Bilateral Economic Impacts of China–Pakistan ... - MDPI
23
Citation: Ali, T.; Huang, J.; Xie, W. Bilateral Economic Impacts of China–Pakistan Economic Corridor. Agriculture 2022, 12, 143. https://doi.org/10.3390/ agriculture12020143 Academic Editor: Piotr Prus Received: 20 December 2021 Accepted: 17 January 2022 Published: 21 January 2022 Publisher’s Note: MDPI stays neutral with regard to jurisdictional claims in published maps and institutional affil- iations. Copyright: © 2022 by the authors. Licensee MDPI, Basel, Switzerland. This article is an open access article distributed under the terms and conditions of the Creative Commons Attribution (CC BY) license (https:// creativecommons.org/licenses/by/ 4.0/). agriculture Article Bilateral Economic Impacts of China–Pakistan Economic Corridor Tariq Ali 1, * , Jikun Huang 2, * and Wei Xie 2 1 School of Economics and Management, Jiangxi Agricultural University, Nanchang 330045, China 2 China Center for Agricultural Policy, School of Advanced Agricultural Sciences, Peking University, Beijing 100871, China; [email protected] * Correspondence: [email protected] (T.A.); [email protected] (J.H.) Abstract: China is making large investments in Pakistan’s transport infrastructure under the China– Pakistan Economic Corridor. This study aims to quantitatively analyze the bilateral impacts of these investments through several policy scenarios in 2025 using a global economic model. Our results show that due to transport infrastructure development, the GDP and welfare of both Pakistan and China will improve, with a maximum of 0.3% and 0.01% increase in GDP, and USD 2.6 billion USD 1.8 billion gains in welfare for Pakistan and China, respectively. Regarding mutual trade, Pakistan’s total and agricultural exports to China will increase in the range of USD 9.6–13.7 billion and USD 4.7– 6.6 billion, respectively. The percentage increase in Pakistan’s net exports of agricultural commodities to China will be higher than that of non-agricultural products. Pakistan will tap into China’s import demand for fresh fruits and vegetables and other perishable food products. Due to changing trade relations, Pakistan’s production structure will undergo slight structural adjustments. For Pakistan’s agriculture sector, the rice and fruit sectors will be top gainers, with 2.1–2.6% and 1.2–1.7% output expansion, respectively. Pakistan will also experience some leveling of income due to a relatively higher increase in wages of unskilled labor than skilled labor. The output of China’s rice sector will drop the most (-1–-1.3%). Overall, the effects on China’s economy are minimal. We suggest several critical policy recommendations in light of our results, especially for Pakistan. Keywords: China; Pakistan; economic; corridor; CGE; agriculture 1. Introduction 1.1. Background The Belt and Road Initiative (BRI) is a global initiative for sharing benefits in trade and other fields. The idea put forward by China in 2013 was to expand the development of Eurasia and create an economic belt along the Silk Road. BRI includes the construction of international economic cooperation corridors and ports and infrastructure projects, investment and financing support to carry out these projects, and other projects related to connectivity for countries along the BRI [1,2]. Regional participation is the highest priority among all the conduits for cooperation under BRI. Pakistan was among the first few countries to pledge cooperation on BRI. To put the mutual will to expand cooperation into practice, during the latter half of 2013, China and Pakistan signed a memorandum of understanding (MoU) on a long-term plan and action plan for the China–Pakistan Economic Corridor (CPEC) [3]. CPEC is a flagship project under BRI and includes constructing a network of highways, railways, energy projects, and special economic zones (SEZs) in Pakistan. The infrastructure projects in Pakistan, stretching over 3000 km from Kashgar in far western China to Islamabad and the port cities of Karachi and Gwadar, near Pakistan’s border with Iran, are expected to strengthen trade ties between China, the Middle East, and Africa. Currently, about 97% of USD 19.4 billion Pakistan–China trade occurs through sea routes [4]. After completing highway networks under CPEC, the bilateral trade will increase Agriculture 2022, 12, 143. https://doi.org/10.3390/agriculture12020143 https://www.mdpi.com/journal/agriculture
-
Upload
khangminh22 -
Category
Documents
-
view
1 -
download
0
Transcript of Bilateral Economic Impacts of China–Pakistan ... - MDPI
�����������������
Citation: Ali, T.; Huang, J.; Xie, W.
Bilateral Economic Impacts of
China–Pakistan Economic Corridor.
Agriculture 2022, 12, 143.
https://doi.org/10.3390/
agriculture12020143
Academic Editor: Piotr Prus
Received: 20 December 2021
Accepted: 17 January 2022
Published: 21 January 2022
Publisher’s Note: MDPI stays neutral
with regard to jurisdictional claims in
published maps and institutional affil-
iations.
Copyright: © 2022 by the authors.
Licensee MDPI, Basel, Switzerland.
This article is an open access article
distributed under the terms and
conditions of the Creative Commons
Attribution (CC BY) license (https://
creativecommons.org/licenses/by/
4.0/).
agriculture
Article
Bilateral Economic Impacts of China–PakistanEconomic CorridorTariq Ali 1,* , Jikun Huang 2,* and Wei Xie 2
1 School of Economics and Management, Jiangxi Agricultural University, Nanchang 330045, China2 China Center for Agricultural Policy, School of Advanced Agricultural Sciences, Peking University,
Beijing 100871, China; [email protected]* Correspondence: [email protected] (T.A.); [email protected] (J.H.)
Abstract: China is making large investments in Pakistan’s transport infrastructure under the China–Pakistan Economic Corridor. This study aims to quantitatively analyze the bilateral impacts of theseinvestments through several policy scenarios in 2025 using a global economic model. Our resultsshow that due to transport infrastructure development, the GDP and welfare of both Pakistan andChina will improve, with a maximum of 0.3% and 0.01% increase in GDP, and USD 2.6 billion USD1.8 billion gains in welfare for Pakistan and China, respectively. Regarding mutual trade, Pakistan’stotal and agricultural exports to China will increase in the range of USD 9.6–13.7 billion and USD 4.7–6.6 billion, respectively. The percentage increase in Pakistan’s net exports of agricultural commoditiesto China will be higher than that of non-agricultural products. Pakistan will tap into China’s importdemand for fresh fruits and vegetables and other perishable food products. Due to changing traderelations, Pakistan’s production structure will undergo slight structural adjustments. For Pakistan’sagriculture sector, the rice and fruit sectors will be top gainers, with 2.1–2.6% and 1.2–1.7% outputexpansion, respectively. Pakistan will also experience some leveling of income due to a relativelyhigher increase in wages of unskilled labor than skilled labor. The output of China’s rice sector willdrop the most (−1–−1.3%). Overall, the effects on China’s economy are minimal. We suggest severalcritical policy recommendations in light of our results, especially for Pakistan.
Keywords: China; Pakistan; economic; corridor; CGE; agriculture
1. Introduction1.1. Background
The Belt and Road Initiative (BRI) is a global initiative for sharing benefits in tradeand other fields. The idea put forward by China in 2013 was to expand the developmentof Eurasia and create an economic belt along the Silk Road. BRI includes the constructionof international economic cooperation corridors and ports and infrastructure projects,investment and financing support to carry out these projects, and other projects related toconnectivity for countries along the BRI [1,2].
Regional participation is the highest priority among all the conduits for cooperationunder BRI. Pakistan was among the first few countries to pledge cooperation on BRI. Toput the mutual will to expand cooperation into practice, during the latter half of 2013,China and Pakistan signed a memorandum of understanding (MoU) on a long-term planand action plan for the China–Pakistan Economic Corridor (CPEC) [3]. CPEC is a flagshipproject under BRI and includes constructing a network of highways, railways, energyprojects, and special economic zones (SEZs) in Pakistan. The infrastructure projects inPakistan, stretching over 3000 km from Kashgar in far western China to Islamabad andthe port cities of Karachi and Gwadar, near Pakistan’s border with Iran, are expected tostrengthen trade ties between China, the Middle East, and Africa.
Currently, about 97% of USD 19.4 billion Pakistan–China trade occurs through searoutes [4]. After completing highway networks under CPEC, the bilateral trade will increase
Agriculture 2022, 12, 143. https://doi.org/10.3390/agriculture12020143 https://www.mdpi.com/journal/agriculture

Agriculture 2022, 12, 143 2 of 23
substantially and shift towards land transportation simultaneously. It is anticipated thatdue to road infrastructure development under CPEC, the distance and time for transportingcommodities between Pakistan and China will decrease considerably compared with thesea route. The reduction promises the high potential for increased trade of agriculturalproducts, especially perishable products such as meats, dairy, and fruits and vegetables.The effects will reverberate beyond China, especially for Pakistan, turning the latter into atransit hub for Central Asia and the regions in the West and South.
However, much of the previous discussion on the possible effects of CPEC on Pakistanand China has been theoretical or speculative and focuses mainly on the impacts of energyand industrial projects [5–13], with little or no attention paid to the effects on agriculture.Most of the studies indicate positive effects on the economies of Pakistan and China,generally without quantitative analysis. Some have pointed toward the broader effectsof CPEC on regional trade, development, and the environment [6,14,15]. There are also afew discussions on the political and defense aspects of CPEC [16,17]. Regardless of theirresults, almost all the studies have used anecdotal discussions to support their conclusionswithout much empirical evidence. No matter how insignificant, the conclusions drawn bythese discussions are much less reliable for both countries’ public and policymakers thanthe outcomes of rigorous quantitative analysis.
To fill this critical gap in the literature, we conducted this study to evaluate the impactsof improved transportation infrastructure under CPEC on Pakistan and China using aglobal economic model (GTAP). These impacts are measured through changes in GDP,welfare, mutual trade, and output for Pakistan and China. As both countries are amongthe top five most populated ones globally and have a high dependence on the agriculturesector for food and employment, we pay particular attention to the effect of CPEC onagriculture in these countries. The specific objectives of the study are: (1) to improve anexisting CGE framework to incorporate the mechanism for reducing transportation costin a context where the existing trade route (sea) will be replaced by a new route (land);(2) to estimate the future impacts of land and sea transport infrastructure improvementsunder CPEC on macro indicators, trade, wages, production of various sectors; (3) to suggestpolicy recommendations for achieving and enhancing the economic gains from theseinfrastructure improvements.
Before moving on to the Section 2, we highlight the context and importance of ourstudy through a short literature review below.
1.2. Literature Review
The significance of infrastructure development has been discussed since the time ofAdam Smith when he described the role of infrastructure in industrial development [18](p. 18). Samuelson [19] and Mundell [20] highlighted the existence of a significant differencein trade cost between traded and non-traded commodities internationally. Many otherstudies have focused on incorporating transportation costs into commodity trade [21–24].Later, several researchers have attempted to explain the relationship between infrastructuredevelopment and different indicators of the economy [25–33].
More recent studies have further highlighted that transport brings better opportunitiesfor the poor, enhances the competitiveness of economies, and improves the global tradein goods and services. For example, farmers can increase and diversify their incomeby connecting to urban markets through rural roads [34]. Agricultural developmentand rural poverty reduction can be significantly facilitated through an efficient ruraltransport system [35]. Practically, a significant portion of the World Bank’s lending was fortransportation infrastructure projects [36].
Literature shows that transport costs can substantially affect domestic products’ mar-ket prices in developing countries. Due to the poor condition of rural roads, transportcosts range between 25% and 33% of domestic products’ wholesale price in former Zaire.Transportation is, on average, 50% less expensive on paved roads than on bad roads [37].There are also several studies on the impact of transportation improvement on the whole
Agriculture 2022, 12, 143 3 of 23
economy and agricultural sectors. The reduction in transportation costs in the 19th centurywas a significant factor in the economic growth of the United States and Europe [38]. Fordeveloping countries, reductions in transport costs allow the reallocation of resourcestowards the more productive units within sectors and permit the more intensive use ofmodern intermediate inputs by the agricultural producing regions [39].
Many impact assessment studies have evaluated the role of infrastructure develop-ment on economic growth and regional development via traditional conduits of improvedconnectivity and accessibility of the markets [40–44]. Improved infrastructure quality hasbeen shown to bring new firms into the market and improve existing firms’ productiv-ity [45]. Improved transport infrastructure can enhance industrial agglomeration and affectoverall market demand. Chen et al. [46] showed that investment in railroad infrastructurein China promoted demand and output that led to overall economic growth in the country.Chen and Haynes [47] used a spatial panel model to find positive spillover effects onregional GDP from land transportation infrastructure in the northeast US.
Several other studies also demonstrated reductions in international trade costs andincreased trade volumes due to improved transportation infrastructure [48–51]. Based ona CGE model analysis, Villafuerte et al. [52] showed that BRI countries’ regional exportswould rise from USD 6.5 billion to USD 135.4 billion due to infrastructure improvements.Western Asian nations and China PR would gain the highest shares in trade and welfaregains. De Soyres et al. [53] found that transport infrastructure development in BRI countrieswould lower shipment time (1.7–3.2%) and trade costs (1.5–2.8%).
Based on the review of literature above, we can conclude that (1) transport infras-tructure plays a critical role in the development of the agriculture sector and the overalleconomy, (2) among various choices, CGE is one of the best approaches to assess the im-pacts of transport infrastructure projects, and (3) there is a dearth of rigorous empiricalstudies to evaluate CPEC infrastructure development on Pakistan and China’s economies.
2. Material and Methods
Economic activity can be severely hampered by poor infrastructure, both domesticallyand across borders. Transport costs in many developing regions of the world are prettyhigh [54]. In addition to the size of the transport infrastructure, this network’s quality cancause high costs for the inland movement of agricultural commodities. For example, poorinfrastructure can account for 60% of predicted transport costs for coastal economies and40% for landlocked economies. The literature shows that land transport infrastructuredevelopment reduces transport costs through several channels. They reduce vehicle op-erating costs, including maintenance, and prolong the asset’s life. They reduce transporttime, resulting in labor cost benefits. They make for better inventory management andimprove overall productivity associated with transport, as the same resource base providesmore services (i.e., the same truck and driver make more deliveries). Economic-wide, bettertransport systems lead to economies of scale, different agglomeration patterns, improvedaccess to markets, network externalities, more efficient market clearing, and enhancedcompetition resulting from improved information flows (see, for example, [55,56]).
2.1. Model Description
Global Trade Analysis Project (GTAP) is a multi-region, multi-sector, computablegeneral equilibrium model with perfect competition and constant returns to scale. Itutilizes economic accounts for 140 countries/regions globally, with detailed industrylinkages. Bilateral trade relations for all countries/regions are also covered. GTAP, similarto many other global CGE models, relies on a fully consistent framework to capture theregional and sectoral interactions. The model provides insights into the underlying dataand mechanisms of economic change resulting from changes in various trade policies andother economic variables. Theoretically, the model derives from optimizing behavior byagents such as firms and households. Households maximize utility, firms minimize costs,and all agents are price takers. The model adopts the fiction of a representative agent:

Agriculture 2022, 12, 143 4 of 23
the household sector consists of infinite identical infinitesimal households, an industryof infinite identical infinitesimal firms so that each sector has the budget shares or input-output ratios of its component agents. Firms produce the final output by combining fiveprimary factors of production (land, natural resources, physical capital, and skilled andunskilled labor) with domestic and imported intermediate inputs. Differentiation betweenimports from different countries is maintained through the ‘Armington elasticities,’ thusallowing a different degree of substitution between imports from various regions andbetween domestic production and imports. In a typical exercise to simulate the effectsof the transport infrastructure improvement, the model endogenously determines all theprices and quantities of marketed commodities, as well as the impacts on incomes andGDP [57]. Figure A3 (in Appendix A) contains the outline of the GTAP model, linkingvarious agents and their respective economic flows.
The advantage of using GTAP, similar to most CGE models, is that it can encapsulatea wide range of outcomes closely resembling the economic theory. The outcomes producedby the model are also in line with our assumption about production possibilities, consumerpreferences, and resource constraints [58]. This consistency with one’s view of the worldhelps us gain critical empirical insights mostly ignored in policy analysis [59]. The modeland accompanying database have been used extensively in policy-related studies, includ-ing the impacts assessment of infrastructure [51,52,60–63], trade policy [64–67], climatechange [68–71], and energy [72–75], among others.
We used a global database containing complete bilateral trade information, transport,and protection linkages with the model. The database (version 9, https://www.gtap.agecon.purdue.edu/databases/v9/v9doco.asp, accessed on 14 January 2022) features the 2011reference year and 140 regions for all 57 GTAP commodities. Before analyzing the impactof infrastructure improvement under CPEC, we aggregated the data (regions, commodities,and endowments) to the desired level, ensuring that important trade and regional partnersand primary agricultural commodities are present in full detail (see Appendix A.2 Table A2for details on regional aggregation).
We also introduced a few critical changes to the database and model for this study.The original database does not contain fruits and vegetables as separate commodities. Weused Horridge’s [76] sector splitting technique to split the existing sector (vegfru) for allthe regions into the vegetables and fruits sectors. The procedure required a considerableamount of data with practical issues of assigning the right shares to the new sectors andbalancing the whole database. The production and consumption shares were obtainedfrom [77], and trade shares are based on [78].
We added a new variable to the model to incorporate the shocks. We aimed to in-troduce a reduction in effective FOB price (p f ob) for Pakistan and China’s mutual traderesulting from the transportation infrastructure development under CPEC. The existing re-lation in the GTAP model [57] between CIF price (pci f ) and p f ob is defined in Equation (1):
pci fi,r,s = p f obi,r,s + transporti,r,s (1)
where transport = transport cost for the trade of i, from r to s; and i is traded commodity; ris exporting region; s is importing region.
However, as the transport infrastructure under CPEC will affect the commodities’export price (pfob) ties, we changed the particular equation referring to the relationshipbetween p f ob and domestic price, as in Equation (2).
p f obi,r,s = pmarketi,r + txi,r + txsi,r,s + ptechi,r,s (2)
wherepmarketi,r = domestic market price of commodity i in region r;txi,r = destination-generic export taxes on commodity i originating from region r;txsi,r,s = destination-specific export taxes on commodity i originating from region r
destined to region s;
Agriculture 2022, 12, 143 5 of 23
ptechi,r,s = a new variable, which captures the reduction in the export price of com-modity i originating from region r destined to region s.
ptechi,r,s mainly acts as an export augmenting technical change for commodity i inregion r. Following the standard procedure, we also added the same (ptechi,r,s) variableinto the equations dealing with export quantities of each commodity i and to the equationdealing with welfare impacts of any changes in prices resulting from policy shocks toptechi,r,s. Our method has the advantage of introducing the change in export prices withoutchanging the government’s tax revenues of region r or s.
2.2. Scenario Design
We established two types of scenarios, i.e., baseline scenario (the business-as-usualscenario without CPEC) and policy scenarios (with CPEC’s infrastructure development).
In the baseline scenario (BL), we portray the global economies in the year 2025. Weaccomplish this by recursively updating the national/regional economies through shocksto capital, labor, and population, which in turn meet the projected growth rates of GDP ineach region. The BL scenario reflects the changes expected to occur in the world economyas closely as possible in the coming years. These changes are grouped into two areas: thefirst deals with each country/region’s macroeconomic forecasts, and the other deals withexpected policy changes. Projections were obtained for the gross domestic product, grossdomestic investment, capital stocks, population, skilled labor, and unskilled labor. Theseprojections were based on the growth estimates of [79].
In order to reflect the changes in trade relations between Pakistan and China due toCPEC’s infrastructure development projects, we designed several policy scenarios. Thesescenarios cover three primary conduits: the increase in trade volume, the decrease in exportprices of the commodities trade through the land, and a decrease in export prices of thecommodities trade through the sea. The three sets of policy scenarios are described below.
2.2.1. Trade Expansion Scenario (TE)
We add a mutual increase in trade between Pakistan and China to the BL scenariounder this scenario. This scenario captures the effects of an increase in trade that was notpossible (between these two neighboring countries) due to the longer sea route and thetime required to transport over that route. The CPEC infrastructure will improve this tradeimmediately by the land route, which was absent in the GTAP database’s baseline. Wehad detailed interview-based discussions with experts and concluded that the export fromPakistan destined for China could increase by 5–10% of Pakistan’s total export ratio toPakistan’s total production in the wake of CPEC land connections. In our model, we haveintroduced a 5% (a modest) shock in the following equation:
QXci1 = QXc
i0 +
(QXt
i0
QOpi0
)× 0.05 (3)
whereQXc
i1 = new level of export of commodity i from Pakistan to China;QXc
i0 = the original level of export of commodity i from Pakistan to China;QOp
i0 = production of export of commodity i in Pakistan;QXt
i0 = original level of the total export of commodity i from Pakistan to all thecountries.
China’s export to Pakistan will also increase, equivalent in value to the increase in
Pakistan’s exports{(
QXti0
QOpi0
)× 0.05
}. However, the increase in China’s export to Pakistan
by each commodity is distributed according to China’s comparative advantage.
Agriculture 2022, 12, 143 6 of 23
2.2.2. Price Reduction Land Scenarios (Land)
This set of scenarios covers the price reduction due to the improved connectivitybetween Pakistan and China (inland and across the borders) with land infrastructureconstruction. We set up price reduction shocks based on a detailed literature reviewand consultation with experts. The literature shows different sizes of reduction in tradecosts due to infrastructure development, e.g., [80] adopted a 50% reduction in railwaytransportation cost; [52] assumed a 25% reduction in road transport cost and 5% reductionin sea transport cost; [60] assumed a 45% lowering of land transport costs. The experts wecontacted opined that transportation cost reductions would be even higher for Pakistanand China due to the shared border. Moreover, the export prices of perishable productswill decrease considerably more than other commodities.
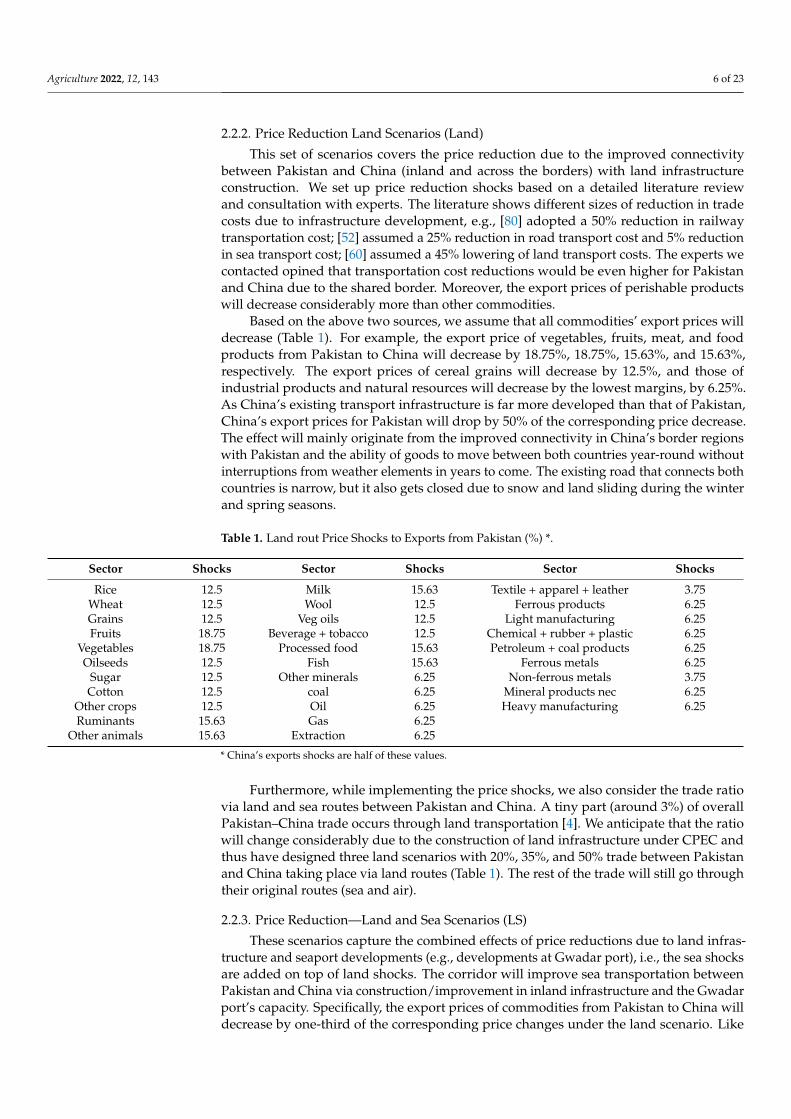
Based on the above two sources, we assume that all commodities’ export prices willdecrease (Table 1). For example, the export price of vegetables, fruits, meat, and foodproducts from Pakistan to China will decrease by 18.75%, 18.75%, 15.63%, and 15.63%,respectively. The export prices of cereal grains will decrease by 12.5%, and those ofindustrial products and natural resources will decrease by the lowest margins, by 6.25%.As China’s existing transport infrastructure is far more developed than that of Pakistan,China’s export prices for Pakistan will drop by 50% of the corresponding price decrease.The effect will mainly originate from the improved connectivity in China’s border regionswith Pakistan and the ability of goods to move between both countries year-round withoutinterruptions from weather elements in years to come. The existing road that connects bothcountries is narrow, but it also gets closed due to snow and land sliding during the winterand spring seasons.
Table 1. Land rout Price Shocks to Exports from Pakistan (%) *.
Sector Shocks Sector Shocks Sector Shocks
Rice 12.5 Milk 15.63 Textile + apparel + leather 3.75Wheat 12.5 Wool 12.5 Ferrous products 6.25Grains 12.5 Veg oils 12.5 Light manufacturing 6.25Fruits 18.75 Beverage + tobacco 12.5 Chemical + rubber + plastic 6.25
Vegetables 18.75 Processed food 15.63 Petroleum + coal products 6.25Oilseeds 12.5 Fish 15.63 Ferrous metals 6.25
Sugar 12.5 Other minerals 6.25 Non-ferrous metals 3.75Cotton 12.5 coal 6.25 Mineral products nec 6.25
Other crops 12.5 Oil 6.25 Heavy manufacturing 6.25Ruminants 15.63 Gas 6.25
Other animals 15.63 Extraction 6.25
* China’s exports shocks are half of these values.
Furthermore, while implementing the price shocks, we also consider the trade ratiovia land and sea routes between Pakistan and China. A tiny part (around 3%) of overallPakistan–China trade occurs through land transportation [4]. We anticipate that the ratiowill change considerably due to the construction of land infrastructure under CPEC andthus have designed three land scenarios with 20%, 35%, and 50% trade between Pakistanand China taking place via land routes (Table 1). The rest of the trade will still go throughtheir original routes (sea and air).
2.2.3. Price Reduction—Land and Sea Scenarios (LS)
These scenarios capture the combined effects of price reductions due to land infras-tructure and seaport developments (e.g., developments at Gwadar port), i.e., the sea shocksare added on top of land shocks. The corridor will improve sea transportation betweenPakistan and China via construction/improvement in inland infrastructure and the Gwadarport’s capacity. Specifically, the export prices of commodities from Pakistan to China willdecrease by one-third of the corresponding price changes under the land scenario. Like
Agriculture 2022, 12, 143 7 of 23
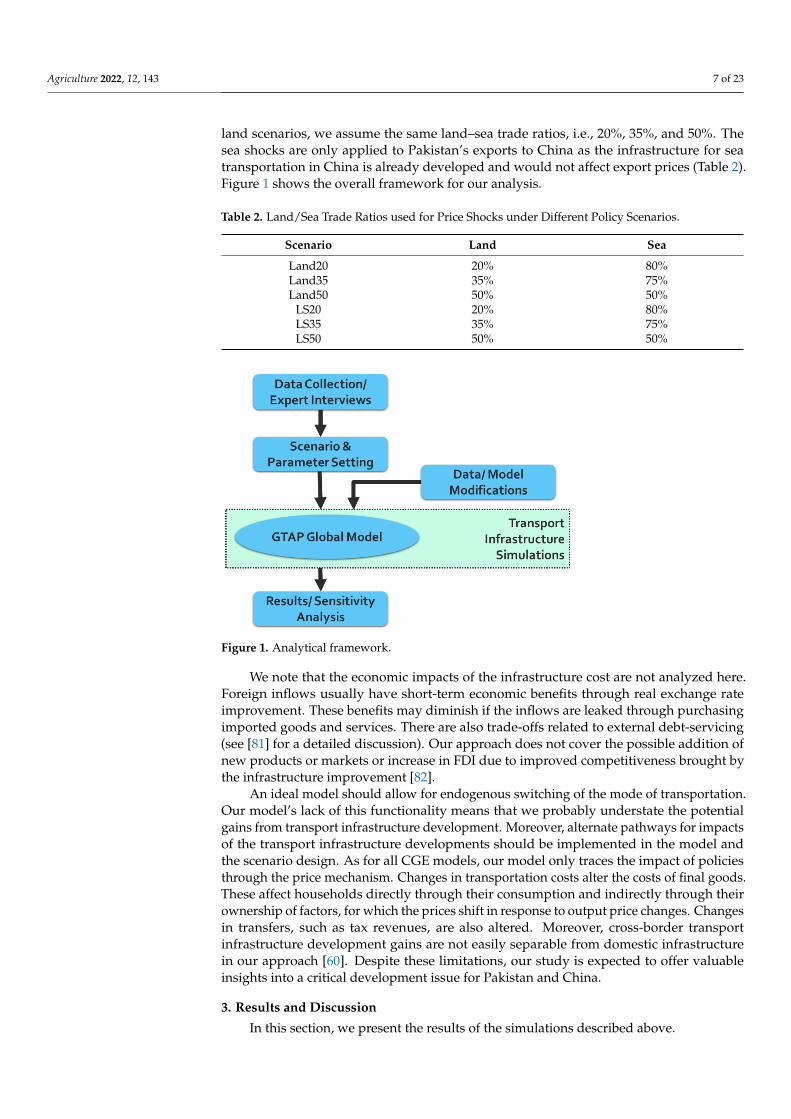
land scenarios, we assume the same land–sea trade ratios, i.e., 20%, 35%, and 50%. Thesea shocks are only applied to Pakistan’s exports to China as the infrastructure for seatransportation in China is already developed and would not affect export prices (Table 2).Figure 1 shows the overall framework for our analysis.
Table 2. Land/Sea Trade Ratios used for Price Shocks under Different Policy Scenarios.
Scenario Land Sea
Land20 20% 80%Land35 35% 75%Land50 50% 50%
LS20 20% 80%LS35 35% 75%LS50 50% 50%
Agriculture 2022, 12, x FOR PEER REVIEW 7 of 24
2.2.3. Price Reduction—Land and Sea Scenarios (LS)
These scenarios capture the combined effects of price reductions due to land infra-
structure and seaport developments (e.g., developments at Gwadar port), i.e., the sea
shocks are added on top of land shocks. The corridor will improve sea transportation be-
tween Pakistan and China via construction/improvement in inland infrastructure and the
Gwadar port’s capacity. Specifically, the export prices of commodities from Pakistan to
China will decrease by one-third of the corresponding price changes under the land sce-
nario. Like land scenarios, we assume the same land–sea trade ratios, i.e., 20%, 35%, and
50%. The sea shocks are only applied to Pakistan’s exports to China as the infrastructure
for sea transportation in China is already developed and would not affect export prices
(Table 2). Figure 1 shows the overall framework for our analysis.
Figure 1. Analytical framework.
We note that the economic impacts of the infrastructure cost are not analyzed here.
Foreign inflows usually have short-term economic benefits through real exchange rate
improvement. These benefits may diminish if the inflows are leaked through purchasing
imported goods and services. There are also trade-offs related to external debt-servicing
(see [81] for a detailed discussion). Our approach does not cover the possible addition of
new products or markets or increase in FDI due to improved competitiveness brought by
the infrastructure improvement [82].
An ideal model should allow for endogenous switching of the mode of transporta-
tion. Our model’s lack of this functionality means that we probably understate the poten-
tial gains from transport infrastructure development. Moreover, alternate pathways for
impacts of the transport infrastructure developments should be implemented in the
model and the scenario design. As for all CGE models, our model only traces the impact
of policies through the price mechanism. Changes in transportation costs alter the costs of
final goods. These affect households directly through their consumption and indirectly
through their ownership of factors, for which the prices shift in response to output price
changes. Changes in transfers, such as tax revenues, are also altered. Moreover, cross-
border transport infrastructure development gains are not easily separable from domestic
infrastructure in our approach [60]. Despite these limitations, our study is expected to
offer valuable insights into a critical development issue for Pakistan and China.
Table 2. Land/Sea Trade Ratios used for Price Shocks under Different Policy Scenarios.
Scenario Land Sea
Land20 20% 80%
Figure 1. Analytical framework.
We note that the economic impacts of the infrastructure cost are not analyzed here.Foreign inflows usually have short-term economic benefits through real exchange rateimprovement. These benefits may diminish if the inflows are leaked through purchasingimported goods and services. There are also trade-offs related to external debt-servicing(see [81] for a detailed discussion). Our approach does not cover the possible addition ofnew products or markets or increase in FDI due to improved competitiveness brought bythe infrastructure improvement [82].
An ideal model should allow for endogenous switching of the mode of transportation.Our model’s lack of this functionality means that we probably understate the potentialgains from transport infrastructure development. Moreover, alternate pathways for impactsof the transport infrastructure developments should be implemented in the model andthe scenario design. As for all CGE models, our model only traces the impact of policiesthrough the price mechanism. Changes in transportation costs alter the costs of final goods.These affect households directly through their consumption and indirectly through theirownership of factors, for which the prices shift in response to output price changes. Changesin transfers, such as tax revenues, are also altered. Moreover, cross-border transportinfrastructure development gains are not easily separable from domestic infrastructurein our approach [60]. Despite these limitations, our study is expected to offer valuableinsights into a critical development issue for Pakistan and China.
3. Results and Discussion
In this section, we present the results of the simulations described above.
Agriculture 2022, 12, 143 8 of 23
3.1. Impacts on Macroeconomic Indicators
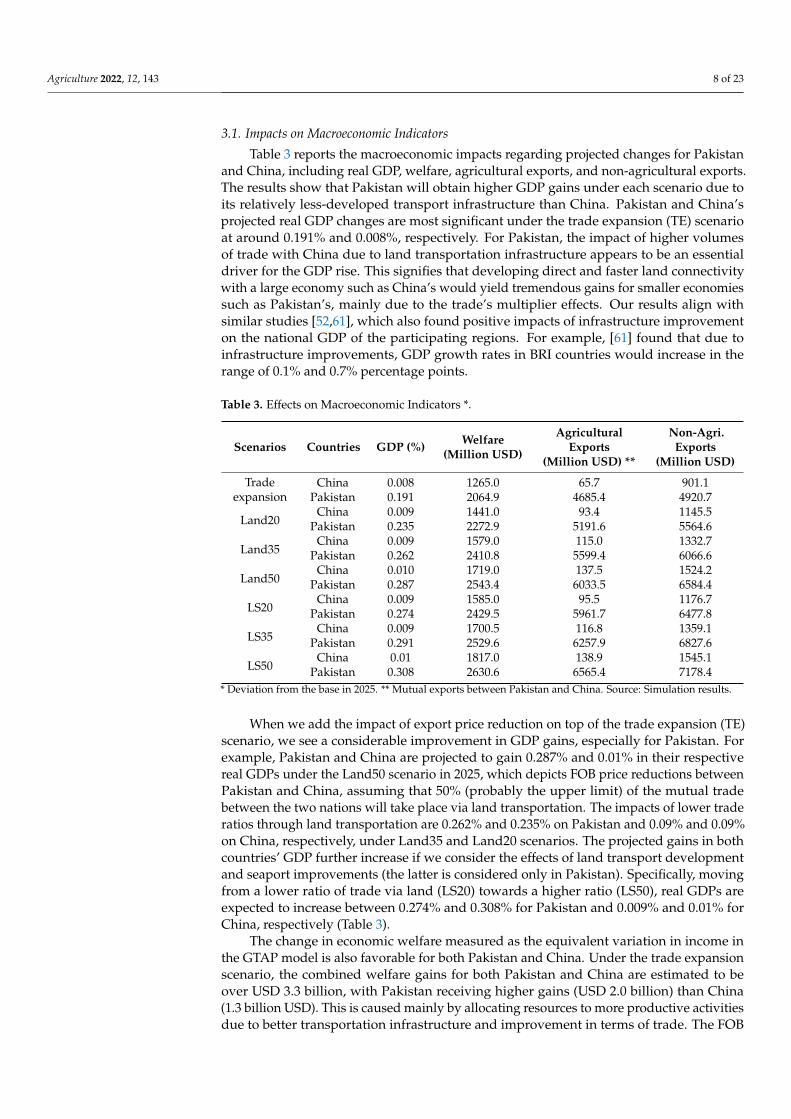
Table 3 reports the macroeconomic impacts regarding projected changes for Pakistanand China, including real GDP, welfare, agricultural exports, and non-agricultural exports.The results show that Pakistan will obtain higher GDP gains under each scenario due toits relatively less-developed transport infrastructure than China. Pakistan and China’sprojected real GDP changes are most significant under the trade expansion (TE) scenarioat around 0.191% and 0.008%, respectively. For Pakistan, the impact of higher volumesof trade with China due to land transportation infrastructure appears to be an essentialdriver for the GDP rise. This signifies that developing direct and faster land connectivitywith a large economy such as China’s would yield tremendous gains for smaller economiessuch as Pakistan’s, mainly due to the trade’s multiplier effects. Our results align withsimilar studies [52,61], which also found positive impacts of infrastructure improvementon the national GDP of the participating regions. For example, [61] found that due toinfrastructure improvements, GDP growth rates in BRI countries would increase in therange of 0.1% and 0.7% percentage points.
Table 3. Effects on Macroeconomic Indicators *.
Scenarios Countries GDP (%) Welfare(Million USD)
AgriculturalExports
(Million USD) **
Non-Agri.Exports
(Million USD)
Tradeexpansion
China 0.008 1265.0 65.7 901.1Pakistan 0.191 2064.9 4685.4 4920.7
Land20China 0.009 1441.0 93.4 1145.5
Pakistan 0.235 2272.9 5191.6 5564.6
Land35China 0.009 1579.0 115.0 1332.7
Pakistan 0.262 2410.8 5599.4 6066.6
Land50China 0.010 1719.0 137.5 1524.2
Pakistan 0.287 2543.4 6033.5 6584.4
LS20China 0.009 1585.0 95.5 1176.7
Pakistan 0.274 2429.5 5961.7 6477.8
LS35China 0.009 1700.5 116.8 1359.1
Pakistan 0.291 2529.6 6257.9 6827.6
LS50China 0.01 1817.0 138.9 1545.1
Pakistan 0.308 2630.6 6565.4 7178.4* Deviation from the base in 2025. ** Mutual exports between Pakistan and China. Source: Simulation results.
When we add the impact of export price reduction on top of the trade expansion (TE)scenario, we see a considerable improvement in GDP gains, especially for Pakistan. Forexample, Pakistan and China are projected to gain 0.287% and 0.01% in their respectivereal GDPs under the Land50 scenario in 2025, which depicts FOB price reductions betweenPakistan and China, assuming that 50% (probably the upper limit) of the mutual tradebetween the two nations will take place via land transportation. The impacts of lower traderatios through land transportation are 0.262% and 0.235% on Pakistan and 0.09% and 0.09%on China, respectively, under Land35 and Land20 scenarios. The projected gains in bothcountries’ GDP further increase if we consider the effects of land transport developmentand seaport improvements (the latter is considered only in Pakistan). Specifically, movingfrom a lower ratio of trade via land (LS20) towards a higher ratio (LS50), real GDPs areexpected to increase between 0.274% and 0.308% for Pakistan and 0.009% and 0.01% forChina, respectively (Table 3).
The change in economic welfare measured as the equivalent variation in income inthe GTAP model is also favorable for both Pakistan and China. Under the trade expansionscenario, the combined welfare gains for both Pakistan and China are estimated to beover USD 3.3 billion, with Pakistan receiving higher gains (USD 2.0 billion) than China(1.3 billion USD). This is caused mainly by allocating resources to more productive activitiesdue to better transportation infrastructure and improvement in terms of trade. The FOB

Agriculture 2022, 12, 143 9 of 23
price reduction scenario with 50% of trade through land transport (Table 3, rows 7–8) willimprove Pakistan and China’s welfare by USD 2.5 billion and USD 1.7 billion, respectively.The welfare impacts of land plus sea routes on Pakistan and China are even more promi-nent. The welfare impacts arising from reductions in trade costs caused by investment ininfrastructure are similar to those found by [61], which also found Pakistan to gain thelargest welfare gains. The study by [63] also found significant positive impacts on China’swelfare under infrastructure investment.
Following the reduction in trade cost, exports between both countries would increaseconsiderably (Table 3). Pakistan, a traditional exporter of agricultural commodities toChina (and the rest of the world), will see a significant increase in its agricultural exportsto China under all scenarios. The same is true for China’s non-agricultural exports toPakistan. For example, Pakistan’s agricultural exports to China will increase by USD6.0 billion and USD 6.5 billion, under Land50 and LS50 scenarios, respectively. Exportsof non-agricultural commodities from China to Pakistan will increase by USD 1.52 billionand USD 1.54 million, under Land50 and LS50 scenarios, respectively. Although theprice of non-agricultural commodities will decrease by much larger margins than theones for agricultural commodities, due to a much higher base level, the exports of non-agricultural commodities from Pakistan to China will increase by relatively higher valuesunder Land50 (USD 6.6 billion) and LS50 (USD 7.2 billion) scenarios. The exports ofagricultural commodities from China to Pakistan will increase by much smaller amountsunder the respective scenarios. These findings highlight the significance of reducingland and sea transportation costs for Pakistan’s economy. Other studies on infrastructuredevelopment [52,60,61] also found similar results on export promotion.
3.2. Effects on Sectoral Output
One of the key benefits of a CGE simulation is that it also generates informationon sectoral changes. Changes in the affected economy’s production structure are criticalbecause they indicate which sectors will be impacted by the proposed policy and indicatethe potential degree of structural adjustment needed in the wake of such policy.
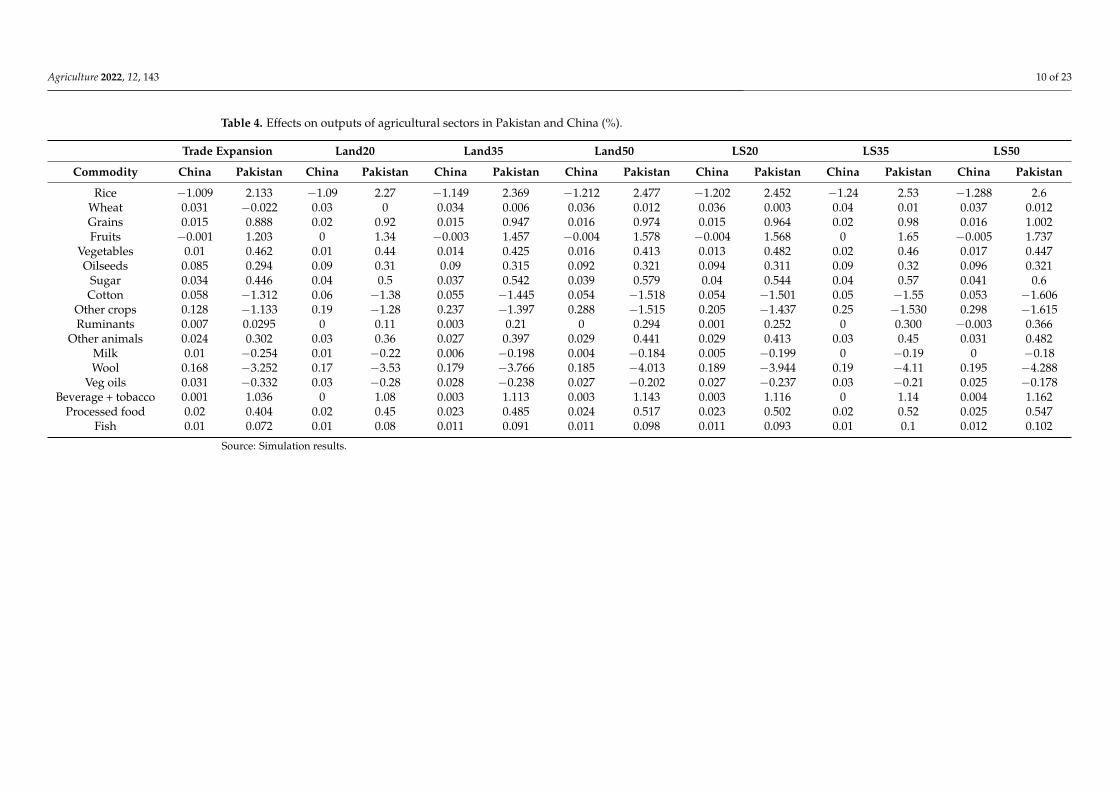
The enhanced trade due to transport infrastructure development in Pakistan andChina under CPEC projects will also cause some changes in the domestic productionstructures, especially for Pakistan (Tables 4 and 5). Regarding agricultural output, underthe trade expansion (TE) scenario, the rice, fruits, and beverage, plus tobacco, sectors ofPakistan will expand by the highest margins of 2.13%, 1.20%, and 1.04%, respectively. Wool(−3.25%), cotton (−1.31%), and other crops (−1.13%) sectors of Pakistan show the highestcontractions under the trade-expansion scenario. Under the same scenario, for China,rice and fruits contract by −1.01% and −0.001%, whereas all the other sectors expand byslight margins (Table 4). In our study, China’s results seem to differ from the findingsof [63], which showed a contraction of agricultural output due to infrastructure investmentunder BRI.
As we move from land only (Land) to land plus sea (LS) scenarios, the impacts onPakistan and China’s sectoral outputs keep increasing, only with a few exceptions. Forexample, Pakistan’s milk and processed oil sectors will contract less under the price reduc-tion scenarios than the TE scenario. This is caused by more exports of these commoditiesfrom Pakistan to China via land routes.
Agriculture 2022, 12, 143 10 of 23
Table 4. Effects on outputs of agricultural sectors in Pakistan and China (%).
Trade Expansion Land20 Land35 Land50 LS20 LS35 LS50
Commodity China Pakistan China Pakistan China Pakistan China Pakistan China Pakistan China Pakistan China Pakistan
Rice −1.009 2.133 −1.09 2.27 −1.149 2.369 −1.212 2.477 −1.202 2.452 −1.24 2.53 −1.288 2.6Wheat 0.031 −0.022 0.03 0 0.034 0.006 0.036 0.012 0.036 0.003 0.04 0.01 0.037 0.012Grains 0.015 0.888 0.02 0.92 0.015 0.947 0.016 0.974 0.015 0.964 0.02 0.98 0.016 1.002Fruits −0.001 1.203 0 1.34 −0.003 1.457 −0.004 1.578 −0.004 1.568 0 1.65 −0.005 1.737
Vegetables 0.01 0.462 0.01 0.44 0.014 0.425 0.016 0.413 0.013 0.482 0.02 0.46 0.017 0.447Oilseeds 0.085 0.294 0.09 0.31 0.09 0.315 0.092 0.321 0.094 0.311 0.09 0.32 0.096 0.321
Sugar 0.034 0.446 0.04 0.5 0.037 0.542 0.039 0.579 0.04 0.544 0.04 0.57 0.041 0.6Cotton 0.058 −1.312 0.06 −1.38 0.055 −1.445 0.054 −1.518 0.054 −1.501 0.05 −1.55 0.053 −1.606
Other crops 0.128 −1.133 0.19 −1.28 0.237 −1.397 0.288 −1.515 0.205 −1.437 0.25 −1.530 0.298 −1.615Ruminants 0.007 0.0295 0 0.11 0.003 0.21 0 0.294 0.001 0.252 0 0.300 −0.003 0.366
Other animals 0.024 0.302 0.03 0.36 0.027 0.397 0.029 0.441 0.029 0.413 0.03 0.45 0.031 0.482Milk 0.01 −0.254 0.01 −0.22 0.006 −0.198 0.004 −0.184 0.005 −0.199 0 −0.19 0 −0.18Wool 0.168 −3.252 0.17 −3.53 0.179 −3.766 0.185 −4.013 0.189 −3.944 0.19 −4.11 0.195 −4.288
Veg oils 0.031 −0.332 0.03 −0.28 0.028 −0.238 0.027 −0.202 0.027 −0.237 0.03 −0.21 0.025 −0.178Beverage + tobacco 0.001 1.036 0 1.08 0.003 1.113 0.003 1.143 0.003 1.116 0 1.14 0.004 1.162
Processed food 0.02 0.404 0.02 0.45 0.023 0.485 0.024 0.517 0.023 0.502 0.02 0.52 0.025 0.547Fish 0.01 0.072 0.01 0.08 0.011 0.091 0.011 0.098 0.011 0.093 0.01 0.1 0.012 0.102
Source: Simulation results.

Agriculture 2022, 12, 143 11 of 23
Table 5. Effects on outputs of non-agricultural sectors in Pakistan and China (%).
Trade Expansion Land20 Land35 Land50 LS20 LS35 LS50
Commodity China Pakistan China Pakistan China Pakistan China Pakistan China Pakistan China Pakistan China Pakistan
Other minerals 0.007 0.242 0.01 0.28 0.007 0.314 0.007 0.345 0.007 0.337 0.01 0.36 0.007 0.38Coal 0.004 −0.007 0 −0.01 0.005 −0.01 0.005 −0.011 0.005 −0.01 0.01 −0.01 0.005 −0.011Oil 0.003 −0.039 0 −0.05 0.003 −0.049 0.003 −0.053 0.003 −0.051 0 −0.05 0.003 −0.057Gas −0.001 −0.021 0 −0.02 −0.001 −0.025 −0.002 −0.027 −0.001 −0.026 0 −0.03 −0.002 −0.029
Extraction 0.01 −0.103 0.01 −0.12 0.011 −0.129 0.011 −0.139 0.012 −0.134 0.01 −0.14 0.012 −0.149Textile + apparel +
leather 0.015 −0.932 0.01 −0.92 0.007 −0.935 0.004 −0.957 0.004 −0.953 0 −0.97 0 −0.995
Ferrous products 0.004 −0.438 0 −0.47 0.004 −0.49 0.003 −0.507 0.004 −0.491 0 −0.5 0.004 −0.509Light
manufacturing 0.011 −0.393 0.01 −0.47 0.012 −0.517 0.013 −0.569 0.013 −0.546 0.01 −0.58 0.014 −0.619
Chemical + rubber+ plastic 0.016 −0.919 0.02 −1.07 0.02 −1.172 0.022 −1.281 0.02 −1.147 0.02 −1.24 0.023 −1.332
Petroleum + coalproducts 0.009 −0.024 0.01 −0.03 0.012 −0.041 0.014 −0.05 0.012 −0.024 0.01 −0.04 0.014 −0.047
Ferrous metals 0.01 −0.073 0.01 0.15 0.011 0.351 0.011 0.561 0.011 0.587 0.01 0.72 0.012 0.862Non-ferrous
metals 0.012 −2.045 0.01 −1.3 0.01 −0.686 0.009 −0.041 0.012 −0.168 0.01 0.27 0.01 0.679
Mineral productsnec 0.011 0.683 0.01 0.62 0.013 0.581 0.014 0.537 0.013 0.671 0.01 0.62 0.015 0.567
Heavymanufacturing 0.01 −1.155 0.01 −1.2 0.009 −1.234 0.009 −1.259 0.011 −1.225 0.01 −1.24 0.01 −1.254
Source: Simulation results.

Agriculture 2022, 12, 143 12 of 23
Table 5 shows that most of the non-agricultural sectors of Pakistan will shrink, andthose of China will expand (though only marginally) under our simulations. Notably,in Pakistan, non-ferrous metals (−2.04%), heavy manufacturing (−1.15%), textile andapparel (−0.93%), and chemical, rubber, and plastic (−0.91%) sectors will undergo themost significant decline in their outputs under the trade expansion scenario. For China, onthe other hand, non-ferrous metals, heavy manufacturing, and chemical, rubber, plasticare the leading sectors showing expansion, though the magnitudes are pretty small. Thescenarios with a reduction in FOB price effects demonstrate that few sectors show differenttrends than those under the trade expansion scenario. For example, when compared withthe trade-expansion scenario, some sectors of Pakistan either start expanding rather thanshrinking (ferrous products), whereas some others, such as non-ferrous metals, at firstshow gradually less decline in output under the land scenarios before they start to expandunder LS scenarios (Table 5). This could be explained by the relatively higher demand ofthese sectors (both for domestic use as intermediate inputs and for exports) due to reducedFOB prices under land plus sea transportation development scenarios. China’s sectoraloutputs do not show any such reversal of sign or size as we move from the trade expansionscenario to the export price reduction scenarios.
Two implications of the changes in sector outputs due to transport infrastructuredevelopment under CPEC are worth mentioning here, viz., structural adjustment costs andchanges in relative wages of skilled and unskilled labor. Overall, the significant outputshifts indicate that transportation infrastructure development would have a moderate tolow impact on production structures and minimal adjustment costs. As expected, theproduction shifts are more pronounced in Pakistan due to its smaller economic size thanChina, and these areas may need some adjustment assistance, albeit probably minimal.
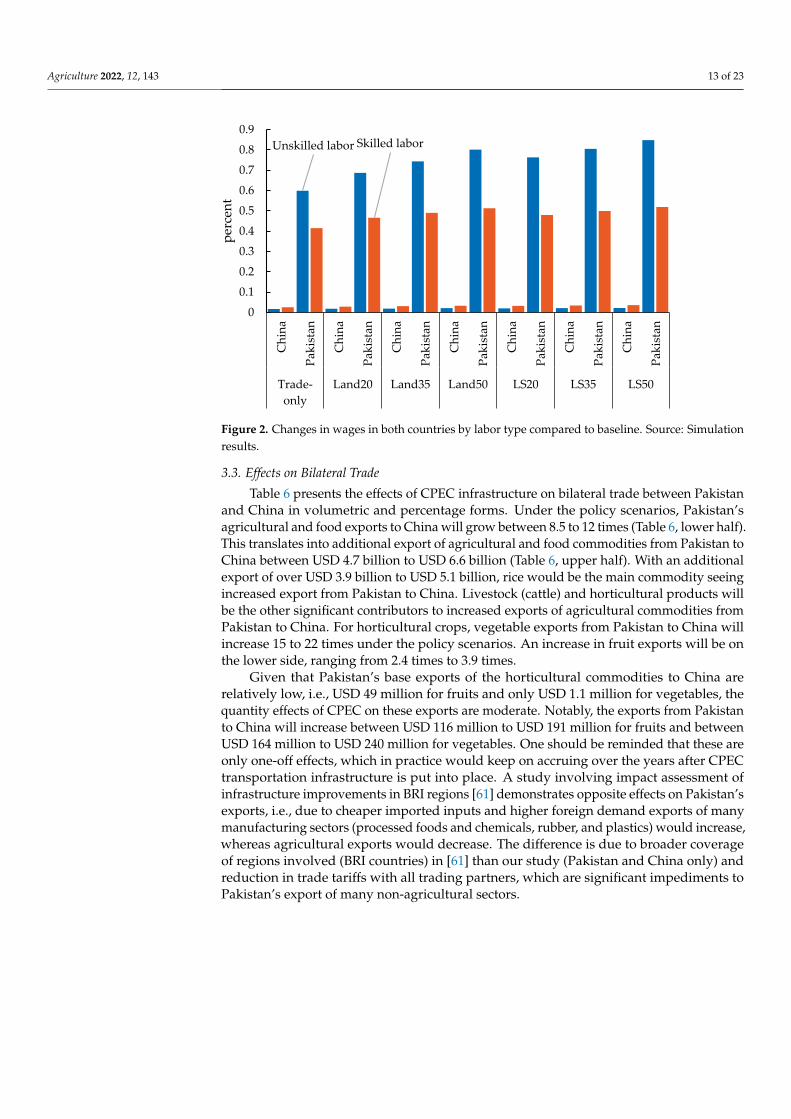
For Pakistan, the sectors with the largest expansion are also the country’s largestproducers and usually have high transport costs. These findings indicate a consolidationtrend for Pakistan. Stone Hertel [60] also showed that some countries would experienceconsolidation due to transport infrastructure projects. For China, on the other hand, thestructural adjustment costs will be negligible. Many of Pakistan’s traditionally export-oriented agricultural sectors expand, which will induce a sizeable rise in the wages for thelabor (most of which are unskilled rural labor) employed in these sectors. Predominantly,the non-agricultural sectors shrink in Pakistan, which will reduce the wage rates forthe labor (mostly skilled or semi-skilled urban labor) of these sectors (Figure 2). Theoverall effects would be a rise in rural residents’ incomes and a slight decline in the urbanpopulation’s incomes. The result could be a decrease in the gap between rural-urbanincomes. Moreover, the rising wages would also encourage labor movement from non-agricultural sectors to agriculture in Pakistan. The wages for unskilled labor in Chinawould rise more than those for skilled labor. Maliszewska [61] also showed that Pakistan’sunskilled wages would rise more relative to skilled. Our results for wage changes inPakistan are opposite [60], which found a higher rise in skilled wages than unskilled wagesin the Greater Mekong Subregion that would benefit the urban households more thanrural ones.
Agriculture 2022, 12, 143 13 of 23Agriculture 2022, 12, x FOR PEER REVIEW 11 of 24
Figure 2. Changes in wages in both countries by labor type compared to baseline. Source: Simula-
tion results.
3.3. Effects on Bilateral Trade
Table 6 presents the effects of CPEC infrastructure on bilateral trade between Paki-
stan and China in volumetric and percentage forms. Under the policy scenarios, Pakistan’s
agricultural and food exports to China will grow between 8.5 to 12 times (Table 6, lower
half). This translates into additional export of agricultural and food commodities from
Pakistan to China between USD 4.7 billion to USD 6.6 billion (Table 6, upper half). With
an additional export of over USD 3.9 billion to USD 5.1 billion, rice would be the main
commodity seeing increased export from Pakistan to China. Livestock (cattle) and horti-
cultural products will be the other significant contributors to increased exports of agricul-
tural commodities from Pakistan to China. For horticultural crops, vegetable exports from
Pakistan to China will increase 15 to 22 times under the policy scenarios. An increase in
fruit exports will be on the lower side, ranging from 2.4 times to 3.9 times.
Given that Pakistan’s base exports of the horticultural commodities to China are rel-
atively low, i.e., USD 49 million for fruits and only USD 1.1 million for vegetables, the
quantity effects of CPEC on these exports are moderate. Notably, the exports from Paki-
stan to China will increase between USD 116 million to USD 191 million for fruits and
between USD 164 million to USD 240 million for vegetables. One should be reminded that
these are only one-off effects, which in practice would keep on accruing over the years
after CPEC transportation infrastructure is put into place. A study involving impact as-
sessment of infrastructure improvements in BRI regions [61] demonstrates opposite ef-
fects on Pakistan’s exports, i.e., due to cheaper imported inputs and higher foreign de-
mand exports of many manufacturing sectors (processed foods and chemicals, rubber,
and plastics) would increase, whereas agricultural exports would decrease. The difference
is due to broader coverage of regions involved (BRI countries) in [61] than our study (Pa-
kistan and China only) and reduction in trade tariffs with all trading partners, which are
significant impediments to Pakistan’s export of many non-agricultural sectors.
3.4. Sensitivity Analysis
The results of most economic simulation models depend highly on the size of shocks
to exogenous variables and choices of exogenous parameters. The shock size may involve
a certain degree of uncertainty, requiring us to assess whether our results depend too
much on shock size. On the other hand, the exogenous parameters may be based on econ-
ometric estimations, and their size may have crucial impacts on model results [83]. For
Unskilled labor Skilled labor
0
0.1
0.2
0.3
0.4
0.5
0.6
0.7
0.8
0.9
Ch
ina
Pak
ista
n
Ch
ina
Pak
ista
n
Ch
ina
Pak
ista
n
Ch
ina
Pak
ista
n
Ch
ina
Pak
ista
n
Ch
ina
Pak
ista
n
Ch
ina
Pak
ista
n
Trade-
only
Land20 Land35 Land50 LS20 LS35 LS50
per
cen
t
Figure 2. Changes in wages in both countries by labor type compared to baseline. Source: Simulationresults.
3.3. Effects on Bilateral Trade
Table 6 presents the effects of CPEC infrastructure on bilateral trade between Pakistanand China in volumetric and percentage forms. Under the policy scenarios, Pakistan’sagricultural and food exports to China will grow between 8.5 to 12 times (Table 6, lower half).This translates into additional export of agricultural and food commodities from Pakistan toChina between USD 4.7 billion to USD 6.6 billion (Table 6, upper half). With an additionalexport of over USD 3.9 billion to USD 5.1 billion, rice would be the main commodity seeingincreased export from Pakistan to China. Livestock (cattle) and horticultural products willbe the other significant contributors to increased exports of agricultural commodities fromPakistan to China. For horticultural crops, vegetable exports from Pakistan to China willincrease 15 to 22 times under the policy scenarios. An increase in fruit exports will be onthe lower side, ranging from 2.4 times to 3.9 times.
Given that Pakistan’s base exports of the horticultural commodities to China arerelatively low, i.e., USD 49 million for fruits and only USD 1.1 million for vegetables, thequantity effects of CPEC on these exports are moderate. Notably, the exports from Pakistanto China will increase between USD 116 million to USD 191 million for fruits and betweenUSD 164 million to USD 240 million for vegetables. One should be reminded that these areonly one-off effects, which in practice would keep on accruing over the years after CPECtransportation infrastructure is put into place. A study involving impact assessment ofinfrastructure improvements in BRI regions [61] demonstrates opposite effects on Pakistan’sexports, i.e., due to cheaper imported inputs and higher foreign demand exports of manymanufacturing sectors (processed foods and chemicals, rubber, and plastics) would increase,whereas agricultural exports would decrease. The difference is due to broader coverageof regions involved (BRI countries) in [61] than our study (Pakistan and China only) andreduction in trade tariffs with all trading partners, which are significant impediments toPakistan’s export of many non-agricultural sectors.

Agriculture 2022, 12, 143 14 of 23
Table 6. Effects on bilateral trade between Pakistan and China.
Agri. + Food Extraction +Mining
LightManufacturing
HeavyManufacturing Service Total
Quantitative Effects (Million USD)
Trade-only Chn-Pak 65.7 12.6 454.0 393.5 41.1 966.8Pak-Chn 4685.4 10.4 2614.9 896.0 1399.4 9606.0
20%FOB + Trade Chn-Pak 93.4 13.1 601.2 488.5 42.7 1238.9Pak-Chn 5191.6 17.3 3068.4 1047.0 1431.8 10,756.1
35%FOB + Trade Chn-Pak 115.0 13.5 714.0 561.3 43.9 1447.7Pak-Chn 5599.4 22.6 3417.0 1169.7 1457.3 11,666.0
50%FOB + Trade Chn-Pak 137.5 14.0 829.4 635.8 45.0 1661.7Pak-Chn 6033.5 27.8 3774.0 1299.6 1482.9 12,617.9
20%LS + Trade Chn-Pak 95.5 13.2 621.2 499.2 43.1 1272.1Pak-Chn 5961.7 27.0 3698.0 1274.6 1478.2 12,439.5
35%LS + Trade Chn-Pak 116.8 13.6 731.0 570.3 44.2 1475.9Pak-Chn 6257.9 30.5 3938.3 1363.7 1495.1 13,085.5
50%LS + Trade Chn-Pak 138.9 14.0 842.8 643.1 45.3 1684.1Pak-Chn 6565.4 34.0 4174.2 1458.4 1511.8 13,743.7
Percentage Effects (%)
Trade-only Chn-Pak 16.5 78.5 10.7 16.0 44.2 13.4Pak-Chn 854.8 2.0 37.4 96.0 142.2 96.1
20%FOB + Trade Chn-Pak 23.5 82.1 14.2 19.8 46.0 17.2Pak-Chn 947.2 3.3 43.8 112.2 145.5 107.6
35%FOB + Trade Chn-Pak 28.9 84.8 16.9 22.8 47.2 20.1Pak-Chn 1021.6 4.3 48.8 125.4 148.1 116.8
50%FOB + Trade Chn-Pak 34.6 87.5 19.6 25.8 48.5 23.1Pak-Chn 1100.8 5.3 53.9 139.3 150.7 126.3
20%LS + Trade Chn-Pak 24.0 82.5 14.7 20.3 46.4 17.7Pak-Chn 1087.7 5.1 52.8 136.6 150.3 124.5
35%LS + Trade Chn-Pak 29.4 85.1 17.3 23.2 47.6 20.5Pak-Chn 1141.7 5.8 56.3 146.1 152.0 131.0
50%LS + Trade Chn-Pak 35.0 87.8 19.9 26.1 48.8 23.4Pak-Chn 1197.8 6.5 59.6 156.3 153.7 137.5
Chn-Pak = China’s exports to Pakistan; Pak-Chn = Pakistan’s exports to China. Source: Simulation results.
3.4. Sensitivity Analysis
The results of most economic simulation models depend highly on the size of shocksto exogenous variables and choices of exogenous parameters. The shock size may involvea certain degree of uncertainty, requiring us to assess whether our results depend too muchon shock size. On the other hand, the exogenous parameters may be based on econometricestimations, and their size may have crucial impacts on model results [83]. For example, theGTAP model has an Armington parameter (ESUBD) determining substitutability betweendomestic and imported commodities. The ‘Systematic Sensitivity Analysis’ (SSA) approachdemonstrates how the analyst makes explicit assumptions regarding the probability dis-tributions of the exogenous model inputs that are not known with certainty. It providesus with statistical estimations of the probability distributions of the model results, such asmeans and variances (discussed in detail in [84]).
To evaluate the reliability of our GTAP-based general equilibrium simulation results,we look at two separate uncertainty checks through SSA: (1) Shocks to variable ‘ptechi,r,s’(Equation (2)), which we vary by ±10% of the values used under the LS50 scenario. Theresults show that the welfare gains for Pakistan and China, a key variable for impact assess-ment, have a high degree of reliability. For Pakistan, the mean value welfare change underSSA is USD 2651.2 million (USD ±21.0 million), which means that our result under SL50(USD 2630.6 million) is very close to the mean value and well within the 95% confidencelimit (USD 2609–2651 million). (2) We also perform a ±10% check on the value of theparameter ‘ESUBD’ used under the LS50 scenario. The mean change in welfare for Pakistanunder this set of SSA results is USD 2633.2 million (USD ±88.9 million), showing thatour outcome (USD 2630.6 million) is almost the same as the mean value under SSA andlies within the 95% confidence interval of USD 2544.3–2733.2 million. The SSA outcomesfurther show that our results are more sensitive to exogenous parameter values than thesize of the shock to the exogenous variable.
For China, on the other hand, the exports of agricultural and food commodities toPakistan will grow by 16–35% under the same policy scenarios (Table 6, lower half). These

Agriculture 2022, 12, 143 15 of 23
changes would be equivalent to volumetric changes between USD 66 million and USD139 million (Table 6, upper half). China’s horticultural exports to Pakistan will increase,with fruits seeing higher growth than vegetables. Specifically, China’s exports to Pakistanwill increase over a range of 18–39% for fruits and 5–22% for vegetables. In value terms,fruit exports from China to Pakistan will increase by USD 4.7 million to USD 10 million,whereas vegetable exports will increase by USD 5.5 million to USD 26 million. Despite thehigher percentage changes in China’s fruit exports to Pakistan, the exports of vegetablesfrom China to Pakistan show a relatively higher quantity increase due to the considerablebaseline export value of vegetables. Our results for China’s export are different fromfindings by [61], which found a higher increase in agricultural exports (7.2% in 2030) underBRI infrastructure improvements than manufacturing sectors (2.7%).
4. Conclusions
This study attempts to explain the relationship between infrastructure development,the overall growth of the economy, and sectoral effects in two neighboring countries withless than optimum trade integration. We use a quantitative method (CGE approach) toassess the likely impacts of the transport infrastructure of CPEC on Pakistan and China,as opposed to the qualitative discussions in earlier studies. Due to the inherent ability totrack the changes in all the interlinking sectors of the economy, the model, in principle, canshow all the first and second-order effects of the transport infrastructure development. Theoverall results are, in many ways, similar to the results of other studies in the field, suchas [52,60,61,85,86].
These investments in transport infrastructure development in Pakistan and China willincrease the mutual trade between Pakistan and China (as a stand-alone effect) and furtherdecrease the export (FOB) prices of commodities traded. Our results confirm that thetransport infrastructure development under CPEC has a non-trivial effect on both countries,especially Pakistan. Pakistan would enjoy relatively higher GDP and welfare gains fromthe transport infrastructure development under CPEC due to higher transport costs thanChina under the baseline. In terms of agricultural trade, our analysis shows that Pakistancan increase its export to China for more perishable commodities such as horticulturalproducts (fruits and vegetable groups). Vegetable exports show far more considerablepotential in percentage terms than fruits. This could be attributed to (1) Pakistan’s highercomparative advantage in vegetable production than fruit production; (2) the openingof land connections would facilitate the vegetable exports by higher margins due to therelative perishability of vegetables compared with fruits. On the other hand, China will seemore substantial increases in exports for fruits (percentage terms) to Pakistan. Thus, bothcountries will expand the mutual horticultural trade, with Pakistan enjoying a better deal.
Reduced regional disparities due to the leveling of wage rates among unskilled andskilled labor should be taken as an impetus to reduce extreme poverty, especially in ruralareas. The policymakers need to make sure that gains from these projects also reach thesmallholder farmers through equitable and inclusive policies. Pakistan needs to adoptand implement policy instruments to improve the productivity and quality of agriculturalproducts to materialize these potential gains in agricultural exports to China fully. Themodernized marketing system is another critical area to capture this export potential.Moreover, the policymakers should address the likely issues of structural adjustment costsand the wage impacts of the transport infrastructure development projects under CPEC.These adjustment costs could be considerably higher in Pakistan (a smaller economy) thanin China.
The realization of potential benefits from transportation development under CPECcould also be affected by several challenges. Pakistan’s security, political, regulatory,and government effectiveness and credit risk ratings could come into play. For instance,Pakistan needs to ensure risk-free security and a stable political environment to implementCPEC projects successfully. Both Pakistan and China are at different levels of economicstability, demanding a more serious effort in coordinating their economic priorities to

Agriculture 2022, 12, 143 16 of 23
implement CPEC projects. Therefore, both countries should engage in an inclusive andhighly consultative process to resolve any remaining issues.
Author Contributions: Conceptualization, T.A. and J.H.; methodology, T.A., J.H. and W.X.; software,T.A. and W.X.; validation, T.A. and J.H.; investigation, T.A. and J.H.; resources, J.H., W.X. and T.A.;writing—original draft preparation, T.A., J.H. and W.X.; writing—review and editing, T.A., W.X. andJ.H.; supervision, J.H.; funding acquisition, J.H. All authors have read and agreed to the publishedversion of the manuscript.
Funding: This research was funded by the National Natural Science Foundation of China (Grant No.71934003; No. 71873009; No. 71922002) and Australian Centre for International Agricultural Research(ACIAR) (Grant No. ADP/2014/043).
Institutional Review Board Statement: Not applicable.
Informed Consent Statement: Not applicable.
Data Availability Statement: The data presented in this study are available on request from thecorresponding author.
Conflicts of Interest: The authors declare no conflict of interest.
Appendix A
Appendix A.1. Pakistan’s Agricultural Trade and CPEC
Appendix A.1.1. Pakistan’s Overall and Agricultural Trade
Pakistan’s foreign trade has increased rapidly during the last two decades (Figure A1a).However, imports have increased much more quickly than exports during the same period.The situation has left Pakistan with an ever-increasing negative trade balance with therest of the world. Specifically, in 2003, Pakistan’s total exports of 11.9 billion USD werecomparable to the total imports of 13 billion USD. However, by 2016, Pakistan’s importshad risen to 47 billion USD, whereas its exports were 20.5 billion USD, resulting in a tradedeficit of 26.5 billion USD. Putting in perspective, Pakistan’s total trade deficit in 2016was over 9.3% of its GDP in that year. Pakistan’s significant import commodities includecrude oil, chemicals, heavy manufacturing, non-ferrous metals, and edible oils. Thesecommodities are mostly imported from (in descending order) China, Saudi Arabia, UnitedArab Emirates, EU, Malaysia, and Kuwait. Pakistan’s major export destinations include (indescending order) the EU, USA, China, Saudi Arabia, UAE, and Afghanistan.
Regarding agricultural trade, the export of the major agricultural commodities fromPakistan has been increasing at a relatively slow pace since the early 2000s (Table A1).Pakistan exports high volumes of cotton (mainly to China), followed by cereals. Theexports of perishable commodities, such as vegetables, fruits, and meat products, have beenrelatively low over the last decade. On the other hand, Pakistan has been importing largevolumes of edible oils (mostly from Malaysia). Cotton, vegetables, and fruits have beenother major agricultural imports by Pakistan. The imports of the agricultural commoditieshave shown a relatively higher rate of increase than the export commodities from Pakistan.
China—the principal partner of CPEC with Pakistan—has emerged as a significanttrading partner with Pakistan in recent years, with trade balance overwhelmingly tiltingtowards China (Figure A1b). Pakistan’s total exports to China have grown steadily overthe last decade. However, the corresponding imports have increased rapidly, so much sothat Pakistan’s total trade deficit with China had grown from USD 1.3 billion in 2003 toover USD 15.5 billion in 2016. The trade deficit with China was about 59% of Pakistan’stotal trade deficit in 2016, which signifies the increasing importance of China’s role inPakistan’s trade.
Pakistan’s trade in agricultural commodities with China has been low and confined toa few commodities (Table A1). On the plus side, Pakistan has maintained a positive tradebalance in agricultural commodities with China during 2003–2016. Cotton is the dominantexport from Pakistan to China, with an average yearly export of USD 500 million to China,

Agriculture 2022, 12, 143 17 of 23
reaching a maximum of USD 2173 million in 2013, before reverting to USD 1034 millionin 2016. Perishable commodities such as meats, fish, vegetables, and fruits are amongPakistan’s top five agricultural exports to China. However, the export of these commoditiesto China has been very low compared with their total exports to the world, and has shownlittle or no increase over the years. Pakistan has been exporting substantial quantities ofprocessed food, animals, and fish to the world; however, China’s share in these exportshas been marginal (Table A1). During 2003–2016, Pakistan’s overall agricultural importsfrom China were much lower than exports but showed a higher range of commodities(Figure A1b and Table A1). Pakistan’s top agricultural imports from China include cotton(increased volumes after 2012), vegetables and fruits (relatively higher average importsover 2003–2016), and other crops (with an increasing trend).
Agriculture 2022, 12, x FOR PEER REVIEW 17 of 24
Institutional Review Board Statement: Not applicable.
Informed Consent Statement: Not applicable.
Data Availability Statement: The data presented in this study are available on request from the
corresponding author.
Conflicts of Interest: The authors declare no conflict of interest.
Appendix A
Appendix A.1. Pakistan’s Agricultural Trade and CPEC
Appendix A.1.1. Pakistan’s Overall and Agricultural Trade
Pakistan’s foreign trade has increased rapidly during the last two decades (Figure
A1a). However, imports have increased much more quickly than exports during the same
period. The situation has left Pakistan with an ever-increasing negative trade balance with
the rest of the world. Specifically, in 2003, Pakistan’s total exports of 11.9 billion USD were
comparable to the total imports of 13 billion USD. However, by 2016, Pakistan’s imports
had risen to 47 billion USD, whereas its exports were 20.5 billion USD, resulting in a trade
deficit of 26.5 billion USD. Putting in perspective, Pakistan’s total trade deficit in 2016 was
over 9.3% of its GDP in that year. Pakistan’s significant import commodities include crude
oil, chemicals, heavy manufacturing, non-ferrous metals, and edible oils. These commod-
ities are mostly imported from (in descending order) China, Saudi Arabia, United Arab
Emirates, EU, Malaysia, and Kuwait. Pakistan’s major export destinations include (in de-
scending order) the EU, USA, China, Saudi Arabia, UAE, and Afghanistan.
Regarding agricultural trade, the export of the major agricultural commodities from
Pakistan has been increasing at a relatively slow pace since the early 2000s (Table A1).
Pakistan exports high volumes of cotton (mainly to China), followed by cereals. The ex-
ports of perishable commodities, such as vegetables, fruits, and meat products, have been
relatively low over the last decade. On the other hand, Pakistan has been importing large
volumes of edible oils (mostly from Malaysia). Cotton, vegetables, and fruits have been
other major agricultural imports by Pakistan. The imports of the agricultural commodities
have shown a relatively higher rate of increase than the export commodities from Paki-
stan.
Export
Import
0
10
20
30
40
50
2003 2006 2009 2012 2015
Tra
de s
ize (
billion U
S$)
a
0
10
20
30
40
50
2003 2006 2009 2012 2015
b
Figure A1. Pakistan’s total exports and imports during 2003–2016. (a), with the world; (b), withChina. Source: Authors used data from [78] to draw this figure.
Table A1. Pakistan’s trade in major agricultural commodities worldwide and with China during2003–2016 (million USD).
Global China
Exports from Pakistan Exports from Pakistan
2003 2007 2010 2013 2016 2003 2007 2010 2013 2016Cotton 2532.7 3439.6 4013.4 5333.8 3497.4 Cotton 453.1 733.8 1087.8 2173.2 1033.8Cereals 667.0 1244.1 2279.6 2181.0 1717.1 Animal Prod. 27.2 71.3 94.1 148.9 85.6Animals 280.4 455.8 596.0 808.6 616.4 Cereals 0.0 0.2 0.4 172.4 250.6
Food 118.8 342.9 370.4 841.7 605.1 Food 0.2 9.9 46.8 53.1 36.3Vege + Fruit 171.5 197.7 373.7 682.9 611.5 Fish 9.6 18.7 37.2 32.5 51.7
Fish 137.9 161.1 231.0 333.1 336.4 Vege + Fruit 1.1 2.3 7.3 42.5 38.7
Imports by Pakistan Imports by Pakistan
Edible oils 999.0 1802.6 2480.2 2458.7 2975.9 Cotton 6.8 18.7 45.5 78.3 249.0Cotton 418.4 981.1 1594.7 1647.0 2419.2 Vege + Fruit 21.0 69.9 125.2 43.8 119.6
Vege + Fruit 294.2 677.7 673.5 1517.0 929.5 Crops other 6.3 33.5 53.8 51.4 144.6Crops other 318.5 917.8 830.9 1046.7 719.3 Food 14.6 31.1 67.5 51.6 75.7
Food 120.7 403.4 624.5 632.7 1282.2 Sugar 12.7 152.1 38.3 23.5 16.7Cereals 225.9 268.2 423.5 412.4 673.0 Cereals 2.5 12.1 38.5 63.5 59.0
Source: Authors’ compilation based on data from [78].

Agriculture 2022, 12, 143 18 of 23
Appendix A.1.2. Core Components of CPEC
CPEC is a regional connectivity framework with potential benefits for Pakistan, China,and the adjoining regions [3]. With a total investment of over USD 62 billion total, thecorridor will run about 3000 km from Kashgar (China) to Gwadar (Pakistan) and is expectedto be completed by 2025–2030. The investment size is unprecedented and is equivalent toover 21% of Pakistan’s GDP in 2016. The connectivity projects are expected to significantlyimprove Pakistan’s domestic transportation and reduce transportation distance from Chinato the Middle East, Africa, and Europe. For China’s foreign trade to the Middle East andEurope, compared with waterborne transportation via the Strait of Malacca, CPEC will savea journey of around 10,000 km. CPEC will also boost Xinjiang’s economic development inChina and North-East Pakistan (Kashgar and Gawadar, respectively) [87–90]. A detaileddescription of the critical components of CPEC is given below.
Road and Rail Projects
CPEC is mainly a corridor of economic activities. In terms of connectivity, the rail andhighway network start from China’s Xinjiang province, enters Pakistan from the Khunjarebborder, and transverses through mountainous regions of northern Pakistan before enteringthe plains of Indus valley connecting with Gwadar port on the Arabian Sea in the south.The highway/rail network of CPEC will run through three main routes (Figure A2):
1. Western Route: (2674 km) connects the Punjab, KPK, and Baluchistan provinces withGwadar.
2. Central Route: (2756 km) passes through KPA, southern Punjab, and Sindh provincesbefore reaching Gwadar.
3. Eastern Route: (2781 km) consists of three motorways (M2, M3, and M5) and connectsmajor industrial hubs of Lahore, Multan, Sukkur, Hyderabad, and Karachi withGwadar Port in Pakistan.
These three routes will cover the construction of new infrastructure and expansion,upgrading, and extension of several existing rail and road tracks [3].
Agriculture 2022, 12, x FOR PEER REVIEW 19 of 24
to significantly improve Pakistan’s domestic transportation and reduce transportation
distance from China to the Middle East, Africa, and Europe. For China’s foreign trade to
the Middle East and Europe, compared with waterborne transportation via the Strait of
Malacca, CPEC will save a journey of around 10,000 km. CPEC will also boost Xinjiang’s
economic development in China and North-East Pakistan (Kashgar and Gawadar, respec-
tively) [87–90]. A detailed description of the critical components of CPEC is given below.
Road and Rail Projects
CPEC is mainly a corridor of economic activities. In terms of connectivity, the rail
and highway network start from China’s Xinjiang province, enters Pakistan from the
Khunjareb border, and transverses through mountainous regions of northern Pakistan be-
fore entering the plains of Indus valley connecting with Gwadar port on the Arabian Sea
in the south. The highway/rail network of CPEC will run through three main routes (Fig-
ure A2):
1. Western Route: (2674 km) connects the Punjab, KPK, and Baluchistan provinces
with Gwadar.
2. Central Route: (2756 km) passes through KPA, southern Punjab, and Sindh
provinces before reaching Gwadar.
3. Eastern Route: (2781 km) consists of three motorways (M2, M3, and M5) and
connects major industrial hubs of Lahore, Multan, Sukkur, Hyderabad, and Karachi
with Gwadar Port in Pakistan.
These three routes will cover the construction of new infrastructure and expansion,
upgrading, and extension of several existing rail and road tracks [3].
Figure A2. Highway network of CPEC. Source: Based on information from [3].
Energy Projects
More than 50% of the CPEC’s investment will be allocated to 23 energy projects
costing around USD 34 billion that can help overcome the chronic electricity shortage in
Pakistan. The projects will increase power production by 16,695 MW for Pakistan. There
Figure A2. Highway network of CPEC. Source: Based on information from [3].
Agriculture 2022, 12, 143 19 of 23
Energy Projects
More than 50% of the CPEC’s investment will be allocated to 23 energy projectscosting around USD 34 billion that can help overcome the chronic electricity shortage inPakistan. The projects will increase power production by 16,695 MW for Pakistan. Thereare 15 priority projects, costing USD 21.6 billion with a capacity of 10,350 MW, and werescheduled to be completed by mid-2018. Another eight projects costing USD 12 billion willimprove power production capacity by 6345 MW later. Most energy projects will produceelectricity using coal, whereas others include hydropower, nuclear, wind, and solar powerstations. The electricity transmission and distribution system will also be improved andexpanded under CPEC [3].
Other Components of CPEC
More than nine special economic zones (SEZ) will be developed to improve the eco-nomic viability and penetration of the corridor. These SEZs will produce specific productsand services based on the availability of local raw materials and other geographic factors.The highway and rail network will provide an efficient transportation system having posi-tive multiplier effects via better accessibility to the markets, additional investments, jobcreation, technology transfer, boosting economic activity, social and economic development.These SEZs will further boost bilateral economic ties and expand trade cooperation betweenChina and Pakistan.
Along with the projects mentioned above, the deep-sea port at Gwadar will also beconstructed and operated under CPEC. Additionally, CPEC also covers the constructionof several mass-transit projects for several metropolitans of Pakistan. Both countries havealso pledged to increase people-to-people exchanges, enhance the transfer of knowledgein different sectors primarily through experts from China delivering training to humanresources in Pakistan, and transfer of knowledge in the education sector by establishing aconsortium of business schools [3].
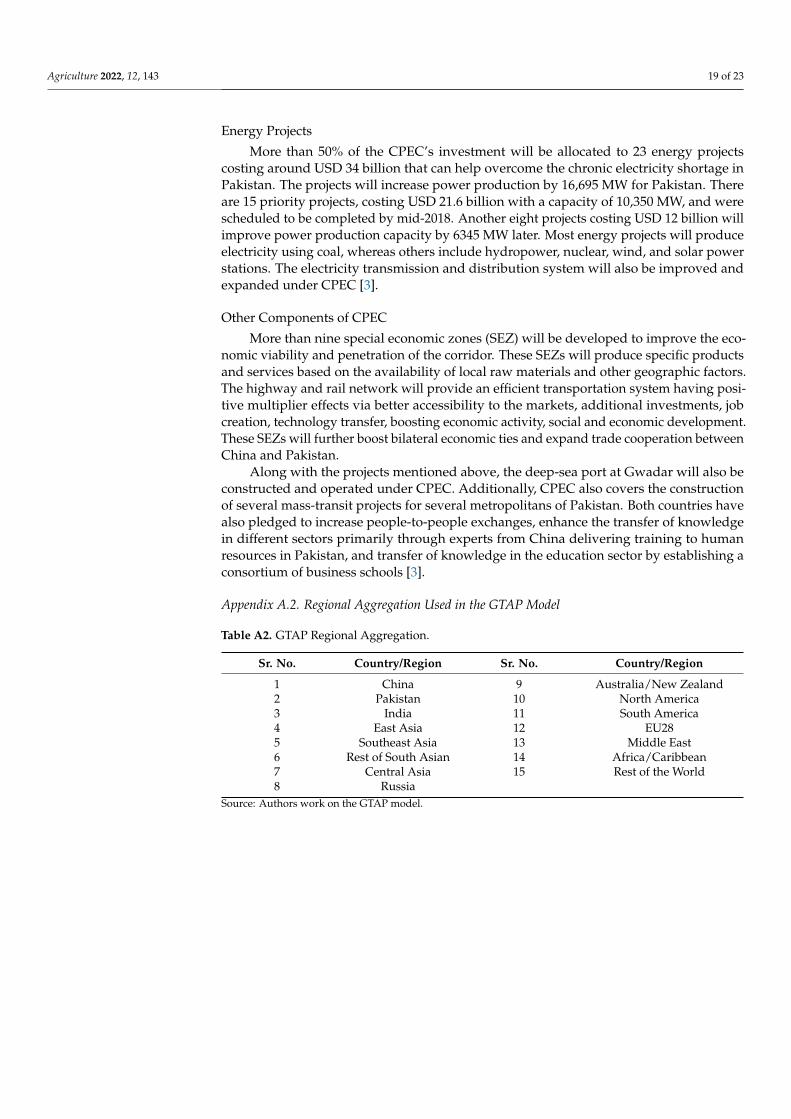
Appendix A.2. Regional Aggregation Used in the GTAP Model
Table A2. GTAP Regional Aggregation.
Sr. No. Country/Region Sr. No. Country/Region
1 China 9 Australia/New Zealand2 Pakistan 10 North America3 India 11 South America4 East Asia 12 EU285 Southeast Asia 13 Middle East6 Rest of South Asian 14 Africa/Caribbean7 Central Asia 15 Rest of the World8 Russia
Source: Authors work on the GTAP model.

Agriculture 2022, 12, 143 20 of 23Agriculture 2022, 12, x FOR PEER REVIEW 21 of 24
Figure A3. Outline of GTAP model. Source: Based on [91].
References
1. State Council of the People’s Republic of China. Full Text: Action Plan on the Belt and Road Initiative; State Council of the People’s
Republic of China: Beijing, China, 2015. Available online: http://english.gov.cn/archive/publications/2015/03/30/con-
tent_281475080249035.htm (accessed on 10 February 2021).
2. State Council of the People’s Republic of China. Silk Road Fund’s 1st Investment Makes China’s Words into Practice; State Council
of the People’s Republic of China: Beijing, China, 2015. Available online: http://english.gov.cn/news/top_news/2015/04/21/con-
tent_281475093213830.htm (accessed on 10 February 2021).
3. GoP (Government of Pakistan). CPEC Secretariat: Ministry of Planning, Development & Reform, Pak-Secretariat: Islamabad,
Pakistan. 2017. Available online: http://www.cpec.gov.pk/faqs (accessed on 10 October 2017).
4. KCCI. China Pakistan Economic Corridor: Is Pakistan Ready to Surf the Tide? Infonalysis; Research and Development Cell; Karachi
Chamber of Commerce and Industry: Karachi, Pakistan, 2017. Available online: http://www.kcci.com.pk/research/wp-con-
tent/uploads/2017/07/CPEC-Is-Pakistan-ready-to-surf-the-tide-Feb-2017.pdf (accessed on 10 October 2017).
5. Ali, Y.; Rasheed, Z.; Muhammad, N.; Yousaf, S. Energy optimization in the wake of China Pakistan Economic Corridor (CPEC).
J. Control. Dec. 2018, 5, 129–147. https://doi.org/10.1080/23307706.2017.1353929.
6. Ali, M. Pakistan’s quest for coal-based energy under the China-Pakistan Economic Corridor (CPEC): Implications for the envi-
ronment. Environ. Sci. Pollut. R. 2018, 25, 31935–31937. https://doi.org/10.1007/s11356-018-3326-y.
7. Garlick, J. Deconstructing the China–Pakistan economic corridor: Pipe dreams versus geopolitical realities. J. Contemp. China
2018, 27, 519–533.
8. Raza, H.; Osama, A.; Hena, S. China Pakistan Economic Corridor (CPEC): The Counter Balancer of Momentous Energy Crisis
in Pakistan. Adv. Soc. Sci Res. J. 2018, 5, 172–180.
9. Ahmed, Z.S. Impact of the China–Pakistan Economic Corridor on nation-building in Pakistan. J. Contemp. China 2019, 28, 400–
414.
10. Alam, K.M.; Li, X.; Baig, S. Impact of transport cost and travel time on trade under China-Pakistan economic corridor (CPEC).
J. Adv. Transp. 2019, 2019, 7178507.
11. Khan, S.; Liu, G. The China–Pakistan Economic Corridor (CPEC): Challenges and prospects. Area Dev. Policy 2019, 4, 466–473.
12. Ali, M. China–Pakistan economic corridor: Prospects and challenges. Contemp. S. Asia 2020, 28, 100–112.
13. Kanwal, S.; Pitafi, A.H.; Rasheed, M.I.; Pitafi, A.; Iqbal, J. Assessment of residents’ perceptions and support toward development
projects: A study of the China–Pakistan Economic Corridor. Soc. Sci. J. 2020. https://doi.org/10.1016/j.soscij.2019.08.001
14. Boyce, T. The China-Pakistan Economic Corridor: Trade Security and Regional Implications; Sandia Report SAND2017-0207; Sandia
National Laboratories: Albuquerque, NM, USA, 2017.
15. Zhang, R.; Andam, F.; Shi, G. Environmental and social risk evaluation of overseas investment under the China-Pakistan Eco-
nomic Corridor. Environ. Monit. Assess. 2017, 189, 253. https://doi.org/10.1007/s10661-017-5967-6.
16. Hameed, M. The politics of the China―Pakistan Economic Corridor. Palgrave Commun. 2018, 4, 64.
https://doi.org/10.1057/s41599-018-0115-7.
17. Basit, S.H. Terrorizing the CPEC: Managing transnational militancy in China–Pakistan relations. Pac. Rev. 2019, 32, 694–724.
https://doi.org/10.1080/09512748.2018.1516694.
18. Smith, A. The Wealth of Nations [1776]; Random House, Inc.: New York, NY, USA, 1937; p. 18.
19. Samuelson, P.A. The transfer problem and transport costs, II: Analysis of effects of trade impediments. Econ. J. 1954, 64, 264–
289.
Figure A3. Outline of GTAP model. Source: Based on [91].
References1. State Council of the People’s Republic of China. Full Text: Action Plan on the Belt and Road Initiative; State Council of the People’s
Republic of China: Beijing, China, 2015. Available online: http://english.gov.cn/archive/publications/2015/03/30/content_281475080249035.htm (accessed on 10 February 2021).
2. State Council of the People’s Republic of China. Silk Road Fund’s 1st Investment Makes China’s Words into Practice; State Councilof the People’s Republic of China: Beijing, China, 2015. Available online: http://english.gov.cn/news/top_news/2015/04/21/content_281475093213830.htm (accessed on 10 February 2021).
3. GoP (Government of Pakistan). CPEC Secretariat: Ministry of Planning, Development & Reform, Pak-Secretariat: Islamabad,Pakistan. 2017. Available online: http://www.cpec.gov.pk/faqs (accessed on 10 October 2017).
4. KCCI. China Pakistan Economic Corridor: Is Pakistan Ready to Surf the Tide? Infonalysis; Research and Development Cell; KarachiChamber of Commerce and Industry: Karachi, Pakistan, 2017. Available online: http://www.kcci.com.pk/research/wp-content/uploads/2017/07/CPEC-Is-Pakistan-ready-to-surf-the-tide-Feb-2017.pdf (accessed on 10 October 2017).
5. Ali, Y.; Rasheed, Z.; Muhammad, N.; Yousaf, S. Energy optimization in the wake of China Pakistan Economic Corridor (CPEC). J.Control. Dec. 2018, 5, 129–147. [CrossRef]
6. Ali, M. Pakistan’s quest for coal-based energy under the China-Pakistan Economic Corridor (CPEC): Implications for theenvironment. Environ. Sci. Pollut. R. 2018, 25, 31935–31937. [CrossRef]
7. Garlick, J. Deconstructing the China–Pakistan economic corridor: Pipe dreams versus geopolitical realities. J. Contemp. China2018, 27, 519–533. [CrossRef]
8. Raza, H.; Osama, A.; Hena, S. China Pakistan Economic Corridor (CPEC): The Counter Balancer of Momentous Energy Crisis inPakistan. Adv. Soc. Sci. Res. J. 2018, 5, 172–180.
9. Ahmed, Z.S. Impact of the China–Pakistan Economic Corridor on nation-building in Pakistan. J. Contemp. China 2019, 28, 400–414.[CrossRef]
10. Alam, K.M.; Li, X.; Baig, S. Impact of transport cost and travel time on trade under China-Pakistan economic corridor (CPEC). J.Adv. Transp. 2019, 2019, 7178507. [CrossRef]
11. Khan, S.; Liu, G. The China–Pakistan Economic Corridor (CPEC): Challenges and prospects. Area Dev. Policy 2019, 4, 466–473.[CrossRef]
12. Ali, M. China–Pakistan economic corridor: Prospects and challenges. Contemp. South Asia 2020, 28, 100–112. [CrossRef]13. Kanwal, S.; Pitafi, A.H.; Rasheed, M.I.; Pitafi, A.; Iqbal, J. Assessment of residents’ perceptions and support toward development
projects: A study of the China–Pakistan Economic Corridor. Soc. Sci. J. 2020. [CrossRef]14. Boyce, T. The China-Pakistan Economic Corridor: Trade Security and Regional Implications; Sandia Report SAND2017-0207; Sandia
National Laboratories: Albuquerque, NM, USA, 2017.15. Zhang, R.; Andam, F.; Shi, G. Environmental and social risk evaluation of overseas investment under the China-Pakistan
Economic Corridor. Environ. Monit. Assess. 2017, 189, 253. [CrossRef] [PubMed]16. Hameed, M. The politics of the China—Pakistan Economic Corridor. Palgrave Commun. 2018, 4, 64. [CrossRef]17. Basit, S.H. Terrorizing the CPEC: Managing transnational militancy in China–Pakistan relations. Pac. Rev. 2019, 32, 694–724.
[CrossRef]18. Smith, A. The Wealth of Nations [1776]; Random House, Inc.: New York, NY, USA, 1937; p. 18.19. Samuelson, P.A. The transfer problem and transport costs, II: Analysis of effects of trade impediments. Econ. J. 1954, 64, 264–289.
[CrossRef]
Agriculture 2022, 12, 143 21 of 23
20. Mundell, R.A. Transport costs in international trade theory. Can. J. Econ. Political Sci. 1957, 23, 331–348. [CrossRef]21. Herberg, H. Economic Growth and International Trade with Transport Costs. J. Inst. Theor. Econ. 1970, 126, 577–600.22. Falvey, R.E. Transport Costs in the Pure Theory of International Trade. Econ. J. 1976, 86, 536–550. [CrossRef]23. Casas, F.R. International trade with produced transport services. Oxf. Econ. Pap. 1983, 35, 89–109. [CrossRef]24. Bougheas, S.; Demetriades, P.O.; Morgenroth, E.L. Infrastructure, transport costs and trade. J. Int. Econ. 1999, 47, 169–189.
[CrossRef]25. Aschauer, D.A. Does public capital crowd out private capital? J. Monet. Econ. 1989, 24, 178–235. [CrossRef]26. Aschauer, D.A. Is public expenditure productive? J. Monet. Econ. 1989, 23, 177–200. [CrossRef]27. Aschauer, D.A. Public investment and productivity growth in the group of seven. Econ. Perspec. 1989, 13, 17–25.28. Munnell, A.H. Policy watch, infrastructure investment and economic growth. J. Econ. Perspec. 1992, 6, 189–198. [CrossRef]29. Holtz-Eakin, D.; Schwartz, A.E. Infrastructure in a structural model of economic growth. Reg. Sci. Urban Econ. 1995, 25, 131–151.
[CrossRef]30. Calderon, C.A.; Servén, L. Trends in Infrastructure in Latin America, 1980–2001; Working Paper WPS3401; The World Bank Group:
Washington, DC, USA, 2004. Available online: https://openknowledge.worldbank.org/bitstream/handle/10986/14129/WPS3401.pdf?sequence=1 (accessed on 10 April 2021).
31. Canning, D.; Bennathan, E. The Rate of Return to Transportation Infrastructure. In European Conference of Ministers of Transport(ECMT), Transport Infrastructure Investment and Economic Productivity; ECMT Round Tables, No. 132; OECD Publishing: Paris,France, 2007. [CrossRef]
32. Crafts, N. Transport infrastructure investment: Implications for growth and productivity. Oxf. Rev. Econ. Policy 2009, 25, 327–343.[CrossRef]
33. Sahoo, P.; Dash, R.K. Infrastructure development and economic growth in India. J. Asia Pac. Econ. 2009, 14, 351–365. [CrossRef]34. World Bank. To Pave or Not to Pave: Developing a Framework for Systematic Decision-Making in the Choice of Paving Technologies for
Rural Roads; Mobility and Transport Connectivity Series; The World Bank Group: Washington, DC, USA, 2021. Available online:https://elibrary.worldbank.org/doi/epdf/10.1596/35163 (accessed on 7 January 2022).
35. Department for International Development (DFID). SLoCaT. In Rural Transport and Agriculture Factsheet; ReCAP: London,UK, 2015. Available online: https://assets.publishing.service.gov.uk/media/57a0898840f0b652dd000284/61280-SloCat_2015_RuralTransportandAgriculture_FactSheet_ReCAP_Eng_v150910.pdf (accessed on 8 January 2022).
36. Amos, P. Safe, Clean, and Affordable . . . Transport for Development: The World Bank Group’s Transport Business Strategy for 2008–2012; Transport Business Strategy No. 46792; The World Bank Group: Washington, DC, USA, 2008. Available online: https://documents1.worldbank.org/curated/en/440361468175472897/pdf/467920WP0Box331usiness1Strategy1web.pdf (accessed on7 January 2022).
37. Minten, B.; Kyle, S. The effect of distance and road quality on food collection, marketing margins, and traders’ wages: Evidencefrom the former Zaire. J. Dev. Econ. 1999, 60, 467–495. [CrossRef]
38. North, D. Ocean freight rates and economic development 1730–1913. J. Econ. Hist 1958, 18, 537–555. [CrossRef]39. Adamopoulos, T. Transportation Costs, Agricultural Productivity, And Cross-Country Income Differences. Int. Econ. Rev. 2011,
52, 489–521. [CrossRef]40. Lall, S.V. Infrastructure and regional growth, growth dynamics and policy relevance for India. Ann. Reg. Sci. 2007, 41, 581–599.
[CrossRef]41. Patuelli, R.; Reggiani, A.; Nijkamp, P.; Bade, F.J. The evolution of the commuting network in Germany: Spatial and connectivity
patterns. J. Transp. Land Use 2010, 2, 5–37. [CrossRef]42. Francois, J.; Manchin, M. Institutions, infrastructure, and trade. World Dev. 2013, 46, 165–175. [CrossRef]43. Parthasarathi, P. Network structure and metropolitan mobility. J. Transp. Land Use 2014, 7, 153–170. [CrossRef]44. Chong, Z.; Qin, C.; Chen, Z. Estimating the economic benefits of high-speed rail in China: A new perspective from the connectivity
improvement. J. Transp. Land Use 2019, 12, 287–302. [CrossRef]45. Puga, D. European regional policies in light of recent location theories. J. Econ. Geogr. 2002, 2, 373–406. [CrossRef]46. Chen, Z.; Xue, J.; Rose, A.; Haynes, K. Impact of high-speed rail investment on the economy and environment in China: A
dynamic CGE analysis. Transp. Res. Part A Policy Pract. 2016, 92, 232–245. [CrossRef]47. Chen, Z.; Haynes, K.E. Public surface transportation and regional output: A spatial panel approach. Pap. Reg. Sci. 2015, 94,
727–751. [CrossRef]48. Limao, N.; Venables, A.J. Infrastructure, geographical disadvantage, transport costs and trade. World Bank Econ. Rev. 2001, 15,
451–479. [CrossRef]49. Brooks, D.H. Infrastructure’s role in lowering Asia’s trade costs. In Infrastructure’s Role in Lowering Asia’s Trade Costs: Building for
Trade; Brooks, D.H., Hummels, D., Eds.; Edward Elgar Publishing: Cheltenham, UK, 2009; pp. 1–17.50. Donaldson, D. Railroads of the Raj: Estimating the impact of transportation infrastructure. Am. Econ. Rev. 2018, 108, 899–934.
[CrossRef]51. De Soyres, F.; Mulabdic, A.; Ruta, M. Common transport infrastructure: A quantitative model and estimates from the Belt and
Road Initiative. J. Dev. Econ. 2020, 143, 102415. [CrossRef]
Agriculture 2022, 12, 143 22 of 23
52. Villafuerte, J.; Corong, E.; Zhuang, J. Trade and Growth Impact of One Belt, One Road on Asia and the World. In Proceedingsof the 19th Annual Conference on Global Economic Analysis, Washington, DC, USA, 15–17 June 2016. Available online:https://www.gtap.agecon.purdue.edu/resources/download/8280.pdf (accessed on 6 January 2022).
53. De Soyres, F.; Mulabdic, A.; Murray, S.; Rocha, N.; Ruta, M. How much will the Belt and Road Initiative reduce trade costs? Int.Econ. 2019, 159, 151–164. [CrossRef]
54. Henderson, J.V.; Shalizi, Z.; Venables, A. Geography and Development. J. Econ. Geogr. 2001, 1, 81–106. [CrossRef]55. Jensen, R. The Digital Provide: Information (Technology), Market Performance, and Welfare in the South Indian Fisheries Sector.
Q. J. Econ. 2007, 3, 879–924. [CrossRef]56. Hulten, C.R.; Bennathan, E.; Srinivasan, S. Infrastructure, Externalities, and Economic Development: A Study of Indian Manufacturing
Industry; The World Bank Group: Washington, DC, USA, 2005.57. Corong, L.E.; Hertel, T.W.; Mcdougall, R.A.; Tsigas, M.E.; Van Der Mensbrugghe, D. The Standard GTAP Model, Version 7. J. Glob.
Econ. Anal. 2017, 2, 1–119.58. Berry, S. Biofuels policy and the empirical inputs to GTAP models. In California Air Resources Board (CARB) Expert Workgroup
Working Paper; Yale University Department of Economics & Cowles Foundation and NBER: Sacramento, CA, USA, 2011. Availableonline: https://citeseerx.ist.psu.edu/viewdoc/download?doi=10.1.1.348.5774&rep=rep1&type=pdf (accessed on 6 January 2022).
59. Hertel, T.; Keeney, R.; Ivanic, M.; Alan Winters, L. Distributional effects of WTO agricultural reforms in rich and poor countries.Econ. Policy 2007, 22, 289–337. [CrossRef]
60. Stone, S.; Strutt, A.; Hertel, T. Socio-Economic Impact of Regional Transport Infrastructure in the Greater Mekong Subregion.In Infrastructure for Asian Connectivity; Bhattacharya, B., Kawai, M., Nag, R., Eds.; Edward Elgar Publishing: Cheltenham, UK;Northampton, MA, USA, 2012; pp. 95–138.
61. Maliszewska, M.; van der Mensbrugghe, D. The Belt and Road Initiative: Economic, Poverty and Environmental Impacts; WorldBank Policy Research Working Paper No. 8814; The World Bank Group: Washington, DC, USA, 2019. Available online:https://ssrn.com/abstract=3369989 (accessed on 6 January 2022).
62. Rana, P.B.; Ji, X. Potential Economic Impact of BRI: A Computable General Equilibrium Analysis. In China’s Belt and Road Initiative;Palgrave Macmillan: Singapore, 2020; pp. 47–69. [CrossRef]
63. Yang, G.; Huang, X.; Huang, J.; Chen, H. Assessment of the effects of infrastructure investment under the belt and road initiative.China Econ. Rev. 2020, 60, 101418. [CrossRef]
64. Dixon, P.B.; Rimmer, M.; Tran, N. Creating a disaggregated CGE model for trade policy analysis: GTAP-MVH. Foreign Trade Rev.2020, 55, 42–79. [CrossRef]
65. Walmsley, T.; Minor, P. US trade actions against China: A supply chain perspective. Foreign Trade Rev. 2020, 55, 337–371. [CrossRef]66. Aguiar, A.; Corong, E.; van der Mensbrugghe, D. Detailed Trade Policy Simulations Using a Global General Equilibrium Model (No.
6199); Center for Global Trade Analysis, Department of Agricultural Economics, Purdue University: West Lafayette, IN, USA,2021.
67. Giesecke, J.A.; Tran, N.H.; Waschik, R. Should Australia be concerned by Beijing’s trade threats: Modelling the economic costs ofa restriction on imports of Australian coal. Aust. J. Agric. Resour. Econ. 2021, 65, 1–22. [CrossRef]
68. Nijkamp, P.; Wang, S.; Kremers, H. Modeling the impacts of international climate change policies in a CGE context: The use of theGTAP-E model. Econ. Model. 2005, 22, 955–974. [CrossRef]
69. Calzadilla, A.; Rehdanz, K.; Betts, R.; Falloon, P.; Wiltshire, A.; Tol, R.S. Climate change impacts on global agriculture. Clim.Chang. 2013, 120, 357–374. [CrossRef]
70. Moore, F.C.; Baldos, U.; Hertel, T.; Diaz, D. New science of climate change impacts on agriculture implies higher social cost ofcarbon. Nat. Commun. 2017, 8, 1607. [CrossRef]
71. Xie, W.; Xiong, W.; Pan, J.; Ali, T.; Cui, Q.; Guan, D.; Meng, J.; Mueller, N.D.; Lin, E.; Davis, S.J. Decreases in global beer supplydue to extreme drought and heat. Nat. Plants 2018, 4, 964–973. [CrossRef] [PubMed]
72. Dandres, T.; Gaudreault, C.; Tirado-Seco, P.; Samson, R. Assessing non-marginal variations with consequential LCA: Applicationto European energy sector. Renew. Sustain. Energy Rev. 2011, 15, 3121–3132. [CrossRef]
73. Golub, A.A.; Hertel, T.W. Modeling land-use change impacts of biofuels in the GTAP-BIO framework. Clim. Chang. Econ. 2012, 3,1250015. [CrossRef]
74. Ali, T.; Huang, J.; Yang, J. Impact assessment of global and national biofuels developments on agriculture in Pakistan. Appl.Energy 2013, 104, 466–474. [CrossRef]
75. Malins, C.; Plevin, R.; Edwards, R. How robust are reductions in modeled estimates from GTAP-BIO of the indirect land usechange induced by conventional biofuels? J. Clean. Prod. 2020, 258, 120716. [CrossRef]
76. Horridge, M. SplitCom—Programs to Disaggregate a GTAP Sector; Centre of Policy Studies, Monash University: Melbourne,Australia, 2005. Available online: www.monash.edu.au/policy/SplitCom.htm (accessed on 19 October 2020).
77. FAOSTAT. 2020. Available online: www.fao.org/faostat/en/ (accessed on 10 March 2021).78. United Nations Statistics Division (UNSD). UN COMTRADE; International Merchandise Trade Statistics, United Nations Statistics
Division: New York, NY, USA, 2020. Available online: http://comtrade.un.org/ (accessed on 13 September 2021).79. Fouré, J.; Bénassy-Quéré, A.; Fontagné, L. Modelling the world economy at the 2050 horizon. Econ. Transit 2013, 21, 617–654.
[CrossRef]80. Herrero, A.G.; Xu, J. China’s belt and road initiative: Can Europe expect trade gains? China World Econ. 2017, 25, 84–99. [CrossRef]
Agriculture 2022, 12, 143 23 of 23
81. Panizza, U. Domestic and external public debt in developing countries. In United Nations Conference on Trade and DevelopmentDiscussion Paper (No. 188); United Nations Conference on Trade and Development (UNCTAD): Geneva, Switzerland, 2008.Available online: https://papers.ssrn.com/sol3/papers.cfm?abstract_id=1147669 (accessed on 8 January 2022).
82. Serebrisky, T. Sustainable Infrastructure for Competitiveness and Inclusive Growth; Inter-American Development Bank InfrastructureStrategy, Inter-American Development Bank: Washington, DC, USA, 2014. Available online: https://publications.iadb.org/en/sustainable-infrastructure-competitiveness-and-inclusive-growth (accessed on 11 January 2022).
83. Arndt, C.; Pearson, K.R. How to Carry Out Systematic Sensitivity Analysis via Gaussian Quadrature and GEMPACK; GTAP TechnicalPaper, 3; The Center for Global Trade Analysis, Purdue University: West Lafayette, IN, USA, 1998. Available online: http://www.gtap.agecon.purdue.edu/resources/download/1209.pdf (accessed on 8 January 2022).
84. Preckel, P.; Verma, M.; Hertel, T.; Martin, W. Systematic Sensitivity Analysis for GTAP–Where We have Been and Where We Are Going;GTAP Technical Paper; The Center for Global Trade Analysis, Purdue University: West Lafayette, IN, USA, 2011. Available online:https://www.gtap.agecon.purdue.edu/resources/download/5307.pdf (accessed on 9 January 2022).
85. Gilbert, J.; Banik, N. Socioeconomic Impacts of Cross-Border Transport Infrastructure Development in South Asia; ADBI Working Paper211; Asian Development Bank Institute: Tokyo, Japan, 2010. Available online: http://www.adbi.org/working-paper/2010/04/14/3655.socioeconomic.transport.infrastructure/ (accessed on 11 November 2020).
86. Portugal-Perez, A.; Wilson, J.S. Export Performance and Trade Facilitation Reform: Hard and Soft Infrastructure. World Dev. 2012,40, 1295–1307. [CrossRef]
87. GoP (Government of Pakistan). Pakistan and China Reaffirms Their Commitment to CPEC in a Meeting between Minister Planning &Development and Mr. Zhang Chuxian, Member of CPEC; Ministry of Planning, Development & Reforms, Pak-Secretariat: Islamabad,Pakistan, 2015. Available online: http://cpec.gov.pk/news/5 (accessed on 28 October 2020).
88. GoP (Government of Pakistan). Long Term Plan for China-Pakistan Economic Corridor; Ministry of Planning, Development & Reform,Pak-Secretariat: Islamabad, Pakistan, 2017. Available online: http://www.cpec.gov.pk/brain/public/uploads/documents/CPEC-LTP.pdf (accessed on 28 October 2020).
89. Chohan, U.W. What Is One Belt One Road? A Surplus Recycling Mechanism Approach; Discussion Paper Series: Notes on the 21stCentury; University of New South Wales (UNSW) Sydney: Kensington, Australia, 2017. Available online: https://ssrn.com/abstract=2997650 (accessed on 21 November 2021).
90. The Express Tribune. CPEC Investment Pushed from $55b to $62b. Available online: https://tribune.com.pk/story/1381733/cpec-investment-pushed-55b-62b (accessed on 18 November 2020).
91. Brockmeier, M.A. Graphical Exposition of the GTAP Model (No. 1236-2016-101374); GTAP Technical Paper No. 8; The Center forGlobal Trade Analysis, Purdue University: West Lafayette, IN, USA, 2001. Available online: https://www.gtap.agecon.purdue.edu/resources/download/181.pdf (accessed on 8 January 2022).