Beneish Model as Effective Complement to the Application of SAS No. 99 in the Conduct of Audit in...
16
Management and Administrative Sciences Review www.absronline.org/masr ISSN: 2308-1368 Volume: 2, Issue: 6, Pages: 640-655 (November 2013) © 2013 Academy of Business & Scientific Research *Corresponding author: Nwoye Ugochukwu J. Doctoral Research Student, Department of Accountancy, NnamdiAzikiwe University, Awka, Nigeria. E-Mail: [email protected] 640 Research Paper Beneish Model as Effective Complement to the Application of SAS No. 99 in the Conduct of Audit in Nigeria Nwoye Ugochukwu J. 1 *, Okoye Emma I. 2 , and Oraka Azubuike O. 3 1. Doctoral Research Student,, Department of Accountancy, Nnamdi Azikiwe University, Awka, Nigeria. 2. Professor, Department of Accountancy, Nnamdi Azikiwe University, Awka, Nigeria. 3. Lecturer, Department of Accountancy, Nnamdi Azikiwe University, Awka, Nigeria. This paper gives due consideration to determining the contribution made by SAS 99 towards improving the skills of Nigerian Auditors in the detection of fraud in Financial Statements of corporate organisations, while laying emphasis on the extent to which the Beneish Model could further strengthen Auditors likelihood to detecting such manipulations in the Financial Statements. The research was descriptively and historically designed. 100 respondents comprising Auditors, Accountants in the Industries and the Accounting Academics in Anambra and Enugu State were infinitely determined using the Topman’s formula. Data from secondary sources comprising Audited Annual Reports of the first five most capitalised manufacturing companies in Nigeria for the years 2002-2006 (in Cadbury, for model confirmatory test purpose) and 2006-2010 were used to complement this work. Inputs from the questionnaire distributed and the Annual Reports and Accounts, were analysed with the aid of SPSS software package using the Two way ANOVA statistical technique, and the Beneish Model. The analyses result showed that SAS 99 will significantly contributed to the deterrence and detection of fraud by Auditors in Nigeria, especially where complemented with the Beneish model. Thus, the Model should be introduced into the Nigeria Audit System as one of the prescribed analytical Audit techniques to aid External Auditors perform the relevant substantive tests where necessary so as to effectively curtail the rising incidence of fraud among corporate organisations in Nigeria. Keywords: Annual Reports and Accounts, Audit analytical techniques, Beneish Model, Engagement team, External Auditors, Financial Statements, Fraud Detection, Manufacturing Companies, SAS No. 99, Substantive tests, INTRODUCTION One of the most difficult issues facing the Auditing profession is that there are no auditing procedures that can provide absolute assurance in detecting all fraudulent financial reporting (Bishop and Wells, 2010). As a result, Auditors have historically attempted to avoid the responsibility for fraud detection, but unsuccessfully. Before Sarbanes- Oxley and despite SAS 82, detecting fraud was not a primary auditing objective and appears to only have been uncovered by chance in the ordinary
-
Upload
absronline -
Category
Documents
-
view
1 -
download
0
Transcript of Beneish Model as Effective Complement to the Application of SAS No. 99 in the Conduct of Audit in...
Management and Administrative Sciences Review www.absronline.org/masr ISSN: 2308-1368 Volume: 2, Issue: 6, Pages: 640-655 (November 2013) © 2013 Academy of Business & Scientific Research
*Corresponding author: Nwoye Ugochukwu J. Doctoral Research Student, Department of Accountancy, NnamdiAzikiwe University, Awka, Nigeria.
E-Mail: [email protected] 640
Research Paper
Beneish Model as Effective Complement to the Application of SAS No. 99 in the Conduct of Audit in Nigeria
Nwoye Ugochukwu J.1*, Okoye Emma I.2, and Oraka Azubuike O.3
1. Doctoral Research Student,, Department of Accountancy, Nnamdi Azikiwe University, Awka, Nigeria.
2. Professor, Department of Accountancy, Nnamdi Azikiwe University, Awka, Nigeria.
3. Lecturer, Department of Accountancy, Nnamdi Azikiwe University, Awka, Nigeria.
This paper gives due consideration to determining the contribution made by SAS 99 towards improving the skills of Nigerian Auditors in the detection of fraud in Financial Statements of corporate organisations, while laying emphasis on the extent to which the Beneish Model could further strengthen Auditors likelihood to detecting such manipulations in the Financial Statements. The research was descriptively and historically designed. 100 respondents comprising Auditors, Accountants in the Industries and the Accounting Academics in Anambra and Enugu State were infinitely determined using the Topman’s formula. Data from secondary sources comprising Audited Annual Reports of the first five most capitalised manufacturing companies in Nigeria for the years 2002-2006 (in Cadbury, for model confirmatory test purpose) and 2006-2010 were used to complement this work. Inputs from the questionnaire distributed and the Annual Reports and Accounts, were analysed with the aid of SPSS software package using the Two way ANOVA statistical technique, and the Beneish Model. The analyses result showed that SAS 99 will significantly contributed to the deterrence and detection of fraud by Auditors in Nigeria, especially where complemented with the Beneish model. Thus, the Model should be introduced into the Nigeria Audit System as one of the prescribed analytical Audit techniques to aid External Auditors perform the relevant substantive tests where necessary so as to effectively curtail the rising incidence of fraud among corporate organisations in Nigeria. Keywords: Annual Reports and Accounts, Audit analytical techniques, Beneish Model, Engagement team, External Auditors, Financial Statements, Fraud Detection, Manufacturing Companies, SAS No. 99, Substantive tests,
INTRODUCTION
One of the most difficult issues facing the Auditing profession is that there are no auditing procedures that can provide absolute assurance in detecting all fraudulent financial reporting (Bishop and Wells, 2010). As a result, Auditors have historically
attempted to avoid the responsibility for fraud detection, but unsuccessfully. Before Sarbanes-Oxley and despite SAS 82, detecting fraud was not a primary auditing objective and appears to only have been uncovered by chance in the ordinary

Manag.Adm. Sci. Rev. ISSN: 2308-1368 Volume: 2, Issue: 6, Pages: 640-655
Nwoye et al.
course of the audit. In a perfect world, Auditors would concentrate primarily on prevention– not detection of fraud.
Indeed, fraud has been a big problem in many companies in recent years. The integrity of the Nigerian Accounting profession has, as a result, been questioned. The reputation of many giant Audit firms in Nigeria such as Akintola Williams & Delloite, Pricewaterhouse Coopers etc, has been greatly undermined, considering their shocking involvement in incidence of fraudulent financial reporting in the country. The aftermath effects of their negligence and unethical conducts has resulted in the witnessed distressed state and collapse of some Nigeria banks and other organisations such as Cadbury Nigeria Plc, Afribank Nigeria Plc, etc.
The need to give better guidance to External Auditors to uncover fraud in a timely manner, and restore public confidence in the Accounting profession, led the Auditing Standard Board of the AICPA to issue the Statement of Auditing Standard No 99 (SAS 99) in December 15, 2002 (Shunlan , 2005). This was also in direct response to the Panel on Auditing Effectiveness (PoAE)’s recommendations and the high profile accounting scandals of the past years, especially in 2001 with special reference to the ENRON scandal in the United States, (which to the extreme, shook the hearts of many promising and prospective investors), Royal Ahold (largely referred to as Euro’s Enron) .and the likes of WorldCom, Tyco etc (Shunlan, 2005). It was certainly a response that laid great or increased emphasis on fraud prevention, detection, and deterrence connected with recent corporate failures, and it significantly changes how licensed practicing Auditors/Chartered Accountants in Nigeria must consider fraud in their audits of Financial Statements.
It is worthy of note that the endless effort of relevant but concerned Accounting Professional bodies such as the American Institute of Certified Public Accountants (AICPA) towards curtailing the increasing cases of scandalous Financial Statement reporting, may have afterall, yielded positive result, considering the tremendous sequence of amendments that virtually led to the
birth of SAS 99 in 2002 (from SAS 53 in 1988 and SAS 82 in 1997).
Yet Auditors, are not short of the fact that the detection of manipulated Financial Statements using normal Audit procedures is apprehensively becoming an incredibly difficult task (Porter and Cameron, 1987; Coderre, 1999 cited in Cynthia, 2005). Utilizing the fraud risk factors as prescribed by SAS 99 may not readily at all times reveal possible areas of fictitious manipulation. That is why the call for effective methods to identifying earnings manipulation in the Financial Statement has remained a consistent outcry among owners of companies, which has since heightened along with the rising incidence of Accounting scandals (Prevoo, 2007).
For stakeholders who are aware of the limitations of a normal Audit exercise, they believe that standard Auditing procedures are no doubt insufficient enough to really detect and deter fraud in Financial reports. These limitations thus suggest the need for additional effective analytical audit procedures for the effective detection of earnings management practices (Spathis, 2002). External Auditors need effective model(s), ratios or statistical techniques to augment the various Audit analytical procedures usually performed in the cause of their Audit assignment. They need tested ratios that possess the capability of pointing to areas in the Financial Statement prone to manipulation, thus strengthening the substantive tests usually performed on the figures and balances of the Financial Statements,.
The report of the Association of Certified Fraud Examiners (ACFE), USA in 2004, also attests to the above belief, as it has positively urged her members, Certified Public Accountants, to adopt the Beneish's ratios otherwise known as the ―Beneish or Probit Model‖ in the performance of Audits, in order to enable them effectively implement the requirements of SAS 99, that they may be reasonably assured that Financial Statements are free from material misstatement (Cynthia, 2005 ). Professor Messod D. Beneish had in i997 through one of his publications practically displayed some financial ratios he referred to as ―5-factored variables (later 8-factored variables in 1999)”. These provide Auditors with a better

Beneish Model as Effective Complement to the Application of SAS 99 Research Paper
642
understanding of what fraud entails, exposing them skillfully to those model indicators and fraud risk factors that constitute and contribute to fraud perpetration in the Financial Statements of corporate organizations in Nigeria.
Thus, the paper intends to clearly determine the effect of the Standard on the general audit performance of Auditors in Nigeria, especially in the area of fraud detection, giving due considerations to determining the extent to which the Beneish Model would strengthen Nigerian Auditors’ effective detection of fraud in the Financial Statements of manufacturing companies in Nigeria.
These led to the following research questions:
1. To what extent has SAS 99 improved the Auditors’ performance in the detection and deterrence of fraud in Nigeria?
2. To what extent can the Beneish Model effectively improve Nigerian Auditors’ detection of fraud in the Financial Statements?
Below are the hypotheses that resulted from the above research questions:
a. Ho: Provisions of SAS 99 have not significantly contributed to the deterrence and detection of fraud by Auditors in the audit of corporate organizations in Nigeria.
b. Ho: The Beneish Model will not effectively improve Nigerian Auditors’ detection of fraud in the Financial Statements.
LITERATURE REVIEW
Overview on SAS 99
While fraud remains something that cannot be completely eliminated, steps can be taken in order to detect it in a timely manner before it causes serious consequences. The increasing trend of corporate scandals typically, has led to the continuous changes in legislation (Oliver, 2007).
SAS 99 is a collection of standards that supercede Statement of Auditing Standard (SAS) No. 82. Consideration of Fraud in Financial Statement Audit. It
is worthy of note that the emergence of SAS No. 99 was to correct some of the shortcomings of SAS No. 82. This has led some to argue that the ―future demand‖ for auditing services will be much dependent upon the Auditors’ capability to ―detect and deter fraud‖ (Carpenter 2007, Wilks & Zimbleman 2004, Elliot 2002). Others believe that adding forensic skills to the audit process assists in fulfilling the expectation gap because clients and shareholders believe these procedures are already being performed (Zikmund & O’Reilly-Allen, 2007, Coenen 2006).
The Standard provides guidance to improve the likelihood that Auditors will detect fraudulent financial reporting (AICPA 2002, 2003 and Cassell et al, 2011), and supplies more structure around the consideration of fraud than the previous fraud standards, SAS No. 53 and SAS No. 82 (AICPA 1988, 1997 and Mactosh et al, 2010).
According to Zimbardo, (2009), SAS 99 contains a multitude of changes to SAS 82, which it supersedes. As with SAS 82, SAS 99’s primary mechanism to deter and detect fraud is through an elevated “professional skepticism” among Auditors, but also enhances the required Audit procedures. The Standard begins by generally describing fraud and the fraud triangle. This provides Auditors with a better understanding of what fraud entails (as against an error), and gives an overview of the factors that contribute to fraud (primarily incentives/pressures, opportunity, and rationalization/attitude).
At the most basic level, Conan et al, (2009) stressed that Auditors cannot detect fraud if they are unable to distinguish it from errors. This overview in the Standard helps to alleviate the problem. It is also likely that ―red flags‖ were or may have been noticed but inexperienced Auditors did not comprehend the magnitude of what they uncovered. SAS 99 set forth a much more details framework for Auditors to follow to systematically uproot fraud. They further opined that the most significant requirement in SAS 99 is that all audits must have a comprehensive ―brainstorming session” on the topic of fraud in the planning phase. This brainstorming session provides an outlet for experienced Auditors to chronicle their prior
Manag.Adm. Sci. Rev. ISSN: 2308-1368 Volume: 2, Issue: 6, Pages: 640-655
Nwoye et al.
experiences with the client to less experienced engagement members and provide examples of ways in which fraud could theoretically be perpetrated by the client..
By understanding the risks of the client, weaknesses can be assessed and the engagement team can identify accounts that are vulnerable to manipulation. With this knowledge, Auditors can develop a much more appropriate audit program that is better tailored to the client’s unique risks.
In general, SAS 99, aside focused on increasing the awareness of fraud, genuinely preaches the message of enhanced brainstorming session and improved professional skepticism (questioning mind) among Auditors towards making reliable independent professional judgment during and/or at the end of the audit exercise/assignment.
THEORETICAL REVIEW
Brainstorming among Auditors
Auditors are required by SAS No. 99, Consideration of Fraud in a Financial Statement Audit, to conduct a ―brainstorming‖ session in every audit. Beasley and Jenkins (2007), believes that Its (SAS 99) purpose is twofold, namely: to consider fraud risks that may be present, and to emphasize the importance of professional skepticism throughout the entire audit process.
To Cotton (2010), the purpose of brainstorming is simply geared towards getting as many ideas as possible from a group of people in the possible shortest time. According to him, quantity and not quality, is the order of the day. It does not matter if the ideas are thought to be unworkable, or crazy, or outlandish by anybody within the group. Sometimes, these ideas are the very ones that are adopted into other forms that solve the problem adequately.
Brazel (2008) agree with this opinion as expressed above, affirming further that Auditors consider fraud in a multi-phase manner. First, Auditors obtain information to identify risks of material misstatement due to fraud (e.g., incentives). Using such information, Auditors brainstorm to identify fraud risk factors and to synthesize this information to develop a fraud risk assessment.
Finally, Auditors develop a response to their fraud risk assessments such as assigning personnel with more experience or specialized skills to the audit or modifying the nature, timing, and extent of audit procedures.
More so, it should be noted that the fact that frauds are difficult to find and are hidden by individuals who perpetrate them, Auditors should attempt to identify risk factors that are associated with the occurrence of fraud. These risk factors are commonly categorized along three dimensions of the fraud triangle: incentives, opportunities, and rationalization (AICPA 2002). Auditors synthesize their understanding of these risk factors with other information (e.g., preliminary analytical procedures) to develop a fraud risk assessment (AICPA 2002).
SAS No. 99 requires Auditors to react to higher fraud risk assessments by designing audit procedures to obtain more reliable evidence.
When audit is carefully and properly planned and managed, brainstorming can lead to many high-quality ideas about possible fraud risks, audit team members would not likely generate individually. A brainstorming session that ignores best practices, however, might quickly give way to inefficiencies and distractions that ultimately could muddy the audit team’s ability to focus on relevant fraud risks. That kind of deterioration can hinder key audit decisions, leading the team down dangerous paths—for example, to incorrect conclusions concerning which fraud risks are present, confusion on how to respond to a disjointed list of identified risk issues or lack of ―buy-in‖ to the brainstorming process (Beaslay et al, 2007).
It is worthy of note that Auditors are much more likely to correctly identify fraud risk conditions if the audit team engages in open-ended, nontraditional considerations of them. Research reviews by researchers with obtained data from numerous stakeholders, such as Forensic Accountants, Internal Auditors, External Auditors and other fraud experts, have reaffirmed the benefits of Auditors engaging in such discussions. Just the difficulty Auditors face in assessing fraud risks partially stems from the fact that most of them have never encountered a material fraud
Beneish Model as Effective Complement to the Application of SAS 99 Research Paper
644
during their careers; thus, they may be less effective when assessing fraud risks on their own, which makes group exploration all the more valuable in identifying them. A barrier to disseminating critical information can be the engagement partner’s or manager’s failure to share information about a client’s honesty and integrity with the engagement team. So, in part, brainstorming sessions prompt the more experienced Auditors to share their insights with less experienced team members and, in turn, encourage those who are less experienced but have recent first-hand knowledge of client processes to provide their insights to the senior members (Beasley et al 2007).
THE BENEISH MODEL
Because the Balance Sheet, Income Statement and Statement of Cash Flows are interrelated, frauds can always pop out when certain numbers do not make sense (Joseph, 2001).
Created by Messod D. Beneish(1999), the M-Score is a mathematical model that uses eight financial ratios to identify whether a company has manipulated its earnings. The variables are constructed from the company’s Financial Statements and create a score to describe the degree to which the earnings have been manipulated. In many ways, it is similar to the Altman Z-Score, but it is focused on detecting earnings manipulation rather than bankruptcy.
This model has a methodology through which falsified Financial Statements are found out as classifying indicators on the manipulation of financial information (Güray et al, 2005). The ratios that made up the model can really help External Auditors, Forensic Accountants/experts and Certified Fraud Examiners flag possible problem areas in the Financial Statement, considering its ability to distinguish and discriminate between manipulators and non-manipulators (Prevoo, 2007), especially as it has been successfully deployed by many researchers in assessing the Financial Statements of companies in the USA including the likes of ENRON, Worldcom, ZZZZ Best etc.
According to Cynthia, (2005), Certified Fraud Examiners appointed by clients to investigate a suspected fraud, can use these tools to help maintain proper focus in their investigations. The variables in the model are designed to capture either the Financial Statement distortions that can result from manipulation or preconditions that might prompt companies to engage in such activity (Burcu, & Güray, 2011).
The ratios measure sales growth, the quality of assets and gross margins, the progression of receivables versus sales, and that ratio of general and administrative expense. The probability of earnings manipulation goes higher with unusual increases in receivables, deteriorating gross margins, decreasing asset quality, sales growth, and increasing accruals. According to Beneish (1999), the results usually point to where there is most likely a problem.
METHODOLOGY
As a survey and analytical research design, the study is based on both primary and secondary sources of information. Aside the primary sources which constitute the use of questionnaire, the secondary sources included published Annual Reports and Audited Accounts of the first-five manufacturing companies in Nigeria, that made the list of the Nigeria Stock Exchange most capitalized companies in the NSE 2011/2012 FactBook.
The sample size of 100 had been infinitely determined using the Topman’s formula for determining the sample size of an infinite population.
n = Z2 (P)(Q)
e2
n = 1.962(0.93)(0.07)
(0.052)
n = 100.0
This was evenly distributed among the three selected respondent subgroups in the two states covered using:
Total Sample size

Manag.Adm. Sci. Rev. ISSN: 2308-1368 Volume: 2, Issue: 6, Pages: 640-655
Nwoye et al.
No of subgroups x No of states/region covered
= 100
3x2 = 16.6 or 17 questionnaire per subgroup
Data received from 91 respondents (46 and 45 questionnaire returned) in Anambra and Enugu States, comprising External and Internal Auditors (Unizik Bursary, selected ICAN and ANAN members in both states), Accountants practicing in companies and the Accounting Academics (in Nnamdi Azikiwe Univeristy, Awka, Anambra State University, Enugu State University of Science and Technology), and obtained through a 5 point Likert scale structured questionnaire, were maximized in testing the first hypothesis using the Two Way ANOVA statistical tool through the SPSS 17.0 statistical software package.
Thus, the published Annual Reports and Audited Accounts of Dangote Cement, Nigeria Breweries, Guinness Nig. Plc, Nestle Nig.Plc, Dangote Sugar Refinery for the years 2006-2010, were selected for the effective application of the Beneish Model.
Based on the eight factor variables of the model that gives a score, we have the model as:
M Score = -4.840 + 0.920 x DSRI + 0.528 x GMI + 0.404 x AQ + 0.892 x SGI + 0.115 x DEPI - 0.172 x SGAI - 0.327 x LVGI + 4.697 x TATA
Where: Days Sales Receivable Index (DSRI)
DSRI = (Net Receivablest / Salest) / Net Receivablest-1 / Salest-1)
Gross Margin Index GMI = [(Salest-1 – Cost Of Goods Soldt-1) / Salest-1] / [(Salest – Cost Of Goods Soldt) / Salest]
Asset Quality Index (AQI) is: AQI = [1 - (Current Assetst + Plant, Property & Equipmentt + Securitiest) / Total Assetst] / [1 - ((Current Assetst-1 + Plant, Property & Equipmentt-
1 + Securitiest-1) / Total Assetst-1)]
Sales Growth Index (SGI) is: SGI = Salest / Salest-1
Depreciation Index (DEPI) is: DEPI = (Depreciationt-1/ (Plant, Property & Equipmentt-1 + Depreciationt-1)) / (Depreciationt / (Plant, Property & Equipmentt + Depreciationt))
SG&A Expense Index (SGAI) is: SGAI = (Selling General & Administrative Expenset / Salest) / (Selling General & Administrative Expenset-1 / Salest-1)
Leverage index (LVGI) is: LVGI = [(Current Liabilitiest + Total Long Term Debtt) / Total Assetst] / [(Current Liabilitiest-1 + Total Long Term Debtt-1) / Total Assetst-1]
Total Accruals to Total Assets (TATA) is: TATA = (Income from Continuing Operationst - Cash Flows from Operationst) / Total Assetst
DATA ANALYSIS AND FINDINGS
Adopting the Two Way ANOVA, hypothesis one was tested with the aid of SPSS 17.0.
Ho: SAS 99 has not significantly improved on the deterrence and detection of fraud by Auditors in the audit of corporate organizations in Nigeria.
Model Interpretation
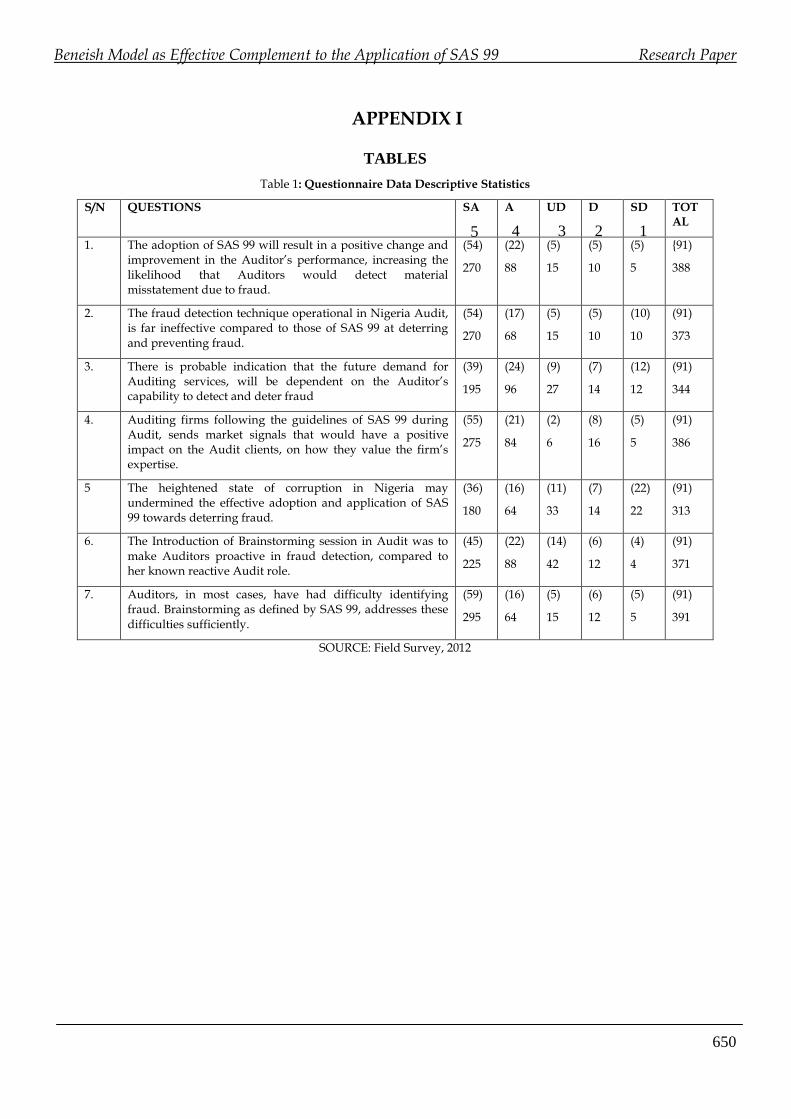
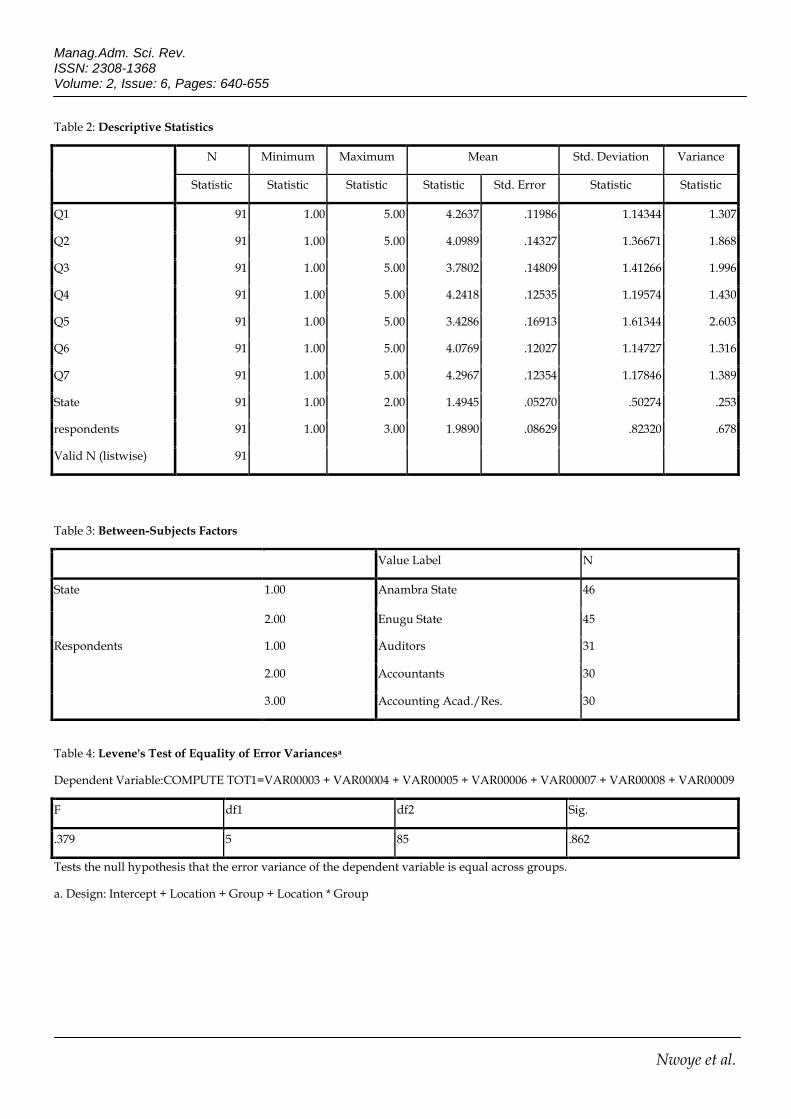
Descriptive Statistics: we see in table 2 (under appendix I) that the mean statistics of the seven questions testing the hypothsis (with the least of them scoring a mean of 3.4286- question five) are higher than 3.00, and thus qualified for usage in testing the hypothesis.
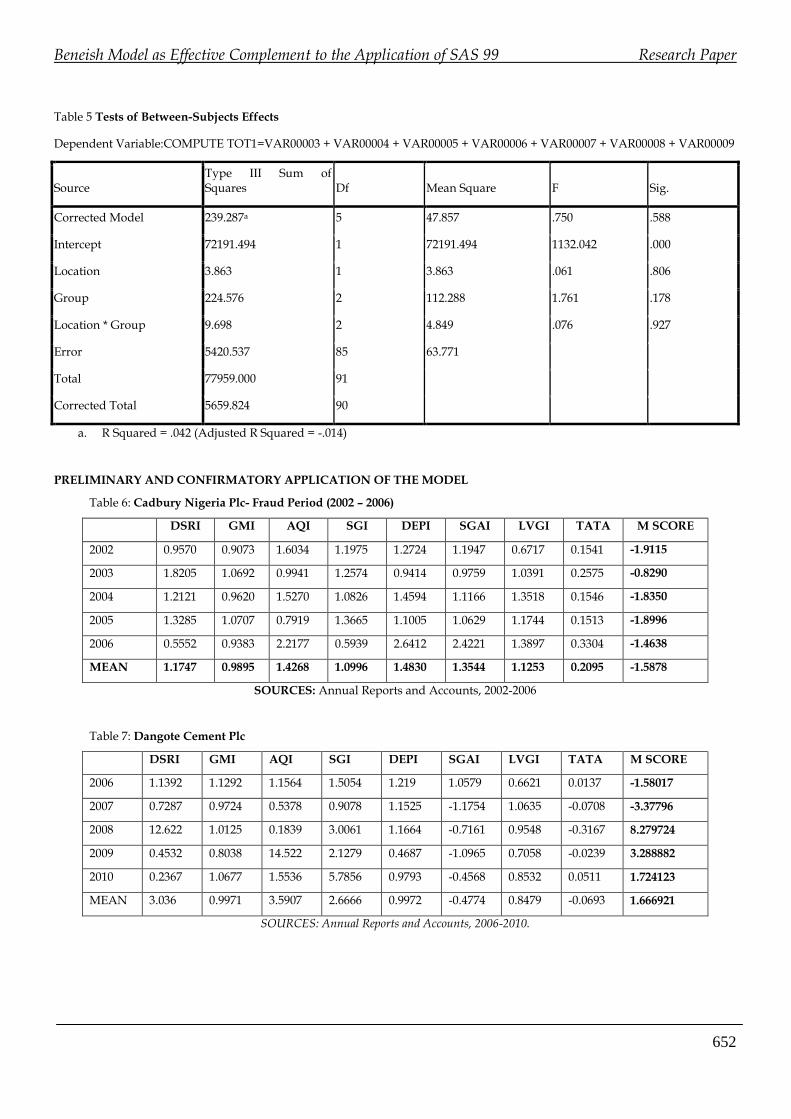
Tests of Between-Subjects Effects: This helps us determine whether an interaction effect exist between the independent variables used in this study, while also considering the significance of such interaction. Thus, going through the row ―Location * Group‖ under the last column ―Sig‖ in table 5, we tend to establish this by ascertaining whether the score is less than or equal to .05. Since the SPSS output in the analysis is higher (.927), it then means that there is no significant difference in the effect of location on how Auditors ability to detect and deter fraud in Nigeria, has been improved by SAS 99 over the years. Further restricting this to the individual independent

Beneish Model as Effective Complement to the Application of SAS 99 Research Paper
646
variables in the study (location and group) towards appreciating the main effect of each of the independent variables, we discovered that neither location (Enugu and Anambra States) nor group (External Auditors, practicing Accountants in the Industries, and the Accounting academics) has any significant main effect since their individual scores under the ―F‖ column (.061 and 1.761) are greater than the .05.
Levene's Test of Equality of Error Variances: Utilizing the score of the ―Sig‖ column (.0862) which represents the Pcalc (as clearly depicted in table 4), we then apply the decision rule below:
Reject the null hypothesis, if Pcalc> .05, otherwise accept and reject the alternate hypothesis.
Since Pcalc(.862) is greater than .05, we reject the null hypothesis and accept the alternate hypothesis. This means that the Provisions of SAS 99 has significantly improved on the deterrence and detection of fraud by Auditors in the audit of corporate organizations in Nigeria.
Hypothesis Two
Ho: The Beneish Model will not effectively improve Nigerian Auditors’detection of fraud in the Financial Statements.
Using the Beneish Model, a preliminary test analysis was carried out on the Financial Statements of Cadbury Nigeria Plc for the periods the beverage giant was ovally and jointly indicted of fraudulent financial reporting by the Nigerian Security Exchange Commission (SEC), and the Administrative Proceedings Committee (APC) of the Federal House of Representative. The positive outcome of this analyses for the years 2002 – 2006 (M-scores of -1.9115, -0.8290, -1.8350, -1.8996, and -1.4638) which correlated 98% plus in reality with the allegations made against the board and Auditor of Cadbury Nigeria Plc (since all M-scores obtained were massively greater than -2.22), served as the very corner stone for the effective utilisation of the Model in testing hypothesis two. Table 1 and figure 1 clearly depicts the above the outcome of the analyses carried out and their
consequent representation in bar charts for better appreciation of the interpretations made in this study.
Implication of Cadbury’s Indicators: The M Scores or better called “the manipulation index” obtained from the above analysis, would no doubt, appear amazing enough especially as bar charts are deployed in this work for better understanding of the implications of the results so obtained from this analysis, even in the cases of big firms that have always attracted the attention, respect and interest of investors in the stock market.
The reality of the outcome of the analysis carried out above on Cadbury Nigeria Plc’s Annual Reports and Accounts for the years 2002 – 2006, the very period the company overstated its income by N13 billion, may not be ignored for any reason. The M scores (less negative value than -2.22; that is, values greater than -2.22) for these years (2002-2006) showed a strong likelihood of Cadbury manipulating figures of its Financial Statements. That is why none of the darker bars came closer to the dotted margin straight line cutting off from the point marked ―-2.22‖ to the very tip of the M-score decision rule bar. This area is referred to as the ―Manipulation Region‖; the very region where the likelihood that companies manipulated their Financial Statements are high or strong, depending on the size of the M-score obtained. But any M-score outside this region (that is, if the bars protruded beyond the dotted straightline) will only imply that such Financial Statements are possibly free from material misstatements that could undermine the true and fairness of such financial information so published. Cadbury’s DSRI, SGI, DEPI and SGAI indicators for the 5 years, as shown in table 1, readily attest to this findings (see table 1 and figure 1 under appendix I and II respectively).
Thus, using the following decision indicators, reliable highlights to the implications of the Beneish Model’s outcome have been clearly portrayed.
DSRI > 1 = Possible revenue inflation.

Manag.Adm. Sci. Rev. ISSN: 2308-1368 Volume: 2, Issue: 6, Pages: 640-655
Nwoye et al.
GMI > 1 = Gross margin is deteriorating and company is more likely to manipulate earnings.
AQI >1 = Tendencies of capitalizing and deferring costs that should have been expensed.
SGI > or too < 1 = firms under possible pressure manipulate earnings to keep up appearances.
DEPI > 1 = Tendencies of Assets being depreciated at a slower rate to boost earnings.
SGAI < 1 = Company possible Manipulation of earnings to defer costs, especially when coefficient is negative.
TATA > 1 = Accruals possibly used to manipulate earnings.
LVGI > 1 = Reflecting pictures of Increase in leverage.
Beneish Model Final Decision Rule
M Score > -2.22 ( a positive value or less negative value than this) = Strong likelihood of Manipulation.
M Score < -2.22 ( a higher negative value than this) = No manipulation region.
COMMITTING TYPE I AND II ERROR
Absolute care must be taken by fraud detection experts when making conclusive decision on the years with M-scores signifying No manipulation tendency. This is because, this could possibly lead them to commit either type 1 error (possibility of viewing a manipulator company as a non manipulator) or type 2 error (possibility of viewing a non manipulator company as a manipulator). Incidentally, Daniel Beneish had earlier revealed in his publication in 1999 that more of type 1 error is usually committed by users of this model than the type 2 error. Hence, further efforts must be made by the model users to closely examining the indicators of the 8 factored variables against their above individual decision rule, even on non manipulation M-scores indicators before drawing their final report on the state of the company’s financial reports.
INDICATORS OF THE FIRST-FIVE TOP MANUFACTURING COMPANIES, 2011/2012.
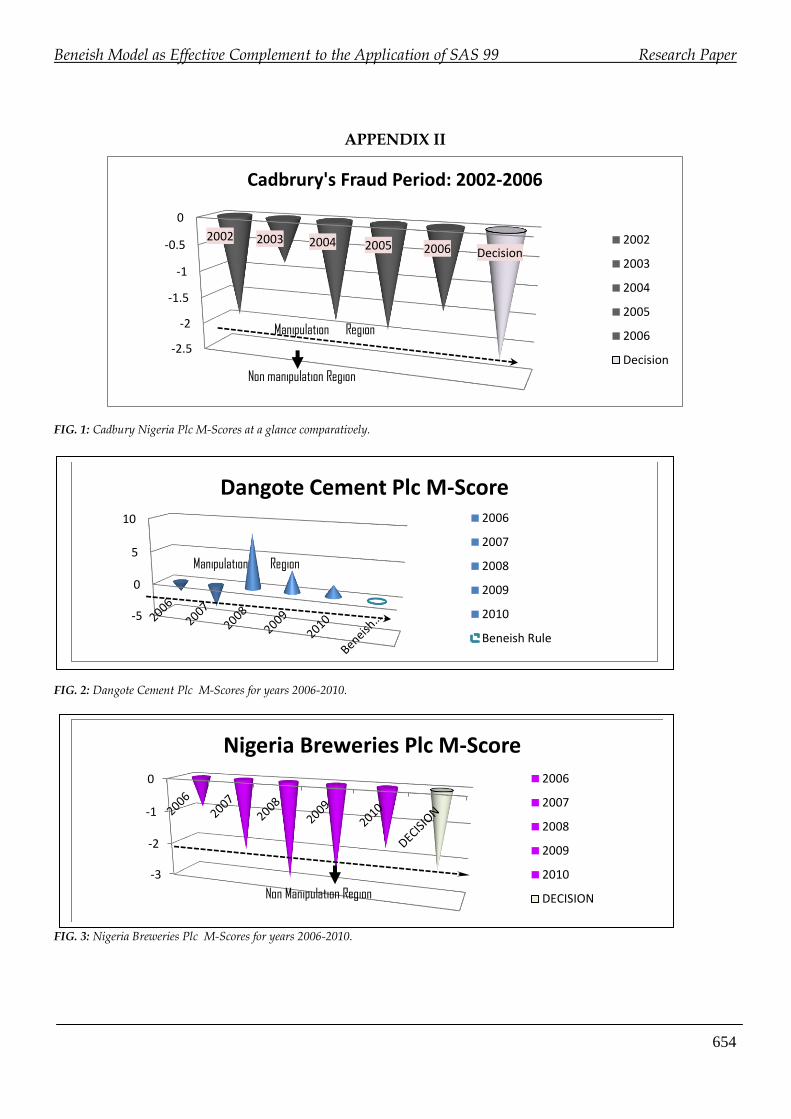
1. Dangote Cement Plc (view table 7, figure 2)
Implications:
M-Scores for the years 2006, 2008, 2009 and 2010 (-1.58017, 8.279724, 3.288882, & 1.724123) strongly fall within the manipulation region.
Above M-Scores are all greater than the company’s Mean Manipulation Index (MMI) of 1.666921.
Presence of red flags is very enormous and alarming.
Shows that the individual indicators of the 8-factored variables (pointers) need be studied closely.
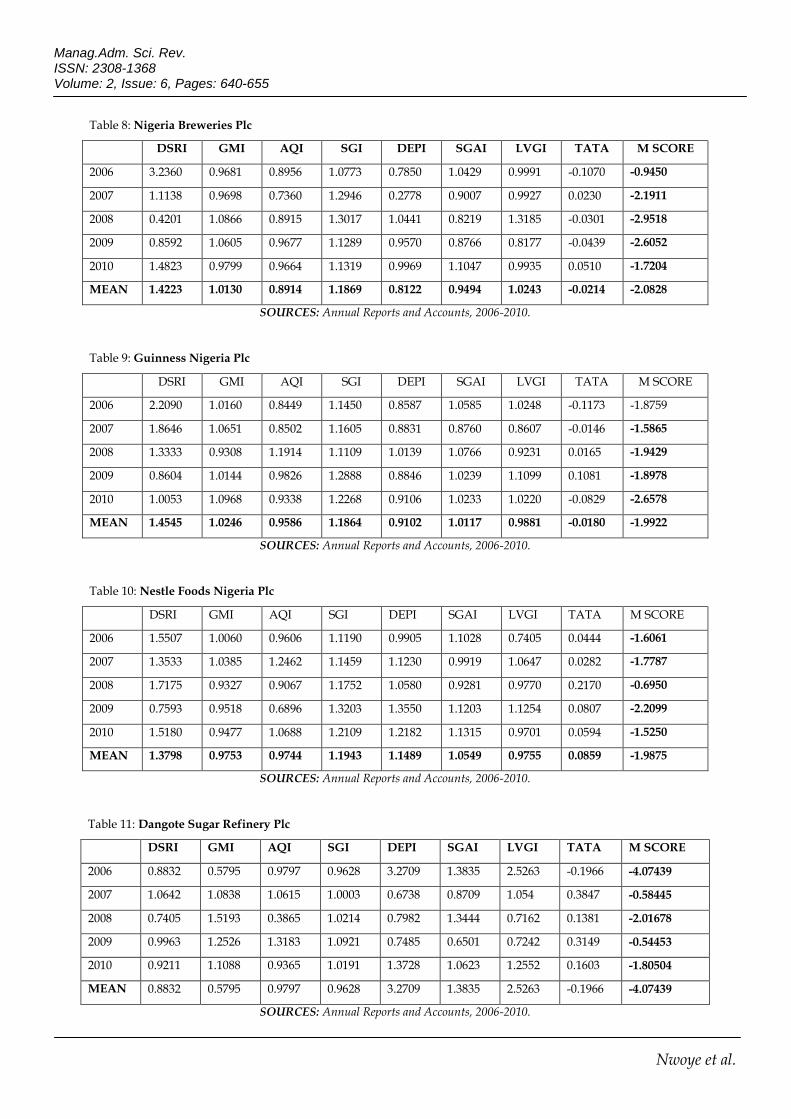
2. Nigeria Breweries Plc (view table 8, figure 3)
Implications:
M-scores indicators for 2006, 2007 and 2010 fall within the earnings manipulation region.
2008 and 2009 indicators maintained a non manipulation status.
A high likelihood of manipulated financial records exists in 2006 and 2010 (-0.9450 and -1.7204).
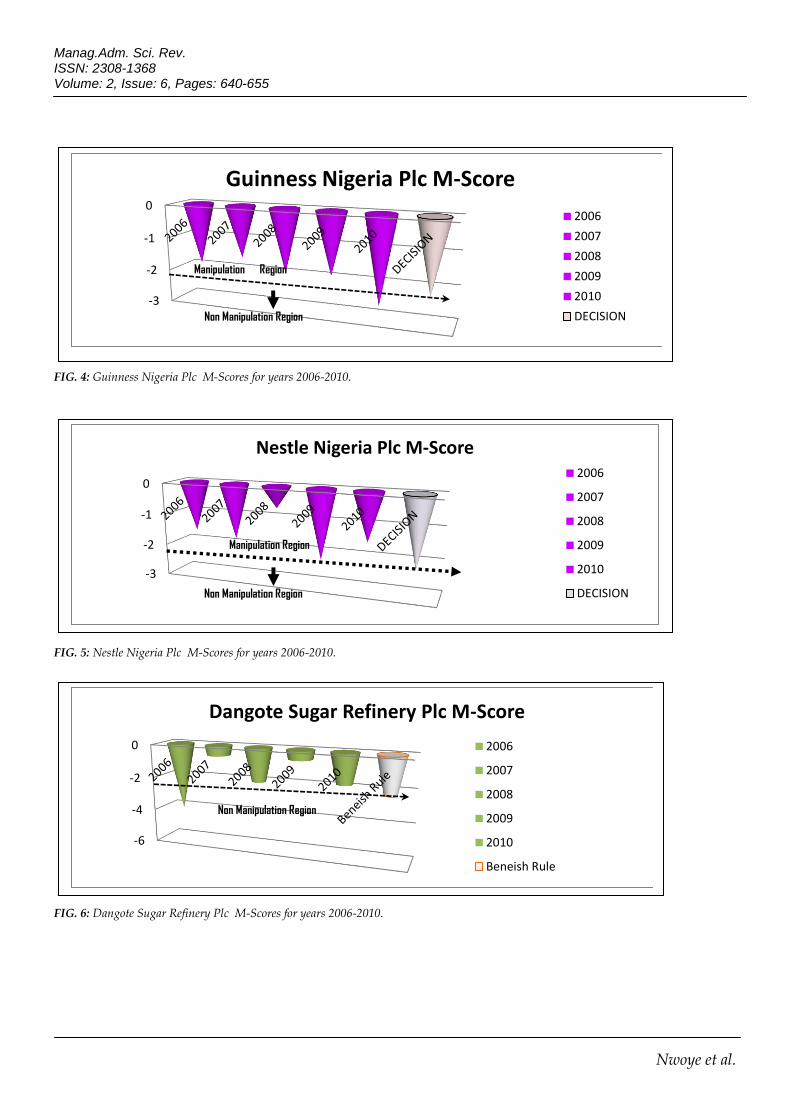
3. Guinness Nigeria Plc (view table 9, figure 4)
Implications:
Except in the year 2010, a strong likelihood to manipulate exist in the company’s financial records for the years covered.
Where convincing explanations backed up by authentic documented evidence(s) are not given by the company, it will then be wise for the independent professional Auditor to assume that the company’s 2006-2009 Financial Statements were possible products of manipulation.

Beneish Model as Effective Complement to the Application of SAS 99 Research Paper
648
Company’s DSRI, SGI and SGAI indicators for the years covered should also serve as sensitive reference point for fraud examiners.
4. Nestle Foods Nigeria Plc (view table 10, figure 5)
Implications:
A strong likelihood of manipulated earnings exist in all five years covered (2006 – 2010), especially in 2008 with M-Scores of -0.6950.
Indicators of Day’s Sales Receivable Index (DSRI) and Sales Growth Index (SGI) for all 5 years exceed the 1.000 benchmark except in 2009 where DSRI was 0.7593. The same applies to the Depreciation Index (DEPI) except in 2006.
Tendencies that company adopted slower rates of depreciation to enable it improve on earnings.
5. Dangote Sugar Refinery Plc (view table 11, figure 6).
Implications:
Except in 2006 where her M-score is -4.07439, the financial disclosures of Dangote Sugar Refinery Plc appear to be questionable.
Indicators of DEPI, SGAI, & LVGI (3.2709, 1.3835, & 2.5263) leaves possible evidence that the company might have been under possible pressure at the end of 2006 as reflected in 2007 indicator.
DEPI of 3.2709 possibly implies that the company revised assets useful life assumptions upwards or adopted income friendly depreciation method(s). See Appendix I for indicators of 8-factored variables.
OPINION JUDGEMENT
Based on the above demonstration and indicators of the Beneish model, we come to terms that the model, if objectively applied, will effectively boost and improve Auditors’ chances of detecting and
deterring fraud in the Financial Statements of manufacturing companies in Nigeria.
CONCLUSION
The fight against fraud in corporate Financial Statements, should no longer be treated as the sole responsibilities of both the Internal and External Auditors working in both the private and public establishments. Fraud deterrence in the Financial Statements of Corporate organisations in Nigeria should hence be treated as the collateral responsibilities of all stakeholders (the shareholders, the government, financial regulatory agencies, financial crimes agencies etc). The adherence of Nigeria Auditors to and the effective implementation of the guidelines of the SAS 99 in the Nigeria Audit process, would not only, strengthen the Auditors knowledge of fraud in the Financial Statement of corporate organisations, but would, no doubt, contribute to her detection and deterrence of fraud, especially as they deploy fraud sensitive models like the Beneish Models when carrying out their various analytical Audit procedures towards encouraging the continual publication of fraud-free Financial Statements among Nigeria manufacturing corporate organisations.
RECOMMENDATIONS
Accounting regulatory bodies in Nigeria such as the newly constituted Financial Reporting Council (FRC), should quickly handle the challenges of ineffective oversight on audit practice in Nigeria, issues of non-compliance to existing auditing, accounting and relevant fraud standards/pronouncements, as well as unethical practises among Auditors in Nigeria,.
Aside inculcating the model in the teaching of Auditing and Forensic Accounting in tertiary institutions, the Beneish Model should also be introduced into the Nigeria Audit System as one of the recommended analytical Audit techniques to aid External Auditors perform the necessary substantive tests when and where relevant, in order to effectively curtail the rising incidence of fraud among corporate organisations in Nigeria.
Manag.Adm. Sci. Rev. ISSN: 2308-1368 Volume: 2, Issue: 6, Pages: 640-655
Nwoye et al.
REFERENCE
AICPA, (1988). The Auditor's Responsibility to Detect and Report Errors and Irregularities.Statement on Auditing Standards, New York, NY.
Beasley, M.S. & Jenkin, G.J. (2007). A Primer for Brainstorming Fraud Risks, available at https://www.aicpa.org/PUBS/jofa/dec2003/beasley.htm (accessed 16 February, 2011)
Beneish, M. D., (1999), The Detection of Earnings Manipulation, Financial Analysts Journal, 55(5), 24-36.
Bishop, T.J. and Wells, J.T. (2010). Breaking Tradition In The Auditing Profession, available at http://www.fraud-magazine.com/article.aspx?id=4294967866 (accessed 16 February, 2011).
Brazel, J.F., Carpenter T.D. and Jenkin, J.G. (2007). A Field Investigation of Auditors’ Use of Brainstorming in the Consideration of Fraud, USA.
Burcu, D. & Güray, K. (2011). The Detection of Earnings Manipulation: The Three Phase Cutting Plane Algorithm using Mathematical Programming, Turkey.
Carpenter, T.D. (2007). Audit Team Brainstorming, Fraud Risk Identification, and Fraud Risk Assessment: Implication of SAS No. 99, Accounting Review, 82(5), 1119-1140
Cassell, C.A., Drake, M.S. and Rasmussen, S.J. (2011). Short Interest as a Signal of Audit Risk, Contomporary Accounting Research. 28(4), 1278-1297
Coenen, T.L. (2006) Why Didn’t Our Auditors Find the Fraud? Wisconsin Law Journal, January 25, 1-3.
Conan, A.C., Steve. A.W., Chad, A.O. and Zimbelman, M. (2009). Fraud Examination, 3rd ed, Louiseville: Transcontinental
Cynthia, H. (2005, March/April). Analysis ratios for detecting Financial Statement fraud, ACFE Fraud Magazine.
Elliott, R.K. (2002). Twenty-first century assurance: Auditing, A Journal of Practice & Theory, 21(1), 139-146.
Güray, K., Yasemin, K.B. & Cemal, K. (2005). Detecting the Manipulation of Financial Information by Using Artificial Neural Network Models, Turkey.
Joseph, T.W. (2001, August). The numbers raise a red flag, Texas: ACFE.
Mactosh, M.O., Francis, W.M. and Ongocho, S. (2010). Public Trust On Auditors And The Auditing Profession Among Cooperative Societies InKisii, Kenya: African Journal of Business & Management (AJBUMA),1, 274-281.
Prevoo, L.J.B. (2007). Detecting Earnings Management: A Critical Assessment of the Beneish Model, Student International Business, Maastricht
Shunlan, L. (2005). SAS 99 and Fraud Detection, Knoxville: University of Tennessee Honors Thesis Project, available at http://trace.tennessee.edu/utk_chanhonoproj/881
Wilks, J.T., & Zimbleman, M.F. (2004). Using Game Theory and Strategic Reasoning Concepts to Prevent and Detect Fraud, Accounting Horizons, 18(3), 173-184.
Zikmund, P.E. & O’Reilly-Allen, M. (2007). I'm an Auditor, Darn It, Not an Investigator, Right? Pennsylvania CPA Journal, 78(3), 28-31.
Zimbardo, P. (2009), SAS No. 99 and the Panel on Audit Effectiveness Recommendations Regarding Fraud and Forensics, available at http://seekingalpha.com/instablog/443555-paul-zimbardo/40650-sas-no-99-the- panel-on-audit-effectiveness-recommendations-regarding-fraud-and-forensics (accessed 16 February, 2011).
Beneish Model as Effective Complement to the Application of SAS 99 Research Paper
650
APPENDIX I
TABLES
Table 1: Questionnaire Data Descriptive Statistics
S/N QUESTIONS SA A UD D SD TOTAL
1. The adoption of SAS 99 will result in a positive change and improvement in the Auditor’s performance, increasing the likelihood that Auditors would detect material misstatement due to fraud.
(54)
270
(22)
88
(5)
15
(5)
10
(5)
5
{91)
388
2. The fraud detection technique operational in Nigeria Audit, is far ineffective compared to those of SAS 99 at deterring and preventing fraud.
(54)
270
(17)
68
(5)
15
(5)
10
(10)
10
(91)
373
3. There is probable indication that the future demand for Auditing services, will be dependent on the Auditor’s capability to detect and deter fraud
(39)
195
(24)
96
(9)
27
(7)
14
(12)
12
(91)
344
4. Auditing firms following the guidelines of SAS 99 during Audit, sends market signals that would have a positive impact on the Audit clients, on how they value the firm’s expertise.
(55)
275
(21)
84
(2)
6
(8)
16
(5)
5
(91)
386
5 The heightened state of corruption in Nigeria may undermined the effective adoption and application of SAS 99 towards deterring fraud.
(36)
180
(16)
64
(11)
33
(7)
14
(22)
22
(91)
313
6. The Introduction of Brainstorming session in Audit was to make Auditors proactive in fraud detection, compared to her known reactive Audit role.
(45)
225
(22)
88
(14)
42
(6)
12
(4)
4
(91)
371
7. Auditors, in most cases, have had difficulty identifying fraud. Brainstorming as defined by SAS 99, addresses these difficulties sufficiently.
(59)
295
(16)
64
(5)
15
(6)
12
(5)
5
(91)
391
SOURCE: Field Survey, 2012
5 4 3 2 1
Manag.Adm. Sci. Rev. ISSN: 2308-1368 Volume: 2, Issue: 6, Pages: 640-655
Nwoye et al.
Table 2: Descriptive Statistics
N Minimum Maximum Mean Std. Deviation Variance
Statistic Statistic Statistic Statistic Std. Error Statistic Statistic
Q1 91 1.00 5.00 4.2637 .11986 1.14344 1.307
Q2 91 1.00 5.00 4.0989 .14327 1.36671 1.868
Q3 91 1.00 5.00 3.7802 .14809 1.41266 1.996
Q4 91 1.00 5.00 4.2418 .12535 1.19574 1.430
Q5 91 1.00 5.00 3.4286 .16913 1.61344 2.603
Q6 91 1.00 5.00 4.0769 .12027 1.14727 1.316
Q7 91 1.00 5.00 4.2967 .12354 1.17846 1.389
State 91 1.00 2.00 1.4945 .05270 .50274 .253
respondents 91 1.00 3.00 1.9890 .08629 .82320 .678
Valid N (listwise) 91
Table 3: Between-Subjects Factors
Value Label N
State 1.00 Anambra State 46
2.00 Enugu State 45
Respondents 1.00 Auditors 31
2.00 Accountants 30
3.00 Accounting Acad./Res. 30
Table 4: Levene's Test of Equality of Error Variancesa
Dependent Variable:COMPUTE TOT1=VAR00003 + VAR00004 + VAR00005 + VAR00006 + VAR00007 + VAR00008 + VAR00009
F df1 df2 Sig.
.379 5 85 .862
Tests the null hypothesis that the error variance of the dependent variable is equal across groups.
a. Design: Intercept + Location + Group + Location * Group
Beneish Model as Effective Complement to the Application of SAS 99 Research Paper
652
Table 5 Tests of Between-Subjects Effects
Dependent Variable:COMPUTE TOT1=VAR00003 + VAR00004 + VAR00005 + VAR00006 + VAR00007 + VAR00008 + VAR00009
Source Type III Sum of Squares Df Mean Square F Sig.
Corrected Model 239.287a 5 47.857 .750 .588
Intercept 72191.494 1 72191.494 1132.042 .000
Location 3.863 1 3.863 .061 .806
Group 224.576 2 112.288 1.761 .178
Location * Group 9.698 2 4.849 .076 .927
Error 5420.537 85 63.771
Total 77959.000 91
Corrected Total 5659.824 90
a. R Squared = .042 (Adjusted R Squared = -.014)
PRELIMINARY AND CONFIRMATORY APPLICATION OF THE MODEL
Table 6: Cadbury Nigeria Plc- Fraud Period (2002 – 2006)
DSRI GMI AQI SGI DEPI SGAI LVGI TATA M SCORE
2002 0.9570 0.9073 1.6034 1.1975 1.2724 1.1947 0.6717 0.1541 -1.9115
2003 1.8205 1.0692 0.9941 1.2574 0.9414 0.9759 1.0391 0.2575 -0.8290
2004 1.2121 0.9620 1.5270 1.0826 1.4594 1.1166 1.3518 0.1546 -1.8350
2005 1.3285 1.0707 0.7919 1.3665 1.1005 1.0629 1.1744 0.1513 -1.8996
2006 0.5552 0.9383 2.2177 0.5939 2.6412 2.4221 1.3897 0.3304 -1.4638
MEAN 1.1747 0.9895 1.4268 1.0996 1.4830 1.3544 1.1253 0.2095 -1.5878
SOURCES: Annual Reports and Accounts, 2002-2006
Table 7: Dangote Cement Plc
DSRI GMI AQI SGI DEPI SGAI LVGI TATA M SCORE
2006 1.1392 1.1292 1.1564 1.5054 1.219 1.0579 0.6621 0.0137 -1.58017
2007 0.7287 0.9724 0.5378 0.9078 1.1525 -1.1754 1.0635 -0.0708 -3.37796
2008 12.622 1.0125 0.1839 3.0061 1.1664 -0.7161 0.9548 -0.3167 8.279724
2009 0.4532 0.8038 14.522 2.1279 0.4687 -1.0965 0.7058 -0.0239 3.288882
2010 0.2367 1.0677 1.5536 5.7856 0.9793 -0.4568 0.8532 0.0511 1.724123
MEAN 3.036 0.9971 3.5907 2.6666 0.9972 -0.4774 0.8479 -0.0693 1.666921
SOURCES: Annual Reports and Accounts, 2006-2010.
Manag.Adm. Sci. Rev. ISSN: 2308-1368 Volume: 2, Issue: 6, Pages: 640-655
Nwoye et al.
Table 8: Nigeria Breweries Plc
DSRI GMI AQI SGI DEPI SGAI LVGI TATA M SCORE
2006 3.2360 0.9681 0.8956 1.0773 0.7850 1.0429 0.9991 -0.1070 -0.9450
2007 1.1138 0.9698 0.7360 1.2946 0.2778 0.9007 0.9927 0.0230 -2.1911
2008 0.4201 1.0866 0.8915 1.3017 1.0441 0.8219 1.3185 -0.0301 -2.9518
2009 0.8592 1.0605 0.9677 1.1289 0.9570 0.8766 0.8177 -0.0439 -2.6052
2010 1.4823 0.9799 0.9664 1.1319 0.9969 1.1047 0.9935 0.0510 -1.7204
MEAN 1.4223 1.0130 0.8914 1.1869 0.8122 0.9494 1.0243 -0.0214 -2.0828
SOURCES: Annual Reports and Accounts, 2006-2010.
Table 9: Guinness Nigeria Plc
DSRI GMI AQI SGI DEPI SGAI LVGI TATA M SCORE
2006 2.2090 1.0160 0.8449 1.1450 0.8587 1.0585 1.0248 -0.1173 -1.8759
2007 1.8646 1.0651 0.8502 1.1605 0.8831 0.8760 0.8607 -0.0146 -1.5865
2008 1.3333 0.9308 1.1914 1.1109 1.0139 1.0766 0.9231 0.0165 -1.9429
2009 0.8604 1.0144 0.9826 1.2888 0.8846 1.0239 1.1099 0.1081 -1.8978
2010 1.0053 1.0968 0.9338 1.2268 0.9106 1.0233 1.0220 -0.0829 -2.6578
MEAN 1.4545 1.0246 0.9586 1.1864 0.9102 1.0117 0.9881 -0.0180 -1.9922
SOURCES: Annual Reports and Accounts, 2006-2010.
Table 10: Nestle Foods Nigeria Plc
DSRI GMI AQI SGI DEPI SGAI LVGI TATA M SCORE
2006 1.5507 1.0060 0.9606 1.1190 0.9905 1.1028 0.7405 0.0444 -1.6061
2007 1.3533 1.0385 1.2462 1.1459 1.1230 0.9919 1.0647 0.0282 -1.7787
2008 1.7175 0.9327 0.9067 1.1752 1.0580 0.9281 0.9770 0.2170 -0.6950
2009 0.7593 0.9518 0.6896 1.3203 1.3550 1.1203 1.1254 0.0807 -2.2099
2010 1.5180 0.9477 1.0688 1.2109 1.2182 1.1315 0.9701 0.0594 -1.5250
MEAN 1.3798 0.9753 0.9744 1.1943 1.1489 1.0549 0.9755 0.0859 -1.9875
SOURCES: Annual Reports and Accounts, 2006-2010.
Table 11: Dangote Sugar Refinery Plc
DSRI GMI AQI SGI DEPI SGAI LVGI TATA M SCORE
2006 0.8832 0.5795 0.9797 0.9628 3.2709 1.3835 2.5263 -0.1966 -4.07439
2007 1.0642 1.0838 1.0615 1.0003 0.6738 0.8709 1.054 0.3847 -0.58445
2008 0.7405 1.5193 0.3865 1.0214 0.7982 1.3444 0.7162 0.1381 -2.01678
2009 0.9963 1.2526 1.3183 1.0921 0.7485 0.6501 0.7242 0.3149 -0.54453
2010 0.9211 1.1088 0.9365 1.0191 1.3728 1.0623 1.2552 0.1603 -1.80504
MEAN 0.8832 0.5795 0.9797 0.9628 3.2709 1.3835 2.5263 -0.1966 -4.07439
SOURCES: Annual Reports and Accounts, 2006-2010.
Beneish Model as Effective Complement to the Application of SAS 99 Research Paper
654
APPENDIX II
FIG. 1: Cadbury Nigeria Plc M-Scores at a glance comparatively.
FIG. 2: Dangote Cement Plc M-Scores for years 2006-2010.
FIG. 3: Nigeria Breweries Plc M-Scores for years 2006-2010.
-2.5
-2
-1.5
-1
-0.5
0
2002 2003 2004 2005 2006 Decision
Cadbrury's Fraud Period: 2002-2006
2002
2003
2004
2005
2006
Decision
Manipulation Region
Non manipulation Region
-5
0
5
10
Dangote Cement Plc M-Score 2006
2007
2008
2009
2010
Beneish Rule
Manipulation Region
-3
-2
-1
0
Nigeria Breweries Plc M-Score 2006
2007
2008
2009
2010
DECISIONNon Manipulation Region
Manag.Adm. Sci. Rev. ISSN: 2308-1368 Volume: 2, Issue: 6, Pages: 640-655
Nwoye et al.
FIG. 4: Guinness Nigeria Plc M-Scores for years 2006-2010.
FIG. 5: Nestle Nigeria Plc M-Scores for years 2006-2010.
FIG. 6: Dangote Sugar Refinery Plc M-Scores for years 2006-2010.
-3
-2
-1
0
Guinness Nigeria Plc M-Score
2006
2007
2008
2009
2010
DECISION
Manipulation Region
Non Manipulation Region
-3
-2
-1
0
Nestle Nigeria Plc M-Score 2006
2007
2008
2009
2010
DECISION
Manipulation Region
Non Manipulation Region
-6
-4
-2
0
DANGOTE SUGAR REFINERY PLC M-SCORE
2006
2007
2008
2009
2010
Beneish Rule
-6
-4
-2
0
Dangote Sugar Refinery Plc M-Score
2006
2007
2008
2009
2010
Beneish Rule
Non Manipulation Region