Behaviour-Related Scalar Habitat Use by Cape Buffalo ...
24
RESEARCH ARTICLE Behaviour-Related Scalar Habitat Use by Cape Buffalo (Syncerus caffer caffer) Emily Bennitt 1¤ *, Mpaphi Casper Bonyongo 2 , Stephen Harris 1 1 School of Biological Sciences, University of Bristol, Bristol, United Kingdom, 2 Okavango Research Institute, Maun, Botswana ¤ Current address: Okavango Research Institute, Maun, Botswana * [email protected] Abstract Studies of habitat use by animals must consider behavioural resource requirements at dif- ferent scales, which could influence the functional value of different sites. Using Cape buf- falo (Syncerus caffer caffer) in the Okavango Delta, Botswana, we tested the hypotheses that behaviour affected use between and within habitats, hereafter referred to as macro- and microhabitats, respectively. We fitted GPS-enabled collars to fifteen buffalo and used the distances and turning angles between consecutive fixes to cluster the resulting data into resting, grazing, walking and relocating behaviours. Distance to water and six vegetation characteristic variables were recorded in sites used for each behaviour, except for relocat- ing, which occurred too infrequently. We used multilevel binomial and multinomial logistic regressions to identify variables that characterised seasonally-preferred macrohabitats and microhabitats used for different behaviours. Our results showed that macrohabitat use was linked to behaviour, although this was least apparent during the rainy season, when resources were most abundant. Behaviour-related microhabitat use was less significant, but variation in forage characteristics could predict some behaviour within all macrohabitats. The variables predicting behaviour were not consistent, but resting and grazing sites were more readily identifiable than walking sites. These results highlight the significance of rest- ing, as well as foraging, site availability in buffalo spatial processes. Our results emphasise the importance of considering several behaviours and scales in studies of habitat use to understand the links between environmental resources and animal behavioural and spatial ecology. Introduction The way in which animals utilise the resources in their environments depends on the charac- teristics of the resources available to them at different scales [1]. Resource use at larger scales therefore restricts options at smaller scales and can affect the way in which animals interact with their environment [2]. Although researchers define macrohabitats according to broad structural characteristics, animals may distinguish between particular sites within those PLOS ONE | DOI:10.1371/journal.pone.0145145 December 16, 2015 1 / 24 OPEN ACCESS Citation: Bennitt E, Bonyongo MC, Harris S (2015) Behaviour-Related Scalar Habitat Use by Cape Buffalo (Syncerus caffer caffer). PLoS ONE 10(12): e0145145. doi:10.1371/journal.pone.0145145 Editor: Sadie Jane Ryan, University of Florida, UNITED STATES Received: May 27, 2015 Accepted: December 1, 2015 Published: December 16, 2015 Copyright: © 2015 Bennitt et al. This is an open access article distributed under the terms of the Creative Commons Attribution License, which permits unrestricted use, distribution, and reproduction in any medium, provided the original author and source are credited. Data Availability Statement: Data are from the Okavango Buffalo Research project, and are available from the Dryad repository (doi:10.5061/ dryad.25jp6). Funding: Support was provided by the Dulverton Trust [http://www.dulverton.org/] to SH; the North of England Zoological Society [http://www.chesterzoo. org/global/north-of-england-zoological-society] to EB; Idea Wild [http://www.ideawild.org/] to EB; the Roberts Fund [https://www.cs.bris.ac.uk/Teaching/ learning/roberts.html] to EB; the Wilderness Safaris Wildlife Trust [http://www.wildernesstrust.com/] to EB; Mr Rodney Fuhr to EB; Mr Ian Fuhr to EB; Mr Martin and Mrs Jenny Bennitt tp EB; Mr Harry Ferguson to
-
Upload
khangminh22 -
Category
Documents
-
view
0 -
download
0
Transcript of Behaviour-Related Scalar Habitat Use by Cape Buffalo ...

RESEARCH ARTICLE
Behaviour-Related Scalar Habitat Use byCape Buffalo (Syncerus caffer caffer)Emily Bennitt1curren Mpaphi Casper Bonyongo2 Stephen Harris1
1 School of Biological Sciences University of Bristol Bristol United Kingdom 2 Okavango ResearchInstitute Maun Botswana
curren Current address Okavango Research Institute Maun Botswana ebennittoriubbw
AbstractStudies of habitat use by animals must consider behavioural resource requirements at dif-
ferent scales which could influence the functional value of different sites Using Cape buf-
falo (Syncerus caffer caffer) in the Okavango Delta Botswana we tested the hypotheses
that behaviour affected use between and within habitats hereafter referred to as macro-
and microhabitats respectively We fitted GPS-enabled collars to fifteen buffalo and used
the distances and turning angles between consecutive fixes to cluster the resulting data into
resting grazing walking and relocating behaviours Distance to water and six vegetation
characteristic variables were recorded in sites used for each behaviour except for relocat-
ing which occurred too infrequently We used multilevel binomial and multinomial logistic
regressions to identify variables that characterised seasonally-preferred macrohabitats and
microhabitats used for different behaviours Our results showed that macrohabitat use was
linked to behaviour although this was least apparent during the rainy season when
resources were most abundant Behaviour-related microhabitat use was less significant
but variation in forage characteristics could predict some behaviour within all macrohabitats
The variables predicting behaviour were not consistent but resting and grazing sites were
more readily identifiable than walking sites These results highlight the significance of rest-
ing as well as foraging site availability in buffalo spatial processes Our results emphasise
the importance of considering several behaviours and scales in studies of habitat use to
understand the links between environmental resources and animal behavioural and spatial
ecology
IntroductionThe way in which animals utilise the resources in their environments depends on the charac-teristics of the resources available to them at different scales [1] Resource use at larger scalestherefore restricts options at smaller scales and can affect the way in which animals interactwith their environment [2] Although researchers define macrohabitats according to broadstructural characteristics animals may distinguish between particular sites within those
PLOSONE | DOI101371journalpone0145145 December 16 2015 1 24
OPEN ACCESS
Citation Bennitt E Bonyongo MC Harris S (2015)Behaviour-Related Scalar Habitat Use by CapeBuffalo (Syncerus caffer caffer) PLoS ONE 10(12)e0145145 doi101371journalpone0145145
Editor Sadie Jane Ryan University of FloridaUNITED STATES
Received May 27 2015
Accepted December 1 2015
Published December 16 2015
Copyright copy 2015 Bennitt et al This is an openaccess article distributed under the terms of theCreative Commons Attribution License which permitsunrestricted use distribution and reproduction in anymedium provided the original author and source arecredited
Data Availability Statement Data are from theOkavango Buffalo Research project and areavailable from the Dryad repository (doi105061dryad25jp6)
Funding Support was provided by the DulvertonTrust [httpwwwdulvertonorg] to SH the North ofEngland Zoological Society [httpwwwchesterzooorgglobalnorth-of-england-zoological-society] to EBIdea Wild [httpwwwideawildorg] to EB theRoberts Fund [httpswwwcsbrisacukTeachinglearningrobertshtml] to EB the Wilderness SafarisWildlife Trust [httpwwwwildernesstrustcom] to EBMr Rodney Fuhr to EB Mr Ian Fuhr to EB Mr Martinand Mrs Jenny Bennitt tp EB Mr Harry Ferguson to
macrohabitats based on their functional value [3] Characteristics such as woody componentsherbaceous composition soil type and water availability vary between macrohabitats but alsowithin them [4] The resulting microhabitats defined here as sites with different structuralcharacteristics within the same macrohabitat type can be of disparate value to animals [5]
Macrohabitat characteristics can affect their suitability for use by animals for particularbehaviours highlighting the need to include behavioural requirements in analyses of resourceuse [6] Some behaviours are highly time-consuming eg foraging but others can be crucialdespite requiring only a small amount of time such as drinking or salt licking [7] Some macro-habitats may be more suited to particular behaviours than others because of their physicalcharacteristics eg resting in shady or sheltered locations [8]
Animal behaviour is identified most accurately through direct observation but technologi-cal developments [2] combined with increasingly refined mathematical techniques [9] allowthe use of data from GPS collars to distinguish between behaviours [10] When foraging withina profitable site animals typically move short distances with large turning angles [11] Pro-longed periods of very small movements indicate resting sites [12] whereas movements overlarger distances with smaller turning angles occur when walking through unprofitable sites[13] Sites used for particular behaviours can therefore be identified remotely then visited todetermine which environmental characteristics govern behaviour-specific site use [10]
Most habitat use studies focus on macrohabitats and although microhabitat use has beenanalysed in small species [14 15] relatively few studies have considered large herbivores [8 1617 18] Also most previous studies on microhabitat use have examined site use for specificbehaviours eg foraging [19] resting [8] or predator avoidance [20 21] rather than differen-tial behavioural use (but see [22 23 24]) Optimal sites for particular behaviours usually differ[25] so the use of specific microhabitats should be related to behaviour [22]
Large-bodied gregarious bulk grazers are among the least selective herbivores [26] so theremay be less ecological pressure for them to distinguish between microhabitats compared tosmaller more selective herbivores However identifying optimal sites for particular behaviourspresumably would enhance the efficiency of their small-scale movements as well as being ben-eficial at larger scales [27] Relating macro- and microhabitat use by bulk grazers to theirbehaviour will improve understanding of their resource requirements at different scales animportant conservation issue given the key role of large herbivores in ecosystems as consumersand facilitators [28] but also as ecosystem engineers that can affect grass species diversity [29]
We used Cape buffalo (Syncerus caffer caffer) in the Okavango Delta Botswana to test thehypotheses that (i) macrohabitat use is related to behaviour and (ii) variations in forage char-acteristics at the microhabitat scale elicit a behavioural response
Methods
Study AreaThe Okavango Delta located between E2200-E2400 and S1850-S2050 [30] is a flood-pulsedecosystem with a dual moisture regime due to local annual rains and a delayed floodingresponse to rainfall further upstream in Angola [31] We defined three seasons the early floodseason (April-July) when flood waters advanced the late flood season (August-November)when flood waters receded and the rainy season (December-March) when most rainfalloccurred The study site in the south-eastern Okavango Delta contained both flooded and dryregions (Fig 1) and covered approximately 5000 km2
We defined ten macrohabitat types based on differences in woody and grass species compo-sition observed during a 3-month pilot study which were similar to previously describedmacrohabitats [32] We developed a macrohabitat map from geo-referenced ortho-
Behaviour-Related Scalar Habitat Use
PLOS ONE | DOI101371journalpone0145145 December 16 2015 2 24
EB and Dr Dane Hawk to EB The funders had norole in study design data collection and analysisdecision to publish or preparation of the manuscript
Competing Interests The authors have declaredthat no competing interests exist
photographs (Okavango Research Institute) taken between 2001 and 2003 To test the accuracyof the map we recorded 792 ground-truthing points in the seven macrohabitat types mostintensively used by buffalo ie a mean plusmn SD of 1131 plusmn 325 (range 65ndash173) points per macro-habitat The map represented the true macrohabitat type 881 of the time accuracy was low-est for grassland (786) and highest for riparian woodland (957)
Secondary floodplain was wet for the whole year so was mapped as a spatial layer identify-ing the location of permanent water We used Google Earth (Google Inc Mountain View CA)to record the locations of every seasonal pan in the study area and mapped them as a spatiallayer identifying the locations of ephemeral water sources
Capture and CollaringWe fitted 15 female buffalo in different herds with Tellus Simplex 4D GPS-enabled satellite col-lars (Followit Lindenberg Sweden) programmed to record hourly GPS fixes defined as geo-graphical coordinates identified by latitude and longitude The collars weighed 18 kg 04 of theweight of the smallest cow we collared (450 kg) Weight was estimated from girth measurementsusing a growth curve developed for buffalo in Botswana (L Patterson 1978 unpublished report)We selected cows because they were more likely to retain their collars [33] and formed the coreof mixed-sex breeding herds so data from each cow were representative of the herd [34] We car-ried out 24 darting operations (15 to fit collars two to replace malfunctioning collars seven toremove collars) We used a helicopter for 22 darting operations and a vehicle twice Animalswere immobilized with 8 mg A3080 reversed with Naltrexone (N = 13) or a combination of10 mgM99 40 mg Azaperone and 5000 iu Hyalase reversed with 42 mgM5050 (N = 11)
Ethics StatementOne of three experienced wildlife veterinarians registered with the government of Botswanacarried out each darting operation under permit numbers EWT 338XXXVII 44 and EWT
Fig 1 Location of the Okavango Delta and the study area in Botswana Shading in the right-hand image shows the permanently flooded areas
doi101371journalpone0145145g001
Behaviour-Related Scalar Habitat Use
PLOS ONE | DOI101371journalpone0145145 December 16 2015 3 24
8364IV 62 from the Department of Wildlife and National Parks All darted animals wereadult females in good condition that were not obviously pregnant or with a young calf Everyeffort was made to minimise the stress to darted buffalo and their herds All buffalo recoveredquickly from the darting operations no ill effects were observed and they were all seen rejoin-ing their herds
Six collars dropped off and were recovered after the belting failed seven animals were dartedto remove collars at the end of the study and two collars could not be recovered because theyfailed suddenly and ceased to emit the VHF signals used to locate the buffalo All capture andhandling procedures were approved by the University of Bristol Ethics Committee (UB08034) and conformed to the American Society of Mammalogistsrsquo guidelines for the use of wildmammals in research [35] All darting operations were carried out on government-owned pro-tected land under control of the Department of Wildlife and National Parks after permissionhad been obtained from concessionaires and all other relevant stake-holders No protected orendangered species were involved in the research
Movement DataPrior to deployment we hung each collar at a height of 1 m for at least 100 hours and we tookthe mean position of these hourly test fixes as the reference position [36] We measured the dis-tance between each test fix and the reference position using the Point Distance tool in ArcGIS100 (ESRI Redlands CA) The 95 circular error probability the area containing 95 of fixes[37] was used to define the minimum distance threshold (MDT) for each collar below which95 of fixes could not be distinguished from stationary relocations [12] The MDT varied withcollar because of slight differences between them in particular the improvements incorporatedinto later batches of collars We calculated the distances and turning angles between temporallyconsecutive GPS fixes using the lsquoPath with distances and bearingsrsquo extension (httpwwwjennessentcomdownloadsFind_Path_onlinepdf) in ArcView 32 (ESRI Redlands CA)
We designated fixesMDT from the previous location as resting and fixesgtMDT fromthe previous location as active [12] and then grouped active fixes into movement states basedon their distances and turning angles using k-means cluster analysis [9] We did not standard-ize the values for distance and turning angle because this would have given both measuresequal weighting for the clustering procedure Distance was more representative of behaviourbecause it defined the speed at which buffalo were moving grazing buffalo must move at aspeed conducive to feeding though the path may be straight or tortuous thereby yielding vari-able turning angles The clustering algorithm produced three clusters consistent with move-ments at different spatial scales grazing within a site walking between sites and relocatingbetween ranges [34] We defined sites as locations used by buffalo for particular behavioursand identified by GPS coordinates We visited those sites to sample the vegetation in a 50 mradius around the coordinates which would have allowed for location error from the collarswhile permitting us to stay close to the safety of the vehicle in a region with high densities ofpotentially dangerous animals
We verified the accuracy of our behavioural identification method through direct observa-tion of behaviours that were later related to GPS fixes confirming that observed behaviourscorresponded to remotely-recorded ones Observations were conducted every time a herd con-taining a collared individual was located approximately once per month providing data acrossthe seasons We also observed signs related to each behaviour in the sampling sites flattenedareas with large amounts of faeces in resting sites clean cuts on grass in grazing sites and tram-pled game trails in walking sites In addition the proportion of time spent in each behaviourwas similar to previous studies [38 39] Thus each GPS fix identified a site where the buffalo
Behaviour-Related Scalar Habitat Use
PLOS ONE | DOI101371journalpone0145145 December 16 2015 4 24
were engaged in one of four behaviours ie resting grazing walking and relocating Howeverrelocating occurred infrequently and so we did not include it in the vegetation sampling analy-ses We assigned a macrohabitat type to every fix after plotting it onto the macrohabitat map
Vegetation SamplingFrom August 2008 to July 2010 we sampled 550 sites associated with resting grazing and walk-ing from macrohabitats in which buffalo spentgt 10 of their time during the first year of datacollection hereafter referred to as seasonally-preferred macrohabitats Increased water levelsduring the second year caused shifts in macrohabitat use [34] and created access problems forsome sampling sites particularly in secondary and tertiary floodplains Insufficient sampleswere obtained to include these macrohabitats in the early flood vegetation sampling datasetalthough they were included in the proportional behaviour analyses We sampled no morethan three sites per day of use per herd with at least four hours between use and a minimum of12 sites per behaviour within each macrohabitat and season (mean plusmn SD = 183 plusmn 42) Varia-tion in vegetation characteristics within macrohabitats were used to distinguish betweenmicrohabitats defined as locations differing in their vegetation characteristics such as biomassand canopy cover but not in their herbaceous and woody species composition These siteswere used by buffalo for a variety of behaviours and were from all over their home ranges sowere assumed to be representative of the macrohabitats They were used to compare vegetationcharacteristics both between and within macrohabitats
Within 50 m of the GPS coordinates recorded by the collars we quantified grass biomassusing a Disc Pasture Meter (DPM) [40] dropped 50 times at 1 m intervals along five ran-domly-placed 10 m transects We avoided DPM drops on woody plants and forbs because theDPM was calibrated for herbaceous biomass only
Y frac14 1633thorn 1791ffiffiffiffi
Xp
eth1THORNwhere X is the mean settling height of 50 DPM drops and Y is the biomass in kgha (WSWTrollope CJ Hines LA Trollope 2000 unpublished report) When sites were flooded we calcu-lated biomass from grass cut to just below the water surface dried in the sun and oven-dried at60degC for 24 hours We added the dried weights from the four quadrats and multiplied them by10 to convert biomass from gm2 to kgha [34]
We recorded forage dispersion at each site using the distance from a measuring stick to thenearest grass tuft [41] at 1 m intervals along four randomly-placed 10 m transects We mea-sured species richness and calculated species composition by throwing a 05 times 05 m quadratrandomly four times identifying each grass species and estimating percentage composition tothe nearest 5 We measured the distance between the ground and the flat portion of fiveleaves per species from different plants to give the mean leaf table height We estimated canopycover by taking four photographs with the camera pointing straight up at 10 m from therecorded GPS coordinate in each of the cardinal directions The percentage canopy cover wascalculated using a grid superimposed on the image and a mean value was generated from thefour photographs We used the water-related raster layers to calculate distance to water foreach fix distance to permanent water was used during the early and late flood seasons and dis-tance to the closest ephemeral or permanent water source was used during the rainy season
From August 2008 to July 2009 we cut samples from all the grass species at each visited siteto determine the species-specific mean proportion of leaf in different seasons Up to five tuftsin the 05 times 05 m quadrats were cut to within 1 cm of the ground dried in the sun oven-driedat 60degC for 24 hours and separated into leaf and stem each of which was weighed to the nearest001 g Leaf to stem ratio is frequently used to indicate plant quality because it is linked to
Behaviour-Related Scalar Habitat Use
PLOS ONE | DOI101371journalpone0145145 December 16 2015 5 24
maturity stage and crude protein content [42] but some samples had very small leaf or stemcomponents and so we used the mean percentage leaf composition of each species of grassThis was scored for every habitat type and season as high (gt 666) intermediate (333ndash666) or low (lt 333) These species-specific scores were combined with the species compo-sition data to produce a palatability index for each site
We calculated one value per site for each of the following independent variables biomasstuft dispersion (dispersion) species richness (richness) mean leaf table height (height) palat-ability index (palatability) canopy cover (canopy) and distance to water (water) These vegeta-tion characteristics described the abundance (biomass dispersion and height) and quality(palatability and richness) of the herbaceous layer and the physical attributes of the site (can-opy and water) One or more variables within each of these three groups of characteristics wereexpected to differ between macrohabitats and between microhabitats [4 43 44]
Statistical AnalysesUsing the criteria defined by the clustering algorithm and the macrohabitat map we allocateda behaviour and macrohabitat type to each fix We then calculated the proportion of timespent engaging in each behaviour by buffalo in each season and in every seasonally-preferredmacrohabitat We used the ldquocompositionsrdquo package in R v310 [45] to transform the data intolog-ratios then analysed them using Multivariate Analyses of Variance (MANOVAs) Thisenabled us to determine whether buffalo changed their proportional behaviour in different sea-sons and macrohabitat types with the latter indicating behaviour-related macrohabitat useUnivariate Analyses of Variance (ANOVAs) identified the proportional behaviours differingbetween seasons and macrohabitat types
To standardize the seven vegetation characteristic variables we subtracted the sample meanfrom each value and divided by the standard deviation of the sample This improved homoge-neity of variance and accounted for the use of different units of measurement without alteringthe distributions of the independent variables [46]
We used MLwiN v 233 [47] to develop mixed binomial and multinomial logistic regressionmodels with logit link functions to identify the factors that differed between macrohabitats andbetween microhabitats We expected patterns of macro- and microhabitat use to vary betweenindividual buffalo which sometimes occupied spatially-distinct areas so we included the ran-dom effect of individual buffalo in the macro- and microhabitat analyses We also wanted toaccount for the possible effect of unbalanced sampling of microhabitats used for differentbehaviours on the vegetation characteristics sampled in the macrohabitats so we included therandom effect of microhabitat in the macrohabitat analyses
A mixed binomial logistic regression model was only used for macrohabitats in the earlyflood season (Eq 2) when only two seasonally-preferred macrohabitat types were accessibleGrassland was selected as the reference macrohabitat type because it was the most commonmacrohabitat type in the study area
logitethpijTHORN frac14 b1x1ij thorn thorn bnxnij eth2THORN
where yij is the categorical response for individual i in microhabitat j and we denote the proba-bility of being in grassland by πij x1 ndashxn are vegetation characteristics
Mixed multinomial logistic regression models were used to identify vegetation characteris-tics differing between the other nine seasonal macrohabitats in the late flood and rainy seasons(Eq 3) Models with different contrasts were used to compare macrohabitats Reference macro-habitat categories were identified based on their prevalence across the study area with theexception of mixed shrubland Although mixed shrubland covered a large proportion of the
Behaviour-Related Scalar Habitat Use
PLOS ONE | DOI101371journalpone0145145 December 16 2015 6 24
study area it was not present in every collared buffalo home range [34] so it was used as acomparison macrohabitat
logethpethsTHORNij
pethtTHORNij
THORN frac14 bethsTHORN0 thorn bethsTHORN
1 x1ij thorn thorn bethsTHORNn xnij thorn uethsTHORN
ij eth3THORN
where yij is the categorical response for individual i in microhabitat j and we denote the proba-
bility of being in macrohabitat s by pethsTHORNij t is the total number of categories x1 ndashxn are vegetation
characteristics and uethsTHORNij is a contrast-specific random effect
Mixed multinomial logistic regression models were used to identify vegetation characteris-tics differing between each of three microhabitats used for different behaviours in the ten sea-sonally-preferred macrohabitats (Eq 4) Models with different contrasts were used to comparemicrohabitats Microhabitats where buffalo rested were used as the main reference categorybecause buffalo spent several consecutive hours there microhabitats that buffalo walkedthrough and spent very little time in were selected as comparison microhabitats
logethpethsTHORNi
pethtTHORNi
THORN frac14 bethsTHORN0 thorn bethsTHORN
1 x1i thorn thorn bethsTHORNn xni thorn uethsTHORN
i eth4THORN
where yi is the categorical response for individual i and we denote the probability of being in
microhabitat s by pethsTHORNi t is the total number of categories x1 ndashxn are vegetation characteristics
and uethsTHORNi is a contrast-specific random effect
We fitted fully saturated models containing all seven vegetation characteristics to differenti-ate between macrohabitats and between microhabitats However no sampling sites in second-ary floodplain during the late flood season had any canopy cover and so to avoid completeseparation this was left out of the late flood season macrohabitat model and the secondaryfloodplain microhabitat model [46] We developed a priorimodel sets based on combinationsof the vegetation characteristics identifying abundance (biomass height and dispersion) andquality (palatability and richness) of the herbaceous layer and physical attributes of the sam-pling site (canopy and water) We ran models with all possible combinations of variables withinthose broader groups of characteristics and used Akaikersquos Information Criterion (AIC) [48] toidentify the model with the best fit The same set of models was used for macrohabitat andmicrohabitat datasets The models were used to predict the percentage of sites assigned to eachmacrohabitat and microhabitat type then compared to the actual percentage as a measure ofmodel accuracy Means are presented plusmn SD
ResultsThe macrohabitat types most prevalent in the study area were grassland (220) mixed shrub-land (159) dense mopane woodland (156) riparian woodland (139) secondary flood-plain (132) open mopane woodland (102) and tertiary floodplain (63) Vegetationcharacteristics varied between macrohabitats (Table 1)
Movement DataBuffalo were collared for three to 16 months after which collars failed or were removed Theclustering technique consistently identified similar distances and turning angles for the behav-iour categories although variation in MDT affected the cut-off point between resting andactive behaviours (Table 2) Individual variation in movement patterns affected the mean val-ues for distance and turning angle highlighting the need to consider individuals separately
Behaviour-Related Scalar Habitat Use
PLOS ONE | DOI101371journalpone0145145 December 16 2015 7 24
The location error of the GPS fixes was 172 plusmn 187 m N = 3524 mean collar range 105ndash341m The percentage success for fix attempts by the collars varied between animals (820 plusmn 46N = 15 range 621ndash912) and seasons Although it was similar in the early (872 plusmn 58N = 14) and late flood seasons (878 plusmn 69 N = 15) it was lower in the rainy season(756 plusmn 135 N = 15) when buffalo spent more time in wooded habitats [34] where extensivecanopy cover could have affected communication between the collars and satellites [36]
Proportional BehaviourSeasonal behaviour data were generated from 14 15 and 15 buffalo in the early flood late floodand rainy seasons respectively MANOVAs showed that there was a significant differencebetween proportional behaviour during the early and late flood seasons (Pillai124 = 0499p = 0002) but not between the early flood and rainy seasons (Pillai124 = 0279 p = 0086) norbetween the late flood and rainy seasons (Pillai125 = 0209 p = 0194) (Fig 2) Buffalo walkedmore during the late flood (F127 = 8443 p = 0007) than the early flood season but there was
Table 1 Vegetation characteristics in different seasonally-preferred macrohabitats
Season Macrohabitat Biomass Richness Palatability Dispersion Height Distance to water Canopy cover
Early flood Grassland 2650 plusmn 1012 27 plusmn 12 057 plusmn 016 78 plusmn 81 170 plusmn 72 1959 plusmn 2426 plusmn 004
Riparian woodland 2166 plusmn 1098 25 plusmn 12 064 plusmn 023 150 plusmn 140 172 plusmn 92 1205 plusmn 1827 021 plusmn 024
Late flood Grassland 2386 plusmn 1032 32 plusmn 12 066 plusmn 014 77 plusmn 66 144 plusmn 72 1208 plusmn 1716 plusmn 004
Riparian woodland 1114 plusmn 806 19 plusmn 13 041 plusmn 028 303 plusmn 277 110 plusmn 89 551 plusmn 1103 022 plusmn 021
Secondary floodplain 3189 plusmn 2152 24 plusmn 11 048 plusmn 020 72 plusmn 88 160 plusmn 105 114 plusmn 393 000 plusmn 000
Tertiary floodplain 2824 plusmn 1034 21 plusmn 10 061 plusmn 007 32 plusmn 39 143 plusmn 68 275 plusmn 665 001 plusmn 005
Rainy Grassland 2348 plusmn 666 35 plusmn 13 069 plusmn 019 75 plusmn 54 161 plusmn 54 315 plusmn 235 003 plusmn 008
Dense mopane woodland 1166 plusmn 795 29 plusmn 13 072 plusmn 020 216 plusmn 156 158 plusmn 77 332 plusmn 783 015 plusmn 015
Open mopane woodland 894 plusmn 710 23 plusmn 12 073 plusmn 019 237 plusmn 185 149 plusmn 71 225 plusmn 215 044 plusmn 018
Mixed shrubland 2122 plusmn 693 26 plusmn 13 053 plusmn 023 139 plusmn 70 201 plusmn 81 791 plusmn 1017 006 plusmn 010
doi101371journalpone0145145t001
Table 2 Mean distances and turning angles defining behaviour calculated by k-means cluster analysis on consecutive GPS fixes
Buffalo Number of consecutive fixes Mean distance (m) plusmn SD Mean turning angle (deg) plusmn SD
Rest Graze Walk Relocate Rest Graze Walk Relocate
B1 758 24 plusmn 18 222 plusmn 107 668 plusmn 171 1788 plusmn 620 85 plusmn 54 67 plusmn 48 57 plusmn 46 36 plusmn 36
B2 2010 22 plusmn 14 176 plusmn 83 528 plusmn 136 1244 plusmn 373 96 plusmn 54 73 plusmn 51 63 plusmn 47 54 plusmn 51
B3 6604 22 plusmn 14 190 plusmn 93 559 plusmn 141 1266 plusmn 365 96 plusmn 53 61 plusmn 48 53 plusmn 45 43 plusmn 42
B4 6614 22 plusmn 14 200 plusmn 101 629 plusmn 177 1709 plusmn 540 97 plusmn 53 67 plusmn 50 54 plusmn 46 46 plusmn 48
B5 8670 31 plusmn 22 258 plusmn 109 689 plusmn 177 1700 plusmn 576 96 plusmn 53 67 plusmn 50 54 plusmn 45 42 plusmn 41
B6 5768 25 plusmn 18 233 plusmn 113 709 plusmn 206 1966 plusmn 528 95 plusmn 55 61 plusmn 48 50 plusmn 44 40 plusmn 32
B7 5876 20 plusmn 13 208 plusmn 106 636 plusmn 169 1560 plusmn 646 99 plusmn 54 71 plusmn 51 57 plusmn 45 43 plusmn 38
B8 6365 31 plusmn 25 272 plusmn 108 679 plusmn 155 1453 plusmn 443 94 plusmn 55 58 plusmn 46 51 plusmn 42 47 plusmn 43
B9 7322 22 plusmn 16 247 plusmn 125 760 plusmn 203 1933 plusmn 644 97 plusmn 53 65 plusmn 50 53 plusmn 45 42 plusmn 41
B10 2080 19 plusmn 13 194 plusmn 107 666 plusmn 216 2263 plusmn 588 104 plusmn 53 76 plusmn 53 59 plusmn 49 21 plusmn 28
B11 5711 16 plusmn 9 204 plusmn 122 692 plusmn 196 1702 plusmn 516 99 plusmn 53 63 plusmn 50 48 plusmn 42 35 plusmn 37
B12 5809 18 plusmn 13 210 plusmn 98 579 plusmn 134 1215 plusmn 396 95 plusmn 54 59 plusmn 47 50 plusmn 42 42 plusmn 39
B13 6178 14 plusmn 8 173 plusmn 108 623 plusmn 172 1535 plusmn 490 99 plusmn 53 68 plusmn 51 51 plusmn 43 48 plusmn 42
B14 1973 24 plusmn 17 256 plusmn 123 725 plusmn 188 1761 plusmn 566 94 plusmn 53 58 plusmn 47 47 plusmn 41 43 plusmn 39
B15 3818 33 plusmn 26 269 plusmn 114 741 plusmn 194 1912 plusmn 660 97 plusmn 54 63 plusmn 48 57 plusmn 48 41 plusmn 43
doi101371journalpone0145145t002
Behaviour-Related Scalar Habitat Use
PLOS ONE | DOI101371journalpone0145145 December 16 2015 8 24
no difference in the time spent resting (F127 = 3332 p = 0079) grazing (F127 = 0323p = 0574) or relocating (F127 = 1703 p = 0203) Grazing formed the largest part of the timebudget accounting for 439 plusmn 51 of proportional behaviour
To avoid possible biases from a small number of fixes data on proportional behaviour inmacrohabitats were only used if a collar had recorded at least 20 fixes within a particularmacrohabitat For the same reason we only analysed proportional behaviour within season-ally-preferred macrohabitats Proportional behaviour varied more during the early and lateflood seasons than during the rainy season (Table 3)
The only macrohabitats in which buffalo proportional behaviour was not significantly dif-ferent during the two flood seasons were grassland and tertiary floodplain both of which wereopen and provided similar resources and environmental conditions Most of the variation inproportional behaviour between macrohabitats was caused by trade-offs between time spentresting and walking (Table 4) Time spent grazing showed no variation between macrohabitatsin keeping with results from seasonal comparisons Proportional behaviour in different macro-habitats was similar during the flood seasons (Fig 3) indicating that the functional value ofmacrohabitats for particular behaviours was not driven by season alone
Multilevel Binomial and Multinomial Logistic RegressionsIn the majority of cases fully saturated models containing all seven vegetation characteristicswere the most parsimonious However the best fitting early flood macrohabitat model earlyflood riparian woodland microhabitat model late flood grassland microhabitat model and lateflood riparian woodland model did not include height or richness richness water and palat-ability respectively Despite being included in the most parsimonious models not all of thevegetation characteristics had a significant effect
The models could distinguish between macrohabitats in every season based on two six andsix variables in the early flood late flood and wet seasons respectively (Table 5 Fig 4) All ofthe variables differed significantly between at least two macrohabitats and the high significanceof most of the parameters indicated that the macrohabitats we defined were clearly distinct in
Fig 2 Seasonal variation in behaviour of 14 15 and 15 female buffalo respectively
doi101371journalpone0145145g002
Behaviour-Related Scalar Habitat Use
PLOS ONE | DOI101371journalpone0145145 December 16 2015 9 24
Table 3 MANOVA results from comparisons of proportional behaviour in seasonally-preferredmacrohabitats
Season Macrohabitat A Macrohabitat B MANOVA result
Early flood Grassland Riparian woodland Pillai122 = 0393 p = 0022
Secondary floodplain Pillai117 = 0521 p = 0010
Tertiary floodplain Pillai121 = 0133 p = 0535
Riparian woodland Secondary floodplain Pillai118 = 0731 plt0001
Tertiary floodplain Pillai122 = 0388 p = 0024
Secondary floodplain Tertiary floodplain Pillai117 = 0543 p = 0007
Late flood Grassland Riparian woodland Pillai125 = 0452 p = 0004
Secondary floodplain Pillai124 = 0484 p = 0002
Tertiary floodplain Pillai125 = 0059 p = 0815
Riparian woodland Secondary floodplain Pillai124 = 0724 plt0001
Tertiary floodplain Pillai125 = 0502 p = 0001
Secondary floodplain Tertiary floodplain Pillai124 = 0387 p = 0016
Rainy Grassland Dense mopane woodland Pillai125 = 0236 p = 0137
Open mopane woodland Pillai125 = 0250 p = 0114
Mixed shrubland Pillai123 = 0060 p = 0828
Dense mopane woodland Open mopane woodland Pillai125 = 0193 p = 0235
Mixed shrubland Pillai123 = 0336 p = 0044
Open mopane woodland Mixed shrubland Pillai123 = 0240 p = 0160
Significant results are in bold
doi101371journalpone0145145t003
Table 4 ANOVA results identifying behaviours causing differences in proportional behaviour between seasonally-preferredmacrohabitats
Season MacrohabitatA MacrohabitatB Behaviour
Rest Graze Walk Relocate
Earlyflood
Grassland Riparian woodland F125 = 9404p = 0005
F125 = 0013p = 0517
F125 = 14568plt0001
F125 = 0105p = 0749
Secondaryfloodplain
F120 = 5303p = 0032
F120 = 0023p = 0882
F120 = 0049p = 0827
F120 = 3835p = 0064
Riparian woodland Secondaryfloodplain
F121 = 16254plt0001
F121 = 0338p = 0567
F121 = 4820p = 0040
F121 = 1406p = 0249
Tertiary floodplain F125 = 5404p = 0029
F125 = 0482p = 0494
F125 = 5876p = 0023
F125 = 1359p = 0255
Secondary floodplain Tertiary floodplain F120 = 6098p = 0023
F120 = 0002p = 0964
F120 = 0567p = 0460
F120 = 0012p = 0913
Late flood Grassland Riparian woodland F128 = 15436plt0001
F128 = 0747p = 0395
F128 = 7876p = 0009
F128 = 4229p = 0049
Secondaryfloodplain
F127 = 21835plt0001
F127 = 3806p = 0062
F127 = 5247p = 0030
F127 = 0424p = 0521
Riparian woodland Secondaryfloodplain
F127 = 58352plt0001
F127 = 8146p = 0008
F127 = 28617plt0001
F127 = 8165p = 0008
Tertiary floodplain F128 = 18713plt0001
F128 = 4182p = 0050
F128 = 11523p = 0002
F128 = 7788p = 0009
Secondary floodplain Tertiary floodplain F127 = 13786plt0001
F127 = 1163p = 0290
F127 = 6165p = 0020
F127 = 0315p = 0579
Rainy Dense mopanewoodland
Mixed shrubland F126lt0001p = 0985
F126 = 9967p = 0004
F126 = 2735p = 0110
F126 = 0582p = 0453
Significant results are in bold
doi101371journalpone0145145t004
Behaviour-Related Scalar Habitat Use
PLOS ONE | DOI101371journalpone0145145 December 16 2015 10 24
terms of their vegetation characteristics Residual plots from the models showed normaldistributions
Physical attributes of sampling sites were best able to distinguish between macrohabitats inthe early flood season indicating that herbaceous characteristics were relatively uniform duringthat period During the late flood season open macrohabitats (grassland secondary and ter-tiary floodplain) were superficially similar in appearance but differed in measures of their her-baceous abundance and quality as well as physical attributes Riparian woodland wascharacterised by low levels of forage abundance whereas measures of vegetation quality werehighest in grassland During the rainy season vegetation characteristics in mixed shrublandwere most different from those in the other macrohabitats Vegetation abundance was lower inboth mopane woodland macrohabitats than in grassland and mixed shrubland and canopycover was highest in open mopane woodland
Group membership as predicted by the macrohabitat models was similar to the actual pro-portion of samples taken from each macrohabitat indicating that the predictive power of themodels was substantial (Table 6) The models were well able to distinguish between macrohabi-tats based on the recorded vegetation characteristics
The models could distinguish between microhabitats used for some of the different behav-iours in every seasonal macrohabitat type but not between microhabitats used for each of thedifferent behaviours (Table 7) Models with the lowest AIC values included at least six predic-tors but not all of those had a significant effect on the dependent variable and levels of signifi-cance were lower than for parameters distinguishing between macrohabitats Pair-wisedifferences were significant nine four and seven times between resting and grazing resting andwalking and grazing and walking sites respectively Height and dispersion were the character-istics that were most and least frequently able to distinguish between sites respectively Nomeasures of herbaceous abundance or quality or of physical attributes were consistently ableto differentiate between pairs of microhabitats used for different behaviours Residual plotsfrom the models showed normal distributions
In both macrohabitats during the early flood season measures of herbaceous abundancewere lowest in resting sites and highest in grazing sites (Fig 5) Grazing sites also had higherquality forage than sites that were walked through which indicated avoidance
Fig 3 Seasonal variation in behaviour between seasonally-preferredmacrohabitats
doi101371journalpone0145145g003
Behaviour-Related Scalar Habitat Use
PLOS ONE | DOI101371journalpone0145145 December 16 2015 11 24
Table 5 Vegetation characteristics differing significantly between seasonally-preferredmacrohabitats
Season Reference habitat Comparison habitat Parameter Estimate Χ2 P-value
Early flood Grassland Riparian woodland Canopy 2393 16004 lt0001
Distance to water -0844 4222 0041
Late flood Grassland Riparian woodland Biomass -1178 18727 lt0001
Height 0414 4426 0022
Palatability -1478 21390 lt0001
Secondary floodplain Biomass 1400 26152 lt0001
Height -0515 5493 0019
Richness -1479 53393 lt0001
Palatability -1860 77632 lt0001
Distance to water -1071 52599 lt0001
Tertiary floodplain Biomass 1238 19007 lt0001
Height -0525 8090 0004
Dispersion -1874 53676 lt0001
Richness -1657 82023 lt0001
Palatability -1399 39184 lt0001
Distance to water -0871 24893 lt0001
Riparian woodland Secondary floodplain Biomass 1999 50754 lt0001
Height -0568 6447 0011
Dispersion -1545 15974 lt0001
Richness -1013 22559 lt0001
Palatability -0890 16479 lt0001
Distance to water -0855 31396 lt0001
Tertiary floodplain Biomass 2696 103898 lt0001
Height -0703 14577 lt0001
Dispersion -1292 29180 lt0001
Richness -1207 43216 lt0001
Distance to water -0650 13376 lt0001
Secondary floodplain Tertiary floodplain Biomass -0747 10426 0001
Dispersion -2691 48619 lt0001
Palatability 1142 31109 lt0001
Distance to water 0453 11907 0001
Rainy Grassland Dense mopane woodland Biomass -1539 51388 lt0001
Height 1000 20730 lt0001
Dispersion 2198 54794 lt0001
Palatability 1030 34360 lt0001
Open mopane woodland Biomass -0984 27796 lt0001
Height 0533 9900 0002
Dispersion 1578 30634 lt0001
Canopy 2901 116600 lt0001
Mixed shrubland Biomass -0673 9435 0002
Height 1230 35703 lt0001
Dispersion 0639 4821 0028
Richness -0527 13007 lt0001
Palatability -0519 8344 0004
Distance to water 0855 4932 0026
Dense mopane woodland Open mopane woodland Canopy 1785 58682 lt0001
Distance to water 0827 5594 0018
(Continued)
Behaviour-Related Scalar Habitat Use
PLOS ONE | DOI101371journalpone0145145 December 16 2015 12 24
During the late flood season resting sites in grassland had more abundant vegetation thangrazing sites (Fig 6) possibly because buffalo would have been better able to select particularforage in the latter In all other macrohabitats grazing sites had high measures of forage qual-ity In secondary floodplain walking sites had the highest measures of herbaceous abundancebut these may have included unpalatable sedges that buffalo would have avoided grazing [49]In contrast walking sites in tertiary floodplain were characterised by the lowest measures ofabundance
During the rainy season canopy cover did not differ between resting sites and the micro-habitats used for grazing or walking so resting site use was based on other characteristics (Fig7) Resting sites consistently had the lowest measures of forage abundance and grazing siteswere characterised by either high abundance or high quality
Models distinguishing between microhabitats used for different behaviours showed a muchlower level of accuracy in predicting group membership than the macrohabitat modelsalthough the distribution of microhabitat samples was more skewed than the macrohabitatsamples (Table 8) This indicated that the differences between microhabitats used for differentbehaviours were less pronounced than the differences between macrohabitats in keeping withthe lower levels of variation in vegetation characteristics between microhabitats than betweenmacrohabitats
DiscussionHabitat selection and use are key topics in ecological studies [50 51] and govern animal distri-bution over several scales because they can have strong influences on fitness and survival [5253 54] Most environments are naturally heterogeneous and animals must detect and respondto variation in resource cues to identify optimal sites for particular behaviours [10 18] Wehave shown that bulk grazers such as buffalo use vegetation characteristics to discriminatebetween sites at the macro- and microhabitat levels indicating that buffalo are responding tovegetation heterogeneity at a scale intermediate between landscape and bite levels [55] Ourstudy shows that buffalo engage in behavioural responses that shape movement patterns on afiner scale than previously considered even in relatively non-selective bulk grazers and high-lights the necessity of incorporating measures of behaviour into studies of habitat use
We did not consider herd size in our analyses which could have contributed to site use [21]because the retrospective identification of sites from GPS data made it impossible to determineherd size during site use Buffalo herds in the Okavango Delta ranged from 10ndash1500 animals
Table 5 (Continued)
Season Reference habitat Comparison habitat Parameter Estimate Χ2 P-value
Mixed shrubland Biomass 1300 29891 lt0001
Dispersion -0681 13542 lt0001
Richness -0576 12538 lt0001
Palatability -1040 28998 lt0001
Distance to water 2897 38546 lt0001
Open mopane woodland Mixed shrubland Biomass 1252 28064 lt0001
Dispersion -0495 7238 0007
Palatability -0871 20447 lt0001
Canopy -1899 81801 lt0001
Distance to water 1518 10124 0001
doi101371journalpone0145145t005
Behaviour-Related Scalar Habitat Use
PLOS ONE | DOI101371journalpone0145145 December 16 2015 13 24
although most were in the 50ndash300 range with no seasonal changes in mean herd size [49]Individual collared animals were frequently observed in herds of varying sizes suggestinghighly dynamic fission-fusion social behaviour [55]
Fig 4 Variables discriminating between seasonally-preferred macrohabitats during the (a) earlyflood (b) late flood and (c) rainy seasons Values marked with () (+) or (^) were not significantly differentfrom each other
doi101371journalpone0145145g004
Behaviour-Related Scalar Habitat Use
PLOS ONE | DOI101371journalpone0145145 December 16 2015 14 24
Behaviour-Related Macrohabitat UseVariation in vegetation characteristics was sufficient to identify key differences between allmacrohabitats The proportion of time that buffalo allocated to different behaviours variedbetween most macrohabitats except during the rainy season supporting our hypothesis thatmacrohabitat use was related to behaviour The majority of this variation was caused by differ-ences in the proportion of time spent resting Cape buffalo avoided resting in secondary flood-plain presumably because this habitat was usually flooded although forest buffalo (Synceruscaffer nanus) select resting sites in marshland where they can wallow [56] Time spent restingwas greatest in woodland macrohabitats that would have provided the most shade in keepingwith findings from Ethiopia [57] and South Africa [58] In contrast forest buffalo in CentralAfrica preferentially rest in open areas where they can maintain high levels of visual and physi-cal contact [59] which would not be possible in dense vegetation [60] However vegetationcharacteristics other than canopy cover were better able to identify macrohabitats during thelate flood season supporting previous findings that vegetation structure was one of the leastimportant factors in buffalo macrohabitat selection [61]
During the late flood season forage abundance was lowest in habitats that were preferen-tially used for resting as evidenced by lower biomass and height and higher tuft dispersionThis may reflect use of sites with beneficial abiotic factors such as shade and shelter [13] whichcan negatively affect forage abundance [4] Sites with low grass abundance also offer greatervisibility with an associated reduction in predation risk [62] Resting behaviour coincides withreduced vigilance and increased vulnerability to predation [63] so resting in locations with lowforage abundance may allow animals to lower their heads while maintaining their capacity todetect predators thereby reducing perceived predation risk an important factor in the selec-tion of resting sites [64] Previous studies have shown that buffalo utilise areas with intermedi-ate levels of herbaceous biomass possibly as a trade-off between forage intake and predationrisk [65 66 67] Our results suggest that visibility in resting sites may be more important thanforage availability given that the majority of a herd is either ruminating or completely inactiveduring resting bouts
Behaviour-related macrohabitat use was less significant during the rainy season than theflooding seasons This may have been caused by more uniform conditions as indicated by thelack of significant differences between dense and open mopane woodland with the exceptionof canopy cover The only difference in proportional behaviour during the rainy seasonbetween dense mopane woodland and mixed shrubland was caused by buffalo spending moretime grazing in the latter where forage biomass was significantly higher The rainy season was
Table 6 Percentages of samples assigned to seasonally-preferred macrohabitats from actual data and frommultilevel model predictions
Season Macrohabitat Predicted percentage Actual percentage
Early flood Grassland 544 545
Riparian woodland 456 455
Late flood Grassland 248 269
Riparian woodland 254 249
Secondary floodplain 245 169
Tertiary floodplain 253 253
Rainy Grassland 254 273
Dense mopane woodland 257 234
Open mopane woodland 246 255
Mixed shrubland 242 238
doi101371journalpone0145145t006
Behaviour-Related Scalar Habitat Use
PLOS ONE | DOI101371journalpone0145145 December 16 2015 15 24
the most productive when new growths of annual and perennial grasses were readily availablein all macrohabitat types This was when overall habitat selection was lowest [33] indicatingthat the benefits of discriminating between macrohabitats were reduced by the abundant highquality grasses prevalent across the landscape Similarly buffalo in Kruger National Park
Table 7 Vegetation characteristics differing significantly betweenmicrohabitats used for different behaviours
Season Habitat Reference behaviour Comparison behaviour Parameter Estimate Χ2 P-value
Early flood Grassland Rest Graze Biomass 0842 4153 0042
Dispersion 0822 6194 0013
Graze Walk Dispersion -0733 3943 0047
Palatability -1467 7508 0006
Canopy -3238 5529 0019
Distance to water 2222 14111 lt0001
Riparian woodland Rest Graze Height 0810 3884 0049
Graze Walk Height -0943 4525 0033
Late flood Grassland Rest Graze Dispersion 1110 5731 0017
Riparian woodland Rest Graze Height -1022 6540 0011
Richness 1873 11537 0001
Canopy 1168 9831 0002
Graze Walk Canopy -0726 4170 0041
Secondary floodplain Rest Graze Biomass -2921 7099 0008
Height 2330 9814 0002
Palatability 2015 4285 0038
Distance to water 0929 5766 0016
Rest Walk Height 2155 9764 0002
Distance to water 1033 7284 0007
Tertiary floodplain Rest Graze Height -1406 11582 0001
Richness 1173 13311 lt0001
Palatability 0823 4645 0031
Rest Walk Height -1557 13506 lt0001
Richness 1222 14741 lt0001
Palatability 1001 6619 0010
Graze Walk Biomass -1516 8532 0003
Rainy Grassland Rest Graze Richness 0679 5423 0020
Rest Walk Richness 0723 6166 0013
Dense mopane woodland Rest Graze Distance to water 0608 3937 0047
Rest Walk Richness 0627 4056 0044
Graze Walk Biomass -1241 11785 0001
Palatability 0854 6374 0012
Canopy -1356 18763 lt0001
Distance to water -0712 4970 0026
Open mopane woodland Rest Graze Height 0987 8824 0003
Palatability -0816 6925 0008
Rest Walk Biomass 0732 4236 0040
Graze Walk Height -1729 16688 lt0001
Canopy -1037 10179 0001
Distance to water -1616 10186 0001
Mixed shrubland Graze Walk Richness -0939 7207 0007
Canopy -0942 5655 0017
doi101371journalpone0145145t007
Behaviour-Related Scalar Habitat Use
PLOS ONE | DOI101371journalpone0145145 December 16 2015 16 24
South Africa showed lower levels of selection in areas characterised by high quality forage thanin less profitable areas [55 68] Large-scale studies of buffalo distribution have shown thattheir patterns of macrohabitat use are related to vegetation greenness a measure of qualitythroughout the year [69 70] but not to vegetation quantity [71]
Behaviour-Related Microhabitat UseOur results supported the hypothesis that Cape buffalo were discriminating between somemicrohabitats and adjusting their behaviour and associated grazing pressure to local vegetationconditions Such a habitat use strategy facilitates exploiting heterogeneous resources that aredistributed unevenly both spatially and temporally [72] The predictive power of the
Fig 5 Variables discriminating betweenmicrohabitats used for different behaviours during the earlyflood season Values marked with () and () were significantly and not significantly different from eachother respectively
doi101371journalpone0145145g005
Fig 6 Variables discriminating betweenmicrohabitats used for different behaviours during the lateflood season Values marked with () and () were significantly and not significantly different from eachother respectively
doi101371journalpone0145145g006
Behaviour-Related Scalar Habitat Use
PLOS ONE | DOI101371journalpone0145145 December 16 2015 17 24
Fig 7 Variables discriminating betweenmicrohabitats used for different behaviours during the rainyseason Values marked with () and () were significantly and not significantly different from each otherrespectively
doi101371journalpone0145145g007
Table 8 Percentages of samples assigned to behaviours from actual data and frommultilevel model predictions
Season Macrohabitat Percentage Rest Graze Walk
Early flood Grassland Predicted 386 378 235
Actual 444 222 333
Riparian woodland Predicted 346 329 325
Actual 500 283 217
Late flood Grassland Predicted 351 327 322
Actual 500 296 204
Riparian woodland Predicted 335 331 333
Actual 500 340 160
Secondary floodplain Predicted 335 330 334
Actual 400 257 343
Tertiary floodplain Predicted 336 334 330
Actual 460 302 238
Rainy Grassland Predicted 340 325 335
Actual 413 254 333
Dense mopane woodland Predicted 333 335 332
Actual 463 222 315
Open mopane woodland Predicted 341 335 323
Actual 458 203 339
Mixed shrubland Predicted 341 327 332
Actual 455 236 309
doi101371journalpone0145145t008
Behaviour-Related Scalar Habitat Use
PLOS ONE | DOI101371journalpone0145145 December 16 2015 18 24
microhabitat models was lower than the macrohabitat models and differences in characteris-tics between microhabitats used for different behaviours were less significant than betweenmacrohabitats However as at the macrohabitat scale differences between microhabitats usedfor different behaviours were least apparent during the rainy season the period when resourceswere most readily available
Mean leaf table height was the characteristic that was most frequently able to distinguishbetween microhabitats used for different behaviours This variable is the best indicator of visi-bility and with the exception of tertiary floodplain during the late flood season was consis-tently lowest in resting sites In most cases biomass species richness and palatability indexwere highest in grazing sites Feeding in sites with high forage abundance and quality wouldfulfil the intake requirements of large herd-dwelling ruminants [25] and such a strategy hasbeen documented in buffalo previously [73] Herd foraging sites must support large numbersof individuals whose interactions and movements may interfere with each otherrsquos ability tograze selectively [74] so grazing in sites with high levels of species richness could be beneficial[57] Large herbivores may identify optimal feeding sites based on general forage characteristicsrather than selecting plants within sites because their morphological features reduce theircapacity to select forage at small scales [75] although selection at the scale of individual plantshas been recorded in buffalo [61]
Distance to water has a strong influence on buffalo distribution at a landscape scale andbuffalo preferentially utilise macrohabitats close to permanent water particularly during thedry season [34 76 77 78] except in the Nama-Karoo where riverine areas are selected duringthe rainy season [58] However we did not find any consistent behavioural response to dis-tance to water at the macro- or microhabitat scales suggesting that it was not a factor thatinfluenced buffalo behaviour beyond determining seasonal home ranges
Relative Importance of Behaviours in Macro- and Microhabitat UseOf the 30 pair-wise differences in characteristics between microhabitats 13 16 and 11 involvedresting grazing and walking sites respectively Use of grazing sites was therefore a key processat the microhabitat scale but there was no difference in time allocated to grazing betweenmacrohabitats Buffalo must consume sufficient forage to meet their requirements as bulk graz-ers so the proportion of time spent foraging may not be as variable as the amount of time dedi-cated to resting or moving Indeed seasonal differences in proportional behaviour were causedby variation in walking while the percentage of time spent grazing remained constant atapproximately 45 although buffalo in the nearby Chobe National Park only spent 375 oftheir time grazing [79]
Characteristics of resting sites were consistent across scales whereby buffalo preferentiallyrested in macro- and microhabitats with high visibility This association between resting andhigh visibility highlights the importance of considering behaviours other than foraging whenanalysing resource use patterns While obtaining sufficient food of suitable quality is essentialto survival the high vulnerability associated with resting may explain the strong associationbetween resting behaviour and habitat characteristics that reduce risks The availability ofappropriate resting sites may therefore have a greater impact on the spatial ecology and fitnessof animals than previously considered
We did not identify any particular macrohabitats that buffalo consistently walked throughAt the microhabitat scale walking sites were the least different from sites used for other behav-iours It is therefore likely that buffalo were selecting particular microhabitats for resting andgrazing and walking through other locations with less distinctive forage characteristicsthereby avoiding them
Behaviour-Related Scalar Habitat Use
PLOS ONE | DOI101371journalpone0145145 December 16 2015 19 24
Implications for Studies of Habitat Use by BuffaloOur findings agree with the results from previous studies on African buffalo macrohabitat useand resource requirements Buffalo graze in sites with high levels of forage abundance andquality [57 65 73 80] and rest in locations with high visibility [59 60] Previous studies havefound that buffalo select areas with intermediate levels of biomass [66 67] but our results sug-gest that they discriminate between grazing and resting sites within those areas Buffalo restmore in woodland macrohabitats with shade but low vegetation abundance seems to be moreimportant than vegetation structure [61] allowing increased visibility for predator detectionbut also for maintaining physical and visual contact as in forest buffalo [59 60] By consideringvariation in vegetation characteristics within macrohabitats and their influence on behaviourwe have provided a more thorough understanding of buffalo resource requirements and theprocesses governing buffalo spatial ecology and highlighted the key role of forage heterogene-ity in driving behaviour [55]
ConclusionsLarge herbivores benefit from high levels of heterogeneity in macrohabitat distribution whichcan buffer the effects of temporal variation in forage availability [81] We have shown thatresource heterogeneity on a smaller scale is also important in herbivore ecology particularlyduring seasons when resources are restricted Despite being bulk grazers and among the leastselective herbivores [25] Cape buffalo are able to detect vegetation differences within macroha-bitat types and adjust their behaviour accordingly Herd-dwelling bulk grazers form a substan-tial portion of the herbivore biomass [82] and can have strong influences on vegetationUnderstanding the factors that attract or repulse them from particular sites can ensure the suc-cessful management of resources Resource use by smaller species that are capable of more pre-cision may be affected even more strongly by disparities in the characteristics of microhabitatsso variation within not just between macrohabitats should be considered during studies ofresource requirements
Macrohabitats are typically defined by species composition and vegetation growth patternsbut our results have shown that measures of forage abundance may be more useful for distin-guishing between functional macrohabitat types Differences in vegetation characteristicswithin observer-defined macrohabitats are also important to animals [83] We have shownthat comparatively small differences between macro- and microhabitats can trigger beha-vioural responses Identifying these triggers will ensure a more holistic approach to under-standing animal spatial patterns Incorporating different behaviours into scalar habitat useanalyses will allow a deeper insight into animal resource requirements which in turn canincrease the efficiency of conservation and management techniques [21] Integrating move-ment patterns and empirical field data increases the value of remotely-acquired GPS data [9]in combination they play a key role in understanding animal behavioural ecology and its influ-ence on scalar habitat use
AcknowledgmentsWe thank the Botswana Ministry of Environment Wildlife and Tourism for permission toconduct this study Laura Atkinson Janette Baarman Roz Balen Shavaughn Davies and Jenni-fer Gilbert for assistance in the field Dane Hawk Rob Jackson and Larry Patterson for veteri-nary support and Guy Lobjoit and Duncan Rowles for logistical support
Behaviour-Related Scalar Habitat Use
PLOS ONE | DOI101371journalpone0145145 December 16 2015 20 24
Author ContributionsConceived and designed the experiments EB MCB SH Performed the experiments EB Ana-lyzed the data EB Contributed reagentsmaterialsanalysis tools EB MCB Wrote the paperEB MCB SH
References1 Senft RL Coughenour MB Bailey DW Rittenhouse LR Sala OE Swift DM Large herbivore foraging
and ecological hierarchies Bioscience 1987 37789ndash795 798ndash799 doi 1023071310545
2 Mayor SJ Schneider DC Schaefer JA Mahoney SP Habitat selection at multiple scales Ecoscience2009 16238ndash247 doi 10298016-2-3238
3 McCann NP Zollner PA Gilbert JH Bias in the use of broadscale vegetation data in the analysis ofhabitat selection J Mammal 2014 95369ndash381 doi 10164413-mamm-a-110
4 Ludwig F de Kroon H Berendse F Prins HHT The influence of savannah trees on nutrient water andlight availability and the understorey vegetation Plant Ecol 2004 17093ndash105 doi 101023bvege00000190232963692
5 de Omena PM Romero GQ Using visual cues of microhabitat traits to find home the case study of abromeliad-living jumping spider (Salticidae) Behav Ecol 2010 21690ndash695 doi 101093behecoarq040
6 Wilson RR Gilbert-Norton L Gese EM Beyond use versus availability behaviour-explicit resourceselection Wildl Biol 2012 18424ndash430 doi 10298112-044
7 Beyer HL Haydon DT Morales JM Frair JL Hebblewhite M Mitchell M et al The interpretation of hab-itat preference metrics under use-availability designs Phil Trans R Soc B 2010 3652245ndash2254 doi101098rstb20100083 PMID 20566501
8 Schneider TC Kowalczyk R Koumlhler M Resting site selection by large herbivoresmdashthe case of Euro-pean bison (Bison bonasus) in Białowieża Primeval Forest Mamm Biol 2013 78438ndash445 doi 101016jmambio201306002
9 Van Moorter B Visscher DR Jerde CL Frair JL Merrill EH Identifying movement states from locationdata using cluster analysis J Wildl Manage 2010 74588ndash594 doi 1021932009-155
10 Owen-Smith N Fryxell JM Merrill EH Foraging theory upscaled the behavioural ecology of herbivoremovement Phil Trans R Soc B 2010 3652267ndash2278 doi 101098rstb20100095 PMID 20566503
11 de Knegt HJ Hengeveld GM van Langevelde F de Boer WF Kirkman KP Patch density determinesmovement patterns and foraging efficiency of large herbivores Behav Ecol 2007 181065ndash1072 doi101093behecoarm080
12 Ganskopp DC Johnson DD GPS error in studies addressing animal movements and activities Range-land Ecol Manage 2007 60350ndash358 doi 1021111551-5028(2007)60[350geisaa]20co2
13 Barraquand F Benhamou S Animal movements in heterogeneous landscapes identifying profitableplaces and homogeneous movement bouts Ecology 2008 893336ndash3348 doi 10189008-01621PMID 19137941
14 Bowne DR Peles JD Barrett GW Effects of landscape spatial structure on movement patterns of thehispid cotton rat (Sigmodon hispidus) Landscape Ecol 1999 1453ndash65 doi 101023a1008025827895
15 Siziba N Chimbari MJ Masundire H Mosepele K Spatial variations of microinvertebrates across differ-ent microhabitats of temporary floodplains of lower Okavango Delta Botswana Afr J Ecol 20125043ndash52 doi 101111j1365-2028201101289x
16 WallisDeVries MF Laca EA Demment MW The importance of scale of patchiness for selectivity ingrazing herbivores Oecologia 1999 121355ndash363 doi 101007s004420050939
17 Matson TK Goldizen AW Jarman PJ Microhabitat use by black-faced impala in the Etosha NationalPark Namibia J Wildl Manage 2005 691708ndash1715 doi 1021930022-541x(2005)69[1708mubbii]20co2
18 Leblond M Dussault C Ouellet J-P What drives fine-scale movements of large herbivores A casestudy using moose Ecography 2010 331102ndash1112 doi 101111j1600-0587200906104x
19 Thornton A Hodge SJ The development of foraging microhabitat preferences in meerkats BehavEcol 2009 20103ndash110 doi 101093behecoarn120
20 Thorson JM Morgan RA Brown JS Norman JE Direct and indirect cues of predatory risk and patchuse by fox squirrels and thirteen-lined ground squirrels Behav Ecol 1998 9151ndash157 doi 101093beheco92151
Behaviour-Related Scalar Habitat Use
PLOS ONE | DOI101371journalpone0145145 December 16 2015 21 24
21 Fortin D Fortin M-E Beyer HL Duchesne T Courant S Dancose K Group-size-mediated habitatselection and group fusion-fission dynamics of bison under predation risk Ecology 2009 902480ndash2490 doi 10189008-03451 PMID 19769126
22 Zollner PA Smith WP Brenna LA Microhabitat characteristics of sites used by swamp rabbit WildlSoc Bull 2000 281003ndash1011 doi 1016560580090312
23 Masseacute A Cocircteacute SD Habitat selection of a large herbivore at high density and without predation trade-off between forage and cover J Mammal 2009 90961ndash970 doi 10164408-MAMM-A-1481
24 Haby NA Conran JG Carthew SM Microhabitat and vegetation structure preference an exampleusing southern brown bandicoots (Isoodon obesulus obesulus) J Mammal 2013 94801ndash812 doi10164412-mamm-a-2201
25 Mysterud A Ims RA Functional responses in habitat use availability influences relative use in trade-offsituations Ecology 1998 791435ndash1441 doi 1018900012-9658(1998)079[1435frihua]20co2
26 Wilmshurst JF Fryxell JM Bergman CM The allometry of patch selection in ruminants Proc R SocLond B 2000 267345ndash349 doi 101098rspb20001007
27 Fortin D Fryxell JM OrsquoBrodovich L Frandsen D Foraging ecology of bison at the landscape and plantcommunity levels the applicability of energy maximization principles Oecologia 2003 134219ndash227doi 101007s00442-002-1112-4 PMID 12647163
28 Valeix M Fritz H Sabatier R Murindagomo F Cumming D Duncan P Elephant-induced structuralchanges in the vegetation and habitat selection by large herbivores in an African savannah Biol Con-serv 2011 144902ndash912 doi 101016jbiocon201010029
29 Prins HHT van Oeveren H Bovini as keystone species and landscape architects In Melletti M BurtonJ editors Ecology evolution and behaviour of wild cattle Cambridge Cambridge University Press2014 pp 21ndash29
30 Heinl M Neuenschwander A Sliva J Vanderpost C Interactions between fire and flooding in a south-ern African floodplain system (Okavango Delta Botswana) Landscape Ecol 2006 21699ndash709 doi101007s10980-005-5243-y
31 Ramberg L Hancock P LindholmM Meyer T Ringrose S Silva J et al Species diversity of the Oka-vango Delta Botswana Aquat Sci 2006 68310ndash337 doi 101007s00027-006-0857-y
32 Bartlam HLA Spatial heterogeneity in a dynamic wetland determinants of herbivore distribution in theOkavango Delta and their relevance to conservation PhD thesis University of Bristol 2010 AvailablehttpherbivoreresearchcomHBartlam_Thesis2010pdf
33 Taolo C Population ecology seasonal movement and habitat use of the African buffalo (Sycerus caf-fer) in Chobe National Park Botswana PhD thesis University of Science and Technology Norway2003
34 Bennitt E Bonyongo MC Harris S Habitat selection by African buffalo (Syncerus caffer) in response tolandscape-level fluctuations in water availability on two temporal scales PLoS One 2014 9(7)e101346 doi 101371journalpone0101346 PMID 24983377
35 Sikes RS GannonWL Animal Care and Use Committee of the American Society of MammalogistsGuidelines of the American Society of Mammalogists for the use of wild animals in research J Mammal2011 92235ndash253 doi 10164410-mamm-f-3551
36 Frair JL Fieberg J Hebblewhite M Cagnacci F DeCesare NJ Pedrotti L Resolving issues of impre-cise and habitat-biased locations in ecological analyses using GPS telemetry data Phil Trans R Soc B2010 3652187ndash2200 doi 101098rstb20100084 PMID 20566496
37 Lewis JS Rachlow JL Garton EO Vierling LA Effects of habitat on GPS collar performance usingdata screening to reduce location error J Appl Ecol 2007 44663ndash671 doi 101111j1365-2664200701286x
38 Prins HHT Ecology and behaviour of the African buffalo social inequality and decision making Lon-don Chapman amp Hall 1996
39 Sinclair ARE The African buffalo a study of resource limitation of populations Chicago University ofChicago Press 1977
40 Bransby DI Matches AG Krause GF Disk meter for rapid estimation of herbage yield in grazing trialsAgron J 1977 69393ndash396 doi 102134agronj197700021962006900030016x
41 Hardy MB Tainton NM Towards a technique for determining basal cover in tufted grasslands Afr JRange Forage Sci 1993 1077ndash81 doi 1010801022011919939638327
42 Buxton DR Quality-related characteristics of forages as influenced by plant environment and agro-nomic factors Anim Feed Sci Technol 1996 5937ndash49 doi 1010160377-8401(95)00885-3
43 Georgiadis NJ Microhabitat variation in an African savanna Effects of woody cover and herbivores inKenya J Trop Ecol 1989 593ndash108 doi 101017S0266467400003254
Behaviour-Related Scalar Habitat Use
PLOS ONE | DOI101371journalpone0145145 December 16 2015 22 24
44 Peterson DW Reich PB Fire frequency and canopy structure influence plant species diversity in a for-est-grassland ecotone Plant Ecol 2008 1945ndash16 doi 101007s11258-007-9270-4
45 Van Der Boogaart KG Tolosana-Delgado R Compositional data analysis with lsquoRrsquo and the packagelsquocompositionsrsquo Geol Soc Lond Spec Publ 2006 264119ndash127 doi 101144gslsp20062640109
46 Quinn GP Keough MJ Experimental design and data analysis for biologists Cambridge CambridgeUniversity Press 2002
47 Rasbash J Charlton C BrowneWJ Healy M Cameron B MLwiN Version 233 Centre for MultilevelModelling University of Bristol 2015
48 Akaike H A new look at the statistical model identification IEEE Trans Automat Cont 1974 19716ndash723 doi 101109TAC19741100705
49 Bennitt E The ecology of African buffalo (Syncerus caffer) in the Okavango Delta Botswana PhD the-sis University of Bristol 2012 Available httpherbivoreresearchcomEmily20Bennitt20PhDpdf
50 Alldredge JR Griswold J Design and analysis of resource selection studies for categorical resourcevariables J Wildl Manage 2006 70337ndash346 doi 1021930022-541X(2006)70[337DAAORS]20CO2
51 Gaillard J-M Hebblewhite M Loison A Fuller M Powell R Basille M et al Habitat-performance rela-tionships finding the right metric at a given spatial scale Phil Trans R Soc B 2010 3652255ndash2265doi 101098rstb20100085 PMID 20566502
52 Russell RE Swihart RK Feng Z Population consequences of movement decisions in a patchy land-scape Oikos 2003 103142ndash152 doi 101034j1600-0706200312418x
53 Morales JM Moorcroft PR Matthiopoulos J Frair JL Kie JG Powell RA et al Building the bridgebetween animal movement and population dynamics Phil Trans R Soc B 2010 3652289ndash2301 doi101098rstb20100082 PMID 20566505
54 Basille M Van Moorter B Herfindal I Martin J Linnell JDC Odden J et al Selecting habitat to survivethe impact of road density on survival in a large carnivore PLoS One 2013 8(7)e65493 doi 101371journalpone0065493 PMID 23874381
55 Winnie JA Cross P Getz W Habitat quality and heterogeneity influence distribution and behavior inAfrican buffalo (Syncerus caffer) Ecology 2008 891457ndash1468 doi 10189007-07721 PMID18543637
56 Korte LM Habitat selection at two spatial scales and diurnal activity patterns of adult female forest buf-falo J Mammal 2008 89 115ndash125 doi 10164406-MAMM-A-4231
57 Megaze A Belay G Balakrishnan M Population structure and ecology of the African buffalo (Synceruscaffer Sparrman 1779) in Chebera Churchura National Park Ethiopia Afr J Ecol 2013 51 393ndash401doi 101111aje12049
58 Venter JA Watson LH Feeding and habitat use of buffalo (Syncerus caffer caffer) in the Nama-KarooSouth Africa South Afr J Wildl Res 2008 38 42ndash51 doi 1039570379-4369-38142
59 Melletti M Penteriani V Boitani L Habitat preferences of the secretive forest buffalo (Syncerus caffernanus) in Central Africa J Zool 2007 271 178ndash186 doi 101111j1469-7998200600196x
60 Melletti M Penteriani V Mirabile M Boitani L Effects of habitat and season on the grouping of forestbuffalo resting places Afr J Ecol 2009 47 121ndash124 doi 101111j1365-2028200800965x
61 Perrin MR Brereton-Stiles R Habitat use and feeding behaviour of the buffalo and the white rhinocerosin the Hluhluwe-Umfolozi Game Reserve South Afr J Wildl Res 1999 29 72ndash80 Available wwwrhinoresourcecentercompdf_files1301307055803pdf
62 Devereux CL WhittinghamMJ Fernandez-Juricic E Vickery JA Krebs JR Predator detection andavoidance by starlings under differing scenarios of predation risk Behav Ecol 2006 17303ndash309 doi101093behecoarj032
63 Semeniuk CAD Dill LM Costbenefit analysis of group and solitary resting in the cowtail stingray Pasti-nachus sephen Behav Ecol 2005 16417ndash426 doi 101093behecoari005
64 Lima SL Rattenborg NC Lesku JA Amlaner CJ Sleeping under the risk of predation Anim Behav2005 70723ndash736 doi 101016janbehav200501008
65 Mugangu TE Hunter ML Gilbert JR Food water and predation a study of habitat selection by buffaloin Virunga National Park Zaire Mammalia 1995 59 349ndash362 doi 101515mamm1995593349
66 Matawa F Murwira A Schmidt KS Explaining elephant (Loxodonta africana) and buffalo (Synceruscaffer) spatial distribution in the Zambezi Valley using maximum entropy modelling Ecol Model 2012242 189ndash197 doi 101016jecolmodel201205010
67 Burkepile DE Burns CE Tambling CJ Amendola E Buis GM Govender N et al Habitat selection bylarge herbivores in a southern African savannah the relative roles of bottom-up and top-down forcesEcosphere 2013 4 art139 doi 101890es13-000781
Behaviour-Related Scalar Habitat Use
PLOS ONE | DOI101371journalpone0145145 December 16 2015 23 24
68 Ryan SJ Knechtel CU Getz WM Range and habitat selection of African buffalo in South Africa J WildlManage 2006 70 764ndash776 doi 1021930022-541X(2006)70[764RAHSOA]20CO2
69 Ryan SJ Cross PC Winnie J Hay C Bowers J Getz WM The utility of normalized difference vegeta-tion index for predicting African buffalo forage quality J Wildl Manage 2012 76 1499ndash1508 doi 101002jwmg407
70 Muposhi VK Chanyandura A Gandiwa E Muvengwi J Muboko N Taru P et al Post-release monitor-ing of diet profile and diet quality of reintroduced African buffalo (Syncerus caffer) in Umfurudzi ParkZimbabwe Trop Cons Science 2014 7 440ndash456 doi edepotwurnl330587
71 Smit IPJ Resources driving landscape-scale distribution patterns of grazers in an African savannaEcography 2011 34 67ndash74 doi 101111j1600-0587201006029x
72 Bailey DW Gross JE Laca EA Rittenhouse LR Coughenour MB Swift DM et al Mechanisms thatresult in large herbivore grazing distribution patterns J Range Manage 1996 49386ndash400 doi 1023074002919
73 Macandza VA Owen-Smith N Cross PC Forage selection by African buffalo in the late dry season intwo landscapes South Afr J Wildl Res 2004 34 113ndash121 Available httpwwwnrmscusgsgovfilesnorockproductsMacandza_et_al2004pdf
74 Shrader AM Kerley GIH Kotler BP Brown JS Social information social feeding and competition ingroup-living goats (Capra hircus) Behav Ecol 2007 18103ndash107 doi 101093behecoar1057
75 Laca EA Sokolow S Galli JR Cangiano CA Allometry and spatial scales of foraging in mammalianherbivores Ecol Lett 2010 13311ndash320 doi 101111j1461-0248200901423x PMID 20100240
76 Chirima GJ Owen-Smith N Erasmus BFN Changing distributions of larger ungulates in the KrugerNational Park from ecological aerial survey data Koedoe 2012 54 24ndash35 doi 104102koedoev54i11009
77 Macandza VA Owen-Smith N Cain JW Habitat and resource partitioning between abundant and rela-tively rare grazing ungulates J Zool 2012 287 175ndash185 doi 101111j1469-7998201200900x
78 Fynn RWS Chase M Roder A Functional habitat heterogeneity and large herbivore seasonal habitatselection in northern Botswana S Afr J Wildl Res 2014 44 1ndash15 doi 1039570560440103
79 Omphile UJ Powell J Large ungulate habitat preference in Chobe National Park Botswana J RangeManage 2002 55 341ndash349 doi 1023074003470
80 Corneacutelis D Benhamou S Janeau G Morellet N Ouedraogo M de Visscher M-N Spatiotemporaldynamics of forage and water resources shape space use of West African savanna buffaloes J Mam-mal 2011 92 1287ndash1297 doi 10164410-mamm-a-3971
81 Owen-Smith N Functional heterogeneity in resources within landscapes and herbivore populationdynamics Landscape Ecol 2004 19761ndash771 doi 101007s10980-005-4862-7
82 Bonyongo MC Harris S Grazers species-packing in the Okavango Delta Botswana Afr J Ecol 200745527ndash534 doi 101111j1365-2028200700764x
83 Knight TW Morris DW Howmany habitats do landscapes contain Ecology 1996 771756ndash1764doi 1023072265781
Behaviour-Related Scalar Habitat Use
PLOS ONE | DOI101371journalpone0145145 December 16 2015 24 24
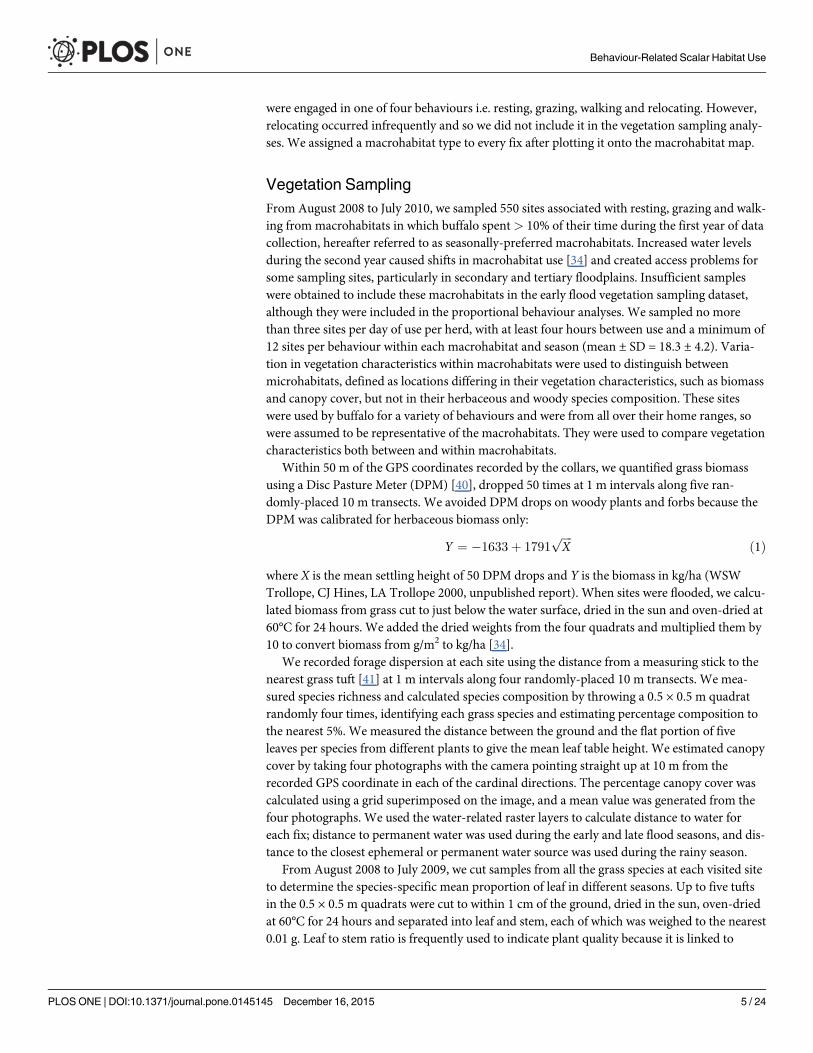
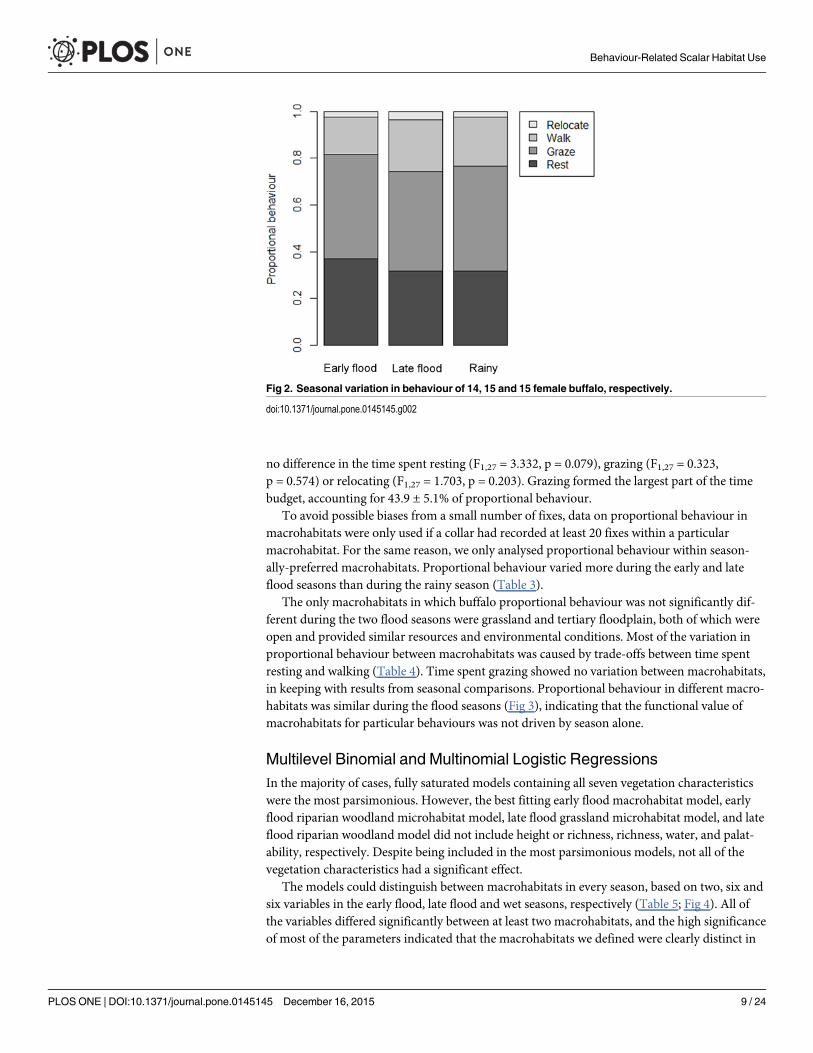
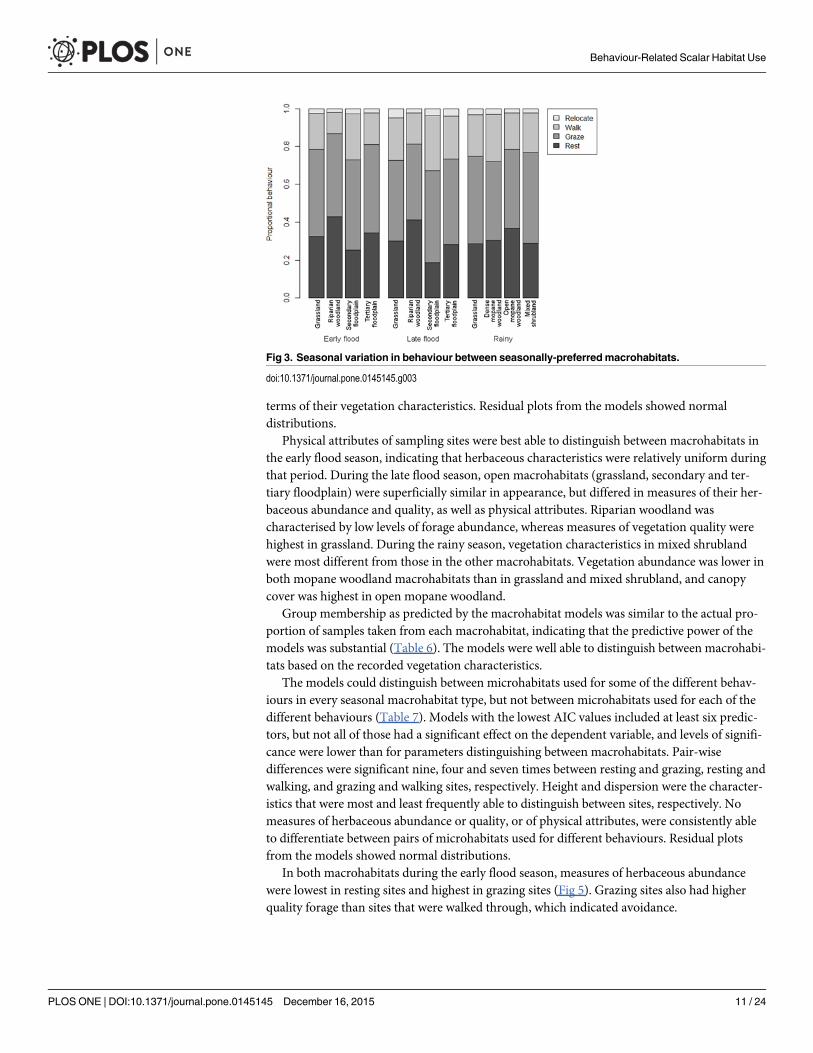
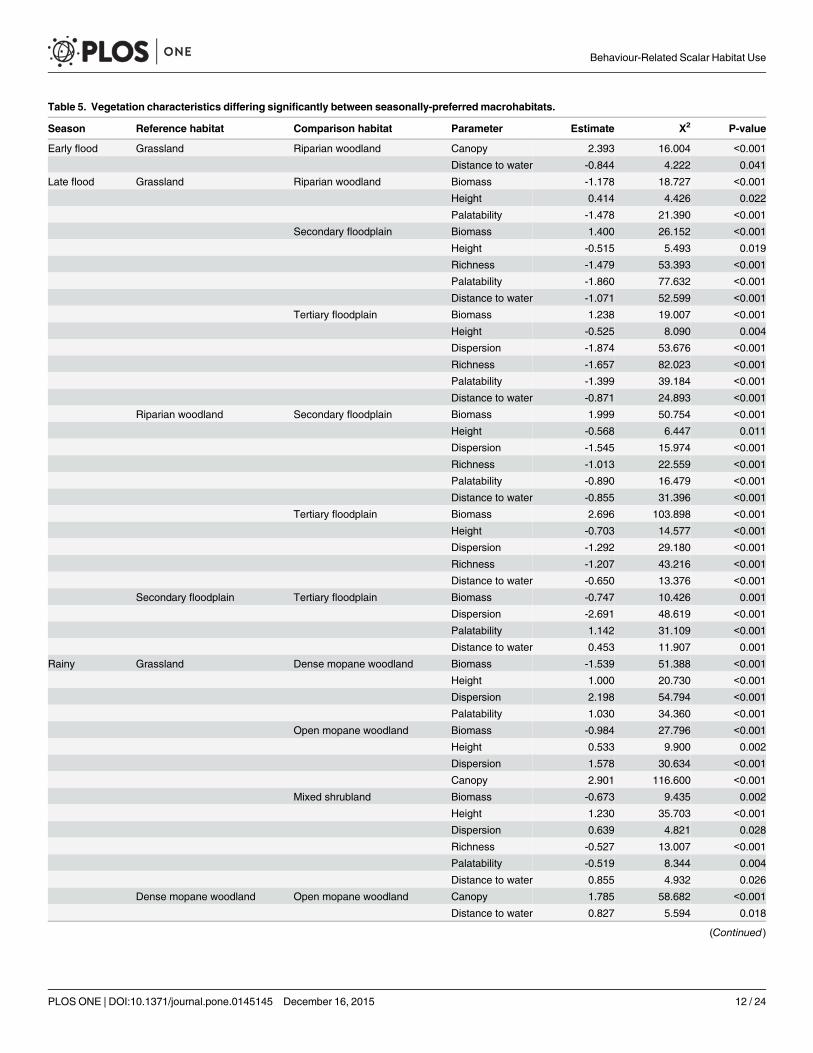