Beacon of Hope an impact assessment study of BRAC's Rural Development Programme
155
Beacon of Hope an impact assessment study of BRAC’s Rural Development Programme Shams Mustafa, Ishrat Ara, Dilruba Banu, Altaf Hossain, Azmal Kabir, Mohammad Mohsin, Abu Yusuf, Sarwar Jahan February 1996 Research and Evaluation Division
Transcript of Beacon of Hope an impact assessment study of BRAC's Rural Development Programme
Beacon of Hope an impact assessment study of BRAC’s
Rural Development Programme
Shams Mustafa, Ishrat Ara, Dilruba Banu, Altaf Hossain, Azmal Kabir,
Mohammad Mohsin, Abu Yusuf, Sarwar Jahan
February 1996
Research and Evaluation Division
Beacon of Hope an impact assessment study of BRAC’s
Rural Development Programme
Shams Mustafa, Ishrat Ara, Dilruba Banu, Altaf Hossain, Azmal Kabir,
Mohammad Mohsin, Abu Yusuf, Sarwar Jahan
February 1996
Consultants
Dr. Angelika Brustinow (CDS, Swansea), Dr. Martin Greeley (IDS, Sussex) and Dr. Richard Montgomery (CDS, Swansea)
Research and Evaluation Division
Impact Assessment Study of RDP
Executive Summary and Policy Implications 1. Introduction and Methods 1.1 The poor in Bangladesh is not served either by the formal sectors including the banking sector or the informal credit market. Support by targeted developmental programmes (including credit) improves the poor’s income earning capacity. BRAC’s Rural Development Programme (RDP) has been serving an increasing number of the rural poor with education, technological services and credit support. A number of research studies have shown that RDP’s impact on the lives of the poor is positive. The Donor Consortium (DC) for RDP and BRAC Management have agreed that an Impact Aassessment System (IAS) was required to gain a better understanding of RDP’s impact on the lives of the rural poor. The first phase of the impact assessment of RDP was undertaken by BRAC’s Research and Evaluation Division, with assistance from three international experts engaged by the DC. The Centre for Development Studies (CDS), Swansea also hosted two members of the IAS for six week to facilitate the production of the Main Findings Report (which preceded the present report, in 1995). 1.2 The RDP was launched in 1986 following the amalgamation of two experimental programmes: the Outreach Programme and the Rural Credit and Training Programme. The Third Phase (1992-1995) of RDP’s operation was due for completion at the end of 1995. In its Second (1989-1991) and Third phases RDP underwent rapid horizontal expansion. During these phases a major change was made in RDP’s strategy by shifting its focus almost entirely on women. 1.3 The impact assessment methodology was constructed on the basis of a set of hypotheses, and incorporated a set of key indicators of impact. The IAS hypothised that various non-RDP factors are likely to influence the impact of RDP’s inputs. The hypothesis was specified with reference to the following factors : (a) length of RDP membership; (b) strength of RDP support (i.e., amount of credit); (c) life-cycle situation of the households, education, and initial endowment on joining BRAC; and (d) local economic dynamism. The criteria for the key indicators of impact were: (a) material well-being of the member households; (b) vulnerability to seasonality and crisis coping capacity; (c) changes in women’s lives; and (d) development of village organisations as institutions. 1.4 Three instruments were used for data generation. The Village Profiles were prepared by using a structured form to collect information from small groups of key informants. The Village Profiles contributed to the assessment of the significance of BRAC inputs in relation to other socio-economic conditions and variables, including regional differences . The profiles were constructed for 225 villages, of which 150 were RDP villages and 75 were villages where RDP was not present (from these the comparison households were sampled). These randomly selected villages represent 15 Area Offices of RDP. The Village Organisation Case Studies were carried out by using informal and a limited number of RRA techniques, to obtain both quantitative and qualitative information. A selected number of (24) case studies contributed to the analysis of BRAC member’s socio-economic context and of the village organisations. The VO case studies were selected on a random basis from the villages in which the BRAC household survey took place. Household Survey of BRAC and non-BRAC clientele, using a pre-coded questionnaire in two rounds to capture seasonal variations in material well-being (October 1993; February 1994). The questionnaire collected information on household features, inputs received from RDP/RCP, economic details (income assets, food stocks, etc.) and some indicators of social attitudes and behavior, and socio-political relations. The household survey covered a total of 2,250 households, of which the RDP households numbered 1500, and socio-economically comparable 750 non-RDP households.
i Impact Assessment Study
2. Impact of RDP Inputs Measuring RDP inputs
2.1 Length of VO membership as a RDP input, shows that the average participation length for the male category is longer (43 months) than that for the female (23 months) category. The larger (47 percent) proportional representation for the female category in the younger length category (less than one year) is the outcome of the shift in emphasis towards women since late 1980s.The rapid expansion during this period and the imperative of staff performance, mean that the effectiveness of targeting (land owned <0.50 acre) is lower for male members (72 percent) whereas it is better for female members (84 percent). The interaction between two of the RDP inputs - length and credit, produces results to suggest that there is positive correlation between the two inputs, that is the cumulative amount of borrowing from RDP increases over longer membership length (from less than Tk. 2500 and Tk. 1000 respectively for male and female categories of less than one year membership, to Tk. 14,000 and Tk. 10,000 for more than six years length). The input indicators show that the cumulative amount of (average) RDP credit per household is larger for the male category (Tk. 8529) than it is for the females (Tk. 3484), which can be explained with reference to the comparatively unequal average participation length for the two categories of RDP households. The gap is very narrow with respect to the average size of the loans (i.e. amount per loan disbursed) and stand at Tk. 2728 for male and Tk. 2525 for female. This shows that male and female borrowers receive similar size loans.
2.2 The pattern of investment of RDP credit by the borrowers shows changes over time, more clearly for the male category than for the females . Investment in revenue earning capital is maintained at high rates between 81 percent and 71 percent respectively. The proportion of investment that are not used for revenue generation purposes remain between less than one percent and 14 percent, respectively for the male and female categories. Material wellbeing
2.3 The results with respect to the material well-being indicators are positive according to membership length. The results show gradual improvements in the indicators such as wealth, revenue earning assets, value of house structure, the level of cash earned , per capita expenditure on food, total household expenditure .Changes in some indicators are slower than the others : for example , the budget structures of the RDP households show slight difference from that of the comparison group ; level of cash earned by the households show small improvements over time . On the other hand, the differences in accumulation of real capital and of wealth show tremendous increases with increasing length of participation. (The values of these for the ‘more than four year membership length’ are 100% and 112% higher than that for the ‘less than one year’ group). 2.4 The impact assessment findings indicate a consistent movement along the path to improved material wellbeing, to greater wealth and expenditure, according to loan size and membership age. While there are undoubtedly other non-RDP factors which influence material wellbeing of member households, the major finding is that before significant changes become measurable RDP households need to receive a minimum amount of cummulative RDP credit (i.e. Tk. 7,500) over a minimum length of RDP membership (i.e., 2.5 years). Throughout the study, the group of households achieving the ‘critical mass’ of RDP inputs have been compared with newer members (i.e., less than 2.5 years) receiving smaller RDP credit (i.e., less than Tk. 2,500). In addition, the results show that the RDP is impacting on less well off households to a comparatively greater degree than better off households. Furthermore, the results show that the focus on (generally poorer) female members is more effective in bringing benefits to BRAC’s target group than would be the case with the male counterparts, both achieving ‘critical mass’ of RDP inputs.
ii Impact Assessment Study
2.5 The combined impact of the RDP inputs, viz. length and credit, shows positive results with respect to all of the major indicators. The results show a gradual improvement in wealth, and expenditure. Most of the other indictors for material well-being : value of house structure , value of livestock, living quarter density, all weather roofing material for living quarters, consumption expenditure, food stock , indicate that figures are significantly larger for the households in the ‘longest - length and largest -loan ‘ category than these are for the counterparts in the lowest end of the scale. 2.6 The differences are more pronounced for the female category compared with the males. This suggests that the improvements for the female are larger and take place with slightly lower levels of average RDP inputs than it is the case for the males. The econometric analyses of wealth and of consumption for the RDP households , suggest that the impact of RDP credit is fairly large and is highly significant. In addition the importance of RDP credit in the determination of the levels consumption expenditure is very important. 2.7 Of particular interest is the results of the separate econometric analyses of consumption expenditure for the respective categories of RDP membership . The value of the impact of RDP credit is larger for the female category than it is for the males. The results show that per capita average weekly consumption expenditure increases between Tk. 6.80 for every thousand taka increase in percaptia RDP loan for the female category whereas it is between Tk. 1.40 and Tk. 5.50 for the male, ceteris-paribus. That the women’s access to credit improves the households well-being is further supported by the evidence that women’s earning is used mainly for the household well-being. Vulnerability
2.8 With respect to the indicators of vulnerability of households to seasonality and to food security, the length-credit hypotheses are supported strongly. The distribution for food security levels according to RDP credit values suggest a discernible pattern, particularly for the female category. The distribution shows that the proportion of households in the ‘severe food deficit’ category decline from 39 percent for the ‘no-loan’ category to 12 percent for the ‘greater than Tk. 10,000’ category. The distribution at the upper end of food security scale show clear improvements: the proportion of ‘food surplus’ households increases from 11 percent to 28 percent for the respective loan categories. That food security is more sensitive to levels of RDP credit than the pure length category, is suggested by the unclear, mixed distributions according to membership length. 2.9 A particular dimension of poverty in Bangladesh is a regular seasonal downturn in economic activities which causes hardship for the poor. This hardship is primarily manifested by decline in consumption levels compared with the better season. The impact of RDP is expected to result in reductions in the differences between the lean season and the peak season with respect to percapita weekly rice consumption, per capita weekly expenditure on food, per capita total expenditure, seasonal food stock, and per capita weekly cash earning. For the respective indicators, an absence of significant (statistically) seasonal difference is assumed to indicate absence of vulnerability. 2.10 Statistical tests to assess the seasonal differences show erratic results for male but these are consistent with the hypothesis for the female category , according to length, to loan, and to the combined levels of RDP input. The results show that seasonal vulnerability is strongly present in the bottom end of the length, the loan, and the combined scales for the female category. The seasonal differences are smaller at successively higher rungs in the respective scales. The results show that seasonal difference is sensitive to both length and loan separately, as well as to the combined RDP inputs. For the top end of the combined ‘length-credit’ scale the tests show striking reduction in seasonal fluctuation, with no significant differences with respect to the indicators.
2.11 That these results of declining seasonal vulnerability are suggestive of more structural changes in RDP members’ material well-being, are supported to a large extent by indicators of enhanced coping capacity and of strengthened grounding of these improvement . First of the indicators in this respect is
iii Impact Assessment Study
the mechanisms which are used to cope with seasonal downturn in the economy. The case studies reveal that the hardship has declined for the members in older VOs whose coping mechanisms are of less damaging nature to the members’ resource base. Diversification of employment and the use of kin and friendship -networks, instead of the harmful ones such as informal credit network and asset depletion, were reported to be used as mechanisms to cope with mild seasonality. The credit from RDP is an enhancement factor for older VO member, in effecting diversification of earning sources in the lean season specifically. This case study finding is supported by household survey data that show comparatively larger share of the petty trade and shop-keeping as cash earning sources in the lean season as compared with peak season. The case studies show that the members in younger VOs, on the other hand, still face seasonality in their livelihood which is supported by household data. For them, the coping mechanisms are of weaker, damaging to resource base, nature that include informal credit network, and asset depletion. Security of Improved Material wellbeing
2.12 Other indicators also suggest a positive change for the RDP members over increasing levels of RDP input. The long term security is indicated with respect to increasing values of real capital in the asset profiles, and declining share of non-RDP saving in proportion to RDP saving, which are stronger for large levels of RDP inputs. The average values of the revenue earning assets show steady increases over longer participation, and larger credit (increasing from Tk. 3,419 to Tk. 6,452 for the females largest loan group). The proportional share of the house structure value is large for all RDP input levels, which suggest the use of high value, more durable, building materials. This may be an indication of the households’ capacity to transfer income from one period to a later one (albeit at a lower value, due to depreciation). The house structure was the second to land in importance of the reported items in wealth ranking exercises in the villages. 2.13 The short term security for the RDP households is also enhanced over time and increasing amount of RDP credit . This is indicated by a process of withdrawal from the informal credit market for the RDP households. The average value of informal borrowing is larger for the middle of the scale input levels and declines for the top end of the scale for both male and female categories (for respective categories from Tk. 5,945 and Tk. 4,233 to Tk. 2,333 and Tk. 1,244, per borrower households). This process, thereby the security of current consumption , is supported by the declining share of consumption as a purpose for informal borrowing. For the female the decline is steady and gradual whereas for the male it fluctuates and, nevertheless, is lowest in the largest input category. Informal borrowing for consumption purposes declines from a high of 55 percent and 67 percent of the total borrowing, respectively for newer the male category and the female, to 32 percent and 41 percent respectively for the largest combined RDP input level. Similar pattern is observed with respect to the use of RDP credit. Smaller proportion of RDP credit is used to meet consumption and other hardship needs; increasing initially at medium level of input (11 and 14 percent respectively categories) and then it declines sharply in the largest input level (4.5 and 5 percent respectively). Changes in Women’s Lives 2.14 With respect to changes in women’s lives, the impact of RDP inputs is smaller but discernible. Status of the female members of RDP at the household level improves as a result of the increased access to RDP credit which the women’s participation created for their husbands. Better treatment by husbands for the wives is evident. At the community level, the opposition voiced by the male section to women’s participation in groups, was reported to gradually decline over time as the women’s contribution to household material well-being becomes evident. Particularly enhanced status is accorded by the villagers to the women who are trained in certain skills, such as poultry vaccination, rearing of day old chicks, village health workers, and other occupational skills. 2.15 The indicator of the control exercised by the women over income produces unclear results; the case studies revealed little evidence to suggest that control over income was increased over increasing
iv Impact Assessment Study
RDP input. However, that the earning of women is spent to improve household well-being is suggested by the household data. On the other hand, there is evidence to show that the RDP credit for women members are mainly used, invested and managed by the male members of the household. The case studies of VOs for women, find that there is a lack of opportunities for women to invest and manage their loans from RDP, directly themselves. 2.16 The role of men as the sole decision maker in the household was reported to be declining, particularly with respect to drawing on RDP credit and the use of women’s earning. Improvement is suggested in data from both the case studies and the household survey. Whereas at the early stages of participation women’s role as the sole decision maker is observed; which is likely to be due to the comparatively smaller sums of credit and earning which were involved. The practice of joint decision making by both the women and their husbands, is more pronounced for the longer length membership categories. That women retain or increase their say in matters related to their participation in RDP and with household affairs, is suggestive of some improvement in their status vis-a-vis men. Village Organisation Development 2.17 The VOs were studied to assess a number of issues that would suggest some conclusions regarding the VOs’ development as ‘institutions’. With respect to the length of formation for the VOs, certain issues that were deemed important for organisational development - cohesion, perception of members, leadership, and group autonomy, have been addressed by case study method. 2.18 In general, discipline and enthusiasm is more evident in the newer and in the VOs for women. Overtime attendance at meetings becomes erratic. The VOs in the more than four years length category are the worst. In fact, in two out of 13 VOs in this category the members of the VOs either deposit their weekly savings and loan repayment installments to the VO president, or send these to the field staff responsible for the respective VO via a male member or children. Although VO discipline deteriorates over time, the financial discipline is nevertheless maintained. 2.19 Cohesion of the VOs was assessed with reference to the social awareness of the members, and collective activities in which the members might have been involved. The case studies found that the recently formed VOs have had little time to engage in activities that would demonstrate cohesiveness amongst the membership. However, the women who were new to RDP, reported an increased level of social awareness which they gained from the Functional Education classes. The women reported that these classes taught them that male violence against women was social exploitation. Such violence, should it happen, they felt should be protested collectively by the members. 2.20 There appears to be a decline in the incidence of collective involvement of both a social and an economic nature, and in managing the VO affairs, from a high level in the early phase of formation to recent years. There may be two likely explanations. The first may be that socio-political actions were not necessary as situations requiring such action did not arise. Second is the RDP’s emphasis on developing a disciplined credit operation, from the late 1980s, which might have reduced the scope for the members to engage themselves in collective investment activities. 2.21 The increased emphasis on system development for credit and technological activities, is also reflected in the decline in social activities of RDP (although there has been an increase in the activities to improve the membership’s legal literacy, which is the subject of a forthcoming research and is not dealt with presently). In the mid 1980s it was thought that the membership’s awareness regarding social issues may be developed by engaging them in regular group discussions. Formally called the ‘issue based meetings’, the activity worked as a refresher exercise for Functional Education (FE). In recent years the frequency of these once-monthly meeting reportedly had declined. Consequently the older members did not retain their FE knowledge. The case studies of VOs reveal that no issue based meetings were held in the three months preceding the field work. Although the members reported that they valued the meetings highly, the field staff when interviewed reported that the members were reluctant to attend such meetings.
v Impact Assessment Study
2.22 The members of older VOs who have experienced longer participation in RDP and consequently more policy changes, were unhappy with the frequency of such changes. Their unhappiness was further increased by the reluctance on the part of the field staff to explain the changes. The group members also reported that the level of interaction between themselves and staff beyond those occasioned by credit operation, have also declined. The field staff in their turn have indicated that they have little opportunity to respond to specific needs, as their time was limited and was governed by programmatic requirement. The members from older VOs that were formed during the Outreach Programme, identified this issue as the motivational nature of the programme necessitated much more interaction both collectively and individually. 2.23 Although all the VOs have a management committee, in reality most, if not all, of the committees are dominated by one member who is either the chairperson or is the secretary of the respective committee. This situation is indicated by a general lack of knowledge on the part of the membership regarding the names of committee members, save the dominant leader. Personal and social attributes distinguish the leaders from the membership. Social attributes such as the extent of kinship and socioeconomic status, played an important role in the selection of male leaders by the membership. On the other hand, personal attributes such as outspokenness, dynamic personality, and absence of family burden were more important for female leaders. These attributes are reflected in the poverty situation of the leaders: the male leaders are from a relatively better-off background whereas the female leaders are more likely to be poorer. 2.24 Although there is a lack of knowledge on the part of the membership about the interest paid by BRAC to the members’ saving, broad operational rules for BRAC credit were known to the members from older VOs. Except the newer members who have yet drawn on BRAC’s credit, the understanding level regarding the insurance scheme for the members was found to be high. The members often made a common mistake: they tended to forget the calendar date for policy renewal! 2.25 As an outcome of participation by the poor in RDP/VO, BRAC expected some change in some social attitudes on the part of the members. Although not spectacular, some changes in attitudes towards particular issues that are deep rooted in tradition and culture, are discernible. The members reported to value highly the importance of secular education in peoples lives. Indeed, the presence of BRAC schools at their door steps might well have reduced gender discrimination which was common not so long ago. Women’s mobility and their involvement in non-traditional activities such as attending meetings at public places and at BRAC offices, were accepted more readily by the men from older VOs than those who were recent recruits. With respect to another social issue, viz. dowry, the membership length alone appear to exert little influence. The members reported that as much as it was a social evil they had no choice but to live with it. The practice of dowry, even among the poor, remains an issue of concern. With regards to the members’ expectation from BRAC, the indication is that they expected to receive benefits more on individual basis rather than on collective basis. The members from older VOs reported the scope for saving created by BRAC as a primary objective for membership. This is not surprising as many of them have generated sizeable saving. On the other hand, for the newer members (1-2 years) the expectations were related to their material condition. For the very new members (less than one years) BRAC was seen as a relief agency which was expected to dole-out food relief, etc. For some others, their exception was to be employed by BRAC, given loans, provided with safe drinking water, education for children.
vi Impact Assessment Study
2.26 The case study data-set does not include some important factors which would indicate changes in the village and micro regional economic structures, such as wage rate, labour relations and tenancy relations. There are some evidence of changes in the informal relations for the members. Some newer VOs reported that some money lenders were unwilling to lend to them because they were BRAC members. Others reported that their credit worthiness had improved for the same reason. In most VO case studies the members reported that it was no longer necessary for them to borrow money from the informal sources. Social interaction with the better off households also reportedly improved for the older members. Marital relations between the two segment of the society are yet to take place.
3. Life cycle factors, initial endowment, and education 3.1 While data show positive impact of RDP inputs when RDP households receive substantial amount of credit over a long membership period, there are undoubtedly other non-RDP factors which influence the impact of RDP on the lives of the rural poor. The exogenous factors are related to the member households resource base, and secondly, to the physical aspects of the respective micro-regions. The households related sources of the non-RDP influences are likely to include life-cycle factors, initial endowment and education. The life-cycle factors include the demographic dependency ratio and the number of working age population in the households. Initial endowment refers to the condition of the members on joining BRAC, and is measured by the amount of landowned. The education variable is constructed on the basis of the household aggregate of scores that was arrived at by assigning a value to each household member according to years of completed schooling. Material Wellbeing 3.2 The life cycle indicator of dependency ratio show negative impact with respect to material well-being. The econometric analysis of consumption expenditure clearly indicate a decline in the levels of per capita expenditure as the ratio for dependents to working age population increase. This negative influence of dependency ratio is likely to continue because an intervention such as RDP is unlikely to alter the ratio in the short run. The implication is that unless fertility declines, the positive impact of RDP inputs is likely to be eroded, in the cases where there are more dependents in the households. 3.3 On the other hand, the results with respect to the number of working age population, from the econometric analysis of wealth, indicate positive influence. It improves the scope for effective investment of RDP credit . The econometric analysis show that for an increase of one working age member in the household there is on average Tk. 1,785 increase in the level of wealth, ceteris paribus. This and the dependency ratio indicators imply that the family size and its age structure are important contributors to the household’s material well-being, as well as RDP inputs. 3.4 Is the impact of RDP on material wellbeing, greater for the households that were better-off at the time of joining BRAC compared with the worse-off? To answer this question, tests were made after controlling for the initial endowment of the households. The results show that RDP is impacting on low endowment (landowned <0.25 acre) households to a comparatively greater degree than the large endowed (landowned >0.51 acre). The difference between the households that received low levels of RDP inputs and those with large levels of inputs for the low endowed group, is greater than the respective differences for the large endowment members. The test results are particularly strong for the female category with respect to such indicators as per capita wealth, food security, value of housing, per capita consumption expenditure. 3.5 It was expected that higher educational level will allow the members to better utilise RDP inputs. The econometric analyses show a positive and significant impact of household aggregate education on the accumulation of wealth and on level of consumption. Furthermore, there is a strong interaction effect of high education and RDP credit, on wealth accumulation. For the households in the highest class of education score, for every thousand taka increase in RDP credit there is on average Tk. 1,090 increase in wealth, constancy assumed. Women’s Lives 3.6 Life cycle factors influence the changes in the women’s lives. Women’s control over income, decision making power, status in the family, and women’s mobility, are enhanced for the women who are older and/or who head their own household. These women are also among the poorer segment of the population. On the other hand the women who are currently married with young children are likely to be the ones who hand over their RDP loans to their husbands.
vii Impact Assessment Study
4. Local condition Material Wellbeing 4.1 The local condition or the dynamism of the micro-regional economy affects the impact of RDP inputs on the lives of the poor. The econometric analyses of wealth and of consumption support this hypothesis. The opportunities for investment, and the return from such investment, are likely to be positively sensitive in more dynamic location than in the lesser ones. The dummy variable for highly vibrant locality show that for the households in such locations the values of wealth and of per capita consumption are larger than the rest of the households by on average Tk. 3,264 and Tk. 11 respectively. The results of the interaction between local condition and RDP credit surprisingly produce insignificant results. Results of the econometric analyses are supported by the pattern of distribution for coping mechanisms by regions. Vulnerability to seasonality 4.2 The locations where members reported, in case studies , lesser hardship in lean season, were the ones that are better served by new or existing all weather roads, access to nearby town, presence of large market place, etc. At these locations RDP loans are put to good use by the members who avail the opportunities offered by local condition. The combination of vibrant locality and RDP credit allow the members to accumulate saving to cope in lean season, or to find alternative earning sources. In more dynamic areas the members either experience generally less severe lean periods or they are less likely to turn to such damaging coping mechanisms such as informal credit or asset depletion. Women’s Lives
At locations where men are engaged in activities which take them outside the village for longer periods than in the agricultural community, women’s mobility within the village is high. Local condition exert little influence on other indicators of women’s life such as status and decision making. 5. Membership Discontinuation /Drop-out 5.1 The increasingly larger membership discontinuation in older VOs is of concern for the Programme as well as for poverty alleviation. There is no evidence to suggest that drop-out members adversely affect the cohesion of the current membership . The implication for poverty alleviation is clear from the analysis of material well-being, and of vulnerability to seasonality. To generate measurable and significant improvements in the members’ lives a minimum level of input is required. With discontinua- tion of older members this process of gradual improvement is disturbed. The reasons for dropout appear that the members need to suit themselves to the given rules and procedure of the intervention. 5.2 With respect to the drop-out members the data show no significant difference on the life cycle indicators of dependency, and of working age population. The results of tests to assess the difference in landholding on joining RDP produce mixed results. For the male dropout members the landholding is smaller than that for the male current members. For the female dropout it is significantly larger than that for the female current members. The typology of reasons for drop out indicate that lack of availability of time to attend weekly meetings is one of the reasons for dropout by the relatively well-off. However, as indicated earlier, the significant difference in initial endowment for the females, is not matched by similar difference with respect to material well being. 6. Unexpected Results 6.1 The positive impact of RDP on the lives of its members are the expected results which are accompanied by some unexpected ones. The unexpected results relate primarily to the village
viii Impact Assessment Study
organisation development aspect of RDP; there being some other minor unexpected results related to targeting, women’s status, reasons for drop-out, etc. 6.2 Targeting efficiency with regards to the poverty aspect of the membership has improved for the female members but has worsened for the male in the recent years. Nearly half of the male category for which participation length was less than one year, was from the landownership category of greater than half-an-acre. It is likely that when replacement of members were necessary in view of dropout by some members, the field staff were less particular with eligibility criteria. The implications of the presence of non-target is not immediately clear, at least the extent of influence their presence might exert on the participation for the poorer members. There is some evidence to suggest, at least at certain pockets of RDP, that the non-targets are influential among the membership and the field staff may utilise this influence to maintain credit discipline. 6.3 Although the case studies reported a general improvement in the status of women within the households, there may be some cause for concern. The household survey data show a decline in decision making by men themselves, regarding the use of women’s earning but at the same time their role on decisions regarding drawing on RDP credit by women members do not decline. The persistence of husbands sole decision making with respect to the timing of loan may have two explanations. Firstly it may be due to a combination of a lack of opportunities for women to invest their own loan and an unwillingness on the part of the women to assume alone the higher risks involved with larger loans. Secondly, it may be related with the sexual division of labour that assign women the smaller and less commercial investment role whereas men assume the more commercialised and larger investment activities. In either case, the gender division of labour is yet to be affected by women focused programme like RDP. 6.4 The major unexpected result is related with the village organisation. The documents of RDP state that, “...BRAC aims to develop self-managed village organisations, promote self-reliance, and enhance the capacity of the poor to participate in the national development process”. At the household level some progress has been achieved with regards to self-reliance and material ‘capacity’, but there is very little to suggest that the VOs are progressing in the direction, BRAC is aiming at. 6.5 The process and the activities identified in the documents have had mixed experience: members become less interested in the VO except for the financial matters; general membership is unwilling to assume greater leadership in the VOs preferring to leave it to the existing few leaders; members have not broken out of the existing networks to embrace the VO as an alternative network for support and promotion of self-interest; and perhaps more importantly, field staff perceive less importance for the social aspects preferring the technical and financial aspects, of the VOs. 6.6 That the VOs did not even approach let alone meet, the criteria and indicators for institution building is not surprising. What is unexpected is the confusion and lack of understanding regarding what the VOs were supposed practice and achieve, were meant for, on the part of both the programme personnel and the membership. 7. Policy Implications Membership targeting 7.1 The success of RDP is due largely to effective management which is evidenced by generally high rates of achievement in meeting performance targets. There is however some disquiet with regards to membership targeting which falls short of other performance achievement (such as 97% loan recovery rate). Some of the shortfall may be explained with reference to human error and to social reality at some localities. Where weaknesses in information led to the recruitment of non-targets, it may be necessary to remove the latter from RDP membership. The withdrawal of membership from non-targets may be considered as a part of targeting which does not necessarily end with group formation. Such membership
ix Impact Assessment Study
withdrawal need not be considered as membership drop-out, and which may be monitored by either the Monitoring Department or RED. 7.2 Secondly, the current method used for target identification may be replaced with a more innovative one. The survey method that is currently used currently is perhaps less at fault for identification weaknesses. The piece-rate mode of payment for the surveyors who are temporarily employed by RDP field office, create incentive for number of households surveyed rather than the quality of the information gathered. Thus, the flawed information is highly likely to lead to similar decision making with regards to targeting. 7.3 The experience of a recent joint exercise by RDP and RED, to develop an alternative identification method, appear to be promising. The researchers at RED developed an innovative method that uses cards that are similar to those used for Wealth Ranking in RRA, and a cross section of villagers participate in ranking the households with the cards according to some pre-determined categories. The exercise has served three purposes : (a) the villagers identified the target households effectively; (b) it generated some indication of willingness on the part of the poor to become members; and (c) it gave opportunity for preliminary information dissemination for motivational purposes. 7.4 At first estimation, the cost of this participatory exercise appear greater than that involved in the surveys made by temporary staff. There is scope to reduce the costs on one hand, and the participatory method saves some other costs that are not accounted for in calculating the survey costs. The experimental exercise was costed on the basis of salaries of field level managerial staff (POs) as well as field assistants, who participated in the exercise. The POs can become trainers, and who can be replaced by more field assistants who act as facilitators in the ranking exercise. The costs will be reduced as fewer POs are involved for less time. Secondly, in the current survey method additional staff time is involved in the post-survey promotional and motivational activities. In the participatory method some of these activities may be performed at the time of village level ranking exercise. Given these two considerations the cost of group formation is unlikely to increase, and targeting becomes more effective. Credit operation 7.5 Since the early 1990s a disciplined credit operation system has been in place. The case studies identified some issues related to credit operation that are not entirely new but may be considered for adoption in the future. At some locations during the group discussion for case studies, the members reported that the current ceiling on RDP credit was inadequate for their occupational activities. At other locations the members reported that the current weekly repayment schedule for RDP credit was in appropriate for their activities which generate revenue at specific times of the years. These ought not to be generalised because these two issues were raised at specific locations and by particular occupational groups.
x Impact Assessment Study
7.6 BRAC may consider introducing some mechanism in its credit operations to meet the needs of cottage and home based industrial activities the working capital requirement for which is larger than the current ceiling on loan size. Secondly, the seasonal nature of activities in the sub-sectors of agriculture may merit seasonal schedule for servicing RDP debt. 7.7 The household survey data show that a per capita specification of RDP credit produces significant results. It also shows that the more dependents there is in a household the worse-off the latter is. In other words some of the gains made possible due to RDP credit may be eroded by high dependency ratio. As fertility is a demographic phenomena it is unlikely to be influenced by RDP in the short or medium term. It may be possible, but the probability is unknown, to prevent the erosion in RDP impact by making provision for larger loans to larger households. In other words, it may be useful to explore the possibility, and the impact of defining floors and ceilings on credit size, in terms of per capita measures, instead of the current per member sizes. Women’s lives 7.8 The major findings are that improvements are experienced by the women members in household material wellbeing and in their status at the home. The women, however, are less involved in the direct utilisation of their RDP credit which they hand over to male household members. The socio-culturally determined gender division of labour act as a barrier to their participation in direct investment activities which require knowledge of and linkages with the market. Those women who are engaged in outside-the-home activities are able to do so because of their life-cycle and socio-economic condition. In addition, there are those who are engaged in home based activities for which men perform the outside-the-home tasks. The third category of women members are those borrowers who hand over the loans to male household members. 7.9 When asked about the reason for handing over their loans to men, the women reported that there was no or little opportunity for them to invest it themselves. This perception is likely to be an outcome of gender division of labour. In view of this BRAC may play a greater role to encourage the women to undertake income earning activities, albeit home-based, in order for the women to further contribute to the material wellbeing of their respective households. 7.10 This motivational aspect may be part of the selection process designed for the sectoral programmes. The programme currently focuses on ‘appropriate’ participants on the basis of a pre-determined set of selection criteria. It needs to be mentioned here that the sectoral programmes have in the 1980s and 1990s undergone steady development and expansion. This expansion is likely to continue in future and BRAC may take the process of expansion as an opportunity to engage more women in direct investment activities. In addition the focus for participant selection may be shifted to those women who currently hand over their loans to male household members. The process of selection necessarily involves a motivational aspect in which the male household members, in addition to the women, may be made a target and to whom the importance of an additional source of income for the household may be emphasised. 7.11 The future horizontal expansion of the sectoral programmes - poultry and livestock, sericulture, fishery, horticulture, social forestry, may be aimed at the women who draw on BRAC credit but are not involved in the investment directly. The expansion is likely to require the need for increased direct investment by BRAC : in such sectors as sericulture, livestock, horticulture which are home-based opportunities. The investment are likely to support the women producers and others in lesser extent, by ensuring availability of quality inputs which are not readily supplied by the market. At the downstream level, BRAC will need to invest in processing and marketing of some output produced by the women, to ensure a competitive market. Needless to say, the extent to which BRAC succeeds in creating such sources is dependent on fund availability.
xi Impact Assessment Study
VO development 7.12 The results of the VO case studies are perhaps more revealing than the other dimensions of RDP’s impact. The overall implication of these results is that BRAC’s vision for the VOs may have been over ambitious, which in the given situation may need to be scaled down restricting its objective regarding the VOs to ‘organisation development’ rather than ‘institutions’. The term ‘institution ‘ implies certain requirement , and whether these can be met by a group of 30-40 men and women in the contexts of the village , micro-region and upto the national environment , needs to be seriously assessed. In addition the contextual factors, the absence of a consciousness on the part of the general membership regarding the VO related objectives of RDP is a further cause for concern. That BRAC or others may view the VOs as units of representation for the members’ interest, and that the VOs are expected to achieve some form and level of autonomy, are completely alien to group members. In the members’ conception the VO is a mechanism for creating access to RDP credit and is as yet far from creating space for collective action or for mutual support. That attendance at older VOs decline without a corresponding decline in savings and loan recovery, is evidence of the conception of the VOs as merely credit mechanisms. The members’ involvement in the VOs affairs appears to be an area which may not have been adequately addressed in the past. 7.13 If BRAC wishes to reconsider the need for ‘institution’ building, than experimentation with alternative strategies for facilitating and supporting village level groups appears necessary. Given the present level of staff involvement in the technological, sectoral programmes and in credit operation, alternative strategies for VOs are likely to involve reconsideration of staffing levels with respect to social development (which has budgetary implications).
xii Impact Assessment Study
Acknowledgment
The Impact Assessment Study (IAS) project is indebted to a number of individuals and organisations. The consortium of donors’ financial support enabled the research team to benefit from the professional guidance provided by the consultance. The donor consortium is thanked for their financial support for IAS. The contribution of the consultants - Drs. Angelika Brustinow, Martin Greeley and Richard Montgomery, is greatfully acknowledged. Dr. AMR Chowdhury and Mr. Ghulam Sattar, Director and Manager respectively, of the Research Division, provided encouragement and advice without which the project might not have been completed. Mr. Fazlul Karim, Senior Research Epidemiologist of RED, and his team of researchers sacrificed the use of the computer that was assigned to them, for IAS use. Mr. Karim’s advice and suggestions enriched the understanding of the IAS team with regards to health related issues. Messers Shahriar Khan and Samir Nath provided valuable advice thereby improving the understanding of the IAS team on issues related with statistics (during the absence of Md. Mohsin who is the statistician for IAS). The construction of the survey questionnaire of IAS benefited from earlier surveys carried out by RED researchers. The bulk of the household survey questionnaire was based on that used in the survey of ‘Oxbowlakes Community’. The components on attitude to women’s mobility, knowledge of the laws and of everyday skills, were borrowed from the questionnaire for the ‘base line survey’ of the ICDDR,B and BRAC joint research project in Matlab. Special thanks are due to Dr. Mick Howes of IDS Sussex, who conducted several training courses for RED researchers, on the methods of P/RRA. The P/RRA tools were applied to conduct the case studies for IAS. The Managers and other staff members of the RDP Area Offices at the respective 15 study locations shared with the three field investigators of IAS, their already crowded accommodation facilities. The cooperation and hospitality of the Area staff is gratefully acknowledged. The analysis and interpretation of the data have been improved by the discussions held at one workshop and a number of seminars where preliminary results were presented. The workshop which was held at RED, was participated by Professor Wahiduddin Mahmud of Dhaka University, Professor Nurul Alam of Jahangirnagar University, Ms. Simeen Mahmud and Dr. Hossain Zillur Rahman of BIDS, Dr. Nasreen Khondker of Dhaka University, Dr. Aruna Rao, Gender Consultant to BRAC, and Dr. Reider Kvam of Norad Dhaka. Two seminar presentation of the preliminary results were made respectively for the representatives of RDP’s donor consortium and for the senior managers of RDP, their comments shed new lights on the data. Thanks are due to Messers Amir Ali (AKF), Phil Harding (ODA/UK), Reider Kvam (Norad), Egon Madsen (Danida), Brian Prosturniak (Canadian High Commission), Nick Roberts (EC) and Christian Romer (EC). The Centre for Development Studies at Swansea hosted two members of the IAS team for six weeks to produce the Main Findings Report. The members of CDS provided sincere cooperation and hospitality to their visitors. Ms. Julia Rees of the CDS and Mr. Nigel O’Leary of the Economics Department deserve special thanks for their comments and advice, and computing support respectively. Ms. Gul Rukh Selim of RED, Dr. Aruna Rao, Ms. Simeen Mahmud and Dr. Martin Greeley of IDS Sussex read earlier versions of some of the chapters and commented on them. Their comments have been very useful but the usual disclaimer applies.
xiii Impact Assessment Study
Messers Nazmul Huda Chowdhury, Arabinda Nath and AKM Shafiqul Islam of BRAC’s computer centre led the computerisation and data cleaning process for the household survey data. Messers. M. Monsur Alam Chowdhury and Soaib Ahmed competently led a team of upto 15 coders and editors who performed a difficult task which was often complicated by unforeseen problems. Messers Mamun-ur-Roshid and Swapan Kumar Dev Roy tirelessly and diligently operated the computers for data analysis, under great pressure. They have put in hours of work far longer than the standard eight-hour-day. Mr. Abdur Razzaque competently word processed this report keeping track of the numerous alterations, arrows and asteric marks. The colleagues at RED, too numerous to name them all, have been wonderfully understanding and cooperative to the IAS team. Many of them suffered delays in their work to accommodate the needs of the IAS, particularly with regards to the use of the scarce computer facilities at RED. Thank you all. Finally, it would remain incomplete if thanks was not said to the subjects of IAS. The VO members and non-members, men and women, who were the respondents and group discussants, sacrificed their valuable time to provide us the information without which the study would be nothing.
xiv Impact Assessment Study
Contents
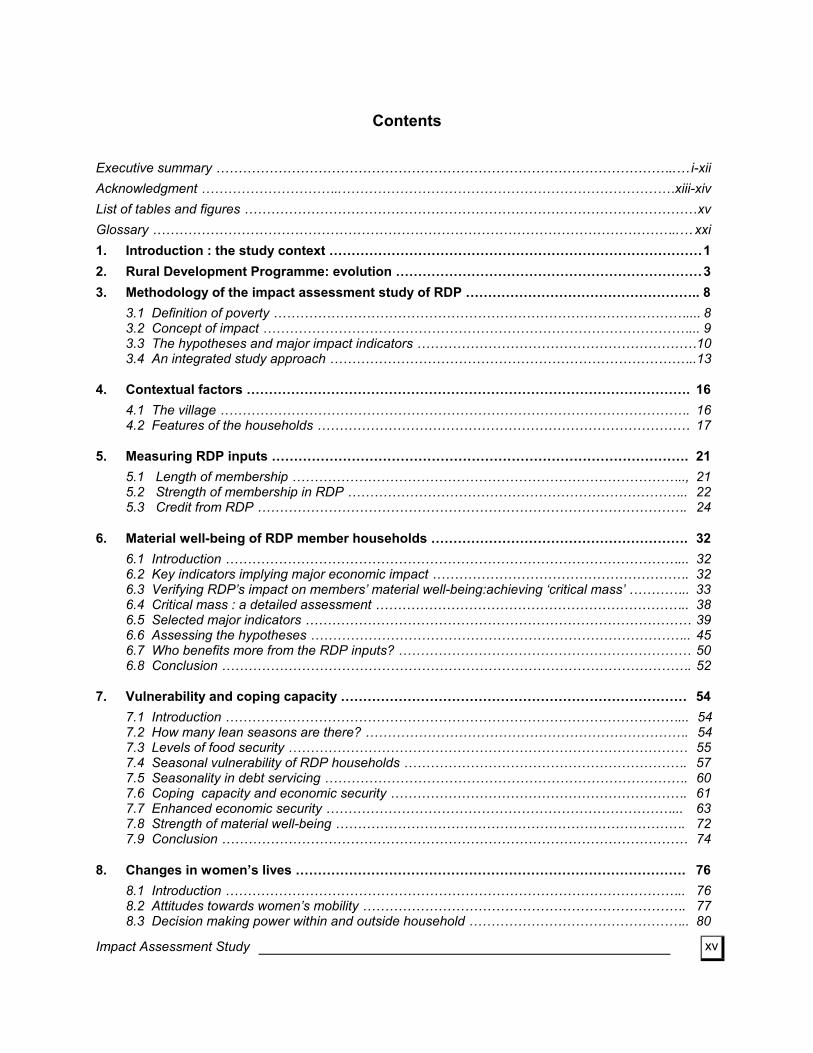
Executive summary …………………………………………………………………………………………..… i-xii Acknowledgment …………………………..…………………………………………………………………xiii-xiv List of tables and figures ………………………………………………………………………………………… xv Glossary ………………………………………………………………………………………………………..… xxi 1. Introduction : the study context ………………………………………………………………………… 1 2. Rural Development Programme: evolution …………………………………………………………… 3 3. Methodology of the impact assessment study of RDP …………………………………………….. 8 3.1 Definition of poverty ………………………………………………………………………………….... 8 3.2 Concept of impact ……………………………………………………………………………………... 9 3.3 The hypotheses and major impact indicators ………………………………………………………10 3.4 An integrated study approach ………………………………………………………………………..13 4. Contextual factors ………………………………………………………………………………………. 16 4.1 The village ……………………………………………………………………………………………. 16 4.2 Features of the households ………………………………………………………………………… 17 5. Measuring RDP inputs …………………………………………………………………………………. 21 5.1 Length of membership …………………………………………………………………………….., 21 5.2 Strength of membership in RDP ………………………………………………………………….. 22 5.3 Credit from RDP ……………………………………………………………………………………. 24 6. Material well-being of RDP member households …………………………………………………. 32 6.1 Introduction …………………………………………………………………………………………... 32 6.2 Key indicators implying major economic impact …………………………………………………. 32 6.3 Verifying RDP’s impact on members’ material well-being:achieving ‘critical mass’ ………….. 33 6.4 Critical mass : a detailed assessment …………………………………………………………….. 38 6.5 Selected major indicators …………………………………………………………………………… 39 6.6 Assessing the hypotheses ………………………………………………………………………….. 45 6.7 Who benefits more from the RDP inputs? ………………………………………………………… 50 6.8 Conclusion ……………………………………………………………………………………………. 52 7. Vulnerability and coping capacity …………………………………………………………………… 54 7.1 Introduction …………………………………………………………………………………………... 54 7.2 How many lean seasons are there? ………………………………………………………………. 54 7.3 Levels of food security ……………………………………………………………………………… 55 7.4 Seasonal vulnerability of RDP households ………………………………………………………. 57 7.5 Seasonality in debt servicing ………………………………………………………………………. 60 7.6 Coping capacity and economic security …………………………………………………………. 61 7.7 Enhanced economic security ……………………………………………………………………... 63 7.8 Strength of material well-being ……………………………………………………………………. 72 7.9 Conclusion …………………………………………………………………………………………… 74 8. Changes in women’s lives ……………………………………………………………………………. 76 8.1 Introduction ………………………………………………………………………………………….. 76 8.2 Attitudes towards women’s mobility ………………………………………………………………. 77
xv Impact Assessment Study
8.3 Decision making power within and outside household ………………………………………….. 80
8.4 Control over income …………………………………………………………………………………. 83 8.5 Change in the status of women ……………………………………………………………………. 85 8.6 An overview of the impact ………………………………………………………………………….. 90 8.7 Conclusion ……………………………………………………………………………………………. 92 9. Village organisation and institution building ……………………………………………………… 94 9.1 Introduction …………………………………………………………………………………………… 94 9.2 Strength, stability and cohesion of VOs …………………………………………………………… 95 9.3 VOs as units for the representation of member’s individual and collective interests ………… 99 9.4 Leadership and management of VOs …………………………………………………………….. 102 9.5 Autonomy of the group ………………………………………………………………………………106 9.6 Conclusion …………………………………………………………………………………………… 110 10. The non-formal primary education programme …………………………………………………… 112 10.1 Introduction ……………………………………………………………………………………….. 112 10.2 NFPE coverage of VO members’ children ……………………………………………………. 112 10.3 Targeting, and the wealth profile of NFPE clientele …………………………………………. 113 10.4 Members’ perceptions of, and involvement in NFPE schools ………………………………. 114 10.5 Conclusions ………………………………………………………………………………………. 115 11. Membership discontinuation ………………………………………………………………………… 116 11.1 What are the reasons …………………………………………………………………………….. 116 11.2 Characteristics of th dropout members…………………………………………………………. 119 11.3 Conclusions ……………………………………………………………………………………… 122 12. Conclusion: policy relevance of IAS results ……………………………………………………… 123 12.1 Membership targeting …………………………………………………………………………… 123 12.2 VO development …………………………………………………………………………………. 124 12.3 Credit operations ………………………………………………………………………………….125 12.4 Women’s status ………………………………………………………………………………….. 125 12.5 Membership discontinuation ……………………………………………………………………. 126 12.6 Impact of RDP ……………………………………………………………………………………. 127 Bibliography ………………………………………………………………………………………………. 129 Annex
xvi Impact Assessment Study
List of tables and figures
Tables in text 3.1 Members in RDP (December 1992) and IAS household survey ……………………………………. 14 4.1 Selected features of the study villages ……………………………………………………………..…. 16 4.2 Local condition & household category …………………………………………………………………. 17 4.3 Land ownership of households …………………………………………………………………………. 18 4.4 Sex of household head and household membership category …………………………………….. 18 4.5 Demographic dependency ratio and head of household …………………………………………….. 19 4.6 Working age population in the household …………………………………………………………….. 19 4.7 Education level of the household ………………………………………………………………………. 20 5.1 Length of membership and household category………………………………………………………. 21 5.2 Training and usefulness of training - male members ………………………………………………… 23 5.3 Training and usefulness of training - women members ……………………………………………… 24 5.4 RDP loan (cumulative) and membership length -female member households …………………… 25 5.5 RDP loan (cumulative) and membership length -male member households …………………….. 25 5.5.1 Average size of RDP loans …………………………………………………………………………….. 26 5.6 RDP loan and initial endowment -male member …………………………………………………….. 26 5.7 RDP loan and initial endowment -female member …………………………………………………… 27 5.8 Sectoral distribution of cumulative RDP loans ……………………………………………………….. 28 5.9 Investment of RDP loan (cumulative) …………………………………………………………………. 30 5.10 Investment of RDP loan (cumulative)- male member households …………………………………. 30 5.11 Investment of RDP loan- female member households ……………………………………………… 31 6.1 Sampled households by length of membership and key indicators of material well-being ……… 33 6.2 Means for key indicators by length of membership and RDP loan groups ……………………….. 35 7.1 Food security of households RDP loan - Male member …………………………………………….. 57 7.2 Female category households seasonal difference in key indicators by RDP credit ……………… 58 7.3 Seasonal difference in key indicator values for female member RDP households, according age of membership and cumulative loan values received ……………………………… 59 7.4 Female categories debt servicing and critical mass of RDP inputs ………………………………... 61 7.5 The ratio of Non-RDP savings to RDP savings deposits, RDP member households and length of membership ……………………………………………………………………………… 66 7.6 Number of average size of informal loan taken by RDP households, by combined levels of loan and length ………………………………………………………………………………… 68 7.7 Ratios of outstanding RDP loan to networth and to saving, by combined levels of RDP inputs … 74 8.1 Different heads of expenditure by women’s income ………………………………………………… 84 8.2 Types of activity by length of membership …………………………………………………………… 87 8.3 Distribution of VO’s by different phases and continuum ……………………………………………. 90 11.1 Assessing the factors of membership discontinuation ……………………………………………… 118 11.2 Socio- Economic change since joining VO for discontinued membership ………………………. 118 11.3 Drop out : Comparison with RDP members according to selected indicators …………………… 120 11.4 Drop out members according to selected indicators ……………………………………………….. 121
xvii Impact Assessment Study
Annexed tables A.1 Distribution of sampled VOs for changes in women’s lives A.2 Distribution of sampled VOs for VOIB B.1 Scoring for local condition index B.2 Weights to construct local condition index B.3 Food consumption expenditure ; comparison between IAS and HES households C1 Membership age and initial endowment - male member C2 Membership age and initial endowment - female member C3 Multiple membership of RDP and membership age - male member C4 Multiple membership of RDP and membership age - female member C5 Intensity of skill training D1 Length of membership and RDP credit, results of T-test for differences in group means of key indicators D2 Group means for key indicators by length of membership , RDP credit received and initialed endowment D3 Length of membership , loan and initial endowment results of T-tests for differences in groups means of key indicators D4 Mean differences in wealth by combined levels of RDP loan and membership length - male members D5 Mean differences in wealth by combined levels of RDP loan and membership length - male members . D6 Mean difference in food consumption expenditure (per capita) by RDP loan size and membership length - male member D7 Mean difference in food consumption expenditure (per capita) by RDP loan size and membership length - female member household D8 Structure of total household expenditure budget D9 Consumption of one-week household expenditure of female household by membership age category D10 Composition of one-week household expenditure of female household by membership age category D11 Food expenditure per capita, loan size and length of membership D12 Food expenditure by loan size and initial endowment - RDP households D12.1 Occupation of RDP members D12.2 Number of cash earners - male member households D12.3 Number of cash earners-female member households D12.4 Assessment of income sources - slack season D12.5 Assessment of income sources - peak season D12.6 Mean difference in one - week cash-receipt: RDP loan and length of membership - male member household D12.7 Mean difference in one - week cash-receipt: RDP loan and length of membership - female member household D12.8 Mean difference one-week cash receipt - RDP loan, length of member ship and initial endowment - male household D12.9 Mean difference one-week cash receipt RDP loan, length of membership and initial endowment-female household D13 Analysis assessing the contribution of the variables to wealth accumulation of RDP household D14 Analysis of wealth of RDP households: Results of regression D15 Analysis of consumption expenditure: Values of standardized coefficients D16 Analysis of consumption expenditure: Results of regression estimation
xviii Impact Assessment Study
D17 Analysis of consumption expenditure: Results of regression estimation for male household D18 Analysis of consumption expenditure: Results of regression estimation for female households D19 Mean Difference in one - week total expenditure: RDP loan and initial endowment - male member households D20 Mean Difference in one - week total expenditure: RDP loan + initial endowment - female member households D21 Wealth , RDP loan and membership age D22 Net worth of wealth , RDP loan and membership age E1 Food deficit months and occupation of household head - male households E2 Food deficit months and occupation of household head - female households E3 Food deficit months and occupation of household head - comparison households E4 Food security of occupation groups - male household E5 Food security of occupation groups - female household E6 Food security of occupation groups - comparison households E7 Food security of households (in the last year) E7.1 Food security of households by RDP loan - male member E8 Cash earnings received per capita E9 Food expenditure (per capita) E10 Total expenditure (per capita) E11 Consumption of rice (gram /capita /week) (home grown and purchased) E12 Seasonal food stock E13 Seasonal difference in key indicators by RDP loans - male member households E14 Seasonal difference in key indicators by RDP loans - female member households E15 Debt servicing level : Seasonal difference by RDP loan category E16 Ratio of debt servicing to total expenditure : Seasonal difference by loan size categories E17 Average value of revenue earning assets of RDP households by membership length E18 Average value of revenue earning assets of RDP households by amount of RDP loan E19 Wealth profile of RDP households by combined levels of RDP input - male members E20 Wealth profile of RDP households by combined levels of RDP input - female members E20.1 Number and proportion of RDP households with informal debts, and their mean size, by length of
membership E20.2 Number of proportion of RDP households with informal debts, and their mean size, by loan
category E21 Use of informal loan and membership length - male households E22 Use of informal loan and membership length - female households E23 Use of informal loan and RDP loan category - male households E24 Use of informal loan and RDP loan category - female households E25 Net worth of RDP households by RDP credit G1.1 Group means for key indicators by BRAC membership status G3.1 Person deciding about spending women’s income by length of BRAC involvement (female BRAC
member respondents only) G3.2 Person deciding about spending women’s income by length of BRAC involvement (non BRAC
member female respondents from BRAC households) G3.3 Person deciding about spending women’s income by amount of current BRAC loan (female
BRAC member respondents) G3.4 Person deciding about taking BRAC loan by length of BRAC involvement (female BRAC
member respondents) G5 Scores received by each VO against each indicators H1 Distribution of drop-out member’s wealth category (in respective community) and reasons for
drop-out
xix Impact Assessment Study
H2 Distribution of drop-out members by wealth category( in respective community) and reasons for drop-out
H3 Distribution of drop-out members by wealth category ( in respective community) and reason for drop-out
Boxes 4. 1 Education scores ………………………………………………………………………………………… 20 5.1 Investment behavior of RDP household ………………………………………………………………. 29 8.1 The case of Selina ………………………………………………………………………………………. 77 8.2 The case of Korimon ……………………………………………………………………………………. 79 8.3 The case of Katchari Ghar ……………………………………………………………………………... 79 10.1 Suggestive findings concerning NFPE’s education impact on VO member children ………….. 113 10.2 NFPE’ s promotion of parental involvement in schools ……………………………………………. 114 11.1 Typology of reasons for membership discontinuation ……………………………………………….117 Figures 6.1 Composition of household budget share ………………………………………………………………. 40 6.2 Household budget share and RDP loan -male members ……………………………………………. 41 6.3 Household budget share and RDP loan - female members …………………………………………. 42 6.4 Food expenditure (per capita/ week) by membership length ………………………………………... 42 6.5 Food expenditure of all RDP households by household loan size ………………………………….. 43 6.6 Food expenditure of all RDP households and initial endowment …………………………………... 43 7.1 Food security of households by RDP loan- male member …………………………………………... 56 7.2 Food security of households by RDP loan- female member ………………………………………... 57 7.3 Average value of revenue earning assets of RDP households by amount of RDP loan …………. 64 7.4 Informal loan and membership length …………………………………………………………………. 67 7.5 Informal loan and RDP credit size categories ………………………………………………………… 68 7.6 Proportion of informal loans used for consumption and hardship purposes, by RDP loan groups ……………………………………………………………………………………… 69 7.7 Use of informal loan and combine levels of RDP inputs -male members …………………………. 70 7.8 Use of informal loan and combine levels of RDP inputs -female member ………………………… 70 7.9 Percentage of the last RDP loan taken before the interview, used for consumption of other hardship purposes ……………………………………………………………………………… 71 7.10 percentage of other male and female member households involved in direct production of paddy, by length of membership ……………………………………………………….. 72 7.11 Ratios of outstanding loan to savings by RDP loan category ……………………………………….. 73 7.12 Ratios of outstanding loan to networth by RDP loan category ………………………………………. 73 8.1 Score of different VO s on changes in women’s lives ……………………………………………….. 91 9.1 Meeting attendance by VO age …………………………………………………………………………. 96 Maps 1. IAS Research location (after page 29) …………………………………………………………………… 15 2. Lean seasons at different location (after page 99) ……………………………………………………… 53 Chart 1 Sampling framework (annex A)
xx Impact Assessment Study
Glossary
Abbreviations
AO Area Office BBS Bangladesh Bureau of Statistics BKB Bangladesh Krishi Bank BEOC Basic Education for Older children (BRAC programme) BRAC Bangladesh Rural Advancement Committee CDS Centre for Development Studies, Swansea DTW Deep Tube-well FE Functional Education(BRAC programme) GTF Group Trust Fund ( welfare found collected from the VO members) GB Grameen Bank HES Household Expenditure Survey (by BBS) HH Household HPP Health and Population Programme (of BRAC) HRLE Human Rights and Legal Education (BRAC programme) IAS Impact Assessment System (developing by BRAC) IB Institution Building MD Monitoring Department (of BRAC) NFPE Non-Formal Primary Education (of BRAC) PA Programme Assistant (field level staff of BRAC) PO Programme Organiser (field level managerial staff of BRAC) PRA Participatory Rural Appraisal RCP Rural Credit Project (of BRAC) RCTP Rural Credit and Training Programme (of BRAC) RDP Rural Development Programme (of BRAC) RED Research and Evaluation Division (of BRAC) RRA Rapid Rural Appraisal SAE Social Awareness Education (BRAC programme, formerly named as functional education) TARC Training and Resource Centre (of BRAC) UP Union Parishad (lowest tier of the Bangladesh’s representative structure) VGD Vulnerable Group Development (operated by the ministry of relief, funded by world food
programme) VO Village Organisation ( organised by BRAC) WHDP Women’s Health and Development Programme (of BRAC)
Bangla words Bhalo Bhalo Katha Promises Shamajik Shoshon Social exploitation Attyachar Violence Khet Majur Shomity Agricultural labourer’s society Unnati Development Kantha Quilt Bhais Brothers Bhangey Jabay To break up Gram Committee Village committee Krishi Kaag Crop cultivation/farming
xxi Impact Assessment Study
Kamla/Dinmujur Day labourer Aman Paddy An indigenous variety of paddy harvested in November-December Patta-dey Taken account of Khaneyala Consumers in the family/ household Purdah Veil worn by women(also used to mean seclusion) Bari A cluster of households where families related by blood live Shastha Sebika Female health worker (trained by BRAC) Bhalo Good ShaaneerShohag-AteyNa Affection of husband has increased Mahajon Money lender Somman Honour Salish Informal village arbitration court Haat Village market (sitting periodically, usually twice a week in the afternoon) Pitha Kind of cake Mushti chaal Fistful of rice Garo A Tribe, living in the north-central part of Bangladesh Mohila Shabha Women’s meetings organised in BRAC’s health and population programme
Bangla Calendar Baisakh April-May Jaistha May-June Ashaar June-July Shabhon July-August Bhadra August-September Aswin September- October Kartik October-November Agrahyan November-December Poush December-January Magha January-February Falgoon February-March Chaitra March-April
xxii Impact Assessment Study
1
1. Introduction : the study context
In most cases the formal credit delivery has not only proven inadequate but has also been found to have high transaction costs, low efficiency, and low coverage. Also, it has not been fully integrated into the overall social and community development in rural areas (Von Pischke and other, 1983, quoted in Khandker and Chowdhury, 1995). The formal credit institutions in Bangladesh such as the Bangladesh Krishi Bank (BKB) has operated within only a very thin network, accounting for only 25 percent of the total credit available in rural areas (BBS 1989). Because of the collateral required to acquire a loan the traditional and the formal credit institutions leave a vast proportion of the rural households out of the credit network. What is more frustrating is that the bulk of formal credit then goes to the rich who do not need it often default on repayment. The existing power structure and administrative norms go against the poor. The poor are forced to rely on the informal market for credit at a very high cost. Credit to the poor has writes Atiur Rahman (1989) the following benefits :
credit increases income;
credit to the poor boosts petty trading;
credit raises agricultural wage which has positive impact on farming techniques and shifts share-cropping terms in favour of the share-croppers;
credit allows other poor to own agricultural means of production;
small credit enhances livestock production and credit boosts vegetable production from kitchen gardens operated by women.
Until the 1980s women had practically no access to institutional credit. Findings of various studies of women’s access to institutional credit portray a dismal picture of their credit worthiness (Rahman, 1989, Hossain and Afsar, 1989). However, specialised programme for women are the proofs of their very positive credit worthiness. The need for their greater access to credit is straight forward. The economic activities of women which are homebased and on self-employed basis, need fixed and working capital. On the other hand, they do not have control over family resources, and poorer families are resource handicapped to scale up their operations for higher income. Injection of external resources - financial, technical and other, w ill enable women to earn higher income. BRAC has pursued the two interrelated goals of poverty alleviation and empowerment of the poor since 1972. In trying to achieve these goals, BRAC has experimented with various targeted approaches in order to develop a programme model which can be replicated on a wide scale. The Rural Development Programme (RDP) of BRAC, started in 1986, has two interrelated core components which are institution building and financial services. In simple terms, credit and savings are a way of alleviating the material dimensions of poverty, and institution building is a way of creating collective strength amongst the poorer people. The two components are interrelated, because the success of one is unlikely to be sustained on any scale without the other. BRAC has a long history of organizing the landless, providing them with loan and training facilities through its different interventions, particularly the RDP. Only a few studies have been carried on RDP over the last five years which show to what extent individual VO members and households have actually benefited - in terms of enhanced incomes, improvement in household assets, social status, etc. from all these inputs. Further, to what extent have they benefited from BRAC's inputs over and above other inputs which the Government may have provided and other changes that may have occurred quite independent of BRAC?
Impact Assessment Study
Introduction : the study context
2
The donor consortium and BRAC Management agreed that an Impact Assessment System (IAS) was required . BRAC and its donors initiated the first phase of IAS in May 1993 with the design of the methodology by BRAC’s Research and Evaluation Division (RED), assisted by a two member team from the Centre for Development Studies, Swansea (funded by the ODA, UK. ), having two basic objectives:
to gain a more extensive understanding of the socio-economic impact of RDP, in both quantitative and qualitative terms
to assist BRAC in the development of its ongoing capacity to assess the socio-economic impact
of RDP, including identifying the most appropriate methodologies to assess different aspects of BRAC’s impact.
The second phase of the IAS is planned to be implemented in 1996-’97 , the findings of which will be used for the mid-term evaluation of RDPs phase IV (1995-2000). The factors which determine impact in the context of this study will need to be carefully selected and defined. With particular attention to the impact on women, such factors may include:
improvements in individual and/or household income;
changes in the volume and nature of household expenditures;
increases in individual and/or household assets, including the diversity of the types of
assets held which thereby serve to reduce vulnerability to shocks;
changes in the volume and nature of indebtedness of households;
changes in the subordinate social and economic position of women in relation to men;
improvements in the status of both the landless as a whole, and of landless women in particular, in relation to their communities, including their access to resources;
formation of cohesive Village Organizations with a sense of identity and purpose, and of the small (5-7 person) groups within the VOs;
development of VOs able to effectively represent the interests of their landless members and influence local power structures.
BRAC has now built up a useful in- house literature on its RDP (eg. Chowdhury , et al 1991). These have provided a useful support for BRAC researches involved in the IAS, and they draw on as preparatory resources for refining and developing the techniques outlined . However, the quality of data has been determined by the quality of the researchers’ preparedness. Scope of the report
In this report chapter one is an introduction to the ion of study context. The evolution of RDP is described in chapter two. Chapter three describes methodology of the study including definition of poverty, indicators to assess poverty alleviation, design and methods. Chapter, four and five explore the contextual factors and measuring RDP inputs respectively. Through chapter six to eleven this report presents the study findings in addressing material well-being, vulnerability to seasonality and coping capacity, gender dimensions by drawing changes in women’s lives, VO institutional development, BRAC’s non-formal primary education programme, and membership continuity. Chapter twelve draws the preceding chapters together as conclusion and explores opportunities and constraints for policy evolution and recommendations for BRAC’s RDP.
Impact Assessment Study
3
2. Rural Development Programme: the evolution
RDP evolved in 1986 out of the integration of two independent programmes operated by BRAC. Outreach and The Rural Credit and Training Project (RCTP) were introduced by BRAC in 1979 to test alternative approaches for socio-economic development of the rural poor in Bangladesh .Both the programmes emphasized mobilisation and empowerment of the poor. The difference between the two was primarily the addition of credit as a major component in RCTP. Reviews and analyses in the early 1980s indicated that these two programme, implemented in isolation, could not bring about a significant change in the lives of the poor. BRAC thus integrated the two approaches, and developed the framework of a new and more comprehensive rural development programme.(RDP Proposal IV, main text). Three phases of RDP RDP has been implemented through phases of development, each phase covering 3 to 5 years. Starting in 1986 , it has already completed two phases (1986-89 and 1990-92), and the third phase is underway (1993-95). The fourth phase (RDP IV) which will run for five years (1996-2000) is the last phase under the current expansion plans (RDP Proposal IV, main text). Core elements, their evolution and current status A. Shift to female members “It is widely acknowledged that women from poor households in Bangladesh face a double disadvantage by virtue of their class and their gender . The statistics on women in Bangladesh confirm this common perception. Women’s life expectancy is lower than men’s (54 for women and 55 for men) , a phenomenon not seen outside South Asia. Women’s literacy remains half of that of men (just under 15 percent for women and 31 percent for men). Nearly 15 Percent of all rural households and 25 percent of landless households are female headed. Between the age of 40 and 50 one woman in four as opposed to only one man in a hundred can expect to be widowed or divorced.” (RDP III Project document). It is evident that the landless and rural women from poorer households are worst off in the society. They are not organized, hardly possess any power and are the victims of various kinds of exploitation, deprivation and injustice. In the context of all these disparity, BRAC decided to pay a special attention to the women of the target households and interestingly found,“ in all areas of the programme, women’s participation is higher than men’s. This in mainly for three reasons . Firstly, women have a “ positive attitude towards participation in development activity. ”Secondly, women are more interested in saving than men are Thirdly, there are more women engaged in economic activities.”(Project document RDP III) In view of these practical reasons BRAC’s development programme is shifted its focus to female members aimed at achieving gender equity in society. B. Group formation Through group formation , BRAC establishes Village Organisation (VO) for men and women separately . VOs are mutual support institutions for their members, creating a degree of cohesion to counteract the isolation and vulnerability that is associated with poverty.
Impact Assessment Study
After opening an area office, RDP staff identify the target population through a survey. As soon as the survey is completed RDP divides the total working area into 160 units each with 50 target households to form a village organization. When the mapping of 160 units is completed, the target population is motivated to form a village organization. Recently the size of the VO has been reduced from 45-55 members to 35-40 members.
Rural Development Programme : the evolution
4
Having required 20 members, a VO is formally announced and starts savings generation and loan disbursement. The additional VO members are mobilized within two years to reach the standard size. Each VO is sub-divided into 7-8 small credit groups each comprising five members. Small group leaders collect the weekly savings and loan installments of each member of her/his ‘collection’ activity . Small group leaders help the PAs in maintaining VO disciplines also. They ensure their group members’ regular and timely presence in the meeting . Each VO has a management committee consisting of the leaders of the small credit groups and elect a chairperson, a secretary and a cashier . During 1990-92, a total of 7,533 village organisations with a membership of 297,005 scattered over 3,571 villages were added to RDP and RCP. This brought the total number of VOs and membership to 13,967 and 649,274 respectively at the end of 1992. This corresponds to an increase of 117% and 85% respectively over the end of 1989-the last year of RDP phase I. Genderwise breakdown of information indicates a higher growth rates for women at 121% compared to men at 21%, which was the result of the shift in target focus to women. (Postscript : Upto December 1994, RDP covered 13,224 villages and formed a total of 24,859 village organizations VO with a total membership of 1,036,254. Almost 90 percent of the total membership is female. This manifests BRAC’s emphasis on the empowerment of women. (RDP annual report 1994). C. Change in VO- BRAC staff interaction during expansion As a development organization BRAC’s long term strategy is to reach 25 percent of the rural poor households by the year 2000. In providing effective development services to large number of rural poor, BRAC has little option but to continue to expand its operations. “It is proposed that 95 new RDP area offices be established in 1993-95 to support this expansion”. (RDP Project document).But the host of additional work, related to the expansion , allegedly deteriorates the interaction between VO and BRAC staff and somewhat decreases quality of work due to the shortage of experienced POs, which ultimately disrupts village organisation development activities. However, RDP has recently changed its strategy as a mitigating measure. According to RDP project proposed -IV “RDP will put more emphasis on the quality of its work particularly in social development activities. It will concentrate on “Programme deepening” instead of ‘Scaling up’ . The number of staff conducting ‘issue based meetings’ has been increased from 2 POs to 10 PAs per area office. These PAs along with their credit and saving related responsibility will conduct these meetings . Measures will be taken (full computerization of all accounting system) to simplify their credit and saving related work which would give them extra time to carry out their additional responsibilities”.(RDP Project Proposal IV). D. Term structure of loan Credit is one of the most important resources which the landless poor do not have. Lack of access to credit is the major constraint for the rural poor from participating in economic activities. Collateral requirement , complex procedure, poor communication and inadequate banking networks have restricted the availability of credit at a cost (comparable to the formal sector) in the rural areas. Having considered increasing need of the rural poor, BRAC launched its credit programme, under RCTP in 1979(Lovell, 1991). Credit is provided to generate self and household employment and incomes, enabling asset formation, and thereby raising standards of living and enhancing security. Credit provision is supported by the sector programmes that include technical assistance and training in the fields of poultry and livestock, sericulture, pisciculture, horticulture production and irrigation. Currently, BRAC’s credit facility takes the form of a revolving loan fund (RLF), operated within the framework of, the RDP which is designed to meet the credit needs of BRAC’s landless group members. Loans realized from the borrowers are credited to and form a part of the RLF which is used for extending for further credit. This revolving process (lending, recovering and again lending) ensures that credit facilities are available,
Impact Assessment Study
Rural Development Programme : the evolution
5
eventually, to all group members for use in creating self employment and earning income. guidelines for access to RDP credit include that:
a borrower must be a member of VO
a borrower must have completed social awareness education
a borrower must have a record of regular attendance at the weekly meetings and regular savings deposit
a borrower must have clear knowledge of the 17 promises;
a borrower must have savings deposit equivalent to the minimum required for each loan;
Loan are disbursed at 20% interest, calculated on the reducing balance basis and are repayable in weekly installments. In addition, there are certain principles which are taken into consideration when sanctioning a loan
priority is given to schemes which are economically viable and socially profitable.
no collateral is required
all loans Provides are subject to continuous monitoring and supervision
no loans are given to borrowers to buy land from fellow group members. Loan proposals are screened and approved by the group during their weekly meetings. To have a loan proposal approved by the group, two-third of the members must be present. Participation and group responsibilities are thus essential elements to the loan process. After group approval, the loan proposal is submitted to the respective Area Manager through the responsible POs. The loan amount is disbursed to the borrower in cash in presence of the management committee of the respective group.“ Loan size varies from Tk. 500 to Tk. 7,000 (US $ 12.5 - 175) . A member may receive more than one loan at a time for different schemes. The loan can be short term, medium term and long term with respective repayment periods of one, two and three years" (BRAC Annual Report -1994). E. Savings rules Savings and credit are both interrelated and complementary to each other . Savings mobilization helps the borrower to save a small portion of the surplus generated from economic schemes. In rural Bangladesh poor people have a very limited opportunity to save money in formal financial institutions . The amount of money which is available to the poor for saving is very small and is not lucrative to the banks. By providing them the opportunity to save small amounts with RDP, BRAC also creates scope to increase future investment opportunities. The prime aim however, is to develop the saving habit and establish a financial resource base to reduce their vulnerability to social stress and shocks, and their dependency on the usurious market when a small amount of money is required in an emergency. (RDP Annual report-1995). RDP, group members are encouraged to save a minimum of Tk. 22 which is collected at the VOs weekly meeting. In addition to the voluntary weekly contribution of members, savings are also mobilized through lending to them. A compulsory 5% deduction is made from each loan when disbursed; the deducted amount being credited to the respective members savings account. BRAC pays a 6% interest on members savings. Up to December 1992, a total of Tk. 224.8 million (men Tk. 61.4 million and women Tk. 163.4 million) has been saved by group members, of which Tk. 156.5 million (or 70%) is saved during the period of RDP II.
Impact Assessment Study
2 according to the RDP project proposes IV VO members will be encouraged to save Tk.. 5 per member per week instead of Tk. 2, in the future.

Rural Development Programme : the evolution
6
F. GTF and life insurance From the very inception of RDP activities , a fund was generated by a 5% compulsory deduction from loan distribution (in addition to 5% for savings), named Group Fund. This fund was generated specially for strengthening the VOs economic base. In 1992 this fund was converted from group fund to Group Trust Fund (GTF) , a contingency fund for the VO. But in course of time it was found that the compulsory 5% deduction for the GTF from disbursement reduced the amount of cash available to the borrowers for investment . So recently deduction for GTF has been discontinued. “An insurance policy for VO members has been introduced from 15th June 1990 . A sudden death of an earning member under poverty condition can jeopardize a family. The insurance policy of BRAC intends to minimize the level of such insecurity. To enter into this insurance policy, a group member must fulfill the following criteria: be a member of the village organization of BRAC and be below the age of 54. The benefits of insurance have been fixed at Tk 5000. The claims will be settled with the nominees of the insured member after his/her death . The member need not pay a premium. The fund is generated by a 1% compulsory deduction from loan disbursement. “ (RDP annual report 1993). Of late “ BRAC stopped deducting funds for insurance. However, BRAC will continue to provide insurance benefits to the VO members from its interest income" (RDP project IV). G. NFPE BRAC’s Non-Formal Primary Education (NFPE) Programme has emerged as an important supplement to the formal education system. BRAC initiated the Non-Formal Primary Education Programme in 1985 with a view to eradicate illiteracy in Bangladesh and achieve ‘Education for All’ by the end of the century. The goal of the Programme is to develop a replicable non-formal primary education model which will provide basic literacy, numerical and social awareness to the poorest rural children who have not yet been touched by the formal school system or who have dropped out. Girls and women are the main focus of this programme since the female literacy status is extremely low throughout the country. The Programme is designed to develop the children’s interest in continuing learning through a relevant curriculum and through singing , dancing, arts and crafts, physical exercise, games and story book reading. “BRAC operates two school models based on the age group it serves. The NFPE model is for children between ages 8-10 and the Basic Education for Older chidden -referred to as the BEOC, is for children between 11-14 years. Having started in 1985 with just 22 experimental schools, expanded by the end of 1994 to 28,274 schools with an enrollment of over 800,000 children . Of late BRAC has changed it’s strategy away from linear expansion to policy advocacy, “ During RDP IV, BRAC will hold its operations at 1995 levels. Much greater emphasis will be placed on policy dialogue with government in an effort to upgrade the national system as a whole, through curriculum development , teacher training and educational management system" (RDP Project Proposal IV Annexure). H. Paralegal : human rights and legal education BRAC believes that legal literacy is a prerequisites to the development of the organizational base from which the landless rural poor can become involved in a sustainable process of poverty alleviation and empowerment. It nitiated the paralegal programme on the presumption that legal awareness of the group members would help them protect themselves from illegal, unfair or discriminatory practices by others. After beginning as an experimental programme in 1986 in Manikganj, the programme has been strengthened further with a more focused approach since 1989. The programme now provides group members with information on Muslim Family Law, Fundamental Rights from the Constitution which
Impact Assessment Study
Rural Development Programme : the evolution
7
commensurate with the Universal Declaration of Human Rights, some information from Criminal Procedure Code, Muslim Law of Inheritance, and Land Law. The main focus of the programme is empowerment through education on human rights and law , but it does not envisage development of a cadre of paraprofessionals who will substitute for lawyers at the rural level. The change in the nomenclature of the programme from paralegal to Human Rights and Legal Education (HRLE) has been done with this focus in mind. The new programme also includes some of the topics which the erstwhile Social Awareness Education (SAE) used to cover. The HRLE is thus a combination of the more effective components of paralegal and SAE programmes carried out during RDP III. I. Monitoring The Monitoring Department, established in 1988 , was initially engaged in piloting a field operation and developing an effective data management system for RDP. Since then the department has emerged as an important BRAC Management support service by extending monitoring support to all of the programmes of BRAC except the health and population programme (HPP). RED is conducting the monitoring functions for HPP. The department started with one staff under RDP’s helm. During phase II of RDP ,the strength of the Department was enhanced and the number of staff stood at 20. At the end of 1990 the Department began functioning as an independent unit. At the beginning of 1995 the number of staff stands at 37 including 30 field monitors. During RDP II (1990-92) , a great deal of effort was put into designing and implementing monitoring techniques and adapting them to programme needs and processes. This was a learning period for the Department. (Since its inception the monitoring department had been performing a two-fold function, namely monitoring and MIS. In the beginning of 1995 MIS evolved as a separate unit under RDP. The management of the department has been reorganized recently . In 1994 , the monitors working in the field were grouped into 5 geographical blocks under the supervision of same number of headquarters staff. In 1995 the number of blocks has been reorganized into four RDP Proposal IV). J. Transition to the RCP In 1990 BRAC introduced another programme approach named Rural Credit Project (RCP) which is being carried out in matured RDP areas. Activity wise there is a very close semblance between RDP and RCP , and they are complementary to each other. Under the ongoing approach , RDP initiates the process of development and operates for a period of four year in a newly intervened area, developing further a viable institutional framework necessary for sustaining a credit activity without BRAC’s subsidized support. The RCP then takes over an RDP branch . This strategy is a step toward financial sustainability of the programme as each RCP branch covers the cost of its credit operations through the interest earned on the loans disbursed . RCP will be converted into BRAC Bank branches if and when the government grants BRAC a banking license.
Impact Assessment Study
Methodology of the impact assessment study of RDP
9
3. Methodology of the impact assessment study of RDP
3.1 Definition of poverty
Poverty consists in the lack of certain basic capabilities of the human beings - the capabilities to live a healthy active life free of avoidable morbidity and premature mortality, the capability to live with dignity, with adequate clothing and shelter, etc. This definition of poverty bespeaks of a complex multi-dimensional approach to the understanding of poverty, as opposed to unidimensional approach which views poverty simply as a matter of income deprivation or nutritional deprivation. Programmes for alleviation of poverty must consider a range of quality of life variables such as nutrition, health and sanitation, housing, personal security, access to state distribution system, participation and institutional capability, crisis-coping capacity, etc. Various dimensions of poverty are by no means reducible to any single indicator of poverty (Task Force, 1991).
What kind of poverty is RDP or any other poverty alleviating intervention in the country, attempting to alleviate? The high infant mortality (90.6 per thousand live births), high illiteracy (75% of all ages), low average calorie intake (85% of the requirement), landlessness (53% of rural population owning less than half an acre of land in 1988-89), and the size of the head count measure of poverty (49% of the population in 1988-89), qualifies Bangladesh for the `absolute’ category of poverty. For the purpose of the IAS it is concluded that the RDP is likely to primarily affect the `absolute’ kind of poverty. Changes according to the `relative’ conception of poverty is likely to be a result of improvements in the absolute level of poverty (or the poor’s objective condition). The present enterprise does not deny the merits of relative approaches to poverty, it is merely placing a hold on the approach for the present purpose. One reason is that, “it is not known how important relative deprivation is to the poor”. To the poor physiological survival may be more important, followed by material wellbeing, then powerlessness and dependence. Robert Chambers suggests the idea of a"hierarchy of needs" among the poor in the sense that basic survival needs have to be satisfied before security, and then, autonomy and self respect become relatively more important (referred to in Kabeer 1991:243). Supported by her own field investigation in rural Bangladesh, Kabeer suggests that, ".... for poor women the notion of self-esteem itself might be more closely tied to the ability to feed themselves and their dependents than to middle-class ideals of female propriety which would hamper their survival strategies" (Kabeer, ibid). Looking at it differently, the IAS case studies find that women report improvements in status at the household as they either earn an income or provide their husbands greater access to credit through their own membership of VOs. Affection from husbands reportedly have increased (shohag aar atey na) for some women. That the poor men on the other hand, experience increased respect or being taken note of (patta-dey) as a result of their participation in RDP and improved access to credit, was reported by the members at group discussions. These two examples illustrate that having access to resources and/or improved ability to earn a livelihood improves one's status at home or in the community. The case studies also find that in discussions of poverty and 'wealth' the villagers (both poor and non-poor) identified the material basis of poverty. The exercise to rank the households according to `wealth’ levels reveal some feature of the poor. The wealth ranking exercise touches on this in order to clarify and cross-check the ranking produced by the villagers. The exercise identifies the poor as those who own little or no land, who own little or no purchased or only share reared livestock, who are of poor health, and those households where the number of earners is lower than the consumers (Khanayala). This latter
Impact Assessment Study
Methodology of the impact assessment study of RDP
10
may be due to the presence of elderly and/or very young members; the household may be headed by a female, etc. Illiteracy of the members have also been cited. In addition to material deprivation, a large number of the poor in Bangladesh experience deprivation and face uncertainly of livelihood for some parts (if not most) of the year. As Osmani (1991) writes in the South Asian context, large numbers of people continue to live below some norm of poverty line and are precariously balanced between subsistence and destitution. The poor are vulnerable to dispossession and destitution as a result of “... changes in personal circumstances (such as illness or death of earning members of family) or of fluctuation in social surroundings (such as crop failure, general recession)” (Dreze and Sen, 1989). A major portion of their vulnerability is due to the seasonality in work and income (and often the outbreak of diseases such as the diarrhoeal ones can result in loss of physical productivity). The indigent’s vulnerability to hunger and deprivation at certain times of the year has been persistent. The brief discussion of peoples perception of poverty can be incorporated into the theory of entitlement as developed by Amartya Sen. Sen’s framework has been loosely used in the design of IAS, and the Task Force on Poverty Alleviation set up by the Interim Government in 1991 conceptualises poverty in similar framework. 3.2 Concept of impact Impact assessment involves the analysis of changes (or their absence) which have occurred due to programme interventions, and an understanding of the causal relationships or variables underlying (or constraining) such changes. In order to demonstrate that changes are a result of programme inputs, the impact assessment was drawn up with four basic principles in mind.
First, changes should be assessed over time (the before/after criterion).
Second, the situation/condition of programme participants should be compared with non-participants of a similar socio-economic group (the with/without criterion).
Third, the methodology should make it possible to gather both quantitative and qualitative data.
Fourth, the assessment should take into account interventions and variables other than programme activities, which might affect BRAC members and the communities in which they live.
Defining terms
Different types of programme results - outputs, effects, and impacts - should be distinguished.
‘outputs’ are the results of programme inputs in relation to the programme's planned performance. Output data are those which the Monitoring Unit collects on a regular basis (e.g. amount of credit disbursed, number of borrowers, etc.). Thus, the term `output' should not be used to refer to the changes in the clienteles' situation (either immediate effects or longer term impacts) caused by a programme.
`Effects' of development interventions are commonly distinguished from `impacts'. `Effects' are
immediate changes, which may not last for more than a short period.
`Impact' is a term which normally refers to sustained structural changes in well-being, i.e.
changes which have a lasting effect.
Impact Assessment Study
Methodology of the impact assessment study of RDP
11
In defining the difference between `effects' and `impacts', the following example is illustrative. A BRAC member may increase her income if she invests a loan in a productive activity. But to argue that this effect is sustainable (and therefore a significant impact), it will be necessary to show either (a) that the income increases continue over time, or (b) that additional changes have occurred in the short term which imply that the income increases are secure (i.e. a ‘structural change’ in her household economic situation has occurred). Showing that BRAC's members have greater economic security relies on a combination of indicators, such as increased assets, increased number of income sources, and decreased seasonal vulnerability - a combination of such changes along with income increases implies that a structural change has occurred at the household level, which will help to sustain and protect higher incomes. The Importance of distinguishing impacts from effects
BRAC's inseparable goals of alleviating poverty and empowering the poor through RDP are an attempt to alter the structural constraints of economic, social (and gender) relations in which vast numbers of the rural population live. The policy of replicating and extending the RDP/RCP model (`going to scale') is an attempt to bring benefits to more and more members. An underlying belief of this policy is that the feature of scale enhances the probability of structural change occurring. It is, however, essential to be able to distinguish between what are short term effects of RDP's inputs (however beneficial) and the sustainable impacts which BRAC is ultimately seeking to bring about. This distinction is essential for the well-being of the present and future membership, which will rely in part on the future development of BRAC's programmes. In turn, the future development of BRAC's programmes must depend partly on a continued understanding of the results of the interventions. If effects are misinterpreted as impacts, future efforts may not be addressed to the most important needs, nor used to their best effect. 3.3 The hypotheses and major impact indicators The hypotheses of impact assessment
It is hypothised that the well-being and institutional position of the rural poor will be dependent on any or a combination of the following factors:
a. Length of membership of RDP measured in months. Specifically, the membership category of 30-72 months that correspond with the first phase and the first half of second phase of RDP, those who have joined the VOs during the period 1988-1991 will show impact more than other age groups;
b. Strength of RDP membership is defined by the number of RDP members in the household, skill
training received, and the aggregate amount of RDP loans received at the date of data collection. The level of loan might need to reach a critical mass before impact may be generated;
c. Life cycle effects are the human resources owned by the households which are defined by
demographic dependency ratio, family size, number of working age population. d. Education level of household members (which is elaborated in chapter 4); e. Area affects or local economic vibrancy (which is elaborated in chapter 4).
Impact Assessment Study
Methodology of the impact assessment study of RDP
12
The following discussion of the Case Studies is necessary because the hypothesis developed for the impact assessment is rationalised with reference to the members perception, and later with reference to the definition of poverty and selection of assessment criteria. A caveat is in order. The VO members identify the resources necessary to generate loan impact, which include factors not all of which are in the household survey data base. As has been pointed out by the experts in June, the data base is weak on the initial endowment (i.e., resource base at the time of joining RDP) of the members. Some proxy indicators will be used for this e.g., land holding. Data on skill level or size of business activity is not included in the data set, therefore this important factor of impact determination is not considered in the study. The IAS was designed with some basic ideas about how the various levels of RDP inputs may react differently in different conditions of household characteristics and local economic environment, to influence the well-being of the RDP households. These ideas had been expanded and reinforced by the experience of the Case Studies, and the inputs from the consultants’ third visit as well as from the Bangladeshi experts from various Dhaka academic institutions who attended a day-long workshop in June 1994. In the Case Study exercise to construct wealth ranks for the VOs, on the question of generating improvements in well-being with RDP support, the VO members identify some determining factors as well as the important input from RDP. Not surprisingly, credit was viewed as most important factor whilst discussions was held on the way an individual was able to improve her condition. The ability to use credit (manage the investment) was considered as most important determinant, which was facilitated by (or constrained through a lack of) other factors such as opportunities available locally, number of earners in the households, initial endowment of the household, education of members. An enabling environment in which one is able to derive benefit from RDP’s credit support has two aspects : first is the household and second is the locality in which the households operate. Household endowment of human and material resources, in the view of the VO members, were reported to be important determinants of impact. Human resource include fewer number of consumers per earning member, which was stated by VO members in most cases. Health status of the household members was another oft cited impact determining factor. Occupation and skill of women members are also likely enhance their capability to invest their loan in activities which generate benefit for the household. The skills of household members to some extent overlap with material resource endowment. A trader or shopkeeper is likely to increase the business stock with RDP credit, and with the experience of existing business, is able to manage the investment better. Skills in specific occupations such as tailoring, artisanal production or crop production, when combined with RDP loan, were reported to improve the households material base (by increasing either working or fixed capital). Engagement in crop production overlaps the material resource base with local development level, in that ownership of a plot of land inside the command area of a minor irrigation (DTW/STW) project enables investment of RDP loan in crop production. The presence of irrigation in the locality has been found to be an important enabling factor to determine impact of credit. On one hand, the employment and increased production generated in an irrigated locality creates opportunities for such self-employment creating activity as trading. On the other hand presence of irrigation enables households to engage in crop production on rented in or owned land which is freed from mortgage, with RDP loan. Other locational factors include infrastructure such as all-weather road and the proximity of a town. Both these create marketing opportunities for craft productions, trade and business, and operation of rural transport.
Impact Assessment Study
Methodology of the impact assessment study of RDP
13
The case studies also reveal how RDP loan may not lead to impact in terms of improved well-being. Two most common reasons are: use of loan money for medical purposes and for daughter’s wedding. To a esser extent, at one location, the VO members complain of excessive repayment collection from them because the previous Programme Assistant failed to update the documents maintained at Area Office. The following section outlines the criteria and indicators of impact. Assessment of poverty : impact indicators
Khondker and Chowdhury (1995) refers to three dimensions of poverty: incidence of poverty, the depth of poverty and the severity of poverty (see also Ravallion 1992 for a description of the FGT class of poverty measures) These measures still reduce poverty to singular measures. To assess the poverty alleviating impact of RDP, the IAS adopts a Key Indicators approach in place of headcounts, single index. Key indicators have been identified as a more promising route to capture, in the words of Sen, `the constitutive plurality of poverty'. The advantage is that key indicators do not try to reduce the poor, in the words of Robert Chambers, to an “amorphous and undifferentiated mass” (both referred to in Kabeer 1991). This will capture the differing experiences of different groups of people in the process of their participation in RDP. The criteria and indicators of assessment are: A. Increased material wellbeing Cash earning;
Shelter: values of house structure, and of household goods; and roofing materials;
Assets: real capital, non-capital assets, and savings;
Expenditure: food, consumption and total expenditures;
Food security: seasonal food stock, and food deficit status. B. Reduced vulnerability to seasonality
Improved food security Reduced seasonal fluctuations in cash income, in expenditure on food, in consumption/total
expenditure, in rice consumption and in servicing of debt to RDP. C. Strengthened coping capacity Coping mechanisms strengthened; Enhanced security of future earning : Asset profile, and improved saving; Enhanced security of current consumption : reduced indebtedness to informal sources,
increasing use of informal borrowing and of RDP credit for non-consumption purposes, direct entitlement to food;
Strength of material wellbeing : ratios of outstanding RDP credit to networth and of outstanding
RDP credit to savings.
Impact Assessment Study
Methodology of the impact assessment study of RDP
14
D. Women’s status improved Assets owned by women Men's attitude towards women working outside the home Decision making by women (spending own income, VO activities) Girl child's schooling E. Institutions Group cohesion Women’s status in the community Visit by candidates in elections Collective activities e.g. DTWs, participation in local salish Age profile of members 3.4 An integrated study approach A methodology enabling integration of various types of data was designed to compare and analyse RDP's impact on socio-economic conditions and the well-being of BRAC's members. In order to satisfy the criteria noted above, a combination of three methods of data gathering were used, providing data on both household and community levels, and comparative data on BRAC clientele, and people (and communities) who have not received any inputs from BRAC. These three methods are:
A Household Survey of BRAC and non-BRAC clientele, using a pre-coded questionnaire, and conducted in two rounds to capture seasonal variations in economic well-being (November 1993; February 1994). The questionnaire collected information on household features, inputs received from RDP/RCP, economic details (income assets, food stocks etc.) and some indicators for social attitudes and behaviour. A total of 2125 households have been surveyed, of which 1375 are RDP member households and 750 comparable non-RDP comparison households. The sampling procedure is detailed in Annex A.
Village Profiles using a structured form - the information for which was collected from small groups
of key informants. The data includes presence of governmental or other programme interventions, infrastructure features (such as transport and marketing facilities) and access to institutions (such as medical and banking facilities). The Village Profiles contribute to the assessment of the significance of BRAC inputs in relation to other socio-economic conditions and variables, including regional differences. The profiles are constructed for 225 villages (150 RDP and 75 non-RDP) where the household surveys were conducted.
Village Organisation Case Studies using informal and a limited number of RRA techniques, to
obtain both quantitative and qualitative information. A selected number of (15) case studies contribute to the analysis of BRAC members' socio-economic context. For example, RRA techniques such as wealth-ranking and timeline-trees were used to identify changes in wealth differentials, gender relations, group development and cohesion, and the relationship between RDP and NFPE schools. The VO case studies were selected on a random basis from the villages in which the BRAC household survey took place. One RDP village was selected randomly for each of the 15 locations. The number of VOs studied stands at 24 as there are more than one VO in some villages.
Impact Assessment Study
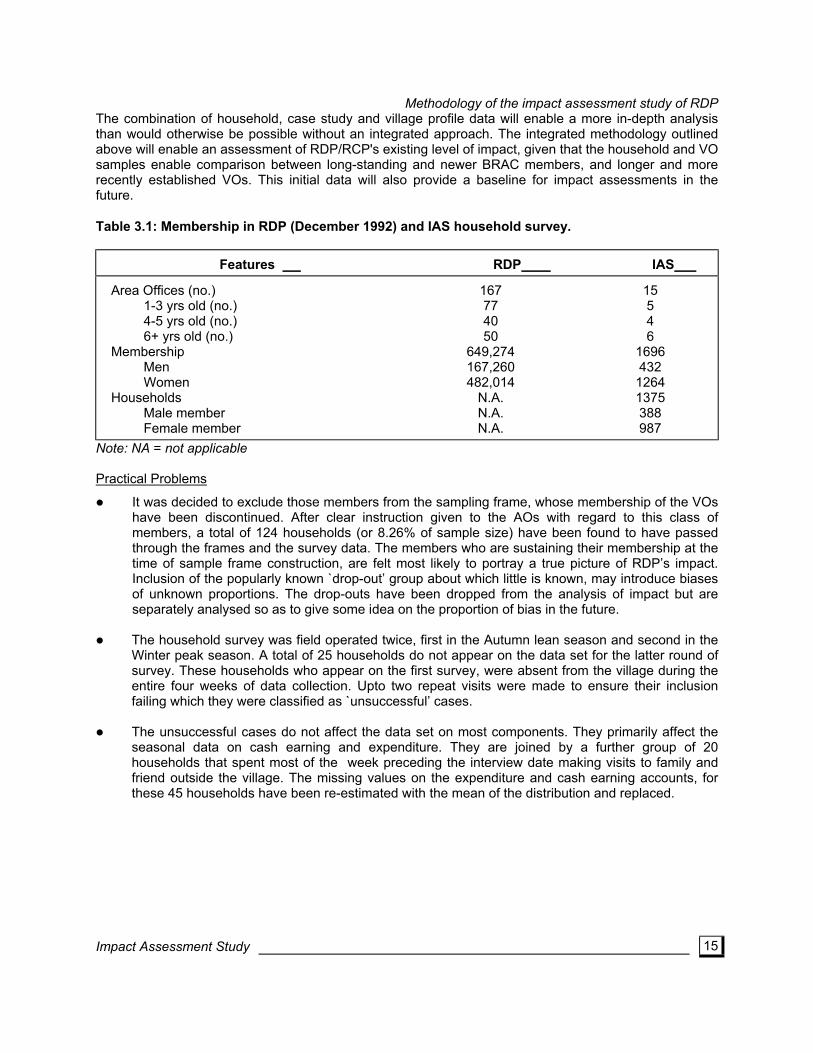
Methodology of the impact assessment study of RDP
15
The combination of household, case study and village profile data will enable a more in-depth analysis than would otherwise be possible without an integrated approach. The integrated methodology outlined above will enable an assessment of RDP/RCP's existing level of impact, given that the household and VO samples enable comparison between long-standing and newer BRAC members, and longer and more recently established VOs. This initial data will also provide a baseline for impact assessments in the future. Table 3.1: Membership in RDP (December 1992) and IAS household survey.
Features RDP IAS
Area Offices (no.) 1-3 yrs old (no.) 4-5 yrs old (no.) 6+ yrs old (no.) Membership Men Women Households Male member Female member
167 77 40 50
649,274 167,260 482,014
N.A. N.A. N.A.
15 5 4 6
1696 432 1264 1375 388 987
Note: NA = not applicable Practical Problems
It was decided to exclude those members from the sampling frame, whose membership of the VOs have been discontinued. After clear instruction given to the AOs with regard to this class of members, a total of 124 households (or 8.26% of sample size) have been found to have passed through the frames and the survey data. The members who are sustaining their membership at the time of sample frame construction, are felt most likely to portray a true picture of RDP’s impact. Inclusion of the popularly known `drop-out’ group about which little is known, may introduce biases of unknown proportions. The drop-outs have been dropped from the analysis of impact but are separately analysed so as to give some idea on the proportion of bias in the future.
The household survey was field operated twice, first in the Autumn lean season and second in the
Winter peak season. A total of 25 households do not appear on the data set for the latter round of survey. These households who appear on the first survey, were absent from the village during the entire four weeks of data collection. Upto two repeat visits were made to ensure their inclusion failing which they were classified as `unsuccessful’ cases.
The unsuccessful cases do not affect the data set on most components. They primarily affect the
seasonal data on cash earning and expenditure. They are joined by a further group of 20 households that spent most of the week preceding the interview date making visits to family and friend outside the village. The missing values on the expenditure and cash earning accounts, for these 45 households have been re-estimated with the mean of the distribution and replaced.
Impact Assessment Study
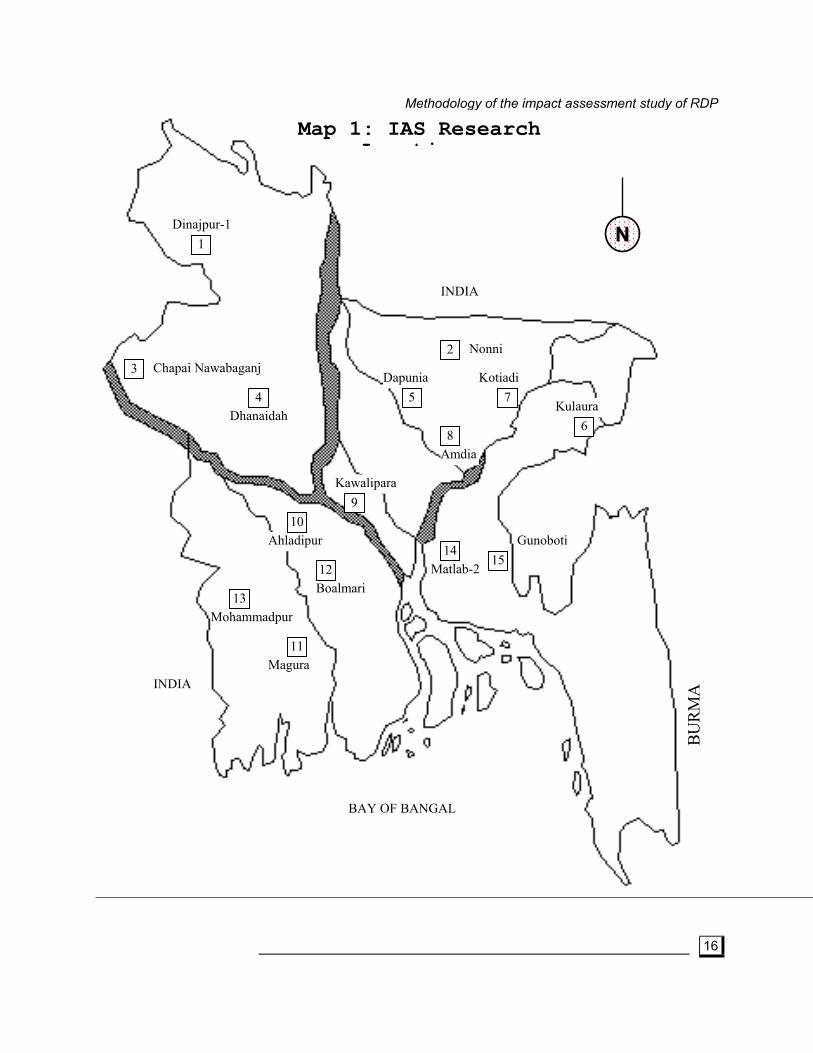
Methodology of the impact assessment study of RDP
16 Impact Assessment Study
BURM
A
���������������������������� NN
Map 1: IAS Research L ti
��������������Dinajpur-1
1
INDIA
Nonni 2 Chapai Nawabaganj 3
Dapunia Kotiadi 4 5 7
Kulaura Dhanaidah
6 8
Amdia
Kawalipara 9
10 Ahladipur Gunoboti
14 15
Matlab-2 12 Boalmari
13 Mohammadpur
11 Magura
INDIA
BAY OF BANGAL
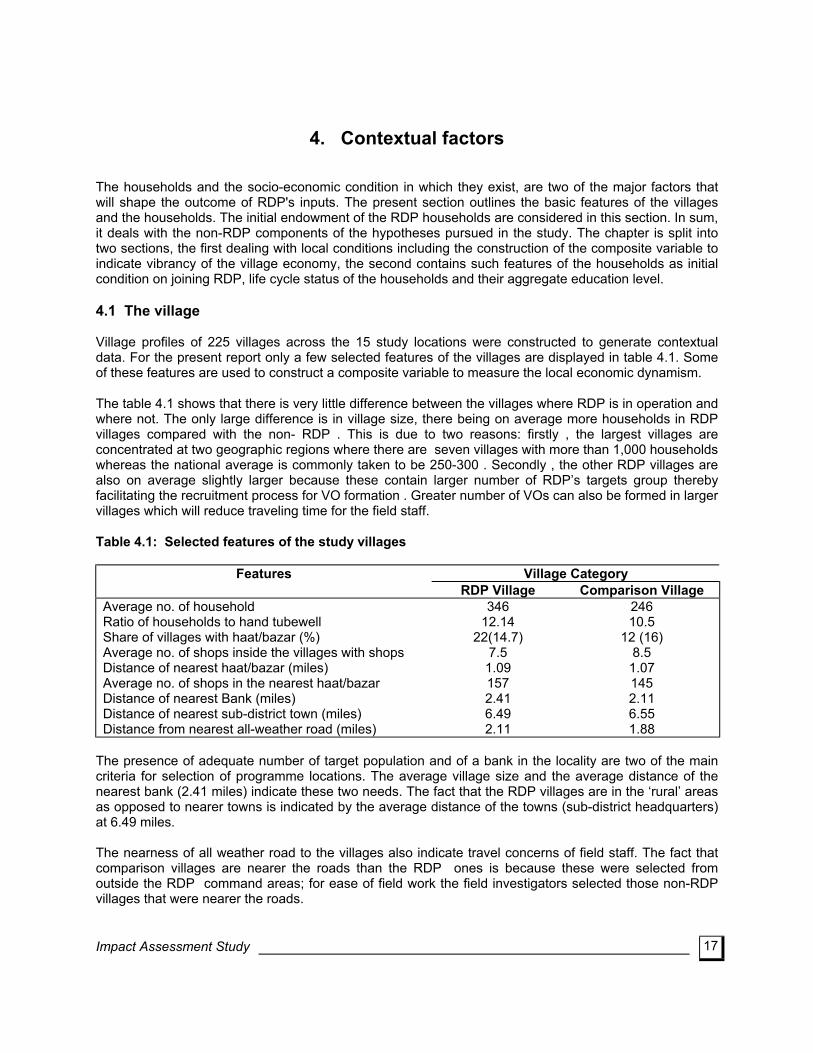
17
4. Contextual factors
The households and the socio-economic condition in which they exist, are two of the major factors that will shape the outcome of RDP's inputs. The present section outlines the basic features of the villages and the households. The initial endowment of the RDP households are considered in this section. In sum, it deals with the non-RDP components of the hypotheses pursued in the study. The chapter is split into two sections, the first dealing with local conditions including the construction of the composite variable to indicate vibrancy of the village economy, the second contains such features of the households as initial condition on joining RDP, life cycle status of the households and their aggregate education level. 4.1 The village Village profiles of 225 villages across the 15 study locations were constructed to generate contextual data. For the present report only a few selected features of the villages are displayed in table 4.1. Some of these features are used to construct a composite variable to measure the local economic dynamism. The table 4.1 shows that there is very little difference between the villages where RDP is in operation and where not. The only large difference is in village size, there being on average more households in RDP villages compared with the non- RDP . This is due to two reasons: firstly , the largest villages are concentrated at two geographic regions where there are seven villages with more than 1,000 households whereas the national average is commonly taken to be 250-300 . Secondly , the other RDP villages are also on average slightly larger because these contain larger number of RDP’s targets group thereby facilitating the recruitment process for VO formation . Greater number of VOs can also be formed in larger villages which will reduce traveling time for the field staff. Table 4.1: Selected features of the study villages
Features Village Category RDP Village Comparison Village
Average no. of household Ratio of households to hand tubewell Share of villages with haat/bazar (%) Average no. of shops inside the villages with shops Distance of nearest haat/bazar (miles) Average no. of shops in the nearest haat/bazar Distance of nearest Bank (miles) Distance of nearest sub-district town (miles) Distance from nearest all-weather road (miles)
346 12.14
22(14.7) 7.5 1.09 157 2.41 6.49 2.11
246 10.5
12 (16) 8.5 1.07 145 2.11 6.55 1.88
The presence of adequate number of target population and of a bank in the locality are two of the main criteria for selection of programme locations. The average village size and the average distance of the nearest bank (2.41 miles) indicate these two needs. The fact that the RDP villages are in the ‘rural’ areas as opposed to nearer towns is indicated by the average distance of the towns (sub-district headquarters) at 6.49 miles. The nearness of all weather road to the villages also indicate travel concerns of field staff. The fact that comparison villages are nearer the roads than the RDP ones is because these were selected from outside the RDP command areas; for ease of field work the field investigators selected those non-RDP villages that were nearer the roads.
Impact Assessment Study
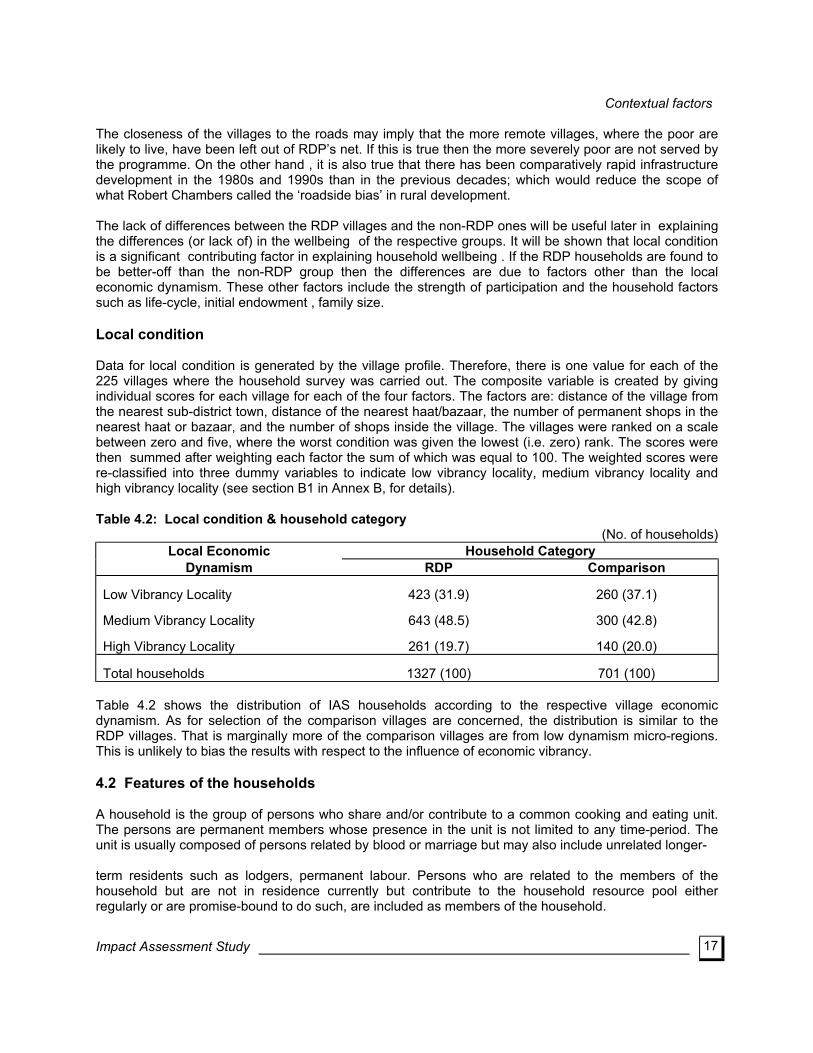
Contextual factors
17
The closeness of the villages to the roads may imply that the more remote villages, where the poor are likely to live, have been left out of RDP’s net. If this is true then the more severely poor are not served by the programme. On the other hand , it is also true that there has been comparatively rapid infrastructure development in the 1980s and 1990s than in the previous decades; which would reduce the scope of what Robert Chambers called the ‘roadside bias’ in rural development. The lack of differences between the RDP villages and the non-RDP ones will be useful later in explaining the differences (or lack of) in the wellbeing of the respective groups. It will be shown that local condition is a significant contributing factor in explaining household wellbeing . If the RDP households are found to be better-off than the non-RDP group then the differences are due to factors other than the local economic dynamism. These other factors include the strength of participation and the household factors such as life-cycle, initial endowment , family size. Local condition Data for local condition is generated by the village profile. Therefore, there is one value for each of the 225 villages where the household survey was carried out. The composite variable is created by giving individual scores for each village for each of the four factors. The factors are: distance of the village from the nearest sub-district town, distance of the nearest haat/bazaar, the number of permanent shops in the nearest haat or bazaar, and the number of shops inside the village. The villages were ranked on a scale between zero and five, where the worst condition was given the lowest (i.e. zero) rank. The scores were then summed after weighting each factor the sum of which was equal to 100. The weighted scores were re-classified into three dummy variables to indicate low vibrancy locality, medium vibrancy locality and high vibrancy locality (see section B1 in Annex B, for details). Table 4.2: Local condition & household category
(No. of households) Local Economic Household Category
Dynamism RDP Comparison
Low Vibrancy Locality 423 (31.9) 260 (37.1)
Medium Vibrancy Locality 643 (48.5) 300 (42.8)
High Vibrancy Locality 261 (19.7) 140 (20.0)
Total households 1327 (100) 701 (100) Table 4.2 shows the distribution of IAS households according to the respective village economic dynamism. As for selection of the comparison villages are concerned, the distribution is similar to the RDP villages. That is marginally more of the comparison villages are from low dynamism micro-regions. This is unlikely to bias the results with respect to the influence of economic vibrancy. 4.2 Features of the households A household is the group of persons who share and/or contribute to a common cooking and eating unit. The persons are permanent members whose presence in the unit is not limited to any time-period. The unit is usually composed of persons related by blood or marriage but may also include unrelated longer- term residents such as lodgers, permanent labour. Persons who are related to the members of the household but are not in residence currently but contribute to the household resource pool either regularly or are promise-bound to do such, are included as members of the household.
Impact Assessment Study
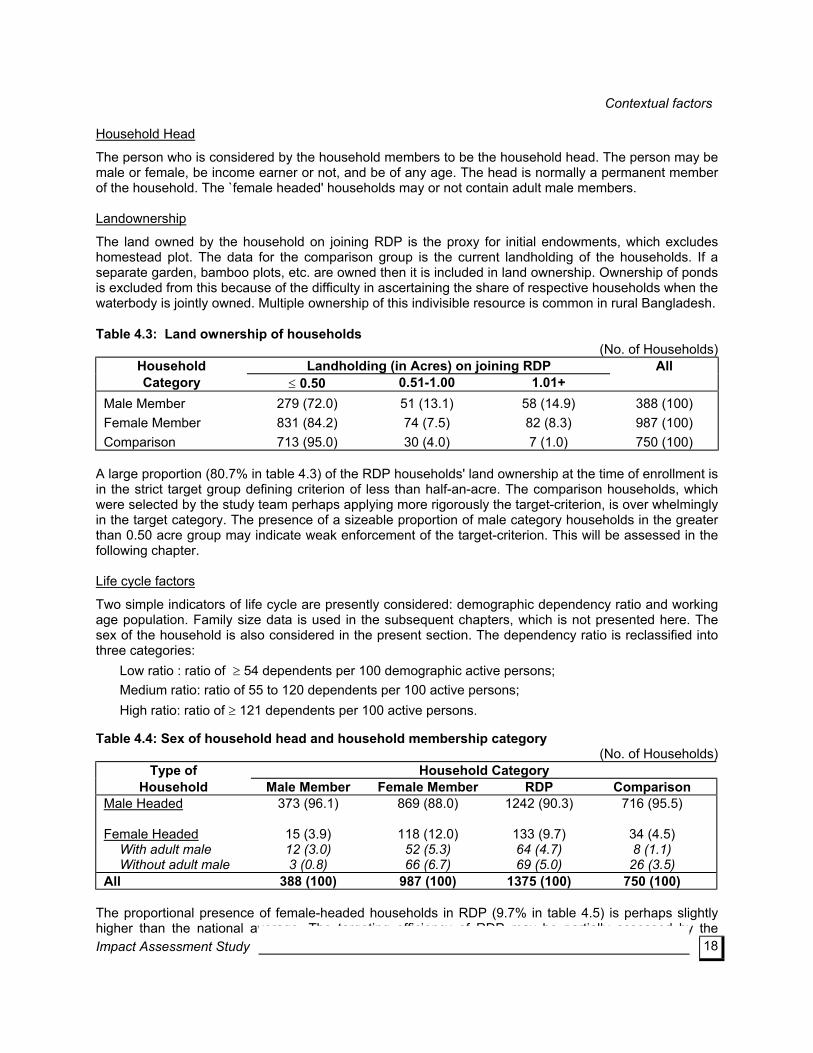
Contextual factors
18
Household Head
The person who is considered by the household members to be the household head. The person may be male or female, be income earner or not, and be of any age. The head is normally a permanent member of the household. The `female headed' households may or not contain adult male members. Landownership
The land owned by the household on joining RDP is the proxy for initial endowments, which excludes homestead plot. The data for the comparison group is the current landholding of the households. If a separate garden, bamboo plots, etc. are owned then it is included in land ownership. Ownership of ponds is excluded from this because of the difficulty in ascertaining the share of respective households when the waterbody is jointly owned. Multiple ownership of this indivisible resource is common in rural Bangladesh. Table 4.3: Land ownership of households (No. of Households)
Household Landholding (in Acres) on joining RDP All Category ≤ 0.50 0.51-1.00 1.01+
Male Member Female Member Comparison
279 (72.0) 831 (84.2) 713 (95.0)
51 (13.1) 74 (7.5) 30 (4.0)
58 (14.9) 82 (8.3) 7 (1.0)
388 (100) 987 (100) 750 (100)
A large proportion (80.7% in table 4.3) of the RDP households' land ownership at the time of enrollment is in the strict target group defining criterion of less than half-an-acre. The comparison households, which were selected by the study team perhaps applying more rigorously the target-criterion, is over whelmingly in the target category. The presence of a sizeable proportion of male category households in the greater than 0.50 acre group may indicate weak enforcement of the target-criterion. This will be assessed in the following chapter. Life cycle factors
Two simple indicators of life cycle are presently considered: demographic dependency ratio and working age population. Family size data is used in the subsequent chapters, which is not presented here. The sex of the household is also considered in the present section. The dependency ratio is reclassified into three categories:
Low ratio : ratio of ≥ 54 dependents per 100 demographic active persons; Medium ratio: ratio of 55 to 120 dependents per 100 active persons; High ratio: ratio of ≥ 121 dependents per 100 active persons.
Table 4.4: Sex of household head and household membership category
(No. of Households) Type of Household Category
Household Male Member Female Member RDP Comparison Male Headed Female Headed
With adult male Without adult male
373 (96.1)
15 (3.9) 12 (3.0) 3 (0.8)
869 (88.0)
118 (12.0) 52 (5.3) 66 (6.7)
1242 (90.3)
133 (9.7) 64 (4.7) 69 (5.0)
716 (95.5)
34 (4.5) 8 (1.1) 26 (3.5)
All 388 (100) 987 (100) 1375 (100) 750 (100)
The proportional presence of female-headed households in RDP (9.7% in table 4.5) is perhaps slightly higher than the national average. The targeting efficiency of RDP may be partially assessed by the
Impact Assessment Study
Contextual factors
19
category's presence in the female member category households. At 12 percent it is higher than the national average. However, female headed households' presence in the comparison group is lower than expected. In the RDP category there are some female-headed household with adult (i.e. ≥18 years' age) men in the households. The social definition of household head as opposed to a strictly economic or income criterion may be responsible for this. The distribution of the households that are male-headed according to categories of dependency ratio is equally spread. Among the female-headed groups the households are distributed with a skewed pattern; indicating fewer children of the women running their own household (living alone may not be appropriate as a woman may share a homestead plot with her parents or siblings and take meals separately). Table 4.5: Demographic dependency ratio and head of household (No. of Households)
Household Type Depending Ratio Category and Category Low
(0-54) Medium (55-120)
High (120+)
Male-Headed Hhs. Male Member Female Member Comparison Female-Headed Hhs. Male Member Female Member Comparison
126 (33.8) 274 (31.5) 259 (36.2)
11 (73.3) 55 (46.6) 19 (55.9)
126 (33.8) 274 (31.5) 229 (32.0)
4 (26.7) 32 (27.1) 7 (20.6)
121 (32.4) 321 (36.9) 228 (31.8)
-
31 (26.3) 8 (23.5)
All 744 (35.00) 672 (31.6) 709 (33.4) Another indicator for life cycle status is the working age (11 years and above) population in the households. The age criterion reflects the common practice in rural areas: children's engagement in either income earning or expenditure saving activities. In addition, use of RDP input (such as training, loan) is improved with helping hands in the family which is the first source of labour supply. On the whole the RDP households in the male category are larger in working age population than their female counterparts as well as the comparison group. There is also some difference in the number between female category and comparison group, at the household level. Table 4.6: Working Age population in the households (Mean/ Household)
Sex of Worker Household Category Male Member Female Member Comparison
Male working age Female working age
2.18
1.84
1.75
1.77
1.63
1.58 Total 4.02 3.53 3.21
Impact Assessment Study
The families with larger over 11-year-old population, may be larger in size and be better endowed with labour power. The male category which on average is made up of 2.18 working age male population is likely to be better-off according to material criteria of well-being (Table 4.6).
Contextual factors
20
Education level
The present report will only consider household aggregate education level instead of population distribution by year of schooling. The family's aggregate education level is derived by the sum of the individual scores of each member. Individual scores relate to year of schooling as displayed in the following Box-4.1 Box-4.1: Education scores
Level of schooling Score Higher and Professional (12 yrs and above) 5 Higher secondary (10 to 11 years) 4 Secondary (6 to 9 years) 3 Primary (1-5 years) 2 Ability to read and write 1 Illiterate 0 Source: Berstecher (1985). The aggregate scores are re-classified:
High aggregate level = 6 and above
Medium-high aggregate = 4 to 5
Medium-low = 2 to 3
Low = 0 to 1 The RDP households on the whole posses higher levels of education than the comparison. However, large proportions of the households fall in the low education level category reflecting the high illiteracy of the groups (Table 4.7). The male category of RDP households appear systematically better endowed according to education level, in comparison with their female counter parts. This is similar to the pattern in land holding which follows the common belief that education is influenced by material endowment. Table 4.7: Education level of the household (No. of Households)
Education Level
Household Category
Male Member Female Member Comparison High Medium High Medium Low Low
66 (17.0) 60 (15.5) 100 (25.7) 162 (41.8)
104 (10.5) 130 (13.2) 229 (23.2) 524 (53.1)
56 (7.5) 63 (8.4)
148 (19.7) 483 (64.4)
All 388 (100) 987 (100) 750 (100) Table 4.7 should be viewed with caution because these are scores and may not reflect the actual level of knowledge which is better assessed by the individuals' years of schooling.
Impact Assessment Study
Measuring RDP inputs
22
5. Measuring RDP inputs
From various Annual Reports produced by RDP and the Monitoring Department the magnitude of RDP support can be gauged. This chapter presents the results of household survey on the level of inputs received by the member households. It reports on membership age, strength of RDP inputs, and, separately, RDP credit which is itself a constituent element of the strength of membership. The strategic elements that are included in the RDP intervention are: group formation, awareness building, saving mobilisation, occupational skill development, credit operation, and technical services and supervision. Given the sample size, many of RDP inputs will not be assessed, particularly those which are spread across the branches but whose depth is shallow (i.e., fewer at each location), will constitute a small proportion of the entire population of the VOs. Known as sectoral programmes, fisheries, sericulture, cattle and goat rearing, horticulture, etc., which include skill training, credit and technical supervision, are not designed to directly reach a large proportion of the membership. The impact of skill development and sectoral or technical activities are expected to be felt as a result of demonstration effect on the wider VO population. Credit on the other hand reaches the parts directly that the other RDP activities can not. A caveat is in order: the rules of credit operation require that the members attend weekly meetings regularly and that the saving with RDP is of a prescribed proportion before a loan is to be made. 5.1 Length of membership The length of membership is measured by accounting for the length of time for which a person has been a member of a village organisation supported by RDP. The length of membership is measured in months from the date on which the first saving contribution was made upto and including the month of September 1993. In some cases where the date is not known, the age is estimated with reference to major commonly known events. The category of `non-response' is recorded in cases where the date of joining the VO cannot be estimated to within 3/4 months of the actual date. In cases where there is multiple membership of RDP/VO in the same household, the age of the first person to join the VO is taken to be the households' length of association with RDP. Table 5.1: Length of membership and household category
Household Membership Age in Months All Category 1-11 12-29 30-47 48-72 73+ Ages1
Male member
Female Member
27 (7.0)
467
(47.3)
94 (24.2)
168
(17.0)
151 (38.9)
238
(24.1)
65 (16.8)
77
(7.8)
45 (11.6)
34
(3.4)
388 (100)
987
(100) All Categories 434
(35.9) 262
(19.1) 389
(28.3) 142
(10.3) 79
(5.7) 1375 (100)
Note: All ages include 6 male and 3 female member households for which data on length is not available.
Impact Assessment Study
The age distribution of the sample households, as shown in Table 5.1, reflect the recent horizontal expansion of RDP which is involved with a membership whose age of association is relatively new (over half is less than 2.5 years of age). Although the sampling design estimated to include larger proportion of members with six or more years' membership (at around 20 percent of the sample size), 5.7 percent of the sample is in reality of this age group. The recent membership turnover experienced by RDP is the
Measuring RDP inputs
23
cause for this reduction. The age group with greater than 2.5 years' membership is likely to experience impact of RDP inputs on their lives, while the younger ones may become a baseline for future assessment of impact, as well as a proxy control group for the present. The extent to which the programme is reaching its declared target group and if there is any variation in target group access to membership in different years, is a standard question posed by evaluative studies. In annexed tables C1 and C2 the land holding by the households on joining RDP is classified into three categories: `target group' (owning <0.50 acre of land), marginally target (owning between 0.5 and 1.0 acre) and non-target (owning more than one acre). Of all RDP households, nearly 81 percent falls in the target group category, 10 percent in the non-target and the rest in the marginal group (Annexed Tables C1 and C2). This distribution is slightly altered if the households are disaggregated by male member and female categories. The male member households are in the non-target category in greater proportions than the female members, at 15.2 and 8.1 percents respectively (Annexed Tables C1 and C2). For male members the recently joining group (i.e. in 1993) appear to contain smaller proportion of pure target group (52 percent) compared with other years. The case studies of VOs indicate that local condition such as acceptance of a non-target by the prospective VO members as their compatriots, and the need to maintain credit discipline in which the non-targets exert influence, motivated some field staff to include non-targets in VO membership (see chapter 9). The presence of non-targets in the female membership is relatively low, particularly those joining in the pre-RDP days before 1987. Since then there has been a slight increase in the proportion of non-target in 1988-91. A near 90 percent coverage of members with less than half-an-acre of land is achieved for the age groups less than 2.5 years (Annexed Table C2). The years of emphasis on women (mid 1991 to late 1993 - for IAS data) has on one hand increased the proportion of non-target in the male groups but it also strengthened the coverage of pure target in the VOs for women. Women from non-target households may be less inclined to join a targeted group whereas men from this category owning marginal or small landholding, may be tempted to enroll. It may be easier for field staff to withstand pressure from non-target women in comparison with non-target men who can convince the target members to accommodate them. It should be noted that at three locations the IAS sample does not contain any male member in VOs which might explain the low presence of pure target in the youngest group (1-11 months) who are likely to have been recruited at Areas where there was some turnover in membership. 5.2 Strength of membership in RDP Credit operation which is a major thrust of RDP is part of the strength of inputs from RDP, is dealt with separately in the following section. In this section structure of household membership and training by RDP are considered. The structure is defined by the number of household members in VOs, which is shown in the annexed table C3 and C4 for male and female member households respectively. Multiple membership of RDP stands at just under 20 percent of all households. When disaggregated by the gender categories, there is a striking but understandable difference. The male category, as constructed for the purpose of IAS, include women from some of those households in the VOs for women, whereas the female category is composed of entirely women’s representation in the VOs for women.
Impact Assessment Study
It is not surprising to find a large proportion (nearly 56 percent in Annexed Table C3) of the male category to contain multiple VO members. A wife or daughter or daughter-in-law of a male member may make up the bulk of the multiple membership for male category. The category proportion is altered when the membership age is considered. Those households joining RDP throughout the 1980s when the emphasis on women was growing but not reached the level of early 1990s, men and women from the same
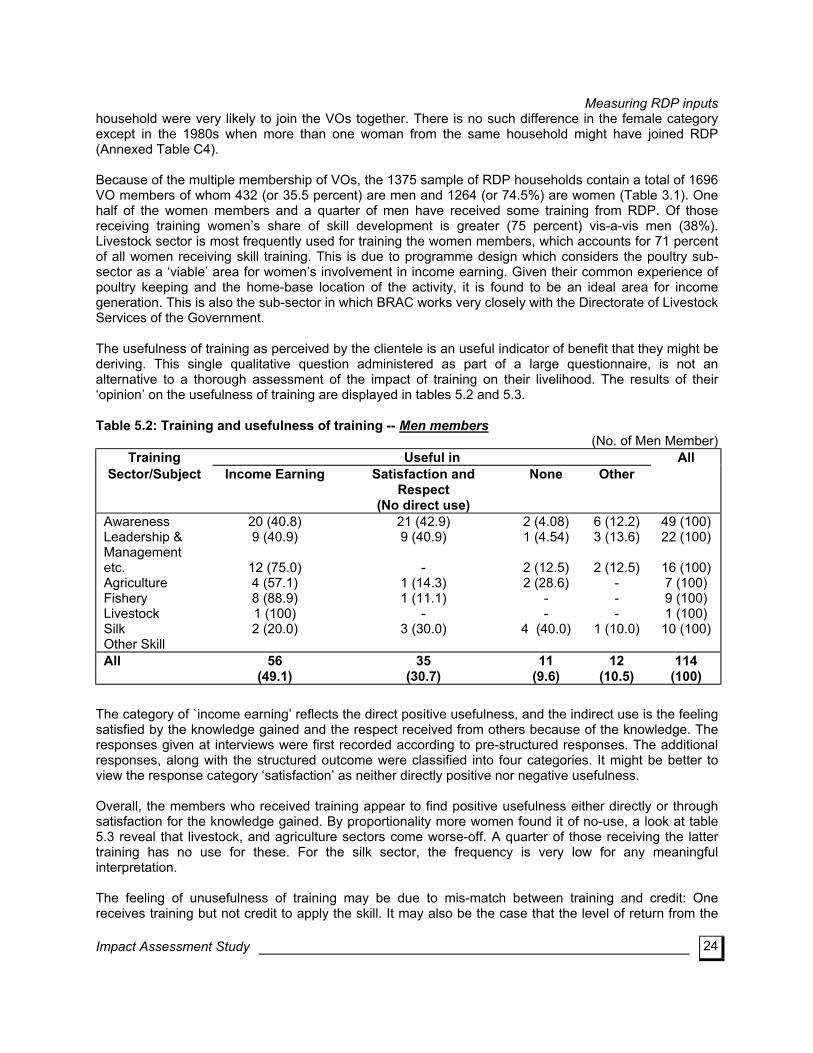
Measuring RDP inputs
24
household were very likely to join the VOs together. There is no such difference in the female category except in the 1980s when more than one woman from the same household might have joined RDP (Annexed Table C4). Because of the multiple membership of VOs, the 1375 sample of RDP households contain a total of 1696 VO members of whom 432 (or 35.5 percent) are men and 1264 (or 74.5%) are women (Table 3.1). One half of the women members and a quarter of men have received some training from RDP. Of those receiving training women’s share of skill development is greater (75 percent) vis-a-vis men (38%). Livestock sector is most frequently used for training the women members, which accounts for 71 percent of all women receiving skill training. This is due to programme design which considers the poultry sub-sector as a ‘viable’ area for women’s involvement in income earning. Given their common experience of poultry keeping and the home-base location of the activity, it is found to be an ideal area for income generation. This is also the sub-sector in which BRAC works very closely with the Directorate of Livestock Services of the Government. The usefulness of training as perceived by the clientele is an useful indicator of benefit that they might be deriving. This single qualitative question administered as part of a large questionnaire, is not an alternative to a thorough assessment of the impact of training on their livelihood. The results of their ‘opinion’ on the usefulness of training are displayed in tables 5.2 and 5.3. Table 5.2: Training and usefulness of training -- Men members (No. of Men Member)
Training Useful in All Sector/Subject Income Earning Satisfaction and
Respect (No direct use)
None Other
Awareness Leadership & Management etc. Agriculture Fishery Livestock Silk Other Skill
20 (40.8) 9 (40.9)
12 (75.0) 4 (57.1) 8 (88.9) 1 (100) 2 (20.0)
21 (42.9) 9 (40.9)
-
1 (14.3) 1 (11.1)
- 3 (30.0)
2 (4.08) 1 (4.54)
2 (12.5) 2 (28.6)
- -
4 (40.0)
6 (12.2) 3 (13.6)
2 (12.5)
- - -
1 (10.0)
49 (100) 22 (100)
16 (100) 7 (100) 9 (100) 1 (100) 10 (100)
All 56 (49.1)
35 (30.7)
11 (9.6)
12 (10.5)
114 (100)
The category of `income earning’ reflects the direct positive usefulness, and the indirect use is the feeling satisfied by the knowledge gained and the respect received from others because of the knowledge. The responses given at interviews were first recorded according to pre-structured responses. The additional responses, along with the structured outcome were classified into four categories. It might be better to view the response category ‘satisfaction’ as neither directly positive nor negative usefulness. Overall, the members who received training appear to find positive usefulness either directly or through satisfaction for the knowledge gained. By proportionality more women found it of no-use, a look at table 5.3 reveal that livestock, and agriculture sectors come worse-off. A quarter of those receiving the latter training has no use for these. For the silk sector, the frequency is very low for any meaningful interpretation. The feeling of unusefulness of training may be due to mis-match between training and credit: One receives training but not credit to apply the skill. It may also be the case that the level of return from the
Impact Assessment Study
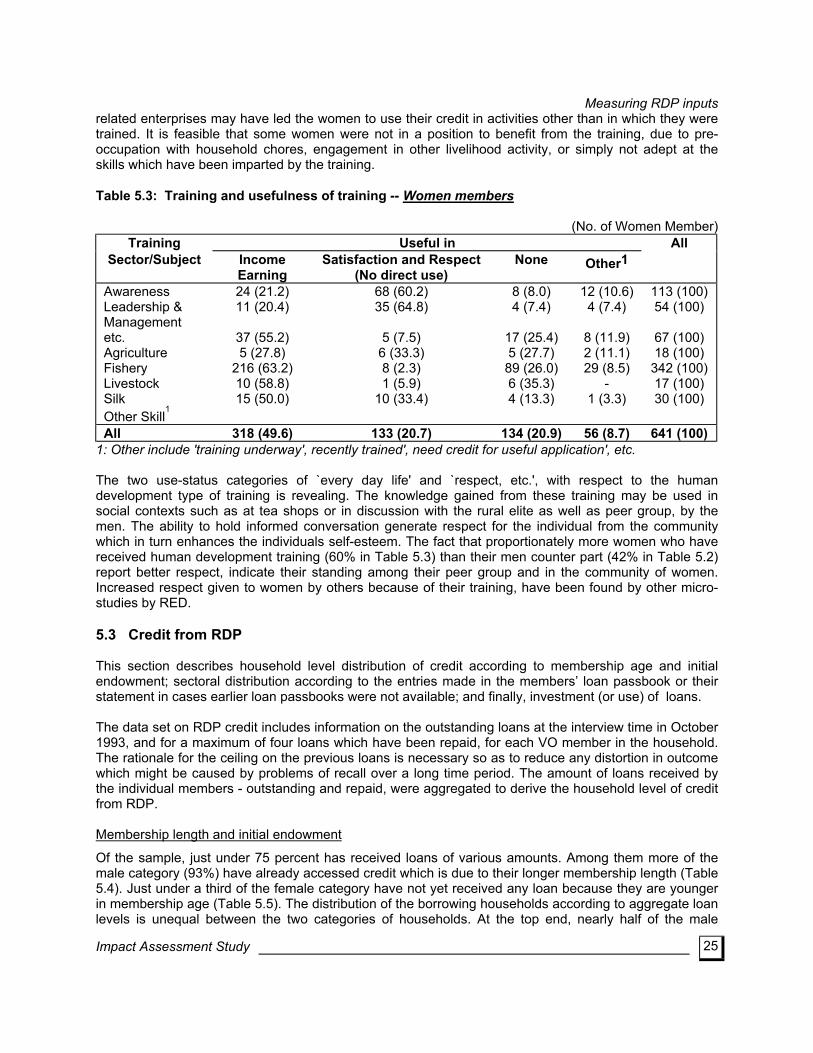
Measuring RDP inputs
25
related enterprises may have led the women to use their credit in activities other than in which they were trained. It is feasible that some women were not in a position to benefit from the training, due to pre-occupation with household chores, engagement in other livelihood activity, or simply not adept at the skills which have been imparted by the training. Table 5.3: Training and usefulness of training -- Women members (No. of Women Member)
Training Useful in All Sector/Subject Income
Earning Satisfaction and Respect
(No direct use) None Other1
Awareness Leadership & Management etc. Agriculture Fishery Livestock Silk Other Skill
1
24 (21.2) 11 (20.4)
37 (55.2) 5 (27.8)
216 (63.2) 10 (58.8) 15 (50.0)
68 (60.2) 35 (64.8)
5 (7.5)
6 (33.3) 8 (2.3) 1 (5.9)
10 (33.4)
8 (8.0) 4 (7.4)
17 (25.4) 5 (27.7) 89 (26.0) 6 (35.3) 4 (13.3)
12 (10.6) 4 (7.4)
8 (11.9) 2 (11.1) 29 (8.5)
- 1 (3.3)
113 (100) 54 (100)
67 (100) 18 (100)
342 (100) 17 (100) 30 (100)
All 318 (49.6) 133 (20.7) 134 (20.9) 56 (8.7) 641 (100) 1: Other include 'training underway', recently trained', need credit for useful application', etc. The two use-status categories of `every day life' and `respect, etc.', with respect to the human development type of training is revealing. The knowledge gained from these training may be used in social contexts such as at tea shops or in discussion with the rural elite as well as peer group, by the men. The ability to hold informed conversation generate respect for the individual from the community which in turn enhances the individuals self-esteem. The fact that proportionately more women who have received human development training (60% in Table 5.3) than their men counter part (42% in Table 5.2) report better respect, indicate their standing among their peer group and in the community of women. Increased respect given to women by others because of their training, have been found by other micro-studies by RED. 5.3 Credit from RDP This section describes household level distribution of credit according to membership age and initial endowment; sectoral distribution according to the entries made in the members’ loan passbook or their statement in cases earlier loan passbooks were not available; and finally, investment (or use) of loans. The data set on RDP credit includes information on the outstanding loans at the interview time in October 1993, and for a maximum of four loans which have been repaid, for each VO member in the household. The rationale for the ceiling on the previous loans is necessary so as to reduce any distortion in outcome which might be caused by problems of recall over a long time period. The amount of loans received by the individual members - outstanding and repaid, were aggregated to derive the household level of credit from RDP. Membership length and initial endowment
Impact Assessment Study
Of the sample, just under 75 percent has received loans of various amounts. Among them more of the male category (93%) have already accessed credit which is due to their longer membership length (Table 5.4). Just under a third of the female category have not yet received any loan because they are younger in membership age (Table 5.5). The distribution of the borrowing households according to aggregate loan levels is unequal between the two categories of households. At the top end, nearly half of the male
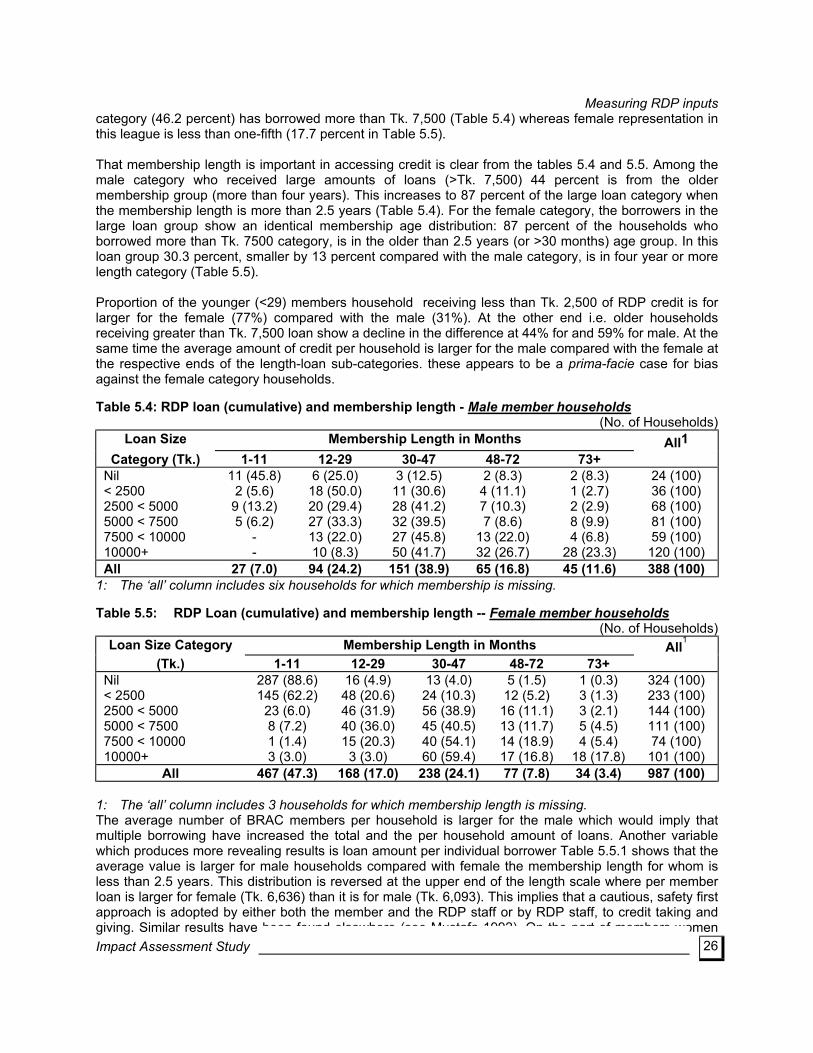
Measuring RDP inputs category (46.2 percent) has borrowed more than Tk. 7,500 (Table 5.4) whereas female representation in this league is less than one-fifth (17.7 percent in Table 5.5). That membership length is important in accessing credit is clear from the tables 5.4 and 5.5. Among the male category who received large amounts of loans (>Tk. 7,500) 44 percent is from the older membership group (more than four years). This increases to 87 percent of the large loan category when the membership length is more than 2.5 years (Table 5.4). For the female category, the borrowers in the large loan group show an identical membership age distribution: 87 percent of the households who borrowed more than Tk. 7500 category, is in the older than 2.5 years (or >30 months) age group. In this loan group 30.3 percent, smaller by 13 percent compared with the male category, is in four year or more length category (Table 5.5). Proportion of the younger (<29) members household receiving less than Tk. 2,500 of RDP credit is for larger for the female (77%) compared with the male (31%). At the other end i.e. older households receiving greater than Tk. 7,500 loan show a decline in the difference at 44% for and 59% for male. At the same time the average amount of credit per household is larger for the male compared with the female at the respective ends of the length-loan sub-categories. these appears to be a prima-facie case for bias against the female category households. Table 5.4: RDP loan (cumulative) and membership length - Male member households
(No. of Households) Loan Size Membership Length in Months All1
Category (Tk.) 1-11 12-29 30-47 48-72 73+ Nil < 2500 2500 < 5000 5000 < 7500 7500 < 10000 10000+
11 (45.8) 2 (5.6)
9 (13.2) 5 (6.2)
- -
6 (25.0) 18 (50.0) 20 (29.4) 27 (33.3) 13 (22.0) 10 (8.3)
3 (12.5) 11 (30.6) 28 (41.2) 32 (39.5) 27 (45.8) 50 (41.7)
2 (8.3) 4 (11.1) 7 (10.3) 7 (8.6)
13 (22.0) 32 (26.7)
2 (8.3) 1 (2.7) 2 (2.9) 8 (9.9) 4 (6.8)
28 (23.3)
24 (100) 36 (100) 68 (100) 81 (100) 59 (100) 120 (100)
All 27 (7.0) 94 (24.2) 151 (38.9) 65 (16.8) 45 (11.6) 388 (100) 1: The ‘all’ column includes six households for which membership is missing. Table 5.5: RDP Loan (cumulative) and membership length -- Female member households
(No. of Households) Loan Size Category Membership Length in Months All1
(Tk.) 1-11 12-29 30-47 48-72 73+ Nil < 2500 2500 < 5000 5000 < 7500 7500 < 10000 10000+
287 (88.6) 145 (62.2)
23 (6.0) 8 (7.2) 1 (1.4) 3 (3.0)
16 (4.9) 48 (20.6) 46 (31.9) 40 (36.0) 15 (20.3)
3 (3.0)
13 (4.0) 24 (10.3) 56 (38.9) 45 (40.5) 40 (54.1) 60 (59.4)
5 (1.5) 12 (5.2)
16 (11.1) 13 (11.7) 14 (18.9) 17 (16.8)
1 (0.3) 3 (1.3) 3 (2.1) 5 (4.5) 4 (5.4)
18 (17.8)
324 (100) 233 (100) 144 (100) 111 (100) 74 (100) 101 (100)
All 467 (47.3) 168 (17.0) 238 (24.1) 77 (7.8) 34 (3.4) 987 (100)
The average number of BRAC members per household is larger for the male which would imply that multiple borrowing have increased the total and the per household amount of loans. Another variable which produces more revealing results is loan amount per individual borrower Table 5.5.1 shows that the average value is larger for male households compared with female the membership length for whom is less than 2.5 years. This distribution is reversed at the upper end of the length scale where per member loan is larger for female (Tk. 6,636) than it is for male (Tk. 6,093). This implies that a cautious, safety first approach is adopted by either both the member and the RDP staff or by RDP staff, to credit taking and giving. Similar results have been found elsewhere (see Mustafa 1992). On the part of members women
1: The ‘all’ column includes 3 households for which membership length is missing.
26 Impact Assessment Study
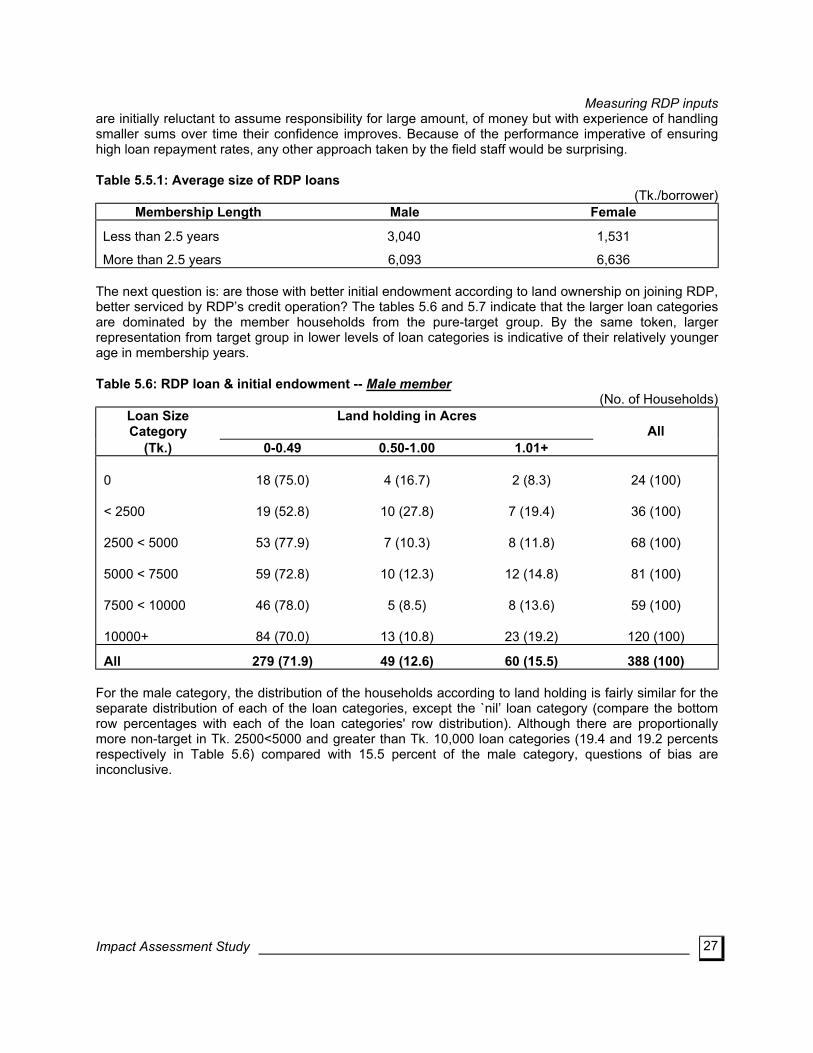
Measuring RDP inputs
27
are initially reluctant to assume responsibility for large amount, of money but with experience of handling smaller sums over time their confidence improves. Because of the performance imperative of ensuring high loan repayment rates, any other approach taken by the field staff would be surprising. Table 5.5.1: Average size of RDP loans
(Tk./borrower) Membership Length Male Female
Less than 2.5 years 3,040 1,531
More than 2.5 years 6,093 6,636 The next question is: are those with better initial endowment according to land ownership on joining RDP, better serviced by RDP’s credit operation? The tables 5.6 and 5.7 indicate that the larger loan categories are dominated by the member households from the pure-target group. By the same token, larger representation from target group in lower levels of loan categories is indicative of their relatively younger age in membership years. Table 5.6: RDP loan & initial endowment -- Male member (No. of Households)
Loan Size Category
Land holding in Acres All
(Tk.) 0-0.49 0.50-1.00 1.01+
0
< 2500
2500 < 5000
5000 < 7500
7500 < 10000
10000+
18 (75.0)
19 (52.8)
53 (77.9)
59 (72.8)
46 (78.0)
84 (70.0)
4 (16.7)
10 (27.8)
7 (10.3)
10 (12.3)
5 (8.5)
13 (10.8)
2 (8.3)
7 (19.4)
8 (11.8)
12 (14.8)
8 (13.6)
23 (19.2)
24 (100)
36 (100)
68 (100)
81 (100)
59 (100)
120 (100)
All 279 (71.9) 49 (12.6) 60 (15.5) 388 (100) For the male category, the distribution of the households according to land holding is fairly similar for the separate distribution of each of the loan categories, except the `nil’ loan category (compare the bottom row percentages with each of the loan categories' row distribution). Although there are proportionally more non-target in Tk. 2500<5000 and greater than Tk. 10,000 loan categories (19.4 and 19.2 percents respectively in Table 5.6) compared with 15.5 percent of the male category, questions of bias are inconclusive.
Impact Assessment Study
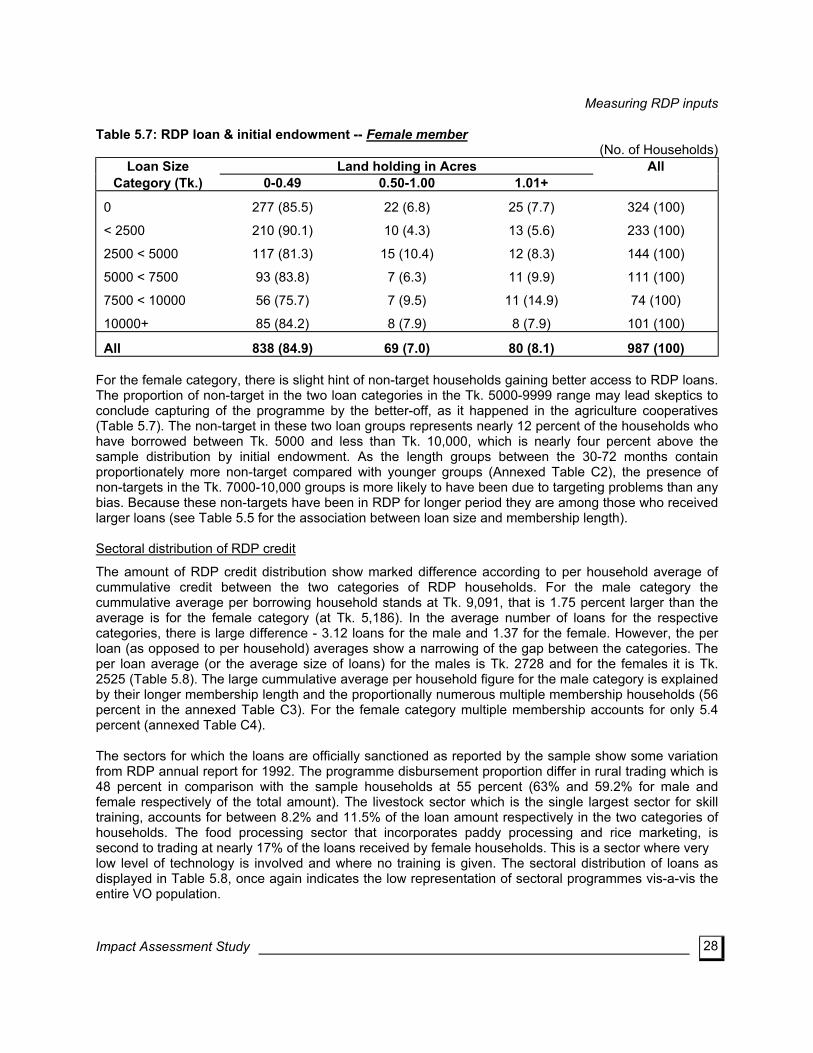
Measuring RDP inputs
28
Table 5.7: RDP loan & initial endowment -- Female member (No. of Households)
Loan Size Land holding in Acres All Category (Tk.) 0-0.49 0.50-1.00 1.01+
0
< 2500
2500 < 5000
5000 < 7500
7500 < 10000
10000+
277 (85.5)
210 (90.1)
117 (81.3)
93 (83.8)
56 (75.7)
85 (84.2)
22 (6.8)
10 (4.3)
15 (10.4)
7 (6.3)
7 (9.5)
8 (7.9)
25 (7.7)
13 (5.6)
12 (8.3)
11 (9.9)
11 (14.9)
8 (7.9)
324 (100)
233 (100)
144 (100)
111 (100)
74 (100)
101 (100)
All 838 (84.9) 69 (7.0) 80 (8.1) 987 (100) For the female category, there is slight hint of non-target households gaining better access to RDP loans. The proportion of non-target in the two loan categories in the Tk. 5000-9999 range may lead skeptics to conclude capturing of the programme by the better-off, as it happened in the agriculture cooperatives (Table 5.7). The non-target in these two loan groups represents nearly 12 percent of the households who have borrowed between Tk. 5000 and less than Tk. 10,000, which is nearly four percent above the sample distribution by initial endowment. As the length groups between the 30-72 months contain proportionately more non-target compared with younger groups (Annexed Table C2), the presence of non-targets in the Tk. 7000-10,000 groups is more likely to have been due to targeting problems than any bias. Because these non-targets have been in RDP for longer period they are among those who received larger loans (see Table 5.5 for the association between loan size and membership length). Sectoral distribution of RDP credit
The amount of RDP credit distribution show marked difference according to per household average of cummulative credit between the two categories of RDP households. For the male category the cummulative average per borrowing household stands at Tk. 9,091, that is 1.75 percent larger than the average is for the female category (at Tk. 5,186). In the average number of loans for the respective categories, there is large difference - 3.12 loans for the male and 1.37 for the female. However, the per loan (as opposed to per household) averages show a narrowing of the gap between the categories. The per loan average (or the average size of loans) for the males is Tk. 2728 and for the females it is Tk. 2525 (Table 5.8). The large cummulative average per household figure for the male category is explained by their longer membership length and the proportionally numerous multiple membership households (56 percent in the annexed Table C3). For the female category multiple membership accounts for only 5.4 percent (annexed Table C4). The sectors for which the loans are officially sanctioned as reported by the sample show some variation from RDP annual report for 1992. The programme disbursement proportion differ in rural trading which is 48 percent in comparison with the sample households at 55 percent (63% and 59.2% for male and female respectively of the total amount). The livestock sector which is the single largest sector for skill training, accounts for between 8.2% and 11.5% of the loan amount respectively in the two categories of households. The food processing sector that incorporates paddy processing and rice marketing, is second to trading at nearly 17% of the loans received by female households. This is a sector where very low level of technology is involved and where no training is given. The sectoral distribution of loans as displayed in Table 5.8, once again indicates the low representation of sectoral programmes vis-a-vis the entire VO population.
Impact Assessment Study
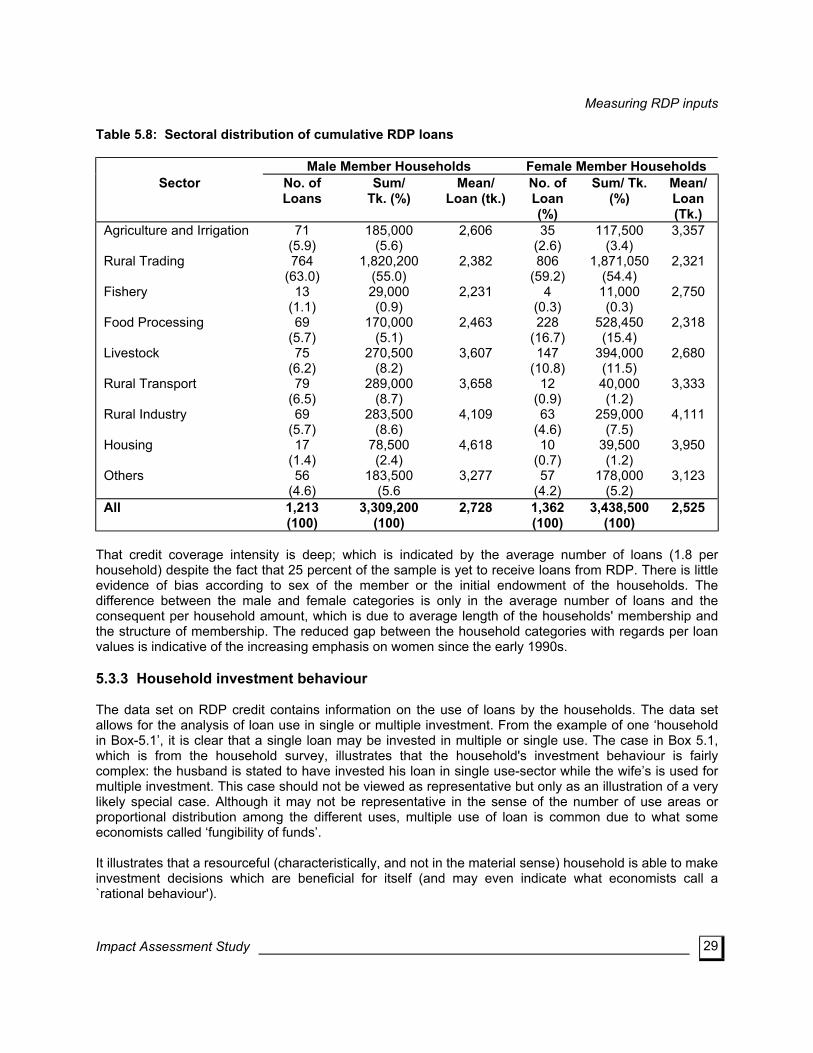
Measuring RDP inputs
29
Table 5.8: Sectoral distribution of cumulative RDP loans
Male Member Households Female Member Households Sector No. of
Loans Sum/
Tk. (%) Mean/
Loan (tk.) No. of Loan (%)
Sum/ Tk. (%)
Mean/ Loan (Tk.)
Agriculture and Irrigation Rural Trading Fishery Food Processing Livestock Rural Transport Rural Industry Housing Others
71 (5.9) 764
(63.0) 13
(1.1) 69
(5.7) 75
(6.2) 79
(6.5) 69
(5.7) 17
(1.4) 56
(4.6)
185,000 (5.6)
1,820,200 (55.0) 29,000 (0.9)
170,000 (5.1)
270,500 (8.2)
289,000 (8.7)
283,500 (8.6)
78,500 (2.4)
183,500 (5.6
2,606
2,382
2,231
2,463
3,607
3,658
4,109
4,618
3,277
35 (2.6) 806
(59.2) 4
(0.3) 228
(16.7) 147
(10.8) 12
(0.9) 63
(4.6) 10
(0.7) 57
(4.2)
117,500 (3.4)
1,871,050 (54.4) 11,000 (0.3)
528,450 (15.4)
394,000 (11.5) 40,000 (1.2)
259,000 (7.5)
39,500 (1.2)
178,000 (5.2)
3,357
2,321
2,750
2,318
2,680
3,333
4,111
3,950
3,123
All 1,213 (100)
3,309,200 (100)
2,728
1,362 (100)
3,438,500 (100)
2,525
That credit coverage intensity is deep; which is indicated by the average number of loans (1.8 per household) despite the fact that 25 percent of the sample is yet to receive loans from RDP. There is little evidence of bias according to sex of the member or the initial endowment of the households. The difference between the male and female categories is only in the average number of loans and the consequent per household amount, which is due to average length of the households' membership and the structure of membership. The reduced gap between the household categories with regards per loan values is indicative of the increasing emphasis on women since the early 1990s. 5.3.3 Household investment behaviour The data set on RDP credit contains information on the use of loans by the households. The data set allows for the analysis of loan use in single or multiple investment. From the example of one ‘household in Box-5.1’, it is clear that a single loan may be invested in multiple or single use. The case in Box 5.1, which is from the household survey, illustrates that the household's investment behaviour is fairly complex: the husband is stated to have invested his loan in single use-sector while the wife’s is used for multiple investment. This case should not be viewed as representative but only as an illustration of a very likely special case. Although it may not be representative in the sense of the number of use areas or proportional distribution among the different uses, multiple use of loan is common due to what some economists called ‘fungibility of funds’. It illustrates that a resourceful (characteristically, and not in the material sense) household is able to make investment decisions which are beneficial for itself (and may even indicate what economists call a `rational behaviour').
Impact Assessment Study
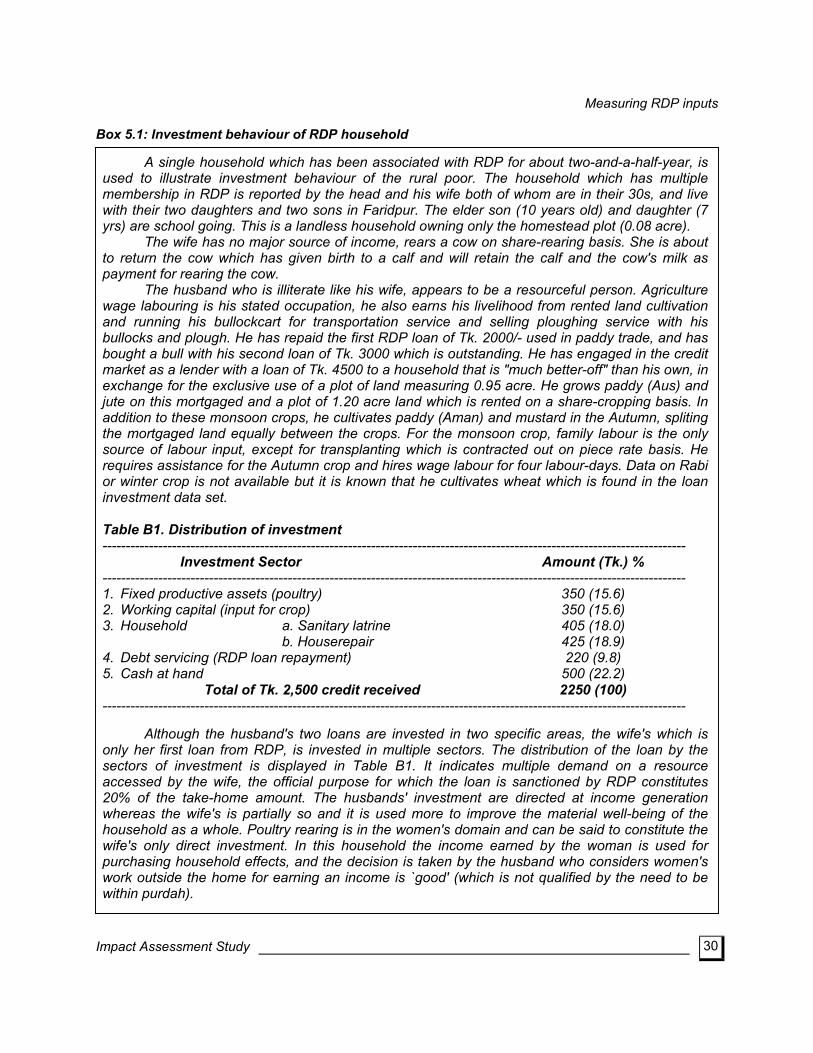
Measuring RDP inputs
30
Box 5.1: Investment behaviour of RDP household
A single household which has been associated with RDP for about two-and-a-half-year, is used to illustrate investment behaviour of the rural poor. The household which has multiple membership in RDP is reported by the head and his wife both of whom are in their 30s, and live with their two daughters and two sons in Faridpur. The elder son (10 years old) and daughter (7 yrs) are school going. This is a landless household owning only the homestead plot (0.08 acre). The wife has no major source of income, rears a cow on share-rearing basis. She is about to return the cow which has given birth to a calf and will retain the calf and the cow's milk as payment for rearing the cow. The husband who is illiterate like his wife, appears to be a resourceful person. Agriculture wage labouring is his stated occupation, he also earns his livelihood from rented land cultivation and running his bullockcart for transportation service and selling ploughing service with his bullocks and plough. He has repaid the first RDP loan of Tk. 2000/- used in paddy trade, and has bought a bull with his second loan of Tk. 3000 which is outstanding. He has engaged in the credit market as a lender with a loan of Tk. 4500 to a household that is "much better-off" than his own, in exchange for the exclusive use of a plot of land measuring 0.95 acre. He grows paddy (Aus) and jute on this mortgaged and a plot of 1.20 acre land which is rented on a share-cropping basis. In addition to these monsoon crops, he cultivates paddy (Aman) and mustard in the Autumn, spliting the mortgaged land equally between the crops. For the monsoon crop, family labour is the only source of labour input, except for transplanting which is contracted out on piece rate basis. He requires assistance for the Autumn crop and hires wage labour for four labour-days. Data on Rabi or winter crop is not available but it is known that he cultivates wheat which is found in the loan investment data set. Table B1. Distribution of investment ------------------------------------------------------------------------------------------------------------------------------ Investment Sector Amount (Tk.) % ------------------------------------------------------------------------------------------------------------------------------ 1. Fixed productive assets (poultry) 350 (15.6) 2. Working capital (input for crop) 350 (15.6) 3. Household a. Sanitary latrine 405 (18.0) b. Houserepair 425 (18.9) 4. Debt servicing (RDP loan repayment) 220 (9.8) 5. Cash at hand 500 (22.2) Total of Tk. 2,500 credit received 2250 (100) ------------------------------------------------------------------------------------------------------------------------------ Although the husband's two loans are invested in two specific areas, the wife's which is only her first loan from RDP, is invested in multiple sectors. The distribution of the loan by the sectors of investment is displayed in Table B1. It indicates multiple demand on a resource accessed by the wife, the official purpose for which the loan is sanctioned by RDP constitutes 20% of the take-home amount. The husbands' investment are directed at income generation whereas the wife's is partially so and it is used more to improve the material well-being of the household as a whole. Poultry rearing is in the women's domain and can be said to constitute the wife's only direct investment. In this household the income earned by the woman is used for purchasing household effects, and the decision is taken by the husband who considers women's work outside the home for earning an income is `good' (which is not qualified by the need to be within purdah).
Impact Assessment Study
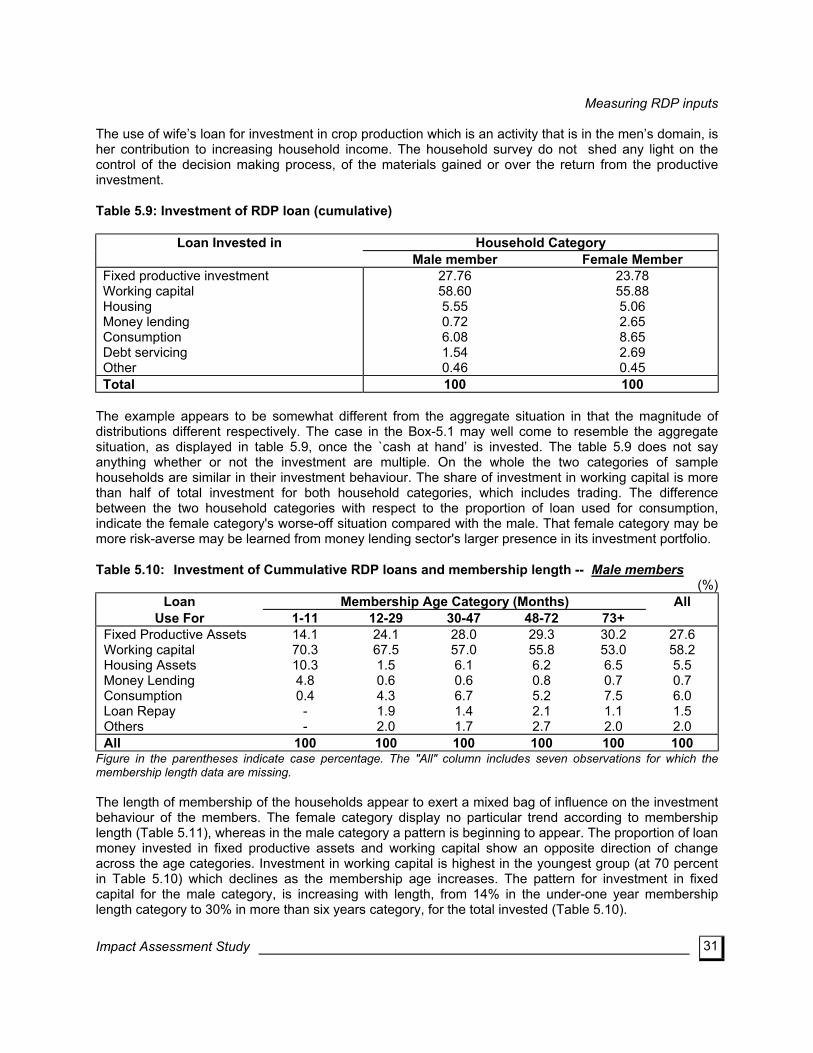
Measuring RDP inputs
31
The use of wife’s loan for investment in crop production which is an activity that is in the men’s domain, is her contribution to increasing household income. The household survey do not shed any light on the control of the decision making process, of the materials gained or over the return from the productive investment. Table 5.9: Investment of RDP loan (cumulative)
Loan Invested in Household Category Male member Female Member
Fixed productive investment Working capital Housing Money lending Consumption Debt servicing Other
27.76 58.60 5.55 0.72 6.08 1.54 0.46
23.78 55.88 5.06 2.65 8.65 2.69 0.45
Total 100 100 The example appears to be somewhat different from the aggregate situation in that the magnitude of distributions different respectively. The case in the Box-5.1 may well come to resemble the aggregate situation, as displayed in table 5.9, once the `cash at hand’ is invested. The table 5.9 does not say anything whether or not the investment are multiple. On the whole the two categories of sample households are similar in their investment behaviour. The share of investment in working capital is more than half of total investment for both household categories, which includes trading. The difference between the two household categories with respect to the proportion of loan used for consumption, indicate the female category's worse-off situation compared with the male. That female category may be more risk-averse may be learned from money lending sector's larger presence in its investment portfolio. Table 5.10: Investment of Cummulative RDP loans and membership length -- Male members
(%) Loan Membership Age Category (Months) All
Use For 1-11 12-29 30-47 48-72 73+ Fixed Productive Assets Working capital Housing Assets Money Lending Consumption Loan Repay Others
14.1 70.3 10.3 4.8 0.4 - -
24.1 67.5 1.5 0.6 4.3 1.9 2.0
28.0 57.0 6.1 0.6 6.7 1.4 1.7
29.3 55.8 6.2 0.8 5.2 2.1 2.7
30.2 53.0 6.5 0.7 7.5 1.1 2.0
27.6 58.2 5.5 0.7 6.0 1.5 2.0
All 100 100 100 100 100 100 Figure in the parentheses indicate case percentage. The "All" column includes seven observations for which the membership length data are missing. The length of membership of the households appear to exert a mixed bag of influence on the investment behaviour of the members. The female category display no particular trend according to membership length (Table 5.11), whereas in the male category a pattern is beginning to appear. The proportion of loan money invested in fixed productive assets and working capital show an opposite direction of change across the age categories. Investment in working capital is highest in the youngest group (at 70 percent in Table 5.10) which declines as the membership age increases. The pattern for investment in fixed capital for the male category, is increasing with length, from 14% in the under-one year membership length category to 30% in more than six years category, for the total invested (Table 5.10).
Impact Assessment Study
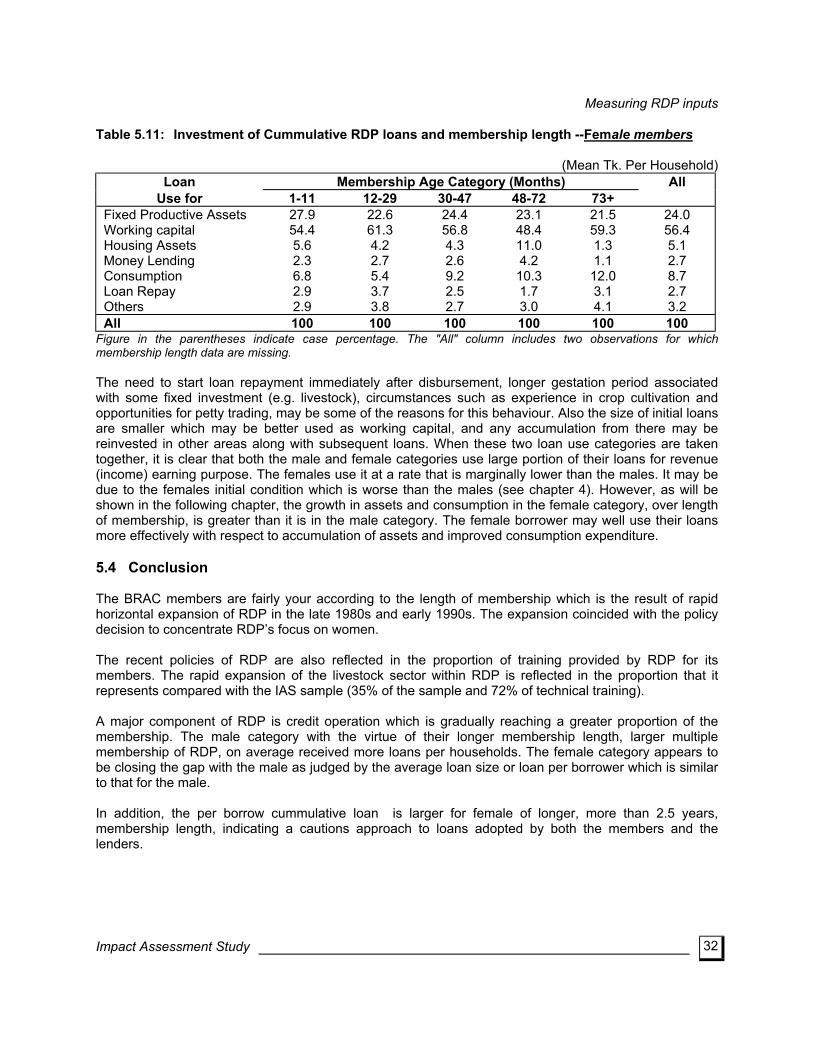
Measuring RDP inputs
32
Table 5.11: Investment of Cummulative RDP loans and membership length --Female members
(Mean Tk. Per Household) Loan Membership Age Category (Months) All
Use for 1-11 12-29 30-47 48-72 73+ Fixed Productive Assets Working capital Housing Assets Money Lending Consumption Loan Repay Others
27.9 54.4 5.6 2.3 6.8 2.9 2.9
22.6 61.3 4.2 2.7 5.4 3.7 3.8
24.4 56.8 4.3 2.6 9.2 2.5 2.7
23.1 48.4 11.0 4.2 10.3 1.7 3.0
21.5 59.3 1.3 1.1
12.0 3.1 4.1
24.0 56.4 5.1 2.7 8.7 2.7 3.2
All 100 100 100 100 100 100 Figure in the parentheses indicate case percentage. The "All" column includes two observations for which membership length data are missing. The need to start loan repayment immediately after disbursement, longer gestation period associated with some fixed investment (e.g. livestock), circumstances such as experience in crop cultivation and opportunities for petty trading, may be some of the reasons for this behaviour. Also the size of initial loans are smaller which may be better used as working capital, and any accumulation from there may be reinvested in other areas along with subsequent loans. When these two loan use categories are taken together, it is clear that both the male and female categories use large portion of their loans for revenue (income) earning purpose. The females use it at a rate that is marginally lower than the males. It may be due to the females initial condition which is worse than the males (see chapter 4). However, as will be shown in the following chapter, the growth in assets and consumption in the female category, over length of membership, is greater than it is in the male category. The female borrower may well use their loans more effectively with respect to accumulation of assets and improved consumption expenditure. 5.4 Conclusion The BRAC members are fairly your according to the length of membership which is the result of rapid horizontal expansion of RDP in the late 1980s and early 1990s. The expansion coincided with the policy decision to concentrate RDP’s focus on women. The recent policies of RDP are also reflected in the proportion of training provided by RDP for its members. The rapid expansion of the livestock sector within RDP is reflected in the proportion that it represents compared with the IAS sample (35% of the sample and 72% of technical training). A major component of RDP is credit operation which is gradually reaching a greater proportion of the membership. The male category with the virtue of their longer membership length, larger multiple membership of RDP, on average received more loans per households. The female category appears to be closing the gap with the male as judged by the average loan size or loan per borrower which is similar to that for the male. In addition, the per borrow cummulative loan is larger for female of longer, more than 2.5 years, membership length, indicating a cautions approach to loans adopted by both the members and the lenders.
Impact Assessment Study
33
6. Material well-being of RDP member households
6.1 Introduction This chapter reports on the impact of RDP on the material wellbeing of the member households. A total of 14 key indicators were used to assess the material condition of the households the data for which was primarily generated by the household survey and supplemented by the case studies when applicable. The chapter contains eight sections. The second section reports on overall difference among RDP households according to membership length. The results are then verified by statistical tests, according to the critical level of input from RDP which is needed to generate significant impact, in the third section. The fourth section presents a more detailed analysis using disaggregated control variables. This analysis was carried out with respect to two of the 14 key indicators in support of the results presented in the earlier section. The data in section five attempts to gain a better insight into household expenditure pattern and sources of cash earning as these have important bearing on poverty levels. The sixth section presents the influence of RDP and non-RDP factors in order to assess the hypothesis presented in chapter three. This was achieved by making econometric analyses of wealth and consumption for RDP households. Using the same econometric specification with respect to consumption as in section six, the male and female categories of RDP households were separately analysed and the results are presented in section seven, the purpose for which was to evaluate the influence of RDP and non-RDP factors on the respective households. The last section concludes. 6.2 Key indicators implying major economic impact Table 6.1 provides a breakdown of household survey interviews by length of RDP membership and key indicators of material well-being. Relevant comparison group (non-RDP) data is also included. Overall, the data suggests that RDP has achieved considerable impact. Comparing those households which joined BRAC in the 11 months preceding the interview, with those households which joined more than four years ago, showed that the latter ("older") group have:
average gross household asset values which were 112% higher
average household revenue-earning (fixed and working capital) assets which were 100% greater in value
average weekly household expenditure which was 26% greater
average weekly per capita expenditure on food which was 15% higher
It should be noted that the comparison group households show lower average values in all economic well-being indicators than the recently joined BRAC households. However, while the differences appear marked (eg. see asset values and weekly expenditure), statistical tests show that these differences do not follow any pattern, i.e. with respect to the ‘stock’ indicators such as wealth the comparison group was worse off whereas the ‘flow’ indicators such as expenditures were not significantly different (see annex tables D4 to D7). In addition, the village profiles show that on average there are no marked infrastructure, market access or economic vibrancy differences between non-BRAC comparison villages and RDP villages. Because of these results the validity of retaining the comparison group as a control is questioned but not conclusively rejected. These results suggest that the comparison group is to be treated with caution.
Impact Assessment Study
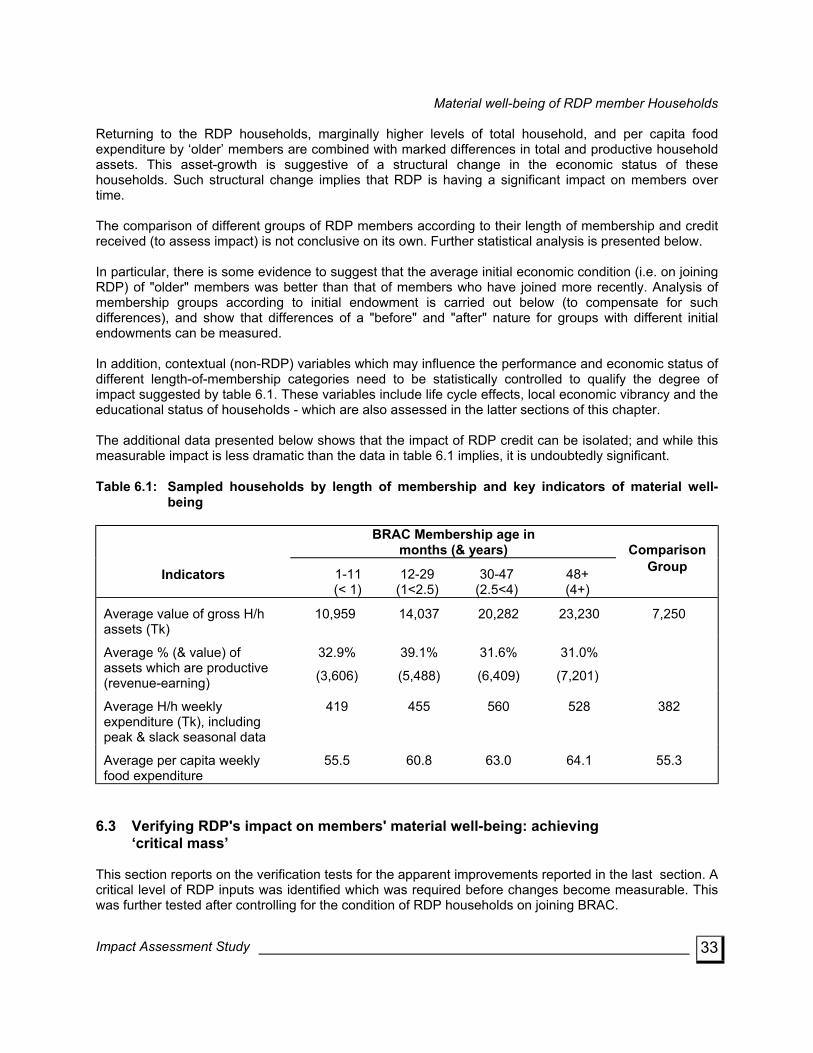
Material well-being of RDP member Households
33
Returning to the RDP households, marginally higher levels of total household, and per capita food expenditure by ‘older’ members are combined with marked differences in total and productive household assets. This asset-growth is suggestive of a structural change in the economic status of these households. Such structural change implies that RDP is having a significant impact on members over time. The comparison of different groups of RDP members according to their length of membership and credit received (to assess impact) is not conclusive on its own. Further statistical analysis is presented below. In particular, there is some evidence to suggest that the average initial economic condition (i.e. on joining RDP) of "older" members was better than that of members who have joined more recently. Analysis of membership groups according to initial endowment is carried out below (to compensate for such differences), and show that differences of a "before" and "after" nature for groups with different initial endowments can be measured. In addition, contextual (non-RDP) variables which may influence the performance and economic status of different length-of-membership categories need to be statistically controlled to qualify the degree of impact suggested by table 6.1. These variables include life cycle effects, local economic vibrancy and the educational status of households - which are also assessed in the latter sections of this chapter. The additional data presented below shows that the impact of RDP credit can be isolated; and while this measurable impact is less dramatic than the data in table 6.1 implies, it is undoubtedly significant. Table 6.1: Sampled households by length of membership and key indicators of material well-
being
BRAC Membership age in months (& years)
Comparison
Indicators 1-11 (< 1)
12-29 (1<2.5)
30-47 (2.5<4)
48+ (4+)
Group
Average value of gross H/h assets (Tk)
10,959 14,037 20,282 23,230 7,250
Average % (& value) of assets which are productive (revenue-earning)
32.9%
(3,606)
39.1%
(5,488)
31.6%
(6,409)
31.0%
(7,201)
Average H/h weekly expenditure (Tk), including peak & slack seasonal data
419 455 560 528 382
Average per capita weekly food expenditure
55.5 60.8 63.0 64.1 55.3
6.3 Verifying RDP's impact on members' material well-being: achieving ‘critical mass’ This section reports on the verification tests for the apparent improvements reported in the last section. A critical level of RDP inputs was identified which was required before changes become measurable. This was further tested after controlling for the condition of RDP households on joining BRAC.
Impact Assessment Study
Material well-being of RDP member Households
34
6.3.1 Critical levels of RDP inputs This section outlines the findings which are summarised by the metaphor of achieving ‘critical mass’. Critical mass is defined as a combination of (a) length of membership and (b) amount of credit received from RDP. To achieve measurable impact the combination of a large amount of credit and a long membership period are both necessary, but neither is a sufficient condition on its own. In other words, there were households in the present sample which joined BRAC relatively recently which have borrowed substantial amounts of credit (as much as the average for "older" members), but for which changes in material well-being were not measurable. In addition, there was a minority of households which had been associated with RDP since its beginning in the mid-1980s, but had not taken significant amounts of credit, and for which changes in economic well-being also were not apparent. The finding that households which have benefited most are those which have taken a large amount of credit over a longer time period suggests that gradual (rather than sudden) impact is experienced by RDP members. Statistical analysis has resulted in a preliminary model of critical mass as: those members who joined RDP more than two and a half years ago, and have taken cumulative loans to the value of Tk 7,500 or more. Also, as "mass" (length of membership and loan amount) increases beyond this level the probability of greater improvements in well-being increases. The above model of critical mass is statistically established by comparing key indicators for different groups, specifically:
those households which had been members of RDP for less than two and a half years, during which time they had received a maximum of only Tk 2,500 worth of credit; and
those households which had received the highest level of RDP support according to length of
membership (over two and a half years) and credit received (more than Tk 7,500).
Because there were apparent systematic differences in the economic statues of male versus female member households, they were disaggregated for the purpose of these tests. These differences suggest that male BRAC members tend to be selected from households which were economically better-off than the female members. The results of the comparisons are presented in table 6.2 below. The comparison of key indicators means for the different male/female - loan/length of membership groups in table 6.2 show that the achievements made by the households in the female category were greater than those in the male category; more specifically:
for male member households: statistical significance tests to measure the differences between the two loan/length defined groups show that a high level of RDP support had generated insignificant differences in terms of cash earning, expenditure, and food stocks. There was a marginal improvement in the value of livestock for the older/higher credit group, but this difference was not significant. However, the values of house structure and total assets were the key indicators that support the critical mass argument in the case of the male category. For both these indicators the differences were marked, and as denoted by ‘*’, were significant. Because total asset and house structure values were undoubtedly crucial features of households' economic status, these results do support the critical mass argument.
Impact Assessment Study
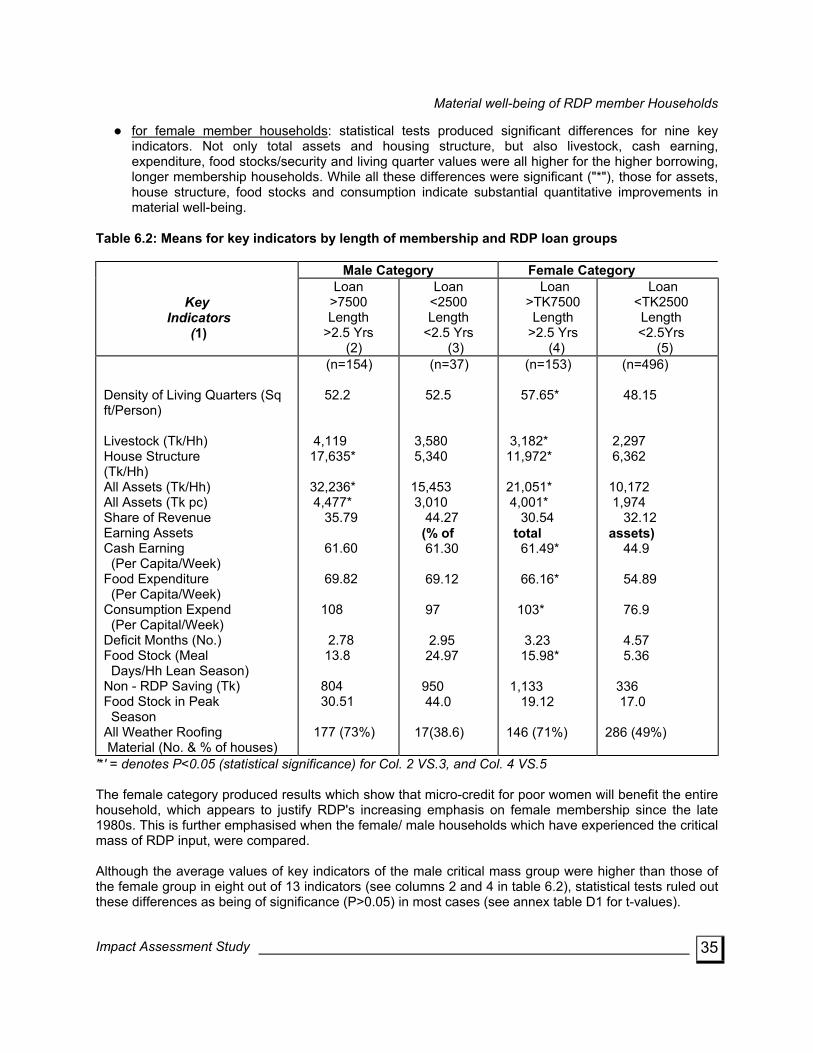
Material well-being of RDP member Households
35
for female member households: statistical tests produced significant differences for nine key
indicators. Not only total assets and housing structure, but also livestock, cash earning, expenditure, food stocks/security and living quarter values were all higher for the higher borrowing, longer membership households. While all these differences were significant ("*"), those for assets, house structure, food stocks and consumption indicate substantial quantitative improvements in material well-being.
Table 6.2: Means for key indicators by length of membership and RDP loan groups
Male Category Female Category
Key Indicators
(1)
Loan >7500 Length
Loan
>2.5 Yrs (2)
<2500 Length
<2.5 Yrs (3)
Loan Loan <TK2500 >TK7500
Length Length >2.5 Yrs <2.5Yrs
(4) (5) Density of Living Quarters (Sq ft/Person)
Livestock (Tk/Hh) House Structure (Tk/Hh) All Assets (Tk/Hh) All Assets (Tk pc) Share of Revenue Earning Assets
(Per Capita/Week) Food Expenditure (Per Capita/Week) Consumption Expend (Per Capital/Week) Deficit Months (No.) Food Stock (Meal Days/Hh Lean Season) Non - RDP Saving (Tk) Food Stock in Peak Season All Weather Roofing Material (No. & % of houses)
(n=154) 52.2 4,119 17,635* 32,236* 4,477* 35.79 61.60 69.82 108 2.78 13.8 804 30.51 177 (73%)
(n=37) 52.5 3,580 5,340 15,453 3,010 44.27 (% of 61.30 69.12
2.95 24.97 950 44.0 17(38.6)
(n=153) 57.65* 3,182* 11,972* 21,051* 4,001* 30.54 total 61.49* 66.16* 103* 3.23 15.98* 1,133 19.12 146 (71%)
(n=496) 48.15 2,297 6,362 10,172 1,974 32.12 assets) 44.9 54.89 76.9 4.57 5.36 336 17.0 286 (49%)
Cash Earning
97
'*' = denotes P<0.05 (statistical significance) for Col. 2 VS.3, and Col. 4 VS.5 The female category produced results which show that micro-credit for poor women will benefit the entire household, which appears to justify RDP's increasing emphasis on female membership since the late 1980s. This is further emphasised when the female/ male households which have experienced the critical mass of RDP input, were compared. Although the average values of key indicators of the male critical mass group were higher than those of the female group in eight out of 13 indicators (see columns 2 and 4 in table 6.2), statistical tests ruled out these differences as being of significance (P>0.05) in most cases (see annex table D1 for t-values).
Impact Assessment Study
Material well-being of RDP member Households
36
These statistical tests indicate that the female group was similar to their male counterparts in terms of material well-being. In 12 out of 13 indicators, the odd one out is the value of household structure and effects, the female group had experienced greater improvements than their counterparts with a low level of RDP input, compared to the differences between the two male groups. A combination of membership length and credit from RDP did enable the female category to make greater improvements than the male group with similarly large RDP input. The analysis thus far raises the issue of the similarity (or not) in the resource endowment of the groups that have been used to assess the issue of critical mass, and the resulting conclusion that loans to female members have generated greater (comparative) impact. If the condition of the recently joined households in the female group was better than their male counterparts, the validity of the critical mass argument would be weakened. This is because the female category may be deemed to have started from a higher level than the males, and would therefore be expected to perform better. A comparison between these two gender categories at the early stages of membership produced results to indicate that the females were worse off compared with the males, according to the indicators. The male group in the recently joined category was better off with respect to seven indicators that were statistically significant, and a further five on average. Thus, these findings suggest that the female group which joined RDP with a poorer endowment than male households generated greater differences - as it received increasing amounts of credit over a longer period of time - and reached levels of material well-being which were similar to their male counterparts (see ‘t’ values, col. 5, annexed table D1). It should be noted that the initial condition as used in the above discussion is the current condition of the new members in the survey sample, and does not necessarily represent the condition of the older members on joining RDP. The term "initial endowment" is used below to mean the latter, and is defined with respect to their land ownership at the time of joining BRAC. 6.3.2 Initial endowment induced impact? The term "initial endowment" is used to refer to the original condition of households when they joined BRAC (i.e. at the pre-RDP intervention, or "before" stage). Because the survey could not collect comprehensive data to assess the pre-RDP condition of households more than four years ago, the proxy indicator of initial endowment used here is the amount of household owned land at the time of joining (calculated on the basis of interview information about present landholding, accounting for any sale or purchase of land "since joining RDP"). It may be argued that households with larger land ownership on joining RDP would have been in a better economic condition generally, and therefore should have "performed better" than those of smaller endowment, but with similar inputs from RDP. In order to test the robustness of the critical mass argument, it is necessary to show that the differences between the two levels of RDP inputs are as large in the case of high endowment households as they are for weak endowment households. In order to assess the influence of initial endowment on the impact of RDP support, the landholding factor was used to define different groups. The membership length and RDP credit (as used above in table 6.2) were retained and the low (weak) and high (strong) initial endowment condition were specified as:
landownership of less than 0.25 acres was taken as indicating low endowment; and
landownership of more than 0.51 acres was taken as indicating high endowment.
Impact Assessment Study
Material well-being of RDP member Households
37
The low endowment group was likely to contain the worst-off amongst BRAC's functionally landless target group (and the degree of change in their economic status would therefore assess the effectiveness of credit for the poorer amongst RDP's membership). Any upward pressure on the economic condition of the households emanating from non-land resources such as human or working capital were assumed to be equal in both of the groups (if not less in the small endowment group). This assumption was based on the proportional distribution of the household heads' occupation by landholding category which showed that cultivation accounted for more of the occupation of large endowment group (34%) compared with the smaller endowed (6.3%); and reverse was the distribution with regards wage employment (44% and 12% respectively). The number of working age population was greater in the larger landholding groups (4.73%) than the smaller (3.34%). Therefore, that smaller landholding groups' economic condition might be improved through non-land resources was unlikely in the case of the present study sample. Each endowment group was analysed separately to assess the difference made by large amounts of credit over a period longer than two and a half years compared to smaller amounts of credit and shorter membership. Each gender category was analysed separately (because of the differences noted above). The high endowment households produced key indicator values that were higher on average than the low endowment group. This was true for both male and female member categories. However, the comparative differences between the two RDP loan/length groups (as measured by the size of t-statistic) were greater for those households with low initial endowment, in both male and female member categories, and the female category in particular. In other words, the high endowment groups in both of the gender categories had achieved smaller comparative differences when the two input size groups were compared (see columns three and five in annex table D3). These results suggest that RDP's impact on the low endowment female group had been more effective, and generated more dramatic changes with respect to material well-being, as and when their involvement with RDP went beyond the critical mass level (compare columns three and seven in annex table D2, and columns 4 & 5 in annex table D3). The results of the tests for differences in the group means with respect to the key indicators were not statistically significant for the female categories' high endowment group (column 5 in annex table D3), implying little incremental improvements. The results for the male member categories produced slightly larger differences (compare columns 1 & 2 in annex table D2, and column 3 in annex table D3). This difference was significant only with respect to wealth and one of its components - the value of house structure (column 3 in annex table D3). The differences for the low endowment group of the female category were equal or greater than that of the high endowment group. Indicators which showed such differences included: both household and per capita wealth (total assets), house structure value, expenditure on consumption generally and food in particular, food stocks in the lean season, food security in the previous 12 months, and cash earnings. The gap between the high and low endowment groups which received a critical mass of RDP input was narrower for the female category than for the male (columns 7 & 6 in annex table D3). The female categories' low endowment group may be narrowing the gap with their female counterparts in the high endowment group. This result is not conclusive because the differences are varied across the indicators. In conclusion, there is little evidence to suggest that the households with high initial endowment are likely to better utilise RDP credit over time than their counterparts in the low endowment group. Indeed, the reverse is suggested by the tests: RDP's impact on poorer households' material well-being has been, in comparative terms, more notable.
Impact Assessment Study
Material well-being of RDP member Households
38
6.4 Critical Mass: A detailed assessment This section reports the results that are supplementary to the preceding section. The results indicate that the critical minimum level of RDP inputs was the outcome of a systematic process and not of chance. Wealth of households
The male category households were divided into eight groups by five levels of credit, and membership length of `relatively young' (length <2.5 years) and `relatively old' (length >2.5 years). They were tested against each other as well as against the comparison group. From table D4, it is clear that the all groups of male households were better-off than the comparison households, with regards asset holding. The male group that has received more than Tk. 7,500 (the largest loan category presently) and was `relatively young' did not improve their wealth situation compared with smaller loan size groups. If the amount of loan alone was expected to cause change in wealth then this result was unexpected. The explanation is in the performance of the ‘relatively old’ and large loan group that was consistently and significantly wealthy than all other groups.. This groups by virtue of age was likely to have received larger average loan over time which allowed them to convert RDP credit into wealth. The second is that the real value of their loan was higher than the relatively young group, because the amount used presently was not adjusted for price level changes. There was consistent difference in the wealth of other groups with smaller loans, but these were not statistically significant. The ‘relatively old’ and medium size loan group owned on average higher value of wealth compared with younger and smaller loan groups. The female category of households, given their more numerous presence in IAS, were divided into nine groups according to two the age categories, and to five loan size groups. The annexed table D5 shows the value of wealth for the `relatively-young-and-large-loan` group in the female category was not significantly larger than those with smaller loans. The results in table D5 show that it was the groups with larger loans and older membership who were likely to be better-off. The difference of `the critical mass group from other groups was not as clear cut as in the case of male category. This group was significantly more wealthy than the zero loan-all ages, and all-ages with less than Tk. 5,000 loan size. This group was on average different from the groups with medium size loans and all ages. This simple analysis indicate consistent movement along the path to greater wealth ownership according to loan size and membership age. The Case Study discussions with VO members revealed that improvement in material well-being was influenced by the manner in which the RDP loan is used. In other words, RDP loan on its own, per se, do not affect improvements. The case studies identified initial endowment and local condition as important contributory factors towards improvement. Food expenditure
The tables D6 and D7 in the Annex D, display results of statistical tests carried out to assess the significance level of differences in expenditure on food. The households were divided into groups according to membership age and loan size, as used for wealth. The male member category was significantly better-off than the comparison group, except the young age members with medium level loan size (Tk. 5000-7500). This young group was found to spend more than the comparison households but this might be due to some exceptionally large spenders among them which had pulled the group average to higher level.
Impact Assessment Study
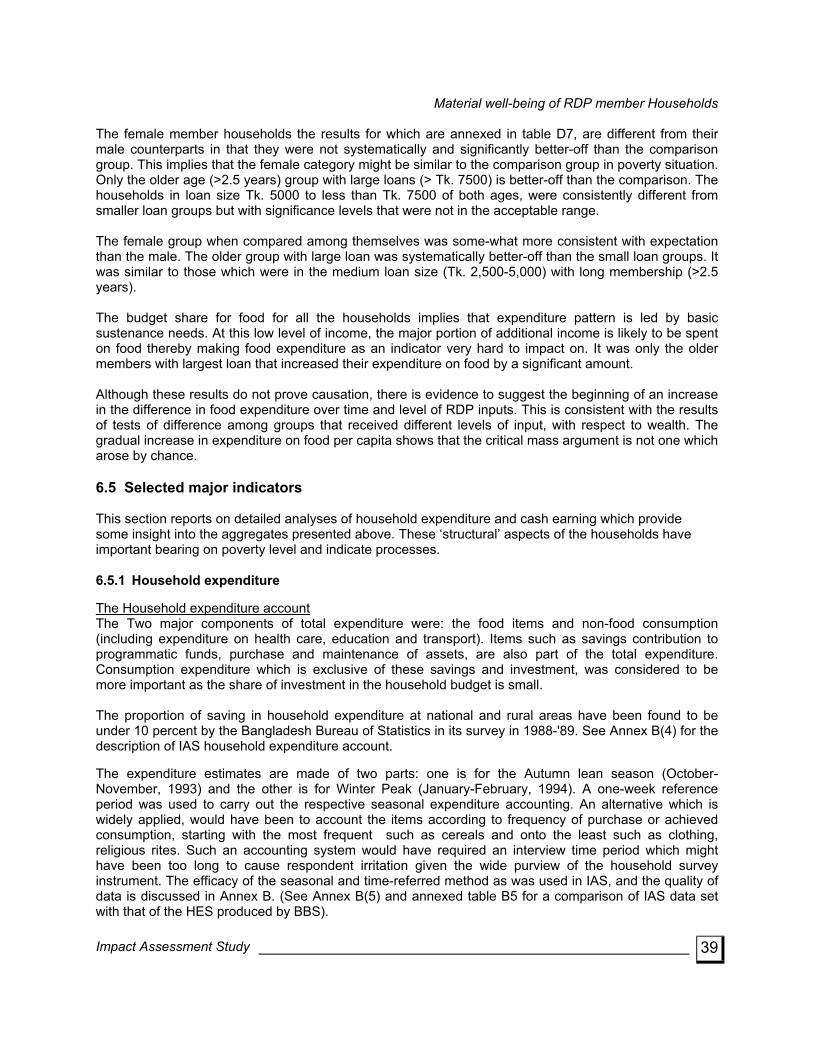
Material well-being of RDP member Households
39
The female member households the results for which are annexed in table D7, are different from their male counterparts in that they were not systematically and significantly better-off than the comparison group. This implies that the female category might be similar to the comparison group in poverty situation. Only the older age (>2.5 years) group with large loans (> Tk. 7500) is better-off than the comparison. The households in loan size Tk. 5000 to less than Tk. 7500 of both ages, were consistently different from smaller loan groups but with significance levels that were not in the acceptable range. The female group when compared among themselves was some-what more consistent with expectation than the male. The older group with large loan was systematically better-off than the small loan groups. It was similar to those which were in the medium loan size (Tk. 2,500-5,000) with long membership (>2.5 years). The budget share for food for all the households implies that expenditure pattern is led by basic sustenance needs. At this low level of income, the major portion of additional income is likely to be spent on food thereby making food expenditure as an indicator very hard to impact on. It was only the older members with largest loan that increased their expenditure on food by a significant amount. Although these results do not prove causation, there is evidence to suggest the beginning of an increase in the difference in food expenditure over time and level of RDP inputs. This is consistent with the results of tests of difference among groups that received different levels of input, with respect to wealth. The gradual increase in expenditure on food per capita shows that the critical mass argument is not one which arose by chance. 6.5 Selected major indicators This section reports on detailed analyses of household expenditure and cash earning which provide some insight into the aggregates presented above. These ‘structural’ aspects of the households have important bearing on poverty level and indicate processes. 6.5.1 Household expenditure The Household expenditure account The Two major components of total expenditure were: the food items and non-food consumption (including expenditure on health care, education and transport). Items such as savings contribution to programmatic funds, purchase and maintenance of assets, are also part of the total expenditure. Consumption expenditure which is exclusive of these savings and investment, was considered to be more important as the share of investment in the household budget is small. The proportion of saving in household expenditure at national and rural areas have been found to be under 10 percent by the Bangladesh Bureau of Statistics in its survey in 1988-'89. See Annex B(4) for the description of IAS household expenditure account. The expenditure estimates are made of two parts: one is for the Autumn lean season (October-November, 1993) and the other is for Winter Peak (January-February, 1994). A one-week reference period was used to carry out the respective seasonal expenditure accounting. An alternative which is widely applied, would have been to account the items according to frequency of purchase or achieved consumption, starting with the most frequent such as cereals and onto the least such as clothing, religious rites. Such an accounting system would have required an interview time period which might have been too long to cause respondent irritation given the wide purview of the household survey instrument. The efficacy of the seasonal and time-referred method as was used in IAS, and the quality of data is discussed in Annex B. (See Annex B(5) and annexed table B5 for a comparison of IAS data set with that of the HES produced by BBS).
Impact Assessment Study
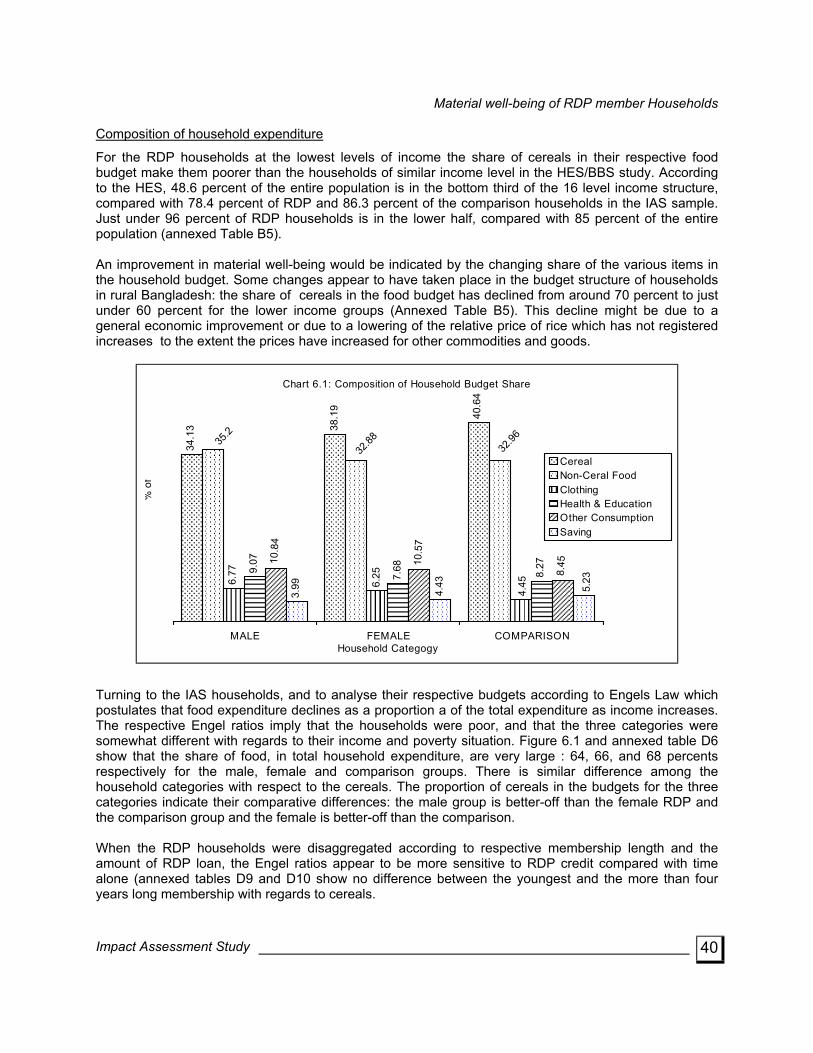
Material well-being of RDP member Households
40
Composition of household expenditure
For the RDP households at the lowest levels of income the share of cereals in their respective food budget make them poorer than the households of similar income level in the HES/BBS study. According to the HES, 48.6 percent of the entire population is in the bottom third of the 16 level income structure, compared with 78.4 percent of RDP and 86.3 percent of the comparison households in the IAS sample. Just under 96 percent of RDP households is in the lower half, compared with 85 percent of the entire population (annexed Table B5). An improvement in material well-being would be indicated by the changing share of the various items in the household budget. Some changes appear to have taken place in the budget structure of households in rural Bangladesh: the share of cereals in the food budget has declined from around 70 percent to just under 60 percent for the lower income groups (Annexed Table B5). This decline might be due to a general economic improvement or due to a lowering of the relative price of rice which has not registered increases to the extent the prices have increased for other commodities and goods.
������������������������������������������������������������������������������������������������������������
���������������������������������������������������������������������������������������������������������������������
������������������������������������������������������������������������������������������������������������������������������
������������������������������������������������������������������������������������������������������������
���������������������������������������������������������������������������������������������������
���������������������������������������������������������������������������������������������������
���������������������������
���������������������������
��������������������
������������������������������������
������������������������������
���������������������������
������������������������������������
������������������������������������
���������������������������
������������������
������������������
������������������
Chart 6.1: Composition of Household Budget Share
34.1
3 38.1
9
40.6
4
6.77
6.259.
07
7.68 8.2710
.84
10.5
7
8.45
3.99 4.43
32.96
32.8835
.2
4.45 5.23
MALE FEMALE COMPARISONHousehold Categogy
���������������������������
% o
f
Cereal Non-Ceral Food ClothingHealth & Education Other ConsumptionSaving
Turning to the IAS households, and to analyse their respective budgets according to Engels Law which postulates that food expenditure declines as a proportion a of the total expenditure as income increases. The respective Engel ratios imply that the households were poor, and that the three categories were somewhat different with regards to their income and poverty situation. Figure 6.1 and annexed table D6 show that the share of food, in total household expenditure, are very large : 64, 66, and 68 percents respectively for the male, female and comparison groups. There is similar difference among the household categories with respect to the cereals. The proportion of cereals in the budgets for the three categories indicate their comparative differences: the male group is better-off than the female RDP and the comparison group and the female is better-off than the comparison. When the RDP households were disaggregated according to respective membership length and the amount of RDP loan, the Engel ratios appear to be more sensitive to RDP credit compared with time alone (annexed tables D9 and D10 show no difference between the youngest and the more than four years long membership with regards to cereals.
Impact Assessment Study
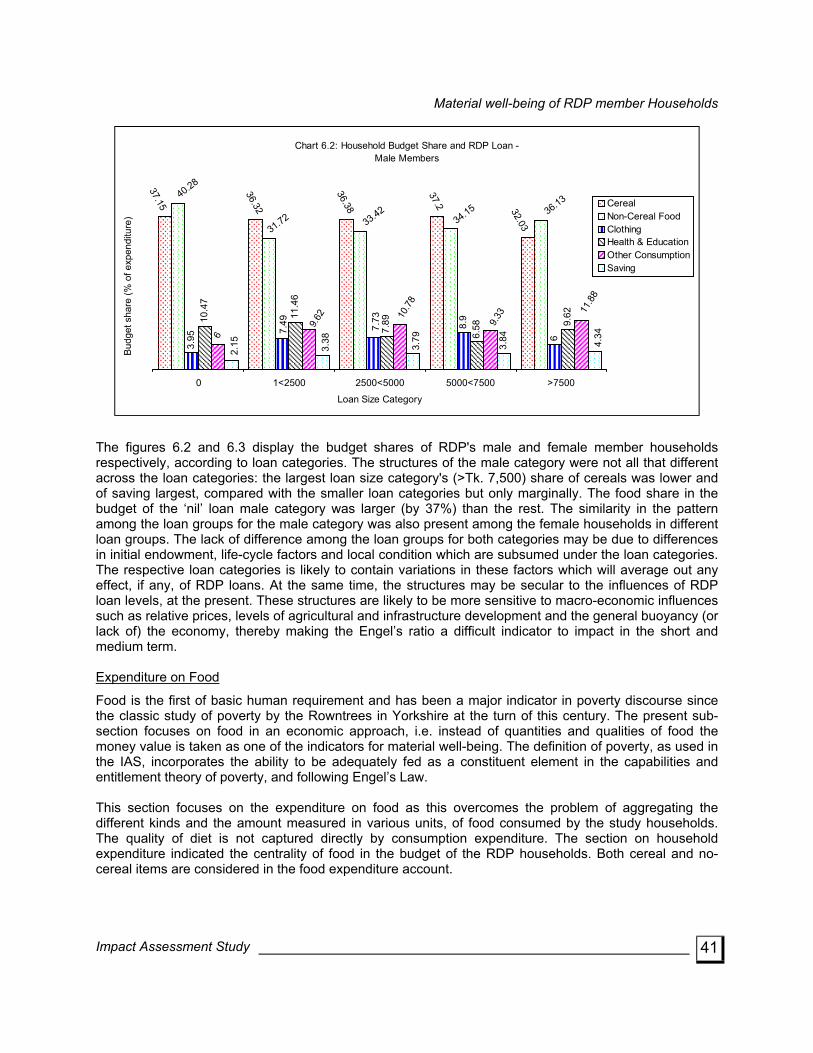
Material well-being of RDP member Households
41
���������������������������������������������������������������������
���������������������������������������������������
���������������������������������������������������������
�������������������������������������������������������������
���������������������������������������������������������������
������������
������������������
������������������
������������������������
������������������
������������������������
������������������������
������������������
������������������
����������������������������
���������������������
������������������������
������������������������
������������������������
������������������������
������������
������������
������������
������������
������������
Chart 6.2: Household Budget Share and RDP Loan -Male Members
8.9
6
3.84
32.03
37.15
36.32
36.38
37.2
40.28
31.72 33.4234.15 36.13
7.73
7.49
3.95
10.4
7
11.4
6
7.89
6.58 9.
62 11.8
8
9.3310
.78
9.62
6
4.34
3.79
3.38
2.15
0 1<2500 2500<5000 5000<7500 >7500
Loan Size Category
Budg
et s
hare
(% o
f exp
endi
ture
)
���������������������
������������������������������������������������������������������
������������������������������������������������������������������
������������������������������������������������������������������
������������������������������������������������������������������
������������������������������������������������������������
���
���������
���
���������
���
���CerealNon-Cereal FoodClothingHealth & EducationOther ConsumptionSaving
The figures 6.2 and 6.3 display the budget shares of RDP's male and female member households respectively, according to loan categories. The structures of the male category were not all that different across the loan categories: the largest loan size category's (>Tk. 7,500) share of cereals was lower and of saving largest, compared with the smaller loan categories but only marginally. The food share in the budget of the ‘nil’ loan male category was larger (by 37%) than the rest. The similarity in the pattern among the loan groups for the male category was also present among the female households in different loan groups. The lack of difference among the loan groups for both categories may be due to differences in initial endowment, life-cycle factors and local condition which are subsumed under the loan categories. The respective loan categories is likely to contain variations in these factors which will average out any effect, if any, of RDP loans. At the same time, the structures may be secular to the influences of RDP loan levels, at the present. These structures are likely to be more sensitive to macro-economic influences such as relative prices, levels of agricultural and infrastructure development and the general buoyancy (or lack of) the economy, thereby making the Engel’s ratio a difficult indicator to impact in the short and medium term. Expenditure on Food
Food is the first of basic human requirement and has been a major indicator in poverty discourse since the classic study of poverty by the Rowntrees in Yorkshire at the turn of this century. The present sub-section focuses on food in an economic approach, i.e. instead of quantities and qualities of food the money value is taken as one of the indicators for material well-being. The definition of poverty, as used in the IAS, incorporates the ability to be adequately fed as a constituent element in the capabilities and entitlement theory of poverty, and following Engel’s Law. This section focuses on the expenditure on food as this overcomes the problem of aggregating the different kinds and the amount measured in various units, of food consumed by the study households. The quality of diet is not captured directly by consumption expenditure. The section on household expenditure indicated the centrality of food in the budget of the RDP households. Both cereal and no-cereal items are considered in the food expenditure account.
Impact Assessment Study
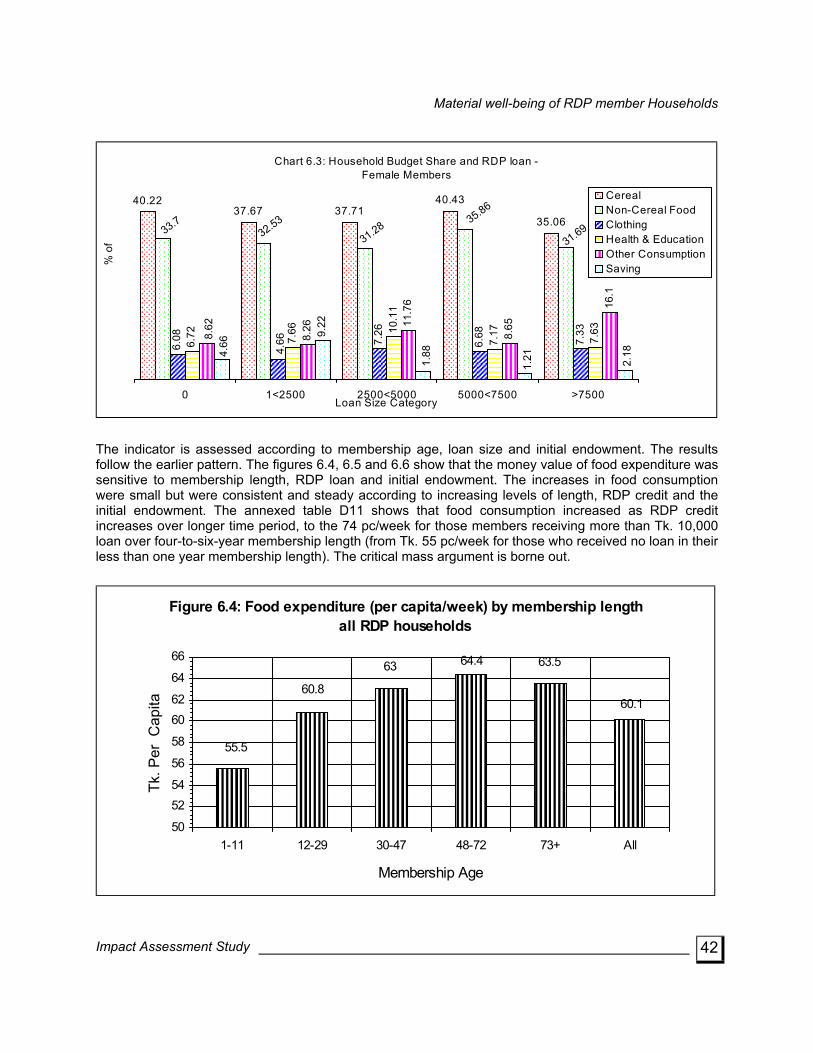
Material well-being of RDP member Households
42
������� ������������������
������������������������������������������������������������
�������������������������������������������������������������
�������������������������������������������������������������
�������������������������������������������������������������������
�������������������������������������������������������
�������
���������������������
������������������
���������������������
������������������
���������������������
���������������������
����������������������������
����������������������������
���������������������
����������������������������
������������������������
����������������������������
������������������������������
����������������������������
������������������������������������
���������������������
����������������������������
��������������
��������������
��������������
Chart 6.3: Household Budget Share and RDP loan - Female Members
40.2237.67 37.71
40.43
35.06
6.08 7.26
6.68 7.33
6.72 7.66 10
.11
7.17 7.638.26 11
.76
8.65
16.1
9.22
31.6935.86
31.2832.5333.7
4.668.
62
2.18
1.211.884.
66
0 1<2500 2500<5000 5000<7500 >7500Loan Size Category
������������������������������
% o
f
������������������������������������������������������������������������
�����������������������������������������������������������������������������
������������������������������������������������������������������
������������������������������������������������������������������������������������
������������������������������������������������������������
�����������
���������
���������
����������
��������
���
CerealNon-Cereal FoodClothingHealth & EducationOther ConsumptionSaving
The indicator is assessed according to membership age, loan size and initial endowment. The results follow the earlier pattern. The figures 6.4, 6.5 and 6.6 show that the money value of food expenditure was sensitive to membership length, RDP loan and initial endowment. The increases in food consumption were small but were consistent and steady according to increasing levels of length, RDP credit and the initial endowment. The annexed table D11 shows that food consumption increased as RDP credit increases over longer time period, to the 74 pc/week for those members receiving more than Tk. 10,000 loan over four-to-six-year membership length (from Tk. 55 pc/week for those who received no loan in their less than one year membership length). The critical mass argument is borne out.
����������������������������������������������������������������������
������������������������������������������������������������������������������������������������������������������������������
��������������������������������������������������������������������������������������������������������������������������������������������
�����������������������������������������������������������������������������������������������������������������������������������������������
�����������������������������������������������������������������������������������������������������������������������������������������������
��������������������������������������������������������������������������������������������������������
Figure 6.4: Food expenditure (per capita/week) by membership length all RDP households
55.5
60.8
63 64.4 63.5
60.1
50
5254
56
58
6062
64
66
1-11 12-29 30-47 48-72 73+ All
Membership Age
Tk. P
er C
apita
Impact Assessment Study
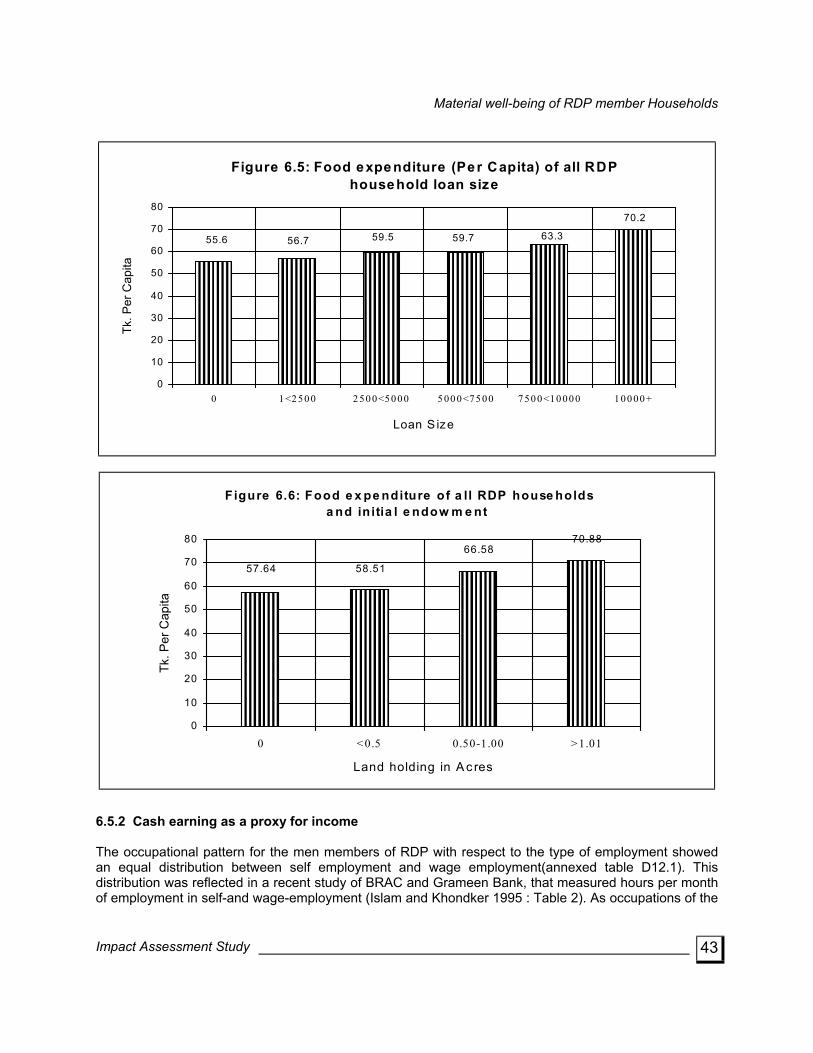
Material well-being of RDP member Households
43
���������������������������������������������������������������������������������������������������������������������������������������
���������������������������������������������������������������������������������������������������������������������������������������
������������������������������������������������������������������������������������������������������������������������������������������������������
������������������������������������������������������������������������������������������������������������������������������������������������������
����������������������������������������������������������������������������������������������������������������������������������������������������������������
���������������������������������������������������������������������������������������������������������������������������������������������������������������������
Figure 6.5: Food expenditure (Per Capita) of all RDPhousehold loan size
55.6 56.7 59.7 63.3
70.2
59.5
0
10
20
30
40
50
60
70
80
0 1 <2 50 0 2 50 0<50 00 5 00 0<75 00 7 50 0<10 00 0 1 00 00 +
Loan S ize
Tk. P
er C
apita
����������������������������������������������������������������������������������������������������������������������������������������������������������������
����������������������������������������������������������������������������������������������������������������������������������������������������������������
��������������������������������������������������������������������������������������������������������������������������������������������������������������������������������
������������������������������������������������������������������������������������������������������������������������������������������������������������������������������������
F igure 6.6: Food e x pe nditure of a ll RDP house holdsa nd initia l e ndow m e nt
58.5157.64
66.5870.88
0
10
20
30
40
50
60
70
80
0 <0.5 0.50-1.00 >1.01
Land holding in A c res
Tk. P
er C
apita
6.5.2 Cash earning as a proxy for income The occupational pattern for the men members of RDP with respect to the type of employment showed an equal distribution between self employment and wage employment(annexed table D12.1). This distribution was reflected in a recent study of BRAC and Grameen Bank, that measured hours per month of employment in self-and wage-employment (Islam and Khondker 1995 : Table 2). As occupations of the
Impact Assessment Study
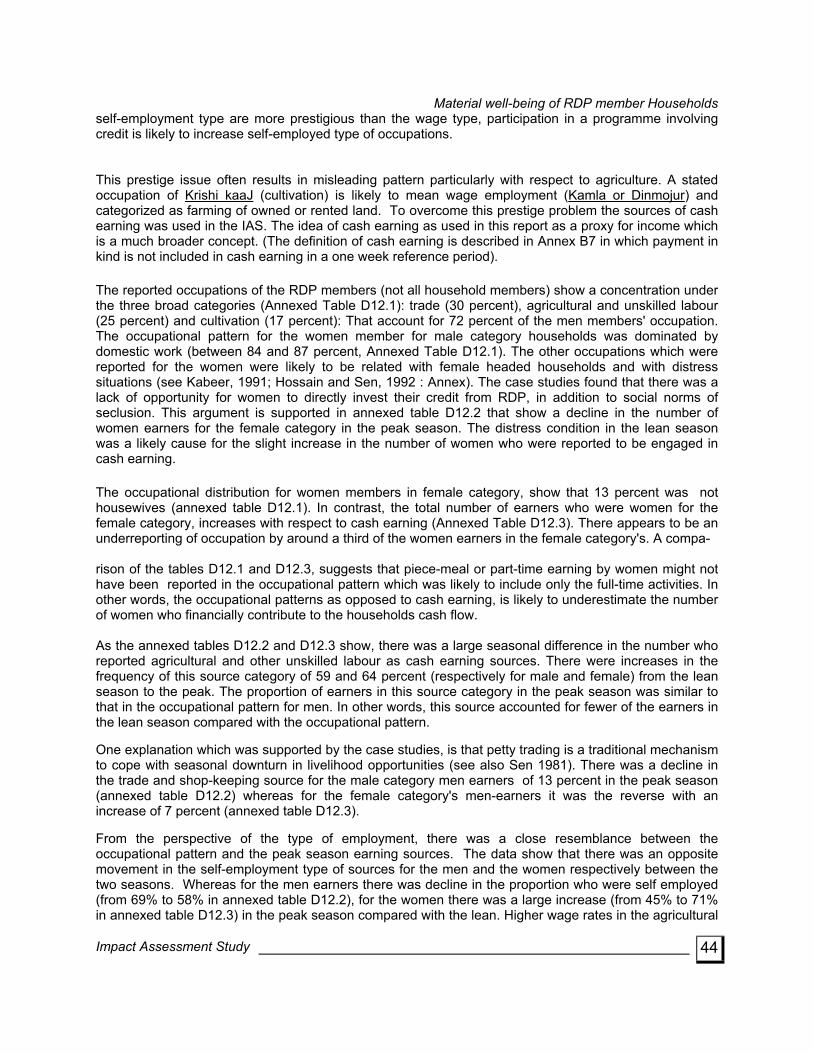
Material well-being of RDP member Households
44
self-employment type are more prestigious than the wage type, participation in a programme involving credit is likely to increase self-employed type of occupations. This prestige issue often results in misleading pattern particularly with respect to agriculture. A stated occupation of Krishi kaaJ (cultivation) is likely to mean wage employment (Kamla or Dinmojur) and categorized as farming of owned or rented land. To overcome this prestige problem the sources of cash earning was used in the IAS. The idea of cash earning as used in this report as a proxy for income which is a much broader concept. (The definition of cash earning is described in Annex B7 in which payment in kind is not included in cash earning in a one week reference period). The reported occupations of the RDP members (not all household members) show a concentration under the three broad categories (Annexed Table D12.1): trade (30 percent), agricultural and unskilled labour (25 percent) and cultivation (17 percent): That account for 72 percent of the men members' occupation. The occupational pattern for the women member for male category households was dominated by domestic work (between 84 and 87 percent, Annexed Table D12.1). The other occupations which were reported for the women were likely to be related with female headed households and with distress situations (see Kabeer, 1991; Hossain and Sen, 1992 : Annex). The case studies found that there was a lack of opportunity for women to directly invest their credit from RDP, in addition to social norms of seclusion. This argument is supported in annexed table D12.2 that show a decline in the number of women earners for the female category in the peak season. The distress condition in the lean season was a likely cause for the slight increase in the number of women who were reported to be engaged in cash earning. The occupational distribution for women members in female category, show that 13 percent was not housewives (annexed table D12.1). In contrast, the total number of earners who were women for the female category, increases with respect to cash earning (Annexed Table D12.3). There appears to be an underreporting of occupation by around a third of the women earners in the female category's. A compa- rison of the tables D12.1 and D12.3, suggests that piece-meal or part-time earning by women might not have been reported in the occupational pattern which was likely to include only the full-time activities. In other words, the occupational patterns as opposed to cash earning, is likely to underestimate the number of women who financially contribute to the households cash flow. As the annexed tables D12.2 and D12.3 show, there was a large seasonal difference in the number who reported agricultural and other unskilled labour as cash earning sources. There were increases in the frequency of this source category of 59 and 64 percent (respectively for male and female) from the lean season to the peak. The proportion of earners in this source category in the peak season was similar to that in the occupational pattern for men. In other words, this source accounted for fewer of the earners in the lean season compared with the occupational pattern. One explanation which was supported by the case studies, is that petty trading is a traditional mechanism to cope with seasonal downturn in livelihood opportunities (see also Sen 1981). There was a decline in the trade and shop-keeping source for the male category men earners of 13 percent in the peak season (annexed table D12.2) whereas for the female category's men-earners it was the reverse with an increase of 7 percent (annexed table D12.3). From the perspective of the type of employment, there was a close resemblance between the occupational pattern and the peak season earning sources. The data show that there was an opposite movement in the self-employment type of sources for the men and the women respectively between the two seasons. Whereas for the men earners there was decline in the proportion who were self employed (from 69% to 58% in annexed table D12.2), for the women there was a large increase (from 45% to 71% in annexed table D12.3) in the peak season compared with the lean. Higher wage rates in the agricultural
Impact Assessment Study
Material well-being of RDP member Households
45
sector at harvest time was the likely cause for the decline in self-employment for the men. The increase observed for the women was likely to be due to two reasons. The concept of cash earning would not have captured wage employment for which the payment was made entirely in kind such as a share of the crop for post harvest processing. The women who were likely to be engaged at home with the women who worked as family labour most likely not to have reported lost saving activities. These might have included post harvest activities as well as producing craft and artisans product, including non-paddy food processing , for which there might have been a particular demand given the economic dynamism of the peak season. The questions now is : where is the impact of RDP? At the current phase of operation, the impact of RDP is likely to be reflected in the proportions for the entrepreneurial or self-employed type of cash earning sources. This reflects the sectoral distribution of the investment of RDP credit which showed a large portfolio for working capital (see chapter 5). Secondly, as seen above the levels of cash earning increases significantly with increasing RDP credit over long period of time. Thirdly, the impact of RDP with respect to earning sources is likely to be measured by the lean season activities in that a shortage of wage employment is off-set by a ‘diversification in earning source’ to trading activities with RDP's credit support. In the discussions for the case studies the villagers reported that RDP credit, inter alia, enabled them to better cope in the lean season through increased saving from better seasons, adoption of self employment, etc. (see chapter 7 in this report). Levels of cash earning
On average the levels of cash earning for RDP households was larger than the comparison group, and it was larger for the male category compared with the females (annexed table D12.4 and D12.5). The seasonal difference in cash earning was more pronounced for the comparison households for which the peak season earning was 20 percent greater than the lean season's. As reported in chapter 7, the seasonal differences in cash earning declined for the female category with increasing membership length, the differences for the less-than-one -year length category having been larger than that for the comparison group(see annexed table E8). The annexed tables D12.4 and D12.5 show that the per household cash earning level was larger for male category in both seasons (perweek Tk. 325 and Tk. 365 for lean and peak seasons respectively). For the female category the figures were lower than those for the male (Tk. 234 and Tk. 269 respectively).For the female the peak season increase was larger at 15 percent that for the males at 12 percent. The peak season earnings from most of the sources were higher for all three categories of households. These higher earnings point-up the seasonal dimensions of employment and earning, in particular, and of poverty in general. The shift observed earlier in the agriculture labour sources can be explained by the demand side : the peak season weekly per earner figures were between 26 percent and 42 percent larger than the lean season. Surpassingly, there were declines in the earnings from the sources categorized as skilled labour during the peak season for both the female category and the comparison households. For the male category there was increases in skilled labour sources. Differences in the type and level of skills may explain the directional differences in earning from these sources between the respective seasons. 6.6 Assessing the hypotheses This section contains the results of econometric analyses conducted to test the hypotheses that a number of variables influence the impact of RDP.
Impact Assessment Study
The impact of RDP on the lives of rural poor which are shown in the earlier sections were assessed according to RDP inputs only. The hypotheses of the study imply that contextual variables are likely to
Material well-being of RDP member Households
46
influence the impact of RDP inputs. The hypotheses identify the contextual variables that either on their own or in interaction with RDP inputs, are likely to determine levels and direction of impact, including life-cycle factors, dynamics in of the micro-regional economy, education levels, and the initial endowment of the households. In order to measure the impact of RDP inputs and the contribution of contextual factors, econometric analyses were carried out with respect to two indicators, viz. household wealth and consumption expenditure. The results of regression analyses support the hypotheses (as the hypotheses is not made formally with concrete conditions for acceptance/rejections, the term ‘support’ is used here to imply not rejection). 6.6.1 Determinants of wealth The results of regressions are presented in the annexed table D14. The variables are discussed below according to their respective contribution in explaining the variation in wealth. The overall impression is that the hypotheses proposed in chapter 3 is a feasible one with respect to the wealth of RDP member households. The annexed table D14 shows that the strength of RDP inputs, particularly the amount of cumulative RDP credit, the life-cycle factors, initial endowment on joining RDP, education level of the households, and the local condition are significant determinants of wealth accumulation by RDP households. Two interaction variables that were constructed to measure the joint impact of two variables, also produce significant results. (The model itself is significant resulting in an adjusted R-squared of 0.442, i.e., the model explains 44% of the variation in wealth). The annexed table D13 shows the standardized coefficients the values of which are used presently to indicate the comparative importance of the explanatory variables. Table D13 suggests the following order of importance of the variables in determining the accumulation of wealth (in descending order) household aggregate of education, landholding on joining RDP, the interaction between high education and cumulative RDP credit, number of working age (>12 years) population, membership age between 30 and 72 months closely followed by cumulative amount of RDP credit, the interaction variable for the initial endowment of the households with more-than-Tk. 7,500 RDP credit, and the respective dummy variables for the highly vibrant locality and for the non-target households. The variables which produce negative results include : female category households with more-than-2.5 years of membership length, and the variable for technical training from RDP measured by the duration of the respective courses (training days). The largest contribution in this specification was made by the education scores. (The following discussion of each variable assumes that except for the factor in question the other factors are held constant). The co-efficient indicate that the level of household wealth was higher on average Tk. 1,483 with an increase of one unit in education score. The initial endowment was next in contribution, for an increase of 0.1 acre in land holding the value of wealth on average was higher by Tk. 420. For the households in high education category the wealth was larger on average by Tk. 1.10 for every one-taka increase in RDP loan, compared with other households. The level of household wealth was increased by a mean amount of Tk. 1,785 with an addition of one working age member in the household population. With larger number of working age members the households might be able to make better use of RDP loans, as noted also by the case study. These members also contribute to wealth by their expenditure saving activities. The contribution made by family labour to household economy is well known, in such sub-sectors as crop production, livestock, artisanal production of craft goods, food processing, etc. The impact of RDP loan in the model specification was lower in the order of importance than the above variables, (as judged by the Beta value of association between wealth and loan), but the magnitude of the
Impact Assessment Study
Material well-being of RDP member Households
47
impact was largest at Tk. 460 for every Tk. 1,000 increase in RDP loan. This is a fairly large impact because there are confounding factors at play in the economy and society. The case study pointed out that conversion of loan into material wellbeing was in turn dependent upon a multitude of factors. As suggested earlier in the section that a length of membership experience may have greater effect on ma- terial well-being than simply loan amount, is borne out by the result produced by the age variable. The membership age category of 2.5 years to upto-six years, was found to be a contributing factor marginally ahead of RDP credit, in wealth level determination. The level of wealth owned by the group was on average Tk. 5,057 higher than other households. There was a positively significant impact of the variable constructed to measure the interaction between loan size and initial endowment. This was the seventh-in-order contributor to the model following the above ones. The households which were in the greater than Tk. 7,500 loan category, owned on average Tk. 220 of wealth for every additional 0.1 acre of land compared with other households. The average land holding for this group was likely to be smaller than the sample because earlier tests showed that the improvement in wealth (and other indicators ) was greater for the small endowed group compared with the large endowed with participation of similar strength. The eight in order of contribution was the variable constructed to measure the wealth level of households which were represented only in the VOs for women and whose membership was of greater than 2.5 years' length. The result was unexpected: the group owned a level of wealth on average lower than all other households by Tk. (-) 3,585. A weakness of the model is that it ought to include a variable similarly constructed for the male category households. Then the two could have been compared. As it stands, positive for RDP, a possible interpretation may be that the group includes households that joined in the pre-RDP phase when the strength of input from RDP was much weaker than the late 1980s onward. Specifically, 55.3 percent of this group was in the less than Tk. 7,500 loan size category (Table 5.5), implying half of the group did not achieve the critical minimum level of RDP inputs. Staying with RDP input the ninth-in-order variable in the specified model deal with the effect of skill training. Measuring the impact of training in terms of the length of training in skill development ,the result was a negative one. For an increase of one unit in training the household wealth level was lower by Tk.(-)265. The skill training by RDP are aimed at improving the household productivity and therefore income but the result of the regression analysis points in the opposite direction. From tables 5.2 and 5.3, it is clear that a sizeable portion of the trained-in-skills have indicated that the training-in-skills have been useful directly in income earning. One explanation for this surprising result, as the RDP members pointed out in the group discussions for the case studies, is that those who were relatively worse-off among the members were usually willing to undertake training. On the other hand, the shortest duration of training on skills is three days for poultry rearing. As proportionately more women were trained in skills among whom poultry rearing was the most frequently offered skill, the worse-off women with low return skills were likely to be slower developer than others. They are also likely to be comparatively newer members among the trained women. In addition , a larger proportion of the women trained in skills had less than 2.5 year membership length (56 percent ) and received smaller RDP credit (41 percent less than Tk. 2,500). The last variable in order of contribution in the regression was a dummy for assessing the effect of local level economic condition or vibrancy. As expected, the indicator for high vibrancy locality was a significant determinant of wealth accumulation. The mean wealth level of the households in economically dynamic micro-regions, was higher by Tk. 3,264 than those in less dynamic localities. Nearness of towns and marketing locations afforded the households greater opportunities for employment and other livelihood activities compared with areas remote from towns and market places, as was reported in the case studies on vulnerability and coping capacity (see chapter 7).
Impact Assessment Study
Material well-being of RDP member Households
48
A note on a specific property of the statistical procedure used in estimating the regression model may be useful. The estimation of the models using a linear regression procedure assumes that the associations between the dependent variable (wealth) and the individual explanatory factors were of a linear nature. A more sophisticated estimation method is necessary to measure the effect of non-linear relationships. That is, many of the explanatory factors are likely decline in their respective influence on the wealth as the values continue to rise. At what point, for example, RDP loan or education will begin to slow down their impact on wealth accumulation, can not be ascertained from the present model specification. 6.6.2 Determinants of consumption expenditure Although there are a number of economic theories of income and consumption, the more commonly used one postulates that current consumption is a function of permanent or `life-cycle' income. It means that the current income, past-saving and expected future income influence the consumption levels at any given time. Over the life cycle of an economic agent, an individual or a household, there are periods of positive saving when consumption level is lower than current income, and dis-saving occur at periods of lower income vis-a-vis consumption. The level of consumption is said to be maintained by the actor over the life-cycle. In order to analyse the consumption behaviour of the RDP households proxy variables were used to account for past-saving and expected future income. These were the wealth of households and the landholding in size (acres). In addition, the analysis accounts for the study hypothesis by the inclusion in the two model specifications the variables that were to measure the effect of the contextual factors in the hypothesis. For the present enterprise, consumption was composed of all food and non-food items purchased from the market as well as gained from production and through exchange for non-monetary items and services. It was measured in money value for aggregation's ease. The seasonal one-week consumption expenditures of the two seasons were averaged to derive a one week measure. The one-week average was divided by the respective family size (unadjusted for age) to derive the per capita consumption expenditure. This was regressed on the variables listed below, using two model specifications. The variables
It was recognized that the RDP inputs and the other factors could be specified in various units of measurement and that the specifications would produce results which would differ in respective models with different variables. The explanatory power of each model (as judged by the value of adjusted R-squared), the direction (positive or negative sign of the coefficients), the magnitude (values of the coefficients) and the significance level (t-statistic) of the various specification would likely vary in the respective models. The cases in point involve the specifications of RDP loan and the household income. The RDP input was specified per capita of amount of cummulative credit. The household aggregate loan was inappropriate for it was (r=0.182, p<0.001) correlated with family size. This is likely to introduce multi-collinearity due to its correlation with wealth (r=0.365, p<0.001), with initial endowment (r=0.182, p<0.001), and with the dummy variable for female category RDP households (r=0.359, p<0.001).
Impact Assessment Study
For the construction of the income variable two different concepts were used in order to assess the differing contribution made by the respective concepts. One concept which is more conventional, derives income from the current expenditure account. The second conceptualisation focuses on the idea of cash receipts earned by the household in the reference period. The cash-receipt concept is not comparable with the production account which is the alternative of and equal to the expenditure account. (The cash concept is defined in B7 in annex B).
Material well-being of RDP member Households
49
These three variables for RDP loan and income were included with a set of other variables in two alternative model specifications. The variables are described in B(6) in annex, B. Results
The model-one that include income from the expenditure account in the specification explain most of the influences on consumption (percapita). Wealth and landholding also exert strong influences on consumption, as suggested in economic theory. The model-2 that did not incorporate income in itsspecification was of high significance but of lower magnitude and explanatory power. The first model was capable of explaining just over 60 percent of the variations in consumption whereas the second model specified with cash earning account, of 22/23 percent of the variations. Consumption RDP loans made significant contribution to or impact on the level of percapita consumption of RDP households, according to both the models. The results of the two regression estimation, as displayed in the annexed tables D15 and D16, indicate that the contribution made by RDP loans was larger than initial endowment in each of the models (as judged by the respective standardized Beta in annexed table D15). The contribution made by wealth and income from the expenditure account were greater than RDP inputs, as expected. The analysis of wealth (Chapter 6.5.1) shows that the contribution of RDP support to wealth accumulation was positive. In other words, RDP loans contributed to consumption expenditure directly as well as through wealth. The regression results are discussed in the following lines. A common variable in the models, wealth is an a priori determinant of consumption, as is income measured from the expenditure account. The cash-receipts which is always smaller than income and wealth in actual values, was estimated to contribute less than wealth (model-2). The RDP households' average consumption per capita was greater by Tk. 0.112 with an increase of one-taka in cash earning. From the model-one in the annexed table D16, the effect of expenditure-income was found to be far greater at Tk. 0.539 for similar increase, on average and assuming other things remain constant. The percapita specification of RDP loan was a highly significant (p<0.001) explanatory variable of consumption levels. When the loan was specified in percapita measure, a one-taka increase explained Tk. 0.003 (t=4.08) of consumption per capita. In other words, the impact of RDP loan on consumption was Tk. 3.0 on average for Tk. 1,000 loan. In magnitude of the co-efficients (parameter), the effect of RDP loan percapita was greater than the influence of wealth (per capita), while the latter was more strongly associated with consumption as judged by standardized coefficient Beta (at 0.144 compared with Beta for loan at 0.068), and by the measure of t-statistic (7.79 and 4.08 respectively). This result is produced by model-one (annexed tables D15 and D16 respectively). The variable landholding on joining RDP that was used as a proxy for initial endowment, made smaller contribution to consumption compared with RDP loan as estimated by the respective regressions. The magnitudes of the effect of these two are not directly comparable because land was specified in size-measure of decimals (0.01 acre = one decimal) whereas the loan was in actual taka. The money value of land was not available in the IAS data-set, which left only the measures of association with consumption for the respective variables, and the significance levels as tools for comparison of the contribution to and the respective variables’ impact on consumption.
Impact Assessment Study
A major explanator of variations in consumption level was the demographic dependency ratio that is consistently produced a significant negative impact in both specifications. This life-cycle indicators impact was estimated to reduce the level of consumption with an increase in the number of dependents . In other words, for every one unit decline in the dependence ratio the average household consumption was increased by Tk. 0.057 per capita in model-one, ceteris paribus. More dependents imply more consumers in proportion to potential or actual earners or active persons. As the Case Studies found, in the peoples
Material well-being of RDP member Households
50
perception of the poverty characteristics of households and the factors that negatively influence conversion of RDP loan into material well-being impact, the number of khaneyala was a major contributor to the determination of consumption levels per person. Support from interventions such as RDP can not in the short or medium term influence the dependency ratio. A decline in fertility rate may reduce the ratio through the under-15 population. The RDP inputs will have to work its way through while this constraint is present. The percapita loan variable instead of per household, may be used by RDP in determining the size of loan for the borrowers to overcome the downward pull made by higher dependency ratio. The contribution made by percapita RDP loan was slightly smaller than the dependency ratio in the expenditure-income model whereas it was larger in the cash earning model. The negative impact of life-cycle situation may be overcome with increases in RDP input, other things remaining constant. What level of increase in RDP loan amount from the cumulative average of Tk. 1,017 percapita, will make a contribution large enough off-set the negative impact made by the demographic factor? The "pathways" through which RDP loan might impact consumption are likely to include the effect of RDP credit on income and wealth, inter alia. The issue is currently under investigation jointly by RED and ICDDR,B in the east-central part of the country, the results of which are expected in the near future. Putting the forthcoming aside, the variables that have been constructed to measure the effect of local condition, and the joint effect of loan and education, produced significant estimates in model-2 (but were insignificant albeit with the expected signs in the expenditure-income model). That the vibrancy of local economy influences consumption was evident: the households that were in high vibrancy locality on average spent Tk. 11 (in model-2) more than the other (those in lower vibrancy condition) households for consumption expenditure, ceteris paribus. This result supports the argument that the market condition influences both the opportunities available for and the return from investment of RDP loan, which in turn determines consumption. The interaction variable that was constructed to measure the combined effect of high vibrancy locality and large RDP loan, produced insignificant measures of impact on RDP households when gender disaggregation was not made (see bellow for results of disaggregated analysis). Another variable to produce unexpected result was that constructed to estimate the impact of increasing RDP credit for the high education households . This variable indicate that consumption levels were lower for high education households with increasing RDP credit. (in model-2). This was likely to be due to the family size : for example, low level of individual education of all members in households of the size 5 or more will produce an aggregate that qualifies it for the high education level. The dependency ratio may also be high in this education category particularly if there are literate members of age more than 64 years and/or schools going children under 15. This has been a preliminary analysis of IAS data set, which may well contain errors in variable construction, etc. The models may need to be altered for better understanding of the impact of RDP. Alternative variable constructions are possible. There offcourse remains the specifications of models which will capture alternative assumptions: instead of the linearity of relationships between consumption and the respective explanatory variables, as was implicit in the foregoing, alternative models where increasing or declining effect is feasible may be used in the future. 6.7 Who benefits more from the RDP inputs? The preceding section reported on the contribution made by, and the impact of RDP inputs and the contextual factors, with respect to the wealth and the consumption expenditure of RDP households. This section measures the impact of the respective variables, with respect to consumption expenditure on the two gender categories of RDP households separately. The results show that the respective variables
Impact Assessment Study
Material well-being of RDP member Households
51
impact the level of consumption of the male and the female categories differently. Annexed tables D17 and D18 present the results of regression for the male and the female respectively, applying two model specifications that were similar to the models discussed in section 6.6.2. Initial endowment The regression results show that the influence of landholding percapita was stronger for the female category households (annexed table D18) compared with the males (annexed table D17) in model-one. In other words, for per unit increase in landownership increases expenditure for the females (Tk. 0.25 in table D18) by a greater amount compared with the males (Tk. 0.12 in table D17).This indicates a better initial endowment position for the male category households, as is evident in chapter-four. Life-cycle affects The overall better situation of the males was also reflected in the influence of life cycle affect. Per unit increase in the dependency ratio consumption was lower by Tk. 0.092 and 0.116 for male and female respectively (in cash-income model in annexed tables D17 and D18 respectively). Income: expenditure and cash earning The results of above two variables held true for the two proxy indicators as used for income-expenditure in model-one and cash earning in model-two. Per unit increase in income derived from the expenditure account caused an increase for the male category (Tk. 0.854) that was double that for female (Tk. 0.44). However, the model-two indicates, with the alternative construction of the proxy indicator with cash earning, that cash earning was significantly more important for the female category than it was for the male. This implies that the female rely more on the current cash flow for meeting consumption needs than the male who may have had better stock of both cash and goods for the one-week reference period. Wealth of households The variable of wealth percapita that was used as a proxy to measure past income and potential for future earning, provide further indication of stronger position for the male category compared with the female. The variable was highly significant for both the categories, explaining more of the variation in consumption for the males (Tk. 0.0063 in cash earning model in annexed table D17) than it did for the female (Tk. 0.0041 in annexed table D18). Local condition The high dynamism of micro-regional economy was found to determine larger amount of consumption for the female in comparison with the males. For the female category, living in the comparatively high dynamic regions, consumption was greater by Tk. 11.55 per person per week (in model-two in annexed Table D18). The local condition was an insignificant factor of consumption for the male category. Credit from RDP That the amount of credit received from RDP is a significant determinant of consumption expenditure was clearly evidenced in the regression analysis. Its impact on consumption was greater for the females than it was for the males. Per capita increase in the amount of RDP credit was found to increase per capita consumption, ceteris paribus, in model-one by Tk. 0.0033 and in model-two by Tk. 0.0068 for the females (annexed table D18). Only the cash-earning model-two produced significant result for the male category, which was smaller than it was for the females (Tk. 0.0055 in Table D17).To the extent that consumption
Impact Assessment Study
Material well-being of RDP member Households
52
levels are an indication of welbeing , the results suggest that RDP credit benefits the female category more than the male. In sum, such factors as life cycle, income and wealth determine greater proportion of consumption for the males than these do for the female. The impact of the local condition and the initial endowment situation, on consumption is greater for the female category. Most importantly, the amount of credit from RDP determines significant amount of consumption for the female category. The results of earlier assessment that showed faster and larger improvements in material wellbeing for the female category over time and with increasing RDP credit , were supported by the results of the gender disaggregated of regression estimations. 6.8 Conclusions From the analysis of the material wellbeing of RDP households the overall conclusion is that RDP is making substantial impact on the material wellbeing of its member households. More specific conclusions are as follows:
improvements in the material wellbeing takes place gradually with the support of substantial amount of RDP credit over a period of time;
the improvements are not induced by the condition of the member households at the time of
joining BRAC;
poorer members with substantial RDP inputs produce greater impact compared with the less poor (large initial endowment);
the female category is generally poorer than the male which is likely to be due to their shorter
membership length during which receiving smaller RDP credit;
female member category generally produce greater impact at a slightly lower critical level of RDP input compared with the male category receiving similar inputs;
poor female category also do better than the male when the categories are disaggregated
according to small and large initial endowment;
the impact of RDP credit is larger on female category households compared with male;
in addition to RDP credit there are other non-RDP factors that influence material wellbeing that include life-cycle factors, education, local economic dynamism.
The results with regard to material wellbeing, as positive as they are, nevertheless are not indicative of improvements in the other dimension of poverty, viz vulnerability to seasonality. The next section assesses the status of vulnerability for the member households, and then attempts to gain a better understanding with regards the obvious evaluative question at this stage of impact assessment: but are the improvements sustainable?
Impact Assessment Study
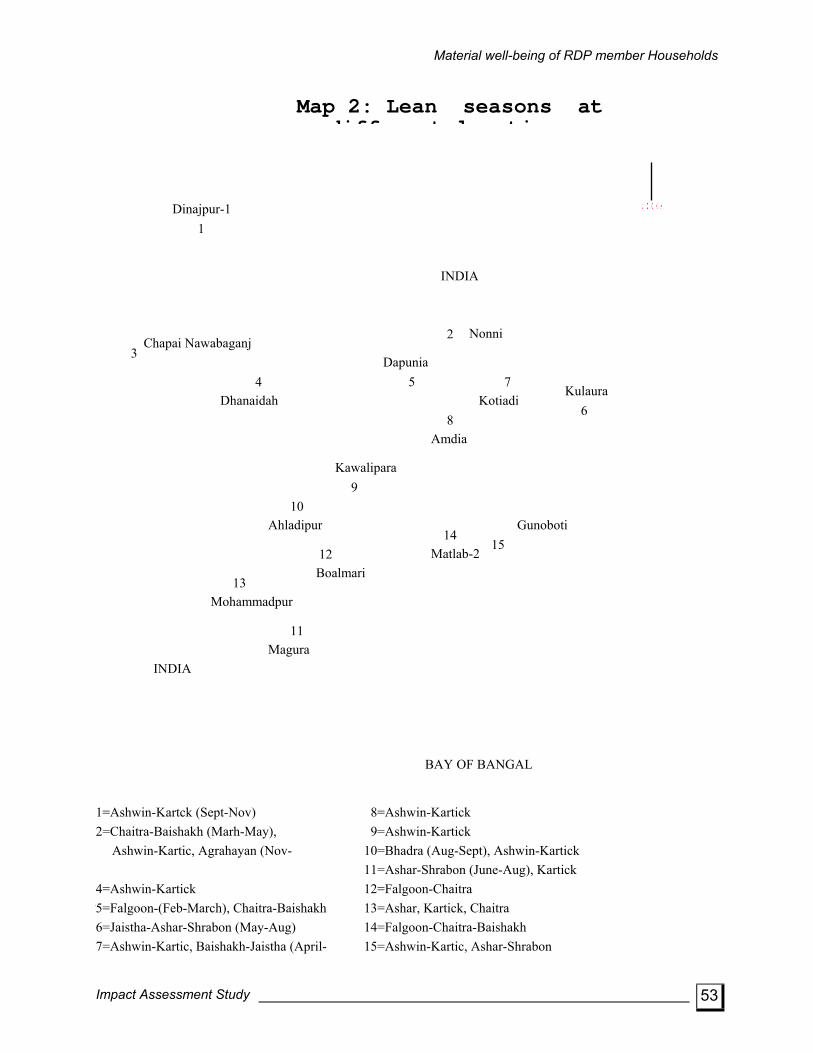
Material well-being of RDP member Households
53
6
BURM
A
���������������������������� NN
=Jaistha-Ashar-Shrabon (May-Aug) 14=Falgoon-Chaitra-Baishakh 13=Ashar, Kartick, Chaitra 12=Falgoon-Chaitra 11=Ashar-Shrabon (June-Aug), Kartick 10=Bhadra (Aug-Sept), Ashwin-Kartick 9=Ashwin-Kartick 8=Ashwin-Kartick
Ashwin-Kartic, Agrahayan (Nov-)3=Ashwin-Kartick
5=Falgoon-(Feb-March), Chaitra-Baishakh 4=Ashwin-Kartick
��������������
2=Chaitra-Baishakh (Marh-May), 1=Ashwin-Kartck (Sept-Nov)
15 14
12
13
7
8
11
10
6
9
5 4
3 2
1
Map 2: Lean seasons at diff t l ti
BAY OF BANGAL
INDIA
INDIA
Matlab-2
Mohammadpur
Boalmari
Magura
Ahladipur
Kawalipara
Amdia
Kotiadi Kulaura
Dapunia
Dhanaidah
Chapai Nawabaganj Nonni
Dinajpur-1
Gunoboti
7=Ashwin-Kartic, Baishakh-Jaistha (April-)
15=Ashwin-Kartic, Ashar-Shrabon
Impact Assessment Study
54
7. Vulnerability and coping capacity
7.1 Introduction Chapter 6 analysed the findings concerning key indicators of material well-being, where it was shown that RDP was achieving a significant poverty reduction impact for its members. However, while the quantitative indicators of assets and average consumption expenditures defining features of poverty, there are wider dimensions of deprivation which need to be assessed. This chapter focuses on the major findings with regard to more "structural" aspects of the economic positions of RDP member households, by considering vulnerability to seasonality and the members’ relative coping capacities including indications of their economic security in the face of stress and crises. By focusing on these more qualitative dimensions of poverty, using both household survey and case study data, a more in-depth assessment of RDP's impact on poverty is possible. 7.2 How many 'lean' seasons are there? Large numbers of the poor in Bangladesh are precariously balanced between subsistence and destitution, facing severe fluctuations in their income and consumption due to the seasonality of wage employment and other income earning opportunities. When such fluctuations are pronounced, the slack (or lean) season can lead to distress conditions, requiring asset sales which exert a downward pressure on the poor's (already meagre) resource base. The IAS methodology was designed to account for seasonal variations in certain aspects of livelihood, and this chapter reports the findings on this issue.
“Traditionally, there have been two major periods of seasonal deficits, one in late September to early November and the other in late March to early May. With the widespread expansion of winter planting of rice, incidence of the early summer lean season has significantly declined. However, the autumn lean season, coming after the planting of the aman crop and with harvest time a month or more away remains very much a routine order of the day affecting nearly all parts of the country” (Rahman, 1992; emphasis in original).
The decline in the severity of economic depression in the early summer is contested by the findings of the case studies. The months of Chaitra to Jaistha (March to May) still entail declines in employment and income in many parts of the country and for various occupations. The map-two shows the presence of early summer lean period at five locations. The months of monsoon (Ashar and Shrabon) were identified by the case studies as a lean period (at locations, 6, 11, 13, 15). The data-set however doesn't say anything about the past situation in early summer in places where the period was not identified to be lean. That the early summer poses uncertainty over livelihood is evident but it is not as wide-spread as the late autumn one (Aswin and Kartik). The annexed tables E1 to E3, show the occupational structure of food deficit months in the 12 months preceding the household survey that took place in October 1993. Between 35 and 44 percent of the sample households were found to face shortage of food in the early summer. Evidently it was not as severe as that of the late autumn during which between 49 and 64 percent were reported to face difficulty in meeting food needs with established sources of earning. In annexed table E2, the March lean was more severe for the female category of which 44% identified the month as a period when it was difficult to make ends meet. The comparison group was similar to the female category (table E3, annex).
Impact Assessment Study
Vulnerability and coping capacity
55
There also appears an occupational dimension to periodic downturn in the maintenance of livelihood: some occupations experience more severe seasonality than others. The survey found that the severity was lower than average for artisans and skilled workers among RDP households in both of the lean seasons. Fewer of these occupational groups identified these two periods as food deficit periods, compared with other occupations. Food deficit in the two periods were reported by a greater proportion of the petty traders, and agricultural and unskilled labourers compared with other occupations. The famines of 1942 in the geographic Bengal and in 1974 in Bangladesh affected the unskilled labouring and petty trading occupational groups more severely than the others (Sen, 1981). The household survey data show that these two occupations were still vulnerable to seasonality in agricultural activities - through depressed income and demand - in 1993. 7.3 Levels of food security The occupational pattern of the distribution of the food deficit months is also present in the 12 month food security of households. This indicator was constructed by summing the number of months in the 12 months preceding the interview (in October, 1993) in which the households reported to experience deficit in the level of entitlement to food. More of the artisans and other skilled labourer households reported no deficit months than did the other occupational groups, for male member category households. The occupational pattern which was evident with regards to specific seasons, appears differently for the three categories of households when the total number of actual deficit months was considered. For the RDP's male category households the data show a pattern that suggest the respective occupational groups were fairly heterogeneous with respect to levels of food security; ranging from severe deficit (for more than six months in deficit) to no deficit or surplus (table E4 in annex E). On average fewer of the farming households reported to experience severe or moderate deficit from among the RDP member households (Tables E4 and E5 in Annex E). The distribution of the households according to the food security categories, was fairly stable across the occupational groups. In the male category between 36 and 45 percent of the respective occupational groups were in the moderate (for 4 to 5 months in deficit) and severe deficit categories (Annexed Table E4). This situation was worse for the female category as the distribution for respective occupations produced a pattern which was more skewed towards the moderate and severe deficit categories. The percentage figures that showed the proportion of the respective occupations in the latter two categories together, range between 40% for traders and 53% for transport operators in the female category (annexed table E5). This reflects the earlier outcome with respect to material wellbeing: female category was worse-off than the male. Does membership of RDP improve the food security situation? RDP inputs : length of membership and loan values
Analysing the food security issue according to RDP inputs the results were found to be consistent with regards to the hypotheses and with the results in chapter six. The proportion of households in the male category which reported to experienced severe deficit, fluctuated with increasing membership length. For the female category, there was a decline from the youngest category (1-11 months) to the next one (12-29 months) but thereafter the proportions increased with regards severe deficit in successively longer membership length categories. The proportions of households these categories (30-47, 48-72, 73-plus months) which were in severe deficit, were however ,lower than those in the youngest one (annexed table E7). On the other end of the food security scale, proportionately more female members, as well as male, remained in the surplus category as the membership length increased until the ‘more-than-six-year' category. The proportion of female who were in the respective length category, experiencing surplus food security, increased from 10.5 percent in the 'less-than-one-year' category to 18.2 percent in the`four-to-
Impact Assessment Study
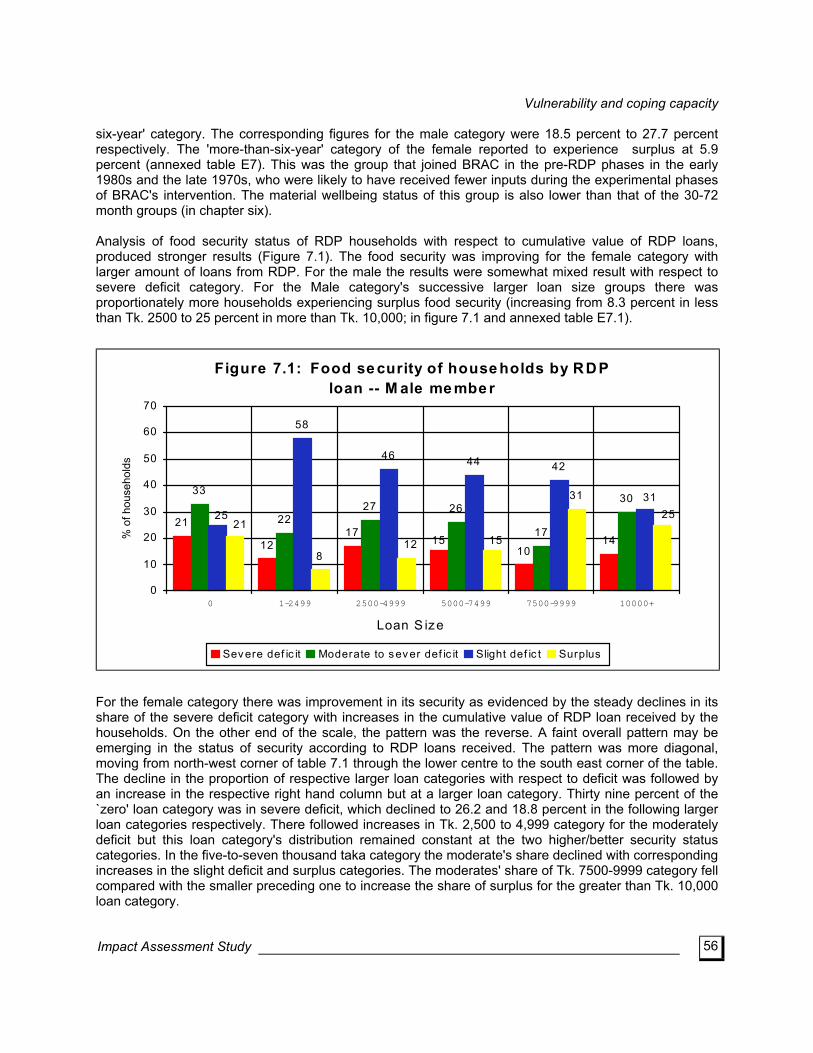
Vulnerability and coping capacity
56
six-year' category. The corresponding figures for the male category were 18.5 percent to 27.7 percent respectively. The 'more-than-six-year' category of the female reported to experience surplus at 5.9 percent (annexed table E7). This was the group that joined BRAC in the pre-RDP phases in the early 1980s and the late 1970s, who were likely to have received fewer inputs during the experimental phases of BRAC's intervention. The material wellbeing status of this group is also lower than that of the 30-72 month groups (in chapter six). Analysis of food security status of RDP households with respect to cumulative value of RDP loans, produced stronger results (Figure 7.1). The food security was improving for the female category with larger amount of loans from RDP. For the male the results were somewhat mixed result with respect to severe deficit category. For the Male category's successive larger loan size groups there was proportionately more households experiencing surplus food security (increasing from 8.3 percent in less than Tk. 2500 to 25 percent in more than Tk. 10,000; in figure 7.1 and annexed table E7.1).
Figure 7.1: Food se curity of house holds by RDPloan -- M ale me mbe r
21
1217
1014
33
2227 26
17
30
58
44 42
8
31
15
3125
46
15
25
12
21
0
10
20
30
40
50
60
70
0 1-2499 2500-4999 5000-7499 7500-9999 10000+
Loan S ize
% o
f hou
seho
lds
Severe def ic it Moderate to sever def ic it Slight def ic t Surplus
For the female category there was improvement in its security as evidenced by the steady declines in its share of the severe deficit category with increases in the cumulative value of RDP loan received by the households. On the other end of the scale, the pattern was the reverse. A faint overall pattern may be emerging in the status of security according to RDP loans received. The pattern was more diagonal, moving from north-west corner of table 7.1 through the lower centre to the south east corner of the table. The decline in the proportion of respective larger loan categories with respect to deficit was followed by an increase in the respective right hand column but at a larger loan category. Thirty nine percent of the `zero' loan category was in severe deficit, which declined to 26.2 and 18.8 percent in the following larger loan categories respectively. There followed increases in Tk. 2,500 to 4,999 category for the moderately deficit but this loan category's distribution remained constant at the two higher/better security status categories. In the five-to-seven thousand taka category the moderate's share declined with corresponding increases in the slight deficit and surplus categories. The moderates' share of Tk. 7500-9999 category fell compared with the smaller preceding one to increase the share of surplus for the greater than Tk. 10,000 loan category.
Impact Assessment Study
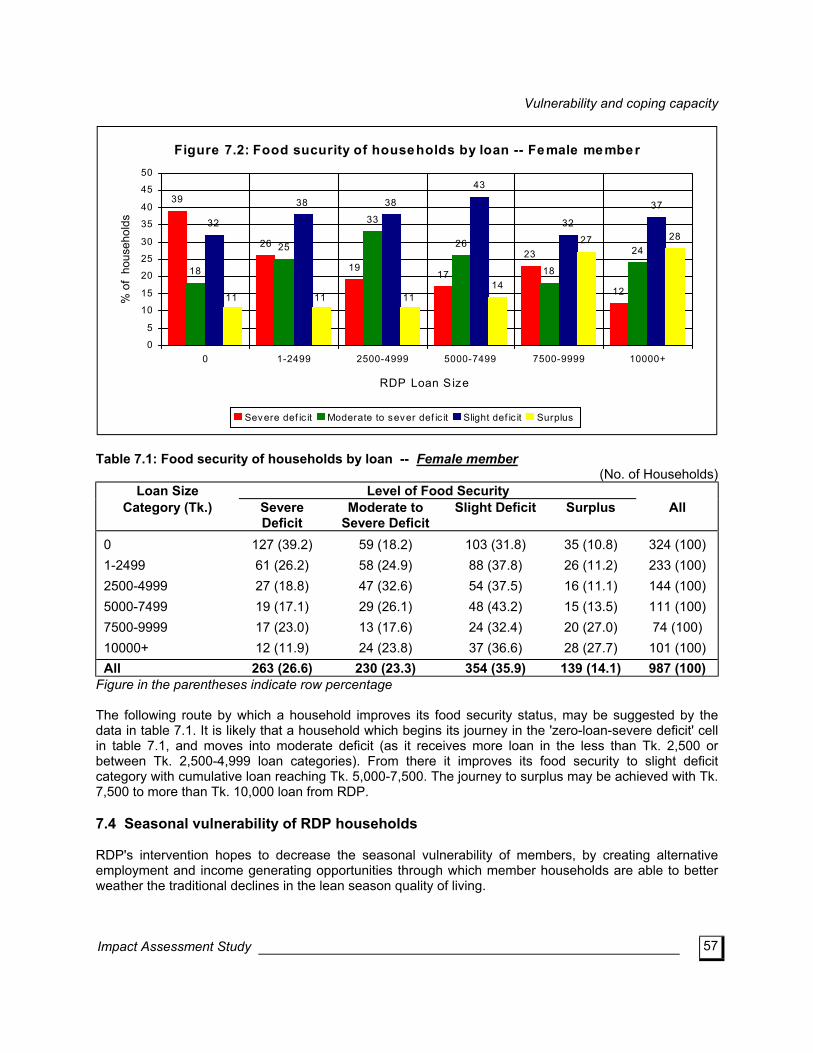
Vulnerability and coping capacity
57
Figure 7.2: Food sucurity of households by loan -- Female member
39
26
1917
23
12
18
25
33
26
18
24
32
38 38
43
32
37
14
27 28
111111
0
5
10
15
20
25
30
35
40
45
50
0 1-2499 2500-4999 5000-7499 7500-9999 10000+
RDP Loan S ize
% o
f ho
useh
olds
Severe def ic it Moderate to sever def ic it Slight def ic it Surplus
Table 7.1: Food security of households by loan -- Female member
(No. of Households) Loan Size Level of Food Security
Category (Tk.) Severe Deficit
Moderate to Severe Deficit
Slight Deficit Surplus All
0 1-2499 2500-4999 5000-7499 7500-9999 10000+
127 (39.2) 61 (26.2) 27 (18.8) 19 (17.1) 17 (23.0) 12 (11.9)
59 (18.2) 58 (24.9) 47 (32.6) 29 (26.1) 13 (17.6) 24 (23.8)
103 (31.8) 88 (37.8) 54 (37.5) 48 (43.2) 24 (32.4) 37 (36.6)
35 (10.8) 26 (11.2) 16 (11.1) 15 (13.5) 20 (27.0) 28 (27.7)
324 (100) 233 (100) 144 (100) 111 (100) 74 (100)
101 (100) All 263 (26.6) 230 (23.3) 354 (35.9) 139 (14.1) 987 (100)
Figure in the parentheses indicate row percentage The following route by which a household improves its food security status, may be suggested by the data in table 7.1. It is likely that a household which begins its journey in the 'zero-loan-severe deficit' cell in table 7.1, and moves into moderate deficit (as it receives more loan in the less than Tk. 2,500 or between Tk. 2,500-4,999 loan categories). From there it improves its food security to slight deficit category with cumulative loan reaching Tk. 5,000-7,500. The journey to surplus may be achieved with Tk. 7,500 to more than Tk. 10,000 loan from RDP. 7.4 Seasonal vulnerability of RDP households RDP's intervention hopes to decrease the seasonal vulnerability of members, by creating alternative employment and income generating opportunities through which member households are able to better weather the traditional declines in the lean season quality of living.
Impact Assessment Study
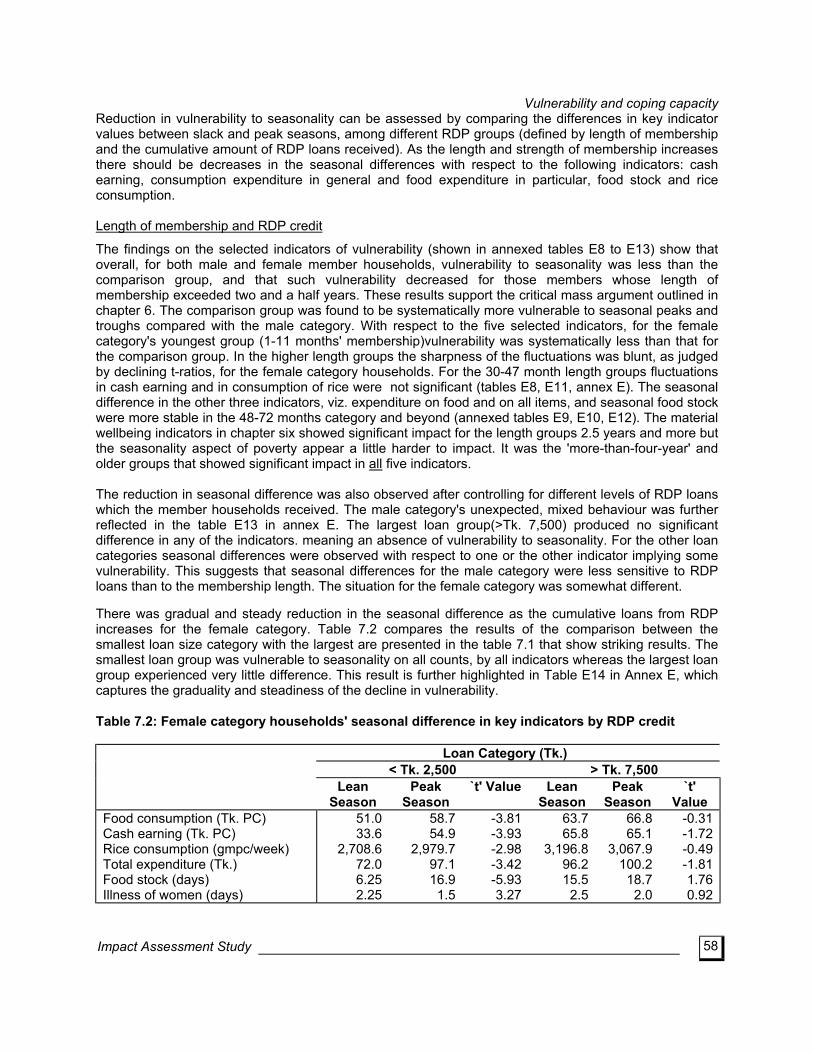
Vulnerability and coping capacity
58
Reduction in vulnerability to seasonality can be assessed by comparing the differences in key indicator values between slack and peak seasons, among different RDP groups (defined by length of membership and the cumulative amount of RDP loans received). As the length and strength of membership increases there should be decreases in the seasonal differences with respect to the following indicators: cash earning, consumption expenditure in general and food expenditure in particular, food stock and rice consumption. Length of membership and RDP credit
The findings on the selected indicators of vulnerability (shown in annexed tables E8 to E13) show that overall, for both male and female member households, vulnerability to seasonality was less than the comparison group, and that such vulnerability decreased for those members whose length of membership exceeded two and a half years. These results support the critical mass argument outlined in chapter 6. The comparison group was found to be systematically more vulnerable to seasonal peaks and troughs compared with the male category. With respect to the five selected indicators, for the female category's youngest group (1-11 months' membership)vulnerability was systematically less than that for the comparison group. In the higher length groups the sharpness of the fluctuations was blunt, as judged by declining t-ratios, for the female category households. For the 30-47 month length groups fluctuations in cash earning and in consumption of rice were not significant (tables E8, E11, annex E). The seasonal difference in the other three indicators, viz. expenditure on food and on all items, and seasonal food stock were more stable in the 48-72 months category and beyond (annexed tables E9, E10, E12). The material wellbeing indicators in chapter six showed significant impact for the length groups 2.5 years and more but the seasonality aspect of poverty appear a little harder to impact. It was the 'more-than-four-year' and older groups that showed significant impact in all five indicators. The reduction in seasonal difference was also observed after controlling for different levels of RDP loans which the member households received. The male category's unexpected, mixed behaviour was further reflected in the table E13 in annex E. The largest loan group(>Tk. 7,500) produced no significant difference in any of the indicators. meaning an absence of vulnerability to seasonality. For the other loan categories seasonal differences were observed with respect to one or the other indicator implying some vulnerability. This suggests that seasonal differences for the male category were less sensitive to RDP loans than to the membership length. The situation for the female category was somewhat different. There was gradual and steady reduction in the seasonal difference as the cumulative loans from RDP increases for the female category. Table 7.2 compares the results of the comparison between the smallest loan size category with the largest are presented in the table 7.1 that show striking results. The smallest loan group was vulnerable to seasonality on all counts, by all indicators whereas the largest loan group experienced very little difference. This result is further highlighted in Table E14 in Annex E, which captures the graduality and steadiness of the decline in vulnerability. Table 7.2: Female category households' seasonal difference in key indicators by RDP credit
Loan Category (Tk.) < Tk. 2,500 > Tk. 7,500 Lean
Season Peak
Season `t' Value Lean
Season Peak
Season `t'
Value Food consumption (Tk. PC) Cash earning (Tk. PC) Rice consumption (gmpc/week) Total expenditure (Tk.) Food stock (days) Illness of women (days)
51.0 33.6
2,708.6 72.0 6.25 2.25
58.7 54.9
2,979.7 97.1 16.9
1.5
-3.81 -3.93 -2.98 -3.42 -5.93 3.27
63.7 65.8
3,196.8 96.2 15.5
2.5
66.8 65.1
3,067.9 100.2
18.7 2.0
-0.31 -1.72 -0.49 -1.81 1.76 0.92
Impact Assessment Study
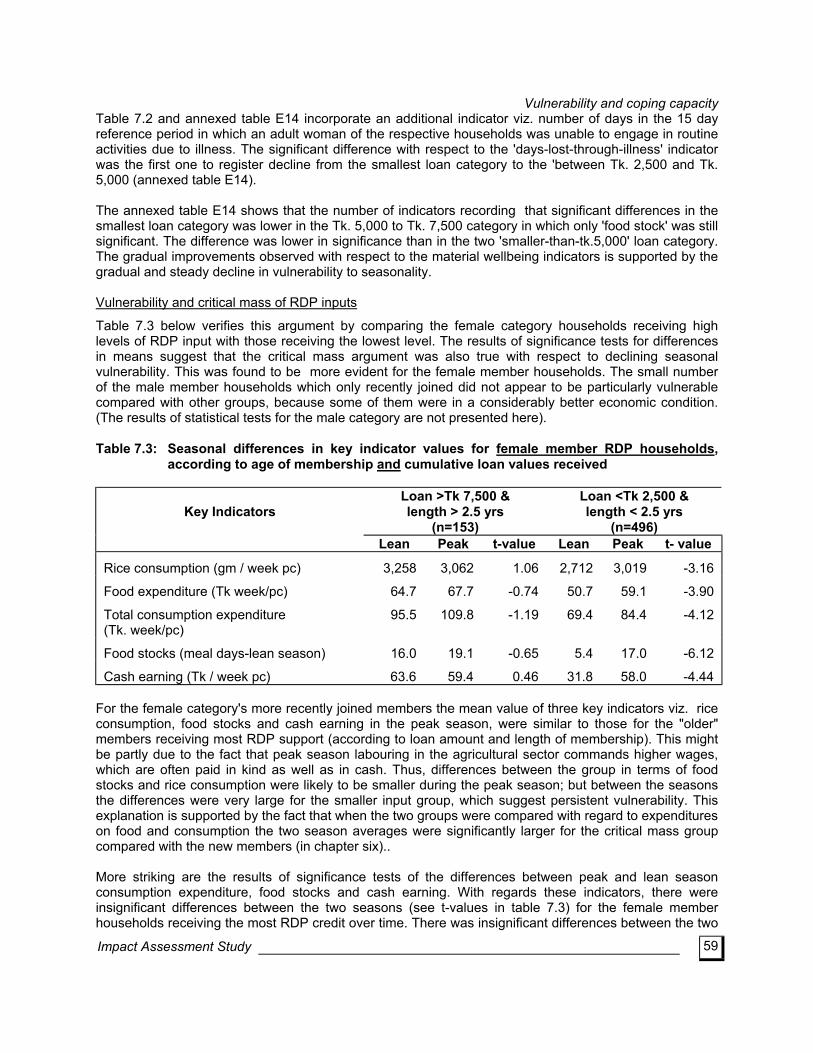
Vulnerability and coping capacity
59
Table 7.2 and annexed table E14 incorporate an additional indicator viz. number of days in the 15 day reference period in which an adult woman of the respective households was unable to engage in routine activities due to illness. The significant difference with respect to the 'days-lost-through-illness' indicator was the first one to register decline from the smallest loan category to the 'between Tk. 2,500 and Tk. 5,000 (annexed table E14). The annexed table E14 shows that the number of indicators recording that significant differences in the smallest loan category was lower in the Tk. 5,000 to Tk. 7,500 category in which only 'food stock' was still significant. The difference was lower in significance than in the two 'smaller-than-tk.5,000' loan category. The gradual improvements observed with respect to the material wellbeing indicators is supported by the gradual and steady decline in vulnerability to seasonality. Vulnerability and critical mass of RDP inputs
Table 7.3 below verifies this argument by comparing the female category households receiving high levels of RDP input with those receiving the lowest level. The results of significance tests for differences in means suggest that the critical mass argument was also true with respect to declining seasonal vulnerability. This was found to be more evident for the female member households. The small number of the male member households which only recently joined did not appear to be particularly vulnerable compared with other groups, because some of them were in a considerably better economic condition. (The results of statistical tests for the male category are not presented here). Table 7.3: Seasonal differences in key indicator values for female member RDP households,
according to age of membership and cumulative loan values received
Key Indicators
Loan >Tk 7,500 & length > 2.5 yrs
(n=153)
Loan <Tk 2,500 & length < 2.5 yrs
(n=496) Lean Peak t-value Lean Peak t- value
Rice consumption (gm / week pc) 3,258 3,062 1.06 2,712 3,019 -3.16
Food expenditure (Tk week/pc) 64.7 67.7 -0.74 50.7 59.1 -3.90
Total consumption expenditure (Tk. week/pc)
95.5 109.8 -1.19 69.4 84.4 -4.12
Food stocks (meal days-lean season) 16.0 19.1 -0.65 5.4 17.0 -6.12
Cash earning (Tk / week pc) 63.6 59.4 0.46 31.8 58.0 -4.44 For the female category's more recently joined members the mean value of three key indicators viz. rice consumption, food stocks and cash earning in the peak season, were similar to those for the "older" members receiving most RDP support (according to loan amount and length of membership). This might be partly due to the fact that peak season labouring in the agricultural sector commands higher wages, which are often paid in kind as well as in cash. Thus, differences between the group in terms of food stocks and rice consumption were likely to be smaller during the peak season; but between the seasons the differences were very large for the smaller input group, which suggest persistent vulnerability. This explanation is supported by the fact that when the two groups were compared with regard to expenditures on food and consumption the two season averages were significantly larger for the critical mass group compared with the new members (in chapter six)..
Impact Assessment Study
More striking are the results of significance tests of the differences between peak and lean season consumption expenditure, food stocks and cash earning. With regards these indicators, there were insignificant differences between the two seasons (see t-values in table 7.3) for the female member households receiving the most RDP credit over time. There was insignificant differences between the two
Vulnerability and coping capacity
60
seasons (see t-values in table 7.3) for. The reverse was the case for those households joining more recently and receiving under Tk 2,500 of credit. These results clearly indicate that the seasonal vulnerability of the "older" members was declining , whereas the more recently joined was experiencing highly significant fluctuations in all aspects included in the table, and particularly with regard to food stocks, consumption expenditure and cash earning. 7.5 Seasonality in debt servicing Before considering the issues of economic security and the strength of the foundation on which the material wellbeing of households is grounded, in the following chapter, an additional issue which is likely to be influenced by seasonality and, further, likely to indicate economic strength is discussed below. Servicing of RDP loans by the borrower households is a multidimensional issue. For a borrower household it is an unavoidable weekly event which might be adversely affected in the lean seasons and thereby indicate vulnerability. On the other hand, a borrower household’s sustained participation in RDP is contingent upon regular servicing of its debt to RDP. It is hypothised that the households that have achieved improvements in material wellbeing and have reduced vulnerability should also perform similarly with respect to debt servicing. (Non-RDP debt servicing is not considered here). Two aspects of the debt issue were considered for the present purpose: the amount of repayment which was made by borrowers, and its ratio to total household expenditure, for the respective seasonal one week reference periods. The average amount of repayment made by the borrowing RDP households was increasing along with cumulative loan size categories for both the male and the female categories (annexed table E15). The average values of debt servicing show that there were differences in magnitude for the respective membership sex categories. The comparatively larger average debt outstanding to RDP for the male category as compared with the female, was reflected in their comparatively larger average repayment figures. The seasonal differences were noticeable (by their respective t-ratios) in the smallest loan category for female category, and in the second to smallest (Tk. 2,500-Tk. 5,000) for the males. The seasonal vulnerability of the smaller loan receivers as was observed above for the female category is further pointed-up with respect to level of debt servicing. The apparent low level of vulnerability for the larger loan group could be explained with reference to the overall reduction in vulnerability. More important explanation might be the nature of the RDP in requiring weekly repayment. The t-values which measure the differences in mean values, for the female category in particular reveal that there was an increasing pattern from the Tk. 2,500 to Tk. 5,000 loan categories and upward. Meaning, that the seasonal differences though insignificant at each loan category, was increasing in terms of percentage difference between one loan category to the next larger category. Whether or not the t-values would remain insignificant if the increasing pattern of percentage difference is sustained as the households continue to borrow larger sums, remains to be seen. This, however, should generate food-for-thought for both policy makers and policy analysts. The seasonal difference in debt servicing ratio (the amount of repayment to total household expenditure) follow the pattern as it was for the amount paid to service the debt, i.e., significant difference was observed for the female category's smallest loan group (annexed table E16). The t-values for the female category loan size sub-groups was computed to become smaller in the successive larger loan sub-group indicating steady reduction in seasonal difference. However, the ratios for the Tk. 5,000-7,500 loan group and the largest loan group appear large at between 20 percent and 26.6 percent, for the female (annexed table E16); these ratios were increasing from 5.34 percent and 7.07 for smallest loan groups in lean and peak seasons respectively. A closer look at the rate of increase from the smallest to the second smallest (196% and 75% for respective seasons),
Impact Assessment Study
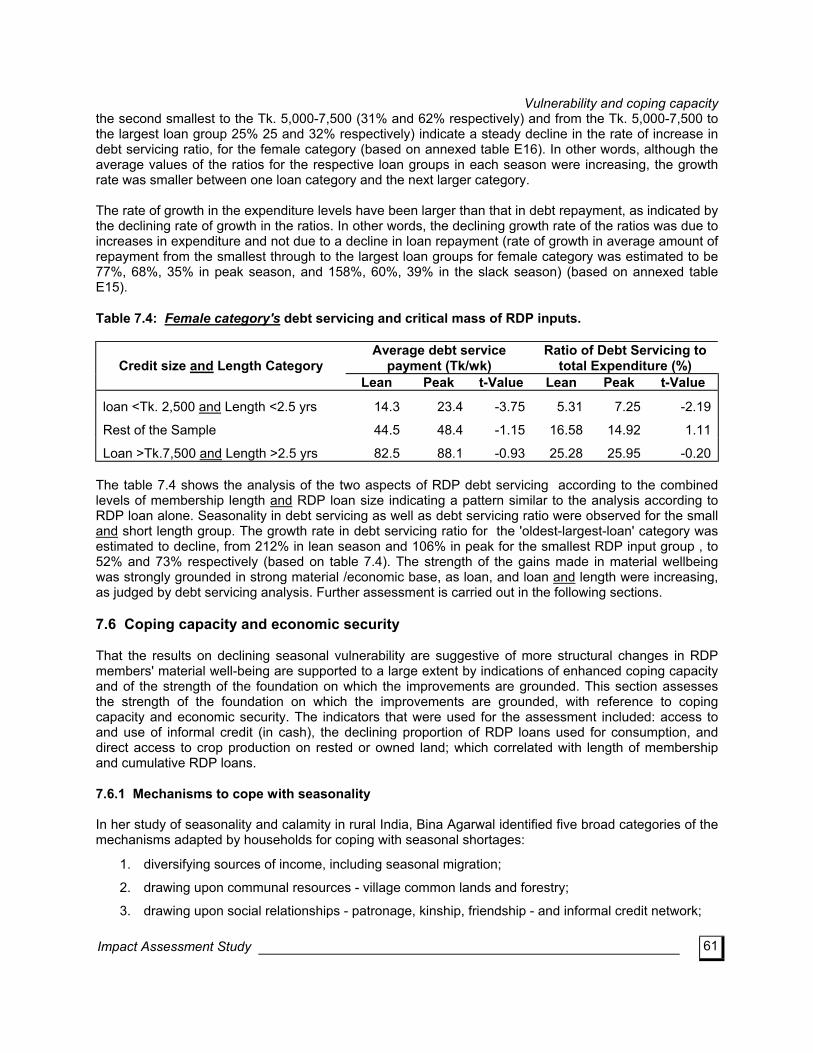
Vulnerability and coping capacity
61
the second smallest to the Tk. 5,000-7,500 (31% and 62% respectively) and from the Tk. 5,000-7,500 to the largest loan group 25% 25 and 32% respectively) indicate a steady decline in the rate of increase in debt servicing ratio, for the female category (based on annexed table E16). In other words, although the average values of the ratios for the respective loan groups in each season were increasing, the growth rate was smaller between one loan category and the next larger category. The rate of growth in the expenditure levels have been larger than that in debt repayment, as indicated by the declining rate of growth in the ratios. In other words, the declining growth rate of the ratios was due to increases in expenditure and not due to a decline in loan repayment (rate of growth in average amount of repayment from the smallest through to the largest loan groups for female category was estimated to be 77%, 68%, 35% in peak season, and 158%, 60%, 39% in the slack season) (based on annexed table E15). Table 7.4: Female category's debt servicing and critical mass of RDP inputs.
Credit size and Length Category
Average debt service payment (Tk/wk)
Ratio of Debt Servicing to total Expenditure (%)
Lean Peak t-Value Lean Peak t-Value
loan <Tk. 2,500 and Length <2.5 yrs 14.3 23.4 -3.75 5.31 7.25 -2.19
Rest of the Sample 44.5 48.4 -1.15 16.58 14.92 1.11
Loan >Tk.7,500 and Length >2.5 yrs 82.5 88.1 -0.93 25.28 25.95 -0.20 The table 7.4 shows the analysis of the two aspects of RDP debt servicing according to the combined levels of membership length and RDP loan size indicating a pattern similar to the analysis according to RDP loan alone. Seasonality in debt servicing as well as debt servicing ratio were observed for the small and short length group. The growth rate in debt servicing ratio for the 'oldest-largest-loan' category was estimated to decline, from 212% in lean season and 106% in peak for the smallest RDP input group , to 52% and 73% respectively (based on table 7.4). The strength of the gains made in material wellbeing was strongly grounded in strong material /economic base, as loan, and loan and length were increasing, as judged by debt servicing analysis. Further assessment is carried out in the following sections. 7.6 Coping capacity and economic security That the results on declining seasonal vulnerability are suggestive of more structural changes in RDP members' material well-being are supported to a large extent by indications of enhanced coping capacity and of the strength of the foundation on which the improvements are grounded. This section assesses the strength of the foundation on which the improvements are grounded, with reference to coping capacity and economic security. The indicators that were used for the assessment included: access to and use of informal credit (in cash), the declining proportion of RDP loans used for consumption, and direct access to crop production on rested or owned land; which correlated with length of membership and cumulative RDP loans. 7.6.1 Mechanisms to cope with seasonality In her study of seasonality and calamity in rural India, Bina Agarwal identified five broad categories of the mechanisms adapted by households for coping with seasonal shortages:
1. diversifying sources of income, including seasonal migration;
2. drawing upon communal resources - village common lands and forestry;
3. drawing upon social relationships - patronage, kinship, friendship - and informal credit network;
Impact Assessment Study
Vulnerability and coping capacity
62
4. drawing upon household stores (of food, fuel, etc.) and adjusting current consumption patterns;
5. drawing upon assets (1991:345).
Agarwal (ibid) argued that social security measures to remedy the effects of uncertainty of livelihood at times of the year needed to 'ensure that such interventions complement and strengthen rather than substitute for peoples own efforts in dealing with contingencies' (p-342, emphasis added). This section explores if and how the RDP inputs `complement and strengthen' the members' efforts. The data that were used to analyse the coping capacity and economic security of the member households were generated by both the households survey and the case studies of 24 VOs. Group discussions with VO members revealed striking similarity in the coping mechanisms adopted by the poor in rural Bangladesh, with those identified by Agarwal. During the group discussions for the case studies the VO members reported that seasonal hardship was declining in some areas as a result of improvements in the economic environment in which the households operate. The two factors found to be contributing to the improvements in lean season were:
a. development taking place in the locality including infrastructure, marketing opportunities etc.; and
b. the households' access to RDP inputs, particularly credit.
The case studies respondents reported there was a reduction in the severity of lean season at eight out of 15 study locations. Of these eight, six were in the ‘old’ category of length of formation (i.e., these VOs were formed four years prior to the case studies in January 1994) and two were in the `new' or less than four years in existence. In the six VOs where lean season was severe and the coping capacity was assessed to be weak (eg. recourse to money lenders at usurious rates, reduction in consumption, asset depletion, etc.), five were in the `new' category. In one VO-old, seasonality was not an issue of concern to the VO members as employment and other livelihood opportunities were reported to be well-served by a very large market place, a railway station and easy communication to the District town, all in the vicinity of the one village . As for the mechanisms which were adopted by the households to tied than over the lean season(s), there were evidences from the case studies , of a discernible pattern. First, the coping mechanisms which the villagers reported to use , could be classified as `common' i.e., a mechanism which was repeatedly or frequently reported, or collectively agreed to by the group members as a widely adopted course of action in the respective locality; and as `selective' or exceptional in that the mechanism was adopted in exceptional circumstances or by very few of the members. Secondly, the choice of mechanism was also a reflection of the households status vis-a-vis severity of hardship experienced in the lean season. A household was classified as ‘strong’ for experiencing less hardship and where the hardship was severe as the ‘weak’ households. Diversification of income sources
The VOs where no hardship was reported by the members, in lean season, identified no mechanisms for this category. At locations where the intensity of hardship was low or none, the households used RDP credit to avail the opportunities present in the locality. These activities included: investment in the irrigated land; shifting from wage labour to cash crop production with RDP loan, which was made possi- ble by opening of a wholesale centre supplying the capital city; investment in rural transport to ply the newly constructed or existing all weather road; expansion of trade and women's activities in the artisanal and craft good production sector. These allowed for stability of income flow or for saving from earlier period. Instances of migration (seasonal) was eliminated in the cash crop growing area.
Impact Assessment Study
Vulnerability and coping capacity
63
Depleting household stores and adjusting consumption
This category of mechanisms were `common' for weaker households, second in the frequency of reporting, whereas these were reported to be `selective' courses of action for the stronger households. The mechanisms that were reported include sale of savings in kind (poultry birds, eggs, were frequently reported as `saving' by the group members), use of mushti chaal (a fistful of rice which is customarily kept aside at each meal cooking time). Reduction in consumption expenditure was reported at three locations as `common' practice by the weaker households. As `selective' choice it was reported at three of the stronger household locations. Drawing upon common resources
Given the country's high population density and rapid deforestation, it is not surprising that seasonal 'gathering' of fuel wood was reported in only one location in the highlands of the north-central Bangladesh. What is surprising is that drawing upon the vast waterbodies in the country which is exploited as a common resource by large proportion of the rural population, was not reported as a coping mechanism. Drawing upon social relations
This was the most frequently reported category of mechanisms used to cope in lean season by both strong and weak households. Two newer VOs which were weak according to severity of hardship as well as nature of the mechanisms used, reported to take out credit from high interest sources. The older and stronger VO households at three locations were using the networks of kinship and friendship. These networks were also used by three weaker location-households. Depleting assets
This the second least frequently reported mechanism category was `common' at three locations that were characterized by weak coping capacity. The mechanisms included the sales of livestock and land, and the pawning of land, productive assets, both for cash. Depleting assets was used as a coping mechanism reportedly in the later stages, as the situations worsen when other courses have been exhausted (see also Rahman 1992; Agarwal 1991). In sum, the results in the earlier chapter on household data are supported by the case study data. Households which were in the older VOs were able to comparatively better withstand the stress of the lean seasons. They were able to make use of the local condition with RDP input. The new VO members were the reverse. It would have been interesting to investigate the condition of the newer members at locations where local condition is similar to those where the stronger households exist. 7.7 Enhanced economic security Improvements in asset holding, consumption and vulnerability indicate the current situation. This section assesses the economic security or the strength of the households to maintain the observed improvements in the future as well as the security of current consumption levels. The indicators which were used for this analysis included asset profile as a proxy for future earning capacity, involvement in the informal credit market, and direct entitlement to food to assess security of current consumption. 7.7.1 Security of future earning Changes in RDP households' asset profile
Table 6.1 shows that, on average, total household asset values were increasing with length of membership and amount of credit. More significant for household security is the fact that revenue-earning assets increased notably. Member households which joined more than four years ago had, on average,
Impact Assessment Study
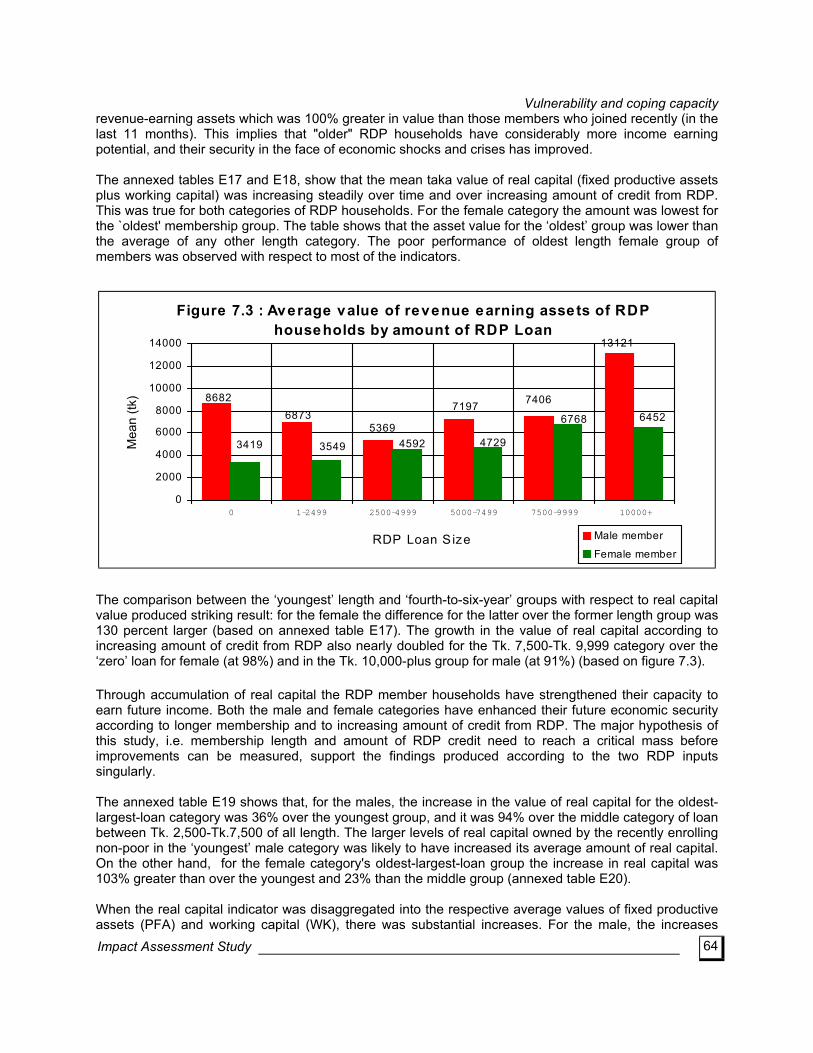
Vulnerability and coping capacity revenue-earning assets which was 100% greater in value than those members who joined recently (in the last 11 months). This implies that "older" RDP households have considerably more income earning potential, and their security in the face of economic shocks and crises has improved. The annexed tables E17 and E18, show that the mean taka value of real capital (fixed productive assets plus working capital) was increasing steadily over time and over increasing amount of credit from RDP. This was true for both categories of RDP households. For the female category the amount was lowest for the `oldest' membership group. The table shows that the asset value for the ‘oldest’ group was lower than the average of any other length category. The poor performance of oldest length female group of members was observed with respect to most of the indicators.
Figure 7.3 : Average value of revenue earning assets of RDP households by amount of RDP Loan
13121
74067197
53696873
8682
64526768
4729459235493419
0
2000
4000
6000
8000
10000
12000
14000
0 1-2499 2500-4999 5000-7499 7500-9999 10000+
RDP Loan S ize
Mea
n (tk
)
Male member
Female member
The comparison between the ‘youngest’ length and ‘fourth-to-six-year’ groups with respect to real capital value produced striking result: for the female the difference for the latter over the former length group was 130 percent larger (based on annexed table E17). The growth in the value of real capital according to increasing amount of credit from RDP also nearly doubled for the Tk. 7,500-Tk. 9,999 category over the ‘zero’ loan for female (at 98%) and in the Tk. 10,000-plus group for male (at 91%) (based on figure 7.3). Through accumulation of real capital the RDP member households have strengthened their capacity to earn future income. Both the male and female categories have enhanced their future economic security according to longer membership and to increasing amount of credit from RDP. The major hypothesis of this study, i.e. membership length and amount of RDP credit need to reach a critical mass before improvements can be measured, support the findings produced according to the two RDP inputs singularly. The annexed table E19 shows that, for the males, the increase in the value of real capital for the oldest-largest-loan category was 36% over the youngest group, and it was 94% over the middle category of loan between Tk. 2,500-Tk.7,500 of all length. The larger levels of real capital owned by the recently enrolling non-poor in the ‘youngest’ male category was likely to have increased its average amount of real capital. On the other hand, for the female category's oldest-largest-loan group the increase in real capital was 103% greater than over the youngest and 23% than the middle group (annexed table E20).
When the real capital indicator was disaggregated into the respective average values of fixed productive assets (PFA) and working capital (WK), there was substantial increases. For the male, the increases
64 Impact Assessment Study
Vulnerability and coping capacity
65
were greater for the `longest-largest-loan' group than the middle group at 74 percent and 137 percent respectively with respect to FPA and WK. The increases in these two components of real capital for the female 'longest-largest-loan' group over the youngest-smallest loan group, was 60 percent and 358 percent respectively. The growth in real capital for the female category's ‘longest-largest’ group was primarily due to very high rate of increase in working capital. This implies a preference on the part of female category, for a steady, uninterrupted cash flow over production although the share of FPA was more than double that of WK, in proportion to total household wealth/assets (annexed tables E19 and E20). The structures of the wealth of households, i.e. proportion distribution of wealth by the constituent components, were not markedly different for the male and the female categories. The values of the housing structure and real capital accounted for more than 80% of the wealth for the three loan-length categories of females and of males. From the perspective of security of future earning or the capability to reproduce wealth, the value of and the proportion-to-wealth of real capital is an important indicator. For the female category the proportion-to-wealth share of real capital was similar (around 32%) for the 'largest-longest' of RDP input group compared with the two smaller-loan-shorter-length' group (annexed table 20). The impact of combined level of RDP inputs was discernible with respect to the proportion-to-wealth share of working capital and of saving, increasing from 4.7% and 5% respectively for the youngest group to 10.4% and 11.4% respectively for the oldest-largest group (Table E20). The main factor underlying these mixed and confusing figures is perhaps a priority placed by members on assets such as housing structure which is followed by FPA for the males and the females. The case studies found, during wealth ranking exercises, that the quality of housing was perceived as a key determinant of economic status within the rural communities. After landholding, housing was the second most commonly mentioned criterion by which villagers judged household wealth. Nevertheless, these investment priorities do not detract from the important finding that increases in asset values amongst RDP member households over time and over increasing loan suggests that their economic security was being strengthened, and this finding is supported by several other indicators suggesting declining seasonal vulnerability and enhanced coping capacity. Saving with RDP vs. other savings
The data in table 7.5 show a declining of pattern of ratios of non-RDP to RDP savings over time amongst the membership. In monetary terms, RDP savings was observed to increase with length of membership, and non-RDP savings decrease. The increase in RDP savings is unsurprising because weekly deposits, and security savings deducted from loan amounts are requirements of VO membership. There may be competing interpretations of these findings. One possible interpretation will view the findings as ambiguous, mainly because RDP savings themselves are not accessible in times of distress or severe need, and their inflexibility is a matter of concern to many members (see chapters 9 and 11 in this report). In short, RDP savings on their own do not contribute to short term coping capacity of households, and they can only be considered a long term asset. Table 7.5: The ratio of non-RDP savings to RDP savings deposits, RDP member households and
length of membership
Length of membership (in months)
Male member households Female member households
1-11 4.9 2.7 12-29 2.2 1.8 30-47 0.6 0.9 48-72 1.6 1.3 73+ 0.4 0.6
Impact Assessment Study
Vulnerability and coping capacity
66
On the other hands it is possible that households perceive less of a need to keep non-RDP savings, (as reported in the survey) given:
a. their increased access to RDP credit (a small proportion of which is used, in practice, for meeting consumption needs, even by the better off households);
b. more secure sources of income, as implied by increased seasonal stability in consumption levels
and by the mechanisms adopted to reduce fluctuations in income earning; c. the existence of savings in kind as reported by the members in case studies, who identified
poultry as a store of saving, as a mechanism to transfer income from one period to another, and as evidenced in the increasing accumulation of assets in the form of real capital; and
d. a reduction in seasonal fluctuation, and the capability to use stronger coping mechanisms imply a
decline in the need to access short term saving. 7.7.2 Security of current consumption Indebtedness to informal sources
The household survey data show that nearly half of all households (46% and 41% of male and female member households, respectively) had informal debts at the time of interview in the (autumn) lean season of 1993 (annexed table E20.1). These aggregate figures cannot be interpreted at face value, since they hide various types of informal loans (including those taken from kin, friends and neighbours as well as moneylenders). Also, the case studies found that in five out of the 15 locations VO members reported that (since joining RDP) they no longer had to go to the local mohajans who lent out small sums at very high interest rates. In another five VOs, members reported that local moneylenders saw them as having increased creditworthiness. These findings indicate the complexity of informal markets. The indebtedness of households to informal sector moneylenders may be interpreted in two ways, depending on the nature of the informal credit. For some households, high interest loans may constitute dependence on exploitative moneylenders; while for other households access to certain types of informal credit may represent increased creditworthiness and coping capacity. However, in general the survey data suggests that "older" RDP member households have a reduced reliance on the informal credit market, which in turn suggests increasing economic security. Case study data on mechanisms to cope in lean season support this finding. Indeed, the findings suggested by the data are that (a) while there was no clear downward trend in the proportion of households taking informal loans as length of membership increases, (b) the average amount of informal credit taken per household declines with increasing membership length, and (c) in addition, "older" member households were using a smaller proportion of their informal credit for consum- ption or hardship purposes - and instead use a higher proportion for investment purposes. These data are illustrated in figure 7.4 below and in annexed table E20.1. However, a more complex picture emerges when analysing data for male and female member households separately. For male member households, as the amount of RDP credit increases, the amount of informal credit taken decreases slightly. For female member households, there is a small positive correlation between increasing RDP credit and informal credit. However, the correlation coefficients are small (-0.043 for male, and 0.001 for female member households), suggesting that these opposite ‘trends’ are both weak. Two interpretations may be offered to account for these results:
Impact Assessment Study
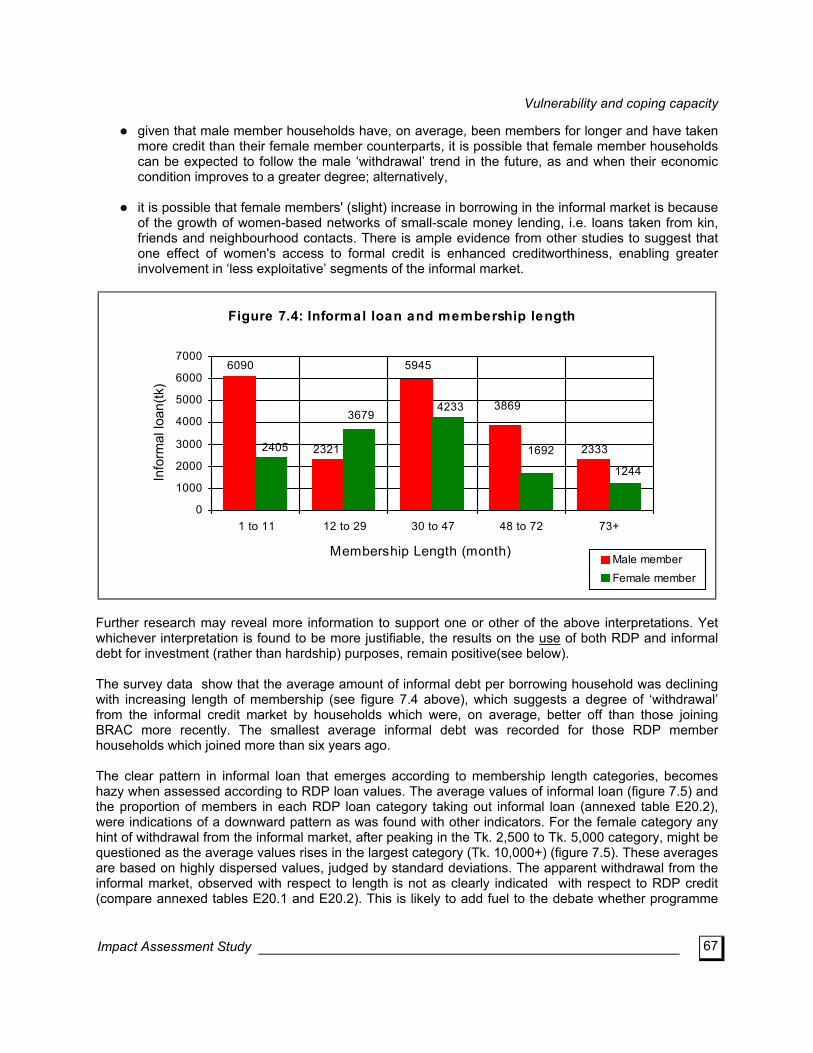
Vulnerability and coping capacity
67
given that male member households have, on average, been members for longer and have taken
more credit than their female member counterparts, it is possible that female member households can be expected to follow the male ‘withdrawal’ trend in the future, as and when their economic condition improves to a greater degree; alternatively,
it is possible that female members' (slight) increase in borrowing in the informal market is because
of the growth of women-based networks of small-scale money lending, i.e. loans taken from kin, friends and neighbourhood contacts. There is ample evidence from other studies to suggest that one effect of women's access to formal credit is enhanced creditworthiness, enabling greater involvement in ‘less exploitative’ segments of the informal market.
Figure 7.4: Informal loan and membership length
2333
3869
5945
2321
6090
1244
1692
42333679
2405
0
1000
2000
3000
4000
5000
6000
7000
1 to 11 12 to 29 30 to 47 48 to 72 73+
Membership Length (month)
Info
rmal
loan
(tk)
Male memberFemale member
Further research may reveal more information to support one or other of the above interpretations. Yet whichever interpretation is found to be more justifiable, the results on the use of both RDP and informal debt for investment (rather than hardship) purposes, remain positive(see below). The survey data show that the average amount of informal debt per borrowing household was declining with increasing length of membership (see figure 7.4 above), which suggests a degree of ‘withdrawal’ from the informal credit market by households which were, on average, better off than those joining BRAC more recently. The smallest average informal debt was recorded for those RDP member households which joined more than six years ago. The clear pattern in informal loan that emerges according to membership length categories, becomes hazy when assessed according to RDP loan values. The average values of informal loan (figure 7.5) and the proportion of members in each RDP loan category taking out informal loan (annexed table E20.2), were indications of a downward pattern as was found with other indicators. For the female category any hint of withdrawal from the informal market, after peaking in the Tk. 2,500 to Tk. 5,000 category, might be questioned as the average values rises in the largest category (Tk. 10,000+) (figure 7.5). These averages are based on highly dispersed values, judged by standard deviations. The apparent withdrawal from the informal market, observed with respect to length is not as clearly indicated with respect to RDP credit (compare annexed tables E20.1 and E20.2). This is likely to add fuel to the debate whether programme
Impact Assessment Study
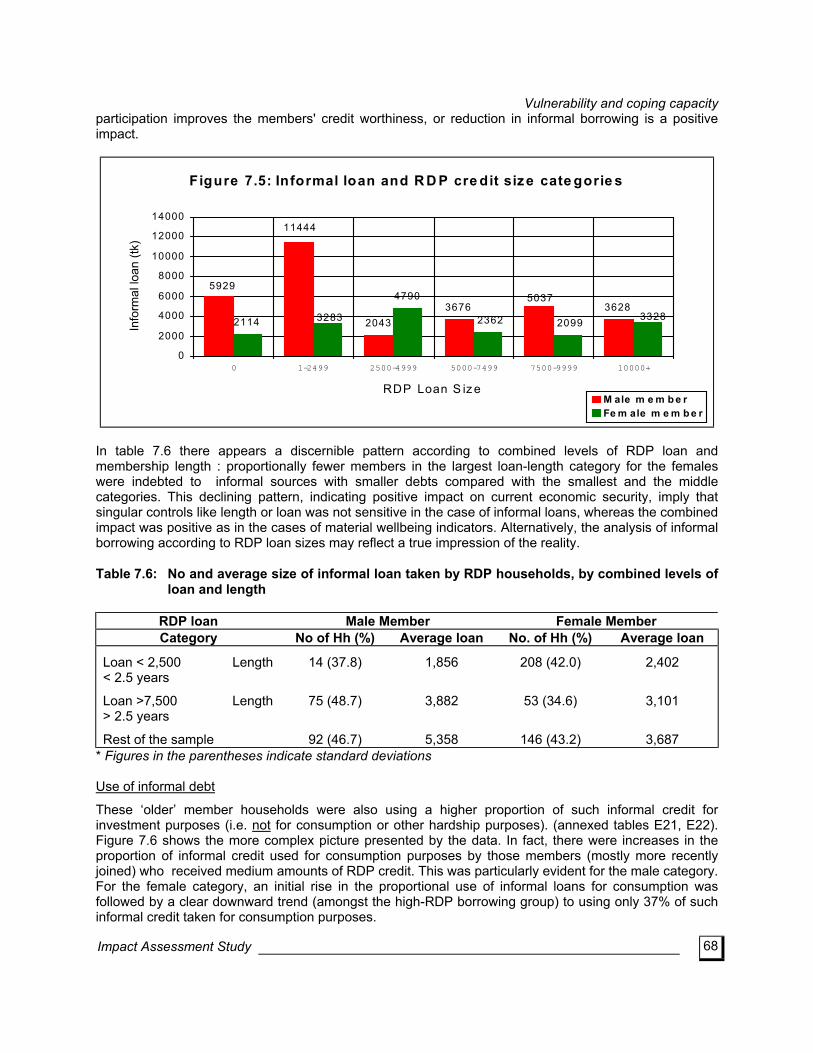
Vulnerability and coping capacity
68
participation improves the members' credit worthiness, or reduction in informal borrowing is a positive impact.
Figure 7.5: Informal loan and R D P cre dit size cate gorie s
20433676 3628
2114
47905929
11444
5037
3283 33282362 2099
0
2000
4000
6000
8000
10000
12000
14000
0 1-2499 2500-4999 5000-7499 7500-9999 10000+
RDP Loan S iz e
Info
rmal
loan
(tk)
M ale m e m b e rFe m ale m e m b e r
In table 7.6 there appears a discernible pattern according to combined levels of RDP loan and membership length : proportionally fewer members in the largest loan-length category for the females were indebted to informal sources with smaller debts compared with the smallest and the middle categories. This declining pattern, indicating positive impact on current economic security, imply that singular controls like length or loan was not sensitive in the case of informal loans, whereas the combined impact was positive as in the cases of material wellbeing indicators. Alternatively, the analysis of informal borrowing according to RDP loan sizes may reflect a true impression of the reality. Table 7.6: No and average size of informal loan taken by RDP households, by combined levels of
loan and length
RDP loan Male Member Female Member Category No of Hh (%) Average loan No. of Hh (%) Average loan
Loan < 2,500 Length < 2.5 years
Loan >7,500 Length > 2.5 years
Rest of the sample
14 (37.8)
75 (48.7)
92 (46.7)
1,856
3,882
5,358
208 (42.0)
53 (34.6)
146 (43.2)
2,402
3,101
3,687
* Figures in the parentheses indicate standard deviations Use of informal debt
These ‘older’ member households were also using a higher proportion of such informal credit for investment purposes (i.e. not for consumption or other hardship purposes). (annexed tables E21, E22). Figure 7.6 shows the more complex picture presented by the data. In fact, there were increases in the proportion of informal credit used for consumption purposes by those members (mostly more recently joined) who received medium amounts of RDP credit. This was particularly evident for the male category. For the female category, an initial rise in the proportional use of informal loans for consumption was followed by a clear downward trend (amongst the high-RDP borrowing group) to using only 37% of such informal credit taken for consumption purposes.
Impact Assessment Study
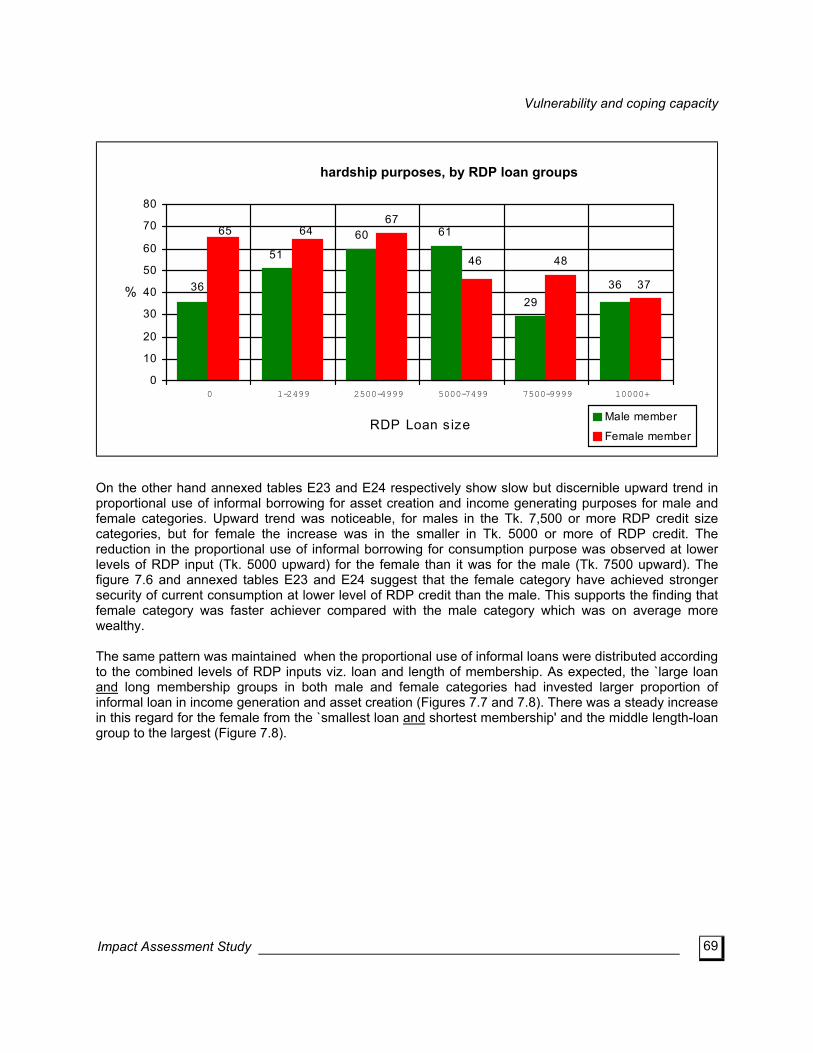
Vulnerability and coping capacity
69
51
60 61
29
67
48
373636
46
6465
0
10
20
30
40
50
60
70
80
0 1-2499 2500-4999 5000-7499 7500-9999 10000+
RDP Loan size
%
Male member
Female member
hardship purposes, by RDP loan groups
On the other hand annexed tables E23 and E24 respectively show slow but discernible upward trend in proportional use of informal borrowing for asset creation and income generating purposes for male and female categories. Upward trend was noticeable, for males in the Tk. 7,500 or more RDP credit size categories, but for female the increase was in the smaller in Tk. 5000 or more of RDP credit. The reduction in the proportional use of informal borrowing for consumption purpose was observed at lower levels of RDP input (Tk. 5000 upward) for the female than it was for the male (Tk. 7500 upward). The figure 7.6 and annexed tables E23 and E24 suggest that the female category have achieved stronger security of current consumption at lower level of RDP credit than the male. This supports the finding that female category was faster achiever compared with the male category which was on average more wealthy. The same pattern was maintained when the proportional use of informal loans were distributed according to the combined levels of RDP inputs viz. loan and length of membership. As expected, the `large loan and long membership groups in both male and female categories had invested larger proportion of informal loan in income generation and asset creation (Figures 7.7 and 7.8). There was a steady increase in this regard for the female from the `smallest loan and shortest membership' and the middle length-loan group to the largest (Figure 7.8).
Impact Assessment Study
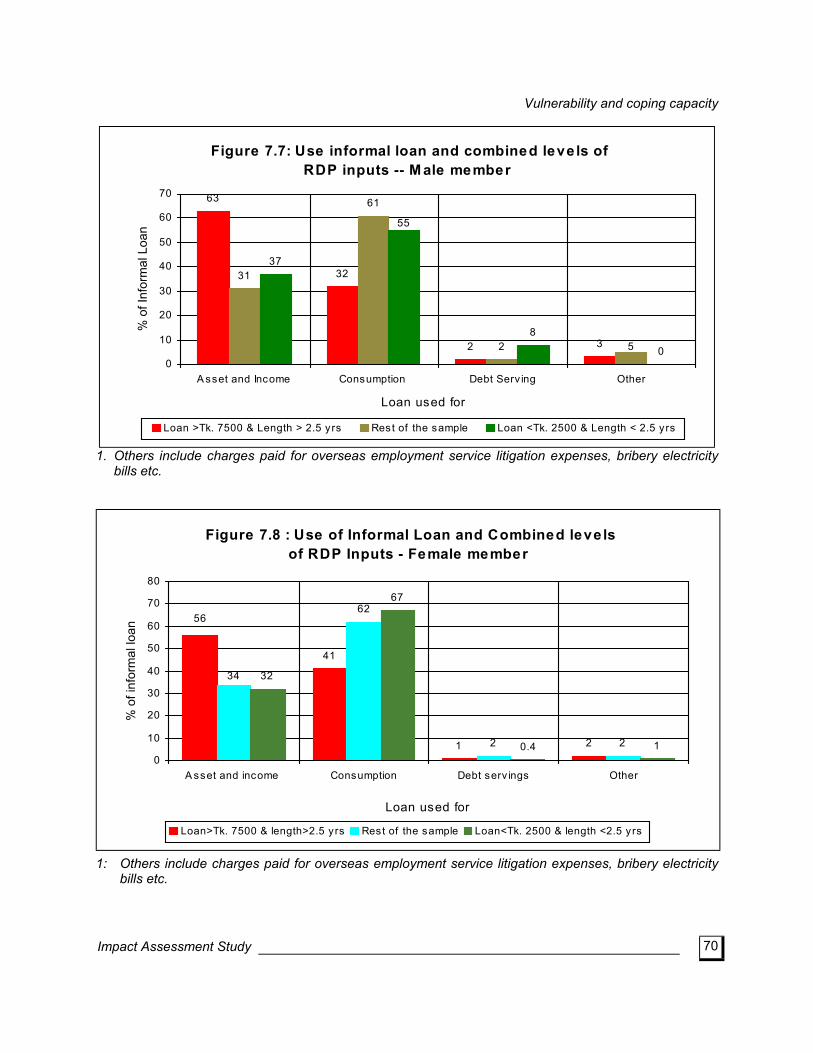
Vulnerability and coping capacity
70
Figure 7.7: Use informal loan and combined leve ls ofRDP inputs -- M ale member
63
32
2 3
31
61
2
37
8
05
55
0
10
20
30
40
50
60
70
A sset and Income Consumption Debt Serv ing Other
Loan used for
% o
f Inf
orm
al L
oan
Loan >Tk. 7500 & Length > 2.5 yrs Rest of the sample Loan <Tk. 2500 & Length < 2.5 yrs
1. Others include charges paid for overseas employment service litigation expenses, bribery electricity bills etc.
Figure 7.8 : Use of Informal Loan and Combined leve lsof RDP Inputs - Female member
41
1 2
62
2 2
32
67
0.4 1
56
34
0
10
20
30
40
50
60
70
80
A sset and income Consumption Debt serv ings Other
Loan used for
% o
f inf
orm
al lo
an
Loan>Tk. 7500 & length>2.5 yrs Rest of the sample Loan<Tk. 2500 & length <2.5 yrs
1: Others include charges paid for overseas employment service litigation expenses, bribery electricity bills etc.
Impact Assessment Study
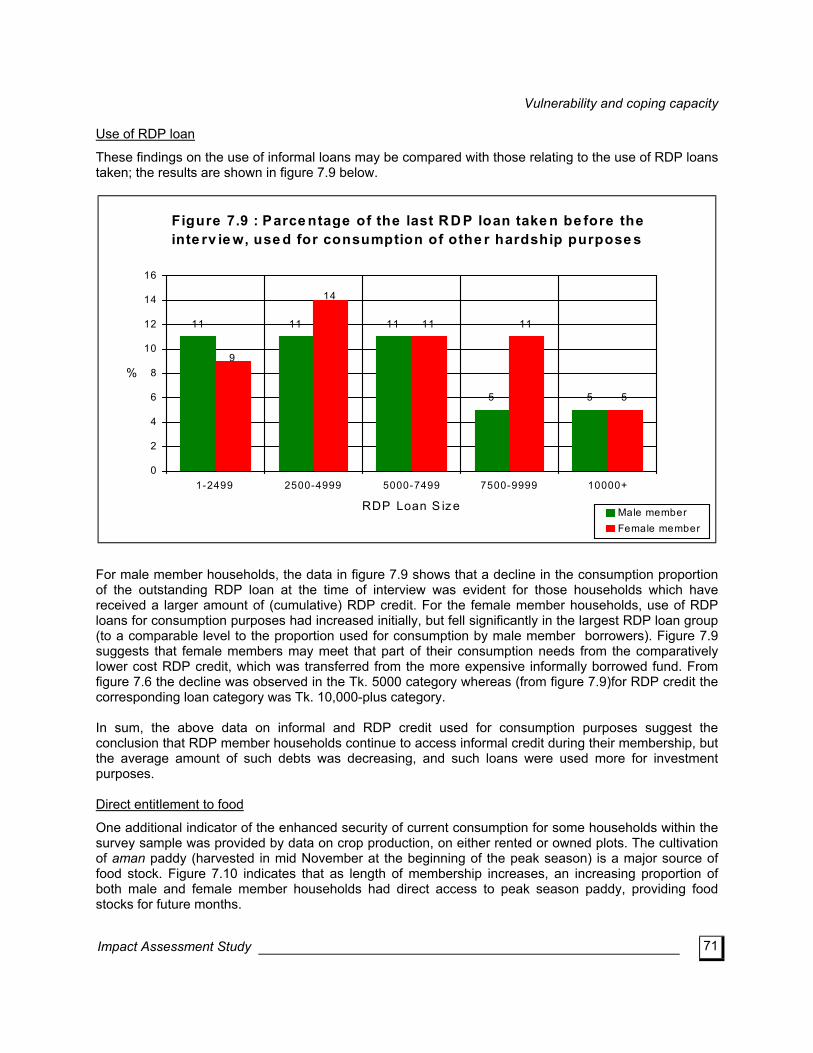
Vulnerability and coping capacity
71
Use of RDP loan
These findings on the use of informal loans may be compared with those relating to the use of RDP loans taken; the results are shown in figure 7.9 below.
Figure 7.9 : Parce ntage of the last R D P loan take n be fore the inte rv ie w, use d for consumption of othe r hardship purpose s
11 11 11
5 5
11 11
5
14
9
0
2
4
6
8
10
12
14
16
1-2499 2500-4999 5000-7499 7500-9999 10000+
RDP Loan S ize
%
Male memberFemale member
For male member households, the data in figure 7.9 shows that a decline in the consumption proportion of the outstanding RDP loan at the time of interview was evident for those households which have received a larger amount of (cumulative) RDP credit. For the female member households, use of RDP loans for consumption purposes had increased initially, but fell significantly in the largest RDP loan group (to a comparable level to the proportion used for consumption by male member borrowers). Figure 7.9 suggests that female members may meet that part of their consumption needs from the comparatively lower cost RDP credit, which was transferred from the more expensive informally borrowed fund. From figure 7.6 the decline was observed in the Tk. 5000 category whereas (from figure 7.9)for RDP credit the corresponding loan category was Tk. 10,000-plus category. In sum, the above data on informal and RDP credit used for consumption purposes suggest the conclusion that RDP member households continue to access informal credit during their membership, but the average amount of such debts was decreasing, and such loans were used more for investment purposes. Direct entitlement to food
One additional indicator of the enhanced security of current consumption for some households within the survey sample was provided by data on crop production, on either rented or owned plots. The cultivation of aman paddy (harvested in mid November at the beginning of the peak season) is a major source of food stock. Figure 7.10 indicates that as length of membership increases, an increasing proportion of both male and female member households had direct access to peak season paddy, providing food stocks for future months.
Impact Assessment Study
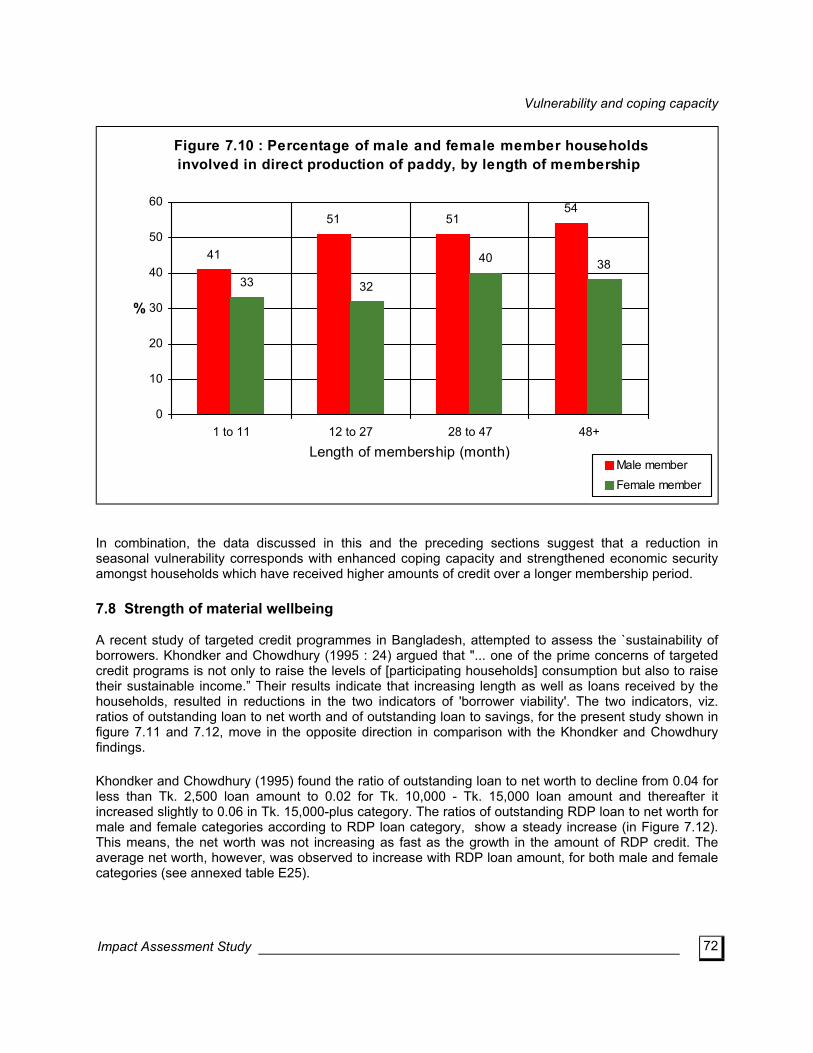
Vulnerability and coping capacity
72
Figure 7.10 : Percentage of male and female member households involved in direct production of paddy, by length of membership
51 5154
33 32
40 3841
0
10
20
30
40
50
60
1 to 11 12 to 27 28 to 47 48+
Length of membership (month)
%
Male memberFemale member
In combination, the data discussed in this and the preceding sections suggest that a reduction in seasonal vulnerability corresponds with enhanced coping capacity and strengthened economic security amongst households which have received higher amounts of credit over a longer membership period. 7.8 Strength of material wellbeing A recent study of targeted credit programmes in Bangladesh, attempted to assess the `sustainability of borrowers. Khondker and Chowdhury (1995 : 24) argued that "... one of the prime concerns of targeted credit programs is not only to raise the levels of [participating households] consumption but also to raise their sustainable income.” Their results indicate that increasing length as well as loans received by the households, resulted in reductions in the two indicators of 'borrower viability'. The two indicators, viz. ratios of outstanding loan to net worth and of outstanding loan to savings, for the present study shown in figure 7.11 and 7.12, move in the opposite direction in comparison with the Khondker and Chowdhury findings. Khondker and Chowdhury (1995) found the ratio of outstanding loan to net worth to decline from 0.04 for less than Tk. 2,500 loan amount to 0.02 for Tk. 10,000 - Tk. 15,000 loan amount and thereafter it increased slightly to 0.06 in Tk. 15,000-plus category. The ratios of outstanding RDP loan to net worth for male and female categories according to RDP loan category, show a steady increase (in Figure 7.12). This means, the net worth was not increasing as fast as the growth in the amount of RDP credit. The average net worth, however, was observed to increase with RDP loan amount, for both male and female categories (see annexed table E25).
Impact Assessment Study
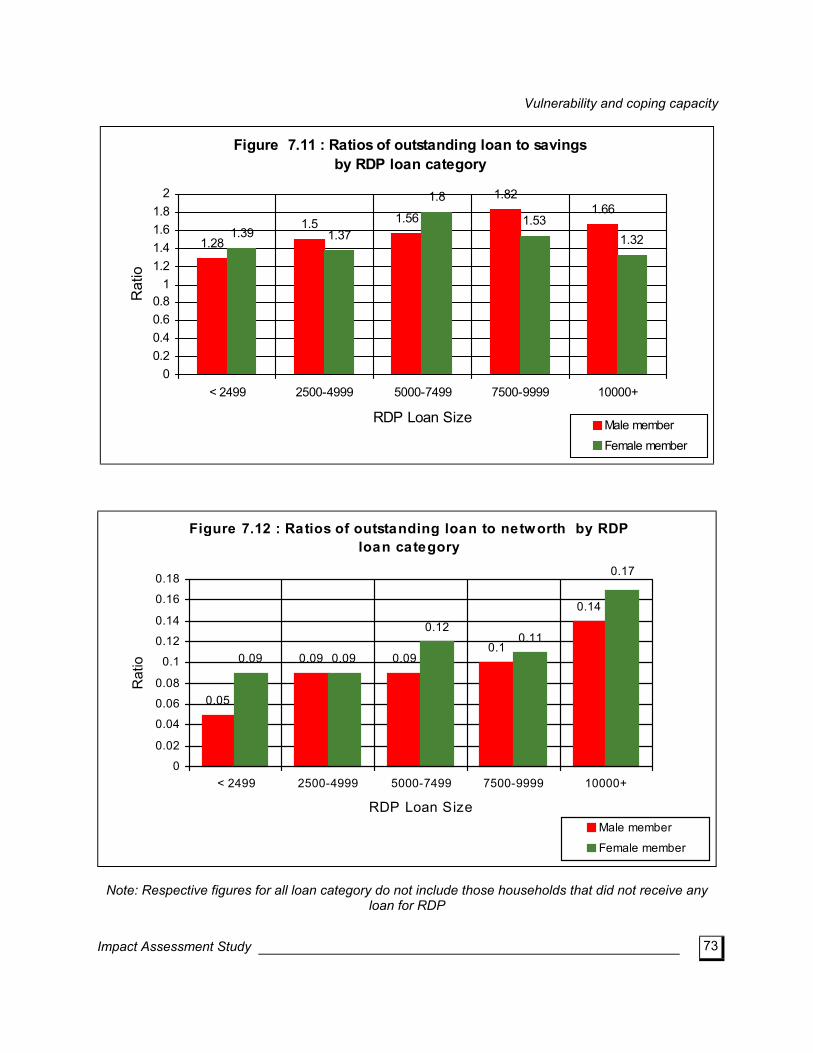
Vulnerability and coping capacity
73
Figure 7.11 : Ratios of outstanding loan to savingsby RDP loan category
1.281.5 1.56
1.821.66
1.39 1.37
1.8
1.531.32
00.20.40.60.8
11.21.41.61.8
2
< 2499 2500-4999 5000-7499 7500-9999 10000+
RDP Loan Size
Rat
io
Male memberFemale member
Figure 7.12 : Ratios of outstanding loan to networth by RDP loan category
0.05
0.09 0.090.1
0.14
0.09 0.09
0.120.11
0.17
0
0.02
0.04
0.06
0.08
0.1
0.12
0.14
0.16
0.18
< 2499 2500-4999 5000-7499 7500-9999 10000+
RDP Loan Size
Rat
io
Male member
Female member
Note: Respective figures for all loan category do not include those households that did not receive any
loan for RDP
Impact Assessment Study
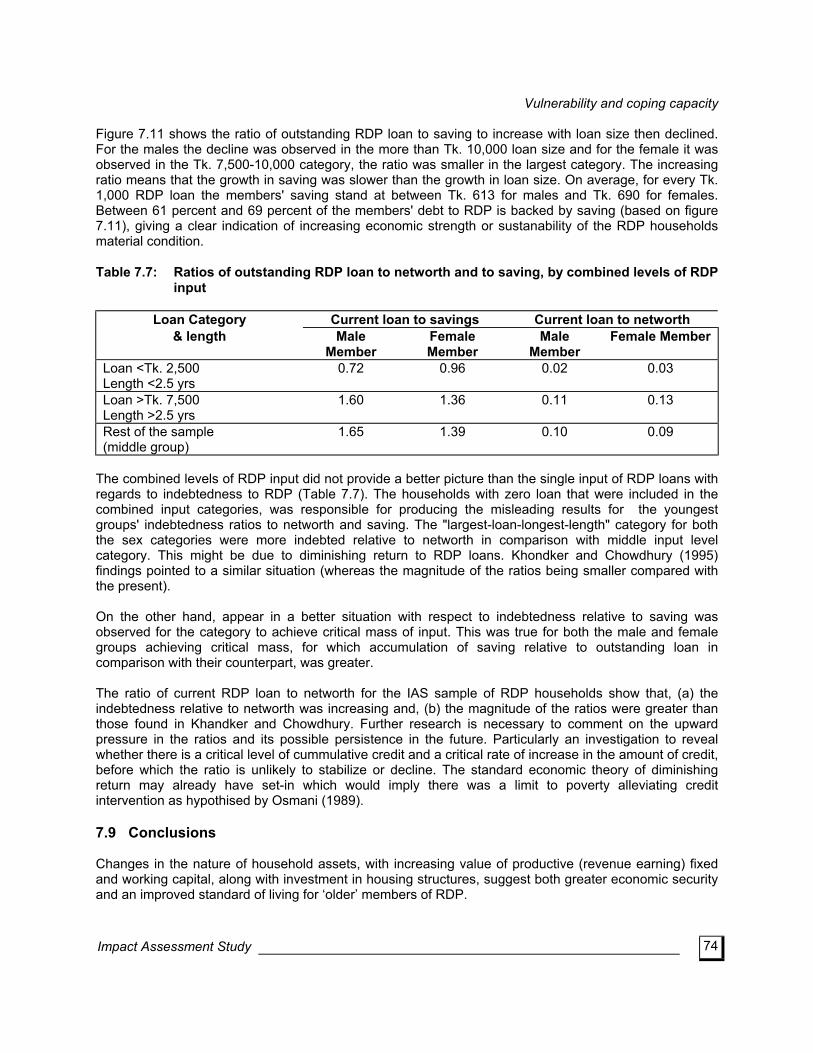
Vulnerability and coping capacity
74
Figure 7.11 shows the ratio of outstanding RDP loan to saving to increase with loan size then declined. For the males the decline was observed in the more than Tk. 10,000 loan size and for the female it was observed in the Tk. 7,500-10,000 category, the ratio was smaller in the largest category. The increasing ratio means that the growth in saving was slower than the growth in loan size. On average, for every Tk. 1,000 RDP loan the members' saving stand at between Tk. 613 for males and Tk. 690 for females. Between 61 percent and 69 percent of the members' debt to RDP is backed by saving (based on figure 7.11), giving a clear indication of increasing economic strength or sustanability of the RDP households material condition. Table 7.7: Ratios of outstanding RDP loan to networth and to saving, by combined levels of RDP
input
Loan Category Current loan to savings Current loan to networth & length Male
Member Female Member
Male Member
Female Member
Loan <Tk. 2,500 Length <2.5 yrs
0.72 0.96 0.02 0.03
Loan >Tk. 7,500 Length >2.5 yrs
1.60 1.36 0.11 0.13
Rest of the sample (middle group)
1.65 1.39 0.10 0.09
The combined levels of RDP input did not provide a better picture than the single input of RDP loans with regards to indebtedness to RDP (Table 7.7). The households with zero loan that were included in the combined input categories, was responsible for producing the misleading results for the youngest groups' indebtedness ratios to networth and saving. The "largest-loan-longest-length" category for both the sex categories were more indebted relative to networth in comparison with middle input level category. This might be due to diminishing return to RDP loans. Khondker and Chowdhury (1995) findings pointed to a similar situation (whereas the magnitude of the ratios being smaller compared with the present). On the other hand, appear in a better situation with respect to indebtedness relative to saving was observed for the category to achieve critical mass of input. This was true for both the male and female groups achieving critical mass, for which accumulation of saving relative to outstanding loan in comparison with their counterpart, was greater. The ratio of current RDP loan to networth for the IAS sample of RDP households show that, (a) the indebtedness relative to networth was increasing and, (b) the magnitude of the ratios were greater than those found in Khandker and Chowdhury. Further research is necessary to comment on the upward pressure in the ratios and its possible persistence in the future. Particularly an investigation to reveal whether there is a critical level of cummulative credit and a critical rate of increase in the amount of credit, before which the ratio is unlikely to stabilize or decline. The standard economic theory of diminishing return may already have set-in which would imply there was a limit to poverty alleviating credit intervention as hypothised by Osmani (1989). 7.9 Conclusions Changes in the nature of household assets, with increasing value of productive (revenue earning) fixed and working capital, along with investment in housing structures, suggest both greater economic security and an improved standard of living for ‘older’ members of RDP.
Impact Assessment Study
Vulnerability and coping capacity
75
Such enhanced security was confirmed most clearly by the reduced seasonal fluctuations in income, expenditure, food consumption and stocks for those members who had joined RDP more than two a half years ago, and received over Tk 7,500 of cumulative RDP loans. These findings clearly indicate that seasonal vulnerability of such households can be reduced by RDP type intervention. In addition, the evidence concerning enhanced coping capacity was generally positive. There was a trend to ‘withdraw’ from the informal credit market, the average amount of credit taken by ‘older’ members was declining, and the use of both RDP and informal loans for consumption or hardship purposes was decreasing with length of membership, just as households experience improvements in their material well-being and ability to weather seasonal lean and peak periods. Although there is an increase in the indebtedness relative to networth, the declining pattern that were observed in indebtedness to savings along with increases in both the absolute values of gross wealth and networth, indicated strengthened capability for RDP households to sustain the improvements in material wellbeing.
Impact Assessment Study
Changes in women's lives
77
8. Changes in women's lives
8.1 Introduction By social custom Bangladeshi women are dominated by men in all spheres of their lives. In her work on poverty in Bangladesh, Lovell (1991) states:
“Women are particularly affected by poverty. Poor women in rural areas have the least power. Traditionally women in Bangladeshi villages have few rights, little choice about the course of their lives, and almost no opportunities to change their situations. Women work nearly twice as many hours each day as men and they are often pregnant or lactating. They have little or no access to people or positions of influence; for the most part they are illiterate; they eat last and eat least. They are often deserted when husbands cannot find income in the villages and move away to pursue work.”
According to most of the usual indices of quality of life and of economic development, women in Bangladesh are disadvantaged in comparison to men. Traditional attitudes and customs in Bangladesh are the major obstacles to any effort to improve the situation of women. A study by ICDDR,B quoted in White (1988) showed that both child mortality and malnutrition rates are higher among female than male children. Females are taken less frequently for medical treatment than male children and their school enrollment rate is lower. Parents do not consider it important to educate girls as they will eventually marry and go away. Boys on the other hand, are expected to shoulder responsibility for the welfare of their parents in old age. Although the Bangladesh constitution grants equal rights to women in all spheres except those governed by Muslim Inheritance Law, in reality, there is a big gap between what women are legally entitled to and what society considers acceptable and justified. Against this background, BRAC along with other NGOs and intervention agencies has realised that true development cannot be achieved unless and until the women are made part of the development process. Consequently, BRAC has been incorporating women into its multifaceted development activities since 1975 (beginning with the Jamalpur Women's Project). In 1991, BRAC made a major shift in targeting from male to female members. Despite its commitment to improving the lives of poor women, BRAC programmes continue to be challenged by the complex web of social and economic relations that hinder change. The main activities of BRAC's Rural Development Programme (RDP) are, a) Institution building including functional education, b) Credit operation, c) Income and employment generation and d) Support service programmes. Each of these interventions are expected to have different kinds of impacts on women's lives. Institution building activities aim to unite VO members, and create a strong sense of group identity and cohesion. It is expected that leadership will emerge from the group and members will act like an autonomous body under this leadership in the pursuit of their common interest. As discussed in the chapter on Institution Building, the process of group formation is also expected to build a sense of self worth among its members. The rest of RDP activities i.e. credit operations, income and employment generation and support service programmes are intended to give women access to loan and income, increase women's control over these resources, raise their decision making power within the household and status. Increased awareness of domestic rights, basic literacy (i.e. learning to write their names) are also expected to change women's status in the household. It is also hypothesized that participation in RDP activities will
Impact Assessment Study
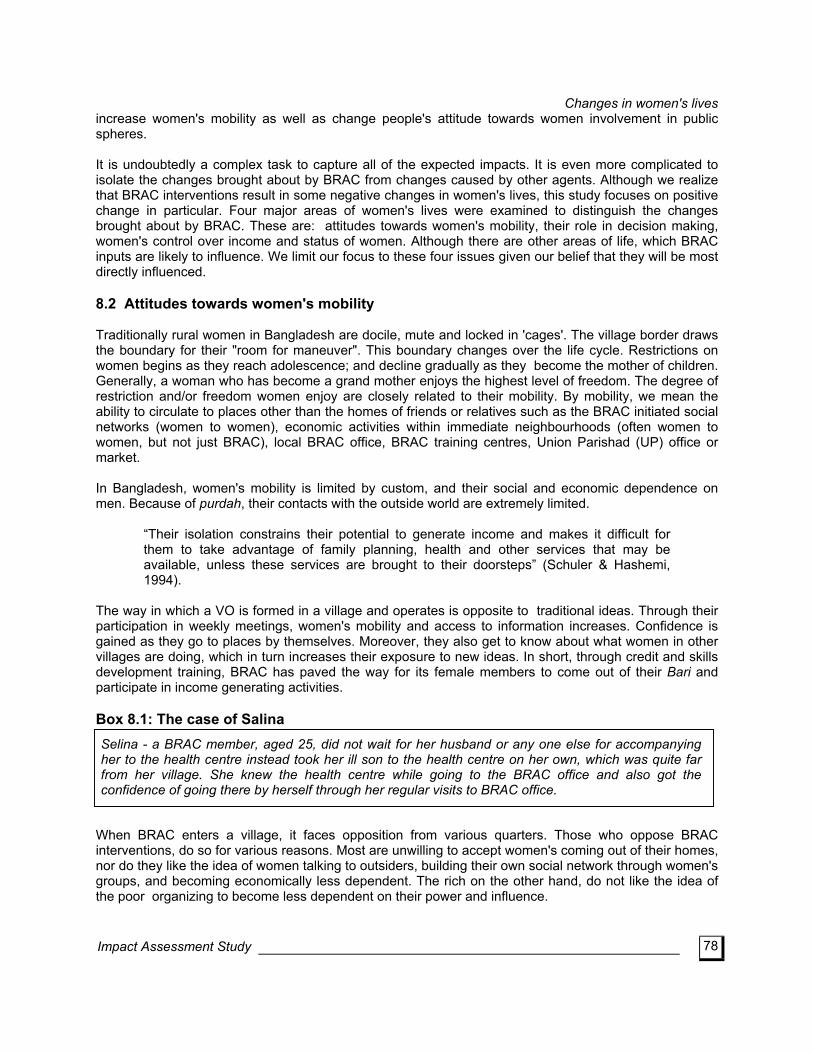
Changes in women's lives
78
increase women's mobility as well as change people's attitude towards women involvement in public spheres. It is undoubtedly a complex task to capture all of the expected impacts. It is even more complicated to isolate the changes brought about by BRAC from changes caused by other agents. Although we realize that BRAC interventions result in some negative changes in women's lives, this study focuses on positive change in particular. Four major areas of women's lives were examined to distinguish the changes brought about by BRAC. These are: attitudes towards women's mobility, their role in decision making, women's control over income and status of women. Although there are other areas of life, which BRAC inputs are likely to influence. We limit our focus to these four issues given our belief that they will be most directly influenced. 8.2 Attitudes towards women's mobility Traditionally rural women in Bangladesh are docile, mute and locked in 'cages'. The village border draws the boundary for their "room for maneuver". This boundary changes over the life cycle. Restrictions on women begins as they reach adolescence; and decline gradually as they become the mother of children. Generally, a woman who has become a grand mother enjoys the highest level of freedom. The degree of restriction and/or freedom women enjoy are closely related to their mobility. By mobility, we mean the ability to circulate to places other than the homes of friends or relatives such as the BRAC initiated social networks (women to women), economic activities within immediate neighbourhoods (often women to women, but not just BRAC), local BRAC office, BRAC training centres, Union Parishad (UP) office or market. In Bangladesh, women's mobility is limited by custom, and their social and economic dependence on men. Because of purdah, their contacts with the outside world are extremely limited.
“Their isolation constrains their potential to generate income and makes it difficult for them to take advantage of family planning, health and other services that may be available, unless these services are brought to their doorsteps” (Schuler & Hashemi, 1994).
The way in which a VO is formed in a village and operates is opposite to traditional ideas. Through their participation in weekly meetings, women's mobility and access to information increases. Confidence is gained as they go to places by themselves. Moreover, they also get to know about what women in other villages are doing, which in turn increases their exposure to new ideas. In short, through credit and skills development training, BRAC has paved the way for its female members to come out of their Bari and participate in income generating activities. Box 8.1: The case of Salina
Selina - a BRAC member, aged 25, did not wait for her husband or any one else for accompanying her to the health centre instead took her ill son to the health centre on her own, which was quite far from her village. She knew the health centre while going to the BRAC office and also got the confidence of going there by herself through her regular visits to BRAC office.
When BRAC enters a village, it faces opposition from various quarters. Those who oppose BRAC interventions, do so for various reasons. Most are unwilling to accept women's coming out of their homes, nor do they like the idea of women talking to outsiders, building their own social network through women's groups, and becoming economically less dependent. The rich on the other hand, do not like the idea of the poor organizing to become less dependent on their power and influence.
Impact Assessment Study
Changes in women's lives
79
Despite all the opposition, women are participating in VO activities with great enthusiasm. Indeed, the large majority of VO members do not encounter any problems in going to BRAC meetings or BRAC Area offices to get loans, medicines or other support services. In the case of two VOs, however, respondents reported that their husbands do not allow them to go away where they would be required to spend the night (e.g., TARCs). Similarly, from the point of view of villagers, they have accepted their women going to BRAC meetings, or to BRAC offices, but still oppose them going to another place for training and staying overnight. Inconvenient timing1 and in certain circumstances, the inappropriateness of training may also explain this opposition. In general, however, the husbands of these VO members, irrespective of whether they themselves are VO members or not, accept their wives’ mobility because of circumstantial reasons. This was evident when we asked them about their views on women related issues. In most cases they told us what they thought we would like to hear: For example, one male respondent group told us that their wives now say:
Women have become more powerful since BRAC came.
They added:
after a whole day's work when we ask them to serve us meal, they just snap at us.
The household survey also confirmed the hypothesis of circumstantial reasons. Majority of the female respondents (70% of comparison group, 69% of female members from the female member households, 64% of female members from the male member households) expressed positive view towards 'because of economic hardship women are going out for their living'. Their positive view includes answers like 'good', to be independent', 'for improvement of economic condition', 'for survival they should'. The comparison group is on the average poorer than BRAC group members (see Table:1 in the Annex-G1). Again the female member households are poorer than the male member households. Respondents from the better off households (i.e. male member households) appeared to be most conservative, in that 32% of them did not think that women should go out. It seems that circumstantial reasons predominates women's positive attitudes towards their mobility. Seventy two percent of the male respondents think that it is either good or women ought to engage themselves in different income generating activities. Again male members from the BRAC involved households were more in favour of it than the male members from the comparison group households (72% from male member households and 74% from female member households as opposed to 69% from the comparison group). However, if we break down BRAC members according to their different lengths of BRAC involvement, we can not really conclude that the older BRAC members have more positive attitudes towards women's mobility. How much power BRAC has really given to these women is open to debate. Villagers have accepted women's mobility insofar as it is necessary for survival. Apart from elders or the extremely religious (both of these more or less overlap), wealthy villagers think it is very good for poor women to join BRAC, just for humanitarian reasons.
It gives them an earning source, in the absence of which they would have been pushed out to begging.
1 By inconvenient timing we mean training does not take into consideration whether the trainees have some one else at their
home to run their home in their absence. Inappropriateness refers to the fact that trainees with no land are being sent for home gardening training or trainees from a village with no ponds are being sent for fishery training etc.
Impact Assessment Study
Changes in women's lives
80
They related the story of Korimon: Box 8.2: The case of Koriman
Korimon a widow of 48 years, has a small family with 2 small grand children. She does not have anything of her own other than her homestead. She does not have anyone to help her either. She is a BRAC member and was trained as a poultry worker. But now that she has become old and cannot see properly, she cannot vaccinate the chicks. She has now moved to a new trade. She goes to the nearby haat (about 8 km. away) to buy toiletries and cosmetic jewelry which she sells to the villagers by going door to door. She got the capital from BRAC. That is how she is managing her family.
The male informant group of this village explained that if Koriman did not have this opportunity, then she would have no alternative except begging. It seems that society is willing to accept mobility among women in vulnerable circumstances, such as those who are divorced or widowed with children to support, and little assets and no income. This outlook differs, however, according to the age of the woman concerned. For example, young women are criticized more frequently for doing work than widows or older women. This criticism comes from people from all walks of life: rich-poor, male-female etc. As a result, few women actively seem to establish their own identity, network of friends, information sources through work. If they have enough to live on, they are quite happy to stay at home. Apart from going to BRAC AO or UP office, VO members rarely go to other places. In some cases, they go to hospitals with their children. But if it is too far, get someone else to go with them. Only a few women from richer families who are lucky enough to be educated have regular out-of-house employment. They are not criticised, because they come from the upper class. BRAC is developing some para-professionals in the villages. These include Shasthya Sebika, Poultry Vaccinators, Paravets etc. Such professions necessitate that women move around the village and on occasion require to travel to distant villages. The number of para-professionals is usually not more than two in one VO. These women tend to be smart, vocal and mobile and as a result, they do not face much criticism. Women are not criticised if they can earn by staying within the house and through maintaining purdah (e.g. embroidery, paddy husking, pitha making etc.) Respondents from a 10 year old female group mentioned that with their BRAC loans, they make `pitha' and sell it to the market through their small children. Although they are relatively older women, they still do not feel comfortable about going to the market. Maintenance of purdah is very important for women members. In almost all cases they mentioned that they go to the BRAC office in proper purdah. So there is no harm in going to BRAC office. Box 8.3 : The Kachari Ghar
In the case of one VO (T), initially the venue for weekly meeting was the "Katchari Ghar" of Munshi Bari. Most female members refused to go there for meeting as it was a public place and it is indecent for women to go there. As a result. their husbands used to deposit their savings and installment for them. After 3 months, the venue was shifted to the secretary's house, and the attendance in the meeting increased remarkably.
Impact Assessment Study
In conclusion it can be inferred that BRAC involvement has increased women's mobility to some extent. Their increased mobility has created lot of reactions among the villagers (See for instance Mannan et al,
Changes in women's lives
81
1994). However, if we want to compare the changes in attitudes towards women's mobility with the date of formation of the VOs, no clear trend can be observed. Initially in many villages there was hostility towards female VOs2 except the ones which began by making many promises or own initiatives by women themselves. All the villagers accept women attending meetings and visiting BRAC AO. But their going to BRAC training centres for more than a day is still not approved of in many areas. Only 5 out of 16 VOs did not raise any objection to women's travelling to other places for BRAC related activities. Among these 5 VOs, 4 cases women were relatively mobile even before BRAC interventions. In the last VO, which is from the pre RDP period, women members are relatively older. Their increased mobility, therefore are attributable to both BRAC interventions and the age of VO members. In all cases, women's work in public places is approved only under extreme circumstances. 8.3 Decision making power within and outside household Decision making power is an important indicator of women's status. However, it is a very difficult indicator to capture changes in. Household decisions are rarely discrete events. Rather, there is a lot of prior discussion, argument and persuasion behind each decision made. Consequently, when we claim that a certain decision was made by a certain member of the household, there is a danger of ignoring the likely involvement of others. Although we are aware of this, in the following analysis, we took the answers from the respondents at face value. It is expected that as a result of participation in BRAC programmes, women will acquire resources, build social networks and gain knowledge and power to make decisions regarding matters both within and outside the households. Blood and Wolfe think "the continual participation of the wife in the occupational world accelerates her maturity toward decision making resourcefulness" (Quoted in Ainun Nahar Mizan, 1994). A study on the Grameen Bank found that greater mobility and a wider scope for association as a whole has resulted in a general elevation of women's self confidence. Greater awareness has also led to increased female participation in household decision making (Huq, 1985). In an attempt to estimate women's decision making power, we divided women's decision making power into private and public spheres. 8.3.1 Decision making within the household To bring about changes in women's status in the household participation in household decisions about the education of their own children, savings, credit, sale or purchase of assets (poultry and livestock) and children's marriage etc. are prerequisites. It was hypothesized that women's involvement in different RDP activities would result in greater female participation in these household decision making process. In terms of children's education, almost all the female group members interviewed stated that they were responsible for monitoring their children's education because they stay at home. As ‘Madhuri’ President of VO ‘N’ stated
Is it possible for any husband to look after the schooling of the children when he is at work the whole day?.
Women also reported spending the small amount of money they save by selling eggs or poultry birds or ‘mushti chal’ (fistful rice) to cover the costs of education. As Ahmed (1980) notes women take pride in spending their own money for their children. It should be noted, however, that most of the women interviewed did not have any children in school before joining BRAC. It was only after BRAC schools were established, that they started sending their
2 Please see Annex- for different age categories of VOs and the rational for such categories.
Impact Assessment Study
Changes in women's lives
82
children to schools. Women now consider themselves the principal guardians of children and they regularly attend monthly parent's meeting. Although the final decision to send children to school is taken by the father, women enjoy the responsibility of looking after their children's education. Savings is another area of decision making. After joining the VO, women usually pay weekly savings from the “expenditure saving homestead activities” like sales from eggs, fruits, home grown vegetables or accumulated ‘mushti chal’. Women also use these sources for repaying their loan installments in cases where husbands do not regularly supply the weekly installment. (Loan repayment from these sources are likely to have a negative outcome in terms of a depletion of daily consumption resources within the household, as well as a depletion in resources otherwise kept for savings.) Members from two (one from pre-RDP period and another from RDP Phase-I) out of sixteen VOs stated that they managed loans themselves from their own (domestic) income. An important observation regarding cash savings is that poorer women tend to report a greater degree of independence than those who are a little better-off than them. For example, one of the VO president - Rohima, a poor woman, said that she and her fellow members decided by themselves how much they would save. She saved Tk. 2,200 herself, and her fellow members also saved a substantial amount. Sufia-a relatively well off member, on the other hand, saved only a small amount. There are several explanations for this. Firstly, male members of the comparatively well-off households tend to use their wives as a means of getting loans and co-operate with them to save the required floor amount needed to obtain the loan only. Poorer women on the other hand, consider their savings as their only asset. Secondly, women from relatively well-off households do not usually work outside the household but are involved in income generating activities within their household. As a result, they have very little cash income of their own. By contrast, women from poorer households are engaged in both home-based and certain types of income generating activities outside the home which give them slightly higher income than the household based-income generating activities. As they earn it themselves, they have greater degree of control over it. Decision making regarding loan is directly related to the production process. Except for a few female headed households all the members from 12 out of 16 VOs stated that they discuss the timing and use of loans with their husbands. The tribal (Garo) female members stated that they decided themselves when to draw loans. Members from three other VOs told us that their husbands usually decide when to draw loan without consulting them. The household (HH) survey data shows that in a household, who decides about whether or not to take loan is influenced by the length of BRAC membership. There is a clear trend of decline in the percentage of women deciding themselves about when to take loan, while the incidence of joint decision making increases over the same period. However, the husband remains the most important decision maker regardless of the length of BRAC involvement (See Table 4 of Annex-G3). This is not necessarily an unacceptable situation. with long BRAC involvement, the size of loan grows. Women themselves do not have opportunities to invest those. Consequently, their husbands are consulted. However, the HH survey data shows that women in general decide where to spend their income (sources of income are not known). Female BRAC members are more assertive compared to non-BRAC female respondents from BRAC HHs. Although the decision making ability of women does not have any relation with the types of activities performed by them, the length of membership does have some bearing on their decision making about spending their income. The percentage of women deciding by themselves and by their husbands steadily goes down with their length of membership. We can assume that with longer BRAC involvement, their income level goes up which they then spend/invest on some productive
Impact Assessment Study
Changes in women's lives
83
purpose (other than HH consumption). And they are now being consulted which is an indication of their improved status (within the HH) also ( See Table1 and Table2 of Annex G3). Regarding loan size and decision maker, although there is a clear distinction between decision makers of smallest loan holder and largest loan holders, but no clear trend can be traced back for other loan holders. For smallest loan holders, more women made their decisions by themselves, for largest loan holders, husbands' involvement increased remarkably (See Table 3 of Annex- G3). Decision making power is highly correlated with control over income and assets. As we discussed earlier, women in general have little control over the income that arises from their loan investments (as it is handled by men). Most of the women own only clothing type of assets except for a few who own land and non land productive assets which they acquired mostly from various sources (other). Women's decision making ability is not related to their asset ownership either. This study confirms that in the case of minor household decisions, women's participation is increasing. In reply to our question about selling and purchasing poultry and livestock, women group members said that they could make decisions about whether to purchase or sell poultry. In the case of VGD (vulnerable group development) card holders, the situation is slightly different. They purchase poultry according to the programme rules. Most of the VGD card holders told us that given the choice, they would have preferred to buy local varieties as their mortality rate is low. But in the case of purchasing or selling of livestock they discuss with their husbands. Two female VOs claimed that they themselves decided on whether to purchase or sell both poultry and livestock. In 7 VOs, women stated that they consulted with their husbands on selling or purchasing assets such as poultry and livestock, while 6 others said that they were influenced by outsiders (e.g. BRAC staff insisted on their buying it). In the remaining 6 VOs women stated that they consider poultry birds as assets only because they had nothing but poultry birds to purchase or sell. In short, it seems that women (except the VGD programme beneficiaries) are enjoying the right to decide on the purchase or sale of poultry , but not livestock. Since most of the time women are directly involved in the management of poultry, this gives them the right and opportunity to participate in decision making. Decisions about children's marriage are important in family life. In our study, almost all our female respondents said that they discuss their children's marriage with their husbands, though they admitted that the final decision is made by their husbands. On the other hand, dowry is handled entirely by men. From the bridegroom's side, either the bridegroom or his father decides how much dowry they want, and on the brides side, it is the father of the bride who negotiates whether or not he will pay that amount. According to the women group members, they have greater power to oppose their husband's second marriage than before. According to the HS 68% of the respondents from BRAC member households know that a marriage to be legalised it has to be registered. This compares to only 32% of the comparison group. Although no incidents of husband's taking a second wife were reported, the women in two VOs (N and Q) claimed that they would resist it if it really happens. Though it is merely a claim it was made decisively. In another instance, in one VO women successfully resisted such a case. When a husband of a VO member wanted to throw his wife out of the house in order to marry again, women members opposed it by threatening:
If you want to marry again, it is you who would leave this house. It was built with your wife's loan money.
However, the HS did not show very encouraging picture about their knowledge about divorce, where 52% of the female respondents from the BRAC member households said that divorce takes place if any one pronounces the word 'divorce' thrice. This compares with 47% from the comparison group.
Impact Assessment Study
Changes in women's lives
84
8.3.2 Decision making outside the household Involvement of women in making decision outside household is critical in achieving desired changes. In women's lives, through RDP, female group members are directly involved in different activities such as the process of VO formation, management committee formation and reformation, VGD card recipient selection, trainees and loanees selection etc. It is presumed that these types of activities will enable women to have a greater say in decisions about matters in the public sphere. If we look at the women's role in political decision making such as voting, it is not very encouraging. Fourteen VOs stated that their husbands decide for whom they will vote. Only two VOs mentioned that they decided who they would vote for in a participatory way with their husbands. The majority of female members, however, claimed that:
The ways followed by the husband should be followed by their wives. However, a few of the informants said that if their husbands pressed them to vote for a bad person they would secretly cast their vote for the person they think is good. When female members of the management committee were asked these questions, they replied that they voted as per their own decision. A number of male member also said that the women could vote for anybody they liked. According to the HS information, 84% of the members from BRAC households cast their votes in the last election whereas the percentage for the comparison group was 77% only. One of the most important areas of decision making is the village organizations to which women are associated. Decisions about joining the VO are considered first. A great number of institution building activities like individual contacts, small and large group discussions take place before a VO is officially formed, which have a big influence on the decisions to form a village organization. According to female members, while they consulted the matter with their husbands, in most cases the decision of the woman was the final one. In some instances, the women were so eager to form a village organisation that they attended the meeting in an adjacent village several times in hopes of being included in the VO. The power exercised by the women in making the decision to join a group represents a great step forward in terms of women's participation in the public sphere. Women also make decisions about the formation and reformation of the management committee. However, in the case of 13 VOs, the management committee has not changed since its formation. It was alleged by the members that BRAC's field staff preferred to depend on a few management committee members, thereby denying many women the opportunity to develop their ability to make decisions. Women also voiced their opinion regarding the other VO activities where women can theoretically participate in the decision making process. These activities include the selection of borrowers, and VGD card recipients. Fourteen VOs reported that except for the first time, all the VGD card holders were selected by BRAC staff and the list of deserving women provided by the VO was not considered. However, in selecting trainees and loanees, almost all VO members stated that they themselves made the decisions. 8.4 Control over income In Bangladesh, women are dominated by men. In rural poor families women provide "household services", but have no involvement in decision making about households' financial matters. They often have no control over their own savings, jewelry and brass utensils, which were given to them at their marriage(see Kabeer, 1994 for instance).
Impact Assessment Study
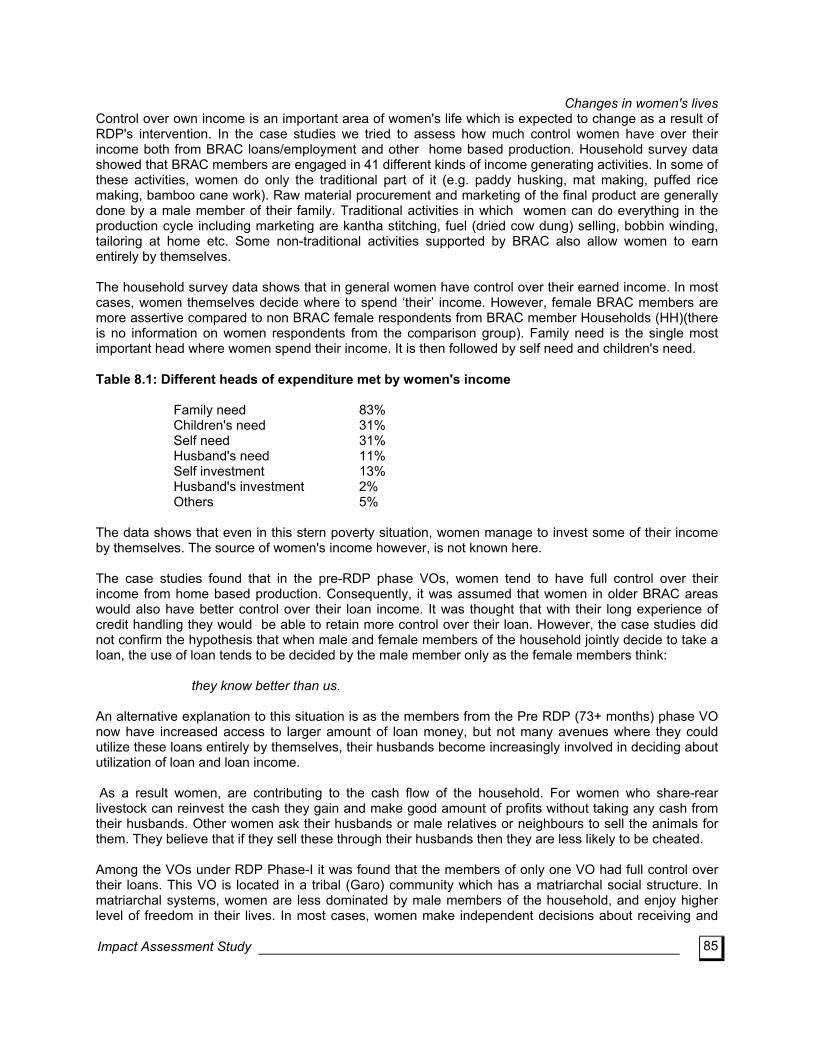
Changes in women's lives
85
Control over own income is an important area of women's life which is expected to change as a result of RDP's intervention. In the case studies we tried to assess how much control women have over their income both from BRAC loans/employment and other home based production. Household survey data showed that BRAC members are engaged in 41 different kinds of income generating activities. In some of these activities, women do only the traditional part of it (e.g. paddy husking, mat making, puffed rice making, bamboo cane work). Raw material procurement and marketing of the final product are generally done by a male member of their family. Traditional activities in which women can do everything in the production cycle including marketing are kantha stitching, fuel (dried cow dung) selling, bobbin winding, tailoring at home etc. Some non-traditional activities supported by BRAC also allow women to earn entirely by themselves. The household survey data shows that in general women have control over their earned income. In most cases, women themselves decide where to spend ‘their’ income. However, female BRAC members are more assertive compared to non BRAC female respondents from BRAC member Households (HH)(there is no information on women respondents from the comparison group). Family need is the single most important head where women spend their income. It is then followed by self need and children's need. Table 8.1: Different heads of expenditure met by women's income
Family need 83% Children's need 31% Self need 31% Husband's need 11% Self investment 13% Husband's investment 2% Others 5%
The data shows that even in this stern poverty situation, women manage to invest some of their income by themselves. The source of women's income however, is not known here. The case studies found that in the pre-RDP phase VOs, women tend to have full control over their income from home based production. Consequently, it was assumed that women in older BRAC areas would also have better control over their loan income. It was thought that with their long experience of credit handling they would be able to retain more control over their loan. However, the case studies did not confirm the hypothesis that when male and female members of the household jointly decide to take a loan, the use of loan tends to be decided by the male member only as the female members think:
they know better than us.
An alternative explanation to this situation is as the members from the Pre RDP (73+ months) phase VO now have increased access to larger amount of loan money, but not many avenues where they could utilize these loans entirely by themselves, their husbands become increasingly involved in deciding about utilization of loan and loan income. As a result women, are contributing to the cash flow of the household. For women who share-rear livestock can reinvest the cash they gain and make good amount of profits without taking any cash from their husbands. Other women ask their husbands or male relatives or neighbours to sell the animals for them. They believe that if they sell these through their husbands then they are less likely to be cheated. Among the VOs under RDP Phase-I it was found that the members of only one VO had full control over their loans. This VO is located in a tribal (Garo) community which has a matriarchal social structure. In matriarchal systems, women are less dominated by male members of the household, and enjoy higher level of freedom in their lives. In most cases, women make independent decisions about receiving and
Impact Assessment Study
Changes in women's lives
86
utilizing loans. They are directly involved in income generating activities and earning themselves. As a result they have full control over income from their own BRAC loan investments as well as earnings from employment as poultry workers, paravets or Shasthya Sebikas. The rest of the VO members in RDP Phase-I also participate in decisions about when to draw loans. As far as spending income from their loan is concerned, women respondents said that they can spend it, but they make their husbands aware.
If our husbands spend ten taka, we can also spend ten taka, but we have to just inform our husbands.
Husbands on the other hand, spend without consulting their wives even if the money belongs to the wives. Before joining BRAC the women had no say whatsoever about their husbands business. Now women claim that they are considered essential to family maintenance as they bring in loans. With their new found economic role, has come an increase in control over household affairs. Self employed female members have different levels of control over their income depending upon their type of employment. For example, a Chick rearer may have less control than a Poultry worker, or a Paravet. In general, women have more control over their income if they do not have to depend on anyone else at any stage of the enterprise. In the case of chick rearing, BRAC's support is often insufficient, a woman must depend on her husband or other male members of the family to buy feed. In fact, when discussing the benefits they receive from BRAC, the husbands of two chick rearers claimed that the rearing units were theirs. When we told them that we knew that those units actually belonged to their wives, they said,
these units are only in their names. We actually run this business. These are ours.
In RDP phase-II areas it was evident that the VO members are yet to experience any change in the degree to which they control income resulting from BRAC programmes. Because these VOs have been formed in recent past and only a few of the members have received substantial loans, women tend to make loan decisions according to their husbands advice. Men also take decisions about spending any income generated from loan investment. Nevertheless, these women feel that their control has been increased a little, because their husbands now depend on them as an important source of cash for the household. In conclusion, it can be inferred that women have control over that part of the income which they earn entirely by themselves and in activities where they do not have to seek help from their male counterparts at any stage. BRAC loans have changed their position within the household to some extent. Often, they cannot use the money themselves, but have to depend upon male members for market-related activities. As a result they cannot exercise full control over their income. If BRAC provided them more with some more avenues for investment, or provided the necessary support so that women might conduct the entire activity by themselves, a significant number of women would then gain more control over their income. This in turn will contribute to the enhancement of their status within the household. Once this is accepted within the household, society will gradually accept it too. 8.5 Change in the status of women In general, the literature defines "women's status" as women's position relative to men's in any given society or to women in other societies. In her work on women's status in rural society Parveen Ahmed (1980) shows how villagers do not consider 'money' the sole determinant of status. Rather, there are many other behaviours which are involved, including the type of work performed. For example, working
Impact Assessment Study
Changes in women's lives
87
as domestic help is considered lowly work. In Ahmed's (1980) study, respondents noted an array of indicators of change in status. They noted how their children now ask them to buy their school books and stationery. They related how they receive visits from important people. Some of whom are perceived to have the power to help them by using outside village contacts. Finally, they remarked that their husbands do not abuse them any more as they now earn money. Chen and Mahmud (1993) define status as a combination of prestige, power and control over productive resources. They hypothesize that development interventions will affect women's lives by increasing their access to and control over resources by altering levels of knowledge, skills, and awareness of wider environment, by modifying women's bargaining power in a variety of relationships and by changing the way in which people perceives women and their perception about women and their perception about themselves. According to the authors, these change are not limited to women alone, but will affect many other societal agents such as ‘family’, ‘community’, ‘elites’ and ‘officials’. BRAC's development interventions are expected to stimulate change of their nature. BRAC's provision of credit is supposed to change women's access to and control over resources. Training is aimed to increase their level of knowledge and regular attendance at meetings, as well as visits to AOs and TARCs are expected to increase their awareness of the wider world. Together these forces are expected to change women's bargaining power, within the household and society at large. which is not possible for us to document the totality of change as experienced in the multiple spheres of women's lives, we will limit ourselves to changes in women's status at the household and community level. 8.5.1 Change within the household Women's lives are governed by a number of powerful institutions; e.g. social, cultural and religious norms, marriage, labour markets and most importantly purdah. All these institutions are characterized by gender inequalities which exacerbate and perpetuate the low status of women. In rural Bangladesh, unemployment and underemployment among men is pervasive. Women have even less opportunity to earn an income. Through the credit program, BRAC has tried to give the rural women skills and knowledge, and to involve them in income generating activities. In the case studies that follow, we try to explore what changes they experienced as a result of their involvement with BRAC. BRAC programmes are generally targeted at the poor who own less than 50 decimals of land and sell manual labour for at least 100 days per year. The primary occupation of member households is agriculture day labour. A much smaller population are petty traders and rickshaw/van pullers. In most cases, the male member of the household is the primary income earner. Women are responsible for household chores, and often assist in the work of their husbands. Along with their domestic duties, most women are also engaged in some sort of traditional income earning activities e.g. growing vegetables, rearing poultry, stitching kantha etc. Eighty two percent of BRAC's target population are women, and 74 percent (Statistical Report, 1993) of BRAC credit is received by them. However, our study found that in majority of cases, male members of the households utilize the loans received by female members. Under normal circumstances, poor people want to be involved with their inherited profession if they are not forced to do otherwise. Social values coupled with lack of opportunity for occupational diversification are responsible for this. Sometimes getting involved in new economic activities requires substantial initial investments of capital which most poor households can ill afford. For this reason, VO members often find it more convenient to invest their loans in their traditional occupations. For women, it is even more difficult as the traditional social sanc- tions do not allow women venture into public spheres, nor to undertake 'men's work'. In view of these pressures, the large proportion of female VO members let their husbands utilize BRAC loans.
Impact Assessment Study
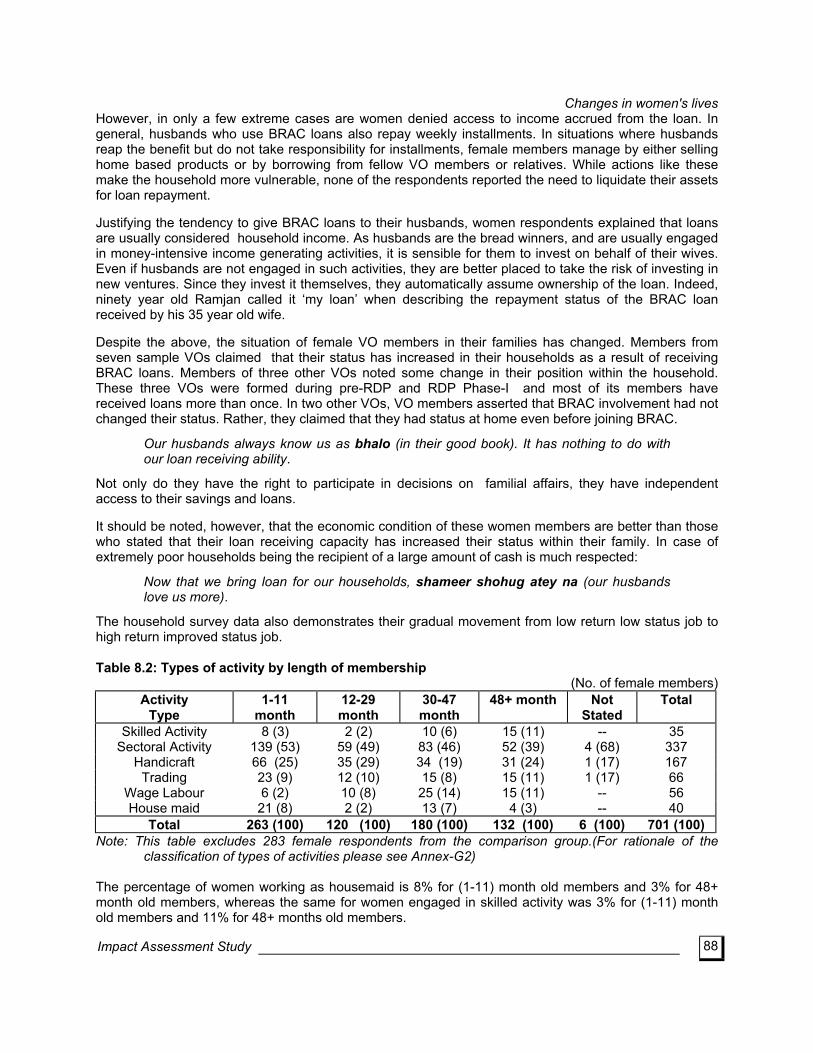
Changes in women's lives
88
However, in only a few extreme cases are women denied access to income accrued from the loan. In general, husbands who use BRAC loans also repay weekly installments. In situations where husbands reap the benefit but do not take responsibility for installments, female members manage by either selling home based products or by borrowing from fellow VO members or relatives. While actions like these make the household more vulnerable, none of the respondents reported the need to liquidate their assets for loan repayment. Justifying the tendency to give BRAC loans to their husbands, women respondents explained that loans are usually considered household income. As husbands are the bread winners, and are usually engaged in money-intensive income generating activities, it is sensible for them to invest on behalf of their wives. Even if husbands are not engaged in such activities, they are better placed to take the risk of investing in new ventures. Since they invest it themselves, they automatically assume ownership of the loan. Indeed, ninety year old Ramjan called it ‘my loan’ when describing the repayment status of the BRAC loan received by his 35 year old wife. Despite the above, the situation of female VO members in their families has changed. Members from seven sample VOs claimed that their status has increased in their households as a result of receiving BRAC loans. Members of three other VOs noted some change in their position within the household. These three VOs were formed during pre-RDP and RDP Phase-I and most of its members have received loans more than once. In two other VOs, VO members asserted that BRAC involvement had not changed their status. Rather, they claimed that they had status at home even before joining BRAC.
Our husbands always know us as bhalo (in their good book). It has nothing to do with our loan receiving ability.
Not only do they have the right to participate in decisions on familial affairs, they have independent access to their savings and loans. It should be noted, however, that the economic condition of these women members are better than those who stated that their loan receiving capacity has increased their status within their family. In case of extremely poor households being the recipient of a large amount of cash is much respected:
Now that we bring loan for our households, shameer shohug atey na (our husbands love us more).
The household survey data also demonstrates their gradual movement from low return low status job to high return improved status job. Table 8.2: Types of activity by length of membership
(No. of female members) Activity
Type 1-11
month 12-29 month
30-47 month
48+ month Not Stated
Total
Skilled Activity 8 (3) 2 (2) 10 (6) 15 (11) -- 35 Sectoral Activity 139 (53) 59 (49) 83 (46) 52 (39) 4 (68) 337
Handicraft 66 (25) 35 (29) 34 (19) 31 (24) 1 (17) 167 Trading 23 (9) 12 (10) 15 (8) 15 (11) 1 (17) 66
Wage Labour 6 (2) 10 (8) 25 (14) 15 (11) -- 56 House maid 21 (8) 2 (2) 13 (7) 4 (3) -- 40
Total 263 (100) 120 (100) 180 (100) 132 (100) 6 (100) 701 (100) Note: This table excludes 283 female respondents from the comparison group.(For rationale of the
classification of types of activities please see Annex-G2) The percentage of women working as housemaid is 8% for (1-11) month old members and 3% for 48+ month old members, whereas the same for women engaged in skilled activity was 3% for (1-11) month old members and 11% for 48+ months old members.
Impact Assessment Study
Changes in women's lives
89
The trend is reversed for women engaged in sectoral activities because the sectoral programmes have started only recently (late '80s early '90s) and that is why it is more likely that new members have received more inputs than the older members. More women are leaving the traditional handicrafts and joining trading activities. Another important change noted by respondents was the increased recognition of women's contribution to familial expenses. It is also a great relief for these poor families as they do not need to go to the mahajan (traditional money lender) to borrow money for contingencies. When a woman from a household which is just making ends meet takes a BRAC loan, this enables the family to manage their budget better. Elem Kazi, himself a BRAC member said,
My wife has the right to buy toiletries and cosmetic jewelry on her own from the income of her loan though it is invested by me. Last month, she bought a cooking pot which cost taka 80. She said it was essential for her kitchen. I did not argue with her about its necessity. But she would not have done this before receiving loan. I used to go outside in the evenings for chanting religious texts. My wife did not raise any objection to it before. Now she often objects to it and compels me to look after the children at night. But I indulge her since it is difficult for me to maintain my family without accepting her monetary and also social support.
Discussion with members of two VOs from RDP phase I revealed that the FE classes has heightened awareness about their status within the household. In particular, they mentioned the oath no. 11 in their savings pass book in which women promise to protest their husband's oppression. In this context, they informed us that their husbands dare not abuse them and take second wives like before. In one VO, the husband of one member wanted to drive his wife away from the house to get a second wife. All the group members came together to protest.
If each of our fifty members pinch this man, then what will happen to him? This woman will stay in this house and if he likes he can build another house for himself.
Functional education also teaches VO members how to sign their names. Women respondents noted how their children have more love and respect for them:
Our children give us somman (honour) when they see their mothers are writing their names correctly.
8.5.2 Change in community status VO case studies also revealed that BRAC involvement has to some extent changed women's status within the community. Before becoming BRAC members, women had no access to institutional loans, nor were they able to borrow money from the traditional money lenders, because they were not considered credit worthy. Occasionally they received short term loans but were charged more interest due to the perceived insecurity of their loan. The VO members believe that BRAC involvement has increased their credit worthiness in the eyes of mohajans. Indeed, some VO members have managed to change their socio-economic situation through repaying their overdue mahajani loans after the receipt and utilization of BRAC loans.
Impact Assessment Study
In the field of social relations with rural elites, the impact of BRAC programmes is still unclear. While VO members mentioned that income generation has reduced their vulnerability, but, they acknowledged that their social status within the community has remained largely unchanged.
Changes in women's lives
90
For some VO members, involvement in BRAC organised sector programmes has enabled them to provide the community with important skills including paramedical, and para veterinarian services. However, as one Shasthya Sebika (health worker) comments:
rural women are grateful to us, because we regularly monitor pregnant women and supply medicines. But it hasn't changed our position in society. The elite class don't want to get their son or daughter married to our family. Moreover, it is often heard that they would never establish matrimonial relation with VO members because of our out-going activities.
In one village from the RDP-I category things seemed to have changed a little more. Here, VO members noted that the well-off families beginning to marry their sons with the daughters of VO member's families in exchange for dowry. Given their belief that VO members are now able to afford dowry because of their improved economic status. BRAC involvement does not appear to have resulted in any change in the position of VO members in relation to the village salish. Usually the elite class of the village assumes leadership roles as an ‘inherited’ right. The VO members passively observe deliberations by the salish, but have no say in the way decisions are made, nor have they the right to disagree. A few VO members claimed that they do participate in the salish but they do it through a right which they inherited. This latter group became poor recently due to their separation from their father's household. They note, however, a change in the way they are treated as their socioeconomic status improves:
in the past we used to sit on the ground, with other poor people. And now we are offered to sit on the bench. So, this is our improvement. May be in future we will be able to sit on chair. We don't have active participation in salish, but we can make plea against the decision if it is taken wrongly.
Females do not participate in the salish, although they may be penalized there. Fortunately, there were no reported incidents of a female VO member being punished in a salish despite strong feelings of antagonism from the rural elites and religious people. In summary, two different trends in the patterns of change in women's status was found. In terms of the economic status of women, improvements have been occurring both within and outside of the household. However, women's social status remains unchanged. As women's status is culturally ascribed (Scott, 1986), there are limits to what BRAC can expect to achieve regarding changes in the social identity of women. To what extent can we attribute changes in women's status to their involvement with BRAC? Indeed, women's status may change due to cultural factors (if religion or custom were more in favour of women, then a small input from BRAC would have had larger impact), life cycle factors, and/or individual characteristics of household circumstances. It is difficult to measure the exact contribution made by any or all of the above mentioned factors. The fact that women's economic status has increased over time could be due to the receipt of BRAC loans or the result of life cycle changes. Women in Bangladesh enjoy different levels of status at different stages of life-cycle. For example, members of older VOs have received more loans and are therefore more mature in handling them. They also receive more respect from household and community members, as they are older. Members of younger VOs on the other hand are in the early stages of their march towards better status both in terms of their age and experience in loan handling. 8.6 An overview of the impact
Impact Assessment Study
In order to identify the degree of change in women's lives we developed a continuum whereby the VO with the highest score is at one end and the VO with the lowest score is at the other end, and the rest of
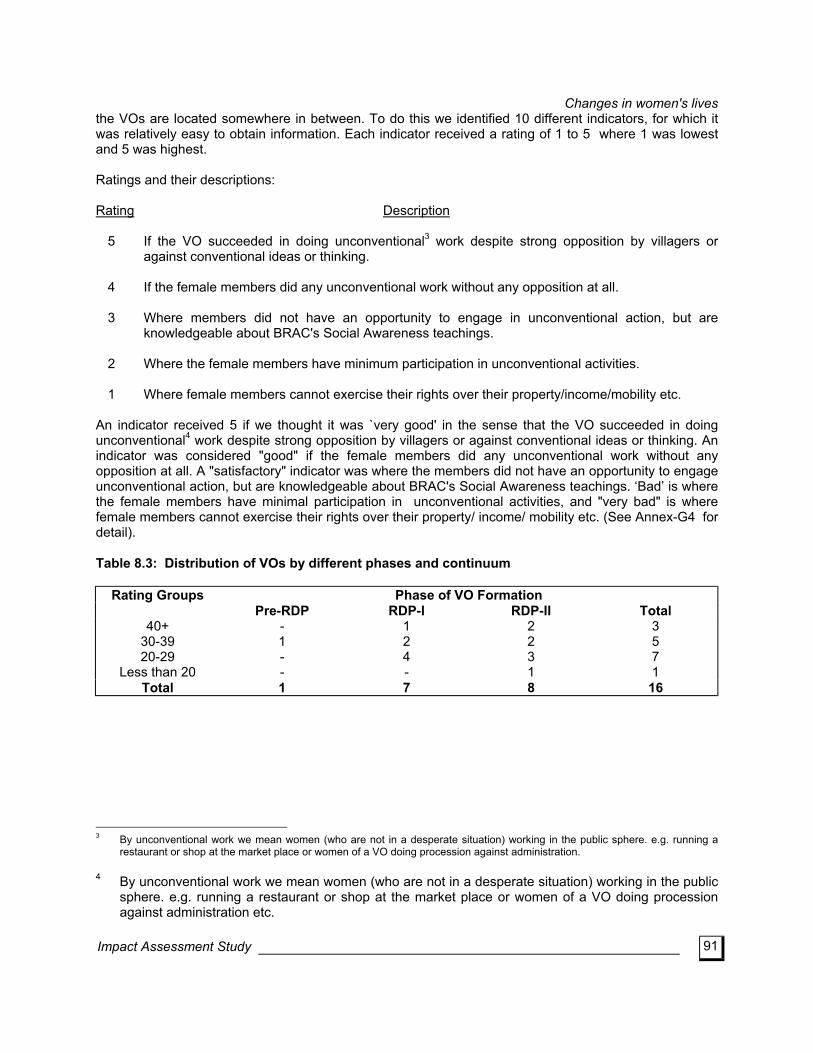
Changes in women's lives
91
the VOs are located somewhere in between. To do this we identified 10 different indicators, for which it was relatively easy to obtain information. Each indicator received a rating of 1 to 5 where 1 was lowest and 5 was highest. Ratings and their descriptions: Rating Description
5 If the VO succeeded in doing unconventional3 work despite strong opposition by villagers or against conventional ideas or thinking.
4 If the female members did any unconventional work without any opposition at all. 3 Where members did not have an opportunity to engage in unconventional action, but are
knowledgeable about BRAC's Social Awareness teachings. 2 Where the female members have minimum participation in unconventional activities. 1 Where female members cannot exercise their rights over their property/income/mobility etc.
An indicator received 5 if we thought it was `very good' in the sense that the VO succeeded in doing unconventional4 work despite strong opposition by villagers or against conventional ideas or thinking. An indicator was considered "good" if the female members did any unconventional work without any opposition at all. A "satisfactory" indicator was where the members did not have an opportunity to engage unconventional action, but are knowledgeable about BRAC's Social Awareness teachings. ‘Bad’ is where the female members have minimal participation in unconventional activities, and "very bad" is where female members cannot exercise their rights over their property/ income/ mobility etc. (See Annex-G4 for detail). Table 8.3: Distribution of VOs by different phases and continuum
Rating Groups Phase of VO Formation Pre-RDP RDP-I RDP-II Total
40+ 30-39 20-29
Less than 20
- 1 - -
1 2 4 -
2 2 3 1
3 5 7 1
Total 1 7 8 16
3 By unconventional work we mean women (who are not in a desperate situation) working in the public sphere. e.g. running a
restaurant or shop at the market place or women of a VO doing procession against administration.
4 By unconventional work we mean women (who are not in a desperate situation) working in the public sphere. e.g. running a restaurant or shop at the market place or women of a VO doing procession against administration etc.
Impact Assessment Study
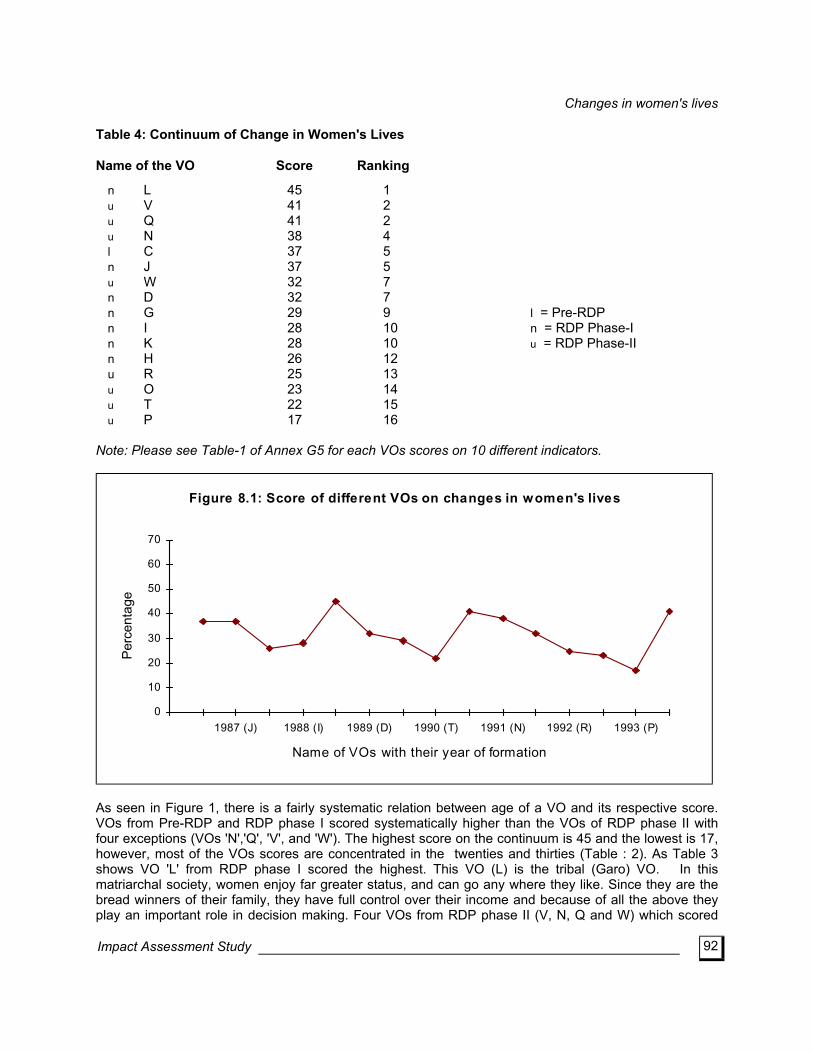
Changes in women's lives
92
Table 4: Continuum of Change in Women's Lives Name of the VO Score Ranking
n L 45 1 u V 41 2 u Q 41 2 u N 38 4 l C 37 5 n J 37 5 u W 32 7 n D 32 7 n G 29 9 l = Pre-RDP n I 28 10 n = RDP Phase-I n K 28 10 u = RDP Phase-II n H 26 12 u R 25 13 u O 23 14 u T 22 15 u P 17 16
Note: Please see Table-1 of Annex G5 for each VOs scores on 10 different indicators.
Figure 8.1: Score of different VOs on changes in women's lives
0
10
20
30
40
50
60
70
1987 (J) 1988 (I) 1989 (D) 1990 (T) 1991 (N) 1992 (R) 1993 (P)
Name of VOs with their year of formation
Perc
enta
ge
As seen in Figure 1, there is a fairly systematic relation between age of a VO and its respective score. VOs from Pre-RDP and RDP phase I scored systematically higher than the VOs of RDP phase II with four exceptions (VOs 'N','Q', 'V', and 'W'). The highest score on the continuum is 45 and the lowest is 17, however, most of the VOs scores are concentrated in the twenties and thirties (Table : 2). As Table 3 shows VO 'L' from RDP phase I scored the highest. This VO (L) is the tribal (Garo) VO. In this matriarchal society, women enjoy far greater status, and can go any where they like. Since they are the bread winners of their family, they have full control over their income and because of all the above they play an important role in decision making. Four VOs from RDP phase II (V, N, Q and W) which scored
Impact Assessment Study
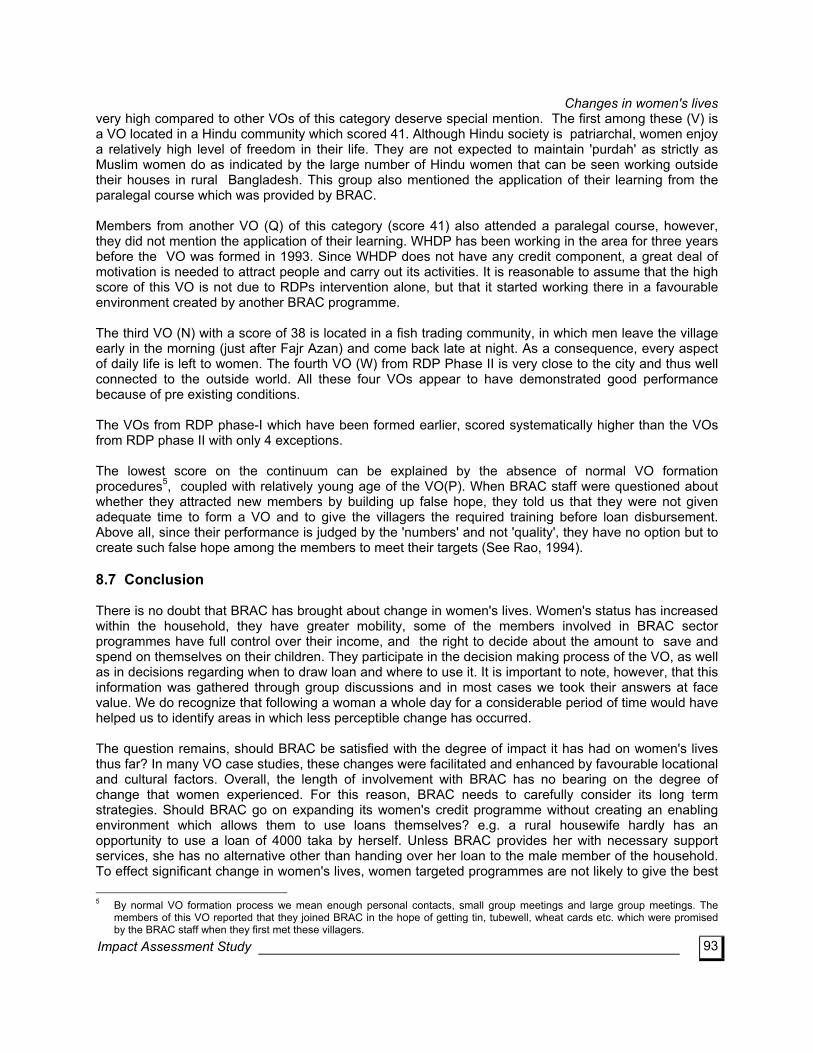
Changes in women's lives
93
very high compared to other VOs of this category deserve special mention. The first among these (V) is a VO located in a Hindu community which scored 41. Although Hindu society is patriarchal, women enjoy a relatively high level of freedom in their life. They are not expected to maintain 'purdah' as strictly as Muslim women do as indicated by the large number of Hindu women that can be seen working outside their houses in rural Bangladesh. This group also mentioned the application of their learning from the paralegal course which was provided by BRAC. Members from another VO (Q) of this category (score 41) also attended a paralegal course, however, they did not mention the application of their learning. WHDP has been working in the area for three years before the VO was formed in 1993. Since WHDP does not have any credit component, a great deal of motivation is needed to attract people and carry out its activities. It is reasonable to assume that the high score of this VO is not due to RDPs intervention alone, but that it started working there in a favourable environment created by another BRAC programme. The third VO (N) with a score of 38 is located in a fish trading community, in which men leave the village early in the morning (just after Fajr Azan) and come back late at night. As a consequence, every aspect of daily life is left to women. The fourth VO (W) from RDP Phase II is very close to the city and thus well connected to the outside world. All these four VOs appear to have demonstrated good performance because of pre existing conditions. The VOs from RDP phase-I which have been formed earlier, scored systematically higher than the VOs from RDP phase II with only 4 exceptions. The lowest score on the continuum can be explained by the absence of normal VO formation procedures5, coupled with relatively young age of the VO(P). When BRAC staff were questioned about whether they attracted new members by building up false hope, they told us that they were not given adequate time to form a VO and to give the villagers the required training before loan disbursement. Above all, since their performance is judged by the 'numbers' and not 'quality', they have no option but to create such false hope among the members to meet their targets (See Rao, 1994). 8.7 Conclusion There is no doubt that BRAC has brought about change in women's lives. Women's status has increased within the household, they have greater mobility, some of the members involved in BRAC sector programmes have full control over their income, and the right to decide about the amount to save and spend on themselves on their children. They participate in the decision making process of the VO, as well as in decisions regarding when to draw loan and where to use it. It is important to note, however, that this information was gathered through group discussions and in most cases we took their answers at face value. We do recognize that following a woman a whole day for a considerable period of time would have helped us to identify areas in which less perceptible change has occurred. The question remains, should BRAC be satisfied with the degree of impact it has had on women's lives thus far? In many VO case studies, these changes were facilitated and enhanced by favourable locational and cultural factors. Overall, the length of involvement with BRAC has no bearing on the degree of change that women experienced. For this reason, BRAC needs to carefully consider its long term strategies. Should BRAC go on expanding its women's credit programme without creating an enabling environment which allows them to use loans themselves? e.g. a rural housewife hardly has an opportunity to use a loan of 4000 taka by herself. Unless BRAC provides her with necessary support services, she has no alternative other than handing over her loan to the male member of the household. To effect significant change in women's lives, women targeted programmes are not likely to give the best
5 By normal VO formation process we mean enough personal contacts, small group meetings and large group meetings. The members of this VO reported that they joined BRAC in the hope of getting tin, tubewell, wheat cards etc. which were promised by the BRAC staff when they first met these villagers.
Impact Assessment Study

Changes in women's lives
94
results. In order to bring about a change in social norms and practices, everybody in the society must be involved. Why is it ‘we’ - the outsiders, who decide what is good for poor rural women? Why cannot ‘they’ decide ‘their’ own life options?
Impact Assessment Study
95
9. Village organisation and institution building
9.1 Introduction The development strategy that BRAC pursues contains two major goals: “alleviation of poverty and empowerment of the poor. To achieve these goals, BRAC prioritizes people and their participation in the development process”(BRAC, 1991). On participation, Oakley and Marsden (1984) in their report for ILO, stated that “for participation to be meaningful, it must involve some direct access to decision making and some active involvement in the determining of problems and practices”. Uphoff(1986) defined organizations as “structures of recognized and accepted roles”. These may operate on a formal or informal basis. This means all organizations are not necessarily institutions. According to Uphoff if an organisation were to disappear and people in the community including the indirect beneficiaries would want it back and even sacrifice something to preserve it, only then an organisation would qualify as an institution. Selznick (1957) argued that to ‘institutionalize’ is to infuse with values beyond the technical requirements of the task at hand. This suggests that an institution is an organisation (or a role, a rule, procedure, a practice, a system of relations) that is valued by persons over and above the direct and immediate benefits they derive from it. (Quoted in Norman Uphoff:1986) BRAC believes Institution Building (IB) to be a key element in participation and the first step towards Institution Building is to develop a viable organisation. The institution building component of the Rural Development Programme (RDP) of BRAC aims to develop self managed village organizations (VOs), promote self reliance, and enhance the capacity of the poor to participate in the national development process (RDP Phase II report, 1990-92). Institution building is a lengthy process involving a series of activities which may be summarised as follows:
• formation of VOs with 20 to 55 members, each made up of a management committee and small joint liability groups (of 5-6 members each);
• introduction and maintenance of encouraging organizational discipline (regular attendance at weekly
meetings and monthly issue-based discussions, regular depositing of savings and loan repayments, and participation of members in VO affairs and discussions);
• building up member’s self esteem and awareness about rural power relationships - through social
awareness (previously “functional education”) and “issue-based” meetings;
• training of selected members in leadership, managerial and human relations development;
• encouragement of the mobilization of both internal and external resources (e.g. savings) and creating opportunities for income and employment generation; and
• motivation of members to participate in local affairs and community decision making (e.g. salish, local
councils and other development activities.(ibid.) The activities of the IB process implies the following ideals: that a successful VO will exhibit strong organisation, management and discipline; its members will value the messages which BRAC is imparting, and value their VO as a support group; the VO will eventually provide a basis for more effective participation (by members) in the social and political affairs of their localities - a practical expression of what is sometimes referred to as "empowerment".
Impact Assessment Study
Village organisation and institution building
96
Milton J. Esman (1972) developed a series of tests to see whether an organisation has been turned into an institution. First, the survival of the organisation is necessary but not a sufficient condition of institutionalization. The second test suggested by Esman can be measured by the autonomy an organisation has achieved in the development of its programme, in its internal management, in its access to resources and by the influence it is able to exercise on its external environment. Esman calls this the achievement of intrinsic value within its environment. The third test is the spread effect of its activities. i.e. whether the relationships and action patterns embodied in the organisation have become normative for other entities with which it interacts. The last test suggested by him is therefore to see whether the institution can continue to innovate. That is whether linked organizations accept the new norms and practices. Following Esman's tests as criteria for assessing the actual impact of RDP's IB activities, the findings of this study are outlined in the following sections followed by discussions in some details. 1. Strength, stability and cohesion of the VOs
The institutionalization process at BRAC starts with VO formation and maintenance of VO organisational discipline. Social awareness education is given to build up self worth among members and make them aware of existing rural power relations. These are expected to make the VOs cohesive, thus increasing their strength. Member continuity is critical for the stability of the VO, since frequent turnover of members act as a barrier to VO cohesion. 2. The ways in which members value their VO
It is very important to have a forum where members can frankly express their views; decide on the ways to mobilize both internal and external resources; plan for participation in social activities like education, health and social welfare; and request BRAC to create income and employment generation opportunities for them. 3. Nature and effectiveness of VO organisation, leadership and management
Esman(1972) identified leadership as the principal change agent of the Institution Building process. BRAC also thinks in the same line and imparts training on leadership development, managerial skills and human relations development. The background of the leaders and the process of leader selection play an important role in the VO group dynamics and institution building. 4. Group autonomy
If a group becomes autonomous in terms of carrying out activities without BRAC's initiation we may then conclude that the VO has matured. They can then participate in the local politics and development activities and thus reap benefits from available resources which could be existing government facilities, unutilized natural resources and BRAC resources. The following sections elaborate on each of the above. 9.2 Strength, stability and cohesion of VOs During fieldwork the case study teams gained impression that older VOs are less disciplined than younger VOs, and that female groups are better organised than male ones. Such discipline in the younger groups was evident in the way they called meetings, sat in an orderly fashion (e.g. each member sitting in lines behind their small group leader), and were generally more enthusiastic. Such impressions were followed up by an
Impact Assessment Study
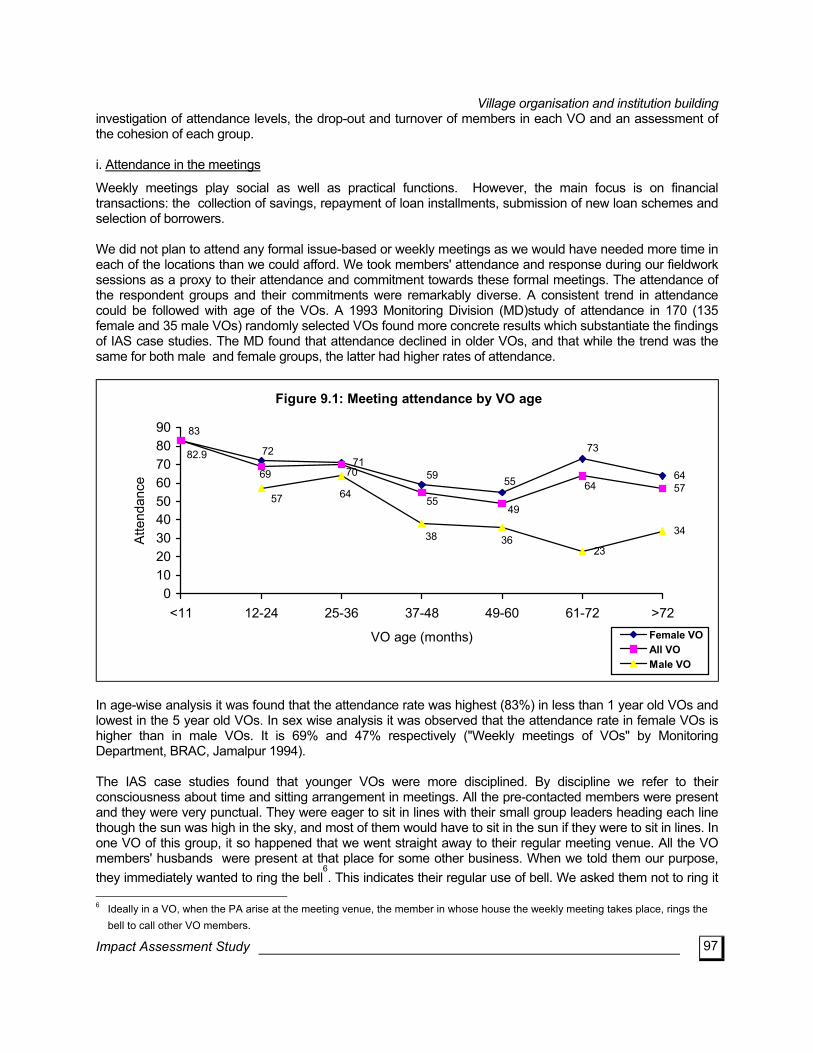
Village organisation and institution building
97
investigation of attendance levels, the drop-out and turnover of members in each VO and an assessment of the cohesion of each group. i. Attendance in the meetings
Weekly meetings play social as well as practical functions. However, the main focus is on financial transactions: the collection of savings, repayment of loan installments, submission of new loan schemes and selection of borrowers. We did not plan to attend any formal issue-based or weekly meetings as we would have needed more time in each of the locations than we could afford. We took members' attendance and response during our fieldwork sessions as a proxy to their attendance and commitment towards these formal meetings. The attendance of the respondent groups and their commitments were remarkably diverse. A consistent trend in attendance could be followed with age of the VOs. A 1993 Monitoring Division (MD)study of attendance in 170 (135 female and 35 male VOs) randomly selected VOs found more concrete results which substantiate the findings of IAS case studies. The MD found that attendance declined in older VOs, and that while the trend was the same for both male and female groups, the latter had higher rates of attendance.
Figure 9.1: Meeting attendance by VO age
716457
23
34
73
5559
72
83
64
4955
7069
82.9
57
36
64
38
0102030405060708090
<11 12-24 25-36 37-48 49-60 61-72 >72
VO age (months)
Atte
ndan
ce
Female VOAll VOMale VO
In age-wise analysis it was found that the attendance rate was highest (83%) in less than 1 year old VOs and lowest in the 5 year old VOs. In sex wise analysis it was observed that the attendance rate in female VOs is higher than in male VOs. It is 69% and 47% respectively ("Weekly meetings of VOs" by Monitoring Department, BRAC, Jamalpur 1994). The IAS case studies found that younger VOs were more disciplined. By discipline we refer to their consciousness about time and sitting arrangement in meetings. All the pre-contacted members were present and they were very punctual. They were eager to sit in lines with their small group leaders heading each line though the sun was high in the sky, and most of them would have to sit in the sun if they were to sit in lines. In one VO of this group, it so happened that we went straight away to their regular meeting venue. All the VO members' husbands were present at that place for some other business. When we told them our purpose, they immediately wanted to ring the bell
6. This indicates their regular use of bell. We asked them not to ring it
Impact Assessment Study
6 Ideally in a VO, when the PA arise at the meeting venue, the member in whose house the weekly meeting takes place, rings the bell to call other VO members.
Village organisation and institution building
98
as we did not want all the members. Then they went around and called some neighboring members who were very cooperative and enthusiastic. They also wanted to sit according to regulation. The attendance of middle aged (12-47 months) VOs, were of mediocre category. There were 8 VOs from 5 AOs (including 3 linked VOs). Out of those, 5 VOs were female and the rest were male. Attendance in the female VOs was higher than in the male VOs. The older (aged 48+ months) VOs were in the worst condition in the sense of attendance in our meetings. There were 13 VOs from 7 AOs, (including 5 linked VOs). Of these, 7 VOs were female and 6 were male. In the female VOs the attendance was higher than in the male VOs. The members of two VOs from this group reported that they do not have any weekly meetings. They either deposit their savings and installments to their VO president just before the savings collection date or send these to the PA through a male member of the household or their children. As they do not have these meetings there is no scope for these members to meet their fellow members or have any interaction with them in a joint forum. These two VOs may be extreme cases. During our discussion, one of the members regretted that,
Before, when we used to have our monthly meetings regularly, the bhais (BRAC Staff) used to tell us bhalo bhalo katha (promises). The VO was much organized then. Now that we do not have meetings anymore the VO has become disorganized.
From the above discussion it is clear that attendance level goes down as a VO becomes older. Newer members are more regular in attending weekly meetings and depositing savings, because they consider these as tickets to loans. Dropout and turnover of members
Continuation of membership is a predominant factor of VO cohesion that has a great influence on strength and stability of VOs. in course of time members acquire knowledge and skill regarding management of village organisation and attain a positive attitude towards collectivity and the need for maintaining various rules and regulations of the VO. Discontinuation of membership is so supposed to be detrimental for VO cohesiveness . In the context of above perception the team wanted to have a clear understanding of itinerary of dropout. The study revealed that majority (56.4%) of the dropout member belongs to the poorer wealth category. Eight VOs those were between one and three years old lost 9% of their members Since formation and 13 VOs of more of than four years old lost 28% of their member. In the latter category two VOs had lost more than 53% of their members. The lowest dropout was 7%. These findings point to a high degree of membership instability amongst the older VOs which is supposed to result in weak cohesive groups. The case study data however, did not suggest any clear conclusion on this. Reasons for dropout are discussed in detail in Chapter 11. ii. VO cohesion
The term ‘cohesion’ is used here in the sense of group unity. Scott (1988) describes cohesion as “the integration of group behaviors as a result of social bonds, attractions or ‘forces’ that hold members of a group in integration over a period of time.” In a highly cohesive group, according to Scott, the members will accept the group's goals, norms and roles unquestioningly and have strong positive feelings toward the group. The group remains stable since the members want to remain in the group.
Impact Assessment Study
In order to achieve this cohesion among the its members, BRAC is organizing them into groups (VOs) and trying to conscientise them. BRAC believes “Before they can improve their positions, poor village men and women must acquire a framework that permits them to reject fatalism and enables them instead to analyze their own communities and the structures of economic forces and exploitation that have caused their poverty. Above all, people need to learn how, through their own actions, they can control their situations” (Lovell, 1992).
Village organisation and institution building
99
In an attempt to provide them with supporting atmosphere, BRAC conducts Functional Education /Social Awareness courses and other human resource development training for the VO members. These are aimed to increase the cohesiveness among the VO members. As the VOs were formed with different motivations
7 by BRAC staff under Outreach programme and RCTP, different impacts of BRAC programmes can be observed there. The case studies tried to ascertain the level of cohesion of individual VOs by analyzing the activities of different study VOs. It considered the degree of social awareness and incidence of political participation of VO members and also their collective activities as mentioned during the timeline sessions. All the VO members did not have a chance to demonstrate their cohesion. The newer VO members (aged < 1 year) mentioned that their level of social awareness has been increased by the Functional Education they received from BRAC. They said, We have learned from the 11th of the 17 promises that the attyachar (violence) of husband
is a shamajik shoshon (social exploitation) . If a husband tries to torture his wife then we should protest against it jointly.
In the middle aged category (12-47 months) there were one or two instances which demonstrated their unity/fellow feelings. In one instance, the VO members campaigned for a fellow member who was competing in the local election; in another instance, the VO members compelled the son-in-law of a VO member to refund the dowry as he divorced his wife without any valid reason. The long term involvement of the remaining members gave them a sense of belonging towards their VOs. In this group, VO `H' was formed under the outreach programme, where the members were encouraged to engage in joint activities, even later, loans were disbursed collectively. The members were encouraged to participate spontaneously in planned and unplanned meetings, cooperate with each other in social action, participate in the works programme activities and wage bargaining and in other collective activities like taking possession of khas land, collective plantations etc. (Ahmed, Z. and Imam, I. 1983). Despite high dropout rates, incidents indicating cohesiveness was present in a few older (48+ months) VOs. However, there is no example of such cohesiveness in these VOs in the recent past. Having an outreach background VO "H" carried out a lot of group activities at BRAC's initiative. After two years of VO formation, in 1981, BRAC left that village for six months, but the VO continued its activities during that period, although a few members left the group. In 1989, in the same VO, a worker of Khet Majur Shamity (Agricultural Labour Society), a front organization of the Communist Party of Bangladesh, threatened to destroy the BRAC office as part of their anti-NGO activities. All the VO members including a few female members along with the members of other VOs guarded the BRAC office with their make shift weapons. There are several other examples of campaigning for election, resisting BRAC’s decision to install DTW, joint cultivation of land, pond and so on (please see Appendix H2 for details). Towards the beginning of RDP, BRAC used to arrange regular issue based meetings for VO members, where some social issues and the problems of the members were discussed in detail. This system also worked as a refresher for their FE and social awareness training. But now-a- days, these meetings do not take place regularly. Consequently, the older members do not retain their knowledge and are not able to practice these messages in their daily lives. All the members of the study VOs mentioned that no issue based meeting was
Impact Assessment Study
7 The staff used to spend lots of time with the villagers explaining them what BRAC is, how it will operate, what benefits they would get from being involved with BRAC. They used to tell them how they could exploit the existing unutilized natural and government resources for their benefit through their joint movement.
Village organisation and institution building
100
held in their VOs during the three months preceding our field visit. Through discussion it appeared that the members highly value these issue based meetings. But the AO staff reported the reverse. They said that in most of the cases they could not arrange issue based meetings due to the reluctance of VO members to attend such meetings. They also mentioned that VO members are more interested in financial matters rather than so- cial awareness activities. This situation is more pronounced in the male VOs than in the female VOs. The rate of member turnover is also high among the older VOs specially male VOs. As high member turnover does not give enough time to develop the bond and unity among the members, this (high turn over) implies that the older male VOs are less strong and stable than the older female VOs. This could be due to BRAC's policy of shifting its emphasis towards women. BRAC staff also find it easier to deal with female members rather than older male members who with their long BRAC involvement experienced all sorts of policy changes and therefore became insolent. Moreover, in most cases, female members do not have any other formal forums of their own, where they can express their opinion which is valued (at least in some cases if not in all cases). Consequently they value these VOs more than the males. As a result of high turnover, all the members are not in equal position. A natural dominance from the older members can be observed in both the male and female VOs. This inhibits equal participation in VO activities by all members which is one important element of the institution building process. 9.3 VOs as units for the representation of member's individual and collective interests VOs are the forums for representing the members’ individual and collective interests. This is an important measure for an effective institution building. In our case studies, we examined the forum to explore how far BRAC programmes meet members’ interest, how members perceive the BRAC rules, to what extent their changes have affected members’ commitment towards the VO and BRAC and how BRAC staff respond to members’ hopes and aspirations. Taken together, such issues help us to assess the ways in which members value their VO and membership. Most of the members joined BRAC VO with the expectation of bringing “Unnati” to their lives. When translated into words, “Unnati” refers to their access to credit, ability to accumulate assets, getting VGD card, educate their children, getting employment from BRAC, ability to raise savings and so on. In order to attract members to the VO, BRAC staff raise lots of unrealistic hopes and expectations among them. This is specially true for young and middle aged VOs. Members from a female VO cited an example of how the BRAC staff enticed them for joining BRAC. They said,
The Area Manager said that the VO would be like our mother. It would give us whatever and whenever we want. But except for access to credit, our hopes were not fulfilled. We wanted a Kantha centre in our village, but BRAC did not agree.
Most of the members do not have a clear idea about BRAC rules regarding saving system, Group Trust Fund (GTF) and insurance operation. They also expressed their dissatisfaction over closed saving system ( as they cannot withdraw their savings even in their emergencies). In general, members found individual loans to be more attractive than collective loans. There are a few examples of collective loans in 2 VOs (formed in early eighties). They encountered problems in distribution of work and profit-sharing. So, they prefer individual loans.
Impact Assessment Study
Since the inception of BRAC’s credit programme, the interest rate of individual loans has been changed several times. Apart from a few members of the VO management committees, often VO members do not have a clear idea of interest rates. This raises a question as to whether this situation could indicate that BRAC staff have not been very successful at explaining the mechanism that regulates these rates. If so, then is it
Village organisation and institution building
101
because they (BRAC staff) wanted to avoid the problems they anticipated if there were a sudden rise of interest rates? In most cases they prefer not to explain these changes to the VO members. General members do not know the actual rate of interest on savings, but they do know that the interest rate on loans is higher than that on savings. The group members knew that except the deduction for insurance premium they would get back the rest of the deducted money in future. They also knew that they would be able to collectively draw a certain percentage (they could not specify how much) of this group fund as loan for production purposes only. In 1991, the members learned that according to a new BRAC rule, they would not get back their group fund, and from then on this fund would be called “Group Trust Fund”(GTF). This fund would be used for meeting emergencies due to natural disasters and repaying the overdue loan of defaulters who have moved away from the village or died without leaving any heirs who could assume the debt . This change caused unhappiness and turnover of members in the older VOs. The members of newer VOs have also expressed their discontent over GTF. Their reaction was somewhat different. They said,
The amount going to GTF is not exempted from our loan money. We pay interest on it. But, at the time of receiving loan they made us promise that we will not ever ask for the GTF money. Then why should we pay interest on it?
But we found that in the course of our field work, group members of some VOs were compelled to repay the overdue loan of other defaulter group members. The members’ request to BRAC staff to balance the overdue loans with the savings of that defaulting loanee, was disregarded. Later they were informed that if they do not repay the loan they would not get further loans. They did not have any alternatives other than to agree. It appears that the “joint liability” mechanism of credit rule is not fully accepted as legitimate in some VOs. VO members mentioned that rules regarding credit repayment period have also changed over time. Some members complained that because of these changes they were forced to pay more interest. However, the repayment period was not changed in the middle of repaying loans for any individual. VO members were also unhappy with the saving system of BRAC. When they joined BRAC, they knew that they would be able to get a first loan if they could save at least 5% of the requested loan amount. The required savings would be 10% and 15% for the second and third loans, respectively. The members complained that BRAC did not follow their savings-credit ratio. Some VO members mentioned that at first BRAC said that a member could withdraw 25% of his savings after 5 years of membership, 50% after 10 years, 75% after 15 years and the total amount only after completion of 20 years membership. Most of the VO members did not know of the restrictions and the percentage distribution for the withdrawal of savings. But all of the members of case study VOs knew that they would be able to withdraw their individual savings after a certain period. Although they did not know exactly when they may withdraw their savings, they were not unhappy with this uncertainty of saving withdrawal time. However, no member of any case study VOs have succeeded in withdrawing any money from their savings.(they can do so only in exchange for discontinuation of their membership). The members with five years VO membership, complained that they wanted to take money out from their account, but BRAC refused. They said that if they could withdraw their savings then they would have saved more for future contingencies. The president of a female VO which was formed in 1987, became seriously ill. So, she could not go to the area office to receive a loan, which had been sanctioned. The other members requested the area staff to give her the loan because she needed to pay for her medical treatment. AO staff refused them. Then the VO members requested the AO staff to return some of her savings to her. This request was also refused. This case seems to be an example of lack of flexibility within the rules or amongst the BRAC staff, when it comes to meeting the special needs of individuals in distress. The VO members are
Impact Assessment Study
Village organisation and institution building
102
unhappy about it. Sometimes it strikes them that the rumors spread by people that "BRAC will run away with all your money" might be true. The VO members mentioned that BRAC gives them interest on their savings once a year. In some cases, their interest is recorded in their savings pass book. While in others, where the amount of receivable interest is very low (1 to 2 taka), they received interest in cash. The VO members wish to get interest in cash. They think that it would help them to trust BRAC with their savings - they cannot be sure that their savings are really being recorded on the savings collection sheet. Out of the 16 study VOs, one VO is under one of the experimental “current account savings” AOs. But the members of that VO did not know any thing about this new system. The VO members mentioned that none of them have ever withdrawn money from their savings. They said,
The Bhais have told us that the VO has been formed for 5 years. After 5 years when the VO will be disbanded, we will be able to withdraw our savings only then.
That BRAC staff told them the VO has been formed for 5 years. After 5 years when the VO is disbanded they would be able to withdraw their savings. The VGD card issue also gave rise to mixed feelings among the female VO members. Before joining BRAC the members were told that if they joined BRAC they would get wheat cards (VGD cards), with which they would be able to get free wheat. This was true of young and middle aged VOs. The members thought that all of them would get these handouts. But in reality, only a few members (in most cases only two member per VO) get these card at a time for a year. Naturally, members who did not receive cards in the first chance became annoyed. They are not ready to wait for their turn. Members from some of the VOs reported that the distribution of these cards was not done in a fair way. In some cases, the basis for decision was simply assertiveness. In other cases, members who have good relations with area staff or are related to management committee members received VGD cards. In these cases the actual needs of people were not taken into account. VO members claimed that BRAC is non-responsive to their needs. Under VGD programme, the selected member will get 30 Kg. of wheat each month. In return she has to pay taka 70 to BRAC and BRAC would give her 2 HYV chicks (in most cases 2 months old). But these chicks hardly survive upto their house. They said,
BRAC charges taka 35 per poultry bird which is available in local market at taka 10. BRAC sell us birds which are poor in quality and are not adaptable to our conditions.
Regarding insurance system, they have a mixed feeling too. Some of them buy it unquestioningly, while others think that they are still too young to die and therefore this policy is not that useful for them. Although, BRAC encourages members to buy a policy, it does not take the responsibility to renew it on time. As a result, lot of the insurance policies become invalid. As to the members’ feelings about the extent to which BRAC meets members’ interests there is not any difference between male and female VOs. However, the female members often complained that BRAC does not give them the promised employment opportunities, but the male members did not have any such complaints. Staff-member interactions are not necessarily directly affected by such dissatisfaction, and VO members interviewed during the case studies did not blame individuals. Instead, they stated that because staff are frequently transferred regularly, there is a lack of continuity and strong relationships with staff rarely develop. There is also strong evidence provided by the 13 VOs established more than four years ago that the nature of staff-member interactions has changed, such relations have become more hierarchical and less flexible in the last few years. This shift towards more hierarchical relations was evident from the fact that in old RDP areas members often referred to BRAC staff as “bhais” (brothers), whereas in the newer areas they are addressed
Impact Assessment Study
Village organisation and institution building
103
as “sir”, and even in the old areas newer members address staff as “sir”. In the older VOs members complained:
The previous bhais were better. They never felt uneasy to sit with us, chat with us or even smoke with us. But the present “bhais” are different. They do not want to talk to us. If we go to the office for any problem, they always tend to refer us to the PAs.
However, field staff interviewed in the Area Offices also admitted that they have little opportunity to respond to specific needs. Their time is limited, and they also feel the rules are rigid. This underlies that statement made by one member in a VO formed several years ago that weekly meetings:
.... are for collection of savings and loan installments only. There is no scope for discussion between VO members and BRAC staff.
In another VO, a member said:
BRAC staff used to advise us, guide us, encourage us, in every aspect of life but now they are only giving loan and recovering it from the group members.
The perceived rigidity of rules, and the limited value given to non-credit aspects of RDP’s operation, combined with the nature of staff-member relations, mean that many members feel that BRAC is only partially responsive to their needs. These findings from the 24 case study VOs underlie the impression that, even in the older VOs, there is little feeling of “ownership”, and more a perception that the VO is simply a credit group, run primarily by BRAC field staff, who have little flexibility to respond to local and individual needs. 9.4 Leadership and management of VOs In an attempt to develop leadership and participatory management capacity within the VO, BRAC provides different types of Human Development Training to selected members who comprise the Leadership Committee of the VO. Apart from these formal training courses, BRAC uses several informal fora to develop members’ leadership and management capacity. These include weekly meetings, issue based meetings, and the inclusion of members in VO decision making processes. In order to investigate the reality of leadership and management of VOs, and the importance of these issues for the institution building process, we explored the following: A. Different types of leadership situation B. Process of election and turnover of leaders C. Actual functions of leaders and D. Leadership and group dynamics.
A. Different types of leadership situation Although all the VOs have a nominal management committee8, the real situation is far from satisfactory. In most cases these committees are dominated by one member - either the VO chairperson or the VO secretary. As most of the responsibilities of the VO management committee are being carried out by the VO leader, very few ordinary members can name other committee members. In our case studies, we came across only one VO in which the members knew all the management committee members. In most cases
8 Each VO has a minimum of 20 members and maximum of 55. Membership is limited to one individual per family. Within each VO, small groups of 5 members are formed. Each of these groups selects a leader who is responsible to the elected management committee. This committee consists of 5-7 members, including a chairperson, a secretary and a cashier, who maintain the VOs financial records and resolution books. These positions are rotated every year. A secretary is elected for each small group for a period of 2 years (RDP Annual Report, 1994).
Impact Assessment Study
Village organisation and institution building
104
they mentioned the name of the VO chairperson or the secretary as the VO leader. In a large number of cases the members were also able to mention the name of the cashiers. Members from majority of VOs were not able to tell us if they were divided into small groups. Only in six VOs did members know the name of their small group leaders. Thus, our case studies suggest that intra-VO organization and leadership is much more simple than the original idea of an institution structured by a management committee and small group leaders. In our analysis, we tried to identify the VO members’ perception about the determining factors of leadership for both the female and male members. The differences between the VO leaders and ordinary members are caused by their personal and social attributes. This is true for both the male and female leaders. However, social attributes play important role in selection of male leaders. Five out of nine male VO leaders have strong kinship networks. Personal attributes play important role in female leader selection. Some times, the situation makes them to acquire these qualities and some times these qualities are inherent.
.... We have elected those women as leaders who have ‘mukh chalu’ (outspokenness) and ‘thang chalu’ (those who are dynamic).
This pattern appears to be quite common. Amongst the 15 VO leaders met, six were widows and five others were the heads of their household. It is therefore, apparent that more independent women - often widows or deserted women who have to struggle for their existence - are often selected as leaders. They are mobile and extrovert, which makes them different from the general members.(Please see Appendix - H2 for details). The differences are caused by economic status also. For men, wealth always brings in power and status. However, there are cases, where men do have the status without any wealth. The case studies also found similar findings. Having a comparatively wealthy background, most of the male leaders have more influence in various spheres of village life compared to many of the other members. For women, the situation is different. In their case, in rural society, wealth usually makes them more constrained. It is their economic vulnerability which gives them a wider room for maneuver and thus more knowledgeable and superior than the general members. Thus in most cases we have female leaders from the poorer classes. The PRA wealth ranking exercises showed that in male VOs it is more common for the leaders to come from amongst the better off households in the group. Out of the nine male VOs studied, five leaders came from the upper three wealth categories, and four came from the lower three. In marked contrast, in the 15 female VOs 12 of the leaders came from the lowest wealth ranks; and the other two leaders were in the middle of the VO’s wealth hierarchy. The leaders need to spend more time for VO or VO related activities compared to general members. As male leaders mostly come from wealthier classes than general members, they can afford to spend a few days at the BRAC training centres as their families will not go hungry. But for general members, a few days without work means hunger for the family. As a result, they do not want to go for training. In the case of female leaders, since they do not have husbands in most cases to care for, they can spend a few days away from home without causing much inconvenience in the households, which the general members cannot afford to do. Moreover, for the same reasons (mentioned above), they can afford to spend more time with the AO staff. It is easy for the AO staff to communicate with the leaders than with the general members. Usually, the AO staff send messages to the general members through the leaders. All these give them a higher status than the general members. We observed that differences in leadership style in male and female VOs have influence on diversity of leadership situation. In most cases male leaders are more dominating than female leaders, who tend to be more “democratic”. Male leaders consider themselves as an umbrella for the ordinary members and essential for the VO. In some situations where male and female VOs in the same community are linked by kin
Impact Assessment Study
Village organisation and institution building
105
relationships, the male leaders consider it their duty to lead those local female VOs. One male VO leader told us:
Female members are all fools. They always depend upon us. Now that we have allowed them to joint the VO, they have become smart. They always tell us ‘ask this to the sirs, ask that to the sirs.
B. Process of election of leaders i. Leaders selection process In almost all our cases, we found that the VO leaders were elected unanimously. In most cases they did not have more than one "suitable" candidates for the posts. Their criteria for selecting a leader are: intelligence, education, communication skills, reliability, decision making ability, socio-economic status, family work burden etc. In most cases, people with these characteristics were the initial contacts of the BRAC staff. Either BRAC staff found them from the village or they went to the BRAC staff asking for a VO in their village and in this way they came into contact with the BRAC staff. Later, when the VO was formed and the management committee were to be decided upon, both the VO members and the BRAC staff mentioned their names. In some cases, the initial contact was appointed as a cashier as that post requires a minimum level of numeracy. There are cases among the female VOs where the VO chairperson was selected for her husband's influence in the community. But the actual work is done by some other member of the committee, who is the leader in true sense. We do not have real data on small group selection processes because we did not encounter many such small groups and in reality they are less active than suggested by the principles of the VO structure stated in BRAC RDP guidelines. Leadership development appears to be limited, as small groups do not function in most VOs. Except for three new VOs (formed in 1993), the study VO members have very little knowledge about the small groups within their VOs. The male members hardly know their respective small group leaders. In the case of female VOs, except for the three new VOs, members from the remaining 9 VOs could identify few of their small group leaders. These small group leaders do not render any special duties. In both male and female VOs, they are dominated by the strong management committee leaders, and therefore ordinary members have very little idea about the roles and responsibilities of small group leaders. ii. Process of re-election of leaders Only a third of VOs have had re-elections of leaders, even though they should ideally occur bi-annually. Many members (and some field staff) are unaware of the election requirements.
• Out of 9 male VOs, only three had changed their leaders only once since they were formed in 1982, 1989 and 1991 respectively.
• Out of 15 female VOs, three had been formed within the last year so it cannot be expected to have changed their leadership. In only five of the remaining 12 VOs had leaders and committee members been changed completely since formation.
Most members were not disapproving of the lack of change in their VO’s managers, for instance one person saying:
...if the leaders work well, why should we change them? C. Function of leaders In brief, the function of the leader is to pursue the objectives of the VO, through organizing the VO members and mobilizing them for different activities. Major responsibilities of the leaders include to ensure the regular attendance of members in meetings, and participation in the selection of trainees, borrowers, VGD beneficiaries and to ensure the repayment of the loan. In addition to these, a leader might be expected to
Impact Assessment Study
Village organisation and institution building
106
render some other responsibilities, such as: to resolve any conflict among group members, help the members in case of emergencies and organise the group against social ills and injustice. One of the main functions of VO leaders is to facilitate decisions on approval of loan applications. Most leaders appeared to make such decisions with the broad consensus of VO members and field staff. However, there seems to be less participation in deciding who should (a) receive sectoral programme benefits, and (b) who should go on training courses. Selection of sectoral programme beneficiaries (eg. chick rearing, vegetable cultivation activities which involve support additional to the loan) can be a matter of contention in some VOs. Our impression is that AO field staff (with VO leaders) usually take it upon themselves to make these decisions rather than involve the whole membership in a participatory manner.
Regarding training, in most cases general members remain indifferent, and allow VO leaders to select trainees. Many leaders have received more than one kind of training, and they often fill the places offered to the VO without consent from ordinary members. This may be a sign of some indifference towards, or simply difficulties for many ordinary members when faced with opportunities to attend courses at the AO, away from their everyday work.
One problem encountered in several VOs was the issue of VGD card distribution. Some VOs complained that there was a lack of fairness in their allocation. In some cases this accusation was leveled against VO leaders, in others it was BRAC staff who were perceived as being at fault. D. Leadership and group dynamics The dynamics of a group is influenced by the relationship among its members, members' external relationship and by the leadership. In the case of BRAC VOs, the relationship between the management committee members, the relationship between the committee members and the ordinary members, and relationship between the leaders and the BRAC field staff determine the way in which the VO functions as a unit. i. Relationship among VO management committee leaders In most cases we found a de facto single member management committee. Even if there is more than one member in some cases, the major responsibilities usually rest on a single leader. This could be the VO Chairperson or the VO Secretary or even the VO Cashier. The situation is more or less same in both the old and new VOs (except for three very new VOs formed in 1993).
The oldest age group (48+ months) category consists of 7 female and 6 male VOs. The relationship among the formal VO management committee members and between VO management committee members and small group leaders of the 7 female VOs is not conflictual--because the VO management committee is recognized as the only decision making body, and the small group leaders, where they exist, do not challenge this. (The male VOs of this age group do not have any small groups at all). As a result of high member turnover (over the last few years), the small groups were disrupted and these are yet to be formed again. This is also true for very old female VOs. ii. Relationship between management committee and ordinary members It is very difficult to capture the real relationship between the VO leaders and the ordinary members in such a short field visit. From personal communication with a RED Researcher we learned that in her fieldwork she initially got the impression of very good relationship between the VO leaders and the ordinary members. But after two or three months of fieldwork, she found out that she got a misleading picture. There were underlying tension between the members and the leader. It should be noted that all our findings are based on two and half days fieldwork in each area.
Although there is a difference in status between the VO leaders and the ordinary members, there still exists an agreeable relationship between them in female VOs.
The leaders of all the male VOs consider themselves as self appointed patrons ‘a cut above’ the general member. They respond more quickly to issues that concern both the leaders and ordinary members. On the other hand, most of the female leaders have good relations with fellow women members. In three cases, the
Impact Assessment Study
Village organisation and institution building
107
leaders mentioned that there should be some remuneration or concessions for the leaders as they have to take on a lot of extra duties. iii. Relationship between VO management committee and BRAC staff The relationship between the VO management committee and BRAC staff is another determinant of group dynamics. This is so because BRAC initially facilitates the formation and activities of the village organisation with the hope that one day these will become self sustaining. The relationship between the VO management committee and BRAC staff has changed over time. This was evident from the fact that in old areas, the members address the BRAC staff as 'Bhai' (brother), whereas in new areas they address them as 'Sir'. Even the new members of the old areas address the BRAC staff as 'Sir'. In the oldest VOs the VO members complained.
The previous `Bhais' were better. They never felt uneasy to sit with us, chat with us or even to smoke with us. But the present `Bhais' are different. They do not want to talk to us. If we go to the office for any problem, they always tend to refer us to the PAs.
It should be noted here that, since these members are associated with BRAC for a long time, they are pretty much aware of the hierarchy within the Area Office. The VOs from 48 plus month category, also mentioned about the frequency of BRAC staff's visit to their VO. They all feel ignored as the BRAC staff do not communicate with them frequent enough and there are insufficient opportunities to clarify rules and procedures and other issues,
The BRAC staff used to advise us, guide us, encourage us, in every aspect of life but now they are only giving loan and recovering it from the group members.
Nevertheless, the BRAC staff communicate with the VOs through the VO management committee. The management committees of three male VOs have been used as instrument of management by the programme. The VO chairperson of one male VO was managing the DTW at BRAC's request. But he never mentioned to the ordinary members that the DTW was run by the member's money. The VO members are under the impression that it was BRAC who was operating the DTW. On the other hand, the leader of the management committee of a female VO informed that she herself made false promises to her fellow villagers to overcome their reluctance to form a VO, with the concurrence of BRAC staff. The newer VOs did not experience any change in the relationship between the VO leaders and the BRAC staff. Because they did not experience the `Bhai culture'. There is no pronounced difference between the male VO and the female VO in terms of the relationship between the management committee members and BRAC staff. In conclusion, we may say that BRAC's ideal leadership and management system is rare in reality. This could be an important barrier in the process of institution building at the grassroots level. This no doubt needs the immediate attention of policy makers at BRAC. 9.5 Autonomy of the group A fully autonomous organisation must have the capability to survive and continue its work without external assistance and resources, so that it does not need to compromise its planned actions (Muhammad Anisur Rahman 1994).
Impact Assessment Study
BRAC’s ideal IB process includes the aim that VOs should gain a degree of autonomy even if total independence is unrealistic for many groups of poor people. Several procedures are being adopted by BRAC to achieve this objective. But autonomy of the group can not be achieved within a short period. At this stage, efforts can be made only to detect the sign of the process of enhancing autonomy. We tried to develop several indicators in order to identify the level of autonomy of the VOs. These are: member's knowledge of BRAC credit, savings and insurance systems, their social attitudes, expectations (past and future) from the
Village organisation and institution building
108
VO, their self representation, activities carried out independent of BRAC, examples of mutual support among members, VO members' relations with other interest groups and the influence of the VO (if any) on existing local social- economic relationships. We tried to consider these issues in all the 24 study VOs. In the following sections we will try to compare the VOs according to age and between male and female VOs. i. Members' knowledge of BRAC credit savings and insurance system We found that most members (9 out of 13 VOs) from the oldest (48 + month) category of VOs clearly know about BRAC's credit operation system; i.e. required savings for getting a loan and the percentage deducted (10% of loan amount) upon drawing a loan; distribution of this 10% deducted amount, the rate of interest on credit and number of installments to be paid for different loans. However, they do not know the use of GTF or who handles it or whether they will ever get it back. Members from five out of eight middle aged (12-47 months) VOs also have similar understanding about credit operation system. Only one VO (out of 3) from the youngest (0-11 months) category know the system correctly. Members from another VO (from the same category) mentioned that they were told during the VO formation, and now cannot recollect. Only the management committee leaders who have received VO management training could tell us in detail about the credit operation system. Majority of the members know very little about the savings system. e.g. the rate of interest on savings, when they would be able to withdraw what percentage of their savings and so on. Members from only 4 VOs (48+ months old) knew detail of the savings operating system. We have a slightly different scenario for the insurance system. As the youngest VO members were yet to become eligible for insurance policies, they did not know much about it, except for the deduction made at source for insurance during their first loan. However, all the members in general have a very good understanding of the insurance system. The only problem they encounter is forgetting the time to renew their policies. ii. Social attitudes of group members and villagers Social attitudes are deeply rooted in age old traditions. One can not expect these to change overnight just by mere programme interventions. Nonetheless, process of change in social attitudes towards education, specially girl child's education, women's mobility (in a limited way), dowry at marriage, caring for pregnant and lactating mother etc. could be traced. Members from all VOs realize the importance of education in people's lives. They now send their children to schools without any gender discrimination. This was partly possible for having BRAC schools at their door steps. Male members from older (48 + months) VOs are more tolerant towards women's nontraditional activities like joining VOs, going to meetings, going to AOs and so on. However, they are yet to accept their women's going away for training to BRAC training centres. The villagers also have similar attitudes. Members from one very young (0-11 months) VO reported that the villagers will denounce the VO if any women engaged in any business activities in the public sphere. This will create problem for the members in getting their children married. Women do not have different views either. They are yet to form, or voice views that are very different from their husbands'. However, in this VO, BRAC’s health programme has been able to replace the traditional way of caring for the pregnant and lactating mothers by scientific ways. Even in older VOs men are not yet ready to see any changes in gender relations because then they would have to forego some of the natural advantages they enjoy. Most women are still passive in accepting any changes in existing relations, as is the norm in the rural society. Yet necessity has forced them to change their views to some extent in recent years.
Impact Assessment Study
Village organisation and institution building
109
Although all the members realize that dowry is a social evil, but they are helpless. If they do not pay the dowry, then their daughters would not get married. For sons' parents, they consider it as a source of income. Every one else in the society asks for dowry, why should not they? iii. Members’ expectation from the VO
Members have various types of expectations from BRAC. These are mostly related to their economic conditions. e.g. getting loans, employment and ability to save for future contingencies. They also hoped to get tin for their houses, provisions for safe drinking water, relief, wheat, cows, goats, education for children and themselves and so on. Members of two VOs (0-11 month) regard BRAC as donating organization and expect "shahajhya" (relief) from BRAC. They hope to get loans for various purposes, tin for houses and wheat to help meet their Household(HH) consumption shortfalls. Members from another VO (0-11 months) hope that BRAC will immediately provide them employment. Members of two VOs formed before 1986 (when RDP was formed) mentioned saving as their prime objectives for joining BRAC. Members from two other VOs also considered BRAC's savings system as an important opportunity. Members of these two VOs have other sources of income (accruing from their membership in other NGOs and foreign remittances). None of their hopes however, reflect hope of uniting to work for their common development goals. All of these hopes are based on the illusions created by the BRAC staff. iv. Self representation
Very few VOs did show any ownership9 towards their VO. They cannot envisage a situation where they would carry out activities for their own improvement by themselves. Most of them joined BRAC in the hope of getting loan and not for uniting under one umbrella and work jointly for their common interest. A handful of members from only one VO (48 + month) mentioned things like this. While members from other VOs made comments like
We have joined BRAC, why should we seek help from others?
or The day BRAC will Bhengey Jabay (become disbanded) we will leave BRAC on that day (implying that they will not leave BRAC unless BRAC wants them to leave BRAC).
These two statements represent the kind of ownership they feel towards BRAC. One group considered BRAC as a donor agency; they see BRAC as responsible for meeting all their material needs. While the other group cannot envisage their VO existing without BRAC. The picture is also not very different for VOs from young and middle age category. Only one male VO (12-47 months old) member expressed the view that they want continued support (loan) from BRAC, but they want to retain full control over their savings. v. Activities carried out independent of BRAC
We found a mixed picture about members' carrying out different activities for their interests without any support from BRAC. The youngest VOs do not have any such example. One female VO in the middle category VO have an example of nominating and electing a UP member. While six VOs from the older category has such examples. These activities range from the Management Committee taking on the responsibility at their own initiative to look after the regularity of weekly installment payment, to leasing pond for fishing, helping fellow members to win UP election, maintaining emergency funds and continuing VO
Impact Assessment Study
9 By ownership we mean VO members belonging to their VO, their loyality to their VO. A sense of propritorship by which they plan to carry out all the VO activities by themselves.
Village organisation and institution building activities for 6 months in the absence of BRAC, resisting BRAC's initiatives to put a DTW in their village etc. (See Annex-3 for more details.) In majority of the cases, these collective activities are connected to high levels of staff interaction. In the recent years, as the level of these interactions have gone down, these have ceased. vi. Examples of mutual support Examples of mutual support among the VO members are not that common. Repaying loans for fellow members is the only example of mutual support that could be traced in VOs from all age categories. However, it could also be the case that the members repaid these loans in their own interest. They know that if that loan remains unpaid, none of the members will get another loan. In one middle aged (12-47 month) VO, the members nominated and elected a poor woman, who taught them FE. This ultimately turned out to be one way support though. Once elected, this woman did not look after the VO members' interests. In another VO, the members demonstrated extreme tolerance towards fellow members. It is the VO members who decided among them who should get the VGD card. They felt that there were more members who badly needed this card and recommended these members to the BRAC office. The office later supplied the additional cards. Apart from repaying the fellow members’ loan and deciding upon VGD card recipients, in one of the older (48 + months) VOs, the members helped a VO member’s husband to win the election. vii. VO members’ relation with other interest groups
Most of the VOs do not have any example of working as an interest group or organisation. This can be explained in terms of inadequate joint forum and joint activities. None of the VOs have issue-based meetings anymore. Most of the VOs have irregular savings meetings. The PA goes to the meeting venues regularly but members or their representatives come one by one and repay their installments and deposit savings. Thus the members never sit together and discuss any issue. In some cases, the PA goes from door to door to collect installments. Two VOs from the older group (48 + month old) have examples of joint projects (DTW). But in neither cases, general members know the real situation. In one case, the members think that BRAC is running the DTW, but in reality, it is the members who own and run the DTW. In the other case, only a few members own the DTW, but all the members claim that the DTW belongs to them. With this level of collective action, it cannot be expected that they would soon act jointly as one interest group. In another old VO (48 + month ) in 1989, the local workers of the Communist Party threatened to destroy the BRAC office. All these VO members along with other members guarded the BRAC office with makeshift weapons. The other example from the same VO dates back to the early eighties when the local elites, as an expression of their opposition to BRAC's activities, created a false case of illegal affair between a PO and a local woman. This created feelings of antagonism among the local people. They wanted to kill the PO. VO members helped the PO to leave the place in disguise and unhurt. There is another example in a young(0-11 month) VO. BRAC's WHDP was working in this area for two years before RDP moved in. The members of Gram Committee, Health cadres and Mohila shabha were also the members of RDP. Before BRAC went to this village, the UP Chairman did not properly distribute UP wheat among the destitute women. These VO members then unanimously decided not to vote this Chairman for next term and acted accordingly. Thus they managed to change the situation by changing the UP Chairman. There is no example of VOs working as interest group in the middle age category. viii. Influence on existing social and economic relation
As the VOs are loosely organised, it is quite difficult to have any influence on existing social relations. Particularly, since the members of the VO do not have any joint forum. They are considered as individuals and this is reflected in our findings. Members from 2 VOs (48 + months) mentioned small changes in their
110 Impact Assessment Study
Village organisation and institution building social relations. In these two cases, they considered changes in attitudes towards women as social change. This is true for all other VOs. These activities have definitely brought some distinguishable changes within the HH. Members of another VO (48 + month) reported that they do not work for the rich villagers anymore. In economic field, almost all the VO members reported some influence on economic relations. They reported that they do not need to go to the traditional moneylenders any more. In one case, they said that the traditional moneylenders now lend them more money as they are not considered risky loanees any more and in 2 other cases, the traditional moneylenders now refuse to lend them anymore as they now go to BRAC for loans. Members from middle aged VOs also have similar experience. Members from a young (0-11 month) reported that the traditional moneylenders of their village did not like the idea of members' independence or reduced dependence upon them. The moneylenders do not want to give them loans any more. They tell them
You now have your BRAC and GB, why do you come to me for loans? Go to them. The same VO had WHDP in the area before RDP went there. This VO experienced a slightly different change. Because of the health training of a few of the members, people from the wealthier village community now take health related advice from them. They even call the VO members to their houses. But the wealthier group are still not ready to establish any matrimonial relationship with these members.
Because they move around the whole village. Genderwise no systematic trend can be observed on these issues. In all the age groups the male VOs and the female VOs behave in the same way. It is only the length of their association with BRAC that matters. Overall, some elements of autonomy can be traced in few of the VOs. They are relatively more prominent in older VOs . In general, most members perceive BRAC’s benefits in concrete terms (loans and the potential for economic advancement) rather than in terms of the wider development goals such as VOs becoming mutual support groups. Collective activities are rare, and a notable degree of independence from BRAC is not evident in any of the older VOs. 9.6 Conclusion We recognize the fact that institution building is a lengthy and complicated process. The case studies did not depict a very encouraging picture of the institution building process in BRAC. BRAC’s vision of VOs as strongly organised and self managed groups, valued by its members and providing the basis for effective participation in the social, economic and political affairs of their localities may have been too ambitious. In recent years, BRAC has realised that the members’ existing social contexts are far from congenial to have such a situation and, therefore, amended its visions of VOs. The VOs are now perceived as a little more than a mechanism for financial transactions (Proposal for RDP IV). High rates of member turnover coupled with frequent change of BRAC rules, strong emphasis on credit activities, etc. create barriers towards the development of a viable organisation which may later turn into a self-sustaining institution. Overall, the VO discipline is more pronounced in the younger VOs compared to older ones. In recent years, BRAC has introduced much disciplined savings and credit policy ensuring high repayment rates. This may have some bearing on younger VOs’ maintenance of discipline. However, discipline in younger VOs also could be due to the fact that the members consider this discipline as their 'gateway to loans'. However, after spending a couple of years with BRAC, they do not feel inclined to abide by the regulations of the VO. Over time they even become reluctant to regularly attend the VO meetings. Moreover, repeated changes in BRAC rules and frequent transfers of BRAC staff have resulted in many instances uncertainty amongst members.
111 Impact Assessment Study
Village organisation and institution building
112
The members generally feel little belonging towards their VOs. This could be explained by high expectations of material gains from BRAC. They consider groups as a means to receive inputs. The VOs do not seem to have a very strong leadership. The leaders act more as BRAC's instrument in maintaining discipline and regularity in repayment of credit. They seldom act in members' interests. In our 24 cases, we found that the leaders and the members acted jointly in their own interest in only two VOs. These two VOs are linked and located in the same area. But this is an exception. With usual type of VO leadership, an organisation is less likely to become autonomous and carry out activities in their own interest. It is no doubt disheartening that the VOs, in their present form, do not work to become anything more than a credit and savings group. The situation is similar for both linked VOs and isolated female VOs. The very few success stories of the BRAC Institution Building process should be analysed with great care in order to identify the possible responses for this success. What the possible reasons could be behind this success should be identified. Before going any further with institution building, the context of the rural community needs should be considered. However, in a situation of dire poverty, where livelihood options are extremely limited, there is a variety of human responses for survival. In such a situation, how far an individual is ready to accept the idea of common interests and operate beyond the domain of individual interests is open to question.
Impact Assessment Study
The non-formal primary education programme
113
10. The non-formal primary education programme
10.1 Introduction Using case study material we have assessed the role of NFPE as part of RDP's integrated package. Specifically:
coverage of VO members' children;
targeting, and the wealth profile of NFPE clientele
members' perceptions of, and involvement in the schools These issues are significant for assessing the importance of NFPE schools as part of the RDP package, and may shed light on the issue of establishing schools outside of RDP villages. The IAS was not designed to assess the educational outcomes and impact of NFPE schools. Alternative studies designed for such purposes have already been carried out by RED several times in recent years. However, some positive findings on the educational effectiveness of NFPE schools can be reported on the basis of parental statements (see Box 6.1 below). 10.2 NFPE coverage of VO members' children Out of 16 case study locations, 12 had at least one NFPE school, and some had access to several (both within and neighbouring to the villages). The following main findings therefore relate to 12 VO locations. On average, just over 20% of the total households in the 12 communities had sent (in the past) or were sending their children to a BRAC school by the time of the interviews. On average, just under 50% of VO member households had children in a BRAC schools. (Note that some VO member households may not have had eligible children). Coverage of VO member households was highest in the two more recently established VOs (61% of households had at least one child in an NFPE school established in the previous year). The percentage of VO members sending children to NFPE school declines over time. In VOs established between one and four years ago, 46% of member families had a child in school at the time of interview, while for the VOs established more than four years ago, the percentage was lower (43%). Some VO members did claim that there were problems in getting their children into school (see below), however the average decline of the proportion of member children in school appears to be "natural". In the second or third cycles of an NFPE school there are relatively fewer eligible BRAC member-children to admit. Therefore the enrollment pattern shifts to including more children from non-BRAC households in the village. This does not appear to be a cause for concern in educational terms - as box 6.1 below suggests.
Impact Assessment Study
The non-formal primary education programme
114
In one VO established more than four years ago there were only 50 children eligible for the four NFPE schools in (and next to) the village. Naturally, these households could not take up a majority of the schools places - most of which were taken by non-member households. Box 10.1 Suggestive findings concerning NFPE's education impact on VO member children.
While the IAS cannot provide any detailed assessment of NFPE's qualitative educational impact, survey interviews of VO member households in the case study locations enabled the collection of additional data on the literacy of 120 8-16 year old boys and girls within those locations. According to this source there are significant differences between the literacy rates of members' children in VOs established more than four years ago, and those VOs formed more recently. Specifically, VOs with NFPE schools which have run for more than one three-year cycle claimed that 56% of their boys and 70% of their girls within the 8-16 year age group can read and write; in VOs recently established, in the middle of the schools' first cycle, literacy rates were 50% for boys and 33% for girls. These findings suggest two main conclusions: (i) over time NFPE schools are having a major impact on the number of VO members' children attaining higher educational abilities, and (ii) while this impact is small in the case of boys, it is extremely marked in the case of girls.
10.3 Targeting, and the wealth profile of NFPE clientele Despite the generally effective coverage of BRAC member households by the NFPE programme, the case studies found that the overall wealth profile of school clientele reflected that of the community as a whole. In other words, NFPE schools are not "poor peoples' schools", but "community schools". Wealth ranking of all households in the communities (irrespective of membership) showed that, on average 40% of the school children come from the poor sections, and 60% from the non-target group. These percentages reflect the proportion of BRAC-eligible (target group) and non-eligible households found in these 12 localities. In five out of 12 VOs complaints were voiced about the number of children from richer households gaining access to the NFPE school. In one place, they said:
This is our school, so our children should read in it. But the children of rich households are selected more. When selecting children the NFPE PO and teacher consults with the village leaders, who are better off and more powerful. They ignore our opinion.
This quote suggests that there can be tensions between the idea of the school as ‘owned’ by the VO, and the reality of the schools' more inclusive approach to enrolling children from all sections of the community. (While NFPE policy emphasises targeting, it does not limit enrollment to VO members only). However, in some of these five VOs in which complaints were voiced, there appeared to be practical reasons for including certain better off children. In one school, a Union Parishad leader threatened to oppose the school unless his relative's daughter was enrolled. Members in several localities also commented that richer people want to send their children to the NFPE school because they run more smoothly, with smaller class sizes and better teaching than the local government primary schools. These observable differences mean that there is demand from all sections of the community to gain enrollment in NFPE for their children. Excluding some children may also generate unwanted conflict in the community.
Impact Assessment Study
The non-formal primary education programme
115
However, in the other seven VO schools, there was no conflict or tension over the issue of who is enrolled. In these cases, selection criteria appeared to be applied more rigorously, and poorer children were given priority. It was only when all (poorer) eligible children were enrolled that children from other (better off) households were accepted. This suggests that when the phasing of enrollment, to ensure poorer households are given "first choice", is carried out carefully, confusions and conflicts over the enrollment of better off children can be avoided. 10.4 Members' perceptions of, and involvement in NFPE schools Box 10.2 NFPE's promotion of parental involvement in schools
Ideally, the selection of sites, teachers and running hours are made with the consent of parents and a four member school committee (including two parents, the teacher and one leading member of the community). This committee organises monthly parent meetings, encourages regular class attendance, maintains school buildings and liaises with the wider community to solve any problems or conflicts. Ideally, NFPE schools are closely linked to the VO, these members playing key roles in the running of the school.
This section discusses findings relating to members' perceptions of NFPE schools, and their involvement in school operation. Such involvement includes the creation process (eg. site and teacher selection), and decisions such as the fixing of school hours. In addition, some incidents of conflict are mentioned. There is no doubt that schools are perceived positively by parents: in most of the case study locations VO members listed common characteristics which distinguish them from government primary schools: the class size is smaller, the teachers more punctual and diligent, the hours are (in most cases) more flexible, and the schools are closer to the concerned households. Opinions about teaching quality were also favourable in 11 out of 12 locations, and parents generally appreciated the fact that they are invited to be involved in school affairs. In addition, there were many comments from groups interviewed which suggest that VOs feel that the schools are "owned" by them, and that they acquire considerable symbolic significance for groups who are disadvantaged in relation to formal primary school access. As one member stated:
The people of this village consider our BRAC school to be a symbol of good fortune and advancement.
The one significant criticism of NFPE schools which was raised in the several places was that they should include religious studies as part of the curriculum. Rumours about BRAC's lack of religion, or even the threat of conversion to Christianity are not uncommon in areas in which religious "fundamentalists" have influence. The concern with curriculum content, where raised, appeared to express a hope that such fundamentalist fears could be undermined by including more evidence of BRAC's commitment to Islamic orthodoxy within the NFPE programme. Many of the NFPE schools in the 12 case study locations had been established partly because the VO members themselves had pressured the AO staff to set one up in their village. The operation of the NFPE programme in neighbouring areas gave rise to such demands. In some VOs the request for a school involved impressive organisation by members - not only did they identify an appropriate site, but they also drew up a comprehensive list of eligible children, to indicate that they had a realistic proposal.
Impact Assessment Study
The non-formal primary education programme
116
This willingness to become involved in school creation was evident from VO histories in the majority of case study locations. The majority of VO members and parent groups participated in decisions regarding site and teacher selection. Six out of 12 VOs said they agreed on the school's running hours. However, in the other cases members claimed that BRAC staff set the hours with the teachers, and that there was little consultation. Parent meetings, while commonly held, are normally conducted either by a PO or by the teacher (in seven out of 12 VOs). Parents' roles in such meetings therefore appear to be limited. Three of the five VOs who claimed more pro-active participation in running meetings were in the four years established age-category. This finding suggests that older VOs can retain a close and successful involvement in the running of schools, even if BRAC member children are a declining proportion of the total clientele. In the two VOs in which there were stories of conflict concerning the NFPE school, they may be summarised as:
attempts by better off households to impose a decision about the school site (which provides the plot-hut owner with a rental income) and who the teacher should be (from the family of one of the better off and influential households). In some cases, such impositions are difficult to refuse (because of high degree of influence which such households can exert), and BRAC field staff are understandably reluctant to allow conflict to develop.
conflict between two VO members who each wanted to rent out their own land for the school.
These two cases may be regarded as relatively minor indications of potential problems to avoid - they do not represent the majority of cases studied, in which no overt conflicts were reported during fieldwork. 10.5 Conclusions After a second or third cycle of an NFPE school the degree of VO involvement (measured by the number and proportion of member-children attending) tends to decline. However, VOs' retain a pride in, and link with school affairs, which implies that they remain a key benefit for VOs. The schools provide a highly valued service to poorer families; perceptions of school quality are overwhelmingly positive. Except for the issue of religious curriculum content, few criticisms were voiced during group interviews. Examples of conflict are rare, and some can be avoided. The key example of this is the need to ensure priority (or "first choice") to poorer households during school enrollment - which can be done by carefully organised and phased child selection. However, the case studies also show that NFPE schools are not exclusively “poor peoples” schools, but tend to include children from all wealth classes. This, in effect, is a result of the schools' perceived qualities - they are attractive to those outside of BRAC's target group. In relation to the issue of isolated NFPE schools (i.e. ones without linkage to a VO) the above main findings raise certain issues. VO member involvement appears to provide a high level of guarantee that poorer children are enrolled. It may be hypothesised that for schools without this VO support, such successful targeting may be harder to attain. The main findings also suggest a need for NFPE staff to pay close attention to applying rigorous and phased enrollment criteria in non-RDP areas. However, since the IAS was confined to RDP villages, these hypotheses are issues for further research.
Impact Assessment Study
Membership discontinuation
117
11. Membership discontinuation
The issue of membership discontinuation which may arise due to withdrawal of membership status by RDP on disciplinary grounds, or as a result of unwillingness on the members’ part to sustain membership, has surfaced recently. The household survey for IAS was designed to exclude this category but for reasons of communication gap between the RED and the respective Area Offices, in the membership lists sent by the AOs which was also the sampling frame , a sizeable number was identified as members whose membership was discontinued. It is more as an after thought rather than by design, that the section is written . This section is designed to give an itinerary on the dropouts. For that reason, both the case study and the household survey information were used in order that a comprehensive picture of the dropout could be drawn. The case studies provided the magnitude and the reasons for the dropout from V0s and the household survey data was used to compare the material well-being of the dropout with those who sustain their membership. A caveat : the result should not be viewed as being representative of the entire population of the discontinued membership. 11.1 What are the reasons? The information from case studies was used to shed some light on the explanation for this phenomena. The case studies were designed to gain an impression of the reasons for the unwillingness of some members to sustain membership or for the membership withdrawal by RDP; however, the case studies did not contain any predetermined categories of explanation. The data generated with open ended interviewing were reclassified andpresented below to formulate factors that might explain this phenomena. The stated reasons for membership discontinuation were grouped, and, for brevity's sake, a typology was constructed in Box 11.1. The explanation for the drop-out appears to be multi-dimensional: the programmatic factors were those which are given by the programme design such as credit and VO discipline, the operational rules that prohibit the AOs to sanction loans for consumption purpose, and policy changes taking place as a result of refinement to and fine-tuning of the design such as the introduction of GTF and modification of the loan repayment schedule. The characteristics of the member households are important in that the respective socio-economic status of the household may influence its behaviour regarding regular attendance at meetings or contribution to the saving account, attitudes towards changes in RDP policy, RDP's practice of forced sale of household items to ensure repayment of loans, or the practice of publicly putting pressure to effect loan repayment that might add insult to injury. The third, a falsity in expectation and a fear which was related to both RDP design, staff practice and the household's objective condition. The changes in RDP policy have created some problems at some of the older Area Offices where members of more than three years age were prone to question the reasons for the changes. The members from one VO said,
In the beginning, dealing with the BRAC staff was good, but now they do not want to listen to our problems. Initially, BRAC told us that Group Trust Fund (GTF)was refundable but now they (BRAC) are refusing to return it. BRAC do not show us written rules for conducting VO activities. If BRAC gives a single paisa then they make a deed. But we never have any written document for us. If we had anything in writing about the previous refundable group fund then we could have sued BRAC.
Impact Assessment Study
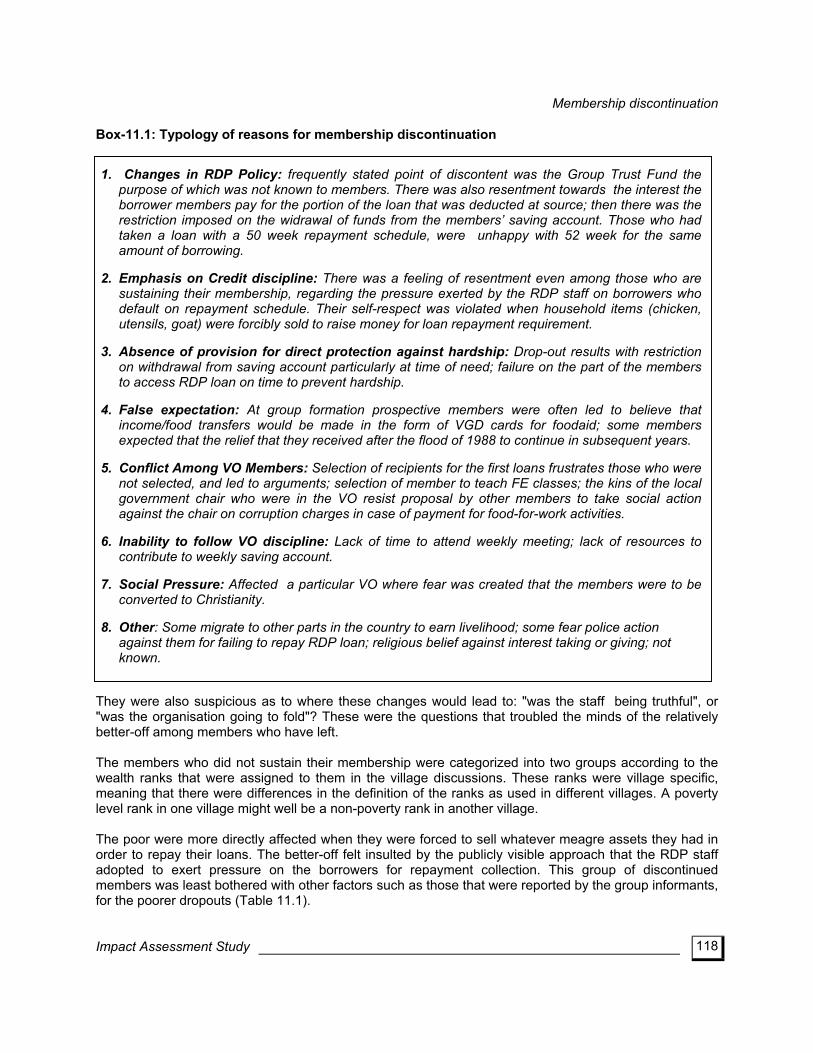
Membership discontinuation
118
Box-11.1: Typology of reasons for membership discontinuation
1. Changes in RDP Policy: frequently stated point of discontent was the Group Trust Fund the purpose of which was not known to members. There was also resentment towards the interest the borrower members pay for the portion of the loan that was deducted at source; then there was the restriction imposed on the widrawal of funds from the members’ saving account. Those who had taken a loan with a 50 week repayment schedule, were unhappy with 52 week for the same amount of borrowing.
2. Emphasis on Credit discipline: There was a feeling of resentment even among those who are
sustaining their membership, regarding the pressure exerted by the RDP staff on borrowers who default on repayment schedule. Their self-respect was violated when household items (chicken, utensils, goat) were forcibly sold to raise money for loan repayment requirement.
3. Absence of provision for direct protection against hardship: Drop-out results with restriction
on withdrawal from saving account particularly at time of need; failure on the part of the members to access RDP loan on time to prevent hardship.
4. False expectation: At group formation prospective members were often led to believe that
income/food transfers would be made in the form of VGD cards for foodaid; some members expected that the relief that they received after the flood of 1988 to continue in subsequent years.
5. Conflict Among VO Members: Selection of recipients for the first loans frustrates those who were
not selected, and led to arguments; selection of member to teach FE classes; the kins of the local government chair who were in the VO resist proposal by other members to take social action against the chair on corruption charges in case of payment for food-for-work activities.
6. Inability to follow VO discipline: Lack of time to attend weekly meeting; lack of resources to
contribute to weekly saving account. 7. Social Pressure: Affected a particular VO where fear was created that the members were to be
converted to Christianity. 8. Other: Some migrate to other parts in the country to earn livelihood; some fear police action
against them for failing to repay RDP loan; religious belief against interest taking or giving; not known.
They were also suspicious as to where these changes would lead to: "was the staff being truthful", or "was the organisation going to fold"? These were the questions that troubled the minds of the relatively better-off among members who have left. The members who did not sustain their membership were categorized into two groups according to the wealth ranks that were assigned to them in the village discussions. These ranks were village specific, meaning that there were differences in the definition of the ranks as used in different villages. A poverty level rank in one village might well be a non-poverty rank in another village. The poor were more directly affected when they were forced to sell whatever meagre assets they had in order to repay their loans. The better-off felt insulted by the publicly visible approach that the RDP staff adopted to exert pressure on the borrowers for repayment collection. This group of discontinued members was least bothered with other factors such as those that were reported by the group informants, for the poorer dropouts (Table 11.1).
Impact Assessment Study
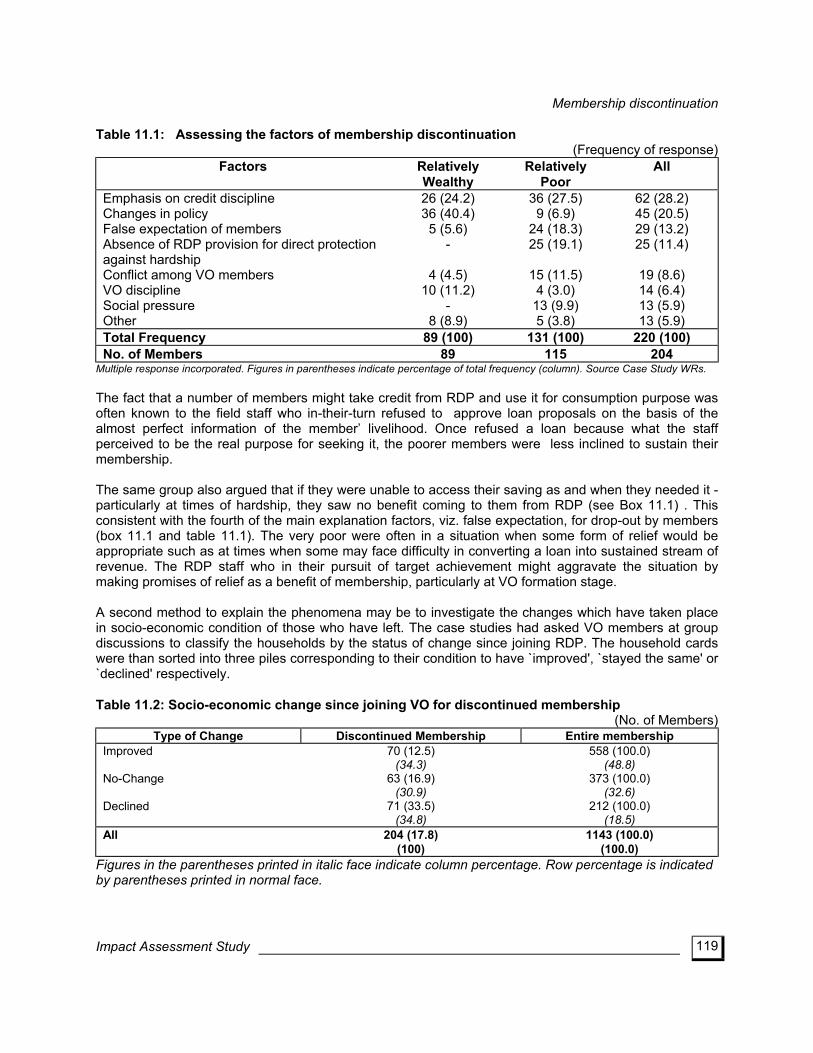
Membership discontinuation
119
Table 11.1: Assessing the factors of membership discontinuation
(Frequency of response) Factors Relatively
Wealthy Relatively
Poor All
Emphasis on credit discipline Changes in policy False expectation of members Absence of RDP provision for direct protection against hardship Conflict among VO members VO discipline Social pressure Other
26 (24.2) 36 (40.4)
5 (5.6) -
4 (4.5) 10 (11.2)
- 8 (8.9)
36 (27.5) 9 (6.9)
24 (18.3) 25 (19.1)
15 (11.5)
4 (3.0) 13 (9.9) 5 (3.8)
62 (28.2) 45 (20.5) 29 (13.2) 25 (11.4)
19 (8.6) 14 (6.4) 13 (5.9) 13 (5.9)
Total Frequency 89 (100) 131 (100) 220 (100) No. of Members 89 115 204
Multiple response incorporated. Figures in parentheses indicate percentage of total frequency (column). Source Case Study WRs. The fact that a number of members might take credit from RDP and use it for consumption purpose was often known to the field staff who in-their-turn refused to approve loan proposals on the basis of the almost perfect information of the member’ livelihood. Once refused a loan because what the staff perceived to be the real purpose for seeking it, the poorer members were less inclined to sustain their membership. The same group also argued that if they were unable to access their saving as and when they needed it - particularly at times of hardship, they saw no benefit coming to them from RDP (see Box 11.1) . This consistent with the fourth of the main explanation factors, viz. false expectation, for drop-out by members (box 11.1 and table 11.1). The very poor were often in a situation when some form of relief would be appropriate such as at times when some may face difficulty in converting a loan into sustained stream of revenue. The RDP staff who in their pursuit of target achievement might aggravate the situation by making promises of relief as a benefit of membership, particularly at VO formation stage. A second method to explain the phenomena may be to investigate the changes which have taken place in socio-economic condition of those who have left. The case studies had asked VO members at group discussions to classify the households by the status of change since joining RDP. The household cards were than sorted into three piles corresponding to their condition to have `improved', `stayed the same' or `declined' respectively.
Table 11.2: Socio-economic change since joining VO for discontinued membership (No. of Members)
Type of Change Discontinued Membership Entire membership Improved No-Change Declined
70 (12.5) (34.3)
63 (16.9) (30.9)
71 (33.5) (34.8)
558 (100.0) (48.8)
373 (100.0) (32.6)
212 (100.0) (18.5)
All 204 (17.8) (100)
1143 (100.0) (100.0)
Figures in the parentheses printed in italic face indicate column percentage. Row percentage is indicated by parentheses printed in normal face.
Impact Assessment Study
Membership discontinuation
120
The results are displayed in table 11.2. Among the entire membership (including drop-out) just under one-fifth was reported to have experienced a decline in their condition. A third of this group was found to have left the RDP whereas only 12.5 percent of those who had improved their condition was no longer with the VOs. The changes indicated by the table 11.2 may be sudden or a gradual one over a period of time. The nature of the changes were not yet unexplored. It may be that those who were classified as to have experienced a decline, might have started the process before joining RDP. It might also have begun after association with RDP. In either case, the `declined' category as a whole had not discontinued its membership, a large portion of it remained with RDP. This raises the question: how long will they continue their membership should they not experience improvements in their present socio-economic condition? The issue of membership turnover has a bearing on the measurement of impact as well as on cohesion among the members of respective VOs. The comparison of the reasons for dropout show that the two wealth groups differ on their reasons. The RDP rules on membership, their credit discipline enforcement practice, and their credit-operation rules were three of the four reasons for membership discontinuation by the relatively poor. It appears that the rules of RDP itself is a ‘barrier to participation’ for the poor whereas the relatively wealthy were concerned to maintain their pride. As chapters 6 and 7 show, the membership needs to be sustained for a certain period before changes become measurable. From this it is imperative to reduce membership discontinuation at longer lengths of membership. 11.2 Characteristics of the dropout members. The household survey sample inadvertently included a number of drop-out members. This section reports on the characteristics of the dropout with respect to some indicators by comparing than with the respective category of member who sustain their membership. The table 11.3 shows that given the data-set, clear-cut conclusion require further, more focussed, investigation. The indicators did not show that they were from the poorer segment of VO members nor was there evidence of "graduation" from the need to draw on RDP support including credit. Life-cycle factors
The differences between the two groups with respect to the life-cycle indicators viz. dependency ratio and the number of working age members in the household, were not significant. There was similarity between the respective sex categories i.e. the dependency ratios were similar for female categories. Initial endowment
The average landholding on joining RDP indicate that for the female category the difference was significantly large with the dropout better endowed. However, the landholding at the time of interview show small decline for the female drop-out whereas it increased by smaller amount for the current female category. This implies that the better-off initial condition of the drop-out might have declined. For the male there were no differences (table 11.3). RDP inputs
The membership length indicator showed no difference for the male category whereas there was a very large difference for the females. This is not surprising. The current membership of RDP was made-up of large proportion of females due to the emphasis on women and to the rapid expansion, in the early 1990s. The drop-out female members were with the VOs on average for nearly double the average length for the current members, at 43 months.
Impact Assessment Study
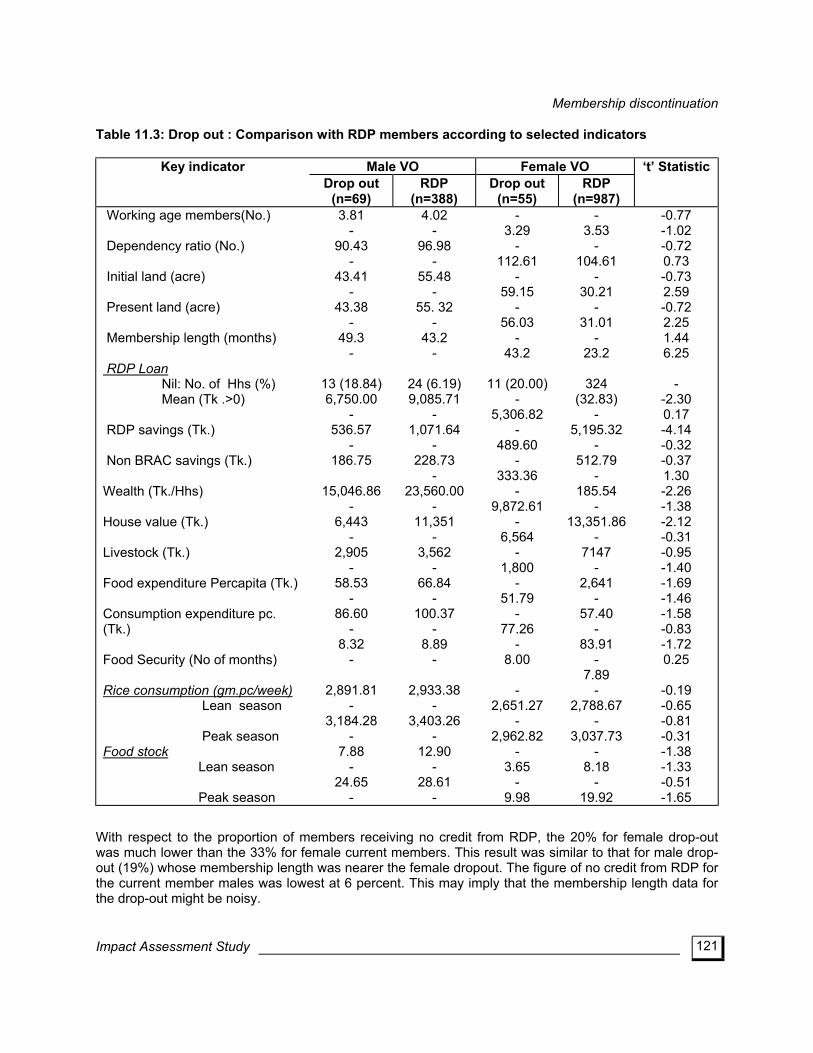
Membership discontinuation
121
Table 11.3: Drop out : Comparison with RDP members according to selected indicators
Key indicator Male VO Female VO ‘t’ Statistic Drop out
(n=69) RDP
(n=388) Drop out
(n=55) RDP
(n=987)
Working age members(No.) Dependency ratio (No.) Initial land (acre) Present land (acre) Membership length (months) RDP Loan Nil: No. of Hhs (%) Mean (Tk .>0) RDP savings (Tk.) Non BRAC savings (Tk.) Wealth (Tk./Hhs) House value (Tk.) Livestock (Tk.) Food expenditure Percapita (Tk.) Consumption expenditure pc. (Tk.) Food Security (No of months) Rice consumption (gm.pc/week) Lean season Peak season Food stock Lean season Peak season
3.81 -
90.43 -
43.41 -
43.38 -
49.3 -
13 (18.84) 6,750.00
- 536.57
- 186.75
15,046.86
- 6,443
- 2,905
- 58.53
- 86.60
- 8.32
-
2,891.81 -
3,184.28 -
7.88 -
24.65 -
4.02 -
96.98 -
55.48 -
55. 32 -
43.2 -
24 (6.19) 9,085.71
- 1,071.64
- 228.73
- 23,560.00
- 11,351
- 3,562
- 66.84
- 100.37
- 8.89
-
2,933.38 -
3,403.26 -
12.90 -
28.61 -
- 3.29
- 112.61
- 59.15
- 56.03
- 43.2
11 (20.00)
- 5,306.82
- 489.60
- 333.36
- 9,872.61
- 6,564
- 1,800
- 51.79
- 77.26
- 8.00
-
2,651.27 -
2,962.82 -
3.65 -
9.98
- 3.53
- 104.61
- 30.21
- 31.01
- 23.2
324
(32.83) -
5,195.32 -
512.79 -
185.54 -
13,351.86 -
7147 -
2,641 -
57.40 -
83.91 -
7.89 -
2,788.67 -
3,037.73 -
8.18 -
19.92
-0.77 -1.02 -0.72 0.73 -0.73 2.59 -0.72 2.25 1.44 6.25
-
-2.30 0.17 -4.14 -0.32 -0.37 1.30 -2.26 -1.38 -2.12 -0.31 -0.95 -1.40 -1.69 -1.46 -1.58 -0.83 -1.72 0.25
-0.19 -0.65 -0.81 -0.31 -1.38 -1.33 -0.51 -1.65
With respect to the proportion of members receiving no credit from RDP, the 20% for female drop-out was much lower than the 33% for female current members. This result was similar to that for male drop-out (19%) whose membership length was nearer the female dropout. The figure of no credit from RDP for the current member males was lowest at 6 percent. This may imply that the membership length data for the drop-out might be noisy.
Impact Assessment Study
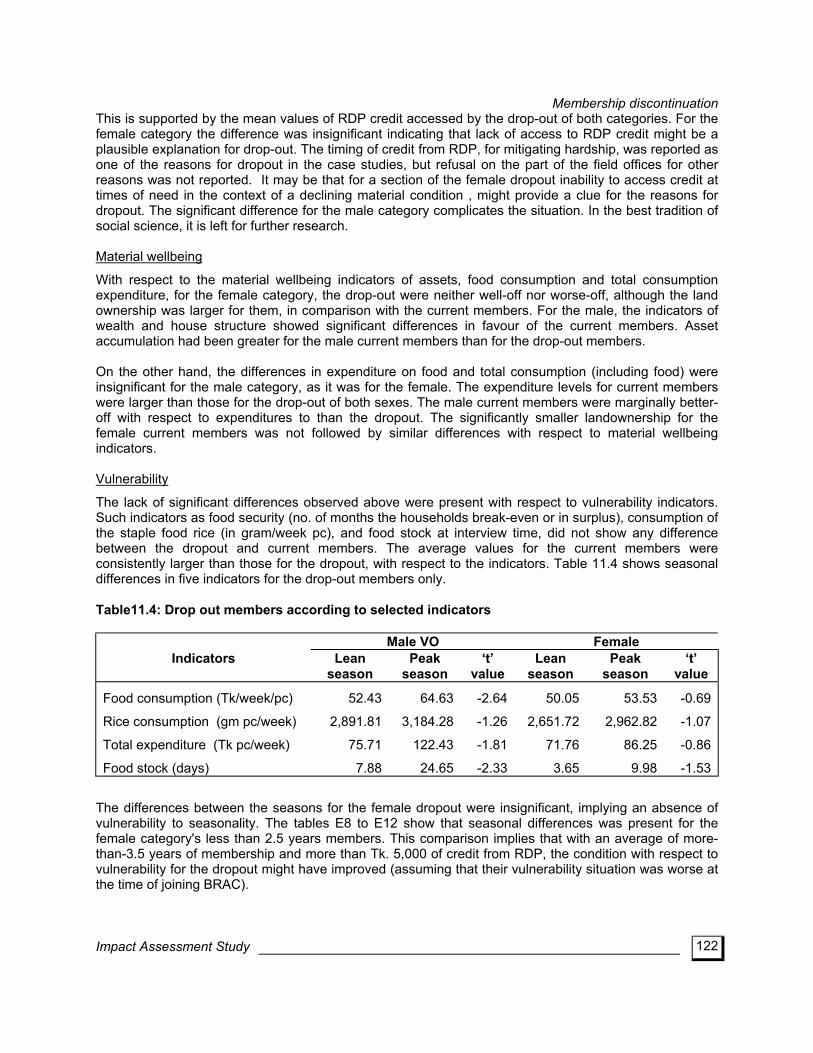
Membership discontinuation
122
This is supported by the mean values of RDP credit accessed by the drop-out of both categories. For the female category the difference was insignificant indicating that lack of access to RDP credit might be a plausible explanation for drop-out. The timing of credit from RDP, for mitigating hardship, was reported as one of the reasons for dropout in the case studies, but refusal on the part of the field offices for other reasons was not reported. It may be that for a section of the female dropout inability to access credit at times of need in the context of a declining material condition , might provide a clue for the reasons for dropout. The significant difference for the male category complicates the situation. In the best tradition of social science, it is left for further research. Material wellbeing
With respect to the material wellbeing indicators of assets, food consumption and total consumption expenditure, for the female category, the drop-out were neither well-off nor worse-off, although the land ownership was larger for them, in comparison with the current members. For the male, the indicators of wealth and house structure showed significant differences in favour of the current members. Asset accumulation had been greater for the male current members than for the drop-out members. On the other hand, the differences in expenditure on food and total consumption (including food) were insignificant for the male category, as it was for the female. The expenditure levels for current members were larger than those for the drop-out of both sexes. The male current members were marginally better-off with respect to expenditures to than the dropout. The significantly smaller landownership for the female current members was not followed by similar differences with respect to material wellbeing indicators. Vulnerability
The lack of significant differences observed above were present with respect to vulnerability indicators. Such indicators as food security (no. of months the households break-even or in surplus), consumption of the staple food rice (in gram/week pc), and food stock at interview time, did not show any difference between the dropout and current members. The average values for the current members were consistently larger than those for the dropout, with respect to the indicators. Table 11.4 shows seasonal differences in five indicators for the drop-out members only. Table11.4: Drop out members according to selected indicators
Male VO Female Indicators Lean
season Peak
season ‘t’
value Lean
season Peak
season ‘t’
value
Food consumption (Tk/week/pc)
Rice consumption (gm pc/week)
Total expenditure (Tk pc/week)
Food stock (days)
52.43
2,891.81
75.71
7.88
64.63
3,184.28
122.43
24.65
-2.64
-1.26
-1.81
-2.33
50.05
2,651.72
71.76
3.65
53.53
2,962.82
86.25
9.98
-0.69
-1.07
-0.86
-1.53
The differences between the seasons for the female dropout were insignificant, implying an absence of vulnerability to seasonality. The tables E8 to E12 show that seasonal differences was present for the female category's less than 2.5 years members. This comparison implies that with an average of more-than-3.5 years of membership and more than Tk. 5,000 of credit from RDP, the condition with respect to vulnerability for the dropout might have improved (assuming that their vulnerability situation was worse at the time of joining BRAC).
Impact Assessment Study
Membership discontinuation
123
For the male dropout, the table 11.4 shows significant low levels of food expenditure and of food stock of the lean season, implying vulnerability of sorts. 11.3 Conclusion The group discussion with the members revealed a number of reasons for dropout : some were related to RDP rules and procedure which were disliked by the members; some were related to their specific condition which did not afford them the time to participate; and others were related with their respective expectations from BRAC. Given the reasons and the comparative household characteristics it is clear that the dropout cases had neither : a) ‘graduated’ in the sense of outgrowing any need for drawing on RDP credit or other inputs; nor (b) been from a poverty status which prevented them benefiting from RDP inputs, for example, by managing an investment of RDP credit. Expectation related causes appear to be plausible explanations for dropout by members. The sources of the unmet expectation are likely to include the members’ own perception regarding RDP and/or the false expectation created by field staff. Unmet expectations appear to have affected both the better-off and the poorer among the dropout. Both the better endowed and the poorer members faced difficulty in maintaining credit discipline, and their expectation of lenience from RDP staff was unmet. In addition, for the comparatively better endowed female dropout even after a length of membership, the expectation with regards to speedy improvement in material condition were likely to have been unmet. Furthermore, some members were led to expect specific support such as relief, wage employment, by the staff which were clearly not part of RDP design.
Impact Assessment Study
Conclusion: policy relevance of IAS results
124
12. Conclusion: policy relevance of IAS results
In the course of impact assessment a number of issues arose some of which were expected and others not, some plausibly explained and others in-explicit; and many of the issues have policy relevance. At the same time, the issues reflect broad indications of the strength and weaknesses of RDP. The substantial impact that is observed at the household level is a reflection of its strength (perhaps more specifically of the credit component). On the other hand, weaknesses were revealed by the members who discontinue their participation, and by the deterioration in VO discipline and the lack of consensus between the members/’customers’ and the organisers, regarding a common perspective for the VOs. The unexpected issues, indicating weaknesses, invariably gain prominence in any discussion of programme impact, lest the unnoticed problems develop into something prominent. The concluding chapter reports on issues which have important policy implications. The issues relate to membership targeting, VO development, credit operation, women’s status, membership dropout, and a discussion of impact. 12.1 Membership targeting The success of RDP is due largely to effective management which is evidenced by The generally high rates of achievement by the staff in meeting performance targets. There is however some disquiet with regards to membership targeting which falls short of other performance achievement (such as 97% loan recovery rate). Targeting efficiency with regards to the poverty aspect of the membership has in the recent years improved for the female members but has worsened for the male. Some of the shortfall may be explained with reference to human error and to social reality at some localities. It is likely that when replacement of members were necessary in view of dropout by some members, the field staff were less particular with eligibility criteria. The implications of the presence of non-target is not immediately clear, at least the extent to which their presence might influence participation by the poorer members. There is some evidence to suggest, at least at certain pockets of RDP, that the non-targets are influential among the membership and the field staff may utilise this influence to maintain credit discipline. Where weaknesses in information led to the recruitment of non-targets, it may be necessary to remove the latter from RDP membership. The withdrawal of membership from non-targets may be considered as a part of targeting which does not necessarily end with group formation. Such membership withdrawal need not be considered membership drop-out, and which may be monitored by either the Monitoring Department or RED. Secondly, the current method used for target identification may be replaced with a more innovative one. The survey method that is currently used is perhaps less at fault for identification weaknesses. The piece-rate mode of payment for the surveyors who are temporarily employed by RDP field offices, create incentive for number of households surveyed rather than the quality of the information gathered. Thus, the flawed information is highly likely to lead to similar decision making with regards to targeting. The experience of a recent joint exercise by RDP and RED, to develop an alternative identification method, appear to be promising. The researchers at RED developed an innovative method that uses cards similar to those used for Wealth Ranking in RRA, and a cross section of villagers participate in ranking the households by pile sorting the cards according to some pre-determined categories. The exercise has served three purposes : (a) the villagers identified the target households effectively; (b) it generated some indication of willingness on the part of the poor to become members; and (c) it created an opportunity for preliminary information dissemination on RDP for motivational purposes.
Impact Assessment Study
Conclusion: policy relevance of IAS results
125
The cost of this participatory exercise, at first estimation appear greater than that involved in the surveys made by temporary staff. There is scope to reduce the cost of the new method on one hand, and the participatory method saves some other costs that are not accounted for in calculating the survey costs. The experimental exercise was costed on the basis of salaries of field level managerial staff (POs) as well as field assistants, who participated in the exercise. The POs can become trainers, and who can be replaced by more field assistants who will act as facilitators in the ranking exercise. The costs will be reduced as fewer POs are involved for less time. Secondly, in the current survey method additional staff time is involved in the post-survey promotional and motivational activities. In the participatory method some of these activities may be performed at the time of village level ranking exercises. Given these two considerations the cost of group formation is unlikely to increase, and targeting becomes more effective. 12.2 VO development The results of the VO case studies are perhaps more revealing than the other dimensions of RDP’s impact. The documents of RDP state that, “...BRAC aims to develop self-managed village organisations, promote self-reliance, and enhance the capacity of the poor to participate in the national development process”. At the household level some progress has been achieved with regards to self-reliance and material ‘capacity’, but there is very little to suggest that the VOs are progressing in the direction BRAC is aiming at. The process and the activities identified in the RDP documents have had mixed experience: members become less interested in the VO except for the financial matters; general membership is unwilling to assume greater leadership in the VOs preferring to leave it to the existing few leaders; members have not broken out of the existing social networks to embrace the VO as an alternative network for support and promotion of self-interest; and perhaps more importantly, field staff perceive less importance for the social aspects preferring the technical and the financial aspects of the VOs. The overall implication of these results is that BRAC’s vision for the VOs may have been over ambitious, which in the given situation may need to be scaled down restricting its objective regarding the VOs to ‘organisation development’ rather than ‘institutions buildings’. The term ‘institution ‘ implies certain requirement, and whether these can be met by a group of 30-40 men and women in the contexts of the village , micro-region and upto the national environment , needs to be seriously assessed. In addition to the contextual factors, the absence of a consciousness on the part of the general membership regarding the VO related objectives of RDP is a further cause for concern. That BRAC or others may view the VOs as units of representation for the members’ interest, and that the VOs are expected to achieve some form and level of autonomy, are completely alien to group members. In the members’ conception the VO is a mechanism for creating access to RDP credit and it is as yet far from creating space for collective action or for mutual support. That attendance at older VOs decline without a corresponding decline in savings and loan recovery, is evidence of the conception of the VOs as merely credit mechanisms. The members’ involvement in the VOs affairs appears to be an area which may not have been adequately addressed in the past. That the VOs did not even approach let alone meet, the criteria and indicators for ‘institution’ building is not surprising. What is unexpected is the confusion and lack of understanding regarding what the VOs were supposed practice and achieve, were meant for, on the part of both the programme personnel and the membership. If BRAC wishes to reconsider the need for ‘institution’ building, than experimentation with alternative strategies for facilitating and supporting village level groups appears necessary. Given the present level of staff involvement in the technology oriented, sectoral programmes and in credit operation, alternative strategies for VOs are likely to involve reconsideration of staffing levels with respect to social development (which has budgetary implications).
Impact Assessment Study
Conclusion: policy relevance of IAS results
126
12.3 Credit operations Since the early 1990s a disciplined credit operation system has been in place. The case studies identified some issues related to credit operation that are not entirely new but may be considered for adoption in the future. At some locations during the group discussion for case studies, the members reported that the current ceiling on RDP credit was inadequate for their occupational activities. At other locations the members reported that the current weekly repayment schedule for RDP credit was inappropriate for their activities which generate revenue at specific times of the years. (These ought not to be generalised because these two issues were raised at specific locations and by particular occupational groups). BRAC may consider introducing some mechanism in its credit operations to meet the needs of cottage and home based industrial activities the working capital requirement for which is larger than the current ceiling on loan size. Secondly, the seasonal nature of activities in the sub-sectors of agriculture may merit seasonal schedule for servicing RDP debt. The household survey data show that a per capita specification of RDP credit produces significant results. It also shows that the more dependents there is in a household the worse-off the latter is. In other words, some of the gains made possible due to RDP credit may be eroded by high dependency ratio. As fertility is a demographic phenomena it is unlikely to be influenced by RDP in the short or medium term. It may be possible, but the probability is unknown, to prevent the erosion in RDP impact by making provision for larger loans to larger households. In other words, it may be useful to explore the possibility of and the impact of defining floors of and ceilings on RDP credit size, in terms of per capita measures, instead of the current per member sizes. 12.4 Women’s status The major findings are that improvements are experienced by the women members in household material wellbeing and in their status at the home. Although the case studies reported a general improvement in the status of women within the households, there may be some cause for concern. The household survey data show a decline in decision making by men themselves, regarding the use of women’s earning but at the same time their role in decisions regarding drawing on RDP credit by women members do not decline. The case studies reported that the women were less involved in the direct utilisation of their RDP credit which they hand over to male household members instead. The persistence of husbands sole decision making with respect to the timing of loan may have two explanations. Firstly, it may be due to a combination of a lack of opportunities for women to invest their own loan and an unwillingness on the part of the women to assume alone the higher risks involved with larger loans. Secondly, it may be related with the sexual division of labour that assign women the smaller and less commercial investment roles whereas men assume the more commercialised and larger investment activities. The socio-culturally determined gender division of labour act as a barrier to their participation in direct investment activities which require knowledge of and linkages with the market. Those women who were engaged in outside-the-home activities were able to do so because of their life-cycle situation and socio-economic condition. Secondly, there are those who were engaged in home based activities for which men performed the outside-the-home tasks. The third category of women members were those borrowers who handed over the RDP loans to male household members.
Impact Assessment Study
When asked about the reason for handing over their loans to men, the women reported that there was little or no opportunity for them to invest it themselves. This might well have been a perceived one rather than real. This perception is likely to be an outcome of gender division of labour. In view of this BRAC may play a greater role to encourage the women to undertake income earning activities, albeit homebased but not necessarily traditional, in order for the women to further contribute to the material wellbeing of their respective households.
Conclusion: policy relevance of IAS results
127
This motivational aspect may be part of the selection process designed for the sectoral programmes. The programme currently focuses on ‘appropriate’ participants on the basis of a pre-determined set of selection criteria. It needs to be mentioned here that the sectoral programmes have in the 1980s and 1990s undergone steady development and expansion. This expansion is likely to continue in future and BRAC may take the process of expansion as an opportunity to engage more women in direct investment activities. In addition the focus for participant selection may be shifted to those women who currently hand over their loans to male household members. The process of selection necessarily involves a motivational aspect in which the male household members, in addition to the women, may be made a target and to whom the importance of an additional source of income for the household which is managed by women, may be emphasised. The expansion of technological sectors is likely to require the need for increased direct investment by BRAC : in such sectors as sericulture, livestock, horticulture which create home-based opportunities for women. The investments are necessary to create mechanisms to link the women with the market vertically, with the more mobile women acting as the linkage points for the women who are at the home based production level. The investments are likely to support the women producers and others in lesser extent, by ensuring availability of quality inputs which are not readily supplied by the market. At the downstream level, BRAC will need to invest in processing and marketing of the output produced by the women, to ensure a competitive market. The extent to which BRAC succeeds in creating such sources, needless to say thereby creating for direct investment by women is dependent on fund availability. 12.5 Membership discontinuation The increasingly larger membership discontinuation in older VOs is of concern for the programme as well as for poverty alleviation. There is no evidence to suggest that drop-out members adversely affect the current membership cohesion. The implication for poverty alleviation is clear from the analysis of material well being and vulnerability to seasonality. The gradual process of improvement which was observed, is likely to be disturbed by the dropout of older members. The profile of the discontinued members show that there is little difference between them and the current members, expect with regards two indicators in the case of female category. The household characteristics that are significantly different include initial landholding and length of membership. The membership length for the drop-out female show that their decision to cease participation was taken after a considerable time since joining RDP. The group discussions revealed a number of reasons for dropout : some were related to RDP rules and procedure which were disliked by the members; some were related to their specific condition which did not afford them the time to sustain their participate; and others were related with their respective expectations from BRAC. Given the reasons and the comparative household characteristics it is clear that the dropout cases had neither : a) ‘graduated’ in the sense of outgrowing any need for drawing on RDP credit or other inputs; nor (b) been from a poverty status which prevented them benefiting from RDP inputs, for example, by managing an investment of RDP credit. Expectation related causes appear to be plausible explanations for dropout by members. The sources of the unmet expectation are likely to include the members’ own perception regarding RDP and/or the false expectation generated by field staff. Unmet expectations appear to have affected both the better-off and
Impact Assessment Study
Conclusion: policy relevance of IAS results
128
the poorer among the dropout. Both the better endowed and the poorer members faced difficulty in maintaining credit discipline, and their expectation of lenience from RDP staff was unmet. In addition for the comparatively better endowed female dropout even after a length of membership, the expectation with regards to speedy improvement in material condition were likely to have been unmet. Furthermore, at the group formation stage some members were led to expect specific support such as relief, wage employment, by the staff which were clearly not part of RDP design. BRAC need to consider controlling dropout, particularly due to expectation causes, as part of its management roles. Retention of members in RDP is a role that can be incorporated into performance targets. This will require development of specific monitoring indicators and their inclusion in management training packages. In addition, efforts needs to be devoted to identifications and construction of mechanisms with which to provide support to the poorer members in exceptional circumstances of need and hardship. One possibility may be to create alternative support network of the members exclusively by encouraging some kind of common resource pooling for use at time of need. The form and content of such a resource pool or support network, the rules and the procedures, and the role of RDP, are to be tested for specificity to location, to condition and to circumstances, perhaps, in a participatory fashion. 12.6 Impact of RDP The household data and case studies revealed that RDP’s impact on the member households and on women’s status were substantial. Women’s status at home and in the community to lesser extent, have improved as a result of their participation. The improvement in the material wellbeing of households for the poorer female category was greater than that for the better-off. More specifically RDP credit had greater impact on the consumption expenditure for the female category compared with the male. In addition to RDP inputs contextual factors such as the households’ life cycle and the local economic dynamism were influential determinants of wealth and expenditure of member households. Most revealing of all is the finding that impact which implies positive change, takes place gradually over sustained participation. The IAS results indicate that the members’ participation in terms of membership length plus cumulative RDP credit value, need to reach a critical minimum level after which significant changes become measureable. The ‘critical mass’ of participation which was measured to be more than two-and a half year for membership length plus a minimum of Tk. 7,500 cumulative RDP credit, need to be further tested. The present data-set produced consistent results with respect to the measurement of the ‘mass’. However, it is not clear if the measured levels are likely to change in the future. For example, the amount of credit that is used presently as a floor, may not remain the same as members sustain their participation in the future. A change is likely if the future data set accounts for price level changes that allows for a measurement based on constant values as opposed to nominal. Future impact assessment will need to adjust the nominal values of RDP credit to account for changes in the price level as well as consider the total number of loans received by respective households. The members are likely to better remember the total numbers of loans received rather than a detailed account in terms of uses for each loan. For this recall problem the present enterprise was limited to gathering data on a maximum of five loans per member and their respective uses. This ceiling on the number of loans studied may be a reason for the insignificant and often contradictory results produced when the number of loans was used as a control variable. The future impact assessment which is planned for in 1996-’97, is likely to offer an opportunity to test the relative robustness of cummulative value of RDP credit and the number of loans received by the households.
Impact Assessment Study
Conclusion: policy relevance of IAS results
129
In addition to the measurement of critical mass, other important results of IAS are related with strength and weakness of impact. The chapter on vulnerability of households to seasonality showed substantially better condition for the households of long standing participation. It indicated that RDP’s impact on material wellbeing was strong and likely to be sustained. The key indicators of strength are likely to be the Engel’s ratio that show food expenditure as a proportion to the total expenditure (in chapter 6), and the food stock in the lean season (in chapter 7). The Engel’s Law dictate that as income increases the share of food in household budget decline which reflecting a structural change that is a defining criterion of impact. The structural change that was observed with respect to Engel’s ratio was a marginal one but none-the-less discernible. The other indicator, increasing food security in the lean season also indicates structural change. An increase in food consumption is a necessary but not sufficient indicator for structural change which would require, inter alia, changes in the structure of poverty e.g. reduction in seasonal vulnerability. If these results suggest that the impact of RDP is sustainable then there is one analysis that is likely to question the suggestion. The ratio of outstanding RDP loan to networth of wealth produces results that may reveal some weakness in the positive impact observed in chapter six. The ratio of current RDP loan to networth for the IAS sample of RDP households show that, (a) the indebtedness relative to networth was increasing and, (b) the magnitude of the ratios were greater than those found in other studies (e.g., Khandker and Chowdhury, 1995). Further research is necessary to comment on the upward pressure in the ratios and the likelihood of its persistence in the future. Particularly, an investigation to reveal whether there is a critical level of cummulative credit and a critical rate of increase in the amount of loan , before which the ratio is unlikely to stabilise or decline. The suggestion of weakness in RDP’s impact when considered in a wider perspective, is unlikely to spell doom for the future prospect of RDP. The IAS results, on the whole, indicate a consistent movement along the path to greater wellbeing. This indication is based on the participation by the members during a time period when repeated changes were made in RDP policies and operational design in order to develop a disciplined credit operation. At the same time, the technology based sectoral programmes which underwent refinement and fine-tuning, has been developed. The horizontal expansion of this programme has been very rapid but the impact of the programme was not measured by the present enterprise. The substantial impact that was observed for a period of considerable changes in system design, will be enhanced in the future when the more disciplined systems of credit and technical operations are in place. This, however, is contingent upon the achievement by RDP of high rates of sustained participation by the members. On the other hand it is not clear to what extent the social objectives related to VO development influence the poverty related impact. If membership drop-out is related with VO development then poverty related objectives are likely to fail should the social objectives fail. Given the relatively short membership length for the current female category it appears that BRAC should not underestimate the potential damage that membership turn-over and weak VOs can cause to the objective of poverty reduction as well as to empowerment.
Impact Assessment Study
Bibliography
130
Bibliography
Ahmed, Parveen, (1980); Income earning as related to the changing status of village women in
Bangladesh: A Case Study, Women for women study and research group. Berstecher, D (ed.) 1985), Education and rural development : issues for planning and research Brussels :
Unesco-International Institute for Education Planning. Begum, Najmir Nur; (1987), Pay or Purdah: Women and Income Earning in rural Bangladesh - Studies in
Development and Social Change. BRAC, (1994), RDP Statistical Report, 1993, BRAC. BRAC, (1992) Proposal For RDP Phase III, BRAC BRAC (1984), Peasant Perception : Famine. Research and Evaluation Division (RED), Dhaka : BRAC. CDS (1993) Report on the Proposed Methodology for the Impact Assessment Study. Swansea. CDS (1994) Second Report on the RDP Impact Assessment Study. Review of Implementation.
Methodology and Future Work. Centre for Development Studies, Swansea. Chen, M.and Mahmud, S, (1993); Assessing Change in Women's lives: Concept paper for the BRAC-
ICDDR,B Collaborative research Project Chowdhury, AMR, Mahmood, M. and Abed, F.H. (1991) "Credit for the Rural Poor - The case of BRAC in
Bangladesh". Small Enterprise Development - an International Journal, Vol. 2, No.3. Dreze, J. P. and Sen, A. K. (1989) Hunger and Public Action Oxford: Clarendon Press. Greeley, M, Kabeer, N , Davis, s. and Hussein, K (1992) Measuring the Poverty Reduction Impact of
Development Interventions. Research Proposal for collaborative research with Actionaid prepared for ODA (UK) . IDS , University of Susex.
Gujarati, DN (1988) Basic Economitrics (2nd edn). New York: Mcgraw-Hill. Hossain, M. and Afsar, R. (1989) Credit for Women's Involvement in Economic Activities in Rural
Bangladesh. Research Report No. 105, Dhaka : BIDS. Hossain, M and Sen , B (1992) “ Rural Poverty in Bangladesh : Trends and determinants”. Asian
Development Review Vol. 10. pp. 1-34. Jonson, M. , Mekay, AD , and Round , J, I. (1990) Income and Expenditure in a System of Houshold
Account: Concepts and Estimation. Social Dimensions of Adjustment in Sub -Sahara Africa , Working Papar no , 10 , Washington : World Bank.
Kabeer, N (1991) “Gender Dimensions of Rural Poverty : analysis from Bangladesh”. The Journal
Peasant Studies Vol. 18, No.2.
Impact Assessment Study
Bibliography
131
Katona-Apte, J (1988) “Coping strategies of destitute women in Bangladesh” . Food and Nutrition
Bulletin. Vol. 10 . no. 3 the United Nations University. Khandker, SA and Chowdhury, OH (1995) Targeted Credit Programmes and Rural Poverty in
Bangladesh. Paper prepared for workshop on research project (RPO 676-59) "Credit Programmes for the Poor", held in Dhaka March 19-22, 1995. World Bank and BIDS.
Lovell, Catherine H., (1991); Breaking the Cycle of Poverty: The BRAC Strategy, Kumarian Press Mannan et all (1994); Fatwabaz Report (Restricted circulation). RED, BRAC. Mizan, Ainon Nahar, (1994); In Quest of Empowerment: The Grameen Bank Impact on Women's Power
and Status, UPL Mustafa S, (1992) “Safety first : a study of credit IGAs in the Productive Employment Project”, Mid-term
evaluation studies of PEP, RESP, GOB/Hifas/SIDA, Dhaka. Osmani, SR (1989) “ Limits to the alleviation of Poverty through Non-Farm credit”, The Bangladesh
Development Studies. Osmani, S. R. (1991) "Social Security in South Asia", in Ahmed et al. (eds) Social Security in
Development Countries. Dhaka: UPL. Rahman, A. (1989) "Credit for Rural Poor", in Institutions (compendium Vol. V). Dhaka: Bangladesh
Agriculture Sector Review, UNDP. Rahman, RI and Khandker, SR (1995), Role of Targeted Credit Programmes in Povmoting Employment
and Productivity of the poor in Bangladesh. Paper prepared for workshop on research project (RPO 676-59) "Credit Programmes for the Poor", held in Dhaka March 19-22, 1995. World Bank and BIDS.
Rahman, H. Z. (1992) "Mora Kartik: Seasonal Deficits and the Vulnerability of the Rural Poor", in
Rahman, H. Z., and Hossain (eds) Re-thinking Rural Poverty: a case for Bangladesh. Analysis of Poverty Trends Project.
Ravallion, M (1992) Poverty Comparisons : a guide to Concepts and Methods. Living standareds
Measurement Study Working Paper No. 88. Washington : World Bank. Ravallion, M. and Sen , B (1994) “ Impact of Rural Poverty of Land Based Targeting . Further results for
Bangladesh” . World Development Vol. 22 no. 6 pp 823-838. Rahman Rushidan Islam, (1986); Impact of Grameen Bank on women's Lives Rao, Aruna, (1994); Study on BRAC Strategic Reforms. Schuler, Sidney R. and Hashemi, S. M., 1994; "Credit Programs, Women's Empowerment, and
Contraceptive Use in Rural Bangladesh". Studies in Family Planning, Volume 25 , Number 2 Scott, William P.; 1986, Dictionary of Sociology,GOYL Saab. Sen, AK (1981) Poverty and Famine : Oxford : Clarendom Press.
Impact Assessment Study
Bibliography
132
Westergard Kristen,1983; Pauperization and rural women in Bangladesh: A case study, Comilla : BARD, White, Sarah, 1991; An evaluation of NGO effectiveness in raising the economic status of the rural poor
Bangladesh Country Study, Final draft, Overseas Development Institute White, Sarah, 1988; In the teeth of crocodile. Class and Gender in Bangladesh, PhD thesis. University of
Bath.
Annexures
Impact Assessment Study
< Back