Beach cusps and inner surf zone processes: growth or destruction? A case study of Trafalgar Beach...
15
Beach cusps and inner surf zone processes: growth or destruction? A case study of Trafalgar Beach (Cádiz, Spain) ROLAND GARNIER 1,2 , MIGUEL ORTEGA-SÁNCHEZ 3 , MIGUEL A. LOSADA 3 , ALBERT FALQUÉS 4 and NICHOLAS DODD 1 1 Environmental Fluid Mechanics Research Centre, Process and Environmental Division, Faculty of Engineering, University of Nottingham, Nottingham, UK. 2 Instituto de Hidráulica Ambiental (IH), Universidad de Cantabria, E.T.S. Ingenieros de Caminos, C. y P., Av. de los Castros, s/n. 39005 Santander, Spain. E-mail: [email protected] 3 Centro Andaluz de Medio Ambiente, Universidad de Granada, Granada, Spain. 4 Departament de Física Aplicada, Universitat Politècnica de Catalunya, Campus Nord - Mòdul B4, 08034 Barcelona, Spain. SUMMARY: Large beach cusps (LBC, wavelength of ~ 30 m) are intertidal features that can alternately exist in the swash and in the inner surf zone due to tidal sea level changes. They have a larger cross-shore extent (up to 50 m) than traditional cusps. This extent has been explained by a shift of the swash zone during falling tide. The cusps immerse at rising tide and previous studies indicate that surf zone processes are exclusively destructive. Here, the behaviour of large beach cusps in the inner surf zone is investigated by using a 2DH morphological numerical model applied to Trafalgar Beach (Cádiz, Spain). The model results indicate that the inner surf zone processes do not always destroy the cusps but can in fact reinforce them by considering neither the swash processes nor the tidal changes. More generally, in conditions favouring the presence of the LBC the surf zone of a beach can be unstable, leading to the formation of transverse/oblique sand bars that can have characteristics similar to the LBC. Thus, in principle, the LBC could emerge not only due to swash zone morphodynamics but also due to surf zone morphodynamics or a combination of both. Keywords: beach cusps, surf zone, sand bars, instability, beach morphology, beach features, rip currents, wave processes on beaches. RESUMEN: Formas cuspidales de playas y procesos de la zona de rompientes interna: crecimiento o destruc- ción? Aplicación a la playa de Trafalgar (Cádiz, España). – Las formas cuspidales de grandes dimensiones (LBC, longitudes de onda ~30 m) constituyen un sistema morfológico rítmico a lo largo de la playa que tiene una parte que se encuentra alternativamente en la zona de swash (flujo/reflujo) y en la zona de rompientes interna debido a los cambios del nivel del mar. Tienen una distancia de penetración de hasta 50 m, superior por tanto a la de las cúspides ordinarias. Esta elon- gación parece debido a la traslación de la zona de swash durante la marea descendente. En marea ascendente estas estructuras están sumergidas y los estudios previos consideran que los procesos de la zona de rompientes las destruyen. En este trabajo se analiza el comportamiento de estas formas en la zona de rompientes de la playa de Trafalgar (Cádiz) usando un modelo numérico morfológico 2DH. Los resultados muestran que, sin considerar ni los procesos de swash ni el cambio de marea, los procesos de la zona de rompientes no necesariamente destruyen LBC, sino que pueden reforzarlas. De forma más general, en condiciones favorables a la presencia de LBC, se pueden formar barras de arena con características similares a LBC debido a procesos de auto-organización en la zona de rompientes. Palabras clave: cúspides de playa, zona de rompientes, inestabilidad, morfología de playas, estructura de playas, corriente de retorno superficial, procesos del oleaje sobre las playas. SCIENTIA MARINA 74(3) September 2010, 539-553, Barcelona (Spain) ISSN: 0214-8358 doi: 10.3989/scimar.2010.74n3539
Transcript of Beach cusps and inner surf zone processes: growth or destruction? A case study of Trafalgar Beach...

Beach cusps and inner surf zone processes: growth or destruction? A case study of Trafalgar Beach
(Cádiz, Spain)
ROLAND GARNIER 1,2, MIGUEL ORTEGA-SÁNCHEZ 3, MIGUEL A. LOSADA 3, ALBERT FALQUÉS 4 and NICHOLAS DODD 1
1 Environmental Fluid Mechanics Research Centre, Process and Environmental Division, Faculty of Engineering, University of Nottingham, Nottingham, UK.
2 Instituto de Hidráulica Ambiental (IH), Universidad de Cantabria, E.T.S. Ingenieros de Caminos, C. y P., Av. de los Castros, s/n. 39005 Santander, Spain. E-mail: [email protected]
3 Centro Andaluz de Medio Ambiente, Universidad de Granada, Granada, Spain.4 Departament de Física Aplicada, Universitat Politècnica de Catalunya, Campus Nord - Mòdul B4,
08034 Barcelona, Spain.
SUMMARY: Large beach cusps (LBC, wavelength of ~ 30 m) are intertidal features that can alternately exist in the swash and in the inner surf zone due to tidal sea level changes. They have a larger cross-shore extent (up to 50 m) than traditional cusps. This extent has been explained by a shift of the swash zone during falling tide. The cusps immerse at rising tide and previous studies indicate that surf zone processes are exclusively destructive. Here, the behaviour of large beach cusps in the inner surf zone is investigated by using a 2DH morphological numerical model applied to Trafalgar Beach (Cádiz, Spain). The model results indicate that the inner surf zone processes do not always destroy the cusps but can in fact reinforce them by considering neither the swash processes nor the tidal changes. More generally, in conditions favouring the presence of the LBC the surf zone of a beach can be unstable, leading to the formation of transverse/oblique sand bars that can have characteristics similar to the LBC. Thus, in principle, the LBC could emerge not only due to swash zone morphodynamics but also due to surf zone morphodynamics or a combination of both.
Keywords: beach cusps, surf zone, sand bars, instability, beach morphology, beach features, rip currents, wave processes on beaches.
RESUMEN: Formas cuspidales de playas y procesos de la zona de rompientes interna: crecimiento o destruc-ción? Aplicación a la playa de Trafalgar (Cádiz, España). – Las formas cuspidales de grandes dimensiones (LBC, longitudes de onda ~30 m) constituyen un sistema morfológico rítmico a lo largo de la playa que tiene una parte que se encuentra alternativamente en la zona de swash (flujo/reflujo) y en la zona de rompientes interna debido a los cambios del nivel del mar. Tienen una distancia de penetración de hasta 50 m, superior por tanto a la de las cúspides ordinarias. Esta elon-gación parece debido a la traslación de la zona de swash durante la marea descendente. En marea ascendente estas estructuras están sumergidas y los estudios previos consideran que los procesos de la zona de rompientes las destruyen. En este trabajo se analiza el comportamiento de estas formas en la zona de rompientes de la playa de Trafalgar (Cádiz) usando un modelo numérico morfológico 2DH. Los resultados muestran que, sin considerar ni los procesos de swash ni el cambio de marea, los procesos de la zona de rompientes no necesariamente destruyen LBC, sino que pueden reforzarlas. De forma más general, en condiciones favorables a la presencia de LBC, se pueden formar barras de arena con características similares a LBC debido a procesos de auto-organización en la zona de rompientes.
Palabras clave: cúspides de playa, zona de rompientes, inestabilidad, morfología de playas, estructura de playas, corriente de retorno superficial, procesos del oleaje sobre las playas.
Scientia Marina 74(3)September 2010, 539-553, Barcelona (Spain)
ISSN: 0214-8358doi: 10.3989/scimar.2010.74n3539
540 • R. GARNIER et al.
SCI. MAR., 74(3), September 2010, 539-553. ISSN 0214-8358 doi 10.3989/scimar.2010.74n3539
INTRODUCTION
Beach cusps are a longitudinal regular series of horns and embayments which characterize an undulat-ing shoreline. They have been listed with a large range of length scales: their wavelength λc (alongshore spac-ing between two consecutive horns) can range from centimetres to hundreds of metres. This is strongly related to their time scale, which is from minutes to days, respectively, and also to the wave period of the forcing conditions. The mechanisms at the origin of their formation can also differ, and there is still a large uncertainty regarding this.
The largest cusps are also called ‘megacusps’, ‘gi-ant cusps’ or ‘surf zone cusps’ (λc~100 m). They are due to surf zone processes and commonly correspond to the shore attachment of transverse/oblique bars. These bars and the associated rip current circulation are very often related to an off-shore crescentic bar sys-tem (Inman and Guza, 1982; Wright and Short, 1984; Short, 1999; Ortega-Sánchez et al., 2003; Calvete et al., 2005; Castelle et al., 2007; Garnier et al., 2008).
The smaller cusps (λc~1-50 m) are considered standard beach cusps and are supposed to form by swash zone processes (‘swash cusps’). Currently, two different main theories explain their formation (Mas-selink et al., 1997; Coco et al., 1999; Almar et al., 2008): (1) the standing sub-harmonic edge wave theory (Guza and Inman, 1975; Holland and Holman, 1996) and (2) the self-organization theory (Werner and Fink, 1993; Masselink and Pattiaratchi, 1998; Coco et al., 2000, 2003, 2004; Dodd et al., 2008). The edge wave hypothesis can sometimes explain the initial formation of cusps for non-breaking waves, but not the further step of their evolution. Indeed, the presence of finite amplitude cusps theoretically inhibits the edge waves (Guza and Bowen, 1975), and some experimental studies show that cusps can exist in the absence of edge waves (Masselink et al., 2004). Moreover, although Ciriano et al. (2005) observed the coexistence of cusps and edge waves, there was no evidence that edge waves were standing, which is a key requisite of the edge wave mechanism. In this theory the cusps grow as a reaction to a hydro-dynamical instability. The self-organization theory is probably now the most accepted and can explain the entire evolution of the cusps in agreement with the observations, from their formation and their growth by positive feedback between flow and morphology until the saturation of their growth by diffusion proc-esses. In a recent development in line with the self-organization approach, Dodd et al. (2008) showed that cusps can grow by an apparent hydrodynamical positive feedback mechanism that is intimately linked to bore driven swash, and is enhanced by morphologi-cal feedback.
The study of the rhythmic morphology at a sandy beach in Trafalgar (Spain) carried out by Ortega-Sánchez et al. (2008) distinguishes the smaller cusps
(λc<20 m) from the ‘large beach cusps’ (‘LBC’, λc~30 m), based on the fact that the former have a shorter protruding distance Sc (cross-shore extent of a cusp) than the latter. The classification was made using the threshold value of Sc=5 m. The small cusps (Sc<5 m) appear in the upper beachface and are formed at high tide by swash processes. On the other hand, the large cusps (Sc>5 m) can have a protruding distance of up to Sc=50 m. This can be explained by the cross-shore shift of the swash zone due to the variation of the tide level (the tidal range is between 1.2 and 3.8 m at the study site).
Although the distinction between the small cusps, which are the most frequently observed, and the LBC had not been done before Ortega-Sánchez et al. (2008), other studies already reported the LBC in tidal environ-ments (Holland, 1998; Coco et al., 2004; Almar et al., 2008). The LBC are distinguished from the small cusps as they do not appear exclusively on upper beach; they have a larger scale (wave length) and a larger protrud-ing distance. Moreover the LBC are notable because they sometimes present an oblique orientation with respect to the mean shoreline, and they sometimes migrate alongshore. These distinctions suggest that different mechanisms could be at the origin of the for-mation of these cusps.
Coco et al. (2004) investigated the mechanisms be-hind the behaviour of cusps that are similar to the LBC observed at Trafalgar Beach. They find that the cusps grow during a falling tide because bays erode more than horns. They reproduce this behaviour as a result of self organization by using a numerical model based on the ballistic theory. Conversely their beach surveys indicate that the cusps wane during a rising tide. Two reasons are given. First, water particles infiltrate pref-erentially in embayments causing deposition. Second, the morphology is smoothed seaward of the swash front. They consider this effect, by including an extra diffusion term. Therefore, at the rising tide, when the previously formed cusps shift into the surf zone, they are damped. Their model results show that the main reason for the reduction of the cross-shore extent of cusps is the surf zone diffusivity rather than the swash processes.
However, surf zone modelling studies which do not consider the swash zone processes (Ribas et al., 2003; Caballeria et al., 2002; van Leeuwen et al., 2006; Gar-nier et al., 2006) show that not only can diffusion occur in the surf zone of a planar beach, but also instabilities can emerge from self-organization. In particular, the nonlinear 2DH study by Garnier et al. (2006) reveals the emergence of transverse bars with similar charac-teristics to the large cusps at Trafalgar Beach. These bars are found to be an equilibrium state of the surf zone. One limitation of these surf zone models is the assumption of a rectilinear absorbing wall at the shore-line boundary. Thus, the horizontal shoreline evolu-tion is not taken into account. However, the bed level at the wall is allowed to move vertically and we can
BEACH CUSPS AND INNER SURF ZONE PROCESSES • 541
SCI. MAR., 74(3), September 2010, 539-553. ISSN 0214-8358 doi 10.3989/scimar.2010.74n3539
consider that a horizontal oscillation of the shoreline is induced by the deposition/erosion of sediment next to the wall generating a horn/embayment at the shoreline, respectively. This assumption has been considered to explain the formation of megacusps (Calvete et al., 2005; Garnier et al., 2008), which are well known surf zone features.
Although Coco et al. (2004) succeeded in repro-ducing the general behaviour of the large cusps, and therefore the fact that they were damped in the surf zone, a specific surf zone instability study of a cuspate beach deserves attention. Furthermore, some cusp characteristics, such as the oblique orientation and the alongshore migration, were not correctly reproduced with their model. Thus, the main goal of this work is to study the morphodynamic instability of the surf zone of Trafalgar Beach for wave conditions and initial topographies typically measured during the large cusp events but in highly idealized conditions so as to focus on the basic 2DH processes. For instance, the swash zone processes are excluded and the tide level varia-tions are not taken into account. This work will give insight into the possible growth of the LBC in the surf zone as an analogy with the megacusps. It will allow
us to identify the morphological and hydrodynamical beach configuration that is favourable for this growth. Actually, a new and more general objective is here pur-sued: understanding the interaction between the swash and the surf zones through beach cusp behaviour.
The article is organized as follows. First, the study site and the data used are presented. Then, the rhythmic morphologies and some beach cusps formation events are selected and described. After that, the numerical model and the results are described. Finally, a conclu-sion is given.
STUDY SITE
Trafalgar Beach is located in a mesotidal and swell-dominated coastal environment along the southwest Spanish coast, in the Gulf of Cádiz (Fig. 1). It is an approximately 2-km-long sandy beach with a mean NNW-SSE alignment. The astronomical tide is se-midiurnal, with an average amplitude of 2 m and a tidal range between 0.9 m and 4 m. Waves are predominant-ly from the west and break on the beach within a nar-row breaking zone. A more complete description of the site is given by Ortega-Sánchez et al. (2008). For the
Fig. 1. – Location of the study site and detailed nearshore bathymetry of Trafalgar Beach surveyed in June 2006, with zoom on beach cusps.
542 • R. GARNIER et al.
SCI. MAR., 74(3), September 2010, 539-553. ISSN 0214-8358 doi 10.3989/scimar.2010.74n3539
predominant significant wave height, HS=0.75 m, and the mean tidal range, TR=2 m, the relative tidal range is 2.7. Estimating the settling velocity for a medium grain size of d50=0.5 mm, and for a mean wave period of T=9 s, the beach-type parameter is W=1.2 (Wright and Short, 1984). This value is representative of a re-flective beach, characterized by low-energy and long-period (swell) waves (Masselink and Short, 1993).
Nearshore bathymetry and beach topography meas-ured in 2006 showed that Trafalgar Beach has a width of 40-70 m, increasing towards Trafalgar Cape. It is composed of medium and coarse sand ranging from 0.35 to 1 mm. A plane beach morphology dominates the nearshore zone and no alongshore sand bars were found (Fig. 1). The beach frequently exhibits rhythmic features of different dimensions, with beach cusps being the most common ones (Fig. 1). It can also fre-quently be observed that the geometrical characteris-tics of the cusps vary alongshore, being different close to the cape and far from it. The average beach slope within the cuspate features ranges between 0.06 and 0.10 for the cusp embayments and between 0.10 and 0.18 for the cusp horns. The nearshore beach slope away from the cuspate features ranges between 0.016 near the Cape and 0.026 close to the northern end of the study area.
DATA
Video images
In October 2003 a video-monitoring station based on the ARGUS technique (Aarninkhof and Holman, 1999; Holman and Stanley, 2007) was installed at the Trafalgar lighthouse, 50 m above mean sea level. The station includes 3 video cameras that collect an instan-taneous image (snapshot), a 10-minute time-averaged image (timex) and a variance image every 10 minutes. Hourly images from each day were themselves aver-aged to create a ‘daytimex’, a composite image that reveals the daily mean morphology (Fig. 2).
Using the technique presented by Holland et al. (1997), video images are georeferenced and morpho-logical features can be digitized to estimate their geo-metrical characteristics. The accuracy of this process
is typically one pixel. In the present paper we will concentrate on midbeach, so one pixel corresponds to a ground accuracy of 0.25 and 1.4 m in the cross-shore and alongshore directions, respectively.
Large beach cusps: general description
Geometrical characteristics
Ortega-Sánchez et al. (2008) analysed 2 years of daily time exposure video images from the Argus station to explore the variability of the beachface morphology. Five different morphological states re-lated to the presence or absence of beach cusps and a berm were found: (1) large beach cusps, (2) short-protruding beach cusps, (3) low tide terraces, (4) plane beach berms and (5) plane beaches. The main ‘characteristic’ morphological feature of the large
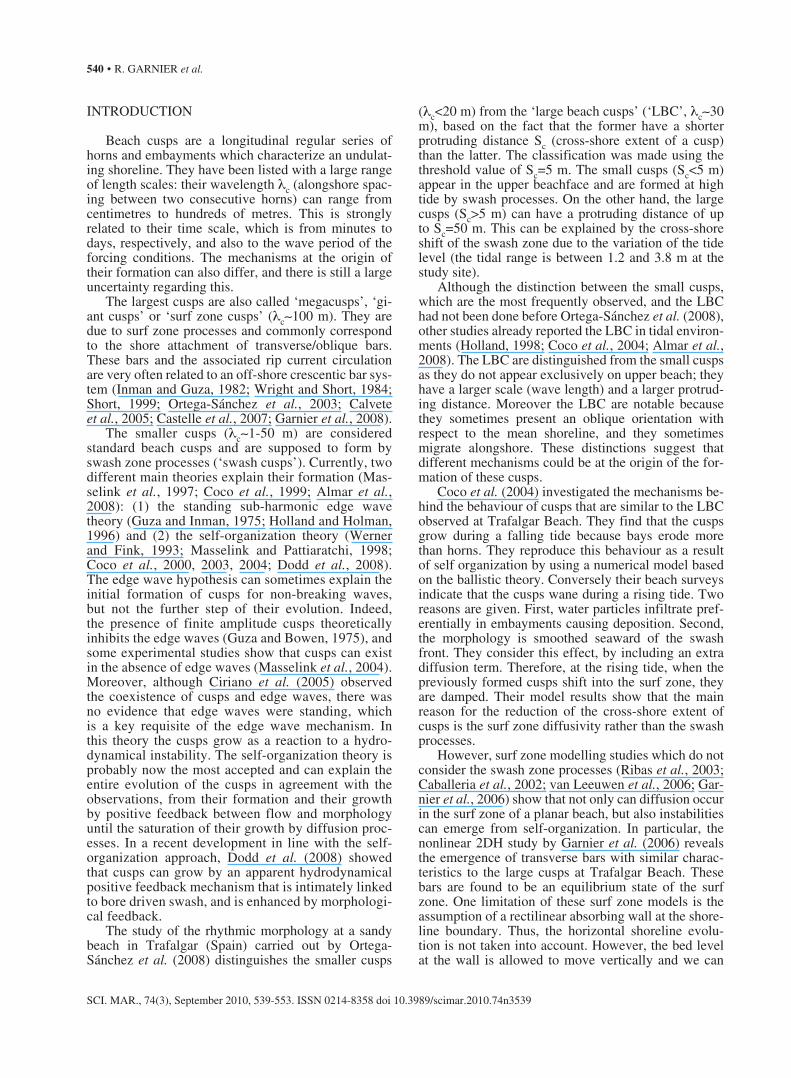
Fig. 2. – Examples of timex images from (a) camera 1 showing the part of the beach closest to Trafalgar Cape; (b) camera 2 looking to the middle of the beach, and (c) camera 3 visualizing the northern part of the beach. 26 January 2005.
SbSc
A c
A b
beach cuspssurf zoneswash zone
x
z
swash zone surf zonebeach cusps
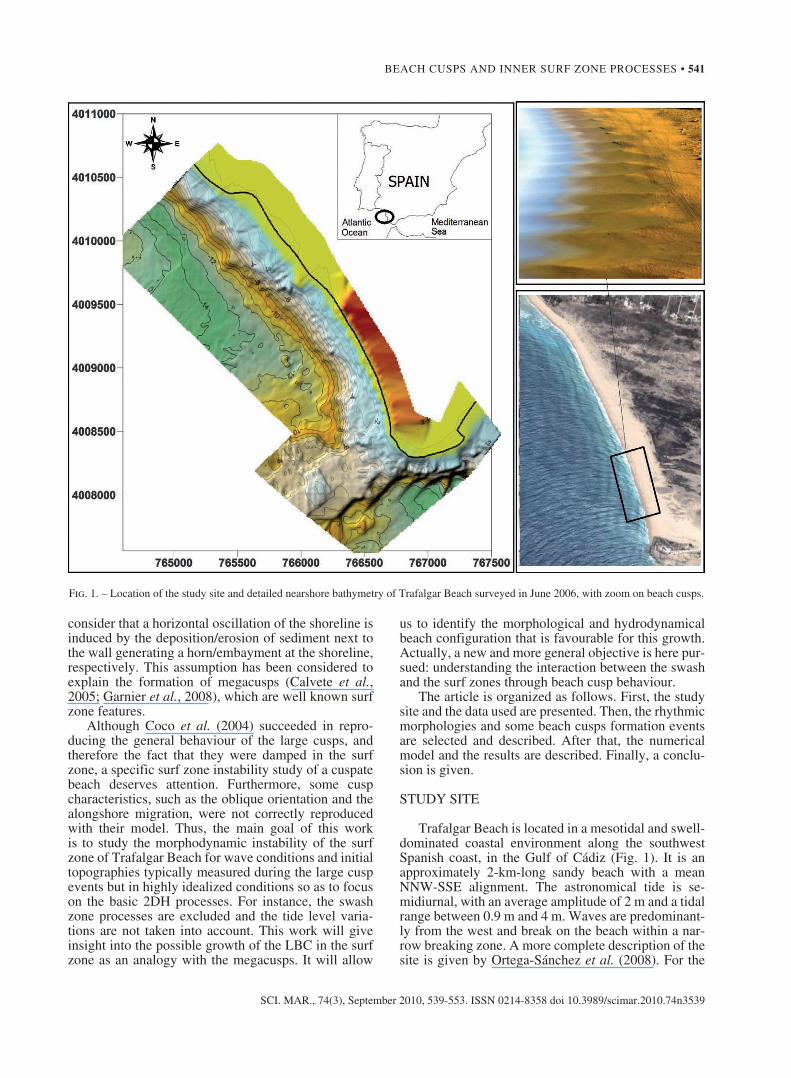
Fig. 3. – Main beach cusp characteristics for a fixed tide. Sc and Ac are the protruding distance and the amplitude of the part of the cusps that is in the swash zone, i.e. these parameters are measured at Trafalgar Beach. Sb and Ab correspond to the surf zone part of the cusps, i.e., where cusps can be interpreted as bars (they are model results). Notice that Sc and Ac are measured at low tide, and Sb and
Ab change with the tide level.

BEACH CUSPS AND INNER SURF ZONE PROCESSES • 543
SCI. MAR., 74(3), September 2010, 539-553. ISSN 0214-8358 doi 10.3989/scimar.2010.74n3539
beach cusps is the protruding distance Sc (Fig. 3). It is defined as the cross-shore span of a horn, so that, if the angle between the cusp horn and the coastline normal is βc, the 2D (horizontal) extent of a cusp is Sc/cos(βc) (Fig. 4). Sc is always larger than 5 m, with some measurements showing values up to 50 m. Large beach cusps (LBC) correspond to the predominant beachface morphology and are present 60% of the time. LBC are located across the intertid-al zone and during high tide waves can break within the embayments. Thus, cusps seem to be interacting with both surf and swash processes. Several of their characteristics are reminiscent of surf zone rhyth-mic features that appear by self-organization (Ribas et al., 2003; Garnier et al., 2006). The first of these are their length scale, i.e. their protruding distance, their wavelength λc (or spacing) and their amplitude Fig. 4. – (a) Plan view of the beach showing LBC morphology, 26
January 2005. (b) Cross-shore profiles, 8 May 2006.
Fig. 5. – Snapshot of the cusps during a tide excursion, 7 January 2005. Left: timex images from camera 2. Right: Plan view after rectification.
544 • R. GARNIER et al.
SCI. MAR., 74(3), September 2010, 539-553. ISSN 0214-8358 doi 10.3989/scimar.2010.74n3539
Ac . Their mean spacing is 30 m but this can vary alongshore, being larger closer to the Cape (around 35 m) than in the north (20 m). A spacing of up to 60 m is sometimes observed. We define the ampli-tude Ac of a cusp as half the height between two con-secutive horns and embayments (Fig. 3). As stated above, large cusps are located across the intertidal zone. Thus, the cusp amplitude can frequently reach values of up to 0.8 m. For instance, Figure 4b shows the cross-shore profile measured with a DGPS of a cusp with an amplitude of 0.5 m. The second simi-larity is that they are frequently oblique with respect to the initially straight shoreline (Fig. 4a). Notice that Figures 4a and 4b do not correspond to the same day, due to the poor quality of the plan-view images during the DGPS measurements.
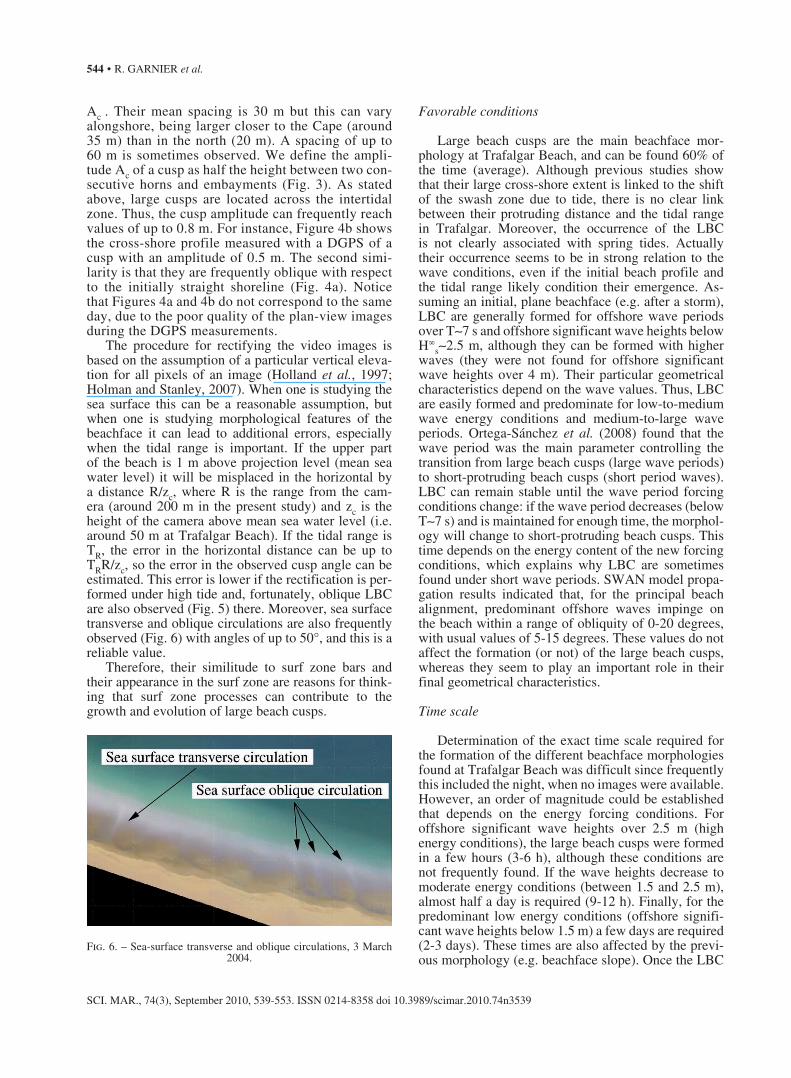
The procedure for rectifying the video images is based on the assumption of a particular vertical eleva-tion for all pixels of an image (Holland et al., 1997; Holman and Stanley, 2007). When one is studying the sea surface this can be a reasonable assumption, but when one is studying morphological features of the beachface it can lead to additional errors, especially when the tidal range is important. If the upper part of the beach is 1 m above projection level (mean sea water level) it will be misplaced in the horizontal by a distance R/zc, where R is the range from the cam-era (around 200 m in the present study) and zc is the height of the camera above mean sea water level (i.e. around 50 m at Trafalgar Beach). If the tidal range is TR, the error in the horizontal distance can be up to TRR/zc, so the error in the observed cusp angle can be estimated. This error is lower if the rectification is per-formed under high tide and, fortunately, oblique LBC are also observed (Fig. 5) there. Moreover, sea surface transverse and oblique circulations are also frequently observed (Fig. 6) with angles of up to 50°, and this is a reliable value.
Therefore, their similitude to surf zone bars and their appearance in the surf zone are reasons for think-ing that surf zone processes can contribute to the growth and evolution of large beach cusps.
Favorable conditions
Large beach cusps are the main beachface mor-phology at Trafalgar Beach, and can be found 60% of the time (average). Although previous studies show that their large cross-shore extent is linked to the shift of the swash zone due to tide, there is no clear link between their protruding distance and the tidal range in Trafalgar. Moreover, the occurrence of the LBC is not clearly associated with spring tides. Actually their occurrence seems to be in strong relation to the wave conditions, even if the initial beach profile and the tidal range likely condition their emergence. As-suming an initial, plane beachface (e.g. after a storm), LBC are generally formed for offshore wave periods over T~7 s and offshore significant wave heights below H∞
s~2.5 m, although they can be formed with higher waves (they were not found for offshore significant wave heights over 4 m). Their particular geometrical characteristics depend on the wave values. Thus, LBC are easily formed and predominate for low-to-medium wave energy conditions and medium-to-large wave periods. Ortega-Sánchez et al. (2008) found that the wave period was the main parameter controlling the transition from large beach cusps (large wave periods) to short-protruding beach cusps (short period waves). LBC can remain stable until the wave period forcing conditions change: if the wave period decreases (below T~7 s) and is maintained for enough time, the morphol-ogy will change to short-protruding beach cusps. This time depends on the energy content of the new forcing conditions, which explains why LBC are sometimes found under short wave periods. SWAN model propa-gation results indicated that, for the principal beach alignment, predominant offshore waves impinge on the beach within a range of obliquity of 0-20 degrees, with usual values of 5-15 degrees. These values do not affect the formation (or not) of the large beach cusps, whereas they seem to play an important role in their final geometrical characteristics.
Time scale
Determination of the exact time scale required for the formation of the different beachface morphologies found at Trafalgar Beach was difficult since frequently this included the night, when no images were available. However, an order of magnitude could be established that depends on the energy forcing conditions. For offshore significant wave heights over 2.5 m (high energy conditions), the large beach cusps were formed in a few hours (3-6 h), although these conditions are not frequently found. If the wave heights decrease to moderate energy conditions (between 1.5 and 2.5 m), almost half a day is required (9-12 h). Finally, for the predominant low energy conditions (offshore signifi-cant wave heights below 1.5 m) a few days are required (2-3 days). These times are also affected by the previ-ous morphology (e.g. beachface slope). Once the LBC
Fig. 6. – Sea-surface transverse and oblique circulations, 3 March 2004.

BEACH CUSPS AND INNER SURF ZONE PROCESSES • 545
SCI. MAR., 74(3), September 2010, 539-553. ISSN 0214-8358 doi 10.3989/scimar.2010.74n3539
are formed, they remain until the forcing conditions are modified (see previous section).
Particular formation events
Two years of daily video images (2003-2005) were analysed to identify events when LBC were formed. A total of 15 events were identified, and 7 of them were se-lected to characterize the evolution of the morphology. Table 1 summarizes the initial hydrodynamical data, where WANA data corresponds to daily offshore wave forecast output in the area (Ortega-Sánchez et al., 2008) provided by Puertos del Estado (Spain). These initial offshore wave data were propagated using the SWAN model (Booij et al., 1999), and nearshore wave data were extracted at 4 m depth (Table 1). Wave heights vary slightly in the propagation, whereas wave angle decreases due to refraction. The last column of Table 1 shows the wave obliquity with respect to the mean align-ment of the shoreline. The beach alignment is not com-pletely straight, but slightly curved, the angle between the north and the shore normal varying from 240 to 265 degrees. Accordingly, three numbers are included for the wave angle at 4 m depth: (1) θ0
max indicates the dif-ference with respect to 240, (2) θ0
min indicates the differ-ence with respect to 265, and (3) θ0 indicates the relative orientation with respect to the beach alignment where the large beach cusps are best formed (255 degrees) and is considered as the most realistic.
Table 2 summarizes the main geometrical and evolutionary characteristics of the morphologies of the events, including the cusp spacing or wavelength, the obliquity or orientation, the protruding distance and the amplitude. The variability of the spacing for the same event is due to the longshore variability of the morphology (Ortega-Sánchez et al., 2008). Accord-ing to the wave data, oblique large beach cusps are formed under low wave-energy conditions (Hs<1.2 m), with peak periods varying within 9-14 s that impinge obliquely to the coast (similar results were found by Ortega-Sánchez et al. (2008)).
The cusp wave length varies from 25 to 40 m (ap-proximately), the predominant value being around 30-35 m. Events 1 and 6 show the minor spacing, which seems to be associated with the lower period (9 s), whereas the higher wavelengths are found for the higher periods (12 s).
Cusp orientation varies within 25-50 degrees. Events 2 and 4 correspond to very oblique incoming waves, showing very oblique cusps; event 7, although showing the same incoming wave direction, does not show the same obliquity, seemingly due to very low energy waves. The rest of the orientations are, in gen-eral, around 35 degrees. The orientation in event 3 would be expected to be higher, but on the previous days there were higher waves (almost 3 m) that must play an important role in that difference.
MODELLING
The MORFO55 numerical model has been used to analyse the morphodynamical instability of the surf zone of Trafalgar Beach. MORFO55 is a 2DH mor-phodynamical model based on a wave- and depth-av-eraged nonlinear shallow water equations solver with wave driver, sediment transport and bed updating (Gar-nier et al., 2006). It is able to reproduce the formation and the long-term evolution of rhythmic sand bars as free instabilities of alongshore uniform beaches excited by a small perturbation added on the initial topography (Garnier et al., 2006, 2008). In particular, Garnier et al. (2006) show that small-scale transverse/oblique bars (λb~30 m) can develop on planar beaches from self-organization mechanisms. However, their emergence strongly depends on the sediment transport parameteri-zation and its formulation has a large degree of uncer-tainty. The general formulation chosen is based on the total load formula of Soulsby and Van Rijn (Soulsby, 1997). The horizontal sediment flux vector reads:
q a v u hb= −( )γ ∇ (1)
Table 1. – Tidal range and initial wave conditions for the selected events of LBC formation (offshore waves: WANA; nearshore waves: SWAN).
Tidal Averaged WANA data SWAN estimations (4 m depth) Event Date range H∞
rms T Direction H0rms Direction θ0
max θ0min θ0
[m] [m] [s] [deg] [m] [deg] [deg] [deg] [deg] Event 1 22-23 Dec. 2003 3.3 0.5 - 0.8 9-10 250 0.8-1.1 250 10 -15 -5Event 2 28-29 Dec. 2003 2.2 1.1 12 290 1.1 270 30 -5 15Event 3 20 Apr. 2004 2.4 0.8 - 1 11.5 285 0.8 - 1 265 25 0 10Event 4 17 May 2004 2 1 14 290 1 270 30 -5 15Event 5 23 Oct. 2004 1.8 1.2 10-11 275 1.2 260 20 -5 5Event 6 01 Nov. 2004 1.7 1 9 270 1.2 260 20 -5 5Event 7 26-27 Dec. 2004 2 0.7 11.2 290 0.7 270 30 -5 15
Table 2. – Cusp characteristics after complete formation of the events: wave length λc, orientation βc, protruding distance Sc and amplitude Ac. An indicative maximum error is given for the cusp angle βc, by assuming that it has been measured at low tide, and that
the error in the horizontal displacement is TRR/zc Event λc [m] βc [deg] Sc [m] Ac [m] Event 1 26-27 38±25 24 0.8Event 2 35 50±8 29 0.6Event 3 35-40 12±13 40 0.6Event 4 33 49±6 37 0.5Event 5 32-39 37±6 45 0.38Event 6 28-30 38±6 40 0.43Event 7 30-33 26±12 33 0.48
546 • R. GARNIER et al.
SCI. MAR., 74(3), September 2010, 539-553. ISSN 0214-8358 doi 10.3989/scimar.2010.74n3539
where a is the stirring factor, g is the bedslope coeffi-cient, ub is the root-mean-square wave orbital velocity amplitude at the bottom and h is the bed-level deviation from the initial alongshore uniform topography.
Two different stirring factors are tested here, a constant wave stirring (CWS) (a=a0=0.01 m) and the formula of Soulsby and Van Rijn (SVR) (a=aSVR). The latter depends essentially on sediment character-istics, water depth, wave orbital velocity and current. Despite the numerous existing sediment transport formulations, the modelling studies by Ribas et al. (2003) and Garnier et al. (2006) show that the use of these two particular formulae allows us to consider all the possible physical configurations of morphological instabilities that can be obtained with our model. The emergence of the instability is strongly related to the depth averaged sediment concentration (also called potential stirring) which is defined as C=a/D, where D is the total depth (Falqués et al., 2000); in particu-lar, for a=a0, the averaged cross-shore profile of C decreases off-shore, while for a=aSVR it increases off-shore up to a certain point and eventually decreases. Garnier et al. (2006) found that a planar beach can be unstable for a=aSVR, whatever the incidence wave an-gle, while the use of a=a0 requires θ0>20° to observe instability (in their particular experiment, i.e. θ0 was defined at 3 m depth).
The use of a0 is less physically founded than the SVR formula, but it is a possible method by which a higher proportion of infra-gravity waves can be included. Moreover, recent experiments reveal that breaking generated turbulence and wave bores entrain a higher concentration in the inner surf zone (Johnson and Smith, 2008), which is not represented by the tra-ditional transport formulae such as the SVR formula, in which the concentration profile is mainly controlled by the wave orbital velocity, and which decays onshore from the breaking point. To be consistent with the SVR formula, the value of a0 has been set to the maximum value of aSVR (a0=0.01 m for the default case).
The beach profile used for the experiments is expo-nential, with an off-shore slope of 0.02 and a shoreline slope of β0. An artificial absorbing wall is imposed at the shoreline with height of a0. The offshore boundary is located at x=Lx=85 m, where the depth is approxi-mately 4 m. At the offshore boundary, constant waves are imposed with the root mean square height H0
rms, period T and angle θ0 (θ0=0 corresponds to normal wave incidence). The sediment size is defined through the parameter d50.
The initial topography consists of an alongshore uniform beach where a perturbation h(x,y,t=0) can be added to excite the instabilities, or to simulate the evolution of pre-existing rhythmic features. The along-shore size of the domain is defined as Ly=300 m. The
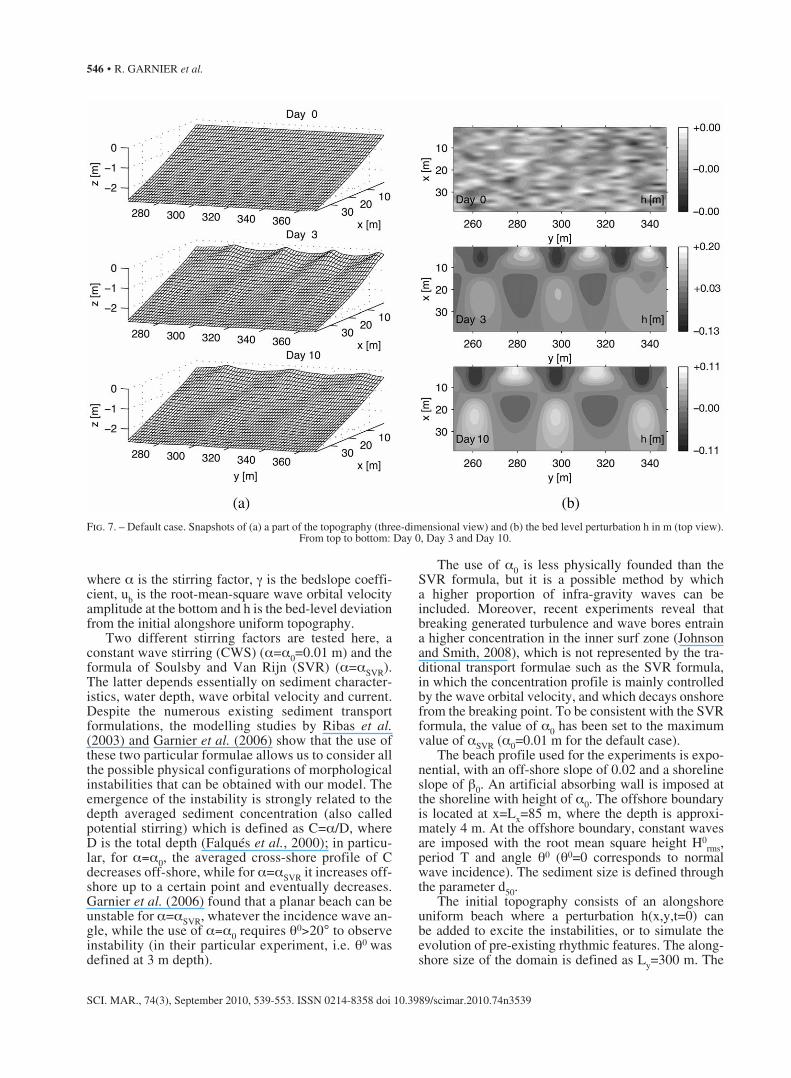
Fig. 7. – Default case. Snapshots of (a) a part of the topography (three-dimensional view) and (b) the bed level perturbation h in m (top view). From top to bottom: Day 0, Day 3 and Day 10.
BEACH CUSPS AND INNER SURF ZONE PROCESSES • 547
SCI. MAR., 74(3), September 2010, 539-553. ISSN 0214-8358 doi 10.3989/scimar.2010.74n3539
cross-shore and alongshore grid spacing are 1.5 m. The morphodynamic time step is 1.14 s.
The first part of the modelling study is dedicated to understanding the formation of cusps as a free instabil-ity of the beach, by adding a small random perturbation to the bathymetry. The default case was chosen as the most characteristic large cusps event, except that nor-mal waves are assumed. A parametric study was made, varying the sediment transport, the wave conditions, and the beach properties, consistent with the observa-tions. The second part consists of simulating the behav-iour of pre-existing cusps to test their decay or main-tenance. First, we impose different initial wavelengths for the three model settings leading to different kinds of instabilities and, second, we investigate the damping of pre-existing cusps (for a fixed wavelength) for the parameters leading to stability.
Free instability
At the initial time, small random perturbations are imposed on the alongshore uniform topography in or-der to excite the beach system and leave the instabil-ity free to develop. The default initial topography is displayed in Figure 7a (Day 0), the maximum bed level perturbation amplitude being 1 mm.
Default case
For the default case, waves are assumed to arrive normally to the coast (θ0=0°) and the wave height and period are set to H0
rms=1 m, T=9 s. The SVR transport is used. The slope at the shoreline is the mean slope found in an embayment: β0=0.075. The height of the shore-line wall is a0=20 cm. The sediment size is d50=0.5 mm.
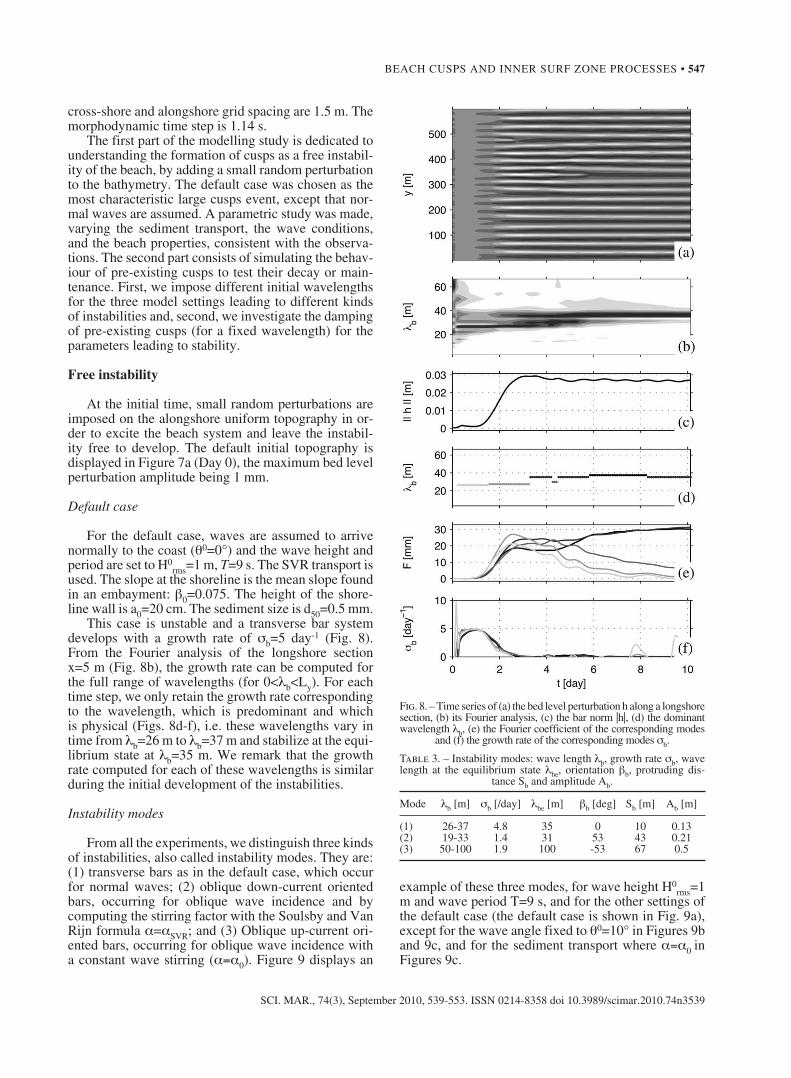
This case is unstable and a transverse bar system develops with a growth rate of sb=5 day-1 (Fig. 8). From the Fourier analysis of the longshore section x=5 m (Fig. 8b), the growth rate can be computed for the full range of wavelengths (for 0<λb<Ly). For each time step, we only retain the growth rate corresponding to the wavelength, which is predominant and which is physical (Figs. 8d-f), i.e. these wavelengths vary in time from λb=26 m to λb=37 m and stabilize at the equi-librium state at λb=35 m. We remark that the growth rate computed for each of these wavelengths is similar during the initial development of the instabilities.
Instability modes
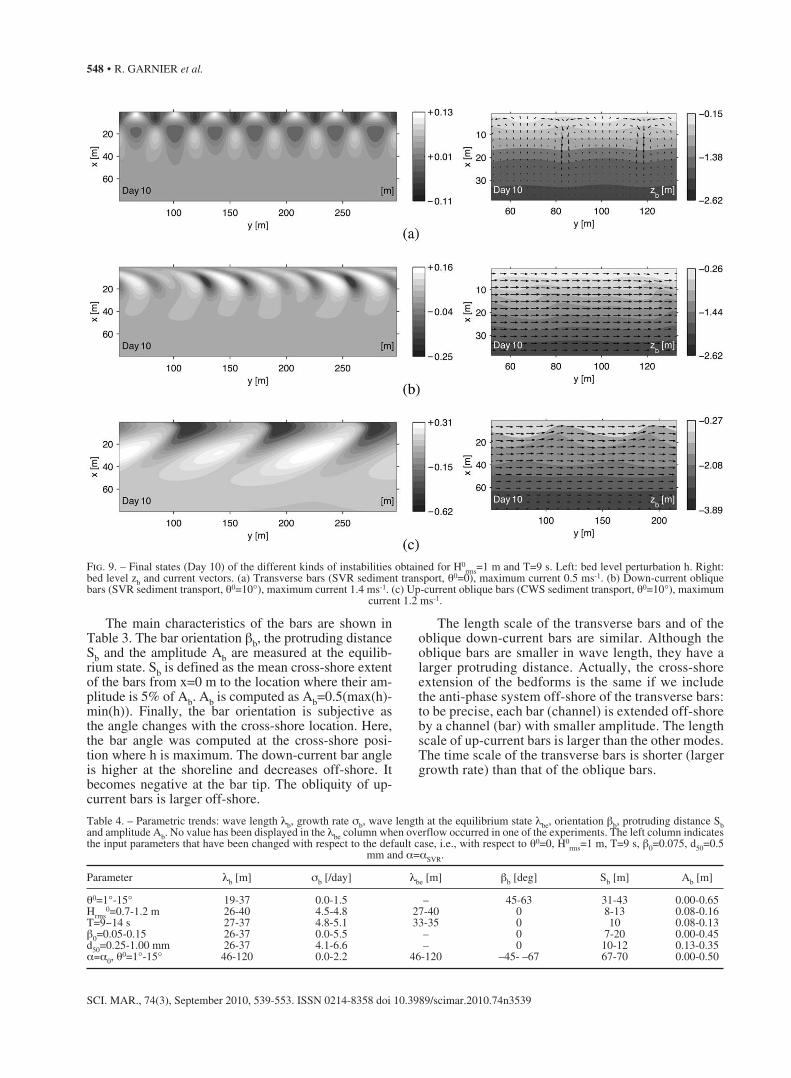
From all the experiments, we distinguish three kinds of instabilities, also called instability modes. They are: (1) transverse bars as in the default case, which occur for normal waves; (2) oblique down-current oriented bars, occurring for oblique wave incidence and by computing the stirring factor with the Soulsby and Van Rijn formula a=aSVR; and (3) Oblique up-current ori-ented bars, occurring for oblique wave incidence with a constant wave stirring (a=a0). Figure 9 displays an
example of these three modes, for wave height H0rms=1
m and wave period T=9 s, and for the other settings of the default case (the default case is shown in Fig. 9a), except for the wave angle fixed to θ0=10° in Figures 9b and 9c, and for the sediment transport where a=a0 in Figures 9c.
Fig. 8. – Time series of (a) the bed level perturbation h along a longshore section, (b) its Fourier analysis, (c) the bar norm |h|, (d) the dominant wavelength λb, (e) the Fourier coefficient of the corresponding modes
and (f) the growth rate of the corresponding modes sb.
Table 3. – Instability modes: wave length λb, growth rate sb, wave length at the equilibrium state λbe, orientation βb, protruding dis-
tance Sb and amplitude Ab. Mode λb [m] sb [/day] λbe [m] βb [deg] Sb [m] Ab [m] (1) 26-37 4.8 35 0 10 0.13(2) 19-33 1.4 31 53 43 0.21(3) 50-100 1.9 100 -53 67 0.5
548 • R. GARNIER et al.
SCI. MAR., 74(3), September 2010, 539-553. ISSN 0214-8358 doi 10.3989/scimar.2010.74n3539
The main characteristics of the bars are shown in Table 3. The bar orientation βb, the protruding distance Sb and the amplitude Ab are measured at the equilib-rium state. Sb is defined as the mean cross-shore extent of the bars from x=0 m to the location where their am-plitude is 5% of Ab. Ab is computed as Ab=0.5(max(h)-min(h)). Finally, the bar orientation is subjective as the angle changes with the cross-shore location. Here, the bar angle was computed at the cross-shore posi-tion where h is maximum. The down-current bar angle is higher at the shoreline and decreases off-shore. It becomes negative at the bar tip. The obliquity of up-current bars is larger off-shore.
The length scale of the transverse bars and of the oblique down-current bars are similar. Although the oblique bars are smaller in wave length, they have a larger protruding distance. Actually, the cross-shore extension of the bedforms is the same if we include the anti-phase system off-shore of the transverse bars: to be precise, each bar (channel) is extended off-shore by a channel (bar) with smaller amplitude. The length scale of up-current bars is larger than the other modes. The time scale of the transverse bars is shorter (larger growth rate) than that of the oblique bars.
Table 4. – Parametric trends: wave length λb, growth rate sb, wave length at the equilibrium state λbe, orientation βb, protruding distance Sb and amplitude Ab. No value has been displayed in the λbe column when overflow occurred in one of the experiments. The left column indicates the input parameters that have been changed with respect to the default case, i.e., with respect to θ0=0, H0
rms=1 m, T=9 s, β0=0.075, d50=0.5 mm and a=aSVR.
Parameter λb [m] sb [/day] λbe [m] βb [deg] Sb [m] Ab [m] θ0=1°-15° 19-37 0.0-1.5 – 45-63 31-43 0.00-0.65Hrms
0=0.7-1.2 m 26-40 4.5-4.8 27-40 0 8-13 0.08-0.16T=9-14 s 27-37 4.8-5.1 33-35 0 10 0.08-0.13β0=0.05-0.15 26-37 0.0-5.5 – 0 7-20 0.00-0.45d50=0.25-1.00 mm 26-37 4.1-6.6 – 0 10-12 0.13-0.35a=a0, θ
0=1°-15° 46-120 0.0-2.2 46-120 –45- –67 67-70 0.00-0.50
Fig. 9. – Final states (Day 10) of the different kinds of instabilities obtained for H0rms=1 m and T=9 s. Left: bed level perturbation h. Right:
bed level zb and current vectors. (a) Transverse bars (SVR sediment transport, θ0=0), maximum current 0.5 ms-1. (b) Down-current oblique bars (SVR sediment transport, θ0=10°), maximum current 1.4 ms-1. (c) Up-current oblique bars (CWS sediment transport, θ0=10°), maximum
current 1.2 ms-1.

BEACH CUSPS AND INNER SURF ZONE PROCESSES • 549
SCI. MAR., 74(3), September 2010, 539-553. ISSN 0214-8358 doi 10.3989/scimar.2010.74n3539
Varying the wave conditions
Table 4 summarizes the bar properties by varying the model parameters. As suggested in the previous section, the kind of instability obtained strongly de-pends on the incident wave angle. Here, the range of incident wave angle (at 4 m depth) found during the Trafalgar cusp events was tested (0<θ0≤15°). As soon as a weak obliquity is imposed (even for θ0=1°), the instability mode differs and the transverse bars do not emerge. For 0<θ0≤2° and θ0>10°, the beach system is stable. For 2°<θ0≤10° oblique down-current bars appear. In some experiments, the model overflows, so equilibrium is not reached. However, the growth rate and the wavelength of the emerging instability can be computed. The growth rate is always smaller than that obtained for normal wave incidence, but the wavelength of the bar is similar, so similar to the cusp wavelength observed in Trafalgar. The sensitivity of the model to the imposed incident wave angle (i.e. dif-ferent modes for θ0=0, 1° and 2°) is not comparable with observations as it corresponds to the uncertainty in wave angle measurements. Furthermore, the wave angle is never regular in nature. However, the present results show the possibility of the emergence of two kinds of instability for normal or near-normal wave incidence, which are comparable, in length scale, to the Trafalgar cusps. Moreover, for strong obliquity (θ0>10°), we obtain stability.
For the wave heights and the wave periods observed at Trafalgar Beach during the cusp events (i.e. 9≤T≤14 s and 0.7≤ H0
rms≤1.2 m), the surf zone is unstable, and the growth rates are similar (i.e. to the default case). The largest variation in bar properties occurs in the wave-length when the wave height varies, i.e. 27≤ λbe≤40 m: the higher the wave, the larger the wavelength.
The presented cusp formation events have an off-shore wave height of less than 1.2 m (H∞
rms Table 1), which corresponds to H0
rms=1.2 m at 4 m depth. Higher wave conditions are not representative of the large cusp events observed at Trafalgar Beach. However, LBC can be observed for high energetic waves, with heights of up to H∞
rms≈1.8 m. This is in agreement with the model results, as these big waves dissipate at a depth greater than 4 m and correspond, at 4 m depth, to waves of H0
rms≈1.2 m. Thus, the model predicts instability for these waves.
For higher waves, H∞rms>2 m, the LBC are gener-
ally destroyed at Trafalgar Beach. These wave condi-tions cannot be simulated as the model neglects the cross-shore surf-zone processes that are essential for high-energy wave conditions.
Varying the beach characteristics
Even in the absence of beach cusps, the beach slope of Trafalgar Beach may vary alongshore. Moreover, due to the large beach cusps, the slope at the shoreline differs if we consider a horn or a bay. In our experi-
ments, the beach profile is assumed to be alongshore-uniform and the beach slope at the shore boundary β0 (at 20 cm depth) and at the off-shore boundary (at 3 m depth) is constant. While the instability of the beach is not sensitive to the off-shore beach slope, β0 can affect the results. A large range has been tested by varying β0 as 0.05<β0<0.15 (Table 4). When β0 decreases, the surf zone width increases and the bedforms are therefore larger (we observe the same wavelength, but Ab and Sb are larger). For the largest beach slope, β0=0.15, the depth at the shoreline seems too deep to allow the (smallest) bedforms to develop, and the beach is found to be stable.
Because of the inhomogeneity in sand size at Trafalgar Beach, we tested different sediment sizes (0.25<d50<1 mm). The growth rate decreases when the sediment size is set larger; however, even for the largest sediment size present at Trafalgar Beach (d50=1 mm), the surf zone is still found to be unstable.
CWS sediment transport
The use of a constant wave stirring (a=a0) leads to the emergence of up-current bars only in the presence of a longshore current. The previous study by Garnier et al. (2006) shows that the up-current bars grow faster if the off-shore wave angle is larger. Table 4 shows the bar characteristics if the wave angle is changed from 1°≤ θ0≤15°. For θ0<3°, the beach is stable, and the growth rate increases with an increasing obliquity. Moreover, for larger θ0, the size of the bars (λbe, Sb and Ab) and their obliquity become larger.
As discussed by Garnier et al. (2006), the uncer-tainty in sediment transport formulae and the lack of measurements of averaged sediment concentration in the surf zone explain our desire to study these two for-mulae; they are fundamentally different, as aSVR gives a peak in the potential stirring (i.e. depth-averaged con-centration C=a/S) cross-shore profile, while a0 gives an offshore decreasing C. Interestingly, whatever the incident wave angle, instability can be observed for some stirring factor: for small wave angles aSVR gives instability, while large angle instability is obtained for a0. Only for a small range of wave angles do both formulae give instability: here, it occurs for 3°< θ0<8° (at 4 m depth), but this range corresponds to the main wave angle observed at Trafalgar Beach. Conclusions on the validity of the two formulae are difficult to give with the Argus system, unless it is used with instru-ments deployed in the surf zone to measure the sedi-ment concentration.
The present study is a first step towards understand-ing the processes behind the surf zone instability that can occur at Trafalgar Beach. A more realistic compari-son would need sediment concentration measurements, in addition to the consideration of a real irregular wave forcing and a real initial topography that is not rectilin-ear, showing a difference in wave angle at 4 m of up to ±20° depending on the alongshore location (Table 1).
550 • R. GARNIER et al.
SCI. MAR., 74(3), September 2010, 539-553. ISSN 0214-8358 doi 10.3989/scimar.2010.74n3539
Starting from pre-existing cusps
Default model settings, changing cusp spacing
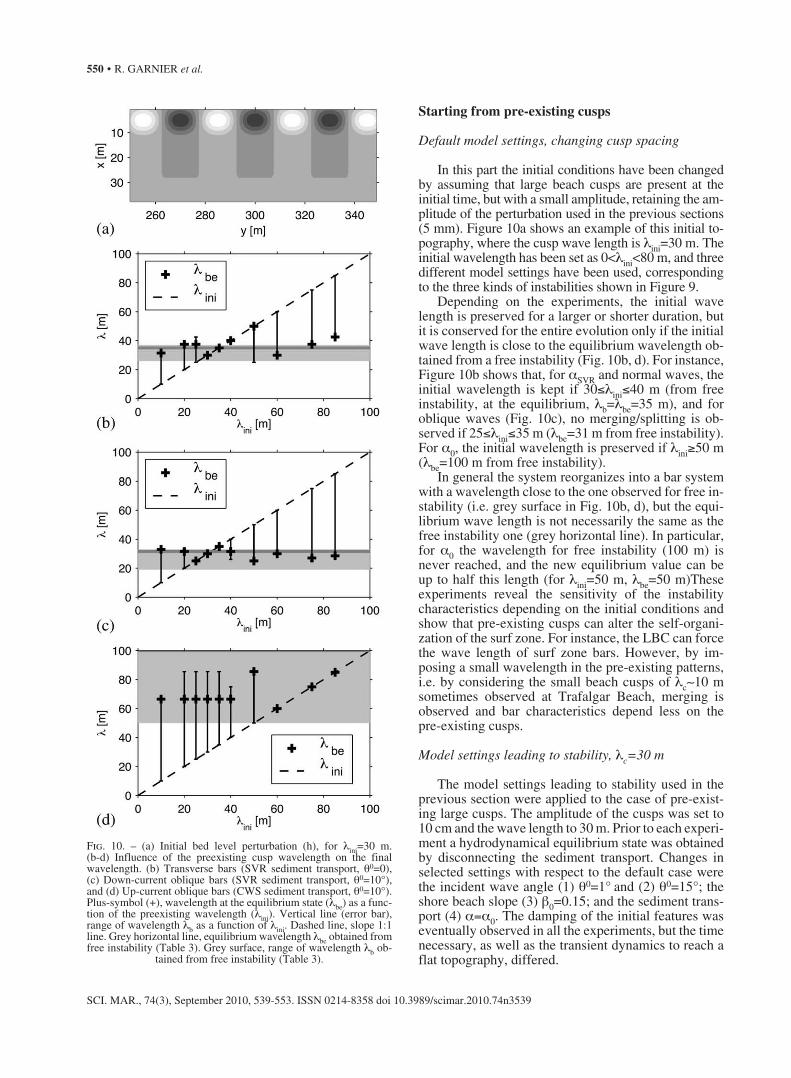
In this part the initial conditions have been changed by assuming that large beach cusps are present at the initial time, but with a small amplitude, retaining the am-plitude of the perturbation used in the previous sections (5 mm). Figure 10a shows an example of this initial to-pography, where the cusp wave length is λini=30 m. The initial wavelength has been set as 0<λini<80 m, and three different model settings have been used, corresponding to the three kinds of instabilities shown in Figure 9.
Depending on the experiments, the initial wave length is preserved for a larger or shorter duration, but it is conserved for the entire evolution only if the initial wave length is close to the equilibrium wavelength ob-tained from a free instability (Fig. 10b, d). For instance, Figure 10b shows that, for aSVR and normal waves, the initial wavelength is kept if 30≤λini≤40 m (from free instability, at the equilibrium, λb=λbe=35 m), and for oblique waves (Fig. 10c), no merging/splitting is ob-served if 25≤λini≤35 m (λbe=31 m from free instability). For a0, the initial wavelength is preserved if λini≥50 m (λbe=100 m from free instability).
In general the system reorganizes into a bar system with a wavelength close to the one observed for free in-stability (i.e. grey surface in Fig. 10b, d), but the equi-librium wave length is not necessarily the same as the free instability one (grey horizontal line). In particular, for a0 the wavelength for free instability (100 m) is never reached, and the new equilibrium value can be up to half this length (for λini=50 m, λbe=50 m)These experiments reveal the sensitivity of the instability characteristics depending on the initial conditions and show that pre-existing cusps can alter the self-organi-zation of the surf zone. For instance, the LBC can force the wave length of surf zone bars. However, by im-posing a small wavelength in the pre-existing patterns, i.e. by considering the small beach cusps of λc~10 m sometimes observed at Trafalgar Beach, merging is observed and bar characteristics depend less on the pre-existing cusps.
Model settings leading to stability, λc=30 m
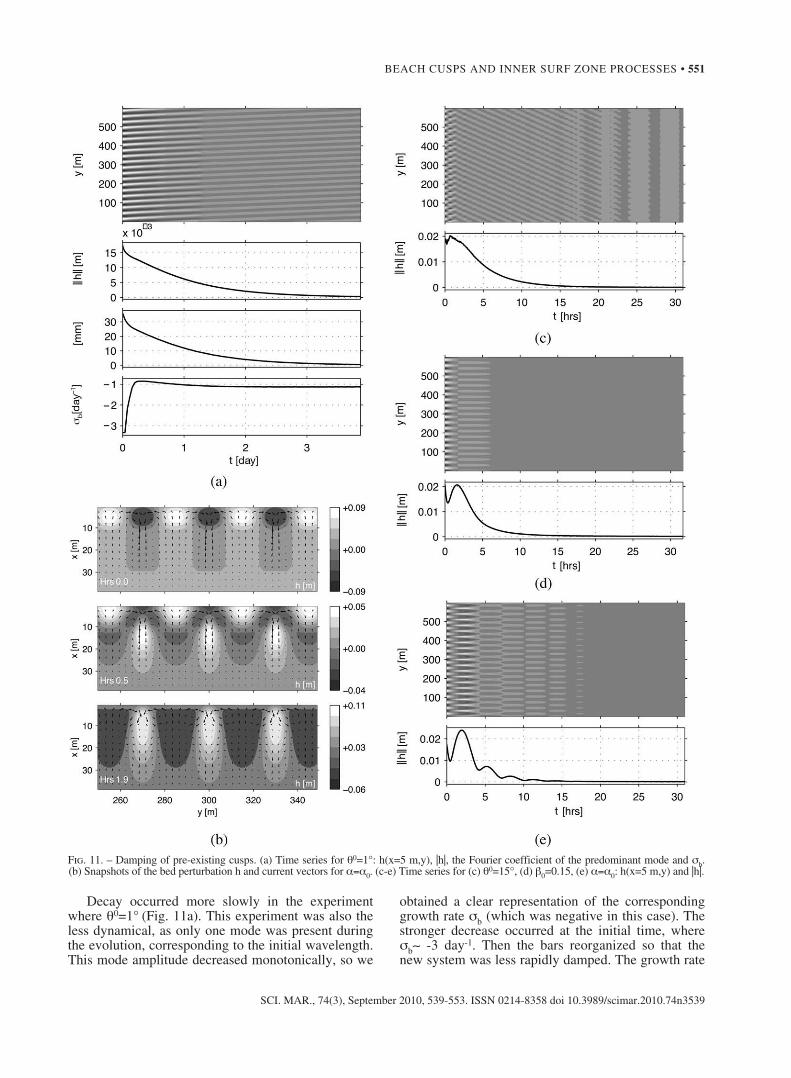
The model settings leading to stability used in the previous section were applied to the case of pre-exist-ing large cusps. The amplitude of the cusps was set to 10 cm and the wave length to 30 m. Prior to each experi-ment a hydrodynamical equilibrium state was obtained by disconnecting the sediment transport. Changes in selected settings with respect to the default case were the incident wave angle (1) θ0=1° and (2) θ0=15°; the shore beach slope (3) β0=0.15; and the sediment trans-port (4) a=a0. The damping of the initial features was eventually observed in all the experiments, but the time necessary, as well as the transient dynamics to reach a flat topography, differed.
Fig. 10. – (a) Initial bed level perturbation (h), for λini=30 m. (b-d) Influence of the preexisting cusp wavelength on the final wavelength. (b) Transverse bars (SVR sediment transport, θ0=0), (c) Down-current oblique bars (SVR sediment transport, θ0=10°), and (d) Up-current oblique bars (CWS sediment transport, θ0=10°). Plus-symbol (+), wavelength at the equilibrium state (λbe) as a func-tion of the preexisting wavelength (λini). Vertical line (error bar), range of wavelength λb as a function of λini. Dashed line, slope 1:1 line. Grey horizontal line, equilibrium wavelength λbe obtained from free instability (Table 3). Grey surface, range of wavelength λb ob-
tained from free instability (Table 3).
BEACH CUSPS AND INNER SURF ZONE PROCESSES • 551
SCI. MAR., 74(3), September 2010, 539-553. ISSN 0214-8358 doi 10.3989/scimar.2010.74n3539
Decay occurred more slowly in the experiment where θ0=1° (Fig. 11a). This experiment was also the less dynamical, as only one mode was present during the evolution, corresponding to the initial wavelength. This mode amplitude decreased monotonically, so we
obtained a clear representation of the corresponding growth rate sb (which was negative in this case). The stronger decrease occurred at the initial time, where sb~ -3 day-1. Then the bars reorganized so that the new system was less rapidly damped. The growth rate
Fig. 11. – Damping of pre-existing cusps. (a) Time series for θ0=1°: h(x=5 m,y), |h|, the Fourier coefficient of the predominant mode and sb. (b) Snapshots of the bed perturbation h and current vectors for a=a0. (c-e) Time series for (c) θ0=15°, (d) β0=0.15, (e) a=a0: h(x=5 m,y) and |h|.
552 • R. GARNIER et al.
SCI. MAR., 74(3), September 2010, 539-553. ISSN 0214-8358 doi 10.3989/scimar.2010.74n3539
was constant (sb~ -1 day-1) until the initial features disappeared after more than 3 days of morphological evolution.
The global processes were much faster in the other experiments, as after 1 day of morphological evolution the beach was flat and stable (Fig. 11c, e). As the oscil-lations in the bar norm plots |h| show, the processes were more complex, in particular in experiment (4) (a=a0). These oscillations were also observed in the Fourier coefficient, so a realistic growth rate cannot be computed as it ranges from strong negative to positive values. The snapshots of the bed level perturbation (Fig. 11b) illustrate the complex behaviours occurring in experiment (4). The damping of the initial features was observed in the first few minutes, but they in-creased again and became higher after two hours, being in anti-phase with the pre-existing cusps. They were fully flattened after 20 hours of evolution.
This experiment illustrates the complexity of the surf zone processes and therefore points out the dif-ficulty of parametrizing these processes in swash zone models. Though the 2DH model predicts stability for particular settings, and pre-existing feature will even-tually be damped, the transient states can be complex and we can observe strong dynamical changes in the first minutes of the morphological evolution and the growth of these feature at some times. These changes occur in the time scale of the cusp formation predicted by the models of Coco et al. (2000) and Dodd et al. (2008). This adds complication to the understanding of cusp dynamics.
Result overview
For characteristic conditions favouring the emer-gence of the LBC, we found three kinds of instabilities, depending on the incident wave angle and on the sedi-ment transport parameterization. For strictly normal waves, transverse bars emerge with wavelength of ~20-30 m using the Soulsby and Van Rijn (SVR) sedi-ment transport formula. As soon as wave obliquity is imposed, the transverse bar mode does not appear, but two other modes can emerge. They are oblique bars oriented down-current or up-current, depending on whether the SVR formula or a constant wave stirring is chosen, respectively. While the down-current bars (wavelength of ~20-40 m) can appear for very weak obliquity and disappear for large obliquity, the up-current bars (wavelength of ~50-120 m) grow faster for a stronger ambient alongshore current (>0.7 ms-1). The transverse bar mode grows faster (i.e. growth rate ~5 day-1) than the oblique bar modes (growth rate ~2 day-1). Further, the instability is favoured by a larger incident wave height and wave period, and by smaller beach slope and smaller grain size. The stability of the beach is obtained for large slope, for some particular values of the incident wave angle using the SVR trans-port formula, for small wave angles using a constant wave stirring, or by simply increasing the bedslope
transport coefficient. With these model settings, the LBC are expected to eventually damp in the surf zone. However, in some cases, complex transient states are found, sometimes showing the growth of the features in the initial step of the morphological evolution (i.e. after some minutes). These transient behaviours need further attention as they occur for the time scale of the cusp formation.
In general, from these self-organization experi-ments (starting from a random perturbed alongshore uniform topography), an equilibrium beach state is reached, and is characterized by a bar wavelength that becomes constant in time. We found that this solution depends on the initial conditions, and in particular on the initial wavelength of pre-existing bedforms. For initial wavelengths in the neighbourhood of the one obtained from free instability, the initial wavelength is conserved. Thus, for the range of the LBC wavelength observed at Trafalgar Beach, merging/splitting is not necessarily expected to occur in the surf zone. How-ever, if the initial wavelength is close to the small cusp wavelength (~10 m), the model predicts reorganization and merging of the cusps in the surf zone.
CONCLUSIONS
Beach cusps are rhythmic systems that feature a periodic undulation of the shoreline with a period (wavelength) ranging from centimetres to tens of me-tres. Based on field observations at the Trafalgar sandy beach (Cádiz, Spain) a distinction within the beach cusps is established. The ‘large beach cusps’ (‘LBC’, wavelength ~30 m) are differentiated from the smaller cusps (wavelength <20 m) in several aspects. Apart from the wavelength, the difference consists in their location (the small cusps appear in the upper beach while the LBC appear in the overall intertidal zone), and in their cross-shore extent (the LBC have a larger protruding distance [up to 50 m] than the small cusps [<5 m], so they alternately stand in the swash and in the inner surf zone due to tidal sea level changes). Moreover, the LBC are notable in that they sometimes present an oblique orientation with respect to the mean shoreline, and they sometimes migrate alongshore. These distinctions suggest that different mechanisms could be at the origin of the formation of these cusps.
Previous studies show that beach cusps appear from swash zone mechanisms and that the surf zone proc-esses are exclusively destructive. However, by using a 2DH surf zone morphodynamical numerical model that neglects the swash zone processes and the changes in tide level, we see that inner surf zone processes do not always destroy the cusps but can in fact reinforce them. More generally, in the conditions leading to the pres-ence of LBC the surf zone can be morphodynamically unstable, with the bars emerging from this instability having characteristics similar to the LBC. Therefore, LBC could also be formed by surf zone processes and an analogy with the megacusps can be made. Further-

BEACH CUSPS AND INNER SURF ZONE PROCESSES • 553
SCI. MAR., 74(3), September 2010, 539-553. ISSN 0214-8358 doi 10.3989/scimar.2010.74n3539
more, surf zone models usually neglect swash zone processes and the presence of beach cusps, but we show that cusps can trigger the formation of transverse/oblique bars by forcing the wavelength of the surf zone features. Thus, the dynamics of beach cusps appears to be closely related to the interaction between surf and swash zones.
Although this study reveals the possibility of the growth of large beach cusps in the surf zone from the results of a 2DH numerical model, the lack of field measurements does not allow direct observation of the growth or the decay of these cusps in the surf zone. First, Argus images are not accurate enough to measure morphological behaviour in the inner surf zone; for instance the strong undertow occurring in the channels can be confounded with breaking over the crests. Second, a validation of the model would need hydrodynamical measurements. Nevertheless, in spite of all these limitations, the present study suggests that beach cusp dynamics does not rely only on swash zone processes, but involve a complex interaction between swash and surf zones that should be explored in future research.
ACKNOWLEDGEMENTS
The work of R. Garnier was supported by the Uni-versity of Nottingham and is part of the Spanish Gov-ernment project under contract CTM2006-08875. The Spanish Ministry of Science and Education (Project BORRASCAS CTM2005-06583) and the Junta de An-dalucía (Projects P05-RNM-968 and P06-RNM-1573) funded part of this research. Their support is gratefully acknowledged. The authors also thank Prof. Holman for the Argus hints.
REFERENCES
Aarninkhof, S. and R. Holman. – 1999. Argus video-based monitor-ing of the nearshore zone: a tool for both nearshore science and coastal zone management. Backscatter, 10(2): 8-11.
Almar, R., G. Coco, K. Bryan, D. Huntley, A. Short, and N. Senechal. – 2008. Video observations of beach cusp morphodynamics. Mar. Geol., 254: 216-223.
Booij, N., R.C. Ris and L.H. Holthuijsen. – 1999. A third-generation wave model for coastal regions: 1. Model description and vali-dation. J. Geophys. Res., 104(C4): 7649-7666.
Caballeria, M., G. Coco, A. Falqués and D.A. Huntley. – 2002. Self-organization mechanisms for the formation of nearshore cres-centic and transverse sand bars. J. Fluid Mech., 465: 379-410.
Calvete, D., N. Dodd, A. Falqués and S.M. van Leeuwen. – 2005. Morphological development of rip channel systems: Normal and near normal wave incidence. J. Geophys. Res., 110(C10006), doi:10.1029/2004JC002803.
Castelle, B., P. Bonneton, H. Dupuis and N. Senechal. – 2007. Dou-ble bar beach dynamics on the high-energy meso-macrotidal french Aquitanian coast: a review. Mar. Geol., 245: 141-159.
Ciriano, Y., G. Coco, K. Bryan and S. Elgar. – 2005. Field ob-servations of infragravity motions in the swash zone and beach cusp evolution. J. Geophys. Res., 110(C02018), doi:10.1029/2004JC002485.
Coco, G., T. J. O’Hare, and D. A. Huntley. – 1999. Beach cusps: a comparison of data and theories for their formation. J. Coastal Res., 15(3): 741-749.
Coco, G., D.A. Huntley and T.J. O’Hare. – 2000. Investigation of a
self-organization model for beach cusp formation and develop-ment. J. Geophys. Res., 105(C9): 21,991-22,002.
Coco, G., T.K. Burnet, B.T. Werner and S. Elgar. – 2003. Test of self-organization in beach cusp formation. J. Geophys. Res., 108(C33101), doi:10.1029/2002JC001496.
Coco, G., T.K. Burnet, B.T. Werner and S. Elgar. – 2004. The role of tides in beach cusp development. J. Geophys. Res., 109(C04011), doi:10.1029/2003JC002154.
Dodd, N., A. Stoker, D. Calvete and A. Sriariyawat. – 2008. On beach cusp formation. J. Fluid Mech., 597: 145-169.
Falqués, A., G. Coco, and D. A. Huntley. – 2000. A mechanism for the generation of wave-driven rhythmic patterns in the surf zone. J. Geophys. Res., 105(C10): 24,071-24,088.
Garnier, R., D. Calvete, A. Falqués and M. Caballeria. – 2006. Generation and nonlinear evolution of shore-oblique/transverse sand bars. J. Fluid Mech., 567: 327-360.
Garnier, R., D. Calvete, A. Falqués and N. Dodd. – 2008. Model-ling the formation and the long-term behaviour of rip channel systems from the deformation of a longshore bar. J. Geophys. Res., 113(C07053), doi:10.1029/2007JC004632.
Guza, R.T. and A. Bowen. – 1975 On the amplitude of beach cusps. J. Geophys. Res., 86: 4125-4131.
Guza, R.T. and D. Inman. – 1975. Edge waves and beach cusps. J. Geophys. Res., 80(21): 2997-3012.
Holland, K.T. – 1998. Beach cusp formation and spacings at Duck, USA. Cont. Shelf Res., 18: 1081-1098.
Holland, K.T. and R.A. Holman. – 1996. Field observations of beach cusps and swash motions. Mar. Geol., 134: 77-93.
Holland, K.T., R.A. Holman, T.C. Lippmann, J. Stanley and N. Plant. – 1997. Practical use of video imagery in nearshore oceanographic field studies. IEEE J. Ocean. Eng., 22(1): 81-92.
Holman, R.A. and J. Stanley. – 2007. The history and technical ca-pabilities of Argus. Coastal Eng., 54(6-7): 477-491.
Inman, D.L. and R.T. Guza. – 1982. The origin of swash cusps on beaches. Mar. Geol., 49: 133-148.
Johnson, B. and J. Smith. – 2008. A two-scale approach to nearshore sediment transport modeling. In: J.M. Smith (ed.), Coastal Eng. 2008, pp. 1671-1683. World Sci., Singapore.
Masselink, G. and C.B. Pattiaratchi. – 1998. Morphological evolu-tion of beach cusp morphology and associated swash circulation patterns. Mar. Geol., 146: 93-113.
Masselink, G. and A.D. Short. – 1993. The effect of the tide range on beach morphodynamics: a conceptual model. J. Coastal Res., 9: 785-800.
Masselink, G., B.J. Hegge and C.B. Pattiaratchi. – 1997. Beach cusp morphodynamics. Earth Surf. Proc. Land., 22: 1139-1155.
Masselink, G., P. Russell, G. Coco and D.A. Huntley. – 2004. Test of edge wave forcing during formation of rhyth-mic beach morphology. J. Geophys. Res., 109(C06003), doi:10.1029/2004JC002339.
Ortega-Sánchez, M., M.A. Losada and A. Baquerizo. – 2003. On the development of large-scale features on a semi-reflective beach: Carchuna beach, southern Spain. Mar. Geol., 198: 209-223.
Ortega-Sánchez, M., S. Fachin, F. Sancho and M.A. Losada. – 2008. Relation between beachface morphology and wave climate at Trafalgar beach (Cádiz, Spain). Geomorphology, 99: 171-185.
Ribas, F., A. Falqués and A. Montoto. – 2003. Nearshore oblique sand bars. J. Geophys. Res., 108(C43119), doi:10.1029/2001JC000985.
Short, A.D. – 1999. Handbook of Beach and Shoreface Morphody-namics. Wiley, Chichester.
Soulsby, R.L. – 1997. Dynamics of Marine Sands, Thomas Telford, London, U.K.
van Leeuwen, S.M., N. Dodd, D. Calvete and A. Falqués. – 2006. Physics of nearshore bed pattern formation under regular or random waves. J. Geophys. Res., 111(F01023), doi:10.1029/2005JF000360.
Werner, B.T. and T.M. Fink. – 1993. Beach cusps as self-organized patterns, Science, 260: 968-971.
Wright, L.D. and A.D. Short. – 1984. Morphodynamic variability of surf zones and beaches: A synthesis. Mar. Geol., 56: 93-118.
Scient. ed.: J. Guillén.Received June 10, 2009. Accepted November 19, 2009.Published online May 20, 2010.