Barriers and Drivers of Health Information Technology Use for ...
1422
Evidence Report/Technology Assessment Number 175 Barriers and Drivers of Health Information Technology Use for the Elderly, Chronically Ill, and Underserved Prepared for: Agency for Healthcare Research and Quality U.S. Department of Health and Human Services 540 Gaither Road Rockville, MD 20850 www.ahrq.gov Contract No. 290-02-0024 Prepared by: Oregon Evidence-based Practice Center, Portland, Oregon Investigators Holly Jimison, Ph.D. Principal Investigator Paul Gorman, M.D. Susan Woods, M.D. Peggy Nygren, M.A. Miranda Walker, M.A. Susan Norris, M.D., M.P.H., M.Sc. William Hersh, M.D. AHRQ Publication No. 09-E004 November 2008
-
Upload
khangminh22 -
Category
Documents
-
view
1 -
download
0
Transcript of Barriers and Drivers of Health Information Technology Use for ...

Evidence Report/Technology Assessment Number 175
Barriers and Drivers of Health Information Technology Use for the Elderly, Chronically Ill, and Underserved
Prepared for: Agency for Healthcare Research and Quality U.S. Department of Health and Human Services 540 Gaither Road Rockville, MD 20850 www.ahrq.gov Contract No. 290-02-0024 Prepared by: Oregon Evidence-based Practice Center, Portland, Oregon Investigators Holly Jimison, Ph.D. Principal Investigator Paul Gorman, M.D. Susan Woods, M.D. Peggy Nygren, M.A. Miranda Walker, M.A. Susan Norris, M.D., M.P.H., M.Sc. William Hersh, M.D. AHRQ Publication No. 09-E004 November 2008

This report is based on research conducted by the Oregon Evidence-based Practice Center (EPC) under contract to the Agency for Healthcare Research and Quality (AHRQ), Rockville, MD (Contract No. 290-02-0024). The findings and conclusions in this document are those of the authors, who are responsible for its content, and do not necessarily represent the views of AHRQ. No statement in this report should be construed as an official position of AHRQ or of the U.S. Department of Health and Human Services. The information in this report is intended to help clinicians, employers, policymakers, and others make informed decisions about the provision of health care services. This report is intended as a reference and not as a substitute for clinical judgment. This report may be used, in whole or in part, as the basis for the development of clinical practice guidelines and other quality enhancement tools, or as a basis for reimbursement and coverage policies. AHRQ or U.S. Department of Health and Human Services endorsement of such derivative products may not be stated or implied.

ii
This document is in the public domain and may be used and reprinted without permission except those copyrighted materials noted for which further reproduction is prohibited without the specific permission of copyright holders.
Suggested Citation: Jimison H, Gorman P, Woods S, Nygren P, Walker M, Norris S, Hersh W. Barriers and Drivers of Health Information Technology Use for the Elderly, Chronically Ill, and Underserved. Evidence Report/Technology Assessment No. 175 (Prepared by the Oregon Evidence-based Practice Center under Contract No. 290-02-0024). AHRQ Publication No. 09-E004. Rockville, MD: Agency for Healthcare Research and Quality. November 2008.
No investigators have any affilications or financial involvement (e.g., employment, consultancies, honoraria, stock options, expert testimony, grants or patents received or pending, or royalties) that conflict with material presented in this report.

iii
Preface The Agency for Healthcare Research and Quality (AHRQ), through its Evidence-Based Practice Centers (EPCs), sponsors the development of evidence reports and technology assessments to assist public- and private-sector organizations in their efforts to improve the quality of health care in the United States. The reports and assessments provide organizations with comprehensive, science-based information on common, costly medical conditions and new health care technologies. The EPCs systematically review the relevant scientific literature on topics assigned to them by AHRQ and conduct additional analyses when appropriate prior to developing their reports and assessments. To bring the broadest range of experts into the development of evidence reports and health technology assessments, AHRQ encourages the EPCs to form partnerships and enter into collaborations with other medical and research organizations. The EPCs work with these partner organizations to ensure that the evidence reports and technology assessments they produce will become building blocks for health care quality improvement projects throughout the Nation. The reports undergo peer review prior to their release. AHRQ expects that the EPC evidence reports and technology assessments will inform individual health plans, providers, and purchasers as well as the health care system as a whole by providing important information to help improve health care quality. We welcome comments on this evidence report. They may be sent by mail to the Task Order Officer named below at: Agency for Healthcare Research and Quality, 540 Gaither Road, Rockville, MD 20850, or by e-mail to [email protected].
Carolyn M. Clancy, M.D. Jean Slutsky, P.A., M.S.P.H. Director Director, Center for Outcomes and Evidence Agency for Healthcare Research and Quality Agency for Healthcare Research and Quality
Beth A. Collins Sharp, R.N., Ph.D. Director, EPC Program
Agency for Healthcare Research and Quality
Teresa Zayas Cabán, Ph.D. Task Order Officer Agency for Healthcare Research and Quality

iv
Acknowledgments The research team would like to express our regard and appreciation for the efforts of
Andrew Hamilton, MLS, for database searching; Kimberly Peterson, M.S., and Lakshmi Harinath, M.D., MPH, for data abstraction assistance; Roger Chou, M.D., for oversight and guidance; Janna Kimel and Alia Broman for program support; and everyone else who shared support and ideas throughout the development of this report. We would also like to offer special thanks to Teresa Zayas Cabán, Ph.D., of the Agency for Healthcare Research and Quality for her contributions as our Task Order Officer.

v
Structured Abstract Objectives: We reviewed the evidence on the barriers and drivers to the use of interactive consumer health information technology (IT) by specific populations, namely the elderly, those with chronic conditions or disabilities, and the underserved. Data Sources: We searched MEDLINE®, CINHAHL®, PsycINFO®, the Cochrane Controlled Trials Register and Database of Systematic Reviews, ERIC, and the American Association of Retired Persons (AARP) AgeLine® databases. We focused on literature 1990 to present. Methods: We included studies of all designs that described the direct use of interactive consumer health IT by at least one of the populations of interest. We then assessed the quality and abstracted and summarized data from these studies with regard to the level of use, the usefulness and usability, the barriers and drivers of use, and the effectiveness of the interactive consumer health IT applications. Results: We identified and reviewed 563 full-text articles and included 129 articles for abstraction. Few of the studies were specifically designed to compare the elderly, chronically ill, or underserved with the general population. We did find that several types of interactive consumer health IT were usable and effective in multiple settings and with all of our populations of interest. Of the studies that reported the impact of interactive consumer health IT on health outcomes, a consistent finding of our review was that these systems tended to have a positive effect when they provided a complete feedback loop that included (a) monitoring of current patient status, (b) interpretation of this data in light of established, often individualized, treatment goals, (c) adjustment of the management plan as needed, (d) communication back to the patient with tailored recommendations or advice, and (e) repetition of this cycle at appropriate intervals. Systems that provided only one or a subset of these functions were less consistently effective.
The barriers and drivers to use were most often reported as secondary outcomes. Many studies were hampered by usability problems and unreliable technology, primarily due to the research being performed on early stage system prototypes. However, the most common factor influencing the successful use of the interactive technology by these specific populations was that the consumers’ perceived a benefit from using the system. Convenience was an important factor. It was critical that data entry not be cumbersome and that the intervention fit into the user’s daily routine. Usage was more successful if the intervention could be delivered on technology consumers used every day for other purposes. Finally, rapid and frequent interactions from a clinician improved use and user satisfaction. Conclusions: The systems described in the studies we examined depended on the active engagement of consumers and patients and the involvement of health professionals, supported by the specific technology interventions. Questions remain as to (a) the optimal frequency of use of the system by the patient, which is likely to be condition-specific; (b) the optimal frequency of use or degree of involvement by health professionals; and (c) whether the success depends on repeated modification of the patient’s treatment regimen or simply ongoing assistance with applying a static treatment plan. However, it is clear that the consumer’s perception of benefit,

vi
convenience, and integration into daily activities will serve to facilitate the successful use of the interactive technologies for the elderly, chronically ill, and underserved.

vii
Contents Executive Summary ............................................................................................................1 Evidence Report .................................................................................................................7 Chapter 1. Introduction .......................................................................................................9
1.a. Goal of the Report ..................................................................................................9 1.b. Background ............................................................................................................9 1.c. Burdens of Illness, Conditions, and the Digital Divide .......................................10
Chapter 2. Methods ...........................................................................................................13 2.a. Technical Expert Panel Input ...............................................................................13 2.b. Key Questions and Analytic Framework..............................................................13 2.c. Population ............................................................................................................15 2.d. Technology ..........................................................................................................15 2.d.i. Further refinement of technologies ....................................................................16 2.e. Outcomes ............................................................................................................. 17 2.f. Study Design ........................................................................................................ 17 2.g. Data Sources and Search Strategy .......................................................................18 2.h. Inclusion and Exclusion of Literature...................................................................18 2.i. Data Abstraction ....................................................................................................18 2.j. Quality Rating of Studies ......................................................................................19 2.k. Data Synthesis ......................................................................................................19 2.l. Peer Review ..........................................................................................................19
Chapter 3. Results .............................................................................................................21 3.a. Findings for Key Question 1: Level of Use of Interactive Consumer Health IT 21 3.a.i. Current level of use of specific forms of interactive consumer health IT 22 3.a.ii. Primary uses of interactive consumer health IT ...............................................23 3.a.iii. Variation of use according to type of interactive consumer health IT application..............................................................................................................24 3.a.iv. Variation of use according to settings and availability of the interactive consumer health IT tools .......................................................................................24 3.a.v. Level and type of use in populations of interest compared with the general population .................................................................................................25 3.a.vi. Summary of findings of the use of interactive consumer health IT..................25 3.b. Findings for Key Question 2: Usability of Interactive Consumer Health IT.......25 3.b.i. Usefulness of various types of interactive consumer health IT applications ....26 3.b.ii. Usability factors associated with various types of interactive consumer health IT ................................................................................................................27 3.b.iii. Usability issues for special populations .......................................................... 28 3.b.iv. Summary of usability and usefulness issues.....................................................29

viii
3.c. Findings for Key Question 3: Barriers to Use of Interactive Consumer Health IT ...............................................................................................................29 3.c.i Lack of perceived benefit ....................................................................................30 3.c.ii. Technology intervention did not fit their lifestyle ............................................31 3.c.iii. Lack of trust of the system ...............................................................................31 3.c.iv. Technological malfunctions .............................................................................31 3.c.v. Technology is too Cumbersome ........................................................................32 3.c.vi. Confusion with the technology and content .....................................................32 3.c.vii. Specific barriers with interactive reminding technologies ..............................32 3.c.viii. Clinician factors as barriers ...........................................................................33 3.c.ix. Cost as a barrier ................................................................................................33 3.c.x. Age and disabilities as barriers .........................................................................33 3.c.xi. Summary of barriers to the use of interactive consumer health IT...................34 3.d. Findings for Key Question 4: Drivers and Facilitators of the Use of Interactive Consumer Health IT ............................................................................34 3.d.i. Perception of health benefit ...............................................................................35 3.d.ii. Perception of convenience and accessibility benefits .......................................36 3.d.iii. Rapid response from clinicians ........................................................................37 3.d.iv. Benefit of anonymity for sensitive health topics .............................................37 3.d.v. Benefit of understanding physicians and the health care system ......................37 3.d.vi. Deliver information on devices they use every day .........................................38 3.d.vii. Tailored to patients’ interest ...........................................................................38 3.d.viii. Patients in poor health benefit more ..............................................................38 3.d.ix. Drivers for older users – Gradual introduction of technology .........................39 3.d.x. Summary of the drivers to the use of interactive consumer health IT ...............39 3.e. Findings for Key Question 5: Effectiveness of Interactive Consumer Health IT ...............................................................................................................39 3.e.i. Complete feedback loops ...................................................................................40 3.e.ii. Reminders, alone and with monitoring .............................................................45 3.e.iii. Monitoring alone ..............................................................................................46 3.e.iv Peer interaction .................................................................................................46 3.e.v. Education or information alone .........................................................................47 3.e.vi. Access to EMR data and email system ............................................................47 3.e.vii Web-based assessment with recommendations ..............................................48 3.e.viii. Systems may not be for everyone ..................................................................48 3.e.ix. Summary of the effectiveness of interactive consumer health IT.....................48 3.f. Specific Findings for Populations of Interest .......................................................49 3.f.i. African-American population..............................................................................49 3.f.ii. Rural population .................................................................................................50 3.f.iii Underserved population .....................................................................................50 3.f.iv. Elderly population .............................................................................................51
Chapter 4. Discussion .......................................................................................................53 4.a. Use of Interactive Consumer Health IT .............................................................. 54 4.b. Usability of Interactive Consumer Health IT .......................................................55

ix
4.c. Barriers to the Use of Interactive Consumer Health IT .......................................56 4.d. Drivers to the Use of Interactive Consumer Health IT ........................................57 4.e. Effectiveness of Interactive Consumer Health IT ................................................57 4.f. Use of Interactive Consumer Health IT by Populations of Interest .....................59 4.g. Technical Difficulties Interfering with Evaluations ............................................59
Chapter 5. Future Research ...............................................................................................61 Chapter 6. Conclusions .....................................................................................................63 References .........................................................................................................................65 Figures Figure 1. Analytic Framework ..........................................................................................14 Figure 2. Spectrum of Information Interventions .............................................................17 Tables Table 1: A summary of populations included in this review............................................15 Table 2: Health IT inclusions and exclusions ..................................................................16 Table 3. Examples of complete feedback loop systems ...................................................58 Summary Tables Summary Table 1. Summary of Usage Studies (KQ1) Summary Table 2. Usability (KQ2) Summary Table 3. Barriers (KQ3) Summary Table 4. Drivers (KQ4) Summary Table 5. Outcomes (KQ5) Summary Table 6. Populations of Interest Appendixes Appendix A. Technical Expert Panel Members Appendix B. Search Strategies Appendix C. Inclusion/Exclusion Criteria Appendix D. Search and Selection of Literature Appendix E. Excluded Studies List Appendix F. Quality Assessment Criteria Appendix G. Peer Reviewers Appendix H. Data Abstraction Table with References Appendix I: Study Quality Assessment Table with References
Appendixes and Evidence Tables are available electronically at http://www.ahrq.gov/downloads/pub/evidence/pdf/hitbarriers/hitbar.pdf

1
Executive Summary
Background
Interactive consumer health information technology (health IT) promises to engage consumers and promote their active participation in improving their health. Interactive technologies provide health information and tools that are patient-centered, offering care and support that integrates individual needs and preferences into clinical information systems. Such technologies, by tailoring health information and delivering targeted care, have significant potential to foster patient self-care monitoring and management. As the evidence on health IT interventions increases, it is important to understand how specific target groups such as the elderly, those with chronic conditions or disabilities, and underserved populations are able to access, use, and benefit from these applications.
This report was prepared on behalf of the Agency for Healthcare Research and Quality (AHRQ), in response to a recommendation from the American Health Information Community. The systematic search conducted for this report focused on studies of interactive health IT used by consumers or patients, and targeted to our populations of interest. The report describes factors influencing the use, usefulness, and usability of interactive consumer health IT for elderly, chronically ill, and underserved populations. It also summarizes the scientific evidence on the effectiveness of interactive health IT applications and identifies gaps in research. By examining factors that influence the use and outcomes of interactive consumer health IT, the report provides a context for future inquiry in the study of applications designed for patients to participate more fully in their health care and health care decisions.
Methods
Our search for the published literature included structured searches of both standard and specialty bibliographic databases. We searched MEDLINE® (1950- Nov 2007), CINAHL® (1982-Feb 2008), PsycINFO® (1806-Feb 2008), the Cochrane Controlled Trials Register and Database of Systematic Reviews (1st quarter 2008), ERIC (1960- March 2008), and the American Association of Retired Persons (AARP) AgeLine® (1978-Dec 2007). We focused our review of citations from 1990 to present. We included studies of all designs that described the use of interactive consumer health IT by at least one of the populations of interest (elderly, chronically ill, or underserved). We then abstracted and summarized data from these studies with regard to key questions on:
1. Level of technology usage 2. Usefulness and usability of the technology 3. Barriers to technology use 4. Drivers and facilitators to technology use 5. Effectiveness of the technology

2
Our analytic framework, developed in consultation with AHRQ and a Technical Expert Panel, helped guide the systematic review process. We specifically searched for articles having primary or subgroup analyses of the following health IT user groups:
1. Elderly (over the age of 65 or functionally elderly) 2. Chronically ill (condition longer than 1 year that would benefit from treatment) or
disabled (impairments leading to activity limitations) 3. Underserved (including underserved minorities, low-income populations, and medically
underserved geographical regions) It was important to clearly define health IT that was both interactive and intended to be used
by patients or consumers. Included papers were those that examined technology meeting the following criteria:
1. A consumer interacts directly with the technology 2. The computer processes the information in some way 3. A consumer receives or has access to patient-specific information in return.
Using this definition led us to include technologies such as self-management systems
providing tailored advice, personal health records with data from a provider’s electronic medical record (EMR), tailored health education, and online support groups. We specifically excluded Web browsing of general health information databases, telemedicine systems which provide a simple conduit for communication between patient and health professional, and passive monitoring systems or electronic surveys without feedback to the patient.
Results
We identified a total of 8,522 abstracts, reviewed 563 full-text articles and included 129 articles for abstraction. Few studies were specifically designed to compare the elderly, chronically ill, or underserved populations with the general population. But in general, we did find evidence that several types of interactive consumer health IT were usable and effective in multiple settings and with all of our populations of interest.
The Level of Use of Interactive Consumer Health IT
In our review of studies having some description on the level of usage of interactive consumer health IT, we found that the data were limited and presented challenges. Measures related to usage varied considerably and offered no apparent standardization of terminology. We also found that the frequency of health IT usage needed to be placed in the context of expected or intended use of the technology.
Some studies reported on the frequency of participant use of technology over time, i.e., mean logins per subjects per month, or allowed an estimation of this measure. Collectively, such studies observed reductions in usage over time. Among studies of web-based interactive systems that offered usage frequency, findings ranged from less than 1 to as many as 27 mean logins per subject month. Empiric observation revealed that more highly used applications offered patient self-management tools and/or peer group support. Studies that compared the use of specific

3
components within an application found the most frequently used functions to be online peer group support, bulletin boards and self-management tools. These applications were tested across a variety of chronic conditions, including diabetes, tobacco use, chronic obstructive lung disease, and congestive heart failure.
The Usefulness and Usability of Interactive Consumer Health IT
Most studies providing information on the usefulness and usability of interactive consumer health IT systems addressed these issues as a secondary component of the study. However, the data indicated that usability played a key role in the use of these systems. Most researchers measured usefulness as part of their usability assessment, finding user perceptions generally rated high, especially for self-management systems. For each type of interactive consumer health information technology, the evidence offered examples that users believed were easy to use as well as those having usability issues. A small number of studies focused on usability testing early in design of the application. In these cases, the goal was to discover and fix usability issues early on in the process. Most issues had to do with graphics clarity and simplicity for older or impaired users.
Barriers to the Use of Interactive Consumer Health IT
The most frequent barrier to consumer use of interactive health IT across studies we examined was the lack of a perceived benefit. In several studies, lack of convenience was an important barrier. Specifically, patients were less likely to use systems requiring access to equipment or technology that did not fit seamlessly into their normal daily routines. Similarly, overly cumbersome data entry was perceived as a barrier. Several studies found that of the level and timeliness of clinician involvement with the system was directly associated with patient use; low clinician participation (when it was expected by the patient) led to low patient use. Technical issues often prevented consistent use of health IT systems, especially among studies conducted on early system prototypes. Finally, although subjects were often provided with the technology for a research trial, several studies identified that costs and access to the technology would serve as barriers to use of health IT beyond the study interval.
Drivers of the Use of Interactive Consumer Health IT
As a counterpoint to the findings above, the most frequent factor associated with increased use of the interactive health IT was the patient’s perception of a health benefit. Most of the systems we reviewed were designed for use by patients with a chronic condition, and it was important that patients believed the system was helping them manage their condition. Convenience of access to the interactive technology, and the amount of time required for the intervention, were both factors driving technology use. Interventions found to be beneficial were those that were delivered on devices familiar to patients and used routinely for other purposes. Clinician involvement was a driver in patient use of the technology; furthermore, rapid response from a clinician was shown to increase patient satisfaction. Also, providing content tailored to an individual consumer was shown to increase both system use and satisfaction. Finally, an

4
important driver of technology use relating to older users was the gradual introduction of technology.
Effectiveness of Interactive Consumer Health IT
An important and consistent finding in this review was that systems were effective when they provided a complete feedback loop that included (a) monitoring of patient status; (b) interpretation of this data by comparison to individual treatment goals; (c) adjustment of management according to patient status; (d) timely communication to the patient of tailored recommendations or advice; and (e) repetition of this cycle at appropriate intervals. These “complete loop” interventions were effective across a wide range of conditions, technologies, geographical areas, and patients’ socioeconomic status. Systems providing only one or a subset of these functions were less consistently effective. Systems that delivered reminders, alone or based on patient self-monitoring were not consistently effective. Systems offering online peer interaction, alone or as part of multi-component systems, were generally effective in improving intermediate outcomes but not health outcomes. Weak but consistent evidence showed that education or information alone had minimal effect on health outcomes. Online access to a patient view of the clinician’s EMR did not improve outcomes, except when combined with tailoring or bi-directional information flow. When asked, in some cases patients expressed a strong preference for human interaction, even with systems that were effective. Many studies showed these systems to be effective in our specific populations of interest: elders, those with chronic illness, members of underserved populations. However, no direct comparisons of interactive health IT between a target population and the general population were identified.
Discussion
There were several challenges to reviewing interventions based on interactive consumer health IT, primarily due to the fact that the interventions being studied varied so widely. First, the underlying technology varied significantly and included Web-based applications, hand-held PDAs or cell phones, touch-screen computers or kiosks. Second, the systems were designed for a wide variety of purposes, not a single intervention. Even though we focused the review on systems for the elderly, chronically ill, and underserved populations, we covered many application areas, such as systems for diabetes, asthma, cancer, mental disorders, smoking cessation, and medication reminding. Children with chronic conditions were included in our review, and we found that they have very different types of usage issues and systems designed for them. Third, the frequency of intended use of the various systems could be quite different. Some were single-use interactive educational systems or decision aids. Others were intended for daily use in the home. Fourth, these systems varied widely in complexity, from simple systems providing a single function to complex systems with a robust suite of diverse features. Last, the embedded care protocols and the degree to which clinicians participated differed dramatically from study to study. All of these issues are critical when interpreting the results of these studies, and the variability in approaches demands caution in generalizing these results too broadly.
Few of the studies were specifically designed to compare the elderly, chronically ill, or underserved to the general population. But in general, we found that several types of interactive consumer health IT applications were usable and effective in many settings and with all of our

5
populations of interest. The most important and consistent finding regarding the effectiveness of these technology interventions was the benefit of systems that provided a complete feedback loop including assessment of current patient status, interpretation of this status information in light of established treatment goals or plans, and communication back to the patient with tailored recommendations or advice, repeated over time. Interactive consumer health IT applications that provided only one or a subset of these functions were less consistently effective.
The barriers and drivers to use were most often reported as secondary outcomes in these studies. Many studies were hampered by usability problems and unreliable technology, primarily due to the nature of research typically being performed on early stage system prototypes. But beyond this, the most common factor influencing the successful use of the interactive technology by these special populations was that the consumers perceived a benefit from using the system. Convenience was also an important factor. It was critical that data entry not be cumbersome and that the intervention fit into the user’s daily routine. Usage was more successful if the intervention could be delivered on technology consumers used every day for other purposes. Finally, rapid and frequent interactions from a clinician improved use and user satisfaction.
The systems described in the studies we examined depended on the active engagement of patients and the involvement of health professionals, supported by the specific technology interventions. Questions remain as to (a) the optimal frequency of use of the system by the patient, which is likely to be condition-specific; (b) the optimal frequency of use or degree of involvement by the health professionals; (c) whether their success depends on repeated modification of the patient’s treatment regimen or simply ongoing assistance with applying a static treatment plan. However, it is clear that the consumer’s perception of benefit, convenience and integration into daily activities will serve to facilitate the successful use of the interactive technologies for the elderly, chronically ill, and underserved. Perhaps most challenging, these systems shift the locus of care away from traditional physician office visits, and many of them involve the participation of a multidisciplinary health care team; these activities are difficult to support financially under current episode-based, fee-for-service health care reimbursement mechanisms.

Evidence Report

9
Chapter 1. Introduction
1. a. Goal of the Report In response to a recommendation given to the U.S. Secretary of Health and Human Services
by the American Health Information Community’s Chronic Care Workgroup, the Agency for Healthcare Research and Quality (AHRQ) contracted with Oregon Health & Science University’s Evidence-based Practice Center to generate an evidence report on the barriers and drivers to the use of health information technology (health IT) by the elderly, those with chronic illness or disabilities, and the underserved. This report describes factors influencing the use and usability of interactive consumer health IT in these populations. It also summarizes the scientific evidence on outcomes of using these technologies, identifies gaps in the evidence, and provides a context for future inquiry. The report’s primary focus is to identify barriers and drivers to use in these populations and to characterize the features of the technology interventions that relate to improved outcomes for these specific populations.
1. b. Background A promising aspect of interactive consumer health IT is the potential to engage and support
consumers in their own care by integrating their health information needs and preferences into information systems. Such technologies provide targeted or tailored health information and/or self-care management tools or applications designed to support patients’ or consumers’ management of their health, health care, or health information. It is important to understand whether and how populations such as the elderly, chronically ill (including individuals with disabilities and individuals who need chronic care or end-of-life care), and underserved populations (e.g., inner-city/rural, low income, minority, etc.) will be able to access, use, and benefit from health IT.
The health care needs of these populations are growing, and health information management tools have the potential to improve access to relevant health information, facilitate communication between patients and providers, and support chronic disease management. There is an opportunity to help bridge health disparities for these populations. In order to develop and provide appropriate and effective approaches, we need to understand the barriers and drivers of health IT use for these populations. Potential barriers and drivers of health IT use include motivation, cost, access to technology, literacy, education, language, culture, or telecommunication infrastructure.
The American Medical Informatics Association (AMIA) Working Group on Consumer Health Informatics defines consumer health informatics as electronic information and communication technologies that patients/consumers use to improve their medical outcomes and/or participate in their health care decisionmaking process.1 In addition, consumer health IT may assist individual consumers in gathering, understanding, and sharing health information with their providers.2
Interactive consumer health technology applications have had an increasingly important role to play in health care. Recent work based on the Institute of Medicine’s Crossing the Quality Chasm report3 has focused on fostering self-management support by encouraging providers to use education and other supportive interventions in order to systematically increase patients’

10
skills and confidence in managing their health problems.4 Two of the specific initiatives have to do with patient-centered care and informatics. Patient-centered care aims to inform and involve patients and their families in decisionmaking and self-management, coordinate and integrate care, provide physical comfort and emotional support, understand patients' concepts of illness and their cultural beliefs, and understand and apply principles of disease prevention and behavioral change appropriate for diverse populations. Informatics aims to communicate, manage knowledge, and support decisionmaking using IT.4
This evidence review focuses on interactive consumer health IT where patients or consumers interact directly with the technology and receive patient-specific information in return. Examples of these systems include home monitoring technology with interactive disease-management or self-management technology, educational or decision-aid software that is interactively tailored to the patient’s needs, online patient support groups, tailored interactive health reminder systems where interactions are linked with electronic medical records, and patient-physician electronic messaging. These types of systems may be implemented on a variety of platforms using Web/Internet technology, desktop computer applications, touch screen kiosks, personal digital assistants (PDAs), cell phones, or combinations of the above.
This review includes care protocols that may or may not involve health care professionals as part of the system, and includes only computer-mediated interactional technology that does more than simply act as a conduit between humans, as in many telemedicine applications. We consider both the specific elements and functions of the technology, as well as the embedded care protocols and implementation features. Many factors relating to how the technology is deployed to the consumer or health system can influence access, usability, and effectiveness.
1. c. Burdens of Illness, Conditions, and the Digital Divide Approximately 120 million Americans have one or more chronic illnesses, accounting for 70
to 80 percent of health care costs. Twenty-five percent of Medicare recipients have four or more chronic conditions, accounting for two thirds of Medicare expenditures.5, 6 Most patients with chronic conditions such as hypertension, diabetes, hyperlipidemia, congestive heart failure, asthma, and depression are not treated adequately, and the burden of chronic illness is magnified by the fact that chronic conditions often occur as comorbidities.7, 8
One key element of systems-oriented chronic care models is support of patient self-management in the home environment.9 Such self-management support can reduce hospitalizations, emergency department use, and overall managed care costs.7, 8, 10-13 In this evidence review, we specifically examine the factors that influence the use and outcomes of technology designed to empower patients to participate more fully in their health care and health care decisions, with a specific emphasis on understanding the issues for the elderly, chronically ill, and underserved.
A great many elderly persons receiving home care have functional limitations, such as reduced sensory, cognitive, or motor capabilities and may require disease management for multiple chronic conditions. Although health IT has the potential to empower patients to become more active in the care process, the elderly may be disadvantaged unless the designers of both software and hardware technology consider their needs explicitly.14 Usability and accessibility issues are important quality criteria for Web-based interventions, but often neglected by designers and evaluators.15

11
Finally, the opportunities afforded by consumer health IT are not equally available to everyone. Both researchers and policy makers have attempted to understand and remedy the link between health disparities and Internet access. Those who most need health information often lack the means, knowledge, and skills necessary to benefit from Internet health resources.16 One significant barrier to the use of Internet health resources is consumer access. In 2006, the Pew Internet and American Life Project found that more than one quarter of U.S. adults had no online presence, and many Americans used a slow-speed connection.17 Non-users were more likely to be poor, less educated, over the age of 65, disabled, members of ethnic minorities, and non-native English speakers.17

13
Chapter 2. Methods
2. a. Technical Expert Panel Input
Eight individuals with relevant expertise served on the Technical Expert Panel to help define the scope of the project, provide feedback on our analytic framework and key questions, and weigh in on other critical issues throughout the project (Appendix A*). We specifically elicited feedback on definitions of the populations of interest (e.g., who constitutes underserved and vulnerable populations), important chronic illnesses, examples and definitions for interactive consumer health information applications, and significant barriers, drivers, and outcomes. The experts also helped to identify sources of unpublished (gray) and difficult-to-find literature and relevant databases.
2. b. Key Questions and Analytic Framework
Our preliminary key questions were developed by AHRQ and edited based on feedback from our team, the Technical Expert Panel, and AHRQ. The final key questions listed below were used to guide the systematic review process.
1. Among elderly, chronically ill, and underserved populations, what is the current level of
use of specific forms of interactive consumer health IT? a. What are the primary uses of interactive consumer health IT? b. How does interactive consumer health IT use vary? c. Does use vary in settings where consumers have access to interactive health IT
tools? d. How does the level and type of health IT use for the elderly, chronically ill, and
underserved populations compare with that of the general population? 2. In the elderly, chronically ill, and underserved populations, what type of interactive
consumer health IT is most useful and easy for people to use? a. How useful are various types of interactive consumer health IT applications? b. What are the usability factors associated with various types of interactive
consumer health IT? 3. In the elderly, chronically ill, and underserved populations, what barriers hinder the use
of consumer health IT? a. How do these barriers vary for these populations of interest? b. How do these barriers vary by type of interactive consumer health IT application?
4. In the elderly, chronically ill and underserved populations, what drivers or facilitators may stimulate or enable the use of consumer health IT?
a. How do these drivers and facilitators vary for these populations of interest? b. How do these drivers and facilitators vary by type of interactive consumer health
IT application?
*Appendixes and Evidence Tables cited in this report are available electronically at http://www.ahrq.gov/clinic/tp/hitbartp.htm

14
5. In the elderly, chronically ill, and underserved populations, is interactive consumer health IT effective in improving outcomes?
a. How does the technology’s effectiveness vary for our populations of interest? b. How does the technology’s effectiveness in these populations of interest differ
from the effectiveness in the general population? The analytic framework (Figure 1) is a graphic representation18 of the relationships among
the populations, interventions, and outcomes examined in the key questions, along with potential barriers and drivers to health IT. We categorized barriers and drivers as: (1) patient characteristics, (2) attributes of the health IT, and (3) environmental factors. The Technical Expert Panel worked with us to refine the analytic framework, as well as to further clarify our definitions of patient populations, technologies, and settings of interest.
Figure 1. Analytic Framework
Note: Analytic framework for the use of health IT by the elderly, chronically ill, and underserved. Solid arrows represent relationships among variables in the framework where we systematically searched for evidence. Dashed arrows represent well-established relationships outside the scope of this review. The circled numbers indicate key questions.
Urban / Rural , Broadband or Wireless Access,
Home / Community / Facility , Medical Services Access, Reimbursement Policies
Outcomes Quality of Life,
Self-report Health Satisfaction,
Health Care Costs
1,1a, 1b, 2
Intermediate Outcomes
Knowledge , Self-efficacy ,
Health behaviors, Treatment decisions,
Physiological measures ,
Shared decision making ,
Health care access
Use of Health IT
Patient Characteristics Age, Gender, Ethnicity Education, Language,
Chronic condition, D isability , Income
Literacy (numeracy included), Technical Expertise Health Belief , Preferences , Health Insu rance Status
Technology Web, Email, Online Support Group,
Telemedicine, Home m onitoring, PDA, Cell Phone,
Video
Environment
5 1,1d, 3,4
3, 4
1,1c, 3, 4
5
* Chronically Ill, Elderly, Underserved
P o p u l a t i o n*

15
2. c. Population
Populations examined in this review (Table 1) include the elderly, chronically ill, and underserved. Elderly was defined as mean age greater than 65 years, or functionally elderly as agreed upon by the reviewers. In considering populations with chronic illnesses, we included conditions that patients had for more than one year and that would benefit from ongoing monitoring or treatment. This included conditions such as diabetes, asthma, heart failure, chronic obstructive pulmonary disease, as well as mental illnesses. We also included disabilities where there was an impairment in body function or structure that interfered with a patient’s activities. We defined underserved populations as those with an inhibited ability to receive either medical or information services. This included underserved minorities, low-income populations, and medically underserved geographic regions.
Table 1: A summary of populations included in this review
Populations Potential Categories
Description
elderly over 65 years of age elderly functionally elderly by life experience or health concerns; need clarity/inter-
observer agreement chronic condition more than 1 year and benefits from ongoing monitoring or
treatment impairment impairment in body function or structure activity limitation difficulty in executing activities
chronically ill or disabled
participation restriction
problems experienced in participating in life situations
medically underserved population or medically underserved area
study uses Bureau of Health Professions / Health Resources and Services Administration designated medically underserved population or medically underserved area
medically underserved area
region where individuals are inhibited in their ability to receive services
underserved
underserved group population which is inhibited in its ability to receive medical or information services
2. d. Technology
Our review focused on highly interactive technologies, intended primarily for use by patients or consumers, that incorporated both patient interaction and patient-specific feedback (Table 2). Examples of included technologies are self-management and monitoring systems with tailored health advice; personal medical records or access to personal data in a provider EMR; health games that adapt to patient conditions; interactive online support or chat groups; and sites with storage, indexing, retrieval, display, or advanced features (summarization and decision support).
Technology interventions were excluded if they had limited or no patient-driven involvement, if the interactions were without computer information support, or if they did not
16
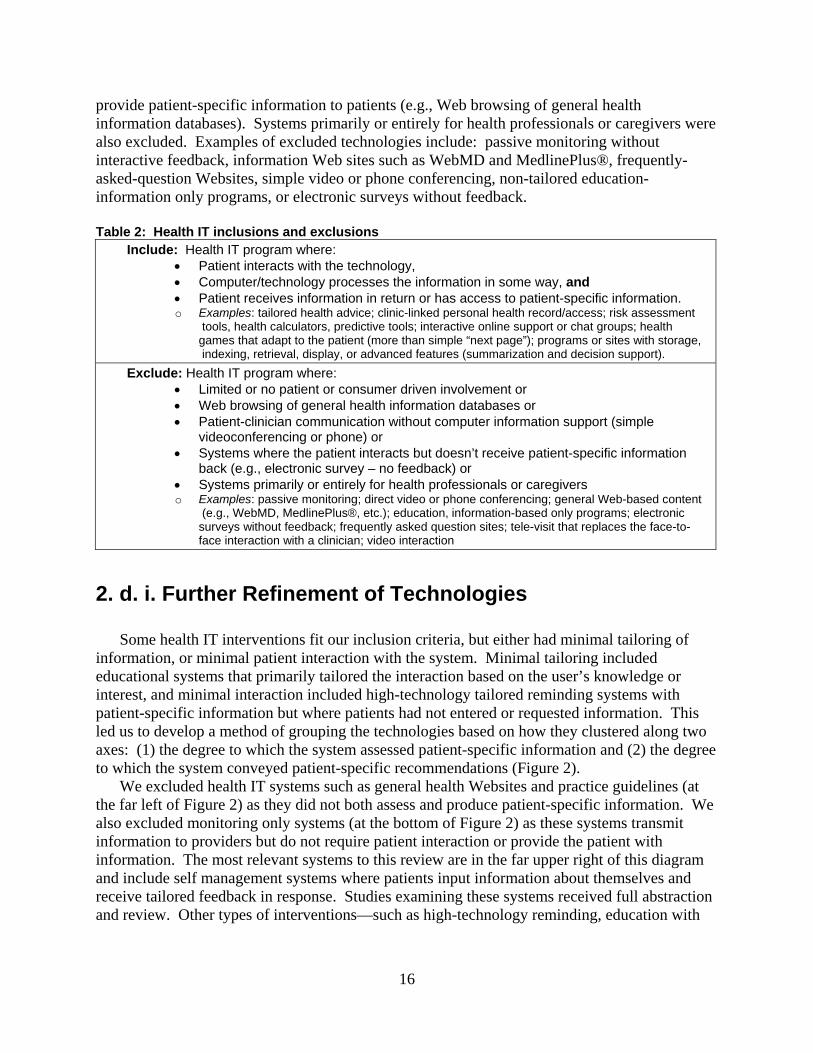
provide patient-specific information to patients (e.g., Web browsing of general health information databases). Systems primarily or entirely for health professionals or caregivers were also excluded. Examples of excluded technologies include: passive monitoring without interactive feedback, information Web sites such as WebMD and MedlinePlus®, frequently-asked-question Websites, simple video or phone conferencing, non-tailored education-information only programs, or electronic surveys without feedback.
Table 2: Health IT inclusions and exclusions
Include: Health IT program where: • Patient interacts with the technology, • Computer/technology processes the information in some way, and • Patient receives information in return or has access to patient-specific information. o Examples: tailored health advice; clinic-linked personal health record/access; risk assessment
tools, health calculators, predictive tools; interactive online support or chat groups; health games that adapt to the patient (more than simple “next page”); programs or sites with storage, indexing, retrieval, display, or advanced features (summarization and decision support).
Exclude: Health IT program where: • Limited or no patient or consumer driven involvement or • Web browsing of general health information databases or • Patient-clinician communication without computer information support (simple
videoconferencing or phone) or • Systems where the patient interacts but doesn’t receive patient-specific information
back (e.g., electronic survey – no feedback) or • Systems primarily or entirely for health professionals or caregivers o Examples: passive monitoring; direct video or phone conferencing; general Web-based content
(e.g., WebMD, MedlinePlus®, etc.); education, information-based only programs; electronic surveys without feedback; frequently asked question sites; tele-visit that replaces the face-to- face interaction with a clinician; video interaction
2. d. i. Further Refinement of Technologies
Some health IT interventions fit our inclusion criteria, but either had minimal tailoring of information, or minimal patient interaction with the system. Minimal tailoring included educational systems that primarily tailored the interaction based on the user’s knowledge or interest, and minimal interaction included high-technology tailored reminding systems with patient-specific information but where patients had not entered or requested information. This led us to develop a method of grouping the technologies based on how they clustered along two axes: (1) the degree to which the system assessed patient-specific information and (2) the degree to which the system conveyed patient-specific recommendations (Figure 2).
We excluded health IT systems such as general health Websites and practice guidelines (at the far left of Figure 2) as they did not both assess and produce patient-specific information. We also excluded monitoring only systems (at the bottom of Figure 2) as these systems transmit information to providers but do not require patient interaction or provide the patient with information. The most relevant systems to this review are in the far upper right of this diagram and include self management systems where patients input information about themselves and receive tailored feedback in response. Studies examining these systems received full abstraction and review. Other types of interventions—such as high-technology reminding, education with

17
minimal tailoring, one-time-use decision aids, and online forums—were summarized qualitatively. Figure 2. Spectrum of Information Interventions
Note: This diagram illustrates how various health information technologies differ to the degree in which they encode information about the patient (along the abscissa) and the degree to which they provide patient-specific recommendations back to the user (along the ordinate). Our technologies of interest did both (lighter colored ellipses).
2. e. Outcomes
We included studies reporting any of a broad spectrum of outcome measures, including technology use, health related behaviors, health service utilization, disease status, quality of life and functional outcomes
2. f. Study Designs
We included a broad spectrum study designs in this review, appropriate to the nature of our key questions. Whereas randomized controlled trials (RCTs) are considered optimal for the assessing the impact of specific interventions on outcomes, other study designs were more appropriate to answer other questions, such as epidemiologic studies to address rates of use of

18
interactive consumer health IT, and qualitative or usability methods to address questions regarding barriers and drivers, or usability. We included only reports of original studies and excluded letters, editorials, opinion pieces, news items, and commentary.
We confined this review to studies where the full-text was available in English. We identified foreign language articles with an English abstract to determine if they contained relevant data but did not find any relevant studies that required translation.
2. g. Data Sources and Search Strategy
Our search for the published literature included structured searches of both standard and specialty bibliographic databases. We searched MEDLINE® (1950-Nov 2007), CINAHL® (1982-Feb 2008), PsycINFO® (1806- Feb 2008), the Cochrane Controlled Trials Register and Database of Systematic Reviews (1st quarter 2008), ERIC (1960-March 2008), and the American Association of Retired Persons (AARP) Ageline® (1978-Dec 2007). Although all database search coverage predated 1990, we focused our review on citations from 1990 to present. Detailed searches and time periods covered are found in Appendix B†.
We also examined the reference lists of key included studies and members of the TEP provided input on additional citations. We examined relevant systematic reviews retrieved from our searches for further citations.
2. h. Inclusion and Exclusion of Literature
In all, 8,522 English abstracts were examined and 563 full-text papers were examined for inclusion by two reviewers using refined inclusion and exclusion criteria (Appendix C). Disagreements between reviewers were resolved by discussion and consensus. Appendix D provides details on the number of captured titles and abstracts and the number of full text papers reviewed for each key question. A listing of the studies excluded after full text review are in Appendix E.
2. i. Data Abstraction
Based on the criteria in Appendix C, we included 129 unique publications for data abstraction. All included studies were abstracted into evidence tables. Data abstracted included study design, recruitment procedures, characteristics of the population, and details on the intent and implementation of the intervention. All data on outcomes including technology use, health related behaviors, health service utilization, disease status, quality-of-life and functional outcomes were abstracted. Many studies applied to more than one question.
†Appendixes and Evidence Tables cited in this report are available electronically at http://www.ahrq.gov/clinic/tp/hitbartp.htm

19
2. j. Quality Rating of Studies
Each study was assessed for internal validity using quality rating criteria developed by the United States Preventive Services Task Force,18 and the Common Drug Review Process.19 Factors such as adequate randomization, allocation concealment, baseline comparability of participants, blinding, and low loss to follow-up were used to assess potential study bias.19, 20 For Key Question 5, which addressed the impact of interactive consumer health IT on outcomes, systematic reviews, randomized controlled trials, cohort studies, and case control studies were included and rated as good, fair, or poor.18 Other studies designs, often using qualitative methods, were considered for key questions on usage, usability, barriers, and drivers. Although our team reviewed criteria for rating qualitative study designs,21 these methods did not lend themselves to also addressing the qualitative secondary outcomes of the effectiveness studies. Thus, we did not formally rank each qualitative study (Appendix F) and incorporated evidence from all studies with information on usability, barriers, and drivers.
2. k. Data Synthesis
We focused our synthesis on interactive consumer health IT for which the patient interaction with the technology was significant and frequent and where subjects received patient-specific information in return. For these technologies, we fully abstracted the data and performed quality assessment. For educational systems with minimal tailoring, as well as for training and reminding systems, we abstracted only major results and provided a separate summary of those findings.
We reviewed and summarized our findings based on suggested approaches for developing both frameworks (as recommended by Popay and colleagues)22 and field design propositions or guidelines for working with evidence from disparate technologies.23, 24 This approach provided an opportunity to obtain an inferred set of findings that transcended individual cases.23 Design propositions such as patient, environment, and technology characteristics; how and to what degree the patients or consumers used the technology; and intermediate and final health outcomes were included.
After studies were abstracted and assessed for quality, the investigators rated the strength of the body of evidence for each key question, also according to the criteria outlined by the Guide to Community Preventive Services.25 In assessing quality at the key question level, investigators considered aggregate internal validity, aggregate external validity, and coherence and consistency. The quality and quantity of the studies and size and consistency of the results were used to grade the overall strength of the evidence.
2. l. Peer Review
We identified five individuals to serve as peer reviewers of our draft evidence report, including those with a range of personal, clinical, and professional interests in the use of health IT. Four federal organizations and four professional societies were also asked to review the draft report (Appendix G).

21
Chapter 3. Results In this section of the report we review existing evidence by key question. Full details
abstracted from individual studies can be found in the Data Table in Appendix H* and Quality Assessment Table in Appendix I. Summary tables for each key question are referred to in that section (Summary Tables 1-5). Although in general we did not find direct comparative evidence within studies regarding the elderly, chronically ill, and underserved populations, a summary of studies that focus on one or more of these groups is provided (Summary Table 6).
3. a. Findings for Key Question 1: Level of Use of Interactive Consumer Health IT
To determine the capacity of interactive consumer health IT to provide benefit and improve
patient outcomes, it is important to quantify individual participation in its use. Ideally, a measure of usage reflects the frequency of interactive consumer health IT use over time.
We initially examined 31 studies that included some description of usage of the technology or system being evaluated.26-56 These studies are shown in Summary Table 1.
While examining the evidence on the usage of interactive consumer health IT, two issues were identified. First, studies varied in the metrics employed to evaluate usage. Eight studies measured the time (minutes) for a subject to complete a task, such as entering data or responding to questions, or the time a subject was logged onto a Website.27, 38, 39, 52-54, 57, 58 This metric was considered a less appropriate method to quantify usage frequency, typically describing a single-use or time-limited program; this measure was more related to usability. Six studies reported a count or proportion of subjects who used the technology, and did not provide insight into the frequency of use over time.26, 45, 47, 48, 50, 59 In six studies, the results did not offer sufficient clarity to extract usable usage data.29, 30, 40, 45, 60, 61 One study offered subject self-report of usage, presenting data as “transmissions per week,”55 the accuracy of this measure was of concern.
*Appendixes and Evidence Tables cited in this report are available electronically at http://www.ahrq.gov/clinic/tp/hitbartp.htm
Among elderly, chronically ill, and underserved populations, what is the level of usage of specific forms of interactive consumer health IT?
a. What are the primary uses of interactive consumer health IT? b. How does interactive consumer health IT use vary? c. Does use vary in settings where consumers have access to interactive health IT tools? d. How does the level and type of interactive health IT use for the elderly, chronically ill,
and underserved populations compare with that of the general population?

22
Second, there was the variation in the expected or “probable” use of each type of technology. This required that usage measurement be put in the context of intended technology use categories. Some technologies were expected to be used once or infrequently, such as educational programs or patient decision tools supporting a treatment choice. Many technologies, particularly Web-based applications with the purpose of patient self care and self-management, offered participants opportunities to use the application ad hoc or at repeated, specified times (e.g., once per day). Still other technologies, such as automatic reminders prompting a patient to adhere to a medication regimen, were not intended to be used at the discretion of the participant; these were not considered amenable to measuring usage. To achieve reasonable consistency while examining the level of technology usage, studies on usage were examined (in this Key Question) if the interactive consumer health IT application was intended for continuous use by consumers.
Studies identified to offer data on frequency-related usage presented one of three types of measurement: (1) the usage of technology by subjects over a specified time interval, (2) the change in technology usage by subjects over time, and (3) the absolute or relative usage of specific functions compared to one another, within a particular technology application. Data sources measuring usage included automated computerized measurement, such as logins or use time, or self-reported information collected by surveys.
Among studies presenting technology usage and examined here, all were quality rated for the primary study design. However, these studies did not have usage measurement as a primary objective of the study. As such, the methods used to rate the quality of the study did not readily apply to the usage findings. We included all usage results in this summary.
3. a. i. Current Level of Use of Specific Forms of Interactive Consumer Health IT
For frequency of technology usage, there was no standard terminology identified. The most common term used to quantify usage was reported as the number of “logins” by subjects during the study interval. Other terms presented included “hits,” “hit-days,” “logons,” and “transmissions” and were assumed to represent a similar metric. The term “hit-days” was a measure of the number of days a subject used the technology or program, perhaps underestimating the total number of logins if this occurred more than once daily. As previously discussed, frequency of usage by subjects was not appropriate for all types of interactive consumer health IT, such as automated voice messaging or clinic-based applications intended for single-time use.
Seventeen studies either reported logins per subject per time interval, or allowed extrapolation of this data to generate an estimate of the mean number of logins per subject per month.28, 31-37, 41-44, 46, 49, 51, 56, 62 These technology applications were accessible to subjects at their will. Among these studies, usage ranged from an average of <1 to over 23 logins per subject per month. Further description of these studies is discussed below and shown in Summary Table 1.

23
Seven studies described changes in interactive consumer health IT usage over time, all reporting some degree of overall reduction in usage over time.33, 34, 37, 44-46, 51 The metrics used to report trends varied widely, including descriptions of change in usage frequency over time, change in time (e.g., minutes) subjects used the technology, and change in the proportion of subjects who logged in within specified time intervals (e.g., first three months vs. last three months). While varied reporting did not allow direct comparisons among studies, some studies observed dramatic reductions in usage over weeks to months.34, 44, 45, 51 Among these studies--which targeted a variety of conditions including heart failure, diabetes, tobacco, and chronic obstructive lung disease--none directly assessed the reasons for usage attrition. Some authors did discuss possible factors playing a role, such as technology inconvenience or reduced motivation over time.
3. a. ii. Primary Uses of Interactive Consumer Health IT
Nine studies reported on the comparative usage of specific components within an interactive consumer health IT application, relative to other components.34-37, 46, 51, 53, 54, 56 Studies that presented usage of components reported varied measures, including time (minutes) that subjects used a function, the frequency of functions used during logins, or the percentage of subjects using each function as part of a health IT application.
Seven studies were randomized, controlled trials (RCTs) that examined the use of technology components among experimental group subjects. These studies employed Web-based programs that offered one or more of the following functions, beyond educational information: patient self-monitoring tools (e.g., glucose, weight), tailored self-management tools (e.g., tailored feedback, decision aids), peer group discussion, ask-an-expert (posting questions to a clinical expert), posts to electronic bulletin boards, a patient’s view of their provider’s electronic medical record (EMR), secure messaging (secure electronic messaging with clinicians and staff), and/or text messaging.34, 35, 37, 46, 51, 53, 54 Overall, online peer group discussion and bulletin boards were the most commonly used functions, compared with other functions available within the applications. In two studies, self-management tools34 and ask-an-expert36 were also frequently used functions. In one study with patients having congestive heart failure who were provided access to their EMR, progress notes were most the commonly viewed component, followed by test results.51
Three cohort studies reported comparative usage of interactive consumer health IT components.32, 36, 56 One study showed that self-monitoring tools were used most frequently by patients with head and neck cancer.56 A second study, offering Web-based self-management and peer group support, found that subjects used the bulletin board function more frequently than self-management tool functions.36
One study, using a randomized design, tested the effect of adding diabetes self-management and peer support functionality to an information-based application.34 The study compared self-management (tailored online coaching), self-management plus peer support (peer group discussion), and information only (non-tailored). Across 10 months of the study, higher usage was seen in both self-management conditions compared with information-only control, and highest in self-management plus peer support. While usage dropped over the study interval for all groups, highest usage was consistently observed in the condition that included the peer group discussion function.

24
3. a. iii. Variation of Use According To Type of Interactive Consumer Health IT Application
Among the subset of 16 studies reporting the frequency of IT usage over time or allowing the estimation of this measure, 11 showed participant usage that was equal to or greater than 4.4 logins per subject per month (range, 4.4 to 27). Five studies showed usage to fall under 2.2 mean logins per subject per month (range, 0.7 to 2.2).
Studies observing a higher participant usage pattern (≥ 4.4 logins per subject/month) included the following interactive health IT functions:
• Patient self-monitoring with secure messaging31, 33 • Patient self-monitoring with e-mail alerts49 • Peer group discussion with self-management tools34-37, 42, 44, 46 • Peer group discussion with secure messaging56 Studies observing a lower usage pattern (≤ 2.2 logins per subject/month) included the
following interactive health IT functions: • Shared EMRs with secure messaging28, 32, 51 • Shared EMRs with quizzes43 • Automated paging and text messaging41 Studies reporting higher levels of technology usage appeared to have either peer group
discussion functions or patient self-monitoring.31, 33-37, 42, 44, 46, 49, 54, 56 Studies reporting a lower frequency of interactive consumer health IT use included four with shared access to electronic records with or without secure messaging with clinicians,28, 32, 51 and one testing automated paging and text messaging,41 and one study using a self-monitoring application that also included quizzing subjects.
This grouping was not based on any prior evidence about interactive consumer health IT usage; it was determined by empirical observation only. From a practical standpoint, the higher range of usage corresponds to logging in once per week or more frequently.
The patient conditions for these studies varied widely, and included heart failure, diabetes, cancer, HIV, and lung transplant. One study included only subjects who were medically underserved women with breast cancer.54
3. a. iv. Variation of Use According To Settings and Availability of the Interactive Consumer Health IT Tools
The studies included within the scope of this report did not specifically address the question of whether use varied according to setting or availability. Researchers typically provided study participants with the technology, if participants did not have it available. Some studies included participants who had little or no prior computer experience or access to the Internet. However, in one RCT testing Web-based diabetes self-management with or without peer support, 83 percent of subjects recruited into the study “had either no or extremely limited Internet experience prior to the study.”34 This study found high usage of peer group discussion and self-management tools.

25
3. a. v. Level and Type of Use in Populations of Interest Compared With the General Population
Few studies reported data describing individual-level factors related to usage. Three studies reported subject use of interactive consumer health IT by individual subject demographic factors. One study was an RCT of tobacco treatment medication with or without Web-based self-management and peer group support.37 Analysis showed that technology usage was correlated with age, such that older participants had higher use frequency (p<0.05); this was not exclusively an elder population, however, in that this subgroup included participants aged 46 and older.
One RCT35 of individuals with AIDS/HIV reported that “women used the program 13 percent more than [did] men”, and that “minorities used discussion somewhat less and information tools somewhat more” than did non-minority subjects; these were stated in the discussion, and data supporting these findings were not presented. A third study found that Web site use was associated with being Caucasian and Non-Hispanic, and with having more symptoms and a greater number of clinic visits; this study, however, showed only a trend toward signifcance.32
No studies were conducted comparing the use of interactive consumer health IT in a subpopulation of interest to a more general population.
3. a. vi. Summary of Findings of the Use of Interactive Consumer Health IT
The evidence on usage of consumer interactive technologies within the scope of this report is limited and presents challenges. Among the studies examined, measurements related to usage were varied and provided little standardization of terminology. Frequency of usage also need be placed in the context of expected or intended use of the technology.
Some studies did report on the frequency of participant use of technology over time (i.e., mean logins per subjects per month), or allowed an estimation of this measure. These applications were tested across a variety of chronic conditions, including diabetes, tobacco use, chronic obstructive lung disease and congestive heart failure. Collectively, such studies observed reductions in usage over time. Among studies of Web-based interactive systems that offered usage frequency, findings ranged from <1 to 27 mean logins per subject month. Empiric observation revealed that higher usage applications offering functions that include patient self-management tools and/or peer group support. Studies that compared the use of specific components within an application found the most frequently used functions to be online peer group support, bulletin boards, and self-management tools.
3. b. Findings for Key Question 2: Usefulness and Usability of Interactive Consumer Health IT
In the elderly, chronically ill and underserved populations, what type of interactive consumer health IT is most useful and easy for people to use?
a. How useful are various types of interactive consumer health IT applications? b. What are the usability factors with various types of interactive consumer health IT?

26
We reviewed 54 studies that addressed issues of usefulness and usability for interactive health IT for consumers (Summary Table 2). The majority of studies (35) were qualitative, formative evaluations,33, 34, 56, 58, 63-93 and the rest were summative evaluations of interventions using study designs that included randomized control trials, cross-over designs, or cohort studies.29-31, 39, 41, 43, 44, 47, 52, 55, 94-102 Although a few of the studies were designed to exclusively look at issues of usability for a particular system, none compared the usability of different types of systems within a single study.65, 88, 95, 98, 103 In addition, most of the studies reported on usability issues as secondary findings, and not part of the primary study design. Given that our quality ratings for the summative evaluations usually did not apply to the qualitative findings on usability, we elected not to apply quality ratings on this qualitative information and considered all usability findings in our summary.
In our review of these studies, we considered usability to be “the degree to which the system and services could be used effectively, efficiently and with satisfaction by the users.”94 This is consistent with the papers reviewed here. Researchers studying the usability of health IT most often referred to using the framework described in Jacob Nielsen’s 1993 book Usability Engineering.104 In this framework, usability is considered to be a component of user acceptance, which refers to the willingness of users to use a system in a particular setting over a period of time. It also comprises social and practical acceptability. Nielsen’s Model of System Acceptability includes the concepts of attractiveness, controllability, efficiency, helpfulness, and “learnability.”
For those studies that specifically addressed the usability issues associated with the interactive consumer health IT, most used protocol analysis with “talk aloud” techniques. However, many studies measured other outcomes and included questionnaire items to measure the usability issues. Those evaluating a Web site often used the 20-item WAMMI (Web site Analysis and Measurement Inventory) instrument105 to assess usability. The questionnaire items directly relate to the Nielsen framework and include a measure of global usability. The general acceptance of a common framework for discussing usability provided us with a useful structure for analyzing the results.
3. b. i. Usefulness of Various Types of Interactive Consumer Health IT Applications
With the wide mix of types of technology, even within our clusters of technology types, the usefulness of a system clearly depends very much upon how it was implemented. For those studies that measured the subjects’ perceived usefulness of the system, the results were generally very positive. For the Web-based interactive self-management systems,30, 31, 52, 55, 65, 71, 73, 79, 86, 87,
94, 95, 97-102, 105 in each case the majority of users found the system to be helpful or useful, and often this was true for more than 90 percent of the users. An automated voice response system for calls to patients with diabetes was found to be very or somewhat helpful for 98 percent of the study participants.47 For single-use systems, such as the shared decisionmaking system for cancer patients,52 usefulness was also generally rated as high (in this case 4.62 out of 5 points). Additionally, efficiency is an aspect of usefulness. Although user efficiency was not often measured explicitly, occasionally perceived efficiency was reported in a study, again with the majority seeing improvements in efficiency by using the system.73 However, some studies detected efficiency problems if users were required to do a significant amount of data entry as

27
part of their self management.29, 30 For these systems, users expressed the opinion that the data entry should be automated.
3. b. ii. Usability factors Associated With Various Types of Interactive Consumer Health IT
Although, most users appreciated the usefulness of the systems we reviewed, there were clearly usability problems detected. The most frequent issue had to do with technical problems encountered during the study. These often thwarted the overall participation of subjects in a study. Technical issues consisted of Internet connection interruptions causing the loss of data,28,
29 system errors,30, 99 and problems with the monitoring devices, including battery issues.30 In addition, sometimes the usability issues had to do with the physical format of the devices. For example, in a medication reminding study, the size and shape of the medication drawers used as part of the overall intervention made it difficult for study participants to small pills.106
Most studies that addressed usability issues measured the participants’ perception of the ease-of-use of the technology. Naturally, this varied even within types of technology, depending on the particular implementation. Most often though, the vast majority of participants (> 90 percent) felt that the technology they were using was understandable and easy to use.30, 31, 39, 43, 72,
73, 95-98 Many of these studies also asked about the specific ease-of-use of system components. For example, with an asthma self-management system, 93 percent felt it was easy to record data and view data.30 Gomez et al. found that subjects using their Web-based HIV/AIDS management system reported that the graphics were easily understood.72 With a system for schizophrenia education, 93 percent of the subjects found the touch screen interface easy to use, but fewer (56 percent) found the overall system easy-to-use (all felt that it was at least “OK”). In this case, the usability issues arose from the organization of the content, as opposed to the usability issues associated with the more system-level interactions. At least one-third of the study participants encountered a display where they were confused on what to do next.39 Yet there were many studies with similar self-management systems with no apparent usability problems. For example, with one diabetes management system,43 most of the participants felt the system was easy to use, relevant, and useful and would recommend it to others. None of the participants reported needing technical help or had confusion about the system at any point. With a self-management system for congestive heart failure, all participants reported that the system was easy to use.31 Similarly, with another diabetes self-management system, all of the participants found the system easy and convenient to use, “with minimal intrusion on their lifestyle.”96 Another indicator used to measure usability was the participants’ willingness to continue using the system after the conclusion of the study. In this case, all participants reported wanting to continue with the program after the study terminated.

28
We found similar results for other types of interactive consumer health IT. For example, with a diabetes system that used a two-way automated messaging pager system to send tailored health-related messages to patients,41 the researchers found that most participants felt there were no problems with the pager (71 percent), enjoyed using the pager (79 percent), and would like to continue using it after the study (68 percent). Patients with bipolar depression were able to input symptoms into a PDA device,85 and although novice users reported being intimidated by the program at first, eventually all users felt that the system was easy to use. However, in a tablet PC for HIV+ patients study,88 many patients had difficulty making selections by tapping the screen, since that particular implementation did not respond to the users’ selections until they lifted the stylus. Many people naturally pressed instead of tapped at first.
An important aspect of the findings from the studies that address the usability of technologies was discovering what system features needed to be modified. One change included revising a patient tutorial for a diabetes home management system and creating a field training program.75 Another modification included improving the contrast, use of color, button size, and graphics clarity for an interactive health information system designed for older users.94 Often the largest usability changes needed to be made with regard to the data entry screens on Web-based systems,29, 30 and in some cases it was the graphic feedback for home monitoring data that needed improvements in clarity.30 Overall, we saw that the usability findings pointed to needing to keep systems simple and free from distracting elements, with an effort toward minimizing jumping from screen to screen. Researchers found that it was important to keep frequently used items on the main Web page with “one-click” access.63
3. b. iii. Usefulness and Usability Issues for Populations of Interest
No studies directly compared differences in usefulness or usability issues for our populations of interest (elderly, chronically ill, and underserved) versus the general population. However, most systems were used by people with chronic illnesses and with a wide range of ages, including the elderly. In addition, some of the studies reporting usability issues were focused on the elderly,98 underserved populations70 or populations with physical disabilities.65, 79, 88 One of the studies that specifically looked at usability issues for an elderly population using an interactive system for obtaining tailored exercise recommendations98 showed that age was directly related to the need for more assistance with the technology. A study of low-income inner city asthma patients70 required subjects to perform routine spirometry tests and to interact with an electronic symptom diary. In this group, 2/3 of the subjects had never used a computer and nearly half had never used an ATM machine for banking. More than half of the subjects in this study were born outside the US and were non-native English speakers. Even in this group, more than 90 percent found the usability of the intervention “not complicated at all” or “not difficult at all.” However, in another study of an interactive educational system for cancer symptom control, where 26 percent of the subjects had never used a computer, only 71 percent of the subjects felt the system was easy to use.

29
There were three studies that dealt with usability issues for patients with physical disabilities.65, 79, 88 One study79 tested a Web-based intervention addressing physical activity for patients with spinal cord injury (33 percent), multiple sclerosis (21 percent) and cerebral palsy (19 percent). The ratings for ease-of-use of the system were still quite high (mean of 4.5 out 5 points). Usability findings from two of the studies addressed issues of eyesight problems. Usability issues were identified in a tablet PC counseling tool for HIV+ patients’ medication management.88 Patients taking HIV medications frequently have eyesight impairment and the researchers found that some patients were having trouble seeing the content on the screen given the room lighting. They recommended increasing both the text size and the contrast level of the interface. Similarly, patients with diabetes often have vision problems. Interviews with patients with diabetes regarding various designs and interfaces for a cardiovascular risk prevention system showed that subjects had concerns about the clarity of the content on the screen, specifically mentioning that it would be common for people with diabetes to have trouble seeing detail on the screen.65
3. b. iv. Summary of Usefulness and Usability Issues
In summary, we found 54 studies that addressed usefulness and usability issues of interactive consumer health IT. Most of these studies addressed usefulness and usability as a secondary component of the study; however, the information collected indicated that usability played a key role in the use of these systems. Most researchers measured usefulness as part of their usability assessment and found that the users’ perceived usefulness was generally rated high, especially for the self-management systems. With regard to the ease-of-use of systems, it is important to note that usability in these studies was always evaluated for a single type of system with a particular implementation, making it difficult to make general claims about usability findings. For each type of interactive consumer health information system there were examples of some that the users felt were easy to use and others with usability issues. There were a small number of studies that focused on usability testing early on in system design. In these cases, the goal was to discover and fix usability issues early on in the process. Most issues had to do with graphics clarity and simplicity for older or impaired users.
3. c. Findings for Key Question 3: Barriers to Use of
Interactive Consumer Health IT
In the elderly, chronically ill and underserved populations, what barriers hinder the use of interactive consumer health IT?
a. How do these barriers vary for these populations of interest? b. How do these barriers vary by type of interactive consumer health IT application?

30
We reviewed 52 studies that addressed the barriers to consumers’ use of interactive health IT for consumers, with a focus on patients with chronic illness, elderly users, and underserved populations (Summary Table 3). The majority of studies (33) were qualitative, formative evaluations,33, 34, 56, 58, 59, 63-71, 74-85, 87-89, 91-93, 101 and the rest were summative evaluations of interventions using study designs that included randomized control trials, cross-over designs, or cohort studies.28-32, 39, 41, 43, 44, 73, 86, 90, 95, 97-99, 106-108 As with the previous section on usability, most of the studies with information on barriers to system use reported this evidence as secondary findings, and not part of the primary study design. Given that our quality ratings for the summative evaluations usually did not apply to the qualitative findings on barriers, we elected not to apply quality ratings on this qualitative information and considered all findings relating to barriers in our summary
Again, we used both Popay and Denyer’s approach to summarizing the evidence,22, 23 where we first summarized a subset of the evidence to cull out major technology design issues and then organized the rest of the evidence within that framework. The following subsections highlight the principle types of barriers to system use that we found in our review.
3. c. i. Lack of Perceived Benefit
The primary barrier to use that was described in studies that addressed this issue was the notion that if the study participants did not perceive that there was a benefit to be derived from using the system they were unlikely to engage with the intervention. This was especially true when there was a significant degree of inconvenience in data entry for the home-based self-management systems. For example, one study found that participants’ use of their asthma self-management system suffered when there was no perceptible immediate benefit to outweigh the inconvenience of doing self-management via Internet. Often improvements in asthma control are not perceptible by the patient.63 In their case, the benefits of using an asthma diary were often not recognized immediately. In a diabetes system, there were three types of patients who reported not seeing a benefit to the intervention: (1) study participants who had not experienced the problems yet, (2) those who did not understand the information, and (3) experienced users who felt they already knew the information.43 This last group also included people with well controlled diabetes who felt they did not need assistance. The researchers’ conclusion from these findings related to the need to tailor the intervention for these subpopulations.43 Many other interventions we reviewed did tailor their materials based on stages of change and related user model variables.
For other types of interventions, such as a tailored medication reminding system, those study participants who were already doing well with their medications were more likely to report that the intervention was a nuisance and intrusive.106 In the case of support groups, we found that needing a critical mass in number of participants was often cited a barrier to successful use of the technology. For example, in a support group for diabetes and physical activity, there was a lack of perceived benefit by many participants (66 percent) because of an insufficient number of people actively participating in discussions.44

31
In some cases, the technology was being evaluated in the context of replacing components of face-to-face interventions. For example, a schizophrenia technology intervention was tested with and without sessions with a community psychiatric nurse, as well as a combined intervention.39 Of the people in the combination group, 13 out of 20 subjects preferred the sessions with the nurse, and 7 out of 20 preferred the sessions with the computer. Interestingly, all participants exposed to the community nurse intervention thought that the information provided by the nurse was relevant, but in the group receiving both the nurse and computer information, the good nurse information made the computer information seem less relevant (i.e., more participants in the computer only group found the computer information to be relevant).39
3. c. ii. Technology Intervention Did Not Fit Their Lifestyle
A second type of reported barrier to the use of interactive consumer health IT was the issue of patients finding it difficult to fit the intervention into their everyday lives. In some studies, although patients reported liking the system, they indicated that they would be unlikely to use it long term because it was not easy to integrate into their lifestyle.63, 83, 91 One study reported factors that had to do with technical and psychological aspects.63 The issues in this study mainly had to do with the fact that their participants had to collect their monitoring data, write it down on paper prior to computer entry. This meant that participants often waited until the weekend to do the data entry and then would only receive feedback days later. They were not using the system continuously and this prevented the intervention from being more effective. The main point in these types of studies where data entry was a barrier was that monitoring needed to be unobtrusive and automatic. In addition, use of the Internet needed to be integrated into patients’ everyday lives. One study found that with reminder systems, it was necessary to consider the out-of home experience and to have a holistic approach to reminding in order to accommodate lifestyle issues.106 For example, some participants were frustrated by perceiving that they “had to build their life around the monitor/reminder” since it would not turn off when they were gone and they were not able to take the device with them when leaving the home.
3. c. iii. Lack of Trust of the System
Another major barrier to the use of the interactive consumer health IT was the lack of trust of the information provided. Findings showed that unexpected messages or advice that contradicted a patient’s experience caused them to disbelieve it and not follow the advice.63 Systems that did not provide an explanation for the recommended action are less likely to have the intended behavior change effect on the users of the system.63 The authors’ recommendation based on this finding is to shift from providing automated treatment changes via the system to providing graded alerts on when to contact the clinician.
3. c. iv. Technological Malfunctions
Many studies encountered a wide variety of technical problems.28-30, 56, 73, 99 These technical problems represented barriers to successful system use, but were also problematic for the quality of the study. Many times, these technological problems were issues that could have been prevented with better pilot testing of the system prior to deployment, but many times the technological problems were representative of issues that system users might encounter independently of the quality of the health technology.

32
The most common technological problem encountered in the studies we reviewed was the lack of reliability of patients’ Internet connection.28-30, 73 As an example, more than half of users had Internet connection issues,30 and in two studies,28, 73 system users had connection problems leading to the loss of some of their data. Systems that required batteries, such as the home monitoring systems,30, 73 were also prone to having reduced patient use because of problems in keeping the batteries charges. The researchers saw a need to introduce battery checking software into their systems.
Other technological issues encountered in the studies we reviewed included system errors,30,
99 incorrect functioning of videos,28 and monitoring device problems.30 In general, many of the technological issues reflected the fact that the papers were reviewed dealt mostly with research systems, as opposed to commercial systems that would presumably be much more robust and reliable. However, the basic issues of Internet connectivity and short battery life are likely to plague future systems as well.
3. c. v. Technology Too Cumbersome
The most consistent issue with many of the self-monitoring systems that required the patients to enter their data into the computer by hand was that this process was cumbersome and took too long.29, 30, 101 In many cases, the technology exists to automate this process, but perhaps at a greater cost. As was noted before, some authors also reported that some of their participants had slow and/or intermittent Internet connections, making it cumbersome to use the intervention.63
3. c. vi. Confusion With the Technology and Content
There were two ways in which users’ lack of understanding emerged as a barrier to the use of the health IT. The first was based on health literacy and numeracy.32, 82, 92, 93, 103 Many patients had difficulty in comprehending the medical jargon in their view of their provider’s EMR.32 The participants in this study felt that they could cope with this issue by using dictionaries or other methods, such as asking friends. They preferred this approach to having the material “watered down” or “sugar-coated.”
Other sources of confusion had more to do with the use of the technology. Several studies mentioned lack of experience with computers and with the Internet as a significant barrier.56, 69,
77-79, 81-83, 89, 101 For example, one study75 found it was necessary to improve their patient tutorial and create a field training program to ensure successful use of the home monitoring diabetes system.
3. c. vii. Specific Barriers With Interactive Reminding Technologies
Some of the barriers to system use were specific to the interactive reminding technologies. Users’ reactions to using their 2-way automated message paging system for diabetes care is one example revealed several challenges to providing this service.41 About 44 percent of the users found the messages to be annoying. Some found the system helpful for a few weeks, until they could anticipate the messages, and others found the messages too overwhelming. One suggestion arising from this work was that it would have been helpful for their messages to have been programmable. They also reported that patients would have liked to have changed the text. A separate barrier to this particular intervention was that the pager didn’t work in all locations (i.e., at work or while traveling).41

33
3. c. viii. Clinician Factors as Barriers
Our evidence review was limited to considerations of the patient or consumer’s use of health IT. However, several of the technological interventions we reviewed required active participation on the part of clinicians. Often these studies mentioned that patients perceived a lack of response and use of the system by physicians. For example, one study showed that if physicians did not examine the system’s report then patients (especially those with chronic illnesses) were less satisfied.109 In this particular study, fewer than half of the physicians looked at the report in front of the patient (49.2 percent) or discussed it with the patient (44.3 percent). Similarly, in a study of patient-provider messaging, monitoring, and email alerts, only 25 percent of the physicians involved used the system.56 In this case, the system was not integrated with the physician’s information system. Additionally, two investigations reported that physicians were reluctant to introduce the systems into their practice because of time constraints.28, 63
3. c. ix. Cost as a Barrier
Although the interactive consumer health IT applications that we reviewed were designed with the intention to provide quality care in a timely manner that would be less expensive than having a clinician available in person, there were two ways in which cost was mentioned as a barrier to the use of these technologies. The most common was the fact that many patients did not have access to a computer in their homes.43, 70, 81-84, 87, 92, 101 This was particularly problematic for low-income populations, in an asthma study with low-income inner city subjects.70 Since 2/3 of the subjects had never used a computer, the cost associated with deploying this type of intervention would have to include both the computer hardware as well as computer training. The second factor was more of an artifact of the specific implementation. The protocol for the use of some systems, such as a tailored educational program for patients with schizophrenia,39 required that the patients come to the clinic to use a touch screen computer. The cost associated with bringing patients to the clinic was deemed to be too high for the intervention to be widely accepted. However, the alternative, being a person-to-person visit with the community nurse counselor, was even more expensive. A diabetes intervention also required technical personnel at hospital for technical support.73 Presumably this would be true for many of the systems if they were to be used in routine clinical care.
The reimbursement for the clinical use of the types of technologies we reviewed was also brought up as a barrier to routine use outside of a study situation. For example, one study found that it would be difficult to have physicians routinely use electronic messaging with their patients if they did not receive payment or reimbursement for those interactions.28
3. c. x. Age and Disabilities as Barriers
We only found only two studies of usability and usefulness that compared older and younger users of an interactive consumer health IT systems, both were diabetes interventions.47, 69 One study found that younger users were more interested in the technology.69 Looking at a wide range of ages using an automated voice response system, one study found that younger patients (less than 55 years of age) were less likely to listen to as many messages, but more likely to want to use the system in the future. Also the younger users more often reported that the diabetes voice system would make them more satisfied with their health care.47

34
In addition, given that most of the health IT interventions reviewed were focused on chronic conditions, many studies we reviewed included a substantial number of elderly participants. For example, one study focused on a low-income elderly disabled population living in a publicly subsidized housing project.82 Computer literacy and computer anxiety were determined to be major barriers to subjects’ use of the personal health record the researchers were testing. In this group 63 percent had computer literacy problems (needing help in learning to turn the computer on, use a mouse device, etc.) and 58 percent had computer anxiety problems (unwilling to attempt to use the computer). Other barriers identified in this study included cognitive impairment (34 percent) that limited subjects’ ability to remember their user name, password and Web URL address; health literacy (29 percent) that caused confusion about the content; and physical impairments (26 percent). The impairments included vision problems that made viewing the screen difficult, and decreased function of arms and hands due to cerebral vascular accidents, arthritis, multiple sclerosis, and Parkinson’s disease.82 All of these issues made using a computer much more time consuming and difficult. An additional study specifically looked at usability issues with a Web-based system designed to provide tailored exercise recommendations for older users.98 Within this study of users over the age of 60, they found a direct relationship between age and increasing need for technical assistance. 3. c. xi. Summary of Barriers to the Use of Interactive Consumer Health It
In summary, we found 53 studies that addressed the barriers to consumer’s use of interactive
health IT. The most frequently mentioned barrier to consumers’ use of the interactive health IT across these studies was a lack of perceived benefit. The lack of convenience was an important barrier in many studies. For example, patients were less likely to use systems that required them to access equipment or technology that did not fit into their normal daily routine, or similarly if the data entry was overly cumbersome. Several studies also found that a lack of clinician involvement was associated with less system use. In addition, due to the fact that many studies were conducted on early prototype systems, technical issues often prevented consistent use of these systems. Finally, although in these research studies patients are generally provided with the technology, several articles mentioned that for use beyond a funded study, the costs and access to the technology would be a barrier.
3. d. Findings for Key Question 4: Drivers and Facilitators
of the Use of Interactive Consumer Health IT
In the elderly, chronically ill and medically-underserved populations, what drivers or facilitators may stimulate or enable the use of interactive consumer health IT?
a. How do these drivers vary for these populations of interest? b. How do these drivers or facilitators vary by type of interactive consumer health IT
application?

35
We identified 60 studies that addressed factors that were drivers for interactive health IT for consumers (Summary Table 4). This included 36 qualitative, formative evaluations,33, 34, 39, 58, 59,
63-72, 74-85, 87-93, 101, 110 and 24 summative evaluations of interventions using study designs that included randomized control trials, cross-over designs, or cohort studies.28, 29, 31, 32, 41, 43, 44, 46, 47, 56,
73, 86, 94-96, 98, 99, 102, 106, 108, 111-114 As with the previous findings on usability and barriers, most of the studies with information on drivers or facilitators to system use reported this evidence as secondary findings, and not part of the primary study design. Given that our quality ratings for the summative evaluations usually did not apply to the qualitative findings on drivers, we elected not to apply quality ratings on this qualitative information and considered all findings on drivers in our summary. The following sections describe the clusters of key concepts that were reported.
3. d. i. Perception of Health Benefit
The most general and important driver of the use of interactive consumer health IT was that the user perceived a benefit to using the system. In the following section we will review the evidence for health and quality-of-life outcomes, but here we are making a distinction as to whether the patient actually perceives some benefit. Often with self-management systems there may be long term positive outcomes that are not perceptible to the patient at the time of system use. Some examples of systems where patients did perceive a benefit during system use are listed below. Most of these studies also measured increased use related to the perceived benefits.
• Diabetes: In general, a driver of the use of interactive health IT interventions for patients with diabetes had to do with patients feeling empowered77, 83 with an increased sense of security about their health. In a study of a diabetes self-management system, patients felt more confident in adjusting their insulin doses in response to monitoring data feedback.96 Similarly, one study showed that the majority of users perceived improved glycemic control, easier treatment changes, better communication with doctor, and better diabetes education.73 Also, participants in a study of a 2-way pager system for diabetes felt they received better health care when using the paging system. In addition, they perceived the messages to be comforting, helpful, convenient and useful. Some reported an additional benefit of reporting their blood glucose values in this way as improving their personal accountability.41
• Asthma: Patients using an asthma system perceived that keeping an electronic diary helped them manage their disease.63 However, with a pediatric asthma system,111 only the caregivers perceived quality-of-life improvements to a significant degree, while in children a similar trend was not statistically significant. Still, we considered this to be a driver of system use because satisfaction on the part of caregivers caring for asthmatic children improves the likelihood that the children will use the system. In this study, the children reported that using the system was fun and like that it helped them remember to take medication, compared with those with a paper diary who sometimes lost it or forgot to enter the data, in addition to reporting that they often forgot to take their medications.111 A study of low-income inner city adult patients with asthma revealed that a driver to use of the system was that the technology provided a sense of security (88.2 percent of the patients felt safer while being monitored) and all stated that it was either extremely or very important for them to know that the results were reviewed by clinicians immediately.70

36
• Heart Failure: One study showed that reminders helped heart failure patients to stay on a schedule with noticeable improvements in medication management, diet and exercise, leading them to perceive that they felt better, that their blood pressure was more stable, and they had less worry.106 These patients also realized that they required less nitroglycerine in the management of their heart failure. In another heart failure system with access to the patient’s EMR, the patients perceived improvements in knowledge for self management saw an immediate benefit of having access to the electronic health record for reminding them about their most recent regimen changes, medication doses, and lab results.32 This group also saw an improvement in reassurance (they no longer had to assume “no news is good news” and could check for accuracy of their medical record).32
• Chronic Obstructive Pulmonary Disease (COPD): Of patients using a self-management system for COPD, 73 percent were either very or completely satisfied with the system.113 Their primary perceived benefit to using the system was increased access to their health information.
• Osteoarthritis: One intervention102 using the Web-based tailored feedback and recommendations based on guidelines for osteoarthristis care, showed that most participants felt that using the Website would help them receive better care from their physician (77 percent).
• Hypertension: A study of an interactive voice response phone system for patients with hypertension.71 A driver to the use of this system was that nearly all of the subjects felt it made them more aware of their condition (95 percent) and most felt that it relieved their worries about the disease (79 percent).
• HIV/AIDS: In a system for HIV/AIDS, the patients perceived that their health was better when using the system, but in addition they reported having a sense of greater control over their situation.72
• Physical Disabilities: One study79 of a Web-based system to promote physical activity for patients with physical disabilities (spinal cord injury (33 percent), multiple sclerosis (21 percent), and cerebral palsy (19 percent)) notes that a driver for the use of this system was the patients’ perception of increased health and performance, associated with motivational messages.
3. d. ii. Perception of Convenience and Accessibility Benefits
The perceptions of convenience and ease of access were also important drivers to the use of the health IT.32, 39, 46, 47, 69, 77, 84, 91, 92, 95, 110 Many patients with chronic conditions who were in support groups found it much more convenient to use the online format. In a study of breast cancer patients, many participants expressed difficulty finding or being able to attend support services in their home communities, and average travel time to receive breast cancer treatment or follow-up was over 1 hour.46 Similarly, with an automated voice response phone system for diabetes, patients liked being able to receive the calls at a time and place that was convenient for them.47 Also, heart failure patients reported that it was helpful to be able to check lab results and medication dosages while traveling.32 Diabetic patients received tailored recommendations via both Internet and mobile phone, and a driver to use was the convenience of immediate download of information and accessibility on a mobile device.115

37
An additional perception of convenience was the time required to complete educational sessions. A study discovered that many participants in the schizophrenia tailored education intervention preferred the shorter length of the computer sessions to the longer sessions with the community nurse counselor.39
3. d. iii. Rapid Response From Clinicians
A corollary to convenience as a facilitator of system use has to do with the participation of clinicians in health IT interventions. Active and timely response on the part of health care professionals was seen to be important when it was an expected component of the intervention. For example, one study reported that rapid electronic messaging turnaround and replies by their physicians increased patient satisfaction (the average turnaround time was 48 hrs in this study).28 Similarly, patients receiving tailored printed feedback to share with their provider on smoking cessation and physical activity were more satisfied if the physician examined the report during the office visit.109
3. d. iv. Benefit of Anonymity for Sensitive Health Topics
We found evidence of a perceived benefit to the use of health IT in the area of anonymity regarding sensitive health problems.72, 85, 87-89 For example, the HIV/AIDS technology study patients’ appreciated the anonymity of the communications and this appeared to lead to greater perceived control over their condition and increased use of the system.72 HIV+ participants also preferred to “discuss” sensitive topics with the computer because it reduced feelings of embarrassment and promoted privacy.88 In this study 17 percent of the patients reported being more honest with the computer. Similarly, with a PDA system for bipolar disorder, patients reported preferring to use the tool because it was discrete and not stigmatizing.85 Finally, for breast cancer patients using an online support group with the CHESS system, anonymity within the support groups appeared to foster a more equal participation among subjects.87
3. d. v. Benefit of Understanding Physicians and the Health Care System
It appears from the studies we reviewed that having a better understanding of the health care system and a better connection with their doctors is important to patients and a driver of system use. A system for heart failure patients provided patients with secure web access to their medical records, a guide to heart failure and a messaging system for communicating with their doctor and sharing information with other doctors.32 The perceived benefits for the patients included: (1) they better understood the doctors’ thought processes and decisionmaking, (2) they had a better understanding of the medical care process, leading to the perception of more control, (3) they perceived they could communicate better with the doctor and felt that they had an increased participation in care—a more active role, and (4) they felt they had more of an appreciation for the doctors’ skill & expertise.32 Similarly, the HIV/AIDS system study participants perceived that it was beneficial to have access to experts and second opinions.72 Finally, in a patient-provider messaging/monitoring and email alert system, 83 percent of the patients felt the system provided a sense of security in being able to contact a health care provider in the hospital and 75 percent felt the system helped them communicate better with their health care providers.56

38
3. d. vi. Deliver Information on Devices Patients Use Every Day
Another clear message about improving the use of interactive consumer health IT is to deliver the messages on devices the patients or consumers use every day. One study found that if the Internet is not part of one’s daily life, then SMS (Short Message Service for sending short messages to mobile devices) might work better for immediate feedback systems.63 These researchers suggested using rewards (free SMS units) to provide perceived benefit when the physiological benefit is not obvious to the patient.63 Text messaging was found to be especially appropriate for a younger mobile population. Rodgers et al. used mobile text messaging for smoking cessation intervention for young adults. Their arguments were that the use of cell phones with a young population is “popular, has caché among peers, is age appropriate … and that the ownership of cell phones is much higher among lower SES groups than computers.” They anticipated that the use of the new multimedia phones will allow them to offer even more sophisticated distracter activities for smoking cessation that will still be low cost.114
3. d. vii. Tailor to Patients’ Interest
Several literature reviews have demonstrated the benefits of tailoring health information for patients, both in terms of behavior change and satisfaction.116 In our review, we found similar evidence to support this. With a diabetes system, patients preferred tailored information on several counts: (1) it answered their questions better, (2) it related to their interests and current concerns, (3) it met their comprehension level, (4) was relevant to their family history, and (5) the information was ordered according to importance to them as individuals.43 Additionally, the system had most of the information geared toward newly diagnosed patients, and these were the participants who found the material most helpful. In a tailored versus generic information for diabetes and physical exercise, the participants using the system with tailored information had both greater system use and greater satisfaction with the system.44 A diabetes simulation program found that the participants were motivated to download the software because they are interested in how insulin therapy varies with respect to their own circumstances.110 With a similar diabetes system, the participants’ ability to view glucose value trends provided confidence for dramatic treatment change. Looking at their own trends allow patients to be able to test insulin dose / snack effects and to develop an understanding of the causal relationships.29
3. d. viii. Patients in Poor Health Benefit More
Interactive consumer health IT systems seem to do better and have greater use when they are offered to patients who are sicker or more compromised, thus feeling the need for additional assistance. For example, in an online support group for women with breast cancer, those with lower perceived health status showed the greatest improvements over time. The intervention was most effective for those who started with greater expression of sadness, anxiety, and negative emotions. The women most recently diagnosed, and experiencing distress, were the most likely to benefit.46 In addition, patients with another diabetes system said it would be most useful when they might not be in good control, when there were weather changes, or when they were planning a long journey.29

39
3. d. ix. Drivers for Older Users – Gradual Introduction of Technology
In the studies that concentrated on older users, the main finding that appeared to drive increased use of the systems was to gradually introduce the new technology. One researcher recommended starting with familiar tools and having a gradual introduction of technology to ensure successful use by older participants.94 In addition, that study identified benefits to involving older users in the design process. They also found that using the technology to integrate older users with family caregivers and with society in general drove system use by elders. Similarly, another study reported that gradual introduction of technology worked best, stating that people who already had Internet access were more likely to accept and even want to try the new Web-based technology.28
3. d. x. Summary of the Drivers to the Use of Interactive Consumer Health IT
In summary, we found 60 studies that addressed the drivers and facilitators of consumers’ use of health IT. Many of the findings are derived from the set of articles that also discuss barriers. Thus, many of the factors describing the drivers are the converse of the barriers listed in the previous section. The most frequent factor associated with increased use of the interactive consumer health IT was the patient’s perception of a health benefit. Most of the systems in this section were designed for use by patients with chronic conditions, and it was important that the patients feel that the system was helping them manage their condition. Convenience in terms of access to the technology and the amount of time required for the intervention was shown to be a factor driving technology use. It was shown to be beneficial to deliver the interventions on devices consumers use every day for other reasons. Again, clinician involvement was a driver to the use of the technology. A rapid response from the clinician was shown to improve patient satisfaction. Also, providing content tailored to an individual consumer was shown to increase both system use and satisfaction. Finally, an important driver of technology use relating to older users was the gradual introduction of technology.
3. e. Findings for Key Question 5: Effectiveness of
Interactive Consumer Health IT In the elderly, chronically ill, and underserved populations, is interactive consumer health IT
effective in improving outcomes? a) How does the technology’s effectiveness vary for our populations of interest? b) How does the technology’s effectiveness in these populations of interest differ from the effectiveness in the general population? We identified 74 studies reporting on the outcomes of interactive consumer health IT,
including 50 randomized controlled trials,30, 35, 38, 41, 42, 44, 46, 48-51, 54, 62, 66, 78, 79, 93, 100, 102, 106-108, 114-
141 three studies using a cohort design,39, 97, 142 17 trials with a case series (or before-after) design,27, 29, 31, 33, 34, 95, 113, 143-152, three studies with cross sectional designs, 53, 99, 153 and one with a qualitative design.32

40
Interactive consumer health IT systems are implemented to achieve a broad variety of outcomes, from enhancing self-efficacy, to reducing levels of glycated hemoglobin, to improving functional status as measured by the Medical Outcomes Study Short-Form 36 (MOS SF36). Because this body of literature is so variable in terms of the types of outcomes used to assess the impact of interactive consumer health IT, we were broadly inclusive in terms of the outcomes reported, including:
• Attitudes, such as self-efficacy or the perception of social support. • Knowledge, of one’s condition or its treatment. • Health-related behaviors, such as diet, exercise, or medication adherence. • Disease status measures, such as glycated hemoglobin values, Beck Depression Inventory
score, or peak expiratory flow rates. • Functional status measures, such as the six-minute walk test. • Quality of life measures, whether general or disease-specific. While broadly inclusive in terms of the study designs employed and the types of outcomes
measured, we were more restrictive in terms of the quality and likely validity of included reports. Using established criteria as described in the Methods section of this report, each publication was independently assessed for study quality and assigned a rating of Good, Fair, or Poor. Findings from studies assigned a rating of Good or Fair are included in this research synthesis. Findings from studies assigned a rating of Poor are discussed only to the degree that they lend additional insight, such as illustrating the importance of ensuring that systems are technically sound prior to conducting clinical trials to assess their impact.154
Taken together, this body of literature can be summarized in terms of a series of tentative conclusions or propositions23 about the effectiveness of interactive consumer health IT, as follows.
3. e. i. Complete Feedback Loops
A recurring pattern that is apparent in the evidence examined for this report is the effectiveness of systems that provide a complete feedback loop with regular communication between patient and clinician or system. Across a range of medical conditions, IT, geographic areas, and socioeconomic status, we found a consistent pattern of effectiveness of multi-component systems that provide a timely response to information about the current or evolving status of the patient as part of a complete loop of interaction between patient and health professionals. These systems are highly varied and include differing combinations of component functions, but have in common components that enable:
• Monitoring and transmission of data about the current status of the patient, such as daily blood pressure, weight, and symptoms in heart failure patients, or blood glucose, diet, and activity in diabetics.
• Interpretation of this data about current patient status by comparison to previously established individual treatment goals or to published guidelines.
• Adjustment of medications, diet, or provision of information as needed, according to the data received about patient status.
• Timely feedback to the patient of adjustments in medications, diet, self-management education, or support, whether by email, voice messaging, telephone, or other means.
• Repetition of this cycle at the appropriate intervals.

41
Systems that provide such a complete feedback loop are grouped here according to their
intended duration of use: 1. Ongoing chronic disease management systems, intended for indefinite, continuous use in
the care of chronic conditions such as diabetes, heart failure, or asthma. 2. Multiple session training or treatment systems, consisting of a finite series of modules
that must be completed by the patient, usually over a period of weeks, either to provide training in self-care or as a means of delivering the treatment itself, in the case of some mental health disorders.
3. Single session systems intended for one-time use, often as part of a visit to a health professional, to assist in assessment, decisionmaking, or goal setting.
3. e. i. 1. Ongoing chronic disease management
Health professional feedback. We found ten randomized controlled trials78, 93, 115, 123,
127, 131-133, 135, 136, 139 and two case series31, 147 of interactive consumer health IT for chronic conditions in which a health professional reviewed and responded to health status data sent by the patient. All of these showed benefits in at least some outcome measures. Positive effects were reported with systems that included a variety of health professionals reviewing and responding to the data, using a variety of technologies to communicate recommendations back to the patient, including: physician feedback using secure email;123 nurse practitioner,31 pharmacist,127 or case manager139 feedback through a the system Website accessible to the patient; nurse feedback and advice via text (SMS) messaging;78,
115 and physician,136 nurse,131 or members of a diabetic care team including physicians, nurses, and dieticians depending on the message,132 using conventional telephone lines.
We found three reports of systems for management of hypertension that provided a complete, interactive feedback loop. In a randomized trial of patients with hypertension, blood pressure control was improved in 261 patients who used a Website to report daily blood pressure values and who received biweekly medication adjustment from a pharmacist, compared with: (a) 259 controls who received training and advice to perform home BP monitoring, plus training in Web-based access to their EMR;155 and (b) 258 control patients who received routine hypertension education and were given Web-based access to their EMR. Another randomized trial of adults with hypertension found reductions in blood pressure, more frequent treatment adjustments, and a higher odds ratio of hypertension being controlled when patients used a home system that combined blood pressure monitoring with reporting, review, and adjustment by a physician.136 Finally, a case series of 49 hypertensive adults reported that greater reductions in blood pressure correlated with greater adherence to using a system that included home blood pressure monitoring, medication reminding, and physician interaction, although this study had no control group and no accounting for confounders such as medication adherence.147

42
We found four reports of randomized trials of persons with diabetes using systems with a complete, interactive feedback loop, each reporting improved outcomes. An initial 12-week randomized trial132 and a subsequent 30-week randomized trial123 of a program in Taiwan combined (a) home monitoring of blood glucose, weight, and medications with (b) daily review of these data by a physician and (c) regular communication back to the patient of recommendations from a member of diabetic care team that included physicians, nurses, and dieticians. Intervention patients also had Web-based access to their EMR. Compared to patients receiving usual care, the intervention group had lower values of glycated hemoglobin and reduced fluctuation in their blood glucose values. Outcomes, including glycated hemoglobin, fasting blood glucose, and reported physical activity, were also improved in a 12-week trial to increase physical activity in adult diabetics who, following an initial assessment, performed and reported physical activity and received weekly nurse telephone contact to monitor progress and provide stage-appropriate recommendations.131 In a 12-week randomized trial, adults with diabetes (N = 51) had improved glycated hemoglobin and post prandial glucose using a system that combined Web-based monitoring of blood glucose, medications, and events with weekly nurse review and text message (SMS) feedback including medication adjustments, education, and reinforcement.78, 115
Three studies reported improved outcomes in patients with heart failure using systems that included home monitoring by the patient and feedback from a health professional. Southard reported on a randomized trial that included weekly monitoring of weight, activity, diet, and other data by heart failure patients, with feedback and recommendations from a case manager and dietician.139 Patients using the intervention had greater weight loss during the 6-month trial, while both intervention and control patients had improvements in diet, activity, and serum lipids. Delgado reported on a case series of 16 patients with heart failure using a Web-based system to report daily monitoring of weight, blood pressure, heart rate, and symptoms, and receive daily responses from a nurse practitioner.31 After 3 months, patients had improvements in three subscales of the Minnesota Living with Heart Failure Questionnaire. LaFramboise randomized 103 patients with heart failure to receive a) a health IT intervention that included monitoring, clinician assessment, and feedback with advice or encouragement; b) the health IT intervention plus home care; c) home care alone; or d) telephone care. Patients using the health IT intervention had increased self-efficacy, while all groups had equal improvement in health related quality of life, the, 6-minute walk test, and depression scores.133
One randomized trial included frail elderly veterans with at least one chronic condition: heart failure, chronic obstructive pulmonary disease, and/or diabetes. Patients randomized to a telecare system with regular monitoring, clinician review, and nurse case manager feedback for six months had fewer hospital days, fewer urgent care visits, and among those with diabetes, lower glycated hemoglobin, although cognition and quality of life were not affected.135
One study did not fit this pattern: adults recovering from bypass surgery improved equally after discharge with routine nurse telephone follow-up every 2 weeks compared with daily Web-based monitoring of symptoms with scripted management replies from a case manager.93

43
Voice message feedback. We found one randomized trial reporting results of a voice message system for patients with heart failure that included daily monitoring of symptoms by the patient and, on the basis of current symptoms, selected daily voice messages about self care, reviewed for appropriateness by research nurses.119 Compared with patients receiving usual pre-discharge education, patients using the system had improved self-efficacy, health related behaviors, and improvements in some scales of the Medical Outcomes Study (MOS) Short Form-36 (SF36).
Computer-assisted feedback. Three studies, two in persons with diabetes and one in persons with asthma, reported improved outcomes using systems with complete feedback loops where feedback was provided by computer alone or by a physician with computer assistance. A randomized trial of 105 adults with diabetes—-using online monitoring of diet and activity with expert system diet analysis and advice—reported improved diabetic knowledge and dietary behaviors.108 In a case series, persons with diabetes receiving computer automated dietary feedback based on periodic online dietary assessments (plus access to a diabetic self-management Website and diabetic information) had improved dietary fat compliance, diabetic support, and cholesterol, although exercise and glycated hemoglobin were unchanged.34 Computer assisted physician recommendations were examined in a randomized trial of 100 adults with asthma.49 Using a touch tone phone or the Internet for daily monitoring of peak flow, subjects received secure e-mail feedback from a physician assisted by computerized decision support. Intervention patients had fewer symptoms, better quality of life, improved adherence to medications, and improved use of an action plan, compared with self management training with action plan alone or with usual care.
No feedback. No benefit was found in a randomized trial of a system for patients with obstructive sleep apnea that provided daily monitoring of continuous positive airway pressure (CPAP) use and symptoms but no feedback such as personalization, adjustment, or support unless the patient was “high risk”.107 Functional status and CPAP use were no different after 30 days in 56 patients using the system compared with 56 controls.
3. e. i. 2. Multiple session training or treatment Like interactive consumer health information systems intended for ongoing chronic
disease management, systems intended for use in a finite series of sessions or modules tended to be effective when they incorporated a complete feedback loop that combined patient assessment or data entry with feedback based on information about the current state of the patient, but this finding was less clear and consistent for these systems. We found six studies showing improvement in outcomes with training or treatment of this type, two in patients with asthma,130, 144 three in depression,124, 143, 149 and one in panic or phobic disorder.97 We found one study showing a negative effect, where improvement in alcoholic behaviors occurred with face-to-face but not with secure e-mail counseling.118 One study of a system that provided no feedback showed no improvement,46 while two studies did not provide evidence on the question because of weaknesses in study design or reporting.44, 48

44
Urban African-American teenagers with asthma had fewer days of symptoms, fewer days of missed school or missed activities, fewer hospitalizations, and improved access to controller medications 6 months after completing a four-session program on school computers that provided tailored education, including both normative (‘compared with other students’) and ipsative (related to self) feedback (‘compared with your last session’).130 Patients had fairly low rates of medication availability or use at baseline. Ten children with asthma had significantly improved inhaler technique and improved peak flows using video monitoring and case management. Of note, Web-based symptom diaries were used less frequently than paper-based diaries.144
Among 57 patients with depression randomized to Internet-based self-help modules that included therapist feedback by e-mail, measures of depression symptoms improved compared with 60 controls participating in a moderated discussion group.143 Improvement was also reported in a case series of 72 patients with depression who completed 8 weeks of Web-based monitoring, feedback, online cognitive behavioral therapy, e-consultation, and medication reminding. Of note, half of those enrolled did not complete the full 8 weeks, and adherence was higher with case manager reminding than with automated reminding.149 Depressed patients solicited on the Internet had improvement in depression symptoms and depression literacy using either Web-based education or Web-based cognitive behavioral therapy compared with controls.124 The degree to which education or therapy was tailored or personalized could not be determined from the report. Panic and phobic disorder symptoms improved equally well in patients using computerized cognitive behavioral therapy with brief therapist support, whether delivered over the Internet or delivered in a clinic.97
No Benefit. One study in this group had negative findings: alcoholic factory workers randomized to two face-to-face counseling sessions had improved knowledge and attitudes and reduced alcohol consumption, but workers randomized to e-mail counseling had no significant changes compared with controls.118
No Feedback. Owen found no difference in health-related quality of life, psychological well being, or physical function in a randomized trial of patients with breast cancer who completed self guided coping skills training in a system that also included peer support, a bulletin board, resource directory, and other features, but no mechanism for feedback, adjustment, or tailoring of information according to patient status.46 A possible ceiling effect due to the patients’ high baseline quality of life, and the small sample size suggest the potential for Type II error in this study.
Indeterminate. Pike randomized smokers seeking to quit to a static Website with downloadable booklets or any of five smoking cessation Websites, some of which included personalized feedback features.48 Intervention patients and controls had similar abstinence rates (11 percent), but higher abstinence rates were found in sites that had higher rates of use. Data was combined for all five sites, so characteristics associated with higher use were not discernible from the study, and the influence of personalized feedback could not be determined from the report. McKay reported on a randomized trial of sedentary adults with diabetes offered an 8-week Web-based personalized training program with goal setting, monitoring, feedback, a personal coach, and peer forum.44 Controls simply given pointers to generic Internet sites had equivalent significant increase in physical activity, but little can be inferred from this because of limited actual use by the intervention group,

45
using the peer forum once on average, and the personal coach only twice in 8 weeks, on average.
3. e. i. 3. Single session systems Four of the interactive consumer health IT studies we identified that involved a
complete feedback loop were intended for use in a single session, providing tailored information in the form of computer-assisted goal setting100, 148 or tailored education and advice.99, 122
In a case series 320 adults with diabetes using office-based education and computer-assisted goal setting showed improvement in self-reported diet, but no change in glycated hemoglobin or body mass index.148 There was no difference if patients received follow-up calls, telephone calls, a binder of community resources, or both. Children with asthma using an interactive CD-ROM to create a personalized treatment plan had greater knowledge of asthma at 1 month and fewer courses of steroids and fewer hospitalizations at 6 months, though the latter finding was not significant with intention-to-treat analysis.100
Low-income women significantly increased their intake of fruit and vegetables after viewing a dietary education CD-ROM followed by two reminder phone calls; there was a nonsignificant dietary change after CD-ROM alone and after a control CD-ROM concerned with stress management.122 Of low-income women smokers using an interactive video with tailored advice, 79 percent reported at least one smoking cessation behavior, and favorable attitudes toward smoking declined.99
3. e. ii. Reminders, Alone and With Monitoring
We identified five randomized trials of interactive consumer health IT systems that provided individualized reminders to patients, and these showed inconsistent results. No difference was found in glycated hemoglobin among 25 persons with diabetes receiving automated text pages or e-mail reminders about diet, medications, exercise, etc. compared with 25 controls,41 although patients had a positive attitude toward the technology. There was improvement in self-efficacy, self-reported adherence, and perceived support, but no difference in glycated hemoglobin among pediatric patients with diabetes receiving daily individualized reminders via mobile phone text (SMS) messages based on previous clinic visit goal-setting; knowledge of diabetes improved equally in intervention and control patients.125 Self reported and cotinine-verified quit rates were higher among adult smokers receiving SMS text reminder messages over 6 months compared with controls receiving periodic thank you messages.114 Adherence to medications and monitoring of peak flow, missed school days, urgent care calls, and days with severe obstruction were all improved among 66 urban children with asthma using a telephone-based monitoring and reminding device, compared with 68 controls using a paper-based diary.128 HIV/AIDS patients had nonsignificant increase in medication adherence (though a significant increase in the subgroup with impaired memory), lower HIV RNA load, and nonsignificant increase in CD4 counts 24 weeks after randomization to use of an automated reminding device.117

46
3. e. iii. Monitoring Alone
Because this report is focused on interactive health IT for use by patients or consumers, we excluded reports of surveillance systems that automatically transmit physiologic data such as heart rhythm to providers without direct participation by the patient. Monitoring by the patient was but one component of the multi-functional interactive consumer health IT described above under Complete Feedback Loops. Three reports that we identified in our search provide some evidence on the effect of consumer health IT for monitoring alone, and the results are inconsistent. As mentioned above, a randomized trial of patients with obstructive sleep apnea using daily monitoring of CPAP use and symptoms, without feedback or other interaction, found no change in functional status or CPAP use,107 suggesting no benefit of monitoring alone. On the other hand weight loss was correlated with adherence to monitoring, which overall was poor in a case control study of overweight adults using a handheld device to monitor calorie intake and weight.152 Finally, control group heart failure patients provided with a scale and weight log had improvement in self care and quality of life equal to that of intervention patients with a specialized device for transmitting daily weights, suggesting that monitoring alone may have an effect.106
3. e. iv. Peer Interaction
We identified eight reports of studies of peer interaction in online forums or discussion groups, four concerned with peer interaction alone34, 121, 141, 151 and four in which peer interaction is one element in a complex, multi-component system.42, 46, 53, 129
Peer interaction alone. We found three randomized trials that suggest that social and personal outcomes such as peer support and self efficacy are improved by interactive consumer health IT systems providing peer support. Peer interaction in an online forum among adults with diabetes increased perceived social support more than interaction with a Web-based health professional, or Web-based information access alone.121 Peer support services among persons with diabetes increased perceived peer support at 10 months, compared with subjects receiving automated Internet services alone or regular communication with a professional health coach.34 Measures of depression, stress, and post-traumatic stress disorder symptoms were improved among 36 women with breast cancer involved in a Web-based, structured breast cancer social support group, actively moderated by a mental health professional though no difference was found in other behavior, attitude, or anxiety measures.141
Peer interaction in multi-component systems. We found moderate, inconsistent evidence in three randomized trials and one correlation study that social and personal outcomes such as peer support and self efficacy are improved by interactive consumer health IT systems that provide peer support components as part of a complex, multi-component system. A randomized trial of HIV/AIDS patients using a complex multi-component system including information, decision aids, expert consultation, and peer support reported higher quality of life and lower utilization of health services during and after a 3 to 6 month trial.129 Though some services were used more heavily than others, it could not be determined from the available data which service or combination of services were responsible for the effects, but peer communication services were among the most heavily used. One correlation study of 231 breast cancer patients using a multi-component system including information, decision aids, expert consultation, and peer support found that information competence correlated with use of information and interactive services but not with communication or expert services.53 A randomized trial of patients with

47
chronic diseases receiving 6 weeks of peer-moderated Web-based training regarding diet, exercise, symptom management, medication use, and communication, along with online forum had no change in global health, illness intrusiveness, disability, aerobic exercise, or utilization, but did have improvements in pain, dyspnea, health distress, fatigue, and stretching exercises.42 Women with breast cancer using self-guided coping training combined with peer support bulletin board, resource directory, library, and art and poetry repository had no change in health-related quality of life.46
3. e. v. Education or Information Alone
As described in the Methods, we excluded general-purpose Internet sites that provide information for the general public without tailoring, individualization, or direct patient interaction. We found one report that education alone impacts knowledge, and five reports that provide weak but consistent evidence that outcomes are not affected by systems that provide education alone. Children with asthma had improvement in some measures of knowledge about self-management, and possibly in self-efficacy, using an interactive CD-ROM game with role-playing and education.138 Peer support was not affected in adults with diabetes in the control group provided with information alone, compared with interactions with health professionals or peers through an online forum.121 Hypertension control did not improve in the control group receiving education and a blood pressure monitor compared with the monitoring and feedback intervention.127 Teenagers in the control group receiving asthma education using generic asthma Websites were less likely to complete all four sessions and less likely to improve health-related behaviors than were those in the group receiving tailored education.130 Users of a telephone-based cancer information service (controls) had less new knowledge and knowledge of their condition of interest than did users of an instant messaging based cancer information service, although baseline differences in groups were significant and this could simply be different populations of users.153 Adult diabetics in the control group receiving educational materials alone did not have reduction in glycated hemoglobin and fasting blood glucose or increase in physical activity found in the intervention group using physical activity monitoring, feedback, education, and stage-appropriate prescription, including weekly nurse contacts to monitor progress and adjust recommendations.131
3. e. vi. Access to EMR Data and Secure Email System
We found two studies that provide weak evidence that online access to the clinician’s EMR and optional secure email with clinicians does not by itself improve outcomes, except when combined with tailoring or more bidirectional information. Hypertension patients in a control group receiving online access to their EMR and the option of e-mail with clinicians did not improve their degree of hypertension control and showed limited actual use of the system, compared with the intervention group patients.127 Heart failure patients in the control group with online access to the EMR and the option of e-mail with clinicians had improved ‘general adherence,’ but more ED visits, more clinic contacts, and no difference in self efficacy, health status, medication adherence, hospitalizations, clinic visits, or deaths.51

48
3. e. vii. Web-based Assessment With Recommendations
Our search retrieved one report of the outcomes of Web-based assessment and recommendations. In a randomized trial of in adults with knee osteoarthritis, satisfaction with prior care was not reduced when patients used a Website to self assess their condition and obtain with recommendations for care, compared with controls.102
3. e. viii. Systems May Not Be for Everyone
Of the studies concerned with the effect of interactive consumer health IT on outcomes, patients in six demonstrated or stated a preference not to use the technology. These included (a) asthma patients who stated a preference for and had higher adherence with paper logs;30 (b) obese patients of whom 44 percent did not prefer a PDA to a paper-based diary for monitoring;152 (c) patients with schizophrenia, of whom those given nurse-based education showed more improvement in mental state at the end of the sessions, and who on the whole were more satisfied with the nurse-based education;39 and (d) children with asthma who used paper-based diaries twice as much as Web-based diaries in a study using video monitoring and feedback.144 Among persons with depression adherence was higher with case manager reminding than with automated reminding.149 Finally, problem drinkers and smokers in a primary care setting evaluated a brief tailored video doctor intervention favorably, but "Despite this overall positive response to the program, 72 percent of participants said they would be more comfortable answering questions about personal health from a ‘real doctor’ compared with a video doctor and 71 percent said they believe a ‘real doctor’ would do a better job of offering patients recommendations about wellness and healthy living than would a video doctor."95 3. e. ix. Summary of the Effectiveness of Interactive Consumer Health IT
In summary, we reviewed 74 studies that reported the effect of interactive consumer health
IT on health outcomes or health care process measures relevant to Key Question 5. The most important and consistent finding of this review was that systems were effective when they provided a complete feedback loop that included (a) monitoring and transmission of patient status; (b) interpretation of this data by comparison with previously established individual treatment goals or published guidelines; (c) adjustment of medications, diet, or information according to patient status; (d) timely communication back to the patient with tailored recommendations or advice; and (e) repetition of this cycle at appropriate intervals. These 'complete loop' interventions were effective across a wide range of medical conditions, monitoring and communication technologies, geographical areas, and patients' socioeconomic status.

49
Interactive consumer health IT that provided only one or a subset of these functions were less consistently effective. Systems that provided reminders, alone or based on monitoring, were less consistently effective. Systems that provided peer interaction, alone or as part of multi-component systems, were generally effective for improving intermediate outcomes but not for health outcomes. Weak but consistent evidence showed that education or information alone had minimal effect on health outcomes. Online access to data in the clinicians' EMR and optional e-mail with clinicians did not by itself improve outcomes, except when combined with tailoring or more bidirectional information flow.
When asked, in some cases patients sometimes expressed a strong preference for human interaction, even with systems that were effective. Many studies showed these systems to be effective in specific populations of interest: elders, those with chronic illness, members of underserved populations, but our search identified no direct comparisons of outcomes among subpopulations or between a target population and the general population.
3. f. Specific Findings for Populations of Interest Each of our key questions had sub-questions about the relative use and effectiveness of the
technology by our populations of interest (elderly, chronically ill, and underserved). However, we did not find evidence for relative comparisons between groups of interest on the same technology. There were certainly papers that primarily focused on special populations, such as a specific minority group, a low income area, an elderly population, or a rural setting, but they did not answer questions of relative use and outcomes. In most of the studies we identified, the interactive consumer health IT interventions were directed at a specific subpopulation, such as rural women with breast cancer54, 156 or inner city teens with asthma.128, 130 Although computers were sometimes provided for subjects,129, 130 access to e-mail or the Internet was often an inclusion criterion,30, 31, 34, 48, 51, 53, 54, 62, 102, 107, 116, 123, 127, 132, 139, 143, 149 making it difficult to study the underserved. Also, few of the studies we identified included samples of sufficient size to permit reliable inferences about differences in subgroups. As a consequence, limited and only tentative conclusions can be made about differences in effectiveness among subpopulations, based on extrapolation from this data or on indirect comparisons. We have summarized the evidence relating to the use of interactive consumer health IT by specific populations in Summary Table 6 and the sections below.
3. f. i. African-American Population
Fifteen studies provided ethnicity data for study participants ranging from 4-88 percent African American.47, 53, 86, 95, 102, 106, 107, 113, 128, 130, 141, 153, 157-159 Although other potentially underserved ethnic groups were listed in many of the studies, only African American populations made up the majority in any of the studies we reviewed (Summary Table 6). Three studies106, 128,
160 focused primarily on African American populations in urban settings, with proportions ranging from 65 percent106 to more than 98 percent160. Subjects reported technical usability problems in these studies, specifically difficulties reading the screen or monitor. Moreover, problems with perception of letters due to their color and difficulties related to sound were also documented.106 The remainder of the studies providing ethnicity data had samples of less than 50 percent African American, and no subgroup analysis was provided. As noted earlier, no studies provided direct comparisons for this subgroup with other populations.

50
3. f. ii. Rural Population
There were a total of 9 studies that concentrated on rural underserved areas.36, 53, 54, 60, 75, 146,
151, 156, 161 Of these, five36, 54, 60, 151, 156 were based wholly on rural areas whereas the remaining four53, 75, 146, 161 examined a combination of small city, rural, and urban settings.
The Ferrer-Roca 2004 study reported that 71 percent of the intervention subjects and 92 percent of the control subjects thought that the system was easy to use whereas 50 percent of the intervention subjects and 88 percent of the control subjects had difficulties in accessing the system (p<0.01). Besides these relevant findings, the same study also showed that 86 percent of the intervention subjects and 40 percent of the control subjects would recommend the site (p<0.01) whereas 33 percent of the intervention subjects and 12 percent of the control subjects did not find the system useful and efficient (p<0.05).60
Interestingly, the Kaufman 2003 study based on rural upstate New York and Hispanic New York City populations, classified usability concerns into system barriers and cognitive/skill barriers. Some of the system barriers documented in this study were problematic widgets, small fonts, bad spacing, complex tasks, screen transitions, and system stability. The cognitive/skill barriers included mouse-keyboard skill, mental model, literacy, and numeracy. Anxiety, self-efficacy, and motivation were also found to be important issues surrounding health IT use.75
3. f. iii. Underserved Population
One study was based in public health clinics with one provider for 10 clinic sites and 63.3 percent of the subjects having some chronic illness. A majority of the study subjects (81.1 percent) felt that the computer was easy to use whereas 12 percent asked for help and 24.8 percent had privacy concerns regarding use of the computer. Satisfaction with provider visit was significantly related to having a chronic condition, being a nonsmoker, and having a provider who reviewed the report with the patient.109 In addition, investigators specifically looked at the barriers to the use of personal health records by low-income elderly people living in a publicly subsidized housing project.82 They found that computer literacy and computer anxiety were the major barriers to use in this population, with 63 percent of the group having problems with computer literacy and 58 percent having problems with computer anxiety. Barriers due to cognitive impairment (34 percent), health literacy (29 percent), and physical impairments (26 percent) were also significant factors affecting the use of the personal health records. In a study of low-income women who smoked,99 the factors associated with increased satisfaction and system use were readiness-to-change, minority, and a greater than high-school level of education. Finally, one study tested a computer tool for monitoring asthma symptoms and spirometry values in a low-income inner city area where 2/3 of the subjects had never used a computer and nearly half had never used an ATM machine for banking.70 In addition, the majority of the subjects were non-native English speakers. Their primary barriers to the use of the asthma monitoring system were a lack of computer experience, limited availability of instructional assistance for both the computer and the intervention, and the cost associated with providing the system beyond the study period.

51
3. f. iv. Elderly Population
We found 13 studies with study subjects over the age of 65 years.36, 38, 45, 47, 62, 69, 75, 82, 98, 113,
119, 120, 162 In two of the studies, the elderly population was examined as a subgroup.38, 62 Six studies were conducted on subjects aged 65 years and above36, 82, 119, 120, 162 and the remaining four had subjects with mean age ranging from 69.1 to 73.7 years.45, 75, 98, 113 One study found that younger users were more interested in their diabetes system.69 Another found that their younger patients with diabetes (less than 55 years of age) were less likely to listen to as many messages, but more likely to want to use the system in the future.47 With a physical exercise system specifically designed for elders, researchers found that even within an older group, age was directly related to increased need for assistance with the technology. Then as mentioned above, a study with low-income elderly participants using a personal health record found computer literacy and computer anxiety to be the major barriers to use of the system.82

53
Chapter 4. Discussion
The results of our analysis of the literature pertaining to the barriers and drivers to the use of interactive consumer health IT by the chronically ill, elderly, and underserved is based on the relationships modeled in our analytic framework. As described in the methods section, we modeled the factors that influenced the degree of use of health IT as arising from patient characteristics, technology characteristics, and environmental factors. Our key questions were then generated to test these relationships, as well as the assumption that increased or improved use of the systems would improve intermediate outcomes, such as knowledge, self-efficacy, or health behaviors, as well as end outcomes, such as quality-of-life, satisfaction with care, or costs.
The summarization of evidence described in this chapter is based on Denyer23 and Popay’s22 frameworks. For each of our five key questions, we first analyzed a subset of the papers to develop a model of how best to describe the technologies and interventions, as well as to describe the use characteristics and associated issues. This preliminary synthesis served as a framework for the rest of our summarization. Our focus in this review was on consumer health IT that was interactive, meaning that the consumer or patient was the primary user of the system and received computer-mediated patient-specific information in return. Through our review process, we found distinct technology types that needed to be assessed separately:
• In-home monitoring, disease management, and self-management systems. • Online forums on health topics. • Patient access to their EMR and patient/physician e-mail. • Single or sporadic use of an interactive educational system. • Interactive training systems that monitor patient signals and provide immediate feedback. • Interactive and tailored reminding systems. There are several challenges to reviewing interventions based on interactive consumer health
IT, primarily due to the fact that the interventions being studied in the articles we reviewed were highly varied. Firstly, the underlying technology varied significantly and could include Web-based applications, hand-held PDAs or cell phones, and touch-screen computers or kiosks. Secondly, the systems were designed for a wide variety of purposes, not a single intervention. Even though we focused the review on systems for the elderly, chronically ill, and underserved populations, we covered many application areas, such as systems for diabetes, asthma, cancer, mental disorders, smoking cessation, and medication reminding. Children with chronic conditions were included in our review, and we found that they have very different types of usage issues and systems designed for them. Thirdly, the frequency of intended use of the various systems could be quite different. Some were single use interactive educational systems or decision aids. Others were intended for daily use in the home. Fourth, these systems varied widely in complexity, from simple systems providing a single function to complex systems with an robust suite of diverse features. Finally, the embedded care protocols and the degree to which clinicians participated on the other end differed dramatically from study to study. All of these issues are critical when interpreting the results of these studies, and the variability in approaches has made us cautious in generalizing our results too broadly.

54
Another issue we confronted in reviewing studies of interactive consumer health IT involved
the quality ratings for our evidence. We incorporated two quality ratings, one based on the appropriateness of the methodology to the study question and the second based on the quality of the study execution. We based our ratings on a number of systems appropriate for rating evidence pertaining to our key questions on system usage and outcomes.18, 19, 163 However, for the key questions on usability, barriers, and drivers to system use, we needed to consider the quality of the evidence for those components of the study separately. Although some articles directly addressed these issues, in most cases our evidence for usability, barriers, and drivers came from studies where these issues were not a key part of the study design, but rather qualitative evidence that accompanied an outcomes study. For these studies we did not formally rate the quality of the evidence on usability, barriers, and drivers separately.
The technologies and interventions we reviewed were typically “leading edge” and not in routine clinical use. Complex interventions such as these are difficult to deploy on a limited budget, especially in an academic setting. One of the primary barriers to system use in the studies we reviewed was that many users had technology malfunctions of some sort. Under these circumstances, it is difficult to determine whether the results of the study are representative of a more polished and tested intervention. Our evidence review of health IT has a smaller percentage of studies rated as high quality, compared with reviews of more straight-forward interventions, such as a pharmaceutical therapy. Yet this is appropriate for studies of evolving technologies. Devoting resources for a large randomized controlled trial of a complex technology early in its development stage is not warranted. Stead et al. proposed guidelines for matching the level of evaluation to the stage of development.154, 164 For example, as systems move from specification to component development to combining components and integrating them into the environment, the appropriate evaluations move from laboratory bench tests to tests of validity and then efficacy in the field. But it is only when systems have gone through thorough quality assurance and piloting in the field that large studies designed to provide high quality outcomes information are warranted. Many of the studies we reviewed for the barriers and drivers to the use of health IT were in the relatively early stages of development and not in routine clinical use. Thus, these studies often involved a small number of subjects and measured intermediate outcomes. Additionally, the information on barriers and drivers often came from qualitative additions to studies and not the main study design.
4. a. Use of Interactive Consumer Health IT Findings regarding usage of interactive consumer health IT need to be interpreted with regard
to the intended frequency of use of the system. For example, self-management and monitoring systems may be intended to be used on a regular and continuing basis, whereas many of the educational systems we reviewed were intended to be used only once. Availability was also an issue. Some systems were only available to patients in their clinician’s office. However, in studies of interventions with multiple components we were able to observe the relative frequency of patient access. For example, from these studies we found that online peer discussion and bulletin boards were the functionalities used most frequently compared with patient interactions with self-management, self-monitoring, health educational, or ask-an-expert functions within the same system. However, in general, self-management tools and systems with ask-an-expert modules were used frequently by subjects in the studies.

55
In general, we have found that the measurement and understanding of the usage of interactive consumer health IT has begun to be addressed, however, there remains a lack of clarity or standardized metrics. These varied measures, along with differing expectations for use for each system, presents challenges in comparing usage between systems in a meaningful way. The issue gains relevance as the field strives to determine if the measurement of health technology usage can serve as a means of determining individual engagement, activation, or preference, and whether it can serve as a proxy for intervention exposure or “dose.”
The findings describing the frequency of health IT usage (mean logins per subject per month) suggest that certain interactive consumer health IT functionality —peer group support, bulletin board, and secure messaging—may be associated with greater usage by subjects. Patient and consumer surveys have identified peer support (e-groups, chat rooms) as desirable services, providing anytime social support and person-to-person interaction.
It also seems reasonable that some types of interactive consumer health IT would be expected to be used only on an intermittent or ad-hoc basis—shared access to electronic records, or messaging alone added to automatic paging—and not be used as frequently as social support and self-management applications.
4. b. Usefulness and Usability of Interactive Consumer Health IT
A great number of home care patients who require disease management are elderly and/or have functional limitations, such as reduced sensory, cognitive or motor capabilities. Although the Internet has the potential to revolutionize the process of health care delivery and empower patients to become more active in the care process, the fastest growing segment of the U.S. population— i.e., people over the age of 50 years—are at a disadvantage because designers of both software and hardware technology fail to consider them as a potential user group.14 Usability and accessibility issues are important quality criteria for Web-based interventions, but are frequently ignored by designers and evaluators.15 The design of a usable Web-based information system for healthy users who are familiar with computer technology is a challenge. When a system needs to address age-related constraints and the functional limitations of inexperienced users, it becomes even more difficult. Designers of systems for home care patients should aim to increase functional accessibility165 and employ rigorous usability testing methods.
Only two of the studies we reviewed were primarily targeted at discovering usability issues, and no studies compared the usability of more than one system at a time, or across populations of users. However, in all studies reporting usability results, a majority of the users found the systems under study to be helpful or useful. Often this was true for more than 90 percent of users.
People with diabetes tended to have vision problems and were concerned about clarity and size of graphics. Several systems required improvements in the display contrast, use of color, and button size. In general, there was a need for clearer and simpler graphics for t older users or those with chronic disabilities. Often the largest usability changes needed to be made with regard to the data entry screens on Web-based systems, although in some cases it was the graphic feedback for home monitoring data that needed improvements in clarity. An additional general finding was that it was important to minimize the need for a user to jump from screen to screen. Researchers found that it was important to keep frequently used items on the main Web page with “one-click” access to important information or data entry screens. Overall, we saw that the

56
usability findings pointed to needing to keep systems simple and free from distracting elements. These issues were particularly relevant for older users and those with functional limitations, however, the findings were still important across all populations.
4. c. Barriers to the Use of Interactive Consumer Health IT Our summary of the evidence on the barriers to the use of interactive consumer health IT
pointed mainly to issues of motivation, access, ease of use, and convenience. Most importantly, if users did not perceive a potential health benefit (regardless of an actual benefit or not) they were less likely to use the system. Additionally, if consumers or patients did not already know how to use computers, and especially if they did not have easy access to a computer in their home, there tended to be difficulties in using the intervention.
Many of the technology interventions being studied suffered from usability and technology problems that prevented routine use as intended. Many systems were deployed for evaluation before sufficient quality testing to ensure that even motivated participants could use them. Common technology problems included unreliable Internet access, system crashes, and battery issues. Many of the systems also required updates to fix displays that generated confusion on the part of the users. Oftentimes these issues were not caught in advance of full deployment in a study.
Feedback on the lack of use of some systems often pointed to the difficulty of finding a convenient time or situation to interact with the system. Similarly, data entry on the part of patients was often viewed as cumbersome and too time consuming. Interfaces for reminding systems for medications or for chronic disease management were particularly difficult to implement in a way that would encourage sustained use.
One interesting barrier to use of some disease management or interactive self-management systems that provided either recommendations or changes in treatment based on computer protocols was a lack of trust on the part of some patients. If the system’s recommendation did not fit with the patient’s mental model or perception of the situation, the patient was unlikely to comply with the advice. In general, if patients did not trust the technology they were less likely to use the system or manage their health in accordance with the recommendations.
Some of the interactive consumer health IT reviewed involved the participation of a clinician as part of the intervention. This could range from secure physician e-mails to a patient, supplemental phone interactions in addition to tailored computer feedback, or clinician review of monitoring data. For interventions where patients expected clinician interaction and did not receive timely responses, usage of the system and satisfaction on the part of the patient tended to drop. These studies reported that a barrier to the successful implementation of these technology interventions was the lack of appropriate resources and workflow modifications for the health care professionals. They identified issues of the lack of reimbursement for e-health encounters and the perception of additional time required. In general, cost was often mentioned as a barrier to system use on the part of both the patient and the health care provider.
In the studies we reviewed, we did not find direct evidence for differential use of the interactive consumer health IT by populations in rural or frontier areas, minorities, low-income groups, or low education groups. There was weak evidence for age being a barrier to anticipated future use of some interventions.
As mentioned in the previous section, usability issues plagued many studies and would also be considered to be a barrier to use. Older age was associated with lower usage in some studies

57
of systems addressing chronic diseases, such as diabetes where vision and other functional disabilities required improved screen contrast and font size. In most studies, these issues were identified as barriers after the system had been deployed.
4. d. Drivers to the Use of Interactive Consumer Health IT Patient perception that the system was helping them appeared to be the most important driver
of system use. Generally, these were perceived health benefits. For applications that dealt with sensitive health topics, such as HIV/AIDS, patients identified the anonymity and nonjudgmental nature of interacting with a computer system as a benefit. Other perceived benefits, such as better understanding their doctors and the medical system, were also identified as drivers of technology use.
A further driver corresponding to one of the identified barriers included information from studies where the care protocols involved clinician participation. They found that a rapid response from the participating clinician improved patient satisfaction and sustained use of the system.
One important driver of system use identified in many studies was delivery of the intervention on familiar devices used by consumers or patients every day for other purposes. For example, cell phones with SMS messaging worked especially well for younger ages, and people who routinely used a computer throughout the day anyway would have an easier time adhering to protocols for interactions with self-management systems on the Web. In general, we found that it was important that patients feel the systems were convenient and easy to use, especially for interventions that required frequent sustained use. A particular driver for older individual’s use of new technologies was to have an implementation that provided a gradual stepwise introduction to the technology. Finally, several studies identified the tailoring of delivered content as a driver of patient satisfaction, perceived benefit, and system use.
4. e. Effectiveness of Interactive Consumer Health IT Ongoing self management support for chronic conditions was effective if it included a
‘closed feedback loop.’ Among the studies we reviewed, including 13 randomized trials and three studies with other designs, we found that consumer health IT systems that provided a complete feedback loop were generally effective at improving outcomes in chronic conditions. These systems included a combination of (a) monitoring and transmission of data about the current status of the patient; (b) interpretation of this data in light of previously established treatment goals or published guidelines; (c) adjustment of medications, diet, or patient education as required; (d) timely communication back to the patient of recommendations, advice, or information appropriate to their current state, and (e) regular repetition of this cycle. This process is analogous to the familiar Deming-Shewhart cycle for process improvement that serves as the basis for continuous quality improvement in healthcare.166 These systems provide the means for continuous improvement through repeated refinement or adjustment of the management of the patient according to their current condition. We observed this pattern across a spectrum of chronic conditions including diabetes, heart failure, hypertension, and asthma. Effective complete feedback loop systems most often incorporated a health professional in the loop—including pharmacists, dieticians, nurses, and physicians—alone or with computer

58
decision support (Table 3), and used a variety of IT, including home computers, voice messaging, text messaging, e-mail, and the telephone.31, 34, 49, 78, 108, 115, 123, 127, 131-133, 135, 136, 139 Table 3: Examples of complete feedback loop systems
Author, Year, Design
Condition Monitor Frequency
Feedback Frequency Feedback Source
Nature of Information
Cho, 2006, RCT123 DM
Daily Semi-weekly
Clinician e-mail State-specific
Delgado, 2003, Case series31 CHF
Daily Daily Nurse Practitioner Website
State-specific
Glasgow, 2003, Before/After34
DM/Diet NR Quarterly "Automatic feedback" State-specific
Green, 2008, RCT127 HTN
Daily Biweekly Pharmacist State-specific
Kashem, 2006 RCT40 CHF
> Weekly > Weekly RN, MD; phone, system
State-specific
Kim, 2006, RCT131 DM/ACT
> Weekly Weekly RN phone State-specific
Kim, 2007, RCT115 DM
> Weekly Weekly RN via SMS and web State-specific
Kwon, 2004, RCT132 DM
3x/Week > Weekly MD, RN, RD State-specific
LaFramboise, 2003, RCT133 CHF
Daily Daily RN, phone system State-specific
Noel 2004, RCT135
CHF, COPD,
DM
Not clear Not clear Nurse case manager advice
State-specific
Rasmussen, 2005, RCT49 Asthma
Daily Regular Physician w/CDSS State-specific
Rogers, 2001, RCT136 HTN
3x/week Weekly Physician, by phone State-specific
Southard, 2003, RCT139 CHF
> Weekly Weekly Web use State-specific
Turnin, 1992, RCT crossover108
DM 6x/month 6x/month Expert system for diet,
calorie analysis State-specific
In essence, then, this group of closed feedback loop systems are health IT based forms of
self-management support of the sort proposed in the Chronic Care Model. Of note, the systems described in the studies we examined depended on active engagement of patients and involvement of health professionals, supported by the specific technology interventions. Questions remain as to (a) the optimal frequency of monitoring, adjustment, and feedback, which are likely to be condition specific; (b) the optimal level of participation by members of the health care team; (c) the degree to which the process depends on familiarity and trust between the

59
patient and the other elements of the system; and (d) the role of support and encouragement, as opposed to refinement of the management plan. Perhaps most challenging, these systems increase the frequency of patient-provider interaction while shifting the location of interaction away from episode-driven office-based care, and no mechanism exists to support these activities under current health care reimbursement mechanisms.
Training or treatment through the use of multiple session or one-time use systems appear to be effective when it includes a similar complete loop of patient-specific information as the basis for tailored advice or education, although the evidence is less strong. Studies of these interactive consumer health IT systems were fewer in number and used weaker study designs, but overall the findings were comparable to the findings for chronic disease self management. Tailoring of information or adjustment of treatment based on patient state appear to be consistent elements in the effective systems, but robust studies of direct comparisons were not identified in this review. Systems providing such training or treatment were effective for patients with asthma,130, 144 depression,143, 149 and panic/phobic disorder,97 while a study with no feedback for patients with breast cancer showed no improvement,46 and a study of problem drinkers found face-to-face counseling to be effective while electronic counseling was not.118 It is unclear from the evidence available whether these systems will have a sustained impact, and they may be best suited for conditions requiring short-term treatment. Interactive consumer health IT systems that provided peer interaction, alone or as part of multi-component systems, were generally effective for improving intermediate outcomes but not for health outcomes.
Consumer health IT systems that provide monitoring alone or reminding alone were not clearly effective. We found fewer studies of such systems, those identified had weaker study designs, and the evidence from them was not consistent. The heterogeneity of the systems described in these studies and the variety of chronic conditions to which they were applied make it difficult to generalize about their effects or lack of effects. The same can be said for systems that provide access to the EMR when they are not part of a “complete feedback loop”: fewer studies were identified; the studies reviewed employed weaker study designs; and the results did not consistently show benefit, in terms of peer support, self efficacy, or other outcomes (Appendix H∗).
4. f. Use of Interactive Consumer Health IT by Populations of Interest
Each of our key questions had sub-questions about the relative use and effectiveness of the technology by key populations (elderly, chronically ill, and underserved). However, we did not find evidence for relative comparisons between groups of interest on the same technology. There were certainly studies that primarily focused on special populations, such as a specific minority group, a low income area, an elderly population, or a rural setting, but they did not answer questions of relative use and outcomes.
4. g. Technical Difficulties Interfering With Evaluations Of the studies of interactive consumer health IT reporting health outcomes, nine studies were
compromised by technical problems that limited use by patients and limited evaluation by
∗ Appendixes and Evidence Tables cited in this report are available electronically at http://www.ahrq.gov/clinic/tp/hitbartp.htm

60
investigators, several of which had to be excluded on this basis. Depressed patients withdrew from a randomized trial of a self-help system, with 21 of 57 reporting the system was too demanding and only 65 percent completing all modules.143 Elderly heart failure patients had difficulty getting medications out of a reminder device and reported difficulty reading the screen, limiting potential effect on medication adherence.106 After initial enthusiasm, adult patients with diabetes failed to enter data, and only one of six entered data for three consecutive weeks as required for the study, citing loss of Internet connection and difficult-to-use data entry screens.29 Adults with asthma had higher adherence to peak flow monitoring using a paper diary than an Internet-based log, citing problems with Internet connection, system errors, and other technical problems, though subjects retained a positive attitude toward Internet monitoring.30 Geriatric diabetic patients had limited benefit from a voice message system, citing difficulty using buttons on the mobile phone and lost connections.145 Of 30 COPD patients, 14 dropped out because of technical and other difficulties using the system.113 An interactive voice response system failed to reach 30 percent of smokers after cardiac hospitalization and only 18 of 50 patients actually received all three calls,50 while another IVR system frequently failed to reach veterans with diabetes.47 Of 56 obstructive sleep apnea patients one in seven was unable to use the device to monitor sleep and CPAP use.107 In contrast, systems without such technical problems enjoyed more complete and effective use and a more robust evaluation.

61
Chapter 5. Future Research
In our review of the evidence on the barriers and drivers of the use of interactive consumer health IT by the elderly, chronically ill, and underserved populations we identified several areas for future work. The most pressing need is for a principled taxonomy of interactive consumer health IT and related interventions, so that the resulting outcomes of studies involving these systems can be better interpreted by understanding effects of the various components. Currently, it is difficult to generalize across the wide variety of systems. Similarly, future research is needed to understand best practices for the design and implementation of these interactive health technologies for patients. A clear taxonomy will facilitate this effort.
In addition to standardizing our descriptions of the variety of interactive consumer health IT applications, it will be important to develop standardized and clear definitions of the intermediate outcomes relating to the use of these technologies. For example, in the studies we reviewed, system usage has been measured by logins, Web clicks, or time within a session. These varied measures, along with differing expectations for use for each system, make it difficult to compare usage between systems in a meaningful way. The issue gains relevance as the field strives to determine if the measurement of the health technology usage can serve as a means of determining individual engagement, activation, or preference, and whether it can serve as a proxy for intervention exposure or “dose.”
Finally, there is a paucity of research with direct comparison of the use and outcomes of these technologies by the general population versus disadvantaged populations, such as minorities, low-income groups, elderly, disabled, and geographically remote populations. It would be very useful to test the same technology, protocol, and implementation interventions with comparison populations within the same study, to truly understand the barriers and drivers associated with these interventions.

63
Chapter 6. Conclusions
The findings from our evidence review on the barriers and drivers to the use of interactive consumer health IT by the elderly, chronically ill, and underserved were derived from our summarization of papers that met our inclusion criteria and quality standards (Appendix H*). These papers were reviewed according to each of our key questions on the level of use of the technology, the usability and usefulness of the technology, the barriers and drivers to the use of the technology, and the outcomes from the use of the technology. We found that it was important to characterize and specify the technology components, intended use, care protocols, content and system environment in order to interpret evidence from disparate technologies, populations, and implementations. The barriers to consumers’ use of interactive consumer health IT were heavily influenced by unreliable and difficult to use technology. This was partially due to many of the studies using early stage system prototypes, as is typical for a relatively new field. Few of the studies we reviewed were specifically designed to compare the elderly, chronically ill, or underserved to the general population. But in general, we did find that several types of interactive consumer health IT were usable and effective in many settings and with all of our populations of interest. We saw that convenience and ease-of-use were important drivers of system use, especially if the interventions could be delivered on technologies users already had and interacted with on a daily basis. It was critical that data entry not be cumbersome and that the intervention fit into the user’s daily routine. Perceived benefit, system trust, anonymity for sensitive health conditions, and rapid clinician feedback were also important factors influencing the successful use of interactive consumer health IT.
The most important and consistent finding regarding the effectiveness of these technology interventions was that it was important that the systems provide a complete feedback loop that included some assessment of current patient status, interpretation of this status information in light of established treatment goals or plans, and communication back the patient with tailored recommendations or advice. Interactive consumer health IT that provided only one or a subset of these functions were less consistently effective.
The systems described in the studies we examined depended on active engagement of patients and involvement of health professionals, supported by the specific technology interventions. Questions remain as to (a) the optimal frequency of use of the system by the patient, which is likely to be condition specific; (b) the optimal frequency of use or degree of involvement by the health professionals; (c) whether their success depends on repeated modification of the patient’s treatment regimen or simply ongoing assistance with applying a static treatment plan. Perhaps most challenging, these systems shift the locus of care away from traditional physician office visits and many of them involve the participation of a multidisciplinary health care team; it is difficult to support these activities financially under current episode-based, fee-for-service health care reimbursement mechanisms.
*Appendixes and Evidence Tables cited in this report are available electronically at http://www.ahrq.gov/clinic/tp/hitbartp.htm

65
References
1. Keselman A, Logan R, Smith CA, Leroy G, Zeng-Treitler Q. Developing Informatics Tools and Strategies for Consumer-centered Health Communication. JAMIA. 2008;15:473-483.
2. US Dept of Heath and Human Services. http://www.hhs.gov/healthit/. Accessed July 10, 2008.
3. Committee on Quality Health Care in America. Crossing the quality chasm: a new health system for the 21st century. Washington D.C.: Institute of Medicine; 2001.
4. New Health Partnerships. Supporting Self Management. http://www.newhealthpartnerships.org/ProvidersPeopleInCirclePrint.aspx?id=78&linkidentifier=id&itemid=78. Accessed July 10, 2008.
5. Hoffman C, Rice D, Sung HY. Persons with chronic conditions. Their prevalence and costs. JAMA. 1996;276:1473-1479.
6. Wagner EH. Meeting the needs of chronically ill people. . BMJ. 2001;323(945-6).
7. Bodenheimer T, Lorig K, Holman H, Grumbach K. Patient self-management of chronic disease in primary care. JAMA. 2002;288(19):2469-2475.
8. Bodenheimer T, Wagner EH, Grumbach K. Improving primary care for patients with chronic illness: the chronic care model, Part 2. JAMA. 2002;288(15):1909-1914.
9. Robert Wood Johnson Foundation. Improving chronic illness care. http://www.improvingchroniccare.org. Accessed July 5, 2008.
10. Coleman MT, Newton KS. Supporting self-management in patients with chronic illness. Am Fam Physician. 2005;72(8):1503-1510.
11. Lorig KR, Ritter P, Stewart AL, et al. Chronic disease self-management program: 2-year health status and health care utilization outcomes. Med Care. 2001;39(11):1217-1223.
12. Renders CM, Valk GD, Griffin SJ, Wagner EH, Eijk Van JT, Assendelft WJ. Interventions to improve the management of diabetes in primary care, outpatient, and community settings: a systematic review. Diabetes Care. 2001;24(10):1821-1833.
13. Whitlock WL, Brown A, Moore K, et al. Telemedicine improved diabetic management. Mil Med. 2000;165(8):579-584.
14. Demeris G, Eysenbach G. Internet use in disease management for home care patients: a call for papers. J Med Internet Res. 2002;4(2):E6.
15. Eysenbach G, Powell J, Kuss O, Sa E-R. Empirical studies assessing the quality of health information for consumers on the world wide web: a systematic review. JAMA. 2002;287(20):2691-2700.
16. Ratzan L. Making sense of the Web: a metaphorical approach. Information Research. 2000;6(1).
17. Madden M, Fox S. Riding the Waves of "Web 2.0": More than a buzzword, but still not easily defined: Pew Internet Project; October 5, 2006.
18. Harris RP, Hefland M, Woolf SH, et al. Methods Work Group, Third US Preventive Services Task Force. Current methods of the US Preventive Services Task Force: a review of the process. Am J Prev Med. 2001;20(3 Suppl):21-35.
19. Khan K, ter Riet G, Popay J, Nixon J, Kleijnen J. Undertaking Systematic Reviews of Research on Effectiveness: Stage II: Conducting the Review. York: University of York; 2001.
20. Verhagen AP, de Vet HC, de Bie RA, et al. The delphi list a criteria list for quality assessment of randomized clinical trials for conducting systematic reviews developed by delphi consensus. J Clin Epidemiol. 1998;51(12):1235-1241.
21. Critical Appraisal Skills Programme. 10 questions to help you make sense of qualitative research: Milton Keynes Primary Care Trust; 2002.
22. Popay J, Baldwin S, Arai L, et al. Methods Briefing 22: Narrative Synthesis in Systematic Reviews. Manchester, England: Cathie Marsh Centre for Census and Survey Research; 2006.
23. Denyer D, Tranfield D, van Aken JE. Developing Design Propositions through

66
Research Synthesis. Organization Studies. 2008;29(3):393-413.
24. Tranfield DR, Denyer D, Smart P. Towards a methodology for developing evidence-informed management knowledge by means of systematic review. British Journal of Management. 2003;14:207-222.
25. Task Force on Community Preventive Services. Guide to Community Preventive Services: What works to promote health? New York: Center for Disease Control; 2005.
26. An LC, Perry CL, Lein EB, et al. Strategies for increasing adherence to an online smoking cessation intervention for college students. Nicotine Tob Res. 2006;8 Suppl 1:S7-12.
27. Bachofen M, Nakagawa A, Marks IM, et al. Home self-assessment and self-treatment of obsessive-compulsive disorder using a manual and a computer-conducted telephone interview: replication of a UK-US study. J Clin Psychiatry. 1999;60(8):545-549.
28. Cathala N, Brillat F, Mombet A, et al. Patient followup after radical prostatectomy by Internet medical file. J Urol. 2003;170(6 Pt 1):2284-2287.
29. Cavan DA, Everett J, Plougmann S, Hejlesen OK. Use of the Internet to optimize self-management of type 1 diabetes: preliminary experience with DiasNet. J Telemed Telecare. 2003;9 Suppl 1:S50-52.
30. Cruz-Correia R, Fonseca J, Lima L, et al. Web-based or paper-based self-management tools for asthma--patients' opinions and quality of data in a randomized crossover study. Stud Health Technol Inform. 2007;127:178-189.
31. Delgado DH, Costigan J, Wu R, Ross HJ. An interactive Internet site for the management of patients with congestive heart failure. Can J Cardiol. 2003;19(12):1381-1385.
32. Earnest MA, Ross SE, Wittevrongel L, Moore LA, Lin C-T. Use of a patient-accessible electronic medical record in a practice for congestive heart failure: patient and physician experiences. JAMIA. 2004;11(5):410-417.
33. Finkelstein SM, Snyder M, Edin-Stibbe C, et al. Monitoring progress after lung transplantation from home-patient adherence. J Med Eng Technol. 1996;20(6):203-210.
34. Glasgow RE, Boles SM, McKay HG, Feil EG, Barrera M, Jr. The D-Net diabetes self-management program: long-term implementation, outcomes, and generalization results. Prev Med. 2003;36(4):410-419.
35. Gustafson DH, Hawkins RP, Boberg EW, Bricker E, Pingree S, Chan CL. The use and impact of a computer-based support system for people living with AIDS and HIV infection. Proc Annu Symp Comput Appl Med Care. 1994:604-608.
36. Gustafson DH, McTavish F, Hawkins R, et al. Computer support for elderly women with breast cancer. JAMA. 1998;280(15):1305.
37. Japuntich SJ, Zehner ME, Smith SS, et al. Smoking cessation via the internet: a randomized clinical trial of an internet intervention as adjuvant treatment in a smoking cessation intervention. Nicotine Tob Res. 2006;8 Suppl 1:S59-67.
38. Jones R, Pearson J, McGregor S, et al. Randomised trial of personalised computer based information for cancer patients. BMJ. 1999;319(7219):1241-1247.
39. Jones RB, Atkinson JM, Coia DA, et al. Randomised trial of personalised computer based information for patients with schizophrenia.[erratum appears in BMJ 2001 May 5;322(7294):1103]. BMJ. 2001;322(7290):835-840.
40. Kashem A, Droogan MT, Santamore WP, et al. Web-based Internet telemedicine management of patients with heart failure. Telemed J E Health. 2006;12(4):439-447.
41. Leu MG, Norris TE, Hummel J, Isaac M, Brogan MW. A randomized, controlled trial of an automated wireless messaging system for diabetes. Diabetes Technol Ther. 2005;7(5):710-718; discussion 719-720.
42. Lorig KR, Ritter PL, Laurent DD, Plant K. Internet-based chronic disease self-management: a randomized trial. Med Care. 2006;44(11):964-971.
43. Ma C, Warren J, Phillips P, Stanek J. Empowering patients with essential information and communication support in the context of diabetes. Int J Med Inf. 2006;75(8):577-596.
44. McKay HG, King D, Eakin EG, Seeley JR, Glasgow RE. The diabetes network internet-based physical activity intervention: a randomized pilot study. Diabetes Care. 2001;24(8):1328-1334.
45. Nguyen HQ, Carrieri-Kohlman V, Rankin SA, Slaughter R, Stulbarg MS. Pilot study of an online dyspnea self-management program for COPD. AMIA Annu Symp Proc. 2003;Annual

67
Symposium Proceedings/AMIA Symposium.:951.
46. Owen JE, Klapow JC, Roth DL, et al. Randomized pilot of a self-guided internet coping group for women with early-stage breast cancer. Ann Behav Med. 2005;30(1):54-64.
47. Piette JD, Mah CA. The feasibility of automated voice messaging as an adjunct to diabetes outpatient care. Diabetes Care. 1997;20(1):15-21.
48. Pike KJ, Rabius V, McAlister A, Geiger A. American Cancer Society's QuitLink: randomized trial of Internet assistance. Nicotine Tob Res. 2007;9(3):415-420.
49. Rasmussen LM, Phanareth K, Nolte H, Backer V. Internet-based monitoring of asthma: a long-term, randomized clinical study of 300 asthmatic subjects. J Allergy Clin Immunol. 2005;115(6):1137-1142.
50. Reid RD, Pipe AL, Quinlan B, Oda J. Interactive voice response telephony to promote smoking cessation in patients with heart disease: a pilot study. Patient Educ Couns. 2007;66(3):319-326.
51. Ross SE, Moore LA, Earnest MA, Wittevrongel L, Lin C-T. Providing a web-based online medical record with electronic communication capabilities to patients with congestive heart failure: randomized trial. J Med Internet Res. 2004;6(2):e12.
52. Ruland CM, White T, Stevens M, Fanciullo G, Khilani SM. Effects of a computerized system to support shared decision making in symptom management of cancer patients: preliminary results. JAMIA. 2003;10(6):573-579.
53. Shaw BR, Han JY, Baker T, et al. How women with breast cancer learn using interactive cancer communication systems. Health Educ Res. 2007;22(1):108-119.
54. Smith L, Weinert C. Telecommunication support for rural women with diabetes. Diabetes Educ. 2000;26(4):645-655.
55. Tsang MW, Mok M, Kam G, et al. Improvement in diabetes control with a monitoring system based on a hand-held, touch-screen electronic diary. J Telemed Telecare. 2001;7(1):47-50.
56. van den Brink JL, Moorman PW, de Boer MF, Pruyn JFA, Verwoerd CDA, van Bemmel JH. Involving the patient: a prospective study on use, appreciation and effectiveness of an
information system in head and neck cancer care. Int J Med Inf. 2005;74(10):839-849.
57. Nakagawa A, Marks IM, Park JM, et al. Self-treatment of obsessive-compulsive disorder guided by manual and computer-conducted telephone interview. J Telemed Telecare. 2000;6(1):22-26.
58. Wilkie DJ, Huang HY, Berry DL, et al. Cancer symptom control: feasibility of a tailored, interactive computerized program for patients. Fam Community Health. 2001;24(3):48-62.
59. Zabinski MF, Wilfley DE, Pung MA, Winzelberg AJ, Eldredge K, Taylor CB. An interactive internet-based intervention for women at risk of eating disorders: a pilot study. Int J Eat Disord. 2001;30(2):129-137.
60. Ferrer-Roca O, Franco Burbano K, Cardenas A, Pulido P, Diaz-Cardama A. Web-based diabetes control. J Telemed Telecare. 2004b;10(5):277-281.
61. Zrebiec JF, Jacobson AM. What attracts patients with diabetes to an internet support group? A 21-month longitudinal website study. Diabet Med. 2001;18(2):154-158.
62. Lee T-I, Yeh Y-T, Liu C-T, Chen P-L. Development and evaluation of a patient-oriented education system for diabetes management. Int J Med Inf. 2007;76(9):655-663.
63. Anhoj J, Nielsen L. Quantitative and qualitative usage data of an Internet-based asthma monitoring tool. J Med Internet Res. 2004;6(3):e23.
64. Bond GE. Lessons learned from the implementation of a Web-based nursing intervention. Cin Comput Inform Nurs. 2006;24(2):66-74.
65. Carroll C, Marsden P, Soden P, Naylor E, New J, Dornan T. Involving users in the design and usability evaluation of a clinical decision support system. Comput Methods Programs Biomed. 2002;69(2):123-135.
66. Chen H, Yeh M, Chao Y. Comparing effects of auricular acupressure with and without an Internet-assisted program on smoking cessation and self-efficacy of adolescents. J Altern Complement Med. 2006;12(2):147-152.
67. Cleland J, Caldow J, Ryan D. A qualitative study of the attitudes of patients and staff to the use of mobile phone technology for recording and gathering asthma data. J Telemed Telecare. 2007;13(2):85-89.

68
68. Crosbie JH, Lennon S, McNeill MDJ, McDonough SM. Virtual reality in the rehabilitation of the upper limb after stroke: the user's perspective. Cyberpsychol Behav. 2006;9(2):137-141.
69. Feil EG, Glasgow RE, Boles S, McKay HG. Who participates in Internet-based self-management programs? A study among novice computer users in a primary care setting. Diabetes Educ. 2000;26(5):806-811.
70. Finkelstein J, Hripcsak G, Cabrera MR. Patients' acceptance of Internet-based home asthma telemonitoring. Proc AMIA Symp. 1998;Annual Symposium.:336-340.
71. Friedman RH, Stollerman JE, Mahoney DM, Rozenblyum L. The virtual visit: using telecommunications technology to take care of patients. JAMIA. 1997;4(6):413-425.
72. Gomez EJ, Caceres C, Lopez D, Del Pozo F. A web-based self-monitoring system for people living with HIV/AIDS. Comput Methods Programs Biomed. 2002a;69(1):75-86.
73. Gomez EJ, Hernando ME, Garcia A, et al. Telemedicine as a tool for intensive management of diabetes: the DIABTel experience. Comput Methods Programs Biomed. 2002b;69(2):163-177.
74. Gustafson DH, Hawkins R, Pingree S, et al. Effect of computer support on younger women with breast cancer. J Gen Intern Med. 2001;16(7):435-445.
75. Kaufman DR, Patel VL, Hilliman C, et al. Usability in the real world: assessing medical information technologies in patients' homes. J Biomed Inform. 2003b;36(1-2):45-60.
76. Kerkenbush NL, Lasome CEM. The emerging role of electronic diaries in the management of diabetes mellitus. AACN Clin Issues. 2003;14(3):371-378.
77. Kim H, Yoo Y, Shim H. Effects of an Internet-based intervention on plasma glucose levels in patients with type 2 diabetes. J Nurs Care Qual. 2005;20(4):335-340.
78. Kim HS, Jeong HS. A nurse short message service by cellular phone in type-2 diabetic patients for six months. J Clin Nurs. 2007;16(6):1082-1087.
79. Kosma M, Cardinal BJ, McCubbin JA. A pilot study of a web-based physical activity motivational program for adults with physical disabilities. Disabil Rehabil. 2005;27(23):1435-1442.
80. Laplante-Levesque A, Pichora-Fuller KM, Gagne J. Providing an internet-based audiological counselling programme to new hearing aid users: a qualitative study. Int J Audiol. 2006;45(12):697-706.
81. Liu C, Yeh Y, Lee T, Li Y. Observations on online services for diabetes management. Diabetes Care. 2005;28(11):2807-2808.
82. Lober WB, Zierler B, Herbaugh A, et al. Barriers to the use of a personal health record by an elderly population. AMIA Annu Symp Proc. 2006;Annual Symposium Proceedings/AMIA Symposium.:514-518.
83. Ralston JD, Revere D, Robins LS, Goldberg HI. Patients' experience with a diabetes support programme based on an interactive electronic medical record: qualitative study. BMJ. 2004;328(7449):1159.
84. Reed K, Lehmann ED. Website review: diabetes insight--www.diabetes-insight.info. Diabetes Technol Ther. 2005b;7(3):573-580.
85. Schärer LO, Hartweg V, Valerius G, et al. Life charts on a palmtop computer: first results of a feasibility study with an electronic diary for bipolar patients. Bipolar Disord. 2002;4 Suppl 1:107-108.
86. Sciamanna CN, Novak SP, Houston TK, Gramling R, Marcus BH. Visit satisfaction and tailored health behavior communications in primary care. Am J Prev Med. 2004;26(5):426-430.
87. Shaw BR, McTavish F, Hawkins R, Gustafson DH, Pingree S. Experiences of women with breast cancer: exchanging social support over the CHESS computer network. J Health Commun. 2000;5(2):135-159.
88. Skeels MM, Kurth A, Clausen M, Severynen A, Garcia-Smith H. CARE+ user study: usability and attitudes towards a tablet pc computer counseling tool for HIV+ men and women. AMIA Annu Symp Proc. 2006;Annual Symposium Proceedings/AMIA Symposium.:729-733.
89. Smaglik P, Hawkins RP, Pingree S, Gustafson DH, Boberg E, Bricker E. The quality of interactive computer use among HIV-infected individuals. J Health Commun. 1998;3(1):53-68.
90. van den Brink JL, Moorman PW, de Boer MF, van Bemmel JH, Pruyn JFA, Verwoerd CDA. An information system to support the care for head and neck cancer patients. Support Care Cancer. 2003;11(7):452-459.

69
91. van't Riet A, Berg M, Hiddema F, Sol K. Meeting patients' needs with patient information systems: potential benefits of qualitative research methods. Int J Med Inf. 2001;64(1):1-14.
92. Yeh Y-T, Chiu Y-T, Liu C-T, Wu S-J, Lee T-I. Development and evaluation of an integrated patient-oriented education management system for diabetes. Stud Health Technol Inform. 2006;122:172-175.
93. Zimmerman L, Barnason S, Nieveen J, Schmaderer M. Symptom management intervention in elderly coronary artery bypass graft patients. Outcomes Manag. 2004;8(1):5-12.
94. Andersson NB, Hanson E, Magnusson L. Views of family carers and older people of information technology. Br J Nurs. 2002;11(12):827-831.
95. Gerbert B, Berg-Smith S, Mancuso M, et al. Using innovative video doctor technology in primary care to deliver brief smoking and alcohol intervention. Health Promot Pract. 2003;4(3):249-261.
96. Holman RR, Smale AD, Pemberton E, Riefflin A, Nealon JL. Randomized controlled pilot trial of a hand-held patient-oriented, insulin regimen optimizer. Med Inform (Lond). 1996;21(4):317-326.
97. Kenwright M, Marks IM. Computer-aided self-help for phobia/panic via internet at home: a pilot study. Br J Psychiatry. 2004;184:448-449.
98. Kressig RW, Echt KV. Exercise prescribing: computer application in older adults. Gerontologist. 2002;42(2):273-277.
99. McDaniel AM, Hutchison S, Casper GR, Ford RT, Stratton R, Rembusch M. Usability testing and outcomes of an interactive computer program to promote smoking cessation in low income women. Proc AMIA Symp. 2002;Annual Symposium.:509-513.
100. McPherson AC, Glazebrook C, Forster D, James C, Smyth A. A randomized, controlled trial of an interactive educational computer package for children with asthma. Pediatrics. 2006;117(4):1046-1054.
101. Sciamanna CN, Ford DE, Flynn JA, Langford C. An evidence-based interactive computer program to assist physicians in counseling smokers to quit. MD Comput. 1999;16(5):54-60.
102. Sciamanna CN, Harrold LR, Manocchia M, Walker NJ, Mui S. The effect of web-based, personalized, osteoarthritis quality improvement feedback on patient satisfaction with osteoarthritis care. Am J Med Qual. 2005;20(3):127-137.
103. Kaufman DR, Starren J, Patel VL, et al. A cognitive framework for understanding barriers to the productive use of a diabetes home telemedicine system. AMIA Annu Symp Proc. 2003a;Annual Symposium Proceedings/AMIA Symposium.:356-360.
104. Nielsen J. Usability Engineering. San Francisco, CA: Morgan Kaufmann Publishers; 1993.
105. Kirakowski J, Claridge N. The Website Analysis and Measurement Inventory: WAMMI. http://www.wammi.com/. Accessed 24 Jun, 2008.
106. Artinian NT, Harden JK, Kronenberg MW, et al. Pilot study of a Web-based compliance monitoring device for patients with congestive heart failure. Heart Lung. 2003;32(4):226-233.
107. Taylor Y, Eliasson A, Andrada T, Kristo D, Howard R. The role of telemedicine in CPAP compliance for patients with obstructive sleep apnea syndrome. Sleep Breath. 2006;10(3):132-138.
108. Turnin MC, Beddok RH, Clottes JP, et al. Telematic expert system Diabeto. New tool for diet self-monitoring for diabetic patients. Diabetes Care. 1992;15(2):204-212.
109. Sciamanna CN, Gifford DR, Smith RJ. Design and acceptability of patient-oriented computerized diabetes care reminders for use at the point of care. Med Inform Internet Med. 2004;29(2):157-168.
110. Reed K, Lehmann ED. Diabetes website review: www.2aida.org. Diabetes Technol Ther. 2005a;7(5):741-754.
111. Jan R-L, Wang J-Y, Huang M-C, Tseng S-M, Su H-J, Liu L-F. An internet-based interactive telemonitoring system for improving childhood asthma outcomes in Taiwan. Telemed J E Health. 2007;13(3):257-268.
112. Kenwright M, Marks I, Graham C, Franses A, Mataix-Cols D. Brief scheduled phone support from a clinician to enhance computer-aided self-help for obsessive-compulsive disorder: randomized controlled trial. J Clin Psychol. 2005;61(12):1499-1508.
113. Nguyen HQ, Carrieri-Kohlman V, Rankin SH, Slaughter R, Stulbarg MS. Is Internet-based

70
support for dyspnea self-management in patients with chronic obstructive pulmonary disease possible? Results of a pilot study. Heart Lung. 2005;34(1):51-62.
114. Rodgers A, Corbett T, Bramley D, et al. Do u smoke after txt? Results of a randomised trial of smoking cessation using mobile phone text messaging. Tob Control. 2005;14(4):255-261.
115. Kim H. A randomized controlled trial of a nurse short-message service by cellular phone for people with diabetes. Int J Nurs Stud. 2007;44(5):687-692.
116. Strecher VJ, Shiffman S, West R. Moderators and mediators of a web-based computer-tailored smoking cessation program among nicotine patch users. Nicotine Tob Res. 2006;8 Suppl 1:S95-101.
117. Andrade ASA, McGruder HF, Wu AW, et al. A programmable prompting device improves adherence to highly active antiretroviral therapy in HIV-infected subjects with memory impairment. Clin Infect Dis. 2005;41(6):875-882.
118. Araki I, Hashimoto H, Kono K, Matsuki H, Yano E. Controlled trial of worksite health education through face-to-face counseling vs. e-mail on drinking behavior modification. J Occup Health. 2006;48(4):239-245.
119. Barnason S, Zimmerman L, Nieveen J, Schmaderer M, Carranza B, Reilly S. Impact of a home communication intervention for coronary artery bypass graft patients with ischemic heart failure on self-efficacy, coronary disease risk factor modification, and functioning. Heart Lung. 2003;32(3):147-158.
120. Barnason S, Zimmerman L, Nieveen J, Hertzog M. Impact of a telehealth intervention to augment home health care on functional and recovery outcomes of elderly patients undergoing coronary artery bypass grafting. Heart Lung. 2006;35(4):225-233.
121. Barrera M, Jr., Glasgow RE, McKay HG, Boles SM, Feil EG. Do Internet-based support interventions change perceptions of social support?: An experimental trial of approaches for supporting diabetes self-management. Am J Community Psychol. 2002;30(5):637-654.
122. Block G, Wakimoto P, Metz D, et al. A randomized trial of the Little by Little CD-ROM: demonstrated effectiveness in increasing fruit and vegetable intake in a low-income population. Prev Chronic Dis. 2004;1(3):A08.
123. Cho J-H, Chang S-A, Kwon H-S, et al. Long-term effect of the Internet-based glucose monitoring system on HbA1c reduction and glucose stability: a 30-month follow-up study for diabetes management with a ubiquitous medical care system. Diabetes Care. 2006;29(12):2625-2631.
124. Christensen H, Griffiths KM, Jorm AF. Delivering interventions for depression by using the internet: randomised controlled trial. BMJ. 2004;328(7434):265.
125. Franklin VL, Waller A, Pagliari C, Greene SA. A randomized controlled trial of Sweet Talk, a text-messaging system to support young people with diabetes. Diabet Med. 2006;23(12):1332-1338.
126. Frenn M, Malin S, Brown RL, et al. Changing the tide: an Internet/video exercise and low-fat diet intervention with middle-school students. Applied nursing research : ANR. 2005;18(1):13-21.
127. Green B, et al. Effectiveness of Home Blood Pressure Monitoring, Web Communication, and Pharmacist Care on Hypertension Control. JAMA. 2008;299(24):2857-2867.
128. Guendelman S, Meade K, Benson M, Chen YQ, Samuels S. Improving asthma outcomes and self-management behaviors of inner-city children: a randomized trial of the Health Buddy interactive device and an asthma diary. Arch Pediatr Adolesc Med. 2002;156(2):114-120.
129. Gustafson DH, Hawkins R, Boberg E, et al. Impact of a patient-centered, computer-based health information/support system. Am J Prev Med. 1999;16(1):1-9.
130. Joseph CLM, Peterson E, Havstad S, et al. A web-based, tailored asthma management program for urban African-American high school students. Am J Respir Crit Care Med. 2007;175(9):888-895.
131. Kim C, Kang D. Utility of a Web-based intervention for individuals with type 2 diabetes: the impact on physical activity levels and glycemic control. Cin Comput Inform Nurs. 2006a;24(6):337-345.
132. Kwon H-S, Cho J-H, Kim H-S, et al. Establishment of blood glucose monitoring system using the internet. Diabetes Care. 2004;27(2):478-483.
133. LaFramboise LM, Todero CM, Zimmerman L, Agrawal S. Comparison of Health Buddy with traditional approaches to heart failure

71
management. Fam Community Health. 2003;26(4):275-288.
134. Levetan CS, Dawn KR, Robbins DC, Ratner RE. Impact of computer-generated personalized goals on HbA(1c). Diabetes Care. 2002;25(1):2-8.
135. Noel HC, Vogel DC, Erdos JJ, Cornwall D, Levin F. Home telehealth reduces healthcare costs. Telemed J E Health. 2004;10(2):170-183.
136. Rogers MAM, Small D, Buchan DA, et al. Home monitoring service improves mean arterial pressure in patients with essential hypertension: a randomized, controlled trial. Ann Intern Med. 2001;134(11):1024-1032, I1042.
137. Safren SA, Hendriksen ES, Desousa N, Boswell SL, Mayer KH. Use of an on-line pager system to increase adherence to antiretroviral medications. AIDS Care. 2003;15(6):787-793.
138. Shegog R, Bartholomew LK, Parcel GS, Sockrider MM, Masse L, Abramson SL. Impact of a computer-assisted education program on factors related to asthma self-management behavior. JAMIA. 2001;8(1):49-61.
139. Southard BH, Southard DR, Nuckolls J. Clinical trial of an Internet-based case management system for secondary prevention of heart disease. J Cardiopulm Rehabil. 2003;23(5):341-348.
140. Stuart GW, Laraia MT, Ornstein SM, Nietert PJ. An interactive voice response system to enhance antidepressant medication compliance. Top Health Inf Manage. 2003;24(1):15-20.
141. Winzelberg AJ, Classen C, Alpers GW, et al. Evaluation of an internet support group for women with primary breast cancer. Cancer. 2003;97(5):1164-1173.
142. Albisser AM, Harris RI, Albisser JB, Sperlich M. The impact of initiatives in education, self-management training, and computer-assisted self-care on outcomes in diabetes disease management. Diabetes Technol Ther. 2001;3(4):571-579.
143. Andersson G, Bergstrom J, Hollandare F, Carlbring P, Kaldo V, Ekselius L. Internet-based self-help for depression: randomised controlled trial. Br J Psychiatry. 2005;187:456-461.
144. Chan DS, Callahan CW, Sheets SJ, Moreno CN, Malone FJ. An Internet-based store-and-forward video home telehealth system for improving asthma outcomes in children. Am J Health-Syst Pharm. 2003;60(19):1976-1981.
145. Durso SC, Wendel I, Letzt AM, Lefkowitz J, Kaseman DF, Seifert RF. Older adults using cellular telephones for diabetes management: a pilot study. Medsurg Nurs. 2003;12(5):313-317.
146. Estabrooks PA, Nelson CC, Xu S, et al. The frequency and behavioral outcomes of goal choices in the self-management of diabetes. Diabetes Educ. 2005;31(3):391-400.
147. Ewald S, vor dem Esche J, Uen S, Neikes F, Vetter H, Mengden T. Relationship between the frequency of blood pressure self-measurement and blood pressure reduction with antihypertensive therapy : results of the OLMETEL (OLMEsartan TELemonitoring blood pressure) study. Clin Drug Invest. 2006;26(8):439-446.
148. Glasgow RE, Toobert DJ. Brief, computer-assisted diabetes dietary self-management counseling: effects on behavior, physiologic outcomes, and quality of life. Med Care. 2000;38(11):1062-1073.
149. Robertson L, Smith M, Castle D, Tannenbaum D. Using the Internet to enhance the treatment of depression. Australas. 2006;14(4):413-417.
150. Safren S. Internet paging system helps improve adherence. Counseling is combined with reminders. Aids Alert. 2002;17(9):118-119.
151. Woodruff SI, Edwards CC, Conway TL, Elliott SP. Pilot test of an Internet virtual world chat room for rural teen smokers. J Adolesc Health. 2001;29(4):239-243.
152. Yon BA, Johnson RK, Harvey-Berino J, Gold BC, Howard AB. Personal digital assistants are comparable to traditional diaries for dietary self-monitoring during a weight loss program. J Behav Med. 2007;30(2):165-175.
153. La Porta M, Hagood H, Kornfeld J, Treiman K. Evaluating the NCI's Cancer Information Service Contact Centers: meeting and exceeding the expectations of the public. J Cancer Educ. 2007a;22(1 Suppl):S18-25.
154. Stead WW, Haynes RB, Fuller S, et al. Designing medical informatics research and library--resource projects to increase what is learned. JAMIA. 1994;1(1):28-33.

72
155. Bell KM. Report to the Office of the National Coordinator for Health Information Technology on Defining Key Health Information Technology Terms Washington, DC: The National Alliance for Health Information Technology; April 28, 2008.
156. Hill W, Weinert C, Cudney S. Influence of a computer intervention on the psychological status of chronically ill rural women: preliminary results. Nurs Res. 2006;55(1):34-42.
157. Brennan PF, Moore SM, Bjornsdottir G, Jones J, Visovsky C, Rogers M. HeartCare: an Internet-based information and support system for patient home recovery after coronary artery bypass graft (CABG) surgery. J Adv Nurs. 2001;35(5):699-708.
158. La Porta M, Hagood H, Patt J, Hodorowski JK, Treiman K. The NCI's Cancer Information Service: meeting the public's cancer information needs via the internet. J Cancer Educ. 2007b;22(1 Suppl):S26-34.
159. Meigs JB, Cagliero E, Dubey A, et al. A controlled trial of web-based diabetes disease management: the MGH diabetes primary care improvement project. Diabetes Care. 2003;26(3):750-757.
160. Joseph AM. Care Coordination and Telehealth Technology in Promoting Self-Management Among Chronically Ill Patients. Telemed J E Health. 2006;12(2):156-159.
161. Gustafson DH, Hawkins RP, Boberg EW, et al. CHESS: ten years of research and development in consumer health informatics for broad populations, including the underserved. Medinfo. 2001;10(Pt 2):1459-1563.
162. Holbrook A, Labiris R, Goldsmith CH, Ota K, Harb S, Sebaldt RJ. Influence of decision aids on patient preferences for anticoagulant therapy: a randomized trial. Cmaj. 2007;176(11):1583-1587.
163. Critical Appraisal Skills Programme (CASP): 10 Questions to Help You Make Sense of Qualitative Research: National CASP Collaboration for Qualitative Methodologies; 2002.
164. Stead WW. Matching the level of evaluation to a project's stage of development. JAMIA. 1996;3(1):92-94.
165. Demiris G, Finkelstein SM, Speedie SM. Considerations for the design of a Web-based clinical monitoring and educational system for elderly patients. JAMIA. 2001;8(5):468-472.
166. Berwick DM. Continuous improvement as an ideal in health care. N Engl J Med. 1989;320(1):53-56.

Summary Table 1. Level of Use of Interactive Consumer Health IT (KQ 1)
SUMMARY TABLES
1 of 6

Summary Table 1. Level of Use of Interactive Consumer Health IT (KQ 1)Author, Year
Design, NCondition and/or
Population Interactive Health IT Findings: Technology Usage Usage CommentsAn, 200626
Cohort, N=47Experimental arm of RCT, N=257
SmokingCollege students
Web-based self-monitoring and goal setting; discussion board; quiz with tailored feedback; weekly email reminders; Question of the Week; peer coach emails weekly if not completing tasks
Website use by study: Pilot: % subjects using site was 53%, 21% and 26% for weeks 1, 2, and 5, respectivelyRCT: mean 95% over 20 weeks (range, 89% to 98%)
Subject proportion usage
Bachofen, 199927
Cohort studyN=21
Obsessive-compulsive disorder
IVR self-management;IVR calls after reading a190-page manual on ERP(clinician-guided exposureand ritual prevention)
Subjects used system mean 67.2 +/- 38.3 days22 days for self-assessment;45 days for ERP
Limited-time intervention;Unclear inteneded use;Mean time used reported
Cathala, 200328
Cohort, N=140Prostate cancer; post-op radical prostatectomy
Web-based access to hospital medical records, secure messaging with surgical team, monitoring PSA level, and answer questions
Website use over 6 months: 95% “regularly connected”, mean logons 8/subject (range: 1-22); Mean 2 PSA entries/subject; Mean 2 messages/subject
58% subjects described as “senior executives”;Usage Estimate: 1.3 logins/subject/month
Cavan, 200329
Cohort, N=6Type I Diabetes Web-based monitoring blood glucose
and insulin use; food diary; feedback with glucose level simulation; patient decision support for insulin dosing
Website use over 6 months:1 of 6 subjects input 4 days’ data on 3 occasions first month (study request). No input for several wks; Subjects input mean of 5 sets of data (range: 2-8)
Unable to estimate frequency
Cruz-Correia, 200730
Randomized, cross-over study, N=21
Asthma Web-based self-monitoring of peak flow and symptoms; tailored action plan; decision support tool for patients and physician; Compared to paper-based monitoring
Website use during 4 week periods: variable monitoring, about half of scheduled monitoring conducted; paper tools more likely complete
Unable to estimate frequency
Delgado, 200331
Cohort, N=6Congestive heart failure
Web-based self-monitoring of weight, BP, medication; secure messaging with providers; educational content
Website use over 3 months: Mean 73 logons/subject
Poor description of use over time;Usage Estimate: 22 logins/subject/month
Earnest, 200432
Randomized trial, N=107
Congestive heart failure
Web-based access to electronic records, secure messaging with clinical team; educational content
Website use over 1 year (N= 54): 80% used once or more, mean 8 hit-days/subject; Results suggest use associated with White, Non-Hispanic, more symptoms, more clinic visits (NS)
Usage Estimate: 0.7 logins/subject/month
2 of 6

Summary Table 1. Level of Use of Interactive Consumer Health IT (KQ 1)Author, Year
Design, NCondition and/or
Population Interactive Health IT Findings: Technology Usage Usage CommentsFinkelstein, 199633
Cohort, N=41Lung transplant Web-based self-monitoring of
symptoms, vital signs and automated spirometry readings; symptom diary; weekly transmission to clinicians
Monitoring over 1 year: 82% submitted weekly data; 8941 transmissions by 41 subjects, for mean of 4.5 records/week sent; Initial 6.2 records/wk , remained >3.9 records/wk for 43 weeks
Usage Estimate: 16 logins/subject/month
Glasgow, 200334
Randomized trial, N=320
Type II Diabetes Web-based educational content, dietary goal setting (Basic); with glucose monitoring and feedback, online coach 2x/wk, Q & A forum (Self-Mgmt Condition); with online peer support monitored, e-news (Peer Support Condition )
Website use over 10 months: Highest in months 1-3, continued drop months 4-6 and 7-10; Mean logons/subject/month with Peer Support 18.7, with Self-Mgmt 16.7, with Basic 9.4 and 11.4; Use higher in Peer Support for months 4-6 (13.2) and 7-10 (6.7)
Usage Estimate: 18.7 logins/subject/month
Gustafson, 199435
Randomized trial, N=204
HIV/AIDS CHESS: computerized information and problem-solving, Q & A, ask an expert, health profile, peer discussion group, personal stories, decision aids
Use over 3 to 6 months (N= 116): 116 subjects used 15,966 times; Mean 138 uses/subject; Mean time use 39 hrs/subject; 34% of use occurred 9 pm – 7 am; 73% of use was peer discussion, 17% was information and 4% was problem-solving; Use 13% more in women; Minorities used discussion slightly less and information slightly more
Usage Estimate: 23 logins/subject/month
Gustafson, 199836
Cohort, N=38Breast cancer CHESS: computerized information
and problem-solving, Q & A, ask an expert, health profile, peer discussion group, personal stories, decision aids
Use over 10 weeks: Mean 6.8 uses/week/subject; 100% used discussion group, ask an expert, Q & A, health profile; 71% of uses for social support, 16% of uses for information
Usage Estimate: 27 logins/subject/month
Japuntich, 200637
Randomized trial, N=284
Smoking CHESS: web-based information and problem-solving, discussion group, chat room, Q & A, ask an expert, mood self-management
Use over 12 wks (N=140): Use declined over period; Mean logins 33.6/subject ; Mean total time on 486.4 min; Support tools (discussion, chat) used most and information least; Gender, race, education not associated with use; older age correlated with greater use
Usage Estimate: 11.2 logins/subject/month
Jones, 199938
Randomized trial, N=525
Breast, cervical, prostate or laryngeal cancer
Computer touch-screen access to general (N=167) or personalized (n=93) information including electronic record, explanation of content, print-outs
Program use over 3 months: Mean time use was 12 minutes; 29% returned to use program; 11.8% with personalized information used after wk 3, vs. 2.6% with general information
Unclear inteneded use;Mean time use reported;Subject proportion usage
3 of 6

Summary Table 1. Level of Use of Interactive Consumer Health IT (KQ 1)Author, Year
Design, NCondition and/or
Population Interactive Health IT Findings: Technology Usage Usage CommentsJones, 200139
Randomized trial, N=112
Schizophrenia Computer touch-screen access to general or personalized information including electronic record, explanation of content, feedback displays, print-outs
Program use: Median time for 5 sessions 69 min (range 34-143)
Limited-time intervention;Median time use reported
Kashem, 200640
RCTN=36
Congestive heart failure
Web-based self-monitoring weight, vitals, medications, graphic data feedback, patient-provider text messaging
Patient data entry: 1,253Patient text messaging: 362Provider non-tailored messages: 836Provider tailored text messages: 416Total Internet interactions: 2,867
Transactions reported; unable to measure frequency
Leu, 200541
Randomized trial, N=50
Type I & II Diabetes
Wireless paging and messaging: automated reminders of subject’s choice (e.g. check glucose, eat, take Rx, exercise), 2-way text messaging
Use over 3-6 months (N=25): 12,025 messages sent to subjects, with 1,676 responses; 114 additional messages sent from subjects, 16 needing action
Usage Estimate: < 1 message/subject/month
Lorig, 200642
Randomized trial, N=958
Heart disease, Type II diabetes, or chronic lung disease
Web-based self-management, with bulletin board, discussion group, educational information, weekly postings and moderated activities for 6 weeks, buddy support by email, email reminders to participate
Website use over 1 year (N=354): Mean logon 26.5 times/subject (range 0-177); 8 never logged on;
Usage Estimate: 17.7 logins/subject/month
Ma, 200643
Cohort, N=12Type II Diabetes Diabetes Information Profile (DIP):
info tailoring and priority algorithms; Quiz Service: quiz tailoring and priority algorithms; Agenda Service: agenda algorithms.
Website use over 3 months: Median login 6 times/subject (range 2-15); total logins 82; 82 of 257 information items visited for 10 sec or more; 1 of 12 subjects made an agenda; of 5 subjects using quizzes, mean 61.8 questions conducted
Usage Estimate: 2 logins/subject/month
Mckay, 200144
Randomized trial, N=78
Type II Diabetes who were sedentary
Web-based self-management, goal physical activity setting, tailored and graphic feedback, online coaching, peer discussion group; Control condition basic website
Use over 8 weeks: Total logons 341 for full program vs. 105 for informational website; Mean logon/wk 1.1 vs. 0.3; Mean group posting 1.1/subject; Mean messg to coach 2.1/subject; Use declined from mean 2.7 logons/subject/wk first 2 weeks to 0.5 in last 2 weeks
Usage Estimate: 4.4 logins/subject/month
Nguyen, 200345
Cohort, N=16Chronic obstructive pulmonary disease
Web-based self-management with exercise monitoring, goal setting and feedback, pulmonary function and symptom monitoring, weekly education, peer and professional chat, bulletin boards, email
First month registered most logins (330) compared to 104 in the final month
Unable to estimate frequency
4 of 6

Summary Table 1. Level of Use of Interactive Consumer Health IT (KQ 1)Author, Year
Design, NCondition and/or
Population Interactive Health IT Findings: Technology Usage Usage CommentsOwen, 200546
Cohort, N=62Breast cancer Web-based self-guided training for
coping skills, posted exercises every 2 weeks, bulletin board, discussion group, symptom management, educational information, email reminders
Use over 12 weeks: Mean 35.5 total logins/subject; Mean 9.5 bulletin posts/subject; Coping skills component highest use for 8 weeks then steep drop; Bulletin board had highest continuous use
Usage Estimate: 11.8 logins/subject/month
Piette, 199747
Cohort, N=65Diabetes Automated voice messaging to
communicate messages, collect information, and identify concerning issues (promting a clinician telephone call)
AVM contact over 4 weeks: 3.3 out of 4 calls completed; 57% contacted all 4 wks, 23% contacted 3 of 4 wks, 15% contacted twice, 5% contacted once
Subject proportion usage
Pike, 200748
Cohort, N=NRSmoking Recruitment to an interactive, tailored
websiteWide variation in website use; 3 sites had higher use (20% or more subjects making 5 or more visits) and 3 had lower use (<10% make 5 or more visits); non-ITT quitting was 26% vs. 22.1% in high vs. low site use.
Subject proportion usage
Rasmussen, 200549
Randomized trial, N=300
Asthma Web-based self-monitoring, input peak flow and symptoms, tailored action plans feedback, decision support for clinicians, email if treatment changes needed
Website use over 6 months: Mean use of self-management tool was 4 times in 2-week periods (range, 1-6)
Usage Estimate: 8 logins/subject/month
Reid, 200750
Randomized trial, N=99
Smokers with heart disease
Interactive voice response after discharge from hospital on day 3, 14 and 30. If subject wanted to quit or had confidence <7 (out of 10), nurse counselor called 3 times over 8 week period
IVR contact (N=50):Day 3, 35/50 (70%)Day 14, 36/50 (72%)Day 30, 34/50 (68%)
Subject proportion usage
Ross, 200451
Randomized trial, N=107
Congestive heart failure
Web-based access to electronic records, secure messaging with clinical team; educational content
Website use over 1 year (N=54): 43 subjects logged in 581 times; Use highest during month 1 to 3, thereafter 24% used it monthly; Subjects most frequently viewed clinical notes and lab results, and education guide was viewed least; 41 subjects sent 63 e-messages; Message categories: appointment 20%, refills 15%, Rx question 14%, tests 12%, feeling ill 8%, info 3%
Usage Estimate:0.9 logins/subject/month
5 of 6

Summary Table 1. Level of Use of Interactive Consumer Health IT (KQ 1)Author, Year
Design, NCondition and/or
Population Interactive Health IT Findings: Technology Usage Usage CommentsRuland, 200352
Randomized trial, N=52
Cancer Computerized touch-screen shared decision support for patients and clinicians, on patient symptoms, functional problems, and preferences, printed rank-order summary used for shared clinical decision-making
Use of decision tool: Median time 9 min to complete (range 0.5-49 minutes); 25% of subjects used <5 minutes
Limited-time intervention;Median time use reported
Shaw, 200753
Randomized trial, N=231
Breast cancer Underserved
CHESS: Web-based information, discussion group, ask an expert, and interactive services (tailored action plan, decision aids, health tracking
Use over 4 months, by category: Mean use discussion 506.2 min; Mean use information 35.5 min; Mean use ask an expert 28 min; Mean interactive service 27.9 min
Minutes used, not frequency
Smith, 200054
Randomized trial, N=30
DiabetesRural women
Computer with web-based health and diabetes information. ‘health chat’ self-management training, monitored discussion group, ‘Mailbox’ private email, structured classroom, Q & A, bulletin board
Website use over 5 months: Mean use time 63.8 min/month; First month use 129 min, then mean time declined to 68, 78, 44, an 37 min for month 2 through 5; Highest use for discussion group, mean 111 times/subject total; Mailbox (email) 40 times/subject; Self-mgmt 38 times/subject
Minutes used, not frequency
Tsang, 200155
Randomized cross-over study, N=20
Diabetes Computer diabetes monitoring with food diary and nutritional feedback, blood glucose monitoring, messaging to and from clinicians
Use over 6 months (N=19): Transmissions per week reported as >7/week by 15.8%, 5-6 by 10.5%, 3-4 by 21%, 1-2 by 36.8%, and <1 by 15.8%
Subject self-report
van den Brink, 200556
Cohort, N=36
Head and neck cancer
Web-based secure messaging, health and cancer information, support group forum, monitoring by questionnaire, e-mail alerts for concerning responses
Use over 6 weeks: Total sessions 982, with mean sessions/subject 273 (range 4-69); Sessions lasted mean 12 mins; 16% occurred after office hours; Use of functions: monitoring 100%, ask questions 64%, read messages 75%, contact subjects 8%, review information 61%
Usage Estimate:5 logins/subject/month
< X = less than X PSA = prostate-specific antigen> X = greater than X Q&A = question and answer> X or < X = greater than or equal to X or less than or equal to X RCT = randomized controlled trialBP = blood pressure Rx = precriptionCHESS = Comprehensive Health Enhancement Support System sec(s) = second(s)DIP = diabetes information profile TBD = to be determinedmgmt = management wk(s) = week(s)min(s) = minute(s)
Abbreviations
6 of 6

Summary Table 2. Usability of Interactive Consumer Health IT (KQ 2)
Author, Year, Design, N Condition
Intervention/Technology Type
Useful (technology elements)
Problematic technology elements Ease of Use Satisfaction
Andersson, 200294
RCT, N=44Headaches Therapist initiated telephone
contact via the internetGradual introduction AttractiveUser involvement in developmentFamiliar toolsControllability
Contrast, color, button size, graphics
HelpfulnessLearn ability
EfficiencyGlobal Usability
Anhoj, 200463
Qualitative, N=231Asthma Website with tailored feedback
and supportOne-click access to frequently used items
Distracting news, flashy graphics, opinion polls
NR NR
Bond, 200664
Qualitative Study, N=35 users; 52 surveyed
Diabetes Tailored self-management instruction, chat/discussion, bulletin boards, advice, counseling, log of self-management activities, and information
Tailored program greatly increased usability
Size, graphics NR NR
Carroll, 200265
Qualitative Study, N=14
Type II Diabetes Specifically usability testing; CV risk prevention; used in clinic; qualitative interviews comparing designs and interfaces.
Plain, simple backgrounds for displayUsing pie charts
Concern about clarity of information
NR 86%
Cavan, 200329
Cohort, N=16Type I Diabetes Web-based, feedback, patient
decision support NR Data entry screens hard to
followNR NR
Chen, 200666
Qualitative Study, N=77
Smoking (Cessation program)
Smoking cessation program (classroom), and Internet-assisted instruction program
Very easy to use NR Difficulty: 1.36 out of 7 (very low difficulty)
Very helpful in quitting smoking
Cleland, 200767
Qualitative Study, N=12
Asthma Electronic peak flow meter linked to a mobile phone with an interactive screen to record current asthma symptoms transmitted to and stored in a server
Fast, easy to use, time saver
Problematic cable attachments and data head, sensitivity of Piko meter, absence of a good cell signal
Very easy to use
Staff agreed that technology was easy to use and wildly popular with pts
Crosbie, 200668
Qualitative Study, N=20
Stroke Stroke rehabilitation, user moves arms and hands in a virtual environment and interacts with familiar objects
VE allowed pts with limited movement to experience sense of 'presence'
Virtual reality made some of the healthy users motion sick
Easy to use Very satisfied
Usability Outcomes
1 of 8

Summary Table 2. Usability of Interactive Consumer Health IT (KQ 2)
Author, Year, Design, N Condition
Intervention/Technology Type
Useful (technology elements)
Problematic technology elements Ease of Use Satisfaction
Cruz-Correia, 200730
RCT, N=21
Asthma Web-based self-monitoring, tailored action plan; decision support
East to record data, view data,
User interface issues, difficult to interpret content
Useful Like it
Delgado, 200331
Cohort, N=6Congestive heart failure
Web-based, secure messaging, educational content
Reliable responses from clinicGood quality of care
NR Easy to use Useful
Feil, 200069
Qualitative Study, N=160
Type 2 Diabetes D-Net intervention: peer social support and personalized dietary intervention
NR Computer was initial barrier to program participants
NR NR
Finkelstein, 199633
Qualitative Study, N=41
Post Lung Transplant patients
Electronic spirometer/diary (patient daily self-measurements of standard spirometry, vital signs, and symptoms recorded at home)
NR Very few phone calls, only tech glitches were in the original developmental stages of device
All patients able to record daily entries
NR
Finkelstein, 199870
Qualitative Study, N=17
Asthma/underserved
Symptom diary and spirometry test
NR NR Not complicated at all, very easy to use
NR
Friedman, 199771
Qualitative Study, N=516
Elderly/Chronically Ill
TLC: carries out automated, telephone-based health care encounters with patients in their homes
NR NR Majority found it very easy to use
Satisfied, made more aware of disease/alleviated worries about disease
Gerbert, 200395
Randomized Trial, N=52
Smoking & Alcoholism (48% AA; 12%Latino; low income)
Brief motivational video risk assessment with tailored advice
Convenience (right amount of time;5.7 / 7); privacy(5.95/ 7 pts); confidential (5.9/7pts); honest (6.94/7 pts)
71% would feel more comfortable with a "real" doctor.
6.8 on 7 pt scale
5.7 on 7pt scale
Glasgow, 200334
Qualitative Study, N=320
Diabetes Mellitus
Computer assessed, analyzed, and presented feedback on patients' dietary patterns, barriers to and support for dietary self-management, and tailored dietary fat reduction goal
NR NR NR NR
Usability Outcomes
2 of 8

Summary Table 2. Usability of Interactive Consumer Health IT (KQ 2)
Author, Year, Design, N Condition
Intervention/Technology Type
Useful (technology elements)
Problematic technology elements Ease of Use Satisfaction
Gomez, 2002a72
Qualitative, N=NRHIV/AIDS Web based self monitoring
system for HIV/AIDS patient care
Graphics NR NR NR
Gomez, 2002b73
Qualitative, N=NRHIV/AIDS Web based self monitoring
system for HIV/AIDS patient care
Reliable NR Easy to useEasy to learn
Good efficiency
Gustafson, 200174
Qualitative Study, NR
HIV/AIDS, breast cancer
Elderly, have/had cancer, not specific to one study!!
NR NR NR NR
Holman, 199696
Randomized, cross-over, N=6
Diabetes Hand held computer for self management and to make treatment recommendations
Convenient to use NR Easy to use Enjoyed using the system Wanted to continue
Jones, 200139
RCT, N=112Schizophrenia Computer touch-screen,
electronic record, feedback displays
Touch screen easy to use
Some displays confusing Easy to use NR
Kaufman, 200375
Qualitative, N=25Diabetes Videoconferencing, vitals
upload and review, education, email
NR Patient tutorial needs revision; creation of a field training program
NR NR
Kenwright, 200497
Cohort, N=27Phobia or Panic Disorder
FearFighter - Internet self-help system
"generally felt comfortable using the system"
(70% satisfied with an Internet Intervention)
Kerkenbush, 200376
Qualitative Study, NR
DM Track blood glucose levels, dietary intake, and activity level
NR NR Easy to use NR
Kim, 200577
Qualitative Study, N=42
Diabetes Mellitus
Access a website via their mobile phone or Internet and input their blood glucose levels every day; patients were sent the optimal recommendations by both the mobile phone and the internet
NR NR Easy to use Very satisfied
Usability Outcomes
3 of 8

Summary Table 2. Usability of Interactive Consumer Health IT (KQ 2)
Author, Year, Design, N Condition
Intervention/Technology Type
Useful (technology elements)
Problematic technology elements Ease of Use Satisfaction
Kim, 200778
Qualitative Study, N=33
Diabetes Mellitus
Nurse short message service by mobile phone and internet on glycosylated hemoglobin (HbA1c) levels and adherence to diabetes control recommendations; patients input information and were sent weekly recommendations
NR NR NR NR
Kosma, 200579
Qualitative Study, N=25
Physical Disability
Web-based physical activity motivational with and without discussion, weekly motivational messages
NR NR 4.5 out of 5 Helpful: 3.4/5
Kressig 200298
Cohort, N=34Physical activity for elderly
computer system for exercise promotion (questionnaire with tailored recommendations)
Most problems had to do with survey issues, not computer. 22% questions were mouse related.
4.6/5pt 21.45/24pts on acceptability of recommendation
LaPlante-Levesque, 200680
Qualitative Study, N=3
Impaired hearing/hearing loss
Email communication between a new hearing aid user and the audiologist or from the audiologist to the client
All seemed 'comfortable' with the program-study is broken down into experience of each individual
NR NR NR
Leu, 200541
RCT, N=50Type I & II Diabetes
Wireless messaging, automated reminders
Pager useful NR NR Enjoyed using pagerWanted to continue (68%)
Liu, 200581
Qualitative Study, N=274
Type II Diabetes POEM: Education management system: patient specific educational materials, medication data, and laboratory test results, as well as reminders with emails and short messages via cell phone
NR NR NR NR
Usability Outcomes
4 of 8

Summary Table 2. Usability of Interactive Consumer Health IT (KQ 2)
Author, Year, Design, N Condition
Intervention/Technology Type
Useful (technology elements)
Problematic technology elements Ease of Use Satisfaction
Lober, 200682
Qualitative Study, N=38
Elderly Personal health records with areas for communication with health professional
Ability to print out PHR Visibility, icon size, graphics NR NR
Ma, 200643
Cohort, N=12Type II Diabetes Information tailoring, question
tailoring System was usefulSystem is relevant
None Easy to use Would recommend system to others
McDaniel, 200299
Cohort, N=110Smoking; Low income women
Interactive smoking cessation software
technology malfunctions; software errors
60.2 / 70pts; minority participants more satisfied
McKay, 200144
RCT, N=78Type II Diabetes, sedentary
Web-based, tailored and graphic feedback, peer discussion
No difference between groups in helpfulness of the PA section or relevance of the program
NR No difference between groups in ease of use
NR
McPherson, 2006100
Randomized Trial, N=101
Children with Asthma
Multimedia educational program
35 / 37 felt is was a good way to learn about asthma; 31 / 37 felt they learned more from using the computer
Piette, 199747
Cohort, N=65Diabetes Voice messaging No difficulty entering
answers into touchtone system
NR No difficulty understanding the messages
Calls very or somewhat helpfulWanted to continue
Ralston, 200483
Qualitative Study, N=9
Diabetes Mellitus
Living with diabetes program: web-based disease management module to support care
NR NR NR NR
Reed, 200584
Qualitative Study, N=NR
Diabetes Mellitus
Not specified, website review; www.diabetes-insight.info
Easy to navigate and comprehensiveFew advertisements
NR NR NR
Usability Outcomes
5 of 8

Summary Table 2. Usability of Interactive Consumer Health IT (KQ 2)
Author, Year, Design, N Condition
Intervention/Technology Type
Useful (technology elements)
Problematic technology elements Ease of Use Satisfaction
Ruland, 200352
Randomized trial, N=52
Cancer Computerized touch-screen shared decision support and decision-making
Use of touch pad system without assistanceSystem a useful tool
Not rated positively: Learning to use the computerTo get it to do what I wantClear and understandable on how to operateCan become skillful using the computer
Questions easy to answer
Do not find it overall easy to use
NR
Schärer, 200285
Qualitative Study, N=600
Bipolar Disorder PDA; Patients encouraged to report most manic and depressive state not only in the presence of mood swings, information analyzed and sent to patient via email or paper
Experience with PDAs PDA intimidating to novices at beginning
All expressed satisfaction with ease and use of IT
All expressed satisfaction with ease and use of IT
Sciamanna, 1999101
Qualitative Study, N(Pilot)=29, N(Study B)=503
Smoking Patients answer questions, these are analyzed and patient provided with tailored quit-smoking material, also physicians provided with information to help counsel patients
NR NR Easy to use NR
Sciamanna, 200486
Cohort, N=150
Smoking & physical activity
Computer assessment with tailored printed feedback
NR NR Easy to use NR
Sciamanna, 2005102
Quasi-experimental, N=121
Osteoarthritis Computer assessment with tailored feedback about OA and OA care
NR NR Easy to use Most rated IT excellent or very good, no one rated as fair or poor
Shaw, 200087
Qualitative Study, N=20
Breast Cancer CHESS NR NR Found easy to use
NR
Skeels, 200688
Cohort, N=30HIV+ CARE+ Tablet PC counseling NR Tablet PC screen difficult to
seeRadio buttonsConfusion on how to use tablet PC
NR NR
Usability Outcomes
6 of 8

Summary Table 2. Usability of Interactive Consumer Health IT (KQ 2)
Author, Year, Design, N Condition
Intervention/Technology Type
Useful (technology elements)
Problematic technology elements Ease of Use Satisfaction
Smaglik, 200889
Qualitative Study, N=36
HIV/AIDS HIV CHESS support groups NS NS NS NS
Tsang, 200155
Randomized cross-over study, N=19
Diabetes Hand-held electronic diary with touch screen
NR Technical issues 95% felt system was easy to use
NR
van den Brink, 200390
Qualitative Study, N=NR
Head and Neck Cancer
Not specified-summary of electronic information system
NR NR NR NR
van den Brink, 200556
CohortN=36
Head & neck cancer
Electronic health information support system
NR Technical issues NR NR
van't Riet, 200191
Qualitative Study, N=14 families
Amblyopia Interactive computer system that helps with communication between patients, their parents and caregiver
NR NR NR NR
Wilkie, 200158
Descriptive, N=41Cancer The Symptom Report program
was designed as an interactive, touch-screen method for assessment of pain and fatigue.
NR NR System was easy to use
NR
Yeh, 200692
Qualitative Study, N=274
Diabetes Mellitus
POEM: Education management system: patient specific educational materials, medication data, and laboratory test results, as well as reminders with emails and short messages via cell phone
NR NR NR NR
Zimmerman, 200493
Qualitative Study, N=52
CABG/Elderly (>65 yrs)
CABG patients access web for daily information on recovery, provider can observe patients' progress at home
NR NR NR NR
Usability Outcomes
7 of 8

Summary Table 2. Usability of Interactive Consumer Health IT (KQ 2)
< X = less than X< X or > X = less than or equal to X or greater than or equal to X> X = greater than XBP = blood pressureCABG = coronary artery bypass graft CHESS = Comprehensive Health Enhancement Support SystemCV = cardiovascularDM = diabetes mellitusHgBA1c = glycosylated hemoglobinNR = not reportedNS = not significantOA = osteoarthritisPA = peer assessmentPDA = personal digital assistantPHR = personal health recordsRCT = randomized controlled trialTBD = to be determinedVE = virtual entertainment
Abbreviations
8 of 8

Summary Table 3. Barriers to Use of Interactive Consumer Health IT (KQ 3)
Author, Year, Design, NCondition and/or Population Interactive Computer Technology (ICT) Barriers
Anhoj, 200463
Qualitative, N=231Asthma Website with tailored feedback and support - Doctors reluctant due to time constraints
- Did not fit into patients' everyday lives- Used inefficiently- Contradictory information, caused disbelief and results with not follow the advice- Access to the Internet- The benefits are not immediate- Lack of trust with virtual expert
Artinian, 2003106
RCT, N=18Congestive heart failure
Video cassette monitoring connected to telephone line
- 44% hated it- Perception that they had to build their life around the monitor/reminder- Nuisance and intrusive- 44% had technical problems- Difficult to get small pills- Text on screen too small; color contrast difficult to read; needed longer message for clarity
Bond, 200664
Qualitative Study, N=35 users; 52 surveyed
Diabetes Tailored self-management instruction, chat/discussion, bulletin boards, advice, counseling, log of self-management activities, and information
- Lack of computer experience and lack of personal instruction- Non-tailored device/program (in this case, larger text/icons and physical limitations such as double-clicking the mouse had to be implemented)- Lack of access to a computer (computers were given/installed for free in patient's homes in this study)
Carroll, 200265
Qualitative Study, N=14Type II Diabetes Specifically usability testing; CV risk prevention;
used in clinic; qualitative interviews comparing designs and interfaces.
- Visibility- Lack of computer skills
Cathala, 200328
Cohort, N=140Prostate cancer; post-op radical prostatectomy
Web-based monitoring with messaging - 11% had connection problems- 14% had technical problems - Physician email not reimbursed
Cavan, 200329
Cohort, N=16Type I Diabetes Web-based, feedback, patient decision support - Took too much time
- Internet connection interruption caused loss of dataChen, 200666
Qualitative Study, N=77Smoking (Cessation program)
Smoking cessation program (classroom), and Internet-assisted instruction program
- Lack of computer skills- Cost
1 of 6

Summary Table 3. Barriers to Use of Interactive Consumer Health IT (KQ 3)
Author, Year, Design, NCondition and/or Population Interactive Computer Technology (ICT) Barriers
Cleland, 200767
Qualitative Study, N=12Asthma Electronic peak flow meter linked to a mobile
phone with an interactive screen to record current asthma symptoms transmitted to and stored in a server
- Lack of familiarization with mobile phone technology- Failure of technology to work on several occasions -Problems with cable attachments and data head (incomplete transfer of information)- Absence of a good cell signal (inhibited data transmission/sent reminders to patients to send data, if they had recorded it previously-frustrated some to receive redundant reminders)- Sensitivity of Piko meter (suggests in study that unusually high readings indicate that pts 'spat rather than blew into the Piko meter')
Crosbie, 200668
Qualitative Study, N=20Stroke Stroke rehabilitation, user moves arms and hands
in a virtual environment and interacts with familiar objects
- Cost- Side effects associated with technology (in the case of VE, healthy patients experience headaches, sweating, nausea, disorientation, and balance disturbance)- Delays
Cruz-Correia, 200730
Randomized cross-over study, N=21
Asthma Web-based self-monitoring, tailored action plan; decision support
- Technical problems – 9/16 reported problems; Internet connection issues (9) , system errors (3), peak flow meter batteries (5), meter technical problems (2)- Difficult data input for monitoring systems- Poor graphic feedback
Delgado, 200331
Cohort, N=6Congestive heart failure
Web-based, secure messaging, educational content
- Technical problems – system down for 24 hours during 3 months
Earnest, 200432
Randomized trial, N=107Congestive heart failure
Web-based records, secure messaging, educational content
- Not comprehending medical jargon- Watered down or “sugar-coated” information
Feil, 200069
Qualitative Study, N=160Diabetes Mellitus D-Net intervention: peer social support and
personalized dietary intervention- Cost of computer/internet- Lack of computer/internet skills- Computer anxiety
Finkelstein, 199633
Qualitative Study, N=41Post Lung Transplant patients
Electronic spirometer/diary (patient daily self-measurements of standard spirometry, vital signs, and symptoms recorded at home)
- Lack of computer/internet skills- Cost of computer/internet- Failure to replace mouthpieces weekly
Finkelstein, 199870
Qualitative Study, N=17 Asthma/underserved
Symptom diary and spirometry test - Lack of computer/internet skills- Cost- Limited personal instruction
Friedman, 199771
Qualitative Study, N=516Elderly/Chronically Ill
TLC: carries out automated, telephone-based health care encounters with patients in their homes
- Lack of human interaction
2 of 6

Summary Table 3. Barriers to Use of Interactive Consumer Health IT (KQ 3)
Author, Year, Design, NCondition and/or Population Interactive Computer Technology (ICT) Barriers
Gerbert 200395
Randomized Trial, N=52Smoking & Alcoholism
Brief motivational video risk assessment with tailored advice
- 71% would feel more comfortable with a "real" doctor.
Glasgow, 200334
Qualitative Study, N=320Diabetes Mellitus Computer assessed, analyzed, and presented
feedback on patients' dietary patterns, barriers to and support for dietary self-management, and tailored dietary fat reduction goal
- Cost- Level of commitment- Lack of long-term weight loss intervention success
Gomez, 2002b73
Cross Over, N=NRHIV/AIDS Web based self monitoring system for HIV/AIDS
patient care- No battery checking software- Low reliability of research system- Required technical personnel at hospital for support during trial- Required training users on when to call for technical support
Gustafson, 200174
Qualitative Study, NRHIV/AIDS, breast cancer
Elderly, have/had cancer, not specific to one study!!
- Cost- Lack of internet/computer- Lack of computer skills
Jones, 200139
Randomized trial, N=112Schizophrenia Computer touch-screen, electronic record,
feedback displays- Some preferred the nurse because of a “personal touch,” empathy, and talking rather than reading- Bringing pts into the clinic for the touch screen computer was too costly for schizophrenia treatment
Kaufman, 2003b75
Qualitative Study, N=25Diabetes IDEATel project; web-based diabetes diary
(Diabetes Manager) that allows patients to track their own progress for five variables: BP, glucose, medications, exercise, and viewing Hgba1c; Videoconferencing, electronic transmission of glucose and blood pressure readings, secure email, web-based review of clinical data, access to web-based educational material
- Literacy and numeracy- Visibility- Psychomotor skills associated with keyboard/mouse use- Lack of computer skills- Numerous technical difficulties
Kenwright, 200497
Cohort, N=27Phobia or Panic Disorder
FearFighter - Internet self-help system - 3/10 would prefer face-to-face with doctor
Kerkenbush, 200376
Qualitative Study, NRDM Track blood glucose levels, dietary intake, and
activity level- APNs have to evaluate patients to identify ideal candidates for PDAs (excluding people who have little PDA experience)-Cost-Technological demands- The fact that PDAs operate on batteries and sometimes when they run down completely the entire memory is lost
3 of 6

Summary Table 3. Barriers to Use of Interactive Consumer Health IT (KQ 3)
Author, Year, Design, NCondition and/or Population Interactive Computer Technology (ICT) Barriers
Kim, 200577
Qualitative Study, N=42Diabetes Mellitus Access a website via their mobile phone or
Internet and input their blood glucose levels every day; patients were sent the optimal recommendations by both the mobile phone and the internet
- Lack of mobile phone technology skills- Cost
Kim, 200778
Qualitative Study, N=33Diabetes Mellitus Nurse short message service by mobile phone
and internet on glycosylated hemoglobin (HbA1c) levels and adherence to diabetes control recommendations; patients input information and were sent weekly recommendations
- Lack of mobile phone/internet skills- Cost
Kosma, 200579
Qualitative Study, N=25Physical Disability Web-based physical activity motivational with and
without discussion, weekly motivational messages- Patient adherence/motivation- Lack of computer/internet skills
Kressig 200298
Cohort, N=34Physican activity for elderly
computer system for exercise promotion (questionnaire with tailored recommendations)
- Age directly related to increased need for assistance.
LaPlante-Levesque, 200680
Qualitative Study, N=3
Impaired hearing/hearing loss
Email communication between a new hearing aid user and the audiologist or from the audiologist to the client
- Cost- Time
Leu, 200541
Randomized trial, N=50Type I & II Diabetes
Wireless messaging, automated reminders - 44% found messages annoying- Anticipating messages- Messages too overwhelming- Pager didn’t work in all locations- Messages not programmable by patients- Security issues, was this HIPAA compliant
Liu, 200581
Qualitative Study, N=274Type II Diabetes POEM: Education management system: patient
specific educational materials, medication data, and laboratory test results, as well as reminders with emails and short messages via cell phone
- Cost- Lack of computer/internet skills- Lack of cell phone
Lober, 200682
Qualitative Study, N=38Elderly Personal health records with areas for
communication with health professional- Lack of computer/internet- Lack of computer/internet skills- Literacy and numeracy- Legal restrictions to PHR
Ma, 200643
Cohort, N=12Type II Diabetes Information tailoring, question tailoring - Redundancy of information or information they already knew
- Well controlled DM- Lack of computer at home
4 of 6

Summary Table 3. Barriers to Use of Interactive Consumer Health IT (KQ 3)
Author, Year, Design, NCondition and/or Population Interactive Computer Technology (ICT) Barriers
McDaniel, 200299
Cohort, N=110Smoking; Low income women
Interactive smoking cessation software - Participants with less than a high school eduction were less satisfied as were those not seriously thinking about quitting- Technology malfunctions and software errors
McKay, 200144
Randomized trial, N=78Type II Diabetes who were sedentary
Web-based, tailored and graphic feedback, peer discussion
- Only 33% found the peer-to-peer support group helpful- Low number of people in support group, not enough for critical mass
Ralston, 200483
Qualitative Study, N=9Diabetes Mellitus Living with diabetes program: web-based disease
management module to support care- Lack of computer/internet skills- Lack of computer/internet- Unmet expectations of the program- program was Incompatible with daily activities
Reed, 200584
Qualitative Study, N=NRDiabetes Mellitus Not specified, website review;
www.diabetes-insight.info- Lack of computer/internet
Schärer, 200285
Qualitative Study, N=600Bipolar Disorder PDA; Patients encouraged to report most manic
and depressive state not only in the presence of mood swings, information analyzed and sent to patient via email or paper
- Cost- Visibility (small font)
Sciamanna, 1999101
Qualitative Study, N(Pilot)=29, N(Study B)=503
Smoking Patients answer questions, these are analyzed and patient provided with tailored quit-smoking material, also physicians provided with information to help counsel patients
- Cost of internet/computer- Lack of computer/internet skills- Program requires personal responses from patient
Sciamanna, 200486
Cohort, N=150Smoking Tailored printed feedback (primary care setting)
on smoking & physical activity for patients and physicians
- Lack of review/discussion of report by physician with patient
Shaw, 200087
Qualitative Study, N=12Breast Cancer CHESS support groups - Lack of computer/internet skills
- Lack of interestSkeels, 200688
Qualitative Study, N=30HIV/AIDS CARE+; Tablet PC Counseling Tool for HIV+;
medication adherence and secondary HIV prevention; observation & semi-structured interview after use Specifically designed to test barriers & drivers with HIV+ pts
- Visibility- Lack of human interaction/counseling- Unable to ask clarifying questions of questionnaire
Smaglik, 200889
Qualitative Study, N=36HIV/AIDS HIV CHESS support groups - Lack of computer/internet skills
Taylor, 2006107
RCT, N=114Sleep apnea HealthBuddy; CPAP adherence - Telephonic delay between patient and practitioner
Turnin, 1992108
RCT, N=105Diabetes Internet expert system for diabetes - Diabeto - Cost
van den Brink, 200390
Qualitative Study, N=NRHead and Neck Cancer
Not specified-summary of electronic information system
- Lack of computer/internet skills- Lack of interest in site content
5 of 6

Summary Table 3. Barriers to Use of Interactive Consumer Health IT (KQ 3)
Author, Year, Design, NCondition and/or Population Interactive Computer Technology (ICT) Barriers
van den Brink, 200556
Prospective Study, N=36Head and Neck Cancer
Patient-provider messaging; forum; monitoring; email alerts
- Technical difficulties- Lack of computer/internet skills- Program technology not integrated into most GPs tech system
van't Riet, 200191
Qualitative Study, N=14 families
Amblyopia Interactive computer system that helps with communication between patients, their parents and caregiver
- Lack of computer/internet- Cost- Lack of time
Wilkie, 200158
Qualitative Study, N=41Cancer Cancer symptom control; Symptom report
questionnaire; interactive tailored education - Lack of computer skills- Not a comprehensive questionnaire, only about pain
Yeh, 200692
Qualitative Study, N=274Diabetes Mellitus POEM: Education management system: patient
specific educational materials, medication data, and laboratory test results, as well as reminders with emails and short messages via cell phone
- Lack of computer/internet skills- Cost- Literacy
Zabinski, 200159
Pilot study, N=4Eating Disorders Women at risk of eating disorders; synchronous
Internet relay chat; based on cognitive behavioral treatment; facilitated by a moderator
- Lack of body language/facial expression feedback- Unable to control distractions in home environment- Unable to control forwarding of messages
Zimmerman, 200493
Qualitative Study, N=52CABG/Elderly (>65 yrs)
CABG patients access web for daily information on recovery, provider can observe patients' progress at home
- Lack of computer/internet skills- Literacy/numeracy
< X = less than X HgBA1c = glycosylated hemoglobin< X or > X = less than or equal to X or greater than or equal to X HIPAA = Health Insurance Portability and Accountability Act> X = greater than X NR = not reportedAPN = advanced practice nurse PDA = personal digital assistantBP = blood pressure PHR = personal health recordsCABG = coronary artery bypass graft RCT = randomized controlled trialCHESS = Comprehensive Health Enhancement Support System TBD = to be determinedCPAP = continuous positive airway pressure VE = virtual entertainmentDM = diabetes mellitusGP = general practitioner
Abbreviations
6 of 6

Summary Table 4. Drivers and Facilitators of the Use of Interactive Consumer Health IT (KQ 4)Author, Year, Design, N
Condition and/ or Population Interactive Computer Technology (ICT) Drivers
Andersson, 200294
RCT, N=44Headaches Therapist initiated telephone contact via the
internetGradual introduction AttractiveUser involvement in developmentFamiliar toolsControllability
Anhoj, 200463
Qualitative, N=231Asthma Website with tailored feedback and support - Trustworthy and reliable technology
- Perception that an electronic asthma diary helps manage the disease
Artinian, 2003106
RCT, N=18Congestive heart failure
Video cassette monitoring connected to telephone line
- Reminders
Bond, 200664
Qualitative Study, N=35 users; 52 surveyed
Diabetes Tailored self-management instruction, chat/discussion, bulletin boards, advice, counseling, log of self-management activities, and information
- One-on-one instruction- Tailored program
Carroll, 200265
Qualitative Study, N=14
Type II Diabetes Specifically usability testing; CV risk prevention; used in clinic; qualitative interviews comparing designs and interfaces.
- Patient enthusiasm in gaining knowledge- Empowering patient adherence to behavioral changes
Cathala, 200328
Cohort, N=140Prostate cancer; post-op radical prostatectomy
Web-based monitoring with messaging - People who already have Internet access are more likely to accept and even want to try the Web technology
Cavan, 200329
Cohort, N=16Type I Diabetes Web-based, feedback, patient decision support - Increased confidence
- Not in good control- Planning a long journey- Weather changes
Chen, 200666
Qualitative Study, N=77
Smoking (Cessation program)
Smoking cessation program (classroom), and Internet-assisted instruction program
- Quit smoking- Ease of use
Cleland, 200767
Qualitative Study, N=12
Asthma Electronic peak flow meter linked to a mobile phone with an interactive screen to record current asthma symptoms transmitted to and stored in a server
- Intervention that uses a technological staple of society (thus, most pts were familiar with cell phone tech, and reported no problems)- Digital Piko meter also was though to reduce error, therefore yielding a more satisfactory result for both pts and clinicians
Crosbie, 200668
Qualitative Study, N=20
Stroke Stroke rehabilitation, user moves arms and hands in a virtual environment and interacts with familiar objects
- Site of stroke that limits arm movement in the real world that can be remedied by VE- Low levels of interaction between pt and environment- Ineffective traditional paralysis therapy techniques- Very small percentage of time actually spent by pts practicing traditional therapy tasks
1 of 6

Summary Table 4. Drivers and Facilitators of the Use of Interactive Consumer Health IT (KQ 4)Author, Year, Design, N
Condition and/ or Population Interactive Computer Technology (ICT) Drivers
Delgado, 200331
Cohort, N=6Congestive heart failure
Web-based, secure messaging, educational content
- Technology available at any time needed
Earnest, 200532
Randomized trial, N=107
Congestive heart failure
Web-based records, secure messaging, educational content
- Perceived more control- Perceived better communication with doctor- Perceived increased participation in care- Perceived increase in efficiency of getting information
Feil, 200069
Qualitative Study, N=160
Diabetes Mellitus D-Net intervention: peer social support and personalized dietary intervention
- Availability of access to intervention through home computer via the internet- Internet/computer competence
Finkelstein, 199633
Qualitative Study, N=41
Post Lung Transplant patients
Electronic spirometer/diary (patient daily self-measurements of standard spirometry, vital signs, and symptoms recorded at home)
- Daily self-reporting by transplant pts is critical for early detection of disease/illness
Finkelstein, 199870
Qualitative Study, N=17
Asthma/ underserved
Symptom diary and spirometry test - Perceived sense of security- Importance of knowing that results were reviewed after test
Friedman, 199771
Qualitative Study, N=516
Elderly/Chronically Ill
TLC: carries out automated, telephone-based health care encounters with patients in their homes
- Increased awareness of disease- Relieves worries about the disease
Gerbert 200395
Randomized Trial, N=52
Smoking & Alcoholism
Brief motivational video risk assessment with tailored advice
- Convenience (right amount of time;5.7 / 7)- Privacy(5.95/ 7 pts)- Confidential (5.9/7pts)- Honest (6.94/7 pts)- Felt they learned something new(4.9/7pts
Glasgow, 200334
Qualitative Study, N=320
Diabetes Mellitus Computer assessed, analyzed, and presented feedback on patients' dietary patterns, barriers to and support for dietary self-management, and tailored dietary fat reduction goal
- Empowerment of individual (goal setting)- Focus on behavioral changes vs. weight loss
Gomez 2002a72
NR, N=NRHIV/AIDS Web based self monitoring system for HIV/AIDS
patient care- Anonymity- Access to experts / 2nd opinions - Perceived greater control over their situation- Perceived improved health
Gomez 2002b73
NR, N=NRHIV/AIDS Web based self monitoring system for HIV/AIDS
patient care- Perceived improved glycemic control- Better communication with doctor, - Good DM education
2 of 6
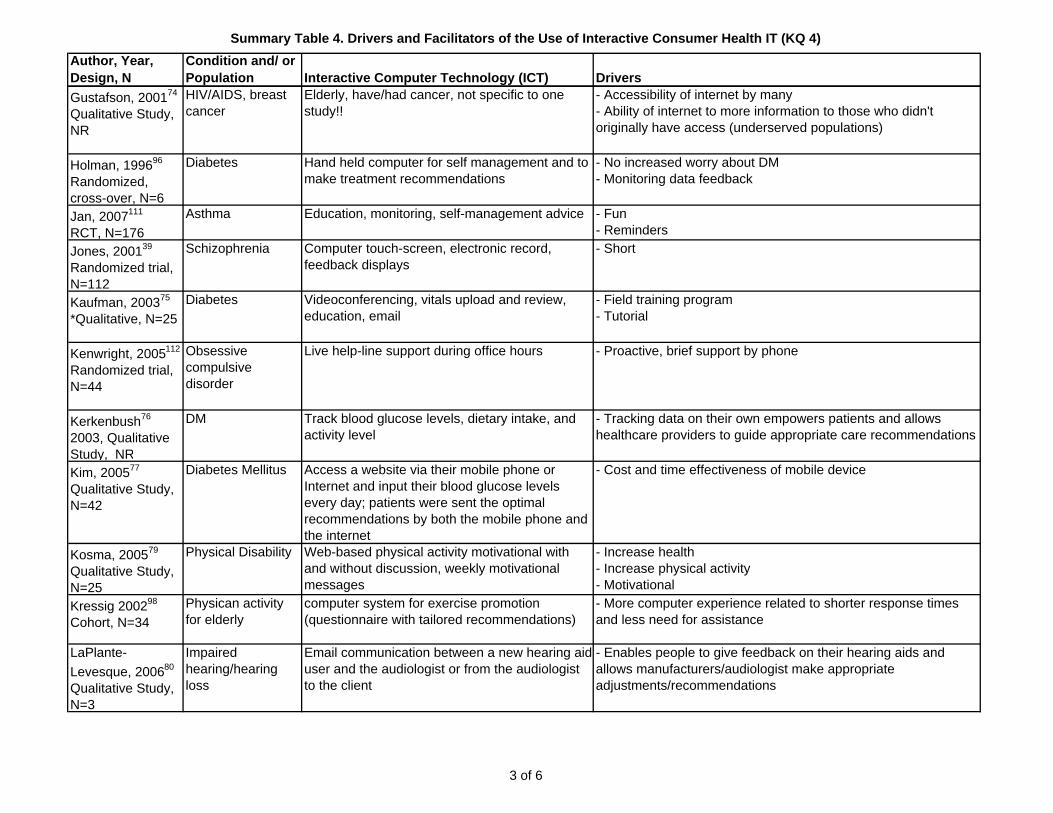
Summary Table 4. Drivers and Facilitators of the Use of Interactive Consumer Health IT (KQ 4)Author, Year, Design, N
Condition and/ or Population Interactive Computer Technology (ICT) Drivers
Gustafson, 200174
Qualitative Study, NR
HIV/AIDS, breast cancer
Elderly, have/had cancer, not specific to one study!!
- Accessibility of internet by many- Ability of internet to more information to those who didn't originally have access (underserved populations)
Holman, 199696
Randomized, cross-over, N=6
Diabetes Hand held computer for self management and to make treatment recommendations
- No increased worry about DM- Monitoring data feedback
Jan, 2007111
RCT, N=176Asthma Education, monitoring, self-management advice - Fun
- RemindersJones, 200139
Randomized trial, N=112
Schizophrenia Computer touch-screen, electronic record, feedback displays
- Short
Kaufman, 200375
*Qualitative, N=25Diabetes Videoconferencing, vitals upload and review,
education, email- Field training program- Tutorial
Kenwright, 2005112
Randomized trial, N=44
Obsessive compulsive disorder
Live help-line support during office hours - Proactive, brief support by phone
Kerkenbush76
2003, Qualitative Study, NR
DM Track blood glucose levels, dietary intake, and activity level
- Tracking data on their own empowers patients and allows healthcare providers to guide appropriate care recommendations
Kim, 200577
Qualitative Study, N=42
Diabetes Mellitus Access a website via their mobile phone or Internet and input their blood glucose levels every day; patients were sent the optimal recommendations by both the mobile phone and the internet
- Cost and time effectiveness of mobile device
Kosma, 200579
Qualitative Study, N=25
Physical Disability Web-based physical activity motivational with and without discussion, weekly motivational messages
- Increase health- Increase physical activity- Motivational
Kressig 200298
Cohort, N=34Physican activity for elderly
computer system for exercise promotion (questionnaire with tailored recommendations)
- More computer experience related to shorter response times and less need for assistance
LaPlante-Levesque, 200680
Qualitative Study, N=3
Impaired hearing/hearing loss
Email communication between a new hearing aid user and the audiologist or from the audiologist to the client
- Enables people to give feedback on their hearing aids and allows manufacturers/audiologist make appropriate adjustments/recommendations
3 of 6

Summary Table 4. Drivers and Facilitators of the Use of Interactive Consumer Health IT (KQ 4)Author, Year, Design, N
Condition and/ or Population Interactive Computer Technology (ICT) Drivers
Leu, 200541
Randomized trial, N=50
Type I & II Diabetes
Wireless messaging, automated reminders - Perceived pager helped their health care to be better - Reminders useful when unusual life events occurred- Monitoring treatment changes- Personal accountability
Liu, 200581
Qualitative Study, N=274
Type II Diabetes POEM: Education management system: patient specific educational materials, medication data, and laboratory test results, as well as reminders with emails and short messages via cell phone
- Ability to review medical information- Appointment reminders- Access to education materials
Lober, 200682
Qualitative Study, N=38
Elderly Personal health records with areas for communication with health professional
- Empowering patients to keep track of PHR- Reassurance that PHR will remain intact electronically
Ma, 200643
Cohort, N=12Type II Diabetes Information tailoring, question tailoring - Tailored information
- Newly diagnosed patients found information more helpfulMcDaniel, 200299
Cohort, N=110Smoking; Low income women
Interactive smoking cessation software - Minority participants were significantly more satisfied with the computer program as well as those with more than a high school education and those who were thinking about quitting in the next month
McKay, 200144
Randomized trial, N=78
Type II Diabetes who were sedentary
Web-based, tailored and graphic feedback, peer discussion
- Tailored action plan with personal feedback - Personal coach- Lesson: focus on keeping people engaged
Nguyen, 2005113
NR, N=23COPD Web site with activities information - Perceived increase access to information
Owen, 200546
Cohort, N=62Breast cancer Web-based self-guided trainings, bulletin board,
discussion group, symptom management, educational information, email reminders
- Low perceived health status- More severe depressive and anxious symptoms- Newly or recently diagnosed
Piette, 199747
Cohort, N=65Diabetes Voice messaging - Convenience
- Fewer messages for younger patients (<55 years old)Ralston, 200883
Qualitative Study, N=9
Diabetes Mellitus Living with diabetes program: web-based disease management module to support care
- Empowerment of patient- Non-acute concerns uniquely valued - Enhanced sense of security about health/health care- Providing valuable feedback
Reed, 2005a110
Qualitative Study, N=NR
Diabetes Mellitus Not specified, website review; www.diabetes-insight.info
- Accessibility of information
Reed, 2005b84
NR, NRDiabetes Website with static information, email support
groups, video Web cast interviews, transcripts and articles
- Patient specific information about insulin therapies
4 of 6

Summary Table 4. Drivers and Facilitators of the Use of Interactive Consumer Health IT (KQ 4)Author, Year, Design, N
Condition and/ or Population Interactive Computer Technology (ICT) Drivers
Rodgers, 200584
RCT, N=1705Smoking Tailored text messages - Use of cell phones with younger individuals
- Low cost- Distracting activities
Schärer, 2002114
Qualitative Study, N=600
Bipolar Disorder PDA; Patients encouraged to report most manic and depressive state not only in the presence of mood swings, information analyzed and sent to patient via email or paper
- Discrete- Not a 'stigmatizing' tool
Sciamanna, 1999101 Qualitative Study, N(Pilot)=29, N(Study B)=503
Smoking Patients answer questions, these are analyzed and patient provided with tailored quit-smoking material, also physicians provided with information to help counsel patients
- Tailored quit-smoking materials- Easy/fun to use
Sciamanna, 200486
Cohort, N=150
Smoking Tailored printed feedback (primary care setting) on smoking & physical activity for patients and physicians
- Tailored printed feedback
Sciamanna, 2005102
Quasi-experimental, N=121
Osteoarthritis Web-tailored feedback and recommendations based on guidelines for osteoarthritis care
- Better care from doctors- Try/recommend website to others
Shaw, 200087
Qualitative Study, N=12
Breast Cancer CHESS support groups - Anonymity within the support group fostered equalized participation
Skeels, 200688
Qualitative Study, N=30
HIV/AIDS CARE+; Tablet PC Counseling Tool for HIV+; medication adherence and secondary HIV prevention; observation & semi-structured interview after use Specifically designed to test barriers & drivers with HIV+ pts
- Computer as "objective" and "non-judgmental"- Privacy- Accessibility and convenience
Smaglik, 200889
Qualitative Study, N=36
HIV/AIDS HIV CHESS support groups - Availability of support group via the internet- Anonymity- Availability of information- Access to professionals who answer e-mails
Turnin, 1992108
RCT, N=105Diabetes Internet expert system for diabetes - Diabeto -24 hour home access
- Free of chargevan den Brink, 200390
Qualitative Study, N=NR
Head and Neck Cancer
Not specified-summary of electronic information system
- Accessibility and availability of information
5 of 6

Summary Table 4. Drivers and Facilitators of the Use of Interactive Consumer Health IT (KQ 4)Author, Year, Design, N
Condition and/ or Population Interactive Computer Technology (ICT) Drivers
van der Brink, 200556
Prospective Study, N=36
Head and Neck Cancer
Patient-provider messaging; forum; monitoring; email alerts
- Sense of security- Enable communication between healthcare providers and patients
van't Riet, 200191
Qualitative Study, N=14 families
Amblyopia Interactive computer system that helps with communication between patients, their parents and caregiver
- Ability to access information and support from home
Wilkie, 200158
Qualitative Study, N=41
Cancer Cancer symptom control; Symptom report questionnaire; interactive tailored education
- Enabling communication- Beneficial for the novice patient
Yeh, 200692
Qualitative Study, N=274
Diabetes Mellitus POEM: Education management system: patient specific educational materials, medication data, and laboratory test results, as well as reminders with emails and short messages via cell phone
- Ability to review medical information- Appointment reminders- Access to education materials
Zabinski, 200159
Pilot study, N=4Eating Disorders Women at risk of eating disorders; synchronous
Internet relay chat; based on cognitive behavioraltreatment; facilitated by a moderator
- Chat room forum- Low cost
Zimmerman, 200493
Qualitative Study, N=52
CABG/Elderly (>65 yrs)
CABG patients access web for daily information on recovery, provider can observe patients' progress at home
- Empowerment of patients to manage symptoms
CABG = coronary artery bypass graftCHESS = Comprehensive Health Enhancement Support SystemCOPD = chronic obstructive pulmonary disease CV = cardiovascularDM = diabetes mellitusNR = not reportedPDA = personal digital assistantPHR = personal health recordsRCT = randomized controlled trialTBD = to be determinedVE = virtual entertainment
Abbreviations
6 of 6

Summary Table 5. Studies of Effectiveness of Interactive Consumer Health IT (KQ 5)
Author, Year Design, N Patients Intervention(s)
Comparison Group(s) Duration, Setting Outcomes
Quality Rating
Andrade, 2005117
RCT, N=64
HIV/AIDS, initial Rx and failed Rx, good and poor memory; 42% female, 88% African American
Rx reminder device; reports to clinician; monthly counseling; auto- adherence monitor
monthly counseling; auto- adherence monitor
24 week; Baltimore; (1999-2002)
Rx adherence 80% v 65% (NS) but in memory impaired subgroup 77% v 57% (p=.001); CD4 301 v 250 (NS); HV RNA decrease 1 log 72% v 41% (p=0.02); undetectable HIV RNA 34% v 38% (NS)
Fair
Araki, 2006118
RCT, N=36Alcoholic factory workers (GGTP high on screen); age 44 yrs
tailored email counseling tailored face to face counseling; no counselling
2 mos, 2 sessions; Tokyo
alcohol consumption and GGTP decreased, knowledge and attitude scores increased significantly in face to face group; nonsignificant or no change in email group or controls
Fair
Artinian, 2003106
RCT, N=18Heart Failure,1 of 18 female, age ~ 68 yrs;LVEF<40, 61% African American
daily monitoring; reminding, daily clinician review and adjustment; (videocassette size device with meds and phone connection)
digital scale; BP monitor, logs, incentive pmts, educ booklet, HF clinic visits, pharmacist review meds
3 mos, Virginia both groups improved self-care, medication adherence, quality of life; neither changed 6 min walk, NYHA class; technical problems: 'most pts did not follow our instructions"; 4/9 hated it, 5/9 loved it
Fair
Barnason, 2003119
RCT, N=18
post CABG HF24 Males71 yrs (65-85 yrs)LVEF<40NYHA I, II
daily monitoring Sx, standardized advice acc to Sx,reviewed by RN, education, encouragement; no human co-intervention (Health Buddy); telephone attachment with 4 buttons (Health Buddy)
17 predischarge education re CABG, CAD RFs, exercise
3,Midwestern hospitalslarger study of 180 CABG patients
SELF EFFICACY43.2 50.1 50.8 vs43 45.7 47.4CV RF MODsalt, exercise, stress adherence greater in TX; others not;MOS SF36overall improvement across all scales, but baseline differences cloud the picture
Fair
Barrera, 2002120
RCT, N=160DM 2,75 males; 59 yrsno internet access, has phone, speak English (of 650 sent letters)
www personal self mgmt coach (with data monitoring and review) vs www social support vs www coach plus support vs education only
none 3,primary care Eugene Oregon
DM Support Scale CTRL 0.10 (1.14) CCH 0.90 (1.46) SS 1.39 (1.44) SS+CCH 1.20 (1.49) ISEL items CTRL−0.08 (0.52) CCH 0.08 (0.68) SS 0.45 (0.82) SS + CCH 0.19 (0.74)
Fair
1 of 13

Summary Table 5. Studies of Effectiveness of Interactive Consumer Health IT (KQ 5)
Author, Year Design, N Patients Intervention(s)
Comparison Group(s) Duration, Setting Outcomes
Quality Rating
Block, 2004122
RCT, N=481Midlife, low income women; 48.4% African American; 75% overwt
CDROM + reminder calls; CDROM alone
stress management CDROM
2 mos; California fruit & vegetable intake increase 1.32/day (p=0.016) v 1.2/day (p=0.52) v 0.71/day in controls; greater effect in less educated; stress reduction CDROM also increased fruit & vegetable intake
Fair
Chan, 2003144
Case series, N=10
Asthma children; 50% F, ~ 7 Y,
web based daily PEF, Sx; education, video monitor 2x/wk by case mgr; case mgr email or phone re PEF, Sx, technique, mgmt plan
paper based daily monitor PEF, Sx, office based education at 2, 6, 12, 24 weeks
6 mos, Hawaii inhaler technique and peak flows increased in both groups
Good
Cho, 2006123
RCT, N=120DM253 yrs (62%) MHbA1c 7.6BMI 23webaccess, > 30 years old, no HF, ESLD, Ckd, insulin pump, prior webprogram
>2x per week monitoring BG, weight; EHR (lab, Hx) access; feedback; daily review by clinic, MD message biweekly; weekly reminder to logon, w/ quarterly clinic visit
education diet, self management; glucometer, paper record quarterly visit, recommendation to monitor at least 3x a week
30 moTaiwan
HBA1c 6.7 v 7.5HFI .47 v .78 (fluctuation index) ~20% 2-3 logins/mo ~50% >3 logins/week NS trend to lower HbA1c in 80%+ adherence to monitoring1586 recommendations by staff to patients (45.3 per person), regimen modificaiton least frequent
Good
Christensen, 2004124
RCT, N=525
Depressed adults, 71% female, age ~36 yrs
weekly contact, web based education vs. web based cognitive behavioral therapy with assessments
weekly contact about lifestyle, health habits
6 weeks, Canberra depression symptoms and depression literacy improved with both interventions compared to untreated controls;
Fair
2 of 13

Summary Table 5. Studies of Effectiveness of Interactive Consumer Health IT (KQ 5)
Author, Year Design, N Patients Intervention(s)
Comparison Group(s) Duration, Setting Outcomes
Quality Rating
Cruz-Correia, 200730
RCT, crossover, N=19
asthma29 yrs (16-65)no bad comorbidity, have internetnone doing self-monitoring
monitoring, graphic feedback, tailored reminding, education vs paper diary, paper action plan
none NRAsthma clinicPorto, Portugal
Technical/Usabilityconnection problems (9), system errors (3), wording (2), peakflow meter (5); problems w/ paper (5)Time to complete same www vs pprHIT Satisfactionhigh overall satisfaction with both ppr and www; small preference for www viewing data Health Behavior:higher monitoring adherence with paper (clearest effect in study)
Fair
Delgado, 200331
Case series, N=16
CHF,10 males53.3 yrs (+12.5)NYHA 7II, 9IIICHF and internet access and >6 months life expectancy
www daily monitoring, display, education, daily communication
none 3, University HF clinicToronto
HIT Satisfactionhigh mean scores on ease of use etcHIT Useone 24 hr breakdownMorb/Util2 hospitalizedQOL59.75 to 49.87 p=0.09relationships, working around home, side effects improved
Fair
Ewald, 2006147
Case Series, N=49
Hypertensive adults, 43% female, age ~58
BP monitor twice daily, physician-patient communication, medication reminding
none 9 weeks, Germany greater BP reduction correlated with more frequent BP monitoring. No controls
Fair
Finkelstein, 199633
Case series, N=NR
lung transplant monitoring none NR HIT Use Good
3 of 13

Summary Table 5. Studies of Effectiveness of Interactive Consumer Health IT (KQ 5)
Author, Year Design, N Patients Intervention(s)
Comparison Group(s) Duration, Setting Outcomes
Quality Rating
Franklin, 2006125
RCT, N=92
DM 149 males12.7, 14.1, 12.6 yrs (Conv Ins, Conv Ins + INT, Int Ins +INT, respectively) (range=8-18 yrs)Diagnosis >1 yrNo social problems, learning difficulties, or needle phobias
daily scheduled individualized text message reminders; text message education; cellphone
none Tayside, UK HbA1c: no change w/ INT; Self Efficacy DM: 56.0 vs 62.1; self rpt adherence: 70.4 vs 77.2; DM Knowledge Score: no change w/ INT; DM Social Supportmore from team, not from family/friendsDKAno changeHypoglyc req assistno changeBMI: no changeVisits: not comparedHIT Satisfaction:80% ‘it helped’ 97% like frequency of msg 90% would keep using
Fair
Gerbert, 200395
Case series, N=52
smokers, problem drinkers, 51% women, 77% nonwhite
1.5 - 3 min tailored advice OR 3-5 min motivational intervention
pamphlets immediate favorable views of video doctor, but 72% would prefer real doctor; intention to quit smoking or reduce drinking after viewing
Fair
Glasgow, 2000148
Case Series, (RCT for components), N=320
DM 259 yrs 43.5 % male
Single use dietary goal setting intervention with touch screen in office computer asst goal setting (all groups); followup phone calls; 3 ring binder of community resources
none 3 and 6,Primary careDenver, COEugene, OR
HbA1c, weight, chol, lipid ration all no changeself efficacy no changediet behaviors improved
Fair
4 of 13

Summary Table 5. Studies of Effectiveness of Interactive Consumer Health IT (KQ 5)
Author, Year Design, N Patients Intervention(s)
Comparison Group(s) Duration, Setting Outcomes
Quality Rating
Glasgow, 200334
Case series (RCT for components), N=320
DM 259 yearsDM for 8 years83% minimal www expindependent, English, phone,
TSM: professional coach online 2x/wk, online resources, Q&A, optional diet data entry and display; PS: online peer support forum, newsletters,
PC in home, periodic online assessment with automated dietary change goals, DM self mgmt website, DM information
12,Primary careDenver, COEugene, OR
Behaviorsdiet better, DM care better, exercise notBiological chol better, HbA1c not: 7.44-7.55,PsychosocialDM support betterCES MDD betterHIT usedrops off in 3 mo, higher in peer support group
Fair
Green, 2008127
RCT, N=778HTN48% maleage 59.1 yrs25% some post bacc; 90% retired or employed, 87% white, 7% smokeInclusion: BP > 140, on Rx, no DM or KD, use PC, email, web access
biweekly pharmacist adjustment, BP monitoring, webaccess EHR
training in BP monitoring and web EHR (I1), or HTN education and web EHR (CTRL)
12 mo HMO in Seattle, WA
SBP C, I1, I2:146.5, 144.2, I2: 139.1; DBP 86, 84.9, 82.7; BP CNTRL 0.29, 0.34, 0.51; BMI 32.5, 32.5, 31.6; phone calls C/I1/I2: 4, 3.8, 7.5; visits specialist less C2, primary care, urgent care, ED, 'not different' professional initiated email threads C/I1/I2: 4.6, 7.4, 22.3; patient initiated email threads 1.8, 2.7, 4.2; ASA use C/I1/I2 0.53; HTN Rxs 1.69, 1.94, 2.16 HRQoL Gen 66.7, 66.7, 66.6; Phys 88.1, 77.7,, 81.0; Emot 71.5, 72.1, 71.7
Fair
5 of 13

Summary Table 5. Studies of Effectiveness of Interactive Consumer Health IT (KQ 5)
Author, Year Design, N Patients Intervention(s)
Comparison Group(s) Duration, Setting Outcomes
Quality Rating
Guendelman, 2002128
RCT, N=134
Asthma 73% mod or severe12 yrs57 male10 white, 90% public asst
home phone device daily monitoring (sx, activity, med use, peak flow), feedback, information, no change in regimen between visits
asthma diary inner city hospital clinic Missed school last 6 week CTRL .44 - .22 INT .52 - .15 Peakflow red CTRL 20/32 26/52 INT 22/36 – 19/57Activity limit CTRL .72 - .47 INT .67 - .32cough/wheeze, sleep trouble no different UTIL, fewer urgent calls, no other diff HRBINT, more adherent to medications and to monitoring (.89 v .65)
Fair
Gustafson, 1999129
RCT, N=107
HIV/AIDS90% male
information (FAQ, library, resource guide, dictionary); expert consultation, peer support forum, stories, assessment, decision aids, action planPC
97 3 to 6 months implementation with 2-3 month follow-up (total 5 to 9 months)Madison, Milwaukee
QoL improved on social support and participation in care, but not other scales; Utilization: fewer hospitalzations and hospital days, more phone calls to clinic among intervention patients
Fair
Jones, 200139
Cohort, N=112Schizophrenia > 65 yrs, recent education uncertain Dx, acutely ill, persistent defaulter
5 session personalised computer education1-3-1 hybrid education
5 session psychiatric nurse education
community psychiatric clinic in Glasgow
NS higher satisfaction with nurse sessions in all categories; Psych outcomes improved in patients completing sessions in all three groups, NS difference by group
Fair
Joseph, 2007130
RCT, N=314Symptomatic Asthma46% male 15.2 yearsurban, 98% African American, high school, 49% medicaid
4 sessions tailored webbased asthma education; referral coordinator interaction based on input
4 sessions timed access to generic asthma website; referral coordinator avoids interaction
6 mo INT 12 mo follow-upschool computers in Detroit
SX/FXN fewer days/nites, Sx fewer days missed school, restr activity UTIL fewer hospitals, trend to fewer ED visits and more MD visits, more obtained controller Rx, HRB trend greater control and adherence, greater rescue med availability, QOL no change
Fair
6 of 13

Summary Table 5. Studies of Effectiveness of Interactive Consumer Health IT (KQ 5)
Author, Year Design, N Patients Intervention(s)
Comparison Group(s) Duration, Setting Outcomes
Quality Rating
Kenwright, 200497
Cohort, N=27
Panic disorder and phobias, 40% female, ~37 years
Self help CBT online Self help CBT in office 16 weeks, London both groups improved on phobia and work and social adjustment scales
Fair
Kim, 2006a131
RCT, N=167DM255 yrs53% maleover 21, FBS under 240, A1c under 10, no complications, no insulin
general information, assessment tool, screening instrument, exercise test individualized physical activity prescription, five stage-matched interventions, a question-and-answer board, weekly nurse phone feedback, update, revision; TTM info available on web
general information, assessment tool, screening instrument, exercise test individualized physical activity prescription, five stage-matched interventions, a question-and-answer board, weekly nurse phone feedback, update, revision; TTM info available in print, (C1) standard DM information (C2)
12 weeks University clinic in South Korea
HbA1c 7.00 – 7.4 (INT), 7.51 – 7.0 (PRINT), 7.87 – 8.3 (UC);FBS 162 – 147, 154 – 138, 157 – 161;Activity 17 – 27 mets/week, 15 – 28 mets/week, 14 – 15 mets/week
Fair
Kim, 2007115
RCT, N=51DM2, 47 yrs, 57% female
monitor and view CBG, Rx doses, events; weekly RN review, adjustment, education, reinforcment.
1 or 2 office based specialty visits
12 weeks University clinic in South Korea
improved HbA1c (8.1 to 6.9 vs 7.6 to 7.7 in controls, improved postprandial glucose
Fair
Kwon, 2004132
RCT, N=110DM254 years67% malesA1c 7.3, BMI 24, webaccess, over 30, no HF or ESLD, Ckd, insulin pump, prior webprogram
3x per week monitoring BG, weight, etc; EHR (lab, Hx) access; feedback; daily review by MD; MD, RN, dietician recommendations; weekly reminder to logon, with quarterly clinic visit
monthly clinic visit, same recommendation to monitor at least 3x a week
12 weeks in Taiwan HBA1c 7.59 - 6.94 INT; 7.19 - 7.62 CTRL HDL increased INT;BG monitor 72 INT, 38 CTRL / 12 weeks;23/50 got reminded to login (7 days w/o);Login 42±32/ 12 weeks
Fair
La Porta, 2007a153
Cross sectional, N=2525
Cancer24% malemore often learned of service onlineall ages, IM users
instant messaging with cancer information specialist
telephone cancer information service
NR IM users a little more knowledge increase, new information received, discussed or plan to discuss with doctor
N/A
7 of 13

Summary Table 5. Studies of Effectiveness of Interactive Consumer Health IT (KQ 5)
Author, Year Design, N Patients Intervention(s)
Comparison Group(s) Duration, Setting Outcomes
Quality Rating
LaFramboise, 2003133
RCT, N=103
Heart Failure monitoring, review by RN, tailored advice, education, encouragement; telephone advice if needed; with OR without home visit
telephone care OR home visit
2 mo self efficacy increased with home visits and HIT, not phone care; 6 min walk test, HRQoL, and depression improved in all groups
Fair
Leu, 200541
RCT, N=50DM1/251 yrsuncontrolled DM1, DM2 (A1c 8-9)
automated text pager/email reminders about BG, Rx, eat, exercise, appointments, labs; clinician replies to requests
could page investigator ~ 5 mo UW clinics in Seattle
HbA1cCTRL 8.5 – 7.9INT 8.5 – 8.2BP > 130 CTRL 17 – 16 of 21INT 16 – 8 of 21ATT minimal differencesINT liked pager
Fair
Levetan, 2002134
RCT, N=128
Diabetic adults, 67.% female, age ~58 yrs, 86% African American
computer generated goals poster, wallet card, monthly postcards, a phone call, and report to physician
usual diabetes care 6 mo, Washington DC HbA1c 8.85 -> 7.78 INTRV HbA1c 8.39 -> 7.78 CTRL; At 6 mo no difference in weight, BP, or lipids
Fair
Lorig, 200642
RCT, N=958Chronic disease (heart, lung, DM2)29% male57.5 yr15+ yrs of education, 88% whiteINCL: internet, e-mailEXCL: cancer
peer moderated web-based education: (diet, exercise, meds, communication, cognitive behavioral training, self-management), forums, reference book Chronic Disease Self-Management Program (CDSMP) 3/wk x 6 wk
usual care 12 mo Health; no diff global health, illness intrusiveness, disability; better health distress, pain, dyspnea, (fatigue); no diff self-efficacyHRB; no diff aerobics, stress mgmt, MD comm; better stretchUTIL; no diff MD, ED, hospital visits
Fair
McDaniel, 200299
Cross-sectional, N=100
Smokers, low income women, age ~42 yrs, 23% African American
interactive video with tailored advice
none 1 week followup 79% reported at least one, 50% two or more behavioral changes such as cutting down, discuss with family, etc.; overall decrease in favorable attitudes toward smoking
Fair
8 of 13

Summary Table 5. Studies of Effectiveness of Interactive Consumer Health IT (KQ 5)
Author, Year Design, N Patients Intervention(s)
Comparison Group(s) Duration, Setting Outcomes
Quality Rating
McKay, 200144
RCT, N=68DM2, sedentary 47% male52.3% yrs50% bacc deg, 62% employedEXCL <40
personalized goal setting, feedback, strategies, online monitoring, forum online coach biweekly prompts 8 week
generic internet information
8 weeksUS, Canada
USE higher in INT v CTRL, fell sharplyEXINT had no effect; both groups increased walking & vigorous exercise
Fair
McPherson, 2006100
RCT, N=101
Asthmatic children, age 7-14 yrs
CDROM interactive asthma and self management education, role playing, tailored goal setting
asthma booklet 6 mo, United Kingdom At 1 mo: greater asthma knowledge, no difference in flow rates; At 6 mo: fewer courses of steroids and school absences, but not only a trend in intention to treat analysis
Fair
Noel, 2004135
RCT, N=104CHF, COPD, DM frail, elderly veterans 3% female, ~71 yrs
monitoring signs and symptoms, messaging, clinician advice and case management
home health care and case menagment
6 mo, Connecticut fewer hospital days and urgent care, lower HbA1c with telecare; no change in cogntion or quality of life;
Fair
Owen, 200546
RCT, crossover, N=62
breast cancer100% female52 yrs
self guided coping skills trainig, email reminders, library, peer forum, resources, art/poetry
academic center in Southeast US
no difference in HRQOL, psychological well being, physical fxn; subgroup analysis: worst at baseline showed benefit
Fair
Pike, 200748
RCT, N=645130% male41 yrs21 ciggarettes/day6 prior attempts to quit, smokers visiting American Cancer Society website, frequent internet users
5 independent smoking cessation sites
internet accessible booklets
4 mo US 54% follow-up (3500)7 day prev 23.6% abstinence all sites, v 22.3% CTRLS less than 5 slips 11% both
Fair
Rasmussen, 200549
RCT, N=300
Asthma25% mod, 25% severe, 5% mild101 male30 yrs
daily monitoring (web or touch tone) peak flow, action plan; CDSS for MD; MD email or phone adjustment; 1 mo steroids for severe
CTRL-1 patient given peak flow meter, action plan, instruction Rx adjustment CTRL-2 told to contact GP with spirometer results;
6 mo in Denmark Sx improved: 64 INT .40 C1 .35 C2Asthma QoL improved: .33, .18, .19FEV1 .32, .13, .09HAVE PLAN .88, .66, .06ADHERE .32-.87, .25-.79, .36-.54VISITS .037, .021, .013 per mo; ED/Hosp 2, 1, 1
Fair
9 of 13

Summary Table 5. Studies of Effectiveness of Interactive Consumer Health IT (KQ 5)
Author, Year Design, N Patients Intervention(s)
Comparison Group(s) Duration, Setting Outcomes
Quality Rating
Reid, 200750
RCT, N=100Smoking CAD54 yrs61% males91% 12+ years education, 80% ACS, 80% 1st smoke in 30 min from awakeadults, recent ACS, PCI, card cath
pre discharge smoking cessation then IVR at 3, 14, 30 days, then nurse phone counseling 3 x 20 min on quit request
pre discharge smoking cessation only
12 mos hospital in Ottawa
7day abstinence 23 INT, 17 CTRL (NS)
Fair
Robertson, 2006149
Case series, N=144
MDD54% malewebaccess, willingness, cognitive intact
weekly then biweekly then monthly monitoring w/ feedback, education, online CBT, e-consultation, med list, information, strategies, clinician review, automated or case manager reminding
none 12 mo Perth, AU
adherence higher with case manager than with automated reminding' depresssion severity reduced in 72 completing 8 weeks
Fair
Rodgers, 2005114
RCT, N=1705
Smokers42% male25 yrsover 15, have mobilephone
set quit date, regular, personalised (person but not state specific) text messages providing smoking cessation advice, support, and distraction; quit buddy, quit quiz, quit messages on request
txt message thanks every 2 weeks, incentive to continue to follow-up measurements leading to higher complete participation rate
6 mo New Zealand self report quit: 239 v 109 at 6 weeks;cotinue quit 17/83 v 6/42
Good
Rogers, 2001136
RCT, N=121Hypertension, 50% female, age ~61 yrs
BP monitoring 3x/wk; fax weekly reports to patient, physician, physician adjustment by phone and/or visit
usual care 8 weeks, Syracuse, NY SBP, DBP, mean BP improved at 6 mo; adjusted odds ratio for control of BP 2.6 - 2.8; marked benefit in African Americans (10% subgroup); more treatment adjustments in intervention group
Good
10 of 13

Summary Table 5. Studies of Effectiveness of Interactive Consumer Health IT (KQ 5)
Author, Year Design, N Patients Intervention(s)
Comparison Group(s) Duration, Setting Outcomes
Quality Rating
Ross, 200451
RCT, N=107Heart failure56 yrs77% malesNYHA II, over 18, webuser, not health proffessional
webaccess to EHR labs, notes; email to providers
HF clinic in Colorado No difference self efficacy, health status, Improved adherence, UTIL more ED visits, no diff hospitals (22 v 21) visits (325 v 324) or deaths (6 v 6);INT 287 calls, 63 msgs; CTRL 267 msgs
Good
Sciamanna, 2005102
RCT, N=121
osteoarthritis in the knee 48 yrs23% male89% white, 25% 4+years, college65% regular webuser 88% surgery and md visit for knee surgery limited by OA
webbased assessment w/ recommendations for care
same, but measured satisfaction before assmt
specialty website no difference in satisfaction with prior care after using site and receiving ~8 suggestions
Fair
Shaw, 200753
Cross-sectional, N=231
Breast cancer52 yrs100% female< 250% poverty, not homeless, literate
information (FAQ, library, resource guide, dictionary); expert consultation, peer support forum, stories, assessment, decision aids, action plan, PC, CHESS training
none 4 mo Detroit, MI/Madison, WI
perceived information competence correlated with information and interactive services use, not with communicaiton expert
Fair
Shegog, 2001138
RCT, N=71Asthmatic children, 8-13 yrs, 35% female, 59% nonwhite
CDROM interactive asthma and self management education, role playing
not described 3 sessions, 3 weeks, Houston
Some knowledge measures higher in intervention group, self-efficacy possibly higher in intervention group
Fair
Southard, 2003139
RCT, N=104
CAD or CHF62 yrs96% white50% retired25% college degree
weekly monitoring surgery and signs, feedback, case manager and dietician led education, risk factor managementt, online forum; phone and mail incentive gifts for participation
usual care 6 mo wt loss (3#) INT v 0 CTRL, both improved activity, BP, chol, HDL, LDL, depression, fat intake
Fair
11 of 13

Summary Table 5. Studies of Effectiveness of Interactive Consumer Health IT (KQ 5)
Author, Year Design, N Patients Intervention(s)
Comparison Group(s) Duration, Setting Outcomes
Quality Rating
Strecher, 2006116
RCT, N=3971
smokers44% male37 yrs23 cigarettes/daysmoke 1st in 30 min of awakening with set date, email, purchased patch
tailored webbased smoking education, newsletters, supportive messages by email, and support person, tailored account to initial questionnaire
generic web based smoking intervention, not tailored to initial questionnaire, no newsletters, no support person
12 weeks UK 10 week abstinence strongest moderators: tobacco related illness, children in household, alcohol consumption;also no adult smoker and less severe smoking
Fair
Taylor, 2006107
RCT, N=11445 yrs88% maleOSA, new Dx, no prior CPAP
monitoring symptoms, CPAP use; education; contact from sleep medicine clinic by phone if high risk
stratified age, severity, 30 days specialty clinic Walter Reed
no difference days CPAP use, hours CPAP use functional status, satisfaction
Fair
Turnin, 1992108
RCT crossover, N=105
Diabetic adults, 42% female, age ~45 yrs, ~ 70% on IDDM
monitoring, dietary analysis, expert system advice, email, education
crossover condition not described
12 mo, Toulouse, FR DM knowledge increased proportional to system use; most diet behaviors improved,body weight was unchanged; HbA1c improved 11.0 -> 9.9 in the second subgroup.
Fair
Winzelberg, 2003141
RCT, N=72
breast cancer36% some grad school80% whitenot suicidal, in CA, English speaking
Web-based MH professional actively moderated structured breast cancer social support group, personal journal, others’ stories
wait list control 12 weeks Palo Alto INT improved CES-D (MDD), PCLC (PTSD), PSS (stress)
Fair
Yon, 2007152
Case series, N=176
obesity13% maleBMI 25-39, over 18 yrs, web access not pregnant, moving, major illness, unable to meet weekly
PDA dietary monitoring, part of 24 week weight loss program, weekly email encouragement monitoring
historical controls using paper based monitoring, weekly encouragement
24 weeks Vermont no difference in wt loss, monitoring, diet compliance; PDA less complaint with exercise goals; actual data not given; weight loss correlated with monitoring, attendance, adherence to diet, exercise
Fair
Zimmerman, 200493
RCT, N=45
CABG daily monitoring symptoms, daily review and scripted response
predischarge teaching, followup phone calls at 2, 4, and 6 weeks
6 weeks, no significant difference in physical functioning or symptom scores
Fair
12 of 13

Summary Table 5. Studies of Effectiveness of Interactive Consumer Health IT (KQ 5)
ASA = aspirin HTN = hypertensionBG = blood glucose INCL = inclusionBP = blood pressure INT = interventionCBT = computer based test KD = kidney diseaseCDSS = clinical decision support system M = maleCHESS = Comprehensive Health Enhancement Support System MD = doctorCHF = chronic heart failure MDD = Major Depressive Disorderchol = cholesterol mgmt = managementCOPD = chronic obstructive pulmonary disease mo(s) = month(s)CTRL = control msg = messageDBP = diastolic blood pressure OA = osteoarthritisdiff = difference OSA = sleep apneaDM = Diabetes Mellitus PDA = personal digital assistantDx = diagnosis QoL = quality of lifeED = emergency department Rx = prescriptionEHR = electronic health records SPB = systolic blood pressureESLD = end stage liver disease sx = symptomsEXCL = exclusion txt = textf/u = follow-up UTIL = utilizedfxn = function wk(s) = week(s)HbA1c = glycosylated hemoglobin wt = weightHF = heart failure yr=year(s)hosps = hospitals
Abbreviations
13 of 13

Summary Table 6. Specific Findings for Populations of Interest
Author, Year, Design, N Population description Condition
Interactive Computer Technology (ICT) Findings
Artinian, 2003106
RCT, N= 1865 % Black (11 pts)35% White (6 pts)
Congestive heart failure
video cassette (Med - Monitor) that sat in a cradle connected to a telephone line
Majority (56%) loved itLifestyle change seen in 67%BP more stable by remembering meds; need less nitroglycerineImproved self care behaviors and QOLSome technical difficulties reported
Brennen, 2001157
RCT, N= 14012% African American86% Caucasian
CABG Computerized, internet-based information and support system that provides extension and enhancement of traditional nursing services
For one week snapshot: Group 1 used the HeartCare system a total of 451 times, an average of 64 accesses per day
Gerbert, 200395
RCT, N=5248% African American; 12%Latino; low income
Smoking & Alcoholism
Brief motivational video risk assessment with tailored advice
Convenience (right amount of time;5.7 / 7); privacy(5.95/ 7 pts); confidential (5.9/7pts); honest (6.94/7 pts); ease of use (6.8 /7 pts); satisfaction (5.7 /7pts)71% would feel more comfortable with a "real" doctor.
Guendelman, 2002128
RCT, N= 134
Gp 1: 79% African American8% CaucasianGp 2: 74% African American12% Caucasian
Asthma Interactive communication device with question and response tasks. Questions provided by the nurse to the patient for their respones
Reduction in the number of urgent calls (p= 0.05), ED visits (p= 0.21), hospitalizations, (0.96)Reduction in limitation of activity (p=0.03) Decrease in the number of people having trouble sleeping, (p= 0.83)Reduction in number of subjects that missed school
Joseph, 2007130
RCT, N= 314>98% students were African American
Asthma Web based program focusing on controller medication adherence, rescue inhaler availability,smoking cessation/reduction.
Decrease in symptom days, symptom nights, school days missed/30 days,Decreased days of restricted activity Decrease in days having to change plansDecreased Hospitalizations (p= 0.01) and ED visits/12 months, p= (0.08)Positive behavior in medication adherence (p= 0.09) and rescue inhaler activity (p=0.01)Trend towards better quality of life
African Americans
1 of 9

Summary Table 6. Specific Findings for Populations of Interest
Author, Year, Design, N Population description Condition
Interactive Computer Technology (ICT) Findings
La Porta, 2007a153
Survey, N= 248511% African American75% Caucasian6% Hispanic
Cancer and Smoking
Cancer Information Service and LiveHelp provide cancer patients and family members with real time information and advice
73% reported their knowledge had increased after using the service95% said they were very satisfied or satisfied88% said service met or exceeded expectations67% said they felt more confident in their ability to seek cancer information following the service 60% of those who used the service for themselves (not a family member) and were dx w/cancer, felt more confident in their ability to actively participate in treatment decisionsOf those actively smoking at time of using service, at survey completion: 14% had quit, 35% had cut back, 45% plan to quit or cut back in future
La Porta, 2007b158
Survey, N= 248511% African American75% Caucasian6% Hispanic
Cancer and Smoking
Cancer Information Service (CIS)and LiveHelp provide cancer patients and family members with real time information and advice
Live help group was more likely to gain cancer-related knowledge compared to CIS telephone group (P<0.001) 61% in Live help grp and 59% in CIS grp were very satisfied, 39% in Live help and 35% in CIS grp were satisfied38% in Live Help and 29% in CIS said the system exceeded expections, 56% in Live Help and 59% in CIS said system met expectations
Meigs, 2003159
RCT, N= 598Grp 1 vs Grp 2Black: 19.2% vs 18.9%White: 71% vs 71.1%Other: 9.8% vs 10.0%
Type 2 Diabetes
web based decision support tool, displaying interactive patient specific clinical data,treatment advice, and links to other web based care resources
Positive change seen in all glycemic control outcomes except Mean HbA1c (% Hb)Positive change seen in all cholesterol control outcomesPositive change seen in all BP control outcomes except the Mean systolic BP (mmHg)Increase in the number of subjects having at least one eye examination by an eye care professional and one foot exam in the last 12 months
Nguyen, 2005*113
Between group, N= 23
6% African-American (1)13% White (13)6% Native American (1)6% Other (1)
Chronic ObstructivePulmonary disease
web site to help individuals with COPD by logging onto website at least 3 times/week, 2 weekly chat sessions, online bulletin board and email support, individualized exercise plans
No significant differences in physiologic outcomes.
African Americans
2 of 9

Summary Table 6. Specific Findings for Populations of Interest
Author, Year, Design, N Population description Condition
Interactive Computer Technology (ICT) Findings
Piette, 1997*47
Prospective study, N= 65
9.2% Black61.5% White18.5% Hispanic10.8% Asian/Pacific Islander
Diabetes AVM system using specialised computer technology to telephone patients, communicate messages, and collect information
AVM system with multiple phone line with half time nurse will cost 10% of the human calling systemProgram cost for second year is 2% of human calling system (assuming progam paid for itself in first yr)Almost all of the subjects reported that AVM was useful and would like to receive AVM.Almost all had no difficulty responding to the system37.5% - 85.6% listened to 2 + preventive messages72.2-90.9 % thought AVM would make them more satisfied with VA care
Sciamanna, 2004*86
Cohort, N= 150
4.1% Black (6)83.1% White (123)11.4% Hispanic (17)1.4% Other (2)
chronic illness computer assessment on smoking and physical activity with tailored printed feedback
12% of patients asked for help using computer;81.1% patients felt computer easy to useSatisfaction with provider visit significantly related to having a chronic conditon, being a nonsmoker, and having a provider who reviewed the report with the patient
Sciamanna, 2005102
Quasi experimental, N= 121
6.6% Black86.8% White2.5% American Indian3.3% Hispanic5% Other
osteoarthritis of the knee
computer assessment on OA, satisfaction with care;computer personalized feedback about OA quality of care and treatment recommendations
website ratings-23.1% excellent, 52.9% very good, 24% good;97.5 % said website was easy to useMajority thought that Website could help get better care,help understand and manage osteoarthritis and help talk to doctor
Shaw, 2007*53
RCT, N= 23135.9% African American (83)62.3% Caucasian (144) 1.7% Other minorities
Metastatic Breast Cancer
CHESS: Web-based information, discussion group, ask an expert, and interactive services (tailored action plan, decision aids, health tracking
Positive change in information competenceUse of all four components of ICTUse over 4 months by categoryMean use discussion 506.2 minMean use information 35.5 min Mean use ask an expert 28 min Mean interactive service 27.9 min
African Americans
3 of 9

Summary Table 6. Specific Findings for Populations of Interest
Author, Year, Design, N Population description Condition
Interactive Computer Technology (ICT) Findings
Taylor, 2006107
RCT, N= 114UC vs Exp
40% vs 42% African American60% vs 49% Caucasian0% vs 5% Hispanic0% vs 5% Asian
Obstructive sleep apnea
OSAS library with customized information; Daily questions on sleep and CPAP use, responses monitored and categorized into low/medium/high risk, sleep specialist call patient after 3 days of high-risk responses
83% found HealthBuddy very easy to use; 2 out of 3 reported it a positive experience; 83% had no difficulty using it; 75% wer likely or very likely to continue using it.69% satisfied with Health Buddy, 71% satisfied with communication with clinicians;Mean hours of CPAP use (hrs): Usual care 4.22, Exp 4.29, p=.87CPAP mean proportion (hrs):UC 50.1%, exp 46.9%, p=.61;Functional status, Usual care 2.27, exp group 2.03, p=.76
Winzelberg, 2002141
RCT, N= 72
4% African American80% Caucasian4% Asian6% Hispanic/Latina6% Other
Breast cancer 12 week, structured, web based support group moderated by a mental health professional
Group experience evaluation (% reporting a lot or a great deal)getting support and encouragement: 65helping others: 56learning that problems are not unique: 56develop new friendships: 63get advice: 55express true feelings: 65
Estabrooks, 2005146
RCT, N= 422
Urban as well as rural Type 2 Diabetes
Computer CD-ROM with Goal setting, Tailored action plan, assessments of dietary intake and physical activity, hard copyof pts personal action plan
Decreased fat consumtionincreased veggie and fruit consumptionIncreased moderate/vigorous activity
Ferrer-Roca, 200460
Case series, N= 172(Gp 1 (DM): 12Gp 2 (website review only): 160)
Rural Islanders Diabetes Website with patient and doctor interfaces for inputting data and sending advice
Out of those who entered the trial to test the system 86% would recommend the siteMajority (71%) thought the system was easy33% did not find the system useful and efficient50% had difficulties in accessing the systemAmbiguous results on HIT satisfaction
Out of those who reveiwed the website40% would recommend the siteMajority (92%) thought the system was easy12%did not find the system useful and efficient 88% had difficulties in accessing the system
Rural
African Americans
4 of 9

Summary Table 6. Specific Findings for Populations of Interest
Author, Year, Design, N Population description Condition
Interactive Computer Technology (ICT) Findings
Gustafson, 1998*36
Cohort, N=38
28[76%] of 27 potentially eligible urban vs. 10 [71%] of 14 rural
Breast Cancer CHESS: computerized information and problem-solving, Q & A, ask an expert, health profile, peer discussion group, personal stories, decision aids
Use over 10 weeks: Mean 6.8 uses/week/subject100% used discussion group, ask an expert, Q & A, health profile 71% of uses for social support, 16% of uses for information
Gustafson, 200174
RCT, N = 295Urban, small city and rural areas
Breat cancer Computer based patient support system providing information, decision-making and emotional support
Increased participation and level of comfortIncreased confidence in doctorsIncreased information competenceDecreased unmet information need (5 month Follow up)Increased partici[ation and behavioral involvementBetter quality of life
Hill, 2006156
RCT, N= 120Ranch, Farm or Small town(Rural- lived 25 miles outside an urbanized area (a city of 12,500 or more),having to travel almost 57 miles one way)
Diabetes, Rheumatoid conditions, heart disease, cancer, multiple sclerosis
Online, asynchronous, peer-led support group and health teaching units using WebCT
Trend toward increasing self esteem, (p=0.016)Increase in feeling of empowerment, (p=0.016)Increased seld efficacy (p=0.107)Decreased feelings of depression, loneliness and stress (p= 0.342, 0.206, 0.343 respt)High levels of social support, (p=0.038)
Kaufman, 2003*75
usability cognitive walkthrough and field observation,N= 14 NYC, 11 upstate (but really 2 case studies)
rural upstate NY and hispanic NYC
Diabetes Mellitus
videoconferencing, BP & BG uploading and review, education, email
Usability issuessystem barriers- problematic widgets, small fonts, bad spacing, complext tasks, screen transitions, system stability Cognitive/Skill barriers-mouse-keyboard skill, mental model, literacy, numeracy. Also anxiety, self-efficacy, motivation
Shaw, 2007*53
RCT, N= 231Detroit cohort: unknown. Wisconsin cohort: rural.
Metastatic Breast Cancer
CHESS: Web-based information, discussion group, ask an expert, and interactive services (tailored action plan, decision aids, health tracking
Positive change in information competenceUse of all four components of ICTUse over 4 months by categoryMean use discussion 506.2 minMean use information 35.5 min Mean use ask an expert 28 min Mean interactive service 27.9 min
Rural
5 of 9

Summary Table 6. Specific Findings for Populations of Interest
Author, Year, Design, N Population description Condition
Interactive Computer Technology (ICT) Findings
Smith, 200054
RCT, N= 30Rural-at least 25 miles away from 6 major cities of Montana
Diabetes web based computer intervention on general health and info on diabetes with Conversation area, mailbox, health chat area and resource rack
Time spent using the HIT decreasing over study periodPsychosocial adjustment to illness scale lower in the computer group as compared to the non computer groupRaw mean scores of quality of life and support lower in the computer group
Woodruff, 2001151
pre post cohort study, N= 26
Rural alternative schools Smoking chat room, facilitated by tobacco counselor, using Active World
38.9% self reported not smoking
Finkelstein, 199633
Qualitative Study, N=41
Reside in low-income inner city area, 2/3 had never used a computer, almost 50% had never used a computer or an ATM, >50% born outside US and English was their 2nd language, age range was on older side (most >40 yrs, and 1/3 >50 yrs),
Asthma/underserved
Symptom diary and spirometry test
Not complicated at all, very easy to use
Lober, 2006*82
N=38Low-income elderly and disabled, mean age 69 years (range 49-92 years), 82% Female, 18% Male, many had chronic diseases
Many chronic illnesses
Personal health records with areas for communication with health professional
Empowering patients to keep track of PHR, reassurance that if a natural disaster hits, their PHR will remain intact since they are not paper-form- 93% of providers found the Personal Health Information System useful when treating patients
McDaniel, 200299
Cohort, N=11035% did NOT have HS diploma
Smoking Interactive smoking cessation software
Technology malfunctions; software errors;60.2 / 70pts; minority participants more satisfied
Sciamanna 2004*86
CohortN= 150
Public health clinics1 provider at 10 clinic sites;
63.3% had some chronic illness
computer assessment on smoking and physical activity with tailored printed feedback
12% of patients asked for help using computer;81.1% patients felt computer easy to useSatisfaction with provider visit significantly related to having a chronic conditon, being a nonsmoker, and having a provider who reviewed the report with the patient
Rural
Underserved
6 of 9

Summary Table 6. Specific Findings for Populations of Interest
Author, Year, Design, N Population description Condition
Interactive Computer Technology (ICT) Findings
Barnason, 2003119
RCT w/ repeated measures, N= 35
Age range 65 -85 years Coronary Artery disease
Health buddy:small device attached to patient's telephone. Provides asssessment, strategies, education, and positive reinforcement
Significantly higher self efficacy scores, adjusted physical functioning mean scores, adjusted general health functioning mean scores, mental health functioning and validity functioning in intervention group, Significant time effect [F(1,29)=11.25, P <.002] on the role emotional functioning and pain subscale [F(1,29)=11.25, P <.002]Fewer subjects reported the use of salt when cooking and eating at 4 weeks, 6 weeks, and 3 months postoperatively.Significantly higher exercise adherence (t = 3.09, P < .01) and stress control
Baranson, 2006120
randomized, experitmental two-group repeated measures design,N= 50
Average age- 73.3 years Coronary Artery disease
Health Buddy-12 weeks of a desktop telehealth device with daily interventions with recovery assessment, strategies to manage problems, education and positive reinforcement
Improvement seen in physical and mental health outcomes at 6 wks and 3 months after bypass(Physical- F=9.42, p<0.01; Mental- F= 7.97, p< 0.01)Decreased number of emergency room visits in the intervention grp (p= 0.15) More number of non routine provider visits in the intervention grp( Mean =2.8) as compared to the conrol (mean=2.61)Nursing visit average higher in the experimental group as compared to control group
Feil, 200069
Qualitative Study, N=160
Ages 40-75 years Type 2 Diabetes
D-Net intervention: peer social support and personalized dietary intervention
Computer was initial barrier to program participants
Gustafson, 1998*36
Cohort, N=38
Mean age- 71.8 , SD 6.06 Breast Cancer CHESS: computerized information and problem-solving, Q & A, ask an expert, health profile, peer discussion group, personal stories, decision aids
Use over 10 weeks: Mean 6.8 uses/week/subject100% used discussion group, ask an expert, Q & A, health profile 71% of uses for social support, 16% of uses for information
Holbrook, 2007162
Randomised trial (no control), N= 98
> 65 years Not specified Decision board, decision booklet with audiotape , or interactive computer program with either pie graphs or pictograms
Higher post intervention scores on the Atrial Fibrillation Information Questionnaire (p<0.01)96% of participants felt that the information in the decision aids helped them make their treatment decisionMean difference scores by format and graphic presentation similar in corresponding groups
Elderly
7 of 9

Summary Table 6. Specific Findings for Populations of Interest
Author, Year, Design, N Population description Condition
Interactive Computer Technology (ICT) Findings
Jones, 199938
RCT, N= 525>60 examined as variable Cancer Personalized computer based
information i.e. Cancer information tailored by data in EHR vs not tailored vs printed booklets
NS change depression and cancer adjustment scores; 84% improved anxiety scores, especially PINF (tailores),especially but also BKLT (booklets); subgroups examinedPhysician assessed 'above avg knowledge' 35% GINF(non tailored), 25% PINF, 20% BKLT. [note that in general, docs assessed pt knowledge below average]12 min (1-44) 1st use; 71% no repeat use: 20/169 PINF, 4/155 GINF 80% would prefer 10 min w/ professional (71% PINF, 80% GINF, 90% BKLT); overall 40% satisfied; satisfaction with information higher in PINF
Kaufman, 2003*75
usability cognitive walkthrough and field observation,N= 14 NYC, 11 upstate (but really 2 case studies)
Age-69.6±6 (NYC); 73.7±8 upstate
Diabetes Mellitus
videoconferencing, BP & BG uploading and review, education, email
Usability issuessystem barriers- problematic widgets, small fonts, bad spacing, complext tasks, screen transitions, system stability Cognitive/Skill barriers-mouse-keyboard skill, mental model, literacy, numeracy. Also anxiety, self-efficacy, motivation
Kressig, 200298
Cohort, N=34>60 years Physical
activity for elderly
computer system for exercise promotion (questionnaire with tailored recommendations)
Most problems had to do with survey issues, not computer. 22% questions were mouse related. Ease of use 4.6/5 pts; 21.45/24pts on acceptability of recommendation.
Lee, 200762
Quasi-experimental, N= 274
Elderly examined as subgroup
Type 2 DM Web-based system for managing patients' care of their diabetes
Significant reduction in fasting blood glucose levels (p= 0.001), total cholesterol levels p=0.012 and HbA1c % (p=0.001)Subjects in "College or University" logged into system more often than those in "Illiterate" or "Elementary school/Junior high school" (P=0.007 and P=0.012, respectively)Subjects in the age category of <29 years logged than those in 50-59, 60-69, and 70-79 (P=0.011, P=0.000, P=0.000, respectively)Those in the age category of 40-49 years logged more often than those in the age category of 60-69 and 70-79 (P=0.012 and P=0.040, respectively)
Elderly
8 of 9

Summary Table 6. Specific Findings for Populations of Interest
Author, Year, Design, N Population description Condition
Interactive Computer Technology (ICT) Findings
Lober, 2006*82
N=38Low-income elderly and disabled, mean age 69 years (range 49-92 years), 82% Female, 18% Male, many had chronic diseases
Many chronic illnesses
Personal health records with areas for communication with health professional
Empowering patients to keep track of PHR, reassurance that if a natural disaster hits, their PHR will remain intact since they are not paper-form- 93% of providers found the Personal Health Information System useful when treating patients
Nguyen, 200345
Non randomized trial, N= 16
Mean age = 69.1 (grp 2)range- 55-82
Dyspnoea nurse facilitated and peer supported internet based dyspnoea self management program
FEV1/FVC: 41 +/- 7%; Improvements noted for Dyspnoea (effect size=0.86)Endurance exercie 0.27 for the overall sampleImprovement in self efficacy for managing dyspnoea = 0.94First month registered most logins (330) compared to 104 in the final month
Nguyen, 2005*113
Between groups, N= 23
Age- 69.1 +/- 7.0 (55-82) Chronic ObstructivePulmonary disease
web site to help individuals with COPD by logging onto website at least 3 times/week, 2 weekly chat sessions, online bulletin board and email support, individualized exercise plans
No significant differences in physiologic outcomes.
Piette, 1997*47
Prospective study, N= 65
9.2% Black61.5% White18.5% Hispanic10.8% Asian/Pacific Islander
Diabetes AVM system using specialised computer technology to telephone patients, communicate messages, and collect information
AVM system with multiple phone line with half time nurse will cost 10% of the human calling systemProgram cost for second year is 2% of human calling system (assuming progam paid for itself in first yr)Almost all of the subjects reported that AVM was useful and would like to receive AVM.Almost all had no difficulty responding to the system37.5% - 85.6% listened to 2 + preventive messages72.2-90.9 % thought AVM would make them more satisfied with VA care
*Study appears in more than one category on this table
Elderly
9 of 9

APPENDIX A. TECHNICAL EXPERT PANEL MEMBERS
A-2
S. Ann Becker, PhD Professor in College of Business and College of Engineering, Florida Institute of Technology, Melbourne, Florida Patty Flatley Brennan, RN, PhD Moehlman Bascom Professor of Nursing & Industrial Engineering, School of Nursing & College of Engineering, University of Wisconsin-Madison M. Chris Gibbons, MD, MPH Assistant Professor, Associate Director, Johns Hopkins Urban Health Institute Jennie Chin Hansen, RN, BS, MS AARP Board Member and a Senior Fellow at the University of California, San Francisco, Center for the Health Professions Warren Jones, MD Executive Director, Mississippi Institute for the Improvement of Geographical Minority Health; Distinguished Professor of Health Policy and Senior Health Policy Advisor at the University of Mississippi Medical Center Tom Landauer, PhD Professor in the Department of Psychology of the University of Colorado, Founder of Knowledge Analysis Technologies (now Pearson Knowledge Technologies) Anna M. Nápoles-Springer, PhD Assistant Adjunct Professor, Department of Medicine, University of California at San Francisco John Santa, MD, MPH Adjunct Associate Professor in the Center for Evidence-based Policy at Oregon Health and Science University

APPENDIX B. SEARCH STRATEGIES
A-2
MEDLINE (1950 to November Week 2 2007) 1 exp Chronic Disease/ (173377) 2 exp Cardiovascular Diseases/ (1438368) 3 exp Lung Diseases, Obstructive/ (130454) 4 exp Diabetes Mellitus/ (220904) 5 exp Arthritis/ (157266) 6 exp Neurodegenerative Diseases/ (145561) 7 exp Cognition Disorders/ (33934) 8 exp Mental Retardation/ (67825) 9 exp Memory Disorders/ (14524) 10 exp Spinal Cord Diseases/ (75315) 11 exp Sensation Disorders/ (115283) 12 exp Dyskinesias/ (39533) 13 exp gait disorders, neurologic/ (1434) 14 exp Movement Disorders/ (68290) 15 exp paralysis/ (58765) 16 exp neuromuscular diseases/ (191261) 17 exp communication disorders/ (41578) 18 exp developmental disabilities/ (9477) 19 exp Mental Disorders/ (684932) 20 exp Neoplasms/ (1911694) 21 exp Disabled Persons/ (34321) 22 exp Nervous System Diseases/ (1539072) 23 exp hiv infections/ (169604) 24 exp Palliative Care/ (27918) 25 exp terminal care/ (31467) 26 exp home care/ (32404) 27 exp self care/ (26229) 28 1 or 2 or 3 or 4 or 5 or 6 or 7 or 8 or 9 or 10 or 11 or 12 or 13 or 14 or 15 or 16 or 17 or 18 or 19 or 20 or 21 or 22 or 23 or 24 or 25 or 26 or 27 (5437291) 29 exp Aged/ (1674702) 30 exp Health Services for the Aged/ (11511) 31 Minority Groups/ (7142) 32 exp Ethnic Groups/ (74714) 33 exp Urban Population/ (33470) 34 Urban Health Services/ (1769) 35 Urban Health/ (11071) 36 exp Rural Health/ (18287) 37 exp Rural Health Services/ (5217) 38 exp Rural Population/ (26232) 39 exp Socioeconomic Factors/ (237725) 40 exp "Emigration and Immigration"/ (19800) 41 exp "Transients and Migrants"/ (6397) 42 exp Homeless Persons/ (4401)

APPENDIX B. SEARCH STRATEGIES (continued)
A-3
43 exp vulnerable populations/ (2562) 44 exp Complementary Therapies/ (124194) 45 29 or 30 or 31 or 32 or 33 or 34 or 35 or 36 or 37 or 38 or 39 or 40 or 41 or 42 or 43 or 44 (2103285) 46 exp Information Systems/ (98874) 47 exp Telemedicine/ (8789) 48 exp Computer Systems/ (103462) 49 exp Telemetry/ (5208) 50 exp Telecommunications/ (33833) 51 exp computer assisted instruction/ (6068) 52 exp User-Computer Interface/ (14124) 53 exp video games/ (534) 54 exp computer literacy/ (1012) 55 46 or 47 or 48 or 49 or 50 or 51 or 52 or 53 or 54 (221934) 56 attitude/ or attitude to computers/ or exp attitude to health/ (215232) 57 exp Health Behavior/ (58229) 58 exp Health Education/ (102644) 59 exp Consumer Participation/ (22463) 60 exp Access to Information/ (1956) 61 56 or 57 or 58 or 59 or 60 (315151) 62 28 and 55 and 61 (4166) 63 45 and 55 and 61 (3288) 64 62 or 63 (6051) 65 limit 64 to english language (5756) 66 limit 65 to yr="2005 - 2008" (1751) 67 limit 65 to yr="2001 - 2004" (1819) 68 from 67 keep 1-1819 (1819) America Association of Retired Persons Ageline (1978 to December 2007) 1 ((Health$ or patient$ or medicin$ or medical$) adj5 (Behav$ or educat$ or promot$ or enhanc$ or assess$ or evaluat$ or participat$ or informat$ or access$ or instruct$ or monitor$ or "use" or uses or using or user$ or utiliz$)).mp. [mp=abstract, descriptors, identifiers, title] (18699) 2 ((Computer$ or Information$ or internet or telephon$ or telecommun$ or communicat$) adj5 (technol$ or system$ or access$ or literac$ or interact$ or "use" or uses or using or user$ or utiliz$)).mp. [mp=abstract, descriptors, identifiers, title] (3131) 3 telemedic$.mp. [mp=abstract, descriptors, identifiers, title] (141) 4 1 and 2 (899) 5 3 or 4 (984) 6 limit 5 to yr="1990 - 2008" (743) 7 from 6 keep 1-743 (743) PsycINFO (1806 to February Week 4 2008) 1 exp Chronic Illness/ (12434)

APPENDIX B. SEARCH STRATEGIES (continued)
A-4
2 exp Cardiovascular Disorders/ (21984) 3 exp Lung Disorders/ (1501) 4 exp Diabetes Mellitus/ (2029) 5 exp Arthritis/ (2244) 6 exp Neurodegenerative Diseases/ (24809) 7 exp Cognitive Ability/ (49657) 8 exp Mental Retardation/ (34481) 9 exp Memory Disorders/ (6470) 10 exp Sense organ disorders/ (12090) 11 exp Movement Disorders/ (12584) 12 exp paralysis/ (3316) 13 exp neuromuscular diseases/ (0) 14 exp communication disorders/ (34610) 15 exp developmental disabilities/ (7651) 16 exp Mental Disorders/ (307576) 17 exp Neoplasms/ (17431) 18 exp Disabilities/ (37156) 19 exp Nervous System Disorders/ (117832) 20 exp hiv/ (20142) 21 exp Palliative Care/ (3092) 22 exp terminal care/ (0) 23 exp home care/ (2706) 24 exp self care/ (2581) 25 1 or 2 or 3 or 4 or 5 or 6 or 7 or 8 or 9 or 10 or 11 or 12 or 13 or 14 or 15 or 16 or 17 or 18 or 19 or 20 or 21 or 22 or 23 or 24 (559924) 26 exp Aged/ (1662) 27 exp elder care/ (1877) 28 Minority Groups/ (6897) 29 exp Ethnic Groups/ (64791) 30 exp Urban environments/ (11755) 31 exp Rural Environments/ (7802) 32 exp socioeconomic status/ (26347) 33 exp Sociocultural factors/ (61600) 34 exp psychosocial factors/ (20491) 35 exp Immigration/ (7012) 36 exp human migration/ (4334) 37 exp Homeless/ (3740) 38 exp disadvantaged/ (4831) 39 exp poverty/ (3162) 40 exp at risk populations/ (21985) 41 exp alternative medicine/ (3589) 42 exp holistic health/ (1015) 43 exp "medicinal herbs and plants"/ (742) 44 26 or 27 or 28 or 29 or 30 or 31 or 32 or 33 or 34 or 35 or 36 or 37 or 38 or 39 or 40 or 41 or 42 or 43 (203244) 45 exp Information Systems/ (11332)

APPENDIX B. SEARCH STRATEGIES (continued)
A-5
46 exp Telemedicine/ (819) 47 exp Computers/ (8211) 48 exp computer applications/ (36570) 49 exp Telemetry/ (85) 50 exp computer assisted instruction/ (8563) 51 exp Human Computer Interaction/ (3852) 52 exp video games/ (1146) 53 45 or 46 or 47 or 48 or 49 or 50 or 51 or 52 (52851) 54 exp attitudes/ (199020) 55 exp Health Behavior/ (10516) 56 exp Health Education/ (9901) 57 exp Client Participation/ (826) 58 exp information literacy/ (53) 59 exp digital divide/ (102) 60 54 or 55 or 56 or 57 or 58 or 59 (214695) 61 25 and 53 and 60 (321) 62 44 and 53 and 60 (270) 63 61 or 62 (562) 64 limit 63 to yr="1990 - 2008" (521) 65 from 64 keep 1-521 (521) CINAHL - Cumulative Index to Nursing & Allied Health Literature (1982 to February Week 4 2008) 1 exp Chronic Disease/ (13105) 2 exp Cardiovascular Diseases/ (109186) 3 exp Lung Diseases, Obstructive/ (15894) 4 exp Diabetes Mellitus/ (30301) 5 exp Arthritis/ (11830) 6 exp Neurodegenerative Diseases/ (14138) 7 exp Cognition Disorders/ (5017) 8 exp Mental Retardation/ (6988) 9 exp Memory Disorders/ (1631) 10 exp Spinal Cord Diseases/ (2715) 11 exp Sensation Disorders/ (12372) 12 exp Dyskinesias/ (1982) 13 exp Movement Disorders/ (5096) 14 exp paralysis/ (5061) 15 exp neuromuscular diseases/ (16050) 16 exp communication disorders/ (9672) 17 exp developmental disabilities/ (1961) 18 exp Mental Disorders/ (113649) 19 exp Neoplasms/ (77516) 20 exp Disabled/ (14893) 21 exp Nervous System Diseases/ (150650) 22 exp hiv infections/ (27143)

APPENDIX B. SEARCH STRATEGIES (continued)
A-6
23 exp Palliative Care/ (7652) 24 exp terminal care/ (18364) 25 exp home health care/ (20414) 26 exp self care/ (11961) 27 1 or 2 or 3 or 4 or 5 or 6 or 7 or 8 or 9 or 10 or 11 or 12 or 13 or 14 or 15 or 16 or 17 or 18 or 19 or 20 or 21 or 22 or 23 or 24 or 25 or 26 (491273) 28 exp Aged/ (160564) 29 exp Health Services for the Aged/ (2866) 30 Minority Groups/ (3560) 31 exp Ethnic Groups/ (35621) 32 exp Urban Areas/ (5715) 33 Urban Health Services/ (300) 34 Urban Health/ (1069) 35 exp Rural Health/ (1943) 36 exp Rural Health Services/ (2130) 37 exp Rural Areas/ (6210) 38 exp Socioeconomic Factors/ (83125) 39 exp "Emigration and Immigration"/ (1717) 40 exp "Transients and Migrants"/ (676) 41 exp Homeless Persons/ (1341) 42 exp vulnerable populations/ (975) 43 exp Complementary Therapies/ (52130) 44 28 or 29 or 30 or 31 or 32 or 33 or 34 or 35 or 36 or 37 or 38 or 39 or 40 or 41 or 42 or 43 (316072) 45 exp Information Systems/ (32862) 46 computer systems/ or computer hardware/ or computer peripherals/ or computer processor/ or computer types/ or interactive voice response systems/ or software/ or communications software/ or computer graphics/ or multimedia/ (9023) 47 electronic bulletin boards/ or electronic mail/ or internet/ or wireless communications/ (11359) 48 exp Telemedicine/ (1864) 49 exp Telemetry/ (434) 50 exp computer assisted instruction/ (2868) 51 exp User-Computer Interface/ (1682) 52 exp video games/ (224) 53 exp computer literacy/ (527) 54 45 or 46 or 47 or 48 or 49 or 50 or 51 or 52 or 53 (54149) 55 attitude/ or attitude to abortion/ or attitude to adoption/ or attitude to aging/ or attitude to change/ or attitude to computers/ or exp attitude to death/ or attitude to disability/ or exp attitude to health/ or exp attitude to illness/ or attitude to life/ or attitude to obesity/ or attitude to pregnancy/ or attitude to risk/ or exp attitude to sexuality/ or consumer attitudes/ or cultural bias/ or cultural sensitivity/ or exp family attitudes/ or gender bias/ or patient attitudes/ or exp personal satisfaction/ or exp social attitudes/ or uncertainty/ (81195) 56 exp Health Behavior/ (22660) 57 exp Health Education/ (46582) 58 exp Consumer Participation/ (4961)

APPENDIX B. SEARCH STRATEGIES (continued)
A-7
59 exp Access to Information/ (5087) 60 55 or 56 or 57 or 58 or 59 (136133) 61 27 and 54 and 60 (1444) 62 44 and 54 and 60 (1117) 63 61 or 62 (2094) 64 limit 63 to english language (2065) 65 limit 64 to yr="1990 - 2008" (2052) 66 limit 65 to yr="1990 - 2003" (832) 67 limit 65 to yr="2004 - 2008" (1220) 68 from 67 keep 1-1220 (1220) EBM Reviews - Cochrane Database of Systematic Reviews (1st Quarter 2008) 1 ((health$ or patient$ or home or homes or ((self or selves) adj2 (help$ or care or caring or cares))) adj5 (internet$ or telemedic$ or telehealth$ or web-base$ or (information$ adj2 (technol$ or system$ or computer$)))).mp. (73) 2 from 1 keep 1-73 (73) EBM Reviews - Cochrane Central Register of Controlled Trials (1st Quarter 2008) 1 ((health$ or patient$ or home or homes or ((self or selves) adj2 (help$ or care or caring or cares))) adj5 (internet$ or telemedic$ or telehealth$ or web-base$ or (information$ adj2 (technol$ or system$ or computer$)))).mp. (498) 2 from 1 keep 1-498 (498)

APPENDIX C. INCLUSION/EXCLUSION CRITERIA
A-8
Abstract Level
In or Out Reason
Outcome data likely; ALL DESIGNS Elderly (E) or chronically ill (CI) or medically underserved (MU)* or possible analysis as a subpopulation AND Appropriate Health information technology* Review or meta-analysis with relevant information as specified above Foreign language, meets include criteria and may have data, for use later
Incl
ude
Uncertain (pull paper): May be relevant, can’t tell from abstract Background Retrieve for use in introduction or discussion
Wrong population (e.g., not elderly, underserved, or chronically ill, no subpopulation analysis) Wrong intervention/technology: see definition below No data by design (e.g., opinion, letter, editorial) No data by other parameter (e.g., description of technology only) Foreign language, no data No relevance to evidence report key questions
Excl
ude
Related to topic but does not meet inclusion criteria, unspecified
Paper Level
Population
Task Order Interest
Potential Categories Description
elderly over 65 years of age elderly functionally elderly by life experience or health concerns; need clarity/inter-observer
agreement chronic condition over 1 year + benefits from ongoing monitoring or treatment impairment impairment in body function or structure activity limitation difficulty in executing activities
chronically ill or
disabled participation restriction problems experienced in participating in life situations medically underserved population (MUP) or medically underserved area (MUA)
study uses Bureau of Health Professions/Health Resources and Service Administration designated MUP or MUA
medically underserved area
region where individuals are inhibited in their ability to receive services
medically underserved
medically underserved group
population which is inhibited in its ability to receive services
Technology The most challenging part of classifying the literature relating to the barriers and drivers of health information IT by the elderly, chronically ill and underserved has been in classifying the types of technology – both for the purposes of deciding which types to include in our review and also in our summarization and discussion of the results. Our inclusion / exclusion criteria are:

APPENDIX C. INCLUSION/EXCLUSION CRITERIA (continued)
A-9
Include: Health information technology program where: • Patient interacts with the technology, • Computer / technology processes the information in some way, and • Patient receives information in return and has access to patient-specific information. Examples: tailored health advice; personal medical record/access; risk assessment tools, health calculators, predictive tools; interactive online support or chat groups; health games that adapt to the patient (more than simple “next page”); programs or sites with storage, indexing, retrieval, display, or advanced features (summarization and decision support). Exclude: Health information technology program where: • Limited or no patient or consumer driven involvement or • Web browsing of general health information databases) or • Patient / clinician communication without computer information support (simple videoconferencing or
phone) or • Systems where the patient interacts but doesn’t receive patient-specific information back (e.g., survey
– no feedback) • Systems primarily or entirely for health professionals or caregivers Examples: Passive monitoring; direct video or phone conferencing; general web-based content; WebMD, Medline Plus, etc.; .Education, information based only programs; surveys without feedback; frequently asked question sites; where a tele-visit replaces the face-to-face interaction with a clinician; video interaction

APPENDIX D. LITERATURE SEARCH TREE
A-10
Review titles/abstracts with eligibility criteria
Study meets all inclusion criteria; abstract data and
quality rate; included in results
Database Searches* Download Citations
8,522
563 Total full text papers retrieved and reviewed with refined eligibility criteria†
Exclude (n= 434)†† Wrong intervention/technology n=243 Wrong population n=54 No data n=42 Other n=18 Not on Excluded Studies List (Appendix E) Background/check grey literature n=77
129
* includes Medline, Cinahl, Psychinfo, ERIC, Ageline, Cochrane (See Appendix B for search strategies) † see Appendix C for details on inclusion/exclusion criteria ††Studies may be excluded for more than one reason **Many studies are included in more than one Key Question
7,959 excluded
31 54 52
KQ2 KQ1
60 74
KQ3 KQ4 KQ5
Studies included in the evidence report by Key Question**

Appendix E. Excluded Studies List
A-11
EXCLUDE CODE E: Other E1: Wrong Population E2: No Data E3: Wrong Intervention/Technology 1. Use the Internet to reach more patients
with your demand management programs. Healthcare Demand & Disease Management, 1997. 3(5): p. 75-7. Exclude Code: E1
2. Elderly patients embrace touch-screen
technology. Telemedicine & Virtual Reality, 1998. 3(12): p. 144. Exclude Code: E3
3. Online advice on problem drinking could
fulfill unmet need: success of services depends on proper targeting. Alcoholism & Drug Abuse Weekly, 2006. 18(13): p. 5-7. Exclude Code: E2
4. Telehealth helps hospital cut
readmissions by 75%. Healthcare Benchmarks & Quality Improvement, 2007. 14(8): p. 92-4. Exclude Code: E2
5. Abroms, L.C., et al., The STRENGTH
Ezine: an application of e-mail for health promotion in adolescent girls. American Journal of Health Promotion, 2004. 19(1): p. 28-32. Exclude Code: E1
6. Adams, W.G., et al., TLC-Asthma: an
integrated information system for patient-centered monitoring, case management, and point-of-care decision support. AMIA, 2003. Annual Symposium Proceedings/AMIA Symposium.: p. 1-5. Exclude Code: E
7. Adamsen, L. and J.M. Rasmussen,
Exploring and encouraging through social interaction: a qualitative study of nurses' participation in self-help groups for cancer patients. Cancer Nursing, 2003. 26(1): p. 28-36. Exclude Code: E3
8. Adkins, J.W., et al., Home-based
behavioral health intervention: Use of a telehealth model to address poor adherence to type-1 diabetes medical regimens. Telemedicine Journal & E-
Health, 2006. 12(3): p. 370-2. Exclude Code: E3
9. Adler, K.G., Web portals in primary care:
an evaluation of patient readiness and willingness to pay for online services. Journal of Medical Internet Research, 2006. 8(4): p. e26. Exclude Code: E3
10. Agnew, T., User friendly at any age. Nursing Older People, 2006. 18(8): p. 8-9. Exclude Code: E2
11. Agre, P., Interactive computer
technology. Cancer Practice, 1994. 2(1): p. 74-6. Exclude Code: E
12. Agrell, H., S. Dahlberg, and A.F. Jerant,
Patients' perceptions regarding home telecare. Telemedicine Journal & E-Health, 2000. 6(4): p. 409-15. Exclude Code: E3
13. Ahmed, M., F. Bayog, and C.M.
Boisvert, Computer-facilitated therapy for inpatients with schizophrenia. Psychiatric Services, 1997. 48(10): p. 1334-5. Exclude Code: E1
14. Ahring, K.K., et al., Telephone modem
access improves diabetes control in those with insulin-requiring diabetes. Diabetes Care, 1992. 15(8): p. 971-5. Exclude Code: E3
15. Alemi, F., et al., Electronic self-help and
support groups. Medical Care, 1996. 34(10 Suppl): p. OS32-44. Exclude Code: E
16. Alemi, F., et al., Automated monitoring
of outcomes: application to treatment of drug abuse. Medical Decision Making, 1994. 14(2): p. 180-7. Exclude Code: E3
17. Alemi, F., et al., Educating patients at
home. Community Health Rap. Medical Care, 1996. 34(10 Suppl): p. OS21-31. Exclude Code: E3
Appendix E. Excluded Studies List (continued)
A-12
18. Allen, A. and J. Hayes, Patient
satisfaction with telemedicine in a rural clinic. American Journal of Public Health, 1994. 84(10): p. 1693. Exclude Code: E3
19. Allen, D.N., et al., Teaching memory
strategies to persons with multiple sclerosis. Journal of Rehabilitation Research & Development, 1998. 35(4): p. 405-10. Exclude Code: E3
20. Alonso, A., A new model for home care
for COPD. Studies in Health Technology & Informatics, 2004. 103: p. 368-73. Exclude Code: E3
21. Als, A.B., The desk-top computer as a
magic box: patterns of behaviour connected with the desk-top computer; GPs' and patients' perceptions. Family Practice, 1997. 14(1): p. 17-23. Exclude Code: E3
22. Alterman, A.I. and T.G. Baughman,
Videotape versus computer interactive education in alcoholic and nonalcoholic controls. Alcoholism: Clinical & Experimental Research, 1991. 15(1): p. 39-44. Exclude Code: E3
23. Alwan, M., et al., Impact of monitoring
technology in assisted living: outcome pilot. IEEE Transactions on Information Technology in Biomedicine, 2006. 10(1): p. 192-8. Exclude Code: E3
24. Anderson, E.S., et al., A computerized
social cognitive intervention for nutrition behavior: direct and mediated effects on fat, fiber, fruits, and vegetables, self-efficacy, and outcome expectations among food shoppers. Annals of Behavioral Medicine, 2001. 23(2): p. 88-100. Exclude Code: E1
25. Andreassen, H.K., et al., Patients who
use e-mediated communication with their doctor: new constructions of trust in the patient-doctor relationship. Qualitative health research, 2006. 16(2): p. 238-48. Exclude Code: E1
26. Andrews, G., ClimateGP - web based
patient education. Australian Family Physician, 2007. 36(5): p. 371-2. Exclude Code: E3
27. Anhoj, J. and C. Moldrup, Feasibility of
collecting diary data from asthma patients through mobile phones and SMS (short message service): response rate analysis and focus group evaluation from a pilot study. Journal of Medical Internet Research, 2004. 6(4): p. e42. Exclude Code: E
28. Anogianakis, G., S. Maglavera, and A.
Pomportsis, ATTRACT--applications in telemedicine taking rapid advantage of cable television network evolution. Studies in Health Technology & Informatics, 1998. 50: p. 60-6. Exclude Code: E3
29. Ansari, M., et al., Improving guideline
adherence: a randomized trial evaluating strategies to increase beta-blocker use in heart failure. Circulation, 2003. 107(22): p. 2799-804. Exclude Code: E3
30. Aoki, N., et al., Edutainment tools for
initial education of type-1 diabetes mellitus: initial diabetes education with fun. Medinfo, 2004. 11(Pt 2): p. 855-9. Exclude Code: E3
31. Aoki, N., et al., INSULOT: a cellular
phone-based edutainment learning tool for children with type 1 diabetes. Diabetes Care, 2005. 28(3): p. 760. Exclude Code: E3
32. Aoki, N., et al., u-SHARE: web-based
decision support/risk communication tool for healthcare consumers with unruptured intracranial aneurysms. Medinfo, 2007. 12(Pt 2): p. 1012-6. Exclude Code: E3
33. Artinian, N.T., et al., Effects of nurse-
managed telemonitoring on blood pressure at 12-month follow-up among urban African Americans. Nursing research, 2007. 56(5): p. 312-22. Exclude Code: E3
34. Artinian, N.T., et al., Effects of nurse-

Appendix E. Excluded Studies List (continued)
A-13
managed telemonitoring on blood pressure at 12-month follow-up among urban African Americans. Nursing Research, 2007. 56(5): p. 312-22. Exclude Code: E3
35. Artinian, N.T., et al., Effects of nurse-
managed telemonitoring on blood pressure at 12-month follow-up among urban African Americans. Nursing Research, 2007. 56(5): p. 312-22. Exclude Code: E3
36. Artinian, N.T., O.G. Washington, and
T.N. Templin, Effects of home telemonitoring and community-based monitoring on blood pressure control in urban African Americans: a pilot study. Heart & Lung, 2001. 30(3): p. 191-9. Exclude Code: E3
37. Atkinson, N.L., et al., Assessment of the
nutrition and physical activity education needs of low-income, rural mothers: can technology play a role? Journal of Community Health, 2007. 32(4): p. 245-67. Exclude Code: E3
38. Baba, M., D. Seckin, and S. Kapdali, A
comparison of teledermatology using store-and-forward methodology alone, and in combination with Web camera videoconferencing. Journal of Telemedicine & Telecare, 2005. 11(7): p. 354-60. Exclude Code: E3
39. Baehring, T.U., et al., Using the World
Wide Web--a new approach to risk identification of diabetes mellitus. International Journal of Medical Informatics, 1997. 46(1): p. 31-9. Exclude Code: E3
40. Baker, L., et al., Use of the Internet and
e-mail for health care information: results from a national survey. JAMA, 2003. 289(18): p. 2400-6. Exclude Code: E1
41. Bakken, S., et al., Development,
validation, and use of English and Spanish versions of the telemedicine satisfaction and usefulness questionnaire. Journal of the American Medical Informatics Association, 2006.
13(6): p. 660-7. Exclude Code: E3 42. Balas, E.A., et al., Electronic
communication with patients. Evaluation of distance medicine technology. JAMA, 1997. 278(2): p. 152-9. Exclude Code: E3
43. Baranowski, T., et al., The Fun, Food,
and Fitness Project (FFFP): the Baylor GEMS pilot study. Ethnicity & disease, 2003. 13(1 Suppl 1): p. S30-9. Exclude Code: E3
44. Barber, J.G., Computer-assisted drug
prevention. Journal of Substance Abuse Treatment, 1990. 7(2): p. 125-31. Exclude Code: E2
45. Barnes, N., et al., Liverpool Telecare
Pilot: case studies. Informatics in Primary Care, 2006. 14(3): p. 197-202. Exclude Code: E3
46. Barnett, T.E., et al., The effectiveness of
a care coordination home telehealth program for veterans with diabetes mellitus: a 2-year follow-up. American Journal of Managed Care, 2006. 12(8): p. 467-474. Exclude Code: E3
47. Baron, J., et al., Effect of assessment
method on the discrepancy between judgments of health disorders people have and do not have: a web study. Medical Decision Making, 2003. 23(5): p. 422-34. Exclude Code: E1
48. Bartholomew, L., et al., Watch,
Discover, Think, and Act: Evaluation of computer-assisted instruction to improve asthma self-management in inner-city children. Patient Education and Counseling, 2000. 39(2-3): p. 269-280. Exclude Code: E2
49. Bartholomew, L.K., et al., Watch,
Discover, Think, and Act: evaluation of computer-assisted instruction to improve asthma self-management in inner-city children. Patient Education & Counseling, 2000. 39(2-3): p. 269-80. Exclude Code: E2
50. Bartholomew, L.K., et al., Watch,

Appendix E. Excluded Studies List (continued)
A-14
Discover, Think, and Act: a model for patient education program development. Patient Education & Counseling, 2000. 39(2-3): p. 253-68. Exclude Code: E2
51. Basch, E., et al., Patient online self-
reporting of toxicity symptoms during chemotherapy. Journal of Clinical Oncology, 2005. 23(15): p. 3552-61. Exclude Code: E3
52. Basch, E., et al., Evaluation of an online
platform for cancer patient self-reporting of chemotherapy toxicities. Journal of the American Medical Informatics Association, 2007. 14(3): p. 264-8. Exclude Code: E3
53. Bastian, L.A., et al., Evaluating
participants' use of a hormone replacement therapy decision-making intervention. Patient Education & Counseling, 2002. 48(3): p. 283-91. Exclude Code: E3
54. Baum, L.S., Internet parent support
groups for primary caregivers of a child with special health care needs. Pediatric Nursing. 30(5): p. 381-8. Exclude Code: E3
55. Beale, I.L., et al., Improvement in
cancer-related knowledge following use of a psychoeducational video game for adolescents and young adults with cancer. Journal of Adolescent Health, 2007. 41(3): p. 263-70. Exclude Code: E3
56. Beaudin, J.S., S.S. Intille, and M.E.
Morris, To track or not to track: user reactions to concepts in longitudinal health monitoring. Journal of Medical Internet Research, 2006. 8(4): p. e29. Exclude Code: E1
57. Bechtel-Blackwell, D.A., Computer-
assisted self-interview and nutrition education in pregnant teens. Clinical Nursing Research, 2002. 11(4): p. 450-62. Exclude Code: E1
58. Beck, H., et al., Computer skills in
patients with movement disorders. Parkinsonism & Related Disorders,
2005. 11(7): p. 421-6. Exclude Code: E3 59. Benatar, D., et al., Outcomes of chronic
heart failure. Archives of internal medicine, 2003. 163(3): p. 347-52. Exclude Code: E3
60. Bendixen, R.M., K. Horn, and C. Levy,
Using telerehabilitation to support elders with chronic illness in their homes. Topics in Geriatric Rehabilitation, 2007. 23(1): p. 47-51. Exclude Code: E3
61. Bensink, M., et al., Investigating the
cost-effectiveness of videotelephone based support for newly diagnosed paediatric oncology patients and their families: design of a randomised controlled trial. BMC Health Services Research, 2007. 7: p. 38. Exclude Code: E3
62. Berry, D.L., et al., Actual use and perceived usefulness of a web-based, decision support program for men with prostate cancer. Studies in Health Technology & Informatics, 2006. 122: p. 781-2. Exclude Code: E3
63. Bielli, E., et al., A Wireless Health
Outcomes Monitoring System (WHOMS): development and field testing with cancer patients using mobile phones. BMC Medical Informatics & Decision Making, 2004. 4: p. 7. Exclude Code: E3
64. Biermann, E., et al., Are there time and
cost savings by using telemanagement for patients on intensified insulin therapy? A randomised, controlled trial. Computer Methods & Programs in Biomedicine, 2002. 69(2): p. 137-46. Exclude Code: E3
65. Bik-Multanowski, M., et al., Use of
handheld computers for assessment of prefrontal cortex function in patients with phenylketonuria. Molecular Genetics & Metabolism, 2005. 86 Suppl 1: p. S142-4. Exclude Code: E3
66. Birkmann, C., R.C. Dumitru, and H.U.
Prokosch, Evaluation of health-related Internet use in Germany. Methods of Information in Medicine, 2006. 45(4): p.

Appendix E. Excluded Studies List (continued)
A-15
367-76. Exclude Code: E1 67. Block, G., et al., An interactive CD-ROM
for nutrition screening and counseling. American Journal of Public Health, 2000. 90(5): p. 781-5. Exclude Code: E
68. Bock, B., et al., Acceptability of
computer assessments among ethnically diverse, low-income smokers. American Journal of Health Promotion, 1999. 13(5): p. 299-304. Exclude Code: E3
69. Boisen, E., et al., Copability, coping, and
learning as focal concepts in the evaluation of computerised diabetes disease management. International Journal of Medical Informatics, 2003. 70(2-3): p. 353-63. Exclude Code: E2
70. Boissy, P., K. Jacobs, and S.H. Roy,
Usability of a barcode scanning system as a means of data entry on a PDA for self-report health outcome questionnaires: a pilot study in individuals over 60 years of age. BMC Medical Informatics & Decision Making, 2006. 6: p. 42. Exclude Code: E3
71. Bosworth, H.B., et al., Hypertension
Intervention Nurse Telemedicine Study (HINTS): testing a multifactorial tailored behavioral/educational and a medication management intervention for blood pressure control. American Heart Journal, 2007. 153(6): p. 918-24. Exclude Code: E3
72. Bowen, A.M., K. Horvath, and M.L.
Williams, A randomized control trial of Internet-delivered HIV prevention targeting rural MSM. Health Education Research, 2007. 22(1): p. 120-7. Exclude Code: E3
73. Bratan, T., et al., Evaluation of the
practical feasibility and acceptability of home monitoring in residential homes. Journal of Telemedicine & Telecare, 2005. 11 Suppl 1: p. 29-31. Exclude Code: E3
74. Brenner, B., Is the provision of
laboratory results via the Internet
acceptable to patients? A survey of private patients in a large, specialist gynaecology practice. New Zealand Medical Journal, 2003. 116(1187): p. U711. Exclude Code: E1
75. Brown, C.L., N. Tangsinmankong, and
P.J. Emmanuel, Improving care of HIV-infected patients in the outpatient setting with patient data flow sheets. Journal of the Association of Nurses in AIDS Care, 2002. 13(4): p. 58-63. Exclude Code: E3
76. Brown, S.J., et al., Educational video
game for juvenile diabetes: results of a controlled trial. Medical Informatics, 1997. 22(1): p. 77-89. Exclude Code: E3
77. Bruning Brown, J., et al., An evaluation
of an Internet-delivered eating disorder prevention program for adolescents and their parents. Journal of Adolescent Health, 2004. 35(4): p. 290-6. Exclude Code: E1
78. Bulmer, P.J., et al., A randomized trial
comparing the effectiveness and preference of a touch-screen computer system with a leaflet for providing women with information on urinary symptoms suggestive of detrusor instability. BJU International, 2001. 88(6): p. 532-5. Exclude Code: E3
79. Burkhart, P.V., et al., Testing an
intervention to promote children's adherence to asthma self-management. Journal of Nursing Scholarship, 2007. 39(2): p. 133-40. Exclude Code: E
80. Bush, N., et al., Development, feasibility
and compliance of a web-based system for very frequent QOL and symptom home self-assessment after hematopoietic stem cell transplantation. Quality of Life Research, 2005. 14(1): p. 77-93. Exclude Code: E3
81. Butler, S.F., et al., Working it out:
development and testing of a multimedia, vocational education program. Substance Use & Misuse, 2004. 39(13-14): p. 2525-58. Exclude Code: E3

Appendix E. Excluded Studies List (continued)
A-16
82. Campbell, E., et al., Encouraging underscreened women to have cervical cancer screening: the effectiveness of a computer strategy. Preventive Medicine, 1997. 26(6): p. 801-7. Exclude Code: E1
83. Campbell, M.K., et al., Randomized trial
of a tailored nutrition education CD-ROM program for women receiving food assistance. Journal of Nutrition Education and Behavior, 2004. 36(2): p. 58-66. Exclude Code: E3
84. Carlbring, P., et al., Remote treatment of
panic disorder: a randomized trial of internet-based cognitive behavior therapy supplemented with telephone calls. The American journal of psychiatry, 2006. 163(12): p. 2119-25. Exclude Code: E3
85. Carlbring, P., et al., Treatment of social
phobia: randomised trial of internet-delivered cognitive-behavioural therapy with telephone support. British Journal of Psychiatry, 2007. 190: p. 123-8. Exclude Code: E3
86. Carlbring, P., et al., Treatment of panic
disorder via the Internet: A randomized trial of a self-help program. Behavior Therapy, 2001. 32(4): p. 751-764. Exclude Code: E3
87. Carpenter, K.M., et al., Teaching brief
interventions for smoking cessation via an interactive computer-based tutorial. Journal of Health Psychology, 2003. 8(1): p. 149-60. Exclude Code: E3
88. Chen, H.H. and M.L. Yeh, Developing
and evaluating a smoking cessation program combined with an Internet-assisted instruction program for adolescents with smoking. Patient education and counseling, 2006. 61(3): p. 411-8. Exclude Code: E
89. Cherry, J.C., et al., Diabetes disease
management program for an indigent population empowered by telemedicine technology. Diabetes Technology & Therapeutics, 2002. 4(6): p. 783-91. Exclude Code: E3
90. Chou, M., et al., Exploring the self-learning experiences of patients with depression participating in a multimedia education program. Journal of Nursing Research, 2004. 12(4): p. 297-305. Exclude Code: E3
91. Christensen, D.B., et al., Assessing
compliance to antihypertensive medications using computer-based pharmacy records. Medical Care, 1997. 35(11): p. 1164-70. Exclude Code: E3
92. Christenson, M.A., Assessing an elder's
need for assistance: one technological tool. Generations, 1995. 19(1): p. 54-55. Exclude Code: E2
93. Chung, M. and M. Akahoshi, Reducing
home nursing visit costs using a remote access infusion pump system. Journal of Intravenous Nursing, 1999. 22(6): p. 309-14. Exclude Code: E3
94. Clemensen, J., S.B. Larsen, and N.
Ejskjaer, Telemedical treatment at home of diabetic foot ulcers. Journal of Telemedicine & Telecare, 2005. 11 Suppl 2: p. S14-6. Exclude Code: E3
95. Crosbie, J.H., et al., Virtual reality in the
rehabilitation of the upper limb after stroke: the user's perspective. Cyberpsychology & Behavior, 2006. 9(2): p. 137-41. Exclude Code: E3
96. Cunningham, J.A., K. Humphreys, and
A. Koski-Jannes, Providing personalized assessment feedback for problem drinking on the Internet: a pilot project. Journal of Studies on Alcohol, 2000. 61(6): p. 794-8. Exclude Code: E1
97. Cunningham, J.A., et al., Internet and
paper self-help materials for problem drinking: is there an additive effect? Addictive Behaviors, 2005. 30(8): p. 1517-23. Exclude Code: E1
98. Cunningham, J.A., P. Selby, and T. van
Mierlo, Integrated online services for smokers and drinkers? Use of the check your drinking assessment screener by participants of the Stop Smoking Center. Nicotine & Tobacco Research, 2006. 8

Appendix E. Excluded Studies List (continued)
A-17
Suppl 1: p. S21-5. Exclude Code: E2 99. Cytryn, K.N. and V.L. Patel, Reasoning
about diabetes and its relationship to the use of telecommunication technology by patients and physicians. International Journal of Medical Informatics, 1998. 51(2-3): p. 137-51. Exclude Code: E
100. Dale, J., S. Connor, and K. Tolley, An
evaluation of the west Surrey telemedicine monitoring project. Journal of Telemedicine & Telecare, 2003. 9 Suppl 1: p. S39-41. Exclude Code: E3
101. Datto, C.J., et al., The pilot study of a
telephone disease management program for depression. General Hospital Psychiatry, 2003. 25(3): p. 169-77. Exclude Code: E3
102. De Bourdeaudhuij, I., et al., Evaluation
of an interactive computer-tailored nutrition intervention in a real-life setting. Annals of Behavioral Medicine, 2007. 33(1): p. 39-48. Exclude Code: E
103. de Lusignan, S., et al., A pilot study of
radiotelemetry for continuous cardiopulmonary monitoring of patients at home. Journal of Telemedicine & Telecare, 2000. 6 Suppl 1: p. S119-22. Exclude Code: E3
104. DeLenardo, C., Web-based tools steer
patient-focused care: portal technology empowers patients to track and improve outcomes. Holistic Nursing Practice, 2005. 19(2): p. 90-2. Exclude Code: E2
105. Delgado, M. and J. Santiago, HIV/AIDS
in a Puerto Rican/Dominican community: a collaborative project with a botanical shop. Social Work, 1998. 43(2): p. 183-6. Exclude Code: E3
106. Delic, D., O. Polasek, and J. Kern,
Internet health-information seekers in Croatia--who, what, and why? Medical Informatics & the Internet in Medicine, 2006. 31(4): p. 267-73. Exclude Code: E3
107. DePalma, A., Prostate Cancer Shared
Decision: a CD-ROM educational and
decision-assisting tool for men with prostate cancer. Seminars in Urologic Oncology, 2000. 18(3): p. 178-81. Exclude Code: E2
108. Diamond, B.J., et al., Telerehabilitation,
cognition and user-accessibility. Neurorehabilitation, 2003. 18(2): p. 171-7. Exclude Code: E3
109. Diefenbach, M.A. and B.P. Butz, A
multimedia interactive education system for prostate cancer patients: development and preliminary evaluation. Journal of Medical Internet Research, 2004. 6(1): p. e3. Exclude Code: E3
110. Dobscha, S.K., et al., Measuring
depression and pain with home health monitors. Telemedicine Journal & E-Health, 2006. 12(6): p. 702-6. Exclude Code: E3
111. Donald, S., et al., Evaluation of use of
cellphones to aid compliance with drug therapy for HIV patients. AIDS Care, 2007. 19(5): p. 605-7. Exclude Code: E
112. Dragone, M.A., et al., Development and
evaluation of an interactive CD-ROM for children with leukemia and their families. Patient Education & Counseling, 2002. 46(4): p. 297-307. Exclude Code: E3
113. Duff, A., et al., Betterland: an interactive
cd-rom guide for children with cystic fibrosis. Paediatric Nursing, 2006. 18(7): p. 30-3. Exclude Code: E2
114. Dunbar, P.J., et al., A two-way
messaging system to enhance antiretroviral adherence. Journal of the American Medical Informatics Association, 2003. 10(1): p. 11-5. Exclude Code: E3
115. Edworthy, S.M. and G.M. Devins,
Improving medication adherence through patient education distinguishing between appropriate and inappropriate utilization. Patient Education Study Group. Journal of Rheumatology, 1999. 26(8): p. 1793-801. Exclude Code: E3
116. Eisermann, U., I. Haase, and B. Kladny,
Appendix E. Excluded Studies List (continued)
A-18
Computer-aided multimedia training in orthopedic rehabilitation. American Journal of Physical Medicine & Rehabilitation, 2004. 83(9): p. 670-80. Exclude Code: E3
117. Emery, J., et al., The GRAIDS Trial: a
cluster randomised controlled trial of computer decision support for the management of familial cancer risk in primary care. British Journal of Cancer, 2007. 97(4): p. 486-93. Exclude Code: E1
118. Engelbrecht, R., et al., DIABCARD--an
application of a portable medical record for persons with diabetes. Medical Informatics, 1996. 21(4): p. 273-82. Exclude Code: E3
119. Eriksson, J., A. Ek, and G. Johansson,
Design and evaluation of a software prototype for participatory planning of environmental adaptations. IEEE Transactions on Rehabilitation Engineering, 2000. 8(1): p. 94-106. Exclude Code: E3
120. Finkel, S., et al., E-care: a telecommunications technology intervention for family caregivers of dementia patients. American Journal of Geriatric Psychiatry, 2007. 15(5): p. 443-448. Exclude Code: E1
121. Finkelstein, J., M.R. Cabrera, and G.
Hripcsak, Internet-based home asthma telemonitoring: can patients handle the technology? Chest, 2000. 117(1): p. 148-55. Exclude Code: E
122. Fortney, J.C., et al., Design and
implementation of the telemedicine-enhanced antidepressant management study. General hospital psychiatry, 2006. 28(1): p. 18-26. Exclude Code: E3
123. Franck, L.S. and M. Jones, Computer-
taught coping techniques for venepuncture: preliminary findings from usability testing with children, parents and staff. Journal of Child Health Care, 2003. 7(1): p. 41-54. Exclude Code: E3
124. Friedman, R.H., et al., A
telecommunications system to manage
patients with chronic disease. Medinfo, 1998. 9 Pt 2: p. 1330-4. Exclude Code: E2
125. Frosch, D.L., R.M. Kaplan, and V.J.
Felitti, A randomized controlled trial comparing internet and video to facilitate patient education for men considering the prostate specific antigen test. Journal of General Internal Medicine, 2003. 18(10): p. 781-7. Exclude Code: E3
126. Gerber, B.S., et al., Implementation of
computer multimedia for diabetes prevention in African-American women. AMIA, 2005. Annual Symposium Proceedings/AMIA Symposium.: p. 962. Exclude Code: E3
127. Giallauria, F., et al., Efficacy of
telecardiology in improving the results of cardiac rehabilitation after acute myocardial infarction. Monaldi Archives for Chest Disease, 2006. 66(1): p. 8-12. Exclude Code: E3
128. Glasgow, R.E., et al., Long-term effects
and costs of brief behavioural dietary intervention for patients with diabetes delivered from the medical office. Patient Education & Counseling, 1997. 32(3): p. 175-84. Exclude Code: E3
129. Glazebrook, C., et al., Impact of a
multimedia intervention "Skinsafe" on patients' knowledge and protective behaviors. Preventive Medicine, 2006. 42(6): p. 449-54. Exclude Code: E1
130. Goldfield, G.S. and A. Boachie, Delivery
of family therapy in the treatment of anorexia nervosa using telehealth. Telemedicine Journal & E-Health, 2003. 9(1): p. 111-4. Exclude Code: E3
131. Gomez, E.J., et al., Telemedicine as a
tool for intensive management of diabetes: the DIABTel experience. Computer Methods & Programs in Biomedicine, 2002. 69(2): p. 163-77. Exclude Code: E3
132. Graham, A.L., et al., Characteristics of
smokers reached and recruited to an

Appendix E. Excluded Studies List (continued)
A-19
internet smoking cessation trial: a case of denominators. Nicotine & Tobacco Research, 2006. 8 Suppl 1: p. S43-8. Exclude Code: E3
133. Grant, R.W., et al., Design and
implementation of a web-based patient portal linked to an ambulatory care electronic health record: patient gateway for diabetes collaborative care. Diabetes Technology & Therapeutics, 2006. 8(5): p. 576-86. Exclude Code: E2
134. Gray, J., et al., Baby CareLink:
development and implementation of a WWW-based system for neonatal home telemedicine. Proceedings / AMIA, 1998. Annual Symposium.: p. 351-5. Exclude Code: E1
135. Gray, J.E., et al., Baby CareLink: using
the internet and telemedicine to improve care for high-risk infants. Pediatrics, 2000. 106(6): p. 1318-24. Exclude Code: E1
136. Gustafson, D.H., et al., CHESS: 10
years of research and development in consumer health informatics for broad populations, including the underserved. International Journal of Medical Informatics, 2002. 65(3): p. 169-77. Exclude Code: E2
137. Hahn, E.A., et al., The talking
touchscreen: a new approach to outcomes assessment in low literacy. Psycho-Oncology, 2004. 13(2): p. 86-95. Exclude Code: E3
138. Han, H.R. and A.E. Belcher, Computer-
mediated support group use among parents of children with cancer--an exploratory study. Computers in Nursing, 2001. 19(1): p. 27-33. Exclude Code: E1
139. Hebert, M.A. and B. Korabek,
Stakeholder readiness for telehomecare: implications for implementation. Telemedicine Journal & E-Health, 2004. 10(1): p. 85-92. Exclude Code: E3
140. Hebert, M.A., M.J. Paquin, and S.
Iversen, Predicting success: stakeholder readiness for home telecare diabetic support. Journal of Telemedicine & Telecare, 2002. 8 Suppl 3: p. S3:33-6. Exclude Code: E3
141. Heiberg, T., et al., Daily health status
registration (patient diary) in patients with rheumatoid arthritis: a comparison between personal digital assistant and paper-pencil format. Arthritis & Rheumatism, 2007. 57(3): p. 454-60. Exclude Code: E3
142. Heidgerken, A.D., et al., Telehealth
intervention for adolescents with type 1 diabetes. Journal of Pediatrics, 2006. 148(5): p. 707-8. Exclude Code: E3
143. Heisler, M., et al., "I am not alone": the
feasibility and acceptability of interactive voice response-facilitated telephone peer support among older adults with heart failure. Congestive Heart Failure, 2007. 13(3): p. 149-57. Exclude Code: E3
144. Hill, W., C. Weinert, and S. Cudney,
Influence of a computer intervention on the psychological status of chronically ill rural women: preliminary results. Nursing Research, 2006. 55(1): p. 34-42. Exclude Code: E3
145. Hill, W.G. and C. Weinert, An evaluation
of an online intervention to provide social support and health education. CIN: Computers, Informatics, Nursing, 2004. 22(5): p. 282-8. Exclude Code: E1
146. Hoffmann, T., et al., Randomised trial of
a computer-generated tailored written education package for patients following stroke. Age & Ageing, 2007. 36(3): p. 280-6. Exclude Code: E3
147. Hoffmann, T., T. Russell, and K.
McKenna, Producing computer-generated tailored written information for stroke patients and their carers: system development and preliminary evaluation. International Journal of Medical Informatics, 2004. 73(11-12): p. 751-8. Exclude Code: E3

Appendix E. Excluded Studies List (continued)
A-20
148. Hofmann, M., et al., Interactive computer-based cognitive training in patients with Alzheimer's disease. Journal of Psychiatric Research, 1996. 30(6): p. 493-501. Exclude Code: E3
149. Holbrook, A., et al., Influence of decision
aids on patient preferences for anticoagulant therapy: a randomized trial. CMAJ Canadian Medical Association Journal, 2007. 176(11): p. 1583-7. Exclude Code: E3
150. Hong, O., et al., Efficacy of a computer-
based hearing test and tailored hearing protection intervention. International Journal of Behavioral Medicine, 2006. 13(4): p. 304-14. Exclude Code: E3
151. Hudson, L.R., et al., Remote
physiological monitoring: clinical, financial, and behavioral outcomes in a heart failure population. Disease Management, 2005. 8(6): p. 372-81. Exclude Code: E3
152. Hunkeler, E.M., et al., Efficacy of nurse
telehealth care and peer support in augmenting treatment of depression in primary care. Archives of Family Medicine, 2000. 9(8): p. 700-8. Exclude Code: E3
153. Huss, K., et al., Computer game for
inner-city children does not improve asthma outcomes. Journal of Pediatric Health Care, 2003. 17(2): p. 72-8. Exclude Code: E3
154. Illyes, M., T. Mengden, and A. Tisler,
The virtual hypertension clinic. Blood Pressure Monitoring, 2002. 7(1): p. 67-8. Exclude Code: E2
155. Im, E.-O. and W. Chee, Evaluation of
the decision support computer program for cancer pain management. Oncology Nursing Forum Online, 2006. 33(5): p. 977-82. Exclude Code: E3
156. James, S.D. and R.E. Thomas,
Problems in community healthcare information systems: a case study. Health Informatics Journal, 1999. 5(3): p. 146-53. Exclude Code: E2
157. Jantz, C., J. Anderson, and S.M. Gould,
Using computer-based assessments to evaluate interactive multimedia nutrition education among low-income predominantly Hispanic participants. Journal of Nutrition Education and Behavior, 2002. 34(5): p. 252-60. Exclude Code: E3
158. Jenkins, R.L. and M. McSweeney,
Assessing elderly patients with congestive heart failure via in-home interactive telecommunication. Journal of Gerontological Nursing, 2001. 27(1): p. 21-7. Exclude Code: E3
159. Jerant, A.F., R. Azari, and T.S. Nesbitt,
Reducing the cost of frequent hospital admissions for congestive heart failure: a randomized trial of a home telecare intervention. Medical Care, 2001. 39(11): p. 1234-1245. Exclude Code: E3
160. Jibaja-Weiss, M.L., et al., Entertainment
education for informed breast cancer treatment decisions in low-literate women: development and initial evaluation of a patient decision aid. Journal of Cancer Education, 2006. 21(3): p. 133-9. Exclude Code: E3
161. Johnson, M.J., et al., The development
and evaluation of alternative communication strategies to facilitate interactions with Somali refugees in primary care: a preliminary study. Informatics in Primary Care, 2006. 14(3): p. 183-9. Exclude Code: E3
162. Johnston, B., et al., Outcomes of the
Kaiser Permanente Tele-Home Health Research Project. Archives of Family Medicine, 2000. 9(1): p. 40-5. Exclude Code: E3
163. Kaminer, Y., et al., An interactive voice
response (IVR) system for adolescents with alcohol use disorders: a pilot study. American Journal on Addictions, 2006. 15 Suppl 1: p. 122-5. Exclude Code: E3
164. Kaplan, B., R. Farzanfar, and R.H.
Friedman, Personal relationships with an intelligent interactive telephone

Appendix E. Excluded Studies List (continued)
A-21
health behavior advisor system: a multimethod study using surveys and ethnographic interviews. International Journal of Medical Informatics, 2003. 71(1): p. 33-41. Exclude Code: E1
165. Karagiannis, G.E., et al., Health and
lifestyle management via interactive TV in patients with severe chronic cardiovascular diseases. Journal of Telemedicine & Telecare, 2006. 12 Suppl 1: p. 17-9. Exclude Code: E3
166. Karp, W.B., et al., Use of telemedicine
for children with special health care needs. Pediatrics, 2000. 105(4 part 1): p. 843-7. Exclude Code: E3
167. Katz, N., et al., Interactive virtual
environment training for safe street crossing of right hemisphere stroke patients with unilateral spatial neglect. Disability & Rehabilitation, 2005. 27(20): p. 1235-43. Exclude Code: E3
168. Kaufman, D.R., et al., A cognitive
framework for understanding barriers to the productive use of a diabetes home telemedicine system. AMIA, 2003. Annual Symposium Proceedings/AMIA Symposium.: p. 356-60. Exclude Code: E2
169. Kearney, N., et al., Utilising handheld
computers to monitor and support patients receiving chemotherapy: results of a UK-based feasibility study. Supportive Care in Cancer, 2006. 14(7): p. 742-52. Exclude Code: E3
170. Keaton, L., et al., An E-rehabilitation
team helps caregivers deal with stroke. Internet Journal of Allied Health Sciences & Practice, 2004. 2(4): p. 17p. Exclude Code: E1
171. Keener, R.E., Tracking HIV treatment:
technology and drugs make AIDS a manageable disease. Health Management Technology, 2000. 21(10): p. 48, 50-1. Exclude Code: E3
172. Kerr, C., et al., Internet interventions for
long-term conditions: patient and caregiver quality criteria. Journal of
Medical Internet Research, 2006. 8(3): p. e13. Exclude Code: E
173. Keulers, B.J., et al., Can face-to-face
patient education be replaced by computer-based patient education? A randomised trial. Patient Education and Counseling, 2007. 67(1-2): p. 176-82. Exclude Code: E3
174. Kim, H.-S., Y.-S. Yoo, and H.-S. Shim,
Effects of an Internet-based intervention on plasma glucose levels in patients with type 2 diabetes. Journal of Nursing Care Quality, 2005. 20(4): p. 335-40. Exclude Code: E3
175. Kinsella, A., Managing technology.
Telehealthcare under PPS: tools to make it work. Home Healthcare Nurse, 2001. 19(9): p. 579-81. Exclude Code: E2
176. Kinzie, M.B., J.B. Schorling, and M.
Siegel, Prenatal alcohol education for low-income women with interactive multimedia. Patient Education and Counseling, 1993. 21(1/2): p. 51-60. Exclude Code: E3
177. Kleinpell, R.M. and B. Avitall, Integrating
telehealth as a strategy for patient management after discharge for cardiac surgery: results of a pilot study. Journal of Cardiovascular Nursing, 2007. 22(1): p. 38-42. Exclude Code: E3
178. Kreisel, K., Evaluation of a computer-
based nutrition education tool. Public Health Nutrition, 2004. 7(2): p. 271-7. Exclude Code: E1
179. Krishna, S., et al., Internet-enabled
interactive multimedia asthma education program: a randomized trial. Pediatrics, 2003. 111(3): p. 503-10. Exclude Code: E3
180. Krishna, S., et al., Internet-enabled
interactive multimedia asthma education program: a randomized trial. Pediatrics, 2003. 111(3): p. 503-10. Exclude Code: E3
181. Kukafka, R., et al., Web-based tailoring
Appendix E. Excluded Studies List (continued)
A-22
and its effect on self-efficacy: results from the MI-HEART randomized controlled trial. Proceedings / AMIA, 2002. Annual Symposium.: p. 410-4. Exclude Code: E1
182. Kully, D., Telehealth in speech
pathology: applications to the treatment of stuttering. Journal of Telemedicine & Telecare, 2000. 6 Suppl 2: p. S39-41. Exclude Code: E3
183. Laron, Z., et al., Four years experience
with the microcomputer system "Diacon" in the treatment and education of diabetes. Hormone & Metabolic Research - Supplement, 1990. 24: p. 129-40. Exclude Code: E3
184. Latessa, R.A., et al., Changing practices
in the use of pneumococcal vaccine. Family Medicine, 2000. 32(3): p. 196-200. Exclude Code: E3
185. Lawton, D.F., Older Adults Eager To
Explore Cyberspace. 2001. Exclude Code: E3
186. Leahy, A., et al., Computerised
biofeedback games: a new method for teaching stress management and its use in irritable bowel syndrome. Journal of the Royal College of Physicians of London, 1998. 32(6): p. 552-6. Exclude Code: E3
187. Lee, J.H., et al., A telemedicine system
as a care modality for dementia patients in Korea. Alzheimer Disease & Associated Disorders, 2000. 14(2): p. 94-101. Exclude Code: E3
188. Lehmann, E.D., Spontaneous
comments from users of the AIDA interactive educational diabetes simulator. Diabetes Educator. 26(4): p. 633-8. Exclude Code: E3
189. Lehmann, E.D., Preliminary experience
with the Internet release of AIDA--an interactive educational diabetes simulator. Computer Methods & Programs in Biomedicine, 1998. 56(2): p. 109-32. Exclude Code: E3
190. Lehmann, E.D., Experience with the Internet release of AIDA v4.0--http://www.diabetic.org.uk.aida.htm--an interactive educational diabetes simulator. Diabetes Technology & Therapeutics, 1999. 1(1): p. 41-54. Exclude Code: E3
191. Lehmann, E.D., The freeware AIDA
interactive educational diabetes simulator--http://www.2aida.org--(1). A download survey for AIDA v4.0. Medical Science Monitor, 2001. 7(3): p. 504-15. Exclude Code: E3
192. Lehmann, E.D., Why are people
downloading the freeware AIDA diabetes computing software program: a pilot study. Diabetes Technology & Therapeutics, 2002. 4(6): p. 793-808. Exclude Code: E3
193. Lehmann, E.D., Who is downloading the
freeware AIDA v43 interactive educational diabetes simulator? An audit of 2437 downloads. Diabetes Technology & Therapeutics, 2002. 4(4): p. 467-77. Exclude Code: E3
194. Lehmann, E.D., Who is downloading the
free AIDA v4.3a interactive educational diabetes computer software? A 1-year survey of 3864 downloads. Diabetes Technology & Therapeutics, 2003. 5(5): p. 879-90. Exclude Code: E3
195. Lehmann, E.D., Why people download
the freeware AIDA v4.3a diabetes software program: a proof-of-concept semi-automated analysis. Diabetes Technology & Therapeutics, 2003. 5(3): p. 477-90. Exclude Code: E3
196. Lehmann, E.D., Research use of the
AIDA www.2aida.org diabetes software simulation program: a review-part 1. decision support testing and neural network training. Diabetes Technology & Therapeutics, 2003. 5(3): p. 425-38. Exclude Code: E2
197. Lehmann, E.D., Usage of the
www.2aida.org AIDA diabetes software Website: a pilot study. Diabetes Technology & Therapeutics, 2003. 5(1):

Appendix E. Excluded Studies List (continued)
A-23
p. 75-89. Exclude Code: E3 198. Lehmann, E.D., British Diabetic
Association review of the AIDA v4 diabetes software simulator program. Diabetes Technology & Therapeutics, 2004. 6(1): p. 87-96. Exclude Code: E3
199. Lehmann, E.D. and T. Deutsch, An
interactive, educational model for insulin dosage and dietary adjustment in type I diabetes mellitus. Proceedings - the Annual Symposium on Computer Applications in Medical Care, 1992: p. 205-9. Exclude Code: E3
200. Levetan, C.S., et al., Impact of
computer-generated personalized goals on HbA(1c). Diabetes Care, 2002. 25(1): p. 2-8. Exclude Code: E3
201. Lewis, D., J. Cooper, and S.
Gunawardena, Caring Connection: Internet resources for family caregivers of children with cancer. AMIA, 2006. Annual Symposium Proceedings/AMIA Symposium.: p. 1007. Exclude Code: E1
202. Lillis, K., Electronically enhanced
therapy: behavioral health plan rolls out online, interactive "coaching" series for members. Health Management Technology, 2004. 25(8): p. 42. Exclude Code: E2
203. Lin, Z., J. Effken, and Y. Li, Designing and evaluating a Web-based, tailored breast cancer education program. CIN: Computers, Informatics, Nursing, 2006. 24(5): p. 300. Exclude Code: E
204. Linke, S., et al., Internet-based
interactive health intervention for the promotion of sensible drinking: patterns of use and potential impact on members of the general public. Journal of Medical Internet Research, 2007. 9(2): p. e10. Exclude Code: E1
205. Linne, A.B. and H. Liedholm, Effects of
an interactive CD-program on 6 months readmission rate in patients with heart failure - a randomised, controlled trial [NCT00311194]. BMC Cardiovascular Disorders, 2006. 6: p. 30. Exclude
Code: E3 206. Lo, R., et al., The development and
evaluation of a computer-aided diabetes education program. Australian Journal of Advanced Nursing, 1996. 13(4): p. 19-27. Exclude Code: E3
207. Long, J.D., et al., Pilot using world wide
Web to prevent diabetes in adolescents. Clinical Nursing Research, 2006. 15(1): p. 67-79. Exclude Code: E
208. Lopez, A.M., et al., Increasing access to
care via tele-health: the Arizona experience. Journal of Ambulatory Care Management, 2005. 28(1): p. 16-23. Exclude Code: E3
209. Lovell, K., et al., Telephone
administered cognitive behaviour therapy for treatment of obsessive compulsive disorder: randomised controlled non-inferiority trial. BMJ, 2006. 333(7574): p. 883-6. Exclude Code: E3
210. Lowe, P., H. Hearnshaw, and F.
Griffiths, Attitudes of young people with diabetes to an Internet-based virtual clinic. Journal of Telemedicine & Telecare, 2005. 11 Suppl 1: p. 59-60. Exclude Code: E3
211. Maaske, L., A study of interactivity in
educational patient hypermedia. Journal of Biocommunication, 1999. 26(3): p. 2-11. Exclude Code: E3
212. Mackenzie, S.L.C., et al., Patient and
staff perspectives on the use of a computer counseling tool for HIV and sexually transmitted infection risk reduction. Journal of Adolescent Health, 2007. 40(6): p. 572.e9-16. Exclude Code: E3
213. Mahoney, D.F., et al., Effects of a
multimedia project on users' knowledge about normal forgetting and serious memory loss. Journal of the American Medical Informatics Association, 2002. 9(4): p. 383-94. Exclude Code: E3
214. Malasanos, T.H., et al., School nurse,

Appendix E. Excluded Studies List (continued)
A-24
family and provider connectivity in the FITE diabetes project. Journal of Telemedicine & Telecare, 2005. 11 Suppl 1: p. 76-8. Exclude Code: E3
215. Marco, C.A. and G.L. Larkin, Public
education regarding resuscitation: effects of a multimedia intervention. Annals of Emergency Medicine, 2003. 42(2): p. 256-60. Exclude Code: E3
216. Markman, M., et al., Profile of ovarian
cancer patients seeking information from a web-based decision support program. Journal of Women's Health, 2006. 15(3): p. 312-8. Exclude Code: E3
217. Matheson, D. and C. Achterberg,
Ecologic study of children's use of a computer nutrition education program. Journal of Nutrition Education, 2001. 33(1): p. 2-9. Exclude Code: E1
218. Matthew, A.G., et al., Serial personal
digital assistant data capture of health-related quality of life: a randomized controlled trial in a prostate cancer clinic. Health & Quality of Life Outcomes, 2007. 5: p. 38. Exclude Code: E3
219. McGrew, K.B. and C.A. Quinn,
Examining the effectiveness of telephone assessment and care planning for homecare services. Generations, 1997. 21(1): p. 66-67. Exclude Code: E3
220. Meneghini, L.F., et al., An electronic case manager for diabetes control. Diabetes Care, 1998. 21(4): p. 591-6. Exclude Code: E3
221. Mengden, T., et al., Telemonitoring of
blood pressure self measurement in the OLMETEL study... Proceedings from the "European Society of Hypertension Working Group on Blood Pressure Monitoring Scientific Workshop: What's New in Blood Pressure Measurement?"; held June 2004 in Paris, France. Blood Pressure Monitoring, 2004. 9(6): p. 321-5. Exclude Code: E3
222. Mermelstein, R. and L. Turner, Web-
based support as an adjunct to group-
based smoking cessation for adolescents. Nicotine & Tobacco Research, 2006. 8 Suppl 1: p. S69-76. Exclude Code: E3
223. Meyerhoff, C., F. Bischof, and E.F.
Pfeiffer, Long-term experiences with a computerized diabetes management and glucose monitoring system in insulin-dependent diabetic patients. Diabetes Research & Clinical Practice, 1994. 24(1): p. 1-7. Exclude Code: E3
224. Miloud, G.L., Response to: Heartcare:
an Internet-based information and support system for patient home recovery after coronary artery bypass graft (CABG) surgery by P. Flatley Brennan, S.M. Moore, G. Bjornsdottir, J. Jones, C. Visovsky and M. Rogers (2001) Journal Of Advanced Nursing 35, 699-708. Journal of Advanced Nursing, 2002. 38(4): p. 425; author reply 425-6. Exclude Code: E
225. Molenaar, S., et al., Exploring the black
box of a decision aid: what information do patients select from an interactive Cd-Rom on treatment options in breast cancer? Patient Education & Counseling, 2007. 65(1): p. 122-30. Exclude Code: E3
226. Molenaar, S., et al., Decision support for
patients with early-stage breast cancer: effects of an interactive breast cancer CDROM on treatment decision, satisfaction, and quality of life. Journal of Clinical Oncology, 2001. 19(6): p. 1676-87. Exclude Code: E3
227. Morlion, B., et al., Internet-based home
monitoring of pulmonary function after lung transplantation. American Journal of Respiratory & Critical Care Medicine, 2002. 165(5): p. 694-7. Exclude Code: E3
228. Mullan, B., et al., Home monitoring for
lung transplant candidates. Progress in Transplantation, 2003. 13(3): p. 176-82. Exclude Code: E3
229. Murtagh, M.J., et al., Qualitative
methods in a randomised controlled

Appendix E. Excluded Studies List (continued)
A-25
trial: the role of an integrated qualitative process evaluation in providing evidence to discontinue the intervention in one arm of a trial of a decision support tool. Quality & Safety in Health Care, 2007. 16(3): p. 224-9. Exclude Code: E3
230. Nakajima, K., et al., Low-cost, email-
based system for self blood pressure monitoring at home. Journal of Telemedicine & Telecare, 2006. 12(4): p. 203-7. Exclude Code: E3
231. Nakamura, K., T. Takano, and C. Akao,
Effectiveness of videophones in home healthcare for the elderly. Medical Care, 1999. 37(2): p. 117-125. Exclude Code: E3
232. Neafsey, P.J., et al., An interactive
technology approach to educate older adults about drug interactions arising from over-the-counter self-medication practices. Public Health Nursing, 2002. 19(4): p. 255-62. Exclude Code: E3
233. Nebel, I.-T., et al., Evaluation of a
computer based interactive diabetes education program designed to train the estimation of the energy or carbohydrate contents of foods. Patient Education & Counseling, 2002. 46(1): p. 55-9. Exclude Code: E3
234. Nebel, I.-T., et al., Comparative analysis
of conventional and an adaptive computer-based hypoglycaemia education programs. Patient Education & Counseling, 2004. 53(3): p. 315-8. Exclude Code: E3
235. Neville, R., et al., Mobile phone text
messaging can help young people manage asthma. BMJ, 2002. 325(7364): p. 600. Exclude Code: E3
236. Neville, R., et al., E-mail consultations in
general practice. British Journal of General Practice, 2004. 54(504): p. 546. Exclude Code: E
237. Neville, R.G., et al., Email consultations
in general practice. Informatics in Primary Care, 2004. 12(4): p. 207-14.
Exclude Code: E1 238. Nijeweme-d'Hollosy, W.O., et al., Tele-
treatment of patients with amyotrophic lateral sclerosis (ALS). Journal of Telemedicine & Telecare, 2006. 12 Suppl 1: p. 31-4. Exclude Code: E3
239. Oberleitner, R. and S. Laxminarayan,
Information technology and behavioral medicine: impact on autism treatment & research. Studies in Health Technology & Informatics, 2004. 103: p. 215-22. Exclude Code: E2
240. Ogawa, H., et al., A web-based care-
requiring client and Home Helper mutual support system. Biomedical Sciences Instrumentation, 2005. 41: p. 159-62. Exclude Code: E
241. O'Grady, L.A., Consumer e-health
education in HIV/AIDS: a pilot study of a web-based video workshop. BMC Medical Informatics & Decision Making, 2006. 6: p. 10. Exclude Code: E1
242. Osman, L.M., et al., Reducing hospital
admission through computer supported education for asthma patients. BMJ, 1994. 308(6928): p. 568-71. Exclude Code: E3
243. Owens, B.H. and K.C. Robbins,
CHESS: comprehensive health enhancement support system for women with breast cancer. Plastic Surgical Nursing. 16(3): p. 172-5. Exclude Code: E2
244. Page, S.J. and P. Levine, Modified constraint-induced therapy extension: using remote technologies to improve function. Archives of Physical Medicine & Rehabilitation, 2007. 88(7): p. 922-7. Exclude Code: E3
245. Palermo, T.M., D. Valenzuela, and P.P.
Stork, A randomized trial of electronic versus paper pain diaries in children: impact on compliance, accuracy, and acceptability. Pain, 2004. 107(3): p. 213-9. Exclude Code: E3
246. Papadaki, A. and J.A. Scott, The
Mediterranean Eating in Scotland

Appendix E. Excluded Studies List (continued)
A-26
Experience project: evaluation of an Internet-based intervention promoting the Mediterranean diet. British Journal of Nutrition, 2005. 94(2): p. 290-8. Exclude Code: E
247. Papakonstantinou, E., et al.,
Assessment of perceptions of nutrition knowledge and disease using a group interactive system: the PERCEPTION ANALYZER. Journal of the American Dietetic Association, 2002. 102(11): p. 1663-8. Exclude Code: E1
248. Peters, A.L. and M.B. Davidson,
Application of a diabetes managed care program. The feasibility of using nurses and a computer system to provide effective care. Diabetes Care, 1998. 21(7): p. 1037-43. Exclude Code: E3
249. Petersen, M., What are blood counts? A
computer-assisted program for pediatric patients. Pediatric Nursing, 1996. 22(1): p. 21-5; quiz 26-7. Exclude Code: E3
250. Phelps-Fredette, S., Cardiology patient
page. Learn, take action, and live: a guide to using online tools to prevent and manage heart disease and stroke. Circulation, 2005. 112(20): p. e318-9. Exclude Code: E2
251. Pierce, L.L., V. Steiner, and A.L.
Govoni, In-home online support for caregivers of survivors of stroke: a feasibility study. CIN: Computers, Informatics, Nursing, 2002. 20(4): p. 157-64. Exclude Code: E1
252. Pierce, L.L., et al., Internet-based
support for rural caregivers of persons with stroke shows promise. Rehabilitation Nursing. 29(3): p. 95-9. Exclude Code: E1
253. Plougmann, S., O.K. Hejlesen, and D.A.
Cavan, DiasNet--a diabetes advisory system for communication and education via the internet. International Journal of Medical Informatics, 2001. 64(2-3): p. 319-30. Exclude Code: E2
254. Port, K., K. Palm, and M. Viigimaa, Daily
usage and efficiency of remote home
monitoring in hypertensive patients over a one-year period. Journal of Telemedicine & Telecare, 2005. 11 Suppl 1: p. 34-6. Exclude Code: E3
255. Porter, S.C., et al., The asthma kiosk: a
patient-centered technology for collaborative decision support in the emergency department. Journal of the American Medical Informatics Association, 2004. 11(6): p. 458-67. Exclude Code: E
256. Porter, S.C., et al., Impact of patient-
centered decision support on quality of asthma care in the emergency department. Pediatrics, 2006. 117(1): p. e33-42. Exclude Code: E3
257. Porter, S.C., et al., Parents as direct
contributors to the medical record: validation of their electronic input. Annals of Emergency Medicine, 2000. 35(4): p. 346-52. Exclude Code: E1
258. Pyper, C., et al., Access to electronic
health records in primary care-a survey of patients' views. Medical Science Monitor, 2004. 10(11): p. SR17-22. Exclude Code: E1
259. Redsell, S.A., et al., Multimedia versus
written information for nocturnal enuresis education: a cluster randomized controlled trial. Child: Care, Health & Development, 2003. 29(2): p. 121-9. Exclude Code: E3
260. Reis, J., B. McGinty, and S. Jones, An
e-learning caregiving program for prostate cancer patients and family members. Journal of Medical Systems, 2003. 27(1): p. 1-12. Exclude Code: E3
261. Rice, V.H., et al., Exemplary program
development: hypermedia interactive smoking cessation intervention program for pregnant women... including commentary by Budin WC. Journal of Perinatal Education, 1997. 6(3): p. 47-61. Exclude Code: E3
262. Riley, E.D., et al., Use of audio
computer-assisted self-interviews to assess tuberculosis-related risk

Appendix E. Excluded Studies List (continued)
A-27
behaviors. American Journal of Respiratory & Critical Care Medicine, 2001. 164(1): p. 82-5. Exclude Code: E3
263. Riva, A., R. Bellazzi, and M. Stefanelli,
A Web-based system for the intelligent management of diabetic patients. MD Computing, 1997. 14(5): p. 360-4. Exclude Code: E2
264. Robbins, K.C., CHESS: the
Comprehensive Health Enhancement Support System. A computer based program for patients and families. Connecticut Nursing News, 1999. 72(1): p. 14. Exclude Code: E2
265. Rogers, A. and N. Mead, More than
technology and access: primary care patients' views on the use and non-use of health information in the Internet age. Health and Social Care in the Community, 2004. 12(2): p. 102-10. Exclude Code: E3
266. Rosen, J., et al., Educating the families
of nursing home residents: a pilot study using a computer-based system. Journal of the American Medical Directors Association, 2003. 4(3): p. 128-34. Exclude Code: E1
267. Roumie, C.L., et al., A three-part
intervention to change the use of hormone replacement therapy in response to new evidence. Annals of Internal Medicine, 2004. 141(2): p. 118-25. Exclude Code: E1
268. Rutscher, A., E. Salzsieder, and U.
Fischer, KADIS: model-aided education in type I diabetes. Karlsburg Diabetes Management System. Computer Methods & Programs in Biomedicine, 1994. 41(3-4): p. 205-15. Exclude Code: E
269. Sabati, N., et al., Facilitators and
barriers to adherence with home monitoring using electronic spirometry. AACN Clinical Issues, 2001. 12(2): p. 178-85. Exclude Code: E3
270. Sanchez-Franco, M.J., Exploring the
influence of gender on the web usage
via partial least squares. Behaviour & Information Technology, 2006. 25(1): p. 19-36. Exclude Code: E3
271. Scherr, D., et al., Mobile phone-based
surveillance of cardiac patients at home. Journal of Telemedicine & Telecare, 2006. 12(5): p. 255-61. Exclude Code: E3
272. Schinke, S.P., et al., Feasibility of
interactive videodisc technology to teach minority youth about preventing HIV infection. Public Health Reports, 1992. 107(3): p. 323-30. Exclude Code: E3
273. Schrot, R.J., et al., A computerized
model for home glucose monitoring proficiency testing: efficacy of an innovative testing program. Diabetes Educator, 1999. 25(1): p. 48-55. Exclude Code: E3
274. Sciamanna, C.N., et al., Effects of a
Website designed to improve the management of migraines. Headache, 2006. 46(1): p. 92-100. Exclude Code: E3
275. Sciamanna, C.N., et al., Visit
satisfaction and tailored health behavior communications in primary care. American Journal of Preventive Medicine, 2004. 26(5): p. 426-30. Exclude Code: E3
276. Sequist, T.D., et al., A randomized trial
of electronic clinical reminders to improve quality of care for diabetes and coronary artery disease. Journal of the American Medical Informatics Association, 2005. 12(4): p. 431-7. Exclude Code: E3
277. Sevick, M.A., et al., A preliminary study of PDA-based dietary self-monitoring in hemodialysis patients. Journal of Renal Nutrition, 2005. 15(3): p. 304-11. Exclude Code: E3
278. Shah, N.B., et al., Prevention of
hospitalizations for heart failure with an interactive home monitoring program. American Heart Journal, 1998. 135(3): p. 373-8. Exclude Code: E3

Appendix E. Excluded Studies List (continued)
A-28
279. Shames, R.S., et al., Effectiveness of a multicomponent self-management program in at-risk, school-aged children with asthma. Annals of Allergy, Asthma, & Immunology, 2004. 92(6): p. 611-8. Exclude Code: E3
280. Shaw, B., et al., How Underserved
Breast Cancer Patients Use and Benefit From eHealth Programs: Implications for Closing the Digital Divide. American Behavioral Scientist, 2006. 49(6): p. 823-834. Exclude Code: E2
281. Sims, T.L., et al., Multimedia quality of
life assessment: advances with FLAIR. AMIA, 2005. Annual Symposium Proceedings/AMIA Symposium.: p. 694-8. Exclude Code: E3
282. Sixsmith, A.J., An evaluation of an
intelligent home monitoring system. Journal of Telemedicine & Telecare, 2000. 6(2): p. 63-72. Exclude Code: E3
283. Slootmaker, S.M., et al., Promoting
physical activity using an activity monitor and a tailored web-based advice: design of a randomized controlled trial [ISRCTN93896459]. BMC Public Health, 2005. 5: p. 134. Exclude Code: E2
284. Soghikian, K., et al., Home blood
pressure monitoring. Effect on use of medical services and medical care costs. Medical Care, 1992. 30(9): p. 855-65. Exclude Code: E3
285. Starren, J., et al., Columbia University's
Informatics for Diabetes Education and Telemedicine (IDEATel) project: technical implementation. Journal of the American Medical Informatics Association, 2002. 9(1): p. 25-36. Exclude Code: E3
286. Steel, S., et al., A feasibility study of
remote monitoring of asthmatic patients. Journal of Telemedicine & Telecare, 2002. 8(5): p. 290-6. Exclude Code: E3
287. Steier, J., et al., Optical feedback
training of inhalation with Autohaler and Turbuhaler in COPD patients. Lung, 2003. 181(4): p. 183-92. Exclude Code:
E3 288. Stillman, J.K., et al., Telepaediatrics and
diabetic retinopathy screening of young people with diabetes in Queensland. Journal of Telemedicine & Telecare, 2004. 10 Suppl 1: p. 92-4. Exclude Code: E3
289. Stricklin, M.L.V., S. Jones, and S.A.
Niles, HOME TALK/healthy talk: improving patients' health status with telephone technology. Home Healthcare Nurse, 2000. 18(1): p. 53-62. Exclude Code: E3
290. Stromberg, A., et al., Interactive
education on CD-ROM-a new tool in the education of heart failure patients. Patient Education & Counseling, 2002. 46(1): p. 75-81. Exclude Code: E3
291. Sun, P., et al., Internet accessibility and
usage among urban adolescents in Southern California: implications for web-based health research. Cyberpsychology & Behavior, 2005. 8(5): p. 441-53. Exclude Code: E
292. Suzuki, L.K. and I.L. Beale, Personal
Web home pages of adolescents with cancer: self-presentation, information dissemination, and interpersonal connection. Journal of Pediatric Oncology Nursing, 2006. 23(3): p. 152-61. Exclude Code: E3
293. Sweeney, N.M., D. Glaser, and C.
Tedeschi, The eating and physical activity habits of inner-city adolescents. Journal of Pediatric Health Care, 2007. 21(1): p. 13-21. Exclude Code: E3
294. Tam, S., et al., Evaluating the efficacy of
tele-cognitive rehabilitation for functional performance in three case studies. Occupational Therapy International, 2003. 10(1): p. 20-38. Exclude Code: E3
295. Tang, P.C., et al., PAMFOnline:
integrating EHealth with an electronic medical record system. AMIA, 2003. Annual Symposium Proceedings/AMIA Symposium.: p. 644-8. Exclude Code: E1

Appendix E. Excluded Studies List (continued)
A-29
296. Tessaro, I., et al., Effectiveness of a
nutrition intervention with rural low-income women. American Journal of Health Behavior, 2007. 31(1): p. 35-43. Exclude Code: E3
297. Thomson, R.G., et al., A patient decision
aid to support shared decision-making on anti-thrombotic treatment of patients with atrial fibrillation: randomised controlled trial. Quality & Safety in Health Care, 2007. 16(3): p. 216-23. Exclude Code: E3
298. Tomuro, K., Oral home telecare tutorials
for the community-dwelling elderly. Journal of Medical & Dental Sciences, 2004. 51(3): p. 165-71. Exclude Code: E3
299. Tudiver, F., et al., Primary care
providers' perceptions of home diabetes telemedicine care in the IDEATel project. Journal of Rural Health, 2007. 23(1): p. 55-61. Exclude Code: E1
300. Van Biervliet, A. and T.R. Gest, A
multimedia guide to spinal cord injury: empowerment through self instruction. Medinfo, 1995. 8 Pt 2: p. 1701. Exclude Code: E3
301. Van Diest, S.L., et al., Sex therapy
through the internet for men with sexual dysfunctions: a pilot study. Journal of Sex & Marital Therapy, 2007. 33(2): p. 115-33. Exclude Code: E3
302. van Eijken, M., et al., Interventions to
improve medication compliance in older patients living in the community: a systematic review of the literature. Drugs & Aging, 2003. 20(3): p. 229-40. Exclude Code: E
303. van Lankveld, W.G.J.M., A.M. Derks,
and F.H.J. van den Hoogen, Disease related use of the internet in chronically ill adults: current and expected use. Annals of the Rheumatic Diseases, 2006. 65(1): p. 121-3. Exclude Code: E2
304. Verheijden, M., et al., Web-based
targeted nutrition counselling and social
support for patients at increased cardiovascular risk in general practice: randomized controlled trial. Journal of Medical Internet Research, 2004. 6(4): p. e44. Exclude Code: E
305. Verheijden, M.W., et al., Rates and
determinants of repeated participation in a web-based behavior change program for healthy body weight and healthy lifestyle. Journal of Medical Internet Research, 2007. 9(1): p. e1. Exclude Code: E1
306. Walker, H., Computer-based education
for patients with psychosis. Nursing Standard, 2006. 20(30): p. 49-56. Exclude Code: E3
307. Waller, A., et al., Participatory design of
a text message scheduling system to support young people with diabetes. Health Informatics Journal, 2006. 12(4): p. 304-18. Exclude Code: E3
308. Wangberg, S.C., E. Arsand, and N.
Andersson, Diabetes education via mobile text messaging. Journal of Telemedicine & Telecare, 2006. 12 Suppl 1: p. 55-6. Exclude Code: E
309. Weber, B., et al., Computerized self-
assessment in psychiatric in-patients: acceptability, feasibility and influence of computer attitude. Acta Psychiatrica Scandinavica, 1998. 98(2): p. 140-5. Exclude Code: E1
310. Weinert, C., S. Cudney, and C. Winters,
Social support in cyberspace: the next generation. CIN: Computers, Informatics, Nursing, 2005. 23(1): p. 7-15. Exclude Code: E
311. Welch, J., S. Dowell, and C.S. Johnson,
Feasibility of using a personal digital assistant to self-monitor diet and fluid intake: a pilot study. Nephrology Nursing Journal: Journal of the American Nephrology Nurses' Association, 2007. 34(1): p. 43-8; quiz 49. Exclude Code: E
312. Wells, M., et al., Online mental health
treatment: concerns and considerations. Cyberpsychology & Behavior, 2007.

Appendix E. Excluded Studies List (continued)
A-30
10(3): p. 453-9. Exclude Code: E1 313. Westlake, C., et al., Evaluation of a
Web-based education and counseling pilot program for older heart failure patients. Progress in Cardiovascular Nursing, 2007. 22(1): p. 20-6. Exclude Code: E
314. White, C., V. Sheedy, and N. Lawrence,
Patterns of computer usage among medical practitioners in rural and remote Queensland. Australian Journal of Rural Health, 2002. 10(3): p. 137-46. Exclude Code: E1
315. White, M.J., et al., Implementing a
computer-assisted telephone interview (CATI) system to increase colorectal cancer screening: a process evaluation. Patient Education & Counseling, 2006. 61(3): p. 419-28. Exclude Code: E1
316. Whitlock, W.L., et al., Telemedicine
improved diabetic management. Military Medicine, 2000. 165(8): p. 579-84. Exclude Code: E3
317. Whittaker, S.L., et al., Success factors in
the long-term sustainability of a telediabetes programme. Journal of Telemedicine & Telecare, 2004. 10(2): p. 84-8. Exclude Code: E3
318. Whitten, P., B. Collins, and F. Mair,
Nurse and patient reactions to a developmental home telecare system. Journal of Telemedicine & Telecare, 1998. 4(3): p. 152-60. Exclude Code: E3
319. Whitten, P., G. Doolittle, and M.
Mackert, Telehospice in Michigan: use and patient acceptance. American Journal of Hospice & Palliative Care, 2004. 21(3): p. 191-5. Exclude Code: E3
320. Whitten, P., et al., Telehospice carries
end-of-life care over the lines. Nursing Management, 2003. 34(11): p. 36-9. Exclude Code: E3
321. Whitten, P. and E. Kuwahara, A multi-
phase telepsychiatry programme in Michigan: organizational factors affecting utilization and user
perceptions. Journal of Telemedicine & Telecare, 2004. 10(5): p. 254-61. Exclude Code: E3
322. Whitten, P. and B. Love, Patient and
provider satisfaction with the use of telemedicine: overview and rationale for cautious enthusiasm. Journal of Postgraduate Medicine, 2005. 51(4): p. 294-300. Exclude Code: E2
323. Whitten, P., F. Mair, and B. Collins,
Home telenursing in Kansas: patients' perceptions of uses and benefits. Journal of Telemedicine & Telecare, 1997. 3 Suppl 1: p. 67-9. Exclude Code: E3
324. Whitten, P. and M. Mickus, Home
telecare for COPD/CHF patients: outcomes and perceptions. Journal of Telemedicine & Telecare, 2007. 13(2): p. 69-73. Exclude Code: E3
325. Whitten, P.S. and F. Mair, Telemedicine
and patient satisfaction: current status and future directions. Telemedicine Journal & E-Health, 2000. 6(4): p. 417-23. Exclude Code: E2
326. Wiecha, J.M. and W.G. Adams,
BostonBreathes: improving pediatric asthma care with a home-based interactive website for patient education, monitoring, and clinical teamwork. AMIA, 2006. Annual Symposium Proceedings/AMIA Symposium.: p. 1144. Exclude Code: E2
327. Wilkie, D.J., et al., Usability of a
computerized PAINReportIt in the general public with pain and people with cancer pain. Journal of Pain and Symptom Management, 2003. 25(3): p. 213-24. Exclude Code: E3
328. Williams, C., et al., Efficacy of a drug
prevention CD-ROM intervention for adolescents. Substance Use & Misuse, 2005. 40(6): p. 869-78. Exclude Code: E1
329. Williams, P., D. Nicholas, and P.
Huntington, Non use of health information kiosks examined in an

Appendix E. Excluded Studies List (continued)
A-31
information needs context. Health Information & Libraries Journal, 2003. 20(2): p. 95-103. Exclude Code: E1
330. Williams, T., et al., Patient satisfaction
with store-and-forward teledermatology. Journal of Telemedicine & Telecare, 2001. 7 Suppl 1: p. 45-6. Exclude Code: E3
331. Williams, T.L., et al., Patient satisfaction
with teledermatology is related to perceived quality of life. British Journal of Dermatology, 2001. 145(6): p. 911-7. Exclude Code: E3
332. Wilson, A., et al., Investigating patients'
and general practitioners' views of computerised decision support software for the assessment and management of cardiovascular risk. Informatics in Primary Care, 2007. 15(1): p. 33-44. Exclude Code: E1
333. Wilson, A.E. and P.D. Home, A dataset
to allow exchange of information for monitoring continuing diabetes care. The Diabetes Audit Working Group. Diabetic Medicine, 1993. 10(4): p. 378-90. Exclude Code: E2
334. Wilson, P.N., N. Foreman, and D.
Stanton, Virtual reality, disability and rehabilitation. Disability & Rehabilitation, 1997. 19(6): p. 213-20. Exclude Code: E2
335. Winkelman, W.J., K.J. Leonard, and
P.G. Rossos, Patient-perceived usefulness of online electronic medical records: employing grounded theory in the development of information and communication technologies for use by patients living with chronic illness. Journal of the American Medical Informatics Association, 2005. 12(3): p. 306-14. Exclude Code: E3
336. Wise, M., et al., Internet telehealth for
pediatric asthma case management: integrating computerized and case manager features for tailoring a Web-based asthma education program. Health Promotion Practice, 2007. 8(3): p. 282-91. Exclude Code: E
337. Wolf, J.M., et al., Access and use of the
internet in a hand surgery population. Hand Surgery, 2004. 9(1): p. 29-33. Exclude Code: E1
338. Wolf, S.L., et al., Reducing frailty and
falls in older persons: an investigation of Tai Chi and computerized balance training. Atlanta FICSIT Group. Frailty and Injuries: Cooperative Studies of Intervention Techniques. Journal of the American Geriatrics Society, 1996. 44(5): p. 489-97. Exclude Code: E3
339. Woodall, W.G., et al., Effect of emailed
messages on return use of a nutrition education website and subsequent changes in dietary behavior. Journal of Medical Internet Research, 2007. 9(3): p. e27. Exclude Code: E3
340. Woods, K.F., et al., Sickle cell disease
telemedicine network for rural outreach. Journal of Telemedicine & Telecare, 2000. 6(5): p. 285-90. Exclude Code: E3
341. Woods, K.F., et al., Sickle cell
telemedicine and standard clinical encounters: a comparison of patient satisfaction. Telemedicine Journal, 1999. 5(4): p. 349-56. Exclude Code: E3
342. Wright, P., et al., Text entry on handheld
computers by older users. Ergonomics, 2000. 43(6): p. 702-16. Exclude Code: E3
343. Wright, P., S. Belt, and C. John, Helping
people assess the health risks from lifestyle choices: comparing a computer decision aid with customized printed alternative. Communication & Medicine, 2004. 1(2): p. 183-92. Exclude Code: E1
344. Wright, P., et al., Enhancing an
appointment diary on a pocket computer for use by people after brain injury. International Journal of Rehabilitation Research, 2001. 24(4): p. 299-308. Exclude Code: E
345. Wu, A.W., et al., A randomized trial of the impact of a programmable medication reminder device on quality of life in patients with AIDS. AIDS Patient

Appendix E. Excluded Studies List (continued)
A-32
Care & Stds, 2006. 20(11): p. 773-81. Exclude Code: E3
346. Wu, S.-J., et al., Integrating hospital
medical care data with pharmaceutical education materials for diabetes self management. Studies in Health Technology & Informatics, 2006. 122: p. 660-3. Exclude Code: E
347. Wydra, E.W., The effectiveness of a
self-care management interactive multimedia module. Oncology Nursing Forum, 2001. 28(9): p. 1399-407. Exclude Code: E3
348. Wylie-Rosett, J., et al., Computerized
weight loss intervention optimizes staff time: the clinical and cost results of a controlled clinical trial conducted in a managed care setting. Journal of the American Dietetic Association, 2001. 101(10): p. 1155-62; quiz 1163-4. Exclude Code: E
349. Xavier, A., et al., Cognition, interaction
and ageing: an Internet workshops exploratory study. Studies in Health Technology & Informatics, 2004. 103: p. 289-95. Exclude Code: E3
350. Yager, J., Clinical computing: monitoring
patients with eating disorders by using e-mail as an adjunct to clinical activities. Psychiatric Services, 2003. 54(12): p. 1586-8. Exclude Code: E2
351. Yon, B.A., et al., The use of a personal
digital assistant for dietary self-monitoring does not improve the validity of self-reports of energy intake. Journal of the American Dietetic Association, 2006. 106(8): p. 1256-9. Exclude Code: E3
352. Young, R.J., et al., Pro-active call center
treatment support (PACCTS) to improve glucose control in type 2 diabetes: a randomized controlled trial. Diabetes Care, 2005. 28(2): p. 278-82. Exclude Code: E3
353. Young, T.L. and C. Ireson, Effectiveness
of school-based telehealth care in urban and rural elementary schools.
Pediatrics, 2003. 112(5): p. 1088-94. Exclude Code: E3
354. Yousef, J. and A.N. Lars, Validation of a
real-time wireless telemedicine system, using bluetooth protocol and a mobile phone, for remote monitoring patient in medical practice. European Journal of Medical Research, 2005. 10(6): p. 254-62. Exclude Code: E3
355. Yueh, B., et al., Randomized trial of
amplification strategies. Archives of Otolaryngology-Head & Neck Surgery, 2001. 127(10): p. 1197-204. Exclude Code: E3
356. Zaylor, C., Clinical outcomes in
telepsychiatry. Journal of Telemedicine & Telecare, 1999. 5 Suppl 1: p. S59-60. Exclude Code: E3
357. Zaylor, C., P. Whitten, and C. Kingsley,
Telemedicine services to a county jail. Journal of Telemedicine & Telecare, 2000. 6 Suppl 1: p. S93-5. Exclude Code: E3

APPENDIX F. QUALITY ASSESSMENT CRITERIA
A-33
Study Design United States Preventive Services Task Force quality rating criteria1
Systematic reviews and meta-analyses
• Comprehensiveness of sources considered/search strategy used • Standard appraisal of included studies • Validity of conclusions • Recency and relevance are especially important for systematic
reviews
Case-control studies • Accurate ascertainment of cases • Nonbiased selection of cases/controls with exclusion criteria
applied equally to both • Response rate • Diagnostic testing procedures applied equally to each group • Measurement of exposure accurate and applied equally to each
group • Appropriate attention to potential confounding variables
Randomized controlled trials (RCTs)
• Initial assembly of comparable groups employs adequate randomization, including first concealment and whether potential confounders were distributed equally among groups
• Maintenance of comparable groups (includes attrition, crossovers, adherence, contamination)
• Important differential loss to followup or overall high loss to followup • Measurements are equal, reliable, and valid (includes masking of
outcome assessment) • Clear definition of the interventions • All important outcomes considered
Cohort studies • Initial assembly of comparable groups employs consideration of potential confounders with either restriction or measurement for adjustment in the analysis; consideration of inception cohorts
• Maintenance of comparable groups (includes attrition, crossovers, adherence, contamination)
• Important differential loss to followup or overall high loss to followup • Measurements are equal, reliable, and valid (includes masking of
outcome assessment) • Clear definition of the interventions • All important outcomes considered
Diagnostic accuracy studies
• Screening test relevant, available for primary care, adequately described
• Study uses a credible reference standard, performed regardless of test results
• Reference standard interpreted independently of screening test • Handles indeterminate result in a reasonable manner • Spectrum of patients included in study • Sample size • Administration of reliable screening test

APPENDIX F. QUALITY ASSESSMENT CRITERIA (continued)
A-34
CRD's Guidance for those Carrying Out or Commissioning Reviews Quality criteria for assessment of experimental studies2
1. Was the assignment to the treatment groups really random?
• Adequate approaches to sequence generation - Computer-generated random numbers - Random numbers tables
• Inadequate approaches to sequence generation - Use of alternation, case record numbers, birth dates or week days
2. Was the treatment allocation concealed? • Adequate approaches to concealment of randomization
- Centralized or pharmacy-controlled randomization - Serially-numbered identical containers - On-site computer based system with a randomization sequence that is not
• readable until allocation - Other approaches with robust methods to prevent foreknowledge of the allocation
• sequence to clinicians and patients • Inadequate approaches to concealment of randomization
- Use of alternation, case record numbers, birth dates or week days - Open random numbers lists - Serially numbered envelopes (even sealed opaque envelopes can be subject to
• manipulation) 3. Were the groups similar at baseline in terms of prognostic factors? 4. Were the eligibility criteria specified? 5. Were outcome assessors blinded to the treatment allocation? 6. Was the care provider blinded? 7. Was the patient blinded? 8. Were the point estimates and measure of variability presented for the primary outcome measure? 9. Did the analyses include an intention to treat analysis Some quality criteria for assessment of observational studies Cohort studies
• Is there sufficient description of the groups and the distribution of prognostic factors? • Are the groups assembled at a similar point in their disease progression? • Is the intervention/treatment reliably ascertained? • Were the groups comparable on all important confounding factors? • Was there adequate adjustment for the effects of these confounding variables? • Was a dose-response relationship between intervention and outcome demonstrated? • Was outcome assessment blind to exposure status? • Was follow-up long enough for the outcomes to occur? • What proportion of the cohort was followed-up? • Were drop-out rates and reasons for drop-out similar across intervention and unexposed groups?
Case-control studies • Is the case definition explicit? • Has the disease state of the cases been reliably assessed and validated? • Were the controls randomly selected from the source of population of the cases? • How comparable are the cases and controls with respect to potential confounding factors? • Were interventions and other exposures assessed in the same way for cases and controls? • How was the response rate defined? • Were the non-response rates and reasons for non-response the same in both groups?

APPENDIX F. QUALITY ASSESSMENT CRITERIA (continued)
A-35
• Is it possible that over-matching has occurred in that cases and controls were matched on factors related to exposure?
• Was an appropriate statistical analysis used (matched or unmatched)? Case series
• Is the study based on a representative sample selected from a relevant population? • Are the criteria for inclusion explicit? • Did all individuals enter the survey at a similar point in their disease progression? • Was follow-up long enough for important events to occur? • Were outcomes assessed using objective criteria or was blinding used? • If comparisons of sub-series are being made, was there sufficient description of the series and
the distribution of prognostic factors? Critical Appraisal Skills Programme (CASP)3 Making sense of evidence, 10 questions to help you make sense of qualitative research Currently awaiting approval to re-publish criteria here. References
1. Harris RP, Hefland M, Woolf SH, et al. Methods Work Group, Third US Preventive Services Task Force. Current methods of the US Preventive Services Task Force: a review of the process. American Journal of Preventive Medicine. 2001;20(3 Suppl):21-35.
2. Khan K, ter Riet G, Popay J, Nixon J, Kleijnen J. Undertaking Systematic Reviews of Research on Effectiveness: Stage II: Conducting the Review. York: University of York; 2001.
3. Critical Appraisal Skills Programme. 10 questions to help you make sense of qualitative research: Milton Keynes Primary Care Trust; 2002.

APPENDIX G. PEER REVIEWERS
A-36
Majd Alwan President of CAST (Center for Aging Services Technologies), Washington DC Cheryl Austein-Casnoff Office of Health Information Technology, (HRSA), Rockville, Maryland Joyce Dubow Senior Advisor AARP Office of Policy and Strategy, Washington DC Daryle Gardner-Bonneau, MD Human Factors and Ergonomics Society, Portage, Mississippi Margaret Giannini, MD, FAAP Director, Office on Disability at HHS, Washington DC Linda Golodner, BA President and CEO of the National Consumer's League and chairs the Alliance Against Fraud in Telemarketing and electronic Commerce and serves on the Board of the National Council on Patient Information and Education, the National Patient Safety Foundation, the Patient Safety Institute and the American National Standards Institute, Washington DC Donald Grantt Director, Evidence-Based Disease and Disability Prevention Program U.S. Administration on Aging Office of Planning and Policy Development, Washington DC Rita Kukafka, DrPH, MA Assistant Professor of Sociomedical Sciences, Mailman School of Public Health and Assistant Professor of Biomedical Informatics, College of Physicians and Surgeons, New York City, New York

Appendix H. Data Table
Author YearPatient Recruitment
Setting Clinical Practice SettingPatient Technology
Setting Study design NAlbisser 2001 Mixed model HMO with a
membership of 275,000Primary and/or subspecialty care physicians all generally in a mixed model HMO with a membership of 275,000
Homes Quasi-experimental, longitudinal observation study design
N = 978E-alone: 151E+SMT: 589E+caSC: 238)DCCT initiative: 101
AH-1

Appendix H. Data Table
Author YearAlbisser 2001
Years of Study
Length of follow-up (months) Inclusion Criteria Exclusion Criteria Elderly
NR 12 months *Enrollment in the HMO-sponsored disease management programs.
NR NR
AH-2

Appendix H. Data Table
Author YearAlbisser 2001
Underserved Chronic IllnessDisability/
Impairment Gender (% Male) Age (years)NR DIABETES NR NR Mean Age: 58
Range: 19-81
AH-3

Appendix H. Data Table
Author YearAlbisser 2001
Ethnicity Income (US$) EducationUrban / Rural /
Frontier OtherNR NR NR NR Male body weight at
baseline: 63-136kgFemale body weight at baseline: 56-131kg.
Patient Characteristics*
AH-4

Appendix H. Data Table
Author YearAlbisser 2001
Health Insurance Status Literacy Language(s) Health Beliefs Intervention Name
NR NR NR NR NR
AH-5

Appendix H. Data Table
Author YearAlbisser 2001
Intervention Described Intervention Groups Type of Device* Functions*Each patient received and continued to receive standardized diabetes education. The second initiative sought to augment the education component by adding ongoing, self-management training. The third initiative added computer-assisted self-care to the same education component.
Group 1: (E-alone) Education aloneGroup 2: (E+SMT) education supplemented with self-management trainingGroup 3: (E+caSC) education supplemented with computer-assisted self-careGroup 4: (Control) (DCCT initiative) Glycolated Hemoglobin A1c values in Diabetes patients.
Touch-tone telephone (recorded to a computer)
To record data as reported by patients, pass this information through an algorithm, and pass intervention instructions to the patient.
Intervention*
AH-6

Appendix H. Data Table
Author YearAlbisser 2001
Staff Training Subject Training co-interventions PhysiologicOne case worker was dedicated to the computer-assisted self-care initiative, which was under the direction of an endocrinologist to whole the difficult-to-manage patients were referred.
Received standardized diabetes education
NR HbA1c Group 2 (E+SMT). Significant improvement from baseline (8.8 ± 1.5%) to 8.7 ± 1.4% at 3 months (p < 0.01). Significant improvement from 3 months to 8.9 ± 1.8% at 12 months (p < 0.01). Group 3 (E+caSM): had starting values of HBA1c of 9.5 ± 1.7% and fell significantly (p < 0.01) at 3 months to 8.6 ± 1.6%, then declined slightly to 8.4 ± 1.6% at 12 months (p < 0.01). Group 4, DCCT initiative: significant improvement from baseline (9.2 ± 1.43%) to 7.3 ± 1.4% at 3 months (p < 0.01). Significant improvement from 3 months to 6.7 ± 0.8% at 12 months (p < 0.01). Body weight Group 2 (E+SMT) showed a significant (p < 0.01) change from body weight at baseline (82 ± 15.9 kg) over the next 12 months to (94 ± 18.2 kg).
AH-7

Appendix H. Data Table
Author YearAlbisser 2001
Health Service Utilization Health Care Costs KnowledgeNR Cost of care Per member per month
chargesE-Alone: no additional charges E+SMT: $18 E+caSM: $1.31 DCCT: $11.88
NR
AH-8

Appendix H. Data Table
Author YearAlbisser 2001
Use of Technology Usability HIT SatisfactionNR NR NR
AH-9

Appendix H. Data Table
Author YearAlbisser 2001
Health Satisfaction Self-efficacy Health BehaviorNR NR NR
Outcomes
AH-10

Appendix H. Data Table
Author YearAlbisser 2001
Quality of Life Support WithdrawalsNR NR NR
AH-11

Appendix H. Data Table
Author YearAlbisser 2001
Adverse Effects OtherBody weight gain occurred in both the DCCT and the education and self-management training initiatives.
NR
AH-12

Appendix H. Data Table
Author YearPatient Recruitment
Setting Clinical Practice SettingPatient Technology
Setting Study design NAn 2006 E-mail college students NA WWW Pilot Study and Cohort
Study (experimental arm of RCT)
Pilot: 47Experimental arm of RCT: 257
Studied for technology adherence (RCT): 517
AH-13

Appendix H. Data Table
Author YearAn 2006
Years of Study
Length of follow-up (months) Inclusion Criteria Exclusion Criteria Elderly
2004-2005 5 mos *Students completing survey after an email recruitment*Smoke in the past 30 days*Age 18-24*In school for next 2 semesters
NR NR
AH-14

Appendix H. Data Table
Author YearAn 2006
Underserved Chronic IllnessDisability/
Impairment Gender (% Male) Age (years)NR NR NR Pilot: 27.7%
RCT: 29.6%MeanPilot: 20.1RCT: 20.1
AH-15

Appendix H. Data Table
Author YearAn 2006
Ethnicity Income (US$) EducationUrban / Rural /
Frontier Other
Patient Characteristics*
NR NR All in college NA NR
AH-16

Appendix H. Data Table
Author YearAn 2006
Health Insurance Status Literacy Language(s) Health Beliefs Intervention Name
NR NR NR NR RealU
AH-17

Appendix H. Data Table
Author YearAn 2006
Intervention Described Intervention Groups Type of Device* Functions*
Intervention*
Pilot: subjects send weekly email asking to track their smoking, take an interactive quiz giving tailored feedback, and Question of the Week (answers posted to discussion board), tobacco topic only; RealU modifications to Pilot: Content on broad topics related to college life rather than only tobacco, users guided weekly to complete Tracker, Quiz, Question of the Week emailed, subjects encouraged to set goals weekly, peer coaches sent emails proactively to those not completing weekly tasks.
Pilot study and RealU experimental arm (not reporting on control group, or outcomes)
Tailored interactive website with email reminders and questions
NR
AH-18

Appendix H. Data Table
Author YearAn 2006
Staff Training Subject Training co-interventions PhysiologicNR NR NR NA
AH-19

Appendix H. Data Table
Author YearAn 2006
Health Service Utilization Health Care Costs KnowledgeNA NA NR
AH-20
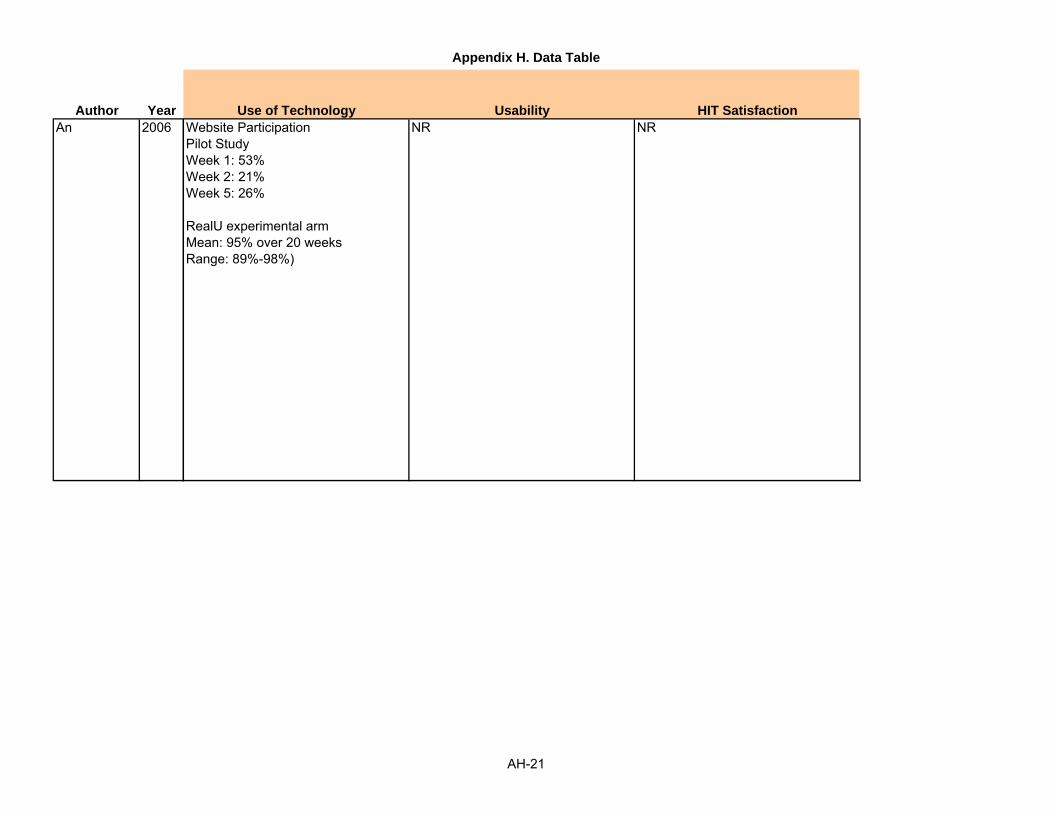
Appendix H. Data Table
Author YearAn 2006
Use of Technology Usability HIT SatisfactionWebsite ParticipationPilot StudyWeek 1: 53%Week 2: 21%Week 5: 26%
RealU experimental armMean: 95% over 20 weeksRange: 89%-98%)
NR NR
AH-21

Appendix H. Data Table
Author YearAn 2006
Health Satisfaction Self-efficacy Health Behavior
Outcomes
NR NR NR
AH-22

Appendix H. Data Table
Author YearAn 2006
Quality of Life Support WithdrawalsNR NR NR
AH-23

Appendix H. Data Table
Author YearAn 2006
Adverse Effects OtherNR NR
AH-24

Appendix H. Data Table
Author YearPatient Recruitment
Setting Clinical Practice SettingPatient Technology
Setting Study design NAndersson 2005 Press release, articles,
advertisementsNR Homes RCT N = 85
Grp 1:36Grp 2: 49
Follow up groupsGrp 1: 36Grp 2: 35
AH-25

Appendix H. Data Table
Author YearAndersson 2005
Years of Study
Length of follow-up (months) Inclusion Criteria Exclusion Criteria Elderly
NR 6 months *Probability of .55 or more for diagnosis of major depression on CIDI-SFt*Total score on the MADRS-S between 15-30, including a score of less than 4 on item 9 (zest for life)*No psychosis (based on meds status)*No bipolar disorder*No antidepressant meds begun or changed during the last month*No history of cognitive behavioral therapy for depression*Age 18 or older*Prepared to work on self-help program for several hours/week*No travel abroad or major surgery planned*Completion of pre-treatment assessment
NR NR
AH-26

Appendix H. Data Table
Author YearAndersson 2005
Underserved Chronic IllnessDisability/
Impairment Gender (% Male) Age (years)NR DEPRESSION NR Grp 1: 22%
Grp 2: 28%Withdrawal: 28%
Mean (SD)Grp 1: 36.4 (+ 11.5)Grp 2: 36.3 (+ 9.9)Grp 3: 35.6 (+10.3)
AH-27

Appendix H. Data Table
Author YearAndersson 2005
Ethnicity Income (US$) EducationUrban / Rural /
Frontier Other
Patient Characteristics*
NR NR Education university levelGrp 1: 64%Grp 2: 61%Grp 3: 50%
45% City dwellers Fewer than 3 self reported episodes of depressionGrp 1: 33%Grp 2: 39%Withdrawal: 28%
No previous Treatment for depressionGrp 1: 44%Grp 2: 39%Grp 3: 44%
Current antidepressant medicationGrp 1: 22%Grp 2: 37%Grp 3: 28%
Baseline BDI (SD)Grp 1: 20.5 (+6.7)Grp 2: 20.9 (+8.5)Grp 3: 21.6 (+7.2)
Baseline QoLi score (SD)Grp 1: -0.1 (+1.1)Grp 2: -0.2 (+1.6)Grp 3: -0.2 (+1.1)
AH-28

Appendix H. Data Table
Author YearAndersson 2005
Health Insurance Status Literacy Language(s) Health Beliefs Intervention Name
NR NR Swedish NR Internet Based Therapy
AH-29

Appendix H. Data Table
Author YearAndersson 2005
Intervention Described Intervention Groups Type of Device* Functions*
Intervention*
Recruiting ads sent those interested to a website. To sign up a computer administered CIDI-SF, MADRS-S and gathered background information. Randomized participants were assigned groups and sent an email with log-in and user name. 89 pages of text as 5 modules were presented. Each module ended with a quiz. Therapist received response and gave email feedback w/i 24h. Participants could read website or download pdfs. 8 weeks was advised for completion. Discussion groups offered separately and monitored. 7 days had to have passed between log ins so depression levels could be monitored.
Group 1: Treatment GroupGroup 2: Control GroupGroup 3: Withdrawal Group
Website Administer psychiatric tests, offer discussion groups, offer therapist feedback.
AH-30

Appendix H. Data Table
Author YearAndersson 2005
Staff Training Subject Training co-interventions PhysiologicNR NR NR NR
AH-31

Appendix H. Data Table
Author YearAndersson 2005
Health Service Utilization Health Care Costs KnowledgeNR NR NR
AH-32

Appendix H. Data Table
Author YearAndersson 2005
Use of Technology Usability HIT SatisfactionNR NR NR
AH-33

Appendix H. Data Table
Author YearAndersson 2005
Health Satisfaction Self-efficacy Health Behavior
Outcomes
NR BDI (0-63 range) Pre, Post, pre-post DifferenceGrp 1: 20.5 (6.7 s.d.), 12.2 (6.8), 8.3 (5.7 to 10.9), Grp 2: 20.9 (8.5), 19.5 (8.1), 1.4 (-1.1 to 3.9)
Follow up, Pre to follow up difference Grp 1: n36 - 13.1 (9.1), 7.8 (4.6 to 11.3)Grp 2: n: 35 - 13.1 (7.6), 7.4 (4.0 to 10.7)
MADRS-S (range 0-54)Pre, Post, pre-post DifferenceGrp 1: 20.1 (5.7), 12.7 (8.3), 5.5 (4.6 to 10.1)Grp 2: 21.6 (7.2), 19.0 (7.6), 2.6 (-0.4 to 4.8)
Follow up, Pre to follow up difference Grp 1: 14.6 (9.2), 6.3 (3.2 to 9.3)Grp 2: 14.5 (9.3), 6.8 (3.9 to 9.7)
Follow up, Pre to follow up difference
AH-34

Appendix H. Data Table
Author YearAndersson 2005
Quality of Life Support WithdrawalsPre-Treatment, Post treatment, Pre-Post differenceGrp 1: -0.1 (1.1), 0.5 (1.6), 0.6 (0.2 to 1.1)Grp 2: -0.2 (1.6), 0.0 (1.5), 0.2 (-0.2 to 0.6)
Follow Up and Pre-treatment to follow up differenceGrp 1: 0.7(1.7), 0.9 (0.4 to 1.4)Grp 2: 0.9 (1.8), 1.0 (0.5 to 1.4)
Group 1: Treatment Modules and discussion groupGroup 2: Discussion group only
N = 32
AH-35

Appendix H. Data Table
Author YearAndersson 2005
Adverse Effects OtherThose who were not chosen for the treatment group received no help. After the study they were given access to the treatment modules.
Limitations include no formal diagnosis of depression made by clinician, those on med regimens were not excluded, short study
AH-36

Appendix H. Data Table
Author YearPatient Recruitment
Setting Clinical Practice SettingPatient Technology
Setting Study design NAndersson 2003 NR NA Homes RCT N = 44 (+8 were
recruited as controls to receive similar treatment outside the study)Grp 1 (Self help+ telephone): 24Grp 2 (Self-help only): 20
AH-37

Appendix H. Data Table
Author YearAndersson 2003
Years of Study
Length of follow-up (months) Inclusion Criteria Exclusion Criteria Elderly
NR 6 weeks *Pts need to have access to a computer, modem and an internet connection.
Pts with specific cluster headache or sign indicating serious physical or psychological disorders and pts with headache less than 6 months were excluded.Pts with Horton headache, whiplash, head trauma, fibromyalgia, major depression, tinnitus, or other medically unclear neurologic symptoms were excluded. Pts who just submitted the interest form and did not return to the site (or who were not ableto call or reach via email) were also excluded.
NR
AH-38

Appendix H. Data Table
Author YearAndersson 2003
Underserved Chronic IllnessDisability/
Impairment Gender (% Male) Age (years)NR HEADACHE NR N = 8 (18%)
Grp 1: N = 4 (17%)Grp 2: N = 4 (20%)
Mean (Range)Grp 1: 36.2 (18-54)Grp 2: 44.9 (25-59)Total: 40.3 (18-59)
AH-39

Appendix H. Data Table
Author YearAndersson 2003
Ethnicity Income (US$) EducationUrban / Rural /
Frontier Other
Patient Characteristics*
NR NR NR NR Probable diagnosisMigrane Total: 20Grp 1: 12Grp 2: 8
Tension type headache total: 15Grp 1: 9Grp 2: 6
Tension type headache and migraine total: 5Grp 1: 2Grp 2: 3
Nonspecific total: 4Grp 1: 1Grp 2: 3
Duration of headache0.5-1 yr total; 2Grp 1: 0Grp 2: 2
1-5 yr total: 14Grp 1: 10Grp 2: 4
6-10 yr total: 5Grp 1: 3
AH-40

Appendix H. Data Table
Author YearAndersson 2003
Health Insurance Status Literacy Language(s) Health Beliefs Intervention Name
NR NR NR NR Internet based treatment with telephone contact
AH-41

Appendix H. Data Table
Author YearAndersson 2003
Intervention Described Intervention Groups Type of Device* Functions*
Intervention*
Therapist initiated telephone contact in the treatment of headache via the internet
The program delivered in 6 weekly treatment modules, information regarding headache and role of psychological factors provided, applied relaxation delivered in separate parts, Rationales, common questions and examples of potential problems added, Relaxation program included various aspects such as tense relax, relax only, cue controlled breathing, rapid relaxation and application training.
Weekly report cards for the exercise, problem solving section with pts able to identify, cope with problems including headache related ones.
Cognitive behavioral techniques for handling negative thoughts and core beliefs added with part of these being optional.
The self help group had all of the above,
Computer Information, questions and answers, email, learn relaxation techniques with downloadable sound files and online presentation of exercises.
AH-42

Appendix H. Data Table
Author YearAndersson 2003
Staff Training Subject Training co-interventions PhysiologicNR NR NR Grp 1 vs. Grp 2
No of subjects- 17 vs. 13
Headache indexPretreatment (pre)- 4.2 (3.7) vs. 3.2 (2.6)Post treatment (post)- 4.0(4.9) vs. 3.1 (2.4)
Headache daysPre- 8.4 (4.4) vs. 7.2 (2.8)Post- 8.5 (4.1) vs. 6.4 (3.8)
Peak headachePre- 2.4 (0.6) vs. 2.4(0.8)Post- 2.3 (1.1) vs. 2.7(0.7)
Rated intensityPre- 2.1 (0.7) vs. 2.0(0.8)Post- 2.0(1.1) vs. 2.3 (0.8)
DurationPre- 9.8(6.3) vs. 7.1 (4.1)Post- 7.0(6.7) vs. 9.5(5.4)
AH-43

Appendix H. Data Table
Author YearAndersson 2003
Health Service Utilization Health Care Costs KnowledgeNR NR NR
AH-44

Appendix H. Data Table
Author YearAndersson 2003
Use of Technology Usability HIT SatisfactionNR NR Author mentions that most subjects
were pleased with the treatment and lack of time was the most common reason for not having practiced to the extent that they wished
AH-45

Appendix H. Data Table
Author YearAndersson 2003
Health Satisfaction Self-efficacy Health Behavior
Outcomes
NR Grp 1 vs. grp 2No of subjects- 15 vs. 9
QuestionnairesHospital and Anxiety depression scale- depression subscalepre- 5.7(4.3) vs. 6.8 (2.5)post- 4.5 (3.9) vs. 4.9(3.3)
Hospital and anxiety depression scale- anxiety subscalepre- 8.7(4.8) vs. 7.7 (4.5)posy- 7.9(5.1) vs. 7.0 (4.8)
Headache disability inventorypre- 46.6(18.4) vs. 48.4 (13.3)post- 33.6 (16.4) vs. 34.4 (14.8)
perceived stress scalepre- 31.3 (7.8) vs. 28.3(3.9)post- 25.7(2.0) vs. 24.7(7.3)
Coping strategies questionnaireGrp 1 vs. Grp 2No of subjects- 15 vs. 9
Diverting attentionPre- 7.4 (3.6) vs. 7.6 (4.6)Post- 8.6(6.7) vs. 9.6(3.5)
Reinterpreting pain sensationsPre- 3.8(5.1) vs. 2.1 (2.6)post- 6.1 (6.1) vs. 4.6 (4.6)
Coping self statementsPre- 17.7 (6.4) vs. 16.3 (5.2)Post- 14.7 (5.2) vs. 18.7 (5.5)
Ignore pain sensationsPre- 16.9(5.1) vs. 17.1 (3.3)Post- 13.7(3.3) vs. 18.2 (7.0)
Praying and hopingPre- 9.1 (5.2) vs. 13.9(9.2)Post- 8.8 (5.5) vs. 15.4 (10.9)
CatastrophizingPre- 17.1 (7.5) vs. 17.9 (8.8)Post- 11.1 (8.5) vs. 16.0 (8.3)
Increased behavioral activitiesPre- 11.3 (6.5) vs. 12.0(6.6)Post- 10.4( 5.1) vs. 13.2 (7.4)
AH-46

Appendix H. Data Table
Author YearAndersson 2003
Quality of Life Support WithdrawalsNR NR Dropout rate
Grp 1: 29% Grp 2: 35%Difference was not statistically significant
N= 44
Grp 1: 24Completed treatment and registrations: 17Completed treatment and questionnaires: 15Failed to respond after exercise modules: 7
Grp 2: 20Completed treatment and registrations: 13Completed treatment and questionnaires: 9Failed to respond after exercise modules: 7
AH-47

Appendix H. Data Table
Author YearAndersson 2003
Adverse Effects OtherNR Significant interaction was found for
duration F (1, 28) =7.16, p= 0.012Post hoc tests showed that the grp 1 had significant decreased durationNumber of subjects reaching a 50% decrease in the headache indexgrp 1 vs. grp2= 29 % vs. 23% the difference was not statistically significant (chi square test)
Significant main effect was found on HADS depression subscaleF (1,22)=4.53, p=0.045
Disability a/w headache , as measured by HDI decreased significantly for both groups with a main effect of timeF(1, 22)= 26.49, p=0.0001
PSS showed main effect of timeF (1,22) =7.1, p=0.014
Significant main effect of time was found for subscale reinterpreting pain sensationsF (1,22) = 11.2, p=0.029
significant reductions found for catatrophizing with amin effect of time
AH-48

Appendix H. Data Table
Author YearPatient Recruitment
Setting Clinical Practice SettingPatient Technology
Setting Study design NAndersson 2006 Newspaper articles in
national and regional papers, notices in health magazines, and link on homepage of Swedish National Anxiety Association
Sweden Homes RCT N=64
AH-49
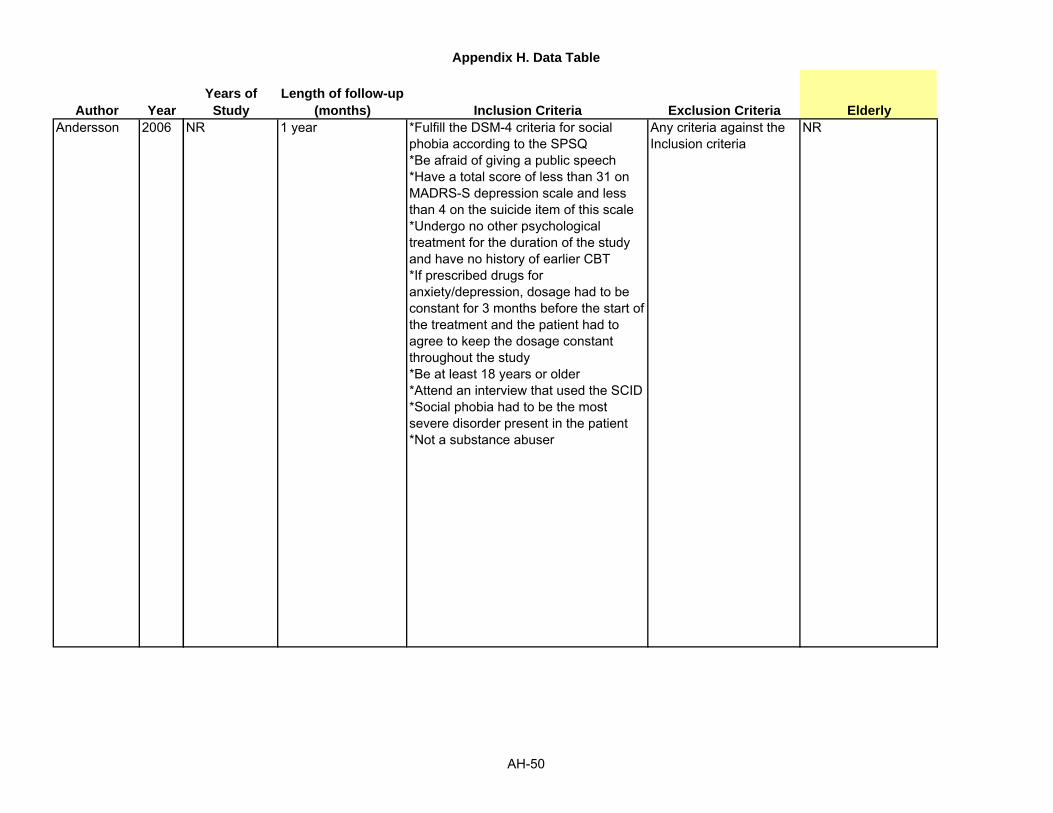
Appendix H. Data Table
Author YearAndersson 2006
Years of Study
Length of follow-up (months) Inclusion Criteria Exclusion Criteria Elderly
NR 1 year *Fulfill the DSM-4 criteria for social phobia according to the SPSQ*Be afraid of giving a public speech*Have a total score of less than 31 on MADRS-S depression scale and less than 4 on the suicide item of this scale*Undergo no other psychological treatment for the duration of the study and have no history of earlier CBT*If prescribed drugs for anxiety/depression, dosage had to be constant for 3 months before the start of the treatment and the patient had to agree to keep the dosage constant throughout the study*Be at least 18 years or older*Attend an interview that used the SCID*Social phobia had to be the most severe disorder present in the patient*Not a substance abuser
Any criteria against the Inclusion criteria
NR
AH-50

Appendix H. Data Table
Author YearAndersson 2006
Underserved Chronic IllnessDisability/
Impairment Gender (% Male) Age (years)NR SOCIAL PHOBIA NR IVR: 44%
CG: 53%Total: 48.4%
IVR: 36.4 (+9.4)Range: 21-53CG: 38.2 (+11.0)Range: 18-67Total: 37.3 (+10.2)Range: 18-67
AH-51

Appendix H. Data Table
Author YearAndersson 2006
Ethnicity Income (US$) EducationUrban / Rural /
Frontier Other
Patient Characteristics*
NR NR Highest educational level (N)Nine-year compulsory school, %IVR: 0, 0CG: 2, 6.3Total: 2, 3.1
Secondary school (not completed), %IVR: 1, 3.1CG: 1, 3.1Total: 2, 3.1
Vocational school (completed), %IVR: 1, 3.1CG: 4, 12.5Total: 5, 7.8
Secondary school (completed), %IVR: 8, 25.0CG: 7, 21.9Total: 15, 23.4
College/university (not completed), %IVR: 7, 21.9CG: 5, 15.6Total: 12, 18.8
NR EMPLOYMENT N, %Full timeIVR: 21, 65.6CG: 21, 65.6Total: 42, 65.6
Part timeIVR: 1, 3.1CG: 3, 9.4Total: 4, 6.3
UnemployedIVR: 2, 6.3CG: 2, 6.3Total: 4, 6.3
StudentIVR: 8, 25CG: 4, 12.5Total: 12, 188
Registered sickIVR: 0, 0CG: 0, 0Total: 0, 0
Disability pensionIVR: 0, 0CG: 1, 3.1Total: 1, 1.6
Retired
AH-52

Appendix H. Data Table
Author YearAndersson 2006
Health Insurance Status Literacy Language(s) Health Beliefs Intervention Name
NR NR Swedish NR NR
AH-53

Appendix H. Data Table
Author YearAndersson 2006
Intervention Described Intervention Groups Type of Device* Functions*
Intervention*
Self-help manual that was adapted for use via the internet; divided into 9 modules
IVR: 32CG: 32 (wait-listed, and received treatment after the IVR group did)
Home computer with access to the internet-access a self-help manual divided into modules
Education, feedback, motivation, encouragement, goal-setting, behavioral experiments, self-focus, safety behaviors
AH-54

Appendix H. Data Table
Author YearAndersson 2006
Staff Training Subject Training co-interventions PhysiologicNR NR Exposure sessions: two
separate 3-hr group exposure sessions facilitated by therapists
Outcome Measures at Each Assessment PointPretreatment, Post treatment1 year F/UEffect Size
B = btwn grp effect size at post treatmentW=w/in grp effect size for treatment grpW/FU=1 yr F/u w/in grp effect size for total grp
Liebowitz Social Anxiety ScaleIVR: 68.5 (+22.5), 45.6 (+25.1)39.0 (+21.2)CG: 66.7 (+20.9), 62.8 (+21.7)46.5 (+21.5)B: 0.73W: 0.91W/FU: 1.29
Social Phobia ScaleIVR: 35.8 (+16.7), 20.7 (+14.8)17.8 (+11.6)CG: 32.5 (+13.1), 31.0 (+15.9)24.2 (+11.8)B: 0.67W: 0.96W/FU: 1.12
Social Interaction Anxiety Scale
AH-55

Appendix H. Data Table
Author YearAndersson 2006
Health Service Utilization Health Care Costs KnowledgeNR NR NR
AH-56

Appendix H. Data Table
Author YearAndersson 2006
Use of Technology Usability HIT SatisfactionNR NR NR
AH-57

Appendix H. Data Table
Author YearAndersson 2006
Health Satisfaction Self-efficacy Health Behavior
Outcomes
NR NR Data for the Proportion of Participants Reaching the Criteria of Clinical Significant Improvement as Defined by Jacobson and Truax (1991)
%, NPost treatment1 yr F/u
Liebowitz Social Anxiety ScaleIVR: 43.3, 1357.1, 28CG: 18.7, 6
Social Phobia ScaleIVR: 56.3, 1853.0, 26CG: 25.0, 8
Social Interaction Anxiety ScaleIVR: 60.0, 1846.9, 23CG: 37.5, 12
Social Phobia Screening QuestionnaireIVR: 73.0, 269.4, 34CG: 15.6, 5
Personal Report of Confidence as a Speaker
AH-58

Appendix H. Data Table
Author YearAndersson 2006
Quality of Life Support WithdrawalsQoL InventoryPretreatment, Post treatment1 yr F/uB = btwn grp effect size at post treatmentW=w/in grp effect size for treatment grpW/FU=1 yr F/u w/in grp effect size for total grp
IVR: 1.5 (+1.1), 2.2 (+1.2)2.2 (+2.1)CG: 1.1 (+1.4), 1.1 (+1.7)1.6 (+2.4)B: 0.83W: 0.61W/FU: 0.43
Data for the Proportion of Participants Reaching the Criteria of Clinical Significant Improvement as Defined by Jacobson and Truax (1991)%, NPost treatment1 yr F/u
QoL InventoryIVR: 66.7, 2053.1, 26CG: 34.4, 11
NR 2 people dropped out during the course of the study12 failed to finish all weekly modules2 pts did not return their questionnaires
AH-59

Appendix H. Data Table
Author YearAndersson 2006
Adverse Effects OtherNR NR
AH-60

Appendix H. Data Table
Author YearPatient Recruitment
Setting Clinical Practice SettingPatient Technology
Setting Study design NAndrade 2005 NR The John Hopkins Moore
HIV clinic in Baltimoredisease management assistance system device
RCT N= 64Intervention grp (IG): 32Control group (CG): 32
AH-61
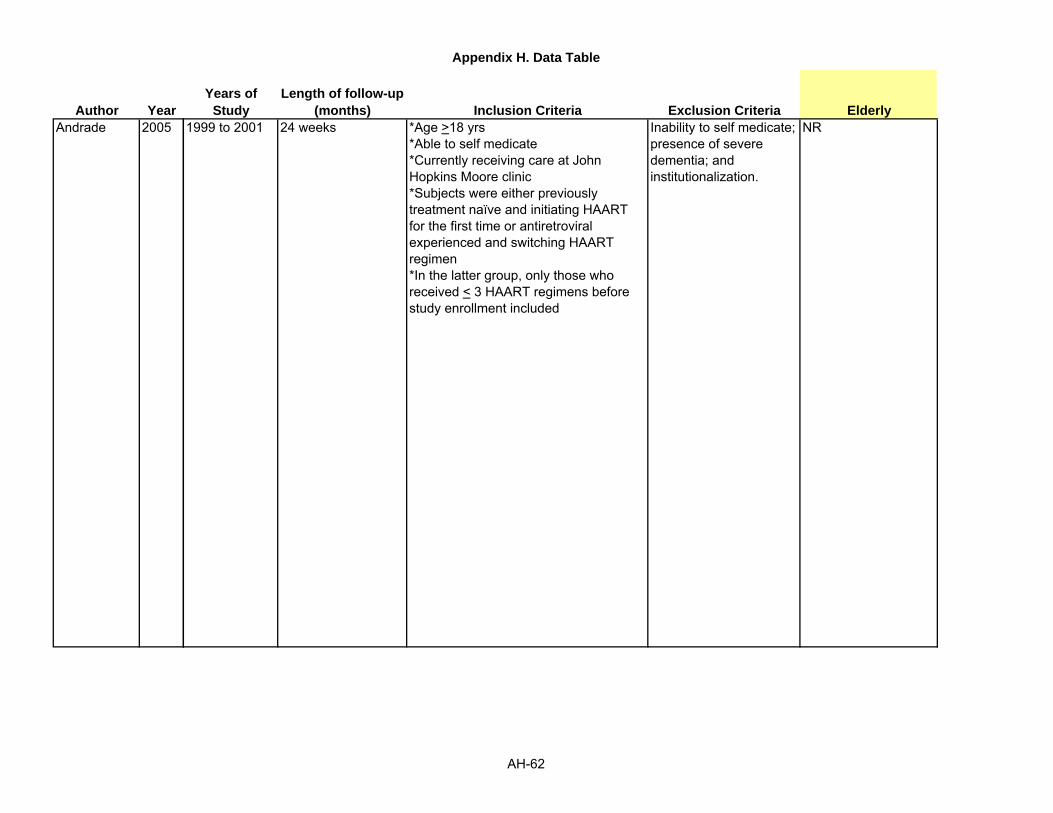
Appendix H. Data Table
Author YearAndrade 2005
Years of Study
Length of follow-up (months) Inclusion Criteria Exclusion Criteria Elderly
1999 to 2001 24 weeks *Age >18 yrs*Able to self medicate*Currently receiving care at John Hopkins Moore clinic*Subjects were either previously treatment naïve and initiating HAART for the first time or antiretroviral experienced and switching HAART regimen*In the latter group, only those who received < 3 HAART regimens before study enrollment included
Inability to self medicate; presence of severe dementia; and institutionalization.
NR
AH-62

Appendix H. Data Table
Author YearAndrade 2005
Underserved Chronic IllnessDisability/
Impairment Gender (% Male) Age (years)NR HIV NR IG: 16 (55)
CG: 18 (62)IG: 38 (+7)CG: 38 (+7)
AH-63

Appendix H. Data Table
Author YearAndrade 2005
Ethnicity Income (US$) EducationUrban / Rural /
Frontier Other
Patient Characteristics*
BlackIG: 26 (90)CG: 25 (86)
NR NR NR CD4 cell counts, IG vs. CG:235 (+141) vs. 213 (+245)
Plasma HIV RNA load,IG vs. CG:4.4 (+0.2) vs. 4.3 (+0.2)
Memory impairedIG vs. CG:14 (48%) vs. 17 (59%)
Neuropsychological test scores, details on AIDS, Drug use in the past 4 days, Methadone treatment, HAART status at study entry, CES-D analysis given, not listed here. (No differences between the two groups were statistically significant)
AH-64

Appendix H. Data Table
Author YearAndrade 2005
Health Insurance Status Literacy Language(s) Health Beliefs Intervention Name
NR NR NR NR The disease management assistance system (DMAS)
AH-65

Appendix H. Data Table
Author YearAndrade 2005
Intervention Described Intervention Groups Type of Device* Functions*
Intervention*
The DMAS is a portable battery powered electronic device that uses a digital signal processor to produce a timed, programmed voice message that prompts subjects to take their antiretrovirals. When a subject pushes a response button, the data can be uploaded and printed. The device can store up to 3 months of messages for up to 25 different medications.
All subjects attended an individualized, 30 min adherence counseling session each month and received adherence feedback from a standardized transcript that provided general education about barriers to adherence, hazards of non adherence and their prescribed HAART regimen. Mean adherence scores obtained from eDEM caps.IG group- provided with DMAS programmed with HAART regimen data to provide verbal reminders at dosing time. When a subject pushes a response button, the data can be uploaded and printed. CG- received only adherence counseling.
Battery powered electronic device
Voice reminders, storage of dosage times and dates.
AH-66

Appendix H. Data Table
Author YearAndrade 2005
Staff Training Subject Training co-interventions PhysiologicNR Subjects trained on usage
of eDEM capsNR Plasma HIV RNA loads
Week 12 IG vs. CG: Undetectable plasma loads: 38% vs. 14%, p=0.014
Week 24 IG vs. CG:Undetectable loads:34% vs. 38%, p=0.49
Week 12 IG vs. CG: Decrease in load of at least 1 log10
copies/mm3: 55% vs. 41%, p= 0.098
Week 24 IG vs. CG: Decrease in load of at least 1 log10
copies/mm3: 72% vs. 41%, p=0.02
Overall mean reductions IG vs. CG: -2.10 vs. -0.98, p=0.02
Mean CD4 cell countsWeek 12 IG vs. CG:337 (+183) vs. 258 (+184), p=0.14
Week 24 IG vs. CG: 301 (+172) vs. 250 (+172), p= 0.28
Overall increase IG vs. CG:68 vs. 45 , p=0.62
AH-67

Appendix H. Data Table
Author YearAndrade 2005
Health Service Utilization Health Care Costs KnowledgeNR NR NR
AH-68

Appendix H. Data Table
Author YearAndrade 2005
Use of Technology Usability HIT SatisfactionWeek 20: 88% of pts in IG reported that they used the device some or all of the time to manage HAART use. 1 subject reported never having used the device.
NR NR
AH-69

Appendix H. Data Table
Author YearAndrade 2005
Health Satisfaction Self-efficacy Health Behavior
Outcomes
NR NR Mean percentage adherence (SE)IG vs. CGWeek 4: 76 ( 5.7) vs. 69 (5.2)Week 8: 75 (6.3) vs. 68 (6.1)Week 12: 87 (4.9) vs. 64 (6.3)Week 16: 83 (5.9) vs. 62 (7.4)Week 20: 80 (5.8) vs. 61(7.3)Week 24: 80 (6.3) vs. 64 (8.2)Overall: 80 (2.3) vs. 65(2.7)
Mean adherence percentage (SE)impaired memory (IG : CG) vs. intact memory (IG : CG)Week 4: 70 (8.8) : 63(6.8) vs. 82 (7.0) : 77 (7.7)Week 8: 75(8.8) : 62 (8.4) vs. 70 (9.4) : 76(8.5)Week 12: 81 (7.3) : 56 (8.4) vs. 88 (7.7) : 77 (8.1)Week 16: 72 (9.3) : 55 (9.8) vs. 91 (6.2) : 76(9.6)Week 20: 73 (7.5) : 49(8.7) vs. 86 (8.9) : 80 (9.3)Week 24: 79(10.8) : 56 (10.6) vs. 82 (8.0) : 76 (12.5)Overall: 77 (3.4) : 57(3.5) vs. 83(3.3) : 77 (3.5)
Among memory impaired subjects, scores were statistically significant and greater in the IG (p=0.001)
AH-70

Appendix H. Data Table
Author YearAndrade 2005
Quality of Life Support WithdrawalsNR NR Intervention group:
1 died, 1 lost to follow up, 29 included in ITT analysisControl group:3 lost to follow up, 29 included in ITT analysis
AH-71

Appendix H. Data Table
Author YearAndrade 2005
Adverse Effects OtherNR Virological and immune responses to
medication between memory impaired and memory intact given, not listed here (NS).
AH-72

Appendix H. Data Table
Author YearPatient Recruitment
Setting Clinical Practice SettingPatient Technology
Setting Study design NAndrade 2001 Johns Hopkins NR Home/with patient RCT N=50
AH-73

Appendix H. Data Table
Author YearAndrade 2001
Years of Study
Length of follow-up (months) Inclusion Criteria Exclusion Criteria Elderly
6 months NR *Patients who were starting highly active antiretroviral therapy for the first time or who had failed it once or twice in the past
NR NR
AH-74

Appendix H. Data Table
Author YearAndrade 2001
Underserved Chronic IllnessDisability/
Impairment Gender (% Male) Age (years)NR HIV/AIDS NR NR NR
AH-75

Appendix H. Data Table
Author YearAndrade 2001
Ethnicity Income (US$) EducationUrban / Rural /
Frontier Other
Patient Characteristics*
American NR NR NR NR
AH-76

Appendix H. Data Table
Author YearAndrade 2001
Health Insurance Status Literacy Language(s) Health Beliefs Intervention Name
NR NR English NR Disease Management Assistance System (DMAS)
AH-77

Appendix H. Data Table
Author YearAndrade 2001
Intervention Described Intervention Groups Type of Device* Functions*
Intervention*
The DMAS emits a beeping sound when patients are supposed to take their medication. They then press "play" button on the DMAS and the device plays a verbal medication reminder. Once the patients have taken their medication they press the "yes" button and the device records the date and time of their medication.
IVR Grp: 50CG: 50
Pager like Medication reminder, adherence recorder
AH-78

Appendix H. Data Table
Author YearAndrade 2001
Staff Training Subject Training co-interventions PhysiologicNR NR Monthly antiretroviral
education and counselingViral loads (Mean)IVR: 1.5 log decreaseCG: 0.5 log decrease
CD4 cell count (Mean)IVR: 50 CD4 cell increaseCG: 10 CD4 cell increase
AH-79

Appendix H. Data Table
Author YearAndrade 2001
Health Service Utilization Health Care Costs KnowledgeNR NR NR
AH-80

Appendix H. Data Table
Author YearAndrade 2001
Use of Technology Usability HIT SatisfactionPreliminary data analysis of the first 19 patients (of 86, 52 who were enrolled through June 2001) showed a mean adherence score of 92% for IVR and 83 for CG. Memory-impaired subjects in IVR group had adherence of 90% vs. 80% in CG.
Reported that younger employees tended to use the e-mail as a communication tool for health counseling more than older employees, and there are different levels of skill and acceptability for e-mail among employees in administrative and manufacturing divisions
NR
AH-81

Appendix H. Data Table
Author YearAndrade 2001
Health Satisfaction Self-efficacy Health Behavior
Outcomes
NR NR NR
AH-82

Appendix H. Data Table
Author YearAndrade 2001
Quality of Life Support WithdrawalsNR NR NR
AH-83

Appendix H. Data Table
Author YearAndrade 2001
Adverse Effects OtherNR All pts were also given EDEM caps
which recorded the time and date pts took medications, to help verify the accuracy of the DMAS recording system
AH-84

Appendix H. Data Table
Author YearPatient Recruitment
Setting Clinical Practice SettingPatient Technology
Setting Study design NAndrewes 1996 NR General teaching hospital
(Royl Melbourne hospital) and a private hospital (Melbourne clinic)
Homes Pre- post N= 54Grp 1 (DIET): 27Grp 2 (CARL): 27
Anhoj 2004 WWW NR WWW Cohort (survey, interview) User online survey: 85Provider mail survey: 131Interview: 15
AH-85

Appendix H. Data Table
Author YearAndrewes 1996
Anhoj 2004
Years of Study
Length of follow-up (months) Inclusion Criteria Exclusion Criteria Elderly
NR NA NR NR NR
2002 NA *Survey responders NR NR
AH-86

Appendix H. Data Table
Author YearAndrewes 1996
Anhoj 2004
Underserved Chronic IllnessDisability/
Impairment Gender (% Male) Age (years)NR Yes- DSM-III-R
diagnosed eating disorders (anorexia nervosa and bulimia)
NR NR Age in years - Mean (SD)DIET vs. Control:22.4 (+5.6) vs. 21.6 (+5.0)
NR ASTHMA NR 29% (N = 17/59) MeanMale: 41Female: 36
AH-87

Appendix H. Data Table
Author YearAndrewes 1996
Anhoj 2004
Ethnicity Income (US$) EducationUrban / Rural /
Frontier Other
Patient Characteristics*
NR NR NR NR NR
NR NR NR NR NR
AH-88

Appendix H. Data Table
Author YearAndrewes 1996
Anhoj 2004
Health Insurance Status Literacy Language(s) Health Beliefs Intervention Name
NR NR NR NR DIET
NR NR NR NR LinkMedica
AH-89

Appendix H. Data Table
Author YearAndrewes 1996
Anhoj 2004
Intervention Described Intervention Groups Type of Device* Functions*
Intervention*
Health education package containing information aimed at educating patients on issuesregarding the dangers and myths surrounding certain methods of dieting and the underlying mechanism which have been found to maintain eating disorders
Grp 1 (DIET): Aim of the program is to educate about anorexia and bulimia and to debunk some of the myths concerning weight control. Areas covered were laxative inefficiency, adverse effects of self induced vomiting, rebound effect of diuretics, effects on the brain due to starvation, natural metabolic rate drops, myths surrounding weight loss and exercise, weight reduction and self esteem, media influence, challenging aspects of puberty and family influences.
Grp 2 (CARL): Subjects interacted with the CARL program by typing in responses toquestions. on directional counseling stimulation.
Computers Health education, questions and answers (typing in responses)
Website with tailored feedback and support
NA WWW Web-based diary, graphic report of peak flow, medication management feedback, knowledge center, support group, ask the expert
AH-90

Appendix H. Data Table
Author YearAndrewes 1996
Anhoj 2004
Staff Training Subject Training co-interventions PhysiologicNR NR NR NR
NR NR NR NA
AH-91

Appendix H. Data Table
Author YearAndrewes 1996
Anhoj 2004
Health Service Utilization Health Care Costs KnowledgeNR NR Eating disorder knowledge
questionnaireGrp 1 vs. Grp 2 mean (SD)
Pre intervention:30.1 (+8.0) vs. 34.4 (+8.0) Post intervention:44.4 (+10.8) vs. 37.1 (+7.9)
F (1, 50)= 50.3, p < 0.001
NR NR NR
AH-92

Appendix H. Data Table
Author YearAndrewes 1996
Anhoj 2004
Use of Technology Usability HIT SatisfactionNR Ease of use, Mean (SD)
Grp 1: 8.5 (+2.6) to 9.8 (+0.6)
Difficult to operate :Grp 2: 4.6 (+2.6)
Mean (SD)Usefulness and relevance Grp1: 7.1 (+2.9) to 8.6 (+2.0)Wanting to receive more info6.3 (+2.5) to 7.9 (+2.2)
Grp 2:Not useful: 2.0 (+1.5)Not enjoyable: 4.1 (+3.0)
NR NR Users rated quality of website functions, but combined patients and providers and survey instrument very poor
AH-93

Appendix H. Data Table
Author YearAndrewes 1996
Anhoj 2004
Health Satisfaction Self-efficacy Health Behavior
Outcomes
Eating disorder attitude questionnaire, Mean (SD)Grp 1 vs. Grp 2 Pre-intervention: 149 (+42.7) vs. 148.6 (+40.4) Post-intervention:166.9 (+49.0) vs. 149.5 (+41.9)
F (1,50) = 6.8, p=0.01
NR NR
NR NR NR
AH-94

Appendix H. Data Table
Author YearAndrewes 1996
Anhoj 2004
Quality of Life Support WithdrawalsNR NR NR
NR NR NR
AH-95

Appendix H. Data Table
Author YearAndrewes 1996
Anhoj 2004
Adverse Effects OtherNR NR
NR Qualitative description of users, categorized as 'controllers' or 'disease neglecters'; patient users felt "doctors ignorant"
AH-96

Appendix H. Data Table
Author YearPatient Recruitment
Setting Clinical Practice SettingPatient Technology
Setting Study design NAraki 2006 Manufacturing Plant NR Manufacturing plant RCT N=36
Armstrong 2005 Patients at Cancer Risk Evaluation Program at U of Pennsylvania were screened for inclusion
NR NR Double blind RCT N = 27Grp 1: 13Grp 2: 14
AH-97

Appendix H. Data Table
Author YearAraki 2006
Armstrong 2005
Years of Study
Length of follow-up (months) Inclusion Criteria Exclusion Criteria Elderly
2 months NR *Employed at a manufacturing plant in Tokyo*Had health data (for the annual checkup) available as of May 20th*Abnormal levels of gamma-GTP
Requiring immediate medical attention, past history of hepatic dysfunction, those who drank less than once a month
NR
2000-2003 6 weeks *Have undergone oophorectomy or mastectomy
No significant residual breast or ovarian cancer risk, those with ovarian cancer or metastatic breast cancer
NR
AH-98

Appendix H. Data Table
Author YearAraki 2006
Armstrong 2005
Underserved Chronic IllnessDisability/
Impairment Gender (% Male) Age (years)NR ALCOHOLISM NR 100% Mean Age (SD)
Grp 1: 43.4 (+8.1)Grp 2: 44.3 (+7.2)Grp 3: 43.8 (+7.3)
NR CANCER Risk, BRCA 1/2 Mutations
NR N = 0% Mean (Range)Total: 43 (26-59)Grp 1: 45 (30-59)Grp 2: 42 (26-54)
AH-99

Appendix H. Data Table
Author YearAraki 2006
Armstrong 2005
Ethnicity Income (US$) EducationUrban / Rural /
Frontier Other
Patient Characteristics*
Japanese NR NR NR NR
Caucasian: 100% NR Overall 74% College educatedGrp 1: 70%Grp 2: 85%
NR NR
AH-100

Appendix H. Data Table
Author YearAraki 2006
Armstrong 2005
Health Insurance Status Literacy Language(s) Health Beliefs Intervention Name
NR NR Japanese Based on the Knowledge-Attitude-Behavior (KAB) model, precise knowledge on appropriate drinking behaviors would likely lead to a favorable attitude to adopting an appropriate behavior, and in turn it would result in an actual behavior
NR
NR NR English NR Tailored Decision Support System
AH-101

Appendix H. Data Table
Author YearAraki 2006
Armstrong 2005
Intervention Described Intervention Groups Type of Device* Functions*
Intervention*
E-mail counseling or face-to-face counseling that included short lectures on potential health risks of excess alcohol consumption and appropriate drinking behaviors. Also included goal setting.
Grp 1 (Face-to-Face): 12Grp 2 (Email): 12Grp 3 (CG): 12
Computer/email, brochure, live counselor
Email was used to encourage cessation of heavy drinking and often used attached brochuresFace-to-face counseling employed real counselors and used brochures as well
Provides individualized survival and cancer incidence curves specific to outcomes of alternative management strategies
Group 1: InterventionGroup 2: Control
Computer was used to create curves, unclear as to patient interaction
Offer decision strategies for dealing with BRCA 1/2
AH-102

Appendix H. Data Table
Author YearAraki 2006
Armstrong 2005
Staff Training Subject Training co-interventions PhysiologicNR NR NR Baseline
Reported alcohol consumption (g Ethanol/day)Grp 1: 24.8 (+15.7)Grp 2: 35.0 (+18.6)Grp 3: 19.8 (+17.9)p=0.1074
Serum gamma-GTPGrp 1: 140.7 (+63.6)Grp 2: 138.1 (+65.4)Grp 3: 117.4 (+40.2)p=0.5613
After IVRGrp 1: 116.3 p=0.05Grp 2&3: not significant change
NR 1:1 meeting with research coordinator, review of educational booklet
NR NR
AH-103

Appendix H. Data Table
Author YearAraki 2006
Armstrong 2005
Health Service Utilization Health Care Costs KnowledgeNR NR NR
NR NR NR
AH-104

Appendix H. Data Table
Author YearAraki 2006
Armstrong 2005
Use of Technology Usability HIT SatisfactionNR Reported that younger employees
tended to use the e-mail as a communication tool for health counseling more than older employees, and there are different levels of skill and acceptability for e-mail among employees in administrative and manufacturing divisions
NR
NR NR NR
AH-105

Appendix H. Data Table
Author YearAraki 2006
Armstrong 2005
Health Satisfaction Self-efficacy Health Behavior
Outcomes
NR NR Baseline/After IVR
Knowledge:Grp 1: 3.2 (+1.7)/5.9 p<0.001Grp 2: 4.2 (+1.1)/4.8Grp 3: 3.6 (+2.2)/NSBaseline p=0.3654
Attitude:Grp 1: 5.6 (+2.2)/7.1 p<0.05Grp 2: 5.2 (+2.5)/NSGrp 3: 6.6 (+2.1)/NSBaseline p=0.3521
Behavior:*see physiologic
NR NR NR
AH-106

Appendix H. Data Table
Author YearAraki 2006
Armstrong 2005
Quality of Life Support WithdrawalsNR NR NR
NR NR 5-3 unable to travel or commit to see research coordinator, one underwent prophylactic mastectomy and oophorecotmy, 1 unreachable for follow up
AH-107

Appendix H. Data Table
Author YearAraki 2006
Armstrong 2005
Adverse Effects OtherNR NR
NR NR
AH-108

Appendix H. Data Table
Author YearPatient Recruitment
Setting Clinical Practice SettingPatient Technology
Setting Study design NArtinian 2003 Urban, Detroit VA medical
centerUrban CHF clinic Homes RCT N=18
Grp 1 (Usual care) :9Grp 2 (Usual care+ compliance device) : 9
AH-109

Appendix H. Data Table
Author YearArtinian 2003
Years of Study
Length of follow-up (months) Inclusion Criteria Exclusion Criteria Elderly
NR 3 months *Age equal to or more than 18 yrs*Symptomatic left ventricular dysfunction *Ejection fraction of 40% or less*Ownership or rental home with a telephone*Ability to read and understand English*Plans to remain in the city for the study period
H/o dementia, mental illness, symptomatic infectious diseaseor advanced liver disease, self reported substance abuse, hemodialysis, coronary angioplasty within last 60 days or coronary artery bypass graft surgery within last 90 days, inability to participate in 6 min walk test or terminal stages of cancer
NR
AH-110

Appendix H. Data Table
Author YearArtinian 2003
Underserved Chronic IllnessDisability/
Impairment Gender (% Male) Age (years)NR CHF NR N = 17 (94%) Mean (SD): 68 (+11
yrs)
AH-111

Appendix H. Data Table
Author YearArtinian 2003
Ethnicity Income (US$) EducationUrban / Rural /
Frontier Other
Patient Characteristics*
Black: 65% (11 pts)Caucasian: 35% (6 pts)
< $ 10,000: 2 pts (13%)$10,000-19,000: 8 pts (53%)$ 20,000-29,999: 4 pts (27%)>$ 40,000: 1 pt (6%)*3 pts chose not to disclose their income
Mean educational level: 13 yrs Range: 8-19yrs
Urban Marital statusUnmarried: 14 pts (78%)Single: 2 pts (11%)Divorced/separated: 10 pts (56%)Widowed: 2 pts (11%)Married: 4 pts (22%)Live alone: 11 pts (61%)Live with spouse or child: 7 pts (39%)
AH-112

Appendix H. Data Table
Author YearArtinian 2003
Health Insurance Status Literacy Language(s) Health Beliefs Intervention Name
NR NR NR NR Med-eMonitor
AH-113

Appendix H. Data Table
Author YearArtinian 2003
Intervention Described Intervention Groups Type of Device* Functions*
Intervention*
*Med-eMonitor device-5 compartments for supplying up to 5 medications using alarm to remind the pts daily when to take, which to take and how many to take.*25 virtual compartments with daily tailored reminders or questions regarding other medications, monitoring, daily weight and BP, reducing salt intake, eating heart healthy and engaging in physical activity*Date and time stamped record of pill taking*Recordings of pts's responses to specific questions*Updates to pts's regimen downloaded and pts info automatically transmitted to server via telephone
Grp 1 : usual care + web based intervention (compliance device)Grp 2: Usual care
All received self care behavior booklet, Grp 1 included visits to the cardiologist in the clinic at regular intervals (frequency determined by severity of HF). On each visit, pharmacist assesses medication taking and provided pts with written info about name, frequency and action of medication. Grp2 received all above + Med- eMonitor
Videocassette (Med - Monitor) that sat in a cradle connected to a telephone line
Compliance device with alarms and reminders, daily monitoring of weight and BP, and answers to specific questions
AH-114

Appendix H. Data Table
Author YearArtinian 2003
Staff Training Subject Training co-interventions PhysiologicNR All pts received an
educational booklet describing CHF self care behaviorspts were instructed on how to use their weight scale and BP monitor
Unclear Functional statusGrp 1 vs. Grp 2
NYHA Functional classBaseline Mean (SD)3 (+0.83) vs. 3 (+0.50)
3 month Mean (SD)3 (+1.01) vs. 2 (+1.01)
ANOVATime---F(1,16)=0.67,p=0.424Group by time interaction- F(1,16)=0.00,p=1.0
6 MWT distance in feetBaseline Mean (SD)846 (+347) vs. 946 (+294)
3 month Mean (SD)983(+299) vs. 995 (+257)
ANOVATime-- F(1,16)=1.28,p=0.276group by time interaction- F(1,16)=0.00,p=0.968
AH-115

Appendix H. Data Table
Author YearArtinian 2003
Health Service Utilization Health Care Costs KnowledgeNR NR NR
AH-116

Appendix H. Data Table
Author YearArtinian 2003
Use of Technology Usability HIT SatisfactionNR Technical difficulties
Difficulties with monitor: 4 pts (44%)Difficulty getting out small pills from compartments: 4 pts(44%)Difficulty reading the screen: 2 ptsColor of lettering hard to see: some ptsMessage needs to be long enough for clarity: manyCould not hear beep of the monitor: 1 pt
Loved it: 5pts(56%)Hated it: 4 pts (44%)
Quotes of the pts included, not listed here
AH-117

Appendix H. Data Table
Author YearArtinian 2003
Health Satisfaction Self-efficacy Health Behavior
Outcomes
Changing lifestyles (i.e. helped establish better routines): 6 (67%)
NR Self care behaviorsGrp 1 vs. Grp 2Baseline Mean(SD)95 (+22) vs. 92 (+8)3 month Mean (SD)108 (+22) vs. 106 (+21)
ANOVATime: F(1,16)=6.81,p=0.019Grp by time interaction: F(1,16)=0.02, p=0.902
Post hoc paired samples t test Grp 1: t (8)= 1.85, p=0.102Grp 2: t (8)=1.85, p= 0.102
Compliance with daily monitoringWeight: Grp 1 vs. Grp 2: 79% vs. 85% , t (15)= 0.57,p=0.577BP: Grp 1 vs. Grp 2 : 51% vs. 81%, t (15)= 1.83, p= 0.095
Grp 2 rates as measured by monitorAverage compliance rates for with weight and BP: 96%Medication compliance rate: 94%
AH-118

Appendix H. Data Table
Author YearArtinian 2003
Quality of Life Support WithdrawalsTotal Quality of life (QOL)Grp 1 vs. Grp 2Baseline mean (SD)43 (+22) vs. 51 (+24)
3 month mean28 (+27) vs. 38 (+25)
ANOVATime: F (1,16) = 10.00, p= 0.006Grp by time interaction-: F (1,16)= 0.05, p=0.832
Post hoc paired samples t testDifference between baseline and follow up mean Grp 1: t (8)=1.78, p=0.113Grp 2: t (8)=4.63, p=0.002
Physical QOLGrp 1 vs. Grp 2Baseline mean(SD)21 (+13) vs. 26 (+9)
3 month mean14 (+11) vs. 19 (+11)
ANOVATime: F (1,16)= 6.20, p=0.024Grp by time interaction: F (1,16)= 0.03, p=0.868
NR NR
AH-119

Appendix H. Data Table
Author YearArtinian 2003
Adverse Effects OtherNR Clinical characteristics of sample at
baseline viz NYHA FC, Perceived health, smoking, BMI -given but not listed hereCronbach alpha values for reliability across time given, not listed here
AH-120

Appendix H. Data Table
Author YearPatient Recruitment
Setting Clinical Practice SettingPatient Technology
Setting Study design NBachofen 1999 NR NR Homes Cohort N=21
AH-121

Appendix H. Data Table
Author YearBachofen 1999
Years of Study
Length of follow-up (months) Inclusion Criteria Exclusion Criteria Elderly
NR 3 mos NR NR NR
AH-122

Appendix H. Data Table
Author YearBachofen 1999
Underserved Chronic IllnessDisability/
Impairment Gender (% Male) Age (years)NR OCD NR N = 56.6% Mean (SD): 31 (+8.2)
Range: 21-54
AH-123

Appendix H. Data Table
Author YearBachofen 1999
Ethnicity Income (US$) EducationUrban / Rural /
Frontier Other
Patient Characteristics*
NR NR NR NR Mean age at onset of OCD (SD): 19 (+6.1)Range: 10-34
Mean OCD duration (SD): 12 yrs (+6.9)Range: 2-28 yrs
OCD rituals (N)Washing: 4Checking: 9Harming self or others: 6Numbers: 4Perfectionism: 3
All but 1 taking psychotropic medication at the time of study
AH-124

Appendix H. Data Table
Author YearBachofen 1999
Health Insurance Status Literacy Language(s) Health Beliefs Intervention Name
NR NR NR NR Self therapy with BT steps
AH-125

Appendix H. Data Table
Author YearBachofen 1999
Intervention Described Intervention Groups Type of Device* Functions*
Intervention*
Self-guiding manual and touch tone phone used to access computer driven interviews via an interactive voice response system
Pts given 190 pg BT STEPS manual and a PIN to access the IVR systemA toll free call could be made from any touch tone telephone in the UK to a computer in Madison, WICoordinator explained steps, pts left to personalize their self treatment program under guidance of the manual and the IVR systemAfter call completion, computer generated and faxed a feedback sheet that summarized the call.After pts started doing the ERP sessions, a personalized ERP homework diary sheet, based on the goals they had entered, was mailed to them each weekPts who did not call the IVR system for a week were contacted by phone or mail to inquire the reason.
Touch Tone telephone Question and answers, feedback sheet, personalized ERP diary sheet,helped personalize self treatment program
AH-126

Appendix H. Data Table
Author YearBachofen 1999
Staff Training Subject Training co-interventions PhysiologicNR A coordinator spent 5 mins
with each pt, explaining how to use the BT steps and make IVR calls and encouraging daily use of the system. For pts who lived far away, manual was mailed and coordinator explained the steps over the phone
NR Y-BOCS (Yale Brown Obsessive Compulsive scale) TotalBaseline vs. Completers (12 week) , Mean (SD)25 (+6.2) vs. 20 (+7.5)Completers (N=19) (t, df, p) vs. ITT analysis (t, df, p)3.19, 18, 0.005 vs. 3.12, 20, 0.005
RitualsBaseline vs. Completers (12 week) , Mean (SD)13 (+3) vs. 10 (+4.4)Completers (N=19) (t, df, p) vs. ITT analysis (t, df, p)3.54, 18, 0.002 vs. 3.43, 20, 0.003
ObsessionsBaseline vs. Completers (12 week), Mean (SD)11 (+3.8) vs. 10 (+3.4)Completers (N=19) (t, df, p) vs. ITT analysis (t, df, p)1.89, 18, 0.074 vs. 1.88, 20, 0.075
PGI- Patient Global impression scaleCompleters (12 week) , Mean (SD)2.8 (+1.0)
AH-127

Appendix H. Data Table
Author YearBachofen 1999
Health Service Utilization Health Care Costs KnowledgeNR The cost of the system compares
favorably to that of medication and clinician guided care. They save 80 % of the per patient time neededby a clinician to guide ERP
NR
AH-128

Appendix H. Data Table
Author YearBachofen 1999
Use of Technology Usability HIT SatisfactionPts used the IVR system over a period of 67.2 (+38.3) daysPts took a mean of 34.6 (+26.5) days from the time they made call 1 until they completed their first ERP sessionPts who did 2 or more ERP sessions took a mean of 64 days doing ERP after completing call 4
NR NR
AH-129

Appendix H. Data Table
Author YearBachofen 1999
Health Satisfaction Self-efficacy Health Behavior
Outcomes
NR NR Hamilton rating scale for depressionBaseline vs. Completers (12 week) , Mean (SD)22 (+8.1) vs. 17 (+8.3)Completers (N=19) (t, df, p) vs. ITT analysis (t, df, p)2.99, 18, 0.008 vs. 2.93, 20, 0.008
Work and social adjustment scale TotalBaseline vs. Completers (12 week) , Mean (SD)20 (+7.3) vs. 17 (+7.6)Completers (N=19) (t, df, p) vs. ITT analysis (t, df, p)2.28, 18, 0.035 vs. 2.27, 19, 0.035
Work itemBaseline vs. Completers (12 week) , Mean (SD)5.2 (+2.7) vs. 4.5 (+2.3)Completers (N=19) (t, df, p) vs. ITT analysis (t, df, p)1.49, 18, 0.154 vs. 1.49, 19, 0.153
Home managementBaseline vs. Completers (12 week) , Mean (SD)6.1 (+1.6) vs. 4.9 (+2.2)Completers (N=19) (t, df, p) vs. ITT analysis (t, df, p)2.15, 17, 0.046 vs. 2.14, 18, 0.047
AH-130

Appendix H. Data Table
Author YearBachofen 1999
Quality of Life Support WithdrawalsNR NR 2 pts had to leave the study as their
turn on the waiting list arrived to begin clinician guided therapy
AH-131

Appendix H. Data Table
Author YearBachofen 1999
Adverse Effects OtherNR Data on improvement in OCD
patients who completed 2 or more versus 1 or no exposure and ritual prevention session given, not listed here
AH-132

Appendix H. Data Table
Author YearPatient Recruitment
Setting Clinical Practice SettingPatient Technology
Setting Study design NBarnason 2003 4 Midwestern hospitals Hospital Homes RCT w/ repeated
measuresN = 35HCI (experiment): 18RC (control): 17
AH-133

Appendix H. Data Table
Author YearBarnason 2003
Years of Study
Length of follow-up (months) Inclusion Criteria Exclusion Criteria Elderly
NR 3 months *From previous parent study of N = 180*Ischemic Heart Failure (HF) *CABG*Written consent*Age >65
Age < 65 yrs Yes: Range 65 -85 yrs.
AH-134

Appendix H. Data Table
Author YearBarnason 2003
Underserved Chronic IllnessDisability/
Impairment Gender (% Male) Age (years)NR CAD NR HCI: 78%
RC: 59%Mean (SD)HCI: 73.72 (+5.06)RC: 72.82 (+ 4.80)
AH-135

Appendix H. Data Table
Author YearBarnason 2003
Ethnicity Income (US$) EducationUrban / Rural /
Frontier Other
Patient Characteristics*
NR NR NR NR "There were no statistically significant differences by group for any of the demographic characteristics (age, gender, or length of hospital stay)'
AH-136
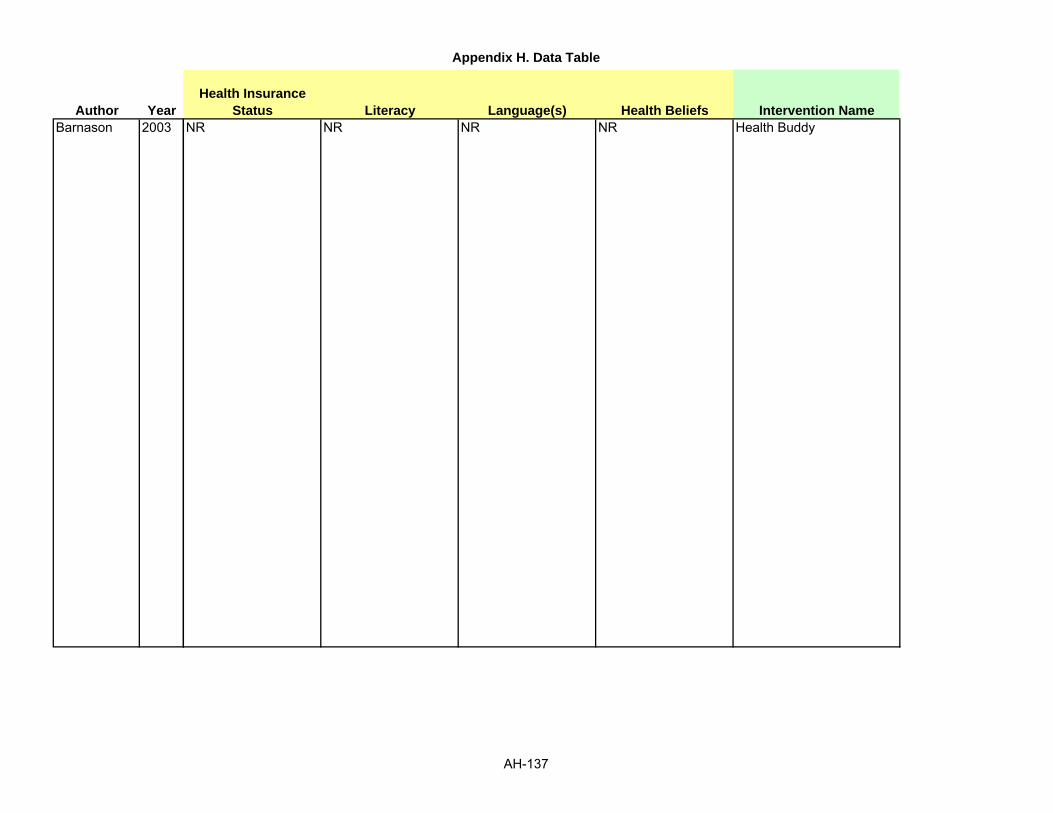
Appendix H. Data Table
Author YearBarnason 2003
Health Insurance Status Literacy Language(s) Health Beliefs Intervention Name
NR NR NR NR Health Buddy
AH-137

Appendix H. Data Table
Author YearBarnason 2003
Intervention Described Intervention Groups Type of Device* Functions*
Intervention*
Small device attached to patient's telephone. Provides assessment, strategies, education, and positive reinforcement
Group 1: (Home Communication Intervention): Health Buddy: daily sessionGroup 2: (Routine Care): RC consisted of the usual patient education and counseling provided to all CABG subjects prior to hospital discharge.Ability to ask questions: NR.
Phone attachment /screen Provides daily: assessment, strategies, education, and positive reinforcement
AH-138

Appendix H. Data Table
Author YearBarnason 2003
Staff Training Subject Training co-interventions PhysiologicNR NR NR NR
AH-139

Appendix H. Data Table
Author YearBarnason 2003
Health Service Utilization Health Care Costs KnowledgeNR NR NR
AH-140

Appendix H. Data Table
Author YearBarnason 2003
Use of Technology Usability HIT SatisfactionNR NR NR
AH-141

Appendix H. Data Table
Author YearBarnason 2003
Health Satisfaction Self-efficacy Health Behavior
Outcomes
NR Self-efficacy score:[F (1,29) = 6.40, P < 0.02]HCI: 50.6 (standard error = 1.1)RC: 46.5 (standard error = 1.1)
Salt Fewer subjects HCI subjects reported the use of salt when cooking and eating at 4 weeks, 6 weeks, and 3 months postoperatively.
There was as significant difference at 4 weeks using salt with cooking (X2 = 6.92, P > .01):RC: 47.1%HCI: 6.3 %
Exercise Adherence The HCI group reported significantly higher exercise adherence (t = 3.09, P < .01) and stress control (t=3.77, P < .01) at 3 months postoperatively.
AH-142

Appendix H. Data Table
Author YearBarnason 2003
Quality of Life Support WithdrawalsPhysical FunctioningHCI subject has significantly [F(1,29) = 4.56, P <.04] higher adjusted physical functioning mean scores (Mean: 84.4, SD: +3.9) compared with the RC group (Mean:71.5, SD: +3.9)
General Health FunctioningHCI subjects had significantly [F(1,29) = 6.99, P <.01] higher adjusted general health functioning mean scores (Mean: 79.8, SD: +2.9) compared with the RC group (Mean: 69.4, SD: +2.8)
PainThere was a significant time effect [F(1,29)=11.25, P <.002] on the pain subscale both HCI and RC:6 weeks: 77.4 (+3.3)3 months: 87.8 (+3.7)
Mental HealthHCI subjects had significantly [F (1,29)= 8.33, P <.007] higher mental health functioning (Mean: 88.7, SD: +3.09) compared with RC group (Mean: 78.0, SD: +3.0).
Validity HCI subjects had significantly [F
NR NR
AH-143

Appendix H. Data Table
Author YearBarnason 2003
Adverse Effects OtherNR NR
AH-144
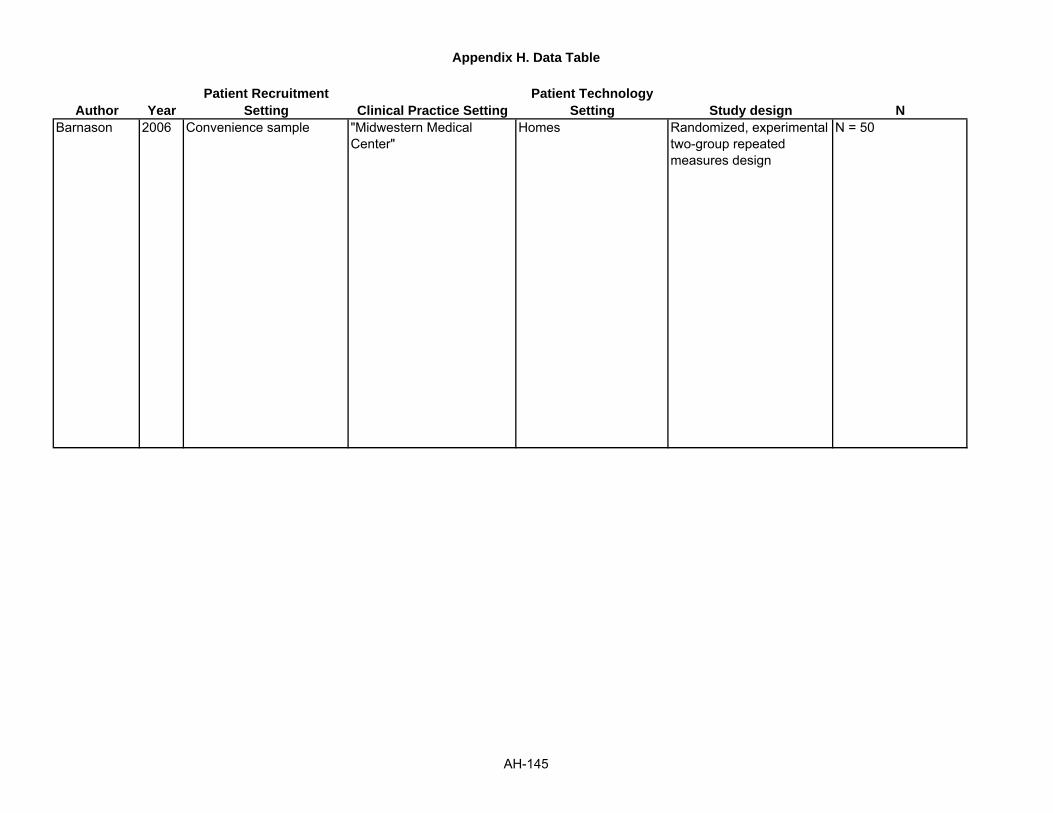
Appendix H. Data Table
Author YearPatient Recruitment
Setting Clinical Practice SettingPatient Technology
Setting Study design NBarnason 2006 Convenience sample "Midwestern Medical
Center"Homes Randomized, experimental
two-group repeated measures design
N = 50
AH-145

Appendix H. Data Table
Author YearBarnason 2006
Years of Study
Length of follow-up (months) Inclusion Criteria Exclusion Criteria Elderly
NR 3 months *Speak/read English*Have telephone service*Undergoing coronary artery bypass graft*Pre-discharge*Ages 65 and older
NR NR
AH-146

Appendix H. Data Table
Author YearBarnason 2006
Underserved Chronic IllnessDisability/
Impairment Gender (% Male) Age (years)NR CORONARY
ARTERY DISEASENR 56% Mean: 75.3
AH-147

Appendix H. Data Table
Author YearBarnason 2006
Ethnicity Income (US$) EducationUrban / Rural /
Frontier Other
Patient Characteristics*
NR NR NR NR NR
AH-148

Appendix H. Data Table
Author YearBarnason 2006
Health Insurance Status Literacy Language(s) Health Beliefs Intervention Name
NR NR English NR Health Buddy
AH-149

Appendix H. Data Table
Author YearBarnason 2006
Intervention Described Intervention Groups Type of Device* Functions*
Intervention*
12 weeks of a desktop telehealth device with daily interventions with recovery assessment, strategies to manage problems, education and positive reinforcement
Group 1: Experimental - received Healthcare Intervention (HCI)Group 2: Control - Routine care (HHC)
Desktop telehealth device Illuminated screen with 4 large buttons - daily feedback
AH-150

Appendix H. Data Table
Author YearBarnason 2006
Staff Training Subject Training co-interventions PhysiologicNR Screened for vision and
key use no reported training
Medical Outcomes Short Form-36 at 6 weeks and 3 mos. after bypass.
Physiological Functioning Scales: IVR mean 77.6, CG mean 69.59
Time improvement Physical: (F [1,36]=9.42, P<.01)
Role Physical:(F[1,36]=5.74, P<.05)
Time Effect Mental Health: (F[1,36]=7.97, P<.01) both groups
Non-Routine provider visits: IVR mean 2.8,CG mean 2.61
Emergency room visits: IVR 1 subject, CG 6 subjects, but not stat. significant (squared =2.1, P=.15)
Nursing visits: IVR avg. 9.68(+5.4), CG avg. 7.48(+6.8)
AH-151

Appendix H. Data Table
Author YearBarnason 2006
Health Service Utilization Health Care Costs KnowledgeNR NR NR
AH-152

Appendix H. Data Table
Author YearBarnason 2006
Use of Technology Usability HIT SatisfactionNR NR NR
AH-153

Appendix H. Data Table
Author YearBarnason 2006
Health Satisfaction Self-efficacy Health Behavior
Outcomes
NR Self report instrument developed by research team
NR
AH-154

Appendix H. Data Table
Author YearBarnason 2006
Quality of Life Support WithdrawalsWITHIN group time effects differences: Both groups improved:Mental Health: (F[1,36=7.97, P<.01)other within group mental health outcomes listed.
NR NR
AH-155

Appendix H. Data Table
Author YearBarnason 2006
Adverse Effects OtherChest pain, fluid in leg, pneumonia, heart failure, wound infection, dysrhythemias, blood clot: leg, Very nervous, GI problems, constipation
NR
AH-156

Appendix H. Data Table
Author YearPatient Recruitment
Setting Clinical Practice SettingPatient Technology
Setting Study design NBarrera 2002 16 Primary care medical
practicesPrimary care medical practices
Homes RCT N= 160CG: 40Coach: 40Social Support: 40Social Support + Coach: 40
AH-157

Appendix H. Data Table
Author YearBarrera 2002
Years of Study
Length of follow-up (months) Inclusion Criteria Exclusion Criteria Elderly
NR 3 mos *Age: 40-75 years old*Live in local area*Have a telephone*Read and write English*Be diagnosed with Type 2 diabetes for least 1 year*Did not previously have Internet access at home or work
NR NR
AH-158

Appendix H. Data Table
Author YearBarrera 2002
Underserved Chronic IllnessDisability/
Impairment Gender (% Male) Age (years)NR TYPE 2 DIABETES NR N = 46.9%
Control: 47.5%Coach: 42.5%Social Support: 52.5%Social Support + Coach: 45%
Mean (SD)Total: 59.3 (+9.4)Control: 60.8 (+9.1)Coach: 57.6 (+9.1)Social Support: 56.7 (+ 9.2)Social Support plus Coach: 62.1 (+ 9.5)
AH-159

Appendix H. Data Table
Author YearBarrera 2002
Ethnicity Income (US$) EducationUrban / Rural /
Frontier Other
Patient Characteristics*
NR Income (this was a 6-point scale where 1 = less than $10,000, and where 6 > $50,000)
N = 160, 2.9 (1.4)Control: (n=40), 2.9 (1.2)Coach: (n=40), 2.7 (1.4)Social Support: 3.1 (1.6)Social Support + Coach: 2.7 (1.3)
Education (This was a 7-point scale where 1 = 6th grade or less, 2 = 7th - 9th grade, 3 = 10th - 11th grade, 4 = high school graduate, 5 = some college, 6 = college graduate, 7 = graduate or professional school)
N = 160, 4.8 (1.3)Control: (n=40), 4.8 (1.2)Coach: (n=40), 5.0 (1.2)Social Support: 4.7 (1.4)Social Support + Coach: 4.9 (1.3)
NR NR
AH-160

Appendix H. Data Table
Author YearBarrera 2002
Health Insurance Status Literacy Language(s) Health Beliefs Intervention Name
NR English literate English NR NR
AH-161

Appendix H. Data Table
Author YearBarrera 2002
Intervention Described Intervention Groups Type of Device* Functions*
Intervention*
This study used a new measure that was designed to provide a fairevaluation of a Internet-based support group that focused on diabetes.
Information Onlycomputer access to an extensive number of informational articles that concerned medical, nutritional, andlifestyle aspects of diabetes.
Personal Coach OnlyInformation Only intervention plus they had computer-mediated access to a professional who had expertise in providing dietary advice to diabetes patients. Participants worked with their coach, viewed resources via the web, had access to an online dietary conference, and accessed a personal database where they could enter information on their daily intake of fruits,
Computers with internet access. Social support websites with forums, live chat, and informational articles.
Computer-based interventions to assess changes in participant perceptions of social support.
NR
AH-162

Appendix H. Data Table
Author YearBarrera 2002
Staff Training Subject Training co-interventions PhysiologicNR Each participant received
training in using the features of the computer that would allow them to access and navigate the website.
NR NR
AH-163

Appendix H. Data Table
Author YearBarrera 2002
Health Service Utilization Health Care Costs KnowledgeNR NR NR
AH-164

Appendix H. Data Table
Author YearBarrera 2002
Use of Technology Usability HIT SatisfactionNR NR NR
AH-165

Appendix H. Data Table
Author YearBarrera 2002
Health Satisfaction Self-efficacy Health Behavior
Outcomes
NR NR NR
AH-166

Appendix H. Data Table
Author YearBarrera 2002
Quality of Life Support WithdrawalsNR Age was significantly related to
change on the DSS, r(123) = -.22, p < .05, and did not show interactions with this condition.
Age (as covariate) and DSS change scores (as criterion), ANCOVA showed significant effect for both age, F(1,118) = 6.46, p < .05, and condition, F(3, 118) = 4.88, p < .01, f = .33.
Information controls contrasted with Social Support Only and Combined Conditions that contained Internet-based social support was significant t(119) = -3.82, p < .001.
Total = 37. Support group = 10, Information, personal coach, and combined condition groups: 9 each. No significant effects for condition or interaction between groups.
AH-167

Appendix H. Data Table
Author YearBarrera 2002
Adverse Effects OtherNR NR
AH-168

Appendix H. Data Table
Author YearPatient Recruitment
Setting Clinical Practice SettingPatient Technology
Setting Study design NBlock 2004 NR Berkeley, California Homes RCT N=491
Brennan 2001 Hospital NR Homes RCT N = 140Grp 1: 50Grp 2: 50Grp 3: 40
AH-169

Appendix H. Data Table
Author YearBlock 2004
Brennan 2001
Years of Study
Length of follow-up (months) Inclusion Criteria Exclusion Criteria Elderly
9 months NR *Female*African American or non-Hispanic white*Age 40-65 yrs*Low-income
Any criteria against the Inclusion criteria
NR
NR 6 mos NR NR NR
AH-170

Appendix H. Data Table
Author YearBlock 2004
Brennan 2001
Underserved Chronic IllnessDisability/
Impairment Gender (% Male) Age (years)YESBelow poverty: 68.0%100-185% of poverty: 24.5%Above 185% of poverty: 7.5%
NR NR 0.00% 50.1 (39-65)
NR CABG NR N = 78% Mean (Range): 63.4 (38-82)
AH-171

Appendix H. Data Table
Author YearBlock 2004
Brennan 2001
Ethnicity Income (US$) EducationUrban / Rural /
Frontier Other
Patient Characteristics*
African American: 48.4%White non-Hispanic: 51.6%
<$10,000: 23.3%10,000-15,000: 9.6%15,000-20,000: 8.5%20,000-25,000: 7.7%25,000-35,000: 17.1%35,000-50,000: 11.6%50,000-65,000: 6.7%>65,000: 15.6%
Elementary only: 0.6%Junior high only: 2.1%HS grad: 31.0%More than HS: 66.3%
NR Fruit and vegetable occurrence/day0: 6.2%1: 15.4%2: 18.3%3: 15.6%4: 16.6%5 or more: 27.9%
Caucasian: 86%African American: 12%
NR NR NR NR
AH-172

Appendix H. Data Table
Author YearBlock 2004
Brennan 2001
Health Insurance Status Literacy Language(s) Health Beliefs Intervention Name
NR NR NR Research overwhelmingly implicates low intakes of fruits and vegetables as factors influencing the prevalence of several chronic disease and poor health
Little by Little
NR NR NR NR HeartCare
AH-173

Appendix H. Data Table
Author YearBlock 2004
Brennan 2001
Intervention Described Intervention Groups Type of Device* Functions*
Intervention*
CD-ROM that includes a brief assessment of fruit and vegetable intake as well as messages and tips to increase intake
CD-ROM Only: 160CD-ROM + 2 phone calls: 162CG: 159
CD-ROM To increase the level of fruit and vegetable intake by lowincome women
Computerized, internet-based information and support system that provides extension and enhancement of traditional nursing services
Group 1: HeartCareGroup 2: CHIPGroup 3: Usual care
Computer/internet Education, support, tailored health information
AH-174

Appendix H. Data Table
Author YearBlock 2004
Brennan 2001
Staff Training Subject Training co-interventions PhysiologicInterviewers were provided with scripts for the two brief telephone calls made to the CD-ROM + telephone call groups
NR NR Change in Fruit/Vegetable Occurrences:CD-ROM + telephone calls: 1.32, p=0.016CD-ROM only: 1.20, p=0.052CG: 0.71, p=NA
None NR NR NR
AH-175

Appendix H. Data Table
Author YearBlock 2004
Brennan 2001
Health Service Utilization Health Care Costs KnowledgeNR NR NR
NR NR NR
AH-176

Appendix H. Data Table
Author YearBlock 2004
Brennan 2001
Use of Technology Usability HIT SatisfactionNR NR NR
For one week snapshot: Group 1 used the HeartCare system a total of 451 times, an average of 64 accesses per day
NR NR
AH-177

Appendix H. Data Table
Author YearBlock 2004
Brennan 2001
Health Satisfaction Self-efficacy Health Behavior
Outcomes
NR NR Change in Stage of Readiness for ChangeCD-ROM Only: 0.41, p=0.01CD-ROM + phone calls: 0.31, p=0.15CG: 0.17, p=NA
NR NR NR
AH-178

Appendix H. Data Table
Author YearBlock 2004
Brennan 2001
Quality of Life Support WithdrawalsNR NR N=10
NR NR NR
AH-179

Appendix H. Data Table
Author YearBlock 2004
Brennan 2001
Adverse Effects OtherNR NR
NR NR
AH-180

Appendix H. Data Table
Author YearPatient Recruitment
Setting Clinical Practice SettingPatient Technology
Setting Study design NCarlbring 2007 NR NR Homes RCT N= 57
IVR: 29CG: 28
AH-181

Appendix H. Data Table
Author YearCarlbring 2007
Years of Study
Length of follow-up (months) Inclusion Criteria Exclusion Criteria Elderly
NR 1 year *Fulfill the DSM-4 criteria for social phobia according to the SPSQ*Have a total score of below 31 on MADRS-S depression scaleand a score of less than 4 on the suicide item of this scale*Agree to undergo no other psychological treatment for the durationof the study, and have no history of earlier cognitive- behavior therapy*If taking prescribed drugs for anxiety or depression, the dosage had to be constant for 3 months before the start of the treatment, and the participants had to agree to keep the dosage constant throughout the study*Have access to a computer with internet connection*Be at least 18 yrs old*Live in Sweden*Be able to speak to the therapists by phone on a weekly basis*Following telephone administration must have social phobia as the primary diagnosis if other co morbid conditions present*Not currently meet diagnostic criteria for psychosis or substance abuse
NR No
AH-182

Appendix H. Data Table
Author YearCarlbring 2007
Underserved Chronic IllnessDisability/
Impairment Gender (% Male) Age (years)NR SOCIAL PHOBIA NR IVR vs. CG:
41 % vs. 29%Mean (SD)IVR vs. CG:32.4 (+9.1) vs. 32.9 (+9.2)
AH-183

Appendix H. Data Table
Author YearCarlbring 2007
Ethnicity Income (US$) EducationUrban / Rural /
Frontier Other
Patient Characteristics*
NR NR Education %IVR vs. CGElementary: 7 vs. 7
High schoolNot completed: 0 vs. 4Completed: 28 vs. 18
Community college: 3 vs. 4
College/universityNot completed: 34 vs. 34Completed: 28 vs. 32
NR Self-rated computer experienceIVR vs. CGFar above average: 34 vs. 32Above average: 24 vs. 21Average: 34 vs. 32Below average: 7 vs. 14
AH-184

Appendix H. Data Table
Author YearCarlbring 2007
Health Insurance Status Literacy Language(s) Health Beliefs Intervention Name
NR NR NR NR Cognitive behavioral therapy with telephone support
AH-185
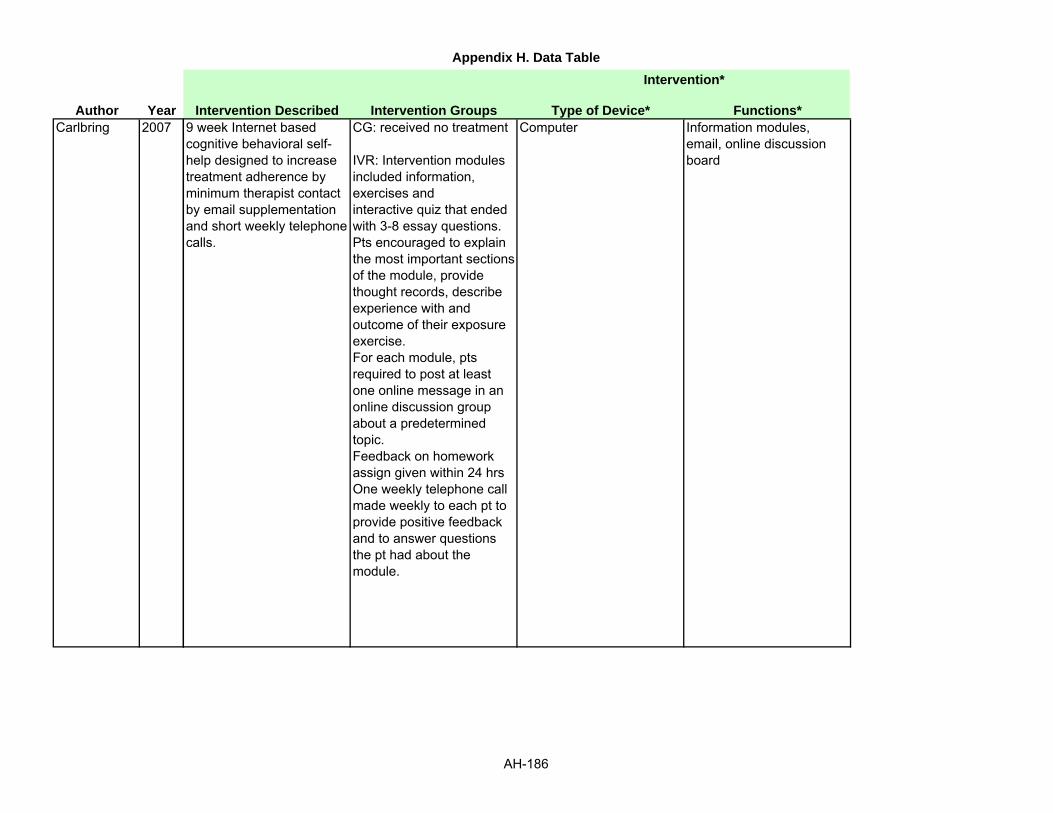
Appendix H. Data Table
Author YearCarlbring 2007
Intervention Described Intervention Groups Type of Device* Functions*
Intervention*
9 week Internet based cognitive behavioral self-help designed to increase treatment adherence by minimum therapist contact by email supplementation and short weekly telephone calls.
CG: received no treatment
IVR: Intervention modules included information, exercises and interactive quiz that ended with 3-8 essay questions. Pts encouraged to explain the most important sections of the module, provide thought records, describe experience with and outcome of their exposure exercise. For each module, pts required to post at least one online message in an online discussion group about a predetermined topic.Feedback on homework assign given within 24 hrsOne weekly telephone call made weekly to each pt to provide positive feedback and to answer questions the pt had about the module.
Computer Information modules, email, online discussion board
AH-186

Appendix H. Data Table
Author YearCarlbring 2007
Staff Training Subject Training co-interventions PhysiologicNR NR NR NR
AH-187

Appendix H. Data Table
Author YearCarlbring 2007
Health Service Utilization Health Care Costs KnowledgeNR NR NR
AH-188

Appendix H. Data Table
Author YearCarlbring 2007
Use of Technology Usability HIT SatisfactionNR NR NR
AH-189

Appendix H. Data Table
Author YearCarlbring 2007
Health Satisfaction Self-efficacy Health Behavior
Outcomes
NR IVR vs. CG
Liebowitz social anxiety scale Fear/AnxietyPre treatment score: Mean (SD)36.0 (+11.7) vs. 34.2 (+10.6)Post treatment score ; Mean (SD)24.2 (+12.0) vs. 36.1 (+12.3)
Main effectTime: F=16.8, (p<0.001), group; F= 3.1
Interaction effect: 32.2 (p<0.001)
Effect sizeWithin group: 1.00 vs. - 0.17Between group: 0.98
AvoidancePre treatment score: Mean (SD)35.2 (+12.9) vs. 33.8 (+11.0) Post treatment score ; Mean (SD)21.6 (+12.8) vs. 33.3 (+11.9)
Main effectTime: F= 34.2 , (p<0.001), group, F= 3.0Interaction effect: 29.2 (p<0.001)
Effect sizeWithin group: 1.06 vs. 0.04
NR
AH-190

Appendix H. Data Table
Author YearCarlbring 2007
Quality of Life Support WithdrawalsQuality of life inventory, Summary scorePre treatment score: Mean (SD) 0.7 (+2.0) vs. 0.5 (+1.7)Post treatment score ; Mean (SD)1.4 (+1.8) vs. 0.7 (+1.8)
Main effectTime: F= 9.9 , (p<0.0125), group, F= 1.16Interaction effect: 3.2
Effect sizeWithin group: 0.37 vs. 0.11Between group: 0.39
NR Total randomized= 60, Treatment grp=30Began other therapy=1eligible for analysis=29Did not return completed measures=1Post treatment assessment= 28Did not complete follow up=1Follow up data = 27
Control grp= 30Began other therapy=1No computer access=1Eligible for analysis=28Post treatment survey= 28No FU for control grp
AH-191

Appendix H. Data Table
Author YearCarlbring 2007
Adverse Effects OtherNR
AH-192

Appendix H. Data Table
Author YearPatient Recruitment
Setting Clinical Practice SettingPatient Technology
Setting Study design NCathala 2003 Outpatient dept. at Institute
MonstourisDept. of Urology, Institute Monstouri
Homes Cohort N = 140
Cavan 2003 NR NR Homes Cohort N= 6
AH-193

Appendix H. Data Table
Author YearCathala 2003
Cavan 2003
Years of Study
Length of follow-up (months) Inclusion Criteria Exclusion Criteria Elderly
Preliminary study: January-March 2000November 2000-April 2002
NR *Patients with localized prostate cancer treated with radical prostatectomy*Computer in home
NR NR
NR 6 months NR NR NR
AH-194

Appendix H. Data Table
Author YearCathala 2003
Cavan 2003
Underserved Chronic IllnessDisability/
Impairment Gender (% Male) Age (years)NR PROSTATE CANCER NR N = 100% Mean: 63
Range: 46-70
Unclear DIABETES NR NR Mean: 36 Range: 29-61
AH-195

Appendix H. Data Table
Author YearCathala 2003
Cavan 2003
Ethnicity Income (US$) EducationUrban / Rural /
Frontier Other
Patient Characteristics*
NR Senior executives and professionals: 58%Tradesmen: 12%
NR NR NR
NR NR NR Unclear NR
AH-196

Appendix H. Data Table
Author YearCathala 2003
Cavan 2003
Health Insurance Status Literacy Language(s) Health Beliefs Intervention Name
NR NR English, French NR Website
NR NR NR NR Diasnet
AH-197

Appendix H. Data Table
Author YearCathala 2003
Cavan 2003
Intervention Described Intervention Groups Type of Device* Functions*
Intervention*
Website to securely house data and answer questions for those with a radical prostatectomy
NR Website History of surgery - techniques and complications, video on operation, glossary, access to medical files including discharge, operative and histology, QOL questionnaire, patient/dr. dialogue
A structured patient education program which utilizes the DiasNet computer modelto display and manipulate patient data. The program used as a training exercise in carbohydrate assessment and insulin dose adjustment to help patients optimize their metabolic control
N=6Pts asked to enter from home or work PC, blood glucose values, insulin doses and a food diary.The computer model generated the a simulation of the blood glucose concentration forthe data collection period. It then suggested alternative insulin doses (regimes), or meal sizes, to reduce risk of hypo and hyperglycemia. Pts entered four days data on three occasions in the first month and then as often as they wished.
Computer Data entry, simulation of blood glucose concentration, suggestion of alternative medicationregimes
AH-198

Appendix H. Data Table
Author YearCathala 2003
Cavan 2003
Staff Training Subject Training co-interventions PhysiologicNR NR NR NR
NR Pts attended a one hour training session, which covered accessing the system, data entry and interpretation.
NR There is a graph showing HbA1c levels but difficult to give precise values, as author has notreported the same.
AH-199

Appendix H. Data Table
Author YearCathala 2003
Cavan 2003
Health Service Utilization Health Care Costs KnowledgeNR NR NR
NR NR NR
AH-200

Appendix H. Data Table
Author YearCathala 2003
Cavan 2003
Use of Technology Usability HIT Satisfaction11% had problems accessing site, 14% had tech problems attributed to incorrect PSA data entry or not having the right software to run the video
NR Satisfied with site sections: 98%Satisfied with medical file: 94%
Pts did not enter any data for several weeks, only one entered data on three consecutive as requested.
All pts found the graphical display and ability to manipulate their data very useful.Qualitative responses of pts given, not listed here
NR
AH-201

Appendix H. Data Table
Author YearCathala 2003
Cavan 2003
Health Satisfaction Self-efficacy Health Behavior
Outcomes
NR NR NR
NR NR NR
AH-202

Appendix H. Data Table
Author YearCathala 2003
Cavan 2003
Quality of Life Support WithdrawalsNR NR NR
NR NR NR
AH-203

Appendix H. Data Table
Author YearCathala 2003
Cavan 2003
Adverse Effects OtherNR Older patients used email follow up
more than younger ones, email follow up was greater for patients living further from the hospital
NR NR
AH-204

Appendix H. Data Table
Author YearPatient Recruitment
Setting Clinical Practice SettingPatient Technology
Setting Study design NCawsey 2000 NR Beatson Oncology center,
GlasgowHomes RCT (more details given in
Jones 1999)N= 525
AH-205

Appendix H. Data Table
Author YearCawsey 2000
Years of Study
Length of follow-up (months) Inclusion Criteria Exclusion Criteria Elderly
NR NR NR Pts receiving palliative treatment, those with no knowledge of their diagnosis, those with only a single treatment planned and those not giving consent to participate
NR
AH-206

Appendix H. Data Table
Author YearCawsey 2000
Underserved Chronic IllnessDisability/
Impairment Gender (% Male) Age (years)NR CANCER NR NR NR
AH-207

Appendix H. Data Table
Author YearCawsey 2000
Ethnicity Income (US$) EducationUrban / Rural /
Frontier Other
Patient Characteristics*
NR NR NR NR NR
AH-208

Appendix H. Data Table
Author YearCawsey 2000
Health Insurance Status Literacy Language(s) Health Beliefs Intervention Name
NR NR NR NR Personalized information system
AH-209

Appendix H. Data Table
Author YearCawsey 2000
Intervention Described Intervention Groups Type of Device* Functions*
Intervention*
Evaluation of a personalized information system for patients with cancer. The system dynamically generates hypertext pages that explain treatment, diseases, measurements etc related to the patient's condition, using information in the patients medial record as the basis for the tailoring
Grp 1: personalized information; access to the system that generated personalized explanation using the medical record, pts received a printout of the dialogue with the system after the session
Grp 2: generalized information; access to system with similar look and feel but only contained generalized information, main differences were the opening screen and detailed content of individual screens.
Grp 3: combined group; this grp had access to both the above systems, an initial screen provided links to both.
Grp 4: leaflets group; grp given opportunity to browse and select from a folder containing a wide range of appropriate leaflets
Computer General and personalized information
AH-210

Appendix H. Data Table
Author YearCawsey 2000
Staff Training Subject Training co-interventions PhysiologicNR The first 3 grps were invited
to carry out a computer consultation at the beginning of their course of radiotherapy in the researcher's office; pts also offered to use a computer again after their first use, but one sited in the waiting room
NR NR
AH-211

Appendix H. Data Table
Author YearCawsey 2000
Health Service Utilization Health Care Costs KnowledgeNR NR Small but not significant effect on
doctor's assessment of how knowledgeable pts were-- with the result that more pts in the general group were viewed as above average, (35% vs. 27%, p=0.19)
AH-212

Appendix H. Data Table
Author YearCawsey 2000
Use of Technology Usability HIT SatisfactionNS difference in the average time spent using the computer and only a small difference (p=0.11) in which group used the computer at any time after the first session.
Pts receiving personalized information was more likely to use the computer between 3 weeks and 3 months (12/80 vs. 4/155, chi sq=12.8, p<0.001)
The majority of the pts used the printouts of their sessions with the computer later at home, 73% of personalized information grp and 59% of general information grp (chi square=3.4, 1 df, p=0.07)
Pts in the personal grp were more likely to report using it with their family
NR Pt views on information given; general vs. personal
Was info useful: 76 (60) vs. 51 (70), p=0.16
Did it tell you anything new: 63 (50) vs. 46 (64), p=0.05
Was information relevant: 85 (66) vs. 63 (85), p= 0.004
Find information easily:109 (85) vs. 63 (89), p= 0.41
Feel overwhelmed with info: 37 (29) vs. 17 (23), p=0.41
Was it too technical:18 (14) vs. 6 (8) , p=0.23
Was it too limited: 71 (56) vs. 30 (41), p= 0.04
Satisfaction score: 44 (26) vs. 36 (42), p= 0.04 A t test between patient satisfaction scores between the two groups shows that the mean score of 2.33 for the personal group is significantly higher than the mean score of 1.64
AH-213

Appendix H. Data Table
Author YearCawsey 2000
Health Satisfaction Self-efficacy Health Behavior
Outcomes
NR NS difference found in the psychological state between the groups as measured by the HADS and MAC questionnaires.NS difference on the doctor's assessment of their anxiety, or of how active/passive they were
NR
AH-214

Appendix H. Data Table
Author YearCawsey 2000
Quality of Life Support WithdrawalsNR NR 789 pts were eligible for the study
74 excluded and 190 refused to take part in the study(more details in Jones et al 1999)
AH-215

Appendix H. Data Table
Author YearCawsey 2000
Adverse Effects OtherNR At 3 months, pts asked if they would
prefer unlimited time with their computer for getting information, or 10 mins with a specialist nurse or radiographer. Most preferred latter, but pts using personalized design were slightly more likely to choose time with the computer(32% vs. 20%), (chi square=2.9, 1df, p=0.09)
AH-216

Appendix H. Data Table
Author YearPatient Recruitment
Setting Clinical Practice SettingPatient Technology
Setting Study design NChan 2003 Pediatric clinic Honolulu, HI Homes Cohort N= 10
AH-217

Appendix H. Data Table
Author YearChan 2003
Years of Study
Length of follow-up (months) Inclusion Criteria Exclusion Criteria Elderly
6 mos NR *Pediatric patients*Ages 6-17*Persistent asthma*Written informed consent obtained from parents/guardians*Assent obtained from all children over the age of 7
NR NR
AH-218

Appendix H. Data Table
Author YearChan 2003
Underserved Chronic IllnessDisability/
Impairment Gender (% Male) Age (years)NR ASTHMA NR Total: 50%
Office grp: 80%Virtual: 20%
Mean (SD)7.6 (+2)
AH-219

Appendix H. Data Table
Author YearChan 2003
Ethnicity Income (US$) EducationUrban / Rural /
Frontier Other
Patient Characteristics*
NR NR NR NR NR
AH-220

Appendix H. Data Table
Author YearChan 2003
Health Insurance Status Literacy Language(s) Health Beliefs Intervention Name
NR NR NR NR Home monitoring service
AH-221

Appendix H. Data Table
Author YearChan 2003
Intervention Described Intervention Groups Type of Device* Functions*
Intervention*
Pts used the digital video camera and computer to record peak flow meter readings and their daily use of the MDI or DPI two times a week
Office group: had scheduled office visits to receive asthma educationVirtual group: received asthma education via the internet
Home computer system, video camera, microphone, cable to access the internet
Receive asthma education via the internet, record peak flow meter use and values, transmit this data
AH-222

Appendix H. Data Table
Author YearChan 2003
Staff Training Subject Training co-interventions PhysiologicNR NR NR Asthma Control
Days 0-90Peak flow values (% of personal best)Total: 84.3Virtual: 82.7Office: 86.0
Total # unscheduled asthma clinic visitsTotal: 2Virtual: 1Office: 1
% symptom-free days as recorded in diaryTotal: 75.1Virtual: 70.8Office: 80.4
Mean (SD) total symptom-control scoreTotal: 4.5 (+0.5)Virtual: 4.5 (+0.6)Office: 4.4 (+0.4)
Mean (SD) # beta-agonist uses in diaryTotal: 10.8 (+18.0Virtual: 3.0 (+3.3)Office: 20.5 (+24.9)
AH-223

Appendix H. Data Table
Author YearChan 2003
Health Service Utilization Health Care Costs KnowledgeTherapeutic AdherenceDays 0-90Virtual vs. Office vs. Total
Total # corticosteroid inhalers refilled:8 vs. 16 vs. 24
Mean (SD) # corticosteroid inhalers per patient per mo0.5 (+0.5) vs. 1.1 (+0.6) vs. 08. (+0.6)
Total # videos of inhaler use sent84 vs. 109 vs. 193
Mean (SD) # videos of inhaler use submitted per person16.8 (+3.4) vs. 21.3 (+6.7) vs. 19.3 (+5.6)
Adherence to submission of videos of inhaler use (%)70.0 vs. 90.8 vs. 80.4
DPI or MDI plus space technique score (%)87.2 vs. 87.3 vs. 87.3
Days 91-180Virtual vs. Office vs. Total
Total # corticosteroid inhalers refilled:6 vs. 8 vs. 14
NR Asthma Knowledge Test and Survey Results, Mean (SD)Virtual vs. Office vs. Total
Knowledge test score (%)Before Study82.0 (+8.8) vs. 77.0 (+5.2) vs. 79.8 (+7.5)After Study84.8 (+7.6) vs. 8.3 (+5.5) vs. 84.0 (+6.6)
AH-224

Appendix H. Data Table
Author YearChan 2003
Use of Technology Usability HIT SatisfactionDiagnostic AdherenceVirtual vs. Office vs. Total
Days 0-90Total # asthma diary entries119 vs. 293 vs. 412
Mean (SD) # asthma diary entries per patient23.8 (+23.8) vs. 58.6 (+39.4) vs. 41.2 (+35.7)
Asthma diary adherence (%)18.7 vs. 65.1 vs. 41.9
Total # videos of peak flow meter use submitted83 vs. 111 vs. 194
Mean (SD) # videos of peak flow meter use submitted per patient16.6 (+3.2) vs. 22.2 (+7.5) vs. 19.4 (+6.2)
Adherence to submission of videos of peak flow meter use (%)69.2 vs. 92.5 vs. 80.8
Peak flow meter technique score (%)99.7 vs. 99.2 vs. 99.5
Days 91-180
NR Virtual vs. Office vs. Total
Satisfaction survey score4.0 (+0.3) vs. 4.2 (+0.6) vs. 4.1 (+0.4)
Satisfaction with electronic checks3.8 (+0.8) vs. 4.3 (+1.0) vs. 4.0 (+0.9)
AH-225

Appendix H. Data Table
Author YearChan 2003
Health Satisfaction Self-efficacy Health Behavior
Outcomes
NR NR NR
AH-226

Appendix H. Data Table
Author YearChan 2003
Quality of Life Support WithdrawalsVirtual vs. Office vs. Total
QoL ScoreBefore StudyCaregiver5.6 (+1.2) vs. 6.4 (+0.7) vs. 6.0 (+1.0)Patient6.6 (+0.4) vs. 6.5 (+0.7) vs. 6.5 (+0.5)
After studyCaregiver6.2 (+1.0) vs. 6.4 (+0.6) vs. 6.3 (+0.8)Patient6.6 (+0.2) vs. 6.6 (+0.6) vs. 6.6 (+0.4)
NR NR
AH-227

Appendix H. Data Table
Author YearChan 2003
Adverse Effects OtherNR NR
AH-228

Appendix H. Data Table
Author YearPatient Recruitment
Setting Clinical Practice SettingPatient Technology
Setting Study design NChen 2006 NR Senior High school
studentsHomes Non-Random Group Total= 77
Grp 1 (auricular acupressure+ internet program): 38Grp 2 (auricular acupressure only): 39
AH-229

Appendix H. Data Table
Author YearChen 2006
Years of Study
Length of follow-up (months) Inclusion Criteria Exclusion Criteria Elderly
NR NR NR NR NR
AH-230

Appendix H. Data Table
Author YearChen 2006
Underserved Chronic IllnessDisability/
Impairment Gender (% Male) Age (years)NR SMOKING NR Grp 1 vs. Grp 2:
100% vs. 87.2%NR
AH-231

Appendix H. Data Table
Author YearChen 2006
Ethnicity Income (US$) EducationUrban / Rural /
Frontier Other
Patient Characteristics*
NR NR High school students NR Grp 1 vs. Grp 2Using antioxidiser:0% vs. 10.3%
Having part time work: 10.5% vs. 20.5%
Experiencing smoking cessation: 57.9% vs. 79.5%
Having family member who is smoking: 65.8% vs. 69.2%
AH-232

Appendix H. Data Table
Author YearChen 2006
Health Insurance Status Literacy Language(s) Health Beliefs Intervention Name
NR NR NR NR Smoking cessation program
AH-233

Appendix H. Data Table
Author YearChen 2006
Intervention Described Intervention Groups Type of Device* Functions*
Intervention*
Comparing effects of auricular acupressure with or without an internet assisted program on smoking cessation and self efficacy of adolescents
Grp 1: received 4 weeks of auricular acupressure plus an internet smoking cessation program
Grp 2: received only auricular acupressure
Auricular acupressure: five common points used, shenmen, lung, mouth, stomach and endocrine points, seed embedding method used, pts asked to press each point for at least a minute, 3-5 times/day for 4 weeks, adhesive patch with the ear seed renewed weekly.
Internet assisted smoking cessation program: website composed of interactive pages with the following unitsa) Impact of smoking (smoking and health, second hand smoking, difficulty of quitting and legal regulationb) Auricular acupressure for smoking cessation
Computers Forums, counseling, education, hyperlinked website surfing
AH-234

Appendix H. Data Table
Author YearChen 2006
Staff Training Subject Training co-interventions PhysiologicNR NR NR Mean serum cotinine level (SD), Grp
1 vs. Grp 2:Before intervention:346.77 ng/ml (142.51) vs. 376.06 ng/ml (169.71)After intervention:342.29 ng/ml (182.70) vs. 379.73 ng/ml (187.68)
In terms of quitting rate-levels under 100 ng/ml (Grp 1vs Grp2):6/38 (15.78%) vs. 1/39 (2.56%)
For the degree of nicotine dependenceBefore intervention, Grp 1 vs. Grp 2Low: 24 (63.2%) vs. 30 (76.9%)Medium: 10 (26.3%) vs. 7 (17.9%)High: 4 (10%) vs. 2 (5.1%)
After intervention, grp 1 vs. grp 2Low: 31 (81.6%) vs. 31 (79.5%)Medium: 6 (15.8%) vs. 5 (12.8%)High: 1 (2.6%) vs. 3 (7.7%)
Group 1 showed a statistically significant difference of nicotine dependence before and after intervention (z= - 2.81, p< 0.01)
Grp 2 did not show any significant difference (z= - 0.47, p > 0.05)
AH-235

Appendix H. Data Table
Author YearChen 2006
Health Service Utilization Health Care Costs KnowledgeNR NR NR
AH-236

Appendix H. Data Table
Author YearChen 2006
Use of Technology Usability HIT SatisfactionNR NR Usefulness of website, Mean (SD)
Overall usefulness of website: 5.02 (+1.49)
Discussion forum: 5.53 (+1.47)
Auricular acupressure for smoking cessation: 5.15 (+1.46)
Impact of smoking: 4.98 (+1.37)
Critical issues in smoking cessation: 4.82 (+1.50)
Hot topics: 4.76 (+1.72)
Hyperlinked websites: 4.66 (+1.61)
Professional counseling: 4.64 (+1.39)
Online questionnaire: 4.51 (+1.60)
AH-237

Appendix H. Data Table
Author YearChen 2006
Health Satisfaction Self-efficacy Health Behavior
Outcomes
NR Self efficacy, M (SD), pretest vs. posttestGrp 1: 45.80 (+15.14) vs. 58.57 (+15.67), t= 5.77, p < 0.001
Grp 2: 43.47 (+14.88) vs. 48.97 (+12.54), t= 2.32, p< 0.05
NR
AH-238

Appendix H. Data Table
Author YearChen 2006
Quality of Life Support WithdrawalsNR NR NR
AH-239

Appendix H. Data Table
Author YearChen 2006
Adverse Effects OtherNR NR
AH-240

Appendix H. Data Table
Author YearPatient Recruitment
Setting Clinical Practice SettingPatient Technology
Setting Study design NCho 2006 NR Kang nam St Mary's
hospital diabetes centerHomes RCT N= 40
CG: 40IVR: 40
AH-241

Appendix H. Data Table
Author YearCho 2006
Years of Study
Length of follow-up (months) Inclusion Criteria Exclusion Criteria Elderly
February 2002-August 2004
30 months *Age > 30 yrs*Followed up for more than 6 months in the clinic
Disabling conditions or disease like heart failure, hepatic dysfunction, a creatinine level > 0.133 mmol/l, severe complications of diabetes, or treatment with an intensified insulin regimen. Also people who did not have internet access in their homes or offices, did not knowhow to use the internet, or did not wish to participate in the study were excluded. Pts having history of participating in other programs that provided similar information or if they received diabetes management education from any other website other than the study website were excluded.
NR
AH-242

Appendix H. Data Table
Author YearCho 2006
Underserved Chronic IllnessDisability/
Impairment Gender (% Male) Age (years)NR TYPE 2 DIABETES NR CG: 57.5%
IG: 65%Mean (SD) CG: 54.6 (+8.6)IG: 51.3 (+9.1)
AH-243

Appendix H. Data Table
Author YearCho 2006
Ethnicity Income (US$) EducationUrban / Rural /
Frontier Other
Patient Characteristics*
NR NR NR NR Mean (SD) CG vs. IG
Diabetes duration in yrs: 6.9 (+5.7) vs. 6.7 (+5.3), p=0.868Hypertension: 13 (+32.5) vs. 11 (+27.5), p=0.808BMI (kg/m2): 23.8 (+2.8) vs. 22.8 (+2.6), p=0.139SBP (mmHg): 128.5 (+16.1) vs. 121.3 (+16.5), p= 0.070DBP (mmHg): 77.2 (+9.1) vs. 74.0 (+11.6), p= 0.187
Glucose control methodsCG vs. IG
Lifestyle modifications: 3 vs. 4Oral medication only: 30 vs. 25Oral + Insulin: 3 vs. 5Insulin only: 4 vs. 6
AH-244

Appendix H. Data Table
Author YearCho 2006
Health Insurance Status Literacy Language(s) Health Beliefs Intervention Name
NR NR NR NR Internet Based Glucose Monitoring System (IBGMS)
AH-245

Appendix H. Data Table
Author YearCho 2006
Intervention Described Intervention Groups Type of Device* Functions*
Intervention*
Internet based system for blood glucose monitoring with additional information such asuse of current medication, blood pressure and weight with appropriate recommendationsprovided by the study team
IG: Pts logged on to biodang.com and uploaded glucose levels on a blood glucose board on the online chart. Additional information on the use of current medication, blood pressure and weight were uploaded. Pts also recorded changes in lifestyle and any questions or detailed information that the pt wished to discuss. The clinical instructors in the team monitored the system and sent appropriate recommendations to each pt every 2 weeks. Every 3 mos, pts had a face to face interview with their physician and provided a blood sample for follow up lab testing.
CG: Pts used a conventional note keeping record system. They were given the clinic's usual recommendations about medications, dosage and lifestyle modification from
Computer Uploading glucose levels, e mail communications.
AH-246

Appendix H. Data Table
Author YearCho 2006
Staff Training Subject Training co-interventions PhysiologicNR Pts were taught how to use
the systemNR Mean (SD): CG vs. IG
FBG (mmol/l) ; Baseline: 7.67 (+2.8) vs. 8.07 (+3.36), p= 0.52615 months: 7.99 (+1.85) vs. 8.96 (+2.61)30 months: 7.87 (+1.83) vs. 8.51 (+2.68)
A1C (%)Baseline: 7.5 (+1.3 ) vs. 7.7 (+1.5), p= 0.45715 months: 7.4 (+1.3) vs. 6.9 (+1.1)30 months: 7.4 (+1.3) vs. 6.7 (+0.9)
Total Cholesterol (mmol/l)Baseline: 4.8 (+0.9) vs. 4.64 (+0.8), p=0.40315 months: 4.27 (+0.83) vs. 4.49 (+0.72)30 months: 4.49 (+0.76) vs. 4.5 (+0.67)
Triglyceride (mmol/l)Baseline: 1.68 (+1.22) vs. 1.24 (+0.8), p= 0.06215 months:1.5 (+0.95) vs. 1.66 (+1.29)30 months: 1.28 (+0.75) vs. 1.16 (+0.73)
AH-247

Appendix H. Data Table
Author YearCho 2006
Health Service Utilization Health Care Costs KnowledgeNR NR NR
AH-248

Appendix H. Data Table
Author YearCho 2006
Use of Technology Usability HIT SatisfactionNR NR NR
AH-249

Appendix H. Data Table
Author YearCho 2006
Health Satisfaction Self-efficacy Health Behavior
Outcomes
NR NR NR
AH-250

Appendix H. Data Table
Author YearCho 2006
Quality of Life Support WithdrawalsNR NR NR
AH-251

Appendix H. Data Table
Author YearCho 2006
Adverse Effects OtherNR Graphs of the long term results given
There is a table of staff recommendations and patient reports given, not listed here
AH-252

Appendix H. Data Table
Author YearPatient Recruitment
Setting Clinical Practice SettingPatient Technology
Setting Study design NChristensen 2004 NR NR Homes RCT N= 525
Bluepages (Grp 1): 166Moodgym (Grp 2): 182Control (Grp 3): 178
AH-253

Appendix H. Data Table
Author YearChristensen 2004
Years of Study
Length of follow-up (months) Inclusion Criteria Exclusion Criteria Elderly
August 2002- May 2003
6 weeks *Access to internet*Scores of 22 or above on the Kesler psychological distress scale*Not receiving clinical care from either a psychologist or a psychiatrist
NR NR
AH-254

Appendix H. Data Table
Author YearChristensen 2004
Underserved Chronic IllnessDisability/
Impairment Gender (% Male) Age (years)NR DEPRESSION NR Bluepages: 31%
MoodGym: 25%Control: 30%
Bluepages: 37.25 (+9.4)MoodGym: 35.85 (+9.5)Control: 36.29 (+9.3)
AH-255

Appendix H. Data Table
Author YearChristensen 2004
Ethnicity Income (US$) EducationUrban / Rural /
Frontier Other
Patient Characteristics*
NR NR Years (SD) spent in educationBluepages: 15.0 (+2.4)MoodGym: 14.6 (+2.4)Control: 14.4 (+2.3)
NR Marital status (%); Bluepage vs. Moodgym vs. ControlMarried/cohabiting:61 vs. 54 vs. 56Divorced/separated:15 vs. 14 vs. 14Never married:30 vs. 31 vs. 36
Mean score (SD) on Kessler psychological distress scaleBluepage vs. Moodgym vs. Control17.5 (+4.9) vs. 17.9 (+5.0) vs. 18.0 (+5.7)
Info on intervention preference, mean score on center for epidemiological studies depression scale given, not listed here
AH-256

Appendix H. Data Table
Author YearChristensen 2004
Health Insurance Status Literacy Language(s) Health Beliefs Intervention Name
NR NR NR Blue page and MoodGym
Blue page and MoodGym
AH-257

Appendix H. Data Table
Author YearChristensen 2004
Intervention Described Intervention Groups Type of Device* Functions*
Intervention*
Blue page: information about depression with evidence based information at 8th grade reading level from the site http://bluepages.anu.edu.au
MoodGym: offered cognitive behavioral therapy for the prevention of depression from site http://moodgym.anu.edu.au
Bluepage (Grp 1): website available freely in world wide web, pts given a login identification number and directed each week to one of the five sections of the website with an overview at 6 weeks, post intervention questionnaire at 6 weeks.
MoodGym (Grp 2): pts given a login identification number and undertook online assessments, MoodGym consisted of five interactive modules which were made available sequentially weekly; pts revised all aspects of the program in the sixth week, post intervention questionnaire at 6 weeks.
Control Grp (Grp 3): Pts phoned weekly by interviewers to discuss lifestyle and environmental factors influencing depression.(Topics included education and hobbies, social, financial and family roles, work
Computer Education, cognitive behavioral therapy (online assessments)
AH-258

Appendix H. Data Table
Author YearChristensen 2004
Staff Training Subject Training co-interventions PhysiologicInterviewers received instruction booklets providing timetables for tracking phone calls and verbatim instructions.
Pts sent detailed guidelines outlining navigation and weekly assignments for MoodGym or Bluepages
NR NR
AH-259

Appendix H. Data Table
Author YearChristensen 2004
Health Service Utilization Health Care Costs KnowledgeNR NR Intention to treat (n=525)
Medical LiteracyBluepages vs. MoodGym vs. Control: -0.6 (+0.7) vs. -0.1 (+0.5) vs. -0.1 (+0.5)Difference (95% CI)Bluepages vs. MoodGym:-0.5 (-0.7 to -0.4) (S)MoodGym vs. Control:0.0 (-0.1 to 0.2)Bluepages vs. Control:-0.5 (-0.6 to -0.3) (S)
Psychological LiteracyBluepages vs. MoodGym vs. Control:-0.7 (+1.1) vs. -0.5 (+1.0) vs. - 0.0 (+0.9)Difference (95% CI)Bluepages vs. MoodGym:-0.3 (-0.5 to 0.0) (S)MoodGym vs. Control:-0.4 (-0.7 to -0.2) (S)Bluepages vs. Control:-0.7 (-1.0 to -0.4) (S)
Lifestyle LiteracyBluepages vs. MoodGym vs. Control:-0.6 (+0.9) vs. -0.0 (+0.5) vs. 0.1 (+0.8)Difference (95% CI)Bluepages vs. MoodGym:
AH-260

Appendix H. Data Table
Author YearChristensen 2004
Use of Technology Usability HIT SatisfactionBluepage: Site visited an avg of 4.49 (SD= 1.35, n=113) with an average of 67.2 (23.9) hitsMoodGYM: pts completed half of 29 exercises (14.8, 9.7)
NR The author states that both the sites were acceptable to pts, with dropout rates of 25% and 15% (these rates are remarkably low in comparison with other interventions)
AH-261

Appendix H. Data Table
Author YearChristensen 2004
Health Satisfaction Self-efficacy Health Behavior
Outcomes
Intention to treat (n=525)
Center for epidemiological studies depression scale, Mean (SD)Bluepages vs. MoodGym vs. Control:3.9 (+9.1) vs. 4.2 (+9.1) vs. 1.0 (+8.4)Difference (95% CI)Bluepages vs. MoodGym:-0.3 ( -2.6 to 2.0)MoodGym vs. Control:3.2 (0.9 to 5.4) (significant at 0.05 level-S)Bluepages vs. Control:2.9 (0.6 to 5.2) (S)
Automatic thoughts questionnaireBluepages vs. MoodGym vs. Control= 6.4 (+18.1) vs. 9.3 (+16.9) vs. 3.1 (+15.8)Difference (95% CI)Bluepages vs. MoodGym:2.8 ( -7.2 to 1.5) MoodGym vs. Control:6.1 (1.9 to 10.4 ) (S)Bluepages vs. Control:3.3 (- 1.1 to 7.7)
Completers (n=414)
Center for epidemiological studies depression scale, Mean (SD)Bluepages vs. MoodGym vs. Control:
NR NR
AH-262

Appendix H. Data Table
Author YearChristensen 2004
Quality of Life Support WithdrawalsNR NR MoodGYM: 25%
Bluepage: 15%
BluepagesAssigned= 165Total dropouts= 25(Too busy=5, not contactable=2, trouble with internet= 1, ill=1, didn't like=1, incorrectly included=1, no reason given=4)
MoodGymAssigned= 182Total dropout= 46(No reason given=12, not contactable=10, too busy=7, family reasons=3, didn't like it=6, trouble with internet=5, other=3)
ControlAssigned= 178Total dropout=19(no reason given=14, lost interest=1, family problem=1, too busy=1, not contactable= 1, ill=1)
AH-263

Appendix H. Data Table
Author YearChristensen 2004
Adverse Effects OtherNR NS
AH-264

Appendix H. Data Table
Author YearPatient Recruitment
Setting Clinical Practice SettingPatient Technology
Setting Study design NCross 2007 University of Maryland IBD
program and gastroenterology clinic at VA in Baltimore
Maryland Homes Cohort N=25
AH-265

Appendix H. Data Table
Author YearCross 2007
Years of Study
Length of follow-up (months) Inclusion Criteria Exclusion Criteria Elderly
2004-2005 6 months *Diagnosable IBD*Comprehend simple instructions in English*Have telephone at home*Ages > 18 years
Posessing other types of colitis (infectious, ischemic, microscopic), no telephone at home, uncontrolled medical or psychiatric disease,had had surgical ostomy, had undergone IBD surgery in the past 6 months, had had a previous colectomy and ileoanal anastomosis, were pregnant, or were less than 18 years of age
NR
AH-266

Appendix H. Data Table
Author YearCross 2007
Underserved Chronic IllnessDisability/
Impairment Gender (% Male) Age (years)NR IBD NR 52% 43.1 + 15.3
AH-267

Appendix H. Data Table
Author YearCross 2007
Ethnicity Income (US$) EducationUrban / Rural /
Frontier Other
Patient Characteristics*
Caucasian: 76%Hispanic: 8%African American: 16%
NR Years (SD) spent in educationBluepages: 15.0 (+2.4)MoodGym: 14.6 (+2.4)Control: 14.4 (+2.3)
NR Type of IBDUlcerative Colitis: 60%Crohn's Disease: 32%Indeterminate Colitis: 8%
Disease severity in previous monthsNone: 16%Mild: 24%Moderate: 44%Severe: 16%
EmploymentFull-time: 56%Part-time: 16%Student: 8%None: 20%
Medical TherapyAminosalicylates: 40%Antibiotis: 20%Steroids: 52%Immunomodulators: 32%Infliximab: 20%Cyclosporine: 4%
Internet UseOnce a day: 76%Once a week: 8%Once a month or less:
AH-268

Appendix H. Data Table
Author YearCross 2007
Health Insurance Status Literacy Language(s) Health Beliefs Intervention Name
NR NR English NR Home Telemanagement System (HAT)
AH-269

Appendix H. Data Table
Author YearCross 2007
Intervention Described Intervention Groups Type of Device* Functions*
Intervention*
Laptop connected to an electronic scale: desgined for pt self-test and symptom diary recording along with medication side effect recording and automated feedback (tailored to the symptoms/side effects of each pt)
All pts received their normal IBD care along with HAT
Laptop and a Scale Education, data input, data collection, tailored feedback
AH-270

Appendix H. Data Table
Author YearCross 2007
Staff Training Subject Training co-interventions PhysiologicNR 30-40 minute instruction
session at homeRegular IBD care NR
AH-271

Appendix H. Data Table
Author YearCross 2007
Health Service Utilization Health Care Costs KnowledgeNR NR Pre-Intervention
Very limited: 32%Good: 64%Excellent: 4%
CCKNOW Scores Baseline vs. 6 months12 + 4.4 vs. 9.2 + 5.3
AH-272

Appendix H. Data Table
Author YearCross 2007
Use of Technology Usability HIT SatisfactionAdherence: overall weekly adherence with self-tests was 91% +11 with only 3 pts (12%) completing less than 80% the self-tests during the 6 month period
91% thought the self-testing was not compolicated and that it took very little time86% said that the testing did not interefere with their normal activities64% said they could do the self-testing more than once a week
81% said that the initial training session was sufficient to use HAT9% thought that it was too limiting to use HAT
91% of pts would consider using HAT in the future
90% of pts were happy with help they received from HAT at 6 mos vs. 70% initially
AH-273

Appendix H. Data Table
Author YearCross 2007
Health Satisfaction Self-efficacy Health Behavior
Outcomes
Baseline vs. 6 monthsHBI3.8 + 4.3 vs 2.2 +3.6p = 0.09
Sedimentation Rate25.7 + 34.4 vs. 16.1 + 17.9p = 0.06
C-reactive Protein11.3 + 25.9 vs. 3 + 4p = 0.13
86% of pts reported receiving excellent care at 6 mos, vs. 65% at baseline
57% of pts had their needs met at baseline, 71% after implementaiton of HAT
NR NR
AH-274

Appendix H. Data Table
Author YearCross 2007
Quality of Life Support WithdrawalsSIBDQ Questionnaire Scores Baseline vs. 6 months49.2 + 15.1 vs. 55.6 + 14.5p = 0.06
NR N=345 did not comply with installation of HAT in home2 pts did not have telphone at home1 pt withdrew after 1st month1 pt had extended hospital stay
AH-275

Appendix H. Data Table
Author YearCross 2007
Adverse Effects OtherNR NS
AH-276

Appendix H. Data Table
Author YearPatient Recruitment
Setting Clinical Practice SettingPatient Technology
Setting Study design NCruz-Correia 2007 Outpatient clinic Immunoallergy clinic Homes Randomized cross-over
studyN = 21Internet first: 7Paper first: 12
AH-277

Appendix H. Data Table
Author YearCruz-Correia 2007
Years of Study
Length of follow-up (months) Inclusion Criteria Exclusion Criteria Elderly
NR 2 mos *Age 16 to 65*Diagnosis of asthma for 6+ months*Use inhaled budesonide/formoterol*Pre-bronchodilator FEV1 >50% predicted
Severe psychiatric, neurological, oncologic or immunologic disease.Unable to access Internet during study period.
NR
AH-278

Appendix H. Data Table
Author YearCruz-Correia 2007
Underserved Chronic IllnessDisability/
Impairment Gender (% Male) Age (years)NR ASTHMA NR N = 29% Mean: 29
AH-279

Appendix H. Data Table
Author YearCruz-Correia 2007
Ethnicity Income (US$) EducationUrban / Rural /
Frontier Other
Patient Characteristics*
NR NR NR NR NR
AH-280

Appendix H. Data Table
Author YearCruz-Correia 2007
Health Insurance Status Literacy Language(s) Health Beliefs Intervention Name
NR NR NR NR P'ASMA
AH-281

Appendix H. Data Table
Author YearCruz-Correia 2007
Intervention Described Intervention Groups Type of Device* Functions*
Intervention*
Web-based monitoring and decision support tool, tailored action plan, for patients and physician, vs. paper-based monitoring
Paper ® Internet (4 wks each)Internet ® Paper (4 wks each)
Peak flow and symptom diary
NR
AH-282

Appendix H. Data Table
Author YearCruz-Correia 2007
Staff Training Subject Training co-interventions PhysiologicNR Subjects given instruction
on instruments and peak-flow monitoring during each 4-week phase of the study
NR NR
AH-283

Appendix H. Data Table
Author YearCruz-Correia 2007
Health Service Utilization Health Care Costs KnowledgeNR NR NR
AH-284

Appendix H. Data Table
Author YearCruz-Correia 2007
Use of Technology Usability HIT SatisfactionMedian time to complete diaries was 3 minutes for paper and Internet (p=.675)
Median time to complete peak flow monitoring was 2 minutes (same for both)
Paper vs. Internet vs. Piko-1 (peak flow):
Easy to record data: 93% vs. 93% vs. 93%
Easy to view data: 81% vs. 93% vs. 67%
Like to use it: 80% vs. 93% vs. 100%
Takes too long to use: 31% vs. 33% vs. 37%
NR
AH-285

Appendix H. Data Table
Author YearCruz-Correia 2007
Health Satisfaction Self-efficacy Health Behavior
Outcomes
NR NR Mean % adherence to self-monitoringPiko-1 during paper: 45%Piko-1 during Internet: 46%Paper diary: 92%Internet diary: 41%
AH-286

Appendix H. Data Table
Author YearCruz-Correia 2007
Quality of Life Support WithdrawalsNR NR NR
AH-287

Appendix H. Data Table
Author YearCruz-Correia 2007
Adverse Effects OtherNR Paper vs. Internet vs. Piko1 (peak
flow):Easy to forget: 44% vs. 47% vs. 40%It may be useful: 87% vs. 100% vs. 93%It may help improve asthma control a lot: 50% vs. 73% vs. 50%It may help improve treatment adherence a lot: 53% vs. 64% vs. 58%
AH-288

Appendix H. Data Table
Author YearPatient Recruitment
Setting Clinical Practice SettingPatient Technology
Setting Study design NDelgado 2003 NR (author says that
patients attending the university heart failure clinic but does not give any otherdetails)
Heart failure clinic at Toronto General hospital
Homes Cohort N=16
AH-289

Appendix H. Data Table
Author YearDelgado 2003
Years of Study
Length of follow-up (months) Inclusion Criteria Exclusion Criteria Elderly
NR 3 months *Confirmed diagnosis of heart failure*Internet access at home or workplace*Pts who did not have access to the internet but who had a caregiver who could access the internet were also invited to participate
Expected survival rate of less than 6 months based on the patient's clinical status and prognostic functional tests (e.g. cardiopulmonary tests ordered by the cardiologist)
NR
AH-290

Appendix H. Data Table
Author YearDelgado 2003
Underserved Chronic IllnessDisability/
Impairment Gender (% Male) Age (years)Unclear HEART FAILURE NR N = 10 pts (62.5%) Mean (SD): 53.3
(+12.5)Range: 32-83
AH-291

Appendix H. Data Table
Author YearDelgado 2003
Ethnicity Income (US$) EducationUrban / Rural /
Frontier Other
Patient Characteristics*
NR NR NR Unclear/NR Ishaemic disease: 5 ptsIdiopathic dilated cardiomyopathy: 9 ptsOther causes: 2 pts
NYHA classificationClass 2: 7 ptsClass 3: 9 pts
Medication profileACEI: 14 pts (87.5%)Beta blockers: 13 pts (81.2%)Spironolactone: 10 pts (62.5%)Digoxin: 13 pts (81.2%)Furosemide: 14 pts (87.5%)ARB: 3 pts (18.7%)Hydralazine/nitrates: 1 pt (0.6%)
AH-292

Appendix H. Data Table
Author YearDelgado 2003
Health Insurance Status Literacy Language(s) Health Beliefs Intervention Name
NR NR NR NR www.heartfunction.com
AH-293

Appendix H. Data Table
Author YearDelgado 2003
Intervention Described Intervention Groups Type of Device* Functions*
Intervention*
Internet communication website was designed to be an informative resource for the patient and a daily communication method between patients and heart failure clinic at Toronto general hospital.
16 patients recruited in the cohort study. The website allowed for quick trending of weights, checkingof medication, tracking goals of therapy and easy communication of non urgent cases. Pt were asked not to use the system for urgent communications.
The website provided updated information of the most relevant clinical trials in heart failure, updates made every 3 months to the homepage, facilitated links to sites like AHA, WHO.
Pts instructed to enter their first morning weight, heart rate and blood pressure and any specific comments or questions, reply sent through the system by research nurse, responses included increasing or decreasing the dose of diuretic, obtain blood work, info about test results, etc.
Computer Daily logs of weight, communication with research nurse, education, links to other sites
AH-294

Appendix H. Data Table
Author YearDelgado 2003
Staff Training Subject Training co-interventions PhysiologicNR NR NR NR
AH-295

Appendix H. Data Table
Author YearDelgado 2003
Health Service Utilization Health Care Costs KnowledgeNR NR NR
AH-296

Appendix H. Data Table
Author YearDelgado 2003
Use of Technology Usability HIT SatisfactionFor pts who completed the study questionnaire within 3 months, the average of logins was 73
Drop off in frequency of site hits by a small group of patients over time, but majority continued usageover long periods (over 1 year)
NR Questionnaire on patient satisfaction, Mean score resultsThe links at the site were useful: 4.37I was able to enter information easily: 5.0I would reliably receive a response from the clinic: 4.56I found the clinic website useful: 4.62Communication using the website improved my quality of care: 4.12
AH-297

Appendix H. Data Table
Author YearDelgado 2003
Health Satisfaction Self-efficacy Health Behavior
Outcomes
NR NR NR
AH-298

Appendix H. Data Table
Author YearDelgado 2003
Quality of Life Support WithdrawalsMean MLHFQ scoreBaseline: 59.75 (+1.5)3 months: 49.87 (+1.3)
3 month scores vs. baseline scoresRelationship with friends and family 3.062 vs. 2.06,p =0.03
Working around the house and yard3.68 vs. 2.81, p=0.008
Side effects of medication2.81 vs. 1.93, p=0.048
NR NR
AH-299

Appendix H. Data Table
Author YearDelgado 2003
Adverse Effects OtherNR Qualitative responses for patient
satisfaction given, not listed here
AH-300

Appendix H. Data Table
Author YearPatient Recruitment
Setting Clinical Practice SettingPatient Technology
Setting Study design NDurso 2003 NR Physician clinic (The
author's practice)Homes Cohort N=10
AH-301

Appendix H. Data Table
Author YearDurso 2003
Years of Study
Length of follow-up (months) Inclusion Criteria Exclusion Criteria Elderly
NR 3 months Not Specified*Type2 diabetes pts *Over 60 yrs of age *Independent in self-care*Able to use the phone
NR NR
AH-302

Appendix H. Data Table
Author YearDurso 2003
Underserved Chronic IllnessDisability/
Impairment Gender (% Male) Age (years)Unclear TYPE 2 DIABETES NR N = 3 (42.86%) Mean (SD): 78.43
(+9.91)
AH-303

Appendix H. Data Table
Author YearDurso 2003
Ethnicity Income (US$) EducationUrban / Rural /
Frontier Other
Patient Characteristics*
NR NR 6 pts had some college or higher level of education
Unclear Living alone in continuing care retirement community: 2 ptsLiving with son: 1 ptLiving with spouses: 4 pts
MedicationTaking 9 or more medicines/day: 4 ptsManaged with insulin: 3 ptsTreated with oral diabetics- others
Cellular telephone used by 1 pt before studyFor the studyCellular telephone used by 3 ptsHome phones used by 2 ptsUsed both - 2 pts
AH-304

Appendix H. Data Table
Author YearDurso 2003
Health Insurance Status Literacy Language(s) Health Beliefs Intervention Name
NR NR NR NR personal diabetes management system (PDMS)
AH-305

Appendix H. Data Table
Author YearDurso 2003
Intervention Described Intervention Groups Type of Device* Functions*
Intervention*
Web based interface into the automated telephone call system used to look into older patient's ability to use the PDMS and its impact on diabetes health behaviors and patient and provider communications
10 patients recruited. At times predetermined by patients and provider, the PDMS prompts patients with interactive recorded human voice messages, these include performing self care activities (e.g. check feet, check blood glucose, take medication),calling the provider for medical advice, providing health education, recording personal health data.Messages customized to meet individual needs. Pts record data by entering values on the key pad.data then transmitted to the secure web site and reviewed by health care provider at his/her discretion.
Telephone Data logs, customized reminders, performing self care activities, providing healtheducation
AH-306

Appendix H. Data Table
Author YearDurso 2003
Staff Training Subject Training co-interventions PhysiologicNR Each pts was provided with
individualized diabetes education. Pts also givenAmerican Diabetes Association (ADA) book Diabetes A to Z. The nurse practitionertaught each pt how to use the cellular phone to receive messages and record glucosevalues and weight.The PDMS prompted pts to call nurse practitioner when pt experienced diabetic symptoms, medication side effects or any problems with the care plan.
NR Glycosylated hemoglobin (%)subject - Before vs. after1001 - 8.6 vs. 7.31002- 7.4 vs. 7.01004- 6.7 vs. 6.81005- 6.0 vs. 6.11007- 8.6 vs. 7.61008- 7.8 vs. 8.01011- 8.3 vs. 5.9
BMIsubject - Before vs. After1001- 30 vs. 321002- 24 vs. 231004- 33 vs. 331005- 29 vs. 281007- 29 vs. 271008- 28 vs. 291011- 35 vs. 33
AH-307

Appendix H. Data Table
Author YearDurso 2003
Health Service Utilization Health Care Costs KnowledgeNR NR Diabetes Knowledge test scores (%)
Subject- Before vs. After1001: 86 vs. 861002: 79 vs. 1001004: 57 vs. 861005: 71 vs. 711007: 79 vs. 1001008: 79 vs. 711011: 64 vs. 57
AH-308

Appendix H. Data Table
Author YearDurso 2003
Use of Technology Usability HIT SatisfactionNR PDMS study usability questions (1-5
scale, 5 is the best), Mean (SD)
Convenience of cellular phones: 3.71 (+1.7)Convenience of home phones: 4.17 (+1.60)Quality of voice on phone: 4.71 (+0.76)Your ability to understand message: 4.71 (+0.76)Ease of cell phone use: 2.57 (+1.40)Ease of home phone use: 4.33 (+1.63)Ease of recording glucose, weight, and exercise: 3.86 (+1.46)Value in management of diabetes: 4.28 (+0.95)Aid to communication with health provider: 4.28 (+1.50)
NR
AH-309

Appendix H. Data Table
Author YearDurso 2003
Health Satisfaction Self-efficacy Health Behavior
Outcomes
NR NR Frequency: % (n) (Before) vs. % (n) (After)
ActivityNever: 42.9% (3) vs. 01-2 X week: 14.3%(1) vs. 14.3% (1)3-4 X week: 14.3% (1) vs. 28.6% (2)5-6 X week: 28.6% (2) vs. 14.3% (1)Everyday: 0 vs. 42.9% (3)
Monitor glucoseNever: 28.6% (2) vs. 14.3% (1)4-6 X week: 14.3% (1) vs. 14.3% (1)Once/day: 28.6% (2) vs. 28.6% (2)More than once/day: 28.6%(2) vs. 42.9% (3)
Miss medicationNever: 85% (6) vs. 85% (6)1-2 X month: 0 vs. 14.3 % (1)1-3 X week: 14.3% (1) vs. 0
Check feetDaily: 100 % (7) vs. 100% (7)
Symptoms of hypoglycemiaNever: 42.9% (3) vs. 14.3% (1)1-2 X month: 57.1 % (4) vs. 71.4 % (5)1-3 X week: 0 vs. 14.3 % (1)
Symptoms of hyperglycemia
AH-310

Appendix H. Data Table
Author YearDurso 2003
Quality of Life Support WithdrawalsNR NR 3 did not complete the study due to
acute illness and hospitalization
AH-311

Appendix H. Data Table
Author YearDurso 2003
Adverse Effects OtherNR Qualitative response in the form of
summary of participants comments given, not listed here
AH-312

Appendix H. Data Table
Author YearPatient Recruitment
Setting Clinical Practice SettingPatient Technology
Setting Study design NEarnest 2004 Waiting room of clinic CHF clinic at U of Colorado
Hospital at Denver Homes RCT N = 107
Grp 1: 54Grp 2: 53
AH-313

Appendix H. Data Table
Author YearEarnest 2004
Years of Study
Length of follow-up (months) Inclusion Criteria Exclusion Criteria Elderly
January- December 2002
12 mos *Followed up in the clinic, *Spoke English*18+ yrs old*Have used a web browser (not necessary to have home internet)
NR NR
AH-314

Appendix H. Data Table
Author YearEarnest 2004
Underserved Chronic IllnessDisability/
Impairment Gender (% Male) Age (years)YES: 10% Minority CHF NR 77% (CI 68-84) Mean: 54
Range: 54-58
AH-315

Appendix H. Data Table
Author YearEarnest 2004
Ethnicity Income (US$) EducationUrban / Rural /
Frontier Other
Patient Characteristics*
Caucasian: 90% >$45k/yr: 53% (CI 42-63)
49% college graduates (CI 39-59)
NR 100% previous experience using internet, 95% had access to a home computer
AH-316
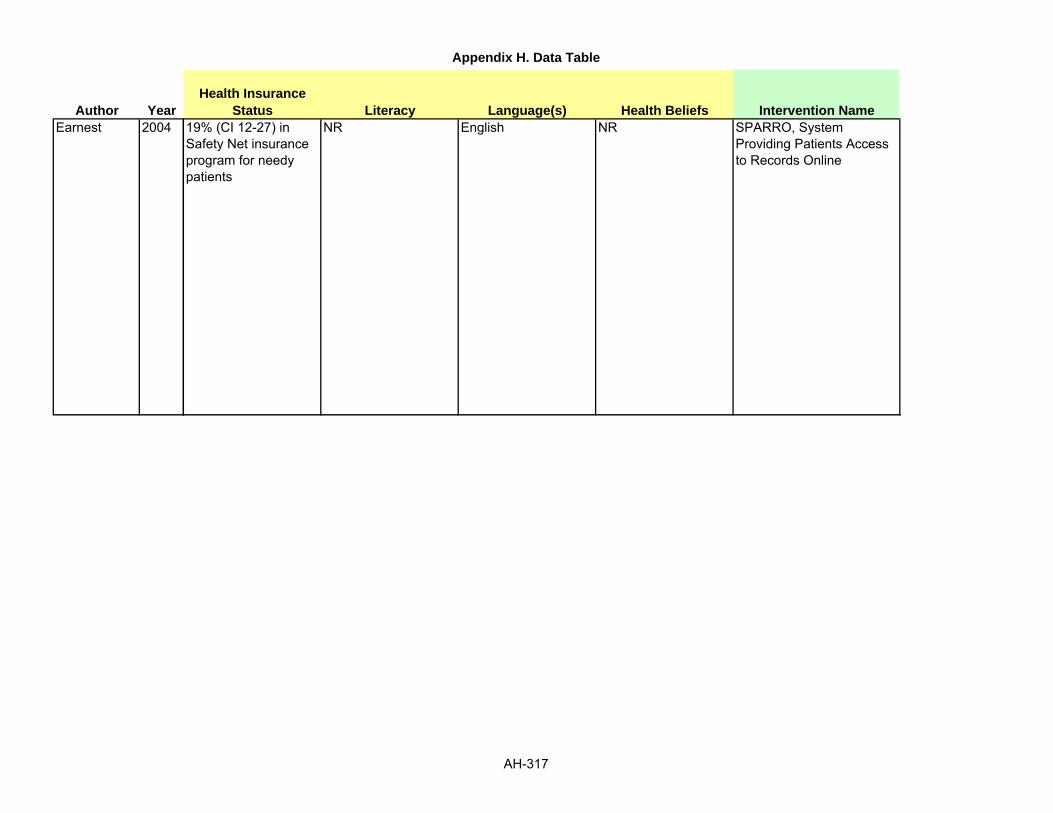
Appendix H. Data Table
Author YearEarnest 2004
Health Insurance Status Literacy Language(s) Health Beliefs Intervention Name
19% (CI 12-27) in Safety Net insurance program for needy patients
NR English NR SPARRO, System Providing Patients Access to Records Online
AH-317

Appendix H. Data Table
Author YearEarnest 2004
Intervention Described Intervention Groups Type of Device* Functions*
Intervention*
Secure web access to medical records, guide to heart failure and a messaging system
Group 1: InterventionGroup 2: Control
Secure website Offer patients access to records, lab tests and educational materials
AH-318

Appendix H. Data Table
Author YearEarnest 2004
Staff Training Subject Training co-interventions PhysiologicNR Written user guide NR Exercise
EnduranceGrp 1 vs. Grp 2: 0.74Pooled: 0.25
StrengtheningGrp 1 vs. Grp 2: 0.40Pooled: 0.95
MOS SF-36PhysicalGrp 1 vs. Grp 2: 0.75Pooled: 1.0
Physical role functioningGrp 1 vs. Grp 2: 0.60Pooled: 0.14
AH-319

Appendix H. Data Table
Author YearEarnest 2004
Health Service Utilization Health Care Costs KnowledgeNR NR NR
AH-320

Appendix H. Data Table
Author YearEarnest 2004
Use of Technology Usability HIT SatisfactionDemographic Factors Associate with use of SPARROAge: p=0.55Gender (%male): p= 0.63Race: p= 0.06Education (%college grad): p= 0.54HH income >$45000: p= 0.25Baseline KCCQ symptom (Mean): p= 0.07Number of clinic visits (Mean): p= 0.10
NR Baseline Expectations of Patients and PhysiciansPatient empowerment: p= 0.01More questions: p= 0.11Worry more: p<0.01reports confusing: p= 0.01Notes offensive: p= 0.03Notes confusing: p= 0.35
AH-321

Appendix H. Data Table
Author YearEarnest 2004
Health Satisfaction Self-efficacy Health Behavior
Outcomes
General Health PerceptionGrp 1 vs. Grp 2: 0.71Pooled: 0.09
NR NR
AH-322

Appendix H. Data Table
Author YearEarnest 2004
Quality of Life Support WithdrawalsNR MOS Social Support
OfflineGrp 1 vs. Grp 2: 0.95Pooled: 0.25
OnlineGrp 1 vs. Grp 2: 0.08Pooled: 0.37
N = 26
AH-323

Appendix H. Data Table
Author YearEarnest 2004
Adverse Effects OtherNR Limitations include a highly educated
patient population, more computer literate and high staff/patient ratio in this clinic
AH-324

Appendix H. Data Table
Author YearPatient Recruitment
Setting Clinical Practice SettingPatient Technology
Setting Study design NEstabrooks 2005 Urban as well as rural NR
Look at Glasgow 2004, Amthauer 2003 has more info on physicianand patient recruiting
Doctor's office Intervention arm of RCT N = 422Grp 1 (Reduce fat): 112Grp 2 (Increase fruits and vegetables): 100Grp 3 (Increase physical activity): 210
AH-325

Appendix H. Data Table
Author YearEstabrooks 2005
Years of Study
Length of follow-up (months) Inclusion Criteria Exclusion Criteria Elderly
NR 6 months *Age equal to or above 25 yrs *Language: English *Presence of Type 2 Diabetes.
Pts who chose smoking cessation as target behavior were excluded
NR
AH-326

Appendix H. Data Table
Author YearEstabrooks 2005
Underserved Chronic IllnessDisability/
Impairment Gender (% Male) Age (years)YES TYPE 2 DIABETES NR Reduce fat: 52.7%
Increase fruit and veggies: 49%Increase physical activity: 45%
Mean (SD)Reduce fat: 62 (+13.37)Increase fruits and vegetables: 60 (+11.86)Increase physical activity: 63 (+12.80)
AH-327

Appendix H. Data Table
Author YearEstabrooks 2005
Ethnicity Income (US$) EducationUrban / Rural /
Frontier Other
Patient Characteristics*
Grp 1 (Reduce fat)Caucasian: 86.5%Hispanic: 10.8%Other: 2.7%
Grp 2 (Increase fruits and veggies)Caucasian: 81%Hispanic: 10.9%Other: 8%
Grp 3 (Increase physical activity)Caucasia: 83.8%Hispanic: 11%Other: 5.2%
IncomeGrp 1 (Reduce fat)< $ 10,000: 10.2%$10,000-29,999: 25.9%$30,000-49,999: 33.3%>$ 50,000: 30.6%
Grp 2 (Increase fruits and veggies)< $ 10,000: 13.5%$10,000-29,999: 30.2%$ 30,000-49,999: 22.9%>$ 50,000: 33.3%
Grp 3 (Increase physical activity)< $ 10,000: 11.2%$10,000-29,999: 24.9%$ 30,000-49,999: 27.4%>$50,000: 36.5%
Grp 1 (Reduce fat)<HS: 12.5%High school graduate: 22.3%College 1-3 yrs: 29.5%College/grad school: 35.7%
Grp 2 (Increase fruits and veggies)<HS: 14%High school graduate: 30%College1-3 yrs: 34%College/grad school: 22%
Grp 3 (Increase physical activity)<HS: 11%High school grad: 27.1%College1-3 yrs: 33.8%College/grad school: 28.1%
Urban as well as rural Married %Grp 1: 70.5Grp 2: 68Grp 3: 68.1
Median number of co-morbid diseasesGrp 1: 2Grp 2: 2Grp 3: 2
DietFat consumption: Mean (SD), p= 0.28Grp 1: 22.27 (+7.78)Grp 2: 19.18 (+8.98)Grp 3: 20.49 (+8.48),
Fruit and vegetable consumption: Mean (SD), p < 0.0001Grp 1: 13.5 (+4.94)Grp 2: 10.65 (+3.59)Grp 3: 12.40 (+4.61)
Physical activityDays of vigorous activity, p< 0.0001Grp 1: 0.42Grp 2: 0.34Grp 3: 0.29
AH-328

Appendix H. Data Table
Author YearEstabrooks 2005
Health Insurance Status Literacy Language(s) Health Beliefs Intervention Name
NR NR NR NR Diabetes priority program
AH-329

Appendix H. Data Table
Author YearEstabrooks 2005
Intervention Described Intervention Groups Type of Device* Functions*
Intervention*
Clinic based, interactive, self management CD-ROM that allowed pts to select a behavioral goal and receive mail and telephone supportfor the initial 6 months followed by additional behavioral assessments.
Goal setting component targeted development of tailored action plan based on the pts needs;Pts completed brief assessment of diet and physical activity; Pts selected a behavioral change goal in the area of diet or exercise; interactive session facilitated pts in selecting specific activities to support the goal, identifying barriers and choosing strategies to overcome these barriers; program generated hard copy, minimal coaching involved, Pt then completed brief counseling session with care manager of that practice to provide goal related feedback
Computer (CD-ROM) Goal setting, Tailored action plan, assessments of dietary intake and physical activity, hard copy of pts personal action plan
AH-330

Appendix H. Data Table
Author YearEstabrooks 2005
Staff Training Subject Training co-interventions PhysiologicNR NR NR Fat consumption, Mean (SD)
Baseline vs. 6 monthsGrp 1: 22.27 (+7.78) vs. 18.42 (+7.99); p < 0.0001Grp 2: 19.18 (+8.99) vs. 16.84 (+8.75), p=0.0029Grp 3: 20.49 (+8.49) vs. 19.09 (+7.80), p= 0.0058Overall comparison= 0.0088
Fruit and veggie consumption, Mean (SD)Baseline vs. 6 monthsGrp 1: 13.5 (+4.94) vs. 14.12 (+5.07) ; p=0.0967Grp 2: 10.65 (+3.59) vs. 12.70 (+4.11) , p<0.0001Grp 3: 12.4 (+4.61) vs. 12.86 (+5.20), p= 0.0587Overall comparison= 0.075
Vigorous activityBaseline vs. 6 monthsGrp 1: 0.42 vs. 0.46 ; p=0.4594Grp 2: 0.34 vs. 0.36 , p= 0.288Grp 3: 0.29 vs. 0.37 , p= 0.0002Overall comparison= 0.1634
Moderate activityBaseline to 6 monthsGrp 1: 0.49 vs. 0.55; p= 0.0917Grp 2: 0.45 vs. 0.48 , p= 0.4515
AH-331

Appendix H. Data Table
Author YearEstabrooks 2005
Health Service Utilization Health Care Costs KnowledgeNR NR NR
AH-332

Appendix H. Data Table
Author YearEstabrooks 2005
Use of Technology Usability HIT SatisfactionNR NR NR
AH-333

Appendix H. Data Table
Author YearEstabrooks 2005
Health Satisfaction Self-efficacy Health Behavior
Outcomes
NR NR NR
AH-334

Appendix H. Data Table
Author YearEstabrooks 2005
Quality of Life Support WithdrawalsNR NR Grp 1 (N)
Baseline vs. 6 months112 vs. 92 (No reasons given)Grp 2 (N)Baseline vs. 6 months100 vs. 90 (No reasons given)Grp 3 (N)Baseline vs. 6 months210 vs. 169 (no reasons given)
AH-335

Appendix H. Data Table
Author YearEstabrooks 2005
Adverse Effects OtherNR No
AH-336

Appendix H. Data Table
Author YearPatient Recruitment
Setting Clinical Practice SettingPatient Technology
Setting Study design NEwald 2006 27 clinical practices 27 clinical practices Homes/Clinic Cohort N=53
Ferrer-Roca 2004b NR Island town Home or Work Cohort N = 172Grp 1 (DM): 12Grp 2 (Website review only): 160
AH-337

Appendix H. Data Table
Author YearEwald 2006
Ferrer-Roca 2004b
Years of Study
Length of follow-up (months) Inclusion Criteria Exclusion Criteria Elderly
3 months None *Age >18 years with essential hypertension requiring antihypertensive therapy
NR NR
September 2002-June 2003
9 mos *Dx of DM*Aged: 18-75 years*Internet access at home or work, or mobile phone with WAP services*Basic knowledge of the IT
NR NR
AH-338

Appendix H. Data Table
Author YearEwald 2006
Ferrer-Roca 2004b
Underserved Chronic IllnessDisability/
Impairment Gender (% Male) Age (years)NR HYPERTENSION NR 55% Mean Age: 57.7
Range: 33-90
YES: rural islanders DM NR NR Mean (Range): 39 (27-68)
AH-339

Appendix H. Data Table
Author YearEwald 2006
Ferrer-Roca 2004b
Ethnicity Income (US$) EducationUrban / Rural /
Frontier Other
Patient Characteristics*
German NR NR NR Mean (Range)BMI: 28.1 (19-41)Duration of HTN (yrs): 6.4 (0-23)
NR NR NR Rural, islanders NR
AH-340

Appendix H. Data Table
Author YearEwald 2006
Ferrer-Roca 2004b
Health Insurance Status Literacy Language(s) Health Beliefs Intervention Name
NR NR German International guidelines for the management of HTN have acknowledged the need to look for alternative methods of BP measurement in order to quantify more precisely the contribution of HTN to CV risk.
TensioPhone 2 telemonitoring BP device
NR NR NR NR Website with patient and doctor interfaces for inputting data and sending advice
AH-341

Appendix H. Data Table
Author YearEwald 2006
Ferrer-Roca 2004b
Intervention Described Intervention Groups Type of Device* Functions*
Intervention*
Device stores BP measurement data. Device is an upper-arm oscillometric device with a built-in modem for data teletransmission via standard telephone lines.
All patients used the device for BPSM
BPSM device To record data, transmit data, and store data
Group 1: those who entered the trial to test the systemGroup 2: those that did not meet study criteria to enter the trial, but reviewed the website only
NR Website Education, data input, advice sending
AH-342

Appendix H. Data Table
Author YearEwald 2006
Ferrer-Roca 2004b
Staff Training Subject Training co-interventions PhysiologicNR Received instruction on
how to operate the BPSM device
HTN medication (lowers BP): olmesartan medoxomil
Office Measurements Systolic (SD)/Diastolic (SD) (mmHG)Baseline (visit 1):162.6 (+18.7)/96.3 (+13.5)Week 12 (visit 2):133.5 (+7.7)/79.8 (+5.8)Systolic diff. v. baseline: 29.1 (+16.9)Diastolic diff. v. baseline: 16.5 (+13.2)BPSMBaseline: 147.8 (+16.1)/85.7 (+11.6)Week 9: 138.6 (+13.2)/79.0 (+10.7)Systolic diff. v. baseline: 9.2 (+16.9)Diastolic diff. v. baseline: 6.7 (+8.9)
NR NR NR NR
AH-343

Appendix H. Data Table
Author YearEwald 2006
Ferrer-Roca 2004b
Health Service Utilization Health Care Costs KnowledgeNR Assuming none since Germany has a
universal health care systemNR
NR NR NR
AH-344

Appendix H. Data Table
Author YearEwald 2006
Ferrer-Roca 2004b
Use of Technology Usability HIT SatisfactionReduction of BP>2 BPSMs/day and 100% compliant: -16.6/-8.0mmHg1 BPSM/day and 75% compliant: -0.2/-3.3.mmHg
NR NR
NR 86% of Grp1 and 40% of Grp 2 would recommend the site (P<0.01)71 % of Grp1 and 92% of Grp 2 thought the system was easy to use (P<0.05)33% of Grp 1 and 12% of Grp 2 did not find the system useful and efficient (P<0.05)50% of Grp 1 and 88% of Grp 2 had difficulties in accessing the system(P<0.01)
Responses were only from Grp1: results are ambiguous, with only 8 subjects completing questions on HIT satisfaction
AH-345

Appendix H. Data Table
Author YearEwald 2006
Ferrer-Roca 2004b
Health Satisfaction Self-efficacy Health Behavior
Outcomes
NR NR NR
NR NR NR
AH-346

Appendix H. Data Table
Author YearEwald 2006
Ferrer-Roca 2004b
Quality of Life Support WithdrawalsNR NR NR
NR NR NR
AH-347

Appendix H. Data Table
Author YearEwald 2006
Ferrer-Roca 2004b
Adverse Effects OtherNR NR
NR NR
AH-348

Appendix H. Data Table
Author YearPatient Recruitment
Setting Clinical Practice SettingPatient Technology
Setting Study design NFerrer-Roca 2004a NR NR Homes Cohort N= 23
Finkelstein 1996 Lung transplant recipients Tertiary care academic center
Home-monitoring Cohort N = 41
AH-349

Appendix H. Data Table
Author YearFerrer-Roca 2004a
Finkelstein 1996
Years of Study
Length of follow-up (months) Inclusion Criteria Exclusion Criteria Elderly
NR 8 months *Pts with diabetes*Access to their own personal mobile phone or access to onebelonging to their relative
NR NR
1993-1994 12 mos *Alive and willing Transplant or training prior to full implementation
NR
AH-350

Appendix H. Data Table
Author YearFerrer-Roca 2004a
Finkelstein 1996
Underserved Chronic IllnessDisability/
Impairment Gender (% Male) Age (years)NR DIABETES NR MR Range 18-75
0-24 yrs: 19 pts25-49 yrs: 1 pt50-75 yrs: 2 pts>75: 1 pt
NR LUNG TRANSPLANT NR N = 41.46% (17/41) Mean (SD): 47.1 (±11.7)Range: 15-66
AH-351

Appendix H. Data Table
Author YearFerrer-Roca 2004a
Finkelstein 1996
Ethnicity Income (US$) EducationUrban / Rural /
Frontier Other
Patient Characteristics*
NR NR NR NR NR
NR NR NR NR NR
AH-352

Appendix H. Data Table
Author YearFerrer-Roca 2004a
Finkelstein 1996
Health Insurance Status Literacy Language(s) Health Beliefs Intervention Name
NR NR NR NR Mobile phone text messaging
NR NR NR NR Electronic spirometer/diary
AH-353

Appendix H. Data Table
Author YearFerrer-Roca 2004a
Finkelstein 1996
Intervention Described Intervention Groups Type of Device* Functions*
Intervention*
Pts used SMS to transmit data (glucose levels and body weight) to a server which automatically answered with an acknowledgement message. A monthly calculatedglycosylated hemoglobin result was also automatically sent to the pt by SMS.
Web based server capable of receiving and displaying patient data. Pts entered their blood glucose or other values such as body weight using their mobile phone.
The server automatically answered via SMS with a pre recorded acknowledgement when a pt entered a blood glucose value, or with specific help or warning messages when data were wrong or out of range for the individual patient.
Each month the system calculated a mean blood glucose value for each pt. Each pt's calculated mean HbA1c value was sent to the pts mobile phone via SMS and stored in the database. Moreover, 4 messages containing advice, automatic reminders or warnings were also sent.
Mobile phone Data input , SMS, acknowledgement message, monthly glycosylated Hb result through SMS, warnings and reminders
Daily home monitoring of symptoms and vital signs in electronic diary, plus automatic recording of spirometer data, with weekly transmission to clinic
All patients received home monitoring diary instrument, plus initial training, weekly phone calls, quarterly newsletter, a hotline, plus usual care
Home spirometer with electronic diary and automatic weekly modem transmission of data
Tracking symptoms and signs
AH-354

Appendix H. Data Table
Author YearFerrer-Roca 2004a
Finkelstein 1996
Staff Training Subject Training co-interventions PhysiologicNR NR NR NR
NR Initial training, weekly phone calls, quarterly newsletter, a hotline,
Weekly phone calls, quarterly newsletter, a hotline
NR
AH-355

Appendix H. Data Table
Author YearFerrer-Roca 2004a
Finkelstein 1996
Health Service Utilization Health Care Costs KnowledgeNR The monthly cost based on pt
sending one text message/day for 5 days/wkThe std cost of text message was US $ 0.18The cost / pt was $ 3.6/month
A total of 25 messages /month including the monthly report, education, warnings and remindersCost to the diabetes manager was $4.5.
These were compared with hypothetical use of premium SMS calls which cost almost $1.2/message.Thus, cost to the pt would be $24 /month, but the diabetes service would make a profit of $ 8.4/month
NR
NR Estimate 4.5-5 minutes per patient per week staff time, over usual care
NR
AH-356

Appendix H. Data Table
Author YearFerrer-Roca 2004a
Finkelstein 1996
Use of Technology Usability HIT SatisfactionAverage of 33 SMS server messages / month from the 23 pts.Reduction in reported activity during aholiday period.
Elderly people had difficulty typing theSMS messages and this was instead done by relatives
People criticized the fact that system did not allow data from previous day to be entered.
Average scores on pt satisfaction surveyQuestion- SMS users (n=6)Are automatic messages of interest?: 4.2Are doctors' messages useful?: 3.8Is your diabetes better controlled with SMS?: 3.0Do you like the SMS diabetes system?: 4.2Is your glycosylated Hb level of interest to you?: 4.2Do you prefer to manage diabetes yourself?: 4.2Do you prefer doctor to manage your diabetes?: 3.7What is your level of satisfaction with the SMS system?: 4.3
8941 transmissions by 41 subjects in 52 weeks; initial 6.2/wk, stable over 3.9/wk; 98% complete symptoms, vital signs, 100% complete spirometry
NR NR
AH-357

Appendix H. Data Table
Author YearFerrer-Roca 2004a
Finkelstein 1996
Health Satisfaction Self-efficacy Health Behavior
Outcomes
NR NR NR
NR NR NR
AH-358

Appendix H. Data Table
Author YearFerrer-Roca 2004a
Finkelstein 1996
Quality of Life Support WithdrawalsNR NR NR
NR NR None (121 screened; 4 refused; 6 unstable; 33 deaths, 37 before intervention ready = 41)
AH-359

Appendix H. Data Table
Author YearFerrer-Roca 2004a
Finkelstein 1996
Adverse Effects OtherNR NS
NR NR
AH-360

Appendix H. Data Table
Author YearPatient Recruitment
Setting Clinical Practice SettingPatient Technology
Setting Study design NFranklin 2006 NR Pediatric Clinics, Tayside Homes RCT N = 92
Grp 1: 28Grp 2: 33Grp 3: 31
AH-361

Appendix H. Data Table
Author YearFranklin 2006
Years of Study
Length of follow-up (months) Inclusion Criteria Exclusion Criteria Elderly
October 2002-February 2003
NR *Type I Diabetes for > 1 year*Tx with insulin therapy (2 or 3 injections per day)
Serious social problems, severe learning disabilities, needle phobia
NR
AH-362

Appendix H. Data Table
Author YearFranklin 2006
Underserved Chronic IllnessDisability/
Impairment Gender (% Male) Age (years)NR TYPE 1 DIABETES NR Grp 1: 63%
Grp 2: 45%Grp 3: 55%
MeanGrp 1: 12.7Grp 2: 14.1Grp 3: 12.6
AH-363

Appendix H. Data Table
Author YearFranklin 2006
Ethnicity Income (US$) EducationUrban / Rural /
Frontier Other
Patient Characteristics*
Not CaucasianGrp 1: 4 ptsGrp 2: 3 ptsGrp 3: 3 pts
NR NR NR NR
AH-364

Appendix H. Data Table
Author YearFranklin 2006
Health Insurance Status Literacy Language(s) Health Beliefs Intervention Name
NR NR NR NR Sweet Talk
AH-365

Appendix H. Data Table
Author YearFranklin 2006
Intervention Described Intervention Groups Type of Device* Functions*
Intervention*
Automated mobile phone text-messaging support system, goal setting
Group 1: Conventional insulin therapy (CIT)Group 2: CIT plus Sweet TalkGroup 3: Basal bolus or pump therapy, Sweet Talk, nutrition counseling
All patients received 3-4 month clinic visits and access to emergency hotline
Phone Text messages, reminders
AH-366

Appendix H. Data Table
Author YearFranklin 2006
Staff Training Subject Training co-interventions PhysiologicGoal setting training for diabetes team by team psychologist; details NR
NR NR HbA1c: Group 1 vs. Group 2: 10.1+1.7, 95% CI -0.7, +0.7, P= 0.99Group 2 vs. Group 3: : 9.2+2.2, 95% CI -1.9, -0.5, P <0.001
Diabetic ketoacidosis (DKA); episodesGroup 1 vs. Group 2: 3 vs. 2, P= 0.58Group 2 vs. Group 3: 2 vs. 7, P=0.10
Severe hypoglycemia; episodesGroup 1 vs. Group 2: 4 vs. 1, P= 0.63Group 2 vs. Group 3: 1 vs. 2, P= 0.37
AH-367

Appendix H. Data Table
Author YearFranklin 2006
Health Service Utilization Health Care Costs KnowledgeNR NR NR
AH-368

Appendix H. Data Table
Author YearFranklin 2006
Use of Technology Usability HIT SatisfactionNR NR NR
AH-369

Appendix H. Data Table
Author YearFranklin 2006
Health Satisfaction Self-efficacy Health Behavior
Outcomes
NR Self-efficacy for diabetes (SED) score:Group 1 vs. Group 256.0+ 13.7 vs. 62.1+6.6, 95% CI +2.6, + 7.5, P=0.003Group 2 vs. Group 362.1+6.6 vs. 63.1+ 7.2, 95% CI -2.1,+4.2, P=0.50
Adherence score (Visual analog scale- self-report)
Group 1 vs. Group 2:70.4 (+20.0) vs. 77.2 (+16.1), 95% CI +0.4, +17.4, P=0.042
Group 2 vs. Group 3: 77.2 (+16.1) vs. 78.8 (+16.2), 95% CI -7.0, +8.0, P=0.90
AH-370

Appendix H. Data Table
Author YearFranklin 2006
Quality of Life Support WithdrawalsNR Diabetes social support interview
(DSSI):Family and friends:Group 1 vs. Group 2: NS, data not providedGroup 2 vs. Group 3: NS, data not provided
NR
AH-371

Appendix H. Data Table
Author YearFranklin 2006
Adverse Effects OtherNR Diabetes social support received
from diabetes teamGroup 1 vs. Group 2: Group 2 vs. Group 3:
AH-372

Appendix H. Data Table
Author YearPatient Recruitment
Setting Clinical Practice SettingPatient Technology
Setting Study design NFrenn 2005 Urban public middle school NA Computer lab Nonrandomized between
groupN= 137IG: 43CG: 60
AH-373

Appendix H. Data Table
Author YearFrenn 2005
Years of Study
Length of follow-up (months) Inclusion Criteria Exclusion Criteria Elderly
NR 1 month NR NR NR
AH-374

Appendix H. Data Table
Author YearFrenn 2005
Underserved Chronic IllnessDisability/
Impairment Gender (% Male) Age (years)YES NR NR IG
DietMore than 3 sessions: 30%Less than 3 sessions of diet: 33.3%
ActivityMore than 2 sessions: 26.3%Less than 2 sessions: 33.3%
CGDiet: 44.9%Activity: 50%
12 yrsIGDietMore than 3 sessions: 45%Less than 3 sessions of diet: 50%
ActivityMore than 2 sessions: 51.2%%Less than 2 sessions: 25%
CGDiet: 51%Activity: 46.7%
13 yrsIGDietMore than 3 sessions: 42.5%Less than 3 sessions of diet: 16.7%
ActivityMore than 2 sessions: 37.2%Less than 2 sessions: 50%
AH-375

Appendix H. Data Table
Author YearFrenn 2005
Ethnicity Income (US$) EducationUrban / Rural /
Frontier Other
Patient Characteristics*
AsianIGDietMore than 3 sessions: 0%Less than 3 sessions of diet: 0%
ActivityMore than 2 sessions: 0%Less than 2 sessions: 0%
CGDiet: 4.1%Activity: 5%
BlackIGDietMore than 3 sessions: 20%Less than 3 sessions of diet: 50%
ActivityMore than 2 sessions: 20.9%Less than 2 sessions: 33.3%
Free lunchIGDietMore than 3 sessions: 75%Less than 3 sessions of diet: 66.7%
ActivityMore than 2 sessions: 72.1%Less than 2 sessions: 75%
CGDiet: 71.4%Activity: 70%
ReducedIGDietMore than 3 sessions: 12.5%Less than 3 sessions of diet: 0%
ActivityMore than 2 sessions: 14%Less than 2 sessions: 8.3%
NR Urban public middle school
NR
AH-376

Appendix H. Data Table
Author YearFrenn 2005
Health Insurance Status Literacy Language(s) Health Beliefs Intervention Name
NR NR NR NR Internet/video exercise and low fat diet intervention
AH-377

Appendix H. Data Table
Author YearFrenn 2005
Intervention Described Intervention Groups Type of Device* Functions*
Intervention*
Eight session health promotion/transtheoretical model internet/video delivered intervention to increase physical activity and reduce dietary fat among low income, culturally diverse, seventh grade students.
IG:Eight session blackboard platform delivered internet approach with 4 two to three min videos. Focus of the intervention on strategies appropriate for all stages of change, particularly for those in precontemplation and contemplation stages. (concepts included consciousness raising, self reevaluation, improve access to healthy foods and physical activity, decisional balance including reduce barriers to healthy foods and physical activity and emphasize benefits for healthy foods and physical activity).Computer generated tailored feedback provided for physical activity and dietary fat; 10 discussion board answers for which individualized e mailed feedback provided; structured workbook provided to record notes.
Computer Education, tailored feedback, emails, discussion board
AH-378

Appendix H. Data Table
Author YearFrenn 2005
Staff Training Subject Training co-interventions PhysiologicNR NR NR Exercise:
IG students who completed more than half the sessions increased moderate/vigorous exercise by an average of 22 mins compared with a decrease of 46 mins for the control groupt (103)= - 1.99, p=0.05Those who completed all 3 sessions (n=39) increased activity by 33 mins.
Dietary fat:IG students participating in more than half of the sessions decreased dietary fat from 30.7 % to 29.9% , t(87)= 2.73, p=0.008CG students had 31.5% dietary fat pretest and 31.6% dietary fat post test.
AH-379

Appendix H. Data Table
Author YearFrenn 2005
Health Service Utilization Health Care Costs KnowledgeNR NR NR
AH-380

Appendix H. Data Table
Author YearFrenn 2005
Use of Technology Usability HIT SatisfactionNR NR NR
AH-381

Appendix H. Data Table
Author YearFrenn 2005
Health Satisfaction Self-efficacy Health Behavior
Outcomes
NR NR NR
AH-382

Appendix H. Data Table
Author YearFrenn 2005
Quality of Life Support WithdrawalsNR NR IG students who did not complete half
the exercises and not included in the analysis=12IG students who participated in less than half the sessions (dietary fat) and removed from analysis = 6
AH-383

Appendix H. Data Table
Author YearFrenn 2005
Adverse Effects OtherNR Change in activity of IG students who
did not complete half the exercises not significantly different from the control students, t (13)= 1.53, p=0.15IG students participating in less than half the sessions on dietary fat were not significantly different than students in the control group, t (16.6)= -1.843, p=0.08
Pre and post test activity and dietary fat for subjects in each stage of change shown in graphic form
Graphs depicting comparative subgroup changes in dietary fat and exercise given but very difficult to obtain precise values
Subgroup analysis Activity; For IG students participating in more than half the activity sessions, moderate and vigorous activity were increased for all racial groupFor CG students, activity decreased in each racial grp
Dietary fat; For IG students participating in more than half the sessions, decreased for all racial groups
AH-384
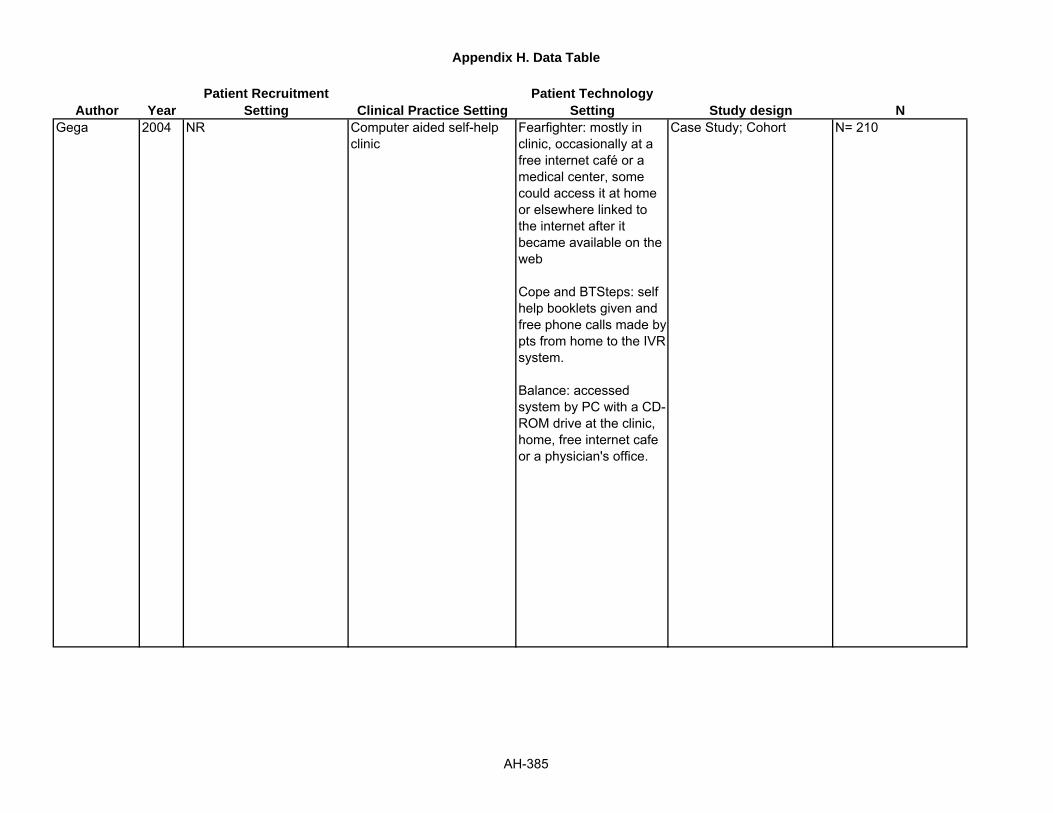
Appendix H. Data Table
Author YearPatient Recruitment
Setting Clinical Practice SettingPatient Technology
Setting Study design NGega 2004 NR Computer aided self-help
clinicFearfighter: mostly in clinic, occasionally at a free internet café or a medical center, some could access it at home or elsewhere linked to the internet after it became available on the web
Cope and BTSteps: self help booklets given and free phone calls made by pts from home to the IVR system.
Balance: accessed system by PC with a CD-ROM drive at the clinic, home, free internet cafe or a physician's office.
Case Study; Cohort N= 210
AH-385

Appendix H. Data Table
Author YearGega 2004
Years of Study
Length of follow-up (months) Inclusion Criteria Exclusion Criteria Elderly
12 months Fearfighter, cope and BT steps=12 weeksBalance=4 weeks
Presence of an anxiety and depressive disorder, motivation to do self help, and no substance abuse, psychosis or active suicidal plans
NR NR
AH-386

Appendix H. Data Table
Author YearGega 2004
Underserved Chronic IllnessDisability/
Impairment Gender (% Male) Age (years)NR ANXIETY or
DEPRESSIVE DISORDER
NR Slightly under half were men (no raw data available)
NR
AH-387

Appendix H. Data Table
Author YearGega 2004
Ethnicity Income (US$) EducationUrban / Rural /
Frontier Other
Patient Characteristics*
NR NR A third were unemployed or students (no raw data )
NR Mean problem duration: 8 yrs with moderately severe problems39% had given up work/long term sick leave
Almost 1/2 were having current treatment from their physician or a mental health professional1/2 were on psychotropic medication (no raw data)
20% had CBT previously35% used computers most days at work
Broad diagnosisDepression: 71Phobia/panic disorder: 60Generalized anxiety disorder: 35Obsessive compulsive disorder: 35
AH-388

Appendix H. Data Table
Author YearGega 2004
Health Insurance Status Literacy Language(s) Health Beliefs Intervention Name
NR NR NR NR Computer aided systems of cognitive behavior therapy (CCBT) (Fearfighter, Cope, Balance and BTSteps)
AH-389

Appendix H. Data Table
Author YearGega 2004
Intervention Described Intervention Groups Type of Device* Functions*
Intervention*
Systems of cognitive behavior therapy accessible at home included fearfighter for phobia/panic; Cope for non-suicidal depression; BTSteps for Obsessive compulsive disorder; Balance for generalized anxiety/mild depression.
CCBT systems help the pts make most of the decisions about how to devise, execute and complete CBT including appropriate homework and relapse prevention. The therapist's role was restricted to briefly screening the patient and offering live advice (by phone) if pt got stuck during CCBT.The clinic's pt accessed Cope and BT Steps by phoning a computer on an interactive voice response system (IVR) system after reading a manual. Computer faxed to the clinic weekly reports of phone calls, duration, modules accessed and for Cope pts, suicide riskBalance and Fearfighter could be accessed via internet and Balance had a CD-ROM form too
Pts told to use the system as much as possible; pts advised to use fearfighter cope or BTSteps
Computer, phone Cognitive behavior therapy, IVR
AH-390

Appendix H. Data Table
Author YearGega 2004
Staff Training Subject Training co-interventions PhysiologicNR Pts were given manuals to
read before calling the Cope and BTSteps system
NR NR
AH-391

Appendix H. Data Table
Author YearGega 2004
Health Service Utilization Health Care Costs KnowledgeNR Assuming administrative costs and
15% overheads, the estimated per pt cost advantage of CCBT over face to face CBT would rise from 15% /pt for 350 pts a yr to 41% per pt for 1,350 pts a yr
The total cost of CCBT nationally might rise if many users who were previously untreated sought CCBT to offset savings from lower per patient cost
NR
AH-392

Appendix H. Data Table
Author YearGega 2004
Use of Technology Usability HIT SatisfactionMean of 58 days from pts starting CCBT to ending it.In this period, mean of 64 mins support from the clinicianThe clinic' pts who accessed computer by phone spent similar total times calling the computer as in previous studies- 2 hrs on Cope calls and 4 hrs on BT Steps calls.
NR Pts fairly satisfied with their CCBT system and satisfied even more with live support and self help clinic as a whole.Marginal preference for therapist over computer guidance seensatisfaction and preference ratings were similar among users of he four different systems.
AH-393

Appendix H. Data Table
Author YearGega 2004
Health Satisfaction Self-efficacy Health Behavior
Outcomes
NR Significant improvement on work/social adjustment for fearfighter, cope and balance users.Significant improvement from pre to post treatment on measures specific to their problem for completers of each self helpClinically meaningful effect size of 0.8 or more exceeded by fearfighter users on the FQ's global phobia and anxiety/depression scores; by cope users on depression and on work/social adjustment; and by BTSteps users on obsessive compulsive total and sub scores.Completers improved comparably to completers in other studies that used the CCBT system and measures.
NR
AH-394

Appendix H. Data Table
Author YearGega 2004
Quality of Life Support WithdrawalsNR NR Over 12 months intake, screening
questionnaires received=355unsuitable on the questionnaire= 8%screening interview with a clinician offered to= 327attended=266suitable=210refused CCBT= 42 (20%)dropped out early or gave no post treatment data= 60 (29%)
AH-395

Appendix H. Data Table
Author YearGega 2004
Adverse Effects OtherNR 3 case illustrations discussed.
AH-396

Appendix H. Data Table
Author YearPatient Recruitment
Setting Clinical Practice SettingPatient Technology
Setting Study design NGerber 2007 Inner city Inner city clinics and
Childhood diabetes registryHomes Cohort N=19
Gerbert 2003 3 primary care clinics San Francisco Bay Area, CA
Clinic RCT N=52
AH-397

Appendix H. Data Table
Author YearGerber 2007
Gerbert 2003
Years of Study
Length of follow-up (months) Inclusion Criteria Exclusion Criteria Elderly
NR 6 months NR NR NR
NR NR *Ages 18-65*Smokes tobacco and/or drinks alcohol
Outside age range, does not smoke tobacco or drink
NR
AH-398

Appendix H. Data Table
Author YearGerber 2007
Gerbert 2003
Underserved Chronic IllnessDisability/
Impairment Gender (% Male) Age (years)YES: inner city DIABETES: Types 1
and 2NR Total: 32% Mean age: 22.3 yrs
(19-26)
YES: recruited from clinic that primarily serves low-income individuals on Medi-Cal
YES: SMOKING and/or DRINKING ALCOHOL
NR 48.00% Range: 18-65
AH-399

Appendix H. Data Table
Author YearGerber 2007
Gerbert 2003
Ethnicity Income (US$) EducationUrban / Rural /
Frontier Other
Patient Characteristics*
African-American: 84%
NR Finished high school: 74%
Urban Had received diabetes education previously: 74%
Had diabetes related complication: 37%
Out of 13 women, 7 had ay least one child
Computer at home: 21%
Current use of computer at work or school: 47%
Very comfortable with computer: 84%Somewhat comfortable: 3%
African-American: 48%Caucasian: 23%Latino: 12%Asian: 10%Other: 8%
NR NR NR Current Smokers: 31%Drinking at risky or hazardous levels: 40%Combination: 29%
AH-400

Appendix H. Data Table
Author YearGerber 2007
Gerbert 2003
Health Insurance Status Literacy Language(s) Health Beliefs Intervention Name
Public aid: 53%No health insurance: 21%Unemployed or disabled: 37%
NR NR NR STYLE- Self management training in youth for lifelong effectiveness
NR NR NR NR Project Choice
AH-401

Appendix H. Data Table
Author YearGerber 2007
Gerbert 2003
Intervention Described Intervention Groups Type of Device* Functions*
Intervention*
Internet based transition support program consisting of background information on diabetes, goal setting exercises with individualized feedback, role playing, group discussions, empowerment activities and communication skills training designed to improve interactions with health professionals.
Internet based program on commercial course management software.
Each week, a diabetes educator introduced a new module with an activity and feedback evaluation form and monitored the discussion board. This board provided encouragement, discussion of clinical and logistic problems and prevented sharing of misinformation.
Three " ask an expert" segments allowed pts to consult with psychologist, patient advocacy expert and a social worker with experience in diabetes related health care access.
Computer Information on diabetes, goal setting exercises with individualized feedback, role playing, group discussions,
This "video doctor" is an interactive, multimedia video doctor, that helps reduce primary care pts smoking and alcohol use by: a) a patient-centered advice message and b) a brief motivational intervention tailored to the information input by the pt
CG: 16Video doctor-advice message: 18Video doctor-advice message + brief intervention: 18
Interactive multimedia software
To provide suggestions about how to quit smoking/drinking to pts
AH-402

Appendix H. Data Table
Author YearGerber 2007
Gerbert 2003
Staff Training Subject Training co-interventions PhysiologicNR NR NR 83% stated that they experienced
greater control of their diabetes following completion of modules
NR NR NR NR
AH-403

Appendix H. Data Table
Author YearGerber 2007
Gerbert 2003
Health Service Utilization Health Care Costs KnowledgeNR NR NR
NR NR NR
AH-404

Appendix H. Data Table
Author YearGerber 2007
Gerbert 2003
Use of Technology Usability HIT SatisfactionSTYLE accessed a total of 4445 times
25.8% of all hits were between 9 PM- 11 PM
STYLE used maximum in the first 2 months (1460 and 1417 hits respectively)
Use declined 262 times the 6th month.
Discussion board had the heaviest use (4-576 per participant, median 57, SD=148.5)
50% completed modules within 30 mins, additional 30% spent 30-60 mins on the modules
50% felt that the modules were very easy or easy to complete with the remainder describing them as somewhat hard.
67% reported trouble completing module activities on time often due to work, school and family commitments
Overall, every one of the pts indicatedthat the module was very helpful.
NR 7 point scaleMean: 6.79
7 point scaleMean: 5.69
AH-405

Appendix H. Data Table
Author YearGerber 2007
Gerbert 2003
Health Satisfaction Self-efficacy Health Behavior
Outcomes
NR NR NR
NR NR 7 point scale intention to change behaviorSmokers: 5.94Alcohol Users: 4.42
AH-406

Appendix H. Data Table
Author YearGerber 2007
Gerbert 2003
Quality of Life Support WithdrawalsNR 50% received encouragement from
family members often or very often to log in to STYLE.
NR
NR NR NR
AH-407

Appendix H. Data Table
Author YearGerber 2007
Gerbert 2003
Adverse Effects OtherNR Qualitative results on the discussion
board reported, not listed here
NR NR
AH-408

Appendix H. Data Table
Author YearPatient Recruitment
Setting Clinical Practice SettingPatient Technology
Setting Study design NGlasgow 2000 Outpatients Primary care physicians-
small group practicesCenter for healthy living, centralized location for most pts
RCT N= 320Grp 1 (no Telephone [TF], no Community resources[CR]): 80Grp 2 (no TF, CR): 80Grp 3 ( TF, no CR): 80Grp 4 (TF, CR): 80
AH-409

Appendix H. Data Table
Author YearGlasgow 2000
Years of Study
Length of follow-up (months) Inclusion Criteria Exclusion Criteria Elderly
NR 6 months *Meeting the Welborn criteria for Type 2 diabetes on the basis of age at diagnosis, body mass index, and when insulin was begun *Age >40 yrs*Living independently*Have a telephone*Not planningto move out of the area during the next year
NR NR
AH-410

Appendix H. Data Table
Author YearGlasgow 2000
Underserved Chronic IllnessDisability/
Impairment Gender (% Male) Age (years)NR DIABETES NR TF, CR: 43.6%
TF, no CR: 43%No TF, CR: 52.6%No TF, no CR: 33.7%
Mean (SD):
(TF, CR) vs. (TF, no CR) vs. (No TF, CR) vs. (No TF, CR)57.4 (+ 9.4) vs. 59 (+9.6) vs. 60.5 (+8.6) vs. 60.6 (+9.5)
AH-411

Appendix H. Data Table
Author YearGlasgow 2000
Ethnicity Income (US$) EducationUrban / Rural /
Frontier Other
Patient Characteristics*
CaucasianTF, CR: 91.4%TF, no CR: 88.6%No TF, CR: 90.9%No TF, CR: 90.0%
NR Some college or more
TF, CR: 58.0%TF, no CR: 63.0%No TF, CR: 59.7%No TF, CR: 46.3%
Unclear Retired, %
(TF, CR) vs. (TF, no CR) vs. (No TF, CR) vs. (No TF, CR)35.8 vs. 31.6 vs. 28.6 vs. 45.0
Live alone, %(TF, CR) vs. (TF, no CR) vs. (No TF, CR) vs. (No TF, CR) 64.2 vs. 44.3 vs. 58.4 vs. 51.2
Years diagnosed, mean(SD)(TF, CR) vs. (TF, no CR) vs. (No TF, CR) vs. (No TF, CR)6.4 (5.9) vs. 7 (6.7) vs. 6.8 (7.6) vs. 5.1 (4.3)
On insulin, % (TF, CR) vs. (TF, no CR) vs. (No TF, CR) vs. (No TF, CR)14.8 vs. 16.5 vs. 15.8 vs. 15.0
Previous diabetes
AH-412

Appendix H. Data Table
Author YearGlasgow 2000
Health Insurance Status Literacy Language(s) Health Beliefs Intervention Name
NR NR NR NR Choosing Well project
AH-413

Appendix H. Data Table
Author YearGlasgow 2000
Intervention Described Intervention Groups Type of Device* Functions*
Intervention*
Interactive multimedia touch screen , computer assessment and feedback sessionThe computer interaction assessed, immediately analyzed and provide feedback on the patient's dietary patterns, barriers to and support for dietary self management and preferences for different intervention strategies. The session concluded with a tailored dietary fat reduction goal based on the participant's eating patterns and preferences and a 1 page goals printout summarizing this info.
Telephone FU- consisted of brief, structured calls to provide ongoing support and reinforcements to pts via continued contact with interventionist who met pts during the office visit. also provided personalized problem solving training based on barriers to dietary self care identified via
Grp 1: no Telephone (TF), no Community resources(CR) Basic intervention pts received the above and a general pamphlet on low fat eatingGrp 2: No Telephone Follow up but community resources providedGrp 3: Telephone follow up, no community resourcesGrp 4: Telephone FU and community resources provided
Computer Assessment, education, analysis and tailored feedback
AH-414

Appendix H. Data Table
Author YearGlasgow 2000
Staff Training Subject Training co-interventions PhysiologicNR NR NR HBA1c, p=NS, n=267
(No TF, no CR) vs. (no TF, CR) vs. (TF, no CR) vs. (TF, CR)Baseline- 7.6(1.2) vs. 7.3 (1.5) vs. 7.5 (1.9) vs. 7.6 (1.8)3 month FU- 7.6 (1.4) vs. 7.3 (1.6) vs. 7.6 (2.1) vs. 7.5 (1.7)6 month FU- 7.4 (1.2) vs. 7.3 (1.4) vs. 7.4 (1.4) vs. 7.5 (1.7)
Total Cholesterol, p=0.010, n=266(No TF, no CR) vs. (no TF, CR) vs. (TF, no CR) vs. (TF, CR)Baseline-210 (40) vs. 203 (39) vs. 202 (38) vs. 205 (35) 3 month FU-201(34) vs. 202 (34) vs. 198(37) vs. 201 (31)6 month FU- 206(39) vs. 194(30) vs. 202(39) vs. 201 (30)
Weight, NS, n=265(No TF, no CR) vs. (no TF, CR) vs. (TF, no CR) vs. (TF, CR)Baseline- 199(36) vs. 212(49) vs. 219949) vs. 221(52)3 month FU- 198(37) vs. 210(46) vs. 217(47) vs. 218(49)6 month FU- 197(37) vs. 210(46) vs. 217(48) vs. 219 (51)
Lipid ratio: total/HDL, NS, n=266(No TF, no CR) vs. (no TF, CR) vs.
AH-415

Appendix H. Data Table
Author YearGlasgow 2000
Health Service Utilization Health Care Costs KnowledgeNR NR NR
AH-416

Appendix H. Data Table
Author YearGlasgow 2000
Use of Technology Usability HIT SatisfactionNR NR Satisfaction with the program
3 month Follow Up, p=NS, n=290
No TF, no CR: 36 (+5.5)No TF, CR: 35 (+5.5)TF, no CR: 36 (+4.7)TF, CR: 37 (+4.3)
AH-417

Appendix H. Data Table
Author YearGlasgow 2000
Health Satisfaction Self-efficacy Health Behavior
Outcomes
NR NR Block fat screener, p-NS, n=265(No TF, no CR) vs. (no TF, CR) vs. (TF, no CR) vs. (TF, CR)Baseline: 48.6 (+28.5) vs. 49.0 (+27.2) vs. 48.8 (+30.6) vs. 54.5 (+33.8)3 month FU: 26.2 (+17.1) vs. 23.8 (+15.2) vs. 26.8 (+19.0) vs. 26.9 (+23.2)6 month FU: 24.7 (+17.5) vs. 23.9 (+14.4) vs. 25.7 (+19.2) vs. 22.8 (+17.4)
Kristal FFB fat composite, p=0.017, n=265(No TF, no CR) vs. (no TF, CR) vs. (TF, no CR) vs. (TF, CR)Baseline: 1.9 (+0.5) vs. 1.9 (+0.5) vs. 2.0 (+0.4) vs. 1.9 (+0.5)3 month FU: 1.9 (+0.5) vs. 1.9 (+0.5) vs. 1.9 (+0.4) vs. 1.8 (+0.5)6 month FU: 1.6 (+0.4) vs. 1.8 (+0.4) vs. 1.7 (+0.4) vs. 1.6 (+0.4)
Kristal FFB fruit and vegetable scale, p= 0.045, n=265(No TF, no CR) vs. (no TF, CR) vs. (TF, no CR) vs. (TF, CR)Baseline: 1.9 (+0.8) vs. 2.0 (+0.8) vs. 2.2 (+0.8) vs. 2.0 (+0.8) 3 month FU: 1.8 (+0.8) vs. 1.9 (+0.8) vs. 2.1 (+0.8) vs. 1.9 (+0.9)
AH-418

Appendix H. Data Table
Author YearGlasgow 2000
Quality of Life Support WithdrawalsDiabetes intrusiveness, p= 0.014, n=267(No TF, no CR) vs. (no TF, CR) vs. (TF, no CR) vs. (TF, CR)Baseline: 25.7(11.1) vs. 29.2 (15.2) vs. 28.6 (12.0) vs. 30.8( 15.7)3 month FU: 31.0 (15.6) vs. 30.6( 15.0) vs. 32.4(13.0) vs. 31.4(13.3)6 month FU: 26.0(12.7) vs. 29.6(14.9) vs. 28.2( 12.40 vs. 29.2(14.0)
NR Attempt to contact: 706 ptsIneligible: 164 (Type 1 DM, not in the area, no telephone)Never reached: 72 (incorrect phone numbers)Asked not to be contacted: 51Declined participation: 99 (not interested in dietary change, not perceiving a problem, too ill, project time too consuming)Participants: 320
At the 6 month FU, 43 failed to provide data5-13 per conditionANOVAs failed to reveal any main effect or interactions involving dropout statusfurther attrition analysis not performed
AH-419

Appendix H. Data Table
Author YearGlasgow 2000
Adverse Effects OtherNR A series of ANOVAs conducted to
determine whether there are any differences in demographic or dietary history/severity variables between pts.Table on intervention implementation by condition given, not listed here
AH-420

Appendix H. Data Table
Author YearPatient Recruitment
Setting Clinical Practice SettingPatient Technology
Setting Study design NGlasgow 2003 NR Primary care medial office Homes RCT N= 320
Gomez 2002a NR Immune Dev. Trust-London, The Lambeth, Southwark and Lewisham Health Authority - London and Apoyo Positivo - Madrid.
NR NR NR
AH-421

Appendix H. Data Table
Author YearGlasgow 2003
Gomez 2002a
Years of Study
Length of follow-up (months) Inclusion Criteria Exclusion Criteria Elderly
NR 10 months *Pts taking insulin met the Welborn criteria based on age at diagnosis, BMI and age ofinsulin initiation*Pts were living independently*Have a telephone*Read and write English *Diagnosed with Type 2 diabetes for at least 1 year*Not planning to move out of the area during the next year
NR NR
NR NR *Patient has HIV/AIDS NR NR
AH-422

Appendix H. Data Table
Author YearGlasgow 2003
Gomez 2002a
Underserved Chronic IllnessDisability/
Impairment Gender (% Male) Age (years)NR TYPE 2 DIABETES
MELLITUSNR N = 150 pts (47%) Mean (SD): 59 (+9.2)
NR HIV/AIDS NR NR NR
AH-423

Appendix H. Data Table
Author YearGlasgow 2003
Gomez 2002a
Ethnicity Income (US$) EducationUrban / Rural /
Frontier Other
Patient Characteristics*
NR NR NR NR NR
NR NR NR NR NR
AH-424

Appendix H. Data Table
Author YearGlasgow 2003
Gomez 2002a
Health Insurance Status Literacy Language(s) Health Beliefs Intervention Name
NR NR NR NR Diabetes network (D- Net)
NR NR English, Spanish NR SEAHORSE II
AH-425

Appendix H. Data Table
Author YearGlasgow 2003
Gomez 2002a
Intervention Described Intervention Groups Type of Device* Functions*
Intervention*
Internet based self management project evaluating the incremental effects of adding tailored self management (TSM) training or peer support components to a basic internet based, information focused comparison
The TSM intervention addressed self efficacy through internet-mediated modeling, accomplishment of graduated goals and development of individual and situation specific problem solving strategies. Pts had access to professional "coach" (could access twice per week) and resources to reach their dietary goals tailored to their needs. Pts also had access to online " dietitian question and answer" conference covering specific topics. They could enter and receive graphical feedback on their pattern of blood glucose levels for different periods of the day.
Information only group: Pts had access to extensive number of articles on topics of medical, nutritional, and lifestyle aspects of diabetes. These provided info only and not individually tailored recommendations. Pts completed assessments online and received automated dietary change goals based on their current levels.TSM Grp: same as abovePeer support Grp: same as above
Computer Live chat, logs, databases, information, forums
Web based self monitoring system for HIV/AIDS patient care
NR Web interface Self-monitoring personal diary, remote doctor support, data analysis, allows user to post comments and articles
AH-426

Appendix H. Data Table
Author YearGlasgow 2003
Gomez 2002a
Staff Training Subject Training co-interventions PhysiologicNR Pts received in home
training in use of computer of approximately two to three visits of 1-2 hrs each
NR Dietary outcomesKristal total
No peer support ( No PS) vs. Peer support (PS)Baseline mean(SD)2.22 (0.41) vs. 2.19(0.50)10 month adjusted mean(SD)2.00(0.38) vs. 1.96(0.38)Group differences- 0.04, MANCOVA/univariate p level- 0.399
No TSM vs. TSMBaseline mean(SD) 2.22(0.45) vs. 2.19(0.46)10 month adjusted mean2.03 (0.38) vs. 1.93(0.38)grp differences- 0.10, MANCOVA/univariate p level- 0.048
Estimated gms of daily fatNo PS vs. PSBaseline mean(SD) 41.3(26.4)vs. 44.0(31.9)10 month adjusted mean(SD)29.8(14.3) vs. 27.9(14.3) Group differences-1.85 , MANCOVA/univariate p level-0.323
No TSM vs. TSMBaseline mean(SD) 44.4(33.8) vs. 40.8(23.8)
NR NR NR NR
AH-427

Appendix H. Data Table
Author YearGlasgow 2003
Gomez 2002a
Health Service Utilization Health Care Costs KnowledgeNR NR NR
NR NR NR
AH-428

Appendix H. Data Table
Author YearGlasgow 2003
Gomez 2002a
Use of Technology Usability HIT SatisfactionAverage logons per participant per monthPS vs. No PS
Month 1-3: 18.7 vs. 9.4Month 4-6: 13.2 vs. 5.1Months 7-10: 6.7 vs. 3.6
TSM vs. No TSM
Months 1-3: 16.7 vs. 11.4Months 4-6: 9.8 vs. 8.5Months 7-10: 5.3 vs. 5.0
NR NR
NR NR NR
AH-429

Appendix H. Data Table
Author YearGlasgow 2003
Gomez 2002a
Health Satisfaction Self-efficacy Health Behavior
Outcomes
NR Psychosocial outcomesCES-D TotalNo PS vs. PSBaseline mean(SD)17.8(10.08) vs. 18.1(10.51)10 month adjusted mean(SD) 14.06(9.12) vs. 12.59(9.13)Group differences-1.47, MANCOVA/univariate p level-0.219
No TSM vs. TSMBaseline mean(SD) 17.9(10.56)vs. 18.0(10.02)10 month adjusted mean 12.93(9.11) vs. 3.72(9.12) grp differences= -0.79 , MANCOVA/univariate p level-0.507
NR
NR NR NR
AH-430

Appendix H. Data Table
Author YearGlasgow 2003
Gomez 2002a
Quality of Life Support WithdrawalsNR No PS vs. PS
Baseline Mean (SD)4.23 (+1.23) vs. 4.05 (+1.28)10 month adjusted Mean (SD) 4.71 (+1.12) vs. 5.22 (+1.11) Group differences= -0.51, MANCOVA/univariate p level-0.001
No TSM vs. TSMBaseline Mean (SD) 4.14 (+1.32) vs. 4.14 (+1.20) 10 month adjusted mean 4.96 (+1.12) vs. 4.97 (+1.12)Grp differences= -0.01 , MANCOVA/univariate p level-0.934
Data were collected on 82% of the randomized participantsAnalyses of those present and those not present done and did not show significant effects
NR NR NR
AH-431

Appendix H. Data Table
Author YearGlasgow 2003
Gomez 2002a
Adverse Effects OtherNR Overall change from baseline to10
month follow-up given but not listed here
NR NR
AH-432

Appendix H. Data Table
Author YearPatient Recruitment
Setting Clinical Practice SettingPatient Technology
Setting Study design NGreen 2008 10 Medical Centers within
Group HealthWashington and Idaho Homes RCT N=778
AH-433

Appendix H. Data Table
Author YearGreen 2008
Years of Study
Length of follow-up (months) Inclusion Criteria Exclusion Criteria Elderly
June 2005-December 2007
12 mos *Ages 25-75*HTN diagnosis and taking HTN medications*Ability to use a computer*Internet access*E-mail address*Willingness to attend screening sessions at a clinic*Diastolic BP 90-109 mmHg*Systolic BP 140-190 mmHg*Written informed consent
Posessing diseases other than HTN such as diabetes, cardiovascular or renal disease, unable to use a computer, lack of access to the internet, no e-mail address, unwilling to attend screening sesions
NR
AH-434

Appendix H. Data Table
Author YearGreen 2008
Underserved Chronic IllnessDisability/
Impairment Gender (% Male) Age (years)NR HTN NR Overall: 47.8%
UC: 55.3%IVR: 54.1%IVR + pharmacist care: 44.1%
Overall: 59.1 (+8.5)UC: 56.8 (+8.5)IVR: 59.5 (+8.3)IVR + PC: 59.3 (+8.6)
AH-435

Appendix H. Data Table
Author YearGreen 2008
Ethnicity Income (US$) EducationUrban / Rural /
Frontier Other
Patient Characteristics*
Overall (%)Caucasian: 82.8African-American: 7.8Asian: 3.7Other: 5.7
UCCaucasian: 82.9African-American: 8.5Asian: 3.1Other: 5.4
IVR + PCCaucasian: 86.1African-American: 6.9Asian: 3.5Other: 3.5
IVR + PCCaucasian: 79.3African-American: 8.0Asian: 4.6Other: 8.0
NR Overall (%)<12 yrs or GED: 8.0Some Post-HS: 41.64 yr College Degree: 25.1Graduate School: 25.3
UC<12 yrs or GED: 8.5Some Post-HS: 45.34 yr College Degree: 18.6Graduate School: 27.5
IVR<12 yrs or GED: 7.3Some Post-HS: 42.54 yr College Degree: 27.8Graduate School: 22.4
IVR + PC<12 yrs or GED: 8.0Some Post-HS: 37.24 yr College Degree: 28.7Graduate School: 26.1
NR Antihypertensive Medication Classes
Overall (%)0: 3.61: 47.02: 33.5>3: 15.8
UC (%)0: 5.01: 49.22: 34.5>3: 11.2
IVR (%)0: 1.91: 46.32: 33.2>3: 18.5
IVR + PC (%)0: 3.81: 45.62: 33.0>3: 17.6
BP, Mean (SD) mmHgOverall
AH-436

Appendix H. Data Table
Author YearGreen 2008
Health Insurance Status Literacy Language(s) Health Beliefs Intervention Name
NR NR English NR NR
AH-437

Appendix H. Data Table
Author YearGreen 2008
Intervention Described Intervention Groups Type of Device* Functions*
Intervention*
Access to Group Health's secure patient Web services (e-mail access, refilling prescriptions, health library, links to behavioral and lifestyle changes, etc), Group Health's HTN pamphlet, home blood pressure monitoring cuff
UC (n=258): Usual HTN care from physiciansIVR (n=259): access to Group Health's web services and home blood pressure monitoring systemIVR + PC (n=261): acces to Group Health's web services and home blood pressure monitoring system and phamacist intervention to help lower BP
Webserver and home BP monitoring cuff
Education, data input, data collection, tailored feedback
AH-438
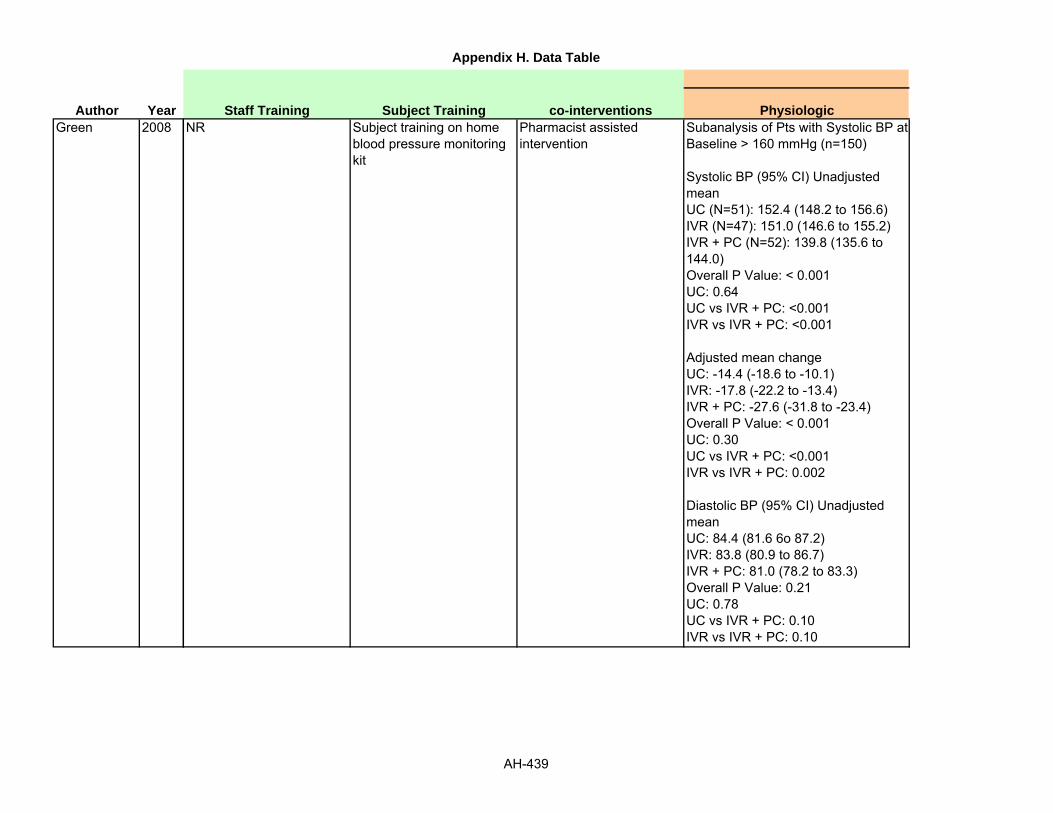
Appendix H. Data Table
Author YearGreen 2008
Staff Training Subject Training co-interventions PhysiologicNR Subject training on home
blood pressure monitoring kit
Pharmacist assisted intervention
Subanalysis of Pts with Systolic BP at Baseline > 160 mmHg (n=150)
Systolic BP (95% CI) Unadjusted meanUC (N=51): 152.4 (148.2 to 156.6)IVR (N=47): 151.0 (146.6 to 155.2)IVR + PC (N=52): 139.8 (135.6 to 144.0)Overall P Value: < 0.001UC: 0.64UC vs IVR + PC: <0.001IVR vs IVR + PC: <0.001
Adjusted mean changeUC: -14.4 (-18.6 to -10.1)IVR: -17.8 (-22.2 to -13.4)IVR + PC: -27.6 (-31.8 to -23.4)Overall P Value: < 0.001UC: 0.30UC vs IVR + PC: <0.001IVR vs IVR + PC: 0.002
Diastolic BP (95% CI) Unadjusted meanUC: 84.4 (81.6 6o 87.2)IVR: 83.8 (80.9 to 86.7)IVR + PC: 81.0 (78.2 to 83.3)Overall P Value: 0.21UC: 0.78UC vs IVR + PC: 0.10IVR vs IVR + PC: 0.10
AH-439

Appendix H. Data Table
Author YearGreen 2008
Health Service Utilization Health Care Costs KnowledgeNS NR NR
AH-440

Appendix H. Data Table
Author YearGreen 2008
Use of Technology Usability HIT SatisfactionAt 12 mos after randomization
Mean (SD) number of message threadsUC: 2.4 (+4.6)IVR: 3.3 (+7.4)IVR + PC: 22.3 (+10.2)
Mean (SD) number of patient initiated threadsUC: 1.8 (+4.2), p = 0.01IVR: 2.7 (+7.1), p <0.01IVR + PC: 4.2 (+6.0), p <0.01
Mean (SD) number of telephone encountersUC: 4.0 (+4.8), p<0.001IVR: 3.8 (+5.0), p<0.001IVR + PC: 7.5 (+9.3)
NR NR
AH-441

Appendix H. Data Table
Author YearGreen 2008
Health Satisfaction Self-efficacy Health Behavior
Outcomes
Consumer Assessment of Healthcare Providers and Systems (Scale 0-10)Missing Data: 65Baseline: 7.9 (+1.5)UC: 8.1 (+1.5)IVR: 8.1 (+1.5)IVR + PC: 8.3 (+1.4)
Differences between IVR Groups, Mean Difference or RR (95% CI)UC vs IVR: 0 (-0.3 to 0.3)UC vs IVR + PC: 0.2 (-0.1 to 0.5)IVR vs IVR + PC: 0.2 (0 to 0.5)
NR NR
AH-442

Appendix H. Data Table
Author YearGreen 2008
Quality of Life Support WithdrawalsSecondary Outcomes at 12 mos for all pts completing f/u in the electronic communications and home blood pressure monitoring trial; Mean (SD)
QoL (1-100 scale)General healthMissing Data: 38Baseline: 67.1 (+20.4)UC: 66.7 (+20.4)IVR: 66.6 (+20.9)IVR + PC: 66.6 (+22.2)
Differences between IVR Groups, Mean Difference or RR (95% CI)UC vs IVR: -0.1 (-4.0 to 3.7)UC vs IVR + PC: -0.1 (-4.0 to 3.8)IVR vs IVR + PC: 0 (-3.9 to 3.9)
Physical healthMissing Data: 44Baseline: 80.6 (+27.0)UC: 78.1 (+27.7)IVR: 77.7 (+30.3)IVR + PC: 81.0 (+26.5)
Differences between IVR Groups, Mean Difference or RR (95% CI)UC vs IVR: -0.4 (-5.6 to 4.7)UC vs IVR + PC: 2.8 (-2.3 to 8.0)IVR vs IVR + PC: 3.3 (-1.9 to 8.5)
NR UC (n=11)4 withdrew1 refused2 could not be contacted3 moved1 other
IVR (n=13)8 withdrew1 could not be contacted2 missed visit2 died
IVR + PC (n=24)8 withdrew5 could not be contacted4 missed visit4 left health plan2 too ill1 died
AH-443

Appendix H. Data Table
Author YearGreen 2008
Adverse Effects OtherNR Secondary Outcomes at 12 mos for
all pts completing f/u in the electronic communications and home blood pressure monitoring trial; Mean (SD)
# of antihypertensive medication classesMissing Data: 0Baseline: 1.64 (+0.85)UC: 1.69 (+0.91)IVR: 1.94 (+0.91)IVR + PC: 2.16 (+0.93)
Differences between IVR Groups, Mean Difference or RR (95% CI)UC vs IVR: 0.3 (0.1 to 0.4)UC vs IVR + PC: 0.5 (0.3 to 0.6)IVR vs IVR + PC: 0.2 (0.1 to 0.4)
Aspirin use, No. (%)Missing Data: 38Baseline: 338 (+48.8)UC: 124 (+53.0)IVR: 131 (+56.0)IVR + PC: 149 (+66.5)
Differences between IVR Groups, Mean Difference or RR (95% CI)UC vs IVR: 1.1 (0.9 to 1.2)UC vs IVR + PC: 1.3 (1.1 to 1.5)IVR vs IVR + PC: 1.2 (1.0 to 1.4)
AH-444

Appendix H. Data Table
Author YearPatient Recruitment
Setting Clinical Practice SettingPatient Technology
Setting Study design NGuendelman 2002 Children's hospital Children's hospital Homes RCT N = 134
Grp 1: 66Grp 2: 68
Gustafson 1999 HIV clinics and organizations in Wisconsin
NR Homes Randomized trial N = 204IVR: 107CG: 97
Gustafson 1994 HIV & AIDS outpatients (no recruitment details)
NR Homes RCT N = 204IVR: 107CG: 97
AH-445

Appendix H. Data Table
Author YearGuendelman 2002
Gustafson 1999
Gustafson 1994
Years of Study
Length of follow-up (months) Inclusion Criteria Exclusion Criteria Elderly
April 1999-July 2000
3 mos *Ages 8-16 years old*English speaking caregivertelephone at home*Diagnosed with persistent asthma following NHLBI clinical practice guidelines
Involved in another asthma or drug efficacy trialInvolved in research requiring behavioral modificationIf they had mental or physical challenges that made it difficult to use the systemCo morbid conditions affecting quality of life
NR
NR 3 to 6 months implementation with 2-3 month follow-up (total 5 to 9 months)
*Pt has HIV Dementia, living with subject in experimental condition, living situation prohibiting computer installation, disappearance
NR
1992-1993 5 months of use, 3 months post use for subset 30 INT/28 CTRL
NR NR NR
AH-446

Appendix H. Data Table
Author YearGuendelman 2002
Gustafson 1999
Gustafson 1994
Underserved Chronic IllnessDisability/
Impairment Gender (% Male) Age (years)YES: children, mostly Medicaid population
ASTHMA NR Grp 1: 61%Grp 2: 54%
Mean (Range): 12 (8-16)
NR HIV NR Exp: 90.9%CG: 89%
Mean (SD)Exp: 34.8CG: 34.1
NR HIV/AIDS NR NR NR
AH-447

Appendix H. Data Table
Author YearGuendelman 2002
Gustafson 1999
Gustafson 1994
Ethnicity Income (US$) EducationUrban / Rural /
Frontier Other
Patient Characteristics*
Grp 1Caucasian: 8%African-American: 79%Grp 2Caucasian: 12%African-American: 74%
NR Of the primary caregiver
<HSGrp 1: 39 %Grp 2: 51%
Some CollegeGrp 1: 61%Grp 2: 49%
NR NR
CaucasianExp Grp: 81.2%CG: 86.7%
NR Mean yearsExp Grp: 14.3CG: 14.7
NR EmployedExp Grp: 53.1% CG: 44.4%
"Minorities:" 39/204 (19.1%)
NR NR NR NR
AH-448

Appendix H. Data Table
Author YearGuendelman 2002
Gustafson 1999
Gustafson 1994
Health Insurance Status Literacy Language(s) Health Beliefs Intervention Name
Public Health InsuranceGrp 1: 92% Grp 2: 93%
English speaking caregiver
NR NR Health Buddy
InsuredExp Grp: 75.8%CG: 80.5%
NR NR NR CHESS
NR NR NR NR CHESS
AH-449

Appendix H. Data Table
Author YearGuendelman 2002
Gustafson 1999
Gustafson 1994
Intervention Described Intervention Groups Type of Device* Functions*
Intervention*
Interactive communication device with question and response tasks. Questions provided by the nurse to the patient for their response
Group 1: Intervention group that used Health BuddyGroup 2: Control group
Website Education, information sharing, advice sending
Computerized information, decision support, expert
NR Computer and Internet Online library, referral directory, assessment, decision aid, action plan, discussion group, ask an expert, personal stories
9 services for information, support, problem solving
NR PC w/ modem Information, social and emotional support, problem solving, in 9 modules
AH-450

Appendix H. Data Table
Author YearGuendelman 2002
Gustafson 1999
Gustafson 1994
Staff Training Subject Training co-interventions PhysiologicNR Those assigned to the
Health Buddy were given a demonstration on how to use the device and explained how to install it at home
NR NR
NR NR NR NR
NR NR NR NR
AH-451

Appendix H. Data Table
Author YearGuendelman 2002
Gustafson 1999
Gustafson 1994
Health Service Utilization Health Care Costs KnowledgeAny urgent calls (Baseline vs. 12 week follow-up) - (P=0.05)Grp 1: 32% vs. 10%Grp 2: 22% vs. 15%
ED visit (baseline vs. 12 week follow-up) - (P=0.21)Grp 1: 27% vs. 10%Grp 2: 28% vs. 18%
Any hospitalizations (baseline vs. 12 week follow-up) - (P=0.96)Grp 1: 14% vs. 6%Grp 2: 13% vs. 2%
NR NR
Similar ambulatory and emergency visits; higher phone calls in Exp group
Lower hospitalization in Exp group: 0.14 per subjectControl: 0.21 per subject (p=.02)
NR NR
Self report visits same; calls to clinic higher; post study self report visits fewer; visit time less; admissions problem 16% v 42% ctrl (NS); LOS 61% higher ctrl, 29% lower interest
NR NR
AH-452

Appendix H. Data Table
Author YearGuendelman 2002
Gustafson 1999
Gustafson 1994
Use of Technology Usability HIT SatisfactionNR NR NR
NR NR NR
15966 uses/116 subjects, ~39 hrs/138 uses each; 73% in Discussion Group, 17% in Info Svc, 2% in Problem Solving
NR NR
AH-453

Appendix H. Data Table
Author YearGuendelman 2002
Gustafson 1999
Gustafson 1994
Health Satisfaction Self-efficacy Health Behavior
Outcomes
NR NR NR
NR NR NR
NR NR No change in risky behavior, improved attitude about reporting HIV status
AH-454
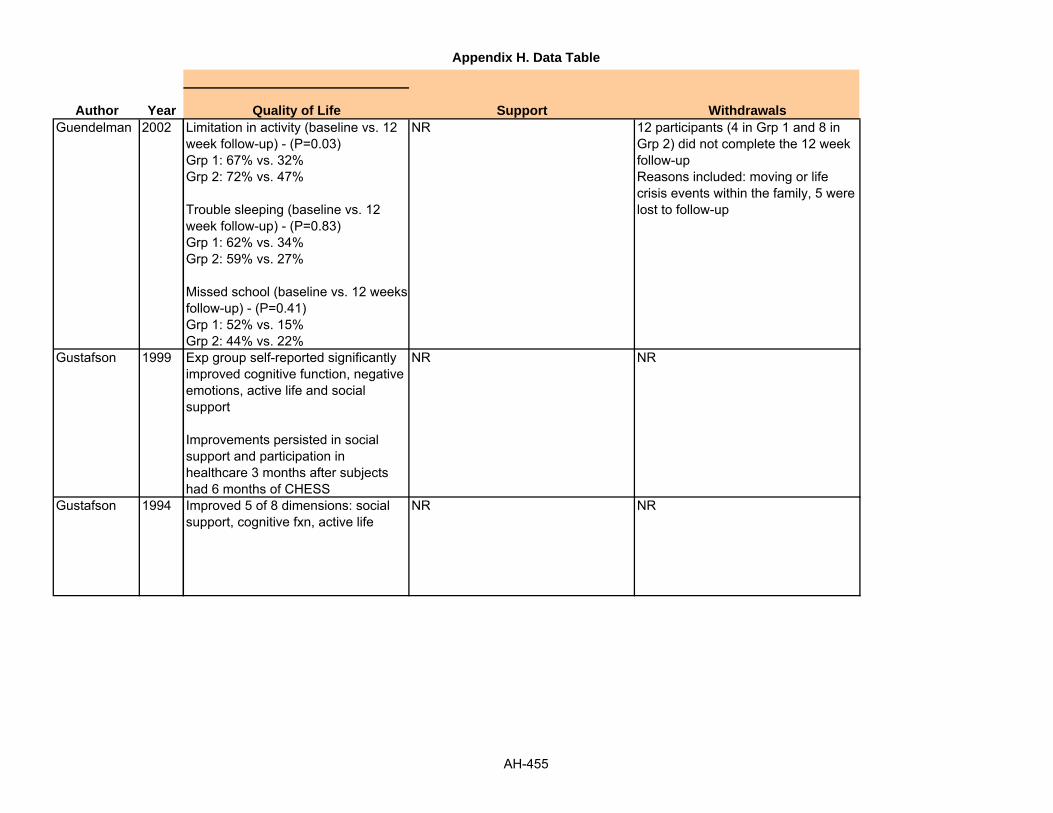
Appendix H. Data Table
Author YearGuendelman 2002
Gustafson 1999
Gustafson 1994
Quality of Life Support WithdrawalsLimitation in activity (baseline vs. 12 week follow-up) - (P=0.03)Grp 1: 67% vs. 32%Grp 2: 72% vs. 47%
Trouble sleeping (baseline vs. 12 week follow-up) - (P=0.83)Grp 1: 62% vs. 34%Grp 2: 59% vs. 27%
Missed school (baseline vs. 12 weeks follow-up) - (P=0.41)Grp 1: 52% vs. 15%Grp 2: 44% vs. 22%
NR 12 participants (4 in Grp 1 and 8 in Grp 2) did not complete the 12 week follow-upReasons included: moving or life crisis events within the family, 5 were lost to follow-up
Exp group self-reported significantly improved cognitive function, negative emotions, active life and social support
Improvements persisted in social support and participation in healthcare 3 months after subjects had 6 months of CHESS
NR NR
Improved 5 of 8 dimensions: social support, cognitive fxn, active life
NR NR
AH-455

Appendix H. Data Table
Author YearGuendelman 2002
Gustafson 1999
Gustafson 1994
Adverse Effects OtherNR NR
NR NR
NR NR
AH-456

Appendix H. Data Table
Author YearPatient Recruitment
Setting Clinical Practice SettingPatient Technology
Setting Study design NGustafson 2001 Urban, small city and rural
areas2 Teaching hospitals; 2 Non-teaching hospitals and a cancer resource center
Homes RCT N= 295Grp 1 (CHESS): 136Grp 2 (Control): 132
N= 246Grp 1: 121Grp 2: 125
AH-457

Appendix H. Data Table
Author YearGustafson 2001
Years of Study
Length of follow-up (months) Inclusion Criteria Exclusion Criteria Elderly
2 yrs (April 1995-May 1997)
5 months *Pts were within 6 months of diagnosis*Age <=60*Not homeless*Not active illegal drug users*Able to give informed consent*Able to understand and answer sample questions from the pre-test survey
Patients treated in small, rural general surgeries were excluded
NR
AH-458

Appendix H. Data Table
Author YearGustafson 2001
Underserved Chronic IllnessDisability/
Impairment Gender (% Male) Age (years)YES: the two non teaching hospitals and the cancer resource center were cateringto underserved population
BREAST CANCER NR N = 0% Mean (SD):Grp 1: 44.3 (+6.6)Grp 2: 44.4 (+7.1)
AH-459

Appendix H. Data Table
Author YearGustafson 2001
Ethnicity Income (US$) EducationUrban / Rural /
Frontier Other
Patient Characteristics*
CaucasianGrp 1: 76% Grp 2: 72%
Income (annual: >$ 40,000)Grp 1: 58.1%Grp 2: 50.8%
Bachelor's degreeGrp 1: 45.8%Grp 2: 40.2%
Urban, small city and rural areas
Living with partner, (%)Grp 1 vs. Grp271.9 vs. 72.6
Days since diagnosisAt pretest; Mean (SD) ; Grp 1 vs. Grp 2 ; 55.0 (+36.3) vs. 47.4 (+32.6)Stage : Early- I or II , (%); Grp 1 vs. Grp 2; 81.9 vs. 78.9
Surgery: Mastectomy,( %); Grp 1v s Grp 2; 55.4 vs. 60.0
Chemotherapy; (%); Grp 1 vs. Grp 2; 54.5 vs. 51.2
Radiation, (%); Grp 1 vs. Grp 2; 38.0 vs. 40.8
AH-460

Appendix H. Data Table
Author YearGustafson 2001
Health Insurance Status Literacy Language(s) Health Beliefs Intervention Name
Private insuranceGrp 1: 86%Grp 2: 84.7%
NR NR NR CHESS
AH-461

Appendix H. Data Table
Author YearGustafson 2001
Intervention Described Intervention Groups Type of Device* Functions*
Intervention*
Computer based patient support system providing information, decision-making and emotional support
Grp 2 (Control): Pts were given a copy of Dr. Susan Love's Breast BookGrp 1 (CHESS): had use of this for 6 months, were trained briefly and had a user's manual.CHESS description *Information system had short answers to frequently asked breast cancer questions, instant library with articles from scientific and popular press, consumer guide with description of health services, identifying good providers and the like, Referral directory with descriptions of and ways to contact local and national breast cancer services
Support services had discussion groups (limited access, facilitated bulletin boardsfor sharing information and support), ask an expert with confidential responses,and personal stories of
Computer Forums, question and answers, library, expert communication, action plan
AH-462

Appendix H. Data Table
Author YearGustafson 2001
Staff Training Subject Training co-interventions PhysiologicNR Grp 1 pts were briefly
trained on how to use CHESS
NR NR
AH-463

Appendix H. Data Table
Author YearGustafson 2001
Health Service Utilization Health Care Costs KnowledgeNR NR NR
AH-464

Appendix H. Data Table
Author YearGustafson 2001
Use of Technology Usability HIT SatisfactionNR NR Participation- Level of comfort
Grp 1vs Grp2 Means (covariate adjusted); Difference between means ; CHESS -Control (95% CI)2 months- 80.7 vs. 74.3 ; 6.4 (2.1 to 10.7), p < 0.015 month-79.1 vs. 76.5; 2.6 ( -1.4 to 6.7)
Confidence in doctorsGrp 1vs Grp2 Means (covariate adjusted); Difference between means ; CHESS -Control (95% CI)2 month - 83.0 vs. 77.3, 5.7 (1.0 to 11.3), p < 0.055 month- 82.8 vs. 79.0, 3.8 ( -2.2 to 9.8)
Information competenceGrp 1vs Grp2 Means (covariate adjusted); Difference between means ; CHESS -Control (95% CI) 2 months- 70.4 vs. 65.6 ; 4.8 (1.5 to 8.1), p < 0.01 5 month - 69.3 vs. 65.8; 3.5 (0.0 to 6.9), p= 0.05
Unmet information need
AH-465

Appendix H. Data Table
Author YearGustafson 2001
Health Satisfaction Self-efficacy Health Behavior
Outcomes
NR NR Participation- behavioral involvementGrp 1vs Grp 2 Means (covariate adjusted); Difference between means; CHESS -Control (95% CI) 2 months: 75.6 vs. 73.1; 2.5 ( - 1.1 to 6.1) 5 month: 74.5 vs. 72.8; 1.7 ( -2.3 to 5.6)
AH-466

Appendix H. Data Table
Author YearGustafson 2001
Quality of Life Support WithdrawalsSocial/Family well beingGrp 1vs grp2 Means (covariate adjusted); Difference between means ; CHESS -Control (95% CI) 2 months- 79.3 vs. 78.2; 1.1 ( -3.0 to 5.4) 5 month - 75.8 vs. 74.7; 1.1 ( - 3.3 to 5.5)
Emotional well beingGrp 1vs grp2 Means (covariate adjusted); Difference between means ; CHESS -Control (95% CI) 2 months- 73.9 vs. 72.8 ; 1.1 ( - 3.1 to 5.2) 5 month - 76.3 vs. 75.3; 1.0 ( -3.0 to 5.0)
Functional well beingGrp 1vs grp2 Means (covariate adjusted); Difference between means ; CHESS -Control (95% CI) 2 months- 62.2 vs. 63.0 ; - 0.8 ( - 5.3 to 3.6) 5 month - 70.4 vs. 69.9 ; 0.5 ( -3.5 to 4.4)
Breast cancer concernsGrp 1vs grp2
Social supportGrp 1 vs. Grp 2 Means (covariate adjusted); Difference between means ; CHESS -Control (95% CI) 2 months: 80.8 vs. 78.4 ; 2.4 (- 1.2 to 5.9) 5 month: 84.2 vs. 79.3; 4.9 (1.4 to 8.4)
Patient's recruited: 296Withdrew before randomization: 1Randomized: 295Control: 148, CHESS: 147
Out of control groupWithdrew before start of study: 16Participated: 132
Out of 132 that participated, Dropped from study: 7Completed trial, five month survey: 125
Out of CHESS groupWithdrew before start of study: 13Died before start of study: 1Participated: 133
Out of 133 that participated, Dropped from study: 12 (Died during study=3, Lost to follow up=9)Completed trial, five month survey: 121
AH-467

Appendix H. Data Table
Author YearGustafson 2001
Adverse Effects OtherNR Recruitment rates in the different
places given, not listed hereReasons for refusal to participate among patients contacted also givenMeasurement issues discussed, not listed here
The author mentions that their sample size of 246 subjects at an alpha= 0.05 provided a 0.80 power to detect a 0.36 SD difference between the CHESS and control groups.
The author has also discussed interactions with indicators of medical under service, not listed here
AH-468

Appendix H. Data Table
Author YearPatient Recruitment
Setting Clinical Practice SettingPatient Technology
Setting Study design NGustafson 1998 5 Wisconsin counties Surgeons at 12 clinics, 10
hospitals, 7 HMOsHomes NR N = 38
Hoch 1999 NR NR NR (Homes) Descriptive N = 497Posts: 155Responses: 342
AH-469

Appendix H. Data Table
Author YearGustafson 1998
Hoch 1999
Years of Study
Length of follow-up (months) Inclusion Criteria Exclusion Criteria Elderly
1997 10 weeks *Elderly women with breast cancer*Medicare eligible*Diagnosis w/in 4 months *Able to read and provide informed consent*No dementia
NR YES
1995-1998 NR NR NR NR
AH-470

Appendix H. Data Table
Author YearGustafson 1998
Hoch 1999
Underserved Chronic IllnessDisability/
Impairment Gender (% Male) Age (years)NR BREAST CANCER NR N = 0% Mean (SD): 71.8
(+6.06)
NR EPILEPSY NR NR NR
AH-471

Appendix H. Data Table
Author YearGustafson 1998
Hoch 1999
Ethnicity Income (US$) EducationUrban / Rural /
Frontier Other
Patient Characteristics*
NR NR NR Potentially eligible urban: 28pts (76%)Rural: 10 pts (71%)
63% living alone, 58% had co morbidities, 5.3% had metastic breast cancer, 37% had computer experience
NR NR NR NR NR
AH-472

Appendix H. Data Table
Author YearGustafson 1998
Hoch 1999
Health Insurance Status Literacy Language(s) Health Beliefs Intervention Name
NR NR English NR CHESS
NR NR NR NR MGH Neurology Epilepsy Web forum
AH-473

Appendix H. Data Table
Author YearGustafson 1998
Hoch 1999
Intervention Described Intervention Groups Type of Device* Functions*
Intervention*
NR NR Website Provides patient education through a home PC, given articles, tutorials about services, anonymous access to experts, monitor health status, help making decisions
Open web forum NR Computer Forum
AH-474

Appendix H. Data Table
Author YearGustafson 1998
Hoch 1999
Staff Training Subject Training co-interventions PhysiologicNR NR NR NR
NR NR NR NR
AH-475

Appendix H. Data Table
Author YearGustafson 1998
Hoch 1999
Health Service Utilization Health Care Costs KnowledgeNR NR NR
NR NR NR
AH-476

Appendix H. Data Table
Author YearGustafson 1998
Hoch 1999
Use of Technology Usability HIT SatisfactionService, Number/% of uses, Number/% of patients using service
Discussion group: 743/33.9%, 38/100%Ask an expert: 374/17.1%, 38/100%Questions and answers: 287/13.1%, 38/100%Health Charts/profiles: 214/9.7%, 38/100%Instant Library: 161/7.3%, 32/85%Personal stories: 138/6.3%, 36/95%Consumer guide/referral: 75/3.4%, 29/76%Decision Analysis: 97/4.4%, 30/79%Stress Management: 52/2.4%, 18/48%Action Plan: 51/2.4%, 20/52%
NR NR
QuestionsCaregivers: 42%Patients: 35%Providers: 2%Unidentified: 21%
AnswersCaregivers: 34%Patients: 38%Providers: 6%Unidentified: 22%
NR NR
AH-477

Appendix H. Data Table
Author YearGustafson 1998
Hoch 1999
Health Satisfaction Self-efficacy Health Behavior
Outcomes
NR NR NR
NR NR NR
AH-478

Appendix H. Data Table
Author YearGustafson 1998
Hoch 1999
Quality of Life Support WithdrawalsNR NR NR
NR NR NR
AH-479

Appendix H. Data Table
Author YearGustafson 1998
Hoch 1999
Adverse Effects OtherNR NR
6% inaccurate responses NR
AH-480

Appendix H. Data Table
Author YearPatient Recruitment
Setting Clinical Practice SettingPatient Technology
Setting Study design NHolman 1996 Diabetic patients Diabetes clinic Homes Randomized cross-over
designN= 6
Jan 2007 Specialty clinic Specialty clinic, university medical center
Homes RCT N = 164IVR: 88CG: 76
AH-481

Appendix H. Data Table
Author YearHolman 1996
Jan 2007
Years of Study
Length of follow-up (months) Inclusion Criteria Exclusion Criteria Elderly
NR NA *Diabetic patients NR NR
2004 3 months *Internet access*"Persistent asthma"
Chronic co morbidity such as bronchopulmonary dysplasia
NR
AH-482

Appendix H. Data Table
Author YearHolman 1996
Jan 2007
Underserved Chronic IllnessDisability/
Impairment Gender (% Male) Age (years)NR DIABETES NR N = 67% Mean (SD): 33.8
(+11.7)
NR ASTHMA NR IVR: 35%CG: 28%
Mean (SD)IVR: 10.9 (±2.5)CG: 9.9 (±3.2)
AH-483

Appendix H. Data Table
Author YearHolman 1996
Jan 2007
Ethnicity Income (US$) EducationUrban / Rural /
Frontier Other
Patient Characteristics*
NR NR NR NR Duration of diabetes years: 12.7 (+10.9)HbA1: 9.3%
Chinese NR NR Urban NR
AH-484

Appendix H. Data Table
Author YearHolman 1996
Jan 2007
Health Insurance Status Literacy Language(s) Health Beliefs Intervention Name
NR NR English NR Patient-oriented, insulin regimen optimizer (POIRO)
NR NR NR NR Blue Angel for Asthma
AH-485

Appendix H. Data Table
Author YearHolman 1996
Jan 2007
Intervention Described Intervention Groups Type of Device* Functions*
Intervention*
Hand held computer to record prep radial glucose level, expected meal size, expected exercise, health level and hypoglycemic episodes, and to recommend correct insulin dose
Cross-over design: each participant had two consecutive three week study periods, with and without the computerized insulin dose advice switched on, in a randomly allocated order.Training: one week lead in period of recording glucose levels. Patients were given written instructions and a 24 hour contact number
Hand-held computer Provide recommended insulin dose based on patient entered glucose level, size of meal, exercise, health and severity of hypoglycemic episodes
Education, monitoring, self-management advice-not entirely clear how tailored
CG: symptom and spirometry diary, guideline based self management educationIVR: internet based symptom and spirometry diary, guideline based self management education, physician advice by email or phone
Computer Education, monitoring, self-management advice - not entirely clear how tailored
AH-486

Appendix H. Data Table
Author YearHolman 1996
Jan 2007
Staff Training Subject Training co-interventions PhysiologicNR NR NR Advice On vs. Advice Off: mean (SE)
Pre-prandial glucose: 8.9 (+0.4) vs. 7.5 (+0.4); p=.015Fructosamine: 492 (+34) vs. 481 (+34); NSHbA1: 9.2 (+0.5) vs. 9.2 (+0.5); NS
NR Family instructed in use of website
NR PEF: NS (better mean INT, better median CTRL)
AH-487

Appendix H. Data Table
Author YearHolman 1996
Jan 2007
Health Service Utilization Health Care Costs KnowledgeNR NR NR
NR NR Asthma knowledgeIVR: 93%CG: 70%
AH-488

Appendix H. Data Table
Author YearHolman 1996
Jan 2007
Use of Technology Usability HIT SatisfactionNR NR Data NR. All the patients said that
they had found POIRO easy and convenient to use
NR NR INT satisfied w/ program, controls not asked
AH-489

Appendix H. Data Table
Author YearHolman 1996
Jan 2007
Health Satisfaction Self-efficacy Health Behavior
Outcomes
NR Data NR. Reported text says most patients felt more confident about changing their insulin dose
NR
NR NR Monitoring adherence fell 96 to 83 IVR vs. 93% to 53% CGChange in peak flow technique NSSpacer use NSSteroid use fell 83% to 63% IVR, 82% to 42 CG
AH-490

Appendix H. Data Table
Author YearHolman 1996
Jan 2007
Quality of Life Support WithdrawalsNR NR Total: 1 patient. 16%
Primary reason: domestic issues unrelated to the trialAdditional factor: disappointment that POIRO "failed to prevent a hypo"
Asthma control 'well controlled' 52 IVR: 52% to 62%CG: 40% to 42%
QoL no difference
NR Withdrew on request or tech failureIVR: 9 (9%)CG: 6 (7%)
Did not return at 12 wkIVR: 6CG: 5
AH-491

Appendix H. Data Table
Author YearHolman 1996
Jan 2007
Adverse Effects OtherNR Ultralente insulin dose, soluble insulin
dose, number of patients with hypoglycemia, number of hypoglycemic episodes
NR Symptoms: improved, but floor effect w/ CNTRLs
AH-492

Appendix H. Data Table
Author YearPatient Recruitment
Setting Clinical Practice SettingPatient Technology
Setting Study design NJapuntich 2006 General population via
billboards, bus posters, flyers, TV ads and press releases
Center for Tobacco Research and Intervention
Homes RCT N= 284Control: 144CHESS SCRP: 140
Jones 1999 Referred for radiotherapy of breast, prostate, larynx or cervical cancer
Radiotherapy clinic In Clinic RCT N = 525BKLT: 180GINF: 167 PINF (personalized byEHR): 178
AH-493

Appendix H. Data Table
Author YearJapuntich 2006
Jones 1999
Years of Study
Length of follow-up (months) Inclusion Criteria Exclusion Criteria Elderly
October 2001 - July 2002
12 mos *Age >18 yrs*Smoking at least 10 cigarettes per day*Having a traditional telephone line*Literate in English
Current depression, current use of psychiatric medication, medical conditions contraindicating bupropion SR use (e.g., history of seizure disorder), current use of a smoking cessation product or treatment, or being pregnant or likely to become pregnant during the treatment phase of the study
NR
1996-1997 3 months *Referred for radiotherapy of breast, prostate, larynx or cervical cancer
Severe symptoms, palliative care, unaware of dx, cognitive or visual disability
Yes: Over 60 examined as variable
AH-494

Appendix H. Data Table
Author YearJapuntich 2006
Jones 1999
Underserved Chronic IllnessDisability/
Impairment Gender (% Male) Age (years)NR SMOKING NR CG: 45.1%
CHESS SCRP: 45%Mean (SD)CG: 41.0 (+11.8)CHESS SCRP: 40.6 (+12.4)
YES: "deprivation category" by external reference
CANCER NR NR NR
AH-495

Appendix H. Data Table
Author YearJapuntich 2006
Jones 1999
Ethnicity Income (US$) EducationUrban / Rural /
Frontier Other
Patient Characteristics*
Not CaucasianCG: 17.4%CHESS SCRP: 24.6%
NR Control Group:Less than high school: 2.8%High school or GED: 27.8%Some college or tech school: 47.2%College or graduate school: 21.5%
CHESS SCRP:Less than high school: 3.6%High school or GED: 29.5%Some college or tech school: 51.8%College or graduate school: 15.1%
NR # of cigarettes per day: Mean (SD):Control: 22.1 (+11.8)CHESS SCRP: 21.1 (+9.5)
Years smoking: Mean (SD):Control: 23.3 (+12.3)CHESS SCRP: 22.7 (+12.1)
Number of quit attempts: Mean (SD):Control: 6.1 (+11.1)CHESS SCRP: 5.4 (+12.5)
NR NR NR NR NR
AH-496

Appendix H. Data Table
Author YearJapuntich 2006
Jones 1999
Health Insurance Status Literacy Language(s) Health Beliefs Intervention Name
NR English literate English NR Comprehensive Health Enhancement Support System for Smoking Cessation and Relapse Prevention (CHESS SCRP)
NR NR NR NR Personalized computer based information
AH-497

Appendix H. Data Table
Author YearJapuntich 2006
Jones 1999
Intervention Described Intervention Groups Type of Device* Functions*
Intervention*
Intensive internet intervention to provide information, emotional support and problem-solving assistance. Four sections. First section provides information about quitting smoking. Second section is a support center that provided chat programs as well as a cognitive behavioral therapy intervention for negative emotions. Third section was an information repository. Fourth section allowed participants to search for information within CHESS SCRP, a list of recommended websites, and tips for evaluating other websites.
Control Group: 9 weeks of twice daily buproprion SR (150mg), three brief individual counseling sessions, and five follow-up visitsCHESS SCRP: all of the above + 12 weeks of access to the CHESS SCRP website
Participant training: in- home training session for use of computers and the specific website.
CHESS SCRP website Information on quitting smoking, chat/discussion groups, ask-an-expert service, self-therapy for bad moods, journal (structured and unstructured), document storage, additional recommended websites, advice for evaluating other websites
Cancer information tailored by data in EHR vs. not tailored vs. printed booklets
Tailored (PINF) vs. non-tailored (GINF) vs. choice of 143 printed booklets (BKLT)
Computer Education
AH-498

Appendix H. Data Table
Author YearJapuntich 2006
Jones 1999
Staff Training Subject Training co-interventions PhysiologicStaff explained basic computer used if necessary. Staff demonstrated all of the CHESS SCRP services and showed where they were located within the website.
NR 9 weeks of twice daily buproprion SR (150mg); 3 individual counseling sessions, five follow-up visits
None
NR NR NR NS change depression and cancer adjustment scores; 84% improved anxiety scores, especially PINF, especially but also BKLT; subgroups examined
AH-499

Appendix H. Data Table
Author YearJapuntich 2006
Jones 1999
Health Service Utilization Health Care Costs KnowledgeNR NR NR
NR NR Physician assessed 'above avg knowledge' 35% GINF, 25% PINF, 20% BKLT. [note that in general, docs assessed pt knowledge below average]
AH-500

Appendix H. Data Table
Author YearJapuntich 2006
Jones 1999
Use of Technology Usability HIT SatisfactionOver 12 week intervention period:Number of log-insMean: 33.6 (+30.8), Median: 24
Minutes logged onMean: 486.4 (+638.9), Median: 202.9
Most popular servicesSupport tools: Mean: 43.29 min (+109.81)Reading discussion group postings: Mean: 24.70 min (+116.13)
Least popular servicesInformation tools: Mean: 7.97 min (+18.41)
Use not correlated with gender, race, education
Use was correlated with age: Mean (SD) logins per week:18-35: 2.02 (+1.53)34-45: 2.18 (+2.54)≥ 46: 3.35 (+2.57)
NR NR
12 min (1-44) 1st use; 71% no repeat use: 20/169 PINF, 4/155 GINF
NR 80% would prefer 10 min w/ professional (71% PINF, 80% GINF, 90% BKLT)Overall 40% satisfiedSatisfaction with information higher in PINF
AH-501

Appendix H. Data Table
Author YearJapuntich 2006
Jones 1999
Health Satisfaction Self-efficacy Health Behavior
Outcomes
NR Center for Epidemiological Studies Depression Scale (CES-D): measure used, Data NR
Fagerstrom Test for Nicotine Dependence (FTND) collected, Data NR
Logistic Regression: use predicts 3 and 6 month abstinence levels (use transformed into 4 discreet categories of logins per week):3 month: O R: 1.79, 95%CI 1.25-2.566 month: O R: 1.59, 95%CI 1.06-2.38
When controlling for # of past quit attempts, longest period of abstinence in the past, how much success the participant expected in this quit attempt, age, and dependence as measured by the FTND: still significant:3 month: O R: 2.10 95%CI 1.36-3.256 month: O R: 2.13 95%CI 1.25-3.61
Cessation rates: ns by gender, education, race/ethnicity. Differed by age at 3 months (OR= 1.026, 95%CI 1.002-1.05), ns at 6 monthsRelapse prevention: access to CHESS SCRP to predict abstinence at 3 or 6 months: ns trend:3 month: O R: 1.07, 95%CI .54-2.146 month: O R: 1.66, 95%CI .76-3.63
NR NR NR
AH-502

Appendix H. Data Table
Author YearJapuntich 2006
Jones 1999
Quality of Life Support WithdrawalsNR NR All dropouts considered smokers in
analyses.CHESS SCRP: 13.6% due to missed appointments; 15% withdrew before 1 year follow-up (reason NR); 19.3% lost to follow-up.Control: 22.2% withdrew before 1 year follow-up (reason NR); 20.8% lost to follow-up.
NR NR NR
AH-503

Appendix H. Data Table
Author YearJapuntich 2006
Jones 1999
Adverse Effects OtherNR NR
NR Cost of intervention calculated less compared to printed booklets at £7 per patient
AH-504

Appendix H. Data Table
Author YearPatient Recruitment
Setting Clinical Practice SettingPatient Technology
Setting Study design NJones 2001 Community practice NR Home, Community
resource centerRCT N = 112
Computer: 56Psych Nurse: 28Both: 28
AH-505

Appendix H. Data Table
Author YearJones 2001
Years of Study
Length of follow-up (months) Inclusion Criteria Exclusion Criteria Elderly
NA 3 months *ICD-10 diagnosis of schizophrenia*Living in southern Glasgow
Age > 65 yrs, had an uncertain diagnosis, judged acutely ill, chronic problems restricting participation, recent participation in an educational program.
NR
AH-506

Appendix H. Data Table
Author YearJones 2001
Underserved Chronic IllnessDisability/
Impairment Gender (% Male) Age (years)NR SCHIZOPHRENIA NR N = 67% Range: 18 to 65
AH-507

Appendix H. Data Table
Author YearJones 2001
Ethnicity Income (US$) EducationUrban / Rural /
Frontier Other
Patient Characteristics*
NR NR NR NR NR
AH-508

Appendix H. Data Table
Author YearJones 2001
Health Insurance Status Literacy Language(s) Health Beliefs Intervention Name
NR NR NR NR NR
AH-509

Appendix H. Data Table
Author YearJones 2001
Intervention Described Intervention Groups Type of Device* Functions*
Intervention*
Computer: 5 web-based sessions giving general information, personal information from medical record, feedback displays;Psych nurse: 5 in-person sessions (1 hour);Both: computer plus psych nurse
Computer program sessionsPsychiatric nurse sessionsBoth computer and nurse sessions
NR WWW NR
AH-510

Appendix H. Data Table
Author YearJones 2001
Staff Training Subject Training co-interventions PhysiologicResearcher trained subjects on computer use
NR NR NR
AH-511

Appendix H. Data Table
Author YearJones 2001
Health Service Utilization Health Care Costs KnowledgeNR Costs (£) of each intervention arm
were estimated (ITT analysis), Computer vs. Nurse vs. Both (includes time + travel):
Staff costs: 138.4, 107.9, 139.8;Patient costs: 14.2-32, 12-28, 17-38
NR
AH-512
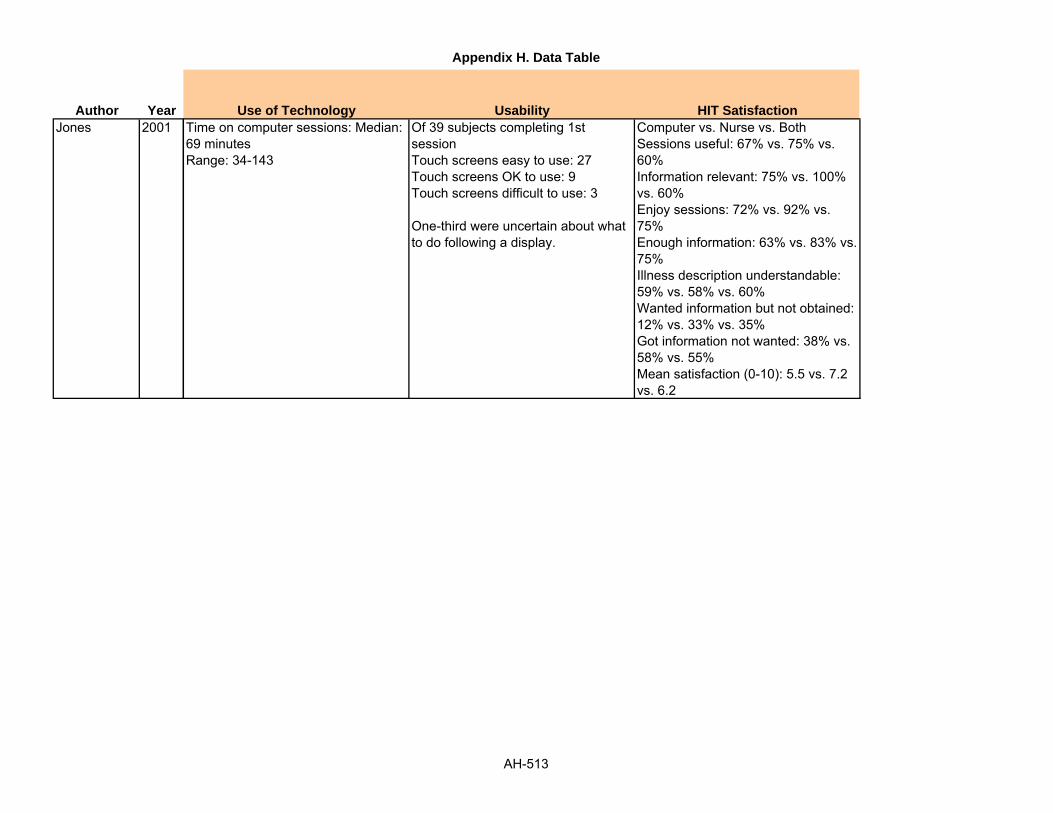
Appendix H. Data Table
Author YearJones 2001
Use of Technology Usability HIT SatisfactionTime on computer sessions: Median: 69 minutesRange: 34-143
Of 39 subjects completing 1st sessionTouch screens easy to use: 27Touch screens OK to use: 9Touch screens difficult to use: 3
One-third were uncertain about what to do following a display.
Computer vs. Nurse vs. BothSessions useful: 67% vs. 75% vs. 60%Information relevant: 75% vs. 100% vs. 60%Enjoy sessions: 72% vs. 92% vs. 75%Enough information: 63% vs. 83% vs. 75%Illness description understandable: 59% vs. 58% vs. 60%Wanted information but not obtained: 12% vs. 33% vs. 35%Got information not wanted: 38% vs. 58% vs. 55%Mean satisfaction (0-10): 5.5 vs. 7.2 vs. 6.2
AH-513

Appendix H. Data Table
Author YearJones 2001
Health Satisfaction Self-efficacy Health Behavior
Outcomes
NR NR NR
AH-514

Appendix H. Data Table
Author YearJones 2001
Quality of Life Support WithdrawalsNR NR Randomized vs. Complete Data (N):
Computer: 56 vs. 34;Nurse: 28 vs. 20;Both: 28 vs. 13
AH-515

Appendix H. Data Table
Author YearJones 2001
Adverse Effects OtherNR Psychological Measures: Computer
vs. Nurse vs. Both: Multiple measures used (BPRS, ITAQ, GAF, KISS) showed no difference across groups.% of patients with improved KISS scores (Knowledge and information about schizophrenia schedule), 1st to 3rd (3 month) interviews: 39%, 21%, 50%, p=.08
AH-516

Appendix H. Data Table
Author YearPatient Recruitment
Setting Clinical Practice SettingPatient Technology
Setting Study design NJoseph 2007 Urban high schools NR Schools RCT N=314
IVR: 162CG: 152
AH-517

Appendix H. Data Table
Author YearJoseph 2007
Years of Study
Length of follow-up (months) Inclusion Criteria Exclusion Criteria Elderly
NR 12 months *Met study criteria for current asthma (defined asreport of ever having a physician diagnosis of asthma accompanied by one or more of the following-daytime and/or nighttime symptoms in the past 30 days-use of medication symptoms for asthma in the past 30 days,-medical care use for asthma in the past yearone or more refills of B-agonists in the past year)*Not reporting a physician diagnosis but answered positively to items from ISAAC and reported symptom frequencies similar to those used in EPR 2 for classification of mild intermittent asthma
NR NR
AH-518

Appendix H. Data Table
Author YearJoseph 2007
Underserved Chronic IllnessDisability/
Impairment Gender (% Male) Age (years)YES: urban African-American youth
ASTHMA NR N = 36.6% Mean (SD): 15.3 (+1.0)
AH-519

Appendix H. Data Table
Author YearJoseph 2007
Ethnicity Income (US$) EducationUrban / Rural /
Frontier Other
Patient Characteristics*
African American: 98%
NR High school students Urban high schools 52% qualities for federal school lunch program. Demographic information ofnon- participants given, not listed here
AH-520

Appendix H. Data Table
Author YearJoseph 2007
Health Insurance Status Literacy Language(s) Health Beliefs Intervention Name
49% Medicaid enrollees
NR NR NR Puff city
AH-521

Appendix H. Data Table
Author YearJoseph 2007
Intervention Described Intervention Groups Type of Device* Functions*
Intervention*
web based program focusing on controller medication adherence, rescue inhaler availability,smoking cessation/reduction. Consists of 4 consecutive educational sessions making use of normative and impassive behavior. Voiced over messages ( accommodates low literacy). Participant specific information obtained at baseline and 4 sessions and used for tailoringTheory based health messages and info on asthma control presented in reference to he 3 core behaviors mentioned above. e.g. info on basic asthma pathophysiology, trigger avoidance, correct use of metered dose inhaler and other devices.
IG- web based tailored program as described above.
CG- students in this grp were directed to existing generic asthma educational websites.
Students restricted to these sites and could not access links for outside programs or generalinterest sites. 4 computer sessions just like IG each of 30 mins
For both IG and CG, a program module including names and illustrations of asthma medications were used to facilitate identification of current usage.
A health care referral coordinator proactively contacted the students in the treatment group depending upon the risk assessment report that had key questions indicating
Computer Education, answering questions
AH-522

Appendix H. Data Table
Author YearJoseph 2007
Staff Training Subject Training co-interventions PhysiologicNR NR NR Grp 1 vs. Grp 2
Adjusted RR (95% CI)
Symptom days(2 wks) 2.1 (+3.0) vs. 2.8 (+3.4) 0.5 (+0.4-0.8); p= 0.003
Symptom nights/2 wks0.9 (+2.3) vs. 1.5 (+2.5)0.4 (+0.2-0.8); p= 0.009
School days missed/30 days0.4 (+1.2) vs. 1.2 (+3.3)0.3 (+0.1-0.7), p= 0.006
Days restricted activity/2 wk1.3 (+2.2) vs. 2.3 (+3.4)0.5 (+0.3-0.8), p= 0.02
Days had to change plans0.4 (+1.2) vs. 0.6 (+1.5)0.5 (+0.3-1.2), p= 0.17
AH-523

Appendix H. Data Table
Author YearJoseph 2007
Health Service Utilization Health Care Costs KnowledgeGrp 1vs Grp 2 Adjusted RR (95% CI), p
Hospitalizations/12 months0.2 (0.6) vs. 0.6 (2.0)0.2 (0.2-0.9); 0.01
ED visits/12 months0.5 (2.0) vs. 0.8 (1.9)0.5 (0.3-1.3); 0.08
Estimated labor costs for the referral coordinator was $ 6.66/treatment student($8.05 per treatment student referred, $11.73 per student contacted)
NR
AH-524

Appendix H. Data Table
Author YearJoseph 2007
Use of Technology Usability HIT SatisfactionNR NR NR
AH-525

Appendix H. Data Table
Author YearJoseph 2007
Health Satisfaction Self-efficacy Health Behavior
Outcomes
NR NR Controller medication adherence, % (n), Positive behaviorGrp 1 vs. Grp 220.4 (31) vs. 12.6 (18), p-- 0.09
No change in negative behaviorGrp 1 vs. Grp 262.5 (95) vs. 63.6 (91), p--?
Negative change in behaviorGrp 1 vs. Grp 217.1 (26) vs. 23.8 (34), p--?
Rescue inhaler activity, % (n)Positive behaviorGrp 1 vs. Grp 238.8 (59) vs. 32.2 (46), p--0.01 ?
no change in negative behaviorGrp 1 vs. Grp 248.7(74) vs. 43.3(62)
Negative change in behaviorGrp 1 vs. Grp 212.5(19) vs. 24.5(35)
Smoking cessation/reduction, % (n)Positive behaviorGrp 1 vs. Grp 295.0 (132) vs. 94.1 (111), p= 0.89?
AH-526

Appendix H. Data Table
Author YearJoseph 2007
Quality of Life Support WithdrawalsCumulative scoreGrp 1 vs. Grp 25.3 (+1.3) vs. 5.0 (+1.5)RR (95% CI)1.2 (0.9-1.6), p=0.35?
Activity domainGrp 1 vs. Grp 25.3 (+1.7) vs. 5.0 (+1.7)RR (95% CI)1.4 (1.0-2.0), p= 0.16
Emotional domainGrp 1 vs. Grp 25.7 (+1.5) vs. 5.3 (+1.6)RR (95% CI)1.2 (0.9-1.7), p-0.38
Symptom domainGrp 1 vs. Grp 25.3 (+1.6) vs. 4.9 (+1.6)RR (95% CI)1.4 (1.0-1.9), p-- 0.07
NR Out of 350 pts who returned consent forms, Baseline incomplete: 36Out of this 36Transferred: 14Moved: 312th grade: 1Other reasons: 18
AH-527

Appendix H. Data Table
Author YearJoseph 2007
Adverse Effects OtherNR Flowchart of study participation and
randomization givenComparison of eligible students by study participation using results of the lung health survey given, not listed hereStudy compliance, status of core behavior, report of controller and rescue medication at session 1 by randomization grp given, not listed hereReasons for contact with referral coordinator and the no of students meeting the coordinator in both grps given, not listed here
AH-528

Appendix H. Data Table
Author YearPatient Recruitment
Setting Clinical Practice SettingPatient Technology
Setting Study design NKashem 2006 NR HF practice at Temple
University medical centerHomes RCT N= 36
Grp C (control): 18Grp T (telemedicine): 18
AH-529

Appendix H. Data Table
Author YearKashem 2006
Years of Study
Length of follow-up (months) Inclusion Criteria Exclusion Criteria Elderly
NR 8 months *Pts with NYHA class 2,3 or 4 Heart failure (HF) and at least 1 HF admission within the past 6 months*All pts required to have telephone and internet access*Be able to read and write*Know basic skills of computer use and internet navigation
NR NR
AH-530

Appendix H. Data Table
Author YearKashem 2006
Underserved Chronic IllnessDisability/
Impairment Gender (% Male) Age (years)NR CHF NR Control: 66.7%
Telemedicine: 72.2%Control: 55.1 (+12.6)Telemedicine: 52.2 (+10.6)
AH-531

Appendix H. Data Table
Author YearKashem 2006
Ethnicity Income (US$) EducationUrban / Rural /
Frontier Other
Patient Characteristics*
Control vs. telemedicine, (%)Caucasian: 66.7 vs. 72.2African American: 27.8 vs. 27.8Latino/Hispanic: 5.6 vs. 0
NR NR NR Grp C vs. Grp TWeight (pounds):206.1 (+66.5) vs. 202.4 (+47.7)
BMI:32 (+12.6) vs. 30.4 (+6.9)
Systolic BP:119.1 (+17.7) vs. 97.8 (+7.2)
Diastolic BP:70.5 (+7.5) vs. 61.7 (+3.4)
Ejection fraction (%):26.6 (+16.4) vs. 23.9 (+17.6)
NYHA (%):Class 2: 42.9 vs. 42.1Class 3: 52.4 vs. 57.9Class 4: 4.8 vs. 0
Cardiomyopathy etiology (%)Ischemic: 44.4 vs. 50Dilated: 38.9 vs. 38.9Other: 16.7 vs. 11.1
AH-532

Appendix H. Data Table
Author YearKashem 2006
Health Insurance Status Literacy Language(s) Health Beliefs Intervention Name
NR NR NR NR Insight Telehealth systems
AH-533

Appendix H. Data Table
Author YearKashem 2006
Intervention Described Intervention Groups Type of Device* Functions*
Intervention*
Evaluation of web based internet telemedicine management system for reducing care encounters in heart failure patients
Grp T: pts reported three times weekly via a secure internet site for telemedicine intervention; received present standard care provided by the advanced HF and cardiomyopathy team.
Pt use of the system: The pt can enter data regarding weight, steps per day with pedometer, blood pressure and heart rate (daily or several days' data can be entered in one login session); the pt can review their data by trend charts and numerical tables displayed on the computer screen; medication screen allows pt or provider to enter medication (each record includes dose, administration schedule, ordering physician, and date of prescription expiration); pt can review his/her medication, dose, frequency, physician and prescription information.
Computer Data entry, review of charts, numerical tables, prescription information, messages between pt and health care provider
AH-534

Appendix H. Data Table
Author YearKashem 2006
Staff Training Subject Training co-interventions PhysiologicNR All pts given
sphygmomanometer and pedometer and instructed how to use them, pt made first time data entry with coaching by a research nurse
NR NR
AH-535

Appendix H. Data Table
Author YearKashem 2006
Health Service Utilization Health Care Costs KnowledgeControl vs. Telemedicine Clinic phone calls:21 vs. 39, p= 0.025Scheduled clinic visits:7 vs. 11, NSUnscheduled clinic visits:5 vs. 3, NSHospitalizations (number):18 vs. 9, p= 0.025Hospital days:133 vs. 44, p= 0.030
NR NR
AH-536

Appendix H. Data Table
Author YearKashem 2006
Use of Technology Usability HIT SatisfactionInteractionsData sent by the patients: 1,253Text messages sent by the patient: 362Generic messages sent by the provider: 836Tailored text messages sent by the provider: 416Total number of internet interactions: 2,867
NR NR
AH-537

Appendix H. Data Table
Author YearKashem 2006
Health Satisfaction Self-efficacy Health Behavior
Outcomes
NR NR NR
AH-538

Appendix H. Data Table
Author YearKashem 2006
Quality of Life Support WithdrawalsNR NR NR
AH-539

Appendix H. Data Table
Author YearKashem 2006
Adverse Effects OtherNR NR
AH-540

Appendix H. Data Table
Author YearPatient Recruitment
Setting Clinical Practice SettingPatient Technology
Setting Study design NKaufman 2003 Diabetic outpatients Medical center Homes Usability cognitive
walkthrough and field observation
N = 25NYC: 14Upstate: 11 (but really 2 case studies)
AH-541

Appendix H. Data Table
Author YearKaufman 2003
Years of Study
Length of follow-up (months) Inclusion Criteria Exclusion Criteria Elderly
NR NA *Patient volunteers*Selected segments based on log files*Contrasted 2 cases at extremes
NR YES
AH-542

Appendix H. Data Table
Author YearKaufman 2003
Underserved Chronic IllnessDisability/
Impairment Gender (% Male) Age (years)YES: rural upstate NY and Hispanic NYC
DM NR NR Mean (SD)NYC: 69.6 (±6) Upstate: 73.7 (±8)
AH-543

Appendix H. Data Table
Author YearKaufman 2003
Ethnicity Income (US$) EducationUrban / Rural /
Frontier Other
Patient Characteristics*
Hispanic: 14ptsCaucasian: 11pts
NR Mean years (SD)NYC: 8.5 (±5)Upstate NY: 12.1 (±3)
NR NR
AH-544

Appendix H. Data Table
Author YearKaufman 2003
Health Insurance Status Literacy Language(s) Health Beliefs Intervention Name
NR NR Spanish: 12English: 13
NR IDEATel
AH-545

Appendix H. Data Table
Author YearKaufman 2003
Intervention Described Intervention Groups Type of Device* Functions*
Intervention*
Videoconferencing, BP & BG uploading and review, education, email
Novice users of system Computer Education, monitoring, videoconferencing,
AH-546

Appendix H. Data Table
Author YearKaufman 2003
Staff Training Subject Training co-interventions PhysiologicNR Ongoing NR NR
AH-547

Appendix H. Data Table
Author YearKaufman 2003
Health Service Utilization Health Care Costs KnowledgeNR NR NR
AH-548
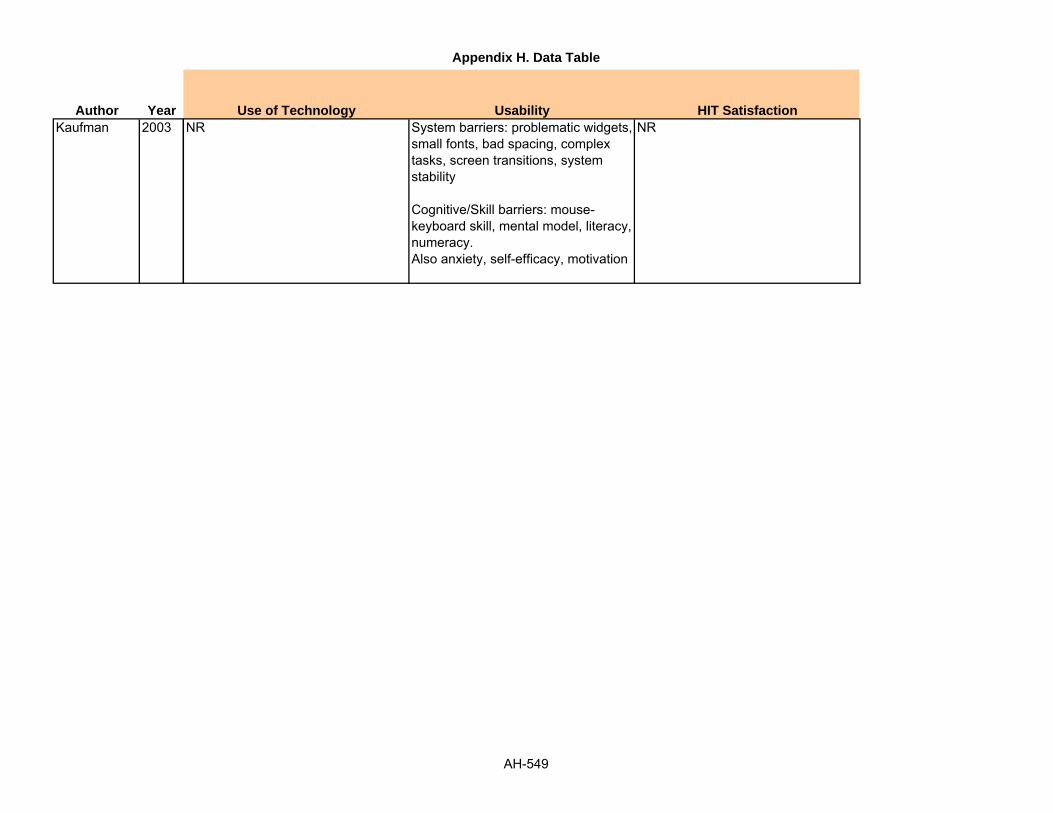
Appendix H. Data Table
Author YearKaufman 2003
Use of Technology Usability HIT SatisfactionNR System barriers: problematic widgets,
small fonts, bad spacing, complex tasks, screen transitions, system stability
Cognitive/Skill barriers: mouse-keyboard skill, mental model, literacy, numeracy. Also anxiety, self-efficacy, motivation
NR
AH-549

Appendix H. Data Table
Author YearKaufman 2003
Health Satisfaction Self-efficacy Health Behavior
Outcomes
NR NR NR
AH-550

Appendix H. Data Table
Author YearKaufman 2003
Quality of Life Support WithdrawalsNR NR NR
AH-551

Appendix H. Data Table
Author YearKaufman 2003
Adverse Effects OtherNR NR
AH-552

Appendix H. Data Table
Author YearPatient Recruitment
Setting Clinical Practice SettingPatient Technology
Setting Study design NKenwright 2005 OCD patients BTSteps clinic Homes Randomized trial N=44
Requested Support: 22 Scheduled Support: 22
AH-553

Appendix H. Data Table
Author YearKenwright 2005
Years of Study
Length of follow-up (months) Inclusion Criteria Exclusion Criteria Elderly
NR 17 weeks *Diagnosed primary obsessive compulsive disorder (OCD) for at least 2 years
Schizophrenia, bipolar disorder, other psychosis, primary major depression, suicidal plans, alcohol or substance abuse.
NR
AH-554

Appendix H. Data Table
Author YearKenwright 2005
Underserved Chronic IllnessDisability/
Impairment Gender (% Male) Age (years)NR OCD NR N = 47.7% Mean: 40
Groups NR
AH-555
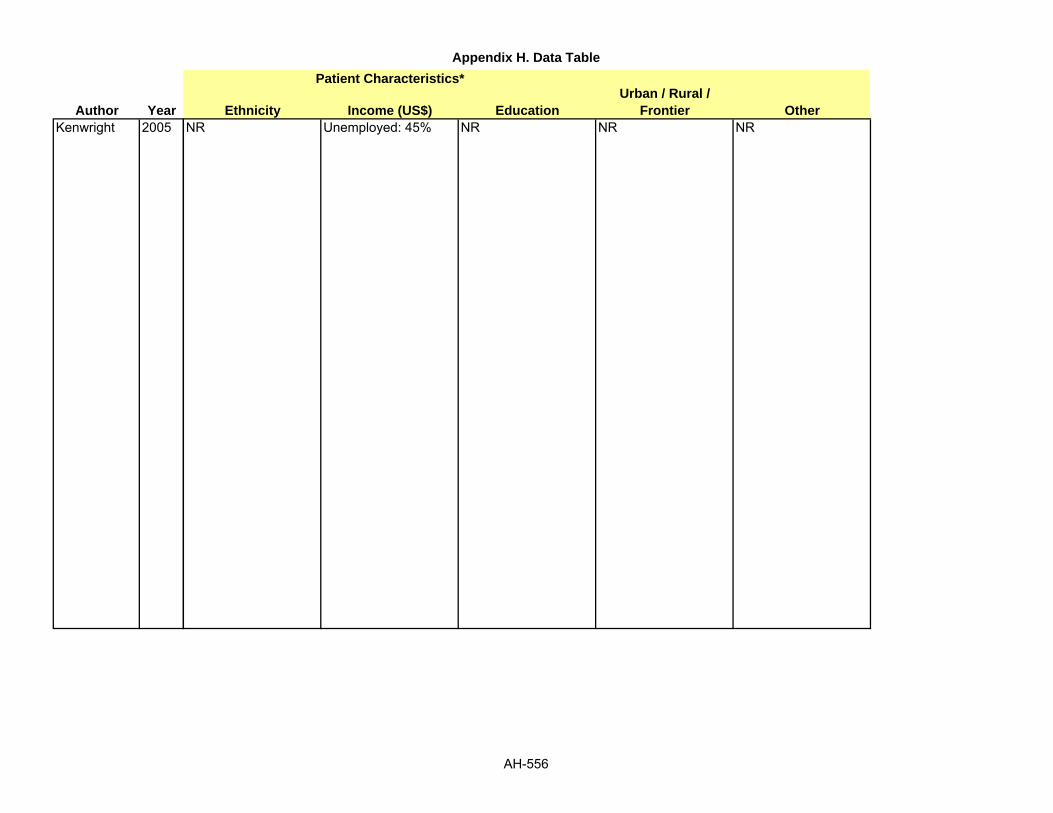
Appendix H. Data Table
Author YearKenwright 2005
Ethnicity Income (US$) EducationUrban / Rural /
Frontier Other
Patient Characteristics*
NR Unemployed: 45% NR NR NR
AH-556

Appendix H. Data Table
Author YearKenwright 2005
Health Insurance Status Literacy Language(s) Health Beliefs Intervention Name
NR NR NR NR NR
AH-557

Appendix H. Data Table
Author YearKenwright 2005
Intervention Described Intervention Groups Type of Device* Functions*
Intervention*
Live help-line support during office hours
Scheduled support: 9 therapist initiated phone calls at set appointments over the 17 weeksRequested support: patient-initiated calls when help was wanted
Phone Help-line support
AH-558

Appendix H. Data Table
Author YearKenwright 2005
Staff Training Subject Training co-interventions PhysiologicNR NR BT Steps: Phone system
with user manual to guide individually tailored self-help for OCD. Uses Behavioral exposure therapy with ritual prevention (ERP). BTSteps guides traditional ERP in 9 steps. Steps 1-3 concern education and self-assessment, steps 4-9 guide daily self-exposure to triggers of rituals, obsessions, and discomfort, followed by self-imposed ritual prevention. IVR system helps users to identify triggers for rituals and obsessions and to set homework tasks that last at least 1 hour a day until discomfort falls for each trigger.
NR
AH-559

Appendix H. Data Table
Author YearKenwright 2005
Health Service Utilization Health Care Costs KnowledgeNR NR NR
AH-560

Appendix H. Data Table
Author YearKenwright 2005
Use of Technology Usability HIT SatisfactionTherapist-Support Phone Time: Mean per patient duration of support calls:Scheduled: Mean: 13 minutes (Range 5-35 minutes)Requested: Mean: 11 minutes (Range 3-25 minutes)
Mean total support time per patient:Scheduled: Mean: 76 minutes (+78); Mean # calls: 7.5 (+3.7)Requested: Mean: 16 minutes (+36); Mean # calls: 1.5 (+2.8)
Mean per patient time spent calling BTSteps's IVR system:Scheduled: 232 minutes (+162)Requested: 178 minutes (+149)
NR NR
AH-561

Appendix H. Data Table
Author YearKenwright 2005
Health Satisfaction Self-efficacy Health Behavior
Outcomes
NR Yale-Brown Obsessive Compulsive Scale (YBOCS):Scheduled patients: significant improvements on YBOCS Total (t= 4.8, 95% CI= 4.6-113.6, effect size=1.2, p<.001,), YBOCS Obsessions (t= 4.8, 95%CI= 2.2-5.6, effect size, 1.0, p<.001), YBOCS Compulsions (t= 4.4, 95%CI= 2.2-6.1, effect size=1.1, p=.04)Requested patients: sig. improvement on YBOCS Compulsions (t= 2.0, 95%CI=.00-2.9, effect size=0.6, p=.04)Improvement significantly greater in Scheduled than Requested patients on YBOCS Total (F= 7.0, p=.01) and YBOCS Compulsions (F= 11.6, p=.001). ns for YBOCS Obsessions.Treated Target Triggers: discomfort during patients first two ERP homework tasks: Scheduled and Requested patients improved significantly, but difference ns (F=.917, p=.346)Work and Social Adjustment: Improvement greater for scheduled than requested patients on WSAS Total (F=3.2, df=1, p=.05)
NR
AH-562

Appendix H. Data Table
Author YearKenwright 2005
Quality of Life Support WithdrawalsNR NR Scheduled: 13.6%
Requested: 59.1% (2-tailed Fisher's exact test= 0.004)
AH-563

Appendix H. Data Table
Author YearKenwright 2005
Adverse Effects OtherNR NR
AH-564

Appendix H. Data Table
Author YearPatient Recruitment
Setting Clinical Practice SettingPatient Technology
Setting Study design NKenwright 2004 NR Computer aided self-help
clinicHomes/clinic Cohort Home internet=10
London clinic= 17
AH-565

Appendix H. Data Table
Author YearKenwright 2004
Years of Study
Length of follow-up (months) Inclusion Criteria Exclusion Criteria Elderly
Dec 2000 to Dec 2001
1 month *Presence of phobia or panic disorder (based on an interview checklist of ICD-10 diagnostic criteria; WHO, 1992)*Motivation to try self- help*Absence of substance misuse, psychosis or active suicidal plan
NR NR
AH-566

Appendix H. Data Table
Author YearKenwright 2004
Underserved Chronic IllnessDisability/
Impairment Gender (% Male) Age (years)NR PHOBIA/PANIC
DISORDERNR Home internet vs.
London clinic60% vs. 52.9%
Home internet vs. London clinic37 yrs vs. 36 yrs
AH-567

Appendix H. Data Table
Author YearKenwright 2004
Ethnicity Income (US$) EducationUrban / Rural /
Frontier Other
Patient Characteristics*
NR NR NR NR Condition; Home internetAgoraphobia with panic= 6Social phobia=3Insect phobia and Claustrophobia=1Co morbid conditions=5 (depression=3, Generalized anxiety disorder=2)
London clinicSpecific phobia=7Agoraphobia with panic= 5Social phobia=4Generalized anxiety disorder=2Obsessive compulsive disorder= 1
Mean problem severityHome internet vs. London clinic= 6 vs. 5.4
Employed full time
AH-568

Appendix H. Data Table
Author YearKenwright 2004
Health Insurance Status Literacy Language(s) Health Beliefs Intervention Name
NR NR NR NR FearFighter
AH-569

Appendix H. Data Table
Author YearKenwright 2004
Intervention Described Intervention Groups Type of Device* Functions*
Intervention*
Computer sided exposure self help system at home on the internet with brief therapist support by phone
Home internet- unlimited access to fearfighter on the internet for 12 weeks, never saw or attended the clinic. Therapist scheduled 7 live 0 min support session by telephone at weeks 1,2, 4, 6, 8, 10 and 12
London clinic-given appointments to use fearfighter on a stand alone computer in the clinic at weeks 1,2,4,6,8,10 and 12. Therapist gave support at start and end of each session, for a total of 10 min per session.
Computer Fearfighter intervention (details of the intervention not available)
AH-570

Appendix H. Data Table
Author YearKenwright 2004
Staff Training Subject Training co-interventions PhysiologicNR NR NR NR
AH-571

Appendix H. Data Table
Author YearKenwright 2004
Health Service Utilization Health Care Costs KnowledgeNR NR NR
AH-572

Appendix H. Data Table
Author YearKenwright 2004
Use of Technology Usability HIT SatisfactionHome internet usersMean use= 16 times (+11), over 66 days (+25)
London clinicMean total of 237 min (+57) at the clinic
NR Internet users generally satisfied and felt comfortable using the system (Further info available on request)3 pts said they would prefer face to face guided self help to internet guided self help.
AH-573

Appendix H. Data Table
Author YearKenwright 2004
Health Satisfaction Self-efficacy Health Behavior
Outcomes
NR Week 0 vs. Week 12 vs. Week 16 vs. Change vs. Effect size
FQ Global phobia (0-8), Mean (SD)Home internet:6.0 (+1.2) vs. 3.4 (+1.3) vs. 2.8 (+1.7) vs. 53 (p<0.001) vs. 1.5London clinic: 5.4 (+2) vs. 3.2 (+1.8) vs. 3.2 (+1.6) vs. 41 (p<0.001) vs. 0.4
FQ total phobia (0-120), Mean (SD)Home internet: 46 (+27) vs. 32 (+24) vs. 35 (+23) vs. 24 (p< 0.001) vs. 0.4London clinic: 49 (+27) vs. 32 (+23) vs. 33 (+27) vs. 33 (p<0.001) vs. 0.6
FQ depression (0-8)Home internet: 4.1 (+1.9) vs. 3.2 (+4) vs. 2 (+1.5) vs. 51 (p<0.05) vs. 0.6London clinic:4.3 (+2.4) vs. 4.3 (+7.1) vs. 2.9 (+2.1) vs. 33 (p<0.05) vs. 0.8
FQ Anxiety/depression (0-48)Home internet: 19.4 (+6.6) vs. 19 (+4.8) vs. 7 (+4.1) vs. 64 (p<0.001) vs. 1.8London clinic:
NR
AH-574

Appendix H. Data Table
Author YearKenwright 2004
Quality of Life Support WithdrawalsNR NR 266 referred to clinic
56 met criteria for treatment with fearfighter154 met criteria for clinic's other computer aided self help systems for depression, general anxiety and obsessive compulsive disorder56 more were unsuitable for computer aided treatment
Out of 56 pts in the fearfighter grp13 refused self help
43 began using intervention, 16 dropped out before completion of treatment (all in the clinic grp)
AH-575

Appendix H. Data Table
Author YearKenwright 2004
Adverse Effects OtherNR Internet users had slightly more
therapist support than stand alone computer users113 min (+28.1) vs. 99 min (+11.4), t= -1.42, p=0.16
AH-576

Appendix H. Data Table
Author YearPatient Recruitment
Setting Clinical Practice SettingPatient Technology
Setting Study design NKim 2006a Outpatient diabetes clinic University hospital Homes RCT N = 73
Grp 1: 28Grp 2: 22Grp 3: 23
AH-577

Appendix H. Data Table
Author YearKim 2006a
Years of Study
Length of follow-up (months) Inclusion Criteria Exclusion Criteria Elderly
NR 3 mos *Age 20 years and older*FBS less than 240 mg/dL and/or *Diabetes mellitus history less than 20 years*No chronic complications of severe retinopathy, nephropathy, or neuropathy*No evidence of heart disease, musculoskeletal disorders, or other disabling diseases that could restrict physical activity*No insulin administration
NR NR
AH-578

Appendix H. Data Table
Author YearKim 2006a
Underserved Chronic IllnessDisability/
Impairment Gender (% Male) Age (years)NR DM NR N = 53.4% Mean: 55
AH-579

Appendix H. Data Table
Author YearKim 2006a
Ethnicity Income (US$) EducationUrban / Rural /
Frontier Other
Patient Characteristics*
Korean NR NR NR NR
AH-580

Appendix H. Data Table
Author YearKim 2006a
Health Insurance Status Literacy Language(s) Health Beliefs Intervention Name
NR Korean Korean NR NR
AH-581

Appendix H. Data Table
Author YearKim 2006a
Intervention Described Intervention Groups Type of Device* Functions*
Intervention*
WB= Web-based intervention, included interactive and animated features, stage-based personalized sections on goal setting, activity planning, determining target heart rates, and psychological and physical readiness questionnaires. Assist sequential movement through relevant stage-based information.
Group 1: WB (web-based intervention group)Group 2: PM (print material intervention group)Group 2: UC (usual care group)
Web-based intervention Education, assessment, advice sending
AH-582

Appendix H. Data Table
Author YearKim 2006a
Staff Training Subject Training co-interventions PhysiologicHealth care providers had to be fully trained for the constructs and meaning of TTM and use of the web-based intervention
NR NR FBS:Grp 1 and Grp 2 both decreased significantly, however did not differ significantlyGrp 1 and Grp 2 decreased significantly more than Gp 3 (P<0.05, both)
HbA1C:Grp 1 and Grp 2 both decreased significantly, however did not differ significantlyGrp 1 and Grp 2 decreased significantly more than Gp 3 (P<0.01 and P<0.05, respectively)
AH-583

Appendix H. Data Table
Author YearKim 2006a
Health Service Utilization Health Care Costs KnowledgeNR NR NR
AH-584

Appendix H. Data Table
Author YearKim 2006a
Use of Technology Usability HIT SatisfactionNR NR 82.9% of Grp 1 reported satisfaction
with the intervention
AH-585
Appendix H. Data Table
Author YearKim 2006a
Health Satisfaction Self-efficacy Health Behavior
Outcomes
NR NR NR
AH-586

Appendix H. Data Table
Author YearKim 2006a
Quality of Life Support WithdrawalsPhysical Activity:Both Grp 1 and Grp 2 increased significantly (P<0.001), however the 2 groups did not differ significantly
Grp 1 and Grp 2 increased significantly more than Grp 3 (P<0.01 and P<0.001, respectively)
NR NR
AH-587

Appendix H. Data Table
Author YearKim 2006a
Adverse Effects OtherNR NR
AH-588

Appendix H. Data Table
Author YearPatient Recruitment
Setting Clinical Practice SettingPatient Technology
Setting Study design NKim 2007 NR Endocrinology outpatient
department of tertiary care hospital in South Korea
Homes Cohort N=60Control group: 30Intervention group: 30
AH-589

Appendix H. Data Table
Author YearKim 2007
Years of Study
Length of follow-up (months) Inclusion Criteria Exclusion Criteria Elderly
Jan 2003 to Aug 2004
12 weeks *Pts should be able to perform blood glucose testing and self injection of medication*Access the website *Have their own cellular phone
Clinical history of an important illness, renal insufficiency with a creatinine level> 0.08 mmol/l, or had been using insulin pumps.
NR
AH-590

Appendix H. Data Table
Author YearKim 2007
Underserved Chronic IllnessDisability/
Impairment Gender (% Male) Age (years)NR DIABETES NR CG: 42.3%
IG: 44%CG: 47.5 (9.1)IG: 46.8 (8.8)
AH-591

Appendix H. Data Table
Author YearKim 2007
Ethnicity Income (US$) EducationUrban / Rural /
Frontier Other
Patient Characteristics*
NR NR NR NR BMI (kg/m2), CG vs. IG23.4 (+2.5) vs. 24.5 (+2.9)
Diabetes duration (yrs) CG : IG:8 (+4.9) : 5.2 (+5.9)
Treatment method, CG : IG
Insulin:8 (+30.8) : 8 (+32)
OHA:18 (+69.2) : 17 (+68.0)
Glucosylated hemoglobin (%):7.59 (+1.09) : 8.09 (+1.72)
Fasting plasma glucose (mmol/l):7.9 (+1.3) vs. 8.4 (+1.4)
2HPMG (mmol/l):12.9 (+4.3) vs. 14.2 (+4.5)
AH-592

Appendix H. Data Table
Author YearKim 2007
Health Insurance Status Literacy Language(s) Health Beliefs Intervention Name
NR NR NR NR Nurse short messaging service
AH-593

Appendix H. Data Table
Author YearKim 2007
Intervention Described Intervention Groups Type of Device* Functions*
Intervention*
To investigate the effectiveness of an educational intervention that used both cellular phone and the internet to provide SMS relating to plasma glucose levels.
CG: pts met the endocrinologist once or twice during the study period and were given recommendations about medication, medication dosage and lifestyle modification by the specialist
IG: pts logged in website and sent their self monitored blood glucose levels and drug information, including the kinds and dosages of insulin and oral anti diabetic medications; data transported to the internet server system and automatically displayed on individual electronic chart in the homepage and pts able to see the recommendations as well as data on the website(After integrating the information, the researcher sent optimal recommendations back to each pt, weekly, by a SMS by a cellular phone or wired internet)
Cellular phone, computer Data collection, recommendations by SMS
AH-594

Appendix H. Data Table
Author YearKim 2007
Staff Training Subject Training co-interventions PhysiologicNR Pt trained on entering data
on the website for 30 mins by a researcher
Glycosylated hemoglobin (%); CG vs. IGBaseline:7.59 (+1.09) vs. 8.09 (+1.72)3 months:7.66 (+0.91) vs. 6.94 (+1.04)Group:0.22 (+0.644)Time:7.46 (+0.008)Group X Time:8.35 (+0.005)
Fasting plasma glucose (mmol/l)Baseline:7.9 (+1.3) vs. 8.4 (+1.4)3 months:8.2 (+2.3) vs. 8.0 (+1.9)Group:0.07 (+0.787)Time:0.40 (+0.532)Group X Time:3.03 (+0.088)
2 HPMG (mmol/l)Baseline:12.9 (+4.3) vs. 14.2 (+4.5)3 months:
NR
AH-595

Appendix H. Data Table
Author YearKim 2007
Health Service Utilization Health Care Costs KnowledgeNR NR NR
AH-596

Appendix H. Data Table
Author YearKim 2007
Use of Technology Usability HIT SatisfactionNR NR NR
AH-597
Appendix H. Data Table
Author YearKim 2007
Health Satisfaction Self-efficacy Health Behavior
Outcomes
NR NR NR
AH-598

Appendix H. Data Table
Author YearKim 2007
Quality of Life Support WithdrawalsNR NR IG: 5 subjects did not record their
glucose levels for more than 4 weeks on the web site
CG: 4 subjects were lost before completing post test , 1 moved to another city and three decided to opt out of the program before completing the post test
AH-599

Appendix H. Data Table
Author YearKim 2007
Adverse Effects OtherNR NS
AH-600

Appendix H. Data Table
Author YearPatient Recruitment
Setting Clinical Practice SettingPatient Technology
Setting Study design NKim 2006b Endocrinology outpatient
department of tertiary care hospitcal located in an urban area
South Korea Homes Quasi-experimental, cohort, 1-group, pretest and posttest
N=45
AH-601

Appendix H. Data Table
Author YearKim 2006b
Years of Study
Length of follow-up (months) Inclusion Criteria Exclusion Criteria Elderly
January 2003 to March 2004
12 weeks *30 years of age or older*Access to internet in the home*Diagnosed diabetes*Able to perform perform blood glucose self-testing and self-injection of medication*Able to input data at the web site*Have their own cell phone
Not following the inclusion criteria, clinical history of heart failure, hepatic dysfunction, renal insufficiency with a creatinine level higher than 1.5 mg/dL, or had been using insulin pumps
NR
AH-602

Appendix H. Data Table
Author YearKim 2006b
Underserved Chronic IllnessDisability/
Impairment Gender (% Male) Age (years)NR DM NR 42% 43.5
AH-603

Appendix H. Data Table
Author YearKim 2006b
Ethnicity Income (US$) EducationUrban / Rural /
Frontier Other
Patient Characteristics*
NR NR NR NR MeanBMI: 24.3Systolic BP: 117.2 mmHgDiastolic BP: 78.9 mmHgDuration of diabetes: 5.6 yrsHbA1c: 8.1%Fasting blood glucose: 164.9 mg/dL
AH-604

Appendix H. Data Table
Author YearKim 2006b
Health Insurance Status Literacy Language(s) Health Beliefs Intervention Name
NR NR Korean NR NR
AH-605

Appendix H. Data Table
Author YearKim 2006b
Intervention Described Intervention Groups Type of Device* Functions*
Intervention*
Pts were asked to input blood glucose levels every day via internet or cell phone. Optimal recommendations were sent weekly to each pt via SMS
NR Website and text messages
Data input and data receiver
AH-606

Appendix H. Data Table
Author YearKim 2006b
Staff Training Subject Training co-interventions PhysiologicNR 30 minute instruction on
how to input data at the website
NR Glycosylated hemoglobin, %Pretest: 8.1 + 2.1Posttest: 7.0 + 1.1Difference: -1.1 + 2.1t: 2.89P: 0.006
Adherence
Diabetic diet, d/wkPretest: 3.8 + 2.8Posttest: 3.0 + 2.7Difference: -0.8 + 1.8t: 1.44P: 0.182
30-minute physical exercise, d/wkPretest: 2.5 + 2.2Posttest: 3.4 + 2.2Difference: 0.9 + 2.0t: 2.22P: 0.036
Diabetic medication taking, d/wkPretest: 4.8 + 2.6Posttest: 5.9 + 1.9Difference: 1.1 + 1.9t: 2.36P: 0.32
Foot care, d/wkPretest: 4.9 + 3.0
AH-607

Appendix H. Data Table
Author YearKim 2006b
Health Service Utilization Health Care Costs KnowledgeNR NR NR
AH-608

Appendix H. Data Table
Author YearKim 2006b
Use of Technology Usability HIT SatisfactionNR NR NR
AH-609

Appendix H. Data Table
Author YearKim 2006b
Health Satisfaction Self-efficacy Health Behavior
Outcomes
NR NR NR
AH-610

Appendix H. Data Table
Author YearKim 2006b
Quality of Life Support WithdrawalsNR NR 12 pts did not record their glucose
levels for more than 4 weeks on the website
AH-611

Appendix H. Data Table
Author YearKim 2006b
Adverse Effects OtherNR Secondary Outcomes at 12 mos for
all pts completing f/u in the electronic communications and home blood pressure monitoring trial; Mean (SD)
# of antihypertensive medication classesMissing Data: 0Baseline: 1.64 (+0.85)UC: 1.69 (+0.91)IVR: 1.94 (+0.91)IVR + PC: 2.16 (+0.93)
Differences between IVR Groups, Mean Difference or RR (95% CI)UC vs IVR: 0.3 (0.1 to 0.4)UC vs IVR + PC: 0.5 (0.3 to 0.6)IVR vs IVR + PC: 0.2 (0.1 to 0.4)
Aspirin use, No. (%)Missing Data: 38Baseline: 338 (+48.8)UC: 124 (+53.0)IVR: 131 (+56.0)IVR + PC: 149 (+66.5)
Differences between IVR Groups, Mean Difference or RR (95% CI)UC vs IVR: 1.1 (0.9 to 1.2)UC vs IVR + PC: 1.3 (1.1 to 1.5)IVR vs IVR + PC: 1.2 (1.0 to 1.4)
AH-612

Appendix H. Data Table
Author YearPatient Recruitment
Setting Clinical Practice SettingPatient Technology
Setting Study design NKosma 2005 Rehabilitation centers,
hospitals, colleges, and disability newsletters
NR Homes Pilot Study; RCT N=75
AH-613

Appendix H. Data Table
Author YearKosma 2005
Years of Study
Length of follow-up (months) Inclusion Criteria Exclusion Criteria Elderly
NR 4 weeks *Female age: 18-54*Male age: 18-44*Inclusion criteria based on health status, stages of change level, age range, disability type, internet access, but is NR what specifically was used to include/exclude pts
Unclear NR
AH-614

Appendix H. Data Table
Author YearKosma 2005
Underserved Chronic IllnessDisability/
Impairment Gender (% Male) Age (years)NR NR Physical Disability
Amputation: 5.3%Cerebral palsy: 18.7%Muscular dystrophy: 4%Spinal Cord injury: 33.3%Multiple Sclerosis: 21.3%Cerebral Palsy: 18.7%Other: 17.3%
28% 38.73 yrs (+8.86)
AH-615

Appendix H. Data Table
Author YearKosma 2005
Ethnicity Income (US$) EducationUrban / Rural /
Frontier Other
Patient Characteristics*
Caucasian: 89.3%African-Americans: 5.3%
NR College Grad: 49.3%Graduate degree: 29.3%HS grad: 4%Some college: 17.3%
NR Stages of ChangePrecontemplation: 10.7%Contemplation: 37.3%Preparation: 33.3%Action: 9.3%Maintenance: 9.3%
AH-616

Appendix H. Data Table
Author YearKosma 2005
Health Insurance Status Literacy Language(s) Health Beliefs Intervention Name
NR NR NR NR NR
AH-617

Appendix H. Data Table
Author YearKosma 2005
Intervention Described Intervention Groups Type of Device* Functions*
Intervention*
Web-based physical activity motivational program with and without discussion, weekly motivational messages
IVR (n=46): 4 week web-based physical activity motivational program with a different lesson plan for each link
CG (n=29): no intervention
Website and emails Motivational messages, discussion
AH-618

Appendix H. Data Table
Author YearKosma 2005
Staff Training Subject Training co-interventions PhysiologicNR NR NR Posttest
CG: more active 9.3 MET hrs/dayIVR: 6.1 MET hrs/day
AH-619

Appendix H. Data Table
Author YearKosma 2005
Health Service Utilization Health Care Costs KnowledgeNR NR NR
AH-620

Appendix H. Data Table
Author YearKosma 2005
Use of Technology Usability HIT SatisfactionNR 75% found the program appropriate
for national distribution among adults with physical disabilities, easy to use scored 4.5 out of a 5 pt scale
Out of a 5 pt scale (5 highest, 1 lowest)Helpfulness: 3.4 (+1.4)Ability to change physical activity: 3.4 (+1.4)Ability to maintain physical activity: 3.3 (+1.2)
AH-621

Appendix H. Data Table
Author YearKosma 2005
Health Satisfaction Self-efficacy Health Behavior
Outcomes
NR NR Stages of change Pretest, nPreconemplation: 8Conemplation: 28Preparation: 25Action: 7Maintenance: 7
Stages of change Posttest, nPrecontemplation: 7Conemplation: 21Preparation: 22Action: 13Maintenance: 12
AH-622

Appendix H. Data Table
Author YearKosma 2005
Quality of Life Support WithdrawalsNR NR NR
AH-623

Appendix H. Data Table
Author YearKosma 2005
Adverse Effects OtherNR NR
AH-624

Appendix H. Data Table
Author YearPatient Recruitment
Setting Clinical Practice SettingPatient Technology
Setting Study design NKressig 2002 Community dwellers VA rehabilitation center and
a local senior centerUnclear Cohort N= 34
AH-625

Appendix H. Data Table
Author YearKressig 2002
Years of Study
Length of follow-up (months) Inclusion Criteria Exclusion Criteria Elderly
NR NR *60 yrs of age and older without medical contraindication for exercise*Intact manual dexterity (ability to dial a phone number)*Intact near vision (ability to read a newspaper)*System included prescreening procedures to ensure pts are at minimal risk for falls and demonstrate normal cognitive function and normal mood
NR YES: 60 yrs and older
AH-626

Appendix H. Data Table
Author YearKressig 2002
Underserved Chronic IllnessDisability/
Impairment Gender (% Male) Age (years)NR NR NR 50% Mean: 7.04 (+6.9)
Range: 60-87
AH-627

Appendix H. Data Table
Author YearKressig 2002
Ethnicity Income (US$) EducationUrban / Rural /
Frontier Other
Patient Characteristics*
NR $10,000 to $39,000: 11$40,000 or higher: 17Did not want to say: 6
Some college education or more: 33
NR No or very little computer experience:15
Cognitive function as measured by OMCT ranged from 0 to 10 with 30 pts (out of 32) scoring between 0 and 2
AH-628

Appendix H. Data Table
Author YearKressig 2002
Health Insurance Status Literacy Language(s) Health Beliefs Intervention Name
NR NR NR NR Exercise expert system
AH-629

Appendix H. Data Table
Author YearKressig 2002
Intervention Described Intervention Groups Type of Device* Functions*
Intervention*
System is a computerized health promotion tool whose ease of use and acceptability of the exercise recommendations were rated by pts. Time and assistance requirements and ability to successfully interface with the software were also evaluated.
Exercise expert system: software generates individualized exercise prescriptions for older healthy individuals based on responses given by clients and their practitioners to three different questionnaires, questionnaires pertain to medical history, mood, functional status, mental status, and specific preferences known to influence exercise behavior and maximize subsequent adherence.
Computer Tailored exercise prescriptions
AH-630

Appendix H. Data Table
Author YearKressig 2002
Staff Training Subject Training co-interventions PhysiologicNR System training manual:
illustrated training manual with elementary mouse training and general instructions for interaction with the system.Pts were seated in front of computer and left alone with the manuals until they were ready to start the computerized questionnaire. Pts encouraged to ask questions after reviewing the manual.
NR NR
AH-631

Appendix H. Data Table
Author YearKressig 2002
Health Service Utilization Health Care Costs KnowledgeNR NR NR
AH-632

Appendix H. Data Table
Author YearKressig 2002
Use of Technology Usability HIT SatisfactionMean (SD), Min to Max in minutesTraining time: 3.76 (+1.50), 1-7Completion time: 32.58 (+15.57), 12-79
Mean (SD), min-max
Ease of use score (0-5)4.58 (+0.66), 3-5
Requests for assistanceMouse related: 0.67 (+1.16), 0-5Non mouse related: 2.36 (+1.90), 0-8
Mean (SD), min- maxPrescription acceptability score (6-24)21.45 (+2.24), 15-24
AH-633

Appendix H. Data Table
Author YearKressig 2002
Health Satisfaction Self-efficacy Health Behavior
Outcomes
NR NR NR
AH-634

Appendix H. Data Table
Author YearKressig 2002
Quality of Life Support WithdrawalsNR NR 33 pts completed the protocol,
1 male pt unable to complete because of fatigue
AH-635

Appendix H. Data Table
Author YearKressig 2002
Adverse Effects OtherNR Pearson correlation (p values) for
objective performance measuresMeasures; Total time vs. total assistance vs. mouse related vs. non mouse related
Age: 0.314 (0.750) vs. 0.532 (0.001) vs. 0.338 (0.054) vs. 0.491 (0.004)
Computer experience: - 0.456 (0.008) vs. - 0.389 (0.025) vs. - 0.303 (0.086) vs. - 0.325 (0.065)
Education: 0.049 (0.785) vs. - 0.116 (0.521) vs. - 0.227 (0.203) vs. - 0.013 (0.944)
OMCT score:0.218 (0.222) vs. 0.081 (0.654) vs. -0.089 (0.622) vs. 0.161 (0.371)
Income: - 0.248 (0.164) vs. - 0.204 (0.256) vs. - 0.139 (0.442) vs. - 0.182 (0.310)
Ease of use score:- 0.481 (0.005) vs. - 0.427 (0.013) vs. - 0.311 (0.079) vs. - 0.370 (0.034)
Prescription acceptability score:- 0.008 (0.967) vs. - 0.057 (0.754) vs.
AH-636

Appendix H. Data Table
Author YearPatient Recruitment
Setting Clinical Practice SettingPatient Technology
Setting Study design NKwon 2004 Outpatient clinic Kangnam St. Mary's
Hospital Diabetes CenterHomes RCT N = 110
Grp 1: 55Grp 2: 55
Labiris 2004 Internet Urban areas of USA, EU, Canada, and Australia
Homes Cohort N=1,234Counseling given to 1,021
AH-637

Appendix H. Data Table
Author YearKwon 2004
Labiris 2004
Years of Study
Length of follow-up (months) Inclusion Criteria Exclusion Criteria Elderly
May-August 2001
3 mos *Type 2 diabetes for >1 year*Internet access*>30 years old
Significant diseases that were likely to affect the outcome and compliance of this studyAny who had participated in other programs that provided any information or education for diabetes management
NR
8 yrs NR NR Need for physical examination and insufficient provision of medical data were the main reasons for failure to answer all requests
NR
AH-638

Appendix H. Data Table
Author YearKwon 2004
Labiris 2004
Underserved Chronic IllnessDisability/
Impairment Gender (% Male) Age (years)NR TYPE 2 DM NR Grp 1: 58%
Grp 2: 64%MeanGp 1: 54 Gp 2: 53
YES YES: Orthopedic related illnesses
NR 60.50% Men: 43 (18-77)Women: 55 (32-75)
AH-639

Appendix H. Data Table
Author YearKwon 2004
Labiris 2004
Ethnicity Income (US$) EducationUrban / Rural /
Frontier Other
Patient Characteristics*
Korean NR NR NR NR
NR NR NR YES: urban areas of EU, USA, Canada, and Australia
NR
AH-640

Appendix H. Data Table
Author YearKwon 2004
Labiris 2004
Health Insurance Status Literacy Language(s) Health Beliefs Intervention Name
NR Korean Korean NR Web-based diabetes management system
NR NR NR NR NR
AH-641

Appendix H. Data Table
Author YearKwon 2004
Labiris 2004
Intervention Described Intervention Groups Type of Device* Functions*
Intervention*
NR Group 1: Intervention groupGroup 2: Control group
NR NR
Internet-based counseling: patients would send e-mails to panel of physicians and orthopedic surgeons, and GPs, and these professionals would respond
Number of RequestsSystemic diseases: 764Pediatric orthopedics: 154Sports Injuries: 143Hand: 81Fracture complications: 64Misc: 28
E-mail To provide online counseling to pts
AH-642

Appendix H. Data Table
Author YearKwon 2004
Labiris 2004
Staff Training Subject Training co-interventions PhysiologicNR NR NR At 12 week follow-up HbA1C levels
for Grp 1 decreased from 7.59 at baseline to 6.94%, (P<0.001) and decreased significantly more at follow-up than Grp 2 (P<0.05)
HDL for Grp 2 changed from 47.9 to 50.6 mg/dl (P<0.05)
No other significant changes
NR NR NR NR
AH-643

Appendix H. Data Table
Author YearKwon 2004
Labiris 2004
Health Service Utilization Health Care Costs KnowledgeNR NR NR
NR NR NR
AH-644

Appendix H. Data Table
Author YearKwon 2004
Labiris 2004
Use of Technology Usability HIT SatisfactionNR NR NR
NR NR NR
AH-645

Appendix H. Data Table
Author YearKwon 2004
Labiris 2004
Health Satisfaction Self-efficacy Health Behavior
Outcomes
NR NR NR
NR NR NR
AH-646

Appendix H. Data Table
Author YearKwon 2004
Labiris 2004
Quality of Life Support WithdrawalsNR NR N = 9
Grp1: 2 for not following the study protocol, 2 for lost to follow-upGrp 2: 5 for lost to follow-up
NR NR NR
AH-647

Appendix H. Data Table
Author YearKwon 2004
Labiris 2004
Adverse Effects OtherNR NR
NR NR
AH-648

Appendix H. Data Table
Author YearPatient Recruitment
Setting Clinical Practice SettingPatient Technology
Setting Study design NLaFramboise 2003 NR NR Homes RCT N= 90
Telephonic grp: 26Home visit: 23Health buddy: 21Home visit/health buddy: 20
AH-649

Appendix H. Data Table
Author YearLaFramboise 2003
Years of Study
Length of follow-up (months) Inclusion Criteria Exclusion Criteria Elderly
NR 2 months *Inclusion criteria were oriented to person, place and time*No visual impairment*Ability to speak and read English*Having an active phone service.
NR NR
AH-650

Appendix H. Data Table
Author YearLaFramboise 2003
Underserved Chronic IllnessDisability/
Impairment Gender (% Male) Age (years)NR CHF NR Telephonic: 16.7%
Home visit: 7.8%Health buddy: 13.3%Home visit/health buddy: 12.2%Total: 50.0%
Mean (Range)
Telephonic: 67.6 (41-86)Home visit: 73.4 (53-85)Health buddy: 66.5 (3991)Home visit/health buddy: 74.4 (56-90)Total: 70.3 (39-91)
AH-651

Appendix H. Data Table
Author YearLaFramboise 2003
Ethnicity Income (US$) EducationUrban / Rural /
Frontier Other
Patient Characteristics*
Telephonic vs. Home visit vs. Health buddy vs. Home visit+health buddy vs. Total
Caucasian:25.6 % vs. 20.0% vs. 21.1% vs. 17.8% vs. 83.3%
African American:3.3% vs. 4.4% v 2.2% vs. 3.3% vs. 13.3%
Other: 0.0% vs. 1.1% vs. 0.0% vs. 1.1% vs. 2.2%
Mean (Range)
Telephonic: $16,646 (5837-32,000)
Home visit: $ 15,179 (5584-32,000)
Health buddy: $ 20,101 (5700-50000)
Home visit+health buddy: $ 21,680 (5800-65000)
Total: $ 18,380 (5584-65,000)
Mean (Range)
Telephonic vs. Home visit vs. Health buddy vs. Home visit+health buddy vs. Total
11.4 (7-14) vs. 10.6 (3-16) vs. 11.9 (6-18) vs. 11.9 (8-16) vs. 11.4 (3-18)
NR Living arrangement (%)
Telephonic vs. Home visit vs. Health buddy vs. Home visit+health buddy vs. Total
Alone: 5.6 vs. 10 vs. 8.9 vs. 8.9 vs. 33.3
With spouse/significant other: 17.8 vs. 8.9 vs. 12.2 vs. 11.1 vs. 50
With other relative: 5.6 vs. 5.6 vs. 2.2 vs. 2.2 vs. 15.6
In home assistant or assisted living: 0 vs. 1.1 vs. 0 vs. 0 vs. 1.1
AH-652

Appendix H. Data Table
Author YearLaFramboise 2003
Health Insurance Status Literacy Language(s) Health Beliefs Intervention Name
NR NR NR NR Health buddy
AH-653

Appendix H. Data Table
Author YearLaFramboise 2003
Intervention Described Intervention Groups Type of Device* Functions*
Intervention*
Simple, user friendly, readily visible, desktop telehealth communication device with daily interventions with recovery assessment, strategies to manage problems, education and positive reinforcement
Telephonic: Baseline focused physical assessment; HF disease management program (nurse provides assessment and education thru 5 weekly phone calls); HFP patient education notebook, non emergency phone number provided to call with questions; 2-month focused physical assessment
Home visit: Everything same as above except that pts received 5 weekly home visits instead of phone calls
Health buddy: everything similar to telephonic grp except Assessment and educational components of the HFP provided daily through Health buddy for up to 6 monthswith phone calls to pts as needed for follow up of high risk responses
Home visits+health buddy:
Computer Education, communication, response to questions
AH-654

Appendix H. Data Table
Author YearLaFramboise 2003
Staff Training Subject Training co-interventions PhysiologicNR NR NR Functional status, Mean (SD)
Telephonic vs. Home visit vs. Health buddy vs. Home visit+health buddy
Baseline: 574.3 (373.6) vs. 510.3 (266.6) vs. 682.4 (465.26) vs. 599.2 (281.25)
2 month: 633.16 (434.13) vs. 604.44 (319.9) vs. 723.4 (462.8) vs. 637.3 (264.2)F (p)= 8.4 (0.005)
Role-physical, mean (SD)
Telephonic vs. Home visit vs. Health buddy vs. Home visit+health buddy
Baseline: 52.9 (44.9) vs. 38(44.5) vs. 31 (36.1) vs. 41.7(40.6)
2 mo: 62.5 (44.9) vs. 58.6 (44.3) vs. 58.3 (48.3) vs. 59.6 (44.7)F (p)= 12.7 (0.001)
Bodily pain, mean (SD)
Telephonic vs. Home visit vs. Health buddy vs. Home visit+health buddy
Baseline: 53.7 (26.7) vs. 59.7 (29.8)
AH-655

Appendix H. Data Table
Author YearLaFramboise 2003
Health Service Utilization Health Care Costs KnowledgeNR NR NR
AH-656

Appendix H. Data Table
Author YearLaFramboise 2003
Use of Technology Usability HIT SatisfactionNR NR NR
AH-657

Appendix H. Data Table
Author YearLaFramboise 2003
Health Satisfaction Self-efficacy Health Behavior
Outcomes
NR Mental status, Mean (SD)
Telephonic vs. Home visit vs. Health buddy vs. Home visit+health buddy
Baseline: 70.6 (21.8) vs. 73.9(21.1) vs. 76.2 (20.7) vs. 76.6 (17.4)
2 mo: 72.9(16.2) vs. 80(14.5) vs. 78.3 (20.8) vs. 83.2 (11.8)F (p)= 7.1 (0.009)
Vitality
Telephonic vs. Home visit vs. Health buddy vs. Home visit+health buddy
Baseline: 39.4 (24) vs. 40.9(23.1) v 35 (22) vs. 37(22.3)
2 mo: 39 (27) vs. 44.8(29) vs. 41.7(23.1) vs. 42.4 (19.5)F (p) = 7.6 (0.007)
NR
AH-658

Appendix H. Data Table
Author YearLaFramboise 2003
Quality of Life Support WithdrawalsNR NR Out of 66 originally assigned to grp
health buddy and grp health buddy/home visit20 (30%) were not able to use health buddy and not eligible for inclusion or continuationOf these, 4 were not interested in being inconvenienced by the technology and 2 were weak or ill because of other conditions.6 lived in retirement homes and had no available outlet for health buddy's electrical cord.
AH-659

Appendix H. Data Table
Author YearLaFramboise 2003
Adverse Effects OtherNR NR
AH-660

Appendix H. Data Table
Author YearPatient Recruitment
Setting Clinical Practice SettingPatient Technology
Setting Study design NLahm 1996 Preschool special
education class2 classes in special schools, 4 classes in rural schools, 5 in medium-sized urban school districts, 7 in large metropolitan districts
Virginia Classroom Convenience Cohort N=48
Lee 2007 Metabolism Center NR Homes RCT N = 274Grp 1: 134Grp 2: 140
AH-661

Appendix H. Data Table
Author YearLahm 1996
Lee 2007
Years of Study
Length of follow-up (months) Inclusion Criteria Exclusion Criteria Elderly
9 months NR *Ages 3-5*Placement in a non-categorical preschool special education class
Not chosen by the teacher to participate in the study
NR
September 2003-May 2004
6 mos *No severe complications that would affect the patients' ability to follow physician's orders*Normal level of consciousnessAbility to read and communicate with spoken language*Have internet access
Invalid test results on one of the laboratory tests
YES
AH-662

Appendix H. Data Table
Author YearLahm 1996
Lee 2007
Underserved Chronic IllnessDisability/
Impairment Gender (% Male) Age (years)NR NR YES:
physical/mental/emotional disability
79.00% Range: 3-5
NR TYPE 2 DM NR Grp 1: 57%Grp 2: 46%
Range<29Grp 1: 7.4%Grp 2: 2.1%30-39Grp 1: 7.5%Grp 2: 2.1%40-49Grp 1: 15.7%Grp 2: 9.3%50-59Grp 1: 34.2%Grp 2: 29.4%60-69Grp 1: 18%Grp 2: 27.9%70-79Grp 1: 14.2%Grp 2: 26.4%>80Grp 1: 3%Grp 2: 2.8%
AH-663

Appendix H. Data Table
Author YearLahm 1996
Lee 2007
Ethnicity Income (US$) EducationUrban / Rural /
Frontier Other
Patient Characteristics*
NR NR Preschool class YES: classes recruited from urban and rural school districts
NR
NR NR IlliterateGrp 1: 9.8%Grp 2: 12.1%
Elementary school/Junior high schoolGrp 1: 32%Grp 2: 27.2%
High SchoolGrp 1: 15.7%Grp 2: 20%
College or UniversityGrp 1: 38.8%Grp 2: 38.6%
Masters or PhDGrp 1: 3.7%Grp 2: 2.1%
NR NR
AH-664

Appendix H. Data Table
Author YearLahm 1996
Lee 2007
Health Insurance Status Literacy Language(s) Health Beliefs Intervention Name
NR NR NR NR NR
NR NR NR NR POEM
AH-665

Appendix H. Data Table
Author YearLahm 1996
Lee 2007
Intervention Described Intervention Groups Type of Device* Functions*
Intervention*
Computer programs designed to engage preschool age children with developmental, physical, or mental disabilities
IVR: 48 Interactive multimedia software
Goal of the study was to identify software design features that enhance engagement of young children with disabilities with instructional software
Web-based system for managing patients' care of their diabetes
Group 1: Intervention group that used POEMGroup 2: Control group
Web-based intervention Education, medical data retrieval, reminders
AH-666

Appendix H. Data Table
Author YearLahm 1996
Lee 2007
Staff Training Subject Training co-interventions Physiologic1 full-day workshop on a single-subject research and alternating treatments design
NR NR NR
NR Intervention group received training on accessing the internet, using the POEM system, and reading their cell phone messages
NR Fasting blood glucose (mg/dl)Grp 1: 125.14 to 108.82 vs.Grp 2: 137.69 to 125.99P=0.001
HbA1C (%)Grp 1: 8.56 to 6.74 vs.Grp 2: 8.90 to 7.42P=0.001
Total cholesterol level (mg/dl)Grp 1: 180.01 to 160.99 vs.Grp 2: 189.56 to 174.60P=0.012
AH-667

Appendix H. Data Table
Author YearLahm 1996
Lee 2007
Health Service Utilization Health Care Costs KnowledgeNR NR NR
NR NR NR
AH-668

Appendix H. Data Table
Author YearLahm 1996
Lee 2007
Use of Technology Usability HIT SatisfactionTwice a day for 5 minutes for a maximum of 15 days
NR NR
Education DifferencesThose in the education category of "College or University" logged into the POEM system more often than those in the education category of "Illiterate" or "Elementary school/Junior high school" (P=0.007 and P=0.012, respectively)
Age DifferencesThose in the age category of <29 years logged into the POEM system more often than those in the age category of 50-59, 60-69, and 70-79 (P=0.011, P=0.000, P=0.000, respectively)Those in the age category of 40-49 years logged into the POEM system more often than those in the age category of 60-69 and 70-79 (P=0.012 and P=0.040, respectively)
NR NR
AH-669

Appendix H. Data Table
Author YearLahm 1996
Lee 2007
Health Satisfaction Self-efficacy Health Behavior
Outcomes
NR NR NR
NR NR NR
AH-670

Appendix H. Data Table
Author YearLahm 1996
Lee 2007
Quality of Life Support WithdrawalsNR NR 19 students had incomplete data
NR NR NR
AH-671

Appendix H. Data Table
Author YearLahm 1996
Lee 2007
Adverse Effects OtherNR NR
NR NR
AH-672

Appendix H. Data Table
Author YearPatient Recruitment
Setting Clinical Practice SettingPatient Technology
Setting Study design NLeu 2005 University of Washington
Physician's network clinics. (no other details given)
20 Primary care providers and 2 endocrinologist clinics
Homes RCT N=50CG: 25Exp Grp: 25
AH-673

Appendix H. Data Table
Author YearLeu 2005
Years of Study
Length of follow-up (months) Inclusion Criteria Exclusion Criteria Elderly
Enrollment occurred from November 6, 2001 through July 8, 2002, The last patient de-enrolled on December 20, 2002
3-6 months *Pts with HbA1c values between 8.0%-9.4% at the time of recruitment with either Type 1 or Type 2 Diabetes.
NR NR
AH-674

Appendix H. Data Table
Author YearLeu 2005
Underserved Chronic IllnessDisability/
Impairment Gender (% Male) Age (years)NR DIABETES NR NR Mean: 51
AH-675

Appendix H. Data Table
Author YearLeu 2005
Ethnicity Income (US$) EducationUrban / Rural /
Frontier Other
Patient Characteristics*
Predominantly Caucasian
NR NR Unclear Type 2 Diabetes: 37 ptsType 1 Diabetes: 13
Pts with Type 1 Diabetes were more likely to participate in the study;1 in 4 participatedPts with Type 1 Diabetes were younger (average age is 46 yrs)
The rate of participation between pts referred by a PCP or an Endocrinologist was the same
19 pts had Hb1Ac checked within 3 months prior to the study enrollment
AH-676

Appendix H. Data Table
Author YearLeu 2005
Health Insurance Status Literacy Language(s) Health Beliefs Intervention Name
NR NR NR NR NR
AH-677

Appendix H. Data Table
Author YearLeu 2005
Intervention Described Intervention Groups Type of Device* Functions*
Intervention*
Wireless two way pager based automated messaging system offering appointment reminders, medication reminders, blood glucose testing reminders, exercise reinforcement, dietary reinforcement, meal time reinforcement, and lab result reporting were offered along with custom reminders of time and birthdays, messages sent to pts via email, pt information stored in the diabetes registry. Responses processed by a constantly running program that forwarded unexpected responses to investigator
Group 1 (Pager): all of the above, training on the use of pager provider, investigator could be reached anytime. Pts had contact numbers and also the number of the UWPN clinic and instructions to dial 911 for emergencies.
Group 2 (No pager):
Pts in pager group could interact with the health care team by sending and receiving paper messagesPts in control group could page the investigator
Pager Send and receive short text messages, Pt could respond to a message with a canned response or by typing in a small rudimentary keyboard.
AH-678

Appendix H. Data Table
Author YearLeu 2005
Staff Training Subject Training co-interventions PhysiologicNR Pts in the pager group
received instructions on how to use the pager.
NR HbA1c No pager (n= 19) vs. pager (n=18)Prior to enrollment: 8.5% vs. 8.5%Preliminary interview: 8.2% vs. 8.3%Exit interview: 7.9% vs. 8.2%Difference (Mean +/- SD)= - 0.3+/- 1.12% vs. - 0.13 +/-0.93%
Blood pressure (% hypertensive)No pager (n= 19) vs. pager (n=18)Preliminary interview68% (17/25) vs. 64% (16/25)Preliminary (stayed enrolled)71%(15/21) vs. 62%(13/21)Exit interview76%(16/21) vs. 38% (8/21)
AH-679

Appendix H. Data Table
Author YearLeu 2005
Health Service Utilization Health Care Costs KnowledgeNR NR NR
AH-680

Appendix H. Data Table
Author YearLeu 2005
Use of Technology Usability HIT SatisfactionMessaging system sent 21,764 messages out of which 12,025 sent to the patient.
1,676 replies, out of which 114 were non-canned
2 pts utilized the system by replying to as many messages as they can i.e. 770 of 884 (87%) and 708 of 830 (85%).
System statistics in detail given in tabular form, not listed here.
NR Attitudes towards technology: pager (post)MessagesAnnoying to comforting: 7.7Unhelpful to helpful: 7.0Inconvenient to convenient: 8.5Not useful to useful: 7.8Patient felt not cared for to cared for by the health care team: 8.5
AH-681

Appendix H. Data Table
Author YearLeu 2005
Health Satisfaction Self-efficacy Health Behavior
Outcomes
Attitude towards the health care teamPager vs. No Pager
Overall satisfaction with diabetes related carePre: 8.5 vs. 8.5 ; Post: 8.8 vs. 7.9
Clear treatment planPre: 8.6 vs. 7.8; Post: 8.8 vs. 8.3
Possible side effects of medications are clearPre: 8.2 vs. 8.5; Post: 8.5 vs. 7.8
Questions concerning diabetes answeredPre: 7.8 vs. 8.4; Post: 8.5 vs. 8.1
NR Attitude towards diabetesPager vs. No pager
Plan for hypoglycemiaPre: 8.4 vs. 7.3; Post: 8.3 vs. 7.8Health: poor to excellentPre: 6.2 vs. 6.5; Post: 6.8 vs. 7.0Diabetes.- unmanageable to manageablePre: 6.2 vs. 6.4; Post: 7.2 vs. 7.0
Glucose monitoringUnimportant to importantPre: 8.2 vs. 8.3; Post: 8.0 vs. 8.3Not done to regularlyPre: 7.8 vs. 6.8; Post: 8.0 to 7.2Difficult to easyPre: 8.4 vs. 7.3; Post:8.6 vs. 7.6
Treatment planRealistic to UnrealisticPre: 7.5 vs. 8.2; Post: 8.1 vs. 8.1
Health care better at end of study: No to yesNo pager (post) vs. pager(post)5.8 vs. 7.2
AH-682

Appendix H. Data Table
Author YearLeu 2005
Quality of Life Support WithdrawalsNR Poor to good family support:
Pager group (post)= 8.0Pager group: 3 withdrew (1 did not use pager, 1 lost the pager, 1 stopped because he felt he received too many pages) and 1 patient passed away from complications of stroke.Experimental group: 3 withdrew and 1 was lost to follow up.
AH-683

Appendix H. Data Table
Author YearLeu 2005
Adverse Effects OtherNR The different message types
requested are given, not listed hereThere is also a table with the message system statistics
Messages were annoying: 44% (8/18)Messages were from my physician: 13%(2/15)Messages were not applicable: 12% (2/17)Pager worked (no problems): 71% (15/21)Enjoyed using the pager: 79% (15/19)Want to continue program now that study is over: 68% (13/19)
AH-684

Appendix H. Data Table
Author YearPatient Recruitment
Setting Clinical Practice SettingPatient Technology
Setting Study design NLevetan 2002 American Diabetes
Association program 3mos prior to enrollment
Penn Medical Laboratory, Washington D.C.
Homes RCT N=150
AH-685

Appendix H. Data Table
Author YearLevetan 2002
Years of Study
Length of follow-up (months) Inclusion Criteria Exclusion Criteria Elderly
6 mos NR *Completing an ADA recognized diabetes education program during the 3mos period before study enrollment
*History of renal insufficiency with Creatinine level > 1.5mg/d*Women who were pregnant at the time or planning a pregnancy during the study period*Pts using insulin pumps*Illiterate pts*Pts receiving blood transfusion within past 30 days*Pts with underlying illness affecting chances of survival during study period
NR
AH-686

Appendix H. Data Table
Author YearLevetan 2002
Underserved Chronic IllnessDisability/
Impairment Gender (% Male) Age (years)NR DIABETES NR CG: 30
IVR: 35p=0.71
CG: 60IVR: 57p=0.25
AH-687

Appendix H. Data Table
Author YearLevetan 2002
Ethnicity Income (US$) EducationUrban / Rural /
Frontier Other
Patient Characteristics*
African AmericanCG: 83IVR: 89p=0.32
NR Education (% no college)CG: 44IVR: 47p=0.62
NR Systolic BP (mmHg)CG: 143IVR: 142p=0.85
Diastolic BP (mmHg)CG: 83IVR: 83p=0.80
Duration of diabetes (years)CG: 3IVR: 5.5p=0.10
HDL (mg/dl)CG: 41IVR: 42p=0.57
LDL (mg/dl)CG: 116IVR: 115p=0.98
HbA1c (%)CG: 8.39 (+2.03)IVR: 8.85 (+2.48)p=0.25
Microalbuminuria (%
AH-688

Appendix H. Data Table
Author YearLevetan 2002
Health Insurance Status Literacy Language(s) Health Beliefs Intervention Name
NR NR NR NR DiaLOG (Diabetes List of Goals)
AH-689

Appendix H. Data Table
Author YearLevetan 2002
Intervention Described Intervention Groups Type of Device* Functions*
Intervention*
Computer-generated customized report presented as an 11"x17" laminated color poster with magnets, with a bulleted list of personalized goals and recommended steps for achieving the goals
IVR: 75Received computer-generated poster as well as 1 phone call from a health educator discussing the poster and the planPts also received a color report that was designed for the pts' medical record; in addition to graphic display of HbA1c, information included pts' BP, lipid, and microalbumin status, and date for pts' next dilated retinal examination
Computer-generated report (poster)
Education, goal setting, encouragement, knowledge
AH-690

Appendix H. Data Table
Author YearLevetan 2002
Staff Training Subject Training co-interventions PhysiologicNR NR NR Changes from baseline at follow-up
Weight (lb)CG: +1.0IVR: +1.54
Systolic BP (mmHg)CG: -4IVR: -4
Diastolic BP (mmHg)CG: -5IVR: -4
HDL (mg/dl)CG: +3IVR: +3
LDLCG: -7IVR: -5
Changes in HbA1c from BaselineBaseline (%)CG: 8.39 (+2.03)IVR: 8.85 (+2.48)
End of Study (%)CG: 7.79 (+1.91)IVR: 7.78 (+2.22)
Change from Baseline (%)
AH-691

Appendix H. Data Table
Author YearLevetan 2002
Health Service Utilization Health Care Costs KnowledgeNR NR Pt Characteristics at Baseline
Heard of an "A-One-C" test (%)CG: 52IVR: 42p=0.47
Changes from baseline at Follow-upHeard of a "A-One-C" test (%)CG: -5.1IVR: +14.3
AH-692

Appendix H. Data Table
Author YearLevetan 2002
Use of Technology Usability HIT SatisfactionNR NR NR
AH-693

Appendix H. Data Table
Author YearLevetan 2002
Health Satisfaction Self-efficacy Health Behavior
Outcomes
NR NR NR
AH-694

Appendix H. Data Table
Author YearLevetan 2002
Quality of Life Support WithdrawalsNR NR CG
1 death3 pts developed debilitating syndromes and dropped7 pts declined F/u
IVR1 death2 lost laboratory specimens7 pts declined F/u1 developed debilitating illness
Final # of pts: 128
AH-695

Appendix H. Data Table
Author YearLevetan 2002
Adverse Effects OtherNR NR
AH-696

Appendix H. Data Table
Author YearPatient Recruitment
Setting Clinical Practice SettingPatient Technology
Setting Study design NLieberman 2003 WWW NA WWW Cross-sectional cohort
studyN = 1455Non-abuse: 248Alc. Abuse: 1207
Lorig 2006 Website postings NR Homes RCT N=958CG: 501IVR: 457
AH-697

Appendix H. Data Table
Author YearLieberman 2003
Lorig 2006
Years of Study
Length of follow-up (months) Inclusion Criteria Exclusion Criteria Elderly
March 2001 - April 2003
NA *Internet connection*Registration with alcoholcheckup.com*Informed consent
Unable to provide consent or "understand text" (NR how this was measured)
NR
18 mos 12 mos *Age >18 yrs*Physician's diagnosis of heart disease, chronic lung disease or type 2 diabetes*Access to a computer with internet and e-mail capabilities*Agree to 1-2 hours per week of log on time spread over at least 3 sessions/week for 6 weeks*Able to complete online questionnaire
Active treatment of cancer within 1 year; participated in the small-group Chronic Disease Self-Management Program
NR
AH-698

Appendix H. Data Table
Author YearLieberman 2003
Lorig 2006
Underserved Chronic IllnessDisability/
Impairment Gender (% Male) Age (years)NR ALCOHOL
DEPENDENCE/USENR Non-abuse: 54.5%
Alc. Abuse: 52.8%MeanNon-abuse: 35.5Alc. Abuse: 34.8
NR HEART DISEASE, HYPERTENSION, LUNG DIASEASE, DIABETES, ARTHRITIS
NR Usual Care: 28.4%; Intervention: 28.8%
Mean (SD)Usual Care: 57.6 (+11.3)IVR: 57.4 (+10.5)
AH-699

Appendix H. Data Table
Author YearLieberman 2003
Lorig 2006
Ethnicity Income (US$) EducationUrban / Rural /
Frontier Other
Patient Characteristics*
NR NR NR NR Mean drinks/week:Non-abuse: 9.6Alc abuse: 36.4 (p<.001);
Age first drink:Non-abuse: 17.2Alc abuse: 16 (p<.001);
CaucasianUsual Care: 88.7%; Intervention: 87.3%
NR Mean years (SD)CG: 15.8 (+3.16)IVR 15.4 (+3.00)
NR NR
AH-700

Appendix H. Data Table
Author YearLieberman 2003
Lorig 2006
Health Insurance Status Literacy Language(s) Health Beliefs Intervention Name
NR NR NR NR alcoholscheckup.com
NR NR NR NR Internet-based Chronic Disease Self- Management Program (CDSMP)
AH-701
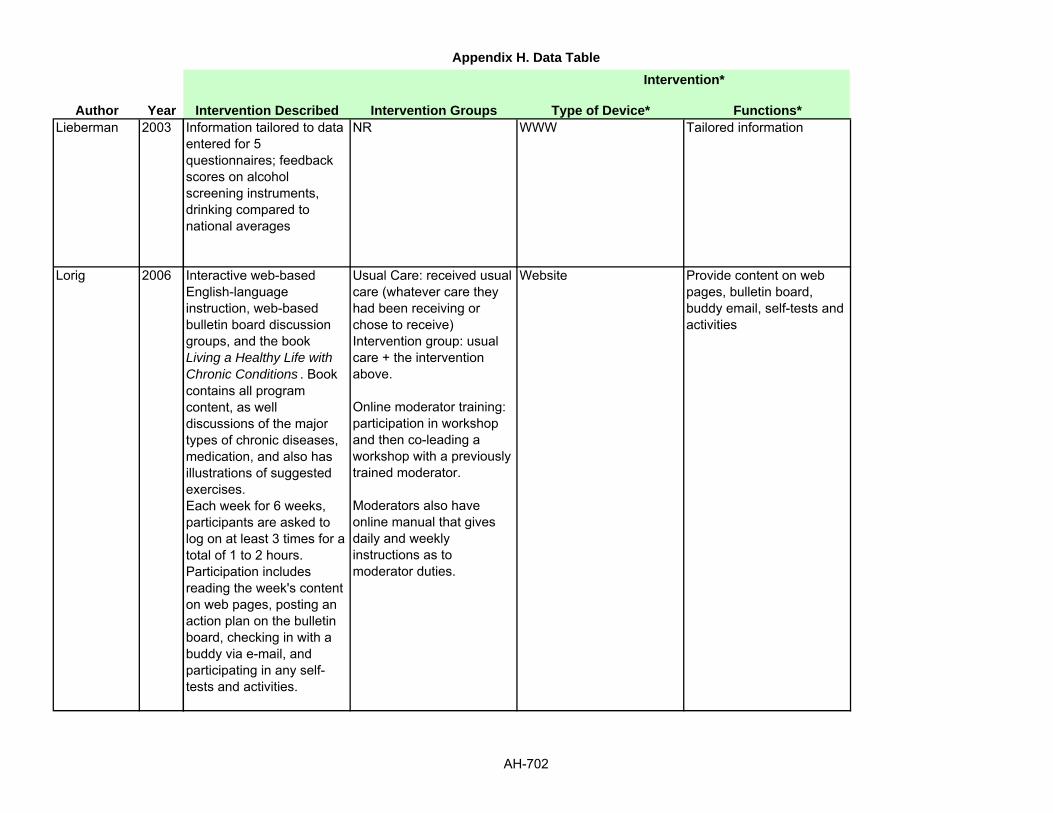
Appendix H. Data Table
Author YearLieberman 2003
Lorig 2006
Intervention Described Intervention Groups Type of Device* Functions*
Intervention*
Information tailored to data entered for 5 questionnaires; feedback scores on alcohol screening instruments, drinking compared to national averages
NR WWW Tailored information
Interactive web-based English-language instruction, web-based bulletin board discussion groups, and the book Living a Healthy Life with Chronic Conditions . Book contains all program content, as well discussions of the major types of chronic diseases, medication, and also has illustrations of suggested exercises.Each week for 6 weeks, participants are asked to log on at least 3 times for a total of 1 to 2 hours. Participation includes reading the week's content on web pages, posting an action plan on the bulletin board, checking in with a buddy via e-mail, and participating in any self-tests and activities.
Usual Care: received usual care (whatever care they had been receiving or chose to receive)Intervention group: usual care + the intervention above.
Online moderator training: participation in workshop and then co-leading a workshop with a previously trained moderator.
Moderators also have online manual that gives daily and weekly instructions as to moderator duties.
Website Provide content on web pages, bulletin board, buddy email, self-tests and activities
AH-702

Appendix H. Data Table
Author YearLieberman 2003
Lorig 2006
Staff Training Subject Training co-interventions PhysiologicNR NR NR NR
Moderator Training; see intervention
NR NR NR
AH-703

Appendix H. Data Table
Author YearLieberman 2003
Lorig 2006
Health Service Utilization Health Care Costs KnowledgeNR NR Asked in information was new and
"unexpected" to themNon-abuse: 8.3Alc abuse 9.4: (p<.001);Correlation between unexpected information and helpfulness: 0.254 (p<.001)
Mean (SD) Changes at 1 year:Physician Visits (during past 6 months): NS
Emergency Visits (during past 6 months): SignificantUsual Care: -0.144 (+1.82), Intervention:-0.00 (+1.06) (p=.030). no longer significant when 6 month data is included (p=0.141).
Days in hospital (during past 6 months): NA
NR NR
AH-704

Appendix H. Data Table
Author YearLieberman 2003
Lorig 2006
Use of Technology Usability HIT SatisfactionNR NR Perceived helpfulness overall:
Non-abuse 8.9Alc. Abuse 10.4 (p<.001);Among alc. Abusers, helpfulness of comparative drinking rates 3.8, SOCRATES screening tool feedback 3.3., AUDIT screening feedback 3.3;
Average log in: 26.5 times (+22.8) Range: 0-177
NR NR
AH-705

Appendix H. Data Table
Author YearLieberman 2003
Lorig 2006
Health Satisfaction Self-efficacy Health Behavior
Outcomes
NR NR Higher perceived helpfulness correlated with higher SOCATES scores (Pearson corr 0.295, p<.001), ability to recognize the problem (Pearson 0.3, p<.001), ambivalence about need to make a change (Pearson 0.3, p<.001), and having taken steps to change (Pearson 0.156, p<.001).
NR Online/ usual care NS (trend p=.06)All subjects: baseline self-efficacy and increases at 6 months were associated with pain, fatigue, disability, illness intrusiveness, health distress, and global general health at 1 year (p< .001) and shortness of breath (p = .007)
M (SD) Changes at 1 year:Self- efficacy: trendUsual Care: 0.200 (1.82) Intervention: 0.406 (1.98) (p=0.051) (effect size= .096)
Mean (SD) Changes in Health Behaviors at 1 year:
Aerobic exercise: NS
Usual Care: Significant
Stretch/strength exercise: CG: 1.16 (+49.6)IVR: 11.9 (+60.4) (p=0.032) (effect size=0.308)
Communication with physician: NS
Practice stress management: NS
AH-706

Appendix H. Data Table
Author YearLieberman 2003
Lorig 2006
Quality of Life Support WithdrawalsNR NR NR
M (SD) Changes in Health Indicators at 1 yearHealth distress: SignificantUsual Care: -0.193 (1.07)Intervention: -0.377 (1.11) (p=.013) (effect size=.160)
Self-reported global health: NSIllness intrusiveness: NSDisability: NS
Fatigue: SignificantUsual Care: -0.358 (2.09)Intervention: -0.720 (2.14) (p=.011) (effect size= 0.151)
Pain: SignificantUsual Care: -0.047 (2.46)Intervention: -0.367 (2.72) (p= .008) (effect size= 0.106)
Shortness of Breath:Usual Care: -0.216(2.40)Intervention: -0.537 (2.41) (p= .020) (effect size =0.097)
NR UC: 15%,IVR: 22.5%Reasons NR
AH-707

Appendix H. Data Table
Author YearLieberman 2003
Lorig 2006
Adverse Effects OtherNR NR
NR Exploratory comparison of intervention group to original study of small group CDSMP. Health indicators, health behaviors, self-efficacy and health utilization are compared
AH-708

Appendix H. Data Table
Author YearPatient Recruitment
Setting Clinical Practice SettingPatient Technology
Setting Study design NMa 2006 Diabetes Center, The
Queen Elizabeth HospitalSpecialty outpatient clinic Homes Phase I: Use case study;
Phase II: CohortPhase I: N = 14Clinicians: 5Patients: 11
Phase II: N = 17Clinicians: 5Patients: 12
McClure 2006 2 Health plans, Group Health Cooperative and Henry Ford Health System
Recruitment through the health plans (letters sent to smokers identified in EHR, and health plan newsletters)
WWW Cohort study (recruitment study)
N = 1866
McDaniel 2002 Inner-city community health center
Indianapolis, Indiana Clinic Cohort N=110
AH-709

Appendix H. Data Table
Author YearMa 2006
McClure 2006
McDaniel 2002
Years of Study
Length of follow-up (months) Inclusion Criteria Exclusion Criteria Elderly
NR Phase II: 3 months Patients:*Diagnosed with diabetes in the past year in the hospital database*If no home internet, willing to use library Internet with assistanceProviders: *Involved in diabetes management
NR NR
Sept 2004 - July 2005 (recruitment)
NR *GHC or HFHS member*Smoked 100 lifetime cigarettes*Current 10+ cig/day*Ready to quit next 30 days *Age 21-70*Home/work access to Internet*E-mail account used 2x/week or more
Enrolled in smoking treatment program; medical contraindication to nicotine therapy
NR
NR 1 week *Female*Smokers*Attend inner-city community health center
NR NR
AH-710

Appendix H. Data Table
Author YearMa 2006
McClure 2006
McDaniel 2002
Underserved Chronic IllnessDisability/
Impairment Gender (% Male) Age (years)NR Phase I, Patients: 10
of 11 had TYPE 2 DIABETES, 1 had TYPE 1 DMPhase II, Patients: All TYPE 2 DM
NR Phase I, Patients: 7 of 12 (58.3%)
RangePhase I, Patients: 38-62 Phase II, Patients: 35-65
NR SMOKING NR N = 40.5% Mean: 46.3
NR YES: SMOKING NR 0.00% 41.5 (+12.4)Range: 18-71
AH-711

Appendix H. Data Table
Author YearMa 2006
McClure 2006
McDaniel 2002
Ethnicity Income (US$) EducationUrban / Rural /
Frontier Other
Patient Characteristics*
NR NR NR NR NR
Caucasian: 79.6% NR HS or less: 24.2%Vocational/tech: 11.9%Some College: 56.3%
NR NR
African-American: 23%Caucasian: 68%
NR 35% did NOT have HS diploma
YES: attending inner-city community clinic
NR
AH-712

Appendix H. Data Table
Author YearMa 2006
McClure 2006
McDaniel 2002
Health Insurance Status Literacy Language(s) Health Beliefs Intervention Name
NR NR NR NR Violet Technology
Insured with participating health plan
NR NR NR Project Quit
NR NR NR NR A New Beginning
AH-713

Appendix H. Data Table
Author YearMa 2006
McClure 2006
McDaniel 2002
Intervention Described Intervention Groups Type of Device* Functions*
Intervention*
Diabetes Information Profile (DIP): info tailoring and priority algorithms; Quiz Service: quiz tailoring and priority algorithms; Agenda Service: agenda algorithms.
NR Web portal Patient profile data collection, information and quizzes tailored to profile (boolean filtering based on profile data) and priority weights (filtering using rules based on patient data, knowledge [level 1, 2, or 3], frequency of information review, and pt-reported information preferences); quizzes filtered based on patient data
Recruitment study, not an intervention study; Project Quit is a tailored interactive tobacco treatment website plus nicotine patch therapy.
NR Website Web-based cognitive behavioral counseling, tailored interactive site
Computer program designed to give tailored smoking cessation messages in a format that would be relevant and acceptable to the users based upon the information entered by the pt
IVR: 100 Computer program Smoking cessation
AH-714

Appendix H. Data Table
Author YearMa 2006
McClure 2006
McDaniel 2002
Staff Training Subject Training co-interventions PhysiologicAvailable NR NR NA
NR NR NR NA
NR NR NR NR
AH-715

Appendix H. Data Table
Author YearMa 2006
McClure 2006
McDaniel 2002
Health Service Utilization Health Care Costs KnowledgeNA NA NA
NA NA NA
NR NR NR
AH-716

Appendix H. Data Table
Author YearMa 2006
McClure 2006
McDaniel 2002
Use of Technology Usability HIT SatisfactionPatients, Phase II: Login times N=82, Individuals 2 to 15 (Median: 6)
Use of InfoService all 12 patients: 82 out of 257 information items visited for 10 sec or greater;
Use of QuizService, 5 of 12 pts: individuals did 5 to 110 quiz questions, (Mean: 61.8)
Use of AgendaService, 1 of 12 pts
Phase II, patients N=9 (agree with the statements below):Easy to use: 7Relevant to DM: 7Tailored info meets needs: 6Tailored info useful: 7Tailored agenda useful: 7Tailored agenda easy to follow: 6Would recommend to others: 6Would continue to use: 5
Focus Group, patients: Experienced patients found the tailored information less useful because they knew it.
Focus Group, professionals: less valuable for more experienced patients or those who have diabetes in control; should add HgA1c and weight tracking; provide summary feedback on quiz results.
3256 visited project website1866 enrolled in study
Recruitment of site visitors: 69% from mailed letters, 21% from newsletter, 9% from other (provider referral, etc.)
Estimated 1.6% and 2.5% of smokers enrolled in study (from health plan 1 and 2)
NR NR
NR Initially, non-applicable information would be presented to certain ptAvg. time to complete program: 13.9 minutes (Range 7.2-88.8 minutes)
Satisfaction Range of 14-70Mean: 60.2 (+6.3)
AH-717

Appendix H. Data Table
Author YearMa 2006
McClure 2006
McDaniel 2002
Health Satisfaction Self-efficacy Health Behavior
Outcomes
NR NR NR
NA NA NA
NR NR Cut down on cigarettes: 52%Quit Smoking for 24 hrs: 15%Called a smoking cessation program: 6%Talked to a doctor about quitting: 15%Read information about quitting: 24%Discussed quitting with friends/family: 40%
AH-718

Appendix H. Data Table
Author YearMa 2006
McClure 2006
McDaniel 2002
Quality of Life Support WithdrawalsNR NR Phase 1: 1 of 12
NA NA NA
NR NR N=10
AH-719

Appendix H. Data Table
Author YearMa 2006
McClure 2006
McDaniel 2002
Adverse Effects OtherNR Health professional feedback on
program:
NA NR
NR NR
AH-720

Appendix H. Data Table
Author YearPatient Recruitment
Setting Clinical Practice SettingPatient Technology
Setting Study design NMcKay 2001 Pts recruited by e-mail
postings to diabetes specific UseNet groups, list serves, web sites and online community groupsinviting them to participate in an internet based Physical activity(PA) program
NA Homes RCT N= 78IVR: 38CG: 40
AH-721

Appendix H. Data Table
Author YearMcKay 2001
Years of Study
Length of follow-up (months) Inclusion Criteria Exclusion Criteria Elderly
6 week recruitment period
2 mos *Diagnosis of Type 2 Diabetes*Age > 40 years*Physical activity level below the current minimumrecommendation by the American college of sports medicine (ACSM) and CDC (i.e. 30 mins of cumulative moderate intensity activity for 5 or more days/week)
NR NR
AH-722

Appendix H. Data Table
Author YearMcKay 2001
Underserved Chronic IllnessDisability/
Impairment Gender (% Male) Age (years)NR TYPE 2 DIABETES NR N = 47% Mean: 52.3
AH-723

Appendix H. Data Table
Author YearMcKay 2001
Ethnicity Income (US$) EducationUrban / Rural /
Frontier Other
Patient Characteristics*
Caucasian: 82% NR Completed college: 50%
NR Employed full time: 62%Taking insulin: 22%Diagnosed with diabetes for more than a year: 83%Had one or more co morbid condition: 75%
AH-724

Appendix H. Data Table
Author YearMcKay 2001
Health Insurance Status Literacy Language(s) Health Beliefs Intervention Name
NR NR NR NR D-net active lives PA intervention
AH-725

Appendix H. Data Table
Author YearMcKay 2001
Intervention Described Intervention Groups Type of Device* Functions*
Intervention*
Multi-level, socio ecological model of diabetes self management and follow up support for behavioral change.The pts in the intervention group received goal setting and personalized feedback, identified and developed strategies to overcome barriers, received and could post messages to an on line personal coach and were involved in peer groupsupport activities.
Control group- received graphic feedback comparing baseline PA level to ACSM recommendations for moderate level PA-received PA safety precautions-Access to information only website
Intervention group- received graphic feedback comparing baseline PA level to ACSM recommendations for moderate level PA- received 5 steps to action personalized PA plan that consisted of Benefits of PA (i.e. personal motivators), Goal setting, Activity exploration, Schedule of weekly activity, Barriers to PA and tips to overcome barriers.- received support from personal coach that consisted of 5 tailored messages over 8 week period, correspondenceas required by pts, referral
Computer Live chat, links to resources sites, messages, graphic feedback of PA levels, communications with personal coach
AH-726

Appendix H. Data Table
Author YearMcKay 2001
Staff Training Subject Training co-interventions PhysiologicNR NR NR Physical activity summary
Moderate to vigorous exercise (min/day)Intervention vs. controlUnadjusted; Baseline- 5.6 +/- 6.2 vs. 7.3 +/- 6.2Unadjusted; follow up- 17.6 +/- 15.3 vs. 18.0 +/- 17.3Log transformed; Baseline- 0.60 +/- 0.47 vs. 0.75 +/- 0.45Log transformed; follow up- 1.03 +/- 0.57 vs. 1.12 +/- 0.42Time---- F (1,64)= 29.59 (p<0.001)Group X time-------F (1,64) = 0.01 (p=0.938); n2= 0.000
Walking (min/day)Intervention vs. ControlUnadjusted; baseline- 6.4 +/- 6.2 vs. 8.4 +/- 8.4Unadjusted; follow up- 12.5 +/- 9.5 vs. 16.8 +/- 22.8Log transformed; baseline- 0.68 +/- 0.45 vs. 0.78 +/- 0.46Log transforms; follow up- 0.96 +/- 0.48 vs. 1.01 +/- 0.49Time---------------- F (1,64)= 15.62, (p<0.001)Group X time--------F = 0.08 (p=0.781), n2=0.001
AH-727

Appendix H. Data Table
Author YearMcKay 2001
Health Service Utilization Health Care Costs KnowledgeNR NR NR
AH-728

Appendix H. Data Table
Author YearMcKay 2001
Use of Technology Usability HIT SatisfactionIVR vs. CGWeb site activity analysis: 341 logons (1.1 logons/pt/week) vs. 105 logons (0.3 logons/pt/week)Total web pages viewed: 9962 vs. 1811Pts average session duration: 3 mins vs. 11 mins
Usage during first 2 weeks and last 2 weeksIVR: 204 logons (2.7/pt) and 40 logons (0.5/pt)CG: 77 logons (0.9/pt) and 7 logons (0.09/pt)
IVR pts had 5938 page views (156.3/pt) within the behavior change focused active lives area and 310 page views (8.2/pt) within the diabetes specific information library area.
IVR pts posted 80 messages (2.1/pt) to personal coach and 42 messages(1.1/pt) to peer support grp area
NR Intervention vs. controlSatisfaction: 4.9 (+1.4) vs. 3.7 (+1.7), Student's t value= 2.07, p=0.047Program's relevance to pts needs: 5.1 (+1.2) vs. 4.1 (+1.2), t= 1.96, p=0.058Ease of use, helpfulness of PA section- results did not differ significantly
In the intervention group, 88% found personal coach helpful and 35% found peer support helpful
AH-729

Appendix H. Data Table
Author YearMcKay 2001
Health Satisfaction Self-efficacy Health Behavior
Outcomes
NR Depressive symptoms (CES-D)Intervention vs. controlBaseline; 16.9 +/- 11.6 vs. 17.6 +/- 10.4Follow up; 14.9 +/- 12.5 vs. 19.9 +/- 14.2Time------- F (1,64)= 0.06 (p=0.809)Group X time--------F(1,64) = 2.77 (p=0.101), n2=0.042
NR
AH-730

Appendix H. Data Table
Author YearMcKay 2001
Quality of Life Support WithdrawalsNR NR Out of 40 control pts, only 33 (82.5%)
completed the post assessment survey
Out of 38 intervention pts, only 35 (92.1%) completed the survey
AH-731

Appendix H. Data Table
Author YearMcKay 2001
Adverse Effects OtherNR The total number of logons was used
to determine the association between program use and the three outcome measures. ANOVA results given for the same, not listed here
AH-732

Appendix H. Data Table
Author YearPatient Recruitment
Setting Clinical Practice SettingPatient Technology
Setting Study design NMcMahon 2005 Volunteer (solicited by mail
and telephone)VA Boston Healthcare System (4 hospital-based clinics and 10 community-based outpatient clinics)
Homes RCT N = 104CG = 52Intervention = 52
AH-733

Appendix H. Data Table
Author YearMcMahon 2005
Years of Study
Length of follow-up (months) Inclusion Criteria Exclusion Criteria Elderly
October 2001-April 2003
None *HbA1C(>=) 9.0%*>18 yrs old*Ability to understand written and spoken English*"Willingness to use glucose-and blood pressure-monitoring devices"*Required to have a VA-based PCP*Access to a telephone
Lacking any/all of the stated criteria above
Mean age: 63(+)7
AH-734

Appendix H. Data Table
Author YearMcMahon 2005
Underserved Chronic IllnessDisability/
Impairment Gender (% Male) Age (years)NR DIABETES NR CG: 100%
Intervention: 99%CG: 63(+) 7Intervention: 64(+)7
AH-735

Appendix H. Data Table
Author YearMcMahon 2005
Ethnicity Income (US$) EducationUrban / Rural /
Frontier Other
Patient Characteristics*
NR NR CG:College or Above: 67%High school graduate: 19%Some HS: 6%Below HS: 2%
Intervention:College or above: 59%HS graduate: 22%Some HS: 12%Below HS: 6%
NR NR
AH-736

Appendix H. Data Table
Author YearMcMahon 2005
Health Insurance Status Literacy Language(s) Health Beliefs Intervention Name
NR NR English Believe that care management has been studied in diabetic patients, but that results have been mixed; believe that with increased use of internet in chronically ill, Internet may help improve QoL and quality of condition
MyCareTeam
AH-737

Appendix H. Data Table
Author YearMcMahon 2005
Intervention Described Intervention Groups Type of Device* Functions*
Intervention*
Website displayed blood pressure and glucose monitoring outcomes in table and graphical form for patients and care management providers, contained web-enabled diabetes educational modules, provided links to other diabetes resource websites, and allowed secure chat/e-mail between patient and care provider. Information submitted was also reviewed by a certified diabetes educator and advanced practice nurse (made recommendations to patient and PCP).
CG: usual care with PCPIntervention: usual care + notebook computer, glucose meter, blood pressure monitor, and access to MyCareTeam website*Intervention group received computer training and support by the study staff (mean 2.3hrs per subject). Allowed to send e-mails to PCP and other experts
Internet, Telephone Education and self-management skills, blood pressure monitoring was recommended at least 3 times weekly, and glucose monitoring was individualized to each patient
AH-738

Appendix H. Data Table
Author YearMcMahon 2005
Staff Training Subject Training co-interventions PhysiologicNR Training time was
dependent on comfort with computers/internet and devices provided
Additional education provided at regularly scheduled clinic visits
BEFORE STUDY: Mean A1C (%)CG: 9.9 (+-)0.8Intervention: 10.0 (+-) 0.8Blood Pressure (mmHg) Systolic, Diastolic:CG: 139(+-)20, 80(+-)7Intervention: 141(+-)21, 81(+-)7Lipids (mg/dl):LDL cholesterolCG: 97(+-)21Intervention: 100(+-)35HDL cholesterolCG: 40(+-)8Intervention: 43(+-)14TriglyceridesCG: 204 (+-)140Intervention: 178(+-)112
AH-739

Appendix H. Data Table
Author YearMcMahon 2005
Health Service Utilization Health Care Costs KnowledgeClinic visits at 0, 3, 6, 9, and 12 months for both groupsIntervention Uploads:
Medians: 1, 18, 31
Persistent User: Log-in every 3 months (n = 30)
Intermittent User: Log-in > 3mos (n = 22)
NR NR
AH-740

Appendix H. Data Table
Author YearMcMahon 2005
Use of Technology Usability HIT SatisfactionNR NR NR
AH-741
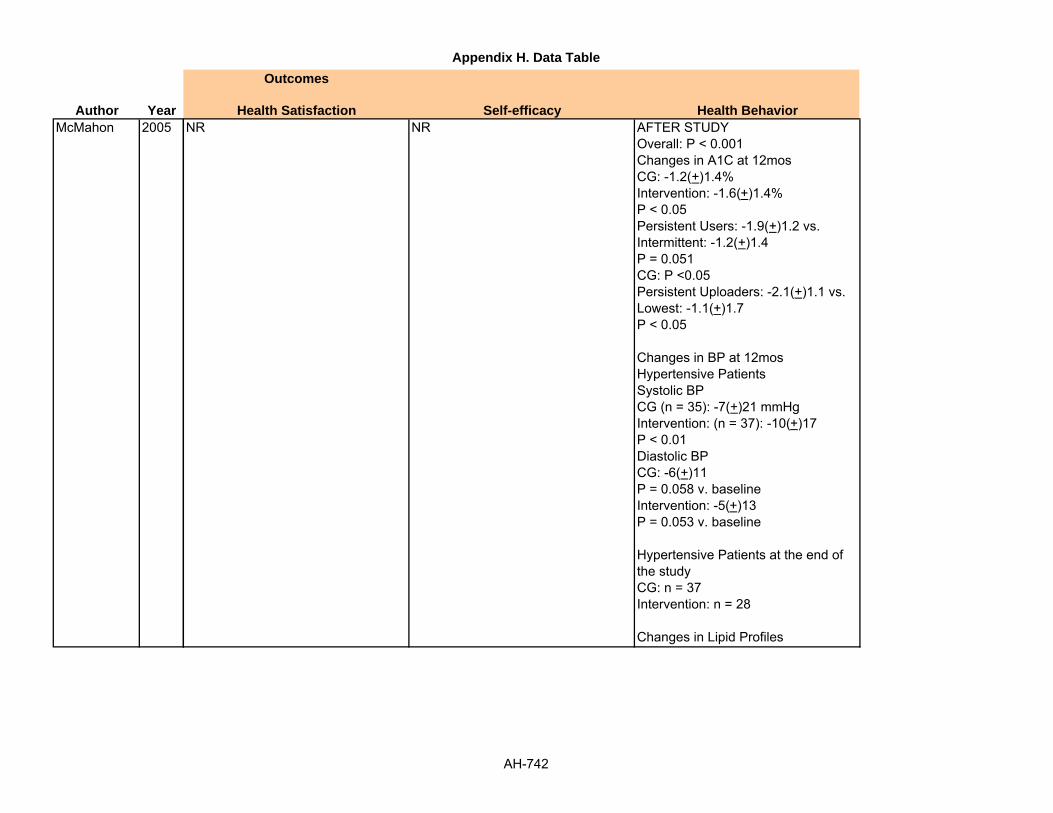
Appendix H. Data Table
Author YearMcMahon 2005
Health Satisfaction Self-efficacy Health Behavior
Outcomes
NR NR AFTER STUDYOverall: P < 0.001Changes in A1C at 12mosCG: -1.2(+)1.4%Intervention: -1.6(+)1.4%P < 0.05Persistent Users: -1.9(+)1.2 vs.Intermittent: -1.2(+)1.4P = 0.051CG: P <0.05Persistent Uploaders: -2.1(+)1.1 vs. Lowest: -1.1(+)1.7P < 0.05
Changes in BP at 12mosHypertensive PatientsSystolic BPCG (n = 35): -7(+)21 mmHgIntervention: (n = 37): -10(+)17P < 0.01Diastolic BPCG: -6(+)11P = 0.058 v. baselineIntervention: -5(+)13P = 0.053 v. baseline
Hypertensive Patients at the end of the studyCG: n = 37Intervention: n = 28
Changes in Lipid Profiles
AH-742

Appendix H. Data Table
Author YearMcMahon 2005
Quality of Life Support WithdrawalsNR NR N = 20
CG:Lost to follow-up: 11Withdrew Consent: 1
Intervention:Lost to follow-up: 7Discontinued intervention: 1
AH-743

Appendix H. Data Table
Author YearMcMahon 2005
Adverse Effects OtherNR Hypoglycemic episodes
CG: 33 events in 11 participants (Median: 2/pt)Intervention: 46 events in 13 participants (Median: 3/pt)
AH-744

Appendix H. Data Table
Author YearPatient Recruitment
Setting Clinical Practice SettingPatient Technology
Setting Study design NMcPherson 2006 Pediatric outpatient
respiratory clinics3 United Kingdom hospitals Homes RCT N=101
McTavish 1994 Inner city Chicago Cook county hospital Homes Pilot study N= 8
AH-745

Appendix H. Data Table
Author YearMcPherson 2006
McTavish 1994
Years of Study
Length of follow-up (months) Inclusion Criteria Exclusion Criteria Elderly
1 years 6 months *Had scheduled follow-up appointment at 1 of 3 clinics in the study period*Parental consent and child assent
Did not have a diagnosis of asthma, were not currently receiving treatment for asthma, or were assessed by parents or clinician to have significant learning or behavioral difficulties
NR
Oct 1, 1993- Jan 15, 1994
15 weeks *All African American women were stage 1 or stage 2 cancer pts
NR No
AH-746

Appendix H. Data Table
Author YearMcPherson 2006
McTavish 1994
Underserved Chronic IllnessDisability/
Impairment Gender (% Male) Age (years)NR YES: ASTHMA NR 54.00% Median, Mode
CG: 9, 7IVR: 11, 8
Inner city Chicago African American women
BREAST CANCER NR All women Range: 36-66 yrs6 of the 8 women were 55 yrs or younger
AH-747

Appendix H. Data Table
Author YearMcPherson 2006
McTavish 1994
Ethnicity Income (US$) EducationUrban / Rural /
Frontier Other
Patient Characteristics*
WhiteCG: 86.3%IVR: 90%
NR NR NR Mean duration of asthmaCG: 6.64 (+3.12); 1-14IVR: 6.91 (+3.64); 3mo to 13
African American All women were on public assistance
Half never completed high school and 3 had prior computer experience
Urban (inner city) Five had lumpectomies and two had mastectomies within the past year(5 had surgery within the past 6 months)
Only 1 women had CHESS prior to deciding what surgery to have.
AH-748

Appendix H. Data Table
Author YearMcPherson 2006
McTavish 1994
Health Insurance Status Literacy Language(s) Health Beliefs Intervention Name
NR NR NR NR The Asthma Files
NR NR NR NR CHESS
AH-749

Appendix H. Data Table
Author YearMcPherson 2006
McTavish 1994
Intervention Described Intervention Groups Type of Device* Functions*
Intervention*
Interactive computer game with a secret-agent theme; as "secret agents" users are encouraged to explore all of the sections, finding out as much about self-management as possible by listening to voiceovers, completing quizzes, and engaging with interactive problem solving tasks
CG: 51IVR: 50
Computer game To provide education about asthma to children
CHESS: web based information, discussion group, ask an expert, and interactive services (tailored action plan, decision aides and health tracking)
Pilot study group with CHESS intervention
Computer Forum, question and answers, library, expert communication, action plan.
AH-750

Appendix H. Data Table
Author YearMcPherson 2006
McTavish 1994
Staff Training Subject Training co-interventions PhysiologicNR NR NR 6 month Follow-Up
Courses of Steroids, MeanIVR: -2.22, p=0.026
Days off school, MeanIVR: 2.1, p=0.034
NR A CHESS staff member gave approx. 1 hour of instruction and orientation
NR NR
AH-751

Appendix H. Data Table
Author YearMcPherson 2006
McTavish 1994
Health Service Utilization Health Care Costs KnowledgeNR NR Mean change in Asthma Knowledge
Assessment scoreCG: 1.55 (0.65-2.48)IVR: 3.97 (3.02-4.92)
NR NR NR
AH-752

Appendix H. Data Table
Author YearMcPherson 2006
McTavish 1994
Use of Technology Usability HIT Satisfaction1-10 times NR 35 of 37 Felt that the game was a
good way to learn about asthma, and the majority (31/37) believed that they had learned more about their asthma from using the package.
CHESS was used 886 times within the 15 wk period
On avg, each woman used CHESS 7 times/ wk and was on the system for more than 1 hour/wk
Use of social support components: 55%Information components: 41%Problem solving components: 4%
Service: number of uses (minutes)Discussion groups: 442 (5046)Ask an expert: 227 (1487)Questions and Answers: 83 (617)Personal stories: 43 (504)Instant library: 48(341)Decisions and conflicts: 20 (208)Getting help/support: 18 (76)Action Plan: 5 (48)
Overall value of CHESS: 7.00 with three services rated below 7.00
AP (action plan) rated lowest at 6.50
Overall CHESS for ease of use: 5.80 and 6 of the services rated above 6.00 in ease of use
AP rated lowest in terms of ease of use: 4.80
DG (disc. groups)was the most used despite the lower ease of use core
CHESS is extremely user friendly and lack of computer experience is not a barrier
Women felt acceptance, understanding and relief while using CHESS,
AH-753

Appendix H. Data Table
Author YearMcPherson 2006
McTavish 1994
Health Satisfaction Self-efficacy Health Behavior
Outcomes
NR NR NR
NR Experienced low levels of negative emotions such as stress, boredom, fear, sadness, indifference, helplessness, and anger,(all less than 3.0) elation and empowerment were low (2.25 and 2.2) while anxiety was high (4.5)
NR
AH-754

Appendix H. Data Table
Author YearMcPherson 2006
McTavish 1994
Quality of Life Support WithdrawalsNR NR 11 lost to follow-up
NR NR NR
AH-755

Appendix H. Data Table
Author YearMcPherson 2006
McTavish 1994
Adverse Effects OtherNR NR
NR Comparison table given- use of CHESS components by percent of total uses in two study population.
AH-756

Appendix H. Data Table
Author YearPatient Recruitment
Setting Clinical Practice SettingPatient Technology
Setting Study design NMeigs 2003 NR Hospital based staff
resident practice. (The adult Medicine clinic)
Unclear RCT N= 598IVR: 307CG: 291
Nakagawa 2000 Waitlist of OCD patients wanting BT
NR Homes Cohort with historical control
N = 43Grp 1: 23Grp 2: 20
AH-757

Appendix H. Data Table
Author YearMeigs 2003
Nakagawa 2000
Years of Study
Length of follow-up (months) Inclusion Criteria Exclusion Criteria Elderly
May 1997-April 1999
NR NR NR NR
NR 3 weeks NR NR NR
AH-758

Appendix H. Data Table
Author YearMeigs 2003
Nakagawa 2000
Underserved Chronic IllnessDisability/
Impairment Gender (% Male) Age (years)NR TYPE 2 DIABETES NR Patients with type 2
DiabetesGrp 1 vs. Grp 2: 44.9% vs. 50.5%
Mean (SD)Grp 1: 68 (+12)Grp 2: 67 (+12)
NR OCD NR Gp 1: 49%Gp 2: 55%
MeanGrp 1: 28.6Grp 2: 27.9
AH-759

Appendix H. Data Table
Author YearMeigs 2003
Nakagawa 2000
Ethnicity Income (US$) EducationUrban / Rural /
Frontier Other
Patient Characteristics*
Grp 1Caucasian: 71%Black: 19.2%Other: 9.8%Grp 2Caucasian: 71.1%Black: 18.9%Other: 10.0%
NR NR NR Mean duration of diabetes (SD)Grp 1 vs. Grp 2 ; 9.9 (+5.5) vs. 9.7 (+5.6), p= 0.8 Diabetes therapy %Grp 1 vs. Grp 2Insulin; 30.6 vs. 36.4, p= 0.1Oral hypoglycemic medications; 60.9 vs. 63.2, p= 0.6Diet and exercise only; 17.9 vs. 10.0, p= 0.005Any lipid lowering medication; 30.9 vs. 38.1 , p= 0.06Any antihypertensive medication; 79.2 vs. 79, p= 1.0Hyperlipidemia; 56.4 vs. 59.8, p=0.4Hypertension; 83.1 vs. 76.0, p= 0.03Smoking; 15.6 vs. 14.8, p= 0.8Any micro vascular complication; 45.3 vs. 50.2, p= 0.2Any cardiovascular
NR NR NR NR NR
AH-760

Appendix H. Data Table
Author YearMeigs 2003
Nakagawa 2000
Health Insurance Status Literacy Language(s) Health Beliefs Intervention Name
PayorCommercial < 65Grp 1: 12.4%Grp 2: 11.0%, p= 0.2
IIMO < 65Grp 1: 17.6%Grp 2: 19.6%
MedicareGrp 1: 60.9%Grp 2: 54.3%
Medicaid or otherGrp 1: 9.2%Grp 2: 15.1%
NR NR NR Diabetes Disease management Application (DMA)
NR NR NR NR BT STEPS
AH-761

Appendix H. Data Table
Author YearMeigs 2003
Nakagawa 2000
Intervention Described Intervention Groups Type of Device* Functions*
Intervention*
Web based decision support tool, displaying interactive patient specific clinical data, treatment advice, and links to other web based care resources
Grp 1: received the intervention- DMA provides a single screen view of patient specific information, enabling decision support at the time of patient contact. It displays trended and tabular real time electronic laboratory data interactively linked to evidence based treatment recommendations, facilities to aid encounter work flow, and links to additional patient and provider care resources.
Grp 2: not given the intervention- no additional details provided
Computer Decision support system, links to other resources, Lab data in trended and tabulated form
Computer driven, telephone interview system using interactive voice response
Group 1: BT STEPS intervention Group 2: Matched waiting list controls
Computer/internet + telephone
Four step self-assessment and five step self-intervention
AH-762

Appendix H. Data Table
Author YearMeigs 2003
Nakagawa 2000
Staff Training Subject Training co-interventions PhysiologicStaff members were systematically exposed to the intervention, receiving formal pre intervention training and two interactive feedback sessions during the intervention year
NR NR Glycemic control outcomesGrp 1 vs. Grp 2at least one HbA1c test in the last 12 monthsPreintervention: 264/86% vs. 256/88%Change: +1.6 % vs. - 1.0%, p= 0.3
Mean number of HbA1c tests/yearPreintervention: 1.7 (0+.1) vs. 1.8 (+0.1)Change: + 0.3 vs. - 0.04, p= 0.008
HbA1c< 7%Preintervention: 51/21.7% vs. 61/26.6%Change: +1.7% vs. - 2.8%, p= 0.2
Mean HbA1c (% hemoglobin)Preintervention: 8.4 (0.1) vs. 8.1 (0.1)Change: - 0.23 vs. + 0.14, p= 0.09
Cholesterol control outcomesGrp 1 vs. Grp 2At least 1 LDL chol test, last 12 monthsPreintervention: 177/57.7% vs. 167/57.4%Change: +7.2% vs. + 3.4%, p= 0.5
Mean number of LDL chol tests /yearPreintervention: 0.8 (0.1) vs. 0.9 (0.1)
NR 5 minutes with coordinator explaining how to use system
NR NR
AH-763

Appendix H. Data Table
Author YearMeigs 2003
Nakagawa 2000
Health Service Utilization Health Care Costs KnowledgeNR NR NR
Grp 1 completed fewer clinician guided ERP sessions than Grp 2 (8 versus 22)
NR NR
AH-764

Appendix H. Data Table
Author YearMeigs 2003
Nakagawa 2000
Use of Technology Usability HIT SatisfactionNR NR NR
NR NR 9 patients in Grp 1 reported being far more satisfied with the clinician guided ERP versus the BT STEPS (P<0.001)
AH-765

Appendix H. Data Table
Author YearMeigs 2003
Nakagawa 2000
Health Satisfaction Self-efficacy Health Behavior
Outcomes
NR NR NR
NR NR NR
AH-766

Appendix H. Data Table
Author YearMeigs 2003
Nakagawa 2000
Quality of Life Support WithdrawalsNR NR Preintervention year- diabetic patients
N= 1595Pts exclusionsNot in study group: 621Study patients not seen during intervention year: 225Clinic chart not found: 36Patient ineligible: 115
NR NR 3 from Grp 12 prior to starting, due to being taken off waiting list and 1 during trial because of marked improvement
AH-767

Appendix H. Data Table
Author YearMeigs 2003
Nakagawa 2000
Adverse Effects OtherNR Demographics related to staff
providers given, not listed hereIntracorrelation coefficients to assess inter abstractor variability given, not listed hereThe author also discusses power issues, not given here
NR NR
AH-768

Appendix H. Data Table
Author YearPatient Recruitment
Setting Clinical Practice SettingPatient Technology
Setting Study design NNguyen 2003 NR NR Homes Cohort N= 16
Grp 1: 7 Grp 2: 9
Nguyen 2005 Grp 1: was recruited from a pool of individuals who previously participated in a face-to-face DSMP, which would allow testing of a "booster” effect. Grp 2: recruited from all other sources (pulmonary practices, Better Breather groups, pulmonary rehabilitation programs, and online COPD groups)
NR Homes Nonrandomized between group
N = 23Grp 1: 12Grp 2: 11
AH-769

Appendix H. Data Table
Author YearNguyen 2003
Nguyen 2005
Years of Study
Length of follow-up (months) Inclusion Criteria Exclusion Criteria Elderly
NR 3 months *Subjects in Grp 1: recruited from a database of patients who participated in face-to-face Dyspnoes Self management program (DSMP)*Subjects in Grp 2: recruited from all other sources and had no relationship with the investigators
NR Yes
NR 3 months *Active use of a computer and Internet/web*Diagnosis of COPD (bronchitis emphysema, irreversible asthma)*ADL limited bydyspnea*Approval from a health provider to start an exercise program*Ability to speak and write English*Resident of the San Francisco Bay area or southern California.
NR Yes
AH-770

Appendix H. Data Table
Author YearNguyen 2003
Nguyen 2005
Underserved Chronic IllnessDisability/
Impairment Gender (% Male) Age (years)NR YES NR NR Mean (Range)
Grp 2: 69.1 (55-82)
YES COPD NR N = 50% Mean (SD)69.1 (+7.0)Range: 55-82
AH-771

Appendix H. Data Table
Author YearNguyen 2003
Nguyen 2005
Ethnicity Income (US$) EducationUrban / Rural /
Frontier Other
Patient Characteristics*
NR NR NR NR NR
African-American: 1pt (6%)Caucasian: 13pts (81%)Native American: 1pt (6%)Other: 1pt (6%)
NR High school: 4pts (25%)Some college: 4pts (25%)College or greater: 8pts (50%)
NR 81% retired or disabled
AH-772

Appendix H. Data Table
Author YearNguyen 2003
Nguyen 2005
Health Insurance Status Literacy Language(s) Health Beliefs Intervention Name
NR NR NR NR iDSMP
NR NR English NR Dyspnea Self-Management Program
AH-773

Appendix H. Data Table
Author YearNguyen 2003
Nguyen 2005
Intervention Described Intervention Groups Type of Device* Functions*
Intervention*
*Nurse facilitated and peer supported internet based dyspnoea self management program*Weekly structures self management education via live text chat*Exercise monitoring, goal setting and feedback*Pulmonary function and symptom monitoring(pts monitor lung function with air watch and data uploaded into the site*Peer and professional communication via chats, bulletin boards, email
Grp 1: pts from database who participated in Face to Face DSMP allowing a test of booster effect
Grp 2: iDSMP - no relationship with investigator in order to evaluate the program as primary intervention
Home visits conducted and process metrics tracked
Computer Communication, chat, emails, symptom monitoring, self management education
Website to help individuals with COPD better manage their condition by being informed of activities that help or exacerbate their condition
Group 1: "boosters" had previously participated in some DSMP
Group 2: Primary intervention, no prior DSMP
Dyspnea Self-Management Program
Logon to website at least 3 times/week, 2 weekly chat sessions, online bulletin board and email support, individualized exercise plans
AH-774

Appendix H. Data Table
Author YearNguyen 2003
Nguyen 2005
Staff Training Subject Training co-interventions PhysiologicNR NR NR FEV1/FVC: 41 +/- 7%
Improvements noted for Dyspnoea (effect size=0.86)Endurance exercise 0.27 for the overall sample
NR 1-2 hours of in home training on web site and spirometry device
AirWatch spirometer P-values
CRQ DyspneaGrp 1 vs. Grp 2: 0.86Pooled sample: 0.005
Dyspnea DistressGrp 1 vs. Grp 2: 0.25Pooled:0 .48
Dyspnea impactGrp 1 vs. Grp 2: 0.43Pooled: 0.48
AH-775

Appendix H. Data Table
Author YearNguyen 2003
Nguyen 2005
Health Service Utilization Health Care Costs KnowledgeNR NR NR
NR NR NR
AH-776

Appendix H. Data Table
Author YearNguyen 2003
Nguyen 2005
Use of Technology Usability HIT SatisfactionFirst month registered most logins (330) compared to 104 in the final month
NR NR
NR NR NR
AH-777

Appendix H. Data Table
Author YearNguyen 2003
Nguyen 2005
Health Satisfaction Self-efficacy Health Behavior
Outcomes
NR Improvement in self efficacy for managing dyspnoea = 0.94
NR
NR Self efficacy for managing dyspnea 1 vs. 2: .38pooled: .009CRQ Mastery1 vs. 2: .08pooled: .14
Exercise, self-report, Measured with Medical Outcomes Study SF-36
AH-778

Appendix H. Data Table
Author YearNguyen 2003
Nguyen 2005
Quality of Life Support WithdrawalsNR Support: 0.32 NR
NR NR N=8Group 1: 2 were too busy,1 overwhelmed, 3 sporadic participationGroup 2: 1 dropped due to computer failure, 1 died of pneumonia
AH-779

Appendix H. Data Table
Author YearNguyen 2003
Nguyen 2005
Adverse Effects OtherNR NR
Computer issues included hand trembles for 3 individuals and paralysis for one, all of whom were able to accommodate their limitations (e.g., using a different mouse). Stiff necks. Patients were sent to a reputable site for computer stretches.
NR
AH-780

Appendix H. Data Table
Author YearPatient Recruitment
Setting Clinical Practice SettingPatient Technology
Setting Study design NNoel 2004 NR VA system Homes single blind single site
randomized trialN=104Grp 1 (IVR): 47Grp 2 (CG): 57
AH-781

Appendix H. Data Table
Author YearNoel 2004
Years of Study
Length of follow-up (months) Inclusion Criteria Exclusion Criteria Elderly
NR 6-12 months *Documented high use of healthcare resources and barriers to accessing healthcare services due to geographic, economic, physical, linguistic, technological, and/or cultural factors*Pts met these criteria and had been actively receiving nurse case management for at least 6 months preceding the study and during the study
NR NR
AH-782

Appendix H. Data Table
Author YearNoel 2004
Underserved Chronic IllnessDisability/
Impairment Gender (% Male) Age (years)NR DM, CHRONIC LUNG
DISEASE, COMPLEX CHF
NR Total= 97%IG: 42%CG: 55%
MeanTotal= 71IG: 72CG: 70
AH-783

Appendix H. Data Table
Author YearNoel 2004
Ethnicity Income (US$) EducationUrban / Rural /
Frontier Other
Patient Characteristics*
NR NR NR NR One morbidity (%),Total vs. IG vs. CGCHF: 57 vs. 30 vs. 27COPD: 35 vs. 16 vs. 17DM: 56 vs. 24 vs. 32
Two co morbidities (%), Total vs. IG vs. CGCHF+COPD: 21 vs. 12 vs.10CHF+DM: 34 vs. 13 vs. 11COPD+DM: 13 vs. 6 vs. 7
Three co morbidities, Total vs. IG vs. CGCHF+COPD+DM: 11 vs. 6 vs. 5
AH-784

Appendix H. Data Table
Author YearNoel 2004
Health Insurance Status Literacy Language(s) Health Beliefs Intervention Name
NR NR NR NR Home telehealth unit
AH-785

Appendix H. Data Table
Author YearNoel 2004
Intervention Described Intervention Groups Type of Device* Functions*
Intervention*
Home telehealth units used standard phone lines to communicate with the hospital. FDA approved peripheral devices monitored vital signs and valid questionnaires were used to evaluate quality of life outcomes with out of range data triggering alerts.
The CG received usual home health care services plus nurse case management
IG received home telehealth plus nurse case managementHome telehealth- user friendly devices with a touch screen interface and step by step instructions using graphics, large text and audio.
FDA approved peripheral devices plug into telehealth unit and collect data for temperature, blood pressure, pulse, blood glucose, 3 lead ECG, stethoscope for heart and lung sounds, pulse oximetry and weight, pain level is self reported; data transmitted through telephone lines to VACT's web based intranet system and directly into the facility's electronic database; digital camera used to monitor wound
Home telehealth device Data input, alerts, disease specific education modules, on screen assessment surveys
AH-786

Appendix H. Data Table
Author YearNoel 2004
Staff Training Subject Training co-interventions PhysiologicNR NR NR Diabetic A1C levels; Mean (SD);
Baseline IG: 8.30 (+1.61)
CG: 7.03 (+1.08)
Between groups; t=+3.233,p=0.003, z=0.004
6 monthsIG: 7.3 (+1.47) , t= + 4.242, p=0.0001, z=0.001
CG: 7.83 (+1.65), - 3.398, p=0.002, z=0.006
Between groups; t= - 1.228, p=0.225, z=0.260
AH-787

Appendix H. Data Table
Author YearNoel 2004
Health Service Utilization Health Care Costs KnowledgeBed days of care (BDOC):Total (n=64) vs. IG (n=26) vs. CG (n=38)Pre: 842 vs. 317 vs. 525Post: 243 vs. 49 vs. 194
Total visits:Total (n=102) vs. IG (n= 46) vs. CG (n=56)Pre: 1613 vs. 682 vs. 931Post: 1520 vs. 682 vs. 838
Urgent visits:Total (n=98) vs. IG (n=44) vs. CG (n=54)Pre: 622 vs. 320 vs. 302Post: 544 vs. 237 vs. 307
Coumadin visits:Total (n=26) vs. IG (n=11) vs. CG (n= 15)Pre: 187 vs. 79 vs. 108Post: 146 vs. 82 vs. 64
RN home visits:Total (n= 21) vs. IG (n=12) vs. CG (n=9)Pre: 223 vs. 119 vs. 104Post= 197 vs. 94 vs. 103
Cost variables, Mean (SD): VA and non VA BDOC
Cost item ($): IG vs. CGRN/home visits Pre study: 11, 067 vs. 9,672Post study: 8,742 vs. 9,579
BDOCPrestudy: 273,918 vs. 567,126Post study: 46,296 vs. 204,474
CoumadinPre study: 1,185 vs. 1,620Post study: 1,230 vs. 960
Total visitsPre study: 34,100 vs. 46,550Post study: 34,100 vs. 41,900
Urgent visitsPre study: 16,000 vs. 15,100Post study: 11,850 vs. 15,350
Transport (VA costs)Prestudy: 35,811 vs. 44,816Post study: 32,258 vs. 40,538
Transport, cost patientPrestudy: 18,186 vs. 22,759Post study: 16,381 vs. 20,586
Telehealth unitIG: 78,302
NR
AH-788

Appendix H. Data Table
Author YearNoel 2004
Use of Technology Usability HIT SatisfactionNR NR NR
AH-789

Appendix H. Data Table
Author YearNoel 2004
Health Satisfaction Self-efficacy Health Behavior
Outcomes
QoL-self rated health status, M (SD)Baseline, IG (n)= 47, CG (n)=57Between grps; p= 0.207, z= 0.208IG: 81.32 (+13.07)CG: 84.86 (+15.33)
3 months, IG (n)= 47, CG (n)= 57Between groups; p= 0.755, z= 0.590IG: 81.34 (+13.71), p= 0.984, z= 0.728CG: 82.25 (+15.83), p= 0.070, z=0.129
6 months, IG (n)= 47, CG (n)= 57Between groups; p= 0.353, z= 0.296IG: 82.47 (+12.89) , p= 0.447, z= 0.392CG: 85.14 (+16.28), p= 0.885, z=0.944
9 months, IG (n)=15, CG (n)= 27Between groups; p= 0.596, z= 0.763IG: 84.40 (+13.23), p= 0.980, z= 0.776CG: 82.11 (+13.34), p= 0.757, z=0.893
12 months, IG (n)=8 , CG (n)= 14Between groups: p= 0.506, z= 0.616IG: 88.00 (+22.16), p= 0.110, z= 0.159CG: 82.21 (+10.81), p= 0.150,
NR NR
AH-790

Appendix H. Data Table
Author YearNoel 2004
Quality of Life Support WithdrawalsQoL -Cognitive status, M (SD)Baseline, IG (n)= 47, CG (n)=57Between grps: p= 0.751, z= 0.844IG: 19.31 (+1.71); CG: 19.42 (+1.51)
3 months, IG (n)= 47, CG (n)= 57Between groups: p= 0.578, z= 0.440IG: 19.62 (+1.06), p= 0.227, z= 0.123CG: 19.46 (+0.169), p= 0.699, z=0.341
6 months, IG (n)= 47, CG (n)= 57Between groups: p= 0.921, z= 0.157IG: 19.70 (+1.06) , p= 0.115, z= 0.056CG: 19.68 (+0.69), p= 0.171, z=0.135
9 months, IG (n)=15, CG (n)= 27Between groups: p= 0.234, z= 0.441IG: 19.80 (+0.414), p= 0.028, z= 0.034CG: 19.56 (+0.892), p= 0.032, z=0.074
12 months, IG (n)=8 , CG (n)= 14Between groups: p= 0.006, z= 0.019IG= 20 (+0.00), p= 0.095, z= 0.102CG= 19.43 (+0.646), p= 0.635, z=0.763
QoL -Functional, M (SD)Baseline, IG (n)= 47, CG (n)=57
NR The author says that there was diminishing participation beyond 6 months but no more details given
AH-791

Appendix H. Data Table
Author YearNoel 2004
Adverse Effects OtherNR Cognitive status showed significant
improvement at 12 months for the few remaining participants in the IGTelehealth added $ 1666 to outcome costs during the 6 months of studyHealthcare costs decreased by 58% for the telehealth grp and 47% for the CG.
AH-792

Appendix H. Data Table
Author YearPatient Recruitment
Setting Clinical Practice SettingPatient Technology
Setting Study design NOwen 2005 NR Hematology/Oncology
outpatient clinic at a large medical center in the US
Homes Randomized wait-list control
N = 62CG: 30IVR: 32
AH-793

Appendix H. Data Table
Author YearOwen 2005
Years of Study
Length of follow-up (months) Inclusion Criteria Exclusion Criteria Elderly
NR 3 mos At the outset: *Women with histological confirmed clinical stage 1 or 2 breast cancerAfter randomization:*Small number of pts were stage 0 or stage 3 and because of their strong desire to participate, were included in the study
Recruitment efforts are described in detail in another study (Owen, Klapow, Roth)
NR
AH-794

Appendix H. Data Table
Author YearOwen 2005
Underserved Chronic IllnessDisability/
Impairment Gender (% Male) Age (years)NR BREAST CANCER NR N = 0% Mean (SD)
CG: 51.3 (+10.5)IG: 52.5 (+8.6)
AH-795

Appendix H. Data Table
Author YearOwen 2005
Ethnicity Income (US$) EducationUrban / Rural /
Frontier Other
Patient Characteristics*
CaucasianCG: 100%IG: 95.8%
Mean Annual Income (SD)CG vs. IGCG: $65,000 (+$24,407)IG: $65,000 (+$114,148)
Mean years (SD)CG: 15.3 (+2)IG: 15.8 (+2.2)
NR Marital status (% Married)CG vs. IG77.8 vs. 87.5
Distance to clinic (miles)- Mean (SD)CG vs. IG55.2 (66.3) vs. 107.5 (301.5)
Employment status (%) Employed full time- CG vs. IG----- 46.7 vs. 42.9Employed part time- CG vs. IG------16.7 vs. 14.3Not employed- CG vs. IG--------36.6 vs. 42.8
Time since diagnosis (months) mean (SD)CG vs. IG--- 31.8(37.6) vs. 23.2 (28.4)
Breast conserving surgery (%)CG vs. IG----- 33.3 vs. 27.8
AH-796

Appendix H. Data Table
Author YearOwen 2005
Health Insurance Status Literacy Language(s) Health Beliefs Intervention Name
NR NR NR NR Survive website
AH-797

Appendix H. Data Table
Author YearOwen 2005
Intervention Described Intervention Groups Type of Device* Functions*
Intervention*
Self guided, internet based coping skills training given to pts in the intervention group
IG: provided with bulletin board for asynchronous group discussions, a dictionary of medical terminology, a database of breast cancer resources and websites, information and coping advice for management of common physical symptoms, a forum for sharing artwork and poetry, and six structured coping skills exercises.
They were identification of passive and active coping styles; communication with family and friends; identification of relationships among stress, emotions and behavior; stress management training; assertiveness training; structured problem solving training
They also received 39 prompts sent by email summarizing a coping skill exercise and suggesting that the pts post a
Computer Discussion groups, bulletin boards, forum, email
AH-798

Appendix H. Data Table
Author YearOwen 2005
Staff Training Subject Training co-interventions PhysiologicNR Pts were given brief
instructions on using the website
NR NR
AH-799

Appendix H. Data Table
Author YearOwen 2005
Health Service Utilization Health Care Costs KnowledgeNR NR NR
AH-800

Appendix H. Data Table
Author YearOwen 2005
Use of Technology Usability HIT SatisfactionAverage total log ins to the website: 35.5Hits to the bulletin board: 52.2Postings sent to the bulletin board: 9.5Uses of the coping exercises: 73.4Hrs spent logged in to the website: 3.4Mins per session over the course of 12 week intervention: 8.2
NR Coping exercises found most helpful: 68.2%Coping group/bulletin board: 59.1%Information about coping with specific symptoms: 57.2%
Either the coping exercises or discussion group was helpful: 82%
AH-801

Appendix H. Data Table
Author YearOwen 2005
Health Satisfaction Self-efficacy Health Behavior
Outcomes
NR NR NR
AH-802

Appendix H. Data Table
Author YearOwen 2005
Quality of Life Support WithdrawalsHealth related quality of life
FACT-Total measure CG vs. IGPre M (SD) = 81(14.3) vs. 78.3(15.7)post M (SD) = 85.3(11.8) vs. 88.7(10.8)F value- grpX baseline interaction effect- 0.33 (1,45)Treatment effect size- 0.30
EQ-5D thermometerCG vs. IGPre M (SD) = 78.4 (17.2) vs. 75.6(20.2)post M (SD) = 83.5(17.1)vs. 85.4 (9.9)F value- grpX baseline interaction effect- 16.40 (1,39), p<0.001Treatment effect size- 0.13
Psychological wellbeing
FACT- EWBCG vs. IGPre M (SD) = 15.4(4.0) vs. 14.8(3.9) post M (SD) = 15.3 (3.6) vs. 16.5(2.6)F value- grpX baseline interaction effect- 1.00 (1,45)Treatment effect size- 0.38, p <0.10
NR Pts expressing interest in the study- 154Excluded- 59 (not interested any more, lack of familiarity with computer, participatingin a competing trial, could not be reached by phone)Did not complete baseline assessment- 33
Randomized- 62, IG=30 (Received intervention-30; did not participate in intervention, never logged in- 5)Loss to follow up=6 (could not be reached or unwilling to complete follow up assessment)Analyzed=26 (excluded from analysis due to incomplete follow up-6)
CG= 30 Loss to follow up= 3 (could not be reached or unwilling to complete follow up assessment)Analyzed= 27 (excluded from analysis due to incomplete follow up data=3)Cross over into intervention group= 18declined to participate= 11
AH-803

Appendix H. Data Table
Author YearOwen 2005
Adverse Effects OtherNR Pts motivation for enrolling in the
study given, not listed hereThere is a graph showing use of each component of the intervention over timeA table showing Pearson correlation coefficients between linguistic variables associated with messages and change scores on dependent variables given, not listed here
AH-804

Appendix H. Data Table
Author YearPatient Recruitment
Setting Clinical Practice SettingPatient Technology
Setting Study design NPiette 1997 NR PAVA Diabetes care clinic,
Endocrinology clinic, General Internal Medicine clinic
Homes Cohort N= 65
AH-805

Appendix H. Data Table
Author YearPiette 1997
Years of Study
Length of follow-up (months) Inclusion Criteria Exclusion Criteria Elderly
NR NR *Pts with diagnosis of IDDM or NIDDM*Proficient in English
Pts excluded if psychotic, demented or blind as determined by the diagnosis in the medical record, residedin a congregate care facility, or did not have a working touch tone telephone in their home.
NR
AH-806

Appendix H. Data Table
Author YearPiette 1997
Underserved Chronic IllnessDisability/
Impairment Gender (% Male) Age (years)NR DIABETES NR N = 62 (92.4%) Range
<55: 15 pts55-64: 20 pts>65: 30 pts
AH-807

Appendix H. Data Table
Author YearPiette 1997
Ethnicity Income (US$) EducationUrban / Rural /
Frontier Other
Patient Characteristics*
TotalCaucasian: 61.5%Black: 9.2%Hispanic: 18.5%Asian/Pacific Islander: 10.8%
Low income % in the groups<55 yrsCaucasian: 66.7% Black: 6.7%Hispanic: 26.7% Hispanic55- 64 yrsCaucasian: 50%Black: 20%Hispanic: 20%Asian/Pacific Islander: 10% >65+ yrsCaucasian: 66.7%Black: 3.3%Hispanic: 13.3%Asian/Pacific Islander: 16.7 %
Pts taking insulinCaucasian: 55.6%Black: 7.4%Hispanic: 33.3%Asian/Pacific Islander:
VA eligible due to low income: 46.9%
Low income:<55 yrs: 43%55-64 yrs: 38.9%65< yrs: 53.1%
Taking insulin: 46.1%Not taking insulin: 47.4%
NR NR Marital status- 53.1% Married , 45.3% not married, 1.6% not applicable Marital status in the groupsLess than 55 yrs- 50% married, 42.9% not married, 7.1% not applicable55-64 yrs- 50% married, 50% not married,65 + yrs- 56.3% married, 43.7% not marriedTaking insulin- 46.2% married, 50.0% not married, 3.8% not applicableNot taking insulin- 57.9% married, 42.1% not married
Employment status-10.9% full time employed, 67.2% unemployed/retired, 21.9% otherEmployment status in the groupsLess than 55 yrs-
AH-808

Appendix H. Data Table
Author YearPiette 1997
Health Insurance Status Literacy Language(s) Health Beliefs Intervention Name
NR NR NR NR Automated voice messaging system (AVM)
AH-809

Appendix H. Data Table
Author YearPiette 1997
Intervention Described Intervention Groups Type of Device* Functions*
Intervention*
AVM system using specialized computer technology to telephone patients, communicate messages, and collect information
n= 65 pts
AVM calling protocol designed:*to inquire about diabetic symptoms that may be prognostic of poor glucose control and adverse health outcomes*to inquire about pts problems with glucose monitoring and foot care,*to inquire about adherence to diet and medication schedule and *to give pts the option of listening to health promotion messages regarding diabetic eye care, foot care, cardiovascular health and management of sick days.
Pts reporting serious problems reached within 48 hrs. At the end of each AVM call, pts instructed to call the PAVA Out patient clinic about health or health care (contact number provided)
Telephones Messages, information/education, storage of data.
AH-810

Appendix H. Data Table
Author YearPiette 1997
Staff Training Subject Training co-interventions PhysiologicNR NR NR Reported health problems
Chest Pain< 55 yrs= 20%, 55-64 yrs= 30%, 65+ = 26.7%, Taking insulin= 23.7%, Not taking insulin= 23.7%, Total= 26.2%Foot problems< 55 yrs= 33.3%, 55-64 yrs= 10%, 65+ = 10%, Taking insulin= 22.2%, Not taking insulin= 15.8%, Total= 18.5%Poor glucose control< 55 yrs= 33.3%, 55-64 yrs= 15%, 65+ = 13.3%, Taking insulin= 25.9%, Not taking insulin= 13.2%, Total= 18.5%Hypoglycemic symptoms , p< 0.05< 55 yrs= 66.7%, 55-64 yrs= 35%, 65+ = 26.7%, Taking insulin= 55.6%, Not taking insulin= 26.3%, Total= 38.5%Hyperglycemic symptoms< 55 yrs= 60%, 55-64 yrs= 50%, 65+ = 36.7%, Taking insulin= 59.3%, Not taking insulin= 36.8%, Total= 46.2%Poor health < 55 yrs= 20%, 55-64 yrs= 10%, 65+ = 10%, Taking insulin= 18.5%, Not taking insulin= 7.9%, Total= 12.3%
Reported self care problemsGlucose monitoring< 55 yrs= 16.7%, 55-64 yrs= 44.4%,
AH-811

Appendix H. Data Table
Author YearPiette 1997
Health Service Utilization Health Care Costs KnowledgeNR Human calling system-generate
390,000 calls/yr, Assuming 10 mins/call, 26 full time staff required at more than $ 1.2 million /yr.
AVM system with multiple phone lines-(costing around $ 90,000) and one all time nurse (costing around $ 22,500) for a total cost of $112,500. (around 10% of human calling system)
Assuming system paid for in the first year, program cost for 2nd year would be $ 22,500 ($3/pt) or 2% of the cost of the human calling program
NR
AH-812

Appendix H. Data Table
Author YearPiette 1997
Use of Technology Usability HIT SatisfactionNR NR Listened to 2+ preventive messages
< 55 yrs: 37.5%55-64 yrs: 74.4%>65: 85.6%Taking insulin: 71.5%Not taking insulin: 70%Total: 70.6%
Reported AVM was helpful< 55 yrs: 92.9%55-64 yrs: 100%>65: 100%Taking insulin: 94.7%Not taking insulin: 100%Total: 98.1%
No difficulty responding< 55 yrs: 100%55-64 yrs: 100%>65: 95.7%Taking insulin: 95.2%Not taking insulin: 100%Total: 98.1%
Would like to receive AVM< 55 yrs: 100%55-64 yrs: 82.4%>65: 87.5%Taking insulin: 95%Not taking insulin: 84.4%Total: 88.5%
AH-813

Appendix H. Data Table
Author YearPiette 1997
Health Satisfaction Self-efficacy Health Behavior
Outcomes
NR NR NR
AH-814

Appendix H. Data Table
Author YearPiette 1997
Quality of Life Support WithdrawalsNR NR Potential eligible pts: 74
Ineligible: 4Difficulty understanding English: 1Had memory deficit: 1
Asked to withdraw because he was dissatisfied with the AVM calls: 1Final sample: 65 pts(2 not accounted for by the author)
AH-815

Appendix H. Data Table
Author YearPiette 1997
Adverse Effects OtherNR Pts ability to respond to AVM calls
given, not reported here
AH-816

Appendix H. Data Table
Author YearPatient Recruitment
Setting Clinical Practice SettingPatient Technology
Setting Study design NPike KJ 2007 American Cancer Society
websiteNA WWW Randomized trial N = 6451
6 randomized groupsCG: Break Away from the Pack static website with pdf self-help filesGrp 1: Oregon Center for Applied ScienceGrp 2: ProChangeGrp 3: QuitNetGrp 4: Smoke ClinicGrp 5: Centre for Addiction & Mental Health
Rami 2006 NR NR Homes Randomized cross over trial
N= 36Telemedicine-PaperDiary group: 18 PD-TM: 18
AH-817

Appendix H. Data Table
Author YearPike KJ 2007
Rami 2006
Years of Study
Length of follow-up (months) Inclusion Criteria Exclusion Criteria Elderly
October 2004 - May 2005
3 months *Visitors to ACS website responding to online recruitment for study*English speaking*Smoke daily*U.S. residents*Complete online informed consent and intake questions
NR NR
NR 6 months *HbA1c >8%*Duration of disease >1 year*Age between 10-19 yrs*Willingness and consent to participate in the study*Willingness to attend follow up visits every 3 months
NR NR
AH-818

Appendix H. Data Table
Author YearPike KJ 2007
Rami 2006
Underserved Chronic IllnessDisability/
Impairment Gender (% Male) Age (years)NR SMOKING NR N = 30% Mean: 41
NR DIABETES-Type 1 NR TM-PD Grp: 50%PD-TM Grp: 61%
TM-PD: 14.5 (12.9-19.3), NSPD-TM: 16.2 (10.7-19.0), NS
AH-819

Appendix H. Data Table
Author YearPike KJ 2007
Rami 2006
Ethnicity Income (US$) EducationUrban / Rural /
Frontier Other
Patient Characteristics*
Caucasian: 87% NR Some college: 75% NR 21% use the Internet daily and 66% use Internet more than once/day
NR NR NR NR TM-PD vs. PD-TMDuration of diabetes (yrs)6.4 (1.0-12.8) vs. 6.1 (2.9-11.1), NS
BMI19.0 (15.9-32.6) vs. 17.8 (18.4-28.7), NS
HbA1c at start (%)9.1 (8.0-11.3) vs. 9.3 (8.3 - 11.6), NS
AH-820

Appendix H. Data Table
Author YearPike KJ 2007
Rami 2006
Health Insurance Status Literacy Language(s) Health Beliefs Intervention Name
NR English literate NR NR Control: pdf files; ORCAS: tailored presentations with role models; ProChange: tailored feedback on stage of change; QuitNet: personalized content and group support; Smoke Clinic: structured assessment with relapse prevention; Centre for Addiction & Mental Health: tailored content and group support with RN moderated discussion
NR NR NR NR VIE-DIAB system
AH-821

Appendix H. Data Table
Author YearPike KJ 2007
Rami 2006
Intervention Described Intervention Groups Type of Device* Functions*
Intervention*
Subjects randomized to use one of 6 websites described above
NR NR NA
Feasibility study of a telemedicine support system (VIE-DIAB)and its effect on glycemic control in adolescents with TIDMVIE-DIAB collects and processes data on glycemic control received from mobile phone services (SMS, GPRS, WAP) and from password protected internet connection to the server, daily serum glucose concentrations glyphs displays, once a week automatically generated SMS or personalized message with advice.
TMVIE-DIAB collects and processes data on glycemic control received from mobile phone services (SMS, GPRS, WAP) and from password protected internet connection to the server such as date and time, serum glucose value, insulin dosage, carbohydrate intake, and additional notes. daily serum glucose concentrations glyphs displays, once a week automatically generated SMS or personalized message with advicePDRoutine scheme with a daily written protocol
Mobile phones SMS, data log, free text, serum glucose levels, on screen tailored glyphs
AH-822

Appendix H. Data Table
Author YearPike KJ 2007
Rami 2006
Staff Training Subject Training co-interventions PhysiologicNA NR NR NR
NR Pts instructed to measure 4 blood glucose values/dayAll pts informed about technical features of the program, of SMS communications, and all pts received a manual containing these instructions.
NR Glycemic control improved during TM stage, p<0.05At the end of the study, HbA1c values reached the same endpointTM-PD vs. PD-TM; median (range)9.2 (7.4-12.6) vs. 8.85 (7.3-11.7%)
AH-823

Appendix H. Data Table
Author YearPike KJ 2007
Rami 2006
Health Service Utilization Health Care Costs KnowledgeNR NR NR
NR Telecommunication costs was low NR
AH-824

Appendix H. Data Table
Author YearPike KJ 2007
Rami 2006
Use of Technology Usability HIT Satisfaction"Wide variation" in individual website use; 3 sites had higher use (20% or more subjects making 5 or more visits) and 3 had lower use (<10% make 5 or more visits)
High vs. low site useNon-ITT quitting: 26% vs. 22.1%
NR NR
NR NR Overall satisfaction goodPts mainly criticized the additional workload and GPRS access problems- because of these problems, pts rated the system time consuming and only half of them wanted to continue with the systemTable showing results of pt satisfaction survey given, not listed here
AH-825

Appendix H. Data Table
Author YearPike KJ 2007
Rami 2006
Health Satisfaction Self-efficacy Health Behavior
Outcomes
NR NR Self-reported, 7-day point prevalence of quitting at 3 months: CG: 22.3% controlExp Grp: 23.5%
Intent-to-treat (54% response; assume non-responders smoking): CG: 10.9%Exp Grp: 11%
NR NR NR
AH-826

Appendix H. Data Table
Author YearPike KJ 2007
Rami 2006
Quality of Life Support WithdrawalsNR NR 46% non-response to follow-up
survey (online with phone f/u)
NR NR NR
AH-827

Appendix H. Data Table
Author YearPike KJ 2007
Rami 2006
Adverse Effects OtherNR NR
NR NR
AH-828

Appendix H. Data Table
Author YearPatient Recruitment
Setting Clinical Practice SettingPatient Technology
Setting Study design NRasmussen 2005 Catchment area of H:S
Bispebjerg university hospital
Asthma specialist clinic, GP clinic
Homes Prospective randomized comparative design(prospective RCT)
N=300Internet Grp: 100Specialist Grp: 100GP Grp: 100
AH-829

Appendix H. Data Table
Author YearRasmussen 2005
Years of Study
Length of follow-up (months) Inclusion Criteria Exclusion Criteria Elderly
NR 6 months *Combination of respiratory symptoms and at least 1 objective measure of asthma viz*Airway hyper responsiveness to inhaledmethacholineless than or =4 µmol*Peak expiratory flow variability (PEF) of equal to or more than 20% and/or minimum of 15% (300mL) increase in FEV1 after bronchodilation
NR NR
AH-830

Appendix H. Data Table
Author YearRasmussen 2005
Underserved Chronic IllnessDisability/
Impairment Gender (% Male) Age (years)NR ASTHMA NR Grp 1: 27%
Grp 2: 30%Grp 3: 30%Withdrawals: 14%
Mean (Range)Grp 1 : 28 (18-44)Grp 2 : 30 (19-45)Grp 3 : 30 (20-45)
AH-831

Appendix H. Data Table
Author YearRasmussen 2005
Ethnicity Income (US$) EducationUrban / Rural /
Frontier Other
Patient Characteristics*
NR NR NR Catchment area NR
AH-832

Appendix H. Data Table
Author YearRasmussen 2005
Health Insurance Status Literacy Language(s) Health Beliefs Intervention Name
NR NR NR NR Physician managed online interactive asthma monitoring tool
AH-833

Appendix H. Data Table
Author YearRasmussen 2005
Intervention Described Intervention Groups Type of Device* Functions*
Intervention*
Electronic diary, action plan for patients, decision support system for physicianPts given a peak flow meter, pts record symptoms, need for rescue medication and PEF values.3 colored warning system with written action planPts fill diary daily and follow instructions given by computer and physicianCheck online repository at www.mosby.com/jaci
Grp 1: Internet groupGrp 2 : Specialist groupGrp 3 : GP group
Grp 1: details given above, also check onlineGrp 2: Pts treated acc to severity and taught how to adjust medication,pts given peak flow meter and written action plan that had a 3 color warning system based on symptom score and PEF valuesGrp 3: Pts asked to contact GP with letter describing study and test results. GP to assess symptoms and tests and decide need for pharmaceutical treatment. pts did not receive treatment or info from study physician
Computer, push-button telephone
Electronic asthma diary, daily recordings of symptoms, PEF values, instructions from physician, decision support for physicians-check online journal
AH-834

Appendix H. Data Table
Author YearRasmussen 2005
Staff Training Subject Training co-interventions PhysiologicNone specified as such- but all GPs received a circular about asthma and GINA guidelines by local authority
Pts instructed in the use of internet diary, pts in SP group taught medication adjustment
NR Improved symptoms -Odds Ratio (95% CI)Grp 1 vs. Grp 2:2.64 (1.43-4.88), p= 0.002Grp 1 vs. Grp 3:3.26 (1.71-6.19), p < 0.001Grp 2 vs. Grp 3: 1.23 (0.66-2.30), p= NS
Improved AQLQ score(Asthma quality of life questionnaire)Odds ratio (95% CI)Grp 1 vs. Grp 2:2.21 (1.09-4.47), p= 0.03Grp 1 vs. Grp 3: 2.10 (1.02-4.31), p = 0.04Grp 2 vs. Grp 3:0.95 (0.43-2.07) , p= NS
Improved FEV1 more than or equal to 300 mLOdds ratio (95% CI)Grp 1 vs. Grp 2:3.26 (1.50-7.11) , p= 0.002Grp 1 vs. Grp 3:4.86 (1.97-11.94), p <0.001 Grp 2 vs. Grp 3:1.49 (0.55-4.05) , p= NS
Improved AHR (airway hyper responsiveness)Odds ratio (95% CI)
AH-835

Appendix H. Data Table
Author YearRasmussen 2005
Health Service Utilization Health Care Costs KnowledgeAcute unscheduled visits by % pts on a monthly basisGrp1 vs. Grp 2 vs. Grp 33.7% vs. 2.1% vs. 1.3% (P= 0.05, chi sq)
GP group visited physician on avg once (95th percentile, 1-3)Internet grp: used tool on avg 4 times in 2 week block (range, 1-6)Sp group: 1 pt hospitalized due to exacerbationmore data on the website
NR NR
AH-836

Appendix H. Data Table
Author YearRasmussen 2005
Use of Technology Usability HIT SatisfactionPts in Internet group used tool on average 4 times in 2-week blocks Range: 1-6
NR NR
AH-837

Appendix H. Data Table
Author YearRasmussen 2005
Health Satisfaction Self-efficacy Health Behavior
Outcomes
NR NR No asthma MedicationGrp 1 (baseline: FU, Mcnemar) vs. Grp 2 (baseline: FU, Mcnemar) vs. Grp 3 (baseline : FU, Mcnemar)44%:0%, <0.001 vs. 57% :1%, <0.001 vs. 53% : 26%, <0.001
Take Inhaled corticosteroidsGrp 1 (baseline: FU, Mcnemar) vs. Grp 2 (baseline: FU, Mcnemar) vs. Grp 3 (baseline : FU, Mcnemar)21% : 91%, <0.001 vs. 20% : 83%, < 0.001 vs. 17% : 29%, 0.04
Good ComplianceGrp 1 (baseline: FU, Mcnemar) vs. Grp 2 (baseline: FU, Mcnemar) vs. Grp 3 (baseline : FU, Mcnemar)32% :87%, <0.001 vs. 25% :79%, <0.001, 36%:54%, <0.001
Use of action planGrp 1 (baseline: FU, Mcnemar) vs. Grp 2 (baseline: FU, Mcnemar) vs. Grp 3 (baseline : FU, Mcnemar)+E42% :88%, <0.001 vs. 3%:66%, <0.001 vs. 0% : 6%, NS
AH-838

Appendix H. Data Table
Author YearRasmussen 2005
Quality of Life Support WithdrawalsNR NR N = 47
Grp 1: 15Grp 2: 12Grp 3: 20no significant difference in the dropout rate, P= 0.26, chi sq
AH-839

Appendix H. Data Table
Author YearRasmussen 2005
Adverse Effects OtherGrp1 vs. Grp 2 vs. Grp 3Dysphonia: 17% vs. 4% vs. 9%Oropharyngeal candidiasus: 18% vs. 3% vs. 4%
Pts characteristics at baseline given, not listed hereViz- symptoms gradingAQLQ scoresFEV1, % predictedAHR
AH-840

Appendix H. Data Table
Author YearPatient Recruitment
Setting Clinical Practice SettingPatient Technology
Setting Study design NReid RD 2007 University of Ottawa Heart
CentreHospital to Home Homes RCT N = 100
IVR: 50CG: 50
AH-841

Appendix H. Data Table
Author YearReid RD 2007
Years of Study
Length of follow-up (months) Inclusion Criteria Exclusion Criteria Elderly
November 2004 - May 2005
12 months *Smoke 5 or more cig/day, *Age 18+*Hospitalized for acute coronary syndrome or catheterization or percutaneous coronary intervention (PCI)
Live 1 hour or more away
NR
AH-842

Appendix H. Data Table
Author YearReid RD 2007
Underserved Chronic IllnessDisability/
Impairment Gender (% Male) Age (years)NR SMOKING NR IVR: 61%
CG: 74%MeanIVR: 54CG: 53.9
AH-843

Appendix H. Data Table
Author YearReid RD 2007
Ethnicity Income (US$) EducationUrban / Rural /
Frontier Other
Patient Characteristics*
NR NR High schoolIVR: 91%CG: 70%
More than HSIVR: 9%CG: 30%
NR NR
AH-844
Appendix H. Data Table
Author YearReid RD 2007
Health Insurance Status Literacy Language(s) Health Beliefs Intervention Name
NR NR NR NR NR
AH-845

Appendix H. Data Table
Author YearReid RD 2007
Intervention Described Intervention Groups Type of Device* Functions*
Intervention*
All subjects: inpatient bedside counseling by nurse specialist and nicotine therapy, if needed. Experimental: IVR contact post-discharge on day 3, 14 and 30. IVR queries on smoking status, confidence in quitting, use of pharmacotherapy, use of self-help; If subject wanted to quit or had confidence <7 (out of 10), nurse counselor called 3 times over 8 week period.
IVR or Usual Care Telephone Subject responses to IVR flag a counselor to call
AH-846

Appendix H. Data Table
Author YearReid RD 2007
Staff Training Subject Training co-interventions PhysiologicNR NR NR NR
AH-847

Appendix H. Data Table
Author YearReid RD 2007
Health Service Utilization Health Care Costs KnowledgeNR NR NR
AH-848

Appendix H. Data Table
Author YearReid RD 2007
Use of Technology Usability HIT SatisfactionIVR contact3 days: 35/5014 days: 36/5030 days: 34/50
NR NR
AH-849

Appendix H. Data Table
Author YearReid RD 2007
Health Satisfaction Self-efficacy Health Behavior
Outcomes
NR NR Self-report not smoking at 52 weeks: unadjusted: IVR: 46%CG: 34.7% (OR 1.6, CI 0.7-3.6, p=0.25)
Adjusted for age, education, diagnosis, prior quitting: OR 2.34, CI 0.92-5.92, p=.07)
AH-850

Appendix H. Data Table
Author YearReid RD 2007
Quality of Life Support WithdrawalsNR NR 1 control subject died
AH-851

Appendix H. Data Table
Author YearReid RD 2007
Adverse Effects OtherNR NR
AH-852

Appendix H. Data Table
Author YearPatient Recruitment
Setting Clinical Practice SettingPatient Technology
Setting Study design NRobertson 2006 NR One public hospital and
public and private clinics Homes Cohort N= 144
AH-853

Appendix H. Data Table
Author YearRobertson 2006
Years of Study
Length of follow-up (months) Inclusion Criteria Exclusion Criteria Elderly
NR 12 mos *Currently receiving treatment for depression under the care of a mental health professional*Previously or currently satisfying the diagnostic criteria for a major depressive episode*Access to a computer and the internet*Willing to use the internet as a part of the treatment*Willing to provide informed consent*Sufficient cognitive functioning*Proficiency in English*Age > 18 yrs
NR NR
AH-854

Appendix H. Data Table
Author YearRobertson 2006
Underserved Chronic IllnessDisability/
Impairment Gender (% Male) Age (years)NR DEPRESSION NR N = 37.5% Mean (Range): 42 (19-
64)
AH-855

Appendix H. Data Table
Author YearRobertson 2006
Ethnicity Income (US$) EducationUrban / Rural /
Frontier Other
Patient Characteristics*
NR NR NR NR NR
AH-856

Appendix H. Data Table
Author YearRobertson 2006
Health Insurance Status Literacy Language(s) Health Beliefs Intervention Name
NR NR NR NR Recovery Road
AH-857

Appendix H. Data Table
Author YearRobertson 2006
Intervention Described Intervention Groups Type of Device* Functions*
Intervention*
E-health system , to be used as an adjunct to treatment by pts and clinicians.
The system facilitates self management and provides patients with a secure online consultation system, automated patient administered progress monitoring questionnaireswith feedback, systematic psychoeducation, and evidence based therapy.
Patient side12 e0sessions for 12 months, e- progress monitoring and progress report, e-psychological therapy-psychoeducation, e-consultation system, e-medical record, e-diary, pt controlled privacy settings, adherence reminders to complete recovery road sessions and to take medicines.
Clinician sidePatient progress monitoring outcomes, access to online questionnaires, flags to identify at risk pts, patient brochures, e-consultations, e-medical record. Later on in the study, automated reminders and case management system added.
Computer progress reports, online consultation, therapy, etc
AH-858

Appendix H. Data Table
Author YearRobertson 2006
Staff Training Subject Training co-interventions PhysiologicNR NR NR NR
AH-859

Appendix H. Data Table
Author YearRobertson 2006
Health Service Utilization Health Care Costs KnowledgeNR NR NR
AH-860

Appendix H. Data Table
Author YearRobertson 2006
Use of Technology Usability HIT SatisfactionNR NR The author mentions that satisfaction
ratings were obtained from pts in public and private sectors using an online questionnaire majority of pts surveyed were satisfied and said that it increased their knowledge of depression and enhanced their relationships with the clinicians
All clinicians reported that they were satisfied with the system, 83% reported that it helped the relationship with the patient, 100% reported that it helped the pt to better manage their condition
AH-861

Appendix H. Data Table
Author YearRobertson 2006
Health Satisfaction Self-efficacy Health Behavior
Outcomes
NR Mean DSS was severe at session 1 and declined to mild by session 8, a large reduction in depression severity ( d (within-subject)= 1.03)58% of pts had subclinical levels of depressive symptomatology at session 8.
The rate of adherence decline was greater for pts who received only automated reminders than those who received case management.By session 8, adherence for case management was 34% higher than automatic reminders.
A Cox regression survival analysis revealed a significant hazard ratio of 2.43 (95% CI=1.01-5.84) for automated reminders relative to case management when controlling for baseline depression severity. Medication adherence at each session ranged from 91% at session 1 to 100% at session 6.
AH-862

Appendix H. Data Table
Author YearRobertson 2006
Quality of Life Support WithdrawalsNR NR Of the 144 pts referred, 7 withdrew
prior to using the system and 23 did not complete the session, data from 2 pts were lost due to technical difficulties
AH-863
Appendix H. Data Table
Author YearRobertson 2006
Adverse Effects OtherNR Graphs depicting adherence to
recovery road across sessions and depression severityof the patient given.
AH-864

Appendix H. Data Table
Author YearPatient Recruitment
Setting Clinical Practice SettingPatient Technology
Setting Study design NRobertson 2005 NR Private psychiatric
practices, public psychiatry services, and general practice
Homes Cohort N= 98Grp 1 (Standard automated email reminders): 69Grp 2 (Case management): 29
AH-865

Appendix H. Data Table
Author YearRobertson 2005
Years of Study
Length of follow-up (months) Inclusion Criteria Exclusion Criteria Elderly
NR 12 months *Previously or currently satisfying the diagnostic criteria for a major depressive episode*Access to a computer and internet*Willing to use the internet as part of treatment*Willing to provide informed consent*Sufficient cognitive functioning*Proficiency in English*Age > 18 yrs
NR NR
AH-866

Appendix H. Data Table
Author YearRobertson 2005
Underserved Chronic IllnessDisability/
Impairment Gender (% Male) Age (years)NR DEPRESSION NR N = 43.87% Range: 19-64
AH-867

Appendix H. Data Table
Author YearRobertson 2005
Ethnicity Income (US$) EducationUrban / Rural /
Frontier Other
Patient Characteristics*
NR NR NR NR NR
AH-868

Appendix H. Data Table
Author YearRobertson 2005
Health Insurance Status Literacy Language(s) Health Beliefs Intervention Name
NR NR NR NR Recovery Road
AH-869

Appendix H. Data Table
Author YearRobertson 2005
Intervention Described Intervention Groups Type of Device* Functions*
Intervention*
Pts provided with education, progress monitoring, e- consultation, e- diary and online evidence based therapy.
12 month progressive monitoring and treatment over 12 months, pts received progressmonitoring questionnaires, progress graphs and summary progress reports.Additional online features included online evidence based therapy, systematic education,a secure e-consultation system, an e diary and a record of currently and previously prescribed medications.
Grp 1: had standard automated e mail reminders for all sessions and in response to non-adherenceGrp 2: case management consisting of standard automated e mail reminders for all sessions and email and telephone follow up by a case manager in response to non-adherence
Computer Progress reports, online consultation, therapy, etc
AH-870

Appendix H. Data Table
Author YearRobertson 2005
Staff Training Subject Training co-interventions PhysiologicNR NR NR NR
AH-871

Appendix H. Data Table
Author YearRobertson 2005
Health Service Utilization Health Care Costs KnowledgeNR NR NR
AH-872

Appendix H. Data Table
Author YearRobertson 2005
Use of Technology Usability HIT SatisfactionNR NR NR
AH-873

Appendix H. Data Table
Author YearRobertson 2005
Health Satisfaction Self-efficacy Health Behavior
Outcomes
NR NR Adherence After first 8 sessions, Grp 1: 55%Grp 2: 84%
For both grps adherence tended to decline over timeCox regression survival analysis of non adherence to Recovery Road, controlling for baseline depression, revealed a significant hazard ratio of 2.4 (95% CI, 1.0-5.8), alpha < 0.05 for automated reminders relative to case management
AH-874

Appendix H. Data Table
Author YearRobertson 2005
Quality of Life Support WithdrawalsNR NR NR
AH-875

Appendix H. Data Table
Author YearRobertson 2005
Adverse Effects OtherNR NR
AH-876

Appendix H. Data Table
Author YearPatient Recruitment
Setting Clinical Practice SettingPatient Technology
Setting Study design NRodgers A 2005 Posters, websites, media
articles, email and text messaging mailing lists, in N.Z.
NA Mobile phone text messaging
RCT N = 1705 randomizedCG: 853Exp Grp: 852
AH-877

Appendix H. Data Table
Author YearRodgers A 2005
Years of Study
Length of follow-up (months) Inclusion Criteria Exclusion Criteria Elderly
NR 6 months *Age 16+*Smoke daily*Ready to quit in 30 days*Able to send/receive text messages*Vodafone owner*Speak English*Informed consent
NR NR
AH-878

Appendix H. Data Table
Author YearRodgers A 2005
Underserved Chronic IllnessDisability/
Impairment Gender (% Male) Age (years)NR SMOKING NR CG: 41.7%
Exp: 41.3%Mean: 22
AH-879

Appendix H. Data Table
Author YearRodgers A 2005
Ethnicity Income (US$) EducationUrban / Rural /
Frontier Other
Patient Characteristics*
EuropeanCG: 63.8%Exp Grp: 62.2%
MaoriCG: 21%Exp Grp: 20.7%
PacificCG: 3.4%Exp Grp: 3.6%
($New Zealand):
< 15000CG: 25.2%Exp Grp: 25.9%
15000-30000CG: 40.9%Exp Grp: 42.7%
>30000CG: 32.1%Exp Grp: 30.1%
NR NR Cig/day Mean: 15 both groups
AH-880

Appendix H. Data Table
Author YearRodgers A 2005
Health Insurance Status Literacy Language(s) Health Beliefs Intervention Name
NR English literate English NR NR
AH-881

Appendix H. Data Table
Author YearRodgers A 2005
Intervention Described Intervention Groups Type of Device* Functions*
Intervention*
Text messages tailored to preferences, smoking history, barriers to quitting, set around a quit date
Exp Group: 5 per day for 1 week before QD and 4 weeks after, then 3 per week for 26 weeks; 1 free month of text msg for 1 month; Text quit buddy (similar subjects put in touch with each other)
CG: text message thanking them and providing contact information every 2 weeks, 1 free month of messaging if completing follow-up.
Mobile phone text messaging
Text messaging, TXT polls, TXT quizzes, TXT buddy
AH-882

Appendix H. Data Table
Author YearRodgers A 2005
Staff Training Subject Training co-interventions PhysiologicNR NR NR Salivary cotinine on random sample
of 100 subjects
AH-883

Appendix H. Data Table
Author YearRodgers A 2005
Health Service Utilization Health Care Costs KnowledgeNR NR NR
AH-884

Appendix H. Data Table
Author YearRodgers A 2005
Use of Technology Usability HIT SatisfactionNR NR NR
AH-885

Appendix H. Data Table
Author YearRodgers A 2005
Health Satisfaction Self-efficacy Health Behavior
Outcomes
NR Confidence in staying quit: Control 20%, Exp 33% (high confidence at 26 weeks);
6-week quit ratesCG: 13%Exp Grp: 28% Relative risk 2.2 (1.79 to 2.70, p<0.0001)
AH-886

Appendix H. Data Table
Author YearRodgers A 2005
Quality of Life Support WithdrawalsNR NR N = 1705
Data available6 wks: 1624, 95% (withdrawal = 81)6 mos: 1265, 74% (withdrawal = 359)
AH-887

Appendix H. Data Table
Author YearRodgers A 2005
Adverse Effects OtherRate of finger painControl: 48 (5.6%)Exp Grp: 52 (6.1%)
Motor Vehicle AccidentControl: 43 (5%)Exp Grp: 38 (4.5%)
NR
AH-888

Appendix H. Data Table
Author YearPatient Recruitment
Setting Clinical Practice SettingPatient Technology
Setting Study design NRogers 2001 NR New York Upstate
university in Syracuse-Internal medicine outpatient practices
Homes RCT N= 121Usual care: 61Home service: 60
AH-889

Appendix H. Data Table
Author YearRogers 2001
Years of Study
Length of follow-up (months) Inclusion Criteria Exclusion Criteria Elderly
May 1999 to April 2000
NR *Adults with previous diagnosis of essential hypertension and under evaluation for a change in antihypertensive therapy because of 1) elevated blood pressure (systolic equal to or more than 140 or diastolic equal to or more than 90 mm Hg) despite current therapy, 2) undesirable side effects of current antihypertensive medications3) office systolic pressure of at least 180 mm Hg or diastolic pressure of at least 110 mm Hg with no current use of antihypertensive medications
*For pts with DM, heart disease, stroke, nephropathy, peripheral arterial disease, or hypertensive retinopathy;*An office systolic BP of at least 130 mm Hg or an office diastolic of at least 85 mm Hg
Pts younger than 18 yrs, pregnant, had secondary hypertension, or did not have the mental or physical capacity to monitor BP at home
NR
AH-890

Appendix H. Data Table
Author YearRogers 2001
Underserved Chronic IllnessDisability/
Impairment Gender (% Male) Age (years)NR HTN NR Home service: 43.3%
Usual care: 55.7%Mean (SD); Home service vs. usual care62.6 (+10) vs. 60.3 (+11.9)
AH-891

Appendix H. Data Table
Author YearRogers 2001
Ethnicity Income (US$) EducationUrban / Rural /
Frontier Other
Patient Characteristics*
Home service vs. usual care (%)White: 80.7 vs. 91.2
African American:12.3 vs. 7.0
Other: 7 vs. 1.8
NR NR NR Cigarette smoking (%)Current: 7.3 vs. 16.4Former: 41.8 s 50.9Never: 50.9 vs. 32.7
Medical history (%)Cardiovascular disease: 13 vs. 20,Stroke or carotid surgery: 9.3 vs. 12.7Chronic bronchitis, emphysema or chronic obstructive pulmonary disease:13 vs. 14.6Diabetes: 22.8 vs. 26.3
Mean body mass index (SD), Kg/m231.5 (+7.6) vs. 28.9 (+5.2)
Mean total physical activity score7.32 (+1.27) vs. 7.77 (+1.52)
Mean intake of highly saturated fatty foods15.1 (+7.1) vs. 14.2 (+7.2)
AH-892

Appendix H. Data Table
Author YearRogers 2001
Health Insurance Status Literacy Language(s) Health Beliefs Intervention Name
Private insurance plans or Medicare
NR NR NR Home monitoring service
AH-893

Appendix H. Data Table
Author YearRogers 2001
Intervention Described Intervention Groups Type of Device* Functions*
Intervention*
A home service consisting of automatic transmission of blood pressure data over telephone lines, computerized conversion of the information into report forms, and weekly electronic transmission of the report forms to physicians and patients
Home service:automatic BP recording at home, central processing and electronic reports weekly to pts and physicians; pts instructed to take BP 3 times in the morning before eating or drinking and 3 times in the evening before going to bed , 3 days per week for 8 weeks (could take additional readings if desired)After each reading, device dialed service support center and transmitted data.Results displayed in report form and faxed to the physician, both pt and physician received weekly reports and a summary report at the end.(physicians adjusted medications thru phone calls/office visits or both if required)
Usual care:Pts assigned to usual care were treated for
Home monitoring service Data input, data transmission, data in report format
AH-894

Appendix H. Data Table
Author YearRogers 2001
Staff Training Subject Training co-interventions PhysiologicNR NR NR Mean systolic BP
Home service: decreased by 4.9 mm Hg (95% CI: - 1.61 to - 8.12, p=0.005)Usual care: 0.1 mm Hg decrease (95% CI: - 3.43 to 3.17, p>0.2)
Mean diastolic BPHome service: decreased by 2 mm Hg (CI: 0.14 to - 4.04, p= 0.072)Usual care: 2.1 mm hg increase(CI: - 0.21 to 4.37, p=0.08)
Average mean arterial pressureHome service= decreased 2.8 mm Hg(CI: - 0.59 to - 5.05 mm Hg; p=0.016)Usual care: 1.3 mmHg increase(CI: - 1.01 to 3.67 mm Hg, p>0.2)
Statistically significant differences seen inMean diastolic pressure (difference): 4.1 mm Hg (CI: 0.93 to 7.13 mm Hg, p= 0.012)Mean systolic pressure (difference): 4.8 mm Hg (CI:0.10 to 9.36 mm Hg, p=0.047)
Mean arterial pressure (difference): 4.1 mm Hg (CI:0.91 to 7.38, p=
AH-895

Appendix H. Data Table
Author YearRogers 2001
Health Service Utilization Health Care Costs KnowledgeOne office visit during the trialHome service: 73.2%Usual care: 60%
Significant difference seen in median length of follow up timeHome service: 79 daysUsual care: 72 days
NR NR
AH-896

Appendix H. Data Table
Author YearRogers 2001
Use of Technology Usability HIT SatisfactionNR NR Pts satisfied with their medical care
In both grps, 94% pts said that they agreed with the statement " I feel I am receiving good medical care"
96% of home service and 89% of usual care strongly agreed to the statement that "I feel my doctor had all the information necessary to diagnose or treat me"
AH-897

Appendix H. Data Table
Author YearRogers 2001
Health Satisfaction Self-efficacy Health Behavior
Outcomes
NR NR NR
AH-898

Appendix H. Data Table
Author YearRogers 2001
Quality of Life Support WithdrawalsNR NR Pts identified as possible candidates=
167cancelled appointment=9, did not keep scheduled appointment=8,found to be ineligible=2Pts approached by study manager= 148declined=17Pts fitted with device=131declined to continue=2, cannot tolerate device=8Pts randomly assigned=121Home service=60completed=56Did not complete=4 (withdrew=3, discontinued coz of health problems=1)Usual care= 61completed trial=55, did not complete=6 (withdrew=4, discontinued coz of health problems=1, lost to follow up=1)
AH-899

Appendix H. Data Table
Author YearRogers 2001
Adverse Effects OtherNR The decrease in BP with home
service evident in both men and women, in younger and older patients and in each ethnic group (graph given, values difficult to pinpoint)
Medication dose changeHome service: 33.3%Usual care: 6.6%p<0.001
Type of antihypertensive medication changed inHome service: 40%Usual care: 27.9%p= 0.159
Significant main outcomes obtained when only pts who participated in the trial for 4 months were includedDifference between the two study groups forMean arterial: p=0.023Diastolic: p= 0.024systolic-p= 0.047
AH-900

Appendix H. Data Table
Author YearPatient Recruitment
Setting Clinical Practice SettingPatient Technology
Setting Study design NRoss SE 2004 Outpatient clinic Specialty clinic Homes RCT N = 107
IVR: 54CG: 53
AH-901

Appendix H. Data Table
Author YearRoss SE 2004
Years of Study
Length of follow-up (months) Inclusion Criteria Exclusion Criteria Elderly
September 2001-September 2002
12 mos *Heart failure patients*Ages 18+*Speak English*Have used Web browser in the past
Patients who were physicians, nurses or physician assistants
NR
AH-902

Appendix H. Data Table
Author YearRoss SE 2004
Underserved Chronic IllnessDisability/
Impairment Gender (% Male) Age (years)YES: Safety Net InsuranceExp Grp: 19%CG: 19%
CHF NR Exp: 80%CG: 74%
MeanExp Grp: 57CG: 55
AH-903

Appendix H. Data Table
Author YearRoss SE 2004
Ethnicity Income (US$) EducationUrban / Rural /
Frontier Other
Patient Characteristics*
CaucasianExp Grp: 92%CG: 88%
<45,000/yearExp Grp: 56%CG: 50%
College GraduateExp Grp: 53%CG: 44%
NR Home computerExp Grp: 96%CG: 94%
AH-904

Appendix H. Data Table
Author YearRoss SE 2004
Health Insurance Status Literacy Language(s) Health Beliefs Intervention Name
Safety Net InsuranceExp Grp: 19%CG: 19%
NR NR NR System Providing Access to Records Online (SPPARO)
AH-905

Appendix H. Data Table
Author YearRoss SE 2004
Intervention Described Intervention Groups Type of Device* Functions*
Intervention*
Web access to medical record, educational guide, secure messaging
Exp: Access to SPPARO;Control: Usual care
WWW PHR: clinical notes, lab and test results
AH-906

Appendix H. Data Table
Author YearRoss SE 2004
Staff Training Subject Training co-interventions PhysiologicNR Exp: Written user guide
provided;Con: None. Offered SPPARO after study was completed
NR MortalityExp Grp: 6pts (11%)CG: 6pts (11%)
AH-907

Appendix H. Data Table
Author YearRoss SE 2004
Health Service Utilization Health Care Costs KnowledgeUtilization during Study Year 2002:% Patients HospitalizedExp Grp: 20%CG: 23%N HospitalizationsExp Grp: 22CG: 21
% going to ERExp Grp: 20%CG: 13%
N ER visitsExp Grp: 20CG: 8
N Heart Failure Clinic VisitsExp Grp: 324CG: 325
NR NR
AH-908
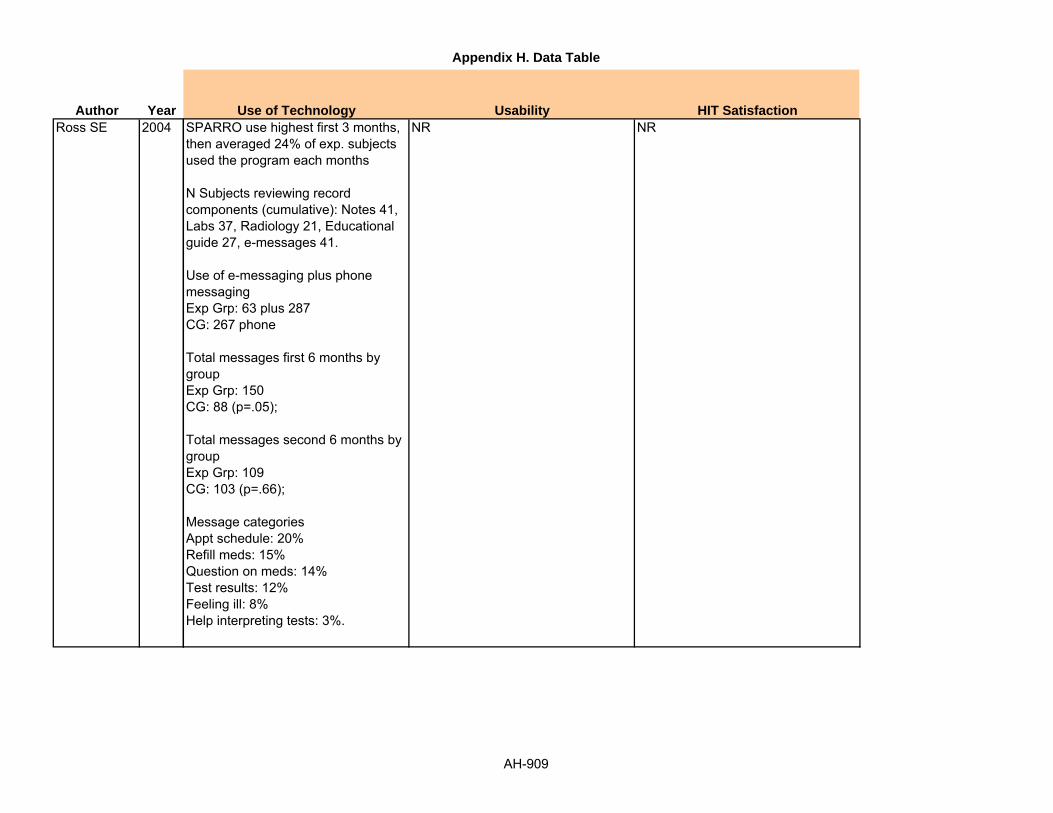
Appendix H. Data Table
Author YearRoss SE 2004
Use of Technology Usability HIT SatisfactionSPARRO use highest first 3 months, then averaged 24% of exp. subjects used the program each months
N Subjects reviewing record components (cumulative): Notes 41, Labs 37, Radiology 21, Educational guide 27, e-messages 41.
Use of e-messaging plus phone messagingExp Grp: 63 plus 287CG: 267 phone
Total messages first 6 months by groupExp Grp: 150CG: 88 (p=.05);
Total messages second 6 months by groupExp Grp: 109CG: 103 (p=.66);
Message categoriesAppt schedule: 20%Refill meds: 15%Question on meds: 14%Test results: 12%Feeling ill: 8%Help interpreting tests: 3%.
NR NR
AH-909

Appendix H. Data Table
Author YearRoss SE 2004
Health Satisfaction Self-efficacy Health Behavior
Outcomes
Satisfaction ratings 0 to 5:
How well doctors understand your problemsBaseline: 4.56 MonthIVR vs. CG: 4.4 vs. 4.4 (Diff 0, CI -0.3, 0.2);12 MonthIVR vs. CG: 4.6 vs. 4.2 (Diff +0.4, CI 0.1, 0.6) p=0.02;
How well doctors explain what they are doing and why? Baseline: 4.26 MonthIVR vs. CG: 4.5 - 4.1 (Diff +0.4, CI 0.1, 0.7);12 MonthIVR vs. CG: 4.5 - 4.1(Diff +0.4, CI 0.1, 0.7) p=0.02;
Scored 0 to 100: Baseline 85;6 month Exp-Control: 88 - 84 (Diff +4, CI -3, 9)12 Month Exp-Control 91 - 85 (Diff + 6, CI -1, 11) p=0.08
Medication Adherence (0 to 4): Baseline 3.4;6 Month Exp-Control: 3.5 - 3.4 (Diff +0.1, CI -0.2, 0.4;12 Month Exp-Control: 3.6 - 3.4 (Diff +0.2, CI -0.1, 0.6), p=0.15'
General Adherence (0 to 100): Baseline 82:6 Month Exp-Control: 81 - 78 (Diff +2.3, CI -3.7, 8.3);12 Month Exp-Cont: 85 - 78 (Diff +6.4, CI 1.8, 10.9), p=0.01
AH-910

Appendix H. Data Table
Author YearRoss SE 2004
Quality of Life Support WithdrawalsScored 0 to 100Baseline: 566 monthExp Grp: 64CG: 59(Diff +5, CI -5, 13)
12 monthExp Grp: 64CG: 62 (Diff +2, CI -7, 11), p=0.63
NR NR
AH-911

Appendix H. Data Table
Author YearRoss SE 2004
Adverse Effects OtherNone reported;1 subject disagreed with medical record relating to alcohol use and requested amendment be made.
NR
AH-912

Appendix H. Data Table
Author YearPatient Recruitment
Setting Clinical Practice SettingPatient Technology
Setting Study design NRotondi AJ 2005 Rehabilitation hospitals NA Homes Cohort N = 17
AH-913

Appendix H. Data Table
Author YearRotondi AJ 2005
Years of Study
Length of follow-up (months) Inclusion Criteria Exclusion Criteria Elderly
NR 6 months TBI patient (traumatic brain injury):*Age 18+ *Was inpatient in rehab hospital*Lives with a female significant other*Speaks English well enough to answer data collection questionsFSO (female significant other) of patient: *Age 18 +*Lives as significant other*Speaks English well enough to answer data questions
Excluded if not possessing above requirements
NR
AH-914

Appendix H. Data Table
Author YearRotondi AJ 2005
Underserved Chronic IllnessDisability/
Impairment Gender (% Male) Age (years)NR NR TBI Patient: 100%
FSO: 0%Mean (Range)Patient: 50.2 (26-67)FSO: 46.4 (24-65)
AH-915

Appendix H. Data Table
Author YearRotondi AJ 2005
Ethnicity Income (US$) EducationUrban / Rural /
Frontier Other
Patient Characteristics*
NR Family income <$30,000: 61.8%
Less than High schoolPatient: 45.5%FSO: 22.7%
NA FSO with no prior computer experience: 23.5%
AH-916

Appendix H. Data Table
Author YearRotondi AJ 2005
Health Insurance Status Literacy Language(s) Health Beliefs Intervention Name
NR English literate NR NR WE CARE (web-enabled caregiver access to resources and education)
AH-917

Appendix H. Data Table
Author YearRotondi AJ 2005
Intervention Described Intervention Groups Type of Device* Functions*
Intervention*
Home computer with Internet access, support group, education and information libraries
NR Computer + Internet Support groups (patient only, caregiver only, both); ask an expert; Q&A Library; Reference library; community resources library and event schedule
AH-918

Appendix H. Data Table
Author YearRotondi AJ 2005
Staff Training Subject Training co-interventions PhysiologicHelp modules; no stated staff training discussed; technical support available
NR NR NA
AH-919

Appendix H. Data Table
Author YearRotondi AJ 2005
Health Service Utilization Health Care Costs KnowledgeNA NR NR
AH-920

Appendix H. Data Table
Author YearRotondi AJ 2005
Use of Technology Usability HIT SatisfactionEvaluation of FSO/Caregiver:Proportion of "hits" to site functions (hits = page view for 1 minute or more)Support group: 68.6%Community services library: 20.1%Q&A library: 5.2%
Number of "hits" for 17 users: 838 (+1015)Range: 26-3679Median: 454.
FSO reports of Ease of Use (1 to 5 point scale, 5=extremely):Overall: 4.1Compared to other websites: 4.2Support group: 3.8Reference library: 3.7Community resources: 3.5Ask expert: 3.7Q&A library: 3.7Event calendar 3.6.
FSO report of Value (1 to 5 scale, 5=extremely valuable):Overall 3.9Compared to other sites: 3.9Support group: 3.8Reference library: 3.4Community resources: 3.3Ask expert: 3.4Q&A library: 3.5Events calendar: 2.5.
FSO reaction to site:Helpful: 75% extremely, 18.8% verySatisfying: 43.8% extremely, 31.3% veryWonderful: 100% extremelyDull: 0% extremely, 0% very, 6.3% moderately
PSO Emotions while using site:Supportive: 7.7% extremely, 76.9% veryMotivation: 7.7% extremely, 38.5% very, 15.4% moderatelyUnderstanding: 26.7% extremely, 33.3% very, 26.7% moderately
AH-921

Appendix H. Data Table
Author YearRotondi AJ 2005
Health Satisfaction Self-efficacy Health Behavior
Outcomes
NR NR NR
AH-922

Appendix H. Data Table
Author YearRotondi AJ 2005
Quality of Life Support WithdrawalsNR Categories (frequencies) of Support
Messages by FSO
Self-disclosure: 32.3%Provide emotional support: 29.1%Request information or clarification: 6.8%Provide advice/offer solution: 6.2%Interpretation: 5.2%Request for feedback: 5.1%Agreement: 4.4%Shared norms/group process: 4.1%Validation/normalization: 3.3%Provide information: 2.3%Identify with group: 1.1%Negative/flaming: 0%.
4 dropped out before computer provided2 received computer but had no interest in the intervention.
AH-923

Appendix H. Data Table
Author YearRotondi AJ 2005
Adverse Effects OtherNR NR
AH-924

Appendix H. Data Table
Author YearPatient Recruitment
Setting Clinical Practice SettingPatient Technology
Setting Study design NRuland 2003 Cancer patients attending
outpatient departmentOutpatient clinic Outpatient clinic Randomized trial (pilot
study)N=52Grp 1 (IG): 27Grp 2 (IG); 25
AH-925

Appendix H. Data Table
Author YearRuland 2003
Years of Study
Length of follow-up (months) Inclusion Criteria Exclusion Criteria Elderly
2 mos Same Day *Age >21 yrs*Able to read, write and speak English*No cognitive impairment*Able to provide informed consent*Not too fatigued*Participation approved by patient's physician
New patients coming for their first visit
NR
AH-926

Appendix H. Data Table
Author YearRuland 2003
Underserved Chronic IllnessDisability/
Impairment Gender (% Male) Age (years)NR CANCER NR N = 61% Mean (SD)
56.3 (+11.3)Range: 23-77
AH-927

Appendix H. Data Table
Author YearRuland 2003
Ethnicity Income (US$) EducationUrban / Rural /
Frontier Other
Patient Characteristics*
NR NR Mean years (SD): 12.8 (+2.38) Range: 4-20
NR Clinician sample N=14Assigned to Grp 1: 9Assigned to Grp 2: 5Clinicians were seeing mean of 3.5 pts (+2.8) Range: 1-9
AH-928

Appendix H. Data Table
Author YearRuland 2003
Health Insurance Status Literacy Language(s) Health Beliefs Intervention Name
NR NR English NR CHOICEs
AH-929

Appendix H. Data Table
Author YearRuland 2003
Intervention Described Intervention Groups Type of Device* Functions*
Intervention*
Comprehensive patient assessment tool for cancer specific symptoms, functional problems, and preferences along physical, psychosocial, emotional and spiritual dimensionsSDM/ care planning component that highlights for clinicians which symptoms patients areexperiencing, severity, degree of bother and importance to the patient
Grp 1: study explained and informed consent taken, use of touch screen computer explained pts completed CHOICEs assessment on the computer with or without help of interview assistant, pts completed the ease of use questionnaire assessment summaries printed and given to pts and clinicians in subsequent consultations
Grp 2: same as above except assessment summaries were neither printed nor given to patient or clinician at any time
Computer Questions, CHOICEs assessment
AH-930

Appendix H. Data Table
Author YearRuland 2003
Staff Training Subject Training co-interventions PhysiologicNR Pts were explained the use
of the touch screen computer
NR Pts Mean score for perceived overall health (SD): 6.17 (+2.5)Range: 0-10
Mean selected symptoms (SD): 15.10 (+13.96)Range: 1-50Number of reported symptoms in IG and CG: No significant difference
Out of 16 problem categories in CHOICEsEnergy problems with associated symptoms: 63.5%Pain: 53.8%Worries/concern: 50.0%Sleep/rest and mood/feelings: 46.2%
Grp differences in congruence b/w Pt reported symptoms and those addressedin the pt consultationCongruence Mean (SD)Grp1 vs. Grp 22.84 (+2.98) vs. 7.63 (+7.37) t= 3.11, df- 50 (1), p < 0.01
Importance weighted congruence Mean (SD)Grp1 vs. Grp 212.8 (+15.7) vs. 33.0 (+33.7), t= 2.84, df- 50 (1), p< 0.01
AH-931

Appendix H. Data Table
Author YearRuland 2003
Health Service Utilization Health Care Costs KnowledgeNR NR NR
AH-932

Appendix H. Data Table
Author YearRuland 2003
Use of Technology Usability HIT SatisfactionTime reqd median of 9 mins (+10.35)Range: 0.5 to 49 mins)25% of sample used 5 mins or less
Completed assessment on touch pad comp without assistance: 80%Had assistance (reasons- too weak, had disabilities, out of convenience): 20%Reliability of instrument: Cronbach's alpha 0.98Personal comments of pts added: not reported hereEase of use correlated with previous comp experience: ( r=0.42, p<0.01)
No significant grp differences in pt satisfactiont= 0.75p=0.45 (pt satisfaction scores skewed)
AH-933

Appendix H. Data Table
Author YearRuland 2003
Health Satisfaction Self-efficacy Health Behavior
Outcomes
NR NR NR
AH-934

Appendix H. Data Table
Author YearRuland 2003
Quality of Life Support WithdrawalsPerceived HRQoL: 6.59 (+2.44)Range: 0-10
NR 73 approached; 14 did not wish to participate; 59 consented; 3 withdrew as received bad news and did not wish to complete questionnaire; 2 were not well; 2 did not like computers
AH-935

Appendix H. Data Table
Author YearRuland 2003
Adverse Effects OtherNR Number of symptoms reported by pts
having influence on number addressed in the consultgiven- ANCOVA results not reported here
AH-936

Appendix H. Data Table
Author YearPatient Recruitment
Setting Clinical Practice SettingPatient Technology
Setting Study design NRunge 2006 Volunteer General Practitioner (GP)
offices and outpatient facilities
36 study centers (includes GP offices and outpatient facilities)
Nonrandomized between group
N = 358
Safren 2002 NR NR Home/with patient Cohort NR
Sciamanna 2004 Public health clinic waiting room
NR Computer in clinic Cohort study N = 150
AH-937

Appendix H. Data Table
Author YearRunge 2006
Safren 2002
Sciamanna 2004
Years of Study
Length of follow-up (months) Inclusion Criteria Exclusion Criteria Elderly
12 months None *Ages 8-16 years*Presence of confirmed asthma diagnosis for at least 1 year*No other asthma program participation prior to study entry*Sufficient knowledge of German language was assumed*Obtain informed consent
Outside age range, no asthma, prior participation in an asthma program, not speaking German, no informed consent
NR
3 months NR NR NR NR
October 2001-February 2002
NA *1 provider at 10 clinic sites*Patient with same day visit with study provider
Non-English speaking NR
AH-938

Appendix H. Data Table
Author YearRunge 2006
Safren 2002
Sciamanna 2004
Underserved Chronic IllnessDisability/
Impairment Gender (% Male) Age (years)NR ASTHMA NR CG: 79.2%
SPMP: 54.7% SPMP + IEP: 65.9%
Ages 8-16 Mean Ages: CG = 11.5 (+)2.9 SPMP = 11.1 (+)2.4 SPMP + IEP: 11.0 (+)2.2
NR HIV/AIDS NR NR NR
YES: all 95 (63.3%) NR N = 32.43% Range<25: 22 pts (14.7%)25-34: 24 pts (16.0%)35-44: 31 pts (20.7%)45-54: 32 pts (21.3%)>55: 41 pts (27.3%)
AH-939

Appendix H. Data Table
Author YearRunge 2006
Safren 2002
Sciamanna 2004
Ethnicity Income (US$) EducationUrban / Rural /
Frontier Other
Patient Characteristics*
German NR NR NR NR
American NR NR NR None
Caucasian: 123 pts (83.1%)Black: 6 pts (4.1%)Hispanic: 17 pts (11.4%)Other: 2 pts (1.4%)
NR <HS: 32 (21.3%)HS: 47 (31.3%)HS+: 71 (47.4%)
NR Exercise <150 min/wk: 51%
AH-940

Appendix H. Data Table
Author YearRunge 2006
Safren 2002
Sciamanna 2004
Health Insurance Status Literacy Language(s) Health Beliefs Intervention Name
Cost-benefit ratio for each intervention strategy was analyzed from the perspective of health insurance (German)
NR German Believe in the positive impact of patient education, but unhappy that only less than 1% of all children in Germany are instructed in a systematic manner per year
Standardized Patient Management Program and Internet based education program (asthmamax.de)
NR NR English NR MediMom
NR NR English NR NR
AH-941

Appendix H. Data Table
Author YearRunge 2006
Safren 2002
Sciamanna 2004
Intervention Described Intervention Groups Type of Device* Functions*
Intervention*
SPMP: educational sessions about asthma knowledge and asthma self-management skill, IEP: internet educational module with asthma-related quizzes and interactive adventure games incorporating asthma-related situations, schedule chats with asthma experts, on-line peak flow protocol, chat rooms
CG (n=48): baseline clinical visit, second clinical visit after 6mos SPMP (n=86): baseline clinical visit, second clinical visit after 6mos, final clinical visit after 12mos + educational instruction SPMP + IEP (n=44): baseline clinical visit, second clinical visit after 6mos, final clinical visit after 12mos + educational instruction + internet-education program access
Classroom, Internet Education and self-management skills, also cost-benefit analysis
Pager system: a clinician or investigator input a patient's medication regimen into an Internet computer program; the patient carried a beeper that had a display window, and when it was time for the patient to prepare or take a pill, the beeper notified the patient with instructions
IVR GrpControl Grp
Pager Medication reminder
Computer assessment with tailored printed feedback
NA Computer Computerized assessment on smoking and physical activity, 4-5 page report tailored feedback, 1-page provider report
AH-942

Appendix H. Data Table
Author YearRunge 2006
Safren 2002
Sciamanna 2004
Staff Training Subject Training co-interventions PhysiologicNR NR NR Lung Function Tests
CG: Baseline PEF = 324+98 First Visit = 341+110*
SPMP: Baseline PEF = 347 + 94 First Visit = 366+101* Second Visit = 376 + 97*
SPMP + IEP: Baseline PEF = 340 + 86* First Visit = 363 + 89* Second Visit = 368 + 92* *P>0.05 v. baseline visit (Wilcoxon test)
NR NR NR NR
NR None, research associate available for help if needed
31.3% patients used Internet
NA
AH-943

Appendix H. Data Table
Author YearRunge 2006
Safren 2002
Sciamanna 2004
Health Service Utilization Health Care Costs KnowledgeClinic visits at 0, 6, and 12 month periods, patient outcomes under usual care was also noted, scheduled chats with asthma experts (IEP only)
*See actual paper for Data (not relevant to list since cost is in Euros and based on universal healthcare)
NR
NR NR NR
NA NR NR
AH-944

Appendix H. Data Table
Author YearRunge 2006
Safren 2002
Sciamanna 2004
Use of Technology Usability HIT SatisfactionAverage 2hours/mo Peak flow protocol section, patient
chat room, and asthma adventure game were the most used of the site
NR
AdherenceIVR Grp2 weeks: 70%12 weeks: 64%CG2 weeks: 56%12 weeks: 52%
Reported that younger employees tended to use the e-mail as a communication tool for health counseling more than older employees, and there are different levels of skill and acceptability for e-mail among employees in administrative and manufacturing divisions
NR
NR Asked for help using computer: 12%Felt computer easy to use: 81.1%
NR
AH-945

Appendix H. Data Table
Author YearRunge 2006
Safren 2002
Sciamanna 2004
Health Satisfaction Self-efficacy Health Behavior
Outcomes
NR See Quality of Life ratings below NR
NR NR NR
Satisfaction with provider visit significantly related to having a chronic condition, being a nonsmoker, and having a provider who reviewed the report with the patient
NR NR
AH-946

Appendix H. Data Table
Author YearRunge 2006
Safren 2002
Sciamanna 2004
Quality of Life Support WithdrawalsKINDL Questionnaire: 75.5+11.78CG: T0 = 76.5T1 = 74.9
SPMP: T0 = 75.0T1 = 77.2T2 = 79.3
SPMP + IEP: T0 = 75.3T1 = 77.3T2 = 80.5
Regular physician check-ups, scheduled chats with asthma experts (IEP only), chat rooms with peers (IEP only), teacher-classmates (SPMP and/or IEP only)
N = 124 (34.6%) Relocation of patients: 6 Withdrawal of Caregiver consent: 6 Nonattendance of scheduled follow-up visits: 11 No returning of mail questionnaires: 41 Relocation of personnel in two study center: 41 Reasons not documented: 41
NR NR NR
NR NR NR
AH-947

Appendix H. Data Table
Author YearRunge 2006
Safren 2002
Sciamanna 2004
Adverse Effects OtherNR *Outcomes not abstracted: cost-
benefit ratio due to reasons listed below
NR Adherence was assessed through a pill bottle system that recorded each time a patient opened the bottle to take out a pill. Could underreport if patient took out more pills, like to go on vacation
Patients: 266/208/150 24.8% patients had privacy concerns using computer
AH-948

Appendix H. Data Table
Author YearPatient Recruitment
Setting Clinical Practice SettingPatient Technology
Setting Study design NSciamanna 2005 Secure website NR WWW Randomized Group N = 121
Grp 1: 57Grp 2: 64
AH-949

Appendix H. Data Table
Author YearSciamanna 2005
Years of Study
Length of follow-up (months) Inclusion Criteria Exclusion Criteria Elderly
NR NA *List of people with self-reported OA from a marketing organization and had knee pain 3+ months, saw doctor for knee pain, and told diagnosis of osteoarthritis
NR NR
AH-950

Appendix H. Data Table
Author YearSciamanna 2005
Underserved Chronic IllnessDisability/
Impairment Gender (% Male) Age (years)NR OSTEOARTHRITIS
OF THE KNEENR N = 23.1% Mean: 47.8
AH-951

Appendix H. Data Table
Author YearSciamanna 2005
Ethnicity Income (US$) EducationUrban / Rural /
Frontier Other
Patient Characteristics*
Caucasian: 86.8%Black: 6.6%Native American: 2.5%Hispanic: 3.3%Other: 5%
NR >College: 25.6% NR NR
AH-952

Appendix H. Data Table
Author YearSciamanna 2005
Health Insurance Status Literacy Language(s) Health Beliefs Intervention Name
NR NR NR NR myexpertdoctor.com
AH-953

Appendix H. Data Table
Author YearSciamanna 2005
Intervention Described Intervention Groups Type of Device* Functions*
Intervention*
Computer assessment with tailored feedback about OA and OA care
Group 1: satisfaction with OA care before using website;Grp 2: satisfaction with OA care after using website
Secure website Computer assessment on OA, satisfaction with care;computer personalized feedback about OA quality of care and treatment recommendations
AH-954

Appendix H. Data Table
Author YearSciamanna 2005
Staff Training Subject Training co-interventions PhysiologicNR NR Uses Internet for health at
least several times per month: 65.5%
NA
AH-955

Appendix H. Data Table
Author YearSciamanna 2005
Health Service Utilization Health Care Costs KnowledgeNA NR NA
AH-956

Appendix H. Data Table
Author YearSciamanna 2005
Use of Technology Usability HIT SatisfactionNR Easy to use: 97.5% Website ratings: 23.1% excellent,
52.9% very good, 24% good;
Website could:*help get better care: 77.7%*help manage OA: 86.8%*help talk to doctor: 81.8%*better understand OA: 90.1%
AH-957

Appendix H. Data Table
Author YearSciamanna 2005
Health Satisfaction Self-efficacy Health Behavior
Outcomes
Overall satisfaction with medical care:Grp 1: 67.9%Grp 2: 69.5%No difference in satisfaction in technical quality, physician manner, doctor-patient communication, or time spent with doctor
NR NR
AH-958

Appendix H. Data Table
Author YearSciamanna 2005
Quality of Life Support WithdrawalsNR NR NR
AH-959

Appendix H. Data Table
Author YearSciamanna 2005
Adverse Effects OtherNR NR
AH-960

Appendix H. Data Table
Author YearPatient Recruitment
Setting Clinical Practice SettingPatient Technology
Setting Study design NShapiro 2007 NR NR Homes Randomized wait-list
controlN= 66Grp 1 (CBT): 22Grp 2 (CD-ROM): 22Grp 3: (Waiting list [WL]): 22
AH-961

Appendix H. Data Table
Author YearShapiro 2007
Years of Study
Length of follow-up (months) Inclusion Criteria Exclusion Criteria Elderly
NR 2 month *Age range between 18-60*Current diagnosis of DSM IV BED based on the SCID broadened to include individuals with sub threshold BED who acknowledged engaging in at least two objective binge eating episodes/month*BMI equal to or more than 27 Kg/m2
*Regular access to IBM compatible computer.
Current AN or BN; current severe depression or active suicidal intent; any developmental or learning disorder or cognitive impairment contraindicating CBT or the effective use of a computer and currently taking medication for the treatment of obesity. Individuals currently taking psychoactive medication were not excluded provided their medication dose was stable and their eating behaviors had remained stable during the course of medication treatment.
NR
AH-962

Appendix H. Data Table
Author YearShapiro 2007
Underserved Chronic IllnessDisability/
Impairment Gender (% Male) Age (years)NR EATING DISORDER NR CBT: 9.09%
CD-ROM: 9.09%WL: 4.55%Total: 7.58%
Mean (SD)CBT: 39.14 (+11.43)CD-ROM: 40.41 (+10.61)WL: 39.09 (+13.48)Total: 39.55 (+11.73)
AH-963

Appendix H. Data Table
Author YearShapiro 2007
Ethnicity Income (US$) EducationUrban / Rural /
Frontier Other
Patient Characteristics*
Black (not Hispanic)CBT: 31.82%CD-ROM: 27.27%WL: 22.73%Total: 27.27%
White (not Hispanic)CBT: 68.18%CD-ROM: 63.64%WL: 77.27%Total: 69.7-%
AsianCBT: 0CD-ROM: 4.55%WL: 0Total: 1.52%
OtherCBT: 0CD-ROM: 4.55%WL: 0Total: 1.52%
NR NR NR Never marriedCBT: 36.36%CD-ROM: 33.33%WL: 22.73%Total: 30.77%
MarriedCBT: 31.82%CD-ROM: 28.57%WL: 27.27%Total: 29.23%
Monogamous relationship and living with partnerCBT: 31.82%CD-ROM: 38.10%WL: 50%Total: 40%
BMI Mean (SD)CBT: 37.72 (+9.45)CD-ROM: 39.63 (+7.88) WL: 34.70 (+6.61)Total: 37.35 (+8.20)
No BEDCBT: 28.57%CD-ROM: 28.57%WL: 33.33%Total: 30.16%
AH-964

Appendix H. Data Table
Author YearShapiro 2007
Health Insurance Status Literacy Language(s) Health Beliefs Intervention Name
NR NR NR NR CD-ROM based cognitive behavioral treatment
AH-965

Appendix H. Data Table
Author YearShapiro 2007
Intervention Described Intervention Groups Type of Device* Functions*
Intervention*
CD-ROM based cognitive behavioral treatment for binge eating disorder focusing on balanced nutrition, regular exercise, psychoeducation, individualized interactive CBT exercises, tracking system applicable to a broad range of adult men and women from all races and background.
Grp 1= Group CBT; 10 weeks of group treatment for weekly 90 min sessions in small grps.Facilitated by PhD level psychologist and consisted of psychoeducation on healthy nutrition, daily food and behavior diaries, identifying thoughts, feelings and behaviors related to binge eating episodes, challenging and restructuring thoughts and techniques for avoiding unhealthy behavior.Grp 2= CD-ROM based cognitive behavioral program for treatment of obesity that focuses on balanced nutrition, regular exercise, psychoeducation, basic concepts , techniques and examples of CBT, individualized interactive CBT exercises, helpful guidelines for slip control and relapse prevention, tracking system to monitor utilization and applicable to a broad range of adult men and women from all races
Computer individualized interactive cognitive behavior exercises, education
AH-966

Appendix H. Data Table
Author YearShapiro 2007
Staff Training Subject Training co-interventions PhysiologicNR NR NR NR
AH-967

Appendix H. Data Table
Author YearShapiro 2007
Health Service Utilization Health Care Costs KnowledgeNR NR NR
AH-968

Appendix H. Data Table
Author YearShapiro 2007
Use of Technology Usability HIT SatisfactionAt the follow up, 66.7% of those in the CD-Rom condition reported that they had used the same at least once or twice after completing the program
NR NR
AH-969

Appendix H. Data Table
Author YearShapiro 2007
Health Satisfaction Self-efficacy Health Behavior
Outcomes
NR NR At baseline, individuals in the CD-ROM reported more binge eating days and fast food consumption and also had a higher weight and BMI than those in the WL condition.At post treatment, no significant difference between the groups.In terms of abstinence, in CD Room grp, 13.3% and 12.5% were binge free at post treatment and follow up respectively.In the group CBT, 7.7% and 22.2% were binge free at post treatment and follow p respectively.In the WL, no pt was binge free at post treatment.Table 2 gives values of outcome variables summarized above
AH-970

Appendix H. Data Table
Author YearShapiro 2007
Quality of Life Support WithdrawalsNR NR Drop out rates prior to the end of 10
weeks,CD-ROM= 31.5%, Group CBT= 40.9%, WL= 9%Overall difference was statistically significant(p<0.05) with significantly more dropouts in the group condition than the WL (p<0.03) and no difference between either CD-ROM and group or CD-ROM and WL.
AH-971

Appendix H. Data Table
Author YearShapiro 2007
Adverse Effects OtherNR Changes in binge days over time
(CDROM vs. Group CBT vs. WL)Baseline LS means (SD)2.85 (0.21) vs. 2.76(0.23) vs. 2.77 (0.18)Post treatment LS means (SD)2.42 (0.18) vs. 2.12(0.18) vs. 2.71( 0.13)Two month follow up LS means (SD)2.00 (0.30) vs. 1.49(0.31) vs. 2.65(0.18)
No pair wise p values were significant but the interaction term for treatment group by visit was significant(p<0.04)
75% of those who completed the WL condition chose to receive the CD-ROM over group treatment
AH-972

Appendix H. Data Table
Author YearPatient Recruitment
Setting Clinical Practice SettingPatient Technology
Setting Study design NShaw 2007 (5) NCI's Cancer
Information Service, hospitals, clinics, public health departments, and Medicaid program.
NR Homes RCT N = 231Exp (HCl): 18CG (RC): 17
AH-973

Appendix H. Data Table
Author YearShaw 2007
Years of Study
Length of follow-up (months) Inclusion Criteria Exclusion Criteria Elderly
Detroit: June 2001 - April 2003Wisconsin: May 2001 - April 2003
4 months *Poverty Level <= 250% of the federal poverty level*Within 1 year of diagnosis or had metastatic breast cancer*Not homeless*Able to read and understand an informed consent letter
Homeless NR
AH-974

Appendix H. Data Table
Author YearShaw 2007
Underserved Chronic IllnessDisability/
Impairment Gender (% Male) Age (years)YES: Low-Income: <=250% of the federal poverty level
METASTIC BREAST CANCER
NR N = 0% Mean (SD): 51.58 (+11.81)
AH-975

Appendix H. Data Table
Author YearShaw 2007
Ethnicity Income (US$) EducationUrban / Rural /
Frontier Other
Patient Characteristics*
N = 231Caucasian: 144 pts (62.3%) African–American: 83pts (35.9%) Other: (1.7%)
NR N = 231Some junior high: 2pts (0.9%) Some high school: 24pts (10.4%) High school degree: 72pts (31.2%) Some college: 69pts (29.9%) Associate or technical degree: 28pts (12.1%) Bachelor’s degree: 28pts (12.1%) Graduate degree: 8pts (3.5%)
Detroit cohort: UnknownWisconsin cohort: Rural
On average, women had been diagnosed 4 months before the start of the DDPP study with more than two-thirds of them being in the relatively early stages of cancer.
AH-976

Appendix H. Data Table
Author YearShaw 2007
Health Insurance Status Literacy Language(s) Health Beliefs Intervention Name
NR Must be able to read and understand an informed consent letter
NR NR CHESS
AH-977

Appendix H. Data Table
Author YearShaw 2007
Intervention Described Intervention Groups Type of Device* Functions*
Intervention*
CHESS: a browser which automatically collects data on an individual keystroke level as participants used the system. This capability enabled us to track each user’s code name, data, time spent and URL of every Web page requested. The key variables of interest are four measures of CHESS service use: information, discussion group, ask an expert, and interactive service.
Group 1: 231 subjects all received same treatment. After submitting their pretest, all study participants were loaned a computer and given Internet access for 4 months. They also received personal training to learn how to use the computer and the Internet, but the majority of time was spent on learning how to use CHESS. Interactive Services, one of four services offered by CHESS; There may be prompts from the computer, but the computer is not, for the most part, guiding the user.
Home computer + Internet To serve as platform for study intervention (CHESS) and
AH-978

Appendix H. Data Table
Author YearShaw 2007
Staff Training Subject Training co-interventions PhysiologicNR They also received
personal training to learn how to use the computer and the Internet, but the majority of time was spent on learning how to use CHESS.
NR NR
AH-979

Appendix H. Data Table
Author YearShaw 2007
Health Service Utilization Health Care Costs KnowledgeNR NR In the current study, the change in
information competence from the pre to post-test was statistically significantPre- test Mean: 2.37 (+0.69)Post-test Mean: 2.83 (+0.64), |t| = 10.21, P < 0.001)
Effect size calculated via Cohen’s d = 0.69Pre-test reliability a = 0.75Post-test reliability a = 0.79
As expected, pre-test level of the dependent variable had a strong, significant relationship with the dependent variable (health information competence) (b = 0.455 or 463, P < 0.01)
Interaction between information and interactive services was significant (b = 0.206, P < 0.01). Interaction between information services and discussion group use (b = 0.163, P < 0.01) was also significant
The first and second interaction effect blocks explained additional significant variances (2.1%) and(2.6%), respectively, in information competence
AH-980

Appendix H. Data Table
Author YearShaw 2007
Use of Technology Usability HIT SatisfactionKey variables of interest are four measures of CHESS service use:
InformationMean: 35.46 (+56.78)Median: 16.89Range: 475.4
Discussion groupMean: 506.18 (+1369.35)Median = 62.59Range: 12743.8
Ask an expertMean: 27.96 (+51.64)Median: 6.46Range: 432.0
Interactive serviceMean: 27.85 (+52.86)Median: 9.88Range: 500.7
NR NR
AH-981

Appendix H. Data Table
Author YearShaw 2007
Health Satisfaction Self-efficacy Health Behavior
Outcomes
NR NR NR
AH-982

Appendix H. Data Table
Author YearShaw 2007
Quality of Life Support WithdrawalsNR NR 286 recruited
231 (81%) completed both pre-test and post-test surveys. Withdrawal: 55, or 19%.
AH-983

Appendix H. Data Table
Author YearShaw 2007
Adverse Effects OtherNR NR
AH-984

Appendix H. Data Table
Author YearPatient Recruitment
Setting Clinical Practice SettingPatient Technology
Setting Study design NShegog 2001 6 clinics and 7 schools in a
large urban areaHouston, TX Clinic RCT N=76
AH-985

Appendix H. Data Table
Author YearShegog 2001
Years of Study
Length of follow-up (months) Inclusion Criteria Exclusion Criteria Elderly
1 year NR *Been diagnosed as having asthma by their health care provider*Age 7-13
Did not have a diagnosis of asthma or was outside of the age range
NR
AH-986

Appendix H. Data Table
Author YearShegog 2001
Underserved Chronic IllnessDisability/
Impairment Gender (% Male) Age (years)NR YES: ASTHMA NR 65.00% Mean: 10.7
Range: 8-13
AH-987

Appendix H. Data Table
Author YearShegog 2001
Ethnicity Income (US$) EducationUrban / Rural /
Frontier Other
Patient Characteristics*
White non-Hispanic: 47.9%African American: 40.8%Hispanic: 7.0%Other: 2.8%Asian: 2.6%
NR School GradesAs&Bs: 73.2%Bs&Cs: 23.9%Cs&Ds: 2.8%
Children recruited from schools and clinics in a "large urban area"
Asthma SeverityLow: 15.5%Mild: 38.0%Moderate: 35.2%Severe: 11.3%
AH-988

Appendix H. Data Table
Author YearShegog 2001
Health Insurance Status Literacy Language(s) Health Beliefs Intervention Name
NR NR NR NR Watch, Discover, Think and Act (WDTA)
AH-989

Appendix H. Data Table
Author YearShegog 2001
Intervention Described Intervention Groups Type of Device* Functions*
Intervention*
Theory-based application of CD-ROM educational technology for pediatric asthma self-management education
IVR: 38CG: 33
Computer game To provide education about asthma to children
AH-990

Appendix H. Data Table
Author YearShegog 2001
Staff Training Subject Training co-interventions PhysiologicNR NR NR NR
AH-991

Appendix H. Data Table
Author YearShegog 2001
Health Service Utilization Health Care Costs KnowledgeNR NR Knowledge questionnaire
Pretest Mean (SD)CG: 15.7 (+5.8)IVR: 18.6 (+5.1)Posttest Mean (SD)CG: 17.8 (+6.3)IVR: 21.1 (+5.4)
Posttest ScoresSelf-regulationCG: 0.06 (+0.3)IVR: 3.3 (+1.3)
PreventionCG: 1.8 (+1.0)IVR: 2.7 (+1.1)
TreatmentCG: 1.5 (+0.8)IVR: 2.7 (+1.4)
AH-992

Appendix H. Data Table
Author YearShegog 2001
Use of Technology Usability HIT SatisfactionNR NR NR
AH-993

Appendix H. Data Table
Author YearShegog 2001
Health Satisfaction Self-efficacy Health Behavior
Outcomes
NR PretestCG: 51.6 (+9.7)IVR: 53.4 (+9.7)
PosttestCG: 51.5 (+10.7)IVR: 56.5 (+9.8)
NR
AH-994

Appendix H. Data Table
Author YearShegog 2001
Quality of Life Support WithdrawalsNR NR Lack of availability for follow-up: 4
Refusal to participate further: 1
AH-995

Appendix H. Data Table
Author YearShegog 2001
Adverse Effects OtherNR NR
AH-996

Appendix H. Data Table
Author YearPatient Recruitment
Setting Clinical Practice SettingPatient Technology
Setting Study design NSkeels 2006 HIV clinic and Community
based HIV organizationOutpatient clinics Clinic Cohort N= 30
AH-997

Appendix H. Data Table
Author YearSkeels 2006
Years of Study
Length of follow-up (months) Inclusion Criteria Exclusion Criteria Elderly
NR 1 week NR NR NR
AH-998

Appendix H. Data Table
Author YearSkeels 2006
Underserved Chronic IllnessDisability/
Impairment Gender (% Male) Age (years)NR HIV NR NR NR
AH-999

Appendix H. Data Table
Author YearSkeels 2006
Ethnicity Income (US$) EducationUrban / Rural /
Frontier Other
Patient Characteristics*
NR NR Middle school /High school: 10 ptsSome college: 15 ptsCollege graduate: 4 pts>Masters Degree: 1 pt
NR Used computer few times or never: 7 ptsExperienced users: 11 pts
AH-1000

Appendix H. Data Table
Author YearSkeels 2006
Health Insurance Status Literacy Language(s) Health Beliefs Intervention Name
NR NR NR NR Computer assessment and treatment education for HIV +(CARE+)
AH-1001

Appendix H. Data Table
Author YearSkeels 2006
Intervention Described Intervention Groups Type of Device* Functions*
Intervention*
Goal - to improve ART adherenceand to lower risk of secondary infectionsPts answer tailored risk assessment questions about social support, sexual behavior etc., CARE+ provides personalized feedback (identifies areas of trouble and areas where they are doing well), skill building videos, risk reduction plan focused on ART adherence or reducing risk of secondary infections. Used in clinic prior to meeting provider, printout of plan received to keep or discuss with provider.
Pts explained on how to navigate CARE+Questionnaire to collect demographic and background info, use of CARE+ observed. Semi structured interview to identify usability issues and assess views on computer counseling
Tablet PC Tailored assessment, personalized plan
AH-1002

Appendix H. Data Table
Author YearSkeels 2006
Staff Training Subject Training co-interventions PhysiologicNR Explained as to how to
navigate CARE+NR NR
AH-1003

Appendix H. Data Table
Author YearSkeels 2006
Health Service Utilization Health Care Costs KnowledgeNR NR NR
AH-1004

Appendix H. Data Table
Author YearSkeels 2006
Use of Technology Usability HIT SatisfactionNR All 30 completed the CARE+, 5 had
experience using Tablet PC beforeMany participants had positive comments- not listed hereThree main issues identified by observation and interview*Seeing the screen (eyesight impairment due to HIV medication, lighting probs)*Target acquisition (difficulty with selecting buttons in CARE+ screens)*Difficulties tapping
More details (pts responses) given but not listed here
NR
AH-1005

Appendix H. Data Table
Author YearSkeels 2006
Health Satisfaction Self-efficacy Health Behavior
Outcomes
NR NR NR
AH-1006

Appendix H. Data Table
Author YearSkeels 2006
Quality of Life Support WithdrawalsNR NR NR
AH-1007

Appendix H. Data Table
Author YearSkeels 2006
Adverse Effects OtherNR Attitudes toward CARE
Issues discussed in the interview Honesty, judgment, embarrassment, compassion, trust, privacy, accessibility convenience, sympathy, importance of human dialogue and interaction miscommunications , preference for computer counseling or person to person counseling. (Detailed response
The author also mentions that the follo
AH-1008

Appendix H. Data Table
Author YearPatient Recruitment
Setting Clinical Practice SettingPatient Technology
Setting Study design NSmith 2000 Rural-at least 25 miles
away from 6 major cities of Montana
Certified diabetes educator centers
Homes RCT N=30Computer: 15Non-computer: 15
AH-1009

Appendix H. Data Table
Author YearSmith 2000
Years of Study
Length of follow-up (months) Inclusion Criteria Exclusion Criteria Elderly
NR 10 months *Female*Diabetes- type 1 or 2*Ages 35-60 yrs*Able to read and write English*Possess the sight and dexterity to use a computer (not necessarily be computer literate)*Have a telephone in theirhome*Live at least 25 miles out of 6 major cities in Montana
NR NR
AH-1010

Appendix H. Data Table
Author YearSmith 2000
Underserved Chronic IllnessDisability/
Impairment Gender (% Male) Age (years)YES: rural DIABETES NR N = 0% Mean: 46.7
AH-1011

Appendix H. Data Table
Author YearSmith 2000
Ethnicity Income (US$) EducationUrban / Rural /
Frontier Other
Patient Characteristics*
NR NR NR Rural: at least 25 miles away from 6 major cities of Montana
Married: 80%Employees: 60%
AH-1012

Appendix H. Data Table
Author YearSmith 2000
Health Insurance Status Literacy Language(s) Health Beliefs Intervention Name
NR NR NR NR Women to women diabetes project
AH-1013

Appendix H. Data Table
Author YearSmith 2000
Intervention Described Intervention Groups Type of Device* Functions*
Intervention*
5 month computer intervention involved installing comp/software, providing each women with a health info notebook on general health and specific diabetes info.
4 components(1) Conversation area- pts encouraged to converse with each other about anything, comments open and available, monitored by CDE, CDE did not actively participate unless invited by pts or to redirect inappropriate participation(2) Mailbox- pts speak privately with each other or to the nurse monitor.(3) Health chat area- structured, electronic classroom, open for all, questions specific to dealing with diabetes encouraged and articles from health info notebook discussed, active role by CDE
Computer Group: all of the aboveNon computer group: hard copy of all materials computer group was given (health info notebook and computer-generated info)
Computer Chats, questions, post messages, mailbox
AH-1014

Appendix H. Data Table
Author YearSmith 2000
Staff Training Subject Training co-interventions PhysiologicNR Computer group trained in
the use of software and how to log in and connect to the systemAt the first visit, confidentiality and support group participation were reviewed and protocol of the project explainedA toll free line available to contact the study team (both groups)
NR NR
AH-1015

Appendix H. Data Table
Author YearSmith 2000
Health Service Utilization Health Care Costs KnowledgeNR NR NR
AH-1016

Appendix H. Data Table
Author YearSmith 2000
Use of Technology Usability HIT SatisfactionMean minutes logged on per monthMonth 1: 129Month 2: 68Month 3: 78Month 4: 44Month 5: 37
Conversation area: each woman used 111 times over the course of 5 monthsMailbox: each woman used around 40 times over the course of 5 monthsHealth chat: accessed 38 times by each
NR NR
AH-1017

Appendix H. Data Table
Author YearSmith 2000
Health Satisfaction Self-efficacy Health Behavior
Outcomes
NR Psychosocial adjustment to illness scaleComputer group vs. non computer group77.79 vs. 80.24
NR
AH-1018

Appendix H. Data Table
Author YearSmith 2000
Quality of Life Support WithdrawalsRaw mean scoresQuality of lifeComputer group: 17.1755Non-Computer group: 17.9014
Raw mean scoresPersonal resource questionnaireComputer Grp: 121.76Non-Computer Grp: 128.53
NR
AH-1019

Appendix H. Data Table
Author YearSmith 2000
Adverse Effects OtherNR Supportive/informational conversation
given but not reported hereImportance of components of the intervention as perceived by pts given, not listed hereAttitudes of the pts toward the intervention describes (qualitative responses recorded) not listed here
AH-1020

Appendix H. Data Table
Author YearPatient Recruitment
Setting Clinical Practice SettingPatient Technology
Setting Study design NSouthard 2003 Hospital and community
physician referralCardiac rehabilitation centers
Homes RCT N = 104CG: 51Exp Grp: 53
AH-1021

Appendix H. Data Table
Author YearSouthard 2003
Years of Study
Length of follow-up (months) Inclusion Criteria Exclusion Criteria Elderly
NR 6 months *Coronary heart disease*CHF*Possessing both
No a priori criteria reported; excluded subjects including a relative of a subject, lack of MD referral, failure to complete blood tests
Yes: Mean age = 62
AH-1022

Appendix H. Data Table
Author YearSouthard 2003
Underserved Chronic IllnessDisability/
Impairment Gender (% Male) Age (years)NR CARDIOVASCULAR
DISEASENR N = 75% Mean
Exp Grp: 61.8Usual Care: 62.8
AH-1023

Appendix H. Data Table
Author YearSouthard 2003
Ethnicity Income (US$) EducationUrban / Rural /
Frontier Other
Patient Characteristics*
Not CaucasianExp Grp: 1.9% UC: 3.9%
Exp Grp<20000: 1.34%20000-40000: 19.2%40000-60000: 13.5%60000-80000: 17.3%80000-100000: 9.6%>100000: 5.8%
Usual Care<20000: 5.9%20000-40000: 25.5%40000-60000: 17.6%60000-80000: 17.3%80000-100000: 9.6%>100000: 7.8%
Exp GrpHS: 26.4%Trade school: 28.3%>HS: 43.4%
CGHS: 25.5%Trade school: 15.7%>HS: 51%
NR NR
AH-1024

Appendix H. Data Table
Author YearSouthard 2003
Health Insurance Status Literacy Language(s) Health Beliefs Intervention Name
NR NR NR NR Online case management, tailored feedback, support group
AH-1025

Appendix H. Data Table
Author YearSouthard 2003
Intervention Described Intervention Groups Type of Device* Functions*
Intervention*
Online case management (once/week for 30 minutes)
NR Website Self-monitoring, secure messaging with case manager and dietician, education modules with graphic feedback, online group
AH-1026

Appendix H. Data Table
Author YearSouthard 2003
Staff Training Subject Training co-interventions PhysiologicNR NR Ad hoc telephone Mean values, baseline and follow-up
WeightCG: 196.2 to 196.7Exp Grp: 202.8 to 199.2 (p=.003)
BMICG: 29.2 to 29.3Exp Grp: 30.9 to 30.3 (p=.003)
Systolic BPCG: 130.9 to 128.8Exp Grp: 131.7 to 129.4 (p=ns)
Diastolic BPCG: 72.1 to 71.8Exp Grp: 74.4 to 72.5 (p=ns)
CholesterolCG: 181.8 to 175.1Exp Grp: 183.3 to 178.1 (ns)
LDLCG: 109.3 to 107.9Exp Grp: 108.4 to 103.4 (ns)
HDLCG: 41.5 to 39.7Exp Grp: 39.5 to 37.7 (ns)
AH-1027

Appendix H. Data Table
Author YearSouthard 2003
Health Service Utilization Health Care Costs KnowledgeMajor cardiovascular event rateCG: 15.7%Exp Grp: 4.1% (Fisher's p = .053)
Estimates for major CVD events: CG: $104,684Exp Grp: $31,110
NR
AH-1028

Appendix H. Data Table
Author YearSouthard 2003
Use of Technology Usability HIT Satisfaction1-week time analysis with 31 experimental subjects: estimated 10.8 hours of health professional time per 6-month period
NR NR
AH-1029

Appendix H. Data Table
Author YearSouthard 2003
Health Satisfaction Self-efficacy Health Behavior
Outcomes
NR NR Minutes of exercise (self-report) per week, baseline and follow-up: CG: 142.4 to 165Exp Grp: 150.2 to 208.4 (NS)
AH-1030

Appendix H. Data Table
Author YearSouthard 2003
Quality of Life Support WithdrawalsNR NR NR
AH-1031

Appendix H. Data Table
Author YearSouthard 2003
Adverse Effects OtherNR NR
AH-1032

Appendix H. Data Table
Author YearPatient Recruitment
Setting Clinical Practice SettingPatient Technology
Setting Study design NStinson 2006 Purposive sample Rheumatology clinic,
university-affiliated pediatric tertiary care center
Homes Cohort N = 10Phase I: 10Phase II: 10
AH-1033

Appendix H. Data Table
Author YearStinson 2006
Years of Study
Length of follow-up (months) Inclusion Criteria Exclusion Criteria Elderly
15 days None *Between ages 9-18*Diagnosed with JIA by rheumatologist*Had experienced pain over past 24 hours*Able to speak and read English
Having known major cognitive or psychiatric disorders that might interfere with ability complete self-reported daily pain ratings, having other known major medical disorders (i.e. Crohn's disease) that would be a source of chronic pain, known severe vision problems that would interfere with ability to see e-Ouch screen, known hand deformities that would prevent use of the electronic diary
NR
AH-1034

Appendix H. Data Table
Author YearStinson 2006
Underserved Chronic IllnessDisability/
Impairment Gender (% Male) Age (years)NR Juvenile Idiopathic
Arthritis [JIA]NR Phase I: 20%
Phase II: 20%Mean Age: 13.55 (+)2.68Phase I: 13.6 (+)2.8Phase II: 13.5 (+)2.72
AH-1035

Appendix H. Data Table
Author YearStinson 2006
Ethnicity Income (US$) EducationUrban / Rural /
Frontier Other
Patient Characteristics*
NR NR School GradePhase I:Public School (n = 6): 60%HS (n=4): 40%Phase II:Public School (n=6): 60%HS (n=4): 40%
NR NR
AH-1036

Appendix H. Data Table
Author YearStinson 2006
Health Insurance Status Literacy Language(s) Health Beliefs Intervention Name
NR NR NR Believe that assessment in the form of documentation is the best way to tackle managing pain and effectiveness of therapies
e-Ouch Electronic Pain Diary
AH-1037

Appendix H. Data Table
Author YearStinson 2006
Intervention Described Intervention Groups Type of Device* Functions*
Intervention*
Obtains 3 daily pain ratings (upon waking, after school, before bed), uses scroll bar slide (No Pain--Very Much Pain) as well as a slide with front and back view of human body asking viewer to indicate "parts of the body picture" where they hurt at that moment
Phase I: usual care + e-Ouch Pain DiaryPhase II: usual care + e-Ouch Pain Diary
Internet, e-Ouch Pain Diary is a PDA
Keep track of severity of pain, medication used, area of pain, and other factors inhibited by pain (social, academic, etc.)
AH-1038

Appendix H. Data Table
Author YearStinson 2006
Staff Training Subject Training co-interventions PhysiologicNR Initial introduction to pain
diary, otherwise NRNR *See table below
AH-1039

Appendix H. Data Table
Author YearStinson 2006
Health Service Utilization Health Care Costs KnowledgeNR NR NR
AH-1040

Appendix H. Data Table
Author YearStinson 2006
Use of Technology Usability HIT SatisfactionNR Quotes: "very easy to learn"
"very easy to use" Quotes: "really cool""better than just getting a book full of blank paper and writing down about your pain each day"
AH-1041

Appendix H. Data Table
Author YearStinson 2006
Health Satisfaction Self-efficacy Health Behavior
Outcomes
NR NR NR
AH-1042

Appendix H. Data Table
Author YearStinson 2006
Quality of Life Support Withdrawals*See table below NR NR
AH-1043

Appendix H. Data Table
Author YearStinson 2006
Adverse Effects OtherNR Various changes to the software to
improve usability and make the program more efficient with fewer errors*Study also includes table that lists the types of arthritis the pts were experiencing
AH-1044

Appendix H. Data Table
Author YearPatient Recruitment
Setting Clinical Practice SettingPatient Technology
Setting Study design NStrecher 2006 NR NR Homes RCT N= 3971
CQ Plan: 1991CG: 1980
AH-1045

Appendix H. Data Table
Author YearStrecher 2006
Years of Study
Length of follow-up (months) Inclusion Criteria Exclusion Criteria Elderly
NR 12 months *Target quit date that was within 7 days of the enrollment date*Provided a valid e-mail address and had internet access for the duration of the study*Were attempting to quit smoking cigarettes (i.e. not smokeless tobacco)*Had been smoking more than 10 cigarettes /day*Had purchased NiQuitin CQ 21 mg*Agreed to be contacted for follow up e-mail and web based questionnaires at 6 and 12 weeks*Age > 18 yrs
NR NR
AH-1046

Appendix H. Data Table
Author YearStrecher 2006
Underserved Chronic IllnessDisability/
Impairment Gender (% Male) Age (years)NR SMOKING NR N = 43.5%
Grp 1 vs. Grp 2:57.9% vs. 50%
Mean (SD): 36.9 (+10.2)
>40 yrsGrp 1: 58.4 Grp 2: 48.6
<40Grp 1: 50.4Grp 2: 40.3
AH-1047

Appendix H. Data Table
Author YearStrecher 2006
Ethnicity Income (US$) EducationUrban / Rural /
Frontier Other
Patient Characteristics*
NR NR NR NR Subjects smoked an average of 23.5 cigarettes/day (+8.2)Pts had smoked cigarettes for an average of 20.1 yrs (+10.3)Subjects who smoked their first cigarette of the day within 30 mins of waking: 88.4%
AH-1048

Appendix H. Data Table
Author YearStrecher 2006
Health Insurance Status Literacy Language(s) Health Beliefs Intervention Name
NR NR NR NR CQ PLAN (committed quitters stop smoking plan)
AH-1049

Appendix H. Data Table
Author YearStrecher 2006
Intervention Described Intervention Groups Type of Device* Functions*
Intervention*
Tailored web based smoking cessation materials
Grp 1: web based committed quitters stop smoking plan- Info collected in the enrollment questionnaire used to tailor CQ PLAN materials including demographics, smoking history, motives for quitting, expected difficulties quitting, ans situations that were expected to present challenges. Pts also identified a supportive person that would receive an email with tailored advice for supporting the subject. Initial web based cessation guide, three sequential tailored newsletters delivered via the web, and behavioral support messages delivered via internet for a 10 week period.
Grp 2: web based control condition- web based materials had a graphic design and navigational structure very similar to the CQ PLAN, cognitive
Computer Tailored web based smoking cessation materials, e mail messages, newsletters etc
AH-1050

Appendix H. Data Table
Author YearStrecher 2006
Staff Training Subject Training co-interventions PhysiologicNR NR NR Tobacco related illness
Yes: Grp 1 vs. Grp 255.6 vs. 38.2 , OR (95%CI)= 2.07 (1.42-3.00), p<0.001No: Grp 1 vs. Grp 251.9 vs. 45.3 , OR(95% CI)=1.30 (1.02-1.66), p<0.05
Interaction OR (95% CI)=1.26(1.01-1.57), p<0.05
AH-1051

Appendix H. Data Table
Author YearStrecher 2006
Health Service Utilization Health Care Costs KnowledgeNR NR NR
AH-1052

Appendix H. Data Table
Author YearStrecher 2006
Use of Technology Usability HIT SatisfactionNR NR NR
AH-1053

Appendix H. Data Table
Author YearStrecher 2006
Health Satisfaction Self-efficacy Health Behavior
Outcomes
NR Self efficacy, Low ; Grp 1 vs. Grp 2; 49.9 vs. 42.2 , OR (95%CI)=1.36 (1.01-1.85) , p<0.05High; Grp 1 vs. Grp 2;56.8 vs. 44.8 , OR(95% CI)= 1.63 (1.22-2.19), p<0.001
Interaction OR (95% CI)= 1.09 (0.89-1.35),
Motivation to quithigh; Grp 1 vs. Grp 2; 54.6 vs. 44.8 , OR (95%CI)= 1.49(1.19-1.93) , p<0.001Low; Grp 1 vs. Grp 2; 48.4 vs. 38.9 , OR(95% CI)= 1.47 (1.00-2.20), p<0.10
Interaction OR (95% CI)= 1.01 (0.80-1.27)
Weight ConcernYes; Grp 1 vs. Grp 2; 55.8 vs. 41.8 , OR (95%CI)= 1.78 (1.18-2.17), p<0.01No; Grp 1 vs. Grp 2; 52.2 vs. 43.7 , OR(95% CI)= 1.41 (1.12-1.79) , p<0.01
interaction OR (95% CI)= 1.12 (0.89-1.43)
No of cigarettes smokedMore than 20; Grp 1 vs. Grp 2; vs. , OR (95%CI)= , p<0.001<20; Grp 1 vs. Grp 2; vs. , OR(95% CI)=, p<0.05
Interaction OR (95% CI)=, p<0.05
First cigarette of the day<5 mins; Grp 1 vs. Grp 2; 51.8 vs. 45, OR (95%CI)=1.32(0.96-1.82), p<0.1No; Grp 1 vs. Grp 2; 53.9 vs. 41.7, OR(95% CI) =1.63 (1.25-2.12),p<0.001
Interaction OR (95% CI)= 1.11 (0.90-1.36)
AH-1054

Appendix H. Data Table
Author YearStrecher 2006
Quality of Life Support WithdrawalsNR NR Total= 3971
CQ Plan: 232 never logged onControl: 238 never logged on
Out of the 3501 who logged on, 31 withdrew CQ PLAN: 15Control: 16
A total of 3470 received the 6 week FU survey1850 responded to this survey
Between the 6 an 12 week survey, 15 more withdrewCQPLAN: 8Control: 7
This left 3455 pts, out of which 1491 responded to the 12 week survey
AH-1055

Appendix H. Data Table
Author YearStrecher 2006
Adverse Effects OtherNR Details about Non smoking children
and adult smokers given, not listed here
Figure depicting mediation pathway of tailored treatment, perceived relevance and smokingcessation given
AH-1056

Appendix H. Data Table
Author YearPatient Recruitment
Setting Clinical Practice SettingPatient Technology
Setting Study design NStuart 2003 30 primary care practices Primary care practices Home Randomzied three group N=647
AH-1057

Appendix H. Data Table
Author YearStuart 2003
Years of Study
Length of follow-up (months) Inclusion Criteria Exclusion Criteria Elderly
1 year NR *Age >18 yrs*English literate*Not currently taking an antidepressant medication*Newly prescribed an antidepressant medication by their primary care provider*Access to a touch-tone telephone*Willingness to participate in the study
Any criteria against the Inclusion criteria
NR
AH-1058

Appendix H. Data Table
Author YearStuart 2003
Underserved Chronic IllnessDisability/
Impairment Gender (% Male) Age (years)NR DEPRESSION NR NR NR
AH-1059

Appendix H. Data Table
Author YearStuart 2003
Ethnicity Income (US$) EducationUrban / Rural /
Frontier Other
Patient Characteristics*
American NR NR NR None
AH-1060

Appendix H. Data Table
Author YearStuart 2003
Health Insurance Status Literacy Language(s) Health Beliefs Intervention Name
NR English literate English NR Interactive Voice Response Intervention
AH-1061

Appendix H. Data Table
Author YearStuart 2003
Intervention Described Intervention Groups Type of Device* Functions*
Intervention*
Automated telephone answering/reminding system
Grp 1: Education-treatment team education and patient self-care educationGrp 2: Education and Call: education listed above + 1 office nurse telephone call within 2 days of the visit when the antidepressant medication was prescribedGrp 3: Education + Call + IVR: education and call listed above + IVR program lasting for 3 months
Telephone Medication reminder/adherence/encouragement/recording device
AH-1062

Appendix H. Data Table
Author YearStuart 2003
Staff Training Subject Training co-interventions PhysiologicNR NR Education and call from
nurse within 2 days of antidepressant prescribed
NR
AH-1063

Appendix H. Data Table
Author YearStuart 2003
Health Service Utilization Health Care Costs KnowledgeNR NR NR
AH-1064

Appendix H. Data Table
Author YearStuart 2003
Use of Technology Usability HIT SatisfactionNR NR NR
AH-1065

Appendix H. Data Table
Author YearStuart 2003
Health Satisfaction Self-efficacy Health Behavior
Outcomes
NR NR No significant differences in patient compliance with their antidepressant medication among the 3 treatment groups
AH-1066

Appendix H. Data Table
Author YearStuart 2003
Quality of Life Support WithdrawalsNR NR NR
AH-1067

Appendix H. Data Table
Author YearStuart 2003
Adverse Effects OtherNR NR
AH-1068

Appendix H. Data Table
Author YearPatient Recruitment
Setting Clinical Practice SettingPatient Technology
Setting Study design NTaylor 2006 Walter Reed Army Medical
CenterSleep disorders center Homes RCT N = 114
CG: 58Telecare: 56
Tsang 2001 Outpatient clinic Diabetes hospital clinic Homes Randomized cross-over study
N = 19DMS to Control: 10Control to DMS: 9
AH-1069

Appendix H. Data Table
Author YearTaylor 2006
Tsang 2001
Years of Study
Length of follow-up (months) Inclusion Criteria Exclusion Criteria Elderly
October 2002 - March 2003
1 month *Diagnosed with obstructive sleep apnea syndrome (OSAS)*Prescribed CPAP (continuous positive airway pressure)
Current or previous treatment with CPAP or other therapies such as oral appliance or surgery for OSAS.
NR
NR 6 mos NR "selected 20 patients from diabetes clinic"
NR NR
AH-1070

Appendix H. Data Table
Author YearTaylor 2006
Tsang 2001
Underserved Chronic IllnessDisability/
Impairment Gender (% Male) Age (years)NR OSA NR UC: 71%
Exp Grp: 66%MeanCG: 44.6Exp Grp: 45.8
NR DIABETES NR DMS to Control: 50%Control to DMS: 78%
MeanDMS to Control: 30Control to DMS: 35
AH-1071

Appendix H. Data Table
Author YearTaylor 2006
Tsang 2001
Ethnicity Income (US$) EducationUrban / Rural /
Frontier Other
Patient Characteristics*
CaucasianUC: 60%Exp Grp: 49%;
African-AmericanUC: 40%Exp Grp: 42%;
HispanicUC: 0%Exp Grp: 5%;
AsianUC: 0%Exp Grp: 5%
0-24999CG: 20%Exp Grp: 11%;
25000-49000CG: 21%Exp Grp: 19%;
50000-74999CG: 25%Exp Grp: 30%;
75000-99999CG: 20%Exp Grp: 27%;
100000+CG: 14%Exp Grp: 13%
High schoolCG: 19%Exp Grp: 20%
2-3 yrs of CollegeCG: 25%Exp Grp: 21%;
Technical/Associate DegreeCG: 6%Exp Grp 7%
BachelorsCG: 25%Exp Grp: 11%Masters DegreeCG: 25%Exp Grp: 37%
Doctorate+CG: 0%Exp Grp: 4%
NR OSAS Severity:MildCG: 25% UCExp Grp: 31%
ModerateCG: 27%Exp Grp: 35%
Severe CG: 48%Exp Grp: 34%
NR NR NR NR DMS-Control vs. Control-DMS:Duration of illness: 5.3 vs. 11.8 yrs (p=.016);Mean BMI: 22.2 vs. 26HgA1c: 8.56 vs. 8.81
AH-1072

Appendix H. Data Table
Author YearTaylor 2006
Tsang 2001
Health Insurance Status Literacy Language(s) Health Beliefs Intervention Name
NR (all military-connected)
NR NR NR The Health Buddy
NR NR NR NR "Diabetes Monitoring System" DMS
AH-1073

Appendix H. Data Table
Author YearTaylor 2006
Tsang 2001
Intervention Described Intervention Groups Type of Device* Functions*
Intervention*
OSAS library with customized information; Daily questions on sleep and CPAP use, responses monitored and categorized into low/medium/high risk, sleep specialist call patient after 3 days of high-risk responses.High<4 h CPAP use;Medium= 4+ CPAP use but poor sleep;Low=4+ CPAP use and good sleep.
Experimental group: daily patient-entered data on CPAP use, monitoring by sleep specialist.
Usual care: clinic visit 1 month after CPAP started, routine access to clinic specialist as needed.
NR Computerized questions, condition-specific library
DMS: Electronic food diary, blood glucose monitoring, email from and to health professionals;Control: usual communication with diabetes clinic
Group 1: used DMS for 12 weeks, then control for 12 wks;Group 2: had control period for 12 weeks, then DMS for 12 wks
Hand-held electronic diary with touch screen
Food and glucose monitoring with feedback
AH-1074

Appendix H. Data Table
Author YearTaylor 2006
Tsang 2001
Staff Training Subject Training co-interventions PhysiologicNR NR Usual care from clinic NR
Instruction with 2-week trial period
NR NR Mean difference in HgA1c from treatment to control: 0.825% (CI 0.155-1.5)
DMS-Control group HgA1c changed from 8.56% to 7.55% (p<0.05)
Control-DMS group HgA1c changed from 8.81% to 8.76 to 8.4 (p=.04);
AH-1075

Appendix H. Data Table
Author YearTaylor 2006
Tsang 2001
Health Service Utilization Health Care Costs KnowledgeNR NR NR
NR NR NR
AH-1076

Appendix H. Data Table
Author YearTaylor 2006
Tsang 2001
Use of Technology Usability HIT SatisfactionNR Exp group
Found HealthBuddy very easy to use: 83%2 out of 3 reported it a positive experienceHad no difficulty using it: 83% Were likely or very likely to continue using it: 75%
Experimental groupSatisfied with Health Buddy: 69%Satisfied with communication with clinicians: 71%
For all 19 subjects:Frequency of use (transmission/week):<1: 31-2: 73-4: 45-6: 2>7: 3
For all 19 subjectsDMS is easy to use: 18Useful to assess eating: 12Would recommend: 11Would use again: 12
NR
AH-1077

Appendix H. Data Table
Author YearTaylor 2006
Tsang 2001
Health Satisfaction Self-efficacy Health Behavior
Outcomes
NR NR Mean hours of CPAP use (hrs):CG: 4.22Exp Grp: 4.29, p=0.87;
CPAP mean proportion (hrs):CG: 50.1%Exp Grp: 46.9%, p=0.61;
NR NR NR
AH-1078

Appendix H. Data Table
Author YearTaylor 2006
Tsang 2001
Quality of Life Support WithdrawalsFunctional status, measured by Modified Functional Outcomes of Sleep Questionnaire (MFOSQ, 8 items, ranges from 0 to 32).UC: 2.27Exp group: 2.03, p=0.76
NR Usual care: 8 subjects did not complete assessments; 1 subject was withdrawn b/c CPAP use was less than 20 days;
Exp. Arm: 7 were withdrawn for not activating HealthBuddy, 1 withdrawn for not using it for 30 day observation period, 1 withdrew b/c of choosing an alternative therapy.
NR NR N = 1
AH-1079

Appendix H. Data Table
Author YearTaylor 2006
Tsang 2001
Adverse Effects OtherNR NR
NR NR
AH-1080

Appendix H. Data Table
Author YearPatient Recruitment
Setting Clinical Practice SettingPatient Technology
Setting Study design NTurnin 1992 150 Km radius of
Toulouse, France. (no other details about setting given)
NR Homes RCT N= 105Group A: 54 ptsGroup B: 51 pts
AH-1081

Appendix H. Data Table
Author YearTurnin 1992
Years of Study
Length of follow-up (months) Inclusion Criteria Exclusion Criteria Elderly
NR 1 yr *Good command of French, spoken as well as written*Age >18 yrs of age.
NR NR
AH-1082

Appendix H. Data Table
Author YearTurnin 1992
Underserved Chronic IllnessDisability/
Impairment Gender (% Male) Age (years)NR IDDM and NIDDM NR NR Grp A: 44.8 (+2.0)
Grp B: 45.2 (+2.0)
AH-1083

Appendix H. Data Table
Author YearTurnin 1992
Ethnicity Income (US$) EducationUrban / Rural /
Frontier Other
Patient Characteristics*
NR NR NR NR Diabetes (%); Grp A vs. Grp BInsulin dependent: 69 vs. 76Non insulin dependent:20 vs. 10Not insulin dependent insulinated: 11 vs. 14
Occupation (%)Grp A vs. Grp BWorking: 74 vs. 75Unemployed: 26 vs. 25
AH-1084

Appendix H. Data Table
Author YearTurnin 1992
Health Insurance Status Literacy Language(s) Health Beliefs Intervention Name
NR NR NR NR Diabeto
AH-1085

Appendix H. Data Table
Author YearTurnin 1992
Intervention Described Intervention Groups Type of Device* Functions*
Intervention*
A computer assisted diet education system with energy requirement calculation, individualized meal analysis, specially adapted menus and recipes, consultation of the monitoring cardiovascular disease (MONICA) general dietary information, and electronic mail
For the first 6 months, Grp A used diabeto and Grp B were control subjectsFor the next 6 months, Group B used diabeto and this Grp was followed before and after use of diabeto
Computer Energy requirement calculation, individualized meal analysis, specially adapted menus and recipes, consultation of the monitoring cardiovascular disease (MONICA) general dietary information, and electronic mail
AH-1086

Appendix H. Data Table
Author YearTurnin 1992
Staff Training Subject Training co-interventions PhysiologicNR 1 hr demonstration of the
operation of the system and then an individualized demonstration of the operation of minitel when creating its dossier. A book of use is also given to the patient.
NR Body weight Change
Study 1:NSGrp A: 64.7 (+2.0) to 64.6 (+1.9)Grp B: 67.5 (+1.6) to 67.4 (+1.6)
For overweight pts, no significant change in body weight between the two phases of the studyGrp A: 75.8 (+3.2) and 75.3 (+3.1)Grp B: 75.4 (+3.3) and 74.7 (+3.4)
Study 2; NS changeChange: 68.5 (+1.7) to 67.0 (+2.3)For overweight pts, significant weight improvement Change: 75.4 (+3.5) to 74.1 (+3.6), p<0.01
Biological variationsStudy 1: Total HbA1 ChangeGrp A: 10.7 (+0.4) to 10.1 (+0.4)Grp B: 10.8 (+0.4) to 11.0 (+0.2)
FructosamineGrp A: 4.71 (+0.16) to 4.41 (+0.17)Grp B: 4.82 (+0.13) to 4.78 (+0.13)
Study 2:
AH-1087

Appendix H. Data Table
Author YearTurnin 1992
Health Service Utilization Health Care Costs KnowledgeNR NR Study 1:
Avg test grades significantly improved for Grp A compared with Grp BThe average increased from 56 (+1) to 64 (+2) for Grp A, p< 0.0001The average decreased from 56 (+2) to 54 (+2) for Grp BDetails grades of test 1,2, 3 and 4 given, not listed here.A figure showing that patients knowledge increased with the time that they spent with the system
Study 2:Avg grades obtained improved significantly from 56 (+1.5) to 62 (+2.5)p<0.0001Detailed grades of test 1,2, 3 and 4 before and after use given, not listed here.
AH-1088

Appendix H. Data Table
Author YearTurnin 1992
Use of Technology Usability HIT SatisfactionEach pt used the system 6 times/month for an avg duration of 15 min/session for a total of 90 min/month9 pts never used the system4 pts used it more than 3 hrs/month
NR Interest in dietetics before use (%)Very low: 2.5Low: 9.2Medium: 51.2High: 26.8Very high: 4.9
Interest in advantages of diabetoHome access 24 hrsVery low: 0Low: 2.4Medium: 4.9High: 46.3Very high: 39
Free of chargeVery low: 0Low: 0Medium: 9.8High: 22Very high: 61
IndividualizedVery low: 0Low: 0Medium: 34.7High: 29.3Very high: 26.8
Two way dialogueVery low: 4.9Low: 19.5
AH-1089

Appendix H. Data Table
Author YearTurnin 1992
Health Satisfaction Self-efficacy Health Behavior
Outcomes
NR NR Study 1; Grp A vs. Grp BCaloric excessBeginning of study, To:365 (+75) vs. 209 (+37)6 months, T6:132 (+81) vs. 238 (+99)
Carbohydrate (%)To: 42.2 (+0.8) vs. 40.7 (+0.8)T6: 44.0 (+0.9) vs. 40.7 (+0.7)
Carbohydrate deficit(%)To: 39.7 (+0.7) vs. 39.1 (+0.7)T6: 42.9 (+0.9) vs. 40.3 (+0.7)
Fat (%)To: 38.3 (+1.0) vs. 38.8 (+0.8)T6: 36.0 (+0.9) vs. 38.5 (+0.8)
Fat excess (%)41.9 (+0.9) vs. 41.4(+0.6)37.4 (+1.1) vs. 40.0 (+0.7)
Study 2; Grp B (beginning vs. 12 months)Caloric excess: 193 (+37) vs. 98 (+49), p<0.05
Carbohydrate (%): 40.3 (+0.9) vs. 42.0 (+1.0), NS
Carbohydrate deficit, (%), 38.9 (+0.8)
AH-1090

Appendix H. Data Table
Author YearTurnin 1992
Quality of Life Support WithdrawalsNR NR First study
9 pts lost to study in minitel grp (never used the system, 2 for personal reasons, 2 for lack of time, 1 moved and 4 could not be accounted for), In the control grp 1 pt moved and was lost to the study
Second study6 pts dropped out, (5 between 6th and the 12th month)
AH-1091

Appendix H. Data Table
Author YearTurnin 1992
Adverse Effects OtherNR The author says that factors favorably
influencing the amount of use of the system were the patients interest in dietetics and their amount of free time. Retired people and those not employed made the most use of the systemThe author also says that the possibility of unlimited use with free access 24 h/day in their own homes was an important factor in motivating the pts to monitor their diet
AH-1092

Appendix H. Data Table
Author YearPatient Recruitment
Setting Clinical Practice SettingPatient Technology
Setting Study design Nvan den Berg 2007 Rheumatology outpatient
clinics3 Teaching hospitals Homes RCT N = 160
Grp 1: 82Grp 2: 78
AH-1093

Appendix H. Data Table
Author Yearvan den Berg 2007
Years of Study
Length of follow-up (months) Inclusion Criteria Exclusion Criteria Elderly
March 2003-August 2004
12 mos *Dx of RA*Physical activity of at least 30 mins a day at least 5 days/week*Access to a computer with internet capabilities*Able to cycle on a bicycle ergometer*No cardiopulmonary conditions which would not allow moderately intensive physical activity
NR NR
AH-1094

Appendix H. Data Table
Author Yearvan den Berg 2007
Underserved Chronic IllnessDisability/
Impairment Gender (% Male) Age (years)NR RHEUMATOID
ARTHRITISNR Grp 1: 24% Median at Baseline
Grp 1: 49.5
AH-1095

Appendix H. Data Table
Author Yearvan den Berg 2007
Ethnicity Income (US$) EducationUrban / Rural /
Frontier Other
Patient Characteristics*
NR NR Grp 1:Low education level: 18%Medium education level: 61%High education level: 21%
NR NR
AH-1096

Appendix H. Data Table
Author Yearvan den Berg 2007
Health Insurance Status Literacy Language(s) Health Beliefs Intervention Name
NR NR NR NR NR
AH-1097

Appendix H. Data Table
Author Yearvan den Berg 2007
Intervention Described Intervention Groups Type of Device* Functions*
Intervention*
Web-based system for reporting physical activity and receiving personalized exercise schedules
Group 1: Intervention group (only one mentioned in this paper)Group 2: General training group (data reported elsewhere)
Web-based intervention Education, personalized exercise schedule, data input and sending
AH-1098

Appendix H. Data Table
Author Yearvan den Berg 2007
Staff Training Subject Training co-interventions PhysiologicSome Homes visits were offered to assist subjects
NR NR NR
AH-1099

Appendix H. Data Table
Author Yearvan den Berg 2007
Health Service Utilization Health Care Costs KnowledgeNR NR NR
AH-1100

Appendix H. Data Table
Author Yearvan den Berg 2007
Use of Technology Usability HIT SatisfactionOver the follow-up period, 70% of Grp 1 logged into the system at least once a week
NR The majority of individuals were satisfied or very satisfied with the system variation and clarity (87% and 94%, respectively).
The majority of individuals were satisfied with the frequency of contact with their PT.
55/62 (89%) reported they did not experience any miscommunications between themselves and their PT due to the use of email.
AH-1101

Appendix H. Data Table
Author Yearvan den Berg 2007
Health Satisfaction Self-efficacy Health Behavior
Outcomes
NR NR Individuals who logged in more frequently participated in more moderate intensity and vigorous intensity physical activity than those who logged in less frequently, at 12 month follow-up (P=0.036 and P=0.001, respectively)
AH-1102

Appendix H. Data Table
Author Yearvan den Berg 2007
Quality of Life Support WithdrawalsRAQoL:Those that reported more often on their physical activity schedules reported significantly greater improvements than those that reported less often (P=0.01)
NR 5 from Grp 1 lost to follow-up
AH-1103

Appendix H. Data Table
Author Yearvan den Berg 2007
Adverse Effects OtherNR NR
AH-1104

Appendix H. Data Table
Author YearPatient Recruitment
Setting Clinical Practice SettingPatient Technology
Setting Study design NVan den Brink
2005 NR Tertiary health care center Homes Cohort N= 36
AH-1105

Appendix H. Data Table
Author YearVan den Brink
2005
Years of Study
Length of follow-up (months) Inclusion Criteria Exclusion Criteria Elderly
September 2000-January 2002
6 weeks *Pts were eligible if they had undergone a laryngectomy, a commando procedure(removal of a tumor in the mouth or throat by splitting the lower jaw) or a neck dissection (removal of the lymph nodes in the neck)*Pts also needed to be able to read and write Dutch*Have a phone at home.
NR NR
AH-1106

Appendix H. Data Table
Author YearVan den Brink
2005Underserved Chronic Illness
Disability/Impairment Gender (% Male) Age (years)
NR HEAD AND NECK CANCER
NR N = 26 pts (72.2%) Mean (Range): 59 (38-78)
AH-1107

Appendix H. Data Table
Author YearVan den Brink
2005Ethnicity Income (US$) Education
Urban / Rural / Frontier Other
Patient Characteristics*
NR NR No education: 0 ptsElementary school: 6 ptsLower technical school: 14 ptsSecondary education: 6 ptsMiddle technical training: 2 ptsHigh school/College: 3 ptsHigher education: 3 ptsUniversity level: 2 pts
Information about marital status given, not listed here
NR 20 pts (56%) had no experience with computers before participation
AH-1108

Appendix H. Data Table
Author YearVan den Brink
2005
Health Insurance Status Literacy Language(s) Health Beliefs Intervention Name
NR NR NR NR Electronic health information support system
AH-1109

Appendix H. Data Table
Author YearVan den Brink
2005Intervention Described Intervention Groups Type of Device* Functions*
Intervention*
Electronic health information system with four different functions, namely, communication, information, contact with fellow sufferers and monitoring of discharged patients in head and neck cancer care.
The electronic support system consisted of the following featuresCommunication: Pts as well as health care providers able to create messages with the subject and type of message, stored centrally. Each pt had own PO box.Information: specially developed website containing general information on cancer treatment of H and N cancer, rehabilitation after treatment, and links to other relevant websitesContact with fellow sufferers: forum where pts could discuss any subject, either anonymously or with their own name.Monitoring: Pts completed electronic monitoring questionnaires on a regular basis after discharge.E-mail alerts: when an abnormal answer appeared in the questionnaire or pt classifies response as question, an email alert generated and sent to the
Computer Email alerts, electronic monitoring questionnaires, forum, information
AH-1110

Appendix H. Data Table
Author YearVan den Brink
2005Staff Training Subject Training co-interventions Physiologic
Involved health care providers received information on how to use the systemand were provided with access passwords
Medical student trained and supervised pts while the patient practice use of the systemin the hospital
NR NR
AH-1111

Appendix H. Data Table
Author YearVan den Brink
2005Health Service Utilization Health Care Costs Knowledge
NR NR NR
AH-1112

Appendix H. Data Table
Author YearVan den Brink
2005Use of Technology Usability HIT Satisfaction
Total number of patient sessions: 982Average: 27.3 (+18.4), Range: 4-69On average, a pt session lasted 12 mins.16% took place after office hours
Details about usage by health care provider also given, not listed here
Encountered difficulty (technical problems) while using the system: 9 pts (25%)Reasons given: system did not work anymore (3 times), too slow (3 times), password forgotten (once), handling the mouse was difficult (once), computer refused to switch off (once)Additional remarks made by pt quoted- not listed here
Felt that being able to contact care providers by means of the system provided a feeling of security: 83%Found that learning how to use the system was not difficult at all: 61%
Use and appreciation of the electronic health information systemMonitoringPts using this functionality: 36 (100%)% of satisfied patient users: 94% (31/33)Mean score (Range): 8.0 (2-10)
Ask questionsPts using this functionality: 23 (64%)% of satisfied patient users: 91 (21/23)mean score (Range): 7.8 (1-10)
Read messages Pts using this functionality: 27 (75%)% of satisfied patient users: 89 (24/27)Mean score (Range): 7.7 (4-10)
Contact with fellow sufferersPts using this functionality: 3 (8%)% of satisfied patient users: 67 (2/3)Mean score (Range): 6.7 (6-8)
InformationPts using this functionality: 22 (61%)% of satisfied patient users: 91 (20/22)Mean score (Range): 7.8 (1-10)
Overall score for the system as a
AH-1113

Appendix H. Data Table
Author YearVan den Brink
2005Health Satisfaction Self-efficacy Health Behavior
Outcomes
NR NR NR
AH-1114

Appendix H. Data Table
Author YearVan den Brink
2005Quality of Life Support Withdrawals
NR NR During the inclusion period, 59 met the criteria for inclusion20 refused to participate (inclusion of 66%)Computer phobia: 9 timesTiredness/need rest: 4 timesDoes not like idea of filling paper questionnaires- 2 timesLooks after demented parent-1Moving house- 1Partner does not allow pt to have access to computer- 1No time- (company ownership)- 1Afraid of theft of laptop computers- 1
Moreover;3 stopped shortly after inclusion2 were too tired to participate1 died
AH-1115

Appendix H. Data Table
Author YearVan den Brink
2005Adverse Effects Other
NR A table detailing information about - subjects of questions generating email alerts given, not listed here.Additional remarks made by pts about the system quoted, not listed hereList of questions asked in the patient's questionnaire with patient answers given, results from the GP's questionnaire also given
AH-1116

Appendix H. Data Table
Author YearPatient Recruitment
Setting Clinical Practice SettingPatient Technology
Setting Study design NVan der Meer 2007 NR 19 general practices, (44
GP's)Out patient clinic of department of pediatrics of Leiden University Medical Center, Netherlands
Homes Cohort N= 97
AH-1117

Appendix H. Data Table
Author YearVan der Meer 2007
Years of Study
Length of follow-up (months) Inclusion Criteria Exclusion Criteria Elderly
NR 1 month follow up (monitoring) after which subjects invited to participate in focus groups
*Physician diagnosed asthma*Age 12-17 yrs*Use of inhaled corticosteroids for at least 3 months in the previous year*No serious co morbid conditions that interfered with asthma treatment*Access to internet at home*Ability to understand Dutch
NR NR
AH-1118

Appendix H. Data Table
Author YearVan der Meer 2007
Underserved Chronic IllnessDisability/
Impairment Gender (% Male) Age (years)NR ASTHMA NR Pts with well controlled
asthma: 55.5%Pts with poorly controlled asthma: 41%p=0.51
Pts with well controlled asthma (well): 14.2 (+1.7)Pts with poorly controlled asthma (poor): 14.7 (+1.5)p= 0.36
AH-1119

Appendix H. Data Table
Author YearVan der Meer 2007
Ethnicity Income (US$) EducationUrban / Rural /
Frontier Other
Patient Characteristics*
NR NR NR NR Duration of asthma, Mean years, (%)Well: 7.4 (4.9); Poor: 8.8 (5.1)Current prescription inhaled corticosteroids, nWell: 17; Poor: 17 Details of care provider also given
AH-1120

Appendix H. Data Table
Author YearVan der Meer 2007
Health Insurance Status Literacy Language(s) Health Beliefs Intervention Name
NR NR NR NR Internet based self management for better asthma control
AH-1121

Appendix H. Data Table
Author YearVan der Meer 2007
Intervention Described Intervention Groups Type of Device* Functions*
Intervention*
Adolescents with mild to moderate persistent asthma monitored their asthma control on a website with return message containing their FEV1 and peak expiratory flow values expressed as percentages. After 4 weeks of monitoring, pts invited to take part in eight focus groups.(more on Van der Meer et al 2006)
All pts received a hand held electronic spirometer and were trained to perform three maneuvers every morning before receiving medication, and to report FEV1 and peak expiratory flow values by entering them daily into a designated web application or via SMS during a 1 month period. Pts received return message with FEV1 and peak expiratory flow values expressed as a percentage of expected or best value. (Methods described in detail in Van der meer et al, 2006.Following the electronic monitoring study, eight focus group sessions lasting 1- 1.5 hrs were conducted where pts were stratified according to asthma control, gender and age.
Computer, cell phone Data log in, return messages.
AH-1122

Appendix H. Data Table
Author YearVan der Meer 2007
Staff Training Subject Training co-interventions PhysiologicNR Trained to perform
spirometry three times before medication
NR Well vs. PoorACQ score0.6 (+0.3) vs. 1.9 (+0.5), p<0.01ATAQ control score0 (+0) vs. 2 (+1.8), p<0.01
Prebronchodilator FEV1, % Predicted, Mean (SD)100.7 (+20.9) vs. 90.7 (+17.7), p=0.14
AH-1123

Appendix H. Data Table
Author YearVan der Meer 2007
Health Service Utilization Health Care Costs KnowledgeNR NR NR
AH-1124

Appendix H. Data Table
Author YearVan der Meer 2007
Use of Technology Usability HIT SatisfactionNR Majority of the participants felt that
sending lung function values and symptom scores via the internet or SMS was easy and fast.
Barriers and benefits of internet based self management: Well vs. Poor, n (%)
Internet based monitoring: electronic monitoring is feasible: 15 (83) vs. 15 (88), p=1.00
Recognize benefits of internet based monitoring: 1 (6) vs. 4 (24) , p=0.18
Internet information: need for comprehensive information: 3 (17) vs. 5 (29), p= 0.44
Positive features of internet information: 11 (61) vs. 12 (71), p=0.73
Internet based action plan: able and ready to use internet based action plan: 2(11) vs. 11 (65), p<0.01
No need to use action plan at all: 14 (78) vs. 3 (18), p<0.01
AH-1125

Appendix H. Data Table
Author YearVan der Meer 2007
Health Satisfaction Self-efficacy Health Behavior
Outcomes
NR Well v. PoorKASE-AQAttitude: 3.7 vs. 3.8, p=0.55Self-efficacy: 4.0 vs. 3.6,p=0.046
Intrinsic barriers to current asthma managementNegative attitude towards asthma management
Well vs. Poor2 (11) vs. 3 (18), p=0.66
Limited perceived ability to manage asthmaWell vs. Poor3 (17) vs. 11 (65),p<0.01
Barriers and benefits of internet based self management:
Internet based medical reviewPositive attitude towards electronic consultation: 8 (44) vs. 10 (59), p=0.51
Negative attitude toward electronic consultation: 2 (11) vs. 2 (12), p=1.00
NR
AH-1126

Appendix H. Data Table
Author YearVan der Meer 2007
Quality of Life Support WithdrawalsNR Intrinsic barriers to current asthma
managementNegative social influencesWell vs. Poor; 0 (0) vs. 3 (18), p=0.11
Invited to participate in one month internet based monitoring study, n=180No informed consent= 79Withdrawal from monitoring study= 4Complete internet based monitoring study=97Contradictory scores on ACQ and ATAQ control domain= 17Eligible for focus group discussion= 80
AH-1127

Appendix H. Data Table
Author YearVan der Meer 2007
Adverse Effects OtherExpressions of acceptance of asthma symptoms given, not listed here
Barriers and drivers for HIT useAttitude towards asthma management: 3 pts with poorly controlled asthma were bothered by face to face medical reviews, since they learned to live with their symptoms and saw no need for regular consultations (driver for HIT use)Views on barriers and benefits of internet based asthma self management:Pts thought that internet based monitoring and reporting was feasible, not time consuming and did not interfere with their daily activities. Also sending lung function values and symptom scores was easy and fast.Pts in the well controlled group had fun doing the measurements but did not think that it is useful and did not observe any benefits from daily electronic monitoring and feedback as they did not have any symptoms atthe time.Pts with poorly controlled asthma reported the usefulness of daily monitoring stating that being able to react to changes in asthma were personal benefits of the system.All pts said that the internet is easy to
AH-1128

Appendix H. Data Table
Author YearPatient Recruitment
Setting Clinical Practice SettingPatient Technology
Setting Study design NWeinert 2005 Clinics where patients with
CI visitedMontana, Idaho, North Dakota, South Dakota, Wyoming
Unclear Three group N=63
Wilkie 2001 Radiation and medical oncology outpatient clinics.
Large medical center In clinical exams rooms at radiation and medical oncology outpatient clinics.
Cohort N = 41*All completed SymptomReportCG: 19IVR: 22
AH-1129

Appendix H. Data Table
Author YearWeinert 2005
Wilkie 2001
Years of Study
Length of follow-up (months) Inclusion Criteria Exclusion Criteria Elderly
2 years NR *Live at least 25 miles outside of an urbanized area (city of >12,500)*Live with a CI
*Live within 25 miles of urbanized area*No CI
Mean age = 54.1
NR 5 weeks *Cancer diagnosisHave pain, fatigue, or both*English literate *Ages > 18 yrs*Physically and cognitively able to complete the study
Blind patients and non-English speaking patients were excluded from the study.
NR
AH-1130

Appendix H. Data Table
Author YearWeinert 2005
Wilkie 2001
Underserved Chronic IllnessDisability/
Impairment Gender (% Male) Age (years)YES Diabetes, Rheumatoid
condition, Heart disease, Cancer, MS
NR 0 Mean (Range)54.1 (38-66)
NR CANCER DIAGNOSIS AND CHRONIC PAIN
NR N = 10 (24%) Mean (SD): 52 (± 12.4)Range: 28-78
AH-1131

Appendix H. Data Table
Author YearWeinert 2005
Wilkie 2001
Ethnicity Income (US$) EducationUrban / Rural /
Frontier Other
Patient Characteristics*
White: 96.8%Hispanic: 1.6%Native American: 1.6%
0-15,000: 20.6%15,000-24,999: 12.7%25,000-34,999: 11.1%35,000-44,999: 15.9%45,000-54,999: 19.0%>55,000: 18.9%
Mean (SD)14.5 (+1.95)
YES: lived at least 25 miles outside of urbanized areaNumber of miles to routine health care: 60.7 (+82.36)
None
Caucasian: 40 ptsAsian: 1 pt
NR HS: 23%Vocational School: 8% Associate Degree: 25% Bachelor's Degree: 25%Master's Degree: 10% Doctoral Degree: 3% Other: 8%
NR Married: 69%Single: 28% Widowed: 3%
AH-1132

Appendix H. Data Table
Author YearWeinert 2005
Wilkie 2001
Health Insurance Status Literacy Language(s) Health Beliefs Intervention Name
NR NR NR NR NR
NR NR NR NR SymptomConsult
AH-1133

Appendix H. Data Table
Author YearWeinert 2005
Wilkie 2001
Intervention Described Intervention Groups Type of Device* Functions*
Intervention*
Online health teaching units with expert facilitated discussions, internet access, and a self-help social support group
Grp 1: online teaching units + expert facilitated discussion + self-help social support groupGrp 2: online teaching unitsGrp 3: CG
Computer/internet lessening depression and isolation and bolstering social support, develop computer skills, acquire internet skills
NR All (41) completed SymptomReport. They then completed the SymptomConsult program. 19 were randomized to choose 1 of 3 computer games. 22 were randomized to view tailored educational materials; reporting pain, safe use of pain medicines, and managing fatigue.
Fujitsu 1600 pentab computer with Windows 98-based SymptomReport program. (touch screen computer)
The SymptomReport program was designed as an interactive, touch-screen method for assessment of pain and fatigue. This is an electronic version of the 1970 edition of the McGill pain questionnaire (MPQ), the pain barriers questionnaire (BQ), and the Schwartz cancer fatigue scale (SCFS-6).
AH-1134

Appendix H. Data Table
Author YearWeinert 2005
Wilkie 2001
Staff Training Subject Training co-interventions PhysiologicNR NR NR NR
The researcher instructed the patient to read and touch the computer screen to start. The researcher provided assistance in completing the computerized SymptomReport if asked by the patient and then documented the assistance provided.
The researcher instructed the patient to read and touch the computer screen to start. The researcher provided assistance in completing the computerized SymptomReport if asked by the patient and then documented the assistance provided.
NR NR
AH-1135

Appendix H. Data Table
Author YearWeinert 2005
Wilkie 2001
Health Service Utilization Health Care Costs KnowledgeNR NR Self-rated computer skills at baseline:
IVR: 4.66 (+1.75)CG: 5.32 (+2.07)
Self-rated computer skills at 18mos:IVR: 5.93 (+1.51)CG: 5.26 (+1.94)
NR NR The Symptom Consult program seemed to increase patients’ understanding of the symptoms, raise their awareness of pain and fatigue, and enhance compliance with symptom management.
AH-1136

Appendix H. Data Table
Author YearWeinert 2005
Wilkie 2001
Use of Technology Usability HIT SatisfactionNR NR NR
Fewer patients completed the computer items the second time, usually because of time constraints or a desire to skip questions not relevant to their clinical situation.
Average time spent viewing SymptomConsult: 20 minutes. Fatigue intervention: 7 minutes. Each pain intervention component: 1-16 minutes.
The majority of participants (71%) indicated that the computer program was easy, enjoyable, informative, and a good tool.
AH-1137

Appendix H. Data Table
Author YearWeinert 2005
Wilkie 2001
Health Satisfaction Self-efficacy Health Behavior
Outcomes
NR NR NR
NR NR Intervention provided a chance to think more and helped enrich communication with doctors.
AH-1138

Appendix H. Data Table
Author YearWeinert 2005
Wilkie 2001
Quality of Life Support WithdrawalsNR NR NR
NR NR NR
AH-1139

Appendix H. Data Table
Author YearWeinert 2005
Wilkie 2001
Adverse Effects OtherNR NR
Patients complained of repetitive questions, especially if the pain questions didn’t personally apply.
NR
AH-1140

Appendix H. Data Table
Author YearPatient Recruitment
Setting Clinical Practice SettingPatient Technology
Setting Study design NWilliamson 2006 NR NR Homes RCT N = 57
AH-1141

Appendix H. Data Table
Author YearWilliamson 2006
Years of Study
Length of follow-up (months) Inclusion Criteria Exclusion Criteria Elderly
NR 2 years *African American girls between 11-15 yrs*BMI above 85th percentile for age and gender*At least one obese biological parent as defined by BMI>30*One designated parent who was overweight BMI>27 and was willing to participate in the study*Adolescent's family was willing to pay $300 out of pocket expenses toward the purchase of a computer worth $1000*Family home had electricity and at least one functional telephone line
NR No
AH-1142

Appendix H. Data Table
Author YearWilliamson 2006
Underserved Chronic IllnessDisability/
Impairment Gender (% Male) Age (years)All African Americans Obesity NR 0 Adolescents: 13.2
(+1.4)Parents: 43.2 (+6.2)
AH-1143

Appendix H. Data Table
Author YearWilliamson 2006
Ethnicity Income (US$) EducationUrban / Rural /
Frontier Other
Patient Characteristics*
African Americans NR NR NR Height (cm)Adolescents: 160 (+8.1) Parents: 162.3 (+6.9)
Weight (kg)Adolescents: 93.3 (+22.5)Parents: 101.2 (+18.4)
BMIAdolescents: 36.4 (+7.9)Parents: 38.4 (+7.2)
Body fat DXA (%)Adolescents: 45.9 (+7.5)Parents: 48.4 (+6.3)
BMI PercentileAdolescents: 98.3 (+2.5)
AH-1144

Appendix H. Data Table
Author YearWilliamson 2006
Health Insurance Status Literacy Language(s) Health Beliefs Intervention Name
NR NR NR NR HipTeens
AH-1145

Appendix H. Data Table
Author YearWilliamson 2006
Intervention Described Intervention Groups Type of Device* Functions*
Intervention*
Interactive Internet based lifestyle behavior modification program for African American girls over 2 year period. Web based program providing nutrition education and behavior modification by asynchronous email communication and links to culturally competentwebsites and interactive components such as weight and activity graphs, food intake monitoring with counselors providing feedback on the same.
Grp 1: ControlGrp 2: Behavioral
Both the groups had the following: 4 face to face counseling session during the first 4 weeks, Weight graph, email to study staff, links to African American health websites, links to women's health website. In the lessons to be read by adolescents and parents, the control grp had lessons for healthy lifestyle whereas the behavioral grp had lessons promoting dietary and behavioral exercise change.
Apart from the above, the behavioral grp had physical activity graph, food monitoring with feedback using traffic light diet, rate your plate exercise for healthy eating habits, behavioral contracting with parent, adolescent, counselor; problem solving to overcome obstacles,
Computer E mail, links to website, activity graphs, monitoring of daily food intake and physical activity
AH-1146

Appendix H. Data Table
Author YearWilliamson 2006
Staff Training Subject Training co-interventions PhysiologicThe counselors were educated on culturally relevant dietary and physical activity issues, and they incorporated this information into face to face and internet counseling sessions.
Adolescents and parents were trained to set up their new computers at home, access and use the website, and use email to communicate with their counselor by the internet.
NR Grp 1 vs. Grp 2 - 24 months
Weight (kg)Adolescents: 6.3 (+1.6) vs. 4.4 (+1.7)Parents: -0.60 (+0.89) vs. - 1.1 (+0.91)
BMIAdolescents: 1.2 (+0.65) vs. 0.73 (+0.66)Parents: 0.04 (+0.34) vs. -0.55 (+0.34)
Body fat DXA (%)Adolescents: 0.84 (+0.72) vs. -0.08 (+0.71)Parents: 0.51 (+0.46) vs. 0.36 (+0.46)
BMI PercentileAdolescents: -0.001 (+0.003) vs. -0.004 (+0.003)
Body weight at baseline significant co variate for body weight changes of parentsF (1, 54)= 27.2 , p < 0.0001
Baseline BMI percentile significant co variate for changes in BMI percentile, F (1, 54) = 10.89, p< 0.001significant overall effect of treatment for parental changes in BMI
AH-1147

Appendix H. Data Table
Author YearWilliamson 2006
Health Service Utilization Health Care Costs KnowledgeNR NR NR
AH-1148

Appendix H. Data Table
Author YearWilliamson 2006
Use of Technology Usability HIT SatisfactionFigure showing mean website hits, activity graph and weight graph hits given, difficult to get the exact numbers
Significant differences in website use between the 2 grps for both adolescents and parents in the first year
Adolescents: F (1,55)= 4.95 , p< 0.05Parents: F (1, 55)= 4.15, p<0.05
Second year- difference diminish; almost equal in both grps (very reduced web usage)
NR NR
AH-1149

Appendix H. Data Table
Author YearWilliamson 2006
Health Satisfaction Self-efficacy Health Behavior
Outcomes
NR NR Dieting and weight concerns of adolescents, Time* treatment approached significance- F (3, 48)= 2.44 , p< 0.08Adolescents (Control grp) decreased dieting and weight concerns during first 6 months, bt scores returned to baseline levels during the next 18 monthsAdolescents in both grps reported improvements in exercise and over eating as compared to baseline.(p<0.05)Adol in behavioral grp reported eating less fattening foods as compared to controlF (1, 48)= 2.08, p< 0.05Parents in behavioral grp reported more exercise than the controlF (1, 49)= 4.10, p< 0.05Parents in behavioral grp reported greater reductions in over eatingParents in both grps reported improvements in avoidance of eating fattening foods during 24 month trial in comparison with baseline.
AH-1150

Appendix H. Data Table
Author YearWilliamson 2006
Quality of Life Support WithdrawalsNR NR Seven families dropped out of control
(24%) and 10 dropped out of treatment (36%)Difference NS
AH-1151

Appendix H. Data Table
Author YearWilliamson 2006
Adverse Effects OtherNR Baseline characteristics of the
sample including height, weight, BMI, Body fat DXA,BMI percentile given, not listed here.
Figure showing mean website hits, weight graph hits and activity graph hits given, not listed here
Figure showing changes in weight loss behaviors from baseline for both parents and adolescents given, not listed here
NS results showing parents in behavioral grp reporting more comfort and interest with computers at baseline showed trends for more website hits and email use during 2nd yr of study
Behavioral correlates of changes in adiposity given, not listed here
AH-1152

Appendix H. Data Table
Author YearPatient Recruitment
Setting Clinical Practice SettingPatient Technology
Setting Study design NWinzelberg 2003 Public service
announcements on local radio, in newspapers and flyers in oncology offices in SFBay and LA
NR Homes Randomized clinical trial N = 72Grp 1: 36Grp 2: 36
Woodruff 2001 Rural alternative schools NA School computer Pre-post cohort study N = 26
AH-1153

Appendix H. Data Table
Author YearWinzelberg 2003
Woodruff 2001
Years of Study
Length of follow-up (months) Inclusion Criteria Exclusion Criteria Elderly
NR 3 mos *Female*Receiving a primary breast carcinoma diagnosis within 32 mos*Not suicidal*Living in CA*Communicate in written English
NR YES
NR 3 months *Age 13 to 18*Obtain parental consent*Smoked 1 cigarette in past month
NR NR
AH-1154

Appendix H. Data Table
Author YearWinzelberg 2003
Woodruff 2001
Underserved Chronic IllnessDisability/
Impairment Gender (% Male) Age (years)NR BREAST CANCER NR N = 0% Mean (SD): 49.5
(+6.2)Range: 30-69
NR SMOKING NR N = 66% Mean: 15
AH-1155

Appendix H. Data Table
Author YearWinzelberg 2003
Woodruff 2001
Ethnicity Income (US$) EducationUrban / Rural /
Frontier Other
Patient Characteristics*
Caucasian: 80%African-American: 4%Asian: 4%Hispanic/Latina: 6% Other: 6%
NR Some graduate school: 36%Bachelor's Degree: 28% Some college: 28% Trade School: 1%<HS: 7%
NR Married: 68%Single: 15%Divorced: 11%Widowed: 4%Separated 1%
34% were in a breast cancer support group or individual counseling at baseline
Caucasian: 55%Hispanic: 28%Other: 17%
NR Alternative school Rural NR
AH-1156

Appendix H. Data Table
Author YearWinzelberg 2003
Woodruff 2001
Health Insurance Status Literacy Language(s) Health Beliefs Intervention Name
NR NR English NR Bosom Buddies
NR NR NR NR Breathing Room
AH-1157

Appendix H. Data Table
Author YearWinzelberg 2003
Woodruff 2001
Intervention Described Intervention Groups Type of Device* Functions*
Intervention*
12 week, structured, web based support group moderated by a mental health professional
Group 1: InterventionGroup 2: Wait-list control
Website Support group, online diary, read survivors stories,
Counselor-facilitated chat room
All users logged onto weekly, 1-hour sessions for 7 weeks
NR Website Chatroom, facilitated by tobacco counselor, using Active World (avatars)
AH-1158

Appendix H. Data Table
Author YearWinzelberg 2003
Woodruff 2001
Staff Training Subject Training co-interventions PhysiologicNR Those who were given
computers to use for the study were "instructed" on their use
NR NR
NR NR NR NA
AH-1159

Appendix H. Data Table
Author YearWinzelberg 2003
Woodruff 2001
Health Service Utilization Health Care Costs KnowledgeNR NR NR
NA NA NR
AH-1160

Appendix H. Data Table
Author YearWinzelberg 2003
Woodruff 2001
Use of Technology Usability HIT SatisfactionNR NR NR
NR NR NR
AH-1161

Appendix H. Data Table
Author YearWinzelberg 2003
Woodruff 2001
Health Satisfaction Self-efficacy Health Behavior
Outcomes
NR NR NR
NR NR 38.9% self-reported not smoking
AH-1162

Appendix H. Data Table
Author YearWinzelberg 2003
Woodruff 2001
Quality of Life Support WithdrawalsNR Group experience evaluation (%
reporting a lot or a great deal) Getting support and encouragement: 65Helping others: 56Learning that problems are not unique: 56Develop new friendships: 63Get advice: 55Express true feelings: 65Model self after group participants: 30Confront difficult probs. and fears: 44Discuss sexual concerns: 44
NR
NR NR NR
AH-1163

Appendix H. Data Table
Author YearWinzelberg 2003
Woodruff 2001
Adverse Effects OtherNR Psychological:
CES-D: F=6.00 (p<0.01)PCL-C: F=8.36 (p<0.01)PSS: F=3.88 (p<0.05)STAI: F=.78Cancer Behavior InventoryF scoresSeeking support: .59Seeking understanding: 0.03Coping: 0.19Affect Regulation: 0.07Positive Attitude: 0.40Activity/Independence: 0.00MiniMacHelpless/hopeless: 0.21Anxious/preoccupation: 0.90Fighting spirit: 0.95Cognitive avoidance: 1.02Fatalism: 0.45
NR NR
AH-1164

Appendix H. Data Table
Author YearPatient Recruitment
Setting Clinical Practice SettingPatient Technology
Setting Study design NYon 2007 NR NR Homes Cohort with historical
controlN= 176PDA Grp: 61CG: 115
AH-1165

Appendix H. Data Table
Author YearYon 2007
Years of Study
Length of follow-up (months) Inclusion Criteria Exclusion Criteria Elderly
NR 24 months *Age > 18 yrs*BMI > 25 and < 39 kg/m2
*Regular access to a computer (not less than 3 yrs old with CD Rom drive, internet connection, at least 64 megabytes of RAM, 350 MHz processor speed and windows 98 or higher as a computer operating system)
Pts ineligible if they planned a pregnancy or to move from the area within the next 12 months, had a history of major medical or psychiatric problems, took medications that had implications for weight loss, were unable to participate in a mild to moderate exercise program, or unable to regularly attend weekly meetings.
NR
AH-1166

Appendix H. Data Table
Author YearYon 2007
Underserved Chronic IllnessDisability/
Impairment Gender (% Male) Age (years)NR OBESITY NR Grp 1: 8 (5%)
Grp 2: 16 (19%)Mean age (SD)Grp 1: 48.2 (+8.7)Grp 2: 46.1 (+9.2)
AH-1167

Appendix H. Data Table
Author YearYon 2007
Ethnicity Income (US$) EducationUrban / Rural /
Frontier Other
Patient Characteristics*
NR NR High school/Vocational schoolGrp 1: 10% Grp 2: 7%
Some collegeGrp 1: 11%Grp 2: 30%
College degreeGrp 1: 18%Grp 2: 34%
Graduate/Professional degreeGrp 1: 22%Grp 2: 44%
NR Marital status (%), p< 0.001
Grp 1 vs. Grp 2Married/civil union: 43 vs. 86Separated/divorced/ widowed: 13 vs. 29Never married: 5 vs. 0
Computer ability (%)Grp 1 vs. Grp 2Novice/basic software: 10 vs. 8Software + internet: 41 vs. 77Hobbyist: 5 vs. 25Professional: 5 vs. 5
AH-1168

Appendix H. Data Table
Author YearYon 2007
Health Insurance Status Literacy Language(s) Health Beliefs Intervention Name
NR NR NR NR Calorie King's Diet diary
AH-1169

Appendix H. Data Table
Author YearYon 2007
Intervention Described Intervention Groups Type of Device* Functions*
Intervention*
Use of the Calorie king software to self monitor food intake and exercise installed in Palmzire 21
Pts given printed lessons for review each week, facilitated by a master' s level grad student, pts instructed to reduce energy intake,individual calorie goals determined, graded goals for programmed physical activity was used, pts encouraged to increase lifestyle exercise,
Grp 1: PDA grp-instructed to self monitor food and exercise with the software, pts electronically submitted their food and exercise diary weekly at group meeting by using the hot-sync function, positive feedback self-monitoring behavior and support provided via weekly email messages from the group facilitator to each subject.Grp 2: small paper weekly diaries provided and a book with calorie listings of food. The diary was handed to the facilitator at weekly meetings and positive
PDA Weight and exercise data
AH-1170

Appendix H. Data Table
Author YearYon 2007
Staff Training Subject Training co-interventions PhysiologicNR Initial orientation and
consent, second orientation session for baseline data collection and technical support and assistance for the PDA and calorie King software provided.
NR Mean weight loss, kg (SD)Grp 1 vs. Grp 26.3 (+6.1) vs. 7.2 (+5.2), F (1, 145)= 0.17, p= 0.68
Mean % weight loss (SD)Grp 1 vs. Grp 27 (+6.5) vs. 8.3 (+5.8), F (1, 145) = 0.99, p=0.32
All subjects Mean weight loss, kg (SD)Grp 1 vs. Grp 25.8 (+6.1) vs. 5.8 (+5.5), F (1,145) = 0.04, p=0.84
AH-1171

Appendix H. Data Table
Author YearYon 2007
Health Service Utilization Health Care Costs KnowledgeNR NR NR
AH-1172

Appendix H. Data Table
Author YearYon 2007
Use of Technology Usability HIT SatisfactionMost pts reported making entries regularly throughout or at the end of the day (61%)Pts entered most or all of the food they consumed (80%) and most of all of the programmed exercise (71%)
The following aspects were liked by the ptsAbility to look up calorie and nutritional information: 65%Portability: 47%Convenience: 34%Ease of entering food and exercise data: 26%
Disliked PDA as unable to find commonly eaten food and it was hard to see the screen: 44$
NR
AH-1173

Appendix H. Data Table
Author YearYon 2007
Health Satisfaction Self-efficacy Health Behavior
Outcomes
NR NR NR
AH-1174

Appendix H. Data Table
Author YearYon 2007
Quality of Life Support WithdrawalsNR NR PDA group: 57 completers (7 %
withdrew)Control group: 93 completers (19% withdrew)
AH-1175

Appendix H. Data Table
Author YearYon 2007
Adverse Effects OtherNR Correlation between dietary self
monitoring and weight loss (ANCOVA results) relationship between attendance and weight loss, relationship between compliance and calorie goals and weight loss and between exercise goals and weight loss given, not listed here
AH-1176

Appendix H. Data Table
Author YearPatient Recruitment
Setting Clinical Practice SettingPatient Technology
Setting Study design NZabinski 2001 Public West coast
universityNA Homes Cohort N= 4
AH-1177

Appendix H. Data Table
Author YearZabinski 2001
Years of Study
Length of follow-up (months) Inclusion Criteria Exclusion Criteria Elderly
NR 10 weeks *Self reported high body image concerns*Failed to report substantial depressivesymptomatology*Did not report thoughts of harming themselves or others
Pts who self reported a past or current eating disorder diagnosis
NR
AH-1178

Appendix H. Data Table
Author YearZabinski 2001
Underserved Chronic IllnessDisability/
Impairment Gender (% Male) Age (years)NR NR NR N = 0% Mean (Range): 19.4
(18-20)
AH-1179

Appendix H. Data Table
Author YearZabinski 2001
Ethnicity Income (US$) EducationUrban / Rural /
Frontier Other
Patient Characteristics*
Caucasians: 2 pts (50%)Asian: 1 pt (25%)Hispanic/Latina: 1 pt (25%)
NR Freshmen in College: 3Sophomore in College: 1
Urban NR
AH-1180

Appendix H. Data Table
Author YearZabinski 2001
Health Insurance Status Literacy Language(s) Health Beliefs Intervention Name
NR NR NR NR Internet Relay Chat (IRC)
AH-1181

Appendix H. Data Table
Author YearZabinski 2001
Intervention Described Intervention Groups Type of Device* Functions*
Intervention*
Chatroom in a public site (yahoo), consisting of electronic newsgroup and a chat room. Forum for pts to discuss reactions to chat, readings and assignments via asynchronous postings moderated by the author
3 components to the treatment. Weekly readings, chat discussions, and summaries of each chat discussions. At the beginning of each week, pts received single page of reading, logged on to the chat room for an hour, moderator assigned homework, and allowed pts to express their feelings, moderator e mailed one page summary of the chat.
Computer Interactive chat room, asynchronous postings on the net
AH-1182

Appendix H. Data Table
Author YearZabinski 2001
Staff Training Subject Training co-interventions PhysiologicNR Instruction manual and
contact number of the research assistant given
NR Measure - M (SD)Baseline vs. Post Tx vs. 10 week follow upEffect sizes Baseline to Post Tx ; Post Tx to follow up
Eating disorder inventory----bulimia subscale10.0 (1.4) vs. 10.5 ( 2.4) vs. 12.0 (7.4) -0.36 ; -0.63----Drive for thinness subscale19.5 (12.5) vs. 20.0 ( 15.2) vs. 15.8 ( 6.2)-0.04 ; 0.28
Eating disorders examination questionnaireGlobal1.5(1.2) vs. 1.1 (1.0) vs. 0.7 (0.7)0.33 ; 0.40Weight1.8(1.3) vs1.5(1.6) vs. 0.7(0.5)0.33 ; 0.40Shape2.2(1.3) vs. 1.3 (1.3) vs. 0.9 (0.7)0.69;0.31Eating0.7 (1.0) vs. 0.4(0.4) vs. 0.25 (0.4)0.30;0.25Restraint
AH-1183

Appendix H. Data Table
Author YearZabinski 2001
Health Service Utilization Health Care Costs KnowledgeNR NR NR
AH-1184

Appendix H. Data Table
Author YearZabinski 2001
Use of Technology Usability HIT SatisfactionMembers participated in 79% of the sessions. Pts who missed a chat session contacted moderator for update (contacts unprompted)
Easier for pts to be honest with the computer- acceptability was high.
Pts rated their satisfaction with the program really high
Table 2 lists specific responses from the participants with raw scores-not listed here
AH-1185

Appendix H. Data Table
Author YearZabinski 2001
Health Satisfaction Self-efficacy Health Behavior
Outcomes
Pts reported that the intervention helped prevent negative attitudes about their weight and shape making them feel bad and to recognize the thoughts and situations that trigger negative feelings or behaviors (4 or higher on 7 point scale)
3 pts also reported that the intervention helped them to challenge negative thought patterns (5 or higher on a 7 point scale).
Table 3 gives ratings of perceived change with pt responses, not listed here
NR NR
AH-1186

Appendix H. Data Table
Author YearZabinski 2001
Quality of Life Support WithdrawalsNR NR NR
AH-1187

Appendix H. Data Table
Author YearZabinski 2001
Adverse Effects OtherNR Qualitative responses of pts given
AH-1188

Appendix H. Data Table
Author YearPatient Recruitment
Setting Clinical Practice SettingPatient Technology
Setting Study design NZimmerman 2004 Large tertiary hospital
where pts who were admitted for elective CABG over a 9 month period
NR Homes RCT N=52
AH-1189

Appendix H. Data Table
Author YearZimmerman 2004
Years of Study
Length of follow-up (months) Inclusion Criteria Exclusion Criteria Elderly
NR 6 months *Age > 65 years*1st CABG surgery*Not visually/hearing impaired*English literate*No apparent physical impairments that would limit their physical functioning after surgery
Any criteria against the Inclusion criteria
YES
AH-1190

Appendix H. Data Table
Author YearZimmerman 2004
Underserved Chronic IllnessDisability/
Impairment Gender (% Male) Age (years)NR CABG NR 72% 71.22 (65-79)
AH-1191

Appendix H. Data Table
Author YearZimmerman 2004
Ethnicity Income (US$) EducationUrban / Rural /
Frontier Other
Patient Characteristics*
100% Caucasian NR NR NR NR
AH-1192

Appendix H. Data Table
Author YearZimmerman 2004
Health Insurance Status Literacy Language(s) Health Beliefs Intervention Name
NR English literate English NR Health Buddy
AH-1193

Appendix H. Data Table
Author YearZimmerman 2004
Intervention Described Intervention Groups Type of Device* Functions*
Intervention*
CABG patients access web for daily information on recovery, provider can observe patients' progress at home
IVR: 24UC: 21
Website Data input, receiving information
AH-1194

Appendix H. Data Table
Author YearZimmerman 2004
Staff Training Subject Training co-interventions PhysiologicNR NR NR Frequency of Evaluation of
Symptoms by Group at 2, 4, and 6 weeks
Fatigue2 week, 4 week, 6 weekUC: 6, 11, 8IVR: 7, 13, 11
Sleep2 week, 4 week, 6 weekUC: 11, 5, 8IVR: 12, 9, 7
Swelling2 week, 4 week, 6 weekUC: 7, 3, 3IVR: 11, 8, 9
Shortness of Breath2 week, 4 week, 6 weekUC: 6, 3, 2IVR: 7, 8, 5
Incisional Pain2 week, 4 week, 6 weekUC: 6, 3, 2IVR: 8, 6, 6
Appetite2 week, 4 week, 6 weekUC: 8, 6, 4
AH-1195

Appendix H. Data Table
Author YearZimmerman 2004
Health Service Utilization Health Care Costs KnowledgeNR NR NR
AH-1196

Appendix H. Data Table
Author YearZimmerman 2004
Use of Technology Usability HIT SatisfactionNR NR NR
AH-1197

Appendix H. Data Table
Author YearZimmerman 2004
Health Satisfaction Self-efficacy Health Behavior
Outcomes
NR NR Mean Scores of Symptom interference on physical functioning at 2, 4, and 6 weeks
Fatigue2 week, 4 week, 6 weekUC: 1, 1.36, 1.12IVR: 1.6, 1.4, 0.76
Sleep2 week, 4 week, 6 weekUC: 0.84, 0.48, 0.64IVR: 0.2, 0.6, 0.28
Swelling2 week, 4 week, 6 weekUC: 0.32, 0.12, 0.12IVR: 0.64, 0.44, 0.36
Shortness of Breath2 week, 4 week, 6 weekUC: 0.52, 0.28, 0.08IVR: 0.6, 0.76, 0.2
Incisional Pain2 week, 4 week, 6 weekUC: 1.04, 0.76, 0.36IVR: 0.72, 0.6, 0.56
Appetite2 week, 4 week, 6 weekUC: 0.44, 0.88, 0.84
AH-1198

Appendix H. Data Table
Author YearZimmerman 2004
Quality of Life Support WithdrawalsMean Scores of symptom interference on enjoyment of life at 2, 4, and 6 weeks
Fatigue2 week, 4 week, 6 weekUC: 1.12, 1.0, 1.08IVR: 1.32, 0.88, 0.68
Sleep2 week, 4 week, 6 weekUC: 0.92, 0.68, 0.68IVR: 0.56, 0.6, 0.44
Swelling2 week, 4 week, 6 weekUC: 0.28, 0.12, 0.12IVR: 0.52, 0.44, 0.36
Shortness of Breath2 week, 4 week, 6 weekUC: 0.52, 0.12, 0.04IVR: 0.76, 0.56, 0.2
Incisional Pain2 week, 4 week, 6 weekUC: 1.04, 0.76, 0.36IVR: 0.4, 0.36, 0.32
Appetite2 week, 4 week, 6 weekUC: 0.24, 0.84, 0.76
NR N=73 were readmitted to a healthcare facility and were unable to obtain healthcare data for over a week1 moved1 had a rotary telephone2 did not want to be contacted
AH-1199

Appendix H. Data Table
Author YearZimmerman 2004
Adverse Effects OtherNR NR
AH-1200

Appendix H. Data Table
Author YearPatient Recruitment
Setting Clinical Practice SettingPatient Technology
Setting Study design NReferences
Armstrong, K., Weber, B., Ubel, P. A., Peters, N., Holmes, J., & Schwartz, J. S. (2005). Individualized survival curves improve satisfaction with cancer risk management decisions in women with BRCA1/2 mutations. Journal of Clinical Oncology, 23 (36), 9319-9328.
Artinian, N. T., Harden, J. K., Kronenberg, M. W., Vander Wal, J. S., Daher, E., Stephens, Q., et al. (2003). Pilot study of a Web-based compliance monitoring device for patients with congestive heart failure. Heart & Lung, 32 (4), 226-233.
An, L. C., Perry, C. L., Lein, E. B., Klatt, C., Farley, D. M., Bliss, R. L., et al. (2006). Strategies for increasing adherence to an online smoking cessation intervention for college students. Nicotine & Tobacco Research, 8 Suppl 1 , S7-12.
Andersson, G., Bergstrom, J., Hollandare, F., Carlbring, P., Kaldo, V., & Ekselius, L. (2005). Internet-based self-help for depression: randomised controlled trial. British Journal of Psychiatry, 187 , 456-461.
Andersson, G., Carlbring, P., Holmstrom, A., Sparthan, E., Furmark, T., Nilsson-Ihrfelt, E., et al. (2006). Internet-based self-help with therapist feedback and in vivo group exposure for social phobia: a randomized controlled trial. Journal of consulting and clinical psychology, 74 (4), 677-686.
Andersson, G., Lundstrom, P., & Strom, L. (2003). Internet-based treatment of headache: does telephone contact add anything? Headache, 43 (4), 353-361.
Andrade, A. S. A., McGruder, H. F., Wu, A. W., Celano, S. A., Skolasky, R. L., Jr., Selnes, O. A., et al. (2005). A programmable prompting device improves adherence to highly active antiretroviral therapy in HIV-infected subjects with memory impairment. Clinical Infectious Diseases, 41 (6), 875-882.
Andrewes, D. G., O'Connor, P., Mulder, C., McLennan, J., Derham, H., Weigall, S., et al. (1996). Computerised psychoeducation for patients with eating disorders. Australian & New Zealand Journal of Psychiatry, 30 (4), 492-497.
Araki, I., Hashimoto, H., Kono, K., Matsuki, H., & Yano, E. (2006). Controlled trial of worksite health education through face-to-face counseling vs. e-mail on drinking behavior modification. Journal of Occupational Health, 48 (4), 239-245.
Albisser, A. M., Harris, R. I., Albisser, J. B., & Sperlich, M. (2001). The impact of initiatives in education, self-management training, and computer-assisted self-care on outcomes in diabetes disease management. Diabetes Technology & Therapeutics, 3 (4), 571-579.
Anhoj, J., & Nielsen, L. (2004). Quantitative and qualitative usage data of an Internet-based asthma monitoring tool. Journal of Medical Internet Research, 6 (3), e23.
AH-1201

Appendix H. Data Table
Author YearReferences
Armstrong, K., Webermanagement decision
Artinian, N. T., Hardenmonitoring device for p
An, L. C., Perry, C. L.,intervention for college
Andersson, G., Bergsttrial. British Journal of
Andersson, G., Carlbrand in vivo group expo
Andersson, G., Lunds361.
Andrade, A. S. A., McGadherence to highly ac
Andrewes, D. G., O'Codisorders. Australian &
Araki, I., Hashimoto, Hdrinking behavior mod
Albisser, A. M., Harrisself-care on outcomes
Anhoj, J., & Nielsen, L6 (3), e23.
Years of Study
Length of follow-up (months) Inclusion Criteria Exclusion Criteria Elderly
References, continued
Cavan, D. A., Everett, J., Plougmann, S., & Hejlesen, O. K. (2003). Use of the Internet to optimize self-management of type 1 diabetes: preliminary experience with DiasNet. Journal of Telemedicine & Telecare, 9 Suppl 1 , S50-52.
Cawsey, A. J., Jones, R. B., & Pearson, J. (2000). The evaluation of a personalised health information system for patients with cancer. User Modeling and User-Adapted Interaction, 10 (1), 47-72.
Block, G., Wakimoto, P., Metz, D., Fujii, M. L., Feldman, N., Mandel, R., et al. (2004). A randomized trial of the Little by Little CD-ROM: demonstrated effectiveness in increasing fruit and vegetable intake in a low-income population. Preventing Chronic Disease, 1 (3), A08.
Brennan, P. F., Moore, S. M., Bjornsdottir, G., Jones, J., Visovsky, C., & Rogers, M. (2001). HeartCare: an Internet-based information and support system for patient home recovery after coronary artery bypass graft (CABG) surgery. Journal of Advanced Nursing, 35 (5), 699-708.
Carlbring, P., Gunnarsdottir, M., Hedensjo, L., Andersson, G., Ekselius, L., & Furmark, T. (2007). Treatment of social phobia: randomised trial of internet-delivered cognitive-behavioural therapy with telephone support. British Journal of Psychiatry, 190 , 123-128.
Cathala, N., Brillat, F., Mombet, A., Lobel, E., Prapotnich, D., Alexandre, L., et al. (2003). Patient followup after radical prostatectomy by Internet medical file. Journal of Urology, 170 (6 Pt 1), 2284-2287.
Chan, D. S., Callahan, C. W., Sheets, S. J., Moreno, C. N., & Malone, F. J. (2003). An Internet-based store-and-forward video home telehealth system for improving asthma outcomes in children. American Journal of Health-System Pharmacy, 60 (19), 1976-1981.
Barnason, S., Zimmerman, L., Nieveen, J., Schmaderer, M., Carranza, B., & Reilly, S. (2003). Impact of a home communication intervention for coronary artery bypass graft patients with ischemic heart failure on self-efficacy, coronary disease risk factor modification, and functioning. Heart & Lung, 32 (3), 147-158.
Barrera, M., Jr., Glasgow, R. E., McKay, H. G., Boles, S. M., & Feil, E. G. (2002). Do Internet-based support interventions change perceptions of social support?: An experimental trial of approaches for supporting diabetes self-management. American Journal of Community Psychology, 30 (5), 637-654.
Bachofen, M., Nakagawa, A., Marks, I. M., Park, J. M., Greist, J. H., Baer, L., et al. (1999). Home self-assessment and self-treatment of obsessive-compulsive disorder using a manual and a computer-conducted telephone interview: replication of a UK-US study. Journal of Clinical Psychiatry, 60 (8), 545-549.
Barnason, S., Zimmerman, L., Nieveen, J., & Hertzog, M. (2006). Impact of a telehealth intervention to augment home health care on functional and recovery outcomes of elderly patients undergoing coronary artery bypass grafting. Heart & Lung, 35 (4), 225-233.
AH-1202

Appendix H. Data Table
Author YearReferences
Armstrong, K., Webermanagement decision
Artinian, N. T., Hardenmonitoring device for p
An, L. C., Perry, C. L.,intervention for college
Andersson, G., Bergsttrial. British Journal of
Andersson, G., Carlbrand in vivo group expo
Andersson, G., Lunds361.
Andrade, A. S. A., McGadherence to highly ac
Andrewes, D. G., O'Codisorders. Australian &
Araki, I., Hashimoto, Hdrinking behavior mod
Albisser, A. M., Harrisself-care on outcomes
Anhoj, J., & Nielsen, L6 (3), e23.
Underserved Chronic IllnessDisability/
Impairment Gender (% Male) Age (years)References, continued
Ferrer-Roca, O., Cardenas, A., Diaz-Cardama, A., & Pulido, P. (2004a). Mobile phone text messaging in the management of diabetes. Journal of Telemedicine & Telecare, 10 (5), 282-285.
Cross, R. K., & Finkelstein, J. (2007). Feasibility and acceptance of a home telemanagement system in patients with inflammatory bowel disease: a 6-month pilot study. Digestive Diseases & Sciences, 52 (2), 357-364.
Cruz-Correia, R., Fonseca, J., Lima, L., Araujo, L., Delgado, L., Castel-Branco, M. G., et al. (2007). Web-based or paper-based self-management tools for asthma--patients' opinions and quality of data in a randomized crossover study. Studies in Health Technology & Informatics, 127 , 178-189.
Ewald, S., vor dem Esche, J., Uen, S., Neikes, F., Vetter, H., & Mengden, T. (2006). Relationship between the frequency of blood pressure self-measurement and blood pressure reduction with antihypertensive therapy : results of the OLMETEL (OLMEsartan TELemonitoring blood pressure) study. Clinical Drug Investigation, 26 (8), 439-446.
Durso, S. C., Wendel, I., Letzt, A. M., Lefkowitz, J., Kaseman, D. F., & Seifert, R. F. (2003). Older adults using cellular telephones for diabetes management: a pilot study. MEDSURG Nursing, 12 (5), 313-317.
Earnest, M. A., Ross, S. E., Wittevrongel, L., Moore, L. A., & Lin, C.-T. (2004). Use of a patient-accessible electronic medical record in a practice for congestive heart failure: patient and physician experiences. Journal of the American Medical Informatics Association, 11 (5), 410-417.
Estabrooks, P. A., Nelson, C. C., Xu, S., King, D., Bayliss, E. A., Gaglio, B., et al. (2005). The frequency and behavioral outcomes of goal choices in the self-management of diabetes. Diabetes Educator, 31 (3), 391-400.
Cho, J.-H., Chang, S.-A., Kwon, H.-S., Choi, Y.-H., Ko, S.-H., Moon, S.-D., et al. (2006). Long-term effect of the Internet-based glucose monitoring system on HbA1c reduction and glucose stability: a 30-month follow-up study for diabetes management with a ubiquitous medical care system. Diabetes Care, 29 (12), 2625-2631.
Christensen, H., Griffiths, K. M., & Jorm, A. F. (2004). Delivering interventions for depression by using the internet: randomised controlled trial. BMJ, 328 (7434), 265.
Chen, H., Yeh, M., & Chao, Y. (2006). Comparing effects of auricular acupressure with and without an Internet-assisted program on smoking cessation and self-efficacy of adolescents. Journal of Alternative and Complementary Medicine, 12 (2), 147-152.
Delgado, D. H., Costigan, J., Wu, R., & Ross, H. J. (2003). An interactive Internet site for the management of patients with congestive heart failure. Canadian Journal of Cardiology, 19 (12), 1381-1385.
AH-1203

Appendix H. Data Table
Author YearReferences
Armstrong, K., Webermanagement decision
Artinian, N. T., Hardenmonitoring device for p
An, L. C., Perry, C. L.,intervention for college
Andersson, G., Bergsttrial. British Journal of
Andersson, G., Carlbrand in vivo group expo
Andersson, G., Lunds361.
Andrade, A. S. A., McGadherence to highly ac
Andrewes, D. G., O'Codisorders. Australian &
Araki, I., Hashimoto, Hdrinking behavior mod
Albisser, A. M., Harrisself-care on outcomes
Anhoj, J., & Nielsen, L6 (3), e23.
Ethnicity Income (US$) EducationUrban / Rural /
Frontier Other
Patient Characteristics*
References, continuedFerrer-Roca, O., Franco Burbano, K., Cardenas, A., Pulido, P., & Diaz-Cardama, A. (2004b). Web-based diabetes control. Journal of Telemedicine & Telecare, 10 (5), 277-281.
Finkelstein, S. M., Snyder, M., Edin-Stibbe, C., Chlan, L., Prasad, B., Dutta, P., et al. (1996). Monitoring progress after lung transplantation from home-patient adherence. Journal of Medical Engineering & Technology, 20 (6), 203-210.
Franklin, V. L., Waller, A., Pagliari, C., & Greene, S. A. (2006). A randomized controlled trial of Sweet Talk, a text-messaging system to support young people with diabetes. Diabetic Medicine, 23 (12), 1332-1338.
Gerbert, B., Berg-Smith, S., Mancuso, M., Caspers, N., McPhee, S., Null, D., et al. (2003). Using innovative video doctor technology in primary care to deliver brief smoking and alcohol intervention. Health Promotion Practice, 4 (3), 249-261.
Glasgow, R. E., Boles, S. M., McKay, H. G., Feil, E. G., & Barrera, M., Jr. (2003). The D-Net diabetes self-management program: long-term implementation, outcomes, and generalization results. Preventive Medicine, 36 (4), 410-419.
Glasgow, R. E., & Toobert, D. J. (2000). Brief, computer-assisted diabetes dietary self-management counseling: effects on behavior, physiologic outcomes, and quality of life. Medical Care, 38 (11), 1062-1073.
Gomez, E. J., Caceres, C., Lopez, D., & Del Pozo, F. (2002a). A web-based self-monitoring system for people living with HIV/AIDS. Computer Methods & Programs in Biomedicine, 69 (1), 75-86.
Green, B., et al. (2008). Effectiveness of Home Blood Pressure Monitoring, Web Communication, and Pharmacist Care on Hypertension Control. JAMA, 299 (24), 2857-2867.
Gerber, B. S., Solomon, M. C., Shaffer, T. L., Quinn, M. T., & Lipton, R. B. (2007). Evaluation of an internet diabetes self-management training program for adolescents and young adults. Diabetes Technology & Therapeutics, 9 (1), 60-67.
Frenn, M., Malin, S., Brown, R. L., Greer, Y., Fox, J., Greer, J., et al. (2005). Changing the tide: an Internet/video exercise and low-fat diet intervention with middle-school students. Applied nursing research : ANR, 18 (1), 13-21.
Gega, L., Marks, I., & Mataix-Cols, D. (2004). Computer-aided CBT self-help for anxiety and depressive disorders: experience of a London clinic and future directions. Journal of Clinical Psychology, 60 (2), 147-157.
AH-1204

Appendix H. Data Table
Author YearReferences
Armstrong, K., Webermanagement decision
Artinian, N. T., Hardenmonitoring device for p
An, L. C., Perry, C. L.,intervention for college
Andersson, G., Bergsttrial. British Journal of
Andersson, G., Carlbrand in vivo group expo
Andersson, G., Lunds361.
Andrade, A. S. A., McGadherence to highly ac
Andrewes, D. G., O'Codisorders. Australian &
Araki, I., Hashimoto, Hdrinking behavior mod
Albisser, A. M., Harrisself-care on outcomes
Anhoj, J., & Nielsen, L6 (3), e23.
Health Insurance Status Literacy Language(s) Health Beliefs Intervention Name
References, continued
Jones, R., Pearson, J., McGregor, S., Cawsey, A. J., Barrett, A., Craig, N., et al. (1999). Randomised trial of personalised computer based information for cancer patients. BMJ, 319 (7219), 1241-1247.
Jones, R. B., Atkinson, J. M., Coia, D. A., Paterson, L., Morton, A. R., McKenna, K., et al. (2001). Randomised trial of personalised computer based information for patients with schizophrenia.[erratum appears in BMJ 2001 May 5;322(7294):1103]. BMJ, 322 (7290), 835-840.
Hoch, D. B., Norris, D., Lester, J. E., & Marcus, A. D. (1999). Information exchange in an epilepsy forum on the World Wide Web. Seizure, 8 (1), 30-34.
Holman, R. R., Smale, A. D., Pemberton, E., Riefflin, A., & Nealon, J. L. (1996). Randomized controlled pilot trial of a hand-held patient-oriented, insulin regimen optimizer. Medical Informatics, 21 (4), 317-326.
Guendelman, S., Meade, K., Benson, M., Chen, Y. Q., & Samuels, S. (2002). Improving asthma outcomes and self-management behaviors of inner-city children: a randomized trial of the Health Buddy interactive device and an asthma diary. Archives of Pediatrics & Adolescent Medicine, 156 (2), 114-120.
Gustafson, D. H., Hawkins, R., Boberg, E., Pingree, S., Serlin, R. E., Graziano, F., et al. (1999). Impact of a patient-centered, computer-based health information/support system. American Journal of Preventive Medicine, 16 (1), 1-9.
Gustafson, D. H., Hawkins, R., Pingree, S., McTavish, F., Arora, N. K., Mendenhall, J., et al. (2001). Effect of computer support on younger women with breast cancer. Journal of General Internal Medicine, 16 (7), 435-445.
Gustafson, D. H., Hawkins, R. P., Boberg, E. W., Bricker, E., Pingree, S., & Chan, C. L. (1994). The use and impact of a computer-based support system for people living with AIDS and HIV infection. Proceedings - the Annual Symposium on Computer Applications in Medical Care , 604-608.
Gustafson, D. H., McTavish, F., Hawkins, R., Pingree, S., Arora, N., Mendenhall, J., et al. (1998). Computer support for elderly women with breast cancer. JAMA, 280 (15), 1305.
Jan, R.-L., Wang, J.-Y., Huang, M.-C., Tseng, S.-M., Su, H.-J., & Liu, L.-F. (2007). An internet-based interactive telemonitoring system for improving childhood asthma outcomes in Taiwan. Telemedicine Journal & E-Health, 13 (3), 257-268.
Japuntich, S. J., Zehner, M. E., Smith, S. S., Jorenby, D. E., Valdez, J. A., Fiore, M. C., et al. (2006). Smoking cessation via the internet: a randomized clinical trial of an internet intervention as adjuvant treatment in a smoking cessation intervention. Nicotine & Tobacco Research, 8 Suppl 1 , S59-67.
AH-1205

Appendix H. Data Table
Author YearReferences
Armstrong, K., Webermanagement decision
Artinian, N. T., Hardenmonitoring device for p
An, L. C., Perry, C. L.,intervention for college
Andersson, G., Bergsttrial. British Journal of
Andersson, G., Carlbrand in vivo group expo
Andersson, G., Lunds361.
Andrade, A. S. A., McGadherence to highly ac
Andrewes, D. G., O'Codisorders. Australian &
Araki, I., Hashimoto, Hdrinking behavior mod
Albisser, A. M., Harrisself-care on outcomes
Anhoj, J., & Nielsen, L6 (3), e23.
Intervention Described Intervention Groups Type of Device* Functions*
Intervention*
References, continued
Kressig, R. W., & Echt, K. V. (2002). Exercise prescribing: computer application in older adults. Gerontologist, 42 (2), 273-277.
Kwon, H.-S., Cho, J.-H., Kim, H.-S., Song, B.-R., Ko, S.-H., Lee, J.-M., et al. (2004). Establishment of blood glucose monitoring system using the internet. Diabetes Care, 27 (2), 478-483.
Kaufman, D. R., Patel, V. L., Hilliman, C., Morin, P. C., Pevzner, J., Weinstock, R. S., et al. (2003b). Usability in the real world: assessing medical information technologies in patients' homes. Journal of Biomedical Informatics, 36 (1-2), 45-60.
Kenwright, M., Marks, I., Graham, C., Franses, A., & Mataix-Cols, D. (2005). Brief scheduled phone support from a clinician to enhance computer-aided self-help for obsessive-compulsive disorder: randomized controlled trial. Journal of Clinical Psychology, 61 (12), 1499-1508.
Kenwright, M., & Marks, I. M. (2004). Computer-aided self-help for phobia/panic via internet at home: a pilot study. British Journal of Psychiatry, 184 , 448-449.
Kim, C., & Kang, D. (2006a). Utility of a Web-based intervention for individuals with type 2 diabetes: the impact on physical activity levels and glycemic control. CIN: Computers, Informatics, Nursing, 24 (6), 337-345.
Kim, H. (2007). A randomized controlled trial of a nurse short-message service by cellular phone for people with diabetes. International Journal of Nursing Studies, 44 (5), 687-692.
Kim, H., Kim, N., & Ahn, S. (2006b). Impact of a nurse short message service intervention for patients with diabetes. Journal of Nursing Care Quality, 21 (3), 266-271.
Kosma, M., Cardinal, B. J., & McCubbin, J. A. (2005). A pilot study of a web-based physical activity motivational program for adults with physical disabilities. Disability and rehabilitation, 27 (23), 1435-1442.
Joseph, C. L. M., Peterson, E., Havstad, S., Johnson, C. C., Hoerauf, S., Stringer, S., et al. (2007). A web-based, tailored asthma management program for urban African-American high school students. American Journal of Respiratory & Critical Care Medicine, 175 (9), 888-895.
Kashem, A., Droogan, M. T., Santamore, W. P., Wald, J. W., Marble, J. F., Cross, R. C., et al. (2006). Web-based Internet telemedicine management of patients with heart failure. Telemedicine journal and e-health : the official journal of the American Telemedicine Association, 12(4), 439-447.
AH-1206

Appendix H. Data Table
Author YearReferences
Armstrong, K., Webermanagement decision
Artinian, N. T., Hardenmonitoring device for p
An, L. C., Perry, C. L.,intervention for college
Andersson, G., Bergsttrial. British Journal of
Andersson, G., Carlbrand in vivo group expo
Andersson, G., Lunds361.
Andrade, A. S. A., McGadherence to highly ac
Andrewes, D. G., O'Codisorders. Australian &
Araki, I., Hashimoto, Hdrinking behavior mod
Albisser, A. M., Harrisself-care on outcomes
Anhoj, J., & Nielsen, L6 (3), e23.
Staff Training Subject Training co-interventions PhysiologicReferences, continued
McClure, J. B., Greene, S. M., Wiese, C., Johnson, K. E., Alexander, G., & Strecher, V. (2006). Interest in an online smoking cessation program and effective recruitment strategies: results from Project Quit. Journal of Medical Internet Research, 8 (3), e14.
McDaniel, A. M., Hutchison, S., Casper, G. R., Ford, R. T., Stratton, R., & Rembusch, M. (2002). Usability testing and outcomes of an interactive computer program to promote smoking cessation in low income women. Proceedings / AMIA, Annual Symposium. , 509-513.
Ma, C., Warren, J., Phillips, P., & Stanek, J. (2006). Empowering patients with essential information and communication support in the context of diabetes. International Journal of Medical Informatics, 75 (8), 577-596.
Labiris, G., Papadopoulis, G., Lentaris, G., Kafentzis, M., & Krakakis, A. (2004). Internet based counseling to remote orthopedic patients. Acta Orthopaedica Scandinavica, 75 (3), 366-367.
LaFramboise, L. M., Todero, C. M., Zimmerman, L., & Agrawal, S. (2003). Comparison of Health Buddy with traditional approaches to heart failure management. Family and Community Health, 26 (4), 275-288.
Lahm, E. A. (1996). Software That Engages Young Children with Disabilities: A Study of Design Features. [Journal Articles Reports - Research]. Focus on Autism and Other Developmental Disabilities, 11(2), 115-124.
Lee, T.-I., Yeh, Y.-T., Liu, C.-T., & Chen, P.-L. (2007). Development and evaluation of a patient-oriented education system for diabetes management. International Journal of Medical Informatics, 76 (9), 655-663.
Leu, M. G., Norris, T. E., Hummel, J., Isaac, M., & Brogan, M. W. (2005). A randomized, controlled trial of an automated wireless messaging system for diabetes. Diabetes Technology & Therapeutics, 7 (5), 710-718; discussion 719-720.
Levetan, C. S., Dawn, K. R., Robbins, D. C., & Ratner, R. E. (2002). Impact of computer-generated personalized goals on HbA(1c). Diabetes Care, 25 (1), 2-8.
Lorig, K. R., Ritter, P. L., Laurent, D. D., & Plant, K. (2006). Internet-based chronic disease self-management: a randomized trial. Medical Care, 44 (11), 964-971.
Lieberman, D. Z. (2003). Determinants of satisfaction with an automated alcohol evaluation program. CyberPsychology & Behavior, 6 (6), 677-682.
AH-1207

Appendix H. Data Table
Author YearReferences
Armstrong, K., Webermanagement decision
Artinian, N. T., Hardenmonitoring device for p
An, L. C., Perry, C. L.,intervention for college
Andersson, G., Bergsttrial. British Journal of
Andersson, G., Carlbrand in vivo group expo
Andersson, G., Lunds361.
Andrade, A. S. A., McGadherence to highly ac
Andrewes, D. G., O'Codisorders. Australian &
Araki, I., Hashimoto, Hdrinking behavior mod
Albisser, A. M., Harrisself-care on outcomes
Anhoj, J., & Nielsen, L6 (3), e23.
Health Service Utilization Health Care Costs KnowledgeReferences, continued
McTavish, F. M., Gustafson, D. H., Owens, B. H., Wise, M., Taylor, J. O., Apantaku, F. M., et al. (1994). CHESS: An interactive computer system for women with breast cancer piloted with an under-served population. Proceedings - the Annual Symposium on Computer Applications in Medical Care, 599-603.
Meigs, J. B., Cagliero, E., Dubey, A., Murphy-Sheehy, P., Gildesgame, C., Chueh, H., et al. (2003). A controlled trial of web-based diabetes disease management: the MGH diabetes primary care improvement project. Diabetes care, 26 (3), 750-757.
Nakagawa, A., Marks, I. M., Park, J. M., Bachofen, M., Baer, L., Dottl, S. L., et al. (2000). Self-treatment of obsessive-compulsive disorder guided by manual and computer-conducted telephone interview. Journal of Telemedicine & Telecare, 6 (1), 22-26.
Owen, J. E., Klapow, J. C., Roth, D. L., Shuster, J. L., Jr., Bellis, J., Meredith, R., et al. (2005). Randomized pilot of a self-guided internet coping group for women with early-stage breast cancer. Annals of Behavioral Medicine, 30 (1), 54-64.
Piette, J. D., & Mah, C. A. (1997). The feasibility of automated voice messaging as an adjunct to diabetes outpatient care. Diabetes Care, 20 (1), 15-21.
Nguyen, H. Q., Carrieri-Kohlman, V., Rankin, S. A., Slaughter, R., & Stulbarg, M. S. (2003). Pilot study of an online dyspnea self-management program for COPD. AMIA, Annual Symposium Proceedings/AMIA Symposium., 951.
McKay, H. G., King, D., Eakin, E. G., Seeley, J. R., & Glasgow, R. E. (2001). The diabetes network internet-based physical activity intervention: a randomized pilot study. Diabetes Care, 24 (8), 1328-1334.
McPherson, A. C., Glazebrook, C., Forster, D., James, C., & Smyth, A. (2006). A randomized, controlled trial of an interactive educational computer package for children with asthma. Pediatrics, 117 (4), 1046-1054.
Nguyen, H. Q., Carrieri-Kohlman, V., Rankin, S. H., Slaughter, R., & Stulbarg, M. S. (2005). Is Internet-based support for dyspnea self-management in patients with chronic obstructive pulmonary disease possible? Results of a pilot study. Heart & Lung, 34 (1), 51-62.
Noel, H. C., Vogel, D. C., Erdos, J. J., Cornwall, D., & Levin, F. (2004). Home telehealth reduces healthcare costs. Telemedicine journal and e-health : the official journal of the American Telemedicine Association, 10(2), 170-183.
McMahon, G. T., Gomes, H. E., Hickson Hohne, S., Hu, T. M., Levine, B. A., & Conlin, P. R. (2005). Web-based care management in patients with poorly controlled diabetes. Diabetes care, 28 (7), 1624-1629.
AH-1208

Appendix H. Data Table
Author YearReferences
Armstrong, K., Webermanagement decision
Artinian, N. T., Hardenmonitoring device for p
An, L. C., Perry, C. L.,intervention for college
Andersson, G., Bergsttrial. British Journal of
Andersson, G., Carlbrand in vivo group expo
Andersson, G., Lunds361.
Andrade, A. S. A., McGadherence to highly ac
Andrewes, D. G., O'Codisorders. Australian &
Araki, I., Hashimoto, Hdrinking behavior mod
Albisser, A. M., Harrisself-care on outcomes
Anhoj, J., & Nielsen, L6 (3), e23.
Use of Technology Usability HIT SatisfactionReferences, continued
Ruland, C. M., White, T., Stevens, M., Fanciullo, G., & Khilani, S. M. (2003). Effects of a computerized system to support shared decision making in symptom management of cancer patients: preliminary results. Journal of the American Medical Informatics Association, 10 (6), 573-579.
Robertson, L., Smith, M., Castle, D., & Tannenbaum, D. (2006). Using the Internet to enhance the treatment of depression. Australasian Psychiatry, 14 (4), 413-417.
Robertson, L., Smith, M., & Tannenbaum, D. (2005). Case management and adherence to an online disease management system. Journal of Telemedicine & Telecare, 11 Suppl 2 , S73-75.
Rasmussen, L. M., Phanareth, K., Nolte, H., & Backer, V. (2005). Internet-based monitoring of asthma: a long-term, randomized clinical study of 300 asthmatic subjects. Journal of Allergy & Clinical Immunology, 115 (6), 1137-1142.
Reid, R. D., Pipe, A. L., Quinlan, B., & Oda, J. (2007). Interactive voice response telephony to promote smoking cessation in patients with heart disease: a pilot study. Patient Education & Counseling, 66 (3), 319-326.
Rodgers, A., Corbett, T., Bramley, D., Riddell, T., Wills, M., Lin, R. B., et al. (2005). Do u smoke after txt? Results of a randomised trial of smoking cessation using mobile phone text messaging. Tobacco Control, 14 (4), 255-261.
Rogers, M. A. M., Small, D., Buchan, D. A., Butch, C. A., Stewart, C. M., Krenzer, B. E., et al. (2001). Home monitoring service improves mean arterial pressure in patients with essential hypertension: a randomized, controlled trial. Annals of Internal Medicine, 134 (11), 1024-1032, I1042.
Pike, K. J., Rabius, V., McAlister, A., & Geiger, A. (2007). American Cancer Society's QuitLink: randomized trial of Internet assistance. Nicotine & Tobacco Research, 9 (3), 415-420.
Rami, B., Popow, C., Horn, W., Waldhoer, T., & Schober, E. (2006). Telemedical support to improve glycemic control in adolescents with type 1 diabetes mellitus. European Journal of Pediatrics, 165 (10), 701-705.
Ross, S. E., Moore, L. A., Earnest, M. A., Wittevrongel, L., & Lin, C.-T. (2004). Providing a web-based online medical record with electronic communication capabilities to patients with congestive heart failure: randomized trial. Journal of Medical Internet Research, 6 (2), e12.
Rotondi, A. J., Sinkule, J., & Spring, M. (2005). An interactive Web-based intervention for persons with TBI and their families: use and evaluation by female significant others. Journal of Head Trauma Rehabilitation, 20 (2), 173-185.
AH-1209

Appendix H. Data Table
Author YearReferences
Armstrong, K., Webermanagement decision
Artinian, N. T., Hardenmonitoring device for p
An, L. C., Perry, C. L.,intervention for college
Andersson, G., Bergsttrial. British Journal of
Andersson, G., Carlbrand in vivo group expo
Andersson, G., Lunds361.
Andrade, A. S. A., McGadherence to highly ac
Andrewes, D. G., O'Codisorders. Australian &
Araki, I., Hashimoto, Hdrinking behavior mod
Albisser, A. M., Harrisself-care on outcomes
Anhoj, J., & Nielsen, L6 (3), e23.
Health Satisfaction Self-efficacy Health Behavior
Outcomes
References, continued
Safren, S. (2002). Internet paging system helps improve adherence. Counseling is combined with reminders. AIDS Alert, 17 (9), 118-119.
Sciamanna, C. N., Harrold, L. R., Manocchia, M., Walker, N. J., & Mui, S. (2005). The effect of web-based, personalized, osteoarthritis quality improvement feedback on patient satisfaction with osteoarthritis care. American Journal of Medical Quality, 20 (3), 127-137.
Sciamanna, C. N., Novak, S. P., Houston, T. K., Gramling, R., & Marcus, B. H. (2004). Visit satisfaction and tailored health behavior communications in primary care. American Journal of Preventive Medicine, 26 (5), 426-430.
Shapiro, J. R., Reba-Harrelson, L., Dymek-Valentine, M., Woolson, S. L., Hamer, R. M., & Bulik, C. M. (2007). Feasibility and acceptability of CD-ROM-based cognitive-behavioural treatment for binge-eating disorder. European Eating Disorders Review, 15 (3), 175-184.
Southard, B. H., Southard, D. R., & Nuckolls, J. (2003). Clinical trial of an Internet-based case management system for secondary prevention of heart disease. Journal of Cardiopulmonary Rehabilitation, 23 (5), 341-348.
Stinson, J. N., Petroz, G. C., Tait, G., Feldman, B. M., Streiner, D., McGrath, P. J., et al. (2006). e-Ouch: usability testing of an electronic chronic pain diary for adolescents with arthritis. Clinical Journal of Pain, 22 (3), 295-305.
Shaw, B. R., Han, J. Y., Baker, T., Witherly, J., Hawkins, R. P., McTavish, F., et al. (2007). How women with breast cancer learn using interactive cancer communication systems. Health Education Research, 22 (1), 108-119.
Shegog, R., Bartholomew, L. K., Parcel, G. S., Sockrider, M. M., Masse, L., & Abramson, S. L. (2001). Impact of a computer-assisted education program on factors related to asthma self-management behavior. Journal of the American Medical Informatics Association, 8 (1), 49-61.
Skeels, M. M., Kurth, A., Clausen, M., Severynen, A., & Garcia-Smith, H. (2006). CARE+ user study: usability and attitudes towards a tablet pc computer counseling tool for HIV+ men and women. AMIA, Annual Symposium Proceedings/AMIA Symposium. , 729-733.
Smith, L., & Weinert, C. (2000). Telecommunication support for rural women with diabetes. Diabetes Educator, 26 (4), 645-655.
Runge, C., Lecheler, J., Horn, M., Tews, J.-T., & Schaefer, M. (2006). Outcomes of a Web-based patient education program for asthmatic children and adolescents. Chest, 129 (3), 581-593.
AH-1210

Appendix H. Data Table
Author YearReferences
Armstrong, K., Webermanagement decision
Artinian, N. T., Hardenmonitoring device for p
An, L. C., Perry, C. L.,intervention for college
Andersson, G., Bergsttrial. British Journal of
Andersson, G., Carlbrand in vivo group expo
Andersson, G., Lunds361.
Andrade, A. S. A., McGadherence to highly ac
Andrewes, D. G., O'Codisorders. Australian &
Araki, I., Hashimoto, Hdrinking behavior mod
Albisser, A. M., Harrisself-care on outcomes
Anhoj, J., & Nielsen, L6 (3), e23.
Quality of Life Support WithdrawalsReferences, continued
Wilkie, D. J., Huang, H. Y., Berry, D. L., Schwartz, A., Lin, Y. C., Ko, N. Y., et al. (2001). Cancer symptom control: feasibility of a tailored, interactive computerized program for patients. Family & Community Health, 24 (3), 48-62.
Taylor, Y., Eliasson, A., Andrada, T., Kristo, D., & Howard, R. (2006). The role of telemedicine in CPAP compliance for patients with obstructive sleep apnea syndrome. Sleep & Breathing, 10 (3), 132-138.
Tsang, M. W., Mok, M., Kam, G., Jung, M., Tang, A., Chan, U., et al. (2001). Improvement in diabetes control with a monitoring system based on a hand-held, touch-screen electronic diary. Journal of Telemedicine & Telecare, 7 (1), 47-50.
Turnin, M. C., Beddok, R. H., Clottes, J. P., Martini, P. F., Abadie, R. G., Buisson, J. C., et al. (1992). Telematic expert system Diabeto. New tool for diet self-monitoring for diabetic patients. Diabetes Care, 15 (2), 204-212.
van den Berg, M. H., Ronday, H. K., Peeters, A. J., Voogt-van der Harst, E. M., Munneke, M., Breedveld, F. C., et al. (2007). Engagement and satisfaction with an Internet-based physical activity intervention in patients with rheumatoid arthritis. Rheumatology, 46 (3), 545-552.
Strecher, V. J., Shiffman, S., & West, R. (2006). Moderators and mediators of a web-based computer-tailored smoking cessation program among nicotine patch users. Nicotine & Tobacco Research, 8 Suppl 1 , S95-101.
Stuart, G. W., Laraia, M. T., Ornstein, S. M., & Nietert, P. J. (2003). An interactive voice response system to enhance antidepressant medication compliance. Topics in Health Information Management, 24 (1), 15-20.
Williamson, D. A., Walden, H. M., White, M. A., York-Crowe, E., Newton, R. L., Jr., Alfonso, A., et al. (2006). Two-Year Internet-Based Randomized Controlled Trial for Weight Loss in African-American Girls. Obesity, 14 (7), 1231-1243.
van den Brink, J. L., Moorman, P. W., de Boer, M. F., Pruyn, J. F. A., Verwoerd, C. D. A., & van Bemmel, J. H. (2005). Involving the patient: a prospective study on use, appreciation and effectiveness of an information system in head and neck cancer care. International Journal of Medical Informatics, 74 (10), 839-849.
van der Meer, V., van Stel, H. F., Detmar, S. B., Otten, W., Sterk, P. J., & Sont, J. K. (2007). Internet-based self-management offers an opportunity to achieve better asthma control in adolescents. Chest, 132 (1), 112-119.
Weinert, C., Cudney, S., & Winters, C. (2005). Social support in cyberspace: the next generation. CIN: Computers, Informatics, Nursing, 23 (1), 7-15.
AH-1211

Appendix H. Data Table
Author YearReferences
Armstrong, K., Webermanagement decision
Artinian, N. T., Hardenmonitoring device for p
An, L. C., Perry, C. L.,intervention for college
Andersson, G., Bergsttrial. British Journal of
Andersson, G., Carlbrand in vivo group expo
Andersson, G., Lunds361.
Andrade, A. S. A., McGadherence to highly ac
Andrewes, D. G., O'Codisorders. Australian &
Araki, I., Hashimoto, Hdrinking behavior mod
Albisser, A. M., Harrisself-care on outcomes
Anhoj, J., & Nielsen, L6 (3), e23.
Adverse Effects OtherReferences, continuedWinzelberg, A. J., Classen, C., Alpers, G. W., Roberts, H., Koopman, C., Adams, R. E., et al. (2003). Evaluation of an internet support group for women with primary breast cancer. Cancer, 97 (5), 1164-1173.
Woodruff, S. I., Edwards, C. C., Conway, T. L., & Elliott, S. P. (2001). Pilot test of an Internet virtual world chat room for rural teen smokers. Journal of Adolescent Health, 29 (4), 239-243.
Yon, B. A., Johnson, R. K., Harvey-Berino, J., Gold, B. C., & Howard, A. B. (2007). Personal digital assistants are comparable to traditional diaries for dietary self-monitoring during a weight loss program. Journal of Behavioral Medicine, 30 (2), 165-175.
Zabinski, M. F., Wilfley, D. E., Pung, M. A., Winzelberg, A. J., Eldredge, K., & Taylor, C. B. (2001). An interactive internet-based intervention for women at risk of eating disorders: a pilot study. International Journal of Eating Disorders, 30 (2), 129-137.
Zimmerman, L., Barnason, S., Nieveen, J., & Schmaderer, M. (2004). Symptom management intervention in elderly coronary artery bypass graft patients. Outcomes Management, 8 (1), 5-12.
AH-1212

Appendix I: Study Quality Assessment Table with References
Randomized Controlled Trials
Author Year Random assignment?Treatment allocation concealed? Groups similar at baseline?
Eligibility criteria specified?
Andersson 2003 Unclear/NR Unclear/NR Yes Yes
Andersson 2006 Yes Unclear; NR Yes Yes
Andersson 2005 No No Yes Yes
Andrade 2005 Unclear No Yes YesAndrade 2001 Unclear NR NR NoAraki 2006 Unclear NR Yes Yes
Armstrong 2005 Unclear/NR Yes Unclear YesArtinian 2003 Yes NR Yes YesBachofen 1999 No No NA NoBarnason 2006 No; use of lot drawing
methodUnclear; NR Unclear Yes
Barnason 2003 No; drawing lot used Unclear; method NR Yes YesBarrera 2002 Unclear, implied NR Yes Yes
Block 2004 Yes Unclear; NR No YesCarlbring 2007 Yes No Yes YesCawsey 2000 NR NR NR YesChan 2003 Yes; random numbers
tableNR Yes Yes
Chen 2006 No N/A Unclear MinimalCho 2006 Yes No Yes Yes
AI ‐ 1

Appendix I: Study Quality Assessment Table with References
Randomized Controlled Trials, continued
Blinding? Author
Care provider blinded? Patient blinded? High withdrawal/attrition rate?
Unclear; NR Andersson No No Yes; 14/44 (31.8%)
NR Andersson N/A No No; 2/64 (3.1%)
Unclear Andersson No No Yes; 32/117=27%
NR Andrade No No NoNR Andrade No No NRNR Araki N/A No No; 1 patient excluded from analysis
(missing data on lab)Yes Armstrong Yes Yes Yes; 5/32 (25%)NR Artinian No No NRUnclear Bachofen No No No (0.09%)Unclear Barnason No No Unclear; NR
Unclear Barnason No No Unclear; NRNR Barrera N/A No Yes; 37/160 (23%); but results of
ANOVA showed that those who dropped out were comparable to those who were assessed at T2
NR Block N/A No No; 10/491 (2%)Unclear Carlbring No No NoNR Cawsey No No NRNo Chan No No No
NR Chen No No NRUnclear Cho No No NR
AI ‐ 2

Appendix I: Study Quality Assessment Table with References
Was the rate differential by group?
Quality Rating
No; self-help+telephone=7/24 (29.2%), self-help alone=7/20 (35.0%)
Fair
No; treatment=2/32 (6.2%), control=0
Fair
Yes; treatment=21/57 (36.8%) (main reason=treatment too demanding), control=11/60 (18.3%)
Poor
No FairNR PoorNo Fair
Unclear FairNR FairNA Poor Unclear; NR Poor
Unclear; NR FairNo; 10/40 (25%) in the Support Group condition and 9/40 (22%) in each of the other three conditions
Fair
NR FairNo FairNR Fair-PoorNo Good
NR PoorNA Good
AI ‐ 3

Appendix I: Study Quality Assessment Table with References
Christensen 2004 Yes Yes No; significantly more years of eduction for one group compared to the others (15.0 vs 14.6 vs 14.4, P=0.04)
Yes
AI ‐ 4

Appendix I: Study Quality Assessment Table with References
NR Christensen No No Yes; 111/525 (21.1%)
AI ‐ 5

Appendix I: Study Quality Assessment Table with References
Yes; Treatment group 1=29/165 (17.6%), Treatment group 2=61/121 (33.5%), control=21/178 (11.8%); but did an ITT
Fair
AI ‐ 6

Appendix I: Study Quality Assessment Table with References
Randomized Controlled Trials, continued
Author Year Random assignment?Treatment allocation concealed? Groups similar at baseline?
Eligibility criteria specified?
Cruz-Correia 2007 Yes NR NR, but crossover trial with patients serving as their own controls
Yes
Estabrooks 2005 No No Yes YesFranklin 2006 Yes NR Yes Yes
Frenn 2003 No N/A Yes for evaluable population, NR for initial population
No
Gega 2004 NA No Yes YesGlasgow 2000 Unclear Unclear; NR Yes Yes
Glasgow 2003 Unclear; NR Unclear; NR No; total cholesterol levels were significantly lower in the one group
Yes
Green 2008 Probably; NR No; serially-numbered envelopes
No: Significantly fewer females in the one group
Yes
Guendelman 2002 NR No Yes Yes
Gustafson 1994 NR NR NR YesGustafson 2001 Unclear NR Yes Yes
Gustafson 2001 Unclear Unclear; NR Unclear Yes
Gustafson 1999 Yes Yes Yes No
AI ‐ 7

Appendix I: Study Quality Assessment Table with References
Randomized Controlled Trials, continued
Blinding? Author
Care provider blinded? Patient blinded? High withdrawal/attrition rate?
NR Cruz-Correia N/A No No; 2/21 (9.5%)
Unclear Estabrooks No No YesNR Franklin No No Somewhat; 14/92 (15.2%) were lost to
follow-up or discontinued intervention
NR Frenn No No Yes; 34/137 (24.8%) for physical activity and 48/137 (35.0%) for dietary fat analyses
No Gega No No Yes (29%)No Glasgow No No No; 43/320 (13.4%)
Unclear Glasgow No No Yes; 18%
Yes Green No No No; 48/778 (6.2%)
No Guendelman No No No; 9%
NR Gustafson No No NRNo Gustafson NR NR Yes; 15.5 % in the control group (23
out of 148) and 17 % in the Intervention group (25 out of 147)
No Gustafson No No No; 19/265 (7.2%)
NR Gustafson No No No; 21/219 (9.6%)
AI ‐ 8

Appendix I: Study Quality Assessment Table with References
Was the rate differential by group?
Quality Rating
Yes: Internet=2/9 (22.2%), Paper=0; but, crossover and analyzed combined treatments periods with noncompleters excluded from both groups
Fair
Yes PoorSomewhat; Group 1=3/28 (10.7%), Group 2=6/33 (18.2%), Group3=5/31 (16.1%)
Fair
Unclear; distribution of dropouts NR
Poor
Unclear PoorYes; basic=13/80 (16.2%), basic+telephone=13/80 (16.2%), basic+community resources=5/80 (6.2%), combined=12/80 (15.0%)
Fair
No; differences described as "ns", but data NR
Fair
No Fair
No; health buddy gorup=4/66 (6.1%), asthma diary=8/68 (11.8%)
Fair
NR PoorNo Fair
No; control=7/132 (5.3%), experimental=12/133 (9.0%)
Fair
No; CHESS=13/107 (12.1%), control=8/97 (8.2%)
Fair
AI ‐ 9

Appendix I: Study Quality Assessment Table with References
Holman 1996 Unclear Unclear/NR Unclear/NR No
AI ‐ 10

Appendix I: Study Quality Assessment Table with References
No Holman No No Yes; 16.7% (1 patient)
AI ‐ 11

Appendix I: Study Quality Assessment Table with References
Yes; 0% in on/off sequence, 33% in off/on sequence
Fair-Poor
AI ‐ 12

Appendix I: Study Quality Assessment Table with References
Randomized Controlled Trials, continued
Author Year Random assignment?Treatment allocation concealed? Groups similar at baseline?
Eligibility criteria specified?
Jan 2007 NR No Unclear Yes
Japuntich 2006 Unclear; randomized- no details on approach
Unclear/NR Yes Yes
Jones 1999 NR NR NR Yes
Jones 2001 Unclear NR Unclear; NR Yes
Joseph 2007 Yes; random number generator
Unclear Yes Yes
Kashem 2006 NR NR No; SBP and DBP were significantly higher in the control group
Yes
Kenwright 2004 No No Yes YesKenwright 2005 Yes; random numbers
tableNo; opaque envelopes contained numbers
Unclear Yes
Kim 2006 NR NR Unclear Yes
Kim 2007 Yes NR Yes for completers (n=51); NR for all randomized participants (n=60)
Yes
Kosma 2005 Unclear/NR NR Yes Yes
Kressig 2002 No No NA YesKwon 2004 Unclear NR Yes Yes
AI ‐ 13

Appendix I: Study Quality Assessment Table with References
Randomized Controlled Trials, continued
Blinding? Author
Care provider blinded? Patient blinded? High withdrawal/attrition rate?
NR Jan No No No; 20/184 (10.9%)
No Japuntich No No Yes; Chess Group: 47.9%Control Group: 43%
NR Jones No No No; 87/525 (16.6%)
NR Jones No No Yes; 66/112 (58.9%); but conducted ITT analysis using LOCF method
Unclear Joseph No No No; 13.0%
NR Kashem No No NR
No Kenwright No No Yes; (37% in London clinic)No Kenwright No No Yes; Scheduled support- 13.6%
Requested support- 59%
NR Kim No No NR; but 100% included in analyses per Table 2
NR Kim No No No; 9/60 (15%)
NR Kosma NR Somewhat Yes50% non-completersMultiple disabilty groups in study
No Kressig No No NoNR Kwon No No No; 9/110 (8.2%)
AI ‐ 14

Appendix I: Study Quality Assessment Table with References
Was the rate differential by group?
Quality Rating
Probably not; of 184 "eligible", 5 families "declined",then 15 more excluded due to "at the request of the participants" or "lack of data due to internet failure": intervention=9/97 (9.3%), control=6/82 (7.3%)
Fair
No Fair-Poor
Yes; personal computer=22/178 (12.3%), general computer=39/167 (23.3%), booklet information=26/180 (14.4%)
Poor
No Fair
No Fair
NR Fair-Poor
Unclear FairYes; 45.4% difference. 2-tailed Fisher's exact test score = .004
Fair- Poor
NR Fair
No; intervention=5/30 (16.7%), control=4/30 (13.3%)
Fair
No Poor
NA FairNo: intervention=4/55 (7.3%), control=5/55 (9.1%)
Fair
AI ‐ 15

Appendix I: Study Quality Assessment Table with References
Randomized Controlled Trials, continued
Author Year Random assignment?Treatment allocation concealed? Groups similar at baseline?
Eligibility criteria specified?
LaFramboise 2003 NR NR Yes for completers (n=90); NR for all randomized participants (n=103)
Yes
Lahm 1996 No N/A Yes NoLee 2007 No No Probably, unclear Yes
Leu 2005 Yes Yes Unclear YesLevetan 2002 Yes NR Yes Yes
Lorig 2006 Unclear Unclear- not reported Yes Yes
McKay 2001 Unclear; NR Unclear Yes Yes
McMahon 2005 Yes; random variables generator
Unclear Yes Yes
McPherson 2006 Unclear; method of sequence generation NR
Unclear No; computer group was older and had more knowledge at baseline
Yes
Meigs 2003 Unclear Yes Yes No
Noel 2004 Unclear NR More patients in intervention group had caregiver (23% vs 0)
Yes
Owen 2005 Yes NR No; participants in treatment group were significantly more likely than those assigned to the control group to have received some treatment with a chemotherapeutic agent
Yes
Pike 2007 NR NR Yes Yes
Rami 2006 Unclear NR Yes YesRasmussen 2005 Unclear/NR No Unclear Yes
AI ‐ 16

Appendix I: Study Quality Assessment Table with References
Randomized Controlled Trials, continued
Blinding? Author
Care provider blinded? Patient blinded? High withdrawal/attrition rate?
NR LaFramboise No No No; 12/103 (12.6%)
No Lahm No No No; all 48 experiments completed NR Lee No No Yes; 25% to 28.5%, due to failing to
return or having invalid test results, differed depending on outcome
No Leu No No Yes; 8/50 (16%)NR Levetan No No No; 22/150 (14.7%)
No Lorig No No Y: treatment: 22.5%; usual care: 15%
NR McKay No No No; 10/78 (12.8%)
No McMahon No No Yes; 19.2%
No McPherson No No No; 14/101 (13.9%)
No Meigs No No Unclear
Unclear Noel No No Unclear; attrition NR
No Owen No No No; 9/62 (14.5%)
NR Pike No No Yes; 2951/4651 (45.7%); but also reported results of ITT analysis
NR Rami No No No; 100% completedUnclear/NR Rasmussen No No Yes; 47/300 (15.7%)
AI ‐ 17

Appendix I: Study Quality Assessment Table with References
Was the rate differential by group?
Quality Rating
Unclear; distribution of dropouts NR
Fair
N/A PoorNo; intervention=36/144 (25%) to 42/144 (29.2%); control=35/144 (24.3%) to 42/144 (29.2%)
Poor
No FairNo; 11/75 (14.7%) in each group
Fair
No Fair
Yes; control=7/40 (17.5%) vs intervention=3/38 (7.9%)
Fair
Yes; Control=23.1%, Intervention=15.4%
Fair
No Fair
Yes Poor
Unclear; attrition NR Fair
No; intervention=6/32 (18.7%) vs control=3/30 (10%)
Fair
No Fair
No FairNo; (15, 12, 20 subjects, respectively; P= 0.26)
Fair
AI ‐ 18

Appendix I: Study Quality Assessment Table with References
Reid 2007 Yes Yes No; significantly more patients in the control group completed some post-secondary eduction (P=0.05)
Yes
AI ‐ 19

Appendix I: Study Quality Assessment Table with References
NR Reid No No No; 15/100 (15%)
AI ‐ 20

Appendix I: Study Quality Assessment Table with References
No; UC=8/50 (16%), IVR=7/50 (14%)
Fair
AI ‐ 21

Appendix I: Study Quality Assessment Table with References
Randomized Controlled Trials, continued
Author Year Random assignment?Treatment allocation concealed? Groups similar at baseline?
Eligibility criteria specified?
Robertson 2006 NA No NA Yes
Robertson 2005 Unclear No Unclear YesRodgers 2005 Unclear/NR Yes Yes Yes
Rogers 2001 Probably Yes No; BMI significantly higher in home service group
Yes
Ross 2004 Yes Yes Yes Yes
Ruland 2003 Unclear/NR Unclear/NR Yes Yes
Sciamanna 2005 Unclear/NR Unclear/NR Yes Yes
Shapiro 2007 YesRandomized block design
No No Yes
Shegog 2001 Unclear Unclear; NR Yes NoSmith 2000 Unclear Unclear; NR Unclear; NR YesSouthard 2003 Yes Unclear/NR Yes YesStretcher 2006 Yes NR Yes YesStuart 2003 Unclear NR NR YesTaylor 2006 Yes NR No; significantly more single patients
in one group (11% vs 0, p=0.01)Yes
Tsang 2001 Unclear NR No; duration of illness significantly greater for one group
No
Turnin 1992 Unclear No Yes Yes
AI ‐ 22

Appendix I: Study Quality Assessment Table with References
Randomized Controlled Trials, continued
Blinding? Author
Care provider blinded? Patient blinded? High withdrawal/attrition rate?
Unclear Robertson No No Yes22 % loss to follow up
Unclear Robertson No No UnclearYes Rodgers No No Yes; 440/1705 (25.8%), but
performed ITT analysis with all patients with missing data
NR Rogers No No No; 10/121 (8.3%); dropouts included in analyses
NR Ross No No Yes for questionnaire returns at 12 months: 26/107 (24.3%), but 15/26 (57.7%) of withdrawals were due to death and all deaths were included in mortality and utilization of health services outcomes
NR Ruland No No No; 7/59 (11.9%)
Yes Sciamanna No No N/A; all measurements and interventions were done during a single session
Yes Shapiro No No Yes
NR Shegog No No No; 5/76 (6.6%)Unclear; NR Smith No No Unclear/NRNo Southard No No No; 4/104=3.8%)Unclear Stretcher NA Yes YesNR Stuart No No NRNR Taylor N/A No No; 7/121 (6%)
No Tsang No No No=1/20 (5%)
Unclear Turnin No No Yes; (16% in group A and 1.9% in group B in study 1)
AI ‐ 23

Appendix I: Study Quality Assessment Table with References
Was the rate differential by group?
Quality Rating
NA Fair
NA PoorNo; control=179/853 (21.0%), active=261/852 (30.6%)
Good
No; home service=4/60 (6.7%), usual care=6/61 (9.8%)
Good
Yes: SPPARO=16/54 (29.6%), Control=10/53 (18.9%)
Good
Unclear; group assignment of withdrawals NR
Fair
N/A Fair
Yes Good
NR FairUnclear/NR PoorNo; SI=4/53 (7.5%), UC=0 FairNo FairNR PoorNo; TC=4/62 (6.4%), TM=3/59 (5.1%)
Fair
No: Group 1=0, Group 2=1/10 (10%)
Fair
Yes Fair
AI ‐ 24

Appendix I: Study Quality Assessment Table with References
Randomized Controlled Trials, continued
Author Year Random assignment?Treatment allocation concealed? Groups similar at baseline?
Eligibility criteria specified?
Williamson 2006 Yes No Yes Yes
Winzelberg 2003 Unclear Unclear/NR Yes Yes
Wylie- Rosett 2001 Yes Unclear Yes YesZimmerman 2004 Unclear No NR Yes
AI ‐ 25

Appendix I: Study Quality Assessment Table with References
Randomized Controlled Trials, continued
Blinding? Author
Care provider blinded? Patient blinded? High withdrawal/attrition rate?
No Williamson No No Yes; (24% in control and 36% in treatment)
Unclear/NR Winzelberg No No Yes; 14/72 (19.4%)
Unclear Wylie- Rosett No No UnclearUnclear Zimmerman No No No
Randomized Controlled Trial References
Armstrong, K., Weber, B., Ubel, P. A., Peters, N., Holmes, J., & Schwartz, J. S. (2005). Individualized survival cmanagement decisions in women with BRCA1/2 mutations. Journal of Clinical Oncology, 23 (36), 9319-9328.Artinian, N. T., Harden, J. K., Kronenberg, M. W., Vander Wal, J. S., Daher, E., Stephens, Q., et al. (2003). Pilodevice for patients with congestive heart failure. Heart & Lung, 32 (4), 226-233.Bachofen, M., Nakagawa, A., Marks, I. M., Park, J. M., Greist, J. H., Baer, L., et al. (1999). Home self-assessmcompulsive disorder using a manual and a computer-conducted telephone interview: replication of a UK-US stu549.Barnason, S., Zimmerman, L., Nieveen, J., & Hertzog, M. (2006). Impact of a telehealth intervention to augmenoutcomes of elderly patients undergoing coronary artery bypass grafting. Heart & Lung, 35 (4), 225-233.Barnason, S., Zimmerman, L., Nieveen, J., Schmaderer, M., Carranza, B., & Reilly, S. (2003). Impact of a homeartery bypass graft patients with ischemic heart failure on self-efficacy, coronary disease risk factor modification158.
Andersson, G., Bergstrom, J., Hollandare, F., Carlbring, P., Kaldo, V., & Ekselius, L. (2005). Internet-based selftrial. British Journal of Psychiatry, 187 , 456-461.Andersson, G., Carlbring, P., Holmstrom, A., Sparthan, E., Furmark, T., Nilsson-Ihrfelt, E., et al. (2006). Internevivo group exposure for social phobia: a randomized controlled trial. Journal of consulting and clinical psychologAndersson, G., Lundstrom, P., & Strom, L. (2003). Internet-based treatment of headache: does telephone conta
Andrade, A. (2001). HIV adherence strategies take a high-tech route. AIDS Alert, 16 (8), 97-98.Andrade, A. S. A., McGruder, H. F., Wu, A. W., Celano, S. A., Skolasky, R. L., Jr., Selnes, O. A., et al. (2005). Aadherence to highly active antiretroviral therapy in HIV-infected subjects with memory impairment. Clinical Infec
Araki, I., Hashimoto, H., Kono, K., Matsuki, H., & Yano, E. (2006). Controlled trial of worksite health education tdrinking behavior modification. Journal of Occupational Health, 48 (4), 239-245.
AI ‐ 26

Appendix I: Study Quality Assessment Table with References
Was the rate differential by group?
Quality Rating
Yes Good
No; intervention=8/36 (22.2%), WLC=6/36 (16.7%)
Fair
NR FairNo Fair
curves improve satisfaction with cancer risk
ot study of a Web-based compliance monitoring
ment and self-treatment of obsessive-udy. Journal of Clinical Psychiatry, 60 (8), 545-
nt home health care on functional and recovery
e communication intervention for coronary n, and functioning. Heart & Lung, 32 (3), 147-
f-help for depression: randomised controlled
et-based self-help with therapist feedback and in gy, 74 (4), 677-686.act add anything? Headache, 43 (4), 353-361.
A programmable prompting device improves ctious Diseases, 41 (6), 875-882.
through face-to-face counseling vs. e-mail on
AI ‐ 27

Appendix I: Study Quality Assessment Table with References
Randomized Controlled Trial References, continuedBarrera, M., Jr., Glasgow, R. E., McKay, H. G., Boles, S. M., & Feil, E. G. (2002). Do Internet-based support interventions change percepsupport?: An experimental trial of approaches for supporting diabetes self-management. American Journal of Community Psychology, 30
Carlbring, P., Gunnarsdottir, M., Hedensjo, L., Andersson, G., Ekselius, L., & Furmark, T. (2007). Treatment of social phobia: randomiseddelivered cognitive-behavioural therapy with telephone support. British Journal of Psychiatry, 190 , 123-128.Cawsey, A. J., Jones, R. B., & Pearson, J. (2000). The evaluation of a personalised health information system for patients with cancer. UUser-Adapted Interaction, 10 (1), 47-72.Chan, D. S., Callahan, C. W., Sheets, S. J., Moreno, C. N., & Malone, F. J. (2003). An Internet-based store-and-forward video home teleimproving asthma outcomes in children. American Journal of Health-System Pharmacy, 60 (19), 1976-1981.
Block, G., Wakimoto, P., Metz, D., Fujii, M. L., Feldman, N., Mandel, R., et al. (2004). A randomized trial of the Little by Little CD-ROM: deffectiveness in increasing fruit and vegetable intake in a low-income population. Preventing Chronic Disease, 1 (3), A08.
Cruz-Correia, R., Fonseca, J., Lima, L., Araujo, L., Delgado, L., Castel-Branco, M. G., et al. (2007). Web-based or paper-based self-manasthma--patients' opinions and quality of data in a randomized crossover study. Studies in Health Technology & Informatics, 127 , 178-18Estabrooks, P. A., Nelson, C. C., Xu, S., King, D., Bayliss, E. A., Gaglio, B., et al. (2005). The frequency and behavioral outcomes of goamanagement of diabetes. Diabetes Educator, 31 (3), 391-400.Franklin, V. L., Waller, A., Pagliari, C., & Greene, S. A. (2006). A randomized controlled trial of Sweet Talk, a text-messaging system to swith diabetes. Diabetic Medicine, 23 (12), 1332-1338.Frenn, M., Malin, S., Brown, R. L., Greer, Y., Fox, J., Greer, J., et al. (2005). Changing the tide: an Internet/video exercise and low-fat diemiddle-school students. Applied nursing research : ANR, 18 (1), 13-21.Gega, L., Marks, I., & Mataix-Cols, D. (2004). Computer-aided CBT self-help for anxiety and depressive disorders: experience of a Londodirections. Journal of Clinical Psychology, 60 (2), 147-157.
Chen, H., Yeh, M., & Chao, Y. (2006). Comparing effects of auricular acupressure with and without an Internet-assisted program on smoself-efficacy of adolescents. Journal of Alternative and Complementary Medicine, 12 (2), 147-152.Cho, J.-H., Chang, S.-A., Kwon, H.-S., Choi, Y.-H., Ko, S.-H., Moon, S.-D., et al. (2006). Long-term effect of the Internet-based glucose mHbA1c reduction and glucose stability: a 30-month follow-up study for diabetes management with a ubiquitous medical care system. Diab2625-2631.Christensen, H., Griffiths, K. M., & Jorm, A. F. (2004). Delivering interventions for depression by using the internet: randomised controlled328 (7434), 265.
Glasgow, R. E., Boles, S. M., McKay, H. G., Feil, E. G., & Barrera, M., Jr. (2003). The D-Net diabetes self-management program: long-teoutcomes, and generalization results. Preventive Medicine, 36 (4), 410-419.Glasgow, R. E., & Toobert, D. J. (2000). Brief, computer-assisted diabetes dietary self-management counseling: effects on behavior, phyand quality of life. Medical Care, 38 (11), 1062-1073.Green, B., et al. (2008). Effectiveness of Home Blood Pressure Monitoring, Web Communication, and Pharmacist Care on Hypertension299 (24), 2857-2867.
AI ‐ 28

Appendix I: Study Quality Assessment Table with References
Randomized Controlled Trial References, continued
Kim, H. (2007). A randomized controlled trial of a nurse short-message service by cellular phone for people withStudies, 44 (5), 687-692.
Kashem, A., Droogan, M. T., Santamore, W. P., Wald, J. W., Marble, J. F., Cross, R. C., et al. (2006). Web-baspatients with heart failure. Telemedicine journal and e-health : the official journal of the American Telemedicine Kenwright, M., Marks, I., Graham, C., Franses, A., & Mataix-Cols, D. (2005). Brief scheduled phone support frohelp for obsessive-compulsive disorder: randomized controlled trial. Journal of Clinical Psychology, 61 (12), 149Kenwright, M., & Marks, I. M. (2004). Computer-aided self-help for phobia/panic via internet at home: a pilot stu
Kim, C., & Kang, D. (2006a). Utility of a Web-based intervention for individuals with type 2 diabetes: the impact CIN: Computers, Informatics, Nursing, 24 (6), 337-345.
Guendelman, S., Meade, K., Benson, M., Chen, Y. Q., & Samuels, S. (2002). Improving asthma outcomes and children: a randomized trial of the Health Buddy interactive device and an asthma diary. Archives of Pediatrics &
Gustafson, D. H., Hawkins, R., Boberg, E., Pingree, S., Serlin, R. E., Graziano, F., et al. (1999). Impact of a patinformation/support system. American Journal of Preventive Medicine, 16 (1), 1-9.
Gustafson, D. H., Hawkins, R., Pingree, S., McTavish, F., Arora, N. K., Mendenhall, J., et al. (2001). Effect of cobreast cancer. Journal of General Internal Medicine, 16 (7), 435-445.
Gustafson, D. H., Hawkins, R. P., Boberg, E. W., Bricker, E., Pingree, S., & Chan, C. L. (1994). The use and impeople living with AIDS and HIV infection. Proceedings - the Annual Symposium on Computer Applications in MGustafson, D. H., Hawkins, R. P., Boberg, E. W., McTavish, F., Owens, B., Wise, M., et al. (2001). CHESS: tenconsumer health informatics for broad populations, including the underserved. Medinfo, 10 (Pt 2), 1459-1563.
Holman, R. R., Smale, A. D., Pemberton, E., Riefflin, A., & Nealon, J. L. (1996). Randomized controlled pilot triaregimen optimizer. Medical Informatics, 21 (4), 317-326.Jan, R.-L., Wang, J.-Y., Huang, M.-C., Tseng, S.-M., Su, H.-J., & Liu, L.-F. (2007). An internet-based interactiveasthma outcomes in Taiwan. Telemedicine Journal & E-Health, 13 (3), 257-268.
Japuntich, S. J., Zehner, M. E., Smith, S. S., Jorenby, D. E., Valdez, J. A., Fiore, M. C., et al. (2006). Smoking ctrial of an internet intervention as adjuvant treatment in a smoking cessation intervention. Nicotine & Tobacco RJones, R., Pearson, J., McGregor, S., Cawsey, A. J., Barrett, A., Craig, N., et al. (1999). Randomised trial of pecancer patients. BMJ, 319 (7219), 1241-1247.Jones, R. B., Atkinson, J. M., Coia, D. A., Paterson, L., Morton, A. R., McKenna, K., et al. (2001). Randomised information for patients with schizophrenia.[erratum appears in BMJ 2001 May 5;322(7294):1103]. BMJ, 322 (72Joseph, C. L. M., Peterson, E., Havstad, S., Johnson, C. C., Hoerauf, S., Stringer, S., et al. (2007). A web-baseurban African-American high school students. American Journal of Respiratory & Critical Care Medicine, 175 (9
ptions of social 0 (5), 637-654.
d trial of internet-
User Modeling and
ehealth system for
demonstrated
nagement tools for 89.al choices in the self-
support young people
et intervention with
on clinic and future
oking cessation and
monitoring system on betes Care, 29 (12),
d trial. BMJ,
erm implementation,
ysiologic outcomes,
n Control. JAMA,
AI ‐ 29

Appendix I: Study Quality Assessment Table with References
h diabetes. International Journal of Nursing
sed Internet telemedicine management of Association, 12(4), 439-447.
om a clinician to enhance computer-aided self-99-1508.udy. British Journal of Psychiatry, 184 , 448-449.
t on physical activity levels and glycemic control.
self-management behaviors of inner-city & Adolescent Medicine, 156 (2), 114-120.
tient-centered, computer-based health
omputer support on younger women with
mpact of a computer-based support system for Medical Care, 604-608.n years of research and development in
al of a hand-held patient-oriented, insulin
e telemonitoring system for improving childhood
cessation via the internet: a randomized clinical Research, 8 Suppl 1 , S59-67.ersonalised computer based information for
trial of personalised computer based 290), 835-840.ed, tailored asthma management program for 9), 888-895.
AI ‐ 30

Appendix I: Study Quality Assessment Table with References
Randomized Controlled Trial References, continued
Rami, B., Popow, C., Horn, W., Waldhoer, T., & Schober, E. (2006). Telemedical support to improve glycemic control in adolescents withmellitus. European Journal of Pediatrics, 165 (10), 701-705.
Lorig, K. R., Ritter, P. L., Laurent, D. D., & Plant, K. (2006). Internet-based chronic disease self-management: a randomized trial. Medica971.McKay, H. G., King, D., Eakin, E. G., Seeley, J. R., & Glasgow, R. E. (2001). The diabetes network internet-based physical activity intervpilot study. Diabetes Care, 24 (8), 1328-1334.McMahon, G. T., Gomes, H. E., Hickson Hohne, S., Hu, T. M., Levine, B. A., & Conlin, P. R. (2005). Web-based care management in pacontrolled diabetes. Diabetes care, 28 (7), 1624-1629.
Noel, H. C., Vogel, D. C., Erdos, J. J., Cornwall, D., & Levin, F. (2004). Home telehealth reduces healthcare costs. Telemedicine journal official journal of the American Telemedicine Association, 10(2), 170-183.Owen, J. E., Klapow, J. C., Roth, D. L., Shuster, J. L., Jr., Bellis, J., Meredith, R., et al. (2005). Randomized pilot of a self-guided internetwomen with early-stage breast cancer. Annals of Behavioral Medicine, 30 (1), 54-64.
Levetan, C. S., Dawn, K. R., Robbins, D. C., & Ratner, R. E. (2002). Impact of computer-generated personalized goals on HbA(1c). Diab8.
Pike, K. J., Rabius, V., McAlister, A., & Geiger, A. (2007). American Cancer Society's QuitLink: randomized trial of Internet assistance. NResearch, 9 (3), 415-420.
McPherson, A. C., Glazebrook, C., Forster, D., James, C., & Smyth, A. (2006). A randomized, controlled trial of an interactive educationafor children with asthma. Pediatrics, 117 (4), 1046-1054.Meigs, J. B., Cagliero, E., Dubey, A., Murphy-Sheehy, P., Gildesgame, C., Chueh, H., et al. (2003). A controlled trial of web-based diabemanagement: the MGH diabetes primary care improvement project. Diabetes care, 26 (3), 750-757.
LaFramboise, L. M., Todero, C. M., Zimmerman, L., & Agrawal, S. (2003). Comparison of Health Buddy with traditional approaches to hemanagement. Family and Community Health, 26 (4), 275-288.Lahm, E. A. (1996). Software That Engages Young Children with Disabilities: A Study of Design Features. [Journal Articles Reports - ReAutism and Other Developmental Disabilities, 11(2), 115-124.Lee, T.-I., Yeh, Y.-T., Liu, C.-T., & Chen, P.-L. (2007). Development and evaluation of a patient-oriented education system for diabetes mInternational Journal of Medical Informatics, 76 (9), 655-663.Leu, M. G., Norris, T. E., Hummel, J., Isaac, M., & Brogan, M. W. (2005). A randomized, controlled trial of an automated wireless messagdiabetes. Diabetes Technology & Therapeutics, 7 (5), 710-718; discussion 719-720.
Kressig, R. W., & Echt, K. V. (2002). Exercise prescribing: computer application in older adults. Gerontologist, 42 (2), 273-277.
Kosma, M., Cardinal, B. J., & McCubbin, J. A. (2005). A pilot study of a web-based physical activity motivational program for adults with pDisability and rehabilitation, 27 (23), 1435-1442.
Kwon, H.-S., Cho, J.-H., Kim, H.-S., Song, B.-R., Ko, S.-H., Lee, J.-M., et al. (2004). Establishment of blood glucose monitoring system uDiabetes Care, 27 (2), 478-483.
AI ‐ 31

Appendix I: Study Quality Assessment Table with References
Randomized Controlled Trial References, continued
Shapiro, J. R., Reba-Harrelson, L., Dymek-Valentine, M., Woolson, S. L., Hamer, R. M., & Bulik, C. M. (2007). Fcognitive-behavioural treatment for binge-eating disorder. European Eating Disorders Review, 15 (3), 175-184.
Shegog, R., Bartholomew, L. K., Parcel, G. S., Sockrider, M. M., Masse, L., & Abramson, S. L. (2001). Impact ofactors related to asthma self-management behavior. Journal of the American Medical Informatics Association,
Rogers, M. A. M., Small, D., Buchan, D. A., Butch, C. A., Stewart, C. M., Krenzer, B. E., et al. (2001). Home mopressure in patients with essential hypertension: a randomized, controlled trial. Annals of Internal Medicine, 134Ross, S. E., Moore, L. A., Earnest, M. A., Wittevrongel, L., & Lin, C.-T. (2004). Providing a web-based online mcapabilities to patients with congestive heart failure: randomized trial. Journal of Medical Internet Research, 6 (2Ruland, C. M., White, T., Stevens, M., Fanciullo, G., & Khilani, S. M. (2003). Effects of a computerized system tmanagement of cancer patients: preliminary results. Journal of the American Medical Informatics Association, 1Sciamanna, C. N., Harrold, L. R., Manocchia, M., Walker, N. J., & Mui, S. (2005). The effect of web-based, persfeedback on patient satisfaction with osteoarthritis care. American Journal of Medical Quality, 20 (3), 127-137.
h type 1 diabetes
Robertson, L., Smith, M., Castle, D., & Tannenbaum, D. (2006). Using the Internet to enhance the treatment of 413-417.Robertson, L., Smith, M., & Tannenbaum, D. (2005). Case management and adherence to an online disease mTelecare, 11 Suppl 2 , S73-75.Rodgers, A., Corbett, T., Bramley, D., Riddell, T., Wills, M., Lin, R. B., et al. (2005). Do u smoke after txt? Resuusing mobile phone text messaging. Tobacco Control, 14 (4), 255-261.
Smith, L., & Weinert, C. (2000). Telecommunication support for rural women with diabetes. Diabetes Educator,
Southard, B. H., Southard, D. R., & Nuckolls, J. (2003). Clinical trial of an Internet-based case management sysJournal of Cardiopulmonary Rehabilitation, 23 (5), 341-348.Strecher, V. J., Shiffman, S., & West, R. (2006). Moderators and mediators of a web-based computer-tailored spatch users. Nicotine & Tobacco Research, 8 Suppl 1 , S95-101.
al Care, 44 (11), 964-
vention: a randomized
atients with poorly
and e-health : the
t coping group for
betes Care, 25 (1), 2-
Nicotine & Tobacco
al computer package
etes disease
Tsang, M. W., Mok, M., Kam, G., Jung, M., Tang, A., Chan, U., et al. (2001). Improvement in diabetes control wtouch-screen electronic diary. Journal of Telemedicine & Telecare, 7 (1), 47-50.Turnin, M. C., Beddok, R. H., Clottes, J. P., Martini, P. F., Abadie, R. G., Buisson, J. C., et al. (1992). Telematicmonitoring for diabetic patients. Diabetes Care, 15 (2), 204-212.
Reid, R. D., Pipe, A. L., Quinlan, B., & Oda, J. (2007). Interactive voice response telephony to promote smokingpilot study. Patient Education & Counseling, 66 (3), 319-326.
eart failure
search]. Focus on
management.
ging system for
Stuart, G. W., Laraia, M. T., Ornstein, S. M., & Nietert, P. J. (2003). An interactive voice response system to enTopics in Health Information Management, 24 (1), 15-20.Taylor, Y., Eliasson, A., Andrada, T., Kristo, D., & Howard, R. (2006). The role of telemedicine in CPAP compliasyndrome. Sleep & Breathing, 10 (3), 132-138.
physical disabilities.
using the internet.
AI ‐ 32

Appendix I: Study Quality Assessment Table with References
Feasibility and acceptability of CD-ROM-based
of a computer-assisted education program on 8 (1), 49-61.
onitoring service improves mean arterial 4 (11), 1024-1032, I1042.
medical record with electronic communication 2), e12.to support shared decision making in symptom 10 (6), 573-579.sonalized, osteoarthritis quality improvement
f depression. Australasian Psychiatry, 14 (4),
management system. Journal of Telemedicine &
ults of a randomised trial of smoking cessation
26 (4), 645-655.
stem for secondary prevention of heart disease.
smoking cessation program among nicotine
with a monitoring system based on a hand-held,
c expert system Diabeto. New tool for diet self-
g cessation in patients with heart disease: a
nhance antidepressant medication compliance.
ance for patients with obstructive sleep apnea
AI ‐ 33

Appendix I: Study Quality Assessment Table with References
Randomized Controlled Trial References, continuedWilliamson, D. A., Walden, H. M., White, M. A., York-Crowe, E., Newton, R. L., Jr., Alfonso, A., et al. (2006). Two-Year Internet-Based RControlled Trial for Weight Loss in African-American Girls. Obesity, 14 (7), 1231-1243.
Zimmerman, L., Barnason, S., Nieveen, J., & Schmaderer, M. (2004). Symptom management intervention in elderly coronary artery bypaOutcomes Management, 8 (1), 5-12.
Wylie-Rosett, J., Swencionis, C., Ginsberg, M., Cimino, C., Wassertheil-Smoller, S., Caban, A., et al. (2001). Computerized weight loss ioptimizes staff time: the clinical and cost results of a controlled clinical trial conducted in a managed care setting. Journal of the AmericanAssociation, 101 (10), 1155-1162; quiz 1163-1154.
Winzelberg, A. J., Classen, C., Alpers, G. W., Roberts, H., Koopman, C., Adams, R. E., et al. (2003). Evaluation of an internet support grprimary breast cancer. Cancer, 97 (5), 1164-1173.
AI ‐ 34

Appendix I: Study Quality Assessment Table with References
Randomized
ass graft patients.
ntervention n Dietetic
roup for women with
AI ‐ 35

Appendix I: Study Quality Assessment Table with References
AI ‐ 36

Appendix I: Study Quality Assessment Table with References
Cohort Studies
Author YearSufficient description of the groups?
Intervention/ treatment reliably ascertained? Groups comparable?
Adequate adjustment of confounding factors?
Alibisser 2001 No Unclear; usage metrics NR
Unclear; comparability of baseline characteristics NR, but possible differences in baseline HbA1c levels (9.5 vs 8.5)
No
An 2006 Yes No Yes for measured characteristics; unclear for unmeasured factors of motivation and readiness to quit
No
Gerber 2007 Yes Yes NA NAKim 2006b Yes Yes Baseline characteristics provided for
group; pre-post test one sampleNA
McClure 2006 Yes Yes No; newsletter recruitees were more likely to be female, caucasian, and older
No
McTavish 1995 Yes Yes NA NANakagawa 2000 Yes Yes Unclear No
Nguyen 2005 Yes Yes Yes NA
Runge 2006 Yes No; 45.2% of ITT population did not use the intervention
No; significantly more males in control group (79.2% vs 54.7% vs 65.9%)
Unclear
Safren 2003 No No NR NRShaw 2007 Yes Yes Yes YesVan den Brink 2005 Yes Unclear NA NAVan der Meer 2007 Yes Yes Yes NAWeinert 2005 Yes Unclear; adherence NR Unclear; baseline characteristics
reported only as combined across groups
No adjustments made
AI ‐ 37

Appendix I: Study Quality Assessment Table with References
Cohort Studies, continued
Groups assembled at a similar point? Author
Blind to exposure status? Follow-up long enough? High withdrawal/attrition rate?
Unclear Alibisser Unclear Yes; 1 year Unclear
Unclear An Unclear Unclear No; 32/304 (10.5%)
Yes Gerber Unclear Yes NoNA Kim NA No; 12 weeks 44 started;33 completed; 27% did not
complete (n=12 )Unclear McClure Unclear Unclear; NR N/A; outcome measure is response
rate
Yes McTavish Unclear Yes NoYes Nakagawa No Unclear; 3 weeks Yes; 52.4%
Unclear Nguyen Unclear Unclear; 3 months Yes; 7/23 (30.4%)
Yes Runge NR Yes; 12 months Yes; 34.8%
NR Safren NR Yes; 12 weeks NRYes Shaw Yes Unclear; 4 months Unclear/NRYes Van den Brink Unclear Yes NoNo Van der Meer Unclear Yes NoUnclear Weinert NR Yes; 18 months NR
AI ‐ 38

Appendix I: Study Quality Assessment Table with References
Rate differential by group? Quality Rating
Unclear Poor
Yes; for abstinance survey; beta=22/47 (46.8%), RealU=10/257 (3.9%)
Poor
NA FairNA Fair
N/A; outcome measure is response rate
Fair
NA FairN/A; historical controls selected, in part, based on availability of case notes and outcome data
Poor
Yes; booster group=5/12 (41.7%), primary=2/11 (18.2%)
Poor
Yes; control=20%, SPMP=63%, SPMP plus IEP=18.5%
Poor
NR PoorUnclear; NR FairNo FairNA FairNR Poor
AI ‐ 39

Appendix I: Study Quality Assessment Table with References
Cohort Study ReferencesAlbisser, A. M., Harris, R. I., Albisser, J. B., & Sperlich, M. (2001). The impact of initiatives in education, self-management training, and cself-care on outcomes in diabetes disease management. Diabetes Technology & Therapeutics, 3 (4), 571-579.An, L. C., Perry, C. L., Lein, E. B., Klatt, C., Farley, D. M., Bliss, R. L., et al. (2006). Strategies for increasing adherence to an online smointervention for college students. Nicotine & Tobacco Research, 8 Suppl 1 , S7-12.Gerber, B. S., Solomon, M. C., Shaffer, T. L., Quinn, M. T., & Lipton, R. B. (2007). Evaluation of an internet diabetes self-management tradolescents and young adults. Diabetes Technology & Therapeutics, 9 (1), 60-67.
Shaw, B. R., Han, J. Y., Baker, T., Witherly, J., Hawkins, R. P., McTavish, F., et al. (2007). How women with breast cancer learn using incommunication systems. Health Education Research, 22 (1), 108-119.van den Brink, J. L., Moorman, P. W., de Boer, M. F., Pruyn, J. F. A., Verwoerd, C. D. A., & van Bemmel, J. H. (2005). Involving the patiestudy on use, appreciation and effectiveness of an information system in head and neck cancer care. International Journal of Medical Inf839-849.
Kim, H., Kim, N., & Ahn, S. (2006b). Impact of a nurse short message service intervention for patients with diabetes. Journal of Nursing C266-271.McClure, J. B., Greene, S. M., Wiese, C., Johnson, K. E., Alexander, G., & Strecher, V. (2006). Interest in an online smoking cessation precruitment strategies: results from Project Quit. Journal of Medical Internet Research, 8 (3), e14.
McTavish, F. M., Gustafson, D. H., Owens, B. H., Wise, M., Taylor, J. O., Apantaku, F. M., et al. (1994). CHESS: An interactive computewith breast cancer piloted with an under-served population. Proceedings - the Annual Symposium on Computer Applications in Medical C
Nakagawa, A., Marks, I. M., Park, J. M., Bachofen, M., Baer, L., Dottl, S. L., et al. (2000). Self-treatment of obsessive-compulsive disordeand computer-conducted telephone interview. Journal of Telemedicine & Telecare, 6 (1), 22-26.Nguyen, H. Q., Carrieri-Kohlman, V., Rankin, S. H., Slaughter, R., & Stulbarg, M. S. (2005). Is Internet-based support for dyspnea self-mpatients with chronic obstructive pulmonary disease possible? Results of a pilot study. Heart & Lung, 34 (1), 51-62.Runge, C., Lecheler, J., Horn, M., Tews, J.-T., & Schaefer, M. (2006). Outcomes of a Web-based patient education program for asthmatadolescents. Chest, 129 (3), 581-593.
Weinert, C., Cudney, S., & Winters, C. (2005). Social support in cyberspace: the next generation. CIN: Computers, Informatics, Nursing,
Safren, S. A., Hendriksen, E. S., Desousa, N., Boswell, S. L., & Mayer, K. H. (2003). Use of an on-line pager system to increase adherenmedications. AIDS Care, 15 (6), 787-793.
van der Meer, V., van Stel, H. F., Detmar, S. B., Otten, W., Sterk, P. J., & Sont, J. K. (2007). Internet-based self-management offers an oachieve better asthma control in adolescents. Chest, 132 (1), 112-119.
AI ‐ 40

Appendix I: Study Quality Assessment Table with References
computer-assisted
oking cessation
raining program for
nteractive cancer
ent: a prospective formatics, 74 (10),
Care Quality, 21 (3),
program and effective
er system for women Care, 599-603.
er guided by manual
management in
tic children and
23 (1), 7-15.
nce to antiretroviral
opportunity to
AI ‐ 41

Appendix I: Study Quality Assessment Table with References
AI ‐ 42

Appendix I: Study Quality Assessment Table with References
Case Series Studies
Author YearRepresentative sample? Inclusion explicit?
Did individuals enter survey at a similar point?
Follow-up long enough?
Brennan 2001 Unclear; selection methods NR
NR Unclear; medical history NR No; 1 week
Cavan 2003 Unclear; how patients were selected
No;patients described as having Type I Diabetes
No; duration of diabetes ranged from 3 to 29 years
Unclear; 6 months
Cross 2007 Yes Yes No; average duration of disease was 5.8, with a SD of 5.1
Yes; 6 months
Durso 2003 No; investigator selected No No; 40% took ≥ 9 medications/day, 30% managed with insulin, others treated with oral antidiabetics
Unclear; 3 months
Ewald 2006 Yes Yes No; duration of hypertension ranged from 0 to 23 years
Yes; 12 weeks
Ferrer-Roca 2004 Unclear Yes Unclear YesFinkelstein 1996 Yes Yes Yes Yes; 12 monthsGerber 2007 No Yes No Yes; 6 monthsGerbert 2003 No Yes NR Yes; single
administrationGustafson 1998 No Yes Yes Unclear; 10 weeks
Labiris 2004 Unclear; recruitment methods NR
No Unclear; only age and gender reported Yes; 8 years
Lieberman 2003 No; self-selected volunteers
Yes Unclear Yes
Ma 2006 No No Unclear; NR Yes; 3 monthsMcDaniel 2002 Unclear if selection was
consecutiveYes No No; 1 week
Nguyen 2003 Unclear; selection criteria NR
N Unclear Unclear; 3 months
Piette 1997 Yes Yes No Unclear; 4 weeks
AI ‐ 43

Appendix I: Study Quality Assessment Table with References
Case Series Studies, continued
Outcomes assessed with objective criteria? Author
Quality Rating
Yes Brennan Poor
No Cavan Poor
Partly; both laboratory and subjective measures used
Cross Fair
Yes Durso Poor
Yes Ewald Fair
Yes Ferrer-Roca PoorYes Finkelstein GoodYes Gerber FairPartly Gerbert Fair
Yes Gustafson Fair
Unclear; used "predetermined questionnaires, in Likert-scale forms
Labiris Poor
Yes Lieberman Poor
Yes Ma FairYes McDaniel Fair
Party Nguyen Poor
Yes Piette Fair
AI ‐ 44

Appendix I: Study Quality Assessment Table with References
AI ‐ 45

Appendix I: Study Quality Assessment Table with References
Case Series Studies, continued
Author YearRepresentative sample? Inclusion explicit?
Did individuals enter survey at a similar point?
Follow-up long enough?
Skeels 2006 Unclear No Unclear/NR No; single session
Stinson 2006 Yes Yes N/A No; 1 sessionvan den Berg 2007 No Yes No Yes; 12 months
van der Meer 2007 Yes Yes N/A No; 1 monthWilkie 2001 No Yes Unclear Unclear; 1 monthWoodruff 2001 No Yes Unclear Unclear; 3 months
Zabinski 2001 Unclear Yes Unclear Unclear; 10 weeks
AI ‐ 46

Appendix I: Study Quality Assessment Table with References
Case Series Studies, continued
Outcomes assessed with objective criteria? Author
Quality Rating
Yes Skeels Poor
Yes Stinson FairParty: Yes for technology usage, No for satisfaction
van den Berg Fair
Yes van der Meer FairYes Wilkie FairNo Woodruff Poor
Yes Zabinski Fair
Case Series Study References
Cross, R. K., & Finkelstein, J. (2007). Feasibility and acceptance of a home telemanagement system in patientspilot study. Digestive Diseases & Sciences, 52 (2), 357-364.Durso, S. C., Wendel, I., Letzt, A. M., Lefkowitz, J., Kaseman, D. F., & Seifert, R. F. (2003). Older adults using pilot study. MEDSURG Nursing, 12 (5), 313-317.
Ewald, S., vor dem Esche, J., Uen, S., Neikes, F., Vetter, H., & Mengden, T. (2006). Relationship between the fand blood pressure reduction with antihypertensive therapy : results of the OLMETEL (OLMEsartan TELemonitInvestigation, 26 (8), 439-446.Ferrer-Roca, O., Cardenas, A., Diaz-Cardama, A., & Pulido, P. (2004a). Mobile phone text messaging in the maTelemedicine & Telecare, 10 (5), 282-285.
Finkelstein, S. M., Snyder, M., Edin-Stibbe, C., Chlan, L., Prasad, B., Dutta, P., et al. (1996). Monitoring progreadherence. Journal of Medical Engineering & Technology, 20 (6), 203-210.
Gerber, B. S., Solomon, M. C., Shaffer, T. L., Quinn, M. T., & Lipton, R. B. (2007). Evaluation of an internet diabadolescents and young adults. Diabetes Technology & Therapeutics, 9 (1), 60-67.Gerbert, B., Berg-Smith, S., Mancuso, M., Caspers, N., McPhee, S., Null, D., et al. (2003). Using innovative vidbrief smoking and alcohol intervention. Health Promotion Practice, 4 (3), 249-261.
Cavan, D. A., Everett, J., Plougmann, S., & Hejlesen, O. K. (2003). Use of the Internet to optimize self-managewith DiasNet. Journal of Telemedicine & Telecare, 9 Suppl 1 , S50-52.
Brennan, P. F., Moore, S. M., Bjornsdottir, G., Jones, J., Visovsky, C., & Rogers, M. (2001). HeartCare: an Intepatient home recovery after coronary artery bypass graft (CABG) surgery. Journal of Advanced Nursing, 35 (5),
AI ‐ 47

Appendix I: Study Quality Assessment Table with References
s with inflammatory bowel disease: a 6-month
cellular telephones for diabetes management: a
frequency of blood pressure self-measurement toring blood pressure) study. Clinical Drug
anagement of diabetes. Journal of
ss after lung transplantation from home-patient
betes self-management training program for
deo doctor technology in primary care to deliver
ement of type 1 diabetes: preliminary experience
ernet-based information and support system for 699-708.
AI ‐ 48

Appendix I: Study Quality Assessment Table with References
Case Series Study References, continued
van der Meer, V., van Stel, H. F., Detmar, S. B., Otten, W., Sterk, P. J., & Sont, J. K. (2007). Internet-based self-management offers an oachieve better asthma control in adolescents. Chest, 132 (1), 112-119.Wilkie, D. J., Huang, H. Y., Berry, D. L., Schwartz, A., Lin, Y. C., Ko, N. Y., et al. (2001). Cancer symptom control: feasibility of a tailored,computerized program for patients. Family & Community Health, 24 (3), 48-62.Woodruff, S. I., Edwards, C. C., Conway, T. L., & Elliott, S. P. (2001). Pilot test of an Internet virtual world chat room for rural teen smokeAdolescent Health, 29 (4), 239-243.Zabinski, M. F., Wilfley, D. E., Pung, M. A., Winzelberg, A. J., Eldredge, K., & Taylor, C. B. (2001). An interactive internet-based intervenrisk of eating disorders: a pilot study. International Journal of Eating Disorders, 30 (2), 129-137.
Piette, J. D., & Mah, C. A. (1997). The feasibility of automated voice messaging as an adjunct to diabetes outpatient care. Diabetes Care
Skeels, M. M., Kurth, A., Clausen, M., Severynen, A., & Garcia-Smith, H. (2006). CARE+ user study: usability and attitudes towards a tabcounseling tool for HIV+ men and women. AMIA, Annual Symposium Proceedings/AMIA Symposium., 729-733.Stinson, J. N., Petroz, G. C., Tait, G., Feldman, B. M., Streiner, D., McGrath, P. J., et al. (2006). e-Ouch: usability testing of an electronicfor adolescents with arthritis. Clinical Journal of Pain, 22 (3), 295-305.van den Berg, M. H., Ronday, H. K., Peeters, A. J., Voogt-van der Harst, E. M., Munneke, M., Breedveld, F. C., et al. (2007). Engagemenwith an Internet-based physical activity intervention in patients with rheumatoid arthritis. Rheumatology, 46 (3), 545-552.
Lieberman, D. Z. (2003). Determinants of satisfaction with an automated alcohol evaluation program. CyberPsychology & Behavior, 6 (6)Ma, C., Warren, J., Phillips, P., & Stanek, J. (2006). Empowering patients with essential information and communication support in the coInternational Journal of Medical Informatics, 75 (8), 577-596.McDaniel, A. M., Hutchison, S., Casper, G. R., Ford, R. T., Stratton, R., & Rembusch, M. (2002). Usability testing and outcomes of an intprogram to promote smoking cessation in low income women. Proceedings / AMIA, Annual Symposium. , 509-513.Nguyen, H. Q., Carrieri-Kohlman, V., Rankin, S. A., Slaughter, R., & Stulbarg, M. S. (2003). Pilot study of an online dyspnea self-manageCOPD. AMIA, Annual Symposium Proceedings/AMIA Symposium., 951.
Labiris, G., Papadopoulis, G., Lentaris, G., Kafentzis, M., & Krakakis, A. (2004). Internet based counseling to remote orthopedic patientsScandinavica, 75 (3), 366-367.
Gustafson, D. H., McTavish, F., Hawkins, R., Pingree, S., Arora, N., Mendenhall, J., et al. (1998). Computer support for elderly women wJAMA, 280 (15), 1305.
AI ‐ 49

Appendix I: Study Quality Assessment Table with References
Abbreviations for all Quality Assessments
opportunity to
, interactive
ers. Journal of
ntion for women at
e, 20 (1), 15-21.
blet pc computer
c chronic pain diary
nt and satisfaction
), 677-682.ontext of diabetes.
teractive computer
ement program for
. Acta Orthopaedica
with breast cancer. BMI = body mass indexCIT = conventional insulin therapyCTRL = controlIIT = individualized insulin therapyITT = Intention to treat analysisIVR = interactive voice responseJAMA = Journal of the American Medical AssociationNA=not applicableNR=not reportedNS=not significantRA = Rheumatoid ArthritisSD = standard deviationSDS = standard deviation scoresSI = special interventionUC = usual careWLC = weight list control
AI ‐ 50

Appendix I: Study Quality Assessment Table with References
AI ‐ 51