Barloworld Limited - ShareData Online
150
Barloworld Limited annual report 2002
-
Upload
khangminh22 -
Category
Documents
-
view
1 -
download
0
Transcript of Barloworld Limited - ShareData Online
Barloworld Limitedannual report 2002
Contents2 Financial highlights3 Chairman’s review8 Introduction to the Global Reporting Initiative (GRI)9 Value Based Management
10 Chief executive officer’s review 14 Overview of the company18 Corporate governance26 Board of directors29 Global management31 Impact and responsibility report
For more information on our company and our brands, contact Barloworld Corporate Communication.Telephone +27 11 445 1202 Fax +27 11 445 1550 E-mail [email protected]
Achieving durability in business through long-term value creation for all our stakeholders.
52 People and community56 Annual financial statements
138 Barloworld in the stock market138 Currency conversion guide139 GRI guidelines – cross reference index142 Notice of annual general meeting143 Proxy form145 Corporate information146 Shareholders’ diary
We provide integrated product
and service solutions to add
value for our customers.
Barloworldis an international industrial brand management company.
2 Barloworld Limited annual report 2002
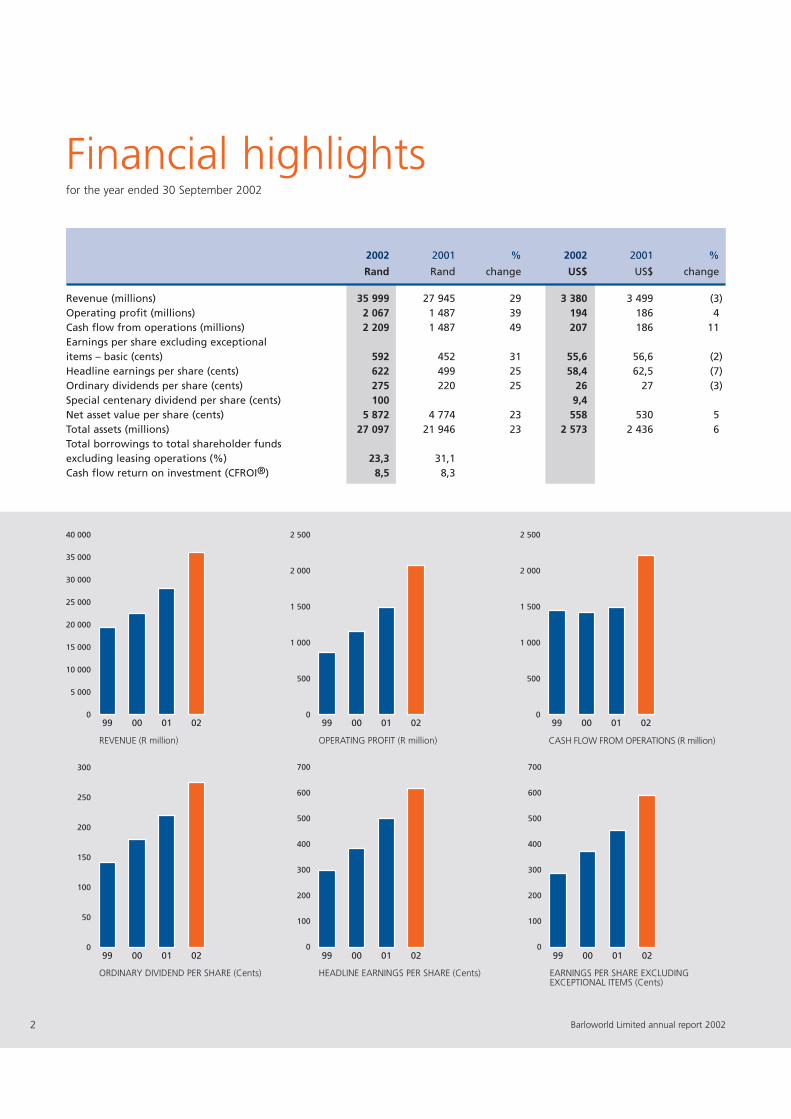
Financial highlights
2002 2001 % 2002 2001 %
Rand Rand change US$ US$ change
Revenue (millions) 35 999 27 945 29 3 380 3 499 (3)Operating profit (millions) 2 067 1 487 39 194 186 4Cash flow from operations (millions) 2 209 1 487 49 207 186 11Earnings per share excluding exceptional items – basic (cents) 592 452 31 55,6 56,6 (2)Headline earnings per share (cents) 622 499 25 58,4 62,5 (7)Ordinary dividends per share (cents) 275 220 25 26 27 (3)Special centenary dividend per share (cents) 100 9,4Net asset value per share (cents) 5 872 4 774 23 558 530 5Total assets (millions) 27 097 21 946 23 2 573 2 436 6Total borrowings to total shareholder funds excluding leasing operations (%) 23,3 31,1Cash flow return on investment (CFROI®) 8,5 8,3
40 000
35 000
30 000
25 000
20 000
15 000
10 000
5 000
099 00 01 02
REVENUE (R million)
2 500
2 000
1 500
1 000
500
099 00 01 02
CASH FLOW FROM OPERATIONS (R million)
2 500
2 000
1 500
1 000
500
099 00 01 02
OPERATING PROFIT (R million)
300
250
200
150
100
50
099 00 01 02
ORDINARY DIVIDEND PER SHARE (Cents)
700
600
500
400
300
200
100
099 00 01 02
EARNINGS PER SHARE EXCLUDINGEXCEPTIONAL ITEMS (Cents)
700
600
500
400
300
200
100
099 00 01 02
HEADLINE EARNINGS PER SHARE (Cents)
for the year ended 30 September 2002
3Barloworld Limited annual report 2002
Our performance in 2002 showed once again
the resilience of Barloworld Limited in difficult
market conditions. Our geographic spread of
businesses, together with our financial strategy
and conservative and straightforward character,
stood us in good stead.
The results, prepared in terms of International
Financial Reporting Standards, showed revenues
increasing by 29% to R35 999 million (2001:
R27 945 million).
Operating profits increased by a pleasing 39%
to R2 067 million. These translated into a
31% increase in earnings per share exclud-
ing exceptional items to 592 cents (2001:
452 cents). Headline earnings increased by
25% to 622 cents (2001: 499 cents) after
taking into account an adjustment for goodwill
amortisation and in this year a special one-off
R100 million provision before tax to cover
pension fund closure costs.
Cash generated at the operating level was
R2 209 million – a 49% increase on that of the
previous year.
The balance sheet remains strong.
Barloworld is now operating in 31 countries
around the world and more than 50% of our
operating profits are earned in hard currencies
outside South Africa.
Your board is pleased to announce a final
dividend of 185 cents, making a total dividend
for the year of 275 cents (2001: 220 cents).
In addition to the annual dividend your board
has declared a special Barloworld centenary
dividend of 100 cents per share.
In this our centenary year, I salute the many
strong leaders we have had in the past and
would especially like to mention the roles played
by our previous chairmen, Mr Mike Rosholt
and the late Mr Punch Barlow.
When I succeeded Mr Mike Rosholt as the
chairman of the board in 1991, I inherited a
group that had achieved its success through
careful planning and sound judgement, a group
with long-term goals and objectives and, above
all, strong values and uncompromising ethics.
To plan where we should go from here, it is
important to understand how we came to be
where we are today. The modern Barloworld
group, led by the chief executive, Mr Tony Phillips,
and his dedicated team of executives and staff,
balanced and augmented by experienced non-
executive directors, continues to acknowledge
the sound principles of the past on which the
group has been built.
The corporate office, which provides leadership
for the group, is in South Africa. This is the
proven base from which to effectively direct
our diverse operations as we move into global
markets of choice with a modern uniform
corporate identity.
South Africa
The Barloworld businesses in South Africa have
had a good year with continued profit growth
coming from the Cement and Lime, Capital
Equipment, Coatings and the Motor divisions.
Chairman’s review
4
Steel Tube, in particular, had a strong
profitability turnaround and much credit must
be given to its management team for standing
their ground when recent market conditions
were against them. The Leasing operation
returned to profitability.
There has been an increase in much needed
infrastructural development expenditure in
South Africa and this is the segment in which
many of our businesses operate.
The South African economy has been growing
steadily, despite the slowdown in the
developed economies of the world. The
economic and fiscal policies, which are being
followed, are sound. The current account is
now in surplus, due in part to the strong
performance of exports.
Inflation is proving to be more problematic
than was expected and this, together with the
undervalued rand, is adding to key input costs,
accelerating wage growth risks, and affecting
food and oil prices. The 2003 inflation targets
will not be reached and with the 2004 targets
getting tougher, they may also become
unachievable.
I hope the recent interest rate hikes – occa-
sioned by the rising inflation perspective – will
not derail the upswing.
The rand is likely to remain soft, amid fears of a
global slowdown with easing commodity prices.
There are concerns over Zimbabwe and its tragic
self-inflicted situation. However, I believe the
knock-on effect on South Africa, as perceived by
foreign commentators, has been overplayed.
Other factors that keep the rand undervalued
include the international perception that some
macro policies concerning bank lending and
aspects of the mining charter are moving in the
wrong direction. All this makes it unlikely for
any meaningful relaxation of exchange control
in the short term.
Elsewhere in the southern African region
where we trade, steady profits were made.
Barloworld has strong African roots and has
the advantage of being able to combine the
right products with adaptable strategies to fit
prevailing conditions. The exception in the past
year has been the Cement interest in
Zimbabwe, which has to cope with deteri-
orating political and hyperinflationary
economic conditions. However, in the longer
term, this will become a strategic investment
for the group.
With the South African government and local
business playing an influential role, there are
early positive indications that the southern
African region, in spite of less than ideal trading
and political conditions, is showing signs of
sustainable economic growth. This is being
driven by the utilisation of the region’s vast oil
reserves. It has been suggested that Africa is
becoming one of the fastest growing sources of
oil and gas for the hungry Western markets,
and is lessening to a degree their dependence
on supplies from the troubled Persian Gulf.
One senses that at long last the lesson is being
learnt in southern Africa that a stable and
transparent democracy is the best guarantee
for economic development. There is also a
growing acceptance that business is the key to
the region’s economic wellbeing and this
sentiment was strongly endorsed at the recent
World Summit on Sustainable Development
successfully hosted by South Africa.
But to hold the interest of business, risk levels
must be acceptable and there must be clear
objectives and lines of accountability. Above
all, action has to occur at a faster rate and also
closer to the private sector modus operandi
than that of the public sector.
Although they might not like to hear it, African
governments have to accept that it is they who
need the private sector for development,
rather than the other way around. The private
sector can always go and invest elsewhere, as
it has done in the past.
Whilst the politicians have the responsibility
to create the environment for change, it is
business investments that will anchor it in place.
Australia
Our business in Australia did well and
investments down under are making a growing
contribution to the Barloworld results.
The Motor companies, including the recent
acquisitions, held their own and Coatings
made a strong profit recovery as this division
continues to establish itself in its competitive
markets.
With hindsight the timing for Barloworld to
invest in Australia was good. The Australian
economy has shown resilience and has
continued to shrug off the negative
international trends.
For corporate Australia, interest rates are low,
the consumers are spending, businesses are
investing and profits are rising.
However, there is a trend of seeing strong sales
growth at the expense of tighter margins and
we will have to respond by controlling costs.
Europe
Turning to Europe, the Materials Handling and
Paper businesses in the United Kingdom were
steady in difficult trading conditions in a not
very exciting business environment. In Scientific
products the Laboratory business produced
good results, whilst the Melles Griot operations
were affected by greatly reduced demand from
the telecommunication sector.
Barloworld Limited annual report 2002
Chairman’s review continued
However, the Capital Equipment division in
Spain and Portugal continues to excel and has
maintained profitability at a high level.
The Spanish and Portuguese economic
planners concentrate on the infrastructural
development of their regions as the engine
room for economic growth and they have an
established track record of success. This is an
appropriate economic strategy for the whole
of the southern African region to emulate.
The Caterpillar dealership in Siberia is in an
establishment phase and should be a growth
point in the future. President Putin is a
pragmatic leader steering Russia to closer
financial and economic ties with Europe.
United States of America
In the USA our businesses were not able to
repeat the results achieved in the past, albeit off
a high base, and there was a negative
contribution to our results. However, in spite of
considerably lower economic conditions, our
businesses did exceptionally well in working
capital management and downsizing their
activities in line with the current lower trading
conditions.
While some recent signals have provided
reassurance that the US economy is continuing
to make progress, there are still no signs of the
strong durable broad-based recovery expected
by the policy makers. There are, as a result,
nagging worries of a second, more prolonged,
recession in the US less than a year after the
last, very brief downturn.
For some time the US economic activity has
seemed to be in an uneasy yet stable holding
pattern. Consumers have kept spending,
though not always strongly enough to keep
the economy at trend growth. Meanwhile
businesses hold back on investment, waiting
for a definite upturn in profits.
More worrying than the direct cost, or even the
arithmetic effect of high oil prices, is that the
prospect of war in the Middle East is adding
another source of uncertainty. This is having
the effect of further dissuading business from
investing or consumers taking on more debt.
Whilst all of our businesses in the US are sound
and in good shape, they are very much in the
hands of the economic climate for growth in
profitability.
Corporate governance
Whilst the subject has been somewhat over-
emphasised by some commentators, corporate
governance – or should I say the lack of it in
some places – is of great concern to many
investors.
At Barloworld we are very aware of this
investor concern, especially as by far the
5Barloworld Limited annual report 2002
6 Barloworld Limited annual report 2002
majority of those who have invested in our
company – either directly or indirectly through
pension funds and other savings instruments –
are dependent on the dividends they receive
and the safety and integrity of their
investment.
The bulk of our shareholders and investors are
not there to play the short-term game.
What has gone wrong in the corporate world
in the 1990s, I believe, can be blamed on the
rise in the glorification of financial gain,
irrespective of longstanding values. The culture
of greed-driven equity markets led to a sad
decrease in professional standards and the
ignoring of conflicts of interest.
The maintenance of the share price had
become the pressing task of some executives,
analysts and individual investment advisors
who often encouraged more creative, dubious
and misleading financial standards to prop up
ill-gotten and unwarranted rewards.
We are now in the era of searching for a tribe
of scapegoats. Whilst there is always a need to
sensibly review and update existing regulations
and practices, what really is needed is to return
to the common sense application of those
principles that have held the business world
and the investors in good stead over the years.
For instance, I do not believe the talked about
compulsory rotation of auditors will boost
independence – in fact it could adversely
affect audit quality. However, audit firms
should revert to having no other responsibility
except the proper audit of accounts. They
should not be ‘consultants’ or ‘corporate
financial advisors’ as this is what has led to
conflicts of interest.
Executive remuneration disclosures should
reveal the total cost to the company and
include the cost of stock options and all the
other perks. The controversies surrounding
executive packages, especially where they are
out of line with company performance, can be
easily resolved by asking shareholders to
approve them at the annual general meeting.
Remuneration information could also be better
covered by publishing the aggregate pay for a
series of bands, with the company defining
and stating the number of employees and
executives within each band. Policies on
training, retraining, succession planning,
assessment, promotion and career develop-
ment should extend far beyond the mere
handful employed at the top.
Collected and published over a number of
years, statistics such as these would illustrate
the evolution of a company’s people policies.
When measured against a backdrop of turnover
and profit, they would reveal a true picture of
the manner in which a company treats its
employees and ultimately become a real test of
progress made on employment equity.
In recent times the trend, in my opinion, has
been to place too much emphasis on company
results at the EBITDA level. More attention on
the amount of cash generated at the operating
level would have revealed many of the
analytical shortcomings that have plagued
investors recently.
The onus for keeping shareholders informed
does fall fairly on the shoulders of directors. It
is not just the financial statements that matter
– the balance sheet and income statement
usually comply with the rule books anyhow –
but it is the purpose behind it. What is lacking
are better reports from directors, with the
chairman and chief executive officer personally
vouching for the company’s statements.
The problem does not lie in the rules and
regulations – it is the effective implementation
that is lacking.
Where there have been accounting and share
dealing abuses, bonuses and other compen-
sation should be repaid and the executives
concerned barred from office.
The pendulum seems to have swung in the
favour of the boardroom villains and those
who profit from them. A good start to stop
abuses would be for the guilty ones to be given
heavy jail sentences.
Chairman’s review continued
7Barloworld Limited annual report 2002
I was recently delving into some of the
Barloworld papers kept in our archives and came
across these words by the late Mr Punch Barlow
in a chairman’s statement many years ago:
“I have said and I believe that the people who
matter in our company are the people who
manage it and the people who are in it. As
long as they are the right sort of people, and
people of integrity, then the shareholders have
got nothing to worry about.”
I believe this applies to the Barloworld of today
and I would like to reiterate that I do not
believe our shareholders, stakeholders and all
who depend upon Barloworld for their
wellbeing, have anything to worry about.
Board and management
There were no changes to the board and
top management during the past year. During
the coming year some members of the top team
will be reaching the mandatory retirement age
and succession plans for these changes are
in hand.
I wish to thank the board, and the executive
team and staff worldwide, ably led by the
chief executive officer, Mr Tony Phillips, for
their support and dedication in working
towards the achievement of our objectives.
Prospects
We continue to position Barloworld for a
subdued business environment. We have
further strengthened our capital position and
are pursuing a policy of diversification, both
geographically and by line of business.
We are in a good position to seek out and
respond to new opportunities to create long-
term value for shareholders. We anticipate
another year of good progress backed by
strong operational cash flows.
WAM Clewlow
Chairman
8 Barloworld Limited annual report 2002
Creating value for allof our stakeholders
This report has been prepared using the Global
Reporting Initiative Guidelines (GRI) as a framework.
The GRI is an international framework for providing
comprehensive information to stakeholders of a
company on its economic, social and environmental
performance – the triple bottom line.
The Initiative was founded in 1997 and is endorsed by
the United Nations. Its goal is to enhance the quality,
rigour and utility of sustainability reporting.
A full cross reference index for the GRI framework is
set out on pages 139 to 141.
www.globalreporting.org
9Barloworld Limited annual report 2002
Value Based Management (VBM) is
the framework through which we are
building a value-creating culture through-
out our company. Our goal is to align
processes and day-to-day behaviour in order
to continually create value for ALL our
stakeholders.
Our customers, employees, shareholders, and
the communities in which we operate (both
human communities and the environment)
must all benefit from our activities and we hold
ourselves accountable to all.
As we enter our third year of implementing
VBM, we are setting higher targets for the
value we create for our shareholders and we
are developing and implementing measurable
targets for customer, employee and
community value.
The proof of the value of VBM for
shareholders lies in our economic
performance. Over the past three years
we have more than doubled shareholder
value.
We align our internal financial measures with
shareholder value by focusing on cash flow
return on investment (CFROI®)* as our metric.
In our view, this method correlates most closely
with total shareholder return (share price
appreciation plus dividends) over the long
term. It accounts for the need to not only
generate superior returns for shareholders, but
also to provide for the replacement of business
assets over the life of those assets in today’s
monetary terms (inflation adjusted).
For our customers we are working hard
to understand their true needs and to
create value-adding partnerships and
solutions that best fulfil their unique
requirements. We are also proactively
looking at ways to devise customer value
propositions that will delight our customers.
For our employees we are systematically
implementing a company-wide model
aimed at fostering an inspiring and
caring climate. Through teamwork and
communication, our goal is to harness the
exceptional intellectual capital we already have
The way we do business is rooted in the values of
Charles Sydney ‘Punch’ Barlow, the son of our
founder. He believed in the highest ethical standards
and in teamwork.
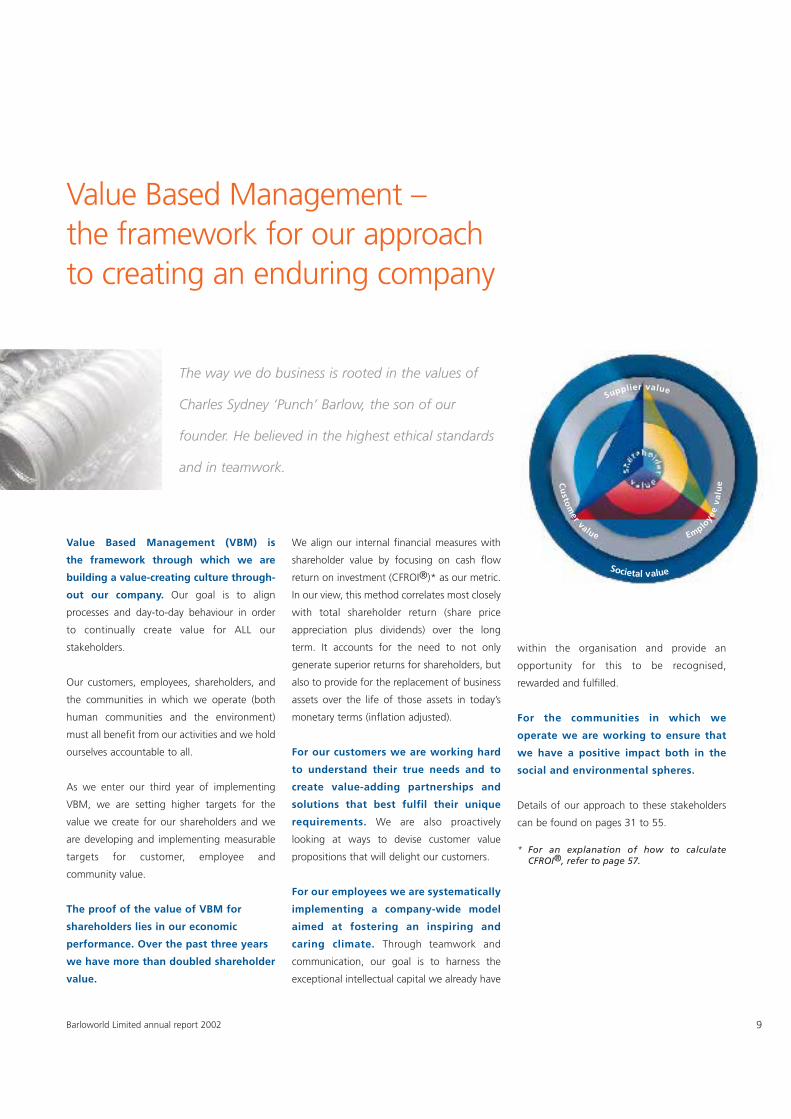
Value Based Management – the framework for our approachto creating an enduring company
within the organisation and provide an
opportunity for this to be recognised,
rewarded and fulfilled.
For the communities in which we
operate we are working to ensure that
we have a positive impact both in the
social and environmental spheres.
Details of our approach to these stakeholders
can be found on pages 31 to 55.
* For an explanation of how to calculateCFROI®, refer to page 57.
Societal value
Supplier value
Employe
ev
alu
eCu
stom
ervalue
10 Barloworld Limited annual report 2002
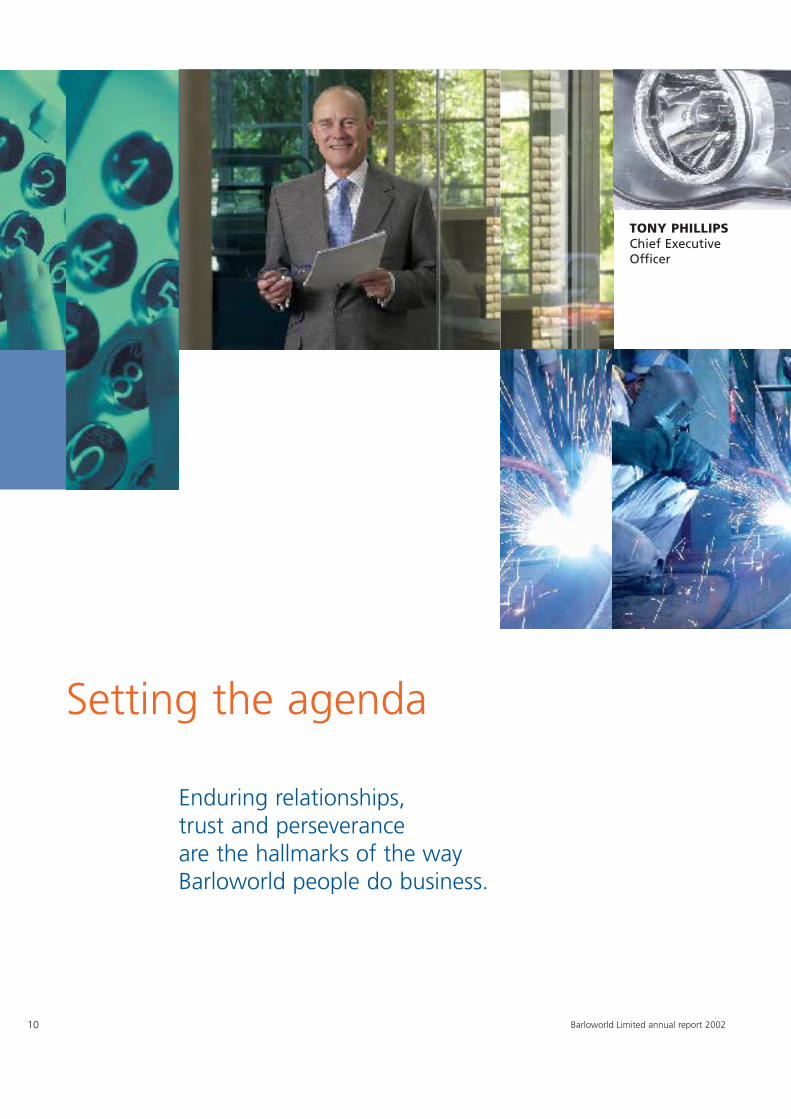
TONY PHILLIPSChief ExecutiveOfficer
Enduring relationships, trust and perseverance are the hallmarks of the way Barloworld people do business.
Setting the agenda
We have now completed three years of
implementing Value Based Management
(VBM) throughout Barloworld and have moved
out of the initial implementation into a phase
where we are consolidating on our success.
I am pleased to report that in the aspect of
creating value for shareholders, we have further
increased the returns we generate.
We use one global cost of capital as a
performance measurement tool for all
business units, for every item of capital
expenditure and for every acquisition
target.
Having achieved our initial target of a cash
flow return on investment (CFROI®) in excess of
our cost of capital last year, the figure has grown
from an 8,3% real CFROI® in 2001 to 8,5%
in 2002.
As I reported last year, this is the visible
aspect of VBM. What remains invisible, but
essential for the long-term durability of the
company, is the manner in which the
VBM process is driving an ongoing review of
the way we do things in every part of the
company. During 2002 we also concentrated
on achieving tangible results in value creation
for other stakeholders – customers, employees
and the communities in which we operate.
This quiet revolution will continue to act as a
powerful catalyst for value creation into the
foreseeable future, since VBM is a never-
ending journey.
Building the Barloworld brand . . .
The Barloworld brand is being built on the
strength of the relationships we build with our
stakeholders. Despite being only two years old,
having been launched in October 2000, it is
increasingly recognised as a symbol of
enduring trust in many of the markets in which
we sell our products and services solutions.
I am also pleased to announce that the
Barloworld trademark has been successfully
registered in one country, and the process to
ensure its legal protection continues in our key
markets around the world.
. . . from the inside out
Industrial brands are built on the strength of long-
term relationships forged between Barloworld
people and the owners and employees of the
companies who form our customer base. Such
relationships can only be built if we have
employees who understand and live by our
company ethos of maintaining the highest level
of integrity in everything they do. In 2002
our employee retention levels were exceptionally
high, particularly at senior levels, and a review of
the management team listed on pages 29 to 30
shows that we have not lost a single member of
the global leadership team to another company
in the past year.
To further strengthen the relationship between
employees and the company and to recognise
individuals who make exceptional contri-
butions above and beyond the call of duty,
I have introduced a company-wide CEO Award
excellence programme. This programme high-
lighted some extraordinary contributions by
our people and the segmental winners set an
example to each and every employee. The
overall winner was Sguntsu Stemela from
our Cement and Lime operations (see remarks
overleaf).
A year of bedding down acquisitions . . .
A flurry of acquisitions at the end of 2001
meant that much of our time has been spent
integrating new groups of employees into
the company and ensuring that, during
their absorption, the acquired businesses
continued to add value. These included motor
dealerships in Australia, the Protean group
of companies in the UK Laboratory business,
Execulink and Optimus in the South African
logistics arena, the Portland Holdings cement
operations in Zimbabwe and Sterling
truck dealerships in the Memphis area of
southeast USA.
. . . disposing of underperforming
business units
VBM demands firm action on businesses that
either do not have the potential to create
sustainable value within the organisation, or
cannot be expanded to grow the contribution
they make. In the past year PPC disposed of its
32,9% stake in Natal Portland Cement and
25% share of Ash Resources. We also sold our
UK Coatings business, the Robor Stewarts &
Lloyds steel distribution outlets, our half share
of steel trading company Stemcor (South
Africa) and our Mitsubishi motor dealerships in
Australia. After the year-end, we also
announced the sale of our South African motor
leasing business.
11Barloworld Limited annual report 2002
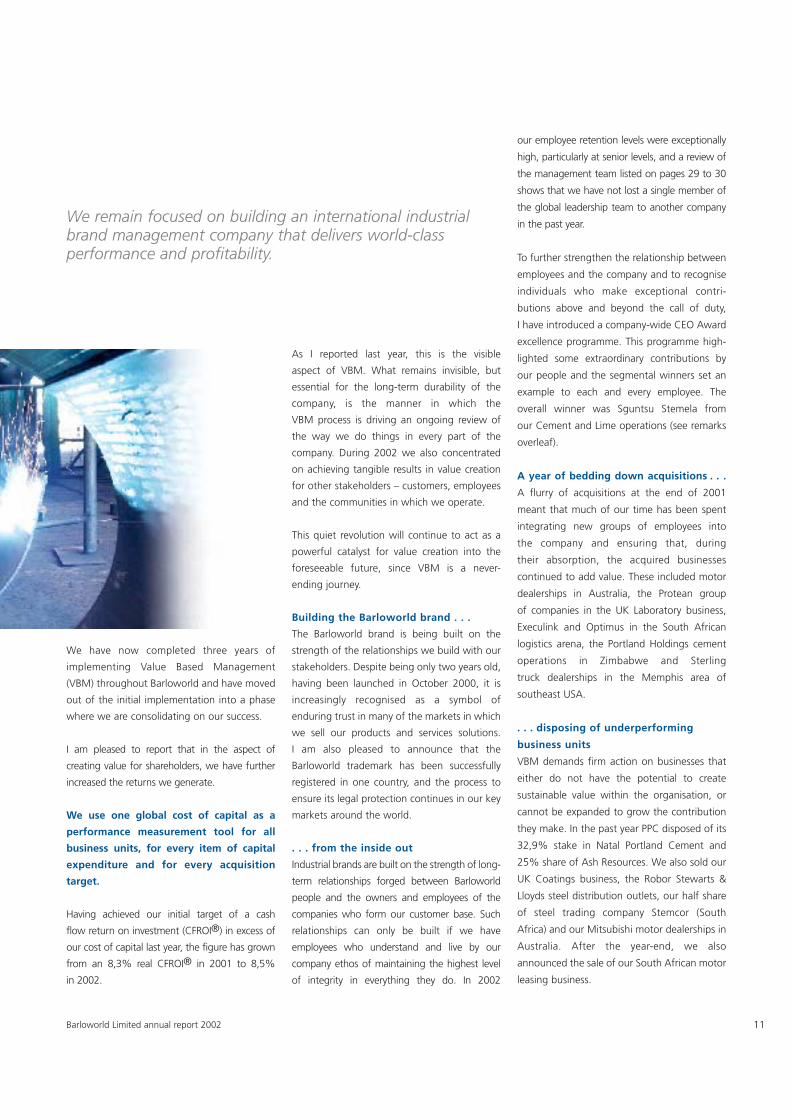
We remain focused on building an international industrialbrand management company that delivers world-classperformance and profitability.
12
executive education for our senior managers,
which we operate in conjunction with the
Gordon Institute of Business Science in
Johannesburg, South Africa, is in its third year
and working well. It is linked to an
MBA programme which ensures that the
participants gain credits towards this
qualification for the studies they undertake.
Employment equity and black economic
empowerment
In South Africa, we remain on track with the
employment equity plans required of all
business units in terms of the Employment
Equity Act. While this is a legal compliance
issue, we believe that the development of
previously disadvantaged people within South
African business units makes good business
sense as well as being morally correct.
As a global company with a global stakeholder
base, the issue of black economic empower-
ment (BEE) in South Africa is similarly being
addressed at appropriate business unit levels.
In that sense Barloworld is no different from
any major multinational that has operations in
a country undergoing necessary transition from
an inequitable historical situation.
. . . expanding within our existing
activities
A cursory look at our lines of business conceals a
constant process of internal re-invention as we
capitalise on opportunities that confront us as
well as those that we create. In our Coatings
business alone, we are expanding our presence
in China to include warehousing and distribution
infrastructure and our first in-country Chinese
employees. We are taking our brands into New
Zealand and in Australia and have become a
house-brand manufacturer for one of the major
Australian retail chains and agreed a licence to
manufacture and market Disney-branded
decorative paints.
. . . and developing grassroots
opportunities within our core
competencies
Our logistics businesses in Spain and in South
Africa are strong proof that we also have the
skills to develop grassroots businesses. Both
have progressed well in the past year, and have
significant potential for growth. Even in some
of our traditional business areas we have
initiated major changes most notably in the
capital equipment arena in southern Africa and
in Spain where we have launched bold
initiatives to become a major player in the
rental of equipment to the construction sector.
Restructuring to create value continues
The ongoing restructuring of our businesses
continued in 2002. There will be further
progress in this never-ending journey in 2003.
Building Barloworld through our people
During the year we have continued to make
good progress on building the concept of an
integrated Barloworld through extensive
internal communication programmes reaching
all of our 23 192 people.
We have made further progress in aligning
reward and incentive systems to value creation.
The ‘Barloworld University’ programme of
Chief executive officer’s review continued
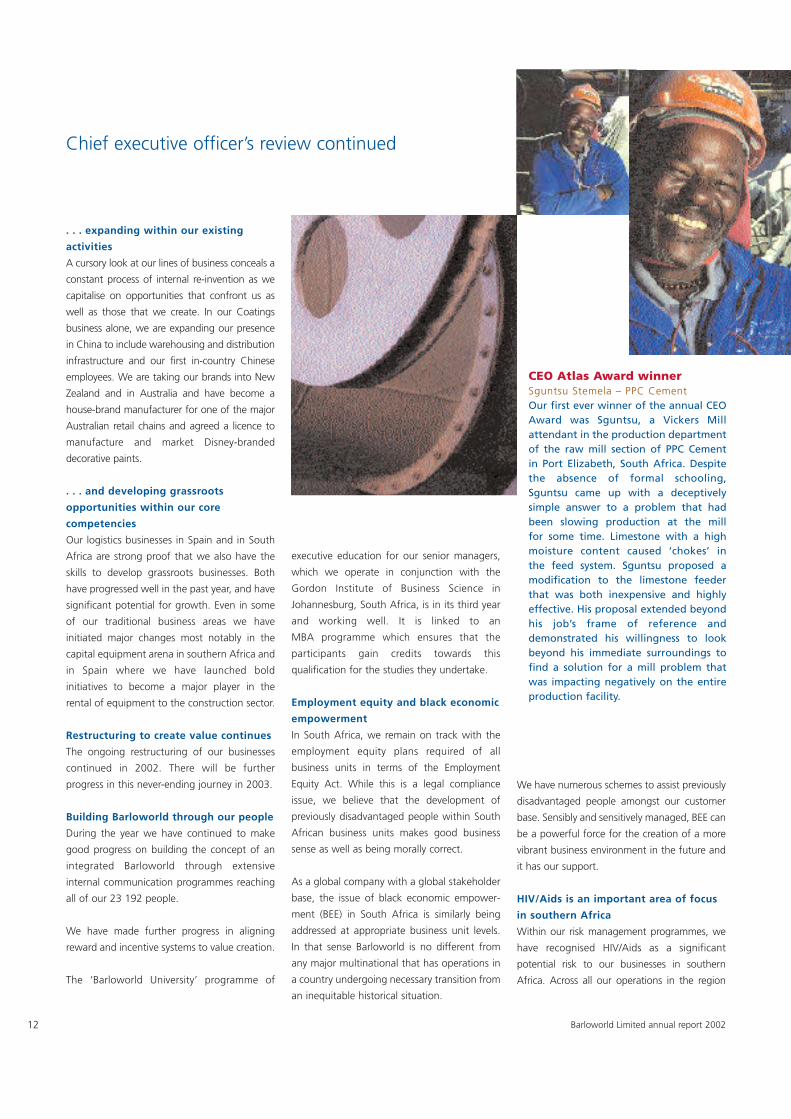
CEO Atlas Award winnerSguntsu Stemela – PPC CementOur first ever winner of the annual CEOAward was Sguntsu, a Vickers Millattendant in the production departmentof the raw mill section of PPC Cementin Port Elizabeth, South Africa. Despitethe absence of formal schooling,Sguntsu came up with a deceptivelysimple answer to a problem that hadbeen slowing production at the millfor some time. Limestone with a highmoisture content caused ‘chokes’ inthe feed system. Sguntsu proposed amodification to the limestone feederthat was both inexpensive and highlyeffective. His proposal extended beyondhis job’s frame of reference anddemonstrated his willingness to lookbeyond his immediate surroundings tofind a solution for a mill problem thatwas impacting negatively on the entireproduction facility.
We have numerous schemes to assist previously
disadvantaged people amongst our customer
base. Sensibly and sensitively managed, BEE can
be a powerful force for the creation of a more
vibrant business environment in the future and
it has our support.
HIV/Aids is an important area of focus
in southern Africa
Within our risk management programmes, we
have recognised HIV/Aids as a significant
potential risk to our businesses in southern
Africa. Across all our operations in the region
Barloworld Limited annual report 2002
we have extensive programmes in place to
address the challenge this creates. They range
from increased intake of trainees to extensive
education programmes and, where appropriate,
the administration of antiretroviral drugs as part
of medical benefit programmes. The latter are
available through both of the major medical
insurance schemes we operate.
Market leadership
We have continued to maintain market
leadership in many areas in which we operate
worldwide – it is an important component of
how we think about the attractiveness of those
markets. In this context, our processes to
create value for customers have always been
highly effective. We continue to ensure that we
systematically analyse key customer needs and
establish objective measures and monitoring
systems focused on better service.
Smart Partnerships™
Our strategy of building Smart Partnerships™
with key customers has been expanded during
the past year. Examples of the success of this
strategy include the growth in Maintenance
and Repair Contracts (MARCs) with our mining
customers in the capital equipment business
(see page 64) and the re-award of the original
Pathfinder contract with the Ministry of
Defence in the United Kingdom through our
industrial distribution business (see page 67).
The alliance we have formed with
underground mining equipment manufacturer
Boart Longyear (see page 64) is a new
development in this area in 2002. Smart
Partnerships™ will remain a growth
component of our business activities in the
future as they take us well beyond, for
example, the ‘lowest unit price wins’ scenario
of equipment distribution into an arena where
our combination of financial strength, skills,
products and services creates a unique value-
adding package for our customers which our
competitors struggle to match.
Pursuing quality of business and
improving strategic planning processes
As I mentioned last year, the VBM process has
led us to place a greater emphasis on the
quality of business we do and, as a result, we
have improved our margins in many areas. This
focus will continue in 2003.
E-commerce
E-commerce is firmly entrenched as an integral
and routine component of our business. Its
impact varies tremendously; it is no longer high
on the agenda as an all-embracing wave which
will sweep established businesses such as ours
onto the proverbial rocks. We do however con-
tinue to watch closely for, and rapidly adopt, new
developments that can enhance what we do.
Implementing the Barloworld
Environmental Code
During the past year we have made satisfactory
progress in implementing a process of continual
improvement in the way in which we interact
with the environment. Our formal Environmental
Code, introduced last year, encompasses all our
businesses. You will find many examples of its
implementation on pages 31 to 51.
Celebrating our centenary
During this year, Barloworld celebrated
100 years of existence in our customary low-
key style. We marked the occasion with,
amongst other things, a centenary global
management conference in Cape Town in
September, the opening of the Mandela
Barloworld Agricultural High School (see
page 54) and the launch of a programme to
plant one tree for every one of our employees
during 2003.
Focusing on quality of earnings and
expansion in turbulent times
Like people, companies that live for a century
have something special within them. In our
case, it is encapsulated in a single word:
13Barloworld Limited annual report 2002
durability. We are a company that endures. We
do so because we adapt and change as the
environment in which we operate changes. As
we approach 2003, my observation made last
year, that we face an increasingly turbulent and
uncertain world, remains true. In the year
ahead, we will be focusing on improving the
quality of earnings we generate out of our
existing businesses, setting our company on a
path to significantly increase the value we
create for all our stakeholders and growing the
size of our company within our areas of
competency.
We will achieve our goals through the
commitment, passion, hard work and loyalty of
the people who work for Barloworld. They are
the true foundation on which we have built
100 years of success.
AJ Phillips
Chief Executive Officer
14
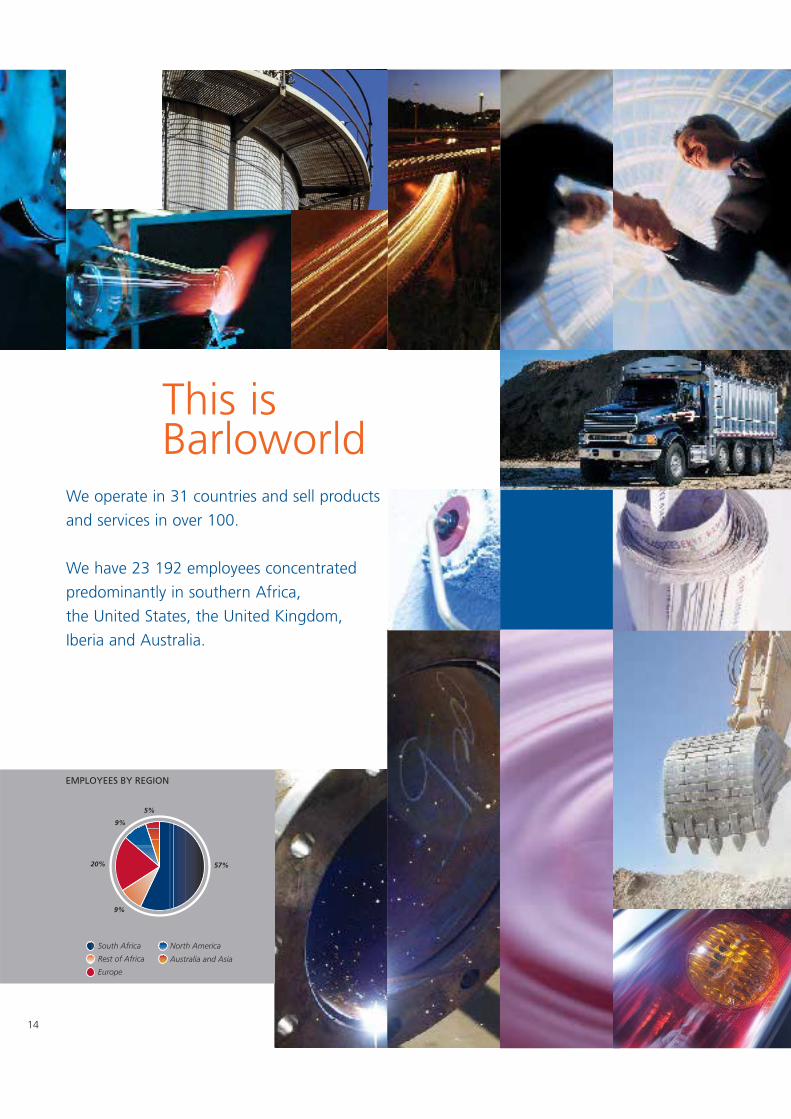
We operate in 31 countries and sell products
and services in over 100.
We have 23 192 employees concentrated
predominantly in southern Africa,
the United States, the United Kingdom,
Iberia and Australia.
This is Barloworld
EMPLOYEES BY REGION
57%
North America
Australia and Asia
Europe
Rest of Africa
South Africa
9%
20%
9%
5%
15Barloworld Limited annual report 2002
The way we conduct our business stems fromthe legacy of Charles Sydney ‘Punch’ Barlow,the son of our founder. He was a man ofintegrity who realised that the growth of hisbusiness came through the actions of people.
It is a blend of old and new business practice.It means business excellence with the word ofa gentleman, the ear of a trusted friend andthe commitment of a partner.
Enduring relationships, trust and perseveranceare the hallmarks of the way Barloworld peopledo business.
Passionately pursuing integrity and honestymakes us different; committed and focused on fulfilling our customers’ needs. Passionatepeople are attentive explorers and creativeproblem solvers. Passionate people feelrewarded by their actions.
What we do makes us different. We liveup to standards of honesty, reliability andintegrity shown not just in what we do,but how we do it.
Capital Equipment (4 980 employees)
Caterpillar Inc. produces over 200 different products in 19 categoriesranging for example from 191 ton operating weight wheel loaders to4,5 ton compact versions, and from power plants which can provideelectricity for whole towns to portable generator setsWe are amongst the world’s leading Caterpillar dealers. We are alsoone of the longest standing, having originally been appointed a dealerin southern Africa in 1927. Caterpillar is the world’s leading brand inearthmoving machines, power systems and related equipmentWhereDealer for Andorra, Angola, Botswana, Bulgaria, Guinea-Bissau,Lesotho, Malawi, Mozambique, Namibia, Portugal, São Tomé andPríncipé, Siberia, South Africa, Spain, Swaziland, Zambia andZimbabweCustomersMining, construction, marine and electrical power generationindustries
Lift trucksWhereDealer for southern AfricaCustomersManufacturing and distribution industries
Diesel enginesWhereDistributor for southern AfricaCustomersPower generation in agricultural and transport industries and forlighting
Rotary blasthole mining drillsWhereDealer for southern AfricaCustomersOpen-cast mines
Articulated dump trucksWhereDealer for southern AfricaCustomersMining and construction industries
Vibratory compactorsWhereDealer for southern AfricaCustomersCivil construction companies
Underground mining equipmentWhereDistributor across southern AfricaCustomersMining industryOther brandsAmazone, Claas, Gehringhoff, Massey Ferguson – agriculturalproductsCircon – power systems in southern AfricaFlemingo – compressed air product rentals in southern AfricaMak – engines in Spain and PortugalMitsubishi – lift truck dealer for Portugal
Our approach to business Industrial Distribution(3 122 employees)
Lift trucksWe are the world’s largest independent lift truck dealer offering ourcustomers a full range of lift trucks and related warehouse/handlingequipment. We have represented the market-leading Hyster brandsince 1929 and have leveraged the strength of the brand by leadingthe market in the introduction of innovative total solutions tocustomers’ materials handling needsWhereSoutheast United States, United Kingdom and BelgiumCustomersManufacturing and distribution industries
TrucksWhereTwelve dealer locations in Arkansas, Tennessee and Mississippi, USACustomersTransport and distribution industries
TrucksWhereThree dealer locations in Memphis and Jackson, Tennessee, andJonesboro, Arkansas, USACustomersTransport and distribution industries
Trenching equipmentWhereGeorgia, USACustomersReticulation industries: telecommunications, power and water
Vacuum conveyance systems and floor maintenance equipmentWhereUK-based manufacture of products for world marketsCustomersMoney and document conveyance markets, especially in thefinancial services sector
Motor(4 369 employees)
Alfa Romeo, Audi, BMW, Chrysler, Fiat, Ford, Freightliner, Holden,Isuzu, Land Rover, Lexus, Mazda, Mercedes-Benz, Mini, Mitsubishi,Nissan, Opel, Subaru, Suzuki, Toyota, Volvo, VolkswagenWe are a leading provider of comprehensive transport solutionsrepresenting the world’s leading passenger, light, medium andheavy commercial vehicle brandsWhereDealerships in South Africa (55), Botswana and Namibia. Fleetmanagement, panel shops and short-term truck hireSubaru distributor for southern AfricaThree dealerships in Melbourne, AustraliaCustomersCorporate and private sector clients
Avis Southern Africa (26% investment)Vehicle rental, fleet management and financial services
TM
16Barloworld Limited annual report 2002
Cement and Lime(3 300 employees)
WhereSouth Africa, Botswana, Zimbabwe, operating primarily withindomestic markets with some exportsCementitious products, ready-mix and aggregatesCustomersConstruction companies, retail DIY/builders merchants andconcrete product manufacturers
Metallurgical grade lime, limestone, burnt dolomite and relatedproductsWhereSouth AfricaCustomersThe pyro-metallurgical industries, mining and water treatmentindustries
Paper and polyethelene sacks WhereSouth AfricaCustomersCement and food product manufacturers
Scientific(2 016 employees)
Laboratory equipment and consumables including glass and plasticlaboratory products as well as related scientific equipmentWhereManufacturing operations in the United Kingdom and Spain.Distribution in New York State, Italy and FranceMarket leader in the United Kingdom and worldwide exportsCustomersEducational organisations, pharmaceutical and biotechnologycompanies and quality control laboratories
A market leader in lasers, optics, opto-mechanical componentsincluding nano-positioning equipment, assemblies and relatedproductsWhereWorldwide sales from manufacturing bases in California, New YorkState and Colorado in the USA; Cambridgeshire, UK; and JapanCustomersSemi-conductor manufacturers, telecommunication, test andmeasurement, medical equipment and reprographic industries
Coatings(2 526 employees)
WhereManufacturing in Durban, Port Elizabeth, Cape Town andJohannesburg in South Africa. The market leader in decorativecoatings in South Africa. Operations and sales in Botswana,Malawi, Namibia and Zambia
WhereManufacturing (three factories) and sales in Australia, exports intoChina through 20 franchise outletsCustomersConsumers and trade through large retail chains, franchised outletsand owned stores
Industrial coatingsJoint ventures with world technology leadersWhereSouth AfricaCustomersMotor manufacturers, packaging, heavy duty coatings, powder andmarine industries
Steel Tube(1 353 employees)
Manufacturer of tube, steel flanges and fittings, accessories, pipingsystems, galvanising and related products up to 200 mm indiameter in both mild and stainless steelWhereManufacturing in Gauteng, South Africa. The market leader inSouth Africa with regional and European (stainless steel pipe)exportsCustomersBuilding and construction, mining, automotive manufacture,agriculture, fluid handling and general engineering industries
Financial Services, Logisticsand Other (1 526 employees)
Financial ServicesIncluding leasing and related productsWhereSouth Africa, United Kingdom, Europe and United StatesCustomersCustomers of our motor, lift truck and capital equipmentbusinesses
LogisticsThird and fourth party logistics operation providing outsourcedservices in logistics systems, warehousing and transportWhereSouth Africa, Portugal, Spain and United KingdomCustomersGeneral manufacturing, automotive, oil and cement industries
Corporate operationsIncluding finance, strategic planning, property management,treasury, IT, communication, tax, legal, risk management, companyadministration and internal auditWhereSouth Africa, United Kingdom, Australia, Botswana and Namibia
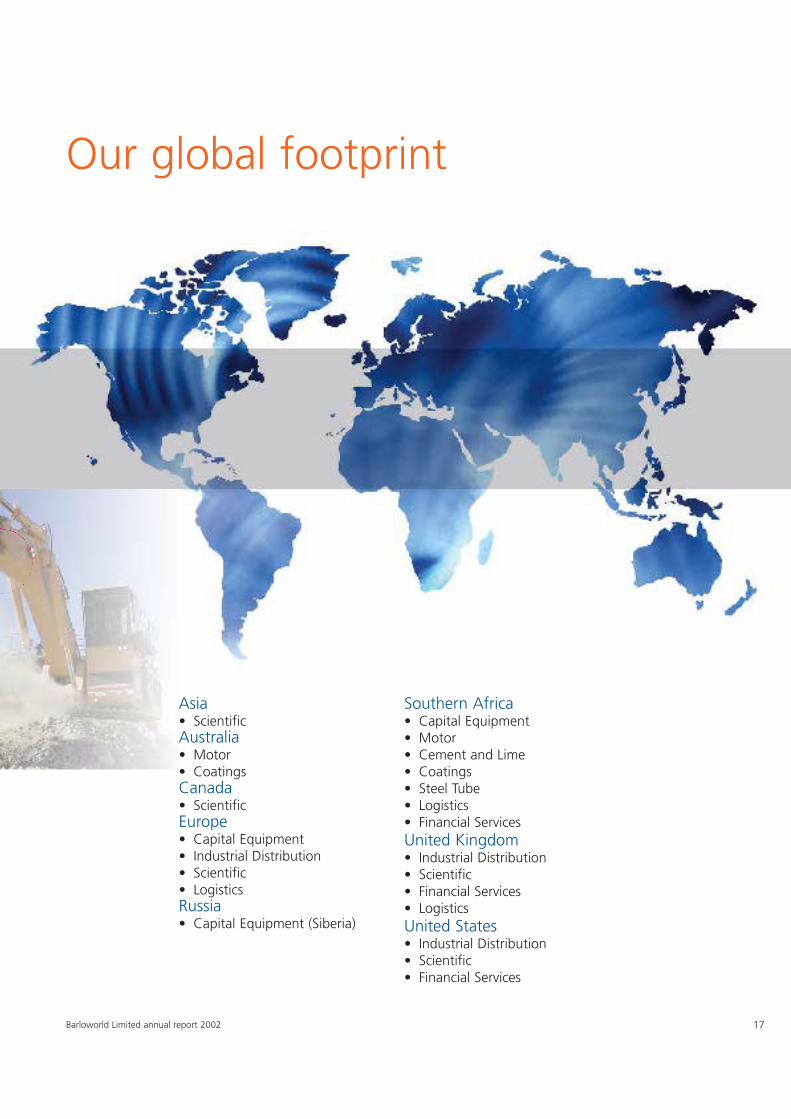
Asia• ScientificAustralia• Motor• CoatingsCanada• ScientificEurope• Capital Equipment • Industrial Distribution• Scientific• LogisticsRussia• Capital Equipment (Siberia)
Southern Africa• Capital Equipment• Motor• Cement and Lime• Coatings• Steel Tube• Logistics• Financial ServicesUnited Kingdom• Industrial Distribution• Scientific• Financial Services• LogisticsUnited States• Industrial Distribution• Scientific• Financial Services
Our global footprint
17Barloworld Limited annual report 2002
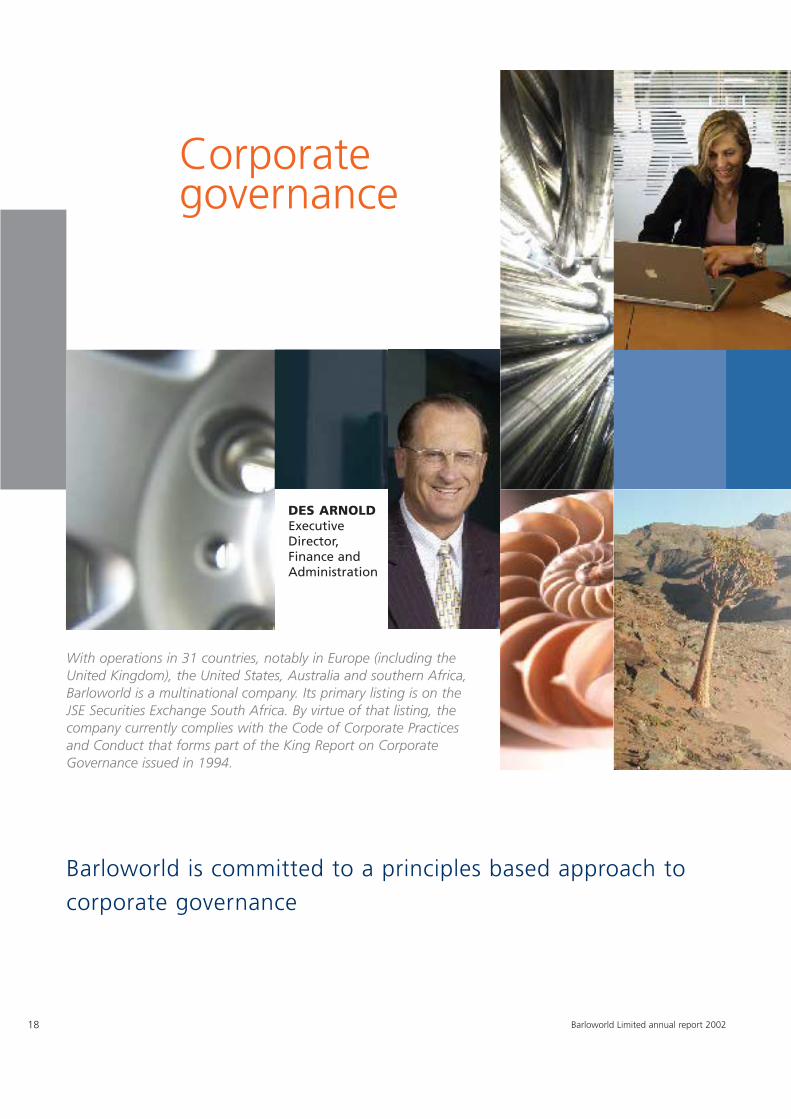
With operations in 31 countries, notably in Europe (including theUnited Kingdom), the United States, Australia and southern Africa,Barloworld is a multinational company. Its primary listing is on theJSE Securities Exchange South Africa. By virtue of that listing, thecompany currently complies with the Code of Corporate Practicesand Conduct that forms part of the King Report on CorporateGovernance issued in 1994.
Corporategovernance
Barloworld is committed to a principles based approach tocorporate governance
DES ARNOLDExecutiveDirector,Finance andAdministration
18 Barloworld Limited annual report 2002
In respect of its financial year ending
30 September 2003 and thereafter, the
company will, under the rules of the JSE
Securities Exchange, be obliged to comply
with the Code of Corporate Practices and
Conduct contained in the King Report on
Corporate Governance in South Africa pub-
lished in March 2002.
The purpose is to raise corporate accountability
to at least a level of compliance this year that will
enable the company to achieve full compliance
for the year ending 30 September 2003.
As an overseas company with a secondary listing
on the London Stock Exchange, the company is
not required to observe the Combined Code –
Principles of Good Governance and Code of
Best Practice adopted by that exchange. Where
a relevant provision of that code is an indicator
of best practice, the company will take account
of it in a balanced manner.
The company is not registered with the
Securities and Exchange Commission in the
United States and has two unsponsored
American Depository Receipt programmes.
Accordingly, the Sarbanes-Oxley Act of 2002
does not apply to it. The principles of that Act
and of the Blue Ribbon Report have been
considered in formulating corporate practices.
A philosophy of balancing disclosures to achieve
the most meaningful overall understanding of
the company’s corporate governance structures,
as well as economic (including financial),
environmental and social performance, has
been adopted. Where there are issues of special
importance in certain countries, such as South
Africa, these are discussed in greater detail in
the relevant context.
Observance of the law in all countries in
which the company operates is a minimum
requirement.
Board accountability and delegated
functions
As a unitary body, the board of directors of
Barloworld Limited seeks equilibrium between
enterprise and governance constraints. In
addition, the directors believe that the
governance principles and practices adopted
are appropriate to the company’s operations
for the benefit of shareowners and are also in
the interests of relevant stakeholders.
Specifically, the board has reserved to itself the
following responsibilities in accordance with its
charter:
• approval of the strategic plan and the annual
business plan, the setting of objectives and
the review of key risks and performance
areas, especially in respect of technology and
systems;
• appointment of the chief executive officer
and maintenance of a succession plan;
• determination of overall policies and processes
to ensure the integrity of the company’s
management of risk and internal control; and
• against a background of economic,
environmental and social issues relevant to
the company, monitoring the implementation
of board plans and strategies, as well as the
mitigation of risks by management.
19Barloworld Limited annual report 2002
While retaining overall accountability and subject
to matters reserved to itself, the board has
delegated to the chief executive officer and other
executive directors authority to run the day-to-
day affairs of the company. The board has also
created audit, general purposes, remuneration,
nomination and risk management strategy
committees to enable it to properly discharge its
duties and responsibilities and to effectively fulfil
its decision-making process.
Each committee acts within terms of reference,
under which certain functions of the board are
delegated with defined purposes, membership
requirements, duties and reporting procedures.
Board committees may take independent
professional advice at the company’s expense
when necessary. The committees are subject to
regular evaluation by the board in regard to
performance and effectiveness. Chairmen of
the board committees are required to attend
annual general meetings to answer any
questions raised by shareowners.
Board of directors
Eleven executive and nine non-executive
directors, of whom the majority are truly
independent, collectively determine major
strategies and policies. Mr MJ Levett is the
chairman and Mr WAM Clewlow is the deputy
chairman of Old Mutual Life Assurance Company
(South Africa) Limited, a substantial shareowner
in the company, while Mr SB Pfeiffer is a partner
in a law firm in the United States that pro-
vides advice to the company from time to time.
Mr RKJ Chambers retired from executive service
in 1999, as did Mr WAM Clewlow.
Effective control is exercised through the
executive directors. They are held accountable
through regular reports to the board and are
measured against agreed performance criteria
and objectives appropriate to the current stage
of the business cycle and the prospects in each
business unit. The non-executive directors are
considered to have the skill and experience to
bring unrestrained judgement to bear on issues
of strategy, resources, transformation, diversity
and employment equity, standards of conduct
and evaluation of results. In a rapidly changing
world, the mix of experience and ability of the
directorate is still believed to meet the present
and future requirements of the company.
The agenda and supporting papers are distributed
to all directors electronically prior to each board
meeting. The appropriate executive director gives
explanations and motivations for items of business
requiring decision in the meeting. This ensures
that relevant facts and circumstances are brought
to the attention of directors who, in any event,
have unrestricted access to all company property,
information and records.
Where directors or executives are based in
countries other than where a meeting is
scheduled and are not able to attend
personally, video conferencing facilities are
used to include them in the relevant
proceedings and allow them to participate in
the decisions and conclusions reached.
Seven board meetings were held during the
financial year. All of the directors attended
these meetings personally, or were included in
the proceedings through video conferencing
facilities, except as indicated in the table below:
Apologies
Date Venue tendered
22.10.2001 Johannesburg SB Pfeiffer
14.11.2001 Johannesburg DB Ntsebeza
28.01.2002 Johannesburg DB Ntsebeza
20.03.2002 London MJ Levett
20.05.2002 Johannesburg DB Ntsebeza
12.07.2002 London RKJ Chambers
25.09.2002 London DB Ntsebeza
and LA Tager
Any new appointment of a director is considered
by the board as a whole. The nominations
committee, comprising non-executive directors,
having ascertained the suitability of each
candidate and that he or she is fit and proper and
is not disqualified from being a director, submits
the nomination and assists the board in this
process. In considering the composition of the
board, competency in respect of the company’s
affairs carries as much weight as independence.
The secretary arranges an induction pro-
gramme for new directors. This includes an
explanation of their fiduciary duties and
responsibilities and visits to divisions, where
discussions with management facilitate an
understanding of the group.
Directors are appraised, whenever relevant, of
any new legislation and changing commercial
risks that may affect the affairs of the company.
In certain circumstances it may become
necessary for a non-executive director to
obtain independent professional advice in
order to act in the best interests of the
company. Such a director has unrestricted
access to the chairman, executive directors and
the secretary. Where a non-executive director
takes reasonable action and costs are incurred,
these are borne by the company.
Each director is elected by members in a
general meeting and must retire by rotation
every three years.
Executive directors retire from the board at
63 years of age whilst non-executive directors
retire at the next annual general meeting
following the director’s 70th birthday. Fees
payable to non-executive directors are
recommended by the board and fixed by the
shareowners in general meeting.
The curriculum vitae of each director of
Barloworld Limited is published on pages 26
to 29.
Barloworld Limited annual report 200220
Corporate governance continued
Having reached retirement age, Messrs
R Fernandez-Urrutia y Carles and G Ross Russell
retire at the annual general meeting to be held
on 30 January 2003 and are not eligible for
re-election.
Messrs K Brown, RKJ Chambers, MD Coward,
AJ Lamprecht, MJ Levett, DB Ntsebeza and
Prof LA Tager retire by rotation in terms of
the articles of association at the forth-
coming annual general meeting. All have
offered themselves for re-election at that
meeting.
There are no contracts of service between any
directors and the company or any of its
subsidiaries that are terminable at periods of
notice exceeding one year and requiring
payment of compensation except Messrs
PJ Maybury and K Brown. The former has an
agreement terminable by not less than two
years’ notice given by the employer or by not less
than six months’ notice given by the director,
while the latter has an agreement terminable by
not less than three years’ notice given by the
employer or by not less than six months’ notice
given by the director.
Details of remuneration, fees or other benefits
earned by directors in the past year are given
on pages 130 to 133.
Eleven meetings of the executive directors and
senior executives were held during the year.
The objective of these was to assist the chief
executive officer to guide and control the
overall direction of the business and to act as a
medium of communication and co-ordination
between business units and the board.
Chairman and chief executive officer
A key aspect of the company’s governance
philosophy is that no one individual has
unfettered powers of decision-making.
Accordingly, responsibility for running the
board and executive responsibility for conduct
of the business are differentiated. The roles of
the chairman of the board and of the chief
executive officer are separate.
The secretary
The secretary provides the board as a whole
and directors individually with detailed
guidance as to how their responsibilities should
be properly discharged in the best interests
of the company. He is also a central source of
guidance and advice to the board and within
the company on matters of ethics and good
governance. Appointment and removal of the
secretary are matters for the board as a whole.
He sees that in accordance with the pertinent
laws, the proceedings and affairs of the
directorate, the company itself and, where
appropriate, owners of securities in the
company, are properly administered. He
ensures compliance with the rules of the JSE
Securities Exchange South Africa, and other
stock exchanges on which the company’s
securities are listed, in this regard. The
secretary also assists in developing the annual
board plan and administers the share option
scheme as well as the statutory requirements
of the company’s subsidiaries in South Africa.
All directors have direct access to him at all times.
He is kept advised about all dealings by
directors and officers in shares of the company
and a report is tabled at each board meeting.
Insider trading
No employee may deal either directly or
indirectly in the company’s shares on the basis
of unpublished price-sensitive information
regarding its business or affairs. No director
or officer of the company may trade in the
company’s shares during the embargo period
determined by the board in terms of a formal
policy implemented by the secretary. A list of
persons regarded as officers for this purpose has
been approved by the board and is revised from
time to time. Periods of embargo are from the
end of the interim and annual reporting periods
to the announcement of financial and operating
results for the respective periods. A register of
directors and officers is available for inspection
at the company’s registered office in Sandton,
South Africa.
Accounting and reporting
The board places strong emphasis on achieving
the highest level of financial management,
accounting and reporting to shareowners.
Successful harmonisation with International
Financial Reporting Standards has been
achieved, whilst maintaining full compliance
with South African Generally Accepted
Accounting Practice.
Audit committee
RKJ Chambers (Chairman), WAM Clewlow,
G Ross-Russell, MJ Levett, EP Theron
The audit committee consists exclusively
of independent and non-executive directors,
including its chairman. The quorum for a
meeting is two independent directors.
The head of internal audit and the senior
audit partner in charge of the external audit
attend all meetings. They have unrestricted access
to the chairman and other members of the audit
committee. The financial director and any other
executives may, at the discretion of the chairman
of the audit committee, be invited to attend and
be heard. No attendee has voting rights.
The audit committee assists the board in
discharging its duties. These relate to the
safeguarding of assets, the identification of and
exposure to significant risks, the operation of
adequate systems and control processes and the
presentation of accurate and balanced financial
statements and reports complying with all
21Barloworld Limited annual report 2002
relevant corporate disclosure requirements and
accounting standards.
During the year under review three meetings
were held. One was focused on business and
strategic risk and control issues. In particular,
the group risk assessment process was
considered and assurance obtained from both
the internal and external auditors that
adequate internal controls and accounting
records are being maintained.
Parameters of the audit and of internal controls
are discussed between the audit committee
and the external auditors as part of the process
of each audit. The company requires the
external auditors to carry out their audit in
combination with the internal audit function.
To this end the audit committee encourages
consultation between the external and internal
auditors and ensures that meetings are
held periodically to discuss matters of
mutual interest and that working papers,
management letters and reports are
exchanged so that there is a common
understanding of audit techniques, methods
and terminology.
The audit committee requires that the
interim results should be subject to an
independent review by the external auditor.
The audit committee tables a report on the
interim results, supported by the external
auditors, at the board meeting held to
adopt the interim results. Should an
independent review not be conducted, the
audit committee would table the reasons
at the board meeting. The committee also
considers the assessment at the previous year-
end of the company’s ability to continue as
a going concern. It determines whether or
not any of the significant factors in the
assessment have changed to such an extent
that the appropriateness of the going concern
assumption has been affected.
The audit committee, with the auditors
present, reviews the audited preliminary profit
statement and the annual financial statements
before they are submitted to the board. The
facts and assumptions used in the assessment
of the going concern status of the company
are presented to the board at the meeting
approving the annual financial statements and
are minuted accordingly.
Each year, the audit committee draws up a
recommendation to the board, which is sub-
mitted to the shareowners for consideration
and acceptance at the annual general meeting,
proposing the re-appointment of the external
auditors.
It is a function of the audit committee to ensure
that the external auditors observe the highest
level of business and professional ethics and,
in particular, that their independence is not
impaired in any way.
The audit committee has set principles for the use
of the external audit firm for non-audit services
and approves the relevant fees above certain
materiality limits. Fees paid to the external audit
firm for non-audit services are disclosed in the
notes to the annual financial statements.
All members attended the committee meetings
during the year under review.
The board has determined that the audit
committee has satisfied its responsibilities for
the year under review in compliance with its
terms of reference.
General purposes committee
WAM Clewlow (Chairman), RKJ Chambers,
MJ Levett, AJ Phillips, EP Theron
The general purposes committee, comprising a
majority of non-executive directors, discusses
issues of significance to the company. It is able
to ensure that matters requiring the attention
of the directorate are submitted timeously for
proper deliberation.
During the year under review, the committee
met six times to discuss and make recommen-
dations to the board on matters impacting
the group’s strategic plan, as well as other
issues considered significant to the company’s
affairs. Annually, the committee appraises
the performance of the chairman of the
board and of the chief executive officer. The
chairman does not participate in discussions
regarding his own performance, nor does
the chief executive officer.
With the exception of Mr MJ Levett, who was
unable to attend the meeting held on
19 March 2002, all committee members
attended the meetings during the year
under review.
The board has determined that the general
purposes committee has satisfied its responsi-
bilities for the year under review in compliance
with its terms of reference.
Nominations committee
WAM Clewlow (Chairman), RKJ Chambers,
MJ Levett, AJ Phillips, EP Theron
The nominations committee makes recom-
mendations to the board on the composition
of the board and the balance between
executive and non-executive directors. Skill and
experience, demographics and diversity are
taken into account in this process.
The committee is responsible for identifying and
nominating candidates for the approval of the
board as additional directors or to fill any
vacancies when they arise. They also advise the
board on succession planning, especially in
respect of the chairman of the board and chief
executive officer.
Corporate governance continued
Barloworld Limited annual report 200222
The committee recommends for re-election
directors who retire in terms of the company’s
articles of association.
During the year under review, the committee
met six times. All committee members attended
these meetings, except Mr MJ Levett who
was unable to attend the meeting held on
19 March 2002.
The board has determined that the nominations
committee has satisfied its responsibilities for
the year under review in compliance with its
terms of reference.
Remuneration committee
WAM Clewlow (Chairman), RKJ Chambers,
MJ Levett, EP Theron
Composed entirely of non-executive directors,
this committee makes recommendations to the
board, within agreed terms of reference,
regarding the remuneration of executive
directors and senior executives as well as fees
proposed to be paid to each non-executive
director. Proposed fees, adopted by the board,
are submitted to the shareowners in general
meeting for approval prior to implementation
and payment.
The company’s philosophy is to set remuner-
ation at realistic levels in order to attract and
retain the directors and executives needed to
run the company successfully. A proportion
of executive directors’ remuneration is
structured so as to link corporate and
individual performance.
In keeping with modern corporate gover-
nance practices, the chief executive officer,
Mr AJ Phillips, has resigned from the
remuneration committee. He attends meetings
but is not entitled to vote. The chief executive
officer does not participate in discussions
regarding his own remuneration.
During the year under review, the committee
met to determine specific remuneration
packages for executive directors of the
company, including performance-based incen-
tives, and to determine criteria that will
encourage good performance, as well as
achieve fair reward for their individual
contributions.
All committee members attended the
meetings during the year under review, except
Mr MJ Levett who was unable to attend the
meeting held on 19 March 2002.
The board has determined that the remu-
neration committee has satisfied its
responsibilities for the year under review in
compliance with its terms of reference.
Strategic and business risks and internal
audit
Internal audit has been operating throughout
the group for a number of years. In the year
under review, the main audit committee
adopted a new internal audit charter that
redefined the functions, responsibilities and
authority of internal audit.
Internal audit is an appraisal function
established to independently and objectively
examine and evaluate the company’s activities
as a service to the board in particular as well as
to management. The board requires that the
internal audit process takes account of
significant strategic and business risks, thus
ensuring that internal audit plans are
appropriately risk focused.
Internal audit is responsible for:
• appraising the procedures and management
controls of business units throughout the
group;
• assisting the board and management in the
monitoring of the risk management process;
• reviewing systems and operations to assess the
extent to which organisational objectives are
achieved and the adequacy of controls over
activities leading to such achievement;
• evaluating the reliability and integrity of
management and financial information;
• appraising the utilisation of resources with
regard to economy, efficiency and effectiveness;
• assessing the means of safeguarding assets
and verifying their existence;
• ascertaining the extent of compliance with
established policies, procedures and instructions;
• recommending improvements in procedures
and systems to prevent waste and fraud;
• advising on appropriate systems of controls, as
well as accounting and operational matters;
• drawing management’s attention to any
failure to take remedial action;
• carrying out any other appraisals,
inspections, investigations, examinations or
reviews required by the board or manage-
ment; and
• co-ordinating with the external auditors to
ensure that the audit programmes are
complementary.
The internal auditor co-ordinates the internal
audit function throughout the Barloworld
group. His duties include, inter alia, liaison
with the relevant businesses and their
external auditors in order to monitor the
performance and recommend improvement of
internal audit. He reports to the main audit
committee on the effectiveness of internal
audit. He has unrestricted access to the audit
committee and its chairman. Subordinate
internal audit reports are submitted to the
audit committees of the respective divisions.
Any major issues arising are referred to the
main audit committee.
Audit plans are drawn up from time to time
to take account of changing business needs.
Follow-up audits are planned in areas where
weaknesses are found. Internal audit plans
are based on risk assessment, as well as on
Barloworld Limited annual report 2002 23
issues highlighted by the audit committee
and management and are of an ongoing
nature so as to identify residual, existing and
emerging risks.
The audit committee approves the internal
audit plan.
Risk management
In terms of a written risk management
philosophy statement issued by the chairman
of the board and endorsed by the directorate,
the company is committed to managing
its risks and opportunities in the interests of
all stakeholders. Every employee has a
responsibility to act in this manner.
An ongoing systematic, multi-tiered and
enterprise-wide risk assessment process
supports the group’s risk management
philosophy. This ensures that risks and
opportunities are not only adequately
identified, evaluated and managed at the
appropriate level in the organisation, but
also that their individual and joint impact on the
group as a whole is taken into consideration.
The risk management strategy committee,
which includes representatives of all divisions,
reviews the activities and effectiveness of the
risk management function twice yearly.
Divisional boards and senior managers carry
out an annual self-assessment of risk. This
process identifies the critical business,
operational, financial and compliance
exposures facing the group and the adequacy
and effectiveness of control factors at all levels.
The top 20 risks of the group are reported to
the board.
The annual risk assessment process is
conducted at business unit, division and main
board levels. This process ensures management
awareness of risk throughout the organisation.
The group risk management department
oversees the process from the perspective
of strategic direction, technical assistance
and management supervision. The facilitation
of the overall process is alternated every
second year between the risk management
department and an external service
provider, Marsh Inc., for the sake of
transparency. Both independent external
auditors and internal auditors check for
robustness and thoroughness in their audit
of the assessment process.
The risk tolerance levels are set at these
organisational levels, and vary depending on
the nature, scope and size of the business. The
tolerance levels are based not only on financial
impact, but also on the potential threat to the
integrity of the business as a going concern, its
reputation and the wellbeing of employees
and other stakeholders.
Development of the risk management website
into a knowledge repository assists this
process. It also provides an information data-
base for risk management and risk control
practitioners throughout the group.
As the company expands into new markets
and territories, it is faced with increasingly
complex and changing environments. By
linking the risk management process to the
principles of Value Based Management, the
risk-return trade-off is optimised, thereby
enhancing competitive advantage, growth and
the employment of capital.
Third-party management
No part of the company’s business was
managed during the year by any third party in
which any director had an interest.
Employment equity
The directors believe that economically viable
and self-sustaining employment equity is an
essential and integral part of corporate
governance within any Barloworld business
units operating in South Africa. All such
units have employment equity programmes,
which receive regular management attention.
The Employment Equity and Skills Develop-
ment Acts have provided a useful frame-
work for formalising our approach. The
formal employment equity plans comply with
the objectives and requirements of the
legislation.
Employee participation
Encouragement of employee participation is
a high priority. The company’s diverse nature,
allied to its philosophy of operational
decentralisation, makes it desirable that each
business unit executes this in a manner best
suited to its own circumstances.
Good progress has been made with the
‘Building Barloworld’ programme. Under the
supervision of senior managers, a process of
improved communication throughout the
group has increased employee awareness of
worldwide business activities and their
counterparts at various operations. Employees
in the programme have generated many
innovative solutions that add value or conserve
resources. They have also posed a wide range
of searching questions and concerns, and
executive directors have addressed these issues
timeously where appropriate.
Value Based Management, derived from an
internationally recognised model, has been
adopted by all business units. Virtually all
employees are engaged in implementing this
process.
Communication
The company subscribes to the principles of
objective, honest, timeous, balanced, relevant
and understandable communication, of both its
financial and non-financial matters. The focus is
24 Barloworld Limited annual report 2002
Corporate governance continued
25Barloworld Limited annual report 2002
on substance, not form, and communication
with stakeholders with a legitimate interest in
the company’s affairs is done sensitively and
systematically. The company regularly enters
into dialogue with institutional investors having
due regard for statutory, regulatory and other
directives prohibiting the dissemination of
unpublished price-sensitive information by the
company and its directors and officers.
In October 2001, Barloworld commenced
non-certificated dealings under the Share
Transactions Totally Electronic programme on
the JSE Securities Exchange South Africa. All
shareowners were assisted with the
implementation processes of the new system.
In line with our vision to constantly improve
our service to all our stakeholders, Barloworld
introduced online receipt by shareowners of
electronic communication for the first time.
Code of ethics
A corporate code of ethics, which outlines the
ethical and professional management practices
that Barloworld upholds, has been adopted.
Individuals and entities dealing with our
organisation are expected to demonstrate the
same level of commitment to organisational
integrity.
The integrity of new appointees to the group
is assessed by our selection and promotion
procedures. Due care is exercised in delegating
discretionary authority to individuals.
All employees are expected to adhere to the
group’s values, standards and compliance
procedures.
An independent and confidential system is
provided by which employees can report
unethical or risky behaviour. Such reports can
be submitted to:
Deloitte & Touche
Tip-Offs Anonymous
Telephone
South Africa 0800 004832
0800 007788
International +27 31 508 6371
Fax
South Africa 031 508 6760
International + 27 31 508 6760
Postal address
Tip-Offs Anonymous
Free Post DN298
Umhlanga Rocks
KwaZulu-Natal
4320
South Africa
Tip-Offs Anonymous is an independent body
within the Deloitte & Touche organisation,
which provides an opportunity to anyone
wishing to report unethical activities or
dishonest behaviour that affects the
Barloworld group. Total anonymity, if desired,
is assured.
The code of ethics is enforced with appropriate
discipline on a consistent basis and action is
taken to prevent a re-occurrence of an offence.
Our code of ethics
Obey the law
Be fair
Be honest
Respect others
Protect the environment
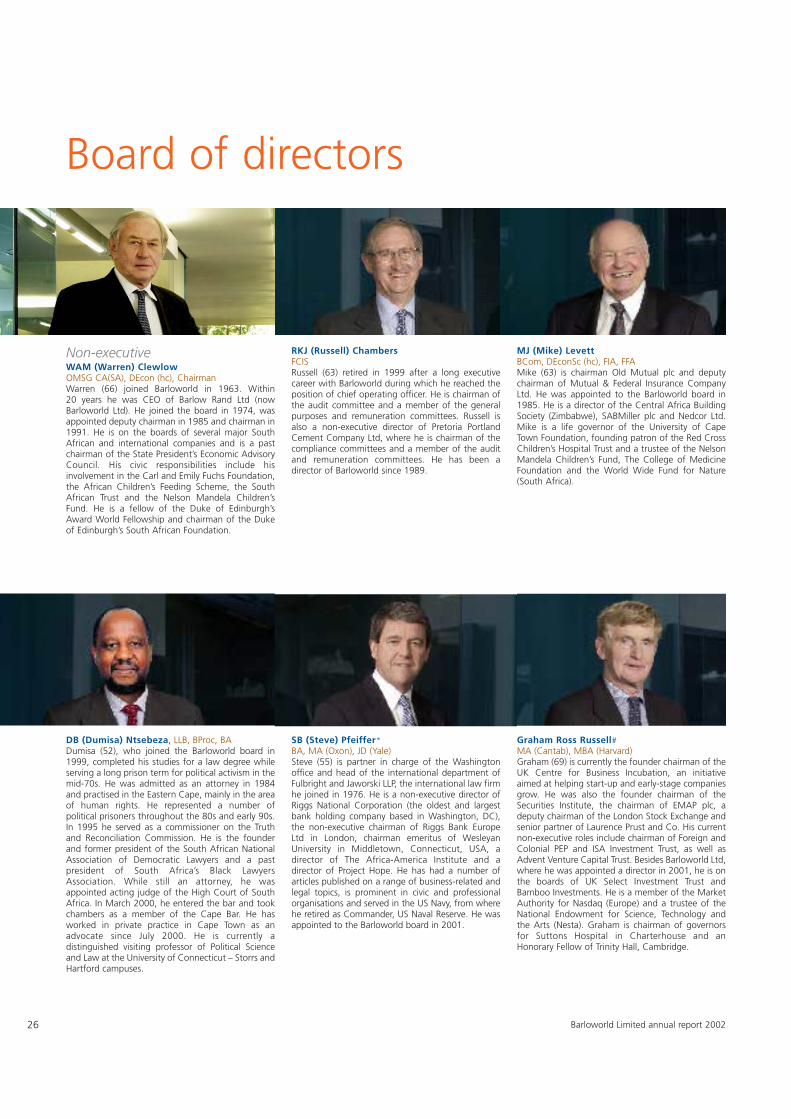
DB (Dumisa) Ntsebeza, LLB, BProc, BADumisa (52), who joined the Barloworld board in1999, completed his studies for a law degree whileserving a long prison term for political activism in themid-70s. He was admitted as an attorney in 1984and practised in the Eastern Cape, mainly in the areaof human rights. He represented a number ofpolitical prisoners throughout the 80s and early 90s.In 1995 he served as a commissioner on the Truthand Reconciliation Commission. He is the founderand former president of the South African NationalAssociation of Democratic Lawyers and a pastpresident of South Africa’s Black LawyersAssociation. While still an attorney, he wasappointed acting judge of the High Court of SouthAfrica. In March 2000, he entered the bar and tookchambers as a member of the Cape Bar. He hasworked in private practice in Cape Town as anadvocate since July 2000. He is currently adistinguished visiting professor of Political Scienceand Law at the University of Connecticut – Storrs andHartford campuses.
SB (Steve) Pfeiffer*BA, MA (Oxon), JD (Yale)Steve (55) is partner in charge of the Washingtonoffice and head of the international department ofFulbright and Jaworski LLP, the international law firmhe joined in 1976. He is a non-executive director ofRiggs National Corporation (the oldest and largestbank holding company based in Washington, DC),the non-executive chairman of Riggs Bank EuropeLtd in London, chairman emeritus of WesleyanUniversity in Middletown, Connecticut, USA, adirector of The Africa-America Institute and adirector of Project Hope. He has had a number ofarticles published on a range of business-related andlegal topics, is prominent in civic and professionalorganisations and served in the US Navy, from wherehe retired as Commander, US Naval Reserve. He wasappointed to the Barloworld board in 2001.
Graham Ross Russell#MA (Cantab), MBA (Harvard)Graham (69) is currently the founder chairman of theUK Centre for Business Incubation, an initiativeaimed at helping start-up and early-stage companiesgrow. He was also the founder chairman of theSecurities Institute, the chairman of EMAP plc, adeputy chairman of the London Stock Exchange andsenior partner of Laurence Prust and Co. His currentnon-executive roles include chairman of Foreign andColonial PEP and ISA Investment Trust, as well asAdvent Venture Capital Trust. Besides Barloworld Ltd,where he was appointed a director in 2001, he is onthe boards of UK Select Investment Trust andBamboo Investments. He is a member of the MarketAuthority for Nasdaq (Europe) and a trustee of theNational Endowment for Science, Technology andthe Arts (Nesta). Graham is chairman of governorsfor Suttons Hospital in Charterhouse and anHonorary Fellow of Trinity Hall, Cambridge.
26
Non-executiveWAM (Warren) ClewlowOMSG CA(SA), DEcon (hc), ChairmanWarren (66) joined Barloworld in 1963. Within20 years he was CEO of Barlow Rand Ltd (nowBarloworld Ltd). He joined the board in 1974, wasappointed deputy chairman in 1985 and chairman in1991. He is on the boards of several major SouthAfrican and international companies and is a pastchairman of the State President’s Economic AdvisoryCouncil. His civic responsibilities include hisinvolvement in the Carl and Emily Fuchs Foundation,the African Children’s Feeding Scheme, the SouthAfrican Trust and the Nelson Mandela Children’sFund. He is a fellow of the Duke of Edinburgh’sAward World Fellowship and chairman of the Dukeof Edinburgh’s South African Foundation.
RKJ (Russell) ChambersFCISRussell (63) retired in 1999 after a long executivecareer with Barloworld during which he reached theposition of chief operating officer. He is chairman ofthe audit committee and a member of the generalpurposes and remuneration committees. Russell isalso a non-executive director of Pretoria PortlandCement Company Ltd, where he is chairman of thecompliance committees and a member of the auditand remuneration committees. He has been adirector of Barloworld since 1989.
MJ (Mike) LevettBCom, DEconSc (hc), FIA, FFAMike (63) is chairman Old Mutual plc and deputychairman of Mutual & Federal Insurance CompanyLtd. He was appointed to the Barloworld board in1985. He is a director of the Central Africa BuildingSociety (Zimbabwe), SABMiller plc and Nedcor Ltd.Mike is a life governor of the University of CapeTown Foundation, founding patron of the Red CrossChildren’s Hospital Trust and a trustee of the NelsonMandela Children’s Fund, The College of MedicineFoundation and the World Wide Fund for Nature(South Africa).
Barloworld Limited annual report 2002
Board of directors
Barloworld Limited annual report 2002 27
# British, * AmericanFor ease of cross-reference, all Barloworld-related companies referred to in these profiles have been incorporated using the current names of the businesses rather than the names in use atthe time.
LA (Louise) TagerBA, LLB, HDip Tax Law, LLM (Harvard)Louise (66) has been a director of Barloworld since1992. Rising to prominence as executive director fora decade from 1985 on the groundbreaking LawReview Project, she now serves, and has served, onnumerous bodies in both the public and privatesectors. She has been recognised for her manyachievements across a broad spectrum of activities inpublic and private sector business, as well as inacademic life, where she has published extensively.She was the first woman to be appointed dean ofany faculty in a South African university and the firstto head up a parastatal enterprise in South Africa.
EP (Eddie) TheronBCom, LLB, FIBSAEddie (61) played a major role in banking in SouthAfrica during his career. He was one of fiveexecutives involved in the formation of StandardMerchant Bank and retired as group chief executiveof Standard Bank Investment Corporation Ltd in1995, following which he was appointed as a non-executive director. He was appointed to theBarloworld board in 1996 and also holds non-executive directorships on the boards of TheStandard Bank of South Africa Ltd, Mutual andFederal Insurance Co Ltd, and Pretoria PortlandCement Company Ltd.
RC (Robert) Tomkinson#MA, FCA, FCTRobert (61) has been a non-executive director ofBarloworld since 2001. He was group financedirector of Electrocomponents plc, the majorelectronic and electrical distribution group, from1986 until his retirement in 1997. Prior to that hewas group finance director of Automotive Productsplc. His earlier career was spent in the energyindustries and merchant banking. He is the non-executive chairman of Pittards plc, of KIG HoldingsLtd and of the Council of the University ofBuckingham and a non-executive director of UGCLtd (The Unipart Group of Companies).
Executive directorsAJ (Tony) Phillips#BSc (Eng), Chief Executive OfficerTony (56) joined Barloworld in 1968 and has spentmost of his career in the capital equipment business,initially in Africa and then in Spain. He made his markwhen between 1992 and 1995, he led theturnaround to profit of the then listed Spanishsubsidiary, Finanzauto SA. He was appointed to theBarloworld board in 1995 and became CEO on1 August 1999. He is a trustee of the Jane GoodallInstitute (South Africa), the Bright Kid Foundation(Edutainers) and Business Against Crime. Tony is onthe board of governors of Michaelhouse inBalgowan, KwaZulu-Natal, the Advisory Council ofthe University of the Witwatersrand School of Civiland Environmental Engineering and is a director ofNOAH (Nurturing Orphans of AIDS for Humanity).
DC (Des) ArnoldCA(SA), FCMA, AMP (Wharton), Executive Director,Finance and AdministrationDes (62) joined Barloworld in 1967 and held anumber of senior financial positions whichculminated in his appointment to the board in 1993.He has been a leading light in the accountancyprofession in South Africa for many years, is a pastpresident of the South African Institute of CharteredAccountants (SAICA) and has been awardedhonorary life membership in recognition of hisservices to the profession. Internationally he hasrepresented SAICA on the Financial andManagement Accounting Committee of theInternational Federation of Accountants and is a pastpresident of the East, Central and Southern AfricanFederation of Accountants.
Ken Brown*Chief Executive Officer, Industrial DistributionKen (60) joined Barloworld in 1967 and rose throughthe Materials Handling business in the UnitedKingdom before being transferred to the UnitedStates in 1980. There he has played a major role inthe development of the US Materials Handlingbusiness, managing a series of acquisitions. In 1992he was appointed chief executive of the MaterialsHandling Division of Barlow’s then UK-listedsubsidiary, J Bibby and Sons, joining the Barloworldboard in 1997. He has served three terms on theHyster Dealer Council and is a past director of the USMaterials Handling Equipment Dealers Association, amember of the Advisory Board, British AmericanBusiness Council of North Carolina and the Charlotte(NC) Chamber of Business. He is also a past chairmanof the Piedmont Employers Association.
28
MD (Mike) CowardCA(SA), Chief Executive Officer, Steel TubeMike (49) joined Barloworld in 1977 and worked onthe financial side of the business, in the mining,electronics, steel and ferro-alloys disciplines, beforemoving across into an operational management rolein 1990. In 1992 he was appointed to head the SteelTube operations of the company as managingdirector of Barloworld Robor and was appointed tothe Barloworld board in 1995.
LS (Lester) Day#CA(SA), Chief Executive Officer, Capital Equipment –Southern Africa, Bulgaria and SiberiaLester (56) joined Barloworld in 1973 and worked inthe capital equipment operations in South Africa,Zimbabwe and the United Kingdom, as well asholding a senior financial role at the Barloworld headoffice. In 1994 he was appointed financial directorof Barloworld Equipment. A year later he wasappointed managing director of the same businessunit and joined the Barloworld board in 1998.
BP (Brandon) DiamondACIS, MBA, Chief Executive Officer, MotorBrandon (51) joined Barloworld in 1970. He initiallyworked in the Capital Equipment business fulfillingvarious roles in accounting and finance. In a variedcareer he has been managing director of BarlowShipping Services and later Circle Freight as well asBarloworld Namibia. He was appointed chief executiveofficer of Barloworld Motor in 1994 and hisappointment to the Barloworld board took effect in2001.
Barloworld Limited annual report 2002
Board of directors continued
# British, † SpanishFor ease of cross-reference, all Barloworld-related companies referred to in these profiles have been incorporated using the current names of the businesses rather than the names in use atthe time.
Ramon Fernandez-Urrutia†Doctorate in Industrial Engineering, Chief ExecutiveOfficer, Capital Equipment – Spain and PortugalRamon (64) joined Barloworld in Spain in 1965 andwas appointed after-sales area director (parts andservice) in 1970. In 1981 he was appointed asgeneral manager and in 1989 he was designated ashead of the subsidiary companies in Spain andPortugal. In 1994 he returned as BarloworldFinanzauto´s deputy general manager, remaining ashead of the subsidiaries. In 1996 he was appointedBarloworld Finanzauto´s managing director,president of Barloworld STET and a board member ofBarloworld plc. His appointment to the Barloworldboard took effect in 2001.
JE (John) Gomersall#CA(SA), Chief Executive Officer, Cement and Lime,and Chairman, Barloworld LogisticsJohn (56) joined Barloworld in 1971 and hascompleted 30 years in capital intensive commoditybusinesses. He started his career in the stainless steeland ferrochrome industries, culminating in hisappointment as group managing director ofMiddelburg Steel and Alloys (Pty) Ltd in 1986. Hejoined the Barloworld board in 1989 and moved intothe Cement and Lime business segment as groupmanaging director of Pretoria Portland Cement in1992. In 1990 he led the business team that createdthe Middelburg Peace Forum, which was the rolemodel for the National Peace Accord in South Africa.He is a past deputy president of the InternationalChrome Development Association, headquartered inParis, and past chairman of the South AfricanCement and Concrete Institute.
AJ (André) LamprechtBCom, LLB, PED – IMD, Executive Director, Namibia,Botswana, Human Resources and Social InvestmentAndré (50) practised as an advocate of the HighCourt of South Africa prior to joining the company in1981. From 1983, he played a leading role insteering the company through a turbulent decade ofpolitical transition into a post-apartheid South Africa.He was appointed to the Barloworld boardin 1993, assuming responsibility for the company’sinterests in Namibia and Botswana in additionto human resources, social investment and otherresponsibilities. He has served on numerouspublic bodies and is a past chairman of BusinessSouth Africa, immediate past president ofDie Afrikaanse Handelsinstituut, and member of theStanding Committee on Economic Policy and amember of the Minister of Finance RetirementFunds Advisory Committee. He is also a director ofthe National Business Initiative, trustee of BusinessTrust, business convenor of the Trade and IndustryChamber of the National Economic Developmentand Labour Council (Nedlac). He is a longstandingsenior member of the Standards Committee of theInternational Labour Organisation.
29
Capital EquipmentSOUTHERN AFRICA, BULGARIA ANDSIBERIA
Peter Bulterman (47), HND Mech Eng, GroupOperations Director. 27
Anton Fourie (44), MDP, General PartsManager. 24
Kenny Gaynor (44), CA(SA), FinancialDirector. 10
Chris Gibb (53), EDP, Managing Director,Mining. 33
Gordon Hall (61), NTC Mech, GeneralManager and Director, Siberia. 34
Jackie le Roux (44), BCom, Human ResourcesDirector. 9
John McCarthy (59), CA(SA), FinancialDirector, Barloworld Equipment, UK. 33
Charles Nell (45), MBA, Chief InformationOfficer. 22
Geoff Tucker (51), CA(Zim), ManagingDirector, Handling and Energy. 21
Rodney Wainwright (51), HND Mech Eng,Managing Director, Construction and Africa. 33
SPAIN AND PORTUGAL
Graeme Lewis (42), MA, ACA, FinancialDirector, Spain and Portugal. 7
Alfonso Moraga (62), Business Admin,Development Director, Spain. 48
Fernando Pastor (61), Degree in Law andPolitics, Power Systems Director, Spain. 35
Alberto Garcia Perea (51), Degree in Law,Human Resources Director, Spain. 30
Guillermo Romero (61), Degree in Law, LargeMachine Sales Director, Spain. 32
Santiago Salazar Coronado (51), BCom,General Director, Portugal. 26
Luis Salgado (64), Business Admin, GeneralMachine Sales Director, Spain. 40
Victor Salzmann (56), BCom, After Sales andInformation Systems Director, Spain. 33
Fabriciano Velasco (60), Industrial Eng,Materials Handling Sales Director, Spain. 35
Industrial DistributionKeith Hay (54), CA, Managing Director,Barloworld Handling UK. 28
James Holmes (42), BSc BusinessAdministration, Vice-president, CorporateServices. 11
Robert Russell (42), BSc Accounting, CPA,Group Director of Finance. 15
Stan Sewell (47), BA, President, BarloworldHandling Inc, USA. 17
Scott Simmons (46), BSc Accounting, CPA,President, Barloworld Freightliner. 22
Rob Tennant (45), BSc, MSc, CPIM, APICS,Chief Information Officer. 23
MotorRocky Cloete (58), CA(SA), Group FinancialDirector. 26
Martin Laubscher (42), BCompt (Hons), CTA,MCom Bus. Management, Director, FranchiseOperations. 15
Bob Smith (53), BEcon, CA(SA), Director, Non-franchise Operations. 9
Global management
Note: The first figure after each name (in brackets) is their age at date of publication of this report. The second figure is the number of years’ service they have with Barloworld.
PJ (Peter) Maybury#MA (Oxon), MCom, Chief Executive Officer, ScientificPeter (58) was educated at Oxford and Birminghamuniversities and spent the early part of his career withTurner and Newall plc, the engineering andautomotive group, in a variety of commercial andgeneral management roles. He joined Barloworld in1984 as commercial director of the Laboratorybusiness and was appointed managing director in1985. He has been chief executive officer of theScientific division since 1998 and was appointed tothe Barloworld board in 2001.
PM (Peter) SurgeyBA, LLB, Chief Executive Officer, CoatingsPeter (47) joined Barloworld from the legalprofession in 1983 and worked in the humanresources and industrial relations arenas until hisappointment as managing director of Plascon Inksand Packaging in 1990. In 1992, he became chiefexecutive officer of Barloworld’s Coatings businessand was appointed to the Barloworld board in 1995.He is a board member of the Business Against Crimeinitiative in South Africa and a past president andcurrent board member of the NOVA Paint Club, analliance of international paint manufacturers.
Barloworld Limited annual report 2002
30 Barloworld Limited annual report 2002
John Smith (60), Non-franchise Director. 20
Andrew Weight (56), CPA, FAICD, FCIS,Chief Executive Officer, Australia. 17
Chris Whitaker (45), BCom, LLB, Director,Strategy. 14
Cement and LimeJohn Blackbeard (45), BSc (Mech) Eng (Hons),Dip Bus Man, Chief Operating Officer. 6
Rod Burn (48), BProc, BA (Hons) Psych,Director Organisational Performance. 15
Harley Dent (51), BSc (Hons), BCom, Data-metrics Diploma, Director Strategic Projects. 24
Deon Heyns (46), BEng (Mech), ManagingDirector, PPC Lime. 18
Peter Nelson (48), BCompt (Hons), CA(SA),Director Finance and Administration. 2
Tony Parry (42), BA (Hons), MBA, ChiefInformation Officer. 13
Scientific ProductsBlake Fennell (37), MBA (Pepperdine Univ),Chief Executive Officer, Melles Griot. 12
Phil Horsfield (55), BA (Hons), ACMA,Finance Director. 15
Eugene Smith (41), MA (Cantab), ACMA,Chief Financial Officer, Melles Griot. 20
John Whitehouse (54), FMS, MCMI,Managing Director, laboratory products. 13
Ed Wynn (46), BSc, MBA, Dip CIM, Sales andMarketing Director, laboratory products. 8
CoatingsMike Christie (46), BA, MBA, Nat Dip CostAcc, Managing Director, Barloworld PlasconSA. 13
Peter Esterhuysen (46), BCom, BAcc,CA(SA), Group Financial Director. 6
Ebrahim Mohamed (48), BA, STD BCom,Executive Director, Barloworld Plascon SAand Managing Director, Barloworld PlasconAfrica. 20
Garth Smart (45), BA, LLB, MBA, ManagingDirector, Barloworld Coatings Australia. 15
Doug Swanson (50), BA, MBA, ManagingDirector, Barloworld Plascon Automotive. 27
Steel TubeCharles Bester (46), BA Soc Sc (GPP), HumanResources Director. 16
Geoff Colloty (54), BEcon, Group MarketingDirector. 30
Ben de Klerk (48), CA(SA), BCompt (Hons)/CTA, Managing Director, Barloworld RoborTube. 6
Rex Hilligan (53), Managing Director,Barloworld Robor Open Sections. 8
Pieter Liebenberg (56), BCom, MBA,Managing Director, Barloworld Robor PipeSystems. 30
Geoff Pallister (60), MSc (Eng), Pr Eng,Group Projects Director. 29
Bill Skillicorn (52), CA(Zim), MDP, ManagingDirector, Barloworld Robor Precision Tube. 22
Alwyn Smith (37), BAcc, MPhil (Oxon),Managing Director, Barloworld SST. 7
Ian Stevens (52), BCom, CA(SA), GroupFinancial Director. 18
Ian Walters (53), BCom, MBA, InformationSystems Director. 21
LogisticsBarry Saxton (59), PMD (Harvard), MarketingDirector. 1
Paul Stuiver (45), BEng (Met), Chief ExecutiveOfficer. 19
Mark Tarlton (43), BSc Eng, MBL, Director,Supply Chain Technology. 15
Francois van Rensburg (37), CA(SA),Financial Director. 6
John Williamson (57), CA(SA), Director,Supply Chain Management. 1
Corporate Operations and Financial ServicesPaul Acott (57), BA (Hons), FCA, GroupInternal Auditor. 21
Andrew Bannister (45), BBusSci(Hons),CA(SA), ACA, Finance Director, BarloworldHoldings Plc. 17
Charles Barnard (38), Manager BusinessDevelopment and Corporate Social Investment. 8
Mike Barnett (60), H Dip Tax Law, H Dip CoLaw, Group Company Secretary. 22
Gary Berndt (43), BA, LLB, MBA, Group LegalAdviser. 14
Tim Bird (56), BSc (Econ), Managing Director,Paper. 20
Arthur Christie (60), CA(SA), GroupRetirement Benefits Manager. 34
Terry Dearling (43), BA, Head of InternalCommunication. 8
Liz Dougall (45), BCom, PGDip Tax, CA(SA),Group Taxation Manager. 3
Mark Drewell (40), MA (Oxon), Head ofCorporate Communication. 12
Mike Fahy (49), FCIS, Company Secretary,Barloworld Holdings. 15
Pieter Haasbroek (59), PhD (Econ), GroupEconomist. 14
Anthony Hardwick (42), CA(SA), ActingManaging Director and Finance Director,Barloworld Namibia. 8
Alan Knight (56), FCCA, Managing Director,Barloworld Finance. 27
Terry Knight (55), CA(SA), ManagingDirector, Barloworld Equipment Finance. 27
Clive Manby (52), BCom, CA(SA), Head ofCorporate Planning. 25
Ivan Martin (61), ACII, CIP, Group Risk andInsurance Manager. 8
Jim Murphy (49), BSc, MBChB, DOH,Occupational Health Manager. 18
Marshall Murton (61), FCIS, HDip Tax Law,FSRM (SA) Group General Manager,Administration. 43
Dave Powell (56), BSc, Chief InformationOfficer. 29
Frank Pretorius (49), CA(SA), Director,Barloworld Leasing. 21
Clive Thomson (36), BCom (Hons), CA(SA),MPhil (Cantab), Group Financial Manager. 5
Peter Stevenson (50), CA(Zim), FPCA (Bots),Managing Director, Barloworld Botswana. 23
Pieter van Dam (46), BSc (Civil) Eng, MBA,Group Strategy Facilitator. 3
Johan van Wyk (39), CA(SA), Group FinancialController. 12
Willie van Zijl (49), Executive: EmploymentLaw. 14
Note: The first figure after each name (in brackets) is their age at date of publication of this report. The second figure is the number of years’ service they have with Barloworld.
Global management continued
31
The goodwill of ourcustomers, principals,employees, intermediaries,and other stakeholderssurrounding them, was vitalto our past success and willremain so.
Economic reconstruction after World War ll
and subsequent development generally
towards a more widely prosperous world have
been enhanced through sensible application of
the principles of the United Nations Universal
Declaration of Human Rights. These principles
have been complemented by many other
international and national conventions.
Together, these affect all aspects of human
existence. However, the world has seen that,
inevitably, there have been, in some quarters,
various practices that undermine human
dignity and ravage irreplaceable natural
resources.
There is growing awareness that a concerted
effort is needed to minimise or eliminate
unnecessary harmful effects on human life and
the environment, now and in the future. The
United Nations is the main sponsor worldwide
of what has become known as Sustainable
Development. The South African Constitution
enshrines the concept and the South African
Human Rights Commission has a monitoring
role. In addition, the JSE Securities Exchange
South Africa, on which the company has its
primary listing, requires compliance with the
Code of Corporate Practices and Conduct
contained in the King Report on Corporate
Governance in South Africa issued in March
2002. In turn, this code has endorsed the
Global Reporting Initiative guidelines on
sustainable development.
As a multinational company headquartered
in South Africa, Barloworld accepts that good
corporate governance includes an imperative
to demonstrate to those impacted by the
conduct of its business that it is a good
corporate citizen at home and abroad. Like
other responsible multinationals, the company
will observe the Global Reporting Initiative
guidelines. These are achieving wide
international recognition.
Most of the core indicators in those guidelines
are addressed below as the first stage in
meeting the company’s obligation to report
fully under them by 2003. In doing so,
operations generating at least 85% of turnover
in each division are discussed.
Initially the emphasis has been placed on
description and the creation of understanding
of how each division interacts with the world
around it. As more detailed information
becomes available and statistics are collated,
the impact and responsibility reporting will be
enhanced until conformity with the Global
Reporting Initiative guidelines has been
accomplished.
The Barloworld Code of Ethics, policies,
procedures and, where applicable, details of
agreements with trade unions are
communicated to employees. This is to assist in
ensuring that fundamental human rights and
principles of the core labour conventions of the
International Labour Organisation are upheld.
Consequently in the group, inter alia, freedom
of association is protected and promoted while
discrimination, child and forced labour are not
tolerated. These principles apply equally to the
supply chain.
In support of the Barloworld Code of Ethics,
policies against conflicts of interest and
acceptance of bribes are enforced.
Capital equipment
The division has two operations:
• Southern Africa and Central Europe, directed
from Johannesburg; and
• Spain and Portugal, directed from Madrid.
Products and services are provided mostly to
corporate and private retail customers, for pur-
poses of mining, public works, construction,
marine, transport and agricultural applications,
Impact andresponsibilityreport
Barloworld Limited annual report 2002
as well as prime and stand-by electrical power
generation.
The southern African and central European
operations are conducted in Angola,
Botswana, Bulgaria, central Siberia in Russia,
Lesotho, Malawi, Mozambique, Namibia, South
Africa, Swaziland, Zambia and Zimbabwe.
Communities with an interest in, or who might
be affected by, the division’s activities are
predominantly in urban or mining areas.
The division’s products in southern Africa
include Caterpillar earthmoving and electrical
power generation equipment, Hyster materials
handling equipment, Perkins diesel engines,
Ingersoll rotary blasthole mining drills, Dezzi
articulated dump trucks, Bitelli vibratory
compactors, Circon power systems, Massey
Ferguson tractors, Claas harvesters and
combines, and Flemingo compressed air
product rentals and services. In Siberia,
Caterpillar earthmoving, power generation and
marine equipment is distributed.
Caterpillar handling equipment is also
distributed in Spain and Portugal; Atlet, OMG
and Quadra handling equipment in Spain only
and Mitsubishi handling equipment in Portugal
only. In Spain and Portugal Fantuzzi and
Reggiane container and port handling
equipment and Mak marine and terrestrial
engines are distributed.
As a dealer in these products, which are
sourced from original equipment
manufacturers, the company provides full
back-up to the equipment by providing parts
and maintenance services. There is little
reliance on outsourcing of services.
Comprehensive hand-over procedures are
followed on delivery of equipment. Training
is given to operators of such equipment. A
24-hour back-up service is provided. Technical
staff are permanently based on mining
properties and marine applications of some
customers.
Customer satisfaction is measured through
periodic independent surveys. Although
operations are geographically fragmented, any
complaints are dealt with expeditiously and
monitored by management.
The original equipment manufacturers are
mostly of international repute and comply with
international standards and norms. Proper pre-
delivery inspections and servicing ensure that
customers receive reliable products.
The division has established long-term
relationships with the main original equipment
manufacturers. In respect of more recently
acquired distributorships, relationships are at
various stages of development. Contractual
terms are believed to be fair to both Barloworld
and the manufacturers. Terms of payment vary
but mostly the division pays within 30 days of
receipt of the products. All manufacturers are
fully paid in terms of the relevant contract
conditions.
Ongoing liaison with manufacturers assists
with product improvement or development.
The workforce in the division comprises 4 980
people.
In South Africa, levies are paid under the Skills
Development Act. To the extent that a
statutory skills development plan has been
developed, implemented through the adoption
of learnerships and updated for further action
in the subsequent year, grants are paid by the
government. These amounted to R1,75 million
during the year.
The division has engaged in the following
social upliftment activities in areas of South
Africa where operations are undertaken:
Barloworld Limited annual report 2002
Impact and responsibility report continued
32
33Barloworld Limited annual report 2002
• An emerging contractors programme
• Street Children Programmes in New
Germany, KwaZulu-Natal (and also in
Malawi)
• Distribution, through the Nelson Mandela
Children’s Fund, of 160 personal computers
to disadvantaged schools
• Training, as artisans and machine operators,
of dependents of employees
• A bursary scheme for children of staff
Formal health and safety committees,
comprising management and worker repre-
sentatives, exist at major operations in South
Africa. Their activities are conducted in
accordance with the requirements for IS0 9002
and IS0 14001 accreditation. Several sites are
IS0 9002 accredited and one is working
towards IS0 14001 accreditation. The
regulations of the National Occupational Safety
Association are also complied with in South
Africa.
All local health and safety regulations in Spain
and Portugal are managed and observed
through a joint management and employee
committee which also includes union
representatives.
Within the Barloworld policy on HIV/Aids,
30 employees have been trained as in-house
counsellors for patients. Advice on preventing
infection and personal management of the
condition is communicated to all South
African employees in terms of a programme
conducted annually. Approximately 90% of
employees belong to a medical aid
scheme/health insurance that provides anti-
retroviral medication.
The division conducts its operations mostly in
industrialised or urban areas. These operations
have minimal impact on terrestrial, fresh water
and marine environments.
In southern Africa, some 800 000 litres of oil
are used annually in respect of products sold or
serviced, while 2,4 million litres of water are
used for cleaning and domestic purposes.
There have been no significant discharges of
used water. Through its service function, the
division receives used oil. This is disposed of to
a registered oil disposal company in southern
Africa. Sludge is removed to a designated
waste dump by an outside transporter. Scrap
metal is sold to dealers. Disposal of
consumables, clothing and packing materials is
also undertaken.
The equivalent details for Spain are:
Oils 178 800 kg
Batteries 44 919 kg
Tyres 22 350 kg
Filters 22 955 kg
Effluents 745 280 kg
Scrap metal 726 006 kg
Other 45 529 kg
All items arising from servicing activities in Spain
and Portugal are disposed of in compliance with
relevant legislation. There have been no
significant spills of either oil or sludge.
Electricity for operations is obtained from
Eskom in South Africa. Electricity is provided by
local suppliers in Spain and Portugal.
Diesel generating sets are rented to customers
for prime or stand-by power purposes.
No fines were imposed for non-compliance
with relevant international, national, regional
or local regulations in respect of environmental
matters.
Industrial distribution
The division distributes mainly industrial
equipment and long-haul trucks to a broad
range of customers in the United States and
the United Kingdom. Many are Fortune 500
corporates and other relatively small
independent owner or operator type
businesses.
Operations are conducted in the United States,
the United Kingdom and Belgium. Some 25%
of sales in the United States and about 75% of
sales in the United Kingdom are financed
through a finance company operated by the
division.
Products distributed include Hyster materials
handling equipment, Freightliner and Sterling
trucks, Ditch Witch trenching equipment and
Lamson vacuum conveyance systems. In
respect of each product, the division is
awarded a dealership by the manufacturer. The
area covered by such dealership is determined
by the manufacturer. There are no joint
ventures or outsourced operations.
As a dealer in these products, which are
sourced from the manufacturers, the division
ensures full back-up to the equipment by
providing parts and service. Safe usage by the
customer is supported by reference to the
manufacturer’s comprehensive operating
34 Barloworld Limited annual report 2002
guidelines distributed with each product. For
industrial products, such as lift trucks,
comprehensive operator training is provided
for customers who choose to use it.
All advertising is done within legally accepted
bounds for ethical behaviour.
Guarantees in respect of each product are
fulfilled by the respective manufacturers. In
addition, customers can expect and obtain
prompt and reliable service in terms of
guarantees given by the division.
Various methods measure customer satis-
faction. These include independent surveys
commissioned by the relevant manufacturer.
Semi-annual meetings are regularly held with
major customers identified by volume of
annual sales. This is additional to day-to-day
contact by management with customers.
Complaints may be received in partnership
meetings with some customers or be received
directly. These also reflect the level of
satisfaction and are monitored to ensure quick
and full resolution.
Dealership agreements with manufacturers
establish clear expectations for supply of
products. The division pays, in accordance
with the respective agreements, within 30 to
45 days of receipt of the products. The division
participates in dealer groups sponsored by
manufacturers to provide feedback on possible
product enhancements.
The division employs 3 122 people.
Occupational deaths, injuries and other
incidents are reported in the United States
to the Occupational Health and Safety
Administration. In the United Kingdom, these
are reported to the health and safety executive.
In conjunction with independent consultants,
annual audits are conducted to identify where
safety practices might be deficient.
Training of employees is conducted in the
division, with emphasis on technical skills. Each
business has between two and five technical
trainers. They conduct sessions that facilitate the
acquisition by employees of the skills necessary
for effective performance of the service
business. Training resources of the division’s
suppliers and local technical schools are used
to provide training for non-technical staff. In
the materials handling operations in both the
United States and the United Kingdom, this
averaged 20 hours per employee during the
year. Technical employees received between
24 and 26 hours and others 16.
A formal programme for up to 35 apprentices
at one time is conducted in the United
Kingdom. A local technical college has been
contracted by the Freightliner business to
train apprentices. The first course will have
10 participants.
Direct training costs in the past year amounted
to £1,4 million in the United Kingdom and
$416 000 in the United States.
The division regularly reviews the practices of
competitor dealers and participates in trade
association surveys to ensure that employee
benefits are in line with competitive and
national norms. In the United States, annual
executive, management and worker pay
average $125 000, $50 000 and $31 000
respectively.
Complementing the Barloworld policy, the
division has its own equal opportunity
policy. This is designed to comply with United
States governmental requirements for
employment and employment practices
towards minority groups and women. In the
United States reports showing current
employment by ethnicity and gender are filed
annually with the government.
Each employee receives an employment
handbook containing an overview of
employment policies. These include equal
employment opportunities, anti-discrimination
and human rights policies and guidance on
their enforcement. New employees attend
orientation and induction programmes. Appeal
practices available to an employee are also
included. No retaliation may be taken against
an employee who files a complaint.
Each employee who might possess confidential
information signs an agreement governing
dissemination of that information. This
includes customer confidentiality.
Employee benefits within operations in the
United States include a retirement savings plan,
health and life insurance, sick pay provisions,
holiday and vacation allowances, uniform
allowances for hourly paid workers and tool
insurance for the technical workforce. A tuition
reimbursement programme, established in
1995, is offered for employees who choose to
further their education in anticipation of
improving their current work performance or
moving into positions of greater responsibility.
Employees are reimbursed for 80% of tuition
costs of classes or work completed at
accredited institutes of higher learning.
In the United Kingdom, all employees earn well
above the statutory minimum wage. A pension
scheme, sick pay provisions and a holiday
entitlement are also provided.
Employee surveys are conducted by
independent contractors on site. Compensation
Impact and responsibility report continued
35Barloworld Limited annual report 2002
and benefits, working conditions, safety,
supervision, senior management and
communication are covered.
The division strongly supports activities where
employees involve themselves in community
assistance or involvement in public schools
with their children. Contributions are made
towards community service projects and many
employees volunteer to serve in such projects.
The division conducts its operations in
industrialised or urban areas. These operations
have minimal effect on any biodiversity-rich
habitats, fresh water or marine environments.
Certain of the products sold to customers
emit greenhouse gases. The emissions are not
measured.
Waste arises from servicing of manufacturers’
products and consists mainly of used motor oil
and fluids, scrap tyres and batteries. Certified
waste management companies are contracted
to remove and discard such waste in a manner
conforming to all legal requirements. During
the year, expenditure by the materials handling
operation on waste disposal amounted to
£55 750 in the United Kingdom for general
items and £292 350 for tyres; $25 000 in the
United States for Freightliner fluids; and
$34 000 by the materials handling operations
in the United States. No spills of oils or fuel
occurred during the year. Water is used for
cleaning and domestic purposes. The quantity
is not significant and usage is not measured.
In the United States, the materials handling
operation incurred a fine from the US
Environmental Protection Agency on two
occasions as a result of mishandling of waste
oil by contracted waste management
companies. Each contractor had filed for
bankruptcy, causing the authorities to seek
restitution for clean-up from customers of
those contractors.
Motor
Corporate and retail customers, mostly in
urban communities, acquire motor vehicles
and related services provided by the division.
The division operates more than 55 motor
retail outlets in South Africa, Botswana and
Namibia. In addition, there are a number of
motor retail operations such as parts
distribution centres and sites for the sale of
used motor vehicles. It also operates a
substantial truck hire business and has
coachworks operations. These are comple-
mented by the provision of significant finance
and insurance services. Its dealerships, the
truck hire business and nine approved
coachworks operations are located in the
major cities in southern Africa. Three motor
dealerships are also operated in Melbourne
and one in Sydney, Australia. A 26%
shareholding in Avis Southern Africa is a
strategic investment that also has significant
synergies with the motor retail operations.
A wide variety of motor manufacturers’ brands
are represented. These include: Alfa Romeo,
Audi, BMW, Chrysler, Fiat, Ford, Freightliner,
Holden, Isuzu, Land Rover, Lexus, Mazda,
Mercedes-Benz, Mini, Mitsubishi, Nissan, Opel,
Subaru (sole importer to South Africa), Suzuki,
Toyota, Volvo and Volkswagen. A finance and
insurance package is available and marketed
under the brand name ‘Optimum’. All of the
represented manufacturers are based outside
South Africa. Some have manufacturing or
assembly facilities in South Africa.
These manufacturers are of international
repute. They comply with international
standards and norms. Supply of vehicles is
largely at the discretion of the relevant
manufacturer. Proper pre-delivery inspections
and servicing confirm that customers receive
reliable products. Product development or
improvement suggestions are transmitted
through dealer councils. Dealer influence on
the manufacturers is limited.
Although these products are sourced from the
original equipment manufacturers, the division
ensures full customer care by providing parts
and maintenance services. There is little
reliance on outsourcing of services.
Customer satisfaction is measured by independ-
ent surveys, mostly sponsored by the manu-
facturers. Any complaints are dealt with
forthwith and are monitored by management.
Longstanding relationships exist with some
manufacturers. Relationships established more
recently are at differing stages of maturity. In
a very competitive sector, contractual terms
favour the manufacturers. Most supply
contracts require payment within 30 days of
delivery or, in some cases, on delivery. All
manufacturers have been fully paid in terms of
the respective contracts.
The workforce comprises 4 369 people. Total
training costs in the division were
approximately R5,6 million.
Health and safety committees, comprising
management and worker representatives, exist
at all South African operations, in terms of
applicable legislation. No work-related deaths
occurred during the year, nor were there any
serious injuries in the division.
In South Africa, there is an industrial council
dispensation governed by statute. Overall,
55% of the motor industry is unionised. In the
division, 85% of the workforce is unionised.
The SA Motor Industrial Council agreements
regulate working hours, minimum wages and
conditions of employment. Qualifications for a
position are also regulated.
South African business units are encouraged to
enter into recognition agreements with unions
in respect of members at each such unit and
collective agreements exist at a number of
dealerships within the division.
Minimum wages and conditions of
employment are regulated by law as well as
industry institutions in Australia. In Botswana
and Namibia legislation on basic terms and
conditions of employment is in place.
In addition to the training costs mentioned
previously, in South Africa, levies are paid under
the Skills Development Act. These amounted to
approximately R3,65 million. To the extent that
a statutory skills development plan, including
targets, has been compiled and lodged with the
authorities, implemented through the adoption
of learnerships and updated for further action in
the subsequent year, grants are claimed from
the government. Such claims amounted to
around R2,4 million during the year.
Training also takes place in Australia, Botswana
and Namibia. In Australia 1% of such costs are
recovered.
In addition to the general principle of being
an equal opportunity employer, the South
African and Namibian operations, in line
with legislative requirements, have formal
employment equity plans in place which are
submitted to the relevant authorities. Such
plans include targets, review mechanisms and
appropriate structures and committees.
Existing grievance and dispute procedures may
be used to regulate all work-related complaints.
Impact and responsibility report continued
Barloworld Limited annual report 200236
As the division conducts operations in urban
areas, there is no impact on sensitive terrestrial,
fresh water and marine environments.
Approximately 1,1 million litres of waste oil, as
well as rags, broken or replaced parts and
packaging accrue each year. Energy use is
negligible and there are minimal discharges of
waste water. No greenhouse gases, ozone-
depleting substances or pollutive air emissions
arise from the retail processes. Most air-
conditioning unit gases are reprocessed.
No fines were incurred in respect of
non-compliance with relevant international,
national, regional or local regulations in respect
of environmental matters.
The effects of the worldwide motor industry
are various. Most manufacturers are using
materials in vehicles that result in a high rate of
reclamation. Against this are engine emissions,
demand for fossil fuel and physical waste
like tyres, old parts and vehicles without
reclamation value.
Cement and Lime
The division supplies cement and lime related
products to the building and construction,
steel manufacturing, chemicals, pulp and
paper, sugar and mining industries, as well as
some retail outlets.
Interfaces with customers, external market
surveys, and toll-free lines are used to
measure customer satisfaction. A retail training
programme was conducted for 756 customers
and sales staff to improve understanding
of different uses of cement products. The
course was conducted by correspondence.
Those with average marks of 50% or higher
received certificates. There were 201
certificates awarded. Sales consultants who
generated support for the programme were
awarded prizes.
Tankers, silos and packaging are labelled to
explain use and any safety precautions.
The division operates in South Africa,
Botswana and Zimbabwe. Its manufacturing
processes use cementitious and lime raw
material inputs. These are extracted in mining
operations. Factories are established near or with
convenient access to the relevant ore bodies.
The division has 3 300 employees.
Sustainable development is about ensuring a
better quality of life for everyone, now, and for
generations to come.
The division is committed on an ongoing basis
to sustainability by the implementation of an
integrated proactive systems approach to
environmental management. It increasingly
broadens its efforts to include social and
economic considerations and is building a
culture to improve competitiveness, increase
internal efficiencies, gain regulatory advantage
and enhance stakeholder relationships.
The division considers it imperative to reduce
the negative impacts of its business activities
on employees, the environment and society at
large. Regular assessments continually re-
examine key performance areas.
Sustainable use of non-renewable resources
The division constantly strives to create wealth
from mining and processing of minerals whilst
minimising environmental effects along the
entire value chain. By adopting a responsible
materials management approach, including
avoiding waste and finding ways of recycling,
it aims to preserve the ability of future
generations to also meet their needs.
• The Environmental Management Programme
Report amendments for mining extensions at
the Riebeeck and Dwaalboom factories have
been approved by the Department of
Minerals and Energy as a means of better
meeting closure and rehabilitation
commitments.
Barloworld Limited annual report 2002 37
38
• The closure and rehabilitation commitments
and end-use objectives for the Pienaars River
operation have been met. These included
making safe and rehabilitating the mining
areas, demolition of mining infrastructure,
upgrading the residential infrastructure and
application for the proclamation of the
village. A closure certificate has been issued
in terms of section 12 of the Minerals Act.
This is a first for the division.
• An extensive redesign and upgrade of the
fresh water dam wall and spillway at
Laezonia was done to ensure dam safety and
to protect an asset for the community after
the life of the mine.
• Closure and decommissioning of the Loerie
operation is progressing. Rehabilitation is
90% complete. This includes demolition of
the mining infrastructure, combating invasive
vegetation, site rehabilitation, drainage and
run-off control, riverbank protection, an
extensive revegetation programme and
maintenance of buildings and infrastructure
required in terms of the end-use plan.
Financial and environmental consultants
have been commissioned to formulate a
sustainable end-use and business plan
for the site after closure. The project has
been nominated for an Excellence in
Mining Environmental Award in the category
of mines in the decommissioning and
closure phase.
Energy efficiency and recycling
During the year, the division utilised as fuel for
kilns at various locations some 60 000 tons of
secondary materials, which would have been
landfilled as waste. This resulted in removal of
waste from the environment, and a reduction
in coal consumption. There was a reduction in
carbon dioxide emissions.
Use of extenders, such as fly ash and slag, adds
value and lengthens the life of the mines,
simultaneously absorbing industrial wastes
from the environment. While producing the
required tons of finished product, some
55 000 tons of alternative raw materials have
been used to replace limestone as a raw
material in the manufacturing process.
With the introduction of each secondary
material, extensive trials are conducted to as-
certain the nature of the environmental impacts
and to ensure that the quality of products is not
negatively affected. Authorisations for the use
of secondary materials are obtained after
significant input from stakeholders.
Health and safety in the workplace
The division’s health and safety facilities
operate in South Africa under the framework
of either the Mine Health and Safety Act or the
Occupational Health and Safety Act and
company operating requirements. An in-house
joint audit process, carried out annually,
ensures compliance. Baseline health and safety
risk assessments have been conducted and are
reviewed annually. Health and safety
agreements are in place with representative
labour bodies.
All health and safety programmes are based
on the National Occupational Safety Associa-
tion management system. The Lime Acres
operation has received certification with the
Occupational Health and Safety Assessment
Series (OHSAS) 18001. It is planned to
implement the OHSAS 18001 standard for
health and safety management throughout the
division within the next four years. All
programmes encourage employee participa-
tion at all levels. Employees receive regular
training on their legal responsibilities by
accredited service providers.
Regular occupational health surveys are
conducted to identify the health risks to which
employees may be exposed. These include
surveys for noise, heat, stress, ventilation and
illumination levels. Identified risks are
engineered out where possible, as the first
choice. Should this not be possible, manage-
ment controls are implemented and the use of
personal protective equipment becomes
mandatory.
Clinics at all operations have trained occupa-
tional health nurses and medical practitioners
in attendance. These clinics also provide
primary health care programmes for local
communities. Employees working in risk areas
undergo annual medical examinations to
ensure their health is not adversely affected by
working conditions and further examinations
on resignation or retirement from service.
Contractors working for the company may use
the clinic facilities.
The majority of employees belong to medical
aid schemes. In these cases the division
contributes to their medical care.
There were no fatalities in the workforce
during the year. Injury frequency rates are low.
The fight to beat HIV/Aids
Over many years, the division has implemented
initiatives aimed at minimising the
consequences of HIV/Aids to its businesses,
employees and, where practical, to the
communities impacted by operations.
Voluntary, consensual anonymous prevalence
studies have been conducted at a number of
sites with trade union support. Prevalence rates
range from 0% to 11%. These rates are lower
than those expected for the relevant regions.
Nearly 50 peer educators were trained during
the past two years to disseminate information
both to employees and the local community.
Impact and responsibility report continued
Barloworld Limited annual report 2002
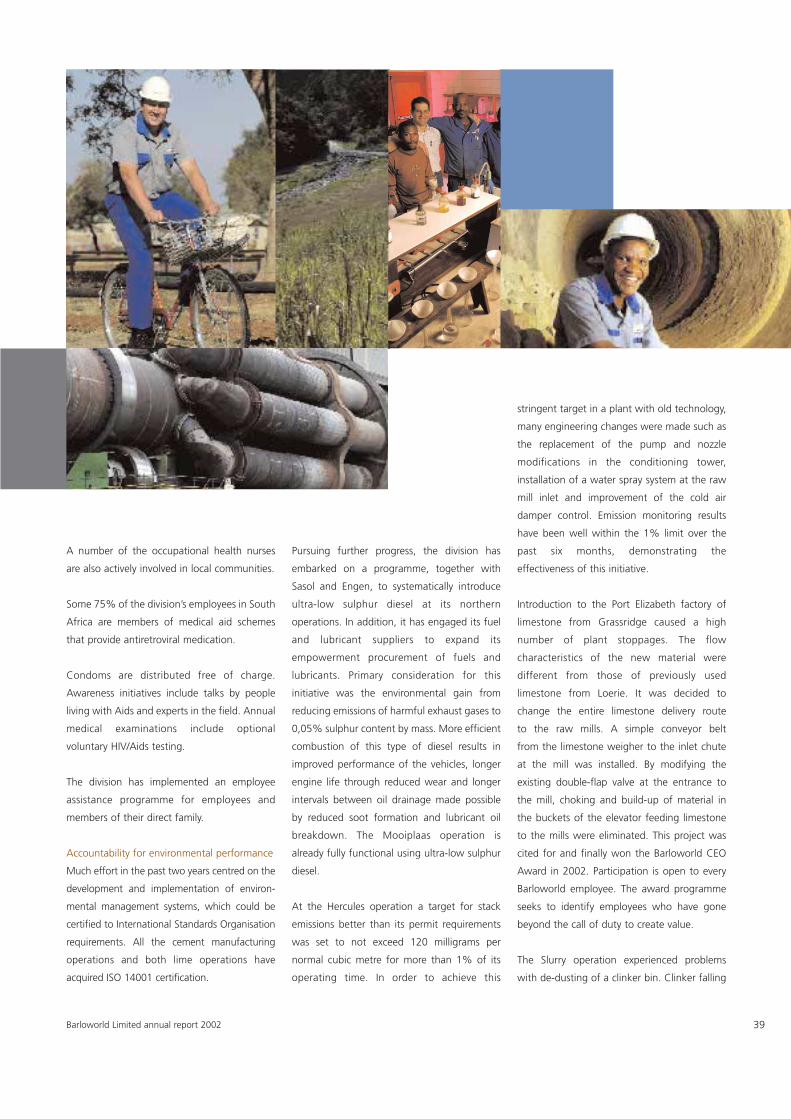
39Barloworld Limited annual report 2002
A number of the occupational health nurses
are also actively involved in local communities.
Some 75% of the division’s employees in South
Africa are members of medical aid schemes
that provide antiretroviral medication.
Condoms are distributed free of charge.
Awareness initiatives include talks by people
living with Aids and experts in the field. Annual
medical examinations include optional
voluntary HIV/Aids testing.
The division has implemented an employee
assistance programme for employees and
members of their direct family.
Accountability for environmental performance
Much effort in the past two years centred on the
development and implementation of environ-
mental management systems, which could be
certified to International Standards Organisation
requirements. All the cement manufacturing
operations and both lime operations have
acquired ISO 14001 certification.
Pursuing further progress, the division has
embarked on a programme, together with
Sasol and Engen, to systematically introduce
ultra-low sulphur diesel at its northern
operations. In addition, it has engaged its fuel
and lubricant suppliers to expand its
empowerment procurement of fuels and
lubricants. Primary consideration for this
initiative was the environmental gain from
reducing emissions of harmful exhaust gases to
0,05% sulphur content by mass. More efficient
combustion of this type of diesel results in
improved performance of the vehicles, longer
engine life through reduced wear and longer
intervals between oil drainage made possible
by reduced soot formation and lubricant oil
breakdown. The Mooiplaas operation is
already fully functional using ultra-low sulphur
diesel.
At the Hercules operation a target for stack
emissions better than its permit requirements
was set to not exceed 120 milligrams per
normal cubic metre for more than 1% of its
operating time. In order to achieve this
stringent target in a plant with old technology,
many engineering changes were made such as
the replacement of the pump and nozzle
modifications in the conditioning tower,
installation of a water spray system at the raw
mill inlet and improvement of the cold air
damper control. Emission monitoring results
have been well within the 1% limit over the
past six months, demonstrating the
effectiveness of this initiative.
Introduction to the Port Elizabeth factory of
limestone from Grassridge caused a high
number of plant stoppages. The flow
characteristics of the new material were
different from those of previously used
limestone from Loerie. It was decided to
change the entire limestone delivery route
to the raw mills. A simple conveyor belt
from the limestone weigher to the inlet chute
at the mill was installed. By modifying the
existing double-flap valve at the entrance to
the mill, choking and build-up of material in
the buckets of the elevator feeding limestone
to the mills were eliminated. This project was
cited for and finally won the Barloworld CEO
Award in 2002. Participation is open to every
Barloworld employee. The award programme
seeks to identify employees who have gone
beyond the call of duty to create value.
The Slurry operation experienced problems
with de-dusting of a clinker bin. Clinker falling
40
from a conveyor into the bin caused rapid
displacement of large quantities of air. This
caused dust to be released from all openings.
By fitting dust collectors to the openings on
top of the clinker bin, the dust is captured
inside the bin and cleaner air can now escape.
Initiatives at the De Hoek plant have set an
example to the rest of the operations by
importing maintenance information from
the BaaN™ maintenance management
programme into the environmental
management system. In this way, scheduled
maintenance activities, as well as maintenance
non-conformances, can be monitored as part
of environmental performance. This has the
potential to include health and safety and
quality monitoring. It will become the
benchmark for best practice in the company.
All operations regularly set improvement
objectives and initiate new projects to improve
efficiencies and environmental performance.
Measuring and monitoring
Consumption of resources is monitored
monthly. Raw materials, coal and water
consumption all decreased during the year.
Continuous monitoring of dust emissions takes
place from kiln stacks. The CODEL™ monitors
are calibrated at regular intervals to ensure
efficient and accurate operation. All cement
operations have complied with or bettered
their permit conditions.
Phased concurrent rehabilitation targets
were set to complete previously neglected
rehabilitation by 2006. The last aerial survey
showed that every mine has exceeded the
targets set for the year, as well as completed
the rehabilitation required for current mining
activities. In this way, the division has been able
to reduce its environmental footprint.
Extensive baseline assessments of releases
to the environment, prior to the introduction
of secondary materials into the manufacturing
process are completed for the relevant
operation. Independent external consultants
determine the nature and extent of health,
safety, quality and environmental impacts
by introducing secondary materials during a
trial period. Once these results have been
reviewed by the relevant government
authorities, application is made for continued
use of such materials and amendment
to the operating permits. Performance is
monitored through various ISO-certified
management systems.
All management systems at operations are
externally assessed at least annually during
surveillance audits. The management systems
are effective.
Environmental audits are used to influence
future training programmes. The division
endeavours to build environmental awareness
amongst employees and in the communities in
which it operates. Stakeholder forums ensure
constant feedback on performance and
awareness of the drive to improve the quality
of life and to provide lasting benefits for those
communities.
Preserving biodiversity
With the exception of the Loerie, Grassridge
and Riebeeck operations, the division does not
have operations in ecologically sensitive areas.
Where the biodiversity on mining ground has
been identified as sensitive or threatened, the
division has preserved this biodiversity.
The Renosterveld biome in the Western Cape
now occupies less than 8% of its original area.
The mine plan for the Riebeeck operation has
been modified, and overburden dump
positions moved to preserve the two hectares
of renosterveld on site. The Riebeeck operation
has been nominated for an Excellence in
Mining Environmental award in the category
for large open-cast mines.
The Grassridge quarry was opened in the
Bonteveld biome of the Eastern Cape. A
demanding environmental management pro-
gramme ensures that anthills, threatened
succulents, bonteveld bush clumps, tortoises
and even the rare Albany adders are preserved.
Mining activities involve the removal to
nurseries of sensitive vegetation from areas to
be mined, and their translocation to
rehabilitated areas afterwards. Fences have
been erected to prevent electrocution of
tortoises venturing towards the secured
crushing plant area. Anthills are relocated to
ensure that the biodiversity of invertebrate
species, which are dependent on the anthills
for their survival, remains intact. Albany
adders, which were last sighted some 60 years
ago, have been sighted three times in the past
year. Snakes have been captured and taken to
the snake park in Port Elizabeth for safe-
keeping. It is envisaged that a breeding
programme should be established on the
Grassridge property, where specimens would
be tracked and monitored using microchips.
Funding is currently being sought to initiate
this programme. The Grassridge quarry has been
nominated for an Excellence in Mining Environ-
mental award in the small mining category.
Fynbos vegetation, which remained
undisturbed during mining activities, formed
an integral part of the end-use objectives for
the Loerie mine.
The lime facilities were successfully re-certified
to ISO 14001 in 2002. Commitment to the
policy of continual improvement includes
construction of a slurry dam using overburden
from a new mining area. Slurry is formed
Impact and responsibility report continued
Barloworld Limited annual report 2002
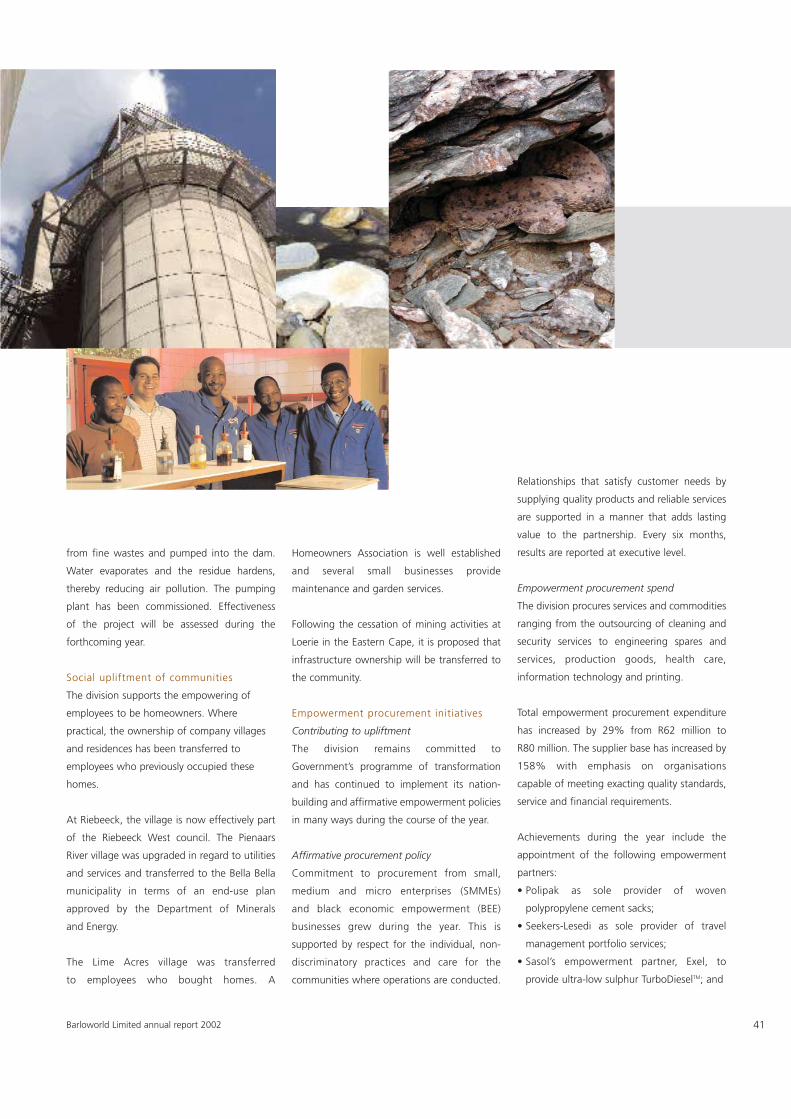
41
from fine wastes and pumped into the dam.
Water evaporates and the residue hardens,
thereby reducing air pollution. The pumping
plant has been commissioned. Effectiveness
of the project will be assessed during the
forthcoming year.
Social upliftment of communities
The division supports the empowering of
employees to be homeowners. Where
practical, the ownership of company villages
and residences has been transferred to
employees who previously occupied these
homes.
At Riebeeck, the village is now effectively part
of the Riebeeck West council. The Pienaars
River village was upgraded in regard to utilities
and services and transferred to the Bella Bella
municipality in terms of an end-use plan
approved by the Department of Minerals
and Energy.
The Lime Acres village was transferred
to employees who bought homes. A
Homeowners Association is well established
and several small businesses provide
maintenance and garden services.
Following the cessation of mining activities at
Loerie in the Eastern Cape, it is proposed that
infrastructure ownership will be transferred to
the community.
Empowerment procurement initiatives
Contributing to upliftment
The division remains committed to
Government’s programme of transformation
and has continued to implement its nation-
building and affirmative empowerment policies
in many ways during the course of the year.
Affirmative procurement policy
Commitment to procurement from small,
medium and micro enterprises (SMMEs)
and black economic empowerment (BEE)
businesses grew during the year. This is
supported by respect for the individual, non-
discriminatory practices and care for the
communities where operations are conducted.
Relationships that satisfy customer needs by
supplying quality products and reliable services
are supported in a manner that adds lasting
value to the partnership. Every six months,
results are reported at executive level.
Empowerment procurement spend
The division procures services and commodities
ranging from the outsourcing of cleaning and
security services to engineering spares and
services, production goods, health care,
information technology and printing.
Total empowerment procurement expenditure
has increased by 29% from R62 million to
R80 million. The supplier base has increased by
158% with emphasis on organisations
capable of meeting exacting quality standards,
service and financial requirements.
Achievements during the year include the
appointment of the following empowerment
partners:
• Polipak as sole provider of woven
polypropylene cement sacks;
• Seekers-Lesedi as sole provider of travel
management portfolio services;
• Sasol’s empowerment partner, Exel, to
provide ultra-low sulphur TurboDieselTM; and
Barloworld Limited annual report 2002
42
• Ilanga Printing to provide all corporate
stationery.
Developing the broader SMME community
The division remains active on the board of the
Corporate SMME Development forum which is
supported by many blue-chip South African
companies. The purpose of the forum is to
procure goods and services from historically
disadvantaged small businesses and to bring
them into the mainstream of the economy.
Benchmarking and business linkages initiative
A number of high-profile corporates, including
the division, participate in a project sponsored
by The Africa Project Development Facility,
GTZ, Ntsika Enterprise Promotion Agency and
Umsobomvu Youth Fund, and facilitated by
Gestalt Corporate Engineers. The project aims
to benchmark empowerment procurement
practices and policies and to strengthen
programmes aimed at providing financing and
capacity building for SMME suppliers.
Support to emerging contractors
Training in contractor development for
36 members of South African Women in
Construction was facilitated and sponsored.
The training was conducted by an empower-
ment training company – Milcorp Construction
Management – and covered contract
documentation, tendering, costing, pricing,
managing materials and using cement in
construction.
The division co-sponsored the training of
63 emerging building contractors from the
North West province in contractor entrepre-
neurial skills. These will assist them to success-
fully tender for and manage building projects
in the future. Participants were awarded
Construction Development Programme
certificates which are accredited by the
Construction Education and Training Authority.
Sponsored workshops for Women for Housing
In conjunction with the Women for Housing
organisation, the division facilitated 12
workshops covering topics related to the
building and construction industry. These
provided female contractors with valuable
information about developing construction
businesses within the housing sector.
Business opportunities for emerging
entrepreneurs
The role of affirmative cement retailers was
successfully applied with regard to the Luvuvhu
Dam in the Limpopo province, utilising the
services of an empowerment company,
Mangoedi Products & Project Managers.
Cement sales through SMMEs and historically
disadvantaged South Africans have risen to
R220 million per annum.
Scientific
The division has two constituent parts:
• A Laboratory business which markets a wide
range of individually branded products; and
• Melles Griot which distributes photonic
components.
The branded laboratory products business
manufactures and supplies scientific
equipment to laboratories engaged in food
analysis, clinical microbiology, environmental
and other scientific research via multinational
or domestic retailers of the products.
Operations are conducted in the United
Kingdom, the United States, France, Spain,
Italy and Germany. Glass, plastic and equip-
ment products are manufactured under brands
that include Pyrex, Sterilin, Azlon, Quickfit,
Emil, Techne, Jenway, Stuart and Carbolite. All
products are made to internationally
recognised standards. All electrical products
must conform to CE standards. These are
independently validated through application of
ISO 9000. All advertising is approved by senior
management and conforms to legal and
ethical advertising standards in all countries in
which operations are conducted.
Products designed, manufactured and
distributed by Melles Griot comprise photonic-
related components and subsystems that
create light, control its efficient use and reliably
hold or position photonics devices. Such
products include gas and solid state lasers,
optics and optical assemblies, optical hardware
and tables, nanopositioning equipment and
optomechatronic assemblies. The Melles Griot
business is conducted in the United States,
Japan, the United Kingdom, Netherlands,
France, Germany, Sweden, Canada and
Singapore.
The Laboratory business has grown strongly
this year, as a result of acquisitions. However,
the underlying markets served are low growth
and not generally subject to significant swings
in demand. The Melles Griot products are
mostly utilised by other manufacturers in
Impact and responsibility report continued
Barloworld Limited annual report 2002
creating further marketable items. Economic
difficulties in these markets prevailed during
the year and had an adverse effect on Melles
Griot. In helium-neon laser items, Melles Griot
has market shares exceeding 25% in the
United States, Canada, Europe and Japan.
Many of the division’s products contribute
significantly to the furthering of human
knowledge and aid in the diagnosis and
treatment of human disease.
Extensive customer training on use of
products, especially on electrical equipment, is
provided. Product labelling and instructional
materials are approved by in-house technical
specialists before being issued. These technical
specialists are present, in the case of the
Laboratory business, on key international
standard-setting bodies, for instance the
relevant organs of the International Standards
Organisation. Current catalogues also contain
sections on safe use of products, principally
glass, electronic and electrical equipment.
Contractual arrangements with customers are
believed to be fair. All terms of trade have been
reviewed for conformity with competition law.
Contract behaviour is governed by a formal
compliance procedure.
When appropriate, in order to ensure high
quality and to improve communication and
service, joint meetings are held with
customers. Mutual needs are met only when
products are consigned to customers at the
required quality standards, delivered at the
correct place and time and the correct value
has been charged. The outcomes of such
meetings are transmitted to relevant
employees, who are all responsible for
achieving customer satisfaction, for
implementation.
Service performance and customer satisfaction
are measured by analysis of on-time delivery,
credit notes issued, formal surveys, face-to-
face meetings and e-mail contact with
customers. The Melles Griot business also
evaluates customer turnover statistics and has
toll-free contact lines in the United States and
Canada. In the Laboratory business, policy is
implemented through ISO 9001 and applies to
the United Kingdom, Europe and the United
States. Complaint systems conform to
ISO 9000 and are independently audited.
Supply chain and service aspects are managed
in the Melles Griot sales office and warehouse
in Holland under ISO 9000 and in Japan under
ISO 14001.
The Laboratory business received the Logistic
Supplier of the Year award from its largest
domestic customer. Customers regularly make
awards to Melles Griot. The Carlsbad laser
factory received awards from Niocolet and
Xerox.
Fair contractual terms have been agreed with
the division’s suppliers. Standards of materials
and services are controlled by written
specifications, with agreed drawings where
appropriate. Incoming goods are sampled
against the relevant standards. If controls are
breached, goods are checked to the extent of
100%, and returned after discussion with the
43Barloworld Limited annual report 2002
44
supplier. Deliveries are recorded in a vendor
control system and monitored. Vendor
performance is reviewed when appropriate
and internal satisfaction is evaluated monthly.
Terms of payment agreed with suppliers range
from 30 to 90 days from date of delivery in
the Unites States and the United Kingdom
and 120 days in Japan. Payments conform to
these terms.
The division has 2 016 employees.
About half of the United Kingdom workforce
are represented by independent trade unions
and are covered by collective agreements. In
Europe, employees have legally enforceable
minimum entitlements derived from national
collective agreements. All European Union
countries have minimum legal requirements
for individual and collective consultation
where employees are affected by operating
changes.
The workforce in Melles Griot declined by 182
as a result of market conditions during the
year, of which 122 redundancies occurred in
North America. The remainder comprised 48 in
Europe and 12 in Japan and resulted from
voluntary decisions.
Salary levels are regularly compared with
survey data to ensure that they are in line with
competitive and national norms. Employment
benefits, including pension, sick pay, holiday
and maternity entitlements, are better than the
legal minima.
In the United Kingdom operations, annual
executive, management and worker pay
averages £51 000, £24 000 and £13 000,
respectively. Competitive remuneration
packages are paid by Melles Griot. Reviews and
upgrades became necessary in the recent
buoyant photonics market. Packages exceed
the statutory minimum in the United States
and Europe. Executive pay averages $165 000
per annum and non-executive pay $50 000.
Each business unit has a training and
development manager. The two major plants in
the Laboratory business have a lifetime
learning policy that encourages and funds
employees to learn new skills. They also have
dedicated employees who conduct on-the-job
training to achieve skill standards necessary for
the business. Additionally, off-the-job training
is provided by local colleges. Many employees
have externally verified national vocational
qualifications. Training expenditure during the
year was £55 000 for executives and £31 500
for other employees.
On average, annual hours of training are 40 for
senior managers, 16 for middle managers,
24 for administrative staff, 8 for production
employees and 20 for maintenance personnel.
Sales office training by Melles Griot in Sweden
averages 43 hours per annum and 14 in
Germany. In the United Kingdom, it averages
5 hours, in Japan 35 hours and in the United
States 15 hours for sales and factory training.
Complementing the Barloworld policy, the
division has its own equal opportunity policy.
Barloworld Limited annual report 2002
Impact and responsibility report continued
This is designed to comply with governmental
requirements for employment of and
employment practices towards minorities and
females. Reports showing current employment
by ethnicity and gender are filed annually with
the respective governments. This information is
compared with population census data for the
regions where operations are conducted. The
division also has an anti-harassment policy.
All employees are accountable for adherence
to equal opportunity and anti-discrimination
policies published by the division. They provide
steps to be taken if an employee feels that the
letter and intent of the policies are broken. No
retaliation may be taken against an employee
who files a complaint.
All business units have policies to ensure
adherence to human rights legislation.
Employees are given information and advice to
support compliance.
Each employee signs an agreement regulating
how confidential information is used. No
employee may perform work for a competitor.
Information about disciplinary practices is
available to all employees. Encouragement is
given to solving problems at source but
disputes may be referred to higher
management, with or without personal or
trade union representation.
Employee opinion surveys are conducted on
site by independent contractors. All aspects
of employment, including compensation
and benefits, working conditions, safety,
supervision, senior management and
communication are covered.
Melles Griot has no trade union representation.
However, collective works council regulations
are observed in respect of 14 employees in
Germany and 11 in Sweden. Rules and
regulations differ between countries regarding
individual and collective consultation where
employees are affected by operating changes.
The division supports activities where
employees are involved in community projects.
Many employees participate in such projects
and sometimes funds are contributed.
Reportable accidents are advised to the health
and safety executive in the United Kingdom
and the Occupational Safety and Health
Administration in the United States. In the
United Kingdom operations, health and safety
meetings are convened under the Safety
Representatives and Safety Committees
Regulations 1997. These are held quarterly and
cover the total workforce.
Donations totalling £10 000 were made by the
Laboratory business during the year, mainly to
local charitable organisations. Slow-moving
optics and hardware items, valued at
$700 000, were donated by Melles Griot to
certain universities and academic institutions in
the United States. Minor charitable donations
were made in Canada.
The Laboratory business annually uses some
2 000 tons of glass, 5 506 tons of polymer,
850 tons of cardboard and 30 tons of wood.
Under 3% of this becomes waste but, in
the case of wood, wastage is about 5%.
Annual electricity and gas consumption are
14,5 million and 9,0 million kilowatt-hours,
respectively, while 42 000 cubic metres of
water are also used. Owing to the high-tech
nature of nearly all of the products, quantities
of materials used in manufacture by Melles
Griot are relatively small. It is not meaningful
to measure these in terms of weight.
Approximately 22 000 Gigajoules of electricity
and 11 million US gallons of water are used
annually in production processes.
Products sold have no significant
environmental impact, except that one
optomechatronics product manufactured in
Japan contains barium and is subject to control
through registration with the relevant
authorities.
About 60 acres of land are occupied by the
Laboratory business for production and
supporting activities. Some 75% is covered by
impermeable surfaces. Within the remainder,
approximately 5% was utilised for a licensed
waste-tip. This has now been removed and the
underlying area returned to a natural state.
The Carbolite operation is located at Hope
in the environmentally sensitive Peak District
National Park in northern England. The division
otherwise has no operations in any protected
or sensitive areas or biodiversity-rich habitats
nor any impact on fresh water and marine
environments. All Melles Griot plants and
offices together occupy approximately 340 000
square feet and are subject to local zoning and
noise requirements. About 85% is covered by
impermeable surfaces. There are no other
sensitive issues.
The use of ozone-depleting substances has
been banned in Melles Griot since 1993. Gas
and other air emissions are minimal and not
measured, except in Japan where the
measurement showed a decline over the past
year.
In Japan, electricity use efficiency improved by
8,7% over the past year. Renewable energy
opportunities and energy efficiency are not
measured.
Waste glass and plastic arising from the
Laboratory business are either recycled or used
for landfill. General waste is used for landfill.
Some oil and insulation materials used in
certain science equipment products are
returned to the suppliers. Residual asbestos has
been removed from one building and disposed
of. All waste disposal is approved by local
waste authorities. In respect of products
accounting for some 30% of Melles Griot
sales, helium-cadmium content and argon can
be reused to the extent of 50% and 90%,
respectively, in the case of the new laser
ranges. Unregulated waste such as glass,
plastic and recycled cardboard, non-regulated
non-hazardous waste which is treated, and
regulated but treated liquid waste are disposed
to public landfill. Hazardous solid waste is
disposed of at hazardous waste landfill sites,
while hazardous liquid waste is fuel blended.
Acetone waste, some glass and polishing
sludge are recycled by outside contractors.
There have been no spills of oils, chemicals or
fuels, nor any discharges of greenhouse gases
or ozone-depleting substances.
45Barloworld Limited annual report 2002
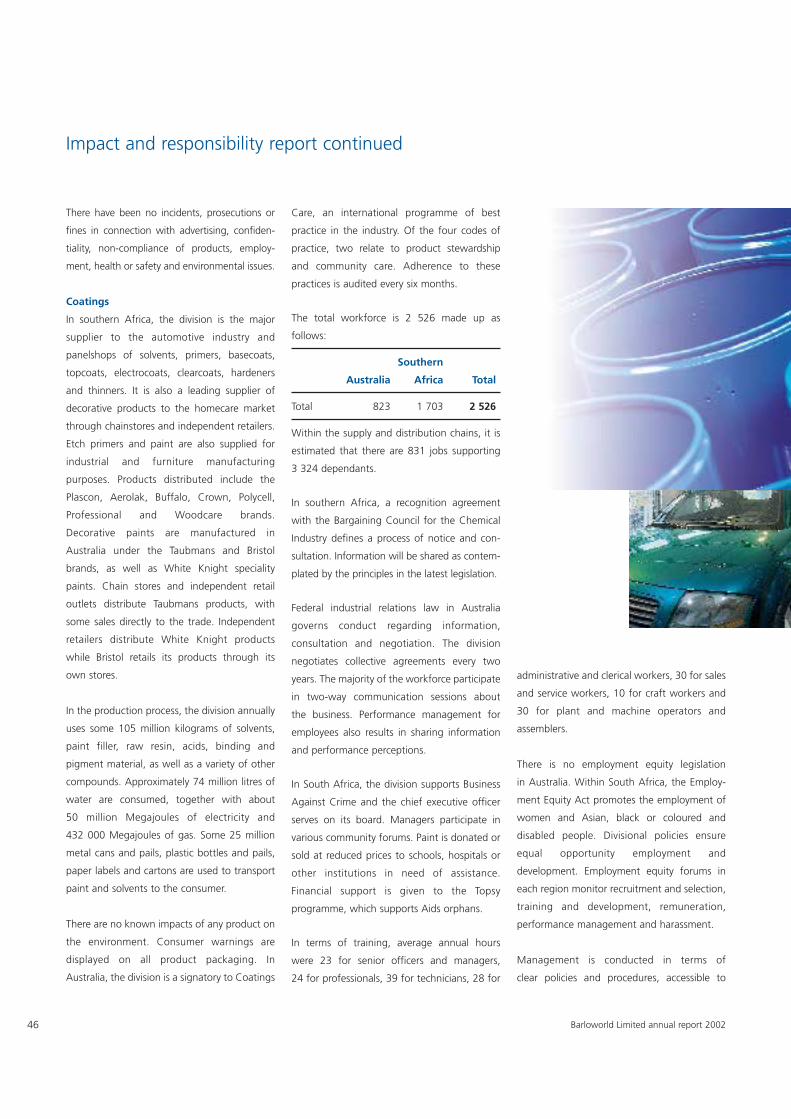
46
There have been no incidents, prosecutions or
fines in connection with advertising, confiden-
tiality, non-compliance of products, employ-
ment, health or safety and environmental issues.
Coatings
In southern Africa, the division is the major
supplier to the automotive industry and
panelshops of solvents, primers, basecoats,
topcoats, electrocoats, clearcoats, hardeners
and thinners. It is also a leading supplier of
decorative products to the homecare market
through chainstores and independent retailers.
Etch primers and paint are also supplied for
industrial and furniture manufacturing
purposes. Products distributed include the
Plascon, Aerolak, Buffalo, Crown, Polycell,
Professional and Woodcare brands.
Decorative paints are manufactured in
Australia under the Taubmans and Bristol
brands, as well as White Knight speciality
paints. Chain stores and independent retail
outlets distribute Taubmans products, with
some sales directly to the trade. Independent
retailers distribute White Knight products
while Bristol retails its products through its
own stores.
In the production process, the division annually
uses some 105 million kilograms of solvents,
paint filler, raw resin, acids, binding and
pigment material, as well as a variety of other
compounds. Approximately 74 million litres of
water are consumed, together with about
50 million Megajoules of electricity and
432 000 Megajoules of gas. Some 25 million
metal cans and pails, plastic bottles and pails,
paper labels and cartons are used to transport
paint and solvents to the consumer.
There are no known impacts of any product on
the environment. Consumer warnings are
displayed on all product packaging. In
Australia, the division is a signatory to Coatings
Care, an international programme of best
practice in the industry. Of the four codes of
practice, two relate to product stewardship
and community care. Adherence to these
practices is audited every six months.
The total workforce is 2 526 made up as
follows:
Southern
Australia Africa Total
Total 823 1 703 2 526
Within the supply and distribution chains, it is
estimated that there are 831 jobs supporting
3 324 dependants.
In southern Africa, a recognition agreement
with the Bargaining Council for the Chemical
Industry defines a process of notice and con-
sultation. Information will be shared as contem-
plated by the principles in the latest legislation.
Federal industrial relations law in Australia
governs conduct regarding information,
consultation and negotiation. The division
negotiates collective agreements every two
years. The majority of the workforce participate
in two-way communication sessions about
the business. Performance management for
employees also results in sharing information
and performance perceptions.
In South Africa, the division supports Business
Against Crime and the chief executive officer
serves on its board. Managers participate in
various community forums. Paint is donated or
sold at reduced prices to schools, hospitals or
other institutions in need of assistance.
Financial support is given to the Topsy
programme, which supports Aids orphans.
In terms of training, average annual hours
were 23 for senior officers and managers,
24 for professionals, 39 for technicians, 28 for
administrative and clerical workers, 30 for sales
and service workers, 10 for craft workers and
30 for plant and machine operators and
assemblers.
There is no employment equity legislation
in Australia. Within South Africa, the Employ-
ment Equity Act promotes the employment of
women and Asian, black or coloured and
disabled people. Divisional policies ensure
equal opportunity employment and
development. Employment equity forums in
each region monitor recruitment and selection,
training and development, remuneration,
performance management and harassment.
Management is conducted in terms of
clear policies and procedures, accessible to
Barloworld Limited annual report 2002
Impact and responsibility report continued
all employees, that accord with company policy
and labour legislation.
At this stage, no portion of any product can be
recycled or reused. Some 287 000 kilograms
of waste from sources external to the division,
such as inward and outward packaging, arise
annually. A project is being pursued in Australia
to explore recovery of paint and packaging.
Annually, approximately 14 000 kilograms
of plastics, 85 000 kilograms of waste paper,
27 000 kilograms of scrap metal and
2,1 million litres of liquid waste materials are
recycled. In addition, some 3,2 million
kilograms of solids and 1,9 million litres of
liquid waste are disposed of by way of
landfill. Run-off of water is estimated at
8 324 kilolitres.
No known ozone-depleting substances are
used in the production processes or contained
in the products. There are no fluorocarbons
used in spray packs.
In Australia, emissions of carbon dioxide from
electricity sources approximate 5 000 tons
annually. Emissions from benzene and fine
particulates are required to be reported in New
South Wales, Australia, but the measurements
fall below the thresholds set by the
Environmental Protection Agency. The effect in
South Africa has not been measured. No other
significant air emissions occur.
No significant spills of chemicals, oils or fuels
occurred during the year.
The division has no operation in any biodiversity-
rich habitats nor any known impact on terrestrial,
freshwater or marine environments.
There were no incidents or fines involving
non-compliance during the year with any
applicable international, national, regional
or local regulation associated with advertising,
customer health and safety, environmental
issues, or labelling and product information.
Steel Tube
The division provides tube and pipe solutions
to the mining, construction, water supply,
automotive and petrochemical industries.
Locally there are over one thousand customers
and more than 50 internationally.
Apart from the usual marketing methods, an
Internet website is used to communicate
details and benefits of the division’s products
to existing and potential customers.
In terms of a 5-Star Customer Value
Programme, which has been in existence for
a number of years, the business units in
the division are rated against world-class
criteria. This ensures constant attention to
solutions that create value for customers. It
achieves a constant flow of communication
with customers on their changing needs and
includes independent surveys at least annually.
Customers are active participants and are the
final judges of performance levels. Conditions
of business are concluded with customers and
monitored to ensure compliance by both
parties.
A separate unit researches new uses for
existing products. Any product proven to be
commercially viable is absorbed into the product
line of the appropriate existing business unit.
Product workshops for customers are held
regularly. Uses and features of the products are
demonstrated. Technical staff are available at
all times.
47Barloworld Limited annual report 2002
48
Carbon steel coils, used in the production
process, are supplied by Iscor and Highveld
Steel. Stainless steel coils are obtained from
Columbus. Terms of supply are agreed with all
suppliers. These are rigorously monitored to
ensure compliance by both parties. Steel
products supplied are manufactured to
international standards. Credit terms are
generally between 30 and 60 days. Regular
discussions are held with suppliers on quality,
delivery and payment issues.
Productivity targets are agreed with each
business unit annually. These and other
targets are communicated to the workforce
and increasingly pursued through mission
directed work teams in the factories.
Meetings involving both suppliers and
customers are held regularly.
The division employs 1 353 people in South
Africa. There are also 484 people in co-
employment relationships. Over the past few
years, the division has become increasingly
efficient in the use of its workforce.
Annual employee value surveys are conducted
by independent contractors. Progress in
employment equity and skill development
matters is reported and monitored monthly.
Employee newsletters are published quarterly.
An internal intranet is employed to keep staff
abreast of news and other developments as
they occur.
An average of 45 hours of training was
received by employees during the year.
Health and safety committees covering all
employees exist at every site.
In the supply and distribution chain, there
could be an estimated 20 000 jobs, supporting
as many as 100 000 people.
Barloworld Limited annual report 2002
Impact and responsibility report continued
49Barloworld Limited annual report 2002
There have been no significant spills of any
chemicals or fuel. No fines have been imposed
by any environmental regulatory authority.
Logistics
With effect from 1 October 2001, Barloworld
Limited purchased Barloworld Logistics
(previously named PPC Logistics) from Pretoria
Portland Cement Company. At the same time,
Barloworld Logistics acquired the logistics
business of Barloworld Motor. Other
acquisitions made during the year further
increased the capacity of the business to
provide logistics solutions.
Although the business is still relatively small, its
vision is to become:
• a significant, international provider of supply
chain solutions;
• the preferred provider in southern Africa;
• the partner of choice; and
• the employer of choice.
Logistics, or supply chain management, is a
service completely reliant on clients
outsourcing some of their traditional in-house
activities. Services offered by Barloworld
Logistics are: procurement, inbound logistics,
transportation, transportation management,
warehousing, inventory management, out-
bound logistics, electronic data interchange
and connectivity, supply chain modelling and
design. The aim is to create innovative
solutions or improvements to existing logistical
systems.
Current focus is on corporate clients in
southern Africa, the United Kingdom, the
United States, Australia and Western Europe.
Services are already being provided to clients
in South Africa, Botswana, Namibia,
Mozambique, the United Kingdom, Germany
and the United States. It is believed that,
worldwide, logistical services span all
industries and are estimated to generate some
10% of global gross national product.
Customer health and safety are an integral
part of the services offered. Customer privacy
is observed.
Customer satisfaction is measured through
independent surveys and further needs are
identified. Non-conformance and complaint
systems are operated to ensure proper follow-
up that results in corrective action and
feedback to the customer.
With the exception of transportation, logistics
operations are environmentally clean.
At the end of the year, 935 people were
employed.
Extensive labour laws and prescribed practices
apply in South Africa. Bargaining council agree-
ments, procedures and processes, including
consultation, operate within this dispensation.
Employer and union collective agreements
prescribe further procedures and processes.
Approximately 60% of employees are covered
in The National Bargaining Council (Road
Freight Industry) Agreement.
External surveys are used to ensure that
remuneration levels are competitive. All
employees enjoy retirement benefits and
participate in an annual incentive scheme.
They also have voluntary access to a medical
scheme.
Each business unit has established a health
and safety committee, in terms of the
Occupational Health and Safety Act,
comprising employer, employee and union
representation. All branches record
occupational issues in accordance with that
Act. Non-conformance is captured on a
database. Annual audits are conducted
through independent consultants to ensure
adherence to legal requirements.
In South Africa, employment equity plans,
including targets, are submitted to the
Department of Manpower. A committee
meets regularly to review progress against
targets, as well as workplace skill plans, and
any related issues. Progress against targets is
satisfactory. Grievance and dispute procedures
exist to address any work-related complaints.
Where joint decision making occurs, employee
representative bodies exist at the relevant
business units. Induction and climate creation
sessions outlining rights and obligations of the
employer and employees have been
conducted for about 400 employees.
50 Barloworld Limited annual report 2002
Training programmes with universities,
business schools and consultants are at an
early stage of development. A group training
and development manager and four regional
driver trainers have been appointed to ensure
that skills necessary to successfully conduct the
business are assimilated by employees. Costs
of training in the year amounted to
R1,1 million. Hours of training have not been
recorded.
In addition, an internal study assistance policy
encourages employees to continue learning
and study to improve their skills. There is
also an owner-driver scheme that empowers
employees to become entrepreneurs.
Approximately 300 vehicles are operated. In a
year, they travel approximately 30 million
kilometres and consume some 16 million litres
of diesel fuel, 63 000 litres of lubricants,
2 000 tyres and incur over R20 million on
spares. Considerable quantities of stationery
and electricity are also utilised.
Typical emission from heavy duty vehicles is
0,18 kilograms of sulphur dioxide per
100 kilometres travelled. A joint experiment is
being conducted with Sasol and
DaimlerChrysler to monitor the effects of using
ultra-low sulphur diesel fuel in place of the
normal product. This is expected to reduce
emission levels to 0,08 kilograms
per 100 kilometres. Any other emissions are
insignificant.
Water is used for washing vehicles (this is re-
cycled and impurities removed) and human
consumption. The quantities are small and
discharges are minimal. No significant spills
of chemicals, oils or fuels occurred during
the year.
Fuel is obtained from Sasol and Shell, both of
which are known for a responsible and
sensitive approach to environmental matters.
Transportation of material classed as hazardous
waste from BHP Billiton operations at Richards
Bay for disposal at sites operated by Pretoria
Portland Cement at Dwaalboom and Port
Elizabeth is undertaken. A full environmental
impact assessment was completed before
commencing these activities.
No fines were imposed for non-compliance
with relevant international, national, regional
Impact and responsibility report continued
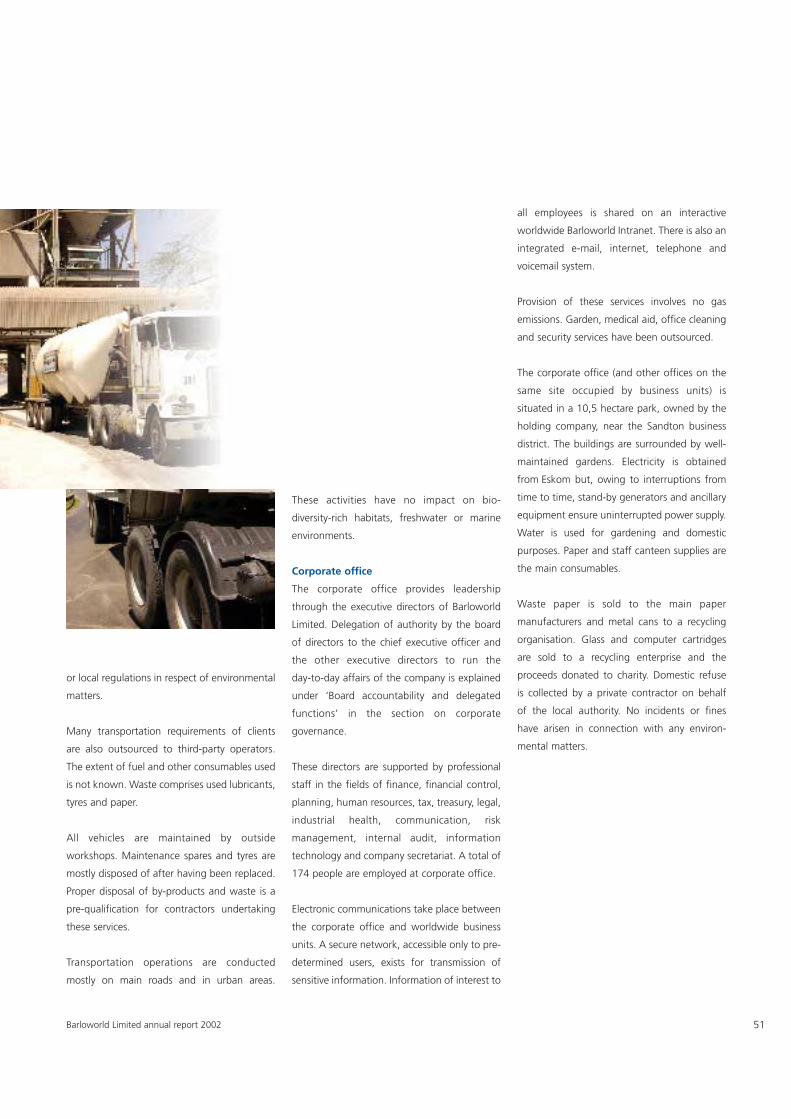
51Barloworld Limited annual report 2002
or local regulations in respect of environmental
matters.
Many transportation requirements of clients
are also outsourced to third-party operators.
The extent of fuel and other consumables used
is not known. Waste comprises used lubricants,
tyres and paper.
All vehicles are maintained by outside
workshops. Maintenance spares and tyres are
mostly disposed of after having been replaced.
Proper disposal of by-products and waste is a
pre-qualification for contractors undertaking
these services.
Transportation operations are conducted
mostly on main roads and in urban areas.
These activities have no impact on bio-
diversity-rich habitats, freshwater or marine
environments.
Corporate office
The corporate office provides leadership
through the executive directors of Barloworld
Limited. Delegation of authority by the board
of directors to the chief executive officer and
the other executive directors to run the
day-to-day affairs of the company is explained
under ‘Board accountability and delegated
functions’ in the section on corporate
governance.
These directors are supported by professional
staff in the fields of finance, financial control,
planning, human resources, tax, treasury, legal,
industrial health, communication, risk
management, internal audit, information
technology and company secretariat. A total of
174 people are employed at corporate office.
Electronic communications take place between
the corporate office and worldwide business
units. A secure network, accessible only to pre-
determined users, exists for transmission of
sensitive information. Information of interest to
all employees is shared on an interactive
worldwide Barloworld Intranet. There is also an
integrated e-mail, internet, telephone and
voicemail system.
Provision of these services involves no gas
emissions. Garden, medical aid, office cleaning
and security services have been outsourced.
The corporate office (and other offices on the
same site occupied by business units) is
situated in a 10,5 hectare park, owned by the
holding company, near the Sandton business
district. The buildings are surrounded by well-
maintained gardens. Electricity is obtained
from Eskom but, owing to interruptions from
time to time, stand-by generators and ancillary
equipment ensure uninterrupted power supply.
Water is used for gardening and domestic
purposes. Paper and staff canteen supplies are
the main consumables.
Waste paper is sold to the main paper
manufacturers and metal cans to a recycling
organisation. Glass and computer cartridges
are sold to a recycling enterprise and the
proceeds donated to charity. Domestic refuse
is collected by a private contractor on behalf
of the local authority. No incidents or fines
have arisen in connection with any environ-
mental matters.
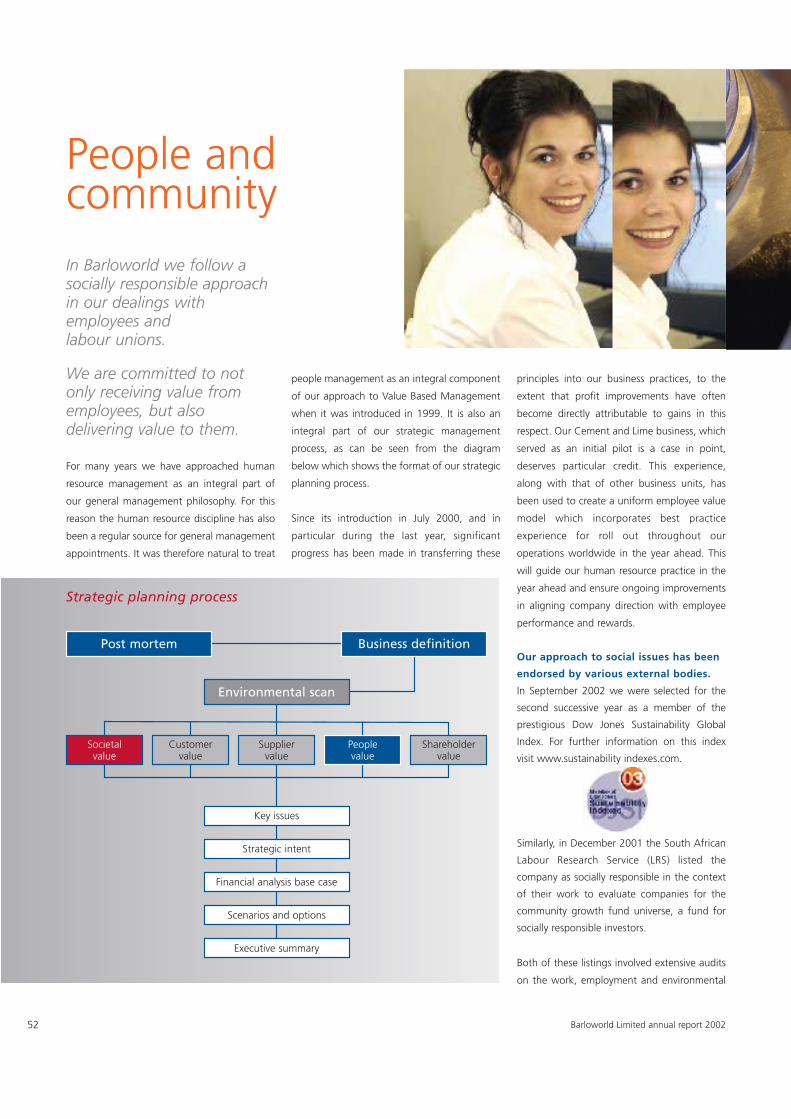
52
Strategic planning process
Executive summary
Key issues
Strategic intent
Financial analysis base case
Scenarios and options
Post mortem Business definition
Environmental scan
Societalvalue
Customervalue
Suppliervalue
Peoplevalue
Shareholdervalue
We are committed to notonly receiving value fromemployees, but alsodelivering value to them.
For many years we have approached human
resource management as an integral part of
our general management philosophy. For this
reason the human resource discipline has also
been a regular source for general management
appointments. It was therefore natural to treat
people management as an integral component
of our approach to Value Based Management
when it was introduced in 1999. It is also an
integral part of our strategic management
process, as can be seen from the diagram
below which shows the format of our strategic
planning process.
Since its introduction in July 2000, and in
particular during the last year, significant
progress has been made in transferring these
principles into our business practices, to the
extent that profit improvements have often
become directly attributable to gains in this
respect. Our Cement and Lime business, which
served as an initial pilot is a case in point,
deserves particular credit. This experience,
along with that of other business units, has
been used to create a uniform employee value
model which incorporates best practice
experience for roll out throughout our
operations worldwide in the year ahead. This
will guide our human resource practice in the
year ahead and ensure ongoing improvements
in aligning company direction with employee
performance and rewards.
Our approach to social issues has been
endorsed by various external bodies.
In September 2002 we were selected for the
second successive year as a member of the
prestigious Dow Jones Sustainability Global
Index. For further information on this index
visit www.sustainability indexes.com.
Similarly, in December 2001 the South African
Labour Research Service (LRS) listed the
company as socially responsible in the context
of their work to evaluate companies for the
community growth fund universe, a fund for
socially responsible investors.
Both of these listings involved extensive audits
on the work, employment and environmental
People andcommunityIn Barloworld we follow asocially responsible approachin our dealings withemployees and labour unions.
Barloworld Limited annual report 2002
practices of the company. The LRS report noted
that the company was accepted ‘for their
excellent environmental practices, good
conditions of employment and corporate
governance’.
Barloworld and the ILO
We also endorse the concept of decent work
as promoted by the International Labour
Organisation (ILO) as well as its core labour
conventions. These are reflected in our
approach to employment and industrial
relations. In this regard the group benefits from
the fact that one of our executive directors is a
longstanding senior employer member of the
ILO conference committee on the application
of labour standards in the world, and a
member of the small group that settle that
committee’s report.
Industrial relations in 2002
During the year under review we experienced
no significant industrial action in the company.
In South Africa for example, where over half
of our 12 496 employees are unionised, we
have 44 trade union recognition agreements
in place and we did not lose a single man-
day due to internal industrial relations strife. The
labour stability enjoyed in Australia this year
contributed to the business turnaround there.
The COSATU-led national stay-aways in South
Africa had minimal impact and we only lost a
total of 27 man-days to these issues in 2002.
Employment equity in South Africa
Compliance, not only in the letter but also in
the spirit of the law, with local legislation and
with such legislation in the employment field is
a basic principle for Barloworld in all the
countries in which we operate.
In the South African context employment equity
provisions are legislated and the company is fully
committed in all its South African businesses to
compliance. All relevant businesses have
compiled and submitted employment equity
reports to the Department of Labour since the
inception of the legislation in 2000. The
approach generally followed is to treat business
units as independent reporting units for
purposes of employment equity promotion.
These businesses accordingly set numerical
targets in consultation with the appropriate
committees and take responsibility for their
implementation. Through this approach we are
able to achieve a close fit with the specific
demographics of the geographic areas within
which each business operates. The numerical
targets and progress are also reviewed regularly
by the various boards of management and
directors and form an integral part of the annual
strategic planning process. We also have
training and development programmes for the
advancement of employees in this context in
order to ensure that over the medium to
long term we have the required skills and
competencies in the designated groups.
Developing our global management
team
During the past year we introduced a global
senior executive programme designed to
enhance the strategic abilities of the
participants in addition to our existing senior
and middle management programme.
Both these programmes are organised by
the Gordon Institute of Business Science in
Johannesburg, South Africa, under the
direction of Professor Nick Binedell and senior
academics from across the world.
General skills and functional development take
place in all business units in line with their
businesses’ requirements.
In 2002 Barloworld CEO Tony Phillips led a
group of 27 executives comprising the executive
board and senior executives on a 10-day South
American business research and development
programme to Argentina, Brazil and Chile. This
programme was facilitated by senior academic
staff of IESE Business School, University of
Navarra, based in Barcelona, Spain.
Providing safe and healthy working
environments
We provide safe and healthy working
environments because we believe it is both
right and sound business sense. This approach
strengthens morale and improves quality and
efficiency. We also provide a number of
services to help promote employee wellness.
Examples include:
• Medical aid/medical insurance in the various
countries where we operate (subject to local
health regimes)
• Twenty on-site clinics in southern Africa that
provide a comprehensive service including
occupational health and primary health care
to employees and in many instances their
dependants
• Employee Assistance Programmes (EAPs)
Facing the challenge of HIV/Aids in
southern Africa
HIV/Aids is a strategic business issue within our
southern African operations. Our aim is always
to prevent new infections, provide appropriate
care and treatment for people living with
HIV/Aids, manage the business risk and
financial impact and engage in community
outreach where feasible.
For many years we have implemented initiatives in
South Africa to minimise the impact of HIV/Aids on
our employees and businesses. These continue.
HIV/Aids is managed like other chronic or life-
threatening conditions, with due regard to the
magnitude of the pandemic.
The provision of antiretroviral medication is just
one aspect of our strategy. All our South
Barloworld Limited annual report 2002 53
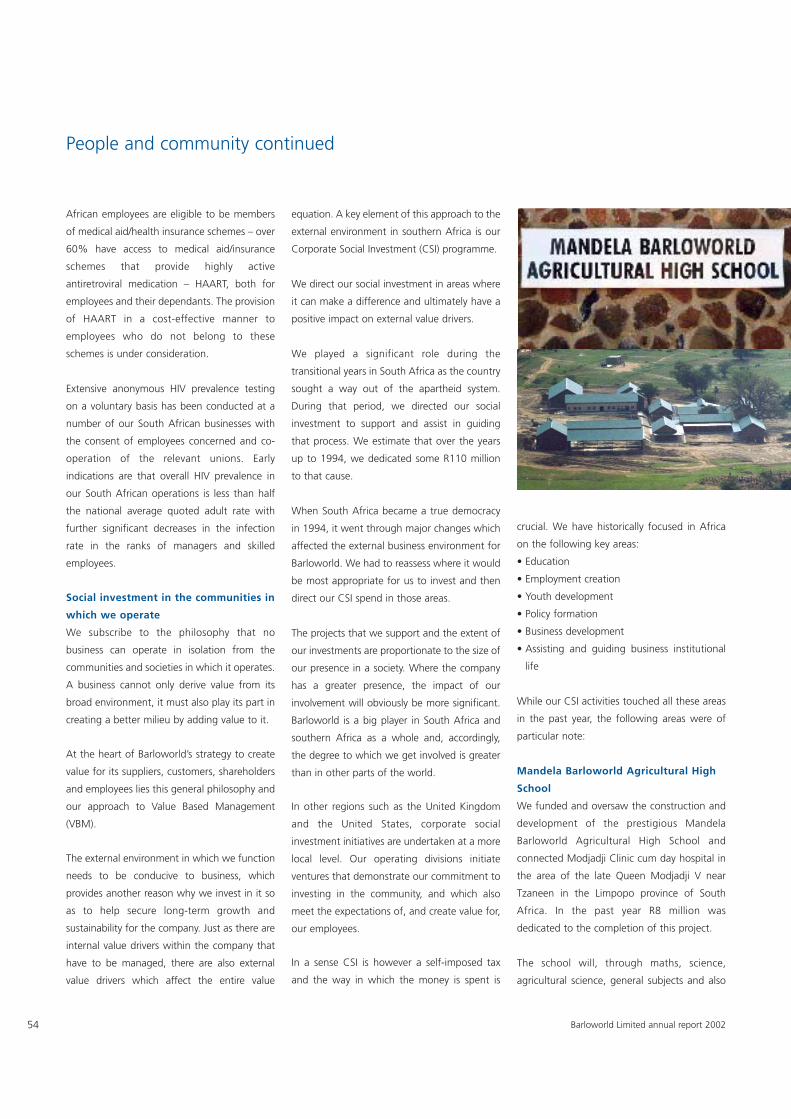
54
People and community continued
African employees are eligible to be members
of medical aid/health insurance schemes – over
60% have access to medical aid/insurance
schemes that provide highly active
antiretroviral medication – HAART, both for
employees and their dependants. The provision
of HAART in a cost-effective manner to
employees who do not belong to these
schemes is under consideration.
Extensive anonymous HIV prevalence testing
on a voluntary basis has been conducted at a
number of our South African businesses with
the consent of employees concerned and co-
operation of the relevant unions. Early
indications are that overall HIV prevalence in
our South African operations is less than half
the national average quoted adult rate with
further significant decreases in the infection
rate in the ranks of managers and skilled
employees.
Social investment in the communities in
which we operate
We subscribe to the philosophy that no
business can operate in isolation from the
communities and societies in which it operates.
A business cannot only derive value from its
broad environment, it must also play its part in
creating a better milieu by adding value to it.
At the heart of Barloworld’s strategy to create
value for its suppliers, customers, shareholders
and employees lies this general philosophy and
our approach to Value Based Management
(VBM).
The external environment in which we function
needs to be conducive to business, which
provides another reason why we invest in it so
as to help secure long-term growth and
sustainability for the company. Just as there are
internal value drivers within the company that
have to be managed, there are also external
value drivers which affect the entire value
equation. A key element of this approach to the
external environment in southern Africa is our
Corporate Social Investment (CSI) programme.
We direct our social investment in areas where
it can make a difference and ultimately have a
positive impact on external value drivers.
We played a significant role during the
transitional years in South Africa as the country
sought a way out of the apartheid system.
During that period, we directed our social
investment to support and assist in guiding
that process. We estimate that over the years
up to 1994, we dedicated some R110 million
to that cause.
When South Africa became a true democracy
in 1994, it went through major changes which
affected the external business environment for
Barloworld. We had to reassess where it would
be most appropriate for us to invest and then
direct our CSI spend in those areas.
The projects that we support and the extent of
our investments are proportionate to the size of
our presence in a society. Where the company
has a greater presence, the impact of our
involvement will obviously be more significant.
Barloworld is a big player in South Africa and
southern Africa as a whole and, accordingly,
the degree to which we get involved is greater
than in other parts of the world.
In other regions such as the United Kingdom
and the United States, corporate social
investment initiatives are undertaken at a more
local level. Our operating divisions initiate
ventures that demonstrate our commitment to
investing in the community, and which also
meet the expectations of, and create value for,
our employees.
In a sense CSI is however a self-imposed tax
and the way in which the money is spent is
crucial. We have historically focused in Africa
on the following key areas:
• Education
• Employment creation
• Youth development
• Policy formation
• Business development
• Assisting and guiding business institutional
life
While our CSI activities touched all these areas
in the past year, the following areas were of
particular note:
Mandela Barloworld Agricultural High
School
We funded and oversaw the construction and
development of the prestigious Mandela
Barloworld Agricultural High School and
connected Modjadji Clinic cum day hospital in
the area of the late Queen Modjadji V near
Tzaneen in the Limpopo province of South
Africa. In the past year R8 million was
dedicated to the completion of this project.
The school will, through maths, science,
agricultural science, general subjects and also
Barloworld Limited annual report 2002
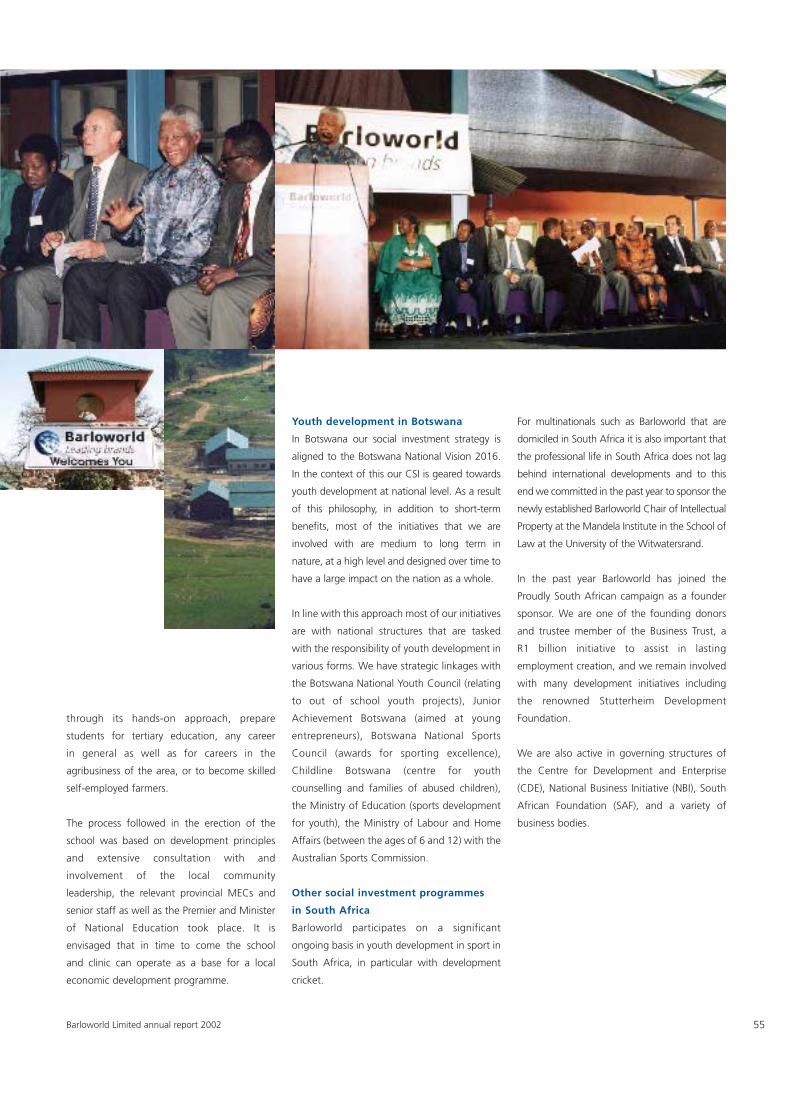
through its hands-on approach, prepare
students for tertiary education, any career
in general as well as for careers in the
agribusiness of the area, or to become skilled
self-employed farmers.
The process followed in the erection of the
school was based on development principles
and extensive consultation with and
involvement of the local community
leadership, the relevant provincial MECs and
senior staff as well as the Premier and Minister
of National Education took place. It is
envisaged that in time to come the school
and clinic can operate as a base for a local
economic development programme.
Youth development in Botswana
In Botswana our social investment strategy is
aligned to the Botswana National Vision 2016.
In the context of this our CSI is geared towards
youth development at national level. As a result
of this philosophy, in addition to short-term
benefits, most of the initiatives that we are
involved with are medium to long term in
nature, at a high level and designed over time to
have a large impact on the nation as a whole.
In line with this approach most of our initiatives
are with national structures that are tasked
with the responsibility of youth development in
various forms. We have strategic linkages with
the Botswana National Youth Council (relating
to out of school youth projects), Junior
Achievement Botswana (aimed at young
entrepreneurs), Botswana National Sports
Council (awards for sporting excellence),
Childline Botswana (centre for youth
counselling and families of abused children),
the Ministry of Education (sports development
for youth), the Ministry of Labour and Home
Affairs (between the ages of 6 and 12) with the
Australian Sports Commission.
Other social investment programmes
in South Africa
Barloworld participates on a significant
ongoing basis in youth development in sport in
South Africa, in particular with development
cricket.
For multinationals such as Barloworld that are
domiciled in South Africa it is also important that
the professional life in South Africa does not lag
behind international developments and to this
end we committed in the past year to sponsor the
newly established Barloworld Chair of Intellectual
Property at the Mandela Institute in the School of
Law at the University of the Witwatersrand.
In the past year Barloworld has joined the
Proudly South African campaign as a founder
sponsor. We are one of the founding donors
and trustee member of the Business Trust, a
R1 billion initiative to assist in lasting
employment creation, and we remain involved
with many development initiatives including
the renowned Stutterheim Development
Foundation.
We are also active in governing structures of
the Centre for Development and Enterprise
(CDE), National Business Initiative (NBI), South
African Foundation (SAF), and a variety of
business bodies.
Barloworld Limited annual report 2002 55
56 Barloworld Limited annual report 2002
Index to Annual Financial Statements
Understanding cash flow return on investment (CFROI®) 57Report of the independent auditors 58Directors’ responsibilities and approval 59Certificate by secretary 59Value added statement 60Financial director’s review 61Operations review:
Capital Equipment 64Industrial Distribution 66Motor 68Cement and Lime 70Scientific Products 71Coatings 73Steel Tube 74Financial Services, Logistics and Other 76
Seven-year summary 78Summary in other currencies 82Segmental analysis between leasing and trading businesses 84Balance sheets 86Income statements 87Cash flow statements 88Notes to the cash flow statements 89Statement of changes in equity 90Notes to the annual financial statements 92
57Barloworld Limited annual report 2002
Understanding cash flow return on investment (CFROI®)
business operations, prior to the impact
of financing activities. It consists of
accounting operating profit before
depreciation, amortisation and other non-
cash items, and is adjusted for the add
back of lease costs (including properties) in
order to arrive at operating cash flow
generated from the assets employed in the
business.
Asset life
This represents the estimated average
economic asset life for property, plant,
equipment, leased assets, and capitalised
research and development costs, where
applicable.
The economic life of each asset category is
estimated from the ratio of its original
cost, to related depreciation expense.
Non-depreciating assets
Non-depreciating assets represent the
asset items of the gross investment that
will not wear out. These non-depreciating
assets include land, inventories which can
be liquidated, receivables which can be
collected, estimated residuals on rental
assets and cash. Because these items still
remain at the end of the project(s), they
are presumed to be released when the
project(s) terminate.
Gross investment
This is made up of depreciating assets and
non-depreciating assets (see above).
Depreciating assets represent the asset
items of the gross investment that will
wear out (depreciable/amortisable) and
are presumed to have no value at the end
of their asset life.
Gross assets are typically defined as total
assets from the balance sheet plus
Over the past three years, Barloworld has
embarked on an intensive focus to apply
Value Based Management (VBM) through-
out the company. A key component of the
financial aspect of VBM is the use of
CFROI® as a performance metric. This
section provides technical information on
CFROI®, explaining how it is calculated and
how it is used in the business.
The CFROI® valuation model was
developed by HOLT Value Associates (now
CSFB HOLT) and has as its foundation the
concept of a net present value based on
discounted expected cash flows.
A company’s warranted value is driven by a
forecast net cash receipt stream which is
translated into a present value by use of
the investors’ discount rate.
The rate at which cash is generated is
reflected by CFROI®, a return metric that
measures economic performance, elimi-
nating accounting distortions and dealing
with real or inflation-adjusted magnitudes.
CFROI® calculation
CFROI® essentially represents an internal
rate of return calculation for the business as
a whole. It uses the following components:
• current operating after tax cash flows or
gross cash flow (Pmt)
• recurring annually over the life of the
asset base (n)
• plus working capital and other non-
depreciating assets realised at the end of
the life (Fv)
• expressed as a return on current
inflation adjusted gross assets or gross
investment (Pv)
Gross cash flow
Gross cash flow is the amount of after tax
cash flow resulting from the company’s
accumulated depreciation, less non-debt
current liabilities and include operating
leases capitalised at today’s real interest
rate, over the full economic life of the
leased assets. Gross assets are adjusted
for inflation so as to ensure that they
are measured in units of the same
purchasing power as the related gross
cash flows which they are employed in
generating. An adjustment is also made
to eliminate the translation impact of
currency movements on the value of
gross assets.
Cost of capital
In terms of the CSFB HOLT methodology,
the discount rate (cost of capital) is a
market-derived weighted average of a real
debt and real equity rate, and it is directly
comparable with the CFROI® performance
metric.
A company-specific cost of capital is
calculated based on adjustments made
for size and financial leverage differentials.
Within Barloworld, we have adopted
an 8% real cost of capital hurdle rate for
performance management and target
setting in each of our global business units.
This hurdle rate is used as follows:
• It is the minimum rate of return the
company requires to adequately reward
capital providers.
• It is the minimum hurdle rate by which
acquisitions and capital expenditure
projects are evaluated.
• It is the discount rate generally used in
discounted cash flow (DCF) calculations
for valuation purposes. In some cases
upward adjustments may be made to
take account of higher levels of risk.
• It is the real cost of capital against which
our CFROI® returns are measured.
58 Barloworld Limited annual report 2002
Understanding CFROI® continued
Barloworld’s shareholder value creation
record
Since the adoption of VBM within the
group, the following shareholder value
creation measures have been achieved:
2002 2001 2000Total shareholder return* 21,7% 15,0% 43,1%CFROI® 8,5% 8,3% 6,6%Components of the CFROI®
calculation:Gross cash flow (Rm) 3 610 2 584 2 126Grossinvestment (Rm) 28 611 21 693 19 729Non-depreciatingassets (Rm) 8 363 6 643 5 390Asset life (years) 11 12 12
* Total shareholder return is the return on
investment for equity holders of the business
and represents capital appreciation in the
share price plus dividends paid expressed
as a percentage of the share price at the
beginning of the year.
CFROI® performance has continued to
improve from 8,3% in 2001 to 8,5%,
notwithstanding a decline in the estimated
average economic asset life from 12 to
11 years. This is largely due to the
expansion of shorter asset life business
activities, including rental.
For further authoritative reading please
refer to the book CFROI VALUATION –
A Total System Approach to Valuing the
Firm by Bartley J Madden published
by Butterworth – Heinemann Finance
(ISBN 0 7506 3865 6)
CFROI® is a registered trademark in the
United States of Credit Suisse First Boston
or its subsidiaries or affiliates.
Report of the independent auditors
TO THE MEMBERS OF BARLOWORLD
LIMITEDWe have audited the annual financialstatements and the group financialstatements of Barloworld Limited, set outon pages 60 to 63 and 78 to 137 for the yearended 30 September 2002. These financialstatements are the responsibility of thecompany’s directors. Our responsibility isto express an opinion on these financialstatements based on our audit.
ScopeWe conducted our audit in accordancewith statements of South African AuditingStandards. Those standards require thatwe plan and perform the audit to obtainreasonable assurance that the financialstatements are free of materialmisstatement.
An audit includes:• examining, on a test basis, evidence
supporting the amounts and disclosuresin the financial statements;
• assessing the accounting principles usedand significant estimates made bymanagement; and
• evaluating the overall financialstatement presentation.
We believe that our audit provides areasonable basis for our opinion.
Audit opinionIn our opinion, the financial statementsfairly present, in all material respects, thefinancial position of the company and ofthe group at 30 September 2002 and theresults of their operations and cash flowsfor the year then ended in accordance with
South African Statements of GenerallyAccepted Accounting Practice andInternational Financial ReportingStandards, and in the manner required bythe Companies Act in South Africa.
Chartered Accountants (SA)Registered Accountants and Auditors
Sandton13 November 2002
for the year ended 30 September 2002
59Barloworld Limited annual report 2002
Directors’ responsibilities and approval
Certificate by secretary
A separate directors’ report has not beenprepared as full details of Barloworldgroup operations are contained inthe reviews by the chairman, the chiefexecutive officer and the financial director.Other statutory requirements anddisclosures are reflected in the annualfinancial statements, the notes thereto andthe statement of corporate governance.
The directors of the company areresponsible for the integrity and objectivityof the annual financial statements, as wellas for all other information containedtherein. The financial statements have beenprepared in accordance with InternationalFinancial Reporting Standards (and theyalso comply with Statements of GenerallyAccepted Accounting Practice in SouthAfrica).
The group maintains suitable internalcontrol systems to provide reasonable
assurance that all assets are safeguardedand that transactions are executed andrecorded in accordance with grouppolicies.
The group internal auditors independentlyevaluate the internal controls and theimplementation of group policies. Theinternal audit coverage is co-ordinatedwith that of the external auditors.
The directors, supported by the auditcommittee which consists of non-executivedirectors, are satisfied that the controls,systems and procedures in place minimisethe possibility of material loss ormisstatement. The external auditors, whohave unrestricted access to all records andinformation as well as the auditcommittee, concur with this statement.
The directors believe that the grouphas adequate resources to continue in
operation for the foreseeable future and,accordingly, the financial statementsappearing on pages 60 to 137 havebeen prepared on a going concern basis.The group external auditors concur withthis statement.
The above statements were approved bythe board of directors and were signed onits behalf by:
WAM Clewlow AJ PhillipsChairman Chief Executive Officer
DC ArnoldDirector, Finance and Administration
Sandton13 November 2002
In terms of section 268G(d) of the South African Companies Act, 1973, as amended (Act), I certify that Barloworld Limited has lodged
with the Registrar of Companies all such returns as are required of a public company in terms of the Act. Further, that such returns are
true, correct and up to date.
MJ Barnett
Secretary
Sandton
13 November 2002
for the year ended 30 September 2002
for the year ended 30 September 2002
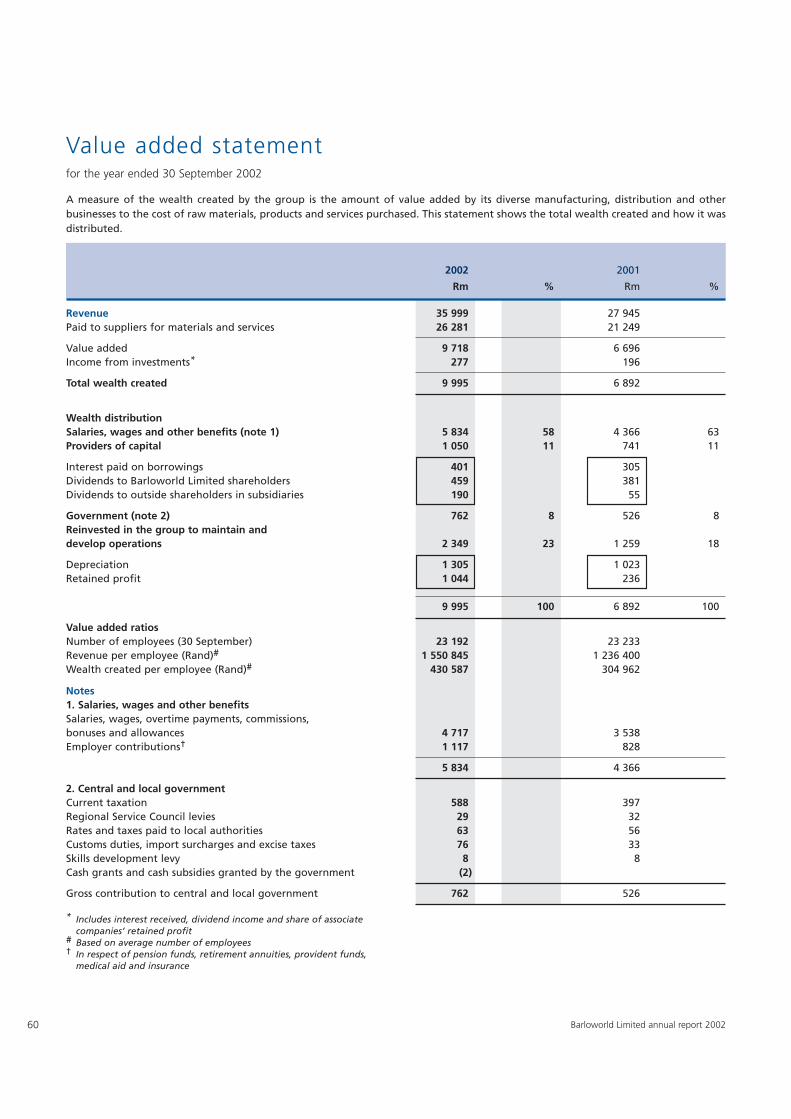
60 Barloworld Limited annual report 2002
2002 2001
Rm % Rm %
Revenue 35 999 27 945Paid to suppliers for materials and services 26 281 21 249
Value added 9 718 6 696Income from investments* 277 196
Total wealth created 9 995 6 892
Wealth distributionSalaries, wages and other benefits (note 1) 5 834 58 4 366 63Providers of capital 1 050 11 741 11
Interest paid on borrowings 401 305Dividends to Barloworld Limited shareholders 459 381Dividends to outside shareholders in subsidiaries 190 55
Government (note 2) 762 8 526 8Reinvested in the group to maintain and develop operations 2 349 23 1 259 18
Depreciation 1 305 1 023Retained profit 1 044 236
9 995 100 6 892 100
Value added ratiosNumber of employees (30 September) 23 192 23 233Revenue per employee (Rand)# 1 550 845 1 236 400Wealth created per employee (Rand)# 430 587 304 962
Notes1. Salaries, wages and other benefitsSalaries, wages, overtime payments, commissions,bonuses and allowances 4 717 3 538Employer contributions† 1 117 828
5 834 4 366
2. Central and local governmentCurrent taxation 588 397Regional Service Council levies 29 32Rates and taxes paid to local authorities 63 56Customs duties, import surcharges and excise taxes 76 33Skills development levy 8 8Cash grants and cash subsidies granted by the government (2)
Gross contribution to central and local government 762 526
* Includes interest received, dividend income and share of associate companies’ retained profit
# Based on average number of employees† In respect of pension funds, retirement annuities, provident funds,
medical aid and insurance
Value added statementfor the year ended 30 September 2002
A measure of the wealth created by the group is the amount of value added by its diverse manufacturing, distribution and otherbusinesses to the cost of raw materials, products and services purchased. This statement shows the total wealth created and how it wasdistributed.
61Barloworld Limited annual report 2002
Financial director’s reviewfor the year ended 30 September 2002
Group operating performance
Worldwide revenues grew 29% to
R35 999 million. Trading conditions in
Europe and Australia were good, and in
South Africa markets improved. By
contrast, demand for our products and
services in the United States remained
depressed and business in parts of the rest
of Africa slowed slightly.
Operating profit rose 39% to
R2 067 million, the increase in margins
being supported by the continued imple-
mentation of value-based management
initiatives in all segments with favourable
effects on costs and productivity. All
business segments improved their results
except Industrial Distribution and Scientific
Products, both of which have major
operations in the United States and
suffered from the prevailing recessionary
conditions.
Finance costs increased from R305 million
to R346 million, whilst interest cover
(excluding leasing operations) improved to
6,1 times (2001: 5,4 times).
Income from investments of R253 million is
in line with R254 million in the previous
year. Dividends received from associates
and joint ventures have been included with
income from associates on the face of the
income statement in the current year,
whereas they were previously included in
income from investments. Comparatives
have not been restated as there is no
impact on bottom-line profits or earnings
per share.
Amortisation of goodwill increased from
R88 million to R116 million. This was due
to the full-year amortisation of goodwill
on the Protean and Motor Australia
acquisitions as well as the impact of the
weakening rand.
Taxation rose from R383 million to
R636 million. The current year’s effective
tax rate, excluding exceptional items,
secondary tax on companies, and goodwill
amortisation, increased to 28,5% (2001:
24,5%), with the prior period being
favourably impacted by a release of over-
provisions.
Income from associates and joint ventures
increased from R31 million to R119 million.
This was mainly attributable to a strong
performance from Avis and the Coatings
joint ventures as well as the inclusion of
R37 million in dividends received from
associates and joint ventures on this line in
the current year (see above).
The minority interest in profits, which
comprises mainly the PPC minorities,
increased from R101 million to
R207 million. Of this amount, R89 million
relates to the minority share of the profit
on sale of Natal Portland Cement (NPC).
Profit before exceptional items increased by
38% from R1 348 million to R1 858 million.
Net profit for the year increased by 144%
from R617 million to R1 503 million.
Exceptional items
There were exceptional profits in the
current year amounting to R369 million
compared to exceptional costs in the prior
year of R278 million. The major items were
as follows:
• Impairment losses of R131 million
which comprise mainly an amount of
R102 million in respect of the write
down of the goodwill arising on the PPC
acquisition of Portland Holdings in
Zimbabwe and R13 million relating to
the impairment of Laezonia quarry.
• Profit on the disposal of properties,
investments and subsidiaries amounting
to R352 million. The significant items
included R263 million on the sale by
PPC of its stake in Natal Portland Cement
and R51 million on the sale of Plascon
International in the United Kingdom.
• A profit of R201 million resulting from
the realisation of foreign currency trans-
lation reserves on the liquidation of off-
shore subsidiaries. The other side of this
is reflected as a transfer out of non-
distributable reserves.
• A charge of R100 million (R70 million net
of deferred tax) in respect of a provision
for pension fund closure costs.
• A profit of R60 million accruing to
Barloworld Limited as a consequence of
the issue of shares by PPC to acquire
Portland Holdings.
Earnings per share
Earnings per share, excluding exceptional
items, increased 31% from 452 cents to
592 cents while headline earnings per
share increased 25% from 499 cents to
622 cents. The lower percentage increase
in headline earnings per share is principally
as a result of the fact that the once-off
exceptional charge relating to the closure
of the pension fund is required to be
adjusted for in the headline earnings
calculation.
The weighted average number of shares in
issue for the year was 195,3 million. This
was down from last year’s 195,6 million
due to the buy-back of shares during the
early part of the previous financial year.
Dividends
Dividends totalling 275 cents per share
were declared in respect of the 2002 year.
This gave a dividend cover of 2,2 times
based on earnings per share excluding
exceptional items, which falls within our
policy of between two and two and a half
times cover. A special centenary dividend
of 100 cents per share was also declared.
Cash flow
Cash flow from operations continued to be
strong, increasing 49% from R1 487 million
to R2 209 million. After dividends paid, net
cash from operations was R1 560 million
(2001: R1 051 million).
62 Barloworld Limited annual report 2002
Net cash utilised in investing activities of
R1 793 million (2001: R2 004 million)
included the acquisition of subsidiaries and
investments of R431 million, capital
expenditure of R1 281 million, investment
in leasing and rental assets of R1 041 million,
and proceeds on disposal of fixed assets
and investments of R960 million.
The net impact of the above was an overall
cash outflow before financing activities of
R233 million compared with an outflow of
R953 million last year.
Balance sheet and gearing
Total assets, which included goodwill and
intangible assets of R1 657 million (2001:
R1 530 million), increased by R5 151 million
to R27 097 million. The increase is due
primarily to replacement and expansion
capital expenditure, acquisition of
subsidiaries and investments, increases in
rental assets, and the impact of the
weakening currency on the translation of
international assets.
Total interest-bearing borrowings
increased to R7 188 million from
R6 222 million last year. The debt-equity
ratio (excluding leasing operations)
improved to 23,3% from 31,1% and
remains well within the upper limit of our
target range, namely 40%. Including the
leasing debt, the debt-equity ratio
improved to 59,8% (2001: 64,1%), which is
also comfortably below the upper limit of
our target range, namely 70%. If the
group’s motor leasing book (to be sold in
2003) had been disposed of at
30 September 2002 it would have reduced
the debt-equity ratio (including leasing
operations) by 6,9% to 52,9%.
The group’s debt covenants in the United
Kingdom were renegotiated to take into
account the growing finance business. The
banks participating in the bilateral facility
have agreed to apply different covenants
to the trading and finance segments.
The finance book in the United States and
United Kingdom is funded in part in terms
of a securitisation facility. Included in
interest-bearing liabilities in the group’s
balance sheet are loans to the value of
R1 137 million (2001: R374 million) which
are secured over specific lease receivables.
Value Based Management
In focusing on the Value Based Manage-
ment approach, the key indicator of
annual performance is cash flow return on
investment (CFROI®). Each operating
division is required to demonstrate it can
achieve a CFROI® in excess of the real cost
of capital of the group over a business
cycle. The group achieved a CFROI® of
8,5% in 2002 which was above the
previous year’s 8,3% and also above the
real cost of capital hurdle rate applied by
the group of 8,0%.
All proposed acquisitions and major capital
expenditure projects are also evaluated on
a CFROI® basis. Some new investments
impact negatively on CFROI® in the short
term but their longer-term prospects are
taken into account in the evaluations.
Acquisitions and disposals
The more significant acquisitions during
the year included:
• Portland Holdings in Zimbabwe through
Pretoria Portland Cement Company
Limited (PPC) for R428 million
• 1 518 153 additional shares in PPC for
R98 million
• A Sterling Truck dealership in Memphis,
Tennessee, through the purchase of its
stock for R9 million
• 50% of Execulink (now Barloworld
Optimus) and 100% of Supply Chain
Solutions (SCS), both logistics companies,
for R10 million and R16 million
respectively
• 10,83% of Energyst BV, a company
dedicated to the rental of Caterpillar
generator sets in Europe for R33 million
• 50% of Finaltair Barloworld, a joint
venture to exploit the production and
sale of energy in Europe by the use of
biomass, for R25 million.
The following disposals took place during
the year under review:
• PPC disposed of its 32,9% stake in Natal
Portland Cement to the Portuguese
cement company, Cimpor-Cimentos de
Portugal SPGS, S.A., for R328 million.
• PPC disposed of its 25% stake in Ash
Resources for a consideration of
R8 million.
• Barloworld Robor disposed of its 50%
share in Stemcor (South Africa) for
R13 million.
• The Mitsubishi operations of the Motor
business in Australia were disposed of
for a consideration of R16 million.
• The business of Plascon International in
the United Kingdom was sold in June
2002 for R64 million.
• The disposal of the steel distribution
branches of Robor Stewarts & Lloyds was
substantially completed at year-end.
Adoption of IAS 39
During the year the group adopted IAS 39
Financial Instruments: Recognition and
Measurement. This standard significantly
increases the use of fair values in
accounting for financial instruments. The
impact on the income statement in the
current year decreased reported profits
before tax by R15 million. Further details
are set out in note 30 to the financial
statements.
For internal management control and
reporting purposes the group still
continues to account, where applicable,
for its inventory and cost of sales using the
rate of exchange in the forward cover
contracts that have been entered into
to hedge the exchange risk. This rate
ultimately reflects what the enterprise is
going to pay for its inventory, and pricing
to customers is determined accordingly.
However, for half yearly and year-end
Financial director’s review continued
63Barloworld Limited annual report 2002
reporting purposes, an adjustment is made
to the financial statements in order to
comply with IAS 21 and IAS 39. This results,
inter alia, in an adjustment to operating
profit to record cost of sales at the average
spot rate at transaction date and a
corresponding adjustment to finance costs
which represents the gain or loss on the
underlying forward exchange contracts.
Post-retirement benefits
The group’s retirement benefit funds
comprise a number of defined benefit and
defined contribution funds throughout
the world. All these funds are in a sound
financial position.
After careful consideration of the latest
trends and developments in the provision
of retirement benefits, including the move
away from defined benefit funds to
defined contribution funds, the board has
approved the principle of winding up one
of the group’s pension funds. A gross
provision of R100 million (R70 million net
of deferred tax) has been raised to cover
additional costs projected to arise on the
closure of this fund. This represents 3,3%
of the value of the fund’s assets, which
amount to approximately R3 billion.
Individual annuities will be purchased for
pensioners whilst active and deferred
members will have their benefits
transferred to a new fund.
Inflation accounting
Due to the hyperinflationary environment
that has prevailed in Zimbabwe, the group
has applied IAS 29 Financial Reporting in
Hyperinflationary Economies to its sub-
sidiaries and associates that operate in this
country. Accordingly, the financial state-
ments of Portland Holdings Ltd and
Barzem Enterprises (Pty) Ltd have been
restated for the decrease in the general
purchasing power of the Zimbabwe dollar.
The change in the producer price index in
the financial year has been 143%.
Elsewhere in the group, cash flows and
results are analysed to monitor the effects
of inflation. The emphasis throughout is
on achieving inflation-adjusted cash flow
return on investments (CFROI®) which
exceed the real cost of capital.
In order to give an added appreciation of
our financial statements, a review is
published for convenience in US dollars,
euros and pounds.
Share buy-backs
No further shares were repurchased in
terms of the share buy-back programme
during the current financial year.
Authority from shareholders to re-
commence buy-backs, depending on
circumstances, will be renewed at the
forthcoming annual general meeting.
Post-balance sheet event
Agreement has been reached for the sale
of the third-party South African motor
vehicle finance book to WesBank, a
division of FirstRand Bank Limited, for
an estimated gross consideration of
R830 million. The final consideration will
be determined by the value of the finance
contracts at the effective date. The deal
will be effective on the first day of the
month following granting of approval by
the competition authorities. Proceeds from
the sale will be used to retire the external
debt used to fund the leases and will have
a positive impact on the gearing of the
group balance sheet.
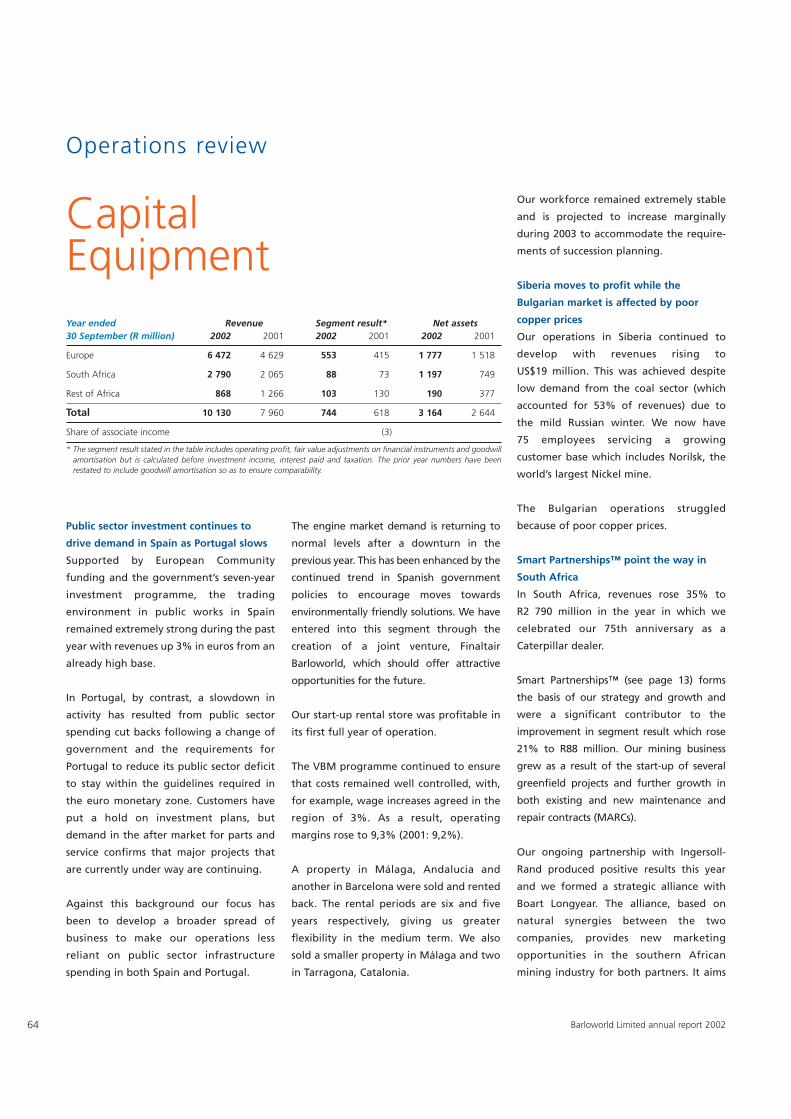
64 Barloworld Limited annual report 2002
Operations review
Public sector investment continues to
drive demand in Spain as Portugal slows
Supported by European Community
funding and the government’s seven-year
investment programme, the trading
environment in public works in Spain
remained extremely strong during the past
year with revenues up 3% in euros from an
already high base.
In Portugal, by contrast, a slowdown in
activity has resulted from public sector
spending cut backs following a change of
government and the requirements for
Portugal to reduce its public sector deficit
to stay within the guidelines required in
the euro monetary zone. Customers have
put a hold on investment plans, but
demand in the after market for parts and
service confirms that major projects that
are currently under way are continuing.
Against this background our focus has
been to develop a broader spread of
business to make our operations less
reliant on public sector infrastructure
spending in both Spain and Portugal.
The engine market demand is returning to
normal levels after a downturn in the
previous year. This has been enhanced by the
continued trend in Spanish government
policies to encourage moves towards
environmentally friendly solutions. We have
entered into this segment through the
creation of a joint venture, Finaltair
Barloworld, which should offer attractive
opportunities for the future.
Our start-up rental store was profitable in
its first full year of operation.
The VBM programme continued to ensure
that costs remained well controlled, with,
for example, wage increases agreed in the
region of 3%. As a result, operating
margins rose to 9,3% (2001: 9,2%).
A property in Málaga, Andalucia and
another in Barcelona were sold and rented
back. The rental periods are six and five
years respectively, giving us greater
flexibility in the medium term. We also
sold a smaller property in Málaga and two
in Tarragona, Catalonia.
Our workforce remained extremely stable
and is projected to increase marginally
during 2003 to accommodate the require-
ments of succession planning.
Siberia moves to profit while the
Bulgarian market is affected by poor
copper prices
Our operations in Siberia continued to
develop with revenues rising to
US$19 million. This was achieved despite
low demand from the coal sector (which
accounted for 53% of revenues) due to
the mild Russian winter. We now have
75 employees servicing a growing
customer base which includes Norilsk, the
world’s largest Nickel mine.
The Bulgarian operations struggled
because of poor copper prices.
Smart Partnerships™ point the way in
South Africa
In South Africa, revenues rose 35% to
R2 790 million in the year in which we
celebrated our 75th anniversary as a
Caterpillar dealer.
Smart Partnerships™ (see page 13) forms
the basis of our strategy and growth and
were a significant contributor to the
improvement in segment result which rose
21% to R88 million. Our mining business
grew as a result of the start-up of several
greenfield projects and further growth in
both existing and new maintenance and
repair contracts (MARCs).
Our ongoing partnership with Ingersoll-
Rand produced positive results this year
and we formed a strategic alliance with
Boart Longyear. The alliance, based on
natural synergies between the two
companies, provides new marketing
opportunities in the southern African
mining industry for both partners. It aims
CapitalEquipmentYear ended Revenue Segment result* Net assets30 September (R million) 2002 2001 2002 2001 2002 2001
Europe 6 472 4 629 553 415 1 777 1 518
South Africa 2 790 2 065 88 73 1 197 749
Rest of Africa 868 1 266 103 130 190 377
Total 10 130 7 960 744 618 3 164 2 644
Share of associate income (3)
* The segment result stated in the table includes operating profit, fair value adjustments on financial instruments and goodwillamortisation but is calculated before investment income, interest paid and taxation. The prior year numbers have beenrestated to include goodwill amortisation so as to ensure comparability.
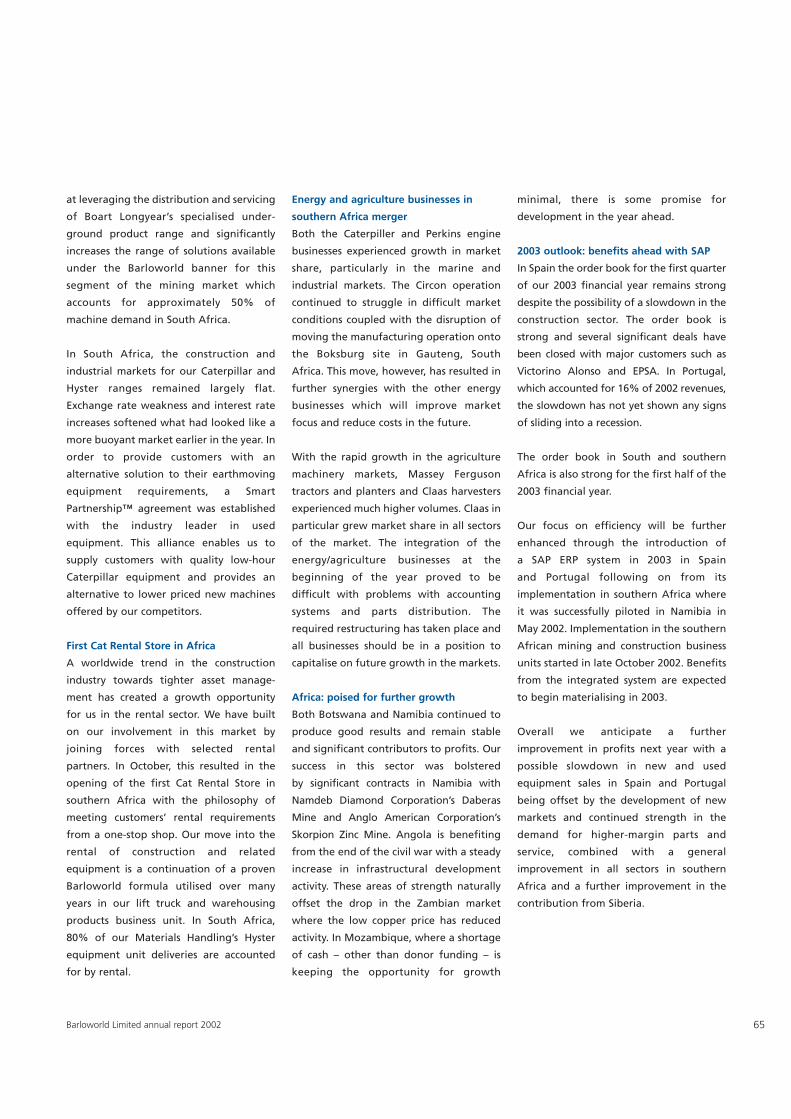
65Barloworld Limited annual report 2002
at leveraging the distribution and servicing
of Boart Longyear’s specialised under-
ground product range and significantly
increases the range of solutions available
under the Barloworld banner for this
segment of the mining market which
accounts for approximately 50% of
machine demand in South Africa.
In South Africa, the construction and
industrial markets for our Caterpillar and
Hyster ranges remained largely flat.
Exchange rate weakness and interest rate
increases softened what had looked like a
more buoyant market earlier in the year. In
order to provide customers with an
alternative solution to their earthmoving
equipment requirements, a Smart
Partnership™ agreement was established
with the industry leader in used
equipment. This alliance enables us to
supply customers with quality low-hour
Caterpillar equipment and provides an
alternative to lower priced new machines
offered by our competitors.
First Cat Rental Store in Africa
A worldwide trend in the construction
industry towards tighter asset manage-
ment has created a growth opportunity
for us in the rental sector. We have built
on our involvement in this market by
joining forces with selected rental
partners. In October, this resulted in the
opening of the first Cat Rental Store in
southern Africa with the philosophy of
meeting customers’ rental requirements
from a one-stop shop. Our move into the
rental of construction and related
equipment is a continuation of a proven
Barloworld formula utilised over many
years in our lift truck and warehousing
products business unit. In South Africa,
80% of our Materials Handling’s Hyster
equipment unit deliveries are accounted
for by rental.
Energy and agriculture businesses in
southern Africa merger
Both the Caterpiller and Perkins engine
businesses experienced growth in market
share, particularly in the marine and
industrial markets. The Circon operation
continued to struggle in difficult market
conditions coupled with the disruption of
moving the manufacturing operation onto
the Boksburg site in Gauteng, South
Africa. This move, however, has resulted in
further synergies with the other energy
businesses which will improve market
focus and reduce costs in the future.
With the rapid growth in the agriculture
machinery markets, Massey Ferguson
tractors and planters and Claas harvesters
experienced much higher volumes. Claas in
particular grew market share in all sectors
of the market. The integration of the
energy/agriculture businesses at the
beginning of the year proved to be
difficult with problems with accounting
systems and parts distribution. The
required restructuring has taken place and
all businesses should be in a position to
capitalise on future growth in the markets.
Africa: poised for further growth
Both Botswana and Namibia continued to
produce good results and remain stable
and significant contributors to profits. Our
success in this sector was bolstered
by significant contracts in Namibia with
Namdeb Diamond Corporation’s Daberas
Mine and Anglo American Corporation’s
Skorpion Zinc Mine. Angola is benefiting
from the end of the civil war with a steady
increase in infrastructural development
activity. These areas of strength naturally
offset the drop in the Zambian market
where the low copper price has reduced
activity. In Mozambique, where a shortage
of cash – other than donor funding – is
keeping the opportunity for growth
minimal, there is some promise for
development in the year ahead.
2003 outlook: benefits ahead with SAP
In Spain the order book for the first quarter
of our 2003 financial year remains strong
despite the possibility of a slowdown in the
construction sector. The order book is
strong and several significant deals have
been closed with major customers such as
Victorino Alonso and EPSA. In Portugal,
which accounted for 16% of 2002 revenues,
the slowdown has not yet shown any signs
of sliding into a recession.
The order book in South and southern
Africa is also strong for the first half of the
2003 financial year.
Our focus on efficiency will be further
enhanced through the introduction of
a SAP ERP system in 2003 in Spain
and Portugal following on from its
implementation in southern Africa where
it was successfully piloted in Namibia in
May 2002. Implementation in the southern
African mining and construction business
units started in late October 2002. Benefits
from the integrated system are expected
to begin materialising in 2003.
Overall we anticipate a further
improvement in profits next year with a
possible slowdown in new and used
equipment sales in Spain and Portugal
being offset by the development of new
markets and continued strength in the
demand for higher-margin parts and
service, combined with a general
improvement in all sectors in southern
Africa and a further improvement in the
contribution from Siberia.
66 Barloworld Limited annual report 2002
Operations review continued
Management (VBM) programme were
greatly improved, with all employees
involved in review meetings to determine
how to improve value delivery. Some
28 000 hours of training were provided this
year, further developing our employees
and reflecting our emphasis on the
learning and growth segment of VBM.
A focus on employee benefits and safety
resulted in a 36% reduction in related
medical costs and a 28% reduction in
employee accidents respectively.
Our Logistics Support Centre (LSC) in
Atlanta developed further during its
second year and helped reduce parts
inventories significantly. The LSC, along
with the centralisation of branch
administration, is moving management
into a more customer-facing environment
by reducing administration functions. This
has released valuable management time in
the branches to focus on marketing
activities.
Ditch Witch in the US: finds it tough in
the trenches
Ditch Witch of Georgia experienced a most
difficult year as the telecommunications
industry sector remained extremely weak.
This, coupled with the general slowdown
in economic activity, resulted in a 50%
market decline for Ditch Witch products.
The market for high-revenue directional
drilling products was particularly soft and
the after market suffered through general
lack of activity. The rental market also
proved to be very difficult with very low
utilisation. This was especially true of the
rock-trenching business, and the fleet has
been reduced by 50% during the year.
Overall the business made a loss.
A highlight of the year was our selection as
the sole supplier of trenching machines for
electricity utility Georgia Power Companies
in an agreement which runs through to
2005. The product range was strengthened
through the introduction of a new
IndustrialDistributionYear ended Revenue Segment result* Net assets30 September (R million) 2002 2001 2002 2001 2002 2001
Europe 2 202 1 684 95 75 946 728
North America 3 812 3 367 28 86 1 545 1 527
Total 6 014 5 051 123 161 2 491 2 255
Share of associate income (8)
* The segment result stated in the table includes operating profit, fair value adjustments on financial instruments and goodwillamortisation but is calculated before investment income, interest paid and taxation. The prior year numbers have beenrestated to include goodwill amortisation so as to ensure comparability.
US materials handling: recession bites
deep
The market for materials handling
equipment in the United States remained
in a recession in the year under review.
As a consequence, the market in the
southeast United States declined a further
22% to 25 994 units in 2002 (2001: 33 412
units). This followed a 30% decline in 2001
compared with the previous year. The key
factor was the manufacturing slowdown,
with recessions in the paper, telecoms and
textile industries having the largest impact
on our business. Our market share fell
half a percent to 14,7% as prices were
aggressively discounted by competitors
to gain what little business was available.
In the face of these difficult conditions,
we continued to reduce costs and
streamline the organisation. Four non-
performing small branches were closed,
adding to the two closed last year. The
number of employees has also been
reduced by 24% over the last two years.
Annual operating expenses were reduced
by $5,7 million and, as a result of lower
inventories, smaller short-term rental
fleets and better management of
receivables, capital employed was reduced
by some $18 million.
Despite the recession we have continued
to invest where it made strategic sense for
the longer-term positioning of the
business. In this context the Nashville,
Tennessee branch was relocated to a new
purpose-built facility. Nashville is an
expanding market where we have been
successful in growing the Hyster lift truck
population with the consequent growth in
after-market (parts and service) sales.
Thirty percent of all deliveries were made
with long-term maintenance agreements
benefiting both the Materials Handling
business unit and Barloworld Fleet Leasing,
the results of which are reflected under the
‘Financial Services, Logistics and Other’
operational reviews on pages 76 to 77. This
reflects our strategy of providing total
service solutions to our customers. Major
maintenance contracts were signed with
larger companies such as M&M Mars, FedEx
Supply Chain and Quebecor Printing as part
of our global goal of building Smart
Partnerships with our larger customers.
VBM in the US: focused commitment
brings results
Employee communications in the United
States through the Value Based
67Barloworld Limited annual report 2002
RT Trencher series with hydrostatic
transmission. Aimed primarily at the utility
installation industry, this product will be
more manoeuvrable and will improve user
productivity.
Barloworld Freightliner in the US:
competitive pricing
The recession also impacted the
Freightliner business with very difficult
market conditions continuing throughout
our territory. The market declined 20%
from the prior year and we sold 950 Class 8
trucks to our retail and fleet customers.
Our Class 8 market share declined slightly
due to aggressive competitor pricing and
the marked reduction in owner/operator
purchases which have traditionally been a
strong market for us. However, our share
in the Class 6 and 7 markets increased from
18% to 26%. This was achieved by better
marketing, giving more focus to these
products through dedicated sales people
in this sector which is not as volatile as the
Class 8 market.
Used truck sales showed an improvement
over 2001 and we sold 779 units, an
increase of 8,5% on the previous year.
However, the value per unit was depressed
by the market glut of used trucks and
revenues remained static.
Both new and used truck sales continue to
be restricted by the tightening of credit
markets. This particularly impacted the
owner/operator market where customers
found it increasingly difficult to borrow
money to finance purchases and, where
funding was available, interest rates were
excessively high. In this environment, the
ability to offer finance to our customers
through Barloworld Fleet Leasing proved
to be a competitive advantage
After-market sales revenues (parts/
service/body shop) for the year showed an
increase of 1,0% over the previous year.
This was against a backdrop of reduced
revenue from warranty as customers have
been keeping units beyond their warranty
period due to the recession. A Smart
Partnership™ initiative, providing large
fleet users with specialist parts support,
also contributed to the growth in the after
market. This support function will
continue to be developed and offered to
other customers.
The new US Environmental Protection
Agency (EPA) statute for cleaner emissions
for over-the-road diesel engines became
law on 1 October 2002. This created a
slight increase in demand in the fourth
quarter of the financial year, as many fleet
buyers preferred to take trucks with the
previous engine, which has a proven track
record for reliability and fuel efficiency.
The first quarter of the 2003 financial year
is likely to be negatively impacted due to
this ‘pre-buying’. However, as the US
economy pulls out of recession, freight will
need to move and demand for our
products should pick up markedly.
An aggressive direct marketing programme
has been undertaken with renewed
emphasis on lower capacity units and also
on the after-market opportunity as the
population of trucks in our territory
continues to age. Personnel have been
realigned to bring a more customer-facing
focus to the business.
The Sterling Truck line was added through a
February 2002 dealership acquisition with
sales outlets in Memphis, Tennessee,
Jackson, Mississippi and Jonesboro, Arkansas.
This is an opportunity for future growth in
our business, as these vehicles operate in
the speciality market of vocational vehicles
(eg dump trucks), where we have not had a
strong presence in the past.
Costs continue to be monitored closely and
two underperforming branches were
closed during the year leaving eight in
operation at the end of the period.
Europe Handling: finishes strongly
The UK manufacturing sector continued in
recession this year but our focus over past
years on new markets has paid off with
growth in sales to retail and distribution
industries. Consequently, our UK handling
business had an all-time record in booked
units with a 22,5% increase over last year,
and we finished the year with a strong
order book.
Another significant achievement in the UK
was the winning of the Ministry of
Defence (MOD) Pathfinder contract. This
contract, together with the Ministry of
Defence Tri-Service contract (won in 2000),
means we are now managing a total
fleet of 4 500 units for the MOD. Further
significant achievements were our winning
of key contracts in diverse market sectors:
retail with Focus Do It All, ports with
Port of Tilbury, and auto manufacture
with MG Rover. All these contracts provide
long-term relationships and revenue gen-
eration as part of our Smart Partnership™
strategy.
Our continued focus on generating
efficiencies in the structure of the business
resulted in the closure of six branches and
their replacement by two modern custom-
built facilities at Leicester and Thurrock.
The introduction this year of Hyster’s first
‘all new European’ reach-truck opens up
the opportunity to improve penetration
into the retail and distribution industries.
This product is key to breaking into
a market where we have traditionally had
a low market share and affords us
a significant opportunity to broaden our
customer base over the coming years.
Barloworld Fleet Rentals continued to be
an important part of our customer
offering in the UK with over 75% of
all units delivered on rental contracts.
This ensures an income stream from
those contracts which ranges from 36 to
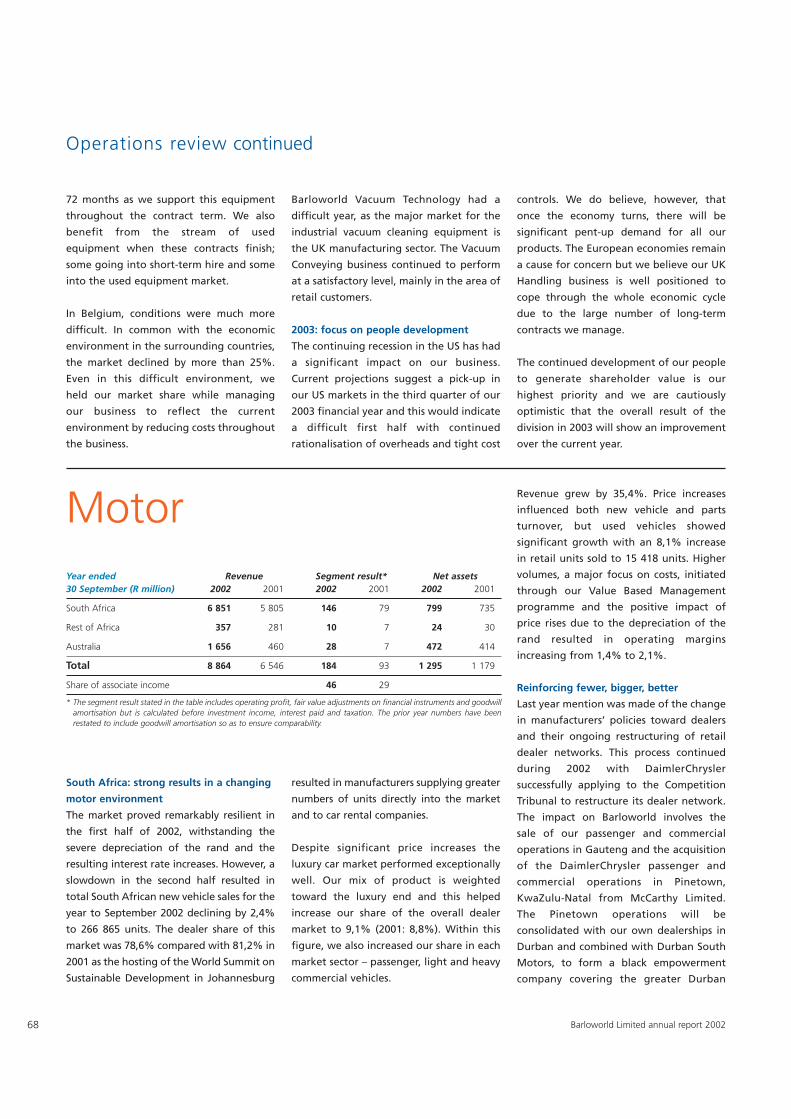
68 Barloworld Limited annual report 2002
Operations review continued
South Africa: strong results in a changing
motor environment
The market proved remarkably resilient in
the first half of 2002, withstanding the
severe depreciation of the rand and the
resulting interest rate increases. However, a
slowdown in the second half resulted in
total South African new vehicle sales for the
year to September 2002 declining by 2,4%
to 266 865 units. The dealer share of this
market was 78,6% compared with 81,2% in
2001 as the hosting of the World Summit on
Sustainable Development in Johannesburg
resulted in manufacturers supplying greater
numbers of units directly into the market
and to car rental companies.
Despite significant price increases the
luxury car market performed exceptionally
well. Our mix of product is weighted
toward the luxury end and this helped
increase our share of the overall dealer
market to 9,1% (2001: 8,8%). Within this
figure, we also increased our share in each
market sector – passenger, light and heavy
commercial vehicles.
Revenue grew by 35,4%. Price increases
influenced both new vehicle and parts
turnover, but used vehicles showed
significant growth with an 8,1% increase
in retail units sold to 15 418 units. Higher
volumes, a major focus on costs, initiated
through our Value Based Management
programme and the positive impact of
price rises due to the depreciation of the
rand resulted in operating margins
increasing from 1,4% to 2,1%.
Reinforcing fewer, bigger, better
Last year mention was made of the change
in manufacturers’ policies toward dealers
and their ongoing restructuring of retail
dealer networks. This process continued
during 2002 with DaimlerChrysler
successfully applying to the Competition
Tribunal to restructure its dealer network.
The impact on Barloworld involves the
sale of our passenger and commercial
operations in Gauteng and the acquisition
of the DaimlerChrysler passenger and
commercial operations in Pinetown,
KwaZulu-Natal from McCarthy Limited.
The Pinetown operations will be
consolidated with our own dealerships in
Durban and combined with Durban South
Motors, to form a black empowerment
company covering the greater Durban
Year ended Revenue Segment result* Net assets30 September (R million) 2002 2001 2002 2001 2002 2001
South Africa 6 851 5 805 146 79 799 735
Rest of Africa 357 281 10 7 24 30
Australia 1 656 460 28 7 472 414
Total 8 864 6 546 184 93 1 295 1 179
Share of associate income 46 29
* The segment result stated in the table includes operating profit, fair value adjustments on financial instruments and goodwillamortisation but is calculated before investment income, interest paid and taxation. The prior year numbers have beenrestated to include goodwill amortisation so as to ensure comparability.
Motor
72 months as we support this equipment
throughout the contract term. We also
benefit from the stream of used
equipment when these contracts finish;
some going into short-term hire and some
into the used equipment market.
In Belgium, conditions were much more
difficult. In common with the economic
environment in the surrounding countries,
the market declined by more than 25%.
Even in this difficult environment, we
held our market share while managing
our business to reflect the current
environment by reducing costs throughout
the business.
Barloworld Vacuum Technology had a
difficult year, as the major market for the
industrial vacuum cleaning equipment is
the UK manufacturing sector. The Vacuum
Conveying business continued to perform
at a satisfactory level, mainly in the area of
retail customers.
2003: focus on people development
The continuing recession in the US has had
a significant impact on our business.
Current projections suggest a pick-up in
our US markets in the third quarter of our
2003 financial year and this would indicate
a difficult first half with continued
rationalisation of overheads and tight cost
controls. We do believe, however, that
once the economy turns, there will be
significant pent-up demand for all our
products. The European economies remain
a cause for concern but we believe our UK
Handling business is well positioned to
cope through the whole economic cycle
due to the large number of long-term
contracts we manage.
The continued development of our people
to generate shareholder value is our
highest priority and we are cautiously
optimistic that the overall result of the
division in 2003 will show an improvement
over the current year.
69Barloworld Limited annual report 2002
area. This transaction commenced after
the end of the period under review. BMW
South Africa has also initiated a black
economic empowerment exercise that will
result in the sale of three of our
dealerships during the first half of the
current financial year. These are Auto
Atlantic in Claremont, Cape Town, and
Club Motors in Bruma and Selby,
Johannesburg. These transactions are
expected to result in appropriate
compensation being paid to Barloworld.
As a result of these changes, and ourstrategy of focusing on fewer, bigger,better facilities Barloworld Motor will have53 dealerships operating out of 80 sites byJanuary 2003. This includes both retail andother motor-related operations.
The process of optimising our facilitiescontinued in 2002. We sold a BMWdealership in East London and closed thePretoria BMW and Germiston Deltadealerships in Gauteng. We opened a newpanel shop in Pretoria. We relocated aDelta parts operation, one Delta and twoFord dealerships in Johannesburg, a Deltadealership in Pretoria and a Toyotadealership in Cape Town. Two newVW/Audi facilities are under constructionin Durban and Cape Town.
Avis Southern Africa Limited, in which wehave a 26% interest, performed well
during the past year and our share of theirincome rose from R24 million in 2001 toR36 million. Dividends received from Avisduring the year were R9,6 million (2001:R8,5 million). The investment in Avis is astrategic alliance and our relationshipgrew strongly during the year with thevolume of business transacted betweenour two organisations trebling fromR64 million to R193 million.
Africa: a satisfactory resultIn Namibia, despite the loss of the LandRover franchise as a result of the sale ofthe brand by BMW to Ford, our BMWoperation performed strongly as a stand-alone dealership, our share of thepassenger vehicle market rose to 7,7%(6,1% in 2001) and the profit contributionwas marginally higher.
The Botswana operations, which compriseof VW/Audi and Ford/Mazda dealerships,had a strong year despite being hamperedby inadequate facilities and increasedoperating profits by 50%. A new facilitywas approved and is currently underconstruction with occupation scheduledfor March 2003.
Australia: attractive propositionThe Australian market remained buoyantand the total market for new units isexpected to top 800 000 for the 2002calendar year. The Holden brandmaintained its market leadership position
with a 24% national market share and ourFerntree Gully Holden dealership had avery satisfactory year performing ahead ofexpectations in its first full year as aBarloworld business. The Geoff Bradydealership had a slower start, but afterinternal reorganisation is now positionedto perform to its potential. Our Melbourne-based Mercedes-Benz operation had avery strong year. Overall operating profitsquadrupled to R28 million on revenuegrowth of 360%. The underperformingMitsubishi dealerships were sold inJune 2002.
2003: interesting prospects aheadFurther interest rate increases in SouthAfrica could put a damper on prospects forgrowth in the retail motor industry nextyear. In this context and as a result of areduction in the overall size of the businessdue to the disposal of some of our BMWdealerships, we anticipate lower profitsfrom the region in 2003.
By contrast, the Australian market remainsan attractive proposition for furthergrowth and we are once again activelyseeking expansion possibilities. The profitcontribution from the region shouldaccordingly increase.
The overall result should be a modestgrowth in the profit contribution of thetotal motor business in 2003.
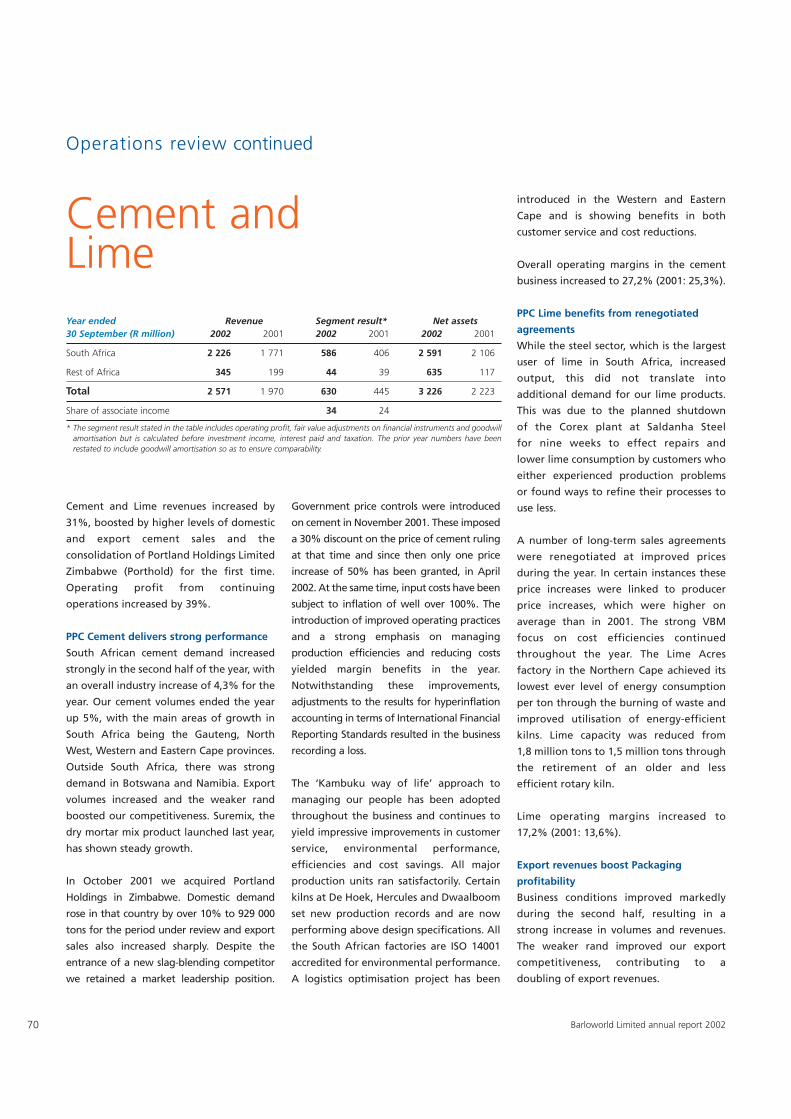
70 Barloworld Limited annual report 2002
introduced in the Western and Eastern
Cape and is showing benefits in both
customer service and cost reductions.
Overall operating margins in the cement
business increased to 27,2% (2001: 25,3%).
PPC Lime benefits from renegotiated
agreements
While the steel sector, which is the largest
user of lime in South Africa, increased
output, this did not translate into
additional demand for our lime products.
This was due to the planned shutdown
of the Corex plant at Saldanha Steel
for nine weeks to effect repairs and
lower lime consumption by customers who
either experienced production problems
or found ways to refine their processes to
use less.
A number of long-term sales agreements
were renegotiated at improved prices
during the year. In certain instances these
price increases were linked to producer
price increases, which were higher on
average than in 2001. The strong VBM
focus on cost efficiencies continued
throughout the year. The Lime Acres
factory in the Northern Cape achieved its
lowest ever level of energy consumption
per ton through the burning of waste and
improved utilisation of energy-efficient
kilns. Lime capacity was reduced from
1,8 million tons to 1,5 million tons through
the retirement of an older and less
efficient rotary kiln.
Lime operating margins increased to
17,2% (2001: 13,6%).
Export revenues boost Packaging
profitability
Business conditions improved markedly
during the second half, resulting in a
strong increase in volumes and revenues.
The weaker rand improved our export
competitiveness, contributing to a
doubling of export revenues.
Cement and Lime revenues increased by
31%, boosted by higher levels of domestic
and export cement sales and the
consolidation of Portland Holdings Limited
Zimbabwe (Porthold) for the first time.
Operating profit from continuing
operations increased by 39%.
PPC Cement delivers strong performance
South African cement demand increased
strongly in the second half of the year, with
an overall industry increase of 4,3% for the
year. Our cement volumes ended the year
up 5%, with the main areas of growth in
South Africa being the Gauteng, North
West, Western and Eastern Cape provinces.
Outside South Africa, there was strong
demand in Botswana and Namibia. Export
volumes increased and the weaker rand
boosted our competitiveness. Suremix, the
dry mortar mix product launched last year,
has shown steady growth.
In October 2001 we acquired Portland
Holdings in Zimbabwe. Domestic demand
rose in that country by over 10% to 929 000
tons for the period under review and export
sales also increased sharply. Despite the
entrance of a new slag-blending competitor
we retained a market leadership position.
Government price controls were introduced
on cement in November 2001. These imposed
a 30% discount on the price of cement ruling
at that time and since then only one price
increase of 50% has been granted, in April
2002. At the same time, input costs have been
subject to inflation of well over 100%. The
introduction of improved operating practices
and a strong emphasis on managing
production efficiencies and reducing costs
yielded margin benefits in the year.
Notwithstanding these improvements,
adjustments to the results for hyperinflation
accounting in terms of International Financial
Reporting Standards resulted in the business
recording a loss.
The ‘Kambuku way of life’ approach to
managing our people has been adopted
throughout the business and continues to
yield impressive improvements in customer
service, environmental performance,
efficiencies and cost savings. All major
production units ran satisfactorily. Certain
kilns at De Hoek, Hercules and Dwaalboom
set new production records and are now
performing above design specifications. All
the South African factories are ISO 14001
accredited for environmental performance.
A logistics optimisation project has been
Cement andLimeYear ended Revenue Segment result* Net assets30 September (R million) 2002 2001 2002 2001 2002 2001
South Africa 2 226 1 771 586 406 2 591 2 106
Rest of Africa 345 199 44 39 635 117
Total 2 571 1 970 630 445 3 226 2 223
Share of associate income 34 24
* The segment result stated in the table includes operating profit, fair value adjustments on financial instruments and goodwillamortisation but is calculated before investment income, interest paid and taxation. The prior year numbers have beenrestated to include goodwill amortisation so as to ensure comparability.
Operations review continued
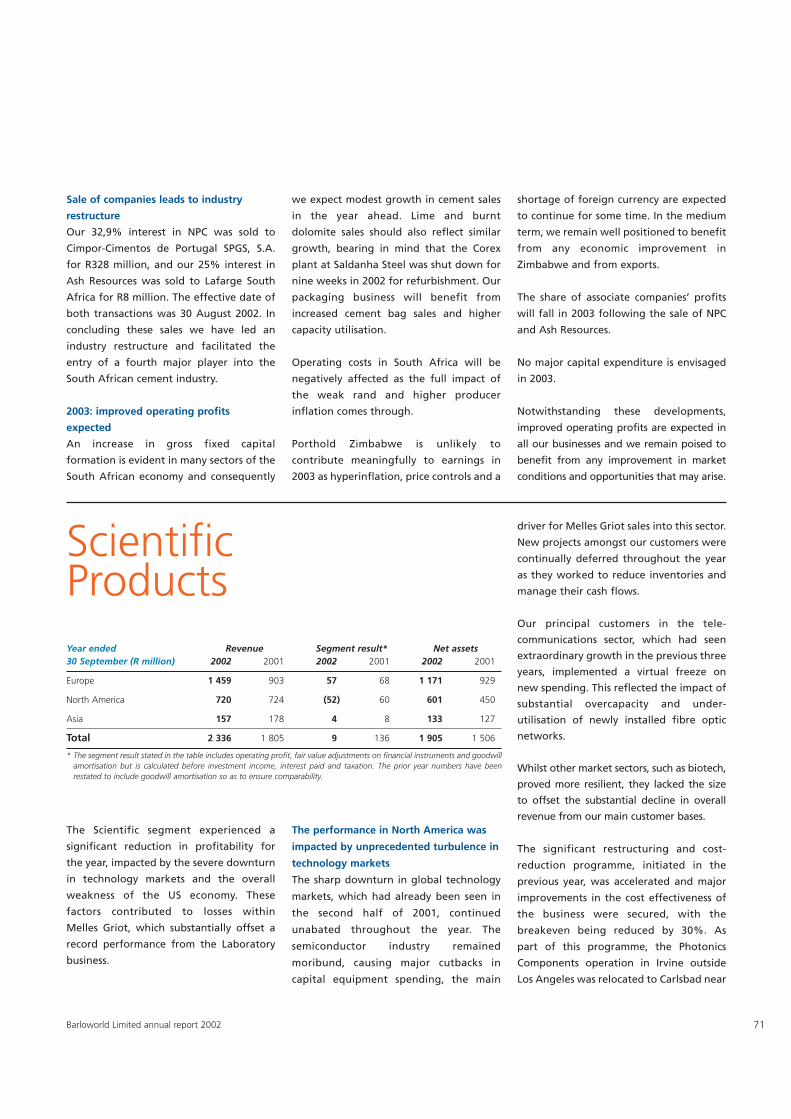
71Barloworld Limited annual report 2002
shortage of foreign currency are expected
to continue for some time. In the medium
term, we remain well positioned to benefit
from any economic improvement in
Zimbabwe and from exports.
The share of associate companies’ profits
will fall in 2003 following the sale of NPC
and Ash Resources.
No major capital expenditure is envisaged
in 2003.
Notwithstanding these developments,
improved operating profits are expected in
all our businesses and we remain poised to
benefit from any improvement in market
conditions and opportunities that may arise.
Sale of companies leads to industry
restructure
Our 32,9% interest in NPC was sold to
Cimpor-Cimentos de Portugal SPGS, S.A.
for R328 million, and our 25% interest in
Ash Resources was sold to Lafarge South
Africa for R8 million. The effective date of
both transactions was 30 August 2002. In
concluding these sales we have led an
industry restructure and facilitated the
entry of a fourth major player into the
South African cement industry.
2003: improved operating profits
expected
An increase in gross fixed capital
formation is evident in many sectors of the
South African economy and consequently
we expect modest growth in cement sales
in the year ahead. Lime and burnt
dolomite sales should also reflect similar
growth, bearing in mind that the Corex
plant at Saldanha Steel was shut down for
nine weeks in 2002 for refurbishment. Our
packaging business will benefit from
increased cement bag sales and higher
capacity utilisation.
Operating costs in South Africa will be
negatively affected as the full impact of
the weak rand and higher producer
inflation comes through.
Porthold Zimbabwe is unlikely to
contribute meaningfully to earnings in
2003 as hyperinflation, price controls and a
The Scientific segment experienced a
significant reduction in profitability for
the year, impacted by the severe downturn
in technology markets and the overall
weakness of the US economy. These
factors contributed to losses within
Melles Griot, which substantially offset a
record performance from the Laboratory
business.
The performance in North America was
impacted by unprecedented turbulence in
technology markets
The sharp downturn in global technology
markets, which had already been seen in
the second half of 2001, continued
unabated throughout the year. The
semiconductor industry remained
moribund, causing major cutbacks in
capital equipment spending, the main
driver for Melles Griot sales into this sector.
New projects amongst our customers were
continually deferred throughout the year
as they worked to reduce inventories and
manage their cash flows.
Our principal customers in the tele-
communications sector, which had seen
extraordinary growth in the previous three
years, implemented a virtual freeze on
new spending. This reflected the impact of
substantial overcapacity and under-
utilisation of newly installed fibre optic
networks.
Whilst other market sectors, such as biotech,
proved more resilient, they lacked the size
to offset the substantial decline in overall
revenue from our main customer bases.
The significant restructuring and cost-
reduction programme, initiated in the
previous year, was accelerated and major
improvements in the cost effectiveness of
the business were secured, with the
breakeven being reduced by 30%. As
part of this programme, the Photonics
Components operation in Irvine outside
Los Angeles was relocated to Carlsbad near
ScientificProductsYear ended Revenue Segment result* Net assets30 September (R million) 2002 2001 2002 2001 2002 2001
Europe 1 459 903 57 68 1 171 929
North America 720 724 (52) 60 601 450
Asia 157 178 4 8 133 127
Total 2 336 1 805 9 136 1 905 1 506
* The segment result stated in the table includes operating profit, fair value adjustments on financial instruments and goodwillamortisation but is calculated before investment income, interest paid and taxation. The prior year numbers have beenrestated to include goodwill amortisation so as to ensure comparability.
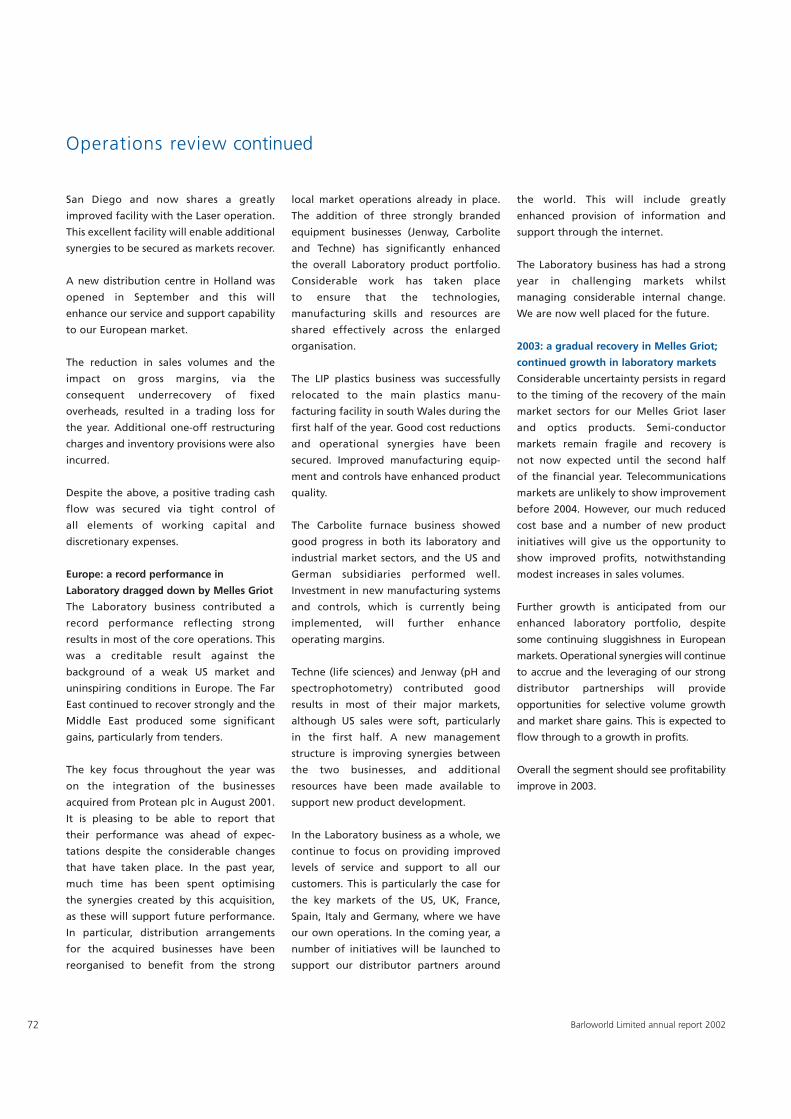
72 Barloworld Limited annual report 2002
Operations review continued
San Diego and now shares a greatly
improved facility with the Laser operation.
This excellent facility will enable additional
synergies to be secured as markets recover.
A new distribution centre in Holland was
opened in September and this will
enhance our service and support capability
to our European market.
The reduction in sales volumes and the
impact on gross margins, via the
consequent underrecovery of fixed
overheads, resulted in a trading loss for
the year. Additional one-off restructuring
charges and inventory provisions were also
incurred.
Despite the above, a positive trading cash
flow was secured via tight control of
all elements of working capital and
discretionary expenses.
Europe: a record performance in
Laboratory dragged down by Melles Griot
The Laboratory business contributed a
record performance reflecting strong
results in most of the core operations. This
was a creditable result against the
background of a weak US market and
uninspiring conditions in Europe. The Far
East continued to recover strongly and the
Middle East produced some significant
gains, particularly from tenders.
The key focus throughout the year was
on the integration of the businesses
acquired from Protean plc in August 2001.
It is pleasing to be able to report that
their performance was ahead of expec-
tations despite the considerable changes
that have taken place. In the past year,
much time has been spent optimising
the synergies created by this acquisition,
as these will support future performance.
In particular, distribution arrangements
for the acquired businesses have been
reorganised to benefit from the strong
local market operations already in place.
The addition of three strongly branded
equipment businesses (Jenway, Carbolite
and Techne) has significantly enhanced
the overall Laboratory product portfolio.
Considerable work has taken place
to ensure that the technologies,
manufacturing skills and resources are
shared effectively across the enlarged
organisation.
The LIP plastics business was successfully
relocated to the main plastics manu-
facturing facility in south Wales during the
first half of the year. Good cost reductions
and operational synergies have been
secured. Improved manufacturing equip-
ment and controls have enhanced product
quality.
The Carbolite furnace business showed
good progress in both its laboratory and
industrial market sectors, and the US and
German subsidiaries performed well.
Investment in new manufacturing systems
and controls, which is currently being
implemented, will further enhance
operating margins.
Techne (life sciences) and Jenway (pH and
spectrophotometry) contributed good
results in most of their major markets,
although US sales were soft, particularly
in the first half. A new management
structure is improving synergies between
the two businesses, and additional
resources have been made available to
support new product development.
In the Laboratory business as a whole, we
continue to focus on providing improved
levels of service and support to all our
customers. This is particularly the case for
the key markets of the US, UK, France,
Spain, Italy and Germany, where we have
our own operations. In the coming year, a
number of initiatives will be launched to
support our distributor partners around
the world. This will include greatly
enhanced provision of information and
support through the internet.
The Laboratory business has had a strong
year in challenging markets whilst
managing considerable internal change.
We are now well placed for the future.
2003: a gradual recovery in Melles Griot;
continued growth in laboratory markets
Considerable uncertainty persists in regard
to the timing of the recovery of the main
market sectors for our Melles Griot laser
and optics products. Semi-conductor
markets remain fragile and recovery is
not now expected until the second half
of the financial year. Telecommunications
markets are unlikely to show improvement
before 2004. However, our much reduced
cost base and a number of new product
initiatives will give us the opportunity to
show improved profits, notwithstanding
modest increases in sales volumes.
Further growth is anticipated from our
enhanced laboratory portfolio, despite
some continuing sluggishness in European
markets. Operational synergies will continue
to accrue and the leveraging of our strong
distributor partnerships will provide
opportunities for selective volume growth
and market share gains. This is expected to
flow through to a growth in profits.
Overall the segment should see profitability
improve in 2003.
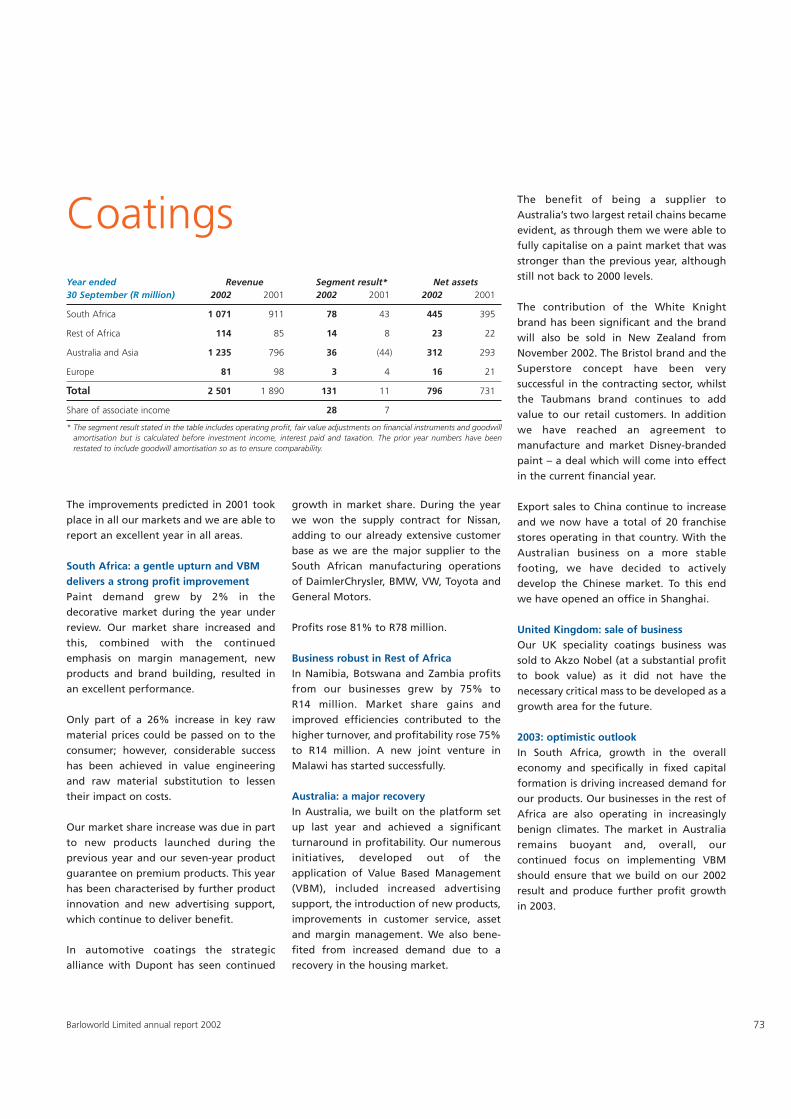
73Barloworld Limited annual report 2002
The improvements predicted in 2001 tookplace in all our markets and we are able toreport an excellent year in all areas.
South Africa: a gentle upturn and VBMdelivers a strong profit improvementPaint demand grew by 2% in thedecorative market during the year underreview. Our market share increased andthis, combined with the continuedemphasis on margin management, newproducts and brand building, resulted inan excellent performance.
Only part of a 26% increase in key rawmaterial prices could be passed on to theconsumer; however, considerable successhas been achieved in value engineeringand raw material substitution to lessentheir impact on costs.
Our market share increase was due in partto new products launched during theprevious year and our seven-year productguarantee on premium products. This yearhas been characterised by further productinnovation and new advertising support,which continue to deliver benefit.
In automotive coatings the strategicalliance with Dupont has seen continued
growth in market share. During the yearwe won the supply contract for Nissan,adding to our already extensive customerbase as we are the major supplier to theSouth African manufacturing operationsof DaimlerChrysler, BMW, VW, Toyota andGeneral Motors.
Profits rose 81% to R78 million.
Business robust in Rest of AfricaIn Namibia, Botswana and Zambia profitsfrom our businesses grew by 75% toR14 million. Market share gains andimproved efficiencies contributed to thehigher turnover, and profitability rose 75%to R14 million. A new joint venture inMalawi has started successfully.
Australia: a major recoveryIn Australia, we built on the platform setup last year and achieved a significantturnaround in profitability. Our numerousinitiatives, developed out of theapplication of Value Based Management(VBM), included increased advertisingsupport, the introduction of new products,improvements in customer service, assetand margin management. We also bene-fited from increased demand due to arecovery in the housing market.
The benefit of being a supplier toAustralia’s two largest retail chains becameevident, as through them we were able tofully capitalise on a paint market that wasstronger than the previous year, althoughstill not back to 2000 levels.
The contribution of the White Knightbrand has been significant and the brandwill also be sold in New Zealand fromNovember 2002. The Bristol brand and theSuperstore concept have been verysuccessful in the contracting sector, whilstthe Taubmans brand continues to addvalue to our retail customers. In additionwe have reached an agreement tomanufacture and market Disney-brandedpaint – a deal which will come into effectin the current financial year.
Export sales to China continue to increaseand we now have a total of 20 franchisestores operating in that country. With theAustralian business on a more stablefooting, we have decided to activelydevelop the Chinese market. To this endwe have opened an office in Shanghai.
United Kingdom: sale of businessOur UK speciality coatings business wassold to Akzo Nobel (at a substantial profitto book value) as it did not have thenecessary critical mass to be developed as agrowth area for the future.
2003: optimistic outlookIn South Africa, growth in the overalleconomy and specifically in fixed capitalformation is driving increased demand forour products. Our businesses in the rest ofAfrica are also operating in increasinglybenign climates. The market in Australiaremains buoyant and, overall, ourcontinued focus on implementing VBMshould ensure that we build on our 2002result and produce further profit growthin 2003.
CoatingsYear ended Revenue Segment result* Net assets30 September (R million) 2002 2001 2002 2001 2002 2001
South Africa 1 071 911 78 43 445 395
Rest of Africa 114 85 14 8 23 22
Australia and Asia 1 235 796 36 (44) 312 293
Europe 81 98 3 4 16 21
Total 2 501 1 890 131 11 796 731
Share of associate income 28 7
* The segment result stated in the table includes operating profit, fair value adjustments on financial instruments and goodwillamortisation but is calculated before investment income, interest paid and taxation. The prior year numbers have beenrestated to include goodwill amortisation so as to ensure comparability.
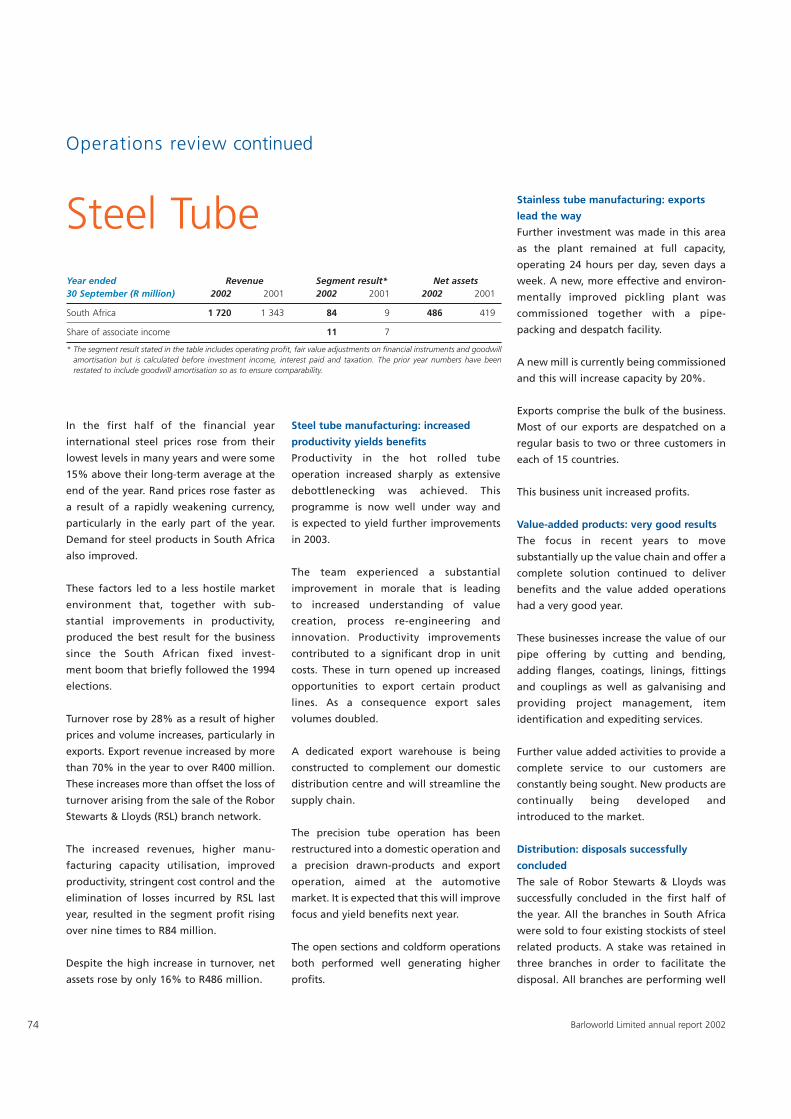
74 Barloworld Limited annual report 2002
Operations review continued
In the first half of the financial year
international steel prices rose from their
lowest levels in many years and were some
15% above their long-term average at the
end of the year. Rand prices rose faster as
a result of a rapidly weakening currency,
particularly in the early part of the year.
Demand for steel products in South Africa
also improved.
These factors led to a less hostile market
environment that, together with sub-
stantial improvements in productivity,
produced the best result for the business
since the South African fixed invest-
ment boom that briefly followed the 1994
elections.
Turnover rose by 28% as a result of higher
prices and volume increases, particularly in
exports. Export revenue increased by more
than 70% in the year to over R400 million.
These increases more than offset the loss of
turnover arising from the sale of the Robor
Stewarts & Lloyds (RSL) branch network.
The increased revenues, higher manu-
facturing capacity utilisation, improved
productivity, stringent cost control and the
elimination of losses incurred by RSL last
year, resulted in the segment profit rising
over nine times to R84 million.
Despite the high increase in turnover, net
assets rose by only 16% to R486 million.
Steel tube manufacturing: increased
productivity yields benefits
Productivity in the hot rolled tube
operation increased sharply as extensive
debottlenecking was achieved. This
programme is now well under way and
is expected to yield further improvements
in 2003.
The team experienced a substantial
improvement in morale that is leading
to increased understanding of value
creation, process re-engineering and
innovation. Productivity improvements
contributed to a significant drop in unit
costs. These in turn opened up increased
opportunities to export certain product
lines. As a consequence export sales
volumes doubled.
A dedicated export warehouse is being
constructed to complement our domestic
distribution centre and will streamline the
supply chain.
The precision tube operation has been
restructured into a domestic operation and
a precision drawn-products and export
operation, aimed at the automotive
market. It is expected that this will improve
focus and yield benefits next year.
The open sections and coldform operations
both performed well generating higher
profits.
Stainless tube manufacturing: exports
lead the way
Further investment was made in this area
as the plant remained at full capacity,
operating 24 hours per day, seven days a
week. A new, more effective and environ-
mentally improved pickling plant was
commissioned together with a pipe-
packing and despatch facility.
A new mill is currently being commissioned
and this will increase capacity by 20%.
Exports comprise the bulk of the business.
Most of our exports are despatched on a
regular basis to two or three customers in
each of 15 countries.
This business unit increased profits.
Value-added products: very good results
The focus in recent years to move
substantially up the value chain and offer a
complete solution continued to deliver
benefits and the value added operations
had a very good year.
These businesses increase the value of our
pipe offering by cutting and bending,
adding flanges, coatings, linings, fittings
and couplings as well as galvanising and
providing project management, item
identification and expediting services.
Further value added activities to provide a
complete service to our customers are
constantly being sought. New products are
continually being developed and
introduced to the market.
Distribution: disposals successfully
concluded
The sale of Robor Stewarts & Lloyds was
successfully concluded in the first half of
the year. All the branches in South Africa
were sold to four existing stockists of steel
related products. A stake was retained in
three branches in order to facilitate the
disposal. All branches are performing well
Steel TubeYear ended Revenue Segment result* Net assets30 September (R million) 2002 2001 2002 2001 2002 2001
South Africa 1 720 1 343 84 9 486 419
Share of associate income 11 7
* The segment result stated in the table includes operating profit, fair value adjustments on financial instruments and goodwillamortisation but is calculated before investment income, interest paid and taxation. The prior year numbers have beenrestated to include goodwill amortisation so as to ensure comparability.
75Barloworld Limited annual report 2002
in the hands of their new owners. The four
purchasers now operate 36 branches
throughout South Africa and continue to
offer strong support to the Robor tube
mills, increasing offtake in this financial
year by 16%.
The 50% investment in Stemcor was sold
to our partners with effect from the end of
May. Whilst the partnership was very
successful, the disposal has enabled us to
focus further resources on our wholly-
owned operations.
Value creation: emphasis on training
We continue to place emphasis on the
training and development of our people.
All senior employees have been compre-
hensively assessed and all have attended
value creation training. This will now
continue at lower levels throughout the
organisation with the objective of training
all employees on their role in value
creation by the end of next year.
Health and safety continue to receive
attention. Our safety record has improved
steadily and is now approaching world-
class benchmarks. The safety committee
is also responsible for environment
management and is presently conducting a
thorough environmental review of all
operations. Thereafter a uniform environ-
mental management programme will be
implemented throughout the business.
The shared services facility consolidated its
operations this year. As a result of the
increased focus on tube making, further
shared services such as logistics and
industrial engineering are being created to
facilitate the sharing of best practice
throughout the operations.
With growing exports and increased
quality demands further improvements in
this area are planned for 2003.
2003: well positioned for possible decline
in steel prices
Steel prices are unlikely to rise much
further and a decline is conceivable next
year unless the world economic outlook
improves. A significant drop in prices
would have a negative impact on results
in 2003.
The business has substantially improved its
competitive position with a lower cost
base, a more diversified product and
geographic base and a greater focus on
value added. It is in a much better position
than before to withstand a drop in prices.
In addition, as the steady change in the
world steel competitive position moves in
favour of the East and the South, southern
Africa has become an increasingly more
productive region for value adding in the
industry. We, together with our customers,
are slowly developing a base as a preferred
global source that is crucial to the
industry’s future in South Africa.
Should international prices stabilise and
the domestic economy remain resilient,
our earnings will continue to improve as a
result of our efforts in value creation.
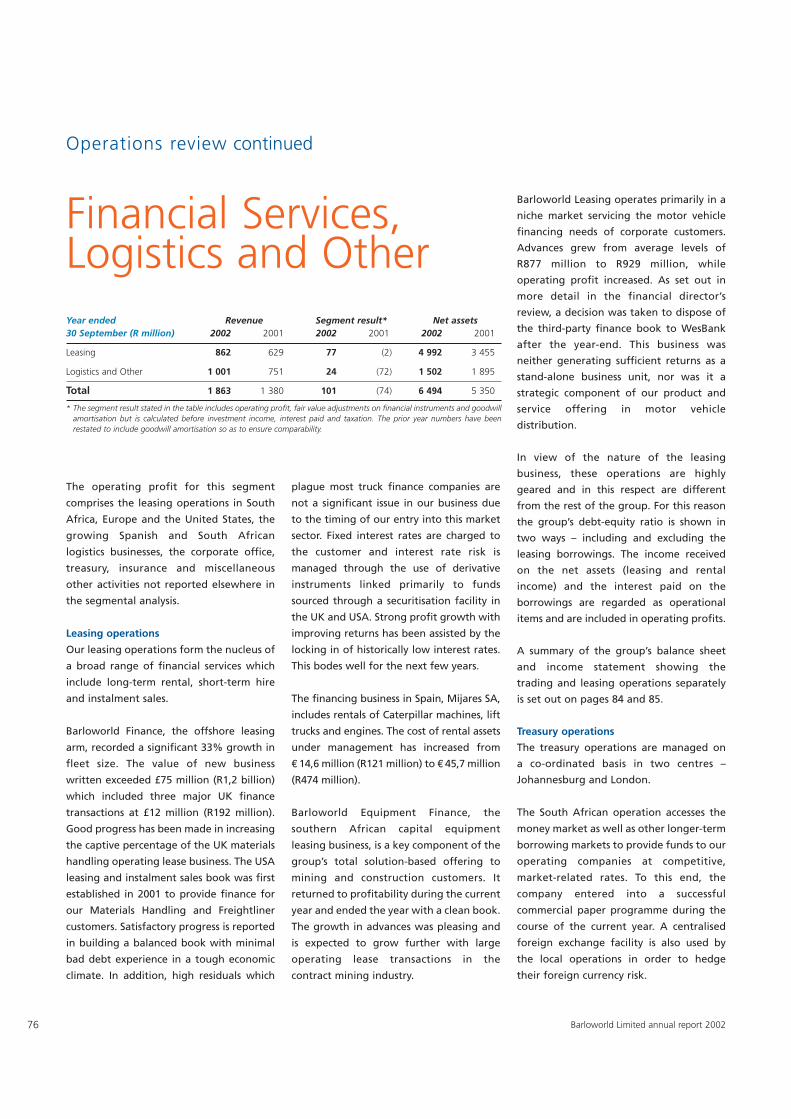
76 Barloworld Limited annual report 2002
Operations review continued
The operating profit for this segment
comprises the leasing operations in South
Africa, Europe and the United States, the
growing Spanish and South African
logistics businesses, the corporate office,
treasury, insurance and miscellaneous
other activities not reported elsewhere in
the segmental analysis.
Leasing operations
Our leasing operations form the nucleus of
a broad range of financial services which
include long-term rental, short-term hire
and instalment sales.
Barloworld Finance, the offshore leasing
arm, recorded a significant 33% growth in
fleet size. The value of new business
written exceeded £75 million (R1,2 billion)
which included three major UK finance
transactions at £12 million (R192 million).
Good progress has been made in increasing
the captive percentage of the UK materials
handling operating lease business. The USA
leasing and instalment sales book was first
established in 2001 to provide finance for
our Materials Handling and Freightliner
customers. Satisfactory progress is reported
in building a balanced book with minimal
bad debt experience in a tough economic
climate. In addition, high residuals which
plague most truck finance companies are
not a significant issue in our business due
to the timing of our entry into this market
sector. Fixed interest rates are charged to
the customer and interest rate risk is
managed through the use of derivative
instruments linked primarily to funds
sourced through a securitisation facility in
the UK and USA. Strong profit growth with
improving returns has been assisted by the
locking in of historically low interest rates.
This bodes well for the next few years.
The financing business in Spain, Mijares SA,
includes rentals of Caterpillar machines, lift
trucks and engines. The cost of rental assets
under management has increased from
14,6 million (R121 million) to 45,7 million
(R474 million).
Barloworld Equipment Finance, the
southern African capital equipment
leasing business, is a key component of the
group’s total solution-based offering to
mining and construction customers. It
returned to profitability during the current
year and ended the year with a clean book.
The growth in advances was pleasing and
is expected to grow further with large
operating lease transactions in the
contract mining industry.
Barloworld Leasing operates primarily in a
niche market servicing the motor vehicle
financing needs of corporate customers.
Advances grew from average levels of
R877 million to R929 million, while
operating profit increased. As set out in
more detail in the financial director’s
review, a decision was taken to dispose of
the third-party finance book to WesBank
after the year-end. This business was
neither generating sufficient returns as a
stand-alone business unit, nor was it a
strategic component of our product and
service offering in motor vehicle
distribution.
In view of the nature of the leasing
business, these operations are highly
geared and in this respect are different
from the rest of the group. For this reason
the group’s debt-equity ratio is shown in
two ways – including and excluding the
leasing borrowings. The income received
on the net assets (leasing and rental
income) and the interest paid on the
borrowings are regarded as operational
items and are included in operating profits.
A summary of the group’s balance sheet
and income statement showing the
trading and leasing operations separately
is set out on pages 84 and 85.
Treasury operations
The treasury operations are managed on
a co-ordinated basis in two centres –
Johannesburg and London.
The South African operation accesses the
money market as well as other longer-term
borrowing markets to provide funds to our
operating companies at competitive,
market-related rates. To this end, the
company entered into a successful
commercial paper programme during the
course of the current year. A centralised
foreign exchange facility is also used by
the local operations in order to hedge
their foreign currency risk.
Financial Services,Logistics and OtherYear ended Revenue Segment result* Net assets30 September (R million) 2002 2001 2002 2001 2002 2001
Leasing 862 629 77 (2) 4 992 3 455
Logistics and Other 1 001 751 24 (72) 1 502 1 895
Total 1 863 1 380 101 (74) 6 494 5 350
* The segment result stated in the table includes operating profit, fair value adjustments on financial instruments and goodwillamortisation but is calculated before investment income, interest paid and taxation. The prior year numbers have beenrestated to include goodwill amortisation so as to ensure comparability.
77Barloworld Limited annual report 2002
Our international operations are financed
at keen rates out of a five-year bilateral
facility which has a further two years to run.
No trading in financial instruments is under-
taken, but derivative instruments are used
to manage the currency and interest rate
risk arising from the group’s operations.
South African logistics: a new paradigm
in integrated management
Established by the merger of two in-house
logistics operations on 1 October 2001,
Barloworld Logistics had, by the last
quarter of the 2002 financial year, evolved
rapidly to become a pre-eminent supplier
of integrated logistics solutions in South
Africa. With revenues of R642 million, the
business now employs 935 people.
At inception it was recognised that transport
was only one element, albeit the largest, of
the integrated logistics offering. The major
challenge has been to build a pre-emptive
and competitive strategy in this fast-evolving
industry, and to populate the business with
world-class skills and experience.
In the practice of modern logistics, there
are two major benefits for clients:
• A radical reduction in lead times and costs
that can yield competitive advantage
• An improvement in service levels that can
lead to competitive advantage, especially
in mature markets
These advantages are not achievable
unless the approach to the logistics
problem is holistic. Also, the solution must
be integrated across ‘silos’ of activity.
During 2001/2, we acquired SCS (Supply
Chains Solutions), South Africa’s leading
integrated logistics management
company; 50% of Optimus (formerly
Execulink), one of the world’s leading
inventory optimisation specialists; and
assets and staff of Incito, the network
modelling and supply chain integration
firm. These acquisitions, together with the
transportation excellence that already lay
within Barloworld, have enabled us to go
to market with an integrated model that
has considerable advantage over our com-
petitors. The acquisitions also bring with
them a level of skill and experience in
holistic logistics practice that is unrivalled
in South Africa. Individuals now employed
by Barloworld Logistics have won the
coveted Logistics Achiever Award in two of
the last four years.
Core competencies in Barloworld Logistics
now include lead logistics management,
inventory optimisation, procurement,
supply chain and freight auditing, demand
forecasting, transportation optimisation,
risk management, network modelling,
warehousing, direct contract carriage,
integrative IT, supply chain consulting and
project management.
Logistics in Spain: good growth
The logistics business in Spain has
continued on the expansion path forecast
last year. Turnover has risen from
9,7 million (R69 million) to 28,7 million
(R282 million), over 70% of which is to
third parties. Operating profit has also
increased commensurately and the
business now employs 104 people. This
result has been helped by continued
growth in the international transport
business segment, the continued strength
of the warehousing contracts and the
contract to distribute DaimlerChrysler
passenger and truck parts won last year.
Warehouse utilisation is around 90%.
Further space will be added to the
Arganda facilities outside Madrid as
growth is expected in 2003 as a result of
having won the contract for the
warehousing and distribution of Exxon-
Mobil oil products in Iberia.
Synergies realised with the Iberian Capital
Equipment dealership businesses include
managing the transportation of parts
deliveries and machines. A 24-hour delivery
truck service from Caterpillar’s Grimbergen
distribution centre has been set up, which
has generated profits for the logistics
business and a significant reduction in the
airfreight cost for the dealership.
Corporate operations and other business
activities
Corporate services and activities contained
within this segment include legal and
tax, company secretarial, economic fore-
casting, corporate finance, value based
management and strategic planning,
internal communication, investor relations,
corporate brand building, as well as risk
and insurance management.
Other business activities contained within
this segment include Barloworld Concrete
Industries which showed a satisfactory
improvement in profitability in 2002. It is,
however, not a core business for Barloworld
and effective 1 October 2002, an 80%
shareholding in this business was sold by
way of a management buy-out, with the
remaining 20% shareholding being held
with a view to disposal to an empowerment
company. Henry Cooke, the speciality
papermaker based in the UK, had a
successful year. The company manufactures
a range of high-performance papers used
for food and medical packaging. The
business improved its profitability
significantly, achieving an operating profit
through a combination of mix enrichment
and tight control of costs. This improvement
was achieved against a background of weak
paper demand in European markets and
higher raw material prices.
2003: further growth in Financial Services
and Logistics in South Africa and Europe
The remaining leasing operations, which
support our core product and service
offerings in capital goods in both South
Africa and Europe, are expected to grow
further in 2003.
The logistics businesses in South Africa and
in Spain are also expected to expand and
grow profitability.
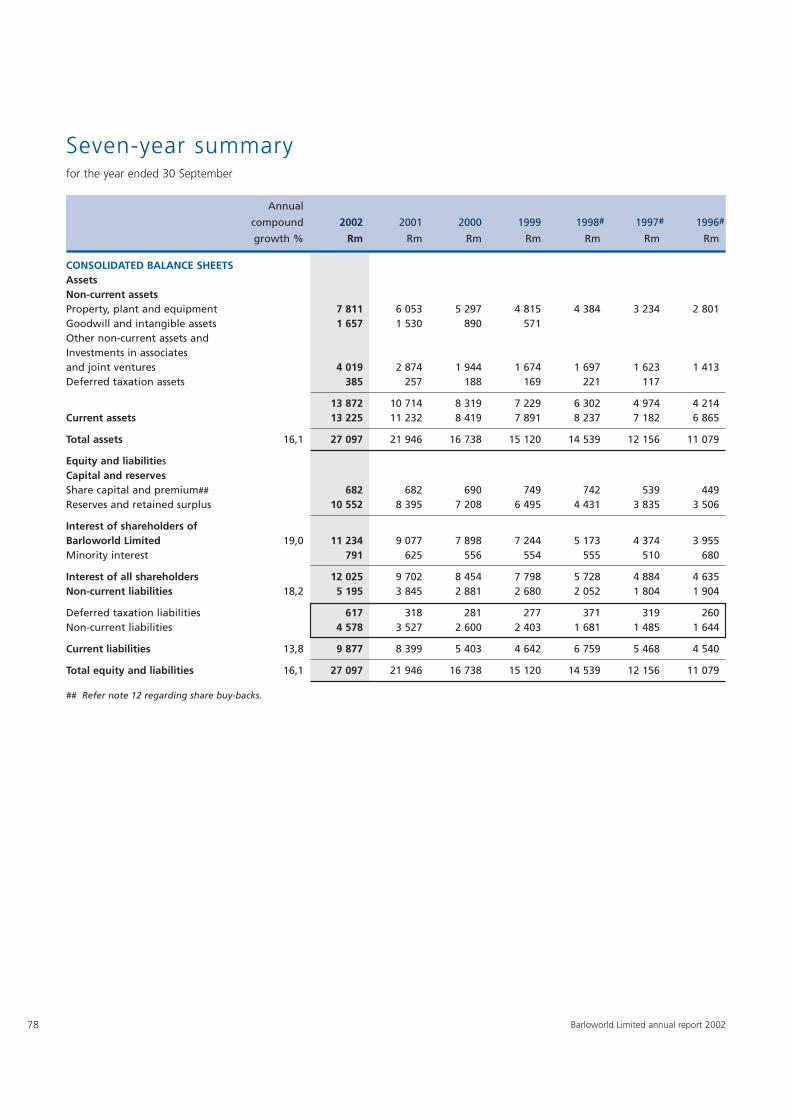
78
Seven-year summaryfor the year ended 30 September
CONSOLIDATED BALANCE SHEETSAssetsNon-current assetsProperty, plant and equipment 7 811 6 053 5 297 4 815 4 384 3 234 2 801Goodwill and intangible assets 1 657 1 530 890 571Other non-current assets and Investments in associatesand joint ventures 4 019 2 874 1 944 1 674 1 697 1 623 1 413Deferred taxation assets 385 257 188 169 221 117
13 872 10 714 8 319 7 229 6 302 4 974 4 214Current assets 13 225 11 232 8 419 7 891 8 237 7 182 6 865
Total assets 16,1 27 097 21 946 16 738 15 120 14 539 12 156 11 079
Equity and liabilitiesCapital and reservesShare capital and premium## 682 682 690 749 742 539 449Reserves and retained surplus 10 552 8 395 7 208 6 495 4 431 3 835 3 506
Interest of shareholders of Barloworld Limited 19,0 11 234 9 077 7 898 7 244 5 173 4 374 3 955Minority interest 791 625 556 554 555 510 680
Interest of all shareholders 12 025 9 702 8 454 7 798 5 728 4 884 4 635Non-current liabilities 18,2 5 195 3 845 2 881 2 680 2 052 1 804 1 904
Deferred taxation liabilities 617 318 281 277 371 319 260Non-current liabilities 4 578 3 527 2 600 2 403 1 681 1 485 1 644
Current liabilities 13,8 9 877 8 399 5 403 4 642 6 759 5 468 4 540
Total equity and liabilities 16,1 27 097 21 946 16 738 15 120 14 539 12 156 11 079
## Refer note 12 regarding share buy-backs.
Annual
compound 2002 2001 2000 1999 1998# 1997# 1996#
growth % Rm Rm Rm Rm Rm Rm Rm
Barloworld Limited annual report 2002
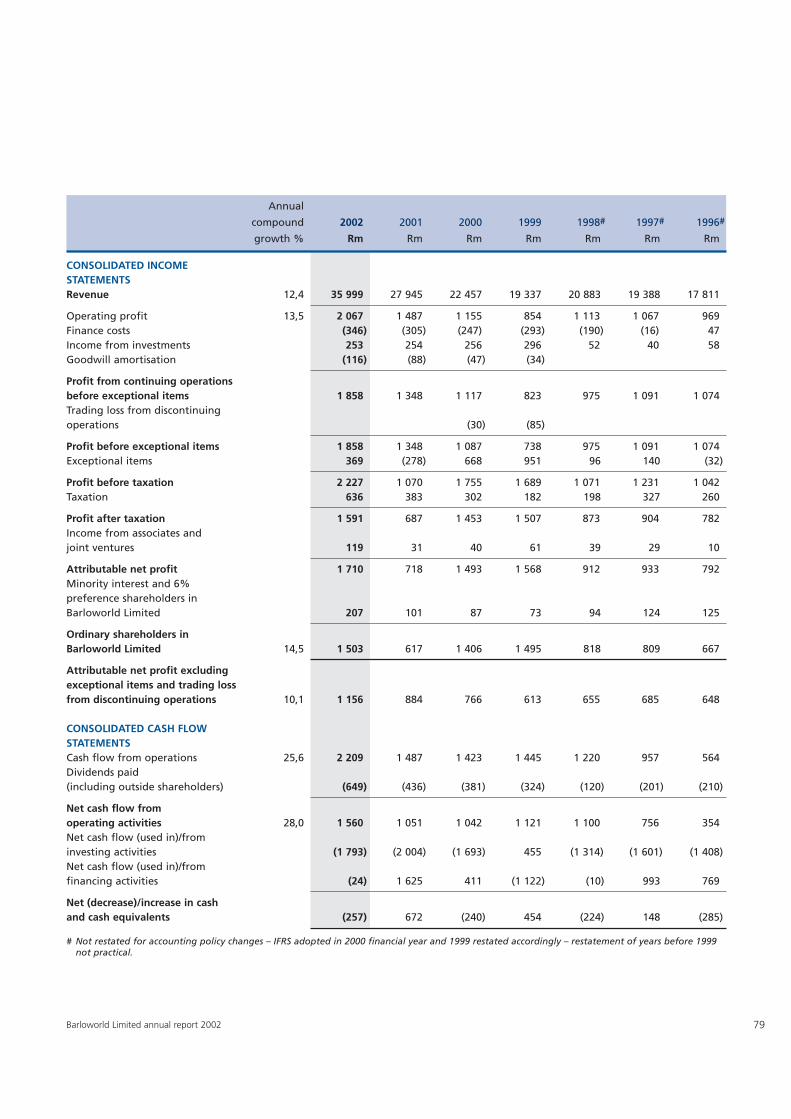
79Barloworld Limited annual report 2002
CONSOLIDATED INCOME STATEMENTSRevenue 12,4 35 999 27 945 22 457 19 337 20 883 19 388 17 811
Operating profit 13,5 2 067 1 487 1 155 854 1 113 1 067 969Finance costs (346) (305) (247) (293) (190) (16) 47Income from investments 253 254 256 296 52 40 58Goodwill amortisation (116) (88) (47) (34)
Profit from continuing operations before exceptional items 1 858 1 348 1 117 823 975 1 091 1 074Trading loss from discontinuing operations (30) (85)
Profit before exceptional items 1 858 1 348 1 087 738 975 1 091 1 074Exceptional items 369 (278) 668 951 96 140 (32)
Profit before taxation 2 227 1 070 1 755 1 689 1 071 1 231 1 042Taxation 636 383 302 182 198 327 260
Profit after taxation 1 591 687 1 453 1 507 873 904 782Income from associates and joint ventures 119 31 40 61 39 29 10
Attributable net profit 1 710 718 1 493 1 568 912 933 792Minority interest and 6% preference shareholders in Barloworld Limited 207 101 87 73 94 124 125
Ordinary shareholders in Barloworld Limited 14,5 1 503 617 1 406 1 495 818 809 667
Attributable net profit excludingexceptional items and trading lossfrom discontinuing operations 10,1 1 156 884 766 613 655 685 648
CONSOLIDATED CASH FLOW STATEMENTSCash flow from operations 25,6 2 209 1 487 1 423 1 445 1 220 957 564Dividends paid (including outside shareholders) (649) (436) (381) (324) (120) (201) (210)
Net cash flow fromoperating activities 28,0 1 560 1 051 1 042 1 121 1 100 756 354Net cash flow (used in)/from investing activities (1 793) (2 004) (1 693) 455 (1 314) (1 601) (1 408)Net cash flow (used in)/from financing activities (24) 1 625 411 (1 122) (10) 993 769
Net (decrease)/increase in cash and cash equivalents (257) 672 (240) 454 (224) 148 (285)
# Not restated for accounting policy changes – IFRS adopted in 2000 financial year and 1999 restated accordingly – restatement of years before 1999not practical.
Annual
compound 2002 2001 2000 1999 1998# 1997# 1996#
growth % Rm Rm Rm Rm Rm Rm Rm
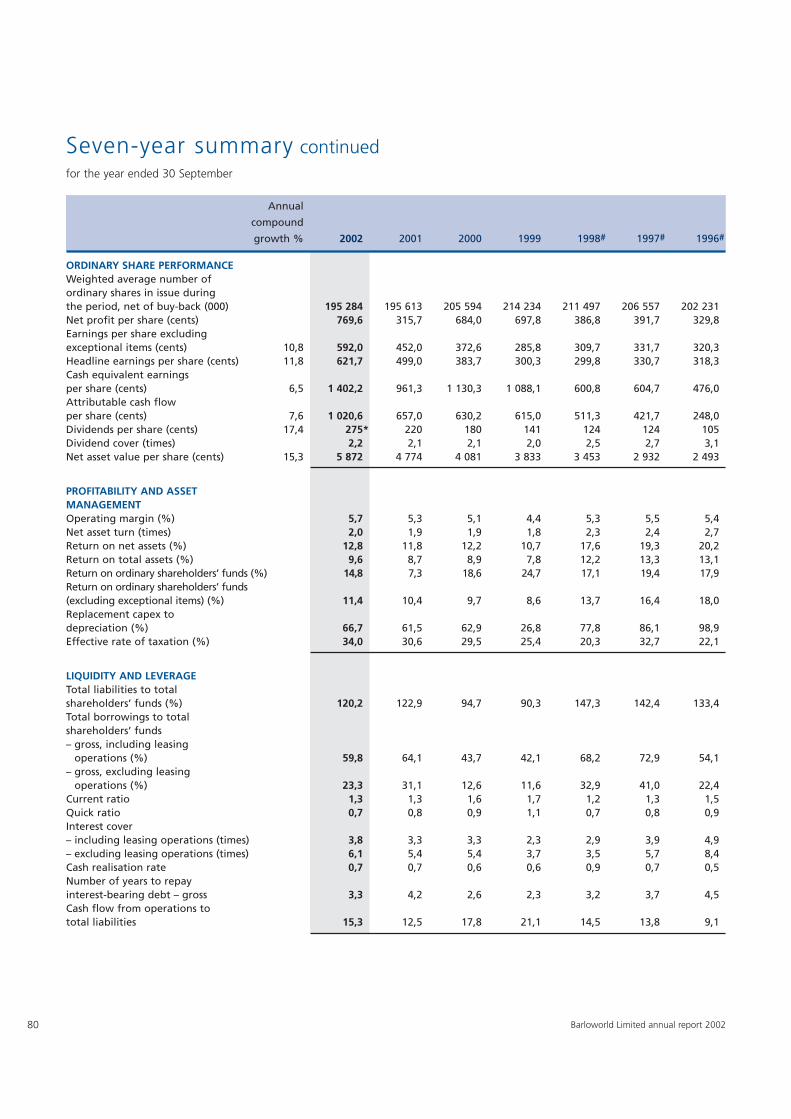
80 Barloworld Limited annual report 2002
Seven-year summary continuedfor the year ended 30 September
ORDINARY SHARE PERFORMANCEWeighted average number of ordinary shares in issue during the period, net of buy-back (000) 195 284 195 613 205 594 214 234 211 497 206 557 202 231Net profit per share (cents) 769,6 315,7 684,0 697,8 386,8 391,7 329,8Earnings per share excluding exceptional items (cents) 10,8 592,0 452,0 372,6 285,8 309,7 331,7 320,3Headline earnings per share (cents) 11,8 621,7 499,0 383,7 300,3 299,8 330,7 318,3Cash equivalent earnings per share (cents) 6,5 1 402,2 961,3 1 130,3 1 088,1 600,8 604,7 476,0Attributable cash flow per share (cents) 7,6 1 020,6 657,0 630,2 615,0 511,3 421,7 248,0Dividends per share (cents) 17,4 275* 220 180 141 124 124 105Dividend cover (times) 2,2 2,1 2,1 2,0 2,5 2,7 3,1Net asset value per share (cents) 15,3 5 872 4 774 4 081 3 833 3 453 2 932 2 493
PROFITABILITY AND ASSET MANAGEMENTOperating margin (%) 5,7 5,3 5,1 4,4 5,3 5,5 5,4Net asset turn (times) 2,0 1,9 1,9 1,8 2,3 2,4 2,7Return on net assets (%) 12,8 11,8 12,2 10,7 17,6 19,3 20,2Return on total assets (%) 9,6 8,7 8,9 7,8 12,2 13,3 13,1Return on ordinary shareholders’ funds (%) 14,8 7,3 18,6 24,7 17,1 19,4 17,9Return on ordinary shareholders’ funds (excluding exceptional items) (%) 11,4 10,4 9,7 8,6 13,7 16,4 18,0Replacement capex to depreciation (%) 66,7 61,5 62,9 26,8 77,8 86,1 98,9Effective rate of taxation (%) 34,0 30,6 29,5 25,4 20,3 32,7 22,1
LIQUIDITY AND LEVERAGETotal liabilities to total shareholders’ funds (%) 120,2 122,9 94,7 90,3 147,3 142,4 133,4Total borrowings to total shareholders’ funds– gross, including leasing
operations (%) 59,8 64,1 43,7 42,1 68,2 72,9 54,1– gross, excluding leasing
operations (%) 23,3 31,1 12,6 11,6 32,9 41,0 22,4Current ratio 1,3 1,3 1,6 1,7 1,2 1,3 1,5Quick ratio 0,7 0,8 0,9 1,1 0,7 0,8 0,9Interest cover – including leasing operations (times) 3,8 3,3 3,3 2,3 2,9 3,9 4,9– excluding leasing operations (times) 6,1 5,4 5,4 3,7 3,5 5,7 8,4Cash realisation rate 0,7 0,7 0,6 0,6 0,9 0,7 0,5Number of years to repay interest-bearing debt – gross 3,3 4,2 2,6 2,3 3,2 3,7 4,5Cash flow from operations to total liabilities 15,3 12,5 17,8 21,1 14,5 13,8 9,1
Annual
compound
growth % 2002 2001 2000 1999 1998# 1997# 1996#
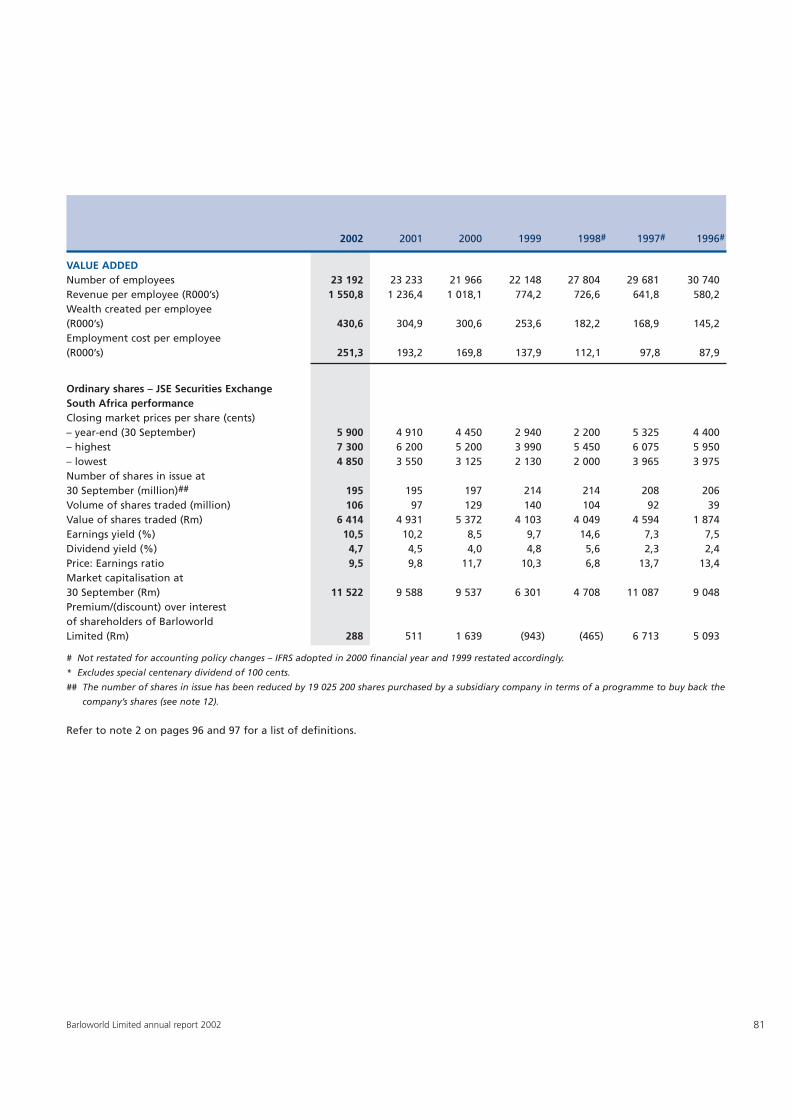
81Barloworld Limited annual report 2002
VALUE ADDEDNumber of employees 23 192 23 233 21 966 22 148 27 804 29 681 30 740Revenue per employee (R000’s) 1 550,8 1 236,4 1 018,1 774,2 726,6 641,8 580,2Wealth created per employee (R000’s) 430,6 304,9 300,6 253,6 182,2 168,9 145,2Employment cost per employee (R000’s) 251,3 193,2 169,8 137,9 112,1 97,8 87,9
Ordinary shares – JSE Securities Exchange South Africa performanceClosing market prices per share (cents)– year-end (30 September) 5 900 4 910 4 450 2 940 2 200 5 325 4 400– highest 7 300 6 200 5 200 3 990 5 450 6 075 5 950– lowest 4 850 3 550 3 125 2 130 2 000 3 965 3 975Number of shares in issue at 30 September (million)## 195 195 197 214 214 208 206Volume of shares traded (million) 106 97 129 140 104 92 39Value of shares traded (Rm) 6 414 4 931 5 372 4 103 4 049 4 594 1 874Earnings yield (%) 10,5 10,2 8,5 9,7 14,6 7,3 7,5Dividend yield (%) 4,7 4,5 4,0 4,8 5,6 2,3 2,4Price: Earnings ratio 9,5 9,8 11,7 10,3 6,8 13,7 13,4Market capitalisation at 30 September (Rm) 11 522 9 588 9 537 6 301 4 708 11 087 9 048Premium/(discount) over interest of shareholders of Barloworld Limited (Rm) 288 511 1 639 (943) (465) 6 713 5 093
# Not restated for accounting policy changes – IFRS adopted in 2000 financial year and 1999 restated accordingly.
* Excludes special centenary dividend of 100 cents.
## The number of shares in issue has been reduced by 19 025 200 shares purchased by a subsidiary company in terms of a programme to buy back the
company’s shares (see note 12).
Refer to note 2 on pages 96 and 97 for a list of definitions.
2002 2001 2000 1999 1998# 1997# 1996#
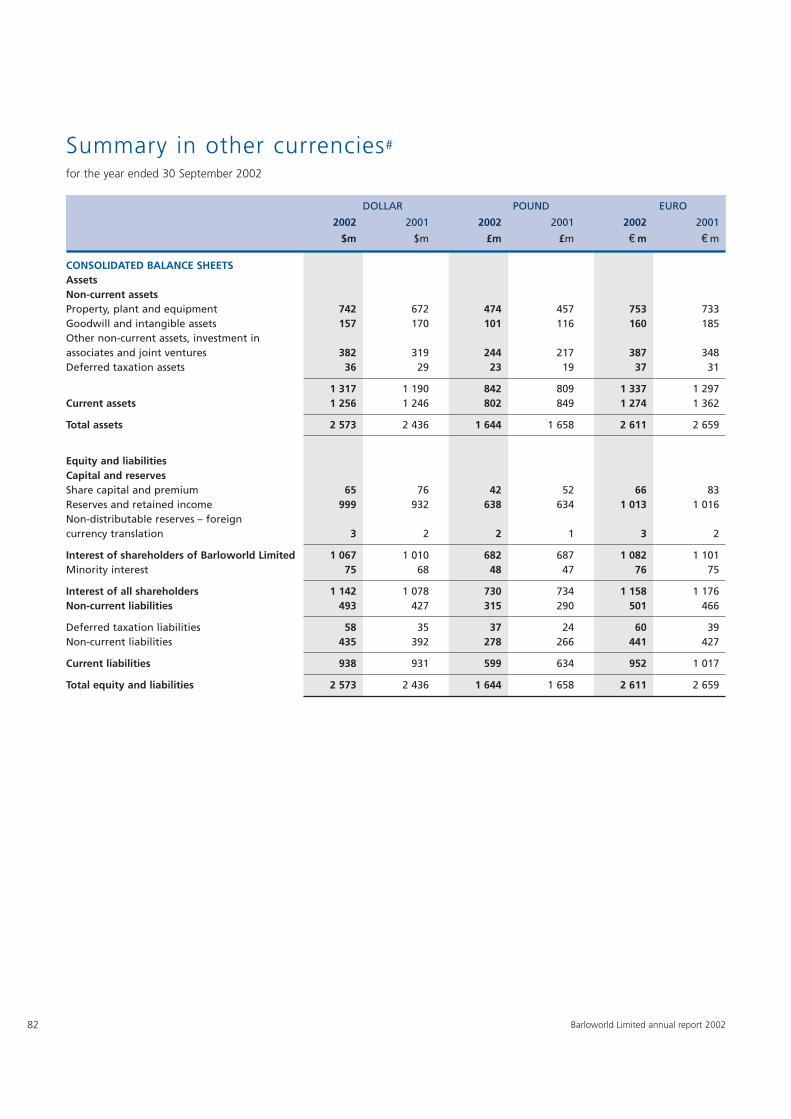
82 Barloworld Limited annual report 2002
Summary in other currencies#
for the year ended 30 September 2002
CONSOLIDATED BALANCE SHEETSAssetsNon-current assetsProperty, plant and equipment 742 672 474 457 753 733Goodwill and intangible assets 157 170 101 116 160 185Other non-current assets, investment in associates and joint ventures 382 319 244 217 387 348Deferred taxation assets 36 29 23 19 37 31
1 317 1 190 842 809 1 337 1 297Current assets 1 256 1 246 802 849 1 274 1 362
Total assets 2 573 2 436 1 644 1 658 2 611 2 659
Equity and liabilitiesCapital and reservesShare capital and premium 65 76 42 52 66 83Reserves and retained income 999 932 638 634 1 013 1 016Non-distributable reserves – foreign currency translation 3 2 2 1 3 2
Interest of shareholders of Barloworld Limited 1 067 1 010 682 687 1 082 1 101Minority interest 75 68 48 47 76 75
Interest of all shareholders 1 142 1 078 730 734 1 158 1 176Non-current liabilities 493 427 315 290 501 466
Deferred taxation liabilities 58 35 37 24 60 39Non-current liabilities 435 392 278 266 441 427
Current liabilities 938 931 599 634 952 1 017
Total equity and liabilities 2 573 2 436 1 644 1 658 2 611 2 659
DOLLAR POUND EURO
2002 2001 2002 2001 2002 2001
$m $m £m £m m m
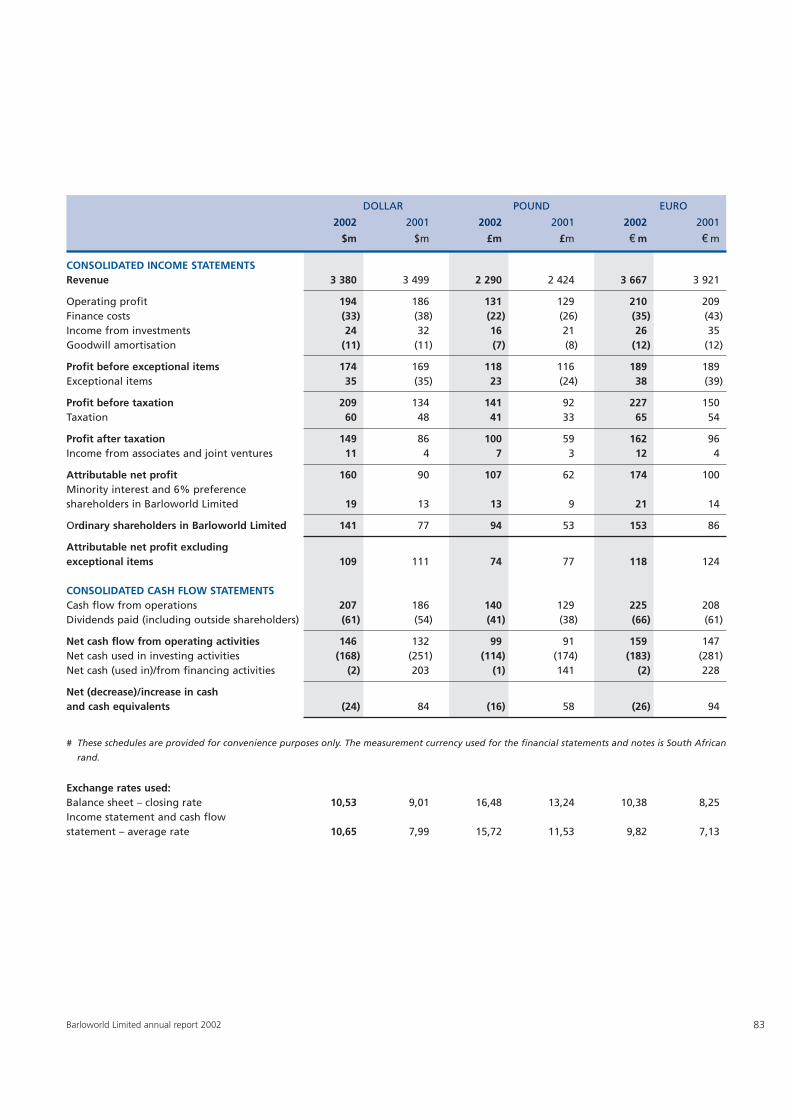
83Barloworld Limited annual report 2002
CONSOLIDATED INCOME STATEMENTSRevenue 3 380 3 499 2 290 2 424 3 667 3 921
Operating profit 194 186 131 129 210 209Finance costs (33) (38) (22) (26) (35) (43)Income from investments 24 32 16 21 26 35Goodwill amortisation (11) (11) (7) (8) (12) (12)
Profit before exceptional items 174 169 118 116 189 189Exceptional items 35 (35) 23 (24) 38 (39)
Profit before taxation 209 134 141 92 227 150Taxation 60 48 41 33 65 54
Profit after taxation 149 86 100 59 162 96Income from associates and joint ventures 11 4 7 3 12 4
Attributable net profit 160 90 107 62 174 100Minority interest and 6% preferenceshareholders in Barloworld Limited 19 13 13 9 21 14
Ordinary shareholders in Barloworld Limited 141 77 94 53 153 86
Attributable net profit excluding exceptional items 109 111 74 77 118 124
CONSOLIDATED CASH FLOW STATEMENTSCash flow from operations 207 186 140 129 225 208Dividends paid (including outside shareholders) (61) (54) (41) (38) (66) (61)
Net cash flow from operating activities 146 132 99 91 159 147Net cash used in investing activities (168) (251) (114) (174) (183) (281)Net cash (used in)/from financing activities (2) 203 (1) 141 (2) 228
Net (decrease)/increase in cash and cash equivalents (24) 84 (16) 58 (26) 94
# These schedules are provided for convenience purposes only. The measurement currency used for the financial statements and notes is South African
rand.
Exchange rates used:Balance sheet – closing rate 10,53 9,01 16,48 13,24 10,38 8,25Income statement and cash flow statement – average rate 10,65 7,99 15,72 11,53 9,82 7,13
DOLLAR POUND EURO
2002 2001 2002 2001 2002 2001
$m $m £m £m m m
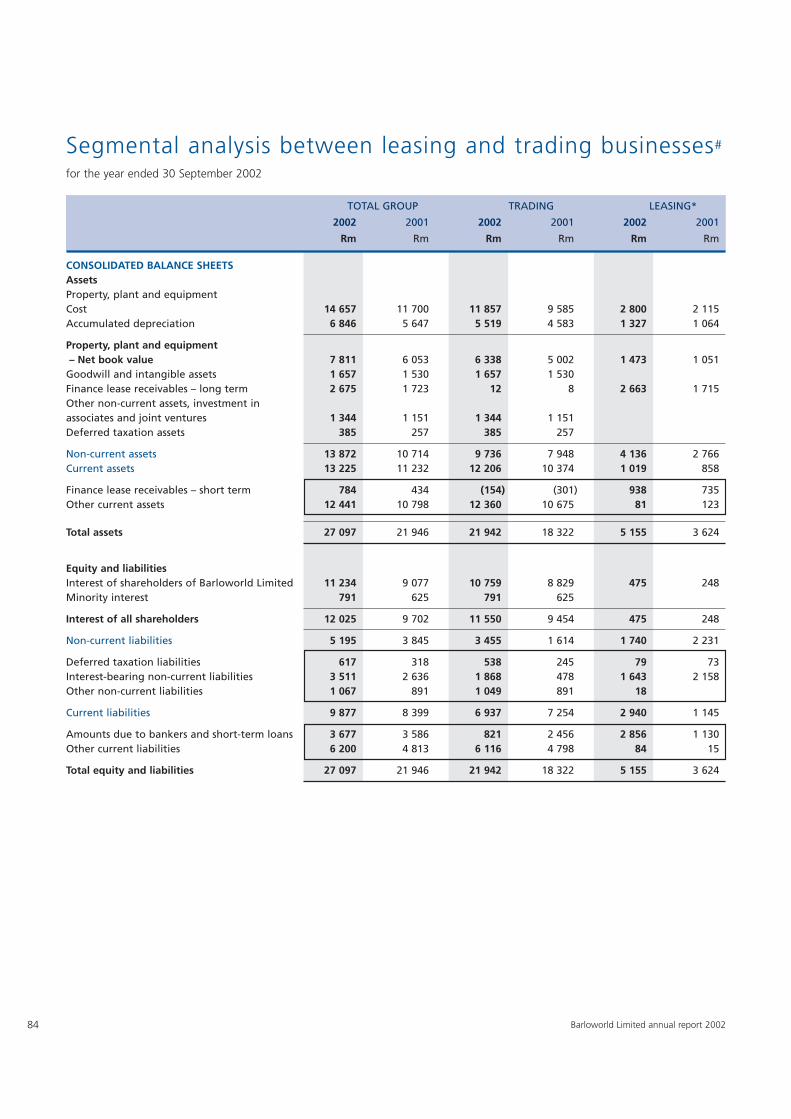
84 Barloworld Limited annual report 2002
Segmental analysis between leasing and trading businesses#
for the year ended 30 September 2002
CONSOLIDATED BALANCE SHEETSAssetsProperty, plant and equipmentCost 14 657 11 700 11 857 9 585 2 800 2 115 Accumulated depreciation 6 846 5 647 5 519 4 583 1 327 1 064
Property, plant and equipment – Net book value 7 811 6 053 6 338 5 002 1 473 1 051
Goodwill and intangible assets 1 657 1 530 1 657 1 530Finance lease receivables – long term 2 675 1 723 12 8 2 663 1 715Other non-current assets, investment in associates and joint ventures 1 344 1 151 1 344 1 151Deferred taxation assets 385 257 385 257
Non-current assets 13 872 10 714 9 736 7 948 4 136 2 766Current assets 13 225 11 232 12 206 10 374 1 019 858
Finance lease receivables – short term 784 434 (154) (301) 938 735Other current assets 12 441 10 798 12 360 10 675 81 123
Total assets 27 097 21 946 21 942 18 322 5 155 3 624
Equity and liabilitiesInterest of shareholders of Barloworld Limited 11 234 9 077 10 759 8 829 475 248Minority interest 791 625 791 625
Interest of all shareholders 12 025 9 702 11 550 9 454 475 248
Non-current liabilities 5 195 3 845 3 455 1 614 1 740 2 231
Deferred taxation liabilities 617 318 538 245 79 73Interest-bearing non-current liabilities 3 511 2 636 1 868 478 1 643 2 158Other non-current liabilities 1 067 891 1 049 891 18
Current liabilities 9 877 8 399 6 937 7 254 2 940 1 145
Amounts due to bankers and short-term loans 3 677 3 586 821 2 456 2 856 1 130Other current liabilities 6 200 4 813 6 116 4 798 84 15
Total equity and liabilities 27 097 21 946 21 942 18 322 5 155 3 624
TOTAL GROUP TRADING LEASING*
2002 2001 2002 2001 2002 2001
Rm Rm Rm Rm Rm Rm
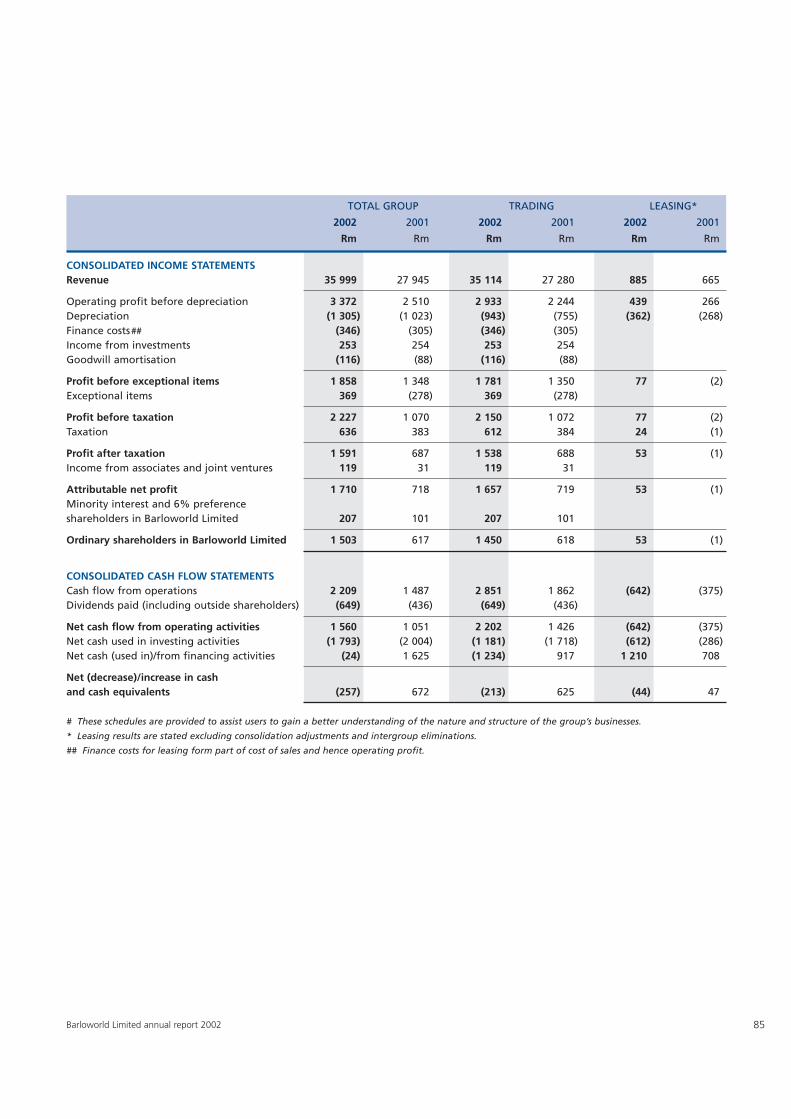
85Barloworld Limited annual report 2002
CONSOLIDATED INCOME STATEMENTSRevenue 35 999 27 945 35 114 27 280 885 665
Operating profit before depreciation 3 372 2 510 2 933 2 244 439 266Depreciation (1 305) (1 023) (943) (755) (362) (268)Finance costs## (346) (305) (346) (305)Income from investments 253 254 253 254Goodwill amortisation (116) (88) (116) (88)
Profit before exceptional items 1 858 1 348 1 781 1 350 77 (2)Exceptional items 369 (278) 369 (278)
Profit before taxation 2 227 1 070 2 150 1 072 77 (2)Taxation 636 383 612 384 24 (1)
Profit after taxation 1 591 687 1 538 688 53 (1)Income from associates and joint ventures 119 31 119 31
Attributable net profit 1 710 718 1 657 719 53 (1)Minority interest and 6% preference shareholders in Barloworld Limited 207 101 207 101
Ordinary shareholders in Barloworld Limited 1 503 617 1 450 618 53 (1)
CONSOLIDATED CASH FLOW STATEMENTSCash flow from operations 2 209 1 487 2 851 1 862 (642) (375)Dividends paid (including outside shareholders) (649) (436) (649) (436)
Net cash flow from operating activities 1 560 1 051 2 202 1 426 (642) (375)Net cash used in investing activities (1 793) (2 004) (1 181) (1 718) (612) (286)Net cash (used in)/from financing activities (24) 1 625 (1 234) 917 1 210 708
Net (decrease)/increase in cash and cash equivalents (257) 672 (213) 625 (44) 47
# These schedules are provided to assist users to gain a better understanding of the nature and structure of the group’s businesses.
* Leasing results are stated excluding consolidation adjustments and intergroup eliminations.
## Finance costs for leasing form part of cost of sales and hence operating profit.
TOTAL GROUP TRADING LEASING*
2002 2001 2002 2001 2002 2001
Rm Rm Rm Rm Rm Rm
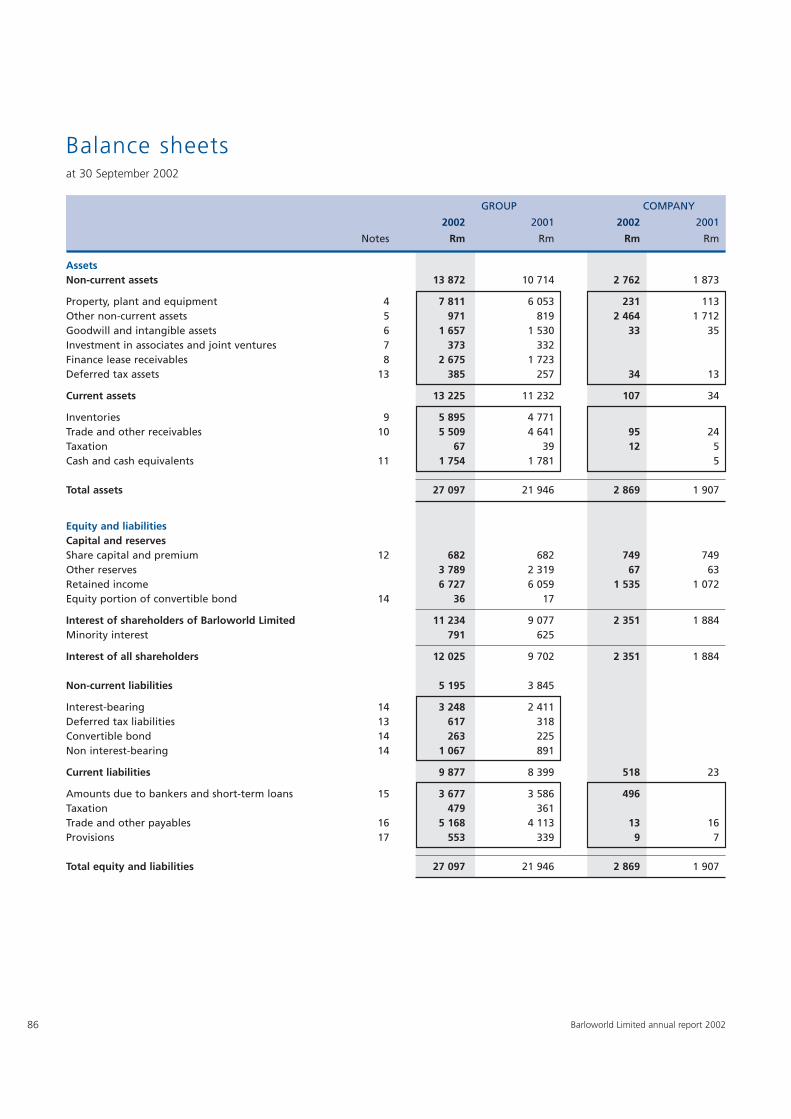
86
Balance sheetsat 30 September 2002
AssetsNon-current assets 13 872 10 714 2 762 1 873
Property, plant and equipment 4 7 811 6 053 231 113Other non-current assets 5 971 819 2 464 1 712Goodwill and intangible assets 6 1 657 1 530 33 35Investment in associates and joint ventures 7 373 332Finance lease receivables 8 2 675 1 723Deferred tax assets 13 385 257 34 13
Current assets 13 225 11 232 107 34
Inventories 9 5 895 4 771Trade and other receivables 10 5 509 4 641 95 24Taxation 67 39 12 5Cash and cash equivalents 11 1 754 1 781 5
Total assets 27 097 21 946 2 869 1 907
Equity and liabilitiesCapital and reservesShare capital and premium 12 682 682 749 749Other reserves 3 789 2 319 67 63Retained income 6 727 6 059 1 535 1 072Equity portion of convertible bond 14 36 17
Interest of shareholders of Barloworld Limited 11 234 9 077 2 351 1 884Minority interest 791 625
Interest of all shareholders 12 025 9 702 2 351 1 884
Non-current liabilities 5 195 3 845
Interest-bearing 14 3 248 2 411Deferred tax liabilities 13 617 318Convertible bond 14 263 225Non interest-bearing 14 1 067 891
Current liabilities 9 877 8 399 518 23
Amounts due to bankers and short-term loans 15 3 677 3 586 496Taxation 479 361Trade and other payables 16 5 168 4 113 13 16Provisions 17 553 339 9 7
Total equity and liabilities 27 097 21 946 2 869 1 907
GROUP COMPANY
2002 2001 2002 2001
Notes Rm Rm Rm Rm
Barloworld Limited annual report 2002
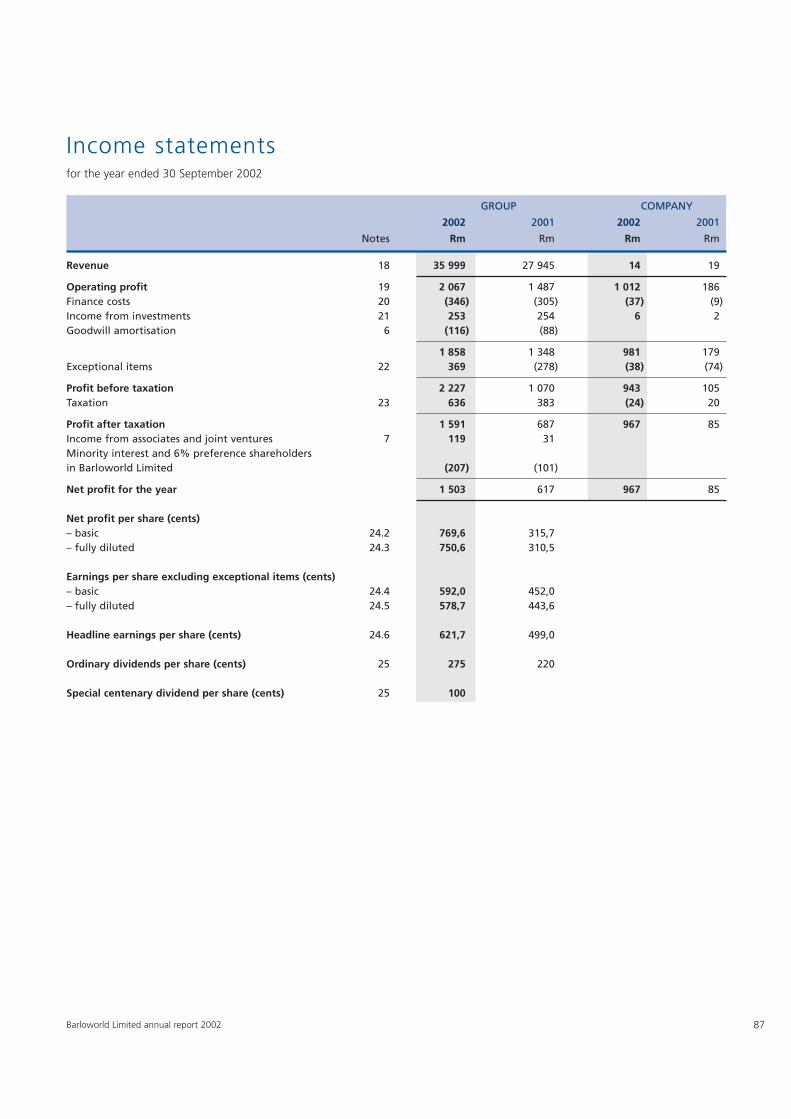
87
Income statementsfor the year ended 30 September 2002
Revenue 18 35 999 27 945 14 19
Operating profit 19 2 067 1 487 1 012 186Finance costs 20 (346) (305) (37) (9)Income from investments 21 253 254 6 2Goodwill amortisation 6 (116) (88)
1 858 1 348 981 179Exceptional items 22 369 (278) (38) (74)
Profit before taxation 2 227 1 070 943 105Taxation 23 636 383 (24) 20
Profit after taxation 1 591 687 967 85Income from associates and joint ventures 7 119 31Minority interest and 6% preference shareholders in Barloworld Limited (207) (101)
Net profit for the year 1 503 617 967 85
Net profit per share (cents)– basic 24.2 769,6 315,7– fully diluted 24.3 750,6 310,5
Earnings per share excluding exceptional items (cents)– basic 24.4 592,0 452,0– fully diluted 24.5 578,7 443,6
Headline earnings per share (cents) 24.6 621,7 499,0
Ordinary dividends per share (cents) 25 275 220
Special centenary dividend per share (cents) 25 100
GROUP COMPANY
2002 2001 2002 2001
Notes Rm Rm Rm Rm
Barloworld Limited annual report 2002
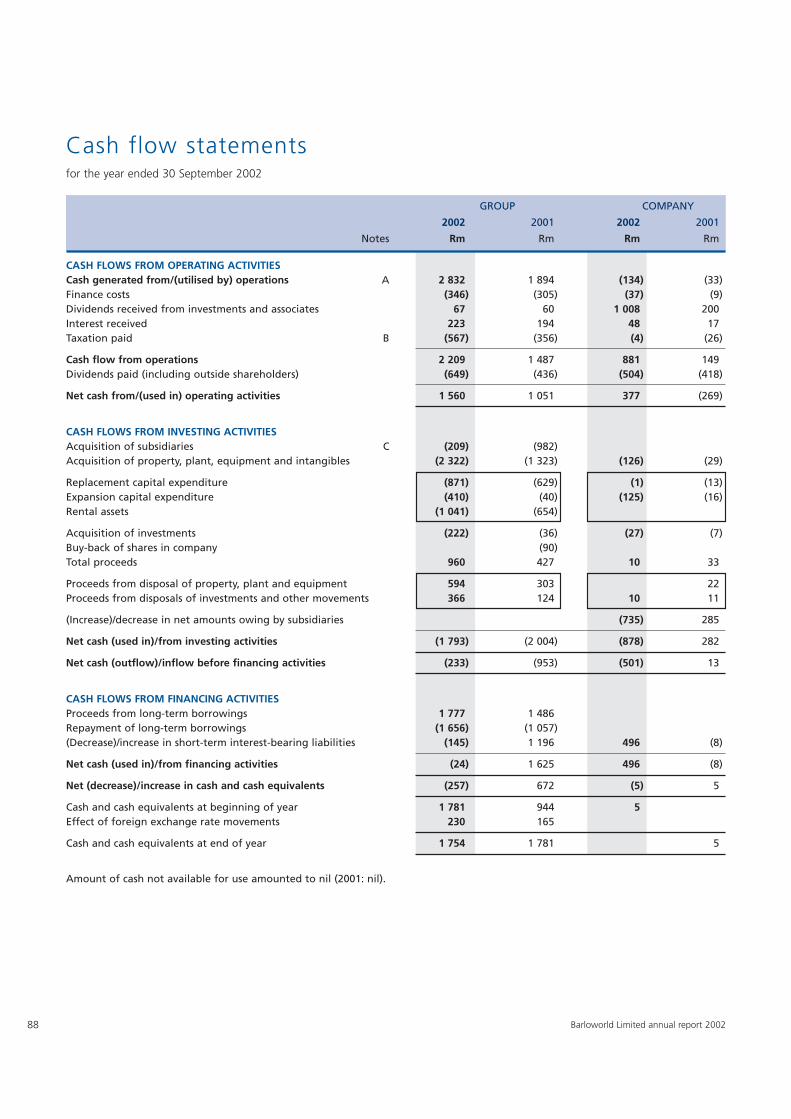
88
Cash flow statementsfor the year ended 30 September 2002
CASH FLOWS FROM OPERATING ACTIVITIESCash generated from/(utilised by) operations A 2 832 1 894 (134) (33)Finance costs (346) (305) (37) (9)Dividends received from investments and associates 67 60 1 008 200Interest received 223 194 48 17Taxation paid B (567) (356) (4) (26)
Cash flow from operations 2 209 1 487 881 149Dividends paid (including outside shareholders) (649) (436) (504) (418)
Net cash from/(used in) operating activities 1 560 1 051 377 (269)
CASH FLOWS FROM INVESTING ACTIVITIESAcquisition of subsidiaries C (209) (982)Acquisition of property, plant, equipment and intangibles (2 322) (1 323) (126) (29)
Replacement capital expenditure (871) (629) (1) (13)Expansion capital expenditure (410) (40) (125) (16)Rental assets (1 041) (654)
Acquisition of investments (222) (36) (27) (7)Buy-back of shares in company (90)Total proceeds 960 427 10 33
Proceeds from disposal of property, plant and equipment 594 303 22Proceeds from disposals of investments and other movements 366 124 10 11
(Increase)/decrease in net amounts owing by subsidiaries (735) 285
Net cash (used in)/from investing activities (1 793) (2 004) (878) 282
Net cash (outflow)/inflow before financing activities (233) (953) (501) 13
CASH FLOWS FROM FINANCING ACTIVITIESProceeds from long-term borrowings 1 777 1 486Repayment of long-term borrowings (1 656) (1 057)(Decrease)/increase in short-term interest-bearing liabilities (145) 1 196 496 (8)
Net cash (used in)/from financing activities (24) 1 625 496 (8)
Net (decrease)/increase in cash and cash equivalents (257) 672 (5) 5
Cash and cash equivalents at beginning of year 1 781 944 5Effect of foreign exchange rate movements 230 165
Cash and cash equivalents at end of year 1 754 1 781 5
Amount of cash not available for use amounted to nil (2001: nil).
GROUP COMPANY
2002 2001 2002 2001
Notes Rm Rm Rm Rm
Barloworld Limited annual report 2002
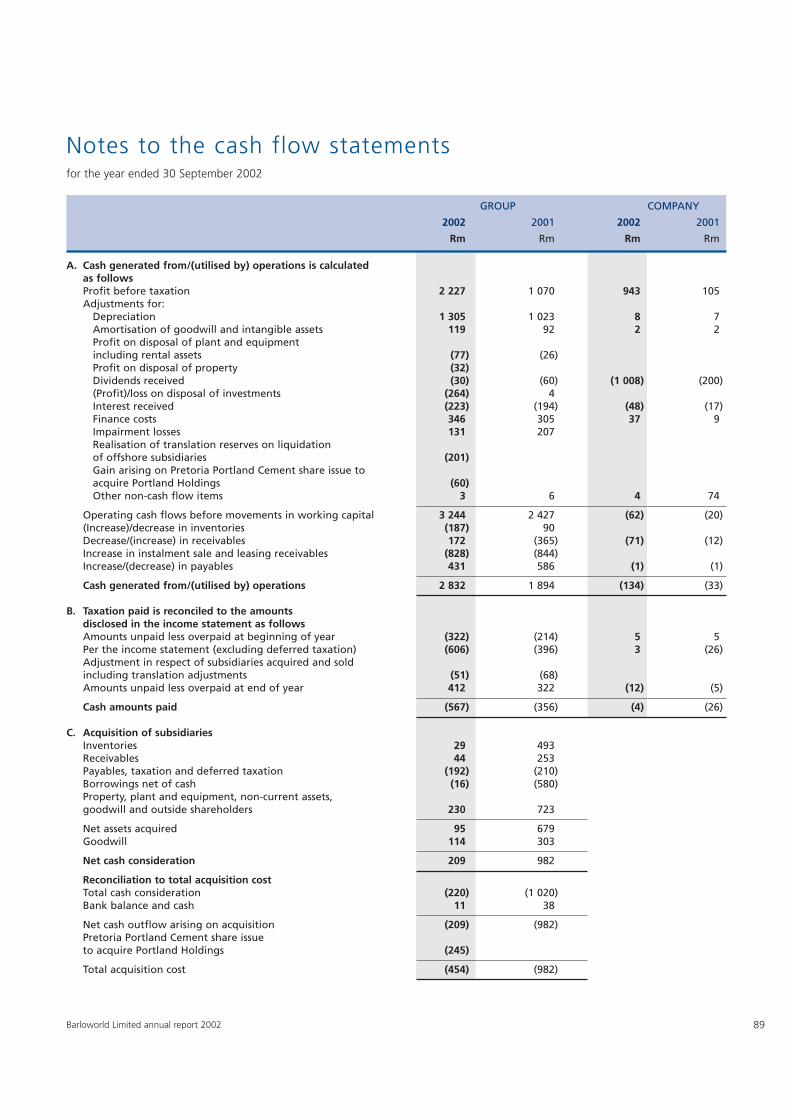
89
Notes to the cash flow statementsfor the year ended 30 September 2002
A. Cash generated from/(utilised by) operations is calculated as followsProfit before taxation 2 227 1 070 943 105Adjustments for:
Depreciation 1 305 1 023 8 7Amortisation of goodwill and intangible assets 119 92 2 2Profit on disposal of plant and equipment including rental assets (77) (26)Profit on disposal of property (32)Dividends received (30) (60) (1 008) (200)(Profit)/loss on disposal of investments (264) 4Interest received (223) (194) (48) (17)Finance costs 346 305 37 9Impairment losses 131 207Realisation of translation reserves on liquidation of offshore subsidiaries (201)Gain arising on Pretoria Portland Cement share issue to acquire Portland Holdings (60)Other non-cash flow items 3 6 4 74
Operating cash flows before movements in working capital 3 244 2 427 (62) (20)(Increase)/decrease in inventories (187) 90Decrease/(increase) in receivables 172 (365) (71) (12)Increase in instalment sale and leasing receivables (828) (844)Increase/(decrease) in payables 431 586 (1) (1)
Cash generated from/(utilised by) operations 2 832 1 894 (134) (33)
B. Taxation paid is reconciled to the amountsdisclosed in the income statement as followsAmounts unpaid less overpaid at beginning of year (322) (214) 5 5Per the income statement (excluding deferred taxation) (606) (396) 3 (26)Adjustment in respect of subsidiaries acquired and soldincluding translation adjustments (51) (68)Amounts unpaid less overpaid at end of year 412 322 (12) (5)
Cash amounts paid (567) (356) (4) (26)
C. Acquisition of subsidiariesInventories 29 493Receivables 44 253Payables, taxation and deferred taxation (192) (210)Borrowings net of cash (16) (580)Property, plant and equipment, non-current assets, goodwill and outside shareholders 230 723
Net assets acquired 95 679Goodwill 114 303
Net cash consideration 209 982
Reconciliation to total acquisition costTotal cash consideration (220) (1 020)Bank balance and cash 11 38
Net cash outflow arising on acquisition (209) (982)Pretoria Portland Cement share issue to acquire Portland Holdings (245)
Total acquisition cost (454) (982)
GROUP COMPANY
2002 2001 2002 2001
Rm Rm Rm Rm
Barloworld Limited annual report 2002
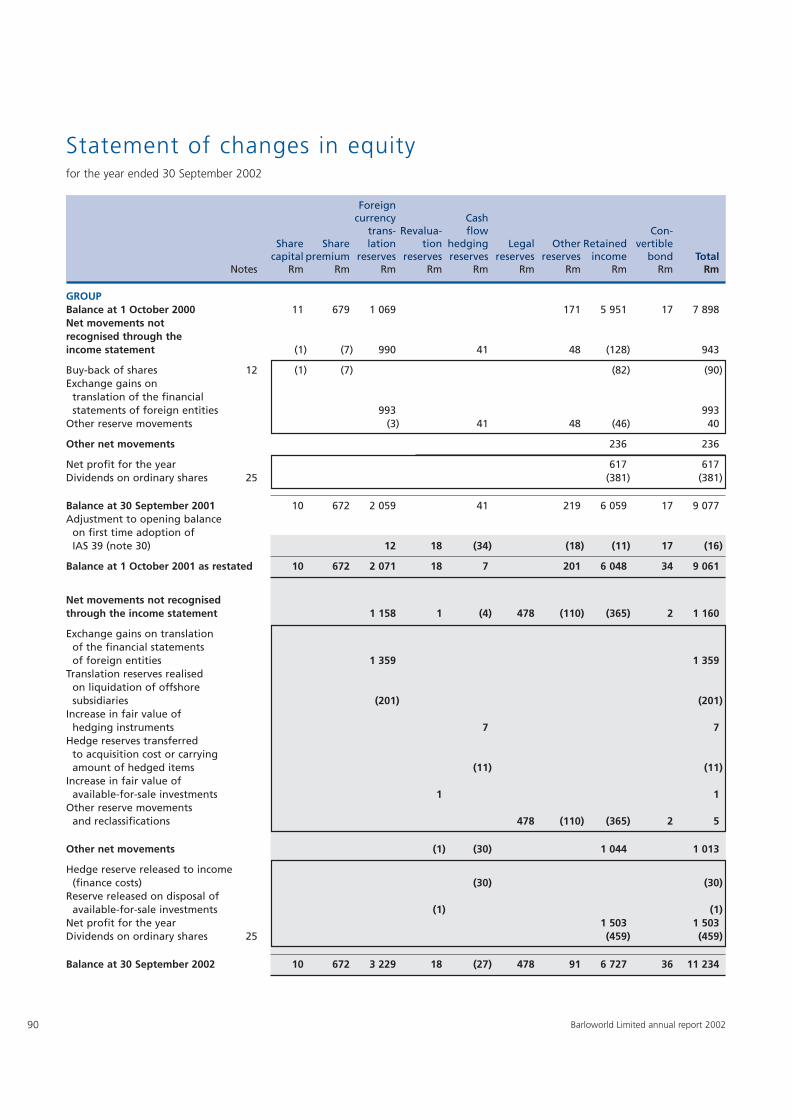
90 Barloworld Limited annual report 2002
Statement of changes in equityfor the year ended 30 September 2002
Foreigncurrency Cash
trans- Revalua- flow Con-Share Share lation tion hedging Legal Other Retained vertible
capital premium reserves reserves reserves reserves reserves income bond TotalNotes Rm Rm Rm Rm Rm Rm Rm Rm Rm Rm
GROUPBalance at 1 October 2000 11 679 1 069 171 5 951 17 7 898 Net movements not recognised through the income statement (1) (7) 990 41 48 (128) 943
Buy-back of shares 12 (1) (7) (82) (90)Exchange gains on
translation of the financialstatements of foreign entities 993 993
Other reserve movements (3) 41 48 (46) 40
Other net movements 236 236
Net profit for the year 617 617Dividends on ordinary shares 25 (381) (381)
Balance at 30 September 2001 10 672 2 059 41 219 6 059 17 9 077Adjustment to opening balance
on first time adoption of IAS 39 (note 30) 12 18 (34) (18) (11) 17 (16)
Balance at 1 October 2001 as restated 10 672 2 071 18 7 201 6 048 34 9 061
Net movements not recognised through the income statement 1 158 1 (4) 478 (110) (365) 2 1 160
Exchange gains on translationof the financial statements of foreign entities 1 359 1 359
Translation reserves realisedon liquidation of offshore subsidiaries (201) (201)
Increase in fair value of hedging instruments 7 7
Hedge reserves transferred to acquisition cost or carrying amount of hedged items (11) (11)
Increase in fair value of available-for-sale investments 1 1
Other reserve movements and reclassifications 478 (110) (365) 2 5
Other net movements (1) (30) 1 044 1 013
Hedge reserve released to income (finance costs) (30) (30)
Reserve released on disposal of available-for-sale investments (1) (1)
Net profit for the year 1 503 1 503 Dividends on ordinary shares 25 (459) (459)
Balance at 30 September 2002 10 672 3 229 18 (27) 478 91 6 727 36 11 234

91Barloworld Limited annual report 2002
Revalua-Share Share tion Retained
capital premium reserves income TotalNotes Rm Rm Rm Rm Rm
COMPANYBalance at 1 October 2000 12 737 63 1 405 2 217
Other net movements (333) (333)
Net profit for the year 85 85Dividends on ordinary shares 25 (418) (418)
Balance at 30 September 2001 12 737 63 1 072 1 884
Net movements not recognised
through the income statement 4 4
Increase in fair value of available-for-sale investments 4 4
Other net movements 463 463
Net profit for the year 967 967 Dividends on ordinary shares 25 (504) (504)
Balance at 30 September 2002 12 737 67 1 535 2 351

for the year ended 30 September 2002
92
Notes to the annual financial statements
Barloworld Limited annual report 2002
ACCOUNTING POLICIES AND BASIS OF
PREPARATION
The financial statements are prepared in
accordance with International Financial
Reporting Standards (IFRS), previously
referred to as International Accounting
Standards (IAS), and with South African
Statements of Generally Accepted
Accounting Practice. They have been
prepared on a basis consistent with the
prior year except for the adoption of IAS 39
Financial Instruments: Recognition and
Measurement and IAS 40 Investment
Properties.
The financial statements are prepared
under the historical cost convention
modified by the restatement of financial
instruments to fair value and adjustments,
where applicable, in respect of hyper-
inflation accounting.
The principal accounting policies adopted
are set out below.
1. PRINCIPAL ACCOUNTING POLICIES
1.1 Basis of consolidation
The consolidated financial statements
incorporate the financial statements of the
company and enterprises controlled by the
company up to 30 September each year.
Control is achieved where the company
has the power to govern the financial and
operating policies of an investee enterprise
so as to obtain benefits from its activities.
The results of subsidiaries acquired or
disposed of during the year are included
in the consolidated income statement from
the effective date of acquisition or up to the
effective date of disposal, as appropriate.
All significant intercompany transactions
and balances between group enterprises
are eliminated on consolidation.
On acquisition of a subsidiary, minorities’
interest is measured at the proportion of
the pre-acquisition fair values of the
identifiable assets and liabilities acquired.
1.2 Borrowing costs
Borrowing costs directly attributable to
the acquisition, construction or production
of assets that necessarily take a substantial
period of time to get ready for their
intended use or sale, are added to the cost
of those assets, until such time as the assets
are substantially ready for their intended
use or sale.
All other borrowing costs are dealt with in
income in the period in which they are
incurred.
1.3 Comparative figures
When an accounting policy is altered,
comparative figures are restated in
accordance with the new policy where
material. This was not required in terms of
the transitional provisions of IAS 39.
1.4 Discontinuing operations
Discontinuing operations are significant,
distinguishable components of an
enterprise that have been sold, abandoned
or are the subject of formal plans for
disposal or discontinuance.
Once an operation has been identified
as discontinuing, or is reclassified as
continuing, the comparative information is
restated.
1.5 Dividends
Dividends declared to equity holders are
included in the statement of changes in
equity in the year in which they are
declared. Taxation costs incurred on
dividends are dealt with in income in the
year in which they are declared.
1.6 Environment and rehabilitation
Group companies are generally required to
restore mine and processing sites at the
end of their producing lives to a condition
acceptable to the relevant authorities and
consistent with the group’s environmental
policies.
The expected cost of any committeddecommissioning or restoration pro-gramme, discounted to its net presentvalue, is provided and capitalised at thebeginning of each project. The capitalisedcost is depreciated over the expected life ofthe asset and the increase or decrease in thenet present value of the provision for theexpected cost is included with finance costs.
The cost of ongoing programmes toprevent and control pollution and torehabilitate the environment is chargedagainst income as incurred.
Annual contributions are made to thegroup’s Environmental Rehabilitation TrustFund, created in accordance with statutoryrequirements, to provide for the estimatedcost of pollution control and rehabilitationduring and to the end of the life of therelated asset.
1.7 Equity compensation plansExecutive directors and senior executiveshave been granted share options in termsof the Barloworld Share Option Scheme.After the date on which the options areexercisable and before the expiry date:• they can be exercised to purchase shares
for cash or through a loan from theBarloworld Share Purchase Trust in whichevent the shares issued are accountedfor in share capital and share premium atthe amount of the option price; or
• they can be ceded to an approvedfinancial institution in which event thereis no increase in share capital or sharepremium until the option is exercised bythe financial institution, at which timethey are accounted for in share capitaland share premium at the amount of theoption price.
1.8 Exceptional itemsExceptional items cover those amountswhich are not considered to be typical ofthe ongoing business, and generallyinclude profit and loss on disposal ofproperty, investments and businesses, othernon-current assets, and impairment losses.
93Barloworld Limited annual report 2002
1.9 Financial instruments
Measurement
Financial instruments are initially measured
at cost, which includes transaction costs,
when the related contractual rights or
obligations exist. Subsequent to initial
recognition these instruments are measured
as set out below.
Investments
Investments in securities are recognised at
trade date (the date an entity commits
itself to purchase or sell a financial
instrument). At subsequent reporting
dates, debt securities that the group has
the intention and ability to hold to
maturity (held-to-maturity debt securities)
are measured at amortised cost, less any
impairment losses recognised to reflect
irrecoverable amounts.
Investments other than held-to-maturity
debt securities are classified as either held
for trading or available-for-sale. Listed
investments are carried at market value,
which is calculated by reference to stock
exchange quoted selling prices at the close
of business on the balance sheet date.
Other investments are shown at fair value.
Trade and other receivables
Trade and other receivables originated by
the group are stated at cost less provision
for doubtful debts.
Cash and cash equivalents
Cash and cash equivalents are measured at
fair value, based on the relevant exchange
rates at balance sheet date.
Financial liabilities
Non-derivative financial liabilities are
recognised at amortised cost, comprising
original debt less principal payments and
amortisations.
Derivative instruments
Derivative instruments are measured at
fair value.
Gains and losses on subsequent
measurement
Unrealised gains and losses on available-
for-sale investments are recognised
directly in equity until the disposal or
impairment of the relevant investment, at
which time the cumulative gain or loss
previously recognised in equity is included
in the net profit or loss for the period.
Other gains and losses from a change in
the fair value of financial instruments that
are not part of a hedging relationship are
included in net profit or loss in the period
in which the change arises.
For the purposes of hedge accounting,
hedges are classified into two categories:
(a) fair value hedges which hedge the
exposure to changes in fair value of a
recognised asset or liability; and (b) cash
flow hedges, which hedge exposure to
variability in cash flows that is either
attributable to a particular risk associated
with a recognised asset or liability or a
forecasted transaction.
In relation to fair value hedges which meet
the conditions for hedge accounting, any
gain or loss on the hedged item
attributable to the hedged risk is adjusted
against the carrying amount of the hedged
item and recognised against income.
In relation to cash flow hedges which meet
the conditions for hedge accounting, the
portion of the gain or loss on the hedging
instrument that is determined to be an
effective hedge is recognised directly in
shareholders’ equity and the ineffective
portion is recognised against income. For
cash flow hedges affecting future
transactions, the gains or losses which are
recognised in shareholders’ equity are
transferred to income in the same period in
which the hedge transaction affects income.
Where the hedge transaction results in the
recognition of an asset or liability, the
associated gains or losses that had previously
been recognised in shareholders’ equity are
included in the initial measurement of the
acquisition cost or other carrying amount of
the asset or liability.
1.10 Foreign currencies
Transactions in currencies other than South
African rand are recorded at the rates of
exchange ruling on the transaction date.
Monetary assets and liabilities denominated
in such currencies are translated at the
rates ruling on the balance sheet date.
Profits and losses arising on exchange are
dealt within the income statement.
In the case of foreign entities the financial
statements of the group’s overseas
operations are translated as follows on
consolidation: assets and liabilities, at
exchange rates ruling on the balance sheet
date, income and expense items at the
average exchange rates for the period
and goodwill and equity at exchange rates
ruling on the dates of the transactions.
Exchange differences arising, if any, are
classified as equity and transferred to the
group’s translation reserve. Such translation
differences are recognised in the income
statement in the period in which the
operation is disposed of.
The financial statements of overseas
operations that are integral to the
operations of the holding company are
translated as if the transactions had been
those of the holding company itself.
The financial statements of foreign entities
that report in the currency of a hyper-
inflationary economy are restated for the
decrease in general purchasing power
of the currency at the balance sheet date
before they are translated into South
African rand.
1.11 Goodwill
Goodwill arising on consolidation
represents the excess of the cost of
acquisition over the group’s interest in the
fair value of the identifiable assets and
liabilities of a subsidiary, associate or
94
Notes to the annual financial statements continued
for the year ended 30 September 2002
Barloworld Limited annual report 2002
jointly controlled entity at the date of
acquisition. Goodwill is recognised as an
asset and amortised on a systematic basis
over its estimated useful life subject to a
maximum of 20 years.
Any negative goodwill that arises where
the fair value of the group’s interest in the
identifiable assets and liabilities of the
subsidiary exceeds the cost of acquisition is
taken to profit immediately:
• where there is no expectation of future
losses;
• in respect of non-monetary assets to the
extent whereby the negative goodwill
exceeds the fair value of acquired
identifiable assets;
• in respect of monetary assets.
To the extent that negative goodwill
relates to depreciable assets, it is recognised
as profit over the useful life of those assets.
Goodwill arising on the acquisition of
subsidiaries, associates and jointly
controlled entities is presented separately
in the balance sheet.
On disposal of a subsidiary, associate or
jointly controlled entity, the attributable
amount of unamortised goodwill is
included in the determination of the profit
or loss on disposal.
1.12 Government grants
Government grants towards staff re-
training costs are recognised as income
over the periods necessary to match them
with the related costs and are deducted in
reporting the related expense. Income is
not recognised until there is reasonable
assurance that it will be received.
1.13 Impairment of assets
At each reporting date, the group reviews
the carrying amounts of its tangible and
intangible assets to determine whether
there is any indication that those assets
have suffered an impairment loss. If any
such indication exists, the recoverable
amount of the asset is estimated in order
to determine the extent of the impairment
loss (if any). Where it is not possible to
estimate the recoverable amount of an
individual asset, the group estimates the
recoverable amount of the cash-
generating unit to which the asset
belongs.
If the recoverable amount of an asset (or
cash-generating unit) is estimated to be
less than its carrying amount, its carrying
amount is reduced to its recoverable
amount. Impairment losses are recognised
in the income statement.
Other than for goodwill, where an
impairment loss subsequently reverses, the
carrying amount of the asset (cash-
generating unit) is increased to the revised
estimate of its recoverable amount. This is
done so that the increased carrying
amount does not exceed the carrying
amount that would have been determined
had no impairment loss been recognised in
prior years. A reversal of an impairment
loss is recognised in the income statement.
1.14 Interests in joint ventures
A joint venture is a contractual arrange-
ment whereby the group and other parties
undertake an economic activity which is
subject to joint control.
The group’s interests in joint ventures have
been accounted for using the equity
method.
1.15 Internally generated intangible
assets – exploration, research and
development expenditure
Exploration and research costs are
expensed in the year in which they are
incurred. Development costs are reviewed
annually and are expensed if they do not
qualify for capitalisation. If a project is
abandoned during the development stage,
the total accumulated expenditure is then
written off. Capitalised development costs
are amortised on a straight-line basis over
the estimated useful life.
1.16 Inventories
Inventories are stated at the lower of cost
and net realisable value. Cost comprises
direct materials and, where applicable,
direct labour costs and those overheads
that have been incurred in bringing the
inventories to their present location and
condition. Where appropriate, cost is
calculated on a specific identification basis.
Otherwise the first-in first-out method or, in
certain subsidiaries, the weighted average
method is used.
Net realisable value represents the
estimated selling price less all estimated
costs to completion and costs to be incurred
in marketing, selling and distribution.
1.17 Investments in associates
An associate is an enterprise over which
the group is in a position to exercise
significant influence, through participation
in the financial and operating policy
decisions of the investee.
The results and assets and liabilities of
associates are incorporated in these
financial statements using the equity
method of accounting. The carrying
amount of such investments is reduced to
recognise any decline in the value of
individual investments.
Where a group enterprise transacts with
an associate of the group, unrealised
profits and losses are eliminated to the
extent of the group’s interest in the
relevant associate.
1.18 Leasing
Leases are classified as finance leases
whenever the terms of the lease transfer
substantially all the risks and rewards of
ownership to the lessee. All other leases
are classified as operating leases.
The group as lessor
Amounts due from lessees under finance
leases are recorded as receivables at the
amount of the group’s net investment in
95Barloworld Limited annual report 2002
the leases. Finance lease income is
allocated to accounting periods so as to
reflect a constant periodic rate of return
on the group’s net investment outstanding
in respect of the leases.
Rental income from operating leases isrecognised on a straight-line basis over theterm of the relevant lease.
The group as lesseeAssets held under finance leases arerecognised as assets of the group at theirfair value at the date of acquisition. Thecorresponding liability to the lessor isdisclosed as a finance lease obligation.Finance costs represent the differencebetween the total leasing commitmentsand the fair value of the assets acquired.They are charged to the income statementover the term of the relevant lease and atinterest rates applicable to the lease on theremaining balance of the obligations foreach accounting period.
Rentals payable under operating leases arecharged to income on a straight-line basisover the term of the relevant lease.
1.19 Partnership interestsPartnership interests are accounted for inthe group accounts by consolidation of thefinancial position and results of thepartnerships.
1.20 Patents and trademarksPatents and trademarks are measuredinitially at cost and amortised on astraight-line basis over their estimateduseful lives, which is on average 10 years.
1.21 Property, plant and equipmentProperties in the course of construction forproduction, rental or administrativepurposes are carried at cost, less anyimpairment loss where the recoverableamount of the asset is estimated to belower than its carrying value.
Other items of property, plant andequipment are stated at cost lessaccumulated depreciation.
Depreciation is charged so as to write offthe depreciable value of the assets, otherthan land, over their estimated useful lives,using the straight-line method, on thefollowing basis:Aircraft 5 yearsBuildings 25 to 50 yearsPlant 5 to 35 yearsVehicles 5 to 10 yearsFurniture and equipment 3 to 6 years
Certain costs of purchase, developmentand installation of major informationsystems (including packaged software) arecapitalised and amortised over theirexpected useful lives (generally five toseven years) on a straight-line basis.
Assets held under finance leases aredepreciated over their expected usefullives or the term of the relevant lease,where shorter.
The gain or loss arising on the disposal orscrapping of property, plant andequipment is recognised in the incomestatement.
The cost model is applied in accounting forinvestment properties. In terms of thismodel, investment properties are recordedat cost less any accumulated depreciationand any accumulated impairment losses.
1.22 ProvisionsProvisions are recognised when the grouphas a present legal or constructiveobligation, as a result of past events, forwhich it is probable that an outflow ofeconomic benefits will be required tosettle the obligation, and a reliableestimate can be made for the amount ofthe obligation. Where the effect ofdiscounting to present value is material,provisions are adjusted to reflect the timevalue of money.
1.23 Retirement benefit costsPayments to defined contributionretirement benefit plans are charged as anexpense as they fall due. Payments made
to industry-managed retirement benefitschemes are dealt with as definedcontribution plans where the group’sobligations under the schemes areequivalent to those arising in a definedcontribution retirement benefit plan.
For defined benefit plans the cost of
providing the benefits is determined using
the projected unit credit method.
Actuarial valuations are conducted on a
triennial basis with interim valuations
performed on an annual basis.
Consideration is given to any event that
could impact the funds up to balance
sheet date where the interim valuation is
performed at an earlier date.
Actuarial gains and losses which exceed
10% of the greater of the present value of
the group’s pension obligations and the
fair value of plan assets are amortised over
the expected average remaining working
lives of the participating employees. Gains
or losses on the curtailment or settlement
of a defined benefit plan are recognised
in the income statement when the
group is demonstrably committed to the
curtailment or settlement.
Past service cost is recognised immediately
to the extent that the benefits are already
vested, and otherwise is amortised on a
straight-line basis over the average period
until the amended benefits become vested.
The amount recognised in the balance
sheet represents the present value of the
defined benefit obligation as adjusted for
unrecognised actuarial gains and losses
and unrecognised past service cost, and
reduced by the fair value of plan assets.
Any asset is limited to unrecognised
actuarial losses, plus the present value of
available refunds and reductions in future
contributions to the plan.
To the extent that there is uncertainty as to
the entitlement to the surplus, no asset is
recorded.
96 Barloworld Limited annual report 2002
Notes to the annual financial statements continued
for the year ended 30 September 2002
1.24 Revenue recognition
Included in revenue are net invoiced sales
to customers for goods and services,
rentals from leasing fixed and movable
property, commission, hire purchase and
finance lease income. Sales of goods are
recognised when goods are delivered and
title has passed. Revenue arising from
services, commission, royalties and rebates
is recognised on the accrual basis in
accordance with the substance of the
relevant agreements. Revenue excludes
indirect taxes.
Interest income is accrued on a time basis,by reference to the principal outstandingand at the interest rate applicable.
Dividend income from investments is
recognised when the shareholders’
rights to receive payment have been
established.
1.25 Segmental reporting
Segment accounting policies are consistent
with those adopted for the preparation
of the financial statements of the
consolidated group. The primary basis for
reporting segment information is business
segments and the secondary basis is by
significant geographical region, which is
based on the location of assets. The basis is
consistent with internal reporting for
management purposes as well as the
source and nature of business risks and
returns.
1.26 Taxation
The charge for current tax is based on the
results for the year as adjusted for items,
which are non-assessable or disallowed. It
is calculated using tax rates that have been
enacted or substantively enacted by the
balance sheet date.
Deferred tax is accounted for using the
balance sheet liability method in respect of
temporary differences arising from
differences between the carrying amount
of assets and liabilities in the financial
statements and the corresponding tax
basis used in the computation of taxable
profit. In principle, deferred tax liabilities
are recognised for all taxable temporary
differences and deferred tax assets are
recognised to the extent that it is
probable that taxable profits will be
available against which deductible
temporary differences can be utilised.
Such assets and liabilities are not
recognised if the temporary difference
arises from goodwill, negative goodwill
nor from the acquisition of an asset, which
does not affect either taxable or
accounting income.
Deferred tax liabilities are recognised
for taxable temporary differences arising
on investments in subsidiaries and
associates, and interests in joint ventures,
except where the group is able to control
the reversal of the temporary difference
and it is probable that the temporary
difference will not reverse in the
foreseeable future.
Deferred tax is calculated at the tax
rates that are expected to apply to the
period when the asset is realised or the
liability is settled. Deferred tax is charged
or credited in the income statement,
except when it relates to items credited
or charged directly to equity, in which
case the deferred tax is also dealt with
in equity.
2. DEFINITIONS
Cash flow return on investment (CFROI®)
Refer to page 57.
Current ratio
Current assets divided by current liabilities.
Dividend cover
Earnings per share excluding exceptional
items divided by dividends per share.
Net profit per share
BasicNet profit attributable to ordinaryshareholders of Barloworld Limited forthe year divided by the weighted
average number of ordinary shares inissue during the year.
Fully diluted
Net profit attributable to ordinary
shareholders of Barloworld Limited for
the year is adjusted by the after tax
interest saving assuming conversion of the
convertible bond where the effect is
dilutive. The weighted average number of
shares in issue is increased by the number
of additional shares in issue assuming the
conversion of the dilutive convertible bond
and the number of additional shares issued
assuming the conversion of dilutive
options excluding the number of notional
shares issued at full value.
Earnings per share (excluding exceptional
items)
Basic
Net profit attributable to ordinary
shareholders of Barloworld Limited for
the year adjusted for the exceptional
items net of tax and minority interest
thereof, divided by the weighted average
number of ordinary shares in issue during
the year.
Fully diluted
Earnings for the year as in the basic
calculation above adjusted by the after tax
interest saving assuming conversion of the
convertible bond where the effect is
dilutive. The weighted average number of
shares in issue is increased by the number
of additional shares in issue assuming the
conversion of the dilutive convertible bond
and the number of additional shares issued
assuming the conversion of dilutive
options excluding the number of notional
shares issued at full value.
Headline earnings per share
Net profit attributable to ordinary share-
holders of Barloworld Limited for the year
adjusted for goodwill amortisation and
capital profits or losses net of tax and
minority interest thereof, divided by the
weighted average number of ordinary
shares in issue during the year.
97Barloworld Limited annual report 2002
Cash equivalent earnings per share
Net profit attributable to ordinary
shareholders of Barloworld Limited adjusted
for non-cash items in attributable earnings
and equity accounted retained earnings,
divided by the weighted average number of
ordinary shares in issue during the year.
Attributable cash flow per share
Attributable cash flow from operations
after adjusting for minority interest and
preference dividends paid, divided by the
weighted average number of ordinary
shares in issue during the year.
Cash realisation rate
Attributable cash flow per share divided by
cash equivalent earnings per share.
Effective rate of taxation
Taxation (excluding prior year taxation and
exceptional items) expressed as a
percentage of profit before taxation
(excluding dividend income and
exceptional items).
Employment cost per employee
Employment cost divided by the average
number of employees.
Interest cover
Profit before interest paid and taxation
divided by interest paid including interest
capitalised. (Profit includes income from
investments, but excludes share of associate
companies’ profits.)
Net assets
Segment assets less segment liabilities.
Segment assets
Total assets less deferred and current
taxation assets.
Segment liabilities
Non-interest-bearing current and non-
current liabilities, excluding deferred and
current taxation liabilities.
Segment result
Segment result represents operating profit
plus any other items that are directly
attributable to segments including fair
value adjustments on financial instruments
and goodwill amortisation. Interest costs
are excluded, due to the centralised nature
of the group’s treasury operations, as well as
investment income and taxation.
Net asset turn
Revenue divided by average net assets.
Net asset value per share
Interest of shareholders of Barloworld
Limited, including investments at market
value, divided by the total number of
ordinary shares in issue.
Number of years to repay debt
The ratio of total borrowings to cash
available from operations.
Operating margin
Operating profit expressed as a percentage
of revenue.
Quick ratio
Current assets excluding inventories
divided by current liabilities.
Replacement capital expenditure to
depreciation
Cash used on replacement capital
expenditure divided by the depreciation
charge for the year.
Revenue per employee
Revenue for the year divided by the
average number of employees.
Return on net assets and total assets
Profit before interest paid and taxation
less goodwill amortisation but including
income from investments and share of
associate companies’ retained profits
expressed as a percentage of average net
or average total assets.
Return on ordinary shareholders’ funds
Net profit attributable to ordinary
shareholders of Barloworld Limited
expressed as a percentage of average
interest of shareholders of Barloworld
Limited.
Return on ordinary shareholders’ funds
(excluding exceptional items)
Net profit attributable to ordinary
shareholders of Barloworld Limited, less
exceptional items (net of exceptional tax
and minorities’ share of exceptional items)
expressed as a percentage of average
interest of shareholders of Barloworld
Limited.
Total assets
Property, plant and equipment, intangible
assets, non-current assets and current
assets.
Total borrowings
Total liabilities less non interest-bearing
liabilities, creditors, provisions and share-
holders for dividends.
Total liabilities
Current liabilities and long-term liabilities.
Deferred taxation is excluded.
Wealth created per employee
Wealth created during the year divided by
the average number of employees.
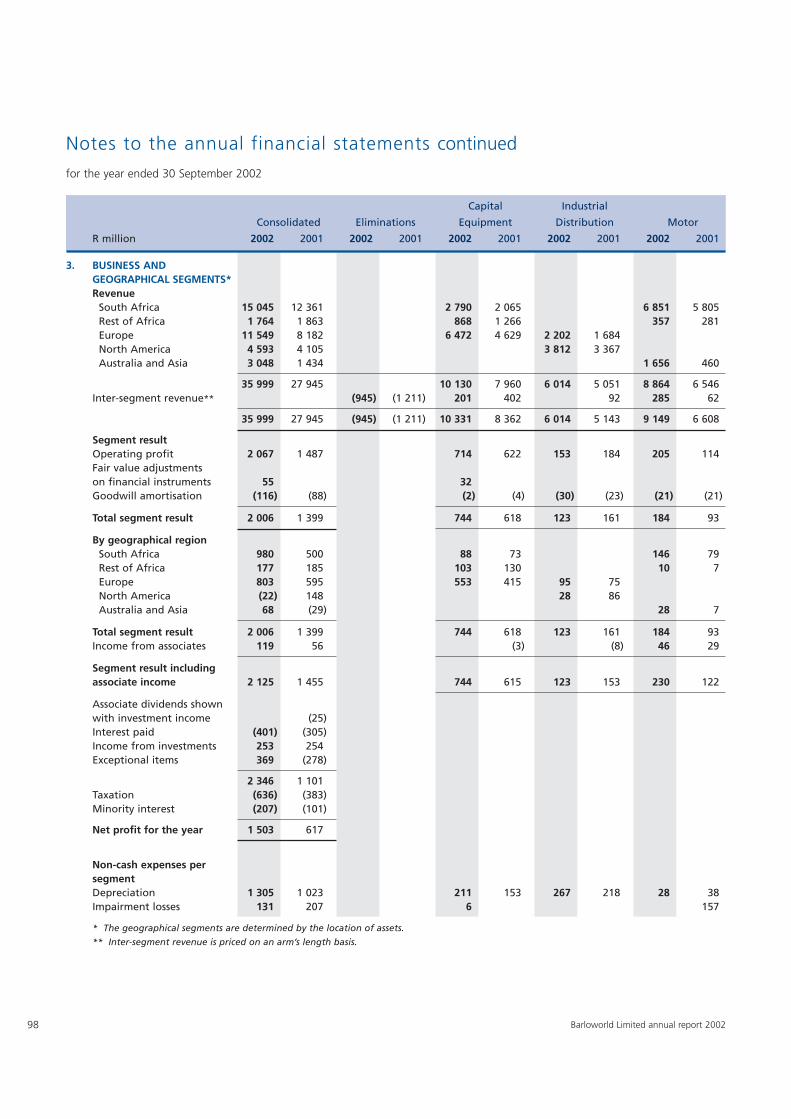
98 Barloworld Limited annual report 2002
Notes to the annual financial statements continued
for the year ended 30 September 2002
3. BUSINESS AND GEOGRAPHICAL SEGMENTS*Revenue
South Africa 15 045 12 361 2 790 2 065 6 851 5 805Rest of Africa 1 764 1 863 868 1 266 357 281Europe 11 549 8 182 6 472 4 629 2 202 1 684North America 4 593 4 105 3 812 3 367Australia and Asia 3 048 1 434 1 656 460
35 999 27 945 10 130 7 960 6 014 5 051 8 864 6 546Inter-segment revenue** (945) (1 211) 201 402 92 285 62
35 999 27 945 (945) (1 211) 10 331 8 362 6 014 5 143 9 149 6 608
Segment resultOperating profit 2 067 1 487 714 622 153 184 205 114Fair value adjustments on financial instruments 55 32Goodwill amortisation (116) (88) (2) (4) (30) (23) (21) (21)
Total segment result 2 006 1 399 744 618 123 161 184 93
By geographical regionSouth Africa 980 500 88 73 146 79Rest of Africa 177 185 103 130 10 7Europe 803 595 553 415 95 75North America (22) 148 28 86Australia and Asia 68 (29) 28 7
Total segment result 2 006 1 399 744 618 123 161 184 93Income from associates 119 56 (3) (8) 46 29
Segment result including associate income 2 125 1 455 744 615 123 153 230 122
Associate dividends shown with investment income (25)Interest paid (401) (305)Income from investments 253 254Exceptional items 369 (278)
2 346 1 101Taxation (636) (383)Minority interest (207) (101)
Net profit for the year 1 503 617
Non-cash expenses per segmentDepreciation 1 305 1 023 211 153 267 218 28 38Impairment losses 131 207 6 157
* The geographical segments are determined by the location of assets.
** Inter-segment revenue is priced on an arm’s length basis.
Capital Industrial
Consolidated Eliminations Equipment Distribution Motor
R million 2002 2001 2002 2001 2002 2001 2002 2001 2002 2001
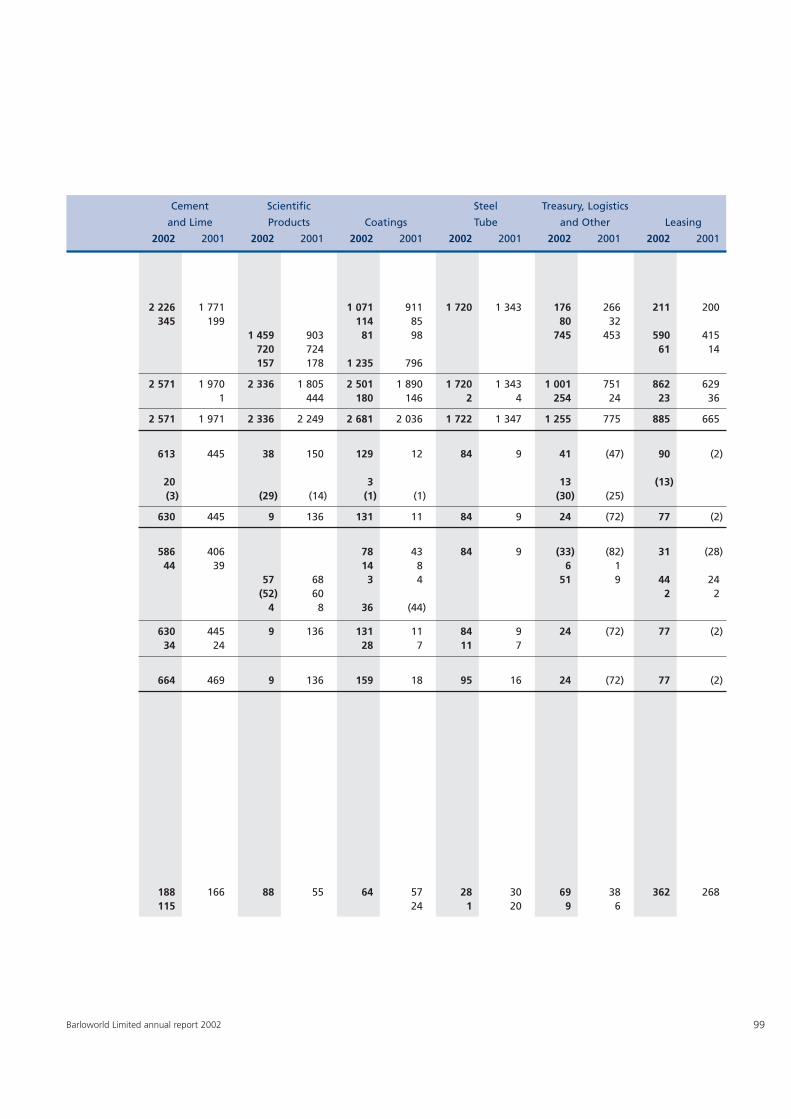
99Barloworld Limited annual report 2002
2 226 1 771 1 071 911 1 720 1 343 176 266 211 200345 199 114 85 80 32
1 459 903 81 98 745 453 590 415720 724 61 14157 178 1 235 796
2 571 1 970 2 336 1 805 2 501 1 890 1 720 1 343 1 001 751 862 6291 444 180 146 2 4 254 24 23 36
2 571 1 971 2 336 2 249 2 681 2 036 1 722 1 347 1 255 775 885 665
613 445 38 150 129 12 84 9 41 (47) 90 (2)
20 3 13 (13)(3) (29) (14) (1) (1) (30) (25)
630 445 9 136 131 11 84 9 24 (72) 77 (2)
586 406 78 43 84 9 (33) (82) 31 (28)44 39 14 8 6 1
57 68 3 4 51 9 44 24(52) 60 2 2
4 8 36 (44)
630 445 9 136 131 11 84 9 24 (72) 77 (2)34 24 28 7 11 7
664 469 9 136 159 18 95 16 24 (72) 77 (2)
188 166 88 55 64 57 28 30 69 38 362 268115 24 1 20 9 6
Cement Scientific Steel Treasury, Logistics
and Lime Products Coatings Tube and Other Leasing
2002 2001 2002 2001 2002 2001 2002 2001 2002 2001 2002 2001
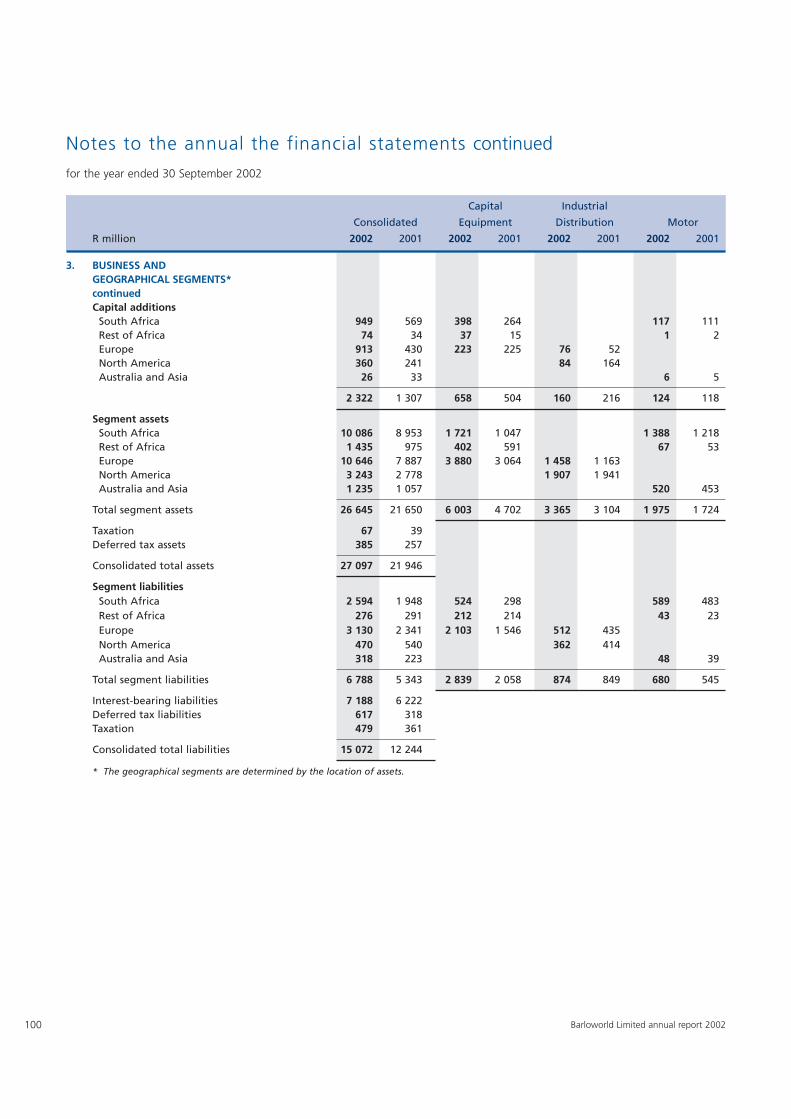
100 Barloworld Limited annual report 2002
Notes to the annual the financial statements continued
for the year ended 30 September 2002
3. BUSINESS AND GEOGRAPHICAL SEGMENTS*continuedCapital additions
South Africa 949 569 398 264 117 111Rest of Africa 74 34 37 15 1 2Europe 913 430 223 225 76 52North America 360 241 84 164Australia and Asia 26 33 6 5
2 322 1 307 658 504 160 216 124 118
Segment assetsSouth Africa 10 086 8 953 1 721 1 047 1 388 1 218Rest of Africa 1 435 975 402 591 67 53Europe 10 646 7 887 3 880 3 064 1 458 1 163North America 3 243 2 778 1 907 1 941Australia and Asia 1 235 1 057 520 453
Total segment assets 26 645 21 650 6 003 4 702 3 365 3 104 1 975 1 724
Taxation 67 39Deferred tax assets 385 257
Consolidated total assets 27 097 21 946
Segment liabilitiesSouth Africa 2 594 1 948 524 298 589 483Rest of Africa 276 291 212 214 43 23Europe 3 130 2 341 2 103 1 546 512 435North America 470 540 362 414Australia and Asia 318 223 48 39
Total segment liabilities 6 788 5 343 2 839 2 058 874 849 680 545
Interest-bearing liabilities 7 188 6 222Deferred tax liabilities 617 318Taxation 479 361
Consolidated total liabilities 15 072 12 244
* The geographical segments are determined by the location of assets.
Capital Industrial
Consolidated Equipment Distribution Motor
R million 2002 2001 2002 2001 2002 2001 2002 2001
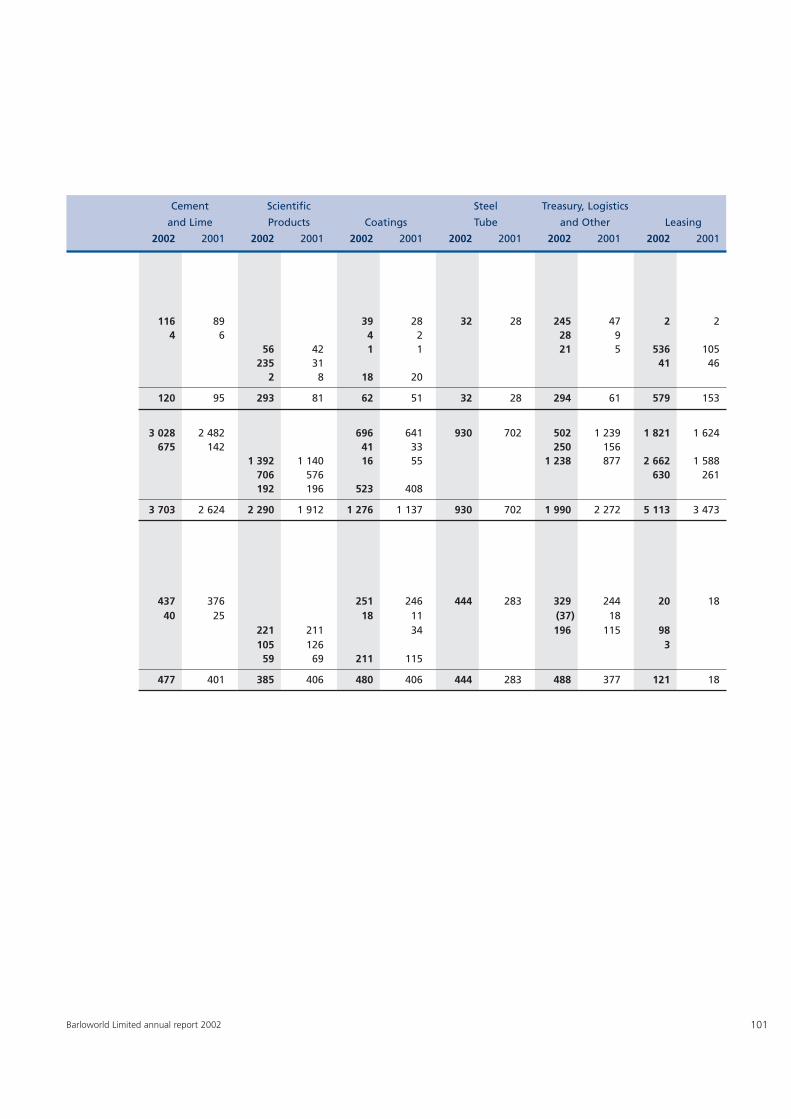
101Barloworld Limited annual report 2002
116 89 39 28 32 28 245 47 2 24 6 4 2 28 9
56 42 1 1 21 5 536 105235 31 41 46
2 8 18 20
120 95 293 81 62 51 32 28 294 61 579 153
3 028 2 482 696 641 930 702 502 1 239 1 821 1 624675 142 41 33 250 156
1 392 1 140 16 55 1 238 877 2 662 1 588706 576 630 261192 196 523 408
3 703 2 624 2 290 1 912 1 276 1 137 930 702 1 990 2 272 5 113 3 473
437 376 251 246 444 283 329 244 20 1840 25 18 11 (37) 18
221 211 34 196 115 98105 126 3
59 69 211 115
477 401 385 406 480 406 444 283 488 377 121 18
Cement Scientific Steel Treasury, Logistics
and Lime Products Coatings Tube and Other Leasing
2002 2001 2002 2001 2002 2001 2002 2001 2002 2001 2002 2001
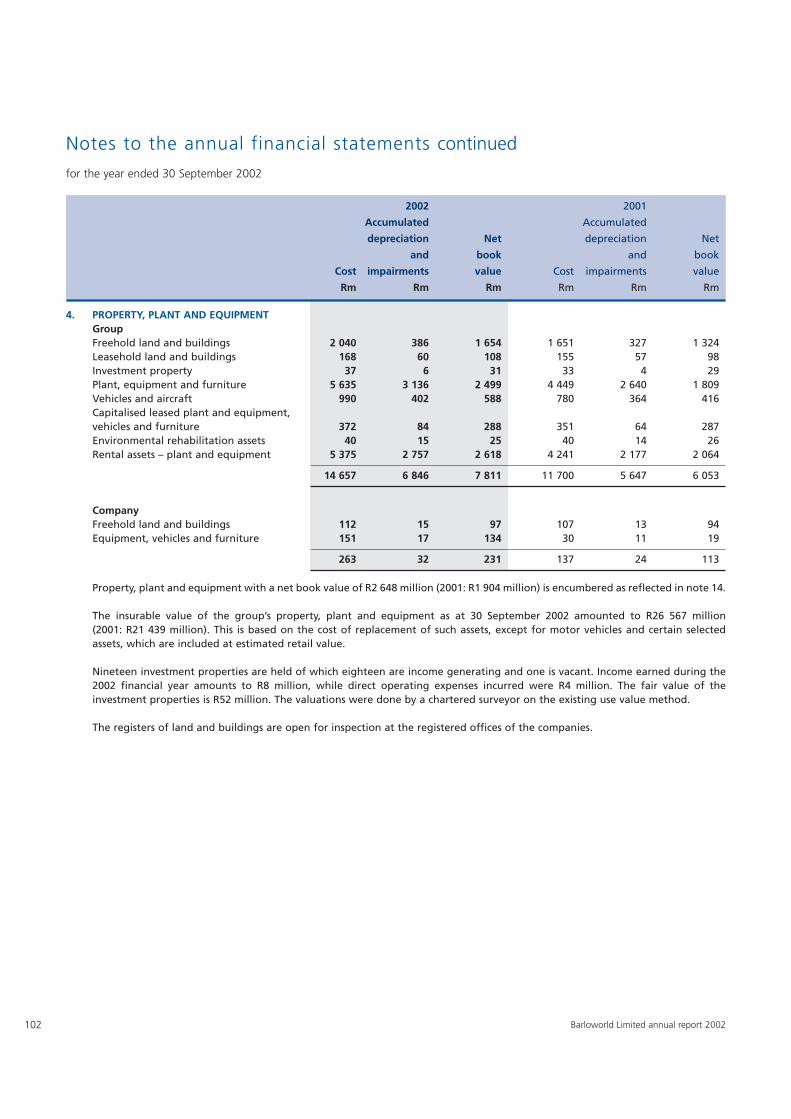
102 Barloworld Limited annual report 2002
Notes to the annual financial statements continued
for the year ended 30 September 2002
4. PROPERTY, PLANT AND EQUIPMENTGroupFreehold land and buildings 2 040 386 1 654 1 651 327 1 324Leasehold land and buildings 168 60 108 155 57 98Investment property 37 6 31 33 4 29Plant, equipment and furniture 5 635 3 136 2 499 4 449 2 640 1 809Vehicles and aircraft 990 402 588 780 364 416Capitalised leased plant and equipment,vehicles and furniture 372 84 288 351 64 287Environmental rehabilitation assets 40 15 25 40 14 26Rental assets – plant and equipment 5 375 2 757 2 618 4 241 2 177 2 064
14 657 6 846 7 811 11 700 5 647 6 053
CompanyFreehold land and buildings 112 15 97 107 13 94Equipment, vehicles and furniture 151 17 134 30 11 19
263 32 231 137 24 113
Property, plant and equipment with a net book value of R2 648 million (2001: R1 904 million) is encumbered as reflected in note 14.
The insurable value of the group’s property, plant and equipment as at 30 September 2002 amounted to R26 567 million (2001: R21 439 million). This is based on the cost of replacement of such assets, except for motor vehicles and certain selectedassets, which are included at estimated retail value.
Nineteen investment properties are held of which eighteen are income generating and one is vacant. Income earned during the2002 financial year amounts to R8 million, while direct operating expenses incurred were R4 million. The fair value of theinvestment properties is R52 million. The valuations were done by a chartered surveyor on the existing use value method.
The registers of land and buildings are open for inspection at the registered offices of the companies.
2002 2001
Accumulated Accumulated
depreciation Net depreciation Net
and book and book
Cost impairments value Cost impairments value
Rm Rm Rm Rm Rm Rm
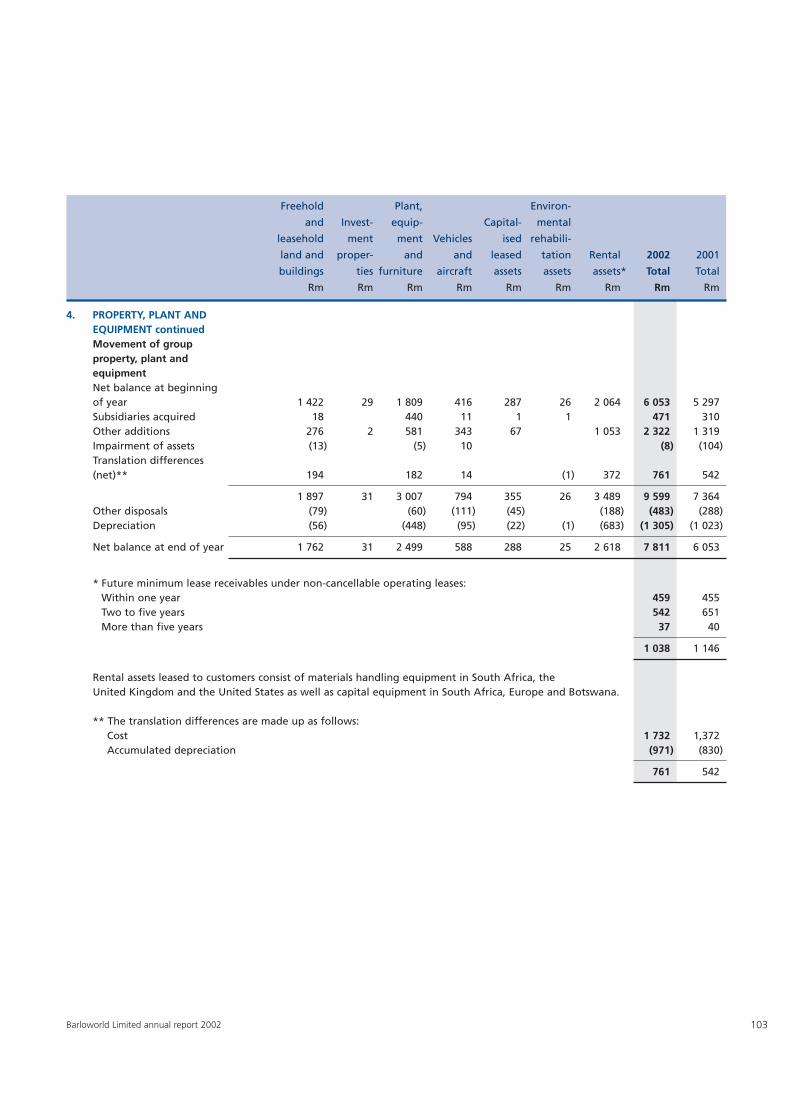
103Barloworld Limited annual report 2002
4. PROPERTY, PLANT AND EQUIPMENT continuedMovement of group property, plant and equipmentNet balance at beginning of year 1 422 29 1 809 416 287 26 2 064 6 053 5 297 Subsidiaries acquired 18 440 11 1 1 471 310Other additions 276 2 581 343 67 1 053 2 322 1 319 Impairment of assets (13) (5) 10 (8) (104)Translation differences (net)** 194 182 14 (1) 372 761 542
1 897 31 3 007 794 355 26 3 489 9 599 7 364 Other disposals (79) (60) (111) (45) (188) (483) (288)Depreciation (56) (448) (95) (22) (1) (683) (1 305) (1 023)
Net balance at end of year 1 762 31 2 499 588 288 25 2 618 7 811 6 053
* Future minimum lease receivables under non-cancellable operating leases:Within one year 459 455Two to five years 542 651More than five years 37 40
1 038 1 146
Rental assets leased to customers consist of materials handling equipment in South Africa, theUnited Kingdom and the United States as well as capital equipment in South Africa, Europe and Botswana.
** The translation differences are made up as follows:Cost 1 732 1,372Accumulated depreciation (971) (830)
761 542
Freehold Plant, Environ-
and Invest- equip- Capital- mental
leasehold ment ment Vehicles ised rehabili-
land and proper- and and leased tation Rental 2002 2001
buildings ties furniture aircraft assets assets assets* Total Total
Rm Rm Rm Rm Rm Rm Rm Rm Rm
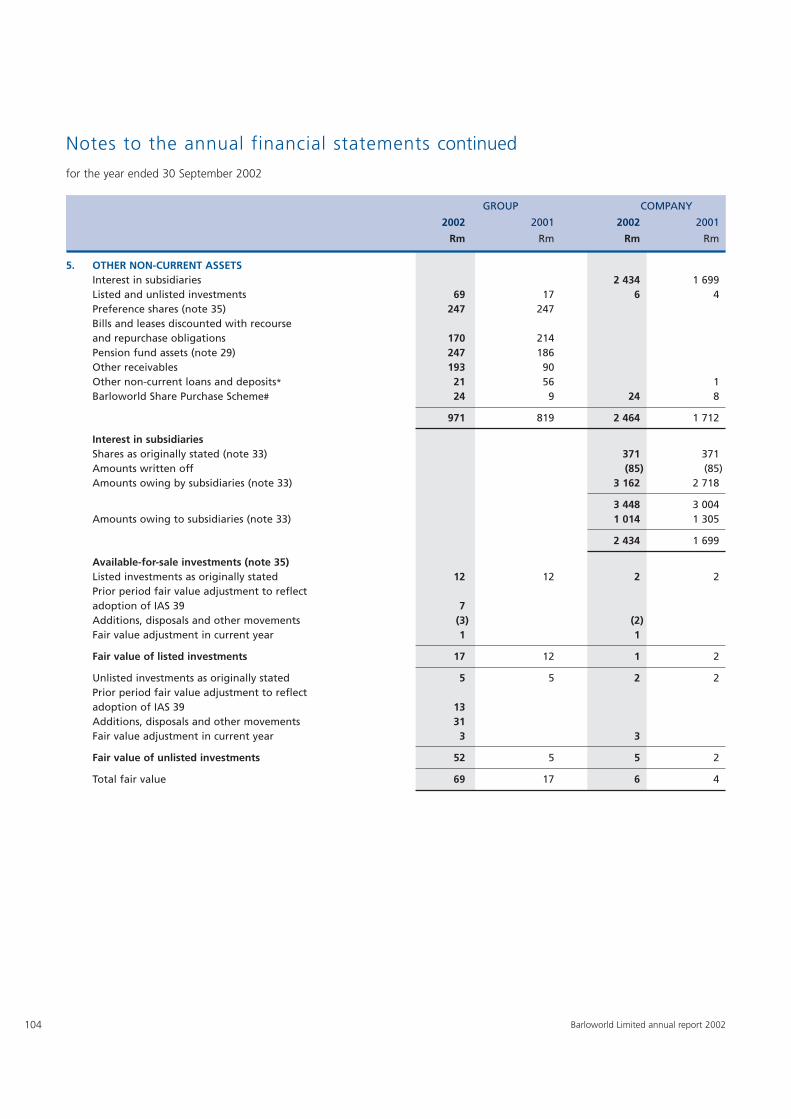
104 Barloworld Limited annual report 2002
Notes to the annual financial statements continued
for the year ended 30 September 2002
5. OTHER NON-CURRENT ASSETSInterest in subsidiaries 2 434 1 699Listed and unlisted investments 69 17 6 4Preference shares (note 35) 247 247Bills and leases discounted with recourse and repurchase obligations 170 214Pension fund assets (note 29) 247 186Other receivables 193 90Other non-current loans and deposits* 21 56 1Barloworld Share Purchase Scheme# 24 9 24 8
971 819 2 464 1 712
Interest in subsidiariesShares as originally stated (note 33) 371 371Amounts written off (85) (85)Amounts owing by subsidiaries (note 33) 3 162 2 718
3 448 3 004Amounts owing to subsidiaries (note 33) 1 014 1 305
2 434 1 699
Available-for-sale investments (note 35)Listed investments as originally stated 12 12 2 2Prior period fair value adjustment to reflect adoption of IAS 39 7Additions, disposals and other movements (3) (2)Fair value adjustment in current year 1 1
Fair value of listed investments 17 12 1 2
Unlisted investments as originally stated 5 5 2 2Prior period fair value adjustment to reflect adoption of IAS 39 13Additions, disposals and other movements 31Fair value adjustment in current year 3 3
Fair value of unlisted investments 52 5 5 2
Total fair value 69 17 6 4
GROUP COMPANY
2002 2001 2002 2001
Rm Rm Rm Rm
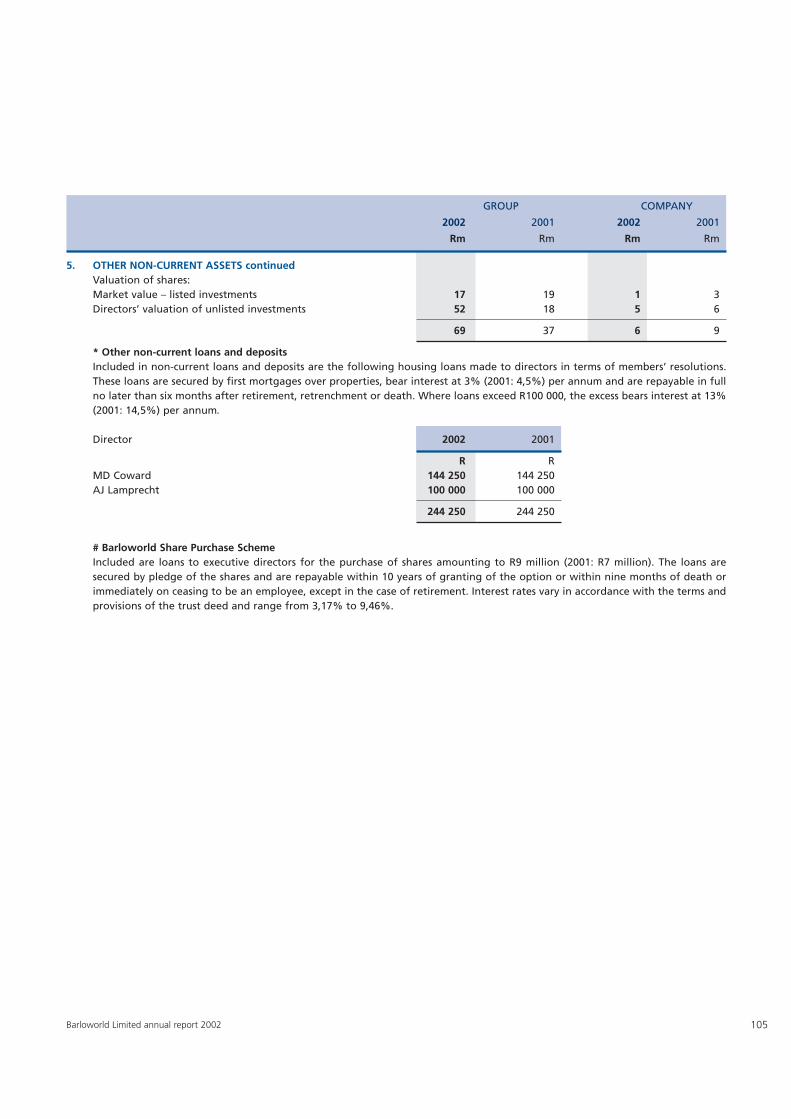
105Barloworld Limited annual report 2002
5. OTHER NON-CURRENT ASSETS continuedValuation of shares:Market value – listed investments 17 19 1 3Directors’ valuation of unlisted investments 52 18 5 6
69 37 6 9
* Other non-current loans and depositsIncluded in non-current loans and deposits are the following housing loans made to directors in terms of members’ resolutions.These loans are secured by first mortgages over properties, bear interest at 3% (2001: 4,5%) per annum and are repayable in fullno later than six months after retirement, retrenchment or death. Where loans exceed R100 000, the excess bears interest at 13%(2001: 14,5%) per annum.
Director 2002 2001
R RMD Coward 144 250 144 250AJ Lamprecht 100 000 100 000
244 250 244 250
# Barloworld Share Purchase SchemeIncluded are loans to executive directors for the purchase of shares amounting to R9 million (2001: R7 million). The loans aresecured by pledge of the shares and are repayable within 10 years of granting of the option or within nine months of death orimmediately on ceasing to be an employee, except in the case of retirement. Interest rates vary in accordance with the terms andprovisions of the trust deed and range from 3,17% to 9,46%.
GROUP COMPANY
2002 2001 2002 2001
Rm Rm Rm Rm
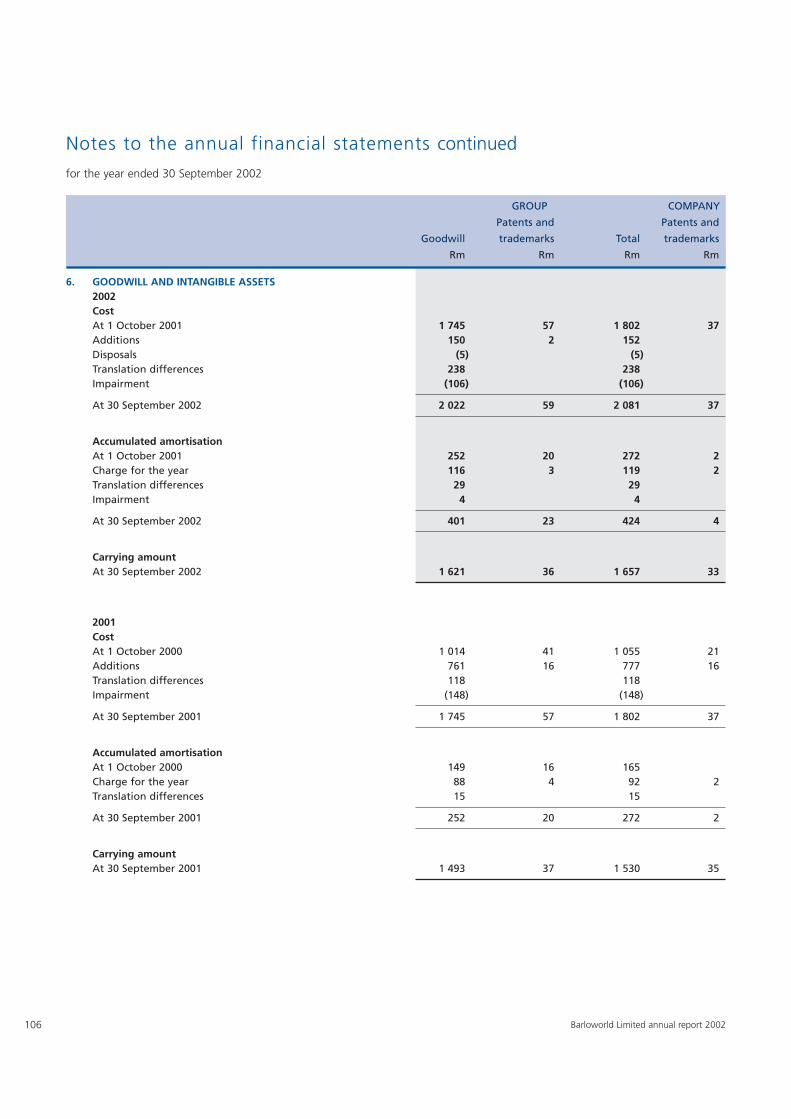
106 Barloworld Limited annual report 2002
Notes to the annual financial statements continued
for the year ended 30 September 2002
6. GOODWILL AND INTANGIBLE ASSETS2002CostAt 1 October 2001 1 745 57 1 802 37Additions 150 2 152Disposals (5) (5)Translation differences 238 238Impairment (106) (106)
At 30 September 2002 2 022 59 2 081 37
Accumulated amortisationAt 1 October 2001 252 20 272 2Charge for the year 116 3 119 2Translation differences 29 29Impairment 4 4
At 30 September 2002 401 23 424 4
Carrying amountAt 30 September 2002 1 621 36 1 657 33
2001CostAt 1 October 2000 1 014 41 1 055 21Additions 761 16 777 16Translation differences 118 118Impairment (148) (148)
At 30 September 2001 1 745 57 1 802 37
Accumulated amortisationAt 1 October 2000 149 16 165Charge for the year 88 4 92 2Translation differences 15 15
At 30 September 2001 252 20 272 2
Carrying amountAt 30 September 2001 1 493 37 1 530 35
GROUP COMPANY
Patents and Patents and
Goodwill trademarks Total trademarks
Rm Rm Rm Rm
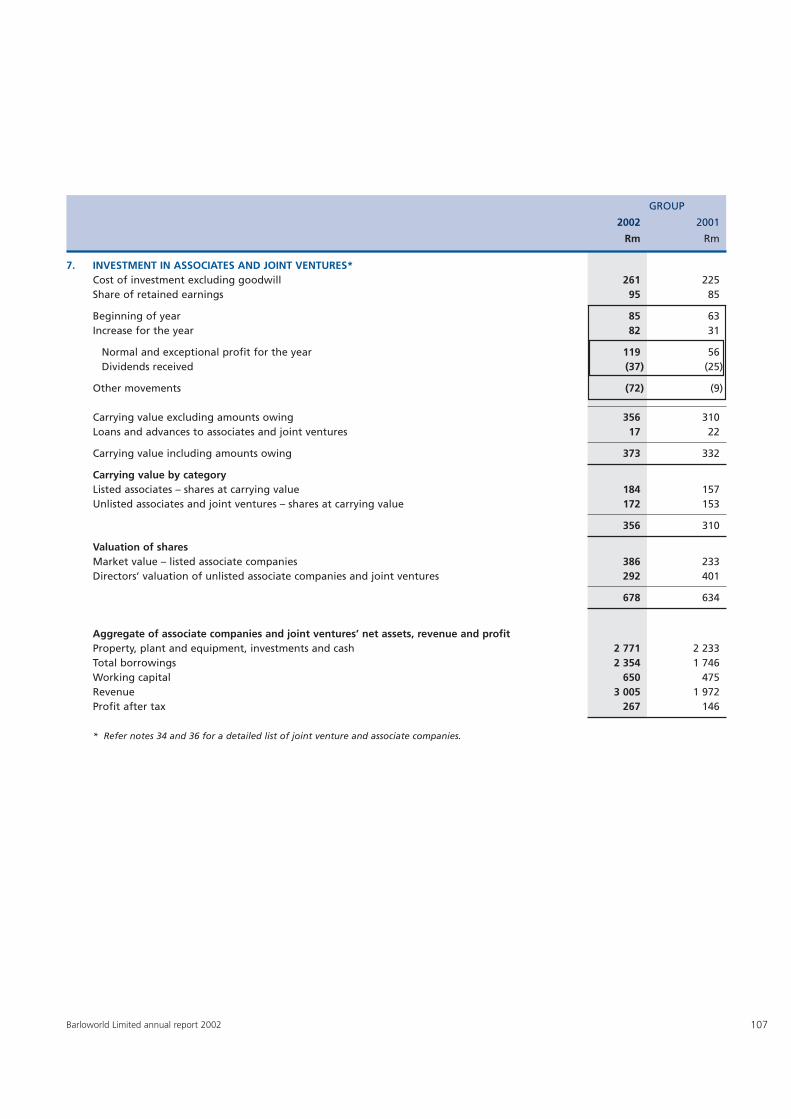
107Barloworld Limited annual report 2002
7. INVESTMENT IN ASSOCIATES AND JOINT VENTURES*Cost of investment excluding goodwill 261 225Share of retained earnings 95 85
Beginning of year 85 63Increase for the year 82 31
Normal and exceptional profit for the year 119 56Dividends received (37) (25)
Other movements (72) (9)
Carrying value excluding amounts owing 356 310Loans and advances to associates and joint ventures 17 22
Carrying value including amounts owing 373 332
Carrying value by categoryListed associates – shares at carrying value 184 157Unlisted associates and joint ventures – shares at carrying value 172 153
356 310
Valuation of sharesMarket value – listed associate companies 386 233Directors’ valuation of unlisted associate companies and joint ventures 292 401
678 634
Aggregate of associate companies and joint ventures’ net assets, revenue and profit Property, plant and equipment, investments and cash 2 771 2 233Total borrowings 2 354 1 746Working capital 650 475Revenue 3 005 1 972Profit after tax 267 146
* Refer notes 34 and 36 for a detailed list of joint venture and associate companies.
GROUP
2002 2001
Rm Rm
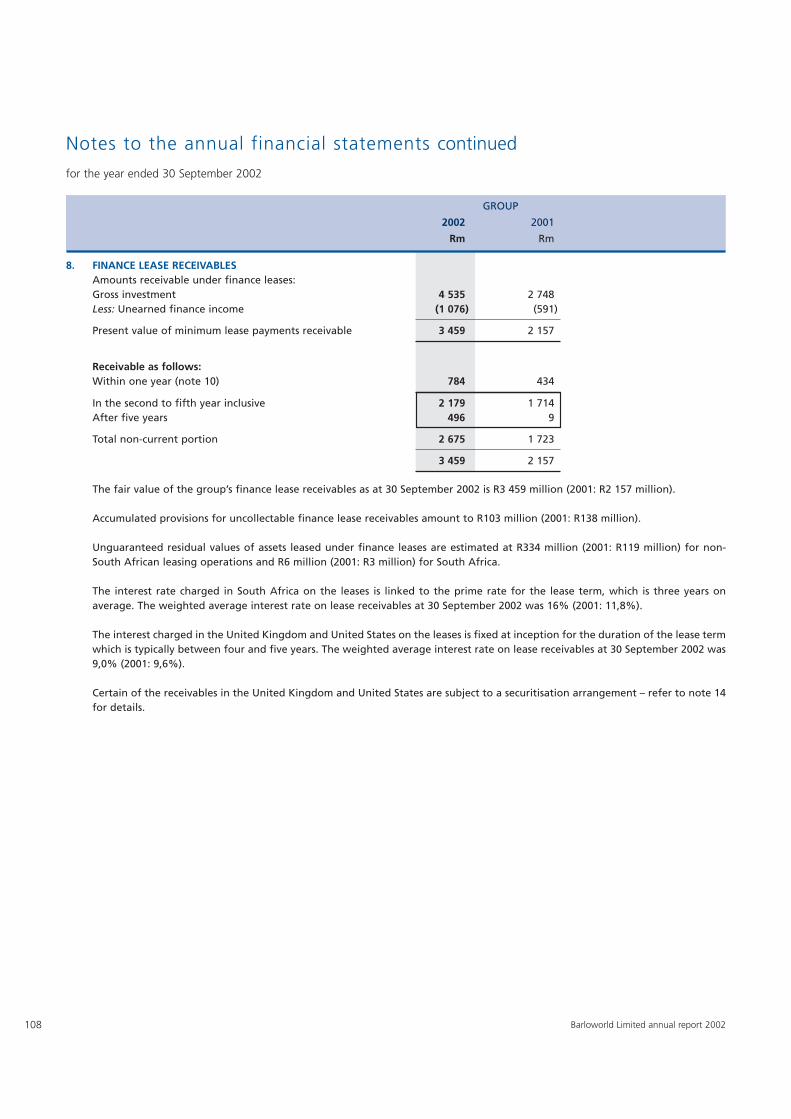
108 Barloworld Limited annual report 2002
Notes to the annual financial statements continued
for the year ended 30 September 2002
GROUP
2002 2001
Rm Rm
8. FINANCE LEASE RECEIVABLESAmounts receivable under finance leases:Gross investment 4 535 2 748Less: Unearned finance income (1 076) (591)
Present value of minimum lease payments receivable 3 459 2 157
Receivable as follows:Within one year (note 10) 784 434
In the second to fifth year inclusive 2 179 1 714After five years 496 9
Total non-current portion 2 675 1 723
3 459 2 157
The fair value of the group’s finance lease receivables as at 30 September 2002 is R3 459 million (2001: R2 157 million).
Accumulated provisions for uncollectable finance lease receivables amount to R103 million (2001: R138 million).
Unguaranteed residual values of assets leased under finance leases are estimated at R334 million (2001: R119 million) for non-South African leasing operations and R6 million (2001: R3 million) for South Africa.
The interest rate charged in South Africa on the leases is linked to the prime rate for the lease term, which is three years onaverage. The weighted average interest rate on lease receivables at 30 September 2002 was 16% (2001: 11,8%).
The interest charged in the United Kingdom and United States on the leases is fixed at inception for the duration of the lease termwhich is typically between four and five years. The weighted average interest rate on lease receivables at 30 September 2002 was9,0% (2001: 9,6%).
Certain of the receivables in the United Kingdom and United States are subject to a securitisation arrangement – refer to note 14for details.
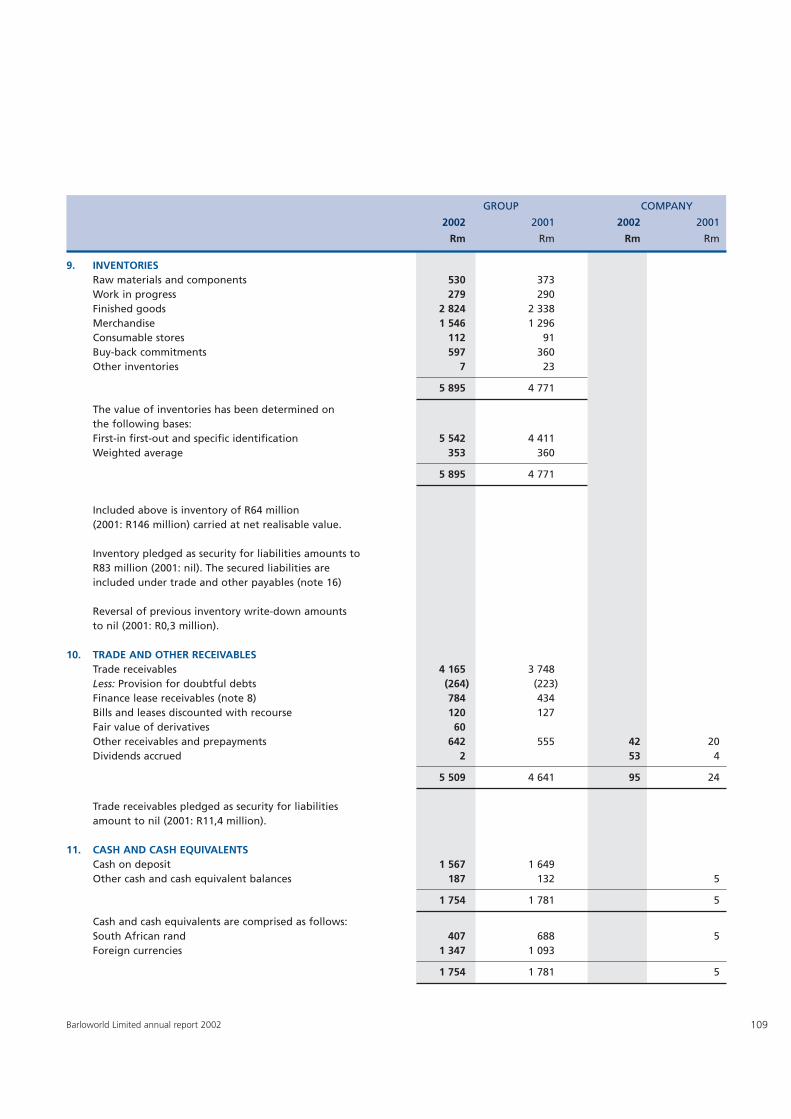
109Barloworld Limited annual report 2002
9. INVENTORIESRaw materials and components 530 373Work in progress 279 290Finished goods 2 824 2 338Merchandise 1 546 1 296Consumable stores 112 91Buy-back commitments 597 360Other inventories 7 23
5 895 4 771
The value of inventories has been determined on the following bases:First-in first-out and specific identification 5 542 4 411Weighted average 353 360
5 895 4 771
Included above is inventory of R64 million (2001: R146 million) carried at net realisable value.
Inventory pledged as security for liabilities amounts toR83 million (2001: nil). The secured liabilities are included under trade and other payables (note 16)
Reversal of previous inventory write-down amounts to nil (2001: R0,3 million).
10. TRADE AND OTHER RECEIVABLESTrade receivables 4 165 3 748Less: Provision for doubtful debts (264) (223)Finance lease receivables (note 8) 784 434Bills and leases discounted with recourse 120 127Fair value of derivatives 60Other receivables and prepayments 642 555 42 20Dividends accrued 2 53 4
5 509 4 641 95 24
Trade receivables pledged as security for liabilities amount to nil (2001: R11,4 million).
11. CASH AND CASH EQUIVALENTSCash on deposit 1 567 1 649Other cash and cash equivalent balances 187 132 5
1 754 1 781 5
Cash and cash equivalents are comprised as follows:South African rand 407 688 5Foreign currencies 1 347 1 093
1 754 1 781 5
GROUP COMPANY
2002 2001 2002 2001
Rm Rm Rm Rm
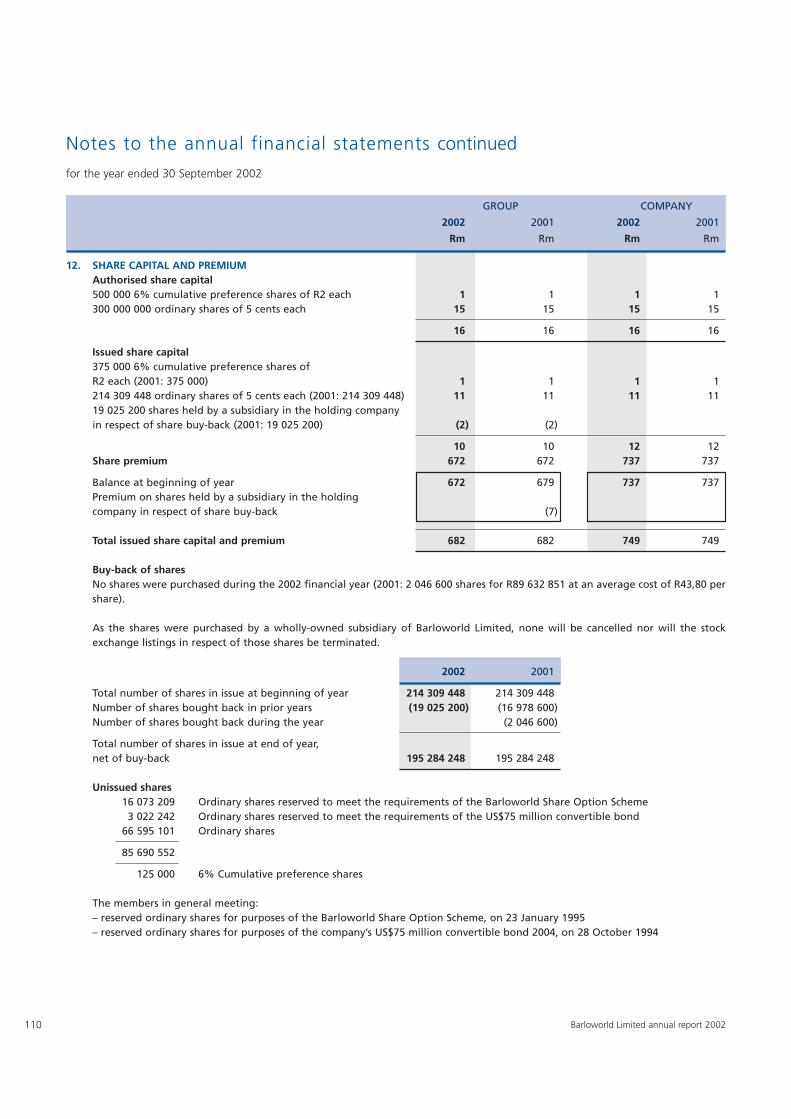
110 Barloworld Limited annual report 2002
Notes to the annual financial statements continued
for the year ended 30 September 2002
12. SHARE CAPITAL AND PREMIUMAuthorised share capital500 000 6% cumulative preference shares of R2 each 1 1 1 1300 000 000 ordinary shares of 5 cents each 15 15 15 15
16 16 16 16
Issued share capital375 000 6% cumulative preference shares of R2 each (2001: 375 000) 1 1 1 1214 309 448 ordinary shares of 5 cents each (2001: 214 309 448) 11 11 11 1119 025 200 shares held by a subsidiary in the holding company in respect of share buy-back (2001: 19 025 200) (2) (2)
10 10 12 12Share premium 672 672 737 737
Balance at beginning of year 672 679 737 737Premium on shares held by a subsidiary in the holding company in respect of share buy-back (7)
Total issued share capital and premium 682 682 749 749
Buy-back of sharesNo shares were purchased during the 2002 financial year (2001: 2 046 600 shares for R89 632 851 at an average cost of R43,80 pershare).
As the shares were purchased by a wholly-owned subsidiary of Barloworld Limited, none will be cancelled nor will the stockexchange listings in respect of those shares be terminated.
2002 2001
Total number of shares in issue at beginning of year 214 309 448 214 309 448Number of shares bought back in prior years (19 025 200) (16 978 600)Number of shares bought back during the year (2 046 600)
Total number of shares in issue at end of year,net of buy-back 195 284 248 195 284 248
Unissued shares16 073 209 Ordinary shares reserved to meet the requirements of the Barloworld Share Option Scheme3 022 242 Ordinary shares reserved to meet the requirements of the US$75 million convertible bond
66 595 101 Ordinary shares
85 690 552
125 000 6% Cumulative preference shares
The members in general meeting:– reserved ordinary shares for purposes of the Barloworld Share Option Scheme, on 23 January 1995– reserved ordinary shares for purposes of the company’s US$75 million convertible bond 2004, on 28 October 1994
GROUP COMPANY
2002 2001 2002 2001
Rm Rm Rm Rm
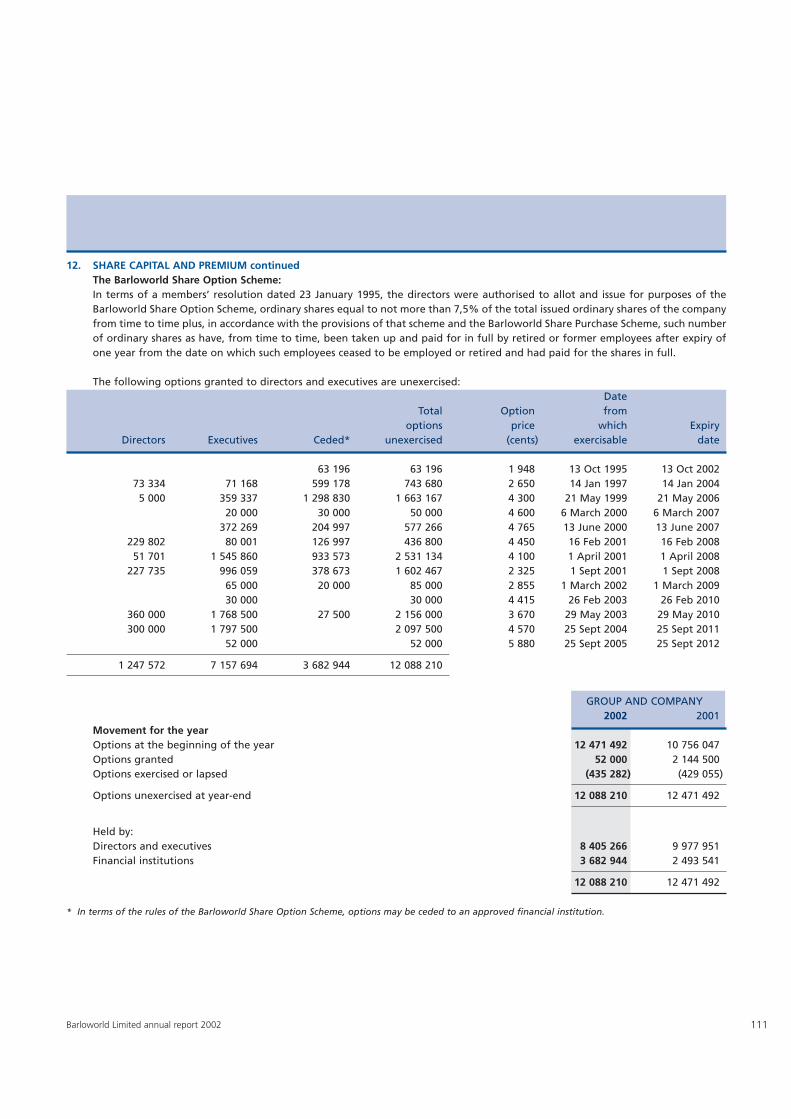
111Barloworld Limited annual report 2002
12. SHARE CAPITAL AND PREMIUM continuedThe Barloworld Share Option Scheme:In terms of a members’ resolution dated 23 January 1995, the directors were authorised to allot and issue for purposes of theBarloworld Share Option Scheme, ordinary shares equal to not more than 7,5% of the total issued ordinary shares of the companyfrom time to time plus, in accordance with the provisions of that scheme and the Barloworld Share Purchase Scheme, such numberof ordinary shares as have, from time to time, been taken up and paid for in full by retired or former employees after expiry ofone year from the date on which such employees ceased to be employed or retired and had paid for the shares in full.
The following options granted to directors and executives are unexercised:Date
Total Option fromoptions price which Expiry
Directors Executives Ceded* unexercised (cents) exercisable date
63 196 63 196 1 948 13 Oct 1995 13 Oct 200273 334 71 168 599 178 743 680 2 650 14 Jan 1997 14 Jan 20045 000 359 337 1 298 830 1 663 167 4 300 21 May 1999 21 May 2006
20 000 30 000 50 000 4 600 6 March 2000 6 March 2007372 269 204 997 577 266 4 765 13 June 2000 13 June 2007
229 802 80 001 126 997 436 800 4 450 16 Feb 2001 16 Feb 200851 701 1 545 860 933 573 2 531 134 4 100 1 April 2001 1 April 2008
227 735 996 059 378 673 1 602 467 2 325 1 Sept 2001 1 Sept 200865 000 20 000 85 000 2 855 1 March 2002 1 March 200930 000 30 000 4 415 26 Feb 2003 26 Feb 2010
360 000 1 768 500 27 500 2 156 000 3 670 29 May 2003 29 May 2010300 000 1 797 500 2 097 500 4 570 25 Sept 2004 25 Sept 2011
52 000 52 000 5 880 25 Sept 2005 25 Sept 2012
1 247 572 7 157 694 3 682 944 12 088 210
GROUP AND COMPANY2002 2001
Movement for the yearOptions at the beginning of the year 12 471 492 10 756 047Options granted 52 000 2 144 500Options exercised or lapsed (435 282) (429 055)
Options unexercised at year-end 12 088 210 12 471 492
Held by:Directors and executives 8 405 266 9 977 951Financial institutions 3 682 944 2 493 541
12 088 210 12 471 492
* In terms of the rules of the Barloworld Share Option Scheme, options may be ceded to an approved financial institution.
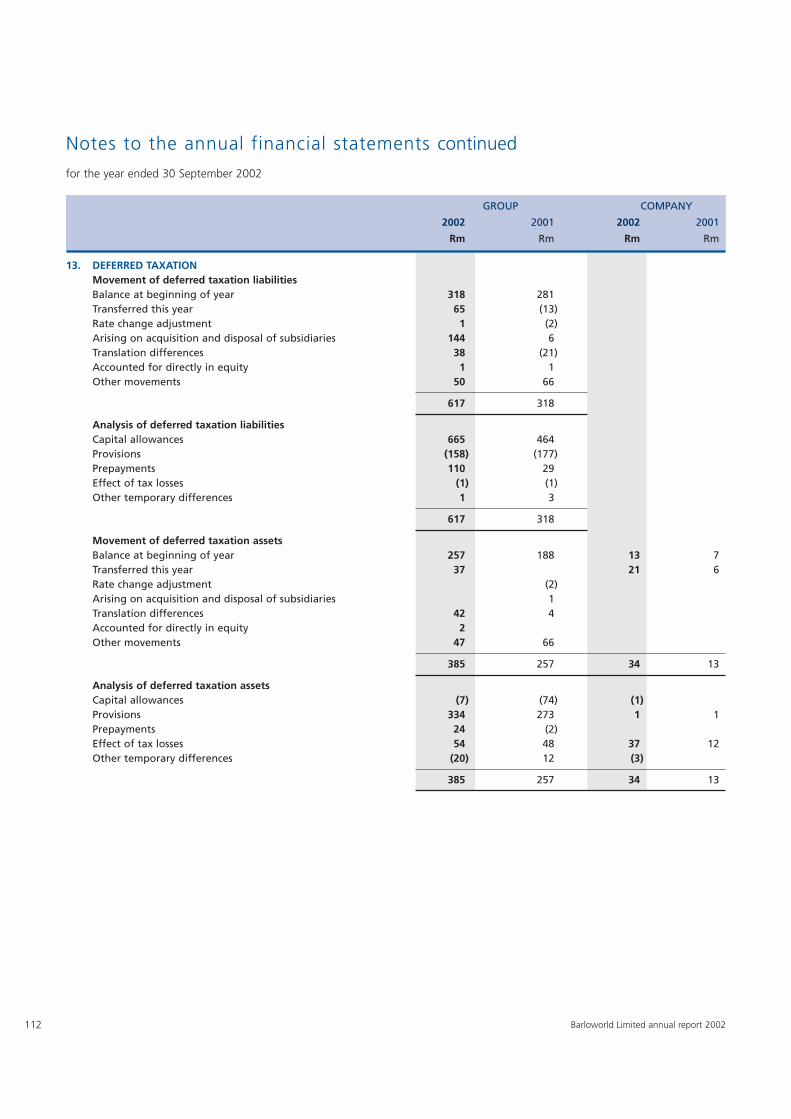
112 Barloworld Limited annual report 2002
Notes to the annual financial statements continued
for the year ended 30 September 2002
13. DEFERRED TAXATIONMovement of deferred taxation liabilitiesBalance at beginning of year 318 281Transferred this year 65 (13)Rate change adjustment 1 (2)Arising on acquisition and disposal of subsidiaries 144 6Translation differences 38 (21)Accounted for directly in equity 1 1Other movements 50 66
617 318
Analysis of deferred taxation liabilitiesCapital allowances 665 464Provisions (158) (177)Prepayments 110 29Effect of tax losses (1) (1)Other temporary differences 1 3
617 318
Movement of deferred taxation assetsBalance at beginning of year 257 188 13 7Transferred this year 37 21 6Rate change adjustment (2)Arising on acquisition and disposal of subsidiaries 1Translation differences 42 4Accounted for directly in equity 2Other movements 47 66
385 257 34 13
Analysis of deferred taxation assetsCapital allowances (7) (74) (1)Provisions 334 273 1 1Prepayments 24 (2)Effect of tax losses 54 48 37 12Other temporary differences (20) 12 (3)
385 257 34 13
GROUP COMPANY
2002 2001 2002 2001
Rm Rm Rm Rm
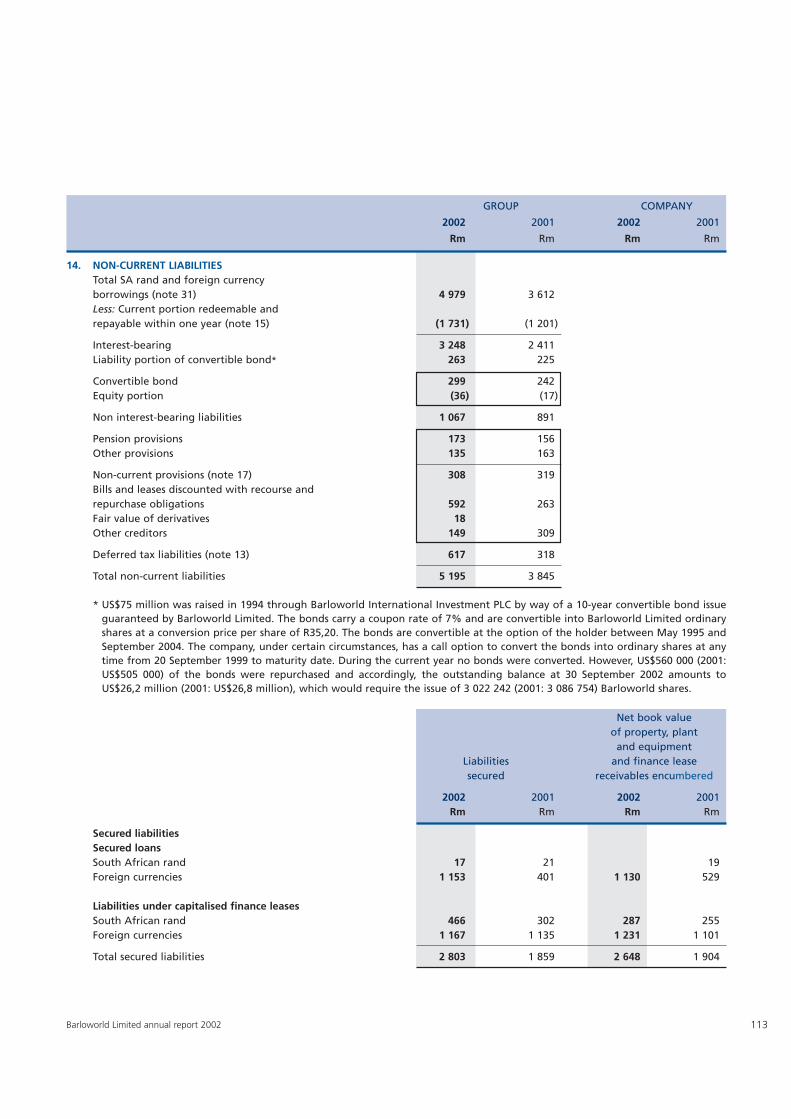
113Barloworld Limited annual report 2002
14. NON-CURRENT LIABILITIESTotal SA rand and foreign currencyborrowings (note 31) 4 979 3 612Less: Current portion redeemable andrepayable within one year (note 15) (1 731) (1 201)
Interest-bearing 3 248 2 411Liability portion of convertible bond* 263 225
Convertible bond 299 242Equity portion (36) (17)
Non interest-bearing liabilities 1 067 891
Pension provisions 173 156Other provisions 135 163
Non-current provisions (note 17) 308 319Bills and leases discounted with recourse andrepurchase obligations 592 263Fair value of derivatives 18Other creditors 149 309
Deferred tax liabilities (note 13) 617 318
Total non-current liabilities 5 195 3 845
* US$75 million was raised in 1994 through Barloworld International Investment PLC by way of a 10-year convertible bond issueguaranteed by Barloworld Limited. The bonds carry a coupon rate of 7% and are convertible into Barloworld Limited ordinaryshares at a conversion price per share of R35,20. The bonds are convertible at the option of the holder between May 1995 andSeptember 2004. The company, under certain circumstances, has a call option to convert the bonds into ordinary shares at anytime from 20 September 1999 to maturity date. During the current year no bonds were converted. However, US$560 000 (2001:US$505 000) of the bonds were repurchased and accordingly, the outstanding balance at 30 September 2002 amounts toUS$26,2 million (2001: US$26,8 million), which would require the issue of 3 022 242 (2001: 3 086 754) Barloworld shares.
Net book valueof property, plant
and equipmentLiabilities and finance leasesecured receivables encumbered
2002 2001 2002 2001Rm Rm Rm Rm
Secured liabilitiesSecured loansSouth African rand 17 21 19Foreign currencies 1 153 401 1 130 529
Liabilities under capitalised finance leasesSouth African rand 466 302 287 255Foreign currencies 1 167 1 135 1 231 1 101
Total secured liabilities 2 803 1 859 2 648 1 904
GROUP COMPANY
2002 2001 2002 2001
Rm Rm Rm Rm
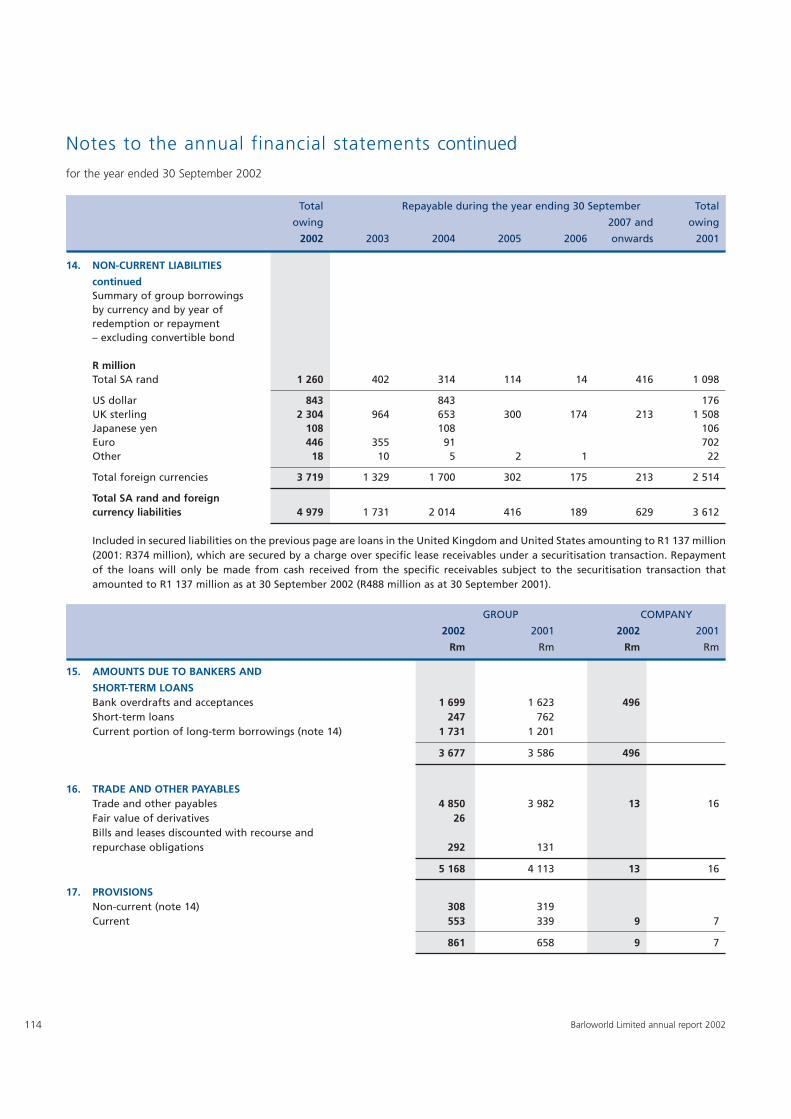
114 Barloworld Limited annual report 2002
Notes to the annual financial statements continued
for the year ended 30 September 2002
14. NON-CURRENT LIABILITIES
continuedSummary of group borrowings by currency and by year of redemption or repayment – excluding convertible bond
R millionTotal SA rand 1 260 402 314 114 14 416 1 098
US dollar 843 843 176UK sterling 2 304 964 653 300 174 213 1 508Japanese yen 108 108 106Euro 446 355 91 702Other 18 10 5 2 1 22
Total foreign currencies 3 719 1 329 1 700 302 175 213 2 514
Total SA rand and foreign currency liabilities 4 979 1 731 2 014 416 189 629 3 612
Included in secured liabilities on the previous page are loans in the United Kingdom and United States amounting to R1 137 million(2001: R374 million), which are secured by a charge over specific lease receivables under a securitisation transaction. Repaymentof the loans will only be made from cash received from the specific receivables subject to the securitisation transaction thatamounted to R1 137 million as at 30 September 2002 (R488 million as at 30 September 2001).
GROUP COMPANY
2002 2001 2002 2001
Rm Rm Rm Rm
15. AMOUNTS DUE TO BANKERS AND
SHORT-TERM LOANSBank overdrafts and acceptances 1 699 1 623 496Short-term loans 247 762Current portion of long-term borrowings (note 14) 1 731 1 201
3 677 3 586 496
16. TRADE AND OTHER PAYABLESTrade and other payables 4 850 3 982 13 16Fair value of derivatives 26Bills and leases discounted with recourse and repurchase obligations 292 131
5 168 4 113 13 16
17. PROVISIONSNon-current (note 14) 308 319Current 553 339 9 7
861 658 9 7
Total Repayable during the year ending 30 September Total
owing 2007 and owing
2002 2003 2004 2005 2006 onwards 2001
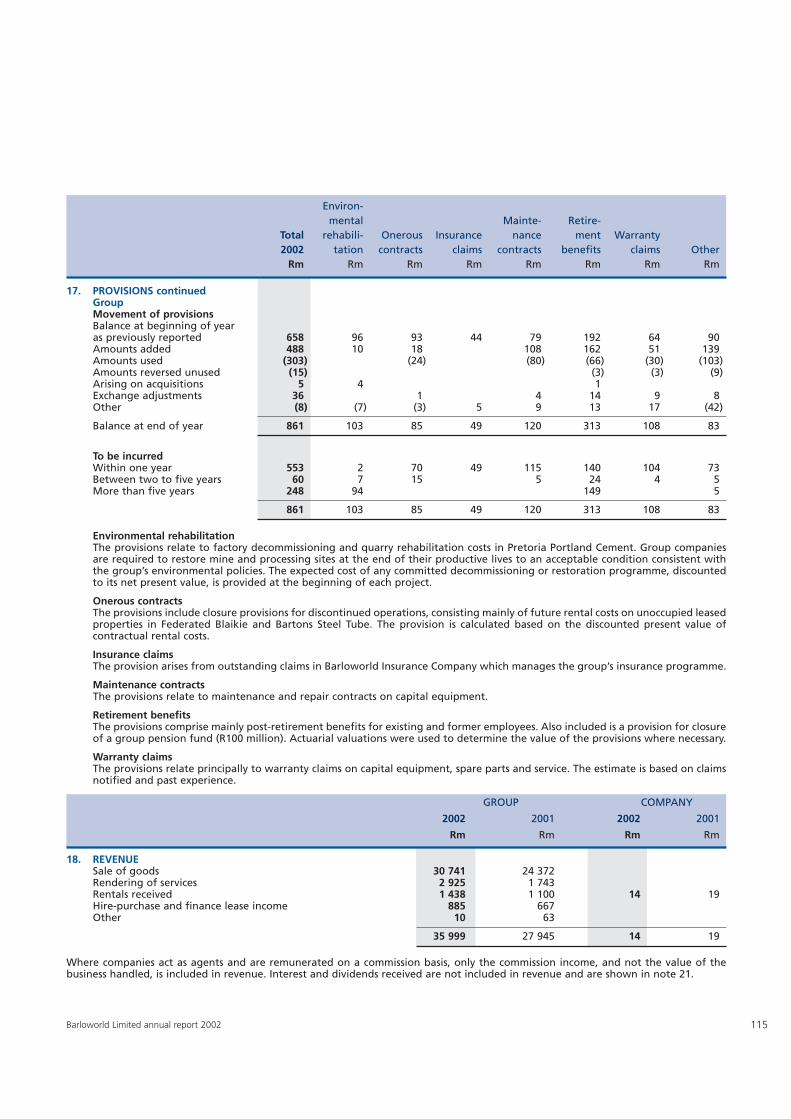
115Barloworld Limited annual report 2002
17. PROVISIONS continuedGroupMovement of provisionsBalance at beginning of year as previously reported 658 96 93 44 79 192 64 90Amounts added 488 10 18 108 162 51 139Amounts used (303) (24) (80) (66) (30) (103)Amounts reversed unused (15) (3) (3) (9)Arising on acquisitions 5 4 1Exchange adjustments 36 1 4 14 9 8Other (8) (7) (3) 5 9 13 17 (42)
Balance at end of year 861 103 85 49 120 313 108 83
To be incurredWithin one year 553 2 70 49 115 140 104 73Between two to five years 60 7 15 5 24 4 5More than five years 248 94 149 5
861 103 85 49 120 313 108 83
Environmental rehabilitationThe provisions relate to factory decommissioning and quarry rehabilitation costs in Pretoria Portland Cement. Group companiesare required to restore mine and processing sites at the end of their productive lives to an acceptable condition consistent withthe group’s environmental policies. The expected cost of any committed decommissioning or restoration programme, discountedto its net present value, is provided at the beginning of each project.
Onerous contractsThe provisions include closure provisions for discontinued operations, consisting mainly of future rental costs on unoccupied leasedproperties in Federated Blaikie and Bartons Steel Tube. The provision is calculated based on the discounted present value ofcontractual rental costs.
Insurance claimsThe provision arises from outstanding claims in Barloworld Insurance Company which manages the group’s insurance programme.
Maintenance contractsThe provisions relate to maintenance and repair contracts on capital equipment.
Retirement benefitsThe provisions comprise mainly post-retirement benefits for existing and former employees. Also included is a provision for closureof a group pension fund (R100 million). Actuarial valuations were used to determine the value of the provisions where necessary.
Warranty claimsThe provisions relate principally to warranty claims on capital equipment, spare parts and service. The estimate is based on claimsnotified and past experience.
GROUP COMPANY
2002 2001 2002 2001
Rm Rm Rm Rm
18. REVENUESale of goods 30 741 24 372Rendering of services 2 925 1 743Rentals received 1 438 1 100 14 19Hire-purchase and finance lease income 885 667Other 10 63
35 999 27 945 14 19
Where companies act as agents and are remunerated on a commission basis, only the commission income, and not the value of thebusiness handled, is included in revenue. Interest and dividends received are not included in revenue and are shown in note 21.
Environ-mental Mainte- Retire-
Total rehabili- Onerous Insurance nance ment Warranty2002 tation contracts claims contracts benefits claims Other
Rm Rm Rm Rm Rm Rm Rm Rm
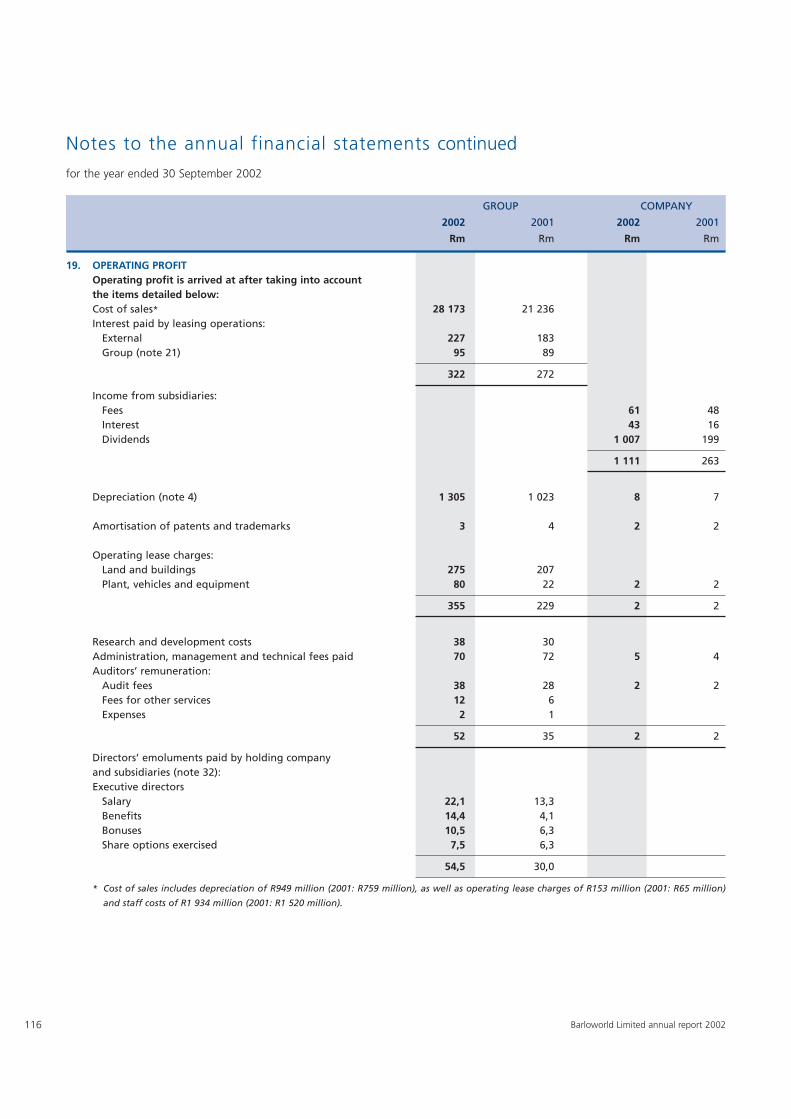
116 Barloworld Limited annual report 2002
Notes to the annual financial statements continued
for the year ended 30 September 2002
19. OPERATING PROFITOperating profit is arrived at after taking into accountthe items detailed below:Cost of sales* 28 173 21 236Interest paid by leasing operations:
External 227 183Group (note 21) 95 89
322 272
Income from subsidiaries:Fees 61 48Interest 43 16Dividends 1 007 199
1 111 263
Depreciation (note 4) 1 305 1 023 8 7
Amortisation of patents and trademarks 3 4 2 2
Operating lease charges:Land and buildings 275 207Plant, vehicles and equipment 80 22 2 2
355 229 2 2
Research and development costs 38 30Administration, management and technical fees paid 70 72 5 4Auditors’ remuneration:
Audit fees 38 28 2 2Fees for other services 12 6Expenses 2 1
52 35 2 2
Directors’ emoluments paid by holding companyand subsidiaries (note 32):Executive directors
Salary 22,1 13,3Benefits 14,4 4,1Bonuses 10,5 6,3Share options exercised 7,5 6,3
54,5 30,0
* Cost of sales includes depreciation of R949 million (2001: R759 million), as well as operating lease charges of R153 million (2001: R65 million)
and staff costs of R1 934 million (2001: R1 520 million).
GROUP COMPANY
2002 2001 2002 2001
Rm Rm Rm Rm
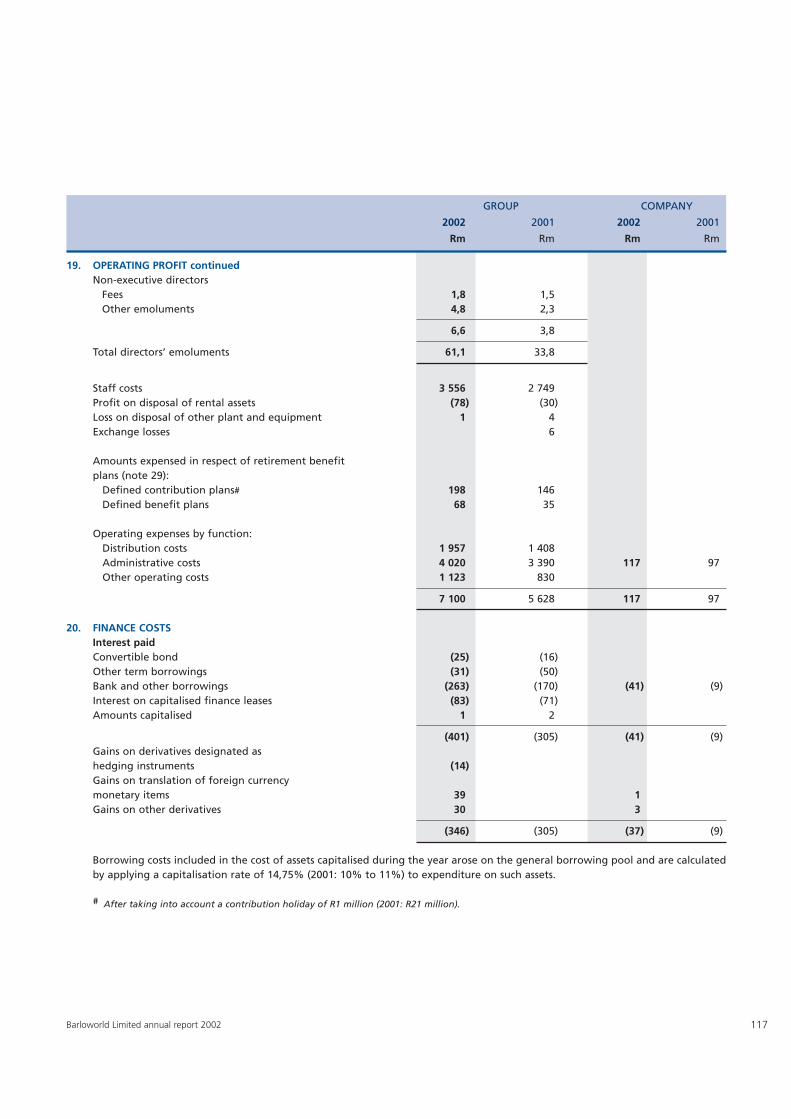
117Barloworld Limited annual report 2002
19. OPERATING PROFIT continuedNon-executive directors
Fees 1,8 1,5Other emoluments 4,8 2,3
6,6 3,8
Total directors’ emoluments 61,1 33,8
Staff costs 3 556 2 749Profit on disposal of rental assets (78) (30)Loss on disposal of other plant and equipment 1 4Exchange losses 6
Amounts expensed in respect of retirement benefitplans (note 29):
Defined contribution plans# 198 146Defined benefit plans 68 35
Operating expenses by function:Distribution costs 1 957 1 408Administrative costs 4 020 3 390 117 97Other operating costs 1 123 830
7 100 5 628 117 97
20. FINANCE COSTSInterest paidConvertible bond (25) (16)Other term borrowings (31) (50)Bank and other borrowings (263) (170) (41) (9)Interest on capitalised finance leases (83) (71)Amounts capitalised 1 2
(401) (305) (41) (9)Gains on derivatives designated as hedging instruments (14)Gains on translation of foreign currency monetary items 39 1Gains on other derivatives 30 3
(346) (305) (37) (9)
Borrowing costs included in the cost of assets capitalised during the year arose on the general borrowing pool and are calculatedby applying a capitalisation rate of 14,75% (2001: 10% to 11%) to expenditure on such assets.
# After taking into account a contribution holiday of R1 million (2001: R21 million).
GROUP COMPANY
2002 2001 2002 2001
Rm Rm Rm Rm
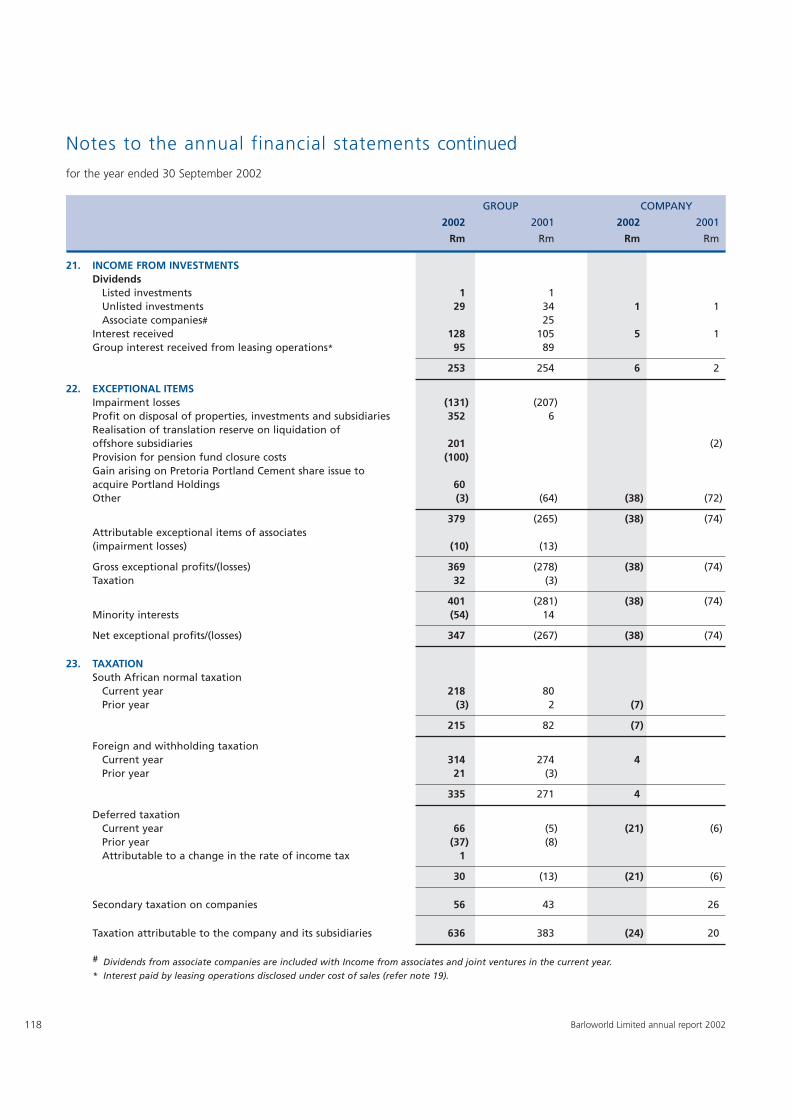
118 Barloworld Limited annual report 2002
Notes to the annual financial statements continued
for the year ended 30 September 2002
21. INCOME FROM INVESTMENTSDividends
Listed investments 1 1Unlisted investments 29 34 1 1Associate companies# 25
Interest received 128 105 5 1Group interest received from leasing operations* 95 89
253 254 6 2
22. EXCEPTIONAL ITEMSImpairment losses (131) (207)Profit on disposal of properties, investments and subsidiaries 352 6Realisation of translation reserve on liquidation of offshore subsidiaries 201 (2)Provision for pension fund closure costs (100)Gain arising on Pretoria Portland Cement share issue to acquire Portland Holdings 60Other (3) (64) (38) (72)
379 (265) (38) (74)Attributable exceptional items of associates (impairment losses) (10) (13)
Gross exceptional profits/(losses) 369 (278) (38) (74)Taxation 32 (3)
401 (281) (38) (74)Minority interests (54) 14
Net exceptional profits/(losses) 347 (267) (38) (74)
23. TAXATIONSouth African normal taxation
Current year 218 80Prior year (3) 2 (7)
215 82 (7)
Foreign and withholding taxationCurrent year 314 274 4Prior year 21 (3)
335 271 4
Deferred taxationCurrent year 66 (5) (21) (6)Prior year (37) (8)Attributable to a change in the rate of income tax 1
30 (13) (21) (6)
Secondary taxation on companies 56 43 26
Taxation attributable to the company and its subsidiaries 636 383 (24) 20
# Dividends from associate companies are included with Income from associates and joint ventures in the current year.* Interest paid by leasing operations disclosed under cost of sales (refer note 19).
GROUP COMPANY
2002 2001 2002 2001
Rm Rm Rm Rm
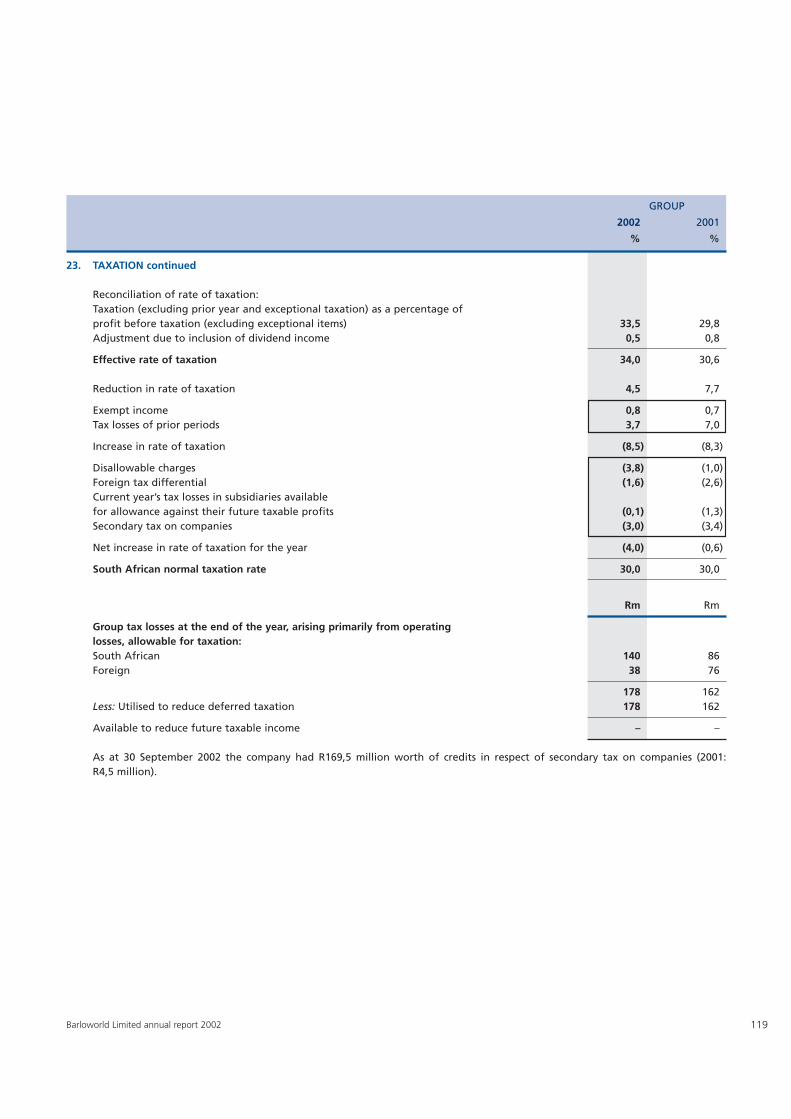
119Barloworld Limited annual report 2002
23. TAXATION continued
Reconciliation of rate of taxation:Taxation (excluding prior year and exceptional taxation) as a percentage of profit before taxation (excluding exceptional items) 33,5 29,8Adjustment due to inclusion of dividend income 0,5 0,8
Effective rate of taxation 34,0 30,6
Reduction in rate of taxation 4,5 7,7
Exempt income 0,8 0,7Tax losses of prior periods 3,7 7,0
Increase in rate of taxation (8,5) (8,3)
Disallowable charges (3,8) (1,0)Foreign tax differential (1,6) (2,6)Current year’s tax losses in subsidiaries available for allowance against their future taxable profits (0,1) (1,3)Secondary tax on companies (3,0) (3,4)
Net increase in rate of taxation for the year (4,0) (0,6)
South African normal taxation rate 30,0 30,0
Rm Rm
Group tax losses at the end of the year, arising primarily from operating losses, allowable for taxation:South African 140 86Foreign 38 76
178 162Less: Utilised to reduce deferred taxation 178 162
Available to reduce future taxable income – –
As at 30 September 2002 the company had R169,5 million worth of credits in respect of secondary tax on companies (2001: R4,5 million).
GROUP
2002 2001
% %
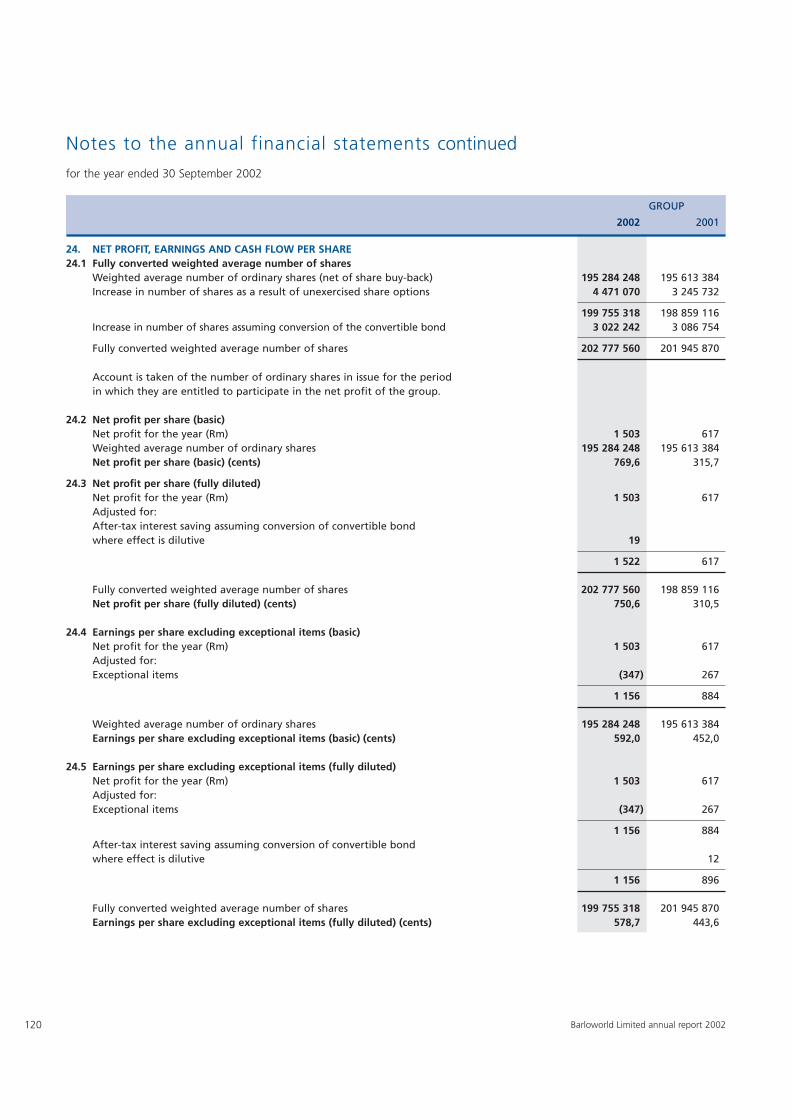
120 Barloworld Limited annual report 2002
Notes to the annual financial statements continued
for the year ended 30 September 2002
24. NET PROFIT, EARNINGS AND CASH FLOW PER SHARE24.1 Fully converted weighted average number of shares
Weighted average number of ordinary shares (net of share buy-back) 195 284 248 195 613 384Increase in number of shares as a result of unexercised share options 4 471 070 3 245 732
199 755 318 198 859 116Increase in number of shares assuming conversion of the convertible bond 3 022 242 3 086 754
Fully converted weighted average number of shares 202 777 560 201 945 870
Account is taken of the number of ordinary shares in issue for the periodin which they are entitled to participate in the net profit of the group.
24.2 Net profit per share (basic)Net profit for the year (Rm) 1 503 617Weighted average number of ordinary shares 195 284 248 195 613 384Net profit per share (basic) (cents) 769,6 315,7
24.3 Net profit per share (fully diluted)Net profit for the year (Rm) 1 503 617Adjusted for:After-tax interest saving assuming conversion of convertible bond where effect is dilutive 19
1 522 617
Fully converted weighted average number of shares 202 777 560 198 859 116Net profit per share (fully diluted) (cents) 750,6 310,5
24.4 Earnings per share excluding exceptional items (basic)Net profit for the year (Rm) 1 503 617Adjusted for:Exceptional items (347) 267
1 156 884
Weighted average number of ordinary shares 195 284 248 195 613 384Earnings per share excluding exceptional items (basic) (cents) 592,0 452,0
24.5 Earnings per share excluding exceptional items (fully diluted)Net profit for the year (Rm) 1 503 617Adjusted for:Exceptional items (347) 267
1 156 884After-tax interest saving assuming conversion of convertible bond where effect is dilutive 12
1 156 896
Fully converted weighted average number of shares 199 755 318 201 945 870Earnings per share excluding exceptional items (fully diluted) (cents) 578,7 443,6
GROUP
2002 2001

121Barloworld Limited annual report 2002
24. NET PROFIT, EARNINGS AND CASH FLOW PER SHARE continued24.6 Headline earnings
Net profit excluding exceptional items (Rm) 1 156 884Provision for pension fund closure costs (net of taxation) (70)Goodwill amortisation 116 88Interest in associate goodwill amortisation 11Loss on sale of plant and equipment (excluding rental assets) 1 4
1 214 976After-tax interest saving assuming conversion of convertible bond where effect is dilutive 12
1 214 988
Weighted average number of ordinary shares 195 284 248 195 613 384Headline earnings per share (basic) (cents) 621,7 499,0
Fully converted weighted average number of shares 199 755 318 201 945 870Headline earnings per share (fully diluted) (cents) 608,2 489,2
24.7 Cash equivalent earningsNet profit for the year (Rm) 1 503 617Adjusted for:Amortisation and depreciation 1 424 1 115Deferred taxation 30 (13)Impairment losses 131 207Amortisation of convertible bond liability 6Other non-cash items (258) 6
2 836 1 932Adjusted for minority share of non-cash items:Amortisation (1)Depreciation (63) (53)Deferred taxation 5 1Impairment losses (39)
2 738 1 880After-tax cash interest saving assuming conversion of convertiblebond where effect is dilutive 14 12
2 752 1 892
Weighted average number of ordinary shares 195 284 248 195 613 384Cash equivalent earnings per share (basic) (cents) 1 402,2 961,3
Fully converted weighted average number of shares 202 777 560 201 945 870Cash equivalent earnings per share (fully diluted) (cents) 1 357,1 937,0
GROUP
2002 2001
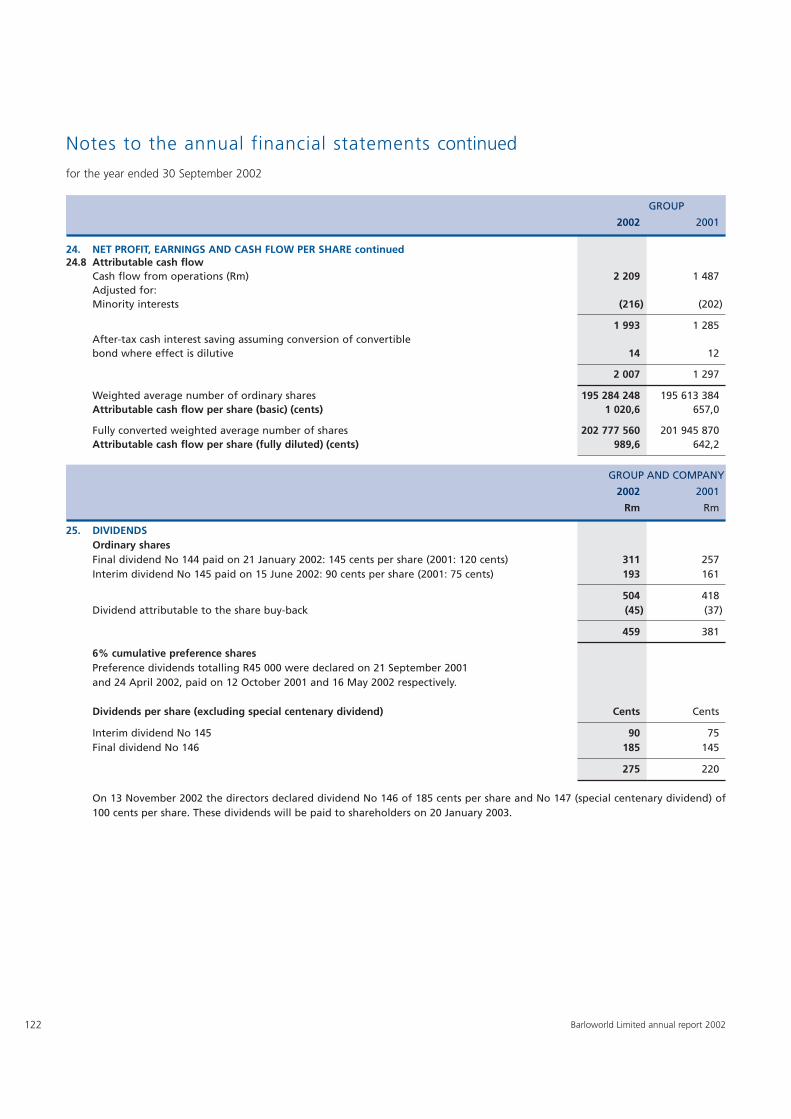
122 Barloworld Limited annual report 2002
Notes to the annual financial statements continued
for the year ended 30 September 2002
24. NET PROFIT, EARNINGS AND CASH FLOW PER SHARE continued24.8 Attributable cash flow
Cash flow from operations (Rm) 2 209 1 487Adjusted for:Minority interests (216) (202)
1 993 1 285After-tax cash interest saving assuming conversion of convertiblebond where effect is dilutive 14 12
2 007 1 297
Weighted average number of ordinary shares 195 284 248 195 613 384Attributable cash flow per share (basic) (cents) 1 020,6 657,0
Fully converted weighted average number of shares 202 777 560 201 945 870Attributable cash flow per share (fully diluted) (cents) 989,6 642,2
GROUP AND COMPANY
2002 2001
Rm Rm
25. DIVIDENDSOrdinary sharesFinal dividend No 144 paid on 21 January 2002: 145 cents per share (2001: 120 cents) 311 257Interim dividend No 145 paid on 15 June 2002: 90 cents per share (2001: 75 cents) 193 161
504 418Dividend attributable to the share buy-back (45) (37)
459 381
6% cumulative preference sharesPreference dividends totalling R45 000 were declared on 21 September 2001 and 24 April 2002, paid on 12 October 2001 and 16 May 2002 respectively.
Dividends per share (excluding special centenary dividend) Cents Cents
Interim dividend No 145 90 75Final dividend No 146 185 145
275 220
On 13 November 2002 the directors declared dividend No 146 of 185 cents per share and No 147 (special centenary dividend) of100 cents per share. These dividends will be paid to shareholders on 20 January 2003.
GROUP
2002 2001
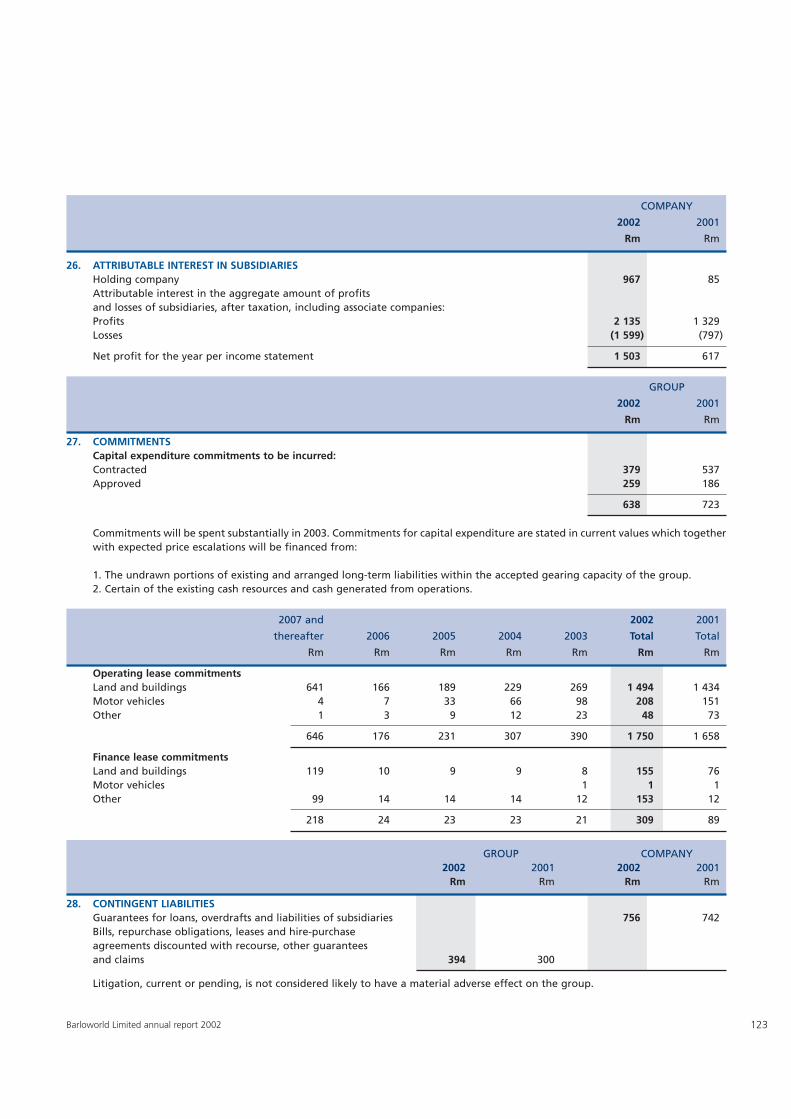
123Barloworld Limited annual report 2002
26. ATTRIBUTABLE INTEREST IN SUBSIDIARIESHolding company 967 85Attributable interest in the aggregate amount of profitsand losses of subsidiaries, after taxation, including associate companies:Profits 2 135 1 329Losses (1 599) (797)
Net profit for the year per income statement 1 503 617
GROUP
2002 2001
Rm Rm
27. COMMITMENTSCapital expenditure commitments to be incurred:Contracted 379 537Approved 259 186
638 723
Commitments will be spent substantially in 2003. Commitments for capital expenditure are stated in current values which togetherwith expected price escalations will be financed from:
1. The undrawn portions of existing and arranged long-term liabilities within the accepted gearing capacity of the group.2. Certain of the existing cash resources and cash generated from operations.
2007 and 2002 2001
thereafter 2006 2005 2004 2003 Total Total
Rm Rm Rm Rm Rm Rm Rm
Operating lease commitmentsLand and buildings 641 166 189 229 269 1 494 1 434Motor vehicles 4 7 33 66 98 208 151Other 1 3 9 12 23 48 73
646 176 231 307 390 1 750 1 658
Finance lease commitmentsLand and buildings 119 10 9 9 8 155 76Motor vehicles 1 1 1Other 99 14 14 14 12 153 12
218 24 23 23 21 309 89
GROUP COMPANY2002 2001 2002 2001
Rm Rm Rm Rm
28. CONTINGENT LIABILITIESGuarantees for loans, overdrafts and liabilities of subsidiaries 756 742Bills, repurchase obligations, leases and hire-purchase agreements discounted with recourse, other guarantees and claims 394 300
Litigation, current or pending, is not considered likely to have a material adverse effect on the group.
COMPANY
2002 2001
Rm Rm
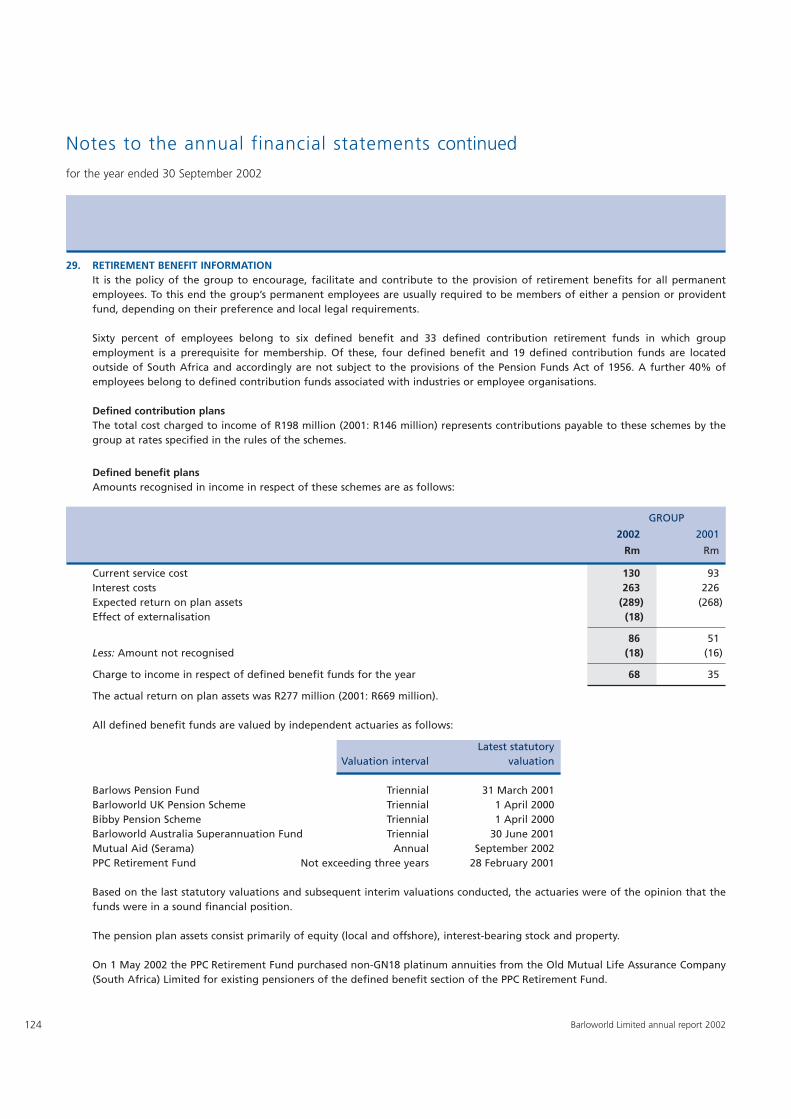
124 Barloworld Limited annual report 2002
Notes to the annual financial statements continued
for the year ended 30 September 2002
29. RETIREMENT BENEFIT INFORMATIONIt is the policy of the group to encourage, facilitate and contribute to the provision of retirement benefits for all permanentemployees. To this end the group’s permanent employees are usually required to be members of either a pension or providentfund, depending on their preference and local legal requirements.
Sixty percent of employees belong to six defined benefit and 33 defined contribution retirement funds in which groupemployment is a prerequisite for membership. Of these, four defined benefit and 19 defined contribution funds are locatedoutside of South Africa and accordingly are not subject to the provisions of the Pension Funds Act of 1956. A further 40% ofemployees belong to defined contribution funds associated with industries or employee organisations.
Defined contribution plansThe total cost charged to income of R198 million (2001: R146 million) represents contributions payable to these schemes by thegroup at rates specified in the rules of the schemes.
Defined benefit plansAmounts recognised in income in respect of these schemes are as follows:
GROUP
2002 2001
Rm Rm
Current service cost 130 93Interest costs 263 226Expected return on plan assets (289) (268)Effect of externalisation (18)
86 51Less: Amount not recognised (18) (16)
Charge to income in respect of defined benefit funds for the year 68 35
The actual return on plan assets was R277 million (2001: R669 million).
All defined benefit funds are valued by independent actuaries as follows:
Latest statutoryValuation interval valuation
Barlows Pension Fund Triennial 31 March 2001Barloworld UK Pension Scheme Triennial 1 April 2000Bibby Pension Scheme Triennial 1 April 2000Barloworld Australia Superannuation Fund Triennial 30 June 2001Mutual Aid (Serama) Annual September 2002PPC Retirement Fund Not exceeding three years 28 February 2001
Based on the last statutory valuations and subsequent interim valuations conducted, the actuaries were of the opinion that thefunds were in a sound financial position.
The pension plan assets consist primarily of equity (local and offshore), interest-bearing stock and property.
On 1 May 2002 the PPC Retirement Fund purchased non-GN18 platinum annuities from the Old Mutual Life Assurance Company(South Africa) Limited for existing pensioners of the defined benefit section of the PPC Retirement Fund.
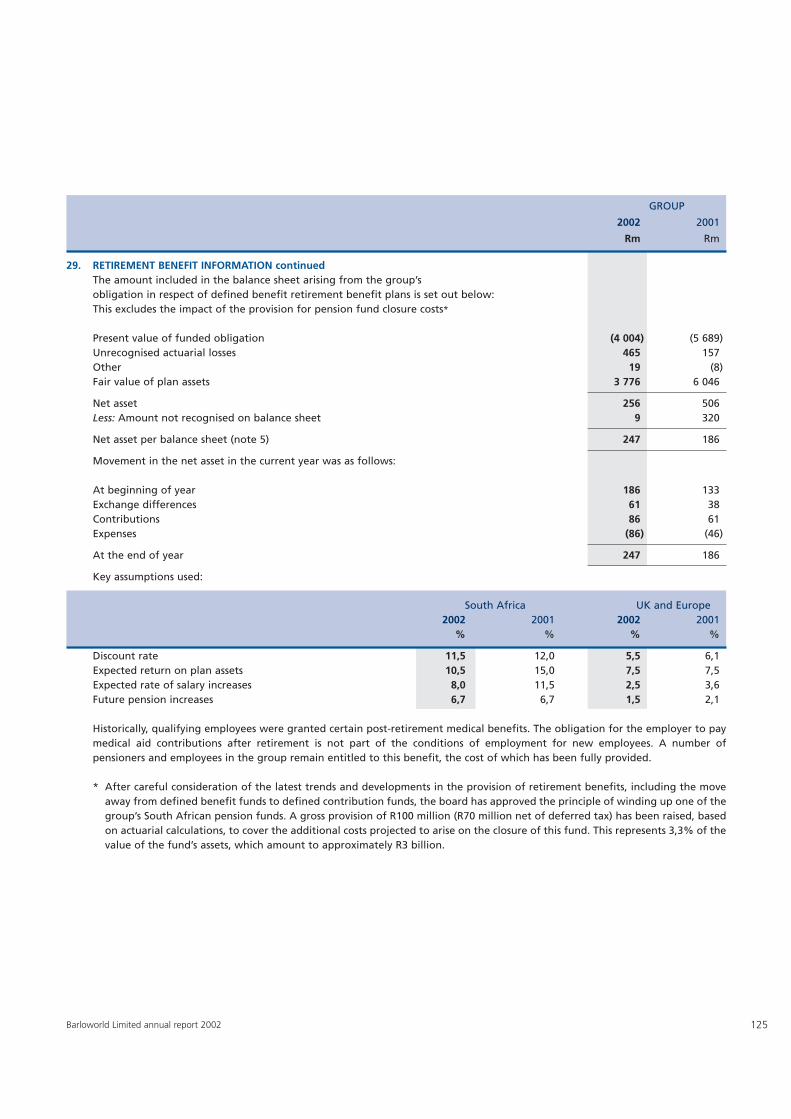
125Barloworld Limited annual report 2002
29. RETIREMENT BENEFIT INFORMATION continuedThe amount included in the balance sheet arising from the group’s obligation in respect of defined benefit retirement benefit plans is set out below:This excludes the impact of the provision for pension fund closure costs*
Present value of funded obligation (4 004) (5 689)Unrecognised actuarial losses 465 157Other 19 (8)Fair value of plan assets 3 776 6 046
Net asset 256 506Less: Amount not recognised on balance sheet 9 320
Net asset per balance sheet (note 5) 247 186
Movement in the net asset in the current year was as follows:
At beginning of year 186 133Exchange differences 61 38Contributions 86 61Expenses (86) (46)
At the end of year 247 186
Key assumptions used:
South Africa UK and Europe2002 2001 2002 2001
% % % %
Discount rate 11,5 12,0 5,5 6,1Expected return on plan assets 10,5 15,0 7,5 7,5Expected rate of salary increases 8,0 11,5 2,5 3,6Future pension increases 6,7 6,7 1,5 2,1
Historically, qualifying employees were granted certain post-retirement medical benefits. The obligation for the employer to paymedical aid contributions after retirement is not part of the conditions of employment for new employees. A number ofpensioners and employees in the group remain entitled to this benefit, the cost of which has been fully provided.
* After careful consideration of the latest trends and developments in the provision of retirement benefits, including the moveaway from defined benefit funds to defined contribution funds, the board has approved the principle of winding up one of thegroup’s South African pension funds. A gross provision of R100 million (R70 million net of deferred tax) has been raised, basedon actuarial calculations, to cover the additional costs projected to arise on the closure of this fund. This represents 3,3% of thevalue of the fund’s assets, which amount to approximately R3 billion.
GROUP
2002 2001
Rm Rm
126 Barloworld Limited annual report 2002
Notes to the annual financial statements continued
for the year ended 30 September 2002
30. CHANGES IN ACCOUNTING POLICY AND DISCLOSURESIn the current year, the group adopted the following International Financial Reporting Standards:
IAS 39 Financial Instruments: Recognition and MeasurementIAS 40 Investment Property
IAS 39 has introduced a comprehensive accounting framework for all financial instruments. The group’s detailed accountingpolicies in respect of such instruments are set out under the principal accounting policies in note 1. The main impact of theadoption of IAS 39 has been that all of the group’s investments are now carried at fair value, and that derivative financialinstruments have been brought on-balance sheet. The adjustments resulting from the remeasurement of investments to fair valueand bringing derivative financial instruments on-balance sheet at fair value have been recognised with effect from 1 October 2001and can be summarised as follows:
Rm
Revaluation reserves – excess of fair value of available-for-sale investments over cost 18Hedging reserves – net fair value of derivatives designated as hedging instruments (34)Retained income – net fair value of derivatives not designated as hedging instruments (11)Foreign currency translation reserve – net fair value adjustments 12Convertible bond – adjustment to equity portion 17Other adjustments to reserves (18)
Total adjustment to reserves as at 1 October 2001 (16)
The impact of adopting IAS 39 on the income statement in the current year has been to decrease profit before tax by R15 million.There has also been a R34 million debit to cash flow hedging reserves.
Under IAS 40, the group’s investment properties continue to be accounted for at cost, less accumulated depreciation and anyaccumulated impairment losses. The adoption of IAS 40 has therefore had no material impact on the group’s reported results.
In the current year, the financial statements reflect the long-term loan made by the PPC Group to Saldanha Steel separately fromthe capitalised lease liability relating to the leased facilities at Saldanha. In the prior year the loan and liability were subject to set-off with only the net liability being shown. If a similar disclosure had been applied in 2001, it would have resulted in an increasein non-current assets of R111,9 million and a corresponding increase in non-current liabilities. No changes to comparatives havebeen made as the impact on the financial statements is not considered material.
In the current year, dividends received from associates and joint ventures have been included with income from associates on theface of the income statement, whereas they were previously disclosed under income from investments. No changes to incomestatement comparatives have been made as there is no impact on reported earnings per share.
31. FINANCIAL RISK MANAGEMENTThe group’s financial instruments consist mainly of deposits with banks, local money market instruments, short-term investments,accounts receivable and payable, loans to and from subsidiaries and bills, leases, hire-purchase agreements discounted withrecourse and derivatives. Details of the agreements discounted with recourse are provided in note 28 to the annual financialstatements.
Derivative instruments are used by the group for hedging purposes. Such instruments used by the group are forward exchangecontracts and fixed interest rate swap agreements. The group does not speculate in the trading of derivative instruments.
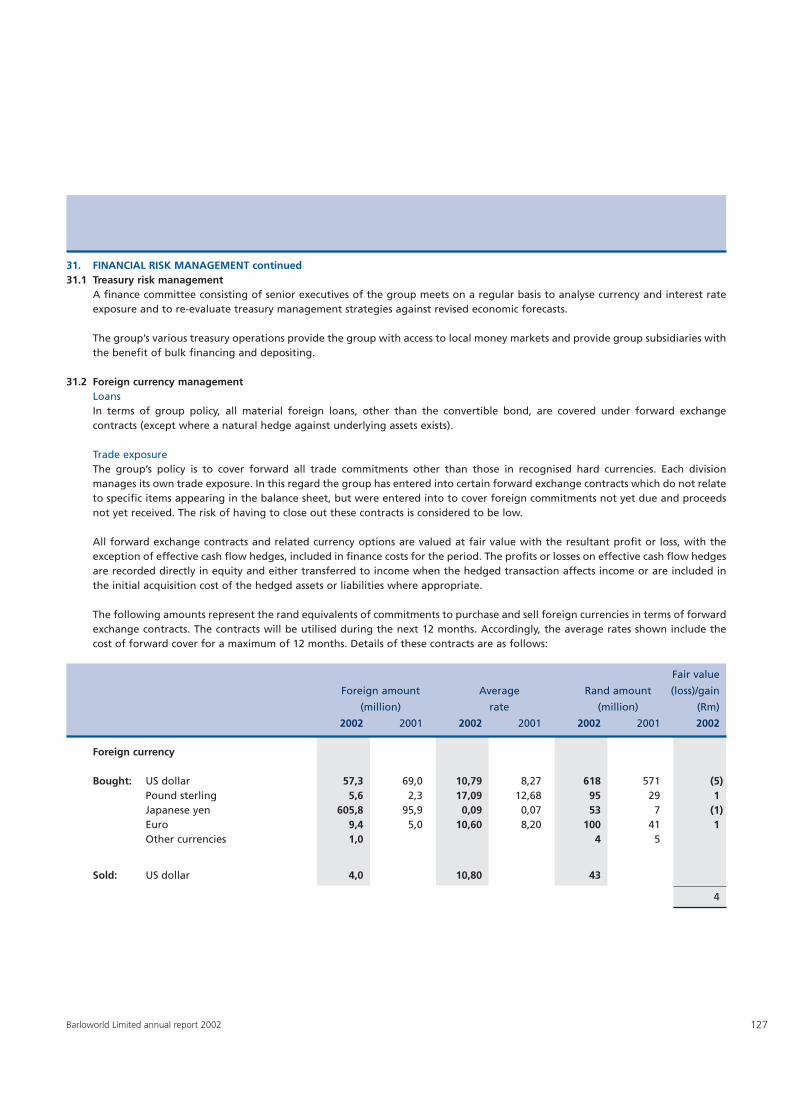
Fair value
Foreign amount Average Rand amount (loss)/gain
(million) rate (million) (Rm)
2002 2001 2002 2001 2002 2001 2002
127Barloworld Limited annual report 2002
31. FINANCIAL RISK MANAGEMENT continued31.1 Treasury risk management
A finance committee consisting of senior executives of the group meets on a regular basis to analyse currency and interest rateexposure and to re-evaluate treasury management strategies against revised economic forecasts.
The group’s various treasury operations provide the group with access to local money markets and provide group subsidiaries withthe benefit of bulk financing and depositing.
31.2 Foreign currency managementLoansIn terms of group policy, all material foreign loans, other than the convertible bond, are covered under forward exchangecontracts (except where a natural hedge against underlying assets exists).
Trade exposureThe group’s policy is to cover forward all trade commitments other than those in recognised hard currencies. Each divisionmanages its own trade exposure. In this regard the group has entered into certain forward exchange contracts which do not relateto specific items appearing in the balance sheet, but were entered into to cover foreign commitments not yet due and proceedsnot yet received. The risk of having to close out these contracts is considered to be low.
All forward exchange contracts and related currency options are valued at fair value with the resultant profit or loss, with theexception of effective cash flow hedges, included in finance costs for the period. The profits or losses on effective cash flow hedgesare recorded directly in equity and either transferred to income when the hedged transaction affects income or are included inthe initial acquisition cost of the hedged assets or liabilities where appropriate.
The following amounts represent the rand equivalents of commitments to purchase and sell foreign currencies in terms of forwardexchange contracts. The contracts will be utilised during the next 12 months. Accordingly, the average rates shown include thecost of forward cover for a maximum of 12 months. Details of these contracts are as follows:
Foreign currency
Bought: US dollar 57,3 69,0 10,79 8,27 618 571 (5)Pound sterling 5,6 2,3 17,09 12,68 95 29 1Japanese yen 605,8 95,9 0,09 0,07 53 7 (1)Euro 9,4 5,0 10,60 8,20 100 41 1Other currencies 1,0 4 5
Sold: US dollar 4,0 10,80 43
4
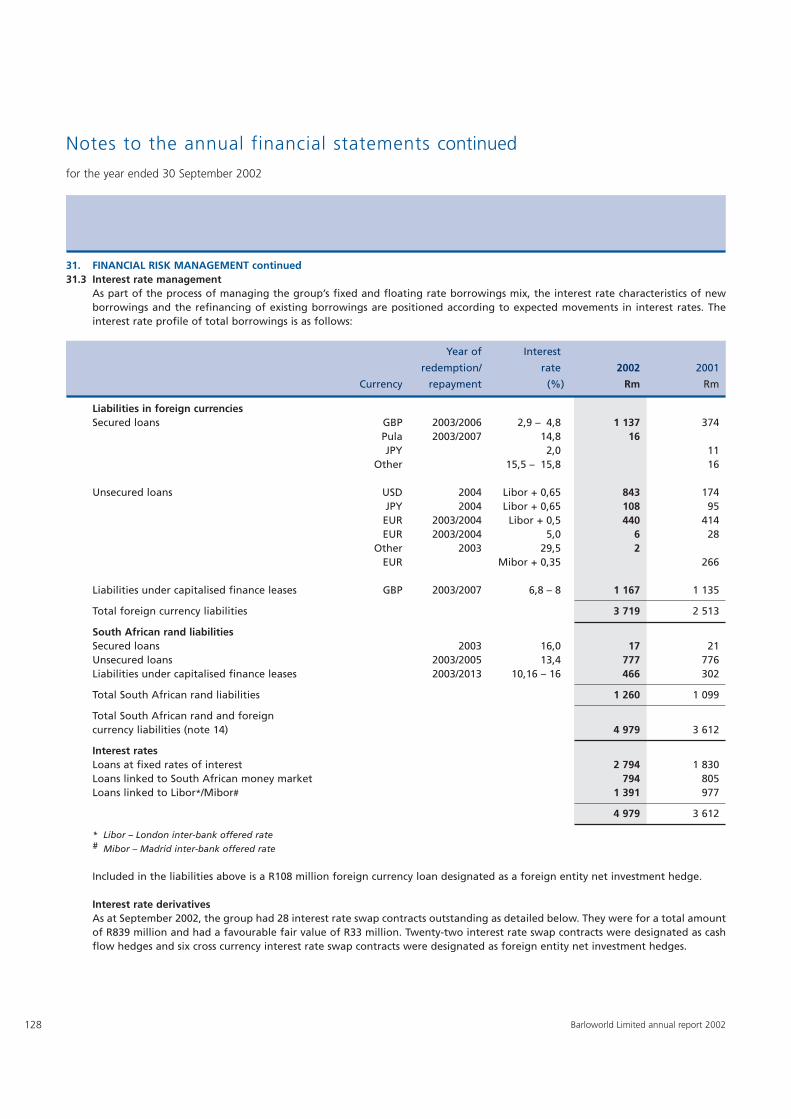
128 Barloworld Limited annual report 2002
Notes to the annual financial statements continued
for the year ended 30 September 2002
31. FINANCIAL RISK MANAGEMENT continued31.3 Interest rate management
As part of the process of managing the group’s fixed and floating rate borrowings mix, the interest rate characteristics of newborrowings and the refinancing of existing borrowings are positioned according to expected movements in interest rates. Theinterest rate profile of total borrowings is as follows:
Year of Interest
redemption/ rate 2002 2001
Currency repayment (%) Rm Rm
Liabilities in foreign currenciesSecured loans GBP 2003/2006 2,9 – 4,8 1 137 374
Pula 2003/2007 14,8 16JPY 2,0 11
Other 15,5 – 15,8 16
Unsecured loans USD 2004 Libor + 0,65 843 174JPY 2004 Libor + 0,65 108 95EUR 2003/2004 Libor + 0,5 440 414EUR 2003/2004 5,0 6 28
Other 2003 29,5 2EUR Mibor + 0,35 266
Liabilities under capitalised finance leases GBP 2003/2007 6,8 – 8 1 167 1 135
Total foreign currency liabilities 3 719 2 513
South African rand liabilitiesSecured loans 2003 16,0 17 21Unsecured loans 2003/2005 13,4 777 776Liabilities under capitalised finance leases 2003/2013 10,16 – 16 466 302
Total South African rand liabilities 1 260 1 099
Total South African rand and foreign currency liabilities (note 14) 4 979 3 612
Interest ratesLoans at fixed rates of interest 2 794 1 830Loans linked to South African money market 794 805Loans linked to Libor*/Mibor# 1 391 977
4 979 3 612
* Libor – London inter-bank offered rate# Mibor – Madrid inter-bank offered rate
Included in the liabilities above is a R108 million foreign currency loan designated as a foreign entity net investment hedge.
Interest rate derivativesAs at September 2002, the group had 28 interest rate swap contracts outstanding as detailed below. They were for a total amountof R839 million and had a favourable fair value of R33 million. Twenty-two interest rate swap contracts were designated as cashflow hedges and six cross currency interest rate swap contracts were designated as foreign entity net investment hedges.
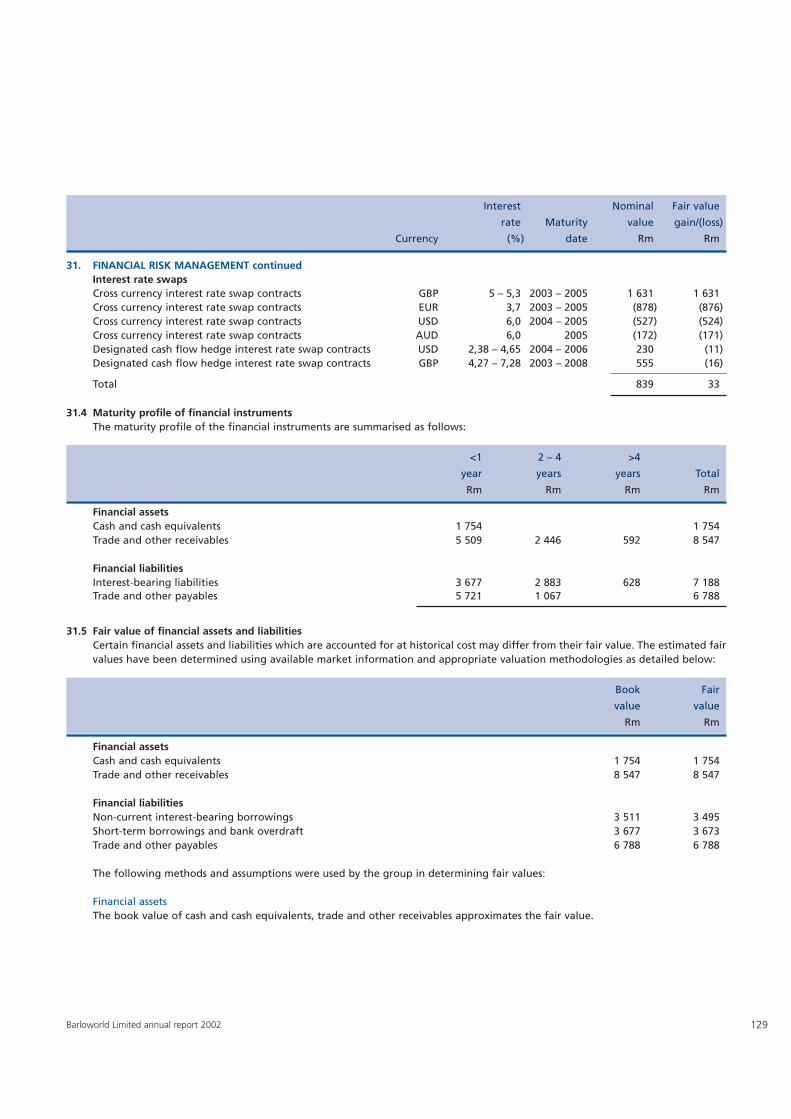
129Barloworld Limited annual report 2002
31. FINANCIAL RISK MANAGEMENT continuedInterest rate swapsCross currency interest rate swap contracts GBP 5 – 5,3 2003 – 2005 1 631 1 631Cross currency interest rate swap contracts EUR 3,7 2003 – 2005 (878) (876)Cross currency interest rate swap contracts USD 6,0 2004 – 2005 (527) (524)Cross currency interest rate swap contracts AUD 6,0 2005 (172) (171)Designated cash flow hedge interest rate swap contracts USD 2,38 – 4,65 2004 – 2006 230 (11)Designated cash flow hedge interest rate swap contracts GBP 4,27 – 7,28 2003 – 2008 555 (16)
Total 839 33
31.4 Maturity profile of financial instrumentsThe maturity profile of the financial instruments are summarised as follows:
<1 2 – 4 >4
year years years Total
Rm Rm Rm Rm
Financial assetsCash and cash equivalents 1 754 1 754Trade and other receivables 5 509 2 446 592 8 547
Financial liabilitiesInterest-bearing liabilities 3 677 2 883 628 7 188Trade and other payables 5 721 1 067 6 788
31.5 Fair value of financial assets and liabilitiesCertain financial assets and liabilities which are accounted for at historical cost may differ from their fair value. The estimated fairvalues have been determined using available market information and appropriate valuation methodologies as detailed below:
Book Fair
value value
Rm Rm
Financial assetsCash and cash equivalents 1 754 1 754Trade and other receivables 8 547 8 547
Financial liabilitiesNon-current interest-bearing borrowings 3 511 3 495Short-term borrowings and bank overdraft 3 677 3 673Trade and other payables 6 788 6 788
The following methods and assumptions were used by the group in determining fair values:
Financial assetsThe book value of cash and cash equivalents, trade and other receivables approximates the fair value.
Interest Nominal Fair value
rate Maturity value gain/(loss)
Currency (%) date Rm Rm
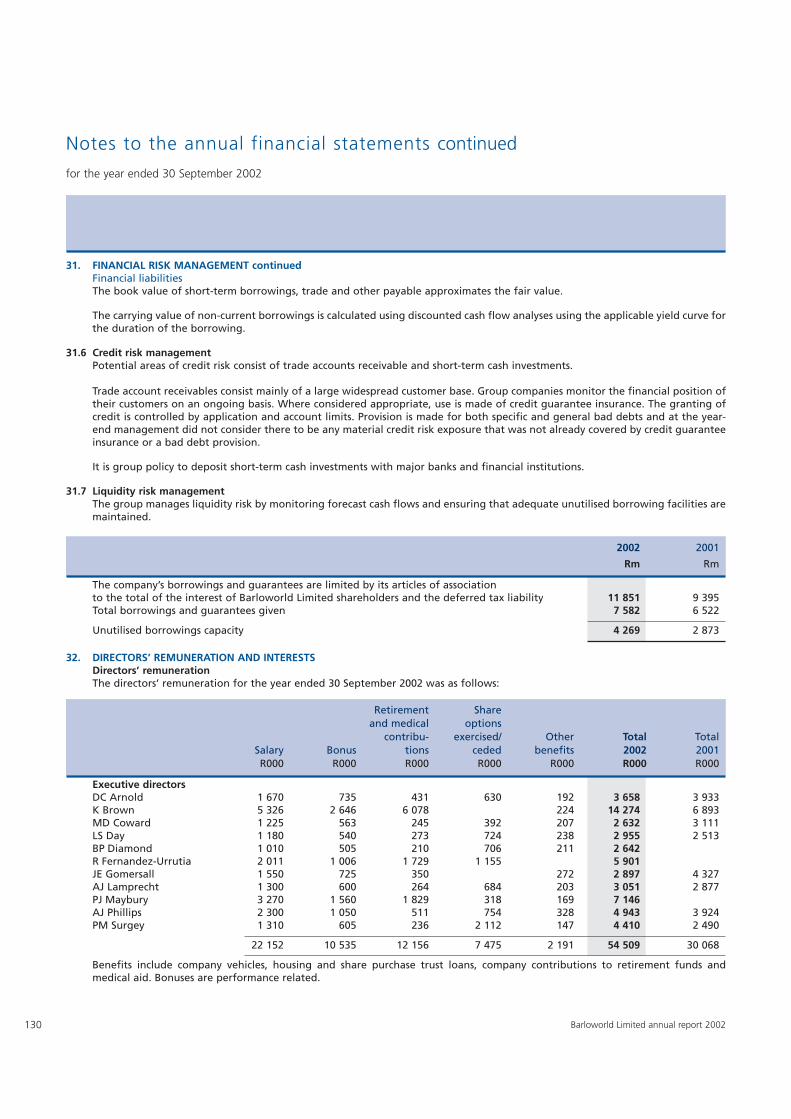
130 Barloworld Limited annual report 2002
Notes to the annual financial statements continued
for the year ended 30 September 2002
31. FINANCIAL RISK MANAGEMENT continuedFinancial liabilitiesThe book value of short-term borrowings, trade and other payable approximates the fair value.
The carrying value of non-current borrowings is calculated using discounted cash flow analyses using the applicable yield curve forthe duration of the borrowing.
31.6 Credit risk managementPotential areas of credit risk consist of trade accounts receivable and short-term cash investments.
Trade account receivables consist mainly of a large widespread customer base. Group companies monitor the financial position oftheir customers on an ongoing basis. Where considered appropriate, use is made of credit guarantee insurance. The granting ofcredit is controlled by application and account limits. Provision is made for both specific and general bad debts and at the year-end management did not consider there to be any material credit risk exposure that was not already covered by credit guaranteeinsurance or a bad debt provision.
It is group policy to deposit short-term cash investments with major banks and financial institutions.
31.7 Liquidity risk managementThe group manages liquidity risk by monitoring forecast cash flows and ensuring that adequate unutilised borrowing facilities aremaintained.
2002 2001
Rm Rm
The company’s borrowings and guarantees are limited by its articles of association to the total of the interest of Barloworld Limited shareholders and the deferred tax liability 11 851 9 395Total borrowings and guarantees given 7 582 6 522
Unutilised borrowings capacity 4 269 2 873
32. DIRECTORS’ REMUNERATION AND INTERESTSDirectors’ remunerationThe directors’ remuneration for the year ended 30 September 2002 was as follows:
Retirement Shareand medical options
contribu- exercised/ Other Total TotalSalary Bonus tions ceded benefits 2002 2001R000 R000 R000 R000 R000 R000 R000
Executive directorsDC Arnold 1 670 735 431 630 192 3 658 3 933K Brown 5 326 2 646 6 078 224 14 274 6 893MD Coward 1 225 563 245 392 207 2 632 3 111LS Day 1 180 540 273 724 238 2 955 2 513BP Diamond 1 010 505 210 706 211 2 642R Fernandez-Urrutia 2 011 1 006 1 729 1 155 5 901JE Gomersall 1 550 725 350 272 2 897 4 327AJ Lamprecht 1 300 600 264 684 203 3 051 2 877PJ Maybury 3 270 1 560 1 829 318 169 7 146AJ Phillips 2 300 1 050 511 754 328 4 943 3 924PM Surgey 1 310 605 236 2 112 147 4 410 2 490
22 152 10 535 12 156 7 475 2 191 54 509 30 068
Benefits include company vehicles, housing and share purchase trust loans, company contributions to retirement funds andmedical aid. Bonuses are performance related.
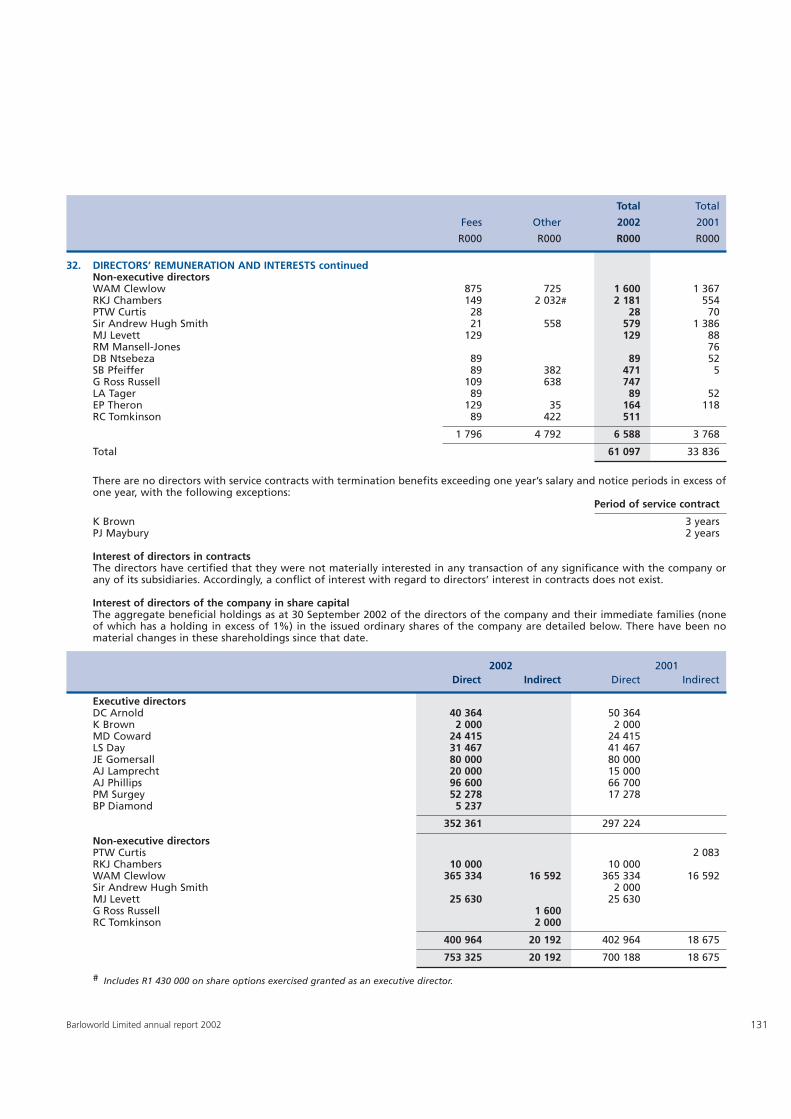
131Barloworld Limited annual report 2002
32. DIRECTORS’ REMUNERATION AND INTERESTS continuedNon-executive directorsWAM Clewlow 875 725 1 600 1 367RKJ Chambers 149 2 032# 2 181 554PTW Curtis 28 28 70Sir Andrew Hugh Smith 21 558 579 1 386MJ Levett 129 129 88RM Mansell-Jones 76DB Ntsebeza 89 89 52SB Pfeiffer 89 382 471 5G Ross Russell 109 638 747LA Tager 89 89 52EP Theron 129 35 164 118RC Tomkinson 89 422 511
1 796 4 792 6 588 3 768
Total 61 097 33 836
There are no directors with service contracts with termination benefits exceeding one year’s salary and notice periods in excess ofone year, with the following exceptions:
Period of service contract
K Brown 3 yearsPJ Maybury 2 years
Interest of directors in contractsThe directors have certified that they were not materially interested in any transaction of any significance with the company orany of its subsidiaries. Accordingly, a conflict of interest with regard to directors’ interest in contracts does not exist.
Interest of directors of the company in share capitalThe aggregate beneficial holdings as at 30 September 2002 of the directors of the company and their immediate families (noneof which has a holding in excess of 1%) in the issued ordinary shares of the company are detailed below. There have been nomaterial changes in these shareholdings since that date.
2002 2001Direct Indirect Direct Indirect
Executive directorsDC Arnold 40 364 50 364K Brown 2 000 2 000MD Coward 24 415 24 415LS Day 31 467 41 467JE Gomersall 80 000 80 000AJ Lamprecht 20 000 15 000AJ Phillips 96 600 66 700PM Surgey 52 278 17 278BP Diamond 5 237
352 361 297 224
Non-executive directorsPTW Curtis 2 083RKJ Chambers 10 000 10 000WAM Clewlow 365 334 16 592 365 334 16 592Sir Andrew Hugh Smith 2 000MJ Levett 25 630 25 630G Ross Russell 1 600RC Tomkinson 2 000
400 964 20 192 402 964 18 675
753 325 20 192 700 188 18 675
# Includes R1 430 000 on share options exercised granted as an executive director.
Total Total
Fees Other 2002 2001
R000 R000 R000 R000
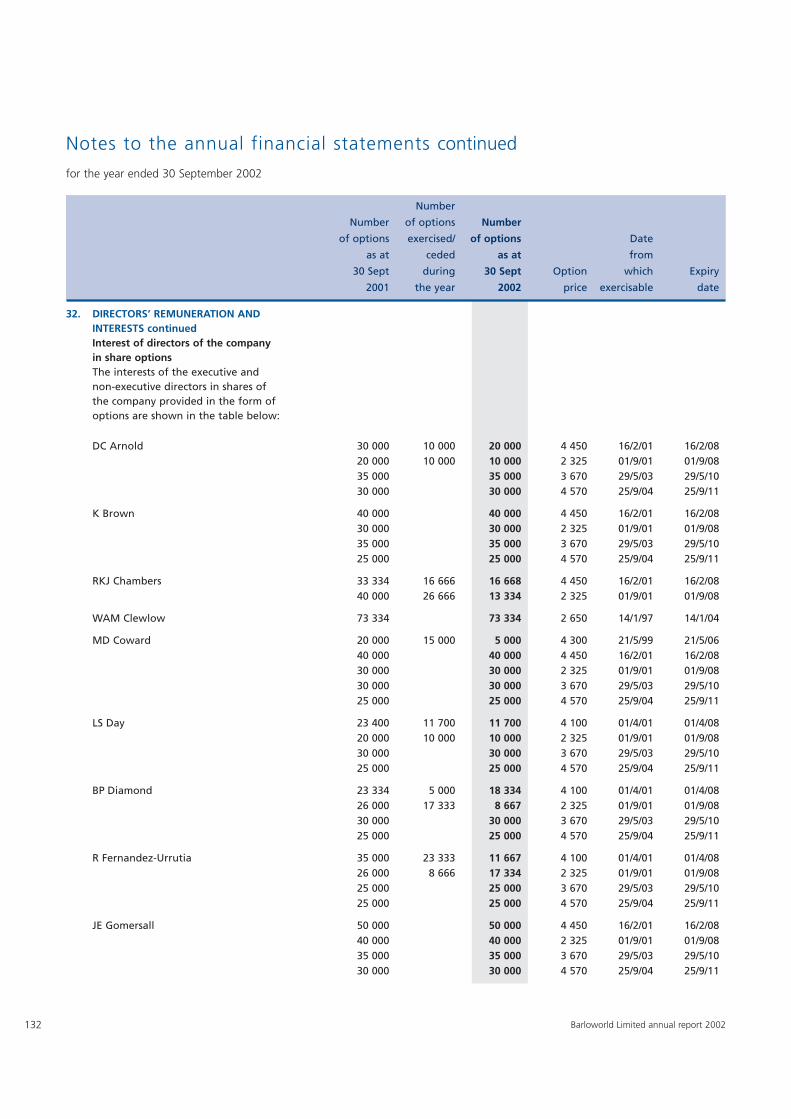
132 Barloworld Limited annual report 2002
Notes to the annual financial statements continued
for the year ended 30 September 2002
32. DIRECTORS’ REMUNERATION AND INTERESTS continuedInterest of directors of the company in share optionsThe interests of the executive and non-executive directors in shares of the company provided in the form of options are shown in the table below:
DC Arnold 30 000 10 000 20 000 4 450 16/2/01 16/2/0820 000 10 000 10 000 2 325 01/9/01 01/9/0835 000 35 000 3 670 29/5/03 29/5/1030 000 30 000 4 570 25/9/04 25/9/11
K Brown 40 000 40 000 4 450 16/2/01 16/2/0830 000 30 000 2 325 01/9/01 01/9/0835 000 35 000 3 670 29/5/03 29/5/1025 000 25 000 4 570 25/9/04 25/9/11
RKJ Chambers 33 334 16 666 16 668 4 450 16/2/01 16/2/0840 000 26 666 13 334 2 325 01/9/01 01/9/08
WAM Clewlow 73 334 73 334 2 650 14/1/97 14/1/04
MD Coward 20 000 15 000 5 000 4 300 21/5/99 21/5/0640 000 40 000 4 450 16/2/01 16/2/0830 000 30 000 2 325 01/9/01 01/9/0830 000 30 000 3 670 29/5/03 29/5/1025 000 25 000 4 570 25/9/04 25/9/11
LS Day 23 400 11 700 11 700 4 100 01/4/01 01/4/0820 000 10 000 10 000 2 325 01/9/01 01/9/0830 000 30 000 3 670 29/5/03 29/5/1025 000 25 000 4 570 25/9/04 25/9/11
BP Diamond 23 334 5 000 18 334 4 100 01/4/01 01/4/0826 000 17 333 8 667 2 325 01/9/01 01/9/0830 000 30 000 3 670 29/5/03 29/5/1025 000 25 000 4 570 25/9/04 25/9/11
R Fernandez-Urrutia 35 000 23 333 11 667 4 100 01/4/01 01/4/0826 000 8 666 17 334 2 325 01/9/01 01/9/0825 000 25 000 3 670 29/5/03 29/5/1025 000 25 000 4 570 25/9/04 25/9/11
JE Gomersall 50 000 50 000 4 450 16/2/01 16/2/0840 000 40 000 2 325 01/9/01 01/9/0835 000 35 000 3 670 29/5/03 29/5/1030 000 30 000 4 570 25/9/04 25/9/11
Number
Number of options Number
of options exercised/ of options Date
as at ceded as at from
30 Sept during 30 Sept Option which Expiry
2001 the year 2002 price exercisable date
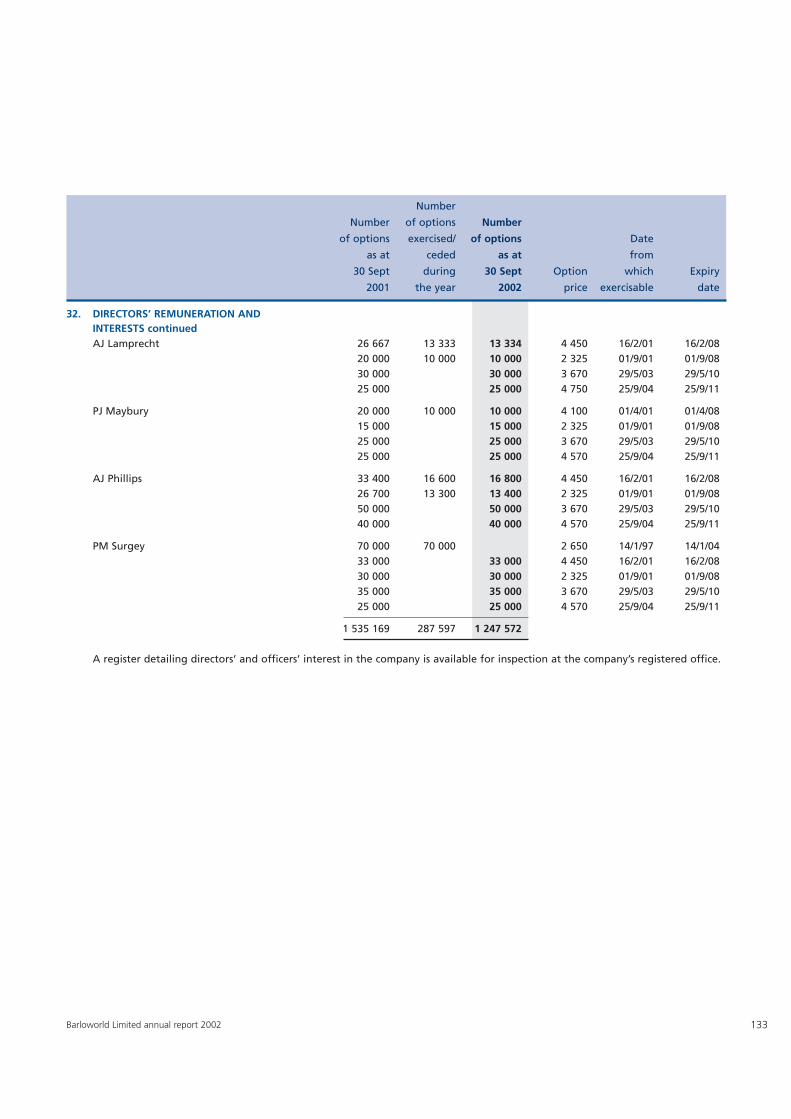
133Barloworld Limited annual report 2002
Number
Number of options Number
of options exercised/ of options Date
as at ceded as at from
30 Sept during 30 Sept Option which Expiry
2001 the year 2002 price exercisable date
32. DIRECTORS’ REMUNERATION AND INTERESTS continuedAJ Lamprecht 26 667 13 333 13 334 4 450 16/2/01 16/2/08
20 000 10 000 10 000 2 325 01/9/01 01/9/0830 000 30 000 3 670 29/5/03 29/5/1025 000 25 000 4 750 25/9/04 25/9/11
PJ Maybury 20 000 10 000 10 000 4 100 01/4/01 01/4/0815 000 15 000 2 325 01/9/01 01/9/0825 000 25 000 3 670 29/5/03 29/5/1025 000 25 000 4 570 25/9/04 25/9/11
AJ Phillips 33 400 16 600 16 800 4 450 16/2/01 16/2/0826 700 13 300 13 400 2 325 01/9/01 01/9/0850 000 50 000 3 670 29/5/03 29/5/1040 000 40 000 4 570 25/9/04 25/9/11
PM Surgey 70 000 70 000 2 650 14/1/97 14/1/0433 000 33 000 4 450 16/2/01 16/2/0830 000 30 000 2 325 01/9/01 01/9/0835 000 35 000 3 670 29/5/03 29/5/1025 000 25 000 4 570 25/9/04 25/9/11
1 535 169 287 597 1 247 572
A register detailing directors’ and officers’ interest in the company is available for inspection at the company’s registered office.
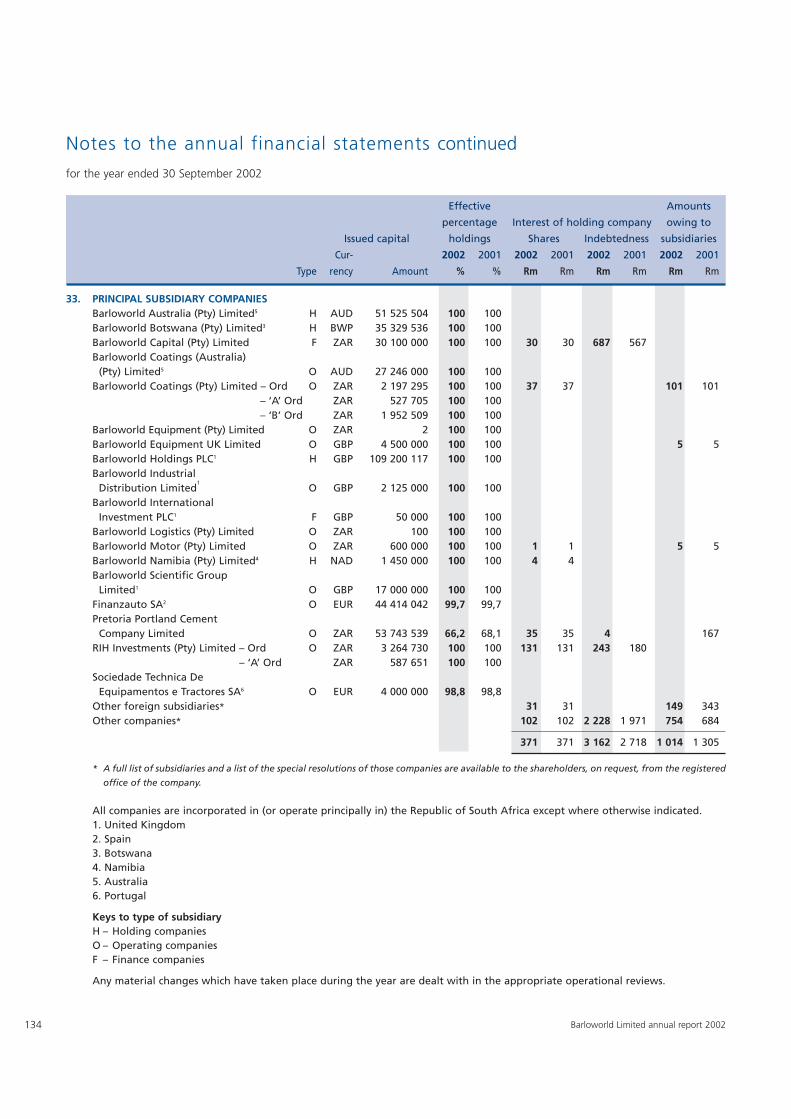
134 Barloworld Limited annual report 2002
Notes to the annual financial statements continued
for the year ended 30 September 2002
Effective Amounts
percentage Interest of holding company owing to
Issued capital holdings Shares Indebtedness subsidiaries
Cur- 2002 2001 2002 2001 2002 2001 2002 2001
Type rency Amount % % Rm Rm Rm Rm Rm Rm
33. PRINCIPAL SUBSIDIARY COMPANIESBarloworld Australia (Pty) Limited5 H AUD 51 525 504 100 100Barloworld Botswana (Pty) Limited3 H BWP 35 329 536 100 100Barloworld Capital (Pty) Limited F ZAR 30 100 000 100 100 30 30 687 567Barloworld Coatings (Australia)
(Pty) Limited5 O AUD 27 246 000 100 100Barloworld Coatings (Pty) Limited – Ord O ZAR 2 197 295 100 100 37 37 101 101
– ‘A’ Ord ZAR 527 705 100 100– ‘B’ Ord ZAR 1 952 509 100 100
Barloworld Equipment (Pty) Limited O ZAR 2 100 100Barloworld Equipment UK Limited O GBP 4 500 000 100 100 5 5Barloworld Holdings PLC1 H GBP 109 200 117 100 100Barloworld Industrial
Distribution Limited1
O GBP 2 125 000 100 100Barloworld International
Investment PLC1 F GBP 50 000 100 100Barloworld Logistics (Pty) Limited O ZAR 100 100 100Barloworld Motor (Pty) Limited O ZAR 600 000 100 100 1 1 5 5Barloworld Namibia (Pty) Limited4 H NAD 1 450 000 100 100 4 4Barloworld Scientific Group
Limited1 O GBP 17 000 000 100 100Finanzauto SA2 O EUR 44 414 042 99,7 99,7Pretoria Portland Cement
Company Limited O ZAR 53 743 539 66,2 68,1 35 35 4 167RIH Investments (Pty) Limited – Ord O ZAR 3 264 730 100 100 131 131 243 180
– ‘A’ Ord ZAR 587 651 100 100Sociedade Technica De
Equipamentos e Tractores SA6 O EUR 4 000 000 98,8 98,8Other foreign subsidiaries* 31 31 149 343Other companies* 102 102 2 228 1 971 754 684
371 371 3 162 2 718 1 014 1 305
* A full list of subsidiaries and a list of the special resolutions of those companies are available to the shareholders, on request, from the registered
office of the company.
All companies are incorporated in (or operate principally in) the Republic of South Africa except where otherwise indicated.1. United Kingdom2. Spain3. Botswana4. Namibia5. Australia6. Portugal
Keys to type of subsidiaryH – Holding companiesO – Operating companiesF – Finance companies
Any material changes which have taken place during the year are dealt with in the appropriate operational reviews.
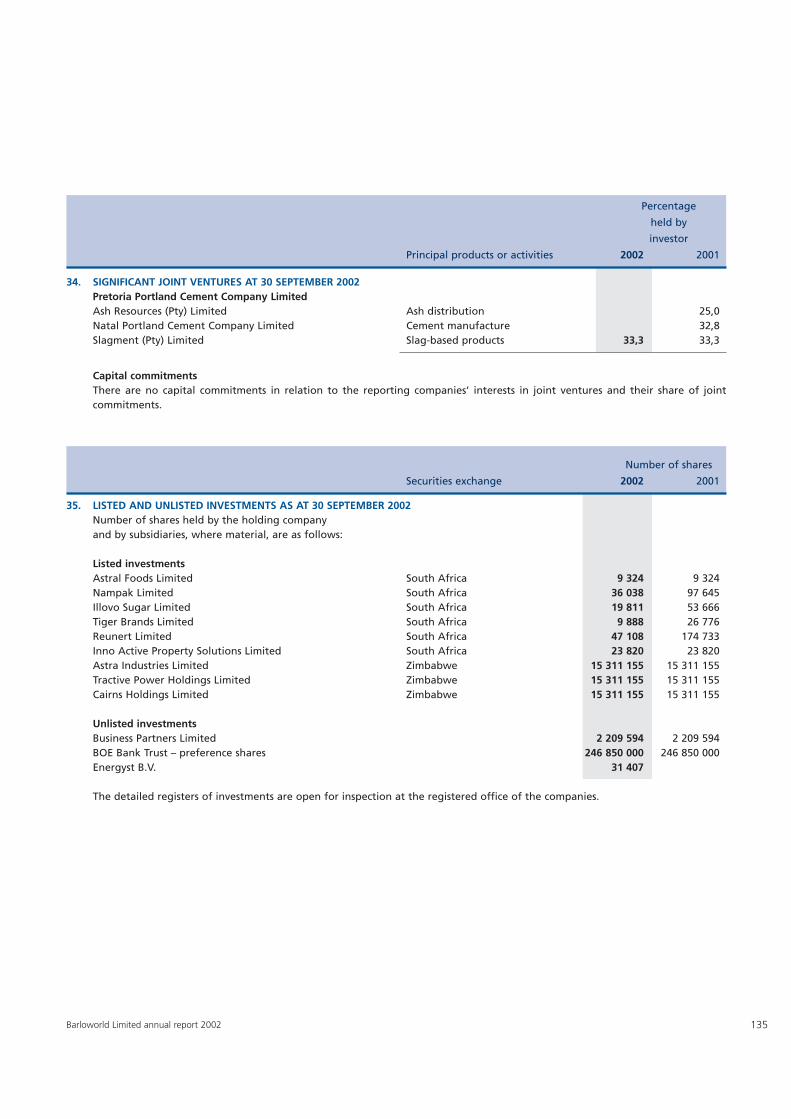
135Barloworld Limited annual report 2002
34. SIGNIFICANT JOINT VENTURES AT 30 SEPTEMBER 2002Pretoria Portland Cement Company LimitedAsh Resources (Pty) Limited Ash distribution 25,0Natal Portland Cement Company Limited Cement manufacture 32,8Slagment (Pty) Limited Slag-based products 33,3 33,3
Capital commitmentsThere are no capital commitments in relation to the reporting companies’ interests in joint ventures and their share of jointcommitments.
Number of shares
Securities exchange 2002 2001
35. LISTED AND UNLISTED INVESTMENTS AS AT 30 SEPTEMBER 2002Number of shares held by the holding company and by subsidiaries, where material, are as follows:
Listed investmentsAstral Foods Limited South Africa 9 324 9 324Nampak Limited South Africa 36 038 97 645Illovo Sugar Limited South Africa 19 811 53 666Tiger Brands Limited South Africa 9 888 26 776Reunert Limited South Africa 47 108 174 733Inno Active Property Solutions Limited South Africa 23 820 23 820Astra Industries Limited Zimbabwe 15 311 155 15 311 155Tractive Power Holdings Limited Zimbabwe 15 311 155 15 311 155Cairns Holdings Limited Zimbabwe 15 311 155 15 311 155
Unlisted investmentsBusiness Partners Limited 2 209 594 2 209 594BOE Bank Trust – preference shares 246 850 000 246 850 000Energyst B.V. 31 407
The detailed registers of investments are open for inspection at the registered office of the companies.
Percentage
held by
investor
Principal products or activities 2002 2001
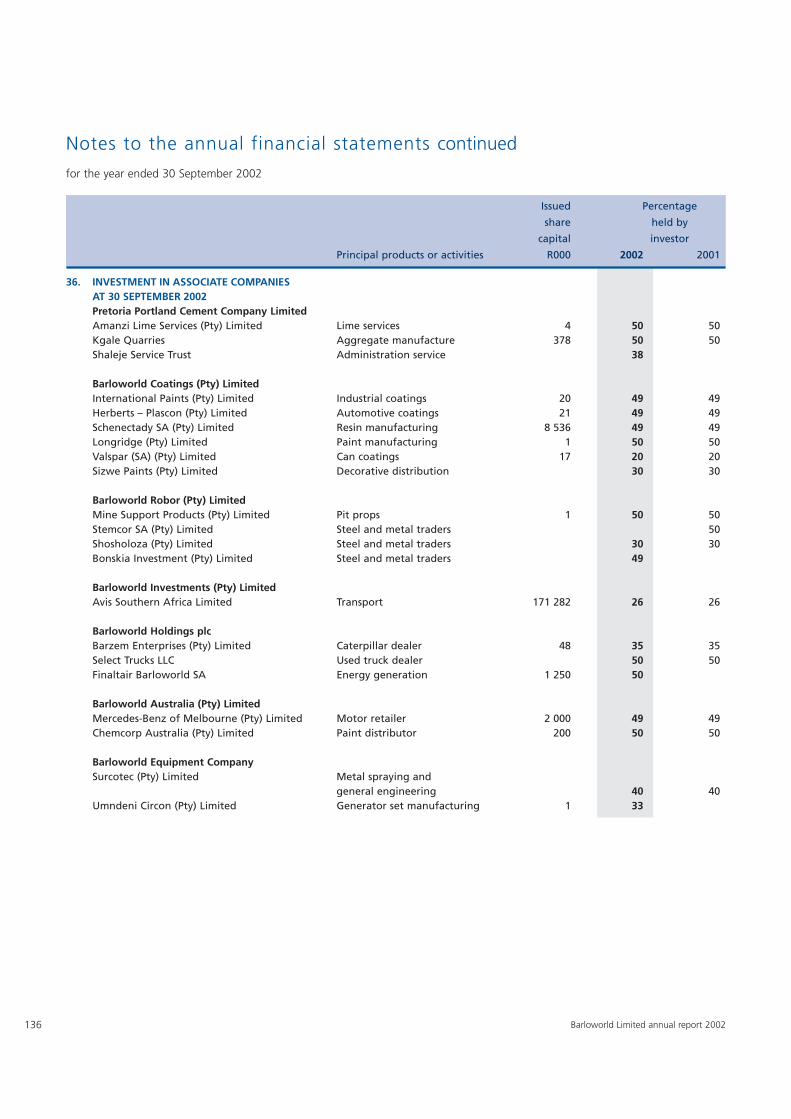
136 Barloworld Limited annual report 2002
36. INVESTMENT IN ASSOCIATE COMPANIESAT 30 SEPTEMBER 2002Pretoria Portland Cement Company LimitedAmanzi Lime Services (Pty) Limited Lime services 4 50 50Kgale Quarries Aggregate manufacture 378 50 50Shaleje Service Trust Administration service 38
Barloworld Coatings (Pty) LimitedInternational Paints (Pty) Limited Industrial coatings 20 49 49Herberts – Plascon (Pty) Limited Automotive coatings 21 49 49Schenectady SA (Pty) Limited Resin manufacturing 8 536 49 49Longridge (Pty) Limited Paint manufacturing 1 50 50Valspar (SA) (Pty) Limited Can coatings 17 20 20Sizwe Paints (Pty) Limited Decorative distribution 30 30
Barloworld Robor (Pty) LimitedMine Support Products (Pty) Limited Pit props 1 50 50Stemcor SA (Pty) Limited Steel and metal traders 50Shosholoza (Pty) Limited Steel and metal traders 30 30Bonskia Investment (Pty) Limited Steel and metal traders 49
Barloworld Investments (Pty) LimitedAvis Southern Africa Limited Transport 171 282 26 26
Barloworld Holdings plcBarzem Enterprises (Pty) Limited Caterpillar dealer 48 35 35Select Trucks LLC Used truck dealer 50 50Finaltair Barloworld SA Energy generation 1 250 50
Barloworld Australia (Pty) LimitedMercedes-Benz of Melbourne (Pty) Limited Motor retailer 2 000 49 49Chemcorp Australia (Pty) Limited Paint distributor 200 50 50
Barloworld Equipment CompanySurcotec (Pty) Limited Metal spraying and
general engineering 40 40Umndeni Circon (Pty) Limited Generator set manufacturing 1 33
Notes to the annual financial statements continued
for the year ended 30 September 2002
Issued Percentage
share held by
capital investor
Principal products or activities R000 2002 2001
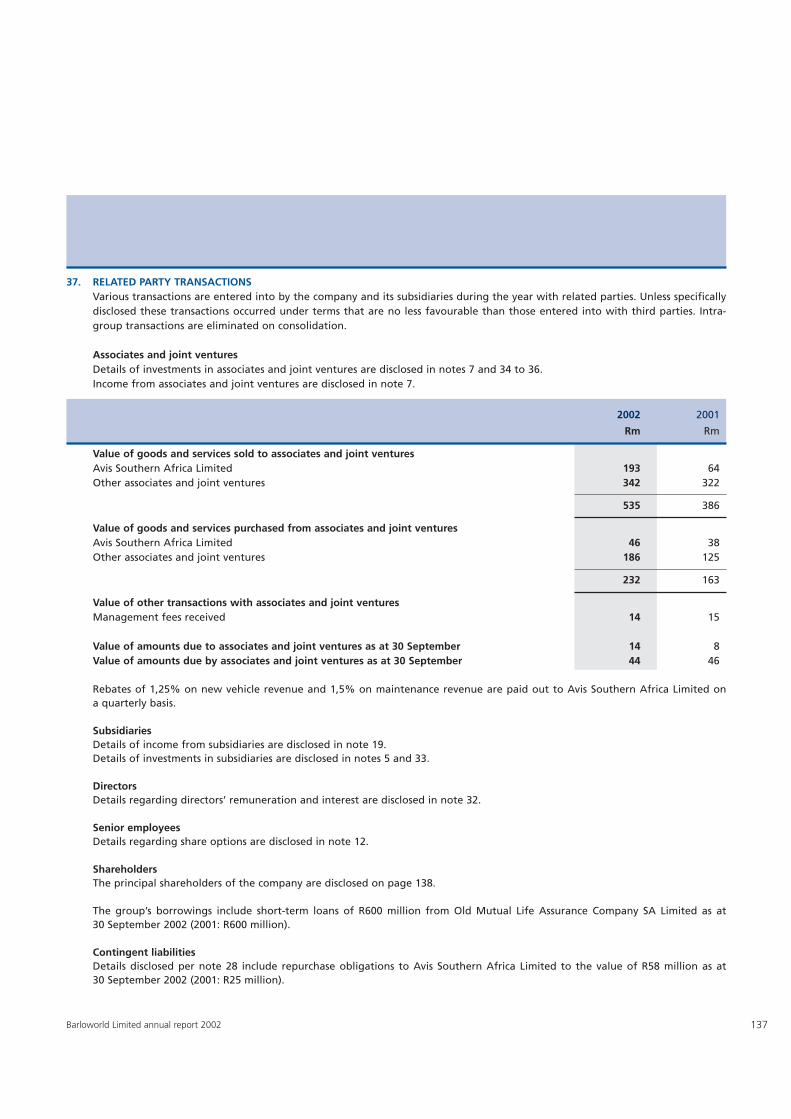
137Barloworld Limited annual report 2002
37. RELATED PARTY TRANSACTIONSVarious transactions are entered into by the company and its subsidiaries during the year with related parties. Unless specificallydisclosed these transactions occurred under terms that are no less favourable than those entered into with third parties. Intra-group transactions are eliminated on consolidation.
Associates and joint venturesDetails of investments in associates and joint ventures are disclosed in notes 7 and 34 to 36.Income from associates and joint ventures are disclosed in note 7.
2002 2001
Rm Rm
Value of goods and services sold to associates and joint venturesAvis Southern Africa Limited 193 64Other associates and joint ventures 342 322
535 386
Value of goods and services purchased from associates and joint venturesAvis Southern Africa Limited 46 38Other associates and joint ventures 186 125
232 163
Value of other transactions with associates and joint venturesManagement fees received 14 15
Value of amounts due to associates and joint ventures as at 30 September 14 8Value of amounts due by associates and joint ventures as at 30 September 44 46
Rebates of 1,25% on new vehicle revenue and 1,5% on maintenance revenue are paid out to Avis Southern Africa Limited ona quarterly basis.
SubsidiariesDetails of income from subsidiaries are disclosed in note 19.Details of investments in subsidiaries are disclosed in notes 5 and 33.
DirectorsDetails regarding directors’ remuneration and interest are disclosed in note 32.
Senior employeesDetails regarding share options are disclosed in note 12.
ShareholdersThe principal shareholders of the company are disclosed on page 138.
The group’s borrowings include short-term loans of R600 million from Old Mutual Life Assurance Company SA Limited as at30 September 2002 (2001: R600 million).
Contingent liabilitiesDetails disclosed per note 28 include repurchase obligations to Avis Southern Africa Limited to the value of R58 million as at30 September 2002 (2001: R25 million).
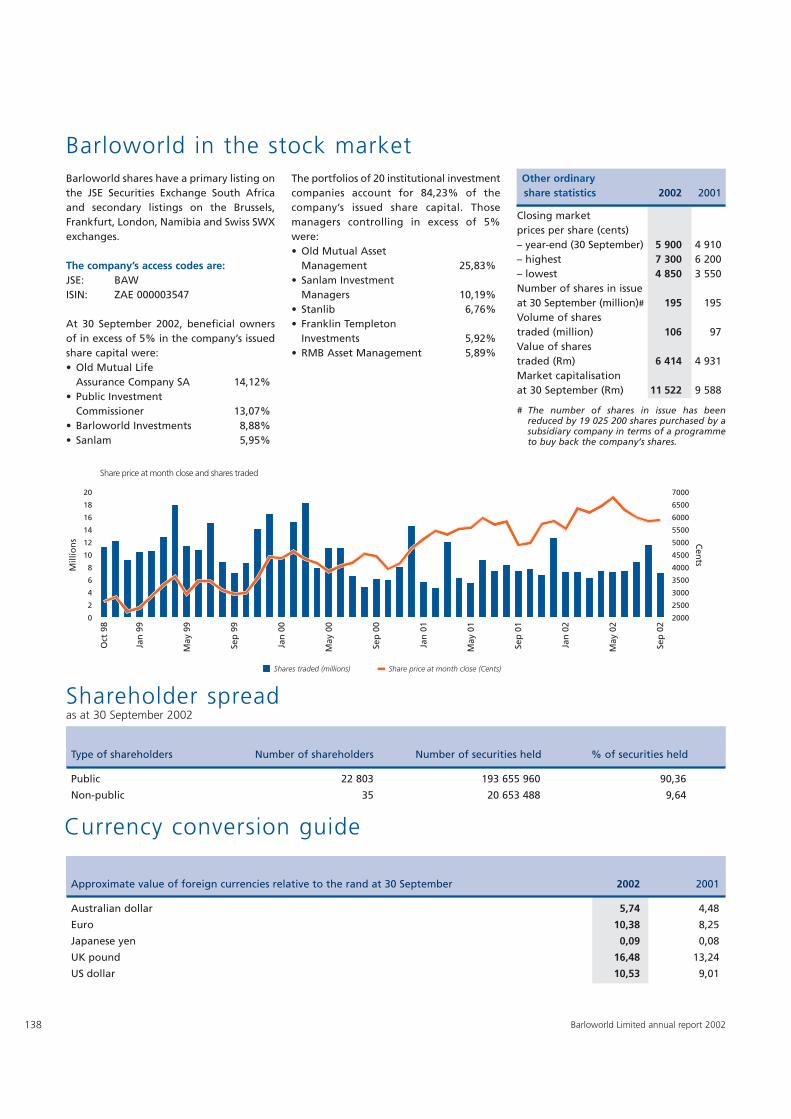
Barloworld shares have a primary listing onthe JSE Securities Exchange South Africaand secondary listings on the Brussels,Frankfurt, London, Namibia and Swiss SWXexchanges.
The company’s access codes are:JSE: BAWISIN: ZAE 000003547
At 30 September 2002, beneficial ownersof in excess of 5% in the company’s issuedshare capital were:• Old Mutual Life
Assurance Company SA 14,12%• Public Investment
Commissioner 13,07%• Barloworld Investments 8,88%• Sanlam 5,95%
Type of shareholders Number of shareholders Number of securities held % of securities held
Public 22 803 193 655 960 90,36
Non-public 35 20 653 488 9,64
The portfolios of 20 institutional investmentcompanies account for 84,23% of thecompany’s issued share capital. Thosemanagers controlling in excess of 5%were:• Old Mutual Asset
Management 25,83%• Sanlam Investment
Managers 10,19%• Stanlib 6,76%• Franklin Templeton
Investments 5,92%• RMB Asset Management 5,89%
Other ordinary share statistics 2002 2001
Closing market prices per share (cents)– year-end (30 September) 5 900 4 910– highest 7 300 6 200– lowest 4 850 3 550Number of shares in issueat 30 September (million)# 195 195Volume of sharestraded (million) 106 97Value of shares traded (Rm) 6 414 4 931Market capitalisation at 30 September (Rm) 11 522 9 588
# The number of shares in issue has beenreduced by 19 025 200 shares purchased by asubsidiary company in terms of a programmeto buy back the company’s shares.
138 Barloworld Limited annual report 2002
Barloworld in the stock market
Shareholder spreadas at 30 September 2002
Approximate value of foreign currencies relative to the rand at 30 September 2002 2001
Australian dollar 5,74 4,48
Euro 10,38 8,25
Japanese yen 0,09 0,08
UK pound 16,48 13,24
US dollar 10,53 9,01
Currency conversion guide
Share price at month close and shares traded
20
18
16
14
12
10
8
6
4
2
0
Oct
98
7000
6500
6000
5500
5000
4500
4000
3500
3000
2500
2000
Mill
ion
s Cen
ts
Jan
99
May
99
Sep
99
Jan
00
May
00
Sep
00
Jan
01
May
01
Sep
01
Jan
02
May
02
Sep
02
Share price at month close (Cents)Shares traded (millions)
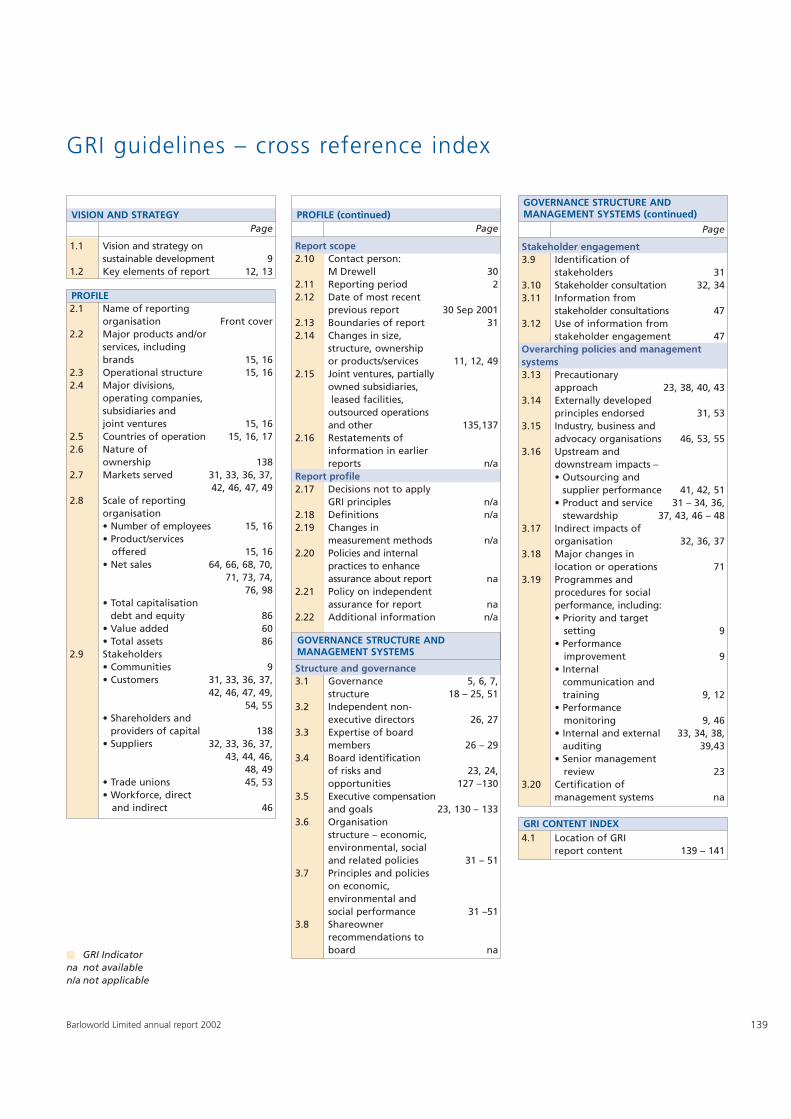
PROFILE
PROFILE (continued)
139Barloworld Limited annual report 2002
VISION AND STRATEGYPage
1.1 Vision and strategy on sustainable development 9
1.2 Key elements of report 12, 13
GRI guidelines – cross reference index
GOVERNANCE STRUCTURE ANDMANAGEMENT SYSTEMS
GOVERNANCE STRUCTURE ANDMANAGEMENT SYSTEMS (continued)
GRI CONTENT INDEX4.1 Location of GRI
report content 139 – 141
2.1 Name of reporting organisation Front cover
2.2 Major products and/or services, including brands 15, 16
2.3 Operational structure 15, 162.4 Major divisions,
operating companies, subsidiaries and joint ventures 15, 16
2.5 Countries of operation 15, 16, 172.6 Nature of
ownership 1382.7 Markets served 31, 33, 36, 37,
42, 46, 47, 492.8 Scale of reporting
organisation• Number of employees 15, 16• Product/services
offered 15, 16• Net sales 64, 66, 68, 70,
71, 73, 74, 76, 98
• Total capitalisation debt and equity 86
• Value added 60• Total assets 86
2.9 Stakeholders• Communities 9 • Customers 31, 33, 36, 37,
42, 46, 47, 49, 54, 55
• Shareholders and providers of capital 138
• Suppliers 32, 33, 36, 37, 43, 44, 46,
48, 49• Trade unions 45, 53• Workforce, direct
and indirect 46
Page
Stakeholder engagement3.9 Identification of
stakeholders 313.10 Stakeholder consultation 32, 343.11 Information from
stakeholder consultations 473.12 Use of information from
stakeholder engagement 47Overarching policies and managementsystems3.13 Precautionary
approach 23, 38, 40, 433.14 Externally developed
principles endorsed 31, 533.15 Industry, business and
advocacy organisations 46, 53, 553.16 Upstream and
downstream impacts –• Outsourcing and
supplier performance 41, 42, 51• Product and service 31 – 34, 36,
stewardship 37, 43, 46 – 483.17 Indirect impacts of
organisation 32, 36, 373.18 Major changes in
location or operations 713.19 Programmes and
procedures for social performance, including:• Priority and target
setting 9• Performance
improvement 9• Internal
communication and training 9, 12
• Performance monitoring 9, 46
• Internal and external 33, 34, 38,auditing 39,43
• Senior management review 23
3.20 Certification of management systems na
GRI Indicatorna not availablen/a not applicable
Page
Report scope2.10 Contact person:
M Drewell 302.11 Reporting period 22.12 Date of most recent
previous report 30 Sep 20012.13 Boundaries of report 312.14 Changes in size,
structure, ownership or products/services 11, 12, 49
2.15 Joint ventures, partiallyowned subsidiaries,leased facilities,
outsourced operations and other 135,137
2.16 Restatements of information in earlier reports n/a
Report profile2.17 Decisions not to apply
GRI principles n/a2.18 Definitions n/a2.19 Changes in
measurement methods n/a2.20 Policies and internal
practices to enhance assurance about report na
2.21 Policy on independent assurance for report na
2.22 Additional information n/a
Structure and governance3.1 Governance 5, 6, 7,
structure 18 – 25, 513.2 Independent non-
executive directors 26, 273.3 Expertise of board
members 26 – 293.4 Board identification
of risks and 23, 24,opportunities 127 –130
3.5 Executive compensationand goals 23, 130 – 133
3.6 Organisation structure – economic, environmental, social and related policies 31 – 51
3.7 Principles and policies on economic, environmental and social performance 31 –51
3.8 Shareowner recommendations to board na
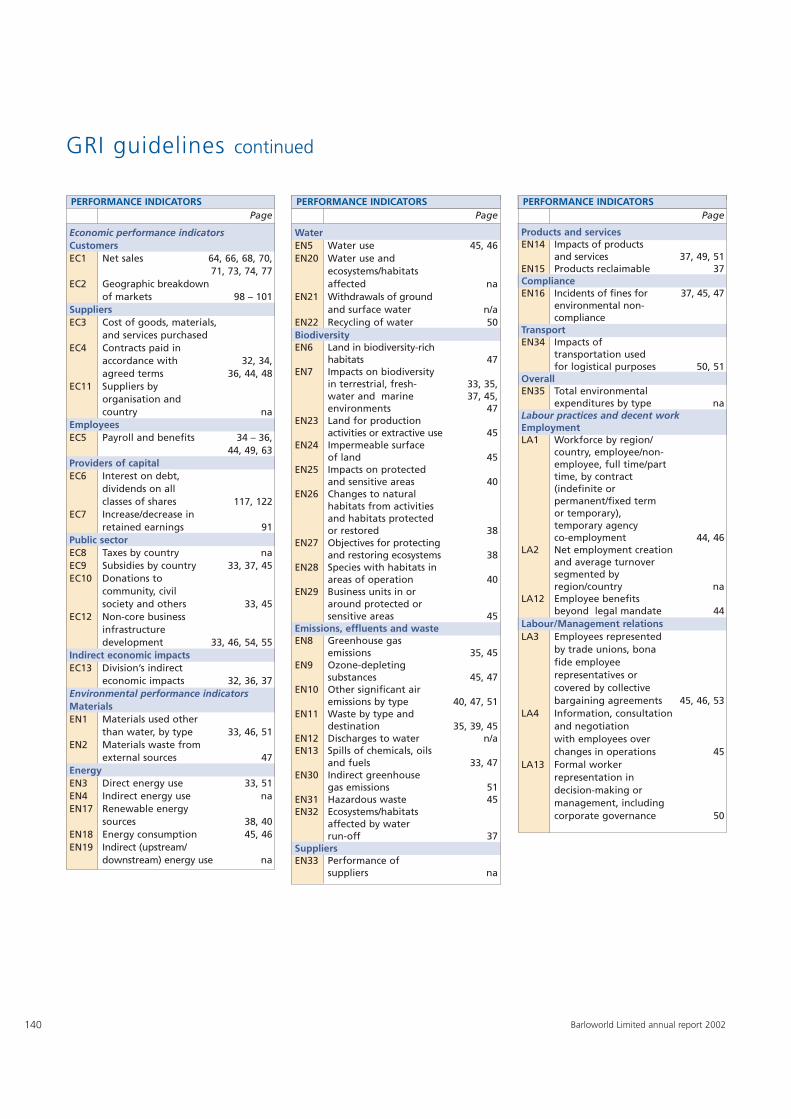
140 Barloworld Limited annual report 2002
GRI guidelines continued
PERFORMANCE INDICATORS PERFORMANCE INDICATORSPage
WaterEN5 Water use 45, 46EN20 Water use and
ecosystems/habitatsaffected na
EN21 Withdrawals of groundand surface water n/a
EN22 Recycling of water 50BiodiversityEN6 Land in biodiversity-rich
habitats 47EN7 Impacts on biodiversity
in terrestrial, fresh- 33, 35,water and marine 37, 45,environments 47
EN23 Land for production activities or extractive use 45
EN24 Impermeable surface of land 45
EN25 Impacts on protected and sensitive areas 40
EN26 Changes to natural habitats from activities and habitats protected or restored 38
EN27 Objectives for protectingand restoring ecosystems 38
EN28 Species with habitats in areas of operation 40
EN29 Business units in or around protected or sensitive areas 45
Emissions, effluents and wasteEN8 Greenhouse gas
emissions 35, 45EN9 Ozone-depleting
substances 45, 47EN10 Other significant air
emissions by type 40, 47, 51 EN11 Waste by type and
destination 35, 39, 45EN12 Discharges to water n/aEN13 Spills of chemicals, oils
and fuels 33, 47EN30 Indirect greenhouse
gas emissions 51EN31 Hazardous waste 45EN32 Ecosystems/habitats
affected by water run-off 37
SuppliersEN33 Performance of
suppliers na
PERFORMANCE INDICATORS PERFORMANCE INDICATORSPage
Products and servicesEN14 Impacts of products
and services 37, 49, 51EN15 Products reclaimable 37ComplianceEN16 Incidents of fines for 37, 45, 47
environmental non-compliance
TransportEN34 Impacts of
transportation usedfor logistical purposes 50, 51
OverallEN35 Total environmental
expenditures by type naLabour practices and decent workEmploymentLA1 Workforce by region/
country, employee/non-employee, full time/part time, by contract (indefinite or permanent/fixed term or temporary), temporary agency co-employment 44, 46
LA2 Net employment creation and average turnover segmented by region/country na
LA12 Employee benefits beyond legal mandate 44
Labour/Management relationsLA3 Employees represented
by trade unions, bona fide employee representatives or covered by collective bargaining agreements 45, 46, 53
LA4 Information, consultation and negotiation with employees over changes in operations 45
LA13 Formal worker representation in decision-making or management, including corporate governance 50
PERFORMANCE INDICATORSPage
Economic performance indicatorsCustomersEC1 Net sales 64, 66, 68, 70,
71, 73, 74, 77EC2 Geographic breakdown
of markets 98 – 101SuppliersEC3 Cost of goods, materials,
and services purchasedEC4 Contracts paid in
accordance with 32, 34, agreed terms 36, 44, 48
EC11 Suppliers by organisation and country na
EmployeesEC5 Payroll and benefits 34 – 36,
44, 49, 63Providers of capitalEC6 Interest on debt,
dividends on all classes of shares 117, 122
EC7 Increase/decrease in retained earnings 91
Public sectorEC8 Taxes by country naEC9 Subsidies by country 33, 37, 45EC10 Donations to
community, civil society and others 33, 45
EC12 Non-core business infrastructuredevelopment 33, 46, 54, 55
Indirect economic impactsEC13 Division’s indirect
economic impacts 32, 36, 37Environmental performance indicatorsMaterialsEN1 Materials used other
than water, by type 33, 46, 51EN2 Materials waste from
external sources 47EnergyEN3 Direct energy use 33, 51EN4 Indirect energy use naEN17 Renewable energy
sources 38, 40EN18 Energy consumption 45, 46EN19 Indirect (upstream/
downstream) energy use na
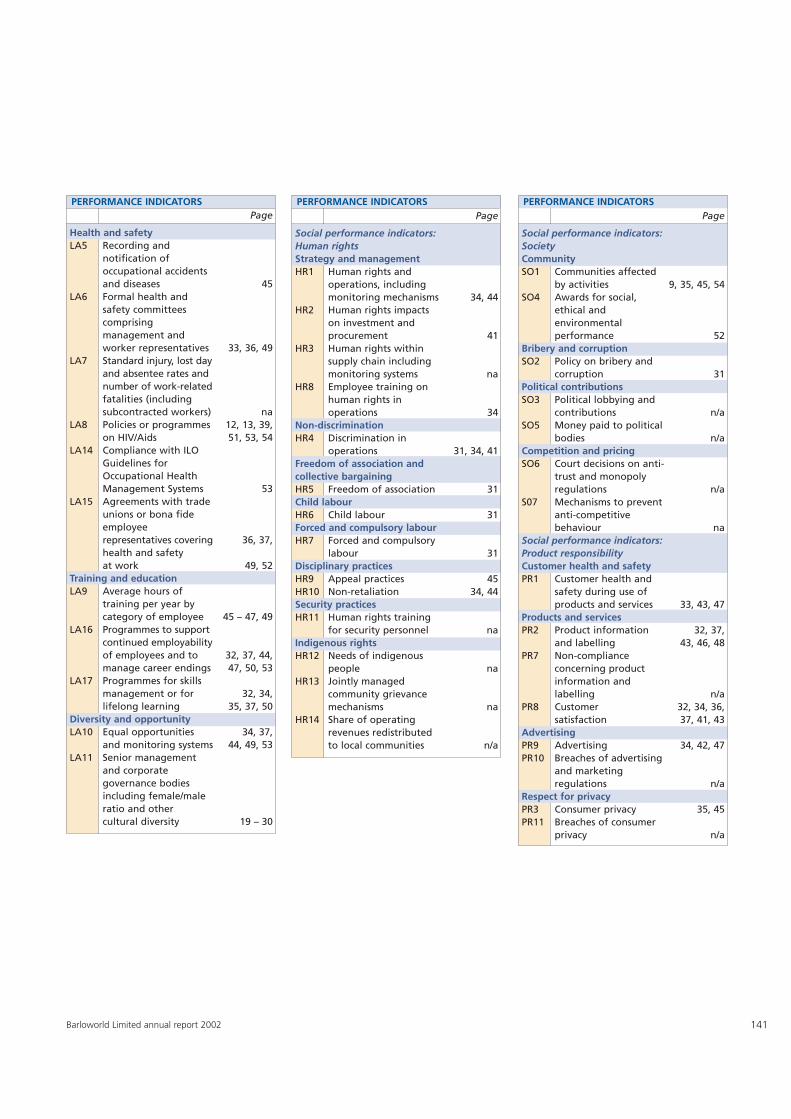
141Barloworld Limited annual report 2002
PERFORMANCE INDICATORSPage
Health and safetyLA5 Recording and
notification of occupational accidents and diseases 45
LA6 Formal health and safety committees comprisingmanagement and worker representatives 33, 36, 49
LA7 Standard injury, lost day and absentee rates and number of work-related fatalities (including subcontracted workers) na
LA8 Policies or programmes 12, 13, 39, on HIV/Aids 51, 53, 54
LA14 Compliance with ILO Guidelines for Occupational Health Management Systems 53
LA15 Agreements with trade unions or bona fide employeerepresentatives covering 36, 37, health and safety at work 49, 52
Training and educationLA9 Average hours of
training per year by category of employee 45 – 47, 49
LA16 Programmes to support continued employability of employees and to 32, 37, 44, manage career endings 47, 50, 53
LA17 Programmes for skills management or for 32, 34, lifelong learning 35, 37, 50
Diversity and opportunityLA10 Equal opportunities 34, 37,
and monitoring systems 44, 49, 53LA11 Senior management
and corporate governance bodies including female/male ratio and other cultural diversity 19 – 30
Page
Social performance indicators: Human rightsStrategy and managementHR1 Human rights and
operations, including monitoring mechanisms 34, 44
HR2 Human rights impacts on investment and procurement 41
HR3 Human rights within supply chain including monitoring systems na
HR8 Employee training on human rights in operations 34
Non-discriminationHR4 Discrimination in
operations 31, 34, 41Freedom of association and collective bargainingHR5 Freedom of association 31Child labourHR6 Child labour 31Forced and compulsory labourHR7 Forced and compulsory
labour 31Disciplinary practicesHR9 Appeal practices 45HR10 Non-retaliation 34, 44Security practicesHR11 Human rights training
for security personnel naIndigenous rightsHR12 Needs of indigenous
people naHR13 Jointly managed
community grievance mechanisms na
HR14 Share of operating revenues redistributed to local communities n/a
PERFORMANCE INDICATORS PERFORMANCE INDICATORSPage
Social performance indicators:SocietyCommunitySO1 Communities affected
by activities 9, 35, 45, 54SO4 Awards for social,
ethical and environmentalperformance 52
Bribery and corruptionSO2 Policy on bribery and
corruption 31Political contributionsSO3 Political lobbying and
contributions n/aSO5 Money paid to political
bodies n/aCompetition and pricingSO6 Court decisions on anti-
trust and monopoly regulations n/a
S07 Mechanisms to prevent anti-competitivebehaviour na
Social performance indicators:Product responsibilityCustomer health and safetyPR1 Customer health and
safety during use of products and services 33, 43, 47
Products and servicesPR2 Product information 32, 37,
and labelling 43, 46, 48PR7 Non-compliance
concerning product information and labelling n/a
PR8 Customer 32, 34, 36, satisfaction 37, 41, 43
AdvertisingPR9 Advertising 34, 42, 47PR10 Breaches of advertising
and marketing regulations n/a
Respect for privacyPR3 Consumer privacy 35, 45PR11 Breaches of consumer
privacy n/a
142 Barloworld Limited annual report 2002
Notice is hereby given that the eighty-sixthannual general meeting of the members ofthe company will be held in the TokyoMeeting Room, Barloworld CorporateOffice, 180 Katherine Street, Sandton, onThursday, 30 January 2003, at 12:30 for thefollowing purposes:
1. To receive and adopt the group annualfinancial statements for the yearended 30 September 2002.
2. To elect directors in accordance withthe provisions of the company’sarticles of association.
3. To consider and, if deemed fit, to passwith or without modification thefollowing ordinary resolution:
That the company hereby approves interms of section 221(1)(a) of theCompanies Act, 1973, as amended,the allotment and issue of sharesto the directors appointed during thefinancial year, in the event of theirexercising their right to take upoptions granted to them prior to theirappointment as a director. The numberof options which could be exercisedare:BP Diamond 82 001R Fernandez-Urrutia 79 001PJ Maybury 75 000
4. To consider and, if deemed fit, to passwith or without modification thefollowing special resolutions:That
(a) The directors of the companybe authorised from time totime to acquire issued shares inthe ordinary share capital of thecompany on the JSE SecuritiesExchange South Africa openmarket at a price no greaterthan 10% above the weightedaverage of the market value forthe securities for the five previousbusiness days immediately pre-ceding the date on which thetransaction was agreed or at a bidprice no greater than the currenttrading price of the share; andthe purchase by any of thecompany’s subsidiaries of shares
in the company in the mannercontemplated by and in accord-ance with the provisions of section89 of the Companies Act, 1973, asamended, and other provisionswhich may be applicable.
(b) The authorisation granted in termsof (a) above shall remain in forcefrom the date of registrationof these special resolutions by theRegistrar of Companies untilthe conclusion of the next annualgeneral meeting of the companyand in any event, no later than15 months from the date onwhich they were passed.
(c) The repurchase by the companyof its own securities in terms of(a) above may not exceed 20% ofthe company’s issued ordinaryshare capital in the aggregatein any one financial year or in thecase of acquisition by any ofthe company’s subsidiaries, 10%of the issued ordinary share capitalin the aggregate.
(d) The company’s intention regard-ing the utilisation of the authoritywhich is sought in terms of (a)above is to continue with the sharebuy-back programme initiatedwith the sanction of shareholderson 26 January 2000 and renewedat each subsequent annual generalmeeting.
(e) In the event that the directors aregranted general authority to buyback a maximum 20% of theissued share capital of Barloworld,or in the case of acquisition by anyof the company’s subsidiaries,10% of the issued ordinary sharecapital in the aggregate, it isthe opinion of the directorsthat following such maximumrepurchase of shares:
• the company and the group willbe able in the ordinary course ofbusiness to pay its debts for aperiod of 12 months after thedate of notice issued in respect ofthe annual general meeting;
• the assets of the company andthe group will be in excess of theliabilities of the company andthe group. For this purpose,the assets and liabilities will berecognised and measured inaccordance with the accountingpolicies used in the latestaudited group annual financialstatements;
• the ordinary capital and reservesof the company and the groupwill be adequate for a period of12 months after the date ofnotice issued in respect of theannual general meeting; and
• the working capital of thecompany and the group willbe adequate for a period of12 months after the date of noticeissued in respect of the annualgeneral meeting.
The reason for proposing the specialresolutions is to permit and authoriseBarloworld to acquire its own shares. Theeffect will be to authorise the directors topurchase shares in Barloworld Limited.
Any member entitled to attend and vote atthe meeting is entitled to appoint a proxyto attend, speak and, on a poll, vote inhis/her stead. The person so appointedneed not be a member of the company.Proxy forms should be forwarded to reachthe company’s transfer secretaries orUnited Kingdom registrars by not laterthan 12:30 (South African time) onTuesday, 28 January 2003.
By order of the board
MJ BarnettGroup Company Secretary
Sandton19 December 2002
Notice of annual general meeting
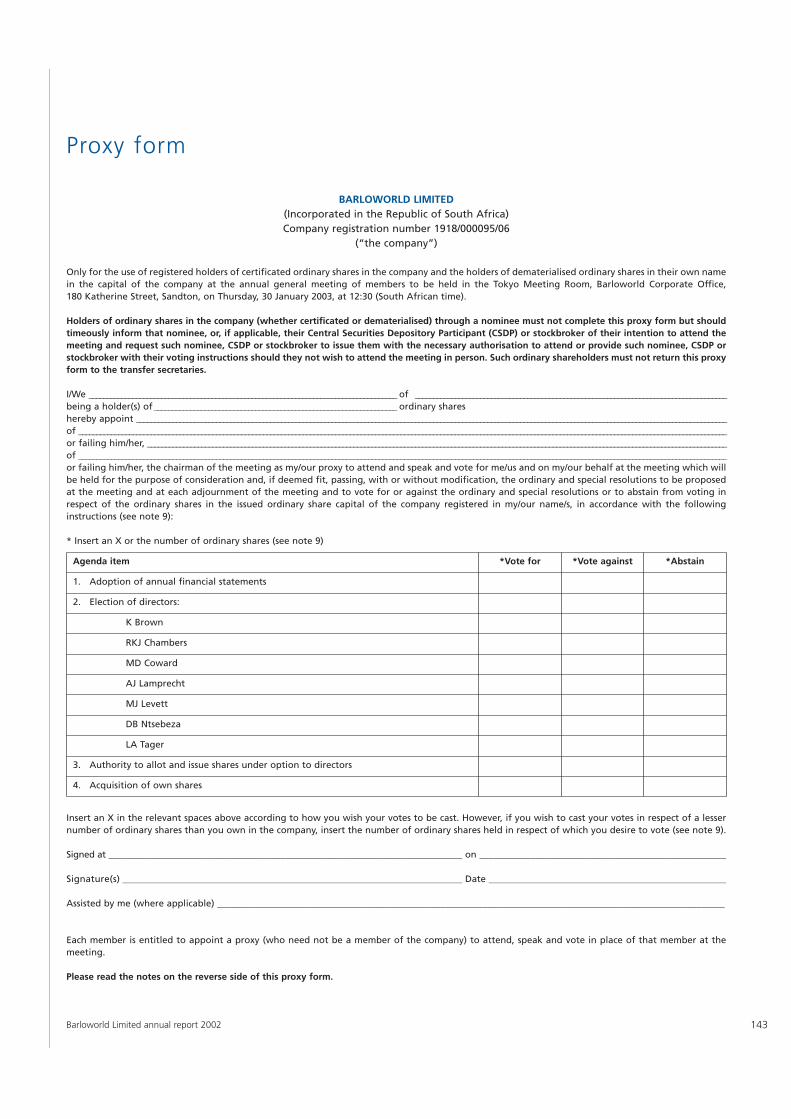
143Barloworld Limited annual report 2002
Proxy form
BARLOWORLD LIMITED(Incorporated in the Republic of South Africa)Company registration number 1918/000095/06
(“the company”)
Only for the use of registered holders of certificated ordinary shares in the company and the holders of dematerialised ordinary shares in their own namein the capital of the company at the annual general meeting of members to be held in the Tokyo Meeting Room, Barloworld Corporate Office,180 Katherine Street, Sandton, on Thursday, 30 January 2003, at 12:30 (South African time).
Holders of ordinary shares in the company (whether certificated or dematerialised) through a nominee must not complete this proxy form but shouldtimeously inform that nominee, or, if applicable, their Central Securities Depository Participant (CSDP) or stockbroker of their intention to attend themeeting and request such nominee, CSDP or stockbroker to issue them with the necessary authorisation to attend or provide such nominee, CSDP orstockbroker with their voting instructions should they not wish to attend the meeting in person. Such ordinary shareholders must not return this proxyform to the transfer secretaries.
I/We _____________________________________________________________________________________ of ______________________________________________________________________________________being a holder(s) of___________________________________________________________________ ordinary shareshereby appoint ___________________________________________________________________________________________________________________________________________________________________of ___________________________________________________________________________________________________________________________________________________________________________________or failing him/her, ________________________________________________________________________________________________________________________________________________________________of ___________________________________________________________________________________________________________________________________________________________________________________or failing him/her, the chairman of the meeting as my/our proxy to attend and speak and vote for me/us and on my/our behalf at the meeting which willbe held for the purpose of consideration and, if deemed fit, passing, with or without modification, the ordinary and special resolutions to be proposedat the meeting and at each adjournment of the meeting and to vote for or against the ordinary and special resolutions or to abstain from voting inrespect of the ordinary shares in the issued ordinary share capital of the company registered in my/our name/s, in accordance with the followinginstructions (see note 9):
* Insert an X or the number of ordinary shares (see note 9)
Agenda item *Vote for *Vote against *Abstain
1. Adoption of annual financial statements
2. Election of directors:
K Brown
RKJ Chambers
MD Coward
AJ Lamprecht
MJ Levett
DB Ntsebeza
LA Tager
3. Authority to allot and issue shares under option to directors
4. Acquisition of own shares
Insert an X in the relevant spaces above according to how you wish your votes to be cast. However, if you wish to cast your votes in respect of a lessernumber of ordinary shares than you own in the company, insert the number of ordinary shares held in respect of which you desire to vote (see note 9).
Signed at ____________________________________________________________________________ on _____________________________________________________
Signature(s) _________________________________________________________________________ Date ___________________________________________________
Assisted by me (where applicable) _____________________________________________________________________________________________________________
Each member is entitled to appoint a proxy (who need not be a member of the company) to attend, speak and vote in place of that member at themeeting.
Please read the notes on the reverse side of this proxy form.
Instructions on signing and lodging of the
annual general meeting proxy form.
1. A deletion of any printed matter and
the completion of any blank spaces
need not be signed or initialled. Any
alterations must be signed, not
initialled.
2. The chairman shall be entitled to
decline to accept the authority of a
signatory:
(a) under a power of attorney; or
(b) on behalf of a company
unless the power of attorney or
authority is deposited with the
transfer secretaries, Computershare
Investor Services Limited, 9th Floor,
70 Marshall Street, PO Box 1053,
Johannesburg, 2000, South Africa, or
the United Kingdom registrars, Lloyds
TSB Registrars, The Causeway,
Worthing, West Sussex BN99 6DA,
England, by not later than 12:30
(South African time) on Tuesday,
28 January 2002.
3. The signatory may insert the name of
any person(s) whom the signatory
wishes to appoint as his/her proxy in
the blank space/s provided for that
purpose.
4. When there are joint holders of shares
and if more than one such joint holder
be present or represented, then the
144 Barloworld Limited annual report 2002
person whose name appears first in
the register of members in respect of
such shares or his/her proxy, as the case
may be, shall alone be entitled to vote
in respect thereof.
5. The completion and lodging of this
form of proxy will not preclude the
signatory from attending the annual
general meeting and speaking and
voting in person thereat should such
person wish to do so, to the exclusion
of any proxy appointed in terms
hereof.
6. If, in the appropriate place on the face
of the proxy, there is no indication of
how to vote in respect of any
resolution the proxy shall be entitled
to vote as he/she deems fit in respect
of that resolution.
7. The chairman of the annual general
meeting may reject or accept any
proxy form which is completed other
than in accordance with these
instructions, provided that in the event
of acceptance, he/she is satisfied as to
the manner in which a member wishes
to vote.
8. If the shareholding is not indicated on
the form of proxy, the proxy will be
deemed to be authorised to vote
the total shareholding registered in the
member’s name.
9. Please insert an X in the relevant space
according to how you wish your votes
to be cast. However, if you wish to cast
your votes in respect of a lesser
number of ordinary shares than you
own in the company, insert the
number of ordinary shares held in
respect of which you wish to vote.
Failure to comply with the above will
be deemed to authorise the proxy to
vote or to abstain from voting at the
meeting as he/she deems fit in respect
of all the ordinary shareholder’s votes
exercisable at the meeting. An
ordinary shareholder or his/her proxy
is not obliged to use all the votes
exercisable by the ordinary share-
holder or by his/her proxy, but the
total of the votes cast in respect of
which abstention is recorded may not
exceed the total number of votes
exercisable by the ordinary share-
holder or by his/her proxy.
Notes to the proxy form
145Barloworld Limited annual report 2002
SECRETARY
MJ Barnett
BUSINESS ADDRESS AND REGISTERED
OFFICE
180 Katherine Street
PO Box 782248, Sandton, 2146
South Africa
Telephone +27 11 445 1000
Telefax +27 11 444 3643
Website www.barloworld.com
AUDITORS
Deloitte & Touche
Deloitte & Touche Place
The Woodlands
Corner Woodlands and Kelvin Drives
Woodmead, 2199
South Africa
Telephone +27 11 806 5000
Telefax +27 11 806 5003
ATTORNEYS
Bowman Gilfillan Inc
Ninth Floor, Twin Towers West
Sandton City, Sandton, 2146, South Africa
Telephone +27 11 881 9800
Telefax +27 11 883 4505
TRANSFER SECRETARIES
Computershare Investor Services Ltd
70 Marshall Street
PO Box 1053, Johannesburg, 2000
South Africa
Telephone +27 11 370 5000
Telefax +27 11 370 5272
UNITED KINGDOM REGISTRAR
Lloyds TSB Registrars
The Causeway, Worthing
West Sussex, BN99 6DA, England
Telephone +44 190 350 2541
Telefax +44 190 385 4031
PRINCIPAL BANKERS
Absa Group Limited
Australia and New Zealand Bank
Banco Bilbao Vizcaya Argentaria SA
Banco Espirito Santo SA
Bank of America NA
Barclays Bank plc
FirstRand Bank Limited
Kredietbank Luxembourgeoise SA
Lloyds TSB Bank plc
Nedbank Limited
Royal Bank of Scotland plc
The Standard Bank of South Africa
Limited
Westdeutsche LB AG
COMPANY REGISTRATION NUMBER
1918/000095/06
SPONSOR
Cazenove, South Africa (Pty) Ltd
(Johannesburg)
First Floor, Moorgate
Dunkeld Park, 6 North Road
Dunkeld West
PO Box 412468, Craighall, 2124
Johannesburg, South Africa
Telephone +27 11 280 7900
Telefax +27 11 341 0377
(London)
12 Tokenhouse Yard
London EC2R 7AN, England
Telephone +44 207 588 2828
Telefax +44 207 606 9205
Corporate informationfor the year ended 30 September 2002
Financial year-end 30 September
Annual general meeting January
REPORTS AND PROFIT STATEMENTS Published:
• Half-yearly interim report May
• Preliminary report for the year November
• Annual report November
DIVIDENDS Declared: Paid:
• 6% cumulative preference shares March April
September October
• Ordinary shares – interim May July
– final November January
• 7% convertible bond interest September
Shareholders’ diary
146 Barloworld Limited annual report 2002
G R A P H I C O R 2 7 8 2 3

Andorra, Angola, Australia, Belgium, Botswana, Bulgaria, Canada, Cape Verde, Denmark, France, Germany,Guinea Bissau, Italy, Japan, Lesotho, Malawi, Mozambique, Namibia, Netherlands, Portugal, Russia, São Toméand Principé, Singapore, South Africa, Spain, Swaziland, Sweden, USA, United Kingdom, Zambia, Zimbabwe
www.barloworld.com