
Bardess-Bytes-50-Qlik-Tips-to-Accelerate-Your-Development ...
96
Bardess Bytes of Wisdom: 50 Qlik Tips to Accelerate Your Development “Bardess Bytes of Wisdom: 50 Qlik Tips to Accelerate Your Development is a great resource for any Qlik user at any level. I learned so much and I recommend this book to anyone looking to get more from their data.” — Mike Muglia, Qlik Luminary, 2018-Present
-
Upload
khangminh22 -
Category
Documents
-
view
0 -
download
0
Transcript of Bardess-Bytes-50-Qlik-Tips-to-Accelerate-Your-Development ...

Bardess Bytes of Wisdom: 50 Qlik Tips to Accelerate Your Development
“Bardess Bytes of Wisdom: 50 Qlik Tips to Accelerate Your Development is a great resource for any Qlik user at any level. I learned so much and I recommend this book to anyone looking to get more from their data.”
— Mike Muglia, Qlik Luminary, 2018-Present

Foreword
“I have had the pleasure of working on numerous projects with Bardess Group over the years and they
bring a level of expertise that is truly unmatched. Bardess Bytes of Wisdom: 50 Qlik Tips to Accelerate
Your Development is a great resource for any Qlik user at any level. I learned so much and I recommend
this book to anyone looking to get more from their data.”
— Mike Muglia, Qlik Luminary, 2018-Present
“I am excited about introducing this first eBook in our knowledge-sharing series, Bardess Bytes of Wisdom,
which is all about people helping people with data. This eBook presents innovative ways to use Qlik
technology and accelerate user adoption. It brings Bardess’ thought leadership to the forefront, and any
user will benefit from our collected knowledge and hands on experience.”
— Barbara Pound, CEO Bardess Group, Ltd.
“Bardess has many talented and passionate Qlik developers, and they represent the best and brightest
advocates of this premier data analytics platform. This book will allow you to take advantage of their
expertise and commitment.”
— Joe DeSiena, President Bardess Group, Ltd.
2

Table of Contents
01 - Call to Action: Subroutines
02 - Generate a Table Without a Source
03 - Change Inline Load Delimiter Setting to Copy from Excel
04 - Create a Change Log to Track Your Work
05 - Naming Conventions are Crucial to Consistency
06 - Clear Your Variables to Save Time Debugging
07 - Use Variable Parameters to Create Your Own Functions
08 - Setup A Lab Environment
09 - Develop Faster Using Test Cases
10 - An Overlooked Gem
11 - Understanding Join Distinct
12 - Dual Data Type Caveat
13 - Configuring the Rules for Qlik Sense® Ports
14 - Quickly Rename Fields with One Statement
15 - Use Preceding Load to Enhance Readability
16 - Load the Entire Contents of a File as a Value
17 - Running Dynamically Created Code
18 - Avoid the Rabbit Hole
19 - Use Placeholder Tables to Establish Field Formats
20 - Use ApplyMap for Fast VLookup Functionality
21 - Do While: How to Loop Until a Condition is Met
22 - Cardinality and How it Impacts Application Size
23 - Use AutoNumber to Optimize Your Data Model
24 - Effectively Work with Qlik Key Fields
25 - Ignore Potential Future Use Cases and Remove Unused Fields
26 - Using Arrays for Iteration
3

27 - Use SubField to Expand Records
28 - Use Wildcard to Load All Similar Files
29 - Dual Behavior in Set Analysis
30 - Use Copy/Paste to Save Time and Avoid Typos
31 - Pick Match, an If Statement Equivalent
32 - How to Associate Mixed Granularity Data
33 - When Should You Upgrade Qlik Sense®?
34 - Create A Codebase
35 - Using Advanced Search to Filter in Set Analysis
36 - Changing Column Width
37 - Making Date Formats Functional
38 - Create Your Own Concatenated Keys
39 - Looping Over Records Using While
40 - Troubleshooting Associations: Subset Ratio
41 - Hidden Default Apps
42 - Using FieldValueList for Loops
43 - Did You Try Turning It Off and On Again?
44 - FileList Mask Order Test
45 - How to Create a Quick Month Map
46 - Get QVD Metadata from XML Headers
47 - Where do Reload Logs Reside?
48 - Natively Loading JSON
49 - Section Access Tips and Tricks
50 - Understanding QVDs and Optimized Loads
Conclusion
4

Call to Action: Subroutines
To start it off I am going to talk about Subroutines. A subroutine is a user defined program within yourscript that you can call at a later time.
For example:
Sub RowCount(pRowTable)
Let RC.Rows = Num(NoOfRows('$(pRowTable)'),'#,##0');
Trace ---------------- $(pRowTable): $(RC.Rows) rows;
RC.Rows=;
End Sub;
Fact:
Load
Rand() as Random
AutoGenerate
(Ceil(Rand()*100));
CALL RowCount('Fact');
5

Which returns:
This is a very simple example, but you can start to see the possibilities.
6

Generate a Table Without a Source
You might have noticed I used this in the last example. AutoGenerate is so useful and has so many use
cases. I probably use this in every app I create: from empty stub tables , generating a new field using
another’s unique values, or as a way to log different steps within the load.
What it does is generate a table with the number of rows specified. This means you can create records
with the output of functions, variables or strings without needing to specify a source.
Here is an example, which includes another tip if you catch it:
// Create empty table and setting field types
Log:
Load
Null() as Log.Table,
Num(Null(),'#,##0') as Log.Rows,
Timestamp(Null()) as Log.Timestamp
AutoGenerate
(0);
Fact:
LOAD
TransLineID,
TransID,
"Num",
Dim1,
Dim2,
Expression1
FROM
[lib://QVD/SampleTransactions.qvd](qvd);
7

// Add Log record
Concatenate(Log)
Load
'Fact' as Log.Table,
NoOfRows('Fact') as Log.Rows,
Now() as Log.Timestamp
AutoGenerate
(1);
Which returns:
8

Changing the Inline Load DelimiterOne thing which would have been useful years ago was knowing I could copy data directly from Excel into
the load script for an Inline Load if I changed the delimiter setting in the load script.
So what this means is you can copy a data set from Excel:
Paste into Qlik and add ‘(delimiter is \t)’ at the end of the Inline Load statement.
* \t is for tab, my Excel default delimiter. You can change this to whatever you want. See the
documentation for more info.
9

Reload and there you have it!
10

Create a Change Log to Track Your WorkThis is a process I wish I had started doing sooner. Nowadays in every app I build, I create a script section
named Change Log. This little piece of documentation gives a bit of background on the app, and then a
list of changes over time with tags to be able to find where they were done easily.
Example
///$tab SubroutineSub RowCount(pRowTable)
Let RC.Rows = Num(NoOfRows('$(pRowTable)'),'#,##0');Trace ---------------- $(pRowTable): $(RC.Rows) rows;
RC.Rows=;
End Sub;
Fact:Load
Rand() as Random
AutoGenerate
(100000); // [v1.1.01]
CALL RowCount('Fact'); // [v1.1.02]
Temp:Load
Chr(IterNo()) as Char
AutoGenerate
(1)While
IterNo() <= 2;
Outer Join(Fact)
Load
CharResident
Temp;
11

Drop Table Temp;
CALL RowCount('Fact');
///$tab Exitexit script;
///$tab Change Log/*************************************************************************************************
Application: 101 - Subroutine
Description:Example application to provide a simple example of how a subroutineworks.
**************************************************************************************************************************************************************************************************
Version: 1.1Date: 2019-05-01
Notes: None
Changes:- Upped the fact records from 1000 to 100000 [v.1.1.01]- Added additional RowCount call. [v1.1.02]
**************************************************************************************************************************************************************************************************
Version: 1.0Date: 2019-041-12
Notes: None
Changes:- Initial Build
**************************************************************************************************************************************************************************************************
Version: X.X (Change Log Definition)Date: %Date of Change%
12
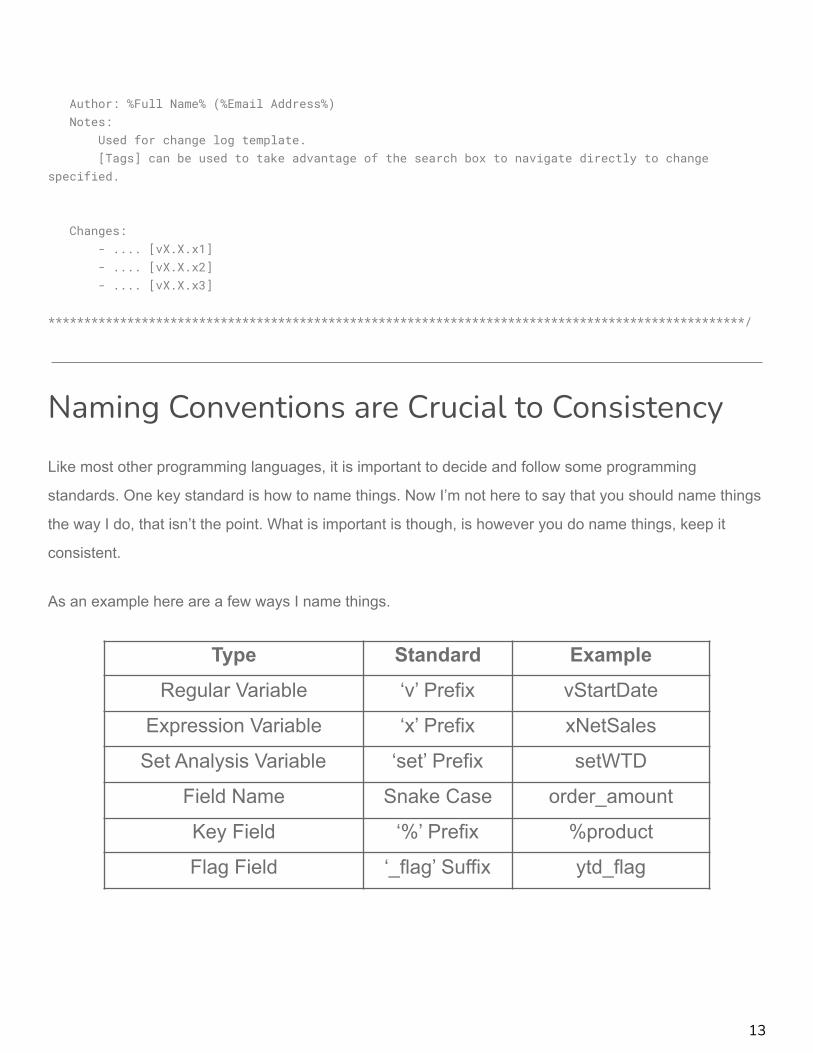
Author: %Full Name% (%Email Address%)Notes:
Used for change log template.[Tags] can be used to take advantage of the search box to navigate directly to change
specified.
Changes:- .... [vX.X.x1]- .... [vX.X.x2]- .... [vX.X.x3]
*************************************************************************************************/
Naming Conventions are Crucial to Consistency
Like most other programming languages, it is important to decide and follow some programming
standards. One key standard is how to name things. Now I’m not here to say that you should name things
the way I do, that isn’t the point. What is important is though, is however you do name things, keep it
consistent.
As an example here are a few ways I name things.
Type Standard ExampleRegular Variable ‘v’ Prefix vStartDate
Expression Variable ‘x’ Prefix xNetSales
Set Analysis Variable ‘set’ Prefix setWTD
Field Name Snake Case order_amount
Key Field ‘%’ Prefix %product
Flag Field ‘_flag’ Suffix ytd_flag
13

As a consultant, I interact with a lot of other people’s apps. In these scenarios, I will take on their way of
doing things to keep the app consistent. I do this so that I am not merging two different styles. So keep in
mind that consistency is the key, and that consistency may require using different standards.
Clear Your Variables to Save Time Debugging
This is a very short and sweet one. Clear your variables. Trust me, it is worth it. It’s easy and will save you
time debugging.
To clear a variable just do:
RC.Rows=;
That’s it.
Use Variable Parameters to Create Your OwnFunctions
In other words, user defined functions. With utilizing variable parameters, you can create your own
functions to use later.
For example, a function to calculate the number of weeks between two date fields:
SET fWeekDiff = '(((Year($2)*52)+Week($2))) - (((Year($1)*52)+Week($1)))';
14

Data:
Load
StartDate,
EndDate,
$(fWeekDiff(StartDate,EndDate)) as NoOfWeeks
;
Load
Date#(StartDate,'M/D/YYYY') as StartDate,
Date#(EndDate,'M/D/YYYY') as EndDate
Inline [
StartDate, EndDate
1/3/2017, 2/14/2017
2/14/2017, 6/1/2017
6/1/2017, 8/14/2017
];
Setup A Lab Environment
While it is great that Qlik® offers a Qlik Sense® desktop version, I usually suggest trying to set up a server
environment for local development. I personally run a Windows Server VM with Qlik Sense® Enterprise
installed using a unified license, which I can access with my browser.
I do it this way for three main reasons.
1. It is the closest local environment to what the majority of customers have.2. It keeps it contained and I can easily take snapshots and do rollbacks.3. I use MacOS and it is cheaper than paying for a hosting service.
While I do it in a VM, it is worth knowing that you can install Qlik Sense® Enterprise locally on a Windows
8+. I have found that this has made things exponentially better for development and testing compared to
using the desktop versions. By using a unified license, applying the same signed key to multiple
deployments lets you share the same users and access types. Users can access all connected
deployments using the same Professional or Analyzer access allocation.
15

Develop Faster Using Test Cases
I am a firm believer that boiling down a problem into its simplest form is the fastest way to solving it. I also
think one of the fundamentals of programming is breaking a problem into a bunch of smaller problems. If
you combine these together, you get test cases out the wazoo.
I find that I am able to develop faster and more accurately by separating out the particular problems out of
the application and testing it on the most simple scenario possible. Another benefit is you can keep these
examples for reference later. Here is a simple one I made on NullAsValue. I made this test case in a
separate app in a couple of minutes, versus trying it on a client’s app over hundreds of millions of rows
with a reload taking hours.
Test Case: NullAsValue Execution Test
Description: This Test is to determine whether the NullAsValue gets applied on the data being loaded in
or on the resulting data.
Result: On the resulting data
status_map:Mapping Load * Inline [input, output1, one2, two3, three];
Raw:Load
'A' as dim,1 as num
AutoGenerate(1);
16

Concatenate(Raw)Load
'B' as dim,Null() as num
AutoGenerate(1);
Concatenate(Raw)Load
'C' as dim,3 as num
AutoGenerate(1);
NullAsValue num;NullValue = 2;
Check:NoConcatenate Load
dim,ApplyMap('status_map',num) as num
residentRaw;
Drop table Raw;
17

An Overlooked Gem - Controlling Data with SetAnalysis
You’d probably be surprised that this is one of my most used functions within a dashboard. It is just such a
cool function. Though, it is almost exclusively used for UI/UX functionality.
Only()
Only is an aggregation function that can be used on a string field. If a single result comes back it will
return the result, if more than one values occur it returns null.
ExampleFieldA FieldB
Apple Fuji
Apple Honey Crip
=Only(FieldA) would return Apple
=Only(FieldB) would return NULL
Documentation
One of the best features is that you can use set analysis with it, which gives you a lot of control. It can be
used to pull out expression definitions stored in a field, used to create dynamic labels, and many other
things.
18

Understanding Join Distinct
This is something that I found out the hard way. The Qlik® Associative Engine applies the DISTINCT
keyword on the resulting dataset. So when you perform a join distinct, you are not joining the distinct table
to the other table. You are doing the join and then returning the distinct records from the resulting join.
Take this example:
original:
Load * Inline [
id, dim, sales
1, A, 100
2, A, 50
3, B, 75
3, B, 75
4, C, 1000
];
Left Join(original)
LOAD Distinct * Inline [
dim, desc
A, Big Fish
B, Reoccurring
B, Reoccurring
C, High Roller
];
19

You might expect:
id dim sales desc
1 A 100 Big Fish
2 A 50 Big Fish
3 B 75 Reoccurring
3 B 75 Reoccurring
4 C 1000 High Roller
However, what you actually get is:
id dim sales desc
1 A 100 Big Fish
2 A 50 Big Fish
3 B 75 Reoccurring
4 C 1000 High Roller
20
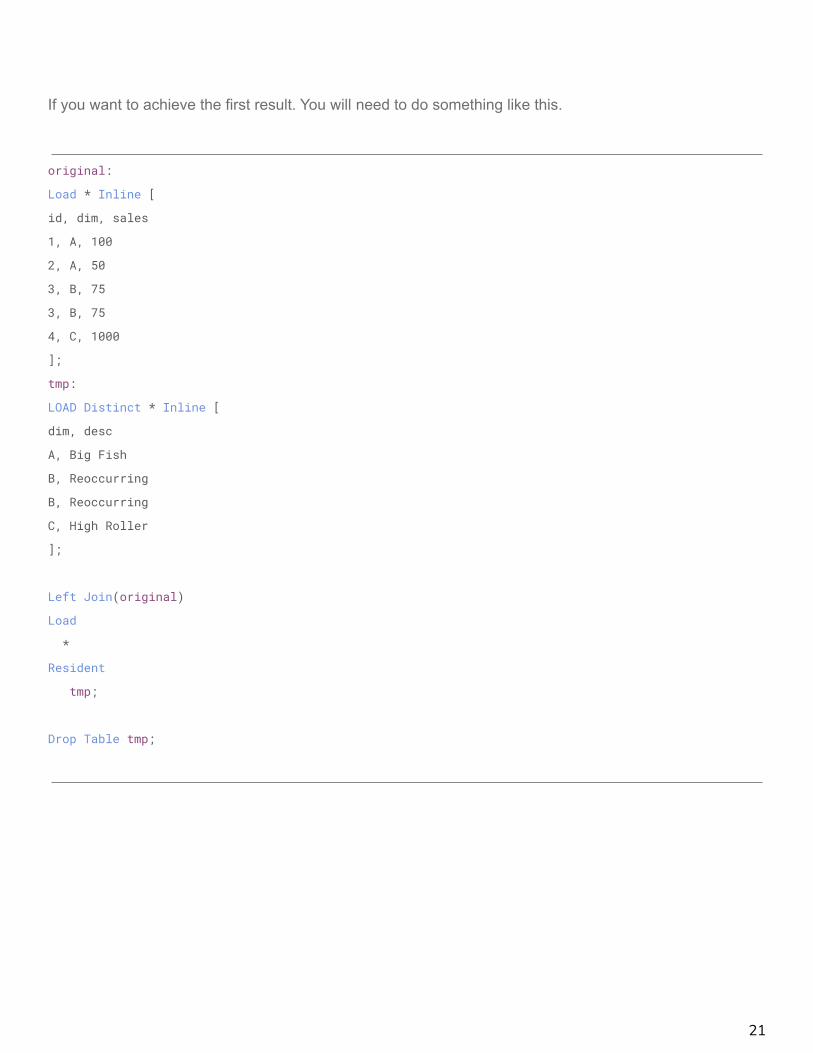
If you want to achieve the first result. You will need to do something like this.
original:
Load * Inline [
id, dim, sales
1, A, 100
2, A, 50
3, B, 75
3, B, 75
4, C, 1000
];
tmp:
LOAD Distinct * Inline [
dim, desc
A, Big Fish
B, Reoccurring
B, Reoccurring
C, High Roller
];
Left Join(original)
Load
*
Resident
tmp;
Drop Table tmp;
21

Dual Data Type Caveat
Dual combines a number and a string into a single record, such that the number representation of the
record can be used for sorting and calculation purposes, while the string value can be used for display
purposes.
Syntax:
Dual(text, number)
Caveat
Now when I think of the data type combining both text and a number value, I tend to think that this means
a value can be the unique combination of the two. However, this is not the case.
The number in Dual is the core value, while the text is just the display value.
What does this mean?
This means a number value can only have one display value. While a text value can be the display value
of multiple numbers
22

.
Example
Data:
Load
RowNo() as Id,
Text(String) as String,
Num(Number) as Number,
Dual(String,Number) as Dual
Inline [
String, Number
A, 1
B, 2
C, 3
A, 4
Z, 1
];
Output
Troubleshooting
I have made this mistake when trying to combine mixed granularity within dates. Say at the end of the
year a client’s finance team closes the books and closes their general ledger at the end of the year. They
then report this at a year level. However, in the current year, they report at the month level.
23

To incorporate both sets of data in a chart I came up with the concept of doing Month-Year, with PY being
a whole previous year.
Month MonthNum Year MonthYear DualPY 0 2018 PY-2018
Jan 1 2019 Jan-19
Feb 2 2019 Feb-19
Mar 3 2019 Mar-19
Apr 4 2019 Apr-19
May 5 2019 May-19
Jun 6 2019 Jun-19
Jul 7 2019 Jul-19
Aug 8 2019 Aug-19
Sep 9 2019 Sep-19
Oct 10 2019 Oct-19
Nov 11 2019 Nov-19
Dec 12 2019 Dec-19
Then a new requirement came and a particular budget was only at the year level. So we stuck with a
similar concept, but this time CY.
24

Month MonthNum Year MonthYear DualPY 0 2018 PY-2018
CY 0 2019 CY-2019
Jan 1 2019 Jan-19
Feb 2 2019 Feb-19
Mar 3 2019 Mar-19
Apr 4 2019 Apr-19
May 5 2019 May-19
Jun 6 2019 Jun-19
Jul 7 2019 Jul-19
Aug 8 2019 Aug-19
Sep 9 2019 Sep-19
Oct 10 2019 Oct-19
Nov 11 2019 Nov-19
Dec 12 2019 Dec-19
Now this worked out as is. However, I had made the Month field a Dual. It took me far too long to realize
that Dual('PY’,0) and Dual('CY’,0) would not provide the expected results. It would always default to
PY since there can only be one display value per number.
Hopefully knowing this can save you some time in the future.
25

Configuring the Rules for Qlik Sense® Ports
Qlik® has great documentation, however it is a bit cumbersome when it talks about networking. Below are
the ports needed.
Also, you need to create an inbound and outbound rule. Here is a tutorial. It is much less complicated than
it sounds.
Ps. I am not covering HTTP because you shouldn’t do it. Period.
Single Node
Port Purpose Comment
443 HTTPS Traffic Absolutely necessary
4244 WindowsAuthentication *Only versions prior to April 2018
4242 Qlik Repository *Only if you want to talk to the QRS API
Multi Node
I suggest looking at the documentation since there are so many variations depending on the use case.
26
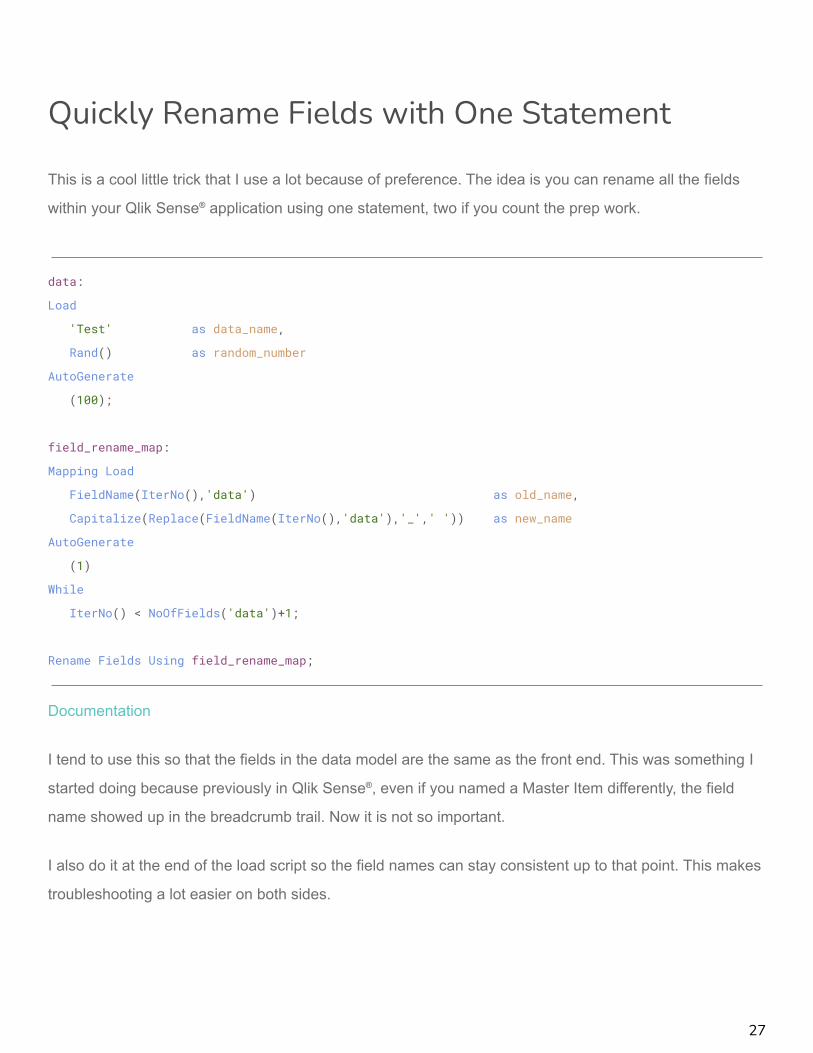
Quickly Rename Fields with One Statement
This is a cool little trick that I use a lot because of preference. The idea is you can rename all the fields
within your Qlik Sense® application using one statement, two if you count the prep work.
data:
Load
'Test' as data_name,
Rand() as random_number
AutoGenerate
(100);
field_rename_map:
Mapping Load
FieldName(IterNo(),'data') as old_name,
Capitalize(Replace(FieldName(IterNo(),'data'),'_',' ')) as new_name
AutoGenerate
(1)
While
IterNo() < NoOfFields('data')+1;
Rename Fields Using field_rename_map;
Documentation
I tend to use this so that the fields in the data model are the same as the front end. This was something I
started doing because previously in Qlik Sense®, even if you named a Master Item differently, the field
name showed up in the breadcrumb trail. Now it is not so important.
I also do it at the end of the load script so the field names can stay consistent up to that point. This makes
troubleshooting a lot easier on both sides.
27

Use Preceding Load to Enhance Readability
Preceding Load allows you to perform additional load steps before initializing a table. Each step uses the
output of the preceding load statement as input.
Original:Load
Pick(Floor((Rand()*10)/2)+1,'A','B','C','D','E') as Customer,'Q'&(Mod(RowNo(), 4)+1) as Quarter,Ceil((Rand() * 100) * (Rand()*10)) as Sales
AutoGenerate(100);
New:Load
CustomerName,Quarter,TotalSales,If(Customer = Previous(Customer),
TotalSales - Previous(TotalSales), 0) as QoQChange;Load
Customer as CustomerName,Quarter,Sum(Sales) as TotalSales
ResidentOriginal
Group ByCustomer,Quarter
Order byCustomer,Quarter;
Drop Table Original;
28

In my opinion, the biggest benefit of using this is code readability. There may be times where putting all
the transformations in a single Load statement is faster, however it is in most cases easier to understand
code that pieces out the transformations into multiple steps versus having a ton of nested functions.
With that said, if performance is a high priority it is worth testing various avenues. All in one load,
preceding load, exporting to QVDs and performing the transformation on a new ingestion, etc... There will
almost always be multiple ways to solve a problem. A priority in any type of development is that it is
readable, whether it is you 6 months in the future or a colleague who takes over support.
Load the Entire Contents of a File as a ValueHave you ever wanted to consume a whole file’s content into Qlik Sense® as a single value? Perhaps, a
series of README files or code files which can be shown on the front end? This is a little tricky since Qlik
Sense® was really built to consume tabular data. So when connecting to files it is trying to determine the
columns and rows. Here is a way to get around that:
test:Load
"@1:n" as SourceFROM
[lib://data/readme.md](fix, utf8, record is 100000 lines);
This will load the entire file contents as one field up to 100,000 lines. This can be changed of course.
29

A more complicated example, say I want to load a series of HTML files, which I will utilize as a source for
an extension to render.
html:Load
Num(Null()) as CounterAutoGenerate
(0);
for each file in FileList('lib://QlikShare/Dev/data/html-test-cases/*.html')
Concatenate(html)Load
'Test Case '&Subfield(FileBaseName(),'.',1) as Id,Subfield(FileBaseName(),'.',2) as Name,"@1:n" as Example,Ceil(Subfield(FileBaseName(),'.',1)/3) as WowFactor,1 as Counter
From[$(file)](fix, utf8, record is 100000 lines);
Next file;
Which results in:
30

Running Dynamically Created Code
This concept can be used in so many ways and can come in handy for complex situations. Essentially,
with the use of dollar sign expansion, you can execute a script you have programmatically built in the
script or pulled in from source files.
Notice $(vAnswer) in the below example. It is going to be expanded by the dollar sign expansion and be
executed like any other script.
Answer:
Load * Inline [
Answer
Yes
No
Maybe
];
Let vAnswer = 'Trace Should you do it? ' & Upper(Peek('Answer',Floor(Rand()*3),'Answer')) &'! ;';
$(vAnswer)
31

Which returns:
Now this is a fun and simple example, but not really practical. A more complex and practical example is
loading script from external files and executing them on the fly.
Let’s say that the DBA team came to you and needed you to run a series of audit queries each day.
However, this list of SQL queries will always be changing and the solution should be flexible. Is this
something that Qlik Sense® can handle?
32

Of course! All we need to do is combine the tip covered above with this concept.
Audit:
Load
Text(Null()) as AuditName,
Text(Null()) as Query
AutoGenerate
(0);
for each file in FileList('lib://QlikShare/audit/queries/*.sql')
Concatenate(Audit)
Load
Subfield(FileBaseName(),'.',2) as AuditName,
"@1:n" as Query
From
[$(file)](fix, utf8, record is 10000 lines);
Next file;
AuditRecords:
NoConcatenate Load
Text(Null()) as AuditName
AutoGenerate
(0);
For q = 0 to NoOfRows('Audit')-1
Let vQuery = Peek('Query',$(q),'Audit');
Let vAuditName = Peek('AuditName',$(q),'Audit');
tmp:
$(vQuery);
33

Concatenate(AuditRecords)
Load
'$(vAuditName)' as AuditName,
NoOfRows('tmp') as AuditRecords
AutoGenerate
(1);
Store tmp into [lib://QlikShare/audit/results/$(vAuditName).csv](txt);
Drop Table tmp;
Next q;
Left Join(Audit)
Load
AuditName,
AuditRecords
Resident
AuditRecords;
Drop Table AuditRecords;
This script will load the script from all of the SQL files in a folder. Then execute them, track the number of
records returned by the query, and then store the individual results to a CSV file for the DBA team to
analyze. Pretty nifty right?
34

Avoid the Rabbit Hole
You should keep in mind that just because you can do something, doesn’t necessarily mean you should.
Try and be aware of the actual value something will provide. If it takes you 40 hours to automate
something that is done manually for 5 minutes every month, it would take you 40 YEARS to see the return
on your investment. That’s over-engineering. Now usually it isn’t something that obvious, but just keep in
mind there are rabbit holes at every step in programming.
To be honest, this is something I still struggle with. For example, if an application is loading from a
database using SELECT *, with no transformation, based on habit I want to export it to a QVD first and
then load that. However, in reality all I am doing is creating additional overhead.
So yeah, this is just a reminder that while we can do crazy things, sometimes the actual business value
benefit is increased by handling it in a much boring simpler way.
Use Placeholder Tables to Establish Field Formats
You might have noticed me using these in a few of the previous examples. The idea is that you create an
empty table that you can concatenate to. The number one reason I do this is to be explicit. I know Qlik
Sense® can and will auto-concatenate, but I want to be extremely clear in what I am doing, so that if there
are any bugs I don’t have to troubleshoot code that has some behind the scenes magic.
Another reason to do this is you can establish the format of a field. This initialization of a table with the
formats will override later formatting attributes.
Placeholder:
Load
Text(Null()) as TextTest,
Num(Null(),'0000') as NumTest,
Timestamp(Null(),'YYYY-MM-DD hh:mm:ss') as TimestampTest
AutoGenerate
(0);
35

Concatenate(Placeholder)
Load
1 as TextTest,
Num(1,'#,##0') as NumTest,
Now() as TimestampTest
AutoGenerate
(1);
Concatenate(Placeholder)
Load
'Two' as TextTest,
2 as NumTest,
Date(Floor(Now()),'MM/DD/YYYY') as TimestampTest
AutoGenerate
(1);
Which returns:
Use ApplyMap for Fast VLookup FunctionalityThis is a post that might be common knowledge to you, but if not this can be a crucial addition to your
workflow.
ApplyMap is a function that is very similar to VLookup in Excel. Essentially you can utilize a mapping table
that you can bulk find and replace; provide an input and receive and return an output that matches.
36

Example
String_map:Mapping Load * Inline [input, output1, One2, Two3, Three];
Data:Load
RowNo() as Num,ApplyMap('String_map',RowNo(),'N/A') as String
AutoGenerate(4);
Which returns:
*Note the third parameter is what should be provided if there isn’t a match. By default it is the input value.
37

While it is a great feature, which can also be accomplished by the LookUp function, it is extremely fast. If
you are working with large datasets, it is usually faster to utilize multiple ApplyMaps than to do a join.
Now I have no evidence to support this claim, but my hypothesis is that ApplyMap is so fast because it
happens at the bit-stuffed pointer level. I would love to have a conversation with Qlik® R&D around this to
better understand the inner workings of the function.
One important thing to remember, the mapping happens against the first field no matter what. Field
names do not matter. So always make sure your input field is the first and your output field is the second.
Due to a few forgetful moments and brainless troubleshooting, I have made it a habit to always create the
mapping tables with the field names ‘input’ and ‘output’. And since the mapping tables are treated
differently, it does not matter if you have several mapping tables with the same name fields.
Another bonus is that the mapping tables are dropped at the end of the script, which alleviates some
cleanup.
Do While: How to Loop Until a Condition is Met
Most loops you will see are For loops. These are great if you can programmatically determine the number
of loops you need to do. For example the number of rows of a table. However, what if you need to loop as
long as it takes to finish? You don’t know how long it will take. Say you want to extract from an unreliable
database that fails for unspecified reasons and you just have to try until you succeed. These types of
examples are where Do While loops come in.
Do..Loop, or as I like to call it Do While, allows you to loop until a condition is met.
In this example, I want to loop for 5 seconds give or take.
// Determine numerical value of a second
Let vSecond = Num(Timestamp#('00:00:01','hh:mm:ss') - Time#('00:00:00','hh:mm:ss'));
Let vEnd = Num(Now()) + ($(vSecond)*3);
38

Set vIter = 0;
Do While Num(Now()) < $(vEnd)
Trace --------------------------- Iteration $(vIter);
Let vIter = Num(vIter + 1,'#,##0');
Loop
Which returns:
39

12,108 iterations in 5 seconds, so 2,481 a second. That’s pretty fast! Granted I wasn’t doing any heavy
lifting, but still. While this example isn’t exactly practical, I think it shows the point.
Cardinality and How it Impacts Application Size
One of the key things to understand when trying to tune a Qlik Sense® application for performance is
understanding the inner-workings. If you haven’t done so already, I very strongly suggest you read
Henric’s blog Symbol Tables and Bit-Stuffed Pointers which goes into detail on how Qlik Sense stores
data.
After grasping that, it starts to make sense why cardinality has such an impact on application size. So
keep in mind, before trying to minimize data size, try and minimize the number of distinct values. It can
play a huge role in cutting down size, without limiting functionality. Which is always an easier sell to your
users.
*PS. Take some time and read through all of Henric’s blogs. He is one of the best Qlik blog writers out
there.
Use AutoNumber to Optimize Your Data Model
To follow up on cardinality, a very useful function is AutoNumber. AutoNumber will create an integer for
each distinct value in your defined namespace, which is usually a field. The second parameter, allows you
to define the namespace, which means you can use it across multiple fields while keeping data
association integrity.
The best use case for AutoNumber is for keys. This will create the smallest footprint for your key fields
and maintain the relationship. This is because the amount of space for an integer is greatly smaller than a
string, or dual value field like a timestamp.
40

One tip, apply AutoNumber at the end of your data model build. It is much easier to troubleshoot data
model issues when you can see the actual data. After you know those linkages are good, then utilize the
function.
41

Effectively Work with Qlik Key Fields
Here are a few things I strongly suggest in working with Qlik key fields.
● Make separate key fields*● Prefix the field with ‘%’● Set HidePrefix variable to ‘%’● Use AutoNumber
*Because of how the association engine works, you should never use a key field in an expression. It can
return some very unexpected results. So to handle this, you should make a duplicate field to handle the
association and then use the other field in your expressions.
A visual of what I mean:
Let HidePrefix = '%';
Sales:
Load
RowNo() as Id,
AutoNumber(Pick(Ceil(Rand()*4), 'A','B','C','D'),'Product') as %ProductId,
Ceil(Rand()*100) as Qty
AutoGenerate
(1000);
Product:
Load
AutoNumber(Chr(RowNo()+64),'Product') as %ProductId,
Chr(RowNo()+64) as ProductId
AutoGenerate
(5);
42
Ignore Potential Future Use Cases and RemoveUnused Fields
I can’t tell you how many times a client has said to leave a field in the data model just in case they want to
use it later.
Just don’t do it. Take it out now, if they want to use it later, then bring it in later. You can easily set up the
app so that it is a super simple task down the road.
● Comment it out● Use a drop field statement which they can remove later (suggested)
The thing is, if you are tuning an app that is already slow and having issues, you should not be thinking
about the future state. You should be thinking about getting what you currently have working to an
acceptable level. You won’t be adding functionality to a clunky app if no one is using it because it takes 3
minutes to load the page.
/end rant
43

Using Arrays for Iteration
Arrays and/or Lists are very common in programming languages. In Qlik scripting there are two ways to
go about creating an array of sorts.
The first way is storing a list in a variable:
Set vCount = 'One','Two','Three';
for each i in $(vCount)
Trace ------------ Variable Array $(i);
Next i
The second way is by using a field:
Cnt:
Load * Inline [
Cnt
One
Two
Three
];
For each x in FieldValueList('Cnt');
Trace ------------ Field Array: $(x);
Next x;
The main use of these will be for iterating over their values. There are not any native list/array operations,
however you can get around that utilizing other Qlik Sense® functions. For example: concatenate, where
not exists, reinitializing the variable, etc…
44
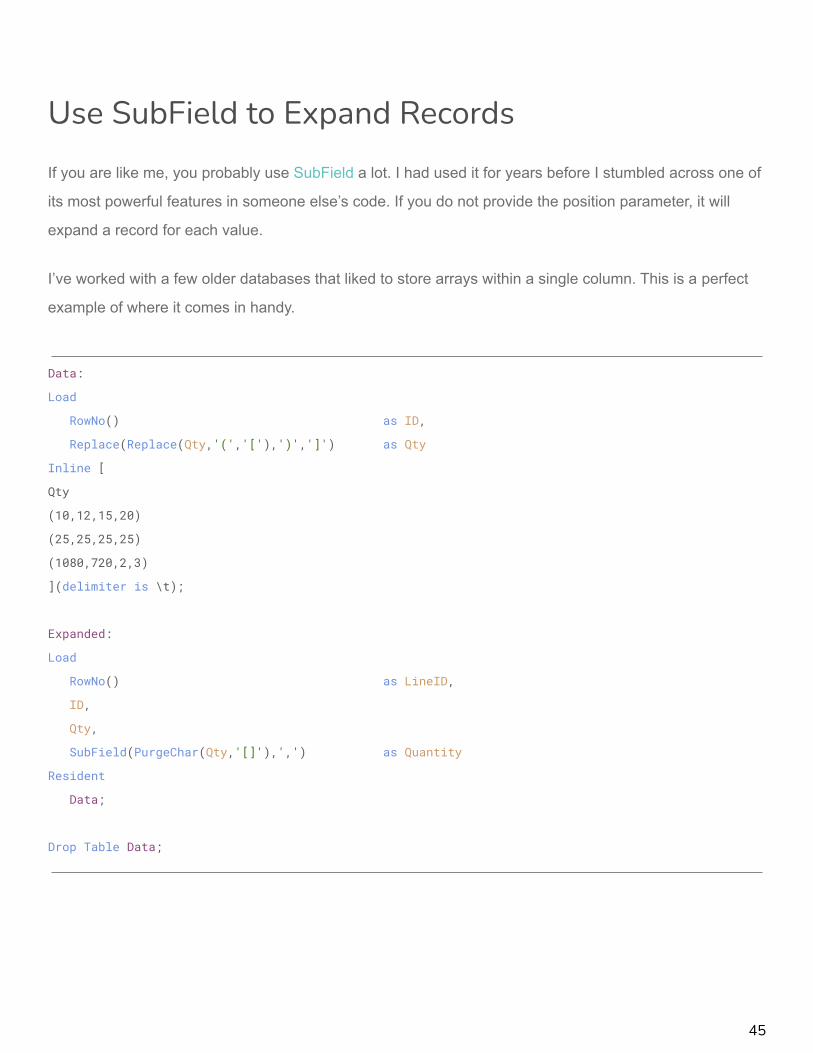
Use SubField to Expand Records
If you are like me, you probably use SubField a lot. I had used it for years before I stumbled across one of
its most powerful features in someone else’s code. If you do not provide the position parameter, it will
expand a record for each value.
I’ve worked with a few older databases that liked to store arrays within a single column. This is a perfect
example of where it comes in handy.
Data:
Load
RowNo() as ID,
Replace(Replace(Qty,'(','['),')',']') as Qty
Inline [
Qty
(10,12,15,20)
(25,25,25,25)
(1080,720,2,3)
](delimiter is \t);
Expanded:
Load
RowNo() as LineID,
ID,
Qty,
SubField(PurgeChar(Qty,'[]'),',') as Quantity
Resident
Data;
Drop Table Data;
45

Which results in:
Wildcard Load for Bulk LoadingOne good thing to know is that you can use an asterisk * within a file name. Qlik Sense® will load all the
files that fit the criteria.
Say you have a directory named QVD, which has all of your QVDs prepped and ready for your data
model. You can simply do the following to load them all.
Load
*
From
[lib://QVD/*.qvd](qvd);
46

If you have extracts with a date or notation to them, you can load them in a similar fashion.
Fact:
Load
*
From
[lib://Data/Sales_*.csv](txt, utf8, embedded labels, delimiter is ',');
Using these files as an example:
All the files would be loaded except for Sales201904.csv, because it doesn’t match the Sales_*.csv
criteria, because it is missing the underscore.
One thing to note is you are relying on the Qlik® Associative Engine’s brain on what to do with the tables.
You aren’t being explicit with what you want. So tables with the same fields will be auto-concatenated,
while others with a different structure will be created as different tables.
If you want to be explicit, which you know I do, you can utilize a loop.
Sales:
Load
Null() as Tmp
AutoGenerate
(0);
47

For each File in FileList('lib://Data/Sales_*.csv')
Concatenate(Sales)
Load
*
From
[$(File)](txt, utf8, embedded labels, delimiter is ',');
Next File
Drop Field Tmp;
Dual Behavior in Set Analysis
By default you need to reference the display (read: string) value of a dual field in set analysis versus the
numerical value. I personally think this is a weird behavior of Qlik Sense®, however it is what it is. The
downside to this is that string operations are much slower than numerical ones. To overcome this you
need to leverage advanced search within set analysis.
Example: Use set analysis to filter down to dual value with numerical value of 1*
*Remember in the Dual Data Type Caveat section how two numbers can represent the same string?
See the different outputs:
You’ll notice that you need to use greater than or equal to and less than or equal to for it to work.
=Only({<Dual={">=1<=1"}>} Dual)
48
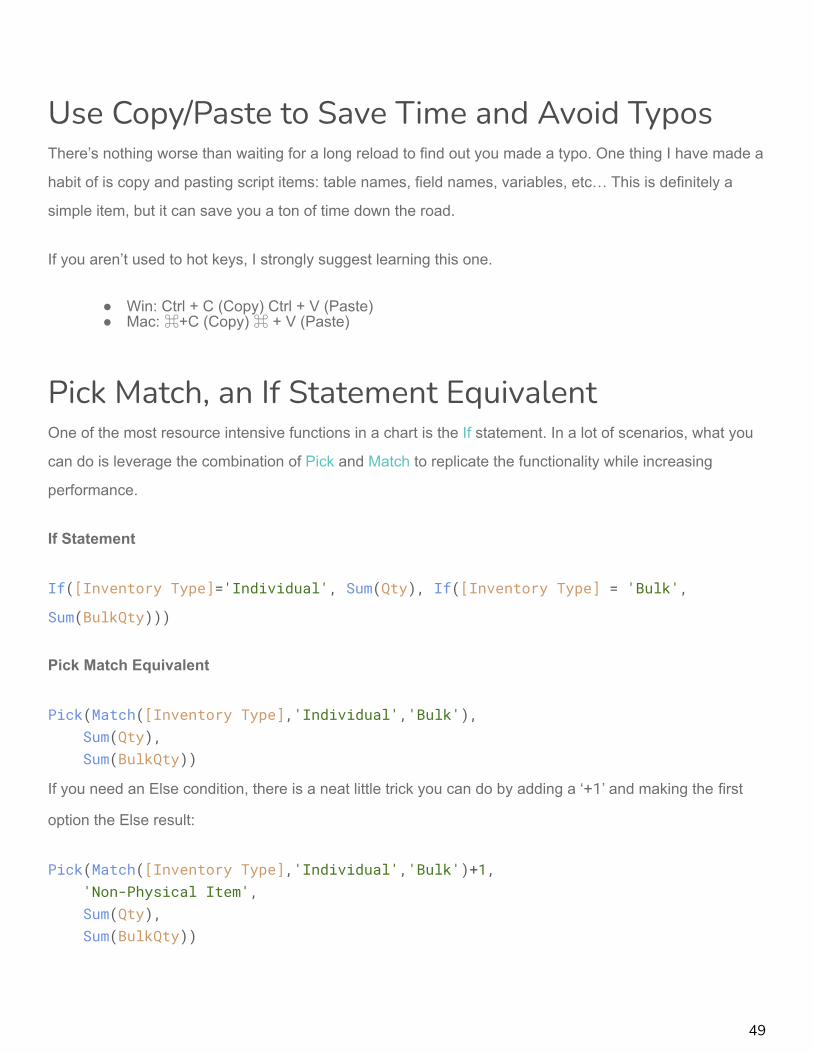
Use Copy/Paste to Save Time and Avoid TyposThere’s nothing worse than waiting for a long reload to find out you made a typo. One thing I have made a
habit of is copy and pasting script items: table names, field names, variables, etc… This is definitely a
simple item, but it can save you a ton of time down the road.
If you aren’t used to hot keys, I strongly suggest learning this one.
● Win: Ctrl + C (Copy) Ctrl + V (Paste)● Mac: ⌘+C (Copy) ⌘ + V (Paste)
Pick Match, an If Statement EquivalentOne of the most resource intensive functions in a chart is the If statement. In a lot of scenarios, what you
can do is leverage the combination of Pick and Match to replicate the functionality while increasing
performance.
If Statement
If([Inventory Type]='Individual', Sum(Qty), If([Inventory Type] = 'Bulk',
Sum(BulkQty)))
Pick Match Equivalent
Pick(Match([Inventory Type],'Individual','Bulk'),Sum(Qty),Sum(BulkQty))
If you need an Else condition, there is a neat little trick you can do by adding a ‘+1’ and making the first
option the Else result:
Pick(Match([Inventory Type],'Individual','Bulk')+1,'Non-Physical Item',Sum(Qty),Sum(BulkQty))
49
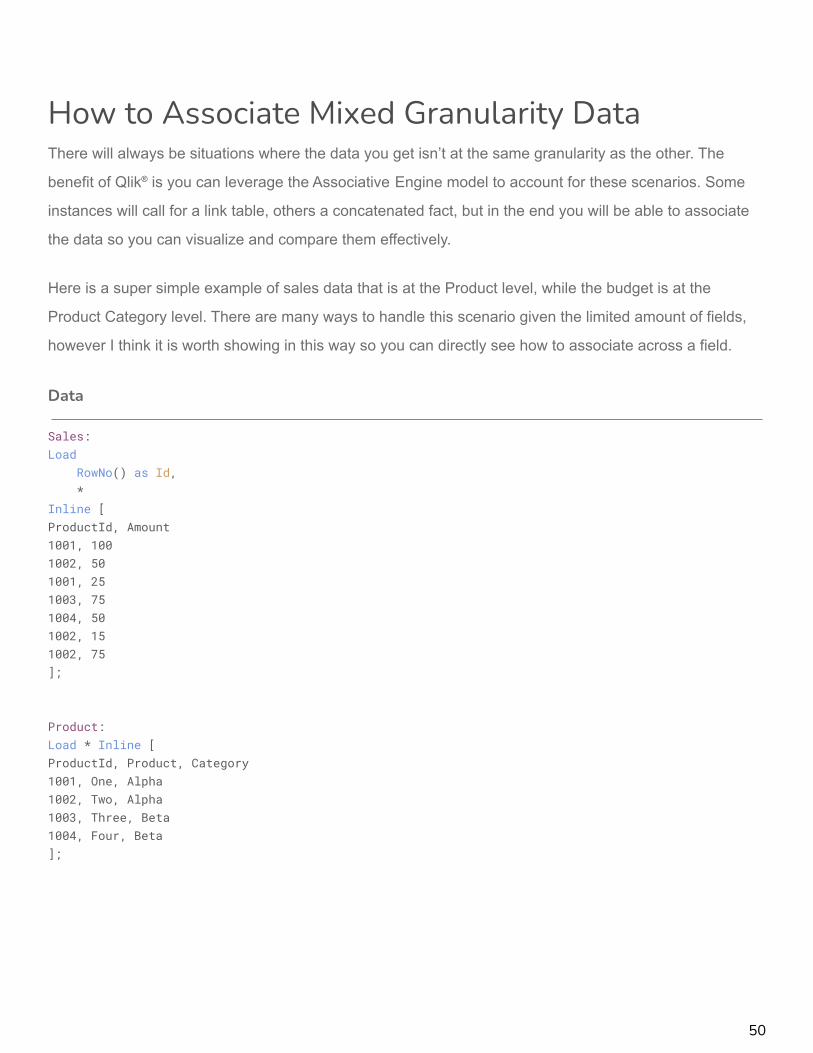
How to Associate Mixed Granularity DataThere will always be situations where the data you get isn’t at the same granularity as the other. The
benefit of Qlik® is you can leverage the Associative Engine model to account for these scenarios. Some
instances will call for a link table, others a concatenated fact, but in the end you will be able to associate
the data so you can visualize and compare them effectively.
Here is a super simple example of sales data that is at the Product level, while the budget is at the
Product Category level. There are many ways to handle this scenario given the limited amount of fields,
however I think it is worth showing in this way so you can directly see how to associate across a field.
Data
Sales:Load
RowNo() as Id,*
Inline [ProductId, Amount1001, 1001002, 501001, 251003, 751004, 501002, 151002, 75];
Product:Load * Inline [ProductId, Product, Category1001, One, Alpha1002, Two, Alpha1003, Three, Beta1004, Four, Beta];
50
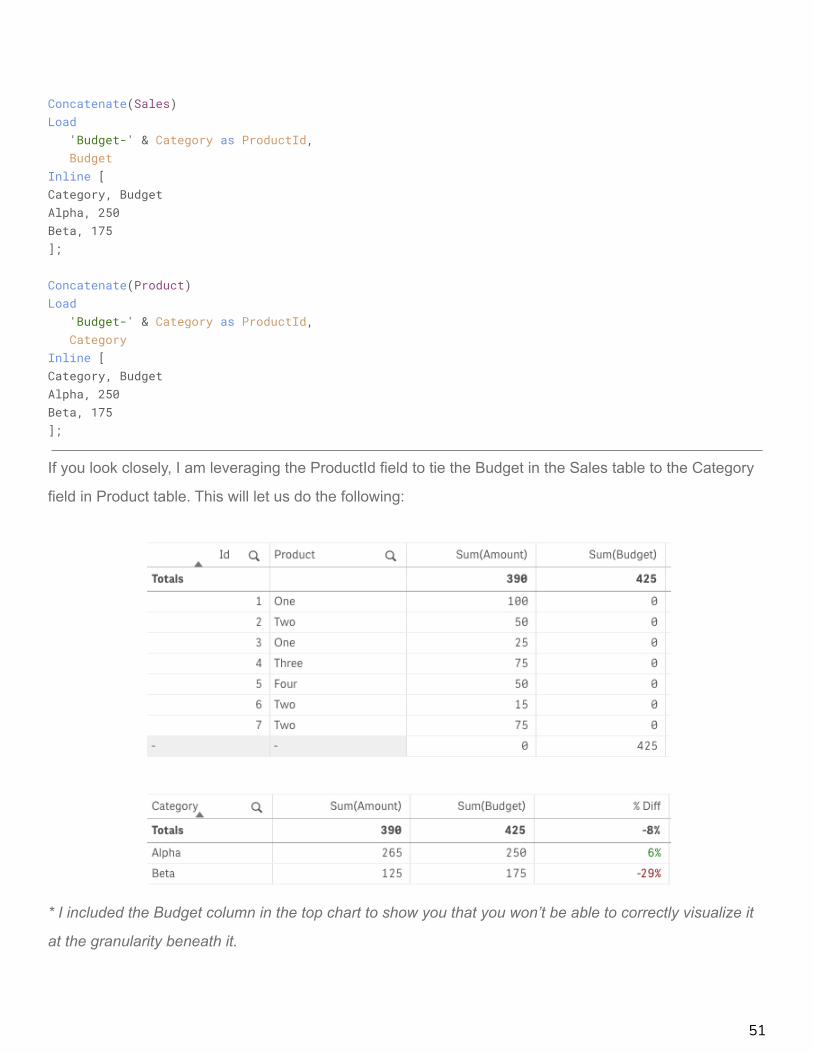
Concatenate(Sales)Load
'Budget-' & Category as ProductId,Budget
Inline [Category, BudgetAlpha, 250Beta, 175];
Concatenate(Product)Load
'Budget-' & Category as ProductId,Category
Inline [Category, BudgetAlpha, 250Beta, 175];
If you look closely, I am leveraging the ProductId field to tie the Budget in the Sales table to the Category
field in Product table. This will let us do the following:
* I included the Budget column in the top chart to show you that you won’t be able to correctly visualize it
at the granularity beneath it.
51
When Should You Upgrade Qlik Sense®?
With Qlik Sense® having multiple releases a year, it can quickly become overwhelming staying up to date
on the latest release. And even then, should you even be on the latest and greatest?
Here is what I recommend as a rule of thumb: when upgrading or installing for the first time, install the
latest release with a patch out. I always suggest staying one release behind so that you aren’t the
production testers. With most software, there will be bugs. If you have mission critical items, it’s better
safe than sorry.
Now, when to upgrade? I suggest staying no more than 3 releases behind. So if you are already one
behind, that means you would upgrade every 2 releases: ~6 months. Note, that each release is only
supported for 2 years. So at the bare minimum, you should stay within that window.
The caveat to these recommendations is if there is a feature or bug fix you need. Those are good reasons
to upgrade outside of these recommendations.
Create A Codebase
One of the reasons I started writing these types of things was to have a place to store my random Qlik
info. But even before this, over the years I have collected a number of code snippets that I can refer to
whenever a similar problem comes up. So you don’t need a blog or ebook, you just need a folder.
To be honest, there are a lot of repetitive problems within the Qlik® ecosphere. I think that is true for
programming languages in general. However with Qlik scripting being a relatively niche area, it is even
more apparent.
So with that said, save your work! Create a folder and start adding .qvs files and give them some
comments. Future you will thank you.
52

I recommend downloading VS Code. There is a Qlik extension made by Xavier Han, which will give you
syntax highlighting among other things. Both great and free. Also, I cannot recommend using the Chrome
extension Add-Sense enough! Credit to Erik Wetterberg, it makes pulling load scripts from Qlik Sense
apps a breeze.
If you want to up your game and potentially learn a new skill, create a Git repo. Many offer at least one
free private repo, I personally use GitHub, but there are tons of options out there. This is a skill I think
every developer should have, even if it’s just the basics.
*Disclaimer: If you are doing work for a client, make sure what you are saving is okay to have a copy of.
Using Advanced Search to Filter in Set Analysis
Set Analysis is extremely powerful, however it can seem a bit overwhelming at times. One thing I felt
helped me further understand the mechanics is recognizing that what will work within a filter search, will
work within a Set Analysis condition between double quotes.
For example, take this dataset:
53

Using advanced search functionality, you can filter down the
data based on an expression:
Apply the same expression in Set Analysis and you will receive the same filtering capability
Expression: =Sum({<id={“=Sum(exp)>50”}>} exp)
54

You can not only use expressions, but take advantage
of the other search features, such as the ? wildcard. In
this example, ???? would filter the name down to
values with 4 characters.
Expression: =Sum({<name={“????”}>} exp)
You can think of Set Analysis as a where clause for an expression or a set of hard coded filters. There is a
series of documentation, cheat sheets, and blogs out there that go into more detail of all the potential
ways you leverage the search capability.
55

Lastly, there are some crazy things you
can do using Dollar-sign expansion as
well. Although I won’t go into it in this
section, it’s worth noting that Qlik Sense’s
feature, the Dollar-sign expansion
preview, has made it much much easier
to implement these types of expressions.
Changing Column Width
I’ve heard a few people mention that you can’t change the column width within a table. This is definitely
possible! If you haven’t stumbled on the solution yet, follow the steps below:
1. In read mode, use your mouse to change the column
to your desired width by dragging the vertical border
on the header.
2. Open Edit mode
3. Click on the table
4. You should see a prompt to “Apply Changes”, click
“Apply” to save your new layout.
I admit the UX is a bit wonky and unintuitive but once you
know it, you won’t forget it.
56

Making Date Formats Functional
I’ve spent a lot of time over the years troubleshooting issues that resulted in it being because of the date
format. After a while I started to make a habit of always using dates in a numerical format when used for
conditions, whether it be in Set Analysis or a Where clause.
Here are a couple examples.
Load Script
Sales:
Load
RowNo() as Id,
Num(Date) as DateNum,
*
Inline [
Date, Amt
10/8/2019, 100
10/9/2019, 125
10/10/2019, 75
11/1/2019, 150
11/10/2019, 200
];
Left Join(Sales)
Load
DateNum,
1 as FutureFlag
Resident
Sales
Where
Num(DateNum) > Num(Today());
57
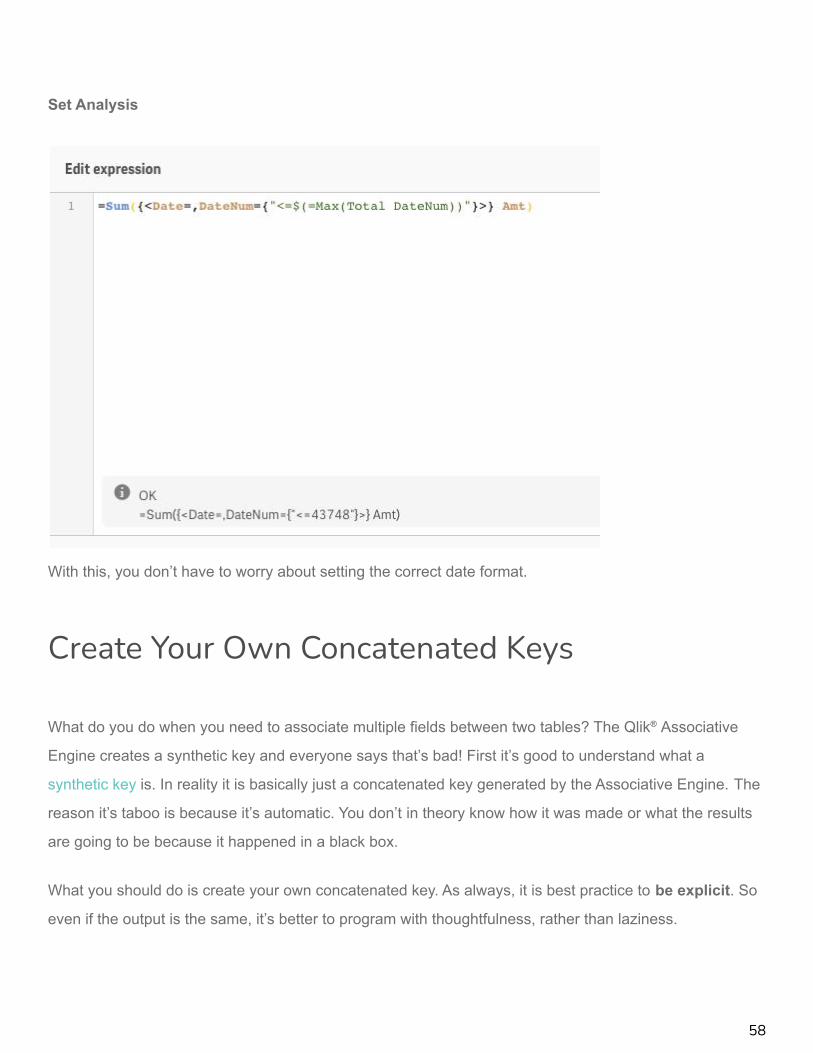
Set Analysis
With this, you don’t have to worry about setting the correct date format.
Create Your Own Concatenated Keys
What do you do when you need to associate multiple fields between two tables? The Qlik® Associative
Engine creates a synthetic key and everyone says that’s bad! First it’s good to understand what a
synthetic key is. In reality it is basically just a concatenated key generated by the Associative Engine. The
reason it’s taboo is because it’s automatic. You don’t in theory know how it was made or what the results
are going to be because it happened in a black box.
What you should do is create your own concatenated key. As always, it is best practice to be explicit. So
even if the output is the same, it’s better to program with thoughtfulness, rather than laziness.
58

Synthetic Key
Concatenated Key
Data:Load
Region & '|' & ProductId as %Region_Product,Region,Qty
Inline [Region, ProductId, QtyNorth, A, 12East, B, 7West, C, 19North, B, 5East, C, 8West, D, 10];
59

Product:Load
Region & '|' & ProductId as %Region_Product,ProductId,Price
Inline [Region, ProductId, PriceNorth, A, 5East, A, 5West, A, 6North, B, 13East, B, 8West, B, 9North, C, 1East, C, 1West, C, 1North, D, 21East, D, 12West, D, 7];
*I almost always use a pipe | as the separator.
By doing the above, it will remove the synthetic key.
In this case, the data results are the same. However, in complex data models synthetic keys can produce
unexpected results. Also, in some scenarios you may not even want the fields associating. So the answer
would not be a concatenated key at all. You would either want to remove the field or rename it, leaving the
one correct field to define the association.
60

Looping Over Records Using WhileThe While clause is an extremely powerful feature that you probably won’t use frequently, but when you
do it’s a god-send. Note that this is a part of the Do..Loop scripting convention. There is not a specific help
page on the keyword.
Using While allows you to loop on a record within a load statement. It will basically keep loading that
record until its condition is met. I like to think of them as mini-loops.
So take this super simple example. I have an array which is separated by pipes. I want to pull in the first
three values of the array, but not any past that.
Data:
Load * Inline [
Array
12|13|AAA|1
12|7|BBB|2
];
NewData:
Load
SubField(Array,'|', IterNo()) as ArrayValue,
IterNo() as ArrayIteration
Resident
Data
While
IterNo() <= 3;
Drop Table Data;
61

IterNo is a function that keeps track of the iteration you are on. You can leverage in your While clause as
well as your field expressions.
This script example uses IterNo as the SubField parameter to pull out the first three values separated by
the delimiter, producing my desired results.
One place you may have seen this used is in Master Calendar scripts floating around on the Community.
I’ve seen it used to get a distinct list of dates quickly and/or to generate a new list of dates
62

Example:
Let vDateField = 'Date';
AllDates:
Load
FieldValue('$(vDateFieldName)', IterNo()) AS EveryDate
AutoGenerate
(1)
While
Not IsNull(FieldValue('$(vDateField)', IterNo()));
Troubleshooting Associations: Subset RatioOne quick tip about data modeling. If you find things in your model are not associating right, take a look at
your key fields. If you add up the subset ratio percentages of a key in each table that it is in and it equals
100%, this means there are no matching values. So even though the data model viewer shows them as
linked because the fields exist in each table, the values within them don’t. This could be due to formatting
or misunderstood key fields.
If you take a look at the example below. %Date in the Calendar table has 46.5%. While %Date in the Sales
table has 53.4%. This equates to ~100%. So each table has values for %Date, but none of them exist in
the other table.
If you take a closer look, you’ll notice that the date formats are different. This is a simple mistake that can
throw off your model entirely.
63

Calendar
64

Sales
Hidden Default AppsMost of us are familiar with the License Monitor and Operations Monitor dashboards. These two logging
apps are automatically installed and placed in the ‘Monitoring apps’ stream.
65

Did you know that these are only a couple of dashboards that come with the Qlik Sense Enterprise
installation?
If you take a look at the following folder location, you will find that there are several additional applications
which can be imported through the QMC. These are especially useful when tuning applications and your
environment.
Folder: C:\ProgramData\Qlik\Sense\Repository\DefaultApps
66

I suggest taking some time to import these apps and reviewing their results. They are extremely handy.
Check the documentation for more info on how to configure and use them.
Using FieldValueList for Loops
This is a very neat option for loops. If you need to loop through a list of field values you can use the
FieldValueList mask. This could replace using the combination of NoOfRows and Peek. That is assuming
you only need to loop through the distinct list of values.
Numbers:Load * Inline [NumZeroOneTwoTwoThree];
Trace --------------------- FieldValueList:;
67

Let vIter = 0;
For each n in FieldValueList('Num')
Trace --------------------- Iteration: $(vIter) | Number: $(n);
Let vIter = $(vIter) + 1;
Next n;
vIter=;n=;
Trace --------------------- NoOfRows + Peek:;
For i = 0 to NoOfRows('Numbers')-1
Let vNum = Peek('Num',$(i),'Numbers');
Trace --------------------- Iteration: $(i) | Number: $(vNum);
Next i;
vNum=;i=;
68

Result
Notice the difference how the two options handle the value Two. FieldValueList (Blue) uses the symbol
table, so it loops over the unique values, whereas NoOfRows + Peek (Red) loops over the rows of the
internal table.
69

Did You Try Turning It Off and On Again?
After working with Qlik Sense® for a long time, you’ll soon find out that restarting the services can solve a
lot of unexpected behaviors and is a good starting point for environment bugs.
If you’re like me it can take a while to remember the order they should be done in. So here is the list of the
correct order.
Single Node Environment
1. Stop Qlik Sense Repository Service (Which will stop the following)1. Qlik Sense Scheduler Service2. Qlik Sense Proxy Service3. Qlik Sense Printing Service4. Qlik Sense Engine Service
2. Stop Qlik Sense Service Dispatcher Service3. *Optional: Restart Qlik Logging Service4. Restart Qlik Sense Repository Database5. Start Qlik Sense Service Dispatcher6. Start Qlik Sense Repository Service7. Start remaining Qlik Sense services in any order
1. Qlik Sense Scheduler Service2. Qlik Sense Proxy Service3. Qlik Sense Printing Service4. Qlik Sense Engine Service
Multi-Node Environment
If you have a multi-node environment, you should first stop the services on all RIM nodes. Perform the
above on the Central node. Once complete, start the services on each of the RIM nodes, starting at step 5
from above.
*If your system has crashed and the Engine Service does not want to stop, feel free to end the process
using the Task Manager.
70

FileList Mask Order Test
There is a feature available when doing a for each loop called FileList. It’s a way to get a list of files in a
directory that matches a wildcard path.
Since this is a parameter of the for each statement and not a function, there is not a lot of information on
it. You might have noticed that I like doing test cases. So I figured I would build a quick test to have as
reference for the future. One of the things I wanted to determine was what determines the returned list
order. So I ended up doing a quick test.
My guess was that there were three options:
1. File Name
2. File Time
3. File Size
Result: File Name ascending by alphabetical order.
Test 1
The test is pretty simple. We are going to create three files then read them back in using the FileList maskand capture the order.
The first test is determined as such:
● File 1: z_Table○ Highest Alpha○ Lowest File Time○ Middle Size
● File 2: m_Table○ Middle Alpha○ Middle File Time○ Highest Size
● File 3: a_Table○ Lowest Alpha○ Highest File Time○ Lowest Size
71

z_Table:Load
1 as FieldAAutoGenerate
(1000);
m_Table:Load
1 as FieldBAutoGenerate
(100000);
a_Table:Load
1 as FieldCAutoGenerate
(10);
result:Load
Num(Null()) as Order,Null() as File
AutoGenerate(0);
For each t in 'z_Table', 'm_Table', 'a_Table'
Trace ---------------- $(t);Store $(t) into [lib://QVD/test/for-each-order/$(t).qvd](qvd);
Next t;
For each file in FileList('lib://QVD/test/for-each-order/*.qvd')
Concatenate(result)Load
RowNo() as Order,'$(file)' as File
AutoGenerate(1);
Next file;
72
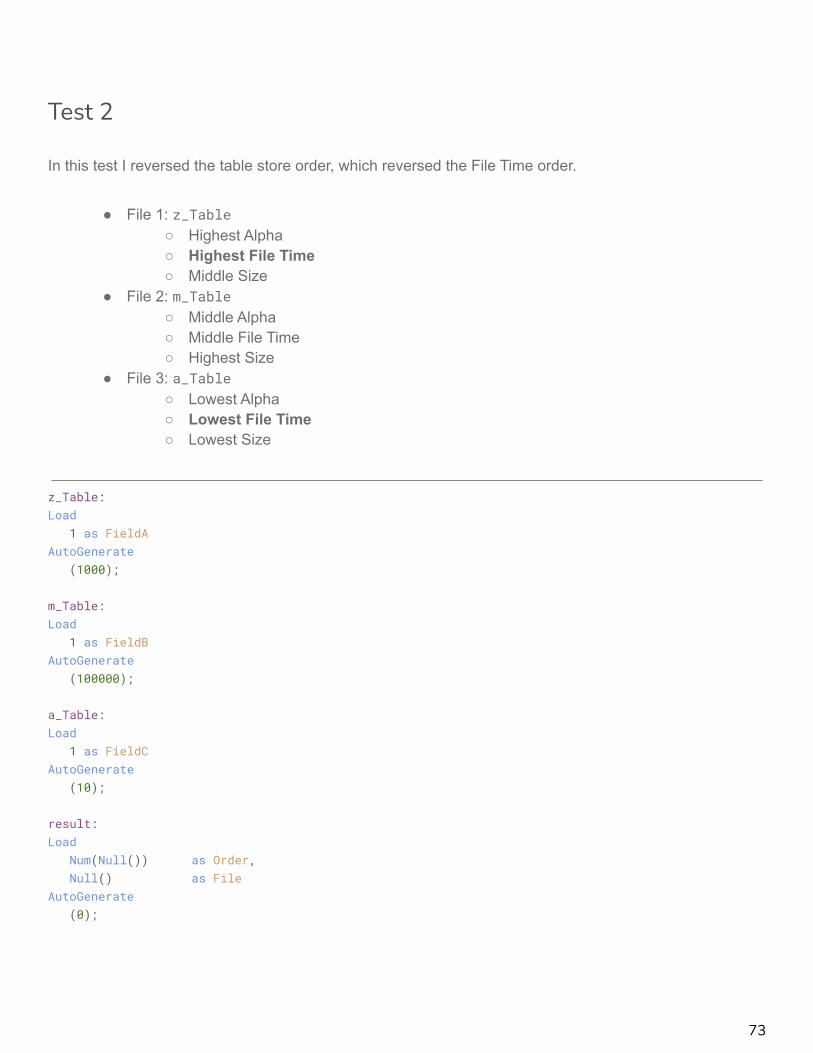
Test 2
In this test I reversed the table store order, which reversed the File Time order.
● File 1: z_Table○ Highest Alpha○ Highest File Time○ Middle Size
● File 2: m_Table○ Middle Alpha○ Middle File Time○ Highest Size
● File 3: a_Table○ Lowest Alpha○ Lowest File Time○ Lowest Size
z_Table:Load
1 as FieldAAutoGenerate
(1000);
m_Table:Load
1 as FieldBAutoGenerate
(100000);
a_Table:Load
1 as FieldCAutoGenerate
(10);
result:Load
Num(Null()) as Order,Null() as File
AutoGenerate(0);
73

For each t in 'a_Table', 'm_Table', 'z_Table'
Trace ---------------- $(t);Store $(t) into [lib://QVD/test/for-each-order/$(t).qvd](qvd);
Next t;
For each file in FileList('lib://QVD/test/for-each-order/*.qvd')
Concatenate(result)Load
RowNo() as Order,'$(file)' as File
AutoGenerate(1);
Next file;
Test 3
In this test I reversed the File Size for z_Table and a_Table.
● File 1: z_Table○ Highest Alpha○ Highest File Time○ Lowest Size
● File 2: m_Table○ Middle Alpha○ Middle File Time○ Highest Size
● File 3: a_Table○ Lowest Alpha○ Lowest File Time○ Middle Size
74

z_Table:Load
1 as FieldAAutoGenerate
(10);
m_Table:Load
1 as FieldBAutoGenerate
(100000);
a_Table:Load
1 as FieldCAutoGenerate
(1000);
result:Load
Num(Null()) as Order,Null() as File
AutoGenerate(0);
For each t in 'a_Table', 'm_Table', 'z_Table'
Trace ---------------- $(t);Store $(t) into [lib://QVD/test/for-each-order/$(t).qvd](qvd);
Next t;
For each file in FileList('lib://QVD/test/for-each-order/*.qvd')
Concatenate(result)Load
RowNo() as Order,'$(file)' as File
AutoGenerate(1);
Next file;
75

Result
Every test returned the same thing: a_Table was the first within the list. This means that the FileList mask
returns an alphabetical file list.
How to Create a Quick Month Map
Here is a super quick tip. If you ever need to convert month names or prefixes to numbers or dates you
can leverage the default variables and Subfield to quickly create a mapping table to later use with an
ApplyMap.
SET ThousandSep=',';SET DecimalSep='.';SET MoneyThousandSep=',';SET MoneyDecimalSep='.';SET MoneyFormat='$#,##0.00;-$#,##0.00';SET TimeFormat='h:mm:ss TT';SET DateFormat='M/D/YYYY';SET TimestampFormat='M/D/YYYY h:mm:ss[.fff] TT';SET FirstWeekDay=6;SET BrokenWeeks=1;SET ReferenceDay=0;SET FirstMonthOfYear=1;SET CollationLocale='en-US';SET MonthNames='Jan;Feb;Mar;Apr;May;Jun;Jul;Aug;Sep;Oct;Nov;Dec';SET LongMonthNames='January;February;March;April;May;June;July;August;September;October;November;December';SET DayNames='Mon;Tue;Wed;Thu;Fri;Sat;Sun';SET LongDayNames='Monday;Tuesday;Wednesday;Thursday;Friday;Saturday;Sunday';SET NumericalAbbreviation='3:k;6:M;9:G;12:T;15:P;18:E;21:Z;24:Y;-3:m;-6:μ;-9:n;-12:p;-15:f;-18:a;-21:z;-24:y';
76

month_map:Mapping Load
SubField('$(MonthNames)',';') as month,RowNo() as month_num
AutoGenerate(1);
example:Load
MakeDate(year,ApplyMap('month_map',month,Null())) as date,ApplyMap('month_map',month,Null()) as month_number,*
Inline [month, year, qtyJan, 2020, 10Feb, 2020, 15Mar, 2020, 5Apr, 2020, 20];
and boom:
77

Get QVD Metadata from XML Headers
Each QVD contains an XML header which contains metadata about that QVD. It is very common to
leverage this to make a QVD Catalog dashboard to provide some overarching insight into all of the QVDs
in your environment.
To see, just select a QVD in a folder connection and change the File format from QVD to XML.
One thing to note is that XML is semi-structured. Fields will appear and disappear based on the data
available. For example, a QVD header will contain a Tag table if any of the fields are tagged. If none are
tagged, it won’t exist for that QVD. So make sure you handle these different edge cases in your load
script.
Where do Reload Logs Reside?
If you didn’t know, reload logs reside in the following folders:
● C:\ProgramData\Qlik\Sense\Log\Script
○ On the Qlik Engine that the application reloaded on.
● ~\QlikShare\ArchivedLogs\%Server_Name%\Script
78
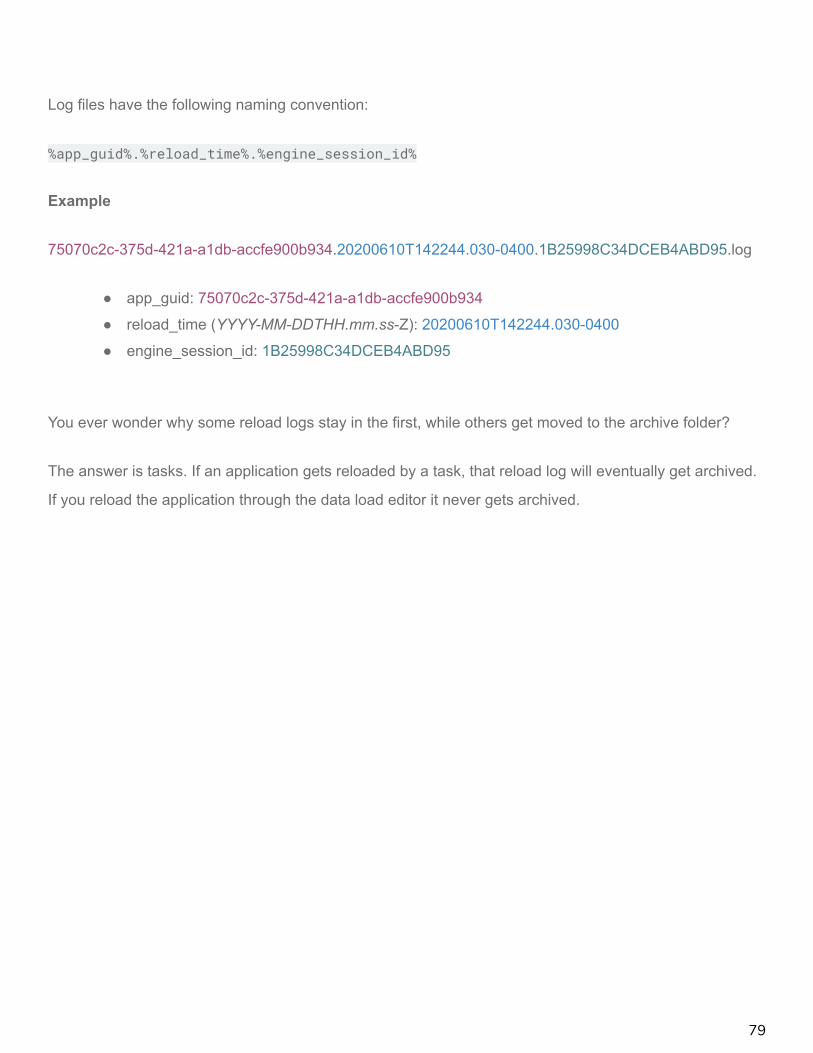
Log files have the following naming convention:
%app_guid%.%reload_time%.%engine_session_id%
Example
75070c2c-375d-421a-a1db-accfe900b934.20200610T142244.030-0400.1B25998C34DCEB4ABD95.log
● app_guid: 75070c2c-375d-421a-a1db-accfe900b934
● reload_time (YYYY-MM-DDTHH.mm.ss-Z): 20200610T142244.030-0400
● engine_session_id: 1B25998C34DCEB4ABD95
You ever wonder why some reload logs stay in the first, while others get moved to the archive folder?
The answer is tasks. If an application gets reloaded by a task, that reload log will eventually get archived.
If you reload the application through the data load editor it never gets archived.
79

Natively Loading JSONI want to start this section off by mentioning that this only works for flat json, meaning non-nested json
hierarchies. It is possible to leverage this for nested json but takes a bit more elbow grease and
knowledge of the schema. Since my intention is to keep these things brief, I’ll save that for another time.
So getting into it, imagine you have a field with json values and we want to convert the json to a table.
What we can do is leverage From_Field and put json for our table format.
Script
raw:LOAD
"@1:n" as session_logsFROM
[lib://QlikShare/Dev/json/session-reload.log](fix, codepage is 28591, embedded labels);
json:Load
*From_Field
(raw, session_logs)(json,utf8, no labels);
80

Result
We can also directly load a .json file as well. Although, for it to to work it can only be a single flat json
structure with no labels or headers.
Example
81
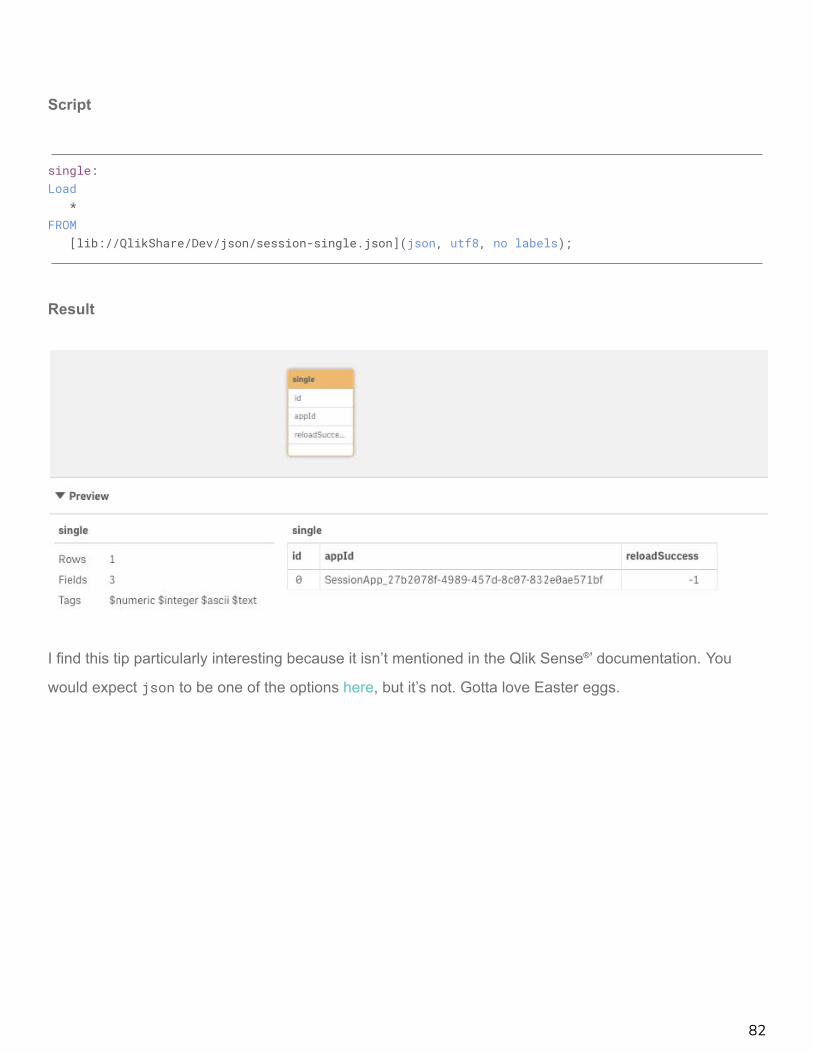
Script
single:Load
*FROM
[lib://QlikShare/Dev/json/session-single.json](json, utf8, no labels);
Result
I find this tip particularly interesting because it isn’t mentioned in the Qlik Sense®’ documentation. You
would expect json to be one of the options here, but it’s not. Gotta love Easter eggs.
82

Section Access Tips and Tricks
This post isn’t necessarily made to teach you what Section Access is, but rather to help you better
understand it and provide you some tools to help troubleshoot it.
Keywords
Admittedly this took me 6-7 years of using Section Access to fully understand what the keywords Section
Access and Section Application did. Essentially, you can think of a Qlik Sense® (or QlikView®) load
script to be defined in two parts. First your application part, which defines everything on your Qlik Sense®
application. Second is your security part, which defines the security portion, meaning it isn’t defining your
application but the security on it.
Section Access basically signifies to the interpreter that we are now defining our access portion. Who
can access What? Section Application then tells us that we are resuming defining our application.
This helped me better understand what each of the keywords did and when to use them.
83

Security Table
The security table is there to define the… well security. The easiest way to think about it is that the table
defines a pre-selection for the user. The data associated with that selection is what they have access to.
Fields
● ACCESS○ ADMIN – Does not apply Section Access to user○ USER – Applies Section Access to user
● USERID○ DOMAIN\USER of user access Qlik dashboard
Tip: Use “=OSUser()” in a KPI chart or the Users page in QMC to see
● GROUP○ User directory Group attribute to use to define rule.
● OMIT○ Field to omit from user’s model.
● %FIELD%○ Name of field to link to a data table to apply row level security, or key to omit table,
which contains OMIT field.
84
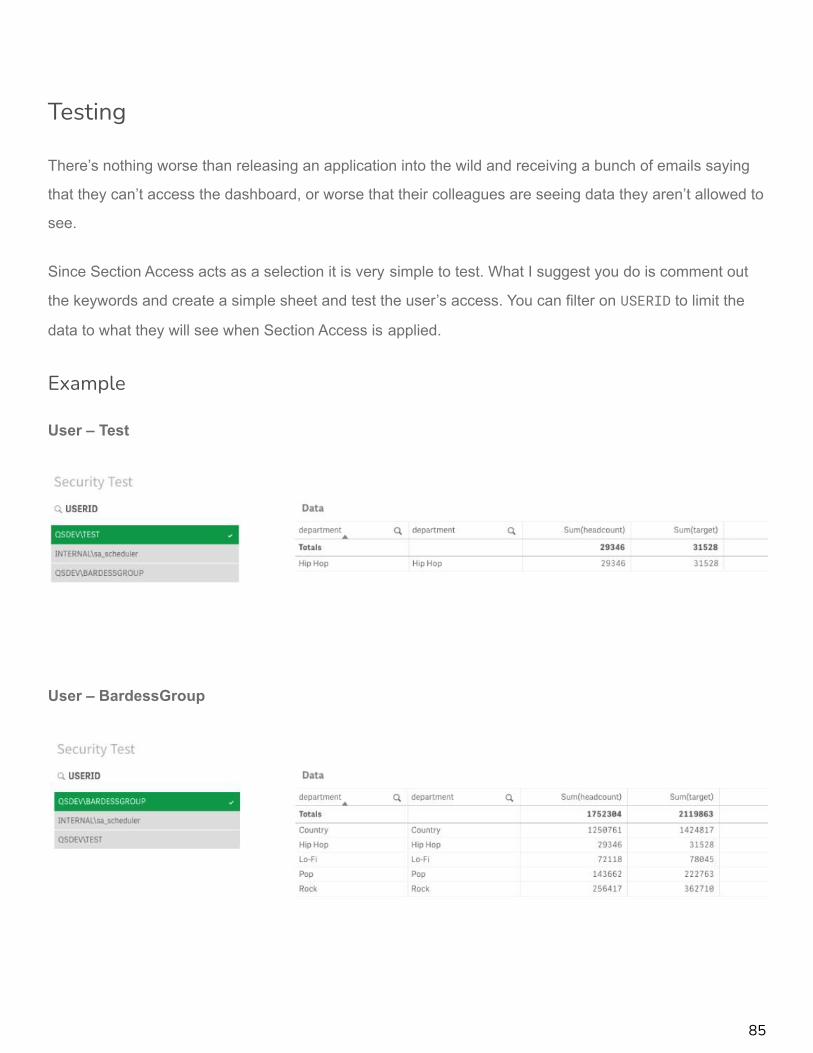
Testing
There’s nothing worse than releasing an application into the wild and receiving a bunch of emails saying
that they can’t access the dashboard, or worse that their colleagues are seeing data they aren’t allowed to
see.
Since Section Access acts as a selection it is very simple to test. What I suggest you do is comment out
the keywords and create a simple sheet and test the user’s access. You can filter on USERID to limit the
data to what they will see when Section Access is applied.
Example
User – Test
User – BardessGroup
85

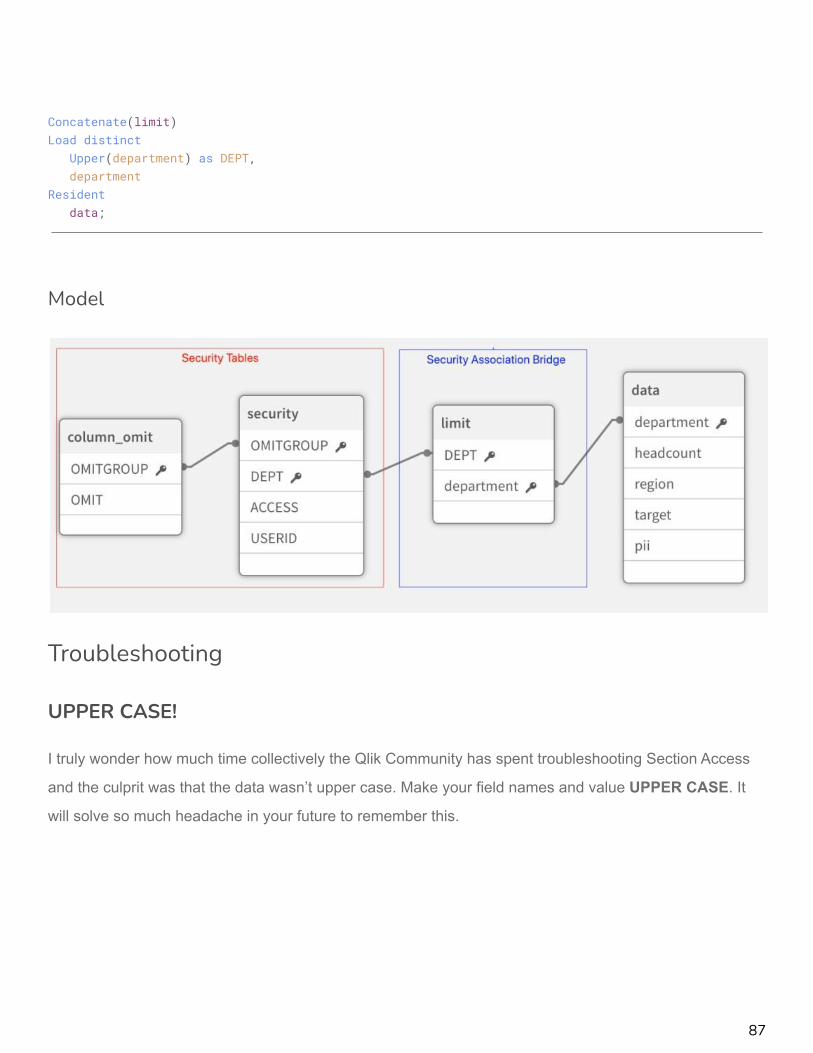
Limit Table
I have over the years grown to always create a bridge table between my security table and my data table.
This is because I want my security table to be one row per user. The limit table will then define the
association and therefore security. Similarly, if you are using OMIT, I will create an omit table which
contains the fields to omit and the group which is tied to those. This is to keep the relationship 1 to many
and my security table one row per user.
Script
Section Access;
security:Load * inline [ACCESS, USERID, DEPT, OMITGROUPADMIN, INTERNAL\sa_schedulerUSER, QSDEV\BARDESSGROUP, ADMINUSER, QSDEV\TEST, HIP HOP, A];
column_omit:Load * Inline [OMITGROUP, OMITA, targetA, pii];
Section Application;
limit:Load distinct
'ADMIN' as DEPT,department
Residentdata
Wheredepartment <> 'Army';
86
Concatenate(limit)Load distinct
Upper(department) as DEPT,department
Residentdata;
Model
Troubleshooting
UPPER CASE!
I truly wonder how much time collectively the Qlik Community has spent troubleshooting Section Access
and the culprit was that the data wasn’t upper case. Make your field names and value UPPER CASE. It
will solve so much headache in your future to remember this.
87

Tasks Fail
If your reload succeeds when run by you in the hub but fails as a task, this is because the internal service
account doesn’t have access. In Qlik Sense this is INTERNAL\SA_SCHEDULER. Make sure to add it to your
Section Access security table as an admin.
Access Denied
If a user cannot open the application from the hub, then they are not in the Section Access security table.
OMIT Experience
If you omit a field for a user and a chart uses that field as a dimension, it will cause an error. To account
for this you will need to make sure there is a calculation condition on the dimension/measure so that it is
hidden for the users that do not have access to it. That or leverage a Hide/Show mechanic in a container
to replace the chart with something else that would be useful.
88

What I typically do is add an expression in the calculation condition:
Example – Omit field pii
=If(Len('$(=MaxString({1}[pii]))')>1,1,0)
I make sure I am using the set of 1 {1} so the user’s that do have access to the field aren’t affected by the
condition because of their filters. Additionally, I am checking the MaxString value so it works for both text
and numeric fields. If the field doesn’t exist, it will return NULL which will return -, hence the condition of
Len() > 1.
89

User With Access
User Without Access
Hopefully this helps. I know I could use back the day or three I’ve spent banging my head against the wall
working with Section Access.
90

Understanding QVDs and Optimized Loads
If you have been working with Qlik Sense® or QlikView® for a bit I am sure you have heard of QVDs. If you
have been working with Qlik a while hopefully you have heard of optimized QVD loads and
non-optimized QVD loads. Either way, hopefully I can shed some of the mystery around QVDs and these
two loads in our final section.
What is a QVD?
A QVD is a proprietary data file format made by Qlik® which is made up of two parts:
1. XML metadata header1. This contains the data around the data…. Number of records, fields, tags, etc..
2. Binary data1. This is the actual data which has been compressed in a way unique to Qlik. One of
Qlik’s key differentiators.
How is data stored in a Qlik application?
This is a crucial point for so many things in the Qlik world. There is a wonderful blog post by Henric
Cronström who explains how the Qlik® Associative Engine stores data internally which you can read
here. I advise any Qlik developer to read this, and read it again. This will drive so many decisions for
optimization.
To summarize, data is stored in a columnar format in the sense that each field has its own structure. There
is a distinct list of values for a field which contain a mapping of the value and a reference point. This
reference point (bit-stuffed pointer) is what is populating the data tables. So ultimately there is only one
single value stored for each field value. All duplicate values for the rows in the table are references. This
allows the data to be compressed immensely. This is also why field cardinality is such a large driver to the
Qlik Sense® application size.
91

QVD Data Storage
So if Qlik® has this special data structure / storage mechanism, how does this affect QVDs? Well QVDs
binary data is stored in a very similar format as it exists in memory.
Optimized QVD Loads
Optimized QVD Loads, in a simple explanation, takes the data from the QVD and pushes it directly into
memory. There is no processing or time necessary to read or interpret the data, it is already in the form it
needs to be in. The time it takes is mainly moving the file from disk to memory. It really is a feat that Qlik
can load hundreds of millions of rows in seconds.
Unoptimized QVD Loads
Now knowing what an optimized QVD load does, it makes more sense of what causes an unoptimized
QVD load. Once you perform a field transformation or where condition, it becomes unoptimized; with a
few exceptions. This is because Qlik Sense® can’t just directly push the data into memory anymore. Now
the data has to be unwrapped and modified before it is stored in memory. This is still typically faster than
other data formats such as flat files, databases, APIs, etc… but it is nowhere near as fast as an optimized
load. This is why the Qlik community holds it in such a high regard.
What breaks a QVD Load?
Honestly, it makes more sense to describe what you can do and still keep a QVD load optimized.
● Renaming fields.● You can load a field twice, with a different name of course.● Simple Where Exists.
○ Simple: Where Exists([Field])○ Not Simple: Where Exists([Field],[FieldA]&[FieldB])○ The field used in the Exists clause must be in the load script.
○ Ex: Tbl: Load Period, Dim, Amt From [Sales.qvd] (qvd)Where Exists(Period);
● Concatenate to a table, only if it contains all of the fields of the table it is concatenating to.○ QVD can contain additional fields.
92

So to summarize what would break an optimization:
● Field transformation● New field: expression, number, string, etc…● Where & While conditions● Joins● Concatenating a QVD to a table which has fields not in the QVD
Strategy
I will admit this is a bit limiting. There are going to be use cases there the data needs to be modified in
some way. My suggestion is frame out your load so as to best leverage QVD loads to optimize getting
data into your application. Sometimes this will be more round about, but will likely be faster.
Example
Sales QVD:
● 400 Million Rows● 15 Years of Data● 3 Company Ledgers
Requirement:
● Rolling Three Years● 0L Ledger Only
93

Traditional Load Script (Unoptimized)
sales:Load
Id,Year,Period,CostCenter,Account,Region,Company,Ledger,Qty,Amount
From[lib://QVD/Sales.qvd](qvd)
WhereYear >= Year(Today())-2AND Ledger = '0L';
Logic
How can I leverage a QVD optimized load to get the smallest data set I need in the quickest way?
Assuming all things are quite equal:
● 400M rows / 15 years = ~27M per year
○ 3 years = ~100M rows
● 400M rows / 3 ledgers = ~133M rows per ledger
○ 1 ledger = 133M rows.
3 years of data seems to be the smaller cut of data.
I would want to leverage the simple where exists condition to filter down to the three years of data and
then further filter down to a single ledger.
94

Optimized Load Script
// Get rolling Three Yearsyear_exists:Load
Year(Today())-(IterNo()-1) as YearAutoGenerate
(1)While
IterNo() <= 3;
sales:Load
Id,Year,Period,CostCenter,Account,Region,Company,Ledger,Qty,Amount
From[lib://QVD/Sales.qvd](qvd)
WhereExists(Year); // Keeping QVD Load optimized
// Remaining LogicInner Join(sales)Load * Inline [Ledger0L];
Drop Table year_exists;
Even though there are more steps, it will cut down the reload time greatly. This is another example of how
you should test different scenarios and strategies to determine which is faster. In our example, it could be
that the 0L ledger only accounts for 10% of the data and is much smaller than three years of the total
dataset.
95

Conclusion
With this, we will come to a close. We hope this information has helped you as much as it has helped us.
Our goal is to innovate and create cool and interesting solutions for complex problems. This has led us to
realize more and more that understanding the fundamentals is crucial to accelerate our journey. We have
found it very rewarding taking these ideas and topics and boiling them down into a simple form to help
teach others, while better understanding them ourselves.
Thank you for reading!
96