Script syntax and chart functions - Qlik | Help
837
Script syntax and chart functions Qlik Sense ® February 2022 Copyright © 1993-2022 QlikTech International AB. All rights reserved. HELP.QLIK.COM
-
Upload
khangminh22 -
Category
Documents
-
view
0 -
download
0
Transcript of Script syntax and chart functions - Qlik | Help
Script syntax and chart functions
Qlik Sense®
February 2022Copyright © 1993-2022 QlikTech International AB. All rights reserved.
HELP.QLIK.COM

© 2022 QlikTech International AB. All rights reserved. All company and/or product names may be tradenames, trademarks and/or registered trademarks of the respective owners with which they are associated.
Script syntax and chart functions - Qlik Sense, February 2022 3
1 What is Qlik Sense? 151.1 What can you do in Qlik Sense? 151.2 How does Qlik Sense work? 15The app model 15The associative experience 15Collaboration and mobility 15
1.3 How can you deploy Qlik Sense? 15Qlik Sense Desktop 16Qlik Sense Enterprise 16
1.4 How to administer and manage a Qlik Sense site 161.5 Extend Qlik Sense and adapt it for your own purposes 16Building extensions and mashups 16Building clients 16Building server tools 16Connecting to other data sources 16
2 Script syntax overview 172.1 Introduction to script syntax 172.2 What is Backus-Naur formalism? 17
2 Script statements and keywords 192.3 Script control statements 19Script control statements overview 19Call 21Do..loop 22End 23Exit 23Exit script 23For..next 24For each..next 25If..then..elseif..else..end if 28Next 29Sub..end sub 29Switch..case..default..end switch 30To 31
2.4 Script prefixes 31Script prefixes overview 31Add 35Buffer 36Concatenate 38Crosstable 38First 41Generic 42Hierarchy 43HierarchyBelongsTo 45Inner 47IntervalMatch 48Join 51Keep 52
Contents
Script syntax and chart functions - Qlik Sense, February 2022 4
Left 53Mapping 54Merge 56NoConcatenate 60Only 61Outer 61Partial reload 62Replace 64Right 66Sample 67Semantic 68Unless 68When 69
2.5 Script regular statements 70Script regular statements overview 70Alias 76AutoNumber 77Binary 80Comment field 81Comment table 82Connect 83Declare 84Derive 87Direct Query 88Directory 92Disconnect 93Drop 94Drop table 95Execute 96Field/Fields 97FlushLog 97Force 97From 99Load 99Let 116Loosen Table 116Map 117NullAsNull 118NullAsValue 118Qualify 119Rem 120Rename 121Search 122Section 123Select 123Set 126Sleep 126SQL 127
Contents
Script syntax and chart functions - Qlik Sense, February 2022 5
SQLColumns 127SQLTables 128SQLTypes 129Star 130Store 131Table/Tables 133Tag 133Trace 134Unmap 134Unqualify 135Untag 135
2.6 Working directory 136Qlik Sense Desktop working directory 136Qlik Sense working directory 136
2 Working with variables in the data load editor 1372.7 Overview 1372.8 Defining a variable 1372.9 Deleting a variable 1382.10 Loading a variable value as a field value 1382.11 Variable calculation 1382.12 System variables 139System variables overview 139CreateSearchIndexOnReload 142HidePrefix 142HideSuffix 143Include 143OpenUrlTimeout 144StripComments 144Verbatim 145
2.13 Value handling variables 145Value handling variables overview 145NullDisplay 146NullInterpret 146NullValue 146OtherSymbol 147
2.14 Number interpretation variables 147Number interpretation variables overview 147BrokenWeeks 149DateFormat 150DayNames 150DecimalSep 150FirstWeekDay 151LongDayNames 151LongMonthNames 151MoneyDecimalSep 152MoneyFormat 152MoneyThousandSep 152
Contents
Script syntax and chart functions - Qlik Sense, February 2022 6
MonthNames 152NumericalAbbreviation 153ReferenceDay 153ThousandSep 153TimeFormat 154TimestampFormat 154
2.15 Direct Discovery variables 157Direct Discovery system variables 157Teradata query banding variables 158Direct Discovery character variables 159Direct Discovery number interpretation variables 160
2.16 Error variables 161Error variables overview 161ErrorMode 161ScriptError 162ScriptErrorCount 163ScriptErrorList 163
2 Script expressions 1643 Visualization expressions 1653.1 Defining the aggregation scope 1653.2 Set analysis 167Set expressions 168Examples 169Natural sets 169Set identifiers 170Set operators 171Set modifiers 172Tutorial - Creating a set expression 192Syntax for set expressions 201
3.3 Visualization expression and aggregation syntax 201General syntax for chart expressions 201General syntax for aggregations 202
4 Operators 2034.1 Bit operators 2034.2 Logical operators 2044.3 Numeric operators 2044.4 Relational operators 2054.5 String operators 206& 207like 207
5 Script functions 2085.1 Analytic connections for server-side extensions (SSE) 2085.2 Aggregation functions 208Using aggregation functions in a data load script 208Using aggregation functions in chart expressions 209How aggregations are calculated 209
Contents
Script syntax and chart functions - Qlik Sense, February 2022 7
Aggregation of key fields 209Basic aggregation functions 210Counter aggregation functions 233Financial aggregation functions 249Statistical aggregation functions 261Statistical test functions 326String aggregation functions 390Synthetic dimension functions 402Nested aggregations 405
5.3 Aggr - chart function 406Examples: Chart expressions using Aggr 408
5.4 Color functions 412Pre-defined color functions 414ARGB 415RGB 416HSL 417
5.5 Conditional functions 418Conditional functions overview 418alt 419class 420coalesce 421if 422match 425mixmatch 428pick 431wildmatch 431
5.6 Counter functions 434Counter functions overview 434autonumber 435autonumberhash128 437autonumberhash256 439IterNo 442RecNo 442RowNo 443RowNo - chart function 445
5.7 Date and time functions 447Date and time functions overview 448addmonths 456addyears 457age 457converttolocaltime 459day 462dayend 462daylightsaving 464dayname 464daynumberofquarter 466daynumberofyear 468daystart 469
Contents
Script syntax and chart functions - Qlik Sense, February 2022 8
firstworkdate 471GMT 473hour 473inday 473indaytotime 475inlunarweek 477inlunarweektodate 479inmonth 481inmonths 483inmonthstodate 486inmonthtodate 488inquarter 490inquartertodate 492inweek 494inweektodate 496inyear 498inyeartodate 500lastworkdate 502localtime 504lunarweekend 505lunarweekname 507lunarweekstart 508makedate 510maketime 512makeweekdate 513minute 513month 514monthend 514monthname 516monthsend 519monthsname 521monthsstart 523monthstart 525networkdays 527now 529quarterend 530quartername 532quarterstart 533second 535setdateyear 536setdateyearmonth 538timezone 539today 539UTC 540week 541weekday 542weekend 545weekname 547
Contents
Script syntax and chart functions - Qlik Sense, February 2022 9
weekstart 549weekyear 551year 552yearend 552yearname 554yearstart 556yeartodate 558
5.8 Exponential and logarithmic functions 5595.9 Field functions 561Count functions 561Field and selection functions 561GetAlternativeCount - chart function 562GetCurrentSelections - chart function 563GetExcludedCount - chart function 565GetFieldSelections - chart function 566GetNotSelectedCount - chart function 568GetObjectDimension - chart function 568GetObjectField - chart function 569GetObjectMeasure - chart function 570GetPossibleCount - chart function 570GetSelectedCount - chart function 572
5.10 File functions 573File functions overview 573Attribute 575ConnectString 582FileBaseName 582FileDir 583FileExtension 583FileName 583FilePath 584FileSize 584FileTime 585GetFolderPath 586QvdCreateTime 587QvdFieldName 588QvdNoOfFields 589QvdNoOfRecords 590QvdTableName 591
5.11 Financial functions 592Financial functions overview 592BlackAndSchole 593FV 594nPer 595Pmt 596PV 597Rate 597
5.12 Formatting functions 598Formatting functions overview 599
Contents
Script syntax and chart functions - Qlik Sense, February 2022 10
ApplyCodepage 600Date 601Dual 602Interval 604Money 605Num 606Time 609Timestamp 610
5.13 General numeric functions 611General numeric functions overview 611Combination and permutation functions 612Modulo functions 612Parity functions 613Rounding functions 613BitCount 613Ceil 614Combin 615Div 615Even 616Fabs 616Fact 617Floor 617Fmod 618Frac 619Mod 620Odd 621Permut 621Round 622Sign 623
5.14 Geospatial functions 624Geospatial functions overview 624GeoAggrGeometry 626GeoBoundingBox 627GeoCountVertex 627GeoGetBoundingBox 628GeoGetPolygonCenter 628GeoInvProjectGeometry 629GeoMakePoint 630GeoProject 630GeoProjectGeometry 631GeoReduceGeometry 631
5.15 Interpretation functions 632Interpretation functions overview 633Date# 634Interval# 635Money# 636Num# 637Text 638
Contents
Script syntax and chart functions - Qlik Sense, February 2022 11
Time# 638Timestamp# 639
5.16 Inter-record functions 640Row functions 640Column functions 641Field functions 642Pivot table functions 642Inter-record functions in the data load script 643Above - chart function 644Below - chart function 648Bottom - chart function 651Column - chart function 656Dimensionality - chart function 658Exists 659FieldIndex 663FieldValue 664FieldValueCount 666LookUp 667NoOfRows - chart function 670Peek 671Previous 678Top - chart function 680SecondaryDimensionality - chart function 684After - chart function 684Before - chart function 685First - chart function 686Last - chart function 687ColumnNo - chart function 688NoOfColumns - chart function 688
5.17 Logical functions 6895.18 Mapping functions 690Mapping functions overview 690ApplyMap 690MapSubstring 692
5.19 Mathematical functions 6945.20 NULL functions 695NULL functions overview 695EmptyIsNull 695IsNull 696NULL 697
5.21 Range functions 698Basic range functions 698Counter range functions 699Statistical range functions 699Financial range functions 700RangeAvg 700RangeCorrel 703RangeCount 705
Contents
Script syntax and chart functions - Qlik Sense, February 2022 12
RangeFractile 707RangeIRR 709RangeKurtosis 710RangeMax 711RangeMaxString 713RangeMin 715RangeMinString 717RangeMissingCount 718RangeMode 720RangeNPV 722RangeNullCount 723RangeNumericCount 724RangeOnly 726RangeSkew 727RangeStdev 728RangeSum 729RangeTextCount 732RangeXIRR 733RangeXNPV 734
5.22 Ranking and clustering functions 735Ranking functions in charts 735Clustering functions in charts 736Rank - chart function 737HRank - chart function 740Optimizing with k-means: A real-world example 742KMeans2D - chart function 751KMeansND - chart function 764KMeansCentroid2D - chart function 777KMeansCentroidND - chart function 778
5.23 Statistical distribution functions 779Statistical distribution functions overview 779CHIDIST 781CHIINV 781FDIST 782FINV 783NORMDIST 783NORMINV 784TDIST 785TINV 786
5.24 String functions 786String functions overview 787Capitalize 790Chr 790Evaluate 791FindOneOf 792Hash128 793Hash160 794Hash256 795
Contents
Script syntax and chart functions - Qlik Sense, February 2022 13
Index 796KeepChar 797Left 798Len 799LevenshteinDist 799Lower 801LTrim 802Mid 803Ord 804PurgeChar 805Repeat 806Replace 807Right 807RTrim 808SubField 809SubStringCount 813TextBetween 813Trim 814Upper 815
5.25 System functions 816System functions overview 816EngineVersion 819IsPartialReload 819ProductVersion 819StateName - chart function 819
5.26 Table functions 820Table functions overview 820FieldName 822FieldNumber 822NoOfFields 823NoOfRows 823
5.27 Trigonometric and hyperbolic functions 8246 File system access restriction 8266.1 Security aspects when connecting to file based ODBC and OLE DB data connections 8266.2 Limitations in standard mode 826System variables 826Regular script statements 828Script control statements 829File functions 829System functions 832
6.3 Disabling standard mode 832Qlik Sense 832Qlik Sense Desktop 832
7 QlikView functions and statements not supported in Qlik Sense 8347.1 Script statements not supported in Qlik Sense 8347.2 Functions not supported in Qlik Sense 8347.3 Prefixes not supported in Qlik Sense 834
Contents
Script syntax and chart functions - Qlik Sense, February 2022 14
8 Functions and statements not recommended in Qlik Sense 8358.1 Script statements not recommended in Qlik Sense 8358.2 Script statement parameters not recommended in Qlik Sense 8358.3 Functions not recommended in Qlik Sense 836ALL qualifier 837
Contents
1 What is Qlik Sense?
1 What is Qlik Sense?Qlik Sense is a platform for data analysis. With Qlik Sense you can analyze data and make datadiscoveries on your own. You can share knowledge and analyze data in groups and across organizations.Qlik Sense lets you ask and answer your own questions and follow your own paths to insight. Qlik Senseenables you and your colleagues to reach decisions collaboratively.
1.1 What can you do in Qlik Sense?Most Business Intelligence (BI) products can help you answer questions that are understood in advance.But what about your follow-up questions? The ones that come after someone reads your report or seesyour visualization? With the Qlik Sense associative experience, you can answer question after questionafter question, moving along your own path to insight. With Qlik Sense you can explore your data freely,with just clicks, learning at each step along the way and coming up with next steps based on earlierfindings.
1.2 How does Qlik Sense work?Qlik Sense generates views of information on the fly for you. Qlik Sense does not require predefined andstatic reports or you being dependent on other users – you just click and learn. Every time you click, QlikSense instantly responds, updating every Qlik Sense visualization and view in the app with a newlycalculated set of data and visualizations specific to your selections.
The app modelInstead of deploying and managing huge business applications, you can create your own Qlik Sense appsthat you can reuse, modify and share with others. The app model helps you ask and answer the nextquestion on your own, without having to go back to an expert for a new report or visualization.
The associative experienceQlik Sense automatically manages all the relationships in the data and presents information to you using agreen/white/gray metaphor. Selections are highlighted in green, associated data is represented in white,and excluded (unassociated) data appears in gray. This instant feedback enables you to think of newquestions and continue to explore and discover.
Collaboration and mobilityQlik Sense further enables you to collaborate with colleagues no matter when and where they are located.All Qlik Sense capabilities, including the associative experience and collaboration, are available on mobiledevices. With Qlik Sense, you can ask and answer your questions and follow-up questions, with yourcolleagues, wherever you are.
1.3 How can you deploy Qlik Sense?There are two versions of Qlik Sense to deploy, Qlik Sense Desktop and Qlik Sense Enterprise.
Script syntax and chart functions - Qlik Sense, February 2022 15
1 What is Qlik Sense?
Qlik Sense DesktopThis is an easy-to-install single user version that is typically installed on a local computer.
Qlik Sense EnterpriseThis version is used to deploy Qlik Sense sites. A site is a collection of one or more server machinesconnected to a common logical repository or central node.
1.4 How to administer and manage a Qlik Sense siteWith the Qlik Management Console you can configure, manage and monitor Qlik Sense sites in an easyand intuitive way. You can manage licenses, access and security rules, configure nodes and data sourceconnections and synchronize content and users among many other activities and resources.
1.5 Extend Qlik Sense and adapt it for your own purposesQlik Sense provides you with flexible APIs and SDKs to develop your own extensions and adapt andintegrate Qlik Sense for different purposes, such as:
Building extensions and mashupsHere you can do web development using JavaScript to build extensions that are custom visualization inQlik Sense apps, or you use a mashups APIs to build websites with Qlik Sense content.
Building clientsYou can build clients in .NET and embed Qlik Sense objects in your own applications. You can also buildnative clients in any programming language that can handle WebSocket communication by using the QlikSense client protocol.
Building server toolsWith service and user directory APIs you can build your own tool to administer and manage Qlik Sensesites.
Connecting to other data sourcesCreate Qlik Sense connectors to retrieve data from custom data sources.
Script syntax and chart functions - Qlik Sense, February 2022 16
2 Script syntax overview
2 Script syntax overview
2.1 Introduction to script syntaxIn a script, the name of the data source, the names of the tables, and the names of the fields included in thelogic are defined. Furthermore, the fields in the access rights definition are defined in the script. A scriptconsists of a number of statements that are executed consecutively.
The Qlik Sense command line syntax and script syntax are described in a notation called Backus-NaurFormalism, or BNF code.
The first lines of code are already generated when a new Qlik Sense file is created. The default values ofthese number interpretation variables are derived from the regional settings of the OS.
The script consists of a number of script statements and keywords that are executed consecutively. Allscript statements must end with a semicolon, ";".
You can use expressions and functions in the LOAD-statements to transform the data that has beenloaded.
For a table file with commas, tabs or semicolons as delimiters, a LOAD-statement may be used. By defaulta LOAD-statement will load all fields of the file.
General databases can be accessed through ODBC or OLE DBdatabase connectors. . Here standard SQLstatements are used. The SQL syntax accepted differs between different ODBC drivers.
Additionally, you can access other data sources using custom connectors.
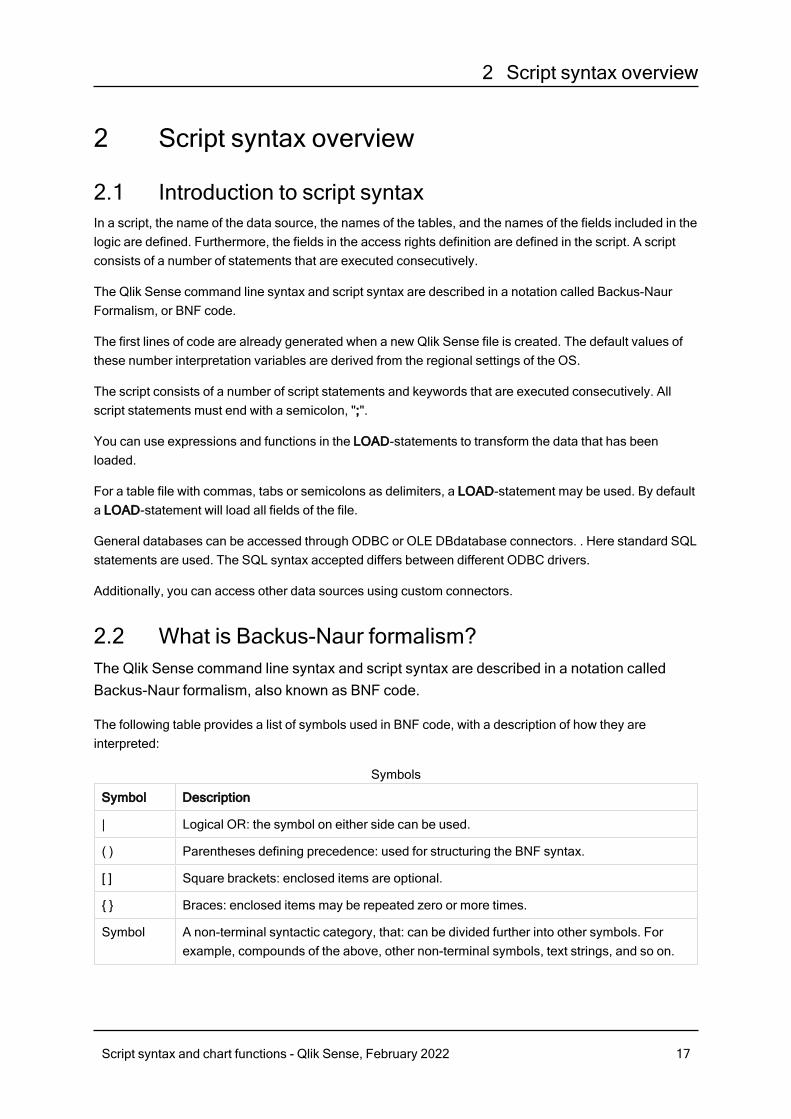
2.2 What is Backus-Naur formalism?The Qlik Sense command line syntax and script syntax are described in a notation calledBackus-Naur formalism, also known as BNF code.
The following table provides a list of symbols used in BNF code, with a description of how they areinterpreted:
Symbol Description
| Logical OR: the symbol on either side can be used.
( ) Parentheses defining precedence: used for structuring the BNF syntax.
[ ] Square brackets: enclosed items are optional.
{ } Braces: enclosed items may be repeated zero or more times.
Symbol A non-terminal syntactic category, that: can be divided further into other symbols. Forexample, compounds of the above, other non-terminal symbols, text strings, and so on.
Symbols
Script syntax and chart functions - Qlik Sense, February 2022 17
2 Script syntax overview
Symbol Description
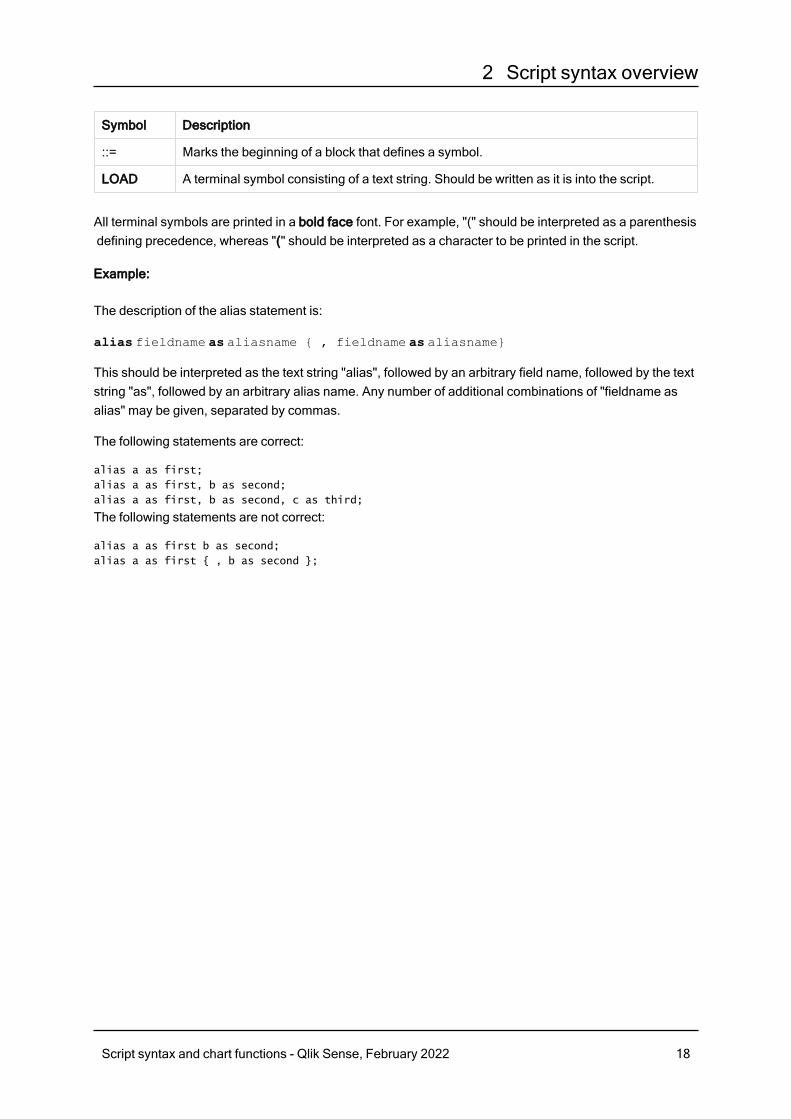
::= Marks the beginning of a block that defines a symbol.
LOAD A terminal symbol consisting of a text string. Should be written as it is into the script.
All terminal symbols are printed in a bold face font. For example, "(" should be interpreted as a parenthesisdefining precedence, whereas "(" should be interpreted as a character to be printed in the script.
Example:
The description of the alias statement is:
alias fieldname as aliasname { , fieldname as aliasname}
This should be interpreted as the text string "alias", followed by an arbitrary field name, followed by the textstring "as", followed by an arbitrary alias name. Any number of additional combinations of "fieldname asalias" may be given, separated by commas.
The following statements are correct:
alias a as first;
alias a as first, b as second;
alias a as first, b as second, c as third;
The following statements are not correct:
alias a as first b as second;
alias a as first { , b as second };
Script syntax and chart functions - Qlik Sense, February 2022 18
2 Script statements and keywords
2 Script statements and keywordsThe Qlik Sense script consists of a number of statements. A statement can be either a regular scriptstatement or a script control statement. Certain statements can be preceded by prefixes.
Regular statements are typically used for manipulating data in one way or another. These statements maybe written over any number of lines in the script and must always be terminated by a semicolon, ";".
Control statements are typically used for controlling the flow of the script execution. Each clause of acontrol statement must be kept inside one script line and may be terminated by a semicolon or the end-of-line.
Prefixes may be applied to applicable regular statements but never to control statements. The when andunless prefixes can however be used as suffixes to a few specific control statement clauses.
In the next subchapter, an alphabetical listing of all script statements, control statements and prefixes, arefound.
All script keywords can be typed with any combination of lower case and upper case characters. Field andvariable names used in the statements are however case sensitive.
2.3 Script control statementsThe Qlik Sense script consists of a number of statements. A statement can be either a regular scriptstatement or a script control statement.
Control statements are typically used for controlling the flow of the script execution. Each clause of acontrol statement must be kept inside one script line and may be terminated by semicolon or end-of-line.
Prefixes are never applied to control statements, with the exceptions of the prefixes when and unlesswhich may be used with a few specific control statements.
All script keywords can be typed with any combination of lower case and upper case characters.
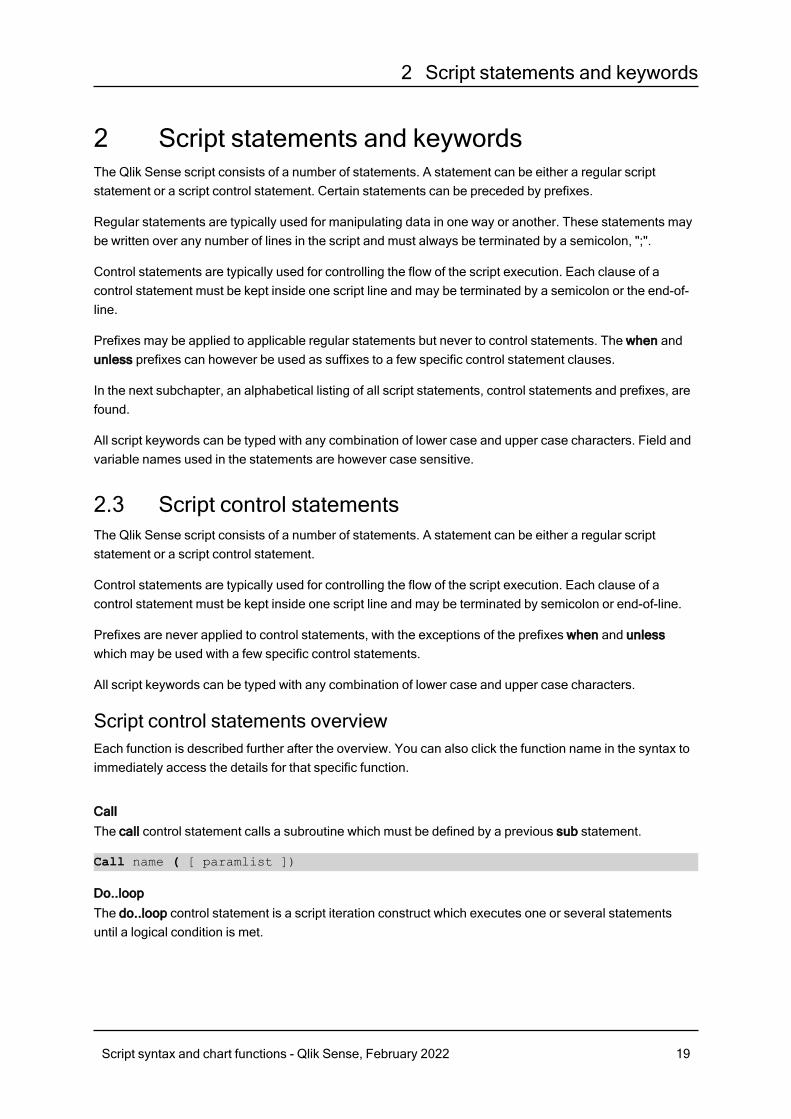
Script control statements overviewEach function is described further after the overview. You can also click the function name in the syntax toimmediately access the details for that specific function.
CallThe call control statement calls a subroutine which must be defined by a previous sub statement.
Call name ( [ paramlist ])
Do..loopThe do..loop control statement is a script iteration construct which executes one or several statementsuntil a logical condition is met.
Script syntax and chart functions - Qlik Sense, February 2022 19
2 Script statements and keywords
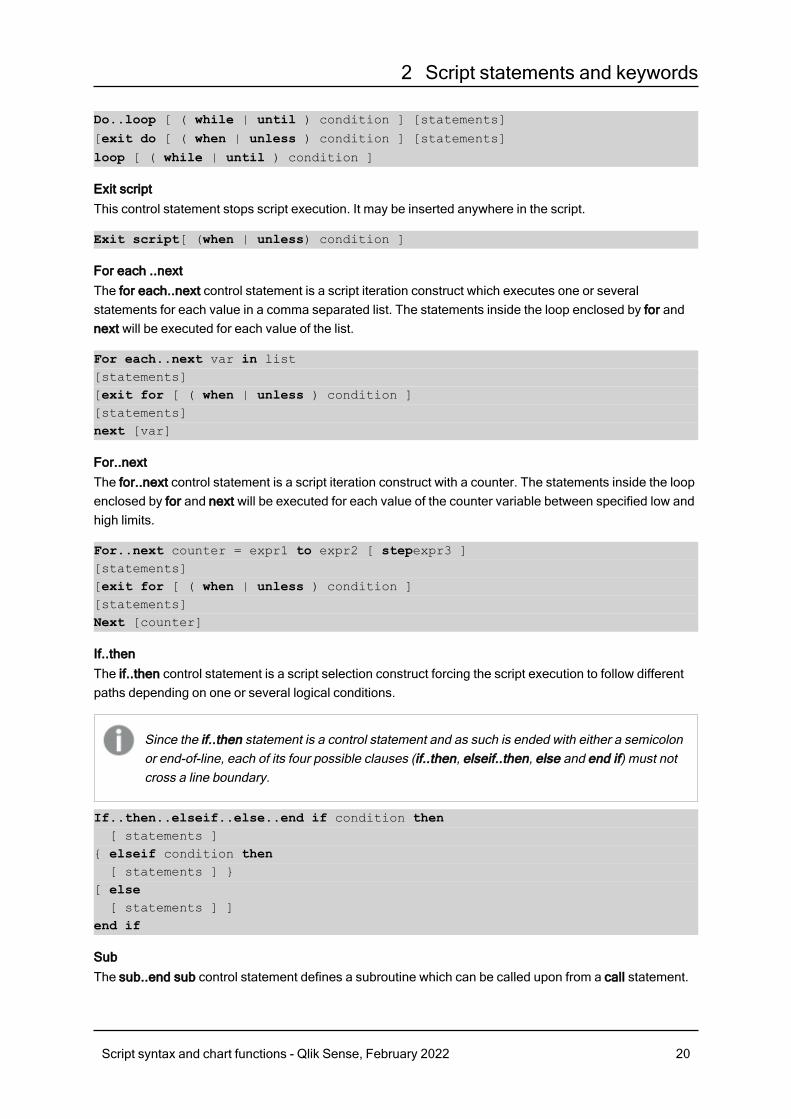
Do..loop [ ( while | until ) condition ] [statements]
[exit do [ ( when | unless ) condition ] [statements]
loop [ ( while | until ) condition ]
Exit scriptThis control statement stops script execution. It may be inserted anywhere in the script.
Exit script[ (when | unless) condition ]
For each ..nextThe for each..next control statement is a script iteration construct which executes one or severalstatements for each value in a comma separated list. The statements inside the loop enclosed by for andnext will be executed for each value of the list.
For each..next var in list[statements][exit for [ ( when | unless ) condition ][statements]next [var]
For..nextThe for..next control statement is a script iteration construct with a counter. The statements inside the loopenclosed by for and next will be executed for each value of the counter variable between specified low andhigh limits.
For..next counter = expr1 to expr2 [ stepexpr3 ][statements][exit for [ ( when | unless ) condition ][statements]Next [counter]
If..thenThe if..then control statement is a script selection construct forcing the script execution to follow differentpaths depending on one or several logical conditions.
Since the if..then statement is a control statement and as such is ended with either a semicolonor end-of-line, each of its four possible clauses (if..then, elseif..then, else and end if) must notcross a line boundary.
If..then..elseif..else..end if condition then[ statements ]
{ elseif condition then[ statements ] }
[ else[ statements ] ]
end if
SubThe sub..end sub control statement defines a subroutine which can be called upon from a call statement.
Script syntax and chart functions - Qlik Sense, February 2022 20

2 Script statements and keywords
Sub..end sub name [ ( paramlist )] statements end sub
SwitchThe switch control statement is a script selection construct forcing the script execution to follow differentpaths, depending on the value of an expression.
Switch..case..default..end switch expression {case valuelist [ statements ]}
[default statements] end switch
CallThe call control statement calls a subroutine which must be defined by a previous substatement.
Syntax:Call name ( [ paramlist ])
Arguments:
Argument Description
name The name of the subroutine.
paramlist A comma separated list of the actual parameters to be sent to thesubroutine. Each item in the list may be a field name, a variable or anarbitrary expression.
Arguments
The subroutine called by a call statement must be defined by a sub encountered earlier during scriptexecution.
Parameters are copied into the subroutine and, if the parameter in the call statement is a variable and notan expression, copied back out again upon exiting the subroutine.
Limitations:
l Since the call statement is a control statement and as such is ended with either a semicolon or end-of-line, it must not cross a line boundary.
l When you define a subroutine with Sub..end sub inside a control statement, for example if..then,you can only call the subroutine from within the same control statement.
Example:
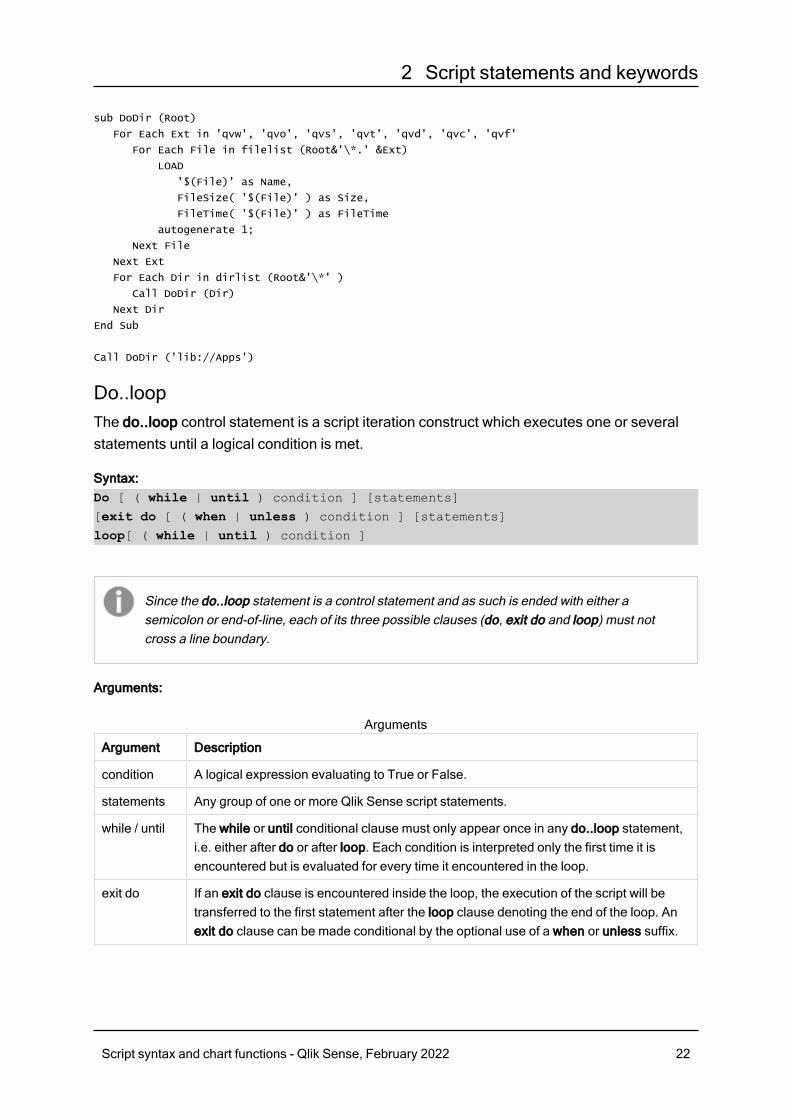
This example lists all Qlik related files in a folder and its subfolders, and stores file information in a table. Itis assumed that you have created a data connection named Apps to the folder .
The DoDir subroutine is called with the reference to the folder, 'lib://Apps', as parameter. Inside thesubroutine, there is a recursive call, Call DoDir (Dir), that makes the function look for files recursively insubfolders.
Script syntax and chart functions - Qlik Sense, February 2022 21
2 Script statements and keywords
sub DoDir (Root)
For Each Ext in 'qvw', 'qvo', 'qvs', 'qvt', 'qvd', 'qvc', 'qvf'
For Each File in filelist (Root&'\*.' &Ext)
LOAD
'$(File)' as Name,
FileSize( '$(File)' ) as Size,
FileTime( '$(File)' ) as FileTime
autogenerate 1;
Next File
Next Ext
For Each Dir in dirlist (Root&'\*' )
Call DoDir (Dir)
Next Dir
End Sub
Call DoDir ('lib://Apps')
Do..loopThe do..loop control statement is a script iteration construct which executes one or severalstatements until a logical condition is met.
Syntax:Do [ ( while | until ) condition ] [statements]
[exit do [ ( when | unless ) condition ] [statements]
loop[ ( while | until ) condition ]
Since the do..loop statement is a control statement and as such is ended with either asemicolon or end-of-line, each of its three possible clauses (do, exit do and loop) must notcross a line boundary.
Arguments:
Argument Description
condition A logical expression evaluating to True or False.
statements Any group of one or more Qlik Sense script statements.
while / until The while or until conditional clause must only appear once in any do..loop statement,i.e. either after do or after loop. Each condition is interpreted only the first time it isencountered but is evaluated for every time it encountered in the loop.
exit do If an exit do clause is encountered inside the loop, the execution of the script will betransferred to the first statement after the loop clause denoting the end of the loop. Anexit do clause can be made conditional by the optional use of a when or unless suffix.
Arguments
Script syntax and chart functions - Qlik Sense, February 2022 22
2 Script statements and keywords
Example:
// LOAD files file1.csv..file9.csv
Set a=1;
Do while a<10
LOAD * from file$(a).csv;
Let a=a+1;
Loop
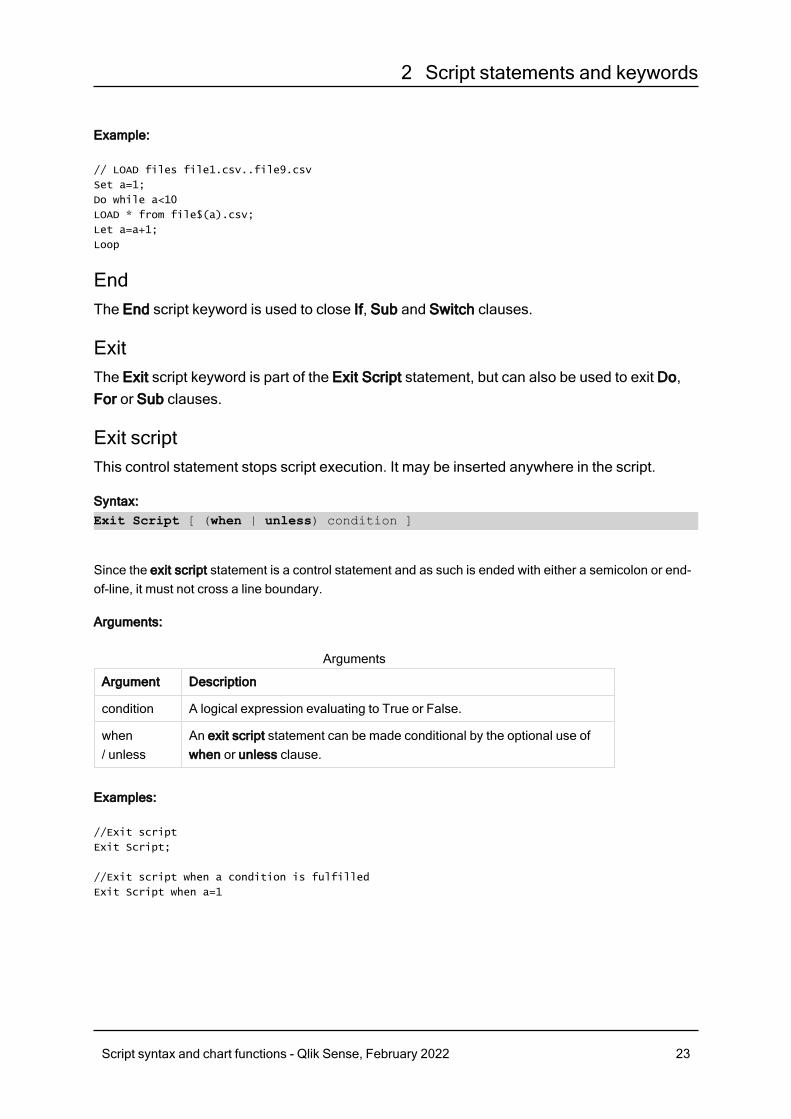
EndThe End script keyword is used to close If, Sub and Switch clauses.
ExitThe Exit script keyword is part of the Exit Script statement, but can also be used to exit Do,For or Sub clauses.
Exit scriptThis control statement stops script execution. It may be inserted anywhere in the script.
Syntax:Exit Script [ (when | unless) condition ]
Since the exit script statement is a control statement and as such is ended with either a semicolon or end-of-line, it must not cross a line boundary.
Arguments:
Argument Description
condition A logical expression evaluating to True or False.
when/ unless
An exit script statement can be made conditional by the optional use ofwhen or unless clause.
Arguments
Examples:
//Exit script
Exit Script;
//Exit script when a condition is fulfilled
Exit Script when a=1
Script syntax and chart functions - Qlik Sense, February 2022 23
2 Script statements and keywords
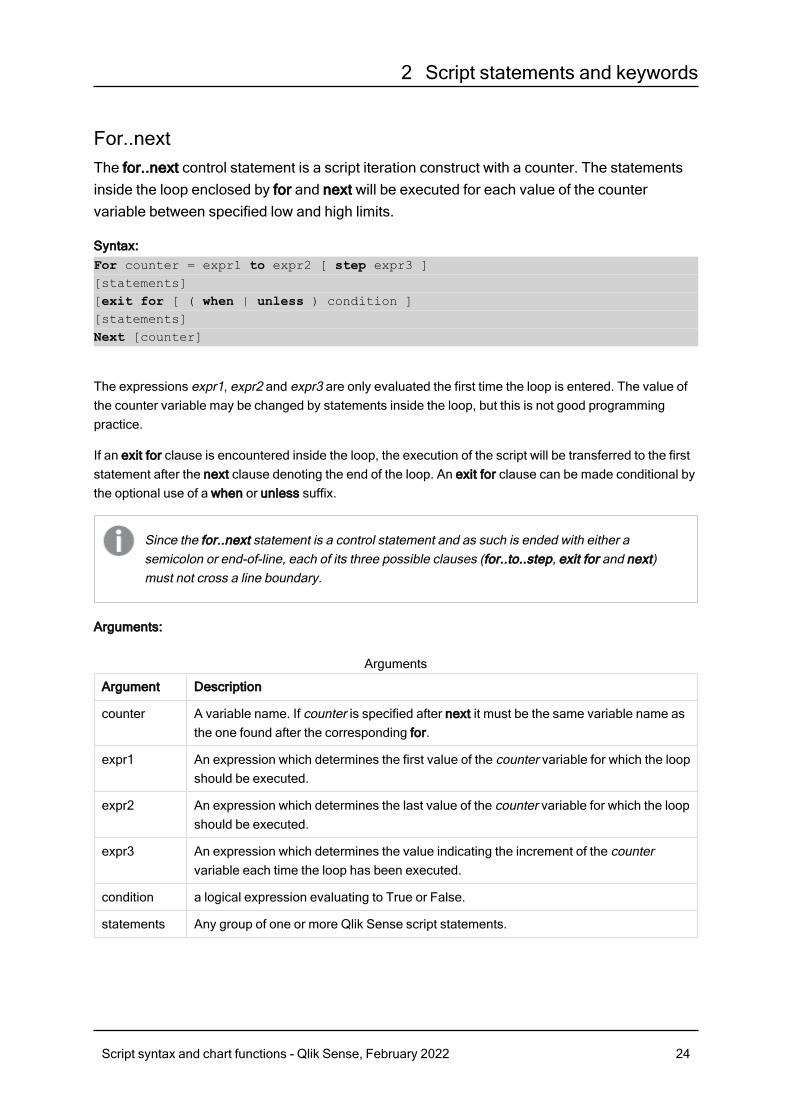
For..nextThe for..next control statement is a script iteration construct with a counter. The statementsinside the loop enclosed by for and next will be executed for each value of the countervariable between specified low and high limits.
Syntax:For counter = expr1 to expr2 [ step expr3 ][statements][exit for [ ( when | unless ) condition ][statements]Next [counter]
The expressions expr1, expr2 and expr3 are only evaluated the first time the loop is entered. The value ofthe counter variable may be changed by statements inside the loop, but this is not good programmingpractice.
If an exit for clause is encountered inside the loop, the execution of the script will be transferred to the firststatement after the next clause denoting the end of the loop. An exit for clause can be made conditional bythe optional use of a when or unless suffix.
Since the for..next statement is a control statement and as such is ended with either asemicolon or end-of-line, each of its three possible clauses (for..to..step, exit for and next)must not cross a line boundary.
Arguments:
Argument Description
counter A variable name. If counter is specified after next it must be the same variable name asthe one found after the corresponding for.
expr1 An expression which determines the first value of the counter variable for which the loopshould be executed.
expr2 An expression which determines the last value of the counter variable for which the loopshould be executed.
expr3 An expression which determines the value indicating the increment of the countervariable each time the loop has been executed.
condition a logical expression evaluating to True or False.
statements Any group of one or more Qlik Sense script statements.
Arguments
Script syntax and chart functions - Qlik Sense, February 2022 24

2 Script statements and keywords
Example 1: Loading a sequence of files
// LOAD files file1.csv..file9.csv
for a=1 to 9
LOAD * from file$(a).csv;
next
Example 2: Loading a random number of files
In this example, we assume there are data files x1.csv, x3.csv, x5.csv, x7.csv and x9.csv. Loading isstopped at a random point using the if rand( )<0.5 then condition.
for counter=1 to 9 step 2
set filename=x$(counter).csv;
if rand( )<0.5 then
exit for unless counter=1
end if
LOAD a,b from $(filename);
next
For each..nextThe for each..next control statement is a script iteration construct which executes one orseveral statements for each value in a comma separated list. The statements inside the loopenclosed by for and next will be executed for each value of the list.
Syntax:Special syntax makes it possible to generate lists with file and directory names in the current directory.
for each var in list[statements][exit for [ ( when | unless ) condition ][statements]next [var]
Arguments:
Argument Description
var A script variable name which will acquire a new value from list for each loop execution. Ifvar is specified after next it must be the same variable name as the one found after thecorresponding for each.
Arguments
The value of the var variable may be changed by statements inside the loop, but this is not goodprogramming practice.
Script syntax and chart functions - Qlik Sense, February 2022 25
2 Script statements and keywords
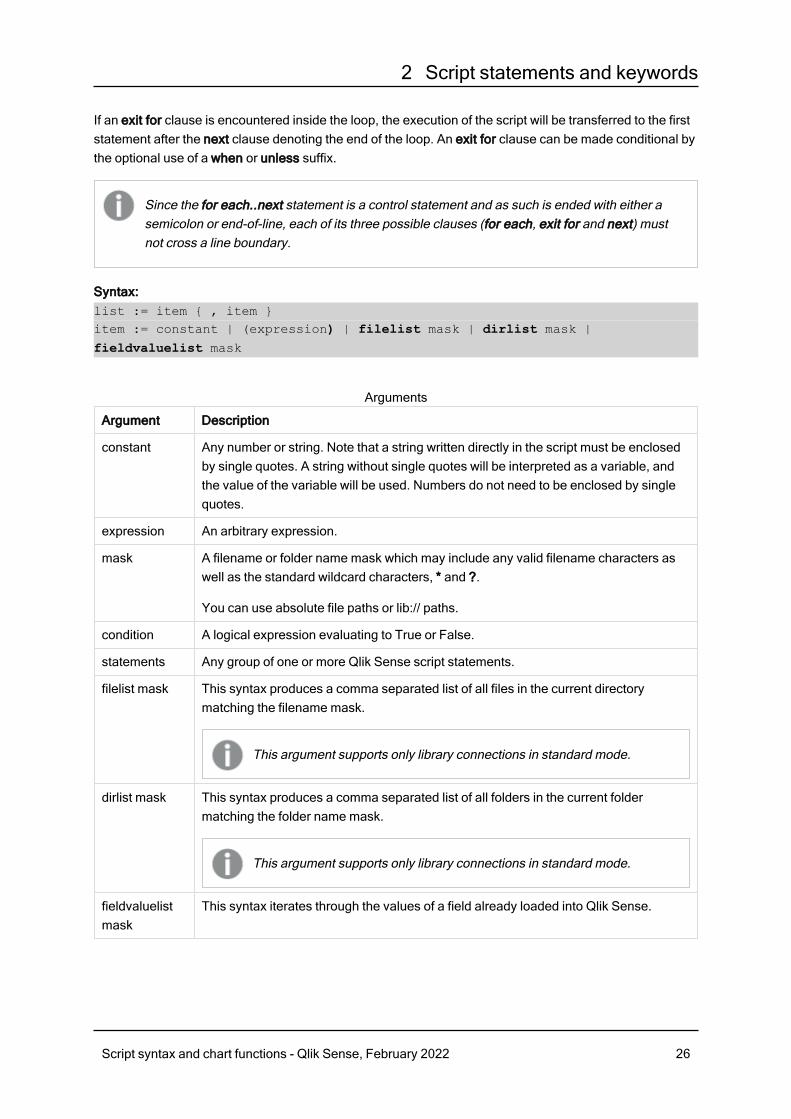
If an exit for clause is encountered inside the loop, the execution of the script will be transferred to the firststatement after the next clause denoting the end of the loop. An exit for clause can be made conditional bythe optional use of a when or unless suffix.
Since the for each..next statement is a control statement and as such is ended with either asemicolon or end-of-line, each of its three possible clauses (for each, exit for and next) mustnot cross a line boundary.
Syntax:list := item { , item }item := constant | (expression) | filelist mask | dirlist mask |
fieldvaluelist mask
Argument Description
constant Any number or string. Note that a string written directly in the script must be enclosedby single quotes. A string without single quotes will be interpreted as a variable, andthe value of the variable will be used. Numbers do not need to be enclosed by singlequotes.
expression An arbitrary expression.
mask A filename or folder name mask which may include any valid filename characters aswell as the standard wildcard characters, * and ?.
You can use absolute file paths or lib:// paths.
condition A logical expression evaluating to True or False.
statements Any group of one or more Qlik Sense script statements.
filelist mask This syntax produces a comma separated list of all files in the current directorymatching the filename mask.
This argument supports only library connections in standard mode.
dirlist mask This syntax produces a comma separated list of all folders in the current foldermatching the folder name mask.
This argument supports only library connections in standard mode.
fieldvaluelistmask
This syntax iterates through the values of a field already loaded into Qlik Sense.
Arguments
Script syntax and chart functions - Qlik Sense, February 2022 26
2 Script statements and keywords
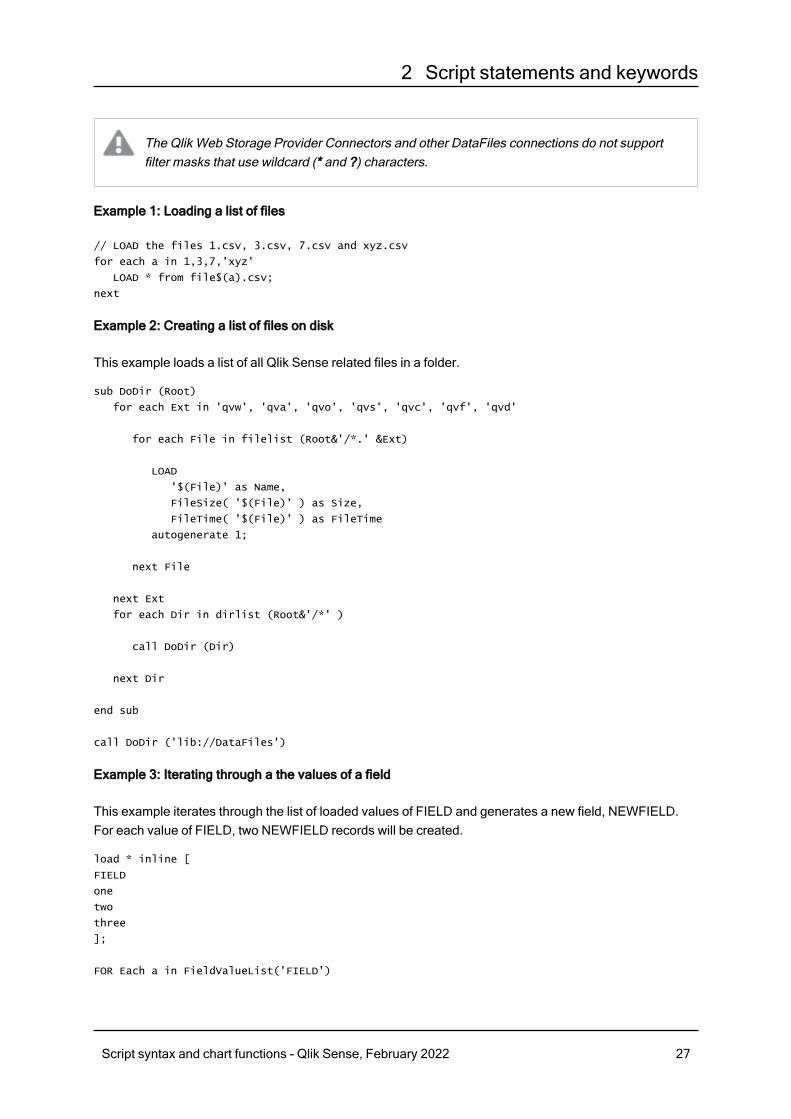
The Qlik Web Storage Provider Connectors and other DataFiles connections do not supportfilter masks that use wildcard (* and ?) characters.
Example 1: Loading a list of files
// LOAD the files 1.csv, 3.csv, 7.csv and xyz.csv
for each a in 1,3,7,'xyz'
LOAD * from file$(a).csv;
next
Example 2: Creating a list of files on disk
This example loads a list of all Qlik Sense related files in a folder.
sub DoDir (Root)
for each Ext in 'qvw', 'qva', 'qvo', 'qvs', 'qvc', 'qvf', 'qvd'
for each File in filelist (Root&'/*.' &Ext)
LOAD
'$(File)' as Name,
FileSize( '$(File)' ) as Size,
FileTime( '$(File)' ) as FileTime
autogenerate 1;
next File
next Ext
for each Dir in dirlist (Root&'/*' )
call DoDir (Dir)
next Dir
end sub
call DoDir ('lib://DataFiles')
Example 3: Iterating through a the values of a field
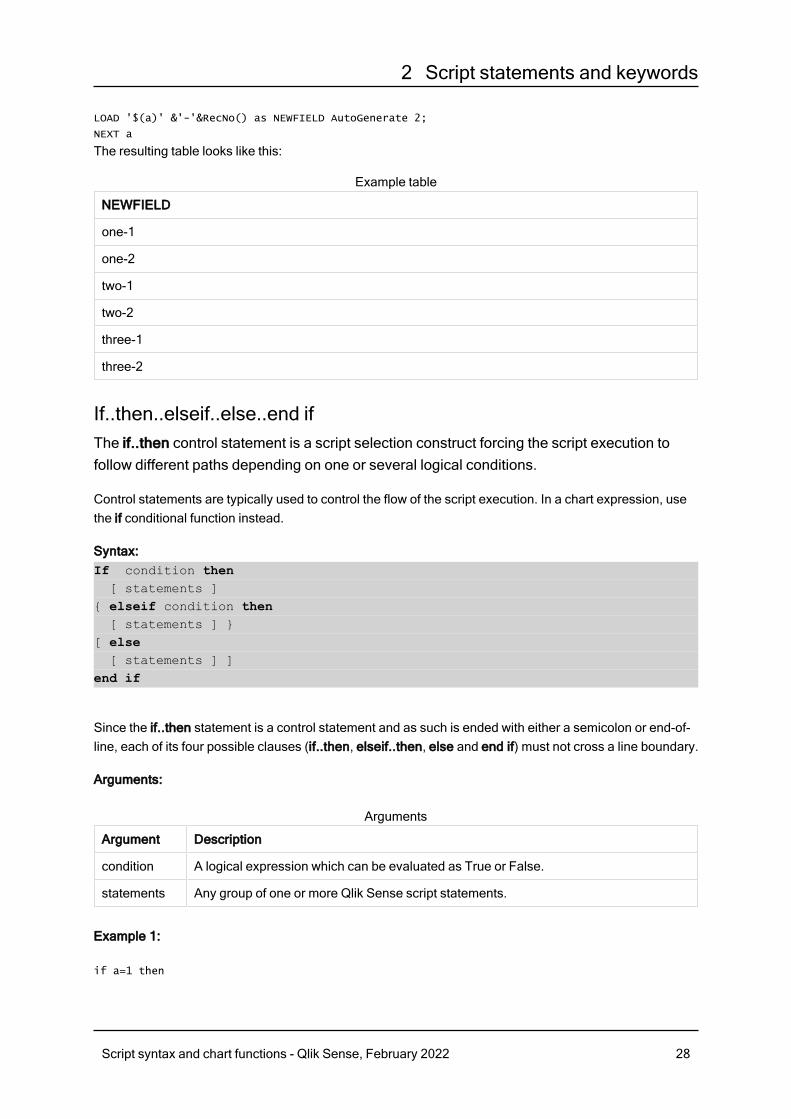
This example iterates through the list of loaded values of FIELD and generates a new field, NEWFIELD.For each value of FIELD, two NEWFIELD records will be created.
load * inline [
FIELD
one
two
three
];
FOR Each a in FieldValueList('FIELD')
Script syntax and chart functions - Qlik Sense, February 2022 27
2 Script statements and keywords
LOAD '$(a)' &'-'&RecNo() as NEWFIELD AutoGenerate 2;
NEXT a
The resulting table looks like this:
NEWFIELD
one-1
one-2
two-1
two-2
three-1
three-2
Example table
If..then..elseif..else..end ifThe if..then control statement is a script selection construct forcing the script execution tofollow different paths depending on one or several logical conditions.
Control statements are typically used to control the flow of the script execution. In a chart expression, usethe if conditional function instead.
Syntax:If condition then[ statements ]
{ elseif condition then[ statements ] }
[ else[ statements ] ]
end if
Since the if..then statement is a control statement and as such is ended with either a semicolon or end-of-line, each of its four possible clauses (if..then, elseif..then, else and end if) must not cross a line boundary.
Arguments:
Argument Description
condition A logical expression which can be evaluated as True or False.
statements Any group of one or more Qlik Sense script statements.
Arguments
Example 1:
if a=1 then
Script syntax and chart functions - Qlik Sense, February 2022 28
2 Script statements and keywords
LOAD * from abc.csv;
SQL SELECT e, f, g from tab1;
end if
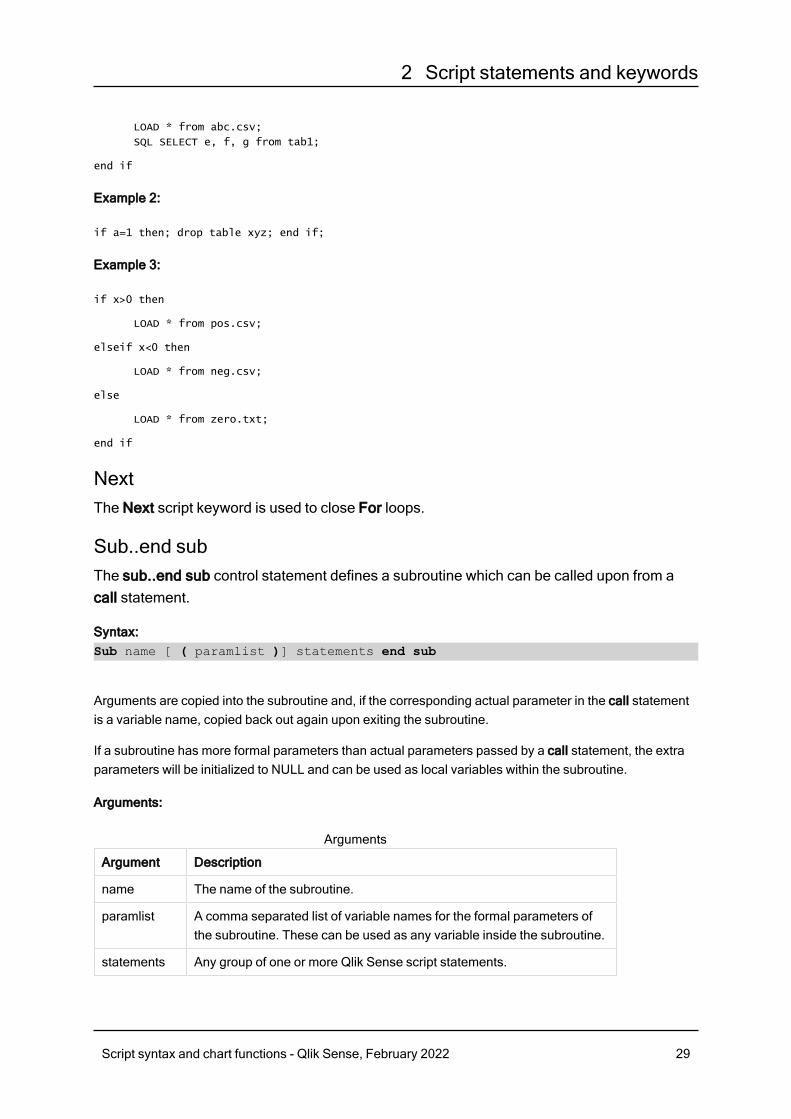
Example 2:
if a=1 then; drop table xyz; end if;
Example 3:
if x>0 then
LOAD * from pos.csv;
elseif x<0 then
LOAD * from neg.csv;
else
LOAD * from zero.txt;
end if
NextThe Next script keyword is used to close For loops.
Sub..end subThe sub..end sub control statement defines a subroutine which can be called upon from acall statement.
Syntax:Sub name [ ( paramlist )] statements end sub
Arguments are copied into the subroutine and, if the corresponding actual parameter in the call statementis a variable name, copied back out again upon exiting the subroutine.
If a subroutine has more formal parameters than actual parameters passed by a call statement, the extraparameters will be initialized to NULL and can be used as local variables within the subroutine.
Arguments:
Argument Description
name The name of the subroutine.
paramlist A comma separated list of variable names for the formal parameters ofthe subroutine. These can be used as any variable inside the subroutine.
statements Any group of one or more Qlik Sense script statements.
Arguments
Script syntax and chart functions - Qlik Sense, February 2022 29
2 Script statements and keywords
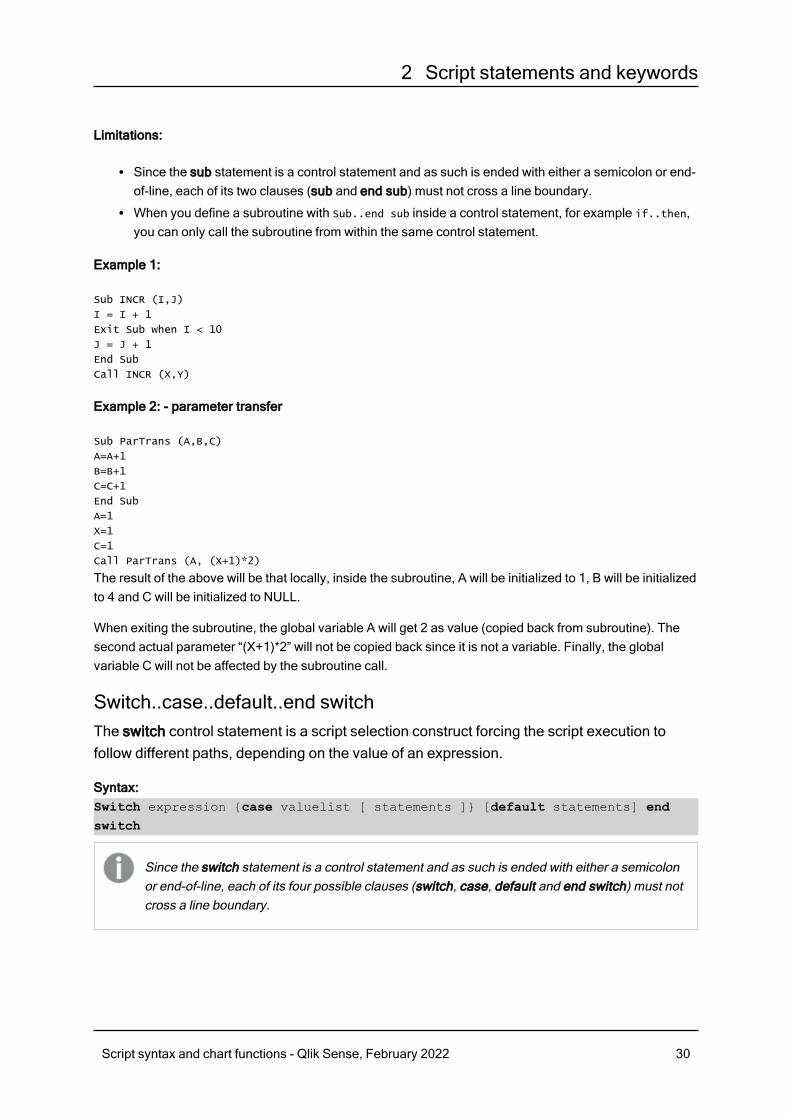
Limitations:
l Since the sub statement is a control statement and as such is ended with either a semicolon or end-of-line, each of its two clauses (sub and end sub) must not cross a line boundary.
l When you define a subroutine with Sub..end sub inside a control statement, for example if..then,you can only call the subroutine from within the same control statement.
Example 1:
Sub INCR (I,J)
I = I + 1
Exit Sub when I < 10
J = J + 1
End Sub
Call INCR (X,Y)
Example 2: - parameter transfer
Sub ParTrans (A,B,C)
A=A+1
B=B+1
C=C+1
End Sub
A=1
X=1
C=1
Call ParTrans (A, (X+1)*2)
The result of the above will be that locally, inside the subroutine, A will be initialized to 1, B will be initializedto 4 and C will be initialized to NULL.
When exiting the subroutine, the global variable A will get 2 as value (copied back from subroutine). Thesecond actual parameter “(X+1)*2” will not be copied back since it is not a variable. Finally, the globalvariable C will not be affected by the subroutine call.
Switch..case..default..end switchThe switch control statement is a script selection construct forcing the script execution tofollow different paths, depending on the value of an expression.
Syntax:Switch expression {case valuelist [ statements ]} [default statements] endswitch
Since the switch statement is a control statement and as such is ended with either a semicolonor end-of-line, each of its four possible clauses (switch, case, default and end switch) must notcross a line boundary.
Script syntax and chart functions - Qlik Sense, February 2022 30
2 Script statements and keywords
Arguments:
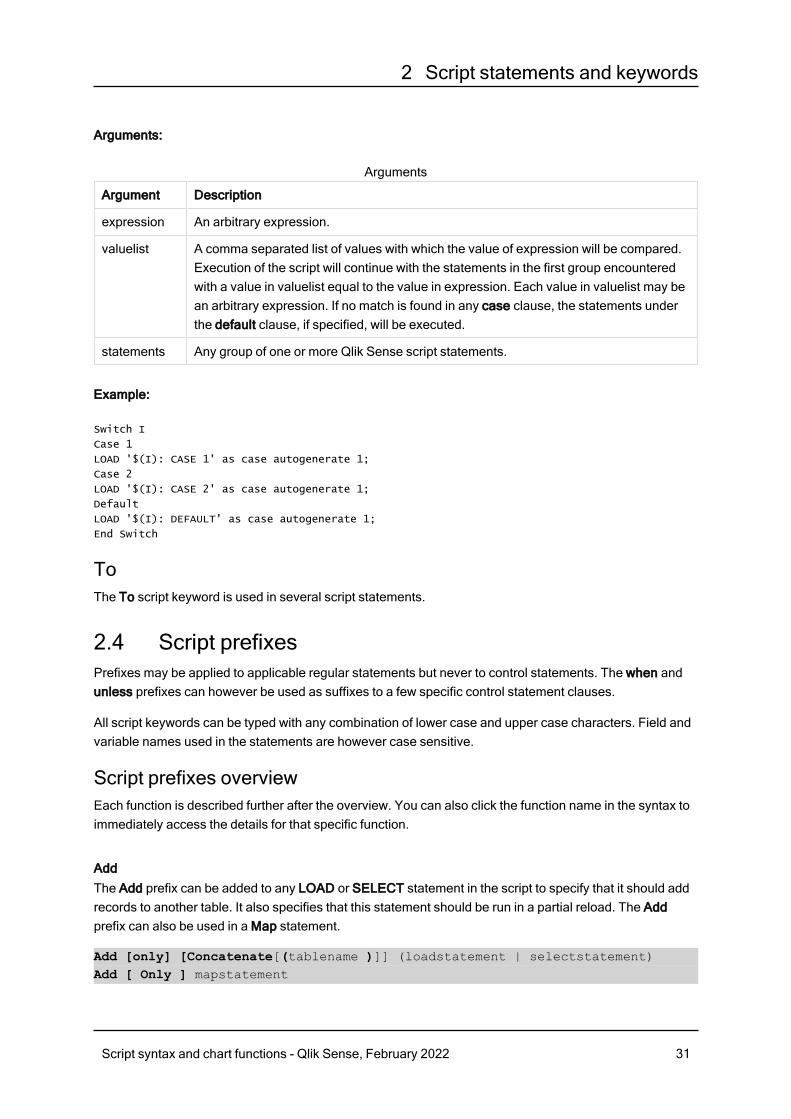
Argument Description
expression An arbitrary expression.
valuelist A comma separated list of values with which the value of expression will be compared.Execution of the script will continue with the statements in the first group encounteredwith a value in valuelist equal to the value in expression. Each value in valuelist may bean arbitrary expression. If no match is found in any case clause, the statements underthe default clause, if specified, will be executed.
statements Any group of one or more Qlik Sense script statements.
Arguments
Example:
Switch I
Case 1
LOAD '$(I): CASE 1' as case autogenerate 1;
Case 2
LOAD '$(I): CASE 2' as case autogenerate 1;
Default
LOAD '$(I): DEFAULT' as case autogenerate 1;
End Switch
ToThe To script keyword is used in several script statements.
2.4 Script prefixesPrefixes may be applied to applicable regular statements but never to control statements. The when andunless prefixes can however be used as suffixes to a few specific control statement clauses.
All script keywords can be typed with any combination of lower case and upper case characters. Field andvariable names used in the statements are however case sensitive.
Script prefixes overviewEach function is described further after the overview. You can also click the function name in the syntax toimmediately access the details for that specific function.
AddThe Add prefix can be added to any LOAD or SELECT statement in the script to specify that it should addrecords to another table. It also specifies that this statement should be run in a partial reload. The Addprefix can also be used in a Map statement.
Add [only] [Concatenate[(tablename )]] (loadstatement | selectstatement)Add [ Only ] mapstatement
Script syntax and chart functions - Qlik Sense, February 2022 31
2 Script statements and keywords
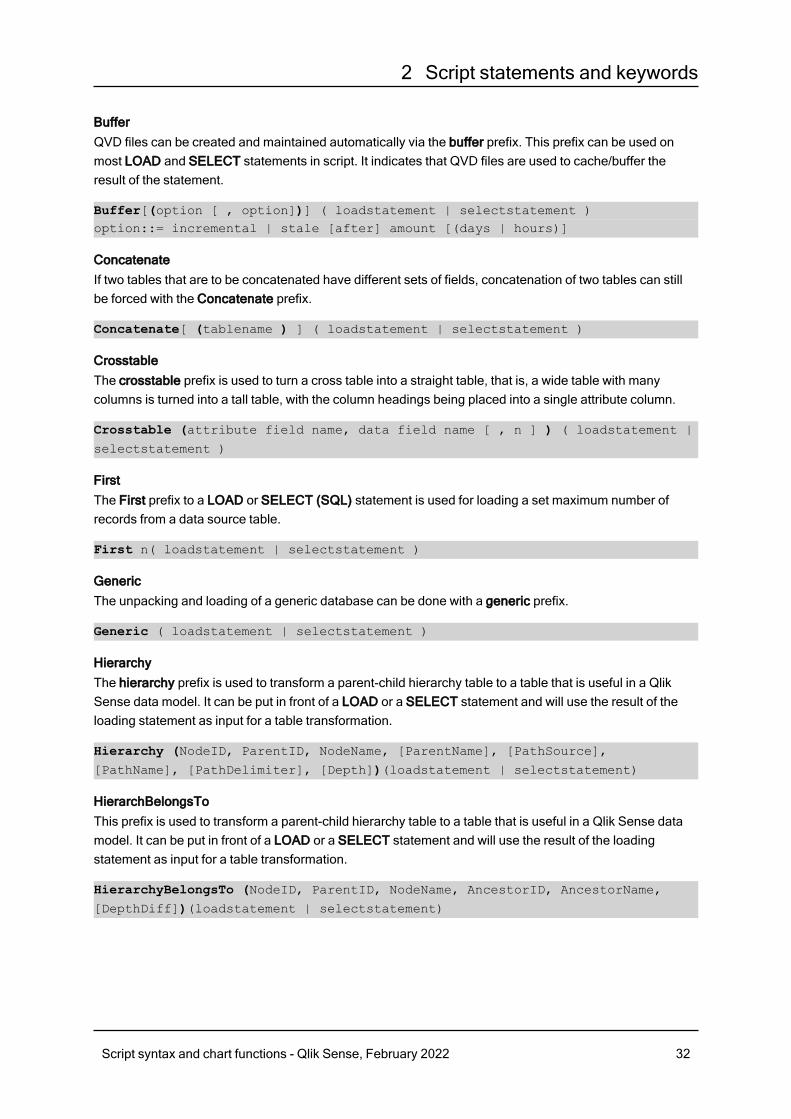
BufferQVD files can be created and maintained automatically via the buffer prefix. This prefix can be used onmost LOAD and SELECT statements in script. It indicates that QVD files are used to cache/buffer theresult of the statement.
Buffer[(option [ , option])] ( loadstatement | selectstatement )option::= incremental | stale [after] amount [(days | hours)]
ConcatenateIf two tables that are to be concatenated have different sets of fields, concatenation of two tables can stillbe forced with the Concatenate prefix.
Concatenate[ (tablename ) ] ( loadstatement | selectstatement )
CrosstableThe crosstable prefix is used to turn a cross table into a straight table, that is, a wide table with manycolumns is turned into a tall table, with the column headings being placed into a single attribute column.
Crosstable (attribute field name, data field name [ , n ] ) ( loadstatement |
selectstatement )
FirstThe First prefix to a LOAD or SELECT (SQL) statement is used for loading a set maximum number ofrecords from a data source table.
First n( loadstatement | selectstatement )
GenericThe unpacking and loading of a generic database can be done with a generic prefix.
Generic ( loadstatement | selectstatement )
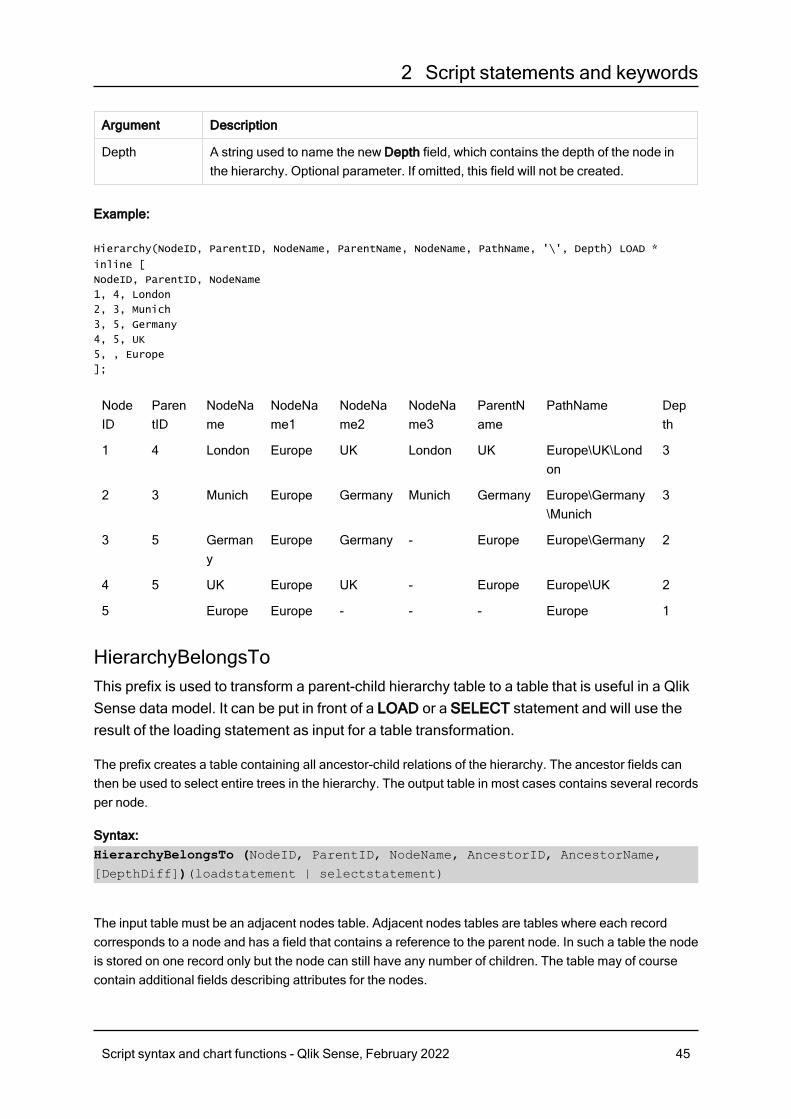
HierarchyThe hierarchy prefix is used to transform a parent-child hierarchy table to a table that is useful in a QlikSense data model. It can be put in front of a LOAD or a SELECT statement and will use the result of theloading statement as input for a table transformation.
Hierarchy (NodeID, ParentID, NodeName, [ParentName], [PathSource],
[PathName], [PathDelimiter], [Depth])(loadstatement | selectstatement)
HierarchBelongsToThis prefix is used to transform a parent-child hierarchy table to a table that is useful in a Qlik Sense datamodel. It can be put in front of a LOAD or a SELECT statement and will use the result of the loadingstatement as input for a table transformation.
HierarchyBelongsTo (NodeID, ParentID, NodeName, AncestorID, AncestorName,
[DepthDiff])(loadstatement | selectstatement)
Script syntax and chart functions - Qlik Sense, February 2022 32
2 Script statements and keywords
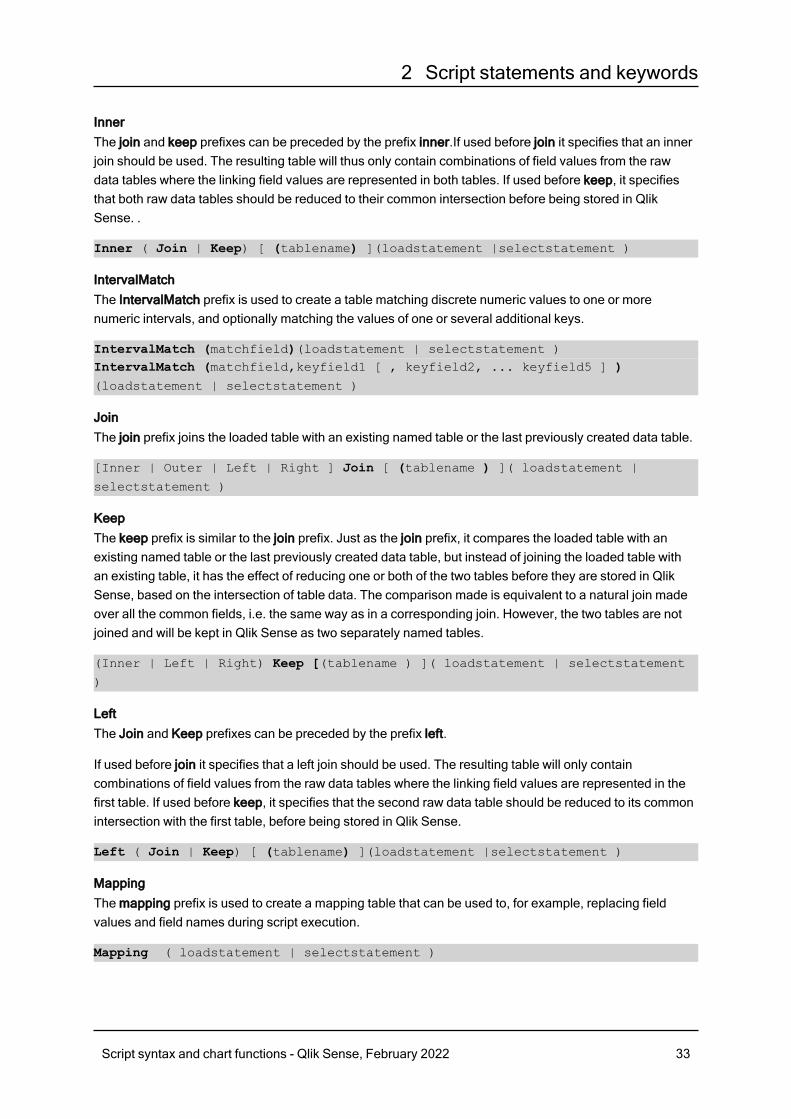
InnerThe join and keep prefixes can be preceded by the prefix inner.If used before join it specifies that an innerjoin should be used. The resulting table will thus only contain combinations of field values from the rawdata tables where the linking field values are represented in both tables. If used before keep, it specifiesthat both raw data tables should be reduced to their common intersection before being stored in QlikSense. .
Inner ( Join | Keep) [ (tablename) ](loadstatement |selectstatement )
IntervalMatchThe IntervalMatch prefix is used to create a table matching discrete numeric values to one or morenumeric intervals, and optionally matching the values of one or several additional keys.
IntervalMatch (matchfield)(loadstatement | selectstatement )IntervalMatch (matchfield,keyfield1 [ , keyfield2, ... keyfield5 ] )(loadstatement | selectstatement )
JoinThe join prefix joins the loaded table with an existing named table or the last previously created data table.
[Inner | Outer | Left | Right ] Join [ (tablename ) ]( loadstatement |
selectstatement )
KeepThe keep prefix is similar to the join prefix. Just as the join prefix, it compares the loaded table with anexisting named table or the last previously created data table, but instead of joining the loaded table withan existing table, it has the effect of reducing one or both of the two tables before they are stored in QlikSense, based on the intersection of table data. The comparison made is equivalent to a natural join madeover all the common fields, i.e. the same way as in a corresponding join. However, the two tables are notjoined and will be kept in Qlik Sense as two separately named tables.
(Inner | Left | Right) Keep [(tablename ) ]( loadstatement | selectstatement
)
LeftThe Join and Keep prefixes can be preceded by the prefix left.
If used before join it specifies that a left join should be used. The resulting table will only containcombinations of field values from the raw data tables where the linking field values are represented in thefirst table. If used before keep, it specifies that the second raw data table should be reduced to its commonintersection with the first table, before being stored in Qlik Sense.
Left ( Join | Keep) [ (tablename) ](loadstatement |selectstatement )
MappingThe mapping prefix is used to create a mapping table that can be used to, for example, replacing fieldvalues and field names during script execution.
Mapping ( loadstatement | selectstatement )
Script syntax and chart functions - Qlik Sense, February 2022 33
2 Script statements and keywords
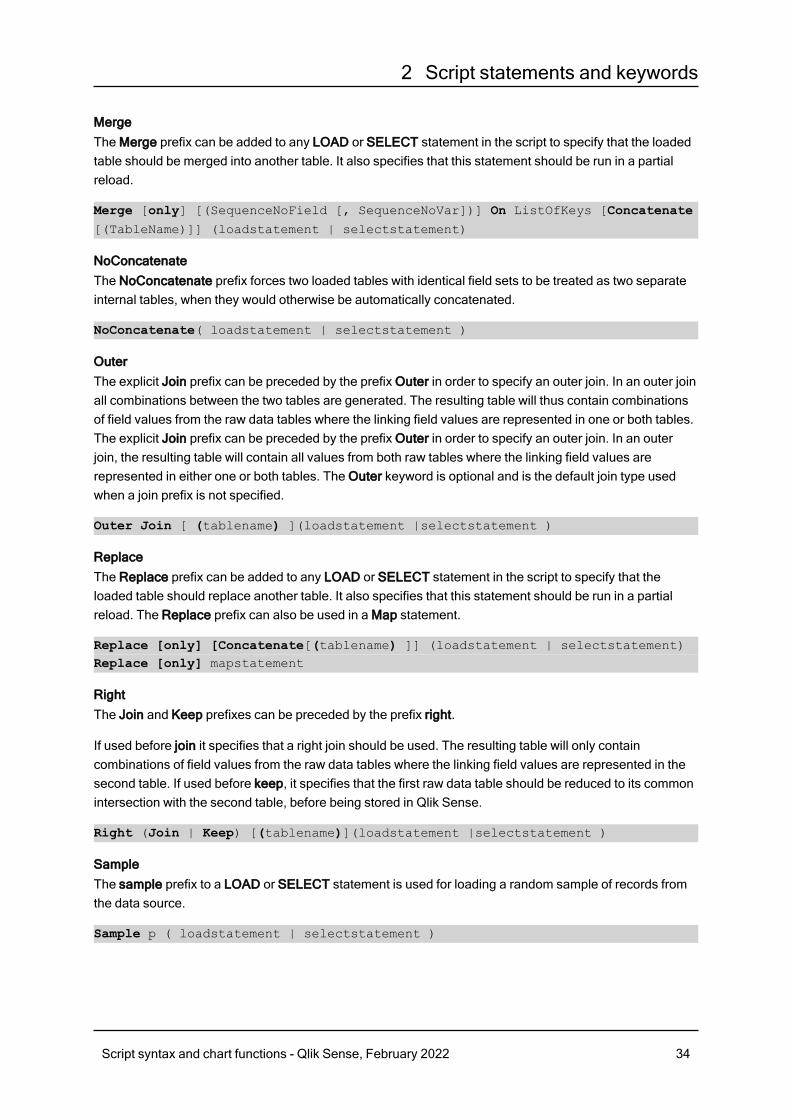
MergeThe Merge prefix can be added to any LOAD or SELECT statement in the script to specify that the loadedtable should be merged into another table. It also specifies that this statement should be run in a partialreload.
Merge [only] [(SequenceNoField [, SequenceNoVar])] On ListOfKeys [Concatenate[(TableName)]] (loadstatement | selectstatement)
NoConcatenateThe NoConcatenate prefix forces two loaded tables with identical field sets to be treated as two separateinternal tables, when they would otherwise be automatically concatenated.
NoConcatenate( loadstatement | selectstatement )
OuterThe explicit Join prefix can be preceded by the prefix Outer in order to specify an outer join. In an outer joinall combinations between the two tables are generated. The resulting table will thus contain combinationsof field values from the raw data tables where the linking field values are represented in one or both tables.The explicit Join prefix can be preceded by the prefix Outer in order to specify an outer join. In an outerjoin, the resulting table will contain all values from both raw tables where the linking field values arerepresented in either one or both tables. The Outer keyword is optional and is the default join type usedwhen a join prefix is not specified.
Outer Join [ (tablename) ](loadstatement |selectstatement )
ReplaceThe Replace prefix can be added to any LOAD or SELECT statement in the script to specify that theloaded table should replace another table. It also specifies that this statement should be run in a partialreload. The Replace prefix can also be used in a Map statement.
Replace [only] [Concatenate[(tablename) ]] (loadstatement | selectstatement)Replace [only] mapstatement
RightThe Join and Keep prefixes can be preceded by the prefix right.
If used before join it specifies that a right join should be used. The resulting table will only containcombinations of field values from the raw data tables where the linking field values are represented in thesecond table. If used before keep, it specifies that the first raw data table should be reduced to its commonintersection with the second table, before being stored in Qlik Sense.
Right (Join | Keep) [(tablename)](loadstatement |selectstatement )
SampleThe sample prefix to a LOAD or SELECT statement is used for loading a random sample of records fromthe data source.
Sample p ( loadstatement | selectstatement )
Script syntax and chart functions - Qlik Sense, February 2022 34
2 Script statements and keywords
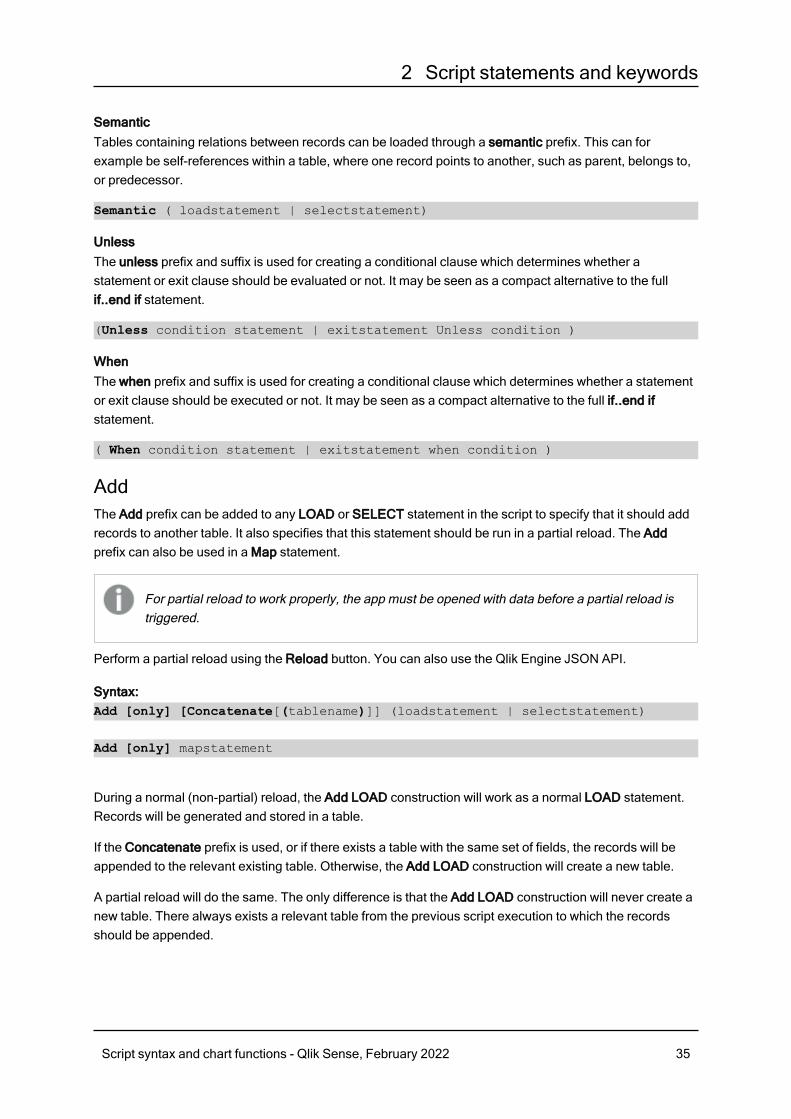
SemanticTables containing relations between records can be loaded through a semantic prefix. This can forexample be self-references within a table, where one record points to another, such as parent, belongs to,or predecessor.
Semantic ( loadstatement | selectstatement)
UnlessThe unless prefix and suffix is used for creating a conditional clause which determines whether astatement or exit clause should be evaluated or not. It may be seen as a compact alternative to the fullif..end if statement.
(Unless condition statement | exitstatement Unless condition )
WhenThe when prefix and suffix is used for creating a conditional clause which determines whether a statementor exit clause should be executed or not. It may be seen as a compact alternative to the full if..end ifstatement.
( When condition statement | exitstatement when condition )
AddThe Add prefix can be added to any LOAD or SELECT statement in the script to specify that it should addrecords to another table. It also specifies that this statement should be run in a partial reload. The Addprefix can also be used in a Map statement.
For partial reload to work properly, the app must be opened with data before a partial reload istriggered.
Perform a partial reload using the Reload button. You can also use the Qlik Engine JSON API.
Syntax:Add [only] [Concatenate[(tablename)]] (loadstatement | selectstatement)
Add [only] mapstatement
During a normal (non-partial) reload, the Add LOAD construction will work as a normal LOAD statement.Records will be generated and stored in a table.
If the Concatenate prefix is used, or if there exists a table with the same set of fields, the records will beappended to the relevant existing table. Otherwise, the Add LOAD construction will create a new table.
A partial reload will do the same. The only difference is that the Add LOAD construction will never create anew table. There always exists a relevant table from the previous script execution to which the recordsshould be appended.
Script syntax and chart functions - Qlik Sense, February 2022 35
2 Script statements and keywords
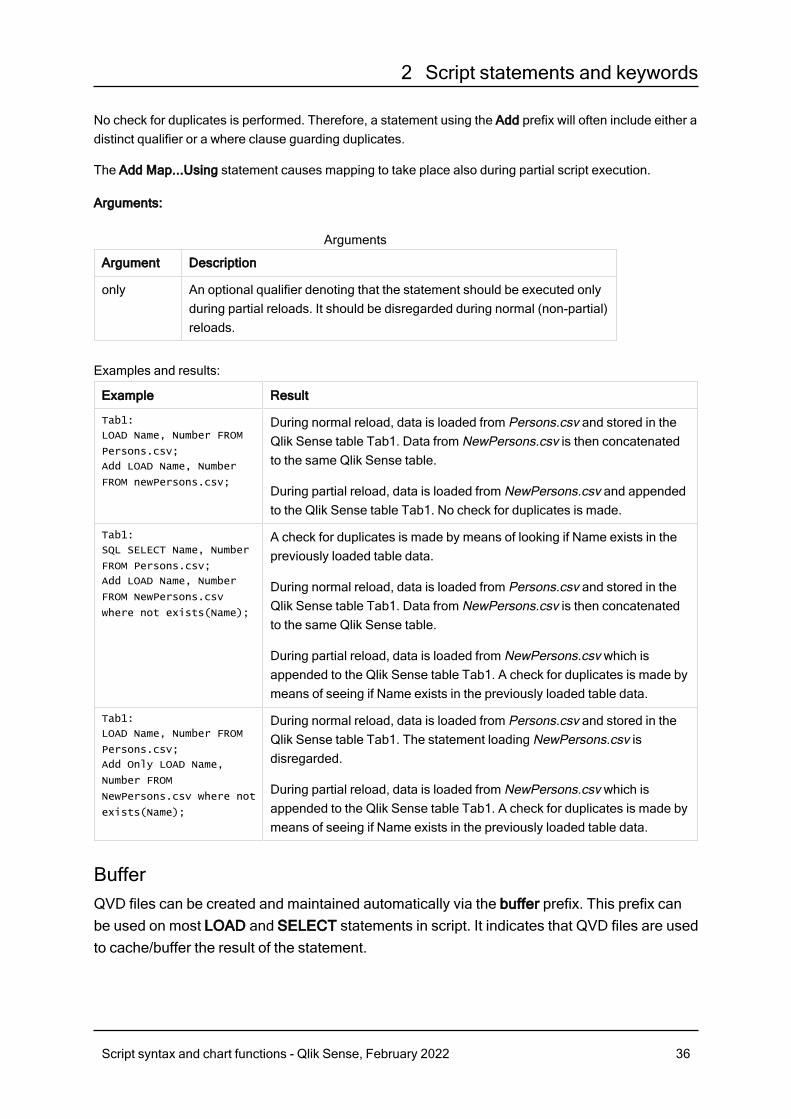
No check for duplicates is performed. Therefore, a statement using the Add prefix will often include either adistinct qualifier or a where clause guarding duplicates.
The Add Map...Using statement causes mapping to take place also during partial script execution.
Arguments:
Argument Description
only An optional qualifier denoting that the statement should be executed onlyduring partial reloads. It should be disregarded during normal (non-partial)reloads.
Arguments
Examples and results:
Example Result
Tab1:
LOAD Name, Number FROM
Persons.csv;
Add LOAD Name, Number
FROM newPersons.csv;
During normal reload, data is loaded from Persons.csv and stored in theQlik Sense table Tab1. Data from NewPersons.csv is then concatenatedto the same Qlik Sense table.
During partial reload, data is loaded from NewPersons.csv and appendedto the Qlik Sense table Tab1. No check for duplicates is made.
Tab1:
SQL SELECT Name, Number
FROM Persons.csv;
Add LOAD Name, Number
FROM NewPersons.csv
where not exists(Name);
A check for duplicates is made by means of looking if Name exists in thepreviously loaded table data.
During normal reload, data is loaded from Persons.csv and stored in theQlik Sense table Tab1. Data from NewPersons.csv is then concatenatedto the same Qlik Sense table.
During partial reload, data is loaded from NewPersons.csv which isappended to the Qlik Sense table Tab1. A check for duplicates is made bymeans of seeing if Name exists in the previously loaded table data.
Tab1:
LOAD Name, Number FROM
Persons.csv;
Add Only LOAD Name,
Number FROM
NewPersons.csv where not
exists(Name);
During normal reload, data is loaded from Persons.csv and stored in theQlik Sense table Tab1. The statement loading NewPersons.csv isdisregarded.
During partial reload, data is loaded from NewPersons.csv which isappended to the Qlik Sense table Tab1. A check for duplicates is made bymeans of seeing if Name exists in the previously loaded table data.
BufferQVD files can be created and maintained automatically via the buffer prefix. This prefix canbe used on most LOAD and SELECT statements in script. It indicates that QVD files are usedto cache/buffer the result of the statement.
Script syntax and chart functions - Qlik Sense, February 2022 36
2 Script statements and keywords
Syntax:Buffer [(option [ , option])] ( loadstatement | selectstatement )option::= incremental | stale [after] amount [(days | hours)]
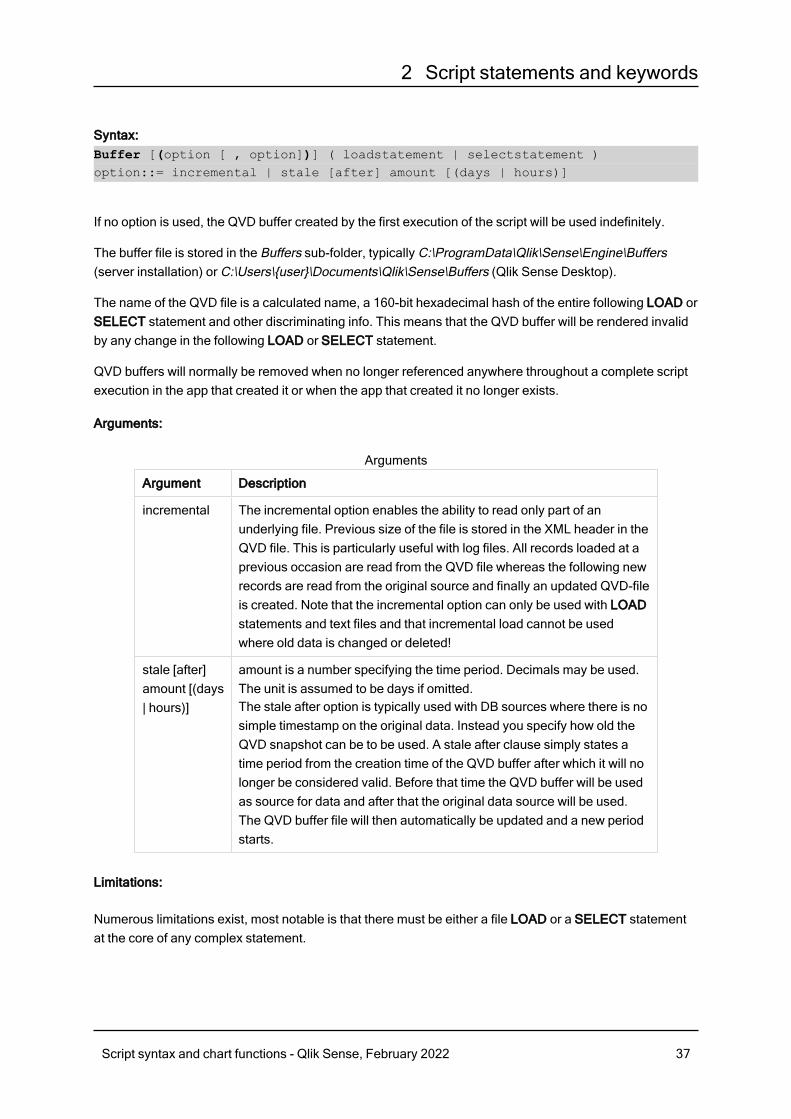
If no option is used, the QVD buffer created by the first execution of the script will be used indefinitely.
The buffer file is stored in the Buffers sub-folder, typically C:\ProgramData\Qlik\Sense\Engine\Buffers(server installation) or C:\Users\{user}\Documents\Qlik\Sense\Buffers (Qlik Sense Desktop).
The name of the QVD file is a calculated name, a 160-bit hexadecimal hash of the entire following LOAD orSELECT statement and other discriminating info. This means that the QVD buffer will be rendered invalidby any change in the following LOAD or SELECT statement.
QVD buffers will normally be removed when no longer referenced anywhere throughout a complete scriptexecution in the app that created it or when the app that created it no longer exists.
Arguments:
Argument Description
incremental The incremental option enables the ability to read only part of anunderlying file. Previous size of the file is stored in the XML header in theQVD file. This is particularly useful with log files. All records loaded at aprevious occasion are read from the QVD file whereas the following newrecords are read from the original source and finally an updated QVD-fileis created. Note that the incremental option can only be used with LOADstatements and text files and that incremental load cannot be usedwhere old data is changed or deleted!
stale [after]amount [(days| hours)]
amount is a number specifying the time period. Decimals may be used.The unit is assumed to be days if omitted.The stale after option is typically used with DB sources where there is nosimple timestamp on the original data. Instead you specify how old theQVD snapshot can be to be used. A stale after clause simply states atime period from the creation time of the QVD buffer after which it will nolonger be considered valid. Before that time the QVD buffer will be usedas source for data and after that the original data source will be used.The QVD buffer file will then automatically be updated and a new periodstarts.
Arguments
Limitations:
Numerous limitations exist, most notable is that there must be either a file LOAD or a SELECT statementat the core of any complex statement.
Script syntax and chart functions - Qlik Sense, February 2022 37
2 Script statements and keywords
Example 1:
Buffer SELECT * from MyTable;
Example 2:
Buffer (stale after 7 days) SELECT * from MyTable;
Example 3:
Buffer (incremental) LOAD * from MyLog.log;
ConcatenateIf two tables that are to be concatenated have different sets of fields, concatenation of twotables can still be forced with the Concatenate prefix. This statement forces concatenationwith an existing named table or the latest previously created logical table.
Syntax:Concatenate[ (tablename ) ] ( loadstatement | selectstatement )
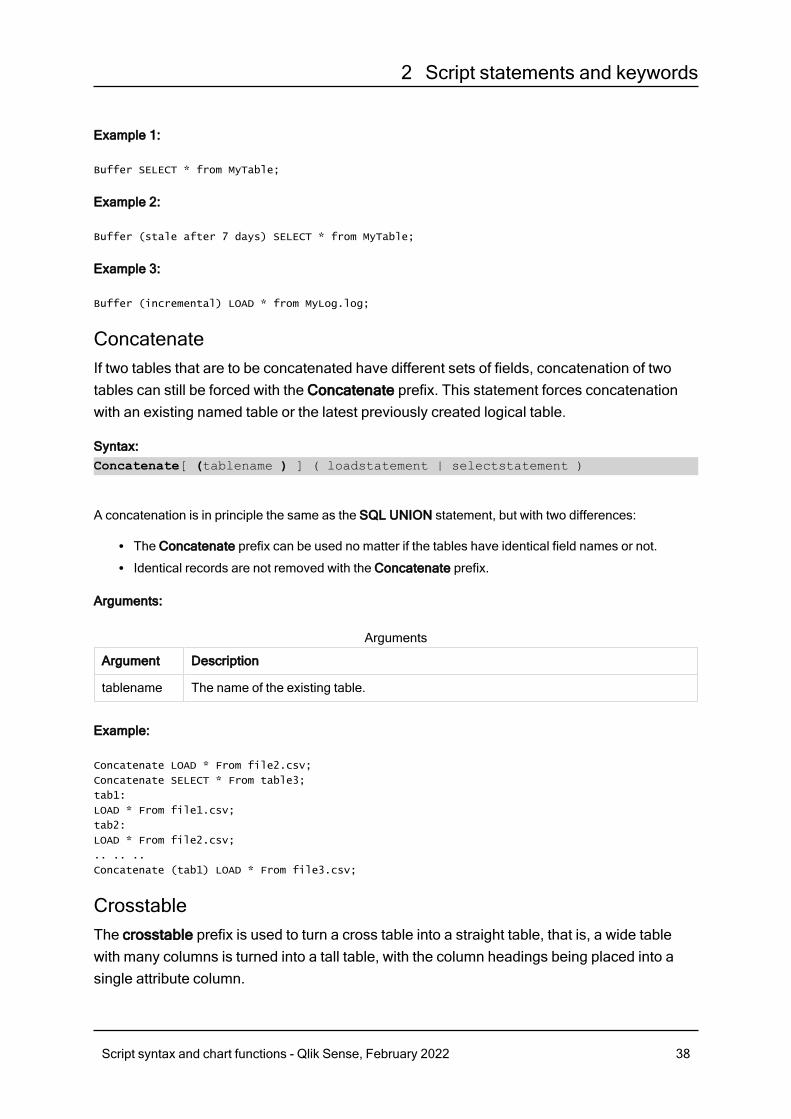
A concatenation is in principle the same as the SQL UNION statement, but with two differences:
l The Concatenate prefix can be used no matter if the tables have identical field names or not.l Identical records are not removed with the Concatenate prefix.
Arguments:
Argument Description
tablename The name of the existing table.
Arguments
Example:
Concatenate LOAD * From file2.csv;
Concatenate SELECT * From table3;
tab1:
LOAD * From file1.csv;
tab2:
LOAD * From file2.csv;
.. .. ..
Concatenate (tab1) LOAD * From file3.csv;
CrosstableThe crosstable prefix is used to turn a cross table into a straight table, that is, a wide tablewith many columns is turned into a tall table, with the column headings being placed into asingle attribute column.
Script syntax and chart functions - Qlik Sense, February 2022 38
2 Script statements and keywords
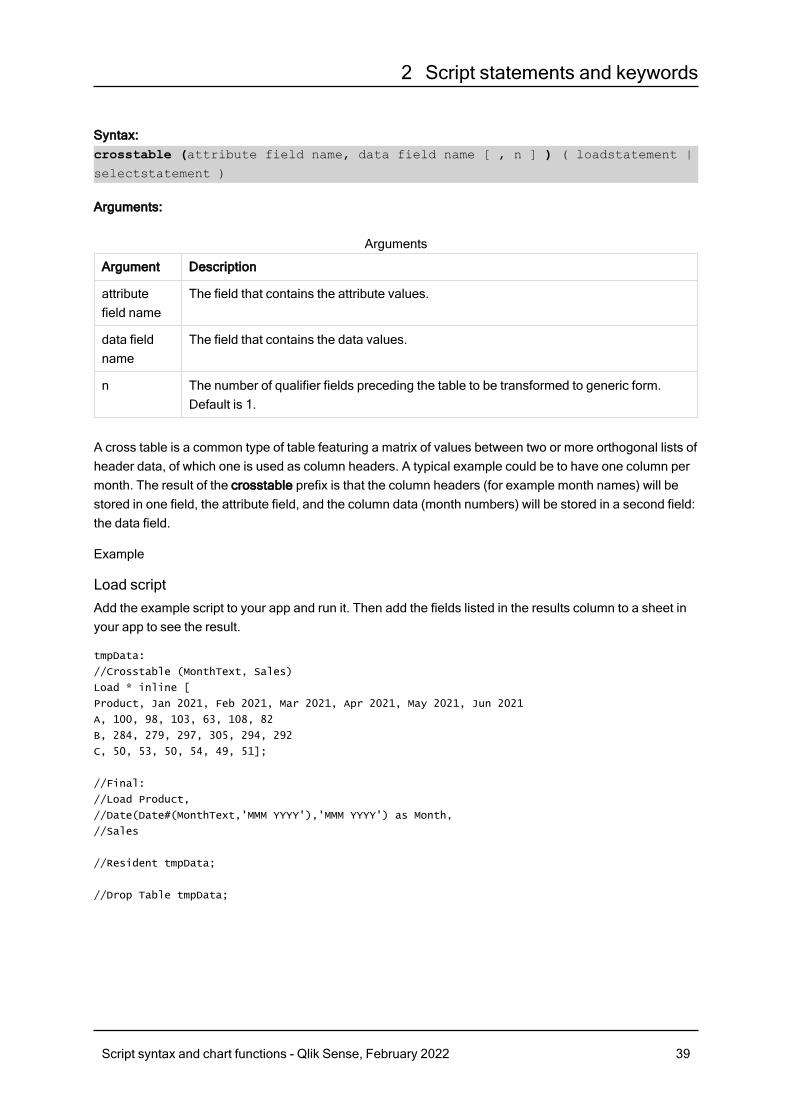
Syntax:crosstable (attribute field name, data field name [ , n ] ) ( loadstatement |
selectstatement )
Arguments:
Argument Description
attributefield name
The field that contains the attribute values.
data fieldname
The field that contains the data values.
n The number of qualifier fields preceding the table to be transformed to generic form.Default is 1.
Arguments
A cross table is a common type of table featuring a matrix of values between two or more orthogonal lists ofheader data, of which one is used as column headers. A typical example could be to have one column permonth. The result of the crosstable prefix is that the column headers (for example month names) will bestored in one field, the attribute field, and the column data (month numbers) will be stored in a second field:the data field.
Example
Load scriptAdd the example script to your app and run it. Then add the fields listed in the results column to a sheet inyour app to see the result.
tmpData:
//Crosstable (MonthText, Sales)
Load * inline [
Product, Jan 2021, Feb 2021, Mar 2021, Apr 2021, May 2021, Jun 2021
A, 100, 98, 103, 63, 108, 82
B, 284, 279, 297, 305, 294, 292
C, 50, 53, 50, 54, 49, 51];
//Final:
//Load Product,
//Date(Date#(MonthText,'MMM YYYY'),'MMM YYYY') as Month,
//Sales
//Resident tmpData;
//Drop Table tmpData;
Script syntax and chart functions - Qlik Sense, February 2022 39
2 Script statements and keywords
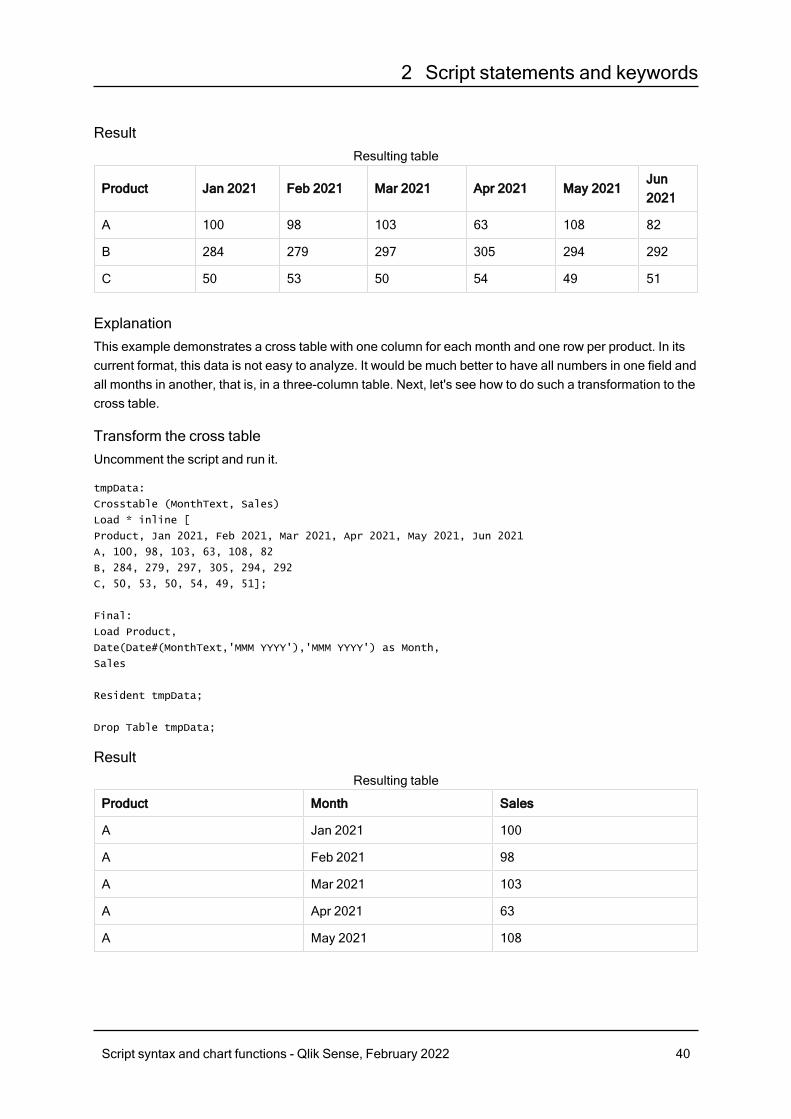
Result
Product Jan 2021 Feb 2021 Mar 2021 Apr 2021 May 2021Jun2021
A 100 98 103 63 108 82
B 284 279 297 305 294 292
C 50 53 50 54 49 51
Resulting table
ExplanationThis example demonstrates a cross table with one column for each month and one row per product. In itscurrent format, this data is not easy to analyze. It would be much better to have all numbers in one field andall months in another, that is, in a three-column table. Next, let's see how to do such a transformation to thecross table.
Transform the cross tableUncomment the script and run it.
tmpData:
Crosstable (MonthText, Sales)
Load * inline [
Product, Jan 2021, Feb 2021, Mar 2021, Apr 2021, May 2021, Jun 2021
A, 100, 98, 103, 63, 108, 82
B, 284, 279, 297, 305, 294, 292
C, 50, 53, 50, 54, 49, 51];
Final:
Load Product,
Date(Date#(MonthText,'MMM YYYY'),'MMM YYYY') as Month,
Sales
Resident tmpData;
Drop Table tmpData;
Result
Product Month Sales
A Jan 2021 100
A Feb 2021 98
A Mar 2021 103
A Apr 2021 63
A May 2021 108
Resulting table
Script syntax and chart functions - Qlik Sense, February 2022 40

2 Script statements and keywords
Product Month Sales
A Jun 2021 82
B Jan 2021 284
B Feb 2021 279
B Mar 2021 297
B Apr 2021 305
B May 2021 294
B Jun 2021 292
C Jan 2021 50
C Feb 2021 53
C Mar 2021 50
C Apr 2021 54
C May 2021 49
C Jun 2021 51
ExplanationThe cross table is transformed into a straight table with one column for Month and another for Sales.
FirstThe First prefix to a LOAD or SELECT (SQL) statement is used for loading a set maximumnumber of records from a data source table.
Syntax:First n ( loadstatement | selectstatement )
Arguments:
Argument Description
n An arbitrary expression that evaluates to an integer indicating the maximum number ofrecords to be read.
n can be enclosed in parentheses, like (n), but this is not required.
Arguments
Examples:
First 10 LOAD * from abc.csv;
First (1) SQL SELECT * from Orders;
Script syntax and chart functions - Qlik Sense, February 2022 41
2 Script statements and keywords
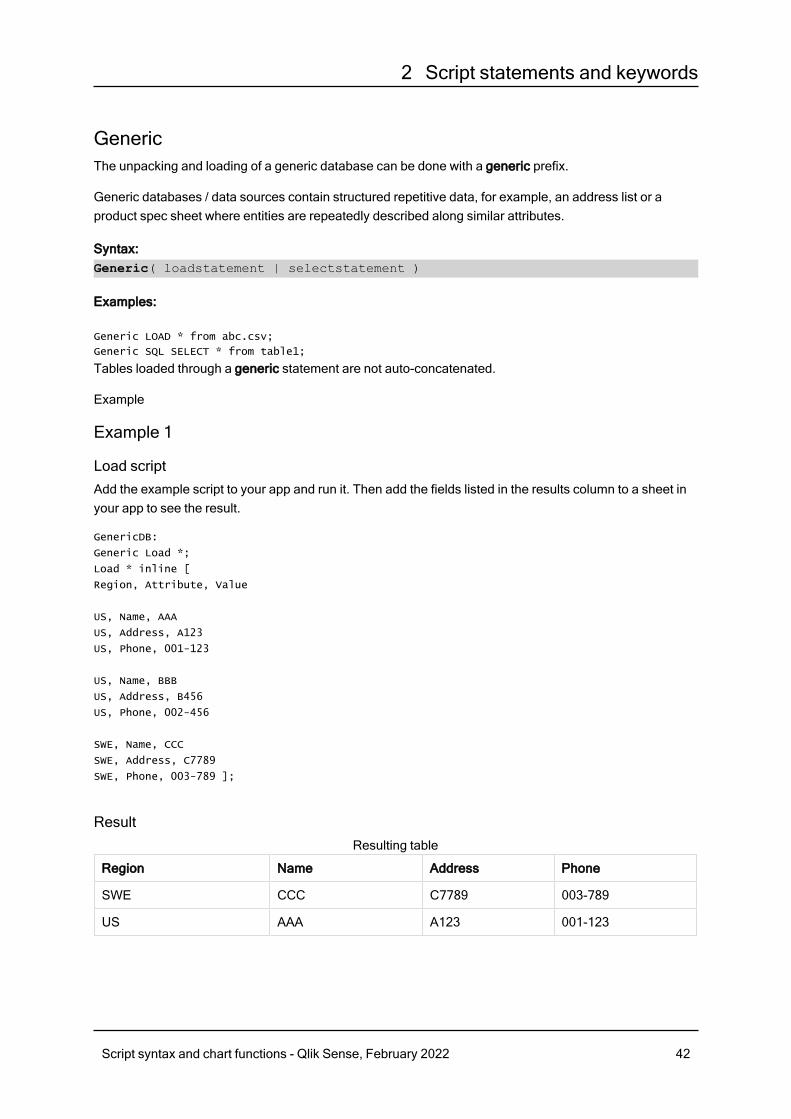
GenericThe unpacking and loading of a generic database can be done with a generic prefix.
Generic databases / data sources contain structured repetitive data, for example, an address list or aproduct spec sheet where entities are repeatedly described along similar attributes.
Syntax:Generic( loadstatement | selectstatement )
Examples:
Generic LOAD * from abc.csv;
Generic SQL SELECT * from table1;
Tables loaded through a generic statement are not auto-concatenated.
Example
Example 1
Load scriptAdd the example script to your app and run it. Then add the fields listed in the results column to a sheet inyour app to see the result.
GenericDB:
Generic Load *;
Load * inline [
Region, Attribute, Value
US, Name, AAA
US, Address, A123
US, Phone, 001-123
US, Name, BBB
US, Address, B456
US, Phone, 002-456
SWE, Name, CCC
SWE, Address, C7789
SWE, Phone, 003-789 ];
Result
Region Name Address Phone
SWE CCC C7789 003-789
US AAA A123 001-123
Resulting table
Script syntax and chart functions - Qlik Sense, February 2022 42
2 Script statements and keywords
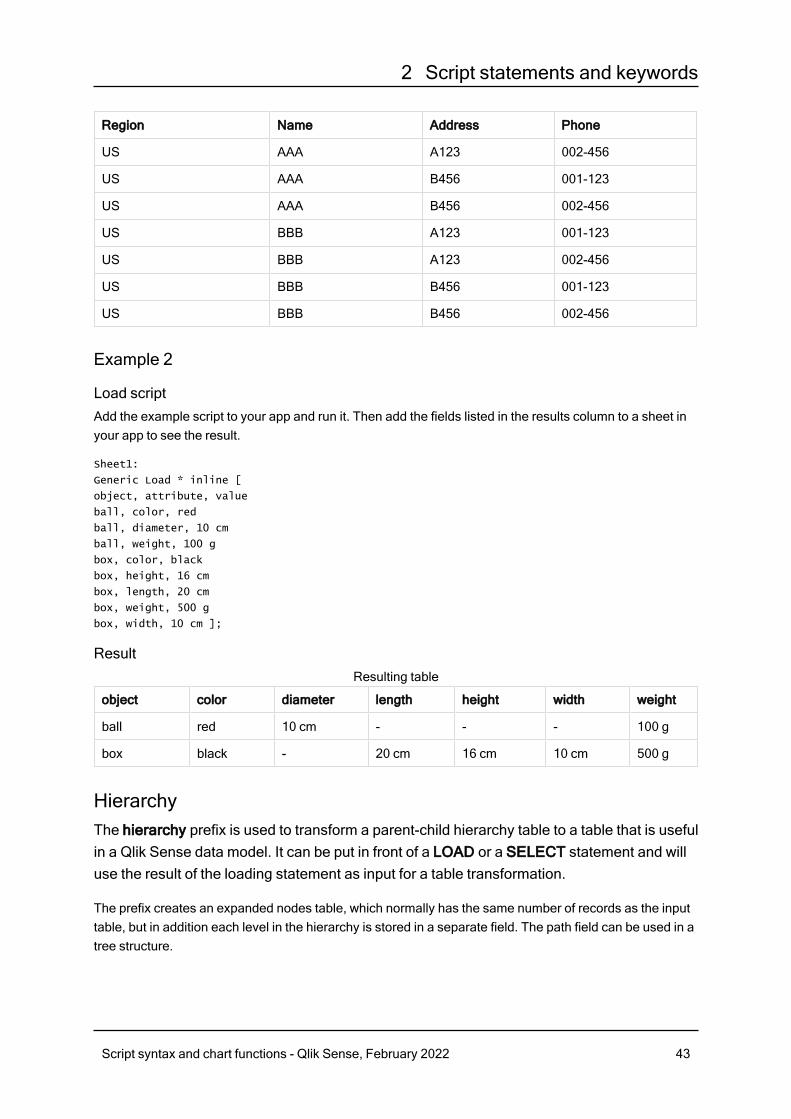
Region Name Address Phone
US AAA A123 002-456
US AAA B456 001-123
US AAA B456 002-456
US BBB A123 001-123
US BBB A123 002-456
US BBB B456 001-123
US BBB B456 002-456
Example 2
Load scriptAdd the example script to your app and run it. Then add the fields listed in the results column to a sheet inyour app to see the result.
Sheet1:
Generic Load * inline [
object, attribute, value
ball, color, red
ball, diameter, 10 cm
ball, weight, 100 g
box, color, black
box, height, 16 cm
box, length, 20 cm
box, weight, 500 g
box, width, 10 cm ];
Result
object color diameter length height width weight
ball red 10 cm - - - 100 g
box black - 20 cm 16 cm 10 cm 500 g
Resulting table
HierarchyThe hierarchy prefix is used to transform a parent-child hierarchy table to a table that is usefulin a Qlik Sense data model. It can be put in front of a LOAD or a SELECT statement and willuse the result of the loading statement as input for a table transformation.
The prefix creates an expanded nodes table, which normally has the same number of records as the inputtable, but in addition each level in the hierarchy is stored in a separate field. The path field can be used in atree structure.
Script syntax and chart functions - Qlik Sense, February 2022 43
2 Script statements and keywords
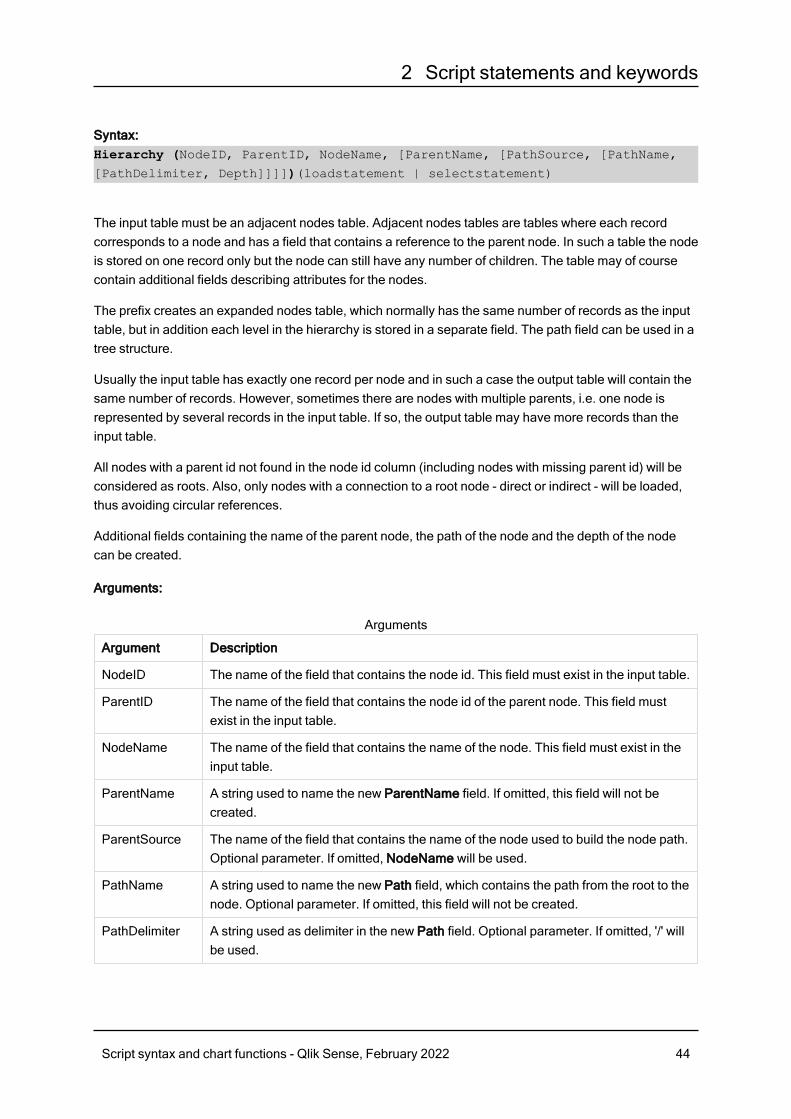
Syntax:Hierarchy (NodeID, ParentID, NodeName, [ParentName, [PathSource, [PathName,
[PathDelimiter, Depth]]]])(loadstatement | selectstatement)
The input table must be an adjacent nodes table. Adjacent nodes tables are tables where each recordcorresponds to a node and has a field that contains a reference to the parent node. In such a table the nodeis stored on one record only but the node can still have any number of children. The table may of coursecontain additional fields describing attributes for the nodes.
The prefix creates an expanded nodes table, which normally has the same number of records as the inputtable, but in addition each level in the hierarchy is stored in a separate field. The path field can be used in atree structure.
Usually the input table has exactly one record per node and in such a case the output table will contain thesame number of records. However, sometimes there are nodes with multiple parents, i.e. one node isrepresented by several records in the input table. If so, the output table may have more records than theinput table.
All nodes with a parent id not found in the node id column (including nodes with missing parent id) will beconsidered as roots. Also, only nodes with a connection to a root node - direct or indirect - will be loaded,thus avoiding circular references.
Additional fields containing the name of the parent node, the path of the node and the depth of the nodecan be created.
Arguments:
Argument Description
NodeID The name of the field that contains the node id. This field must exist in the input table.
ParentID The name of the field that contains the node id of the parent node. This field mustexist in the input table.
NodeName The name of the field that contains the name of the node. This field must exist in theinput table.
ParentName A string used to name the new ParentName field. If omitted, this field will not becreated.
ParentSource The name of the field that contains the name of the node used to build the node path.Optional parameter. If omitted, NodeName will be used.
PathName A string used to name the new Path field, which contains the path from the root to thenode. Optional parameter. If omitted, this field will not be created.
PathDelimiter A string used as delimiter in the new Path field. Optional parameter. If omitted, '/' willbe used.
Arguments
Script syntax and chart functions - Qlik Sense, February 2022 44
2 Script statements and keywords
Argument Description
Depth A string used to name the new Depth field, which contains the depth of the node inthe hierarchy. Optional parameter. If omitted, this field will not be created.
Example:
Hierarchy(NodeID, ParentID, NodeName, ParentName, NodeName, PathName, '\', Depth) LOAD *
inline [
NodeID, ParentID, NodeName
1, 4, London
2, 3, Munich
3, 5, Germany
4, 5, UK
5, , Europe
];
NodeID
ParentID
NodeName
NodeName1
NodeName2
NodeName3
ParentName
PathName Depth
1 4 London Europe UK London UK Europe\UK\London
3
2 3 Munich Europe Germany Munich Germany Europe\Germany\Munich
3
3 5 Germany
Europe Germany - Europe Europe\Germany 2
4 5 UK Europe UK - Europe Europe\UK 2
5 Europe Europe - - - Europe 1
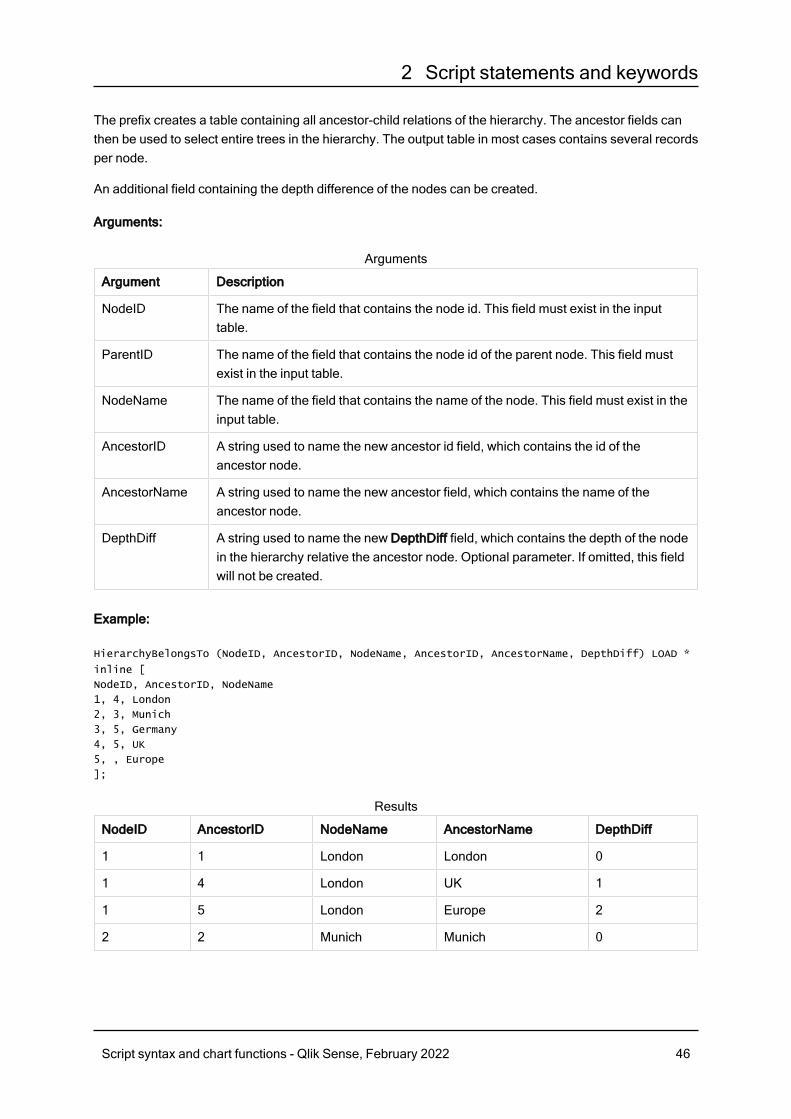
HierarchyBelongsToThis prefix is used to transform a parent-child hierarchy table to a table that is useful in a QlikSense data model. It can be put in front of a LOAD or a SELECT statement and will use theresult of the loading statement as input for a table transformation.
The prefix creates a table containing all ancestor-child relations of the hierarchy. The ancestor fields canthen be used to select entire trees in the hierarchy. The output table in most cases contains several recordsper node.
Syntax:HierarchyBelongsTo (NodeID, ParentID, NodeName, AncestorID, AncestorName,
[DepthDiff])(loadstatement | selectstatement)
The input table must be an adjacent nodes table. Adjacent nodes tables are tables where each recordcorresponds to a node and has a field that contains a reference to the parent node. In such a table the nodeis stored on one record only but the node can still have any number of children. The table may of coursecontain additional fields describing attributes for the nodes.
Script syntax and chart functions - Qlik Sense, February 2022 45
2 Script statements and keywords
The prefix creates a table containing all ancestor-child relations of the hierarchy. The ancestor fields canthen be used to select entire trees in the hierarchy. The output table in most cases contains several recordsper node.
An additional field containing the depth difference of the nodes can be created.
Arguments:
Argument Description
NodeID The name of the field that contains the node id. This field must exist in the inputtable.
ParentID The name of the field that contains the node id of the parent node. This field mustexist in the input table.
NodeName The name of the field that contains the name of the node. This field must exist in theinput table.
AncestorID A string used to name the new ancestor id field, which contains the id of theancestor node.
AncestorName A string used to name the new ancestor field, which contains the name of theancestor node.
DepthDiff A string used to name the new DepthDiff field, which contains the depth of the nodein the hierarchy relative the ancestor node. Optional parameter. If omitted, this fieldwill not be created.
Arguments
Example:
HierarchyBelongsTo (NodeID, AncestorID, NodeName, AncestorID, AncestorName, DepthDiff) LOAD *
inline [
NodeID, AncestorID, NodeName
1, 4, London
2, 3, Munich
3, 5, Germany
4, 5, UK
5, , Europe
];
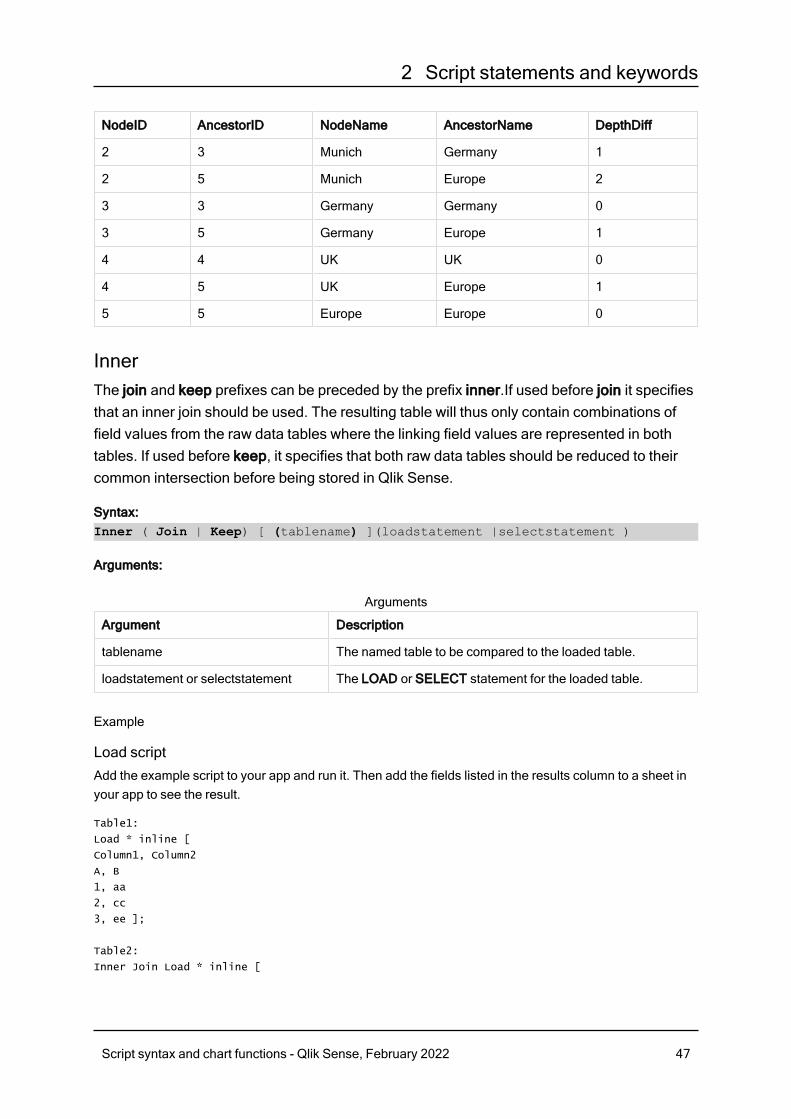
NodeID AncestorID NodeName AncestorName DepthDiff
1 1 London London 0
1 4 London UK 1
1 5 London Europe 2
2 2 Munich Munich 0
Results
Script syntax and chart functions - Qlik Sense, February 2022 46
2 Script statements and keywords
NodeID AncestorID NodeName AncestorName DepthDiff
2 3 Munich Germany 1
2 5 Munich Europe 2
3 3 Germany Germany 0
3 5 Germany Europe 1
4 4 UK UK 0
4 5 UK Europe 1
5 5 Europe Europe 0
InnerThe join and keep prefixes can be preceded by the prefix inner.If used before join it specifiesthat an inner join should be used. The resulting table will thus only contain combinations offield values from the raw data tables where the linking field values are represented in bothtables. If used before keep, it specifies that both raw data tables should be reduced to theircommon intersection before being stored in Qlik Sense.
Syntax:Inner ( Join | Keep) [ (tablename) ](loadstatement |selectstatement )
Arguments:
Argument Description
tablename The named table to be compared to the loaded table.
loadstatement or selectstatement The LOAD or SELECT statement for the loaded table.
Arguments
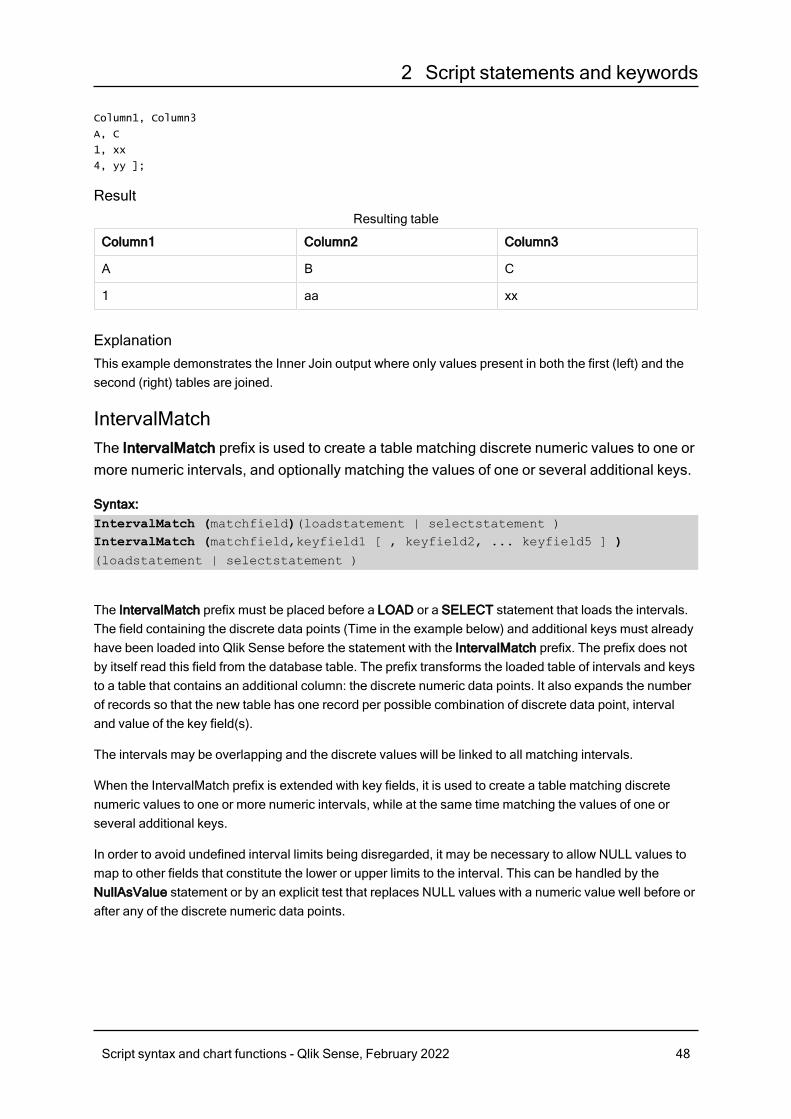
Example
Load scriptAdd the example script to your app and run it. Then add the fields listed in the results column to a sheet inyour app to see the result.
Table1:
Load * inline [
Column1, Column2
A, B
1, aa
2, cc
3, ee ];
Table2:
Inner Join Load * inline [
Script syntax and chart functions - Qlik Sense, February 2022 47
2 Script statements and keywords
Column1, Column3
A, C
1, xx
4, yy ];
Result
Column1 Column2 Column3
A B C
1 aa xx
Resulting table
ExplanationThis example demonstrates the Inner Join output where only values present in both the first (left) and thesecond (right) tables are joined.
IntervalMatchThe IntervalMatch prefix is used to create a table matching discrete numeric values to one ormore numeric intervals, and optionally matching the values of one or several additional keys.
Syntax:IntervalMatch (matchfield)(loadstatement | selectstatement )IntervalMatch (matchfield,keyfield1 [ , keyfield2, ... keyfield5 ] )(loadstatement | selectstatement )
The IntervalMatch prefix must be placed before a LOAD or a SELECT statement that loads the intervals.The field containing the discrete data points (Time in the example below) and additional keys must alreadyhave been loaded into Qlik Sense before the statement with the IntervalMatch prefix. The prefix does notby itself read this field from the database table. The prefix transforms the loaded table of intervals and keysto a table that contains an additional column: the discrete numeric data points. It also expands the numberof records so that the new table has one record per possible combination of discrete data point, intervaland value of the key field(s).
The intervals may be overlapping and the discrete values will be linked to all matching intervals.
When the IntervalMatch prefix is extended with key fields, it is used to create a table matching discretenumeric values to one or more numeric intervals, while at the same time matching the values of one orseveral additional keys.
In order to avoid undefined interval limits being disregarded, it may be necessary to allow NULL values tomap to other fields that constitute the lower or upper limits to the interval. This can be handled by theNullAsValue statement or by an explicit test that replaces NULL values with a numeric value well before orafter any of the discrete numeric data points.
Script syntax and chart functions - Qlik Sense, February 2022 48
2 Script statements and keywords
Arguments:
Argument Description
matchfield The field containing the discrete numeric values to be linked to intervals.
keyfield Fields that contain the additional attributes that are to be matched in thetransformation.
loadstatementorselectstatement
Must result in a table, where the first field contains the lower limit of each interval,the second field contains the upper limit of each interval, and in the case of usingkey matching, the third and any subsequent fields contain the keyfield(s) present inthe IntervalMatch statement. The intervals are always closed, i.e. the end pointsare included in the interval. Non-numeric limits render the interval to bedisregarded (undefined).
Arguments
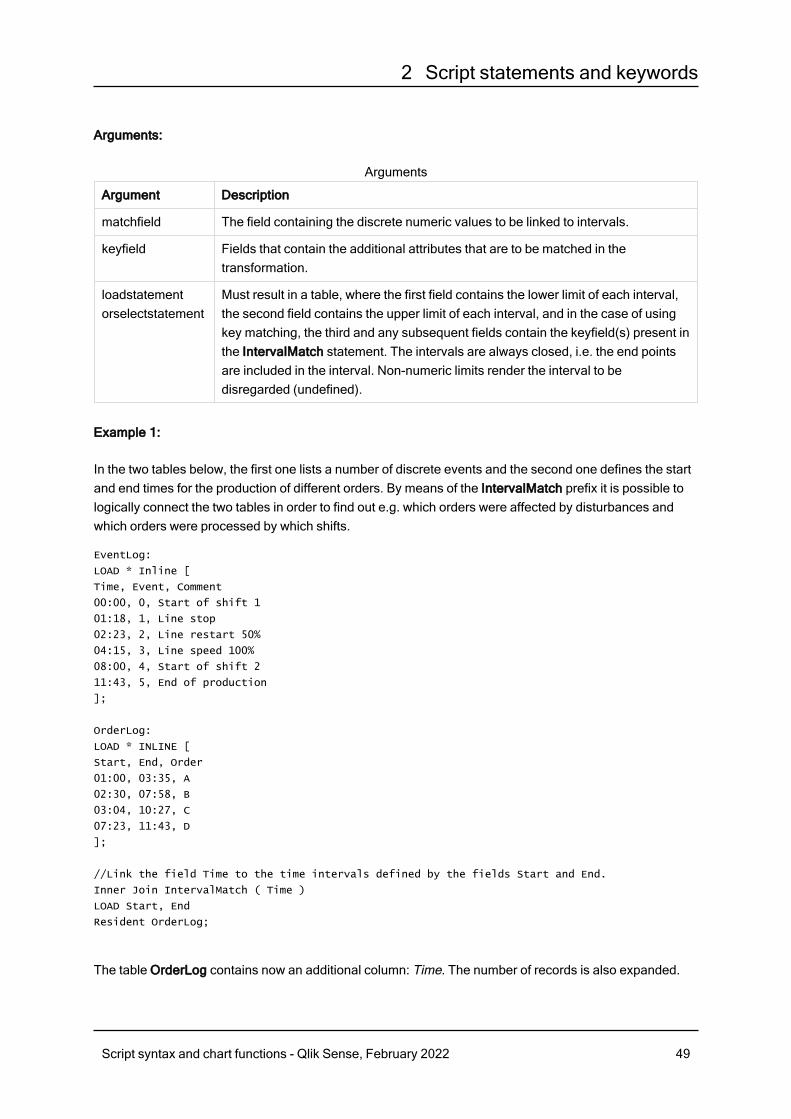
Example 1:
In the two tables below, the first one lists a number of discrete events and the second one defines the startand end times for the production of different orders. By means of the IntervalMatch prefix it is possible tologically connect the two tables in order to find out e.g. which orders were affected by disturbances andwhich orders were processed by which shifts.
EventLog:
LOAD * Inline [
Time, Event, Comment
00:00, 0, Start of shift 1
01:18, 1, Line stop
02:23, 2, Line restart 50%
04:15, 3, Line speed 100%
08:00, 4, Start of shift 2
11:43, 5, End of production
];
OrderLog:
LOAD * INLINE [
Start, End, Order
01:00, 03:35, A
02:30, 07:58, B
03:04, 10:27, C
07:23, 11:43, D
];
//Link the field Time to the time intervals defined by the fields Start and End.
Inner Join IntervalMatch ( Time )
LOAD Start, End
Resident OrderLog;
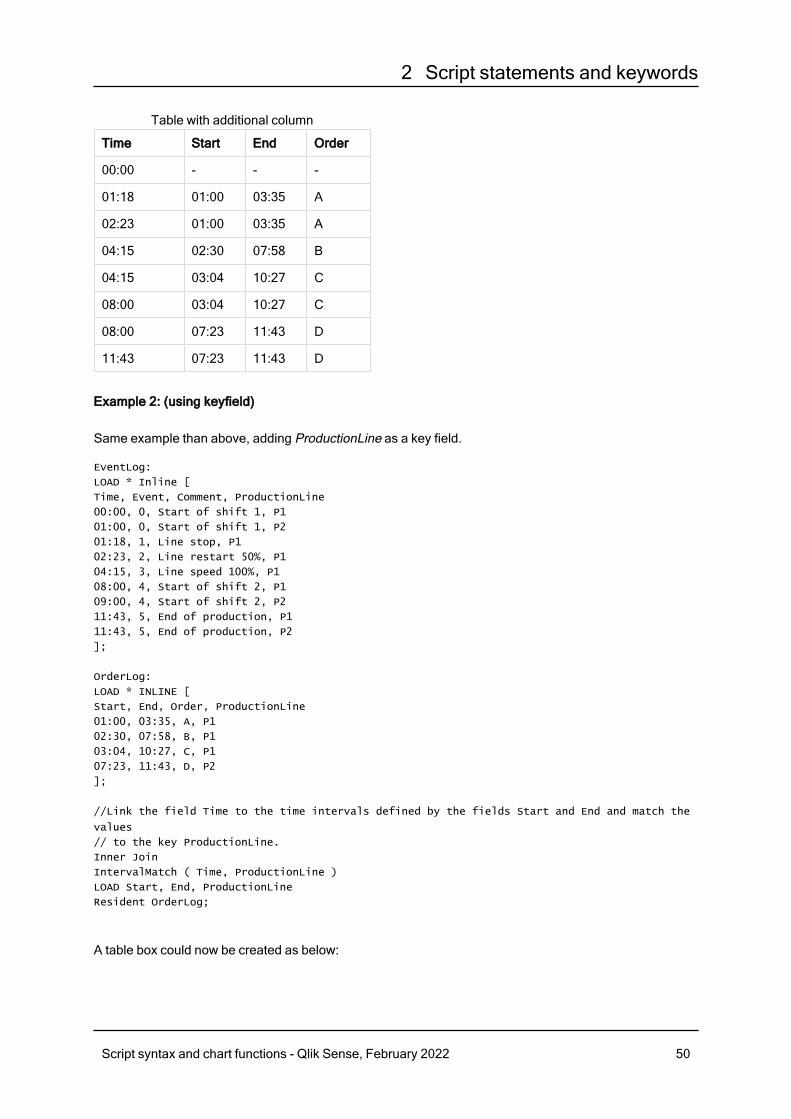
The table OrderLog contains now an additional column: Time. The number of records is also expanded.
Script syntax and chart functions - Qlik Sense, February 2022 49
2 Script statements and keywords
Time Start End Order
00:00 - - -
01:18 01:00 03:35 A
02:23 01:00 03:35 A
04:15 02:30 07:58 B
04:15 03:04 10:27 C
08:00 03:04 10:27 C
08:00 07:23 11:43 D
11:43 07:23 11:43 D
Table with additional column
Example 2: (using keyfield)
Same example than above, adding ProductionLine as a key field.
EventLog:
LOAD * Inline [
Time, Event, Comment, ProductionLine
00:00, 0, Start of shift 1, P1
01:00, 0, Start of shift 1, P2
01:18, 1, Line stop, P1
02:23, 2, Line restart 50%, P1
04:15, 3, Line speed 100%, P1
08:00, 4, Start of shift 2, P1
09:00, 4, Start of shift 2, P2
11:43, 5, End of production, P1
11:43, 5, End of production, P2
];
OrderLog:
LOAD * INLINE [
Start, End, Order, ProductionLine
01:00, 03:35, A, P1
02:30, 07:58, B, P1
03:04, 10:27, C, P1
07:23, 11:43, D, P2
];
//Link the field Time to the time intervals defined by the fields Start and End and match the
values
// to the key ProductionLine.
Inner Join
IntervalMatch ( Time, ProductionLine )
LOAD Start, End, ProductionLine
Resident OrderLog;
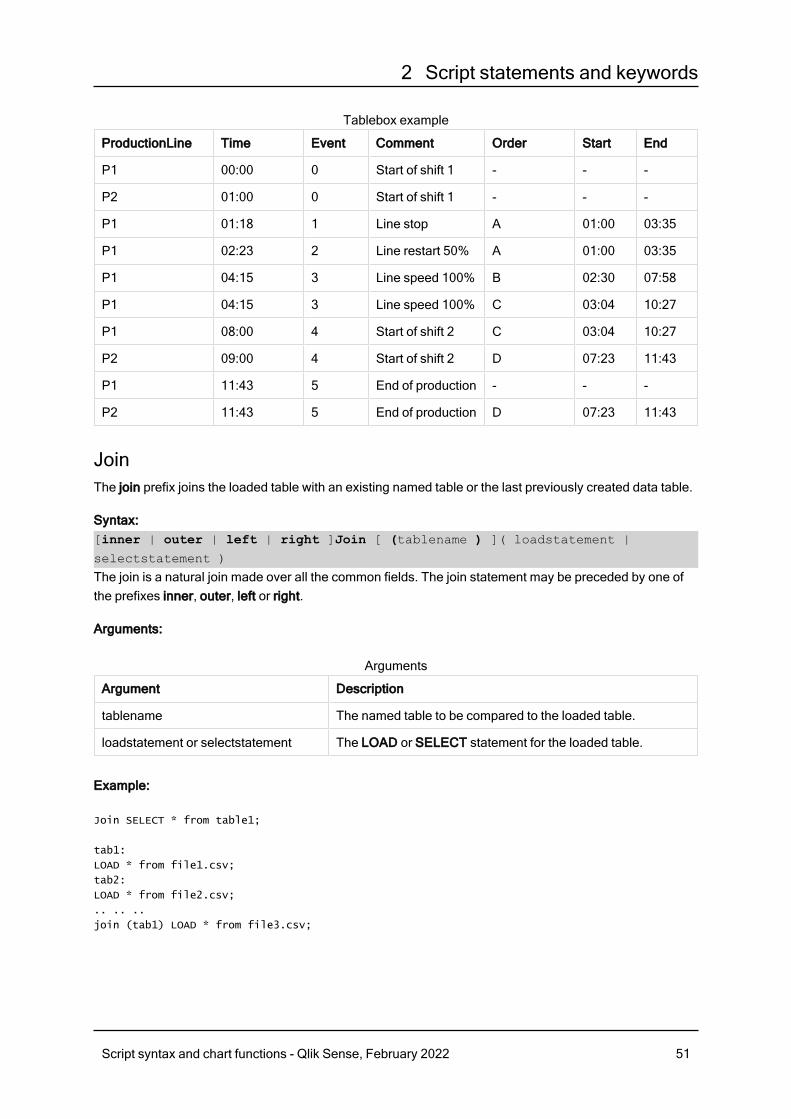
A table box could now be created as below:
Script syntax and chart functions - Qlik Sense, February 2022 50
2 Script statements and keywords
ProductionLine Time Event Comment Order Start End
P1 00:00 0 Start of shift 1 - - -
P2 01:00 0 Start of shift 1 - - -
P1 01:18 1 Line stop A 01:00 03:35
P1 02:23 2 Line restart 50% A 01:00 03:35
P1 04:15 3 Line speed 100% B 02:30 07:58
P1 04:15 3 Line speed 100% C 03:04 10:27
P1 08:00 4 Start of shift 2 C 03:04 10:27
P2 09:00 4 Start of shift 2 D 07:23 11:43
P1 11:43 5 End of production - - -
P2 11:43 5 End of production D 07:23 11:43
Tablebox example
JoinThe join prefix joins the loaded table with an existing named table or the last previously created data table.
Syntax:[inner | outer | left | right ]Join [ (tablename ) ]( loadstatement |
selectstatement )
The join is a natural join made over all the common fields. The join statement may be preceded by one ofthe prefixes inner, outer, left or right.
Arguments:
Argument Description
tablename The named table to be compared to the loaded table.
loadstatement or selectstatement The LOAD or SELECT statement for the loaded table.
Arguments
Example:
Join SELECT * from table1;
tab1:
LOAD * from file1.csv;
tab2:
LOAD * from file2.csv;
.. .. ..
join (tab1) LOAD * from file3.csv;
Script syntax and chart functions - Qlik Sense, February 2022 51

2 Script statements and keywords
Example
Load scriptAdd the example script to your app and run it. Then add the fields listed in the results column to a sheet inyour app to see the result.
Table1:
Load * inline [
Column1, Column2
A, B
1, aa
2, cc
3, ee ];
Table2:
Join Load * inline [
Column1, Column3
A, C
1, xx
4, yy ];
Column1 Column2 Column3
A B C
1 aa xx
2 cc -
3 ee -
4 - yy
Resulting table
ExplanationIn this example, the two tables, Table1 and Table2, are merged into a single table labeled Table1. In caseslike this, the join prefix is often used to join several tables into a single table to perform aggregations overthe values of a single table.
KeepThe keep prefix is similar to the join prefix. Just as the join prefix, it compares the loaded table with anexisting named table or the last previously created data table, but instead of joining the loaded table withan existing table, it has the effect of reducing one or both of the two tables before they are stored in QlikSense, based on the intersection of table data. The comparison made is equivalent to a natural join madeover all the common fields, i.e. the same way as in a corresponding join. However, the two tables are notjoined and will be kept in Qlik Sense as two separately named tables.
Syntax:(inner | left | right) keep [(tablename ) ]( loadstatement | selectstatement
)
The keep prefix must be preceded by one of the prefixes inner, left or right.
Script syntax and chart functions - Qlik Sense, February 2022 52
2 Script statements and keywords
The explicit join prefix in Qlik Sense script language performs a full join of the two tables. The result is onetable. In many cases such joins will result in very large tables. One of the main features of Qlik Sense is itsability to make associations between multiple tables instead of joining them, which greatly reducesmemory usage, increases processing speed and offers enormous flexibility. Explicit joins should thereforegenerally be avoided in Qlik Sense scripts. The keep functionality was designed to reduce the number ofcases where explicit joins needs to be used.
Arguments:
Argument Description
tablename The named table to be compared to the loaded table.
loadstatement or selectstatement The LOAD or SELECT statement for the loaded table.
Arguments
Example:
Inner Keep LOAD * from abc.csv;
Left Keep SELECT * from table1;
tab1:
LOAD * from file1.csv;
tab2:
LOAD * from file2.csv;
.. .. ..
Left Keep (tab1) LOAD * from file3.csv;
LeftThe Join and Keep prefixes can be preceded by the prefix left.
If used before join it specifies that a left join should be used. The resulting table will only containcombinations of field values from the raw data tables where the linking field values are represented in thefirst table. If used before keep, it specifies that the second raw data table should be reduced to its commonintersection with the first table, before being stored in Qlik Sense.
Were you looking for the string function by the same name? See: Left (page 798)
Syntax:Left ( Join | Keep) [ (tablename) ](loadstatement | selectstatement)
Arguments:
Argument Description
tablename The named table to be compared to the loaded table.
loadstatement or selectstatement The LOAD or SELECT statement for the loaded table.
Arguments
Script syntax and chart functions - Qlik Sense, February 2022 53
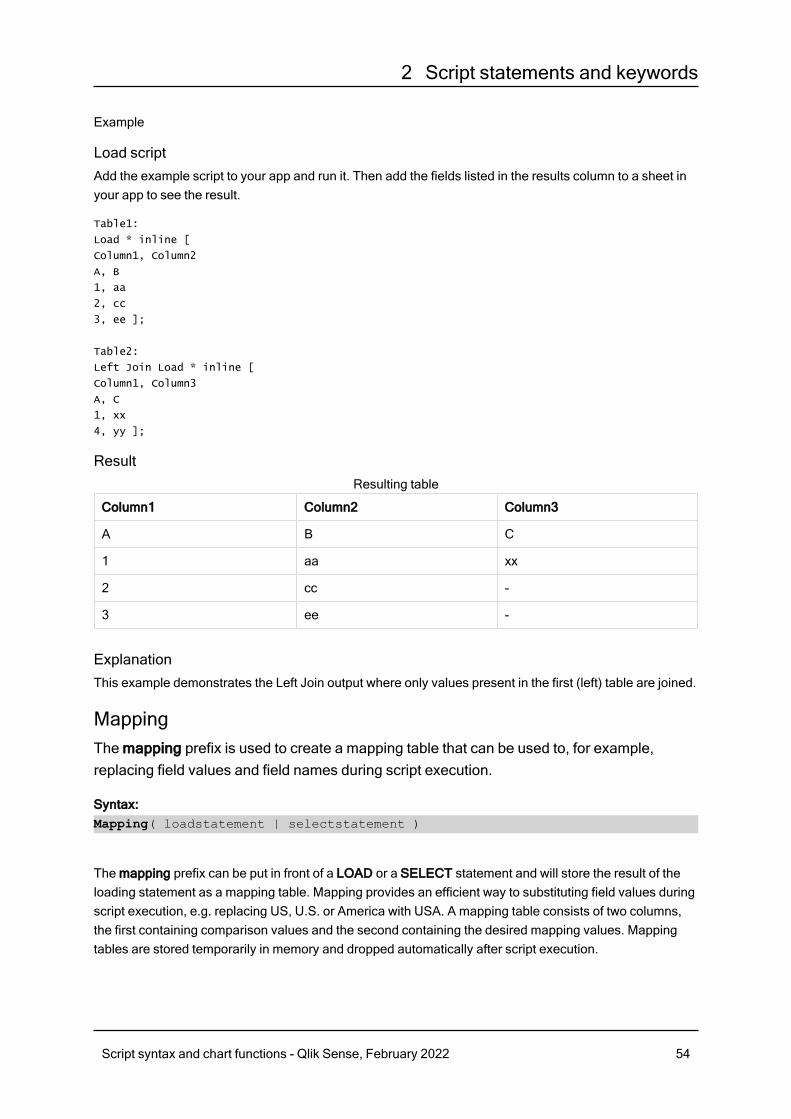
2 Script statements and keywords
Example
Load scriptAdd the example script to your app and run it. Then add the fields listed in the results column to a sheet inyour app to see the result.
Table1:
Load * inline [
Column1, Column2
A, B
1, aa
2, cc
3, ee ];
Table2:
Left Join Load * inline [
Column1, Column3
A, C
1, xx
4, yy ];
Result
Column1 Column2 Column3
A B C
1 aa xx
2 cc -
3 ee -
Resulting table
ExplanationThis example demonstrates the Left Join output where only values present in the first (left) table are joined.
MappingThe mapping prefix is used to create a mapping table that can be used to, for example,replacing field values and field names during script execution.
Syntax:Mapping( loadstatement | selectstatement )
The mapping prefix can be put in front of a LOAD or a SELECT statement and will store the result of theloading statement as a mapping table. Mapping provides an efficient way to substituting field values duringscript execution, e.g. replacing US, U.S. or America with USA. A mapping table consists of two columns,the first containing comparison values and the second containing the desired mapping values. Mappingtables are stored temporarily in memory and dropped automatically after script execution.
Script syntax and chart functions - Qlik Sense, February 2022 54
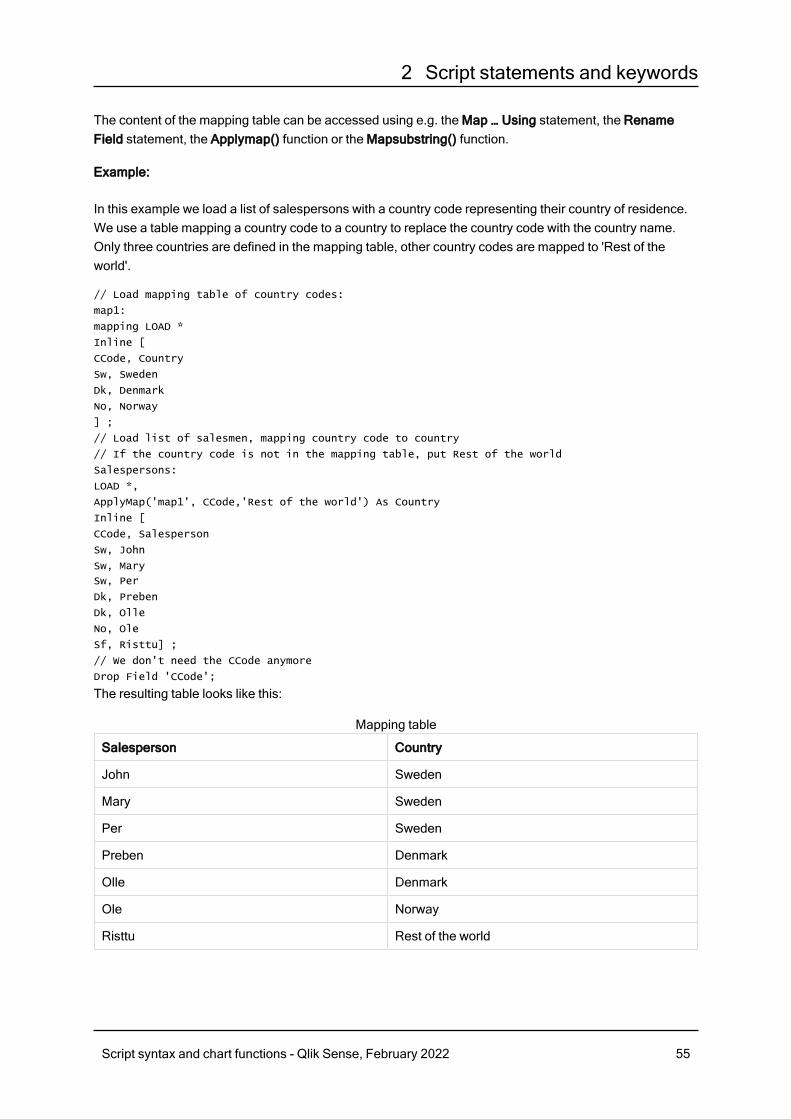
2 Script statements and keywords
The content of the mapping table can be accessed using e.g. the Map … Using statement, the RenameField statement, the Applymap() function or the Mapsubstring() function.
Example:
In this example we load a list of salespersons with a country code representing their country of residence.We use a table mapping a country code to a country to replace the country code with the country name.Only three countries are defined in the mapping table, other country codes are mapped to 'Rest of theworld'.
// Load mapping table of country codes:
map1:
mapping LOAD *
Inline [
CCode, Country
Sw, Sweden
Dk, Denmark
No, Norway
] ;
// Load list of salesmen, mapping country code to country
// If the country code is not in the mapping table, put Rest of the world
Salespersons:
LOAD *,
ApplyMap('map1', CCode,'Rest of the world') As Country
Inline [
CCode, Salesperson
Sw, John
Sw, Mary
Sw, Per
Dk, Preben
Dk, Olle
No, Ole
Sf, Risttu] ;
// We don't need the CCode anymore
Drop Field 'CCode';
The resulting table looks like this:
Salesperson Country
John Sweden
Mary Sweden
Per Sweden
Preben Denmark
Olle Denmark
Ole Norway
Risttu Rest of the world
Mapping table
Script syntax and chart functions - Qlik Sense, February 2022 55
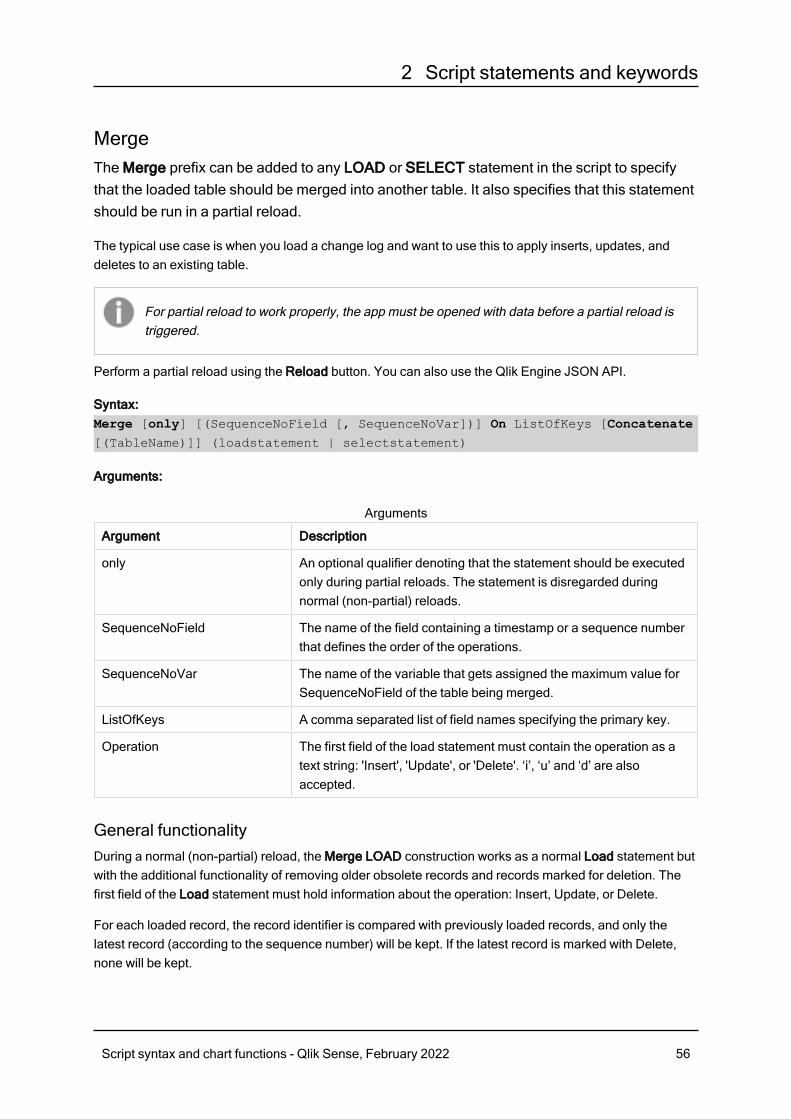
2 Script statements and keywords
MergeThe Merge prefix can be added to any LOAD or SELECT statement in the script to specifythat the loaded table should be merged into another table. It also specifies that this statementshould be run in a partial reload.
The typical use case is when you load a change log and want to use this to apply inserts, updates, anddeletes to an existing table.
For partial reload to work properly, the app must be opened with data before a partial reload istriggered.
Perform a partial reload using the Reload button. You can also use the Qlik Engine JSON API.
Syntax:Merge [only] [(SequenceNoField [, SequenceNoVar])] On ListOfKeys [Concatenate[(TableName)]] (loadstatement | selectstatement)
Arguments:
Argument Description
only An optional qualifier denoting that the statement should be executedonly during partial reloads. The statement is disregarded duringnormal (non-partial) reloads.
SequenceNoField The name of the field containing a timestamp or a sequence numberthat defines the order of the operations.
SequenceNoVar The name of the variable that gets assigned the maximum value forSequenceNoField of the table being merged.
ListOfKeys A comma separated list of field names specifying the primary key.
Operation The first field of the load statement must contain the operation as atext string: 'Insert', 'Update', or 'Delete'. ‘i’, ‘u’ and ‘d’ are alsoaccepted.
Arguments
General functionalityDuring a normal (non-partial) reload, the Merge LOAD construction works as a normal Load statement butwith the additional functionality of removing older obsolete records and records marked for deletion. Thefirst field of the Load statement must hold information about the operation: Insert, Update, or Delete.
For each loaded record, the record identifier is compared with previously loaded records, and only thelatest record (according to the sequence number) will be kept. If the latest record is marked with Delete,none will be kept.
Script syntax and chart functions - Qlik Sense, February 2022 56
2 Script statements and keywords
Target tableWhich table to modify is determined by the set of fields. If a table with the same set of fields (except the firstfield; the operation) already exists, this will be the relevant table to modify. Alternatively, a Concatenateprefix can be used to specify the table. If the target table is not determined, the result of the Merge LOADconstruction is stored in a new table.
If the Concatenate prefix is used, the resulting table has a set of fields corresponding to the union of theexisting table and the input to the merge. Hence, the target table may get more fields than the change logthat is used as input to the merge.
A partial reload does the same as a full reload. One difference is that a partial reload rarely creates a newtable. Unless you have used the Only clause, a target table with the same set of fields from the previousscript execution always exists.
Sequence numberIf the loaded change log is an accumulated log, that is, it contains changes that already have been loaded,the parameter SequenceNoVar can be used in a Where clause to limit the amount of input data. TheMerge LOAD could then be made to only load records where the field SequenceNoField is greater thanSequenceNoVar. Upon completion, the Merge LOAD assigns a new value to the SequenceNoVar with themaximum value seen in the SequenceNoField field.
OperationsThe Merge LOAD can have fewer fields than the target table. The different operations treat missing fieldsdifferently:
Insert: Fields missing in the Merge LOAD, but existing in the target table, get a NULL in the target table.
Delete: Missing fields do not affect the result. The relevant records are deleted anyway.
Update: Fields listed in the Merge LOAD are updated in the target table. Missing fields are not changed.This means that the two following statements are not identical:
l Merge on Key Concatenate Load 'U' as Operation, Key, F1, Null() as F2 From ...;l Merge on Key Concatenate Load 'U' as Operation, Key, F1 From ...;
The first statement updates the listed records and changes F2 to NULL. The second does not change F2,but instead, leaves the values in the target table.
The Merge LOAD cannot be used on records with wildcards, for example, a Section Accesstable with an asterisk to denote all values.
Examples
Example 1: Simple merge with specified tableIn this example, an inline table named Persons is loaded with three rows. Merge then changes the table asfollows:
Script syntax and chart functions - Qlik Sense, February 2022 57
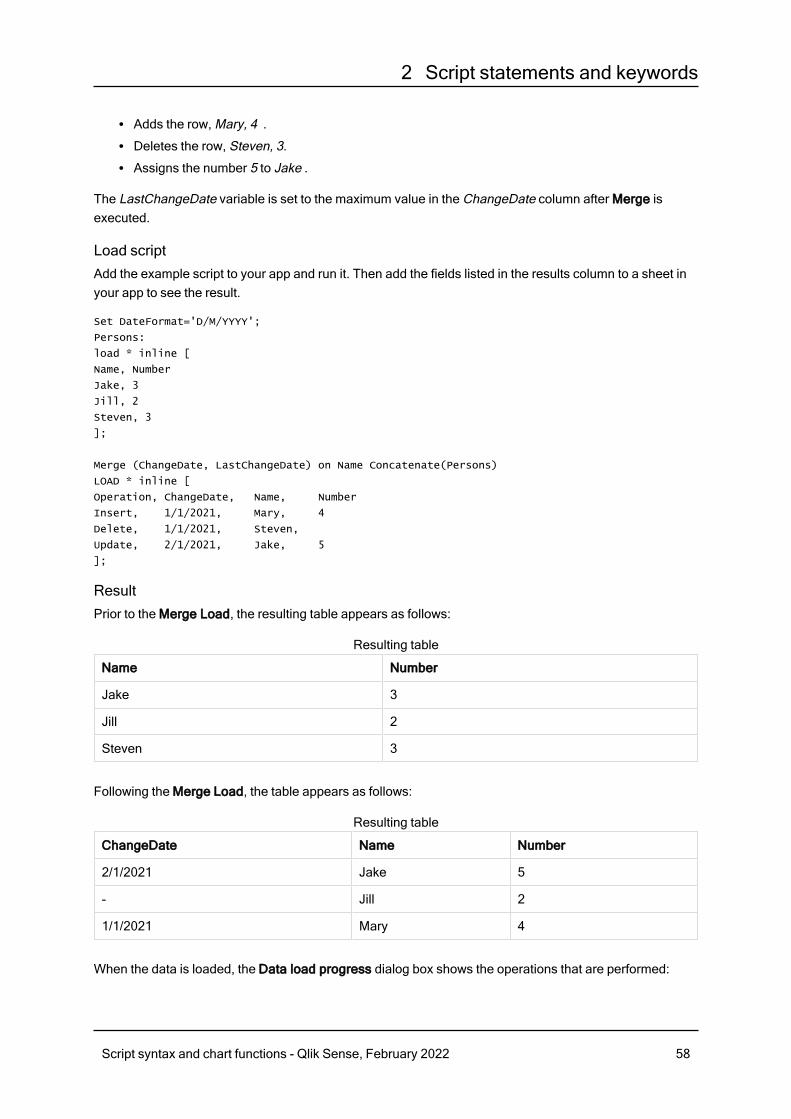
2 Script statements and keywords
l Adds the row, Mary, 4 .l Deletes the row, Steven, 3.l Assigns the number 5 to Jake .
The LastChangeDate variable is set to the maximum value in the ChangeDate column after Merge isexecuted.
Load scriptAdd the example script to your app and run it. Then add the fields listed in the results column to a sheet inyour app to see the result.
Set DateFormat='D/M/YYYY';
Persons:
load * inline [
Name, Number
Jake, 3
Jill, 2
Steven, 3
];
Merge (ChangeDate, LastChangeDate) on Name Concatenate(Persons)
LOAD * inline [
Operation, ChangeDate, Name, Number
Insert, 1/1/2021, Mary, 4
Delete, 1/1/2021, Steven,
Update, 2/1/2021, Jake, 5
];
ResultPrior to the Merge Load, the resulting table appears as follows:
Name Number
Jake 3
Jill 2
Steven 3
Resulting table
Following the Merge Load, the table appears as follows:
ChangeDate Name Number
2/1/2021 Jake 5
- Jill 2
1/1/2021 Mary 4
Resulting table
When the data is loaded, the Data load progress dialog box shows the operations that are performed:
Script syntax and chart functions - Qlik Sense, February 2022 58
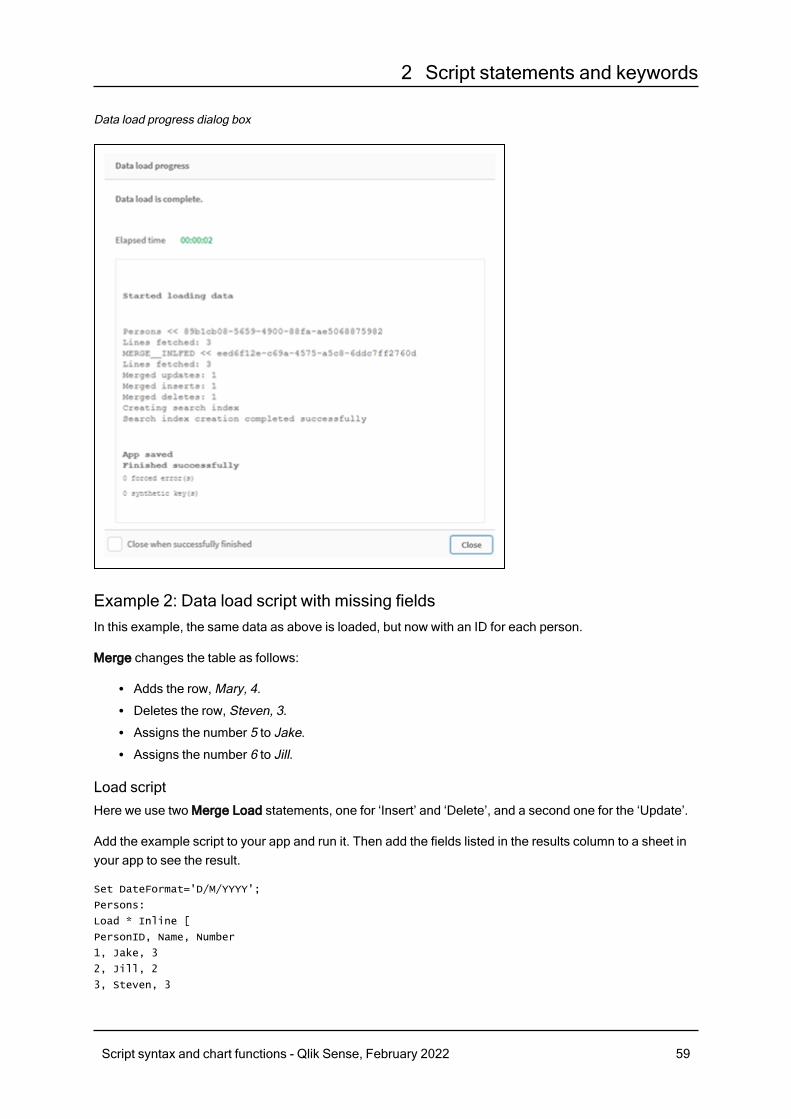
2 Script statements and keywords
Data load progress dialog box
Example 2: Data load script with missing fieldsIn this example, the same data as above is loaded, but now with an ID for each person.
Merge changes the table as follows:
l Adds the row, Mary, 4.l Deletes the row, Steven, 3.l Assigns the number 5 to Jake.l Assigns the number 6 to Jill.
Load scriptHere we use two Merge Load statements, one for ‘Insert’ and ‘Delete’, and a second one for the ‘Update’.
Add the example script to your app and run it. Then add the fields listed in the results column to a sheet inyour app to see the result.
Set DateFormat='D/M/YYYY';
Persons:
Load * Inline [
PersonID, Name, Number
1, Jake, 3
2, Jill, 2
3, Steven, 3
Script syntax and chart functions - Qlik Sense, February 2022 59
2 Script statements and keywords
];
Merge (ChangeDate, LastChangeDate) on PersonID Concatenate(Persons)
Load * Inline [
Operation, ChangeDate, PersonID, Name, Number
Insert, 1/1/2021, 4, Mary, 4
Delete, 1/1/2021, 3, Steven,
];
Merge (ChangeDate, LastChangeDate) on PersonID Concatenate(Persons)
Load * Inline [
Operation, ChangeDate, PersonID, Number
Update, 2/1/2021, 1, 5
Update, 3/1/2021, 2, 6
];
ResultFollowing the Merge Load statements, the table appears as follows:
PersonID ChangeDate Name Number
1 2/1/2021 Jake 5
2 3/1/2021 Jill 6
4 1/1/2021 Mary 4
Resulting table
Note that the second Merge statement does not include the field Name, and as a consequence, the nameshave not been changed.
Example 3: Data load script - Partial reload using a Where-clause withChangeDateIn the following example, the Only argument specifies that the Merge command is only executed during apartial reload. Updates are filtered based on the previously captured LastChangeDate. After Merge isfinished, LastChangeDate variable is assigned the maximum value of the ChangeDate column processedduring the merge.
Load scriptMerge Only (ChangeDate, LastChangeDate) on Name Concatenate(Persons)
LOAD Operation, ChangeDate, Name, Number
from [lib://ChangeFilesFolder/BulkChangesInPersonsTable.csv] (txt)
where ChangeDate >= $(LastChangeDate);
NoConcatenateThe NoConcatenate prefix forces two loaded tables with identical field sets to be treated as two separateinternal tables, when they would otherwise be automatically concatenated.
Syntax:NoConcatenate( loadstatement | selectstatement )
Script syntax and chart functions - Qlik Sense, February 2022 60
2 Script statements and keywords
Example:
LOAD A,B from file1.csv;
NoConcatenate LOAD A,B from file2.csv;
OnlyThe Only script keyword is used as an aggregation function, or as part of the syntax in partial reloadprefixes Add, Replace, and Merge.
OuterThe explicit Join prefix can be preceded by the prefix Outer in order to specify an outer join. In an outer joinall combinations between the two tables are generated. The resulting table will thus contain combinationsof field values from the raw data tables where the linking field values are represented in one or both tables.The explicit Join prefix can be preceded by the prefix Outer in order to specify an outer join. In an outerjoin, the resulting table will contain all values from both raw tables where the linking field values arerepresented in either one or both tables. The Outer keyword is optional and is the default join type usedwhen a join prefix is not specified.
Syntax:Outer Join [ (tablename) ](loadstatement |selectstatement )
Arguments:
Argument Description
tablename The named table to be compared to the loaded table.
loadstatement or selectstatement The LOAD or SELECT statement for the loaded table.
Arguments
Example
Load scriptAdd the example script to your app and run it. Then add the fields listed in the results column to a sheet inyour app to see the result.
Table1:
Load * inline [
Column1, Column2
A, B
1, aa
2, cc
3, ee ];
Table2:
Outer Join Load * inline [
Column1, Column3
A, C
Script syntax and chart functions - Qlik Sense, February 2022 61
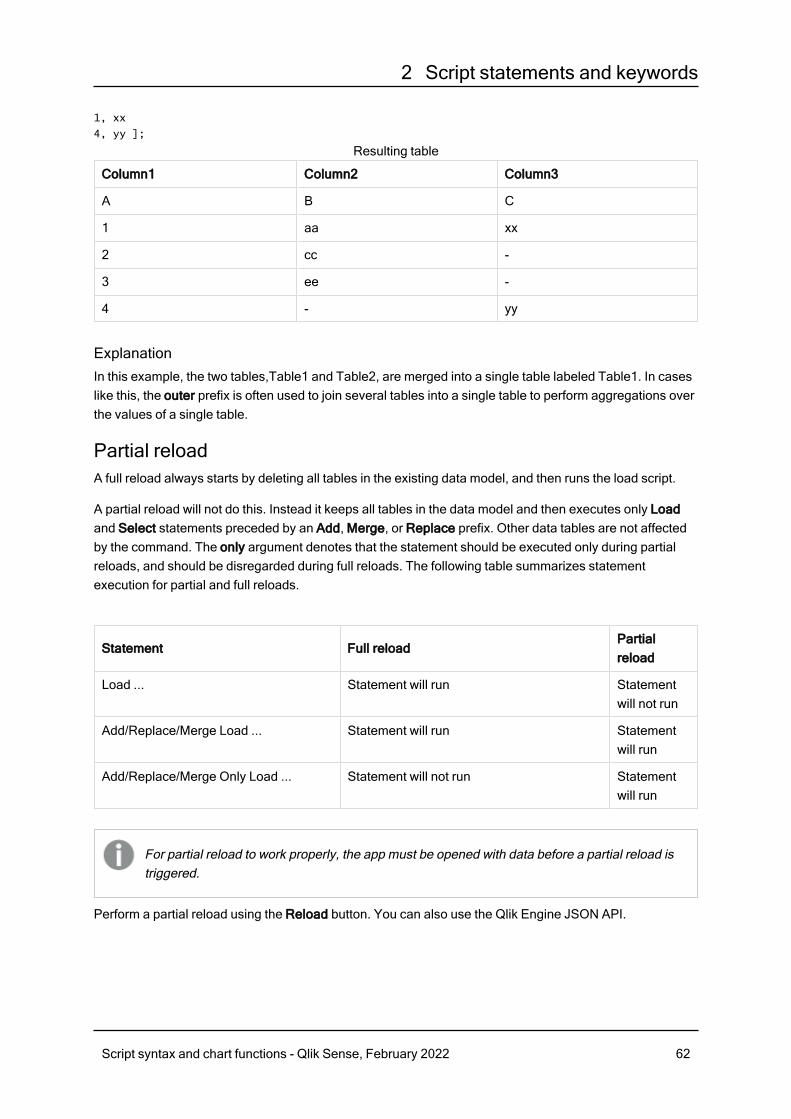
2 Script statements and keywords
1, xx
4, yy ];
Column1 Column2 Column3
A B C
1 aa xx
2 cc -
3 ee -
4 - yy
Resulting table
ExplanationIn this example, the two tables,Table1 and Table2, are merged into a single table labeled Table1. In caseslike this, the outer prefix is often used to join several tables into a single table to perform aggregations overthe values of a single table.
Partial reloadA full reload always starts by deleting all tables in the existing data model, and then runs the load script.
A partial reload will not do this. Instead it keeps all tables in the data model and then executes only Loadand Select statements preceded by an Add, Merge, or Replace prefix. Other data tables are not affectedby the command. The only argument denotes that the statement should be executed only during partialreloads, and should be disregarded during full reloads. The following table summarizes statementexecution for partial and full reloads.
Statement Full reloadPartialreload
Load ... Statement will run Statementwill not run
Add/Replace/Merge Load ... Statement will run Statementwill run
Add/Replace/Merge Only Load ... Statement will not run Statementwill run
For partial reload to work properly, the app must be opened with data before a partial reload istriggered.
Perform a partial reload using the Reload button. You can also use the Qlik Engine JSON API.
Script syntax and chart functions - Qlik Sense, February 2022 62
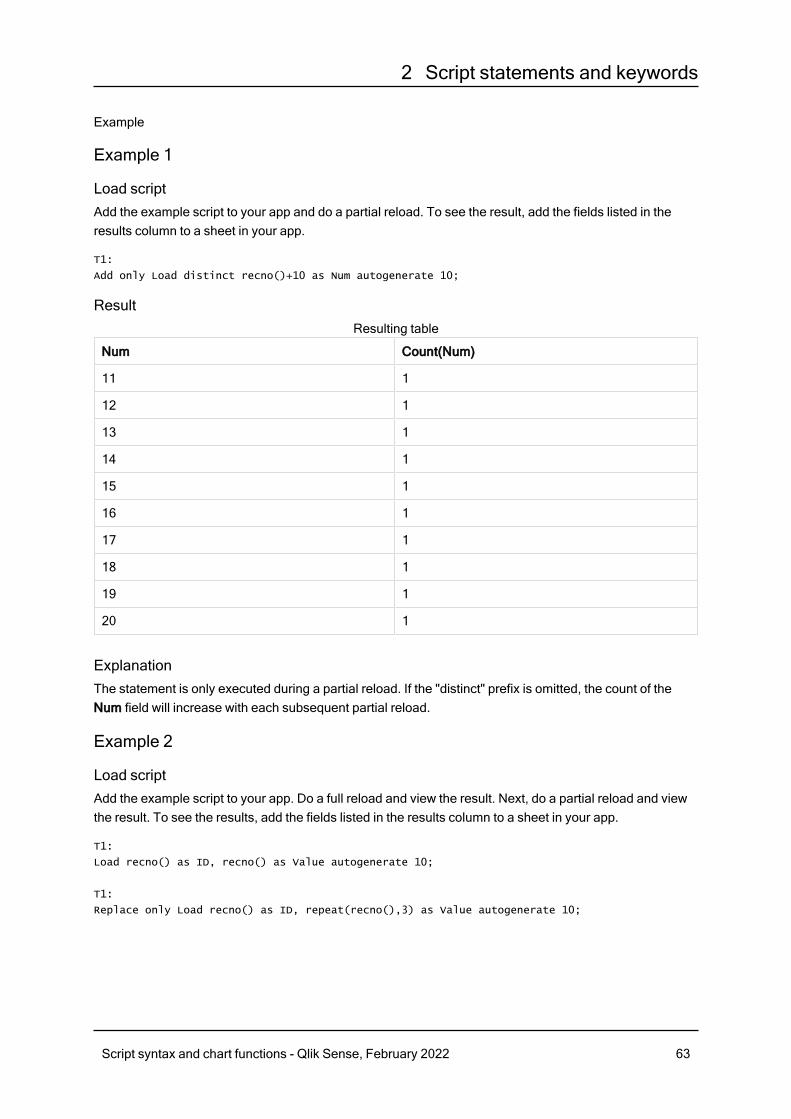
2 Script statements and keywords
Example
Example 1
Load scriptAdd the example script to your app and do a partial reload. To see the result, add the fields listed in theresults column to a sheet in your app.
T1:
Add only Load distinct recno()+10 as Num autogenerate 10;
Result
Num Count(Num)
11 1
12 1
13 1
14 1
15 1
16 1
17 1
18 1
19 1
20 1
Resulting table
ExplanationThe statement is only executed during a partial reload. If the "distinct" prefix is omitted, the count of theNum field will increase with each subsequent partial reload.
Example 2
Load scriptAdd the example script to your app. Do a full reload and view the result. Next, do a partial reload and viewthe result. To see the results, add the fields listed in the results column to a sheet in your app.
T1:
Load recno() as ID, recno() as Value autogenerate 10;
T1:
Replace only Load recno() as ID, repeat(recno(),3) as Value autogenerate 10;
Script syntax and chart functions - Qlik Sense, February 2022 63
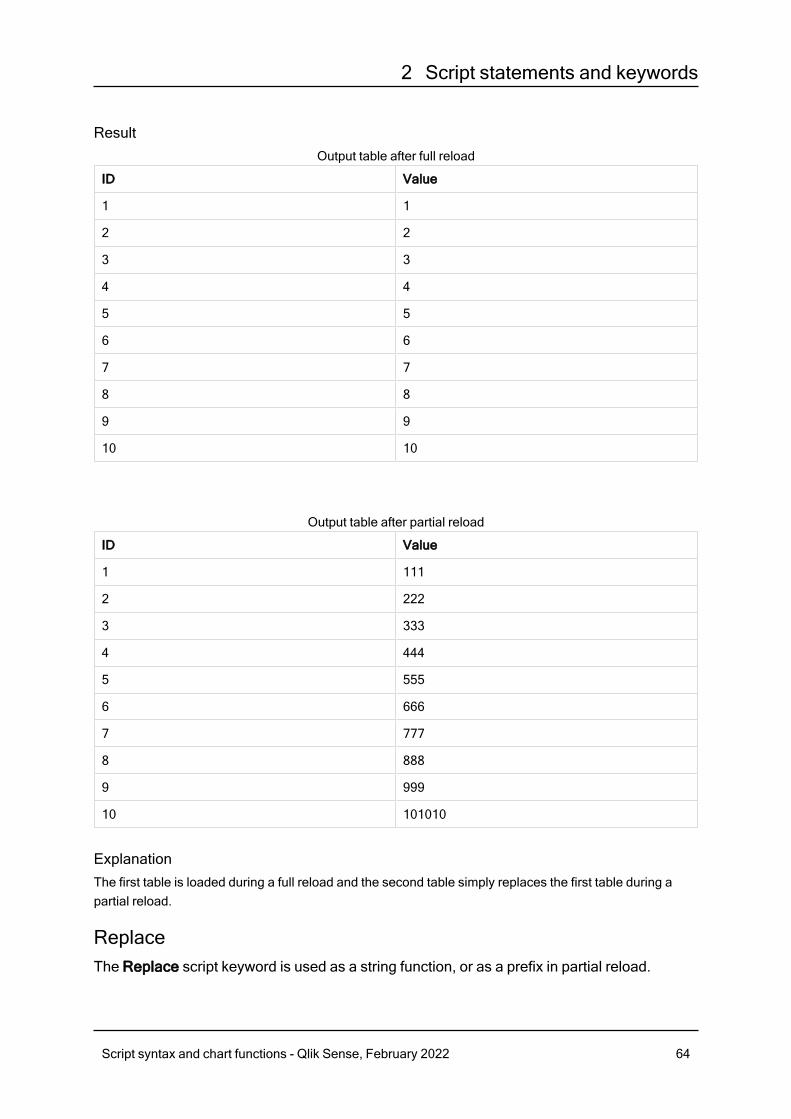
2 Script statements and keywords
Result
ID Value
1 1
2 2
3 3
4 4
5 5
6 6
7 7
8 8
9 9
10 10
Output table after full reload
ID Value
1 111
2 222
3 333
4 444
5 555
6 666
7 777
8 888
9 999
10 101010
Output table after partial reload
ExplanationThe first table is loaded during a full reload and the second table simply replaces the first table during apartial reload.
ReplaceThe Replace script keyword is used as a string function, or as a prefix in partial reload.
Script syntax and chart functions - Qlik Sense, February 2022 64

2 Script statements and keywords
ReplaceThe Replace prefix can be added to any LOAD or SELECT statement in the script to specify that theloaded table should replace another table. It also specifies that this statement should be run in a partialreload. The Replace prefix can also be used in a Map statement.
For partial reload to work properly, the app must be opened with data before a partial reload istriggered.
Perform a partial reload using the Reload button. You can also use the Qlik Engine JSON API.
Syntax:Replace [only] [Concatenate[(tablename)]] (loadstatement | selectstatement)
Replace [only] mapstatement
During a normal (non-partial) reload, the Replace LOAD construction will work as a normal LOADstatement but be preceded by a Drop Table. First the old table will be dropped, then records will begenerated and stored as a new table.
If the Concatenate prefix is used, or if there exists a table with the same set of fields, this will be therelevant table to drop. Otherwise, there is no table to drop and the Replace LOAD construction will beidentical to a normal LOAD.
A partial reload will do the same. The only difference is that there is always a table from the previous scriptexecution to drop. The Replace LOAD construction will always first drop the old table, then create a newone.
The Replace Map...Using statement causes mapping to take place also during partial script execution.
Arguments:
Argument Description
only An optional qualifier denoting that the statement should be executed only during partialreloads. It should be disregarded during normal (non-partial) reloads.
Arguments
Examples and results:
Example Result
Tab1:
Replace LOAD *
from File1.csv;
During both normal and partial reload, the Qlik Sense table Tab1 is initiallydropped. Thereafter new data is loaded from File1.csv and stored in Tab1.
Script syntax and chart functions - Qlik Sense, February 2022 65
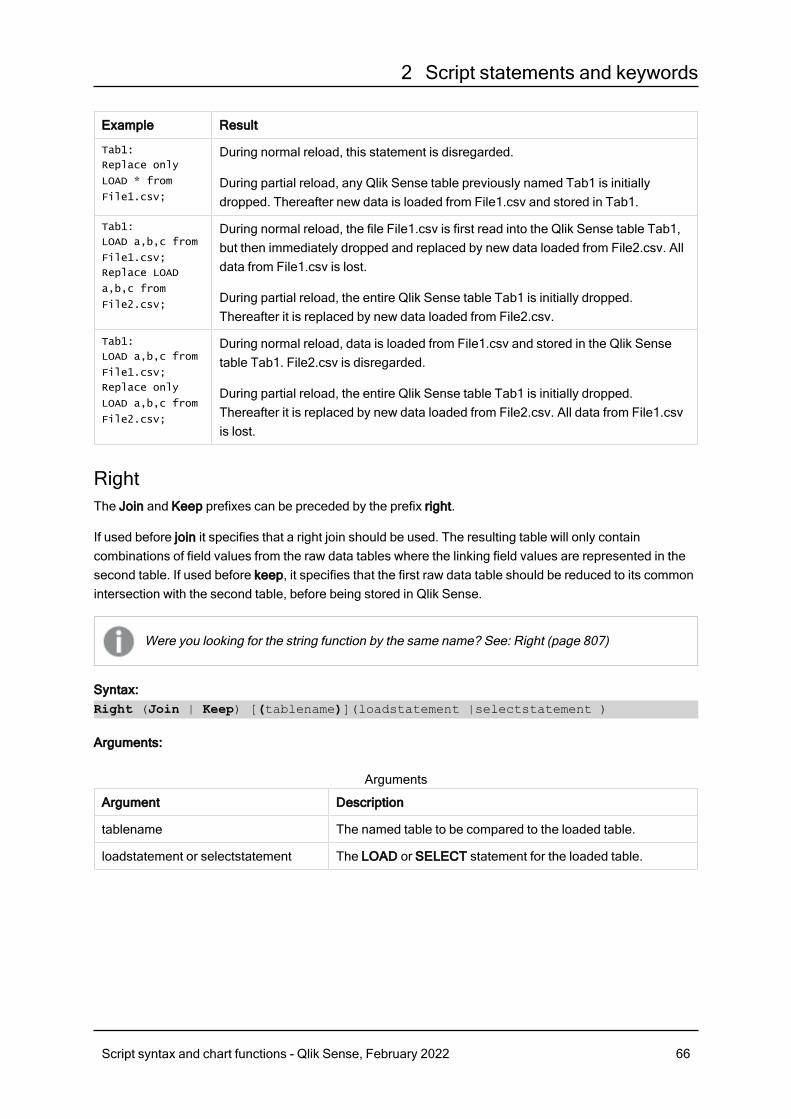
2 Script statements and keywords
Example Result
Tab1:
Replace only
LOAD * from
File1.csv;
During normal reload, this statement is disregarded.
During partial reload, any Qlik Sense table previously named Tab1 is initiallydropped. Thereafter new data is loaded from File1.csv and stored in Tab1.
Tab1:
LOAD a,b,c from
File1.csv;
Replace LOAD
a,b,c from
File2.csv;
During normal reload, the file File1.csv is first read into the Qlik Sense table Tab1,but then immediately dropped and replaced by new data loaded from File2.csv. Alldata from File1.csv is lost.
During partial reload, the entire Qlik Sense table Tab1 is initially dropped.Thereafter it is replaced by new data loaded from File2.csv.
Tab1:
LOAD a,b,c from
File1.csv;
Replace only
LOAD a,b,c from
File2.csv;
During normal reload, data is loaded from File1.csv and stored in the Qlik Sensetable Tab1. File2.csv is disregarded.
During partial reload, the entire Qlik Sense table Tab1 is initially dropped.Thereafter it is replaced by new data loaded from File2.csv. All data from File1.csvis lost.
RightThe Join and Keep prefixes can be preceded by the prefix right.
If used before join it specifies that a right join should be used. The resulting table will only containcombinations of field values from the raw data tables where the linking field values are represented in thesecond table. If used before keep, it specifies that the first raw data table should be reduced to its commonintersection with the second table, before being stored in Qlik Sense.
Were you looking for the string function by the same name? See: Right (page 807)
Syntax:Right (Join | Keep) [(tablename)](loadstatement |selectstatement )
Arguments:
Argument Description
tablename The named table to be compared to the loaded table.
loadstatement or selectstatement The LOAD or SELECT statement for the loaded table.
Arguments
Script syntax and chart functions - Qlik Sense, February 2022 66
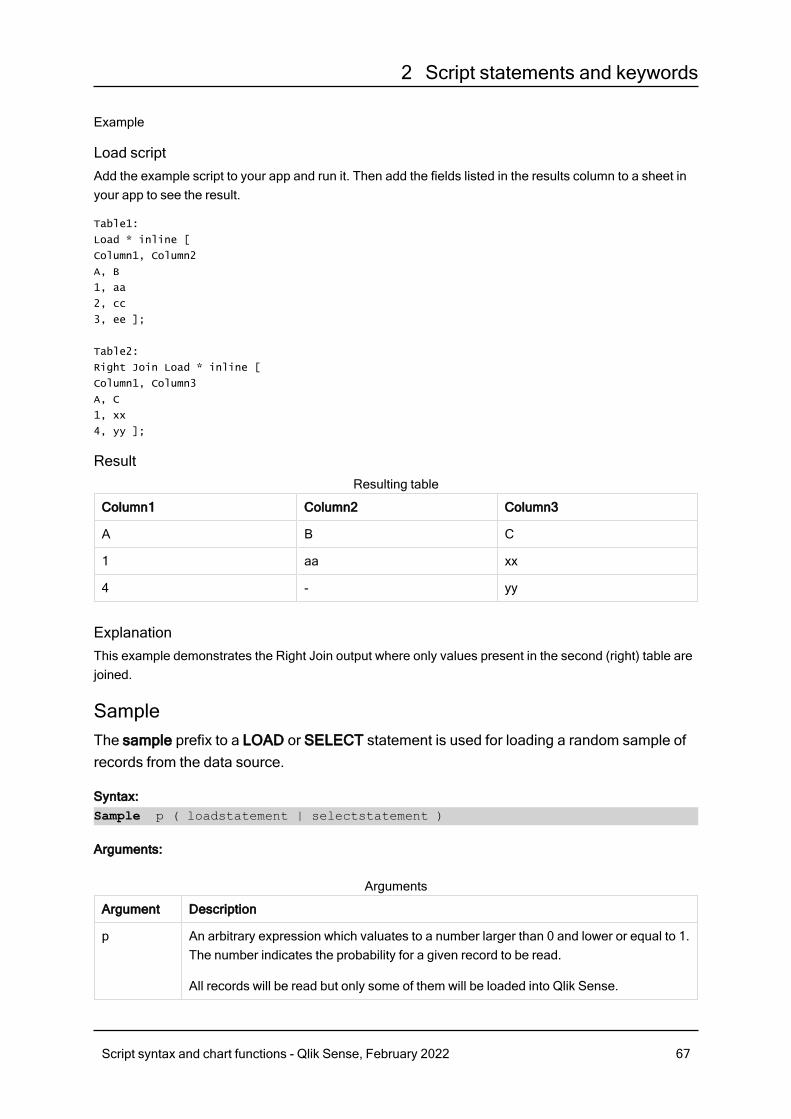
2 Script statements and keywords
Example
Load scriptAdd the example script to your app and run it. Then add the fields listed in the results column to a sheet inyour app to see the result.
Table1:
Load * inline [
Column1, Column2
A, B
1, aa
2, cc
3, ee ];
Table2:
Right Join Load * inline [
Column1, Column3
A, C
1, xx
4, yy ];
Result
Column1 Column2 Column3
A B C
1 aa xx
4 - yy
Resulting table
ExplanationThis example demonstrates the Right Join output where only values present in the second (right) table arejoined.
SampleThe sample prefix to a LOAD or SELECT statement is used for loading a random sample ofrecords from the data source.
Syntax:Sample p ( loadstatement | selectstatement )
Arguments:
Argument Description
p An arbitrary expression which valuates to a number larger than 0 and lower or equal to 1.The number indicates the probability for a given record to be read.
All records will be read but only some of them will be loaded into Qlik Sense.
Arguments
Script syntax and chart functions - Qlik Sense, February 2022 67
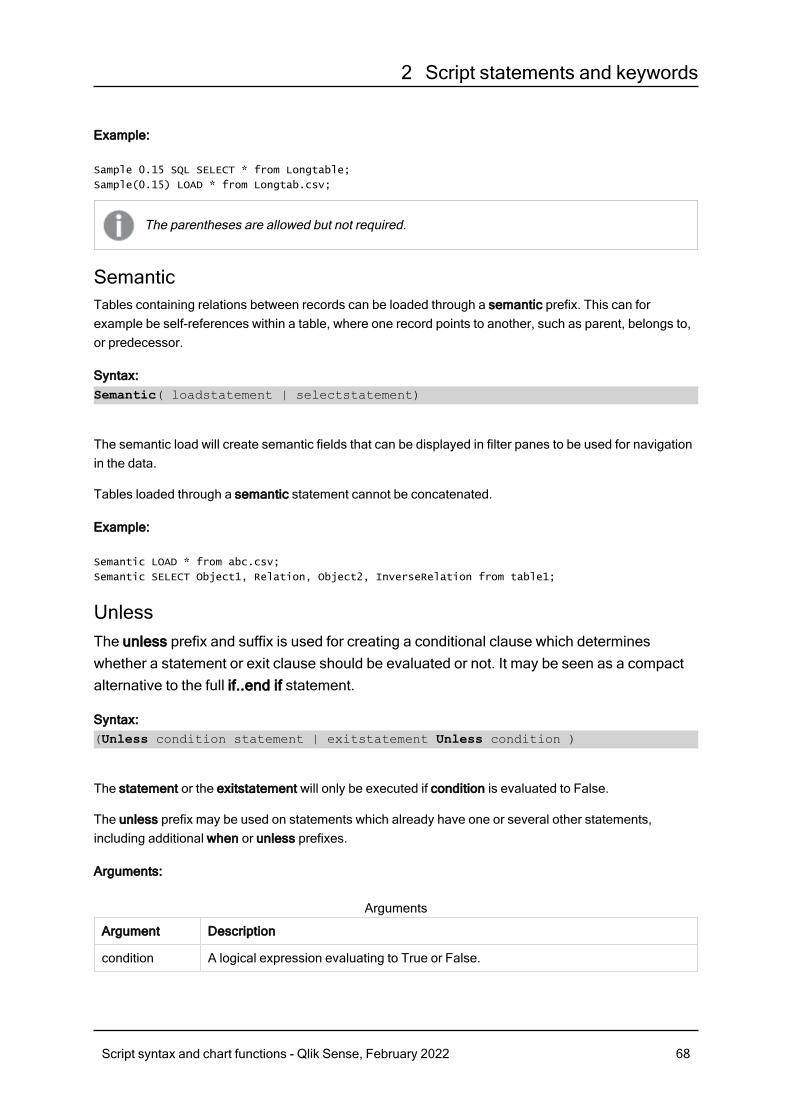
2 Script statements and keywords
Example:
Sample 0.15 SQL SELECT * from Longtable;
Sample(0.15) LOAD * from Longtab.csv;
The parentheses are allowed but not required.
SemanticTables containing relations between records can be loaded through a semantic prefix. This can forexample be self-references within a table, where one record points to another, such as parent, belongs to,or predecessor.
Syntax:Semantic( loadstatement | selectstatement)
The semantic load will create semantic fields that can be displayed in filter panes to be used for navigationin the data.
Tables loaded through a semantic statement cannot be concatenated.
Example:
Semantic LOAD * from abc.csv;
Semantic SELECT Object1, Relation, Object2, InverseRelation from table1;
UnlessThe unless prefix and suffix is used for creating a conditional clause which determineswhether a statement or exit clause should be evaluated or not. It may be seen as a compactalternative to the full if..end if statement.
Syntax:(Unless condition statement | exitstatement Unless condition )
The statement or the exitstatement will only be executed if condition is evaluated to False.
The unless prefix may be used on statements which already have one or several other statements,including additional when or unless prefixes.
Arguments:
Argument Description
condition A logical expression evaluating to True or False.
Arguments
Script syntax and chart functions - Qlik Sense, February 2022 68
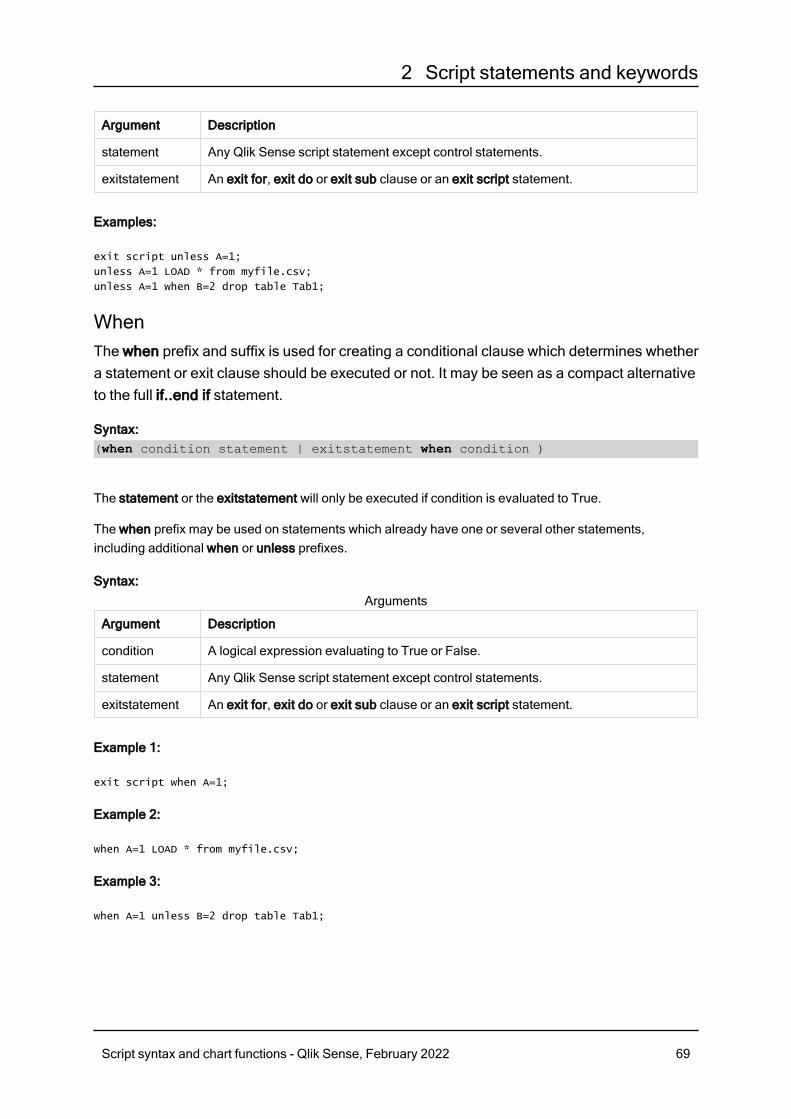
2 Script statements and keywords
Argument Description
statement Any Qlik Sense script statement except control statements.
exitstatement An exit for, exit do or exit sub clause or an exit script statement.
Examples:
exit script unless A=1;
unless A=1 LOAD * from myfile.csv;
unless A=1 when B=2 drop table Tab1;
WhenThe when prefix and suffix is used for creating a conditional clause which determines whethera statement or exit clause should be executed or not. It may be seen as a compact alternativeto the full if..end if statement.
Syntax:(when condition statement | exitstatement when condition )
The statement or the exitstatement will only be executed if condition is evaluated to True.
The when prefix may be used on statements which already have one or several other statements,including additional when or unless prefixes.
Syntax:
Argument Description
condition A logical expression evaluating to True or False.
statement Any Qlik Sense script statement except control statements.
exitstatement An exit for, exit do or exit sub clause or an exit script statement.
Arguments
Example 1:
exit script when A=1;
Example 2:
when A=1 LOAD * from myfile.csv;
Example 3:
when A=1 unless B=2 drop table Tab1;
Script syntax and chart functions - Qlik Sense, February 2022 69
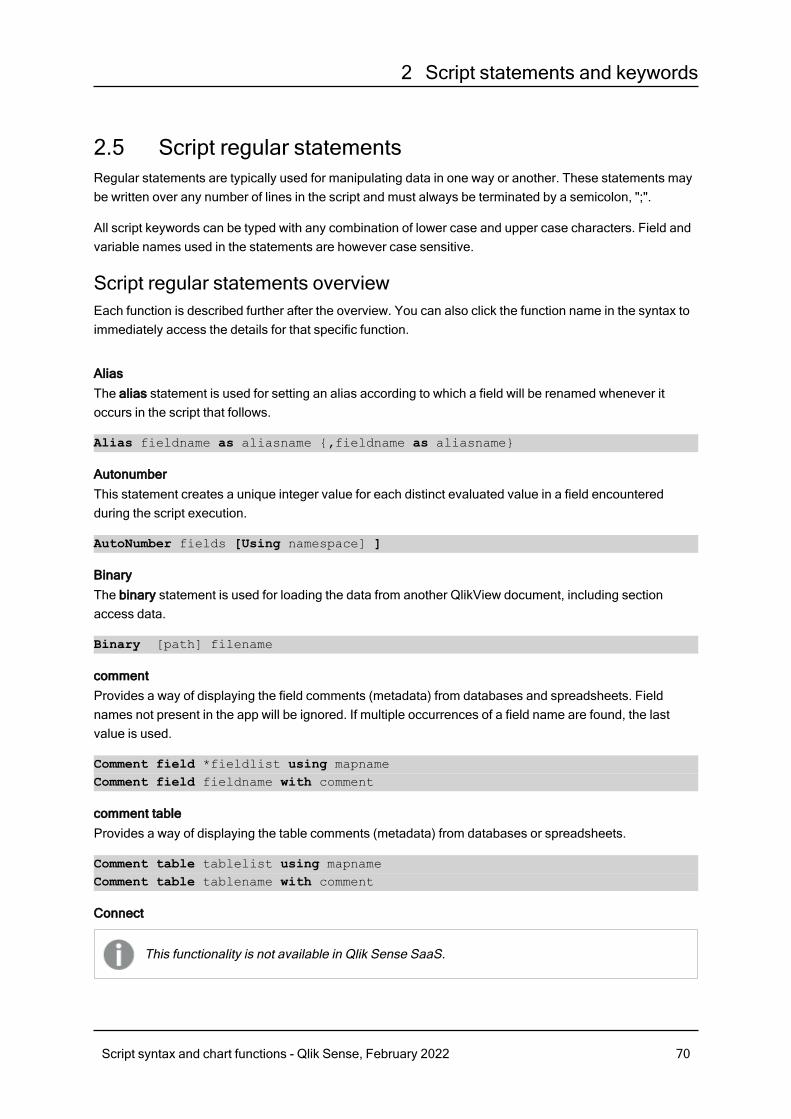
2 Script statements and keywords
2.5 Script regular statementsRegular statements are typically used for manipulating data in one way or another. These statements maybe written over any number of lines in the script and must always be terminated by a semicolon, ";".
All script keywords can be typed with any combination of lower case and upper case characters. Field andvariable names used in the statements are however case sensitive.
Script regular statements overviewEach function is described further after the overview. You can also click the function name in the syntax toimmediately access the details for that specific function.
AliasThe alias statement is used for setting an alias according to which a field will be renamed whenever itoccurs in the script that follows.
Alias fieldname as aliasname {,fieldname as aliasname}
AutonumberThis statement creates a unique integer value for each distinct evaluated value in a field encounteredduring the script execution.
AutoNumber fields [Using namespace] ]
BinaryThe binary statement is used for loading the data from another QlikView document, including sectionaccess data.
Binary [path] filename
commentProvides a way of displaying the field comments (metadata) from databases and spreadsheets. Fieldnames not present in the app will be ignored. If multiple occurrences of a field name are found, the lastvalue is used.
Comment field *fieldlist using mapnameComment field fieldname with comment
comment tableProvides a way of displaying the table comments (metadata) from databases or spreadsheets.
Comment table tablelist using mapnameComment table tablename with comment
Connect
This functionality is not available in Qlik Sense SaaS.
Script syntax and chart functions - Qlik Sense, February 2022 70
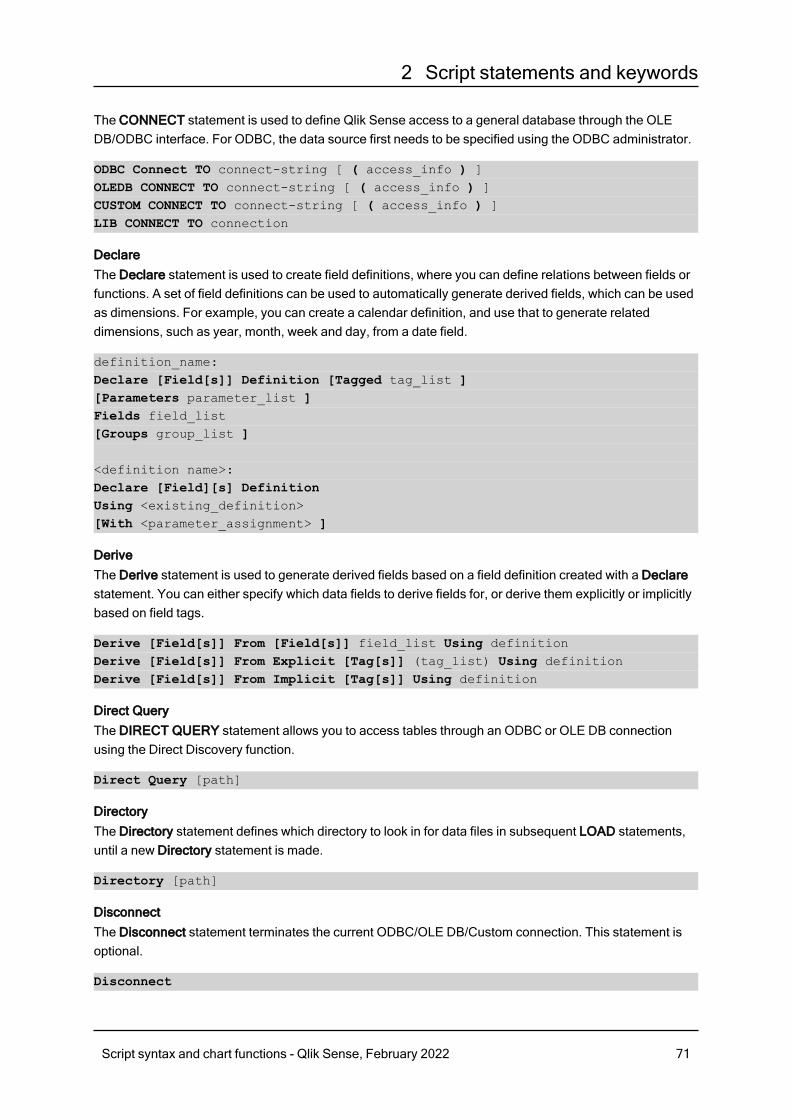
2 Script statements and keywords
The CONNECT statement is used to define Qlik Sense access to a general database through the OLEDB/ODBC interface. For ODBC, the data source first needs to be specified using the ODBC administrator.
ODBC Connect TO connect-string [ ( access_info ) ]OLEDB CONNECT TO connect-string [ ( access_info ) ]CUSTOM CONNECT TO connect-string [ ( access_info ) ]LIB CONNECT TO connection
DeclareThe Declare statement is used to create field definitions, where you can define relations between fields orfunctions. A set of field definitions can be used to automatically generate derived fields, which can be usedas dimensions. For example, you can create a calendar definition, and use that to generate relateddimensions, such as year, month, week and day, from a date field.
definition_name:Declare [Field[s]] Definition [Tagged tag_list ][Parameters parameter_list ]Fields field_list[Groups group_list ]
<definition name>:Declare [Field][s] DefinitionUsing <existing_definition>[With <parameter_assignment> ]
DeriveThe Derive statement is used to generate derived fields based on a field definition created with a Declarestatement. You can either specify which data fields to derive fields for, or derive them explicitly or implicitlybased on field tags.
Derive [Field[s]] From [Field[s]] field_list Using definitionDerive [Field[s]] From Explicit [Tag[s]] (tag_list) Using definitionDerive [Field[s]] From Implicit [Tag[s]] Using definition
Direct QueryThe DIRECT QUERY statement allows you to access tables through an ODBC or OLE DB connectionusing the Direct Discovery function.
Direct Query [path]
DirectoryThe Directory statement defines which directory to look in for data files in subsequent LOAD statements,until a new Directory statement is made.
Directory [path]
DisconnectThe Disconnect statement terminates the current ODBC/OLE DB/Custom connection. This statement isoptional.
Disconnect
Script syntax and chart functions - Qlik Sense, February 2022 71
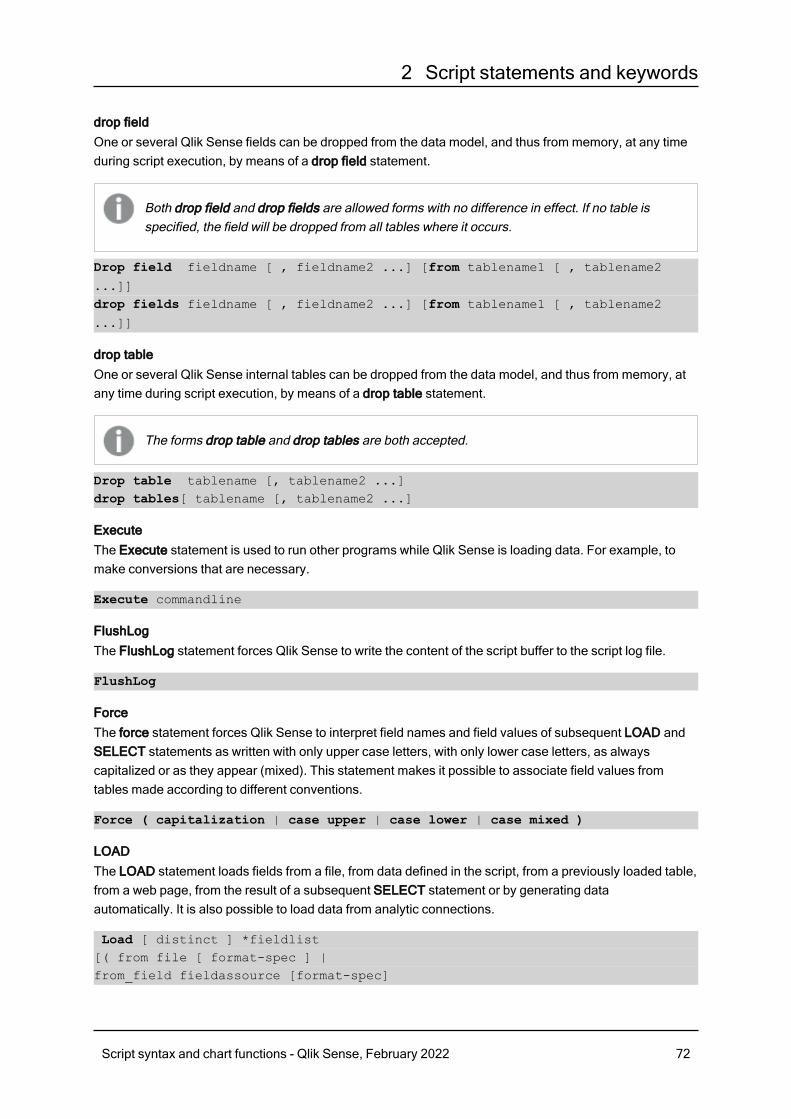
2 Script statements and keywords
drop fieldOne or several Qlik Sense fields can be dropped from the data model, and thus from memory, at any timeduring script execution, by means of a drop field statement.
Both drop field and drop fields are allowed forms with no difference in effect. If no table isspecified, the field will be dropped from all tables where it occurs.
Drop field fieldname [ , fieldname2 ...] [from tablename1 [ , tablename2
...]]drop fields fieldname [ , fieldname2 ...] [from tablename1 [ , tablename2
...]]
drop tableOne or several Qlik Sense internal tables can be dropped from the data model, and thus from memory, atany time during script execution, by means of a drop table statement.
The forms drop table and drop tables are both accepted.
Drop table tablename [, tablename2 ...]drop tables[ tablename [, tablename2 ...]
ExecuteThe Execute statement is used to run other programs while Qlik Sense is loading data. For example, tomake conversions that are necessary.
Execute commandline
FlushLogThe FlushLog statement forces Qlik Sense to write the content of the script buffer to the script log file.
FlushLog
ForceThe force statement forces Qlik Sense to interpret field names and field values of subsequent LOAD andSELECT statements as written with only upper case letters, with only lower case letters, as alwayscapitalized or as they appear (mixed). This statement makes it possible to associate field values fromtables made according to different conventions.
Force ( capitalization | case upper | case lower | case mixed )
LOADThe LOAD statement loads fields from a file, from data defined in the script, from a previously loaded table,from a web page, from the result of a subsequent SELECT statement or by generating dataautomatically. It is also possible to load data from analytic connections.
Load [ distinct ] *fieldlist[( from file [ format-spec ] |from_field fieldassource [format-spec]
Script syntax and chart functions - Qlik Sense, February 2022 72
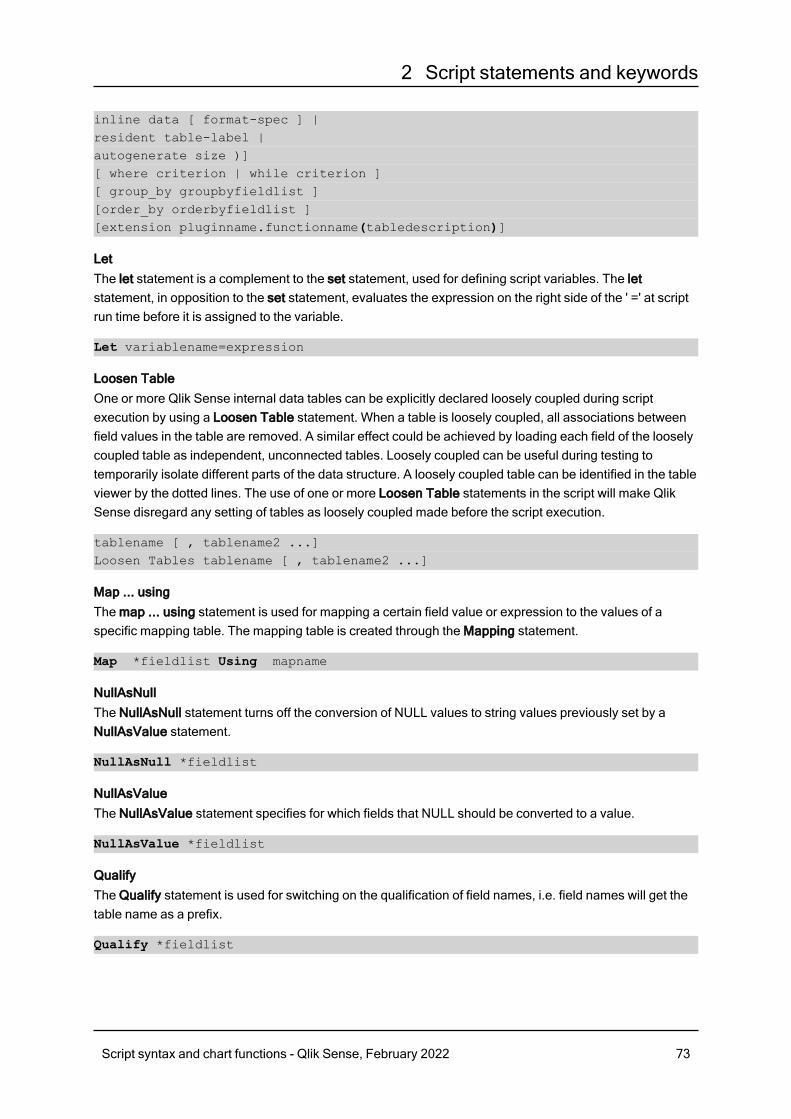
2 Script statements and keywords
inline data [ format-spec ] |resident table-label |autogenerate size )][ where criterion | while criterion ][ group_by groupbyfieldlist ][order_by orderbyfieldlist ][extension pluginname.functionname(tabledescription)]
LetThe let statement is a complement to the set statement, used for defining script variables. The letstatement, in opposition to the set statement, evaluates the expression on the right side of the ' =' at scriptrun time before it is assigned to the variable.
Let variablename=expression
Loosen TableOne or more Qlik Sense internal data tables can be explicitly declared loosely coupled during scriptexecution by using a Loosen Table statement. When a table is loosely coupled, all associations betweenfield values in the table are removed. A similar effect could be achieved by loading each field of the looselycoupled table as independent, unconnected tables. Loosely coupled can be useful during testing totemporarily isolate different parts of the data structure. A loosely coupled table can be identified in the tableviewer by the dotted lines. The use of one or more Loosen Table statements in the script will make QlikSense disregard any setting of tables as loosely coupled made before the script execution.
tablename [ , tablename2 ...]Loosen Tables tablename [ , tablename2 ...]
Map ... usingThe map ... using statement is used for mapping a certain field value or expression to the values of aspecific mapping table. The mapping table is created through the Mapping statement.
Map *fieldlist Using mapname
NullAsNullThe NullAsNull statement turns off the conversion of NULL values to string values previously set by aNullAsValue statement.
NullAsNull *fieldlist
NullAsValueThe NullAsValue statement specifies for which fields that NULL should be converted to a value.
NullAsValue *fieldlist
QualifyThe Qualify statement is used for switching on the qualification of field names, i.e. field names will get thetable name as a prefix.
Qualify *fieldlist
Script syntax and chart functions - Qlik Sense, February 2022 73
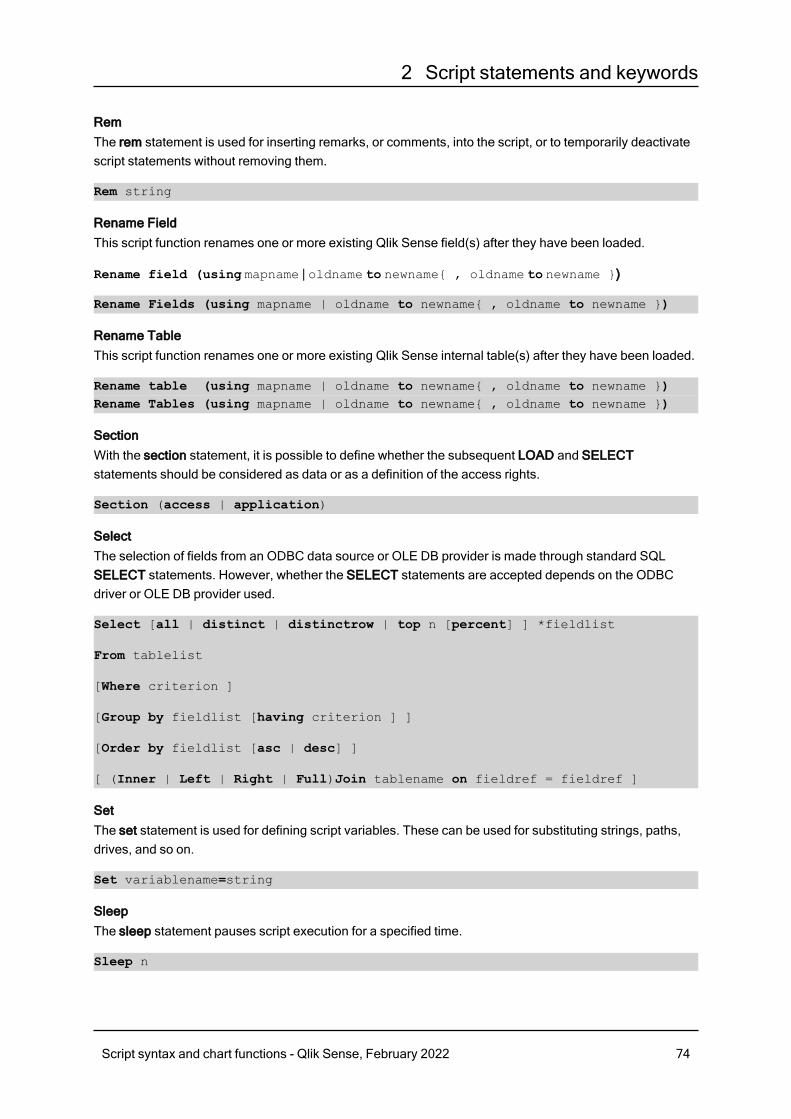
2 Script statements and keywords
RemThe rem statement is used for inserting remarks, or comments, into the script, or to temporarily deactivatescript statements without removing them.
Rem string
Rename FieldThis script function renames one or more existing Qlik Sense field(s) after they have been loaded.
Rename field (using mapname | oldname to newname{ , oldname to newname })
Rename Fields (using mapname | oldname to newname{ , oldname to newname })
Rename TableThis script function renames one or more existing Qlik Sense internal table(s) after they have been loaded.
Rename table (using mapname | oldname to newname{ , oldname to newname })Rename Tables (using mapname | oldname to newname{ , oldname to newname })
SectionWith the section statement, it is possible to define whether the subsequent LOAD and SELECTstatements should be considered as data or as a definition of the access rights.
Section (access | application)
SelectThe selection of fields from an ODBC data source or OLE DB provider is made through standard SQLSELECT statements. However, whether the SELECT statements are accepted depends on the ODBCdriver or OLE DB provider used.
Select [all | distinct | distinctrow | top n [percent] ] *fieldlist
From tablelist
[Where criterion ]
[Group by fieldlist [having criterion ] ]
[Order by fieldlist [asc | desc] ]
[ (Inner | Left | Right | Full)Join tablename on fieldref = fieldref ]
SetThe set statement is used for defining script variables. These can be used for substituting strings, paths,drives, and so on.
Set variablename=string
SleepThe sleep statement pauses script execution for a specified time.
Sleep n
Script syntax and chart functions - Qlik Sense, February 2022 74
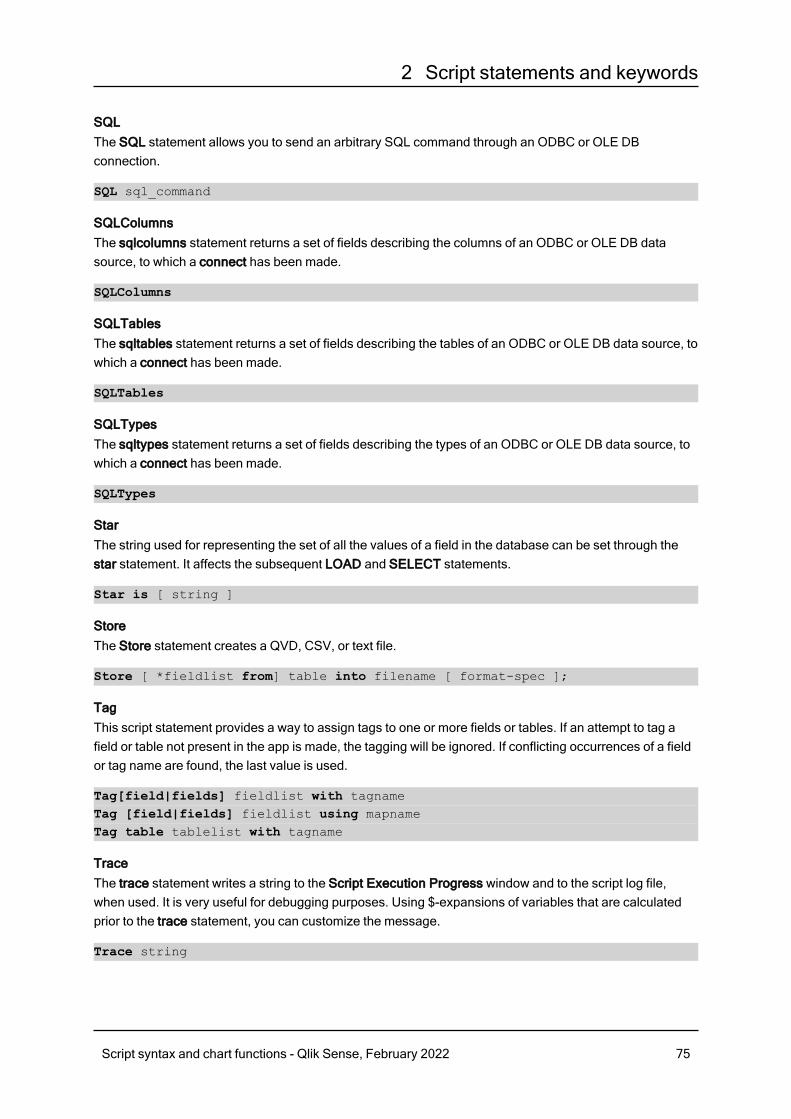
2 Script statements and keywords
SQLThe SQL statement allows you to send an arbitrary SQL command through an ODBC or OLE DBconnection.
SQL sql_command
SQLColumnsThe sqlcolumns statement returns a set of fields describing the columns of an ODBC or OLE DB datasource, to which a connect has been made.
SQLColumns
SQLTablesThe sqltables statement returns a set of fields describing the tables of an ODBC or OLE DB data source, towhich a connect has been made.
SQLTables
SQLTypesThe sqltypes statement returns a set of fields describing the types of an ODBC or OLE DB data source, towhich a connect has been made.
SQLTypes
StarThe string used for representing the set of all the values of a field in the database can be set through thestar statement. It affects the subsequent LOAD and SELECT statements.
Star is [ string ]
StoreThe Store statement creates a QVD, CSV, or text file.
Store [ *fieldlist from] table into filename [ format-spec ];
TagThis script statement provides a way to assign tags to one or more fields or tables. If an attempt to tag afield or table not present in the app is made, the tagging will be ignored. If conflicting occurrences of a fieldor tag name are found, the last value is used.
Tag[field|fields] fieldlist with tagnameTag [field|fields] fieldlist using mapnameTag table tablelist with tagname
TraceThe trace statement writes a string to the Script Execution Progress window and to the script log file,when used. It is very useful for debugging purposes. Using $-expansions of variables that are calculatedprior to the trace statement, you can customize the message.
Trace string
Script syntax and chart functions - Qlik Sense, February 2022 75
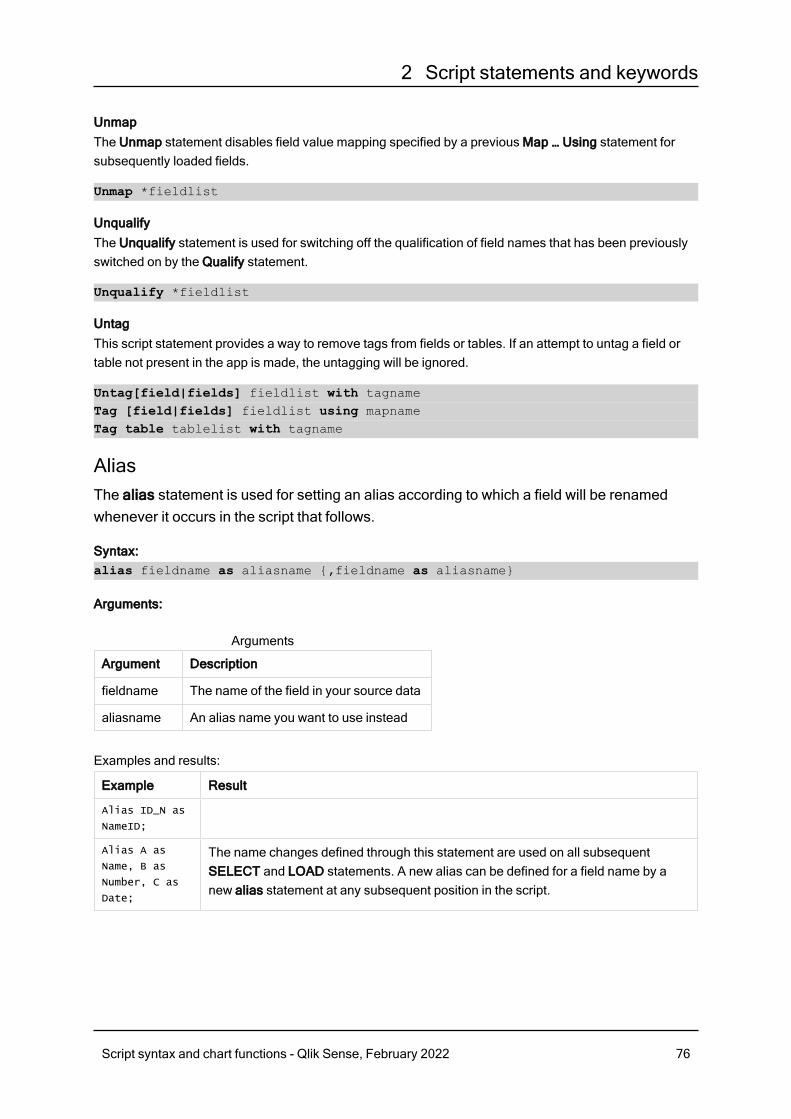
2 Script statements and keywords
UnmapThe Unmap statement disables field value mapping specified by a previous Map … Using statement forsubsequently loaded fields.
Unmap *fieldlist
UnqualifyThe Unqualify statement is used for switching off the qualification of field names that has been previouslyswitched on by the Qualify statement.
Unqualify *fieldlist
UntagThis script statement provides a way to remove tags from fields or tables. If an attempt to untag a field ortable not present in the app is made, the untagging will be ignored.
Untag[field|fields] fieldlist with tagnameTag [field|fields] fieldlist using mapnameTag table tablelist with tagname
AliasThe alias statement is used for setting an alias according to which a field will be renamedwhenever it occurs in the script that follows.
Syntax:alias fieldname as aliasname {,fieldname as aliasname}
Arguments:
Argument Description
fieldname The name of the field in your source data
aliasname An alias name you want to use instead
Arguments
Examples and results:
Example Result
Alias ID_N as
NameID;
Alias A as
Name, B as
Number, C as
Date;
The name changes defined through this statement are used on all subsequentSELECT and LOAD statements. A new alias can be defined for a field name by anew alias statement at any subsequent position in the script.
Script syntax and chart functions - Qlik Sense, February 2022 76
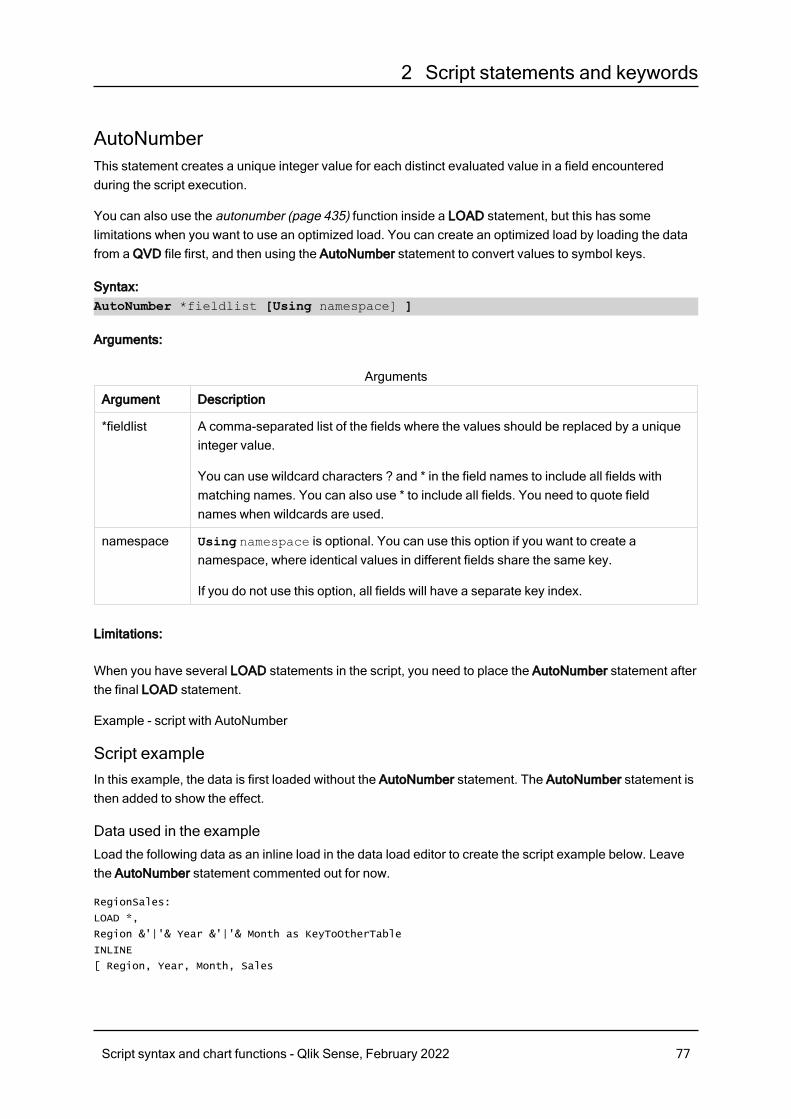
2 Script statements and keywords
AutoNumberThis statement creates a unique integer value for each distinct evaluated value in a field encounteredduring the script execution.
You can also use the autonumber (page 435) function inside a LOAD statement, but this has somelimitations when you want to use an optimized load. You can create an optimized load by loading the datafrom a QVD file first, and then using the AutoNumber statement to convert values to symbol keys.
Syntax:AutoNumber *fieldlist [Using namespace] ]
Arguments:
Argument Description
*fieldlist A comma-separated list of the fields where the values should be replaced by a uniqueinteger value.
You can use wildcard characters ? and * in the field names to include all fields withmatching names. You can also use * to include all fields. You need to quote fieldnames when wildcards are used.
namespace Using namespace is optional. You can use this option if you want to create anamespace, where identical values in different fields share the same key.
If you do not use this option, all fields will have a separate key index.
Arguments
Limitations:
When you have several LOAD statements in the script, you need to place the AutoNumber statement afterthe final LOAD statement.
Example - script with AutoNumber
Script exampleIn this example, the data is first loaded without the AutoNumber statement. The AutoNumber statement isthen added to show the effect.
Data used in the exampleLoad the following data as an inline load in the data load editor to create the script example below. Leavethe AutoNumber statement commented out for now.
RegionSales:
LOAD *,
Region &'|'& Year &'|'& Month as KeyToOtherTable
INLINE
[ Region, Year, Month, Sales
Script syntax and chart functions - Qlik Sense, February 2022 77

2 Script statements and keywords
North, 2014, May, 245
North, 2014, May, 347
North, 2014, June, 127
South, 2014, June, 645
South, 2013, May, 367
South, 2013, May, 221
];
Budget:
LOAD Budget,
Region &'|'& Year &'|'& Month as KeyToOtherTable
INLINE
[Region, Year, Month, Budget
North, 2014, May, 200
North, 2014, May, 350
North, 2014, June, 150
South, 2014, June, 500
South, 2013, May, 300
South, 2013, May, 200
];
//AutoNumber KeyToOtherTable;
Create visualizationsCreate two table visualizations in a Qlik Sense sheet. Add KeyToOtherTable, Region, Year, Month, andSales as dimensions to the first table. Add KeyToOtherTable, Region, Year, Month, and Budget asdimensions to the second table.
Result
KeyToOtherTable Region Year Month Sales
North|2014|June North 2014 June 127
North|2014|May North 2014 May 245
North|2014|May North 2014 May 347
South|2013|May South 2013 May 221
South|2013|May South 2013 May 367
South|2014|June South 2014 June 645
RegionSales table
KeyToOtherTable Region Year Month Budget
North|2014|June North 2014 June 150
Budget table
Script syntax and chart functions - Qlik Sense, February 2022 78
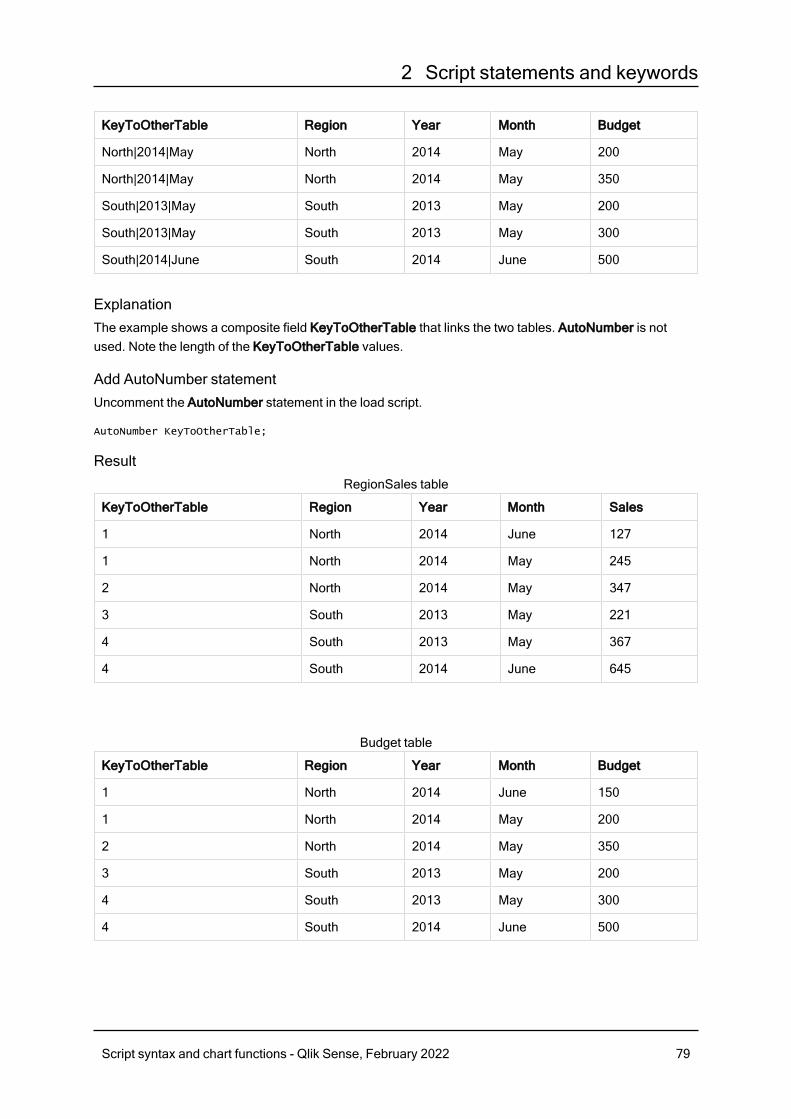
2 Script statements and keywords
KeyToOtherTable Region Year Month Budget
North|2014|May North 2014 May 200
North|2014|May North 2014 May 350
South|2013|May South 2013 May 200
South|2013|May South 2013 May 300
South|2014|June South 2014 June 500
ExplanationThe example shows a composite field KeyToOtherTable that links the two tables. AutoNumber is notused. Note the length of the KeyToOtherTable values.
Add AutoNumber statementUncomment the AutoNumber statement in the load script.
AutoNumber KeyToOtherTable;
Result
KeyToOtherTable Region Year Month Sales
1 North 2014 June 127
1 North 2014 May 245
2 North 2014 May 347
3 South 2013 May 221
4 South 2013 May 367
4 South 2014 June 645
RegionSales table
KeyToOtherTable Region Year Month Budget
1 North 2014 June 150
1 North 2014 May 200
2 North 2014 May 350
3 South 2013 May 200
4 South 2013 May 300
4 South 2014 June 500
Budget table
Script syntax and chart functions - Qlik Sense, February 2022 79
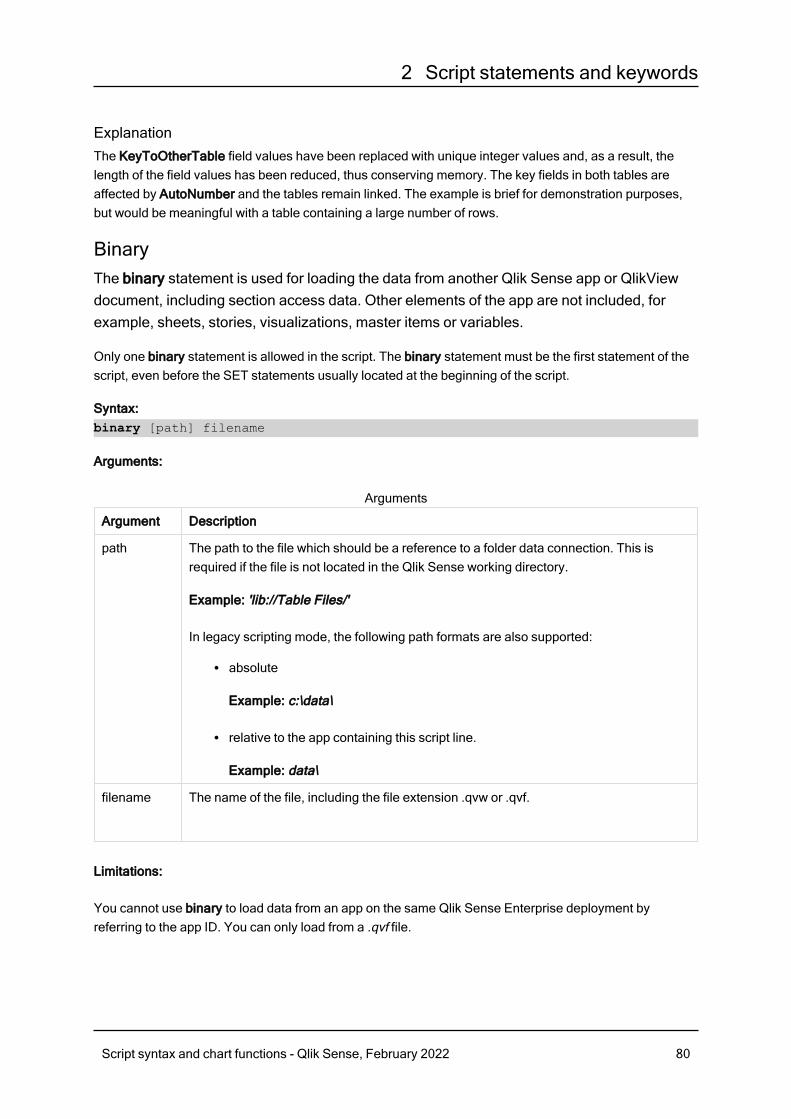
2 Script statements and keywords
ExplanationThe KeyToOtherTable field values have been replaced with unique integer values and, as a result, thelength of the field values has been reduced, thus conserving memory. The key fields in both tables areaffected by AutoNumber and the tables remain linked. The example is brief for demonstration purposes,but would be meaningful with a table containing a large number of rows.
BinaryThe binary statement is used for loading the data from another Qlik Sense app or QlikViewdocument, including section access data. Other elements of the app are not included, forexample, sheets, stories, visualizations, master items or variables.
Only one binary statement is allowed in the script. The binary statement must be the first statement of thescript, even before the SET statements usually located at the beginning of the script.
Syntax:binary [path] filename
Arguments:
Argument Description
path The path to the file which should be a reference to a folder data connection. This isrequired if the file is not located in the Qlik Sense working directory.
Example: 'lib://Table Files/'
In legacy scripting mode, the following path formats are also supported:
l absolute
Example: c:\data\
l relative to the app containing this script line.
Example: data\
filename The name of the file, including the file extension .qvw or .qvf.
Arguments
Limitations:
You cannot use binary to load data from an app on the same Qlik Sense Enterprise deployment byreferring to the app ID. You can only load from a .qvf file.
Script syntax and chart functions - Qlik Sense, February 2022 80
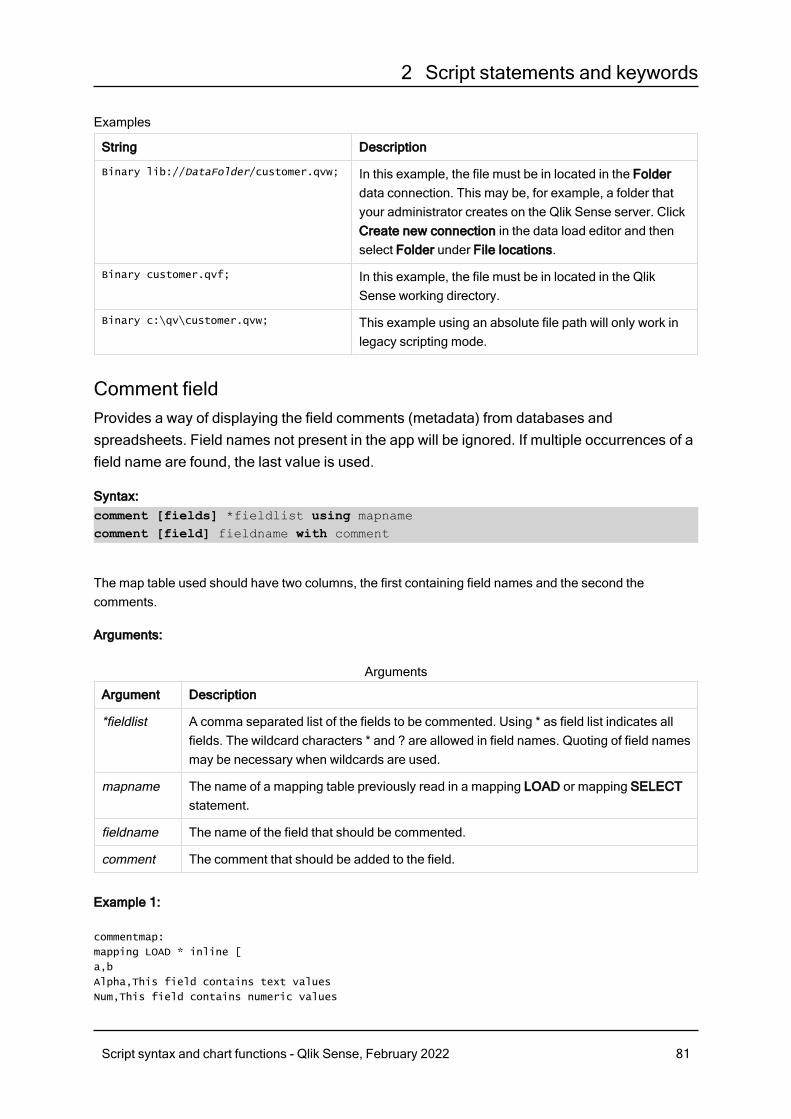
2 Script statements and keywords
Examples
String Description
Binary lib://DataFolder/customer.qvw; In this example, the file must be in located in the Folderdata connection. This may be, for example, a folder thatyour administrator creates on the Qlik Sense server. ClickCreate new connection in the data load editor and thenselect Folder under File locations.
Binary customer.qvf; In this example, the file must be in located in the QlikSense working directory.
Binary c:\qv\customer.qvw; This example using an absolute file path will only work inlegacy scripting mode.
Comment fieldProvides a way of displaying the field comments (metadata) from databases andspreadsheets. Field names not present in the app will be ignored. If multiple occurrences of afield name are found, the last value is used.
Syntax:comment [fields] *fieldlist using mapnamecomment [field] fieldname with comment
The map table used should have two columns, the first containing field names and the second thecomments.
Arguments:
Argument Description
*fieldlist A comma separated list of the fields to be commented. Using * as field list indicates allfields. The wildcard characters * and ? are allowed in field names. Quoting of field namesmay be necessary when wildcards are used.
mapname The name of a mapping table previously read in a mapping LOAD or mapping SELECTstatement.
fieldname The name of the field that should be commented.
comment The comment that should be added to the field.
Arguments
Example 1:
commentmap:
mapping LOAD * inline [
a,b
Alpha,This field contains text values
Num,This field contains numeric values
Script syntax and chart functions - Qlik Sense, February 2022 81
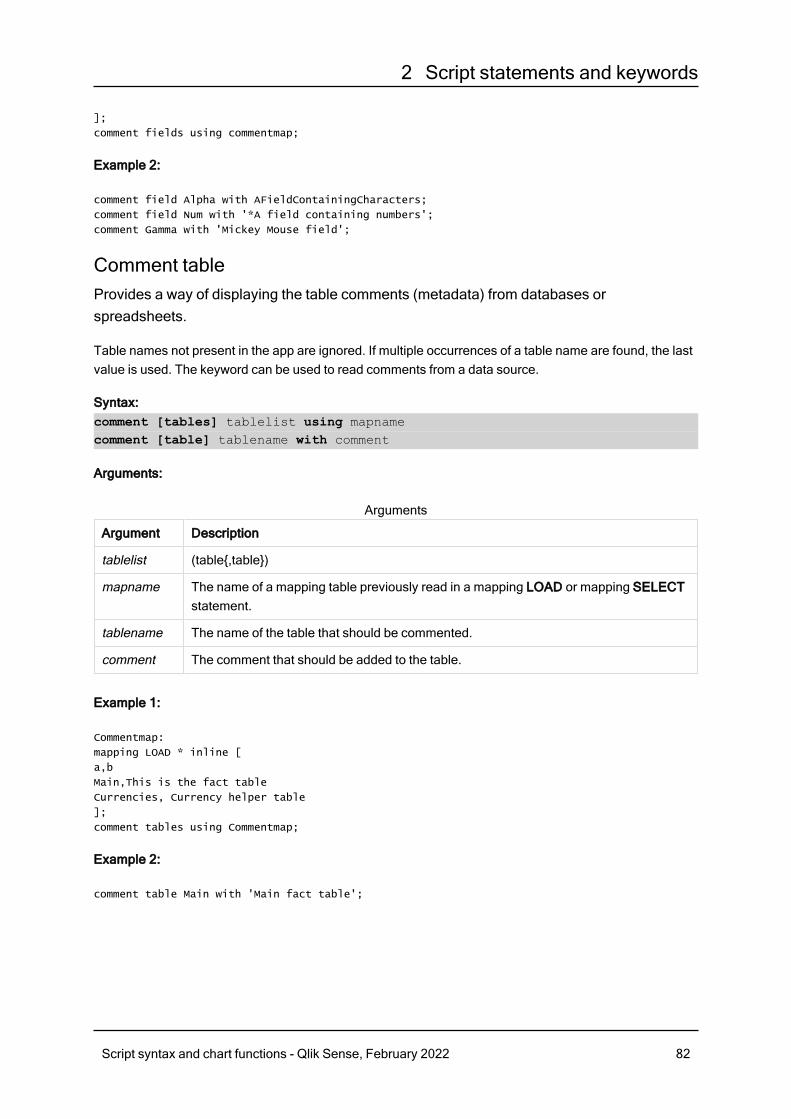
2 Script statements and keywords
];
comment fields using commentmap;
Example 2:
comment field Alpha with AFieldContainingCharacters;
comment field Num with '*A field containing numbers';
comment Gamma with 'Mickey Mouse field';
Comment tableProvides a way of displaying the table comments (metadata) from databases orspreadsheets.
Table names not present in the app are ignored. If multiple occurrences of a table name are found, the lastvalue is used. The keyword can be used to read comments from a data source.
Syntax:comment [tables] tablelist using mapnamecomment [table] tablename with comment
Arguments:
Argument Description
tablelist (table{,table})
mapname The name of a mapping table previously read in a mapping LOAD or mapping SELECTstatement.
tablename The name of the table that should be commented.
comment The comment that should be added to the table.
Arguments
Example 1:
Commentmap:
mapping LOAD * inline [
a,b
Main,This is the fact table
Currencies, Currency helper table
];
comment tables using Commentmap;
Example 2:
comment table Main with 'Main fact table';
Script syntax and chart functions - Qlik Sense, February 2022 82
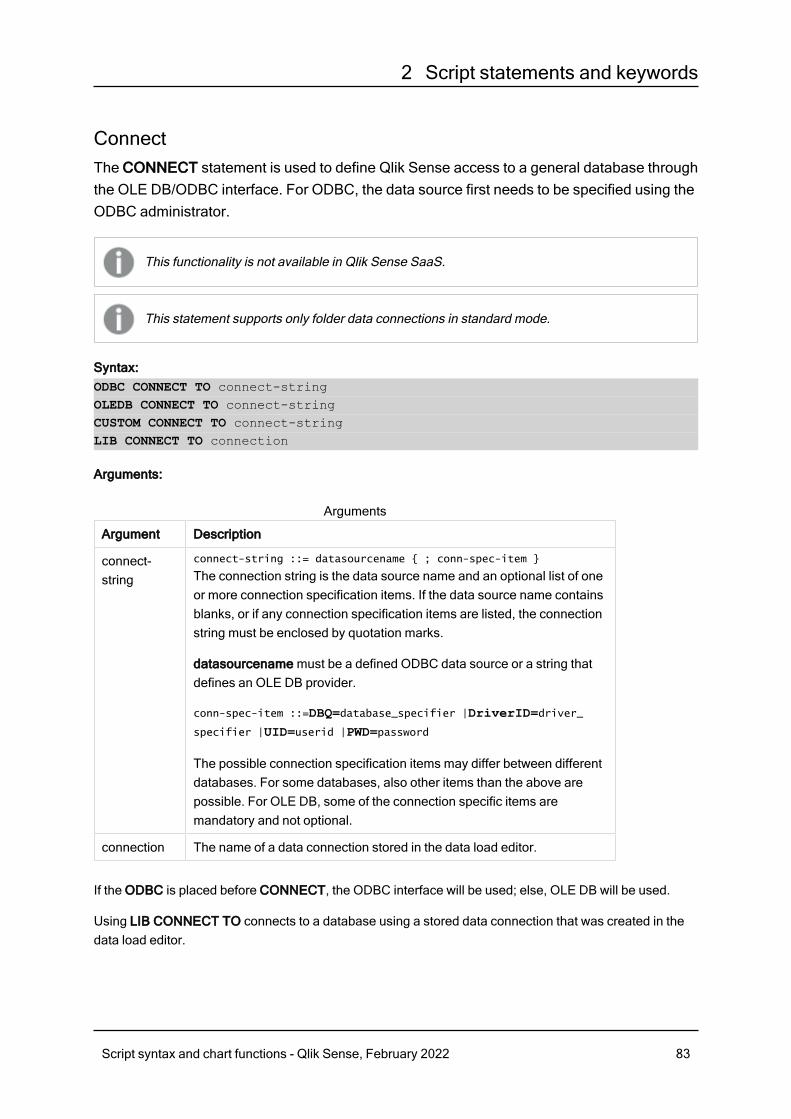
2 Script statements and keywords
ConnectThe CONNECT statement is used to define Qlik Sense access to a general database throughthe OLE DB/ODBC interface. For ODBC, the data source first needs to be specified using theODBC administrator.
This functionality is not available in Qlik Sense SaaS.
This statement supports only folder data connections in standard mode.
Syntax:ODBC CONNECT TO connect-stringOLEDB CONNECT TO connect-stringCUSTOM CONNECT TO connect-stringLIB CONNECT TO connection
Arguments:
Argument Description
connect-string
connect-string ::= datasourcename { ; conn-spec-item }
The connection string is the data source name and an optional list of oneor more connection specification items. If the data source name containsblanks, or if any connection specification items are listed, the connectionstring must be enclosed by quotation marks.
datasourcename must be a defined ODBC data source or a string thatdefines an OLE DB provider.
conn-spec-item ::=DBQ=database_specifier |DriverID=driver_specifier |UID=userid |PWD=password
The possible connection specification items may differ between differentdatabases. For some databases, also other items than the above arepossible. For OLE DB, some of the connection specific items aremandatory and not optional.
connection The name of a data connection stored in the data load editor.
Arguments
If the ODBC is placed before CONNECT, the ODBC interface will be used; else, OLE DB will be used.
Using LIB CONNECT TO connects to a database using a stored data connection that was created in thedata load editor.
Script syntax and chart functions - Qlik Sense, February 2022 83
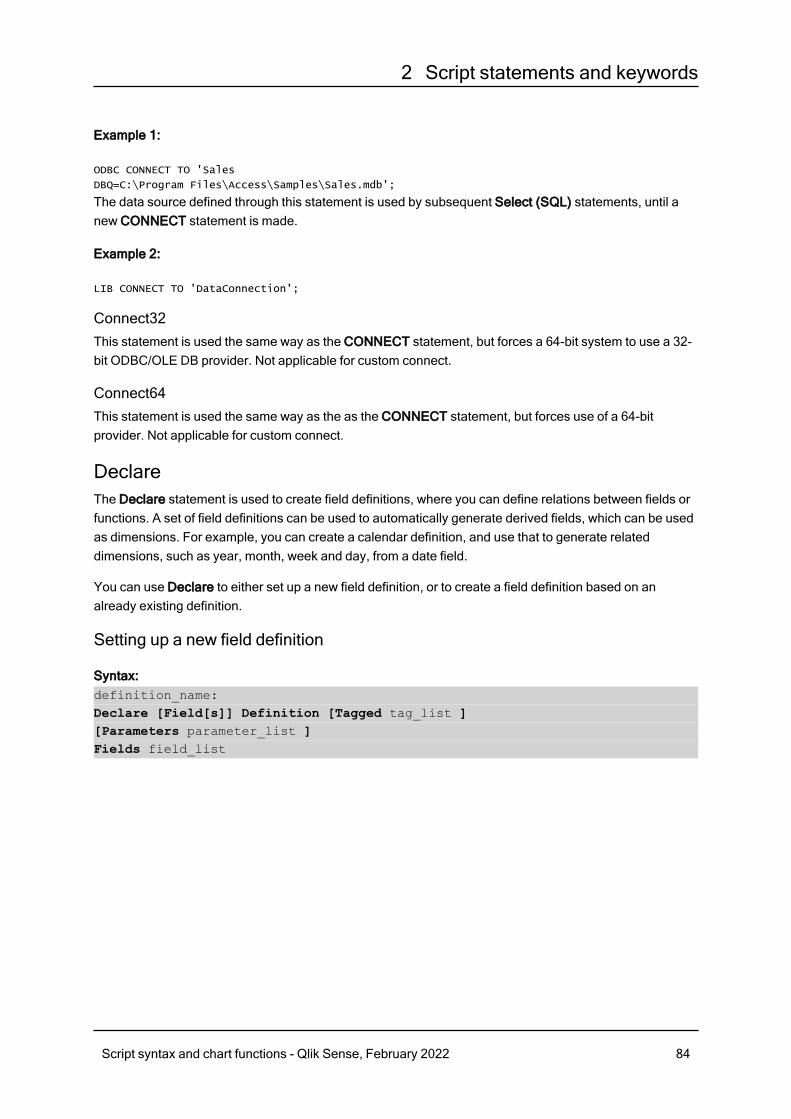
2 Script statements and keywords
Example 1:
ODBC CONNECT TO 'Sales
DBQ=C:\Program Files\Access\Samples\Sales.mdb';
The data source defined through this statement is used by subsequent Select (SQL) statements, until anew CONNECT statement is made.
Example 2:
LIB CONNECT TO 'DataConnection';
Connect32This statement is used the same way as the CONNECT statement, but forces a 64-bit system to use a 32-bit ODBC/OLE DB provider. Not applicable for custom connect.
Connect64This statement is used the same way as the as the CONNECT statement, but forces use of a 64-bitprovider. Not applicable for custom connect.
DeclareThe Declare statement is used to create field definitions, where you can define relations between fields orfunctions. A set of field definitions can be used to automatically generate derived fields, which can be usedas dimensions. For example, you can create a calendar definition, and use that to generate relateddimensions, such as year, month, week and day, from a date field.
You can use Declare to either set up a new field definition, or to create a field definition based on analready existing definition.
Setting up a new field definition
Syntax:definition_name:Declare [Field[s]] Definition [Tagged tag_list ][Parameters parameter_list ]Fields field_list
Script syntax and chart functions - Qlik Sense, February 2022 84
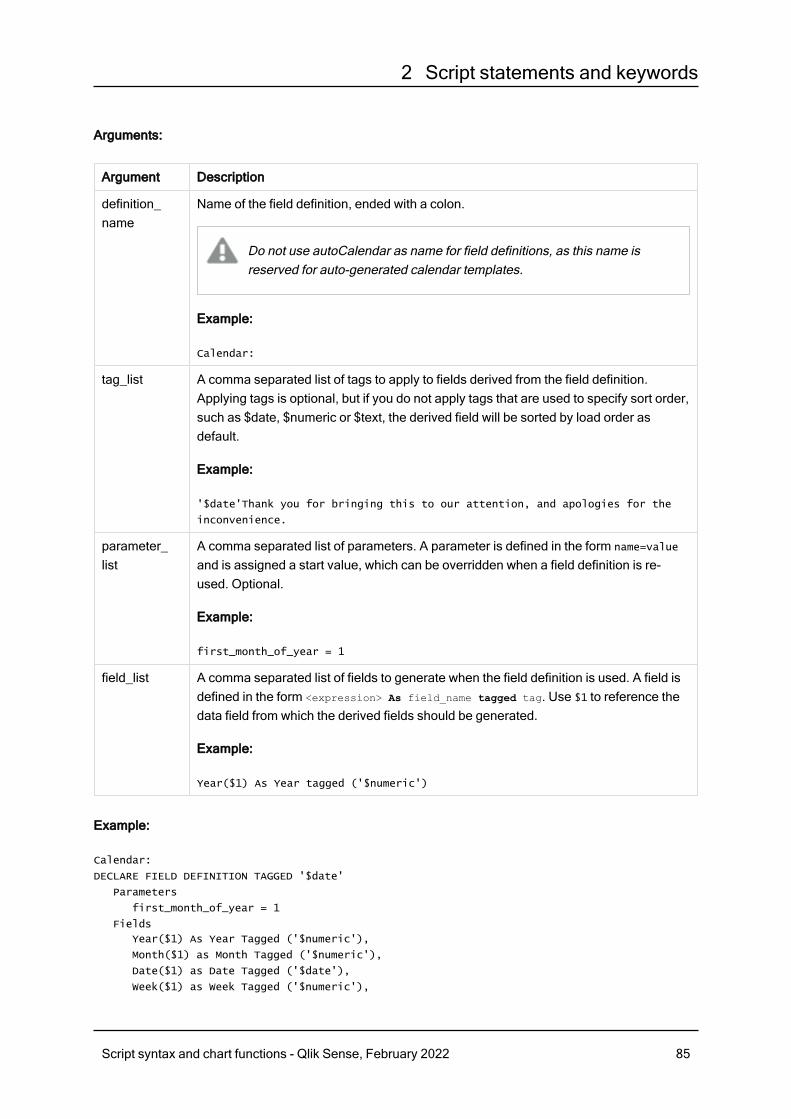
2 Script statements and keywords
Arguments:
Argument Description
definition_name
Name of the field definition, ended with a colon.
Do not use autoCalendar as name for field definitions, as this name isreserved for auto-generated calendar templates.
Example:
Calendar:
tag_list A comma separated list of tags to apply to fields derived from the field definition.Applying tags is optional, but if you do not apply tags that are used to specify sort order,such as $date, $numeric or $text, the derived field will be sorted by load order asdefault.
Example:
'$date'Thank you for bringing this to our attention, and apologies for the
inconvenience.
parameter_list
A comma separated list of parameters. A parameter is defined in the form name=value
and is assigned a start value, which can be overridden when a field definition is re-used. Optional.
Example:
first_month_of_year = 1
field_list A comma separated list of fields to generate when the field definition is used. A field isdefined in the form <expression> As field_name tagged tag. Use $1 to reference thedata field from which the derived fields should be generated.
Example:
Year($1) As Year tagged ('$numeric')
Example:
Calendar:
DECLARE FIELD DEFINITION TAGGED '$date'
Parameters
first_month_of_year = 1
Fields
Year($1) As Year Tagged ('$numeric'),
Month($1) as Month Tagged ('$numeric'),
Date($1) as Date Tagged ('$date'),
Week($1) as Week Tagged ('$numeric'),
Script syntax and chart functions - Qlik Sense, February 2022 85
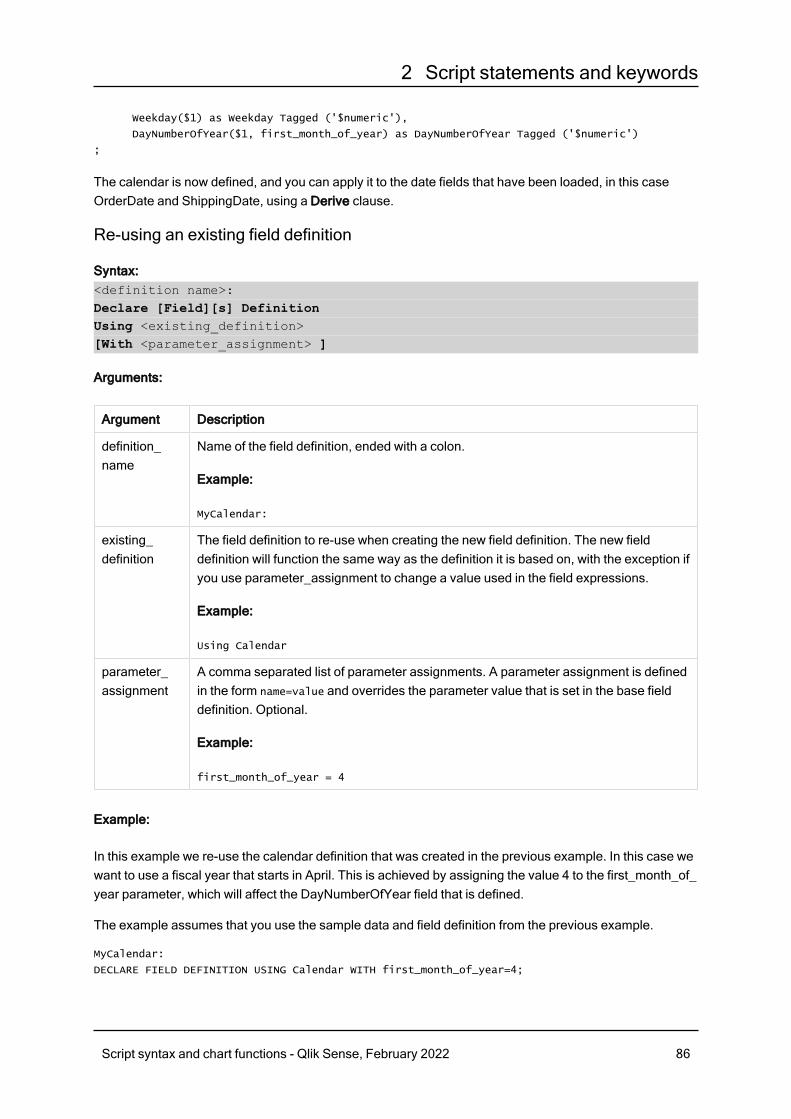
2 Script statements and keywords
Weekday($1) as Weekday Tagged ('$numeric'),
DayNumberOfYear($1, first_month_of_year) as DayNumberOfYear Tagged ('$numeric')
;
The calendar is now defined, and you can apply it to the date fields that have been loaded, in this caseOrderDate and ShippingDate, using a Derive clause.
Re-using an existing field definition
Syntax:<definition name>:Declare [Field][s] DefinitionUsing <existing_definition>[With <parameter_assignment> ]
Arguments:
Argument Description
definition_name
Name of the field definition, ended with a colon.
Example:
MyCalendar:
existing_definition
The field definition to re-use when creating the new field definition. The new fielddefinition will function the same way as the definition it is based on, with the exception ifyou use parameter_assignment to change a value used in the field expressions.
Example:
Using Calendar
parameter_assignment
A comma separated list of parameter assignments. A parameter assignment is definedin the form name=value and overrides the parameter value that is set in the base fielddefinition. Optional.
Example:
first_month_of_year = 4
Example:
In this example we re-use the calendar definition that was created in the previous example. In this case wewant to use a fiscal year that starts in April. This is achieved by assigning the value 4 to the first_month_of_year parameter, which will affect the DayNumberOfYear field that is defined.
The example assumes that you use the sample data and field definition from the previous example.
MyCalendar:
DECLARE FIELD DEFINITION USING Calendar WITH first_month_of_year=4;
Script syntax and chart functions - Qlik Sense, February 2022 86
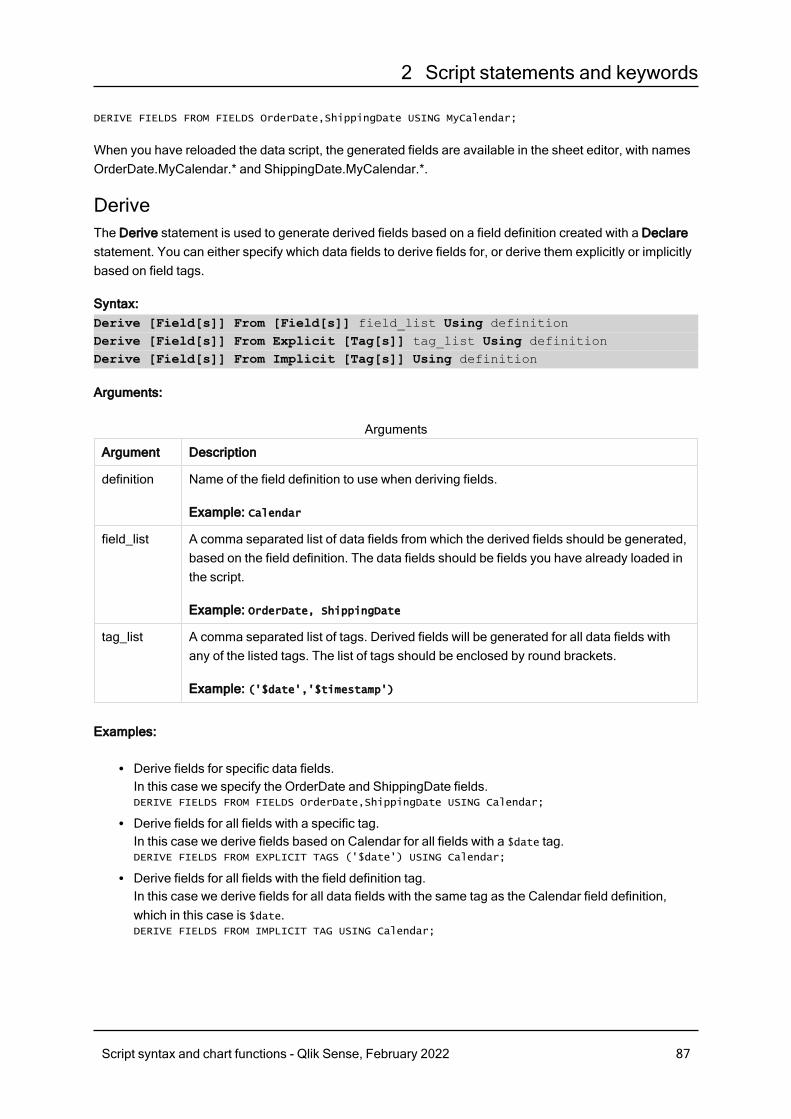
2 Script statements and keywords
DERIVE FIELDS FROM FIELDS OrderDate,ShippingDate USING MyCalendar;
When you have reloaded the data script, the generated fields are available in the sheet editor, with namesOrderDate.MyCalendar.* and ShippingDate.MyCalendar.*.
DeriveThe Derive statement is used to generate derived fields based on a field definition created with a Declarestatement. You can either specify which data fields to derive fields for, or derive them explicitly or implicitlybased on field tags.
Syntax:Derive [Field[s]] From [Field[s]] field_list Using definitionDerive [Field[s]] From Explicit [Tag[s]] tag_list Using definitionDerive [Field[s]] From Implicit [Tag[s]] Using definition
Arguments:
Argument Description
definition Name of the field definition to use when deriving fields.
Example: Calendar
field_list A comma separated list of data fields from which the derived fields should be generated,based on the field definition. The data fields should be fields you have already loaded inthe script.
Example: OrderDate, ShippingDate
tag_list A comma separated list of tags. Derived fields will be generated for all data fields withany of the listed tags. The list of tags should be enclosed by round brackets.
Example: ('$date','$timestamp')
Arguments
Examples:
l Derive fields for specific data fields.In this case we specify the OrderDate and ShippingDate fields.DERIVE FIELDS FROM FIELDS OrderDate,ShippingDate USING Calendar;
l Derive fields for all fields with a specific tag.In this case we derive fields based on Calendar for all fields with a $date tag.DERIVE FIELDS FROM EXPLICIT TAGS ('$date') USING Calendar;
l Derive fields for all fields with the field definition tag.In this case we derive fields for all data fields with the same tag as the Calendar field definition,which in this case is $date.DERIVE FIELDS FROM IMPLICIT TAG USING Calendar;
Script syntax and chart functions - Qlik Sense, February 2022 87
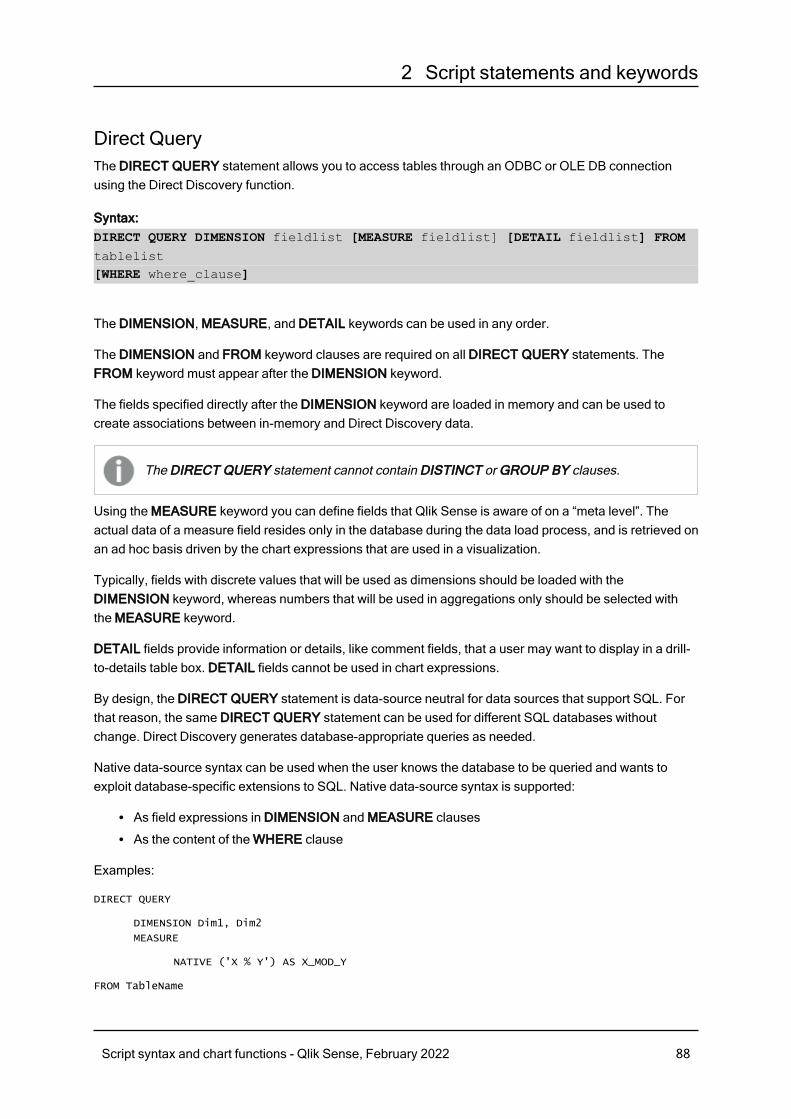
2 Script statements and keywords
Direct QueryThe DIRECT QUERY statement allows you to access tables through an ODBC or OLE DB connectionusing the Direct Discovery function.
Syntax:DIRECT QUERY DIMENSION fieldlist [MEASURE fieldlist] [DETAIL fieldlist] FROMtablelist[WHERE where_clause]
The DIMENSION, MEASURE, and DETAIL keywords can be used in any order.
The DIMENSION and FROM keyword clauses are required on all DIRECT QUERY statements. TheFROM keyword must appear after the DIMENSION keyword.
The fields specified directly after the DIMENSION keyword are loaded in memory and can be used tocreate associations between in-memory and Direct Discovery data.
The DIRECT QUERY statement cannot contain DISTINCT or GROUP BY clauses.
Using the MEASURE keyword you can define fields that Qlik Sense is aware of on a “meta level”. Theactual data of a measure field resides only in the database during the data load process, and is retrieved onan ad hoc basis driven by the chart expressions that are used in a visualization.
Typically, fields with discrete values that will be used as dimensions should be loaded with theDIMENSION keyword, whereas numbers that will be used in aggregations only should be selected withthe MEASURE keyword.
DETAIL fields provide information or details, like comment fields, that a user may want to display in a drill-to-details table box. DETAIL fields cannot be used in chart expressions.
By design, the DIRECT QUERY statement is data-source neutral for data sources that support SQL. Forthat reason, the same DIRECT QUERY statement can be used for different SQL databases withoutchange. Direct Discovery generates database-appropriate queries as needed.
Native data-source syntax can be used when the user knows the database to be queried and wants toexploit database-specific extensions to SQL. Native data-source syntax is supported:
l As field expressions in DIMENSION and MEASURE clausesl As the content of the WHERE clause
Examples:
DIRECT QUERY
DIMENSION Dim1, Dim2
MEASURE
NATIVE ('X % Y') AS X_MOD_Y
FROM TableName
Script syntax and chart functions - Qlik Sense, February 2022 88
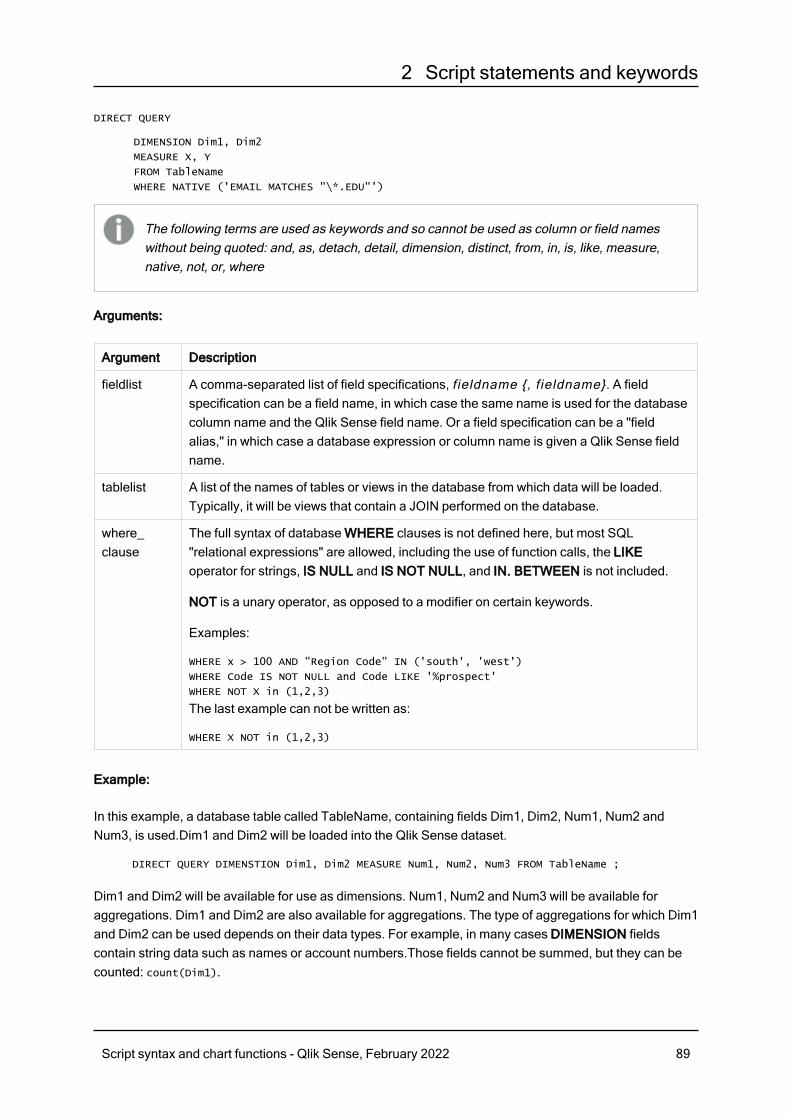
2 Script statements and keywords
DIRECT QUERY
DIMENSION Dim1, Dim2
MEASURE X, Y
FROM TableName
WHERE NATIVE ('EMAIL MATCHES "\*.EDU"')
The following terms are used as keywords and so cannot be used as column or field nameswithout being quoted: and, as, detach, detail, dimension, distinct, from, in, is, like, measure,native, not, or, where
Arguments:
Argument Description
fieldlist A comma-separated list of field specifications, fieldname {, fieldname}. A fieldspecification can be a field name, in which case the same name is used for the databasecolumn name and the Qlik Sense field name. Or a field specification can be a "fieldalias," in which case a database expression or column name is given a Qlik Sense fieldname.
tablelist A list of the names of tables or views in the database from which data will be loaded.Typically, it will be views that contain a JOIN performed on the database.
where_clause
The full syntax of database WHERE clauses is not defined here, but most SQL"relational expressions" are allowed, including the use of function calls, the LIKEoperator for strings, IS NULL and IS NOT NULL, and IN. BETWEEN is not included.
NOT is a unary operator, as opposed to a modifier on certain keywords.
Examples:
WHERE x > 100 AND "Region Code" IN ('south', 'west')
WHERE Code IS NOT NULL and Code LIKE '%prospect'
WHERE NOT X in (1,2,3)
The last example can not be written as:
WHERE X NOT in (1,2,3)
Example:
In this example, a database table called TableName, containing fields Dim1, Dim2, Num1, Num2 andNum3, is used.Dim1 and Dim2 will be loaded into the Qlik Sense dataset.
DIRECT QUERY DIMENSTION Dim1, Dim2 MEASURE Num1, Num2, Num3 FROM TableName ;
Dim1 and Dim2 will be available for use as dimensions. Num1, Num2 and Num3 will be available foraggregations. Dim1 and Dim2 are also available for aggregations. The type of aggregations for which Dim1and Dim2 can be used depends on their data types. For example, in many cases DIMENSION fieldscontain string data such as names or account numbers.Those fields cannot be summed, but they can becounted: count(Dim1).
Script syntax and chart functions - Qlik Sense, February 2022 89
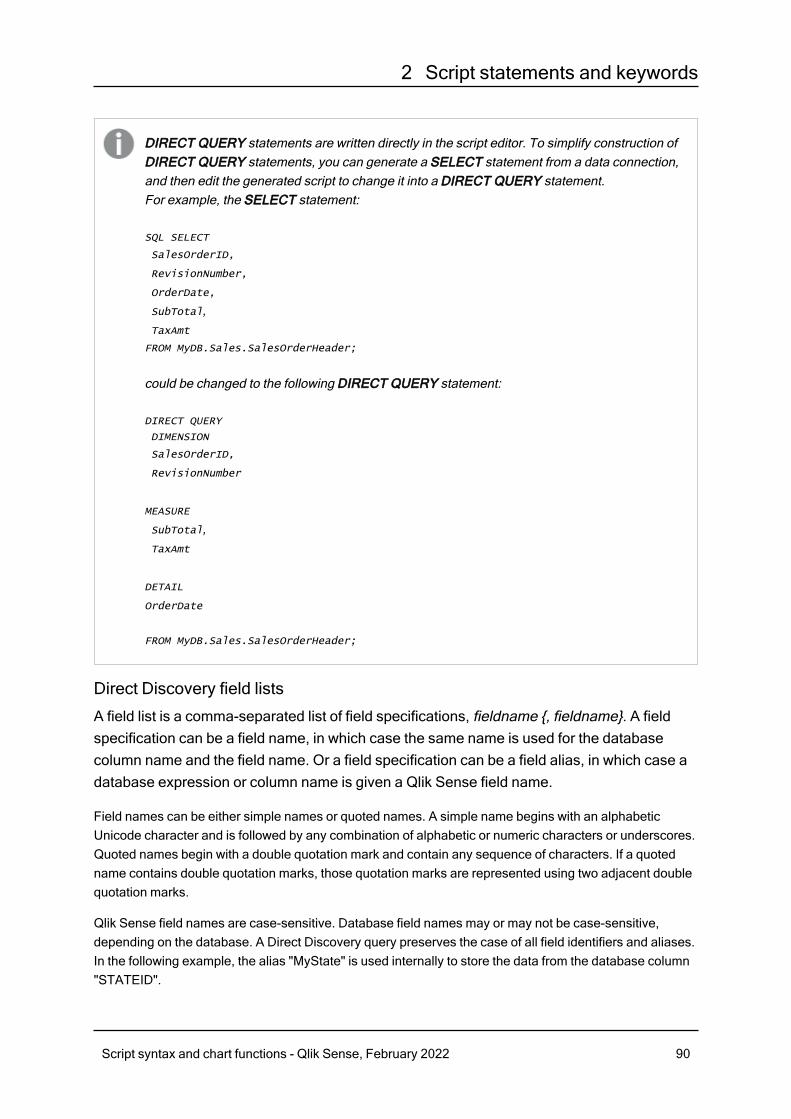
2 Script statements and keywords
DIRECT QUERY statements are written directly in the script editor. To simplify construction ofDIRECT QUERY statements, you can generate a SELECT statement from a data connection,and then edit the generated script to change it into a DIRECT QUERY statement.For example, the SELECT statement:
SQL SELECT
SalesOrderID,
RevisionNumber,
OrderDate,
SubTotal,TaxAmt
FROM MyDB.Sales.SalesOrderHeader;
could be changed to the following DIRECT QUERY statement:
DIRECT QUERY
DIMENSION
SalesOrderID,
RevisionNumber
MEASURE
SubTotal,TaxAmt
DETAIL
OrderDate
FROM MyDB.Sales.SalesOrderHeader;
Direct Discovery field lists
A field list is a comma-separated list of field specifications, fieldname {, fieldname}. A fieldspecification can be a field name, in which case the same name is used for the databasecolumn name and the field name. Or a field specification can be a field alias, in which case adatabase expression or column name is given a Qlik Sense field name.
Field names can be either simple names or quoted names. A simple name begins with an alphabeticUnicode character and is followed by any combination of alphabetic or numeric characters or underscores.Quoted names begin with a double quotation mark and contain any sequence of characters. If a quotedname contains double quotation marks, those quotation marks are represented using two adjacent doublequotation marks.
Qlik Sense field names are case-sensitive. Database field names may or may not be case-sensitive,depending on the database. A Direct Discovery query preserves the case of all field identifiers and aliases.In the following example, the alias "MyState" is used internally to store the data from the database column"STATEID".
Script syntax and chart functions - Qlik Sense, February 2022 90
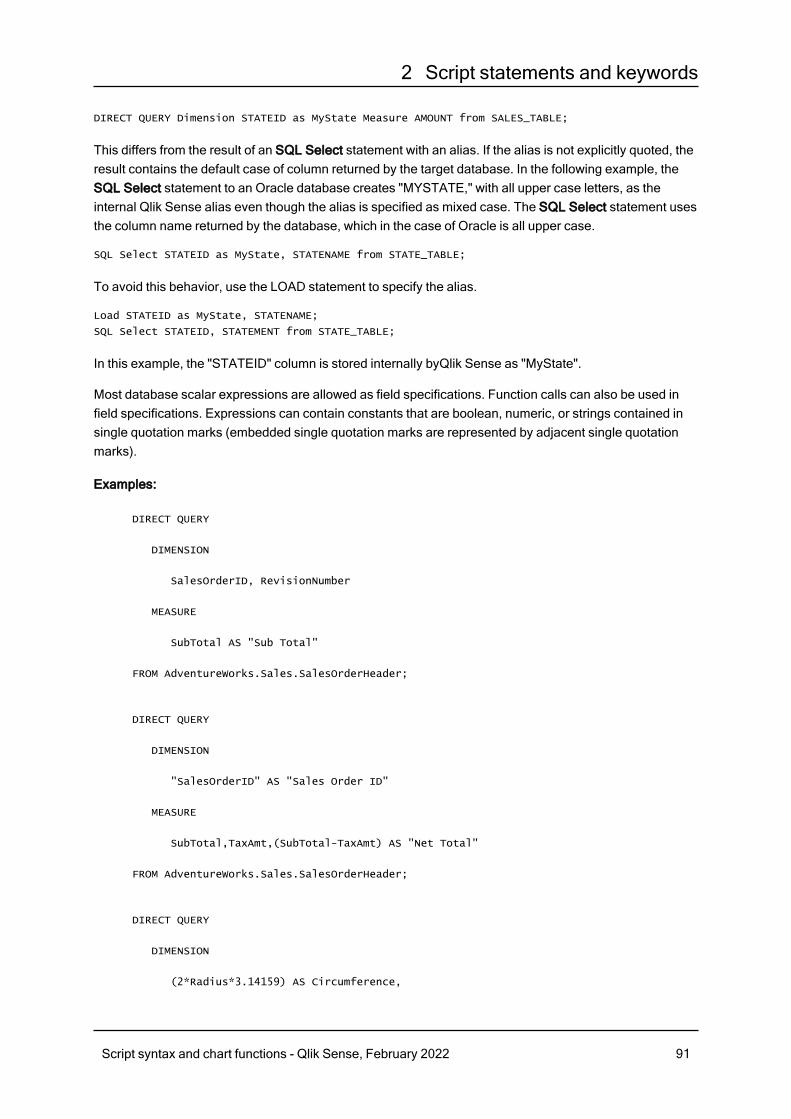
2 Script statements and keywords
DIRECT QUERY Dimension STATEID as MyState Measure AMOUNT from SALES_TABLE;
This differs from the result of an SQL Select statement with an alias. If the alias is not explicitly quoted, theresult contains the default case of column returned by the target database. In the following example, theSQL Select statement to an Oracle database creates "MYSTATE," with all upper case letters, as theinternal Qlik Sense alias even though the alias is specified as mixed case. The SQL Select statement usesthe column name returned by the database, which in the case of Oracle is all upper case.
SQL Select STATEID as MyState, STATENAME from STATE_TABLE;
To avoid this behavior, use the LOAD statement to specify the alias.
Load STATEID as MyState, STATENAME;
SQL Select STATEID, STATEMENT from STATE_TABLE;
In this example, the "STATEID" column is stored internally byQlik Sense as "MyState".
Most database scalar expressions are allowed as field specifications. Function calls can also be used infield specifications. Expressions can contain constants that are boolean, numeric, or strings contained insingle quotation marks (embedded single quotation marks are represented by adjacent single quotationmarks).
Examples:
DIRECT QUERY
DIMENSION
SalesOrderID, RevisionNumber
MEASURE
SubTotal AS "Sub Total"
FROM AdventureWorks.Sales.SalesOrderHeader;
DIRECT QUERY
DIMENSION
"SalesOrderID" AS "Sales Order ID"
MEASURE
SubTotal,TaxAmt,(SubTotal-TaxAmt) AS "Net Total"
FROM AdventureWorks.Sales.SalesOrderHeader;
DIRECT QUERY
DIMENSION
(2*Radius*3.14159) AS Circumference,
Script syntax and chart functions - Qlik Sense, February 2022 91
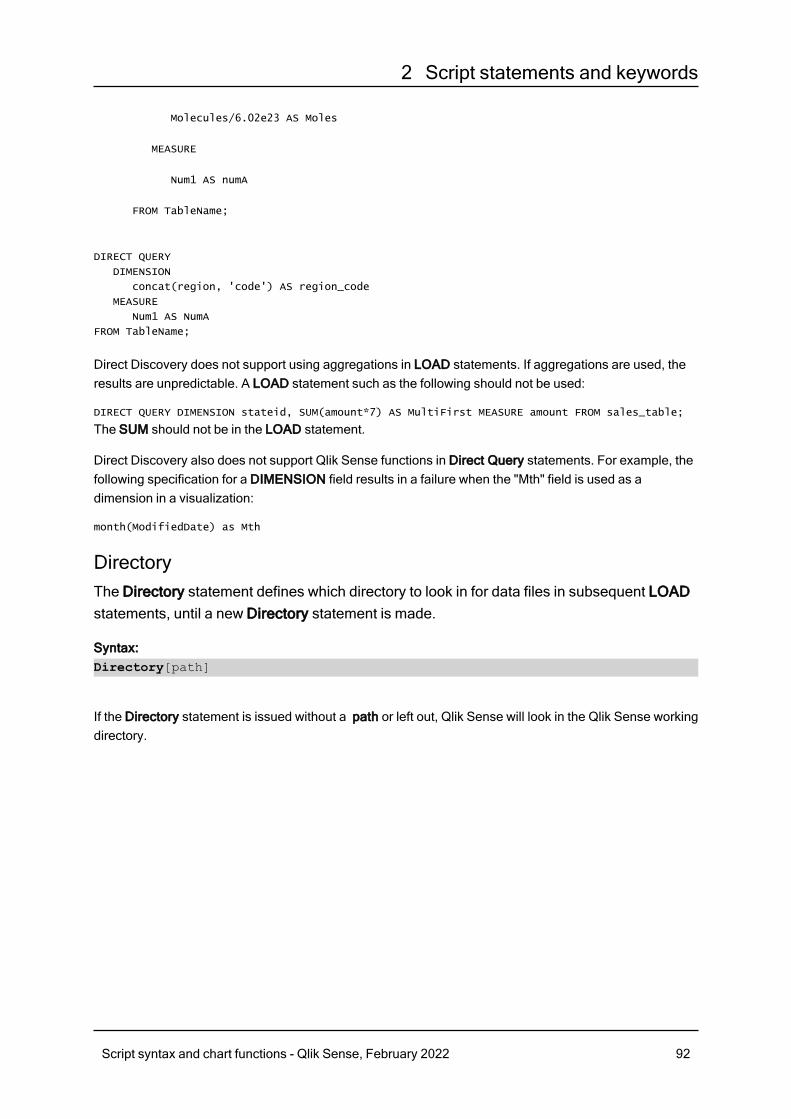
2 Script statements and keywords
Molecules/6.02e23 AS Moles
MEASURE
Num1 AS numA
FROM TableName;
DIRECT QUERY
DIMENSION
concat(region, 'code') AS region_code
MEASURE
Num1 AS NumA
FROM TableName;
Direct Discovery does not support using aggregations in LOAD statements. If aggregations are used, theresults are unpredictable. A LOAD statement such as the following should not be used:
DIRECT QUERY DIMENSION stateid, SUM(amount*7) AS MultiFirst MEASURE amount FROM sales_table;
The SUM should not be in the LOAD statement.
Direct Discovery also does not support Qlik Sense functions in Direct Query statements. For example, thefollowing specification for a DIMENSION field results in a failure when the "Mth" field is used as adimension in a visualization:
month(ModifiedDate) as Mth
DirectoryThe Directory statement defines which directory to look in for data files in subsequent LOADstatements, until a new Directory statement is made.
Syntax:Directory[path]
If the Directory statement is issued without a path or left out, Qlik Sense will look in the Qlik Sense workingdirectory.
Script syntax and chart functions - Qlik Sense, February 2022 92
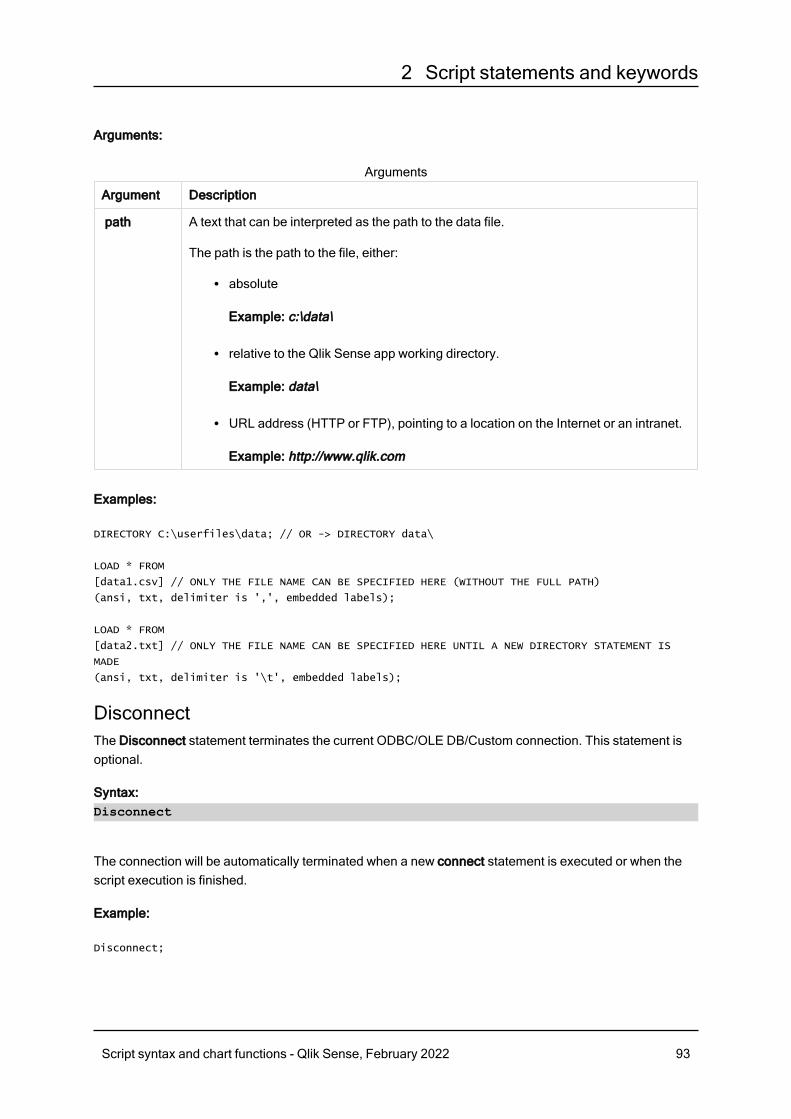
2 Script statements and keywords
Arguments:
Argument Description
path A text that can be interpreted as the path to the data file.
The path is the path to the file, either:
l absolute
Example: c:\data\
l relative to the Qlik Sense app working directory.
Example: data\
l URL address (HTTP or FTP), pointing to a location on the Internet or an intranet.
Example: http://www.qlik.com
Arguments
Examples:
DIRECTORY C:\userfiles\data; // OR -> DIRECTORY data\
LOAD * FROM
[data1.csv] // ONLY THE FILE NAME CAN BE SPECIFIED HERE (WITHOUT THE FULL PATH)
(ansi, txt, delimiter is ',', embedded labels);
LOAD * FROM
[data2.txt] // ONLY THE FILE NAME CAN BE SPECIFIED HERE UNTIL A NEW DIRECTORY STATEMENT IS
MADE
(ansi, txt, delimiter is '\t', embedded labels);
DisconnectThe Disconnect statement terminates the current ODBC/OLE DB/Custom connection. This statement isoptional.
Syntax:Disconnect
The connection will be automatically terminated when a new connect statement is executed or when thescript execution is finished.
Example:
Disconnect;
Script syntax and chart functions - Qlik Sense, February 2022 93
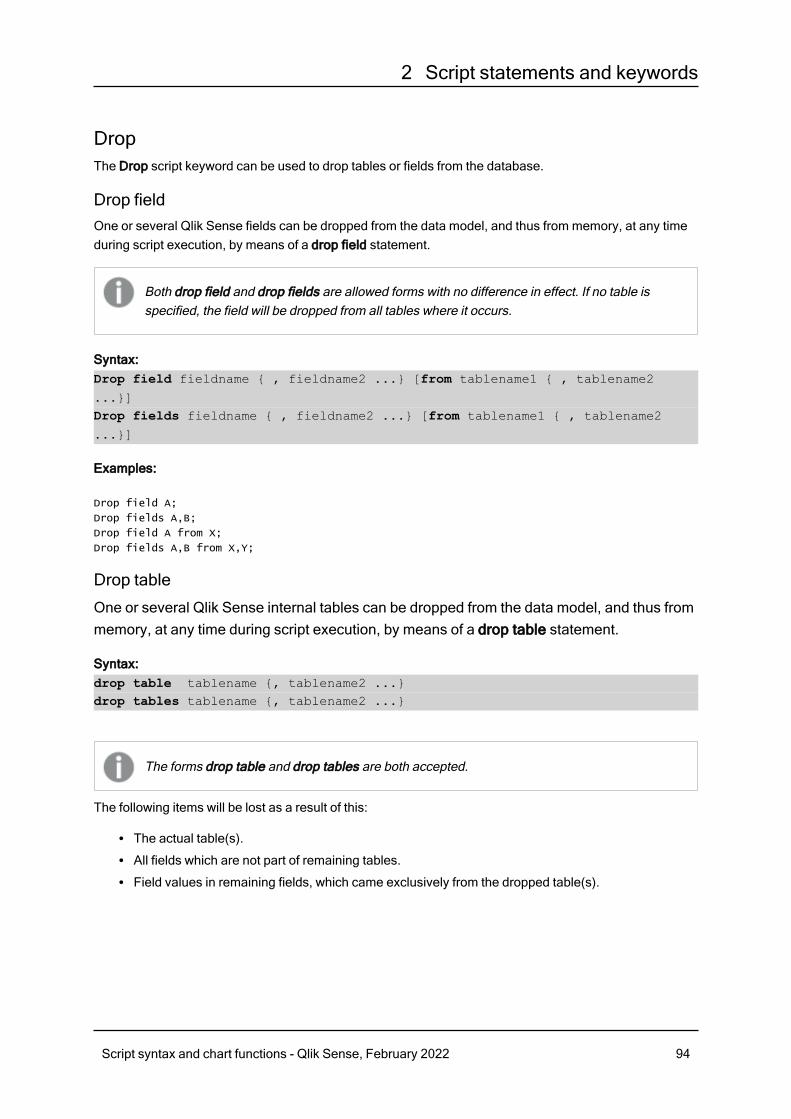
2 Script statements and keywords
DropThe Drop script keyword can be used to drop tables or fields from the database.
Drop fieldOne or several Qlik Sense fields can be dropped from the data model, and thus from memory, at any timeduring script execution, by means of a drop field statement.
Both drop field and drop fields are allowed forms with no difference in effect. If no table isspecified, the field will be dropped from all tables where it occurs.
Syntax:Drop field fieldname { , fieldname2 ...} [from tablename1 { , tablename2
...}]Drop fields fieldname { , fieldname2 ...} [from tablename1 { , tablename2
...}]
Examples:
Drop field A;
Drop fields A,B;
Drop field A from X;
Drop fields A,B from X,Y;
Drop table
One or several Qlik Sense internal tables can be dropped from the data model, and thus frommemory, at any time during script execution, by means of a drop table statement.
Syntax:drop table tablename {, tablename2 ...}drop tables tablename {, tablename2 ...}
The forms drop table and drop tables are both accepted.
The following items will be lost as a result of this:
l The actual table(s).l All fields which are not part of remaining tables.l Field values in remaining fields, which came exclusively from the dropped table(s).
Script syntax and chart functions - Qlik Sense, February 2022 94
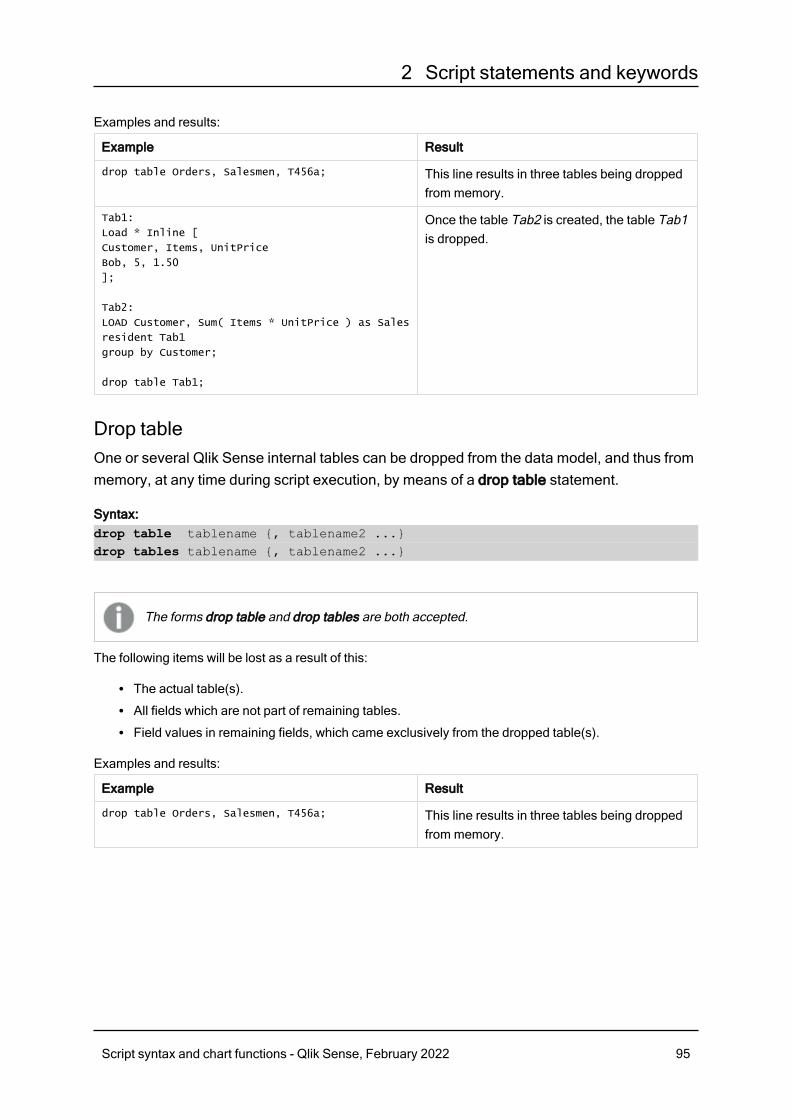
2 Script statements and keywords
Examples and results:
Example Result
drop table Orders, Salesmen, T456a; This line results in three tables being droppedfrom memory.
Tab1:
Load * Inline [
Customer, Items, UnitPrice
Bob, 5, 1.50
];
Tab2:
LOAD Customer, Sum( Items * UnitPrice ) as Sales
resident Tab1
group by Customer;
drop table Tab1;
Once the table Tab2 is created, the table Tab1is dropped.
Drop tableOne or several Qlik Sense internal tables can be dropped from the data model, and thus frommemory, at any time during script execution, by means of a drop table statement.
Syntax:drop table tablename {, tablename2 ...}drop tables tablename {, tablename2 ...}
The forms drop table and drop tables are both accepted.
The following items will be lost as a result of this:
l The actual table(s).l All fields which are not part of remaining tables.l Field values in remaining fields, which came exclusively from the dropped table(s).
Examples and results:
Example Result
drop table Orders, Salesmen, T456a; This line results in three tables being droppedfrom memory.
Script syntax and chart functions - Qlik Sense, February 2022 95

2 Script statements and keywords
Example Result
Tab1:
Load * Inline [
Customer, Items, UnitPrice
Bob, 5, 1.50
];
Tab2:
LOAD Customer, Sum( Items * UnitPrice ) as Sales
resident Tab1
group by Customer;
drop table Tab1;
Once the table Tab2 is created, the table Tab1is dropped.
ExecuteThe Execute statement is used to run other programs while Qlik Sense is loading data. Forexample, to make conversions that are necessary.
This functionality is not available in Qlik Sense SaaS.
This statement is not supported in standard mode.
Syntax:execute commandline
Arguments:
Argument Description
commandline A text that can be interpreted by the operating system as a commandline. You can refer to an absolute file path or a lib:// folder path.
Arguments
If you want to use Execute the following conditions need to be met:
l You must run in legacy mode (applicable for Qlik Sense and Qlik Sense Desktop).l You need to set OverrideScriptSecurity to 1 in Settings.ini (applicable for Qlik Sense).Settings.ini is located in C:\ProgramData\Qlik\Sense\Engine\ and is generally an empty file.
If you set OverrideScriptSecurity to enable Execute, any user can execute files on the server.For example, a user can attach an executable file to an app, and then execute the file in thedata load script.
Script syntax and chart functions - Qlik Sense, February 2022 96
2 Script statements and keywords
Do the following:
1. Make a copy of Settings.ini and open it in a text editor.
2. Check that the file includes [Settings 7] in the first line.
3. Insert a new line and type OverrideScriptSecurity=1.
4. Insert an empty line at the end of the file.
5. Save the file.
6. Substitute Settings.ini with your edited file.
7. Restart Qlik Sense Engine Service (QES).
If Qlik Sense is running as a service, some commands may not behave as expected.
Example:
Execute C:\Program Files\Office12\Excel.exe;
Execute lib://win\notepad.exe // win is a folder connection referring to c:\windows
Field/FieldsThe Field and Fields script keywords are used in Declare, Derive, Drop, Comment, Rename andTag/Untag statements.
FlushLogThe FlushLog statement forces Qlik Sense to write the content of the script buffer to the script log file.
Syntax:FlushLog
The content of the buffer is written to the log file. This command can be useful for debugging purposes, asyou will receive data that otherwise may have been lost in a failed script execution.
Example:
FlushLog;
ForceThe force statement forces Qlik Sense to interpret field names and field values of subsequentLOAD and SELECT statements as written with only upper case letters, with only lower caseletters, as always capitalized or as they appear (mixed). This statement makes it possible toassociate field values from tables made according to different conventions.
Syntax:Force ( capitalization | case upper | case lower | case mixed )
Script syntax and chart functions - Qlik Sense, February 2022 97
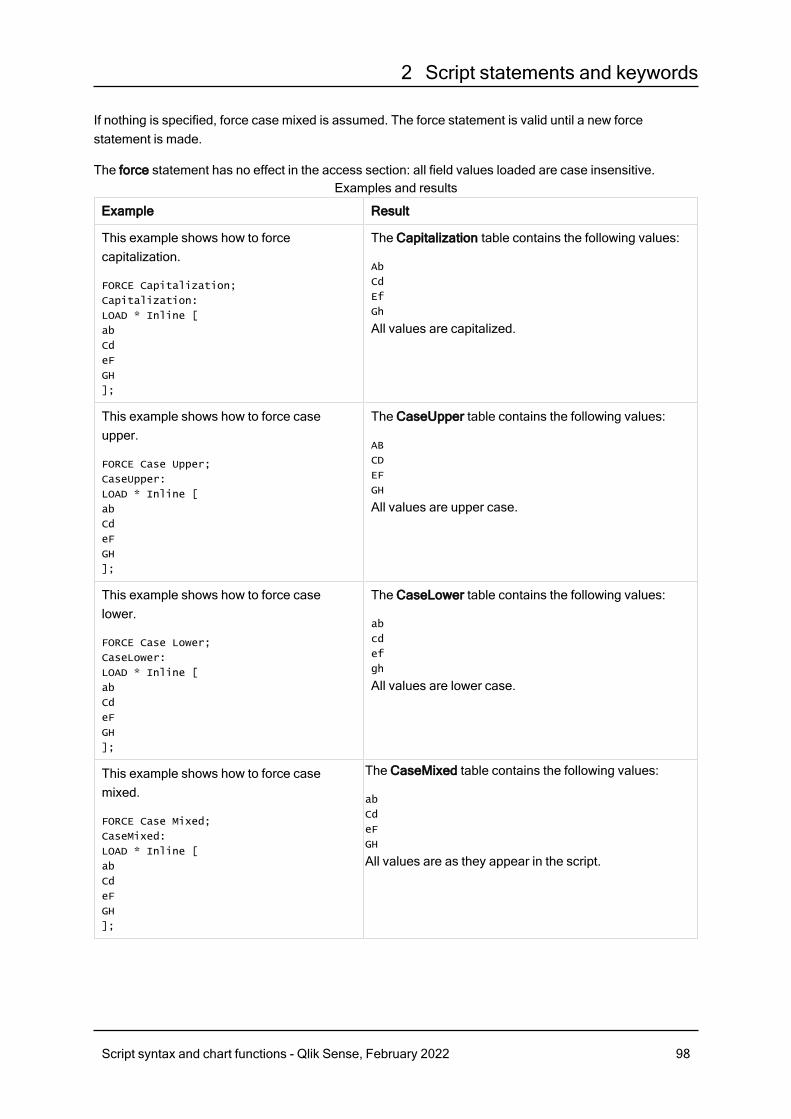
2 Script statements and keywords
If nothing is specified, force case mixed is assumed. The force statement is valid until a new forcestatement is made.
The force statement has no effect in the access section: all field values loaded are case insensitive.
Example Result
This example shows how to forcecapitalization.
FORCE Capitalization;
Capitalization:
LOAD * Inline [
ab
Cd
eF
GH
];
The Capitalization table contains the following values:
Ab
Cd
Ef
Gh
All values are capitalized.
This example shows how to force caseupper.
FORCE Case Upper;
CaseUpper:
LOAD * Inline [
ab
Cd
eF
GH
];
The CaseUpper table contains the following values:
AB
CD
EF
GH
All values are upper case.
This example shows how to force caselower.
FORCE Case Lower;
CaseLower:
LOAD * Inline [
ab
Cd
eF
GH
];
The CaseLower table contains the following values:
ab
cd
ef
gh
All values are lower case.
This example shows how to force casemixed.
FORCE Case Mixed;
CaseMixed:
LOAD * Inline [
ab
Cd
eF
GH
];
The CaseMixed table contains the following values:
ab
Cd
eF
GH
All values are as they appear in the script.
Examples and results
Script syntax and chart functions - Qlik Sense, February 2022 98
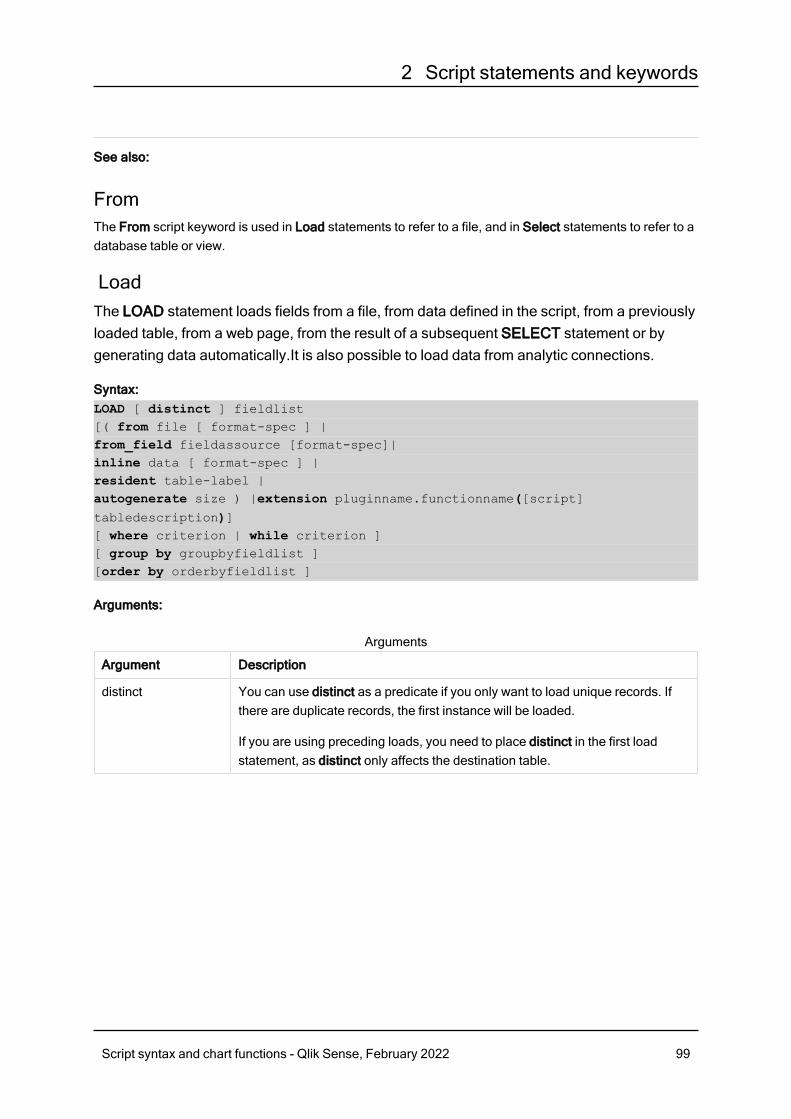
2 Script statements and keywords
See also:
FromThe From script keyword is used in Load statements to refer to a file, and in Select statements to refer to adatabase table or view.
LoadThe LOAD statement loads fields from a file, from data defined in the script, from a previouslyloaded table, from a web page, from the result of a subsequent SELECT statement or bygenerating data automatically.It is also possible to load data from analytic connections.
Syntax:LOAD [ distinct ] fieldlist[( from file [ format-spec ] |from_field fieldassource [format-spec]|inline data [ format-spec ] |resident table-label |autogenerate size ) |extension pluginname.functionname([script]tabledescription)][ where criterion | while criterion ][ group by groupbyfieldlist ][order by orderbyfieldlist ]
Arguments:
Argument Description
distinct You can use distinct as a predicate if you only want to load unique records. Ifthere are duplicate records, the first instance will be loaded.
If you are using preceding loads, you need to place distinct in the first loadstatement, as distinct only affects the destination table.
Arguments
Script syntax and chart functions - Qlik Sense, February 2022 99
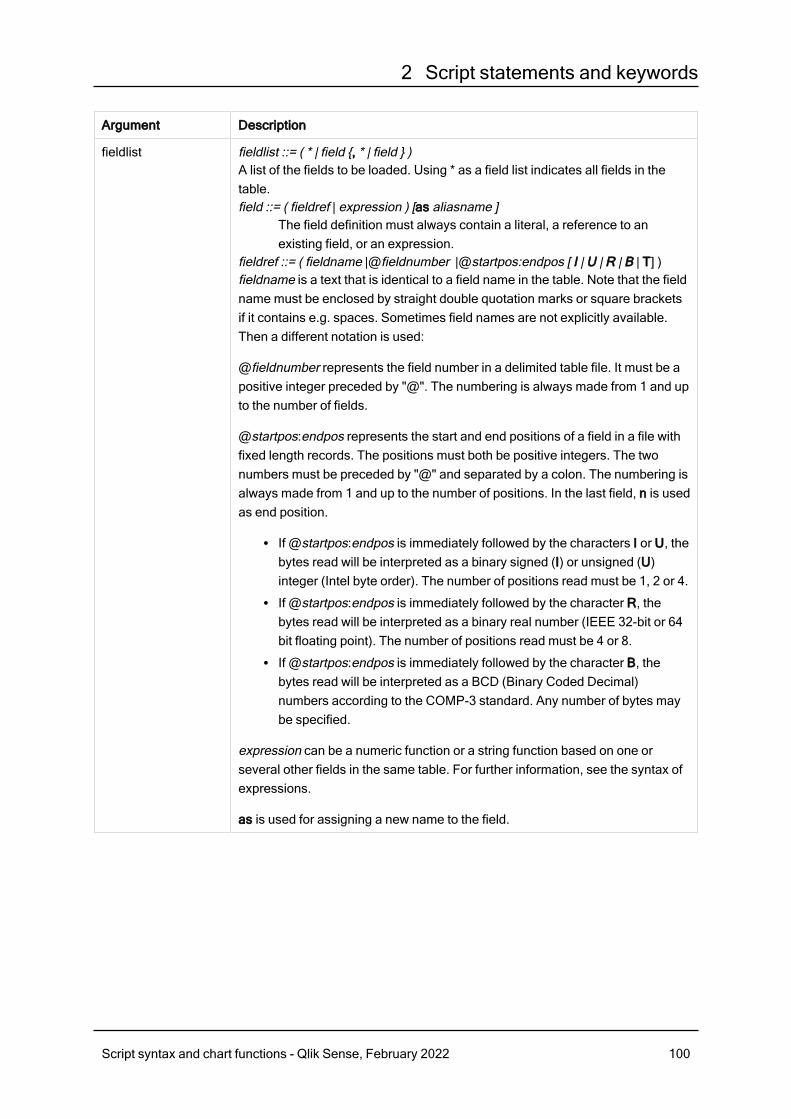
2 Script statements and keywords
Argument Description
fieldlist fieldlist ::= ( * | field {, * | field } )A list of the fields to be loaded. Using * as a field list indicates all fields in thetable.field ::= ( fieldref | expression ) [as aliasname ]
The field definition must always contain a literal, a reference to anexisting field, or an expression.
fieldref ::= ( fieldname |@fieldnumber |@startpos:endpos [ I | U | R | B | T] )fieldname is a text that is identical to a field name in the table. Note that the fieldname must be enclosed by straight double quotation marks or square bracketsif it contains e.g. spaces. Sometimes field names are not explicitly available.Then a different notation is used:
@fieldnumber represents the field number in a delimited table file. It must be apositive integer preceded by "@". The numbering is always made from 1 and upto the number of fields.
@startpos:endpos represents the start and end positions of a field in a file withfixed length records. The positions must both be positive integers. The twonumbers must be preceded by "@" and separated by a colon. The numbering isalways made from 1 and up to the number of positions. In the last field, n is usedas end position.
l If @startpos:endpos is immediately followed by the characters I or U, thebytes read will be interpreted as a binary signed (I) or unsigned (U)integer (Intel byte order). The number of positions read must be 1, 2 or 4.
l If @startpos:endpos is immediately followed by the character R, thebytes read will be interpreted as a binary real number (IEEE 32-bit or 64bit floating point). The number of positions read must be 4 or 8.
l If @startpos:endpos is immediately followed by the character B, thebytes read will be interpreted as a BCD (Binary Coded Decimal)numbers according to the COMP-3 standard. Any number of bytes maybe specified.
expression can be a numeric function or a string function based on one orseveral other fields in the same table. For further information, see the syntax ofexpressions.
as is used for assigning a new name to the field.
Script syntax and chart functions - Qlik Sense, February 2022 100

2 Script statements and keywords
Argument Description
from from is used if data should be loaded from a file using a folder or a web file dataconnection.
file ::= [ path ] filename
Example: 'lib://Table Files/'
If the path is omitted, Qlik Sense searches for the file in the directory specifiedby the Directory statement. If there is no Directory statement, Qlik Sensesearches in the working directory, C:\Users\{user}\Documents\Qlik\Sense\Apps.
In a Qlik Sense server installation, the working directory is specifiedin Qlik Sense Repository Service, by default it isC:\ProgramData\Qlik\Sense\Apps.
The filename may contain the standard DOS wildcard characters ( * and ? ).This will cause all the matching files in the specified directory to be loaded.format-spec ::= ( fspec-item { , fspec-item } )The format specification consists of a list of several format specification items,within brackets.
Legacy scripting mode
In legacy scripting mode, the following path formats are also supported:
l absolute
Example: c:\data\
l relative to the Qlik Sense app working directory.
Example: data\
l URL address (HTTP or FTP), pointing to a location on the Internet or anintranet.
Example: http://www.qlik.com
from_field from_field is used if data should be loaded from a previously loaded field.fieldassource::=(tablename, fieldname)
The field is the name of the previously loaded tablename and fieldname.format-spec ::= ( fspec-item {, fspec-item } )The format specification consists of a list of several format specification items,within brackets.
Script syntax and chart functions - Qlik Sense, February 2022 101
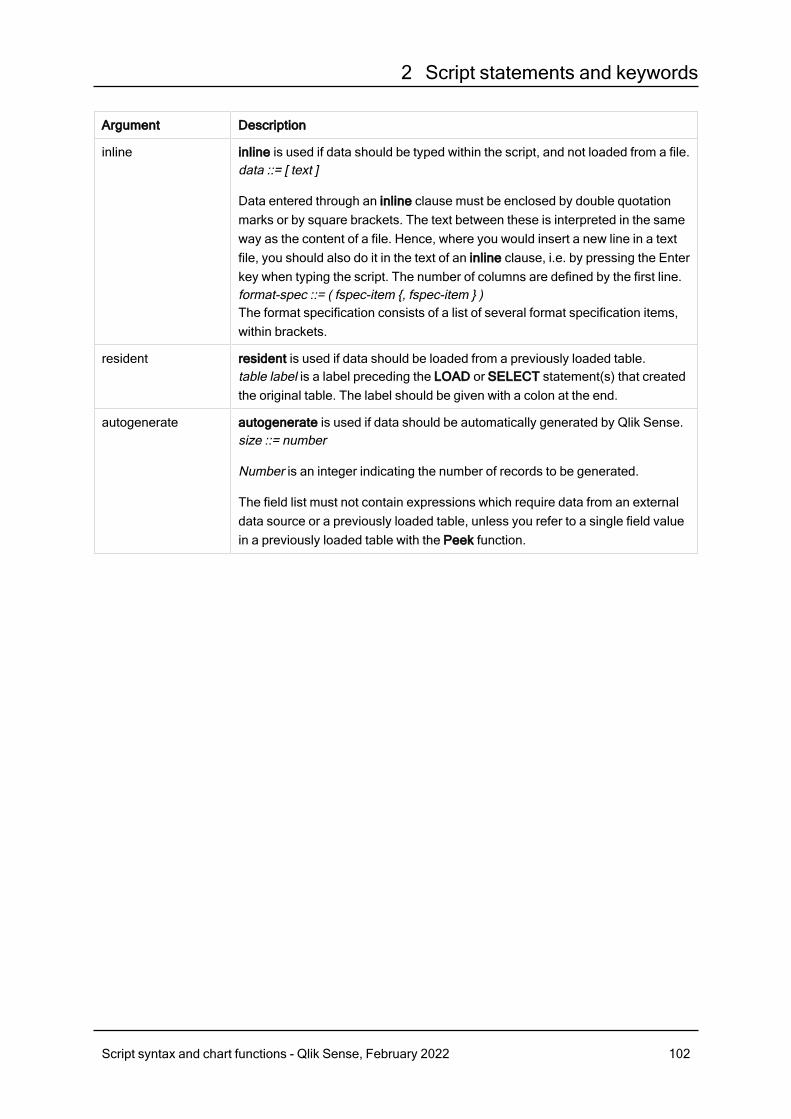
2 Script statements and keywords
Argument Description
inline inline is used if data should be typed within the script, and not loaded from a file.data ::= [ text ]
Data entered through an inline clause must be enclosed by double quotationmarks or by square brackets. The text between these is interpreted in the sameway as the content of a file. Hence, where you would insert a new line in a textfile, you should also do it in the text of an inline clause, i.e. by pressing the Enterkey when typing the script. The number of columns are defined by the first line.format-spec ::= ( fspec-item {, fspec-item } )The format specification consists of a list of several format specification items,within brackets.
resident resident is used if data should be loaded from a previously loaded table.table label is a label preceding the LOAD or SELECT statement(s) that createdthe original table. The label should be given with a colon at the end.
autogenerate autogenerate is used if data should be automatically generated by Qlik Sense.size ::= number
Number is an integer indicating the number of records to be generated.
The field list must not contain expressions which require data from an externaldata source or a previously loaded table, unless you refer to a single field valuein a previously loaded table with the Peek function.
Script syntax and chart functions - Qlik Sense, February 2022 102

2 Script statements and keywords
Argument Description
extension You can load data from analytic connections. You need to use the extensionclause to call a function defined in the server-side extension (SSE) plugin, orevaluate a script.
You can send a single table to the SSE plugin, and a single data table isreturned. If the plugin does not specify the names of the fields that are returned,the fields will be named Field1, Field2, and so on.
Extension pluginname.functionname( tabledescription );
l Loading data using a function in an SSE plugintabledescription ::= (table { ,tablefield} )If you do not state table fields, the fields will be used in load order.
l Loading data by evaluating a script in an SSE plugintabledescription ::= ( script, table { ,tablefield} )
Data type handling in the table field definition
Data types are automatically detected in analytic connections. If the data has nonumeric values and at least one non-NULL text string, the field is considered astext. In any other case it is considered as numeric.
You can force the data type by wrapping a field name with String() or Mixed().
l String() forces the field to be text. If the field is numeric, the text part ofthe dual value is extracted, there is no conversion performed.
l Mixed() forces the field to be dual.
String() or Mixed() cannot be used outside extension table field definitions, andyou cannot use other Qlik Sense functions in a table field definition.
More about analytic connections
You need to configure analytic connections before you can use them.
where where is a clause used for stating whether a record should be included in theselection or not. The selection is included if criterion is True.criterion is a logical expression.
while while is a clause used for stating whether a record should be repeatedly read.The same record is read as long as criterion is True. In order to be useful, awhile clause must typically include the IterNo( ) function.
criterion is a logical expression.
Script syntax and chart functions - Qlik Sense, February 2022 103
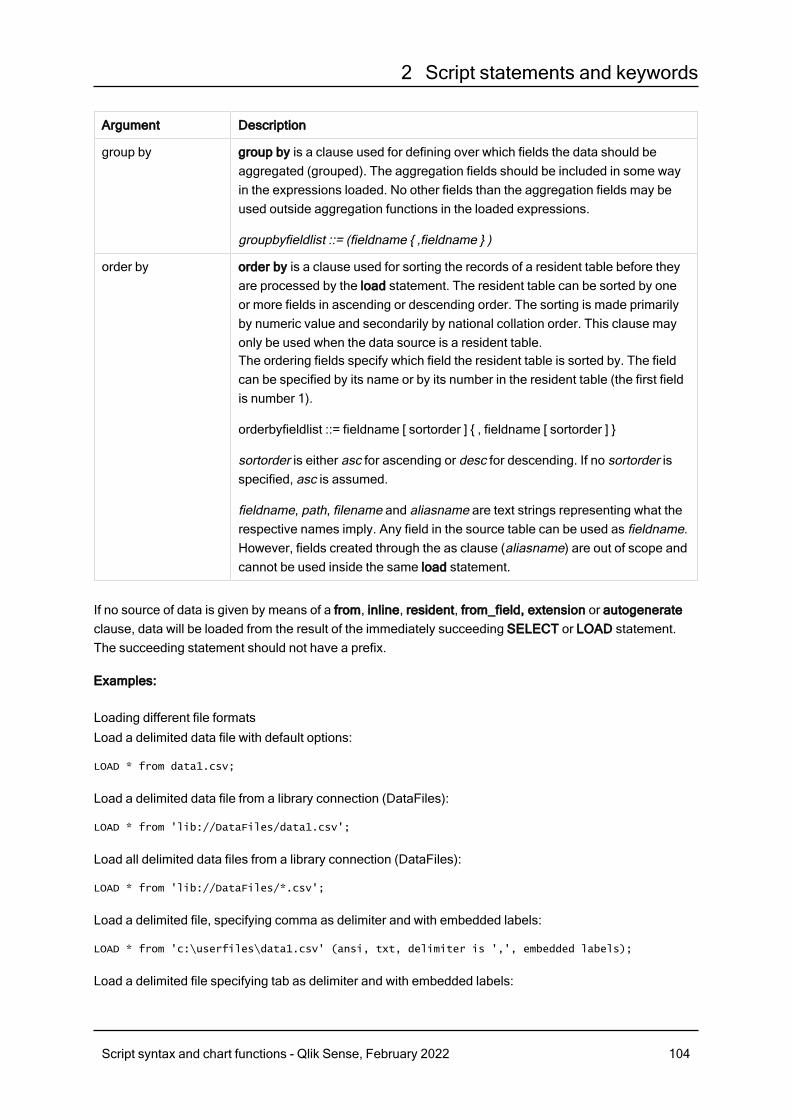
2 Script statements and keywords
Argument Description
group by group by is a clause used for defining over which fields the data should beaggregated (grouped). The aggregation fields should be included in some wayin the expressions loaded. No other fields than the aggregation fields may beused outside aggregation functions in the loaded expressions.
groupbyfieldlist ::= (fieldname { ,fieldname } )
order by order by is a clause used for sorting the records of a resident table before theyare processed by the load statement. The resident table can be sorted by oneor more fields in ascending or descending order. The sorting is made primarilyby numeric value and secondarily by national collation order. This clause mayonly be used when the data source is a resident table.The ordering fields specify which field the resident table is sorted by. The fieldcan be specified by its name or by its number in the resident table (the first fieldis number 1).
orderbyfieldlist ::= fieldname [ sortorder ] { , fieldname [ sortorder ] }
sortorder is either asc for ascending or desc for descending. If no sortorder isspecified, asc is assumed.
fieldname, path, filename and aliasname are text strings representing what therespective names imply. Any field in the source table can be used as fieldname.However, fields created through the as clause (aliasname) are out of scope andcannot be used inside the same load statement.
If no source of data is given by means of a from, inline, resident, from_field, extension or autogenerateclause, data will be loaded from the result of the immediately succeeding SELECT or LOAD statement.The succeeding statement should not have a prefix.
Examples:
Loading different file formatsLoad a delimited data file with default options:
LOAD * from data1.csv;
Load a delimited data file from a library connection (DataFiles):
LOAD * from 'lib://DataFiles/data1.csv';
Load all delimited data files from a library connection (DataFiles):
LOAD * from 'lib://DataFiles/*.csv';
Load a delimited file, specifying comma as delimiter and with embedded labels:
LOAD * from 'c:\userfiles\data1.csv' (ansi, txt, delimiter is ',', embedded labels);
Load a delimited file specifying tab as delimiter and with embedded labels:
Script syntax and chart functions - Qlik Sense, February 2022 104
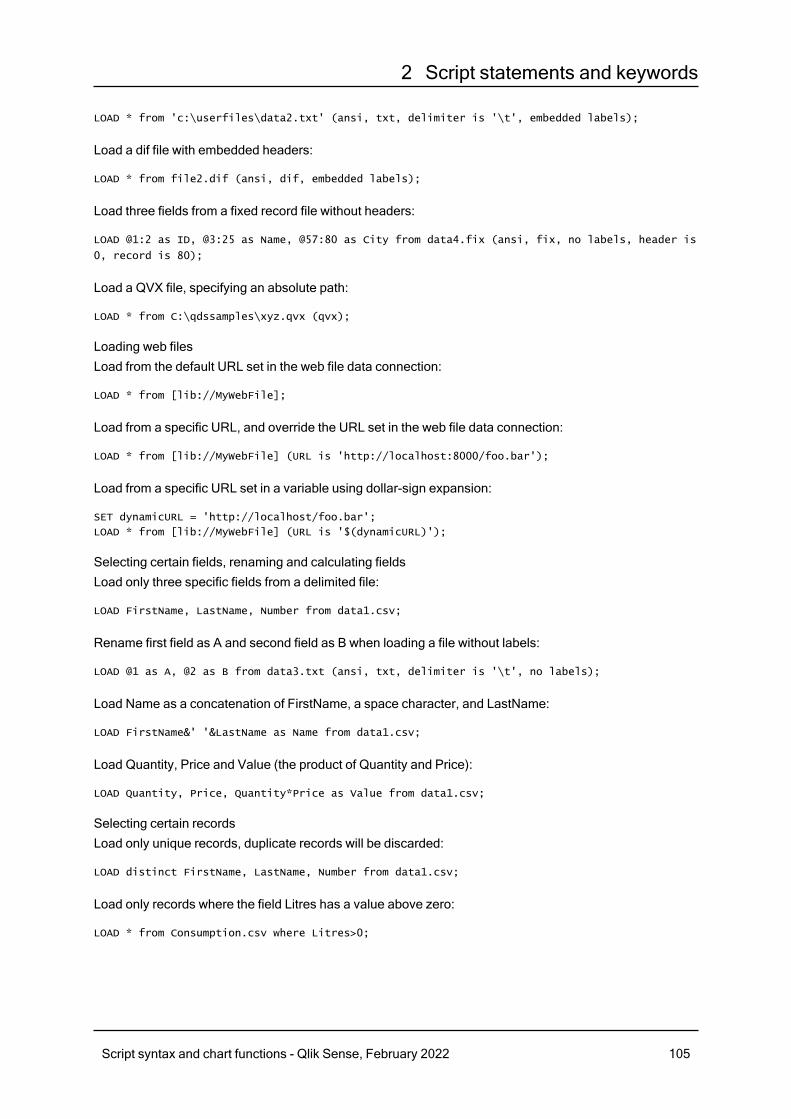
2 Script statements and keywords
LOAD * from 'c:\userfiles\data2.txt' (ansi, txt, delimiter is '\t', embedded labels);
Load a dif file with embedded headers:
LOAD * from file2.dif (ansi, dif, embedded labels);
Load three fields from a fixed record file without headers:
LOAD @1:2 as ID, @3:25 as Name, @57:80 as City from data4.fix (ansi, fix, no labels, header is
0, record is 80);
Load a QVX file, specifying an absolute path:
LOAD * from C:\qdssamples\xyz.qvx (qvx);
Loading web filesLoad from the default URL set in the web file data connection:
LOAD * from [lib://MyWebFile];
Load from a specific URL, and override the URL set in the web file data connection:
LOAD * from [lib://MyWebFile] (URL is 'http://localhost:8000/foo.bar');
Load from a specific URL set in a variable using dollar-sign expansion:
SET dynamicURL = 'http://localhost/foo.bar';
LOAD * from [lib://MyWebFile] (URL is '$(dynamicURL)');
Selecting certain fields, renaming and calculating fieldsLoad only three specific fields from a delimited file:
LOAD FirstName, LastName, Number from data1.csv;
Rename first field as A and second field as B when loading a file without labels:
LOAD @1 as A, @2 as B from data3.txt (ansi, txt, delimiter is '\t', no labels);
Load Name as a concatenation of FirstName, a space character, and LastName:
LOAD FirstName&' '&LastName as Name from data1.csv;
Load Quantity, Price and Value (the product of Quantity and Price):
LOAD Quantity, Price, Quantity*Price as Value from data1.csv;
Selecting certain recordsLoad only unique records, duplicate records will be discarded:
LOAD distinct FirstName, LastName, Number from data1.csv;
Load only records where the field Litres has a value above zero:
LOAD * from Consumption.csv where Litres>0;
Script syntax and chart functions - Qlik Sense, February 2022 105
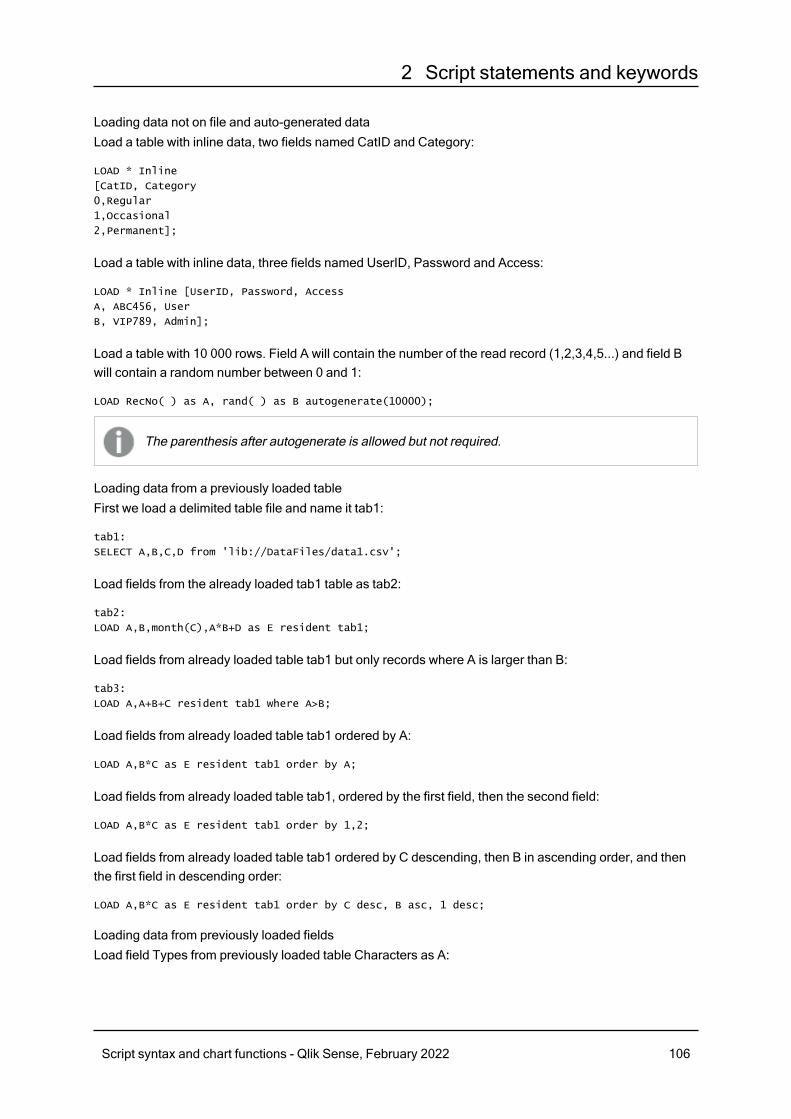
2 Script statements and keywords
Loading data not on file and auto-generated dataLoad a table with inline data, two fields named CatID and Category:
LOAD * Inline
[CatID, Category
0,Regular
1,Occasional
2,Permanent];
Load a table with inline data, three fields named UserID, Password and Access:
LOAD * Inline [UserID, Password, Access
A, ABC456, User
B, VIP789, Admin];
Load a table with 10 000 rows. Field A will contain the number of the read record (1,2,3,4,5...) and field Bwill contain a random number between 0 and 1:
LOAD RecNo( ) as A, rand( ) as B autogenerate(10000);
The parenthesis after autogenerate is allowed but not required.
Loading data from a previously loaded tableFirst we load a delimited table file and name it tab1:
tab1:
SELECT A,B,C,D from 'lib://DataFiles/data1.csv';
Load fields from the already loaded tab1 table as tab2:
tab2:
LOAD A,B,month(C),A*B+D as E resident tab1;
Load fields from already loaded table tab1 but only records where A is larger than B:
tab3:
LOAD A,A+B+C resident tab1 where A>B;
Load fields from already loaded table tab1 ordered by A:
LOAD A,B*C as E resident tab1 order by A;
Load fields from already loaded table tab1, ordered by the first field, then the second field:
LOAD A,B*C as E resident tab1 order by 1,2;
Load fields from already loaded table tab1 ordered by C descending, then B in ascending order, and thenthe first field in descending order:
LOAD A,B*C as E resident tab1 order by C desc, B asc, 1 desc;
Loading data from previously loaded fieldsLoad field Types from previously loaded table Characters as A:
Script syntax and chart functions - Qlik Sense, February 2022 106
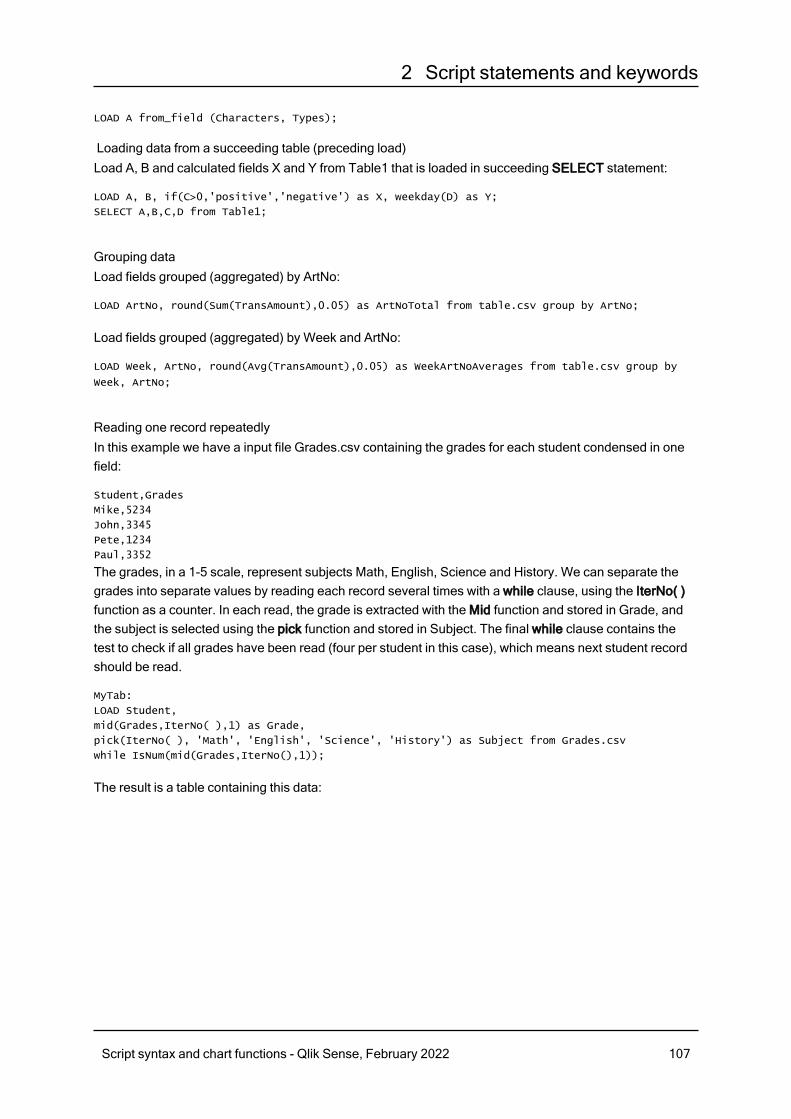
2 Script statements and keywords
LOAD A from_field (Characters, Types);
Loading data from a succeeding table (preceding load)Load A, B and calculated fields X and Y from Table1 that is loaded in succeeding SELECT statement:
LOAD A, B, if(C>0,'positive','negative') as X, weekday(D) as Y;
SELECT A,B,C,D from Table1;
Grouping dataLoad fields grouped (aggregated) by ArtNo:
LOAD ArtNo, round(Sum(TransAmount),0.05) as ArtNoTotal from table.csv group by ArtNo;
Load fields grouped (aggregated) by Week and ArtNo:
LOAD Week, ArtNo, round(Avg(TransAmount),0.05) as WeekArtNoAverages from table.csv group by
Week, ArtNo;
Reading one record repeatedlyIn this example we have a input file Grades.csv containing the grades for each student condensed in onefield:
Student,Grades
Mike,5234
John,3345
Pete,1234
Paul,3352
The grades, in a 1-5 scale, represent subjects Math, English, Science and History. We can separate thegrades into separate values by reading each record several times with a while clause, using the IterNo( )function as a counter. In each read, the grade is extracted with the Mid function and stored in Grade, andthe subject is selected using the pick function and stored in Subject. The final while clause contains thetest to check if all grades have been read (four per student in this case), which means next student recordshould be read.
MyTab:
LOAD Student,
mid(Grades,IterNo( ),1) as Grade,
pick(IterNo( ), 'Math', 'English', 'Science', 'History') as Subject from Grades.csv
while IsNum(mid(Grades,IterNo(),1));
The result is a table containing this data:
Script syntax and chart functions - Qlik Sense, February 2022 107
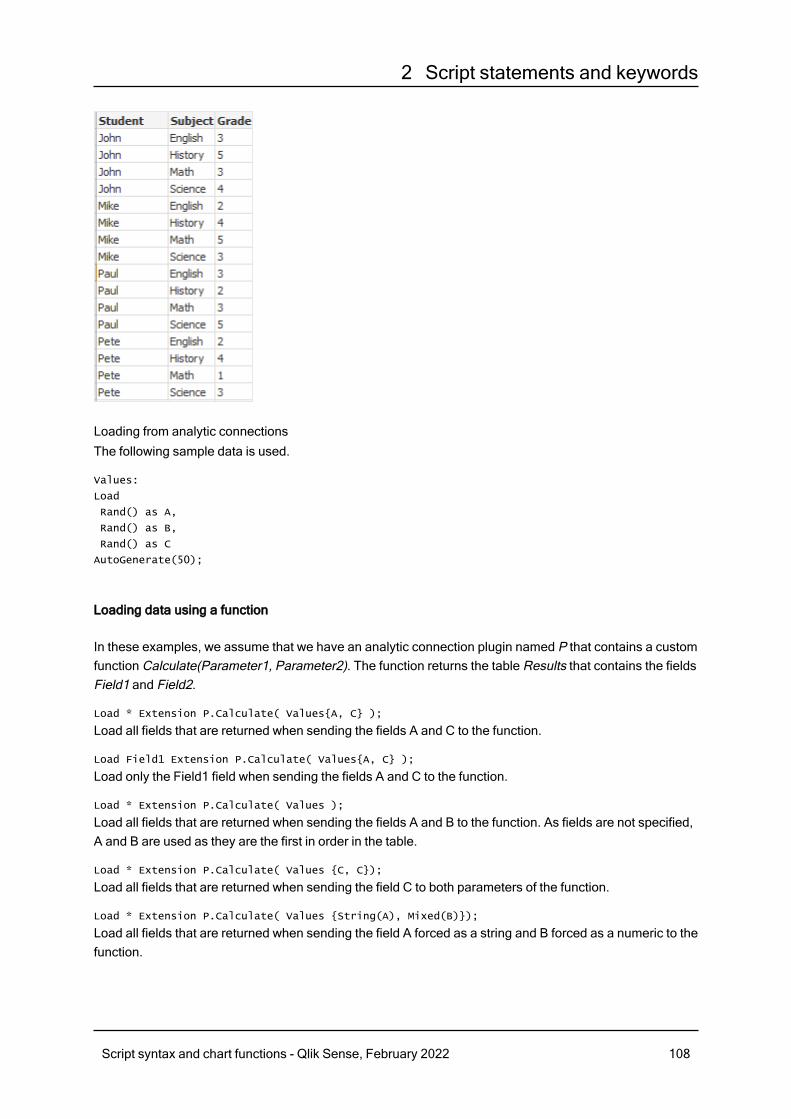
2 Script statements and keywords
Loading from analytic connectionsThe following sample data is used.
Values:
Load
Rand() as A,
Rand() as B,
Rand() as C
AutoGenerate(50);
Loading data using a function
In these examples, we assume that we have an analytic connection plugin named P that contains a customfunction Calculate(Parameter1, Parameter2). The function returns the table Results that contains the fieldsField1 and Field2.
Load * Extension P.Calculate( Values{A, C} );
Load all fields that are returned when sending the fields A and C to the function.
Load Field1 Extension P.Calculate( Values{A, C} );
Load only the Field1 field when sending the fields A and C to the function.
Load * Extension P.Calculate( Values );
Load all fields that are returned when sending the fields A and B to the function. As fields are not specified,A and B are used as they are the first in order in the table.
Load * Extension P.Calculate( Values {C, C});
Load all fields that are returned when sending the field C to both parameters of the function.
Load * Extension P.Calculate( Values {String(A), Mixed(B)});
Load all fields that are returned when sending the field A forced as a string and B forced as a numeric to thefunction.
Script syntax and chart functions - Qlik Sense, February 2022 108
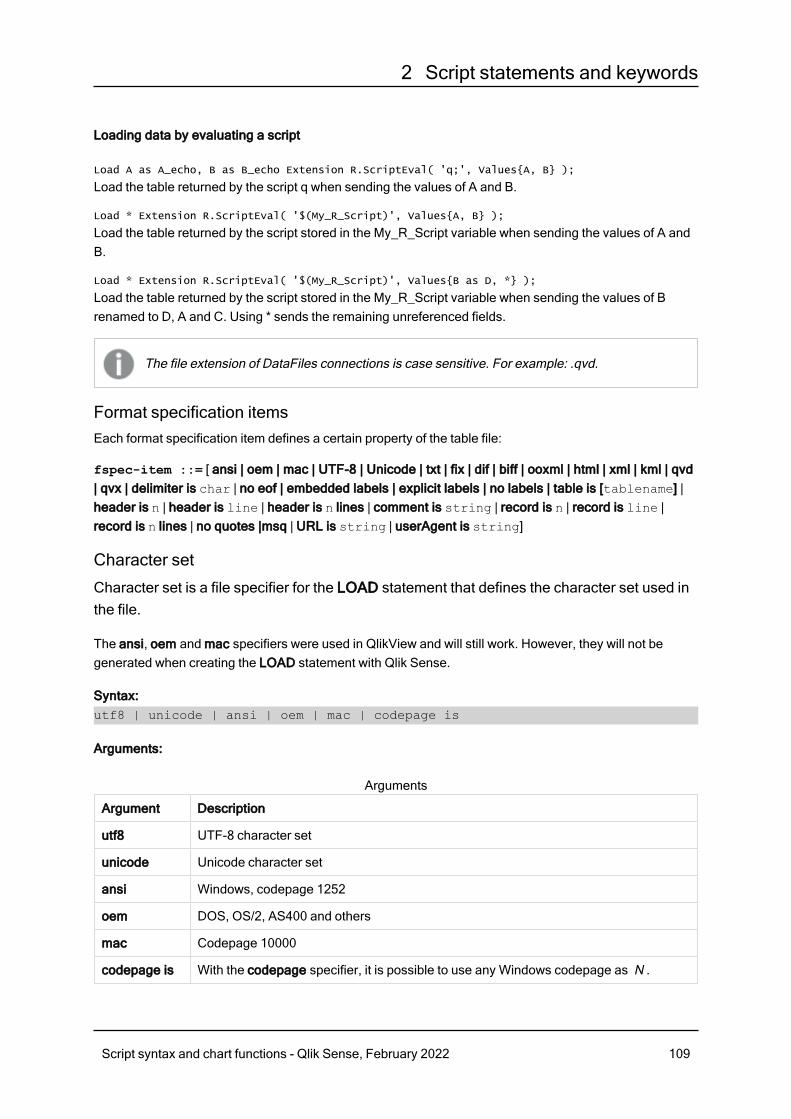
2 Script statements and keywords
Loading data by evaluating a script
Load A as A_echo, B as B_echo Extension R.ScriptEval( 'q;', Values{A, B} );
Load the table returned by the script q when sending the values of A and B.
Load * Extension R.ScriptEval( '$(My_R_Script)', Values{A, B} );
Load the table returned by the script stored in the My_R_Script variable when sending the values of A andB.
Load * Extension R.ScriptEval( '$(My_R_Script)', Values{B as D, *} );
Load the table returned by the script stored in the My_R_Script variable when sending the values of Brenamed to D, A and C. Using * sends the remaining unreferenced fields.
The file extension of DataFiles connections is case sensitive. For example: .qvd.
Format specification itemsEach format specification item defines a certain property of the table file:
fspec-item ::= [ ansi | oem | mac | UTF-8 | Unicode | txt | fix | dif | biff | ooxml | html | xml | kml | qvd| qvx | delimiter is char | no eof | embedded labels | explicit labels | no labels | table is [tablename] |header is n | header is line | header is n lines | comment is string | record is n | record is line |record is n lines | no quotes |msq | URL is string | userAgent is string]
Character set
Character set is a file specifier for the LOAD statement that defines the character set used inthe file.
The ansi, oem and mac specifiers were used in QlikView and will still work. However, they will not begenerated when creating the LOAD statement with Qlik Sense.
Syntax:utf8 | unicode | ansi | oem | mac | codepage is
Arguments:
Argument Description
utf8 UTF-8 character set
unicode Unicode character set
ansi Windows, codepage 1252
oem DOS, OS/2, AS400 and others
mac Codepage 10000
codepage is With the codepage specifier, it is possible to use any Windows codepage as N .
Arguments
Script syntax and chart functions - Qlik Sense, February 2022 109
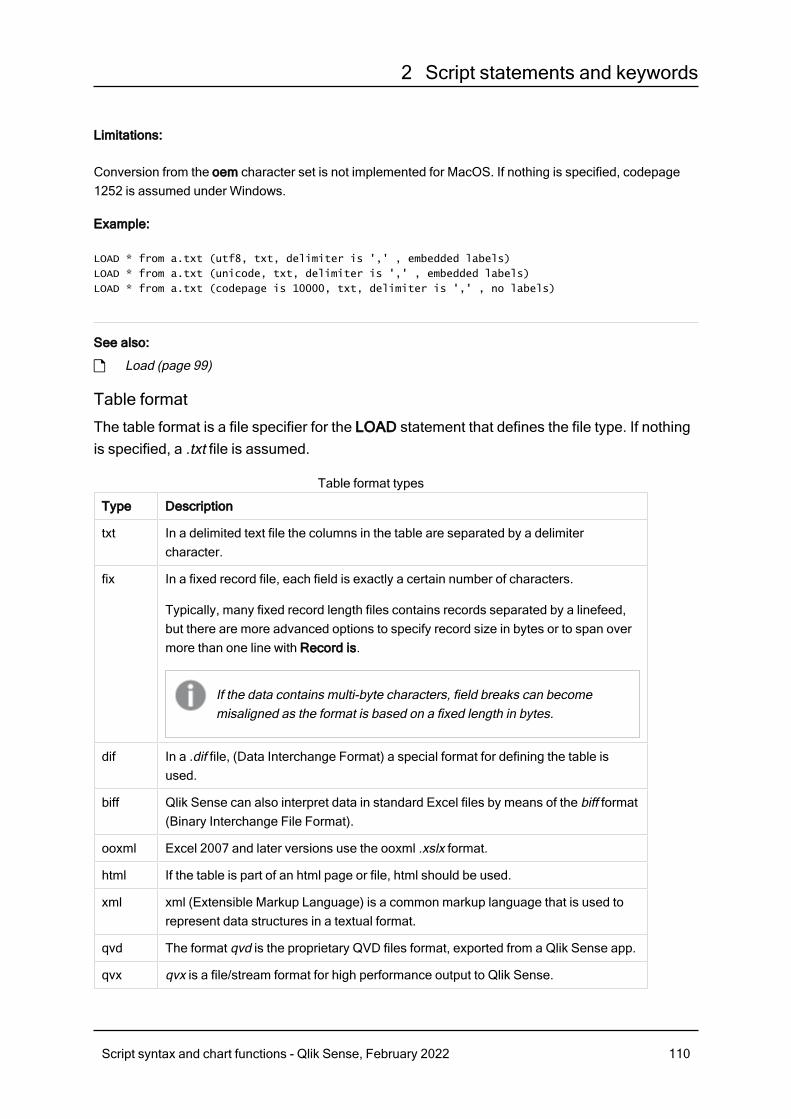
2 Script statements and keywords
Limitations:
Conversion from the oem character set is not implemented for MacOS. If nothing is specified, codepage1252 is assumed under Windows.
Example:
LOAD * from a.txt (utf8, txt, delimiter is ',' , embedded labels)
LOAD * from a.txt (unicode, txt, delimiter is ',' , embedded labels)
LOAD * from a.txt (codepage is 10000, txt, delimiter is ',' , no labels)
See also:
p Load (page 99)
Table format
The table format is a file specifier for the LOAD statement that defines the file type. If nothingis specified, a .txt file is assumed.
Type Description
txt In a delimited text file the columns in the table are separated by a delimitercharacter.
fix In a fixed record file, each field is exactly a certain number of characters.
Typically, many fixed record length files contains records separated by a linefeed,but there are more advanced options to specify record size in bytes or to span overmore than one line with Record is.
If the data contains multi-byte characters, field breaks can becomemisaligned as the format is based on a fixed length in bytes.
dif In a .dif file, (Data Interchange Format) a special format for defining the table isused.
biff Qlik Sense can also interpret data in standard Excel files by means of the biff format(Binary Interchange File Format).
ooxml Excel 2007 and later versions use the ooxml .xslx format.
html If the table is part of an html page or file, html should be used.
xml xml (Extensible Markup Language) is a common markup language that is used torepresent data structures in a textual format.
qvd The format qvd is the proprietary QVD files format, exported from a Qlik Sense app.
qvx qvx is a file/stream format for high performance output to Qlik Sense.
Table format types
Script syntax and chart functions - Qlik Sense, February 2022 110
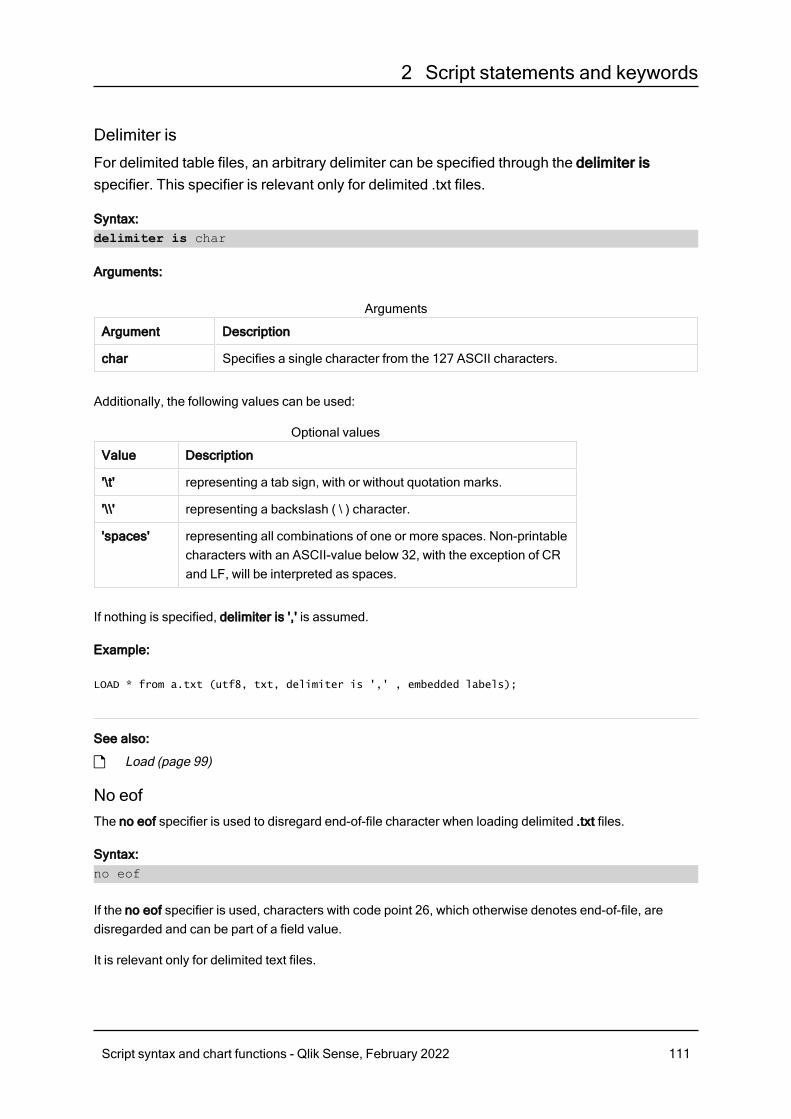
2 Script statements and keywords
Delimiter is
For delimited table files, an arbitrary delimiter can be specified through the delimiter isspecifier. This specifier is relevant only for delimited .txt files.
Syntax:delimiter is char
Arguments:
Argument Description
char Specifies a single character from the 127 ASCII characters.
Arguments
Additionally, the following values can be used:
Value Description
'\t' representing a tab sign, with or without quotation marks.
'\\' representing a backslash ( \ ) character.
'spaces' representing all combinations of one or more spaces. Non-printablecharacters with an ASCII-value below 32, with the exception of CRand LF, will be interpreted as spaces.
Optional values
If nothing is specified, delimiter is ',' is assumed.
Example:
LOAD * from a.txt (utf8, txt, delimiter is ',' , embedded labels);
See also:
p Load (page 99)
No eofThe no eof specifier is used to disregard end-of-file character when loading delimited .txt files.
Syntax:no eof
If the no eof specifier is used, characters with code point 26, which otherwise denotes end-of-file, aredisregarded and can be part of a field value.
It is relevant only for delimited text files.
Script syntax and chart functions - Qlik Sense, February 2022 111
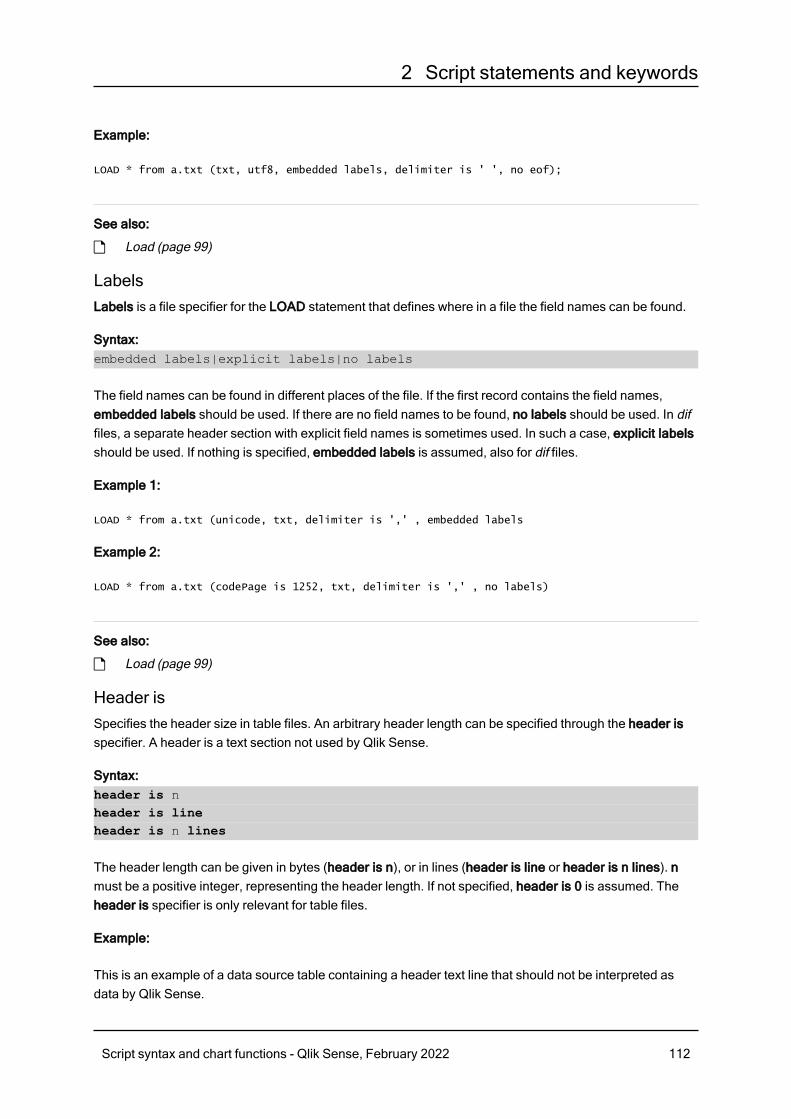
2 Script statements and keywords
Example:
LOAD * from a.txt (txt, utf8, embedded labels, delimiter is ' ', no eof);
See also:
p Load (page 99)
LabelsLabels is a file specifier for the LOAD statement that defines where in a file the field names can be found.
Syntax:embedded labels|explicit labels|no labels
The field names can be found in different places of the file. If the first record contains the field names,embedded labels should be used. If there are no field names to be found, no labels should be used. In diffiles, a separate header section with explicit field names is sometimes used. In such a case, explicit labelsshould be used. If nothing is specified, embedded labels is assumed, also for dif files.
Example 1:
LOAD * from a.txt (unicode, txt, delimiter is ',' , embedded labels
Example 2:
LOAD * from a.txt (codePage is 1252, txt, delimiter is ',' , no labels)
See also:
p Load (page 99)
Header isSpecifies the header size in table files. An arbitrary header length can be specified through the header isspecifier. A header is a text section not used by Qlik Sense.
Syntax:header is nheader is lineheader is n lines
The header length can be given in bytes (header is n), or in lines (header is line or header is n lines). nmust be a positive integer, representing the header length. If not specified, header is 0 is assumed. Theheader is specifier is only relevant for table files.
Example:
This is an example of a data source table containing a header text line that should not be interpreted asdata by Qlik Sense.
Script syntax and chart functions - Qlik Sense, February 2022 112
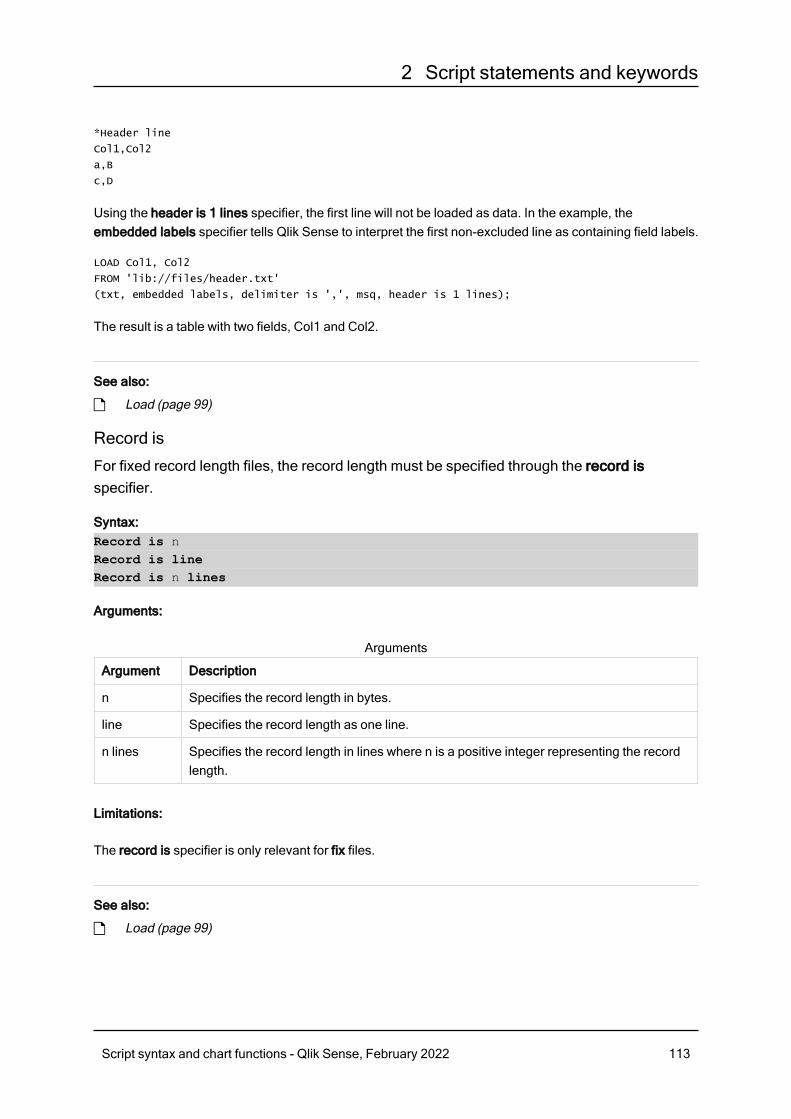
2 Script statements and keywords
*Header line
Col1,Col2
a,B
c,D
Using the header is 1 lines specifier, the first line will not be loaded as data. In the example, theembedded labels specifier tells Qlik Sense to interpret the first non-excluded line as containing field labels.
LOAD Col1, Col2
FROM 'lib://files/header.txt'
(txt, embedded labels, delimiter is ',', msq, header is 1 lines);
The result is a table with two fields, Col1 and Col2.
See also:
p Load (page 99)
Record is
For fixed record length files, the record length must be specified through the record isspecifier.
Syntax:Record is nRecord is lineRecord is n lines
Arguments:
Argument Description
n Specifies the record length in bytes.
line Specifies the record length as one line.
n lines Specifies the record length in lines where n is a positive integer representing the recordlength.
Arguments
Limitations:
The record is specifier is only relevant for fix files.
See also:
p Load (page 99)
Script syntax and chart functions - Qlik Sense, February 2022 113
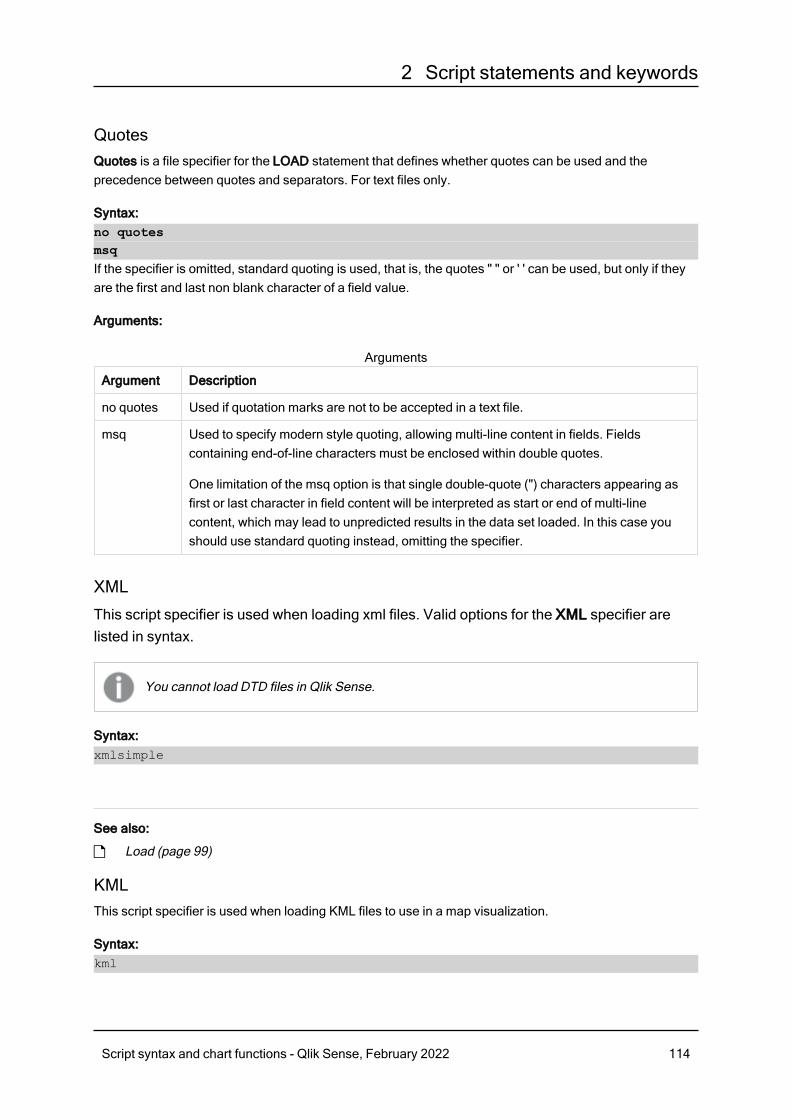
2 Script statements and keywords
QuotesQuotes is a file specifier for the LOAD statement that defines whether quotes can be used and theprecedence between quotes and separators. For text files only.
Syntax:no quotesmsqIf the specifier is omitted, standard quoting is used, that is, the quotes " " or ' ' can be used, but only if theyare the first and last non blank character of a field value.
Arguments:
Argument Description
no quotes Used if quotation marks are not to be accepted in a text file.
msq Used to specify modern style quoting, allowing multi-line content in fields. Fieldscontaining end-of-line characters must be enclosed within double quotes.
One limitation of the msq option is that single double-quote (") characters appearing asfirst or last character in field content will be interpreted as start or end of multi-linecontent, which may lead to unpredicted results in the data set loaded. In this case youshould use standard quoting instead, omitting the specifier.
Arguments
XML
This script specifier is used when loading xml files. Valid options for the XML specifier arelisted in syntax.
You cannot load DTD files in Qlik Sense.
Syntax:xmlsimple
See also:
p Load (page 99)
KMLThis script specifier is used when loading KML files to use in a map visualization.
Syntax:kml
Script syntax and chart functions - Qlik Sense, February 2022 114
2 Script statements and keywords
The KML file can represent either area data (for example, countries or regions) represented by polygons,line data (for example tracks or roads), or point data (for example, cities or places) represented by points inthe form [long, lat].
URL is
This script specifier is used to set the URL of a web file data connection when loading a webfile.
Syntax:URL is string
Arguments:
Argument Description
string Specifies the URL of the file to load. This will override the URL set in the web fileconnection that is used.
Arguments
Limitations:
The URL is specifier is only relevant for web files. You need to use an existing web file data connection.
See also:
p Load (page 99)
userAgent is
This script specifier is used to set the browser user agent when loading a web file.
Syntax:userAgent is string
Arguments:
Argument Description
string Specifies the browser user agent string. This will override the default browser user agent"Mozilla/5.0".
Arguments
Limitations:
The userAgent is specifier is only relevant for web files.
Script syntax and chart functions - Qlik Sense, February 2022 115
2 Script statements and keywords
See also:
p Load (page 99)
LetThe let statement is a complement to the set statement, used for defining script variables.The let statement, in opposition to the set statement, evaluates the expression on the rightside of the ' =' at script run time before it is assigned to the variable.
Syntax:Let variablename=expression
Examples and results:
Example Result
Set x=3+4;
Let y=3+4;
z=$(y)+1;
$(x) will be evaluated as ' 3+4 '
$(y) will be evaluated as ' 7 '
$(z) will be evaluated as ' 8 '
Note the difference between the Set and Let statements. The Setstatement assigns the string '3+4' to the variable, whereas the Letstatement evaluates the string and assigns 7 to the variable.
Let T=now( ); $(T) will be given the value of the current time.
Loosen TableOne or more Qlik Sense internal data tables can be explicitly declared loosely coupled during scriptexecution by using a Loosen Table statement. When a table is loosely coupled, all associations betweenfield values in the table are removed. A similar effect could be achieved by loading each field of the looselycoupled table as independent, unconnected tables. Loosely coupled can be useful during testing totemporarily isolate different parts of the data structure. A loosely coupled table can be identified in the tableviewer by the dotted lines. The use of one or more Loosen Table statements in the script will make QlikSense disregard any setting of tables as loosely coupled made before the script execution.
Syntax:Loosen Tabletablename [ , tablename2 ...]Loosen Tablestablename [ , tablename2 ...]
Either syntax: Loosen Table or Loosen Tables can be used.
Script syntax and chart functions - Qlik Sense, February 2022 116
2 Script statements and keywords
Should Qlik Sense find circular references in the data structure which cannot be broken bytables declared loosely coupled interactively or explicitly in the script, one or more additionaltables will be forced loosely coupled until no circular references remain. When this happens,the Loop Warning dialog, gives a warning.
Example:
Tab1:
SELECT * from Trans;
Loosen Table Tab1;
MapThe map ... using statement is used for mapping a certain field value or expression to thevalues of a specific mapping table. The mapping table is created through the Mappingstatement.
Syntax:Map fieldlist Using mapname
The automatic mapping is done for fields loaded after the Map … Using statement until the end of the scriptor until an Unmap statement is encountered.
The mapping is done last in the chain of events leading up to the field being stored in the internal table inQlik Sense. This means that mapping is not done every time a field name is encountered as part of anexpression, but rather when the value is stored under the field name in the internal table. If mapping on theexpression level is required, the Applymap() function has to be used instead.
Arguments:
Argument Description
fieldlist A comma separated list of the fields that should be mapped from this point in the script.Using * as field list indicates all fields. The wildcard characters * and ? are allowed infield names. Quoting of field names may be necessary when wildcards are used.
mapname The name of a mapping table previously read in a mapping load or mapping selectstatement.
Arguments
Script syntax and chart functions - Qlik Sense, February 2022 117
2 Script statements and keywords
Example Result
Map Country UsingCmap;
Enables mapping of the field Country using the map Cmap.
Map A, B, C Using X; Enables mapping of the fields A, B and C using the map X.
Map * Using GenMap; Enables mapping of all fields using GenMap.
Examples and results:
NullAsNullThe NullAsNull statement turns off the conversion of NULL values to string values previouslyset by a NullAsValue statement.
Syntax:NullAsNull *fieldlist
The NullAsValue statement operates as a switch and can be turned on or off several times in the script,using either a NullAsValue or a NullAsNull statement.
Arguments:
Argument Description
*fieldlist A comma separated list of the fields for which NullAsNull should be turned on. Using *as field list indicates all fields. The wildcard characters * and ? are allowed in fieldnames. Quoting of field names may be necessary when wildcards are used.
Arguments
Example:
NullAsNull A,B;
LOAD A,B from x.csv;
NullAsValueThe NullAsValue statement specifies for which fields that NULL should be converted to avalue.
Syntax:NullAsValue *fieldlist
By default, Qlik Sense considers NULL values to be missing or undefined entities. However, certaindatabase contexts imply that NULL values are to be considered as special values rather than simplymissing values. The fact that NULL values are normally not allowed to link to other NULL values can besuspended by means of the NullAsValue statement.
Script syntax and chart functions - Qlik Sense, February 2022 118
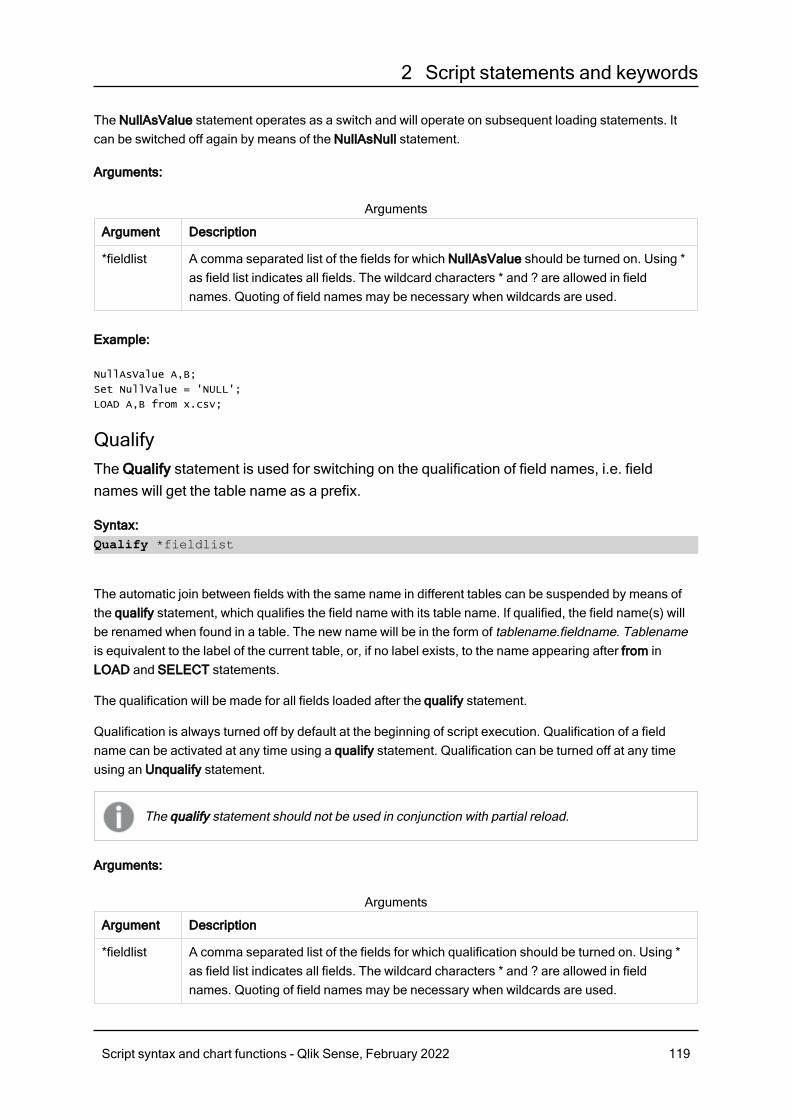
2 Script statements and keywords
The NullAsValue statement operates as a switch and will operate on subsequent loading statements. Itcan be switched off again by means of the NullAsNull statement.
Arguments:
Argument Description
*fieldlist A comma separated list of the fields for which NullAsValue should be turned on. Using *as field list indicates all fields. The wildcard characters * and ? are allowed in fieldnames. Quoting of field names may be necessary when wildcards are used.
Arguments
Example:
NullAsValue A,B;
Set NullValue = 'NULL';
LOAD A,B from x.csv;
QualifyThe Qualify statement is used for switching on the qualification of field names, i.e. fieldnames will get the table name as a prefix.
Syntax:Qualify *fieldlist
The automatic join between fields with the same name in different tables can be suspended by means ofthe qualify statement, which qualifies the field name with its table name. If qualified, the field name(s) willbe renamed when found in a table. The new name will be in the form of tablename.fieldname. Tablenameis equivalent to the label of the current table, or, if no label exists, to the name appearing after from inLOAD and SELECT statements.
The qualification will be made for all fields loaded after the qualify statement.
Qualification is always turned off by default at the beginning of script execution. Qualification of a fieldname can be activated at any time using a qualify statement. Qualification can be turned off at any timeusing an Unqualify statement.
The qualify statement should not be used in conjunction with partial reload.
Arguments:
Argument Description
*fieldlist A comma separated list of the fields for which qualification should be turned on. Using *as field list indicates all fields. The wildcard characters * and ? are allowed in fieldnames. Quoting of field names may be necessary when wildcards are used.
Arguments
Script syntax and chart functions - Qlik Sense, February 2022 119
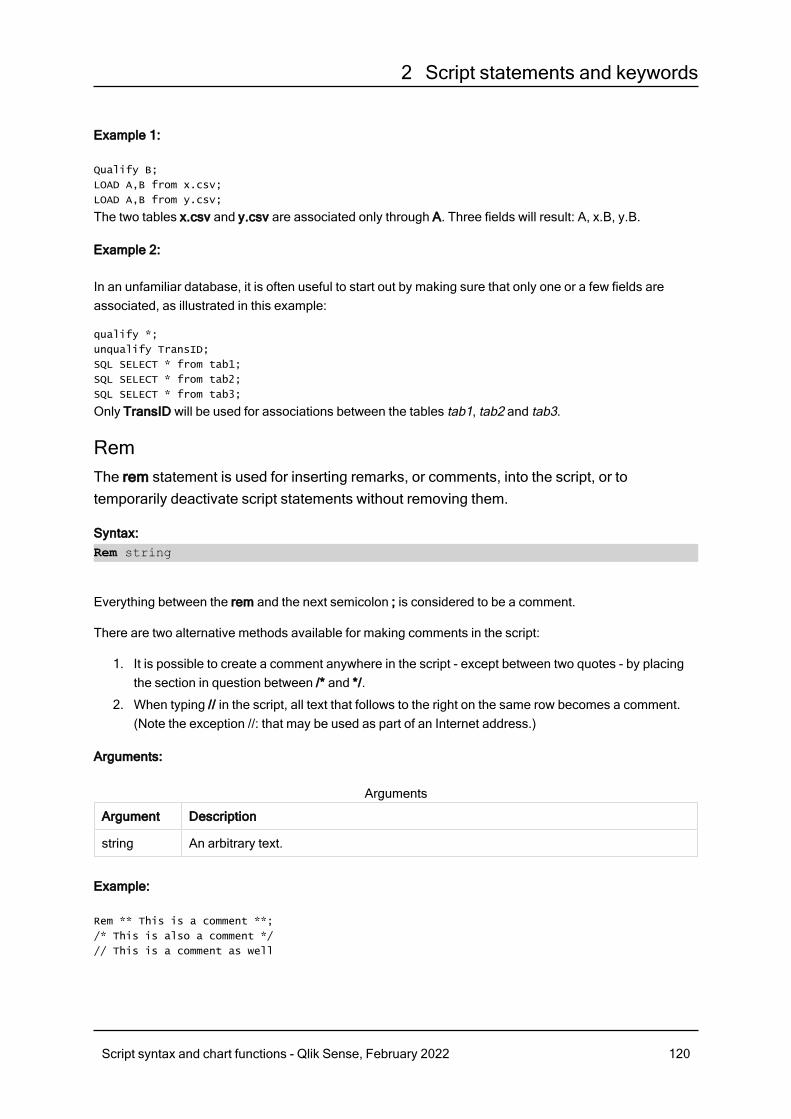
2 Script statements and keywords
Example 1:
Qualify B;
LOAD A,B from x.csv;
LOAD A,B from y.csv;
The two tables x.csv and y.csv are associated only through A. Three fields will result: A, x.B, y.B.
Example 2:
In an unfamiliar database, it is often useful to start out by making sure that only one or a few fields areassociated, as illustrated in this example:
qualify *;
unqualify TransID;
SQL SELECT * from tab1;
SQL SELECT * from tab2;
SQL SELECT * from tab3;
Only TransID will be used for associations between the tables tab1, tab2 and tab3.
RemThe rem statement is used for inserting remarks, or comments, into the script, or totemporarily deactivate script statements without removing them.
Syntax:Rem string
Everything between the rem and the next semicolon ; is considered to be a comment.
There are two alternative methods available for making comments in the script:
1. It is possible to create a comment anywhere in the script - except between two quotes - by placingthe section in question between /* and */.
2. When typing // in the script, all text that follows to the right on the same row becomes a comment.(Note the exception //: that may be used as part of an Internet address.)
Arguments:
Argument Description
string An arbitrary text.
Arguments
Example:
Rem ** This is a comment **;
/* This is also a comment */
// This is a comment as well
Script syntax and chart functions - Qlik Sense, February 2022 120
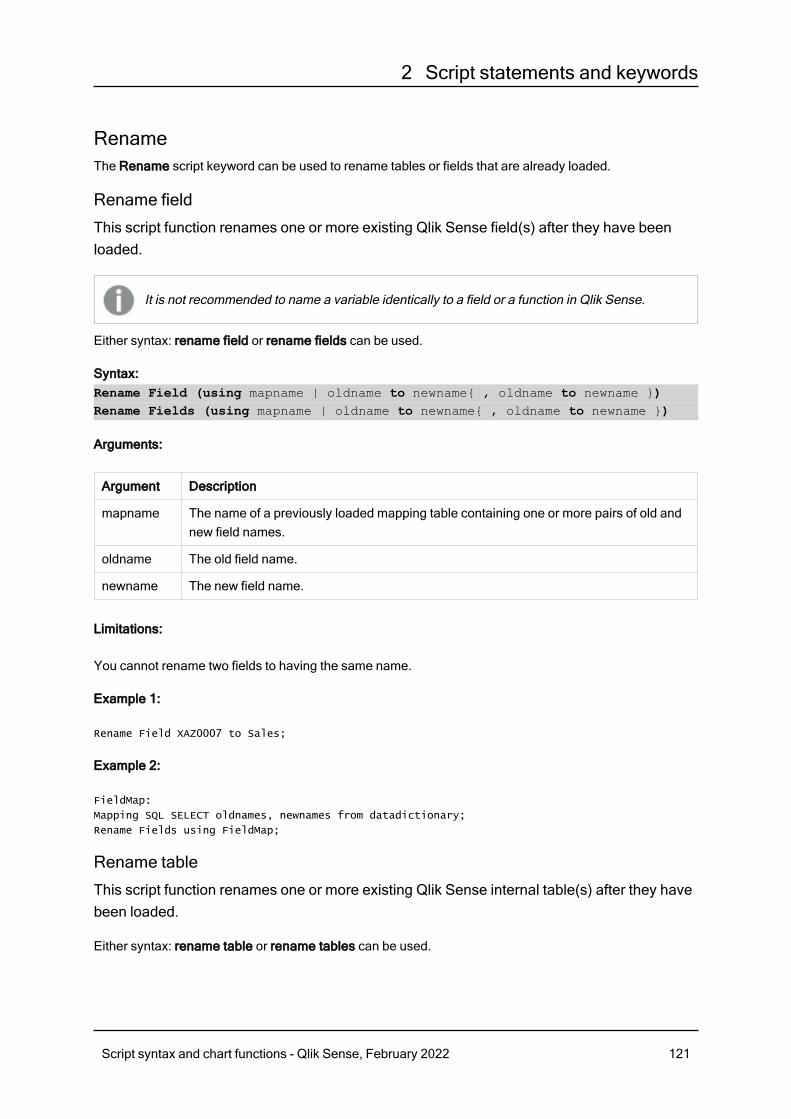
2 Script statements and keywords
RenameThe Rename script keyword can be used to rename tables or fields that are already loaded.
Rename field
This script function renames one or more existing Qlik Sense field(s) after they have beenloaded.
It is not recommended to name a variable identically to a field or a function in Qlik Sense.
Either syntax: rename field or rename fields can be used.
Syntax:Rename Field (using mapname | oldname to newname{ , oldname to newname })Rename Fields (using mapname | oldname to newname{ , oldname to newname })
Arguments:
Argument Description
mapname The name of a previously loaded mapping table containing one or more pairs of old andnew field names.
oldname The old field name.
newname The new field name.
Limitations:
You cannot rename two fields to having the same name.
Example 1:
Rename Field XAZ0007 to Sales;
Example 2:
FieldMap:
Mapping SQL SELECT oldnames, newnames from datadictionary;
Rename Fields using FieldMap;
Rename table
This script function renames one or more existing Qlik Sense internal table(s) after they havebeen loaded.
Either syntax: rename table or rename tables can be used.
Script syntax and chart functions - Qlik Sense, February 2022 121
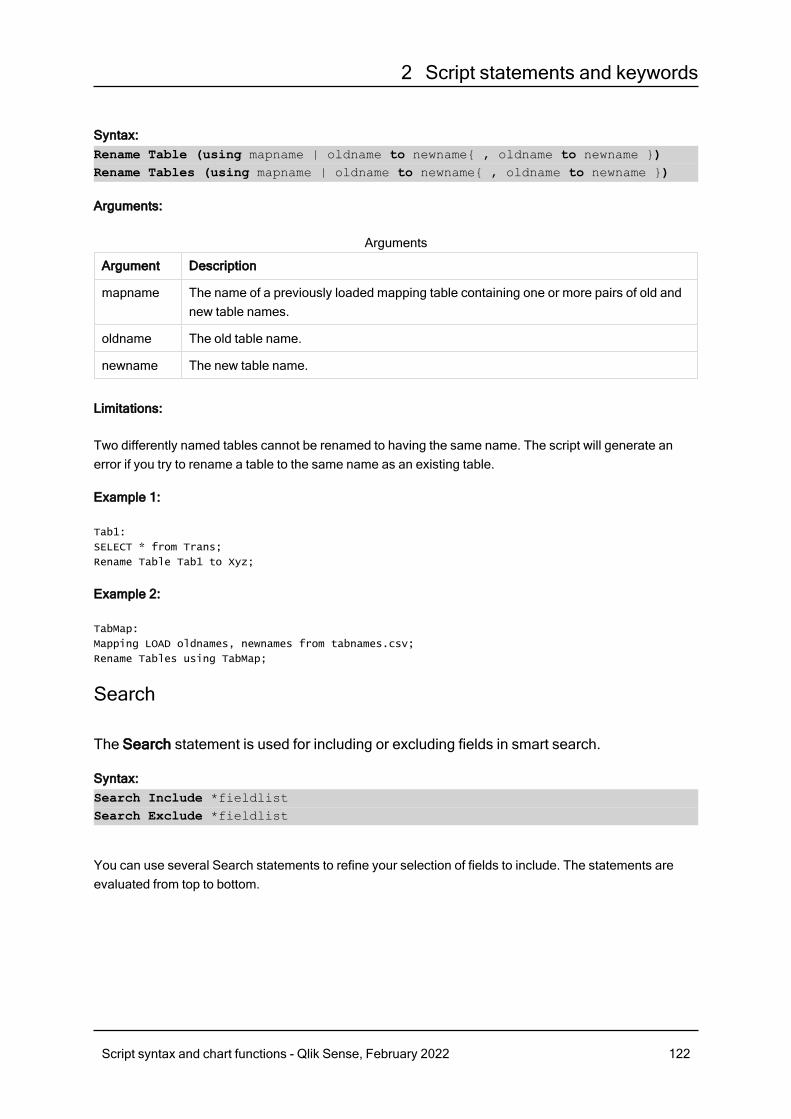
2 Script statements and keywords
Syntax:Rename Table (using mapname | oldname to newname{ , oldname to newname })Rename Tables (using mapname | oldname to newname{ , oldname to newname })
Arguments:
Argument Description
mapname The name of a previously loaded mapping table containing one or more pairs of old andnew table names.
oldname The old table name.
newname The new table name.
Arguments
Limitations:
Two differently named tables cannot be renamed to having the same name. The script will generate anerror if you try to rename a table to the same name as an existing table.
Example 1:
Tab1:
SELECT * from Trans;
Rename Table Tab1 to Xyz;
Example 2:
TabMap:
Mapping LOAD oldnames, newnames from tabnames.csv;
Rename Tables using TabMap;
Search
The Search statement is used for including or excluding fields in smart search.
Syntax:Search Include *fieldlistSearch Exclude *fieldlist
You can use several Search statements to refine your selection of fields to include. The statements areevaluated from top to bottom.
Script syntax and chart functions - Qlik Sense, February 2022 122
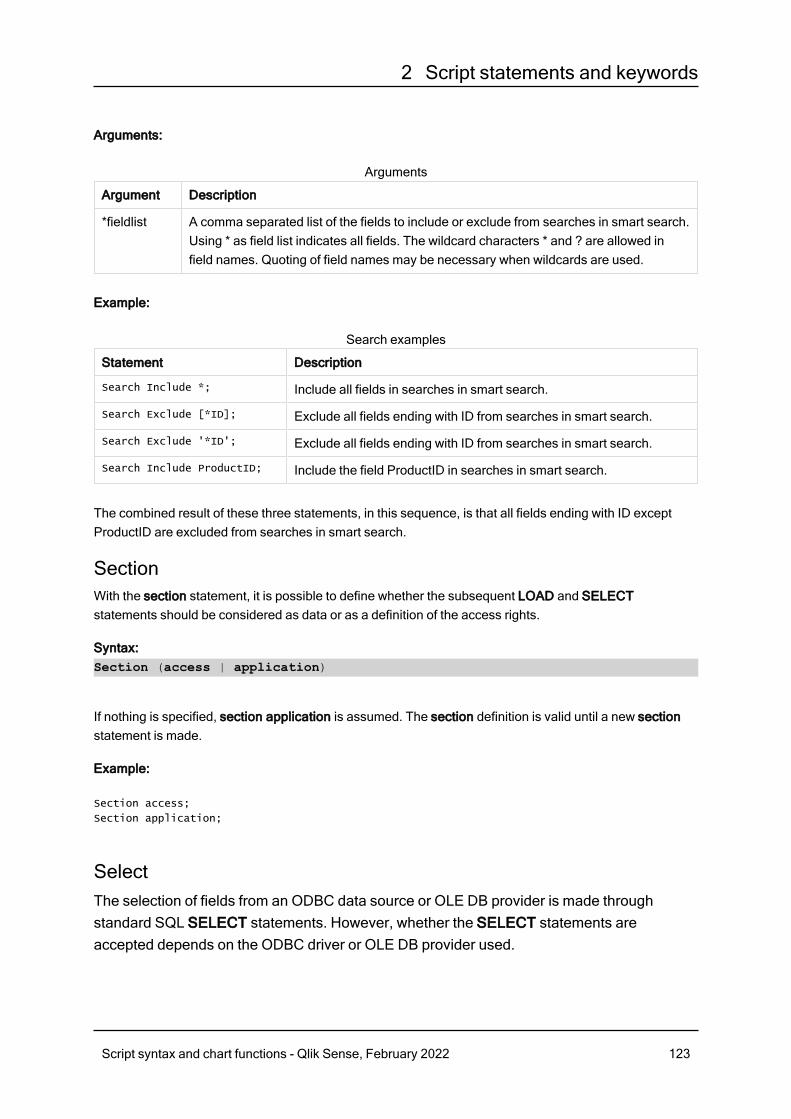
2 Script statements and keywords
Arguments:
Argument Description
*fieldlist A comma separated list of the fields to include or exclude from searches in smart search.Using * as field list indicates all fields. The wildcard characters * and ? are allowed infield names. Quoting of field names may be necessary when wildcards are used.
Arguments
Example:
Statement Description
Search Include *; Include all fields in searches in smart search.
Search Exclude [*ID]; Exclude all fields ending with ID from searches in smart search.
Search Exclude '*ID'; Exclude all fields ending with ID from searches in smart search.
Search Include ProductID; Include the field ProductID in searches in smart search.
Search examples
The combined result of these three statements, in this sequence, is that all fields ending with ID exceptProductID are excluded from searches in smart search.
SectionWith the section statement, it is possible to define whether the subsequent LOAD and SELECTstatements should be considered as data or as a definition of the access rights.
Syntax:Section (access | application)
If nothing is specified, section application is assumed. The section definition is valid until a new sectionstatement is made.
Example:
Section access;
Section application;
SelectThe selection of fields from an ODBC data source or OLE DB provider is made throughstandard SQL SELECT statements. However, whether the SELECT statements areaccepted depends on the ODBC driver or OLE DB provider used.
Script syntax and chart functions - Qlik Sense, February 2022 123
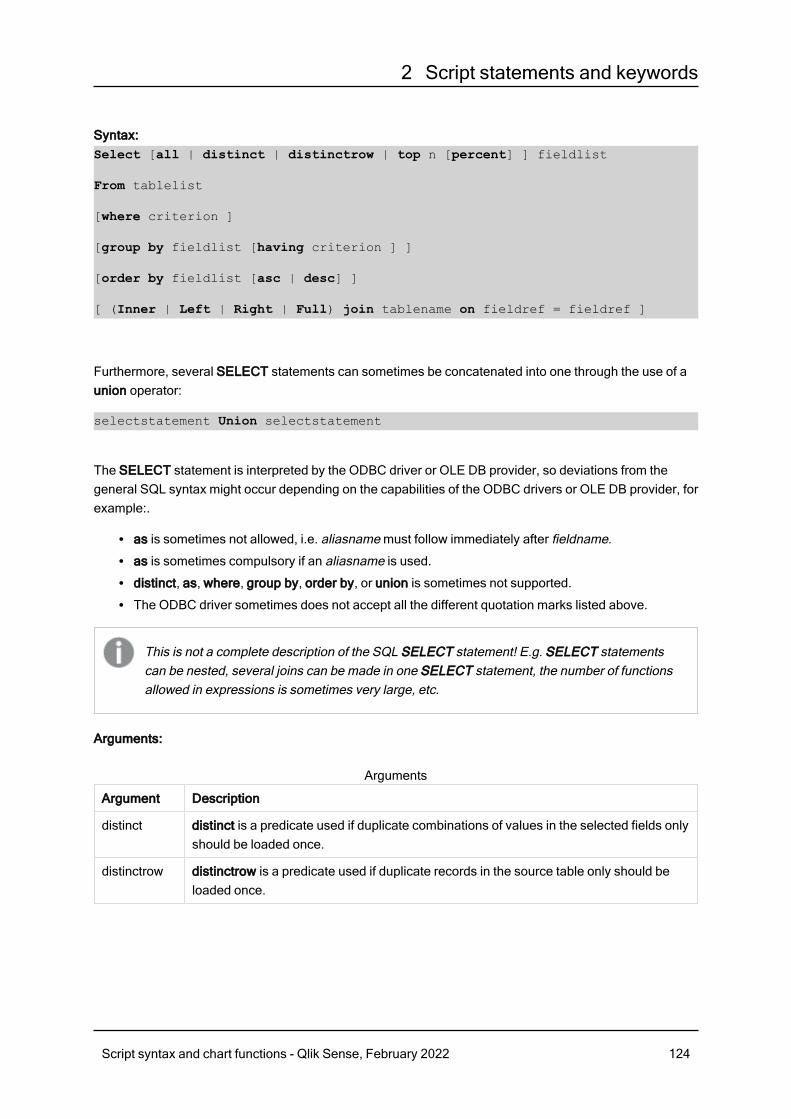
2 Script statements and keywords
Syntax:Select [all | distinct | distinctrow | top n [percent] ] fieldlist
From tablelist
[where criterion ]
[group by fieldlist [having criterion ] ]
[order by fieldlist [asc | desc] ]
[ (Inner | Left | Right | Full) join tablename on fieldref = fieldref ]
Furthermore, several SELECT statements can sometimes be concatenated into one through the use of aunion operator:
selectstatement Union selectstatement
The SELECT statement is interpreted by the ODBC driver or OLE DB provider, so deviations from thegeneral SQL syntax might occur depending on the capabilities of the ODBC drivers or OLE DB provider, forexample:.
l as is sometimes not allowed, i.e. aliasname must follow immediately after fieldname.l as is sometimes compulsory if an aliasname is used.l distinct, as, where, group by, order by, or union is sometimes not supported.l The ODBC driver sometimes does not accept all the different quotation marks listed above.
This is not a complete description of the SQL SELECT statement! E.g. SELECT statementscan be nested, several joins can be made in one SELECT statement, the number of functionsallowed in expressions is sometimes very large, etc.
Arguments:
Argument Description
distinct distinct is a predicate used if duplicate combinations of values in the selected fields onlyshould be loaded once.
distinctrow distinctrow is a predicate used if duplicate records in the source table only should beloaded once.
Arguments
Script syntax and chart functions - Qlik Sense, February 2022 124
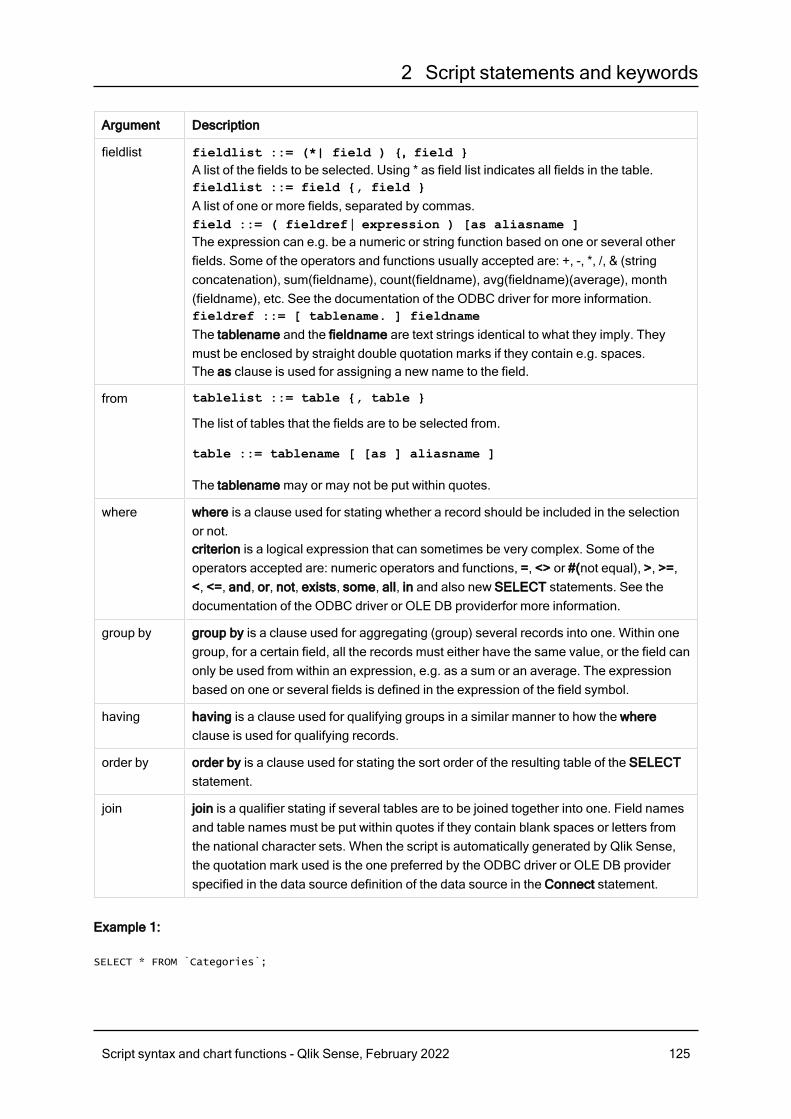
2 Script statements and keywords
Argument Description
fieldlist fieldlist ::= (*| field ) {, field }A list of the fields to be selected. Using * as field list indicates all fields in the table.fieldlist ::= field {, field }A list of one or more fields, separated by commas.field ::= ( fieldref | expression ) [as aliasname ]The expression can e.g. be a numeric or string function based on one or several otherfields. Some of the operators and functions usually accepted are: +, -, *, /, & (stringconcatenation), sum(fieldname), count(fieldname), avg(fieldname)(average), month(fieldname), etc. See the documentation of the ODBC driver for more information.fieldref ::= [ tablename. ] fieldnameThe tablename and the fieldname are text strings identical to what they imply. Theymust be enclosed by straight double quotation marks if they contain e.g. spaces.The as clause is used for assigning a new name to the field.
from tablelist ::= table {, table }
The list of tables that the fields are to be selected from.
table ::= tablename [ [as ] aliasname ]
The tablename may or may not be put within quotes.
where where is a clause used for stating whether a record should be included in the selectionor not.criterion is a logical expression that can sometimes be very complex. Some of theoperators accepted are: numeric operators and functions, =, <> or #(not equal), >, >=,<, <=, and, or, not, exists, some, all, in and also new SELECT statements. See thedocumentation of the ODBC driver or OLE DB providerfor more information.
group by group by is a clause used for aggregating (group) several records into one. Within onegroup, for a certain field, all the records must either have the same value, or the field canonly be used from within an expression, e.g. as a sum or an average. The expressionbased on one or several fields is defined in the expression of the field symbol.
having having is a clause used for qualifying groups in a similar manner to how the whereclause is used for qualifying records.
order by order by is a clause used for stating the sort order of the resulting table of the SELECTstatement.
join join is a qualifier stating if several tables are to be joined together into one. Field namesand table names must be put within quotes if they contain blank spaces or letters fromthe national character sets. When the script is automatically generated by Qlik Sense,the quotation mark used is the one preferred by the ODBC driver or OLE DB providerspecified in the data source definition of the data source in the Connect statement.
Example 1:
SELECT * FROM `Categories`;
Script syntax and chart functions - Qlik Sense, February 2022 125

2 Script statements and keywords
Example 2:
SELECT `Category ID`, `Category Name` FROM `Categories`;
Example 3:
SELECT `Order ID`, `Product ID`,
`Unit Price` * Quantity * (1-Discount) as NetSales
FROM `Order Details`;
Example 4:
SELECT `Order Details`.`Order ID`,
Sum(`Order Details`.`Unit Price` * `Order Details`.Quantity) as `Result`
FROM `Order Details`, Orders
where Orders.`Order ID` = `Order Details`.`Order ID`
group by `Order Details`.`Order ID`;
SetThe set statement is used for defining script variables. These can be used for substituting strings, paths,drives, and so on.
Syntax:Set variablename=string
Example 1:
Set FileToUse=Data1.csv;
Example 2:
Set Constant="My string";
Example 3:
Set BudgetYear=2012;
SleepThe sleep statement pauses script execution for a specified time.
Syntax:Sleep n
Arguments:
Argument Description
n Stated in milliseconds, where n is a positive integer no larger than 3600000 (i.e. 1 hour).The value may be an expression.
Script syntax and chart functions - Qlik Sense, February 2022 126
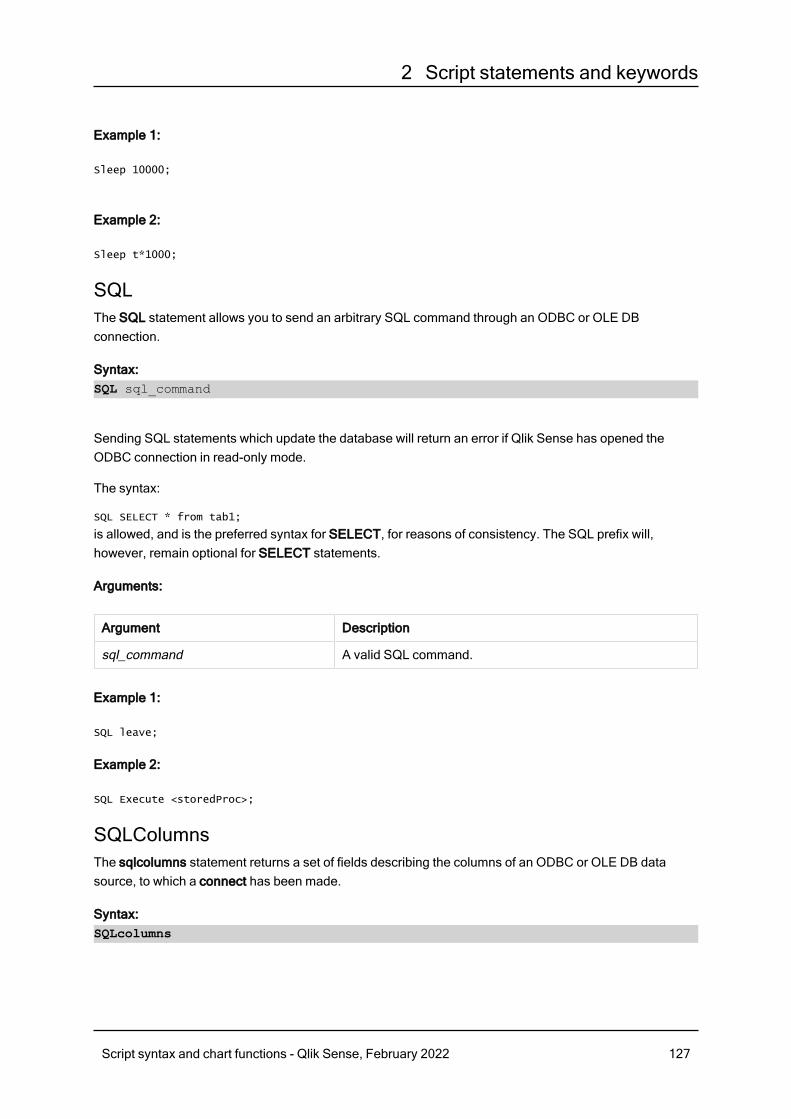
2 Script statements and keywords
Example 1:
Sleep 10000;
Example 2:
Sleep t*1000;
SQLThe SQL statement allows you to send an arbitrary SQL command through an ODBC or OLE DBconnection.
Syntax:SQL sql_command
Sending SQL statements which update the database will return an error if Qlik Sense has opened theODBC connection in read-only mode.
The syntax:
SQL SELECT * from tab1;
is allowed, and is the preferred syntax for SELECT, for reasons of consistency. The SQL prefix will,however, remain optional for SELECT statements.
Arguments:
Argument Description
sql_command A valid SQL command.
Example 1:
SQL leave;
Example 2:
SQL Execute <storedProc>;
SQLColumnsThe sqlcolumns statement returns a set of fields describing the columns of an ODBC or OLE DB datasource, to which a connect has been made.
Syntax:SQLcolumns
Script syntax and chart functions - Qlik Sense, February 2022 127
2 Script statements and keywords
The fields can be combined with the fields generated by the sqltables and sqltypes commands in order togive a good overview of a given database. The twelve standard fields are:
TABLE_QUALIFIER
TABLE_OWNER
TABLE_NAME
COLUMN_NAME
DATA_TYPE
TYPE_NAME
PRECISION
LENGTH
SCALE
RADIX
NULLABLE
REMARKS
For a detailed description of these fields, see an ODBC reference handbook.
Example:
Connect to 'MS Access 7.0 Database; DBQ=C:\Course3\DataSrc\QWT.mbd';
SQLcolumns;
Some ODBC drivers may not support this command. Some ODBC drivers may produceadditional fields.
SQLTablesThe sqltables statement returns a set of fields describing the tables of an ODBC or OLE DB data source, towhich a connect has been made.
Syntax:SQLTables
The fields can be combined with the fields generated by the sqlcolumns and sqltypes commands in orderto give a good overview of a given database. The five standard fields are:
TABLE_QUALIFIER
TABLE_OWNER
TABLE_NAME
Script syntax and chart functions - Qlik Sense, February 2022 128
2 Script statements and keywords
TABLE_TYPE
REMARKS
For a detailed description of these fields, see an ODBC reference handbook.
Example:
Connect to 'MS Access 7.0 Database; DBQ=C:\Course3\DataSrc\QWT.mbd';
SQLTables;
Some ODBC drivers may not support this command. Some ODBC drivers may produceadditional fields.
SQLTypesThe sqltypes statement returns a set of fields describing the types of an ODBC or OLE DB data source, towhich a connect has been made.
Syntax:SQLTypes
The fields can be combined with the fields generated by the sqlcolumns and sqltables commands in orderto give a good overview of a given database. The fifteen standard fields are:
TYPE_NAME
DATA_TYPE
PRECISION
LITERAL_PREFIX
LITERAL_SUFFIX
CREATE_PARAMS
NULLABLE
CASE_SENSITIVE
SEARCHABLE
UNSIGNED_ATTRIBUTE
MONEY
AUTO_INCREMENT
LOCAL_TYPE_NAME
MINIMUM_SCALE
Script syntax and chart functions - Qlik Sense, February 2022 129
2 Script statements and keywords
MAXIMUM_SCALE
For a detailed description of these fields, see an ODBC reference handbook.
Example:
Connect to 'MS Access 7.0 Database; DBQ=C:\Course3\DataSrc\QWT.mbd';
SQLTypes;
Some ODBC drivers may not support this command. Some ODBC drivers may produceadditional fields.
StarThe string used for representing the set of all the values of a field in the database can be setthrough the star statement. It affects the subsequent LOAD and SELECT statements.
Syntax:Star is[ string ]
Arguments:
Argument Description
string An arbitrary text. Note that the string must be enclosed by quotation marks if it containsblanks.
If nothing is specified, star is; is assumed, i.e. there is no star symbol available unlessexplicitly specified. This definition is valid until a new star statement is made.
Arguments
The Star is statement is not recommended for use in the data part of the script (under Section Application)if section access is used. The star character is however fully supported for the protected fields in theSection Access part of the script. In this case you do not need to use the explicit Star is statement sincethis is always implicit in section access.
Limitationsl You cannot use the star character with key fields; that is, fields that link tables.l You cannot use the star character with any fields affected by the Unqualify statement as this canaffect fields that link tables.
l You cannot use the star character with non-logical tables, for example, info-load tables or mapping-load tables.
l When the star character is used in a reducing field (a field that links to the data) in section access , itrepresents the values listed in this field in section access. It does not represent other values thatmay exist in the data but are not listed in section access.
Script syntax and chart functions - Qlik Sense, February 2022 130
2 Script statements and keywords
l You cannot use the star character with fields affected by any form of data reduction outside theSection Access area.
ExampleThe example below is an extract of a data load script featuring section access.
Star is *;
Section Access;
LOAD * INLINE [
ACCESS, USERID, OMIT
ADMIN, ADMIN,
USER, USER1, SALES
USER, USER2, WAREHOUSE
USER, USER3, EMPLOYEES
USER, USER4, SALES
USER, USER4, WAREHOUSE
USER, USER5, *
];
Section Application;
LOAD * INLINE [
SALES, WAREHOUSE, EMPLOYEES, ORDERS
1, 2, 3, 4
];
The following applies:
l The Star sign is *.l The user ADMIN sees all fields. Nothing is omitted.l The user USER1 is not able to see the field SALES.l The user USER2 is not able to see the field WAREHOUSE .l The user USER3 cannot see the field EMPLOYEES.l The user USER4 is added twice to the solution to OMIT two fields for this user, SALES andWAREHOUSE.
l The USER5 has a “*” added which means that all listed fields in OMIT are unavailable, that is, userUSER5 cannot see the fields SALES, WAREHOUSE and EMPLOYEES but this user can see thefield ORDERS.
StoreThe Store statement creates a QVD, CSV, or text file.
Syntax:Store [ fieldlist from] table into filename [ format-spec ];
The statement will create an explicitly named QVD, CSV, or TXT file.
The statement can only export fields from one data table. If fields from several tables are to be exported, anexplicit join must be made previously in the script to create the data table that should be exported.
Script syntax and chart functions - Qlik Sense, February 2022 131
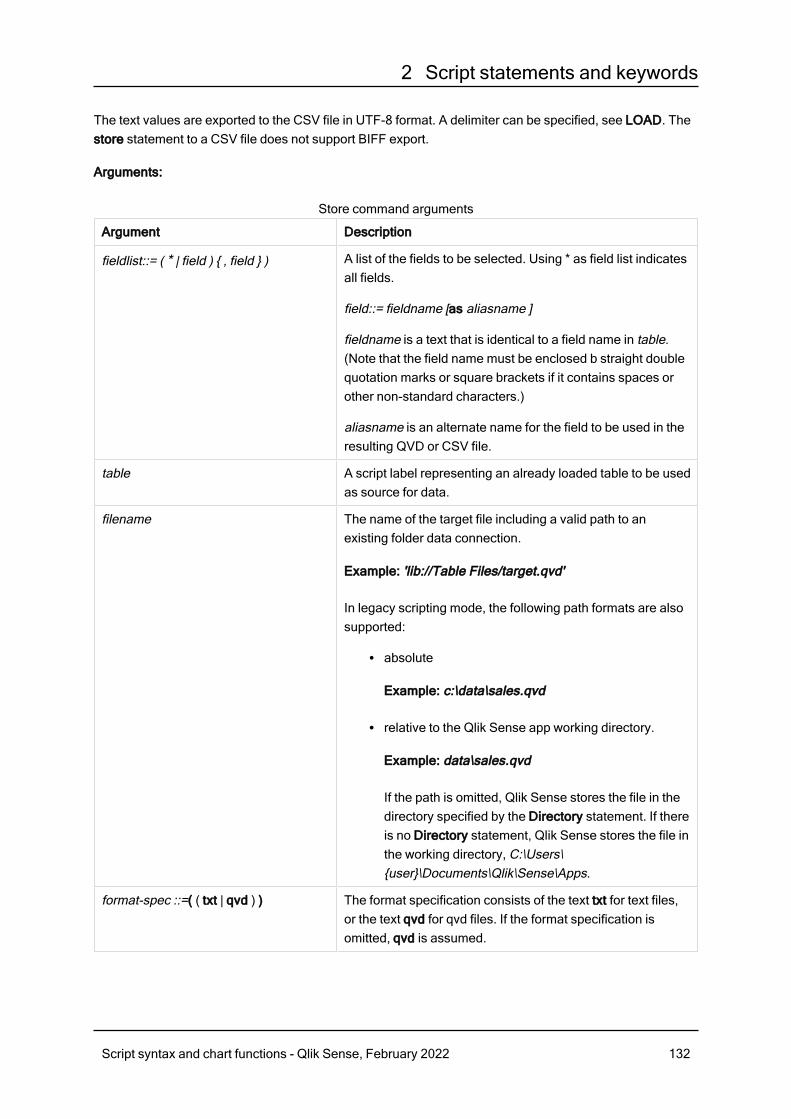
2 Script statements and keywords
The text values are exported to the CSV file in UTF-8 format. A delimiter can be specified, see LOAD. Thestore statement to a CSV file does not support BIFF export.
Arguments:
Argument Description
fieldlist::= ( * | field ) { , field } ) A list of the fields to be selected. Using * as field list indicatesall fields.
field::= fieldname [as aliasname ]
fieldname is a text that is identical to a field name in table.(Note that the field name must be enclosed b straight doublequotation marks or square brackets if it contains spaces orother non-standard characters.)
aliasname is an alternate name for the field to be used in theresulting QVD or CSV file.
table A script label representing an already loaded table to be usedas source for data.
filename The name of the target file including a valid path to anexisting folder data connection.
Example: 'lib://Table Files/target.qvd'
In legacy scripting mode, the following path formats are alsosupported:
l absolute
Example: c:\data\sales.qvd
l relative to the Qlik Sense app working directory.
Example: data\sales.qvd
If the path is omitted, Qlik Sense stores the file in thedirectory specified by the Directory statement. If thereis no Directory statement, Qlik Sense stores the file inthe working directory, C:\Users\{user}\Documents\Qlik\Sense\Apps.
format-spec ::=( ( txt | qvd ) ) The format specification consists of the text txt for text files,or the text qvd for qvd files. If the format specification isomitted, qvd is assumed.
Store command arguments
Script syntax and chart functions - Qlik Sense, February 2022 132
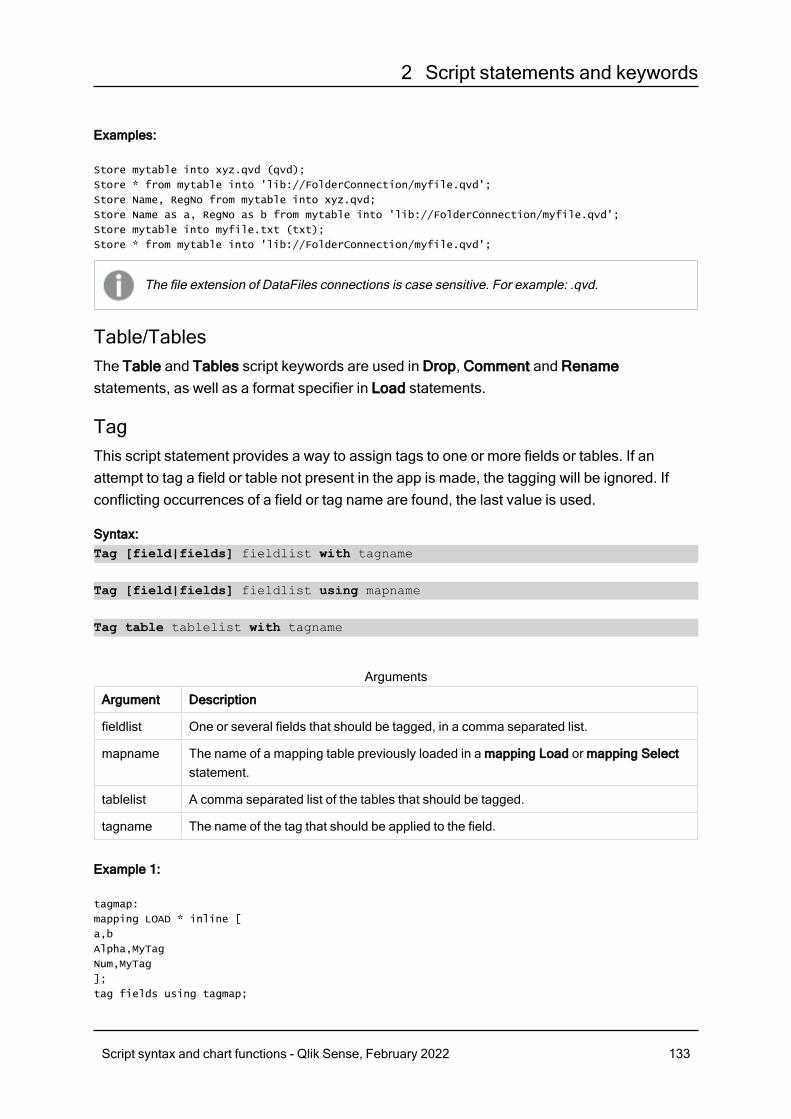
2 Script statements and keywords
Examples:
Store mytable into xyz.qvd (qvd);
Store * from mytable into 'lib://FolderConnection/myfile.qvd';
Store Name, RegNo from mytable into xyz.qvd;
Store Name as a, RegNo as b from mytable into 'lib://FolderConnection/myfile.qvd';
Store mytable into myfile.txt (txt);
Store * from mytable into 'lib://FolderConnection/myfile.qvd';
The file extension of DataFiles connections is case sensitive. For example: .qvd.
Table/TablesThe Table and Tables script keywords are used in Drop, Comment and Renamestatements, as well as a format specifier in Load statements.
TagThis script statement provides a way to assign tags to one or more fields or tables. If anattempt to tag a field or table not present in the app is made, the tagging will be ignored. Ifconflicting occurrences of a field or tag name are found, the last value is used.
Syntax:Tag [field|fields] fieldlist with tagname
Tag [field|fields] fieldlist using mapname
Tag table tablelist with tagname
Argument Description
fieldlist One or several fields that should be tagged, in a comma separated list.
mapname The name of a mapping table previously loaded in a mapping Load or mapping Selectstatement.
tablelist A comma separated list of the tables that should be tagged.
tagname The name of the tag that should be applied to the field.
Arguments
Example 1:
tagmap:
mapping LOAD * inline [
a,b
Alpha,MyTag
Num,MyTag
];
tag fields using tagmap;
Script syntax and chart functions - Qlik Sense, February 2022 133
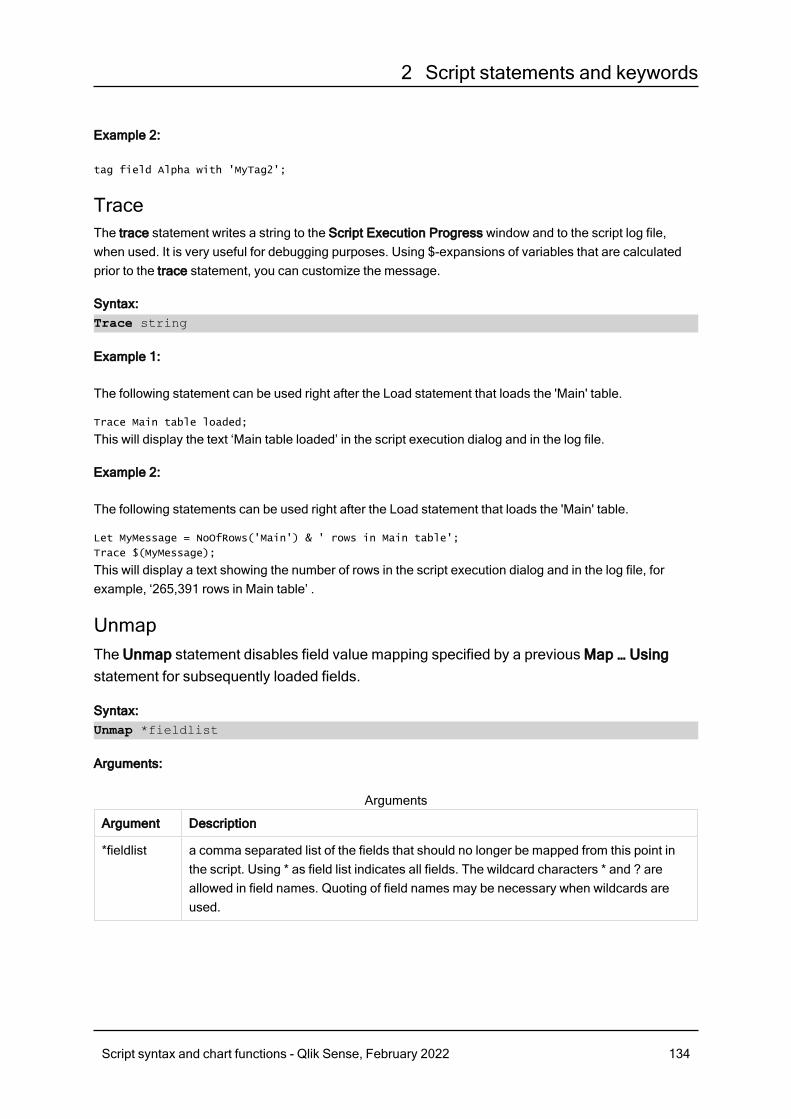
2 Script statements and keywords
Example 2:
tag field Alpha with 'MyTag2';
TraceThe trace statement writes a string to the Script Execution Progress window and to the script log file,when used. It is very useful for debugging purposes. Using $-expansions of variables that are calculatedprior to the trace statement, you can customize the message.
Syntax:Trace string
Example 1:
The following statement can be used right after the Load statement that loads the 'Main' table.
Trace Main table loaded;
This will display the text ‘Main table loaded’ in the script execution dialog and in the log file.
Example 2:
The following statements can be used right after the Load statement that loads the 'Main' table.
Let MyMessage = NoOfRows('Main') & ' rows in Main table';
Trace $(MyMessage);
This will display a text showing the number of rows in the script execution dialog and in the log file, forexample, ‘265,391 rows in Main table’ .
UnmapThe Unmap statement disables field value mapping specified by a previous Map … Usingstatement for subsequently loaded fields.
Syntax:Unmap *fieldlist
Arguments:
Argument Description
*fieldlist a comma separated list of the fields that should no longer be mapped from this point inthe script. Using * as field list indicates all fields. The wildcard characters * and ? areallowed in field names. Quoting of field names may be necessary when wildcards areused.
Arguments
Script syntax and chart functions - Qlik Sense, February 2022 134
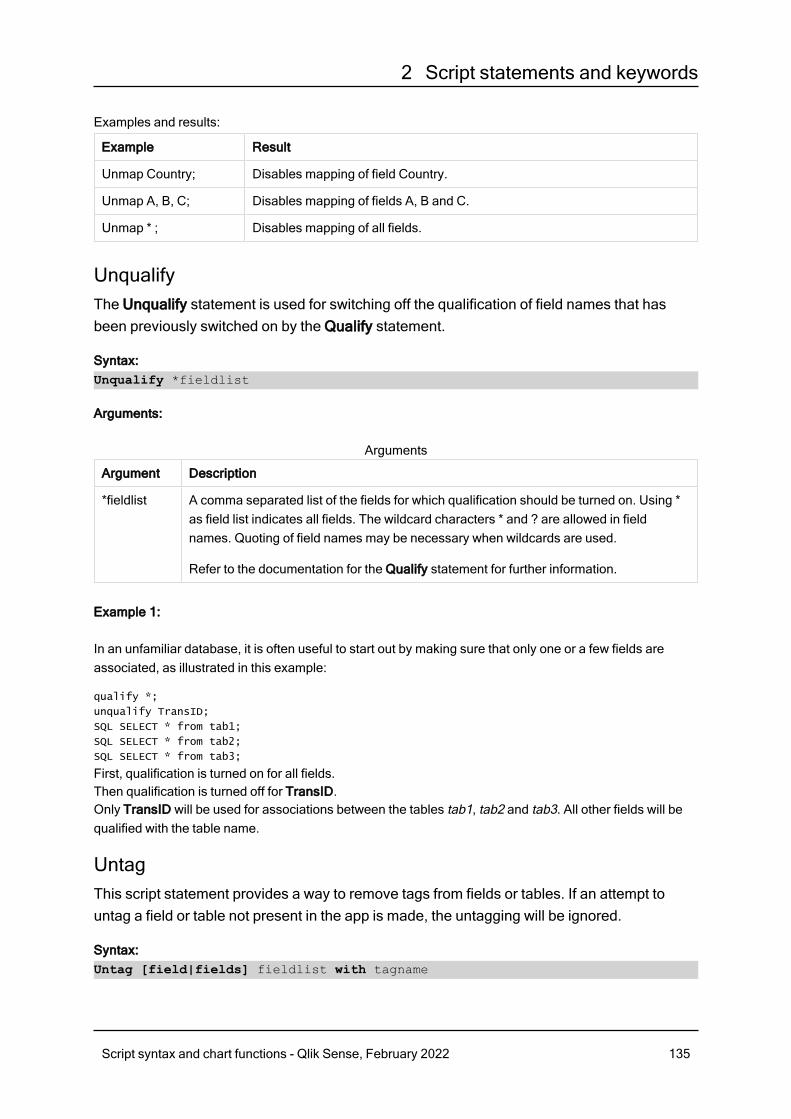
2 Script statements and keywords
Examples and results:
Example Result
Unmap Country; Disables mapping of field Country.
Unmap A, B, C; Disables mapping of fields A, B and C.
Unmap * ; Disables mapping of all fields.
UnqualifyThe Unqualify statement is used for switching off the qualification of field names that hasbeen previously switched on by the Qualify statement.
Syntax:Unqualify *fieldlist
Arguments:
Argument Description
*fieldlist A comma separated list of the fields for which qualification should be turned on. Using *as field list indicates all fields. The wildcard characters * and ? are allowed in fieldnames. Quoting of field names may be necessary when wildcards are used.
Refer to the documentation for the Qualify statement for further information.
Arguments
Example 1:
In an unfamiliar database, it is often useful to start out by making sure that only one or a few fields areassociated, as illustrated in this example:
qualify *;
unqualify TransID;
SQL SELECT * from tab1;
SQL SELECT * from tab2;
SQL SELECT * from tab3;
First, qualification is turned on for all fields.Then qualification is turned off for TransID.Only TransID will be used for associations between the tables tab1, tab2 and tab3. All other fields will bequalified with the table name.
UntagThis script statement provides a way to remove tags from fields or tables. If an attempt tountag a field or table not present in the app is made, the untagging will be ignored.
Syntax:Untag [field|fields] fieldlist with tagname
Script syntax and chart functions - Qlik Sense, February 2022 135
2 Script statements and keywords
Untag [field|fields] fieldlist using mapname
Untag table tablelist with tagname
Arguments:
Argument Description
fieldlist One or several fields which tags should be removed, in a comma separated list.
mapname The name of a mapping table previously loaded in a mapping LOAD or mappingSELECT statement.
tablelist A comma separated list of the tables that should be untagged.
tagname The name of the tag that should be removed from the field.
Arguments
Example 1:
tagmap:
mapping LOAD * inline [
a,b
Alpha,MyTag
Num,MyTag
];
Untag fields using tagmap;
Example 2:
Untag field Alpha with MyTag2;
2.6 Working directoryIf you are referencing a file in a script statement and the path is omitted, Qlik Sense searchesfor the file in the following order:
1. The directory specified by a Directory statement (only supported in legacy scripting mode).
2. If there is no Directory statement, Qlik Sense searches in the working directory.
Qlik Sense Desktop working directoryIn Qlik Sense Desktop, the working directory is C:\Users\{user}\Documents\Qlik\Sense\Apps.
Qlik Sense working directoryIn a Qlik Sense server installation, the working directory is specified in Qlik Sense Repository Service, bydefault it is C:\ProgramData\Qlik\Sense\Apps. See the Qlik Management Console help for moreinformation.
Script syntax and chart functions - Qlik Sense, February 2022 136
2 Working with variables in the data load editor
2 Working with variables in the data load editorA variable in Qlik Sense is a container storing a static value or a calculation, for example anumeric or alphanumeric value. When you use the variable in the app, any change made tothe variable is applied everywhere the variable is used. You can define variables in thevariables overview, or in the script using the data load editor. You set the value of a variableusing Let or Set statements in the data load script.
You can also work with the Qlik Sense variables from the variables overview when editing asheet.
2.7 OverviewIf the first character of a variable value is an equals sign ' = ' Qlik Sense will try to evaluate the value as aformula (Qlik Sense expression) and then display or return the result rather than the actual formula text.
When used, the variable is substituted by its value. Variables can be used in the script for dollar signexpansion and in various control statements. This is very useful if the same string is repeated many timesin the script, for example, a path.
Some special system variables will be set by Qlik Sense at the start of the script execution regardless oftheir previous values.
2.8 Defining a variableVariables provide the ability to store static values or the result of a calculation. When defining a variable,use the following syntax:
set variablename = string
or
let variable = expression
The Set statement is used for string assignment. It assigns the text to the right of the equal sign to thevariable. The Let statement evaluates an expression to the right of the equal sign at script run time andassigns the result of the expression to the variable.
Variables are case sensitive.
It is not recommended to name a variable identically to a field or a function in Qlik Sense.
Examples:
set x = 3 + 4; // the variable will get the string '3 + 4' as the value.
Script syntax and chart functions - Qlik Sense, February 2022 137
2 Working with variables in the data load editor
let x = 3 + 4; // returns 7 as the value.
set x = Today(); // returns 'Today()' as the value.
let x = Today(); // returns today's date as the value, for example, ‘9/27/2021’.
2.9 Deleting a variableIf you remove a variable from the script and reload the data, the variable stays in the app. If you want tofully remove the variable from the app, you must also delete the variable from the variables dialog.
2.10 Loading a variable value as a field valueIf you want to load a variable value as a field value in a LOAD statement and the result of the dollarexpansion is text rather than numeric or an expression then you need to enclose the expanded variable insingle quotes.
Example:
This example loads the system variable containing the list of script errors to a table. You can note that theexpansion of ScriptErrorCount in the If clause does not require quotes, while the expansion ofScriptErrorList requires quotes.
IF $(ScriptErrorCount) >= 1 THEN
LOAD '$(ScriptErrorList)' AS Error AutoGenerate 1;
END IF
2.11 Variable calculationThere are several ways to use variables with calculated values in Qlik Sense, and the result depends onhow you define it and how you call it in an expression.
In this example, we load some inline data:
LOAD * INLINE [
Dim, Sales
A, 150
A, 200
B, 240
B, 230
C, 410
C, 330
];
Let's define two variables:
Let vSales = 'Sum(Sales)' ;
Let vSales2 = '=Sum(Sales)' ;
In the second variable, we add an equal sign before the expression. This will cause the variable to becalculated before it is expanded and the expression is evaluated.
Script syntax and chart functions - Qlik Sense, February 2022 138
2 Working with variables in the data load editor
If you use the vSales variable as it is, for example in a measure, the result will be the string Sum(Sales),that is, no calculation is performed.
If you add a dollar-sign expansion and call $(vSales) in the expression, the variable is expanded, and thesum of Sales is displayed.
Finally, if you call $(vSales2), the variable will be calculated before it is expanded. This means that theresult displayed is the total sum of Sales. The difference between using =$(vSales) and =$(vSales2) asmeasure expressions is seen in this chart showing the results:
Dim $(vSales) $(vSales2)
A 350 1560
B 470 1560
C 740 1560
Results
As you can see, $(vSales) results in the partial sum for a dimension value, while $(vSales2) results in thetotal sum.
The following script variables are available:
l Error variables (page 161)l Number interpretation variables (page 147)l System variables (page 139)l Value handling variables (page 145)
2.12 System variablesSystem variables, some of which are system-defined, provide information about the systemand the Qlik Sense app.
System variables overviewSome of the functions are described further after the overview. For those functions, you can click thefunction name in the syntax to immediately access the details for that specific function.
FloppyReturns the drive letter of the first floppy drive found, normally a:. This is a system-defined variable.
Floppy
This variable is not supported in standard mode.
Script syntax and chart functions - Qlik Sense, February 2022 139
2 Working with variables in the data load editor
CDReturns the drive letter of the first CD-ROM drive found. If no CD-ROM is found, then c: is returned. This isa system-defined variable.
CD
This variable is not supported in standard mode.
IncludeThe Include/Must_Include variable specifies a file that contains text that should be included in the scriptand evaluated as script code. It is not used to add data. You can store parts of your script code in aseparate text file and reuse it in several apps. This is a user-defined variable.
$(Include=filename)$(Must_Include=filename)
HidePrefixAll field names beginning with this text string will be hidden in the same manner as the system fields. Thisis a user-defined variable.
HidePrefix
HideSuffixAll field names ending with this text string will be hidden in the same manner as the system fields. This is auser-defined variable.
HideSuffix
QvPathReturns the browse string to the Qlik Sense executable. This is a system-defined variable.
QvPath
This variable is not supported in standard mode.
QvRootReturns the root directory of the Qlik Sense executable. This is a system-defined variable.
QvRoot
This variable is not supported in standard mode.
QvWorkPathReturns the browse string to the current Qlik Sense app. This is a system-defined variable.
QvWorkPath
Script syntax and chart functions - Qlik Sense, February 2022 140
2 Working with variables in the data load editor
This variable is not supported in standard mode.
QvWorkRootReturns the root directory of the current Qlik Sense app. This is a system-defined variable.
QvWorkRoot
This variable is not supported in standard mode.
StripCommentsIf this variable is set to 0, stripping of /*..*/ and // comments in the script will be inhibited. If this variable isnot defined, stripping of comments will always be performed.
StripComments
VerbatimNormally all field values are automatically stripped of leading and trailing blanks (ASCII 32) before beingloaded into the Qlik Sense database. Setting this variable to 1 suspends the stripping of blanks. Tab (ASCII9) and hard space (ANSI 160) characters are never stripped.
Verbatim
OpenUrlTimeoutThis variable defines the timeout in seconds that Qlik Sense should respect when getting data from URLsources (e.g. HTML pages). If omitted, the timeout is about 20 minutes.
OpenUrlTimeout
WinPathReturns the browse string to Windows. This is a system-defined variable.
WinPath
This variable is not supported in standard mode.
WinRootReturns the root directory of Windows. This is a system-defined variable.
WinRoot
This variable is not supported in standard mode.
CollationLocaleSpecifies which locale to use for sort order and search matching. The value is the culture name of a locale,for example 'en-US'.This is a system-defined variable.
Script syntax and chart functions - Qlik Sense, February 2022 141
2 Working with variables in the data load editor
CollationLocale
CreateSearchIndexOnReloadThis variable defines if search index files should be created during data reload.
CreateSearchIndexOnReload
CreateSearchIndexOnReloadThis variable defines if search index files should be created during data reload.
Syntax:CreateSearchIndexOnReload
You can define if search index files should be created during data reload, or if they should be created afterthe first search request of the user. The benefit of creating search index files during data reload is that youavoid the waiting time experienced by the first user making a search. This needs to be weighed against thelonger data reload time required by search index creation.
If this variable is omitted, search index files will not be created during data reload.
For session apps, search index files will not be created during data reload, regardless of thesetting of this variable.
Example 1: Create search index fields during data reload
set CreateSearchIndexOnReload=1;
Example 2: Create search index fields after first search request
set CreateSearchIndexOnReload=0;
HidePrefixAll field names beginning with this text string will be hidden in the same manner as the systemfields. This is a user-defined variable.
Syntax:HidePrefix
Example:
set HidePrefix='_' ;
If this statement is used, the field names beginning with an underscore will not be shown in the field namelists when the system fields are hidden.
Script syntax and chart functions - Qlik Sense, February 2022 142
2 Working with variables in the data load editor
HideSuffixAll field names ending with this text string will be hidden in the same manner as the systemfields. This is a user-defined variable.
Syntax:HideSuffix
Example:
set HideSuffix='%';
If this statement is used, the field names ending with a percentage sign will not be shown in the field namelists when the system fields are hidden.
IncludeThe Include/Must_Include variable specifies a file that contains text that should be includedin the script and evaluated as script code. It is not used to add data. You can store parts ofyour script code in a separate text file and reuse it in several apps. This is a user-definedvariable.
This variable supports only folder data connections in standard mode.
Syntax:$(Include=filename)
$(Must_Include=filename)
There are two versions of the variable:
l Include does not generate an error if the file cannot be found, it will fail silently.l Must_Include generates an error if the file cannot be found.
If you don't specify a path, the filename will be relative to the Qlik Sense app working directory. You canalso specify an absolute file path, or a path to a lib:// folder connection. Do not put a space character beforeor after the equal sign.
The construction set Include =filename is not applicable.
Examples:
$(Include=abc.txt);
$(Must_Include=lib://DataFiles/abc.txt);
Script syntax and chart functions - Qlik Sense, February 2022 143
2 Working with variables in the data load editor
Limitations
Limited cross-compatibility between UTF-8 encoded files under Windows versus Linux.It is optional to use UTF-8 with BOM (Byte Order Mark). BOM can interfere with the use of UTF-8 insoftware that does not expect non-ASCII bytes at the start of a file, but that could otherwise handle the textstream.
l Windows systems use BOM in UTF-8 to identify that a file is UTF-8 encoded, despite the fact thatthere is no ambiguity in the byte storage.
l Unix/Linux use UTF-8 for Unicode, but does not use the BOM as this interferes with the syntax forcommand files.
This has some implications for Qlik Sense.
l In Windows any file that begins with an UTF-8 BOM is considered a UTF-8 script file. OtherwiseANSI encoding is assumed.
l In Linux, the system default 8 bit code page is UTF-8. This is why the UTF-8 works although it doesnot contain a BOM.
As a result, portability cannot be guaranteed. It is not always possible to create a file on Windows that canbe interpreted by Linux and vice versa. There is no cross compatibility between the two systems regardingUTF-8 encoded files due to different handling of the BOM.
OpenUrlTimeoutThis variable defines the timeout in seconds that Qlik Sense should respect when gettingdata from URL sources (e.g. HTML pages). If omitted, the timeout is about 20 minutes.
Syntax:OpenUrlTimeout
Example:
set OpenUrlTimeout=10;
StripCommentsIf this variable is set to 0, stripping of /*..*/ and // comments in the script will be inhibited. If thisvariable is not defined, stripping of comments will always be performed.
Syntax:StripComments
Certain database drivers use /*..*/ as optimization hints in SELECT statements. If this is the case, thecomments should not be stripped before sending the SELECT statement to the database driver.
Script syntax and chart functions - Qlik Sense, February 2022 144
2 Working with variables in the data load editor
It is recommended that this variable be reset to 1 immediately after the statement(s) where it isneeded.
Example:
set StripComments=0;
SQL SELECT * /* <optimization directive> */ FROM Table ;
set StripComments=1;
VerbatimNormally all field values are automatically stripped of leading and trailing blanks (ASCII 32)before being loaded into the Qlik Sense database. Setting this variable to 1 suspends thestripping of blanks. Tab (ASCII 9) and hard space (ANSI 160) characters are never stripped.
Syntax:Verbatim
Example:
set Verbatim = 1;
2.13 Value handling variablesThis section describes variables that are used for handling NULL and other values.
Value handling variables overviewEach function is described further after the overview. You can also click the function name in the syntax toimmediately access the details for that specific function.
NullDisplayThe defined symbol will substitute all NULL values from ODBC, and connectors, on the lowest level ofdata. This is a user-defined variable.
NullDisplay
NullInterpretThe defined symbol will be interpreted as NULL when it occurs in a text file, Excel file or an inlinestatement. This is a user-defined variable.
NullInterpret
NullValueIf the NullAsValue statement is used, the defined symbol will substitute all NULL values in theNullAsValue specified fields with the specified string.
Script syntax and chart functions - Qlik Sense, February 2022 145
2 Working with variables in the data load editor
NullValue
OtherSymbolDefines a symbol to be treated as 'all other values' before a LOAD/SELECT statement. This is a user-defined variable.
OtherSymbol
NullDisplayThe defined symbol will substitute all NULL values from ODBC, and connectors, on thelowest level of data. This is a user-defined variable.
Syntax:NullDisplay
Example:
set NullDisplay='<NULL>';
NullInterpretThe defined symbol will be interpreted as NULL when it occurs in a text file, Excel file or aninline statement. This is a user-defined variable.
Syntax:NullInterpret
Examples:
set NullInterpret=' ';
set NullInterpret =;
will not return NULL values for blank values in Excel, but it will for a CSV text file.
set NullInterpret ='';
will return NULL values for blank values in Excel.
NullValueIf the NullAsValue statement is used, the defined symbol will substitute all NULL values in theNullAsValue specified fields with the specified string.
Syntax:NullValue
Example:
NullAsValue Field1, Field2;
set NullValue='<NULL>';
Script syntax and chart functions - Qlik Sense, February 2022 146
2 Working with variables in the data load editor
OtherSymbolDefines a symbol to be treated as 'all other values' before a LOAD/SELECT statement. Thisis a user-defined variable.
Syntax:OtherSymbol
Example:
set OtherSymbol='+';
LOAD * inline
[X, Y
a, a
b, b];
LOAD * inline
[X, Z
a, a
+, c];
The field value Y='b' will now link to Z='c' through the other symbol.
2.14 Number interpretation variablesNumber interpretation variables are system defined, that is, they are automatically generated according tothe current regional settings of the operating system when a new app is created. In Qlik Sense Desktop,this is according to the settings of the computer operating system, and in Qlik Sense, it is according to theoperating system of the server where Qlik Sense is installed.
The variables are included at the top of the script of the new Qlik Sense app and substitute operatingsystem defaults for certain number formatting settings at the time of the script execution. They can bedeleted, edited or duplicated freely.
If you want to create an app for a certain locale, the easiest way is probably to use Qlik SenseDesktop on a computer with the desired locale setting in the operating system to create theapp. The app will then contain the appropriate regional settings of that locale, and you canmove it to a Qlik Sense server of choice for further development.
Number interpretation variables overviewEach function is described further after the overview. You can also click the function name in the syntax toimmediately access the details for that specific function.
Currency formattingMoneyDecimalSepThe decimal separator defined replaces the decimal symbol for currency of the operating system (regionalsettings).
Script syntax and chart functions - Qlik Sense, February 2022 147
2 Working with variables in the data load editor
MoneyDecimalSep
MoneyFormatThe symbol defined replaces the currency symbol of the operating system (regional settings).
MoneyFormat
MoneyThousandSepThe thousands separator defined replaces the digit grouping symbol for currency of the operating system(regional settings).
MoneyThousandSep
Number formattingDecimalSepThe decimal separator defined replaces the decimal symbol of the operating system (regional settings).
DecimalSep
ThousandSepThe thousands separator defined replaces the digit grouping symbol of the operating system (regionalsettings).
ThousandSep
NumericalAbbreviationThe numerical abbreviation sets which abbreviation to use for scale prefixes of numerals, for example Mfor mega or a million (106), and µ for micro (10-6).
NumericalAbbreviation
Time formattingDateFormatThis environment variable defines the date format used as the default in the app. The format is used both tointerpret and format dates. If the variable is not defined, the date format of the regional settings of theoperating system will be fetched when the script runs.
DateFormat
TimeFormatThe format defined replaces the time format of the operating system (regional settings).
TimeFormat
TimestampFormatThe format defined replaces the date and time formats of the operating system (regional settings).
TimestampFormat
MonthNamesThe format defined replaces the month names convention of the operating system (regional settings).
Script syntax and chart functions - Qlik Sense, February 2022 148
2 Working with variables in the data load editor
MonthNames
LongMonthNamesThe format defined replaces the long month names convention of the operating system (regional settings).
LongMonthNames
DayNamesThe format defined replaces the weekday names convention of the operating system (regional settings).
DayNames
LongDayNamesThe format defined replaces the long weekday names convention of the operating system (regionalsettings).
LongDayNames
FirstWeekDayInteger that defines which day to use as the first day of the week.
FirstWeekDay
BrokenWeeksThis setting defines if weeks are broken or not.
BrokenWeeks
ReferenceDayThe setting defines which day in January to set as reference day to define week 1.
ReferenceDay
FirstMonthOfYearThe setting defines which month to use as first month of the year, which can be used to define financialyears that use a monthly offset, for example starting April 1.
This setting is currently unused but reserved for future use.
Valid settings are 1 (January) to 12 (December). Default setting is 1.
Syntax:FirstMonthOfYear
Example:
Set FirstMonthOfYear=4; //Sets the year to start in April
BrokenWeeksThis setting defines if weeks are broken or not.
Script syntax and chart functions - Qlik Sense, February 2022 149
2 Working with variables in the data load editor
Syntax:BrokenWeeksBy default, Qlik Sense functions use unbroken weeks. This means that:
l In some years, week 1 starts in December, and in other years, week 52 or 53 continues intoJanuary.
l Week 1 always has at least 4 days in January.
The alternative is to use broken weeks:
l Week 52 or 53 do not continue into January.l Week 1 starts on January 1 and is, in most cases, not a full week.
The following values can be used:
l 0 (=use unbroken weeks)l 1 (= use broken weeks)
Examples:
Set BrokenWeeks=0; //(use unbroken weeks)
Set BrokenWeeks=1; //(use broken weeks)
DateFormatThis environment variable defines the date format used as the default in the app. The format is used both tointerpret and format dates. If the variable is not defined, the date format of the regional settings of theoperating system will be fetched when the script runs.
Syntax:DateFormat
Examples:
Set DateFormat='M/D/YY'; //(US format)
Set DateFormat='DD/MM/YY'; //(UK date format)
Set DateFormat='YYYY-MM-DD'; //(ISO date format)
DayNamesThe format defined replaces the weekday names convention of the operating system (regional settings).
Syntax:DayNames
Example:
Set DayNames='Mon;Tue;Wed;Thu;Fri;Sat;Sun';
DecimalSepThe decimal separator defined replaces the decimal symbol of the operating system (regional settings).
Script syntax and chart functions - Qlik Sense, February 2022 150
2 Working with variables in the data load editor
Syntax:DecimalSep
Examples:
Set DecimalSep='.';
Set DecimalSep=',';
FirstWeekDayInteger that defines which day to use as the first day of the week.
Syntax:FirstWeekDayBy default, Qlik Sense functions use Monday as the first day of the week. The following values can beused:
l 0 (= Monday)l 1 (= Tuesday)l 2 (= Wednesday)l 3 (= Thursday)l 4 (= Friday)l 5 (= Saturday)l 6 (= Sunday)
Examples:
Set FirstWeekDay=6; //(set Sunday as the first day of the week)
LongDayNamesThe format defined replaces the long weekday names convention of the operating system (regionalsettings).
Syntax:LongDayNames
Example:
Set LongDayNames='Monday;Tuesday;Wednesday;Thursday;Friday;Saturday;Sunday';
LongMonthNamesThe format defined replaces the long month names convention of the operating system (regional settings).
Syntax:LongMonthNames
Script syntax and chart functions - Qlik Sense, February 2022 151
2 Working with variables in the data load editor
Example:
Set
LongMonthNames='January;February;March;April;May;June;July;August;September;October;November;D
ecember';
MoneyDecimalSepThe decimal separator defined replaces the decimal symbol for currency of the operating system (regionalsettings).
Syntax:MoneyDecimalSep
Example:
Set MoneyDecimalSep='.';
MoneyFormatThe symbol defined replaces the currency symbol of the operating system (regional settings).
Syntax:MoneyFormat
Example:
Set MoneyFormat='$ #,##0.00; ($ #,##0.00)';
MoneyThousandSepThe thousands separator defined replaces the digit grouping symbol for currency of the operating system(regional settings).
Syntax:MoneyThousandSep
Example:
Set MoneyThousandSep=',';
MonthNamesThe format defined replaces the month names convention of the operating system (regional settings).
Syntax:MonthNames
Example:
Set MonthNames='Jan;Feb;Mar;Apr;May;Jun;Jul;Aug;Sep;Oct;Nov;Dec';
Script syntax and chart functions - Qlik Sense, February 2022 152
2 Working with variables in the data load editor
NumericalAbbreviationThe numerical abbreviation sets which abbreviation to use for scale prefixes of numerals, for example Mfor mega or a million (106), and µ for micro (10-6).
Syntax:NumericalAbbreviationYou set the NumericalAbbreviation variable to a string containing a list of abbreviation definition pairs,delimited by semi colon. Each abbreviation definition pair should contain the scale (the exponent indecimal base) and the abbreviation separated by a colon, for example, 6:M for a million.
The default setting is '3:k;6:M;9:G;12:T;15:P;18:E;21:Z;24:Y;-3:m;-6:µ;-9:n;-12:p;-15:f;-18:a;-21:z;-24:y'.
Examples:
This setting will change the prefix for a thousand to t and the prefix for a billion to B. This would be useful forfinancial applications where you would expect abbreviations like t$, M$, and B$.
Set NumericalAbbreviation='3:t;6:M;9:B;12:T;15:P;18:E;21:Z;24:Y;-3:m;-6:µ;-9:n;-12:p;-15:f;-
18:a;-21:z;-24:y';
ReferenceDayThe setting defines which day in January to set as reference day to define week 1.
Syntax:ReferenceDayBy default, Qlik Sense functions use 4 as the reference day. This means that week 1 must contain January4, or put differently, that week 1 must always have at least 4 days in January.
The following values can be used to set a different reference day:
l 1 (= January 1)l 2 (= January 2)l 3 (= January 3)l 4 (= January 4)l 5 (= January 5)l 6 (= January 6)l 7 (= January 7)
Examples:
Set ReferenceDay=3; //(set January 3 as the reference day)
ThousandSepThe thousands separator defined replaces the digit grouping symbol of the operating system (regionalsettings).
Script syntax and chart functions - Qlik Sense, February 2022 153
2 Working with variables in the data load editor
Syntax:ThousandSep
Examples:
Set ThousandSep=','; //(for example, seven billion must be specified as: 7,000,000,000)
Set ThousandSep=' ';
TimeFormatThe format defined replaces the time format of the operating system (regional settings).
Syntax:TimeFormat
Example:
Set TimeFormat='hh:mm:ss';
TimestampFormatThe format defined replaces the date and time formats of the operating system (regionalsettings).
Syntax:TimestampFormat
Examples and results:The following examples use 1983-12-14T13:15:30Z as timestamp data to show the results of different SETTimestampFormat statements. The date format used is YYYYMMDD and the time format is h:mm:ss TT.The date format is specified in the SET DateFormat statement and the time format is specified in the SETTimeFormat statement, at the top of the data load script.
Example Result
SET TimestampFormat='YYYYMMDD'; 19831214
SET TimestampFormat='M/D/YY hh:mm:ss[.fff]'; 12/14/83 13:15:30
SET TimestampFormat='DD/MM/YYYY hh:mm:ss[.fff]'; 14/12/1983 13:15:30
SET TimestampFormat='DD/MM/YYYY hh:mm:ss[.fff] TT'; 14/12/1983 1:15:30 PM
SET TimestampFormat='YYYY-MM-DD hh:mm:ss[.fff] TT'; 1983-12-14 01:15:30
Results
Script syntax and chart functions - Qlik Sense, February 2022 154
2 Working with variables in the data load editor
Example: Load scriptIn the first load script SET TimestampFormat='DD/MM/YYYY h:mm:ss[.fff] TT' is used. In the second loadscript the timestamp format is changed to SET TimestampFormat='MM/DD/YYYY hh:mm:ss[.fff]'. Thedifferent results show how the SET TimeFormat statement works with different time data formats.
The table below shows the data set that is used in the load scripts that follow. The second column of thetable shows the format of each timestamp in the data set. The first five timestamps follow ISO 8601 rulesbut the sixth does not.
Data set
transaction_timestamp time data format
2018-08-30 YYYY-MM-DD
20180830T193614.857 YYYYMMDDhhmmss.sss
20180830T193614.857+0200 YYYYMMDDhhmmss.sss±hhmm
2018-09-16T12:30-02:00 YYYY-MM-DDhh:mm±hh:mm
2018-09-16T13:15:30Z YYYY-MM-DDhh:mmZ
9/30/18 19:36:14 M/D/YY hh:mm:ss
Table showing the time data used and the format for each timestamp in thedata set.
In the Data load editor, create a new section, and then add the example script and run it. Then add, atleast, the fields listed in the results column to a sheet in your app to see the result.
Load script
SET FirstWeekDay=0;
SET BrokenWeeks=1;
SET ReferenceDay=0;
SET DayNames='Mon;Tue;Wed;Thu;Fri;Sat;Sun';
SET LongDayNames='Monday;Tuesday;Wednesday;Thursday;Friday;Saturday;Sunday';
SET DateFormat='YYYYMMDD';
SET TimestampFormat='DD/MM/YYYY h:mm:ss[.fff] TT';
Transactions:
Load
*,
Timestamp(transaction_timestamp, 'YYYY-MM-DD hh:mm:ss[.fff]') as LogTimestamp
;
Load * Inline [
transaction_id, transaction_timestamp, transaction_amount, transaction_quantity, discount,
customer_id, size, color_code
3750, 2018-08-30, 12423.56, 23, 0,2038593, L, Red
3751, 20180830T193614.857, 5356.31, 6, 0.1, 203521, m, orange
3752, 20180830T193614.857+0200, 15.75, 1, 0.22, 5646471, S, blue
3753, 2018-09-16T12:30-02:00, 1251, 7, 0, 3036491, l, Black
3754, 2018-09-16T13:15:30Z, 21484.21, 1356, 75, 049681, xs, Red
Script syntax and chart functions - Qlik Sense, February 2022 155
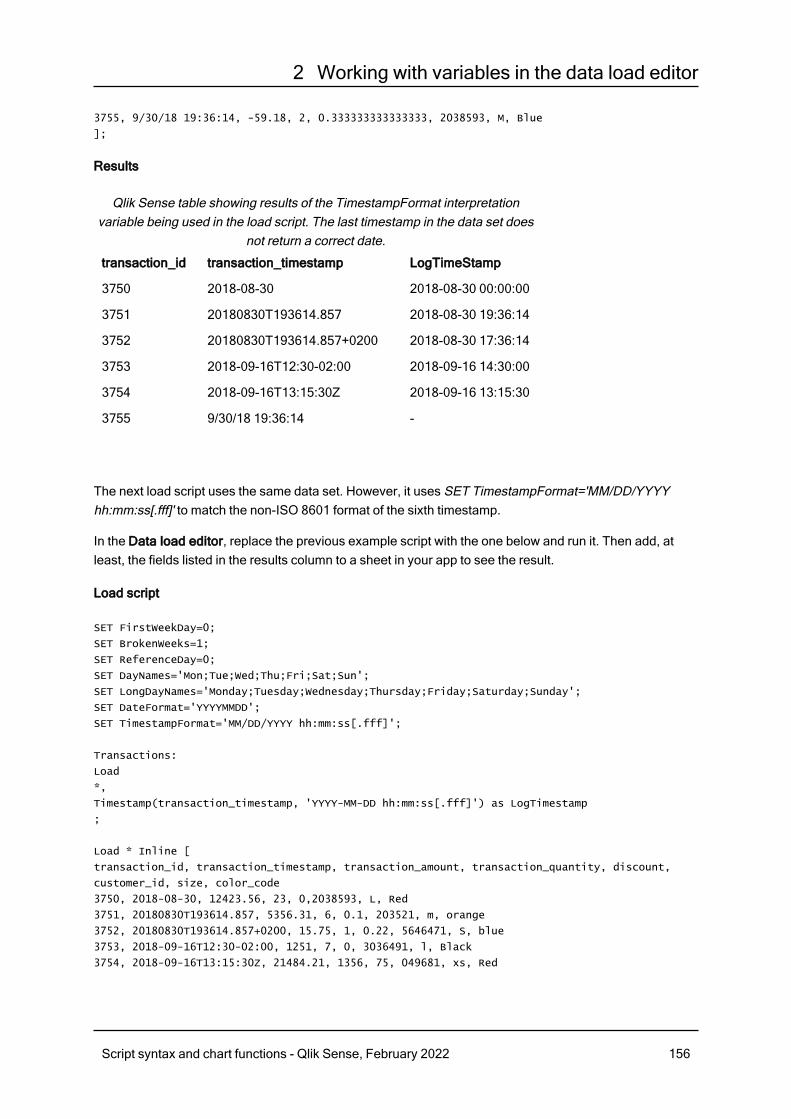
2 Working with variables in the data load editor
3755, 9/30/18 19:36:14, -59.18, 2, 0.333333333333333, 2038593, M, Blue
];
Results
transaction_id transaction_timestamp LogTimeStamp
3750 2018-08-30 2018-08-30 00:00:00
3751 20180830T193614.857 2018-08-30 19:36:14
3752 20180830T193614.857+0200 2018-08-30 17:36:14
3753 2018-09-16T12:30-02:00 2018-09-16 14:30:00
3754 2018-09-16T13:15:30Z 2018-09-16 13:15:30
3755 9/30/18 19:36:14 -
Qlik Sense table showing results of the TimestampFormat interpretationvariable being used in the load script. The last timestamp in the data set does
not return a correct date.
The next load script uses the same data set. However, it uses SET TimestampFormat='MM/DD/YYYYhh:mm:ss[.fff]' to match the non-ISO 8601 format of the sixth timestamp.
In the Data load editor, replace the previous example script with the one below and run it. Then add, atleast, the fields listed in the results column to a sheet in your app to see the result.
Load script
SET FirstWeekDay=0;
SET BrokenWeeks=1;
SET ReferenceDay=0;
SET DayNames='Mon;Tue;Wed;Thu;Fri;Sat;Sun';
SET LongDayNames='Monday;Tuesday;Wednesday;Thursday;Friday;Saturday;Sunday';
SET DateFormat='YYYYMMDD';
SET TimestampFormat='MM/DD/YYYY hh:mm:ss[.fff]';
Transactions:
Load
*,
Timestamp(transaction_timestamp, 'YYYY-MM-DD hh:mm:ss[.fff]') as LogTimestamp
;
Load * Inline [
transaction_id, transaction_timestamp, transaction_amount, transaction_quantity, discount,
customer_id, size, color_code
3750, 2018-08-30, 12423.56, 23, 0,2038593, L, Red
3751, 20180830T193614.857, 5356.31, 6, 0.1, 203521, m, orange
3752, 20180830T193614.857+0200, 15.75, 1, 0.22, 5646471, S, blue
3753, 2018-09-16T12:30-02:00, 1251, 7, 0, 3036491, l, Black
3754, 2018-09-16T13:15:30Z, 21484.21, 1356, 75, 049681, xs, Red
Script syntax and chart functions - Qlik Sense, February 2022 156
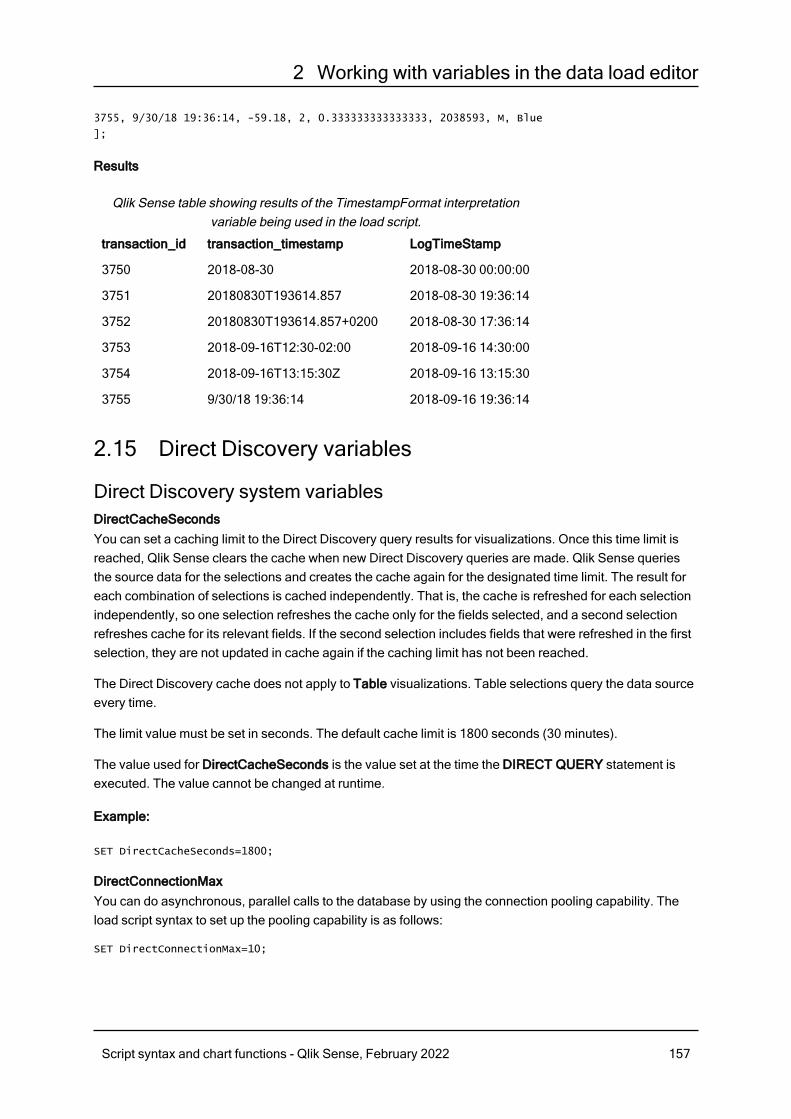
2 Working with variables in the data load editor
3755, 9/30/18 19:36:14, -59.18, 2, 0.333333333333333, 2038593, M, Blue
];
Results
transaction_id transaction_timestamp LogTimeStamp
3750 2018-08-30 2018-08-30 00:00:00
3751 20180830T193614.857 2018-08-30 19:36:14
3752 20180830T193614.857+0200 2018-08-30 17:36:14
3753 2018-09-16T12:30-02:00 2018-09-16 14:30:00
3754 2018-09-16T13:15:30Z 2018-09-16 13:15:30
3755 9/30/18 19:36:14 2018-09-16 19:36:14
Qlik Sense table showing results of the TimestampFormat interpretationvariable being used in the load script.
2.15 Direct Discovery variables
Direct Discovery system variablesDirectCacheSecondsYou can set a caching limit to the Direct Discovery query results for visualizations. Once this time limit isreached, Qlik Sense clears the cache when new Direct Discovery queries are made. Qlik Sense queriesthe source data for the selections and creates the cache again for the designated time limit. The result foreach combination of selections is cached independently. That is, the cache is refreshed for each selectionindependently, so one selection refreshes the cache only for the fields selected, and a second selectionrefreshes cache for its relevant fields. If the second selection includes fields that were refreshed in the firstselection, they are not updated in cache again if the caching limit has not been reached.
The Direct Discovery cache does not apply to Table visualizations. Table selections query the data sourceevery time.
The limit value must be set in seconds. The default cache limit is 1800 seconds (30 minutes).
The value used for DirectCacheSeconds is the value set at the time the DIRECT QUERY statement isexecuted. The value cannot be changed at runtime.
Example:
SET DirectCacheSeconds=1800;
DirectConnectionMaxYou can do asynchronous, parallel calls to the database by using the connection pooling capability. Theload script syntax to set up the pooling capability is as follows:
SET DirectConnectionMax=10;
Script syntax and chart functions - Qlik Sense, February 2022 157
2 Working with variables in the data load editor
The numeric setting specifies the maximum number of database connections the Direct Discovery codeshould use while updating a sheet. The default setting is 1.
This variable should be used with caution. Setting it to greater than 1 is known to causeproblems when connecting to Microsoft SQL Server.
DirectUnicodeStringsDirect Discovery can support the selection of extended Unicode data by using the SQL standard format forextended character string literals (N’<extended string>’) as required by some databases (notably SQLServer). The use of this syntax can be enabled for Direct Discovery with the script variableDirectUnicodeStrings.
Setting this variable to 'true' will enable the use of the ANSI standard wide character marker “N” in front ofthe string literals. Not all databases support this standard. The default setting is 'false'.
DirectDistinctSupportWhen a DIMENSION field value is selected in a Qlik Sense object, a query is generated for the sourcedatabase. When the query requires grouping, Direct Discovery uses the DISTINCT keyword to select onlyunique values. Some databases, however, require the GROUP BY keyword. Set DirectDistinctSupport to'false' to generate GROUP BY instead of DISTINCT in queries for unique values.
SET DirectDistinctSupport='false';
If DirectDistinctSupport is set to true, then DISTINCT is used. If it is not set, the default behavior is to useDISTINCT.
DirectEnableSubqueryIn high cardinality multi-table scenarios, it is possible to generate sub queries in the SQL query instead ofgenerating a large IN clause. This is activated by setting DirectEnableSubquery to 'true'. The default valueis 'false'.
When DirectEnableSubquery is enabled, you cannot load tables that are not in DirectDiscovery mode.
SET DirectEnableSubquery='true';
Teradata query banding variablesTeradata query banding is a function that enables enterprise applications to collaborate with the underlyingTeradata database in order to provide for better accounting, prioritization, and workload management.Using query banding you can wrap metadata, such as user credentials, around a query.
Two variables are available, both are strings that are evaluated and sent to the database.
SQLSessionPrefixThis string is sent when a connection to the database is created.
SET SQLSessionPrefix = 'SET QUERY_BAND = ' & Chr(39) & 'Who=' & OSuser() & ';' & Chr(39) & '
FOR SESSION;';
Script syntax and chart functions - Qlik Sense, February 2022 158
2 Working with variables in the data load editor
If OSuser() for example returns WA\sbt, this will be evaluated to SET QUERY_BAND = 'Who=WA\sbt;' FOR
SESSION; , which is sent to the database when the connection is created.
SQLQueryPrefixThis string is sent for each single query.
SET SQLSessionPrefix = 'SET QUERY_BAND = ' & Chr(39) & 'Who=' & OSuser() & ';' & Chr(39) & '
FOR TRANSACTION;';
Direct Discovery character variablesDirectFieldColumnDelimiterYou can set the character used as the field delimiter in Direct Query statements for databases that requirea character other than comma as the field delimiter. The specified character must be surrounded by singlequotation marks in the SET statement.
SET DirectFieldColumnDelimiter= '|'
DirectStringQuoteCharYou can specify a character to use to quote strings in a generated query. The default is a single quotationmark. The specified character must be surrounded by single quotation marks in the SET statement.
SET DirectStringQuoteChar= '"';
DirectIdentifierQuoteStyleYou can specify that non-ANSI quoting of identifiers be used in generated queries. At this time, the onlynon-ANSI quoting available is GoogleBQ. The default is ANSI. Uppercase, lowercase, and mixed case canbe used (ANSI, ansi, Ansi).
SET DirectIdentifierQuoteStyle="GoogleBQ";
For example, ANSI quoting is used in the following SELECT statement:
SELECT [Quarter] FROM [qvTest].[sales] GROUP BY [Quarter]
When DirectIdentifierQuoteStyle is set to "GoogleBQ", the SELECT statement would use quoting asfollows:
SELECT [Quarter] FROM [qvTest.sales] GROUP BY [Quarter]
DirectIdentifierQuoteCharYou can specify a character to control the quoting of identifiers in a generated query. This can be set toeither one character (such as a double quotation mark) or two (such as a pair of square brackets). Thedefault is a double quotation mark.
SET DirectIdentifierQuoteChar='[]';
SET DirectIdentifierQuoteChar='``';
SET DirectIdentifierQuoteChar=' ';
SET DirectIdentifierQuoteChar='""';
Script syntax and chart functions - Qlik Sense, February 2022 159
2 Working with variables in the data load editor
DirectTableBoxListThresholdWhen Direct Discovery fields are used in a Table visualization, a threshold is set to limit the number ofrows displayed. The default threshold is 1000 records. The default threshold setting can be changed bysetting the DirectTableBoxListThreshold variable in the load script. For example:
SET DirectTableBoxListThreshold=5000;
The threshold setting applies only to Table visualizations that contain Direct Discovery fields. Tablevisualizations that contain only in-memory fields are not limited by the DirectTableBoxListThresholdsetting.
No fields are displayed in the Table visualization until the selection has fewer records than the thresholdlimit.
Direct Discovery number interpretation variablesDirectMoneyDecimalSepThe decimal separator defined replaces the decimal symbol for currency in the SQL statement generatedto load data using Direct Discovery. This character must match the character used in DirectMoneyFormat.
Default value is '.'
Example:
Set DirectMoneyDecimalSep='.';
DirectMoneyFormatThe symbol defined replaces the currency format in the SQL statement generated to load data using DirectDiscovery. The currency symbol for the thousands separator should not be included.
Default value is '#.0000'
Example:
Set DirectMoneyFormat='#.0000';
DirectTimeFormatThe time format defined replaces the time format in the SQL statement generated to load data using DirectDiscovery.
Example:
Set DirectTimeFormat='hh:mm:ss';
DirectDateFormatThe date format defined replaces the date format in the SQL statement generated to load data using DirectDiscovery.
Example:
Set DirectDateFormat='MM/DD/YYYY';
Script syntax and chart functions - Qlik Sense, February 2022 160
2 Working with variables in the data load editor
DirectTimeStampFormatThe format defined replaces the date and time format in the SQL statement generated in the SQLstatement generated to load data using Direct Discovery.
Example:
Set DirectTimestampFormat='M/D/YY hh:mm:ss[.fff]';
2.16 Error variablesThe values of all error variables will exist after the script execution. The first variable, ErrorMode, is inputfrom the user, and the last three are output from Qlik Sense with information on errors in the script.
Error variables overviewEach variable is described further after the overview. You can also click the variable name in the syntax toimmediately access the details for that specific variable.
Refer to the Qlik Sense online help for further details about the variables.
ErrorModeThis error variable determines what action is to be taken by Qlik Sense when an error is encounteredduring script execution.
ErrorMode
ScriptErrorThis error variable returns the error code of the last executed script statement.
ScriptError
ScriptErrorCountThis error variable returns the total number of statements that have caused errors during the current scriptexecution. This variable is always reset to 0 at the start of script execution.
ScriptErrorCount
ScriptErrorListThis error variable will contain a concatenated list of all script errors that have occurred during the lastscript execution. Each error is separated by a line feed.
ScriptErrorList
ErrorModeThis error variable determines what action is to be taken by Qlik Sense when an error is encounteredduring script execution.
Syntax:ErrorMode
Script syntax and chart functions - Qlik Sense, February 2022 161

2 Working with variables in the data load editor
Arguments:
Argument Description
ErrorMode=1 The default setting. The script execution will halt and the user will be prompted foraction (non-batch mode).
ErrorMode =0 Qlik Sense will simply ignore the failure and continue script execution at the nextscript statement.
ErrorMode =2 Qlik Sense will trigger an "Execution of script failed..." error message immediately onfailure, without prompting the user for action beforehand.
Arguments
Example:
set ErrorMode=0;
ScriptErrorThis error variable returns the error code of the last executed script statement.
Syntax:ScriptError
This variable will be reset to 0 after each successfully executed script statement. If an error occurs it will beset to an internal Qlik Sense error code. Error codes are dual values with a numeric and a text component.The following error codes exist:
Errorcode
Description
0 No error. Dual valuetext is empty.
1 General error.
2 Syntax error.
3 General ODBC error.
4 General OLE DB error.
5 General customdatabase error.
6 General XML error.
7 General HTML error.
Script error codes
Script syntax and chart functions - Qlik Sense, February 2022 162
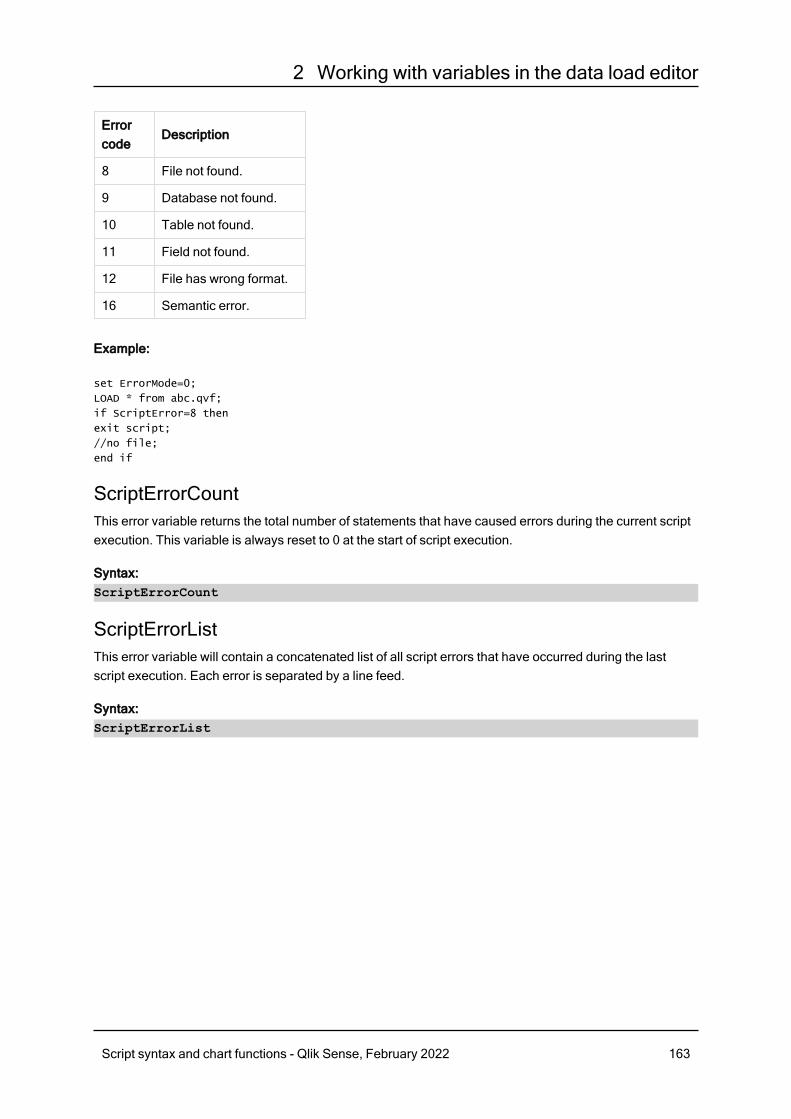
2 Working with variables in the data load editor
Errorcode
Description
8 File not found.
9 Database not found.
10 Table not found.
11 Field not found.
12 File has wrong format.
16 Semantic error.
Example:
set ErrorMode=0;
LOAD * from abc.qvf;
if ScriptError=8 then
exit script;
//no file;
end if
ScriptErrorCountThis error variable returns the total number of statements that have caused errors during the current scriptexecution. This variable is always reset to 0 at the start of script execution.
Syntax:ScriptErrorCount
ScriptErrorListThis error variable will contain a concatenated list of all script errors that have occurred during the lastscript execution. Each error is separated by a line feed.
Syntax:ScriptErrorList
Script syntax and chart functions - Qlik Sense, February 2022 163
2 Script expressions
2 Script expressionsExpressions can be used in both LOAD statements and SELECT statements. The syntaxand functions described here apply to the LOAD statement, and not to the SELECTstatement, since the latter is interpreted by the ODBC driver and not by Qlik Sense. However,most ODBC drivers are often capable of interpreting a number of the functions describedbelow.
Expressions consist of functions, fields and operators, combined in a syntax.
All expressions in a Qlik Sense script return a number and/or a string, whichever is appropriate. Logicalfunctions and operators return 0 for False and -1 for True. Number to string conversions and vice versa areimplicit. Logical operators and functions interpret 0 as False and all else as True.
The general syntax for an expression is:
Expression Fields Operator
expression ::= (constant constant |
expression ::= (constant fieldref |
expression ::= (constant operator1 expression |
expression ::= (constant expression operator2 expression |
expression ::= (constant function |
expression ::= (constant ( expression ) )
General syntax
where:
l constant is a string (a text, a date or a time) enclosed by single straight quotation marks, or anumber. Constants are written with no thousands separator and with a decimal point as the decimalseparator.
l fieldref is a field name of the loaded table.l operator1 is a unary operator (working on one expression, the one to the right).l operator2 is a binary operator (working on two expressions, one on each side).l function ::= functionname( parameters)l parameters ::= expression { , expression }
The number and types of parameters are not arbitrary. They depend on the function used.
Expressions and functions can thus be nested freely, and as long as the expression returns aninterpretable value, Qlik Sense will not give any error messages.
Script syntax and chart functions - Qlik Sense, February 2022 164
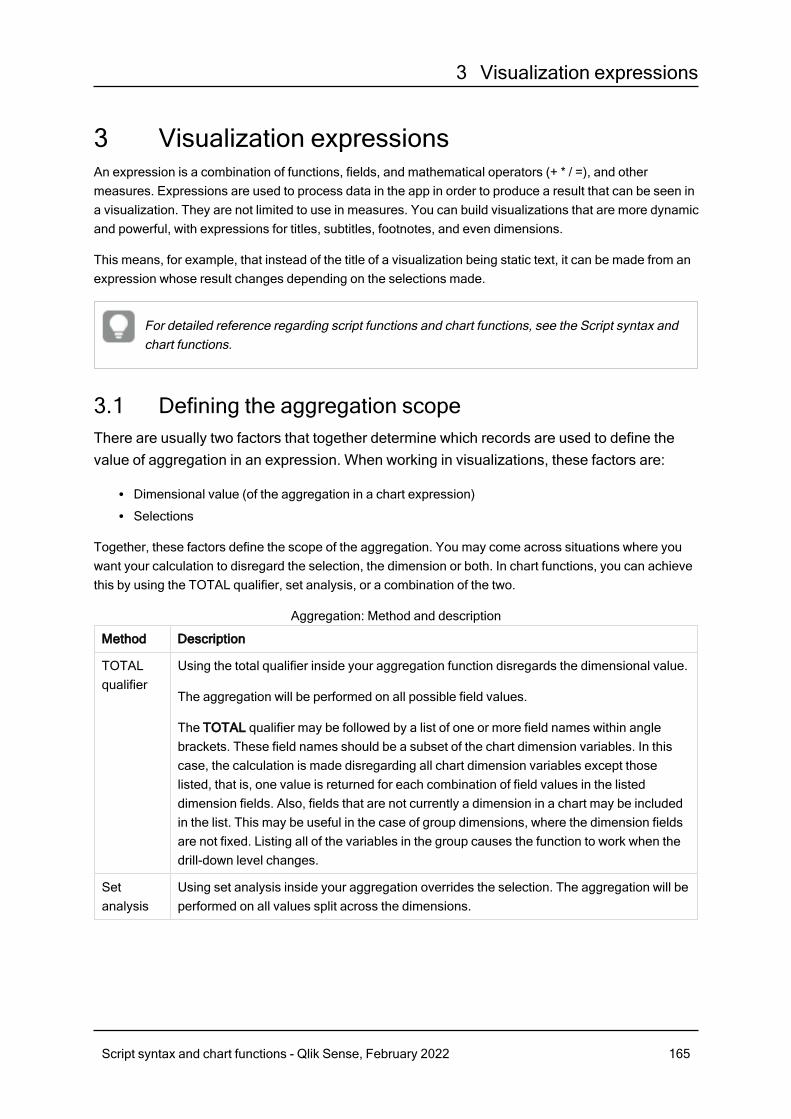
3 Visualization expressions
3 Visualization expressionsAn expression is a combination of functions, fields, and mathematical operators (+ * / =), and othermeasures. Expressions are used to process data in the app in order to produce a result that can be seen ina visualization. They are not limited to use in measures. You can build visualizations that are more dynamicand powerful, with expressions for titles, subtitles, footnotes, and even dimensions.
This means, for example, that instead of the title of a visualization being static text, it can be made from anexpression whose result changes depending on the selections made.
For detailed reference regarding script functions and chart functions, see the Script syntax andchart functions.
3.1 Defining the aggregation scopeThere are usually two factors that together determine which records are used to define thevalue of aggregation in an expression. When working in visualizations, these factors are:
l Dimensional value (of the aggregation in a chart expression)l Selections
Together, these factors define the scope of the aggregation. You may come across situations where youwant your calculation to disregard the selection, the dimension or both. In chart functions, you can achievethis by using the TOTAL qualifier, set analysis, or a combination of the two.
Method Description
TOTALqualifier
Using the total qualifier inside your aggregation function disregards the dimensional value.
The aggregation will be performed on all possible field values.
The TOTAL qualifier may be followed by a list of one or more field names within anglebrackets. These field names should be a subset of the chart dimension variables. In thiscase, the calculation is made disregarding all chart dimension variables except thoselisted, that is, one value is returned for each combination of field values in the listeddimension fields. Also, fields that are not currently a dimension in a chart may be includedin the list. This may be useful in the case of group dimensions, where the dimension fieldsare not fixed. Listing all of the variables in the group causes the function to work when thedrill-down level changes.
Setanalysis
Using set analysis inside your aggregation overrides the selection. The aggregation will beperformed on all values split across the dimensions.
Aggregation: Method and description
Script syntax and chart functions - Qlik Sense, February 2022 165
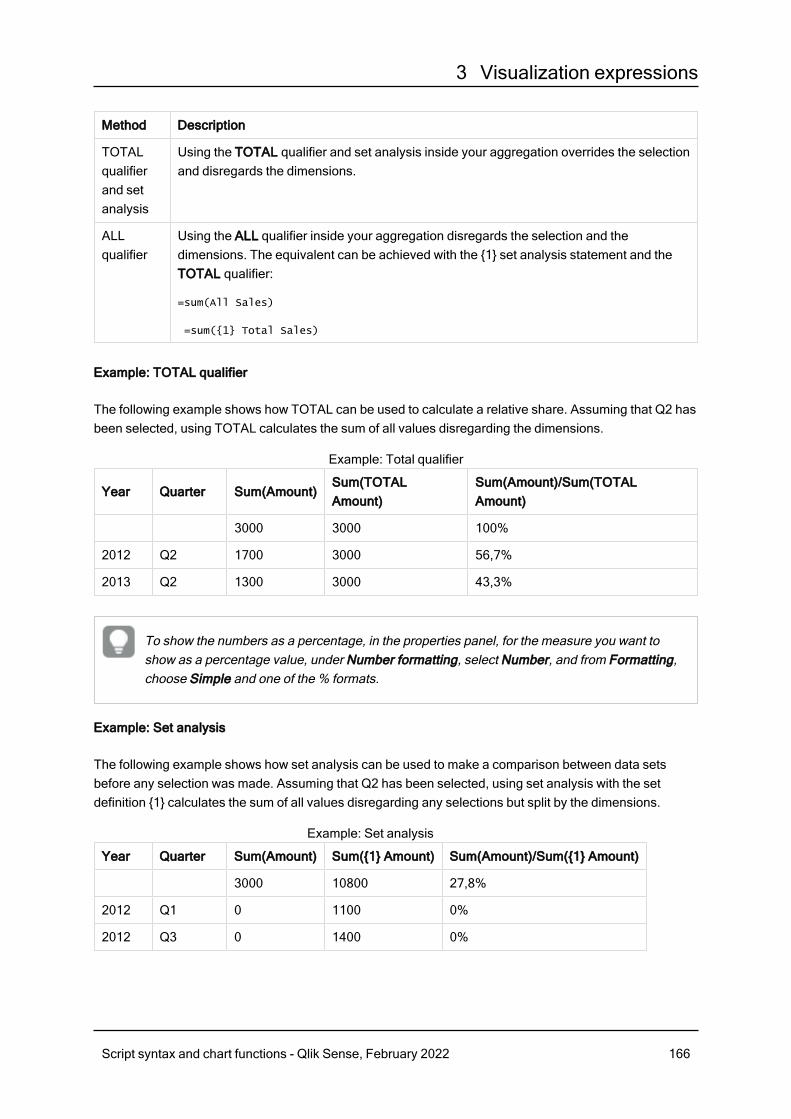
3 Visualization expressions
Method Description
TOTALqualifierand setanalysis
Using the TOTAL qualifier and set analysis inside your aggregation overrides the selectionand disregards the dimensions.
ALLqualifier
Using the ALL qualifier inside your aggregation disregards the selection and thedimensions. The equivalent can be achieved with the {1} set analysis statement and theTOTAL qualifier:
=sum(All Sales)
=sum({1} Total Sales)
Example: TOTAL qualifier
The following example shows how TOTAL can be used to calculate a relative share. Assuming that Q2 hasbeen selected, using TOTAL calculates the sum of all values disregarding the dimensions.
Year Quarter Sum(Amount)Sum(TOTALAmount)
Sum(Amount)/Sum(TOTALAmount)
3000 3000 100%
2012 Q2 1700 3000 56,7%
2013 Q2 1300 3000 43,3%
Example: Total qualifier
To show the numbers as a percentage, in the properties panel, for the measure you want toshow as a percentage value, under Number formatting, select Number, and from Formatting,choose Simple and one of the % formats.
Example: Set analysis
The following example shows how set analysis can be used to make a comparison between data setsbefore any selection was made. Assuming that Q2 has been selected, using set analysis with the setdefinition {1} calculates the sum of all values disregarding any selections but split by the dimensions.
Year Quarter Sum(Amount) Sum({1} Amount) Sum(Amount)/Sum({1} Amount)
3000 10800 27,8%
2012 Q1 0 1100 0%
2012 Q3 0 1400 0%
Example: Set analysis
Script syntax and chart functions - Qlik Sense, February 2022 166

3 Visualization expressions
Year Quarter Sum(Amount) Sum({1} Amount) Sum(Amount)/Sum({1} Amount)
2012 Q4 0 1800 0%
2012 Q2 1700 1700 100%
2013 Q1 0 1000 0%
2013 Q3 0 1100 0%
2013 Q4 0 1400 0%
2013 Q2 1300 1300 100%
Example: TOTAL qualifier and set analysis
The following example shows how set analysis and the TOTAL qualifier can be combined to make acomparison between data sets before any selection was made and across all dimensions. Assuming thatQ2 has been selected, using set analysis with the set definition {1} and the TOTAL qualifier calculates thesum of all values disregarding any selections and disregarding the dimensions.
Year QuarterSum(Amount)
Sum({1} TOTALAmount)
Sum(Amount)/Sum({1} TOTALAmount)
3000 10800 27,8%
2012 Q2 1700 10800 15,7%
2013 Q2 1300 10800 12%
Example: TOTAL qualifier and set analysis
Data used in examples:
AggregationScope:
LOAD * inline [
Year Quarter Amount
2012 Q1 1100
2012 Q2 1700
2012 Q3 1400
2012 Q4 1800
2013 Q1 1000
2013 Q2 1300
2013 Q3 1100
2013 Q4 1400] (delimiter is ' ');
3.2 Set analysisWhen you make a selection in an app, you define a subset of records in the data. Aggregationfunctions, such as Sum(), Max(), Min(), Avg(), and Count() are calculated based on this subset.
In other words, your selection defines the scope of the aggregation; it defines the set of records on whichcalculations are made.
Script syntax and chart functions - Qlik Sense, February 2022 167
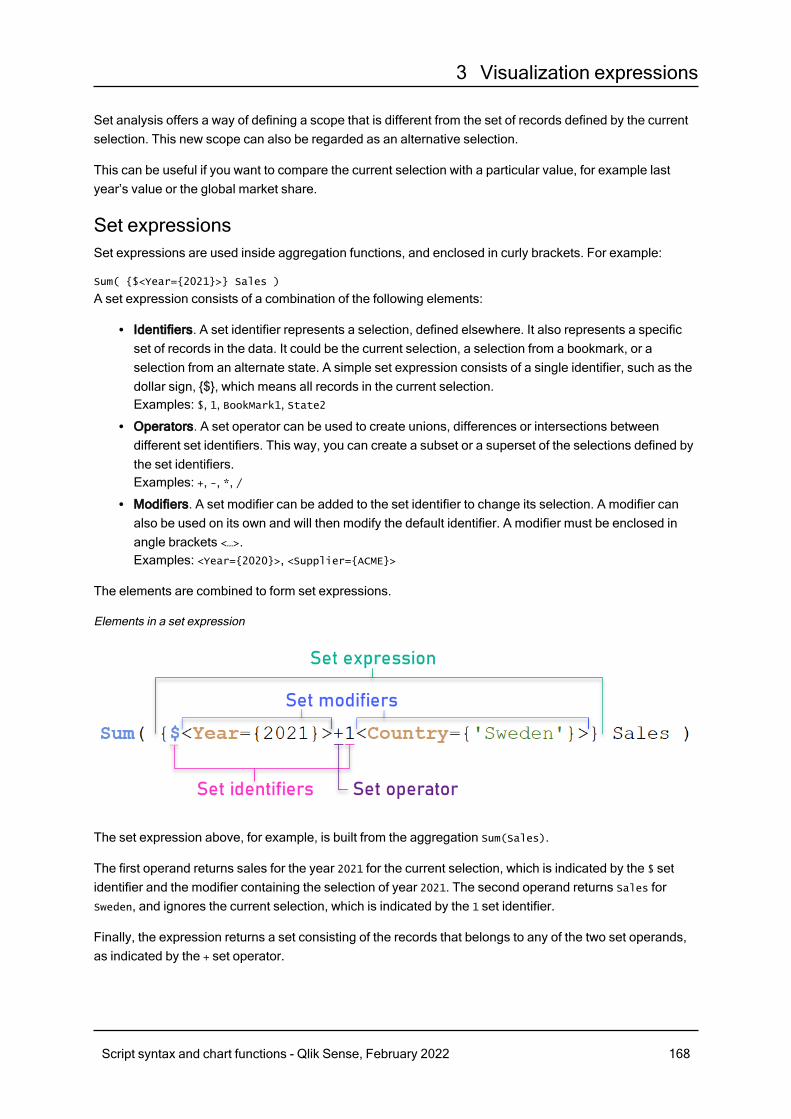
3 Visualization expressions
Set analysis offers a way of defining a scope that is different from the set of records defined by the currentselection. This new scope can also be regarded as an alternative selection.
This can be useful if you want to compare the current selection with a particular value, for example lastyear’s value or the global market share.
Set expressionsSet expressions are used inside aggregation functions, and enclosed in curly brackets. For example:
Sum( {$<Year={2021}>} Sales )
A set expression consists of a combination of the following elements:
l Identifiers. A set identifier represents a selection, defined elsewhere. It also represents a specificset of records in the data. It could be the current selection, a selection from a bookmark, or aselection from an alternate state. A simple set expression consists of a single identifier, such as thedollar sign, {$}, which means all records in the current selection.Examples: $, 1, BookMark1, State2
l Operators. A set operator can be used to create unions, differences or intersections betweendifferent set identifiers. This way, you can create a subset or a superset of the selections defined bythe set identifiers.Examples: +, -, *, /
l Modifiers. A set modifier can be added to the set identifier to change its selection. A modifier canalso be used on its own and will then modify the default identifier. A modifier must be enclosed inangle brackets <…>.Examples: <Year={2020}>, <Supplier={ACME}>
The elements are combined to form set expressions.
Elements in a set expression
The set expression above, for example, is built from the aggregation Sum(Sales).
The first operand returns sales for the year 2021 for the current selection, which is indicated by the $ setidentifier and the modifier containing the selection of year 2021. The second operand returns Sales forSweden, and ignores the current selection, which is indicated by the 1 set identifier.
Finally, the expression returns a set consisting of the records that belongs to any of the two set operands,as indicated by the + set operator.
Script syntax and chart functions - Qlik Sense, February 2022 168
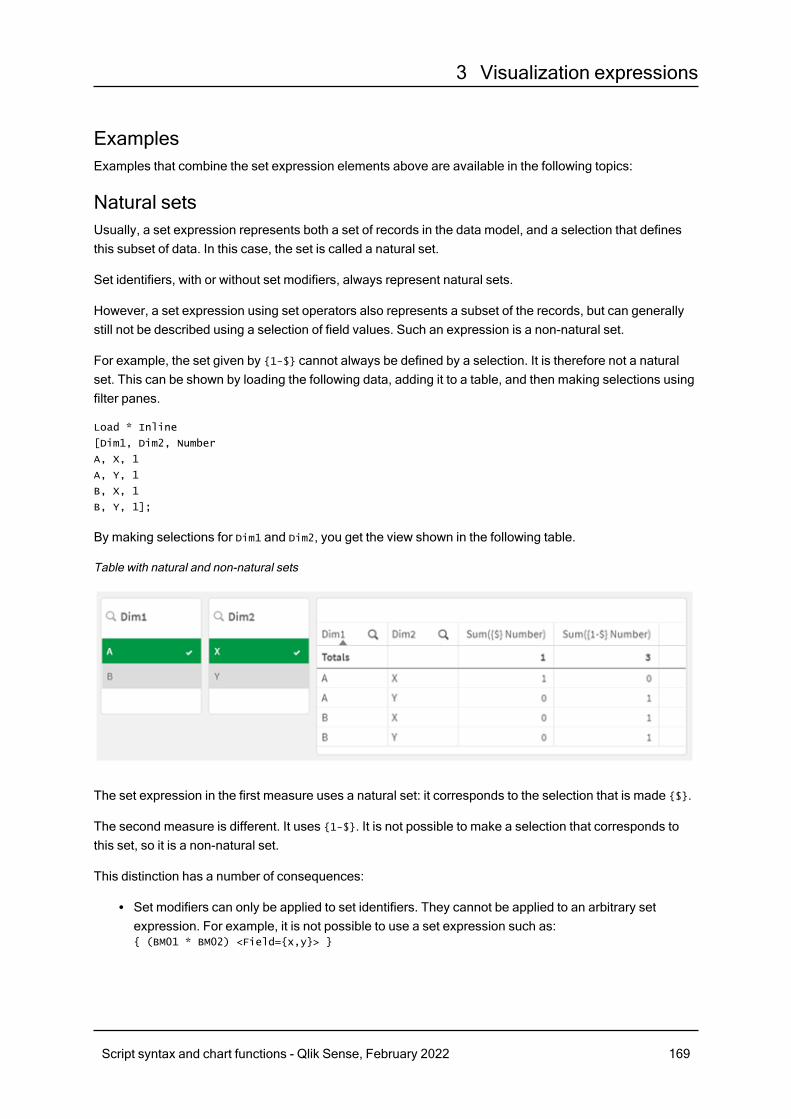
3 Visualization expressions
ExamplesExamples that combine the set expression elements above are available in the following topics:
Natural setsUsually, a set expression represents both a set of records in the data model, and a selection that definesthis subset of data. In this case, the set is called a natural set.
Set identifiers, with or without set modifiers, always represent natural sets.
However, a set expression using set operators also represents a subset of the records, but can generallystill not be described using a selection of field values. Such an expression is a non-natural set.
For example, the set given by {1-$} cannot always be defined by a selection. It is therefore not a naturalset. This can be shown by loading the following data, adding it to a table, and then making selections usingfilter panes.
Load * Inline
[Dim1, Dim2, Number
A, X, 1
A, Y, 1
B, X, 1
B, Y, 1];
By making selections for Dim1 and Dim2, you get the view shown in the following table.
Table with natural and non-natural sets
The set expression in the first measure uses a natural set: it corresponds to the selection that is made {$}.
The second measure is different. It uses {1-$}. It is not possible to make a selection that corresponds tothis set, so it is a non-natural set.
This distinction has a number of consequences:
l Set modifiers can only be applied to set identifiers. They cannot be applied to an arbitrary setexpression. For example, it is not possible to use a set expression such as: { (BM01 * BM02) <Field={x,y}> }
Script syntax and chart functions - Qlik Sense, February 2022 169
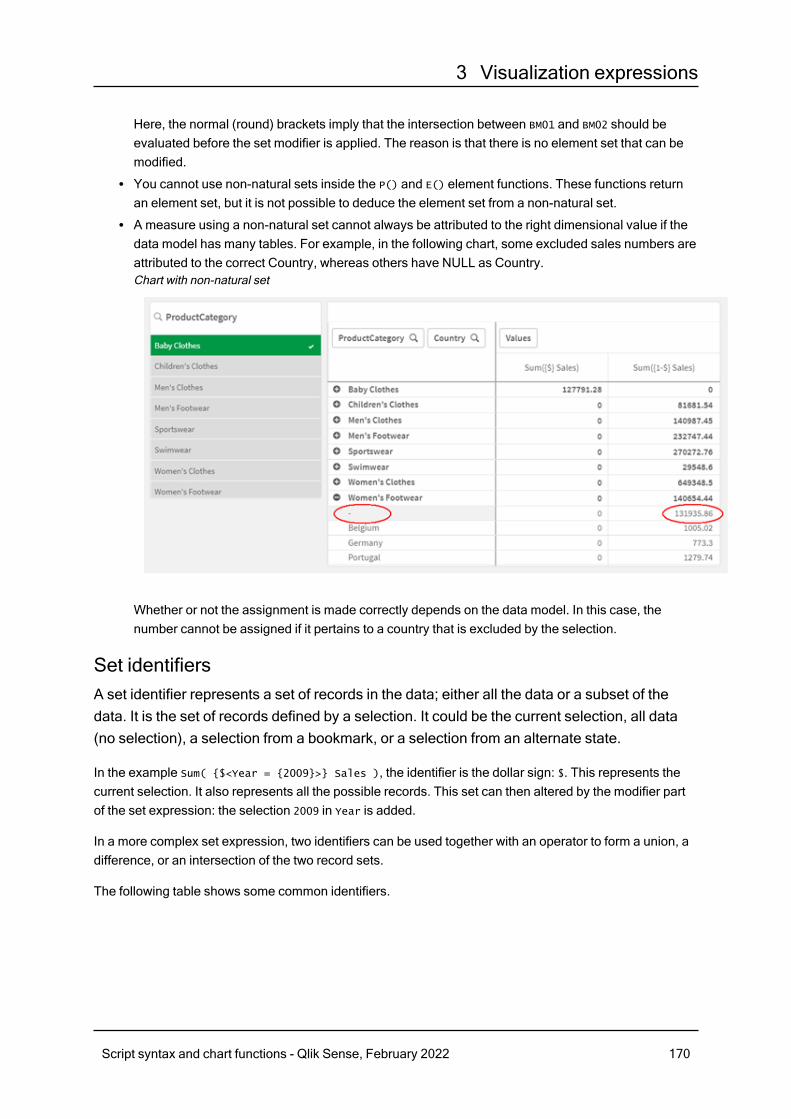
3 Visualization expressions
Here, the normal (round) brackets imply that the intersection between BM01 and BM02 should beevaluated before the set modifier is applied. The reason is that there is no element set that can bemodified.
l You cannot use non-natural sets inside the P() and E() element functions. These functions returnan element set, but it is not possible to deduce the element set from a non-natural set.
l A measure using a non-natural set cannot always be attributed to the right dimensional value if thedata model has many tables. For example, in the following chart, some excluded sales numbers areattributed to the correct Country, whereas others have NULL as Country.Chart with non-natural set
Whether or not the assignment is made correctly depends on the data model. In this case, thenumber cannot be assigned if it pertains to a country that is excluded by the selection.
Set identifiersA set identifier represents a set of records in the data; either all the data or a subset of thedata. It is the set of records defined by a selection. It could be the current selection, all data(no selection), a selection from a bookmark, or a selection from an alternate state.
In the example Sum( {$<Year = {2009}>} Sales ), the identifier is the dollar sign: $. This represents thecurrent selection. It also represents all the possible records. This set can then altered by the modifier partof the set expression: the selection 2009 in Year is added.
In a more complex set expression, two identifiers can be used together with an operator to form a union, adifference, or an intersection of the two record sets.
The following table shows some common identifiers.
Script syntax and chart functions - Qlik Sense, February 2022 170
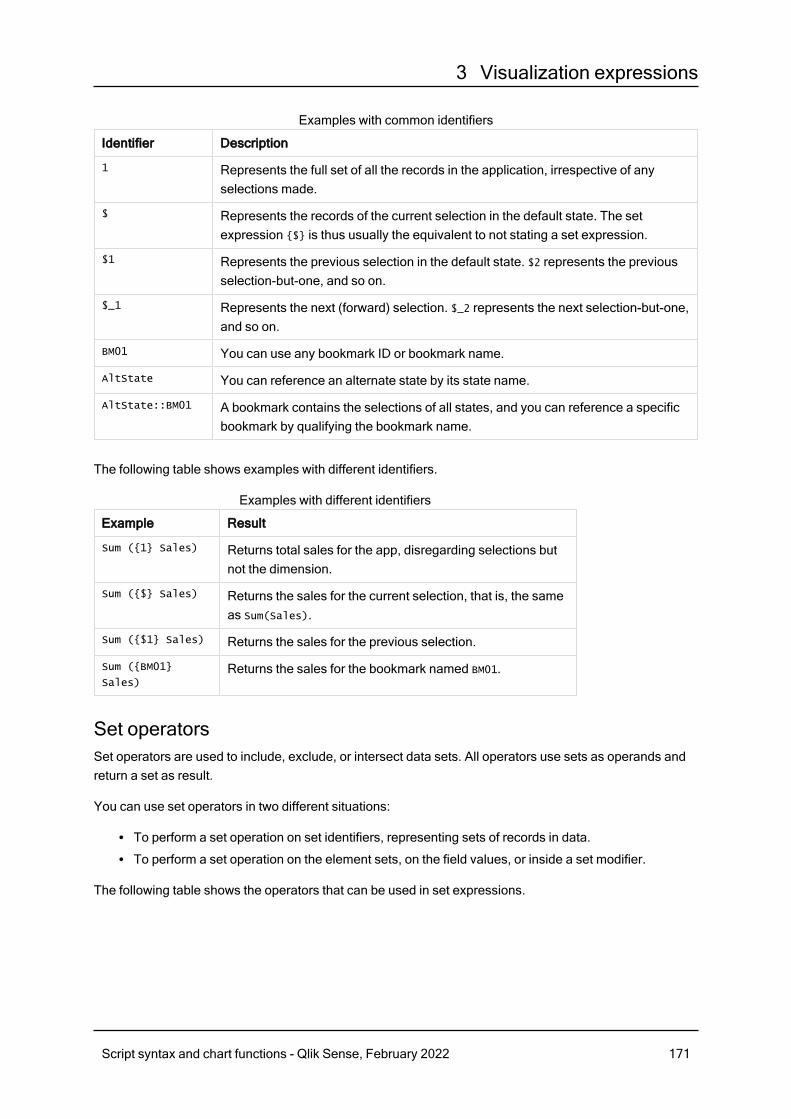
3 Visualization expressions
Identifier Description
1 Represents the full set of all the records in the application, irrespective of anyselections made.
$ Represents the records of the current selection in the default state. The setexpression {$} is thus usually the equivalent to not stating a set expression.
$1 Represents the previous selection in the default state. $2 represents the previousselection-but-one, and so on.
$_1 Represents the next (forward) selection. $_2 represents the next selection-but-one,and so on.
BM01 You can use any bookmark ID or bookmark name.
AltState You can reference an alternate state by its state name.
AltState::BM01 A bookmark contains the selections of all states, and you can reference a specificbookmark by qualifying the bookmark name.
Examples with common identifiers
The following table shows examples with different identifiers.
Example Result
Sum ({1} Sales) Returns total sales for the app, disregarding selections butnot the dimension.
Sum ({$} Sales) Returns the sales for the current selection, that is, the sameas Sum(Sales).
Sum ({$1} Sales) Returns the sales for the previous selection.
Sum ({BM01}
Sales)Returns the sales for the bookmark named BM01.
Examples with different identifiers
Set operatorsSet operators are used to include, exclude, or intersect data sets. All operators use sets as operands andreturn a set as result.
You can use set operators in two different situations:
l To perform a set operation on set identifiers, representing sets of records in data.l To perform a set operation on the element sets, on the field values, or inside a set modifier.
The following table shows the operators that can be used in set expressions.
Script syntax and chart functions - Qlik Sense, February 2022 171
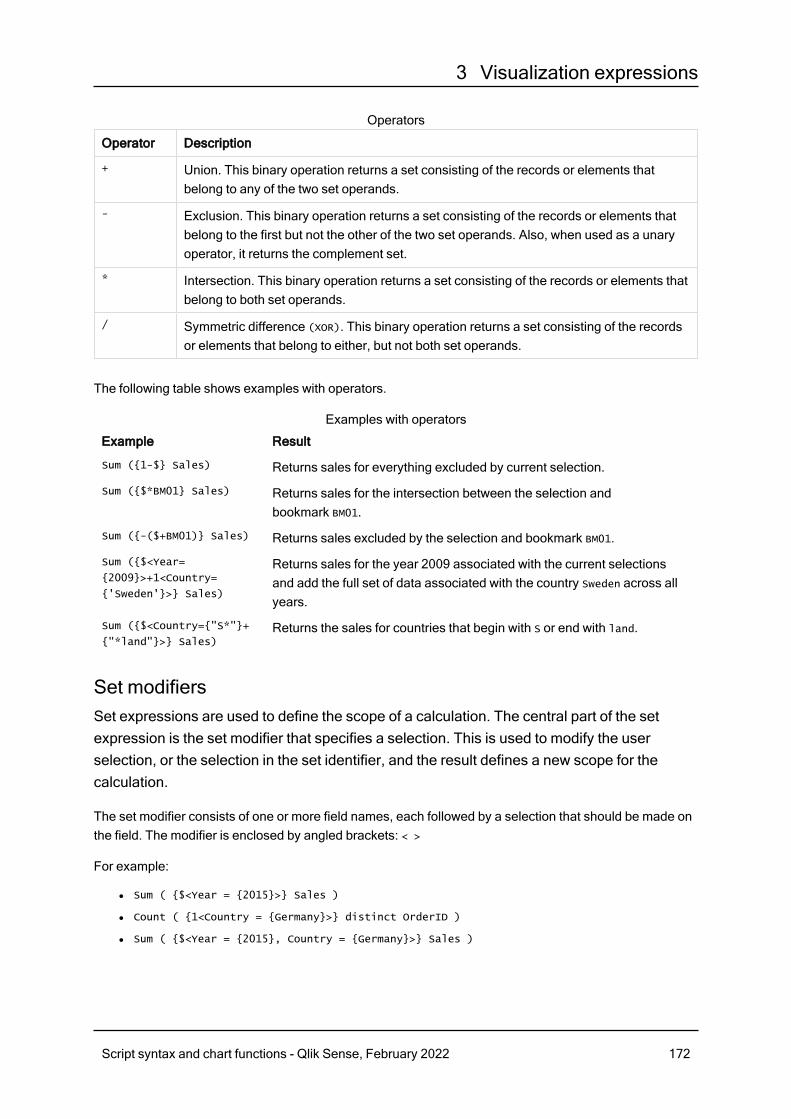
3 Visualization expressions
Operator Description
+ Union. This binary operation returns a set consisting of the records or elements thatbelong to any of the two set operands.
- Exclusion. This binary operation returns a set consisting of the records or elements thatbelong to the first but not the other of the two set operands. Also, when used as a unaryoperator, it returns the complement set.
* Intersection. This binary operation returns a set consisting of the records or elements thatbelong to both set operands.
/ Symmetric difference (XOR). This binary operation returns a set consisting of the recordsor elements that belong to either, but not both set operands.
Operators
The following table shows examples with operators.
Example Result
Sum ({1-$} Sales) Returns sales for everything excluded by current selection.
Sum ({$*BM01} Sales) Returns sales for the intersection between the selection andbookmark BM01.
Sum ({-($+BM01)} Sales) Returns sales excluded by the selection and bookmark BM01.
Sum ({$<Year=
{2009}>+1<Country=
{'Sweden'}>} Sales)
Returns sales for the year 2009 associated with the current selectionsand add the full set of data associated with the country Sweden across allyears.
Sum ({$<Country={"S*"}+
{"*land"}>} Sales)Returns the sales for countries that begin with S or end with land.
Examples with operators
Set modifiersSet expressions are used to define the scope of a calculation. The central part of the setexpression is the set modifier that specifies a selection. This is used to modify the userselection, or the selection in the set identifier, and the result defines a new scope for thecalculation.
The set modifier consists of one or more field names, each followed by a selection that should be made onthe field. The modifier is enclosed by angled brackets: < >
For example:
l Sum ( {$<Year = {2015}>} Sales )
l Count ( {1<Country = {Germany}>} distinct OrderID )
l Sum ( {$<Year = {2015}, Country = {Germany}>} Sales )
Script syntax and chart functions - Qlik Sense, February 2022 172
3 Visualization expressions
Element setsAn element set can be defined using the following:
l A list of valuesl A searchl A reference to another fieldl A set function
If the element set definition is omitted, the set modifier will clear any selection in this field. For example:
Sum( {$<Year = >} Sales )
Examples: Chart expressions for set modifiers based on element setsExamples - chart expressions
Load script
Load the following data as an inline load in the data load editor to create the chart expression examplesbelow.
MyTable:
Load * Inline [
Country, Year, Sales
Argentina, 2014, 66295.03
Argentina, 2015, 140037.89
Austria, 2014, 54166.09
Austria, 2015, 182739.87
Belgium, 2014, 182766.87
Belgium, 2015, 178042.33
Brazil, 2014, 174492.67
Brazil, 2015, 2104.22
Canada, 2014, 101801.33
Canada, 2015, 40288.25
Denmark, 2014, 45273.25
Denmark, 2015, 106938.41
Finland, 2014, 107565.55
Finland, 2015, 30583.44
France, 2014, 115644.26
France, 2015, 30696.98
Germany, 2014, 8775.18
Germany, 2015, 77185.68
];
Chart expressions
Create a table in a Qlik Sense sheet with the following chart expressions.
Script syntax and chart functions - Qlik Sense, February 2022 173
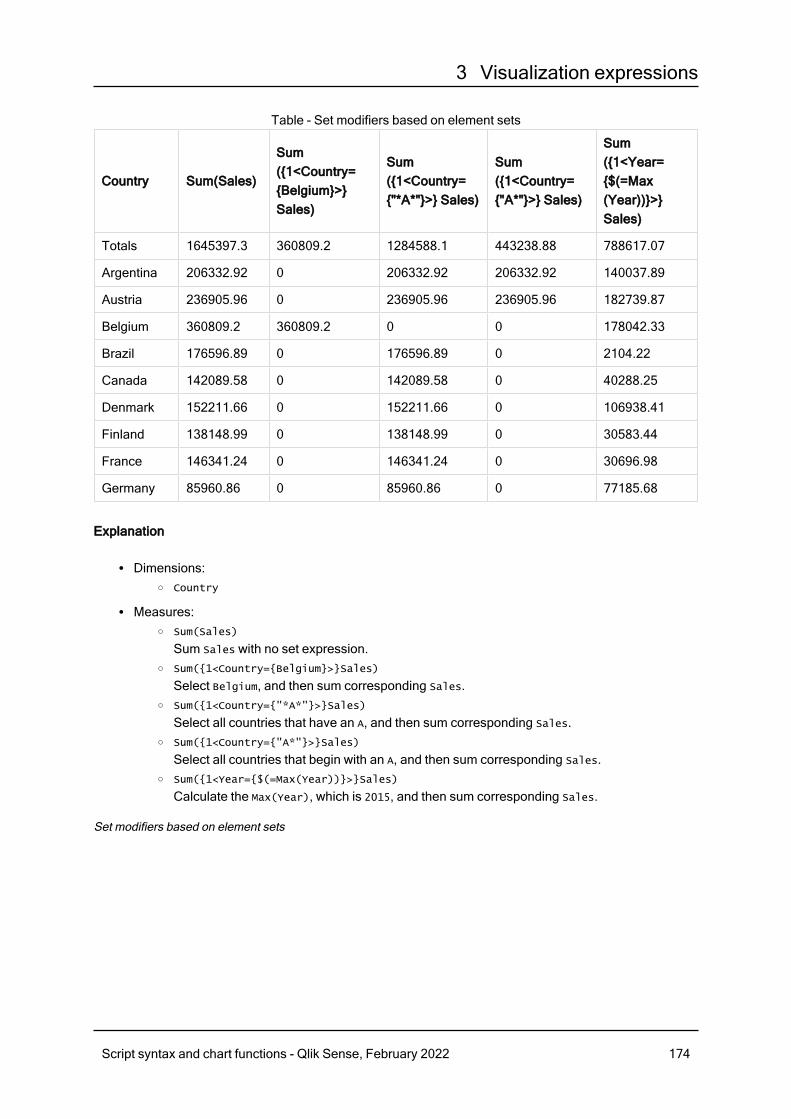
3 Visualization expressions
Country Sum(Sales)
Sum({1<Country={Belgium}>}Sales)
Sum({1<Country={"*A*"}>} Sales)
Sum({1<Country={"A*"}>} Sales)
Sum({1<Year={$(=Max(Year))}>}Sales)
Totals 1645397.3 360809.2 1284588.1 443238.88 788617.07
Argentina 206332.92 0 206332.92 206332.92 140037.89
Austria 236905.96 0 236905.96 236905.96 182739.87
Belgium 360809.2 360809.2 0 0 178042.33
Brazil 176596.89 0 176596.89 0 2104.22
Canada 142089.58 0 142089.58 0 40288.25
Denmark 152211.66 0 152211.66 0 106938.41
Finland 138148.99 0 138148.99 0 30583.44
France 146341.24 0 146341.24 0 30696.98
Germany 85960.86 0 85960.86 0 77185.68
Table - Set modifiers based on element sets
Explanation
l Dimensions:o Country
l Measures:o Sum(Sales)
Sum Sales with no set expression.o Sum({1<Country={Belgium}>}Sales)
Select Belgium, and then sum corresponding Sales.o Sum({1<Country={"*A*"}>}Sales)
Select all countries that have an A, and then sum corresponding Sales.o Sum({1<Country={"A*"}>}Sales)
Select all countries that begin with an A, and then sum corresponding Sales.o Sum({1<Year={$(=Max(Year))}>}Sales)
Calculate the Max(Year), which is 2015, and then sum corresponding Sales.
Set modifiers based on element sets
Script syntax and chart functions - Qlik Sense, February 2022 174
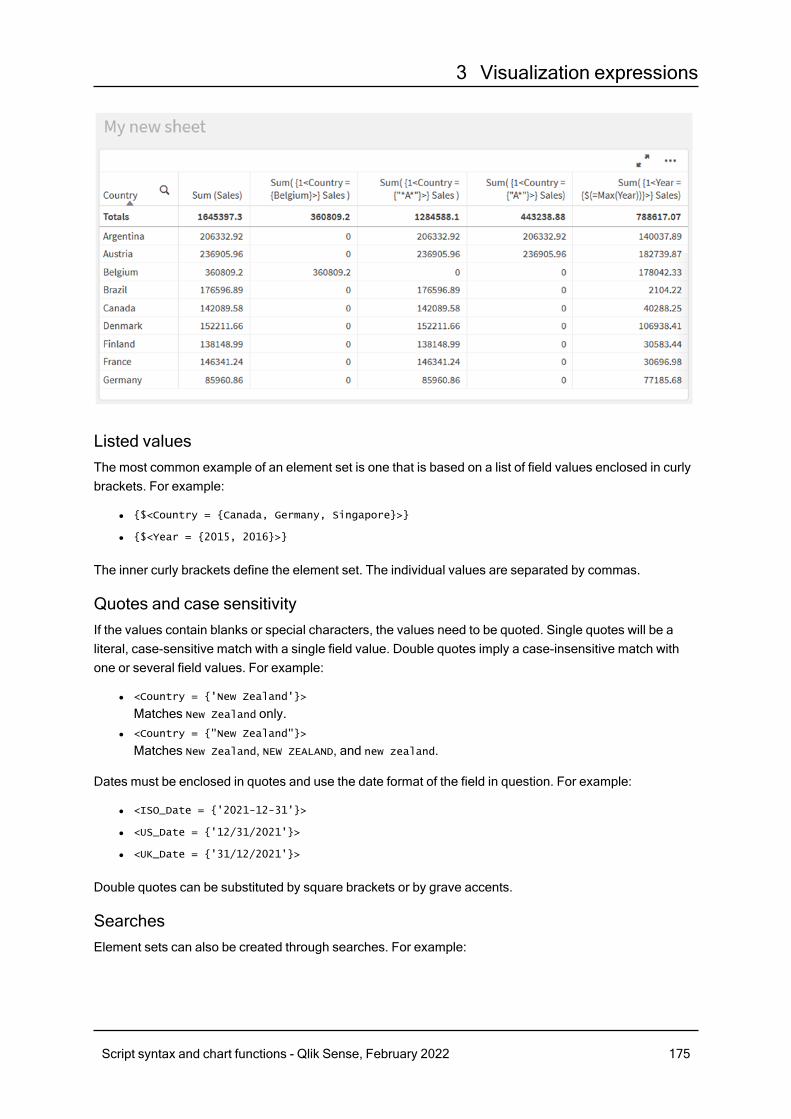
3 Visualization expressions
Listed valuesThe most common example of an element set is one that is based on a list of field values enclosed in curlybrackets. For example:
l {$<Country = {Canada, Germany, Singapore}>}
l {$<Year = {2015, 2016}>}
The inner curly brackets define the element set. The individual values are separated by commas.
Quotes and case sensitivityIf the values contain blanks or special characters, the values need to be quoted. Single quotes will be aliteral, case-sensitive match with a single field value. Double quotes imply a case-insensitive match withone or several field values. For example:
l <Country = {'New Zealand'}>
Matches New Zealand only.l <Country = {"New Zealand"}>
Matches New Zealand, NEW ZEALAND, and new zealand.
Dates must be enclosed in quotes and use the date format of the field in question. For example:
l <ISO_Date = {'2021-12-31'}>
l <US_Date = {'12/31/2021'}>
l <UK_Date = {'31/12/2021'}>
Double quotes can be substituted by square brackets or by grave accents.
SearchesElement sets can also be created through searches. For example:
Script syntax and chart functions - Qlik Sense, February 2022 175
3 Visualization expressions
l <Country = {"C*"}>
l <Ingredient = {"*garlic*"}>
l <Year = {">2015"}>
l <Date = {">12/31/2015"}>
Wildcards can be used in a text searches: An asterisk (*) represents any number of characters, and aquestion mark (?) represents a single character. Relational operators can be used to define numericsearches.
You should always use double quotes for searches. Searches are case-insensitive.
Dollar expansionsDollar expansions are needed if you want to use a calculation inside your element set. For example, if youwant to look at the last possible year only, you can use:
<Year = {$(=Max(Year))}>
Selected values in other fieldsModifiers can be based on the selected values of another field. For example:
<OrderDate = DeliveryDate>
This modifier will take the selected values from DeliveryDate and apply those as a selection on OrderDate.If there are many distinct values – more than a couple of hundred – then this operation is CPU intensive andshould be avoided.
Element set functionsThe element set can also be based on the set functions P() (possible values) and E() (excluded values).
For example, if you want to select countries where the product Cap has been sold, you can use:
<Country = P({1<Product={Cap}>} Country)>
Similarly, if you want to pick out the countries where the product Cap has not been sold, you can use:
<Country = E({1<Product={Cap}>} Country)>
Set modifiers with searches
You can create element sets through searches with set modifiers.
For example:
l <Country = {"C*"}>
l <Year = {">2015"}>
l <Ingredient = {"*garlic*"}>
Searches should always be enclosed in double quotes, square brackets or grave accents. You can use alist with a mixture of literal strings (single quotes) and searches (double quotes). For example:
<Product = {'Nut', "*Bolt", Washer}>
Script syntax and chart functions - Qlik Sense, February 2022 176
3 Visualization expressions
Text searchesWildcards and other symbols can be used in text searches:
l An asterisk (*) will represent any number of characters.l A question mark (?) will represent a single character.l A circumflex accent (^) will mark the beginning of a word.
For example:
l <Country = {"C*", "*land"}>
Match all countries beginning with a C or ending with land.l <Country = {"*^z*"}>
This will match all countries that have a word beginning with z, such as New Zealand.
Numeric searchesYou can make numeric searches using these relational operators: >, >=, <, <=
A numeric search always begins with one of these operators. For example:
l <Year = {">2015"}>
Match 2016 and subsequent years.l <Date = {">=1/1/2015<1/1/2016"}>
Match all dates during 2015. Note the syntax for describing a time range between two dates. Thedate format needs to match the date format of the field in question.
Expression searchesYou can use expression searches to make more advanced searches. An aggregation is then evaluated foreach field value in the search field. All values for which the search expression returns true are selected.
An expression search always begins with an equals sign: =
For example:
<Customer = {"=Sum(Sales)>1000"}>
This will return all customers with a sales value greater than 1000. Sum(Sales) is calculated on the currentselection. This means that if you have a selection in another field, such as the Product field, you will get thecustomers that fulfilled the sales condition for the selected products only.
If you want the condition to be independent of the selection, you need to use set analysis inside the searchstring. For example:
<Customer = {"=Sum({1} Sales)>1000"}>
The expressions after the equals sign will be interpreted as a boolean value. This means that if it evaluatesto something else, any non-zero number will be interpreted as true, while zero and strings are interpretedas false.
Script syntax and chart functions - Qlik Sense, February 2022 177
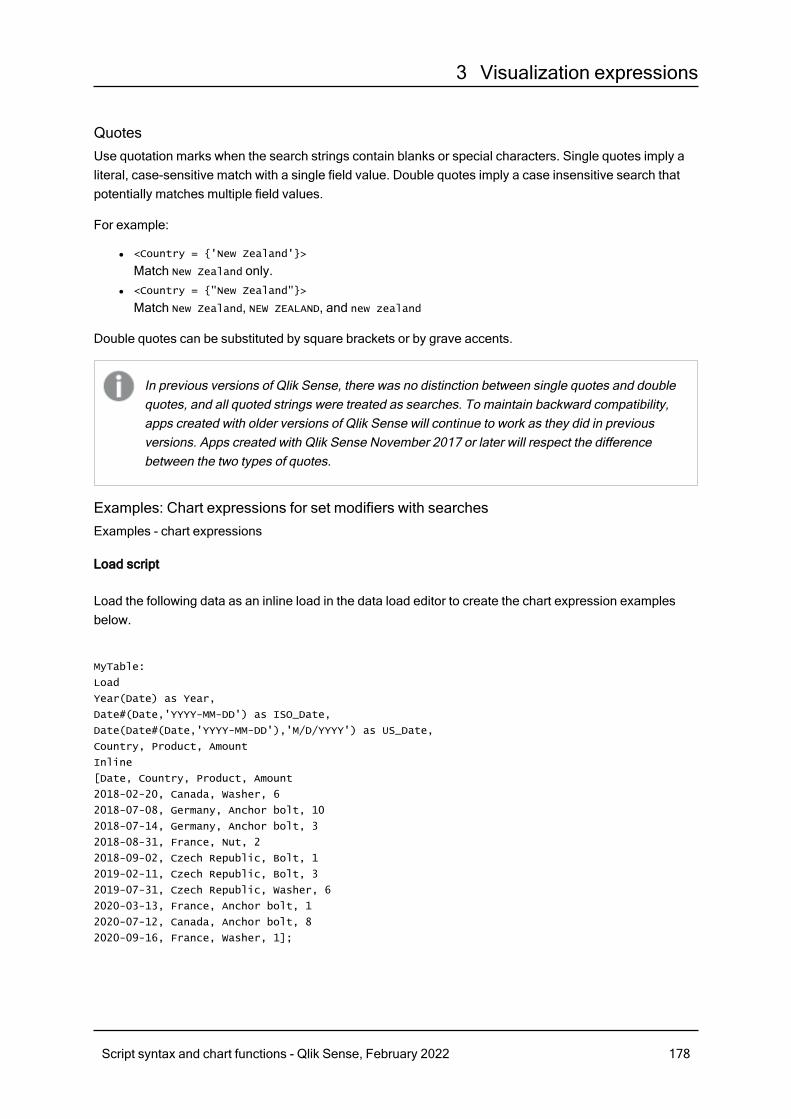
3 Visualization expressions
QuotesUse quotation marks when the search strings contain blanks or special characters. Single quotes imply aliteral, case-sensitive match with a single field value. Double quotes imply a case insensitive search thatpotentially matches multiple field values.
For example:
l <Country = {'New Zealand'}>
Match New Zealand only.l <Country = {"New Zealand"}>
Match New Zealand, NEW ZEALAND, and new zealand
Double quotes can be substituted by square brackets or by grave accents.
In previous versions of Qlik Sense, there was no distinction between single quotes and doublequotes, and all quoted strings were treated as searches. To maintain backward compatibility,apps created with older versions of Qlik Sense will continue to work as they did in previousversions. Apps created with Qlik Sense November 2017 or later will respect the differencebetween the two types of quotes.
Examples: Chart expressions for set modifiers with searchesExamples - chart expressions
Load script
Load the following data as an inline load in the data load editor to create the chart expression examplesbelow.
MyTable:
Load
Year(Date) as Year,
Date#(Date,'YYYY-MM-DD') as ISO_Date,
Date(Date#(Date,'YYYY-MM-DD'),'M/D/YYYY') as US_Date,
Country, Product, Amount
Inline
[Date, Country, Product, Amount
2018-02-20, Canada, Washer, 6
2018-07-08, Germany, Anchor bolt, 10
2018-07-14, Germany, Anchor bolt, 3
2018-08-31, France, Nut, 2
2018-09-02, Czech Republic, Bolt, 1
2019-02-11, Czech Republic, Bolt, 3
2019-07-31, Czech Republic, Washer, 6
2020-03-13, France, Anchor bolt, 1
2020-07-12, Canada, Anchor bolt, 8
2020-09-16, France, Washer, 1];
Script syntax and chart functions - Qlik Sense, February 2022 178
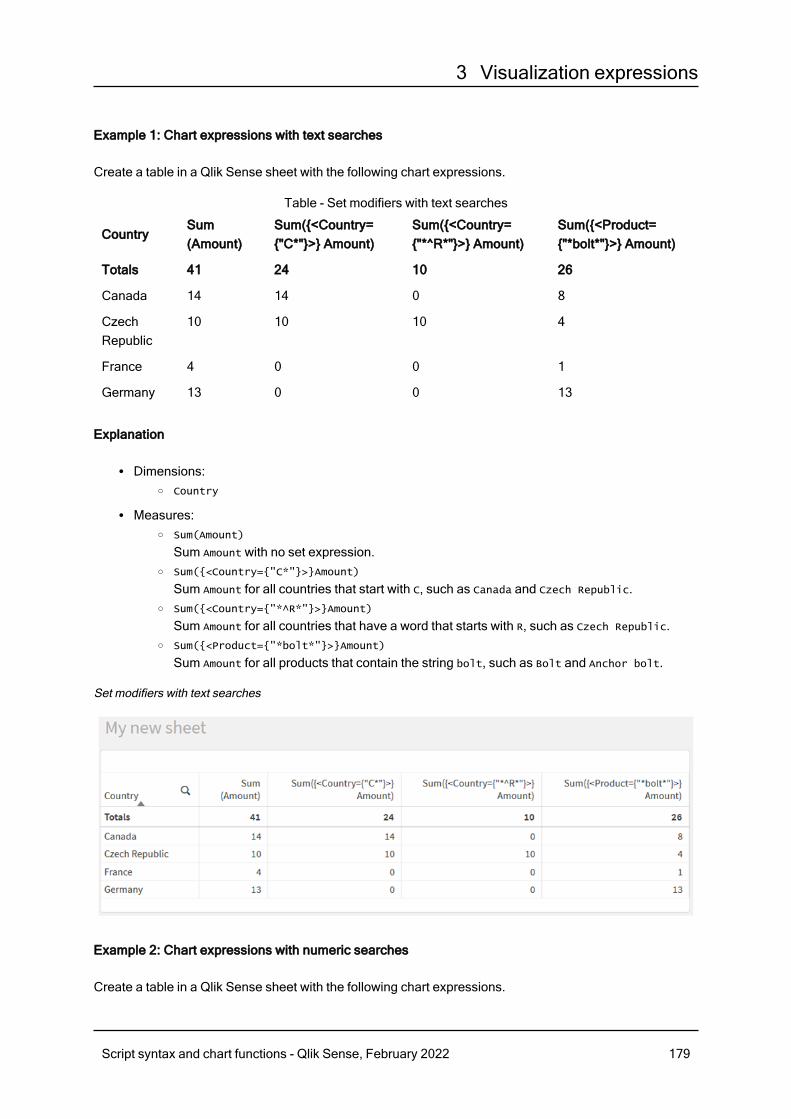
3 Visualization expressions
Example 1: Chart expressions with text searches
Create a table in a Qlik Sense sheet with the following chart expressions.
CountrySum(Amount)
Sum({<Country={"C*"}>} Amount)
Sum({<Country={"*^R*"}>} Amount)
Sum({<Product={"*bolt*"}>} Amount)
Totals 41 24 10 26
Canada 14 14 0 8
CzechRepublic
10 10 10 4
France 4 0 0 1
Germany 13 0 0 13
Table - Set modifiers with text searches
Explanation
l Dimensions:o Country
l Measures:o Sum(Amount)
Sum Amount with no set expression.o Sum({<Country={"C*"}>}Amount)
Sum Amount for all countries that start with C, such as Canada and Czech Republic.o Sum({<Country={"*^R*"}>}Amount)
Sum Amount for all countries that have a word that starts with R, such as Czech Republic.o Sum({<Product={"*bolt*"}>}Amount)
Sum Amount for all products that contain the string bolt, such as Bolt and Anchor bolt.
Set modifiers with text searches
Example 2: Chart expressions with numeric searches
Create a table in a Qlik Sense sheet with the following chart expressions.
Script syntax and chart functions - Qlik Sense, February 2022 179

3 Visualization expressions
CountrySum(Amount)
Sum({<Year={">2019"}>}Amount)
Sum({<ISO_Date={">=2019-07-01"}>}Amount)
Sum({<US_Date={">=4/1/2018<=12/31/2018"}>}Amount)
Totals 41 10 16 16
Canada 14 8 8 0
CzechRepublic
10 0 6 1
France 4 2 2 2
Germany 13 0 0 13
Table - Set modifiers with numeric searches
Explanation
l Dimensions:o Country
l Measures:o Sum(Amount)
Sum Amount with no set expression.o Sum({<Year={">2019"}>}Amount)
Sum Amount for all years after 2019.o Sum({<ISO_Date={">=2019-07-01"}>}Amount)
Sum Amount for all dates on or after 2019-07-01. The format of the date in the search mustmatch the format of the field.
o Sum({<US_Date={">=4/1/2018<=12/31/2018"}>}Amount)
Sum Amount for all dates from 4/1/2018 to 12/31/2018, including the start and end dates. Theformat of the dates in the search must match the format of the field.
Set modifiers with numeric searches
Example 3: Chart expressions with expression searches
Create a table in a Qlik Sense sheet with the following chart expressions.
Script syntax and chart functions - Qlik Sense, February 2022 180
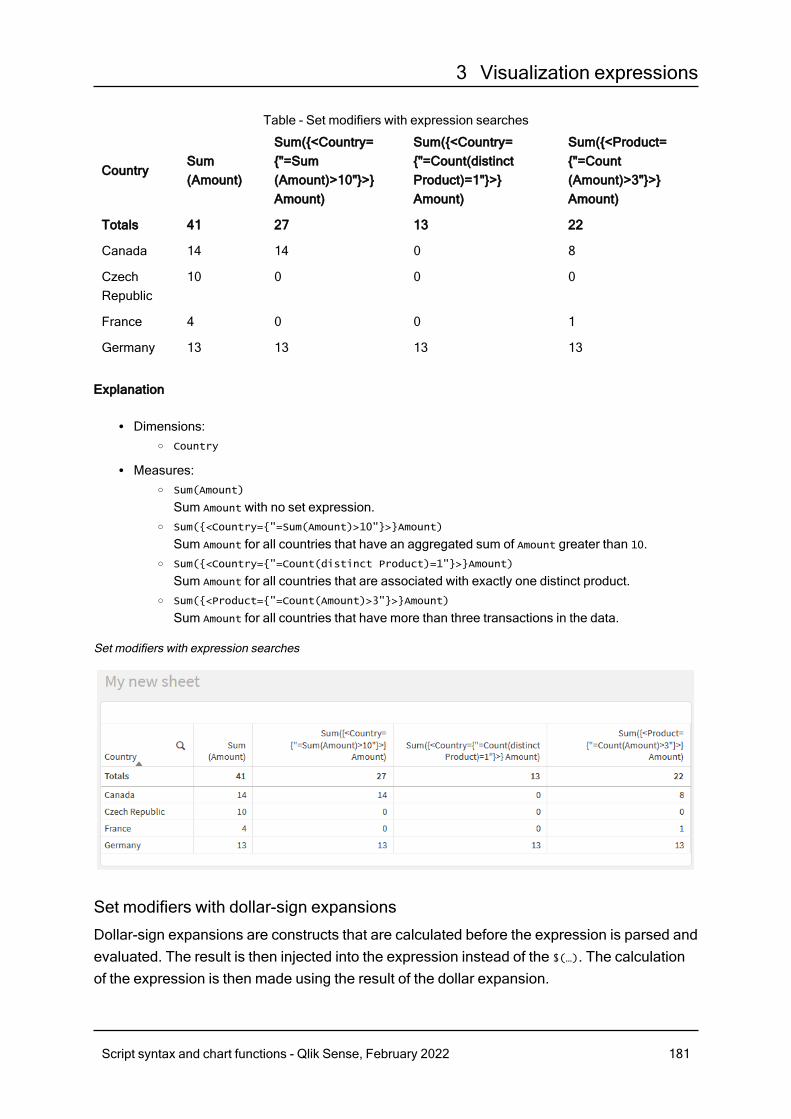
3 Visualization expressions
CountrySum(Amount)
Sum({<Country={"=Sum(Amount)>10"}>}Amount)
Sum({<Country={"=Count(distinctProduct)=1"}>}Amount)
Sum({<Product={"=Count(Amount)>3"}>}Amount)
Totals 41 27 13 22
Canada 14 14 0 8
CzechRepublic
10 0 0 0
France 4 0 0 1
Germany 13 13 13 13
Table - Set modifiers with expression searches
Explanation
l Dimensions:o Country
l Measures:o Sum(Amount)
Sum Amount with no set expression.o Sum({<Country={"=Sum(Amount)>10"}>}Amount)
Sum Amount for all countries that have an aggregated sum of Amount greater than 10.o Sum({<Country={"=Count(distinct Product)=1"}>}Amount)
Sum Amount for all countries that are associated with exactly one distinct product.o Sum({<Product={"=Count(Amount)>3"}>}Amount)
Sum Amount for all countries that have more than three transactions in the data.
Set modifiers with expression searches
Set modifiers with dollar-sign expansions
Dollar-sign expansions are constructs that are calculated before the expression is parsed andevaluated. The result is then injected into the expression instead of the $(…). The calculationof the expression is then made using the result of the dollar expansion.
Script syntax and chart functions - Qlik Sense, February 2022 181
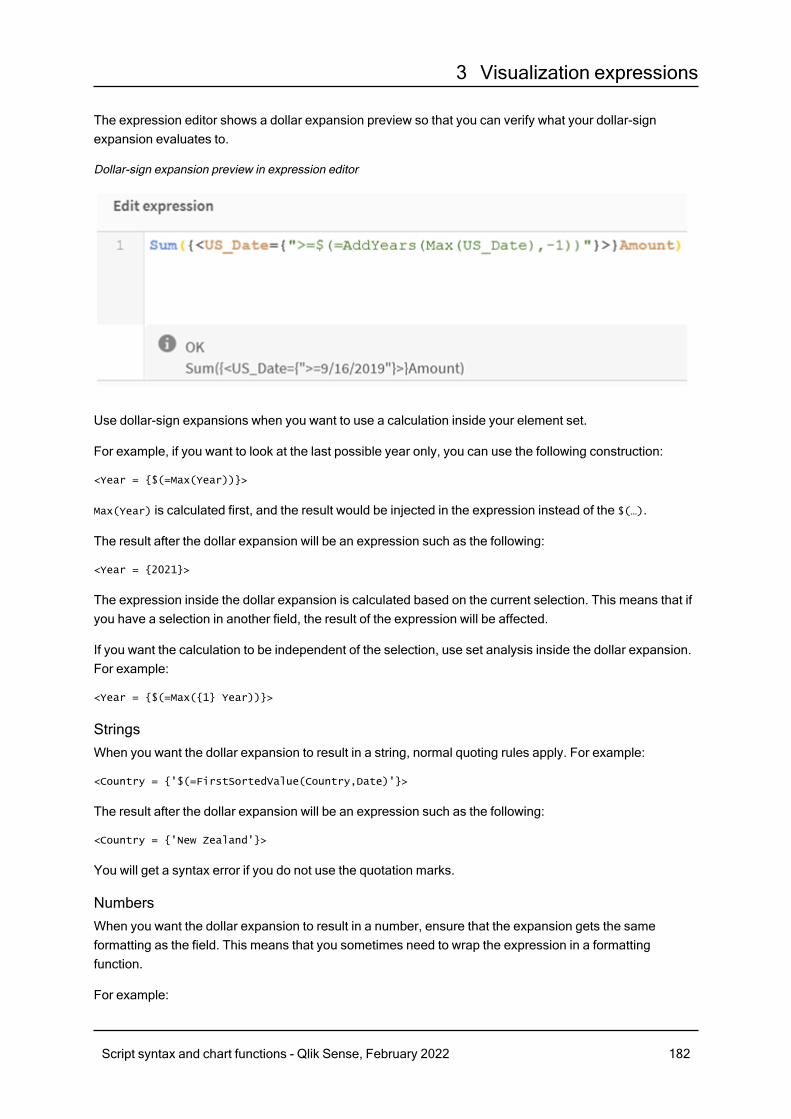
3 Visualization expressions
The expression editor shows a dollar expansion preview so that you can verify what your dollar-signexpansion evaluates to.
Dollar-sign expansion preview in expression editor
Use dollar-sign expansions when you want to use a calculation inside your element set.
For example, if you want to look at the last possible year only, you can use the following construction:
<Year = {$(=Max(Year))}>
Max(Year) is calculated first, and the result would be injected in the expression instead of the $(…).
The result after the dollar expansion will be an expression such as the following:
<Year = {2021}>
The expression inside the dollar expansion is calculated based on the current selection. This means that ifyou have a selection in another field, the result of the expression will be affected.
If you want the calculation to be independent of the selection, use set analysis inside the dollar expansion.For example:
<Year = {$(=Max({1} Year))}>
StringsWhen you want the dollar expansion to result in a string, normal quoting rules apply. For example:
<Country = {'$(=FirstSortedValue(Country,Date)'}>
The result after the dollar expansion will be an expression such as the following:
<Country = {'New Zealand'}>
You will get a syntax error if you do not use the quotation marks.
NumbersWhen you want the dollar expansion to result in a number, ensure that the expansion gets the sameformatting as the field. This means that you sometimes need to wrap the expression in a formattingfunction.
For example:
Script syntax and chart functions - Qlik Sense, February 2022 182
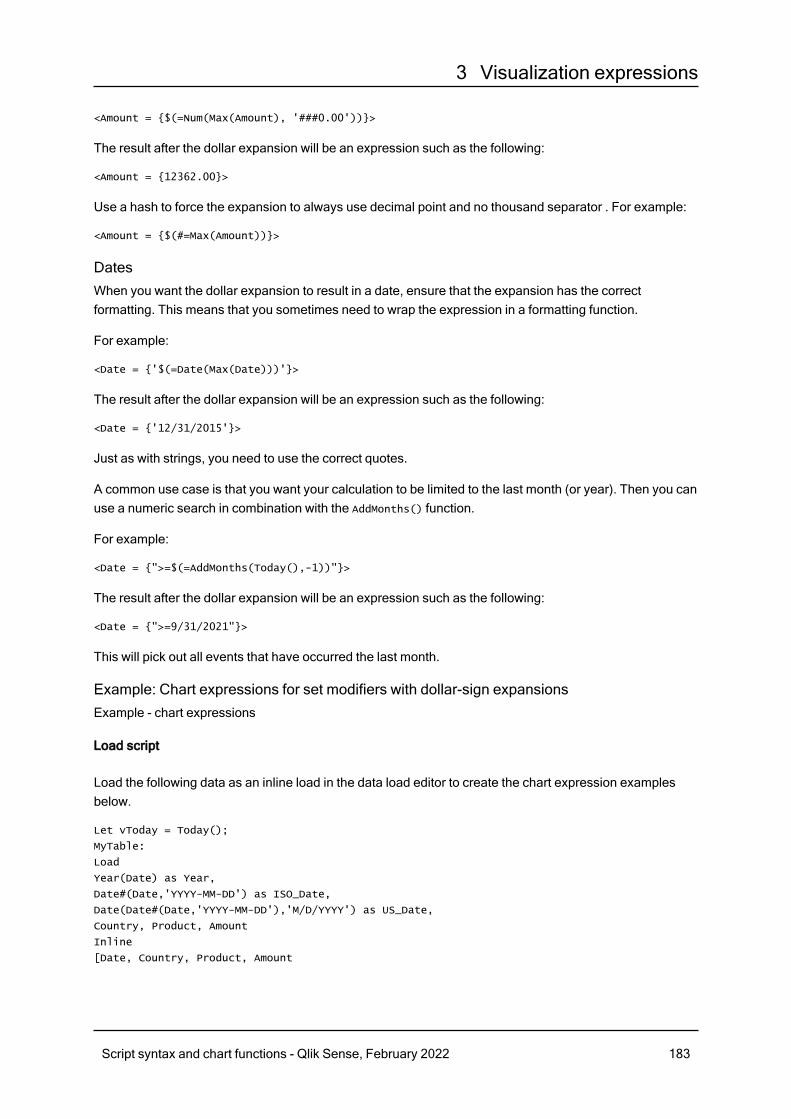
3 Visualization expressions
<Amount = {$(=Num(Max(Amount), '###0.00'))}>
The result after the dollar expansion will be an expression such as the following:
<Amount = {12362.00}>
Use a hash to force the expansion to always use decimal point and no thousand separator . For example:
<Amount = {$(#=Max(Amount))}>
DatesWhen you want the dollar expansion to result in a date, ensure that the expansion has the correctformatting. This means that you sometimes need to wrap the expression in a formatting function.
For example:
<Date = {'$(=Date(Max(Date)))'}>
The result after the dollar expansion will be an expression such as the following:
<Date = {'12/31/2015'}>
Just as with strings, you need to use the correct quotes.
A common use case is that you want your calculation to be limited to the last month (or year). Then you canuse a numeric search in combination with the AddMonths() function.
For example:
<Date = {">=$(=AddMonths(Today(),-1))"}>
The result after the dollar expansion will be an expression such as the following:
<Date = {">=9/31/2021"}>
This will pick out all events that have occurred the last month.
Example: Chart expressions for set modifiers with dollar-sign expansionsExample - chart expressions
Load script
Load the following data as an inline load in the data load editor to create the chart expression examplesbelow.
Let vToday = Today();
MyTable:
Load
Year(Date) as Year,
Date#(Date,'YYYY-MM-DD') as ISO_Date,
Date(Date#(Date,'YYYY-MM-DD'),'M/D/YYYY') as US_Date,
Country, Product, Amount
Inline
[Date, Country, Product, Amount
Script syntax and chart functions - Qlik Sense, February 2022 183
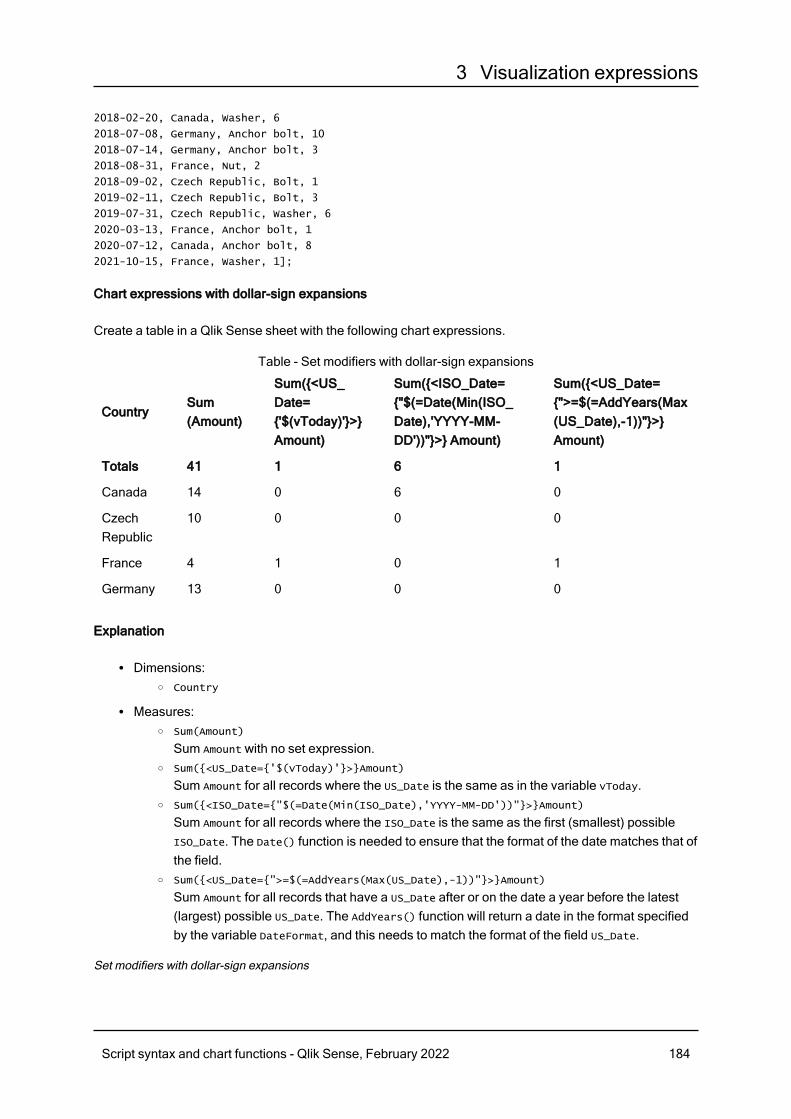
3 Visualization expressions
2018-02-20, Canada, Washer, 6
2018-07-08, Germany, Anchor bolt, 10
2018-07-14, Germany, Anchor bolt, 3
2018-08-31, France, Nut, 2
2018-09-02, Czech Republic, Bolt, 1
2019-02-11, Czech Republic, Bolt, 3
2019-07-31, Czech Republic, Washer, 6
2020-03-13, France, Anchor bolt, 1
2020-07-12, Canada, Anchor bolt, 8
2021-10-15, France, Washer, 1];
Chart expressions with dollar-sign expansions
Create a table in a Qlik Sense sheet with the following chart expressions.
CountrySum(Amount)
Sum({<US_Date={'$(vToday)'}>}Amount)
Sum({<ISO_Date={"$(=Date(Min(ISO_Date),'YYYY-MM-DD'))"}>} Amount)
Sum({<US_Date={">=$(=AddYears(Max(US_Date),-1))"}>}Amount)
Totals 41 1 6 1
Canada 14 0 6 0
CzechRepublic
10 0 0 0
France 4 1 0 1
Germany 13 0 0 0
Table - Set modifiers with dollar-sign expansions
Explanation
l Dimensions:o Country
l Measures:o Sum(Amount)
Sum Amount with no set expression.o Sum({<US_Date={'$(vToday)'}>}Amount)
Sum Amount for all records where the US_Date is the same as in the variable vToday.o Sum({<ISO_Date={"$(=Date(Min(ISO_Date),'YYYY-MM-DD'))"}>}Amount)
Sum Amount for all records where the ISO_Date is the same as the first (smallest) possibleISO_Date. The Date() function is needed to ensure that the format of the date matches that ofthe field.
o Sum({<US_Date={">=$(=AddYears(Max(US_Date),-1))"}>}Amount)
Sum Amount for all records that have a US_Date after or on the date a year before the latest(largest) possible US_Date. The AddYears() function will return a date in the format specifiedby the variable DateFormat, and this needs to match the format of the field US_Date.
Set modifiers with dollar-sign expansions
Script syntax and chart functions - Qlik Sense, February 2022 184
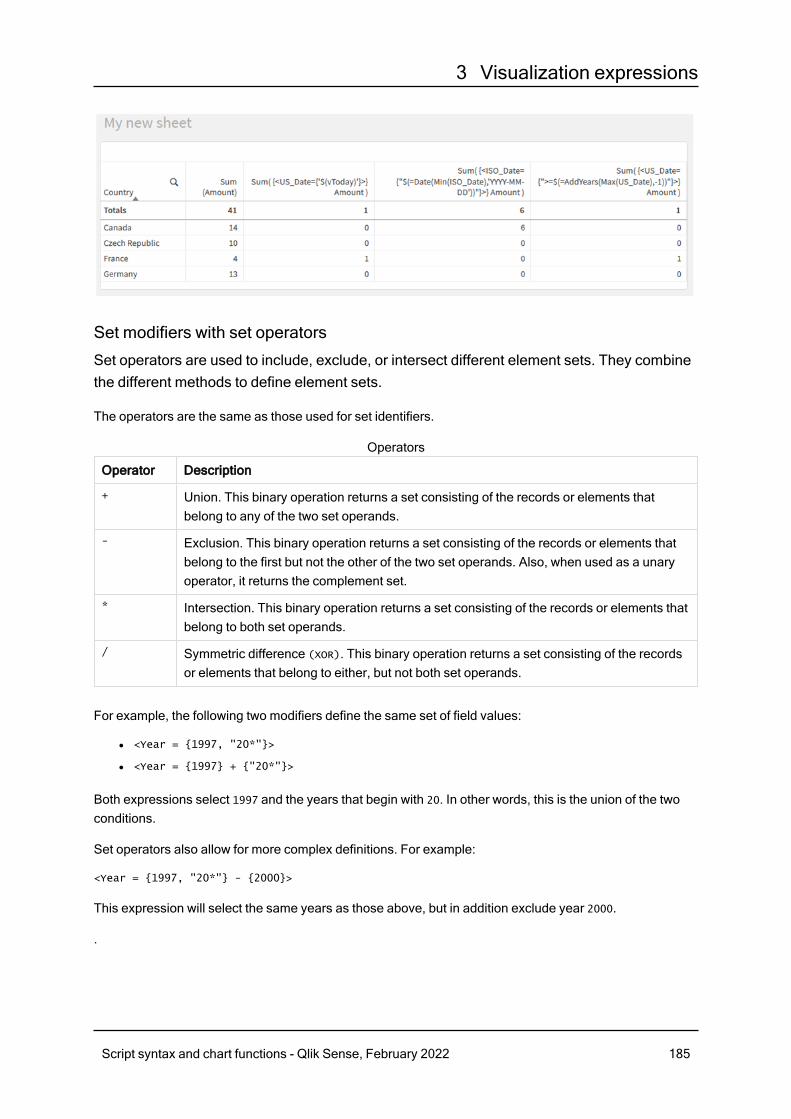
3 Visualization expressions
Set modifiers with set operators
Set operators are used to include, exclude, or intersect different element sets. They combinethe different methods to define element sets.
The operators are the same as those used for set identifiers.
Operator Description
+ Union. This binary operation returns a set consisting of the records or elements thatbelong to any of the two set operands.
- Exclusion. This binary operation returns a set consisting of the records or elements thatbelong to the first but not the other of the two set operands. Also, when used as a unaryoperator, it returns the complement set.
* Intersection. This binary operation returns a set consisting of the records or elements thatbelong to both set operands.
/ Symmetric difference (XOR). This binary operation returns a set consisting of the recordsor elements that belong to either, but not both set operands.
Operators
For example, the following two modifiers define the same set of field values:
l <Year = {1997, "20*"}>
l <Year = {1997} + {"20*"}>
Both expressions select 1997 and the years that begin with 20. In other words, this is the union of the twoconditions.
Set operators also allow for more complex definitions. For example:
<Year = {1997, "20*"} - {2000}>
This expression will select the same years as those above, but in addition exclude year 2000.
.
Script syntax and chart functions - Qlik Sense, February 2022 185
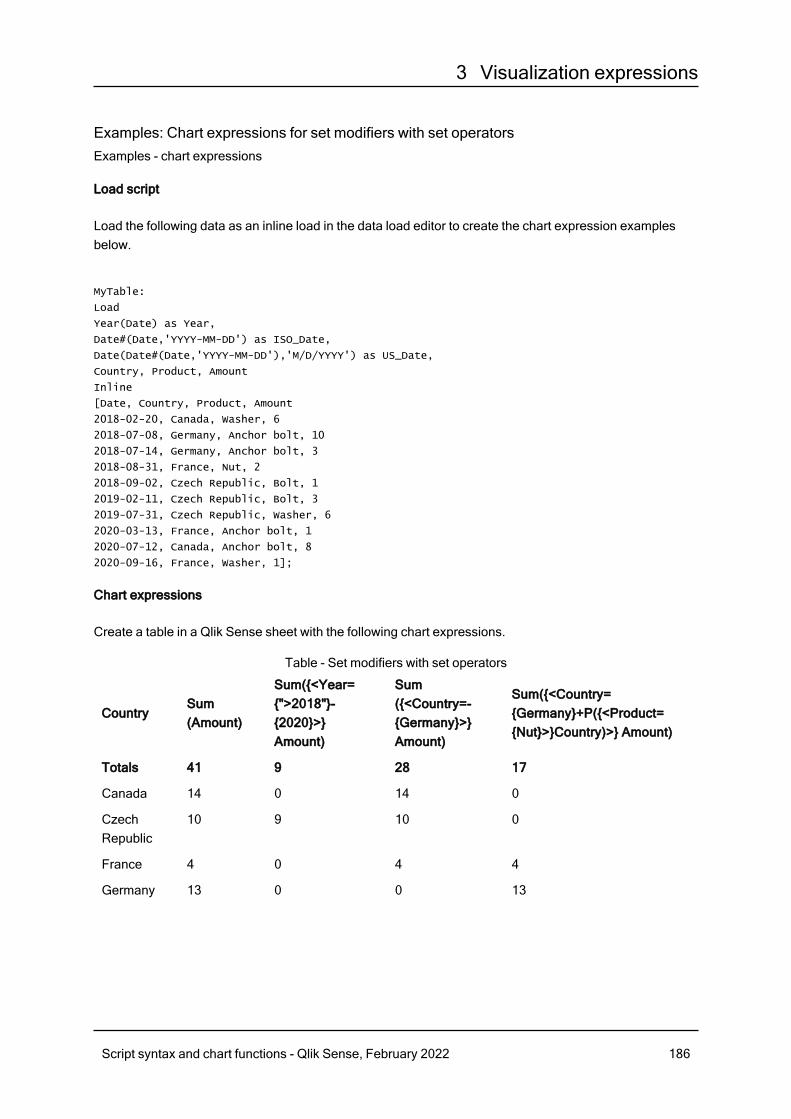
3 Visualization expressions
Examples: Chart expressions for set modifiers with set operatorsExamples - chart expressions
Load script
Load the following data as an inline load in the data load editor to create the chart expression examplesbelow.
MyTable:
Load
Year(Date) as Year,
Date#(Date,'YYYY-MM-DD') as ISO_Date,
Date(Date#(Date,'YYYY-MM-DD'),'M/D/YYYY') as US_Date,
Country, Product, Amount
Inline
[Date, Country, Product, Amount
2018-02-20, Canada, Washer, 6
2018-07-08, Germany, Anchor bolt, 10
2018-07-14, Germany, Anchor bolt, 3
2018-08-31, France, Nut, 2
2018-09-02, Czech Republic, Bolt, 1
2019-02-11, Czech Republic, Bolt, 3
2019-07-31, Czech Republic, Washer, 6
2020-03-13, France, Anchor bolt, 1
2020-07-12, Canada, Anchor bolt, 8
2020-09-16, France, Washer, 1];
Chart expressions
Create a table in a Qlik Sense sheet with the following chart expressions.
CountrySum(Amount)
Sum({<Year={">2018"}-{2020}>}Amount)
Sum({<Country=-{Germany}>}Amount)
Sum({<Country={Germany}+P({<Product={Nut}>}Country)>} Amount)
Totals 41 9 28 17
Canada 14 0 14 0
CzechRepublic
10 9 10 0
France 4 0 4 4
Germany 13 0 0 13
Table - Set modifiers with set operators
Script syntax and chart functions - Qlik Sense, February 2022 186
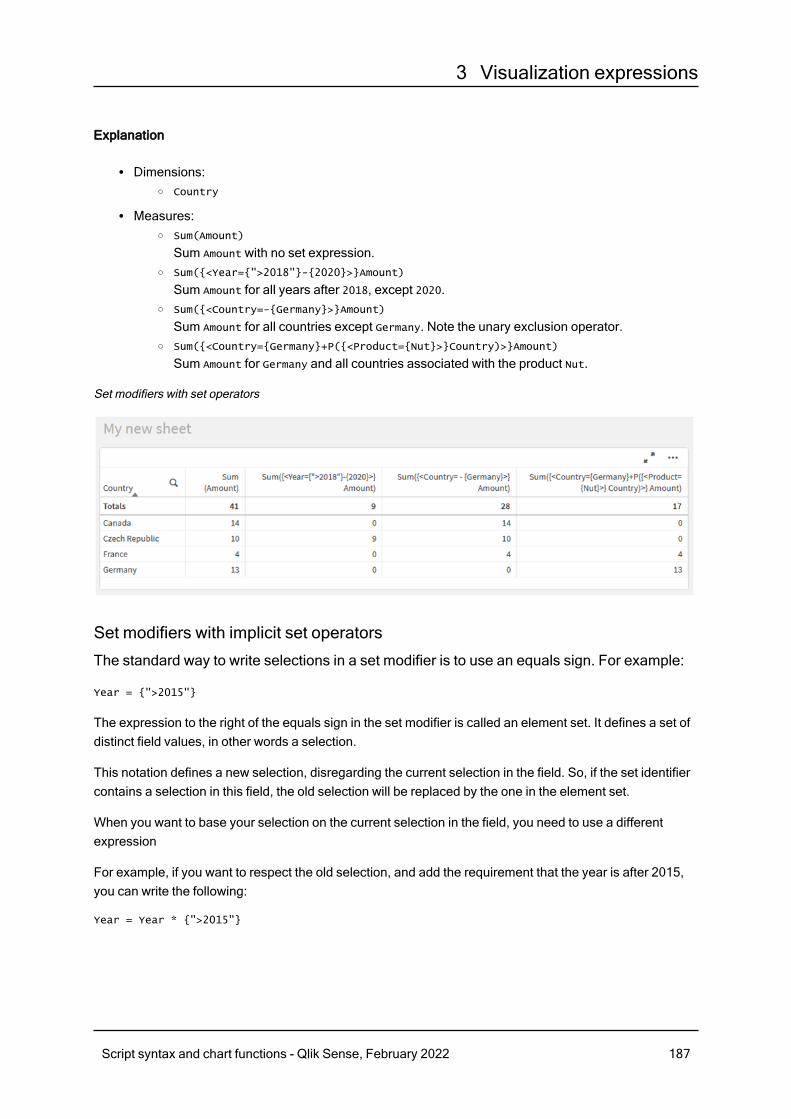
3 Visualization expressions
Explanation
l Dimensions:o Country
l Measures:o Sum(Amount)
Sum Amount with no set expression.o Sum({<Year={">2018"}-{2020}>}Amount)
Sum Amount for all years after 2018, except 2020.o Sum({<Country=-{Germany}>}Amount)
Sum Amount for all countries except Germany. Note the unary exclusion operator.o Sum({<Country={Germany}+P({<Product={Nut}>}Country)>}Amount)
Sum Amount for Germany and all countries associated with the product Nut.
Set modifiers with set operators
Set modifiers with implicit set operators
The standard way to write selections in a set modifier is to use an equals sign. For example:
Year = {">2015"}
The expression to the right of the equals sign in the set modifier is called an element set. It defines a set ofdistinct field values, in other words a selection.
This notation defines a new selection, disregarding the current selection in the field. So, if the set identifiercontains a selection in this field, the old selection will be replaced by the one in the element set.
When you want to base your selection on the current selection in the field, you need to use a differentexpression
For example, if you want to respect the old selection, and add the requirement that the year is after 2015,you can write the following:
Year = Year * {">2015"}
Script syntax and chart functions - Qlik Sense, February 2022 187
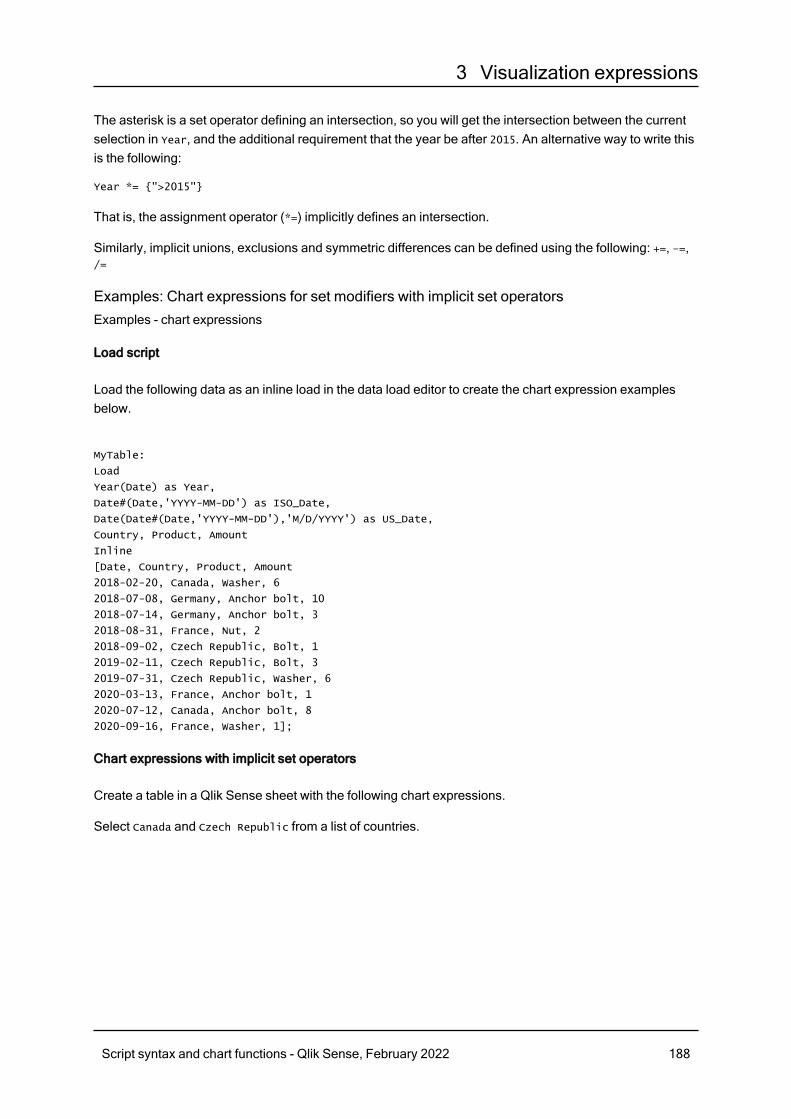
3 Visualization expressions
The asterisk is a set operator defining an intersection, so you will get the intersection between the currentselection in Year, and the additional requirement that the year be after 2015. An alternative way to write thisis the following:
Year *= {">2015"}
That is, the assignment operator (*=) implicitly defines an intersection.
Similarly, implicit unions, exclusions and symmetric differences can be defined using the following: +=, –=,/=
Examples: Chart expressions for set modifiers with implicit set operatorsExamples - chart expressions
Load script
Load the following data as an inline load in the data load editor to create the chart expression examplesbelow.
MyTable:
Load
Year(Date) as Year,
Date#(Date,'YYYY-MM-DD') as ISO_Date,
Date(Date#(Date,'YYYY-MM-DD'),'M/D/YYYY') as US_Date,
Country, Product, Amount
Inline
[Date, Country, Product, Amount
2018-02-20, Canada, Washer, 6
2018-07-08, Germany, Anchor bolt, 10
2018-07-14, Germany, Anchor bolt, 3
2018-08-31, France, Nut, 2
2018-09-02, Czech Republic, Bolt, 1
2019-02-11, Czech Republic, Bolt, 3
2019-07-31, Czech Republic, Washer, 6
2020-03-13, France, Anchor bolt, 1
2020-07-12, Canada, Anchor bolt, 8
2020-09-16, France, Washer, 1];
Chart expressions with implicit set operators
Create a table in a Qlik Sense sheet with the following chart expressions.
Select Canada and Czech Republic from a list of countries.
Script syntax and chart functions - Qlik Sense, February 2022 188
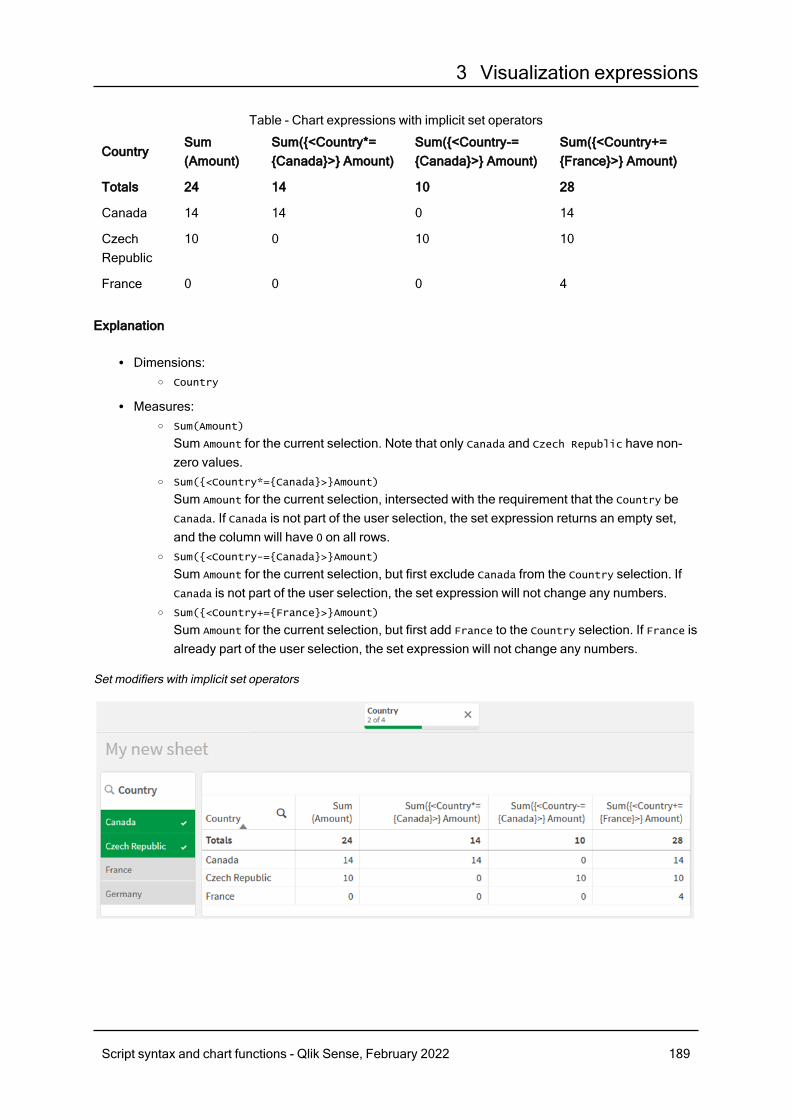
3 Visualization expressions
CountrySum(Amount)
Sum({<Country*={Canada}>} Amount)
Sum({<Country-={Canada}>} Amount)
Sum({<Country+={France}>} Amount)
Totals 24 14 10 28
Canada 14 14 0 14
CzechRepublic
10 0 10 10
France 0 0 0 4
Table - Chart expressions with implicit set operators
Explanation
l Dimensions:o Country
l Measures:o Sum(Amount)
Sum Amount for the current selection. Note that only Canada and Czech Republic have non-zero values.
o Sum({<Country*={Canada}>}Amount)
Sum Amount for the current selection, intersected with the requirement that the Country beCanada. If Canada is not part of the user selection, the set expression returns an empty set,and the column will have 0 on all rows.
o Sum({<Country-={Canada}>}Amount)
Sum Amount for the current selection, but first exclude Canada from the Country selection. IfCanada is not part of the user selection, the set expression will not change any numbers.
o Sum({<Country+={France}>}Amount)
Sum Amount for the current selection, but first add France to the Country selection. If France isalready part of the user selection, the set expression will not change any numbers.
Set modifiers with implicit set operators
Script syntax and chart functions - Qlik Sense, February 2022 189
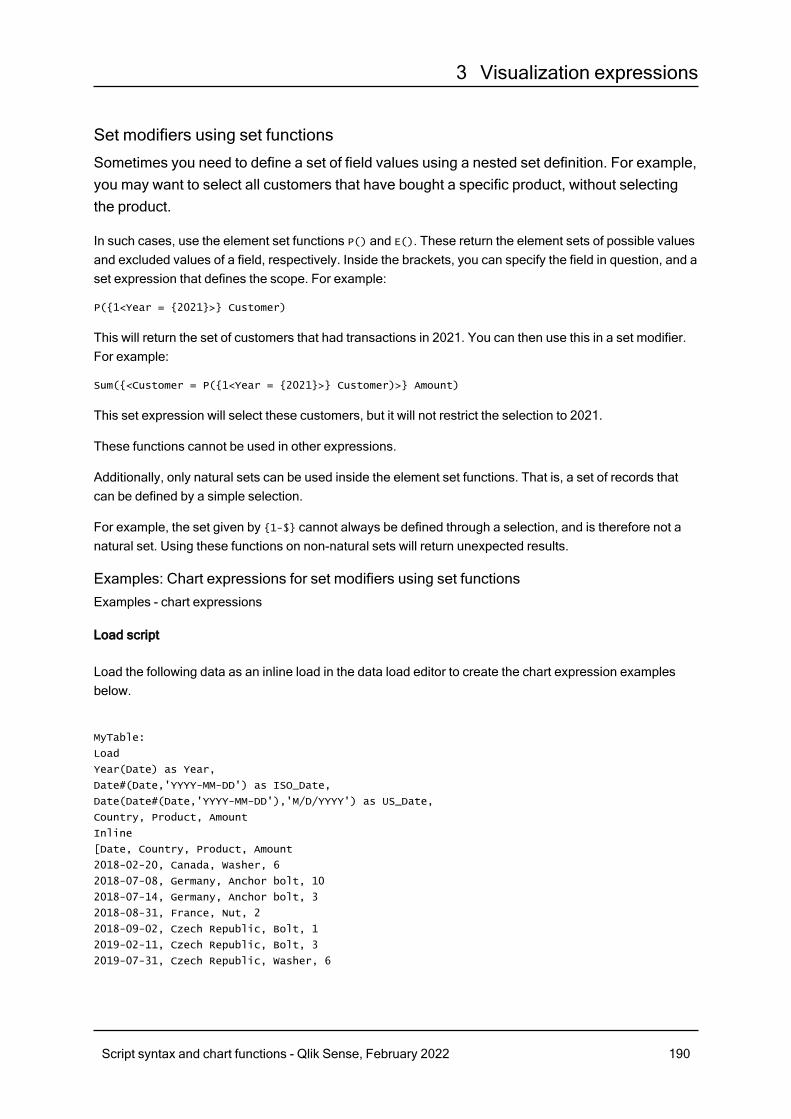
3 Visualization expressions
Set modifiers using set functions
Sometimes you need to define a set of field values using a nested set definition. For example,you may want to select all customers that have bought a specific product, without selectingthe product.
In such cases, use the element set functions P() and E(). These return the element sets of possible valuesand excluded values of a field, respectively. Inside the brackets, you can specify the field in question, and aset expression that defines the scope. For example:
P({1<Year = {2021}>} Customer)
This will return the set of customers that had transactions in 2021. You can then use this in a set modifier.For example:
Sum({<Customer = P({1<Year = {2021}>} Customer)>} Amount)
This set expression will select these customers, but it will not restrict the selection to 2021.
These functions cannot be used in other expressions.
Additionally, only natural sets can be used inside the element set functions. That is, a set of records thatcan be defined by a simple selection.
For example, the set given by {1-$} cannot always be defined through a selection, and is therefore not anatural set. Using these functions on non-natural sets will return unexpected results.
Examples: Chart expressions for set modifiers using set functionsExamples - chart expressions
Load script
Load the following data as an inline load in the data load editor to create the chart expression examplesbelow.
MyTable:
Load
Year(Date) as Year,
Date#(Date,'YYYY-MM-DD') as ISO_Date,
Date(Date#(Date,'YYYY-MM-DD'),'M/D/YYYY') as US_Date,
Country, Product, Amount
Inline
[Date, Country, Product, Amount
2018-02-20, Canada, Washer, 6
2018-07-08, Germany, Anchor bolt, 10
2018-07-14, Germany, Anchor bolt, 3
2018-08-31, France, Nut, 2
2018-09-02, Czech Republic, Bolt, 1
2019-02-11, Czech Republic, Bolt, 3
2019-07-31, Czech Republic, Washer, 6
Script syntax and chart functions - Qlik Sense, February 2022 190
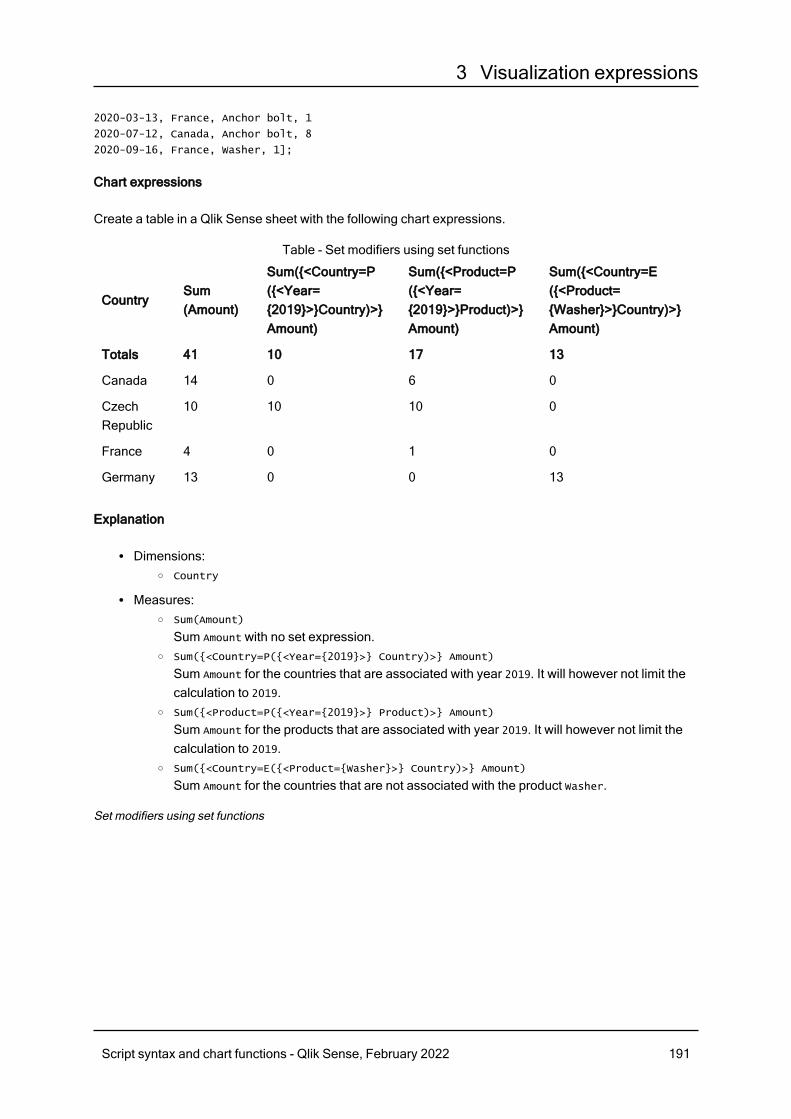
3 Visualization expressions
2020-03-13, France, Anchor bolt, 1
2020-07-12, Canada, Anchor bolt, 8
2020-09-16, France, Washer, 1];
Chart expressions
Create a table in a Qlik Sense sheet with the following chart expressions.
CountrySum(Amount)
Sum({<Country=P({<Year={2019}>}Country)>}Amount)
Sum({<Product=P({<Year={2019}>}Product)>}Amount)
Sum({<Country=E({<Product={Washer}>}Country)>}Amount)
Totals 41 10 17 13
Canada 14 0 6 0
CzechRepublic
10 10 10 0
France 4 0 1 0
Germany 13 0 0 13
Table - Set modifiers using set functions
Explanation
l Dimensions:o Country
l Measures:o Sum(Amount)
Sum Amount with no set expression.o Sum({<Country=P({<Year={2019}>} Country)>} Amount)
Sum Amount for the countries that are associated with year 2019. It will however not limit thecalculation to 2019.
o Sum({<Product=P({<Year={2019}>} Product)>} Amount)
Sum Amount for the products that are associated with year 2019. It will however not limit thecalculation to 2019.
o Sum({<Country=E({<Product={Washer}>} Country)>} Amount)
Sum Amount for the countries that are not associated with the product Washer.
Set modifiers using set functions
Script syntax and chart functions - Qlik Sense, February 2022 191
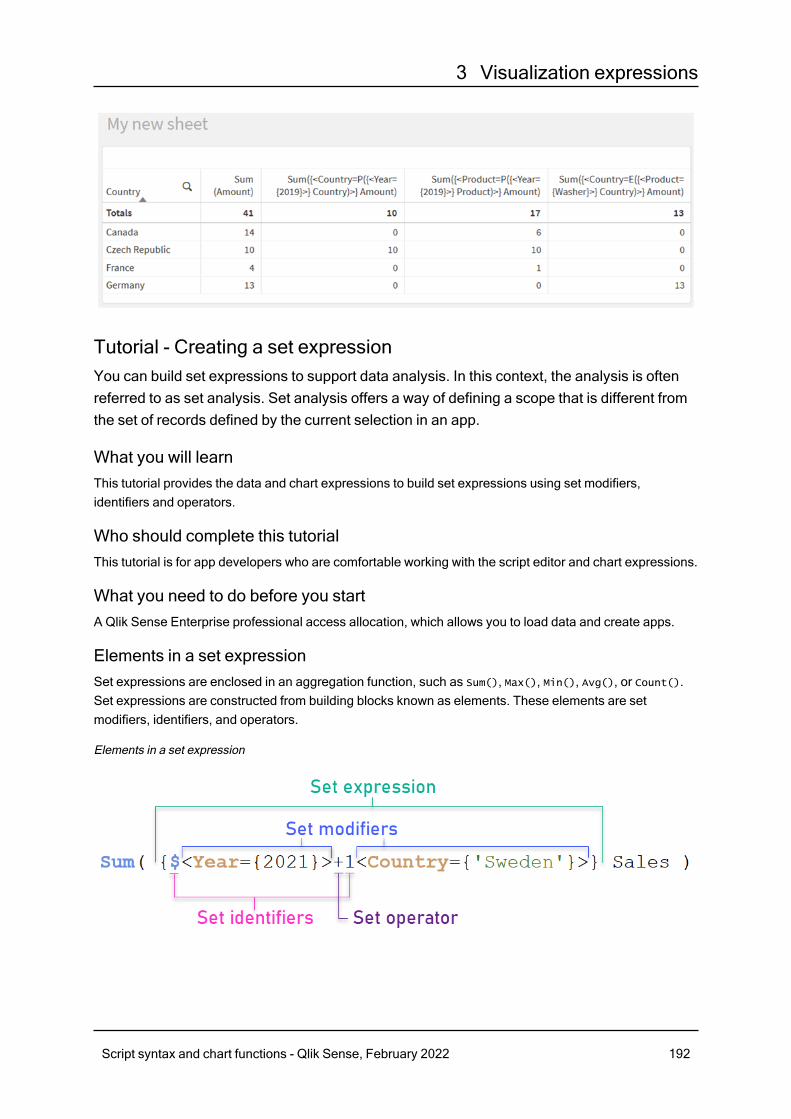
3 Visualization expressions
Tutorial - Creating a set expressionYou can build set expressions to support data analysis. In this context, the analysis is oftenreferred to as set analysis. Set analysis offers a way of defining a scope that is different fromthe set of records defined by the current selection in an app.
What you will learnThis tutorial provides the data and chart expressions to build set expressions using set modifiers,identifiers and operators.
Who should complete this tutorialThis tutorial is for app developers who are comfortable working with the script editor and chart expressions.
What you need to do before you startA Qlik Sense Enterprise professional access allocation, which allows you to load data and create apps.
Elements in a set expressionSet expressions are enclosed in an aggregation function, such as Sum(), Max(), Min(), Avg(), or Count().Set expressions are constructed from building blocks known as elements. These elements are setmodifiers, identifiers, and operators.
Elements in a set expression
Script syntax and chart functions - Qlik Sense, February 2022 192
3 Visualization expressions
The set expression above, for example, is built from the aggregation Sum(Sales). The set expression isenclosed in the outer curly brackets: { }
The first operand in the expression is: $<Year={2021}>
This operand returns sales for the year 2021 for the current selection. The modifier, <Year={2021}>,contains the selection of the year 2021. The $ set identifier indicates that the set expression is based oncurrent selection.
The second operand in the expression is: 1<Country={'Sweden'}>
This operand returns Sales for Sweden. The modifier, <Country={'Sweden'}>, contains the selection of thecountry Sweden. The 1 set identifier indicates that selections made in the app will be ignored.
Finally, the + set operator indicates that the expression returns a set consisting of the records that belongsto any of the two set operands.
Creating a set expression tutorialComplete the following procedures to create the set expressions shown in this tutorial.
Create a new app and load data
Do the following:
1. Create a new app.
2. Click Script editor. Alternatively, click Prepare > Data load editor in the navigation bar.
3. Create a new section in the Data load editor.
4. Copy the following data and paste it into the new section: Set expression tutorial data (page 200)
5. Click Load data. The data is loaded as an inline load.
Create set expressions with modifiersThe set modifier consists of one or more field names, each followed by a selection that should be made onthe field. The modifier is enclosed by angled brackets. For example, in this set expression:
Sum ( {<Year = {2015}>} Sales )
The modifier is:
<Year = {2015}>
This modifier specifies that data from the year 2015 will be selected. The curly brackets in which themodifier is enclosed indicate a set expression.
Script syntax and chart functions - Qlik Sense, February 2022 193
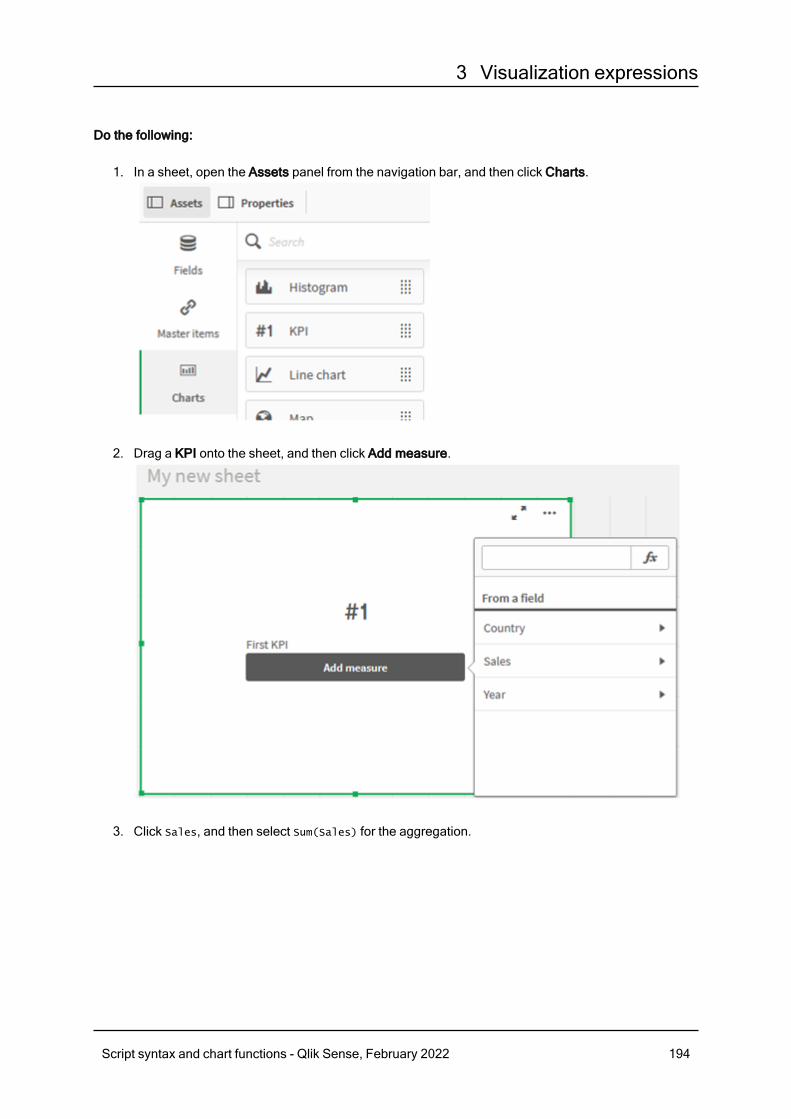
3 Visualization expressions
Do the following:
1. In a sheet, open the Assets panel from the navigation bar, and then click Charts.
2. Drag a KPI onto the sheet, and then click Add measure.
3. Click Sales, and then select Sum(Sales) for the aggregation.
Script syntax and chart functions - Qlik Sense, February 2022 194
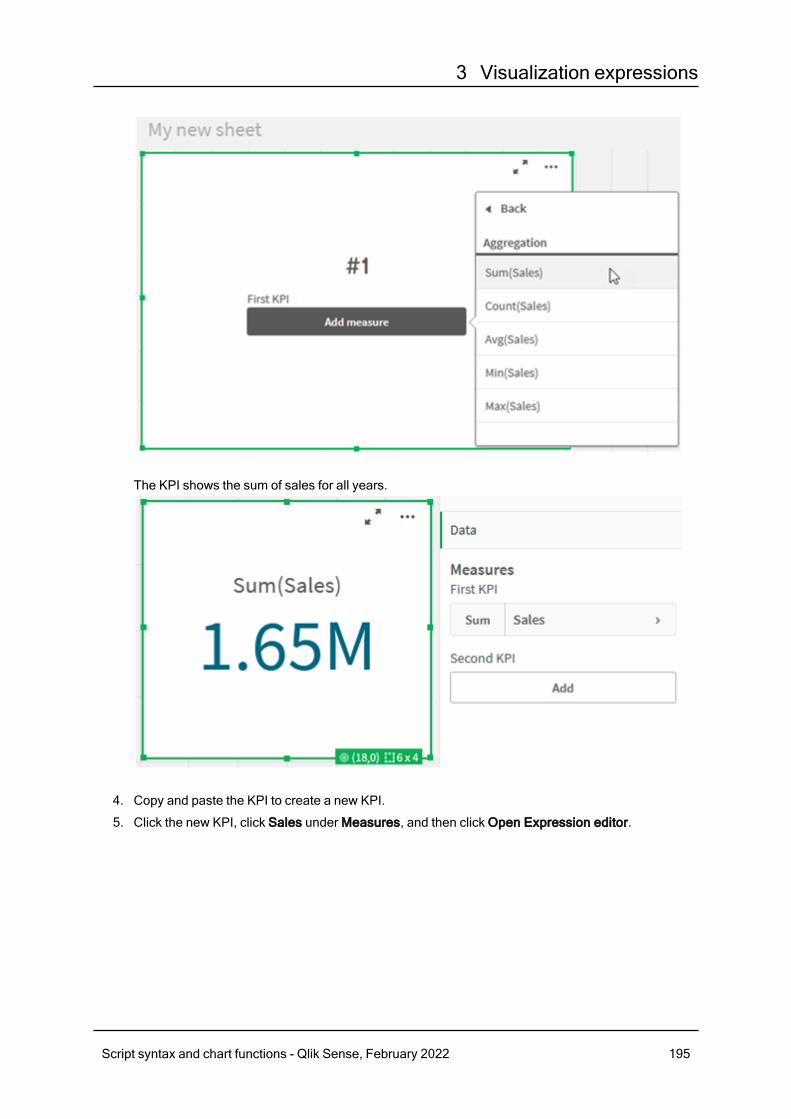
3 Visualization expressions
The KPI shows the sum of sales for all years.
4. Copy and paste the KPI to create a new KPI.
5. Click the new KPI, click Sales under Measures, and then click Open Expression editor.
Script syntax and chart functions - Qlik Sense, February 2022 195
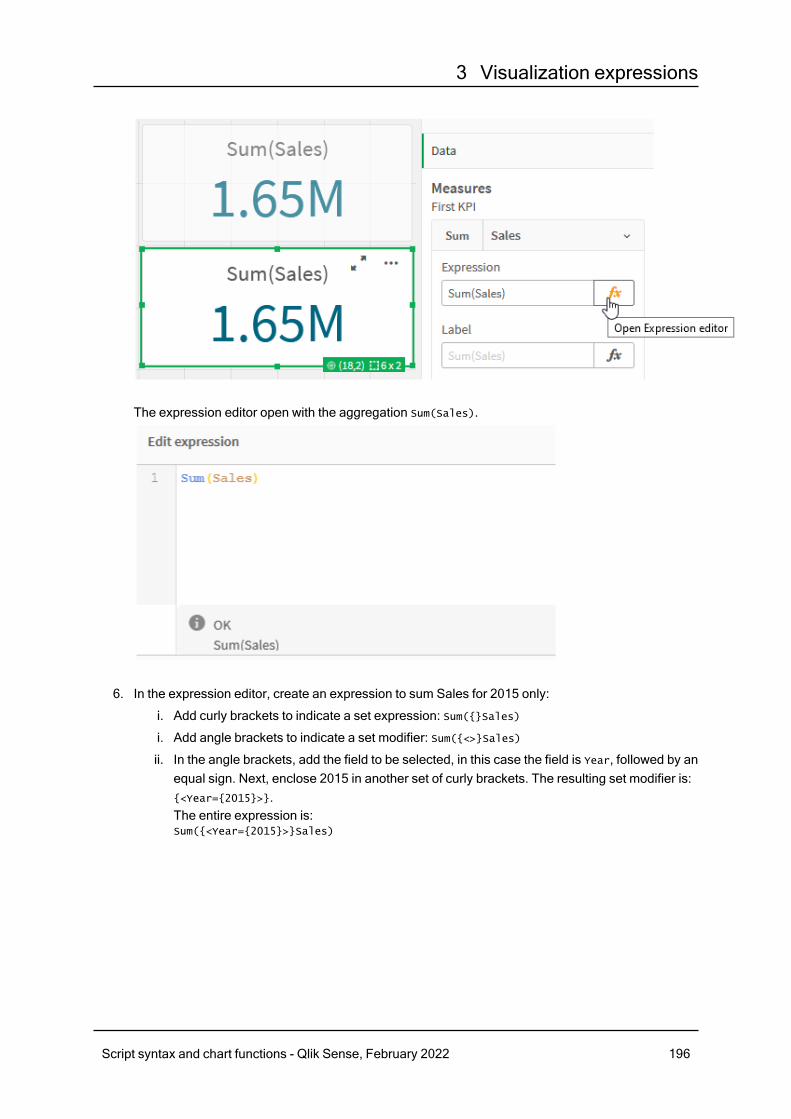
3 Visualization expressions
The expression editor open with the aggregation Sum(Sales).
6. In the expression editor, create an expression to sum Sales for 2015 only:
i. Add curly brackets to indicate a set expression: Sum({}Sales)
i. Add angle brackets to indicate a set modifier: Sum({<>}Sales)
ii. In the angle brackets, add the field to be selected, in this case the field is Year, followed by anequal sign. Next, enclose 2015 in another set of curly brackets. The resulting set modifier is:{<Year={2015}>}.The entire expression is:Sum({<Year={2015}>}Sales)
Script syntax and chart functions - Qlik Sense, February 2022 196
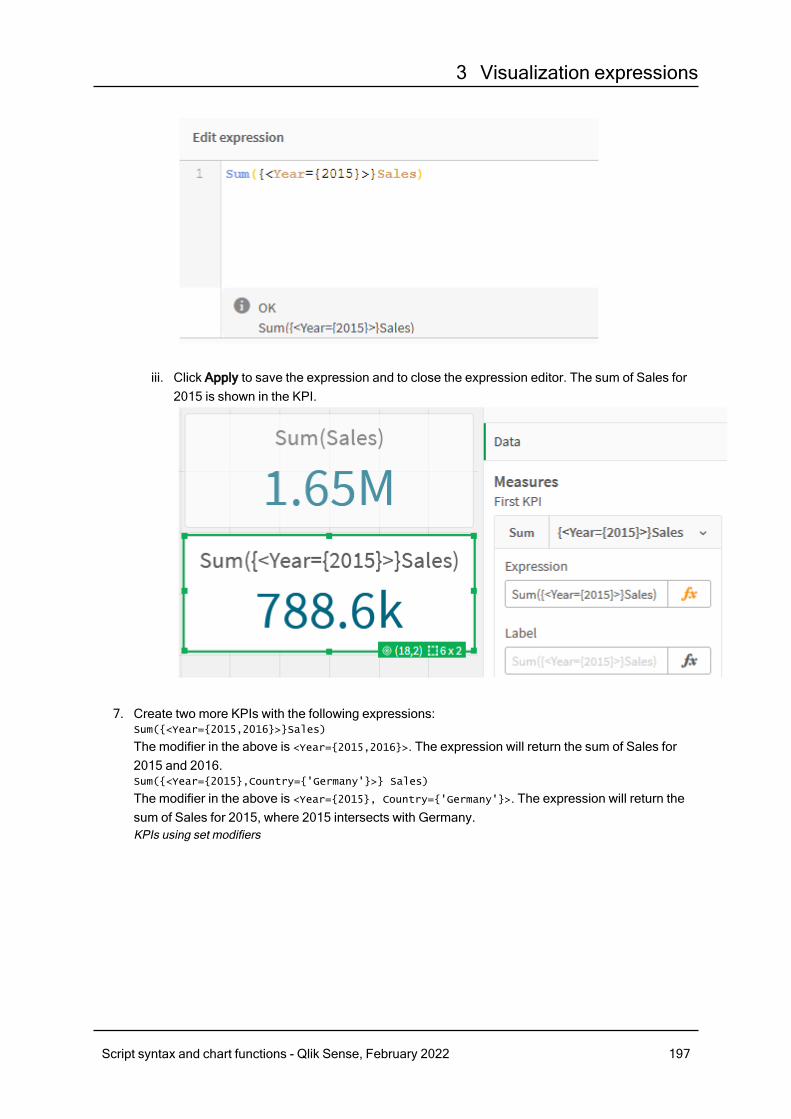
3 Visualization expressions
iii. Click Apply to save the expression and to close the expression editor. The sum of Sales for2015 is shown in the KPI.
7. Create two more KPIs with the following expressions:Sum({<Year={2015,2016}>}Sales)
The modifier in the above is <Year={2015,2016}>. The expression will return the sum of Sales for2015 and 2016.Sum({<Year={2015},Country={'Germany'}>} Sales)
The modifier in the above is <Year={2015}, Country={'Germany'}>. The expression will return thesum of Sales for 2015, where 2015 intersects with Germany.KPIs using set modifiers
Script syntax and chart functions - Qlik Sense, February 2022 197
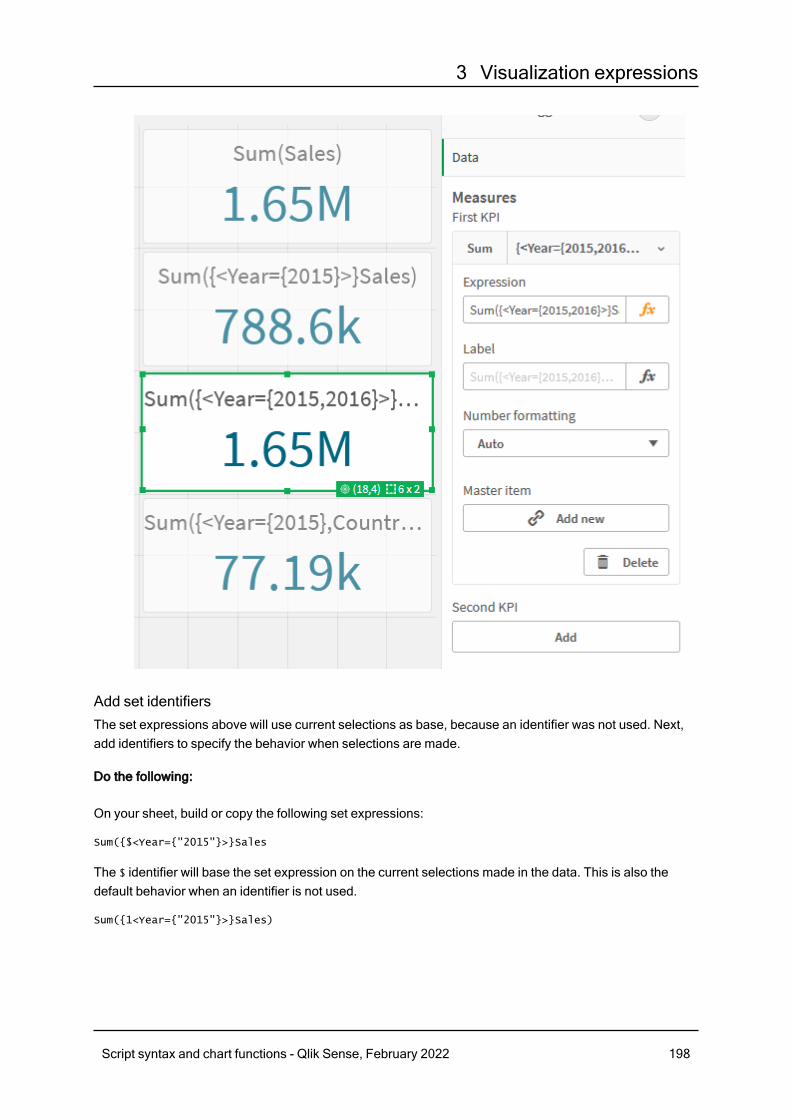
3 Visualization expressions
Add set identifiersThe set expressions above will use current selections as base, because an identifier was not used. Next,add identifiers to specify the behavior when selections are made.
Do the following:
On your sheet, build or copy the following set expressions:
Sum({$<Year={"2015"}>}Sales
The $ identifier will base the set expression on the current selections made in the data. This is also thedefault behavior when an identifier is not used.
Sum({1<Year={"2015"}>}Sales)
Script syntax and chart functions - Qlik Sense, February 2022 198
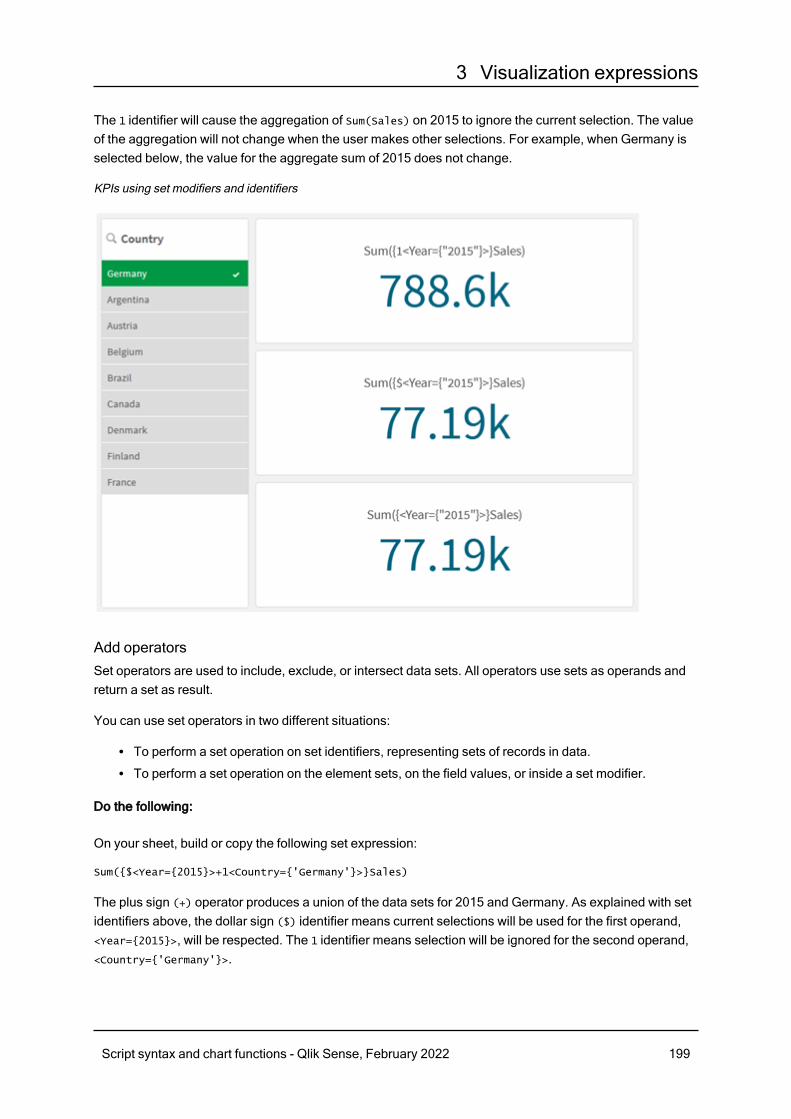
3 Visualization expressions
The 1 identifier will cause the aggregation of Sum(Sales) on 2015 to ignore the current selection. The valueof the aggregation will not change when the user makes other selections. For example, when Germany isselected below, the value for the aggregate sum of 2015 does not change.
KPIs using set modifiers and identifiers
Add operatorsSet operators are used to include, exclude, or intersect data sets. All operators use sets as operands andreturn a set as result.
You can use set operators in two different situations:
l To perform a set operation on set identifiers, representing sets of records in data.l To perform a set operation on the element sets, on the field values, or inside a set modifier.
Do the following:
On your sheet, build or copy the following set expression:
Sum({$<Year={2015}>+1<Country={'Germany'}>}Sales)
The plus sign (+) operator produces a union of the data sets for 2015 and Germany. As explained with setidentifiers above, the dollar sign ($) identifier means current selections will be used for the first operand,<Year={2015}>, will be respected. The 1 identifier means selection will be ignored for the second operand,<Country={'Germany'}>.
Script syntax and chart functions - Qlik Sense, February 2022 199
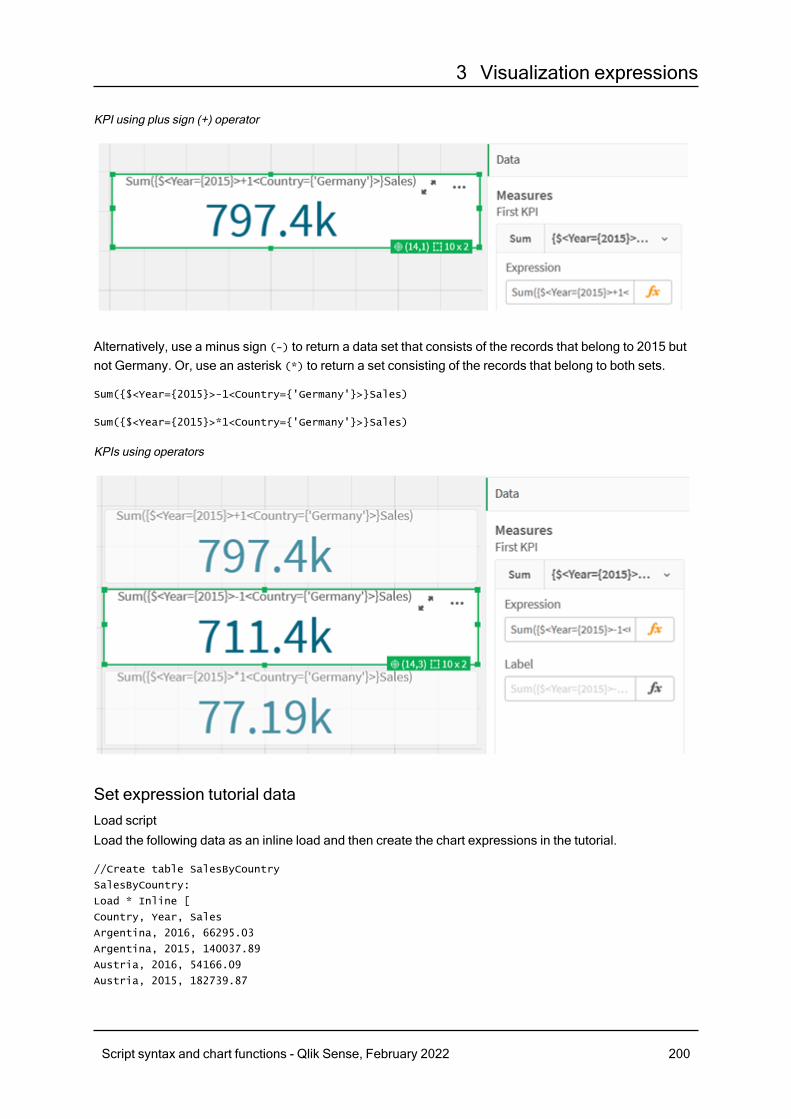
3 Visualization expressions
KPI using plus sign (+) operator
Alternatively, use a minus sign (-) to return a data set that consists of the records that belong to 2015 butnot Germany. Or, use an asterisk (*) to return a set consisting of the records that belong to both sets.
Sum({$<Year={2015}>-1<Country={'Germany'}>}Sales)
Sum({$<Year={2015}>*1<Country={'Germany'}>}Sales)
KPIs using operators
Set expression tutorial dataLoad scriptLoad the following data as an inline load and then create the chart expressions in the tutorial.
//Create table SalesByCountry
SalesByCountry:
Load * Inline [
Country, Year, Sales
Argentina, 2016, 66295.03
Argentina, 2015, 140037.89
Austria, 2016, 54166.09
Austria, 2015, 182739.87
Script syntax and chart functions - Qlik Sense, February 2022 200
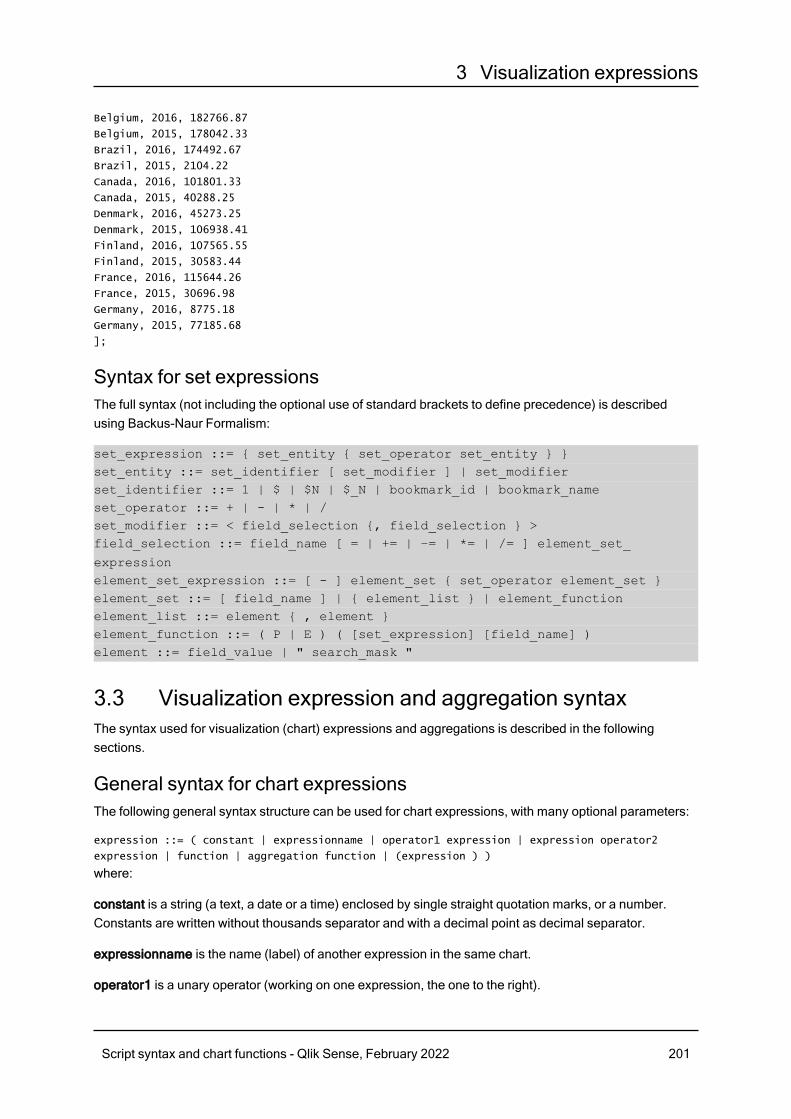
3 Visualization expressions
Belgium, 2016, 182766.87
Belgium, 2015, 178042.33
Brazil, 2016, 174492.67
Brazil, 2015, 2104.22
Canada, 2016, 101801.33
Canada, 2015, 40288.25
Denmark, 2016, 45273.25
Denmark, 2015, 106938.41
Finland, 2016, 107565.55
Finland, 2015, 30583.44
France, 2016, 115644.26
France, 2015, 30696.98
Germany, 2016, 8775.18
Germany, 2015, 77185.68
];
Syntax for set expressionsThe full syntax (not including the optional use of standard brackets to define precedence) is describedusing Backus-Naur Formalism:
set_expression ::= { set_entity { set_operator set_entity } }set_entity ::= set_identifier [ set_modifier ] | set_modifierset_identifier ::= 1 | $ | $N | $_N | bookmark_id | bookmark_nameset_operator ::= + | - | * | /set_modifier ::= < field_selection {, field_selection } >field_selection ::= field_name [ = | += | –= | *= | /= ] element_set_
expressionelement_set_expression ::= [ - ] element_set { set_operator element_set }element_set ::= [ field_name ] | { element_list } | element_functionelement_list ::= element { , element }element_function ::= ( P | E ) ( [set_expression] [field_name] )element ::= field_value | " search_mask "
3.3 Visualization expression and aggregation syntaxThe syntax used for visualization (chart) expressions and aggregations is described in the followingsections.
General syntax for chart expressionsThe following general syntax structure can be used for chart expressions, with many optional parameters:
expression ::= ( constant | expressionname | operator1 expression | expression operator2
expression | function | aggregation function | (expression ) )
where:
constant is a string (a text, a date or a time) enclosed by single straight quotation marks, or a number.Constants are written without thousands separator and with a decimal point as decimal separator.
expressionname is the name (label) of another expression in the same chart.
operator1 is a unary operator (working on one expression, the one to the right).
Script syntax and chart functions - Qlik Sense, February 2022 201
3 Visualization expressions
operator2 is a binary operator (working on two expressions, one on each side).
function ::= functionname ( parameters )
parameters ::= expression { , expression }
The number and types of parameters are not arbitrary. They depend on the function used.
aggregationfunction ::= aggregationfunctionname ( parameters2 )
parameters2 ::= aggrexpression { , aggrexpression }
The number and types of parameters are not arbitrary. They depend on the function used.
General syntax for aggregationsThe following general syntax structure can be used for aggregations, with many optional parameters:
aggrexpression ::= ( fieldref | operator1 aggrexpression | aggrexpression operator2
aggrexpression | functioninaggr | ( aggrexpression ) )
fieldref is a field name.
functionaggr ::= functionname ( parameters2 )
Expressions and functions can thus be nested freely, as long as fieldref is always enclosed by exactly oneaggregation function and provided the expression returns an interpretable value, Qlik Sense does not giveany error messages.
Script syntax and chart functions - Qlik Sense, February 2022 202
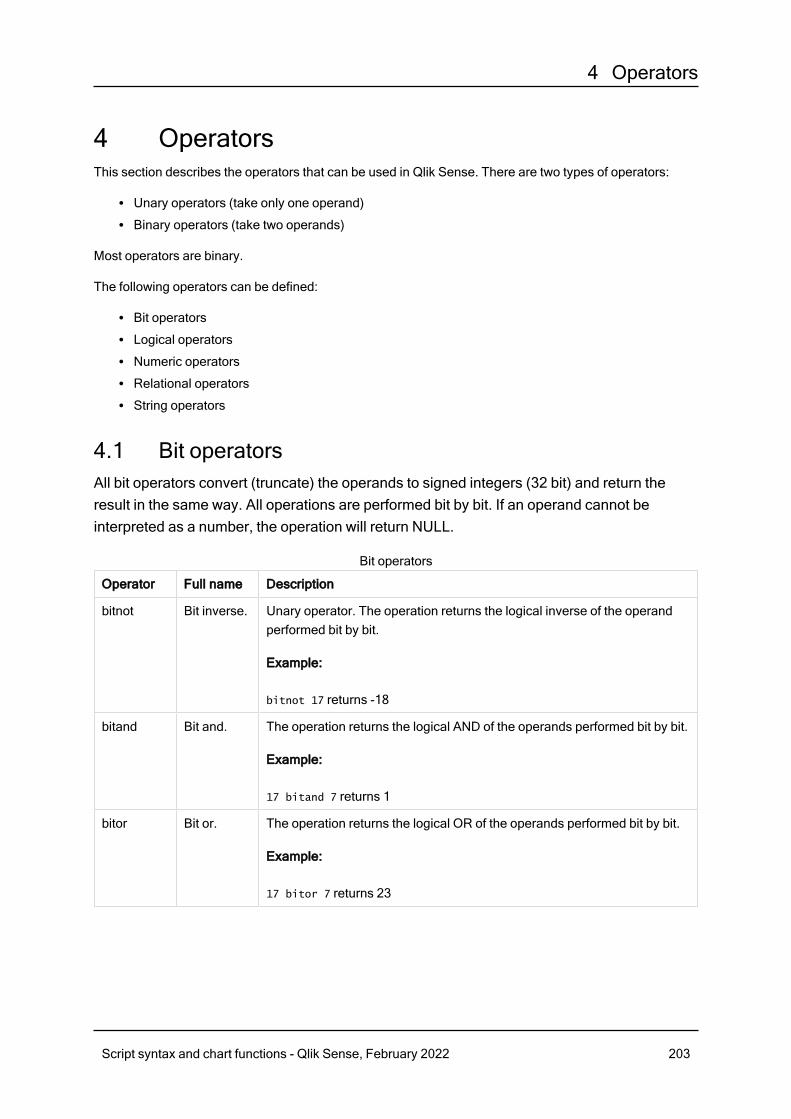
4 Operators
4 OperatorsThis section describes the operators that can be used in Qlik Sense. There are two types of operators:
l Unary operators (take only one operand)l Binary operators (take two operands)
Most operators are binary.
The following operators can be defined:
l Bit operatorsl Logical operatorsl Numeric operatorsl Relational operatorsl String operators
4.1 Bit operatorsAll bit operators convert (truncate) the operands to signed integers (32 bit) and return theresult in the same way. All operations are performed bit by bit. If an operand cannot beinterpreted as a number, the operation will return NULL.
Operator Full name Description
bitnot Bit inverse. Unary operator. The operation returns the logical inverse of the operandperformed bit by bit.
Example:
bitnot 17 returns -18
bitand Bit and. The operation returns the logical AND of the operands performed bit by bit.
Example:
17 bitand 7 returns 1
bitor Bit or. The operation returns the logical OR of the operands performed bit by bit.
Example:
17 bitor 7 returns 23
Bit operators
Script syntax and chart functions - Qlik Sense, February 2022 203
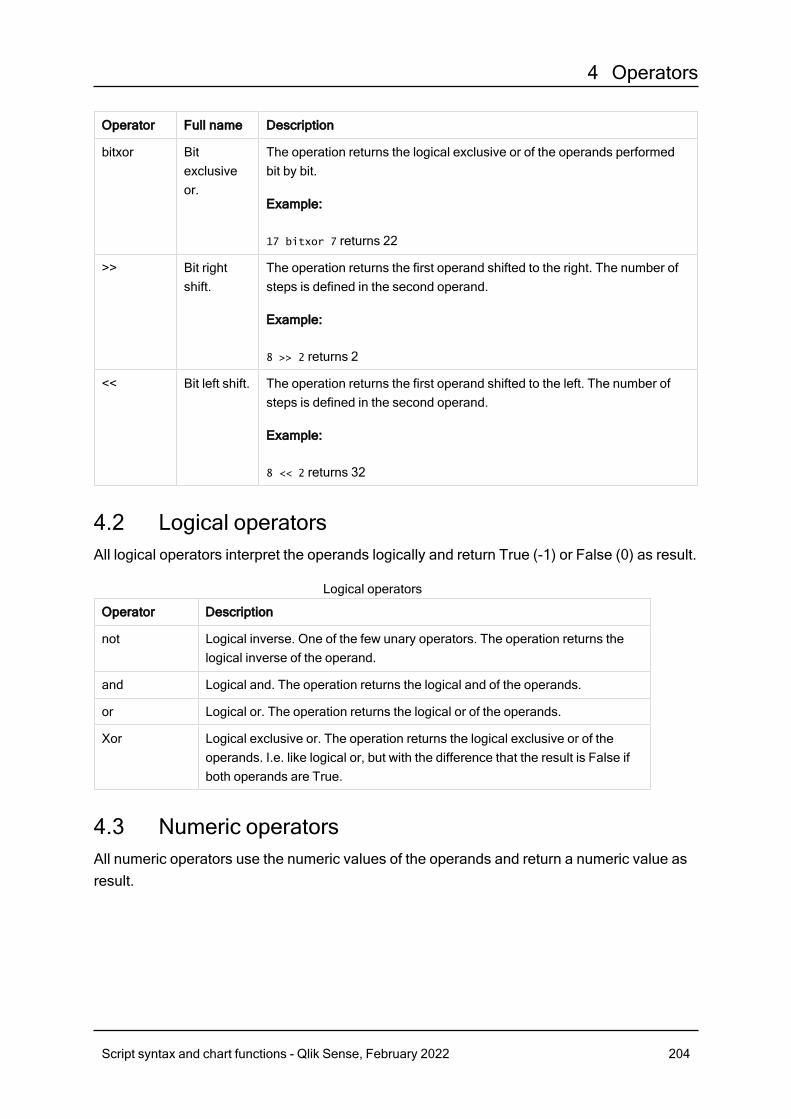
4 Operators
Operator Full name Description
bitxor Bitexclusiveor.
The operation returns the logical exclusive or of the operands performedbit by bit.
Example:
17 bitxor 7 returns 22
>> Bit rightshift.
The operation returns the first operand shifted to the right. The number ofsteps is defined in the second operand.
Example:
8 >> 2 returns 2
<< Bit left shift. The operation returns the first operand shifted to the left. The number ofsteps is defined in the second operand.
Example:
8 << 2 returns 32
4.2 Logical operatorsAll logical operators interpret the operands logically and return True (-1) or False (0) as result.
Operator Description
not Logical inverse. One of the few unary operators. The operation returns thelogical inverse of the operand.
and Logical and. The operation returns the logical and of the operands.
or Logical or. The operation returns the logical or of the operands.
Xor Logical exclusive or. The operation returns the logical exclusive or of theoperands. I.e. like logical or, but with the difference that the result is False ifboth operands are True.
Logical operators
4.3 Numeric operatorsAll numeric operators use the numeric values of the operands and return a numeric value asresult.
Script syntax and chart functions - Qlik Sense, February 2022 204
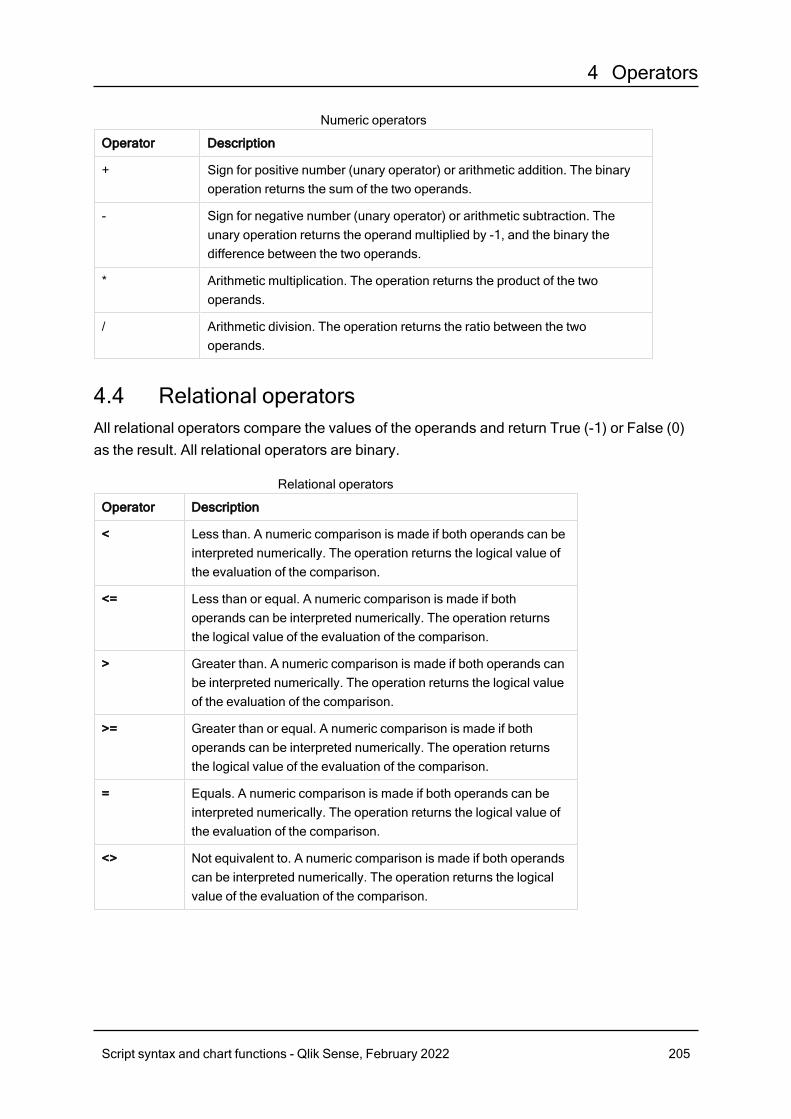
4 Operators
Operator Description
+ Sign for positive number (unary operator) or arithmetic addition. The binaryoperation returns the sum of the two operands.
- Sign for negative number (unary operator) or arithmetic subtraction. Theunary operation returns the operand multiplied by -1, and the binary thedifference between the two operands.
* Arithmetic multiplication. The operation returns the product of the twooperands.
/ Arithmetic division. The operation returns the ratio between the twooperands.
Numeric operators
4.4 Relational operatorsAll relational operators compare the values of the operands and return True (-1) or False (0)as the result. All relational operators are binary.
Operator Description
< Less than. A numeric comparison is made if both operands can beinterpreted numerically. The operation returns the logical value ofthe evaluation of the comparison.
<= Less than or equal. A numeric comparison is made if bothoperands can be interpreted numerically. The operation returnsthe logical value of the evaluation of the comparison.
> Greater than. A numeric comparison is made if both operands canbe interpreted numerically. The operation returns the logical valueof the evaluation of the comparison.
>= Greater than or equal. A numeric comparison is made if bothoperands can be interpreted numerically. The operation returnsthe logical value of the evaluation of the comparison.
= Equals. A numeric comparison is made if both operands can beinterpreted numerically. The operation returns the logical value ofthe evaluation of the comparison.
<> Not equivalent to. A numeric comparison is made if both operandscan be interpreted numerically. The operation returns the logicalvalue of the evaluation of the comparison.
Relational operators
Script syntax and chart functions - Qlik Sense, February 2022 205
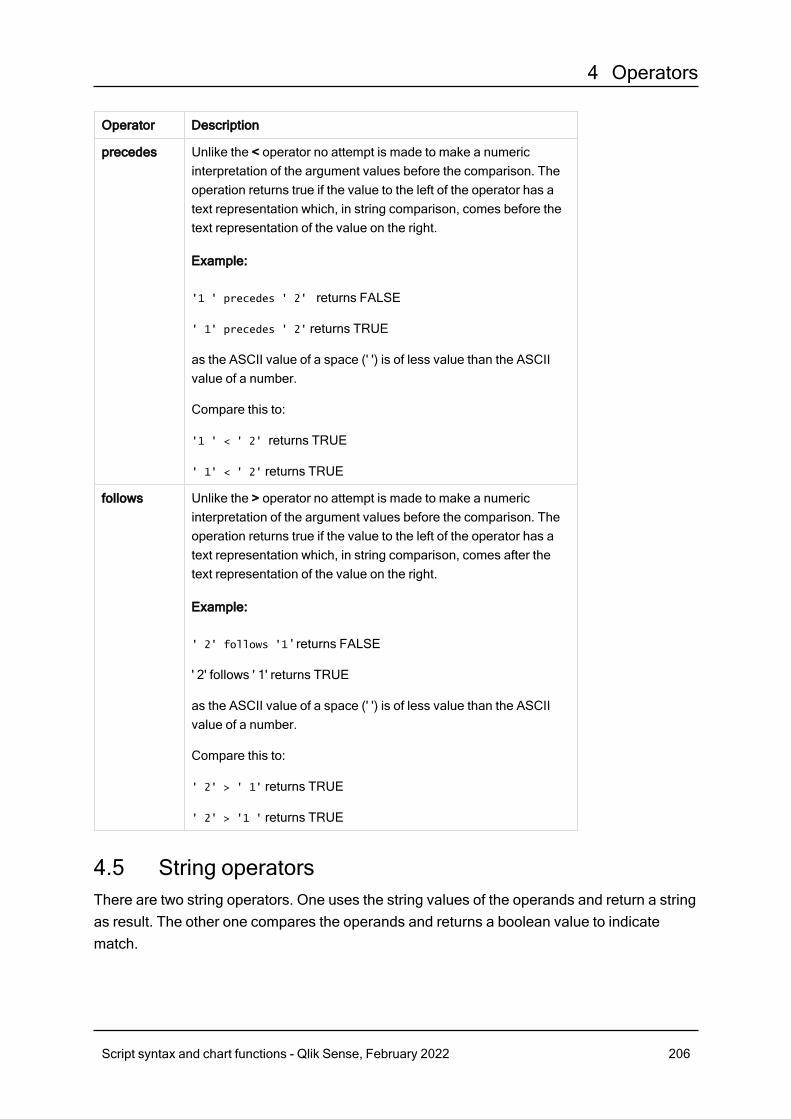
4 Operators
Operator Description
precedes Unlike the < operator no attempt is made to make a numericinterpretation of the argument values before the comparison. Theoperation returns true if the value to the left of the operator has atext representation which, in string comparison, comes before thetext representation of the value on the right.
Example:
'1 ' precedes ' 2' returns FALSE
' 1' precedes ' 2' returns TRUE
as the ASCII value of a space (' ') is of less value than the ASCIIvalue of a number.
Compare this to:
'1 ' < ' 2' returns TRUE
' 1' < ' 2' returns TRUE
follows Unlike the > operator no attempt is made to make a numericinterpretation of the argument values before the comparison. Theoperation returns true if the value to the left of the operator has atext representation which, in string comparison, comes after thetext representation of the value on the right.
Example:
' 2' follows '1 ' returns FALSE
' 2' follows ' 1' returns TRUE
as the ASCII value of a space (' ') is of less value than the ASCIIvalue of a number.
Compare this to:
' 2' > ' 1' returns TRUE
' 2' > '1 ' returns TRUE
4.5 String operatorsThere are two string operators. One uses the string values of the operands and return a stringas result. The other one compares the operands and returns a boolean value to indicatematch.
Script syntax and chart functions - Qlik Sense, February 2022 206

4 Operators
&String concatenation. The operation returns a text string, that consists of the two operand strings, one afteranother.
Example:
'abc' & 'xyz' returns 'abcxyz'
likeString comparison with wildcard characters. The operation returns a boolean True (-1) if the string beforethe operator is matched by the string after the operator. The second string may contain the wildcardcharacters * (any number of arbitrary characters) or ? (one arbitrary character).
Example:
'abc' like 'a*' returns True (-1)
'abcd' like 'a?c*' returns True (-1)
'abc' like 'a??bc' returns False (0)
Script syntax and chart functions - Qlik Sense, February 2022 207
5 Script functions
5 Script functionsThis section describes functions that can be used in Qlik Sense data load scripts to transform andaggregate data.
Many functions can be used in the same way in both data load scripts and chart expressions, but there area number of exceptions:
l Some functions can only be used in data load scripts, denoted by - script function.l Some functions can only be used in chart expressions, denoted by - chart function.l Some functions can be used in both data load scripts and chart expressions, but with differences inparameters and application. These are described in separate topics denoted by - script function or -chart function.
5.1 Analytic connections for server-side extensions (SSE)Functions enabled by analytic connections will only be visible if you have configured the analyticconnections and Qlik Sense has started.
You configure the analytic connections in the QMC, see the topic " Creating an analytic connection" in theguide Manage Qlik Sense sites.
In Qlik Sense Desktop, you configure the analytic connections by editing the Settings.ini file, see the topic "Configuring analytic connections in Qlik Sense Desktop" in the guide Qlik Sense Desktop.
5.2 Aggregation functionsThe family of functions known as aggregation functions consists of functions that takemultiple field values as their input and return a single result per group, where the grouping isdefined by a chart dimension or a group by clause in the script statement.
Aggregation functions include Sum(), Count(), Min(), Max(), and many more.
Most aggregation functions can be used in both the data load script and chart expressions, but the syntaxdiffers.
Limitations:
The parameter of the aggregation function must not contain other aggregation functions, unless theseinner aggregations contain the TOTAL qualifier. For more advanced nested aggregations, use theadvanced function Aggr, in combination with a specified dimension.
Using aggregation functions in a data load scriptAggregation functions can only be used inside LOAD and SELECT statements.
Script syntax and chart functions - Qlik Sense, February 2022 208
5 Script functions
Using aggregation functions in chart expressionsThe parameter of the aggregation function must not contain other aggregation functions, unless theseinner aggregations contain the TOTAL qualifier. For more advanced nested aggregations, use theadvanced function Aggr, in combination with a specified dimension.
An aggregation function aggregates over the set of possible records defined by the selection. However, analternative set of records can be defined by using a set expression in set analysis.
How aggregations are calculatedAn aggregation loops over the records of a specific table, aggregating the records in it. For example, Count(<Field>) will count the number of records in the table where <Field> resides. Should you want toaggregate just the distinct field values, you need to use the distinct clause, such as Count(distinct<Field>).
If the aggregation function contains fields from different tables, the aggregation function will loop over therecords of the cross product of the tables of the constituent fields. This has a performance penalty, and forthis reason such aggregations should be avoided, particularly when you have large amounts of data.
Aggregation of key fieldsThe way aggregations are calculated means that you cannot aggregate key fields because it is not clearwhich table should be used for the aggregation. For example, if the field <Key> links two tables, it is notclear whether Count(<Key>) should return the number of records from the first or the second table.
However, if you use the distinct clause, the aggregation is well-defined and can be calculated.
So, if you use a key field inside an aggregation function without the distinct clause, Qlik Sense will return anumber which may be meaningless. The solution is to either use the distinct clause, or use a copy of thekey – a copy that resides in one table only.
For example, in the following tables, ProductID is the key between the tables.
ProductID key between Products and Details tables
Script syntax and chart functions - Qlik Sense, February 2022 209
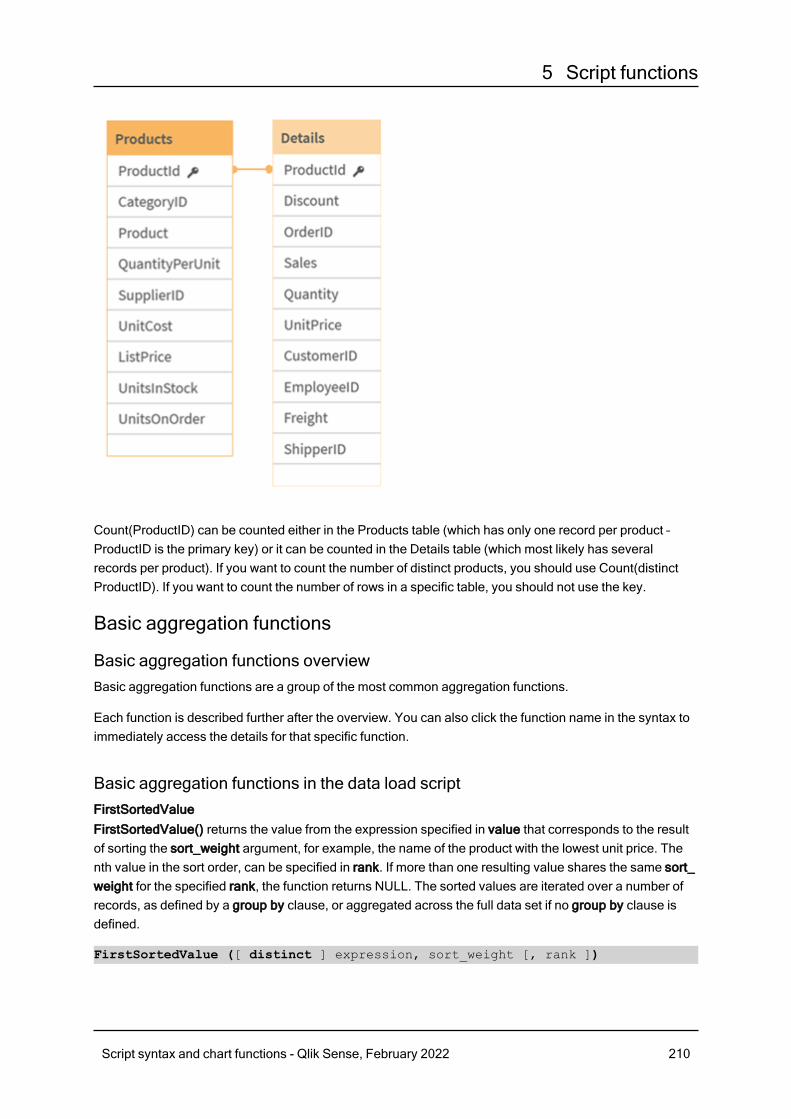
5 Script functions
Count(ProductID) can be counted either in the Products table (which has only one record per product –ProductID is the primary key) or it can be counted in the Details table (which most likely has severalrecords per product). If you want to count the number of distinct products, you should use Count(distinctProductID). If you want to count the number of rows in a specific table, you should not use the key.
Basic aggregation functions
Basic aggregation functions overviewBasic aggregation functions are a group of the most common aggregation functions.
Each function is described further after the overview. You can also click the function name in the syntax toimmediately access the details for that specific function.
Basic aggregation functions in the data load scriptFirstSortedValueFirstSortedValue() returns the value from the expression specified in value that corresponds to the resultof sorting the sort_weight argument, for example, the name of the product with the lowest unit price. Thenth value in the sort order, can be specified in rank. If more than one resulting value shares the same sort_weight for the specified rank, the function returns NULL. The sorted values are iterated over a number ofrecords, as defined by a group by clause, or aggregated across the full data set if no group by clause isdefined.
FirstSortedValue ([ distinct ] expression, sort_weight [, rank ])
Script syntax and chart functions - Qlik Sense, February 2022 210
5 Script functions
MaxMax() finds the highest numeric value of the aggregated data in the expression, as defined by a group byclause. By specifying a rank n, the nth highest value can be found.
Max ( expression[, rank])
MinMin() returns the lowest numeric value of the aggregated data in the expression, as defined by a group byclause. By specifying a rank n, the nth lowest value can be found.
Min ( expression[, rank])
ModeMode() returns the most commonly-occurring value, the mode value, of the aggregated data in theexpression, as defined by a group by clause. The Mode() function can return numeric values as well astext values.
Mode (expression )
OnlyOnly() returns a value if there is one and only one possible result from the aggregated data. If recordscontain only one value then that value is returned, otherwise NULL is returned. Use the group by clause toevaluate over multiple records. The Only() function can return numeric and text values.
Only (expression )
SumSum() calculates the total of the values aggregated in the expression, as defined by a group by clause.Sum ([distinct]expression)
Basic aggregation functions in chart expressionsChart aggregation functions can only be used on fields in chart expressions. The argument expression ofone aggregation function must not contain another aggregation function.
FirstSortedValueFirstSortedValue() returns the value from the expression specified in value that corresponds to the resultof sorting the sort_weight argument, for example, the name of the product with the lowest unit price. Thenth value in the sort order, can be specified in rank. If more than one resulting value shares the same sort_weight for the specified rank, the function returns NULL.
FirstSortedValue - chart function([{SetExpression}] [DISTINCT] [TOTAL [<fld
{,fld}>]] value, sort_weight [,rank])
MaxMax() finds the highest value of the aggregated data. By specifying a rank n, the nth highest value can befound.Max - chart functionMax() finds the highest value of the aggregated data. Byspecifying a rank n, the nth highest value can be found. You might also wantto look at FirstSortedValue and rangemax, which have similar functionality tothe Max function. Max([{SetExpression}] [TOTAL [<fld {,fld}>]] expr [,rank])
Script syntax and chart functions - Qlik Sense, February 2022 211
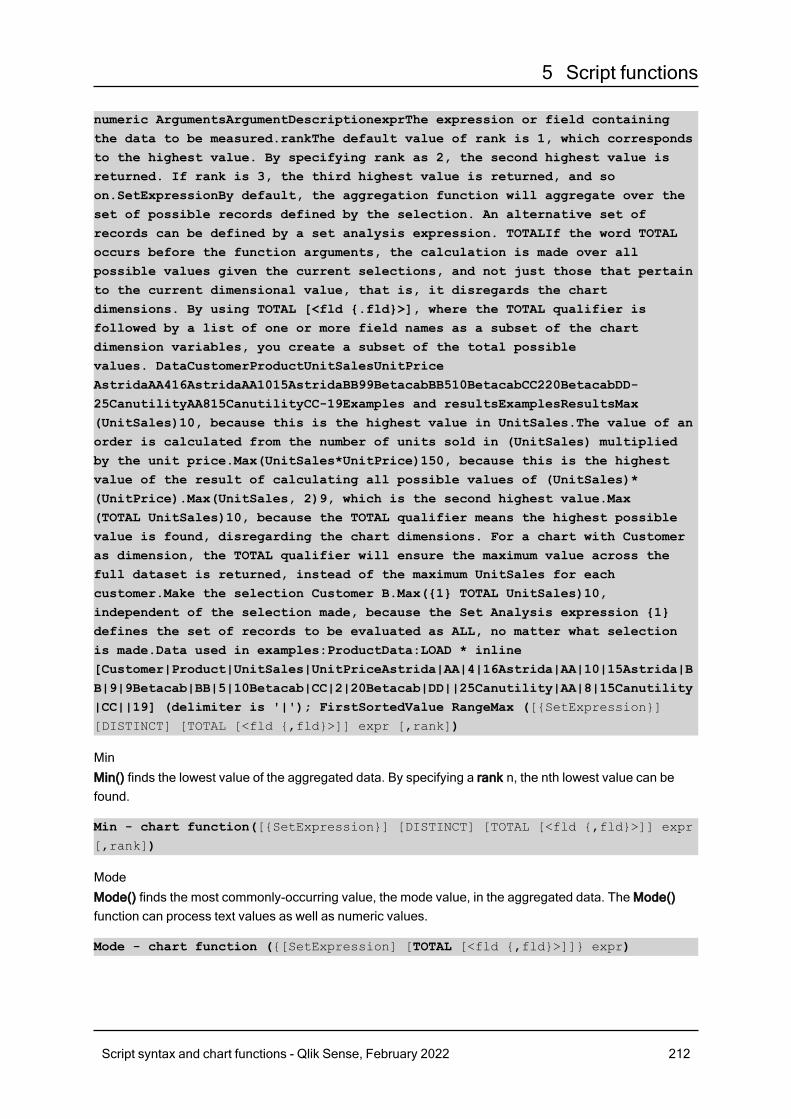
5 Script functions
numeric ArgumentsArgumentDescriptionexprThe expression or field containingthe data to be measured.rankThe default value of rank is 1, which correspondsto the highest value. By specifying rank as 2, the second highest value isreturned. If rank is 3, the third highest value is returned, and soon.SetExpressionBy default, the aggregation function will aggregate over theset of possible records defined by the selection. An alternative set ofrecords can be defined by a set analysis expression. TOTALIf the word TOTALoccurs before the function arguments, the calculation is made over allpossible values given the current selections, and not just those that pertainto the current dimensional value, that is, it disregards the chartdimensions. By using TOTAL [<fld {.fld}>], where the TOTAL qualifier isfollowed by a list of one or more field names as a subset of the chartdimension variables, you create a subset of the total possiblevalues. DataCustomerProductUnitSalesUnitPriceAstridaAA416AstridaAA1015AstridaBB99BetacabBB510BetacabCC220BetacabDD-25CanutilityAA815CanutilityCC-19Examples and resultsExamplesResultsMax(UnitSales)10, because this is the highest value in UnitSales.The value of anorder is calculated from the number of units sold in (UnitSales) multipliedby the unit price.Max(UnitSales*UnitPrice)150, because this is the highestvalue of the result of calculating all possible values of (UnitSales)*(UnitPrice).Max(UnitSales, 2)9, which is the second highest value.Max(TOTAL UnitSales)10, because the TOTAL qualifier means the highest possiblevalue is found, disregarding the chart dimensions. For a chart with Customeras dimension, the TOTAL qualifier will ensure the maximum value across thefull dataset is returned, instead of the maximum UnitSales for eachcustomer.Make the selection Customer B.Max({1} TOTAL UnitSales)10,independent of the selection made, because the Set Analysis expression {1}defines the set of records to be evaluated as ALL, no matter what selectionis made.Data used in examples:ProductData:LOAD * inline[Customer|Product|UnitSales|UnitPriceAstrida|AA|4|16Astrida|AA|10|15Astrida|BB|9|9Betacab|BB|5|10Betacab|CC|2|20Betacab|DD||25Canutility|AA|8|15Canutility|CC||19] (delimiter is '|'); FirstSortedValue RangeMax ([{SetExpression}][DISTINCT] [TOTAL [<fld {,fld}>]] expr [,rank])
MinMin() finds the lowest value of the aggregated data. By specifying a rank n, the nth lowest value can befound.
Min - chart function([{SetExpression}] [DISTINCT] [TOTAL [<fld {,fld}>]] expr
[,rank])
ModeMode() finds the most commonly-occurring value, the mode value, in the aggregated data. The Mode()function can process text values as well as numeric values.
Mode - chart function ({[SetExpression] [TOTAL [<fld {,fld}>]]} expr)
Script syntax and chart functions - Qlik Sense, February 2022 212
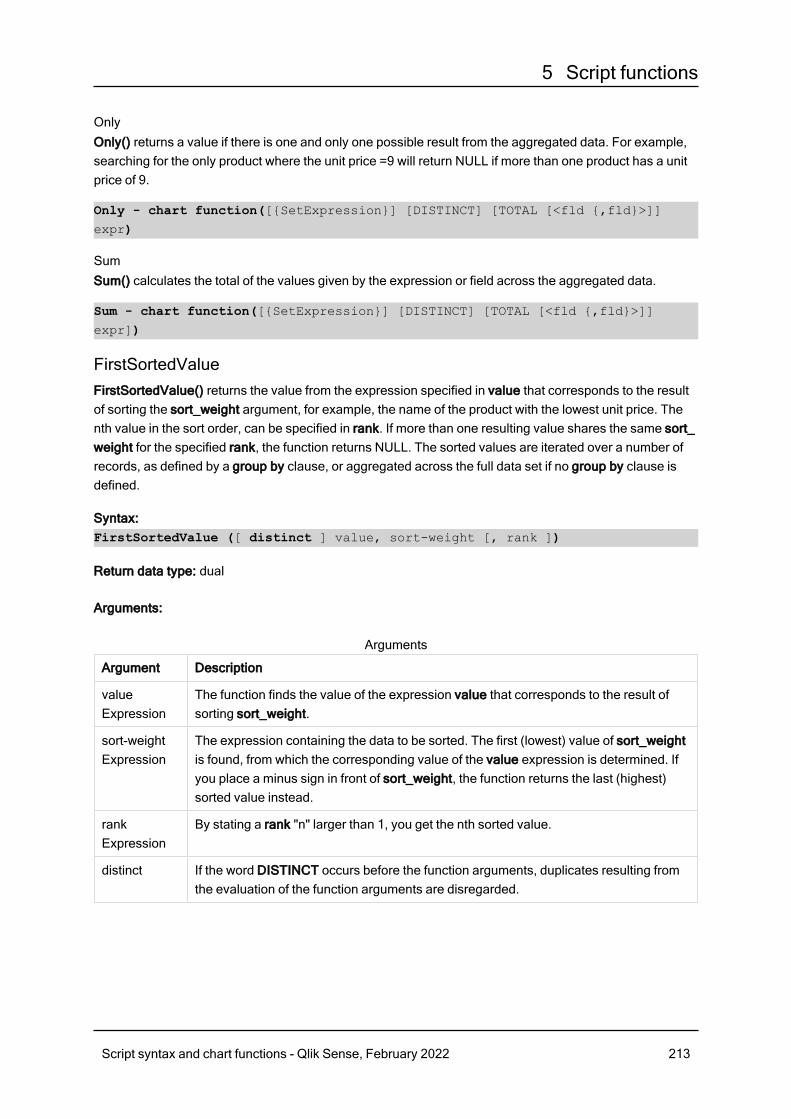
5 Script functions
OnlyOnly() returns a value if there is one and only one possible result from the aggregated data. For example,searching for the only product where the unit price =9 will return NULL if more than one product has a unitprice of 9.
Only - chart function([{SetExpression}] [DISTINCT] [TOTAL [<fld {,fld}>]]
expr)
SumSum() calculates the total of the values given by the expression or field across the aggregated data.
Sum - chart function([{SetExpression}] [DISTINCT] [TOTAL [<fld {,fld}>]]
expr])
FirstSortedValueFirstSortedValue() returns the value from the expression specified in value that corresponds to the resultof sorting the sort_weight argument, for example, the name of the product with the lowest unit price. Thenth value in the sort order, can be specified in rank. If more than one resulting value shares the same sort_weight for the specified rank, the function returns NULL. The sorted values are iterated over a number ofrecords, as defined by a group by clause, or aggregated across the full data set if no group by clause isdefined.
Syntax:FirstSortedValue ([ distinct ] value, sort-weight [, rank ])
Return data type: dual
Arguments:
Argument Description
valueExpression
The function finds the value of the expression value that corresponds to the result ofsorting sort_weight.
sort-weightExpression
The expression containing the data to be sorted. The first (lowest) value of sort_weightis found, from which the corresponding value of the value expression is determined. Ifyou place a minus sign in front of sort_weight, the function returns the last (highest)sorted value instead.
rankExpression
By stating a rank "n" larger than 1, you get the nth sorted value.
distinct If the word DISTINCT occurs before the function arguments, duplicates resulting fromthe evaluation of the function arguments are disregarded.
Arguments
Script syntax and chart functions - Qlik Sense, February 2022 213
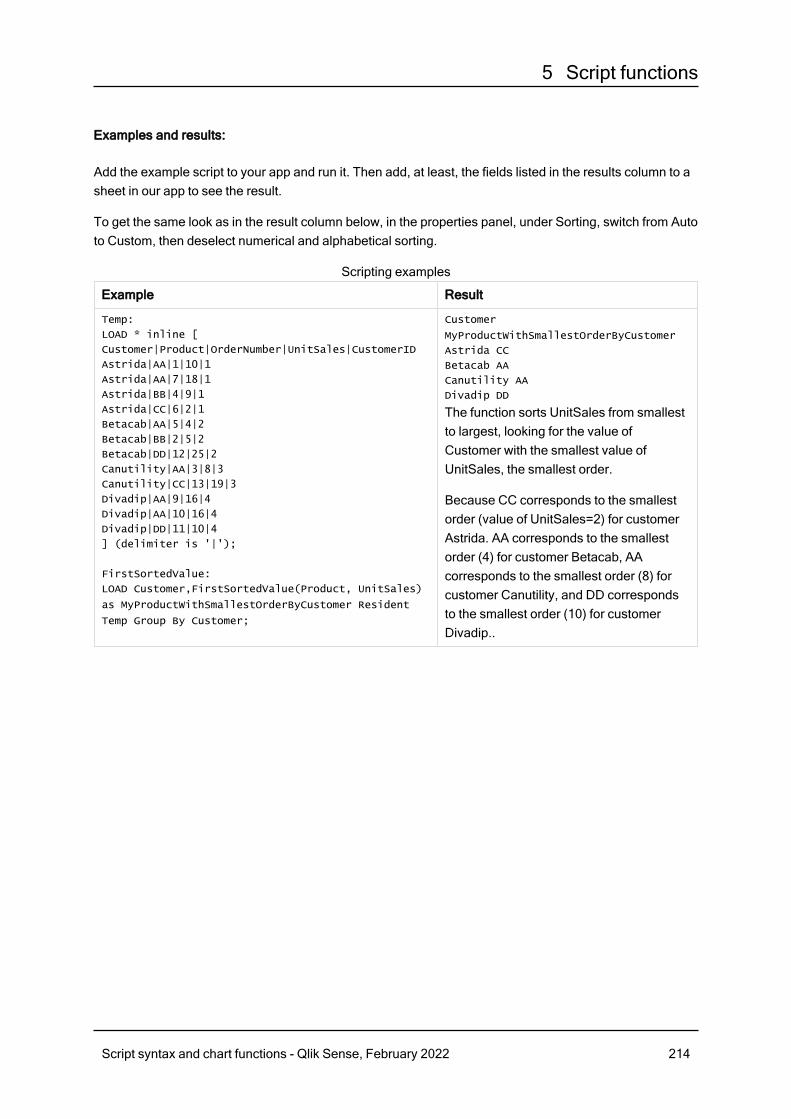
5 Script functions
Examples and results:
Add the example script to your app and run it. Then add, at least, the fields listed in the results column to asheet in our app to see the result.
To get the same look as in the result column below, in the properties panel, under Sorting, switch from Autoto Custom, then deselect numerical and alphabetical sorting.
Example Result
Temp:
LOAD * inline [
Customer|Product|OrderNumber|UnitSales|CustomerID
Astrida|AA|1|10|1
Astrida|AA|7|18|1
Astrida|BB|4|9|1
Astrida|CC|6|2|1
Betacab|AA|5|4|2
Betacab|BB|2|5|2
Betacab|DD|12|25|2
Canutility|AA|3|8|3
Canutility|CC|13|19|3
Divadip|AA|9|16|4
Divadip|AA|10|16|4
Divadip|DD|11|10|4
] (delimiter is '|');
FirstSortedValue:
LOAD Customer,FirstSortedValue(Product, UnitSales)
as MyProductWithSmallestOrderByCustomer Resident
Temp Group By Customer;
Customer
MyProductWithSmallestOrderByCustomer
Astrida CC
Betacab AA
Canutility AA
Divadip DD
The function sorts UnitSales from smallestto largest, looking for the value ofCustomer with the smallest value ofUnitSales, the smallest order.
Because CC corresponds to the smallestorder (value of UnitSales=2) for customerAstrida. AA corresponds to the smallestorder (4) for customer Betacab, AAcorresponds to the smallest order (8) forcustomer Canutility, and DD correspondsto the smallest order (10) for customerDivadip..
Scripting examples
Script syntax and chart functions - Qlik Sense, February 2022 214
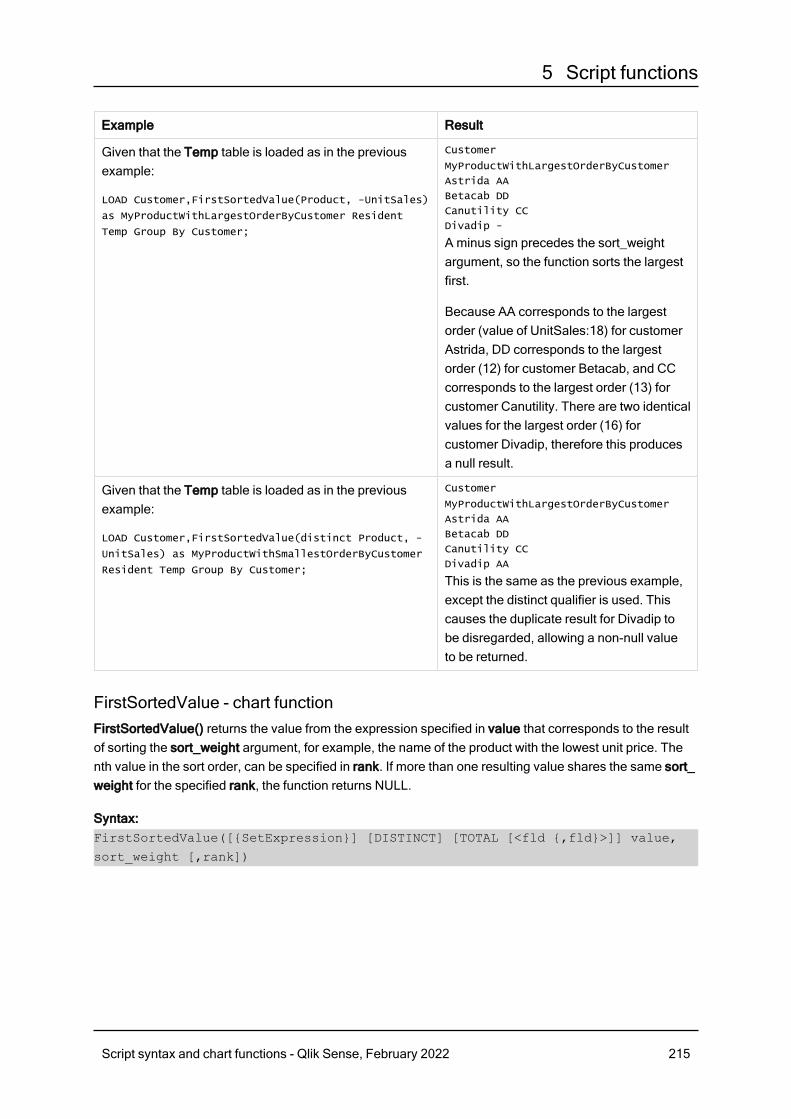
5 Script functions
Example Result
Given that the Temp table is loaded as in the previousexample:
LOAD Customer,FirstSortedValue(Product, -UnitSales)
as MyProductWithLargestOrderByCustomer Resident
Temp Group By Customer;
Customer
MyProductWithLargestOrderByCustomer
Astrida AA
Betacab DD
Canutility CC
Divadip -
A minus sign precedes the sort_weightargument, so the function sorts the largestfirst.
Because AA corresponds to the largestorder (value of UnitSales:18) for customerAstrida, DD corresponds to the largestorder (12) for customer Betacab, and CCcorresponds to the largest order (13) forcustomer Canutility. There are two identicalvalues for the largest order (16) forcustomer Divadip, therefore this producesa null result.
Given that the Temp table is loaded as in the previousexample:
LOAD Customer,FirstSortedValue(distinct Product, -
UnitSales) as MyProductWithSmallestOrderByCustomer
Resident Temp Group By Customer;
Customer
MyProductWithLargestOrderByCustomer
Astrida AA
Betacab DD
Canutility CC
Divadip AA
This is the same as the previous example,except the distinct qualifier is used. Thiscauses the duplicate result for Divadip tobe disregarded, allowing a non-null valueto be returned.
FirstSortedValue - chart functionFirstSortedValue() returns the value from the expression specified in value that corresponds to the resultof sorting the sort_weight argument, for example, the name of the product with the lowest unit price. Thenth value in the sort order, can be specified in rank. If more than one resulting value shares the same sort_weight for the specified rank, the function returns NULL.
Syntax:FirstSortedValue([{SetExpression}] [DISTINCT] [TOTAL [<fld {,fld}>]] value,
sort_weight [,rank])
Script syntax and chart functions - Qlik Sense, February 2022 215
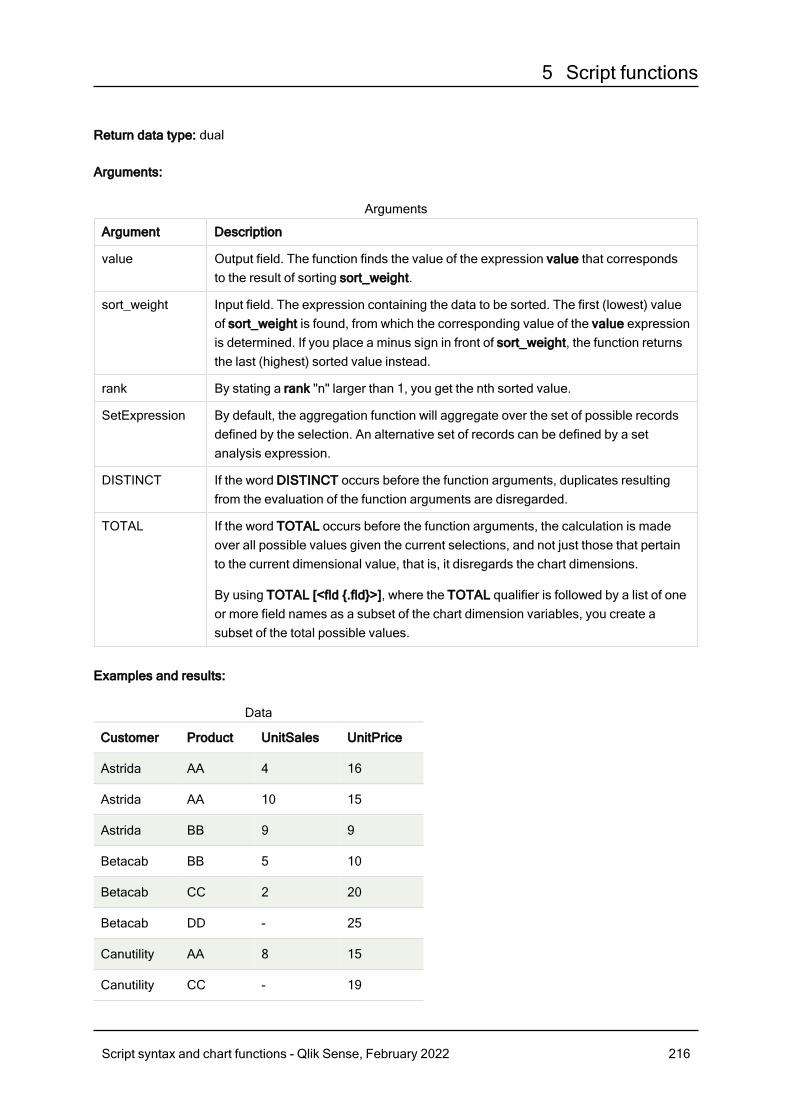
5 Script functions
Return data type: dual
Arguments:
Argument Description
value Output field. The function finds the value of the expression value that correspondsto the result of sorting sort_weight.
sort_weight Input field. The expression containing the data to be sorted. The first (lowest) valueof sort_weight is found, from which the corresponding value of the value expressionis determined. If you place a minus sign in front of sort_weight, the function returnsthe last (highest) sorted value instead.
rank By stating a rank "n" larger than 1, you get the nth sorted value.
SetExpression By default, the aggregation function will aggregate over the set of possible recordsdefined by the selection. An alternative set of records can be defined by a setanalysis expression.
DISTINCT If the word DISTINCT occurs before the function arguments, duplicates resultingfrom the evaluation of the function arguments are disregarded.
TOTAL If the word TOTAL occurs before the function arguments, the calculation is madeover all possible values given the current selections, and not just those that pertainto the current dimensional value, that is, it disregards the chart dimensions.
By using TOTAL [<fld {.fld}>], where the TOTAL qualifier is followed by a list of oneor more field names as a subset of the chart dimension variables, you create asubset of the total possible values.
Arguments
Examples and results:
Customer Product UnitSales UnitPrice
Astrida AA 4 16
Astrida AA 10 15
Astrida BB 9 9
Betacab BB 5 10
Betacab CC 2 20
Betacab DD - 25
Canutility AA 8 15
Canutility CC - 19
Data
Script syntax and chart functions - Qlik Sense, February 2022 216
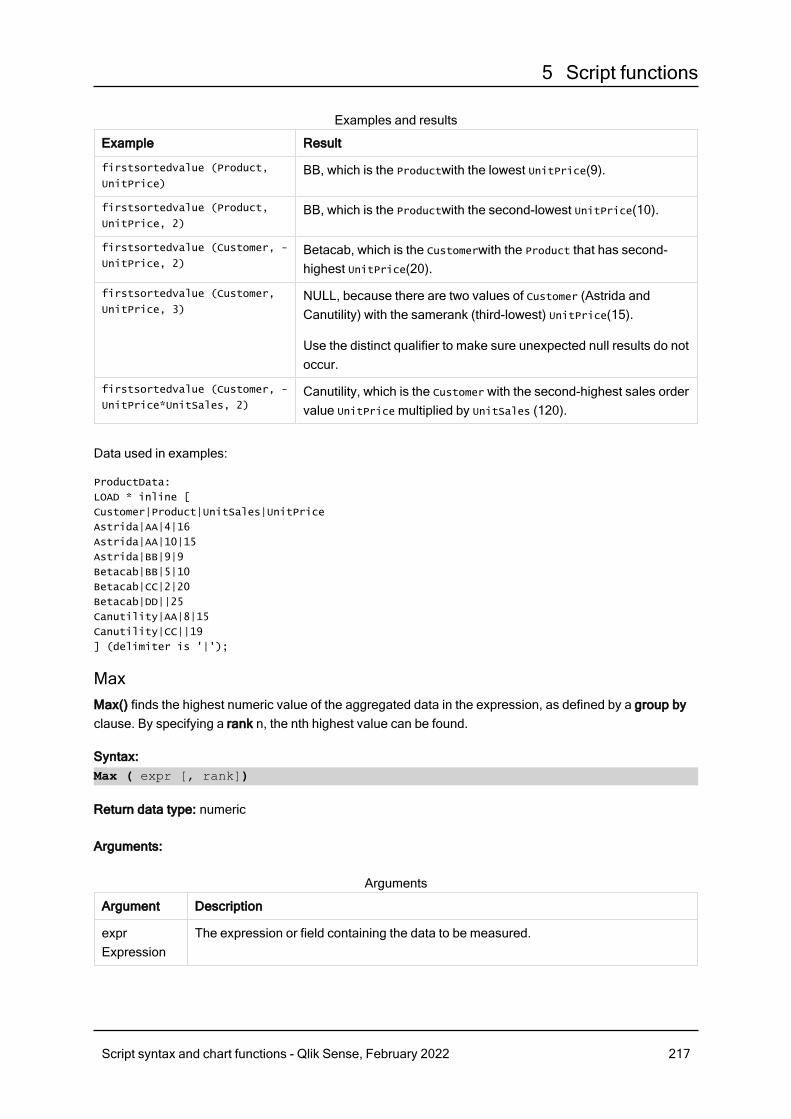
5 Script functions
Example Result
firstsortedvalue (Product,
UnitPrice)BB, which is the Productwith the lowest UnitPrice(9).
firstsortedvalue (Product,
UnitPrice, 2)BB, which is the Productwith the second-lowest UnitPrice(10).
firstsortedvalue (Customer, -
UnitPrice, 2)Betacab, which is the Customerwith the Product that has second-highest UnitPrice(20).
firstsortedvalue (Customer,
UnitPrice, 3)NULL, because there are two values of Customer (Astrida andCanutility) with the samerank (third-lowest) UnitPrice(15).
Use the distinct qualifier to make sure unexpected null results do notoccur.
firstsortedvalue (Customer, -
UnitPrice*UnitSales, 2)Canutility, which is the Customer with the second-highest sales ordervalue UnitPricemultiplied by UnitSales (120).
Examples and results
Data used in examples:
ProductData:
LOAD * inline [
Customer|Product|UnitSales|UnitPrice
Astrida|AA|4|16
Astrida|AA|10|15
Astrida|BB|9|9
Betacab|BB|5|10
Betacab|CC|2|20
Betacab|DD||25
Canutility|AA|8|15
Canutility|CC||19
] (delimiter is '|');
MaxMax() finds the highest numeric value of the aggregated data in the expression, as defined by a group byclause. By specifying a rank n, the nth highest value can be found.
Syntax:Max ( expr [, rank])
Return data type: numeric
Arguments:
Argument Description
exprExpression
The expression or field containing the data to be measured.
Arguments
Script syntax and chart functions - Qlik Sense, February 2022 217
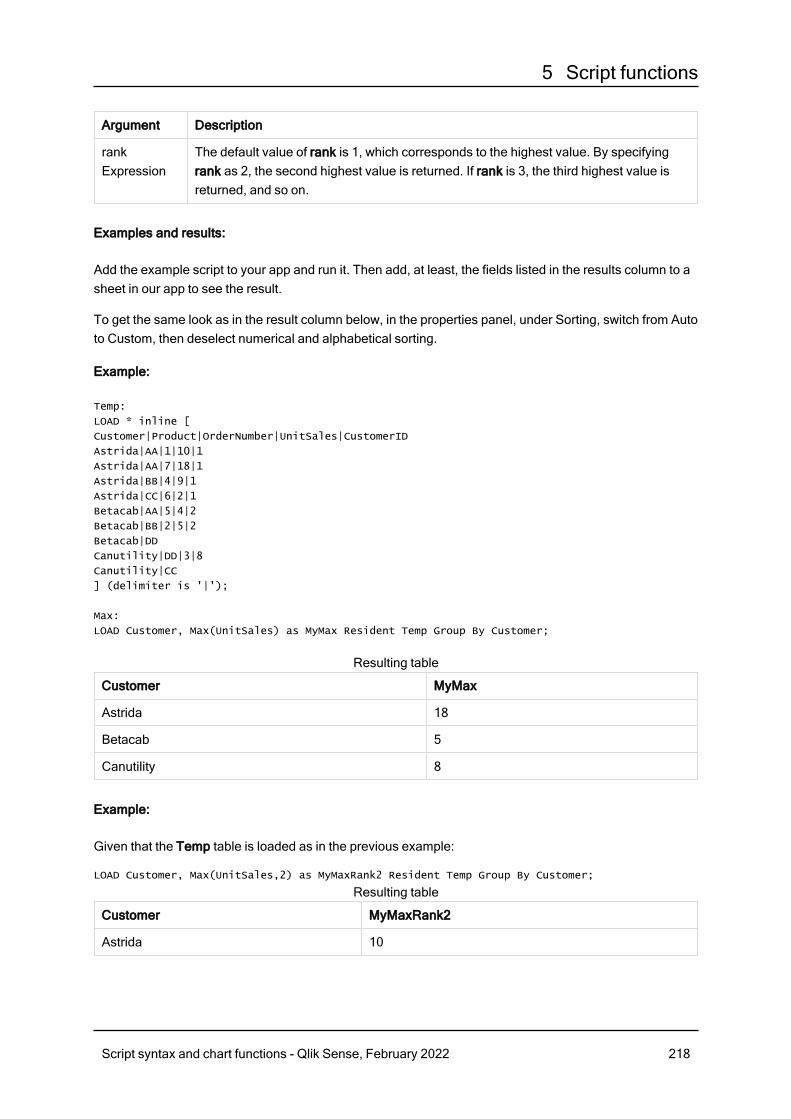
5 Script functions
Argument Description
rankExpression
The default value of rank is 1, which corresponds to the highest value. By specifyingrank as 2, the second highest value is returned. If rank is 3, the third highest value isreturned, and so on.
Examples and results:
Add the example script to your app and run it. Then add, at least, the fields listed in the results column to asheet in our app to see the result.
To get the same look as in the result column below, in the properties panel, under Sorting, switch from Autoto Custom, then deselect numerical and alphabetical sorting.
Example:
Temp:
LOAD * inline [
Customer|Product|OrderNumber|UnitSales|CustomerID
Astrida|AA|1|10|1
Astrida|AA|7|18|1
Astrida|BB|4|9|1
Astrida|CC|6|2|1
Betacab|AA|5|4|2
Betacab|BB|2|5|2
Betacab|DD
Canutility|DD|3|8
Canutility|CC
] (delimiter is '|');
Max:
LOAD Customer, Max(UnitSales) as MyMax Resident Temp Group By Customer;
Customer MyMax
Astrida 18
Betacab 5
Canutility 8
Resulting table
Example:
Given that the Temp table is loaded as in the previous example:
LOAD Customer, Max(UnitSales,2) as MyMaxRank2 Resident Temp Group By Customer;
Customer MyMaxRank2
Astrida 10
Resulting table
Script syntax and chart functions - Qlik Sense, February 2022 218
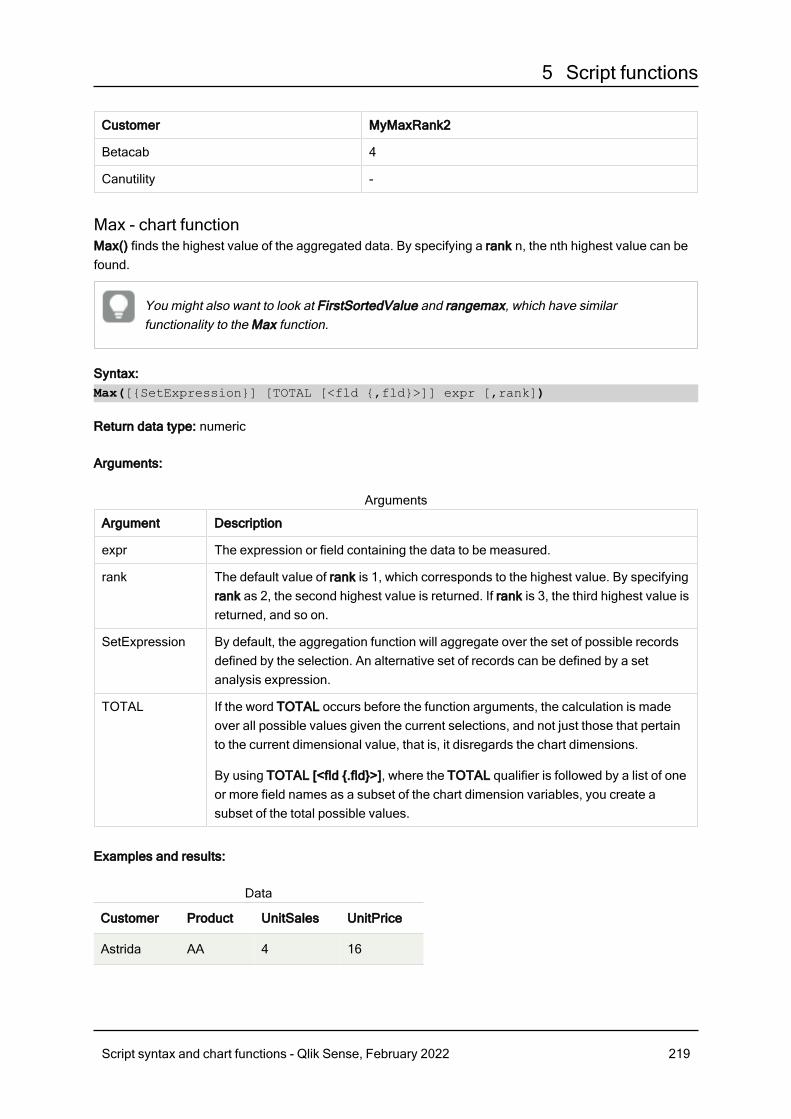
5 Script functions
Customer MyMaxRank2
Betacab 4
Canutility -
Max - chart functionMax() finds the highest value of the aggregated data. By specifying a rank n, the nth highest value can befound.
You might also want to look at FirstSortedValue and rangemax, which have similarfunctionality to the Max function.
Syntax:Max([{SetExpression}] [TOTAL [<fld {,fld}>]] expr [,rank])
Return data type: numeric
Arguments:
Argument Description
expr The expression or field containing the data to be measured.
rank The default value of rank is 1, which corresponds to the highest value. By specifyingrank as 2, the second highest value is returned. If rank is 3, the third highest value isreturned, and so on.
SetExpression By default, the aggregation function will aggregate over the set of possible recordsdefined by the selection. An alternative set of records can be defined by a setanalysis expression.
TOTAL If the word TOTAL occurs before the function arguments, the calculation is madeover all possible values given the current selections, and not just those that pertainto the current dimensional value, that is, it disregards the chart dimensions.
By using TOTAL [<fld {.fld}>], where the TOTAL qualifier is followed by a list of oneor more field names as a subset of the chart dimension variables, you create asubset of the total possible values.
Arguments
Examples and results:
Customer Product UnitSales UnitPrice
Astrida AA 4 16
Data
Script syntax and chart functions - Qlik Sense, February 2022 219
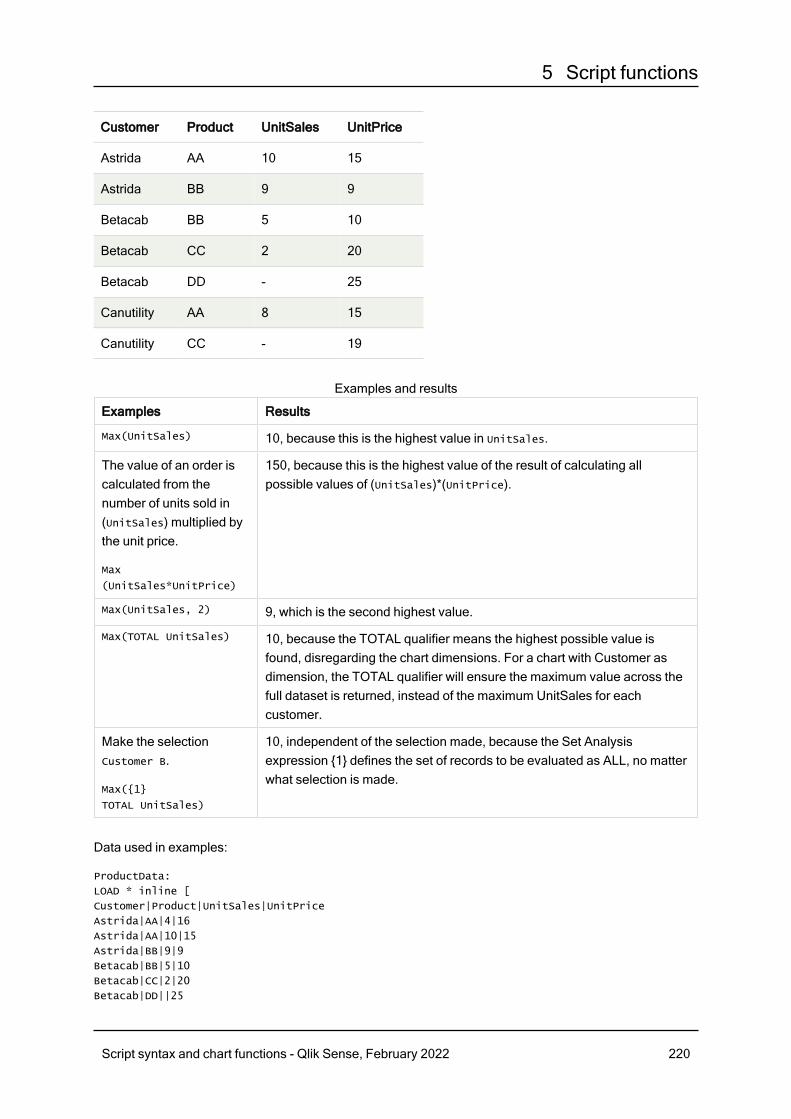
5 Script functions
Customer Product UnitSales UnitPrice
Astrida AA 10 15
Astrida BB 9 9
Betacab BB 5 10
Betacab CC 2 20
Betacab DD - 25
Canutility AA 8 15
Canutility CC - 19
Examples Results
Max(UnitSales) 10, because this is the highest value in UnitSales.
The value of an order iscalculated from thenumber of units sold in(UnitSales) multiplied bythe unit price.
Max
(UnitSales*UnitPrice)
150, because this is the highest value of the result of calculating allpossible values of (UnitSales)*(UnitPrice).
Max(UnitSales, 2) 9, which is the second highest value.
Max(TOTAL UnitSales) 10, because the TOTAL qualifier means the highest possible value isfound, disregarding the chart dimensions. For a chart with Customer asdimension, the TOTAL qualifier will ensure the maximum value across thefull dataset is returned, instead of the maximum UnitSales for eachcustomer.
Make the selectionCustomer B.
Max({1}
TOTAL UnitSales)
10, independent of the selection made, because the Set Analysisexpression {1} defines the set of records to be evaluated as ALL, no matterwhat selection is made.
Examples and results
Data used in examples:
ProductData:
LOAD * inline [
Customer|Product|UnitSales|UnitPrice
Astrida|AA|4|16
Astrida|AA|10|15
Astrida|BB|9|9
Betacab|BB|5|10
Betacab|CC|2|20
Betacab|DD||25
Script syntax and chart functions - Qlik Sense, February 2022 220
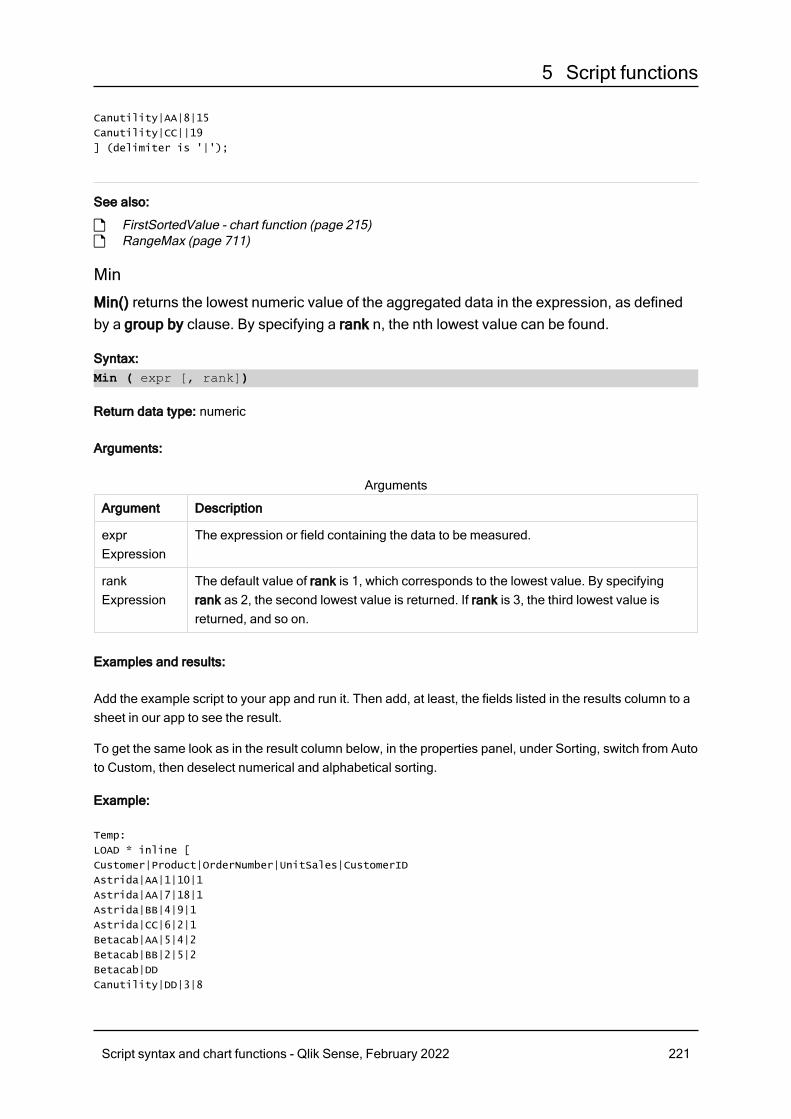
5 Script functions
Canutility|AA|8|15
Canutility|CC||19
] (delimiter is '|');
See also:
p FirstSortedValue - chart function (page 215)p RangeMax (page 711)
Min
Min() returns the lowest numeric value of the aggregated data in the expression, as definedby a group by clause. By specifying a rank n, the nth lowest value can be found.
Syntax:Min ( expr [, rank])
Return data type: numeric
Arguments:
Argument Description
exprExpression
The expression or field containing the data to be measured.
rankExpression
The default value of rank is 1, which corresponds to the lowest value. By specifyingrank as 2, the second lowest value is returned. If rank is 3, the third lowest value isreturned, and so on.
Arguments
Examples and results:
Add the example script to your app and run it. Then add, at least, the fields listed in the results column to asheet in our app to see the result.
To get the same look as in the result column below, in the properties panel, under Sorting, switch from Autoto Custom, then deselect numerical and alphabetical sorting.
Example:
Temp:
LOAD * inline [
Customer|Product|OrderNumber|UnitSales|CustomerID
Astrida|AA|1|10|1
Astrida|AA|7|18|1
Astrida|BB|4|9|1
Astrida|CC|6|2|1
Betacab|AA|5|4|2
Betacab|BB|2|5|2
Betacab|DD
Canutility|DD|3|8
Script syntax and chart functions - Qlik Sense, February 2022 221
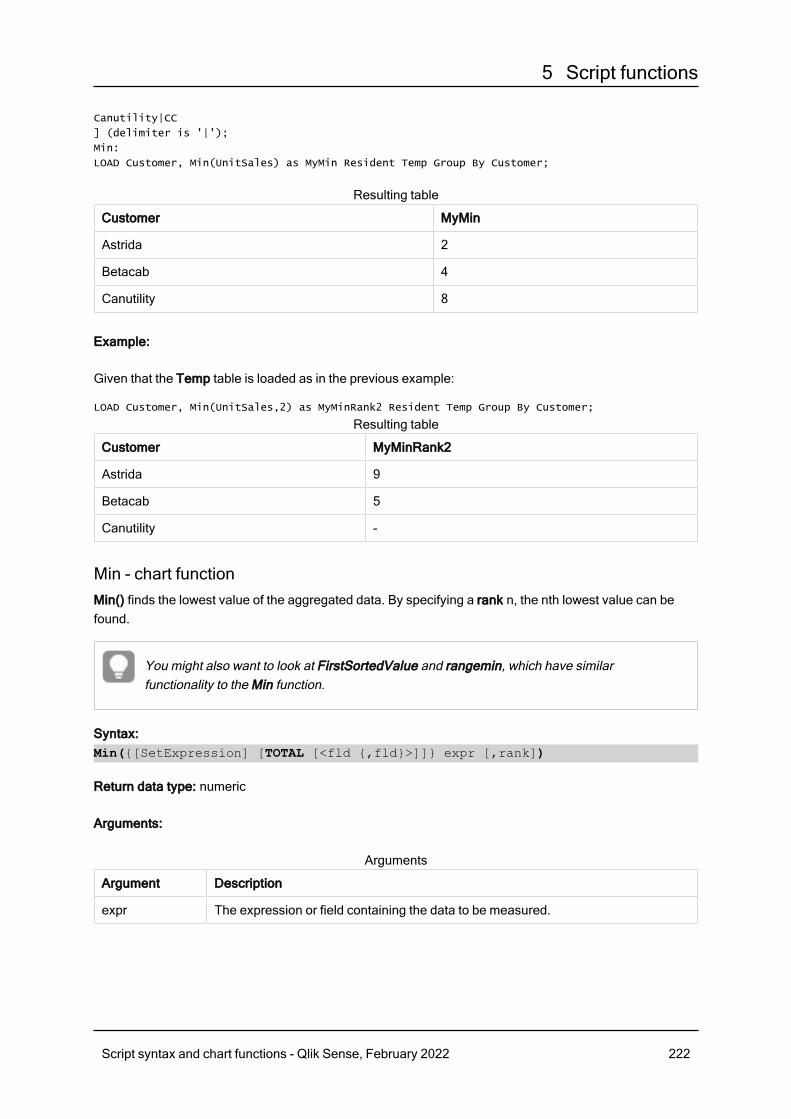
5 Script functions
Canutility|CC
] (delimiter is '|');
Min:
LOAD Customer, Min(UnitSales) as MyMin Resident Temp Group By Customer;
Customer MyMin
Astrida 2
Betacab 4
Canutility 8
Resulting table
Example:
Given that the Temp table is loaded as in the previous example:
LOAD Customer, Min(UnitSales,2) as MyMinRank2 Resident Temp Group By Customer;
Customer MyMinRank2
Astrida 9
Betacab 5
Canutility -
Resulting table
Min - chart functionMin() finds the lowest value of the aggregated data. By specifying a rank n, the nth lowest value can befound.
You might also want to look at FirstSortedValue and rangemin, which have similarfunctionality to the Min function.
Syntax:Min({[SetExpression] [TOTAL [<fld {,fld}>]]} expr [,rank])
Return data type: numeric
Arguments:
Argument Description
expr The expression or field containing the data to be measured.
Arguments
Script syntax and chart functions - Qlik Sense, February 2022 222
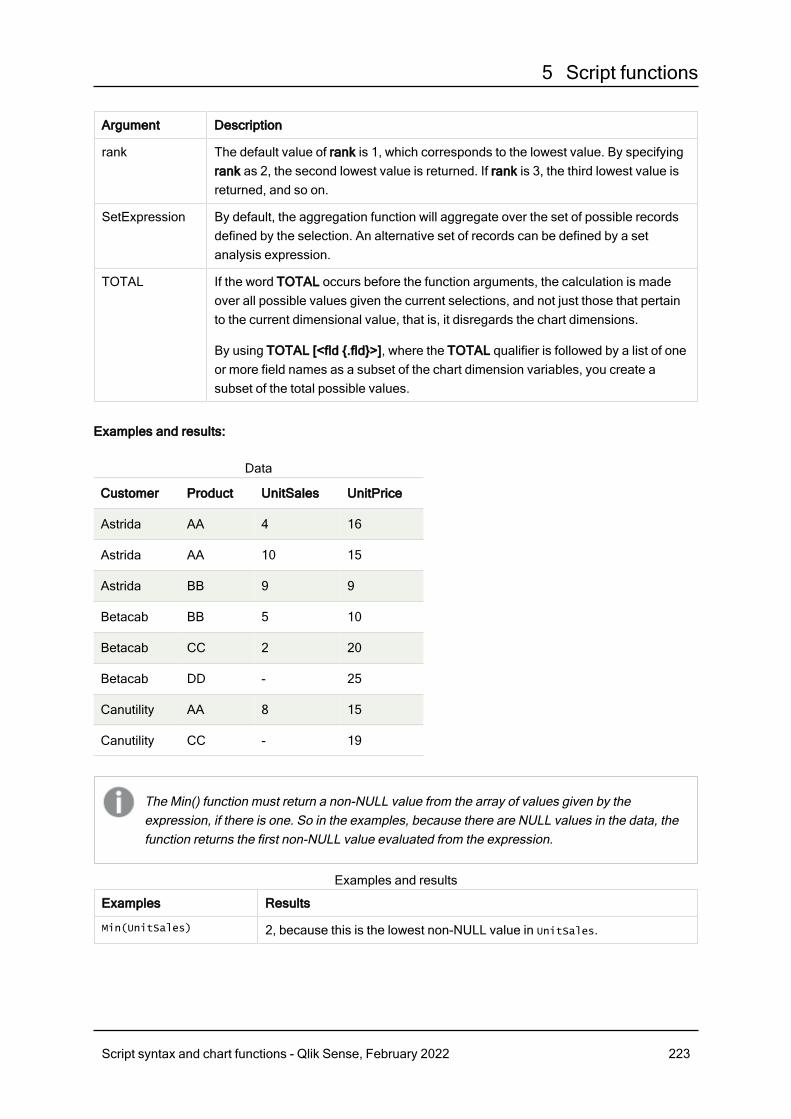
5 Script functions
Argument Description
rank The default value of rank is 1, which corresponds to the lowest value. By specifyingrank as 2, the second lowest value is returned. If rank is 3, the third lowest value isreturned, and so on.
SetExpression By default, the aggregation function will aggregate over the set of possible recordsdefined by the selection. An alternative set of records can be defined by a setanalysis expression.
TOTAL If the word TOTAL occurs before the function arguments, the calculation is madeover all possible values given the current selections, and not just those that pertainto the current dimensional value, that is, it disregards the chart dimensions.
By using TOTAL [<fld {.fld}>], where the TOTAL qualifier is followed by a list of oneor more field names as a subset of the chart dimension variables, you create asubset of the total possible values.
Examples and results:
Customer Product UnitSales UnitPrice
Astrida AA 4 16
Astrida AA 10 15
Astrida BB 9 9
Betacab BB 5 10
Betacab CC 2 20
Betacab DD - 25
Canutility AA 8 15
Canutility CC - 19
Data
The Min() function must return a non-NULL value from the array of values given by theexpression, if there is one. So in the examples, because there are NULL values in the data, thefunction returns the first non-NULL value evaluated from the expression.
Examples Results
Min(UnitSales) 2, because this is the lowest non-NULL value in UnitSales.
Examples and results
Script syntax and chart functions - Qlik Sense, February 2022 223
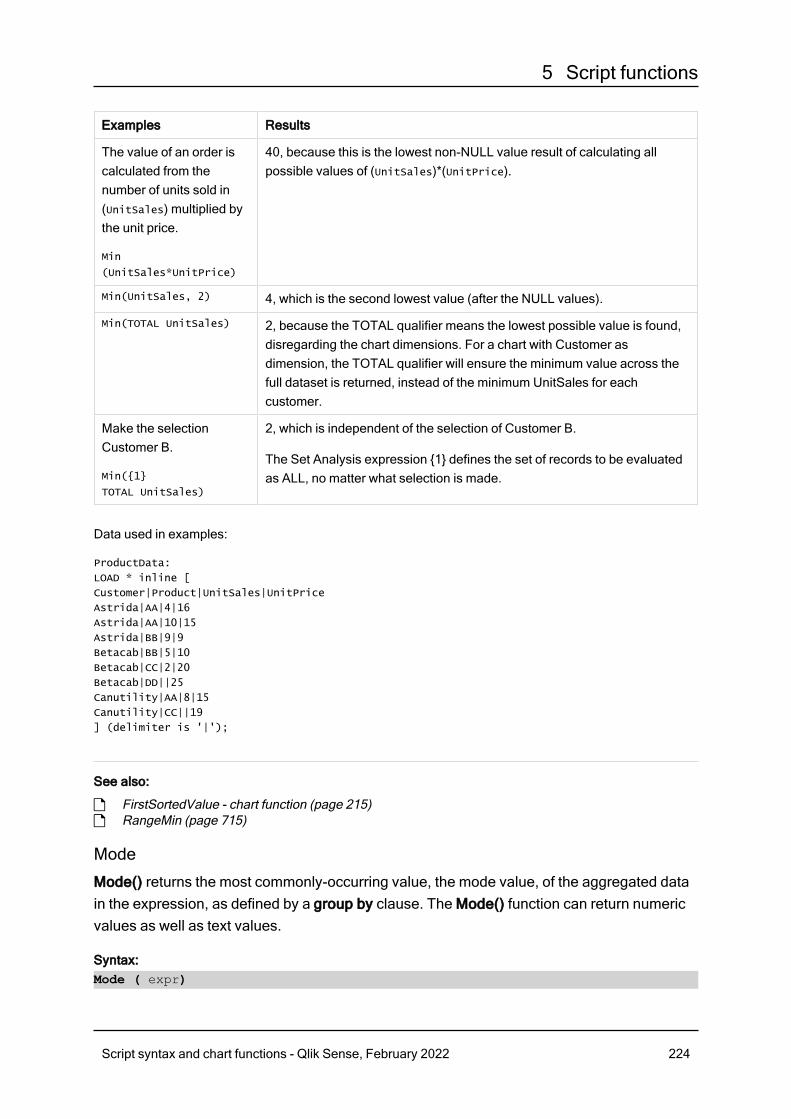
5 Script functions
Examples Results
The value of an order iscalculated from thenumber of units sold in(UnitSales) multiplied bythe unit price.
Min
(UnitSales*UnitPrice)
40, because this is the lowest non-NULL value result of calculating allpossible values of (UnitSales)*(UnitPrice).
Min(UnitSales, 2) 4, which is the second lowest value (after the NULL values).
Min(TOTAL UnitSales) 2, because the TOTAL qualifier means the lowest possible value is found,disregarding the chart dimensions. For a chart with Customer asdimension, the TOTAL qualifier will ensure the minimum value across thefull dataset is returned, instead of the minimum UnitSales for eachcustomer.
Make the selectionCustomer B.
Min({1}
TOTAL UnitSales)
2, which is independent of the selection of Customer B.
The Set Analysis expression {1} defines the set of records to be evaluatedas ALL, no matter what selection is made.
Data used in examples:
ProductData:
LOAD * inline [
Customer|Product|UnitSales|UnitPrice
Astrida|AA|4|16
Astrida|AA|10|15
Astrida|BB|9|9
Betacab|BB|5|10
Betacab|CC|2|20
Betacab|DD||25
Canutility|AA|8|15
Canutility|CC||19
] (delimiter is '|');
See also:
p FirstSortedValue - chart function (page 215)p RangeMin (page 715)
Mode
Mode() returns the most commonly-occurring value, the mode value, of the aggregated datain the expression, as defined by a group by clause. The Mode() function can return numericvalues as well as text values.
Syntax:Mode ( expr)
Script syntax and chart functions - Qlik Sense, February 2022 224
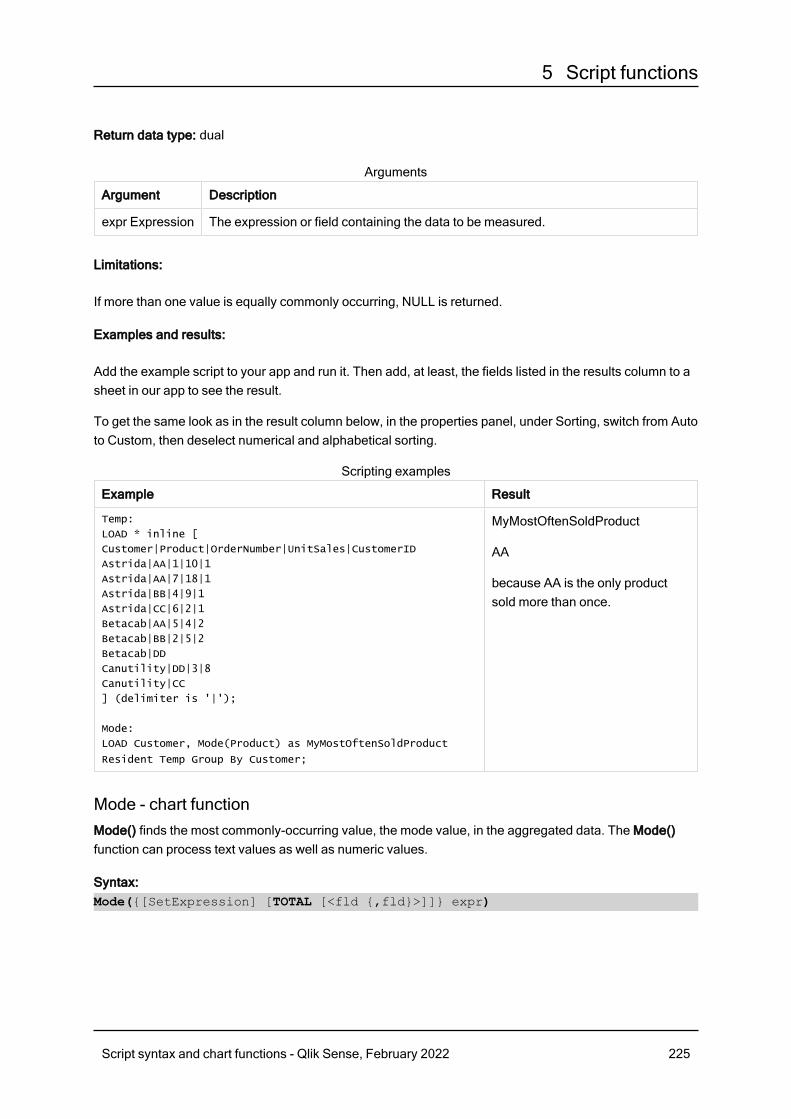
5 Script functions
Return data type: dual
Argument Description
expr Expression The expression or field containing the data to be measured.
Arguments
Limitations:
If more than one value is equally commonly occurring, NULL is returned.
Examples and results:
Add the example script to your app and run it. Then add, at least, the fields listed in the results column to asheet in our app to see the result.
To get the same look as in the result column below, in the properties panel, under Sorting, switch from Autoto Custom, then deselect numerical and alphabetical sorting.
Example Result
Temp:
LOAD * inline [
Customer|Product|OrderNumber|UnitSales|CustomerID
Astrida|AA|1|10|1
Astrida|AA|7|18|1
Astrida|BB|4|9|1
Astrida|CC|6|2|1
Betacab|AA|5|4|2
Betacab|BB|2|5|2
Betacab|DD
Canutility|DD|3|8
Canutility|CC
] (delimiter is '|');
Mode:
LOAD Customer, Mode(Product) as MyMostOftenSoldProduct
Resident Temp Group By Customer;
MyMostOftenSoldProduct
AA
because AA is the only productsold more than once.
Scripting examples
Mode - chart functionMode() finds the most commonly-occurring value, the mode value, in the aggregated data. The Mode()function can process text values as well as numeric values.
Syntax:Mode({[SetExpression] [TOTAL [<fld {,fld}>]]} expr)
Script syntax and chart functions - Qlik Sense, February 2022 225
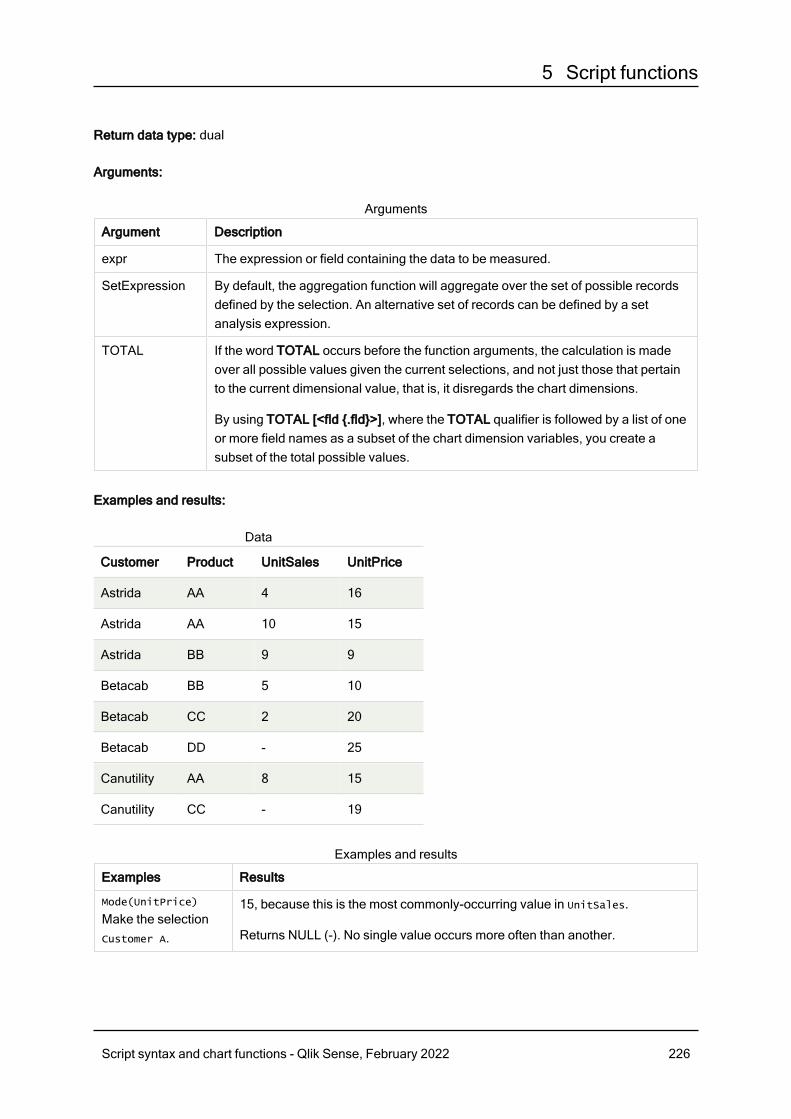
5 Script functions
Return data type: dual
Arguments:
Argument Description
expr The expression or field containing the data to be measured.
SetExpression By default, the aggregation function will aggregate over the set of possible recordsdefined by the selection. An alternative set of records can be defined by a setanalysis expression.
TOTAL If the word TOTAL occurs before the function arguments, the calculation is madeover all possible values given the current selections, and not just those that pertainto the current dimensional value, that is, it disregards the chart dimensions.
By using TOTAL [<fld {.fld}>], where the TOTAL qualifier is followed by a list of oneor more field names as a subset of the chart dimension variables, you create asubset of the total possible values.
Arguments
Examples and results:
Customer Product UnitSales UnitPrice
Astrida AA 4 16
Astrida AA 10 15
Astrida BB 9 9
Betacab BB 5 10
Betacab CC 2 20
Betacab DD - 25
Canutility AA 8 15
Canutility CC - 19
Data
Examples Results
Mode(UnitPrice)
Make the selectionCustomer A.
15, because this is the most commonly-occurring value in UnitSales.
Returns NULL (-). No single value occurs more often than another.
Examples and results
Script syntax and chart functions - Qlik Sense, February 2022 226
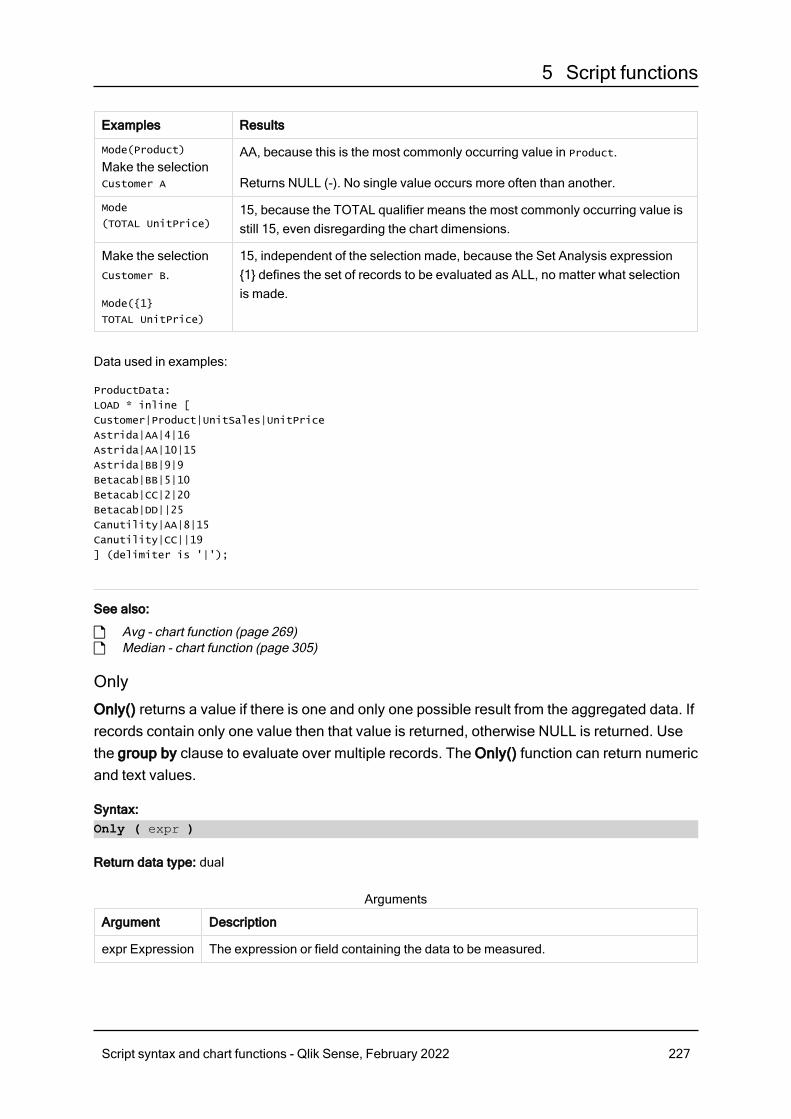
5 Script functions
Examples Results
Mode(Product)
Make the selectionCustomer A
AA, because this is the most commonly occurring value in Product.
Returns NULL (-). No single value occurs more often than another.
Mode
(TOTAL UnitPrice)15, because the TOTAL qualifier means the most commonly occurring value isstill 15, even disregarding the chart dimensions.
Make the selectionCustomer B.
Mode({1}
TOTAL UnitPrice)
15, independent of the selection made, because the Set Analysis expression{1} defines the set of records to be evaluated as ALL, no matter what selectionis made.
Data used in examples:
ProductData:
LOAD * inline [
Customer|Product|UnitSales|UnitPrice
Astrida|AA|4|16
Astrida|AA|10|15
Astrida|BB|9|9
Betacab|BB|5|10
Betacab|CC|2|20
Betacab|DD||25
Canutility|AA|8|15
Canutility|CC||19
] (delimiter is '|');
See also:
p Avg - chart function (page 269)p Median - chart function (page 305)
Only
Only() returns a value if there is one and only one possible result from the aggregated data. Ifrecords contain only one value then that value is returned, otherwise NULL is returned. Usethe group by clause to evaluate over multiple records. The Only() function can return numericand text values.
Syntax:Only ( expr )
Return data type: dual
Argument Description
expr Expression The expression or field containing the data to be measured.
Arguments
Script syntax and chart functions - Qlik Sense, February 2022 227
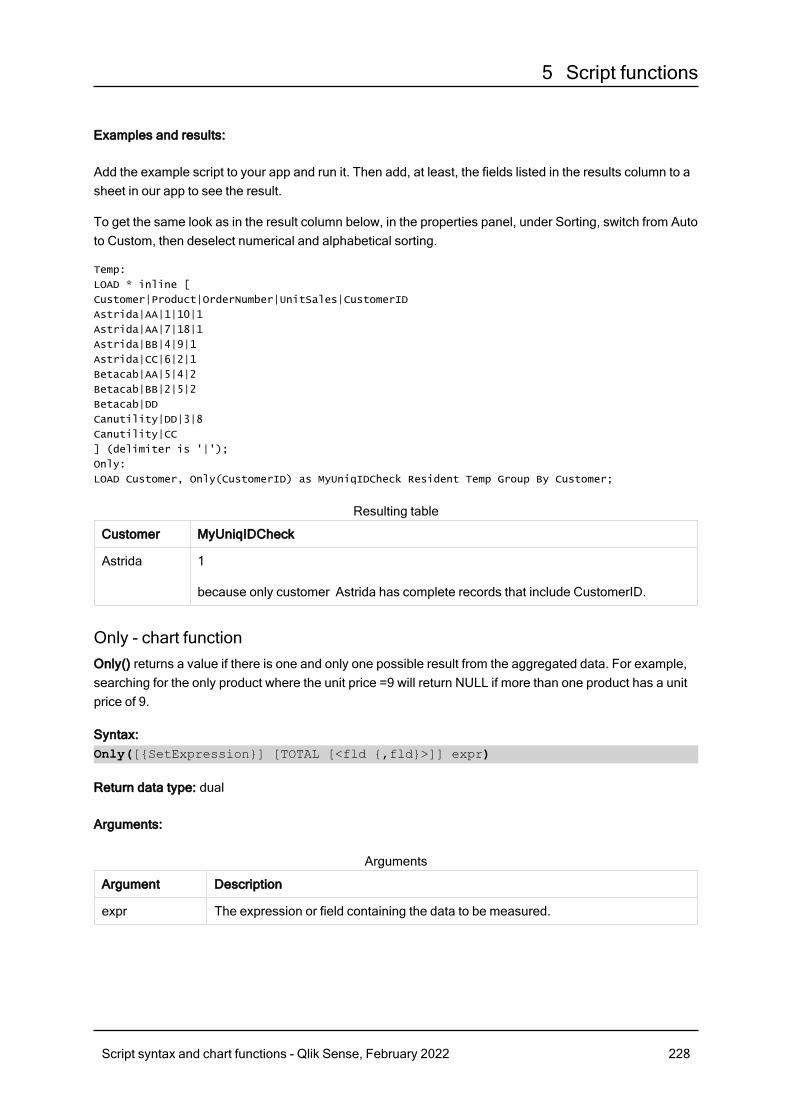
5 Script functions
Examples and results:
Add the example script to your app and run it. Then add, at least, the fields listed in the results column to asheet in our app to see the result.
To get the same look as in the result column below, in the properties panel, under Sorting, switch from Autoto Custom, then deselect numerical and alphabetical sorting.
Temp:
LOAD * inline [
Customer|Product|OrderNumber|UnitSales|CustomerID
Astrida|AA|1|10|1
Astrida|AA|7|18|1
Astrida|BB|4|9|1
Astrida|CC|6|2|1
Betacab|AA|5|4|2
Betacab|BB|2|5|2
Betacab|DD
Canutility|DD|3|8
Canutility|CC
] (delimiter is '|');
Only:
LOAD Customer, Only(CustomerID) as MyUniqIDCheck Resident Temp Group By Customer;
Customer MyUniqIDCheck
Astrida 1
because only customer Astrida has complete records that include CustomerID.
Resulting table
Only - chart functionOnly() returns a value if there is one and only one possible result from the aggregated data. For example,searching for the only product where the unit price =9 will return NULL if more than one product has a unitprice of 9.
Syntax:Only([{SetExpression}] [TOTAL [<fld {,fld}>]] expr)
Return data type: dual
Arguments:
Argument Description
expr The expression or field containing the data to be measured.
Arguments
Script syntax and chart functions - Qlik Sense, February 2022 228
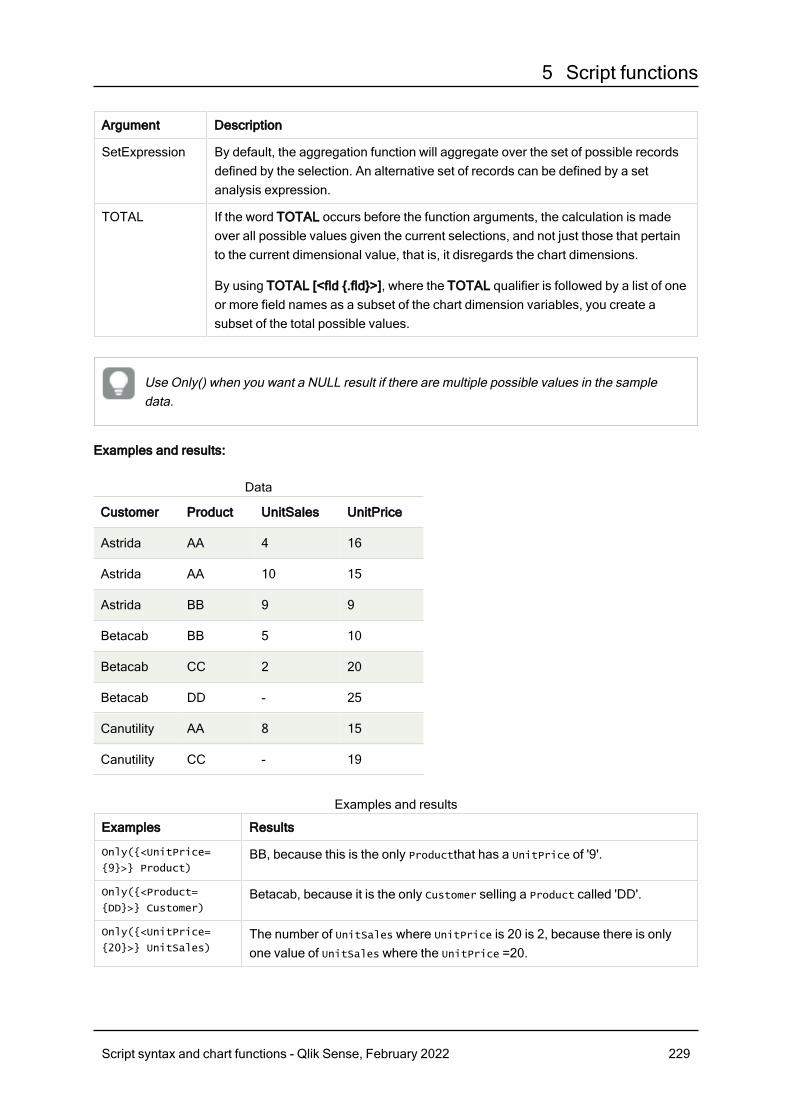
5 Script functions
Argument Description
SetExpression By default, the aggregation function will aggregate over the set of possible recordsdefined by the selection. An alternative set of records can be defined by a setanalysis expression.
TOTAL If the word TOTAL occurs before the function arguments, the calculation is madeover all possible values given the current selections, and not just those that pertainto the current dimensional value, that is, it disregards the chart dimensions.
By using TOTAL [<fld {.fld}>], where the TOTAL qualifier is followed by a list of oneor more field names as a subset of the chart dimension variables, you create asubset of the total possible values.
Use Only() when you want a NULL result if there are multiple possible values in the sampledata.
Examples and results:
Customer Product UnitSales UnitPrice
Astrida AA 4 16
Astrida AA 10 15
Astrida BB 9 9
Betacab BB 5 10
Betacab CC 2 20
Betacab DD - 25
Canutility AA 8 15
Canutility CC - 19
Data
Examples Results
Only({<UnitPrice=
{9}>} Product)BB, because this is the only Productthat has a UnitPrice of '9'.
Only({<Product=
{DD}>} Customer)Betacab, because it is the only Customer selling a Product called 'DD'.
Only({<UnitPrice=
{20}>} UnitSales)The number of UnitSales where UnitPrice is 20 is 2, because there is onlyone value of UnitSales where the UnitPrice =20.
Examples and results
Script syntax and chart functions - Qlik Sense, February 2022 229
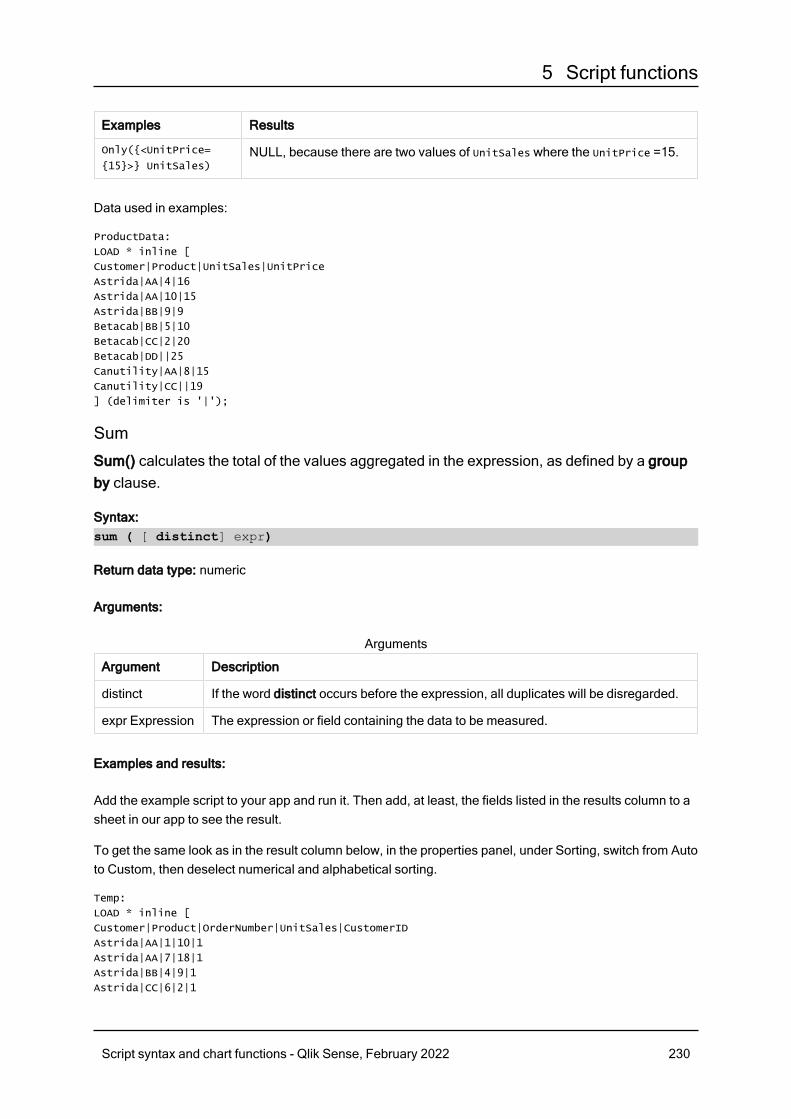
5 Script functions
Examples Results
Only({<UnitPrice=
{15}>} UnitSales)NULL, because there are two values of UnitSales where the UnitPrice =15.
Data used in examples:
ProductData:
LOAD * inline [
Customer|Product|UnitSales|UnitPrice
Astrida|AA|4|16
Astrida|AA|10|15
Astrida|BB|9|9
Betacab|BB|5|10
Betacab|CC|2|20
Betacab|DD||25
Canutility|AA|8|15
Canutility|CC||19
] (delimiter is '|');
Sum
Sum() calculates the total of the values aggregated in the expression, as defined by a groupby clause.
Syntax:sum ( [ distinct] expr)
Return data type: numeric
Arguments:
Argument Description
distinct If the word distinct occurs before the expression, all duplicates will be disregarded.
expr Expression The expression or field containing the data to be measured.
Arguments
Examples and results:
Add the example script to your app and run it. Then add, at least, the fields listed in the results column to asheet in our app to see the result.
To get the same look as in the result column below, in the properties panel, under Sorting, switch from Autoto Custom, then deselect numerical and alphabetical sorting.
Temp:
LOAD * inline [
Customer|Product|OrderNumber|UnitSales|CustomerID
Astrida|AA|1|10|1
Astrida|AA|7|18|1
Astrida|BB|4|9|1
Astrida|CC|6|2|1
Script syntax and chart functions - Qlik Sense, February 2022 230
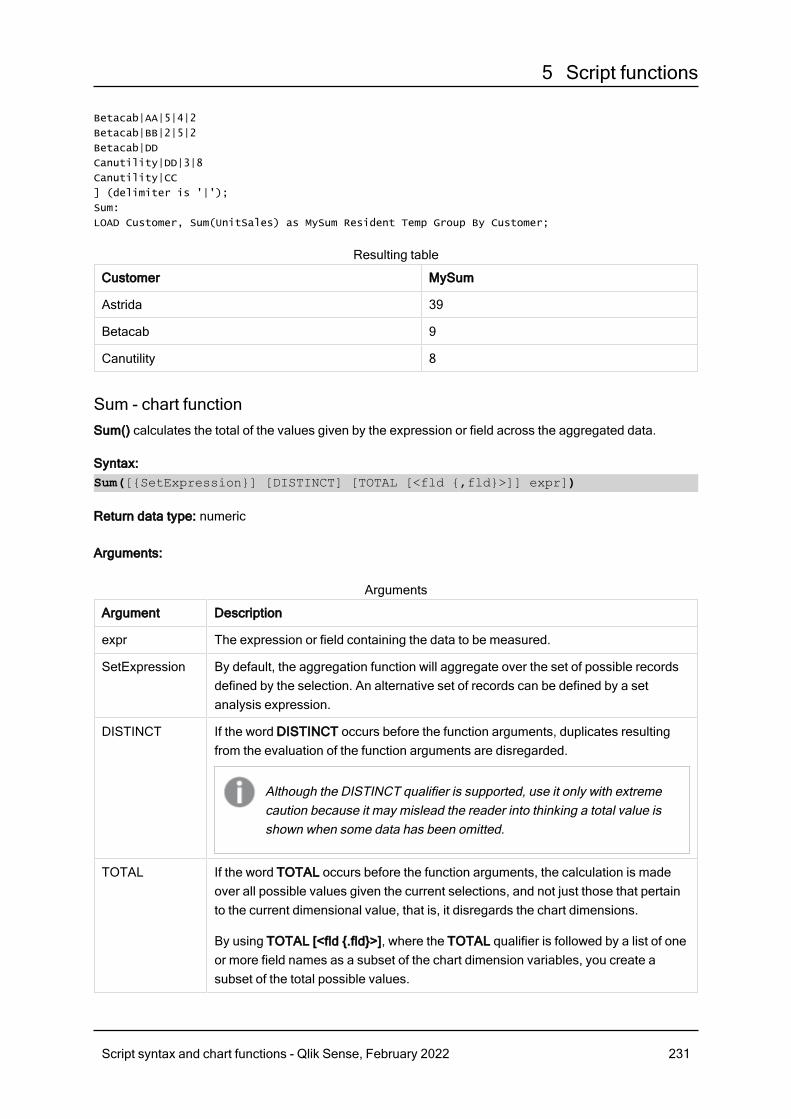
5 Script functions
Betacab|AA|5|4|2
Betacab|BB|2|5|2
Betacab|DD
Canutility|DD|3|8
Canutility|CC
] (delimiter is '|');
Sum:
LOAD Customer, Sum(UnitSales) as MySum Resident Temp Group By Customer;
Customer MySum
Astrida 39
Betacab 9
Canutility 8
Resulting table
Sum - chart functionSum() calculates the total of the values given by the expression or field across the aggregated data.
Syntax:Sum([{SetExpression}] [DISTINCT] [TOTAL [<fld {,fld}>]] expr])
Return data type: numeric
Arguments:
Argument Description
expr The expression or field containing the data to be measured.
SetExpression By default, the aggregation function will aggregate over the set of possible recordsdefined by the selection. An alternative set of records can be defined by a setanalysis expression.
DISTINCT If the word DISTINCT occurs before the function arguments, duplicates resultingfrom the evaluation of the function arguments are disregarded.
Although the DISTINCT qualifier is supported, use it only with extremecaution because it may mislead the reader into thinking a total value isshown when some data has been omitted.
TOTAL If the word TOTAL occurs before the function arguments, the calculation is madeover all possible values given the current selections, and not just those that pertainto the current dimensional value, that is, it disregards the chart dimensions.
By using TOTAL [<fld {.fld}>], where the TOTAL qualifier is followed by a list of oneor more field names as a subset of the chart dimension variables, you create asubset of the total possible values.
Arguments
Script syntax and chart functions - Qlik Sense, February 2022 231

5 Script functions
Examples and results:
Customer Product UnitSales UnitPrice
Astrida AA 4 16
Astrida AA 10 15
Astrida BB 9 9
Betacab BB 5 10
Betacab CC 2 20
Betacab DD - 25
Canutility AA 8 15
Canutility CC - 19
Data
Examples Results
Sum(UnitSales) 38. The total of the values in UnitSales.
Sum(UnitSales*UnitPrice) 505. The total of UnitPricemultiplied by UnitSales aggregated.
Sum
(TOTAL UnitSales*UnitPrice)505 for all rows in the table as well as the total, because the TOTALqualifier means the sum is still 505, disregarding the chartdimensions.
Make the selection Customer B.
Sum({1}
TOTAL UnitSales*UnitPrice)
505, independent of the selection made, because the Set Analysisexpression {1} defines the set of records to be evaluated as ALL, nomatter what selection is made.
Examples and results
Data used in examples:
ProductData:
LOAD * inline [
Customer|Product|UnitSales|UnitPrice
Astrida|AA|4|16
Astrida|AA|10|15
Astrida|BB|9|9
Betacab|BB|5|10
Betacab|CC|2|20
Betacab|DD||25
Canutility|AA|8|15
Canutility|CC||19
] (delimiter is '|');
Script syntax and chart functions - Qlik Sense, February 2022 232

5 Script functions
Counter aggregation functionsCounter aggregation functions return various types of counts of an expression over a number of records ina data load script, or a number of values in a chart dimension.
Each function is described further after the overview. You can also click the function name in the syntax toimmediately access the details for that specific function.
Counter aggregation functions in the data load scriptCountCount() returns the number of values aggregated in expression, as defined by a group by clause.
Count ([distinct ] expression | * )
MissingCountMissingCount() returns the number of missing values aggregated in the expression, as defined by a groupby clause.
MissingCount ([ distinct ] expression)
NullCountNullCount() returns the number of NULL values aggregated in the expression, as defined by a group byclause.
NullCount ([ distinct ] expression)
NumericCountNumericCount() returns the number of numeric values found in the expression, as defined by a group byclause.
NumericCount ([ distinct ] expression)
TextCountTextCount() returns the number of field values that are non-numeric aggregated in the expression, asdefined by a group by clause.
TextCount ([ distinct ] expression)
Counter aggregation functions in chart expressionsThe following counter aggregation functions can be used in charts:
CountCount() is used to aggregate the number of values, text and numeric, in each chart dimension.
Count - chart function({[SetExpression] [DISTINCT] [TOTAL [<fld {,fld}>]]}
expr)
Script syntax and chart functions - Qlik Sense, February 2022 233

5 Script functions
MissingCountMissingCount() is used to aggregate the number of missing values in each chart dimension. Missingvalues are all non-numeric values.
MissingCount - chart function({[SetExpression] [DISTINCT] [TOTAL [<fld
{,fld}>]] expr)
NullCountNullCount() is used to aggregate the number of NULL values in each chart dimension.
NullCount - chart function({[SetExpression][DISTINCT] [TOTAL [<fld {,fld}>]]}
expr)
NumericCountNumericCount() aggregates the number of numeric values in each chart dimension.
NumericCount - chart function({[SetExpression] [DISTINCT] [TOTAL [<fld
{,fld}>]]} expr)
TextCountTextCount() is used to aggregate the number of field values that are non-numeric in each chart dimension.
TextCount - chart function({[SetExpression] [DISTINCT] [TOTAL [<fld
{,fld}>]]} expr)
Count
Count() returns the number of values aggregated in expression, as defined by a group byclause.
Syntax:Count( [distinct ] expr)
Return data type: integer
Arguments:
Argument Description
expr The expression or field containing the data to be measured.
distinct If the word distinct occurs before the expression, all duplicates are disregarded.
Arguments
Examples and results:
Add the example script to your app and run it. Then add, at least, the fields listed in the results column to asheet in our app to see the result.
To get the same look as in the result column below, in the properties panel, under Sorting, switch from Autoto Custom, then deselect numerical and alphabetical sorting.
Script syntax and chart functions - Qlik Sense, February 2022 234

5 Script functions
Example Result
Temp:
LOAD * inline [
Customer|Product|OrderNumber|UnitSales|UnitPrice
Astrida|AA|1|4|16
Astrida|AA|7|10|15
Astrida|BB|4|9|9
Betacab|CC|6|5|10
Betacab|AA|5|2|20
Betacab|BB|1|25| 25
Canutility|AA|3|8|15
Canutility|CC|||19
Divadip|CC|2|4|16
Divadip|DD|3|1|25
] (delimiter is '|');
Count1:
LOAD Customer,Count(OrderNumber) as
OrdersByCustomer Resident Temp Group By Customer;
Customer OrdersByCustomer
Astrida 3
Betacab 3
Canutility 2
Divadip 2
As long as the dimension Customer isincluded in the table on the sheet, otherwisethe result for OrdersByCustomer is 3, 2.
Given that the Temp table is loaded as in the previousexample:
LOAD Count(OrderNumber) as TotalOrderNumber
Resident Temp;
TotalOrderNumber
10
Given that the Temp table is loaded as in the firstexample:
LOAD Count(distinct OrderNumber) as
TotalOrderNumber Resident Temp;
TotalOrderNumber
8
Because there are two values ofOrderNumber with the same value, 1, andone null value.
Scripting examples
Count - chart functionCount() is used to aggregate the number of values, text and numeric, in each chart dimension.
Syntax:Count({[SetExpression] [DISTINCT] [TOTAL [<fld {,fld}>]]} expr)
Return data type: integer
Arguments:
Argument Description
expr The expression or field containing the data to be measured.
Arguments
Script syntax and chart functions - Qlik Sense, February 2022 235
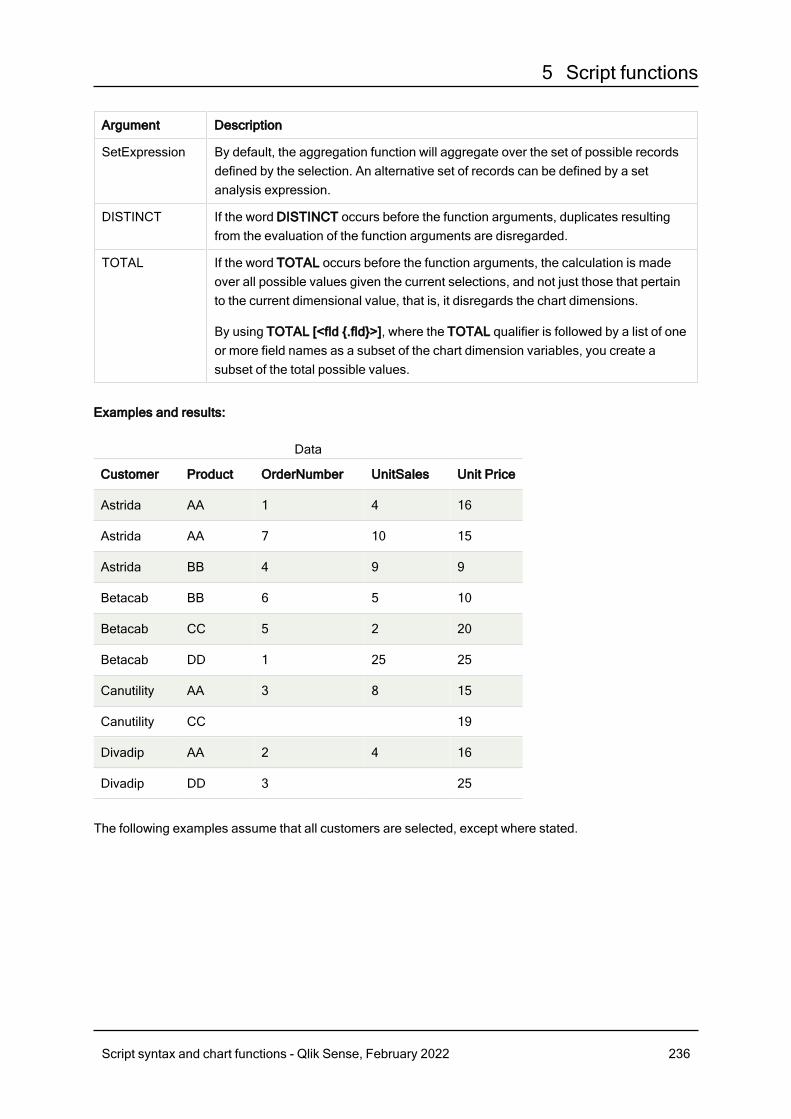
5 Script functions
Argument Description
SetExpression By default, the aggregation function will aggregate over the set of possible recordsdefined by the selection. An alternative set of records can be defined by a setanalysis expression.
DISTINCT If the word DISTINCT occurs before the function arguments, duplicates resultingfrom the evaluation of the function arguments are disregarded.
TOTAL If the word TOTAL occurs before the function arguments, the calculation is madeover all possible values given the current selections, and not just those that pertainto the current dimensional value, that is, it disregards the chart dimensions.
By using TOTAL [<fld {.fld}>], where the TOTAL qualifier is followed by a list of oneor more field names as a subset of the chart dimension variables, you create asubset of the total possible values.
Examples and results:
Customer Product OrderNumber UnitSales Unit Price
Astrida AA 1 4 16
Astrida AA 7 10 15
Astrida BB 4 9 9
Betacab BB 6 5 10
Betacab CC 5 2 20
Betacab DD 1 25 25
Canutility AA 3 8 15
Canutility CC 19
Divadip AA 2 4 16
Divadip DD 3 25
Data
The following examples assume that all customers are selected, except where stated.
Script syntax and chart functions - Qlik Sense, February 2022 236
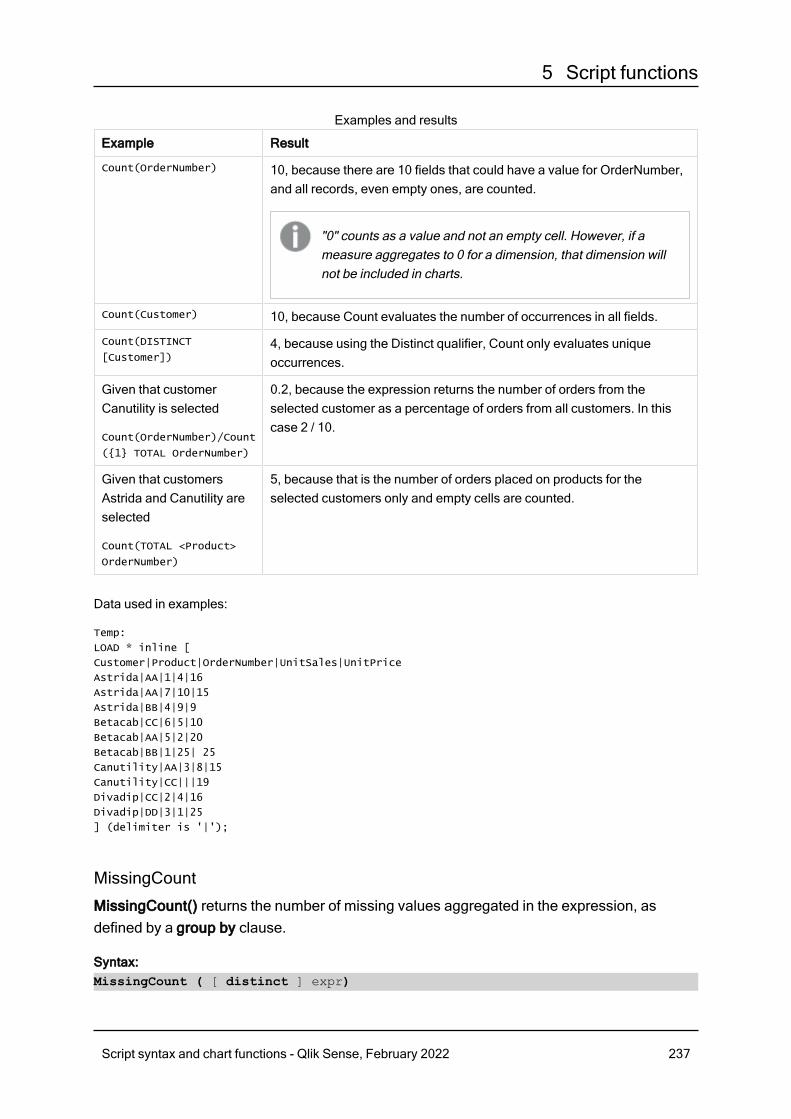
5 Script functions
Example Result
Count(OrderNumber) 10, because there are 10 fields that could have a value for OrderNumber,and all records, even empty ones, are counted.
"0" counts as a value and not an empty cell. However, if ameasure aggregates to 0 for a dimension, that dimension willnot be included in charts.
Count(Customer) 10, because Count evaluates the number of occurrences in all fields.
Count(DISTINCT
[Customer])4, because using the Distinct qualifier, Count only evaluates uniqueoccurrences.
Given that customerCanutility is selected
Count(OrderNumber)/Count
({1} TOTAL OrderNumber)
0.2, because the expression returns the number of orders from theselected customer as a percentage of orders from all customers. In thiscase 2 / 10.
Given that customersAstrida and Canutility areselected
Count(TOTAL <Product>
OrderNumber)
5, because that is the number of orders placed on products for theselected customers only and empty cells are counted.
Examples and results
Data used in examples:
Temp:
LOAD * inline [
Customer|Product|OrderNumber|UnitSales|UnitPrice
Astrida|AA|1|4|16
Astrida|AA|7|10|15
Astrida|BB|4|9|9
Betacab|CC|6|5|10
Betacab|AA|5|2|20
Betacab|BB|1|25| 25
Canutility|AA|3|8|15
Canutility|CC|||19
Divadip|CC|2|4|16
Divadip|DD|3|1|25
] (delimiter is '|');
MissingCount
MissingCount() returns the number of missing values aggregated in the expression, asdefined by a group by clause.
Syntax:MissingCount ( [ distinct ] expr)
Script syntax and chart functions - Qlik Sense, February 2022 237
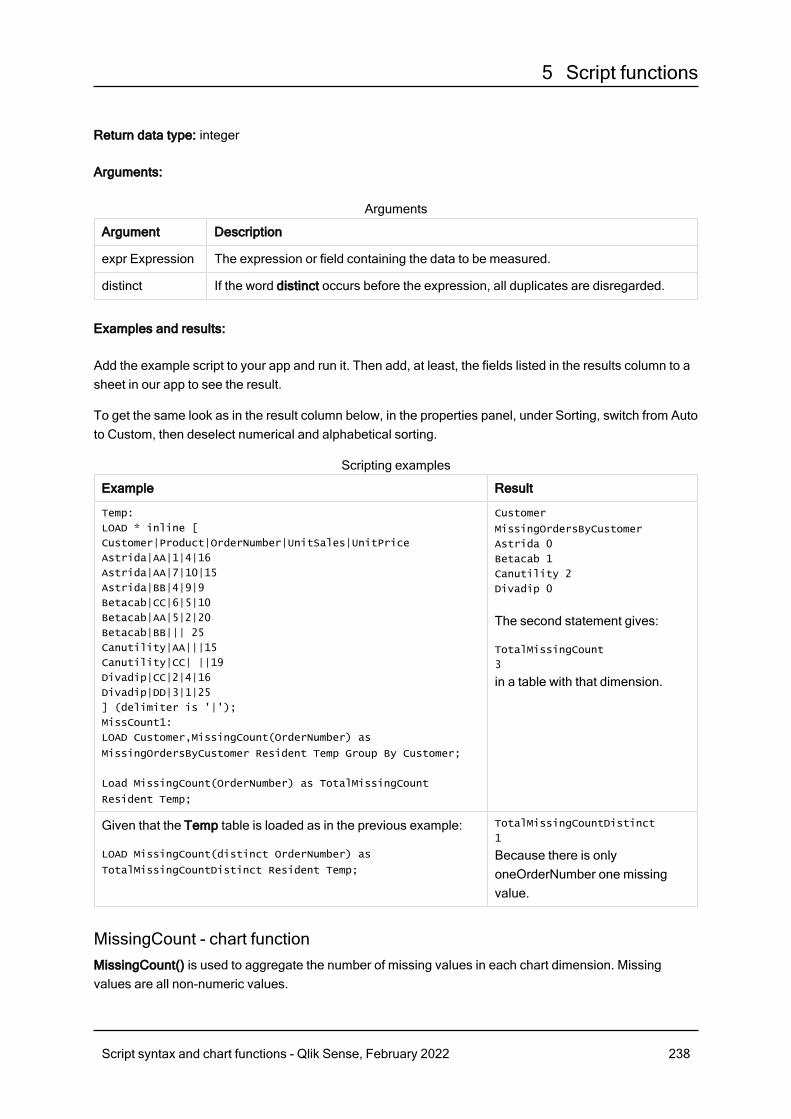
5 Script functions
Return data type: integer
Arguments:
Argument Description
expr Expression The expression or field containing the data to be measured.
distinct If the word distinct occurs before the expression, all duplicates are disregarded.
Arguments
Examples and results:
Add the example script to your app and run it. Then add, at least, the fields listed in the results column to asheet in our app to see the result.
To get the same look as in the result column below, in the properties panel, under Sorting, switch from Autoto Custom, then deselect numerical and alphabetical sorting.
Example Result
Temp:
LOAD * inline [
Customer|Product|OrderNumber|UnitSales|UnitPrice
Astrida|AA|1|4|16
Astrida|AA|7|10|15
Astrida|BB|4|9|9
Betacab|CC|6|5|10
Betacab|AA|5|2|20
Betacab|BB||| 25
Canutility|AA|||15
Canutility|CC| ||19
Divadip|CC|2|4|16
Divadip|DD|3|1|25
] (delimiter is '|');
MissCount1:
LOAD Customer,MissingCount(OrderNumber) as
MissingOrdersByCustomer Resident Temp Group By Customer;
Load MissingCount(OrderNumber) as TotalMissingCount
Resident Temp;
Customer
MissingOrdersByCustomer
Astrida 0
Betacab 1
Canutility 2
Divadip 0
The second statement gives:
TotalMissingCount
3
in a table with that dimension.
Given that the Temp table is loaded as in the previous example:
LOAD MissingCount(distinct OrderNumber) as
TotalMissingCountDistinct Resident Temp;
TotalMissingCountDistinct
1
Because there is onlyoneOrderNumber one missingvalue.
Scripting examples
MissingCount - chart functionMissingCount() is used to aggregate the number of missing values in each chart dimension. Missingvalues are all non-numeric values.
Script syntax and chart functions - Qlik Sense, February 2022 238
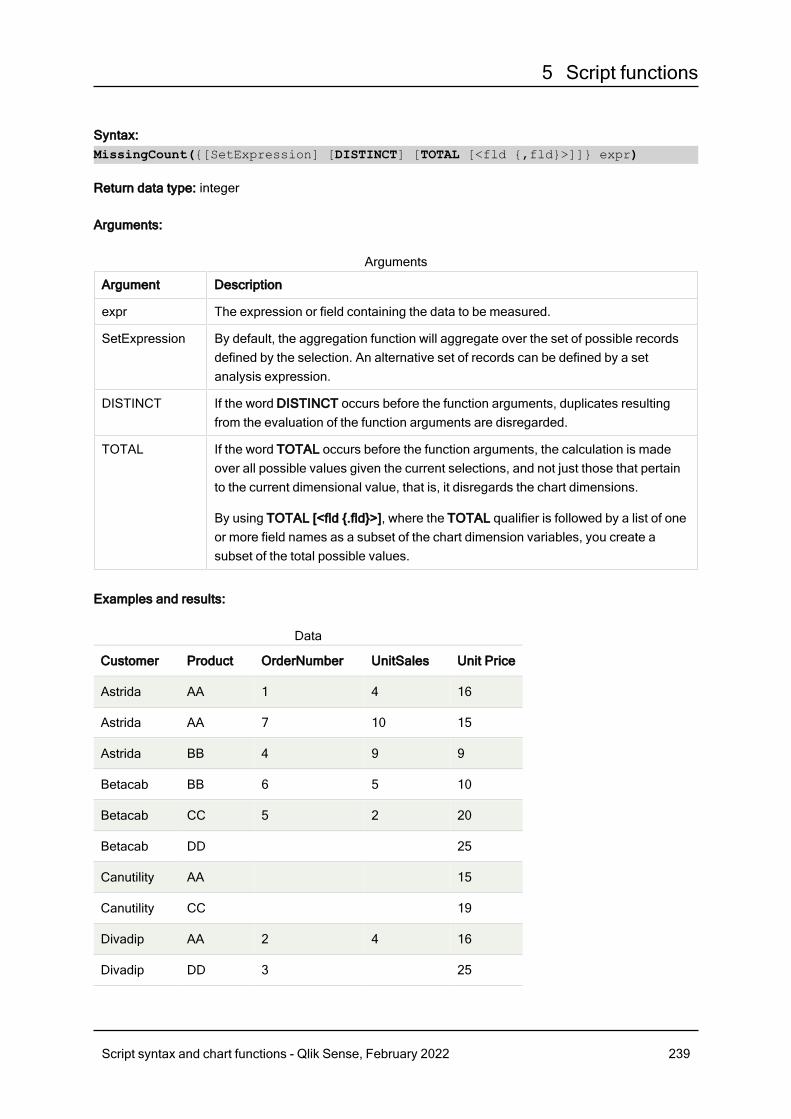
5 Script functions
Syntax:MissingCount({[SetExpression] [DISTINCT] [TOTAL [<fld {,fld}>]]} expr)
Return data type: integer
Arguments:
Argument Description
expr The expression or field containing the data to be measured.
SetExpression By default, the aggregation function will aggregate over the set of possible recordsdefined by the selection. An alternative set of records can be defined by a setanalysis expression.
DISTINCT If the word DISTINCT occurs before the function arguments, duplicates resultingfrom the evaluation of the function arguments are disregarded.
TOTAL If the word TOTAL occurs before the function arguments, the calculation is madeover all possible values given the current selections, and not just those that pertainto the current dimensional value, that is, it disregards the chart dimensions.
By using TOTAL [<fld {.fld}>], where the TOTAL qualifier is followed by a list of oneor more field names as a subset of the chart dimension variables, you create asubset of the total possible values.
Arguments
Examples and results:
Customer Product OrderNumber UnitSales Unit Price
Astrida AA 1 4 16
Astrida AA 7 10 15
Astrida BB 4 9 9
Betacab BB 6 5 10
Betacab CC 5 2 20
Betacab DD 25
Canutility AA 15
Canutility CC 19
Divadip AA 2 4 16
Divadip DD 3 25
Data
Script syntax and chart functions - Qlik Sense, February 2022 239
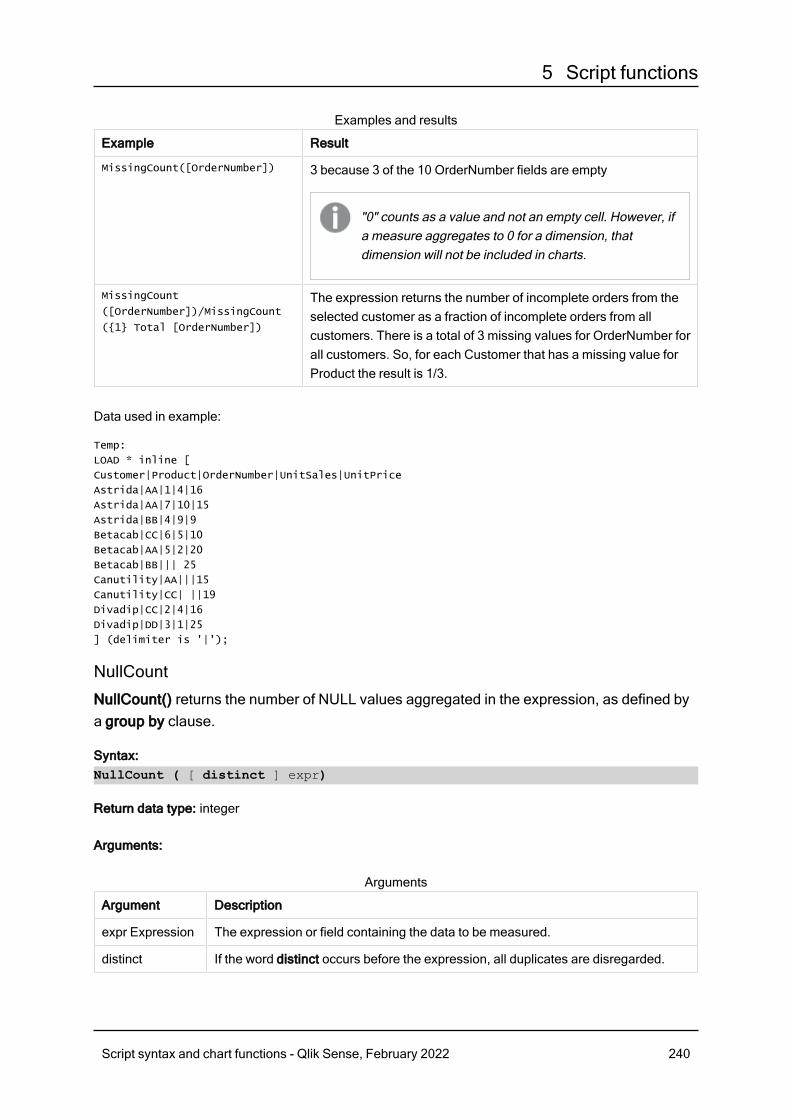
5 Script functions
Example Result
MissingCount([OrderNumber]) 3 because 3 of the 10 OrderNumber fields are empty
"0" counts as a value and not an empty cell. However, ifa measure aggregates to 0 for a dimension, thatdimension will not be included in charts.
MissingCount
([OrderNumber])/MissingCount
({1} Total [OrderNumber])
The expression returns the number of incomplete orders from theselected customer as a fraction of incomplete orders from allcustomers. There is a total of 3 missing values for OrderNumber forall customers. So, for each Customer that has a missing value forProduct the result is 1/3.
Examples and results
Data used in example:
Temp:
LOAD * inline [
Customer|Product|OrderNumber|UnitSales|UnitPrice
Astrida|AA|1|4|16
Astrida|AA|7|10|15
Astrida|BB|4|9|9
Betacab|CC|6|5|10
Betacab|AA|5|2|20
Betacab|BB||| 25
Canutility|AA|||15
Canutility|CC| ||19
Divadip|CC|2|4|16
Divadip|DD|3|1|25
] (delimiter is '|');
NullCount
NullCount() returns the number of NULL values aggregated in the expression, as defined bya group by clause.
Syntax:NullCount ( [ distinct ] expr)
Return data type: integer
Arguments:
Argument Description
expr Expression The expression or field containing the data to be measured.
distinct If the word distinct occurs before the expression, all duplicates are disregarded.
Arguments
Script syntax and chart functions - Qlik Sense, February 2022 240
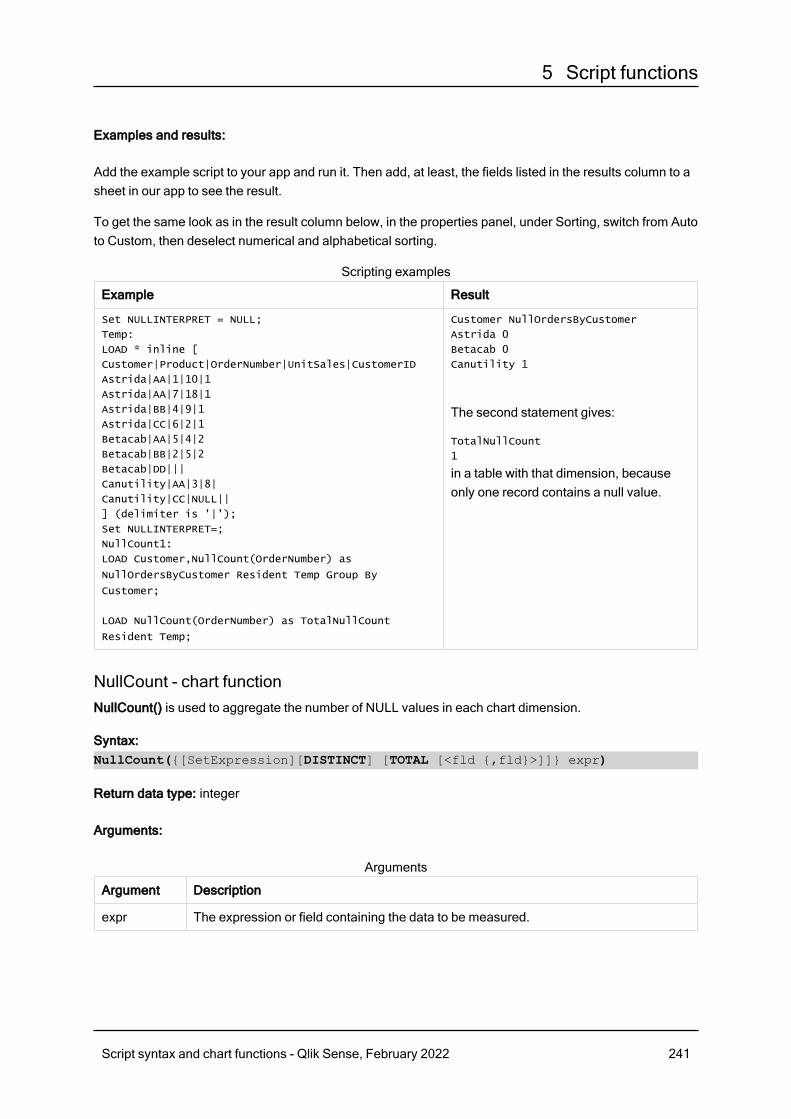
5 Script functions
Examples and results:
Add the example script to your app and run it. Then add, at least, the fields listed in the results column to asheet in our app to see the result.
To get the same look as in the result column below, in the properties panel, under Sorting, switch from Autoto Custom, then deselect numerical and alphabetical sorting.
Example Result
Set NULLINTERPRET = NULL;
Temp:
LOAD * inline [
Customer|Product|OrderNumber|UnitSales|CustomerID
Astrida|AA|1|10|1
Astrida|AA|7|18|1
Astrida|BB|4|9|1
Astrida|CC|6|2|1
Betacab|AA|5|4|2
Betacab|BB|2|5|2
Betacab|DD|||
Canutility|AA|3|8|
Canutility|CC|NULL||
] (delimiter is '|');
Set NULLINTERPRET=;
NullCount1:
LOAD Customer,NullCount(OrderNumber) as
NullOrdersByCustomer Resident Temp Group By
Customer;
LOAD NullCount(OrderNumber) as TotalNullCount
Resident Temp;
Customer NullOrdersByCustomer
Astrida 0
Betacab 0
Canutility 1
The second statement gives:
TotalNullCount
1
in a table with that dimension, becauseonly one record contains a null value.
Scripting examples
NullCount - chart functionNullCount() is used to aggregate the number of NULL values in each chart dimension.
Syntax:NullCount({[SetExpression][DISTINCT] [TOTAL [<fld {,fld}>]]} expr)
Return data type: integer
Arguments:
Argument Description
expr The expression or field containing the data to be measured.
Arguments
Script syntax and chart functions - Qlik Sense, February 2022 241
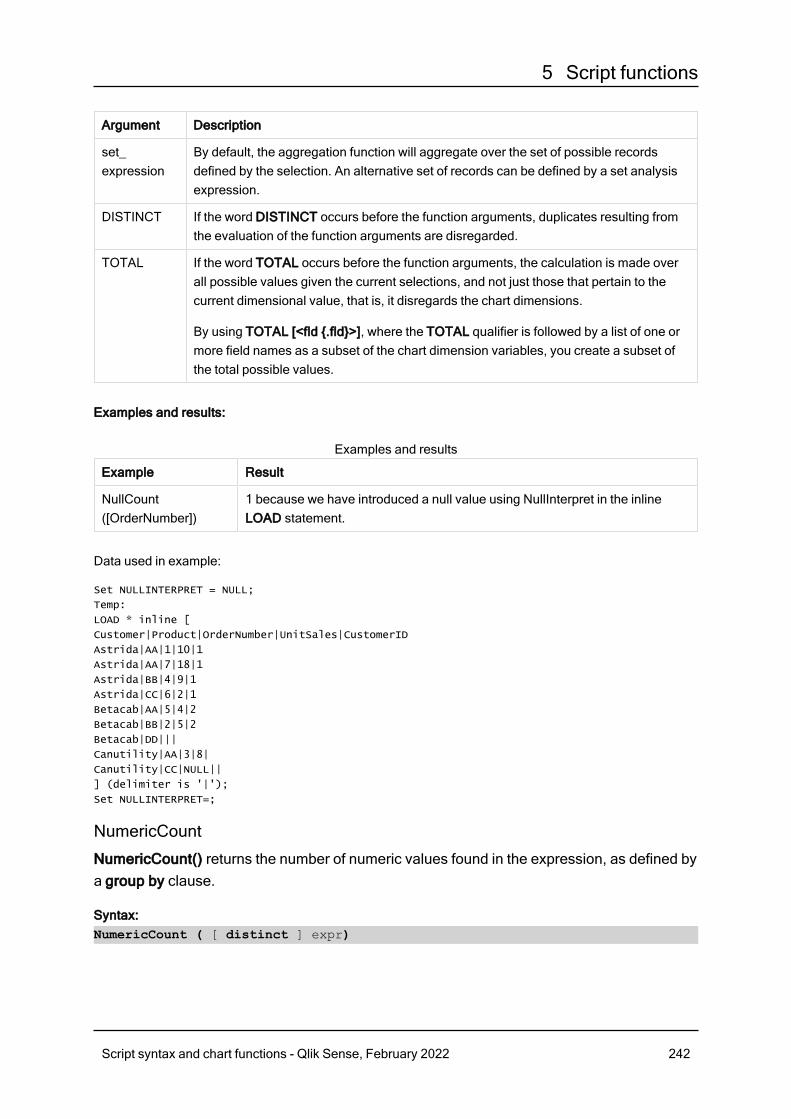
5 Script functions
Argument Description
set_expression
By default, the aggregation function will aggregate over the set of possible recordsdefined by the selection. An alternative set of records can be defined by a set analysisexpression.
DISTINCT If the word DISTINCT occurs before the function arguments, duplicates resulting fromthe evaluation of the function arguments are disregarded.
TOTAL If the word TOTAL occurs before the function arguments, the calculation is made overall possible values given the current selections, and not just those that pertain to thecurrent dimensional value, that is, it disregards the chart dimensions.
By using TOTAL [<fld {.fld}>], where the TOTAL qualifier is followed by a list of one ormore field names as a subset of the chart dimension variables, you create a subset ofthe total possible values.
Examples and results:
Example Result
NullCount([OrderNumber])
1 because we have introduced a null value using NullInterpret in the inlineLOAD statement.
Examples and results
Data used in example:
Set NULLINTERPRET = NULL;
Temp:
LOAD * inline [
Customer|Product|OrderNumber|UnitSales|CustomerID
Astrida|AA|1|10|1
Astrida|AA|7|18|1
Astrida|BB|4|9|1
Astrida|CC|6|2|1
Betacab|AA|5|4|2
Betacab|BB|2|5|2
Betacab|DD|||
Canutility|AA|3|8|
Canutility|CC|NULL||
] (delimiter is '|');
Set NULLINTERPRET=;
NumericCount
NumericCount() returns the number of numeric values found in the expression, as defined bya group by clause.
Syntax:NumericCount ( [ distinct ] expr)
Script syntax and chart functions - Qlik Sense, February 2022 242
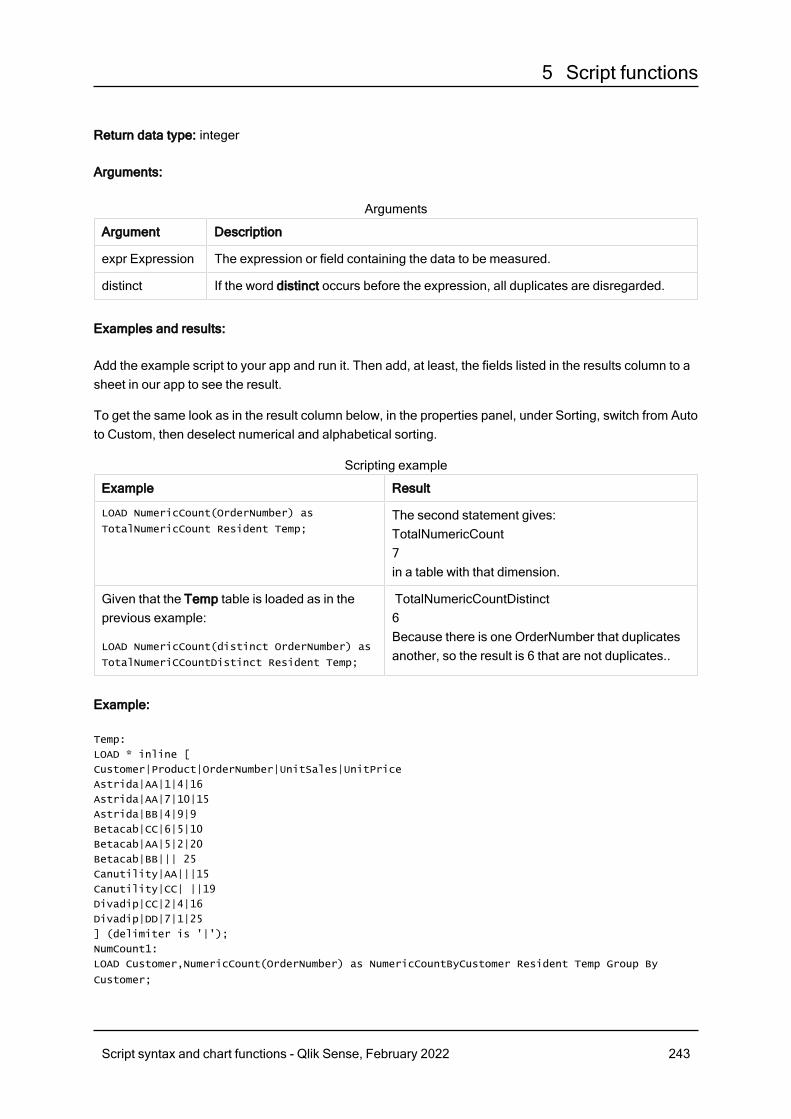
5 Script functions
Return data type: integer
Arguments:
Argument Description
expr Expression The expression or field containing the data to be measured.
distinct If the word distinct occurs before the expression, all duplicates are disregarded.
Arguments
Examples and results:
Add the example script to your app and run it. Then add, at least, the fields listed in the results column to asheet in our app to see the result.
To get the same look as in the result column below, in the properties panel, under Sorting, switch from Autoto Custom, then deselect numerical and alphabetical sorting.
Example Result
LOAD NumericCount(OrderNumber) as
TotalNumericCount Resident Temp;The second statement gives:TotalNumericCount7in a table with that dimension.
Given that the Temp table is loaded as in theprevious example:
LOAD NumericCount(distinct OrderNumber) as
TotalNumeriCCountDistinct Resident Temp;
TotalNumericCountDistinct6Because there is one OrderNumber that duplicatesanother, so the result is 6 that are not duplicates..
Scripting example
Example:
Temp:
LOAD * inline [
Customer|Product|OrderNumber|UnitSales|UnitPrice
Astrida|AA|1|4|16
Astrida|AA|7|10|15
Astrida|BB|4|9|9
Betacab|CC|6|5|10
Betacab|AA|5|2|20
Betacab|BB||| 25
Canutility|AA|||15
Canutility|CC| ||19
Divadip|CC|2|4|16
Divadip|DD|7|1|25
] (delimiter is '|');
NumCount1:
LOAD Customer,NumericCount(OrderNumber) as NumericCountByCustomer Resident Temp Group By
Customer;
Script syntax and chart functions - Qlik Sense, February 2022 243
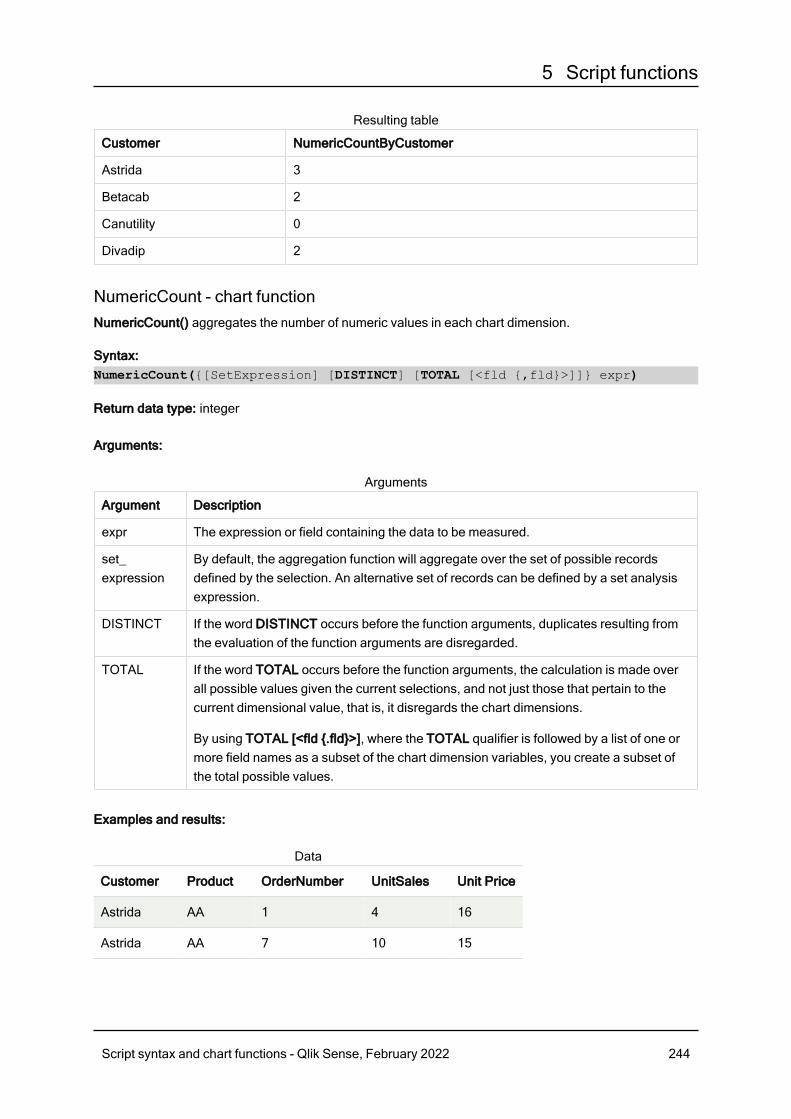
5 Script functions
Customer NumericCountByCustomer
Astrida 3
Betacab 2
Canutility 0
Divadip 2
Resulting table
NumericCount - chart functionNumericCount() aggregates the number of numeric values in each chart dimension.
Syntax:NumericCount({[SetExpression] [DISTINCT] [TOTAL [<fld {,fld}>]]} expr)
Return data type: integer
Arguments:
Argument Description
expr The expression or field containing the data to be measured.
set_expression
By default, the aggregation function will aggregate over the set of possible recordsdefined by the selection. An alternative set of records can be defined by a set analysisexpression.
DISTINCT If the word DISTINCT occurs before the function arguments, duplicates resulting fromthe evaluation of the function arguments are disregarded.
TOTAL If the word TOTAL occurs before the function arguments, the calculation is made overall possible values given the current selections, and not just those that pertain to thecurrent dimensional value, that is, it disregards the chart dimensions.
By using TOTAL [<fld {.fld}>], where the TOTAL qualifier is followed by a list of one ormore field names as a subset of the chart dimension variables, you create a subset ofthe total possible values.
Arguments
Examples and results:
Customer Product OrderNumber UnitSales Unit Price
Astrida AA 1 4 16
Astrida AA 7 10 15
Data
Script syntax and chart functions - Qlik Sense, February 2022 244
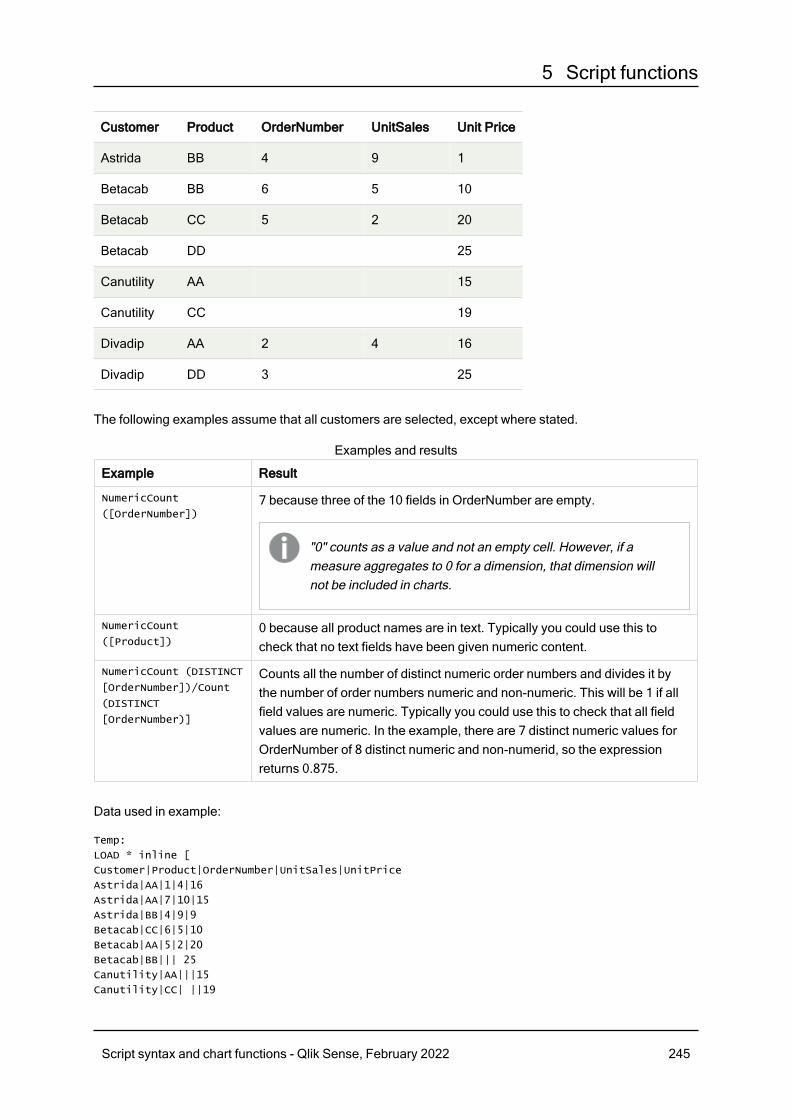
5 Script functions
Customer Product OrderNumber UnitSales Unit Price
Astrida BB 4 9 1
Betacab BB 6 5 10
Betacab CC 5 2 20
Betacab DD 25
Canutility AA 15
Canutility CC 19
Divadip AA 2 4 16
Divadip DD 3 25
The following examples assume that all customers are selected, except where stated.
Example Result
NumericCount
([OrderNumber])7 because three of the 10 fields in OrderNumber are empty.
"0" counts as a value and not an empty cell. However, if ameasure aggregates to 0 for a dimension, that dimension willnot be included in charts.
NumericCount
([Product])0 because all product names are in text. Typically you could use this tocheck that no text fields have been given numeric content.
NumericCount (DISTINCT
[OrderNumber])/Count
(DISTINCT
[OrderNumber)]
Counts all the number of distinct numeric order numbers and divides it bythe number of order numbers numeric and non-numeric. This will be 1 if allfield values are numeric. Typically you could use this to check that all fieldvalues are numeric. In the example, there are 7 distinct numeric values forOrderNumber of 8 distinct numeric and non-numerid, so the expressionreturns 0.875.
Examples and results
Data used in example:
Temp:
LOAD * inline [
Customer|Product|OrderNumber|UnitSales|UnitPrice
Astrida|AA|1|4|16
Astrida|AA|7|10|15
Astrida|BB|4|9|9
Betacab|CC|6|5|10
Betacab|AA|5|2|20
Betacab|BB||| 25
Canutility|AA|||15
Canutility|CC| ||19
Script syntax and chart functions - Qlik Sense, February 2022 245
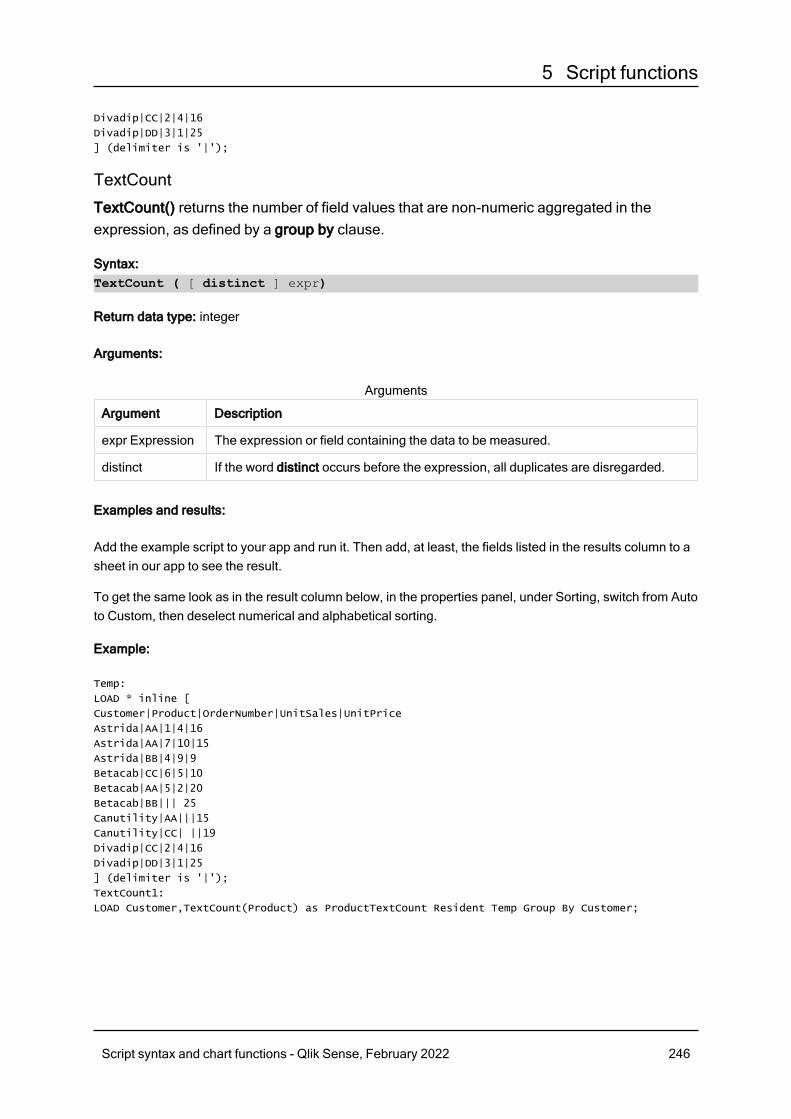
5 Script functions
Divadip|CC|2|4|16
Divadip|DD|3|1|25
] (delimiter is '|');
TextCount
TextCount() returns the number of field values that are non-numeric aggregated in theexpression, as defined by a group by clause.
Syntax:TextCount ( [ distinct ] expr)
Return data type: integer
Arguments:
Argument Description
expr Expression The expression or field containing the data to be measured.
distinct If the word distinct occurs before the expression, all duplicates are disregarded.
Arguments
Examples and results:
Add the example script to your app and run it. Then add, at least, the fields listed in the results column to asheet in our app to see the result.
To get the same look as in the result column below, in the properties panel, under Sorting, switch from Autoto Custom, then deselect numerical and alphabetical sorting.
Example:
Temp:
LOAD * inline [
Customer|Product|OrderNumber|UnitSales|UnitPrice
Astrida|AA|1|4|16
Astrida|AA|7|10|15
Astrida|BB|4|9|9
Betacab|CC|6|5|10
Betacab|AA|5|2|20
Betacab|BB||| 25
Canutility|AA|||15
Canutility|CC| ||19
Divadip|CC|2|4|16
Divadip|DD|3|1|25
] (delimiter is '|');
TextCount1:
LOAD Customer,TextCount(Product) as ProductTextCount Resident Temp Group By Customer;
Script syntax and chart functions - Qlik Sense, February 2022 246
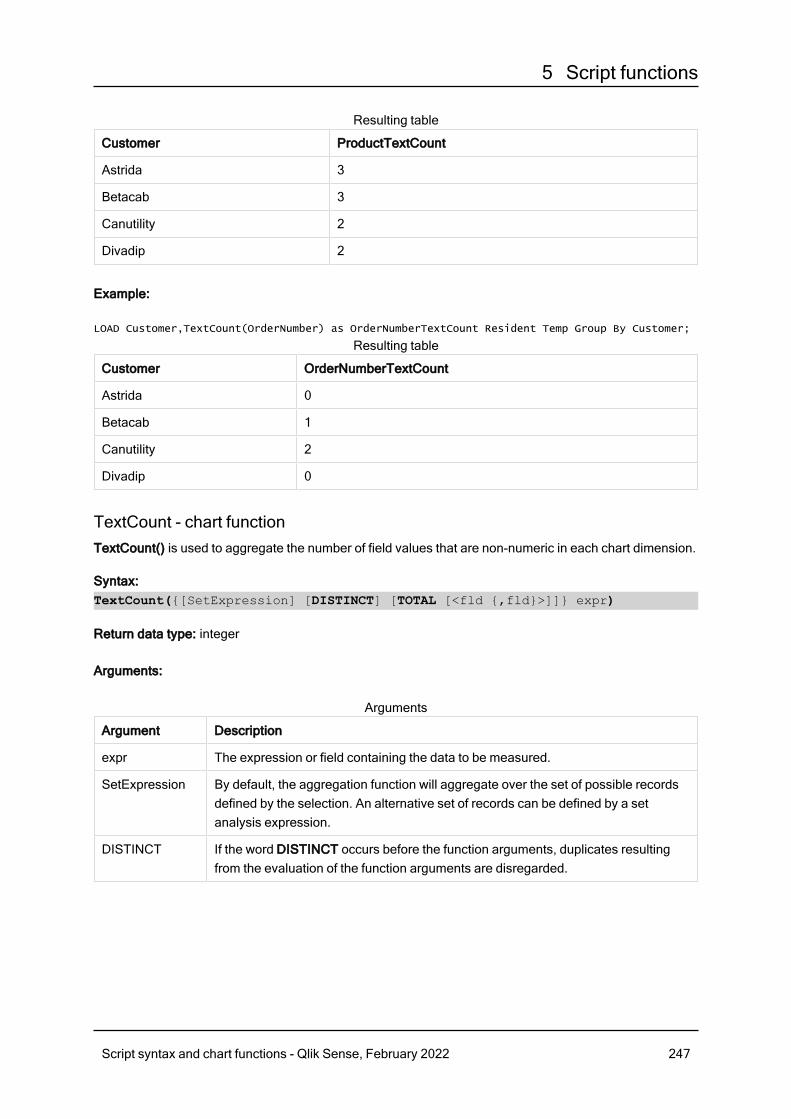
5 Script functions
Customer ProductTextCount
Astrida 3
Betacab 3
Canutility 2
Divadip 2
Resulting table
Example:
LOAD Customer,TextCount(OrderNumber) as OrderNumberTextCount Resident Temp Group By Customer;
Customer OrderNumberTextCount
Astrida 0
Betacab 1
Canutility 2
Divadip 0
Resulting table
TextCount - chart functionTextCount() is used to aggregate the number of field values that are non-numeric in each chart dimension.
Syntax:TextCount({[SetExpression] [DISTINCT] [TOTAL [<fld {,fld}>]]} expr)
Return data type: integer
Arguments:
Argument Description
expr The expression or field containing the data to be measured.
SetExpression By default, the aggregation function will aggregate over the set of possible recordsdefined by the selection. An alternative set of records can be defined by a setanalysis expression.
DISTINCT If the word DISTINCT occurs before the function arguments, duplicates resultingfrom the evaluation of the function arguments are disregarded.
Arguments
Script syntax and chart functions - Qlik Sense, February 2022 247
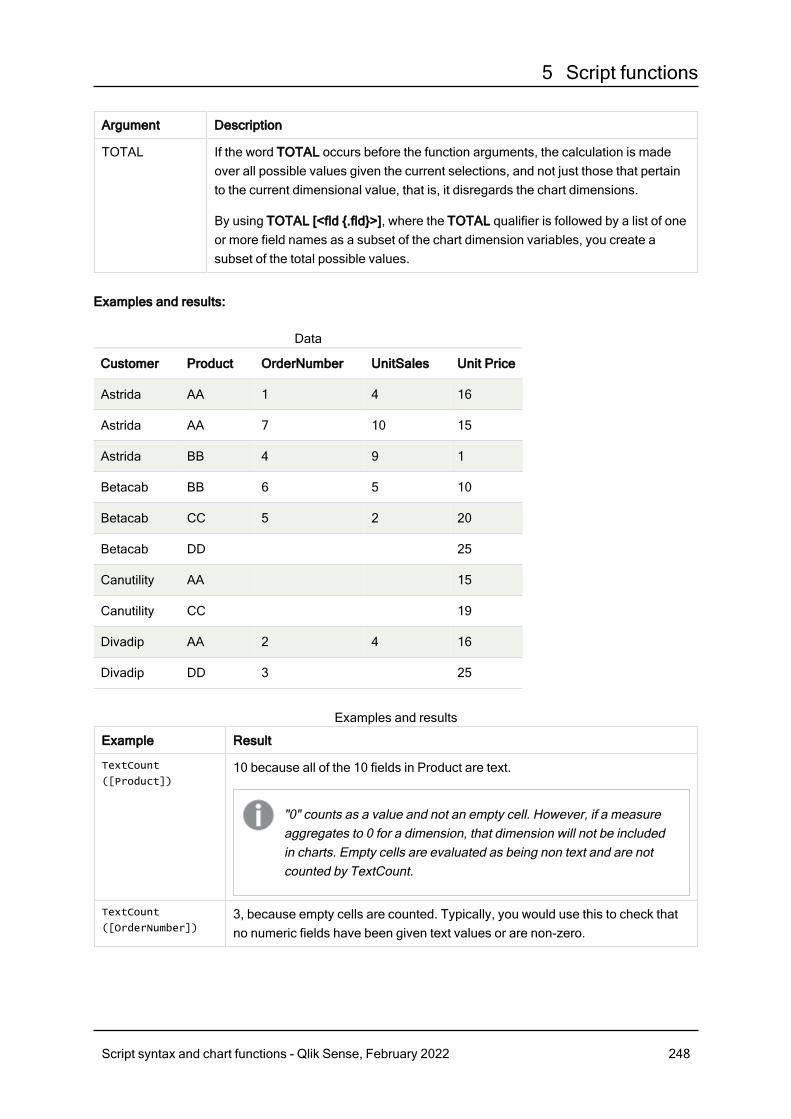
5 Script functions
Argument Description
TOTAL If the word TOTAL occurs before the function arguments, the calculation is madeover all possible values given the current selections, and not just those that pertainto the current dimensional value, that is, it disregards the chart dimensions.
By using TOTAL [<fld {.fld}>], where the TOTAL qualifier is followed by a list of oneor more field names as a subset of the chart dimension variables, you create asubset of the total possible values.
Examples and results:
Customer Product OrderNumber UnitSales Unit Price
Astrida AA 1 4 16
Astrida AA 7 10 15
Astrida BB 4 9 1
Betacab BB 6 5 10
Betacab CC 5 2 20
Betacab DD 25
Canutility AA 15
Canutility CC 19
Divadip AA 2 4 16
Divadip DD 3 25
Data
Example Result
TextCount
([Product])10 because all of the 10 fields in Product are text.
"0" counts as a value and not an empty cell. However, if a measureaggregates to 0 for a dimension, that dimension will not be includedin charts. Empty cells are evaluated as being non text and are notcounted by TextCount.
TextCount
([OrderNumber])3, because empty cells are counted. Typically, you would use this to check thatno numeric fields have been given text values or are non-zero.
Examples and results
Script syntax and chart functions - Qlik Sense, February 2022 248
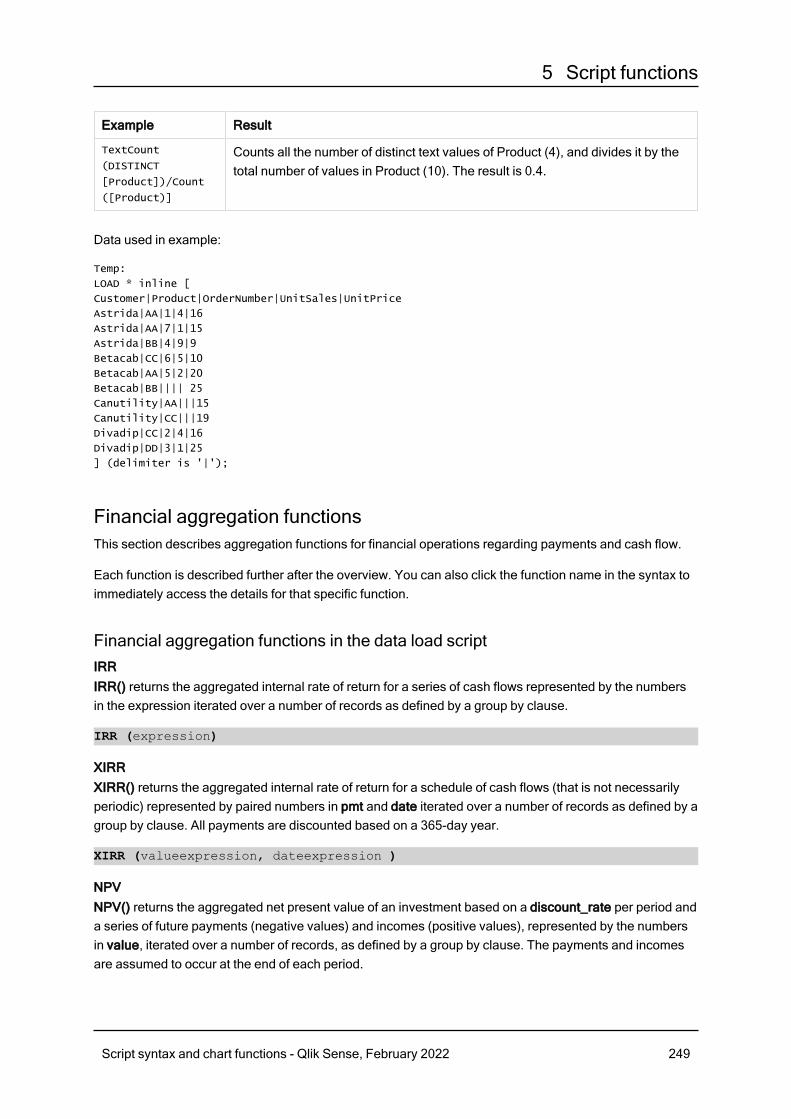
5 Script functions
Example Result
TextCount
(DISTINCT
[Product])/Count
([Product)]
Counts all the number of distinct text values of Product (4), and divides it by thetotal number of values in Product (10). The result is 0.4.
Data used in example:
Temp:
LOAD * inline [
Customer|Product|OrderNumber|UnitSales|UnitPrice
Astrida|AA|1|4|16
Astrida|AA|7|1|15
Astrida|BB|4|9|9
Betacab|CC|6|5|10
Betacab|AA|5|2|20
Betacab|BB|||| 25
Canutility|AA|||15
Canutility|CC|||19
Divadip|CC|2|4|16
Divadip|DD|3|1|25
] (delimiter is '|');
Financial aggregation functionsThis section describes aggregation functions for financial operations regarding payments and cash flow.
Each function is described further after the overview. You can also click the function name in the syntax toimmediately access the details for that specific function.
Financial aggregation functions in the data load scriptIRRIRR() returns the aggregated internal rate of return for a series of cash flows represented by the numbersin the expression iterated over a number of records as defined by a group by clause.
IRR (expression)
XIRRXIRR() returns the aggregated internal rate of return for a schedule of cash flows (that is not necessarilyperiodic) represented by paired numbers in pmt and date iterated over a number of records as defined by agroup by clause. All payments are discounted based on a 365-day year.
XIRR (valueexpression, dateexpression )
NPVNPV() returns the aggregated net present value of an investment based on a discount_rate per period anda series of future payments (negative values) and incomes (positive values), represented by the numbersin value, iterated over a number of records, as defined by a group by clause. The payments and incomesare assumed to occur at the end of each period.
Script syntax and chart functions - Qlik Sense, February 2022 249
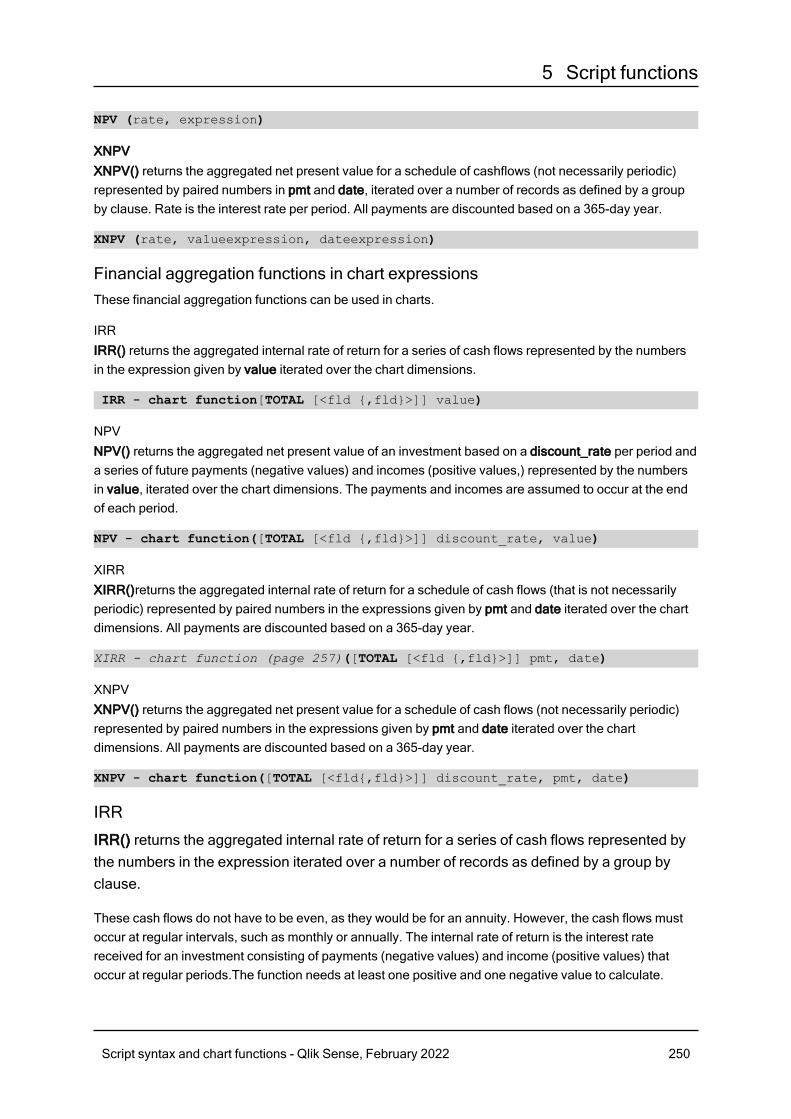
5 Script functions
NPV (rate, expression)
XNPVXNPV() returns the aggregated net present value for a schedule of cashflows (not necessarily periodic)represented by paired numbers in pmt and date, iterated over a number of records as defined by a groupby clause. Rate is the interest rate per period. All payments are discounted based on a 365-day year.
XNPV (rate, valueexpression, dateexpression)
Financial aggregation functions in chart expressionsThese financial aggregation functions can be used in charts.
IRRIRR() returns the aggregated internal rate of return for a series of cash flows represented by the numbersin the expression given by value iterated over the chart dimensions.
IRR - chart function[TOTAL [<fld {,fld}>]] value)
NPVNPV() returns the aggregated net present value of an investment based on a discount_rate per period anda series of future payments (negative values) and incomes (positive values,) represented by the numbersin value, iterated over the chart dimensions. The payments and incomes are assumed to occur at the endof each period.
NPV - chart function([TOTAL [<fld {,fld}>]] discount_rate, value)
XIRRXIRR()returns the aggregated internal rate of return for a schedule of cash flows (that is not necessarilyperiodic) represented by paired numbers in the expressions given by pmt and date iterated over the chartdimensions. All payments are discounted based on a 365-day year.
XIRR - chart function (page 257)([TOTAL [<fld {,fld}>]] pmt, date)
XNPVXNPV() returns the aggregated net present value for a schedule of cash flows (not necessarily periodic)represented by paired numbers in the expressions given by pmt and date iterated over the chartdimensions. All payments are discounted based on a 365-day year.
XNPV - chart function([TOTAL [<fld{,fld}>]] discount_rate, pmt, date)
IRR
IRR() returns the aggregated internal rate of return for a series of cash flows represented bythe numbers in the expression iterated over a number of records as defined by a group byclause.
These cash flows do not have to be even, as they would be for an annuity. However, the cash flows mustoccur at regular intervals, such as monthly or annually. The internal rate of return is the interest ratereceived for an investment consisting of payments (negative values) and income (positive values) thatoccur at regular periods.The function needs at least one positive and one negative value to calculate.
Script syntax and chart functions - Qlik Sense, February 2022 250
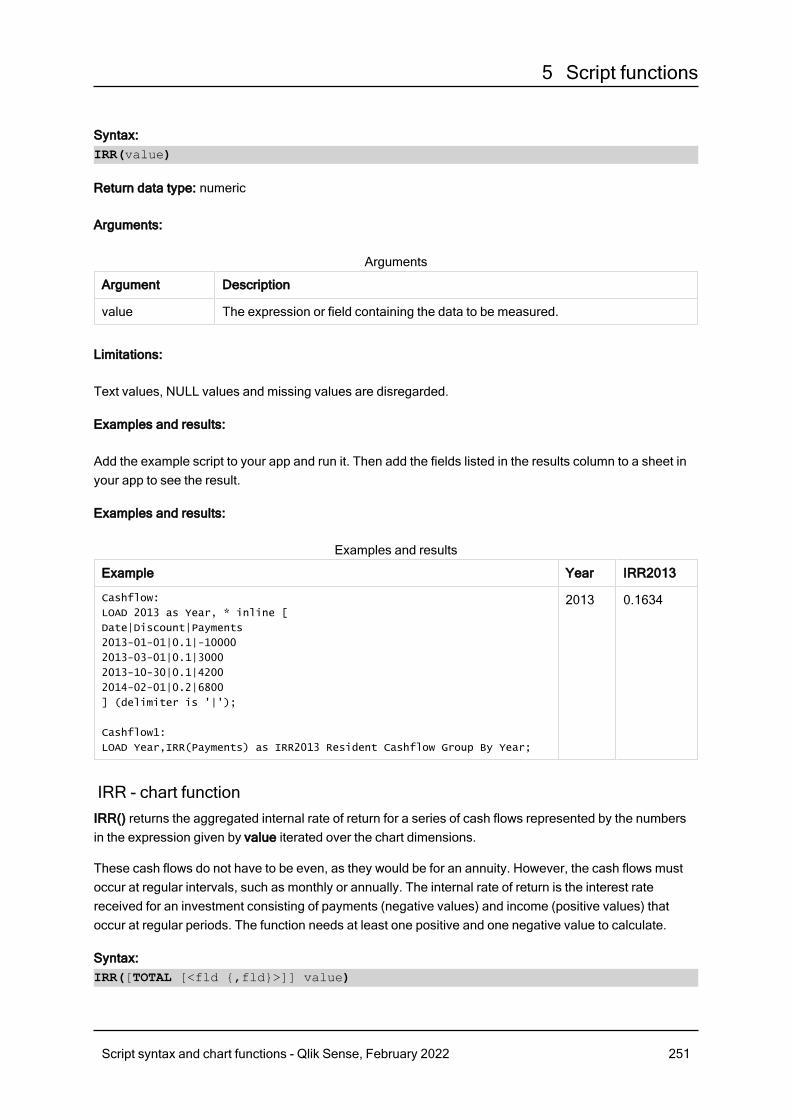
5 Script functions
Syntax:IRR(value)
Return data type: numeric
Arguments:
Argument Description
value The expression or field containing the data to be measured.
Arguments
Limitations:
Text values, NULL values and missing values are disregarded.
Examples and results:
Add the example script to your app and run it. Then add the fields listed in the results column to a sheet inyour app to see the result.
Examples and results:
Example Year IRR2013
Cashflow:
LOAD 2013 as Year, * inline [
Date|Discount|Payments
2013-01-01|0.1|-10000
2013-03-01|0.1|3000
2013-10-30|0.1|4200
2014-02-01|0.2|6800
] (delimiter is '|');
Cashflow1:
LOAD Year,IRR(Payments) as IRR2013 Resident Cashflow Group By Year;
2013 0.1634
Examples and results
IRR - chart functionIRR() returns the aggregated internal rate of return for a series of cash flows represented by the numbersin the expression given by value iterated over the chart dimensions.
These cash flows do not have to be even, as they would be for an annuity. However, the cash flows mustoccur at regular intervals, such as monthly or annually. The internal rate of return is the interest ratereceived for an investment consisting of payments (negative values) and income (positive values) thatoccur at regular periods. The function needs at least one positive and one negative value to calculate.
Syntax:IRR([TOTAL [<fld {,fld}>]] value)
Script syntax and chart functions - Qlik Sense, February 2022 251
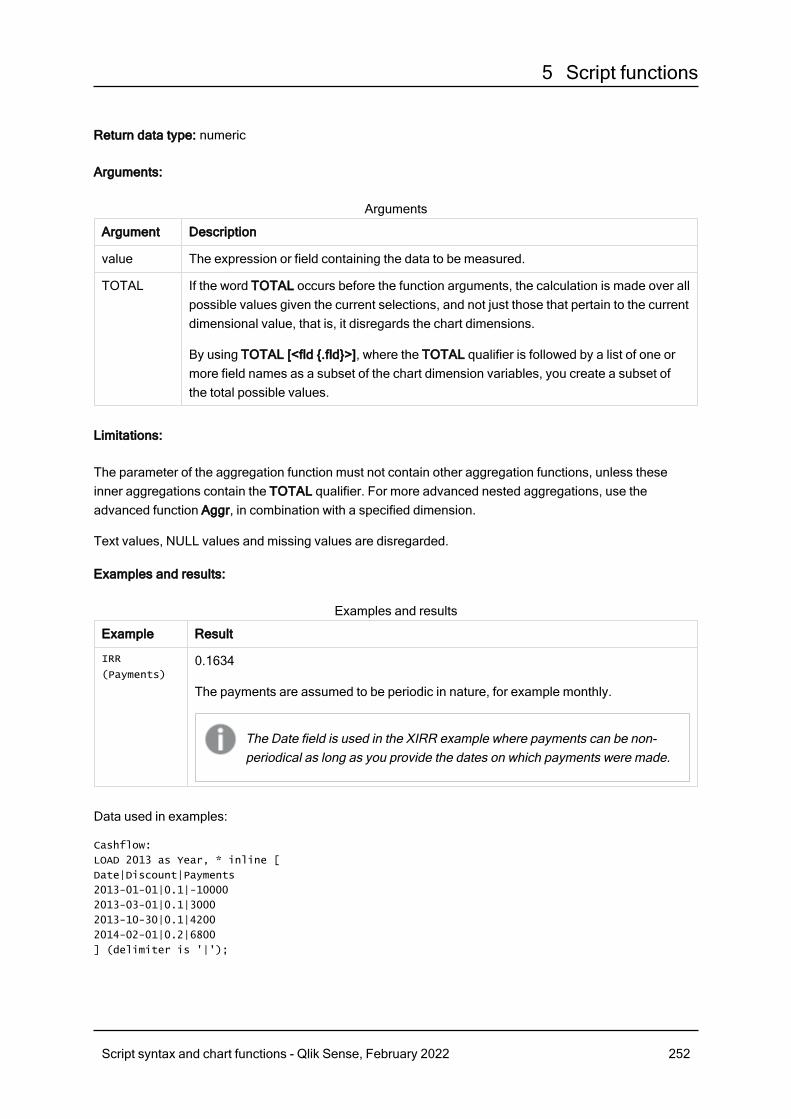
5 Script functions
Return data type: numeric
Arguments:
Argument Description
value The expression or field containing the data to be measured.
TOTAL If the word TOTAL occurs before the function arguments, the calculation is made over allpossible values given the current selections, and not just those that pertain to the currentdimensional value, that is, it disregards the chart dimensions.
By using TOTAL [<fld {.fld}>], where the TOTAL qualifier is followed by a list of one ormore field names as a subset of the chart dimension variables, you create a subset ofthe total possible values.
Arguments
Limitations:
The parameter of the aggregation function must not contain other aggregation functions, unless theseinner aggregations contain the TOTAL qualifier. For more advanced nested aggregations, use theadvanced function Aggr, in combination with a specified dimension.
Text values, NULL values and missing values are disregarded.
Examples and results:
Example Result
IRR
(Payments)0.1634
The payments are assumed to be periodic in nature, for example monthly.
The Date field is used in the XIRR example where payments can be non-periodical as long as you provide the dates on which payments were made.
Examples and results
Data used in examples:
Cashflow:
LOAD 2013 as Year, * inline [
Date|Discount|Payments
2013-01-01|0.1|-10000
2013-03-01|0.1|3000
2013-10-30|0.1|4200
2014-02-01|0.2|6800
] (delimiter is '|');
Script syntax and chart functions - Qlik Sense, February 2022 252
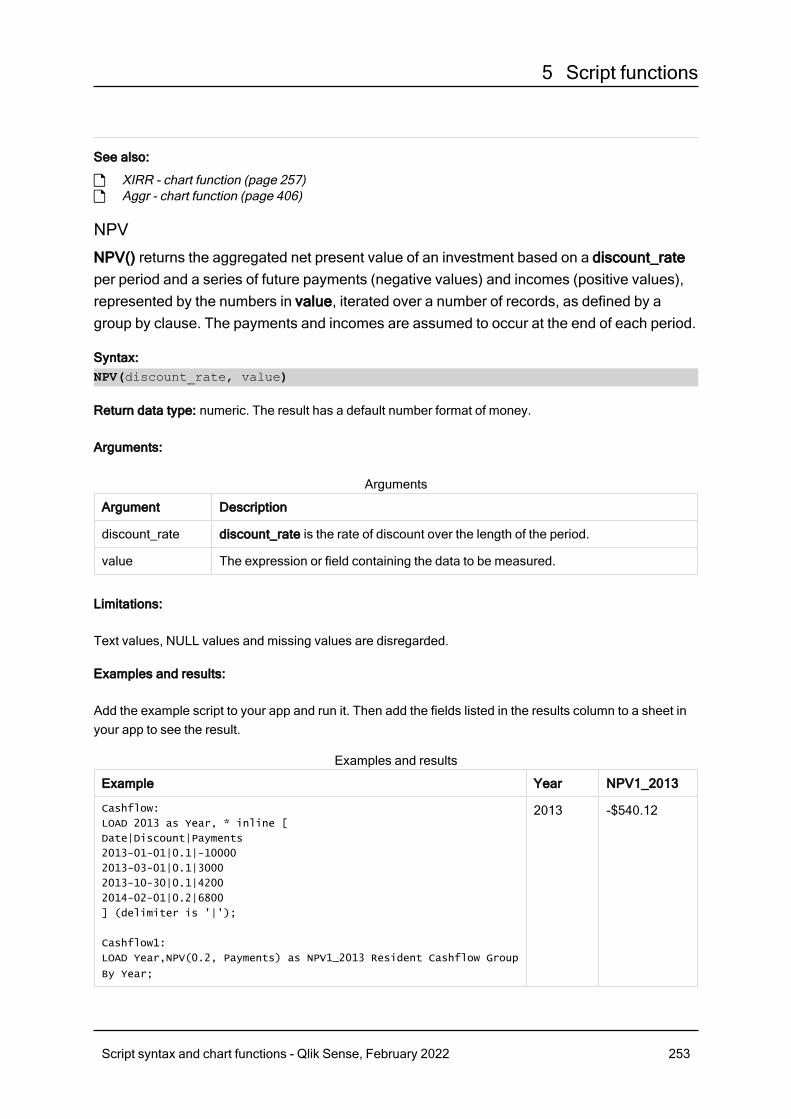
5 Script functions
See also:
p XIRR - chart function (page 257)p Aggr - chart function (page 406)
NPV
NPV() returns the aggregated net present value of an investment based on a discount_rateper period and a series of future payments (negative values) and incomes (positive values),represented by the numbers in value, iterated over a number of records, as defined by agroup by clause. The payments and incomes are assumed to occur at the end of each period.
Syntax:NPV(discount_rate, value)
Return data type: numeric. The result has a default number format of money.
Arguments:
Argument Description
discount_rate discount_rate is the rate of discount over the length of the period.
value The expression or field containing the data to be measured.
Arguments
Limitations:
Text values, NULL values and missing values are disregarded.
Examples and results:
Add the example script to your app and run it. Then add the fields listed in the results column to a sheet inyour app to see the result.
Example Year NPV1_2013
Cashflow:
LOAD 2013 as Year, * inline [
Date|Discount|Payments
2013-01-01|0.1|-10000
2013-03-01|0.1|3000
2013-10-30|0.1|4200
2014-02-01|0.2|6800
] (delimiter is '|');
Cashflow1:
LOAD Year,NPV(0.2, Payments) as NPV1_2013 Resident Cashflow Group
By Year;
2013 -$540.12
Examples and results
Script syntax and chart functions - Qlik Sense, February 2022 253
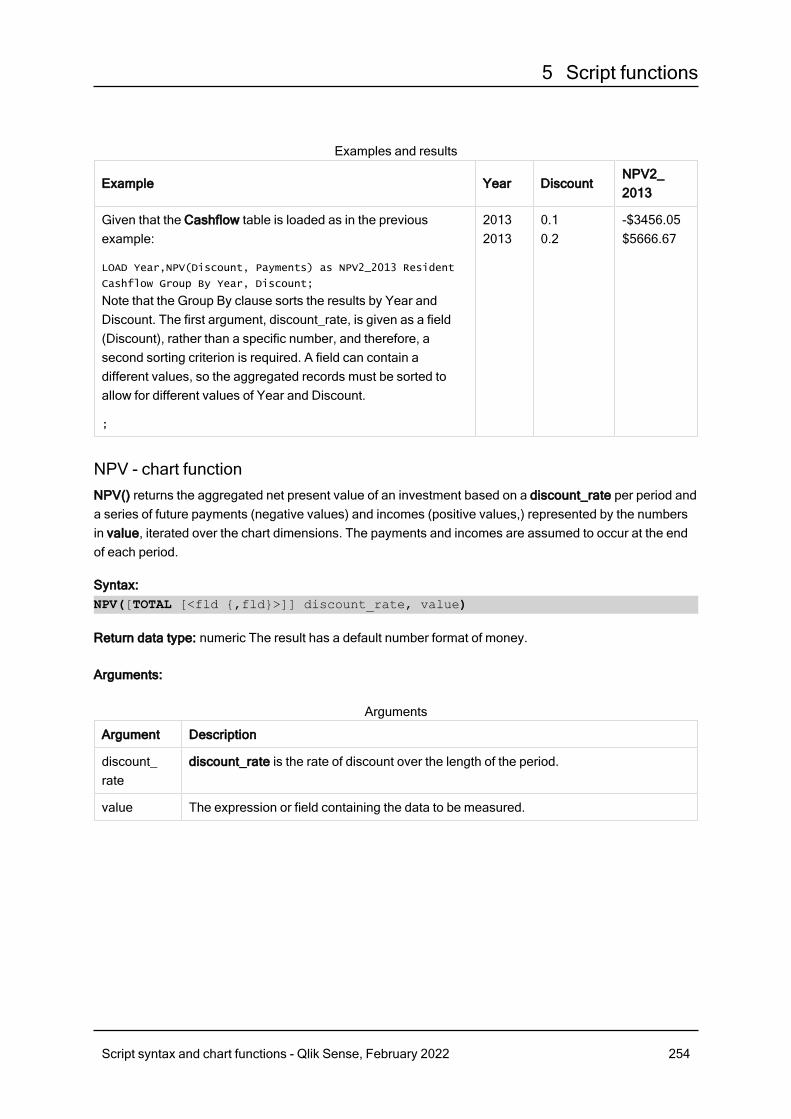
5 Script functions
Example Year DiscountNPV2_2013
Given that the Cashflow table is loaded as in the previousexample:
LOAD Year,NPV(Discount, Payments) as NPV2_2013 Resident
Cashflow Group By Year, Discount;
Note that the Group By clause sorts the results by Year andDiscount. The first argument, discount_rate, is given as a field(Discount), rather than a specific number, and therefore, asecond sorting criterion is required. A field can contain adifferent values, so the aggregated records must be sorted toallow for different values of Year and Discount.
;
20132013
0.10.2
-$3456.05$5666.67
Examples and results
NPV - chart functionNPV() returns the aggregated net present value of an investment based on a discount_rate per period anda series of future payments (negative values) and incomes (positive values,) represented by the numbersin value, iterated over the chart dimensions. The payments and incomes are assumed to occur at the endof each period.
Syntax:NPV([TOTAL [<fld {,fld}>]] discount_rate, value)
Return data type: numeric The result has a default number format of money.
Arguments:
Argument Description
discount_rate
discount_rate is the rate of discount over the length of the period.
value The expression or field containing the data to be measured.
Arguments
Script syntax and chart functions - Qlik Sense, February 2022 254
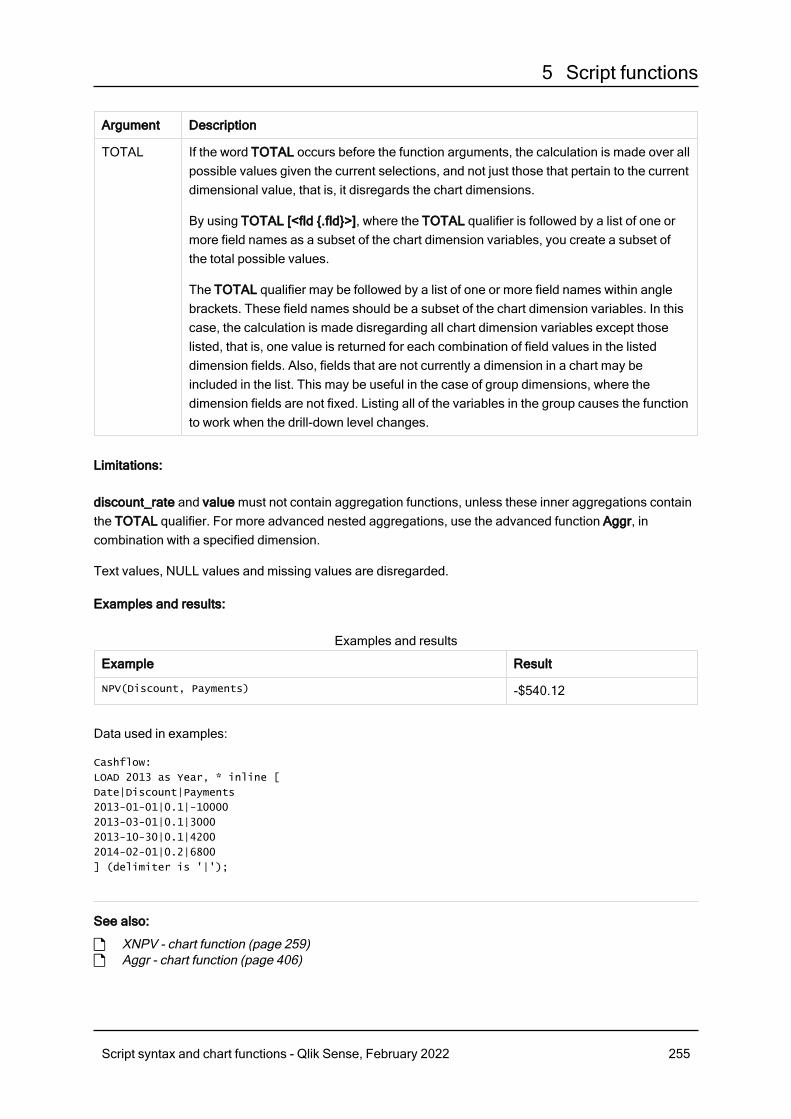
5 Script functions
Argument Description
TOTAL If the word TOTAL occurs before the function arguments, the calculation is made over allpossible values given the current selections, and not just those that pertain to the currentdimensional value, that is, it disregards the chart dimensions.
By using TOTAL [<fld {.fld}>], where the TOTAL qualifier is followed by a list of one ormore field names as a subset of the chart dimension variables, you create a subset ofthe total possible values.
The TOTAL qualifier may be followed by a list of one or more field names within anglebrackets. These field names should be a subset of the chart dimension variables. In thiscase, the calculation is made disregarding all chart dimension variables except thoselisted, that is, one value is returned for each combination of field values in the listeddimension fields. Also, fields that are not currently a dimension in a chart may beincluded in the list. This may be useful in the case of group dimensions, where thedimension fields are not fixed. Listing all of the variables in the group causes the functionto work when the drill-down level changes.
Limitations:
discount_rate and value must not contain aggregation functions, unless these inner aggregations containthe TOTAL qualifier. For more advanced nested aggregations, use the advanced function Aggr, incombination with a specified dimension.
Text values, NULL values and missing values are disregarded.
Examples and results:
Example Result
NPV(Discount, Payments) -$540.12
Examples and results
Data used in examples:
Cashflow:
LOAD 2013 as Year, * inline [
Date|Discount|Payments
2013-01-01|0.1|-10000
2013-03-01|0.1|3000
2013-10-30|0.1|4200
2014-02-01|0.2|6800
] (delimiter is '|');
See also:
p XNPV - chart function (page 259)p Aggr - chart function (page 406)
Script syntax and chart functions - Qlik Sense, February 2022 255
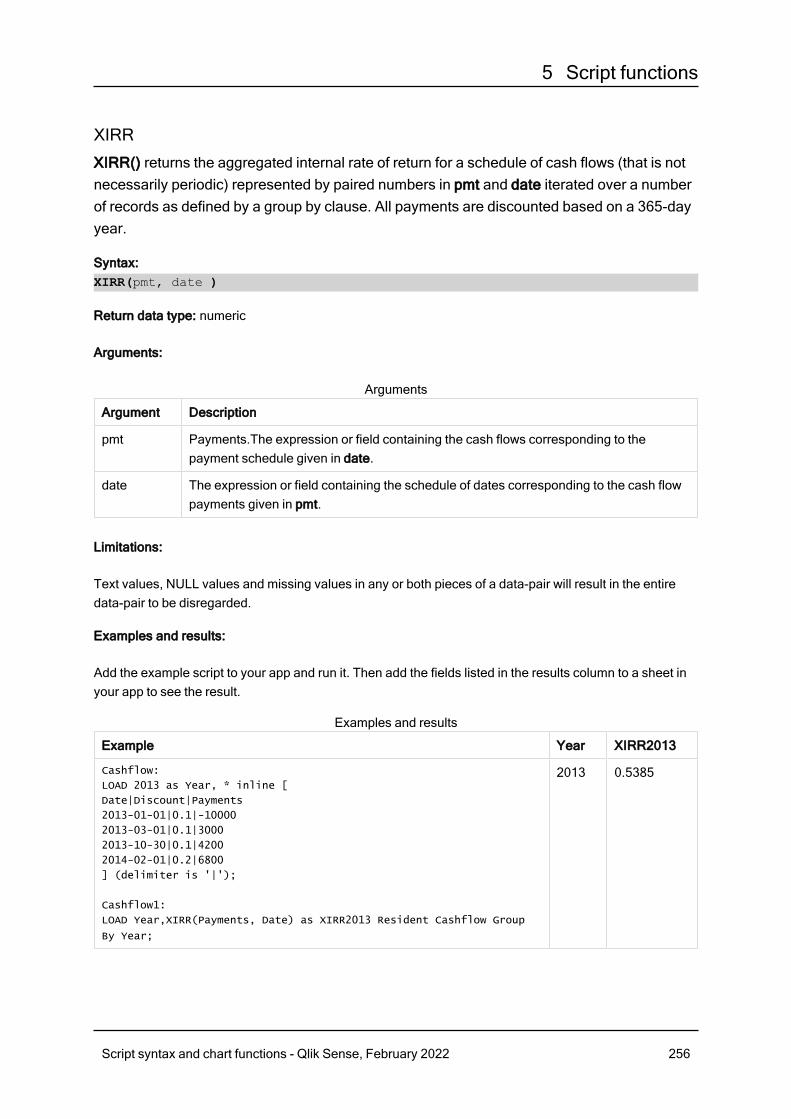
5 Script functions
XIRR
XIRR() returns the aggregated internal rate of return for a schedule of cash flows (that is notnecessarily periodic) represented by paired numbers in pmt and date iterated over a numberof records as defined by a group by clause. All payments are discounted based on a 365-dayyear.
Syntax:XIRR(pmt, date )
Return data type: numeric
Arguments:
Argument Description
pmt Payments.The expression or field containing the cash flows corresponding to thepayment schedule given in date.
date The expression or field containing the schedule of dates corresponding to the cash flowpayments given in pmt.
Arguments
Limitations:
Text values, NULL values and missing values in any or both pieces of a data-pair will result in the entiredata-pair to be disregarded.
Examples and results:
Add the example script to your app and run it. Then add the fields listed in the results column to a sheet inyour app to see the result.
Example Year XIRR2013
Cashflow:
LOAD 2013 as Year, * inline [
Date|Discount|Payments
2013-01-01|0.1|-10000
2013-03-01|0.1|3000
2013-10-30|0.1|4200
2014-02-01|0.2|6800
] (delimiter is '|');
Cashflow1:
LOAD Year,XIRR(Payments, Date) as XIRR2013 Resident Cashflow Group
By Year;
2013 0.5385
Examples and results
Script syntax and chart functions - Qlik Sense, February 2022 256
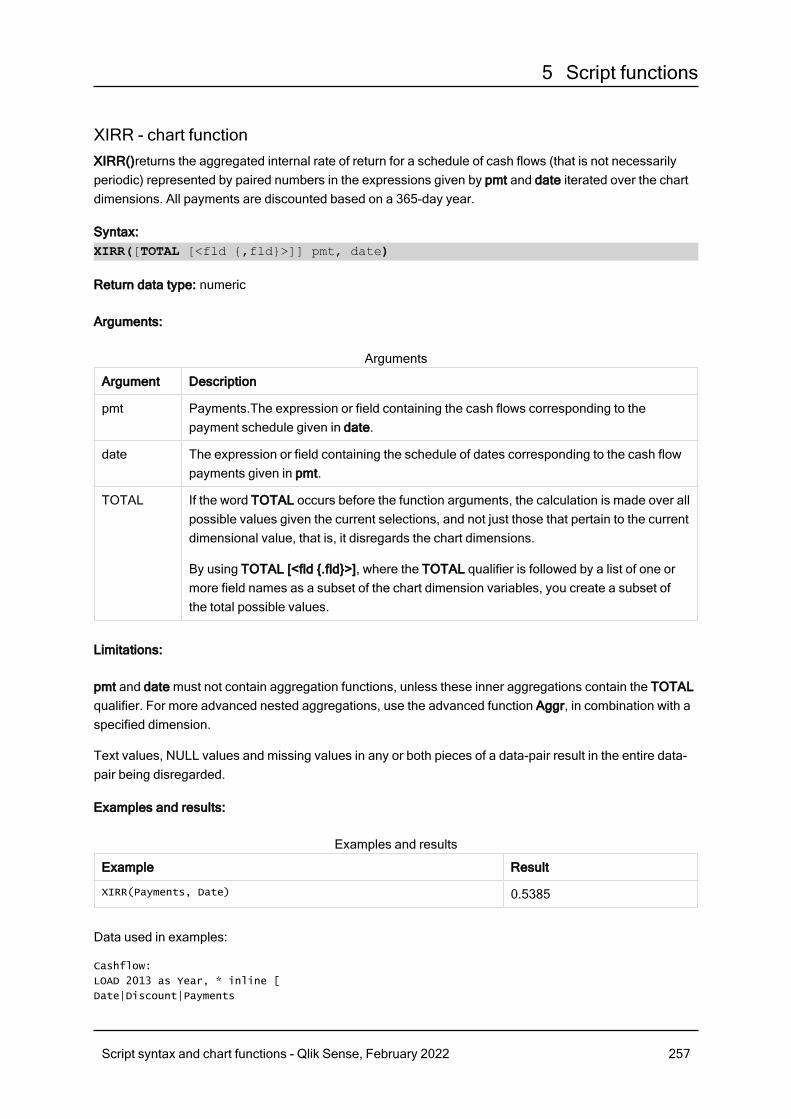
5 Script functions
XIRR - chart functionXIRR()returns the aggregated internal rate of return for a schedule of cash flows (that is not necessarilyperiodic) represented by paired numbers in the expressions given by pmt and date iterated over the chartdimensions. All payments are discounted based on a 365-day year.
Syntax:XIRR([TOTAL [<fld {,fld}>]] pmt, date)
Return data type: numeric
Arguments:
Argument Description
pmt Payments.The expression or field containing the cash flows corresponding to thepayment schedule given in date.
date The expression or field containing the schedule of dates corresponding to the cash flowpayments given in pmt.
TOTAL If the word TOTAL occurs before the function arguments, the calculation is made over allpossible values given the current selections, and not just those that pertain to the currentdimensional value, that is, it disregards the chart dimensions.
By using TOTAL [<fld {.fld}>], where the TOTAL qualifier is followed by a list of one ormore field names as a subset of the chart dimension variables, you create a subset ofthe total possible values.
Arguments
Limitations:
pmt and date must not contain aggregation functions, unless these inner aggregations contain the TOTALqualifier. For more advanced nested aggregations, use the advanced function Aggr, in combination with aspecified dimension.
Text values, NULL values and missing values in any or both pieces of a data-pair result in the entire data-pair being disregarded.
Examples and results:
Example Result
XIRR(Payments, Date) 0.5385
Examples and results
Data used in examples:
Cashflow:
LOAD 2013 as Year, * inline [
Date|Discount|Payments
Script syntax and chart functions - Qlik Sense, February 2022 257
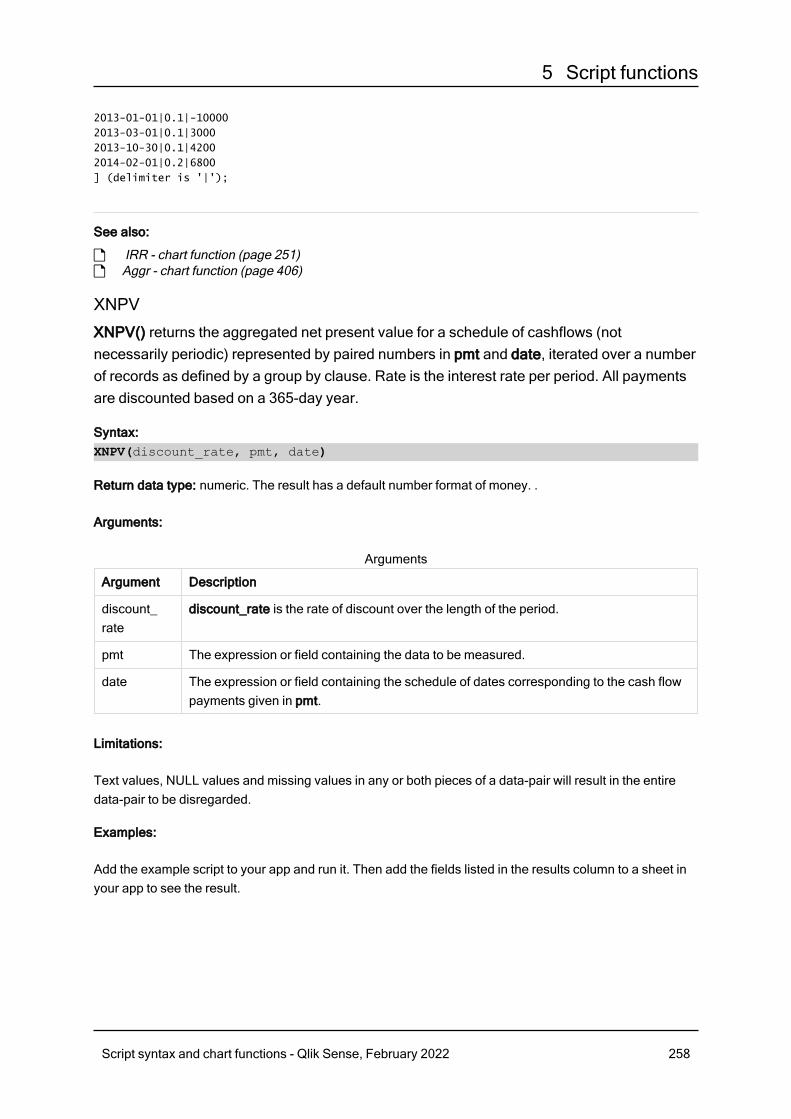
5 Script functions
2013-01-01|0.1|-10000
2013-03-01|0.1|3000
2013-10-30|0.1|4200
2014-02-01|0.2|6800
] (delimiter is '|');
See also:
p IRR - chart function (page 251)p Aggr - chart function (page 406)
XNPV
XNPV() returns the aggregated net present value for a schedule of cashflows (notnecessarily periodic) represented by paired numbers in pmt and date, iterated over a numberof records as defined by a group by clause. Rate is the interest rate per period. All paymentsare discounted based on a 365-day year.
Syntax:XNPV(discount_rate, pmt, date)
Return data type: numeric. The result has a default number format of money. .
Arguments:
Argument Description
discount_rate
discount_rate is the rate of discount over the length of the period.
pmt The expression or field containing the data to be measured.
date The expression or field containing the schedule of dates corresponding to the cash flowpayments given in pmt.
Arguments
Limitations:
Text values, NULL values and missing values in any or both pieces of a data-pair will result in the entiredata-pair to be disregarded.
Examples:
Add the example script to your app and run it. Then add the fields listed in the results column to a sheet inyour app to see the result.
Script syntax and chart functions - Qlik Sense, February 2022 258
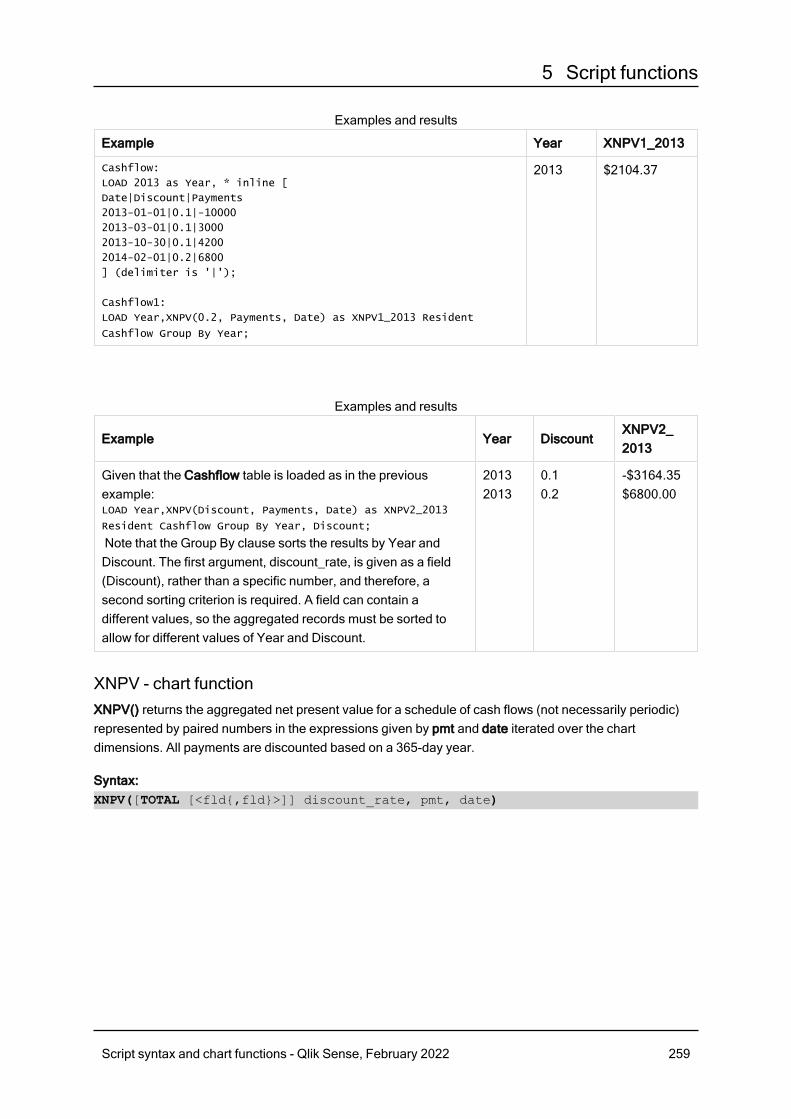
5 Script functions
Example Year XNPV1_2013
Cashflow:
LOAD 2013 as Year, * inline [
Date|Discount|Payments
2013-01-01|0.1|-10000
2013-03-01|0.1|3000
2013-10-30|0.1|4200
2014-02-01|0.2|6800
] (delimiter is '|');
Cashflow1:
LOAD Year,XNPV(0.2, Payments, Date) as XNPV1_2013 Resident
Cashflow Group By Year;
2013 $2104.37
Examples and results
Example Year DiscountXNPV2_2013
Given that the Cashflow table is loaded as in the previousexample:LOAD Year,XNPV(Discount, Payments, Date) as XNPV2_2013
Resident Cashflow Group By Year, Discount;
Note that the Group By clause sorts the results by Year andDiscount. The first argument, discount_rate, is given as a field(Discount), rather than a specific number, and therefore, asecond sorting criterion is required. A field can contain adifferent values, so the aggregated records must be sorted toallow for different values of Year and Discount.
20132013
0.10.2
-$3164.35$6800.00
Examples and results
XNPV - chart functionXNPV() returns the aggregated net present value for a schedule of cash flows (not necessarily periodic)represented by paired numbers in the expressions given by pmt and date iterated over the chartdimensions. All payments are discounted based on a 365-day year.
Syntax:XNPV([TOTAL [<fld{,fld}>]] discount_rate, pmt, date)
Script syntax and chart functions - Qlik Sense, February 2022 259
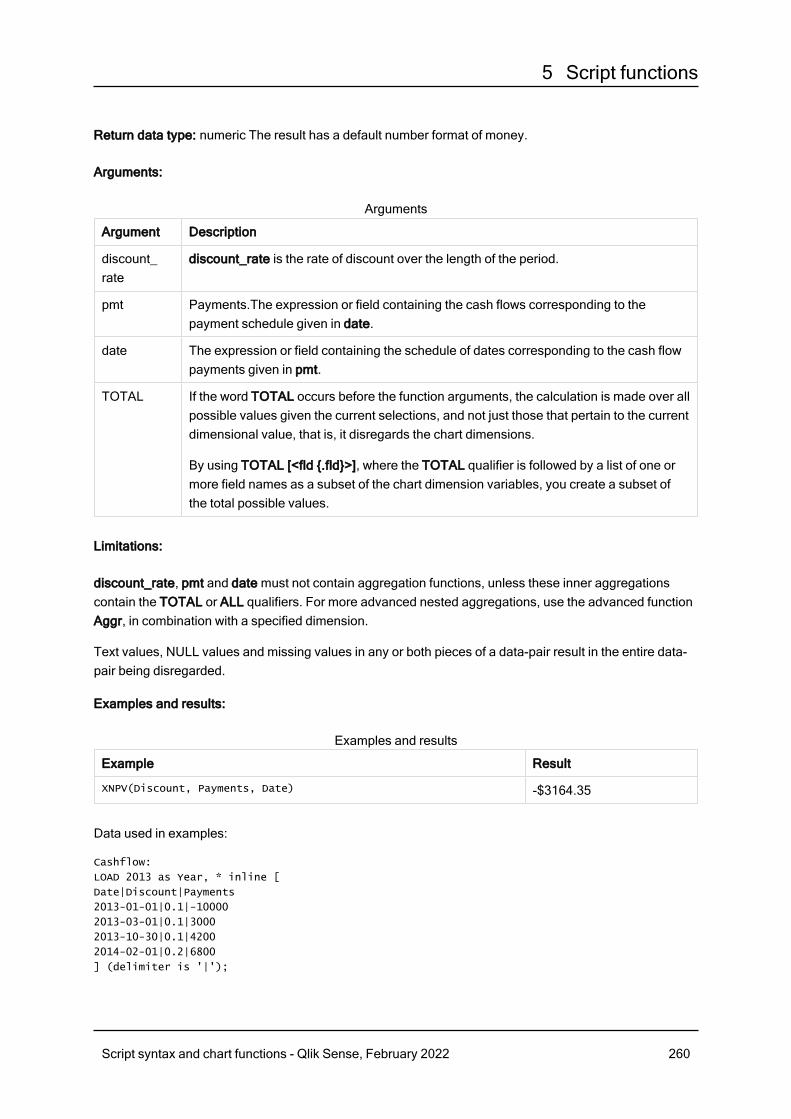
5 Script functions
Return data type: numeric The result has a default number format of money.
Arguments:
Argument Description
discount_rate
discount_rate is the rate of discount over the length of the period.
pmt Payments.The expression or field containing the cash flows corresponding to thepayment schedule given in date.
date The expression or field containing the schedule of dates corresponding to the cash flowpayments given in pmt.
TOTAL If the word TOTAL occurs before the function arguments, the calculation is made over allpossible values given the current selections, and not just those that pertain to the currentdimensional value, that is, it disregards the chart dimensions.
By using TOTAL [<fld {.fld}>], where the TOTAL qualifier is followed by a list of one ormore field names as a subset of the chart dimension variables, you create a subset ofthe total possible values.
Arguments
Limitations:
discount_rate, pmt and date must not contain aggregation functions, unless these inner aggregationscontain the TOTAL or ALL qualifiers. For more advanced nested aggregations, use the advanced functionAggr, in combination with a specified dimension.
Text values, NULL values and missing values in any or both pieces of a data-pair result in the entire data-pair being disregarded.
Examples and results:
Example Result
XNPV(Discount, Payments, Date) -$3164.35
Examples and results
Data used in examples:
Cashflow:
LOAD 2013 as Year, * inline [
Date|Discount|Payments
2013-01-01|0.1|-10000
2013-03-01|0.1|3000
2013-10-30|0.1|4200
2014-02-01|0.2|6800
] (delimiter is '|');
Script syntax and chart functions - Qlik Sense, February 2022 260
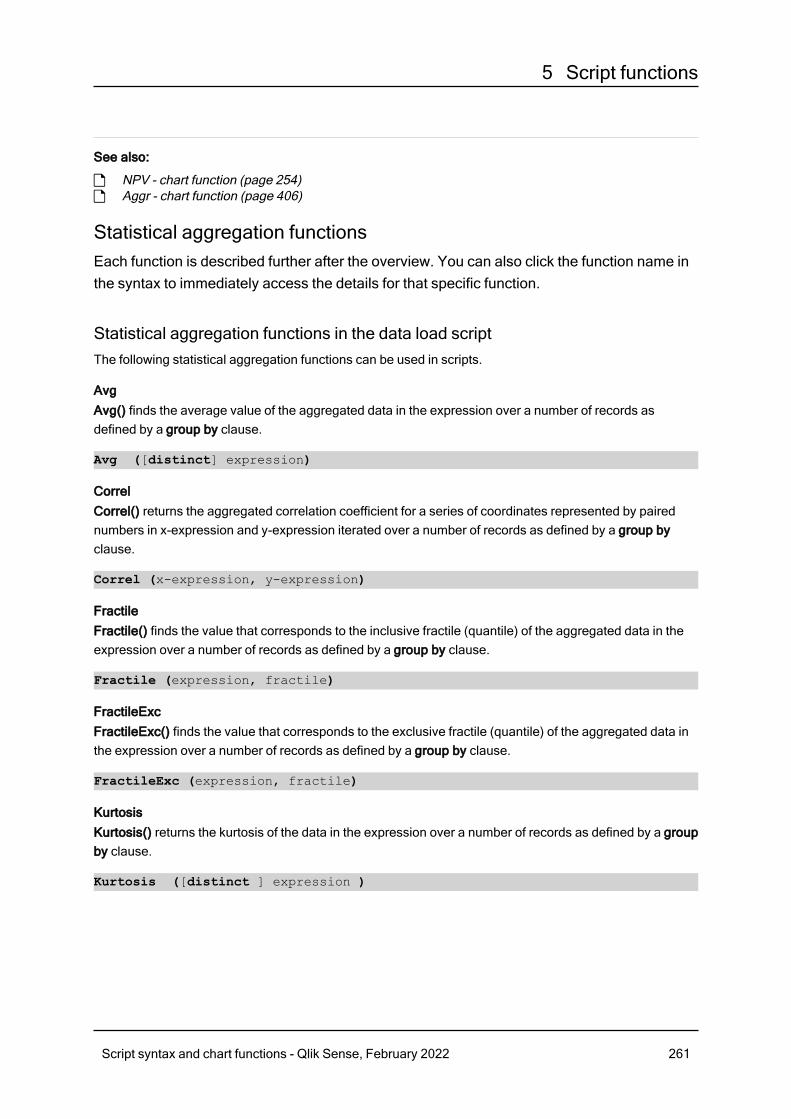
5 Script functions
See also:
p NPV - chart function (page 254)p Aggr - chart function (page 406)
Statistical aggregation functionsEach function is described further after the overview. You can also click the function name inthe syntax to immediately access the details for that specific function.
Statistical aggregation functions in the data load scriptThe following statistical aggregation functions can be used in scripts.
AvgAvg() finds the average value of the aggregated data in the expression over a number of records asdefined by a group by clause.
Avg ([distinct] expression)
CorrelCorrel() returns the aggregated correlation coefficient for a series of coordinates represented by pairednumbers in x-expression and y-expression iterated over a number of records as defined by a group byclause.
Correl (x-expression, y-expression)
FractileFractile() finds the value that corresponds to the inclusive fractile (quantile) of the aggregated data in theexpression over a number of records as defined by a group by clause.
Fractile (expression, fractile)
FractileExcFractileExc() finds the value that corresponds to the exclusive fractile (quantile) of the aggregated data inthe expression over a number of records as defined by a group by clause.
FractileExc (expression, fractile)
KurtosisKurtosis() returns the kurtosis of the data in the expression over a number of records as defined by a groupby clause.
Kurtosis ([distinct ] expression )
Script syntax and chart functions - Qlik Sense, February 2022 261
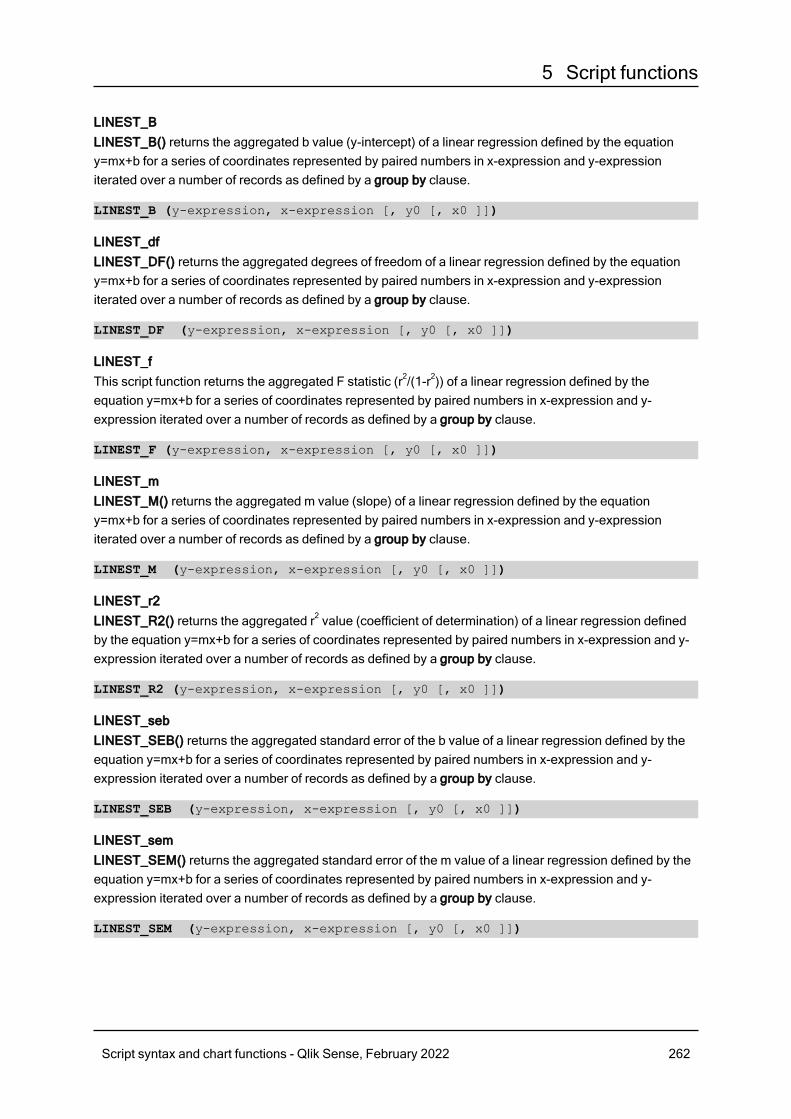
5 Script functions
LINEST_BLINEST_B() returns the aggregated b value (y-intercept) of a linear regression defined by the equationy=mx+b for a series of coordinates represented by paired numbers in x-expression and y-expressioniterated over a number of records as defined by a group by clause.
LINEST_B (y-expression, x-expression [, y0 [, x0 ]])
LINEST_dfLINEST_DF() returns the aggregated degrees of freedom of a linear regression defined by the equationy=mx+b for a series of coordinates represented by paired numbers in x-expression and y-expressioniterated over a number of records as defined by a group by clause.
LINEST_DF (y-expression, x-expression [, y0 [, x0 ]])
LINEST_fThis script function returns the aggregated F statistic (r2/(1-r2)) of a linear regression defined by theequation y=mx+b for a series of coordinates represented by paired numbers in x-expression and y-expression iterated over a number of records as defined by a group by clause.
LINEST_F (y-expression, x-expression [, y0 [, x0 ]])
LINEST_mLINEST_M() returns the aggregated m value (slope) of a linear regression defined by the equationy=mx+b for a series of coordinates represented by paired numbers in x-expression and y-expressioniterated over a number of records as defined by a group by clause.
LINEST_M (y-expression, x-expression [, y0 [, x0 ]])
LINEST_r2LINEST_R2() returns the aggregated r2 value (coefficient of determination) of a linear regression definedby the equation y=mx+b for a series of coordinates represented by paired numbers in x-expression and y-expression iterated over a number of records as defined by a group by clause.
LINEST_R2 (y-expression, x-expression [, y0 [, x0 ]])
LINEST_sebLINEST_SEB() returns the aggregated standard error of the b value of a linear regression defined by theequation y=mx+b for a series of coordinates represented by paired numbers in x-expression and y-expression iterated over a number of records as defined by a group by clause.
LINEST_SEB (y-expression, x-expression [, y0 [, x0 ]])
LINEST_semLINEST_SEM() returns the aggregated standard error of the m value of a linear regression defined by theequation y=mx+b for a series of coordinates represented by paired numbers in x-expression and y-expression iterated over a number of records as defined by a group by clause.
LINEST_SEM (y-expression, x-expression [, y0 [, x0 ]])
Script syntax and chart functions - Qlik Sense, February 2022 262

5 Script functions
LINEST_seyLINEST_SEY() returns the aggregated standard error of the y estimate of a linear regression defined bythe equation y=mx+b for a series of coordinates represented by paired numbers in x-expression and y-expression iterated over a number of records as defined by a group by clause.
LINEST_SEY (y-expression, x-expression [, y0 [, x0 ]])
LINEST_ssregLINEST_SSREG() returns the aggregated regression sum of squares of a linear regression defined by theequation y=mx+b for a series of coordinates represented by paired numbers in x-expression and y-expression iterated over a number of records as defined by a group by clause.
LINEST_SSREG (y-expression, x-expression [, y0 [, x0 ]])
Linest_ssresidLINEST_SSRESID() returns the aggregated residual sum of squares of a linear regression defined by theequation y=mx+b for a series of coordinates represented by paired numbers in x-expression and y-expression iterated over a number of records as defined by a group by clause.
LINEST_SSRESID (y-expression, x-expression [, y0 [, x0 ]])
MedianMedian() returns the aggregated median of the values in the expression over a number of records asdefined by a group by clause.
Median (expression)
SkewSkew() returns the skewness of expression over a number of records as defined by a group by clause.
Skew ([ distinct] expression)
StdevStdev() returns the standard deviation of the values given by the expression over a number of records asdefined by a group by clause.
Stdev ([distinct] expression)
SterrSterr() returns the aggregated standard error (stdev/sqrt(n)) for a series of values represented by theexpression iterated over a number of records as defined by a group by clause.
Sterr ([distinct] expression)
STEYXSTEYX() returns the aggregated standard error of the predicted y-value for each x-value in the regressionfor a series of coordinates represented by paired numbers in x-expression and y-expression iterated over anumber of records as defined by a group by clause.
STEYX (y-expression, x-expression)
Script syntax and chart functions - Qlik Sense, February 2022 263
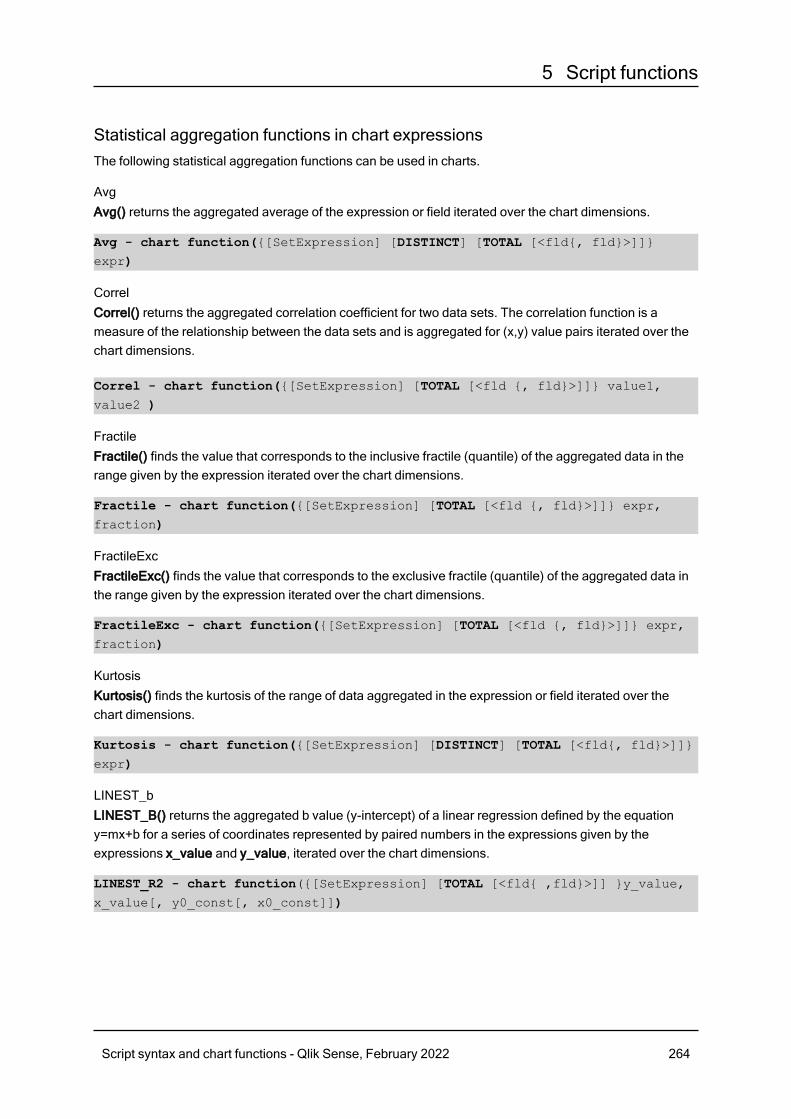
5 Script functions
Statistical aggregation functions in chart expressionsThe following statistical aggregation functions can be used in charts.
AvgAvg() returns the aggregated average of the expression or field iterated over the chart dimensions.
Avg - chart function({[SetExpression] [DISTINCT] [TOTAL [<fld{, fld}>]]}
expr)
CorrelCorrel() returns the aggregated correlation coefficient for two data sets. The correlation function is ameasure of the relationship between the data sets and is aggregated for (x,y) value pairs iterated over thechart dimensions.
Correl - chart function({[SetExpression] [TOTAL [<fld {, fld}>]]} value1,
value2 )
FractileFractile() finds the value that corresponds to the inclusive fractile (quantile) of the aggregated data in therange given by the expression iterated over the chart dimensions.
Fractile - chart function({[SetExpression] [TOTAL [<fld {, fld}>]]} expr,
fraction)
FractileExcFractileExc() finds the value that corresponds to the exclusive fractile (quantile) of the aggregated data inthe range given by the expression iterated over the chart dimensions.
FractileExc - chart function({[SetExpression] [TOTAL [<fld {, fld}>]]} expr,
fraction)
KurtosisKurtosis() finds the kurtosis of the range of data aggregated in the expression or field iterated over thechart dimensions.
Kurtosis - chart function({[SetExpression] [DISTINCT] [TOTAL [<fld{, fld}>]]}
expr)
LINEST_bLINEST_B() returns the aggregated b value (y-intercept) of a linear regression defined by the equationy=mx+b for a series of coordinates represented by paired numbers in the expressions given by theexpressions x_value and y_value, iterated over the chart dimensions.
LINEST_R2 - chart function({[SetExpression] [TOTAL [<fld{ ,fld}>]] }y_value,
x_value[, y0_const[, x0_const]])
Script syntax and chart functions - Qlik Sense, February 2022 264
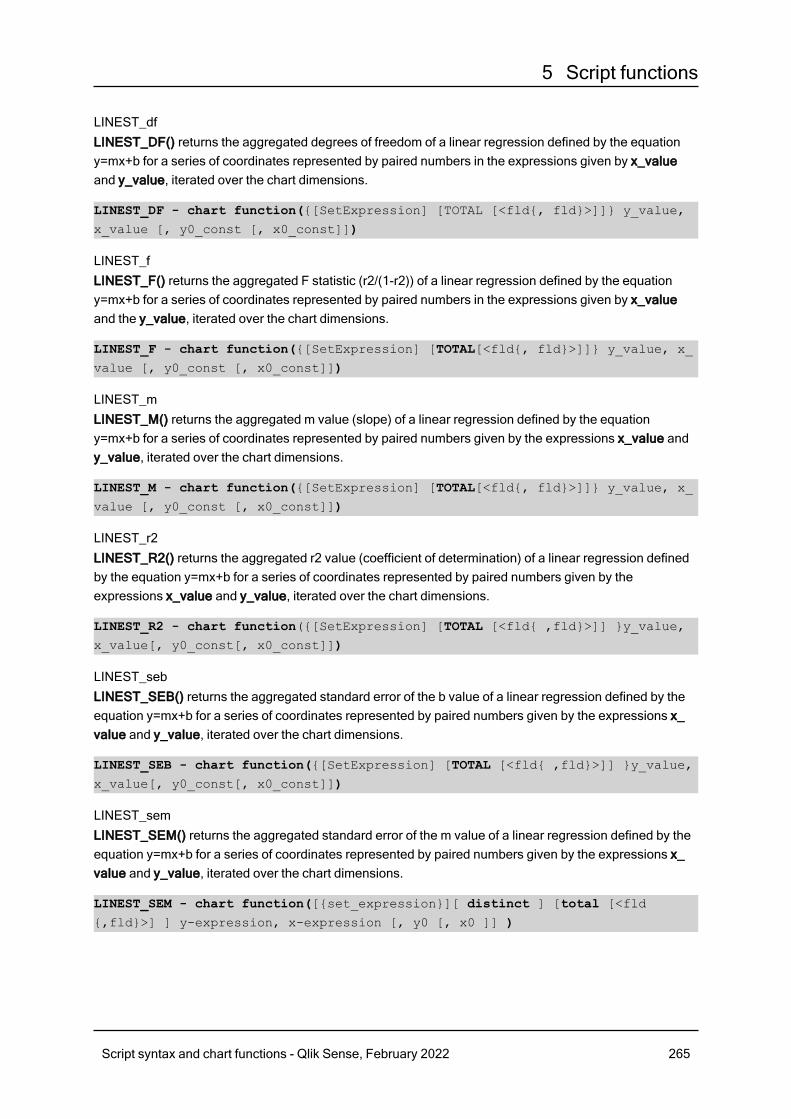
5 Script functions
LINEST_dfLINEST_DF() returns the aggregated degrees of freedom of a linear regression defined by the equationy=mx+b for a series of coordinates represented by paired numbers in the expressions given by x_valueand y_value, iterated over the chart dimensions.
LINEST_DF - chart function({[SetExpression] [TOTAL [<fld{, fld}>]]} y_value,
x_value [, y0_const [, x0_const]])
LINEST_fLINEST_F() returns the aggregated F statistic (r2/(1-r2)) of a linear regression defined by the equationy=mx+b for a series of coordinates represented by paired numbers in the expressions given by x_valueand the y_value, iterated over the chart dimensions.
LINEST_F - chart function({[SetExpression] [TOTAL[<fld{, fld}>]]} y_value, x_
value [, y0_const [, x0_const]])
LINEST_mLINEST_M() returns the aggregated m value (slope) of a linear regression defined by the equationy=mx+b for a series of coordinates represented by paired numbers given by the expressions x_value andy_value, iterated over the chart dimensions.
LINEST_M - chart function({[SetExpression] [TOTAL[<fld{, fld}>]]} y_value, x_
value [, y0_const [, x0_const]])
LINEST_r2LINEST_R2() returns the aggregated r2 value (coefficient of determination) of a linear regression definedby the equation y=mx+b for a series of coordinates represented by paired numbers given by theexpressions x_value and y_value, iterated over the chart dimensions.
LINEST_R2 - chart function({[SetExpression] [TOTAL [<fld{ ,fld}>]] }y_value,
x_value[, y0_const[, x0_const]])
LINEST_sebLINEST_SEB() returns the aggregated standard error of the b value of a linear regression defined by theequation y=mx+b for a series of coordinates represented by paired numbers given by the expressions x_value and y_value, iterated over the chart dimensions.
LINEST_SEB - chart function({[SetExpression] [TOTAL [<fld{ ,fld}>]] }y_value,
x_value[, y0_const[, x0_const]])
LINEST_semLINEST_SEM() returns the aggregated standard error of the m value of a linear regression defined by theequation y=mx+b for a series of coordinates represented by paired numbers given by the expressions x_value and y_value, iterated over the chart dimensions.
LINEST_SEM - chart function([{set_expression}][ distinct ] [total [<fld
{,fld}>] ] y-expression, x-expression [, y0 [, x0 ]] )
Script syntax and chart functions - Qlik Sense, February 2022 265
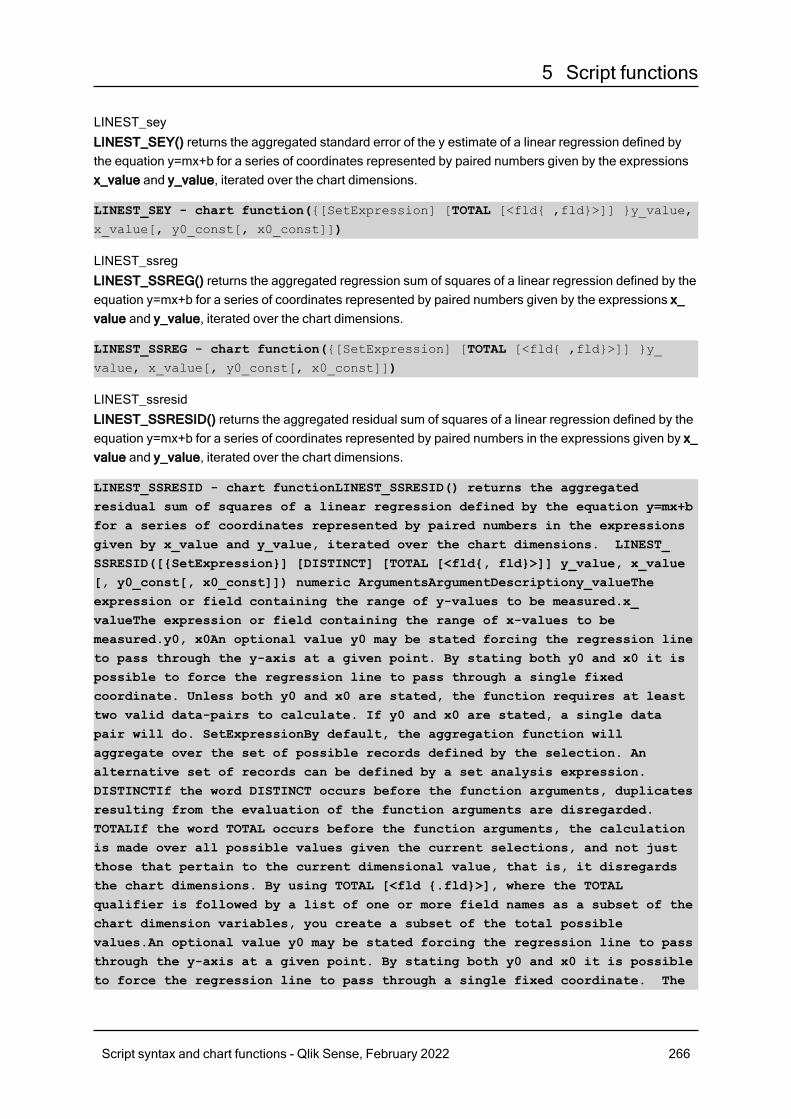
5 Script functions
LINEST_seyLINEST_SEY() returns the aggregated standard error of the y estimate of a linear regression defined bythe equation y=mx+b for a series of coordinates represented by paired numbers given by the expressionsx_value and y_value, iterated over the chart dimensions.
LINEST_SEY - chart function({[SetExpression] [TOTAL [<fld{ ,fld}>]] }y_value,
x_value[, y0_const[, x0_const]])
LINEST_ssregLINEST_SSREG() returns the aggregated regression sum of squares of a linear regression defined by theequation y=mx+b for a series of coordinates represented by paired numbers given by the expressions x_value and y_value, iterated over the chart dimensions.
LINEST_SSREG - chart function({[SetExpression] [TOTAL [<fld{ ,fld}>]] }y_
value, x_value[, y0_const[, x0_const]])
LINEST_ssresidLINEST_SSRESID() returns the aggregated residual sum of squares of a linear regression defined by theequation y=mx+b for a series of coordinates represented by paired numbers in the expressions given by x_value and y_value, iterated over the chart dimensions.
LINEST_SSRESID - chart functionLINEST_SSRESID() returns the aggregatedresidual sum of squares of a linear regression defined by the equation y=mx+bfor a series of coordinates represented by paired numbers in the expressionsgiven by x_value and y_value, iterated over the chart dimensions. LINEST_SSRESID([{SetExpression}] [DISTINCT] [TOTAL [<fld{, fld}>]] y_value, x_value[, y0_const[, x0_const]]) numeric ArgumentsArgumentDescriptiony_valueTheexpression or field containing the range of y-values to be measured.x_valueThe expression or field containing the range of x-values to bemeasured.y0, x0An optional value y0 may be stated forcing the regression lineto pass through the y-axis at a given point. By stating both y0 and x0 it ispossible to force the regression line to pass through a single fixedcoordinate. Unless both y0 and x0 are stated, the function requires at leasttwo valid data-pairs to calculate. If y0 and x0 are stated, a single datapair will do. SetExpressionBy default, the aggregation function willaggregate over the set of possible records defined by the selection. Analternative set of records can be defined by a set analysis expression.DISTINCTIf the word DISTINCT occurs before the function arguments, duplicatesresulting from the evaluation of the function arguments are disregarded.TOTALIf the word TOTAL occurs before the function arguments, the calculationis made over all possible values given the current selections, and not justthose that pertain to the current dimensional value, that is, it disregardsthe chart dimensions. By using TOTAL [<fld {.fld}>], where the TOTALqualifier is followed by a list of one or more field names as a subset of thechart dimension variables, you create a subset of the total possiblevalues.An optional value y0 may be stated forcing the regression line to passthrough the y-axis at a given point. By stating both y0 and x0 it is possibleto force the regression line to pass through a single fixed coordinate. The
Script syntax and chart functions - Qlik Sense, February 2022 266
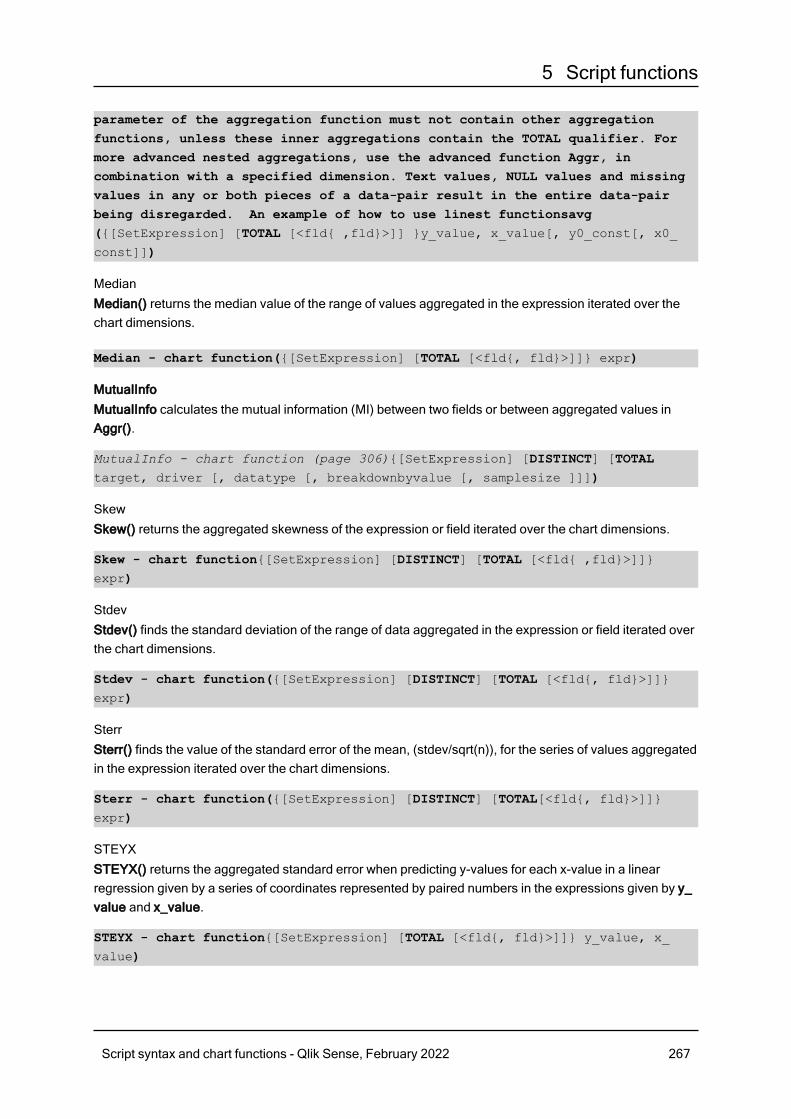
5 Script functions
parameter of the aggregation function must not contain other aggregationfunctions, unless these inner aggregations contain the TOTAL qualifier. Formore advanced nested aggregations, use the advanced function Aggr, incombination with a specified dimension. Text values, NULL values and missingvalues in any or both pieces of a data-pair result in the entire data-pairbeing disregarded. An example of how to use linest functionsavg({[SetExpression] [TOTAL [<fld{ ,fld}>]] }y_value, x_value[, y0_const[, x0_
const]])
MedianMedian() returns the median value of the range of values aggregated in the expression iterated over thechart dimensions.
Median - chart function({[SetExpression] [TOTAL [<fld{, fld}>]]} expr)
MutualInfoMutualInfo calculates the mutual information (MI) between two fields or between aggregated values inAggr().
MutualInfo - chart function (page 306){[SetExpression] [DISTINCT] [TOTALtarget, driver [, datatype [, breakdownbyvalue [, samplesize ]]])
SkewSkew() returns the aggregated skewness of the expression or field iterated over the chart dimensions.
Skew - chart function{[SetExpression] [DISTINCT] [TOTAL [<fld{ ,fld}>]]}
expr)
StdevStdev() finds the standard deviation of the range of data aggregated in the expression or field iterated overthe chart dimensions.
Stdev - chart function({[SetExpression] [DISTINCT] [TOTAL [<fld{, fld}>]]}
expr)
SterrSterr() finds the value of the standard error of the mean, (stdev/sqrt(n)), for the series of values aggregatedin the expression iterated over the chart dimensions.
Sterr - chart function({[SetExpression] [DISTINCT] [TOTAL[<fld{, fld}>]]}
expr)
STEYXSTEYX() returns the aggregated standard error when predicting y-values for each x-value in a linearregression given by a series of coordinates represented by paired numbers in the expressions given by y_value and x_value.
STEYX - chart function{[SetExpression] [TOTAL [<fld{, fld}>]]} y_value, x_
value)
Script syntax and chart functions - Qlik Sense, February 2022 267
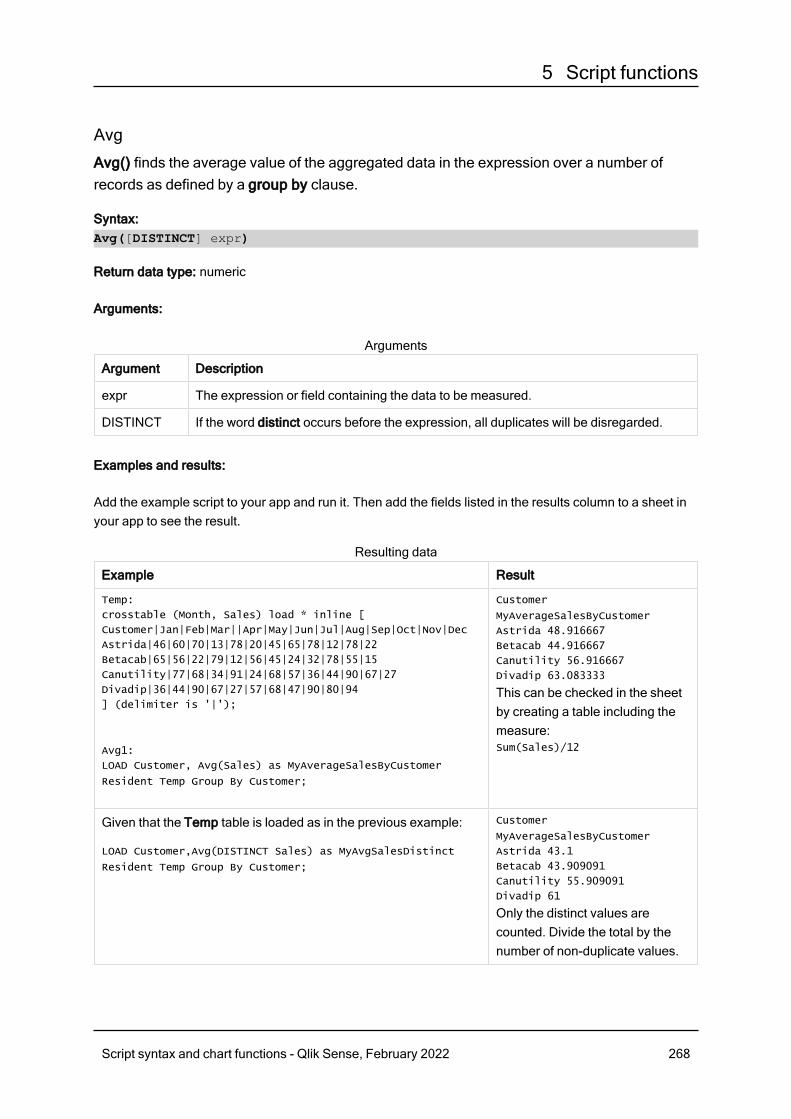
5 Script functions
Avg
Avg() finds the average value of the aggregated data in the expression over a number ofrecords as defined by a group by clause.
Syntax:Avg([DISTINCT] expr)
Return data type: numeric
Arguments:
Argument Description
expr The expression or field containing the data to be measured.
DISTINCT If the word distinct occurs before the expression, all duplicates will be disregarded.
Arguments
Examples and results:
Add the example script to your app and run it. Then add the fields listed in the results column to a sheet inyour app to see the result.
Example Result
Temp:
crosstable (Month, Sales) load * inline [
Customer|Jan|Feb|Mar||Apr|May|Jun|Jul|Aug|Sep|Oct|Nov|Dec
Astrida|46|60|70|13|78|20|45|65|78|12|78|22
Betacab|65|56|22|79|12|56|45|24|32|78|55|15
Canutility|77|68|34|91|24|68|57|36|44|90|67|27
Divadip|36|44|90|67|27|57|68|47|90|80|94
] (delimiter is '|');
Avg1:
LOAD Customer, Avg(Sales) as MyAverageSalesByCustomer
Resident Temp Group By Customer;
Customer
MyAverageSalesByCustomer
Astrida 48.916667
Betacab 44.916667
Canutility 56.916667
Divadip 63.083333
This can be checked in the sheetby creating a table including themeasure:Sum(Sales)/12
Given that the Temp table is loaded as in the previous example:
LOAD Customer,Avg(DISTINCT Sales) as MyAvgSalesDistinct
Resident Temp Group By Customer;
Customer
MyAverageSalesByCustomer
Astrida 43.1
Betacab 43.909091
Canutility 55.909091
Divadip 61
Only the distinct values arecounted. Divide the total by thenumber of non-duplicate values.
Resulting data
Script syntax and chart functions - Qlik Sense, February 2022 268
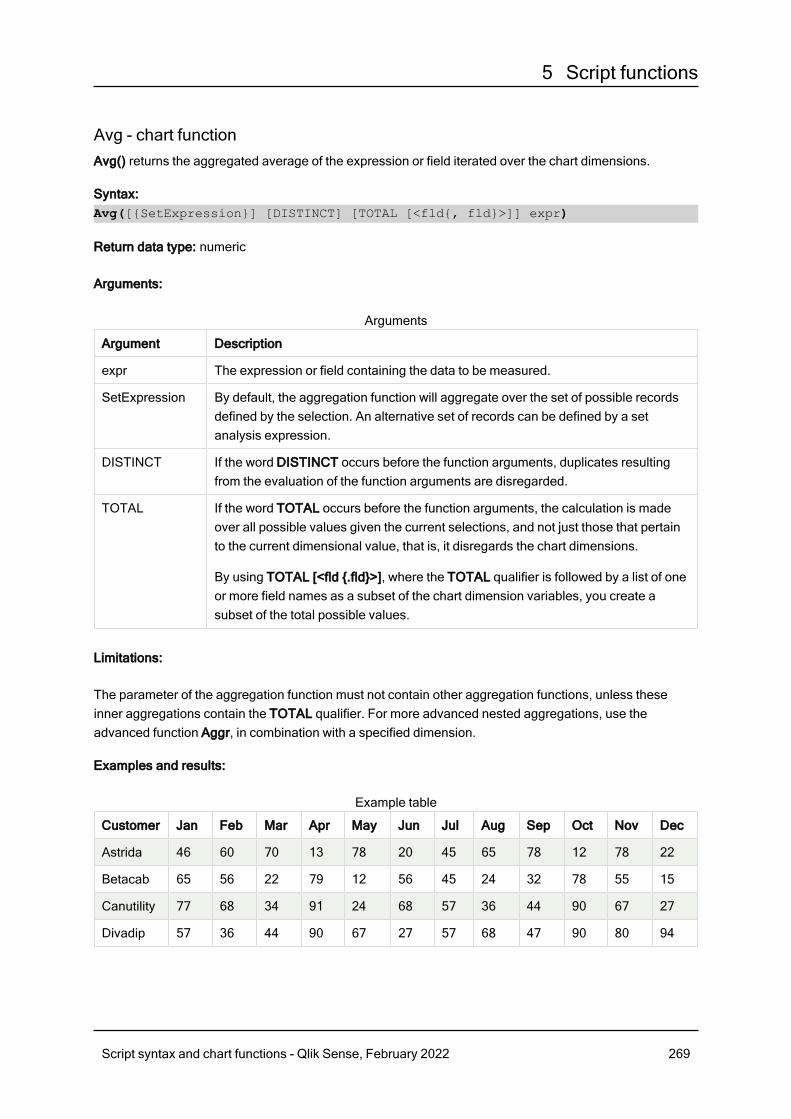
5 Script functions
Avg - chart functionAvg() returns the aggregated average of the expression or field iterated over the chart dimensions.
Syntax:Avg([{SetExpression}] [DISTINCT] [TOTAL [<fld{, fld}>]] expr)
Return data type: numeric
Arguments:
Argument Description
expr The expression or field containing the data to be measured.
SetExpression By default, the aggregation function will aggregate over the set of possible recordsdefined by the selection. An alternative set of records can be defined by a setanalysis expression.
DISTINCT If the word DISTINCT occurs before the function arguments, duplicates resultingfrom the evaluation of the function arguments are disregarded.
TOTAL If the word TOTAL occurs before the function arguments, the calculation is madeover all possible values given the current selections, and not just those that pertainto the current dimensional value, that is, it disregards the chart dimensions.
By using TOTAL [<fld {.fld}>], where the TOTAL qualifier is followed by a list of oneor more field names as a subset of the chart dimension variables, you create asubset of the total possible values.
Arguments
Limitations:
The parameter of the aggregation function must not contain other aggregation functions, unless theseinner aggregations contain the TOTAL qualifier. For more advanced nested aggregations, use theadvanced function Aggr, in combination with a specified dimension.
Examples and results:
Customer Jan Feb Mar Apr May Jun Jul Aug Sep Oct Nov Dec
Astrida 46 60 70 13 78 20 45 65 78 12 78 22
Betacab 65 56 22 79 12 56 45 24 32 78 55 15
Canutility 77 68 34 91 24 68 57 36 44 90 67 27
Divadip 57 36 44 90 67 27 57 68 47 90 80 94
Example table
Script syntax and chart functions - Qlik Sense, February 2022 269
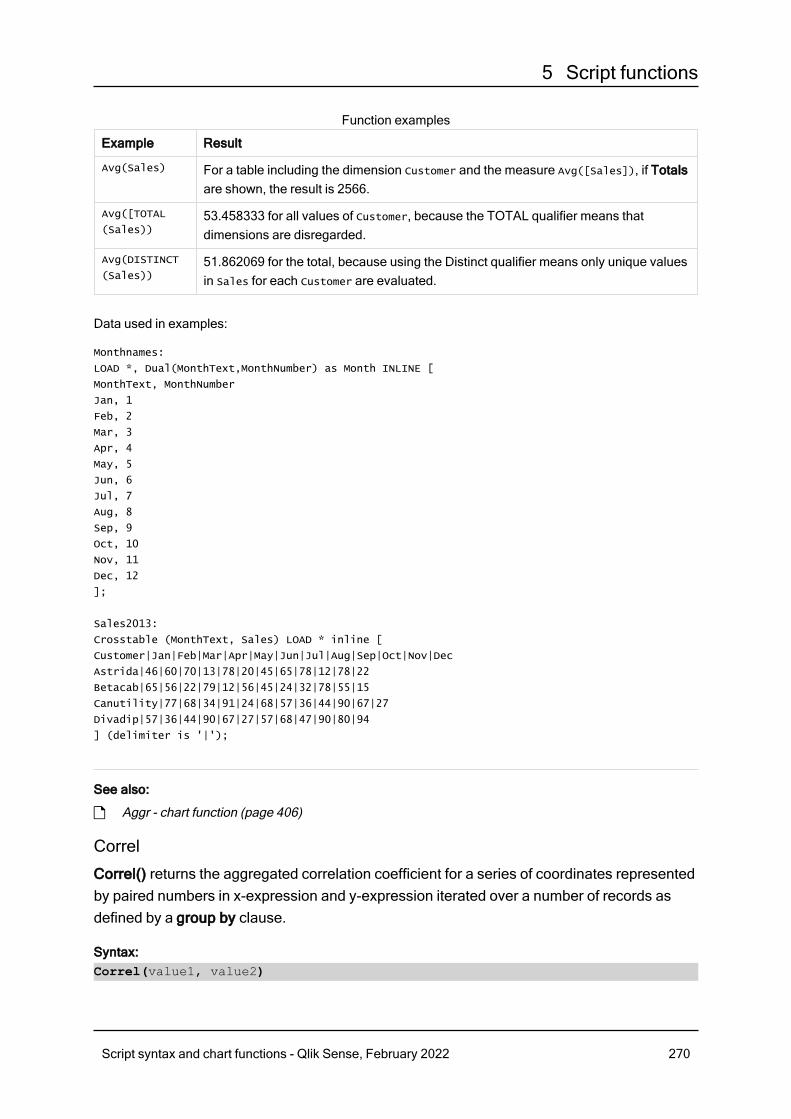
5 Script functions
Example Result
Avg(Sales) For a table including the dimension Customer and the measure Avg([Sales]), if Totalsare shown, the result is 2566.
Avg([TOTAL
(Sales))53.458333 for all values of Customer, because the TOTAL qualifier means thatdimensions are disregarded.
Avg(DISTINCT
(Sales))51.862069 for the total, because using the Distinct qualifier means only unique valuesin Sales for each Customer are evaluated.
Function examples
Data used in examples:
Monthnames:
LOAD *, Dual(MonthText,MonthNumber) as Month INLINE [
MonthText, MonthNumber
Jan, 1
Feb, 2
Mar, 3
Apr, 4
May, 5
Jun, 6
Jul, 7
Aug, 8
Sep, 9
Oct, 10
Nov, 11
Dec, 12
];
Sales2013:
Crosstable (MonthText, Sales) LOAD * inline [
Customer|Jan|Feb|Mar|Apr|May|Jun|Jul|Aug|Sep|Oct|Nov|Dec
Astrida|46|60|70|13|78|20|45|65|78|12|78|22
Betacab|65|56|22|79|12|56|45|24|32|78|55|15
Canutility|77|68|34|91|24|68|57|36|44|90|67|27
Divadip|57|36|44|90|67|27|57|68|47|90|80|94
] (delimiter is '|');
See also:
p Aggr - chart function (page 406)
Correl
Correl() returns the aggregated correlation coefficient for a series of coordinates representedby paired numbers in x-expression and y-expression iterated over a number of records asdefined by a group by clause.
Syntax:Correl(value1, value2)
Script syntax and chart functions - Qlik Sense, February 2022 270
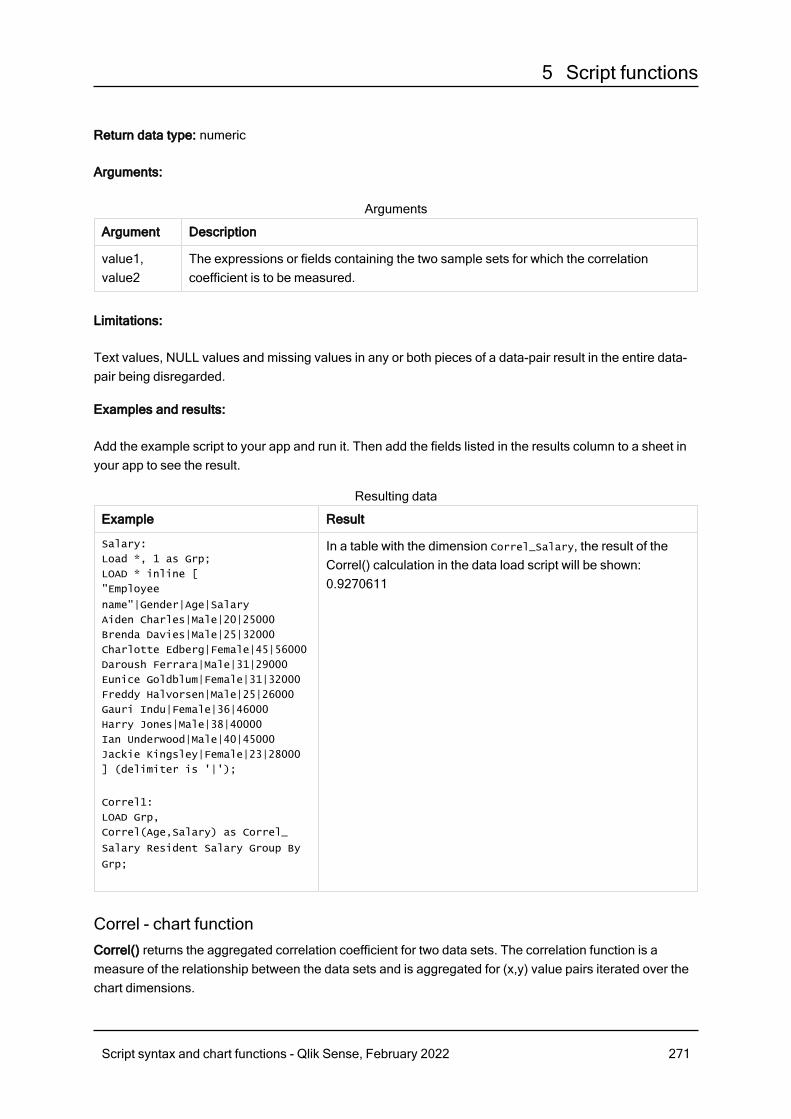
5 Script functions
Return data type: numeric
Arguments:
Argument Description
value1,value2
The expressions or fields containing the two sample sets for which the correlationcoefficient is to be measured.
Arguments
Limitations:
Text values, NULL values and missing values in any or both pieces of a data-pair result in the entire data-pair being disregarded.
Examples and results:
Add the example script to your app and run it. Then add the fields listed in the results column to a sheet inyour app to see the result.
Example Result
Salary:
Load *, 1 as Grp;
LOAD * inline [
"Employee
name"|Gender|Age|Salary
Aiden Charles|Male|20|25000
Brenda Davies|Male|25|32000
Charlotte Edberg|Female|45|56000
Daroush Ferrara|Male|31|29000
Eunice Goldblum|Female|31|32000
Freddy Halvorsen|Male|25|26000
Gauri Indu|Female|36|46000
Harry Jones|Male|38|40000
Ian Underwood|Male|40|45000
Jackie Kingsley|Female|23|28000
] (delimiter is '|');
Correl1:
LOAD Grp,
Correl(Age,Salary) as Correl_
Salary Resident Salary Group By
Grp;
In a table with the dimension Correl_Salary, the result of theCorrel() calculation in the data load script will be shown:0.9270611
Resulting data
Correl - chart functionCorrel() returns the aggregated correlation coefficient for two data sets. The correlation function is ameasure of the relationship between the data sets and is aggregated for (x,y) value pairs iterated over thechart dimensions.
Script syntax and chart functions - Qlik Sense, February 2022 271
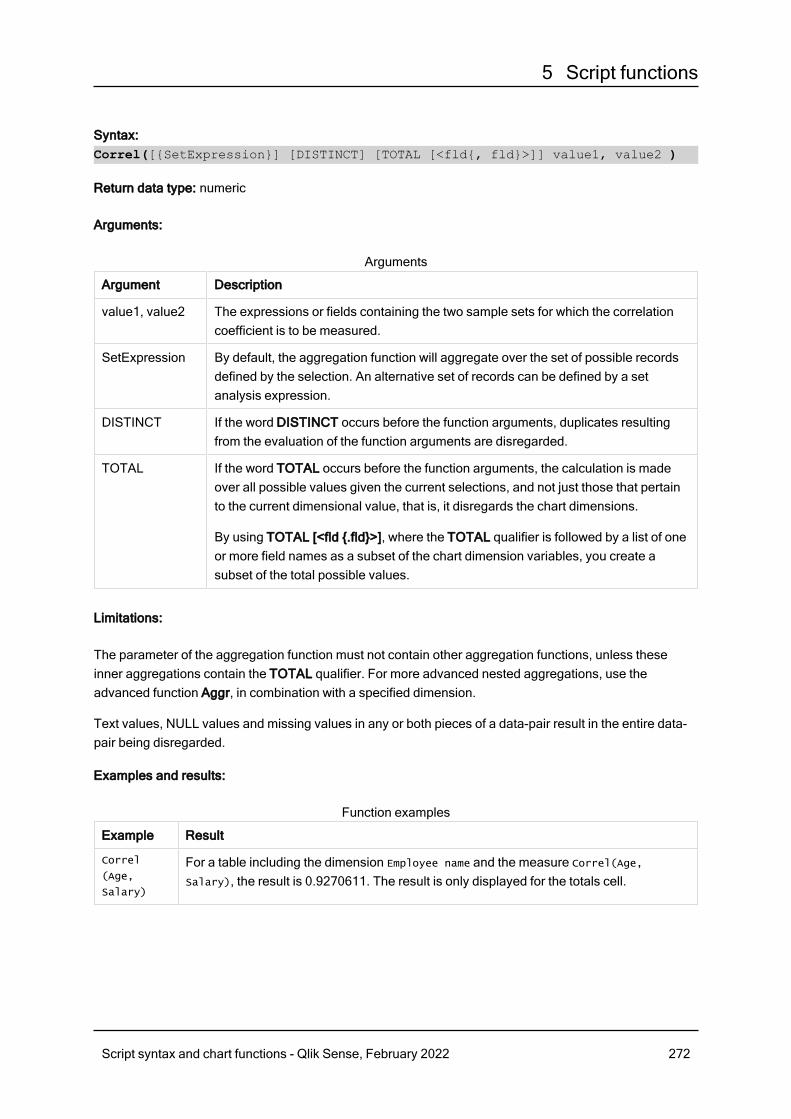
5 Script functions
Syntax:Correl([{SetExpression}] [DISTINCT] [TOTAL [<fld{, fld}>]] value1, value2 )
Return data type: numeric
Arguments:
Argument Description
value1, value2 The expressions or fields containing the two sample sets for which the correlationcoefficient is to be measured.
SetExpression By default, the aggregation function will aggregate over the set of possible recordsdefined by the selection. An alternative set of records can be defined by a setanalysis expression.
DISTINCT If the word DISTINCT occurs before the function arguments, duplicates resultingfrom the evaluation of the function arguments are disregarded.
TOTAL If the word TOTAL occurs before the function arguments, the calculation is madeover all possible values given the current selections, and not just those that pertainto the current dimensional value, that is, it disregards the chart dimensions.
By using TOTAL [<fld {.fld}>], where the TOTAL qualifier is followed by a list of oneor more field names as a subset of the chart dimension variables, you create asubset of the total possible values.
Arguments
Limitations:
The parameter of the aggregation function must not contain other aggregation functions, unless theseinner aggregations contain the TOTAL qualifier. For more advanced nested aggregations, use theadvanced function Aggr, in combination with a specified dimension.
Text values, NULL values and missing values in any or both pieces of a data-pair result in the entire data-pair being disregarded.
Examples and results:
Example Result
Correl
(Age,
Salary)
For a table including the dimension Employee name and the measure Correl(Age,
Salary), the result is 0.9270611. The result is only displayed for the totals cell.
Function examples
Script syntax and chart functions - Qlik Sense, February 2022 272

5 Script functions
Example Result
Correl
(TOTAL
Age,
Salary))
0.927. This and the following results are shown to three decimal places for readability.
If you create a filter pane with the dimension Gender, and make selections from it, yousee the result 0.951 when Female is selected and 0.939 if Male is selected. This isbecause the selection excludes all results that do not belong to the other value ofGender.
Correl({1}
TOTAL Age,
Salary))
0.927. Independent of selections. This is because the set expression {1} disregards allselections and dimensions.
Correl
(TOTAL
<Gender>
Age,
Salary))
0.927 in the total cell, 0.939 for all values of Male, and 0.951 for all values of Female. Thiscorresponds to the results from making the selections in a filter pane based on Gender.
Data used in examples:
Salary:
LOAD * inline [
"Employee name"|Gender|Age|Salary
Aiden Charles|Male|20|25000
Brenda Davies|Male|25|32000
Charlotte Edberg|Female|45|56000
Daroush Ferrara|Male|31|29000
Eunice Goldblum|Female|31|32000
Freddy Halvorsen|Male|25|26000
Gauri Indu|Female|36|46000
Harry Jones|Male|38|40000
Ian Underwood|Male|40|45000
Jackie Kingsley|Female|23|28000
] (delimiter is '|');
See also:
p Aggr - chart function (page 406)p Avg - chart function (page 269)p RangeCorrel (page 703)
Fractile
Fractile() finds the value that corresponds to the inclusive fractile (quantile) of the aggregateddata in the expression over a number of records as defined by a group by clause.
You can use FractileExc (page 277) to calculate the exclusive fractile.
Syntax:Fractile(expr, fraction)
Script syntax and chart functions - Qlik Sense, February 2022 273
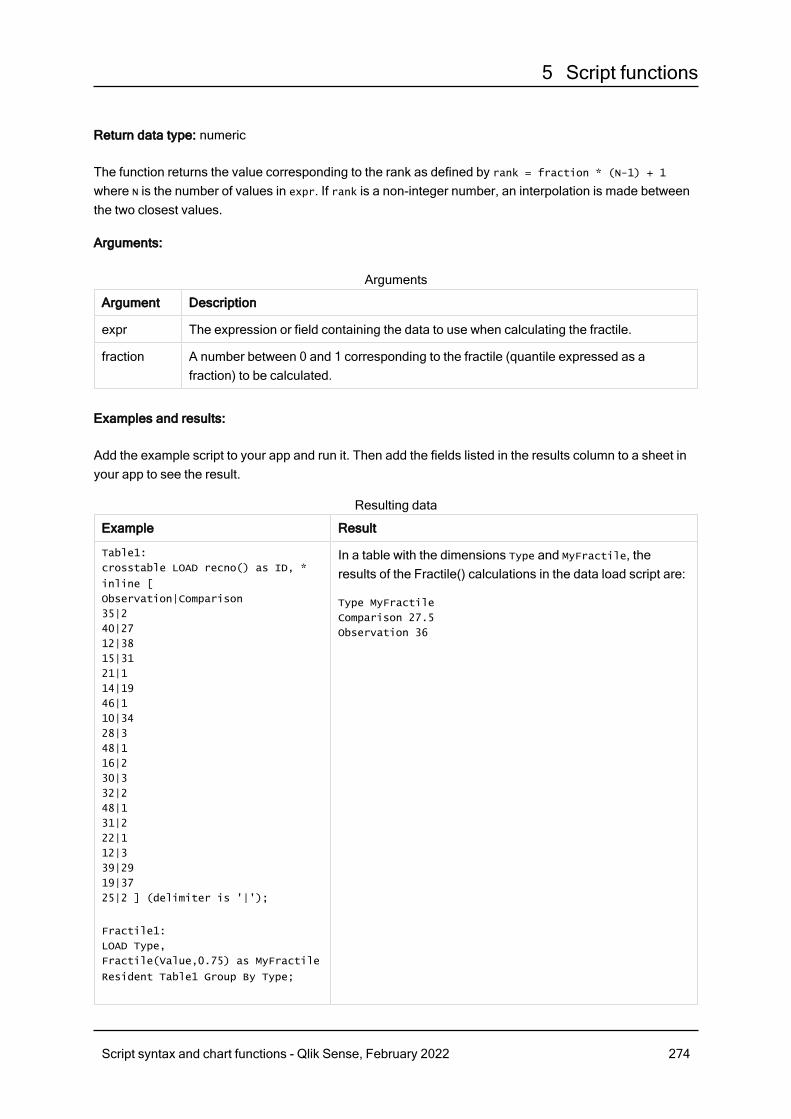
5 Script functions
Return data type: numeric
The function returns the value corresponding to the rank as defined by rank = fraction * (N-1) + 1
where N is the number of values in expr. If rank is a non-integer number, an interpolation is made betweenthe two closest values.
Arguments:
Argument Description
expr The expression or field containing the data to use when calculating the fractile.
fraction A number between 0 and 1 corresponding to the fractile (quantile expressed as afraction) to be calculated.
Arguments
Examples and results:
Add the example script to your app and run it. Then add the fields listed in the results column to a sheet inyour app to see the result.
Example Result
Table1:
crosstable LOAD recno() as ID, *
inline [
Observation|Comparison
35|2
40|27
12|38
15|31
21|1
14|19
46|1
10|34
28|3
48|1
16|2
30|3
32|2
48|1
31|2
22|1
12|3
39|29
19|37
25|2 ] (delimiter is '|');
Fractile1:
LOAD Type,
Fractile(Value,0.75) as MyFractile
Resident Table1 Group By Type;
In a table with the dimensions Type and MyFractile, theresults of the Fractile() calculations in the data load script are:
Type MyFractile
Comparison 27.5
Observation 36
Resulting data
Script syntax and chart functions - Qlik Sense, February 2022 274
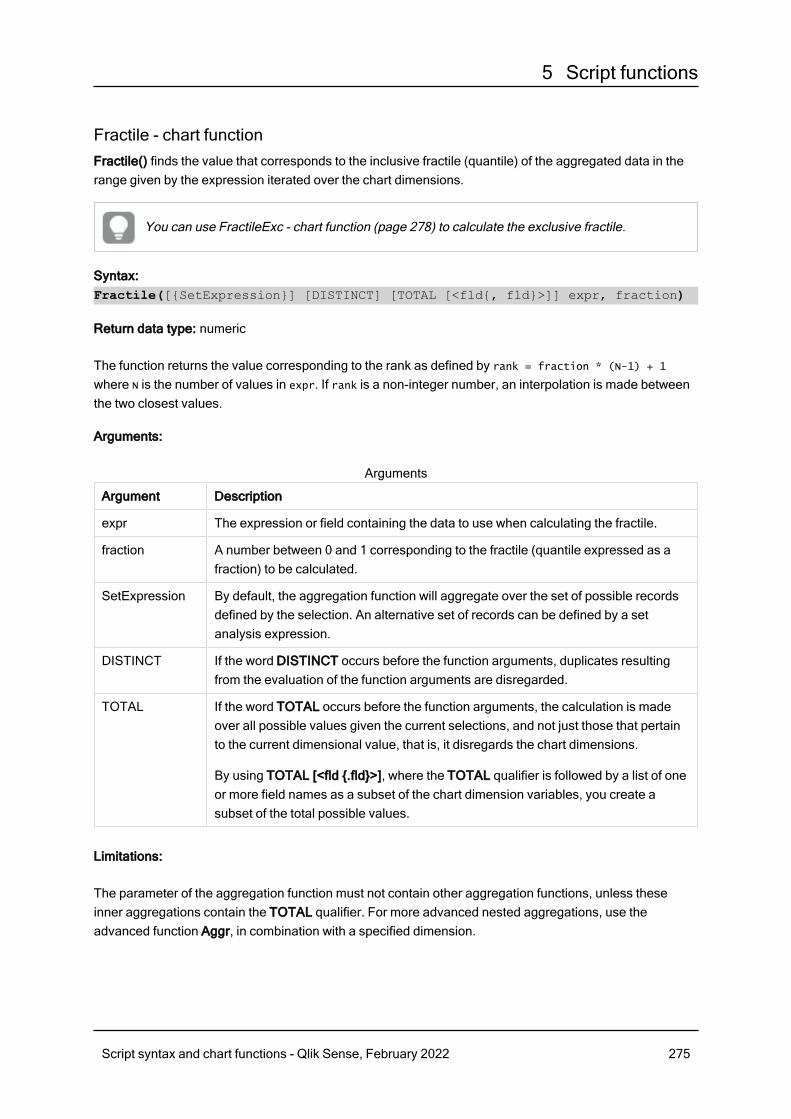
5 Script functions
Fractile - chart functionFractile() finds the value that corresponds to the inclusive fractile (quantile) of the aggregated data in therange given by the expression iterated over the chart dimensions.
You can use FractileExc - chart function (page 278) to calculate the exclusive fractile.
Syntax:Fractile([{SetExpression}] [DISTINCT] [TOTAL [<fld{, fld}>]] expr, fraction)
Return data type: numeric
The function returns the value corresponding to the rank as defined by rank = fraction * (N-1) + 1
where N is the number of values in expr. If rank is a non-integer number, an interpolation is made betweenthe two closest values.
Arguments:
Argument Description
expr The expression or field containing the data to use when calculating the fractile.
fraction A number between 0 and 1 corresponding to the fractile (quantile expressed as afraction) to be calculated.
SetExpression By default, the aggregation function will aggregate over the set of possible recordsdefined by the selection. An alternative set of records can be defined by a setanalysis expression.
DISTINCT If the word DISTINCT occurs before the function arguments, duplicates resultingfrom the evaluation of the function arguments are disregarded.
TOTAL If the word TOTAL occurs before the function arguments, the calculation is madeover all possible values given the current selections, and not just those that pertainto the current dimensional value, that is, it disregards the chart dimensions.
By using TOTAL [<fld {.fld}>], where the TOTAL qualifier is followed by a list of oneor more field names as a subset of the chart dimension variables, you create asubset of the total possible values.
Arguments
Limitations:
The parameter of the aggregation function must not contain other aggregation functions, unless theseinner aggregations contain the TOTAL qualifier. For more advanced nested aggregations, use theadvanced function Aggr, in combination with a specified dimension.
Script syntax and chart functions - Qlik Sense, February 2022 275
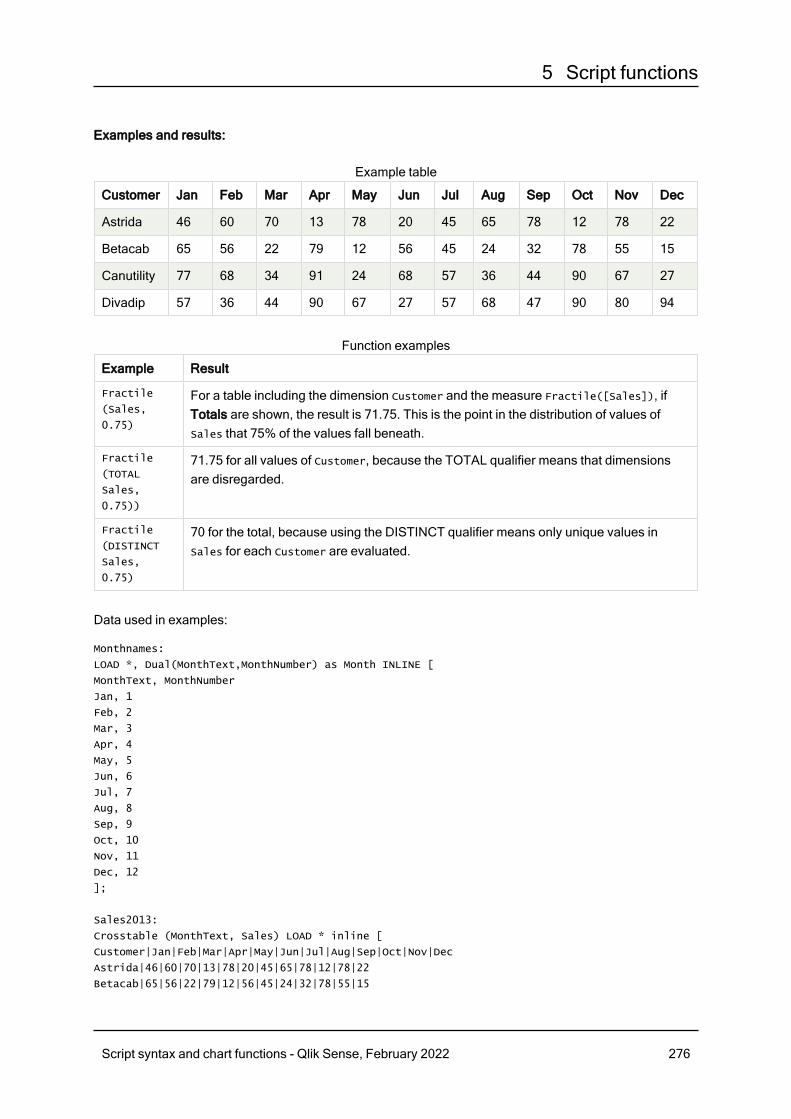
5 Script functions
Examples and results:
Customer Jan Feb Mar Apr May Jun Jul Aug Sep Oct Nov Dec
Astrida 46 60 70 13 78 20 45 65 78 12 78 22
Betacab 65 56 22 79 12 56 45 24 32 78 55 15
Canutility 77 68 34 91 24 68 57 36 44 90 67 27
Divadip 57 36 44 90 67 27 57 68 47 90 80 94
Example table
Example Result
Fractile
(Sales,
0.75)
For a table including the dimension Customer and the measure Fractile([Sales]), ifTotals are shown, the result is 71.75. This is the point in the distribution of values ofSales that 75% of the values fall beneath.
Fractile
(TOTAL
Sales,
0.75))
71.75 for all values of Customer, because the TOTAL qualifier means that dimensionsare disregarded.
Fractile
(DISTINCT
Sales,
0.75)
70 for the total, because using the DISTINCT qualifier means only unique values inSales for each Customer are evaluated.
Function examples
Data used in examples:
Monthnames:
LOAD *, Dual(MonthText,MonthNumber) as Month INLINE [
MonthText, MonthNumber
Jan, 1
Feb, 2
Mar, 3
Apr, 4
May, 5
Jun, 6
Jul, 7
Aug, 8
Sep, 9
Oct, 10
Nov, 11
Dec, 12
];
Sales2013:
Crosstable (MonthText, Sales) LOAD * inline [
Customer|Jan|Feb|Mar|Apr|May|Jun|Jul|Aug|Sep|Oct|Nov|Dec
Astrida|46|60|70|13|78|20|45|65|78|12|78|22
Betacab|65|56|22|79|12|56|45|24|32|78|55|15
Script syntax and chart functions - Qlik Sense, February 2022 276
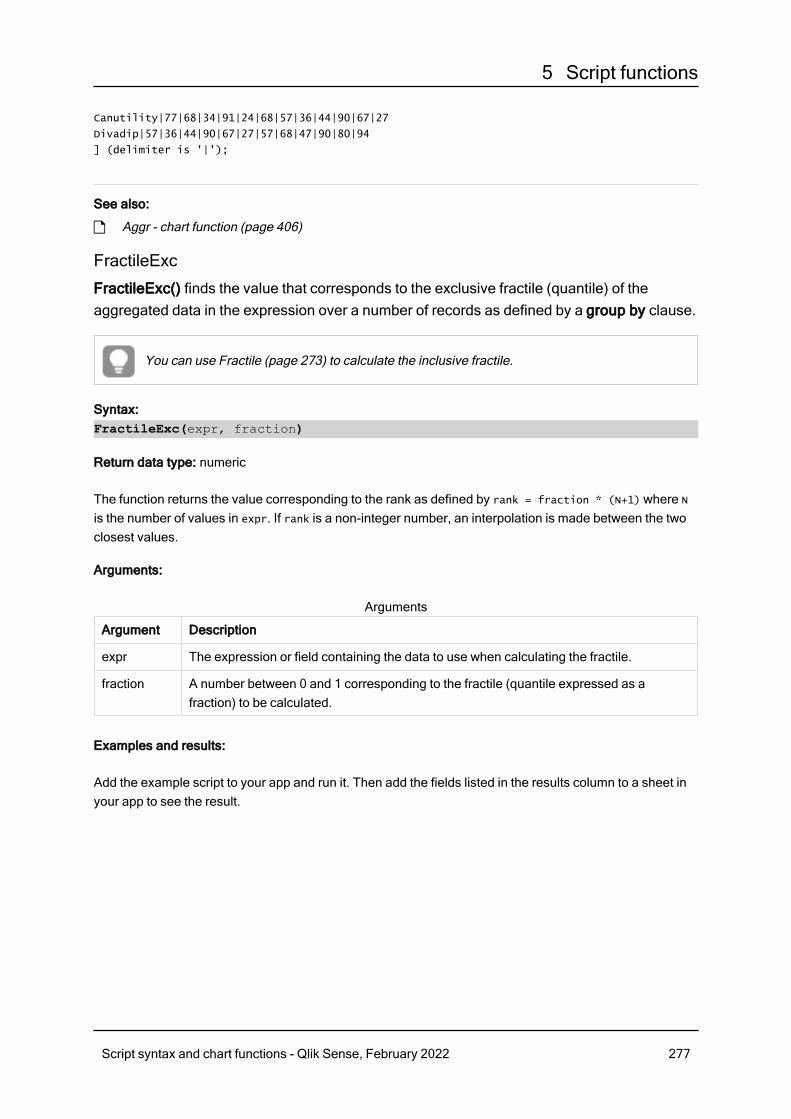
5 Script functions
Canutility|77|68|34|91|24|68|57|36|44|90|67|27
Divadip|57|36|44|90|67|27|57|68|47|90|80|94
] (delimiter is '|');
See also:
p Aggr - chart function (page 406)
FractileExc
FractileExc() finds the value that corresponds to the exclusive fractile (quantile) of theaggregated data in the expression over a number of records as defined by a group by clause.
You can use Fractile (page 273) to calculate the inclusive fractile.
Syntax:FractileExc(expr, fraction)
Return data type: numeric
The function returns the value corresponding to the rank as defined by rank = fraction * (N+1) where N
is the number of values in expr. If rank is a non-integer number, an interpolation is made between the twoclosest values.
Arguments:
Argument Description
expr The expression or field containing the data to use when calculating the fractile.
fraction A number between 0 and 1 corresponding to the fractile (quantile expressed as afraction) to be calculated.
Arguments
Examples and results:
Add the example script to your app and run it. Then add the fields listed in the results column to a sheet inyour app to see the result.
Script syntax and chart functions - Qlik Sense, February 2022 277
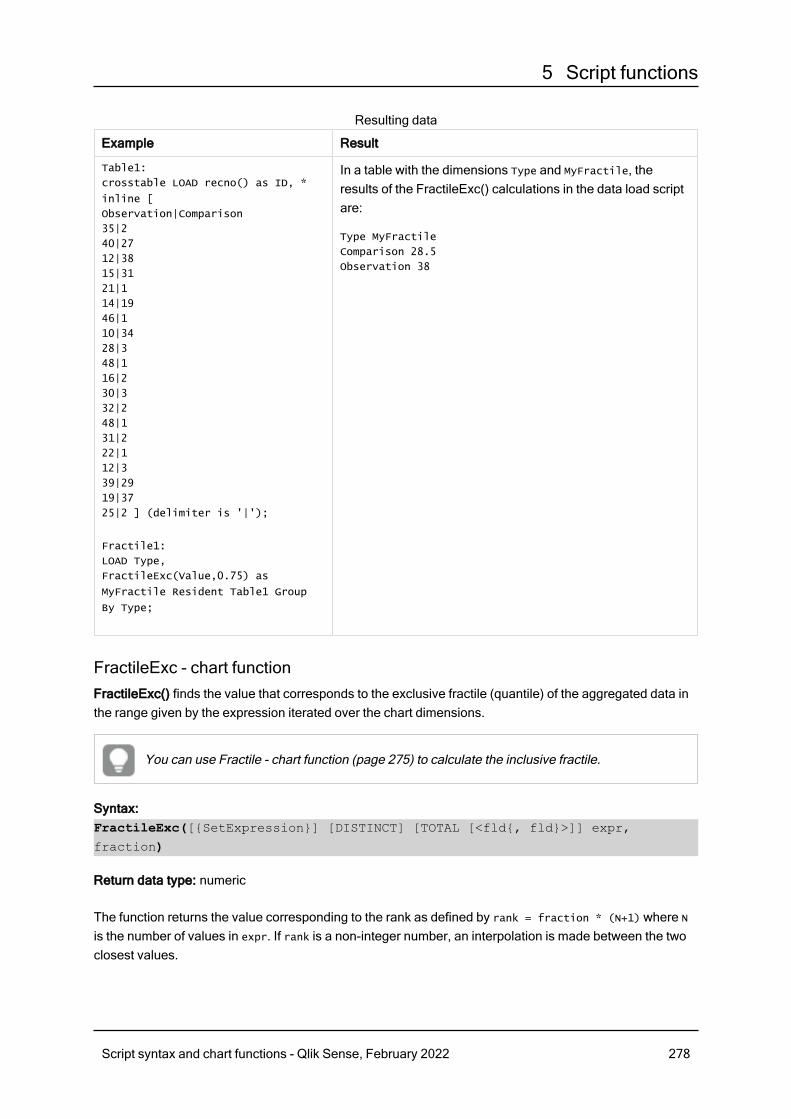
5 Script functions
Example Result
Table1:
crosstable LOAD recno() as ID, *
inline [
Observation|Comparison
35|2
40|27
12|38
15|31
21|1
14|19
46|1
10|34
28|3
48|1
16|2
30|3
32|2
48|1
31|2
22|1
12|3
39|29
19|37
25|2 ] (delimiter is '|');
Fractile1:
LOAD Type,
FractileExc(Value,0.75) as
MyFractile Resident Table1 Group
By Type;
In a table with the dimensions Type and MyFractile, theresults of the FractileExc() calculations in the data load scriptare:
Type MyFractile
Comparison 28.5
Observation 38
Resulting data
FractileExc - chart functionFractileExc() finds the value that corresponds to the exclusive fractile (quantile) of the aggregated data inthe range given by the expression iterated over the chart dimensions.
You can use Fractile - chart function (page 275) to calculate the inclusive fractile.
Syntax:FractileExc([{SetExpression}] [DISTINCT] [TOTAL [<fld{, fld}>]] expr,
fraction)
Return data type: numeric
The function returns the value corresponding to the rank as defined by rank = fraction * (N+1) where N
is the number of values in expr. If rank is a non-integer number, an interpolation is made between the twoclosest values.
Script syntax and chart functions - Qlik Sense, February 2022 278
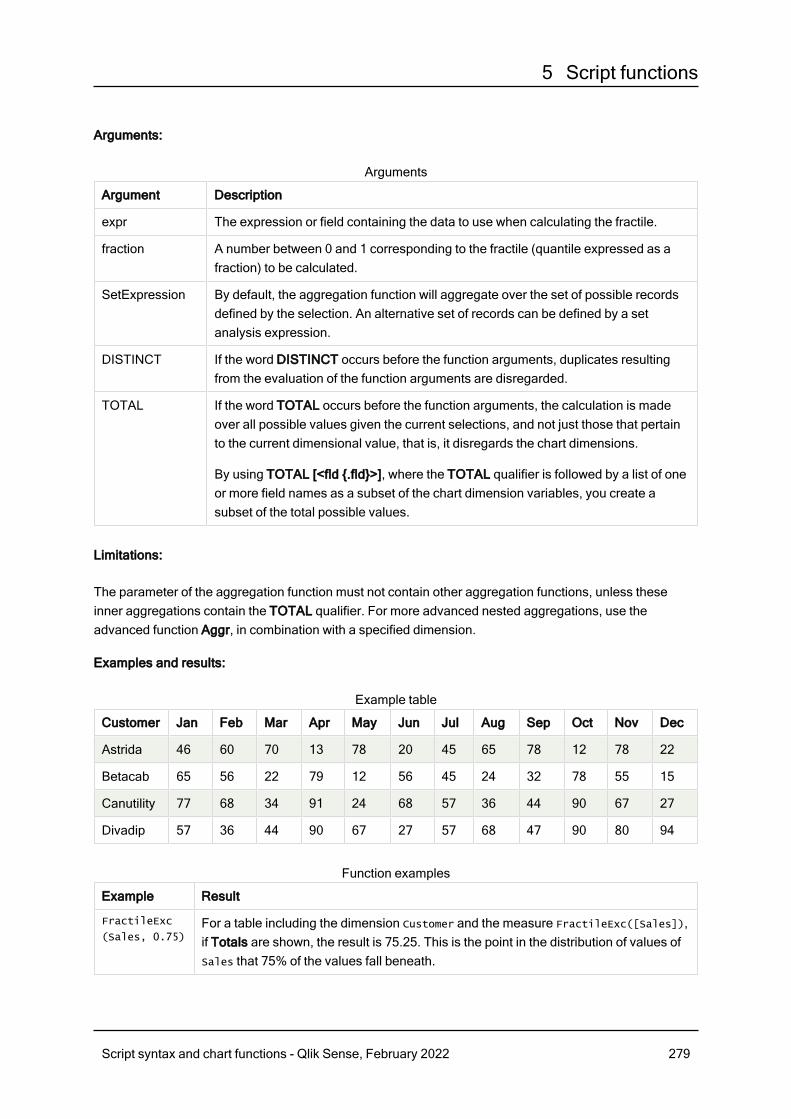
5 Script functions
Arguments:
Argument Description
expr The expression or field containing the data to use when calculating the fractile.
fraction A number between 0 and 1 corresponding to the fractile (quantile expressed as afraction) to be calculated.
SetExpression By default, the aggregation function will aggregate over the set of possible recordsdefined by the selection. An alternative set of records can be defined by a setanalysis expression.
DISTINCT If the word DISTINCT occurs before the function arguments, duplicates resultingfrom the evaluation of the function arguments are disregarded.
TOTAL If the word TOTAL occurs before the function arguments, the calculation is madeover all possible values given the current selections, and not just those that pertainto the current dimensional value, that is, it disregards the chart dimensions.
By using TOTAL [<fld {.fld}>], where the TOTAL qualifier is followed by a list of oneor more field names as a subset of the chart dimension variables, you create asubset of the total possible values.
Arguments
Limitations:
The parameter of the aggregation function must not contain other aggregation functions, unless theseinner aggregations contain the TOTAL qualifier. For more advanced nested aggregations, use theadvanced function Aggr, in combination with a specified dimension.
Examples and results:
Customer Jan Feb Mar Apr May Jun Jul Aug Sep Oct Nov Dec
Astrida 46 60 70 13 78 20 45 65 78 12 78 22
Betacab 65 56 22 79 12 56 45 24 32 78 55 15
Canutility 77 68 34 91 24 68 57 36 44 90 67 27
Divadip 57 36 44 90 67 27 57 68 47 90 80 94
Example table
Example Result
FractileExc
(Sales, 0.75)For a table including the dimension Customer and the measure FractileExc([Sales]),if Totals are shown, the result is 75.25. This is the point in the distribution of values ofSales that 75% of the values fall beneath.
Function examples
Script syntax and chart functions - Qlik Sense, February 2022 279
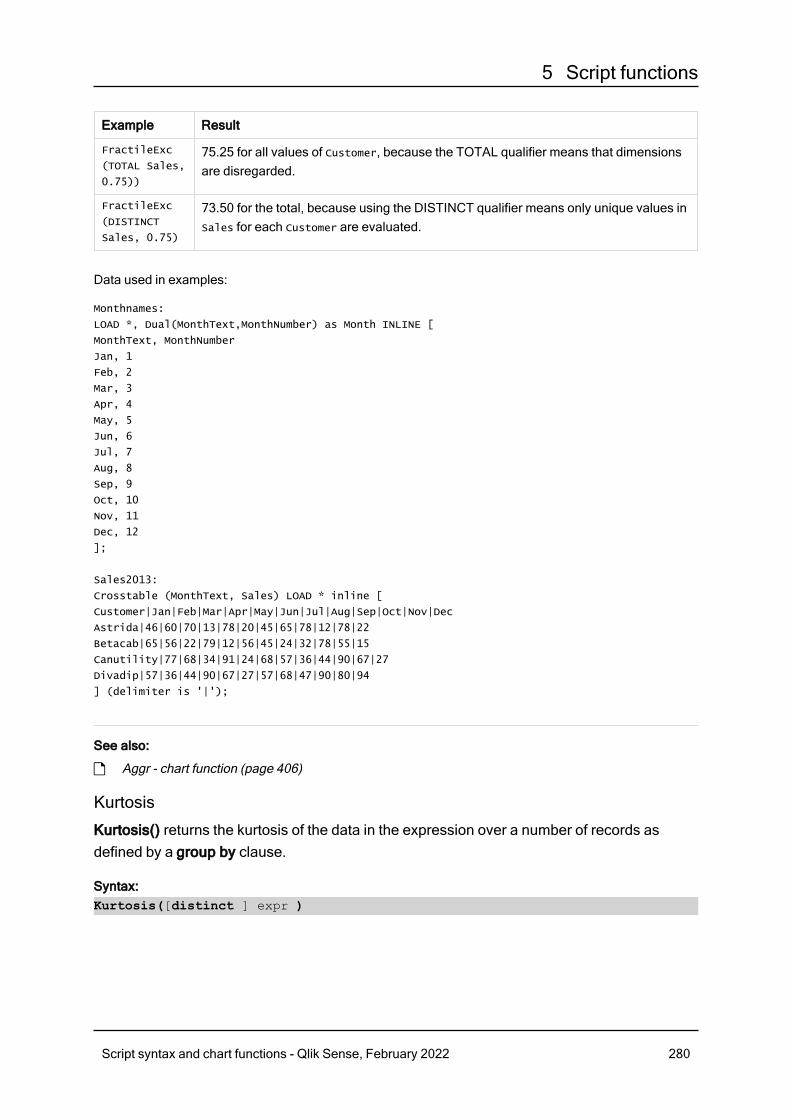
5 Script functions
Example Result
FractileExc
(TOTAL Sales,
0.75))
75.25 for all values of Customer, because the TOTAL qualifier means that dimensionsare disregarded.
FractileExc
(DISTINCT
Sales, 0.75)
73.50 for the total, because using the DISTINCT qualifier means only unique values inSales for each Customer are evaluated.
Data used in examples:
Monthnames:
LOAD *, Dual(MonthText,MonthNumber) as Month INLINE [
MonthText, MonthNumber
Jan, 1
Feb, 2
Mar, 3
Apr, 4
May, 5
Jun, 6
Jul, 7
Aug, 8
Sep, 9
Oct, 10
Nov, 11
Dec, 12
];
Sales2013:
Crosstable (MonthText, Sales) LOAD * inline [
Customer|Jan|Feb|Mar|Apr|May|Jun|Jul|Aug|Sep|Oct|Nov|Dec
Astrida|46|60|70|13|78|20|45|65|78|12|78|22
Betacab|65|56|22|79|12|56|45|24|32|78|55|15
Canutility|77|68|34|91|24|68|57|36|44|90|67|27
Divadip|57|36|44|90|67|27|57|68|47|90|80|94
] (delimiter is '|');
See also:
p Aggr - chart function (page 406)
Kurtosis
Kurtosis() returns the kurtosis of the data in the expression over a number of records asdefined by a group by clause.
Syntax:Kurtosis([distinct ] expr )
Script syntax and chart functions - Qlik Sense, February 2022 280
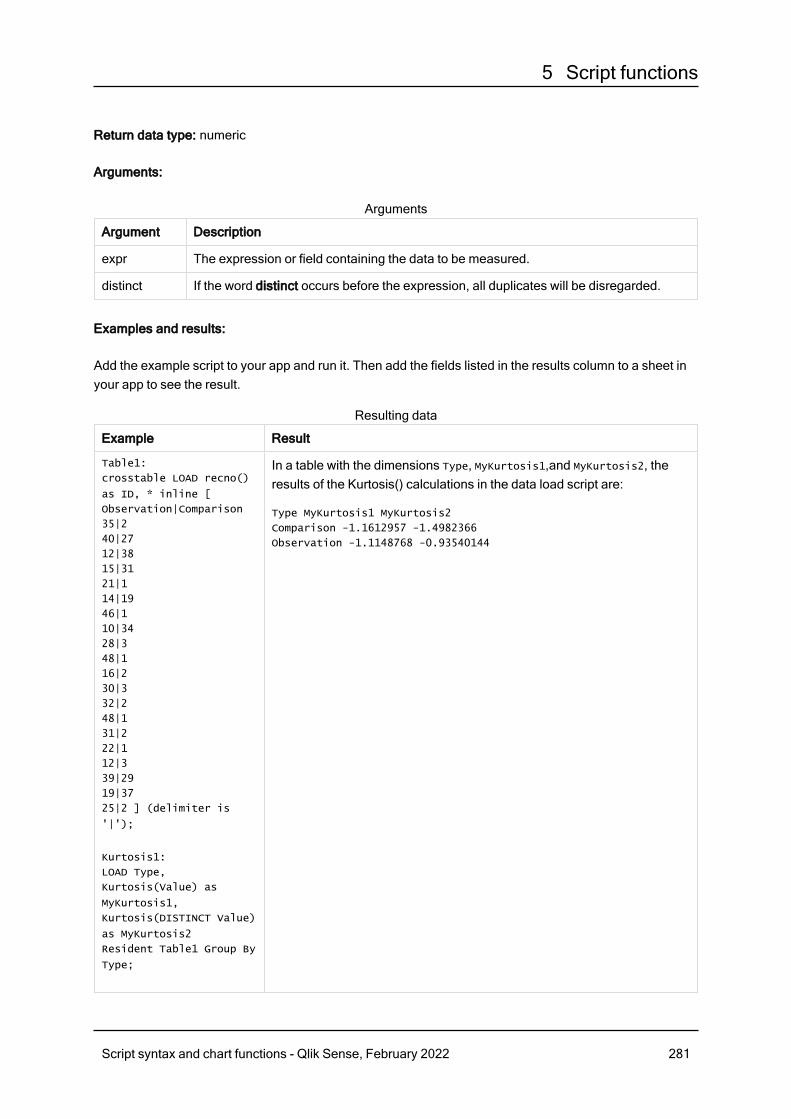
5 Script functions
Return data type: numeric
Arguments:
Argument Description
expr The expression or field containing the data to be measured.
distinct If the word distinct occurs before the expression, all duplicates will be disregarded.
Arguments
Examples and results:
Add the example script to your app and run it. Then add the fields listed in the results column to a sheet inyour app to see the result.
Example Result
Table1:
crosstable LOAD recno()
as ID, * inline [
Observation|Comparison
35|2
40|27
12|38
15|31
21|1
14|19
46|1
10|34
28|3
48|1
16|2
30|3
32|2
48|1
31|2
22|1
12|3
39|29
19|37
25|2 ] (delimiter is
'|');
Kurtosis1:
LOAD Type,
Kurtosis(Value) as
MyKurtosis1,
Kurtosis(DISTINCT Value)
as MyKurtosis2
Resident Table1 Group By
Type;
In a table with the dimensions Type, MyKurtosis1,and MyKurtosis2, theresults of the Kurtosis() calculations in the data load script are:
Type MyKurtosis1 MyKurtosis2
Comparison -1.1612957 -1.4982366
Observation -1.1148768 -0.93540144
Resulting data
Script syntax and chart functions - Qlik Sense, February 2022 281
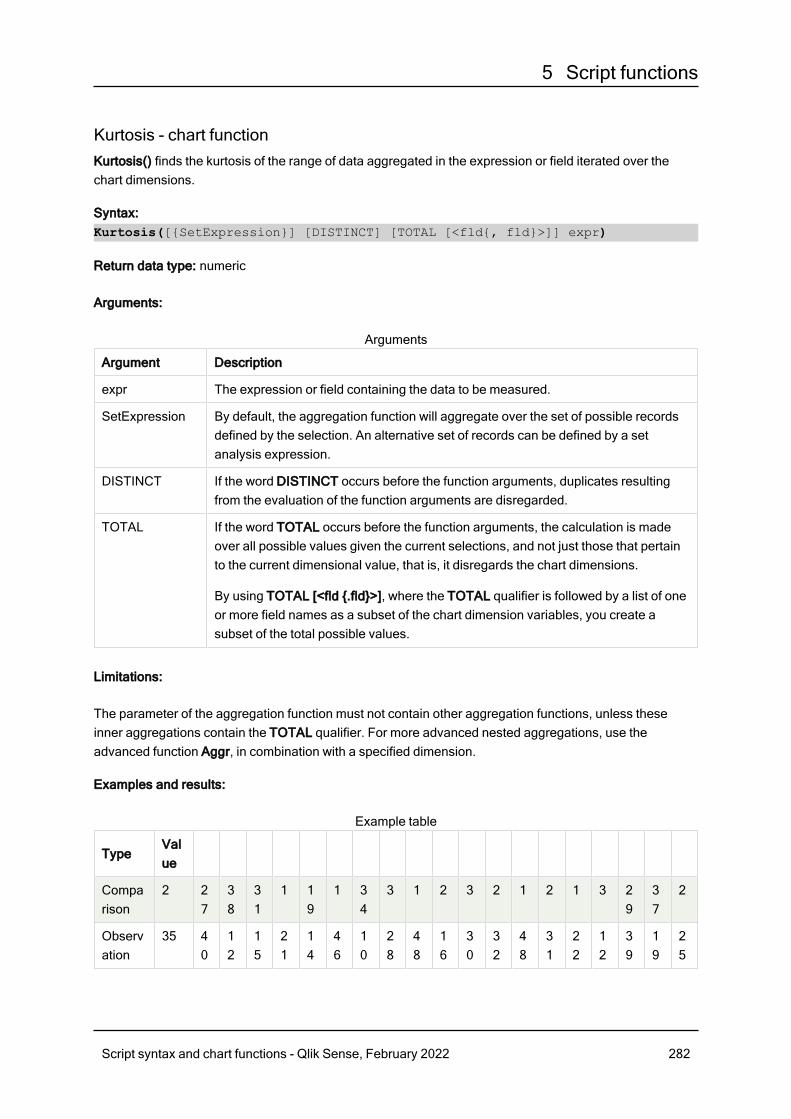
5 Script functions
Kurtosis - chart functionKurtosis() finds the kurtosis of the range of data aggregated in the expression or field iterated over thechart dimensions.
Syntax:Kurtosis([{SetExpression}] [DISTINCT] [TOTAL [<fld{, fld}>]] expr)
Return data type: numeric
Arguments:
Argument Description
expr The expression or field containing the data to be measured.
SetExpression By default, the aggregation function will aggregate over the set of possible recordsdefined by the selection. An alternative set of records can be defined by a setanalysis expression.
DISTINCT If the word DISTINCT occurs before the function arguments, duplicates resultingfrom the evaluation of the function arguments are disregarded.
TOTAL If the word TOTAL occurs before the function arguments, the calculation is madeover all possible values given the current selections, and not just those that pertainto the current dimensional value, that is, it disregards the chart dimensions.
By using TOTAL [<fld {.fld}>], where the TOTAL qualifier is followed by a list of oneor more field names as a subset of the chart dimension variables, you create asubset of the total possible values.
Arguments
Limitations:
The parameter of the aggregation function must not contain other aggregation functions, unless theseinner aggregations contain the TOTAL qualifier. For more advanced nested aggregations, use theadvanced function Aggr, in combination with a specified dimension.
Examples and results:
TypeValue
Comparison
2 27
38
31
1 19
1 34
3 1 2 3 2 1 2 1 3 29
37
2
Observation
35 40
12
15
21
14
46
10
28
48
16
30
32
48
31
22
12
39
19
25
Example table
Script syntax and chart functions - Qlik Sense, February 2022 282
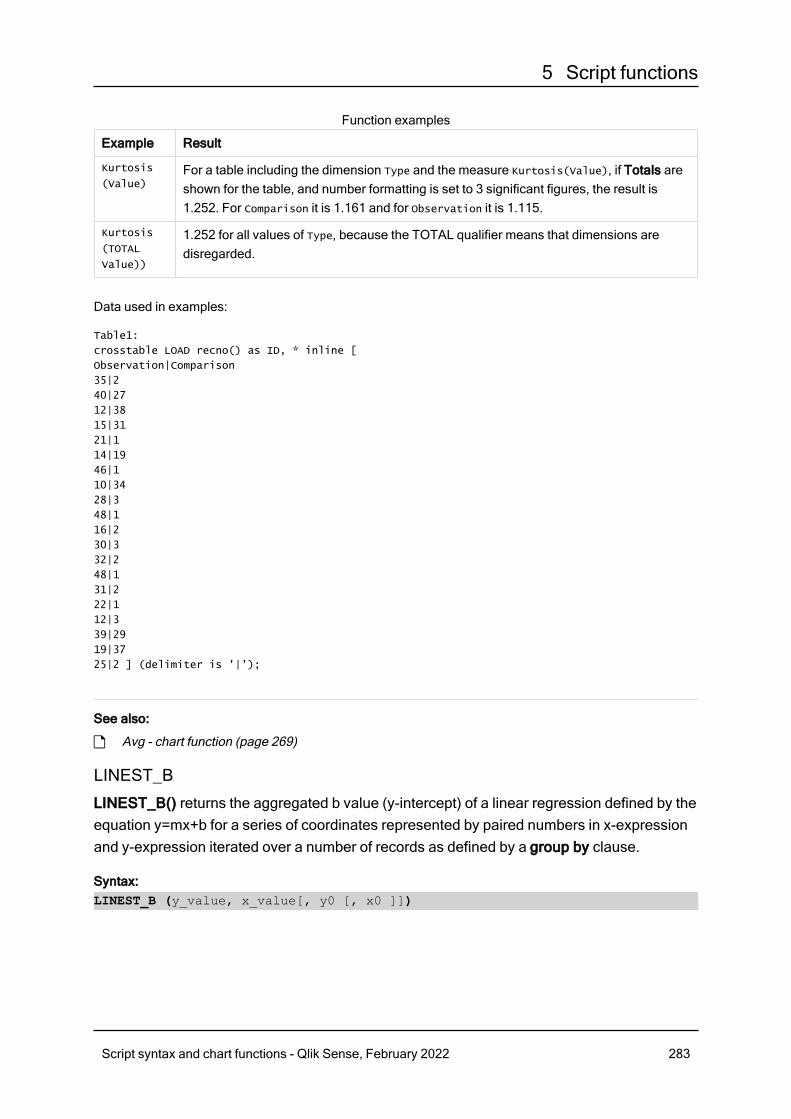
5 Script functions
Example Result
Kurtosis
(Value)For a table including the dimension Type and the measure Kurtosis(Value), if Totals areshown for the table, and number formatting is set to 3 significant figures, the result is1.252. For Comparison it is 1.161 and for Observation it is 1.115.
Kurtosis
(TOTAL
Value))
1.252 for all values of Type, because the TOTAL qualifier means that dimensions aredisregarded.
Function examples
Data used in examples:
Table1:
crosstable LOAD recno() as ID, * inline [
Observation|Comparison
35|2
40|27
12|38
15|31
21|1
14|19
46|1
10|34
28|3
48|1
16|2
30|3
32|2
48|1
31|2
22|1
12|3
39|29
19|37
25|2 ] (delimiter is '|');
See also:
p Avg - chart function (page 269)
LINEST_B
LINEST_B() returns the aggregated b value (y-intercept) of a linear regression defined by theequation y=mx+b for a series of coordinates represented by paired numbers in x-expressionand y-expression iterated over a number of records as defined by a group by clause.
Syntax:LINEST_B (y_value, x_value[, y0 [, x0 ]])
Script syntax and chart functions - Qlik Sense, February 2022 283
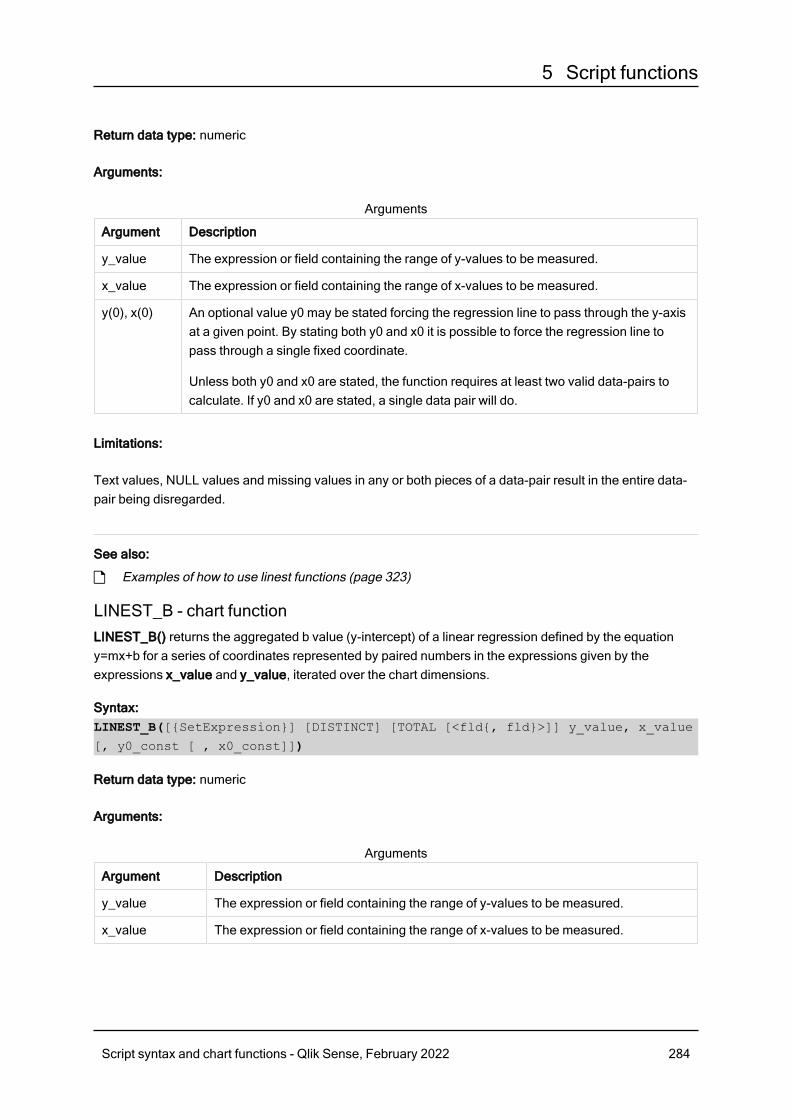
5 Script functions
Return data type: numeric
Arguments:
Argument Description
y_value The expression or field containing the range of y-values to be measured.
x_value The expression or field containing the range of x-values to be measured.
y(0), x(0) An optional value y0 may be stated forcing the regression line to pass through the y-axisat a given point. By stating both y0 and x0 it is possible to force the regression line topass through a single fixed coordinate.
Unless both y0 and x0 are stated, the function requires at least two valid data-pairs tocalculate. If y0 and x0 are stated, a single data pair will do.
Arguments
Limitations:
Text values, NULL values and missing values in any or both pieces of a data-pair result in the entire data-pair being disregarded.
See also:
p Examples of how to use linest functions (page 323)
LINEST_B - chart functionLINEST_B() returns the aggregated b value (y-intercept) of a linear regression defined by the equationy=mx+b for a series of coordinates represented by paired numbers in the expressions given by theexpressions x_value and y_value, iterated over the chart dimensions.
Syntax:LINEST_B([{SetExpression}] [DISTINCT] [TOTAL [<fld{, fld}>]] y_value, x_value
[, y0_const [ , x0_const]])
Return data type: numeric
Arguments:
Argument Description
y_value The expression or field containing the range of y-values to be measured.
x_value The expression or field containing the range of x-values to be measured.
Arguments
Script syntax and chart functions - Qlik Sense, February 2022 284
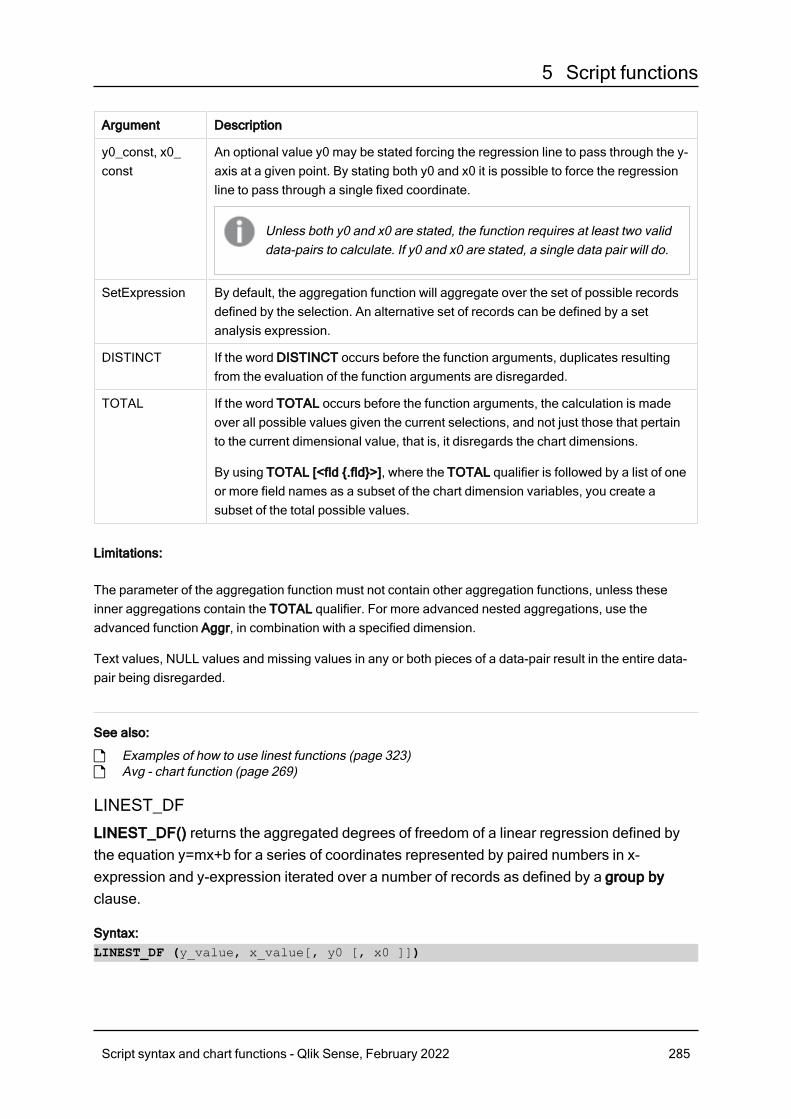
5 Script functions
Argument Description
y0_const, x0_const
An optional value y0 may be stated forcing the regression line to pass through the y-axis at a given point. By stating both y0 and x0 it is possible to force the regressionline to pass through a single fixed coordinate.
Unless both y0 and x0 are stated, the function requires at least two validdata-pairs to calculate. If y0 and x0 are stated, a single data pair will do.
SetExpression By default, the aggregation function will aggregate over the set of possible recordsdefined by the selection. An alternative set of records can be defined by a setanalysis expression.
DISTINCT If the word DISTINCT occurs before the function arguments, duplicates resultingfrom the evaluation of the function arguments are disregarded.
TOTAL If the word TOTAL occurs before the function arguments, the calculation is madeover all possible values given the current selections, and not just those that pertainto the current dimensional value, that is, it disregards the chart dimensions.
By using TOTAL [<fld {.fld}>], where the TOTAL qualifier is followed by a list of oneor more field names as a subset of the chart dimension variables, you create asubset of the total possible values.
Limitations:
The parameter of the aggregation function must not contain other aggregation functions, unless theseinner aggregations contain the TOTAL qualifier. For more advanced nested aggregations, use theadvanced function Aggr, in combination with a specified dimension.
Text values, NULL values and missing values in any or both pieces of a data-pair result in the entire data-pair being disregarded.
See also:
p Examples of how to use linest functions (page 323)p Avg - chart function (page 269)
LINEST_DF
LINEST_DF() returns the aggregated degrees of freedom of a linear regression defined bythe equation y=mx+b for a series of coordinates represented by paired numbers in x-expression and y-expression iterated over a number of records as defined by a group byclause.
Syntax:LINEST_DF (y_value, x_value[, y0 [, x0 ]])
Script syntax and chart functions - Qlik Sense, February 2022 285

5 Script functions
Return data type: numeric
Arguments:
Argument Description
y_value The expression or field containing the range of y-values to be measured.
x_value The expression or field containing the range of x-values to be measured.
y(0), x(0) An optional value y0 may be stated forcing the regression line to pass through the y-axisat a given point. By stating both y0 and x0 it is possible to force the regression line topass through a single fixed coordinate.
Unless both y0 and x0 are stated, the function requires at least two valid data-pairs tocalculate. If y0 and x0 are stated, a single data pair will do.
Arguments
Limitations:
Text values, NULL values and missing values in any or both pieces of a data-pair result in the entire data-pair being disregarded.
See also:
p Examples of how to use linest functions (page 323)
LINEST_DF - chart functionLINEST_DF() returns the aggregated degrees of freedom of a linear regression defined by the equationy=mx+b for a series of coordinates represented by paired numbers in the expressions given by x_valueand y_value, iterated over the chart dimensions.
Syntax:LINEST_DF([{SetExpression}] [DISTINCT] [TOTAL [<fld{, fld}>]] y_value, x_
value [, y0_const [, x0_const]])
Return data type: numeric
Arguments:
Argument Description
y_value The expression or field containing the range of y-values to be measured.
x_value The expression or field containing the range of x-values to be measured.
Arguments
Script syntax and chart functions - Qlik Sense, February 2022 286
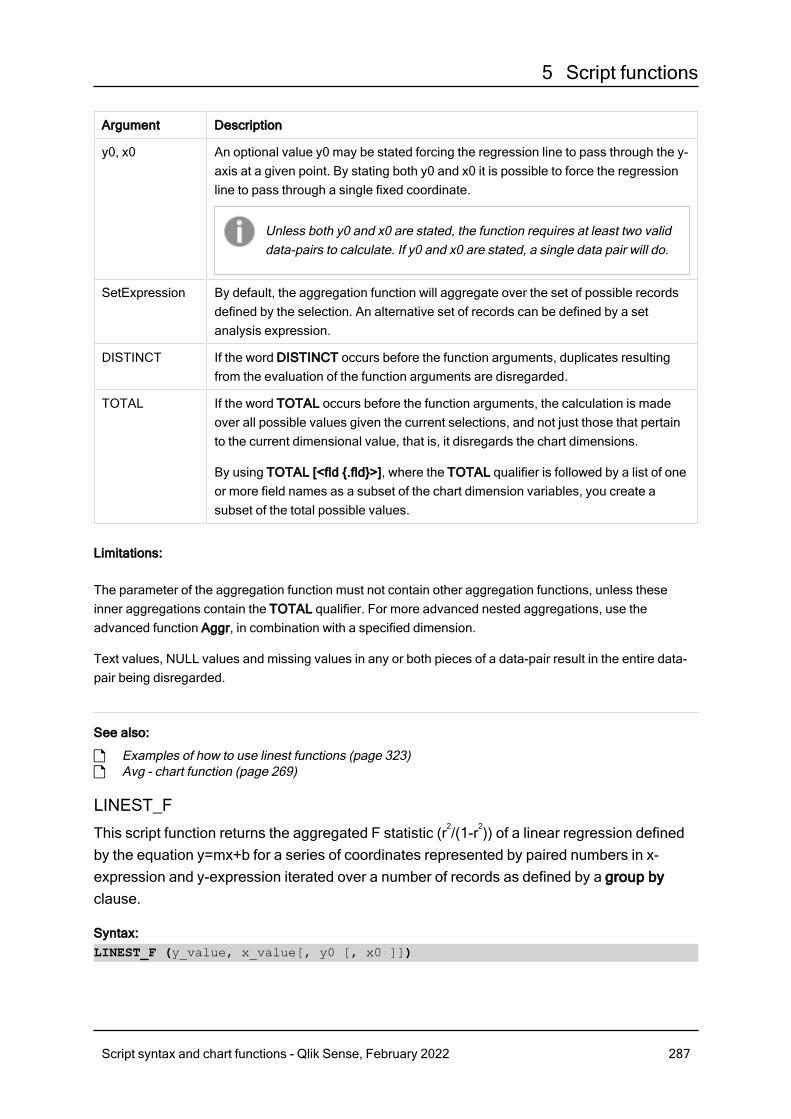
5 Script functions
Argument Description
y0, x0 An optional value y0 may be stated forcing the regression line to pass through the y-axis at a given point. By stating both y0 and x0 it is possible to force the regressionline to pass through a single fixed coordinate.
Unless both y0 and x0 are stated, the function requires at least two validdata-pairs to calculate. If y0 and x0 are stated, a single data pair will do.
SetExpression By default, the aggregation function will aggregate over the set of possible recordsdefined by the selection. An alternative set of records can be defined by a setanalysis expression.
DISTINCT If the word DISTINCT occurs before the function arguments, duplicates resultingfrom the evaluation of the function arguments are disregarded.
TOTAL If the word TOTAL occurs before the function arguments, the calculation is madeover all possible values given the current selections, and not just those that pertainto the current dimensional value, that is, it disregards the chart dimensions.
By using TOTAL [<fld {.fld}>], where the TOTAL qualifier is followed by a list of oneor more field names as a subset of the chart dimension variables, you create asubset of the total possible values.
Limitations:
The parameter of the aggregation function must not contain other aggregation functions, unless theseinner aggregations contain the TOTAL qualifier. For more advanced nested aggregations, use theadvanced function Aggr, in combination with a specified dimension.
Text values, NULL values and missing values in any or both pieces of a data-pair result in the entire data-pair being disregarded.
See also:
p Examples of how to use linest functions (page 323)p Avg - chart function (page 269)
LINEST_F
This script function returns the aggregated F statistic (r2/(1-r2)) of a linear regression definedby the equation y=mx+b for a series of coordinates represented by paired numbers in x-expression and y-expression iterated over a number of records as defined by a group byclause.
Syntax:LINEST_F (y_value, x_value[, y0 [, x0 ]])
Script syntax and chart functions - Qlik Sense, February 2022 287

5 Script functions
Return data type: numeric
Arguments:
Argument Description
y_value The expression or field containing the range of y-values to be measured.
x_value The expression or field containing the range of x-values to be measured.
y(0), x(0) An optional value y0 may be stated forcing the regression line to pass through the y-axisat a given point. By stating both y0 and x0 it is possible to force the regression line topass through a single fixed coordinate.
Unless both y0 and x0 are stated, the function requires at least two valid data-pairs tocalculate. If y0 and x0 are stated, a single data pair will do.
Arguments
Limitations:
Text values, NULL values and missing values in any or both pieces of a data-pair result in the entire data-pair being disregarded.
See also:
p Examples of how to use linest functions (page 323)
LINEST_F - chart functionLINEST_F() returns the aggregated F statistic (r2/(1-r2)) of a linear regression defined by the equationy=mx+b for a series of coordinates represented by paired numbers in the expressions given by x_valueand the y_value, iterated over the chart dimensions.
Syntax:LINEST_F([{SetExpression}] [DISTINCT] [TOTAL [<fld{, fld}>]] y_value, x_value
[, y0_const [, x0_const]])
Return data type: numeric
Arguments:
Argument Description
y_value The expression or field containing the range of y-values to be measured.
x_value The expression or field containing the range of x-values to be measured.
Arguments
Script syntax and chart functions - Qlik Sense, February 2022 288
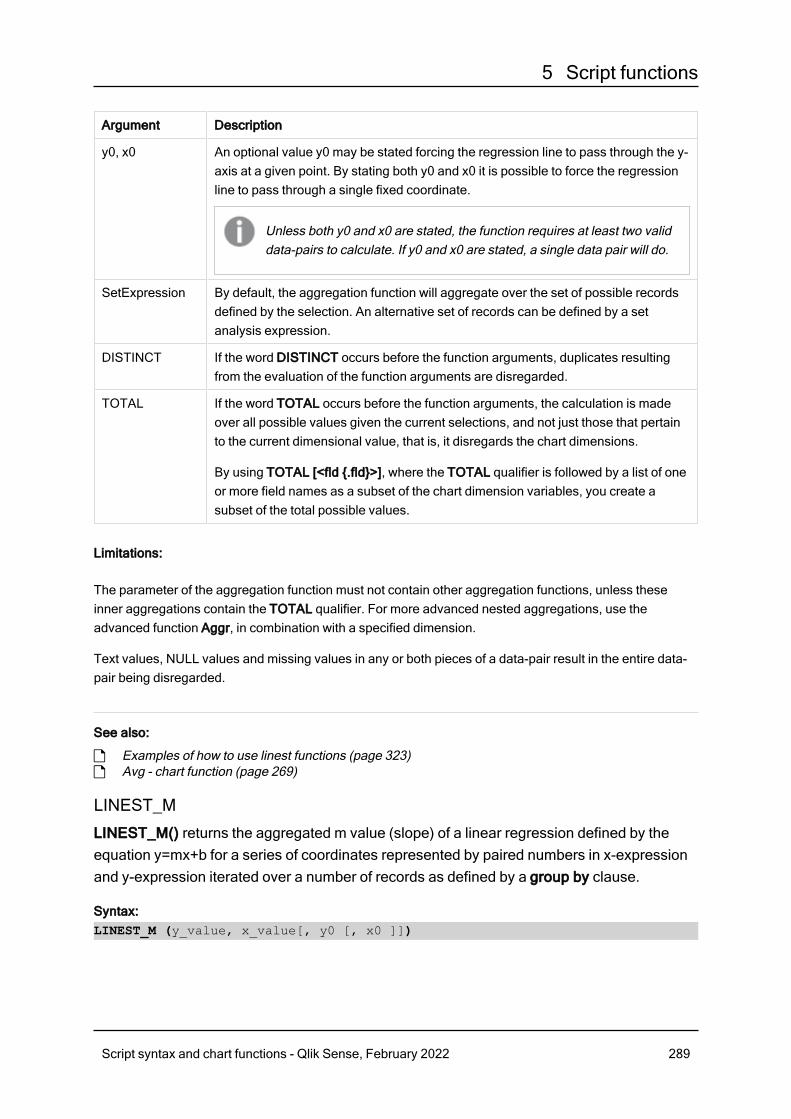
5 Script functions
Argument Description
y0, x0 An optional value y0 may be stated forcing the regression line to pass through the y-axis at a given point. By stating both y0 and x0 it is possible to force the regressionline to pass through a single fixed coordinate.
Unless both y0 and x0 are stated, the function requires at least two validdata-pairs to calculate. If y0 and x0 are stated, a single data pair will do.
SetExpression By default, the aggregation function will aggregate over the set of possible recordsdefined by the selection. An alternative set of records can be defined by a setanalysis expression.
DISTINCT If the word DISTINCT occurs before the function arguments, duplicates resultingfrom the evaluation of the function arguments are disregarded.
TOTAL If the word TOTAL occurs before the function arguments, the calculation is madeover all possible values given the current selections, and not just those that pertainto the current dimensional value, that is, it disregards the chart dimensions.
By using TOTAL [<fld {.fld}>], where the TOTAL qualifier is followed by a list of oneor more field names as a subset of the chart dimension variables, you create asubset of the total possible values.
Limitations:
The parameter of the aggregation function must not contain other aggregation functions, unless theseinner aggregations contain the TOTAL qualifier. For more advanced nested aggregations, use theadvanced function Aggr, in combination with a specified dimension.
Text values, NULL values and missing values in any or both pieces of a data-pair result in the entire data-pair being disregarded.
See also:
p Examples of how to use linest functions (page 323)p Avg - chart function (page 269)
LINEST_M
LINEST_M() returns the aggregated m value (slope) of a linear regression defined by theequation y=mx+b for a series of coordinates represented by paired numbers in x-expressionand y-expression iterated over a number of records as defined by a group by clause.
Syntax:LINEST_M (y_value, x_value[, y0 [, x0 ]])
Script syntax and chart functions - Qlik Sense, February 2022 289
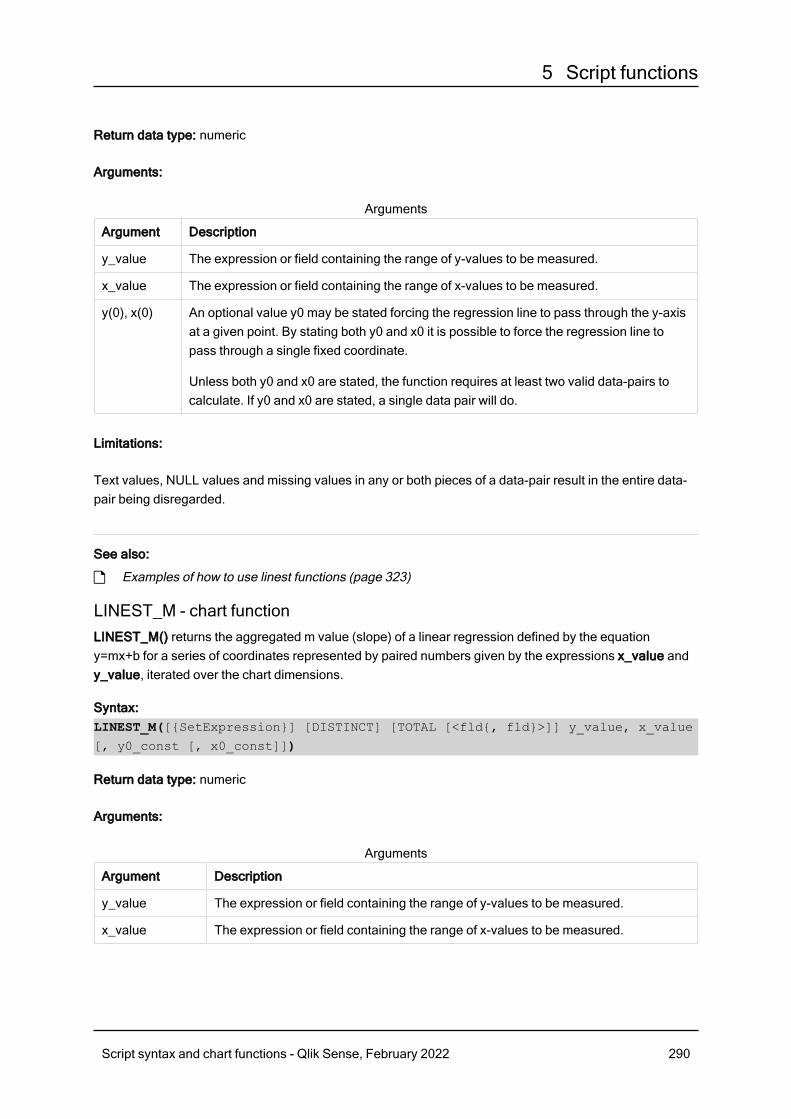
5 Script functions
Return data type: numeric
Arguments:
Argument Description
y_value The expression or field containing the range of y-values to be measured.
x_value The expression or field containing the range of x-values to be measured.
y(0), x(0) An optional value y0 may be stated forcing the regression line to pass through the y-axisat a given point. By stating both y0 and x0 it is possible to force the regression line topass through a single fixed coordinate.
Unless both y0 and x0 are stated, the function requires at least two valid data-pairs tocalculate. If y0 and x0 are stated, a single data pair will do.
Arguments
Limitations:
Text values, NULL values and missing values in any or both pieces of a data-pair result in the entire data-pair being disregarded.
See also:
p Examples of how to use linest functions (page 323)
LINEST_M - chart functionLINEST_M() returns the aggregated m value (slope) of a linear regression defined by the equationy=mx+b for a series of coordinates represented by paired numbers given by the expressions x_value andy_value, iterated over the chart dimensions.
Syntax:LINEST_M([{SetExpression}] [DISTINCT] [TOTAL [<fld{, fld}>]] y_value, x_value
[, y0_const [, x0_const]])
Return data type: numeric
Arguments:
Argument Description
y_value The expression or field containing the range of y-values to be measured.
x_value The expression or field containing the range of x-values to be measured.
Arguments
Script syntax and chart functions - Qlik Sense, February 2022 290
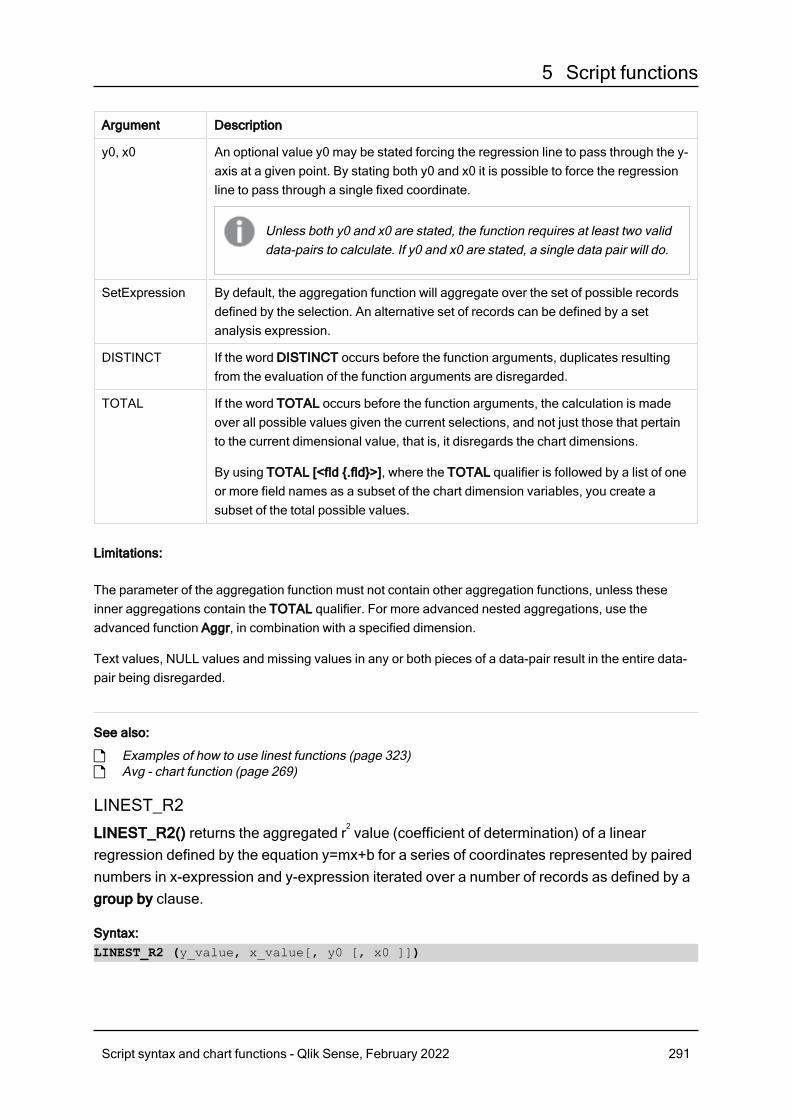
5 Script functions
Argument Description
y0, x0 An optional value y0 may be stated forcing the regression line to pass through the y-axis at a given point. By stating both y0 and x0 it is possible to force the regressionline to pass through a single fixed coordinate.
Unless both y0 and x0 are stated, the function requires at least two validdata-pairs to calculate. If y0 and x0 are stated, a single data pair will do.
SetExpression By default, the aggregation function will aggregate over the set of possible recordsdefined by the selection. An alternative set of records can be defined by a setanalysis expression.
DISTINCT If the word DISTINCT occurs before the function arguments, duplicates resultingfrom the evaluation of the function arguments are disregarded.
TOTAL If the word TOTAL occurs before the function arguments, the calculation is madeover all possible values given the current selections, and not just those that pertainto the current dimensional value, that is, it disregards the chart dimensions.
By using TOTAL [<fld {.fld}>], where the TOTAL qualifier is followed by a list of oneor more field names as a subset of the chart dimension variables, you create asubset of the total possible values.
Limitations:
The parameter of the aggregation function must not contain other aggregation functions, unless theseinner aggregations contain the TOTAL qualifier. For more advanced nested aggregations, use theadvanced function Aggr, in combination with a specified dimension.
Text values, NULL values and missing values in any or both pieces of a data-pair result in the entire data-pair being disregarded.
See also:
p Examples of how to use linest functions (page 323)p Avg - chart function (page 269)
LINEST_R2
LINEST_R2() returns the aggregated r2 value (coefficient of determination) of a linearregression defined by the equation y=mx+b for a series of coordinates represented by pairednumbers in x-expression and y-expression iterated over a number of records as defined by agroup by clause.
Syntax:LINEST_R2 (y_value, x_value[, y0 [, x0 ]])
Script syntax and chart functions - Qlik Sense, February 2022 291

5 Script functions
Return data type: numeric
Arguments:
Argument Description
y_value The expression or field containing the range of y-values to be measured.
x_value The expression or field containing the range of x-values to be measured.
y(0), x(0) An optional value y0 may be stated forcing the regression line to pass through the y-axisat a given point. By stating both y0 and x0 it is possible to force the regression line topass through a single fixed coordinate.
Unless both y0 and x0 are stated, the function requires at least two valid data-pairs tocalculate. If y0 and x0 are stated, a single data pair will do.
Arguments
Limitations:
Text values, NULL values and missing values in any or both pieces of a data-pair result in the entire data-pair being disregarded.
See also:
p Examples of how to use linest functions (page 323)
LINEST_R2 - chart functionLINEST_R2() returns the aggregated r2 value (coefficient of determination) of a linear regression definedby the equation y=mx+b for a series of coordinates represented by paired numbers given by theexpressions x_value and y_value, iterated over the chart dimensions.
Syntax:LINEST_R2([{SetExpression}] [DISTINCT] [TOTAL [<fld{, fld}>]] y_value, x_
value[, y0_const[, x0_const]])
Return data type: numeric
Arguments:
Argument Description
y_value The expression or field containing the range of y-values to be measured.
x_value The expression or field containing the range of x-values to be measured.
Arguments
Script syntax and chart functions - Qlik Sense, February 2022 292

5 Script functions
Argument Description
y0, x0 An optional value y0 may be stated forcing the regression line to pass through the y-axis at a given point. By stating both y0 and x0 it is possible to force the regressionline to pass through a single fixed coordinate.
Unless both y0 and x0 are stated, the function requires at least two validdata-pairs to calculate. If y0 and x0 are stated, a single data pair will do.
SetExpression By default, the aggregation function will aggregate over the set of possible recordsdefined by the selection. An alternative set of records can be defined by a setanalysis expression.
DISTINCT If the word DISTINCT occurs before the function arguments, duplicates resultingfrom the evaluation of the function arguments are disregarded.
TOTAL If the word TOTAL occurs before the function arguments, the calculation is madeover all possible values given the current selections, and not just those that pertainto the current dimensional value, that is, it disregards the chart dimensions.
By using TOTAL [<fld {.fld}>], where the TOTAL qualifier is followed by a list of oneor more field names as a subset of the chart dimension variables, you create asubset of the total possible values.
Limitations:
The parameter of the aggregation function must not contain other aggregation functions, unless theseinner aggregations contain the TOTAL qualifier. For more advanced nested aggregations, use theadvanced function Aggr, in combination with a specified dimension.
Text values, NULL values and missing values in any or both pieces of a data-pair result in the entire data-pair being disregarded.
See also:
p Examples of how to use linest functions (page 323)p Avg - chart function (page 269)
LINEST_SEB
LINEST_SEB() returns the aggregated standard error of the b value of a linear regressiondefined by the equation y=mx+b for a series of coordinates represented by paired numbers inx-expression and y-expression iterated over a number of records as defined by a group byclause.
Syntax:LINEST_SEB (y_value, x_value[, y0 [, x0 ]])
Script syntax and chart functions - Qlik Sense, February 2022 293
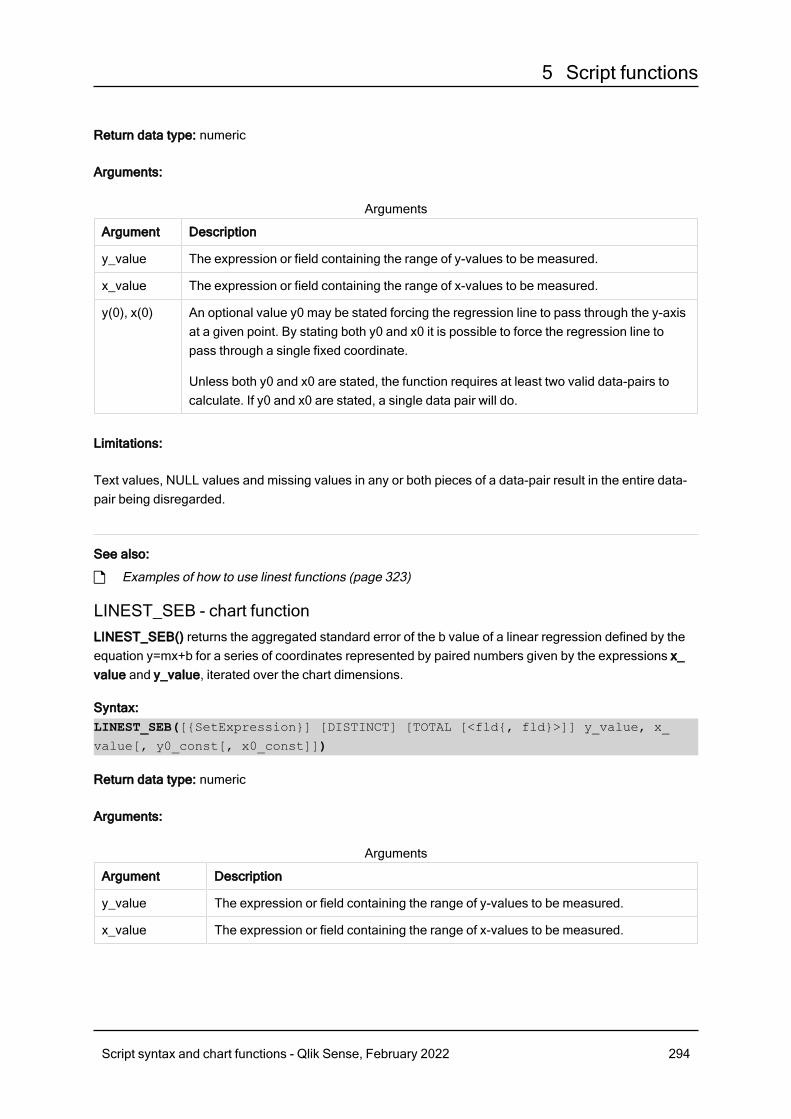
5 Script functions
Return data type: numeric
Arguments:
Argument Description
y_value The expression or field containing the range of y-values to be measured.
x_value The expression or field containing the range of x-values to be measured.
y(0), x(0) An optional value y0 may be stated forcing the regression line to pass through the y-axisat a given point. By stating both y0 and x0 it is possible to force the regression line topass through a single fixed coordinate.
Unless both y0 and x0 are stated, the function requires at least two valid data-pairs tocalculate. If y0 and x0 are stated, a single data pair will do.
Arguments
Limitations:
Text values, NULL values and missing values in any or both pieces of a data-pair result in the entire data-pair being disregarded.
See also:
p Examples of how to use linest functions (page 323)
LINEST_SEB - chart functionLINEST_SEB() returns the aggregated standard error of the b value of a linear regression defined by theequation y=mx+b for a series of coordinates represented by paired numbers given by the expressions x_value and y_value, iterated over the chart dimensions.
Syntax:LINEST_SEB([{SetExpression}] [DISTINCT] [TOTAL [<fld{, fld}>]] y_value, x_
value[, y0_const[, x0_const]])
Return data type: numeric
Arguments:
Argument Description
y_value The expression or field containing the range of y-values to be measured.
x_value The expression or field containing the range of x-values to be measured.
Arguments
Script syntax and chart functions - Qlik Sense, February 2022 294

5 Script functions
Argument Description
y0, x0 An optional value y0 may be stated forcing the regression line to pass through the y-axis at a given point. By stating both y0 and x0 it is possible to force the regressionline to pass through a single fixed coordinate.
Unless both y0 and x0 are stated, the function requires at least two validdata-pairs to calculate. If y0 and x0 are stated, a single data pair will do.
SetExpression By default, the aggregation function will aggregate over the set of possible recordsdefined by the selection. An alternative set of records can be defined by a setanalysis expression.
DISTINCT If the word DISTINCT occurs before the function arguments, duplicates resultingfrom the evaluation of the function arguments are disregarded.
TOTAL If the word TOTAL occurs before the function arguments, the calculation is madeover all possible values given the current selections, and not just those that pertainto the current dimensional value, that is, it disregards the chart dimensions.
By using TOTAL [<fld {.fld}>], where the TOTAL qualifier is followed by a list of oneor more field names as a subset of the chart dimension variables, you create asubset of the total possible values.
Limitations:
The parameter of the aggregation function must not contain other aggregation functions, unless theseinner aggregations contain the TOTAL qualifier. For more advanced nested aggregations, use theadvanced function Aggr, in combination with a specified dimension.
Text values, NULL values and missing values in any or both pieces of a data-pair result in the entire data-pair being disregarded.
See also:
p Examples of how to use linest functions (page 323)p Avg - chart function (page 269)
LINEST_SEM
LINEST_SEM() returns the aggregated standard error of the m value of a linear regressiondefined by the equation y=mx+b for a series of coordinates represented by paired numbers inx-expression and y-expression iterated over a number of records as defined by a group byclause.
Syntax:LINEST_SEM (y_value, x_value[, y0 [, x0 ]])
Script syntax and chart functions - Qlik Sense, February 2022 295

5 Script functions
Return data type: numeric
Arguments:
Argument Description
y_value The expression or field containing the range of y-values to be measured.
x_value The expression or field containing the range of x-values to be measured.
y(0), x(0) An optional value y0 may be stated forcing the regression line to pass through the y-axisat a given point. By stating both y0 and x0 it is possible to force the regression line topass through a single fixed coordinate.
Unless both y0 and x0 are stated, the function requires at least two valid data-pairs tocalculate. If y0 and x0 are stated, a single data pair will do.
Limitations:
Text values, NULL values and missing values in any or both pieces of a data-pair result in the entire data-pair being disregarded.
See also:
p Examples of how to use linest functions (page 323)
LINEST_SEM - chart functionLINEST_SEM() returns the aggregated standard error of the m value of a linear regression defined by theequation y=mx+b for a series of coordinates represented by paired numbers given by the expressions x_value and y_value, iterated over the chart dimensions.
Syntax:LINEST_SEM([{SetExpression}] [DISTINCT] [TOTAL [<fld{, fld}>]] y_value, x_
value[, y0_const[, x0_const]])
Return data type: numeric
Arguments:
Argument Description
y_value The expression or field containing the range of y-values to be measured.
x_value The expression or field containing the range of x-values to be measured.
Arguments
Script syntax and chart functions - Qlik Sense, February 2022 296

5 Script functions
Argument Description
y0, x0 An optional value y0 may be stated forcing the regression line to pass through the y-axis at a given point. By stating both y0 and x0 it is possible to force the regressionline to pass through a single fixed coordinate.
Unless both y0 and x0 are stated, the function requires at least two validdata-pairs to calculate. If y0 and x0 are stated, a single data pair will do.
SetExpression By default, the aggregation function will aggregate over the set of possible recordsdefined by the selection. An alternative set of records can be defined by a setanalysis expression.
DISTINCT If the word DISTINCT occurs before the function arguments, duplicates resultingfrom the evaluation of the function arguments are disregarded.
TOTAL If the word TOTAL occurs before the function arguments, the calculation is madeover all possible values given the current selections, and not just those that pertainto the current dimensional value, that is, it disregards the chart dimensions.
By using TOTAL [<fld {.fld}>], where the TOTAL qualifier is followed by a list of oneor more field names as a subset of the chart dimension variables, you create asubset of the total possible values.
Limitations:
The parameter of the aggregation function must not contain other aggregation functions, unless theseinner aggregations contain the TOTAL qualifier. For more advanced nested aggregations, use theadvanced function Aggr, in combination with a specified dimension.
Text values, NULL values and missing values in any or both pieces of a data-pair result in the entire data-pair being disregarded.
See also:
p Examples of how to use linest functions (page 323)p Avg - chart function (page 269)
LINEST_SEY
LINEST_SEY() returns the aggregated standard error of the y estimate of a linear regressiondefined by the equation y=mx+b for a series of coordinates represented by paired numbers inx-expression and y-expression iterated over a number of records as defined by a group byclause.
Syntax:LINEST_SEY (y_value, x_value[, y0 [, x0 ]])
Script syntax and chart functions - Qlik Sense, February 2022 297
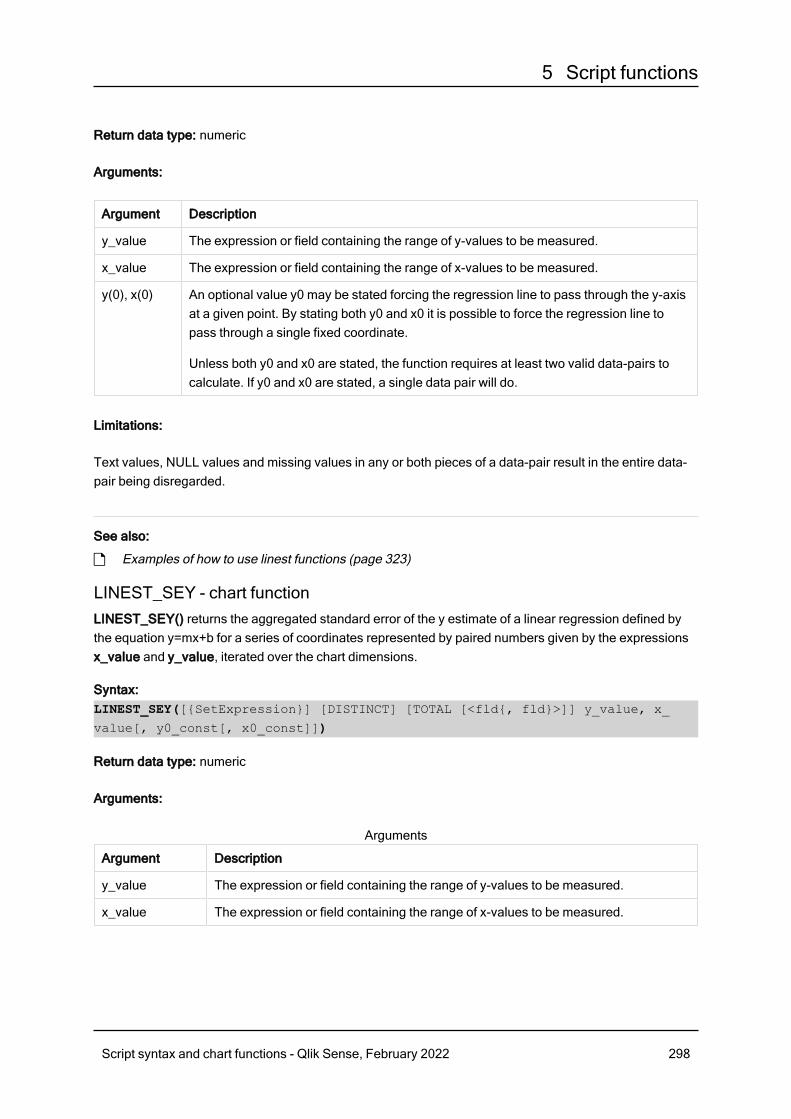
5 Script functions
Return data type: numeric
Arguments:
Argument Description
y_value The expression or field containing the range of y-values to be measured.
x_value The expression or field containing the range of x-values to be measured.
y(0), x(0) An optional value y0 may be stated forcing the regression line to pass through the y-axisat a given point. By stating both y0 and x0 it is possible to force the regression line topass through a single fixed coordinate.
Unless both y0 and x0 are stated, the function requires at least two valid data-pairs tocalculate. If y0 and x0 are stated, a single data pair will do.
Limitations:
Text values, NULL values and missing values in any or both pieces of a data-pair result in the entire data-pair being disregarded.
See also:
p Examples of how to use linest functions (page 323)
LINEST_SEY - chart functionLINEST_SEY() returns the aggregated standard error of the y estimate of a linear regression defined bythe equation y=mx+b for a series of coordinates represented by paired numbers given by the expressionsx_value and y_value, iterated over the chart dimensions.
Syntax:LINEST_SEY([{SetExpression}] [DISTINCT] [TOTAL [<fld{, fld}>]] y_value, x_
value[, y0_const[, x0_const]])
Return data type: numeric
Arguments:
Argument Description
y_value The expression or field containing the range of y-values to be measured.
x_value The expression or field containing the range of x-values to be measured.
Arguments
Script syntax and chart functions - Qlik Sense, February 2022 298
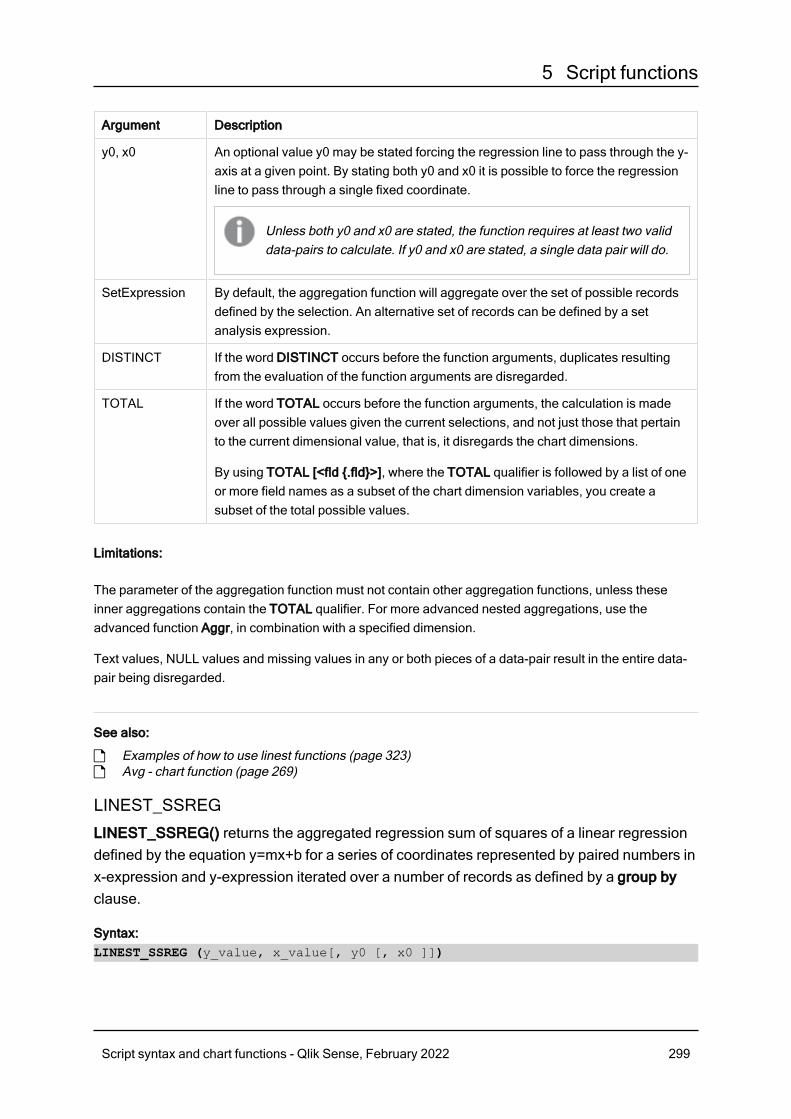
5 Script functions
Argument Description
y0, x0 An optional value y0 may be stated forcing the regression line to pass through the y-axis at a given point. By stating both y0 and x0 it is possible to force the regressionline to pass through a single fixed coordinate.
Unless both y0 and x0 are stated, the function requires at least two validdata-pairs to calculate. If y0 and x0 are stated, a single data pair will do.
SetExpression By default, the aggregation function will aggregate over the set of possible recordsdefined by the selection. An alternative set of records can be defined by a setanalysis expression.
DISTINCT If the word DISTINCT occurs before the function arguments, duplicates resultingfrom the evaluation of the function arguments are disregarded.
TOTAL If the word TOTAL occurs before the function arguments, the calculation is madeover all possible values given the current selections, and not just those that pertainto the current dimensional value, that is, it disregards the chart dimensions.
By using TOTAL [<fld {.fld}>], where the TOTAL qualifier is followed by a list of oneor more field names as a subset of the chart dimension variables, you create asubset of the total possible values.
Limitations:
The parameter of the aggregation function must not contain other aggregation functions, unless theseinner aggregations contain the TOTAL qualifier. For more advanced nested aggregations, use theadvanced function Aggr, in combination with a specified dimension.
Text values, NULL values and missing values in any or both pieces of a data-pair result in the entire data-pair being disregarded.
See also:
p Examples of how to use linest functions (page 323)p Avg - chart function (page 269)
LINEST_SSREG
LINEST_SSREG() returns the aggregated regression sum of squares of a linear regressiondefined by the equation y=mx+b for a series of coordinates represented by paired numbers inx-expression and y-expression iterated over a number of records as defined by a group byclause.
Syntax:LINEST_SSREG (y_value, x_value[, y0 [, x0 ]])
Script syntax and chart functions - Qlik Sense, February 2022 299

5 Script functions
Return data type: numeric
Arguments:
Argument Description
y_value The expression or field containing the range of y-values to be measured.
x_value The expression or field containing the range of x-values to be measured.
y(0), x(0) An optional value y0 may be stated forcing the regression line to pass through the y-axisat a given point. By stating both y0 and x0 it is possible to force the regression line topass through a single fixed coordinate.
Unless both y0 and x0 are stated, the function requires at least two valid data-pairs tocalculate. If y0 and x0 are stated, a single data pair will do.
Arguments
Limitations:
Text values, NULL values and missing values in any or both pieces of a data-pair result in the entire data-pair being disregarded.
See also:
p Examples of how to use linest functions (page 323)
LINEST_SSREG - chart functionLINEST_SSREG() returns the aggregated regression sum of squares of a linear regression defined by theequation y=mx+b for a series of coordinates represented by paired numbers given by the expressions x_value and y_value, iterated over the chart dimensions.
Syntax:LINEST_SSREG([{SetExpression}] [DISTINCT] [TOTAL [<fld{, fld}>]] y_value, x_
value[, y0_const[, x0_const]])
Return data type: numeric
Arguments:
Argument Description
y_value The expression or field containing the range of y-values to be measured.
x_value The expression or field containing the range of x-values to be measured.
Arguments
Script syntax and chart functions - Qlik Sense, February 2022 300

5 Script functions
Argument Description
y0, x0 An optional value y0 may be stated forcing the regression line to pass through the y-axis at a given point. By stating both y0 and x0 it is possible to force the regressionline to pass through a single fixed coordinate.
Unless both y0 and x0 are stated, the function requires at least two validdata-pairs to calculate. If y0 and x0 are stated, a single data pair will do.
SetExpression By default, the aggregation function will aggregate over the set of possible recordsdefined by the selection. An alternative set of records can be defined by a setanalysis expression.
DISTINCT If the word DISTINCT occurs before the function arguments, duplicates resultingfrom the evaluation of the function arguments are disregarded.
TOTAL If the word TOTAL occurs before the function arguments, the calculation is madeover all possible values given the current selections, and not just those that pertainto the current dimensional value, that is, it disregards the chart dimensions.
By using TOTAL [<fld {.fld}>], where the TOTAL qualifier is followed by a list of oneor more field names as a subset of the chart dimension variables, you create asubset of the total possible values.
Limitations:
The parameter of the aggregation function must not contain other aggregation functions, unless theseinner aggregations contain the TOTAL qualifier. For more advanced nested aggregations, use theadvanced function Aggr, in combination with a specified dimension.
Text values, NULL values and missing values in any or both pieces of a data-pair result in the entire data-pair being disregarded.
See also:
p Examples of how to use linest functions (page 323)p Avg - chart function (page 269)
LINEST_SSRESID
LINEST_SSRESID() returns the aggregated residual sum of squares of a linear regressiondefined by the equation y=mx+b for a series of coordinates represented by paired numbers inx-expression and y-expression iterated over a number of records as defined by a group byclause.
Syntax:LINEST_SSRESID (y_value, x_value[, y0 [, x0 ]])
Script syntax and chart functions - Qlik Sense, February 2022 301
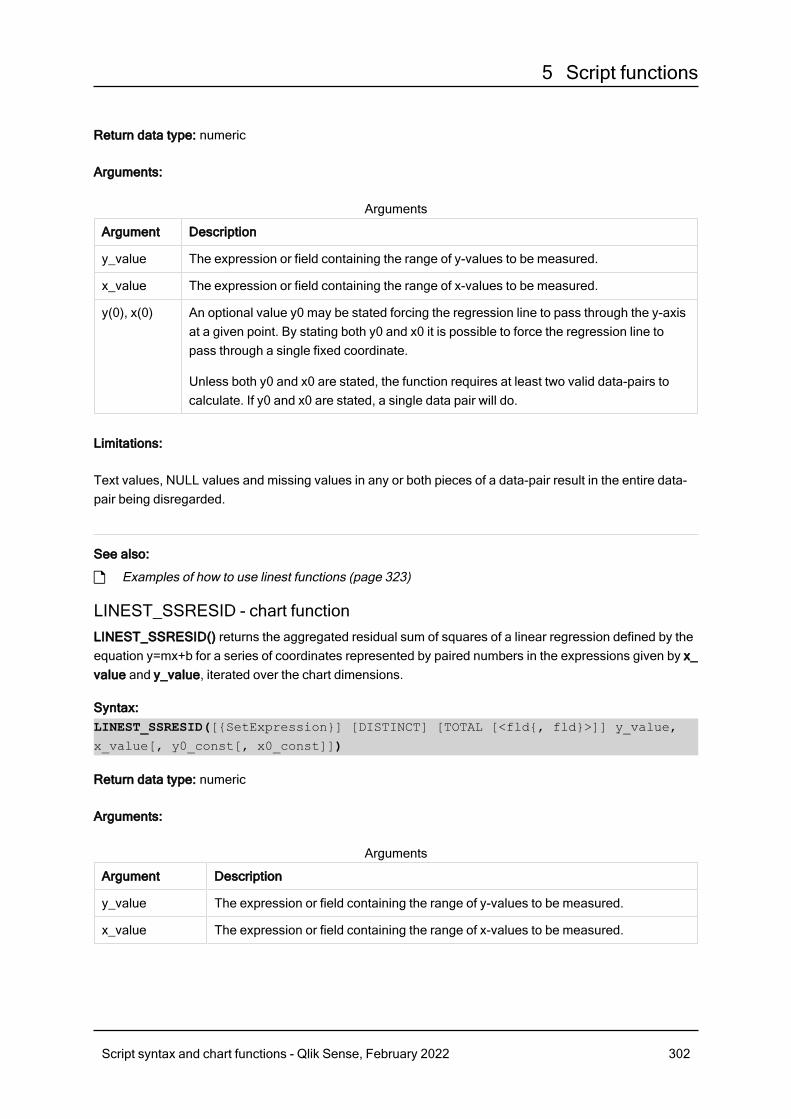
5 Script functions
Return data type: numeric
Arguments:
Argument Description
y_value The expression or field containing the range of y-values to be measured.
x_value The expression or field containing the range of x-values to be measured.
y(0), x(0) An optional value y0 may be stated forcing the regression line to pass through the y-axisat a given point. By stating both y0 and x0 it is possible to force the regression line topass through a single fixed coordinate.
Unless both y0 and x0 are stated, the function requires at least two valid data-pairs tocalculate. If y0 and x0 are stated, a single data pair will do.
Arguments
Limitations:
Text values, NULL values and missing values in any or both pieces of a data-pair result in the entire data-pair being disregarded.
See also:
p Examples of how to use linest functions (page 323)
LINEST_SSRESID - chart functionLINEST_SSRESID() returns the aggregated residual sum of squares of a linear regression defined by theequation y=mx+b for a series of coordinates represented by paired numbers in the expressions given by x_value and y_value, iterated over the chart dimensions.
Syntax:LINEST_SSRESID([{SetExpression}] [DISTINCT] [TOTAL [<fld{, fld}>]] y_value,
x_value[, y0_const[, x0_const]])
Return data type: numeric
Arguments:
Argument Description
y_value The expression or field containing the range of y-values to be measured.
x_value The expression or field containing the range of x-values to be measured.
Arguments
Script syntax and chart functions - Qlik Sense, February 2022 302
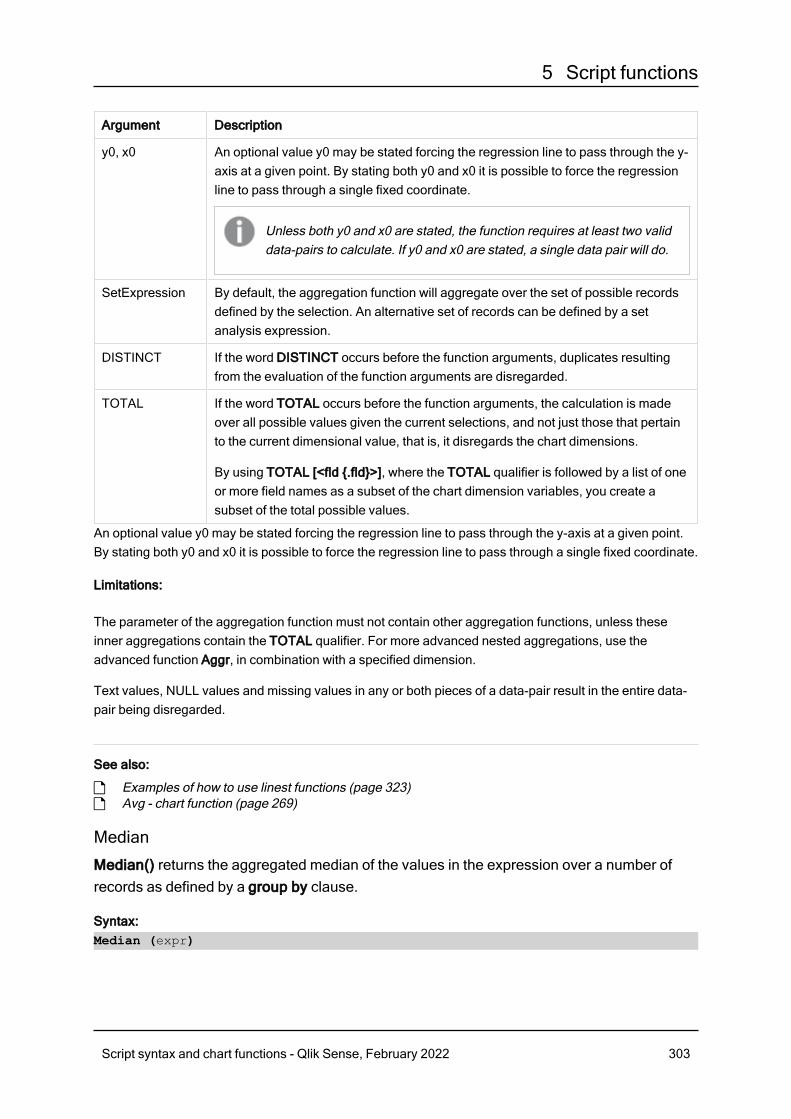
5 Script functions
Argument Description
y0, x0 An optional value y0 may be stated forcing the regression line to pass through the y-axis at a given point. By stating both y0 and x0 it is possible to force the regressionline to pass through a single fixed coordinate.
Unless both y0 and x0 are stated, the function requires at least two validdata-pairs to calculate. If y0 and x0 are stated, a single data pair will do.
SetExpression By default, the aggregation function will aggregate over the set of possible recordsdefined by the selection. An alternative set of records can be defined by a setanalysis expression.
DISTINCT If the word DISTINCT occurs before the function arguments, duplicates resultingfrom the evaluation of the function arguments are disregarded.
TOTAL If the word TOTAL occurs before the function arguments, the calculation is madeover all possible values given the current selections, and not just those that pertainto the current dimensional value, that is, it disregards the chart dimensions.
By using TOTAL [<fld {.fld}>], where the TOTAL qualifier is followed by a list of oneor more field names as a subset of the chart dimension variables, you create asubset of the total possible values.
An optional value y0 may be stated forcing the regression line to pass through the y-axis at a given point.By stating both y0 and x0 it is possible to force the regression line to pass through a single fixed coordinate.
Limitations:
The parameter of the aggregation function must not contain other aggregation functions, unless theseinner aggregations contain the TOTAL qualifier. For more advanced nested aggregations, use theadvanced function Aggr, in combination with a specified dimension.
Text values, NULL values and missing values in any or both pieces of a data-pair result in the entire data-pair being disregarded.
See also:
p Examples of how to use linest functions (page 323)p Avg - chart function (page 269)
Median
Median() returns the aggregated median of the values in the expression over a number ofrecords as defined by a group by clause.
Syntax:Median (expr)
Script syntax and chart functions - Qlik Sense, February 2022 303
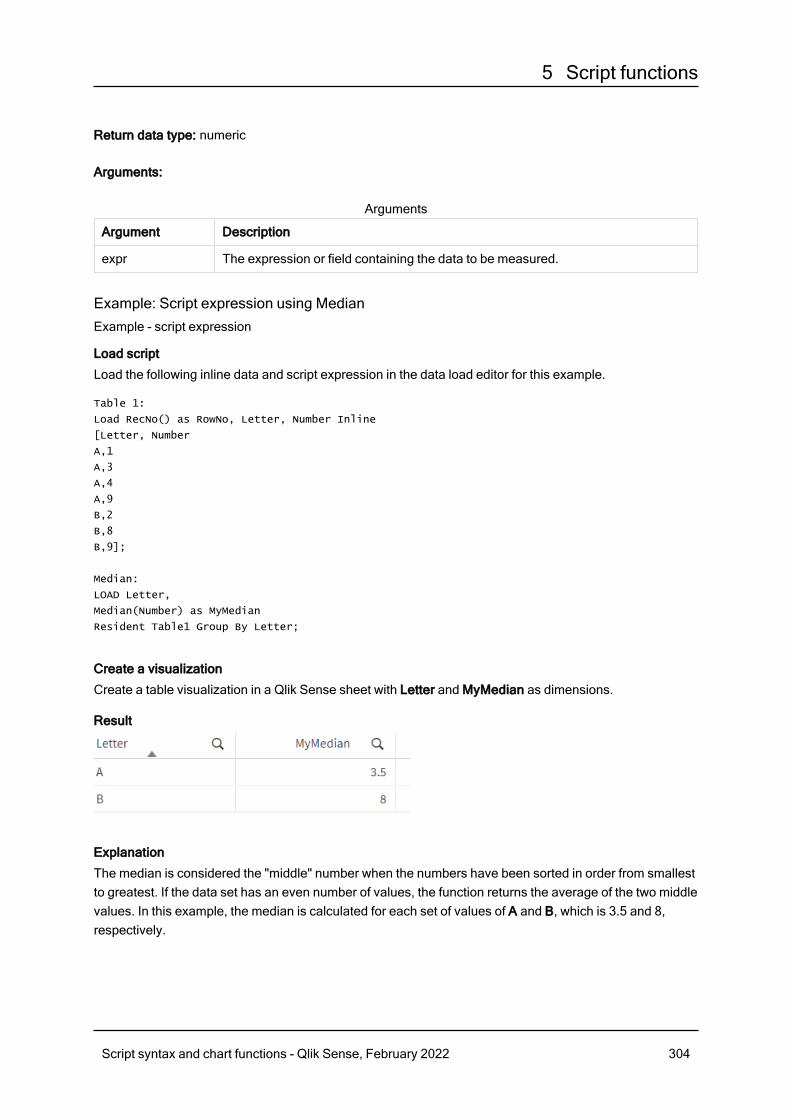
5 Script functions
Return data type: numeric
Arguments:
Argument Description
expr The expression or field containing the data to be measured.
Arguments
Example: Script expression using MedianExample - script expression
Load script
Load the following inline data and script expression in the data load editor for this example.
Table 1:
Load RecNo() as RowNo, Letter, Number Inline
[Letter, Number
A,1
A,3
A,4
A,9
B,2
B,8
B,9];
Median:
LOAD Letter,
Median(Number) as MyMedian
Resident Table1 Group By Letter;
Create a visualization
Create a table visualization in a Qlik Sense sheet with Letter and MyMedian as dimensions.
Result
Explanation
The median is considered the "middle" number when the numbers have been sorted in order from smallestto greatest. If the data set has an even number of values, the function returns the average of the two middlevalues. In this example, the median is calculated for each set of values of A and B, which is 3.5 and 8,respectively.
Script syntax and chart functions - Qlik Sense, February 2022 304
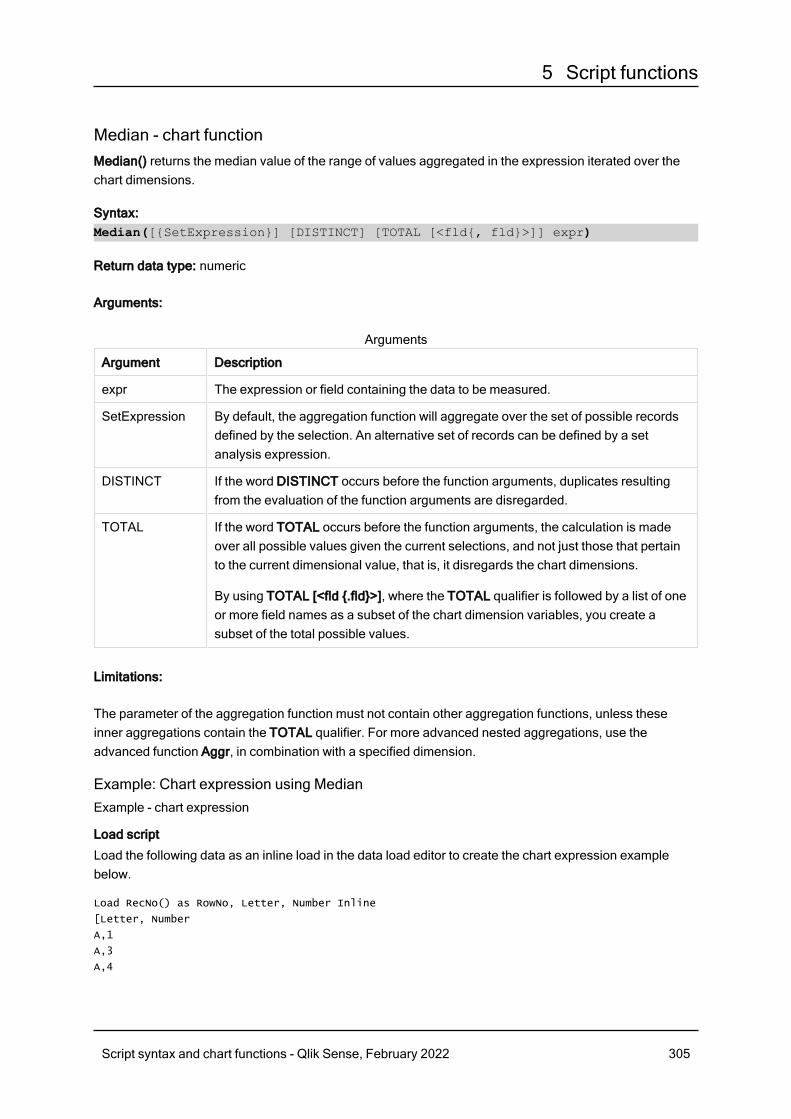
5 Script functions
Median - chart functionMedian() returns the median value of the range of values aggregated in the expression iterated over thechart dimensions.
Syntax:Median([{SetExpression}] [DISTINCT] [TOTAL [<fld{, fld}>]] expr)
Return data type: numeric
Arguments:
Argument Description
expr The expression or field containing the data to be measured.
SetExpression By default, the aggregation function will aggregate over the set of possible recordsdefined by the selection. An alternative set of records can be defined by a setanalysis expression.
DISTINCT If the word DISTINCT occurs before the function arguments, duplicates resultingfrom the evaluation of the function arguments are disregarded.
TOTAL If the word TOTAL occurs before the function arguments, the calculation is madeover all possible values given the current selections, and not just those that pertainto the current dimensional value, that is, it disregards the chart dimensions.
By using TOTAL [<fld {.fld}>], where the TOTAL qualifier is followed by a list of oneor more field names as a subset of the chart dimension variables, you create asubset of the total possible values.
Arguments
Limitations:
The parameter of the aggregation function must not contain other aggregation functions, unless theseinner aggregations contain the TOTAL qualifier. For more advanced nested aggregations, use theadvanced function Aggr, in combination with a specified dimension.
Example: Chart expression using MedianExample - chart expression
Load script
Load the following data as an inline load in the data load editor to create the chart expression examplebelow.
Load RecNo() as RowNo, Letter, Number Inline
[Letter, Number
A,1
A,3
A,4
Script syntax and chart functions - Qlik Sense, February 2022 305
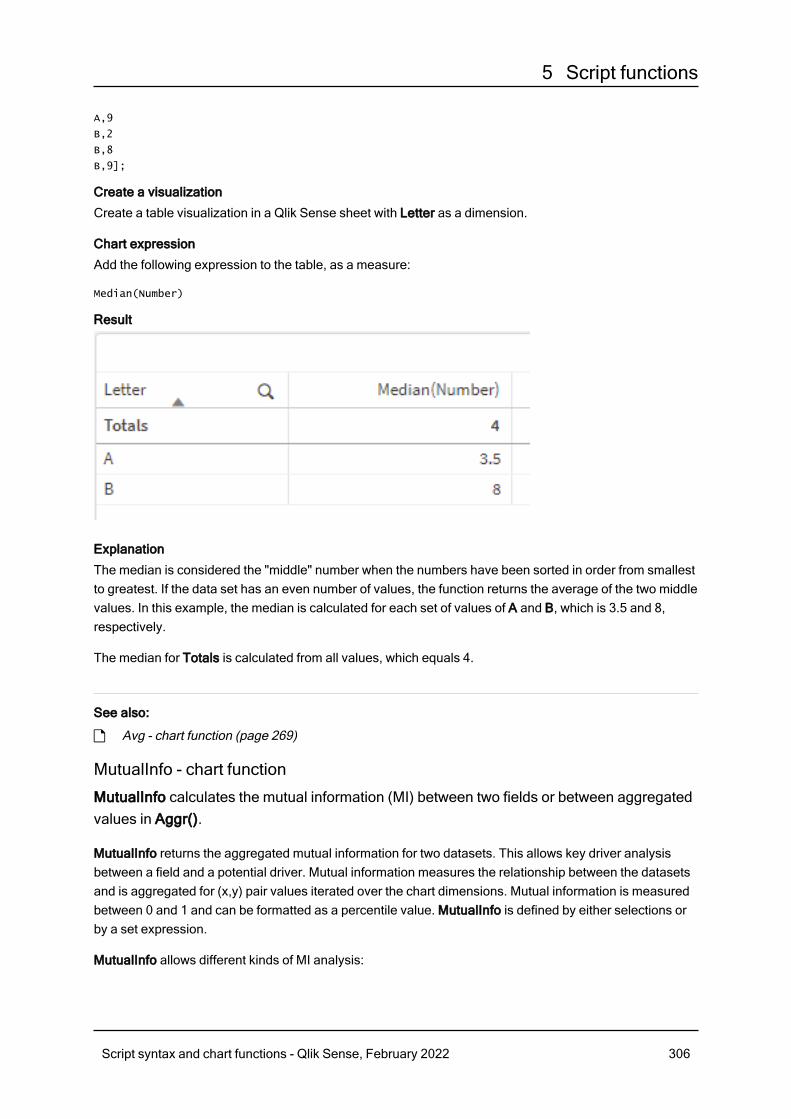
5 Script functions
A,9
B,2
B,8
B,9];
Create a visualization
Create a table visualization in a Qlik Sense sheet with Letter as a dimension.
Chart expression
Add the following expression to the table, as a measure:
Median(Number)
Result
Explanation
The median is considered the "middle" number when the numbers have been sorted in order from smallestto greatest. If the data set has an even number of values, the function returns the average of the two middlevalues. In this example, the median is calculated for each set of values of A and B, which is 3.5 and 8,respectively.
The median for Totals is calculated from all values, which equals 4.
See also:
p Avg - chart function (page 269)
MutualInfo - chart function
MutualInfo calculates the mutual information (MI) between two fields or between aggregatedvalues in Aggr().
MutualInfo returns the aggregated mutual information for two datasets. This allows key driver analysisbetween a field and a potential driver. Mutual information measures the relationship between the datasetsand is aggregated for (x,y) pair values iterated over the chart dimensions. Mutual information is measuredbetween 0 and 1 and can be formatted as a percentile value. MutualInfo is defined by either selections orby a set expression.
MutualInfo allows different kinds of MI analysis:
Script syntax and chart functions - Qlik Sense, February 2022 306
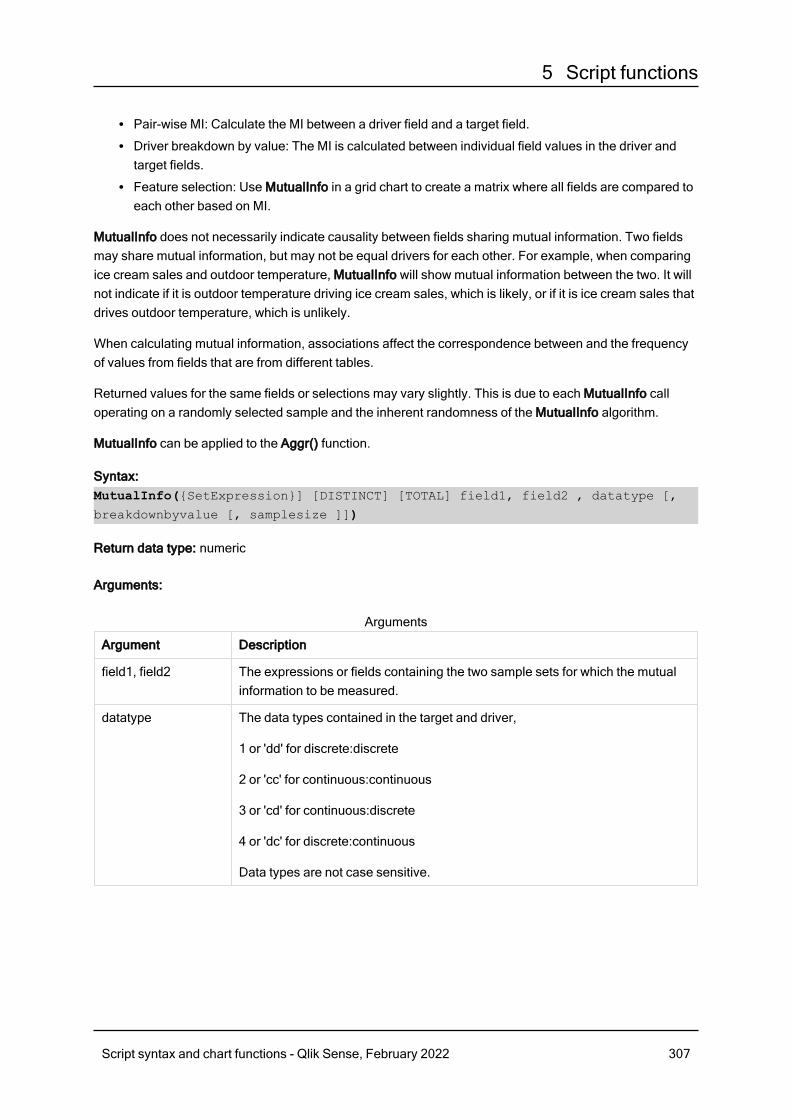
5 Script functions
l Pair-wise MI: Calculate the MI between a driver field and a target field.l Driver breakdown by value: The MI is calculated between individual field values in the driver andtarget fields.
l Feature selection: Use MutualInfo in a grid chart to create a matrix where all fields are compared toeach other based on MI.
MutualInfo does not necessarily indicate causality between fields sharing mutual information. Two fieldsmay share mutual information, but may not be equal drivers for each other. For example, when comparingice cream sales and outdoor temperature, MutualInfo will show mutual information between the two. It willnot indicate if it is outdoor temperature driving ice cream sales, which is likely, or if it is ice cream sales thatdrives outdoor temperature, which is unlikely.
When calculating mutual information, associations affect the correspondence between and the frequencyof values from fields that are from different tables.
Returned values for the same fields or selections may vary slightly. This is due to each MutualInfo calloperating on a randomly selected sample and the inherent randomness of the MutualInfo algorithm.
MutualInfo can be applied to the Aggr() function.
Syntax:MutualInfo({SetExpression}] [DISTINCT] [TOTAL] field1, field2 , datatype [,
breakdownbyvalue [, samplesize ]])
Return data type: numeric
Arguments:
Argument Description
field1, field2 The expressions or fields containing the two sample sets for which the mutualinformation to be measured.
datatype The data types contained in the target and driver,
1 or 'dd' for discrete:discrete
2 or 'cc' for continuous:continuous
3 or 'cd' for continuous:discrete
4 or 'dc' for discrete:continuous
Data types are not case sensitive.
Arguments
Script syntax and chart functions - Qlik Sense, February 2022 307
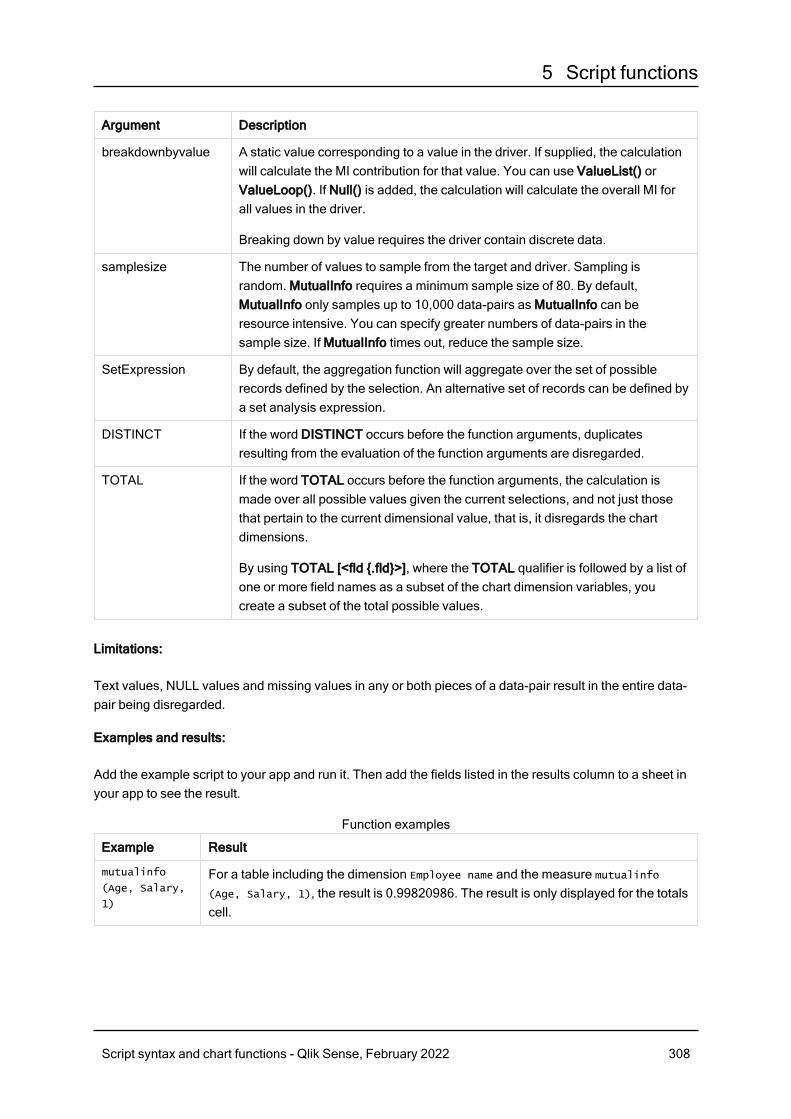
5 Script functions
Argument Description
breakdownbyvalue A static value corresponding to a value in the driver. If supplied, the calculationwill calculate the MI contribution for that value. You can use ValueList() orValueLoop(). If Null() is added, the calculation will calculate the overall MI forall values in the driver.
Breaking down by value requires the driver contain discrete data.
samplesize The number of values to sample from the target and driver. Sampling israndom. MutualInfo requires a minimum sample size of 80. By default,MutualInfo only samples up to 10,000 data-pairs as MutualInfo can beresource intensive. You can specify greater numbers of data-pairs in thesample size. If MutualInfo times out, reduce the sample size.
SetExpression By default, the aggregation function will aggregate over the set of possiblerecords defined by the selection. An alternative set of records can be defined bya set analysis expression.
DISTINCT If the word DISTINCT occurs before the function arguments, duplicatesresulting from the evaluation of the function arguments are disregarded.
TOTAL If the word TOTAL occurs before the function arguments, the calculation ismade over all possible values given the current selections, and not just thosethat pertain to the current dimensional value, that is, it disregards the chartdimensions.
By using TOTAL [<fld {.fld}>], where the TOTAL qualifier is followed by a list ofone or more field names as a subset of the chart dimension variables, youcreate a subset of the total possible values.
Limitations:
Text values, NULL values and missing values in any or both pieces of a data-pair result in the entire data-pair being disregarded.
Examples and results:
Add the example script to your app and run it. Then add the fields listed in the results column to a sheet inyour app to see the result.
Example Result
mutualinfo
(Age, Salary,
1)
For a table including the dimension Employee name and the measure mutualinfo
(Age, Salary, 1), the result is 0.99820986. The result is only displayed for the totalscell.
Function examples
Script syntax and chart functions - Qlik Sense, February 2022 308
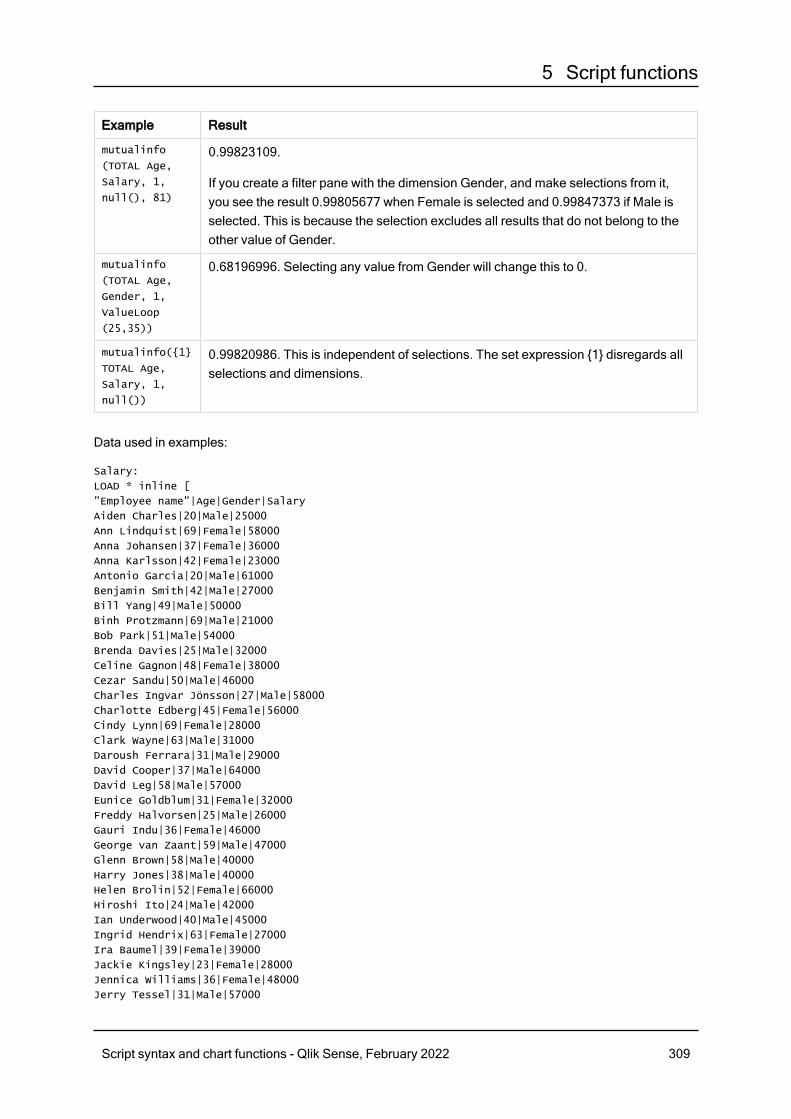
5 Script functions
Example Result
mutualinfo
(TOTAL Age,
Salary, 1,
null(), 81)
0.99823109.
If you create a filter pane with the dimension Gender, and make selections from it,you see the result 0.99805677 when Female is selected and 0.99847373 if Male isselected. This is because the selection excludes all results that do not belong to theother value of Gender.
mutualinfo
(TOTAL Age,
Gender, 1,
ValueLoop
(25,35))
0.68196996. Selecting any value from Gender will change this to 0.
mutualinfo({1}
TOTAL Age,
Salary, 1,
null())
0.99820986. This is independent of selections. The set expression {1} disregards allselections and dimensions.
Data used in examples:
Salary:
LOAD * inline [
"Employee name"|Age|Gender|Salary
Aiden Charles|20|Male|25000
Ann Lindquist|69|Female|58000
Anna Johansen|37|Female|36000
Anna Karlsson|42|Female|23000
Antonio Garcia|20|Male|61000
Benjamin Smith|42|Male|27000
Bill Yang|49|Male|50000
Binh Protzmann|69|Male|21000
Bob Park|51|Male|54000
Brenda Davies|25|Male|32000
Celine Gagnon|48|Female|38000
Cezar Sandu|50|Male|46000
Charles Ingvar Jönsson|27|Male|58000
Charlotte Edberg|45|Female|56000
Cindy Lynn|69|Female|28000
Clark Wayne|63|Male|31000
Daroush Ferrara|31|Male|29000
David Cooper|37|Male|64000
David Leg|58|Male|57000
Eunice Goldblum|31|Female|32000
Freddy Halvorsen|25|Male|26000
Gauri Indu|36|Female|46000
George van Zaant|59|Male|47000
Glenn Brown|58|Male|40000
Harry Jones|38|Male|40000
Helen Brolin|52|Female|66000
Hiroshi Ito|24|Male|42000
Ian Underwood|40|Male|45000
Ingrid Hendrix|63|Female|27000
Ira Baumel|39|Female|39000
Jackie Kingsley|23|Female|28000
Jennica Williams|36|Female|48000
Jerry Tessel|31|Male|57000
Script syntax and chart functions - Qlik Sense, February 2022 309
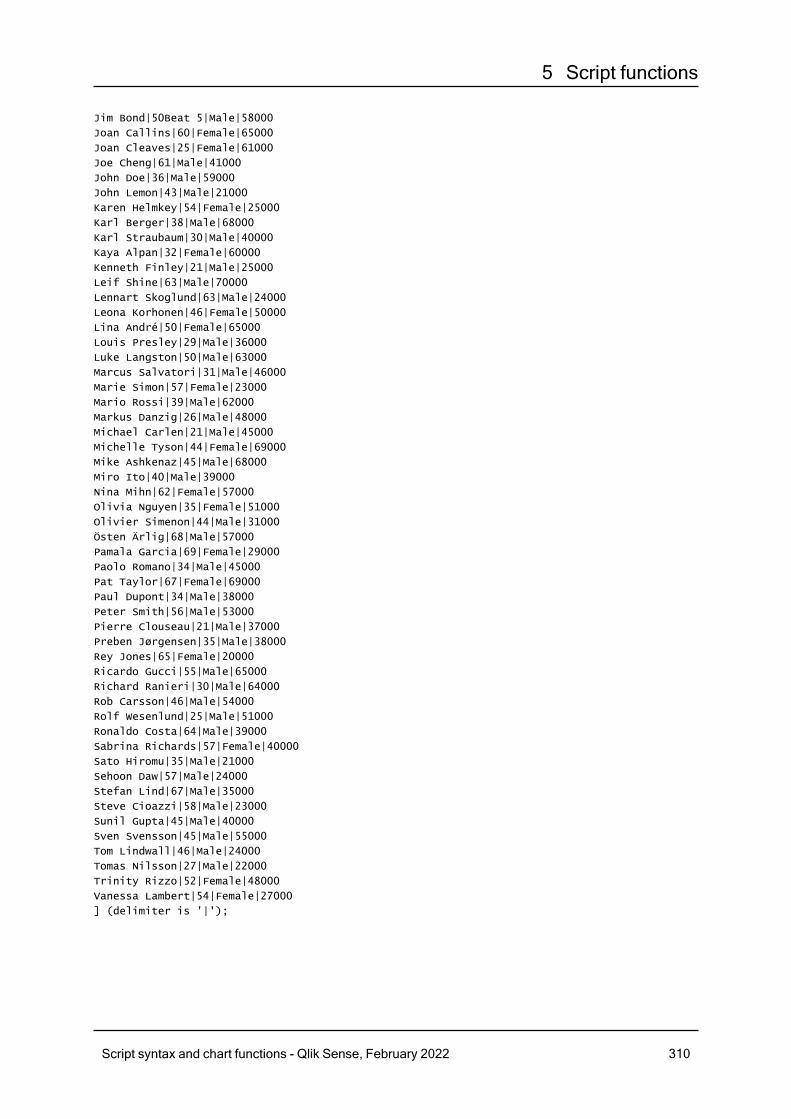
5 Script functions
Jim Bond|50Beat 5|Male|58000
Joan Callins|60|Female|65000
Joan Cleaves|25|Female|61000
Joe Cheng|61|Male|41000
John Doe|36|Male|59000
John Lemon|43|Male|21000
Karen Helmkey|54|Female|25000
Karl Berger|38|Male|68000
Karl Straubaum|30|Male|40000
Kaya Alpan|32|Female|60000
Kenneth Finley|21|Male|25000
Leif Shine|63|Male|70000
Lennart Skoglund|63|Male|24000
Leona Korhonen|46|Female|50000
Lina André|50|Female|65000
Louis Presley|29|Male|36000
Luke Langston|50|Male|63000
Marcus Salvatori|31|Male|46000
Marie Simon|57|Female|23000
Mario Rossi|39|Male|62000
Markus Danzig|26|Male|48000
Michael Carlen|21|Male|45000
Michelle Tyson|44|Female|69000
Mike Ashkenaz|45|Male|68000
Miro Ito|40|Male|39000
Nina Mihn|62|Female|57000
Olivia Nguyen|35|Female|51000
Olivier Simenon|44|Male|31000
Östen Ärlig|68|Male|57000
Pamala Garcia|69|Female|29000
Paolo Romano|34|Male|45000
Pat Taylor|67|Female|69000
Paul Dupont|34|Male|38000
Peter Smith|56|Male|53000
Pierre Clouseau|21|Male|37000
Preben Jørgensen|35|Male|38000
Rey Jones|65|Female|20000
Ricardo Gucci|55|Male|65000
Richard Ranieri|30|Male|64000
Rob Carsson|46|Male|54000
Rolf Wesenlund|25|Male|51000
Ronaldo Costa|64|Male|39000
Sabrina Richards|57|Female|40000
Sato Hiromu|35|Male|21000
Sehoon Daw|57|Male|24000
Stefan Lind|67|Male|35000
Steve Cioazzi|58|Male|23000
Sunil Gupta|45|Male|40000
Sven Svensson|45|Male|55000
Tom Lindwall|46|Male|24000
Tomas Nilsson|27|Male|22000
Trinity Rizzo|52|Female|48000
Vanessa Lambert|54|Female|27000
] (delimiter is '|');
Script syntax and chart functions - Qlik Sense, February 2022 310
5 Script functions
Skew
Skew() returns the skewness of expression over a number of records as defined by a groupby clause.
Syntax:Skew([ distinct] expr)
Return data type: numeric
Arguments:
Argument Description
expr The expression or field containing the data to be measured.
DISTINCT If the word distinct occurs before the expression, all duplicates will be disregarded.
Arguments
Examples and results:
Add the example script to your app and run it. Then build a straight table with Type and MySkew asdimensions.
Script syntax and chart functions - Qlik Sense, February 2022 311
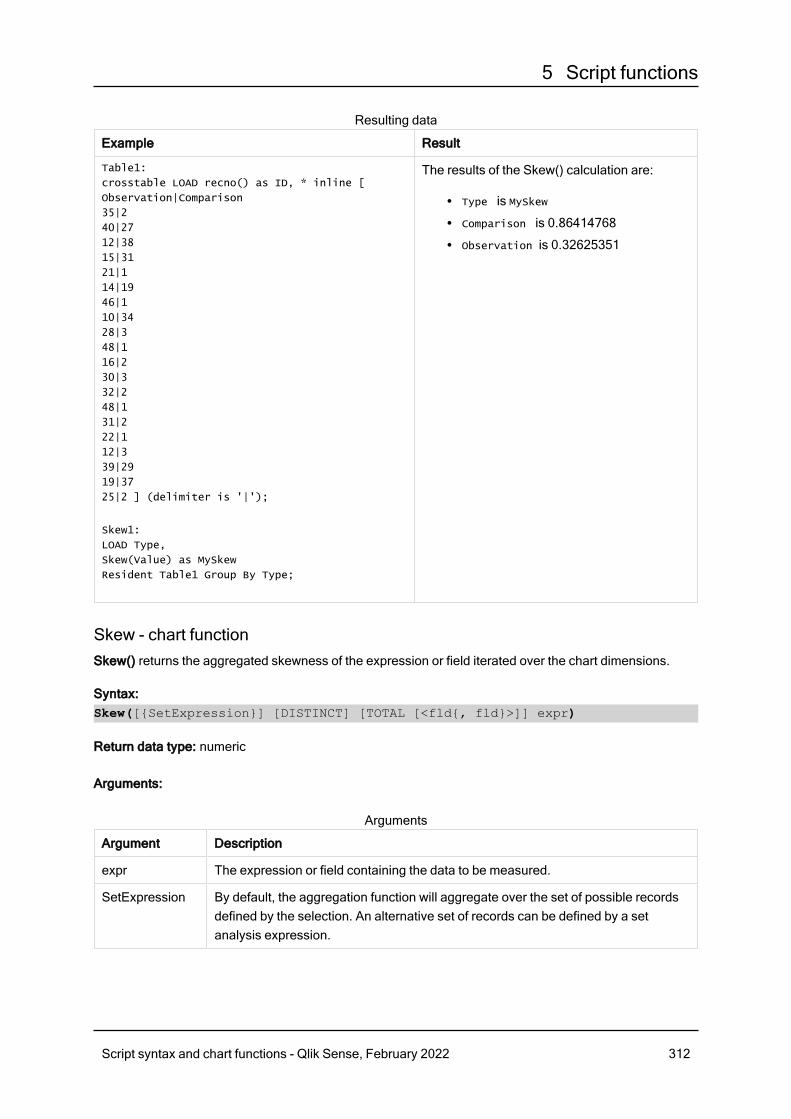
5 Script functions
Example Result
Table1:
crosstable LOAD recno() as ID, * inline [
Observation|Comparison
35|2
40|27
12|38
15|31
21|1
14|19
46|1
10|34
28|3
48|1
16|2
30|3
32|2
48|1
31|2
22|1
12|3
39|29
19|37
25|2 ] (delimiter is '|');
Skew1:
LOAD Type,
Skew(Value) as MySkew
Resident Table1 Group By Type;
The results of the Skew() calculation are:
l Type is MySkewl Comparison is 0.86414768l Observation is 0.32625351
Resulting data
Skew - chart functionSkew() returns the aggregated skewness of the expression or field iterated over the chart dimensions.
Syntax:Skew([{SetExpression}] [DISTINCT] [TOTAL [<fld{, fld}>]] expr)
Return data type: numeric
Arguments:
Argument Description
expr The expression or field containing the data to be measured.
SetExpression By default, the aggregation function will aggregate over the set of possible recordsdefined by the selection. An alternative set of records can be defined by a setanalysis expression.
Arguments
Script syntax and chart functions - Qlik Sense, February 2022 312
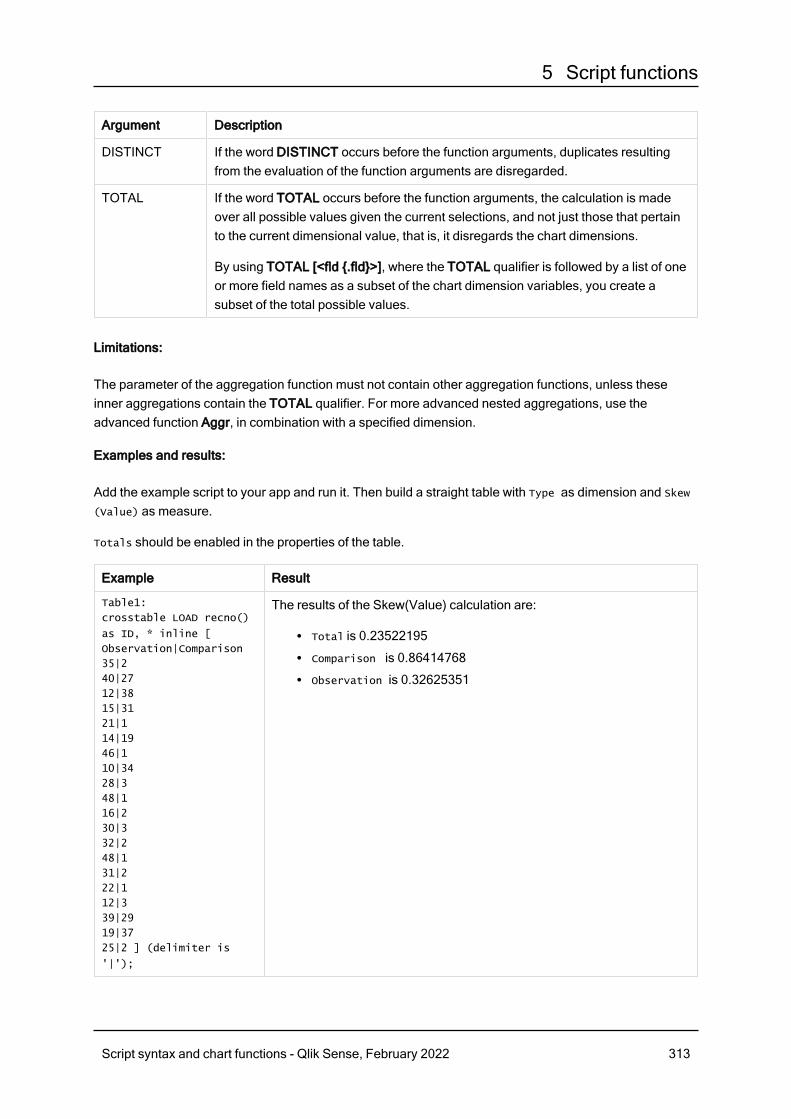
5 Script functions
Argument Description
DISTINCT If the word DISTINCT occurs before the function arguments, duplicates resultingfrom the evaluation of the function arguments are disregarded.
TOTAL If the word TOTAL occurs before the function arguments, the calculation is madeover all possible values given the current selections, and not just those that pertainto the current dimensional value, that is, it disregards the chart dimensions.
By using TOTAL [<fld {.fld}>], where the TOTAL qualifier is followed by a list of oneor more field names as a subset of the chart dimension variables, you create asubset of the total possible values.
Limitations:
The parameter of the aggregation function must not contain other aggregation functions, unless theseinner aggregations contain the TOTAL qualifier. For more advanced nested aggregations, use theadvanced function Aggr, in combination with a specified dimension.
Examples and results:
Add the example script to your app and run it. Then build a straight table with Type as dimension and Skew
(Value) as measure.
Totals should be enabled in the properties of the table.
Example Result
Table1:
crosstable LOAD recno()
as ID, * inline [
Observation|Comparison
35|2
40|27
12|38
15|31
21|1
14|19
46|1
10|34
28|3
48|1
16|2
30|3
32|2
48|1
31|2
22|1
12|3
39|29
19|37
25|2 ] (delimiter is
'|');
The results of the Skew(Value) calculation are:
l Total is 0.23522195l Comparison is 0.86414768l Observation is 0.32625351
Script syntax and chart functions - Qlik Sense, February 2022 313
5 Script functions
See also:
p Avg - chart function (page 269)
Stdev
Stdev() returns the standard deviation of the values given by the expression over a number ofrecords as defined by a group by clause.
Syntax:Stdev([distinct] expr)
Return data type: numeric
Arguments:
Argument Description
expr The expression or field containing the data to be measured.
distinct If the word distinct occurs before the expression, all duplicates will be disregarded.
Arguments
Examples and results:
Add the example script to your app and run it. Then build a straight table with Type and MyStdev asdimensions.
Script syntax and chart functions - Qlik Sense, February 2022 314
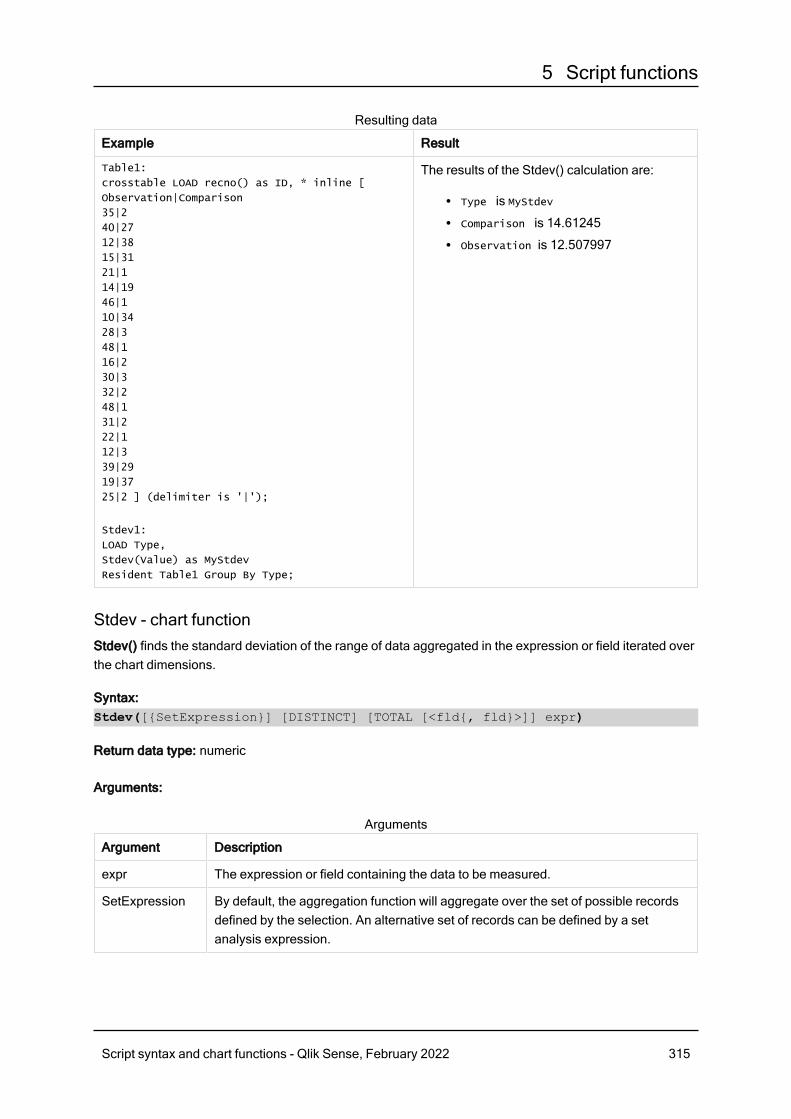
5 Script functions
Example Result
Table1:
crosstable LOAD recno() as ID, * inline [
Observation|Comparison
35|2
40|27
12|38
15|31
21|1
14|19
46|1
10|34
28|3
48|1
16|2
30|3
32|2
48|1
31|2
22|1
12|3
39|29
19|37
25|2 ] (delimiter is '|');
Stdev1:
LOAD Type,
Stdev(Value) as MyStdev
Resident Table1 Group By Type;
The results of the Stdev() calculation are:
l Type is MyStdevl Comparison is 14.61245l Observation is 12.507997
Resulting data
Stdev - chart functionStdev() finds the standard deviation of the range of data aggregated in the expression or field iterated overthe chart dimensions.
Syntax:Stdev([{SetExpression}] [DISTINCT] [TOTAL [<fld{, fld}>]] expr)
Return data type: numeric
Arguments:
Argument Description
expr The expression or field containing the data to be measured.
SetExpression By default, the aggregation function will aggregate over the set of possible recordsdefined by the selection. An alternative set of records can be defined by a setanalysis expression.
Arguments
Script syntax and chart functions - Qlik Sense, February 2022 315
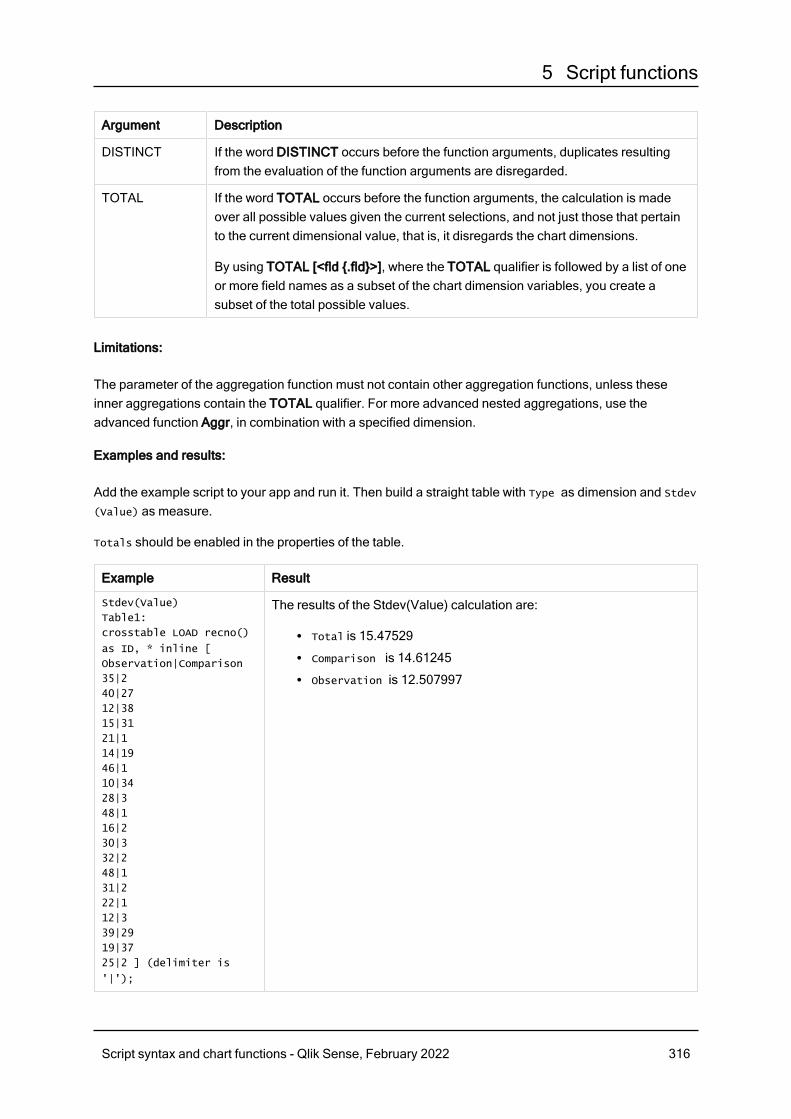
5 Script functions
Argument Description
DISTINCT If the word DISTINCT occurs before the function arguments, duplicates resultingfrom the evaluation of the function arguments are disregarded.
TOTAL If the word TOTAL occurs before the function arguments, the calculation is madeover all possible values given the current selections, and not just those that pertainto the current dimensional value, that is, it disregards the chart dimensions.
By using TOTAL [<fld {.fld}>], where the TOTAL qualifier is followed by a list of oneor more field names as a subset of the chart dimension variables, you create asubset of the total possible values.
Limitations:
The parameter of the aggregation function must not contain other aggregation functions, unless theseinner aggregations contain the TOTAL qualifier. For more advanced nested aggregations, use theadvanced function Aggr, in combination with a specified dimension.
Examples and results:
Add the example script to your app and run it. Then build a straight table with Type as dimension and Stdev
(Value) as measure.
Totals should be enabled in the properties of the table.
Example Result
Stdev(Value)
Table1:
crosstable LOAD recno()
as ID, * inline [
Observation|Comparison
35|2
40|27
12|38
15|31
21|1
14|19
46|1
10|34
28|3
48|1
16|2
30|3
32|2
48|1
31|2
22|1
12|3
39|29
19|37
25|2 ] (delimiter is
'|');
The results of the Stdev(Value) calculation are:
l Total is 15.47529l Comparison is 14.61245l Observation is 12.507997
Script syntax and chart functions - Qlik Sense, February 2022 316
5 Script functions
See also:
p Avg - chart function (page 269)p STEYX - chart function (page 321)
Sterr
Sterr() returns the aggregated standard error (stdev/sqrt(n)) for a series of valuesrepresented by the expression iterated over a number of records as defined by a group byclause.
Syntax:Sterr ([distinct] expr)
Return data type: numeric
Arguments:
Argument Description
expr The expression or field containing the data to be measured.
distinct If the word distinct occurs before the expression, all duplicates will be disregarded.
Arguments
Limitations:
Text values, NULL values and missing values are disregarded.
Examples and results:
Add the example script to your app and run it. Then add the fields listed in the results column to a sheet inyour app to see the result.
Script syntax and chart functions - Qlik Sense, February 2022 317
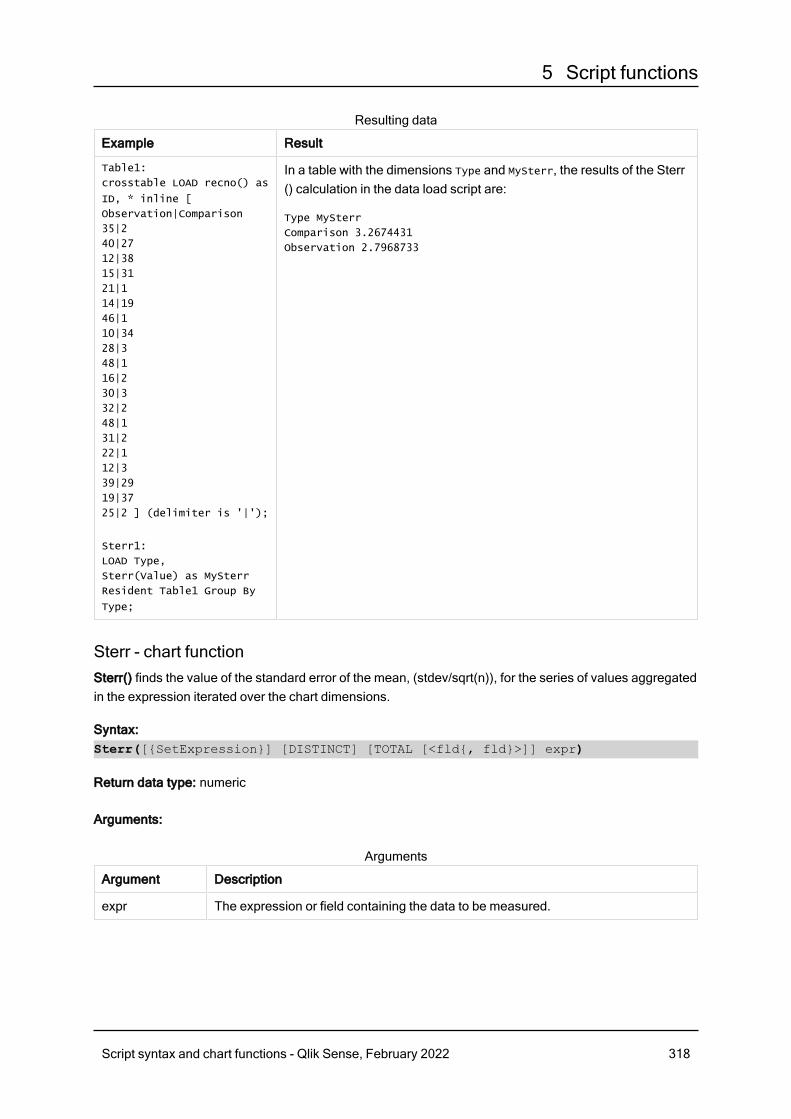
5 Script functions
Example Result
Table1:
crosstable LOAD recno() as
ID, * inline [
Observation|Comparison
35|2
40|27
12|38
15|31
21|1
14|19
46|1
10|34
28|3
48|1
16|2
30|3
32|2
48|1
31|2
22|1
12|3
39|29
19|37
25|2 ] (delimiter is '|');
Sterr1:
LOAD Type,
Sterr(Value) as MySterr
Resident Table1 Group By
Type;
In a table with the dimensions Type and MySterr, the results of the Sterr() calculation in the data load script are:
Type MySterr
Comparison 3.2674431
Observation 2.7968733
Resulting data
Sterr - chart functionSterr() finds the value of the standard error of the mean, (stdev/sqrt(n)), for the series of values aggregatedin the expression iterated over the chart dimensions.
Syntax:Sterr([{SetExpression}] [DISTINCT] [TOTAL [<fld{, fld}>]] expr)
Return data type: numeric
Arguments:
Argument Description
expr The expression or field containing the data to be measured.
Arguments
Script syntax and chart functions - Qlik Sense, February 2022 318
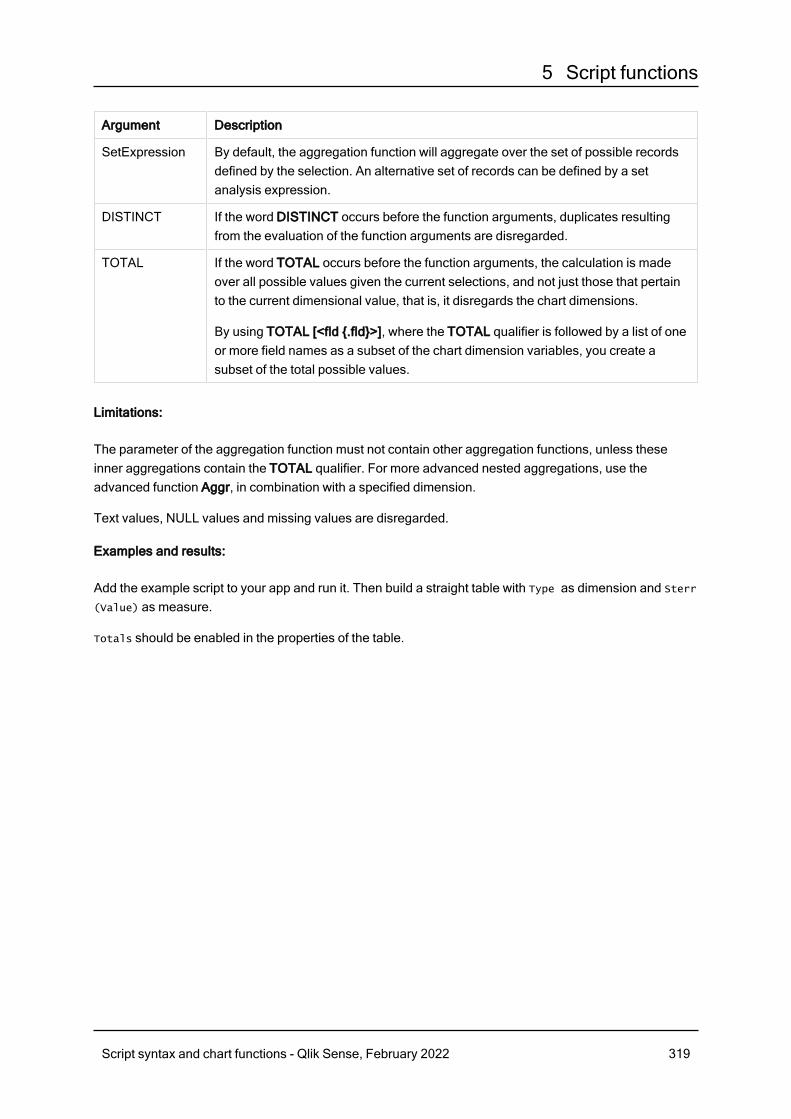
5 Script functions
Argument Description
SetExpression By default, the aggregation function will aggregate over the set of possible recordsdefined by the selection. An alternative set of records can be defined by a setanalysis expression.
DISTINCT If the word DISTINCT occurs before the function arguments, duplicates resultingfrom the evaluation of the function arguments are disregarded.
TOTAL If the word TOTAL occurs before the function arguments, the calculation is madeover all possible values given the current selections, and not just those that pertainto the current dimensional value, that is, it disregards the chart dimensions.
By using TOTAL [<fld {.fld}>], where the TOTAL qualifier is followed by a list of oneor more field names as a subset of the chart dimension variables, you create asubset of the total possible values.
Limitations:
The parameter of the aggregation function must not contain other aggregation functions, unless theseinner aggregations contain the TOTAL qualifier. For more advanced nested aggregations, use theadvanced function Aggr, in combination with a specified dimension.
Text values, NULL values and missing values are disregarded.
Examples and results:
Add the example script to your app and run it. Then build a straight table with Type as dimension and Sterr
(Value) as measure.
Totals should be enabled in the properties of the table.
Script syntax and chart functions - Qlik Sense, February 2022 319
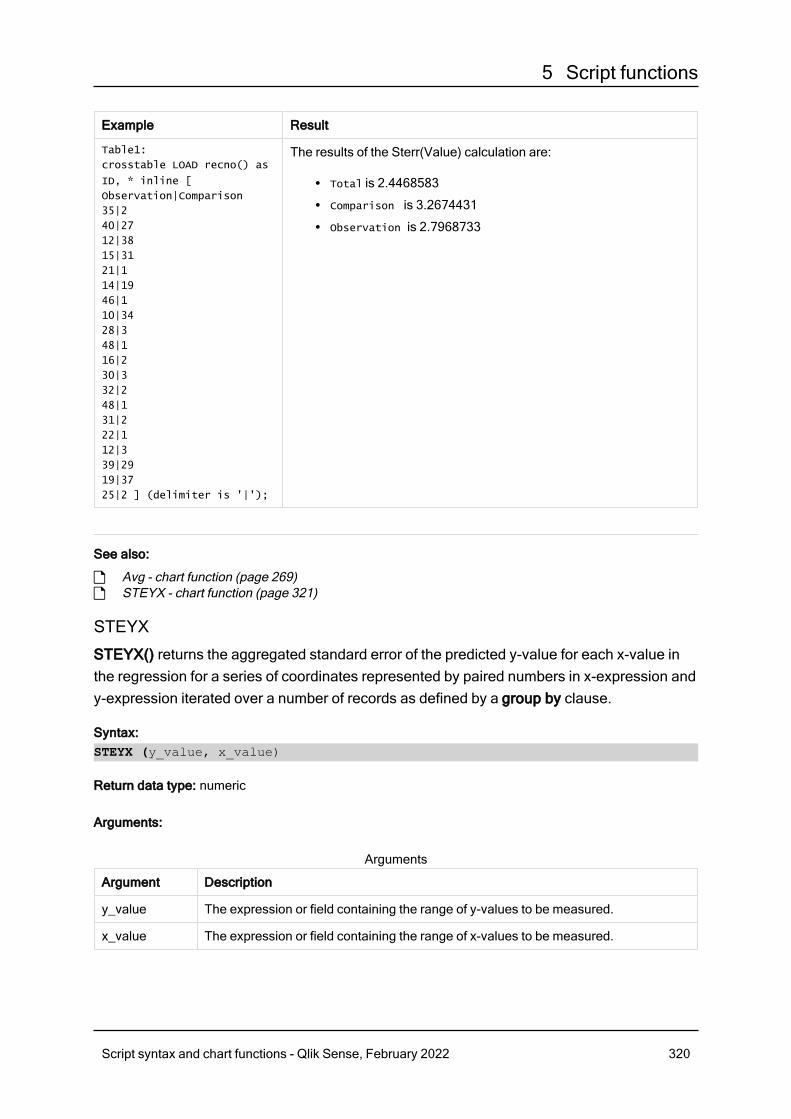
5 Script functions
Example Result
Table1:
crosstable LOAD recno() as
ID, * inline [
Observation|Comparison
35|2
40|27
12|38
15|31
21|1
14|19
46|1
10|34
28|3
48|1
16|2
30|3
32|2
48|1
31|2
22|1
12|3
39|29
19|37
25|2 ] (delimiter is '|');
The results of the Sterr(Value) calculation are:
l Total is 2.4468583l Comparison is 3.2674431l Observation is 2.7968733
See also:
p Avg - chart function (page 269)p STEYX - chart function (page 321)
STEYX
STEYX() returns the aggregated standard error of the predicted y-value for each x-value inthe regression for a series of coordinates represented by paired numbers in x-expression andy-expression iterated over a number of records as defined by a group by clause.
Syntax:STEYX (y_value, x_value)
Return data type: numeric
Arguments:
Argument Description
y_value The expression or field containing the range of y-values to be measured.
x_value The expression or field containing the range of x-values to be measured.
Arguments
Script syntax and chart functions - Qlik Sense, February 2022 320
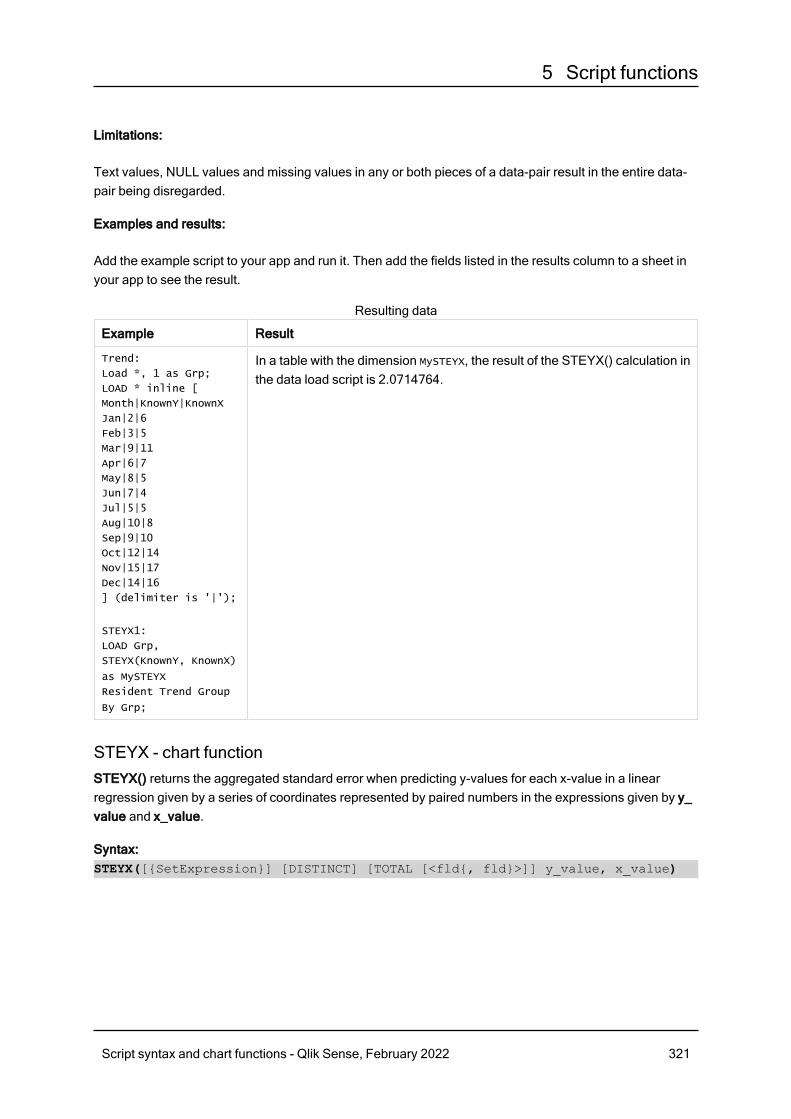
5 Script functions
Limitations:
Text values, NULL values and missing values in any or both pieces of a data-pair result in the entire data-pair being disregarded.
Examples and results:
Add the example script to your app and run it. Then add the fields listed in the results column to a sheet inyour app to see the result.
Example Result
Trend:
Load *, 1 as Grp;
LOAD * inline [
Month|KnownY|KnownX
Jan|2|6
Feb|3|5
Mar|9|11
Apr|6|7
May|8|5
Jun|7|4
Jul|5|5
Aug|10|8
Sep|9|10
Oct|12|14
Nov|15|17
Dec|14|16
] (delimiter is '|');
STEYX1:
LOAD Grp,
STEYX(KnownY, KnownX)
as MySTEYX
Resident Trend Group
By Grp;
In a table with the dimension MySTEYX, the result of the STEYX() calculation inthe data load script is 2.0714764.
Resulting data
STEYX - chart functionSTEYX() returns the aggregated standard error when predicting y-values for each x-value in a linearregression given by a series of coordinates represented by paired numbers in the expressions given by y_value and x_value.
Syntax:STEYX([{SetExpression}] [DISTINCT] [TOTAL [<fld{, fld}>]] y_value, x_value)
Script syntax and chart functions - Qlik Sense, February 2022 321
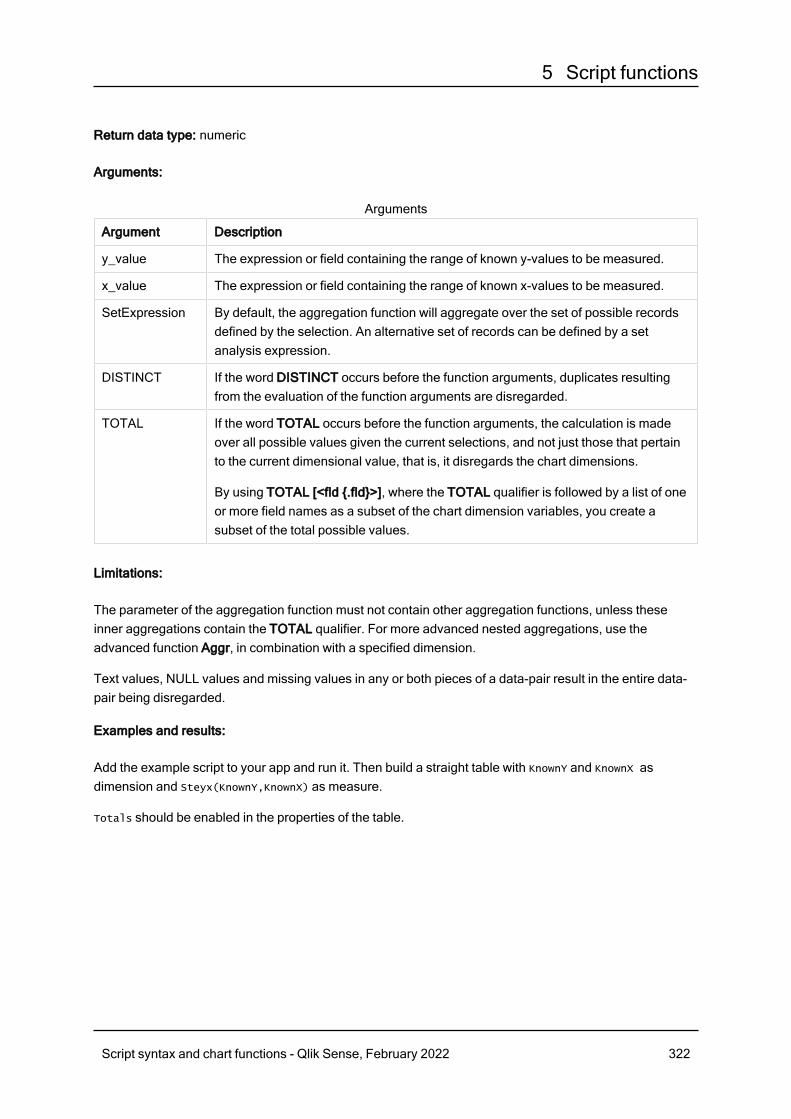
5 Script functions
Return data type: numeric
Arguments:
Argument Description
y_value The expression or field containing the range of known y-values to be measured.
x_value The expression or field containing the range of known x-values to be measured.
SetExpression By default, the aggregation function will aggregate over the set of possible recordsdefined by the selection. An alternative set of records can be defined by a setanalysis expression.
DISTINCT If the word DISTINCT occurs before the function arguments, duplicates resultingfrom the evaluation of the function arguments are disregarded.
TOTAL If the word TOTAL occurs before the function arguments, the calculation is madeover all possible values given the current selections, and not just those that pertainto the current dimensional value, that is, it disregards the chart dimensions.
By using TOTAL [<fld {.fld}>], where the TOTAL qualifier is followed by a list of oneor more field names as a subset of the chart dimension variables, you create asubset of the total possible values.
Arguments
Limitations:
The parameter of the aggregation function must not contain other aggregation functions, unless theseinner aggregations contain the TOTAL qualifier. For more advanced nested aggregations, use theadvanced function Aggr, in combination with a specified dimension.
Text values, NULL values and missing values in any or both pieces of a data-pair result in the entire data-pair being disregarded.
Examples and results:
Add the example script to your app and run it. Then build a straight table with KnownY and KnownX asdimension and Steyx(KnownY,KnownX) as measure.
Totals should be enabled in the properties of the table.
Script syntax and chart functions - Qlik Sense, February 2022 322
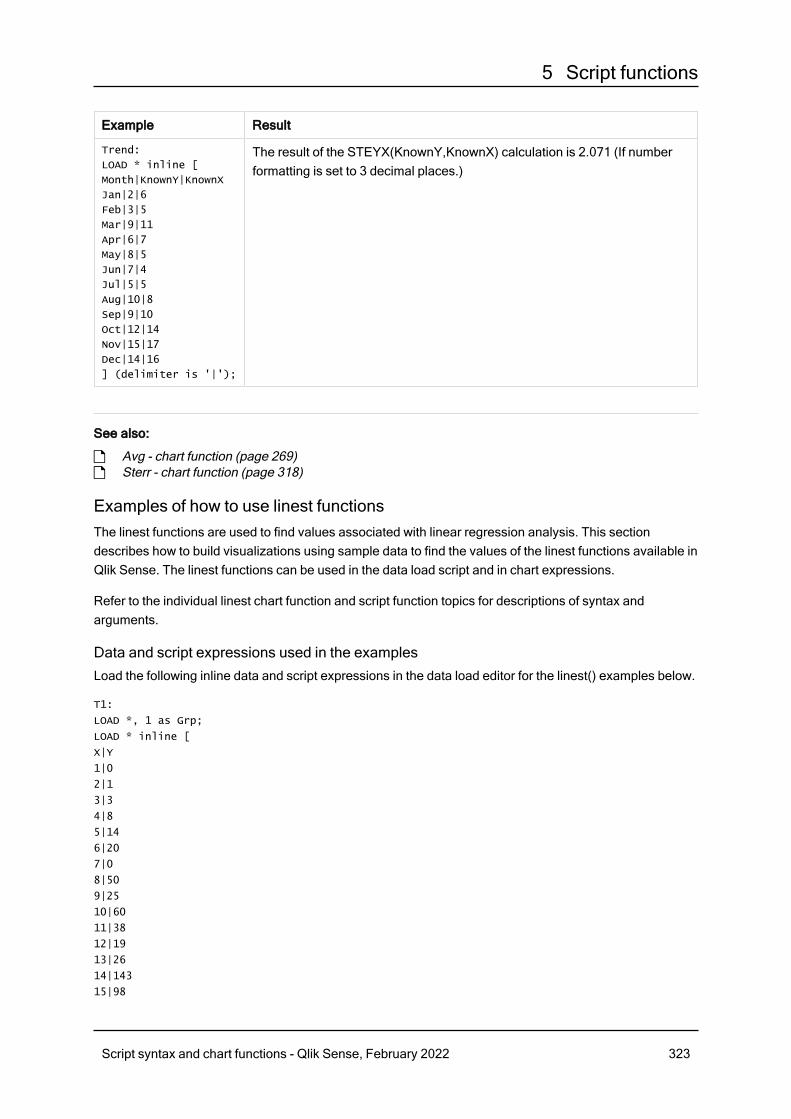
5 Script functions
Example Result
Trend:
LOAD * inline [
Month|KnownY|KnownX
Jan|2|6
Feb|3|5
Mar|9|11
Apr|6|7
May|8|5
Jun|7|4
Jul|5|5
Aug|10|8
Sep|9|10
Oct|12|14
Nov|15|17
Dec|14|16
] (delimiter is '|');
The result of the STEYX(KnownY,KnownX) calculation is 2.071 (If numberformatting is set to 3 decimal places.)
See also:
p Avg - chart function (page 269)p Sterr - chart function (page 318)
Examples of how to use linest functionsThe linest functions are used to find values associated with linear regression analysis. This sectiondescribes how to build visualizations using sample data to find the values of the linest functions available inQlik Sense. The linest functions can be used in the data load script and in chart expressions.
Refer to the individual linest chart function and script function topics for descriptions of syntax andarguments.
Data and script expressions used in the examplesLoad the following inline data and script expressions in the data load editor for the linest() examples below.
T1:
LOAD *, 1 as Grp;
LOAD * inline [
X|Y
1|0
2|1
3|3
4|8
5|14
6|20
7|0
8|50
9|25
10|60
11|38
12|19
13|26
14|143
15|98
Script syntax and chart functions - Qlik Sense, February 2022 323
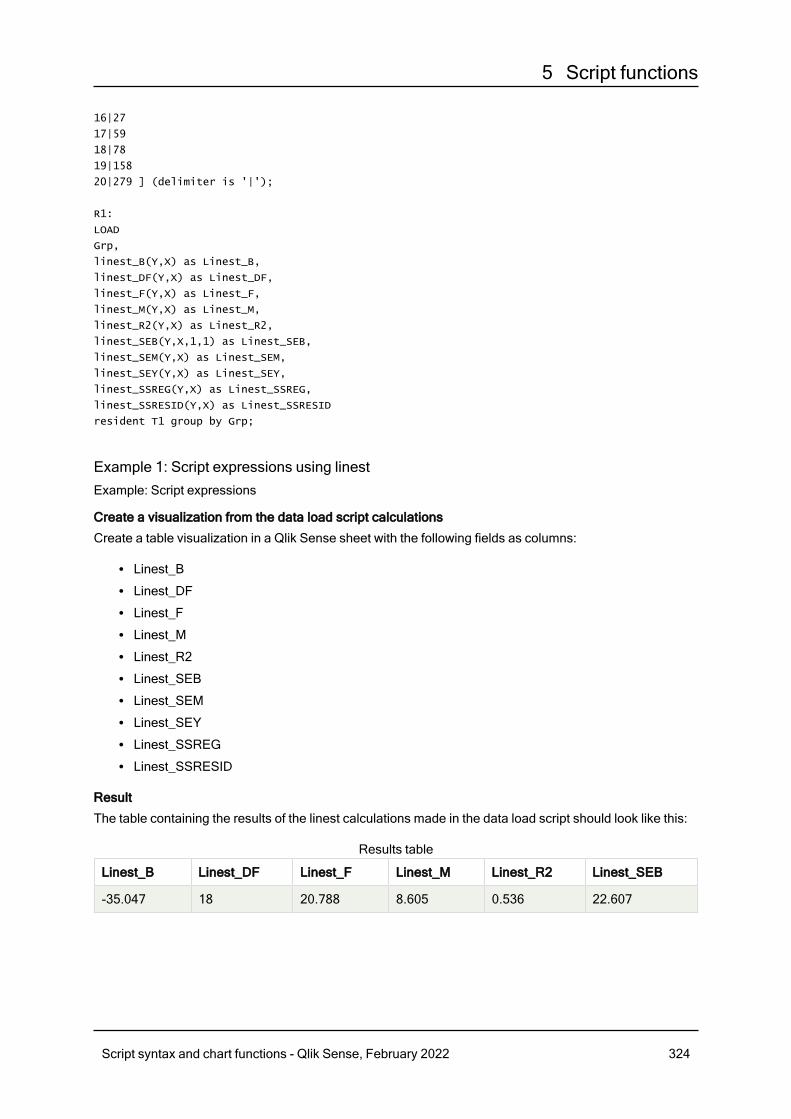
5 Script functions
16|27
17|59
18|78
19|158
20|279 ] (delimiter is '|');
R1:
LOAD
Grp,
linest_B(Y,X) as Linest_B,
linest_DF(Y,X) as Linest_DF,
linest_F(Y,X) as Linest_F,
linest_M(Y,X) as Linest_M,
linest_R2(Y,X) as Linest_R2,
linest_SEB(Y,X,1,1) as Linest_SEB,
linest_SEM(Y,X) as Linest_SEM,
linest_SEY(Y,X) as Linest_SEY,
linest_SSREG(Y,X) as Linest_SSREG,
linest_SSRESID(Y,X) as Linest_SSRESID
resident T1 group by Grp;
Example 1: Script expressions using linestExample: Script expressions
Create a visualization from the data load script calculations
Create a table visualization in a Qlik Sense sheet with the following fields as columns:
l Linest_Bl Linest_DFl Linest_Fl Linest_Ml Linest_R2l Linest_SEBl Linest_SEMl Linest_SEYl Linest_SSREGl Linest_SSRESID
Result
The table containing the results of the linest calculations made in the data load script should look like this:
Linest_B Linest_DF Linest_F Linest_M Linest_R2 Linest_SEB
-35.047 18 20.788 8.605 0.536 22.607
Results table
Script syntax and chart functions - Qlik Sense, February 2022 324
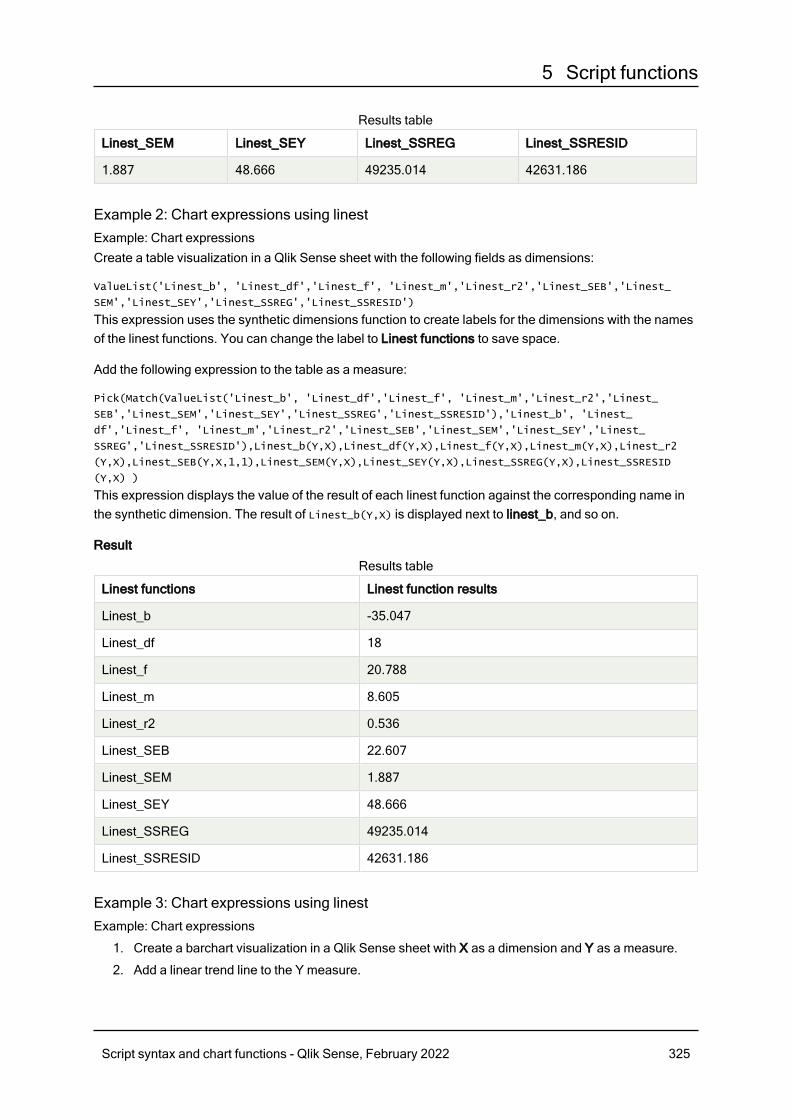
5 Script functions
Linest_SEM Linest_SEY Linest_SSREG Linest_SSRESID
1.887 48.666 49235.014 42631.186
Results table
Example 2: Chart expressions using linestExample: Chart expressionsCreate a table visualization in a Qlik Sense sheet with the following fields as dimensions:
ValueList('Linest_b', 'Linest_df','Linest_f', 'Linest_m','Linest_r2','Linest_SEB','Linest_
SEM','Linest_SEY','Linest_SSREG','Linest_SSRESID')
This expression uses the synthetic dimensions function to create labels for the dimensions with the namesof the linest functions. You can change the label to Linest functions to save space.
Add the following expression to the table as a measure:
Pick(Match(ValueList('Linest_b', 'Linest_df','Linest_f', 'Linest_m','Linest_r2','Linest_
SEB','Linest_SEM','Linest_SEY','Linest_SSREG','Linest_SSRESID'),'Linest_b', 'Linest_
df','Linest_f', 'Linest_m','Linest_r2','Linest_SEB','Linest_SEM','Linest_SEY','Linest_
SSREG','Linest_SSRESID'),Linest_b(Y,X),Linest_df(Y,X),Linest_f(Y,X),Linest_m(Y,X),Linest_r2
(Y,X),Linest_SEB(Y,X,1,1),Linest_SEM(Y,X),Linest_SEY(Y,X),Linest_SSREG(Y,X),Linest_SSRESID
(Y,X) )
This expression displays the value of the result of each linest function against the corresponding name inthe synthetic dimension. The result of Linest_b(Y,X) is displayed next to linest_b, and so on.
Result
Linest functions Linest function results
Linest_b -35.047
Linest_df 18
Linest_f 20.788
Linest_m 8.605
Linest_r2 0.536
Linest_SEB 22.607
Linest_SEM 1.887
Linest_SEY 48.666
Linest_SSREG 49235.014
Linest_SSRESID 42631.186
Results table
Example 3: Chart expressions using linestExample: Chart expressions
1. Create a barchart visualization in a Qlik Sense sheet with X as a dimension and Y as a measure.
2. Add a linear trend line to the Y measure.
Script syntax and chart functions - Qlik Sense, February 2022 325

5 Script functions
3. Add a KPI visualization to the sheet.
1. Add slope as a label for the KPI.
2. Add sum(Linest_M) as an expression for the KPI.
4. Add a second KPI visualization to the sheet.
1. Add intercept as a label for the KPI.
2. Add Sum(Linest_B) as an expression for the KPI.
5. Add a third KPI visualization to the sheet.
1. Add coefficient of determination as a label for the KPI.
2. Add Sum(Linest_R2) as an expression for the KPI.
Result
Explanation
The barchart shows the plotting of the X and Y data. Relevant linest() functions provide values for the linearregression equation that the trend line is based on, namely y = m * x + b. The equation uses the "leastsquares" method to calculate a straight line (trend line) by returning an array that describes a line that bestfits the data.
The KPIs display the results of the linest() functions sum(Linest_M) for slope and sum(Linest_B) for the Yintercept, which are variables in the linear regression equation, and the corresponding aggregated R2value for coefficient of determination.
Statistical test functionsStatistical test functions can be used in both the data load script and chart expressions, butthe syntax differs.
Chi-2 test functionsGenerally used in the study of qualitative variables. One can compare observed frequencies in a one-wayfrequency table with expected frequencies, or study the connection between two variables in a contingencytable.
Script syntax and chart functions - Qlik Sense, February 2022 326
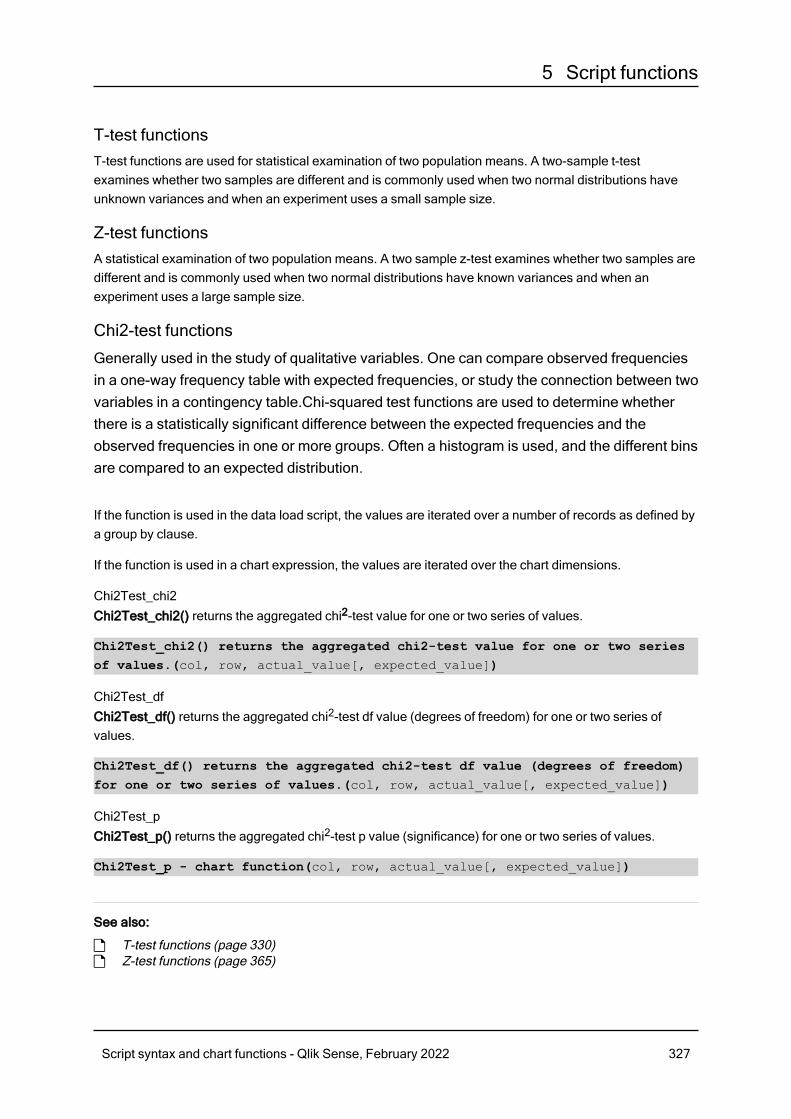
5 Script functions
T-test functionsT-test functions are used for statistical examination of two population means. A two-sample t-testexamines whether two samples are different and is commonly used when two normal distributions haveunknown variances and when an experiment uses a small sample size.
Z-test functionsA statistical examination of two population means. A two sample z-test examines whether two samples aredifferent and is commonly used when two normal distributions have known variances and when anexperiment uses a large sample size.
Chi2-test functions
Generally used in the study of qualitative variables. One can compare observed frequenciesin a one-way frequency table with expected frequencies, or study the connection between twovariables in a contingency table.Chi-squared test functions are used to determine whetherthere is a statistically significant difference between the expected frequencies and theobserved frequencies in one or more groups. Often a histogram is used, and the different binsare compared to an expected distribution.
If the function is used in the data load script, the values are iterated over a number of records as defined bya group by clause.
If the function is used in a chart expression, the values are iterated over the chart dimensions.
Chi2Test_chi2Chi2Test_chi2() returns the aggregated chi2-test value for one or two series of values.
Chi2Test_chi2() returns the aggregated chi2-test value for one or two seriesof values.(col, row, actual_value[, expected_value])
Chi2Test_dfChi2Test_df() returns the aggregated chi2-test df value (degrees of freedom) for one or two series ofvalues.
Chi2Test_df() returns the aggregated chi2-test df value (degrees of freedom)for one or two series of values.(col, row, actual_value[, expected_value])
Chi2Test_pChi2Test_p() returns the aggregated chi2-test p value (significance) for one or two series of values.
Chi2Test_p - chart function(col, row, actual_value[, expected_value])
See also:
p T-test functions (page 330)p Z-test functions (page 365)
Script syntax and chart functions - Qlik Sense, February 2022 327
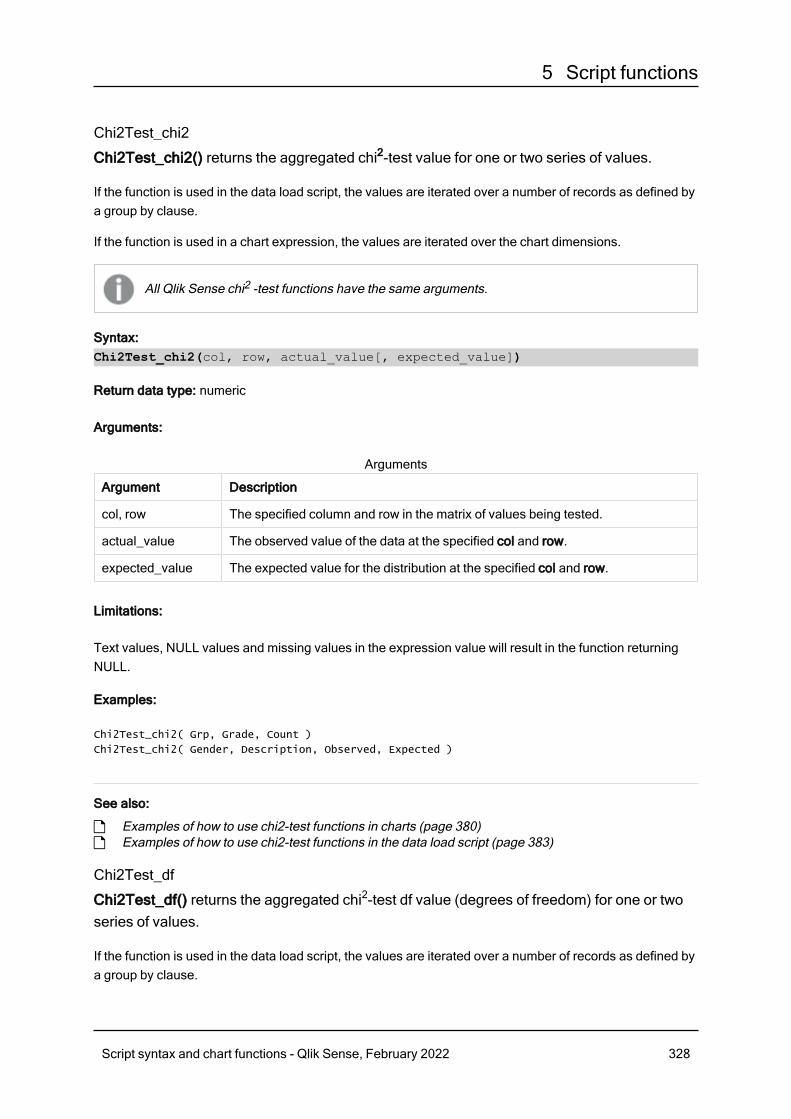
5 Script functions
Chi2Test_chi2
Chi2Test_chi2() returns the aggregated chi2-test value for one or two series of values.
If the function is used in the data load script, the values are iterated over a number of records as defined bya group by clause.
If the function is used in a chart expression, the values are iterated over the chart dimensions.
All Qlik Sense chi2 -test functions have the same arguments.
Syntax:Chi2Test_chi2(col, row, actual_value[, expected_value])
Return data type: numeric
Arguments:
Argument Description
col, row The specified column and row in the matrix of values being tested.
actual_value The observed value of the data at the specified col and row.
expected_value The expected value for the distribution at the specified col and row.
Arguments
Limitations:
Text values, NULL values and missing values in the expression value will result in the function returningNULL.
Examples:
Chi2Test_chi2( Grp, Grade, Count )
Chi2Test_chi2( Gender, Description, Observed, Expected )
See also:
p Examples of how to use chi2-test functions in charts (page 380)p Examples of how to use chi2-test functions in the data load script (page 383)
Chi2Test_df
Chi2Test_df() returns the aggregated chi2-test df value (degrees of freedom) for one or twoseries of values.
If the function is used in the data load script, the values are iterated over a number of records as defined bya group by clause.
Script syntax and chart functions - Qlik Sense, February 2022 328
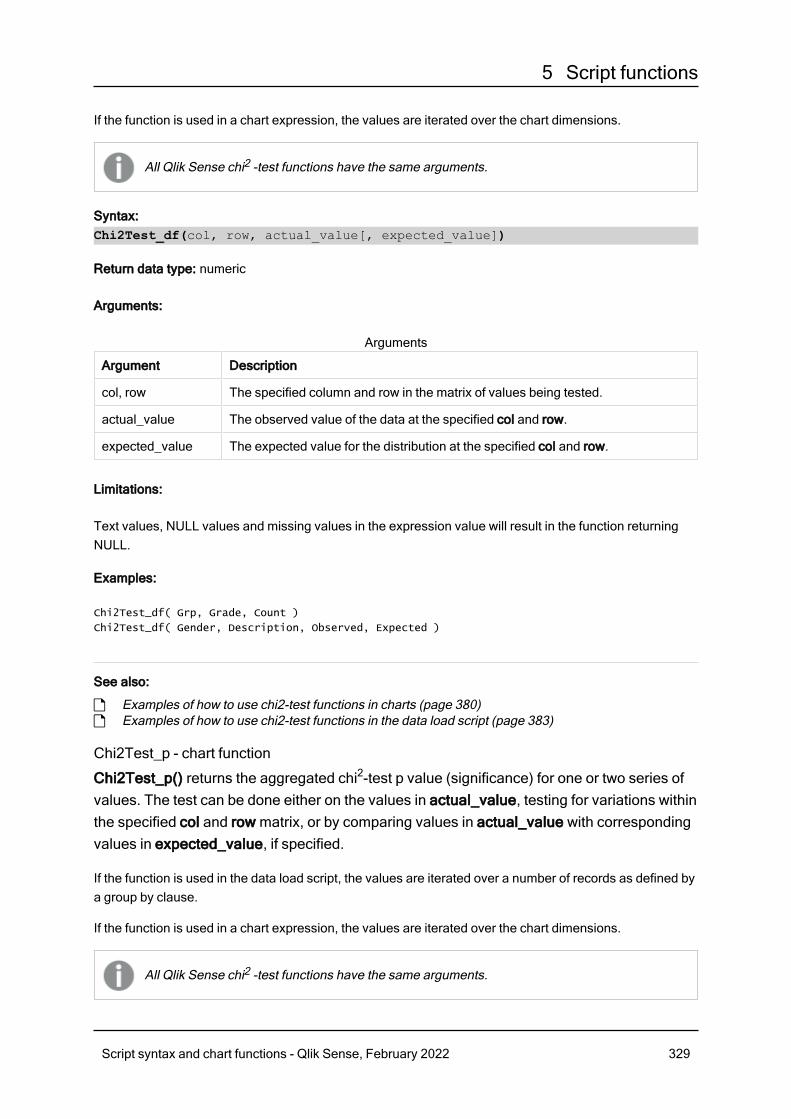
5 Script functions
If the function is used in a chart expression, the values are iterated over the chart dimensions.
All Qlik Sense chi2 -test functions have the same arguments.
Syntax:Chi2Test_df(col, row, actual_value[, expected_value])
Return data type: numeric
Arguments:
Argument Description
col, row The specified column and row in the matrix of values being tested.
actual_value The observed value of the data at the specified col and row.
expected_value The expected value for the distribution at the specified col and row.
Arguments
Limitations:
Text values, NULL values and missing values in the expression value will result in the function returningNULL.
Examples:
Chi2Test_df( Grp, Grade, Count )
Chi2Test_df( Gender, Description, Observed, Expected )
See also:
p Examples of how to use chi2-test functions in charts (page 380)p Examples of how to use chi2-test functions in the data load script (page 383)
Chi2Test_p - chart function
Chi2Test_p() returns the aggregated chi2-test p value (significance) for one or two series ofvalues. The test can be done either on the values in actual_value, testing for variations withinthe specified col and row matrix, or by comparing values in actual_value with correspondingvalues in expected_value, if specified.
If the function is used in the data load script, the values are iterated over a number of records as defined bya group by clause.
If the function is used in a chart expression, the values are iterated over the chart dimensions.
All Qlik Sense chi2 -test functions have the same arguments.
Script syntax and chart functions - Qlik Sense, February 2022 329
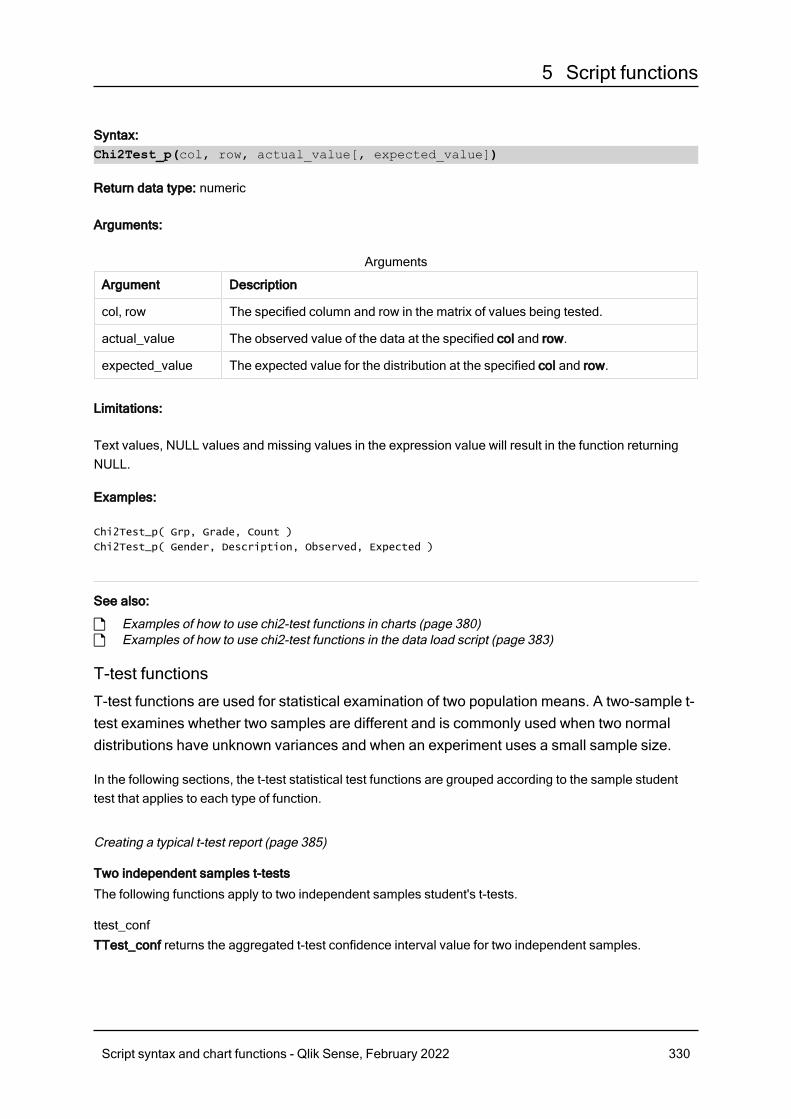
5 Script functions
Syntax:Chi2Test_p(col, row, actual_value[, expected_value])
Return data type: numeric
Arguments:
Argument Description
col, row The specified column and row in the matrix of values being tested.
actual_value The observed value of the data at the specified col and row.
expected_value The expected value for the distribution at the specified col and row.
Arguments
Limitations:
Text values, NULL values and missing values in the expression value will result in the function returningNULL.
Examples:
Chi2Test_p( Grp, Grade, Count )
Chi2Test_p( Gender, Description, Observed, Expected )
See also:
p Examples of how to use chi2-test functions in charts (page 380)p Examples of how to use chi2-test functions in the data load script (page 383)
T-test functions
T-test functions are used for statistical examination of two population means. A two-sample t-test examines whether two samples are different and is commonly used when two normaldistributions have unknown variances and when an experiment uses a small sample size.
In the following sections, the t-test statistical test functions are grouped according to the sample studenttest that applies to each type of function.
Creating a typical t-test report (page 385)
Two independent samples t-tests
The following functions apply to two independent samples student's t-tests.
ttest_confTTest_conf returns the aggregated t-test confidence interval value for two independent samples.
Script syntax and chart functions - Qlik Sense, February 2022 330
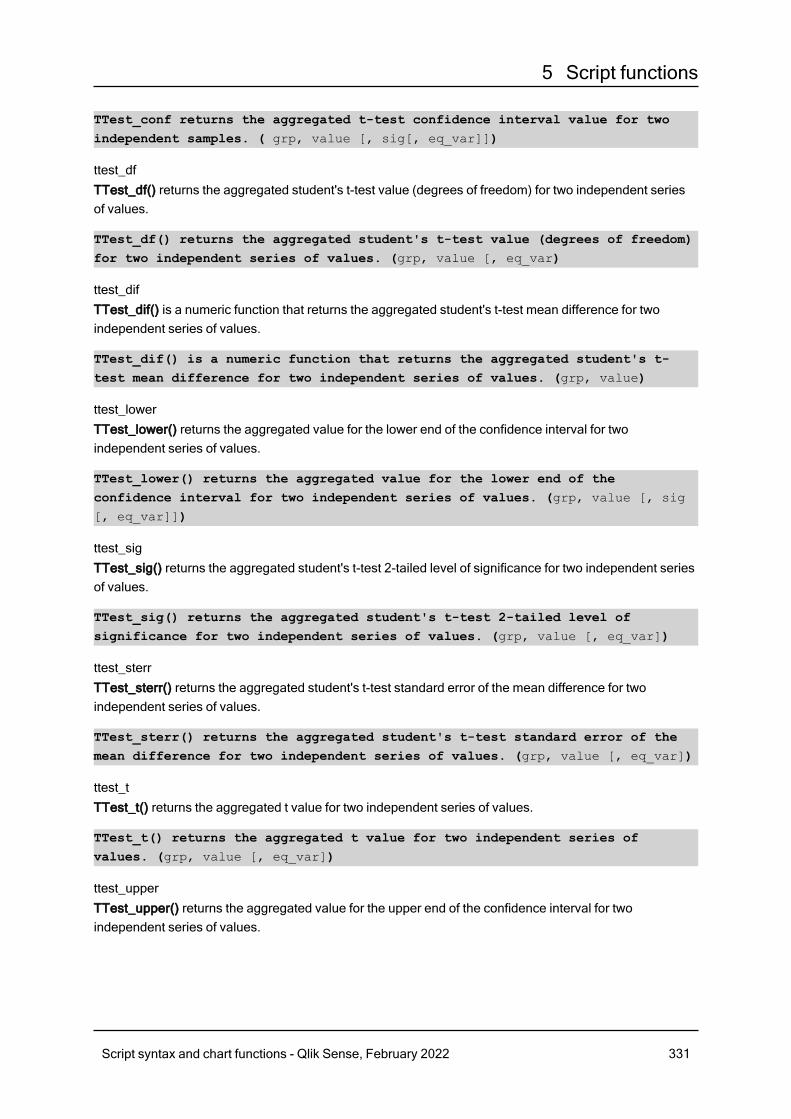
5 Script functions
TTest_conf returns the aggregated t-test confidence interval value for twoindependent samples. ( grp, value [, sig[, eq_var]])
ttest_dfTTest_df() returns the aggregated student's t-test value (degrees of freedom) for two independent seriesof values.
TTest_df() returns the aggregated student's t-test value (degrees of freedom)for two independent series of values. (grp, value [, eq_var)
ttest_difTTest_dif() is a numeric function that returns the aggregated student's t-test mean difference for twoindependent series of values.
TTest_dif() is a numeric function that returns the aggregated student's t-test mean difference for two independent series of values. (grp, value)
ttest_lowerTTest_lower() returns the aggregated value for the lower end of the confidence interval for twoindependent series of values.
TTest_lower() returns the aggregated value for the lower end of theconfidence interval for two independent series of values. (grp, value [, sig
[, eq_var]])
ttest_sigTTest_sig() returns the aggregated student's t-test 2-tailed level of significance for two independent seriesof values.
TTest_sig() returns the aggregated student's t-test 2-tailed level ofsignificance for two independent series of values. (grp, value [, eq_var])
ttest_sterrTTest_sterr() returns the aggregated student's t-test standard error of the mean difference for twoindependent series of values.
TTest_sterr() returns the aggregated student's t-test standard error of themean difference for two independent series of values. (grp, value [, eq_var])
ttest_tTTest_t() returns the aggregated t value for two independent series of values.
TTest_t() returns the aggregated t value for two independent series ofvalues. (grp, value [, eq_var])
ttest_upperTTest_upper() returns the aggregated value for the upper end of the confidence interval for twoindependent series of values.
Script syntax and chart functions - Qlik Sense, February 2022 331
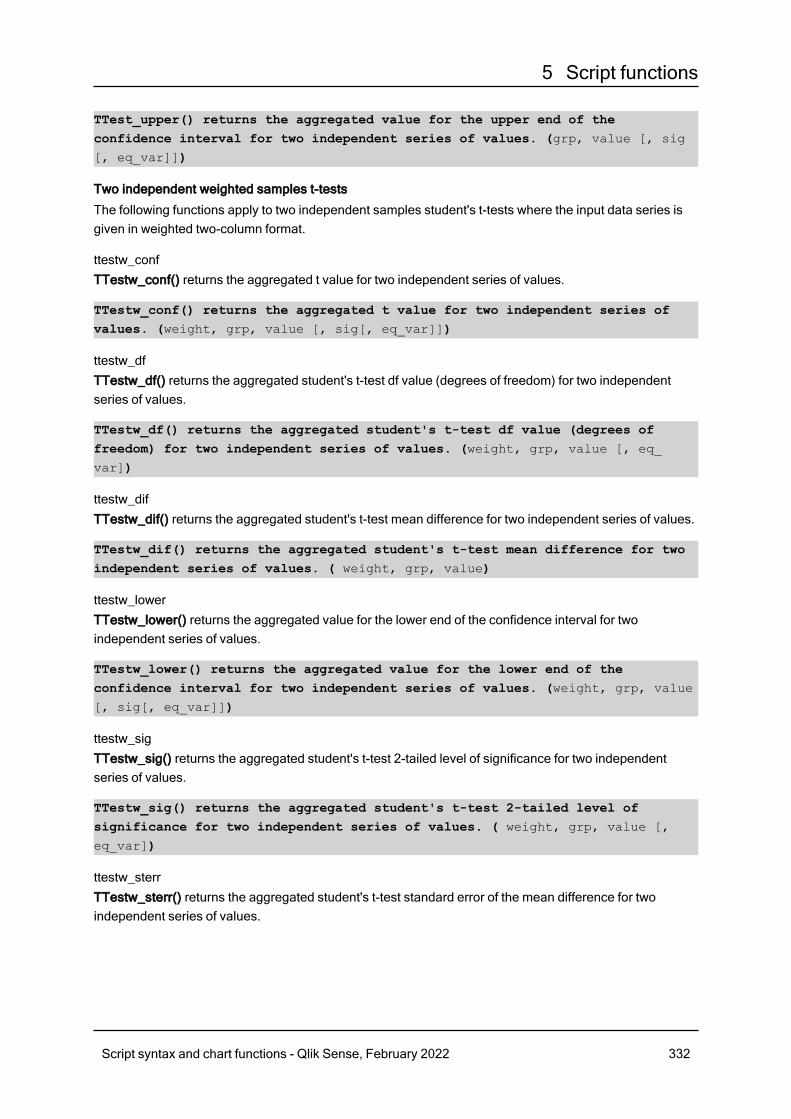
5 Script functions
TTest_upper() returns the aggregated value for the upper end of theconfidence interval for two independent series of values. (grp, value [, sig
[, eq_var]])
Two independent weighted samples t-tests
The following functions apply to two independent samples student's t-tests where the input data series isgiven in weighted two-column format.
ttestw_confTTestw_conf() returns the aggregated t value for two independent series of values.
TTestw_conf() returns the aggregated t value for two independent series ofvalues. (weight, grp, value [, sig[, eq_var]])
ttestw_dfTTestw_df() returns the aggregated student's t-test df value (degrees of freedom) for two independentseries of values.
TTestw_df() returns the aggregated student's t-test df value (degrees offreedom) for two independent series of values. (weight, grp, value [, eq_
var])
ttestw_difTTestw_dif() returns the aggregated student's t-test mean difference for two independent series of values.
TTestw_dif() returns the aggregated student's t-test mean difference for twoindependent series of values. ( weight, grp, value)
ttestw_lowerTTestw_lower() returns the aggregated value for the lower end of the confidence interval for twoindependent series of values.
TTestw_lower() returns the aggregated value for the lower end of theconfidence interval for two independent series of values. (weight, grp, value
[, sig[, eq_var]])
ttestw_sigTTestw_sig() returns the aggregated student's t-test 2-tailed level of significance for two independentseries of values.
TTestw_sig() returns the aggregated student's t-test 2-tailed level ofsignificance for two independent series of values. ( weight, grp, value [,
eq_var])
ttestw_sterrTTestw_sterr() returns the aggregated student's t-test standard error of the mean difference for twoindependent series of values.
Script syntax and chart functions - Qlik Sense, February 2022 332
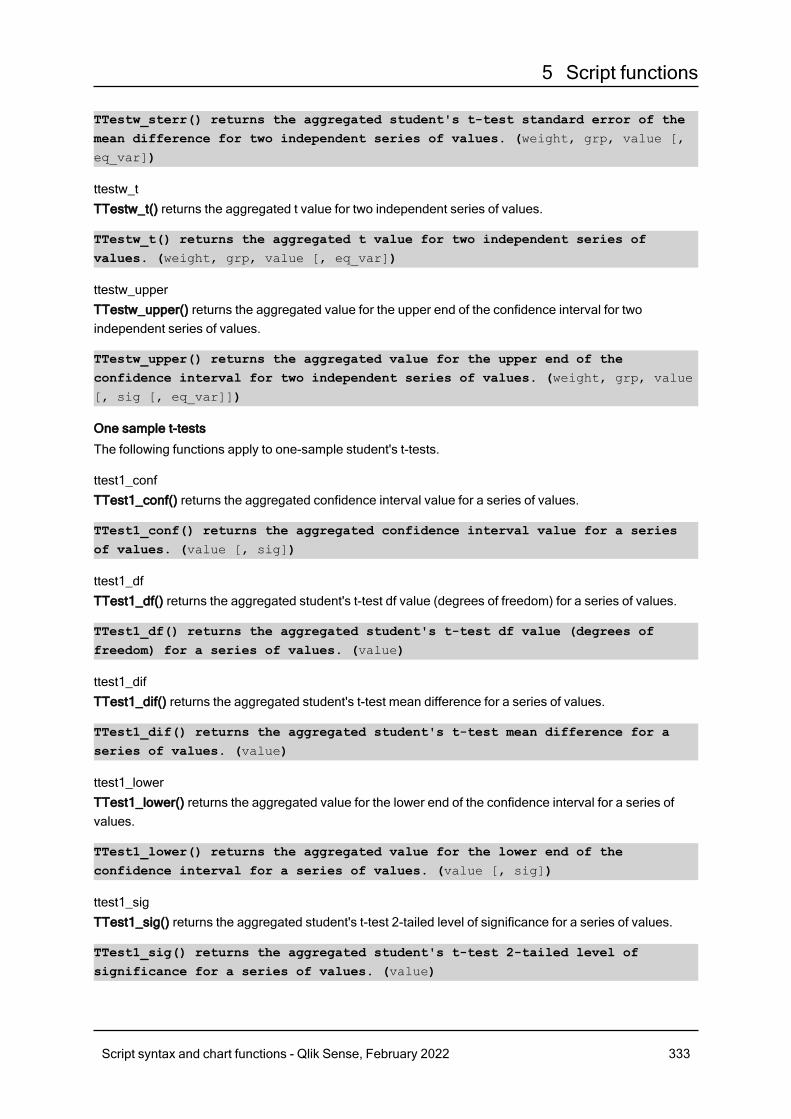
5 Script functions
TTestw_sterr() returns the aggregated student's t-test standard error of themean difference for two independent series of values. (weight, grp, value [,
eq_var])
ttestw_tTTestw_t() returns the aggregated t value for two independent series of values.
TTestw_t() returns the aggregated t value for two independent series ofvalues. (weight, grp, value [, eq_var])
ttestw_upperTTestw_upper() returns the aggregated value for the upper end of the confidence interval for twoindependent series of values.
TTestw_upper() returns the aggregated value for the upper end of theconfidence interval for two independent series of values. (weight, grp, value
[, sig [, eq_var]])
One sample t-tests
The following functions apply to one-sample student's t-tests.
ttest1_confTTest1_conf() returns the aggregated confidence interval value for a series of values.
TTest1_conf() returns the aggregated confidence interval value for a seriesof values. (value [, sig])
ttest1_dfTTest1_df() returns the aggregated student's t-test df value (degrees of freedom) for a series of values.
TTest1_df() returns the aggregated student's t-test df value (degrees offreedom) for a series of values. (value)
ttest1_difTTest1_dif() returns the aggregated student's t-test mean difference for a series of values.
TTest1_dif() returns the aggregated student's t-test mean difference for aseries of values. (value)
ttest1_lowerTTest1_lower() returns the aggregated value for the lower end of the confidence interval for a series ofvalues.
TTest1_lower() returns the aggregated value for the lower end of theconfidence interval for a series of values. (value [, sig])
ttest1_sigTTest1_sig() returns the aggregated student's t-test 2-tailed level of significance for a series of values.
TTest1_sig() returns the aggregated student's t-test 2-tailed level ofsignificance for a series of values. (value)
Script syntax and chart functions - Qlik Sense, February 2022 333
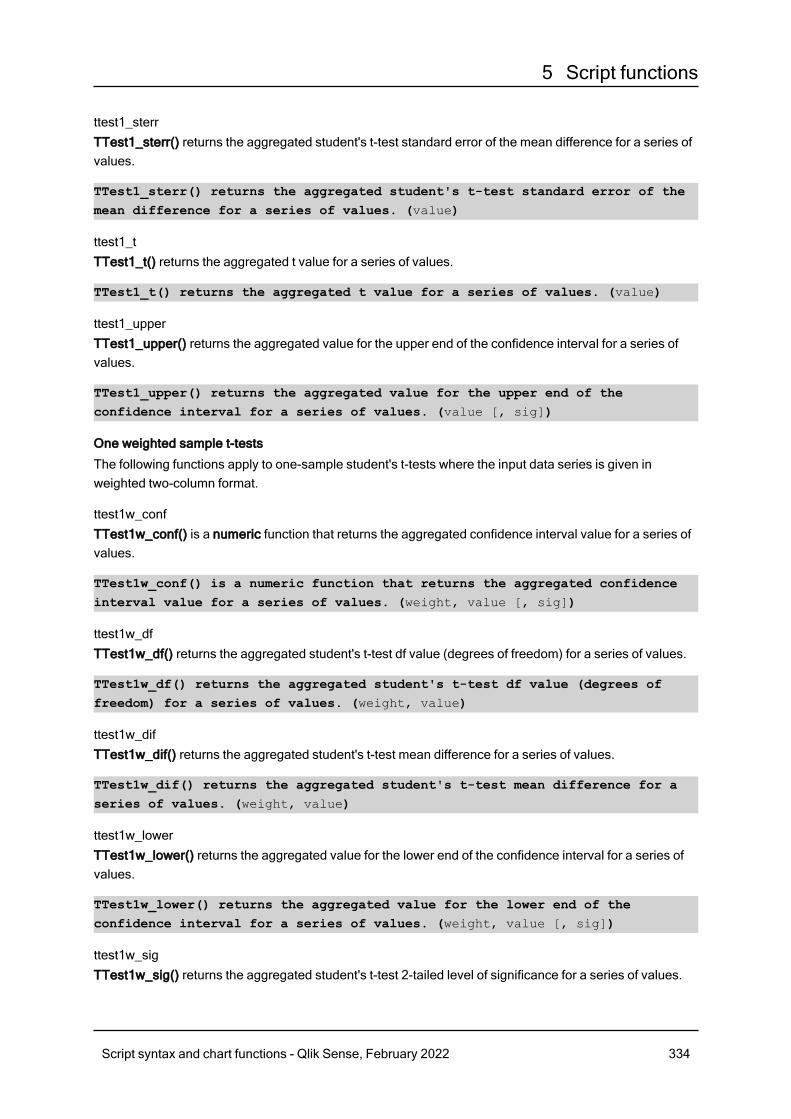
5 Script functions
ttest1_sterrTTest1_sterr() returns the aggregated student's t-test standard error of the mean difference for a series ofvalues.
TTest1_sterr() returns the aggregated student's t-test standard error of themean difference for a series of values. (value)
ttest1_tTTest1_t() returns the aggregated t value for a series of values.
TTest1_t() returns the aggregated t value for a series of values. (value)
ttest1_upperTTest1_upper() returns the aggregated value for the upper end of the confidence interval for a series ofvalues.
TTest1_upper() returns the aggregated value for the upper end of theconfidence interval for a series of values. (value [, sig])
One weighted sample t-tests
The following functions apply to one-sample student's t-tests where the input data series is given inweighted two-column format.
ttest1w_confTTest1w_conf() is a numeric function that returns the aggregated confidence interval value for a series ofvalues.
TTest1w_conf() is a numeric function that returns the aggregated confidenceinterval value for a series of values. (weight, value [, sig])
ttest1w_dfTTest1w_df() returns the aggregated student's t-test df value (degrees of freedom) for a series of values.
TTest1w_df() returns the aggregated student's t-test df value (degrees offreedom) for a series of values. (weight, value)
ttest1w_difTTest1w_dif() returns the aggregated student's t-test mean difference for a series of values.
TTest1w_dif() returns the aggregated student's t-test mean difference for aseries of values. (weight, value)
ttest1w_lowerTTest1w_lower() returns the aggregated value for the lower end of the confidence interval for a series ofvalues.
TTest1w_lower() returns the aggregated value for the lower end of theconfidence interval for a series of values. (weight, value [, sig])
ttest1w_sigTTest1w_sig() returns the aggregated student's t-test 2-tailed level of significance for a series of values.
Script syntax and chart functions - Qlik Sense, February 2022 334
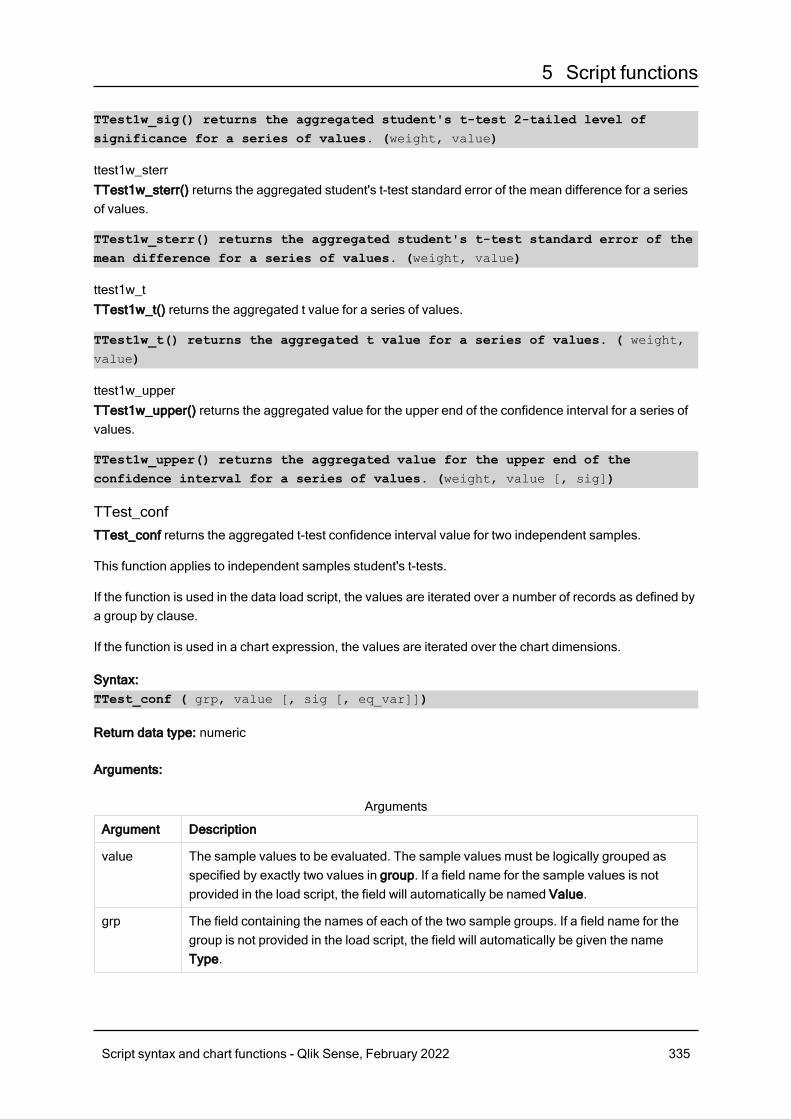
5 Script functions
TTest1w_sig() returns the aggregated student's t-test 2-tailed level ofsignificance for a series of values. (weight, value)
ttest1w_sterrTTest1w_sterr() returns the aggregated student's t-test standard error of the mean difference for a seriesof values.
TTest1w_sterr() returns the aggregated student's t-test standard error of themean difference for a series of values. (weight, value)
ttest1w_tTTest1w_t() returns the aggregated t value for a series of values.
TTest1w_t() returns the aggregated t value for a series of values. ( weight,
value)
ttest1w_upperTTest1w_upper() returns the aggregated value for the upper end of the confidence interval for a series ofvalues.
TTest1w_upper() returns the aggregated value for the upper end of theconfidence interval for a series of values. (weight, value [, sig])
TTest_confTTest_conf returns the aggregated t-test confidence interval value for two independent samples.
This function applies to independent samples student's t-tests.
If the function is used in the data load script, the values are iterated over a number of records as defined bya group by clause.
If the function is used in a chart expression, the values are iterated over the chart dimensions.
Syntax:TTest_conf ( grp, value [, sig [, eq_var]])
Return data type: numeric
Arguments:
Argument Description
value The sample values to be evaluated. The sample values must be logically grouped asspecified by exactly two values in group. If a field name for the sample values is notprovided in the load script, the field will automatically be named Value.
grp The field containing the names of each of the two sample groups. If a field name for thegroup is not provided in the load script, the field will automatically be given the nameType.
Arguments
Script syntax and chart functions - Qlik Sense, February 2022 335
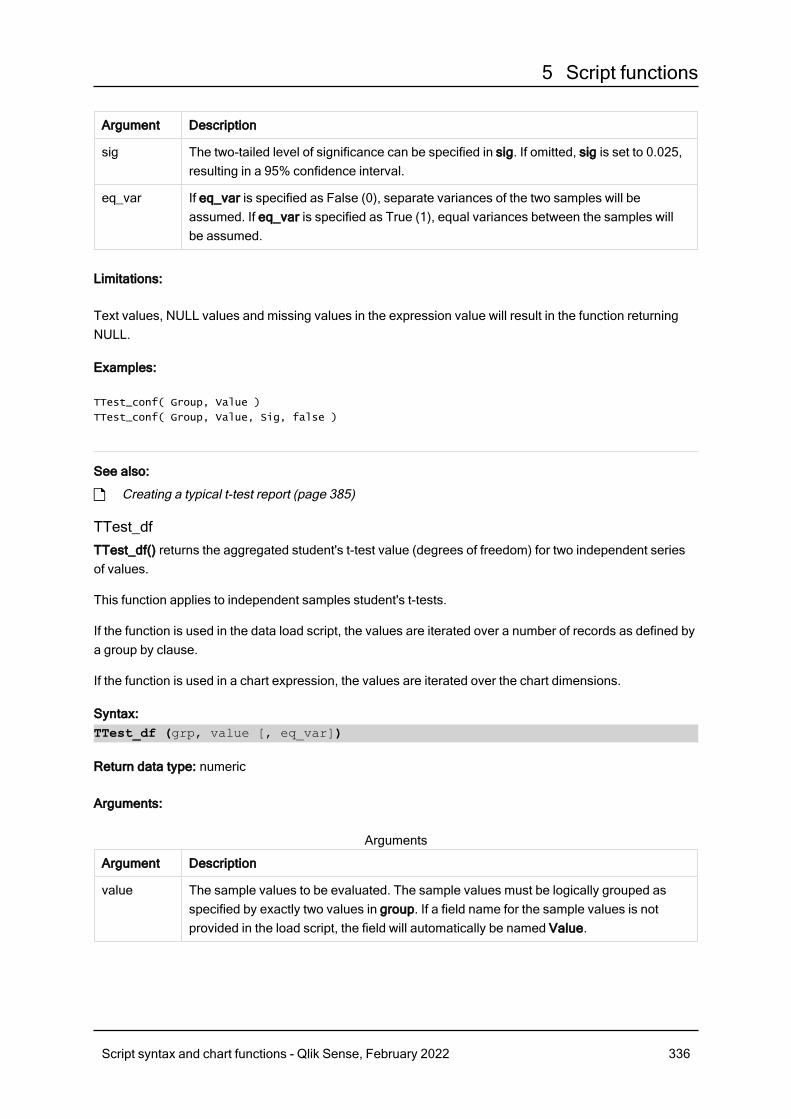
5 Script functions
Argument Description
sig The two-tailed level of significance can be specified in sig. If omitted, sig is set to 0.025,resulting in a 95% confidence interval.
eq_var If eq_var is specified as False (0), separate variances of the two samples will beassumed. If eq_var is specified as True (1), equal variances between the samples willbe assumed.
Limitations:
Text values, NULL values and missing values in the expression value will result in the function returningNULL.
Examples:
TTest_conf( Group, Value )
TTest_conf( Group, Value, Sig, false )
See also:
p Creating a typical t-test report (page 385)
TTest_dfTTest_df() returns the aggregated student's t-test value (degrees of freedom) for two independent seriesof values.
This function applies to independent samples student's t-tests.
If the function is used in the data load script, the values are iterated over a number of records as defined bya group by clause.
If the function is used in a chart expression, the values are iterated over the chart dimensions.
Syntax:TTest_df (grp, value [, eq_var])
Return data type: numeric
Arguments:
Argument Description
value The sample values to be evaluated. The sample values must be logically grouped asspecified by exactly two values in group. If a field name for the sample values is notprovided in the load script, the field will automatically be named Value.
Arguments
Script syntax and chart functions - Qlik Sense, February 2022 336
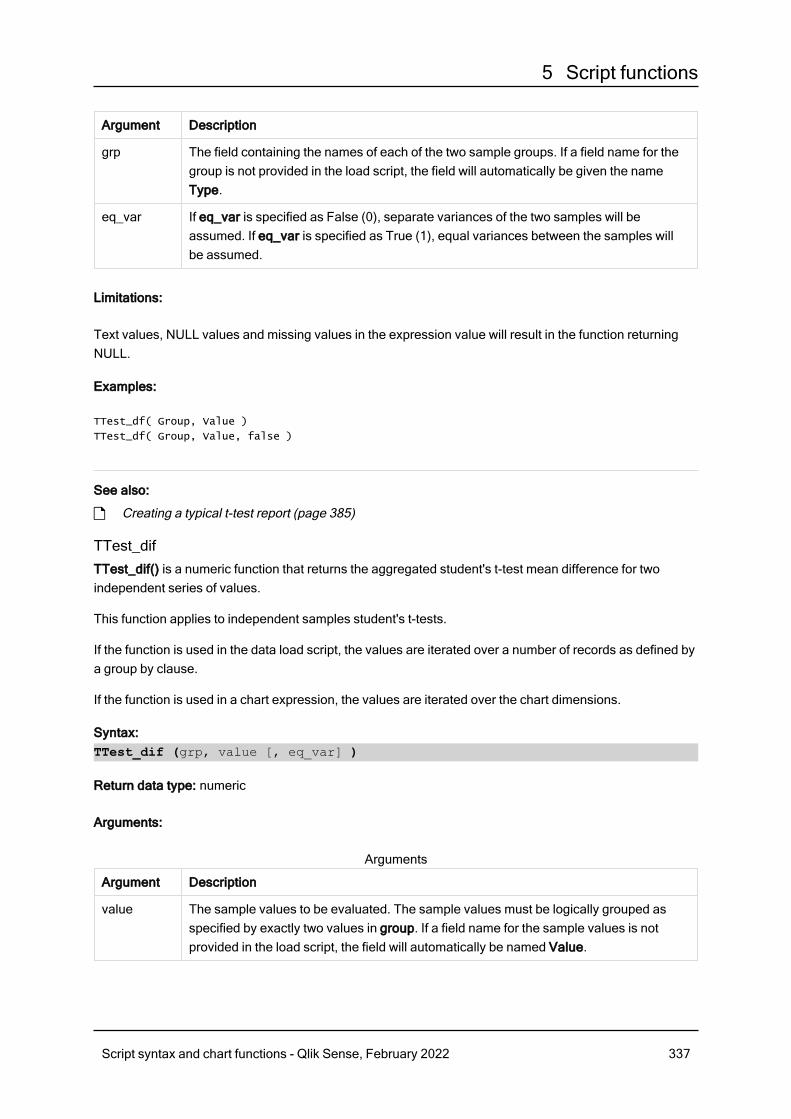
5 Script functions
Argument Description
grp The field containing the names of each of the two sample groups. If a field name for thegroup is not provided in the load script, the field will automatically be given the nameType.
eq_var If eq_var is specified as False (0), separate variances of the two samples will beassumed. If eq_var is specified as True (1), equal variances between the samples willbe assumed.
Limitations:
Text values, NULL values and missing values in the expression value will result in the function returningNULL.
Examples:
TTest_df( Group, Value )
TTest_df( Group, Value, false )
See also:
p Creating a typical t-test report (page 385)
TTest_difTTest_dif() is a numeric function that returns the aggregated student's t-test mean difference for twoindependent series of values.
This function applies to independent samples student's t-tests.
If the function is used in the data load script, the values are iterated over a number of records as defined bya group by clause.
If the function is used in a chart expression, the values are iterated over the chart dimensions.
Syntax:TTest_dif (grp, value [, eq_var] )
Return data type: numeric
Arguments:
Argument Description
value The sample values to be evaluated. The sample values must be logically grouped asspecified by exactly two values in group. If a field name for the sample values is notprovided in the load script, the field will automatically be named Value.
Arguments
Script syntax and chart functions - Qlik Sense, February 2022 337
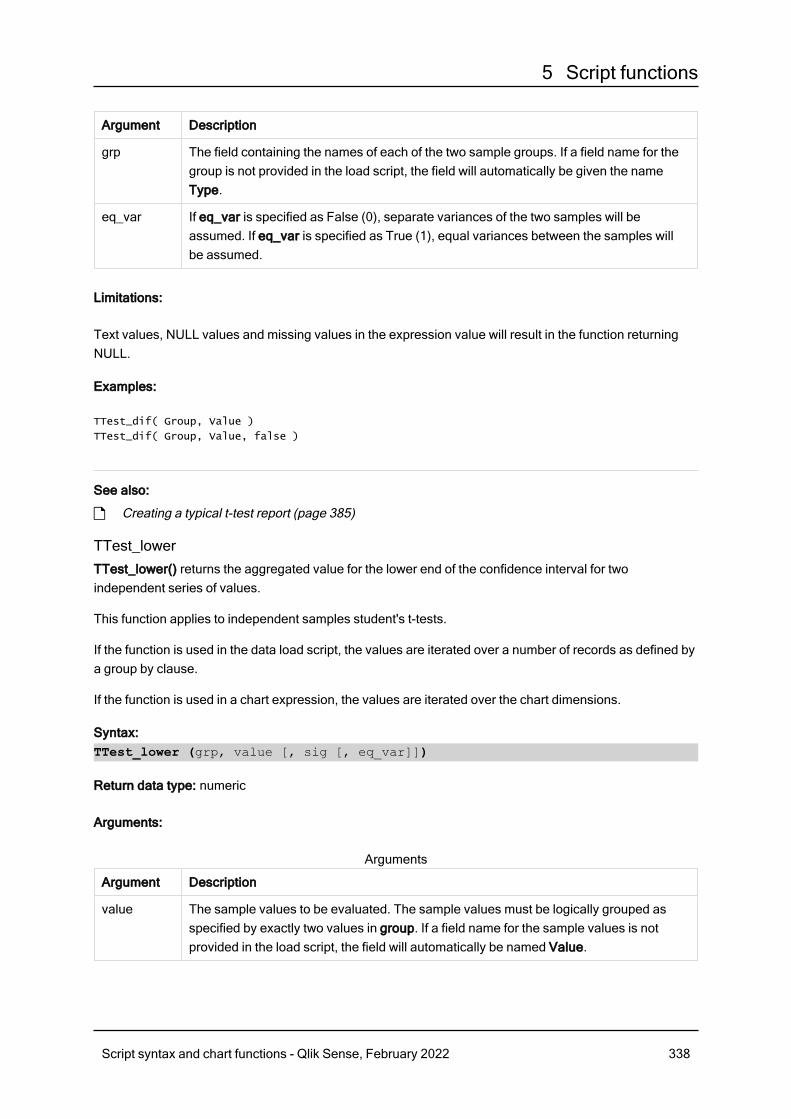
5 Script functions
Argument Description
grp The field containing the names of each of the two sample groups. If a field name for thegroup is not provided in the load script, the field will automatically be given the nameType.
eq_var If eq_var is specified as False (0), separate variances of the two samples will beassumed. If eq_var is specified as True (1), equal variances between the samples willbe assumed.
Limitations:
Text values, NULL values and missing values in the expression value will result in the function returningNULL.
Examples:
TTest_dif( Group, Value )
TTest_dif( Group, Value, false )
See also:
p Creating a typical t-test report (page 385)
TTest_lowerTTest_lower() returns the aggregated value for the lower end of the confidence interval for twoindependent series of values.
This function applies to independent samples student's t-tests.
If the function is used in the data load script, the values are iterated over a number of records as defined bya group by clause.
If the function is used in a chart expression, the values are iterated over the chart dimensions.
Syntax:TTest_lower (grp, value [, sig [, eq_var]])
Return data type: numeric
Arguments:
Argument Description
value The sample values to be evaluated. The sample values must be logically grouped asspecified by exactly two values in group. If a field name for the sample values is notprovided in the load script, the field will automatically be named Value.
Arguments
Script syntax and chart functions - Qlik Sense, February 2022 338

5 Script functions
Argument Description
grp The field containing the names of each of the two sample groups. If a field name for thegroup is not provided in the load script, the field will automatically be given the nameType.
sig The two-tailed level of significance can be specified in sig. If omitted, sig is set to 0.025,resulting in a 95% confidence interval.
eq_var If eq_var is specified as False (0), separate variances of the two samples will beassumed. If eq_var is specified as True (1), equal variances between the samples willbe assumed.
Limitations:
Text values, NULL values and missing values in the expression value will result in the function returningNULL.
Examples:
TTest_lower( Group, Value )
TTest_lower( Group, Value, Sig, false )
See also:
p Creating a typical t-test report (page 385)
TTest_sigTTest_sig() returns the aggregated student's t-test 2-tailed level of significance for two independent seriesof values.
This function applies to independent samples student's t-tests.
If the function is used in the data load script, the values are iterated over a number of records as defined bya group by clause.
If the function is used in a chart expression, the values are iterated over the chart dimensions.
Syntax:TTest_sig (grp, value [, eq_var])
Script syntax and chart functions - Qlik Sense, February 2022 339
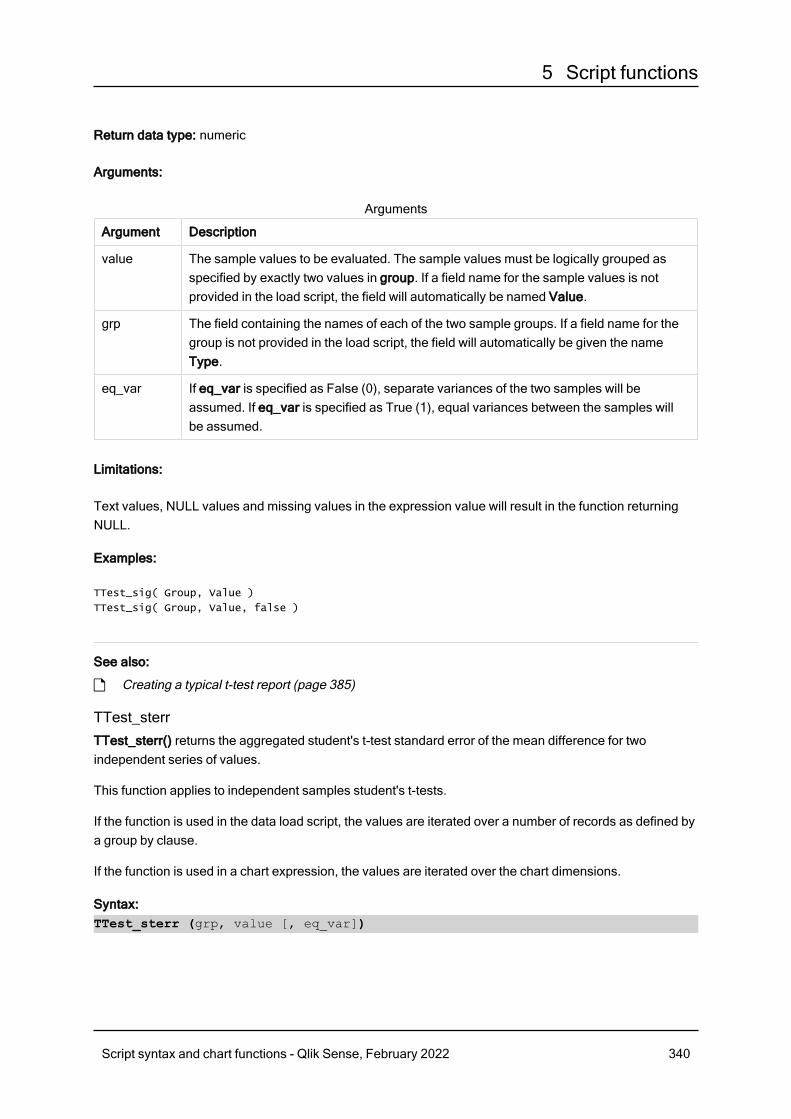
5 Script functions
Return data type: numeric
Arguments:
Argument Description
value The sample values to be evaluated. The sample values must be logically grouped asspecified by exactly two values in group. If a field name for the sample values is notprovided in the load script, the field will automatically be named Value.
grp The field containing the names of each of the two sample groups. If a field name for thegroup is not provided in the load script, the field will automatically be given the nameType.
eq_var If eq_var is specified as False (0), separate variances of the two samples will beassumed. If eq_var is specified as True (1), equal variances between the samples willbe assumed.
Arguments
Limitations:
Text values, NULL values and missing values in the expression value will result in the function returningNULL.
Examples:
TTest_sig( Group, Value )
TTest_sig( Group, Value, false )
See also:
p Creating a typical t-test report (page 385)
TTest_sterrTTest_sterr() returns the aggregated student's t-test standard error of the mean difference for twoindependent series of values.
This function applies to independent samples student's t-tests.
If the function is used in the data load script, the values are iterated over a number of records as defined bya group by clause.
If the function is used in a chart expression, the values are iterated over the chart dimensions.
Syntax:TTest_sterr (grp, value [, eq_var])
Script syntax and chart functions - Qlik Sense, February 2022 340
5 Script functions
Return data type: numeric
Arguments:
Argument Description
value The sample values to be evaluated. The sample values must be logically grouped asspecified by exactly two values in group. If a field name for the sample values is notprovided in the load script, the field will automatically be named Value.
grp The field containing the names of each of the two sample groups. If a field name for thegroup is not provided in the load script, the field will automatically be given the nameType.
eq_var If eq_var is specified as False (0), separate variances of the two samples will beassumed. If eq_var is specified as True (1), equal variances between the samples willbe assumed.
Arguments
Limitations:
Text values, NULL values and missing values in the expression value will result in the function returningNULL.
Examples:
TTest_sterr( Group, Value )
TTest_sterr( Group, Value, false )
See also:
p Creating a typical t-test report (page 385)
TTest_tTTest_t() returns the aggregated t value for two independent series of values.
This function applies to independent samples student's t-tests.
If the function is used in the data load script, the values are iterated over a number of records as defined bya group by clause.
If the function is used in a chart expression, the values are iterated over the chart dimensions.
Syntax:TTest_t(grp, value[, eq_var])
Script syntax and chart functions - Qlik Sense, February 2022 341
5 Script functions
Return data type: numeric
Arguments:
Argument Description
value The sample values to be evaluated. The sample values must be logically grouped asspecified by exactly two values in group. If a field name for the sample values is notprovided in the load script, the field will automatically be named Value.
grp The field containing the names of each of the two sample groups. If a field name for thegroup is not provided in the load script, the field will automatically be given the nameType.
eq_var If eq_var is specified as False (0), separate variances of the two samples will beassumed. If eq_var is specified as True (1), equal variances between the samples willbe assumed.
Arguments
Limitations:
Text values, NULL values and missing values in the expression value will result in the function returningNULL.
Example:
TTest_t( Group, Value, false )
See also:
p Creating a typical t-test report (page 385)
TTest_upperTTest_upper() returns the aggregated value for the upper end of the confidence interval for twoindependent series of values.
This function applies to independent samples student's t-tests.
If the function is used in the data load script, the values are iterated over a number of records as defined bya group by clause.
If the function is used in a chart expression, the values are iterated over the chart dimensions.
Syntax:TTest_upper (grp, value [, sig [, eq_var]])
Script syntax and chart functions - Qlik Sense, February 2022 342
5 Script functions
Return data type: numeric
Arguments:
Argument Description
value The sample values to be evaluated. The sample values must be logically grouped asspecified by exactly two values in group. If a field name for the sample values is notprovided in the load script, the field will automatically be named Value.
grp The field containing the names of each of the two sample groups. If a field name for thegroup is not provided in the load script, the field will automatically be given the nameType.
sig The two-tailed level of significance can be specified in sig. If omitted, sig is set to 0.025,resulting in a 95% confidence interval.
eq_var If eq_var is specified as False (0), separate variances of the two samples will beassumed. If eq_var is specified as True (1), equal variances between the samples willbe assumed.
Arguments
Limitations:
Text values, NULL values and missing values in the expression value will result in the function returningNULL.
Examples:
TTest_upper( Group, Value )
TTest_upper( Group, Value, sig, false )
See also:
p Creating a typical t-test report (page 385)
TTestw_confTTestw_conf() returns the aggregated t value for two independent series of values.
This function applies to two independent samples student's t-tests where the input data series is given inweighted two-column format.
If the function is used in the data load script, the values are iterated over a number of records as defined bya group by clause.
If the function is used in a chart expression, the values are iterated over the chart dimensions.
Syntax:TTestw_conf (weight, grp, value [, sig [, eq_var]])
Script syntax and chart functions - Qlik Sense, February 2022 343
5 Script functions
Return data type: numeric
Arguments:
Argument Description
value The sample values to be evaluated. The sample values must be logically grouped asspecified by exactly two values in group. If a field name for the sample values is notprovided in the load script, the field will automatically be named Value.
weight Each value in value can be counted one or more times according to a correspondingweight value in weight.
grp The field containing the names of each of the two sample groups. If a field name for thegroup is not provided in the load script, the field will automatically be given the nameType.
sig The two-tailed level of significance can be specified in sig. If omitted, sig is set to 0.025,resulting in a 95% confidence interval.
eq_var If eq_var is specified as False (0), separate variances of the two samples will beassumed. If eq_var is specified as True (1), equal variances between the samples willbe assumed.
Arguments
Limitations:
Text values, NULL values and missing values in the expression value will result in the function returningNULL.
Examples:
TTestw_conf( Weight, Group, Value )
TTestw_conf( Weight, Group, Value, sig, false )
See also:
p Creating a typical t-test report (page 385)
TTestw_dfTTestw_df() returns the aggregated student's t-test df value (degrees of freedom) for two independentseries of values.
This function applies to two independent samples student's t-tests where the input data series is given inweighted two-column format.
If the function is used in the data load script, the values are iterated over a number of records as defined bya group by clause.
If the function is used in a chart expression, the values are iterated over the chart dimensions.
Script syntax and chart functions - Qlik Sense, February 2022 344
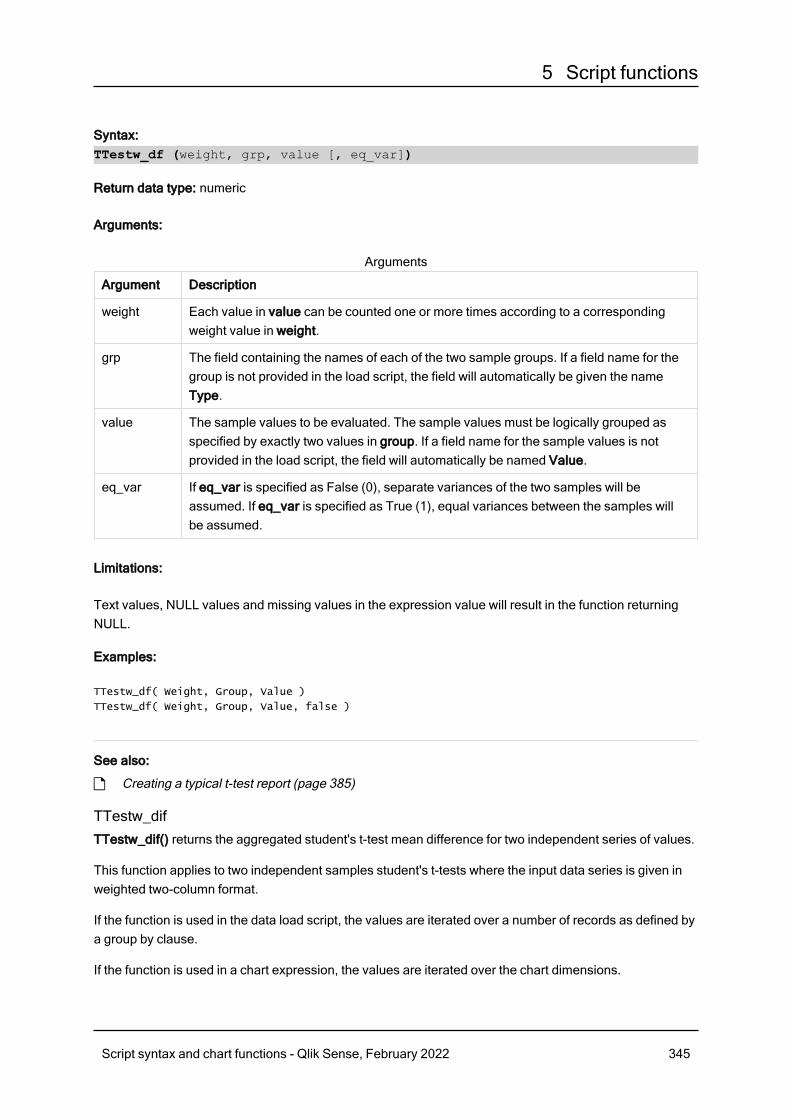
5 Script functions
Syntax:TTestw_df (weight, grp, value [, eq_var])
Return data type: numeric
Arguments:
Argument Description
weight Each value in value can be counted one or more times according to a correspondingweight value in weight.
grp The field containing the names of each of the two sample groups. If a field name for thegroup is not provided in the load script, the field will automatically be given the nameType.
value The sample values to be evaluated. The sample values must be logically grouped asspecified by exactly two values in group. If a field name for the sample values is notprovided in the load script, the field will automatically be named Value.
eq_var If eq_var is specified as False (0), separate variances of the two samples will beassumed. If eq_var is specified as True (1), equal variances between the samples willbe assumed.
Arguments
Limitations:
Text values, NULL values and missing values in the expression value will result in the function returningNULL.
Examples:
TTestw_df( Weight, Group, Value )
TTestw_df( Weight, Group, Value, false )
See also:
p Creating a typical t-test report (page 385)
TTestw_difTTestw_dif() returns the aggregated student's t-test mean difference for two independent series of values.
This function applies to two independent samples student's t-tests where the input data series is given inweighted two-column format.
If the function is used in the data load script, the values are iterated over a number of records as defined bya group by clause.
If the function is used in a chart expression, the values are iterated over the chart dimensions.
Script syntax and chart functions - Qlik Sense, February 2022 345
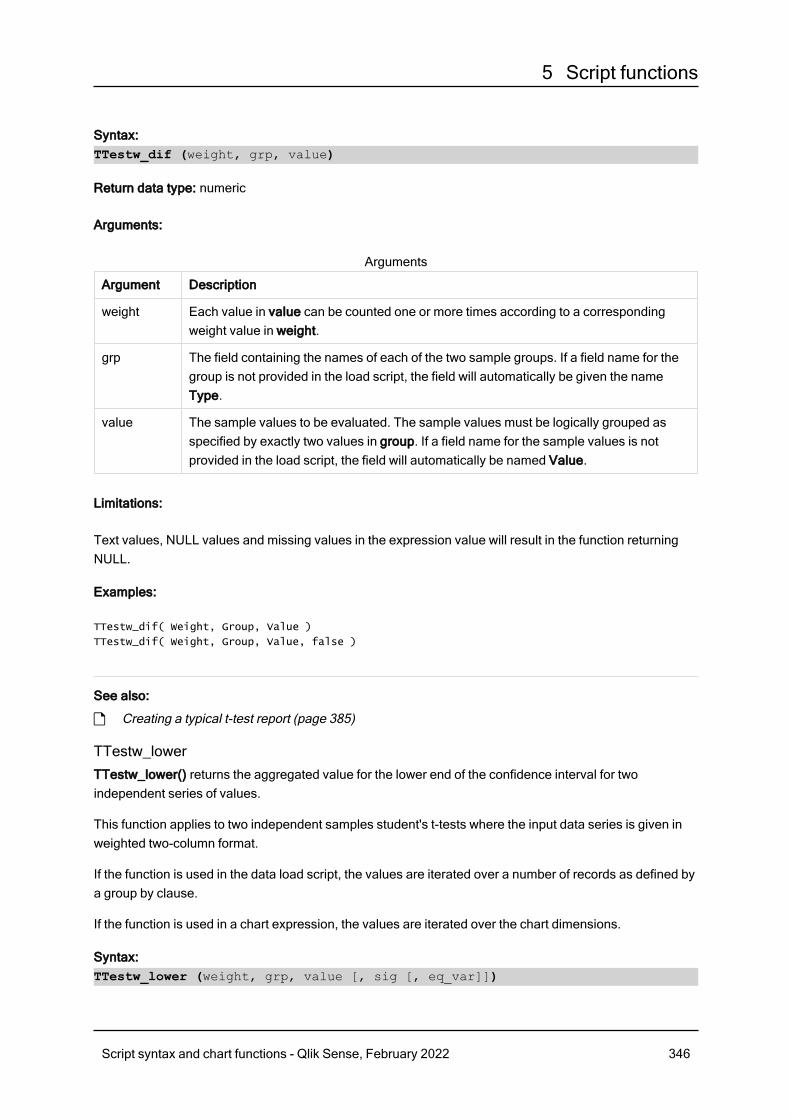
5 Script functions
Syntax:TTestw_dif (weight, grp, value)
Return data type: numeric
Arguments:
Argument Description
weight Each value in value can be counted one or more times according to a correspondingweight value in weight.
grp The field containing the names of each of the two sample groups. If a field name for thegroup is not provided in the load script, the field will automatically be given the nameType.
value The sample values to be evaluated. The sample values must be logically grouped asspecified by exactly two values in group. If a field name for the sample values is notprovided in the load script, the field will automatically be named Value.
Arguments
Limitations:
Text values, NULL values and missing values in the expression value will result in the function returningNULL.
Examples:
TTestw_dif( Weight, Group, Value )
TTestw_dif( Weight, Group, Value, false )
See also:
p Creating a typical t-test report (page 385)
TTestw_lowerTTestw_lower() returns the aggregated value for the lower end of the confidence interval for twoindependent series of values.
This function applies to two independent samples student's t-tests where the input data series is given inweighted two-column format.
If the function is used in the data load script, the values are iterated over a number of records as defined bya group by clause.
If the function is used in a chart expression, the values are iterated over the chart dimensions.
Syntax:TTestw_lower (weight, grp, value [, sig [, eq_var]])
Script syntax and chart functions - Qlik Sense, February 2022 346

5 Script functions
Return data type: numeric
Arguments:
Argument Description
weight Each value in value can be counted one or more times according to a correspondingweight value in weight.
grp The field containing the names of each of the two sample groups. If a field name for thegroup is not provided in the load script, the field will automatically be given the nameType.
value The sample values to be evaluated. The sample values must be logically grouped asspecified by exactly two values in group. If a field name for the sample values is notprovided in the load script, the field will automatically be named Value.
sig The two-tailed level of significance can be specified in sig. If omitted, sig is set to 0.025,resulting in a 95% confidence interval.
eq_var If eq_var is specified as False (0), separate variances of the two samples will beassumed. If eq_var is specified as True (1), equal variances between the samples willbe assumed.
Arguments
Limitations:
Text values, NULL values and missing values in the expression value will result in the function returningNULL.
Examples:
TTestw_lower( Weight, Group, Value )
TTestw_lower( Weight, Group, Value, sig, false )
See also:
p Creating a typical t-test report (page 385)
TTestw_sigTTestw_sig() returns the aggregated student's t-test 2-tailed level of significance for two independentseries of values.
This function applies to two independent samples student's t-tests where the input data series is given inweighted two-column format.
If the function is used in the data load script, the values are iterated over a number of records as defined bya group by clause.
If the function is used in a chart expression, the values are iterated over the chart dimensions.
Script syntax and chart functions - Qlik Sense, February 2022 347
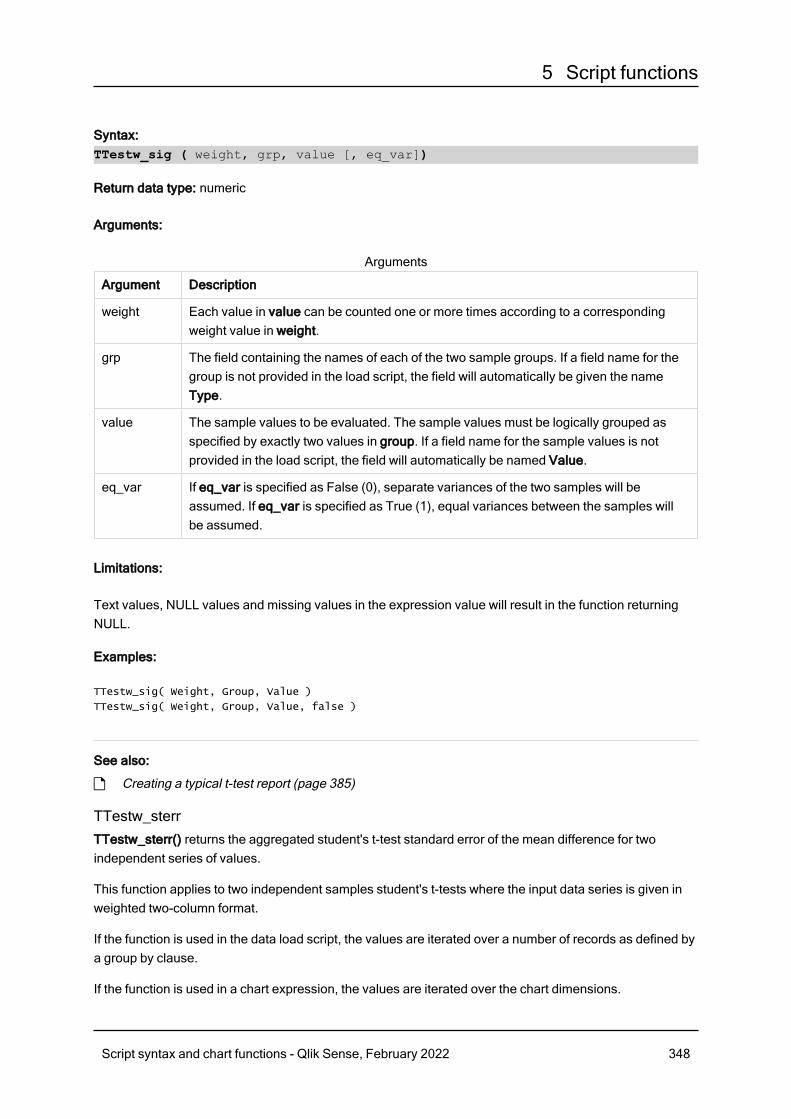
5 Script functions
Syntax:TTestw_sig ( weight, grp, value [, eq_var])
Return data type: numeric
Arguments:
Argument Description
weight Each value in value can be counted one or more times according to a correspondingweight value in weight.
grp The field containing the names of each of the two sample groups. If a field name for thegroup is not provided in the load script, the field will automatically be given the nameType.
value The sample values to be evaluated. The sample values must be logically grouped asspecified by exactly two values in group. If a field name for the sample values is notprovided in the load script, the field will automatically be named Value.
eq_var If eq_var is specified as False (0), separate variances of the two samples will beassumed. If eq_var is specified as True (1), equal variances between the samples willbe assumed.
Arguments
Limitations:
Text values, NULL values and missing values in the expression value will result in the function returningNULL.
Examples:
TTestw_sig( Weight, Group, Value )
TTestw_sig( Weight, Group, Value, false )
See also:
p Creating a typical t-test report (page 385)
TTestw_sterrTTestw_sterr() returns the aggregated student's t-test standard error of the mean difference for twoindependent series of values.
This function applies to two independent samples student's t-tests where the input data series is given inweighted two-column format.
If the function is used in the data load script, the values are iterated over a number of records as defined bya group by clause.
If the function is used in a chart expression, the values are iterated over the chart dimensions.
Script syntax and chart functions - Qlik Sense, February 2022 348
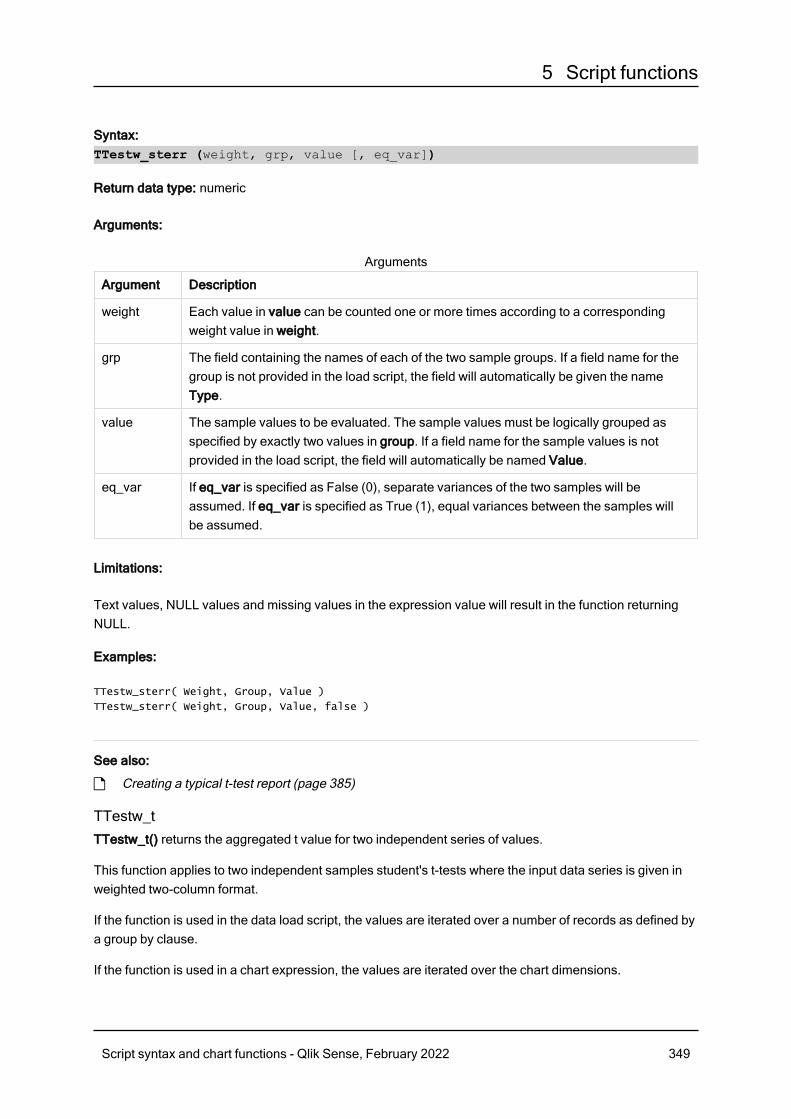
5 Script functions
Syntax:TTestw_sterr (weight, grp, value [, eq_var])
Return data type: numeric
Arguments:
Argument Description
weight Each value in value can be counted one or more times according to a correspondingweight value in weight.
grp The field containing the names of each of the two sample groups. If a field name for thegroup is not provided in the load script, the field will automatically be given the nameType.
value The sample values to be evaluated. The sample values must be logically grouped asspecified by exactly two values in group. If a field name for the sample values is notprovided in the load script, the field will automatically be named Value.
eq_var If eq_var is specified as False (0), separate variances of the two samples will beassumed. If eq_var is specified as True (1), equal variances between the samples willbe assumed.
Arguments
Limitations:
Text values, NULL values and missing values in the expression value will result in the function returningNULL.
Examples:
TTestw_sterr( Weight, Group, Value )
TTestw_sterr( Weight, Group, Value, false )
See also:
p Creating a typical t-test report (page 385)
TTestw_tTTestw_t() returns the aggregated t value for two independent series of values.
This function applies to two independent samples student's t-tests where the input data series is given inweighted two-column format.
If the function is used in the data load script, the values are iterated over a number of records as defined bya group by clause.
If the function is used in a chart expression, the values are iterated over the chart dimensions.
Script syntax and chart functions - Qlik Sense, February 2022 349

5 Script functions
Syntax:ttestw_t (weight, grp, value [, eq_var])
Return data type: numeric
Arguments:
Argument Description
value The sample values to be evaluated. The sample values must be logically grouped asspecified by exactly two values in group. If a field name for the sample values is notprovided in the load script, the field will automatically be named Value.
weight Each value in value can be counted one or more times according to a correspondingweight value in weight.
grp The field containing the names of each of the two sample groups. If a field name for thegroup is not provided in the load script, the field will automatically be given the nameType.
eq_var If eq_var is specified as False (0), separate variances of the two samples will beassumed. If eq_var is specified as True (1), equal variances between the samples willbe assumed.
Arguments
Limitations:
Text values, NULL values and missing values in the expression value will result in the function returningNULL.
Examples:
TTestw_t( Weight, Group, Value )
TTestw_t( Weight, Group, Value, false )
See also:
p Creating a typical t-test report (page 385)
TTestw_upper
TTestw_upper() returns the aggregated value for the upper end of the confidence interval fortwo independent series of values.
This function applies to two independent samples student's t-tests where the input data series is given inweighted two-column format.
If the function is used in the data load script, the values are iterated over a number of records as defined bya group by clause.
If the function is used in a chart expression, the values are iterated over the chart dimensions.
Script syntax and chart functions - Qlik Sense, February 2022 350
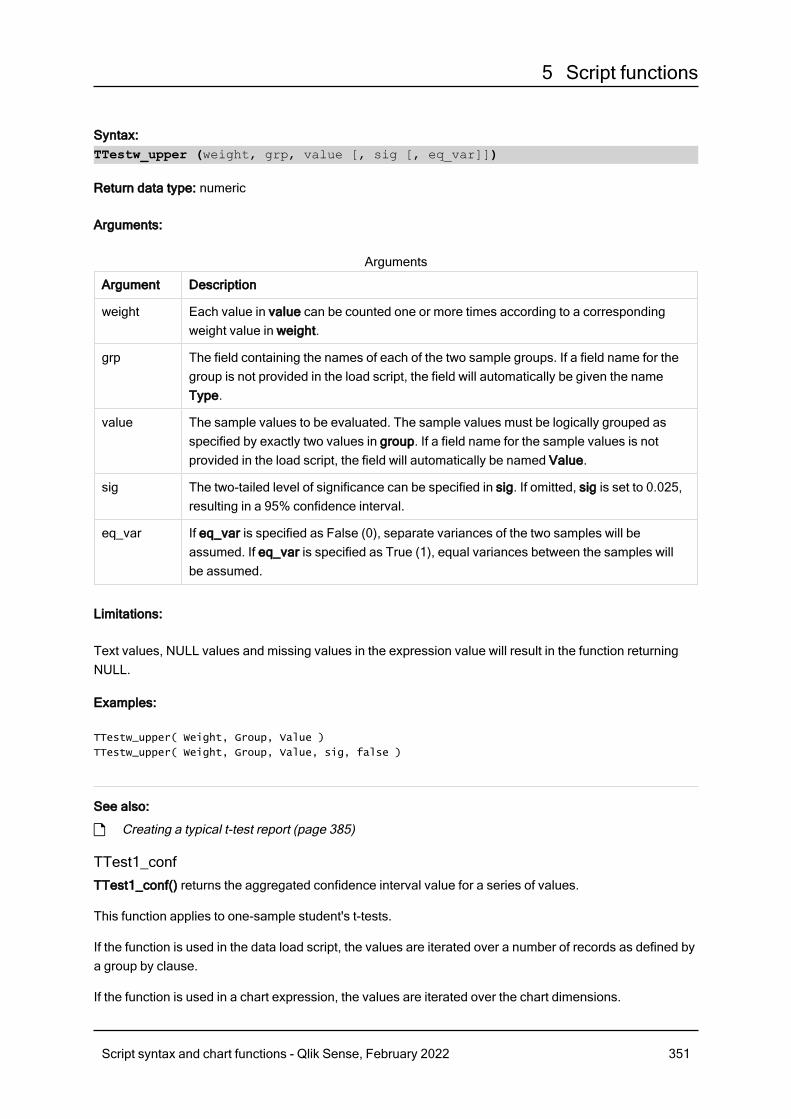
5 Script functions
Syntax:TTestw_upper (weight, grp, value [, sig [, eq_var]])
Return data type: numeric
Arguments:
Argument Description
weight Each value in value can be counted one or more times according to a correspondingweight value in weight.
grp The field containing the names of each of the two sample groups. If a field name for thegroup is not provided in the load script, the field will automatically be given the nameType.
value The sample values to be evaluated. The sample values must be logically grouped asspecified by exactly two values in group. If a field name for the sample values is notprovided in the load script, the field will automatically be named Value.
sig The two-tailed level of significance can be specified in sig. If omitted, sig is set to 0.025,resulting in a 95% confidence interval.
eq_var If eq_var is specified as False (0), separate variances of the two samples will beassumed. If eq_var is specified as True (1), equal variances between the samples willbe assumed.
Arguments
Limitations:
Text values, NULL values and missing values in the expression value will result in the function returningNULL.
Examples:
TTestw_upper( Weight, Group, Value )
TTestw_upper( Weight, Group, Value, sig, false )
See also:
p Creating a typical t-test report (page 385)
TTest1_confTTest1_conf() returns the aggregated confidence interval value for a series of values.
This function applies to one-sample student's t-tests.
If the function is used in the data load script, the values are iterated over a number of records as defined bya group by clause.
If the function is used in a chart expression, the values are iterated over the chart dimensions.
Script syntax and chart functions - Qlik Sense, February 2022 351
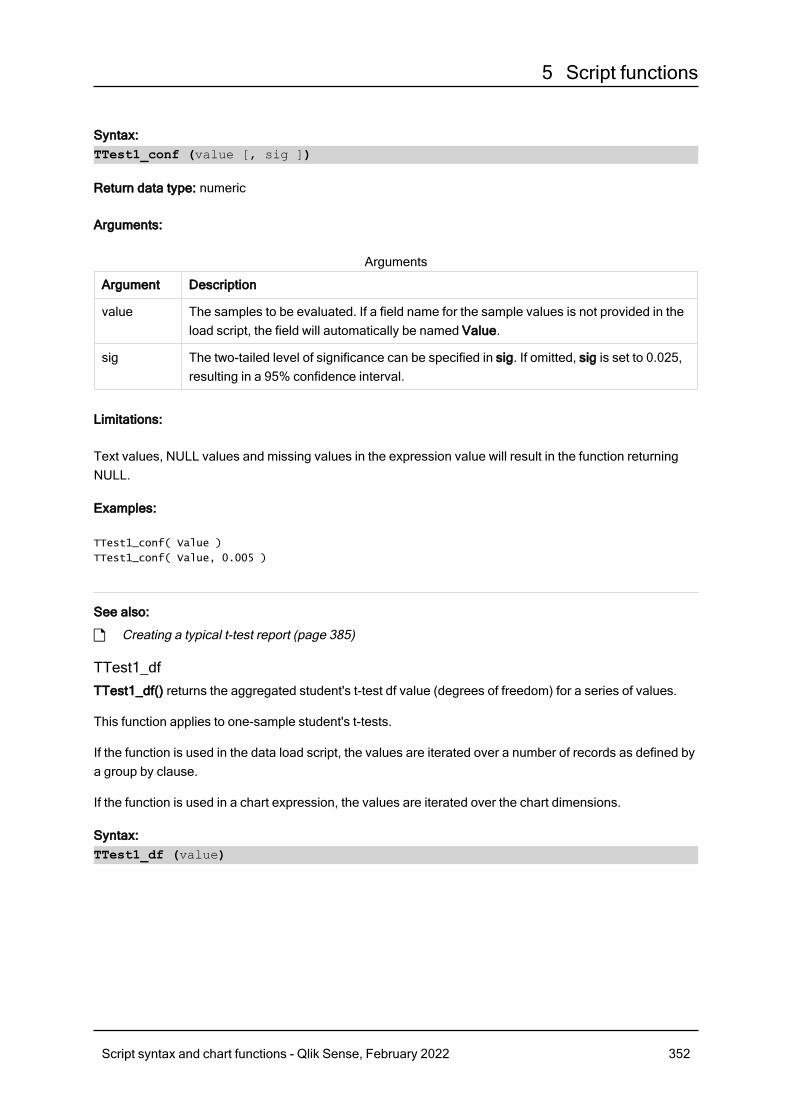
5 Script functions
Syntax:TTest1_conf (value [, sig ])
Return data type: numeric
Arguments:
Argument Description
value The samples to be evaluated. If a field name for the sample values is not provided in theload script, the field will automatically be named Value.
sig The two-tailed level of significance can be specified in sig. If omitted, sig is set to 0.025,resulting in a 95% confidence interval.
Arguments
Limitations:
Text values, NULL values and missing values in the expression value will result in the function returningNULL.
Examples:
TTest1_conf( Value )
TTest1_conf( Value, 0.005 )
See also:
p Creating a typical t-test report (page 385)
TTest1_dfTTest1_df() returns the aggregated student's t-test df value (degrees of freedom) for a series of values.
This function applies to one-sample student's t-tests.
If the function is used in the data load script, the values are iterated over a number of records as defined bya group by clause.
If the function is used in a chart expression, the values are iterated over the chart dimensions.
Syntax:TTest1_df (value)
Script syntax and chart functions - Qlik Sense, February 2022 352
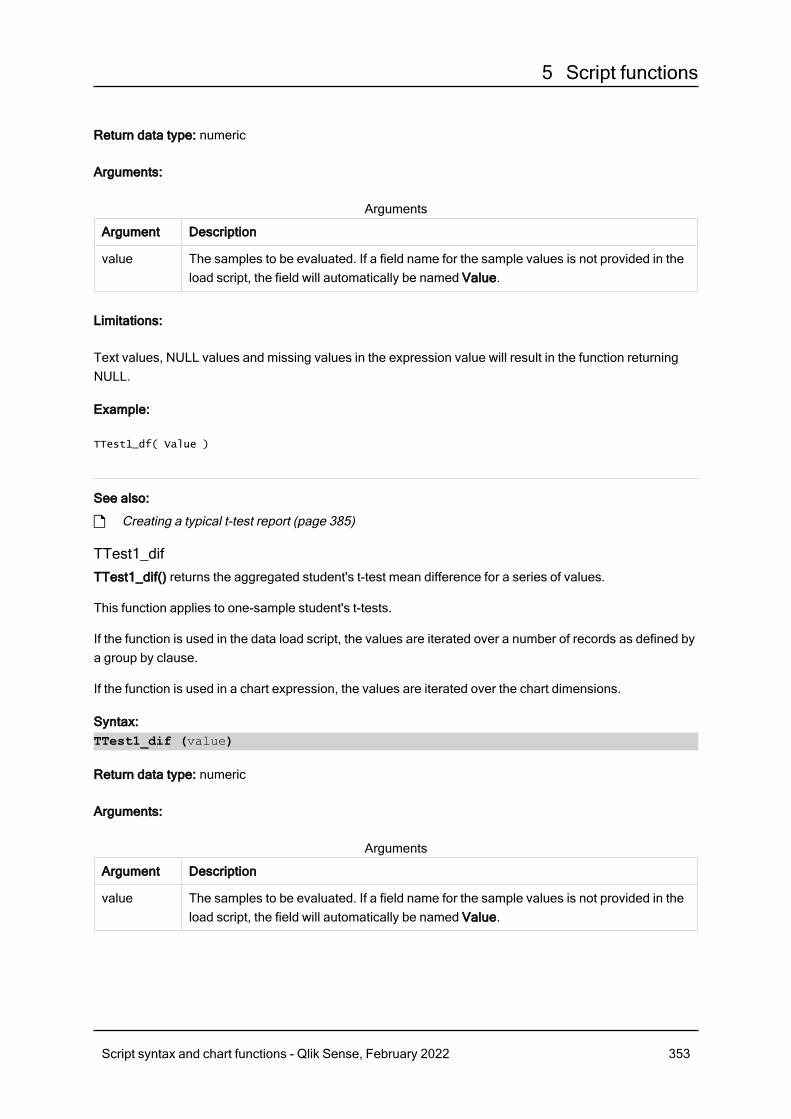
5 Script functions
Return data type: numeric
Arguments:
Argument Description
value The samples to be evaluated. If a field name for the sample values is not provided in theload script, the field will automatically be named Value.
Arguments
Limitations:
Text values, NULL values and missing values in the expression value will result in the function returningNULL.
Example:
TTest1_df( Value )
See also:
p Creating a typical t-test report (page 385)
TTest1_difTTest1_dif() returns the aggregated student's t-test mean difference for a series of values.
This function applies to one-sample student's t-tests.
If the function is used in the data load script, the values are iterated over a number of records as defined bya group by clause.
If the function is used in a chart expression, the values are iterated over the chart dimensions.
Syntax:TTest1_dif (value)
Return data type: numeric
Arguments:
Argument Description
value The samples to be evaluated. If a field name for the sample values is not provided in theload script, the field will automatically be named Value.
Arguments
Script syntax and chart functions - Qlik Sense, February 2022 353

5 Script functions
Limitations:
Text values, NULL values and missing values in the expression value will result in the function returningNULL.
Example:
TTest1_dif( Value )
See also:
p Creating a typical t-test report (page 385)
TTest1_lowerTTest1_lower() returns the aggregated value for the lower end of the confidence interval for a series ofvalues.
This function applies to one-sample student's t-tests.
If the function is used in the data load script, the values are iterated over a number of records as defined bya group by clause.
If the function is used in a chart expression, the values are iterated over the chart dimensions.
Syntax:TTest1_lower (value [, sig])
Return data type: numeric
Arguments:
Argument Description
value The samples to be evaluated. If a field name for the sample values is not provided in theload script, the field will automatically be named Value.
sig The two-tailed level of significance can be specified in sig. If omitted, sig is set to 0.025,resulting in a 95% confidence interval.
Arguments
Limitations:
Text values, NULL values and missing values in the expression value will result in the function returningNULL.
Examples:
TTest1_lower( Value )
TTest1_lower( Value, 0.005 )
Script syntax and chart functions - Qlik Sense, February 2022 354
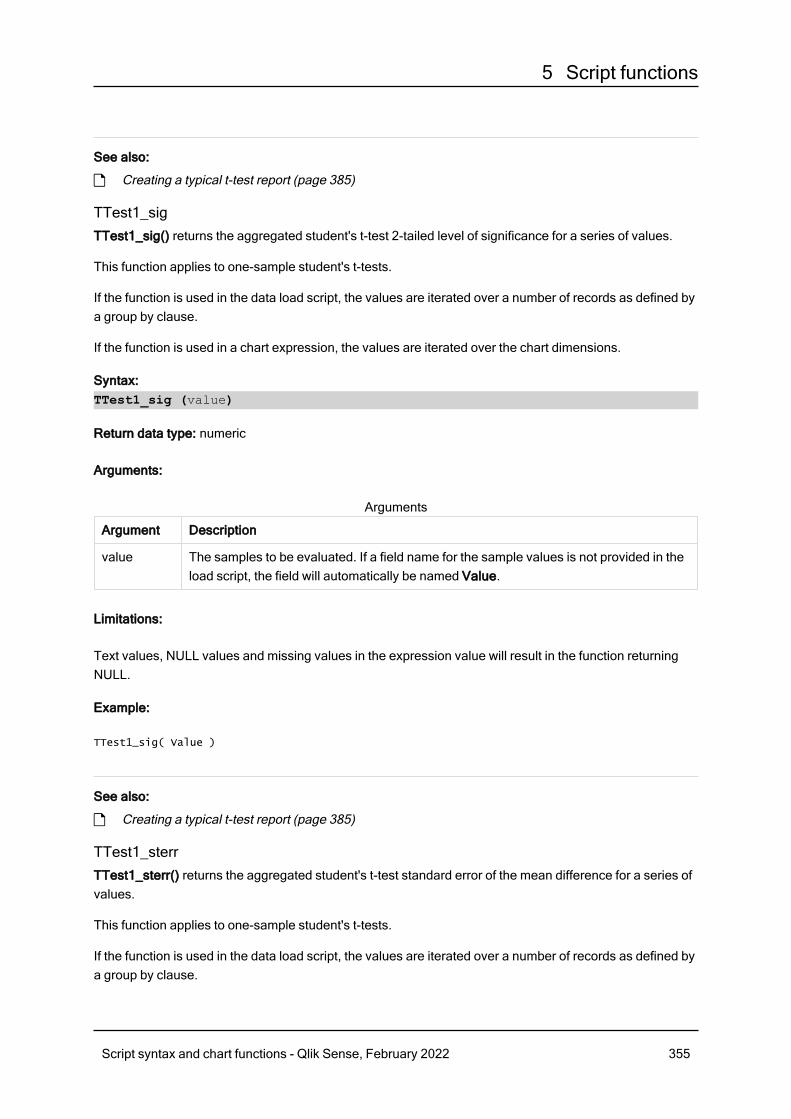
5 Script functions
See also:
p Creating a typical t-test report (page 385)
TTest1_sigTTest1_sig() returns the aggregated student's t-test 2-tailed level of significance for a series of values.
This function applies to one-sample student's t-tests.
If the function is used in the data load script, the values are iterated over a number of records as defined bya group by clause.
If the function is used in a chart expression, the values are iterated over the chart dimensions.
Syntax:TTest1_sig (value)
Return data type: numeric
Arguments:
Argument Description
value The samples to be evaluated. If a field name for the sample values is not provided in theload script, the field will automatically be named Value.
Arguments
Limitations:
Text values, NULL values and missing values in the expression value will result in the function returningNULL.
Example:
TTest1_sig( Value )
See also:
p Creating a typical t-test report (page 385)
TTest1_sterrTTest1_sterr() returns the aggregated student's t-test standard error of the mean difference for a series ofvalues.
This function applies to one-sample student's t-tests.
If the function is used in the data load script, the values are iterated over a number of records as defined bya group by clause.
Script syntax and chart functions - Qlik Sense, February 2022 355
5 Script functions
If the function is used in a chart expression, the values are iterated over the chart dimensions.
Syntax:TTest1_sterr (value)
Return data type: numeric
Arguments:
Argument Description
value The samples to be evaluated. If a field name for the sample values is not provided in theload script, the field will automatically be named Value.
Arguments
Limitations:
Text values, NULL values and missing values in the expression value will result in the function returningNULL.
Example:
TTest1_sterr( Value )
See also:
p Creating a typical t-test report (page 385)
TTest1_tTTest1_t() returns the aggregated t value for a series of values.
This function applies to one-sample student's t-tests.
If the function is used in the data load script, the values are iterated over a number of records as defined bya group by clause.
If the function is used in a chart expression, the values are iterated over the chart dimensions.
Syntax:TTest1_t (value)
Return data type: numeric
Arguments:
Argument Description
value The samples to be evaluated. If a field name for the sample values is not provided in theload script, the field will automatically be named Value.
Arguments
Script syntax and chart functions - Qlik Sense, February 2022 356
5 Script functions
Limitations:
Text values, NULL values and missing values in the expression value will result in the function returningNULL.
Example:
TTest1_t( Value )
See also:
p Creating a typical t-test report (page 385)
TTest1_upperTTest1_upper() returns the aggregated value for the upper end of the confidence interval for a series ofvalues.
This function applies to one-sample student's t-tests.
If the function is used in the data load script, the values are iterated over a number of records as defined bya group by clause.
If the function is used in a chart expression, the values are iterated over the chart dimensions.
Syntax:TTest1_upper (value [, sig])
Return data type: numeric
Arguments:
Argument Description
value The samples to be evaluated. If a field name for the sample values is not provided in theload script, the field will automatically be named Value.
sig The two-tailed level of significance can be specified in sig. If omitted, sig is set to 0.025,resulting in a 95% confidence interval.
Arguments
Limitations:
Text values, NULL values and missing values in the expression value will result in the function returningNULL.
Examples:
TTest1_upper( Value )
TTest1_upper( Value, 0.005 )
Script syntax and chart functions - Qlik Sense, February 2022 357
5 Script functions
See also:
p Creating a typical t-test report (page 385)
TTest1w_confTTest1w_conf() is a numeric function that returns the aggregated confidence interval value for a series ofvalues.
This function applies to one-sample student's t-tests where the input data series is given in weighted two-column format.
If the function is used in the data load script, the values are iterated over a number of records as defined bya group by clause.
If the function is used in a chart expression, the values are iterated over the chart dimensions.
Syntax:TTest1w_conf (weight, value [, sig ])
Return data type: numeric
Arguments:
Argument Description
value The samples to be evaluated. If a field name for the sample values is not provided in theload script, the field will automatically be named Value.
weight Each value in value can be counted one or more times according to a correspondingweight value in weight.
sig The two-tailed level of significance can be specified in sig. If omitted, sig is set to 0.025,resulting in a 95% confidence interval.
Arguments
Limitations:
Text values, NULL values and missing values in the expression value will result in the function returningNULL.
Examples:
TTest1w_conf( Weight, Value )
TTest1w_conf( Weight, Value, 0.005 )
See also:
p Creating a typical t-test report (page 385)
Script syntax and chart functions - Qlik Sense, February 2022 358
5 Script functions
TTest1w_dfTTest1w_df() returns the aggregated student's t-test df value (degrees of freedom) for a series of values.
This function applies to one-sample student's t-tests where the input data series is given in weighted two-column format.
If the function is used in the data load script, the values are iterated over a number of records as defined bya group by clause.
If the function is used in a chart expression, the values are iterated over the chart dimensions.
Syntax:TTest1w_df (weight, value)
Return data type: numeric
Arguments:
Argument Description
value The samples to be evaluated. If a field name for the sample values is not provided in theload script, the field will automatically be named Value.
weight Each value in value can be counted one or more times according to a correspondingweight value in weight.
Arguments
Limitations:
Text values, NULL values and missing values in the expression value will result in the function returningNULL.
Example:
TTest1w_df( Weight, Value )
See also:
p Creating a typical t-test report (page 385)
TTest1w_difTTest1w_dif() returns the aggregated student's t-test mean difference for a series of values.
This function applies to one-sample student's t-tests where the input data series is given in weighted two-column format.
If the function is used in the data load script, the values are iterated over a number of records as defined bya group by clause.
If the function is used in a chart expression, the values are iterated over the chart dimensions.
Script syntax and chart functions - Qlik Sense, February 2022 359

5 Script functions
Syntax:TTest1w_dif (weight, value)
Return data type: numeric
Arguments:
Argument Description
value The samples to be evaluated. If a field name for the sample values is not provided in theload script, the field will automatically be named Value.
weight Each value in value can be counted one or more times according to a correspondingweight value in weight.
Arguments
Limitations:
Text values, NULL values and missing values in the expression value will result in the function returningNULL.
Example:
TTest1w_dif( Weight, Value )
See also:
p Creating a typical t-test report (page 385)
TTest1w_lowerTTest1w_lower() returns the aggregated value for the lower end of the confidence interval for a series ofvalues.
This function applies to one-sample student's t-tests where the input data series is given in weighted two-column format.
If the function is used in the data load script, the values are iterated over a number of records as defined bya group by clause.
If the function is used in a chart expression, the values are iterated over the chart dimensions.
Syntax:TTest1w_lower (weight, value [, sig ])
Script syntax and chart functions - Qlik Sense, February 2022 360
5 Script functions
Return data type: numeric
Arguments:
Argument Description
value The samples to be evaluated. If a field name for the sample values is not provided in theload script, the field will automatically be named Value.
weight Each value in value can be counted one or more times according to a correspondingweight value in weight.
sig The two-tailed level of significance can be specified in sig. If omitted, sig is set to 0.025,resulting in a 95% confidence interval.
Arguments
Limitations:
Text values, NULL values and missing values in the expression value will result in the function returningNULL.
Examples:
TTest1w_lower( Weight, Value )
TTest1w_lower( Weight, Value, 0.005 )
See also:
p Creating a typical t-test report (page 385)
TTest1w_sigTTest1w_sig() returns the aggregated student's t-test 2-tailed level of significance for a series of values.
This function applies to one-sample student's t-tests where the input data series is given in weighted two-column format.
If the function is used in the data load script, the values are iterated over a number of records as defined bya group by clause.
If the function is used in a chart expression, the values are iterated over the chart dimensions.
Syntax:TTest1w_sig (weight, value)
Script syntax and chart functions - Qlik Sense, February 2022 361
5 Script functions
Return data type: numeric
Arguments:
Argument Description
value The samples to be evaluated. If a field name for the sample values is not provided in theload script, the field will automatically be named Value.
weight Each value in value can be counted one or more times according to a correspondingweight value in weight.
Arguments
Limitations:
Text values, NULL values and missing values in the expression value will result in the function returningNULL.
Example:
TTest1w_sig( Weight, Value )
See also:
p Creating a typical t-test report (page 385)
TTest1w_sterrTTest1w_sterr() returns the aggregated student's t-test standard error of the mean difference for a seriesof values.
This function applies to one-sample student's t-tests where the input data series is given in weighted two-column format.
If the function is used in the data load script, the values are iterated over a number of records as defined bya group by clause.
If the function is used in a chart expression, the values are iterated over the chart dimensions.
Syntax:TTest1w_sterr (weight, value)
Script syntax and chart functions - Qlik Sense, February 2022 362
5 Script functions
Return data type: numeric
Arguments:
Argument Description
value The samples to be evaluated. If a field name for the sample values is not provided in theload script, the field will automatically be named Value.
weight Each value in value can be counted one or more times according to a correspondingweight value in weight.
Arguments
Limitations:
Text values, NULL values and missing values in the expression value will result in the function returningNULL.
Example:
TTest1w_sterr( Weight, Value )
See also:
p Creating a typical t-test report (page 385)
TTest1w_tTTest1w_t() returns the aggregated t value for a series of values.
This function applies to one-sample student's t-tests where the input data series is given in weighted two-column format.
If the function is used in the data load script, the values are iterated over a number of records as defined bya group by clause.
If the function is used in a chart expression, the values are iterated over the chart dimensions.
Syntax:TTest1w_t ( weight, value)
Script syntax and chart functions - Qlik Sense, February 2022 363

5 Script functions
Return data type: numeric
Arguments:
Argument Description
value The samples to be evaluated. If a field name for the sample values is not provided in theload script, the field will automatically be named Value.
weight Each value in value can be counted one or more times according to a correspondingweight value in weight.
Arguments
Limitations:
Text values, NULL values and missing values in the expression value will result in the function returningNULL.
Example:
TTest1w_t( Weight, Value )
See also:
p Creating a typical t-test report (page 385)
TTest1w_upperTTest1w_upper() returns the aggregated value for the upper end of the confidence interval for a series ofvalues.
This function applies to one-sample student's t-tests where the input data series is given in weighted two-column format.
If the function is used in the data load script, the values are iterated over a number of records as defined bya group by clause.
If the function is used in a chart expression, the values are iterated over the chart dimensions.
Syntax:TTest1w_upper (weight, value [, sig])
Script syntax and chart functions - Qlik Sense, February 2022 364
5 Script functions
Return data type: numeric
Arguments:
Argument Description
value The samples to be evaluated. If a field name for the sample values is not provided in theload script, the field will automatically be named Value.
weight Each value in value can be counted one or more times according to a correspondingweight value in weight.
sig The two-tailed level of significance can be specified in sig. If omitted, sig is set to 0.025,resulting in a 95% confidence interval.
Arguments
Limitations:
Text values, NULL values and missing values in the expression value will result in the function returningNULL.
Examples:
TTest1w_upper( Weight, Value )
TTest1w_upper( Weight, Value, 0.005 )
See also:
p Creating a typical t-test report (page 385)
Z-test functions
A statistical examination of two population means. A two sample z-test examines whether twosamples are different and is commonly used when two normal distributions have knownvariances and when an experiment uses a large sample size.
The z-test statistical test functions are grouped according the type of input data series that applies to thefunction.
If the function is used in the data load script, the values are iterated over a number of records as defined bya group by clause.
If the function is used in a chart expression, the values are iterated over the chart dimensions.
Examples of how to use z-test functions (page 388)
One column format functions
The following functions apply to z-tests with simple input data series.
Script syntax and chart functions - Qlik Sense, February 2022 365
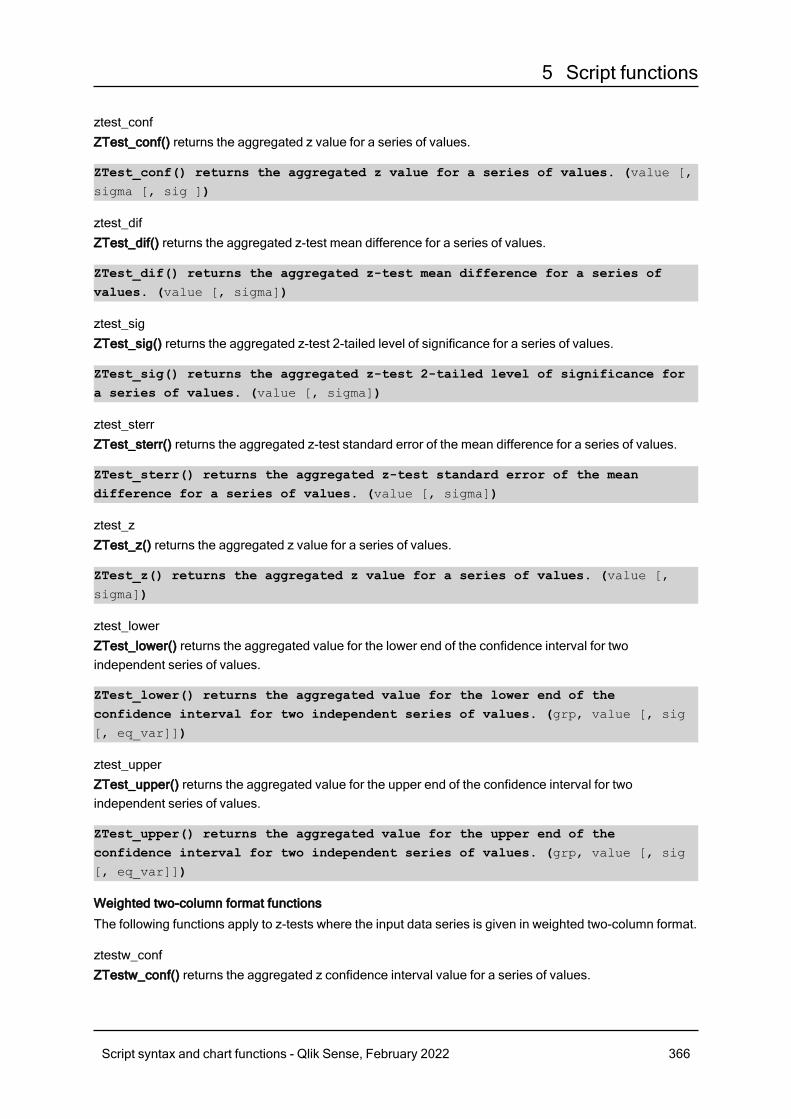
5 Script functions
ztest_confZTest_conf() returns the aggregated z value for a series of values.
ZTest_conf() returns the aggregated z value for a series of values. (value [,
sigma [, sig ])
ztest_difZTest_dif() returns the aggregated z-test mean difference for a series of values.
ZTest_dif() returns the aggregated z-test mean difference for a series ofvalues. (value [, sigma])
ztest_sigZTest_sig() returns the aggregated z-test 2-tailed level of significance for a series of values.
ZTest_sig() returns the aggregated z-test 2-tailed level of significance fora series of values. (value [, sigma])
ztest_sterrZTest_sterr() returns the aggregated z-test standard error of the mean difference for a series of values.
ZTest_sterr() returns the aggregated z-test standard error of the meandifference for a series of values. (value [, sigma])
ztest_zZTest_z() returns the aggregated z value for a series of values.
ZTest_z() returns the aggregated z value for a series of values. (value [,
sigma])
ztest_lowerZTest_lower() returns the aggregated value for the lower end of the confidence interval for twoindependent series of values.
ZTest_lower() returns the aggregated value for the lower end of theconfidence interval for two independent series of values. (grp, value [, sig
[, eq_var]])
ztest_upperZTest_upper() returns the aggregated value for the upper end of the confidence interval for twoindependent series of values.
ZTest_upper() returns the aggregated value for the upper end of theconfidence interval for two independent series of values. (grp, value [, sig
[, eq_var]])
Weighted two-column format functions
The following functions apply to z-tests where the input data series is given in weighted two-column format.
ztestw_confZTestw_conf() returns the aggregated z confidence interval value for a series of values.
Script syntax and chart functions - Qlik Sense, February 2022 366
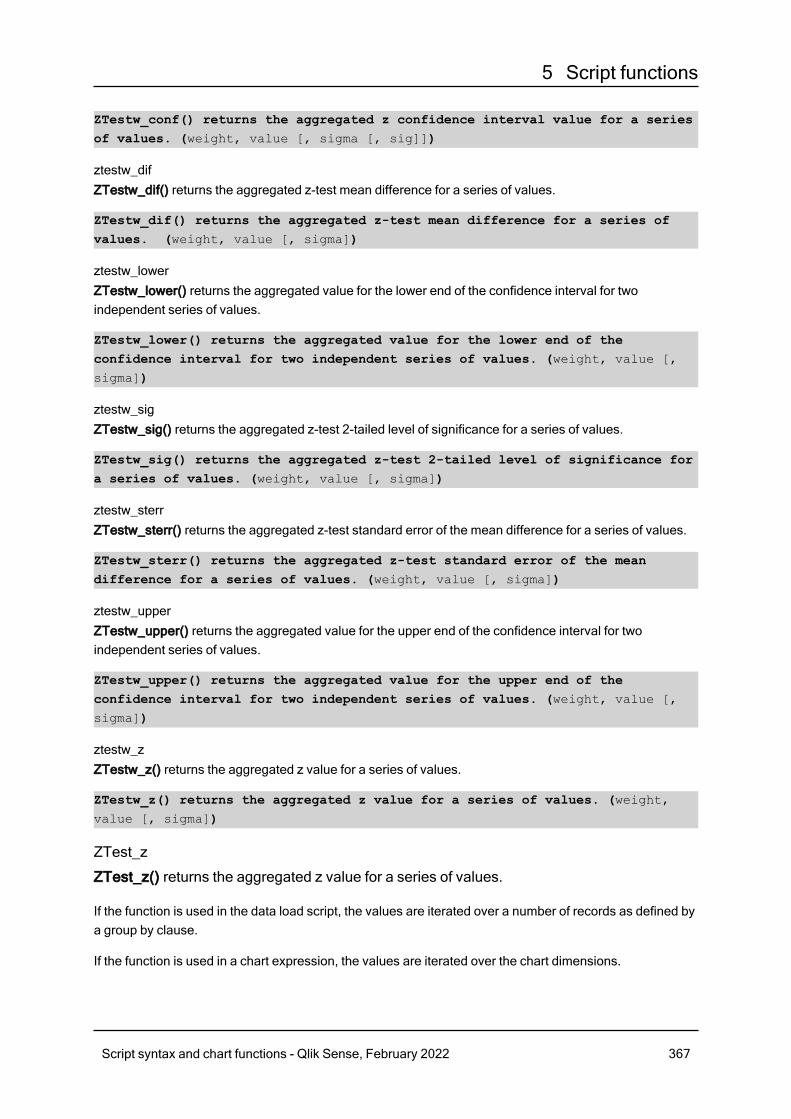
5 Script functions
ZTestw_conf() returns the aggregated z confidence interval value for a seriesof values. (weight, value [, sigma [, sig]])
ztestw_difZTestw_dif() returns the aggregated z-test mean difference for a series of values.
ZTestw_dif() returns the aggregated z-test mean difference for a series ofvalues. (weight, value [, sigma])
ztestw_lowerZTestw_lower() returns the aggregated value for the lower end of the confidence interval for twoindependent series of values.
ZTestw_lower() returns the aggregated value for the lower end of theconfidence interval for two independent series of values. (weight, value [,
sigma])
ztestw_sigZTestw_sig() returns the aggregated z-test 2-tailed level of significance for a series of values.
ZTestw_sig() returns the aggregated z-test 2-tailed level of significance fora series of values. (weight, value [, sigma])
ztestw_sterrZTestw_sterr() returns the aggregated z-test standard error of the mean difference for a series of values.
ZTestw_sterr() returns the aggregated z-test standard error of the meandifference for a series of values. (weight, value [, sigma])
ztestw_upperZTestw_upper() returns the aggregated value for the upper end of the confidence interval for twoindependent series of values.
ZTestw_upper() returns the aggregated value for the upper end of theconfidence interval for two independent series of values. (weight, value [,
sigma])
ztestw_zZTestw_z() returns the aggregated z value for a series of values.
ZTestw_z() returns the aggregated z value for a series of values. (weight,value [, sigma])
ZTest_z
ZTest_z() returns the aggregated z value for a series of values.
If the function is used in the data load script, the values are iterated over a number of records as defined bya group by clause.
If the function is used in a chart expression, the values are iterated over the chart dimensions.
Script syntax and chart functions - Qlik Sense, February 2022 367
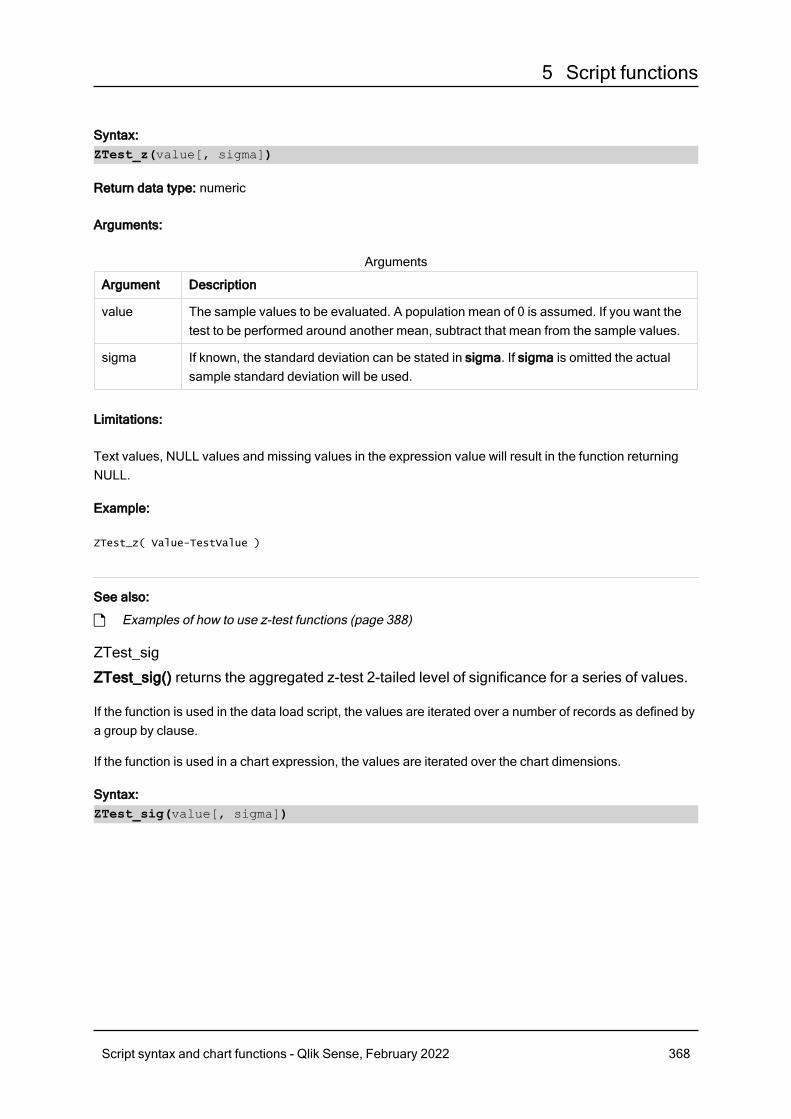
5 Script functions
Syntax:ZTest_z(value[, sigma])
Return data type: numeric
Arguments:
Argument Description
value The sample values to be evaluated. A population mean of 0 is assumed. If you want thetest to be performed around another mean, subtract that mean from the sample values.
sigma If known, the standard deviation can be stated in sigma. If sigma is omitted the actualsample standard deviation will be used.
Arguments
Limitations:
Text values, NULL values and missing values in the expression value will result in the function returningNULL.
Example:
ZTest_z( Value-TestValue )
See also:
p Examples of how to use z-test functions (page 388)
ZTest_sig
ZTest_sig() returns the aggregated z-test 2-tailed level of significance for a series of values.
If the function is used in the data load script, the values are iterated over a number of records as defined bya group by clause.
If the function is used in a chart expression, the values are iterated over the chart dimensions.
Syntax:ZTest_sig(value[, sigma])
Script syntax and chart functions - Qlik Sense, February 2022 368
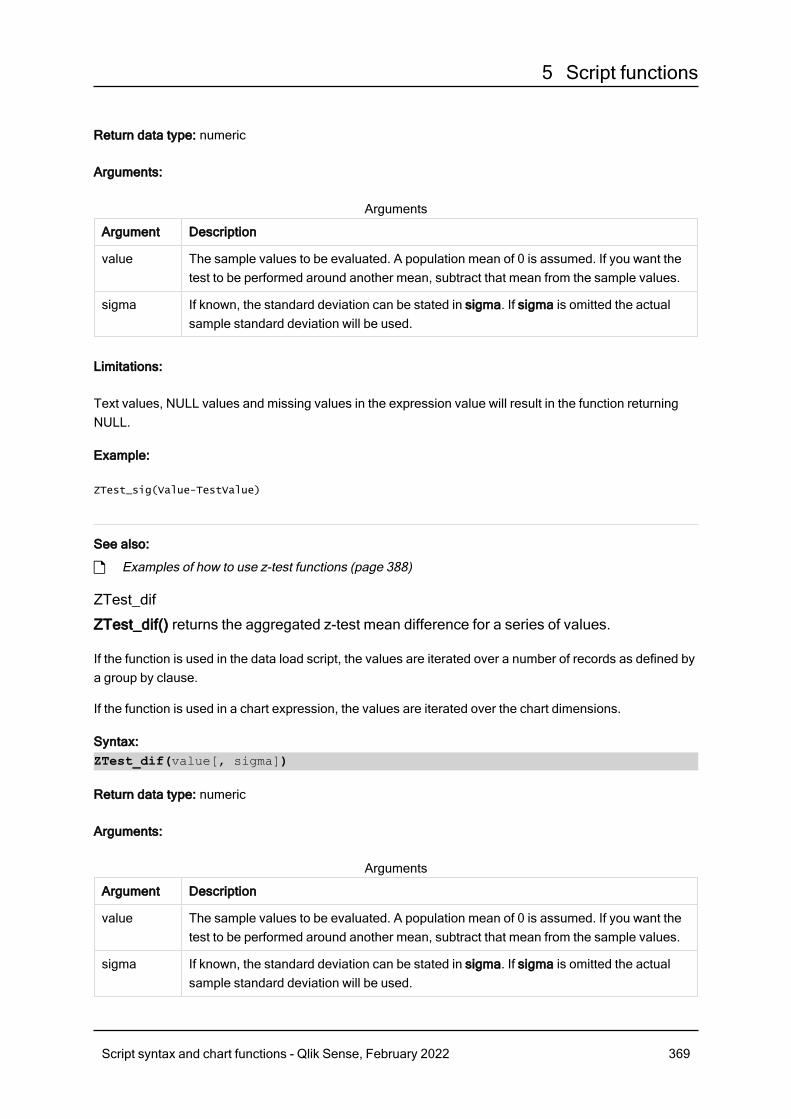
5 Script functions
Return data type: numeric
Arguments:
Argument Description
value The sample values to be evaluated. A population mean of 0 is assumed. If you want thetest to be performed around another mean, subtract that mean from the sample values.
sigma If known, the standard deviation can be stated in sigma. If sigma is omitted the actualsample standard deviation will be used.
Arguments
Limitations:
Text values, NULL values and missing values in the expression value will result in the function returningNULL.
Example:
ZTest_sig(Value-TestValue)
See also:
p Examples of how to use z-test functions (page 388)
ZTest_dif
ZTest_dif() returns the aggregated z-test mean difference for a series of values.
If the function is used in the data load script, the values are iterated over a number of records as defined bya group by clause.
If the function is used in a chart expression, the values are iterated over the chart dimensions.
Syntax:ZTest_dif(value[, sigma])
Return data type: numeric
Arguments:
Argument Description
value The sample values to be evaluated. A population mean of 0 is assumed. If you want thetest to be performed around another mean, subtract that mean from the sample values.
sigma If known, the standard deviation can be stated in sigma. If sigma is omitted the actualsample standard deviation will be used.
Arguments
Script syntax and chart functions - Qlik Sense, February 2022 369
5 Script functions
Limitations:
Text values, NULL values and missing values in the expression value will result in the function returningNULL.
Example:
ZTest_dif(Value-TestValue)
See also:
p Examples of how to use z-test functions (page 388)
ZTest_sterr
ZTest_sterr() returns the aggregated z-test standard error of the mean difference for a seriesof values.
If the function is used in the data load script, the values are iterated over a number of records as defined bya group by clause.
If the function is used in a chart expression, the values are iterated over the chart dimensions.
Syntax:ZTest_sterr(value[, sigma])
Return data type: numeric
Arguments:
Argument Description
value The sample values to be evaluated. A population mean of 0 is assumed. If you want thetest to be performed around another mean, subtract that mean from the sample values.
sigma If known, the standard deviation can be stated in sigma. If sigma is omitted the actualsample standard deviation will be used.
Arguments
Limitations:
Text values, NULL values and missing values in the expression value will result in the function returningNULL.
Example:
ZTest_sterr(Value-TestValue)
Script syntax and chart functions - Qlik Sense, February 2022 370
5 Script functions
See also:
p Examples of how to use z-test functions (page 388)
ZTest_conf
ZTest_conf() returns the aggregated z value for a series of values.
If the function is used in the data load script, the values are iterated over a number of records as defined bya group by clause.
If the function is used in a chart expression, the values are iterated over the chart dimensions.
Syntax:ZTest_conf(value[, sigma[, sig]])
Return data type: numeric
Arguments:
Argument Description
value The sample values to be evaluated. A population mean of 0 is assumed. If you want thetest to be performed around another mean, subtract that mean from the sample values.
sigma If known, the standard deviation can be stated in sigma. If sigma is omitted the actualsample standard deviation will be used.
sig The two-tailed level of significance can be specified in sig. If omitted, sig is set to 0.025,resulting in a 95% confidence interval.
Arguments
Limitations:
Text values, NULL values and missing values in the expression value will result in the function returningNULL.
Example:
ZTest_conf(Value-TestValue)
See also:
p Examples of how to use z-test functions (page 388)
ZTest_lower
ZTest_lower() returns the aggregated value for the lower end of the confidence interval fortwo independent series of values.
Script syntax and chart functions - Qlik Sense, February 2022 371
5 Script functions
If the function is used in the data load script, the values are iterated over a number of records as defined bya group by clause.
If the function is used in a chart expression, the values are iterated over the chart dimensions.
Syntax:ZTest_lower (grp, value [, sig [, eq_var]])
Return data type: numeric
Arguments:
Argument Description
value The sample values to be evaluated. The sample values must be logically grouped asspecified by exactly two values in group. If a field name for the sample values is notprovided in the load script, the field will automatically be named Value.
grp The field containing the names of each of the two sample groups. If a field name for thegroup is not provided in the load script, the field will automatically be given the nameType.
sig The two-tailed level of significance can be specified in sig. If omitted, sig is set to 0.025,resulting in a 95% confidence interval.
eq_var If eq_var is specified as False (0), separate variances of the two samples will beassumed. If eq_var is specified as True (1), equal variances between the samples willbe assumed.
Arguments
Limitations:
Text values, NULL values and missing values in the expression value will result in the function returningNULL.
Examples:
ZTest_lower( Group, Value )
ZTest_lower( Group, Value, sig, false )
See also:
p Examples of how to use z-test functions (page 388)
ZTest_upper
ZTest_upper() returns the aggregated value for the upper end of the confidence interval fortwo independent series of values.
This function applies to independent samples student's t-tests.
Script syntax and chart functions - Qlik Sense, February 2022 372
5 Script functions
If the function is used in the data load script, the values are iterated over a number of records as defined bya group by clause.
If the function is used in a chart expression, the values are iterated over the chart dimensions.
Syntax:ZTest_upper (grp, value [, sig [, eq_var]])
Return data type: numeric
Arguments:
Argument Description
value The sample values to be evaluated. The sample values must be logically grouped asspecified by exactly two values in group. If a field name for the sample values is notprovided in the load script, the field will automatically be named Value.
grp The field containing the names of each of the two sample groups. If a field name for thegroup is not provided in the load script, the field will automatically be given the nameType.
sig The two-tailed level of significance can be specified in sig. If omitted, sig is set to 0.025,resulting in a 95% confidence interval.
eq_var If eq_var is specified as False (0), separate variances of the two samples will beassumed. If eq_var is specified as True (1), equal variances between the samples willbe assumed.
Arguments
Limitations:
Text values, NULL values and missing values in the expression value will result in the function returningNULL.
Examples:
ZTest_upper( Group, Value )
ZTest_upper( Group, Value, sig, false )
See also:
p Examples of how to use z-test functions (page 388)
ZTestw_z
ZTestw_z() returns the aggregated z value for a series of values.
This function applies to z-tests where the input data series is given in weighted two-column format.
Script syntax and chart functions - Qlik Sense, February 2022 373
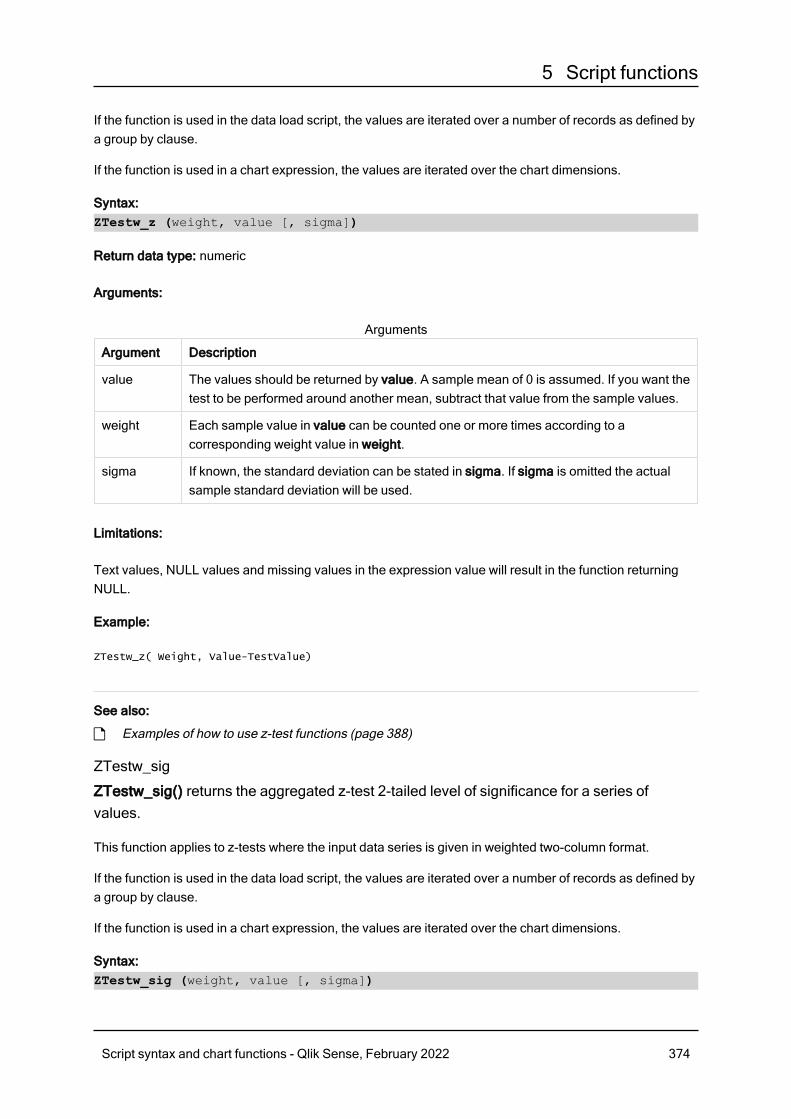
5 Script functions
If the function is used in the data load script, the values are iterated over a number of records as defined bya group by clause.
If the function is used in a chart expression, the values are iterated over the chart dimensions.
Syntax:ZTestw_z (weight, value [, sigma])
Return data type: numeric
Arguments:
Argument Description
value The values should be returned by value. A sample mean of 0 is assumed. If you want thetest to be performed around another mean, subtract that value from the sample values.
weight Each sample value in value can be counted one or more times according to acorresponding weight value in weight.
sigma If known, the standard deviation can be stated in sigma. If sigma is omitted the actualsample standard deviation will be used.
Arguments
Limitations:
Text values, NULL values and missing values in the expression value will result in the function returningNULL.
Example:
ZTestw_z( Weight, Value-TestValue)
See also:
p Examples of how to use z-test functions (page 388)
ZTestw_sig
ZTestw_sig() returns the aggregated z-test 2-tailed level of significance for a series ofvalues.
This function applies to z-tests where the input data series is given in weighted two-column format.
If the function is used in the data load script, the values are iterated over a number of records as defined bya group by clause.
If the function is used in a chart expression, the values are iterated over the chart dimensions.
Syntax:ZTestw_sig (weight, value [, sigma])
Script syntax and chart functions - Qlik Sense, February 2022 374

5 Script functions
Return data type: numeric
Arguments:
Argument Description
value The values should be returned by value. A sample mean of 0 is assumed. If you want thetest to be performed around another mean, subtract that value from the sample values.
weight Each sample value in value can be counted one or more times according to acorresponding weight value in weight.
sigma If known, the standard deviation can be stated in sigma. If sigma is omitted the actualsample standard deviation will be used.
Arguments
Limitations:
Text values, NULL values and missing values in the expression value will result in the function returningNULL.
Example:
ZTestw_sig( Weight, Value-TestValue)
See also:
p Examples of how to use z-test functions (page 388)
ZTestw_dif
ZTestw_dif() returns the aggregated z-test mean difference for a series of values.
This function applies to z-tests where the input data series is given in weighted two-column format.
If the function is used in the data load script, the values are iterated over a number of records as defined bya group by clause.
If the function is used in a chart expression, the values are iterated over the chart dimensions.
Syntax:ZTestw_dif ( weight, value [, sigma])
Script syntax and chart functions - Qlik Sense, February 2022 375

5 Script functions
Return data type: numeric
Arguments:
Argument Description
value The values should be returned by value. A sample mean of 0 is assumed. If you want thetest to be performed around another mean, subtract that value from the sample values.
weight Each sample value in value can be counted one or more times according to acorresponding weight value in weight.
sigma If known, the standard deviation can be stated in sigma. If sigma is omitted the actualsample standard deviation will be used.
Arguments
Limitations:
Text values, NULL values and missing values in the expression value will result in the function returningNULL.
Example:
ZTestw_dif( Weight, Value-TestValue)
See also:
p Examples of how to use z-test functions (page 388)
ZTestw_sterr
ZTestw_sterr() returns the aggregated z-test standard error of the mean difference for aseries of values.
This function applies to z-tests where the input data series is given in weighted two-column format.
If the function is used in the data load script, the values are iterated over a number of records as defined bya group by clause.
If the function is used in a chart expression, the values are iterated over the chart dimensions.
Syntax:ZTestw_sterr (weight, value [, sigma])
Script syntax and chart functions - Qlik Sense, February 2022 376
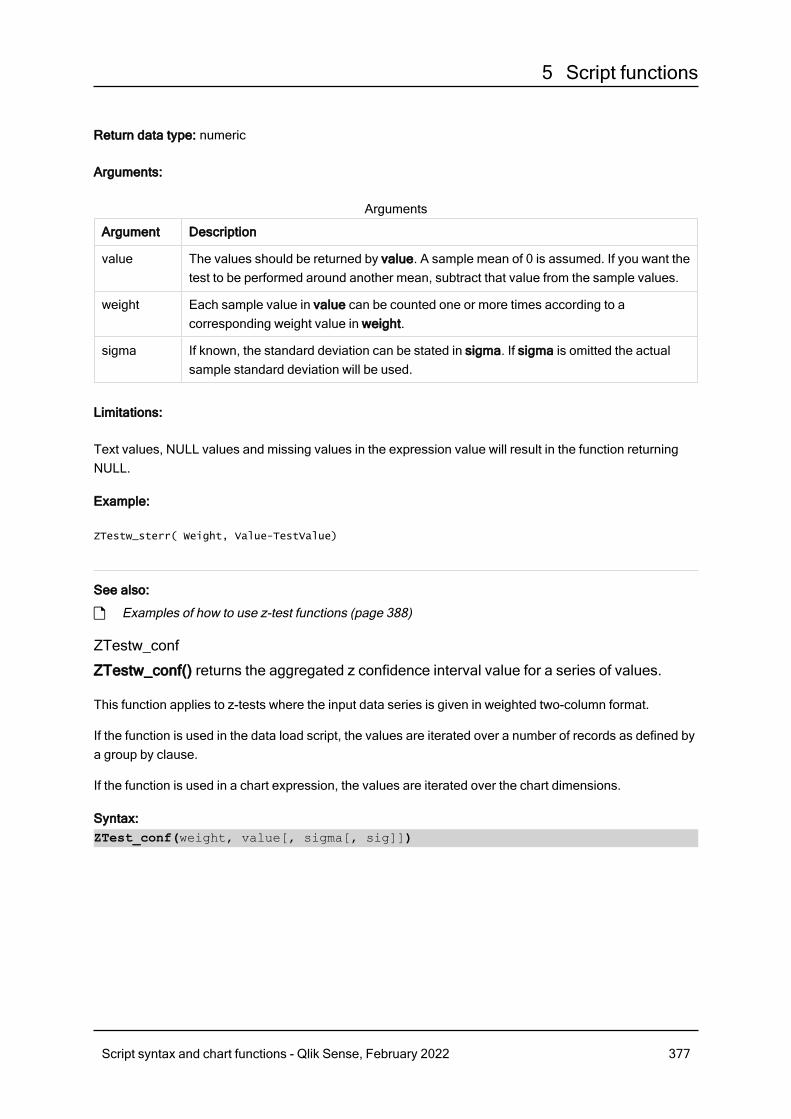
5 Script functions
Return data type: numeric
Arguments:
Argument Description
value The values should be returned by value. A sample mean of 0 is assumed. If you want thetest to be performed around another mean, subtract that value from the sample values.
weight Each sample value in value can be counted one or more times according to acorresponding weight value in weight.
sigma If known, the standard deviation can be stated in sigma. If sigma is omitted the actualsample standard deviation will be used.
Arguments
Limitations:
Text values, NULL values and missing values in the expression value will result in the function returningNULL.
Example:
ZTestw_sterr( Weight, Value-TestValue)
See also:
p Examples of how to use z-test functions (page 388)
ZTestw_conf
ZTestw_conf() returns the aggregated z confidence interval value for a series of values.
This function applies to z-tests where the input data series is given in weighted two-column format.
If the function is used in the data load script, the values are iterated over a number of records as defined bya group by clause.
If the function is used in a chart expression, the values are iterated over the chart dimensions.
Syntax:ZTest_conf(weight, value[, sigma[, sig]])
Script syntax and chart functions - Qlik Sense, February 2022 377
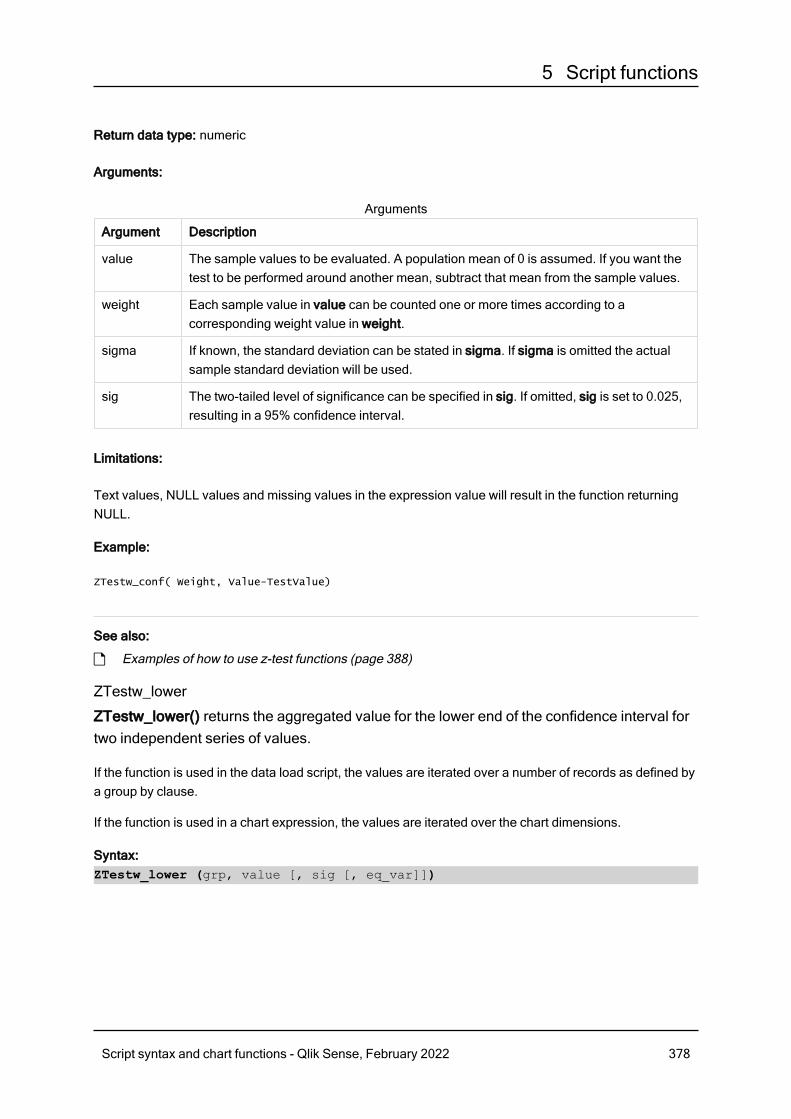
5 Script functions
Return data type: numeric
Arguments:
Argument Description
value The sample values to be evaluated. A population mean of 0 is assumed. If you want thetest to be performed around another mean, subtract that mean from the sample values.
weight Each sample value in value can be counted one or more times according to acorresponding weight value in weight.
sigma If known, the standard deviation can be stated in sigma. If sigma is omitted the actualsample standard deviation will be used.
sig The two-tailed level of significance can be specified in sig. If omitted, sig is set to 0.025,resulting in a 95% confidence interval.
Arguments
Limitations:
Text values, NULL values and missing values in the expression value will result in the function returningNULL.
Example:
ZTestw_conf( Weight, Value-TestValue)
See also:
p Examples of how to use z-test functions (page 388)
ZTestw_lower
ZTestw_lower() returns the aggregated value for the lower end of the confidence interval fortwo independent series of values.
If the function is used in the data load script, the values are iterated over a number of records as defined bya group by clause.
If the function is used in a chart expression, the values are iterated over the chart dimensions.
Syntax:ZTestw_lower (grp, value [, sig [, eq_var]])
Script syntax and chart functions - Qlik Sense, February 2022 378
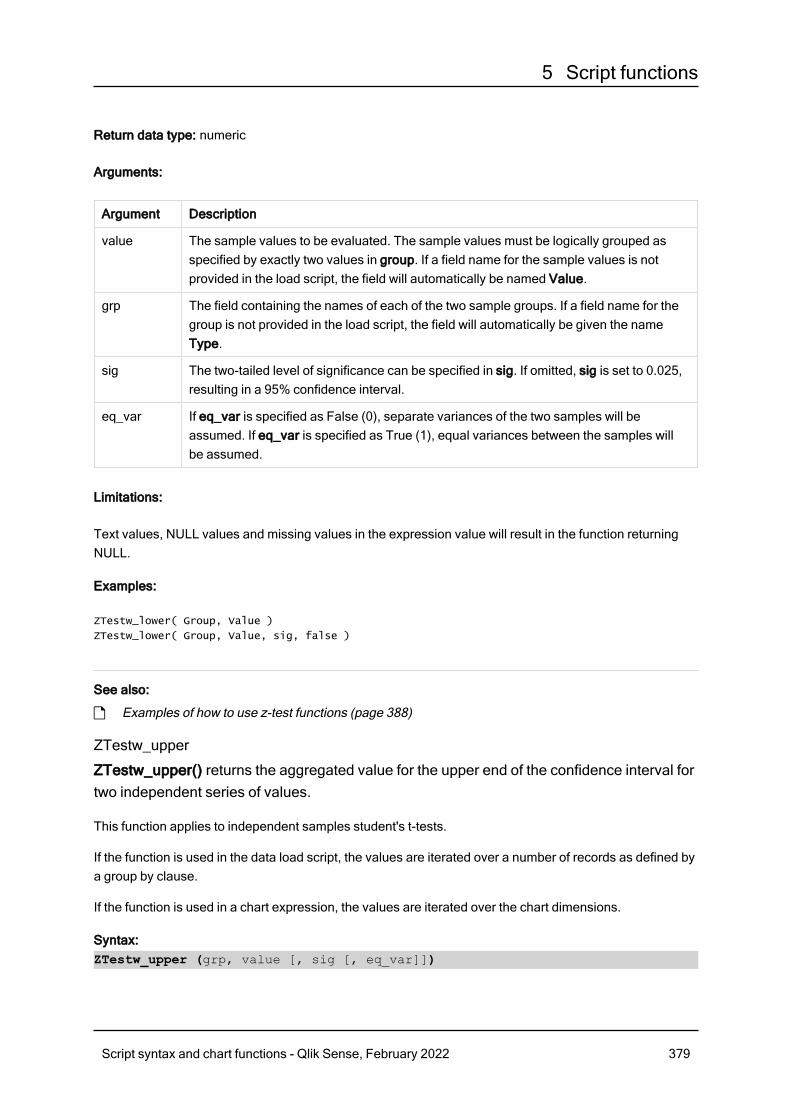
5 Script functions
Return data type: numeric
Arguments:
Argument Description
value The sample values to be evaluated. The sample values must be logically grouped asspecified by exactly two values in group. If a field name for the sample values is notprovided in the load script, the field will automatically be named Value.
grp The field containing the names of each of the two sample groups. If a field name for thegroup is not provided in the load script, the field will automatically be given the nameType.
sig The two-tailed level of significance can be specified in sig. If omitted, sig is set to 0.025,resulting in a 95% confidence interval.
eq_var If eq_var is specified as False (0), separate variances of the two samples will beassumed. If eq_var is specified as True (1), equal variances between the samples willbe assumed.
Limitations:
Text values, NULL values and missing values in the expression value will result in the function returningNULL.
Examples:
ZTestw_lower( Group, Value )
ZTestw_lower( Group, Value, sig, false )
See also:
p Examples of how to use z-test functions (page 388)
ZTestw_upper
ZTestw_upper() returns the aggregated value for the upper end of the confidence interval fortwo independent series of values.
This function applies to independent samples student's t-tests.
If the function is used in the data load script, the values are iterated over a number of records as defined bya group by clause.
If the function is used in a chart expression, the values are iterated over the chart dimensions.
Syntax:ZTestw_upper (grp, value [, sig [, eq_var]])
Script syntax and chart functions - Qlik Sense, February 2022 379
5 Script functions
Return data type: numeric
Arguments:
Argument Description
value The sample values to be evaluated. The sample values must be logically grouped asspecified by exactly two values in group. If a field name for the sample values is notprovided in the load script, the field will automatically be named Value.
grp The field containing the names of each of the two sample groups. If a field name for thegroup is not provided in the load script, the field will automatically be given the nameType.
sig The two-tailed level of significance can be specified in sig. If omitted, sig is set to 0.025,resulting in a 95% confidence interval.
eq_var If eq_var is specified as False (0), separate variances of the two samples will beassumed. If eq_var is specified as True (1), equal variances between the samples willbe assumed.
Arguments
Limitations:
Text values, NULL values and missing values in the expression value will result in the function returningNULL.
Examples:
ZTestw_upper( Group, Value )
ZTestw_upper( Group, Value, sig, false )
See also:
p Examples of how to use z-test functions (page 388)
Statistical test function examples
This section includes examples of statistical test functions as applied to charts and the dataload script.
Examples of how to use chi2-test functions in charts
The chi2-test functions are used to find values associated with chi squared statisticalanalysis.
This section describes how to build visualizations using sample data to find the values of the chi-squareddistribution test functions available in Qlik Sense. Please refer to the individual chi2-test chart functiontopics for descriptions of syntax and arguments.
Script syntax and chart functions - Qlik Sense, February 2022 380
5 Script functions
Loading the data for the samples
There are three sets of sample data describing three different statistical samples to be loaded into thescript.
Do the following:
1. Create a new app.
2. In the data load, enter the following:// Sample_1 data is pre-aggregated... Note: make sure you set your DecimalSep='.' at the
top of the script.
Sample_1:
LOAD * inline [
Grp,Grade,Count
I,A,15
I,B,7
I,C,9
I,D,20
I,E,26
I,F,19
II,A,10
II,B,11
II,C,7
II,D,15
II,E,21
II,F,16
];
// Sample_2 data is pre-aggregated: If raw data is used, it must be aggregated using
count()...
Sample_2:
LOAD * inline [
Sex,Opinion,OpCount
1,2,58
1,1,11
1,0,10
2,2,35
2,1,25
2,0,23 ] (delimiter is ',');
// Sample_3a data is transformed using the crosstable statement...
Sample_3a:
crosstable(Gender, Actual) LOAD
Description,
[Men (Actual)] as Men,
[Women (Actual)] as Women;
LOAD * inline [
Men (Actual),Women (Actual),Description
58,35,Agree
11,25,Neutral
10,23,Disagree ] (delimiter is ',');
// Sample_3b data is transformed using the crosstable statement...
Sample_3b:
crosstable(Gender, Expected) LOAD
Description,
[Men (Expected)] as Men,
[Women (Expected)] as Women;
LOAD * inline [
Men (Expected),Women (Expected),Description
Script syntax and chart functions - Qlik Sense, February 2022 381
5 Script functions
45.35,47.65,Agree
17.56,18.44,Neutral
16.09,16.91,Disagree ] (delimiter is ',');
// Sample_3a and Sample_3b will result in a (fairly harmless) Synthetic Key...
3. Click to load data.
Creating the chi2-test chart function visualizations
Example: Sample 1
Do the following:
1. In the data load editor, click to go to the app view and then click the sheet you created before.
The sheet view is opened.
2. Click Edit sheet to edit the sheet.
3. From Charts add a table, and from Fields add Grp, Grade, and Count as dimensions.This table shows the sample data.
4. Add another table with the following expression as a dimension:ValueList('p','df','Chi2')
This uses the synthetic dimensions function to create labels for the dimensions with the names ofthe three chi2-test functions.
5. Add the following expression to the table as a measure:IF(ValueList('p','df','Chi2')='p',Chi2Test_p(Grp,Grade,Count),
IF(ValueList('p','df','Chi2')='df',Chi2Test_df(Grp,Grade,Count),
Chi2Test_Chi2(Grp,Grade,Count)))
This has the effect of putting the resulting value of each chi2-test function in the table next to itsassociated synthetic dimension.
6. Set the Number formatting of the measure to Number and 3Significant figures.
In the expression for the measure, you could use the following expression instead: Pick(Match(ValueList('p','df','Chi2'),'p','df','Chi2'),Chi2Test_p(Grp,Grade,Count),Chi2Test_
df(Grp,Grade,Count),Chi2Test_Chi2(Grp,Grade,Count))
Result:
The resulting table for the chi2-test functions for the Sample 1 data will contain the following values:
p df Chi2
0.820 5 2.21
Results table
Example: Sample 2
Do the following:
1. In the sheet you were editing in the example Sample 1, from Charts add a table, and from Fieldsadd Sex, Opinion, and OpCount as dimensions.
Script syntax and chart functions - Qlik Sense, February 2022 382
5 Script functions
2. Make a copy of the results table from Sample 1 using the Copy and Paste commands. Edit theexpression in the measure and replace the arguments in all three chi2-test functions with the namesof the fields used in the Sample 2 data, for example: Chi2Test_p(Sex,Opinion,OpCount).
Result:
The resulting table for the chi2-test functions for the Sample 2 data will contain the following values:
p df Chi2
0.000309 2 16.2
Results table
Example: Sample 3
Do the following:
1. Create two more tables in the same way as in the examples for Sample 1 and Sample 2 data. In thedimensions table, use the following fields as dimensions: Gender, Description, Actual, andExpected.
2. In the results table, use the names of the fields used in the Sample 3 data, for example: Chi2Test_p(Gender,Description,Actual,Expected).
Result:
The resulting table for the chi2-test functions for the Sample 3 data will contain the following values:
p df Chi2
0.000308 2 16.2
Results table
Examples of how to use chi2-test functions in the data load script
The chi2-test functions are used to find values associated with chi squared statisticalanalysis. This section describes how to use the chi-squared distribution test functionsavailable in Qlik Sense in the data load script. Please refer to the individual chi2-test scriptfunction topics for descriptions of syntax and arguments.
This example uses a table containing the number of students achieving a grade (A-F) for two groups ofstudents (I and II).
Group A B C D E F
I 15 7 9 20 26 19
II 10 11 7 15 21 16
Data table
Loading the sample data
Do the following:
Script syntax and chart functions - Qlik Sense, February 2022 383
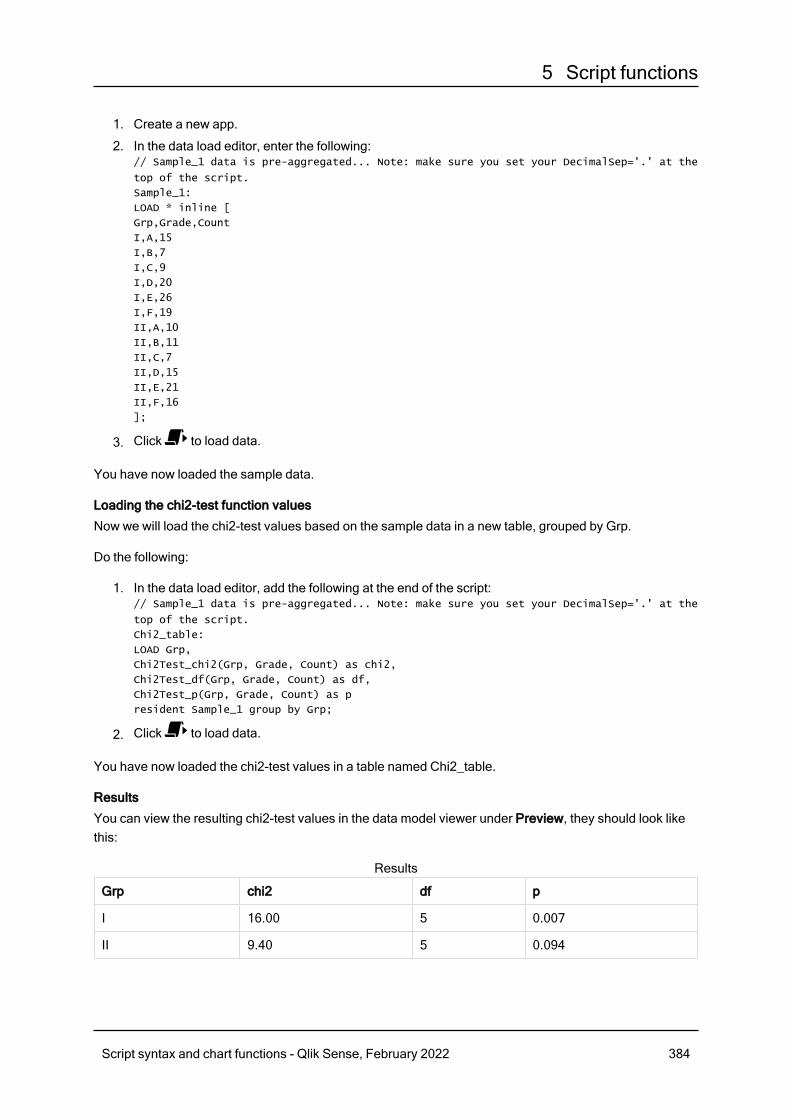
5 Script functions
1. Create a new app.
2. In the data load editor, enter the following:// Sample_1 data is pre-aggregated... Note: make sure you set your DecimalSep='.' at the
top of the script.
Sample_1:
LOAD * inline [
Grp,Grade,Count
I,A,15
I,B,7
I,C,9
I,D,20
I,E,26
I,F,19
II,A,10
II,B,11
II,C,7
II,D,15
II,E,21
II,F,16
];
3. Click to load data.
You have now loaded the sample data.
Loading the chi2-test function values
Now we will load the chi2-test values based on the sample data in a new table, grouped by Grp.
Do the following:
1. In the data load editor, add the following at the end of the script:// Sample_1 data is pre-aggregated... Note: make sure you set your DecimalSep='.' at the
top of the script.
Chi2_table:
LOAD Grp,
Chi2Test_chi2(Grp, Grade, Count) as chi2,
Chi2Test_df(Grp, Grade, Count) as df,
Chi2Test_p(Grp, Grade, Count) as p
resident Sample_1 group by Grp;
2. Click to load data.
You have now loaded the chi2-test values in a table named Chi2_table.
Results
You can view the resulting chi2-test values in the data model viewer under Preview, they should look likethis:
Grp chi2 df p
I 16.00 5 0.007
II 9.40 5 0.094
Results
Script syntax and chart functions - Qlik Sense, February 2022 384
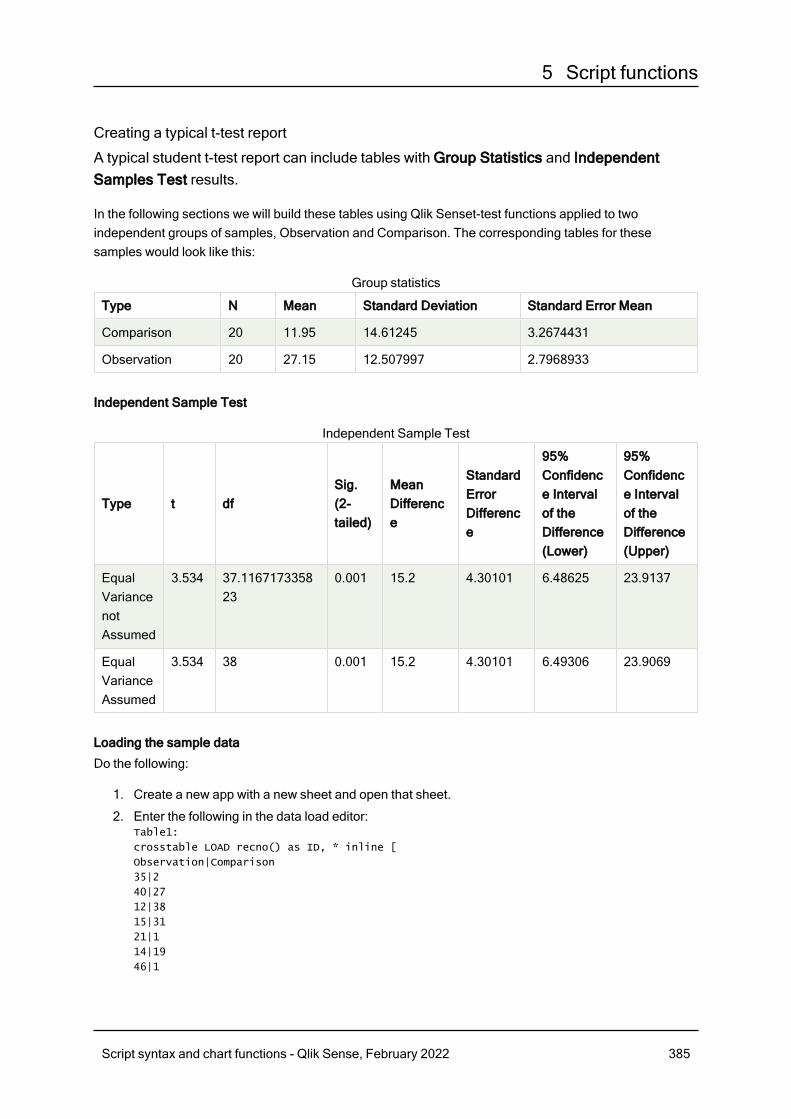
5 Script functions
Creating a typical t-test report
A typical student t-test report can include tables with Group Statistics and IndependentSamples Test results.
In the following sections we will build these tables using Qlik Senset-test functions applied to twoindependent groups of samples, Observation and Comparison. The corresponding tables for thesesamples would look like this:
Type N Mean Standard Deviation Standard Error Mean
Comparison 20 11.95 14.61245 3.2674431
Observation 20 27.15 12.507997 2.7968933
Group statistics
Independent Sample Test
Type t dfSig.(2-tailed)
MeanDifference
StandardErrorDifference
95%Confidence Intervalof theDifference(Lower)
95%Confidence Intervalof theDifference(Upper)
EqualVariancenotAssumed
3.534 37.116717335823
0.001 15.2 4.30101 6.48625 23.9137
EqualVarianceAssumed
3.534 38 0.001 15.2 4.30101 6.49306 23.9069
Independent Sample Test
Loading the sample data
Do the following:
1. Create a new app with a new sheet and open that sheet.
2. Enter the following in the data load editor:Table1:
crosstable LOAD recno() as ID, * inline [
Observation|Comparison
35|2
40|27
12|38
15|31
21|1
14|19
46|1
Script syntax and chart functions - Qlik Sense, February 2022 385
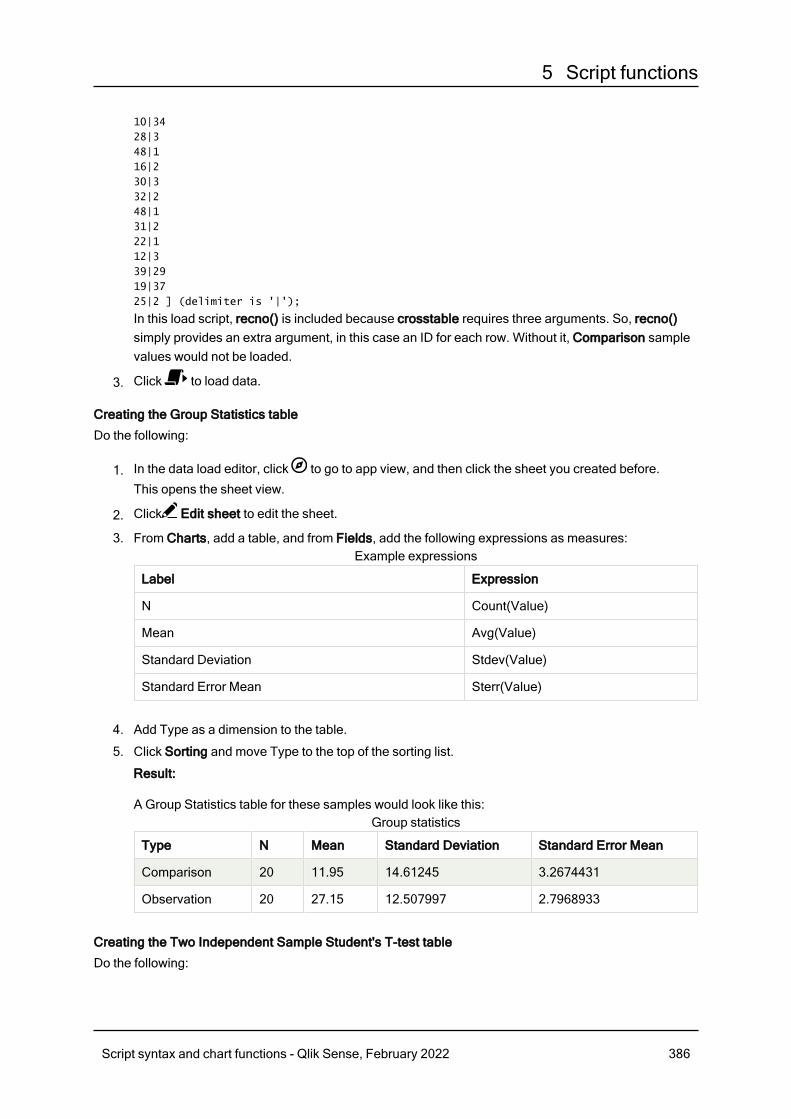
5 Script functions
10|34
28|3
48|1
16|2
30|3
32|2
48|1
31|2
22|1
12|3
39|29
19|37
25|2 ] (delimiter is '|');
In this load script, recno() is included because crosstable requires three arguments. So, recno()simply provides an extra argument, in this case an ID for each row. Without it, Comparison samplevalues would not be loaded.
3. Click to load data.
Creating the Group Statistics table
Do the following:
1. In the data load editor, click to go to app view, and then click the sheet you created before.
This opens the sheet view.
2. Click Edit sheet to edit the sheet.
3. From Charts, add a table, and from Fields, add the following expressions as measures:
Label Expression
N Count(Value)
Mean Avg(Value)
Standard Deviation Stdev(Value)
Standard Error Mean Sterr(Value)
Example expressions
4. Add Type as a dimension to the table.
5. Click Sorting and move Type to the top of the sorting list.
Result:
A Group Statistics table for these samples would look like this:
Type N Mean Standard Deviation Standard Error Mean
Comparison 20 11.95 14.61245 3.2674431
Observation 20 27.15 12.507997 2.7968933
Group statistics
Creating the Two Independent Sample Student's T-test table
Do the following:
Script syntax and chart functions - Qlik Sense, February 2022 386
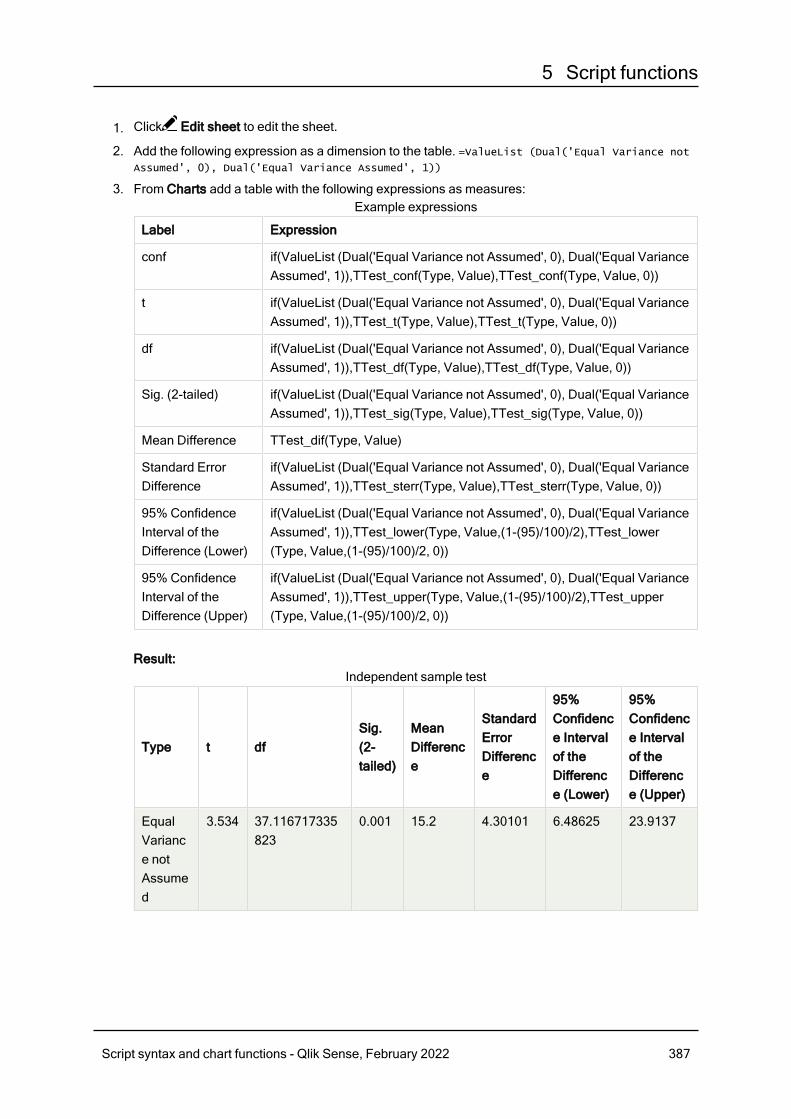
5 Script functions
1. Click Edit sheet to edit the sheet.
2. Add the following expression as a dimension to the table. =ValueList (Dual('Equal Variance not
Assumed', 0), Dual('Equal Variance Assumed', 1))
3. From Charts add a table with the following expressions as measures:
Label Expression
conf if(ValueList (Dual('Equal Variance not Assumed', 0), Dual('Equal VarianceAssumed', 1)),TTest_conf(Type, Value),TTest_conf(Type, Value, 0))
t if(ValueList (Dual('Equal Variance not Assumed', 0), Dual('Equal VarianceAssumed', 1)),TTest_t(Type, Value),TTest_t(Type, Value, 0))
df if(ValueList (Dual('Equal Variance not Assumed', 0), Dual('Equal VarianceAssumed', 1)),TTest_df(Type, Value),TTest_df(Type, Value, 0))
Sig. (2-tailed) if(ValueList (Dual('Equal Variance not Assumed', 0), Dual('Equal VarianceAssumed', 1)),TTest_sig(Type, Value),TTest_sig(Type, Value, 0))
Mean Difference TTest_dif(Type, Value)
Standard ErrorDifference
if(ValueList (Dual('Equal Variance not Assumed', 0), Dual('Equal VarianceAssumed', 1)),TTest_sterr(Type, Value),TTest_sterr(Type, Value, 0))
95% ConfidenceInterval of theDifference (Lower)
if(ValueList (Dual('Equal Variance not Assumed', 0), Dual('Equal VarianceAssumed', 1)),TTest_lower(Type, Value,(1-(95)/100)/2),TTest_lower(Type, Value,(1-(95)/100)/2, 0))
95% ConfidenceInterval of theDifference (Upper)
if(ValueList (Dual('Equal Variance not Assumed', 0), Dual('Equal VarianceAssumed', 1)),TTest_upper(Type, Value,(1-(95)/100)/2),TTest_upper(Type, Value,(1-(95)/100)/2, 0))
Example expressions
Result:
Type t dfSig.(2-tailed)
MeanDifference
StandardErrorDifference
95%Confidence Intervalof theDifference (Lower)
95%Confidence Intervalof theDifference (Upper)
EqualVariance notAssumed
3.534 37.116717335823
0.001 15.2 4.30101 6.48625 23.9137
Independent sample test
Script syntax and chart functions - Qlik Sense, February 2022 387
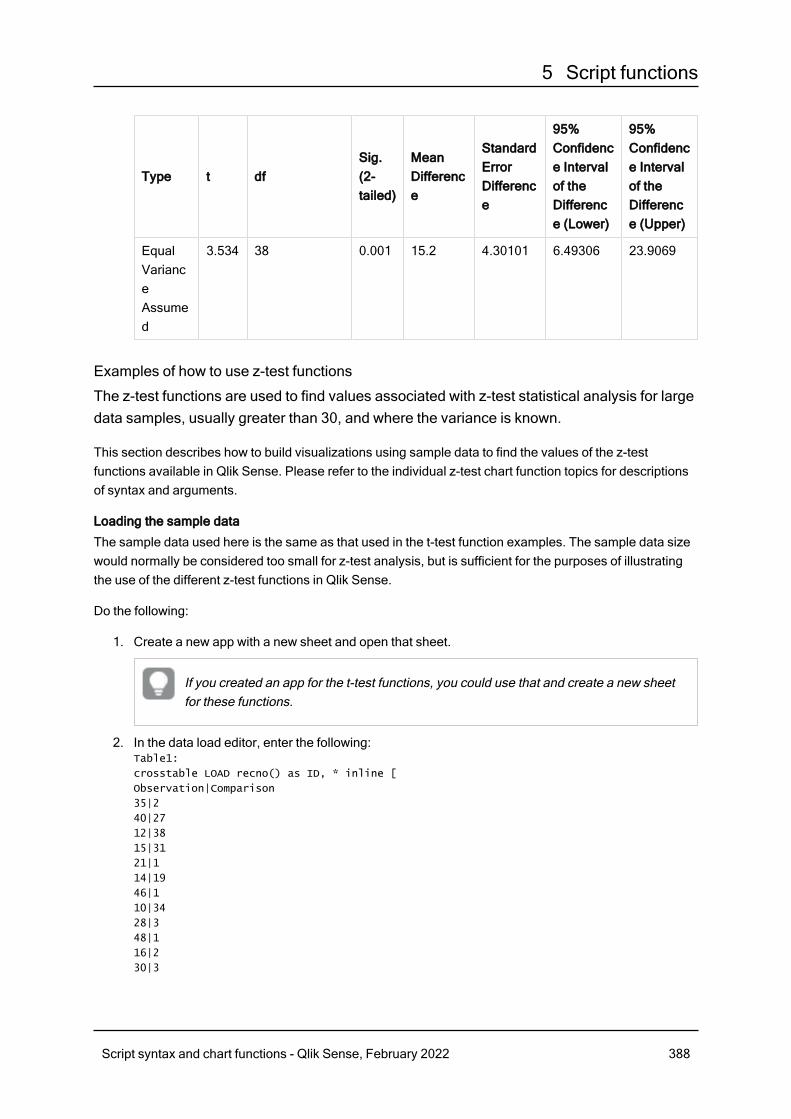
5 Script functions
Type t dfSig.(2-tailed)
MeanDifference
StandardErrorDifference
95%Confidence Intervalof theDifference (Lower)
95%Confidence Intervalof theDifference (Upper)
EqualVarianceAssumed
3.534 38 0.001 15.2 4.30101 6.49306 23.9069
Examples of how to use z-test functions
The z-test functions are used to find values associated with z-test statistical analysis for largedata samples, usually greater than 30, and where the variance is known.
This section describes how to build visualizations using sample data to find the values of the z-testfunctions available in Qlik Sense. Please refer to the individual z-test chart function topics for descriptionsof syntax and arguments.
Loading the sample data
The sample data used here is the same as that used in the t-test function examples. The sample data sizewould normally be considered too small for z-test analysis, but is sufficient for the purposes of illustratingthe use of the different z-test functions in Qlik Sense.
Do the following:
1. Create a new app with a new sheet and open that sheet.
If you created an app for the t-test functions, you could use that and create a new sheetfor these functions.
2. In the data load editor, enter the following:Table1:
crosstable LOAD recno() as ID, * inline [
Observation|Comparison
35|2
40|27
12|38
15|31
21|1
14|19
46|1
10|34
28|3
48|1
16|2
30|3
Script syntax and chart functions - Qlik Sense, February 2022 388
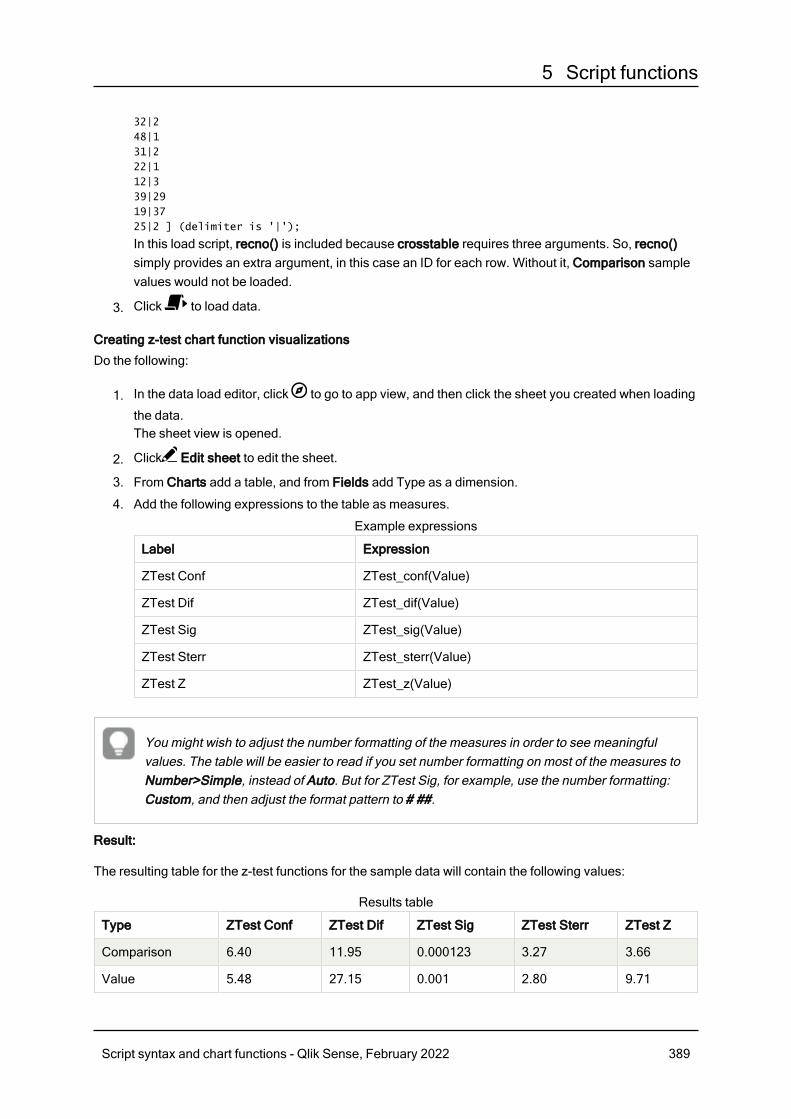
5 Script functions
32|2
48|1
31|2
22|1
12|3
39|29
19|37
25|2 ] (delimiter is '|');
In this load script, recno() is included because crosstable requires three arguments. So, recno()simply provides an extra argument, in this case an ID for each row. Without it, Comparison samplevalues would not be loaded.
3. Click to load data.
Creating z-test chart function visualizations
Do the following:
1. In the data load editor, click to go to app view, and then click the sheet you created when loading
the data.The sheet view is opened.
2. Click Edit sheet to edit the sheet.
3. From Charts add a table, and from Fields add Type as a dimension.
4. Add the following expressions to the table as measures.
Label Expression
ZTest Conf ZTest_conf(Value)
ZTest Dif ZTest_dif(Value)
ZTest Sig ZTest_sig(Value)
ZTest Sterr ZTest_sterr(Value)
ZTest Z ZTest_z(Value)
Example expressions
You might wish to adjust the number formatting of the measures in order to see meaningfulvalues. The table will be easier to read if you set number formatting on most of the measures toNumber>Simple, instead of Auto. But for ZTest Sig, for example, use the number formatting:Custom, and then adjust the format pattern to # ##.
Result:
The resulting table for the z-test functions for the sample data will contain the following values:
Type ZTest Conf ZTest Dif ZTest Sig ZTest Sterr ZTest Z
Comparison 6.40 11.95 0.000123 3.27 3.66
Value 5.48 27.15 0.001 2.80 9.71
Results table
Script syntax and chart functions - Qlik Sense, February 2022 389
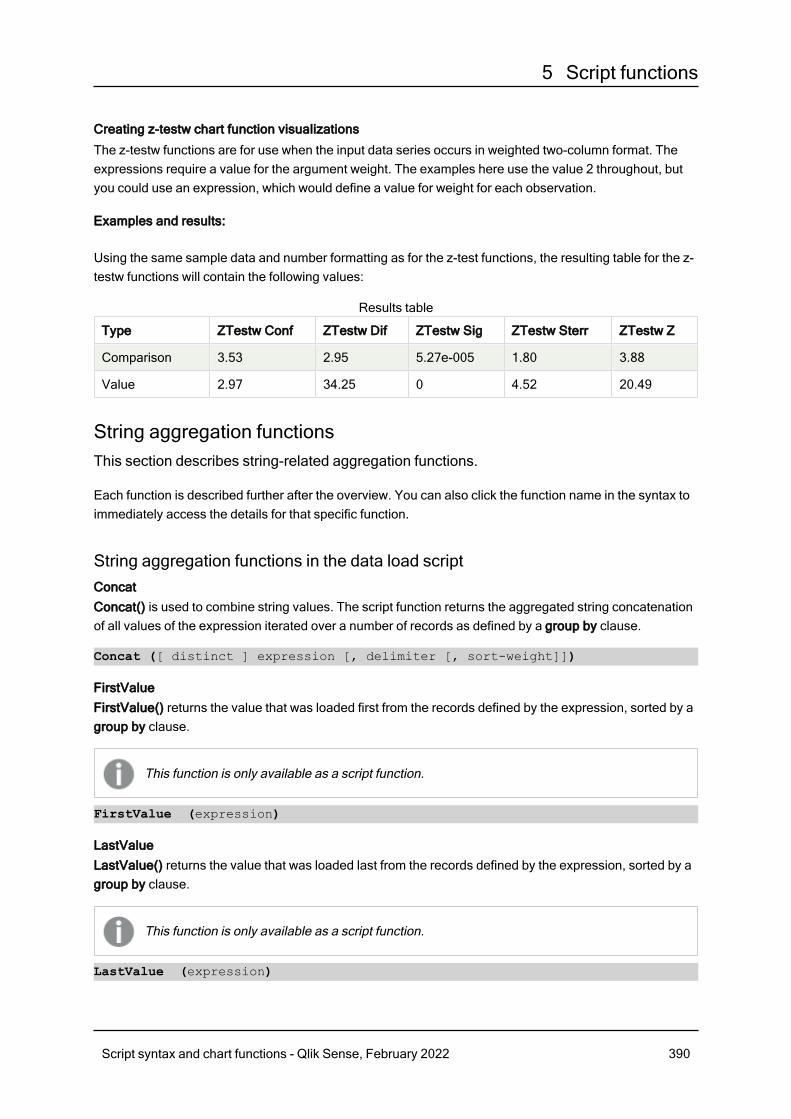
5 Script functions
Creating z-testw chart function visualizations
The z-testw functions are for use when the input data series occurs in weighted two-column format. Theexpressions require a value for the argument weight. The examples here use the value 2 throughout, butyou could use an expression, which would define a value for weight for each observation.
Examples and results:
Using the same sample data and number formatting as for the z-test functions, the resulting table for the z-testw functions will contain the following values:
Type ZTestw Conf ZTestw Dif ZTestw Sig ZTestw Sterr ZTestw Z
Comparison 3.53 2.95 5.27e-005 1.80 3.88
Value 2.97 34.25 0 4.52 20.49
Results table
String aggregation functionsThis section describes string-related aggregation functions.
Each function is described further after the overview. You can also click the function name in the syntax toimmediately access the details for that specific function.
String aggregation functions in the data load scriptConcatConcat() is used to combine string values. The script function returns the aggregated string concatenationof all values of the expression iterated over a number of records as defined by a group by clause.
Concat ([ distinct ] expression [, delimiter [, sort-weight]])
FirstValueFirstValue() returns the value that was loaded first from the records defined by the expression, sorted by agroup by clause.
This function is only available as a script function.
FirstValue (expression)
LastValueLastValue() returns the value that was loaded last from the records defined by the expression, sorted by agroup by clause.
This function is only available as a script function.
LastValue (expression)
Script syntax and chart functions - Qlik Sense, February 2022 390
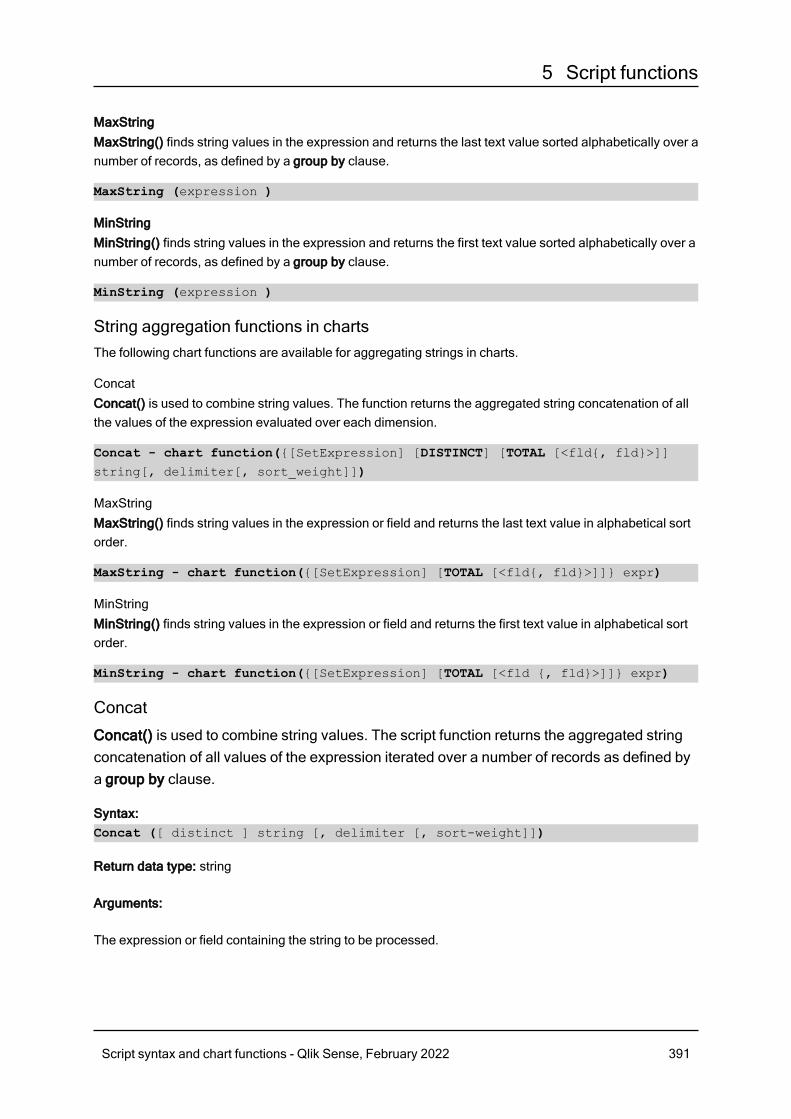
5 Script functions
MaxStringMaxString() finds string values in the expression and returns the last text value sorted alphabetically over anumber of records, as defined by a group by clause.
MaxString (expression )
MinStringMinString() finds string values in the expression and returns the first text value sorted alphabetically over anumber of records, as defined by a group by clause.
MinString (expression )
String aggregation functions in chartsThe following chart functions are available for aggregating strings in charts.
ConcatConcat() is used to combine string values. The function returns the aggregated string concatenation of allthe values of the expression evaluated over each dimension.
Concat - chart function({[SetExpression] [DISTINCT] [TOTAL [<fld{, fld}>]]
string[, delimiter[, sort_weight]])
MaxStringMaxString() finds string values in the expression or field and returns the last text value in alphabetical sortorder.
MaxString - chart function({[SetExpression] [TOTAL [<fld{, fld}>]]} expr)
MinStringMinString() finds string values in the expression or field and returns the first text value in alphabetical sortorder.
MinString - chart function({[SetExpression] [TOTAL [<fld {, fld}>]]} expr)
Concat
Concat() is used to combine string values. The script function returns the aggregated stringconcatenation of all values of the expression iterated over a number of records as defined bya group by clause.
Syntax:Concat ([ distinct ] string [, delimiter [, sort-weight]])
Return data type: string
Arguments:
The expression or field containing the string to be processed.
Script syntax and chart functions - Qlik Sense, February 2022 391
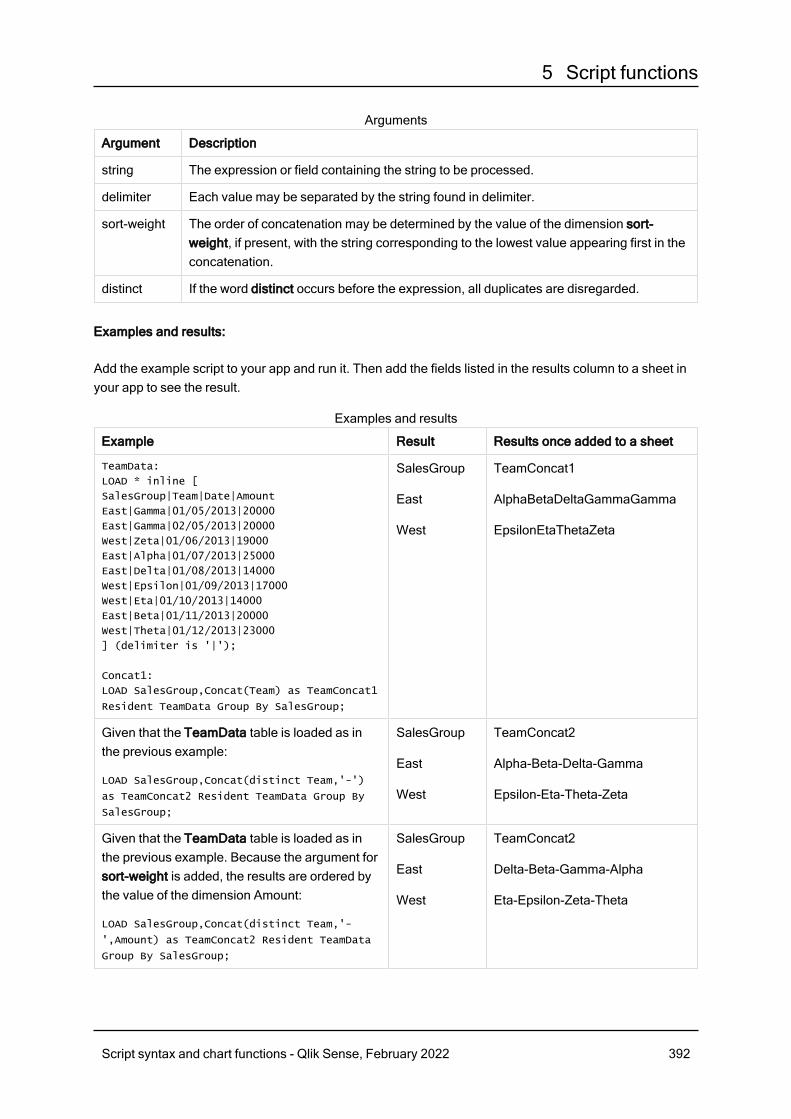
5 Script functions
Argument Description
string The expression or field containing the string to be processed.
delimiter Each value may be separated by the string found in delimiter.
sort-weight The order of concatenation may be determined by the value of the dimension sort-weight, if present, with the string corresponding to the lowest value appearing first in theconcatenation.
distinct If the word distinct occurs before the expression, all duplicates are disregarded.
Arguments
Examples and results:
Add the example script to your app and run it. Then add the fields listed in the results column to a sheet inyour app to see the result.
Example Result Results once added to a sheet
TeamData:
LOAD * inline [
SalesGroup|Team|Date|Amount
East|Gamma|01/05/2013|20000
East|Gamma|02/05/2013|20000
West|Zeta|01/06/2013|19000
East|Alpha|01/07/2013|25000
East|Delta|01/08/2013|14000
West|Epsilon|01/09/2013|17000
West|Eta|01/10/2013|14000
East|Beta|01/11/2013|20000
West|Theta|01/12/2013|23000
] (delimiter is '|');
Concat1:
LOAD SalesGroup,Concat(Team) as TeamConcat1
Resident TeamData Group By SalesGroup;
SalesGroup
East
West
TeamConcat1
AlphaBetaDeltaGammaGamma
EpsilonEtaThetaZeta
Given that the TeamData table is loaded as inthe previous example:
LOAD SalesGroup,Concat(distinct Team,'-')
as TeamConcat2 Resident TeamData Group By
SalesGroup;
SalesGroup
East
West
TeamConcat2
Alpha-Beta-Delta-Gamma
Epsilon-Eta-Theta-Zeta
Given that the TeamData table is loaded as inthe previous example. Because the argument forsort-weight is added, the results are ordered bythe value of the dimension Amount:
LOAD SalesGroup,Concat(distinct Team,'-
',Amount) as TeamConcat2 Resident TeamData
Group By SalesGroup;
SalesGroup
East
West
TeamConcat2
Delta-Beta-Gamma-Alpha
Eta-Epsilon-Zeta-Theta
Examples and results
Script syntax and chart functions - Qlik Sense, February 2022 392
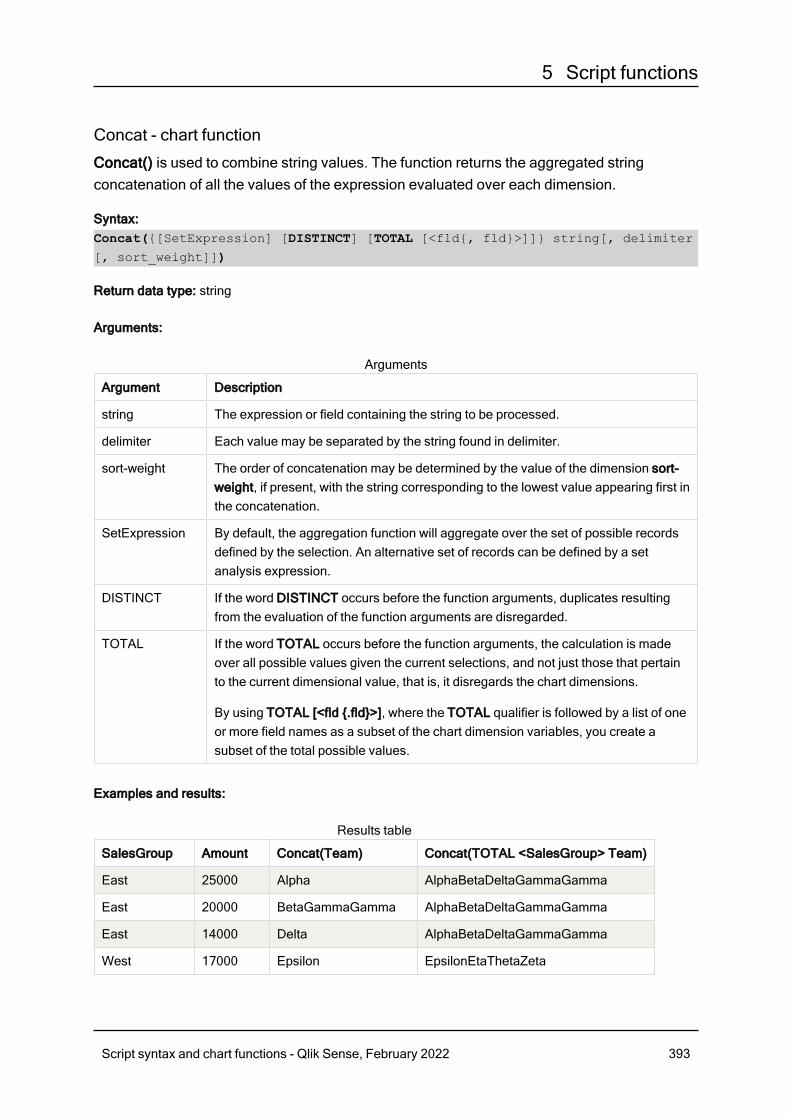
5 Script functions
Concat - chart function
Concat() is used to combine string values. The function returns the aggregated stringconcatenation of all the values of the expression evaluated over each dimension.
Syntax:Concat({[SetExpression] [DISTINCT] [TOTAL [<fld{, fld}>]]} string[, delimiter
[, sort_weight]])
Return data type: string
Arguments:
Argument Description
string The expression or field containing the string to be processed.
delimiter Each value may be separated by the string found in delimiter.
sort-weight The order of concatenation may be determined by the value of the dimension sort-weight, if present, with the string corresponding to the lowest value appearing first inthe concatenation.
SetExpression By default, the aggregation function will aggregate over the set of possible recordsdefined by the selection. An alternative set of records can be defined by a setanalysis expression.
DISTINCT If the word DISTINCT occurs before the function arguments, duplicates resultingfrom the evaluation of the function arguments are disregarded.
TOTAL If the word TOTAL occurs before the function arguments, the calculation is madeover all possible values given the current selections, and not just those that pertainto the current dimensional value, that is, it disregards the chart dimensions.
By using TOTAL [<fld {.fld}>], where the TOTAL qualifier is followed by a list of oneor more field names as a subset of the chart dimension variables, you create asubset of the total possible values.
Arguments
Examples and results:
SalesGroup Amount Concat(Team) Concat(TOTAL <SalesGroup> Team)
East 25000 Alpha AlphaBetaDeltaGammaGamma
East 20000 BetaGammaGamma AlphaBetaDeltaGammaGamma
East 14000 Delta AlphaBetaDeltaGammaGamma
West 17000 Epsilon EpsilonEtaThetaZeta
Results table
Script syntax and chart functions - Qlik Sense, February 2022 393
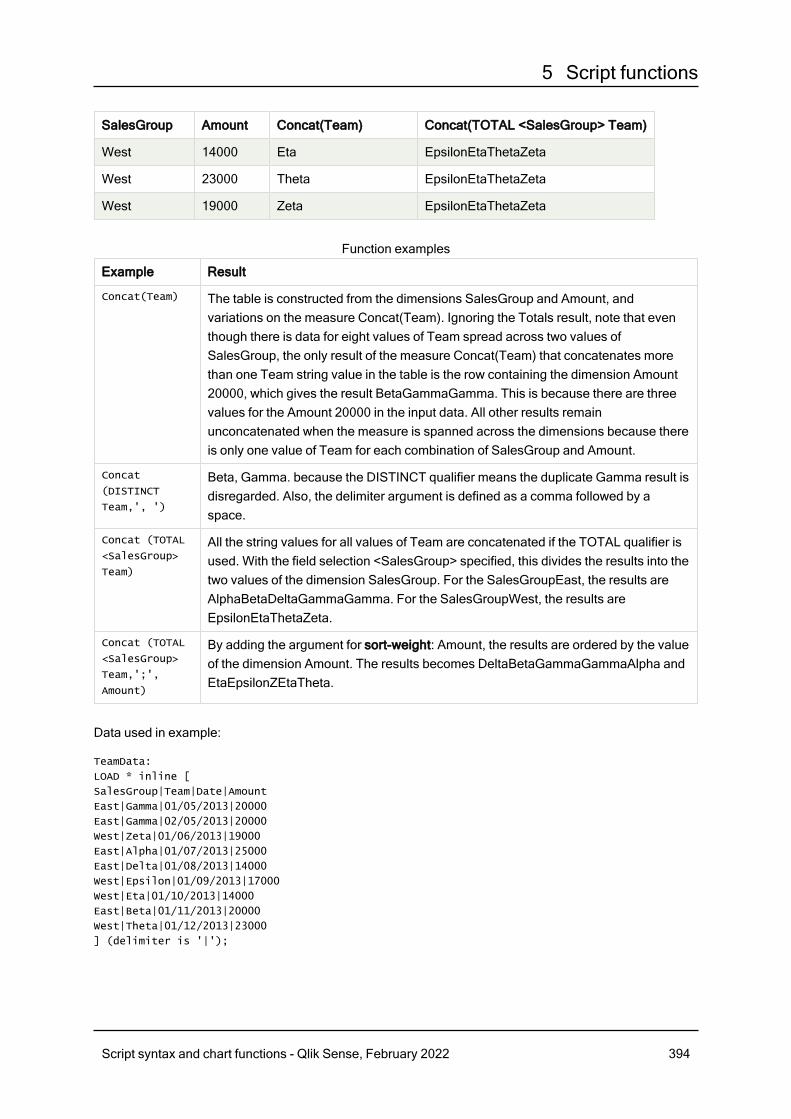
5 Script functions
SalesGroup Amount Concat(Team) Concat(TOTAL <SalesGroup> Team)
West 14000 Eta EpsilonEtaThetaZeta
West 23000 Theta EpsilonEtaThetaZeta
West 19000 Zeta EpsilonEtaThetaZeta
Example Result
Concat(Team) The table is constructed from the dimensions SalesGroup and Amount, andvariations on the measure Concat(Team). Ignoring the Totals result, note that eventhough there is data for eight values of Team spread across two values ofSalesGroup, the only result of the measure Concat(Team) that concatenates morethan one Team string value in the table is the row containing the dimension Amount20000, which gives the result BetaGammaGamma. This is because there are threevalues for the Amount 20000 in the input data. All other results remainunconcatenated when the measure is spanned across the dimensions because thereis only one value of Team for each combination of SalesGroup and Amount.
Concat
(DISTINCT
Team,', ')
Beta, Gamma. because the DISTINCT qualifier means the duplicate Gamma result isdisregarded. Also, the delimiter argument is defined as a comma followed by aspace.
Concat (TOTAL
<SalesGroup>
Team)
All the string values for all values of Team are concatenated if the TOTAL qualifier isused. With the field selection <SalesGroup> specified, this divides the results into thetwo values of the dimension SalesGroup. For the SalesGroupEast, the results areAlphaBetaDeltaGammaGamma. For the SalesGroupWest, the results areEpsilonEtaThetaZeta.
Concat (TOTAL
<SalesGroup>
Team,';',
Amount)
By adding the argument for sort-weight: Amount, the results are ordered by the valueof the dimension Amount. The results becomes DeltaBetaGammaGammaAlpha andEtaEpsilonZEtaTheta.
Function examples
Data used in example:
TeamData:
LOAD * inline [
SalesGroup|Team|Date|Amount
East|Gamma|01/05/2013|20000
East|Gamma|02/05/2013|20000
West|Zeta|01/06/2013|19000
East|Alpha|01/07/2013|25000
East|Delta|01/08/2013|14000
West|Epsilon|01/09/2013|17000
West|Eta|01/10/2013|14000
East|Beta|01/11/2013|20000
West|Theta|01/12/2013|23000
] (delimiter is '|');
Script syntax and chart functions - Qlik Sense, February 2022 394
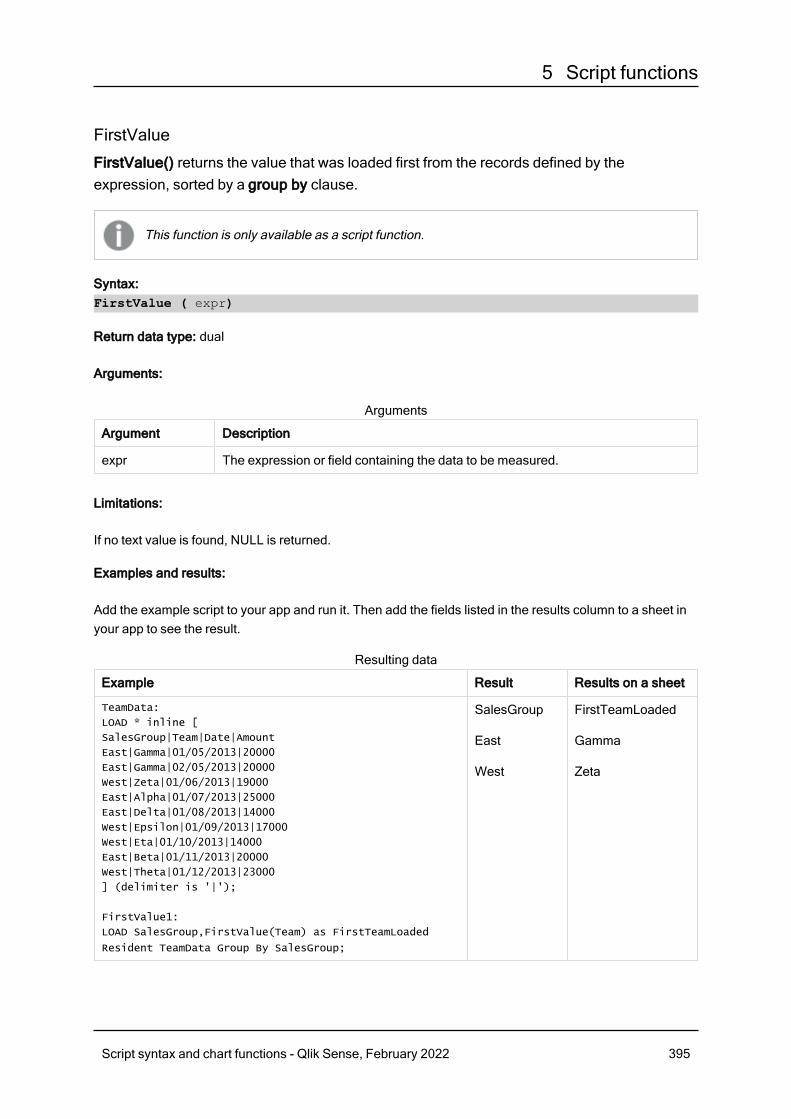
5 Script functions
FirstValue
FirstValue() returns the value that was loaded first from the records defined by theexpression, sorted by a group by clause.
This function is only available as a script function.
Syntax:FirstValue ( expr)
Return data type: dual
Arguments:
Argument Description
expr The expression or field containing the data to be measured.
Arguments
Limitations:
If no text value is found, NULL is returned.
Examples and results:
Add the example script to your app and run it. Then add the fields listed in the results column to a sheet inyour app to see the result.
Example Result Results on a sheet
TeamData:
LOAD * inline [
SalesGroup|Team|Date|Amount
East|Gamma|01/05/2013|20000
East|Gamma|02/05/2013|20000
West|Zeta|01/06/2013|19000
East|Alpha|01/07/2013|25000
East|Delta|01/08/2013|14000
West|Epsilon|01/09/2013|17000
West|Eta|01/10/2013|14000
East|Beta|01/11/2013|20000
West|Theta|01/12/2013|23000
] (delimiter is '|');
FirstValue1:
LOAD SalesGroup,FirstValue(Team) as FirstTeamLoaded
Resident TeamData Group By SalesGroup;
SalesGroup
East
West
FirstTeamLoaded
Gamma
Zeta
Resulting data
Script syntax and chart functions - Qlik Sense, February 2022 395
5 Script functions
LastValue
LastValue() returns the value that was loaded last from the records defined by theexpression, sorted by a group by clause.
This function is only available as a script function.
Syntax:LastValue ( expr )
Return data type: dual
Arguments:
Argument Description
expr The expression or field containing the data to be measured.
Arguments
Limitations:
If no text value is found, NULL is returned.
Examples and results:
Add the example script to your app and run it. Then add, at least, the fields listed in the results column to asheet in our app to see the result.
To get the same look as in the result column below, in the properties panel, under Sorting, switch from Autoto Custom, then deselect numerical and alphabetical sorting.
Script syntax and chart functions - Qlik Sense, February 2022 396
5 Script functions
Example ResultResult with customsorting
TeamData:
LOAD * inline [
SalesGroup|Team|Date|Amount
East|Gamma|01/05/2013|20000
East|Gamma|02/05/2013|20000
West|Zeta|01/06/2013|19000
East|Alpha|01/07/2013|25000
East|Delta|01/08/2013|14000
West|Epsilon|01/09/2013|17000
West|Eta|01/10/2013|14000
East|Beta|01/11/2013|20000
West|Theta|01/12/2013|23000
] (delimiter is '|');
LastValue1:
LOAD SalesGroup,LastValue(Team) as LastTeamLoaded
Resident TeamData Group By SalesGroup;
SalesGroup
East
West
LastTeamLoaded
Beta
Theta
MaxStringMaxString() finds string values in the expression and returns the last text value sorted alphabetically over anumber of records, as defined by a group by clause.
Syntax:MaxString ( expr )
Return data type: dual
Arguments:
Argument Description
expr The expression or field containing the data to be measured.
Limitations:
If no text value is found, NULL is returned.
Examples and results:
Add the example script to your app and run it. Then add the fields listed in the results column to a sheet inyour app to see the result.
Script syntax and chart functions - Qlik Sense, February 2022 397

5 Script functions
Example Result
TeamData:
LOAD * inline [
SalesGroup|Team|Date|Amount
East|Gamma|01/05/2013|20000
East|Gamma|02/05/2013|20000
West|Zeta|01/06/2013|19000
East|Alpha|01/07/2013|25000
East|Delta|01/08/2013|14000
West|Epsilon|01/09/2013|17000
West|Eta|01/10/2013|14000
East|Beta|01/11/2013|20000
West|Theta|01/12/2013|23000
] (delimiter is '|');
Concat1:
LOAD SalesGroup,MaxString(Team) as MaxString1 Resident
TeamData Group By SalesGroup;
SalesGroup
East
West
MaxString1
Gamma
Zeta
Given that the TeamData table is loaded as in the previous example,and your data load script has the SET statement:SET DateFormat='DD/MM/YYYY';':
LOAD SalesGroup,MaxString(Date) as MaxString2 Resident
TeamData Group By SalesGroup;
SalesGroup
East
West
MaxString2
01/11/2013
01/12/2013
MaxString - chart function
MaxString() finds string values in the expression or field and returns the last text value inalphabetical sort order.
Syntax:MaxString({[SetExpression] [TOTAL [<fld{, fld}>]]} expr)
Return data type: dual
Arguments:
Argument Description
expr The expression or field containing the data to be measured.
SetExpression By default, the aggregation function will aggregate over the set of possible recordsdefined by the selection. An alternative set of records can be defined by a setanalysis expression.
Arguments
Script syntax and chart functions - Qlik Sense, February 2022 398
5 Script functions
Argument Description
TOTAL If the word TOTAL occurs before the function arguments, the calculation is madeover all possible values given the current selections, and not just those that pertainto the current dimensional value, that is, it disregards the chart dimensions.
By using TOTAL [<fld {.fld}>], where the TOTAL qualifier is followed by a list of oneor more field names as a subset of the chart dimension variables, you create asubset of the total possible values.
Limitations:
If the expression contains no values with a string representation NULL is returned.
Examples and results:
SalesGroup Amount MaxString(Team) MaxString(Date)
East 14000 Delta 2013/08/01
East 20000 Gamma 2013/11/01
East 25000 Alpha 2013/07/01
West 14000 Eta 2013/10/01
West 17000 Epsilon 2013/09/01
West 19000 Zeta 2013/06/01
West 23000 Theta 2013/12/01
Results table
Example Result
MaxString
(Team)There are three values of 20000 for the dimension Amount: two of Gamma (on differentdates), and one of Beta. The result of the measure MaxString (Team) is thereforeGamma, because this is the highest value in the sorted strings.
MaxString
(Date)2013/11/01 is the greatest Date value of the three associated with the dimensionAmount. This assumes your script has the SET statement SET DateFormat='YYYY-
MM-DD';'
Function examples
Data used in example:
TeamData:
LOAD * inline [
SalesGroup|Team|Date|Amount
East|Gamma|01/05/2013|20000
East|Gamma|02/05/2013|20000
West|Zeta|01/06/2013|19000
East|Alpha|01/07/2013|25000
East|Delta|01/08/2013|14000
Script syntax and chart functions - Qlik Sense, February 2022 399
5 Script functions
West|Epsilon|01/09/2013|17000
West|Eta|01/10/2013|14000
East|Beta|01/11/2013|20000
West|Theta|01/12/2013|23000
] (delimiter is '|');
MinString
MinString() finds string values in the expression and returns the first text value sortedalphabetically over a number of records, as defined by a group by clause.
Syntax:MinString ( expr )
Return data type: dual
Arguments:
Argument Description
expr The expression or field containing the data to be measured.
Arguments
Limitations:
If no text value is found, NULL is returned.
Examples and results:
Add the example script to your app and run it. Then add the fields listed in the results column to a sheet inyour app to see the result.
Example Result
TeamData:
LOAD * inline [
SalesGroup|Team|Date|Amount
East|Gamma|01/05/2013|20000
East|Gamma|02/05/2013|20000
West|Zeta|01/06/2013|19000
East|Alpha|01/07/2013|25000
East|Delta|01/08/2013|14000
West|Epsilon|01/09/2013|17000
West|Eta|01/10/2013|14000
East|Beta|01/11/2013|20000
West|Theta|01/12/2013|23000
] (delimiter is '|');
Concat1:
LOAD SalesGroup,MinString(Team) as MinString1 Resident
TeamData Group By SalesGroup;
SalesGroup
East
West
MinString1
Alpha
Epsilon
Resulting data
Script syntax and chart functions - Qlik Sense, February 2022 400
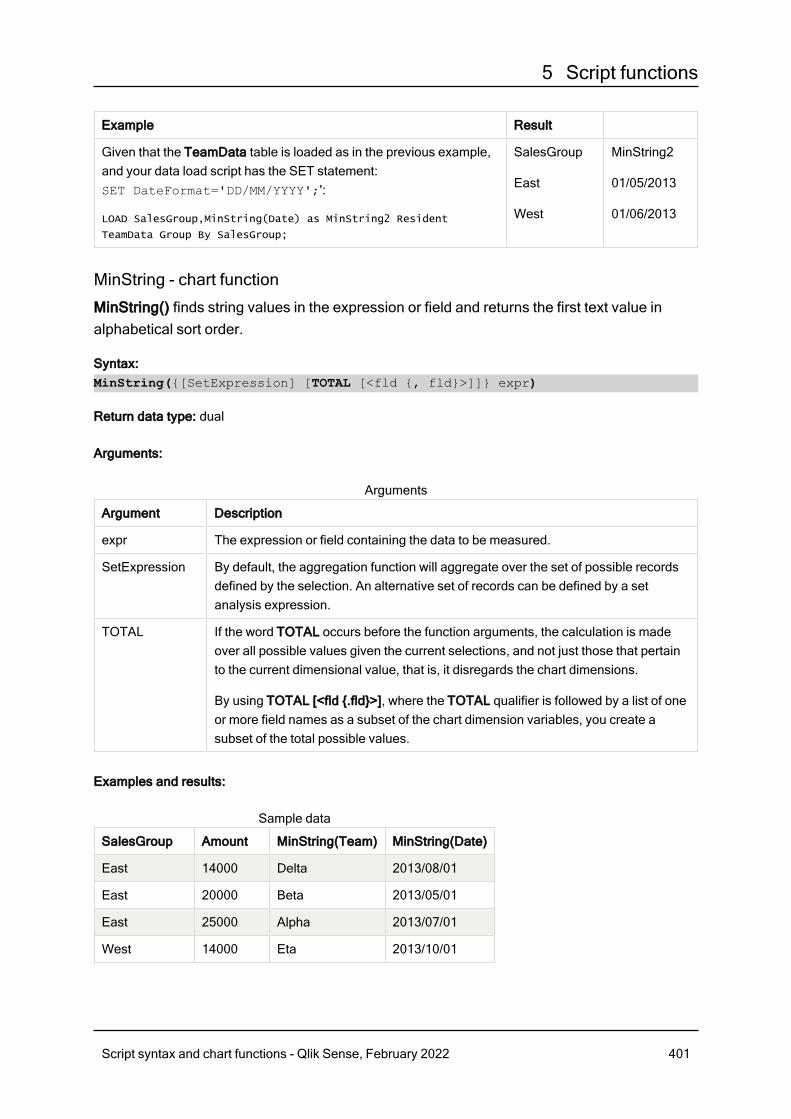
5 Script functions
Example Result
Given that the TeamData table is loaded as in the previous example,and your data load script has the SET statement:SET DateFormat='DD/MM/YYYY';':
LOAD SalesGroup,MinString(Date) as MinString2 Resident
TeamData Group By SalesGroup;
SalesGroup
East
West
MinString2
01/05/2013
01/06/2013
MinString - chart function
MinString() finds string values in the expression or field and returns the first text value inalphabetical sort order.
Syntax:MinString({[SetExpression] [TOTAL [<fld {, fld}>]]} expr)
Return data type: dual
Arguments:
Argument Description
expr The expression or field containing the data to be measured.
SetExpression By default, the aggregation function will aggregate over the set of possible recordsdefined by the selection. An alternative set of records can be defined by a setanalysis expression.
TOTAL If the word TOTAL occurs before the function arguments, the calculation is madeover all possible values given the current selections, and not just those that pertainto the current dimensional value, that is, it disregards the chart dimensions.
By using TOTAL [<fld {.fld}>], where the TOTAL qualifier is followed by a list of oneor more field names as a subset of the chart dimension variables, you create asubset of the total possible values.
Arguments
Examples and results:
SalesGroup Amount MinString(Team) MinString(Date)
East 14000 Delta 2013/08/01
East 20000 Beta 2013/05/01
East 25000 Alpha 2013/07/01
West 14000 Eta 2013/10/01
Sample data
Script syntax and chart functions - Qlik Sense, February 2022 401
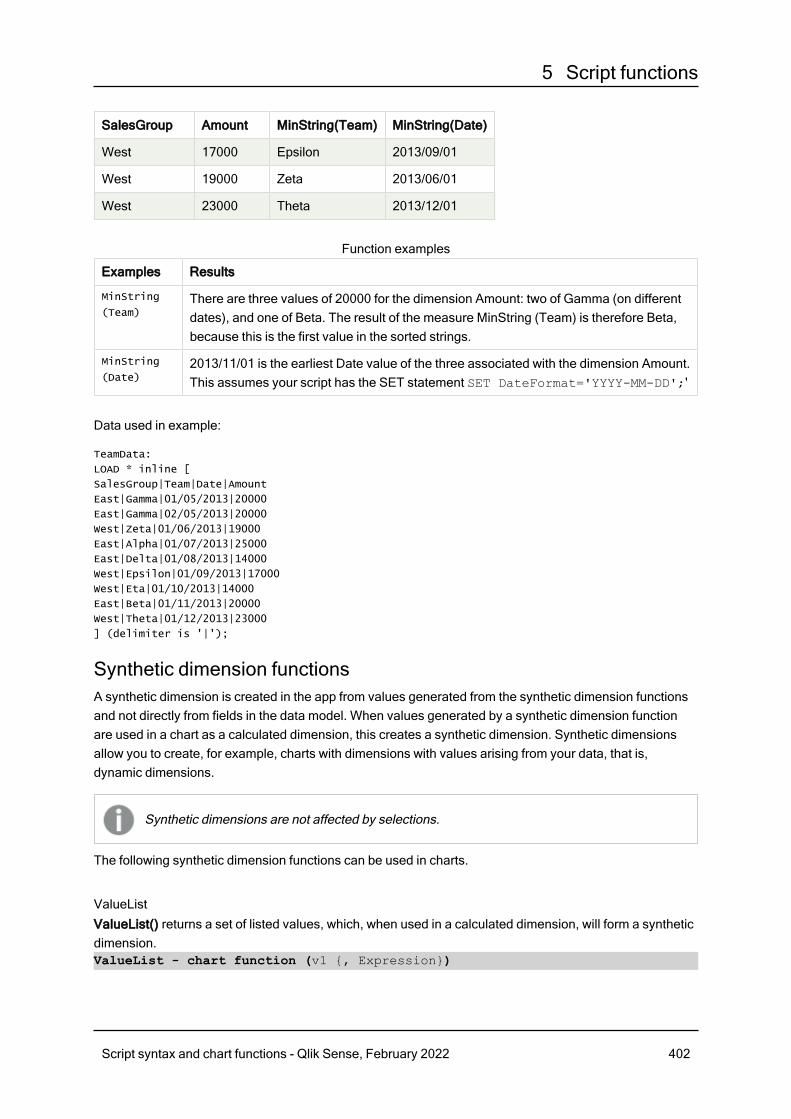
5 Script functions
SalesGroup Amount MinString(Team) MinString(Date)
West 17000 Epsilon 2013/09/01
West 19000 Zeta 2013/06/01
West 23000 Theta 2013/12/01
Examples Results
MinString
(Team)There are three values of 20000 for the dimension Amount: two of Gamma (on differentdates), and one of Beta. The result of the measure MinString (Team) is therefore Beta,because this is the first value in the sorted strings.
MinString
(Date)2013/11/01 is the earliest Date value of the three associated with the dimension Amount.This assumes your script has the SET statement SET DateFormat='YYYY-MM-DD';'
Function examples
Data used in example:
TeamData:
LOAD * inline [
SalesGroup|Team|Date|Amount
East|Gamma|01/05/2013|20000
East|Gamma|02/05/2013|20000
West|Zeta|01/06/2013|19000
East|Alpha|01/07/2013|25000
East|Delta|01/08/2013|14000
West|Epsilon|01/09/2013|17000
West|Eta|01/10/2013|14000
East|Beta|01/11/2013|20000
West|Theta|01/12/2013|23000
] (delimiter is '|');
Synthetic dimension functionsA synthetic dimension is created in the app from values generated from the synthetic dimension functionsand not directly from fields in the data model. When values generated by a synthetic dimension functionare used in a chart as a calculated dimension, this creates a synthetic dimension. Synthetic dimensionsallow you to create, for example, charts with dimensions with values arising from your data, that is,dynamic dimensions.
Synthetic dimensions are not affected by selections.
The following synthetic dimension functions can be used in charts.
ValueListValueList() returns a set of listed values, which, when used in a calculated dimension, will form a syntheticdimension.ValueList - chart function (v1 {, Expression})
Script syntax and chart functions - Qlik Sense, February 2022 402
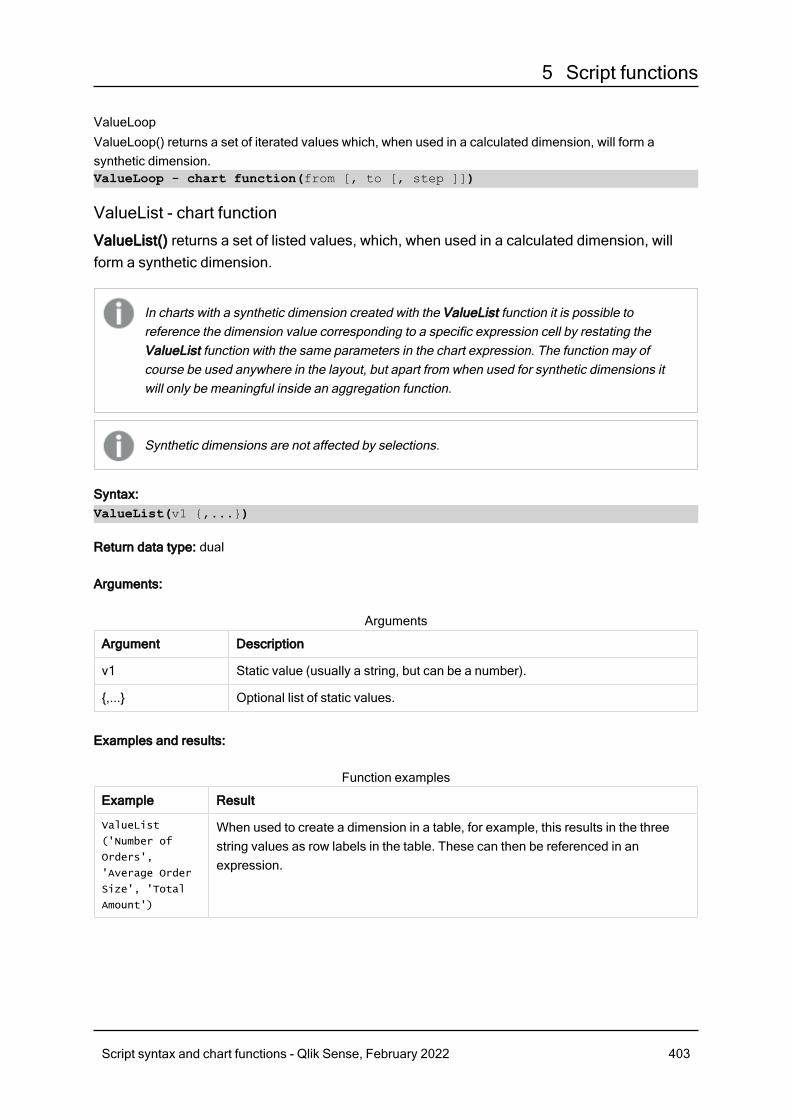
5 Script functions
ValueLoopValueLoop() returns a set of iterated values which, when used in a calculated dimension, will form asynthetic dimension.ValueLoop - chart function(from [, to [, step ]])
ValueList - chart function
ValueList() returns a set of listed values, which, when used in a calculated dimension, willform a synthetic dimension.
In charts with a synthetic dimension created with the ValueList function it is possible toreference the dimension value corresponding to a specific expression cell by restating theValueList function with the same parameters in the chart expression. The function may ofcourse be used anywhere in the layout, but apart from when used for synthetic dimensions itwill only be meaningful inside an aggregation function.
Synthetic dimensions are not affected by selections.
Syntax:ValueList(v1 {,...})
Return data type: dual
Arguments:
Argument Description
v1 Static value (usually a string, but can be a number).
{,...} Optional list of static values.
Arguments
Examples and results:
Example Result
ValueList
('Number of
Orders',
'Average Order
Size', 'Total
Amount')
When used to create a dimension in a table, for example, this results in the threestring values as row labels in the table. These can then be referenced in anexpression.
Function examples
Script syntax and chart functions - Qlik Sense, February 2022 403
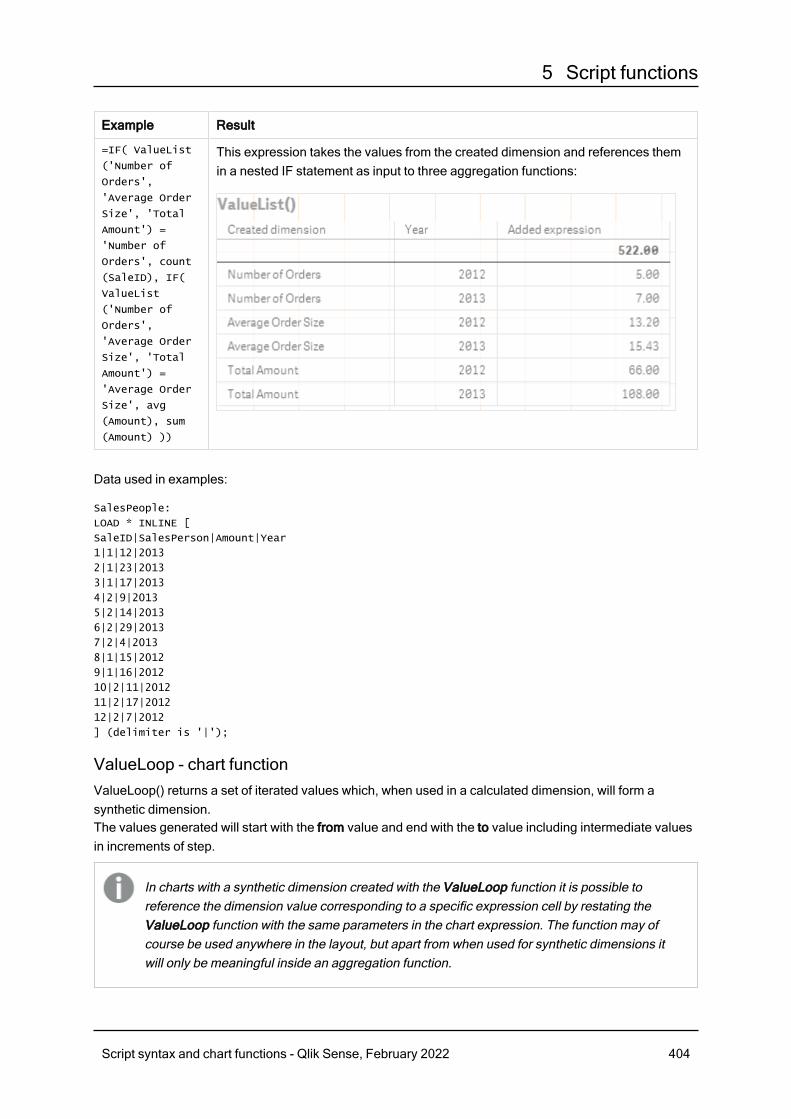
5 Script functions
Example Result
=IF( ValueList
('Number of
Orders',
'Average Order
Size', 'Total
Amount') =
'Number of
Orders', count
(SaleID), IF(
ValueList
('Number of
Orders',
'Average Order
Size', 'Total
Amount') =
'Average Order
Size', avg
(Amount), sum
(Amount) ))
This expression takes the values from the created dimension and references themin a nested IF statement as input to three aggregation functions:
Data used in examples:
SalesPeople:
LOAD * INLINE [
SaleID|SalesPerson|Amount|Year
1|1|12|2013
2|1|23|2013
3|1|17|2013
4|2|9|2013
5|2|14|2013
6|2|29|2013
7|2|4|2013
8|1|15|2012
9|1|16|2012
10|2|11|2012
11|2|17|2012
12|2|7|2012
] (delimiter is '|');
ValueLoop - chart functionValueLoop() returns a set of iterated values which, when used in a calculated dimension, will form asynthetic dimension.The values generated will start with the from value and end with the to value including intermediate valuesin increments of step.
In charts with a synthetic dimension created with the ValueLoop function it is possible toreference the dimension value corresponding to a specific expression cell by restating theValueLoop function with the same parameters in the chart expression. The function may ofcourse be used anywhere in the layout, but apart from when used for synthetic dimensions itwill only be meaningful inside an aggregation function.
Script syntax and chart functions - Qlik Sense, February 2022 404
5 Script functions
Synthetic dimensions are not affected by selections.
Syntax:ValueLoop(from [, to [, step ]])
Return data type: dual
Arguments:
Arguments Description
from Start value in the set of values to be generated.
to End value in the set of values to be generated.
step Size of increment between values.
Arguments
Examples and results:
Example Result
ValueLoop
(1, 10)This creates a dimension in a table, for example, that can be used for purposes such asnumbered labeling. The example here results in values numbered 1 to 10. These valuescan then be referenced in an expression.
ValueLoop
(2, 10,2)This example results in values numbered 2, 4, 6, 8, and 10 because the argument stephas a value of 2.
Function examples
Nested aggregationsYou may come across situations where you need to apply an aggregation to the result of anotheraggregation. This is referred to as nesting aggregations.
As a general rule, it is not allowed to nest aggregations in a Qlik Sense chart expression. Nesting is onlyallowed if you:
l Use the TOTAL qualifier in the inner aggregation function.
No more than 100 levels of nesting is allowed.
Script syntax and chart functions - Qlik Sense, February 2022 405
5 Script functions
Nested aggregations with the TOTAL qualifier
Example:
You want to calculate the sum of the field Sales, but only include transactions with an OrderDate equal tothe last year. The last year can be obtained via the aggregation function Max(TOTAL Year
(OrderDate)).
The following aggregation would return the desired result:
Sum(If(Year(OrderDate)=Max(TOTAL Year(OrderDate)), Sales))
The inclusion of the TOTAL qualifier is absolutely necessary for this kind of nesting to be accepted by QlikSense, but then again also necessary for the desired comparison. This type of nesting need is quitecommon and is a good practice.
See also:
p Aggr - chart function (page 406)
5.3 Aggr - chart functionAggr() returns an array of values for the expression calculated over the stated dimension or dimensions.For example, the maximum value of sales, per customer, per region.
The Aggr function is used for nested aggregations, in which its first parameter (the inner aggregation) iscalculated once per dimensional value. The dimensions are specified in the second parameter (andsubsequent parameters).
In addition, the Aggr function should be enclosed in an outer aggregation function, using the array ofresults from the Aggr function as input to the aggregation in which it is nested.
Syntax:Aggr({SetExpression}[DISTINCT] [NODISTINCT ] expr, StructuredParameter{,
StructuredParameter})
Return data type: dual
Arguments:
Argument Description
expr An expression consisting of an aggregation function. By default, theaggregation function will aggregate over the set of possible records definedby the selection.
Arguments
Script syntax and chart functions - Qlik Sense, February 2022 406
5 Script functions
Argument Description
StructuredParameter StructuredParameter consists of a dimension and optionally, sorting criteria inthe format: (Dimension(Sort-type, Ordering))
The dimension is a single field and cannot be an expression. The dimensionis used to determine the array of values the Aggr expression is calculated for.
If sorting criteria are included, the array of values created by the Aggrfunction, calculated for the dimension, is sorted. This is important when thesort order affects the result of the expression the Aggr function is enclosed in.
For details of how to use sorting criteria, see Adding sorting criteria to thedimension in the structured parameter.
SetExpression By default, the aggregation function will aggregate over the set of possiblerecords defined by the selection. An alternative set of records can be definedby a set analysis expression.
DISTINCT If the expression argument is preceded by the distinct qualifier or if noqualifier is used at all, each distinct combination of dimension values willgenerate only one return value. This is the normal way aggregations aremade – each distinct combination of dimension values will render one line inthe chart.
NODISTINCT If the expression argument is preceded by the nodistinct qualifier, eachcombination of dimension values may generate more than one return value,depending on underlying data structure. If there is only one dimension, theaggr function will return an array with the same number of elements as thereare rows in the source data.
Basic aggregation functions, such as Sum, Min, and Avg, return a single numerical value, whereas theAggr() function can be compared to creating a temporary staged result set (a virtual table), over whichanother aggregation can be made. For example, by computing an average sales value by summing thesales by customer in an Aggr() statement, and then calculating the average of the summed results: Avg(TOTAL Aggr(Sum(Sales),Customer)).
Use the Aggr() function in calculated dimensions if you want to create nested chartaggregations on multiple levels.
Limitations:
Each dimension in an Aggr() function must be a single field, and cannot be an expression (calculateddimension).
Script syntax and chart functions - Qlik Sense, February 2022 407
5 Script functions
Adding sorting criteria to the dimension in the structured parameter
In its basic form, the argument StructuredParameter in the Aggr function syntax is a single dimension. Theexpression: Aggr(Sum(Sales, Month)) finds the total value of sales for each month. However, whenenclosed in another aggregation function, there can be unexpected results unless sorting criteria are used.This is because some dimensions can be sorted numerically or alphabetically, and so on.
In the StructuredParameter argument in the Aggr function, you can specify sorting criteria on thedimension in your expression. This way, you impose a sort order on the virtual table that is produced by theAggr function.
The argument StructuredParameter has the following syntax:
(FieldName, (Sort-type, Ordering))
Structured parameters can be nested:
(FieldName, (FieldName2, (Sort-type, Ordering)))
Sort-type can be: NUMERIC, TEXT, FREQUENCY, or LOAD_ORDER.
The Ordering types associated with each Sort-type are as follows:
Sort-type Allowed Ordering types
NUMERIC ASCENDING, DESCENDING, or REVERSE
TEXT ASCENDING, A2Z, DESCENDING, REVERSE, or Z2A
FREQUENCY DESCENDING, REVERSE or ASCENDING
LOAD_ORDER ASCENDING, ORIGINAL, DESCENDING, or REVERSE
Allowed ordering types
The ordering types REVERSE and DESCENDING are equivalent.
For Sort-type TEXT, the ordering types ASCENDING and A2Z are equivalent, and DESCENDING,REVERSE, and Z2A are equivalent.
For Sort-type LOAD_ORDER, the ordering types ASCENDING and ORIGINAL are equivalent.
Examples: Chart expressions using AggrExamples - chart expressions
Chart expression example 1
Load scriptLoad the following data as an inline load in the data load editor to create the chart expression examplebelow.
Script syntax and chart functions - Qlik Sense, February 2022 408
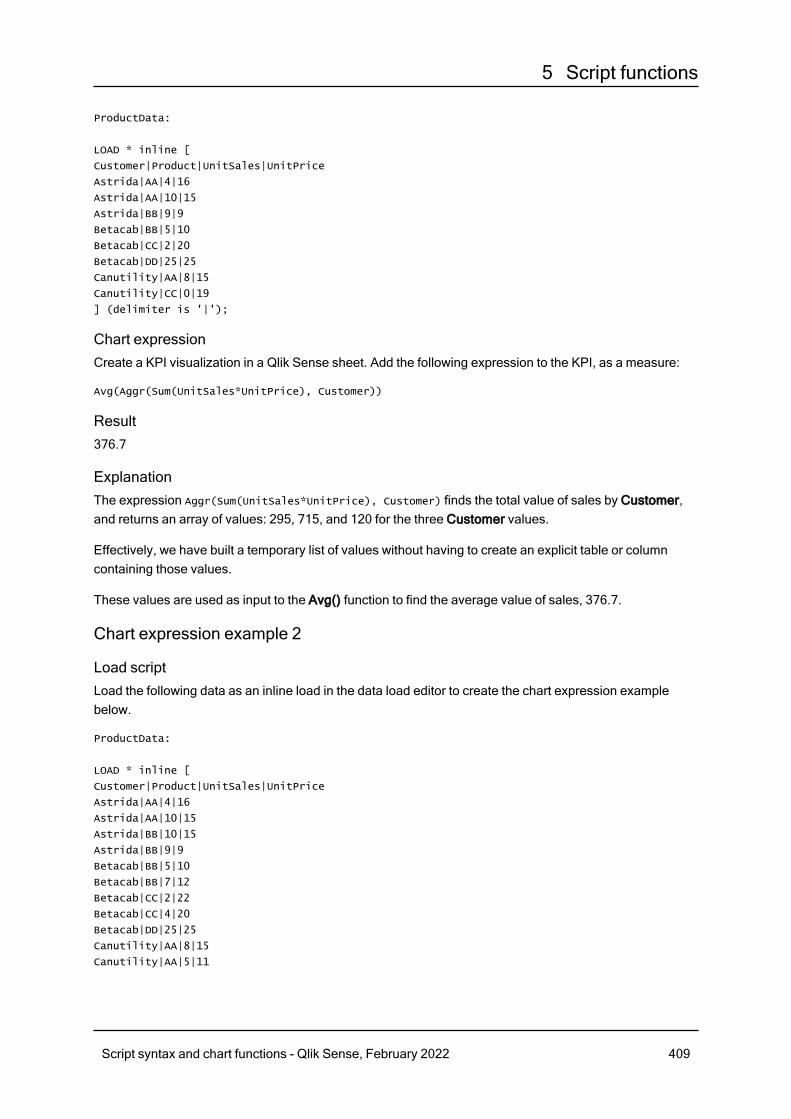
5 Script functions
ProductData:
LOAD * inline [
Customer|Product|UnitSales|UnitPrice
Astrida|AA|4|16
Astrida|AA|10|15
Astrida|BB|9|9
Betacab|BB|5|10
Betacab|CC|2|20
Betacab|DD|25|25
Canutility|AA|8|15
Canutility|CC|0|19
] (delimiter is '|');
Chart expressionCreate a KPI visualization in a Qlik Sense sheet. Add the following expression to the KPI, as a measure:
Avg(Aggr(Sum(UnitSales*UnitPrice), Customer))
Result376.7
ExplanationThe expression Aggr(Sum(UnitSales*UnitPrice), Customer) finds the total value of sales by Customer,and returns an array of values: 295, 715, and 120 for the three Customer values.
Effectively, we have built a temporary list of values without having to create an explicit table or columncontaining those values.
These values are used as input to the Avg() function to find the average value of sales, 376.7.
Chart expression example 2
Load scriptLoad the following data as an inline load in the data load editor to create the chart expression examplebelow.
ProductData:
LOAD * inline [
Customer|Product|UnitSales|UnitPrice
Astrida|AA|4|16
Astrida|AA|10|15
Astrida|BB|10|15
Astrida|BB|9|9
Betacab|BB|5|10
Betacab|BB|7|12
Betacab|CC|2|22
Betacab|CC|4|20
Betacab|DD|25|25
Canutility|AA|8|15
Canutility|AA|5|11
Script syntax and chart functions - Qlik Sense, February 2022 409
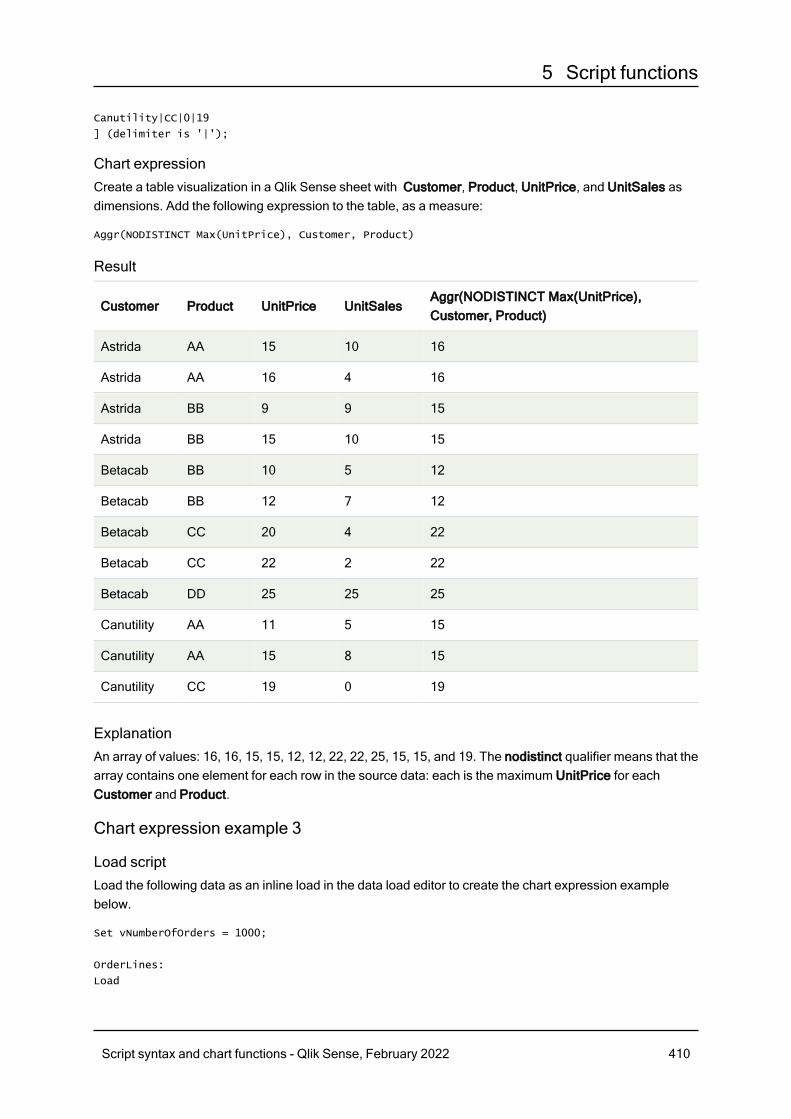
5 Script functions
Canutility|CC|0|19
] (delimiter is '|');
Chart expressionCreate a table visualization in a Qlik Sense sheet with Customer, Product, UnitPrice, and UnitSales asdimensions. Add the following expression to the table, as a measure:
Aggr(NODISTINCT Max(UnitPrice), Customer, Product)
Result
Customer Product UnitPrice UnitSalesAggr(NODISTINCT Max(UnitPrice),Customer, Product)
Astrida AA 15 10 16
Astrida AA 16 4 16
Astrida BB 9 9 15
Astrida BB 15 10 15
Betacab BB 10 5 12
Betacab BB 12 7 12
Betacab CC 20 4 22
Betacab CC 22 2 22
Betacab DD 25 25 25
Canutility AA 11 5 15
Canutility AA 15 8 15
Canutility CC 19 0 19
ExplanationAn array of values: 16, 16, 15, 15, 12, 12, 22, 22, 25, 15, 15, and 19. The nodistinct qualifier means that thearray contains one element for each row in the source data: each is the maximum UnitPrice for eachCustomer and Product.
Chart expression example 3
Load scriptLoad the following data as an inline load in the data load editor to create the chart expression examplebelow.
Set vNumberOfOrders = 1000;
OrderLines:
Load
Script syntax and chart functions - Qlik Sense, February 2022 410
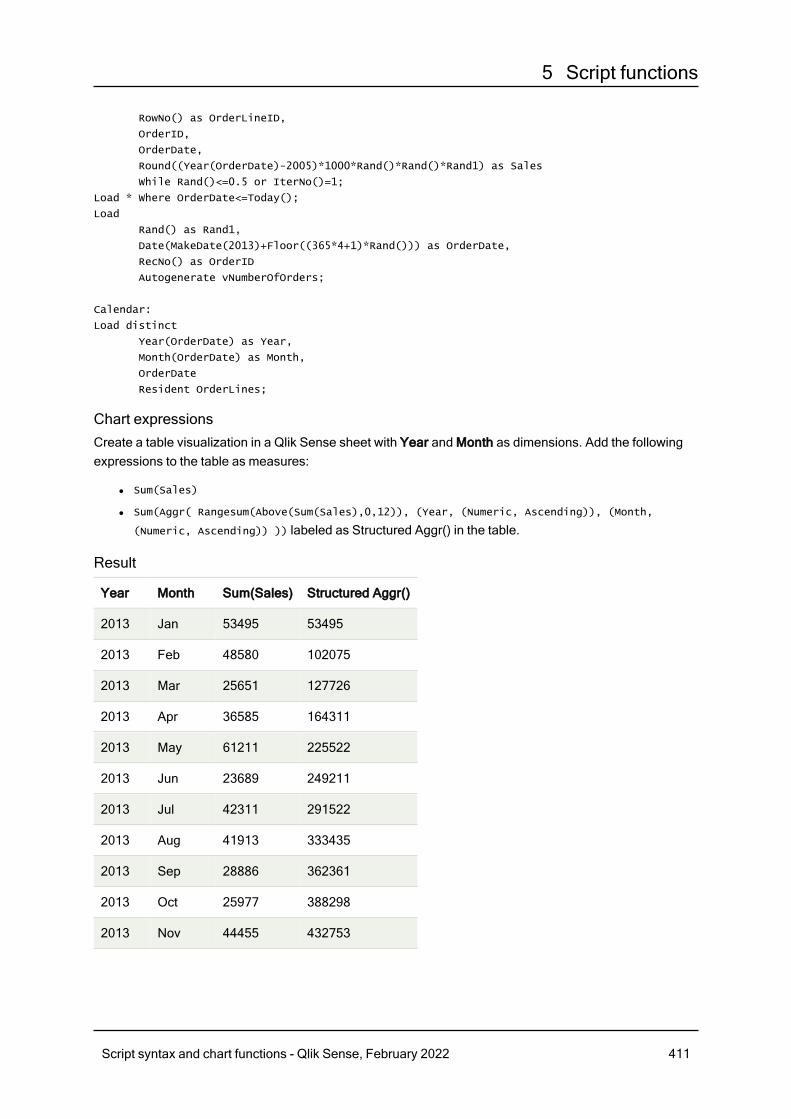
5 Script functions
RowNo() as OrderLineID,
OrderID,
OrderDate,
Round((Year(OrderDate)-2005)*1000*Rand()*Rand()*Rand1) as Sales
While Rand()<=0.5 or IterNo()=1;
Load * Where OrderDate<=Today();
Load
Rand() as Rand1,
Date(MakeDate(2013)+Floor((365*4+1)*Rand())) as OrderDate,
RecNo() as OrderID
Autogenerate vNumberOfOrders;
Calendar:
Load distinct
Year(OrderDate) as Year,
Month(OrderDate) as Month,
OrderDate
Resident OrderLines;
Chart expressionsCreate a table visualization in a Qlik Sense sheet with Year and Month as dimensions. Add the followingexpressions to the table as measures:
l Sum(Sales)
l Sum(Aggr( Rangesum(Above(Sum(Sales),0,12)), (Year, (Numeric, Ascending)), (Month,
(Numeric, Ascending)) )) labeled as Structured Aggr() in the table.
Result
Year Month Sum(Sales) Structured Aggr()
2013 Jan 53495 53495
2013 Feb 48580 102075
2013 Mar 25651 127726
2013 Apr 36585 164311
2013 May 61211 225522
2013 Jun 23689 249211
2013 Jul 42311 291522
2013 Aug 41913 333435
2013 Sep 28886 362361
2013 Oct 25977 388298
2013 Nov 44455 432753
Script syntax and chart functions - Qlik Sense, February 2022 411
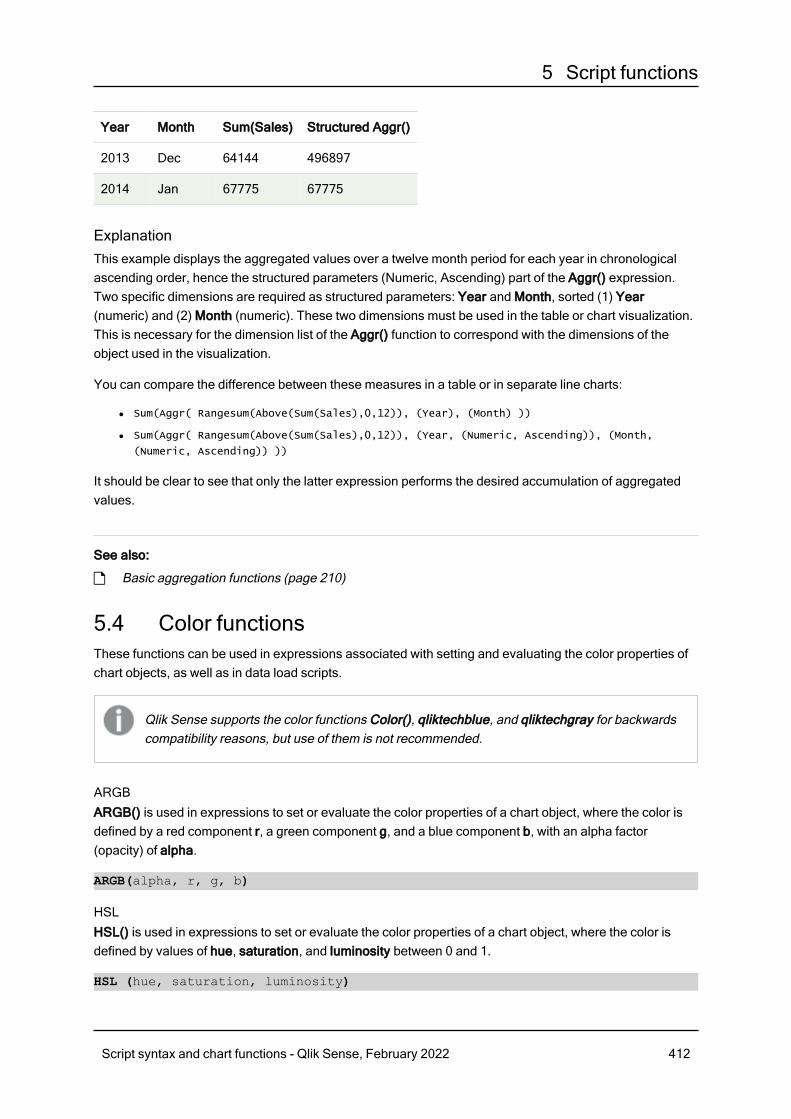
5 Script functions
Year Month Sum(Sales) Structured Aggr()
2013 Dec 64144 496897
2014 Jan 67775 67775
ExplanationThis example displays the aggregated values over a twelve month period for each year in chronologicalascending order, hence the structured parameters (Numeric, Ascending) part of the Aggr() expression.Two specific dimensions are required as structured parameters: Year and Month, sorted (1) Year(numeric) and (2) Month (numeric). These two dimensions must be used in the table or chart visualization.This is necessary for the dimension list of the Aggr() function to correspond with the dimensions of theobject used in the visualization.
You can compare the difference between these measures in a table or in separate line charts:
l Sum(Aggr( Rangesum(Above(Sum(Sales),0,12)), (Year), (Month) ))
l Sum(Aggr( Rangesum(Above(Sum(Sales),0,12)), (Year, (Numeric, Ascending)), (Month,
(Numeric, Ascending)) ))
It should be clear to see that only the latter expression performs the desired accumulation of aggregatedvalues.
See also:
p Basic aggregation functions (page 210)
5.4 Color functionsThese functions can be used in expressions associated with setting and evaluating the color properties ofchart objects, as well as in data load scripts.
Qlik Sense supports the color functions Color(), qliktechblue, and qliktechgray for backwardscompatibility reasons, but use of them is not recommended.
ARGBARGB() is used in expressions to set or evaluate the color properties of a chart object, where the color isdefined by a red component r, a green component g, and a blue component b, with an alpha factor(opacity) of alpha.
ARGB(alpha, r, g, b)
HSLHSL() is used in expressions to set or evaluate the color properties of a chart object, where the color isdefined by values of hue, saturation, and luminosity between 0 and 1.
HSL (hue, saturation, luminosity)
Script syntax and chart functions - Qlik Sense, February 2022 412
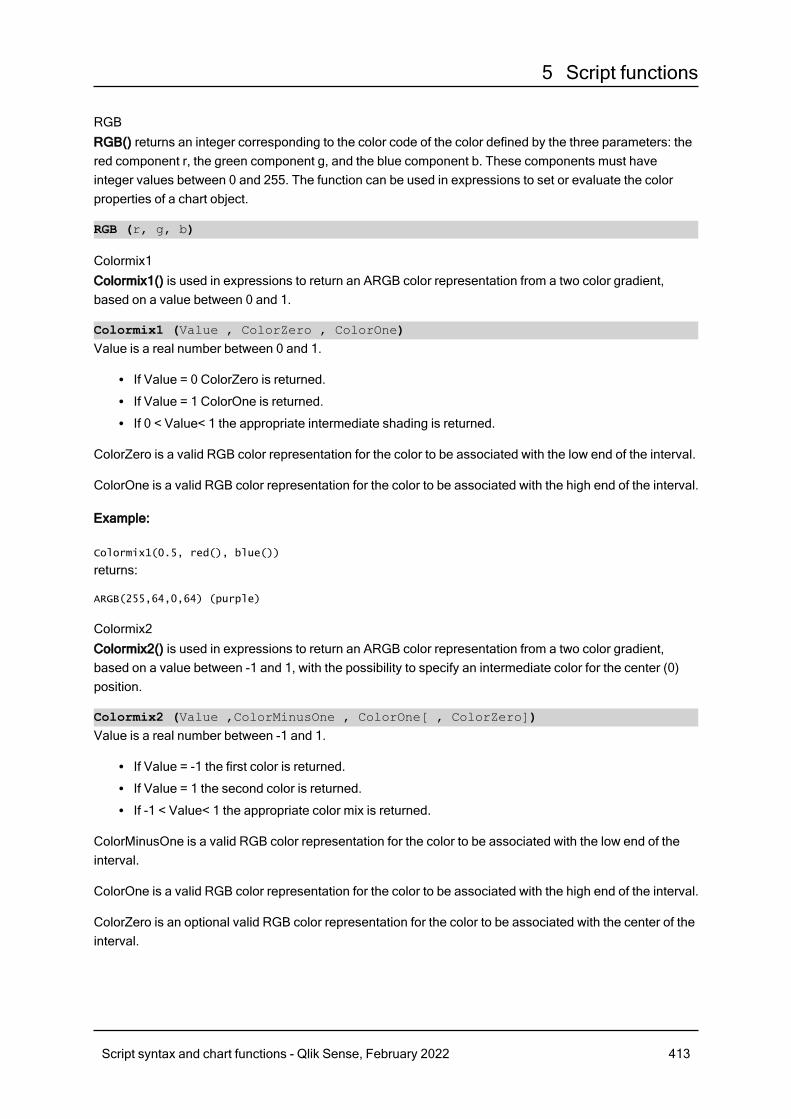
5 Script functions
RGBRGB() returns an integer corresponding to the color code of the color defined by the three parameters: thered component r, the green component g, and the blue component b. These components must haveinteger values between 0 and 255. The function can be used in expressions to set or evaluate the colorproperties of a chart object.
RGB (r, g, b)
Colormix1Colormix1() is used in expressions to return an ARGB color representation from a two color gradient,based on a value between 0 and 1.
Colormix1 (Value , ColorZero , ColorOne)Value is a real number between 0 and 1.
l If Value = 0 ColorZero is returned.l If Value = 1 ColorOne is returned.l If 0 < Value< 1 the appropriate intermediate shading is returned.
ColorZero is a valid RGB color representation for the color to be associated with the low end of the interval.
ColorOne is a valid RGB color representation for the color to be associated with the high end of the interval.
Example:
Colormix1(0.5, red(), blue())
returns:
ARGB(255,64,0,64) (purple)
Colormix2Colormix2() is used in expressions to return an ARGB color representation from a two color gradient,based on a value between -1 and 1, with the possibility to specify an intermediate color for the center (0)position.
Colormix2 (Value ,ColorMinusOne , ColorOne[ , ColorZero])Value is a real number between -1 and 1.
l If Value = -1 the first color is returned.l If Value = 1 the second color is returned.l If -1 < Value< 1 the appropriate color mix is returned.
ColorMinusOne is a valid RGB color representation for the color to be associated with the low end of theinterval.
ColorOne is a valid RGB color representation for the color to be associated with the high end of the interval.
ColorZero is an optional valid RGB color representation for the color to be associated with the center of theinterval.
Script syntax and chart functions - Qlik Sense, February 2022 413
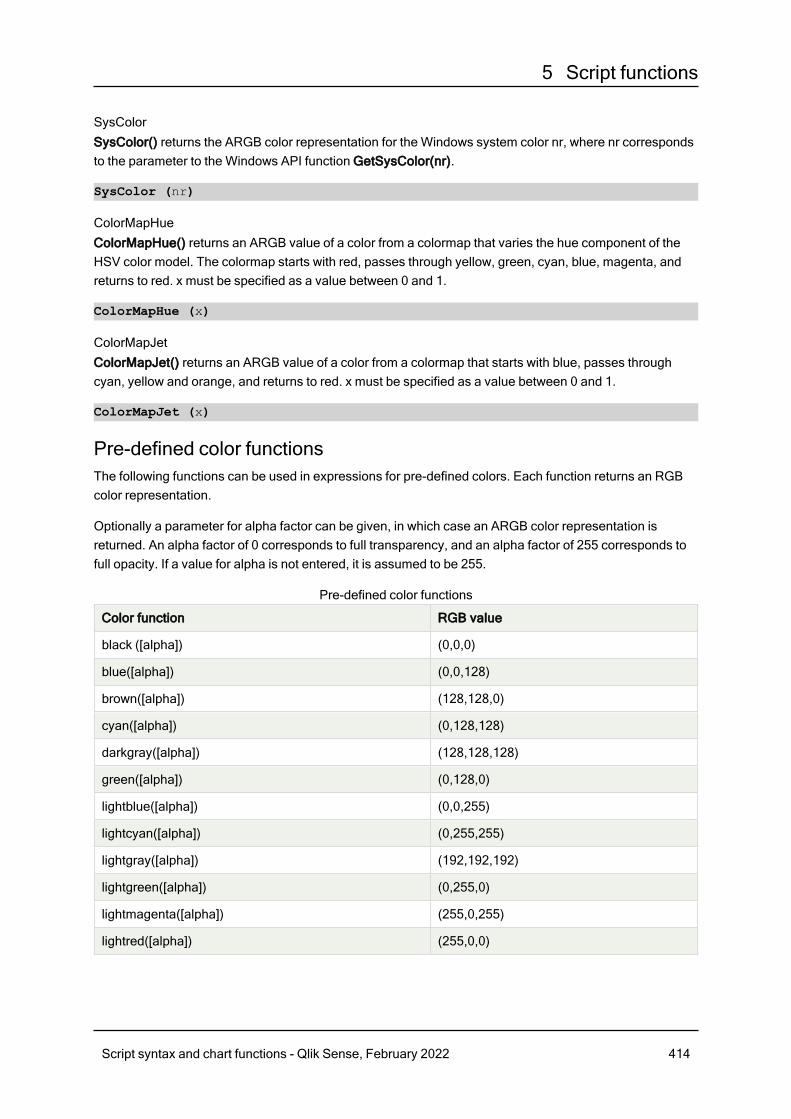
5 Script functions
SysColorSysColor() returns the ARGB color representation for the Windows system color nr, where nr correspondsto the parameter to the Windows API function GetSysColor(nr).
SysColor (nr)
ColorMapHueColorMapHue() returns an ARGB value of a color from a colormap that varies the hue component of theHSV color model. The colormap starts with red, passes through yellow, green, cyan, blue, magenta, andreturns to red. x must be specified as a value between 0 and 1.
ColorMapHue (x)
ColorMapJetColorMapJet() returns an ARGB value of a color from a colormap that starts with blue, passes throughcyan, yellow and orange, and returns to red. x must be specified as a value between 0 and 1.
ColorMapJet (x)
Pre-defined color functionsThe following functions can be used in expressions for pre-defined colors. Each function returns an RGBcolor representation.
Optionally a parameter for alpha factor can be given, in which case an ARGB color representation isreturned. An alpha factor of 0 corresponds to full transparency, and an alpha factor of 255 corresponds tofull opacity. If a value for alpha is not entered, it is assumed to be 255.
Color function RGB value
black ([alpha]) (0,0,0)
blue([alpha]) (0,0,128)
brown([alpha]) (128,128,0)
cyan([alpha]) (0,128,128)
darkgray([alpha]) (128,128,128)
green([alpha]) (0,128,0)
lightblue([alpha]) (0,0,255)
lightcyan([alpha]) (0,255,255)
lightgray([alpha]) (192,192,192)
lightgreen([alpha]) (0,255,0)
lightmagenta([alpha]) (255,0,255)
lightred([alpha]) (255,0,0)
Pre-defined color functions
Script syntax and chart functions - Qlik Sense, February 2022 414
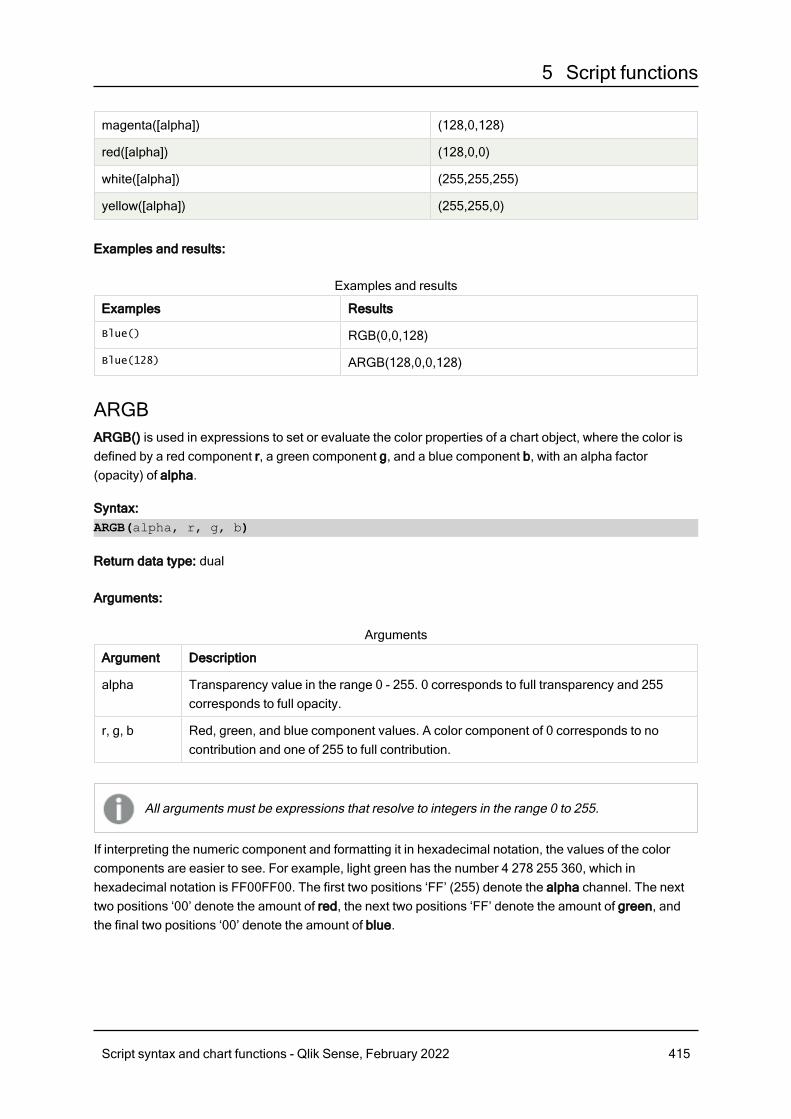
5 Script functions
magenta([alpha]) (128,0,128)
red([alpha]) (128,0,0)
white([alpha]) (255,255,255)
yellow([alpha]) (255,255,0)
Examples and results:
Examples Results
Blue() RGB(0,0,128)
Blue(128) ARGB(128,0,0,128)
Examples and results
ARGBARGB() is used in expressions to set or evaluate the color properties of a chart object, where the color isdefined by a red component r, a green component g, and a blue component b, with an alpha factor(opacity) of alpha.
Syntax:ARGB(alpha, r, g, b)
Return data type: dual
Arguments:
Argument Description
alpha Transparency value in the range 0 - 255. 0 corresponds to full transparency and 255corresponds to full opacity.
r, g, b Red, green, and blue component values. A color component of 0 corresponds to nocontribution and one of 255 to full contribution.
Arguments
All arguments must be expressions that resolve to integers in the range 0 to 255.
If interpreting the numeric component and formatting it in hexadecimal notation, the values of the colorcomponents are easier to see. For example, light green has the number 4 278 255 360, which inhexadecimal notation is FF00FF00. The first two positions ‘FF’ (255) denote the alpha channel. The nexttwo positions ‘00’ denote the amount of red, the next two positions ‘FF’ denote the amount of green, andthe final two positions ‘00’ denote the amount of blue.
Script syntax and chart functions - Qlik Sense, February 2022 415
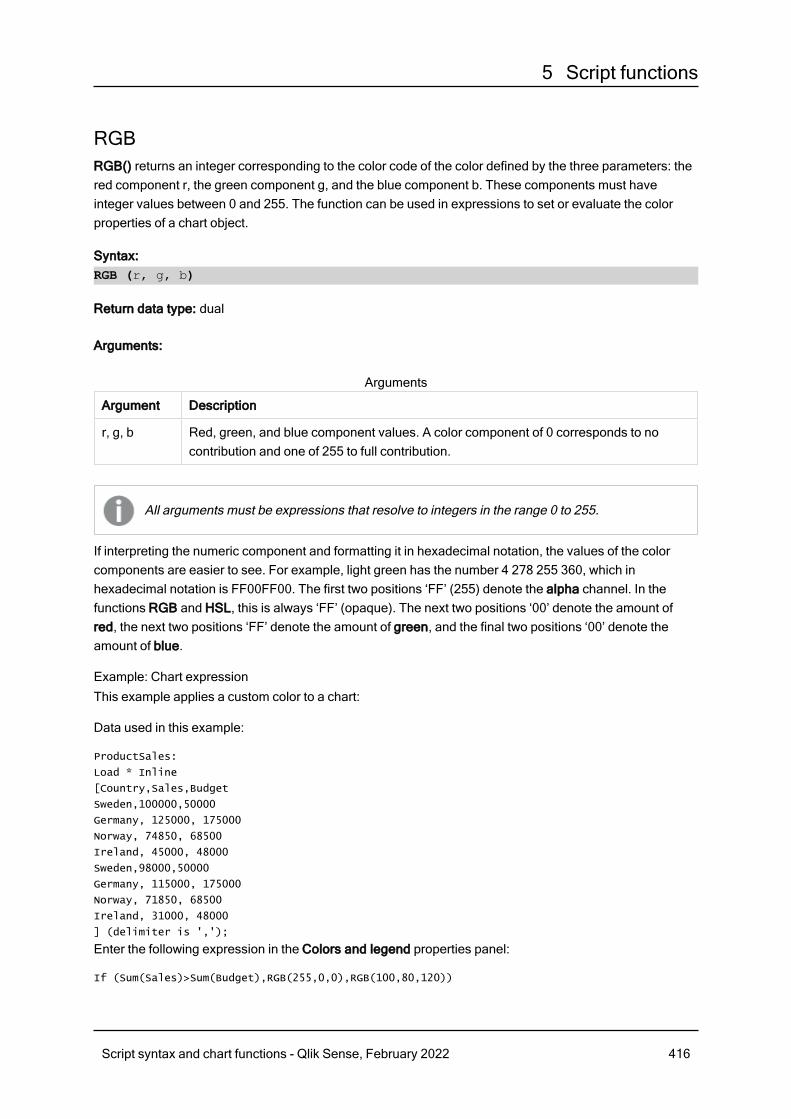
5 Script functions
RGBRGB() returns an integer corresponding to the color code of the color defined by the three parameters: thered component r, the green component g, and the blue component b. These components must haveinteger values between 0 and 255. The function can be used in expressions to set or evaluate the colorproperties of a chart object.
Syntax:RGB (r, g, b)
Return data type: dual
Arguments:
Argument Description
r, g, b Red, green, and blue component values. A color component of 0 corresponds to nocontribution and one of 255 to full contribution.
Arguments
All arguments must be expressions that resolve to integers in the range 0 to 255.
If interpreting the numeric component and formatting it in hexadecimal notation, the values of the colorcomponents are easier to see. For example, light green has the number 4 278 255 360, which inhexadecimal notation is FF00FF00. The first two positions ‘FF’ (255) denote the alpha channel. In thefunctions RGB and HSL, this is always ‘FF’ (opaque). The next two positions ‘00’ denote the amount ofred, the next two positions ‘FF’ denote the amount of green, and the final two positions ‘00’ denote theamount of blue.
Example: Chart expressionThis example applies a custom color to a chart:
Data used in this example:
ProductSales:
Load * Inline
[Country,Sales,Budget
Sweden,100000,50000
Germany, 125000, 175000
Norway, 74850, 68500
Ireland, 45000, 48000
Sweden,98000,50000
Germany, 115000, 175000
Norway, 71850, 68500
Ireland, 31000, 48000
] (delimiter is ',');
Enter the following expression in the Colors and legend properties panel:
If (Sum(Sales)>Sum(Budget),RGB(255,0,0),RGB(100,80,120))
Script syntax and chart functions - Qlik Sense, February 2022 416
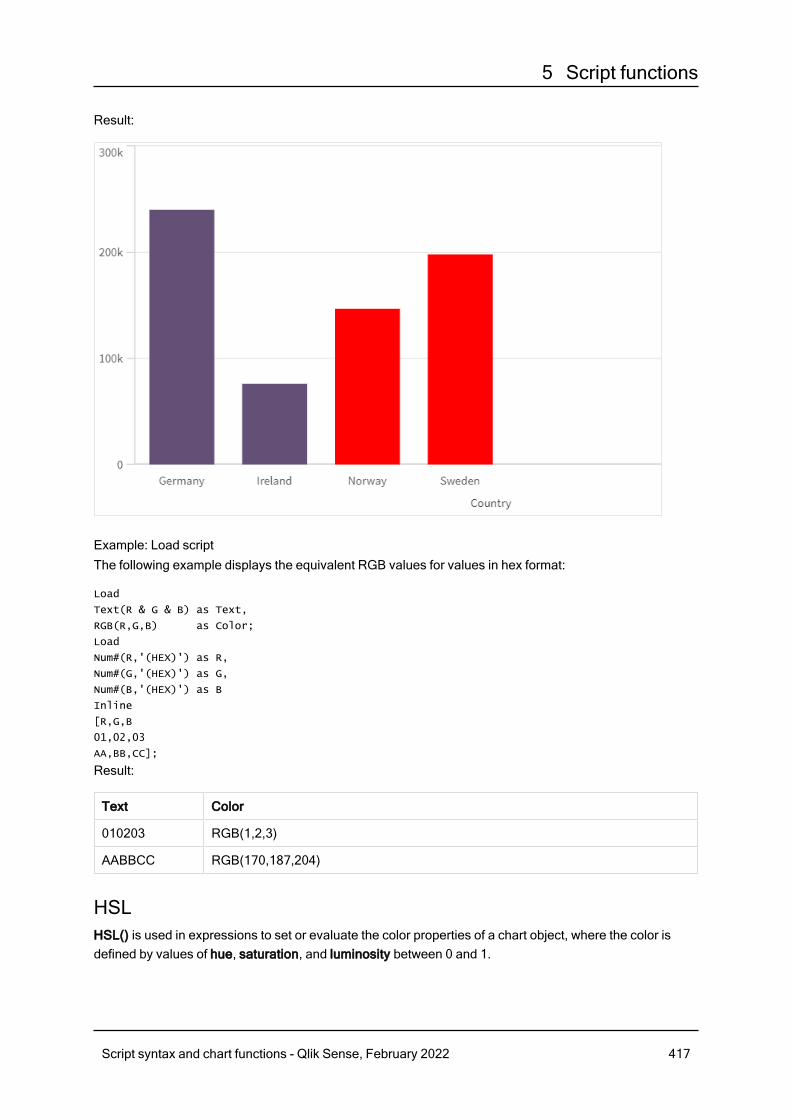
5 Script functions
Result:
Example: Load scriptThe following example displays the equivalent RGB values for values in hex format:
Load
Text(R & G & B) as Text,
RGB(R,G,B) as Color;
Load
Num#(R,'(HEX)') as R,
Num#(G,'(HEX)') as G,
Num#(B,'(HEX)') as B
Inline
[R,G,B
01,02,03
AA,BB,CC];
Result:
Text Color
010203 RGB(1,2,3)
AABBCC RGB(170,187,204)
HSLHSL() is used in expressions to set or evaluate the color properties of a chart object, where the color isdefined by values of hue, saturation, and luminosity between 0 and 1.
Script syntax and chart functions - Qlik Sense, February 2022 417
5 Script functions
Syntax:HSL (hue, saturation, luminosity)
Return data type: dual
Arguments:
Argument Description
hue, saturation,luminosity
hue, saturation, and luminosity component values ranging between 0 and1.
Arguments
All arguments must be expressions that resolve to integers in the range 0 to 1.
If interpreting the numeric component and formatting it in hexadecimal notation, the RGB values of thecolor components are easier to see. For example, light green has the number 4 278 255 360, which inhexadecimal notation is FF00FF00 and RGB (0,255,0). This is equivalent to HSL (80/240, 240/240,120/240) - a HSL value of (0.33, 1, 0.5).
5.5 Conditional functionsThe conditional functions all evaluate a condition and then return different answersdepending on the condition value. The functions can be used in the data load script and inchart expressions.
Conditional functions overviewEach function is described further after the overview. You can also click the function name in the syntax toimmediately access the details for that specific function.
altThe alt function returns the first of the parameters that has a valid number representation. If no such matchis found, the last parameter will be returned. Any number of parameters can be used.
alt (expr1[ , expr2 , expr3 , ...] , else)
classThe class function assigns the first parameter to a class interval. The result is a dual value with a<=x<b asthe textual value, where a and b are the upper and lower limits of the bin, and the lower bound as numericvalue.
class (expression, interval [ , label [ , offset ]])
Script syntax and chart functions - Qlik Sense, February 2022 418
5 Script functions
coalesceThe coalesce function returns the first of the parameters that has a valid non-NULL representation. Anynumber of parameters can be used.
coalesce(expr1[ , expr2 , expr3 , ...])
ifThe if function returns a value depending on whether the condition provided with the function evaluates asTrue or False.
if (condition , then , else)
matchThe match function compares the first parameter with all the following ones and returns the numericlocation of the expressions that match. The comparison is case sensitive.
match ( str, expr1 [ , expr2,...exprN ])
mixmatchThe mixmatch function compares the first parameter with all the following ones and returns the numericlocation of the expressions that match. The comparison is case insensitive.
mixmatch ( str, expr1 [ , expr2,...exprN ])
pickThe pick function returns the n:th expression in the list.
pick (n, expr1[ , expr2,...exprN])
wildmatchThe wildmatch function compares the first parameter with all the following ones and returns the number ofthe expression that matches. It permits the use of wildcard characters ( * and ?) in the comparison strings.* matches any sequence of characters. ? matches any single character. The comparison is caseinsensitive.
wildmatch ( str, expr1 [ , expr2,...exprN ])
altThe alt function returns the first of the parameters that has a valid number representation. Ifno such match is found, the last parameter will be returned. Any number of parameters canbe used.
Syntax:alt(expr1[ , expr2 , expr3 , ...] , else)
Script syntax and chart functions - Qlik Sense, February 2022 419
5 Script functions
Arguments:
Argument Description
expr1 The first expression to check for a valid number representation.
expr2 The second expression to check for a valid number representation.
expr3 The third expression to check for a valid number representation.
else Value to return if none of the previous parameters has a valid number representation.
Arguments
The alt function is often used with number or date interpretation functions. This way, Qlik Sense can testdifferent date formats in a prioritized order. It can also be used to handle NULL values in numericalexpressions.
Examples and results:
Example Result
alt( date#( dat , 'YYYY/MM/DD' ),
date#( dat , 'MM/DD/YYYY' ),
date#( dat , 'MM/DD/YY' ),
'No valid date' )
This expression will test if the field date contains a dateaccording to any of the three specified date formats. If so, it willreturn a dual value containing the original string and a validnumber representation of a date. If no match is found, the text'No valid date' will be returned (without any valid numberrepresentation).
alt(Sales,0) + alt(Margin,0) This expression adds the fields Sales and Margin, replacingany missing value (NULL) with a 0.
Scripting examples
classThe class function assigns the first parameter to a class interval. The result is a dual valuewith a<=x<b as the textual value, where a and b are the upper and lower limits of the bin, andthe lower bound as numeric value.
Syntax:class(expression, interval [ , label [ , offset ]])
Arguments:
Argument Description
interval A number that specifies the bin width.
label An arbitrary string that can replace the 'x' in the result text.
offset A number that can be used as offset from the default starting point of theclassification. The default starting point is normally 0.
Arguments
Script syntax and chart functions - Qlik Sense, February 2022 420
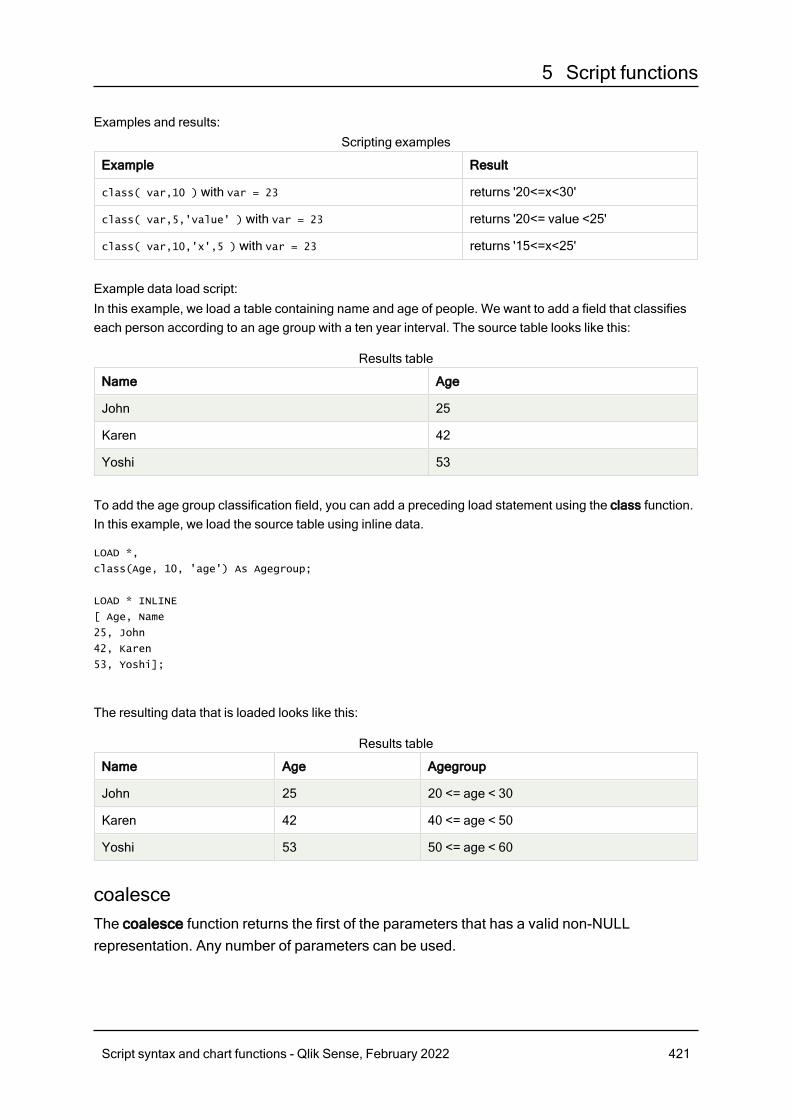
5 Script functions
Examples and results:
Example Result
class( var,10 ) with var = 23 returns '20<=x<30'
class( var,5,'value' ) with var = 23 returns '20<= value <25'
class( var,10,'x',5 ) with var = 23 returns '15<=x<25'
Scripting examples
Example data load script:In this example, we load a table containing name and age of people. We want to add a field that classifieseach person according to an age group with a ten year interval. The source table looks like this:
Name Age
John 25
Karen 42
Yoshi 53
Results table
To add the age group classification field, you can add a preceding load statement using the class function.In this example, we load the source table using inline data.
LOAD *,
class(Age, 10, 'age') As Agegroup;
LOAD * INLINE
[ Age, Name
25, John
42, Karen
53, Yoshi];
The resulting data that is loaded looks like this:
Name Age Agegroup
John 25 20 <= age < 30
Karen 42 40 <= age < 50
Yoshi 53 50 <= age < 60
Results table
coalesceThe coalesce function returns the first of the parameters that has a valid non-NULLrepresentation. Any number of parameters can be used.
Script syntax and chart functions - Qlik Sense, February 2022 421
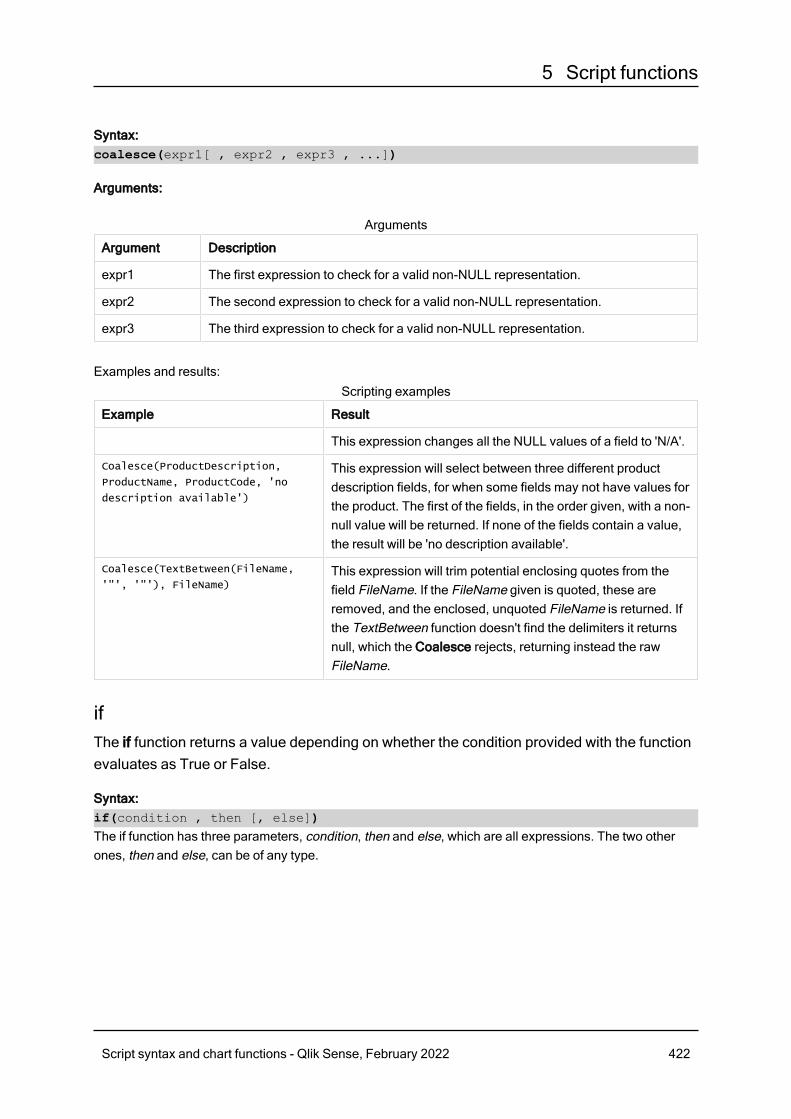
5 Script functions
Syntax:coalesce(expr1[ , expr2 , expr3 , ...])
Arguments:
Argument Description
expr1 The first expression to check for a valid non-NULL representation.
expr2 The second expression to check for a valid non-NULL representation.
expr3 The third expression to check for a valid non-NULL representation.
Arguments
Examples and results:
Example Result
This expression changes all the NULL values of a field to 'N/A'.
Coalesce(ProductDescription,
ProductName, ProductCode, 'no
description available')
This expression will select between three different productdescription fields, for when some fields may not have values forthe product. The first of the fields, in the order given, with a non-null value will be returned. If none of the fields contain a value,the result will be 'no description available'.
Coalesce(TextBetween(FileName,
'"', '"'), FileName)This expression will trim potential enclosing quotes from thefield FileName. If the FileName given is quoted, these areremoved, and the enclosed, unquoted FileName is returned. Ifthe TextBetween function doesn't find the delimiters it returnsnull, which the Coalesce rejects, returning instead the rawFileName.
Scripting examples
ifThe if function returns a value depending on whether the condition provided with the functionevaluates as True or False.
Syntax:if(condition , then [, else])The if function has three parameters, condition, then and else, which are all expressions. The two otherones, then and else, can be of any type.
Script syntax and chart functions - Qlik Sense, February 2022 422
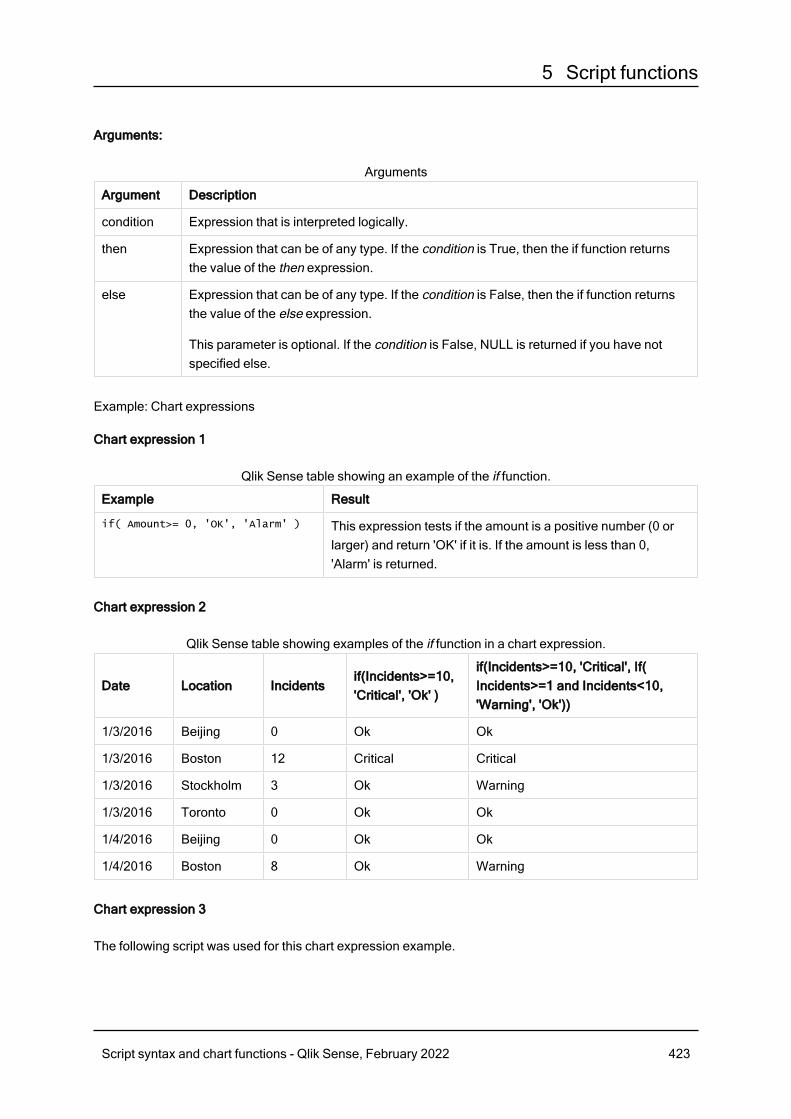
5 Script functions
Arguments:
Argument Description
condition Expression that is interpreted logically.
then Expression that can be of any type. If the condition is True, then the if function returnsthe value of the then expression.
else Expression that can be of any type. If the condition is False, then the if function returnsthe value of the else expression.
This parameter is optional. If the condition is False, NULL is returned if you have notspecified else.
Arguments
Example: Chart expressions
Chart expression 1
Example Result
if( Amount>= 0, 'OK', 'Alarm' ) This expression tests if the amount is a positive number (0 orlarger) and return 'OK' if it is. If the amount is less than 0,'Alarm' is returned.
Qlik Sense table showing an example of the if function.
Chart expression 2
Date Location Incidentsif(Incidents>=10,'Critical', 'Ok' )
if(Incidents>=10, 'Critical', If( Incidents>=1 and Incidents<10,'Warning', 'Ok'))
1/3/2016 Beijing 0 Ok Ok
1/3/2016 Boston 12 Critical Critical
1/3/2016 Stockholm 3 Ok Warning
1/3/2016 Toronto 0 Ok Ok
1/4/2016 Beijing 0 Ok Ok
1/4/2016 Boston 8 Ok Warning
Qlik Sense table showing examples of the if function in a chart expression.
Chart expression 3
The following script was used for this chart expression example.
Script syntax and chart functions - Qlik Sense, February 2022 423
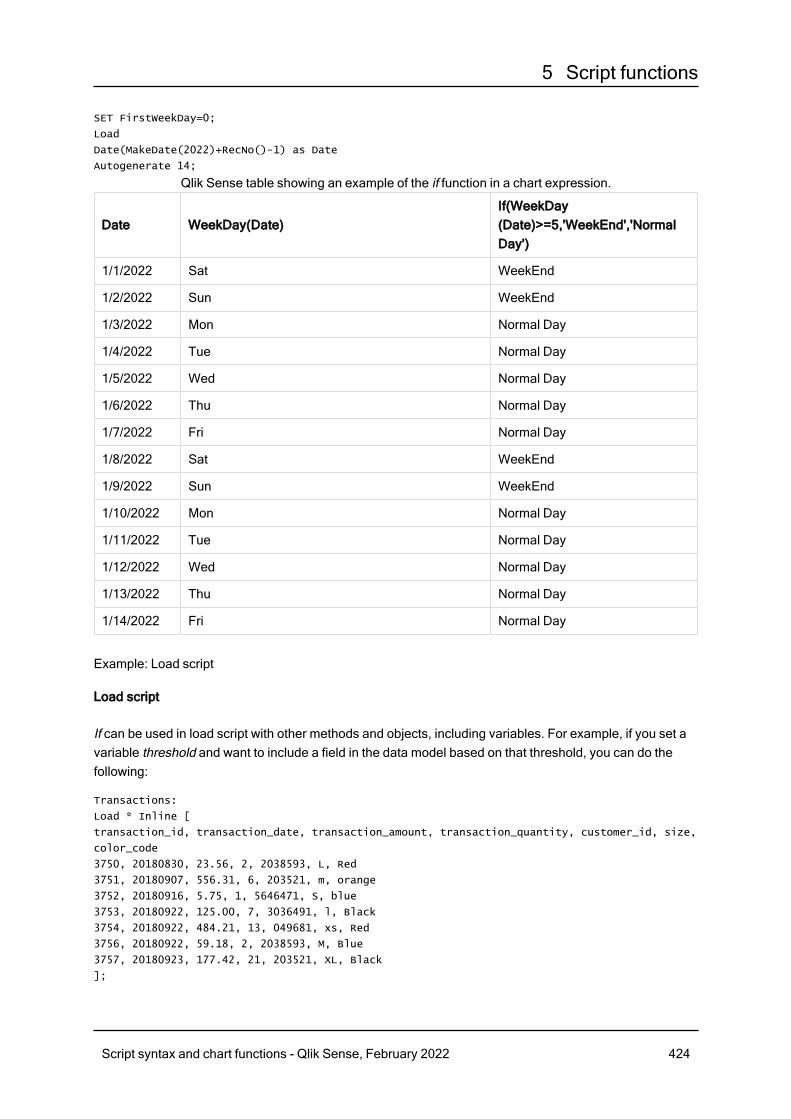
5 Script functions
SET FirstWeekDay=0;
Load
Date(MakeDate(2022)+RecNo()-1) as Date
Autogenerate 14;
Date WeekDay(Date)If(WeekDay(Date)>=5,'WeekEnd','NormalDay')
1/1/2022 Sat WeekEnd
1/2/2022 Sun WeekEnd
1/3/2022 Mon Normal Day
1/4/2022 Tue Normal Day
1/5/2022 Wed Normal Day
1/6/2022 Thu Normal Day
1/7/2022 Fri Normal Day
1/8/2022 Sat WeekEnd
1/9/2022 Sun WeekEnd
1/10/2022 Mon Normal Day
1/11/2022 Tue Normal Day
1/12/2022 Wed Normal Day
1/13/2022 Thu Normal Day
1/14/2022 Fri Normal Day
Qlik Sense table showing an example of the if function in a chart expression.
Example: Load script
Load script
If can be used in load script with other methods and objects, including variables. For example, if you set avariable threshold and want to include a field in the data model based on that threshold, you can do thefollowing:
Transactions:
Load * Inline [
transaction_id, transaction_date, transaction_amount, transaction_quantity, customer_id, size,
color_code
3750, 20180830, 23.56, 2, 2038593, L, Red
3751, 20180907, 556.31, 6, 203521, m, orange
3752, 20180916, 5.75, 1, 5646471, S, blue
3753, 20180922, 125.00, 7, 3036491, l, Black
3754, 20180922, 484.21, 13, 049681, xs, Red
3756, 20180922, 59.18, 2, 2038593, M, Blue
3757, 20180923, 177.42, 21, 203521, XL, Black
];
Script syntax and chart functions - Qlik Sense, February 2022 424
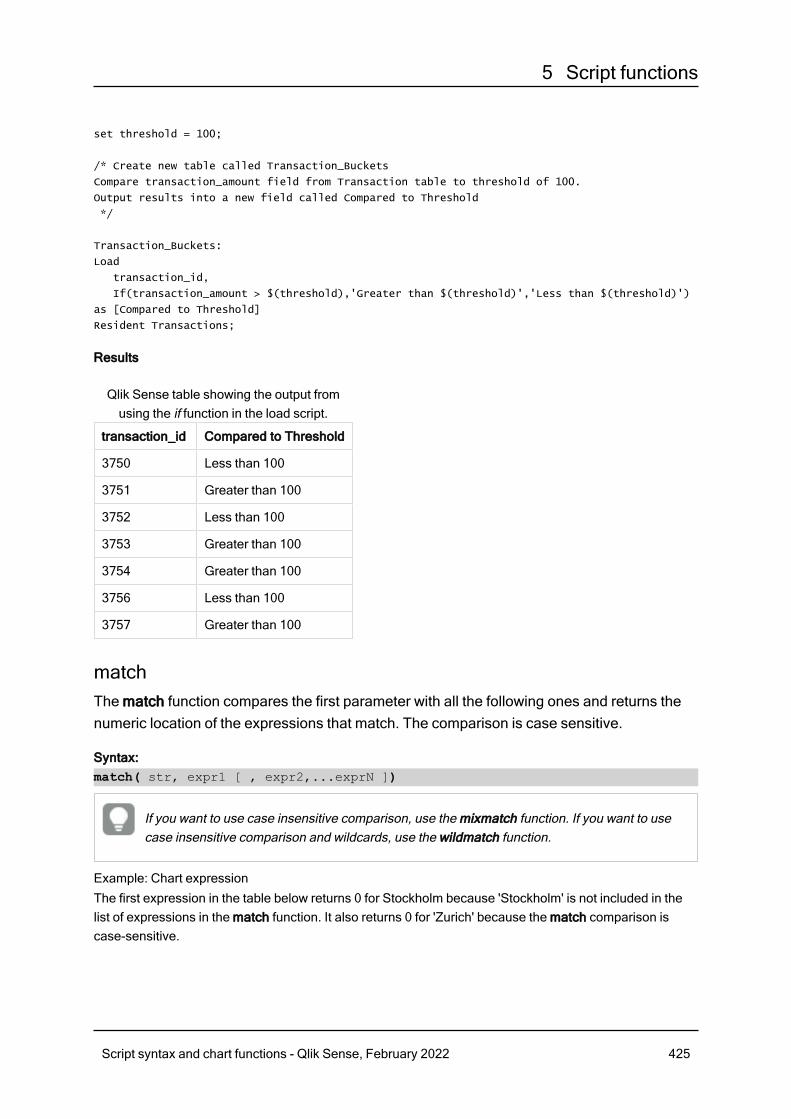
5 Script functions
set threshold = 100;
/* Create new table called Transaction_Buckets
Compare transaction_amount field from Transaction table to threshold of 100.
Output results into a new field called Compared to Threshold
*/
Transaction_Buckets:
Load
transaction_id,
If(transaction_amount > $(threshold),'Greater than $(threshold)','Less than $(threshold)')
as [Compared to Threshold]
Resident Transactions;
Results
transaction_id Compared to Threshold
3750 Less than 100
3751 Greater than 100
3752 Less than 100
3753 Greater than 100
3754 Greater than 100
3756 Less than 100
3757 Greater than 100
Qlik Sense table showing the output fromusing the if function in the load script.
matchThe match function compares the first parameter with all the following ones and returns thenumeric location of the expressions that match. The comparison is case sensitive.
Syntax:match( str, expr1 [ , expr2,...exprN ])
If you want to use case insensitive comparison, use the mixmatch function. If you want to usecase insensitive comparison and wildcards, use the wildmatch function.
Example: Chart expressionThe first expression in the table below returns 0 for Stockholm because 'Stockholm' is not included in thelist of expressions in the match function. It also returns 0 for 'Zurich' because the match comparison iscase-sensitive.
Script syntax and chart functions - Qlik Sense, February 2022 425
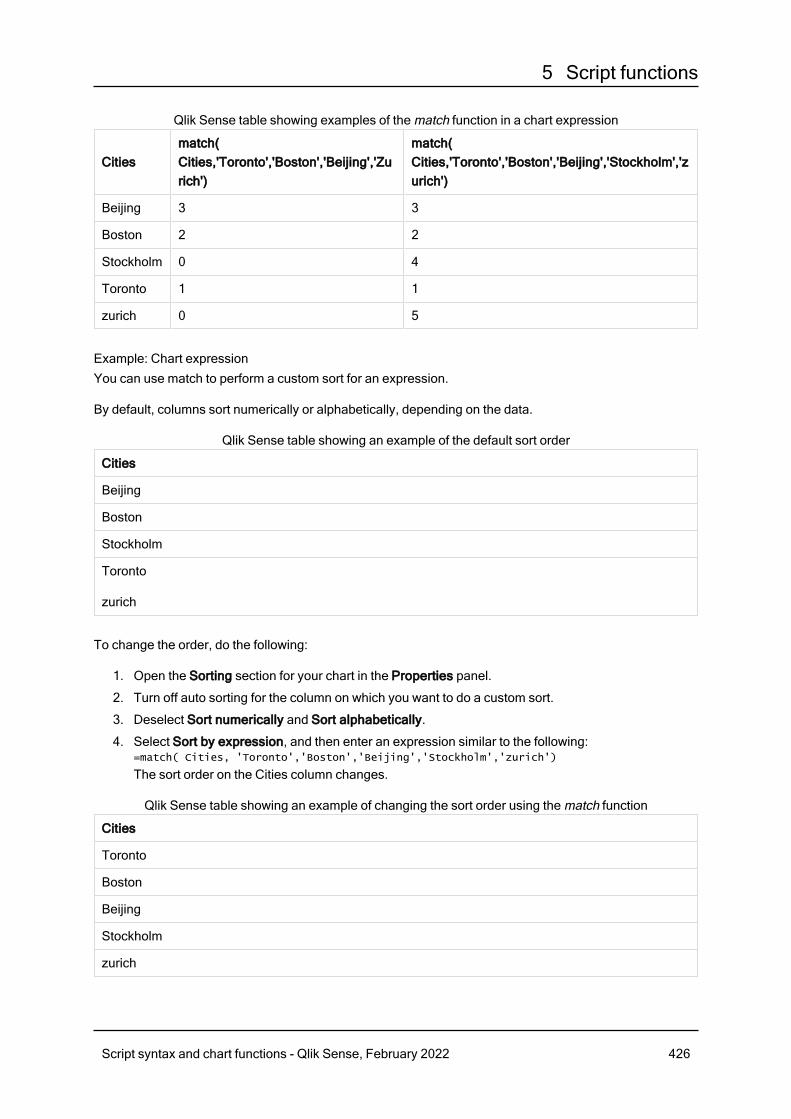
5 Script functions
Citiesmatch( Cities,'Toronto','Boston','Beijing','Zurich')
match( Cities,'Toronto','Boston','Beijing','Stockholm','zurich')
Beijing 3 3
Boston 2 2
Stockholm 0 4
Toronto 1 1
zurich 0 5
Qlik Sense table showing examples of the match function in a chart expression
Example: Chart expressionYou can use match to perform a custom sort for an expression.
By default, columns sort numerically or alphabetically, depending on the data.
Cities
Beijing
Boston
Stockholm
Toronto
zurich
Qlik Sense table showing an example of the default sort order
To change the order, do the following:
1. Open the Sorting section for your chart in the Properties panel.
2. Turn off auto sorting for the column on which you want to do a custom sort.
3. Deselect Sort numerically and Sort alphabetically.
4. Select Sort by expression, and then enter an expression similar to the following:=match( Cities, 'Toronto','Boston','Beijing','Stockholm','zurich')
The sort order on the Cities column changes.
Cities
Toronto
Boston
Beijing
Stockholm
zurich
Qlik Sense table showing an example of changing the sort order using the match function
Script syntax and chart functions - Qlik Sense, February 2022 426

5 Script functions
You can also view the numeric value that is returned.
Cities Cities & ' - ' & match ( Cities, 'Toronto','Boston', 'Beijing','Stockholm','zurich')
Toronto Toronto - 1
Boston Boston - 2
Beijing Beijing - 3
Stockholm Stockholm - 4
zurich zurich - 5
Qlik Sense table showing an example of the numeric values that are returned from the match function
Example: Load script
Load script
You can use match to load a subset of data. For example, you can return a numeric value for an expressionin the function. You can then limit the data loaded based on the numeric value. Match returns 0 if there isno match. All expressions that are not matched in this example will therefore return 0 and will be excludedfrom the data load by the WHERE statement.
In the Data load editor, create a new section called Load, and then add the following:
Transactions:
Load * Inline [
transaction_id, transaction_date, transaction_amount, transaction_quantity, customer_id, size,
color_code
3750, 20180830, 23.56, 2, 2038593, L, Red
3751, 20180907, 556.31, 6, 203521, m, orange
3752, 20180916, 5.75, 1, 5646471, S, blue
3753, 20180922, 125.00, 7, 3036491, l, Black
3754, 20180922, 484.21, 13, 049681, xs, Red
3756, 20180922, 59.18, 2, 2038593, M, Blue
3757, 20180923, 177.42, 21, 203521, XL, Black
];
/*
Create new table called Transaction_Buckets
Create new fields called Customer, and Color code - Blue and Black
Load Transactions table.
Match returns 1 for 'Blue', 2 for 'Black'.
Does not return a value for 'blue' because match is case sensitive.
Only values that returned numeric value greater than 0
are loaded by WHERE statment into Transactions_Buckets table.
*/
Transaction_Buckets:
Load
customer_id,
customer_id as [Customer],
color_code as [Color Code Blue and Black]
Script syntax and chart functions - Qlik Sense, February 2022 427

5 Script functions
Resident Transactions
Where match(color_code,'Blue','Black') > 0;
Results
Color Code Blue and Black Customer
Black 203521
Black 3036491
Blue 2038593
Qlik Sense table showing the output fromusing the match function in the load script
mixmatchThe mixmatch function compares the first parameter with all the following ones and returnsthe numeric location of the expressions that match. The comparison is case insensitive.
Syntax:mixmatch( str, expr1 [ , expr2,...exprN ])
If you want to use case sensitive comparison, use the match function. If you want to use caseinsensitive comparison and wildcards, use the wildmatch function.
Example: Chart expressionThe first expression in the table below returns 0 for Stockholm because 'Stockholm' is not included in thelist of expressions in the mixmatch function. It returns 4 for 'Zurich' because the mixmatch comparison isnot case-sensitive.
Citiesmixmatch( Cities,'Toronto','Boston','Beijing','Zurich')
mixmatch( Cities,'Toronto','Boston','Beijing','Stockholm','Zurich')
Beijing 3 3
Boston 2 2
Stockholm 0 4
Toronto 1 1
zurich 4 5
Qlik Sense table showing examples of the mixmatch function in a chart expression
Example: Chart expressionYou can use mixmatch to perform a custom sort for an expression.
By default, columns sort numerically or alphabetically, depending on the data.
Script syntax and chart functions - Qlik Sense, February 2022 428
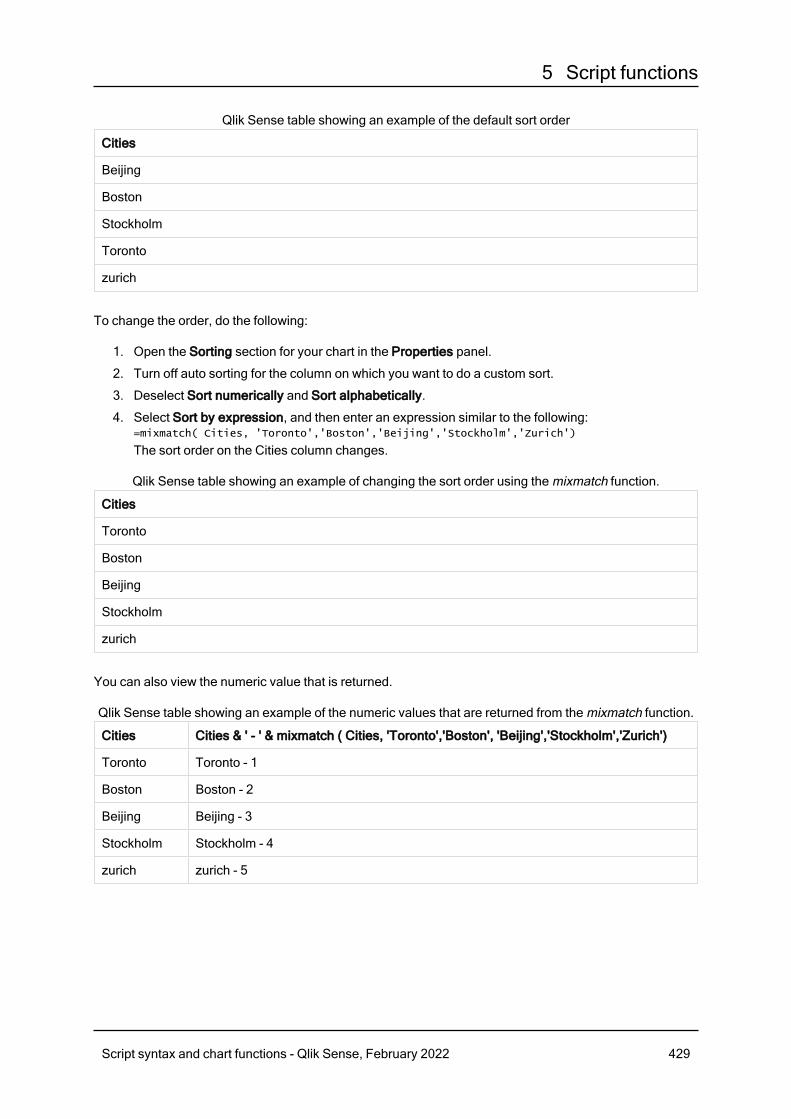
5 Script functions
Cities
Beijing
Boston
Stockholm
Toronto
zurich
Qlik Sense table showing an example of the default sort order
To change the order, do the following:
1. Open the Sorting section for your chart in the Properties panel.
2. Turn off auto sorting for the column on which you want to do a custom sort.
3. Deselect Sort numerically and Sort alphabetically.
4. Select Sort by expression, and then enter an expression similar to the following:=mixmatch( Cities, 'Toronto','Boston','Beijing','Stockholm','Zurich')
The sort order on the Cities column changes.
Cities
Toronto
Boston
Beijing
Stockholm
zurich
Qlik Sense table showing an example of changing the sort order using the mixmatch function.
You can also view the numeric value that is returned.
Cities Cities & ' - ' & mixmatch ( Cities, 'Toronto','Boston', 'Beijing','Stockholm','Zurich')
Toronto Toronto - 1
Boston Boston - 2
Beijing Beijing - 3
Stockholm Stockholm - 4
zurich zurich - 5
Qlik Sense table showing an example of the numeric values that are returned from the mixmatch function.
Script syntax and chart functions - Qlik Sense, February 2022 429
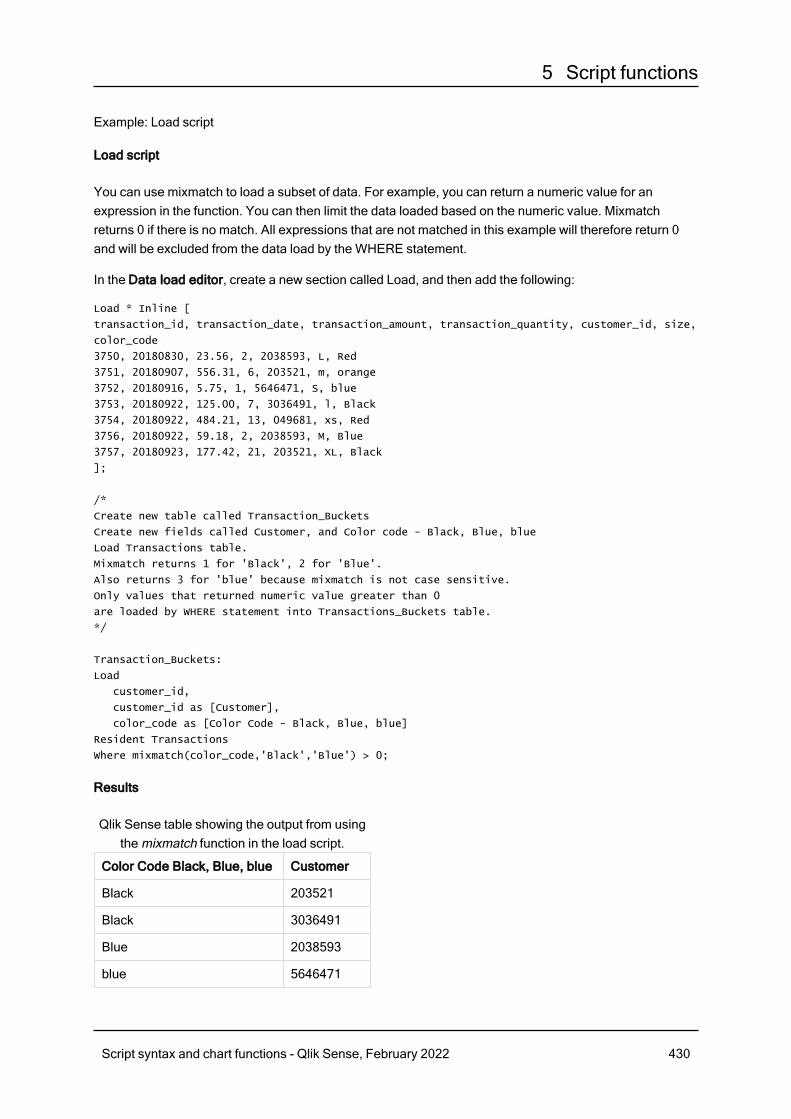
5 Script functions
Example: Load script
Load script
You can use mixmatch to load a subset of data. For example, you can return a numeric value for anexpression in the function. You can then limit the data loaded based on the numeric value. Mixmatchreturns 0 if there is no match. All expressions that are not matched in this example will therefore return 0and will be excluded from the data load by the WHERE statement.
In the Data load editor, create a new section called Load, and then add the following:
Load * Inline [
transaction_id, transaction_date, transaction_amount, transaction_quantity, customer_id, size,
color_code
3750, 20180830, 23.56, 2, 2038593, L, Red
3751, 20180907, 556.31, 6, 203521, m, orange
3752, 20180916, 5.75, 1, 5646471, S, blue
3753, 20180922, 125.00, 7, 3036491, l, Black
3754, 20180922, 484.21, 13, 049681, xs, Red
3756, 20180922, 59.18, 2, 2038593, M, Blue
3757, 20180923, 177.42, 21, 203521, XL, Black
];
/*
Create new table called Transaction_Buckets
Create new fields called Customer, and Color code - Black, Blue, blue
Load Transactions table.
Mixmatch returns 1 for 'Black', 2 for 'Blue'.
Also returns 3 for 'blue' because mixmatch is not case sensitive.
Only values that returned numeric value greater than 0
are loaded by WHERE statement into Transactions_Buckets table.
*/
Transaction_Buckets:
Load
customer_id,
customer_id as [Customer],
color_code as [Color Code - Black, Blue, blue]
Resident Transactions
Where mixmatch(color_code,'Black','Blue') > 0;
Results
Color Code Black, Blue, blue Customer
Black 203521
Black 3036491
Blue 2038593
blue 5646471
Qlik Sense table showing the output from usingthe mixmatch function in the load script.
Script syntax and chart functions - Qlik Sense, February 2022 430
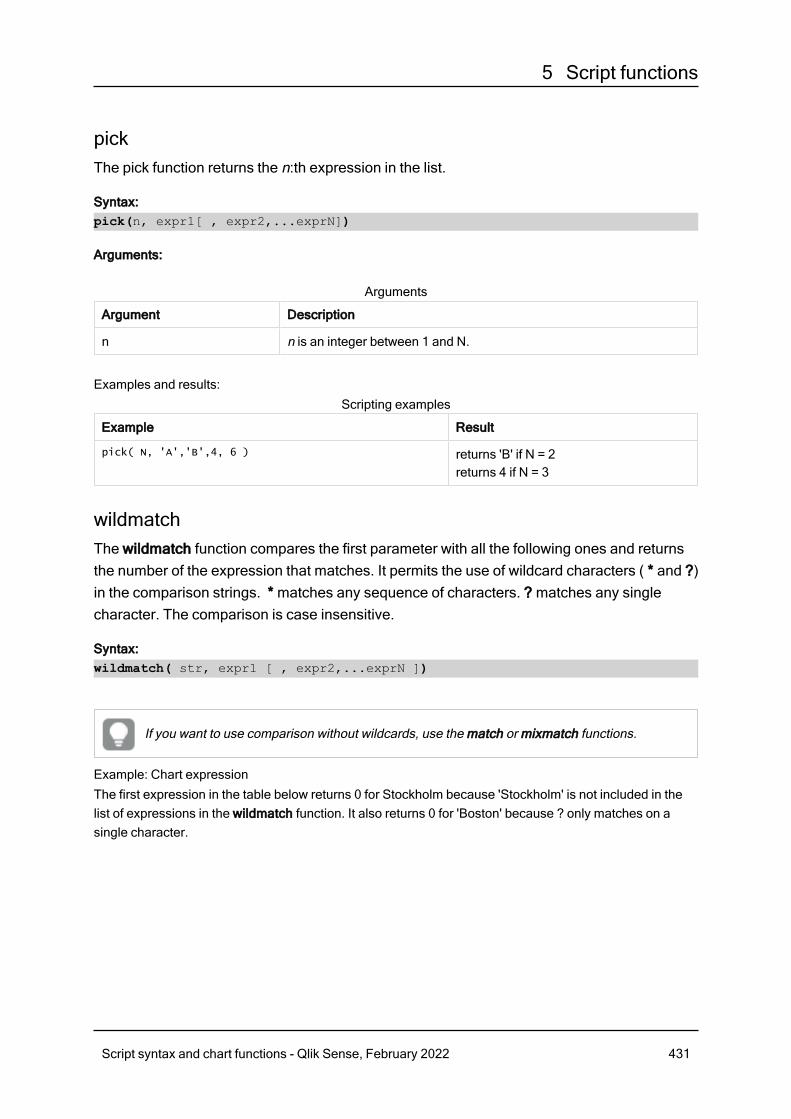
5 Script functions
pickThe pick function returns the n:th expression in the list.
Syntax:pick(n, expr1[ , expr2,...exprN])
Arguments:
Argument Description
n n is an integer between 1 and N.
Arguments
Examples and results:
Example Result
pick( N, 'A','B',4, 6 ) returns 'B' if N = 2returns 4 if N = 3
Scripting examples
wildmatchThe wildmatch function compares the first parameter with all the following ones and returnsthe number of the expression that matches. It permits the use of wildcard characters ( * and ?)in the comparison strings. * matches any sequence of characters. ? matches any singlecharacter. The comparison is case insensitive.
Syntax:wildmatch( str, expr1 [ , expr2,...exprN ])
If you want to use comparison without wildcards, use the match or mixmatch functions.
Example: Chart expressionThe first expression in the table below returns 0 for Stockholm because 'Stockholm' is not included in thelist of expressions in the wildmatch function. It also returns 0 for 'Boston' because ? only matches on asingle character.
Script syntax and chart functions - Qlik Sense, February 2022 431
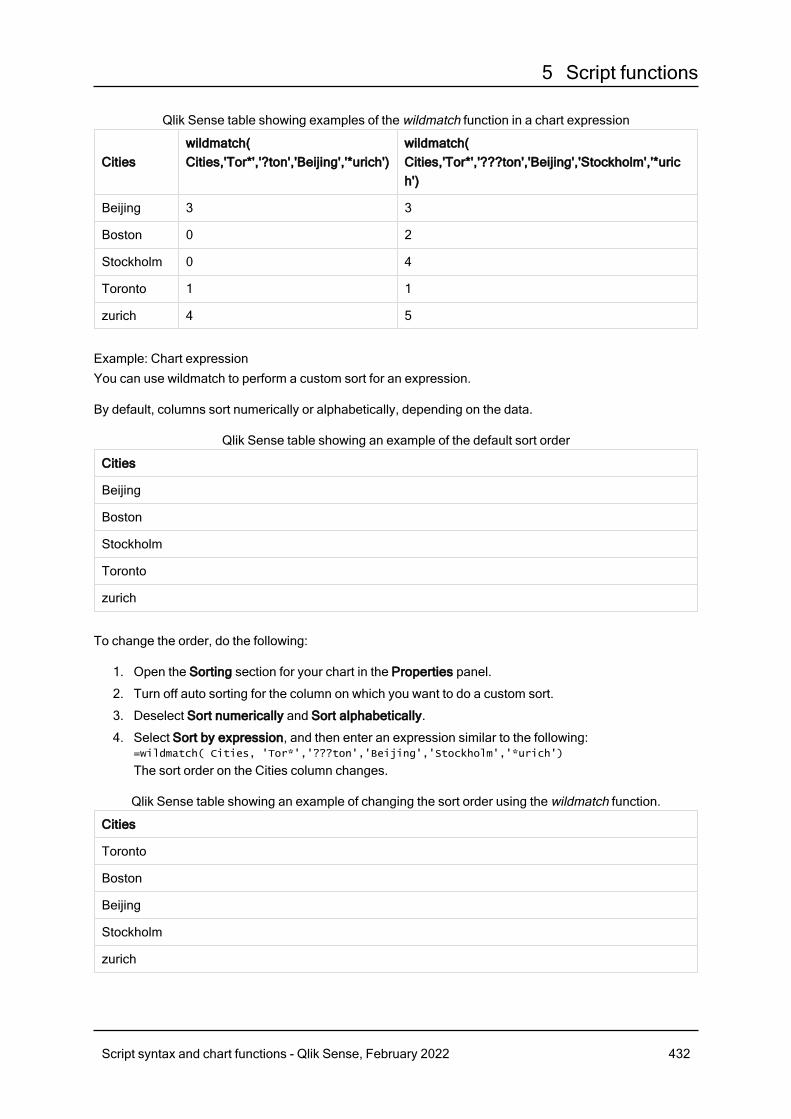
5 Script functions
Citieswildmatch( Cities,'Tor*','?ton','Beijing','*urich')
wildmatch( Cities,'Tor*','???ton','Beijing','Stockholm','*urich')
Beijing 3 3
Boston 0 2
Stockholm 0 4
Toronto 1 1
zurich 4 5
Qlik Sense table showing examples of the wildmatch function in a chart expression
Example: Chart expressionYou can use wildmatch to perform a custom sort for an expression.
By default, columns sort numerically or alphabetically, depending on the data.
Cities
Beijing
Boston
Stockholm
Toronto
zurich
Qlik Sense table showing an example of the default sort order
To change the order, do the following:
1. Open the Sorting section for your chart in the Properties panel.
2. Turn off auto sorting for the column on which you want to do a custom sort.
3. Deselect Sort numerically and Sort alphabetically.
4. Select Sort by expression, and then enter an expression similar to the following:=wildmatch( Cities, 'Tor*','???ton','Beijing','Stockholm','*urich')
The sort order on the Cities column changes.
Cities
Toronto
Boston
Beijing
Stockholm
zurich
Qlik Sense table showing an example of changing the sort order using the wildmatch function.
Script syntax and chart functions - Qlik Sense, February 2022 432
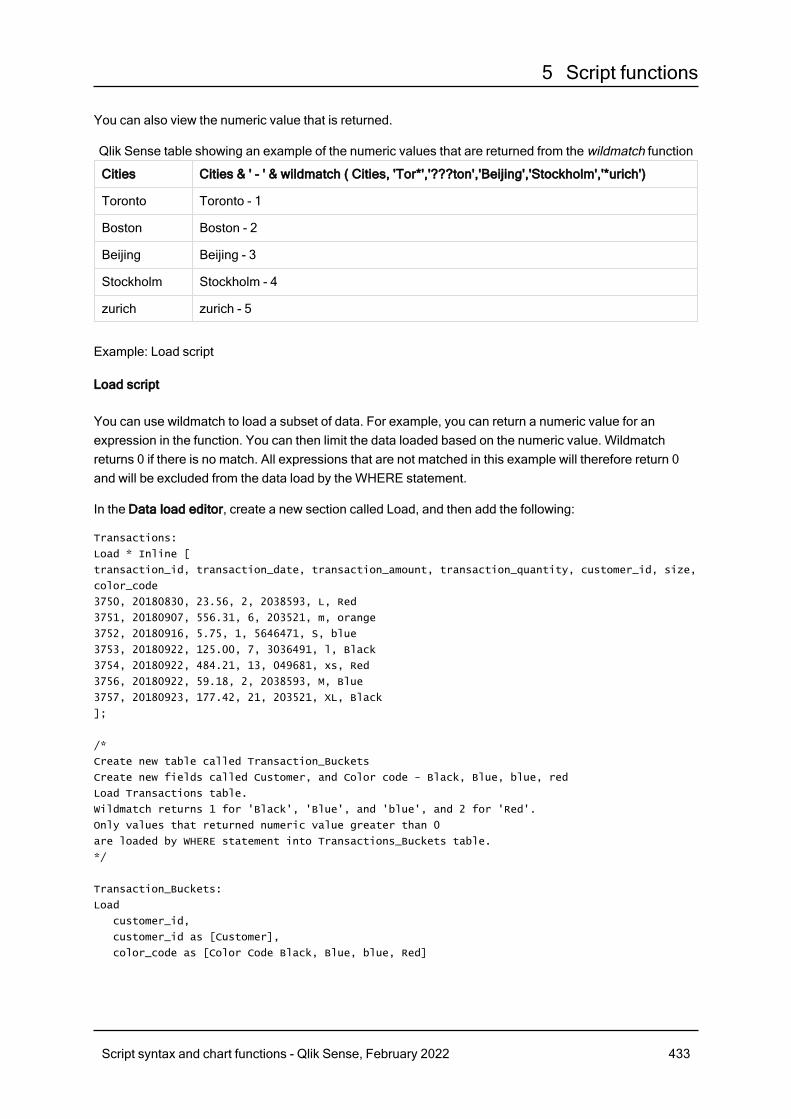
5 Script functions
You can also view the numeric value that is returned.
Cities Cities & ' - ' & wildmatch ( Cities, 'Tor*','???ton','Beijing','Stockholm','*urich')
Toronto Toronto - 1
Boston Boston - 2
Beijing Beijing - 3
Stockholm Stockholm - 4
zurich zurich - 5
Qlik Sense table showing an example of the numeric values that are returned from the wildmatch function
Example: Load script
Load script
You can use wildmatch to load a subset of data. For example, you can return a numeric value for anexpression in the function. You can then limit the data loaded based on the numeric value. Wildmatchreturns 0 if there is no match. All expressions that are not matched in this example will therefore return 0and will be excluded from the data load by the WHERE statement.
In the Data load editor, create a new section called Load, and then add the following:
Transactions:
Load * Inline [
transaction_id, transaction_date, transaction_amount, transaction_quantity, customer_id, size,
color_code
3750, 20180830, 23.56, 2, 2038593, L, Red
3751, 20180907, 556.31, 6, 203521, m, orange
3752, 20180916, 5.75, 1, 5646471, S, blue
3753, 20180922, 125.00, 7, 3036491, l, Black
3754, 20180922, 484.21, 13, 049681, xs, Red
3756, 20180922, 59.18, 2, 2038593, M, Blue
3757, 20180923, 177.42, 21, 203521, XL, Black
];
/*
Create new table called Transaction_Buckets
Create new fields called Customer, and Color code - Black, Blue, blue, red
Load Transactions table.
Wildmatch returns 1 for 'Black', 'Blue', and 'blue', and 2 for 'Red'.
Only values that returned numeric value greater than 0
are loaded by WHERE statement into Transactions_Buckets table.
*/
Transaction_Buckets:
Load
customer_id,
customer_id as [Customer],
color_code as [Color Code Black, Blue, blue, Red]
Script syntax and chart functions - Qlik Sense, February 2022 433
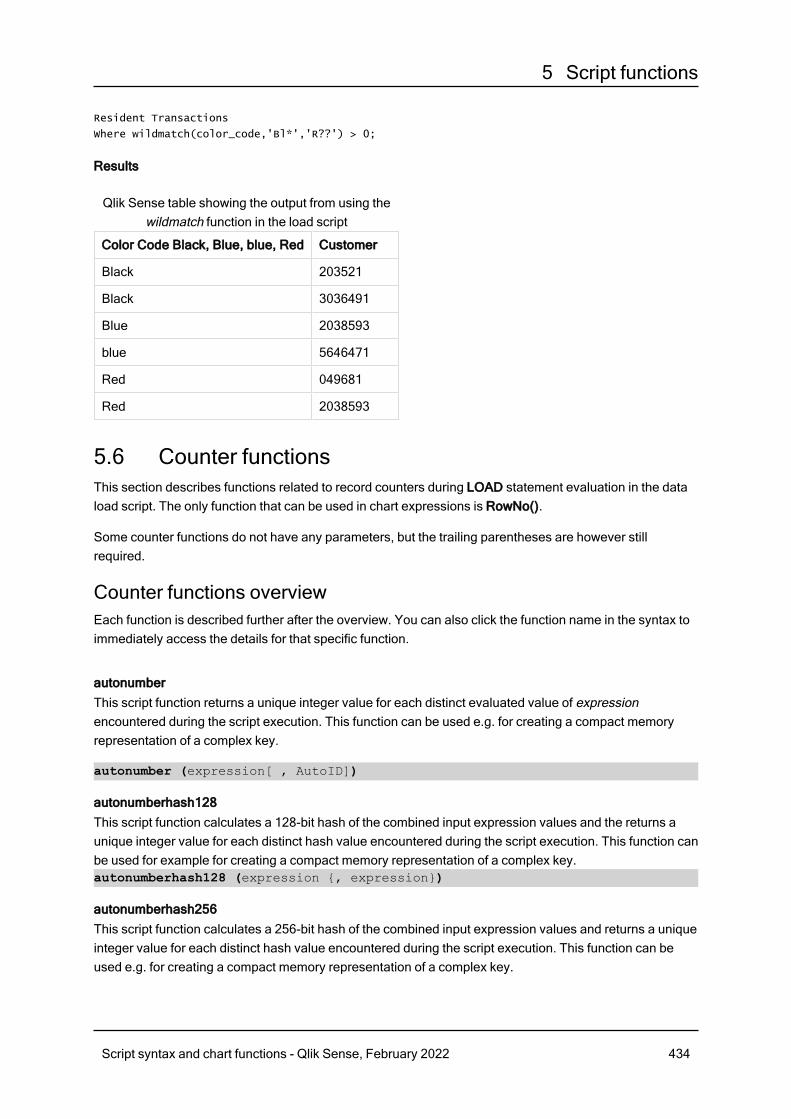
5 Script functions
Resident Transactions
Where wildmatch(color_code,'Bl*','R??') > 0;
Results
Color Code Black, Blue, blue, Red Customer
Black 203521
Black 3036491
Blue 2038593
blue 5646471
Red 049681
Red 2038593
Qlik Sense table showing the output from using thewildmatch function in the load script
5.6 Counter functionsThis section describes functions related to record counters during LOAD statement evaluation in the dataload script. The only function that can be used in chart expressions is RowNo().
Some counter functions do not have any parameters, but the trailing parentheses are however stillrequired.
Counter functions overviewEach function is described further after the overview. You can also click the function name in the syntax toimmediately access the details for that specific function.
autonumberThis script function returns a unique integer value for each distinct evaluated value of expressionencountered during the script execution. This function can be used e.g. for creating a compact memoryrepresentation of a complex key.
autonumber (expression[ , AutoID])
autonumberhash128This script function calculates a 128-bit hash of the combined input expression values and the returns aunique integer value for each distinct hash value encountered during the script execution. This function canbe used for example for creating a compact memory representation of a complex key.autonumberhash128 (expression {, expression})
autonumberhash256This script function calculates a 256-bit hash of the combined input expression values and returns a uniqueinteger value for each distinct hash value encountered during the script execution. This function can beused e.g. for creating a compact memory representation of a complex key.
Script syntax and chart functions - Qlik Sense, February 2022 434
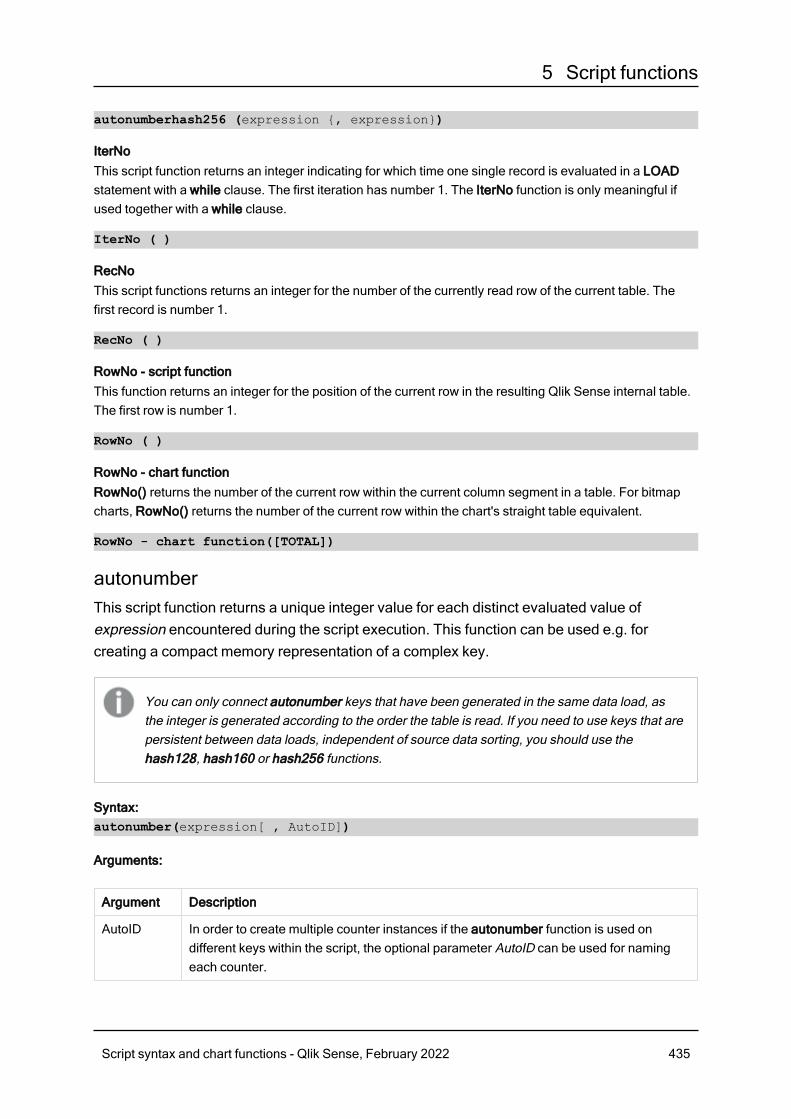
5 Script functions
autonumberhash256 (expression {, expression})
IterNoThis script function returns an integer indicating for which time one single record is evaluated in a LOADstatement with a while clause. The first iteration has number 1. The IterNo function is only meaningful ifused together with a while clause.
IterNo ( )
RecNoThis script functions returns an integer for the number of the currently read row of the current table. Thefirst record is number 1.
RecNo ( )
RowNo - script functionThis function returns an integer for the position of the current row in the resulting Qlik Sense internal table.The first row is number 1.
RowNo ( )
RowNo - chart functionRowNo() returns the number of the current row within the current column segment in a table. For bitmapcharts, RowNo() returns the number of the current row within the chart's straight table equivalent.
RowNo - chart function([TOTAL])
autonumberThis script function returns a unique integer value for each distinct evaluated value ofexpression encountered during the script execution. This function can be used e.g. forcreating a compact memory representation of a complex key.
You can only connect autonumber keys that have been generated in the same data load, asthe integer is generated according to the order the table is read. If you need to use keys that arepersistent between data loads, independent of source data sorting, you should use thehash128, hash160 or hash256 functions.
Syntax:autonumber(expression[ , AutoID])
Arguments:
Argument Description
AutoID In order to create multiple counter instances if the autonumber function is used ondifferent keys within the script, the optional parameter AutoID can be used for namingeach counter.
Script syntax and chart functions - Qlik Sense, February 2022 435
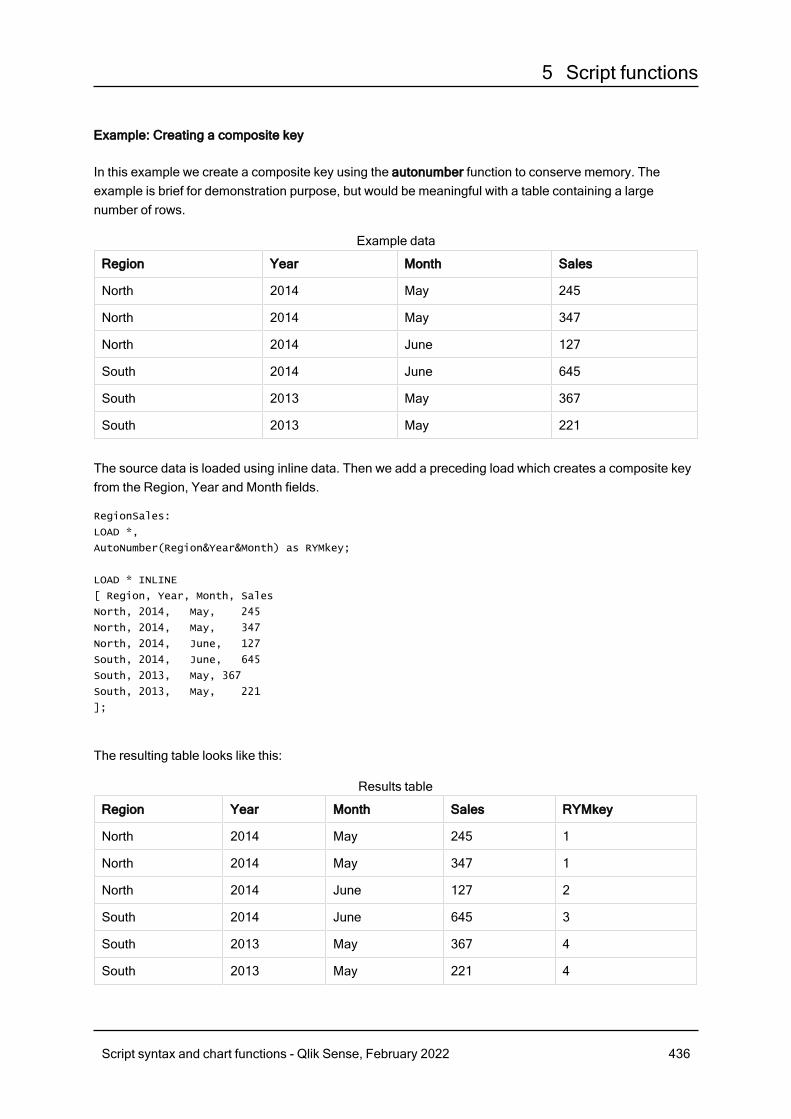
5 Script functions
Example: Creating a composite key
In this example we create a composite key using the autonumber function to conserve memory. Theexample is brief for demonstration purpose, but would be meaningful with a table containing a largenumber of rows.
Region Year Month Sales
North 2014 May 245
North 2014 May 347
North 2014 June 127
South 2014 June 645
South 2013 May 367
South 2013 May 221
Example data
The source data is loaded using inline data. Then we add a preceding load which creates a composite keyfrom the Region, Year and Month fields.
RegionSales:
LOAD *,
AutoNumber(Region&Year&Month) as RYMkey;
LOAD * INLINE
[ Region, Year, Month, Sales
North, 2014, May, 245
North, 2014, May, 347
North, 2014, June, 127
South, 2014, June, 645
South, 2013, May, 367
South, 2013, May, 221
];
The resulting table looks like this:
Region Year Month Sales RYMkey
North 2014 May 245 1
North 2014 May 347 1
North 2014 June 127 2
South 2014 June 645 3
South 2013 May 367 4
South 2013 May 221 4
Results table
Script syntax and chart functions - Qlik Sense, February 2022 436
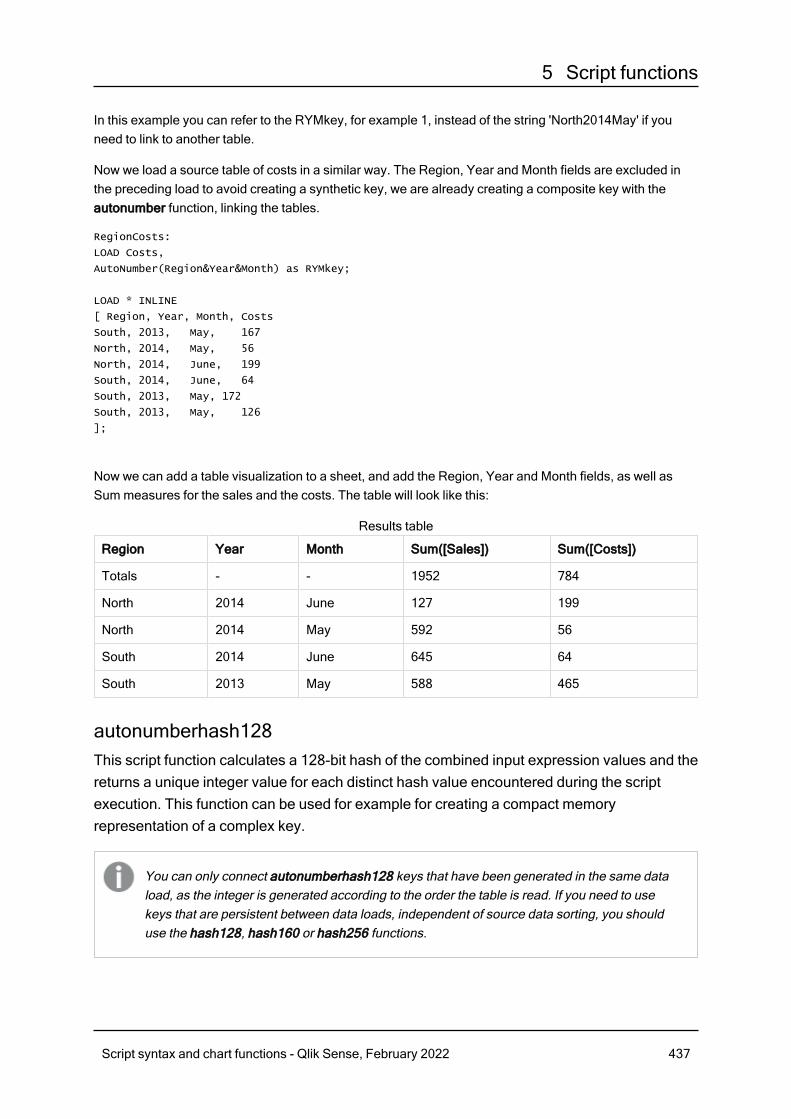
5 Script functions
In this example you can refer to the RYMkey, for example 1, instead of the string 'North2014May' if youneed to link to another table.
Now we load a source table of costs in a similar way. The Region, Year and Month fields are excluded inthe preceding load to avoid creating a synthetic key, we are already creating a composite key with theautonumber function, linking the tables.
RegionCosts:
LOAD Costs,
AutoNumber(Region&Year&Month) as RYMkey;
LOAD * INLINE
[ Region, Year, Month, Costs
South, 2013, May, 167
North, 2014, May, 56
North, 2014, June, 199
South, 2014, June, 64
South, 2013, May, 172
South, 2013, May, 126
];
Now we can add a table visualization to a sheet, and add the Region, Year and Month fields, as well asSummeasures for the sales and the costs. The table will look like this:
Region Year Month Sum([Sales]) Sum([Costs])
Totals - - 1952 784
North 2014 June 127 199
North 2014 May 592 56
South 2014 June 645 64
South 2013 May 588 465
Results table
autonumberhash128This script function calculates a 128-bit hash of the combined input expression values and thereturns a unique integer value for each distinct hash value encountered during the scriptexecution. This function can be used for example for creating a compact memoryrepresentation of a complex key.
You can only connect autonumberhash128 keys that have been generated in the same dataload, as the integer is generated according to the order the table is read. If you need to usekeys that are persistent between data loads, independent of source data sorting, you shoulduse the hash128, hash160 or hash256 functions.
Script syntax and chart functions - Qlik Sense, February 2022 437
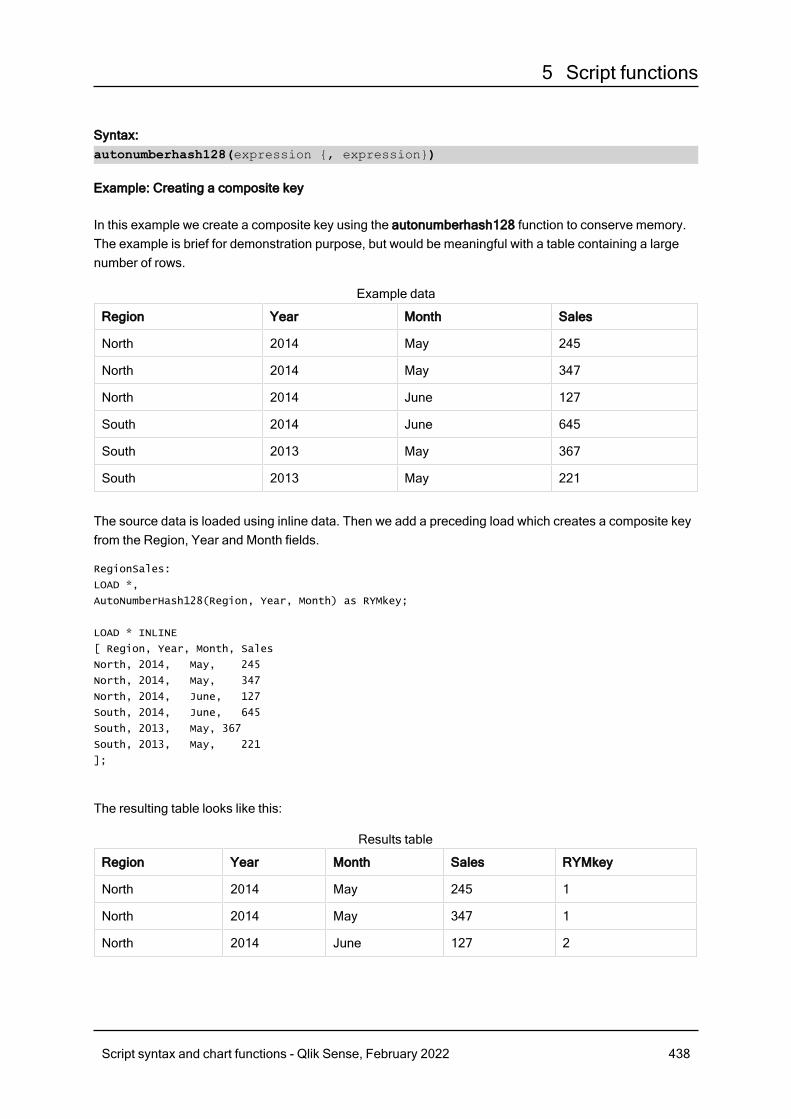
5 Script functions
Syntax:autonumberhash128(expression {, expression})
Example: Creating a composite key
In this example we create a composite key using the autonumberhash128 function to conserve memory.The example is brief for demonstration purpose, but would be meaningful with a table containing a largenumber of rows.
Region Year Month Sales
North 2014 May 245
North 2014 May 347
North 2014 June 127
South 2014 June 645
South 2013 May 367
South 2013 May 221
Example data
The source data is loaded using inline data. Then we add a preceding load which creates a composite keyfrom the Region, Year and Month fields.
RegionSales:
LOAD *,
AutoNumberHash128(Region, Year, Month) as RYMkey;
LOAD * INLINE
[ Region, Year, Month, Sales
North, 2014, May, 245
North, 2014, May, 347
North, 2014, June, 127
South, 2014, June, 645
South, 2013, May, 367
South, 2013, May, 221
];
The resulting table looks like this:
Region Year Month Sales RYMkey
North 2014 May 245 1
North 2014 May 347 1
North 2014 June 127 2
Results table
Script syntax and chart functions - Qlik Sense, February 2022 438

5 Script functions
Region Year Month Sales RYMkey
South 2014 June 645 3
South 2013 May 367 4
South 2013 May 221 4
In this example you can refer to the RYMkey, for example 1, instead of the string 'North2014May' if youneed to link to another table.
Now we load a source table of costs in a similar way. The Region, Year and Month fields are excluded inthe preceding load to avoid creating a synthetic key, we are already creating a composite key with theautonumberhash128 function, linking the tables.
RegionCosts:
LOAD Costs,
AutoNumberHash128(Region, Year, Month) as RYMkey;
LOAD * INLINE
[ Region, Year, Month, Costs
South, 2013, May, 167
North, 2014, May, 56
North, 2014, June, 199
South, 2014, June, 64
South, 2013, May, 172
South, 2013, May, 126
];
Now we can add a table visualization to a sheet, and add the Region, Year and Month fields, as well asSummeasures for the sales and the costs. The table will look like this:
Region Year Month Sum([Sales]) Sum([Costs])
Totals - - 1952 784
North 2014 June 127 199
North 2014 May 592 56
South 2014 June 645 64
South 2013 May 588 465
Results table
autonumberhash256This script function calculates a 256-bit hash of the combined input expression values andreturns a unique integer value for each distinct hash value encountered during the scriptexecution. This function can be used e.g. for creating a compact memory representation of acomplex key.
Script syntax and chart functions - Qlik Sense, February 2022 439
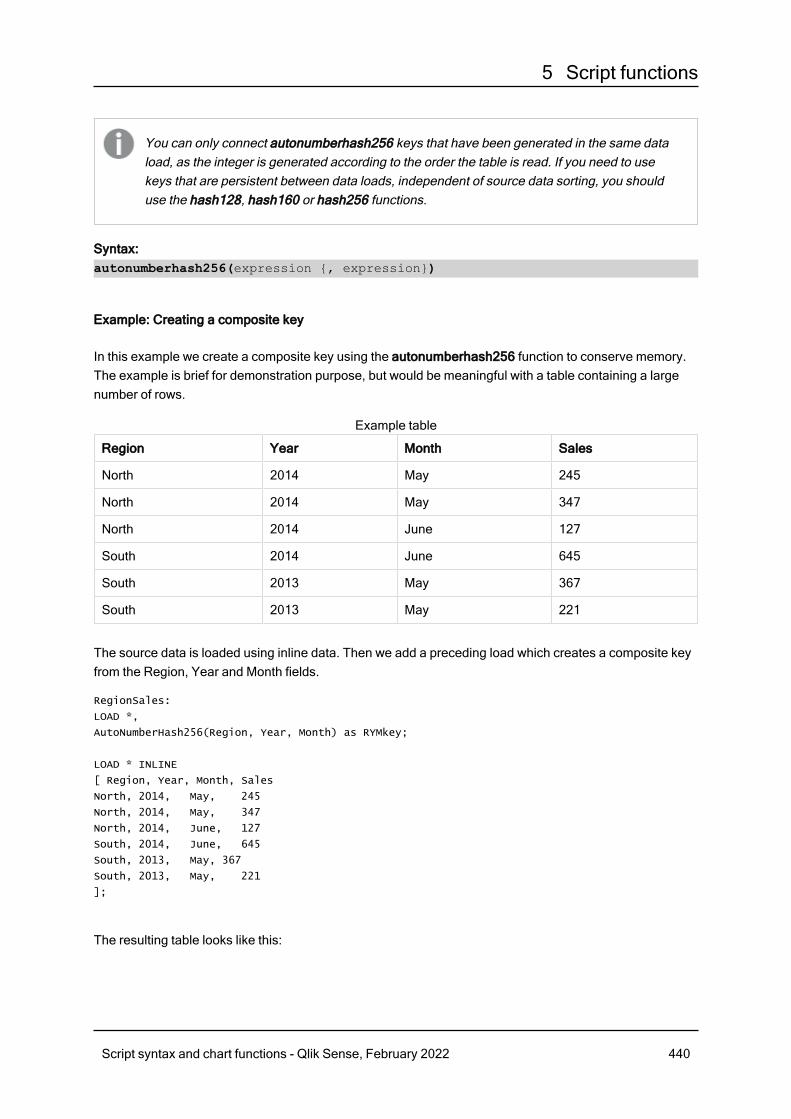
5 Script functions
You can only connect autonumberhash256 keys that have been generated in the same dataload, as the integer is generated according to the order the table is read. If you need to usekeys that are persistent between data loads, independent of source data sorting, you shoulduse the hash128, hash160 or hash256 functions.
Syntax:autonumberhash256(expression {, expression})
Example: Creating a composite key
In this example we create a composite key using the autonumberhash256 function to conserve memory.The example is brief for demonstration purpose, but would be meaningful with a table containing a largenumber of rows.
Region Year Month Sales
North 2014 May 245
North 2014 May 347
North 2014 June 127
South 2014 June 645
South 2013 May 367
South 2013 May 221
Example table
The source data is loaded using inline data. Then we add a preceding load which creates a composite keyfrom the Region, Year and Month fields.
RegionSales:
LOAD *,
AutoNumberHash256(Region, Year, Month) as RYMkey;
LOAD * INLINE
[ Region, Year, Month, Sales
North, 2014, May, 245
North, 2014, May, 347
North, 2014, June, 127
South, 2014, June, 645
South, 2013, May, 367
South, 2013, May, 221
];
The resulting table looks like this:
Script syntax and chart functions - Qlik Sense, February 2022 440
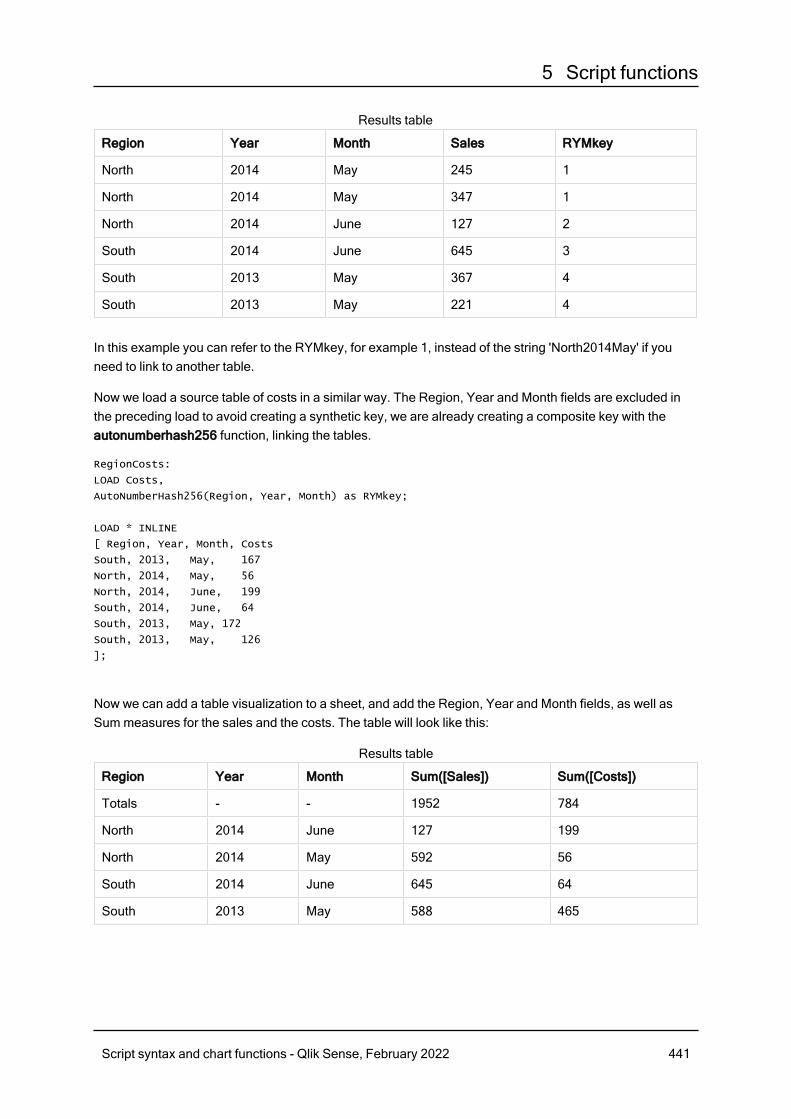
5 Script functions
Region Year Month Sales RYMkey
North 2014 May 245 1
North 2014 May 347 1
North 2014 June 127 2
South 2014 June 645 3
South 2013 May 367 4
South 2013 May 221 4
Results table
In this example you can refer to the RYMkey, for example 1, instead of the string 'North2014May' if youneed to link to another table.
Now we load a source table of costs in a similar way. The Region, Year and Month fields are excluded inthe preceding load to avoid creating a synthetic key, we are already creating a composite key with theautonumberhash256 function, linking the tables.
RegionCosts:
LOAD Costs,
AutoNumberHash256(Region, Year, Month) as RYMkey;
LOAD * INLINE
[ Region, Year, Month, Costs
South, 2013, May, 167
North, 2014, May, 56
North, 2014, June, 199
South, 2014, June, 64
South, 2013, May, 172
South, 2013, May, 126
];
Now we can add a table visualization to a sheet, and add the Region, Year and Month fields, as well asSummeasures for the sales and the costs. The table will look like this:
Region Year Month Sum([Sales]) Sum([Costs])
Totals - - 1952 784
North 2014 June 127 199
North 2014 May 592 56
South 2014 June 645 64
South 2013 May 588 465
Results table
Script syntax and chart functions - Qlik Sense, February 2022 441
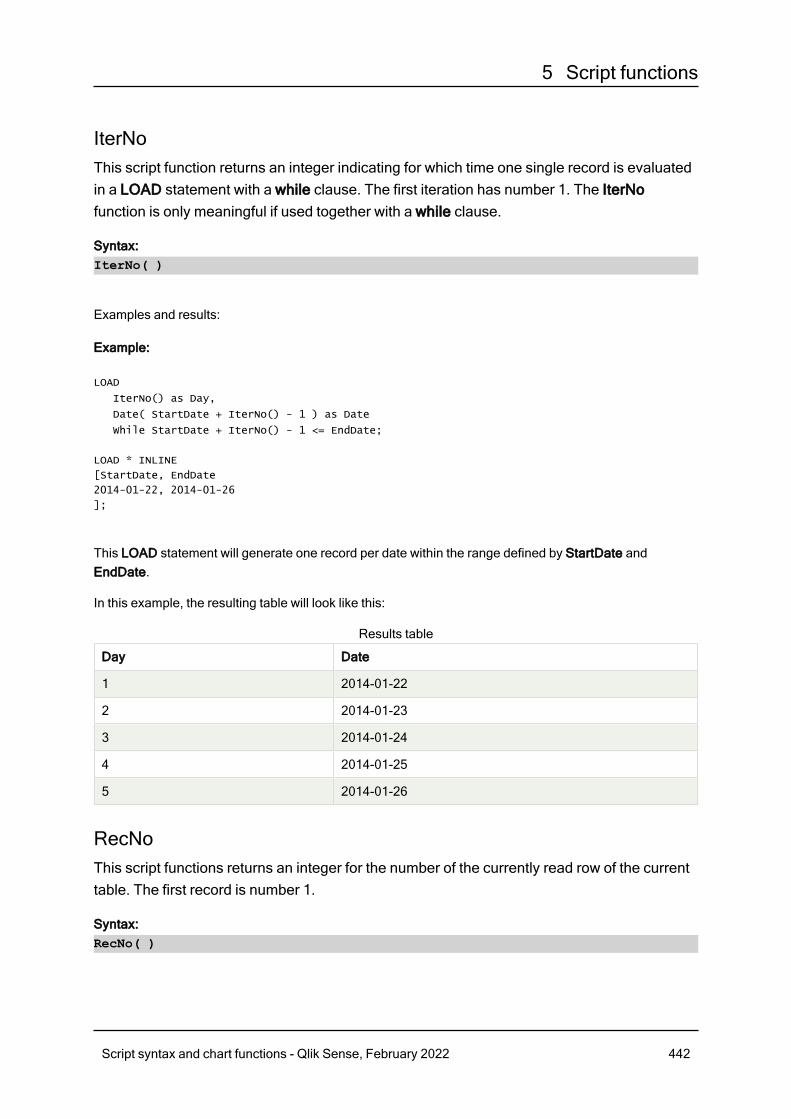
5 Script functions
IterNoThis script function returns an integer indicating for which time one single record is evaluatedin a LOAD statement with a while clause. The first iteration has number 1. The IterNofunction is only meaningful if used together with a while clause.
Syntax:IterNo( )
Examples and results:
Example:
LOAD
IterNo() as Day,
Date( StartDate + IterNo() - 1 ) as Date
While StartDate + IterNo() - 1 <= EndDate;
LOAD * INLINE
[StartDate, EndDate
2014-01-22, 2014-01-26
];
This LOAD statement will generate one record per date within the range defined by StartDate andEndDate.
In this example, the resulting table will look like this:
Day Date
1 2014-01-22
2 2014-01-23
3 2014-01-24
4 2014-01-25
5 2014-01-26
Results table
RecNoThis script functions returns an integer for the number of the currently read row of the currenttable. The first record is number 1.
Syntax:RecNo( )
Script syntax and chart functions - Qlik Sense, February 2022 442
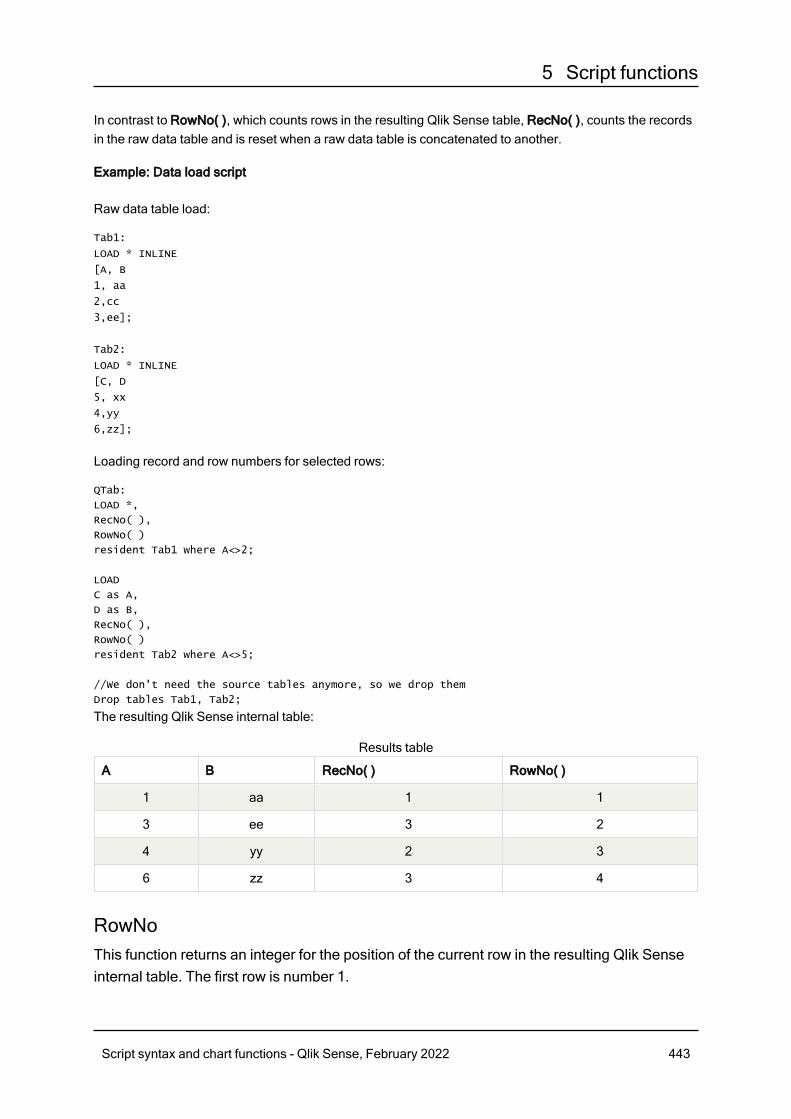
5 Script functions
In contrast to RowNo( ), which counts rows in the resulting Qlik Sense table, RecNo( ), counts the recordsin the raw data table and is reset when a raw data table is concatenated to another.
Example: Data load script
Raw data table load:
Tab1:
LOAD * INLINE
[A, B
1, aa
2,cc
3,ee];
Tab2:
LOAD * INLINE
[C, D
5, xx
4,yy
6,zz];
Loading record and row numbers for selected rows:
QTab:
LOAD *,
RecNo( ),
RowNo( )
resident Tab1 where A<>2;
LOAD
C as A,
D as B,
RecNo( ),
RowNo( )
resident Tab2 where A<>5;
//We don't need the source tables anymore, so we drop them
Drop tables Tab1, Tab2;
The resulting Qlik Sense internal table:
A B RecNo( ) RowNo( )
1 aa 1 1
3 ee 3 2
4 yy 2 3
6 zz 3 4
Results table
RowNoThis function returns an integer for the position of the current row in the resulting Qlik Senseinternal table. The first row is number 1.
Script syntax and chart functions - Qlik Sense, February 2022 443
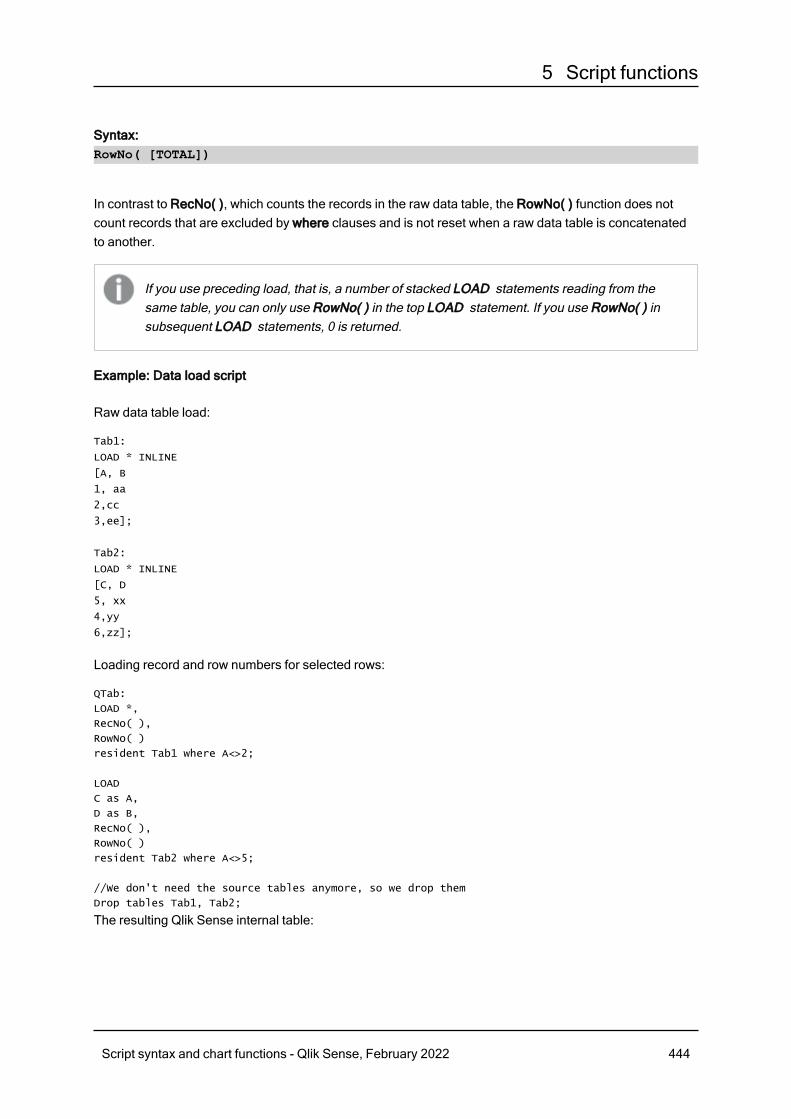
5 Script functions
Syntax:RowNo( [TOTAL])
In contrast to RecNo( ), which counts the records in the raw data table, the RowNo( ) function does notcount records that are excluded by where clauses and is not reset when a raw data table is concatenatedto another.
If you use preceding load, that is, a number of stacked LOAD statements reading from thesame table, you can only use RowNo( ) in the top LOAD statement. If you use RowNo( ) insubsequent LOAD statements, 0 is returned.
Example: Data load script
Raw data table load:
Tab1:
LOAD * INLINE
[A, B
1, aa
2,cc
3,ee];
Tab2:
LOAD * INLINE
[C, D
5, xx
4,yy
6,zz];
Loading record and row numbers for selected rows:
QTab:
LOAD *,
RecNo( ),
RowNo( )
resident Tab1 where A<>2;
LOAD
C as A,
D as B,
RecNo( ),
RowNo( )
resident Tab2 where A<>5;
//We don't need the source tables anymore, so we drop them
Drop tables Tab1, Tab2;
The resulting Qlik Sense internal table:
Script syntax and chart functions - Qlik Sense, February 2022 444
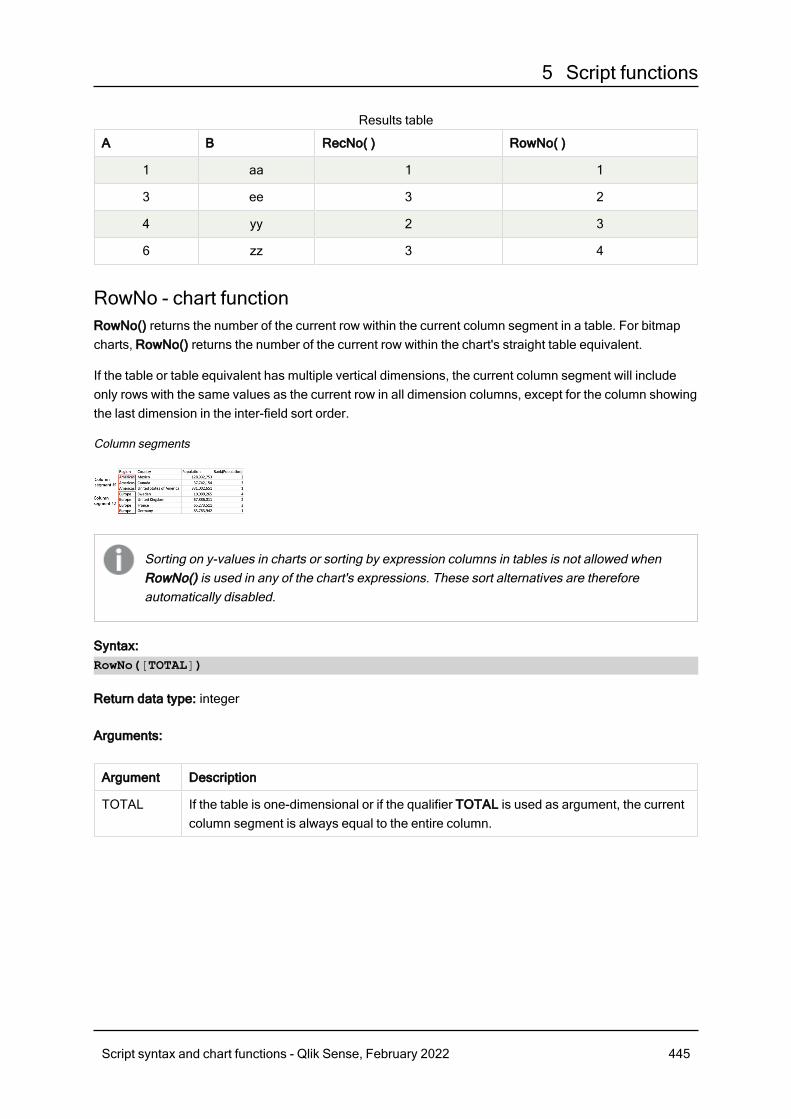
5 Script functions
A B RecNo( ) RowNo( )
1 aa 1 1
3 ee 3 2
4 yy 2 3
6 zz 3 4
Results table
RowNo - chart functionRowNo() returns the number of the current row within the current column segment in a table. For bitmapcharts, RowNo() returns the number of the current row within the chart's straight table equivalent.
If the table or table equivalent has multiple vertical dimensions, the current column segment will includeonly rows with the same values as the current row in all dimension columns, except for the column showingthe last dimension in the inter-field sort order.
Column segments
Sorting on y-values in charts or sorting by expression columns in tables is not allowed whenRowNo() is used in any of the chart's expressions. These sort alternatives are thereforeautomatically disabled.
Syntax:RowNo([TOTAL])
Return data type: integer
Arguments:
Argument Description
TOTAL If the table is one-dimensional or if the qualifier TOTAL is used as argument, the currentcolumn segment is always equal to the entire column.
Script syntax and chart functions - Qlik Sense, February 2022 445
5 Script functions
Example: Chart expression using RowNoExample - chart expression
Load scriptLoad the following data as an inline load in the data load editor to create the chart expression examplesbelow.
Temp:
LOAD * inline [
Customer|Product|OrderNumber|UnitSales|UnitPrice
Astrida|AA|1|4|16
Astrida|AA|7|10|15
Astrida|BB|4|9|9
Betacab|CC|6|5|10
Betacab|AA|5|2|20
Betacab|BB|1|25| 25
Canutility|AA|3|8|15
Canutility|CC|5|4|19
Divadip|CC|2|4|16
Divadip|DD|3|1|25
] (delimiter is '|');
Chart expressionCreate a table visualization in a Qlik Sense sheet with Customer and UnitSales as dimensions. Add RowNo
( ) and RowNo(TOTAL) as measures labeled Row in Segment and Row Number, respectively. Add thefollowing expression to the table as a measure:
If( RowNo( )=1, 0, UnitSales / Above( UnitSales ))
Result
Customer UnitSalesRow inSegment
RowNumber
If( RowNo( )=1, 0, UnitSales / Above( UnitSales ))
Astrida 4 1 1 0
Astrida 9 2 2 2.25
Astrida 10 3 3 1.1111111111111
Betacab 2 1 4 0
Betacab 5 2 5 2.5
Betacab 25 3 6 5
Canutility 4 1 7 0
Canutility 8 2 8 2
Script syntax and chart functions - Qlik Sense, February 2022 446
5 Script functions
Customer UnitSalesRow inSegment
RowNumber
If( RowNo( )=1, 0, UnitSales / Above( UnitSales ))
Divadip 1 1 9 0
Divadip 4 2 10 4
ExplanationThe Row in Segment column shows the results 1,2,3 for the column segment containing the values ofUnitSales for customer Astrida. The row numbering then begins at 1 again for the next column segment,which is Betacab.
The Row Number column disregards the dimensions because of the TOTAL argument for RowNo() andcounts the rows in the table.
This expression returns 0 for the first row in each column segment, so the column shows:
0, 2.25, 1.1111111, 0, 2.5, 5, 0, 2, 0, and 4.
See also:
p Above - chart function (page 644)
5.7 Date and time functionsQlik Sense date and time functions are used to transform and convert date and time values. All functionscan be used in both the data load script and in chart expressions.
Functions are based on a date-time serial number that equals the number of days since December 30,1899. The integer value represents the day and the fractional value represents the time of the day.
Qlik Sense uses the numerical value of the parameter, so a number is valid as a parameter also when it isnot formatted as a date or a time. If the parameter does not correspond to numerical value, for example,because it is a string, then Qlik Sense attempts to interpret the string according to the date and timeenvironment variables.
If the time format used in the parameter does not correspond to the one set in the environment variables,Qlik Sense will not be able to make a correct interpretation. To resolve this, either change the settings oruse an interpretation function.
In the examples for each function, the default time and date formats hh:mm:ss and YYYY-MM-DD (ISO8601) are assumed.
Script syntax and chart functions - Qlik Sense, February 2022 447

5 Script functions
When processing a timestamp with a date or time function, Qlik Sense ignores any daylightsavings time parameters unless the date or time function includes a geographical position.
For example, ConvertToLocalTime( filetime('Time.qvd'), 'Paris') would use daylightsavings time parameters while ConvertToLocalTime(filetime('Time.qvd'), 'GMT-01:00')
would not use daylight savings time parameters.
Date and time functions overviewEach function is described further after the overview. You can also click the function name in the syntax toimmediately access the details for that specific function.
Integer expressions of timesecondThis function returns an integer representing the second when the fraction of the expression is interpretedas a time according to the standard number interpretation.
second (expression)
minuteThis function returns an integer representing the minute when the fraction of the expression is interpretedas a time according to the standard number interpretation.
minute (expression)
hourThis function returns an integer representing the hour when the fraction of the expression is interpreted asa time according to the standard number interpretation.
hour (expression)
dayThis function returns an integer representing the day when the fraction of the expression is interpreted as adate according to the standard number interpretation.
day (expression)
weekThis function returns an integer representing the week number according to ISO 8601. The week number iscalculated from the date interpretation of the expression, according to the standard number interpretation.
week (expression)
monthThis function returns a dual value: a month name as defined in the environment variable MonthNames andan integer between 1-12. The month is calculated from the date interpretation of the expression, accordingto the standard number interpretation.
Script syntax and chart functions - Qlik Sense, February 2022 448
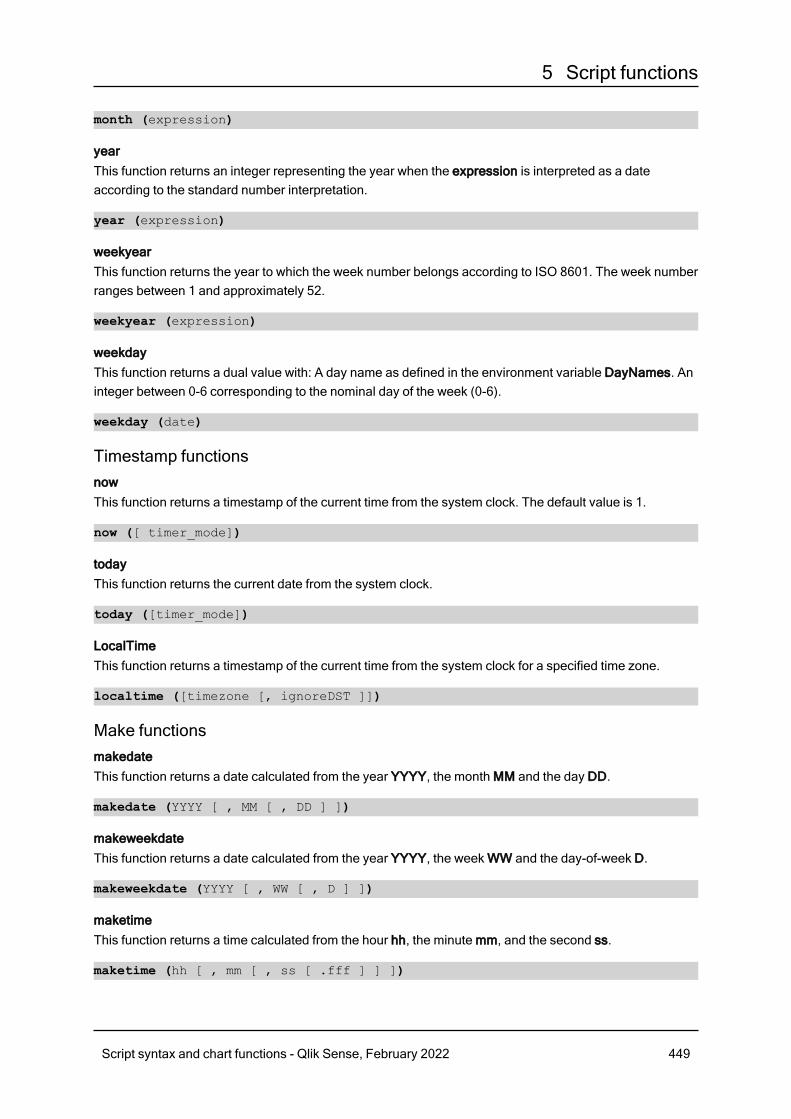
5 Script functions
month (expression)
yearThis function returns an integer representing the year when the expression is interpreted as a dateaccording to the standard number interpretation.
year (expression)
weekyearThis function returns the year to which the week number belongs according to ISO 8601. The week numberranges between 1 and approximately 52.
weekyear (expression)
weekdayThis function returns a dual value with: A day name as defined in the environment variable DayNames. Aninteger between 0-6 corresponding to the nominal day of the week (0-6).
weekday (date)
Timestamp functionsnowThis function returns a timestamp of the current time from the system clock. The default value is 1.
now ([ timer_mode])
todayThis function returns the current date from the system clock.
today ([timer_mode])
LocalTimeThis function returns a timestamp of the current time from the system clock for a specified time zone.
localtime ([timezone [, ignoreDST ]])
Make functionsmakedateThis function returns a date calculated from the year YYYY, the month MM and the day DD.
makedate (YYYY [ , MM [ , DD ] ])
makeweekdateThis function returns a date calculated from the year YYYY, the week WW and the day-of-week D.
makeweekdate (YYYY [ , WW [ , D ] ])
maketimeThis function returns a time calculated from the hour hh, the minute mm, and the second ss.
maketime (hh [ , mm [ , ss [ .fff ] ] ])
Script syntax and chart functions - Qlik Sense, February 2022 449
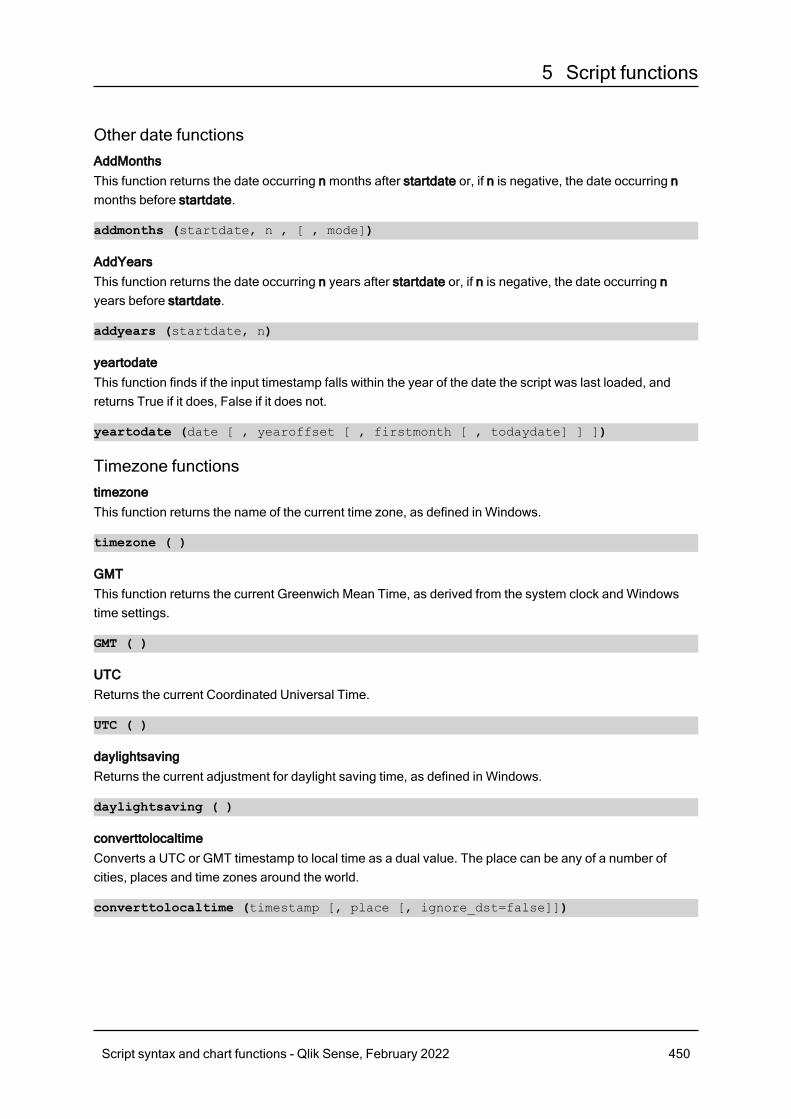
5 Script functions
Other date functionsAddMonthsThis function returns the date occurring n months after startdate or, if n is negative, the date occurring nmonths before startdate.
addmonths (startdate, n , [ , mode])
AddYearsThis function returns the date occurring n years after startdate or, if n is negative, the date occurring nyears before startdate.
addyears (startdate, n)
yeartodateThis function finds if the input timestamp falls within the year of the date the script was last loaded, andreturns True if it does, False if it does not.
yeartodate (date [ , yearoffset [ , firstmonth [ , todaydate] ] ])
Timezone functionstimezoneThis function returns the name of the current time zone, as defined in Windows.
timezone ( )
GMTThis function returns the current Greenwich Mean Time, as derived from the system clock and Windowstime settings.
GMT ( )
UTCReturns the current Coordinated Universal Time.
UTC ( )
daylightsavingReturns the current adjustment for daylight saving time, as defined in Windows.
daylightsaving ( )
converttolocaltimeConverts a UTC or GMT timestamp to local time as a dual value. The place can be any of a number ofcities, places and time zones around the world.
converttolocaltime (timestamp [, place [, ignore_dst=false]])
Script syntax and chart functions - Qlik Sense, February 2022 450
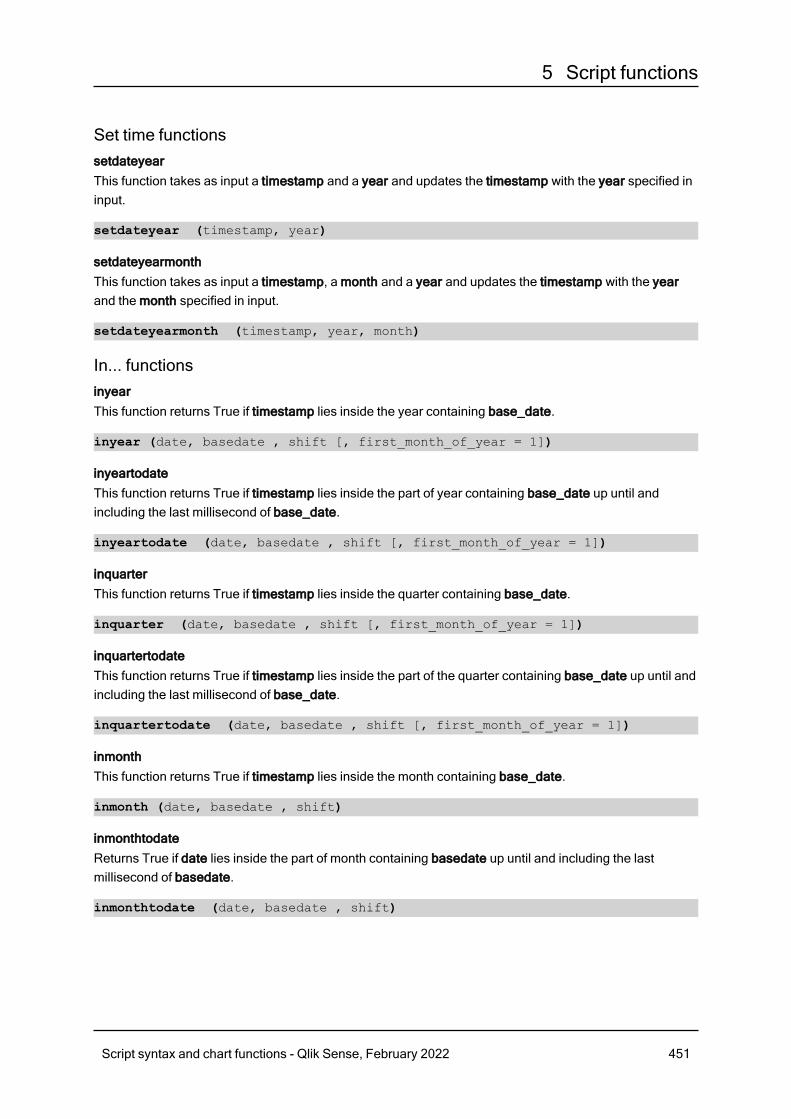
5 Script functions
Set time functionssetdateyearThis function takes as input a timestamp and a year and updates the timestamp with the year specified ininput.
setdateyear (timestamp, year)
setdateyearmonthThis function takes as input a timestamp, a month and a year and updates the timestamp with the yearand the month specified in input.
setdateyearmonth (timestamp, year, month)
In... functionsinyearThis function returns True if timestamp lies inside the year containing base_date.
inyear (date, basedate , shift [, first_month_of_year = 1])
inyeartodateThis function returns True if timestamp lies inside the part of year containing base_date up until andincluding the last millisecond of base_date.
inyeartodate (date, basedate , shift [, first_month_of_year = 1])
inquarterThis function returns True if timestamp lies inside the quarter containing base_date.
inquarter (date, basedate , shift [, first_month_of_year = 1])
inquartertodateThis function returns True if timestamp lies inside the part of the quarter containing base_date up until andincluding the last millisecond of base_date.
inquartertodate (date, basedate , shift [, first_month_of_year = 1])
inmonthThis function returns True if timestamp lies inside the month containing base_date.
inmonth (date, basedate , shift)
inmonthtodateReturns True if date lies inside the part of month containing basedate up until and including the lastmillisecond of basedate.
inmonthtodate (date, basedate , shift)
Script syntax and chart functions - Qlik Sense, February 2022 451
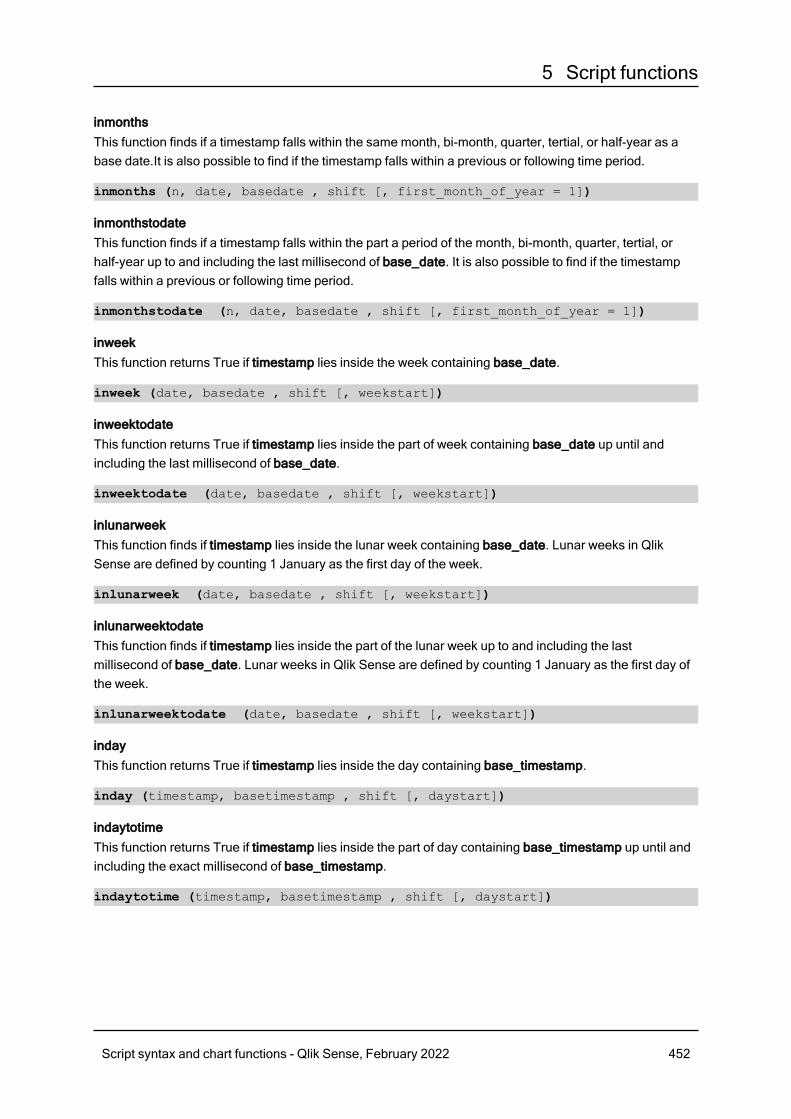
5 Script functions
inmonthsThis function finds if a timestamp falls within the same month, bi-month, quarter, tertial, or half-year as abase date.It is also possible to find if the timestamp falls within a previous or following time period.
inmonths (n, date, basedate , shift [, first_month_of_year = 1])
inmonthstodateThis function finds if a timestamp falls within the part a period of the month, bi-month, quarter, tertial, orhalf-year up to and including the last millisecond of base_date. It is also possible to find if the timestampfalls within a previous or following time period.
inmonthstodate (n, date, basedate , shift [, first_month_of_year = 1])
inweekThis function returns True if timestamp lies inside the week containing base_date.
inweek (date, basedate , shift [, weekstart])
inweektodateThis function returns True if timestamp lies inside the part of week containing base_date up until andincluding the last millisecond of base_date.
inweektodate (date, basedate , shift [, weekstart])
inlunarweekThis function finds if timestamp lies inside the lunar week containing base_date. Lunar weeks in QlikSense are defined by counting 1 January as the first day of the week.
inlunarweek (date, basedate , shift [, weekstart])
inlunarweektodateThis function finds if timestamp lies inside the part of the lunar week up to and including the lastmillisecond of base_date. Lunar weeks in Qlik Sense are defined by counting 1 January as the first day ofthe week.
inlunarweektodate (date, basedate , shift [, weekstart])
indayThis function returns True if timestamp lies inside the day containing base_timestamp.
inday (timestamp, basetimestamp , shift [, daystart])
indaytotimeThis function returns True if timestamp lies inside the part of day containing base_timestamp up until andincluding the exact millisecond of base_timestamp.
indaytotime (timestamp, basetimestamp , shift [, daystart])
Script syntax and chart functions - Qlik Sense, February 2022 452
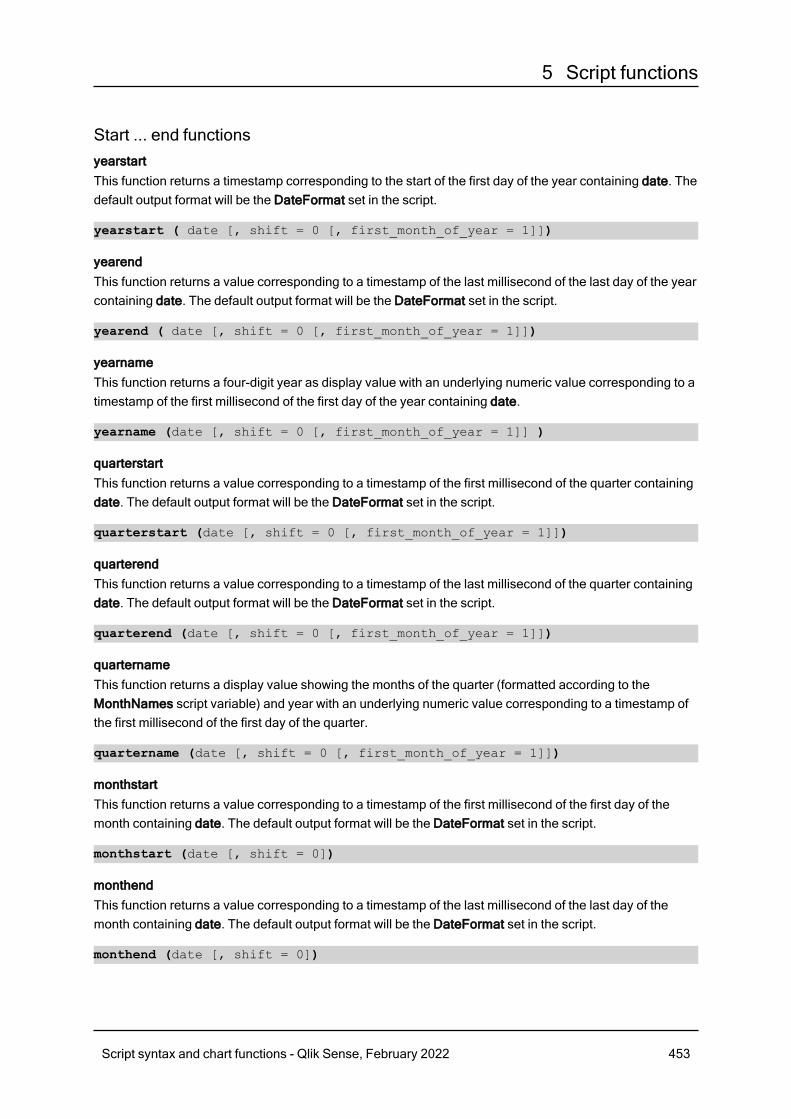
5 Script functions
Start ... end functionsyearstartThis function returns a timestamp corresponding to the start of the first day of the year containing date. Thedefault output format will be the DateFormat set in the script.
yearstart ( date [, shift = 0 [, first_month_of_year = 1]])
yearendThis function returns a value corresponding to a timestamp of the last millisecond of the last day of the yearcontaining date. The default output format will be the DateFormat set in the script.
yearend ( date [, shift = 0 [, first_month_of_year = 1]])
yearnameThis function returns a four-digit year as display value with an underlying numeric value corresponding to atimestamp of the first millisecond of the first day of the year containing date.
yearname (date [, shift = 0 [, first_month_of_year = 1]] )
quarterstartThis function returns a value corresponding to a timestamp of the first millisecond of the quarter containingdate. The default output format will be the DateFormat set in the script.
quarterstart (date [, shift = 0 [, first_month_of_year = 1]])
quarterendThis function returns a value corresponding to a timestamp of the last millisecond of the quarter containingdate. The default output format will be the DateFormat set in the script.
quarterend (date [, shift = 0 [, first_month_of_year = 1]])
quarternameThis function returns a display value showing the months of the quarter (formatted according to theMonthNames script variable) and year with an underlying numeric value corresponding to a timestamp ofthe first millisecond of the first day of the quarter.
quartername (date [, shift = 0 [, first_month_of_year = 1]])
monthstartThis function returns a value corresponding to a timestamp of the first millisecond of the first day of themonth containing date. The default output format will be the DateFormat set in the script.
monthstart (date [, shift = 0])
monthendThis function returns a value corresponding to a timestamp of the last millisecond of the last day of themonth containing date. The default output format will be the DateFormat set in the script.
monthend (date [, shift = 0])
Script syntax and chart functions - Qlik Sense, February 2022 453
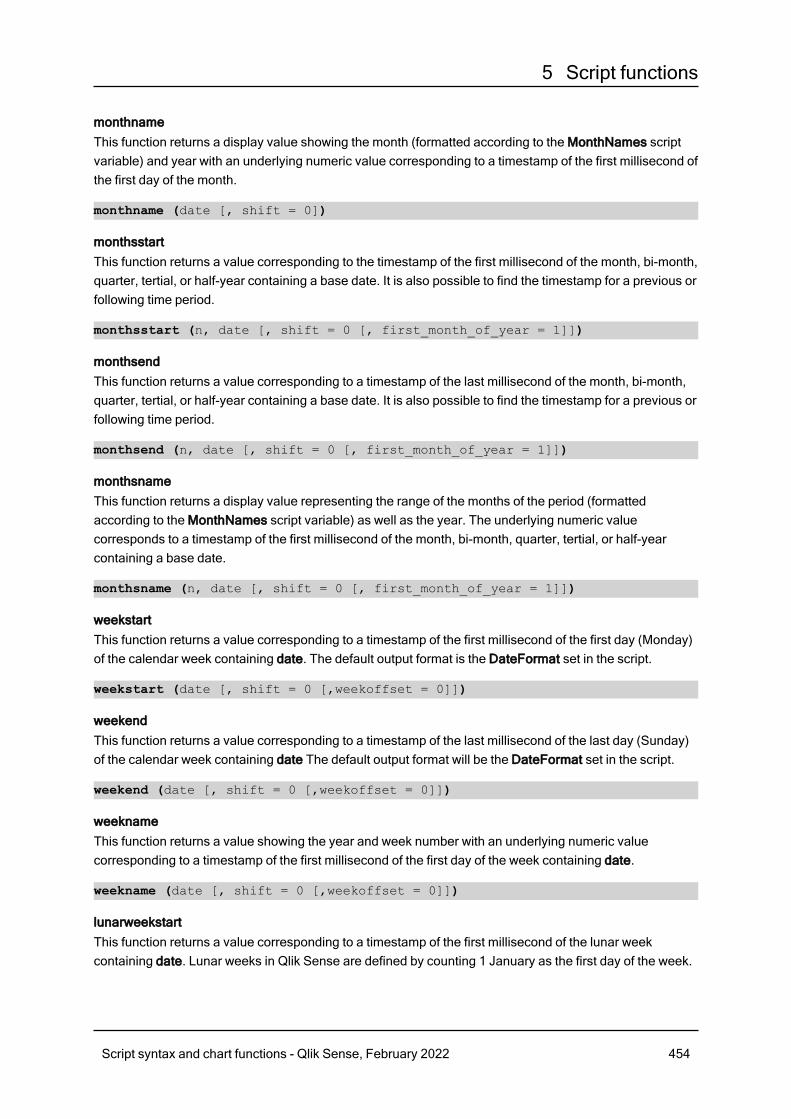
5 Script functions
monthnameThis function returns a display value showing the month (formatted according to the MonthNames scriptvariable) and year with an underlying numeric value corresponding to a timestamp of the first millisecond ofthe first day of the month.
monthname (date [, shift = 0])
monthsstartThis function returns a value corresponding to the timestamp of the first millisecond of the month, bi-month,quarter, tertial, or half-year containing a base date. It is also possible to find the timestamp for a previous orfollowing time period.
monthsstart (n, date [, shift = 0 [, first_month_of_year = 1]])
monthsendThis function returns a value corresponding to a timestamp of the last millisecond of the month, bi-month,quarter, tertial, or half-year containing a base date. It is also possible to find the timestamp for a previous orfollowing time period.
monthsend (n, date [, shift = 0 [, first_month_of_year = 1]])
monthsnameThis function returns a display value representing the range of the months of the period (formattedaccording to the MonthNames script variable) as well as the year. The underlying numeric valuecorresponds to a timestamp of the first millisecond of the month, bi-month, quarter, tertial, or half-yearcontaining a base date.
monthsname (n, date [, shift = 0 [, first_month_of_year = 1]])
weekstartThis function returns a value corresponding to a timestamp of the first millisecond of the first day (Monday)of the calendar week containing date. The default output format is the DateFormat set in the script.
weekstart (date [, shift = 0 [,weekoffset = 0]])
weekendThis function returns a value corresponding to a timestamp of the last millisecond of the last day (Sunday)of the calendar week containing date The default output format will be the DateFormat set in the script.
weekend (date [, shift = 0 [,weekoffset = 0]])
weeknameThis function returns a value showing the year and week number with an underlying numeric valuecorresponding to a timestamp of the first millisecond of the first day of the week containing date.
weekname (date [, shift = 0 [,weekoffset = 0]])
lunarweekstartThis function returns a value corresponding to a timestamp of the first millisecond of the lunar weekcontaining date. Lunar weeks in Qlik Sense are defined by counting 1 January as the first day of the week.
Script syntax and chart functions - Qlik Sense, February 2022 454
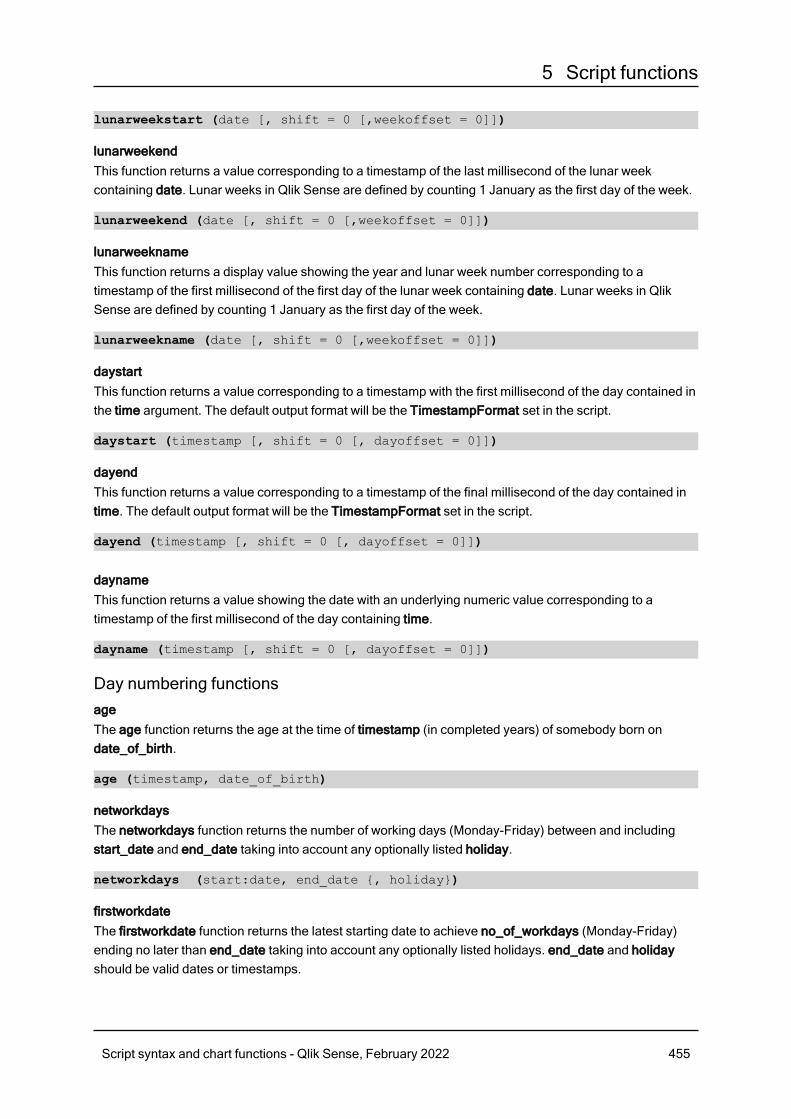
5 Script functions
lunarweekstart (date [, shift = 0 [,weekoffset = 0]])
lunarweekendThis function returns a value corresponding to a timestamp of the last millisecond of the lunar weekcontaining date. Lunar weeks in Qlik Sense are defined by counting 1 January as the first day of the week.
lunarweekend (date [, shift = 0 [,weekoffset = 0]])
lunarweeknameThis function returns a display value showing the year and lunar week number corresponding to atimestamp of the first millisecond of the first day of the lunar week containing date. Lunar weeks in QlikSense are defined by counting 1 January as the first day of the week.
lunarweekname (date [, shift = 0 [,weekoffset = 0]])
daystartThis function returns a value corresponding to a timestamp with the first millisecond of the day contained inthe time argument. The default output format will be the TimestampFormat set in the script.
daystart (timestamp [, shift = 0 [, dayoffset = 0]])
dayendThis function returns a value corresponding to a timestamp of the final millisecond of the day contained intime. The default output format will be the TimestampFormat set in the script.
dayend (timestamp [, shift = 0 [, dayoffset = 0]])
daynameThis function returns a value showing the date with an underlying numeric value corresponding to atimestamp of the first millisecond of the day containing time.
dayname (timestamp [, shift = 0 [, dayoffset = 0]])
Day numbering functionsageThe age function returns the age at the time of timestamp (in completed years) of somebody born ondate_of_birth.
age (timestamp, date_of_birth)
networkdaysThe networkdays function returns the number of working days (Monday-Friday) between and includingstart_date and end_date taking into account any optionally listed holiday.
networkdays (start:date, end_date {, holiday})
firstworkdateThe firstworkdate function returns the latest starting date to achieve no_of_workdays (Monday-Friday)ending no later than end_date taking into account any optionally listed holidays. end_date and holidayshould be valid dates or timestamps.
Script syntax and chart functions - Qlik Sense, February 2022 455

5 Script functions
firstworkdate (end_date, no_of_workdays {, holiday} )
lastworkdateThe lastworkdate function returns the earliest ending date to achieve no_of_workdays (Monday-Friday) ifstarting at start_date taking into account any optionally listed holiday. start_date and holiday should bevalid dates or timestamps.
lastworkdate (start_date, no_of_workdays {, holiday})
daynumberofyearThis function calculates the day number of the year in which a timestamp falls. The calculation is madefrom the first millisecond of the first day of the year, but the first month can be offset.
daynumberofyear (date[,firstmonth])
daynumberofquarterThis function calculates the day number of the quarter in which a timestamp falls.
daynumberofquarter (date[,firstmonth])
addmonthsThis function returns the date occurring n months after startdate or, if n is negative, the dateoccurring n months before startdate.
Syntax:AddMonths(startdate, n , [ , mode])
Return data type: dual
The AddMonths function returns a dual value with both the string and the number value. The function takesthe numeric value of the input expression and generates a string representing the number. The string isdisplayed, whereas the numeric value is used for all numerical calculations and sorting.
Arguments:
Argument Description
startdate The start date as a time stamp, for example '2012-10-12'.
n Number of months as a positive or negative integer.
mode Specifies if the month is added relative to the beginning or to the end of the month.Default mode is 0 for additions relative to the beginning of the month. Set mode to 1 foradditions relative to the end of the month. When mode is set to 1 and the input date is the28th or above, the function checks how many days are left to reach the end of the monthon the startdate. The same number of days to reach the end of the month are set on thedate returned.
Arguments
Script syntax and chart functions - Qlik Sense, February 2022 456
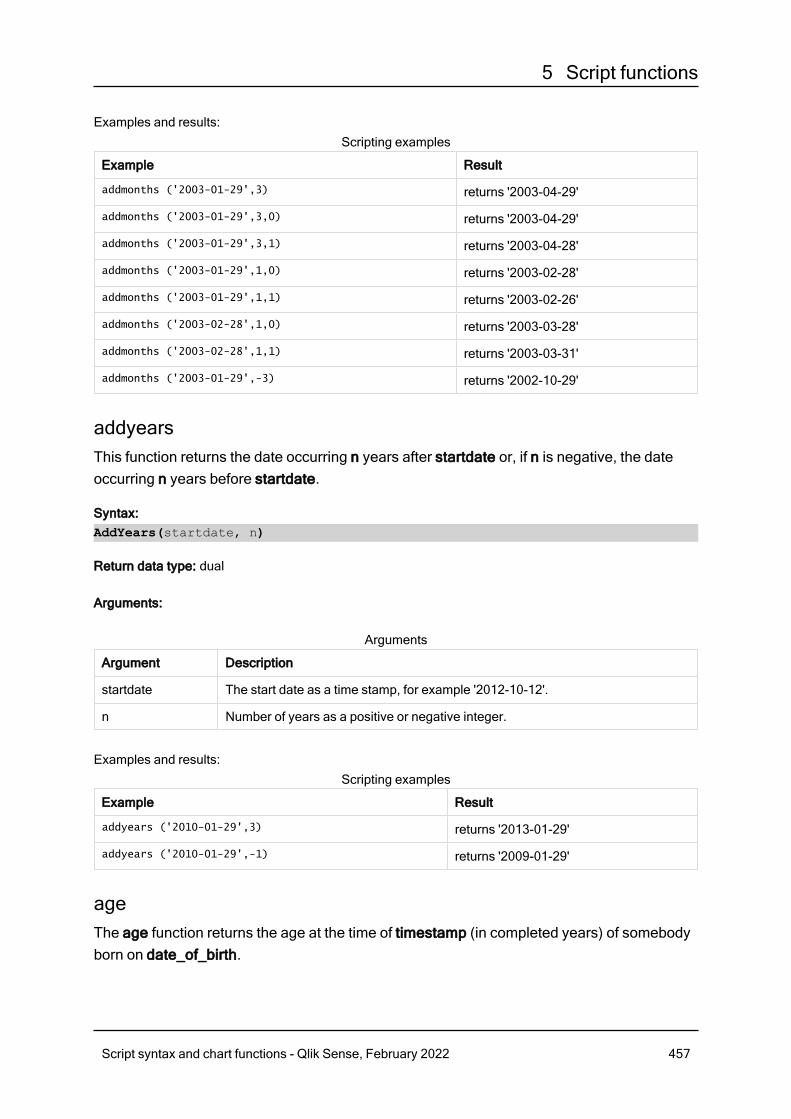
5 Script functions
Examples and results:
Example Result
addmonths ('2003-01-29',3) returns '2003-04-29'
addmonths ('2003-01-29',3,0) returns '2003-04-29'
addmonths ('2003-01-29',3,1) returns '2003-04-28'
addmonths ('2003-01-29',1,0) returns '2003-02-28'
addmonths ('2003-01-29',1,1) returns '2003-02-26'
addmonths ('2003-02-28',1,0) returns '2003-03-28'
addmonths ('2003-02-28',1,1) returns '2003-03-31'
addmonths ('2003-01-29',-3) returns '2002-10-29'
Scripting examples
addyearsThis function returns the date occurring n years after startdate or, if n is negative, the dateoccurring n years before startdate.
Syntax:AddYears(startdate, n)
Return data type: dual
Arguments:
Argument Description
startdate The start date as a time stamp, for example '2012-10-12'.
n Number of years as a positive or negative integer.
Arguments
Examples and results:
Example Result
addyears ('2010-01-29',3) returns '2013-01-29'
addyears ('2010-01-29',-1) returns '2009-01-29'
Scripting examples
ageThe age function returns the age at the time of timestamp (in completed years) of somebodyborn on date_of_birth.
Script syntax and chart functions - Qlik Sense, February 2022 457
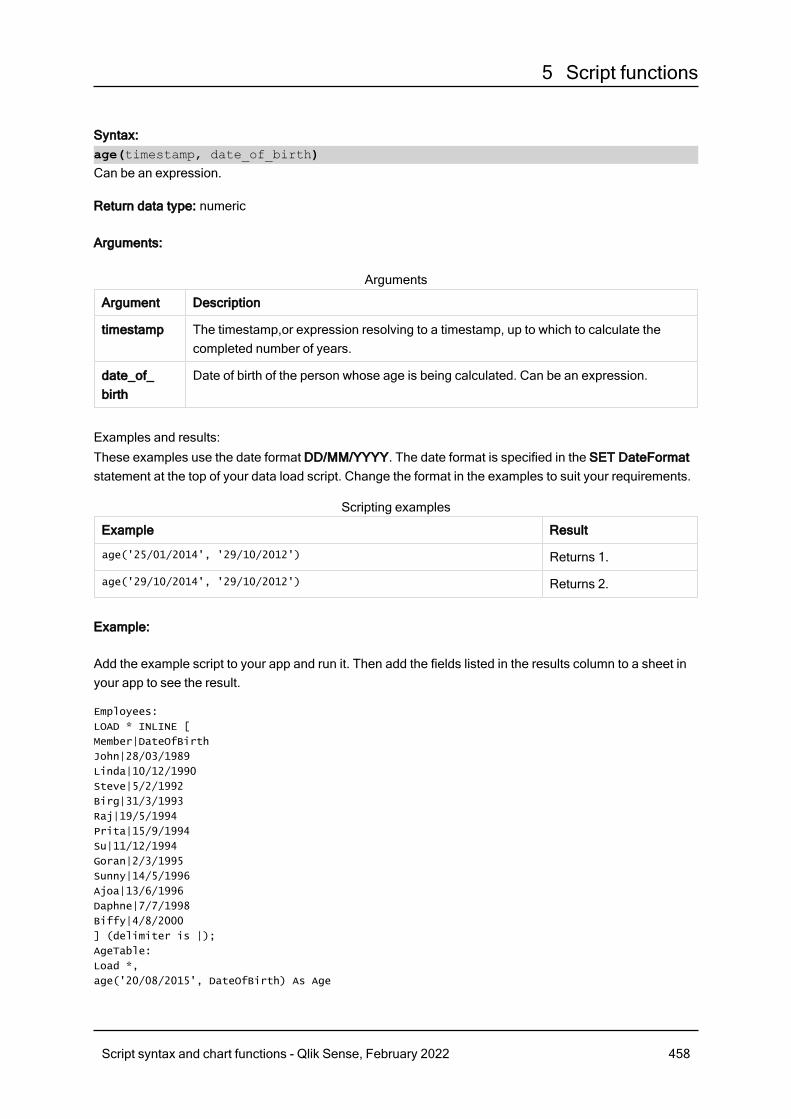
5 Script functions
Syntax:age(timestamp, date_of_birth)Can be an expression.
Return data type: numeric
Arguments:
Argument Description
timestamp The timestamp,or expression resolving to a timestamp, up to which to calculate thecompleted number of years.
date_of_birth
Date of birth of the person whose age is being calculated. Can be an expression.
Arguments
Examples and results:These examples use the date format DD/MM/YYYY. The date format is specified in the SET DateFormatstatement at the top of your data load script. Change the format in the examples to suit your requirements.
Example Result
age('25/01/2014', '29/10/2012') Returns 1.
age('29/10/2014', '29/10/2012') Returns 2.
Scripting examples
Example:
Add the example script to your app and run it. Then add the fields listed in the results column to a sheet inyour app to see the result.
Employees:
LOAD * INLINE [
Member|DateOfBirth
John|28/03/1989
Linda|10/12/1990
Steve|5/2/1992
Birg|31/3/1993
Raj|19/5/1994
Prita|15/9/1994
Su|11/12/1994
Goran|2/3/1995
Sunny|14/5/1996
Ajoa|13/6/1996
Daphne|7/7/1998
Biffy|4/8/2000
] (delimiter is |);
AgeTable:
Load *,
age('20/08/2015', DateOfBirth) As Age
Script syntax and chart functions - Qlik Sense, February 2022 458
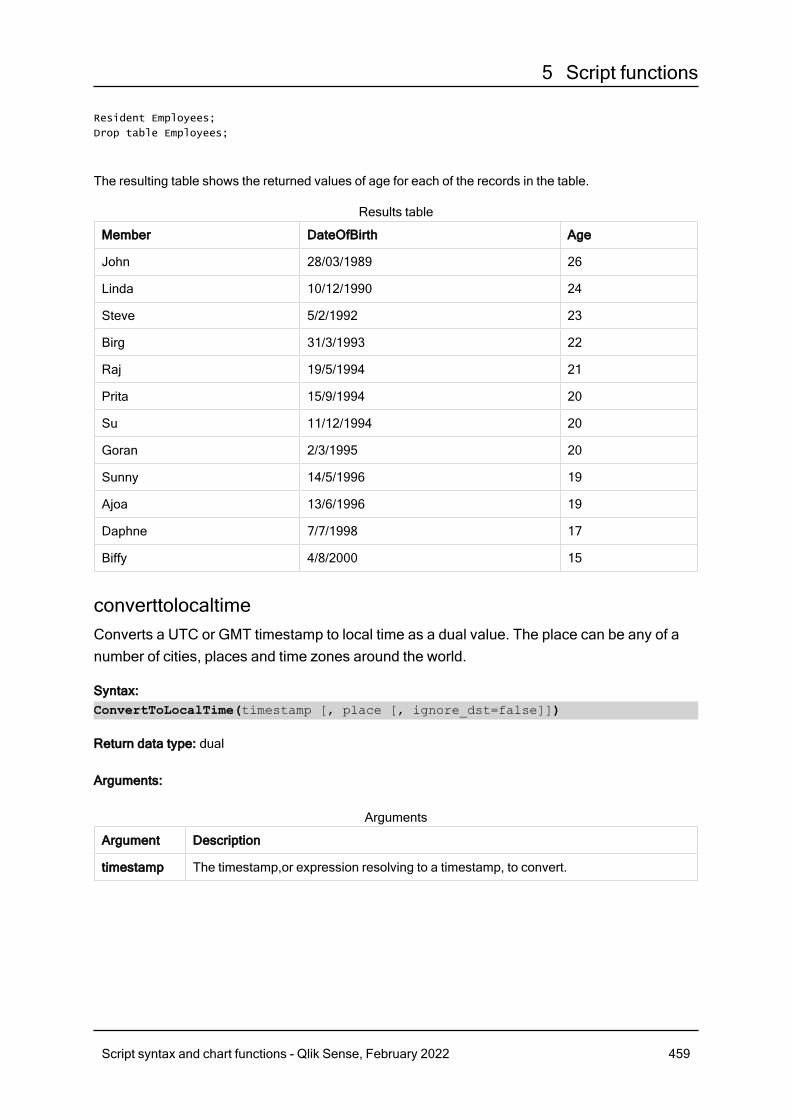
5 Script functions
Resident Employees;
Drop table Employees;
The resulting table shows the returned values of age for each of the records in the table.
Member DateOfBirth Age
John 28/03/1989 26
Linda 10/12/1990 24
Steve 5/2/1992 23
Birg 31/3/1993 22
Raj 19/5/1994 21
Prita 15/9/1994 20
Su 11/12/1994 20
Goran 2/3/1995 20
Sunny 14/5/1996 19
Ajoa 13/6/1996 19
Daphne 7/7/1998 17
Biffy 4/8/2000 15
Results table
converttolocaltimeConverts a UTC or GMT timestamp to local time as a dual value. The place can be any of anumber of cities, places and time zones around the world.
Syntax:ConvertToLocalTime(timestamp [, place [, ignore_dst=false]])
Return data type: dual
Arguments:
Argument Description
timestamp The timestamp,or expression resolving to a timestamp, to convert.
Arguments
Script syntax and chart functions - Qlik Sense, February 2022 459
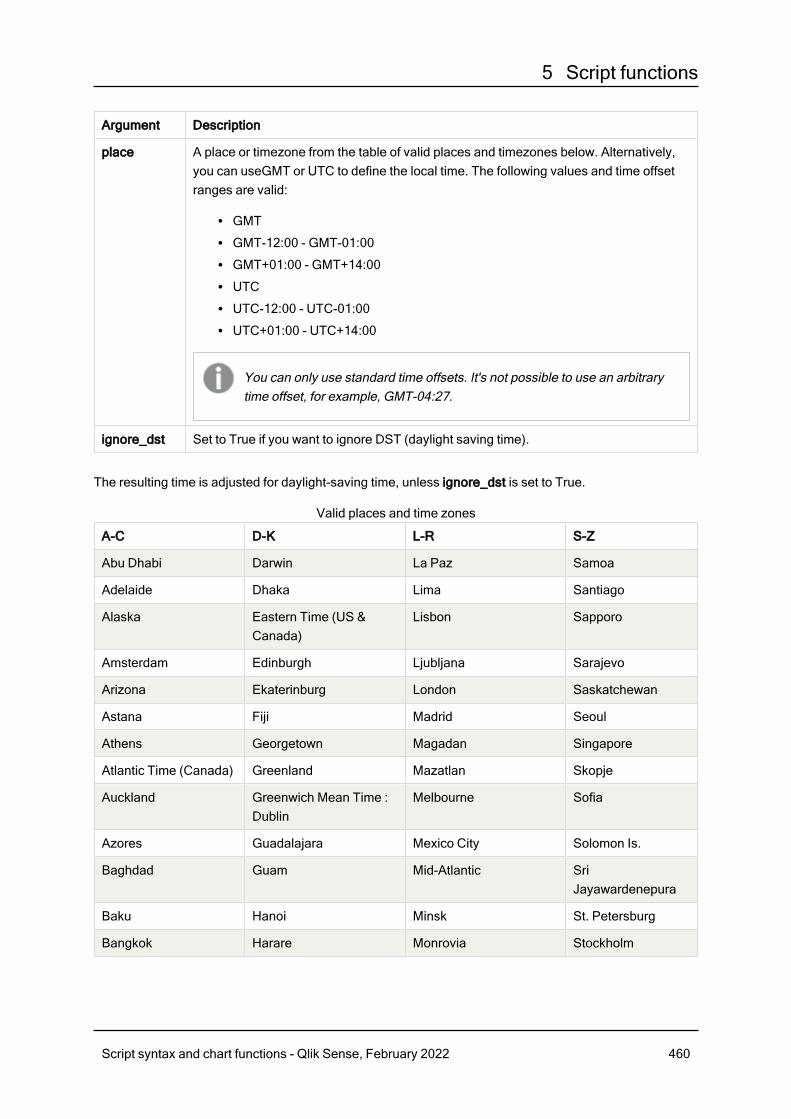
5 Script functions
Argument Description
place A place or timezone from the table of valid places and timezones below. Alternatively,you can useGMT or UTC to define the local time. The following values and time offsetranges are valid:
l GMTl GMT-12:00 - GMT-01:00l GMT+01:00 - GMT+14:00l UTCl UTC-12:00 - UTC-01:00l UTC+01:00 - UTC+14:00
You can only use standard time offsets. It's not possible to use an arbitrarytime offset, for example, GMT-04:27.
ignore_dst Set to True if you want to ignore DST (daylight saving time).
The resulting time is adjusted for daylight-saving time, unless ignore_dst is set to True.
A-C D-K L-R S-Z
Abu Dhabi Darwin La Paz Samoa
Adelaide Dhaka Lima Santiago
Alaska Eastern Time (US &Canada)
Lisbon Sapporo
Amsterdam Edinburgh Ljubljana Sarajevo
Arizona Ekaterinburg London Saskatchewan
Astana Fiji Madrid Seoul
Athens Georgetown Magadan Singapore
Atlantic Time (Canada) Greenland Mazatlan Skopje
Auckland Greenwich Mean Time :Dublin
Melbourne Sofia
Azores Guadalajara Mexico City Solomon Is.
Baghdad Guam Mid-Atlantic SriJayawardenepura
Baku Hanoi Minsk St. Petersburg
Bangkok Harare Monrovia Stockholm
Valid places and time zones
Script syntax and chart functions - Qlik Sense, February 2022 460
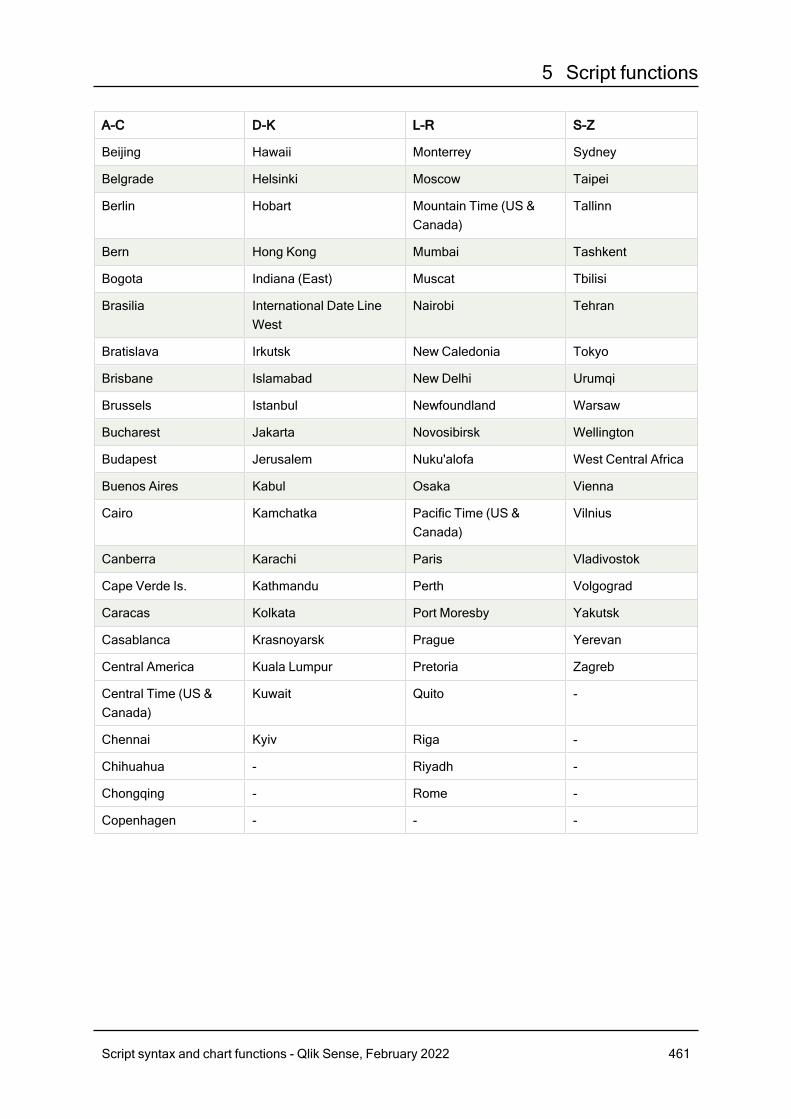
5 Script functions
A-C D-K L-R S-Z
Beijing Hawaii Monterrey Sydney
Belgrade Helsinki Moscow Taipei
Berlin Hobart Mountain Time (US &Canada)
Tallinn
Bern Hong Kong Mumbai Tashkent
Bogota Indiana (East) Muscat Tbilisi
Brasilia International Date LineWest
Nairobi Tehran
Bratislava Irkutsk New Caledonia Tokyo
Brisbane Islamabad New Delhi Urumqi
Brussels Istanbul Newfoundland Warsaw
Bucharest Jakarta Novosibirsk Wellington
Budapest Jerusalem Nuku'alofa West Central Africa
Buenos Aires Kabul Osaka Vienna
Cairo Kamchatka Pacific Time (US &Canada)
Vilnius
Canberra Karachi Paris Vladivostok
Cape Verde Is. Kathmandu Perth Volgograd
Caracas Kolkata Port Moresby Yakutsk
Casablanca Krasnoyarsk Prague Yerevan
Central America Kuala Lumpur Pretoria Zagreb
Central Time (US &Canada)
Kuwait Quito -
Chennai Kyiv Riga -
Chihuahua - Riyadh -
Chongqing - Rome -
Copenhagen - - -
Script syntax and chart functions - Qlik Sense, February 2022 461
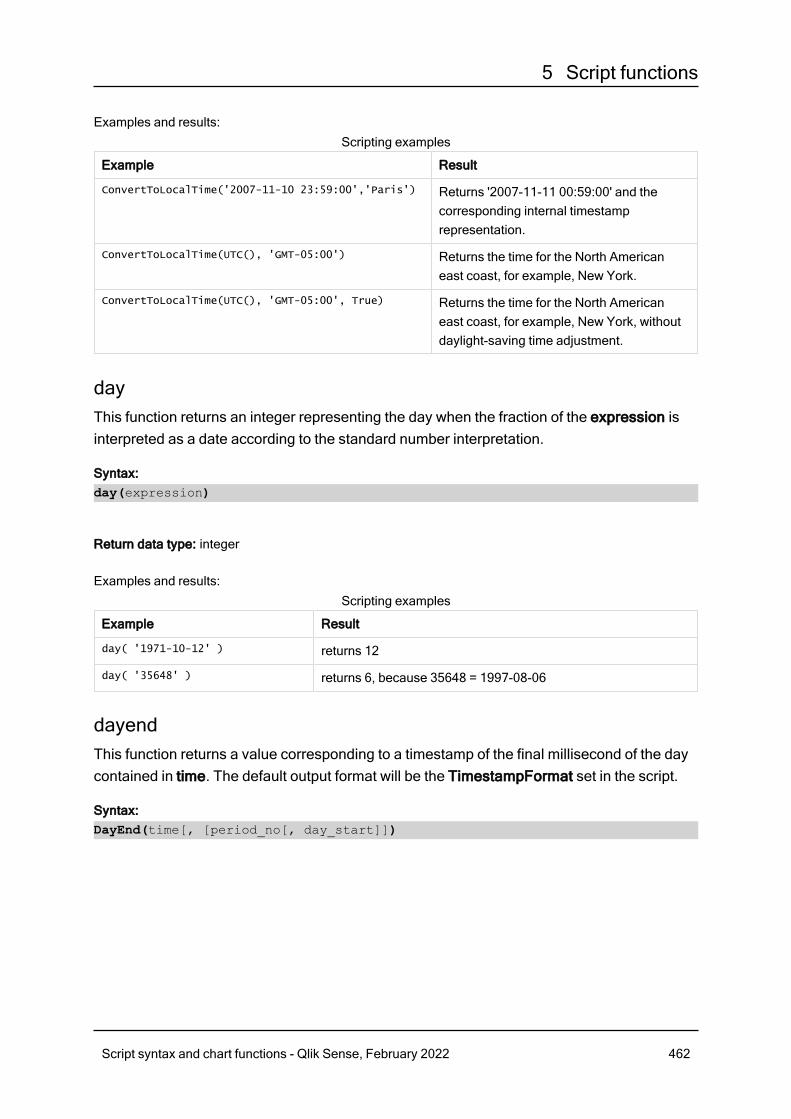
5 Script functions
Examples and results:
Example Result
ConvertToLocalTime('2007-11-10 23:59:00','Paris') Returns '2007-11-11 00:59:00' and thecorresponding internal timestamprepresentation.
ConvertToLocalTime(UTC(), 'GMT-05:00') Returns the time for the North Americaneast coast, for example, New York.
ConvertToLocalTime(UTC(), 'GMT-05:00', True) Returns the time for the North Americaneast coast, for example, New York, withoutdaylight-saving time adjustment.
Scripting examples
dayThis function returns an integer representing the day when the fraction of the expression isinterpreted as a date according to the standard number interpretation.
Syntax:day(expression)
Return data type: integer
Examples and results:
Example Result
day( '1971-10-12' ) returns 12
day( '35648' ) returns 6, because 35648 = 1997-08-06
Scripting examples
dayendThis function returns a value corresponding to a timestamp of the final millisecond of the daycontained in time. The default output format will be the TimestampFormat set in the script.
Syntax:DayEnd(time[, [period_no[, day_start]])
Script syntax and chart functions - Qlik Sense, February 2022 462
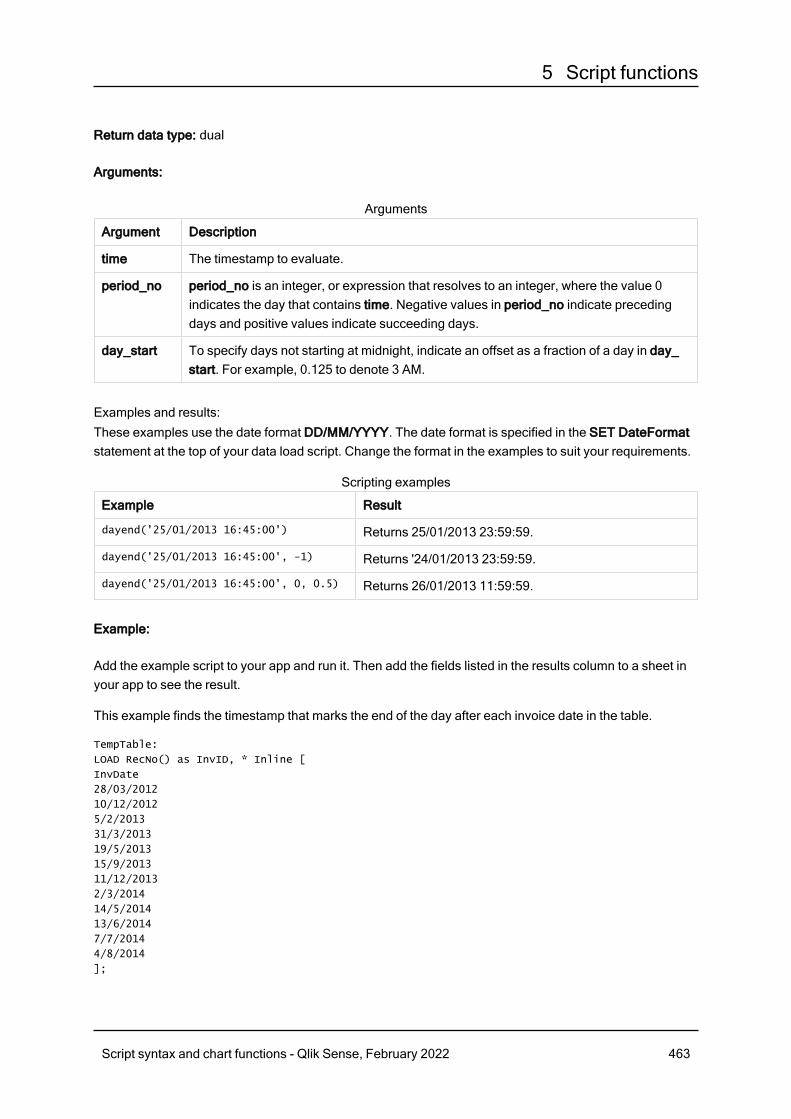
5 Script functions
Return data type: dual
Arguments:
Argument Description
time The timestamp to evaluate.
period_no period_no is an integer, or expression that resolves to an integer, where the value 0indicates the day that contains time. Negative values in period_no indicate precedingdays and positive values indicate succeeding days.
day_start To specify days not starting at midnight, indicate an offset as a fraction of a day in day_start. For example, 0.125 to denote 3 AM.
Arguments
Examples and results:These examples use the date format DD/MM/YYYY. The date format is specified in the SET DateFormatstatement at the top of your data load script. Change the format in the examples to suit your requirements.
Example Result
dayend('25/01/2013 16:45:00') Returns 25/01/2013 23:59:59.
dayend('25/01/2013 16:45:00', -1) Returns '24/01/2013 23:59:59.
dayend('25/01/2013 16:45:00', 0, 0.5) Returns 26/01/2013 11:59:59.
Scripting examples
Example:
Add the example script to your app and run it. Then add the fields listed in the results column to a sheet inyour app to see the result.
This example finds the timestamp that marks the end of the day after each invoice date in the table.
TempTable:
LOAD RecNo() as InvID, * Inline [
InvDate
28/03/2012
10/12/2012
5/2/2013
31/3/2013
19/5/2013
15/9/2013
11/12/2013
2/3/2014
14/5/2014
13/6/2014
7/7/2014
4/8/2014
];
Script syntax and chart functions - Qlik Sense, February 2022 463
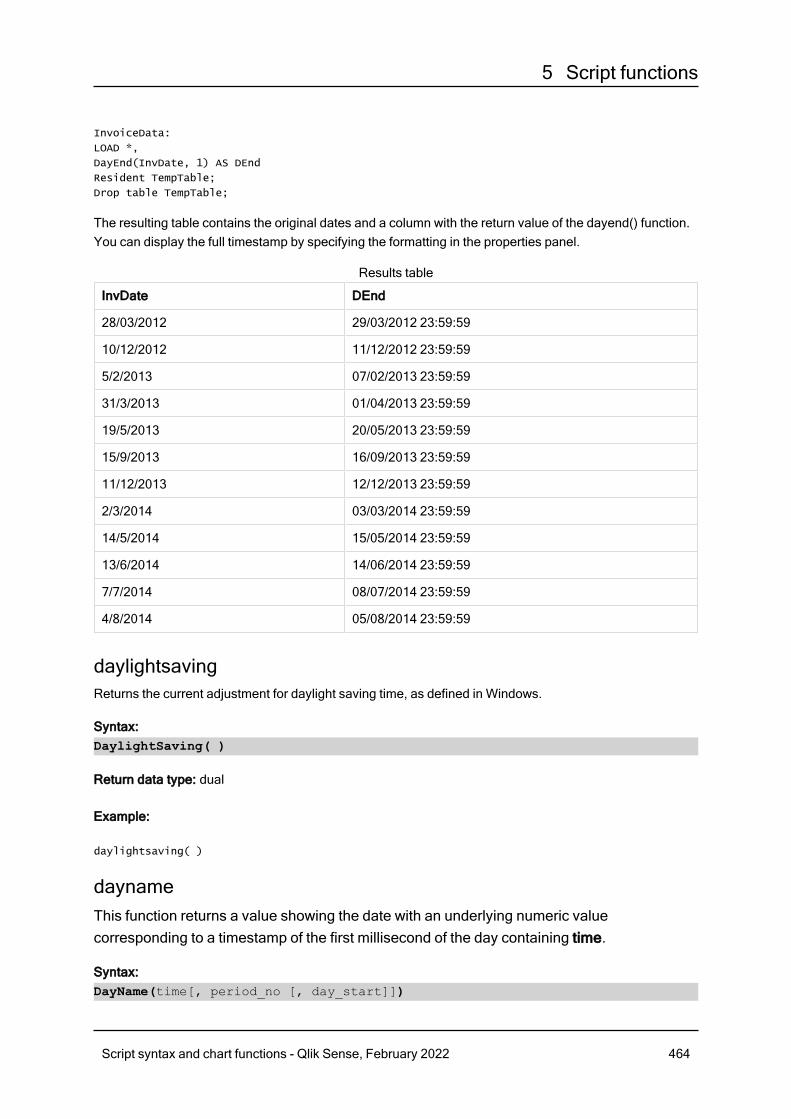
5 Script functions
InvoiceData:
LOAD *,
DayEnd(InvDate, 1) AS DEnd
Resident TempTable;
Drop table TempTable;
The resulting table contains the original dates and a column with the return value of the dayend() function.You can display the full timestamp by specifying the formatting in the properties panel.
InvDate DEnd
28/03/2012 29/03/2012 23:59:59
10/12/2012 11/12/2012 23:59:59
5/2/2013 07/02/2013 23:59:59
31/3/2013 01/04/2013 23:59:59
19/5/2013 20/05/2013 23:59:59
15/9/2013 16/09/2013 23:59:59
11/12/2013 12/12/2013 23:59:59
2/3/2014 03/03/2014 23:59:59
14/5/2014 15/05/2014 23:59:59
13/6/2014 14/06/2014 23:59:59
7/7/2014 08/07/2014 23:59:59
4/8/2014 05/08/2014 23:59:59
Results table
daylightsavingReturns the current adjustment for daylight saving time, as defined in Windows.
Syntax:DaylightSaving( )
Return data type: dual
Example:
daylightsaving( )
daynameThis function returns a value showing the date with an underlying numeric valuecorresponding to a timestamp of the first millisecond of the day containing time.
Syntax:DayName(time[, period_no [, day_start]])
Script syntax and chart functions - Qlik Sense, February 2022 464
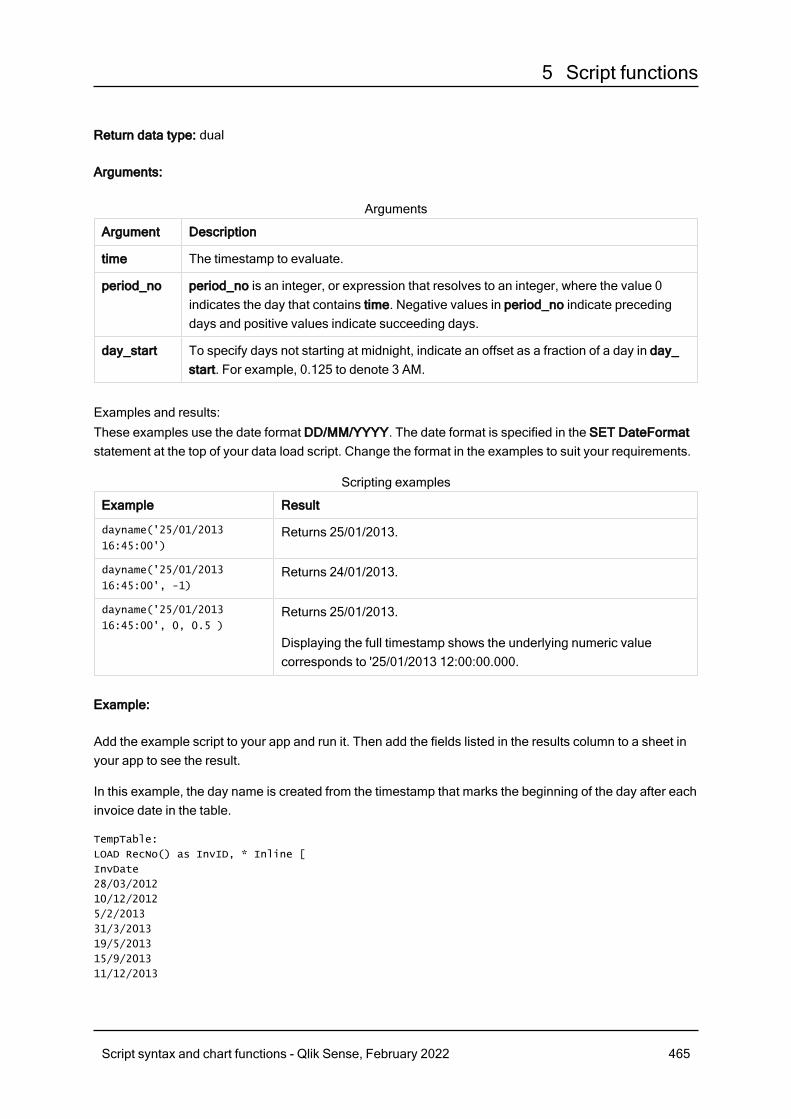
5 Script functions
Return data type: dual
Arguments:
Argument Description
time The timestamp to evaluate.
period_no period_no is an integer, or expression that resolves to an integer, where the value 0indicates the day that contains time. Negative values in period_no indicate precedingdays and positive values indicate succeeding days.
day_start To specify days not starting at midnight, indicate an offset as a fraction of a day in day_start. For example, 0.125 to denote 3 AM.
Arguments
Examples and results:These examples use the date format DD/MM/YYYY. The date format is specified in the SET DateFormatstatement at the top of your data load script. Change the format in the examples to suit your requirements.
Example Result
dayname('25/01/2013
16:45:00')Returns 25/01/2013.
dayname('25/01/2013
16:45:00', -1)Returns 24/01/2013.
dayname('25/01/2013
16:45:00', 0, 0.5 )Returns 25/01/2013.
Displaying the full timestamp shows the underlying numeric valuecorresponds to '25/01/2013 12:00:00.000.
Scripting examples
Example:
Add the example script to your app and run it. Then add the fields listed in the results column to a sheet inyour app to see the result.
In this example, the day name is created from the timestamp that marks the beginning of the day after eachinvoice date in the table.
TempTable:
LOAD RecNo() as InvID, * Inline [
InvDate
28/03/2012
10/12/2012
5/2/2013
31/3/2013
19/5/2013
15/9/2013
11/12/2013
Script syntax and chart functions - Qlik Sense, February 2022 465
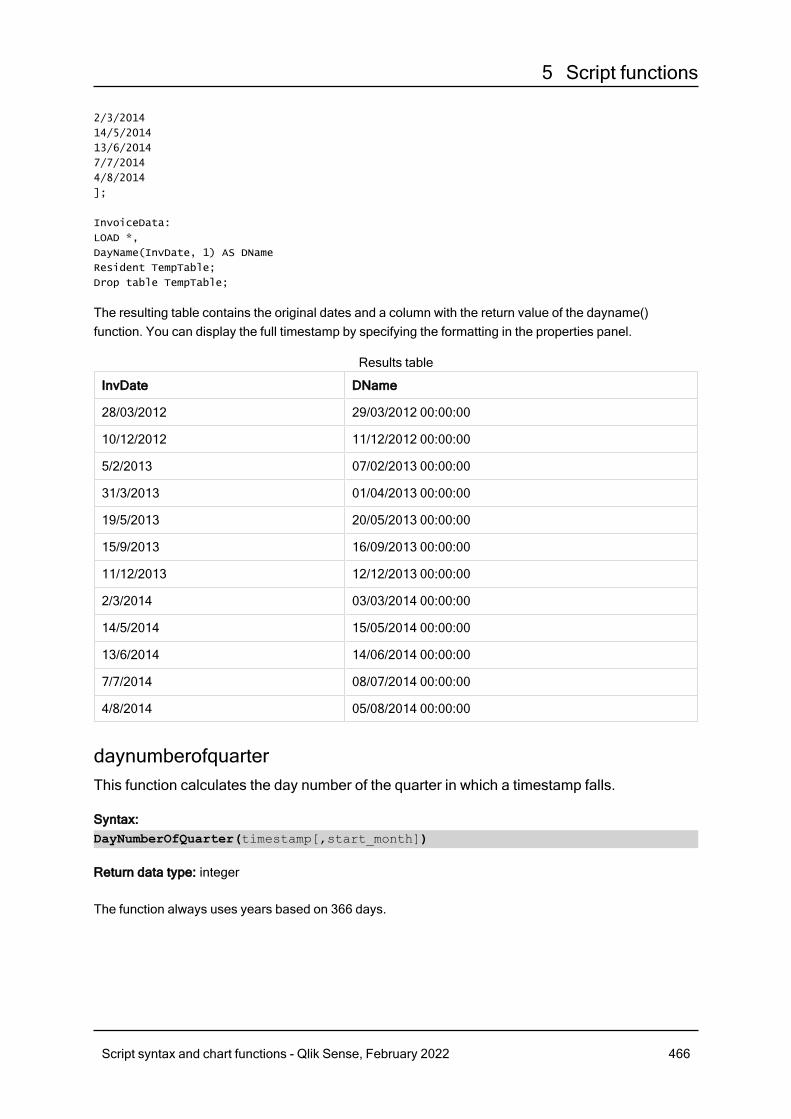
5 Script functions
2/3/2014
14/5/2014
13/6/2014
7/7/2014
4/8/2014
];
InvoiceData:
LOAD *,
DayName(InvDate, 1) AS DName
Resident TempTable;
Drop table TempTable;
The resulting table contains the original dates and a column with the return value of the dayname()function. You can display the full timestamp by specifying the formatting in the properties panel.
InvDate DName
28/03/2012 29/03/2012 00:00:00
10/12/2012 11/12/2012 00:00:00
5/2/2013 07/02/2013 00:00:00
31/3/2013 01/04/2013 00:00:00
19/5/2013 20/05/2013 00:00:00
15/9/2013 16/09/2013 00:00:00
11/12/2013 12/12/2013 00:00:00
2/3/2014 03/03/2014 00:00:00
14/5/2014 15/05/2014 00:00:00
13/6/2014 14/06/2014 00:00:00
7/7/2014 08/07/2014 00:00:00
4/8/2014 05/08/2014 00:00:00
Results table
daynumberofquarterThis function calculates the day number of the quarter in which a timestamp falls.
Syntax:DayNumberOfQuarter(timestamp[,start_month])
Return data type: integer
The function always uses years based on 366 days.
Script syntax and chart functions - Qlik Sense, February 2022 466
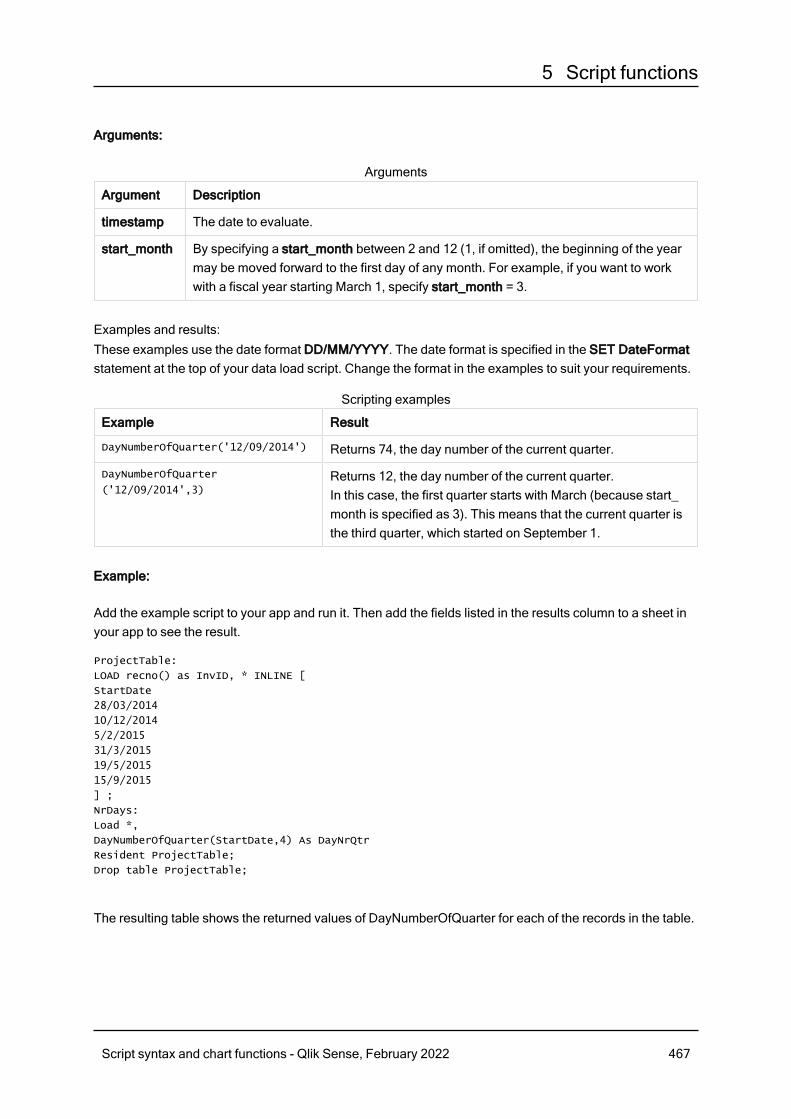
5 Script functions
Arguments:
Argument Description
timestamp The date to evaluate.
start_month By specifying a start_month between 2 and 12 (1, if omitted), the beginning of the yearmay be moved forward to the first day of any month. For example, if you want to workwith a fiscal year starting March 1, specify start_month = 3.
Arguments
Examples and results:These examples use the date format DD/MM/YYYY. The date format is specified in the SET DateFormatstatement at the top of your data load script. Change the format in the examples to suit your requirements.
Example Result
DayNumberOfQuarter('12/09/2014') Returns 74, the day number of the current quarter.
DayNumberOfQuarter
('12/09/2014',3)Returns 12, the day number of the current quarter.In this case, the first quarter starts with March (because start_month is specified as 3). This means that the current quarter isthe third quarter, which started on September 1.
Scripting examples
Example:
Add the example script to your app and run it. Then add the fields listed in the results column to a sheet inyour app to see the result.
ProjectTable:
LOAD recno() as InvID, * INLINE [
StartDate
28/03/2014
10/12/2014
5/2/2015
31/3/2015
19/5/2015
15/9/2015
] ;
NrDays:
Load *,
DayNumberOfQuarter(StartDate,4) As DayNrQtr
Resident ProjectTable;
Drop table ProjectTable;
The resulting table shows the returned values of DayNumberOfQuarter for each of the records in the table.
Script syntax and chart functions - Qlik Sense, February 2022 467
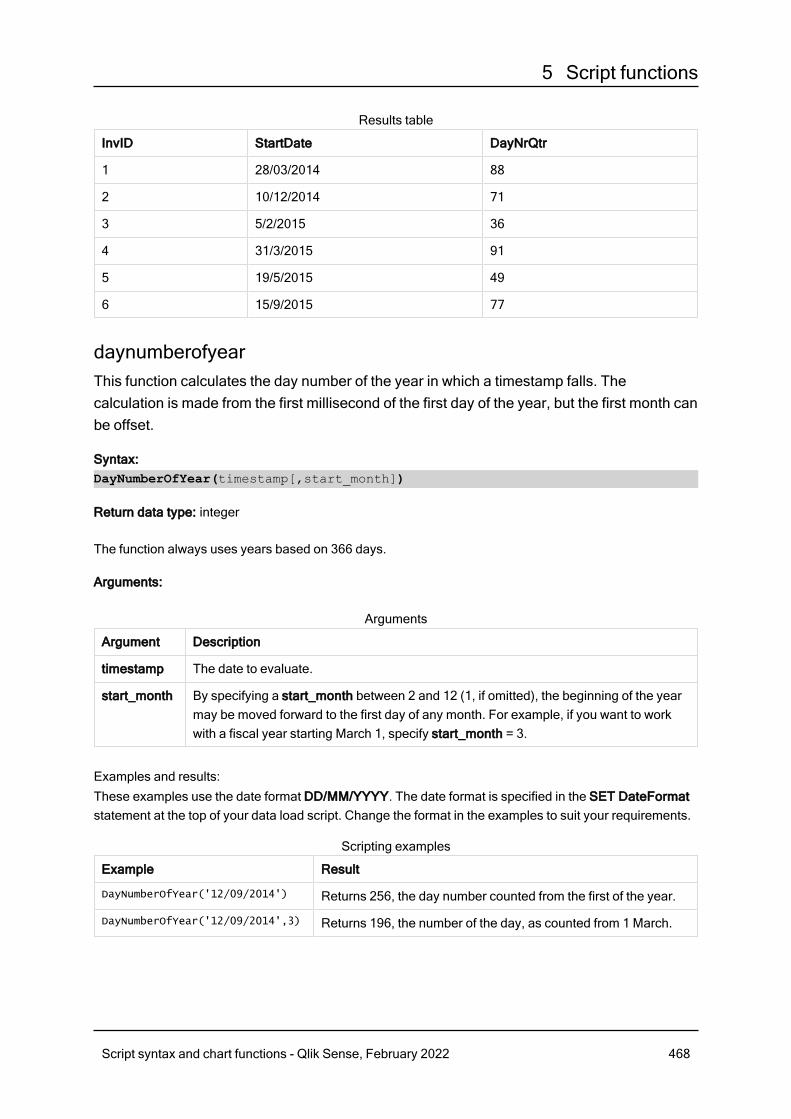
5 Script functions
InvID StartDate DayNrQtr
1 28/03/2014 88
2 10/12/2014 71
3 5/2/2015 36
4 31/3/2015 91
5 19/5/2015 49
6 15/9/2015 77
Results table
daynumberofyearThis function calculates the day number of the year in which a timestamp falls. Thecalculation is made from the first millisecond of the first day of the year, but the first month canbe offset.
Syntax:DayNumberOfYear(timestamp[,start_month])
Return data type: integer
The function always uses years based on 366 days.
Arguments:
Argument Description
timestamp The date to evaluate.
start_month By specifying a start_month between 2 and 12 (1, if omitted), the beginning of the yearmay be moved forward to the first day of any month. For example, if you want to workwith a fiscal year starting March 1, specify start_month = 3.
Arguments
Examples and results:These examples use the date format DD/MM/YYYY. The date format is specified in the SET DateFormatstatement at the top of your data load script. Change the format in the examples to suit your requirements.
Example Result
DayNumberOfYear('12/09/2014') Returns 256, the day number counted from the first of the year.
DayNumberOfYear('12/09/2014',3) Returns 196, the number of the day, as counted from 1 March.
Scripting examples
Script syntax and chart functions - Qlik Sense, February 2022 468
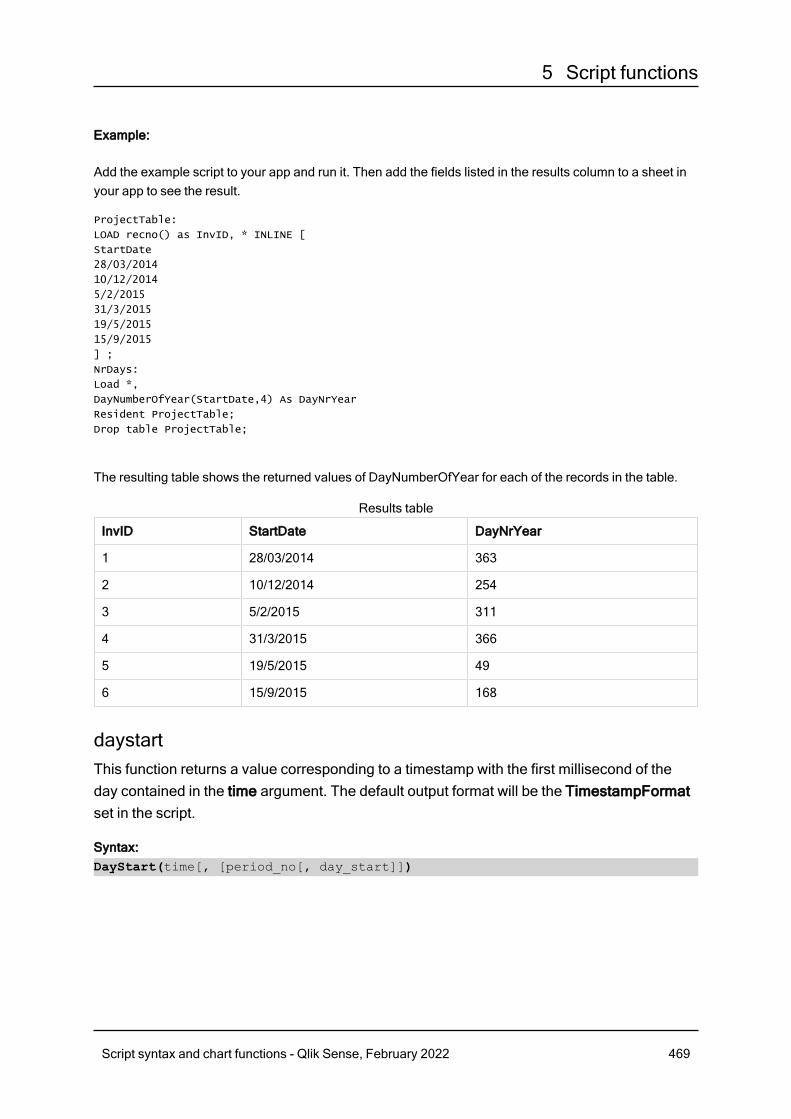
5 Script functions
Example:
Add the example script to your app and run it. Then add the fields listed in the results column to a sheet inyour app to see the result.
ProjectTable:
LOAD recno() as InvID, * INLINE [
StartDate
28/03/2014
10/12/2014
5/2/2015
31/3/2015
19/5/2015
15/9/2015
] ;
NrDays:
Load *,
DayNumberOfYear(StartDate,4) As DayNrYear
Resident ProjectTable;
Drop table ProjectTable;
The resulting table shows the returned values of DayNumberOfYear for each of the records in the table.
InvID StartDate DayNrYear
1 28/03/2014 363
2 10/12/2014 254
3 5/2/2015 311
4 31/3/2015 366
5 19/5/2015 49
6 15/9/2015 168
Results table
daystartThis function returns a value corresponding to a timestamp with the first millisecond of theday contained in the time argument. The default output format will be the TimestampFormatset in the script.
Syntax:DayStart(time[, [period_no[, day_start]])
Script syntax and chart functions - Qlik Sense, February 2022 469
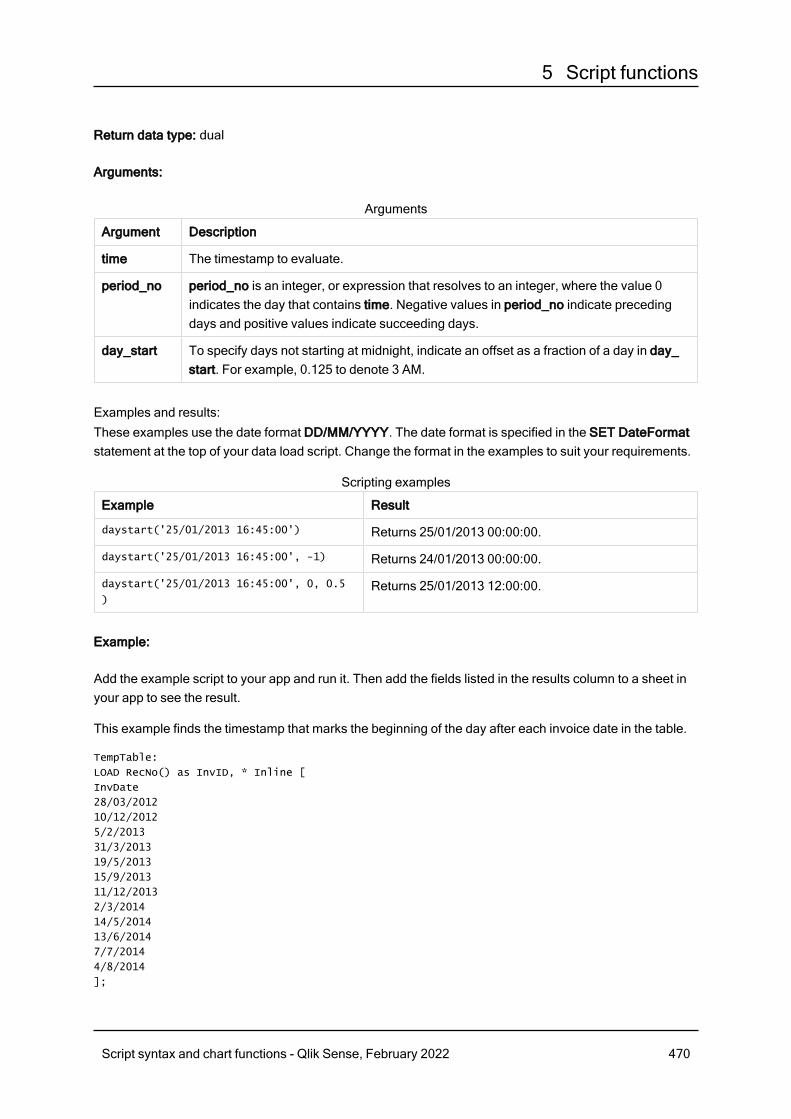
5 Script functions
Return data type: dual
Arguments:
Argument Description
time The timestamp to evaluate.
period_no period_no is an integer, or expression that resolves to an integer, where the value 0indicates the day that contains time. Negative values in period_no indicate precedingdays and positive values indicate succeeding days.
day_start To specify days not starting at midnight, indicate an offset as a fraction of a day in day_start. For example, 0.125 to denote 3 AM.
Arguments
Examples and results:These examples use the date format DD/MM/YYYY. The date format is specified in the SET DateFormatstatement at the top of your data load script. Change the format in the examples to suit your requirements.
Example Result
daystart('25/01/2013 16:45:00') Returns 25/01/2013 00:00:00.
daystart('25/01/2013 16:45:00', -1) Returns 24/01/2013 00:00:00.
daystart('25/01/2013 16:45:00', 0, 0.5
)Returns 25/01/2013 12:00:00.
Scripting examples
Example:
Add the example script to your app and run it. Then add the fields listed in the results column to a sheet inyour app to see the result.
This example finds the timestamp that marks the beginning of the day after each invoice date in the table.
TempTable:
LOAD RecNo() as InvID, * Inline [
InvDate
28/03/2012
10/12/2012
5/2/2013
31/3/2013
19/5/2013
15/9/2013
11/12/2013
2/3/2014
14/5/2014
13/6/2014
7/7/2014
4/8/2014
];
Script syntax and chart functions - Qlik Sense, February 2022 470
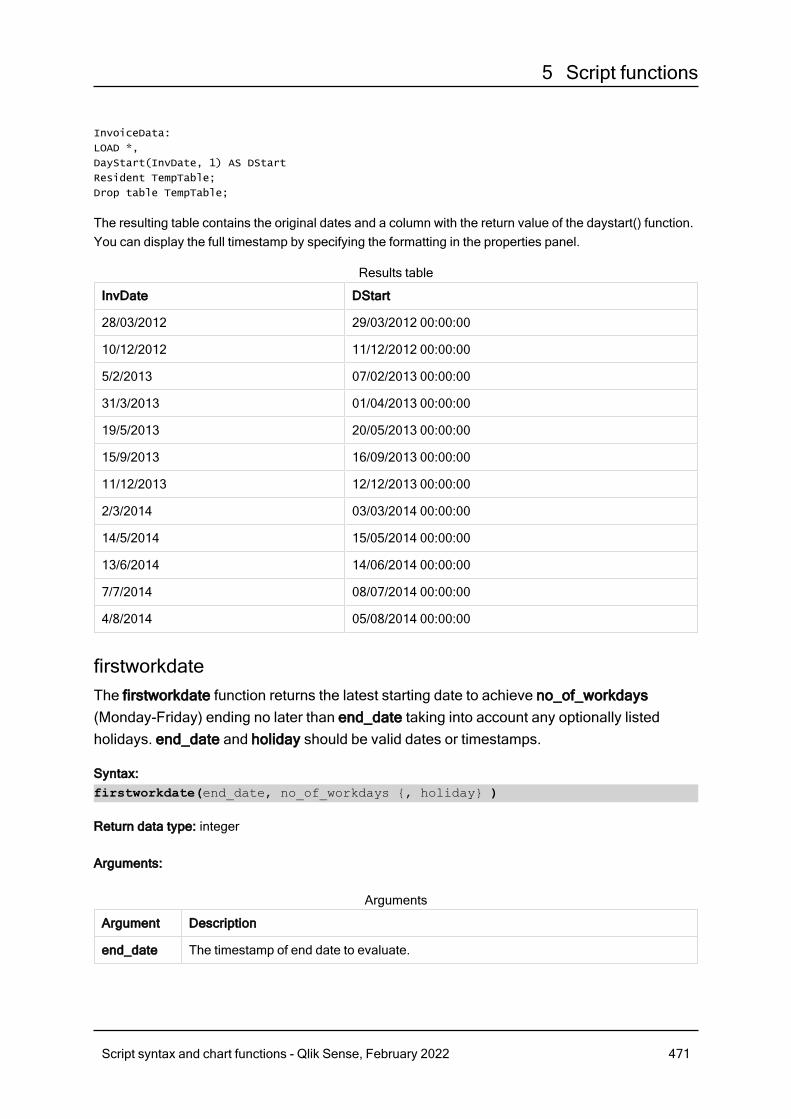
5 Script functions
InvoiceData:
LOAD *,
DayStart(InvDate, 1) AS DStart
Resident TempTable;
Drop table TempTable;
The resulting table contains the original dates and a column with the return value of the daystart() function.You can display the full timestamp by specifying the formatting in the properties panel.
InvDate DStart
28/03/2012 29/03/2012 00:00:00
10/12/2012 11/12/2012 00:00:00
5/2/2013 07/02/2013 00:00:00
31/3/2013 01/04/2013 00:00:00
19/5/2013 20/05/2013 00:00:00
15/9/2013 16/09/2013 00:00:00
11/12/2013 12/12/2013 00:00:00
2/3/2014 03/03/2014 00:00:00
14/5/2014 15/05/2014 00:00:00
13/6/2014 14/06/2014 00:00:00
7/7/2014 08/07/2014 00:00:00
4/8/2014 05/08/2014 00:00:00
Results table
firstworkdateThe firstworkdate function returns the latest starting date to achieve no_of_workdays(Monday-Friday) ending no later than end_date taking into account any optionally listedholidays. end_date and holiday should be valid dates or timestamps.
Syntax:firstworkdate(end_date, no_of_workdays {, holiday} )
Return data type: integer
Arguments:
Argument Description
end_date The timestamp of end date to evaluate.
Arguments
Script syntax and chart functions - Qlik Sense, February 2022 471
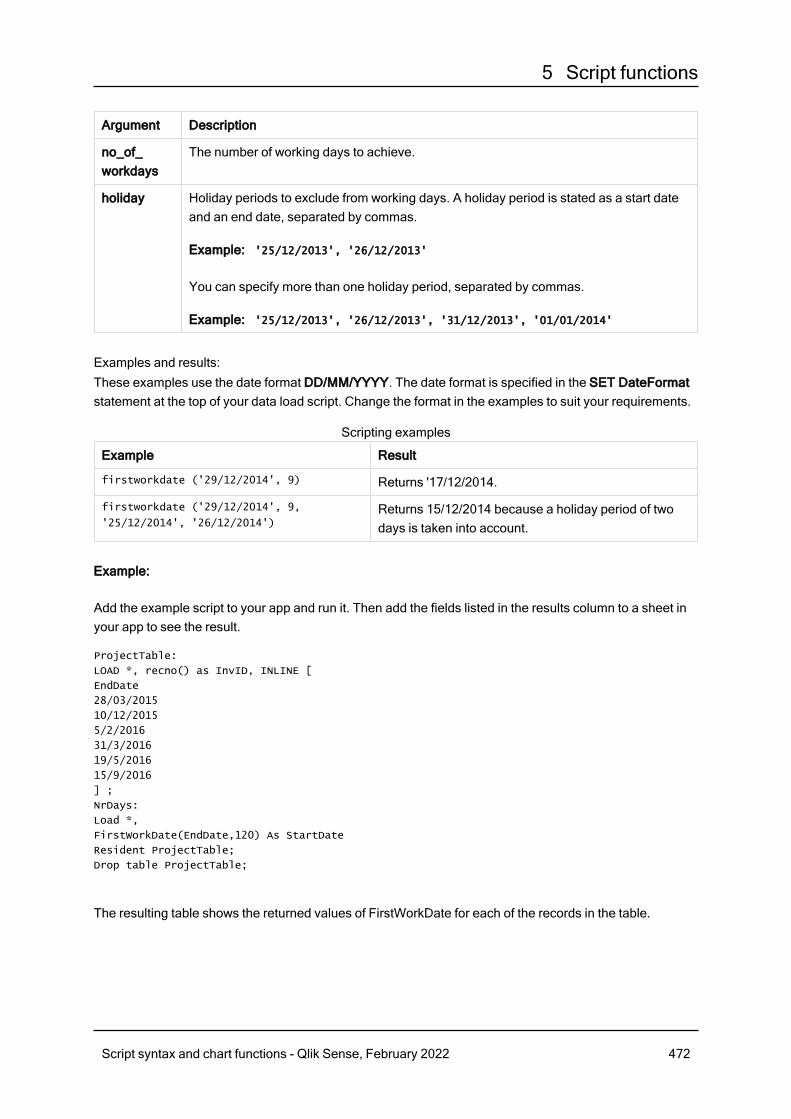
5 Script functions
Argument Description
no_of_workdays
The number of working days to achieve.
holiday Holiday periods to exclude from working days. A holiday period is stated as a start dateand an end date, separated by commas.
Example: '25/12/2013', '26/12/2013'
You can specify more than one holiday period, separated by commas.
Example: '25/12/2013', '26/12/2013', '31/12/2013', '01/01/2014'
Examples and results:These examples use the date format DD/MM/YYYY. The date format is specified in the SET DateFormatstatement at the top of your data load script. Change the format in the examples to suit your requirements.
Example Result
firstworkdate ('29/12/2014', 9) Returns '17/12/2014.
firstworkdate ('29/12/2014', 9,
'25/12/2014', '26/12/2014')Returns 15/12/2014 because a holiday period of twodays is taken into account.
Scripting examples
Example:
Add the example script to your app and run it. Then add the fields listed in the results column to a sheet inyour app to see the result.
ProjectTable:
LOAD *, recno() as InvID, INLINE [
EndDate
28/03/2015
10/12/2015
5/2/2016
31/3/2016
19/5/2016
15/9/2016
] ;
NrDays:
Load *,
FirstWorkDate(EndDate,120) As StartDate
Resident ProjectTable;
Drop table ProjectTable;
The resulting table shows the returned values of FirstWorkDate for each of the records in the table.
Script syntax and chart functions - Qlik Sense, February 2022 472
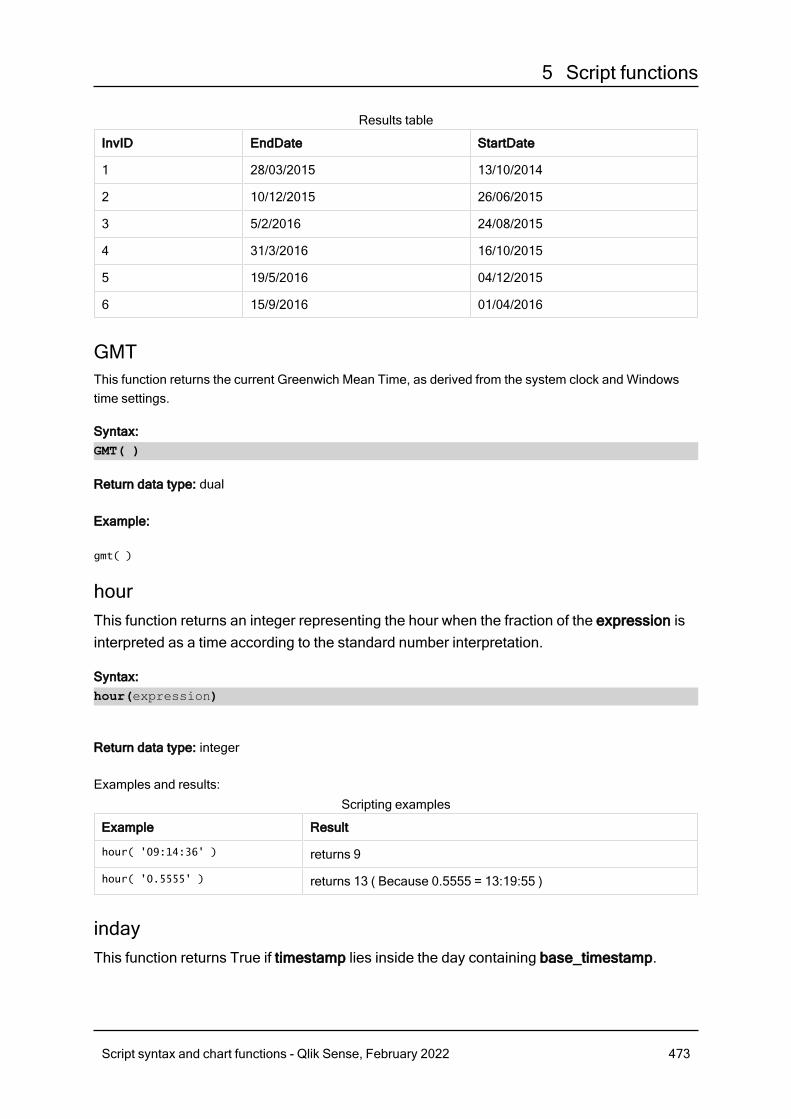
5 Script functions
InvID EndDate StartDate
1 28/03/2015 13/10/2014
2 10/12/2015 26/06/2015
3 5/2/2016 24/08/2015
4 31/3/2016 16/10/2015
5 19/5/2016 04/12/2015
6 15/9/2016 01/04/2016
Results table
GMTThis function returns the current Greenwich Mean Time, as derived from the system clock and Windowstime settings.
Syntax:GMT( )
Return data type: dual
Example:
gmt( )
hourThis function returns an integer representing the hour when the fraction of the expression isinterpreted as a time according to the standard number interpretation.
Syntax:hour(expression)
Return data type: integer
Examples and results:
Example Result
hour( '09:14:36' ) returns 9
hour( '0.5555' ) returns 13 ( Because 0.5555 = 13:19:55 )
Scripting examples
indayThis function returns True if timestamp lies inside the day containing base_timestamp.
Script syntax and chart functions - Qlik Sense, February 2022 473
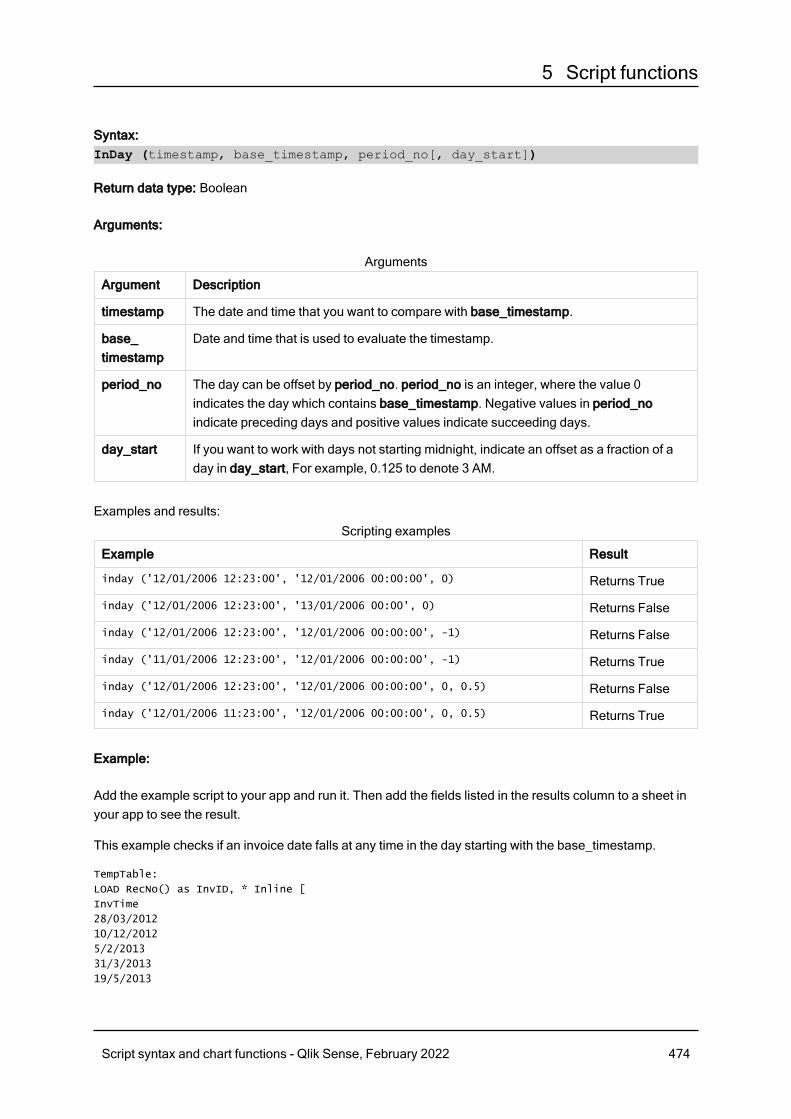
5 Script functions
Syntax:InDay (timestamp, base_timestamp, period_no[, day_start])
Return data type: Boolean
Arguments:
Argument Description
timestamp The date and time that you want to compare with base_timestamp.
base_timestamp
Date and time that is used to evaluate the timestamp.
period_no The day can be offset by period_no. period_no is an integer, where the value 0indicates the day which contains base_timestamp. Negative values in period_noindicate preceding days and positive values indicate succeeding days.
day_start If you want to work with days not starting midnight, indicate an offset as a fraction of aday in day_start, For example, 0.125 to denote 3 AM.
Arguments
Examples and results:
Example Result
inday ('12/01/2006 12:23:00', '12/01/2006 00:00:00', 0) Returns True
inday ('12/01/2006 12:23:00', '13/01/2006 00:00', 0) Returns False
inday ('12/01/2006 12:23:00', '12/01/2006 00:00:00', -1) Returns False
inday ('11/01/2006 12:23:00', '12/01/2006 00:00:00', -1) Returns True
inday ('12/01/2006 12:23:00', '12/01/2006 00:00:00', 0, 0.5) Returns False
inday ('12/01/2006 11:23:00', '12/01/2006 00:00:00', 0, 0.5) Returns True
Scripting examples
Example:
Add the example script to your app and run it. Then add the fields listed in the results column to a sheet inyour app to see the result.
This example checks if an invoice date falls at any time in the day starting with the base_timestamp.
TempTable:
LOAD RecNo() as InvID, * Inline [
InvTime
28/03/2012
10/12/2012
5/2/2013
31/3/2013
19/5/2013
Script syntax and chart functions - Qlik Sense, February 2022 474
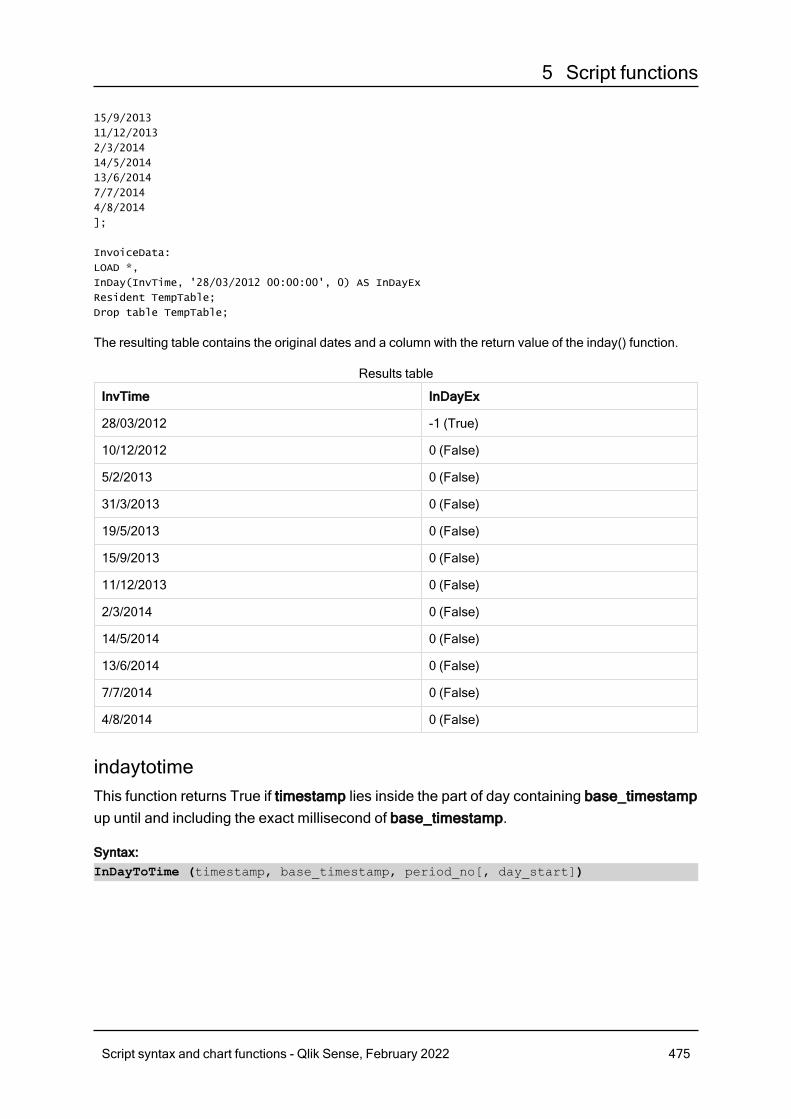
5 Script functions
15/9/2013
11/12/2013
2/3/2014
14/5/2014
13/6/2014
7/7/2014
4/8/2014
];
InvoiceData:
LOAD *,
InDay(InvTime, '28/03/2012 00:00:00', 0) AS InDayEx
Resident TempTable;
Drop table TempTable;
The resulting table contains the original dates and a column with the return value of the inday() function.
InvTime InDayEx
28/03/2012 -1 (True)
10/12/2012 0 (False)
5/2/2013 0 (False)
31/3/2013 0 (False)
19/5/2013 0 (False)
15/9/2013 0 (False)
11/12/2013 0 (False)
2/3/2014 0 (False)
14/5/2014 0 (False)
13/6/2014 0 (False)
7/7/2014 0 (False)
4/8/2014 0 (False)
Results table
indaytotimeThis function returns True if timestamp lies inside the part of day containing base_timestampup until and including the exact millisecond of base_timestamp.
Syntax:InDayToTime (timestamp, base_timestamp, period_no[, day_start])
Script syntax and chart functions - Qlik Sense, February 2022 475
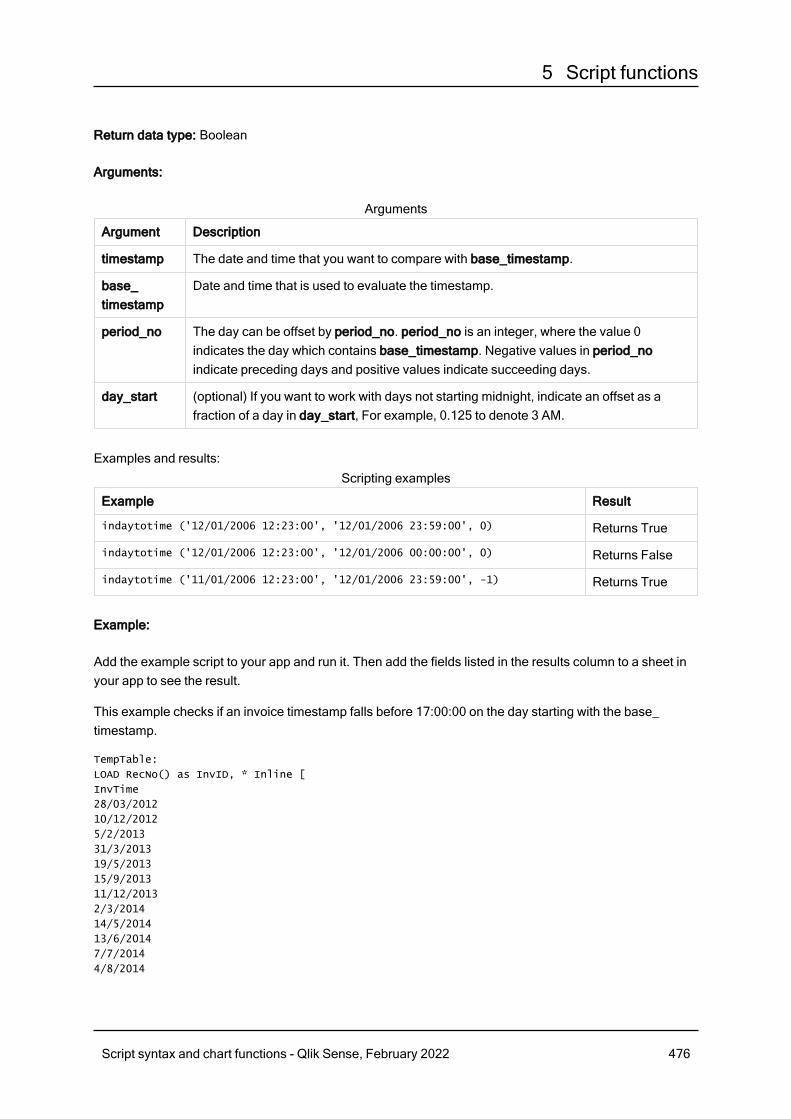
5 Script functions
Return data type: Boolean
Arguments:
Argument Description
timestamp The date and time that you want to compare with base_timestamp.
base_timestamp
Date and time that is used to evaluate the timestamp.
period_no The day can be offset by period_no. period_no is an integer, where the value 0indicates the day which contains base_timestamp. Negative values in period_noindicate preceding days and positive values indicate succeeding days.
day_start (optional) If you want to work with days not starting midnight, indicate an offset as afraction of a day in day_start, For example, 0.125 to denote 3 AM.
Arguments
Examples and results:
Example Result
indaytotime ('12/01/2006 12:23:00', '12/01/2006 23:59:00', 0) Returns True
indaytotime ('12/01/2006 12:23:00', '12/01/2006 00:00:00', 0) Returns False
indaytotime ('11/01/2006 12:23:00', '12/01/2006 23:59:00', -1) Returns True
Scripting examples
Example:
Add the example script to your app and run it. Then add the fields listed in the results column to a sheet inyour app to see the result.
This example checks if an invoice timestamp falls before 17:00:00 on the day starting with the base_timestamp.
TempTable:
LOAD RecNo() as InvID, * Inline [
InvTime
28/03/2012
10/12/2012
5/2/2013
31/3/2013
19/5/2013
15/9/2013
11/12/2013
2/3/2014
14/5/2014
13/6/2014
7/7/2014
4/8/2014
Script syntax and chart functions - Qlik Sense, February 2022 476
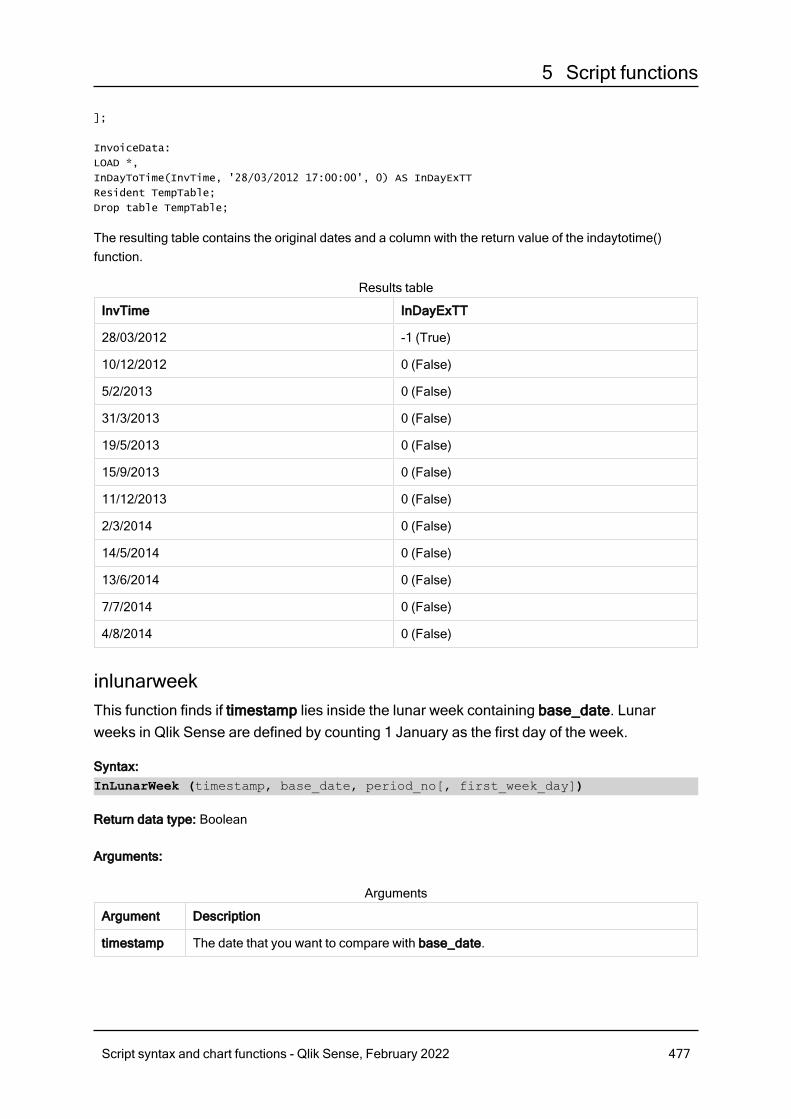
5 Script functions
];
InvoiceData:
LOAD *,
InDayToTime(InvTime, '28/03/2012 17:00:00', 0) AS InDayExTT
Resident TempTable;
Drop table TempTable;
The resulting table contains the original dates and a column with the return value of the indaytotime()function.
InvTime InDayExTT
28/03/2012 -1 (True)
10/12/2012 0 (False)
5/2/2013 0 (False)
31/3/2013 0 (False)
19/5/2013 0 (False)
15/9/2013 0 (False)
11/12/2013 0 (False)
2/3/2014 0 (False)
14/5/2014 0 (False)
13/6/2014 0 (False)
7/7/2014 0 (False)
4/8/2014 0 (False)
Results table
inlunarweekThis function finds if timestamp lies inside the lunar week containing base_date. Lunarweeks in Qlik Sense are defined by counting 1 January as the first day of the week.
Syntax:InLunarWeek (timestamp, base_date, period_no[, first_week_day])
Return data type: Boolean
Arguments:
Argument Description
timestamp The date that you want to compare with base_date.
Arguments
Script syntax and chart functions - Qlik Sense, February 2022 477
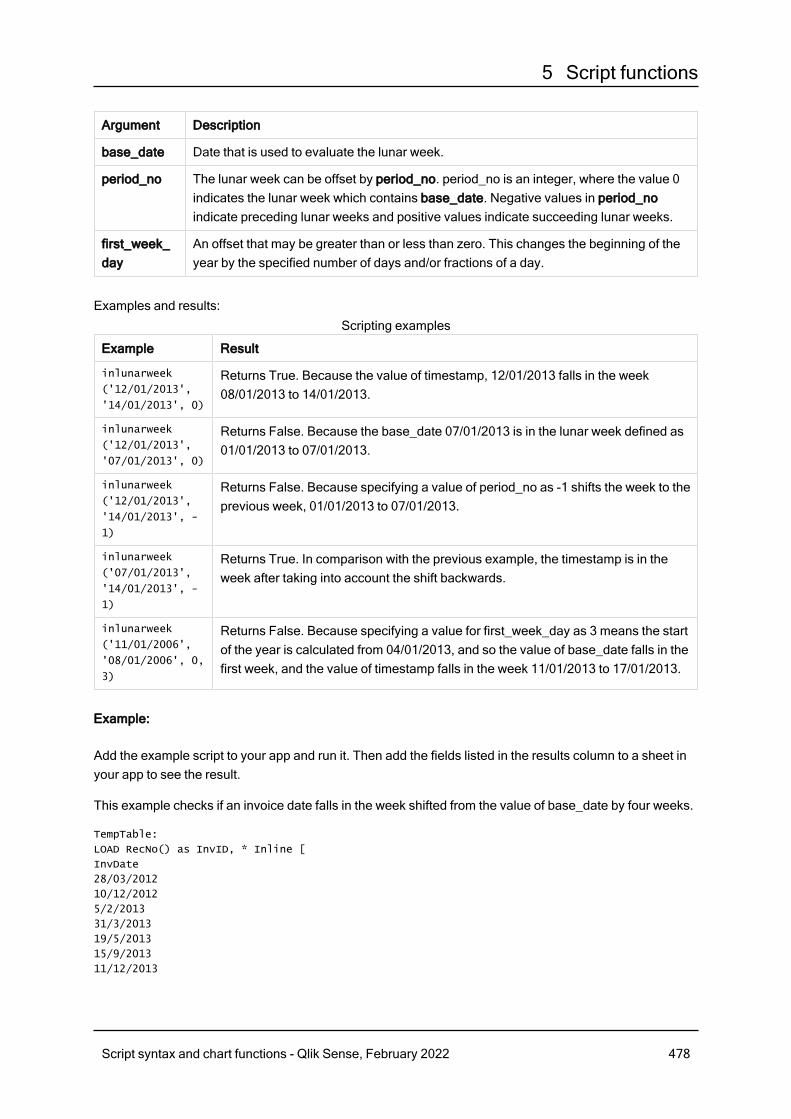
5 Script functions
Argument Description
base_date Date that is used to evaluate the lunar week.
period_no The lunar week can be offset by period_no. period_no is an integer, where the value 0indicates the lunar week which contains base_date. Negative values in period_noindicate preceding lunar weeks and positive values indicate succeeding lunar weeks.
first_week_day
An offset that may be greater than or less than zero. This changes the beginning of theyear by the specified number of days and/or fractions of a day.
Examples and results:
Example Result
inlunarweek
('12/01/2013',
'14/01/2013', 0)
Returns True. Because the value of timestamp, 12/01/2013 falls in the week08/01/2013 to 14/01/2013.
inlunarweek
('12/01/2013',
'07/01/2013', 0)
Returns False. Because the base_date 07/01/2013 is in the lunar week defined as01/01/2013 to 07/01/2013.
inlunarweek
('12/01/2013',
'14/01/2013', -
1)
Returns False. Because specifying a value of period_no as -1 shifts the week to theprevious week, 01/01/2013 to 07/01/2013.
inlunarweek
('07/01/2013',
'14/01/2013', -
1)
Returns True. In comparison with the previous example, the timestamp is in theweek after taking into account the shift backwards.
inlunarweek
('11/01/2006',
'08/01/2006', 0,
3)
Returns False. Because specifying a value for first_week_day as 3 means the startof the year is calculated from 04/01/2013, and so the value of base_date falls in thefirst week, and the value of timestamp falls in the week 11/01/2013 to 17/01/2013.
Scripting examples
Example:
Add the example script to your app and run it. Then add the fields listed in the results column to a sheet inyour app to see the result.
This example checks if an invoice date falls in the week shifted from the value of base_date by four weeks.
TempTable:
LOAD RecNo() as InvID, * Inline [
InvDate
28/03/2012
10/12/2012
5/2/2013
31/3/2013
19/5/2013
15/9/2013
11/12/2013
Script syntax and chart functions - Qlik Sense, February 2022 478
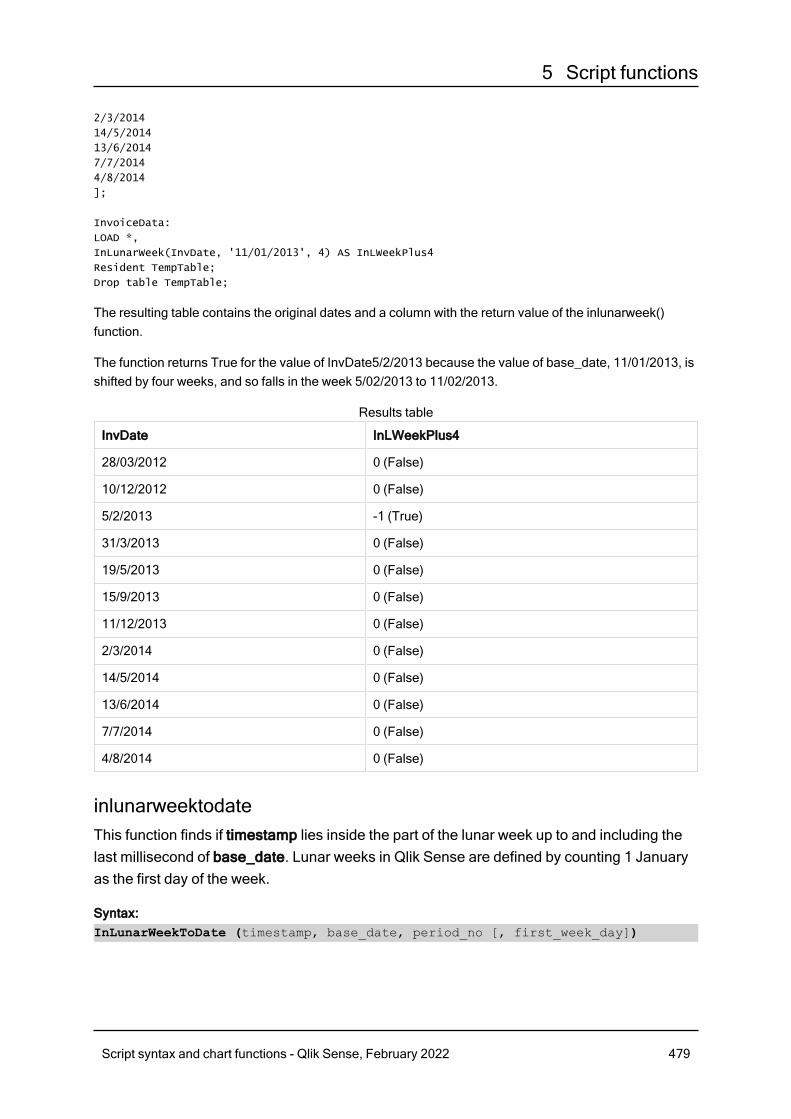
5 Script functions
2/3/2014
14/5/2014
13/6/2014
7/7/2014
4/8/2014
];
InvoiceData:
LOAD *,
InLunarWeek(InvDate, '11/01/2013', 4) AS InLWeekPlus4
Resident TempTable;
Drop table TempTable;
The resulting table contains the original dates and a column with the return value of the inlunarweek()function.
The function returns True for the value of InvDate5/2/2013 because the value of base_date, 11/01/2013, isshifted by four weeks, and so falls in the week 5/02/2013 to 11/02/2013.
InvDate InLWeekPlus4
28/03/2012 0 (False)
10/12/2012 0 (False)
5/2/2013 -1 (True)
31/3/2013 0 (False)
19/5/2013 0 (False)
15/9/2013 0 (False)
11/12/2013 0 (False)
2/3/2014 0 (False)
14/5/2014 0 (False)
13/6/2014 0 (False)
7/7/2014 0 (False)
4/8/2014 0 (False)
Results table
inlunarweektodateThis function finds if timestamp lies inside the part of the lunar week up to and including thelast millisecond of base_date. Lunar weeks in Qlik Sense are defined by counting 1 Januaryas the first day of the week.
Syntax:InLunarWeekToDate (timestamp, base_date, period_no [, first_week_day])
Script syntax and chart functions - Qlik Sense, February 2022 479
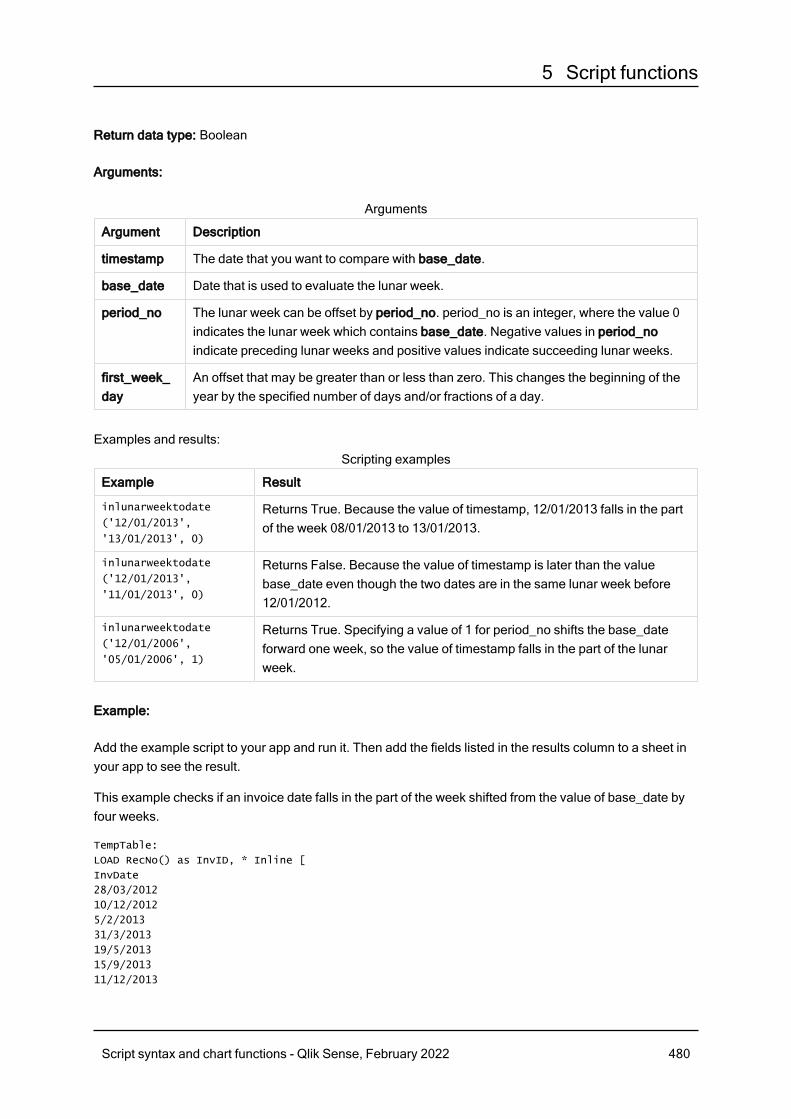
5 Script functions
Return data type: Boolean
Arguments:
Argument Description
timestamp The date that you want to compare with base_date.
base_date Date that is used to evaluate the lunar week.
period_no The lunar week can be offset by period_no. period_no is an integer, where the value 0indicates the lunar week which contains base_date. Negative values in period_noindicate preceding lunar weeks and positive values indicate succeeding lunar weeks.
first_week_day
An offset that may be greater than or less than zero. This changes the beginning of theyear by the specified number of days and/or fractions of a day.
Arguments
Examples and results:
Example Result
inlunarweektodate
('12/01/2013',
'13/01/2013', 0)
Returns True. Because the value of timestamp, 12/01/2013 falls in the partof the week 08/01/2013 to 13/01/2013.
inlunarweektodate
('12/01/2013',
'11/01/2013', 0)
Returns False. Because the value of timestamp is later than the valuebase_date even though the two dates are in the same lunar week before12/01/2012.
inlunarweektodate
('12/01/2006',
'05/01/2006', 1)
Returns True. Specifying a value of 1 for period_no shifts the base_dateforward one week, so the value of timestamp falls in the part of the lunarweek.
Scripting examples
Example:
Add the example script to your app and run it. Then add the fields listed in the results column to a sheet inyour app to see the result.
This example checks if an invoice date falls in the part of the week shifted from the value of base_date byfour weeks.
TempTable:
LOAD RecNo() as InvID, * Inline [
InvDate
28/03/2012
10/12/2012
5/2/2013
31/3/2013
19/5/2013
15/9/2013
11/12/2013
Script syntax and chart functions - Qlik Sense, February 2022 480
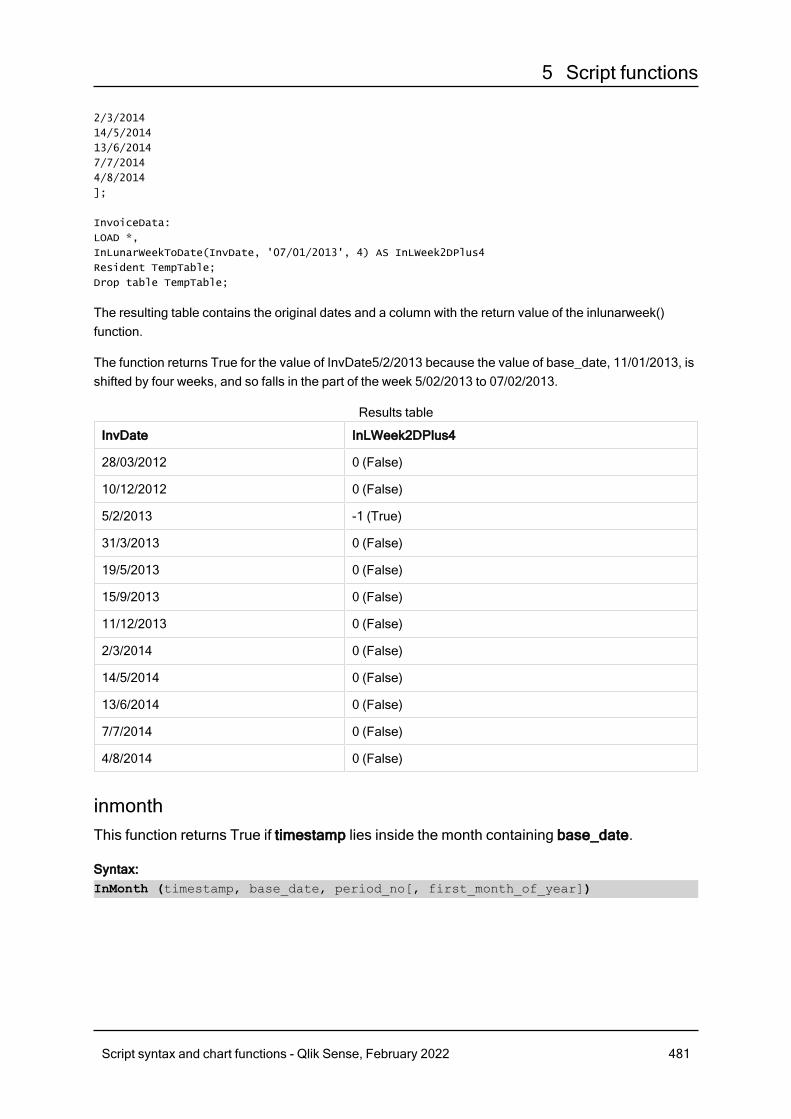
5 Script functions
2/3/2014
14/5/2014
13/6/2014
7/7/2014
4/8/2014
];
InvoiceData:
LOAD *,
InLunarWeekToDate(InvDate, '07/01/2013', 4) AS InLWeek2DPlus4
Resident TempTable;
Drop table TempTable;
The resulting table contains the original dates and a column with the return value of the inlunarweek()function.
The function returns True for the value of InvDate5/2/2013 because the value of base_date, 11/01/2013, isshifted by four weeks, and so falls in the part of the week 5/02/2013 to 07/02/2013.
InvDate InLWeek2DPlus4
28/03/2012 0 (False)
10/12/2012 0 (False)
5/2/2013 -1 (True)
31/3/2013 0 (False)
19/5/2013 0 (False)
15/9/2013 0 (False)
11/12/2013 0 (False)
2/3/2014 0 (False)
14/5/2014 0 (False)
13/6/2014 0 (False)
7/7/2014 0 (False)
4/8/2014 0 (False)
Results table
inmonthThis function returns True if timestamp lies inside the month containing base_date.
Syntax:InMonth (timestamp, base_date, period_no[, first_month_of_year])
Script syntax and chart functions - Qlik Sense, February 2022 481
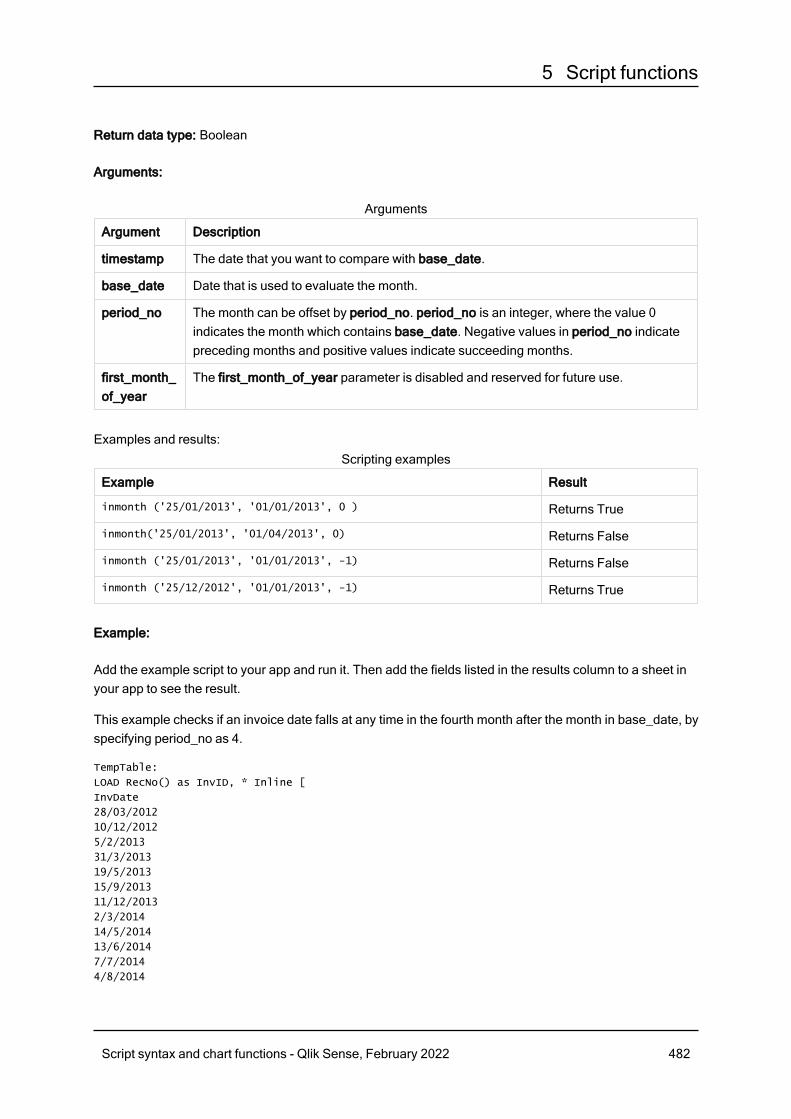
5 Script functions
Return data type: Boolean
Arguments:
Argument Description
timestamp The date that you want to compare with base_date.
base_date Date that is used to evaluate the month.
period_no The month can be offset by period_no. period_no is an integer, where the value 0indicates the month which contains base_date. Negative values in period_no indicatepreceding months and positive values indicate succeeding months.
first_month_of_year
The first_month_of_year parameter is disabled and reserved for future use.
Arguments
Examples and results:
Example Result
inmonth ('25/01/2013', '01/01/2013', 0 ) Returns True
inmonth('25/01/2013', '01/04/2013', 0) Returns False
inmonth ('25/01/2013', '01/01/2013', -1) Returns False
inmonth ('25/12/2012', '01/01/2013', -1) Returns True
Scripting examples
Example:
Add the example script to your app and run it. Then add the fields listed in the results column to a sheet inyour app to see the result.
This example checks if an invoice date falls at any time in the fourth month after the month in base_date, byspecifying period_no as 4.
TempTable:
LOAD RecNo() as InvID, * Inline [
InvDate
28/03/2012
10/12/2012
5/2/2013
31/3/2013
19/5/2013
15/9/2013
11/12/2013
2/3/2014
14/5/2014
13/6/2014
7/7/2014
4/8/2014
Script syntax and chart functions - Qlik Sense, February 2022 482
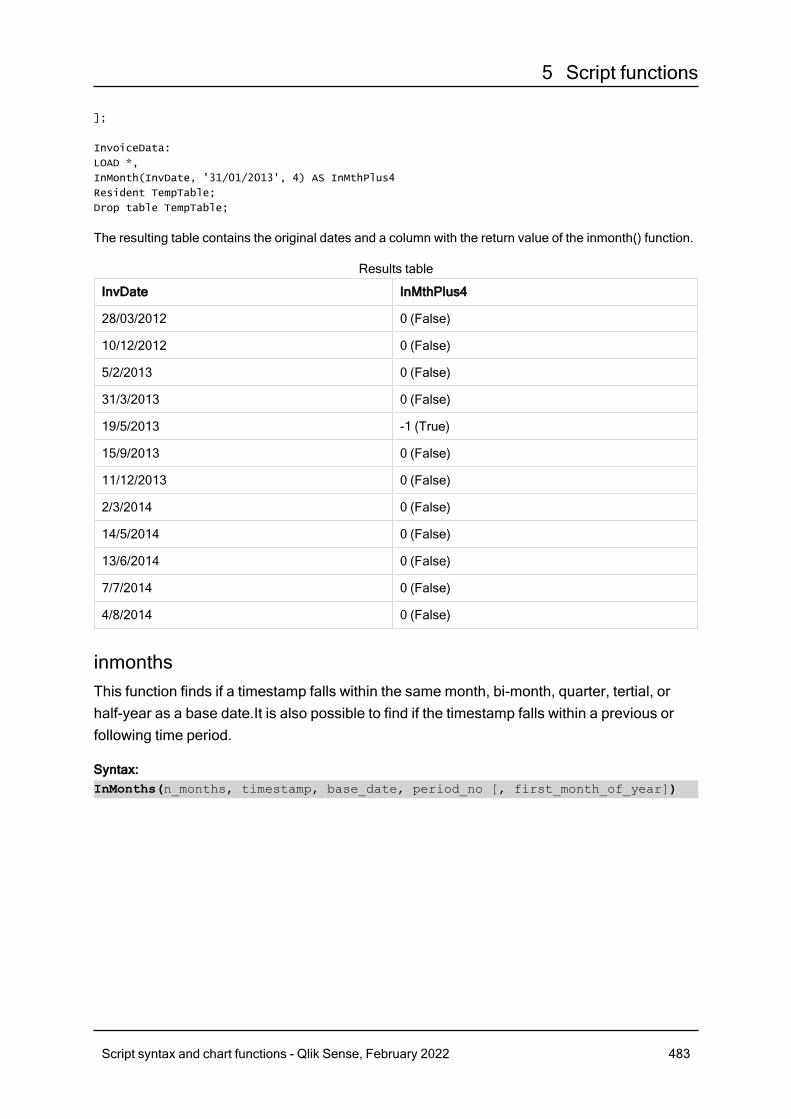
5 Script functions
];
InvoiceData:
LOAD *,
InMonth(InvDate, '31/01/2013', 4) AS InMthPlus4
Resident TempTable;
Drop table TempTable;
The resulting table contains the original dates and a column with the return value of the inmonth() function.
InvDate InMthPlus4
28/03/2012 0 (False)
10/12/2012 0 (False)
5/2/2013 0 (False)
31/3/2013 0 (False)
19/5/2013 -1 (True)
15/9/2013 0 (False)
11/12/2013 0 (False)
2/3/2014 0 (False)
14/5/2014 0 (False)
13/6/2014 0 (False)
7/7/2014 0 (False)
4/8/2014 0 (False)
Results table
inmonthsThis function finds if a timestamp falls within the same month, bi-month, quarter, tertial, orhalf-year as a base date.It is also possible to find if the timestamp falls within a previous orfollowing time period.
Syntax:InMonths(n_months, timestamp, base_date, period_no [, first_month_of_year])
Script syntax and chart functions - Qlik Sense, February 2022 483
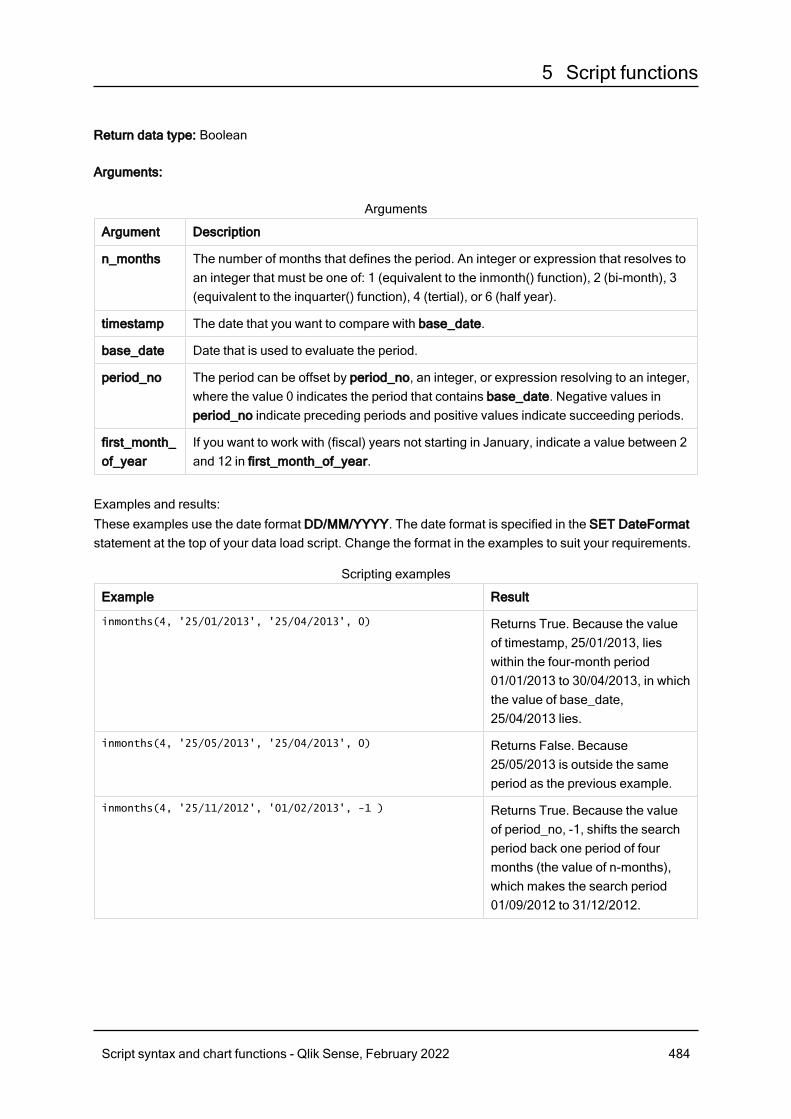
5 Script functions
Return data type: Boolean
Arguments:
Argument Description
n_months The number of months that defines the period. An integer or expression that resolves toan integer that must be one of: 1 (equivalent to the inmonth() function), 2 (bi-month), 3(equivalent to the inquarter() function), 4 (tertial), or 6 (half year).
timestamp The date that you want to compare with base_date.
base_date Date that is used to evaluate the period.
period_no The period can be offset by period_no, an integer, or expression resolving to an integer,where the value 0 indicates the period that contains base_date. Negative values inperiod_no indicate preceding periods and positive values indicate succeeding periods.
first_month_of_year
If you want to work with (fiscal) years not starting in January, indicate a value between 2and 12 in first_month_of_year.
Arguments
Examples and results:These examples use the date format DD/MM/YYYY. The date format is specified in the SET DateFormatstatement at the top of your data load script. Change the format in the examples to suit your requirements.
Example Result
inmonths(4, '25/01/2013', '25/04/2013', 0) Returns True. Because the valueof timestamp, 25/01/2013, lieswithin the four-month period01/01/2013 to 30/04/2013, in whichthe value of base_date,25/04/2013 lies.
inmonths(4, '25/05/2013', '25/04/2013', 0) Returns False. Because25/05/2013 is outside the sameperiod as the previous example.
inmonths(4, '25/11/2012', '01/02/2013', -1 ) Returns True. Because the valueof period_no, -1, shifts the searchperiod back one period of fourmonths (the value of n-months),which makes the search period01/09/2012 to 31/12/2012.
Scripting examples
Script syntax and chart functions - Qlik Sense, February 2022 484
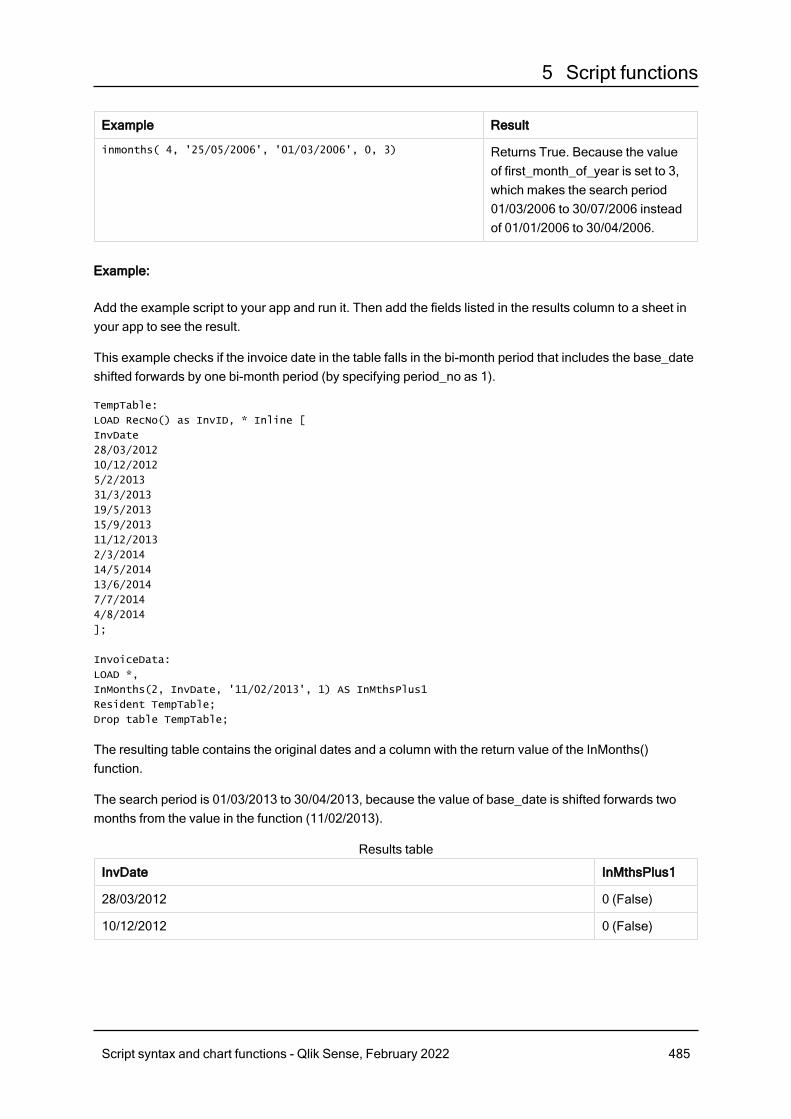
5 Script functions
Example Result
inmonths( 4, '25/05/2006', '01/03/2006', 0, 3) Returns True. Because the valueof first_month_of_year is set to 3,which makes the search period01/03/2006 to 30/07/2006 insteadof 01/01/2006 to 30/04/2006.
Example:
Add the example script to your app and run it. Then add the fields listed in the results column to a sheet inyour app to see the result.
This example checks if the invoice date in the table falls in the bi-month period that includes the base_dateshifted forwards by one bi-month period (by specifying period_no as 1).
TempTable:
LOAD RecNo() as InvID, * Inline [
InvDate
28/03/2012
10/12/2012
5/2/2013
31/3/2013
19/5/2013
15/9/2013
11/12/2013
2/3/2014
14/5/2014
13/6/2014
7/7/2014
4/8/2014
];
InvoiceData:
LOAD *,
InMonths(2, InvDate, '11/02/2013', 1) AS InMthsPlus1
Resident TempTable;
Drop table TempTable;
The resulting table contains the original dates and a column with the return value of the InMonths()function.
The search period is 01/03/2013 to 30/04/2013, because the value of base_date is shifted forwards twomonths from the value in the function (11/02/2013).
InvDate InMthsPlus1
28/03/2012 0 (False)
10/12/2012 0 (False)
Results table
Script syntax and chart functions - Qlik Sense, February 2022 485
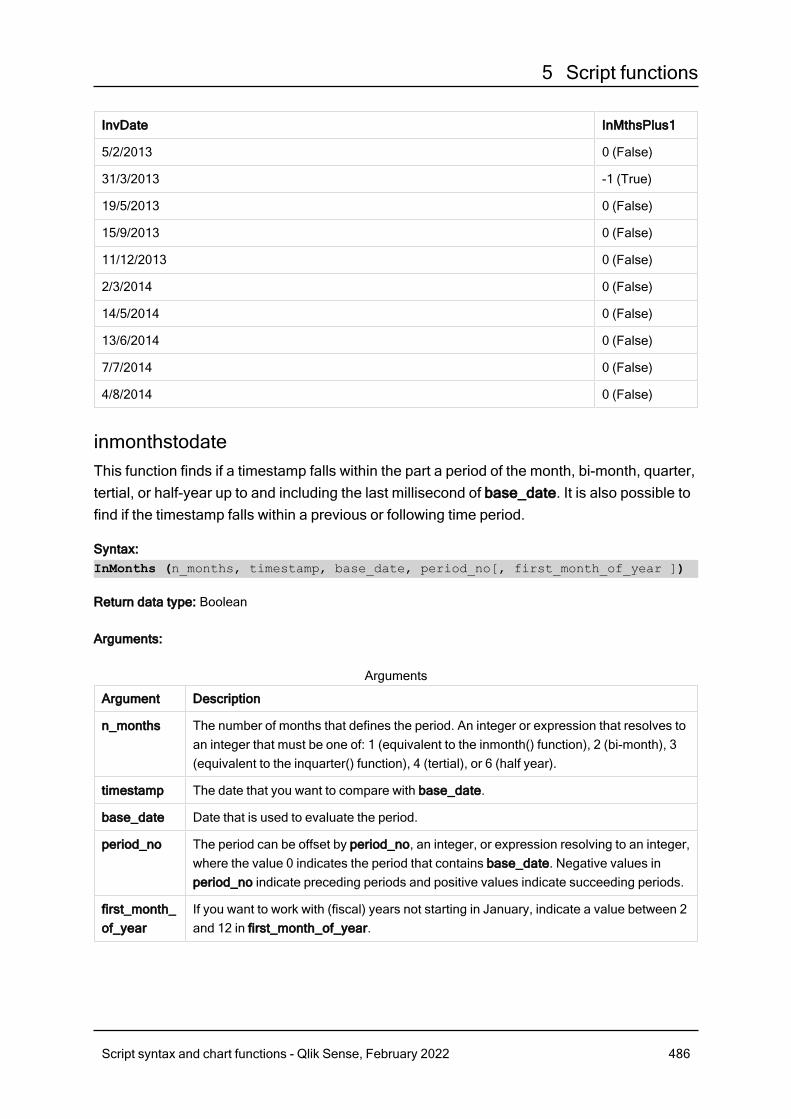
5 Script functions
InvDate InMthsPlus1
5/2/2013 0 (False)
31/3/2013 -1 (True)
19/5/2013 0 (False)
15/9/2013 0 (False)
11/12/2013 0 (False)
2/3/2014 0 (False)
14/5/2014 0 (False)
13/6/2014 0 (False)
7/7/2014 0 (False)
4/8/2014 0 (False)
inmonthstodateThis function finds if a timestamp falls within the part a period of the month, bi-month, quarter,tertial, or half-year up to and including the last millisecond of base_date. It is also possible tofind if the timestamp falls within a previous or following time period.
Syntax:InMonths (n_months, timestamp, base_date, period_no[, first_month_of_year ])
Return data type: Boolean
Arguments:
Argument Description
n_months The number of months that defines the period. An integer or expression that resolves toan integer that must be one of: 1 (equivalent to the inmonth() function), 2 (bi-month), 3(equivalent to the inquarter() function), 4 (tertial), or 6 (half year).
timestamp The date that you want to compare with base_date.
base_date Date that is used to evaluate the period.
period_no The period can be offset by period_no, an integer, or expression resolving to an integer,where the value 0 indicates the period that contains base_date. Negative values inperiod_no indicate preceding periods and positive values indicate succeeding periods.
first_month_of_year
If you want to work with (fiscal) years not starting in January, indicate a value between 2and 12 in first_month_of_year.
Arguments
Script syntax and chart functions - Qlik Sense, February 2022 486
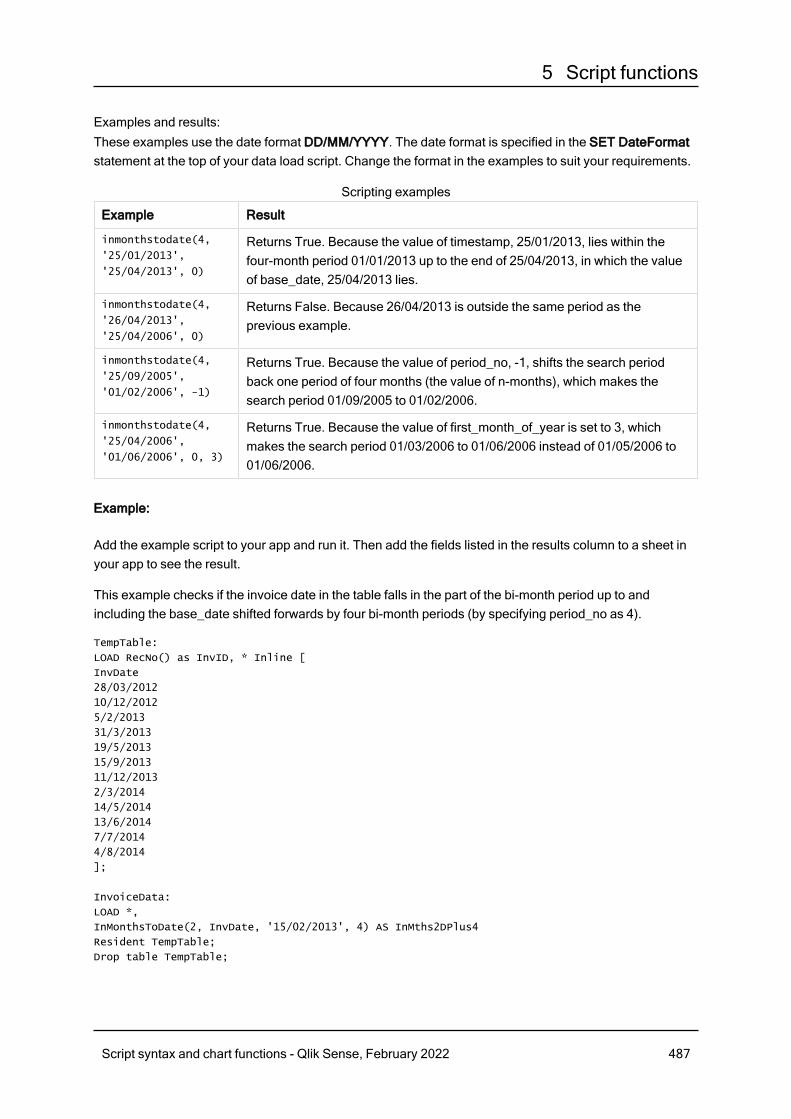
5 Script functions
Examples and results:These examples use the date format DD/MM/YYYY. The date format is specified in the SET DateFormatstatement at the top of your data load script. Change the format in the examples to suit your requirements.
Example Result
inmonthstodate(4,
'25/01/2013',
'25/04/2013', 0)
Returns True. Because the value of timestamp, 25/01/2013, lies within thefour-month period 01/01/2013 up to the end of 25/04/2013, in which the valueof base_date, 25/04/2013 lies.
inmonthstodate(4,
'26/04/2013',
'25/04/2006', 0)
Returns False. Because 26/04/2013 is outside the same period as theprevious example.
inmonthstodate(4,
'25/09/2005',
'01/02/2006', -1)
Returns True. Because the value of period_no, -1, shifts the search periodback one period of four months (the value of n-months), which makes thesearch period 01/09/2005 to 01/02/2006.
inmonthstodate(4,
'25/04/2006',
'01/06/2006', 0, 3)
Returns True. Because the value of first_month_of_year is set to 3, whichmakes the search period 01/03/2006 to 01/06/2006 instead of 01/05/2006 to01/06/2006.
Scripting examples
Example:
Add the example script to your app and run it. Then add the fields listed in the results column to a sheet inyour app to see the result.
This example checks if the invoice date in the table falls in the part of the bi-month period up to andincluding the base_date shifted forwards by four bi-month periods (by specifying period_no as 4).
TempTable:
LOAD RecNo() as InvID, * Inline [
InvDate
28/03/2012
10/12/2012
5/2/2013
31/3/2013
19/5/2013
15/9/2013
11/12/2013
2/3/2014
14/5/2014
13/6/2014
7/7/2014
4/8/2014
];
InvoiceData:
LOAD *,
InMonthsToDate(2, InvDate, '15/02/2013', 4) AS InMths2DPlus4
Resident TempTable;
Drop table TempTable;
Script syntax and chart functions - Qlik Sense, February 2022 487
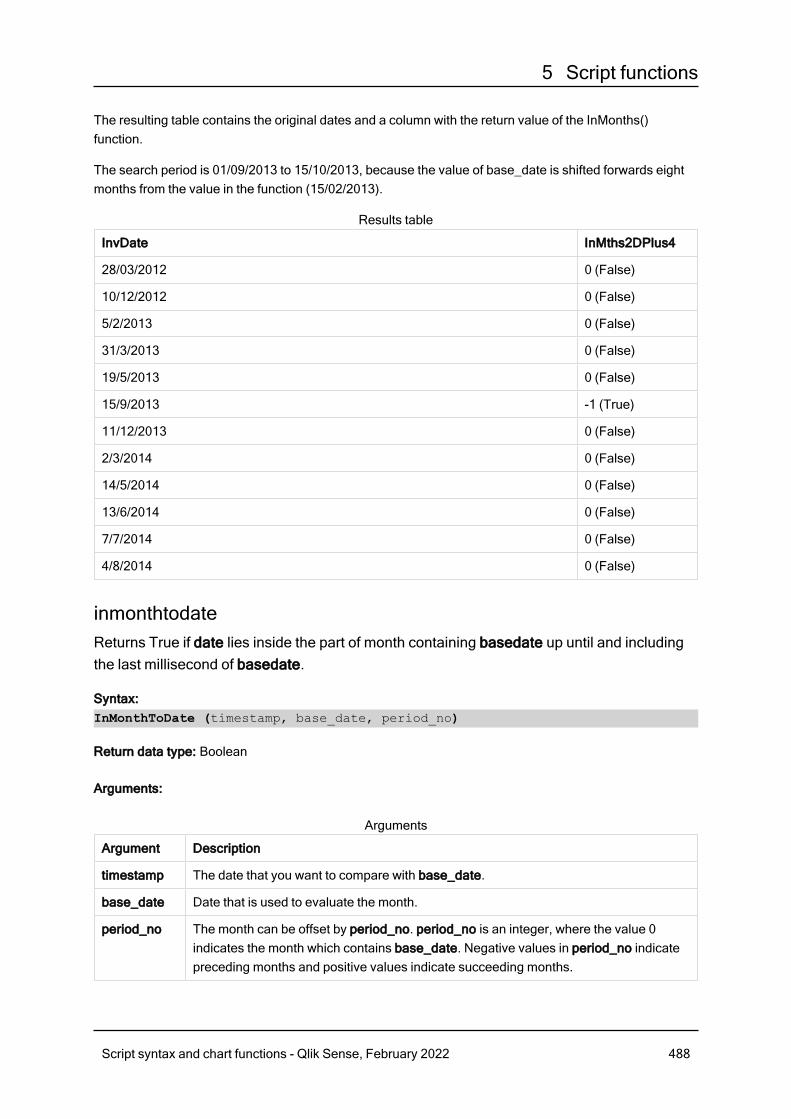
5 Script functions
The resulting table contains the original dates and a column with the return value of the InMonths()function.
The search period is 01/09/2013 to 15/10/2013, because the value of base_date is shifted forwards eightmonths from the value in the function (15/02/2013).
InvDate InMths2DPlus4
28/03/2012 0 (False)
10/12/2012 0 (False)
5/2/2013 0 (False)
31/3/2013 0 (False)
19/5/2013 0 (False)
15/9/2013 -1 (True)
11/12/2013 0 (False)
2/3/2014 0 (False)
14/5/2014 0 (False)
13/6/2014 0 (False)
7/7/2014 0 (False)
4/8/2014 0 (False)
Results table
inmonthtodateReturns True if date lies inside the part of month containing basedate up until and includingthe last millisecond of basedate.
Syntax:InMonthToDate (timestamp, base_date, period_no)
Return data type: Boolean
Arguments:
Argument Description
timestamp The date that you want to compare with base_date.
base_date Date that is used to evaluate the month.
period_no The month can be offset by period_no. period_no is an integer, where the value 0indicates the month which contains base_date. Negative values in period_no indicatepreceding months and positive values indicate succeeding months.
Arguments
Script syntax and chart functions - Qlik Sense, February 2022 488
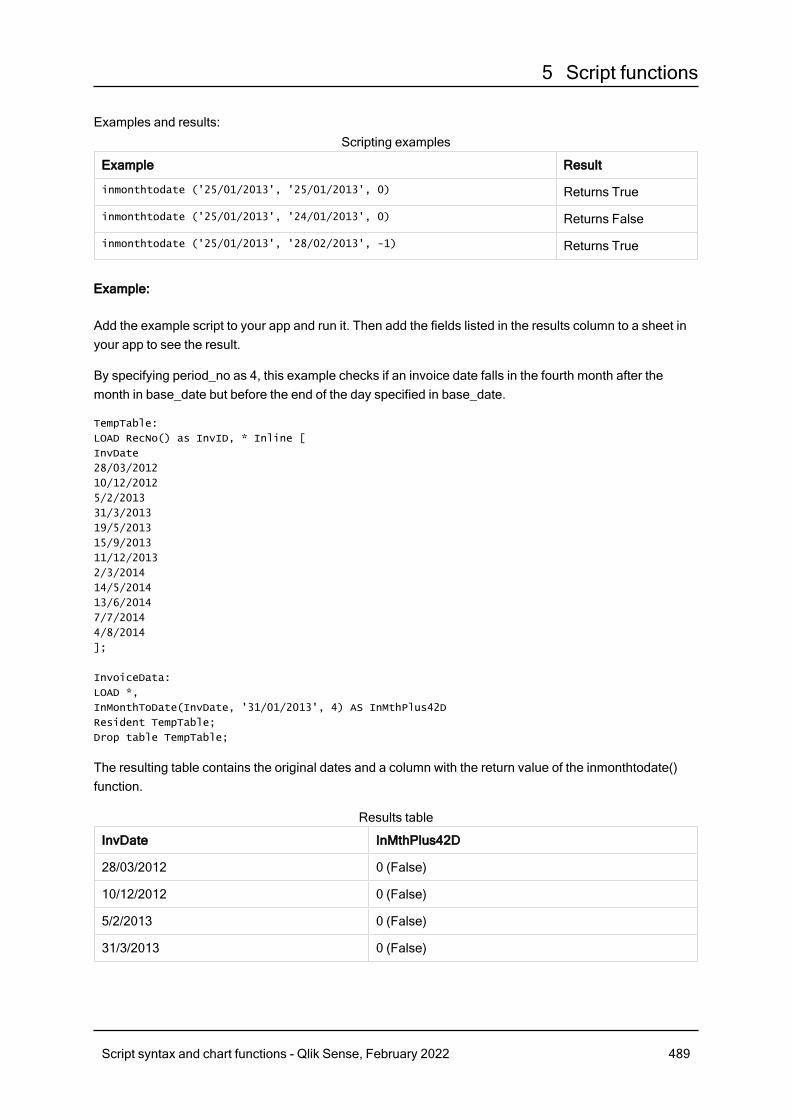
5 Script functions
Examples and results:
Example Result
inmonthtodate ('25/01/2013', '25/01/2013', 0) Returns True
inmonthtodate ('25/01/2013', '24/01/2013', 0) Returns False
inmonthtodate ('25/01/2013', '28/02/2013', -1) Returns True
Scripting examples
Example:
Add the example script to your app and run it. Then add the fields listed in the results column to a sheet inyour app to see the result.
By specifying period_no as 4, this example checks if an invoice date falls in the fourth month after themonth in base_date but before the end of the day specified in base_date.
TempTable:
LOAD RecNo() as InvID, * Inline [
InvDate
28/03/2012
10/12/2012
5/2/2013
31/3/2013
19/5/2013
15/9/2013
11/12/2013
2/3/2014
14/5/2014
13/6/2014
7/7/2014
4/8/2014
];
InvoiceData:
LOAD *,
InMonthToDate(InvDate, '31/01/2013', 4) AS InMthPlus42D
Resident TempTable;
Drop table TempTable;
The resulting table contains the original dates and a column with the return value of the inmonthtodate()function.
InvDate InMthPlus42D
28/03/2012 0 (False)
10/12/2012 0 (False)
5/2/2013 0 (False)
31/3/2013 0 (False)
Results table
Script syntax and chart functions - Qlik Sense, February 2022 489
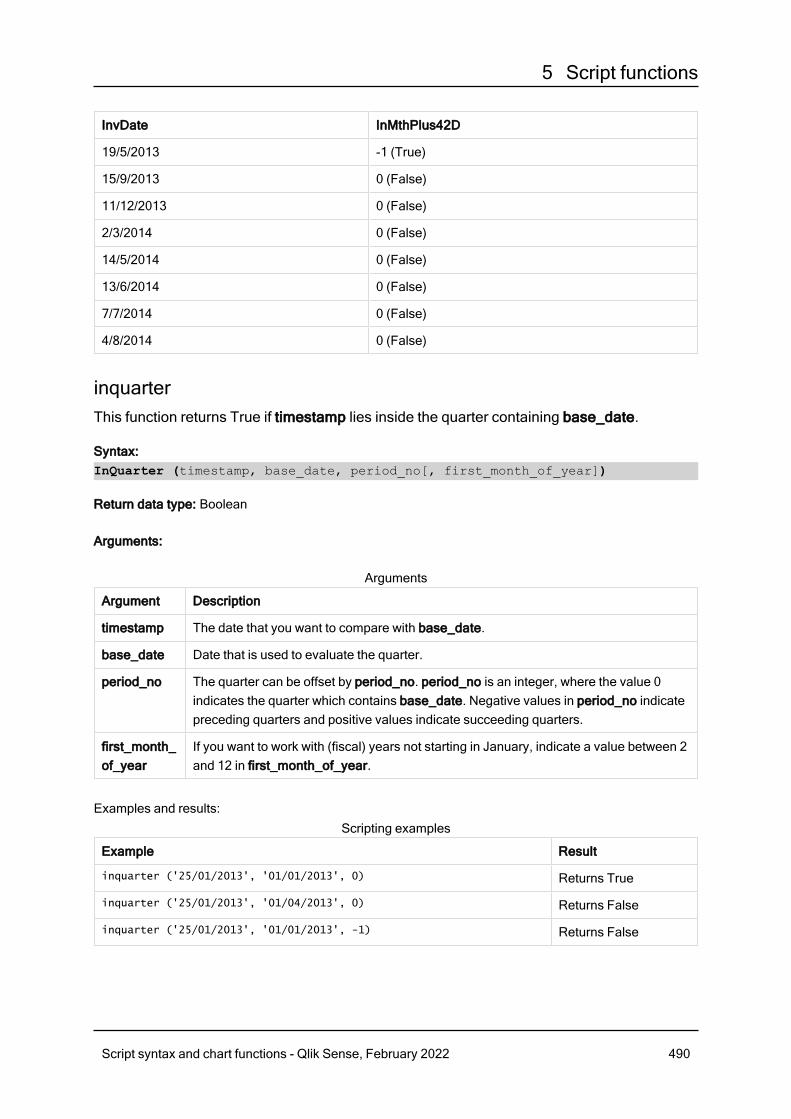
5 Script functions
InvDate InMthPlus42D
19/5/2013 -1 (True)
15/9/2013 0 (False)
11/12/2013 0 (False)
2/3/2014 0 (False)
14/5/2014 0 (False)
13/6/2014 0 (False)
7/7/2014 0 (False)
4/8/2014 0 (False)
inquarterThis function returns True if timestamp lies inside the quarter containing base_date.
Syntax:InQuarter (timestamp, base_date, period_no[, first_month_of_year])
Return data type: Boolean
Arguments:
Argument Description
timestamp The date that you want to compare with base_date.
base_date Date that is used to evaluate the quarter.
period_no The quarter can be offset by period_no. period_no is an integer, where the value 0indicates the quarter which contains base_date. Negative values in period_no indicatepreceding quarters and positive values indicate succeeding quarters.
first_month_of_year
If you want to work with (fiscal) years not starting in January, indicate a value between 2and 12 in first_month_of_year.
Arguments
Examples and results:
Example Result
inquarter ('25/01/2013', '01/01/2013', 0) Returns True
inquarter ('25/01/2013', '01/04/2013', 0) Returns False
inquarter ('25/01/2013', '01/01/2013', -1) Returns False
Scripting examples
Script syntax and chart functions - Qlik Sense, February 2022 490
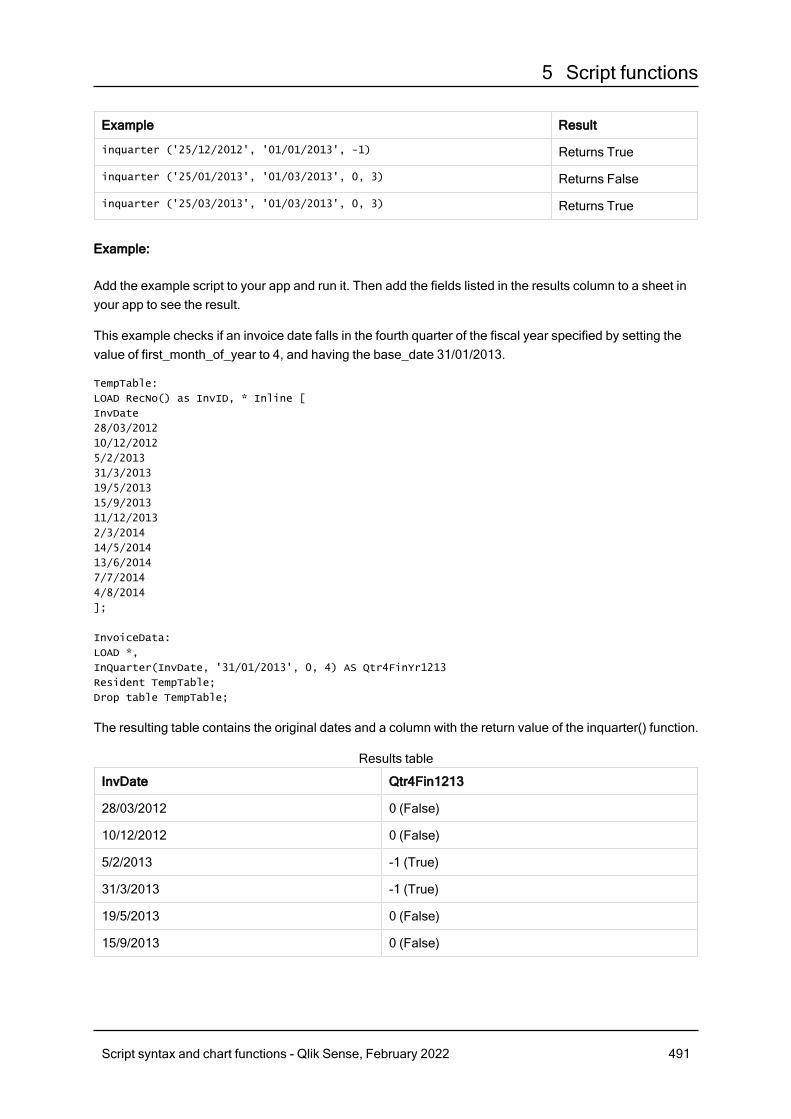
5 Script functions
Example Result
inquarter ('25/12/2012', '01/01/2013', -1) Returns True
inquarter ('25/01/2013', '01/03/2013', 0, 3) Returns False
inquarter ('25/03/2013', '01/03/2013', 0, 3) Returns True
Example:
Add the example script to your app and run it. Then add the fields listed in the results column to a sheet inyour app to see the result.
This example checks if an invoice date falls in the fourth quarter of the fiscal year specified by setting thevalue of first_month_of_year to 4, and having the base_date 31/01/2013.
TempTable:
LOAD RecNo() as InvID, * Inline [
InvDate
28/03/2012
10/12/2012
5/2/2013
31/3/2013
19/5/2013
15/9/2013
11/12/2013
2/3/2014
14/5/2014
13/6/2014
7/7/2014
4/8/2014
];
InvoiceData:
LOAD *,
InQuarter(InvDate, '31/01/2013', 0, 4) AS Qtr4FinYr1213
Resident TempTable;
Drop table TempTable;
The resulting table contains the original dates and a column with the return value of the inquarter() function.
InvDate Qtr4Fin1213
28/03/2012 0 (False)
10/12/2012 0 (False)
5/2/2013 -1 (True)
31/3/2013 -1 (True)
19/5/2013 0 (False)
15/9/2013 0 (False)
Results table
Script syntax and chart functions - Qlik Sense, February 2022 491
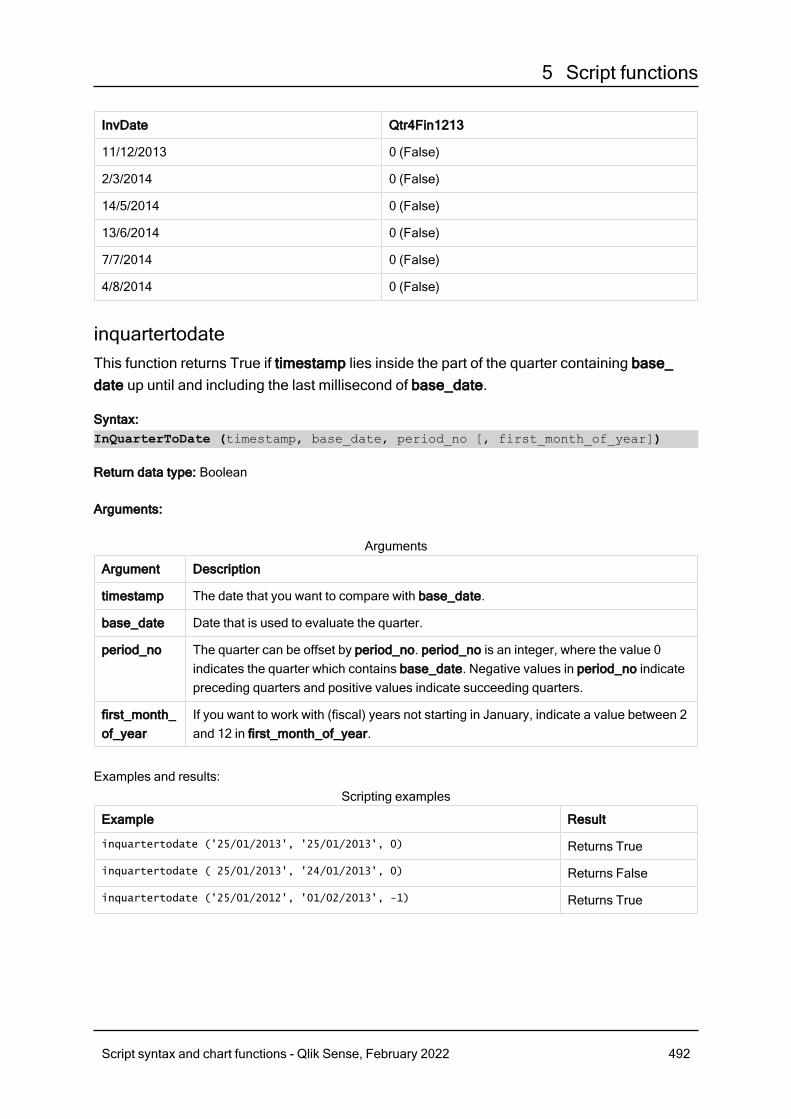
5 Script functions
InvDate Qtr4Fin1213
11/12/2013 0 (False)
2/3/2014 0 (False)
14/5/2014 0 (False)
13/6/2014 0 (False)
7/7/2014 0 (False)
4/8/2014 0 (False)
inquartertodateThis function returns True if timestamp lies inside the part of the quarter containing base_date up until and including the last millisecond of base_date.
Syntax:InQuarterToDate (timestamp, base_date, period_no [, first_month_of_year])
Return data type: Boolean
Arguments:
Argument Description
timestamp The date that you want to compare with base_date.
base_date Date that is used to evaluate the quarter.
period_no The quarter can be offset by period_no. period_no is an integer, where the value 0indicates the quarter which contains base_date. Negative values in period_no indicatepreceding quarters and positive values indicate succeeding quarters.
first_month_of_year
If you want to work with (fiscal) years not starting in January, indicate a value between 2and 12 in first_month_of_year.
Arguments
Examples and results:
Example Result
inquartertodate ('25/01/2013', '25/01/2013', 0) Returns True
inquartertodate ( 25/01/2013', '24/01/2013', 0) Returns False
inquartertodate ('25/01/2012', '01/02/2013', -1) Returns True
Scripting examples
Script syntax and chart functions - Qlik Sense, February 2022 492
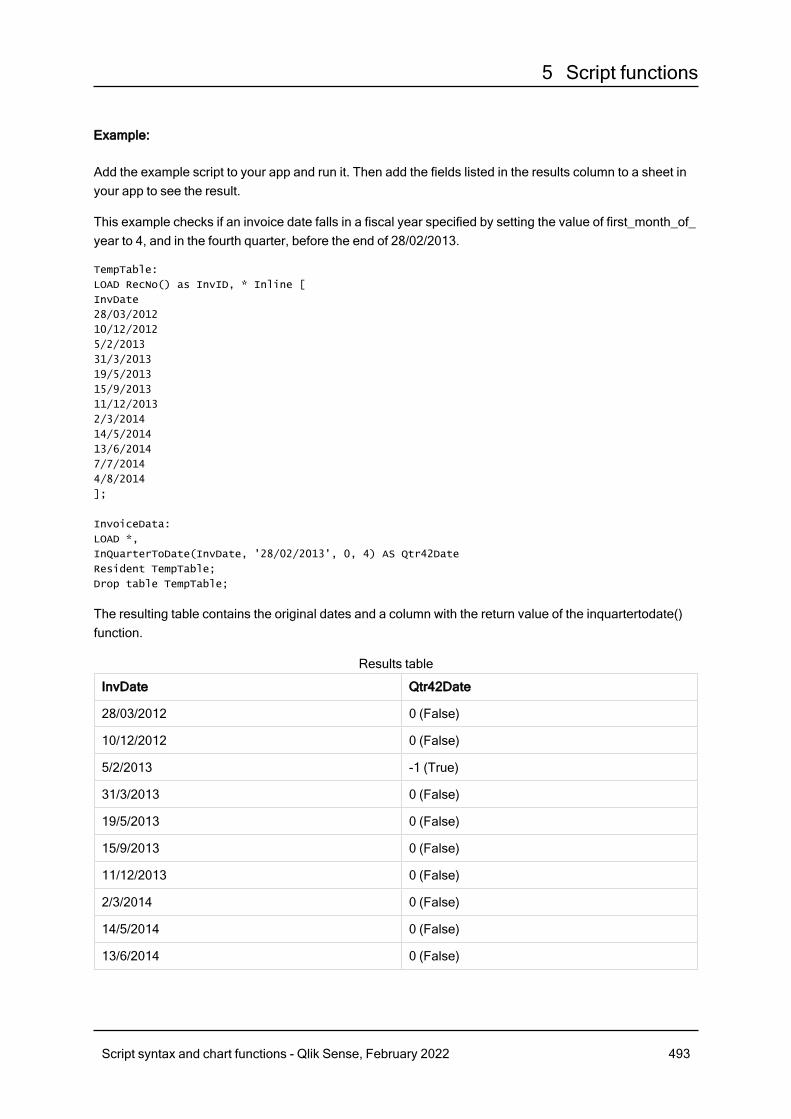
5 Script functions
Example:
Add the example script to your app and run it. Then add the fields listed in the results column to a sheet inyour app to see the result.
This example checks if an invoice date falls in a fiscal year specified by setting the value of first_month_of_year to 4, and in the fourth quarter, before the end of 28/02/2013.
TempTable:
LOAD RecNo() as InvID, * Inline [
InvDate
28/03/2012
10/12/2012
5/2/2013
31/3/2013
19/5/2013
15/9/2013
11/12/2013
2/3/2014
14/5/2014
13/6/2014
7/7/2014
4/8/2014
];
InvoiceData:
LOAD *,
InQuarterToDate(InvDate, '28/02/2013', 0, 4) AS Qtr42Date
Resident TempTable;
Drop table TempTable;
The resulting table contains the original dates and a column with the return value of the inquartertodate()function.
InvDate Qtr42Date
28/03/2012 0 (False)
10/12/2012 0 (False)
5/2/2013 -1 (True)
31/3/2013 0 (False)
19/5/2013 0 (False)
15/9/2013 0 (False)
11/12/2013 0 (False)
2/3/2014 0 (False)
14/5/2014 0 (False)
13/6/2014 0 (False)
Results table
Script syntax and chart functions - Qlik Sense, February 2022 493
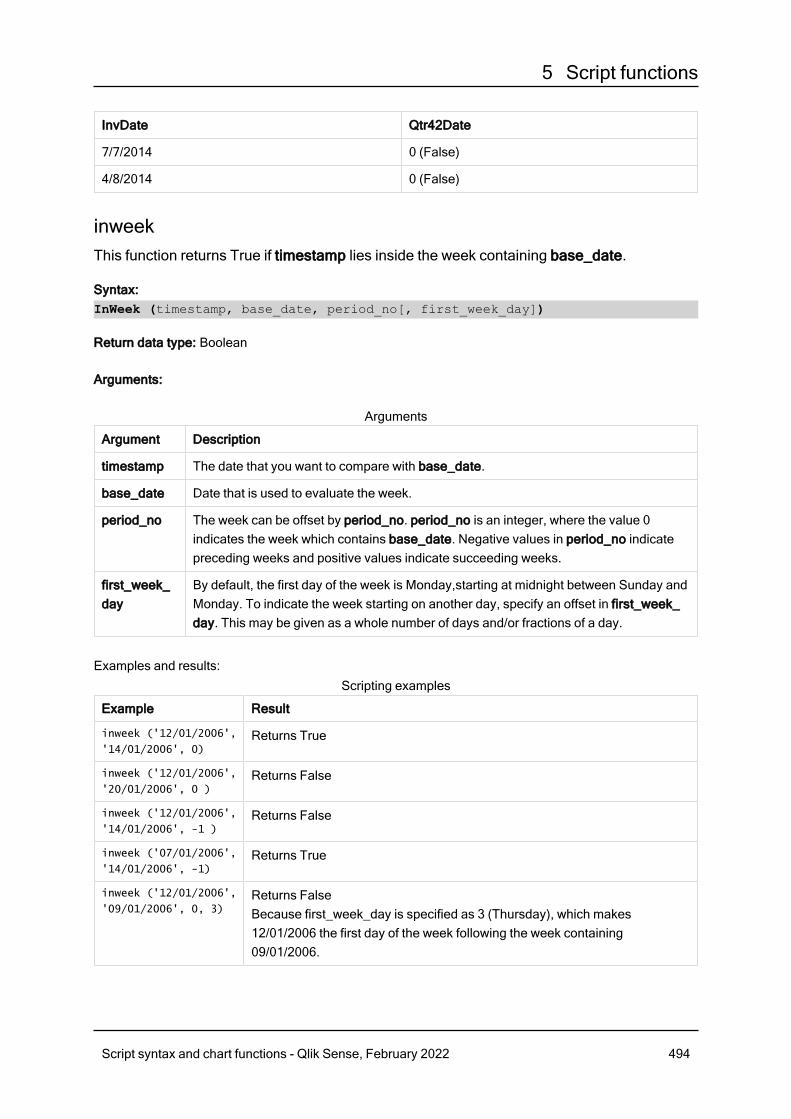
5 Script functions
InvDate Qtr42Date
7/7/2014 0 (False)
4/8/2014 0 (False)
inweekThis function returns True if timestamp lies inside the week containing base_date.
Syntax:InWeek (timestamp, base_date, period_no[, first_week_day])
Return data type: Boolean
Arguments:
Argument Description
timestamp The date that you want to compare with base_date.
base_date Date that is used to evaluate the week.
period_no The week can be offset by period_no. period_no is an integer, where the value 0indicates the week which contains base_date. Negative values in period_no indicatepreceding weeks and positive values indicate succeeding weeks.
first_week_day
By default, the first day of the week is Monday,starting at midnight between Sunday andMonday. To indicate the week starting on another day, specify an offset in first_week_day. This may be given as a whole number of days and/or fractions of a day.
Arguments
Examples and results:
Example Result
inweek ('12/01/2006',
'14/01/2006', 0)Returns True
inweek ('12/01/2006',
'20/01/2006', 0 )Returns False
inweek ('12/01/2006',
'14/01/2006', -1 )Returns False
inweek ('07/01/2006',
'14/01/2006', -1)Returns True
inweek ('12/01/2006',
'09/01/2006', 0, 3)Returns FalseBecause first_week_day is specified as 3 (Thursday), which makes12/01/2006 the first day of the week following the week containing09/01/2006.
Scripting examples
Script syntax and chart functions - Qlik Sense, February 2022 494
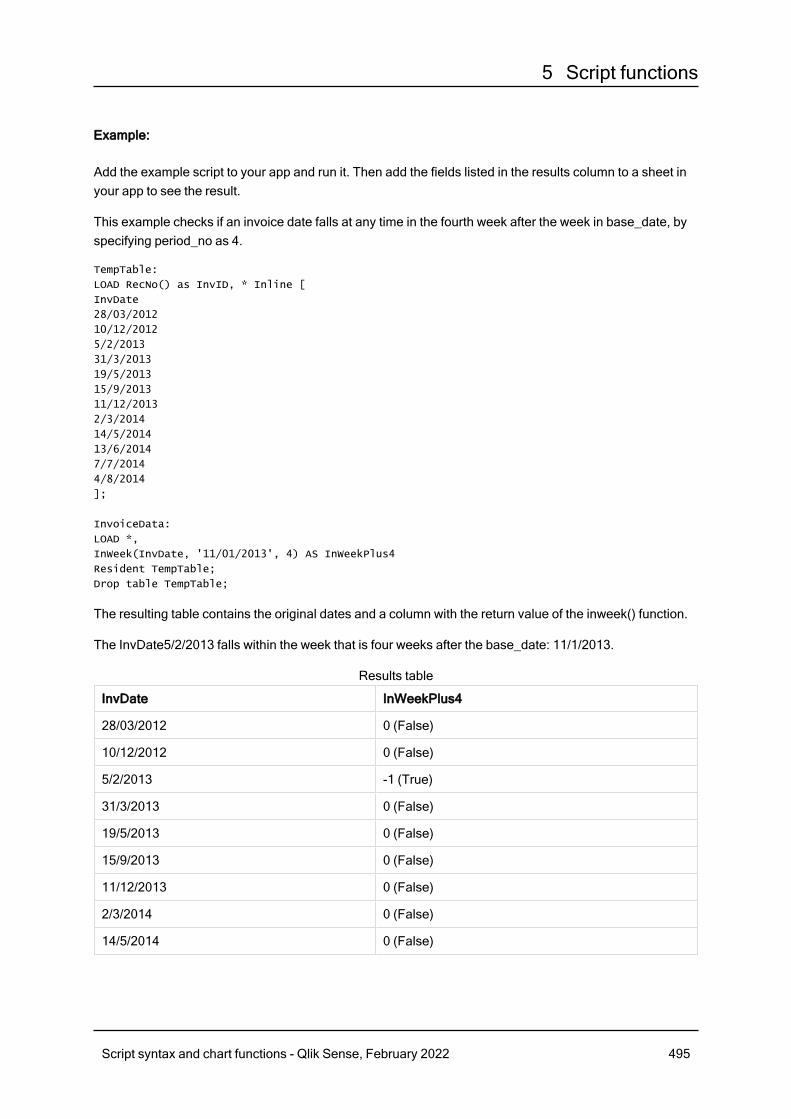
5 Script functions
Example:
Add the example script to your app and run it. Then add the fields listed in the results column to a sheet inyour app to see the result.
This example checks if an invoice date falls at any time in the fourth week after the week in base_date, byspecifying period_no as 4.
TempTable:
LOAD RecNo() as InvID, * Inline [
InvDate
28/03/2012
10/12/2012
5/2/2013
31/3/2013
19/5/2013
15/9/2013
11/12/2013
2/3/2014
14/5/2014
13/6/2014
7/7/2014
4/8/2014
];
InvoiceData:
LOAD *,
InWeek(InvDate, '11/01/2013', 4) AS InWeekPlus4
Resident TempTable;
Drop table TempTable;
The resulting table contains the original dates and a column with the return value of the inweek() function.
The InvDate5/2/2013 falls within the week that is four weeks after the base_date: 11/1/2013.
InvDate InWeekPlus4
28/03/2012 0 (False)
10/12/2012 0 (False)
5/2/2013 -1 (True)
31/3/2013 0 (False)
19/5/2013 0 (False)
15/9/2013 0 (False)
11/12/2013 0 (False)
2/3/2014 0 (False)
14/5/2014 0 (False)
Results table
Script syntax and chart functions - Qlik Sense, February 2022 495
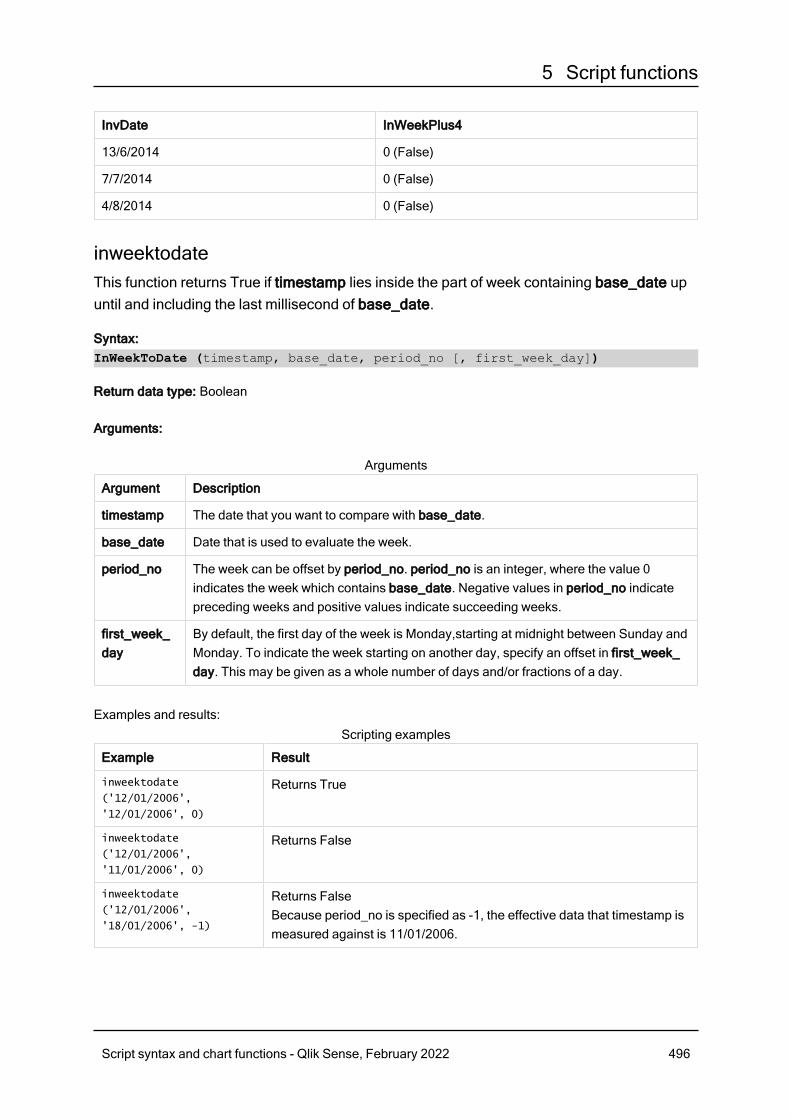
5 Script functions
InvDate InWeekPlus4
13/6/2014 0 (False)
7/7/2014 0 (False)
4/8/2014 0 (False)
inweektodateThis function returns True if timestamp lies inside the part of week containing base_date upuntil and including the last millisecond of base_date.
Syntax:InWeekToDate (timestamp, base_date, period_no [, first_week_day])
Return data type: Boolean
Arguments:
Argument Description
timestamp The date that you want to compare with base_date.
base_date Date that is used to evaluate the week.
period_no The week can be offset by period_no. period_no is an integer, where the value 0indicates the week which contains base_date. Negative values in period_no indicatepreceding weeks and positive values indicate succeeding weeks.
first_week_day
By default, the first day of the week is Monday,starting at midnight between Sunday andMonday. To indicate the week starting on another day, specify an offset in first_week_day. This may be given as a whole number of days and/or fractions of a day.
Arguments
Examples and results:
Example Result
inweektodate
('12/01/2006',
'12/01/2006', 0)
Returns True
inweektodate
('12/01/2006',
'11/01/2006', 0)
Returns False
inweektodate
('12/01/2006',
'18/01/2006', -1)
Returns FalseBecause period_no is specified as -1, the effective data that timestamp ismeasured against is 11/01/2006.
Scripting examples
Script syntax and chart functions - Qlik Sense, February 2022 496
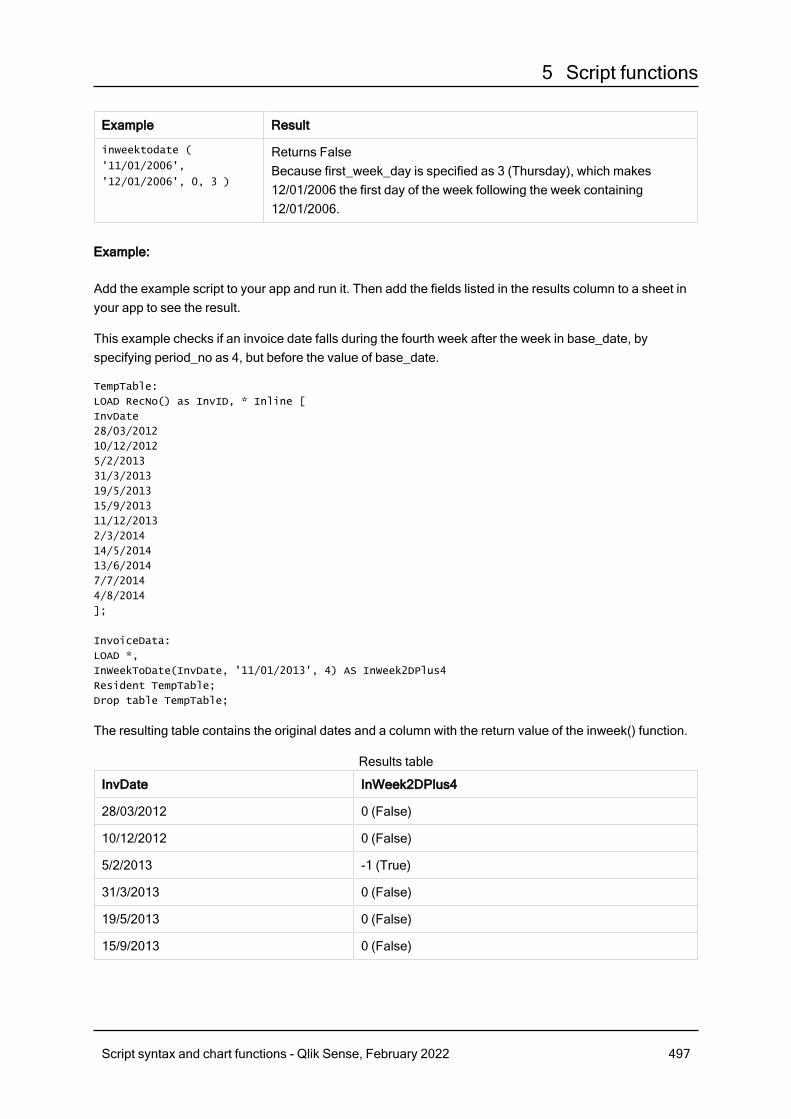
5 Script functions
Example Result
inweektodate (
'11/01/2006',
'12/01/2006', 0, 3 )
Returns FalseBecause first_week_day is specified as 3 (Thursday), which makes12/01/2006 the first day of the week following the week containing12/01/2006.
Example:
Add the example script to your app and run it. Then add the fields listed in the results column to a sheet inyour app to see the result.
This example checks if an invoice date falls during the fourth week after the week in base_date, byspecifying period_no as 4, but before the value of base_date.
TempTable:
LOAD RecNo() as InvID, * Inline [
InvDate
28/03/2012
10/12/2012
5/2/2013
31/3/2013
19/5/2013
15/9/2013
11/12/2013
2/3/2014
14/5/2014
13/6/2014
7/7/2014
4/8/2014
];
InvoiceData:
LOAD *,
InWeekToDate(InvDate, '11/01/2013', 4) AS InWeek2DPlus4
Resident TempTable;
Drop table TempTable;
The resulting table contains the original dates and a column with the return value of the inweek() function.
InvDate InWeek2DPlus4
28/03/2012 0 (False)
10/12/2012 0 (False)
5/2/2013 -1 (True)
31/3/2013 0 (False)
19/5/2013 0 (False)
15/9/2013 0 (False)
Results table
Script syntax and chart functions - Qlik Sense, February 2022 497
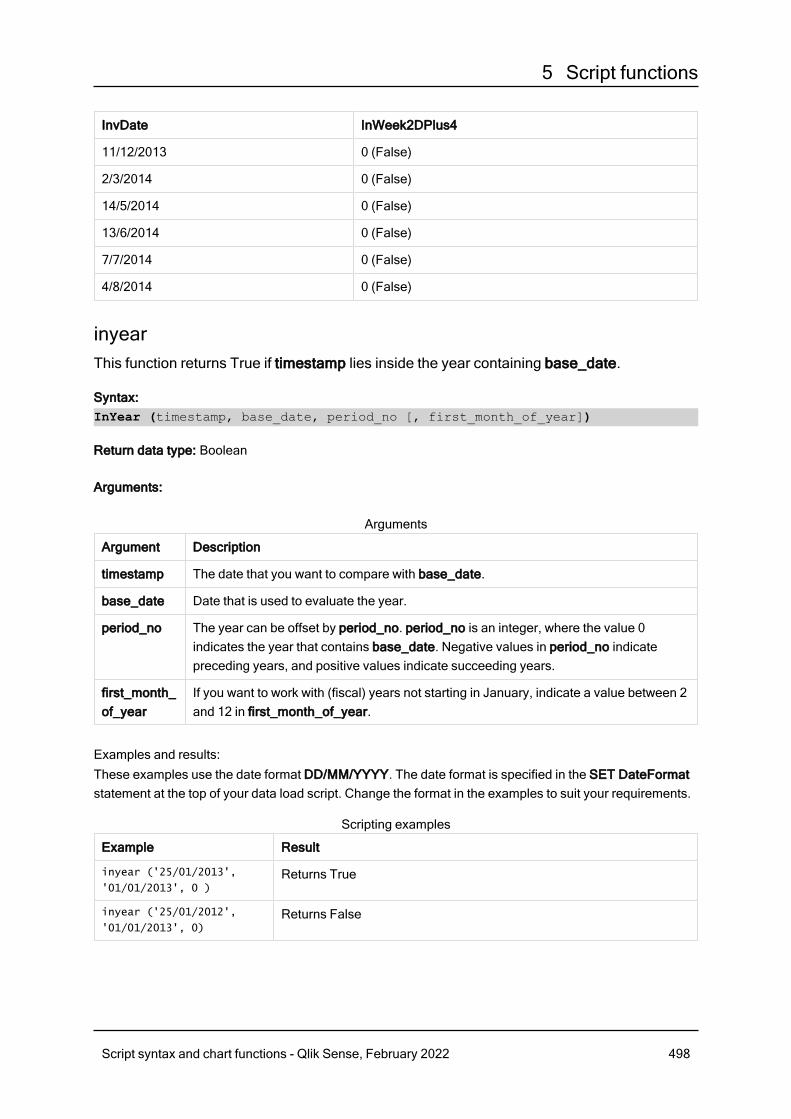
5 Script functions
InvDate InWeek2DPlus4
11/12/2013 0 (False)
2/3/2014 0 (False)
14/5/2014 0 (False)
13/6/2014 0 (False)
7/7/2014 0 (False)
4/8/2014 0 (False)
inyearThis function returns True if timestamp lies inside the year containing base_date.
Syntax:InYear (timestamp, base_date, period_no [, first_month_of_year])
Return data type: Boolean
Arguments:
Argument Description
timestamp The date that you want to compare with base_date.
base_date Date that is used to evaluate the year.
period_no The year can be offset by period_no. period_no is an integer, where the value 0indicates the year that contains base_date. Negative values in period_no indicatepreceding years, and positive values indicate succeeding years.
first_month_of_year
If you want to work with (fiscal) years not starting in January, indicate a value between 2and 12 in first_month_of_year.
Arguments
Examples and results:These examples use the date format DD/MM/YYYY. The date format is specified in the SET DateFormatstatement at the top of your data load script. Change the format in the examples to suit your requirements.
Example Result
inyear ('25/01/2013',
'01/01/2013', 0 )Returns True
inyear ('25/01/2012',
'01/01/2013', 0)Returns False
Scripting examples
Script syntax and chart functions - Qlik Sense, February 2022 498
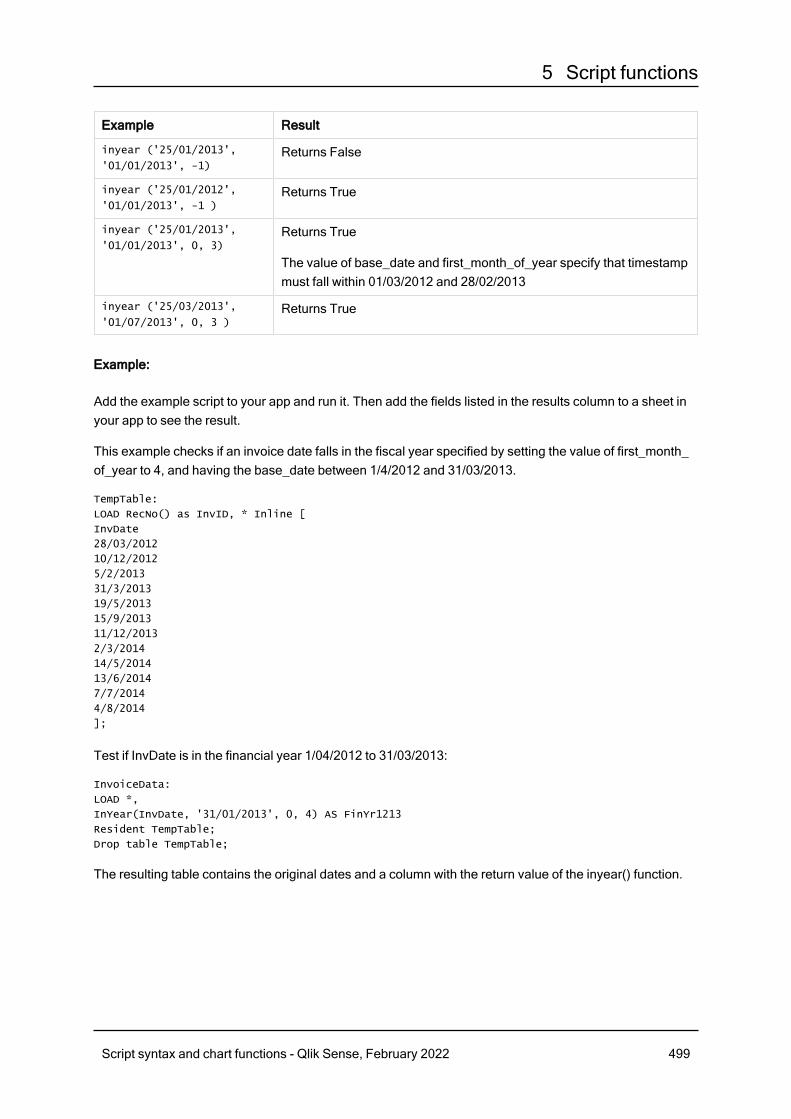
5 Script functions
Example Result
inyear ('25/01/2013',
'01/01/2013', -1)Returns False
inyear ('25/01/2012',
'01/01/2013', -1 )Returns True
inyear ('25/01/2013',
'01/01/2013', 0, 3)Returns True
The value of base_date and first_month_of_year specify that timestampmust fall within 01/03/2012 and 28/02/2013
inyear ('25/03/2013',
'01/07/2013', 0, 3 )Returns True
Example:
Add the example script to your app and run it. Then add the fields listed in the results column to a sheet inyour app to see the result.
This example checks if an invoice date falls in the fiscal year specified by setting the value of first_month_of_year to 4, and having the base_date between 1/4/2012 and 31/03/2013.
TempTable:
LOAD RecNo() as InvID, * Inline [
InvDate
28/03/2012
10/12/2012
5/2/2013
31/3/2013
19/5/2013
15/9/2013
11/12/2013
2/3/2014
14/5/2014
13/6/2014
7/7/2014
4/8/2014
];
Test if InvDate is in the financial year 1/04/2012 to 31/03/2013:
InvoiceData:
LOAD *,
InYear(InvDate, '31/01/2013', 0, 4) AS FinYr1213
Resident TempTable;
Drop table TempTable;
The resulting table contains the original dates and a column with the return value of the inyear() function.
Script syntax and chart functions - Qlik Sense, February 2022 499
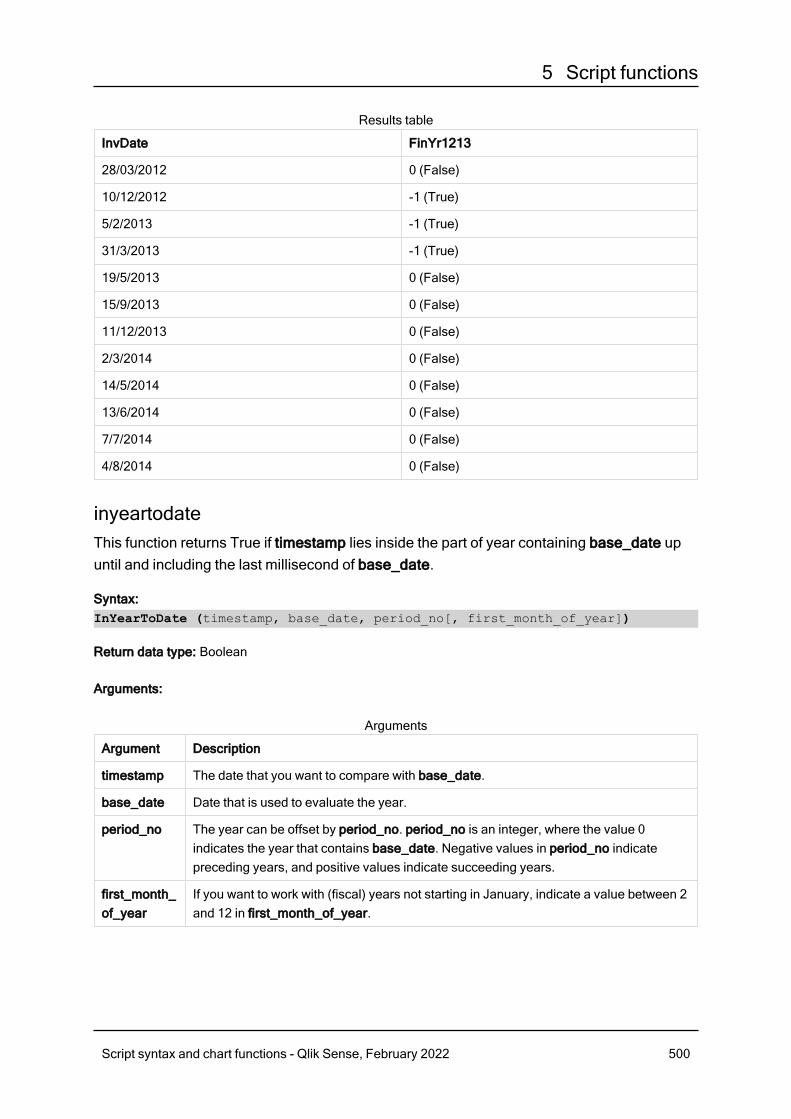
5 Script functions
InvDate FinYr1213
28/03/2012 0 (False)
10/12/2012 -1 (True)
5/2/2013 -1 (True)
31/3/2013 -1 (True)
19/5/2013 0 (False)
15/9/2013 0 (False)
11/12/2013 0 (False)
2/3/2014 0 (False)
14/5/2014 0 (False)
13/6/2014 0 (False)
7/7/2014 0 (False)
4/8/2014 0 (False)
Results table
inyeartodateThis function returns True if timestamp lies inside the part of year containing base_date upuntil and including the last millisecond of base_date.
Syntax:InYearToDate (timestamp, base_date, period_no[, first_month_of_year])
Return data type: Boolean
Arguments:
Argument Description
timestamp The date that you want to compare with base_date.
base_date Date that is used to evaluate the year.
period_no The year can be offset by period_no. period_no is an integer, where the value 0indicates the year that contains base_date. Negative values in period_no indicatepreceding years, and positive values indicate succeeding years.
first_month_of_year
If you want to work with (fiscal) years not starting in January, indicate a value between 2and 12 in first_month_of_year.
Arguments
Script syntax and chart functions - Qlik Sense, February 2022 500
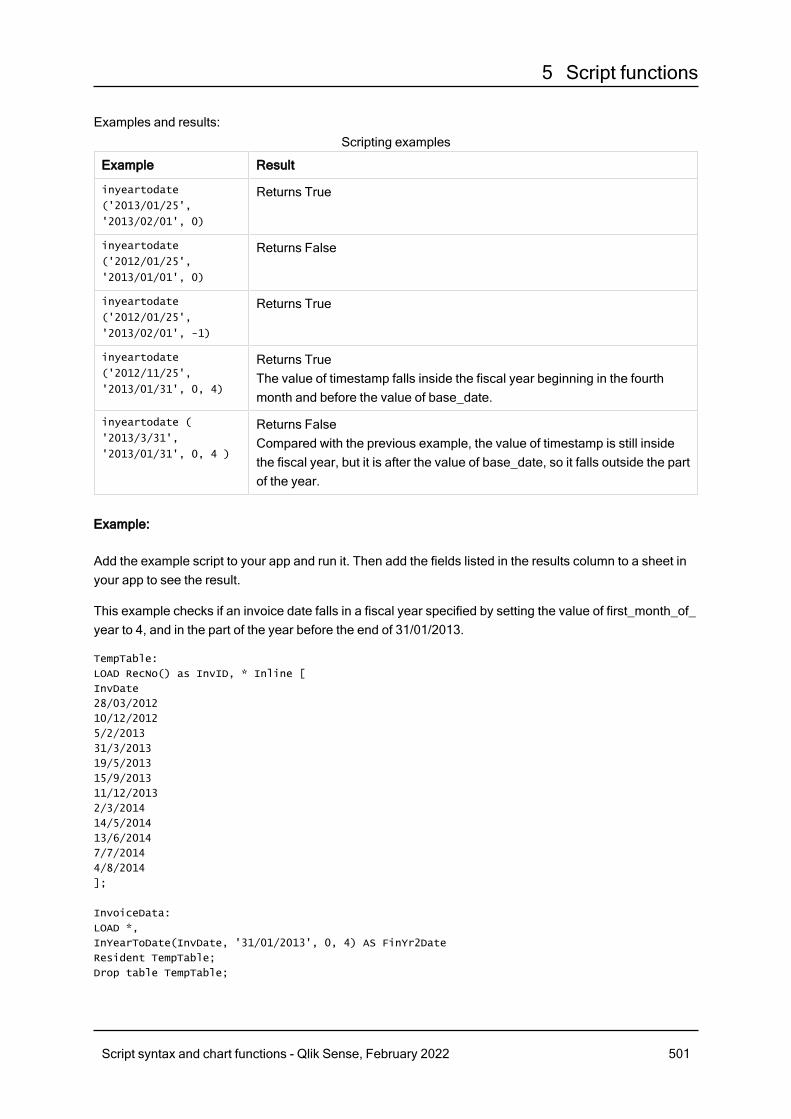
5 Script functions
Examples and results:
Example Result
inyeartodate
('2013/01/25',
'2013/02/01', 0)
Returns True
inyeartodate
('2012/01/25',
'2013/01/01', 0)
Returns False
inyeartodate
('2012/01/25',
'2013/02/01', -1)
Returns True
inyeartodate
('2012/11/25',
'2013/01/31', 0, 4)
Returns TrueThe value of timestamp falls inside the fiscal year beginning in the fourthmonth and before the value of base_date.
inyeartodate (
'2013/3/31',
'2013/01/31', 0, 4 )
Returns FalseCompared with the previous example, the value of timestamp is still insidethe fiscal year, but it is after the value of base_date, so it falls outside the partof the year.
Scripting examples
Example:
Add the example script to your app and run it. Then add the fields listed in the results column to a sheet inyour app to see the result.
This example checks if an invoice date falls in a fiscal year specified by setting the value of first_month_of_year to 4, and in the part of the year before the end of 31/01/2013.
TempTable:
LOAD RecNo() as InvID, * Inline [
InvDate
28/03/2012
10/12/2012
5/2/2013
31/3/2013
19/5/2013
15/9/2013
11/12/2013
2/3/2014
14/5/2014
13/6/2014
7/7/2014
4/8/2014
];
InvoiceData:
LOAD *,
InYearToDate(InvDate, '31/01/2013', 0, 4) AS FinYr2Date
Resident TempTable;
Drop table TempTable;
Script syntax and chart functions - Qlik Sense, February 2022 501
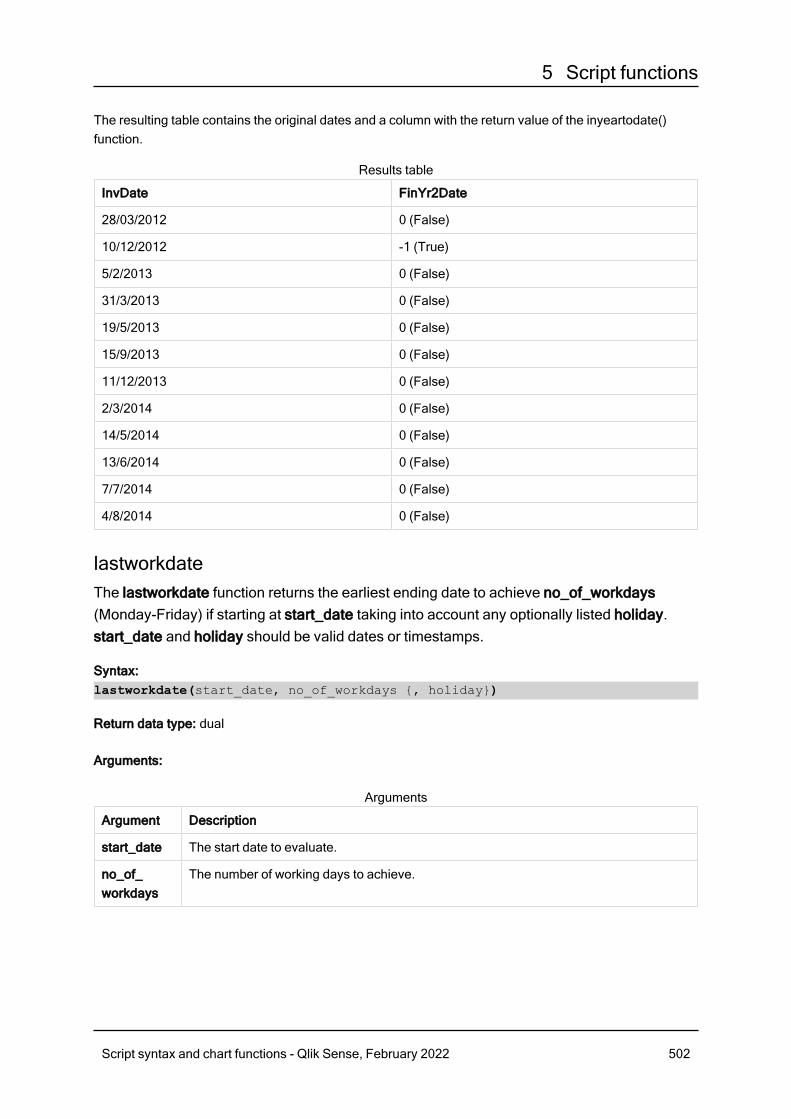
5 Script functions
The resulting table contains the original dates and a column with the return value of the inyeartodate()function.
InvDate FinYr2Date
28/03/2012 0 (False)
10/12/2012 -1 (True)
5/2/2013 0 (False)
31/3/2013 0 (False)
19/5/2013 0 (False)
15/9/2013 0 (False)
11/12/2013 0 (False)
2/3/2014 0 (False)
14/5/2014 0 (False)
13/6/2014 0 (False)
7/7/2014 0 (False)
4/8/2014 0 (False)
Results table
lastworkdateThe lastworkdate function returns the earliest ending date to achieve no_of_workdays(Monday-Friday) if starting at start_date taking into account any optionally listed holiday.start_date and holiday should be valid dates or timestamps.
Syntax:lastworkdate(start_date, no_of_workdays {, holiday})
Return data type: dual
Arguments:
Argument Description
start_date The start date to evaluate.
no_of_workdays
The number of working days to achieve.
Arguments
Script syntax and chart functions - Qlik Sense, February 2022 502
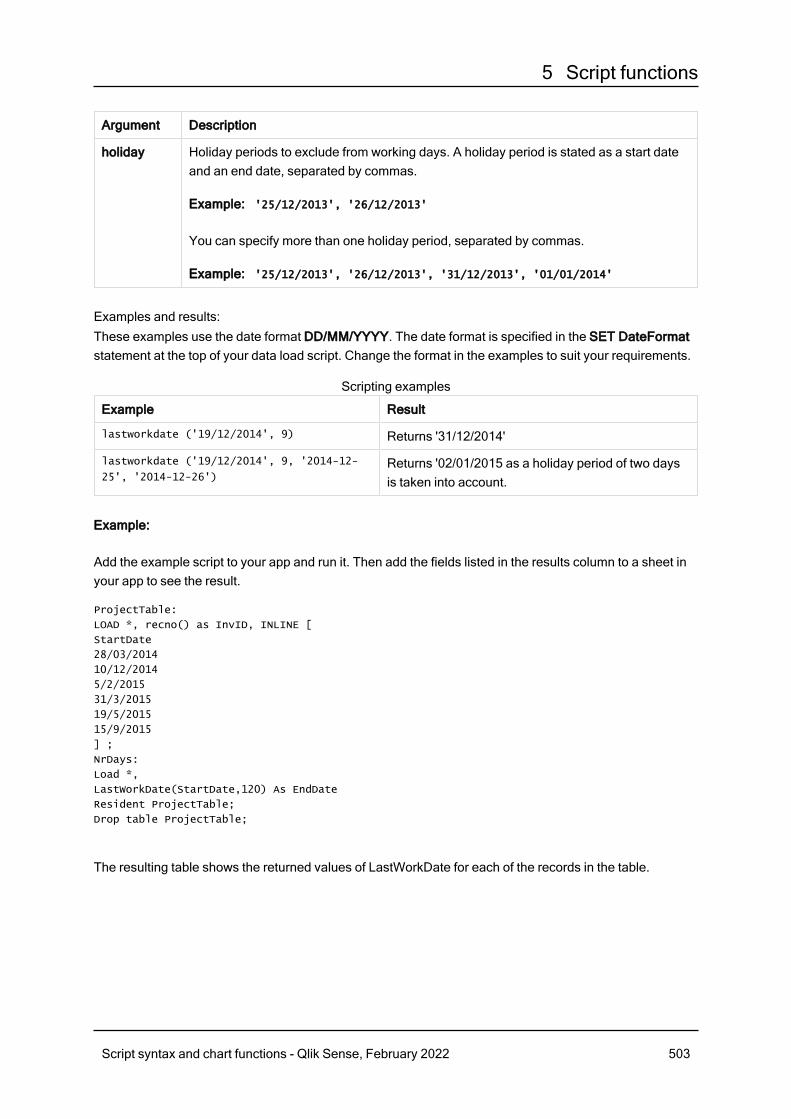
5 Script functions
Argument Description
holiday Holiday periods to exclude from working days. A holiday period is stated as a start dateand an end date, separated by commas.
Example: '25/12/2013', '26/12/2013'
You can specify more than one holiday period, separated by commas.
Example: '25/12/2013', '26/12/2013', '31/12/2013', '01/01/2014'
Examples and results:These examples use the date format DD/MM/YYYY. The date format is specified in the SET DateFormatstatement at the top of your data load script. Change the format in the examples to suit your requirements.
Example Result
lastworkdate ('19/12/2014', 9) Returns '31/12/2014'
lastworkdate ('19/12/2014', 9, '2014-12-
25', '2014-12-26')Returns '02/01/2015 as a holiday period of two daysis taken into account.
Scripting examples
Example:
Add the example script to your app and run it. Then add the fields listed in the results column to a sheet inyour app to see the result.
ProjectTable:
LOAD *, recno() as InvID, INLINE [
StartDate
28/03/2014
10/12/2014
5/2/2015
31/3/2015
19/5/2015
15/9/2015
] ;
NrDays:
Load *,
LastWorkDate(StartDate,120) As EndDate
Resident ProjectTable;
Drop table ProjectTable;
The resulting table shows the returned values of LastWorkDate for each of the records in the table.
Script syntax and chart functions - Qlik Sense, February 2022 503

5 Script functions
InvID StartDate EndDate
1 28/03/2014 11/09/2014
2 10/12/2014 26/05/2015
3 5/2/2015 27/07/2015
4 31/3/2015 14/09/2015
5 19/5/2015 02/11/2015
6 15/9/2015 29/02/2016
Results table
localtimeThis function returns a timestamp of the current time from the system clock for a specifiedtime zone.
Syntax:LocalTime([timezone [, ignoreDST ]])
Return data type: dual
Arguments:
Argument Description
timezone The timezone is specified as a string containing any of the geographical places listedunder Time Zone in the Windows Control Panel for Date and Time or as a string in theform 'GMT+hh:mm'.
If no time zone is specified the local time will be returned.
ignoreDST If ignoreDST is -1 (True) daylight savings time will be ignored.
Arguments
Examples and results:
The examples below are based on the function being called on 2014-10-22 12:54:47 local time, with thelocal time zone being GMT+01:00.
Example Result
localtime () Returns the local time 2014-10-22 12:54:47.
localtime ('London') Returns the local time in London, 2014-10-22 11:54:47.
localtime
('GMT+02:00')Returns the local time in the timezone of GMT+02:00, 2014-10-22 13:54:47.
Scripting examples
Script syntax and chart functions - Qlik Sense, February 2022 504
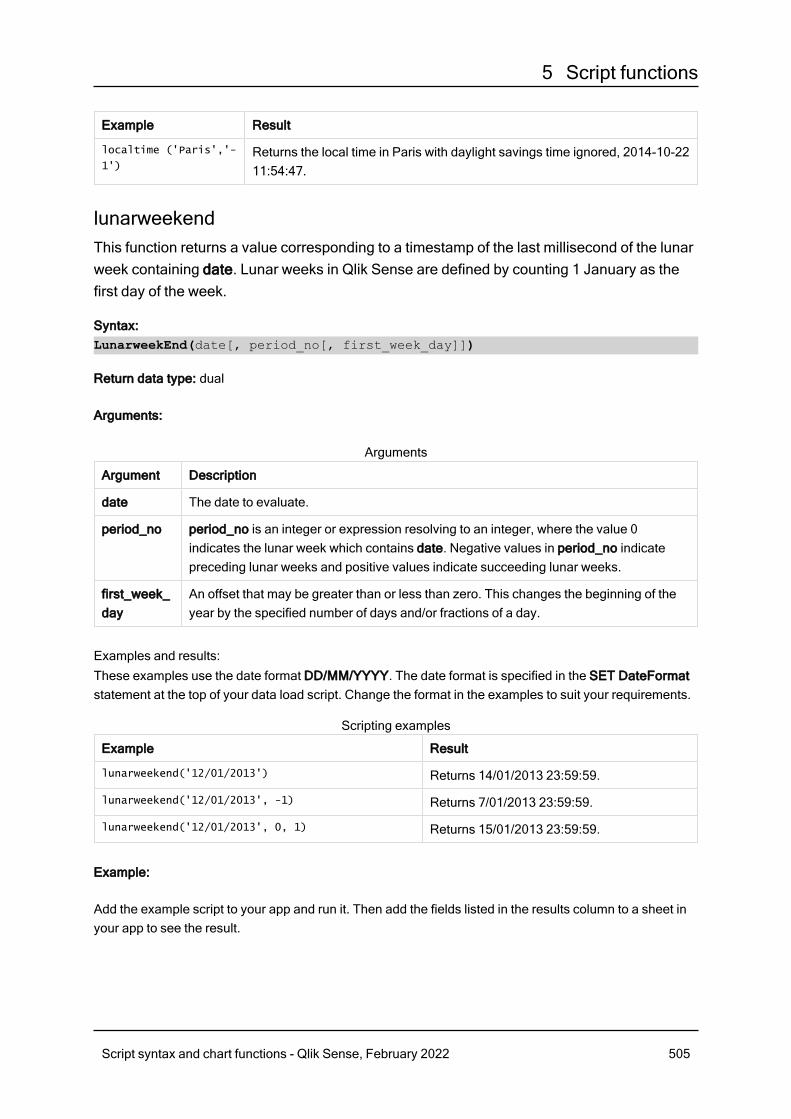
5 Script functions
Example Result
localtime ('Paris','-
1')Returns the local time in Paris with daylight savings time ignored, 2014-10-2211:54:47.
lunarweekendThis function returns a value corresponding to a timestamp of the last millisecond of the lunarweek containing date. Lunar weeks in Qlik Sense are defined by counting 1 January as thefirst day of the week.
Syntax:LunarweekEnd(date[, period_no[, first_week_day]])
Return data type: dual
Arguments:
Argument Description
date The date to evaluate.
period_no period_no is an integer or expression resolving to an integer, where the value 0indicates the lunar week which contains date. Negative values in period_no indicatepreceding lunar weeks and positive values indicate succeeding lunar weeks.
first_week_day
An offset that may be greater than or less than zero. This changes the beginning of theyear by the specified number of days and/or fractions of a day.
Arguments
Examples and results:These examples use the date format DD/MM/YYYY. The date format is specified in the SET DateFormatstatement at the top of your data load script. Change the format in the examples to suit your requirements.
Example Result
lunarweekend('12/01/2013') Returns 14/01/2013 23:59:59.
lunarweekend('12/01/2013', -1) Returns 7/01/2013 23:59:59.
lunarweekend('12/01/2013', 0, 1) Returns 15/01/2013 23:59:59.
Scripting examples
Example:
Add the example script to your app and run it. Then add the fields listed in the results column to a sheet inyour app to see the result.
Script syntax and chart functions - Qlik Sense, February 2022 505
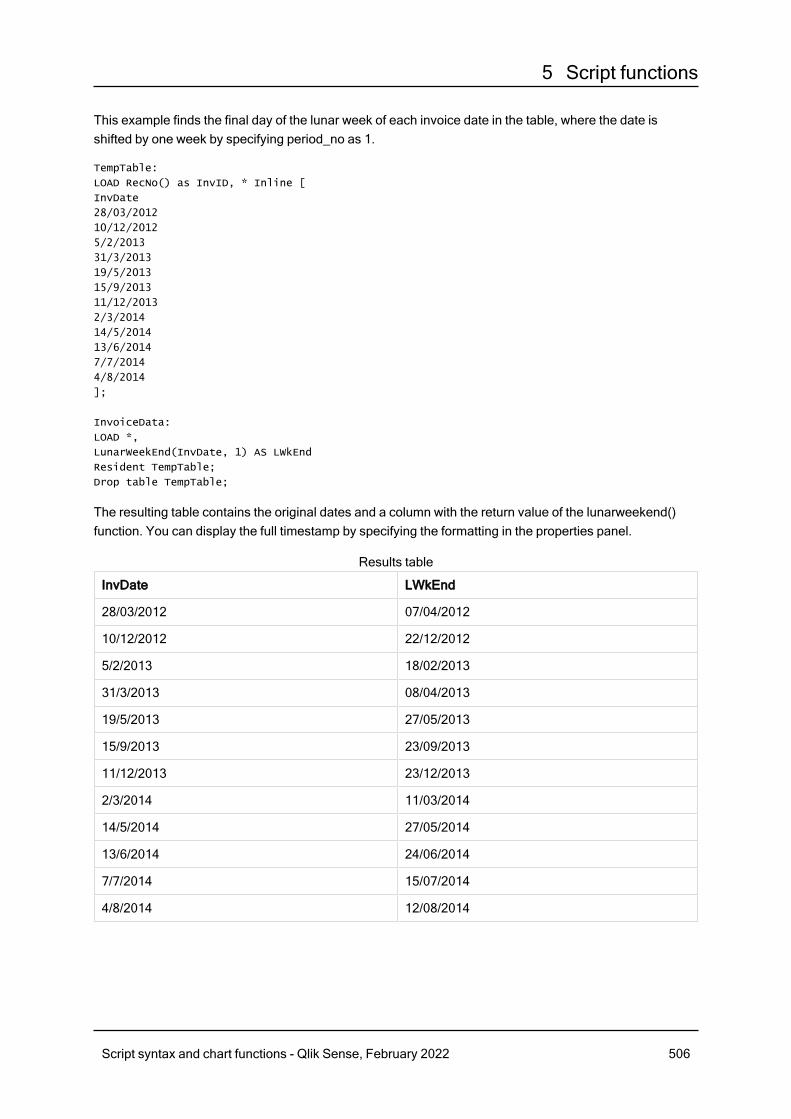
5 Script functions
This example finds the final day of the lunar week of each invoice date in the table, where the date isshifted by one week by specifying period_no as 1.
TempTable:
LOAD RecNo() as InvID, * Inline [
InvDate
28/03/2012
10/12/2012
5/2/2013
31/3/2013
19/5/2013
15/9/2013
11/12/2013
2/3/2014
14/5/2014
13/6/2014
7/7/2014
4/8/2014
];
InvoiceData:
LOAD *,
LunarWeekEnd(InvDate, 1) AS LWkEnd
Resident TempTable;
Drop table TempTable;
The resulting table contains the original dates and a column with the return value of the lunarweekend()function. You can display the full timestamp by specifying the formatting in the properties panel.
InvDate LWkEnd
28/03/2012 07/04/2012
10/12/2012 22/12/2012
5/2/2013 18/02/2013
31/3/2013 08/04/2013
19/5/2013 27/05/2013
15/9/2013 23/09/2013
11/12/2013 23/12/2013
2/3/2014 11/03/2014
14/5/2014 27/05/2014
13/6/2014 24/06/2014
7/7/2014 15/07/2014
4/8/2014 12/08/2014
Results table
Script syntax and chart functions - Qlik Sense, February 2022 506

5 Script functions
lunarweeknameThis function returns a display value showing the year and lunar week number correspondingto a timestamp of the first millisecond of the first day of the lunar week containing date. Lunarweeks in Qlik Sense are defined by counting 1 January as the first day of the week.
Syntax:LunarWeekName(date [, period_no[, first_week_day]])
Return data type: dual
Arguments:
Argument Description
date The date to evaluate.
period_no period_no is an integer or expression resolving to an integer, where the value 0indicates the lunar week which contains date. Negative values in period_no indicatepreceding lunar weeks and positive values indicate succeeding lunar weeks.
first_week_day
An offset that may be greater than or less than zero. This changes the beginning of theyear by the specified number of days and/or fractions of a day.
Arguments
Examples and results:
Example Result
lunarweekname('12/01/2013') Returns 2006/02.
lunarweekname('12/01/2013', -1) Returns 2006/01.
lunarweekname('12/01/2013', 0, 1) Returns 2006/02.
Scripting examples
Example:
Add the example script to your app and run it. Then add the fields listed in the results column to a sheet inyour app to see the result.
In this example, for each invoice date in the table, the lunar week name is created from the year in whichthe week lies and its associated lunar week number, shifted one week by specifying period_no as 1.
TempTable:
LOAD RecNo() as InvID, * Inline [
InvDate
28/03/2012
10/12/2012
5/2/2013
31/3/2013
19/5/2013
Script syntax and chart functions - Qlik Sense, February 2022 507
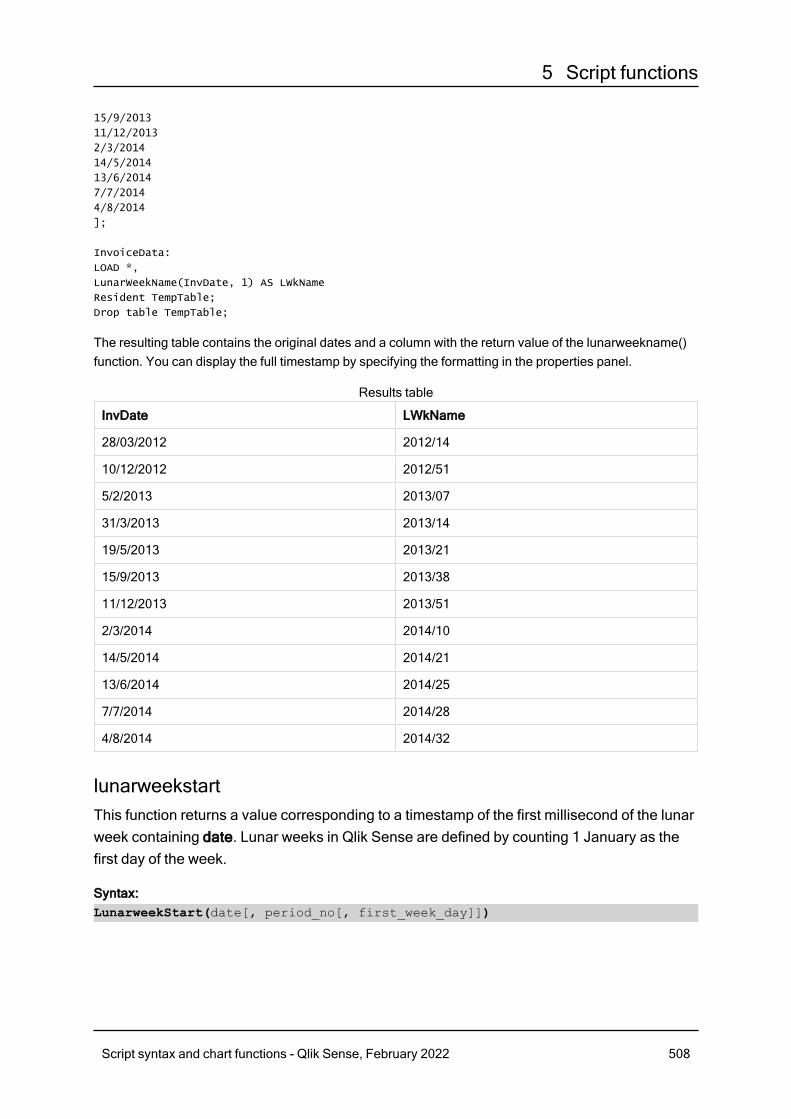
5 Script functions
15/9/2013
11/12/2013
2/3/2014
14/5/2014
13/6/2014
7/7/2014
4/8/2014
];
InvoiceData:
LOAD *,
LunarWeekName(InvDate, 1) AS LWkName
Resident TempTable;
Drop table TempTable;
The resulting table contains the original dates and a column with the return value of the lunarweekname()function. You can display the full timestamp by specifying the formatting in the properties panel.
InvDate LWkName
28/03/2012 2012/14
10/12/2012 2012/51
5/2/2013 2013/07
31/3/2013 2013/14
19/5/2013 2013/21
15/9/2013 2013/38
11/12/2013 2013/51
2/3/2014 2014/10
14/5/2014 2014/21
13/6/2014 2014/25
7/7/2014 2014/28
4/8/2014 2014/32
Results table
lunarweekstartThis function returns a value corresponding to a timestamp of the first millisecond of the lunarweek containing date. Lunar weeks in Qlik Sense are defined by counting 1 January as thefirst day of the week.
Syntax:LunarweekStart(date[, period_no[, first_week_day]])
Script syntax and chart functions - Qlik Sense, February 2022 508
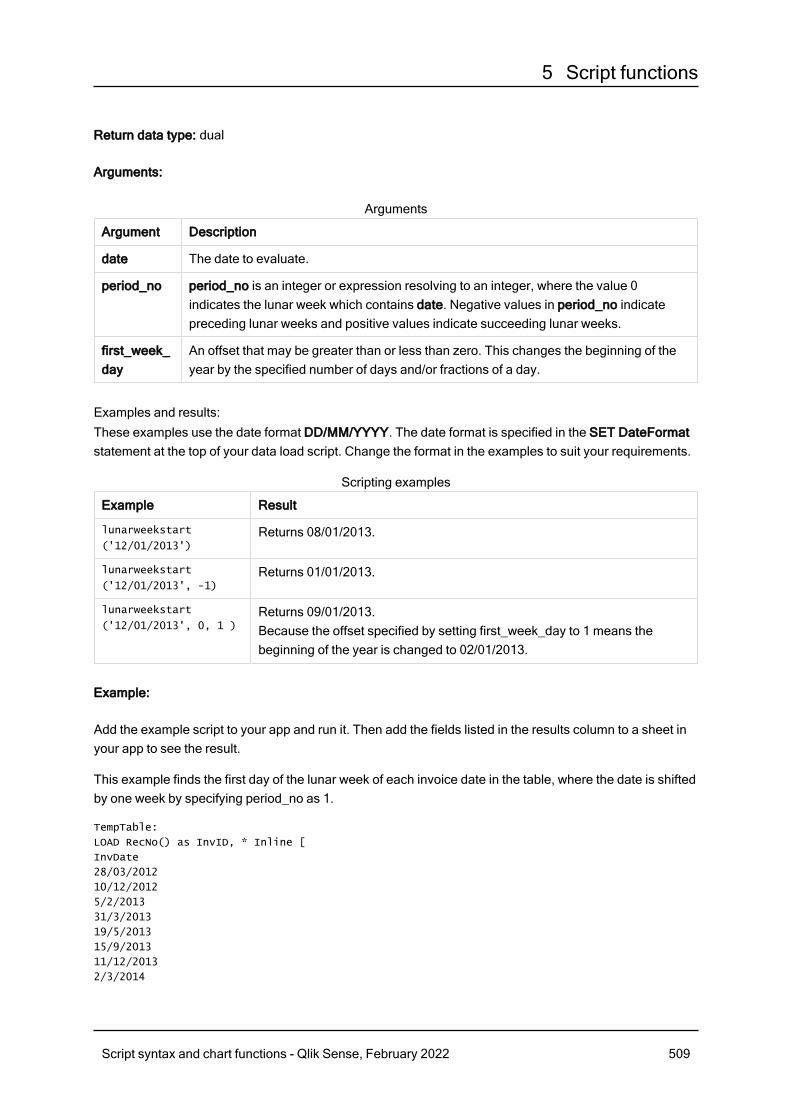
5 Script functions
Return data type: dual
Arguments:
Argument Description
date The date to evaluate.
period_no period_no is an integer or expression resolving to an integer, where the value 0indicates the lunar week which contains date. Negative values in period_no indicatepreceding lunar weeks and positive values indicate succeeding lunar weeks.
first_week_day
An offset that may be greater than or less than zero. This changes the beginning of theyear by the specified number of days and/or fractions of a day.
Arguments
Examples and results:These examples use the date format DD/MM/YYYY. The date format is specified in the SET DateFormatstatement at the top of your data load script. Change the format in the examples to suit your requirements.
Example Result
lunarweekstart
('12/01/2013')Returns 08/01/2013.
lunarweekstart
('12/01/2013', -1)Returns 01/01/2013.
lunarweekstart
('12/01/2013', 0, 1 )Returns 09/01/2013.Because the offset specified by setting first_week_day to 1 means thebeginning of the year is changed to 02/01/2013.
Scripting examples
Example:
Add the example script to your app and run it. Then add the fields listed in the results column to a sheet inyour app to see the result.
This example finds the first day of the lunar week of each invoice date in the table, where the date is shiftedby one week by specifying period_no as 1.
TempTable:
LOAD RecNo() as InvID, * Inline [
InvDate
28/03/2012
10/12/2012
5/2/2013
31/3/2013
19/5/2013
15/9/2013
11/12/2013
2/3/2014
Script syntax and chart functions - Qlik Sense, February 2022 509
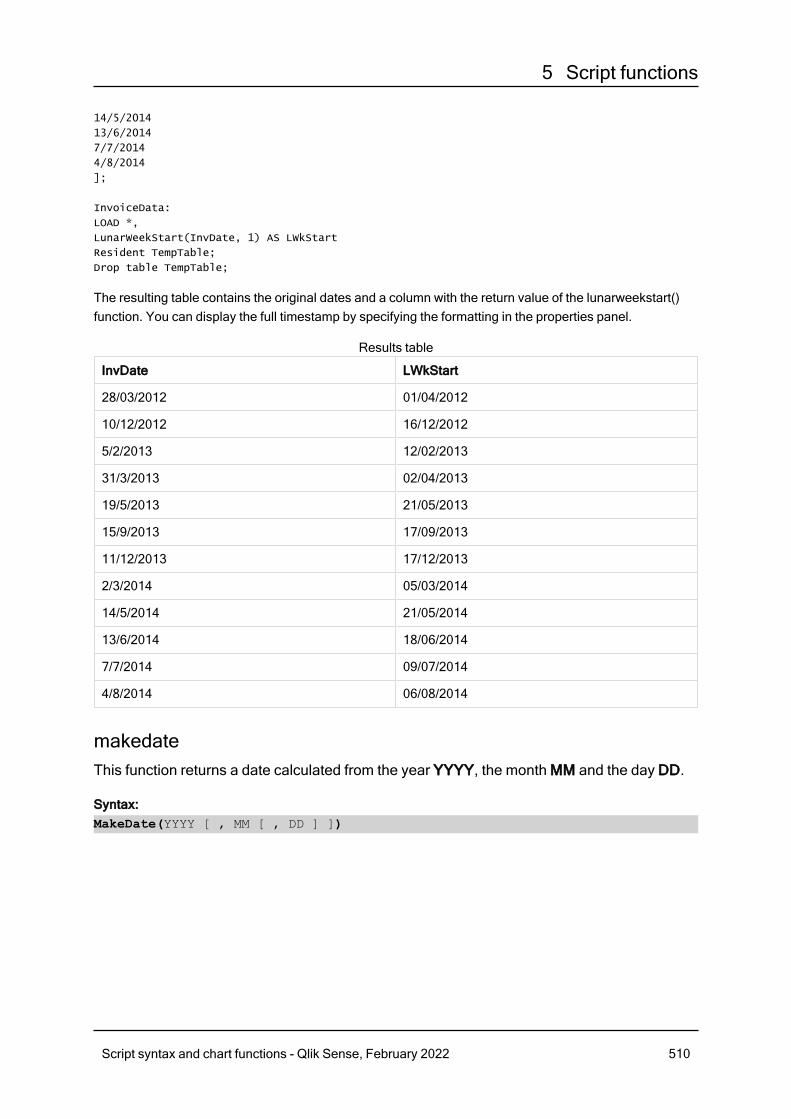
5 Script functions
14/5/2014
13/6/2014
7/7/2014
4/8/2014
];
InvoiceData:
LOAD *,
LunarWeekStart(InvDate, 1) AS LWkStart
Resident TempTable;
Drop table TempTable;
The resulting table contains the original dates and a column with the return value of the lunarweekstart()function. You can display the full timestamp by specifying the formatting in the properties panel.
InvDate LWkStart
28/03/2012 01/04/2012
10/12/2012 16/12/2012
5/2/2013 12/02/2013
31/3/2013 02/04/2013
19/5/2013 21/05/2013
15/9/2013 17/09/2013
11/12/2013 17/12/2013
2/3/2014 05/03/2014
14/5/2014 21/05/2014
13/6/2014 18/06/2014
7/7/2014 09/07/2014
4/8/2014 06/08/2014
Results table
makedateThis function returns a date calculated from the year YYYY, the month MM and the day DD.
Syntax:MakeDate(YYYY [ , MM [ , DD ] ])
Script syntax and chart functions - Qlik Sense, February 2022 510
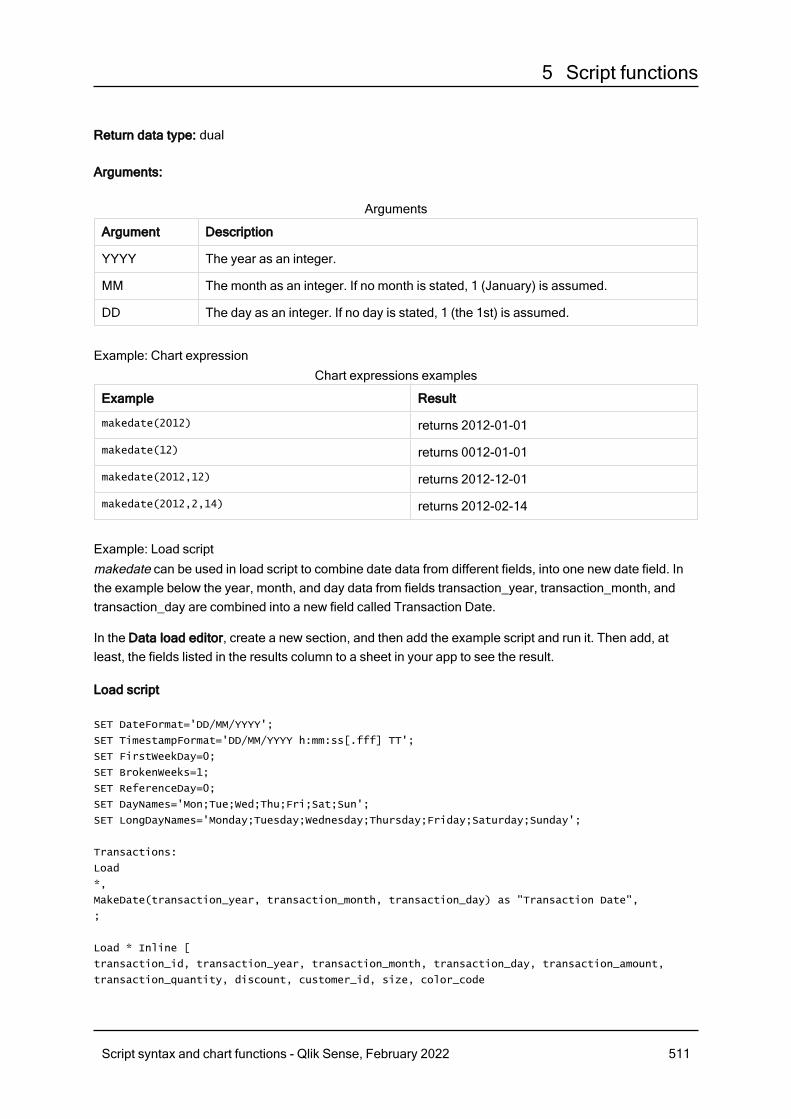
5 Script functions
Return data type: dual
Arguments:
Argument Description
YYYY The year as an integer.
MM The month as an integer. If no month is stated, 1 (January) is assumed.
DD The day as an integer. If no day is stated, 1 (the 1st) is assumed.
Arguments
Example: Chart expression
Example Result
makedate(2012) returns 2012-01-01
makedate(12) returns 0012-01-01
makedate(2012,12) returns 2012-12-01
makedate(2012,2,14) returns 2012-02-14
Chart expressions examples
Example: Load scriptmakedate can be used in load script to combine date data from different fields, into one new date field. Inthe example below the year, month, and day data from fields transaction_year, transaction_month, andtransaction_day are combined into a new field called Transaction Date.
In the Data load editor, create a new section, and then add the example script and run it. Then add, atleast, the fields listed in the results column to a sheet in your app to see the result.
Load script
SET DateFormat='DD/MM/YYYY';
SET TimestampFormat='DD/MM/YYYY h:mm:ss[.fff] TT';
SET FirstWeekDay=0;
SET BrokenWeeks=1;
SET ReferenceDay=0;
SET DayNames='Mon;Tue;Wed;Thu;Fri;Sat;Sun';
SET LongDayNames='Monday;Tuesday;Wednesday;Thursday;Friday;Saturday;Sunday';
Transactions:
Load
*,
MakeDate(transaction_year, transaction_month, transaction_day) as "Transaction Date",
;
Load * Inline [
transaction_id, transaction_year, transaction_month, transaction_day, transaction_amount,
transaction_quantity, discount, customer_id, size, color_code
Script syntax and chart functions - Qlik Sense, February 2022 511
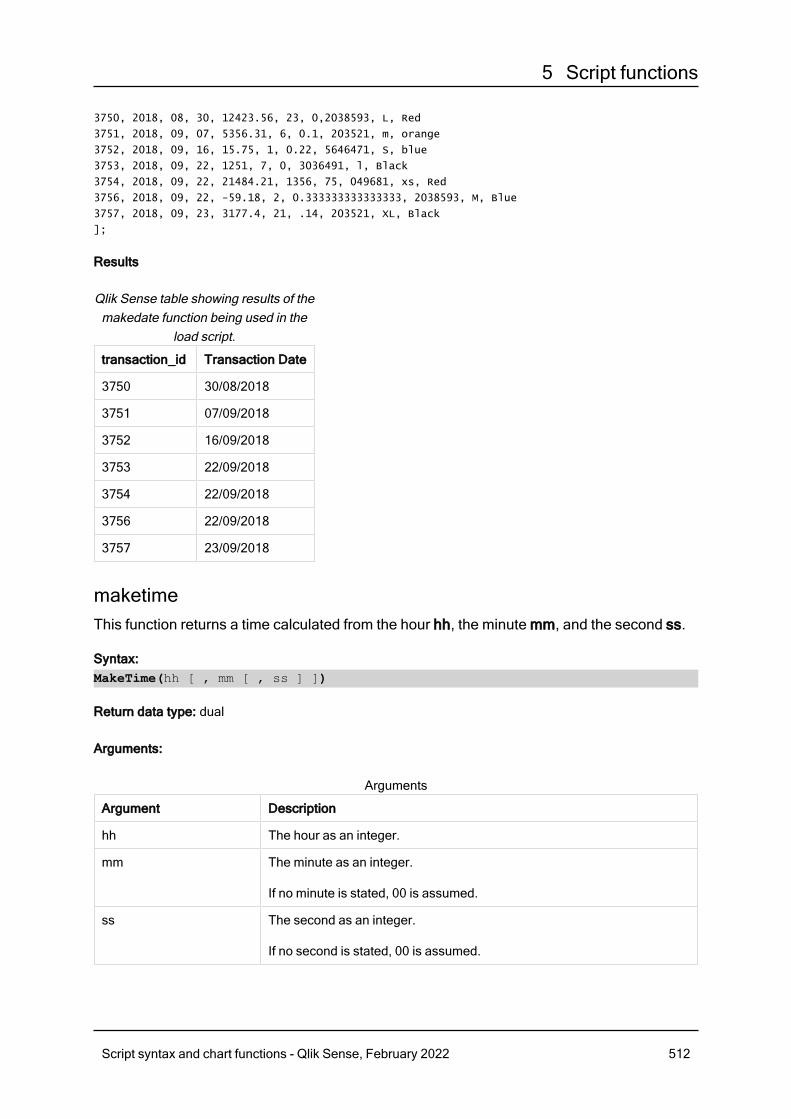
5 Script functions
3750, 2018, 08, 30, 12423.56, 23, 0,2038593, L, Red
3751, 2018, 09, 07, 5356.31, 6, 0.1, 203521, m, orange
3752, 2018, 09, 16, 15.75, 1, 0.22, 5646471, S, blue
3753, 2018, 09, 22, 1251, 7, 0, 3036491, l, Black
3754, 2018, 09, 22, 21484.21, 1356, 75, 049681, xs, Red
3756, 2018, 09, 22, -59.18, 2, 0.333333333333333, 2038593, M, Blue
3757, 2018, 09, 23, 3177.4, 21, .14, 203521, XL, Black
];
Results
transaction_id Transaction Date
3750 30/08/2018
3751 07/09/2018
3752 16/09/2018
3753 22/09/2018
3754 22/09/2018
3756 22/09/2018
3757 23/09/2018
Qlik Sense table showing results of themakedate function being used in the
load script.
maketimeThis function returns a time calculated from the hour hh, the minute mm, and the second ss.
Syntax:MakeTime(hh [ , mm [ , ss ] ])
Return data type: dual
Arguments:
Argument Description
hh The hour as an integer.
mm The minute as an integer.
If no minute is stated, 00 is assumed.
ss The second as an integer.
If no second is stated, 00 is assumed.
Arguments
Script syntax and chart functions - Qlik Sense, February 2022 512
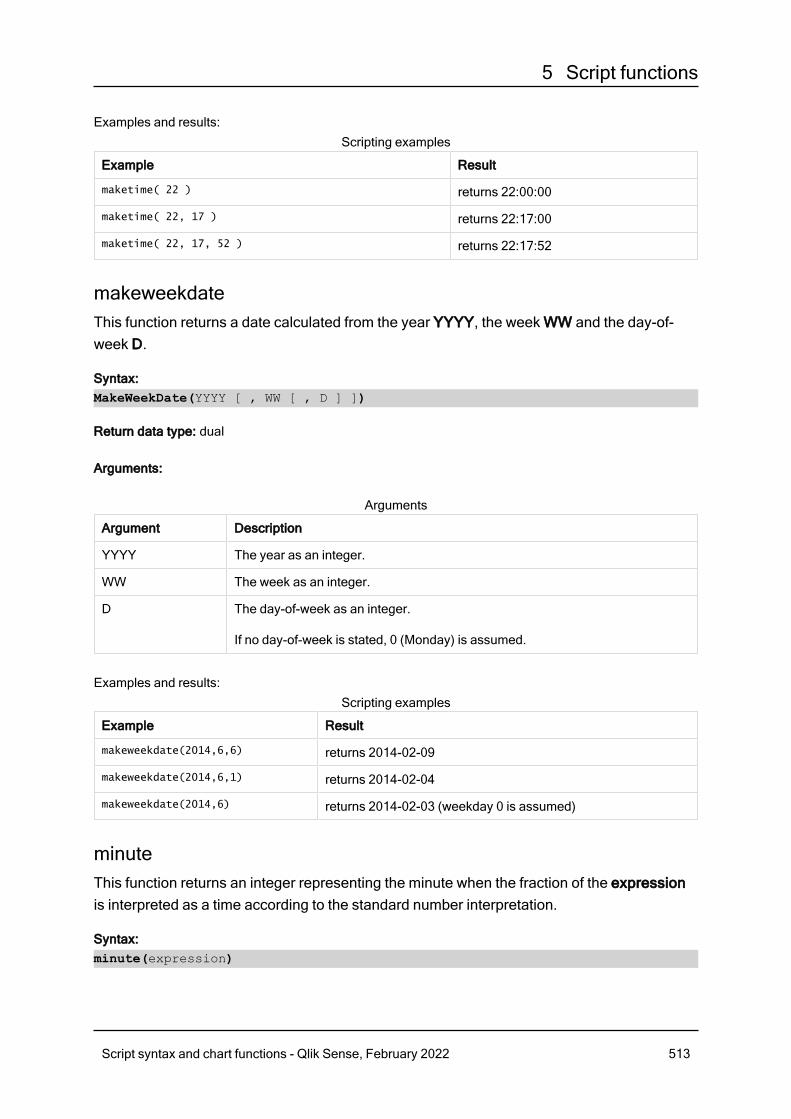
5 Script functions
Examples and results:
Example Result
maketime( 22 ) returns 22:00:00
maketime( 22, 17 ) returns 22:17:00
maketime( 22, 17, 52 ) returns 22:17:52
Scripting examples
makeweekdateThis function returns a date calculated from the year YYYY, the week WW and the day-of-week D.
Syntax:MakeWeekDate(YYYY [ , WW [ , D ] ])
Return data type: dual
Arguments:
Argument Description
YYYY The year as an integer.
WW The week as an integer.
D The day-of-week as an integer.
If no day-of-week is stated, 0 (Monday) is assumed.
Arguments
Examples and results:
Example Result
makeweekdate(2014,6,6) returns 2014-02-09
makeweekdate(2014,6,1) returns 2014-02-04
makeweekdate(2014,6) returns 2014-02-03 (weekday 0 is assumed)
Scripting examples
minuteThis function returns an integer representing the minute when the fraction of the expressionis interpreted as a time according to the standard number interpretation.
Syntax:minute(expression)
Script syntax and chart functions - Qlik Sense, February 2022 513
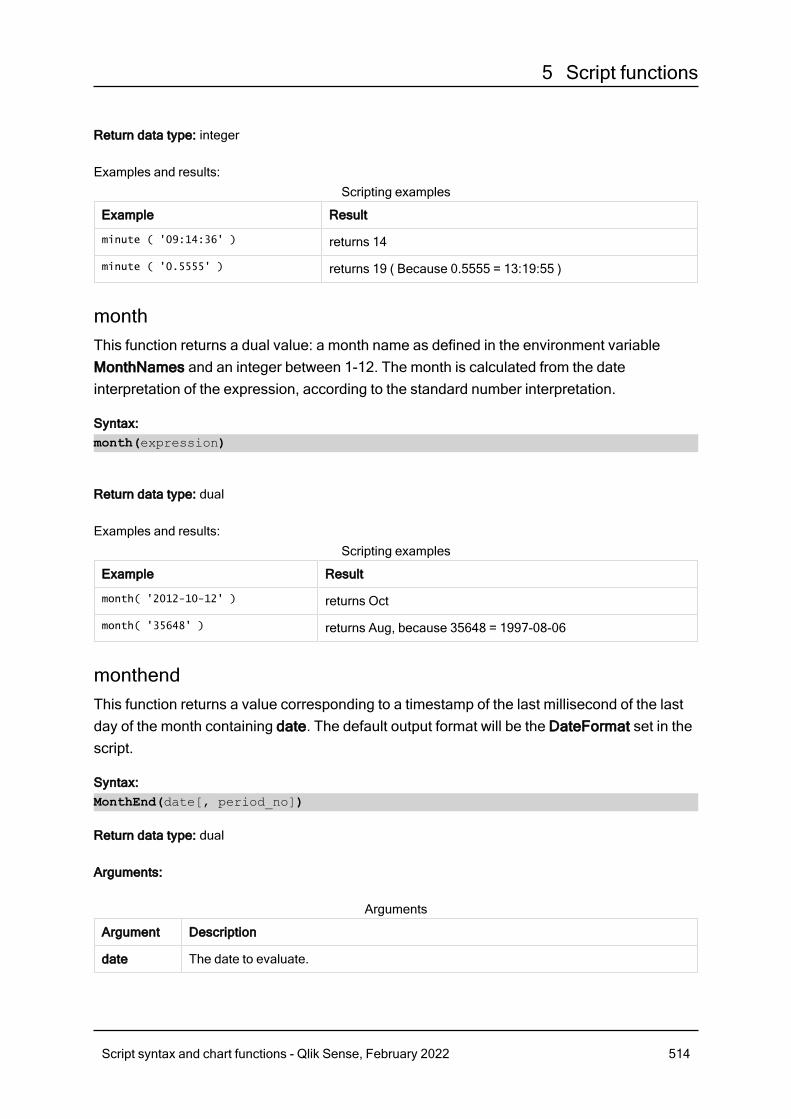
5 Script functions
Return data type: integer
Examples and results:
Example Result
minute ( '09:14:36' ) returns 14
minute ( '0.5555' ) returns 19 ( Because 0.5555 = 13:19:55 )
Scripting examples
monthThis function returns a dual value: a month name as defined in the environment variableMonthNames and an integer between 1-12. The month is calculated from the dateinterpretation of the expression, according to the standard number interpretation.
Syntax:month(expression)
Return data type: dual
Examples and results:
Example Result
month( '2012-10-12' ) returns Oct
month( '35648' ) returns Aug, because 35648 = 1997-08-06
Scripting examples
monthendThis function returns a value corresponding to a timestamp of the last millisecond of the lastday of the month containing date. The default output format will be the DateFormat set in thescript.
Syntax:MonthEnd(date[, period_no])
Return data type: dual
Arguments:
Argument Description
date The date to evaluate.
Arguments
Script syntax and chart functions - Qlik Sense, February 2022 514
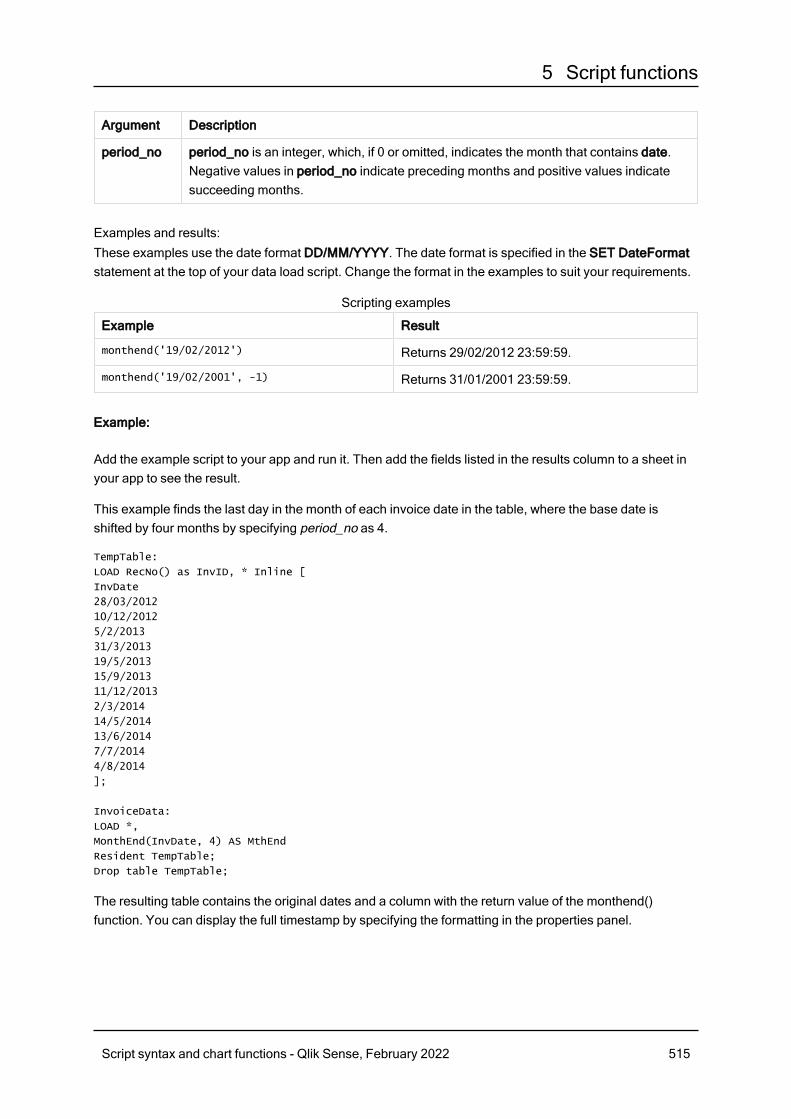
5 Script functions
Argument Description
period_no period_no is an integer, which, if 0 or omitted, indicates the month that contains date.Negative values in period_no indicate preceding months and positive values indicatesucceeding months.
Examples and results:These examples use the date format DD/MM/YYYY. The date format is specified in the SET DateFormatstatement at the top of your data load script. Change the format in the examples to suit your requirements.
Example Result
monthend('19/02/2012') Returns 29/02/2012 23:59:59.
monthend('19/02/2001', -1) Returns 31/01/2001 23:59:59.
Scripting examples
Example:
Add the example script to your app and run it. Then add the fields listed in the results column to a sheet inyour app to see the result.
This example finds the last day in the month of each invoice date in the table, where the base date isshifted by four months by specifying period_no as 4.
TempTable:
LOAD RecNo() as InvID, * Inline [
InvDate
28/03/2012
10/12/2012
5/2/2013
31/3/2013
19/5/2013
15/9/2013
11/12/2013
2/3/2014
14/5/2014
13/6/2014
7/7/2014
4/8/2014
];
InvoiceData:
LOAD *,
MonthEnd(InvDate, 4) AS MthEnd
Resident TempTable;
Drop table TempTable;
The resulting table contains the original dates and a column with the return value of the monthend()function. You can display the full timestamp by specifying the formatting in the properties panel.
Script syntax and chart functions - Qlik Sense, February 2022 515
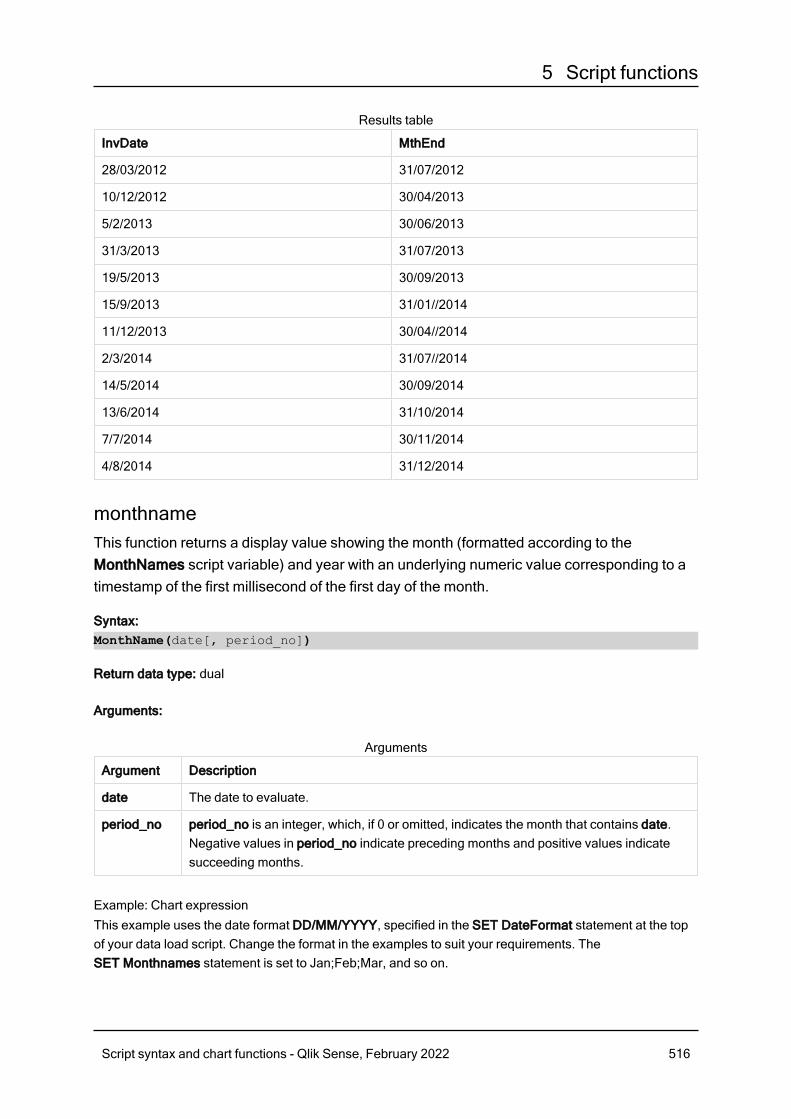
5 Script functions
InvDate MthEnd
28/03/2012 31/07/2012
10/12/2012 30/04/2013
5/2/2013 30/06/2013
31/3/2013 31/07/2013
19/5/2013 30/09/2013
15/9/2013 31/01//2014
11/12/2013 30/04//2014
2/3/2014 31/07//2014
14/5/2014 30/09/2014
13/6/2014 31/10/2014
7/7/2014 30/11/2014
4/8/2014 31/12/2014
Results table
monthnameThis function returns a display value showing the month (formatted according to theMonthNames script variable) and year with an underlying numeric value corresponding to atimestamp of the first millisecond of the first day of the month.
Syntax:MonthName(date[, period_no])
Return data type: dual
Arguments:
Argument Description
date The date to evaluate.
period_no period_no is an integer, which, if 0 or omitted, indicates the month that contains date.Negative values in period_no indicate preceding months and positive values indicatesucceeding months.
Arguments
Example: Chart expressionThis example uses the date format DD/MM/YYYY, specified in the SET DateFormat statement at the topof your data load script. Change the format in the examples to suit your requirements. TheSET Monthnames statement is set to Jan;Feb;Mar, and so on.
Script syntax and chart functions - Qlik Sense, February 2022 516

5 Script functions
Example Result
monthname('19/10/2013') Returns Oct 2013
monthname('19/10/2013', -1) Returns Sep 2013
Chart expression examples
Example: Load scriptIn this example, for each invoice date in the table, the month name is created from the month name shiftedfour months from base_date, and from the year.
In the Data load editor, create a new section, and then add the example script and run it. Then add, atleast, the fields listed in the results column to a sheet in your app to see the result.
Load script
TempTable:
LOAD RecNo() as InvID, * Inline [
InvDate
28/03/2012
10/12/2012
5/2/2013
31/3/2013
19/5/2013
15/9/2013
11/12/2013
2/3/2014
14/5/2014
13/6/2014
7/7/2014
4/8/2014
];
InvoiceData:
LOAD *,
MonthName(InvDate, 4) AS MthName
Resident TempTable;
Drop table TempTable;
Results
InvDate MthName
28/03/2012 Jul 2012
10/12/2012 Apr 2013
5/2/2013 Jun 2013
The resulting table contains theoriginal dates and a columnwith the return value of themonthname() function..
Script syntax and chart functions - Qlik Sense, February 2022 517
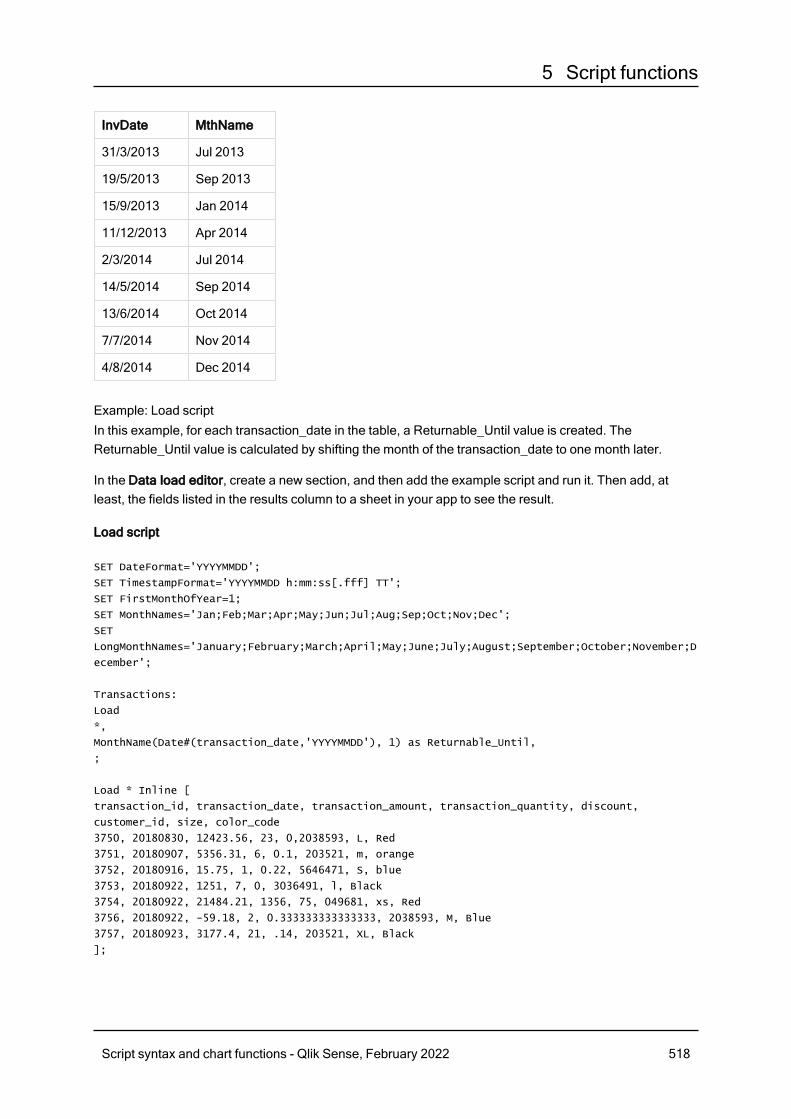
5 Script functions
InvDate MthName
31/3/2013 Jul 2013
19/5/2013 Sep 2013
15/9/2013 Jan 2014
11/12/2013 Apr 2014
2/3/2014 Jul 2014
14/5/2014 Sep 2014
13/6/2014 Oct 2014
7/7/2014 Nov 2014
4/8/2014 Dec 2014
Example: Load scriptIn this example, for each transaction_date in the table, a Returnable_Until value is created. TheReturnable_Until value is calculated by shifting the month of the transaction_date to one month later.
In the Data load editor, create a new section, and then add the example script and run it. Then add, atleast, the fields listed in the results column to a sheet in your app to see the result.
Load script
SET DateFormat='YYYYMMDD';
SET TimestampFormat='YYYYMMDD h:mm:ss[.fff] TT';
SET FirstMonthOfYear=1;
SET MonthNames='Jan;Feb;Mar;Apr;May;Jun;Jul;Aug;Sep;Oct;Nov;Dec';
SET
LongMonthNames='January;February;March;April;May;June;July;August;September;October;November;D
ecember';
Transactions:
Load
*,
MonthName(Date#(transaction_date,'YYYYMMDD'), 1) as Returnable_Until,
;
Load * Inline [
transaction_id, transaction_date, transaction_amount, transaction_quantity, discount,
customer_id, size, color_code
3750, 20180830, 12423.56, 23, 0,2038593, L, Red
3751, 20180907, 5356.31, 6, 0.1, 203521, m, orange
3752, 20180916, 15.75, 1, 0.22, 5646471, S, blue
3753, 20180922, 1251, 7, 0, 3036491, l, Black
3754, 20180922, 21484.21, 1356, 75, 049681, xs, Red
3756, 20180922, -59.18, 2, 0.333333333333333, 2038593, M, Blue
3757, 20180923, 3177.4, 21, .14, 203521, XL, Black
];
Script syntax and chart functions - Qlik Sense, February 2022 518

5 Script functions
Results
transaction_id transaction_date Returnable_Until
3750 20180830 Sep 2018
3751 20180907 Oct 2018
3752 20180916 Oct 2018
3753 20180922 Oct 2018
3754 20180922 Oct 2018
3756 20180922 Oct 2018
3757 20180923 Oct 2018
Qlik Sense table showing results of the monthnamefunction being used in the load script.
monthsendThis function returns a value corresponding to a timestamp of the last millisecond of themonth, bi-month, quarter, tertial, or half-year containing a base date. It is also possible to findthe timestamp for a previous or following time period.
Syntax:MonthsEnd(n_months, date[, period_no [, first_month_of_year]])
Return data type: dual
Arguments:
Argument Description
n_months The number of months that defines the period. An integer or expression that resolves toan integer that must be one of: 1 (equivalent to the inmonth() function), 2 (bi-month), 3(equivalent to the inquarter() function), 4 (tertial), or 6 (half year).
date The date to evaluate.
period_no The period can be offset by period_no, an integer, or expression resolving to an integer,where the value 0 indicates the period that contains base_date. Negative values inperiod_no indicate preceding periods and positive values indicate succeeding periods.
first_month_of_year
If you want to work with (fiscal) years not starting in January, indicate a value between 2and 12 in first_month_of_year.
Arguments
Script syntax and chart functions - Qlik Sense, February 2022 519
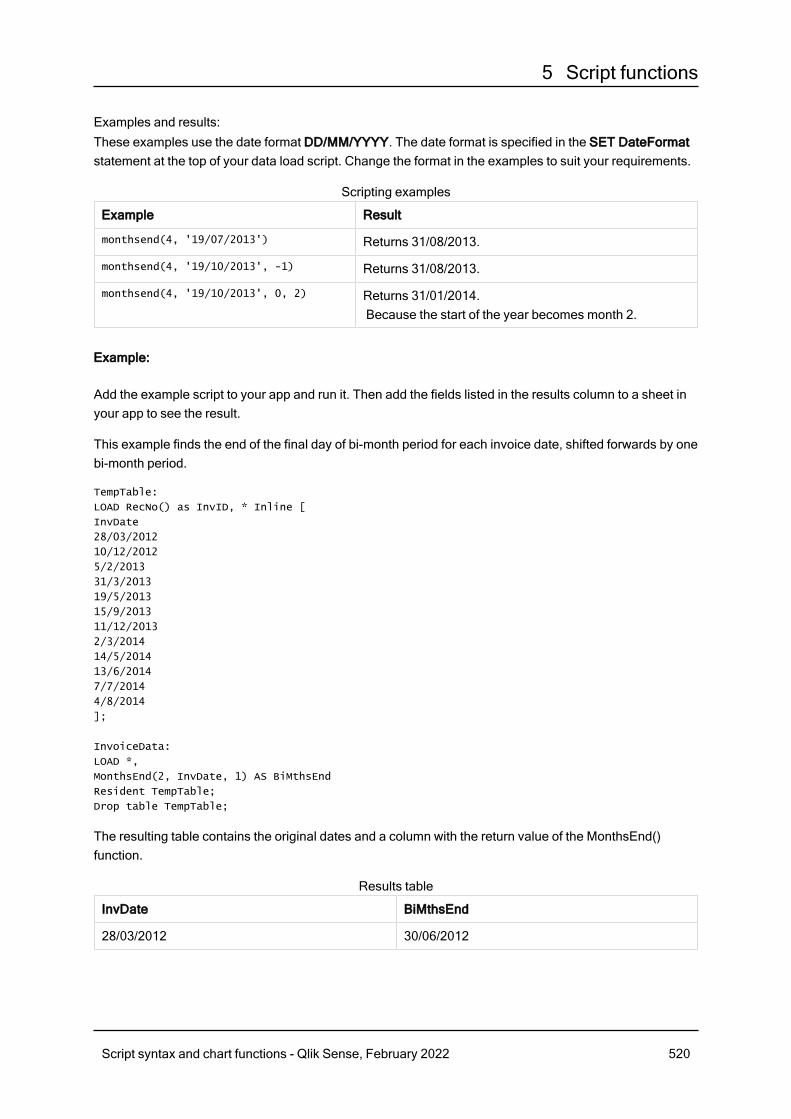
5 Script functions
Examples and results:These examples use the date format DD/MM/YYYY. The date format is specified in the SET DateFormatstatement at the top of your data load script. Change the format in the examples to suit your requirements.
Example Result
monthsend(4, '19/07/2013') Returns 31/08/2013.
monthsend(4, '19/10/2013', -1) Returns 31/08/2013.
monthsend(4, '19/10/2013', 0, 2) Returns 31/01/2014.Because the start of the year becomes month 2.
Scripting examples
Example:
Add the example script to your app and run it. Then add the fields listed in the results column to a sheet inyour app to see the result.
This example finds the end of the final day of bi-month period for each invoice date, shifted forwards by onebi-month period.
TempTable:
LOAD RecNo() as InvID, * Inline [
InvDate
28/03/2012
10/12/2012
5/2/2013
31/3/2013
19/5/2013
15/9/2013
11/12/2013
2/3/2014
14/5/2014
13/6/2014
7/7/2014
4/8/2014
];
InvoiceData:
LOAD *,
MonthsEnd(2, InvDate, 1) AS BiMthsEnd
Resident TempTable;
Drop table TempTable;
The resulting table contains the original dates and a column with the return value of the MonthsEnd()function.
InvDate BiMthsEnd
28/03/2012 30/06/2012
Results table
Script syntax and chart functions - Qlik Sense, February 2022 520
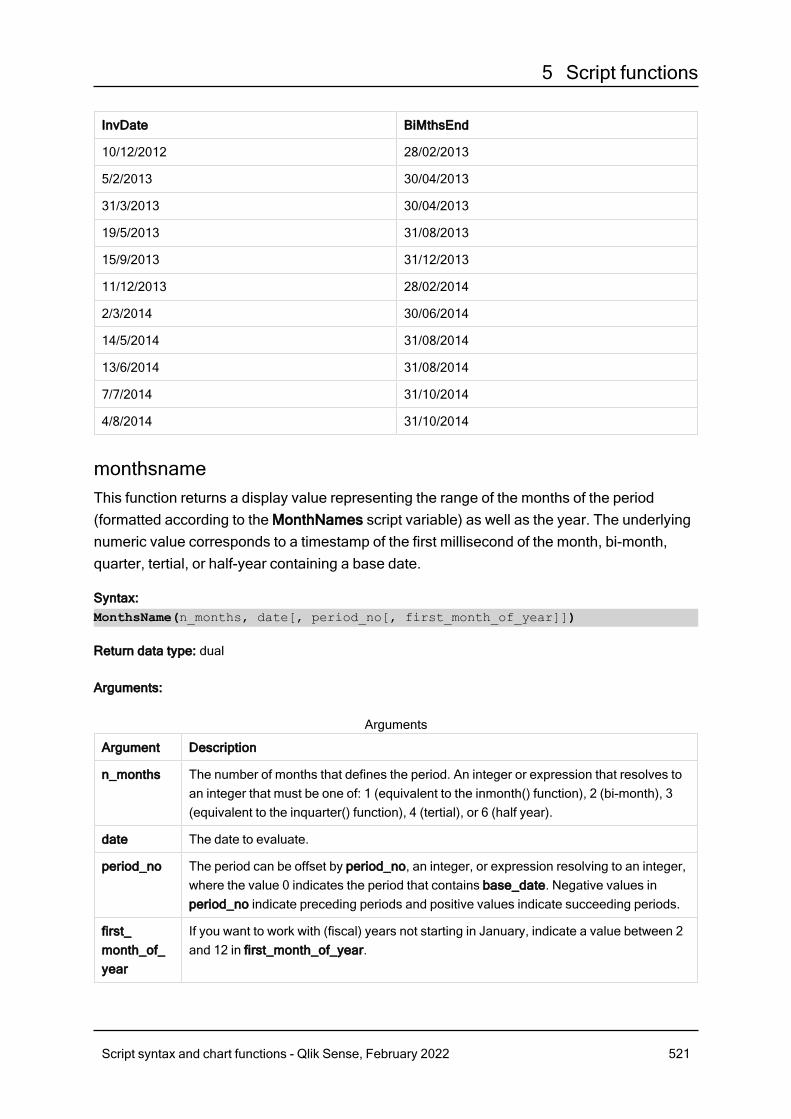
5 Script functions
InvDate BiMthsEnd
10/12/2012 28/02/2013
5/2/2013 30/04/2013
31/3/2013 30/04/2013
19/5/2013 31/08/2013
15/9/2013 31/12/2013
11/12/2013 28/02/2014
2/3/2014 30/06/2014
14/5/2014 31/08/2014
13/6/2014 31/08/2014
7/7/2014 31/10/2014
4/8/2014 31/10/2014
monthsnameThis function returns a display value representing the range of the months of the period(formatted according to the MonthNames script variable) as well as the year. The underlyingnumeric value corresponds to a timestamp of the first millisecond of the month, bi-month,quarter, tertial, or half-year containing a base date.
Syntax:MonthsName(n_months, date[, period_no[, first_month_of_year]])
Return data type: dual
Arguments:
Argument Description
n_months The number of months that defines the period. An integer or expression that resolves toan integer that must be one of: 1 (equivalent to the inmonth() function), 2 (bi-month), 3(equivalent to the inquarter() function), 4 (tertial), or 6 (half year).
date The date to evaluate.
period_no The period can be offset by period_no, an integer, or expression resolving to an integer,where the value 0 indicates the period that contains base_date. Negative values inperiod_no indicate preceding periods and positive values indicate succeeding periods.
first_month_of_year
If you want to work with (fiscal) years not starting in January, indicate a value between 2and 12 in first_month_of_year.
Arguments
Script syntax and chart functions - Qlik Sense, February 2022 521
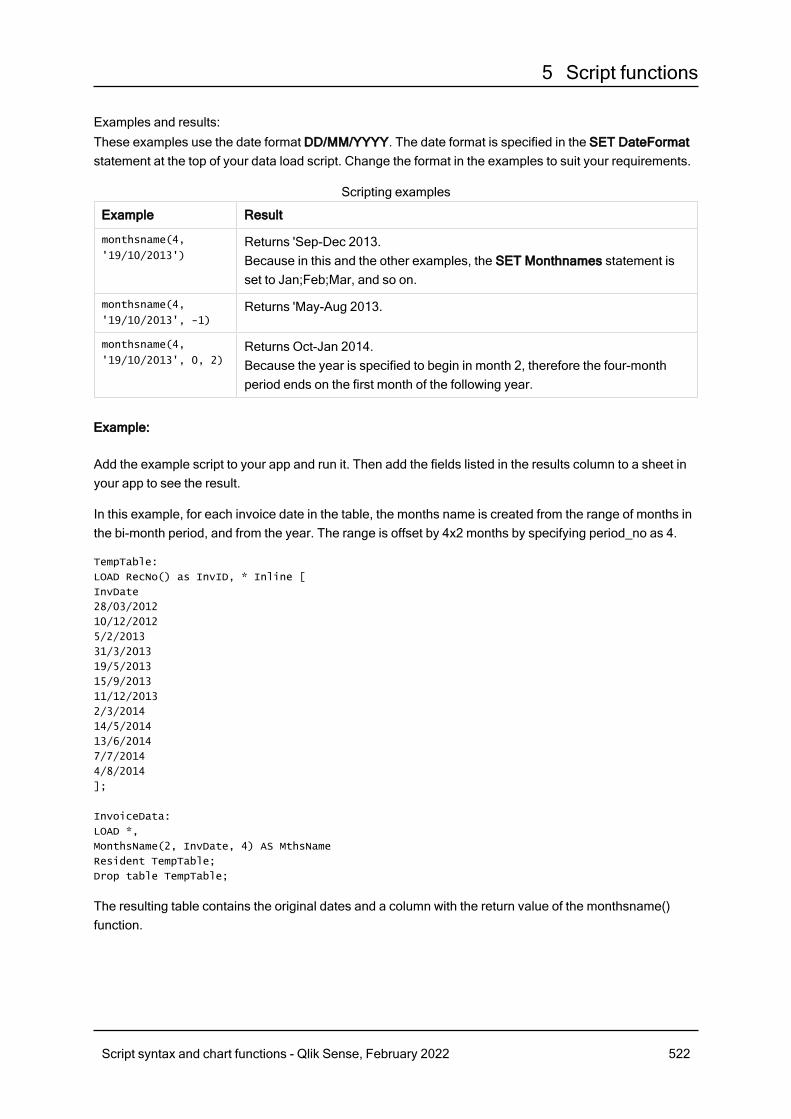
5 Script functions
Examples and results:These examples use the date format DD/MM/YYYY. The date format is specified in the SET DateFormatstatement at the top of your data load script. Change the format in the examples to suit your requirements.
Example Result
monthsname(4,
'19/10/2013')Returns 'Sep-Dec 2013.Because in this and the other examples, the SET Monthnames statement isset to Jan;Feb;Mar, and so on.
monthsname(4,
'19/10/2013', -1)Returns 'May-Aug 2013.
monthsname(4,
'19/10/2013', 0, 2)Returns Oct-Jan 2014.Because the year is specified to begin in month 2, therefore the four-monthperiod ends on the first month of the following year.
Scripting examples
Example:
Add the example script to your app and run it. Then add the fields listed in the results column to a sheet inyour app to see the result.
In this example, for each invoice date in the table, the months name is created from the range of months inthe bi-month period, and from the year. The range is offset by 4x2 months by specifying period_no as 4.
TempTable:
LOAD RecNo() as InvID, * Inline [
InvDate
28/03/2012
10/12/2012
5/2/2013
31/3/2013
19/5/2013
15/9/2013
11/12/2013
2/3/2014
14/5/2014
13/6/2014
7/7/2014
4/8/2014
];
InvoiceData:
LOAD *,
MonthsName(2, InvDate, 4) AS MthsName
Resident TempTable;
Drop table TempTable;
The resulting table contains the original dates and a column with the return value of the monthsname()function.
Script syntax and chart functions - Qlik Sense, February 2022 522
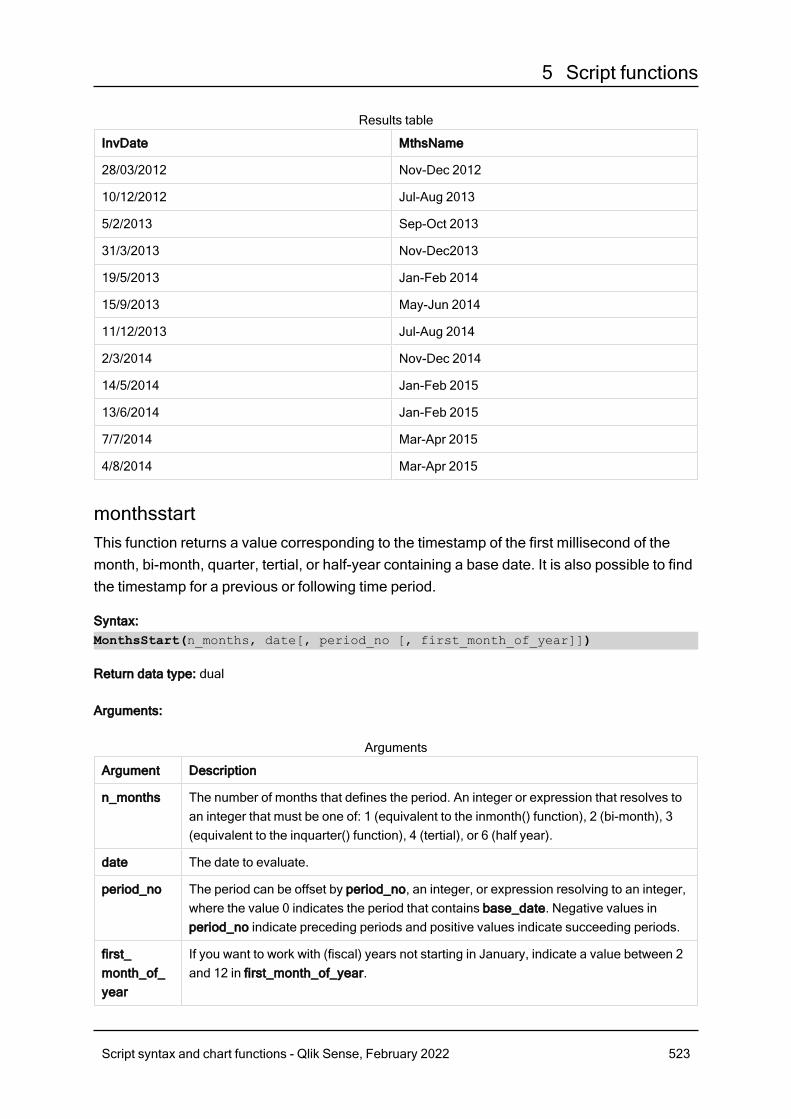
5 Script functions
InvDate MthsName
28/03/2012 Nov-Dec 2012
10/12/2012 Jul-Aug 2013
5/2/2013 Sep-Oct 2013
31/3/2013 Nov-Dec2013
19/5/2013 Jan-Feb 2014
15/9/2013 May-Jun 2014
11/12/2013 Jul-Aug 2014
2/3/2014 Nov-Dec 2014
14/5/2014 Jan-Feb 2015
13/6/2014 Jan-Feb 2015
7/7/2014 Mar-Apr 2015
4/8/2014 Mar-Apr 2015
Results table
monthsstartThis function returns a value corresponding to the timestamp of the first millisecond of themonth, bi-month, quarter, tertial, or half-year containing a base date. It is also possible to findthe timestamp for a previous or following time period.
Syntax:MonthsStart(n_months, date[, period_no [, first_month_of_year]])
Return data type: dual
Arguments:
Argument Description
n_months The number of months that defines the period. An integer or expression that resolves toan integer that must be one of: 1 (equivalent to the inmonth() function), 2 (bi-month), 3(equivalent to the inquarter() function), 4 (tertial), or 6 (half year).
date The date to evaluate.
period_no The period can be offset by period_no, an integer, or expression resolving to an integer,where the value 0 indicates the period that contains base_date. Negative values inperiod_no indicate preceding periods and positive values indicate succeeding periods.
first_month_of_year
If you want to work with (fiscal) years not starting in January, indicate a value between 2and 12 in first_month_of_year.
Arguments
Script syntax and chart functions - Qlik Sense, February 2022 523
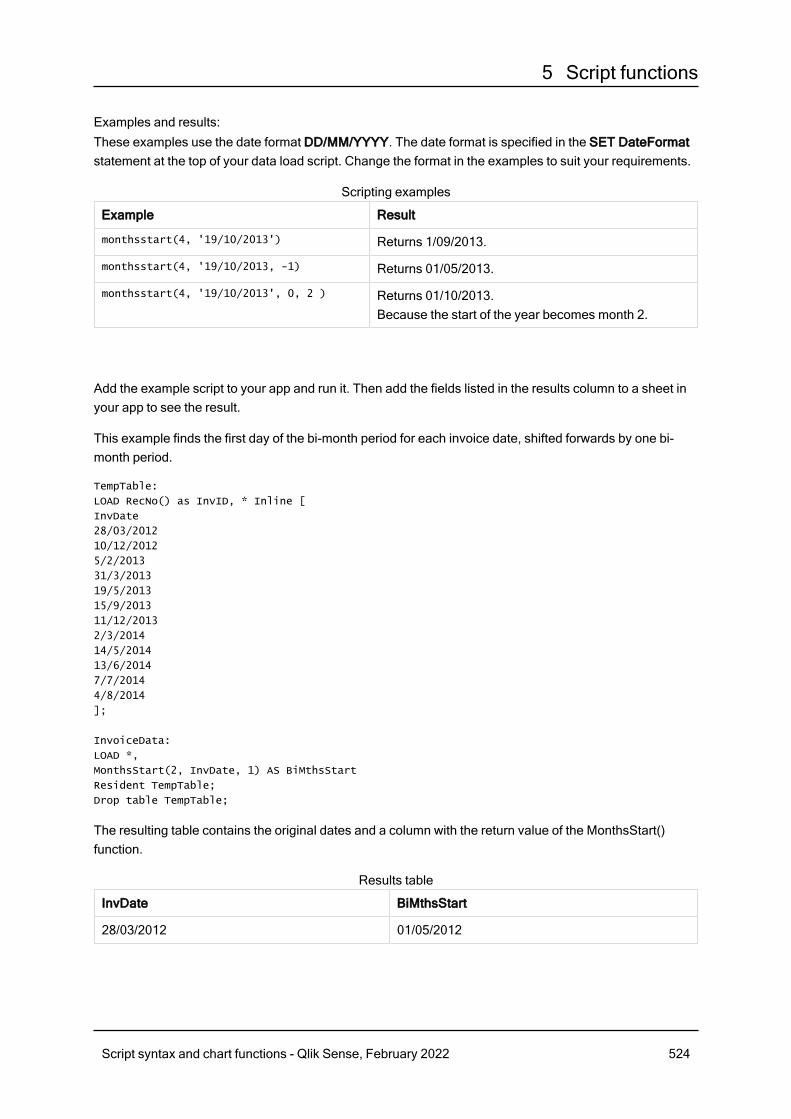
5 Script functions
Examples and results:These examples use the date format DD/MM/YYYY. The date format is specified in the SET DateFormatstatement at the top of your data load script. Change the format in the examples to suit your requirements.
Example Result
monthsstart(4, '19/10/2013') Returns 1/09/2013.
monthsstart(4, '19/10/2013, -1) Returns 01/05/2013.
monthsstart(4, '19/10/2013', 0, 2 ) Returns 01/10/2013.Because the start of the year becomes month 2.
Scripting examples
Add the example script to your app and run it. Then add the fields listed in the results column to a sheet inyour app to see the result.
This example finds the first day of the bi-month period for each invoice date, shifted forwards by one bi-month period.
TempTable:
LOAD RecNo() as InvID, * Inline [
InvDate
28/03/2012
10/12/2012
5/2/2013
31/3/2013
19/5/2013
15/9/2013
11/12/2013
2/3/2014
14/5/2014
13/6/2014
7/7/2014
4/8/2014
];
InvoiceData:
LOAD *,
MonthsStart(2, InvDate, 1) AS BiMthsStart
Resident TempTable;
Drop table TempTable;
The resulting table contains the original dates and a column with the return value of the MonthsStart()function.
InvDate BiMthsStart
28/03/2012 01/05/2012
Results table
Script syntax and chart functions - Qlik Sense, February 2022 524
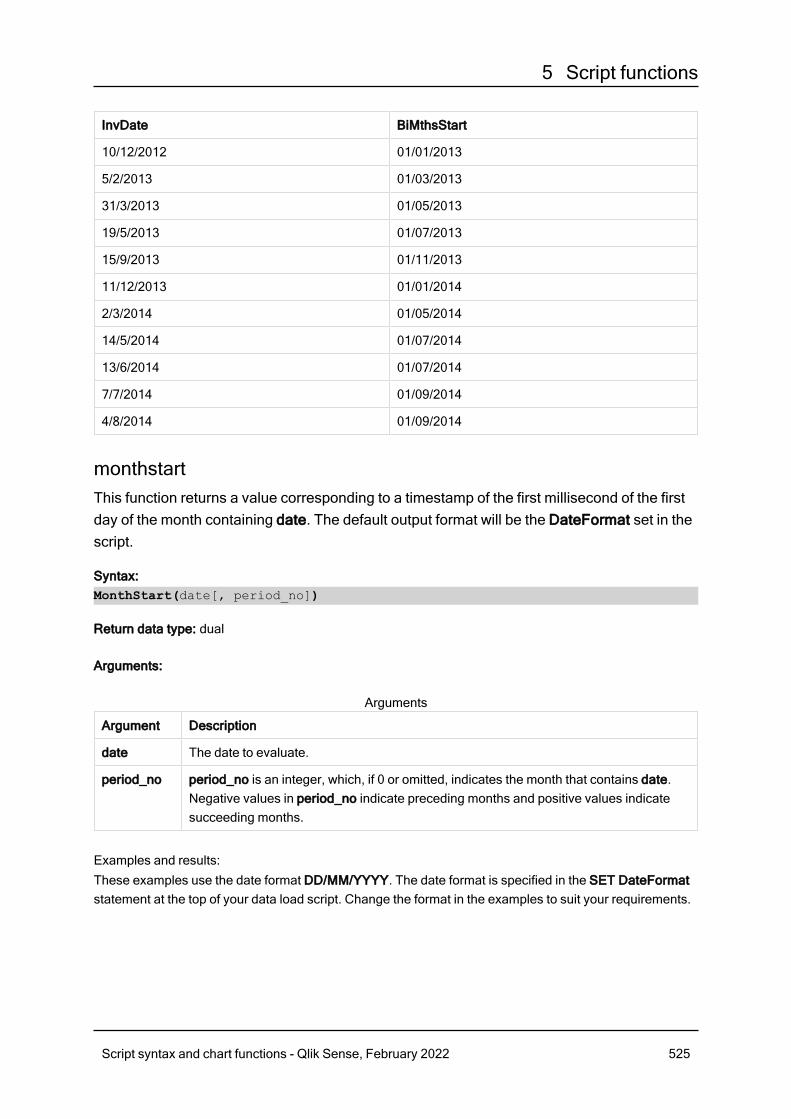
5 Script functions
InvDate BiMthsStart
10/12/2012 01/01/2013
5/2/2013 01/03/2013
31/3/2013 01/05/2013
19/5/2013 01/07/2013
15/9/2013 01/11/2013
11/12/2013 01/01/2014
2/3/2014 01/05/2014
14/5/2014 01/07/2014
13/6/2014 01/07/2014
7/7/2014 01/09/2014
4/8/2014 01/09/2014
monthstartThis function returns a value corresponding to a timestamp of the first millisecond of the firstday of the month containing date. The default output format will be the DateFormat set in thescript.
Syntax:MonthStart(date[, period_no])
Return data type: dual
Arguments:
Argument Description
date The date to evaluate.
period_no period_no is an integer, which, if 0 or omitted, indicates the month that contains date.Negative values in period_no indicate preceding months and positive values indicatesucceeding months.
Arguments
Examples and results:These examples use the date format DD/MM/YYYY. The date format is specified in the SET DateFormatstatement at the top of your data load script. Change the format in the examples to suit your requirements.
Script syntax and chart functions - Qlik Sense, February 2022 525
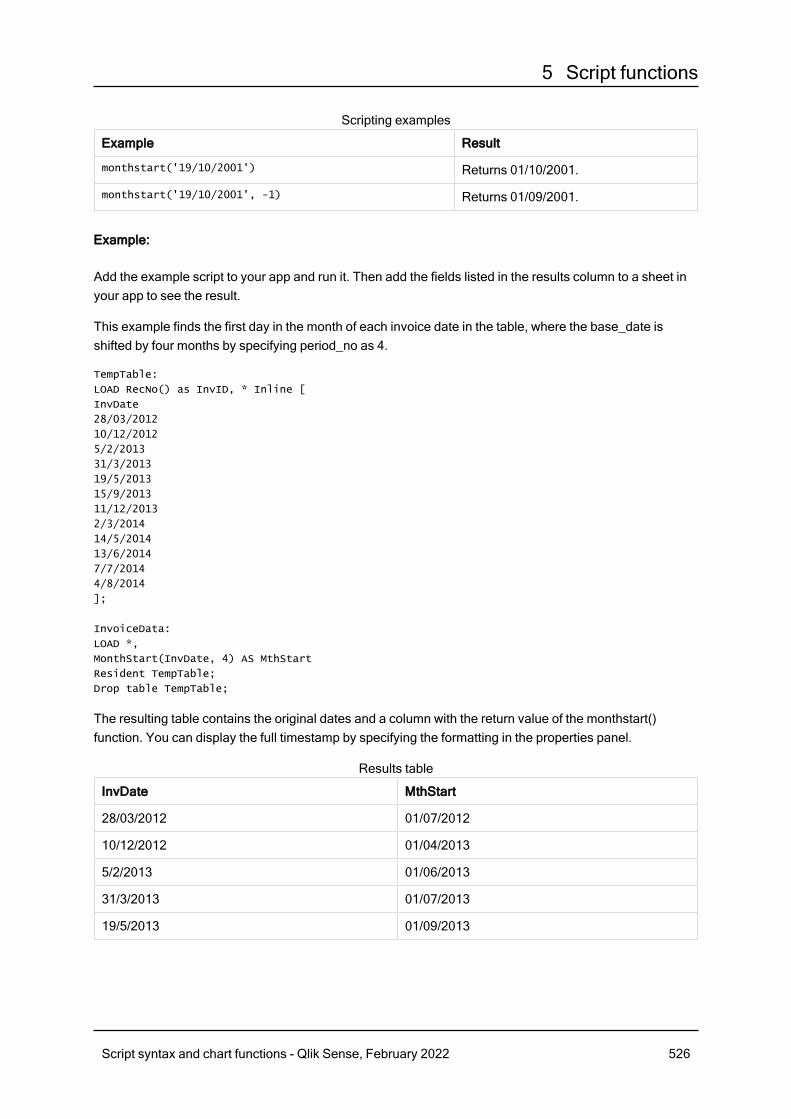
5 Script functions
Example Result
monthstart('19/10/2001') Returns 01/10/2001.
monthstart('19/10/2001', -1) Returns 01/09/2001.
Scripting examples
Example:
Add the example script to your app and run it. Then add the fields listed in the results column to a sheet inyour app to see the result.
This example finds the first day in the month of each invoice date in the table, where the base_date isshifted by four months by specifying period_no as 4.
TempTable:
LOAD RecNo() as InvID, * Inline [
InvDate
28/03/2012
10/12/2012
5/2/2013
31/3/2013
19/5/2013
15/9/2013
11/12/2013
2/3/2014
14/5/2014
13/6/2014
7/7/2014
4/8/2014
];
InvoiceData:
LOAD *,
MonthStart(InvDate, 4) AS MthStart
Resident TempTable;
Drop table TempTable;
The resulting table contains the original dates and a column with the return value of the monthstart()function. You can display the full timestamp by specifying the formatting in the properties panel.
InvDate MthStart
28/03/2012 01/07/2012
10/12/2012 01/04/2013
5/2/2013 01/06/2013
31/3/2013 01/07/2013
19/5/2013 01/09/2013
Results table
Script syntax and chart functions - Qlik Sense, February 2022 526
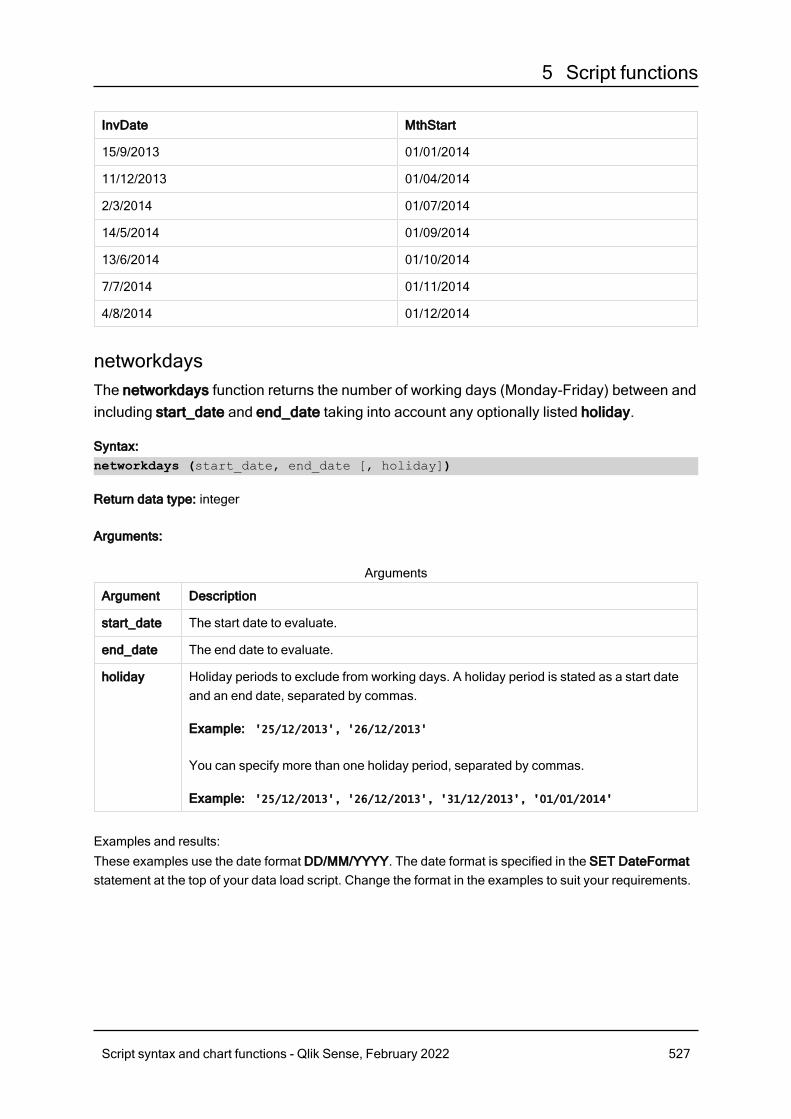
5 Script functions
InvDate MthStart
15/9/2013 01/01/2014
11/12/2013 01/04/2014
2/3/2014 01/07/2014
14/5/2014 01/09/2014
13/6/2014 01/10/2014
7/7/2014 01/11/2014
4/8/2014 01/12/2014
networkdaysThe networkdays function returns the number of working days (Monday-Friday) between andincluding start_date and end_date taking into account any optionally listed holiday.
Syntax:networkdays (start_date, end_date [, holiday])
Return data type: integer
Arguments:
Argument Description
start_date The start date to evaluate.
end_date The end date to evaluate.
holiday Holiday periods to exclude from working days. A holiday period is stated as a start dateand an end date, separated by commas.
Example: '25/12/2013', '26/12/2013'
You can specify more than one holiday period, separated by commas.
Example: '25/12/2013', '26/12/2013', '31/12/2013', '01/01/2014'
Arguments
Examples and results:These examples use the date format DD/MM/YYYY. The date format is specified in the SET DateFormatstatement at the top of your data load script. Change the format in the examples to suit your requirements.
Script syntax and chart functions - Qlik Sense, February 2022 527
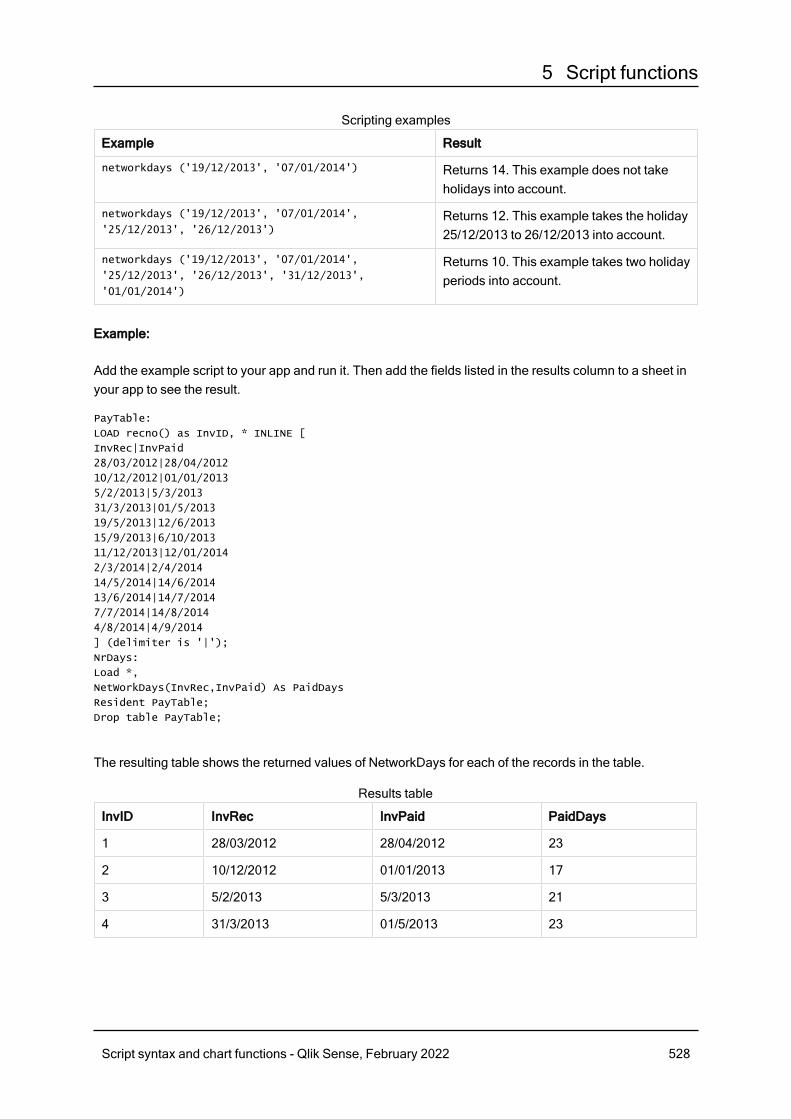
5 Script functions
Example Result
networkdays ('19/12/2013', '07/01/2014') Returns 14. This example does not takeholidays into account.
networkdays ('19/12/2013', '07/01/2014',
'25/12/2013', '26/12/2013')Returns 12. This example takes the holiday25/12/2013 to 26/12/2013 into account.
networkdays ('19/12/2013', '07/01/2014',
'25/12/2013', '26/12/2013', '31/12/2013',
'01/01/2014')
Returns 10. This example takes two holidayperiods into account.
Scripting examples
Example:
Add the example script to your app and run it. Then add the fields listed in the results column to a sheet inyour app to see the result.
PayTable:
LOAD recno() as InvID, * INLINE [
InvRec|InvPaid
28/03/2012|28/04/2012
10/12/2012|01/01/2013
5/2/2013|5/3/2013
31/3/2013|01/5/2013
19/5/2013|12/6/2013
15/9/2013|6/10/2013
11/12/2013|12/01/2014
2/3/2014|2/4/2014
14/5/2014|14/6/2014
13/6/2014|14/7/2014
7/7/2014|14/8/2014
4/8/2014|4/9/2014
] (delimiter is '|');
NrDays:
Load *,
NetWorkDays(InvRec,InvPaid) As PaidDays
Resident PayTable;
Drop table PayTable;
The resulting table shows the returned values of NetworkDays for each of the records in the table.
InvID InvRec InvPaid PaidDays
1 28/03/2012 28/04/2012 23
2 10/12/2012 01/01/2013 17
3 5/2/2013 5/3/2013 21
4 31/3/2013 01/5/2013 23
Results table
Script syntax and chart functions - Qlik Sense, February 2022 528
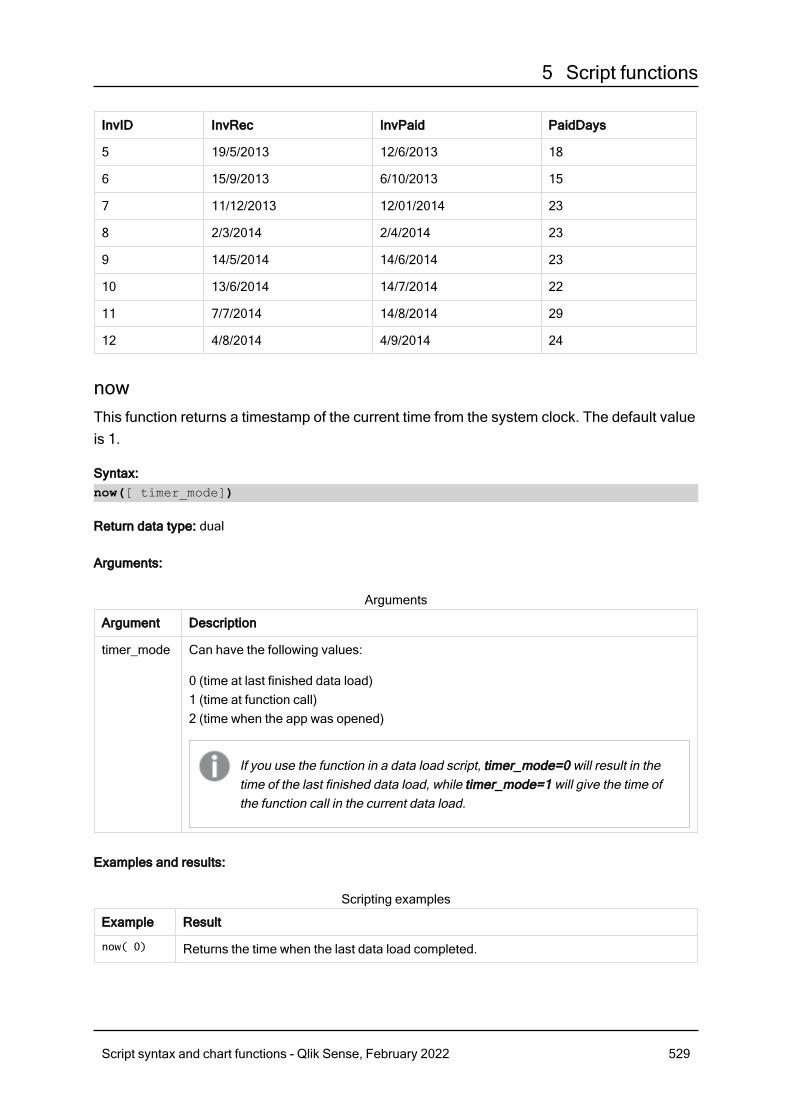
5 Script functions
InvID InvRec InvPaid PaidDays
5 19/5/2013 12/6/2013 18
6 15/9/2013 6/10/2013 15
7 11/12/2013 12/01/2014 23
8 2/3/2014 2/4/2014 23
9 14/5/2014 14/6/2014 23
10 13/6/2014 14/7/2014 22
11 7/7/2014 14/8/2014 29
12 4/8/2014 4/9/2014 24
nowThis function returns a timestamp of the current time from the system clock. The default valueis 1.
Syntax:now([ timer_mode])
Return data type: dual
Arguments:
Argument Description
timer_mode Can have the following values:
0 (time at last finished data load)1 (time at function call)2 (time when the app was opened)
If you use the function in a data load script, timer_mode=0 will result in thetime of the last finished data load, while timer_mode=1 will give the time ofthe function call in the current data load.
Arguments
Examples and results:
Example Result
now( 0) Returns the time when the last data load completed.
Scripting examples
Script syntax and chart functions - Qlik Sense, February 2022 529
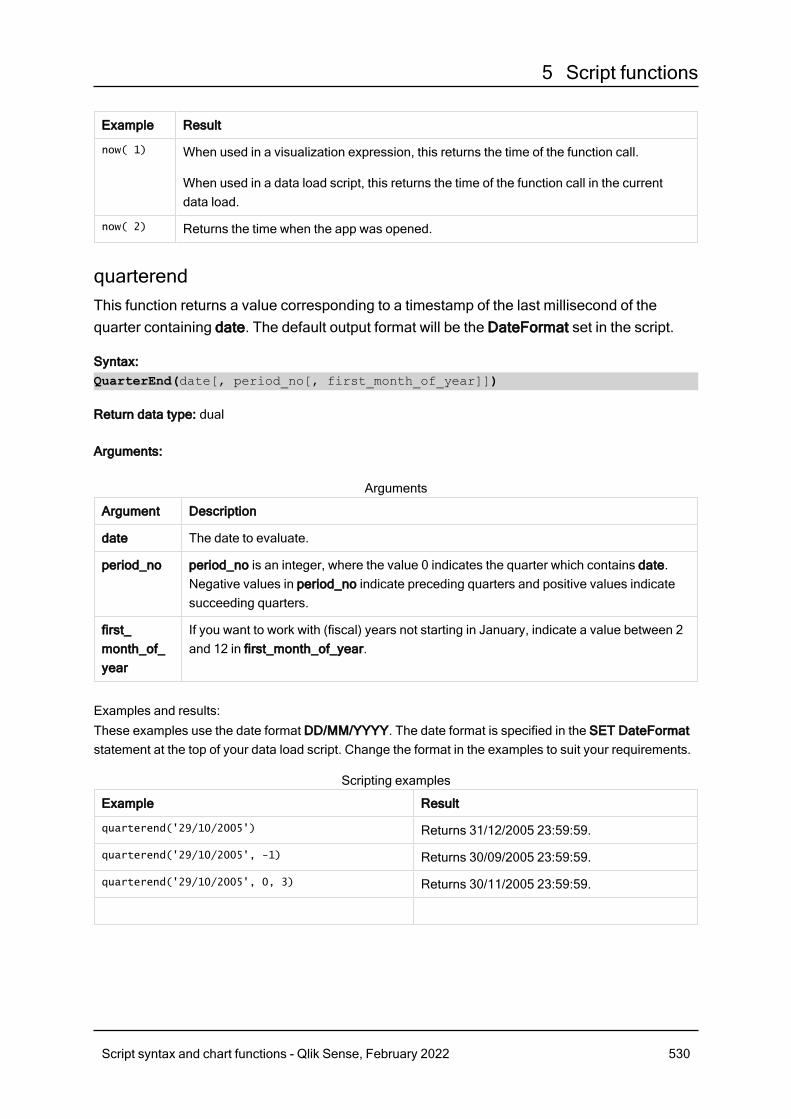
5 Script functions
Example Result
now( 1) When used in a visualization expression, this returns the time of the function call.
When used in a data load script, this returns the time of the function call in the currentdata load.
now( 2) Returns the time when the app was opened.
quarterendThis function returns a value corresponding to a timestamp of the last millisecond of thequarter containing date. The default output format will be the DateFormat set in the script.
Syntax:QuarterEnd(date[, period_no[, first_month_of_year]])
Return data type: dual
Arguments:
Argument Description
date The date to evaluate.
period_no period_no is an integer, where the value 0 indicates the quarter which contains date.Negative values in period_no indicate preceding quarters and positive values indicatesucceeding quarters.
first_month_of_year
If you want to work with (fiscal) years not starting in January, indicate a value between 2and 12 in first_month_of_year.
Arguments
Examples and results:These examples use the date format DD/MM/YYYY. The date format is specified in the SET DateFormatstatement at the top of your data load script. Change the format in the examples to suit your requirements.
Example Result
quarterend('29/10/2005') Returns 31/12/2005 23:59:59.
quarterend('29/10/2005', -1) Returns 30/09/2005 23:59:59.
quarterend('29/10/2005', 0, 3) Returns 30/11/2005 23:59:59.
Scripting examples
Script syntax and chart functions - Qlik Sense, February 2022 530
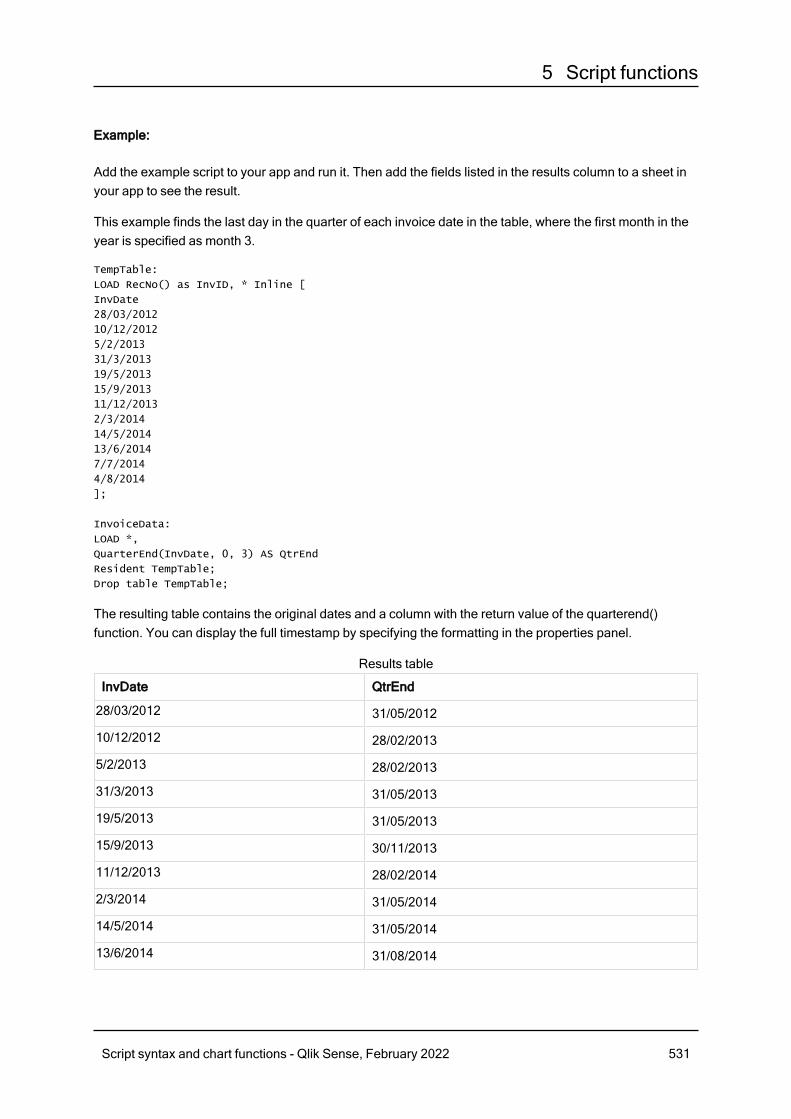
5 Script functions
Example:
Add the example script to your app and run it. Then add the fields listed in the results column to a sheet inyour app to see the result.
This example finds the last day in the quarter of each invoice date in the table, where the first month in theyear is specified as month 3.
TempTable:
LOAD RecNo() as InvID, * Inline [
InvDate
28/03/2012
10/12/2012
5/2/2013
31/3/2013
19/5/2013
15/9/2013
11/12/2013
2/3/2014
14/5/2014
13/6/2014
7/7/2014
4/8/2014
];
InvoiceData:
LOAD *,
QuarterEnd(InvDate, 0, 3) AS QtrEnd
Resident TempTable;
Drop table TempTable;
The resulting table contains the original dates and a column with the return value of the quarterend()function. You can display the full timestamp by specifying the formatting in the properties panel.
InvDate QtrEnd
28/03/2012 31/05/2012
10/12/2012 28/02/2013
5/2/2013 28/02/2013
31/3/2013 31/05/2013
19/5/2013 31/05/2013
15/9/2013 30/11/2013
11/12/2013 28/02/2014
2/3/2014 31/05/2014
14/5/2014 31/05/2014
13/6/2014 31/08/2014
Results table
Script syntax and chart functions - Qlik Sense, February 2022 531
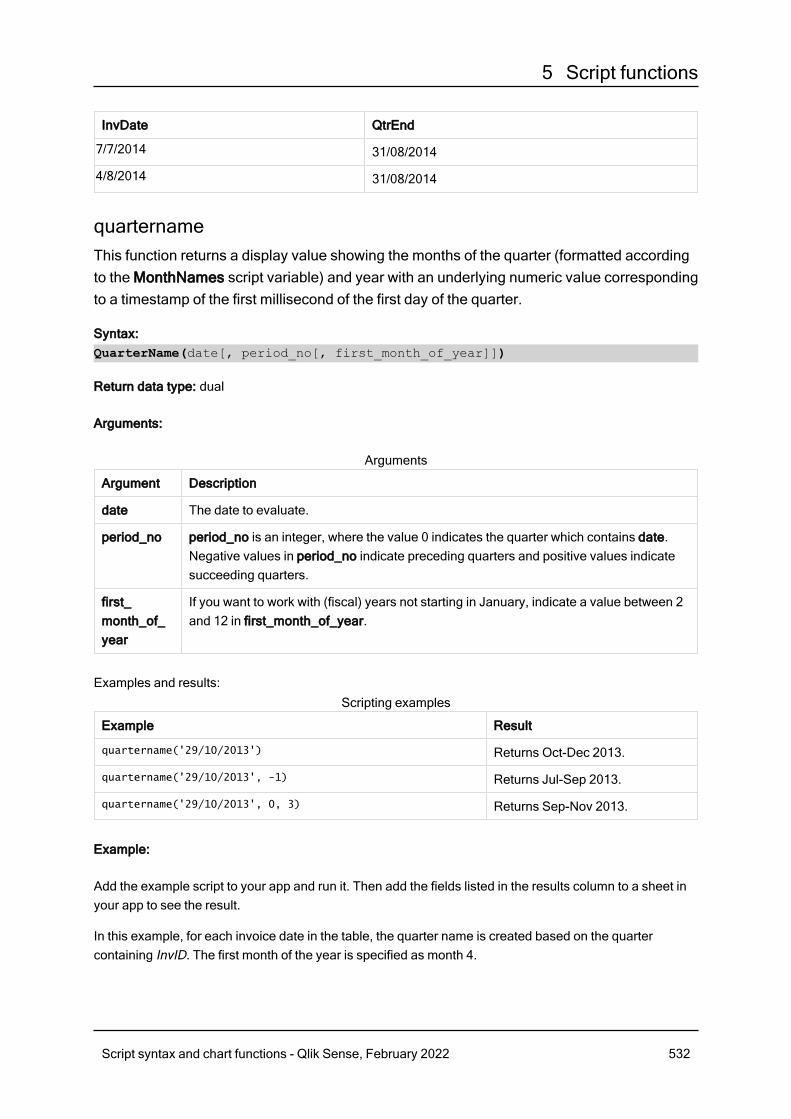
5 Script functions
InvDate QtrEnd
7/7/2014 31/08/2014
4/8/2014 31/08/2014
quarternameThis function returns a display value showing the months of the quarter (formatted accordingto the MonthNames script variable) and year with an underlying numeric value correspondingto a timestamp of the first millisecond of the first day of the quarter.
Syntax:QuarterName(date[, period_no[, first_month_of_year]])
Return data type: dual
Arguments:
Argument Description
date The date to evaluate.
period_no period_no is an integer, where the value 0 indicates the quarter which contains date.Negative values in period_no indicate preceding quarters and positive values indicatesucceeding quarters.
first_month_of_year
If you want to work with (fiscal) years not starting in January, indicate a value between 2and 12 in first_month_of_year.
Arguments
Examples and results:
Example Result
quartername('29/10/2013') Returns Oct-Dec 2013.
quartername('29/10/2013', -1) Returns Jul-Sep 2013.
quartername('29/10/2013', 0, 3) Returns Sep-Nov 2013.
Scripting examples
Example:
Add the example script to your app and run it. Then add the fields listed in the results column to a sheet inyour app to see the result.
In this example, for each invoice date in the table, the quarter name is created based on the quartercontaining InvID. The first month of the year is specified as month 4.
Script syntax and chart functions - Qlik Sense, February 2022 532
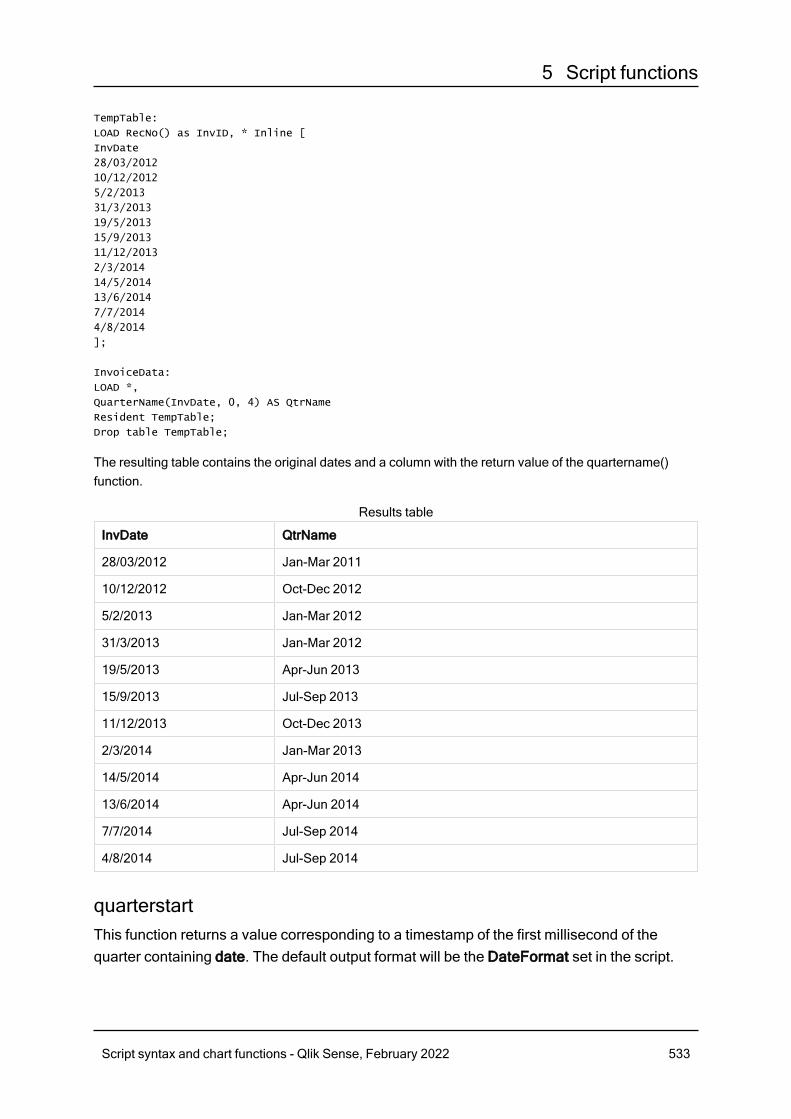
5 Script functions
TempTable:
LOAD RecNo() as InvID, * Inline [
InvDate
28/03/2012
10/12/2012
5/2/2013
31/3/2013
19/5/2013
15/9/2013
11/12/2013
2/3/2014
14/5/2014
13/6/2014
7/7/2014
4/8/2014
];
InvoiceData:
LOAD *,
QuarterName(InvDate, 0, 4) AS QtrName
Resident TempTable;
Drop table TempTable;
The resulting table contains the original dates and a column with the return value of the quartername()function.
InvDate QtrName
28/03/2012 Jan-Mar 2011
10/12/2012 Oct-Dec 2012
5/2/2013 Jan-Mar 2012
31/3/2013 Jan-Mar 2012
19/5/2013 Apr-Jun 2013
15/9/2013 Jul-Sep 2013
11/12/2013 Oct-Dec 2013
2/3/2014 Jan-Mar 2013
14/5/2014 Apr-Jun 2014
13/6/2014 Apr-Jun 2014
7/7/2014 Jul-Sep 2014
4/8/2014 Jul-Sep 2014
Results table
quarterstartThis function returns a value corresponding to a timestamp of the first millisecond of thequarter containing date. The default output format will be the DateFormat set in the script.
Script syntax and chart functions - Qlik Sense, February 2022 533
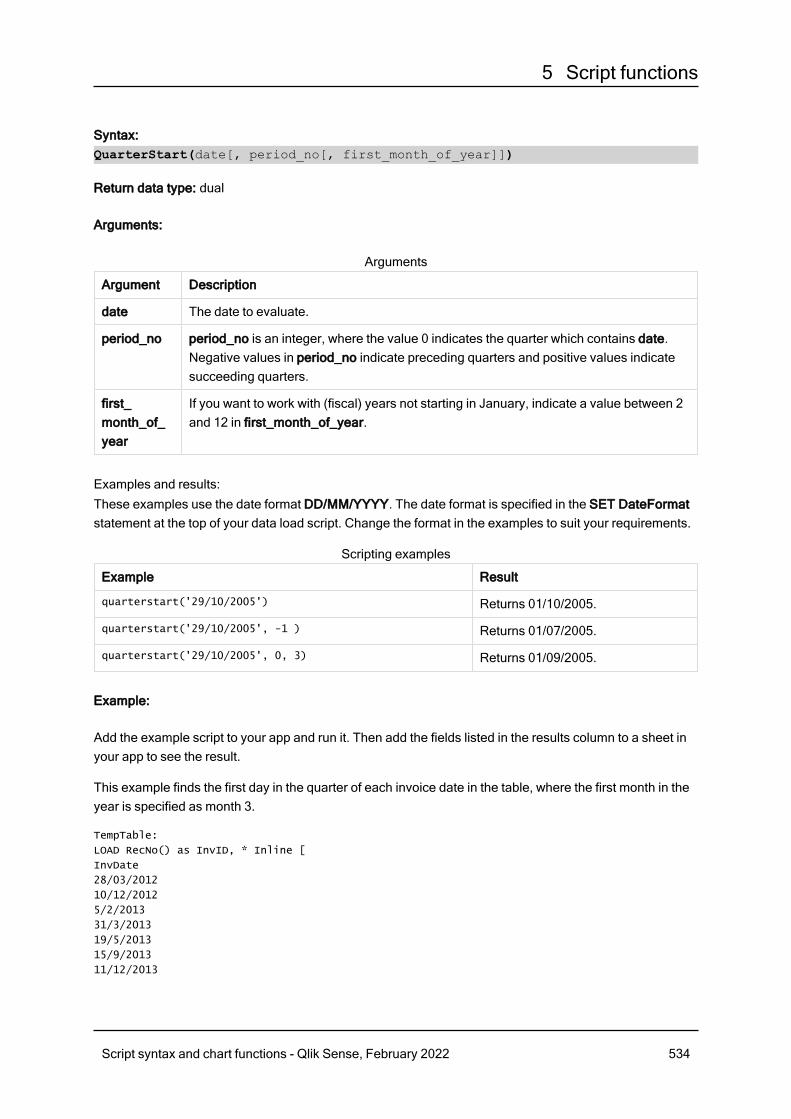
5 Script functions
Syntax:QuarterStart(date[, period_no[, first_month_of_year]])
Return data type: dual
Arguments:
Argument Description
date The date to evaluate.
period_no period_no is an integer, where the value 0 indicates the quarter which contains date.Negative values in period_no indicate preceding quarters and positive values indicatesucceeding quarters.
first_month_of_year
If you want to work with (fiscal) years not starting in January, indicate a value between 2and 12 in first_month_of_year.
Arguments
Examples and results:These examples use the date format DD/MM/YYYY. The date format is specified in the SET DateFormatstatement at the top of your data load script. Change the format in the examples to suit your requirements.
Example Result
quarterstart('29/10/2005') Returns 01/10/2005.
quarterstart('29/10/2005', -1 ) Returns 01/07/2005.
quarterstart('29/10/2005', 0, 3) Returns 01/09/2005.
Scripting examples
Example:
Add the example script to your app and run it. Then add the fields listed in the results column to a sheet inyour app to see the result.
This example finds the first day in the quarter of each invoice date in the table, where the first month in theyear is specified as month 3.
TempTable:
LOAD RecNo() as InvID, * Inline [
InvDate
28/03/2012
10/12/2012
5/2/2013
31/3/2013
19/5/2013
15/9/2013
11/12/2013
Script syntax and chart functions - Qlik Sense, February 2022 534
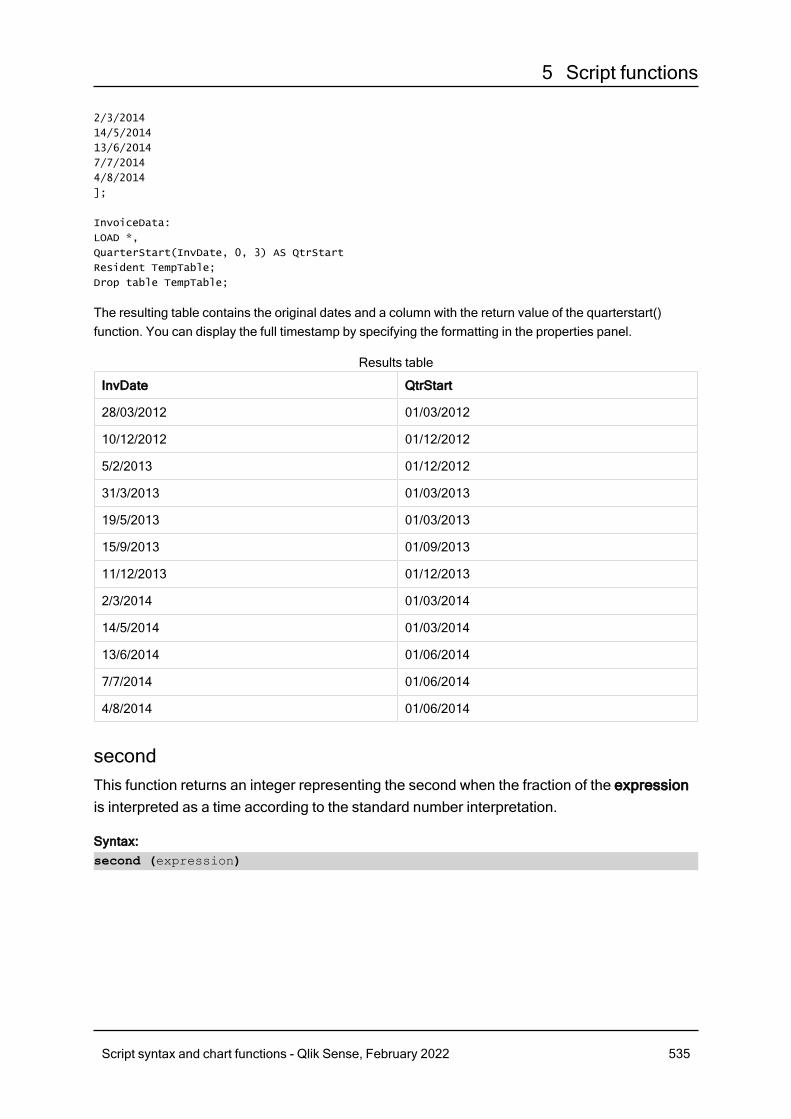
5 Script functions
2/3/2014
14/5/2014
13/6/2014
7/7/2014
4/8/2014
];
InvoiceData:
LOAD *,
QuarterStart(InvDate, 0, 3) AS QtrStart
Resident TempTable;
Drop table TempTable;
The resulting table contains the original dates and a column with the return value of the quarterstart()function. You can display the full timestamp by specifying the formatting in the properties panel.
InvDate QtrStart
28/03/2012 01/03/2012
10/12/2012 01/12/2012
5/2/2013 01/12/2012
31/3/2013 01/03/2013
19/5/2013 01/03/2013
15/9/2013 01/09/2013
11/12/2013 01/12/2013
2/3/2014 01/03/2014
14/5/2014 01/03/2014
13/6/2014 01/06/2014
7/7/2014 01/06/2014
4/8/2014 01/06/2014
Results table
secondThis function returns an integer representing the second when the fraction of the expressionis interpreted as a time according to the standard number interpretation.
Syntax:second (expression)
Script syntax and chart functions - Qlik Sense, February 2022 535
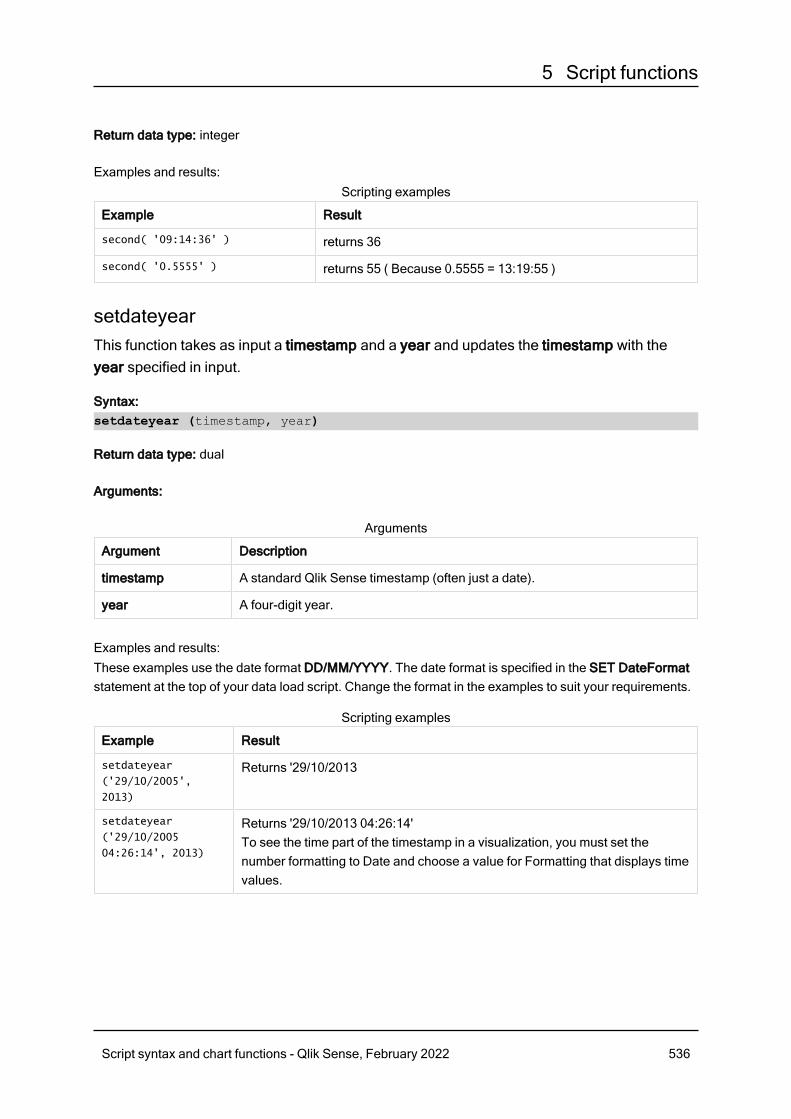
5 Script functions
Return data type: integer
Examples and results:
Example Result
second( '09:14:36' ) returns 36
second( '0.5555' ) returns 55 ( Because 0.5555 = 13:19:55 )
Scripting examples
setdateyearThis function takes as input a timestamp and a year and updates the timestamp with theyear specified in input.
Syntax:setdateyear (timestamp, year)
Return data type: dual
Arguments:
Argument Description
timestamp A standard Qlik Sense timestamp (often just a date).
year A four-digit year.
Arguments
Examples and results:These examples use the date format DD/MM/YYYY. The date format is specified in the SET DateFormatstatement at the top of your data load script. Change the format in the examples to suit your requirements.
Example Result
setdateyear
('29/10/2005',
2013)
Returns '29/10/2013
setdateyear
('29/10/2005
04:26:14', 2013)
Returns '29/10/2013 04:26:14'To see the time part of the timestamp in a visualization, you must set thenumber formatting to Date and choose a value for Formatting that displays timevalues.
Scripting examples
Script syntax and chart functions - Qlik Sense, February 2022 536
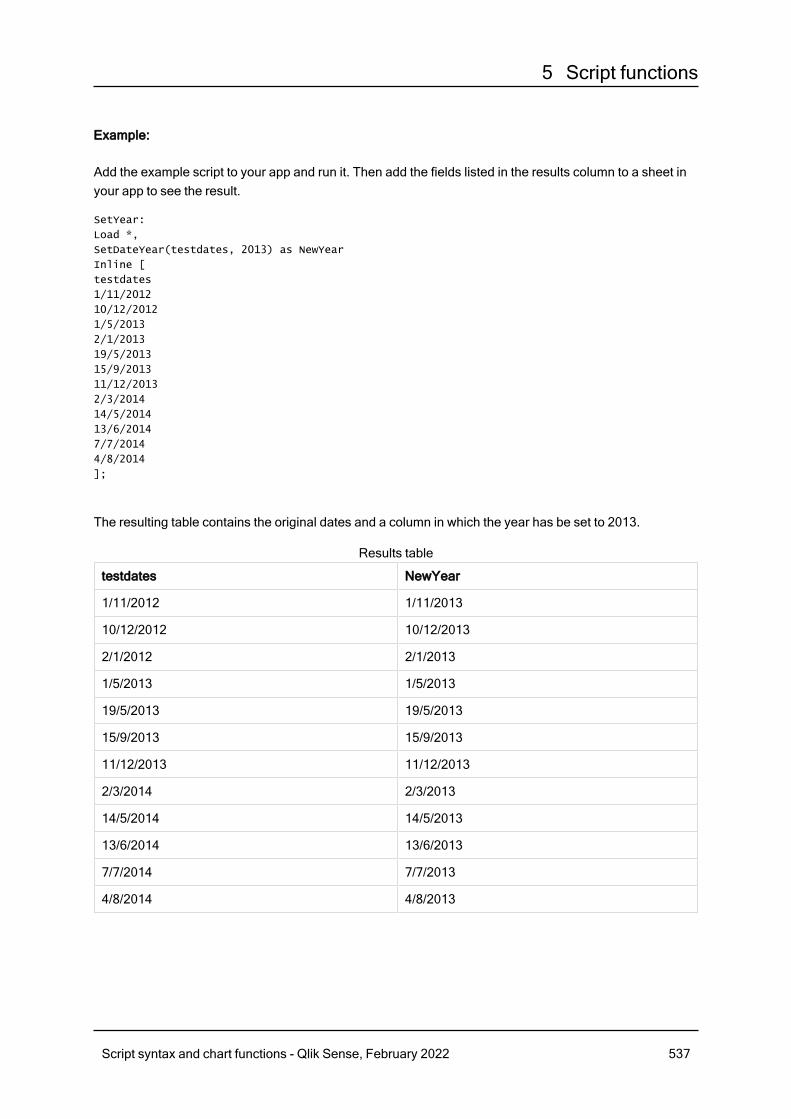
5 Script functions
Example:
Add the example script to your app and run it. Then add the fields listed in the results column to a sheet inyour app to see the result.
SetYear:
Load *,
SetDateYear(testdates, 2013) as NewYear
Inline [
testdates
1/11/2012
10/12/2012
1/5/2013
2/1/2013
19/5/2013
15/9/2013
11/12/2013
2/3/2014
14/5/2014
13/6/2014
7/7/2014
4/8/2014
];
The resulting table contains the original dates and a column in which the year has be set to 2013.
testdates NewYear
1/11/2012 1/11/2013
10/12/2012 10/12/2013
2/1/2012 2/1/2013
1/5/2013 1/5/2013
19/5/2013 19/5/2013
15/9/2013 15/9/2013
11/12/2013 11/12/2013
2/3/2014 2/3/2013
14/5/2014 14/5/2013
13/6/2014 13/6/2013
7/7/2014 7/7/2013
4/8/2014 4/8/2013
Results table
Script syntax and chart functions - Qlik Sense, February 2022 537
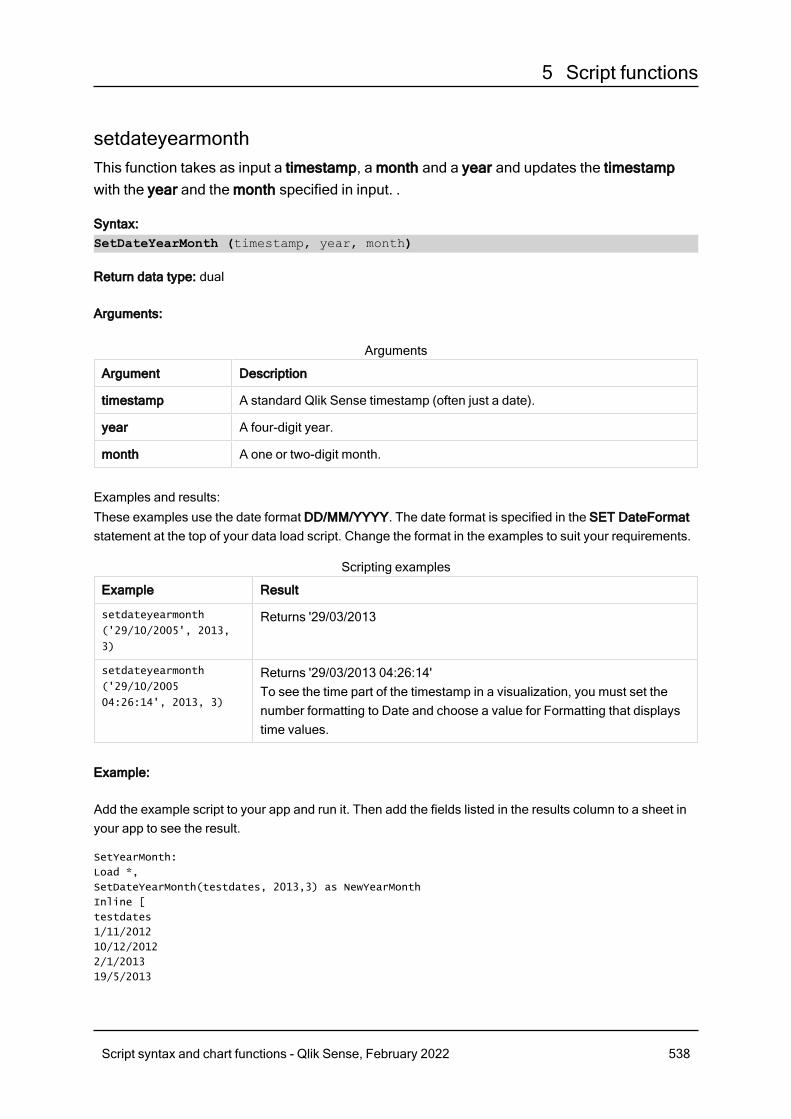
5 Script functions
setdateyearmonthThis function takes as input a timestamp, a month and a year and updates the timestampwith the year and the month specified in input. .
Syntax:SetDateYearMonth (timestamp, year, month)
Return data type: dual
Arguments:
Argument Description
timestamp A standard Qlik Sense timestamp (often just a date).
year A four-digit year.
month A one or two-digit month.
Arguments
Examples and results:These examples use the date format DD/MM/YYYY. The date format is specified in the SET DateFormatstatement at the top of your data load script. Change the format in the examples to suit your requirements.
Example Result
setdateyearmonth
('29/10/2005', 2013,
3)
Returns '29/03/2013
setdateyearmonth
('29/10/2005
04:26:14', 2013, 3)
Returns '29/03/2013 04:26:14'To see the time part of the timestamp in a visualization, you must set thenumber formatting to Date and choose a value for Formatting that displaystime values.
Scripting examples
Example:
Add the example script to your app and run it. Then add the fields listed in the results column to a sheet inyour app to see the result.
SetYearMonth:
Load *,
SetDateYearMonth(testdates, 2013,3) as NewYearMonth
Inline [
testdates
1/11/2012
10/12/2012
2/1/2013
19/5/2013
Script syntax and chart functions - Qlik Sense, February 2022 538
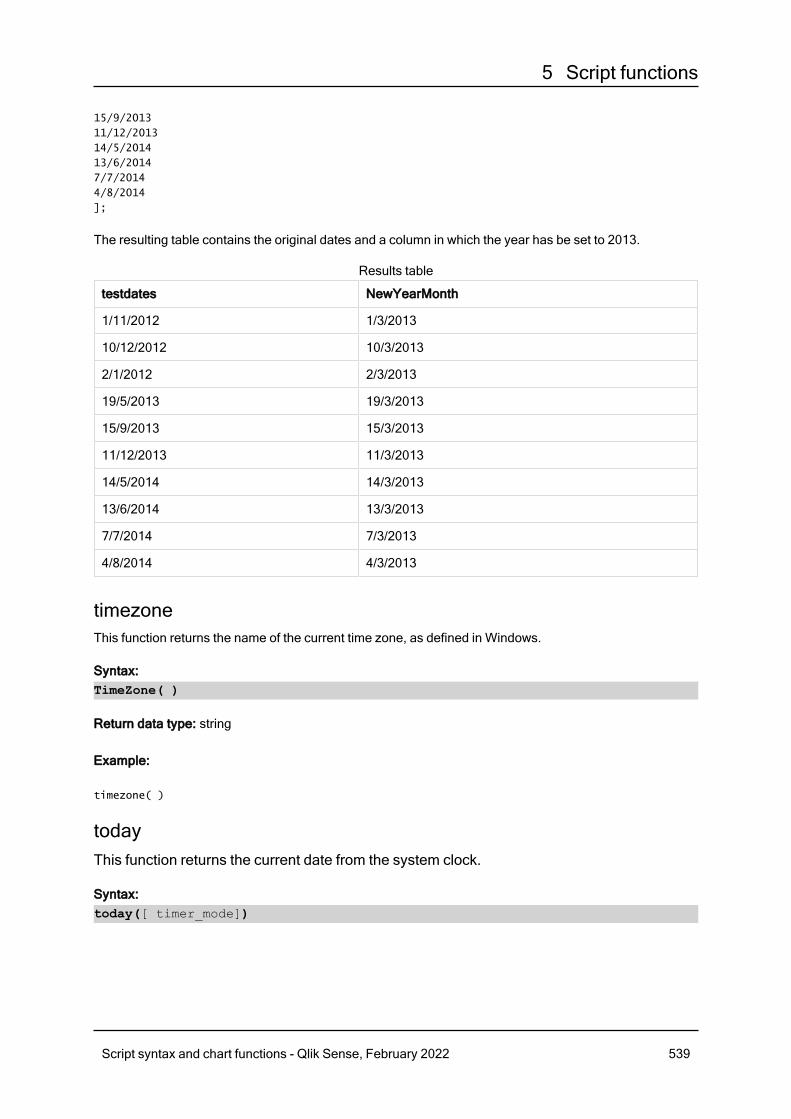
5 Script functions
15/9/2013
11/12/2013
14/5/2014
13/6/2014
7/7/2014
4/8/2014
];
The resulting table contains the original dates and a column in which the year has be set to 2013.
testdates NewYearMonth
1/11/2012 1/3/2013
10/12/2012 10/3/2013
2/1/2012 2/3/2013
19/5/2013 19/3/2013
15/9/2013 15/3/2013
11/12/2013 11/3/2013
14/5/2014 14/3/2013
13/6/2014 13/3/2013
7/7/2014 7/3/2013
4/8/2014 4/3/2013
Results table
timezoneThis function returns the name of the current time zone, as defined in Windows.
Syntax:TimeZone( )
Return data type: string
Example:
timezone( )
todayThis function returns the current date from the system clock.
Syntax:today([ timer_mode])
Script syntax and chart functions - Qlik Sense, February 2022 539

5 Script functions
Return data type: dual
Arguments:
Argument Description
timer_mode Can have the following values:
0 (day of last finished data load)1 (day of function call)2 (day when the app was opened)
If you use the function in a data load script, timer_mode=0 will result in theday of the last finished data load, while timer_mode=1 will give the day ofthe current data load.
Arguments
Examples and results:
Example Result
Today( 0) Returns the day of the last finished data load.
Today( 1) When used in a visualization expression, this returns the day of the function call.
When used in a data load script, this returns the day when the current data load started.
Today( 2) Returns the day when the app was opened.
Scripting examples
UTCReturns the current Coordinated Universal Time.
Syntax:UTC( )
Return data type: dual
Example:
utc( )
Script syntax and chart functions - Qlik Sense, February 2022 540
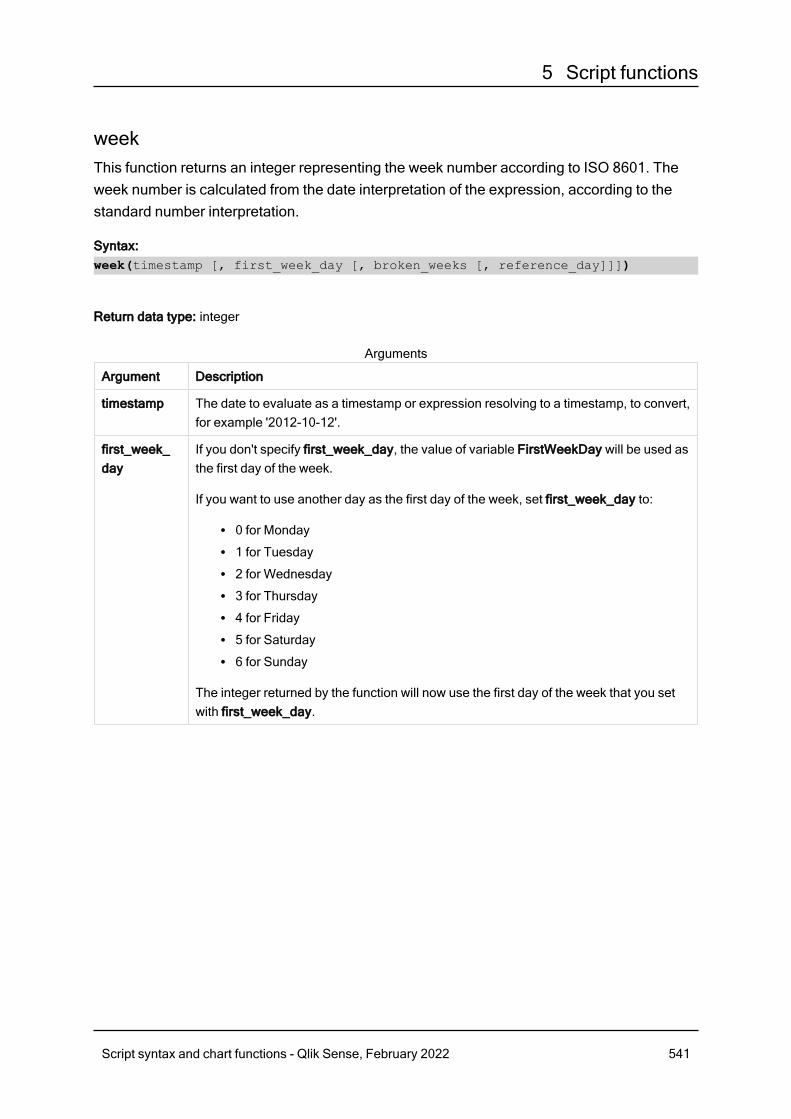
5 Script functions
weekThis function returns an integer representing the week number according to ISO 8601. Theweek number is calculated from the date interpretation of the expression, according to thestandard number interpretation.
Syntax:week(timestamp [, first_week_day [, broken_weeks [, reference_day]]])
Return data type: integer
Argument Description
timestamp The date to evaluate as a timestamp or expression resolving to a timestamp, to convert,for example '2012-10-12'.
first_week_day
If you don't specify first_week_day, the value of variable FirstWeekDay will be used asthe first day of the week.
If you want to use another day as the first day of the week, set first_week_day to:
l 0 for Mondayl 1 for Tuesdayl 2 for Wednesdayl 3 for Thursdayl 4 for Fridayl 5 for Saturdayl 6 for Sunday
The integer returned by the function will now use the first day of the week that you setwith first_week_day.
Arguments
Script syntax and chart functions - Qlik Sense, February 2022 541
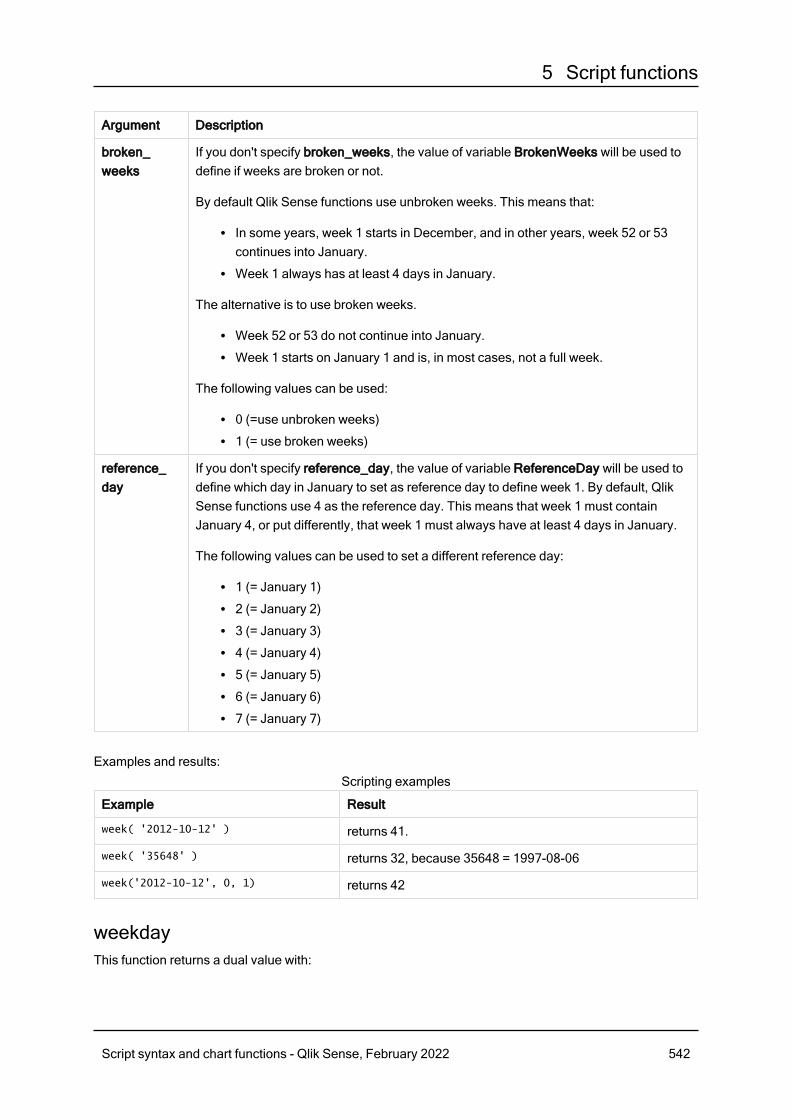
5 Script functions
Argument Description
broken_weeks
If you don't specify broken_weeks, the value of variable BrokenWeeks will be used todefine if weeks are broken or not.
By default Qlik Sense functions use unbroken weeks. This means that:
l In some years, week 1 starts in December, and in other years, week 52 or 53continues into January.
l Week 1 always has at least 4 days in January.
The alternative is to use broken weeks.
l Week 52 or 53 do not continue into January.l Week 1 starts on January 1 and is, in most cases, not a full week.
The following values can be used:
l 0 (=use unbroken weeks)l 1 (= use broken weeks)
reference_day
If you don't specify reference_day, the value of variable ReferenceDay will be used todefine which day in January to set as reference day to define week 1. By default, QlikSense functions use 4 as the reference day. This means that week 1 must containJanuary 4, or put differently, that week 1 must always have at least 4 days in January.
The following values can be used to set a different reference day:
l 1 (= January 1)l 2 (= January 2)l 3 (= January 3)l 4 (= January 4)l 5 (= January 5)l 6 (= January 6)l 7 (= January 7)
Examples and results:
Example Result
week( '2012-10-12' ) returns 41.
week( '35648' ) returns 32, because 35648 = 1997-08-06
week('2012-10-12', 0, 1) returns 42
Scripting examples
weekdayThis function returns a dual value with:
Script syntax and chart functions - Qlik Sense, February 2022 542
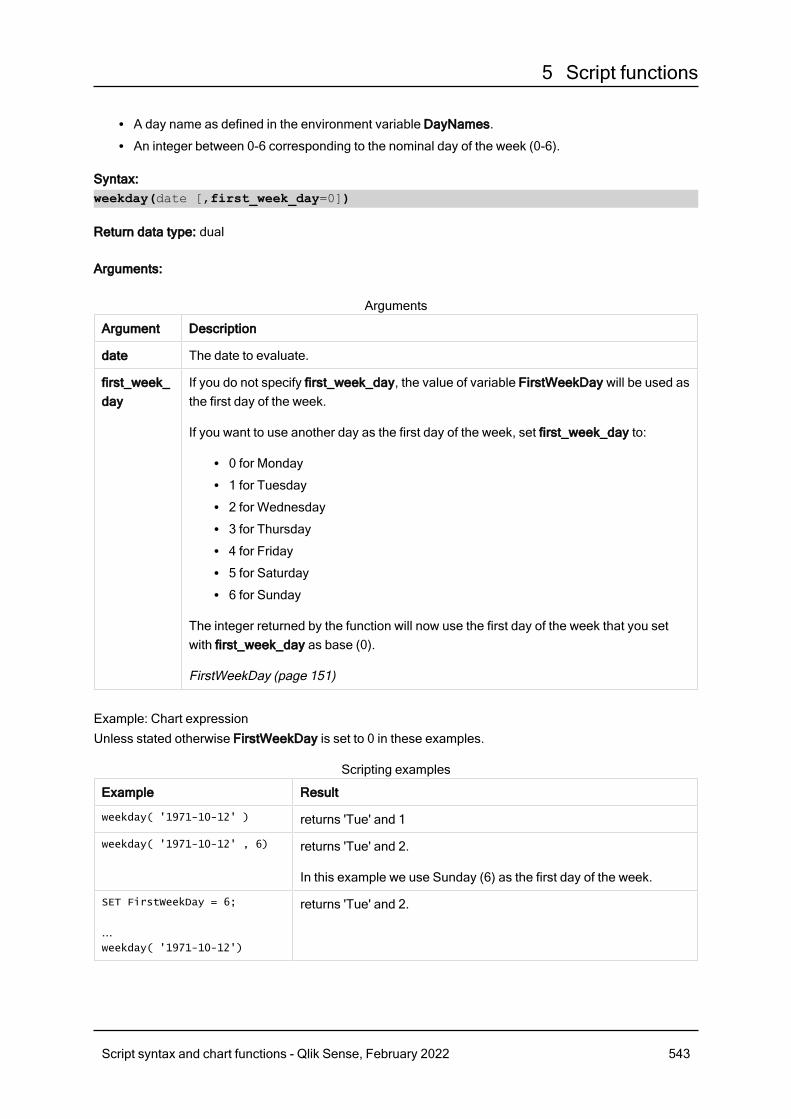
5 Script functions
l A day name as defined in the environment variable DayNames.l An integer between 0-6 corresponding to the nominal day of the week (0-6).
Syntax:weekday(date [,first_week_day=0])
Return data type: dual
Arguments:
Argument Description
date The date to evaluate.
first_week_day
If you do not specify first_week_day, the value of variable FirstWeekDay will be used asthe first day of the week.
If you want to use another day as the first day of the week, set first_week_day to:
l 0 for Mondayl 1 for Tuesdayl 2 for Wednesdayl 3 for Thursdayl 4 for Fridayl 5 for Saturdayl 6 for Sunday
The integer returned by the function will now use the first day of the week that you setwith first_week_day as base (0).
FirstWeekDay (page 151)
Arguments
Example: Chart expressionUnless stated otherwise FirstWeekDay is set to 0 in these examples.
Example Result
weekday( '1971-10-12' ) returns 'Tue' and 1
weekday( '1971-10-12' , 6) returns 'Tue' and 2.
In this example we use Sunday (6) as the first day of the week.
SET FirstWeekDay = 6;
...weekday( '1971-10-12')
returns 'Tue' and 2.
Scripting examples
Script syntax and chart functions - Qlik Sense, February 2022 543
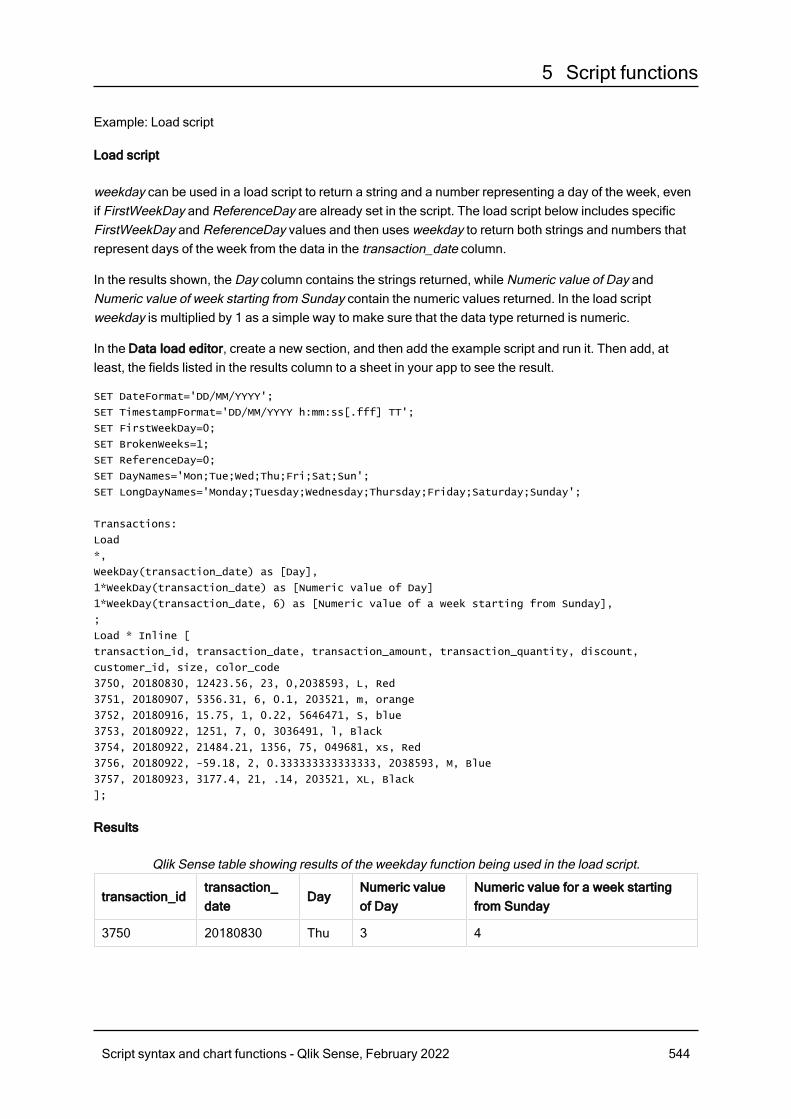
5 Script functions
Example: Load script
Load script
weekday can be used in a load script to return a string and a number representing a day of the week, evenif FirstWeekDay and ReferenceDay are already set in the script. The load script below includes specificFirstWeekDay and ReferenceDay values and then uses weekday to return both strings and numbers thatrepresent days of the week from the data in the transaction_date column.
In the results shown, the Day column contains the strings returned, while Numeric value of Day andNumeric value of week starting from Sunday contain the numeric values returned. In the load scriptweekday is multiplied by 1 as a simple way to make sure that the data type returned is numeric.
In the Data load editor, create a new section, and then add the example script and run it. Then add, atleast, the fields listed in the results column to a sheet in your app to see the result.
SET DateFormat='DD/MM/YYYY';
SET TimestampFormat='DD/MM/YYYY h:mm:ss[.fff] TT';
SET FirstWeekDay=0;
SET BrokenWeeks=1;
SET ReferenceDay=0;
SET DayNames='Mon;Tue;Wed;Thu;Fri;Sat;Sun';
SET LongDayNames='Monday;Tuesday;Wednesday;Thursday;Friday;Saturday;Sunday';
Transactions:
Load
*,
WeekDay(transaction_date) as [Day],
1*WeekDay(transaction_date) as [Numeric value of Day]
1*WeekDay(transaction_date, 6) as [Numeric value of a week starting from Sunday],
;
Load * Inline [
transaction_id, transaction_date, transaction_amount, transaction_quantity, discount,
customer_id, size, color_code
3750, 20180830, 12423.56, 23, 0,2038593, L, Red
3751, 20180907, 5356.31, 6, 0.1, 203521, m, orange
3752, 20180916, 15.75, 1, 0.22, 5646471, S, blue
3753, 20180922, 1251, 7, 0, 3036491, l, Black
3754, 20180922, 21484.21, 1356, 75, 049681, xs, Red
3756, 20180922, -59.18, 2, 0.333333333333333, 2038593, M, Blue
3757, 20180923, 3177.4, 21, .14, 203521, XL, Black
];
Results
transaction_idtransaction_date
DayNumeric valueof Day
Numeric value for a week startingfrom Sunday
3750 20180830 Thu 3 4
Qlik Sense table showing results of the weekday function being used in the load script.
Script syntax and chart functions - Qlik Sense, February 2022 544
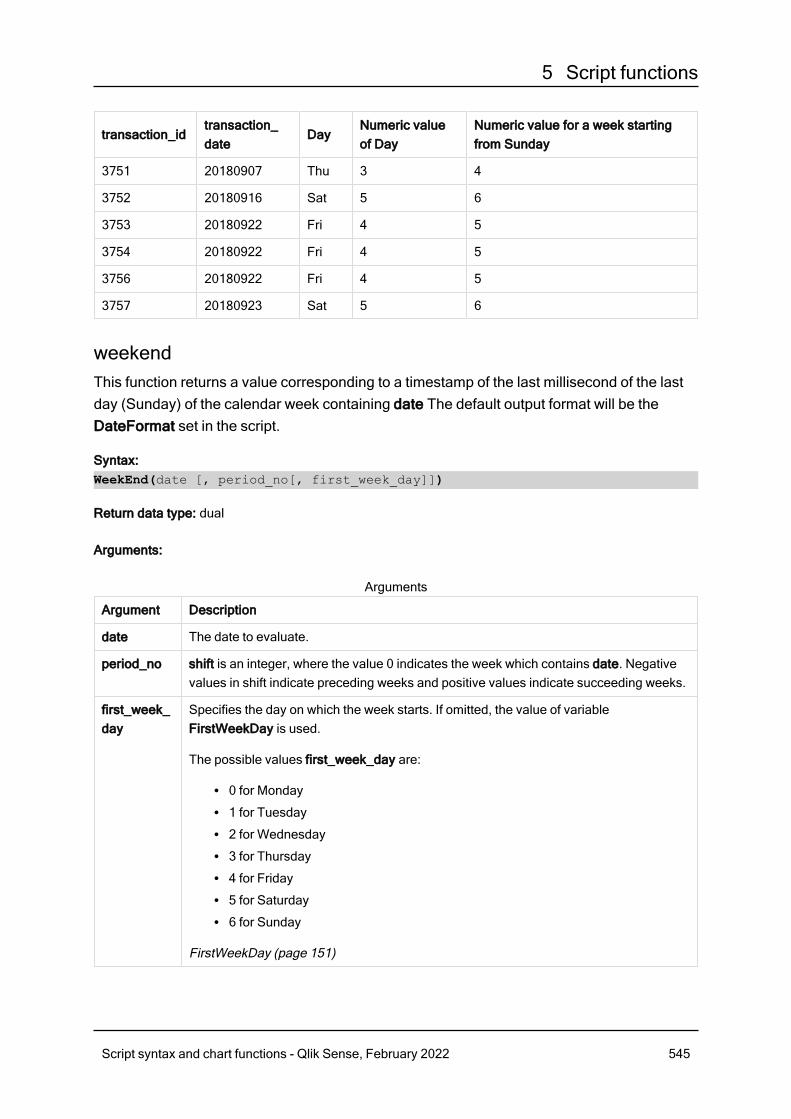
5 Script functions
transaction_idtransaction_date
DayNumeric valueof Day
Numeric value for a week startingfrom Sunday
3751 20180907 Thu 3 4
3752 20180916 Sat 5 6
3753 20180922 Fri 4 5
3754 20180922 Fri 4 5
3756 20180922 Fri 4 5
3757 20180923 Sat 5 6
weekendThis function returns a value corresponding to a timestamp of the last millisecond of the lastday (Sunday) of the calendar week containing date The default output format will be theDateFormat set in the script.
Syntax:WeekEnd(date [, period_no[, first_week_day]])
Return data type: dual
Arguments:
Argument Description
date The date to evaluate.
period_no shift is an integer, where the value 0 indicates the week which contains date. Negativevalues in shift indicate preceding weeks and positive values indicate succeeding weeks.
first_week_day
Specifies the day on which the week starts. If omitted, the value of variableFirstWeekDay is used.
The possible values first_week_day are:
l 0 for Mondayl 1 for Tuesdayl 2 for Wednesdayl 3 for Thursdayl 4 for Fridayl 5 for Saturdayl 6 for Sunday
FirstWeekDay (page 151)
Arguments
Script syntax and chart functions - Qlik Sense, February 2022 545
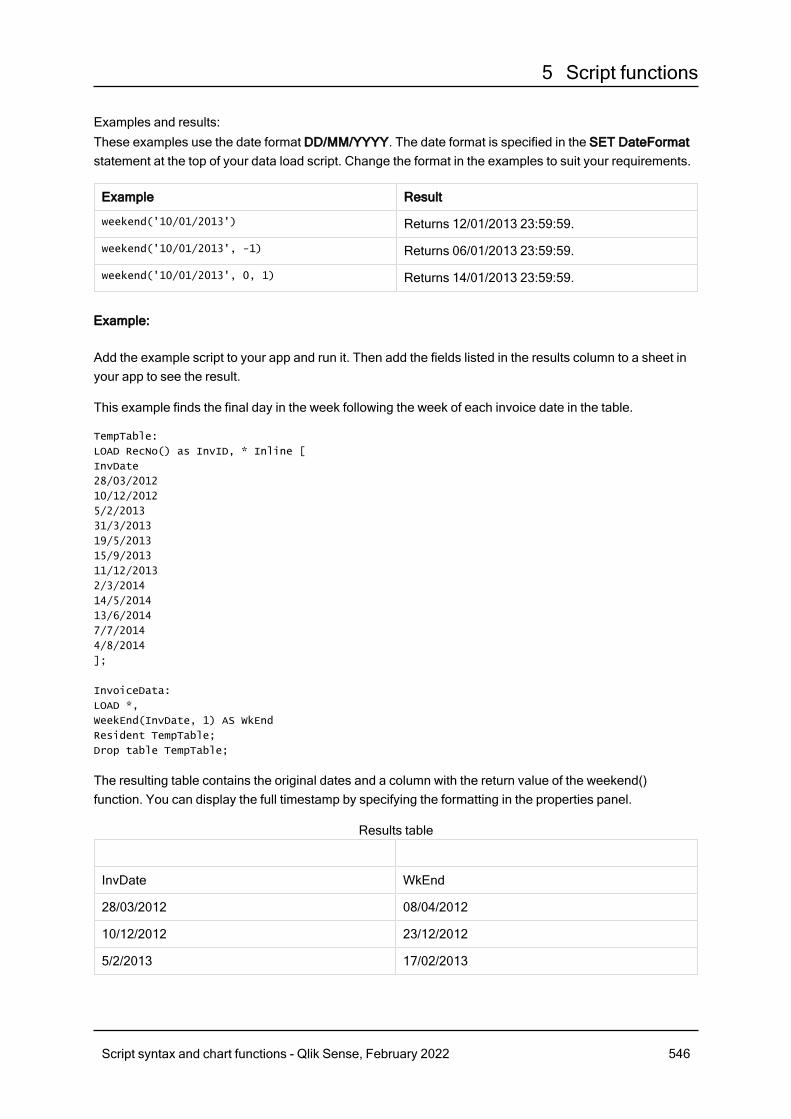
5 Script functions
Examples and results:These examples use the date format DD/MM/YYYY. The date format is specified in the SET DateFormatstatement at the top of your data load script. Change the format in the examples to suit your requirements.
Example Result
weekend('10/01/2013') Returns 12/01/2013 23:59:59.
weekend('10/01/2013', -1) Returns 06/01/2013 23:59:59.
weekend('10/01/2013', 0, 1) Returns 14/01/2013 23:59:59.
Example:
Add the example script to your app and run it. Then add the fields listed in the results column to a sheet inyour app to see the result.
This example finds the final day in the week following the week of each invoice date in the table.
TempTable:
LOAD RecNo() as InvID, * Inline [
InvDate
28/03/2012
10/12/2012
5/2/2013
31/3/2013
19/5/2013
15/9/2013
11/12/2013
2/3/2014
14/5/2014
13/6/2014
7/7/2014
4/8/2014
];
InvoiceData:
LOAD *,
WeekEnd(InvDate, 1) AS WkEnd
Resident TempTable;
Drop table TempTable;
The resulting table contains the original dates and a column with the return value of the weekend()function. You can display the full timestamp by specifying the formatting in the properties panel.
InvDate WkEnd
28/03/2012 08/04/2012
10/12/2012 23/12/2012
5/2/2013 17/02/2013
Results table
Script syntax and chart functions - Qlik Sense, February 2022 546
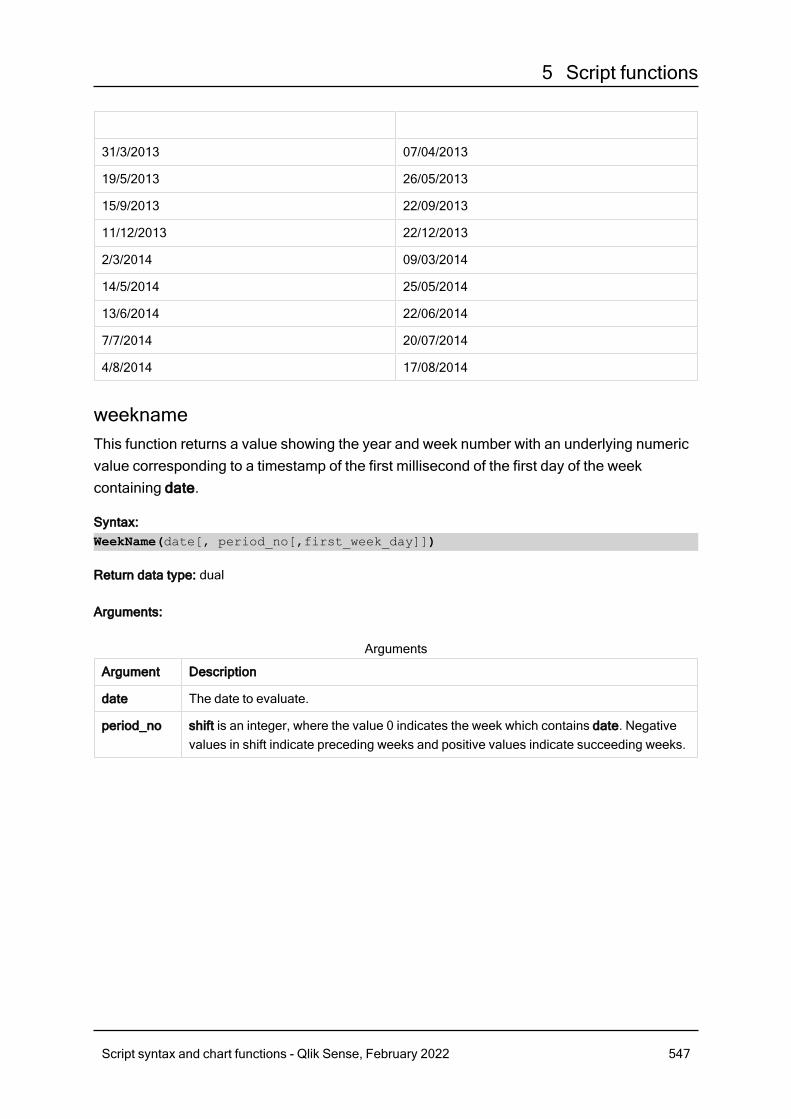
5 Script functions
31/3/2013 07/04/2013
19/5/2013 26/05/2013
15/9/2013 22/09/2013
11/12/2013 22/12/2013
2/3/2014 09/03/2014
14/5/2014 25/05/2014
13/6/2014 22/06/2014
7/7/2014 20/07/2014
4/8/2014 17/08/2014
weeknameThis function returns a value showing the year and week number with an underlying numericvalue corresponding to a timestamp of the first millisecond of the first day of the weekcontaining date.
Syntax:WeekName(date[, period_no[,first_week_day]])
Return data type: dual
Arguments:
Argument Description
date The date to evaluate.
period_no shift is an integer, where the value 0 indicates the week which contains date. Negativevalues in shift indicate preceding weeks and positive values indicate succeeding weeks.
Arguments
Script syntax and chart functions - Qlik Sense, February 2022 547
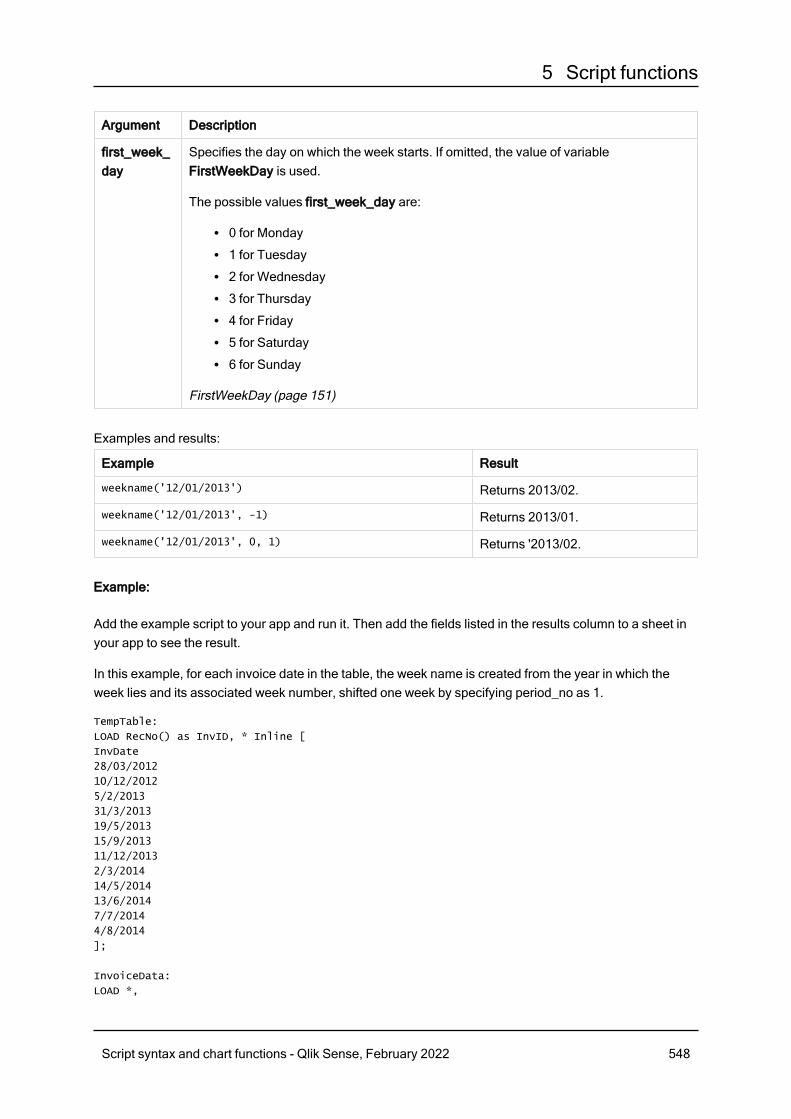
5 Script functions
Argument Description
first_week_day
Specifies the day on which the week starts. If omitted, the value of variableFirstWeekDay is used.
The possible values first_week_day are:
l 0 for Mondayl 1 for Tuesdayl 2 for Wednesdayl 3 for Thursdayl 4 for Fridayl 5 for Saturdayl 6 for Sunday
FirstWeekDay (page 151)
Examples and results:
Example Result
weekname('12/01/2013') Returns 2013/02.
weekname('12/01/2013', -1) Returns 2013/01.
weekname('12/01/2013', 0, 1) Returns '2013/02.
Example:
Add the example script to your app and run it. Then add the fields listed in the results column to a sheet inyour app to see the result.
In this example, for each invoice date in the table, the week name is created from the year in which theweek lies and its associated week number, shifted one week by specifying period_no as 1.
TempTable:
LOAD RecNo() as InvID, * Inline [
InvDate
28/03/2012
10/12/2012
5/2/2013
31/3/2013
19/5/2013
15/9/2013
11/12/2013
2/3/2014
14/5/2014
13/6/2014
7/7/2014
4/8/2014
];
InvoiceData:
LOAD *,
Script syntax and chart functions - Qlik Sense, February 2022 548
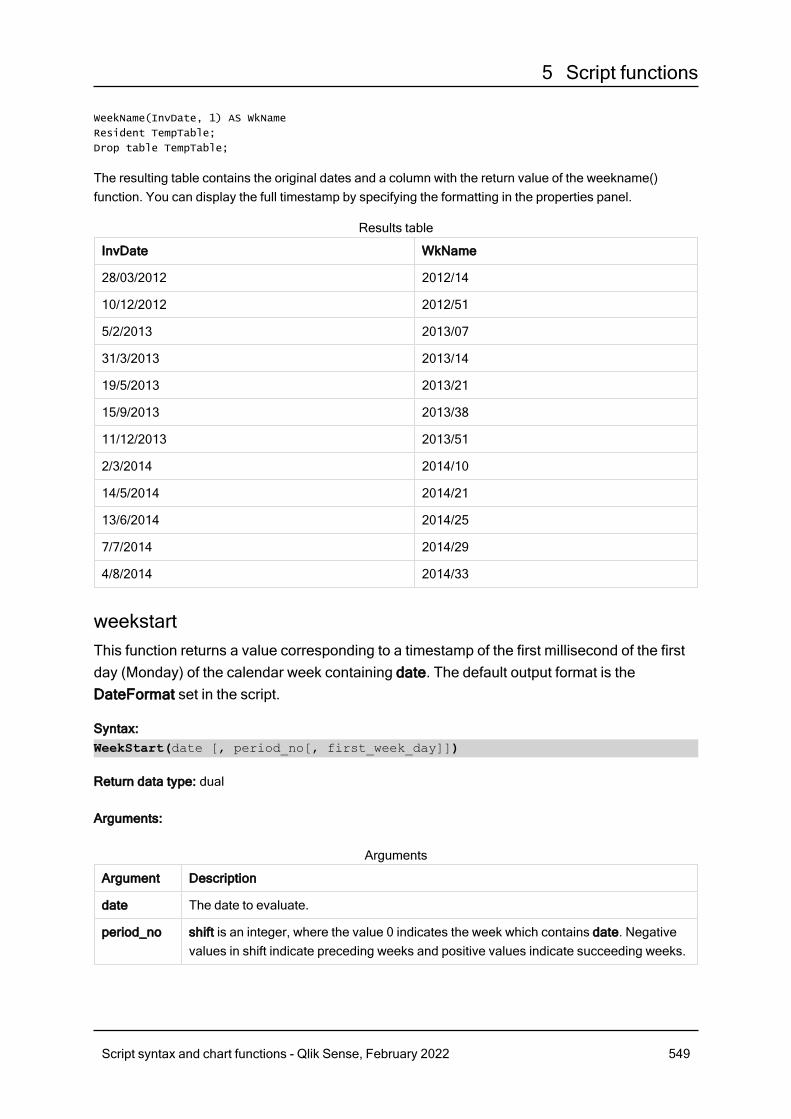
5 Script functions
WeekName(InvDate, 1) AS WkName
Resident TempTable;
Drop table TempTable;
The resulting table contains the original dates and a column with the return value of the weekname()function. You can display the full timestamp by specifying the formatting in the properties panel.
InvDate WkName
28/03/2012 2012/14
10/12/2012 2012/51
5/2/2013 2013/07
31/3/2013 2013/14
19/5/2013 2013/21
15/9/2013 2013/38
11/12/2013 2013/51
2/3/2014 2014/10
14/5/2014 2014/21
13/6/2014 2014/25
7/7/2014 2014/29
4/8/2014 2014/33
Results table
weekstartThis function returns a value corresponding to a timestamp of the first millisecond of the firstday (Monday) of the calendar week containing date. The default output format is theDateFormat set in the script.
Syntax:WeekStart(date [, period_no[, first_week_day]])
Return data type: dual
Arguments:
Argument Description
date The date to evaluate.
period_no shift is an integer, where the value 0 indicates the week which contains date. Negativevalues in shift indicate preceding weeks and positive values indicate succeeding weeks.
Arguments
Script syntax and chart functions - Qlik Sense, February 2022 549
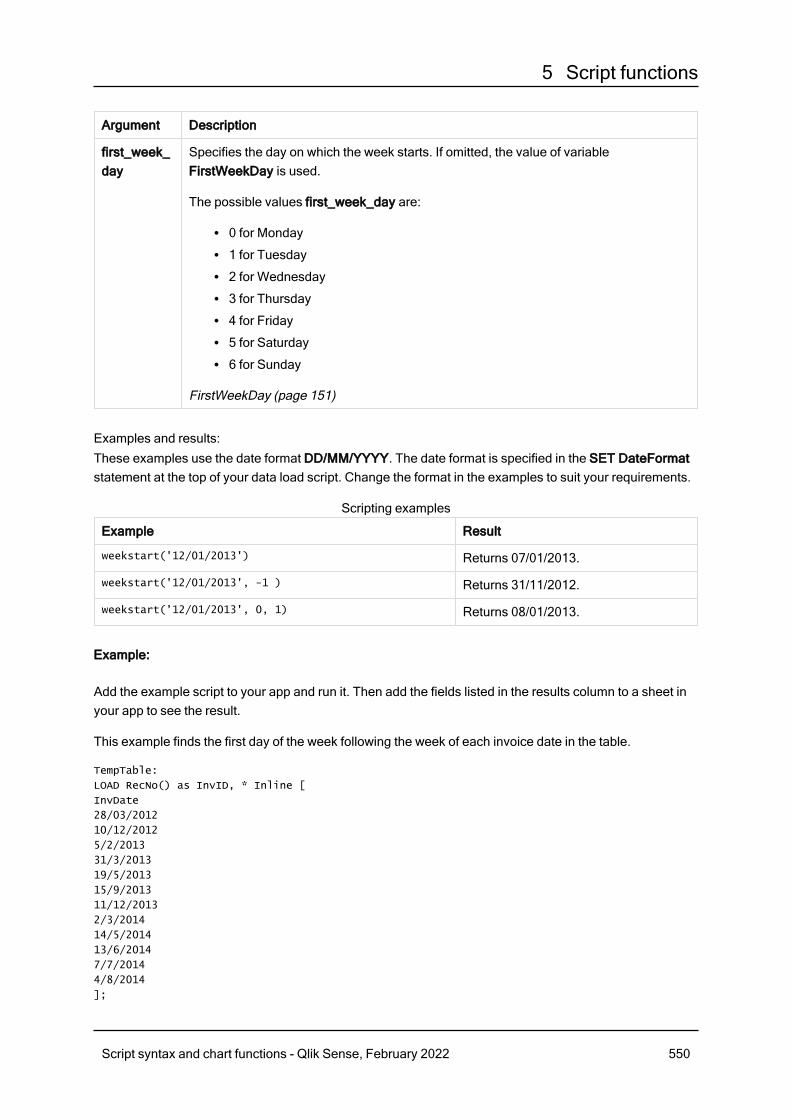
5 Script functions
Argument Description
first_week_day
Specifies the day on which the week starts. If omitted, the value of variableFirstWeekDay is used.
The possible values first_week_day are:
l 0 for Mondayl 1 for Tuesdayl 2 for Wednesdayl 3 for Thursdayl 4 for Fridayl 5 for Saturdayl 6 for Sunday
FirstWeekDay (page 151)
Examples and results:These examples use the date format DD/MM/YYYY. The date format is specified in the SET DateFormatstatement at the top of your data load script. Change the format in the examples to suit your requirements.
Example Result
weekstart('12/01/2013') Returns 07/01/2013.
weekstart('12/01/2013', -1 ) Returns 31/11/2012.
weekstart('12/01/2013', 0, 1) Returns 08/01/2013.
Scripting examples
Example:
Add the example script to your app and run it. Then add the fields listed in the results column to a sheet inyour app to see the result.
This example finds the first day of the week following the week of each invoice date in the table.
TempTable:
LOAD RecNo() as InvID, * Inline [
InvDate
28/03/2012
10/12/2012
5/2/2013
31/3/2013
19/5/2013
15/9/2013
11/12/2013
2/3/2014
14/5/2014
13/6/2014
7/7/2014
4/8/2014
];
Script syntax and chart functions - Qlik Sense, February 2022 550
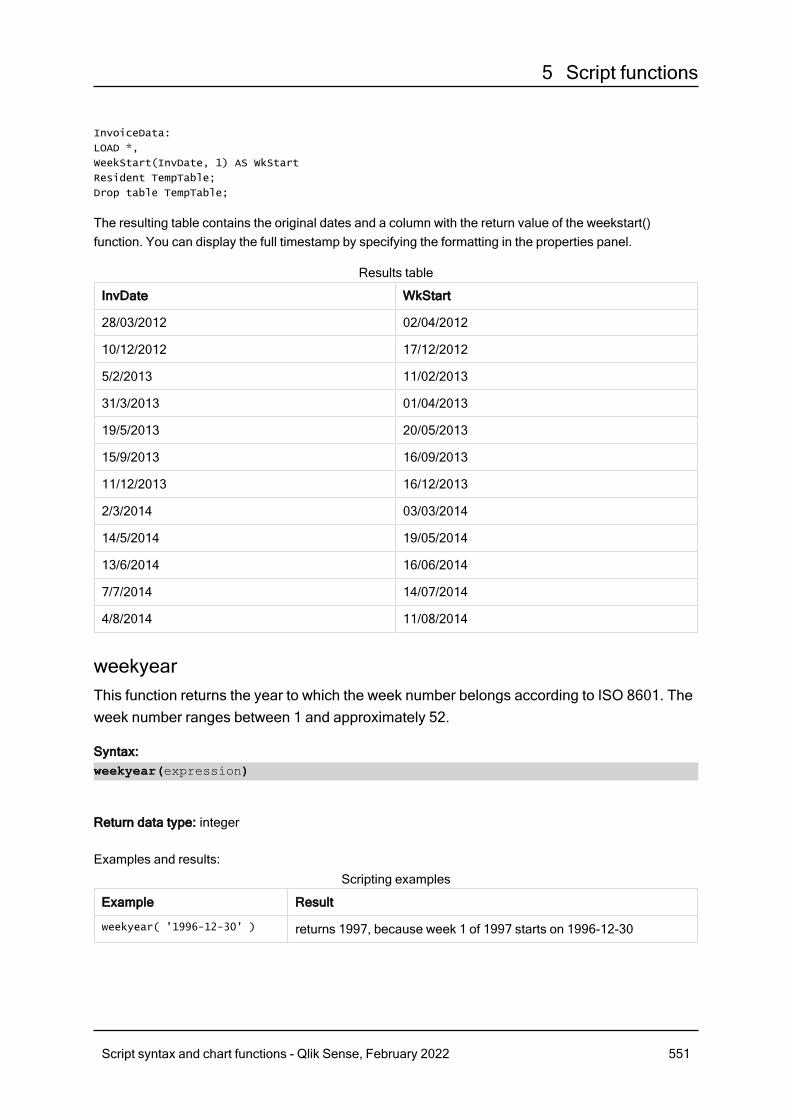
5 Script functions
InvoiceData:
LOAD *,
WeekStart(InvDate, 1) AS WkStart
Resident TempTable;
Drop table TempTable;
The resulting table contains the original dates and a column with the return value of the weekstart()function. You can display the full timestamp by specifying the formatting in the properties panel.
InvDate WkStart
28/03/2012 02/04/2012
10/12/2012 17/12/2012
5/2/2013 11/02/2013
31/3/2013 01/04/2013
19/5/2013 20/05/2013
15/9/2013 16/09/2013
11/12/2013 16/12/2013
2/3/2014 03/03/2014
14/5/2014 19/05/2014
13/6/2014 16/06/2014
7/7/2014 14/07/2014
4/8/2014 11/08/2014
Results table
weekyearThis function returns the year to which the week number belongs according to ISO 8601. Theweek number ranges between 1 and approximately 52.
Syntax:weekyear(expression)
Return data type: integer
Examples and results:
Example Result
weekyear( '1996-12-30' ) returns 1997, because week 1 of 1997 starts on 1996-12-30
Scripting examples
Script syntax and chart functions - Qlik Sense, February 2022 551
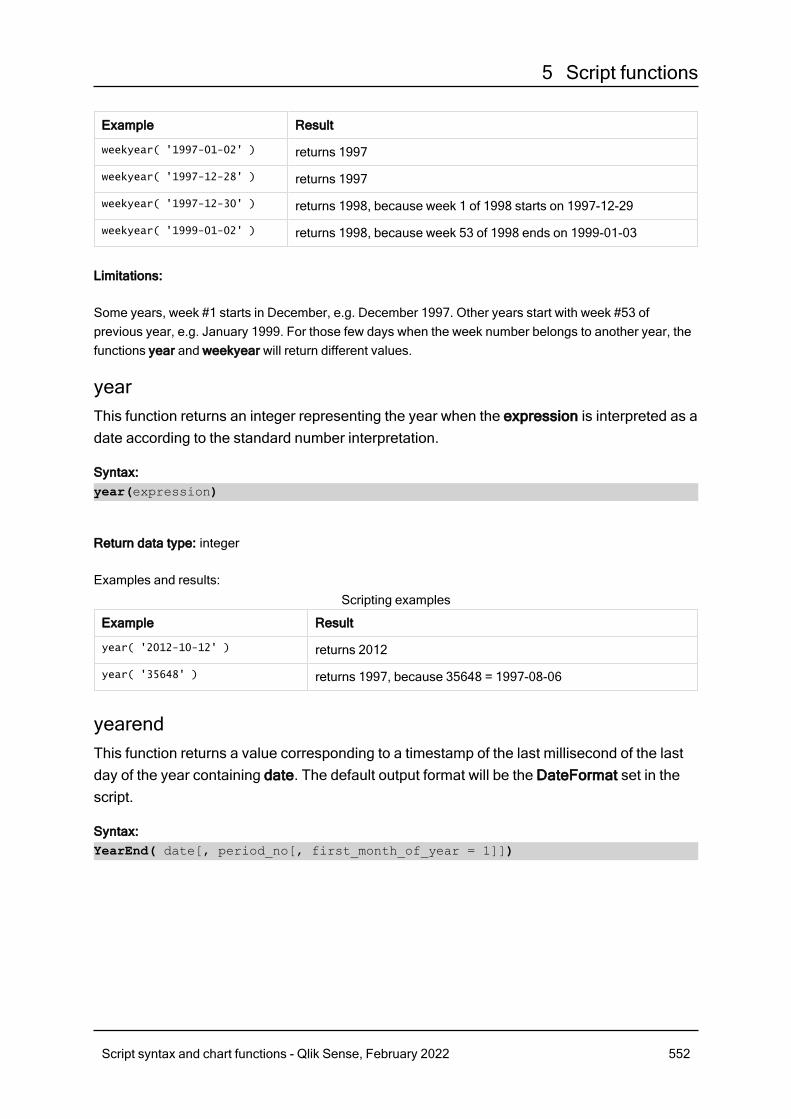
5 Script functions
Example Result
weekyear( '1997-01-02' ) returns 1997
weekyear( '1997-12-28' ) returns 1997
weekyear( '1997-12-30' ) returns 1998, because week 1 of 1998 starts on 1997-12-29
weekyear( '1999-01-02' ) returns 1998, because week 53 of 1998 ends on 1999-01-03
Limitations:
Some years, week #1 starts in December, e.g. December 1997. Other years start with week #53 ofprevious year, e.g. January 1999. For those few days when the week number belongs to another year, thefunctions year and weekyear will return different values.
yearThis function returns an integer representing the year when the expression is interpreted as adate according to the standard number interpretation.
Syntax:year(expression)
Return data type: integer
Examples and results:
Example Result
year( '2012-10-12' ) returns 2012
year( '35648' ) returns 1997, because 35648 = 1997-08-06
Scripting examples
yearendThis function returns a value corresponding to a timestamp of the last millisecond of the lastday of the year containing date. The default output format will be the DateFormat set in thescript.
Syntax:YearEnd( date[, period_no[, first_month_of_year = 1]])
Script syntax and chart functions - Qlik Sense, February 2022 552
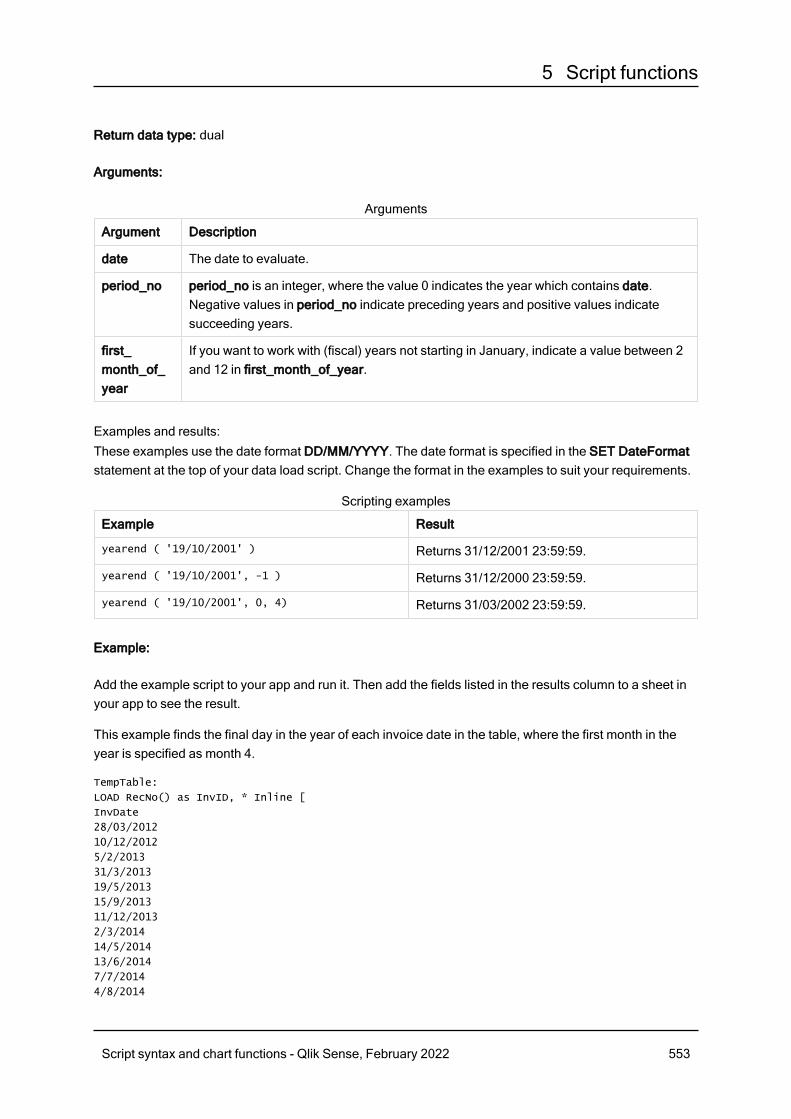
5 Script functions
Return data type: dual
Arguments:
Argument Description
date The date to evaluate.
period_no period_no is an integer, where the value 0 indicates the year which contains date.Negative values in period_no indicate preceding years and positive values indicatesucceeding years.
first_month_of_year
If you want to work with (fiscal) years not starting in January, indicate a value between 2and 12 in first_month_of_year.
Arguments
Examples and results:These examples use the date format DD/MM/YYYY. The date format is specified in the SET DateFormatstatement at the top of your data load script. Change the format in the examples to suit your requirements.
Example Result
yearend ( '19/10/2001' ) Returns 31/12/2001 23:59:59.
yearend ( '19/10/2001', -1 ) Returns 31/12/2000 23:59:59.
yearend ( '19/10/2001', 0, 4) Returns 31/03/2002 23:59:59.
Scripting examples
Example:
Add the example script to your app and run it. Then add the fields listed in the results column to a sheet inyour app to see the result.
This example finds the final day in the year of each invoice date in the table, where the first month in theyear is specified as month 4.
TempTable:
LOAD RecNo() as InvID, * Inline [
InvDate
28/03/2012
10/12/2012
5/2/2013
31/3/2013
19/5/2013
15/9/2013
11/12/2013
2/3/2014
14/5/2014
13/6/2014
7/7/2014
4/8/2014
Script syntax and chart functions - Qlik Sense, February 2022 553
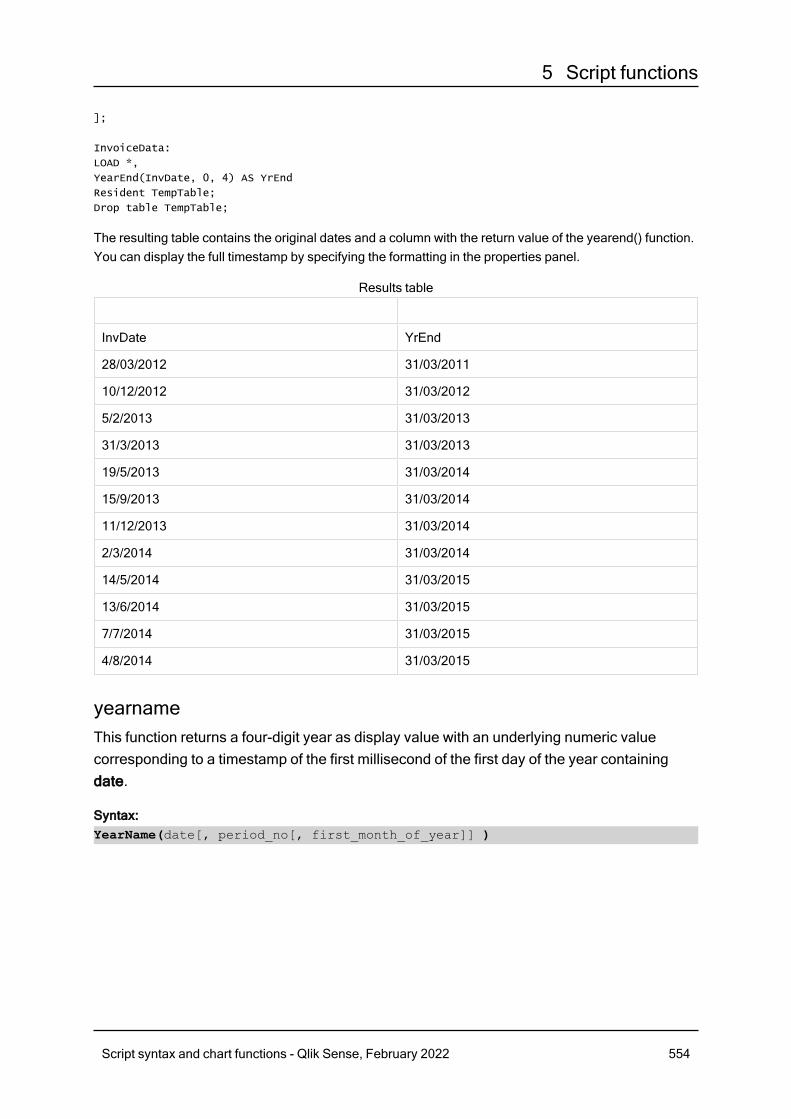
5 Script functions
];
InvoiceData:
LOAD *,
YearEnd(InvDate, 0, 4) AS YrEnd
Resident TempTable;
Drop table TempTable;
The resulting table contains the original dates and a column with the return value of the yearend() function.You can display the full timestamp by specifying the formatting in the properties panel.
InvDate YrEnd
28/03/2012 31/03/2011
10/12/2012 31/03/2012
5/2/2013 31/03/2013
31/3/2013 31/03/2013
19/5/2013 31/03/2014
15/9/2013 31/03/2014
11/12/2013 31/03/2014
2/3/2014 31/03/2014
14/5/2014 31/03/2015
13/6/2014 31/03/2015
7/7/2014 31/03/2015
4/8/2014 31/03/2015
Results table
yearnameThis function returns a four-digit year as display value with an underlying numeric valuecorresponding to a timestamp of the first millisecond of the first day of the year containingdate.
Syntax:YearName(date[, period_no[, first_month_of_year]] )
Script syntax and chart functions - Qlik Sense, February 2022 554
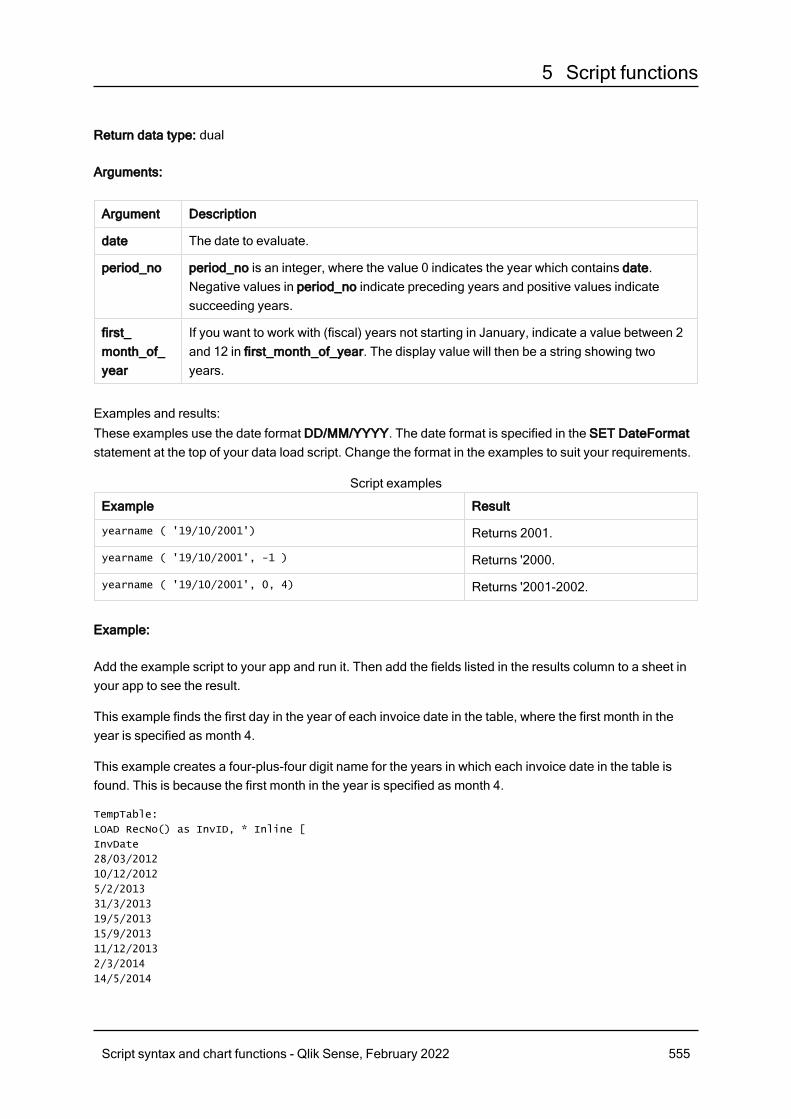
5 Script functions
Return data type: dual
Arguments:
Argument Description
date The date to evaluate.
period_no period_no is an integer, where the value 0 indicates the year which contains date.Negative values in period_no indicate preceding years and positive values indicatesucceeding years.
first_month_of_year
If you want to work with (fiscal) years not starting in January, indicate a value between 2and 12 in first_month_of_year. The display value will then be a string showing twoyears.
Examples and results:These examples use the date format DD/MM/YYYY. The date format is specified in the SET DateFormatstatement at the top of your data load script. Change the format in the examples to suit your requirements.
Example Result
yearname ( '19/10/2001') Returns 2001.
yearname ( '19/10/2001', -1 ) Returns '2000.
yearname ( '19/10/2001', 0, 4) Returns '2001-2002.
Script examples
Example:
Add the example script to your app and run it. Then add the fields listed in the results column to a sheet inyour app to see the result.
This example finds the first day in the year of each invoice date in the table, where the first month in theyear is specified as month 4.
This example creates a four-plus-four digit name for the years in which each invoice date in the table isfound. This is because the first month in the year is specified as month 4.
TempTable:
LOAD RecNo() as InvID, * Inline [
InvDate
28/03/2012
10/12/2012
5/2/2013
31/3/2013
19/5/2013
15/9/2013
11/12/2013
2/3/2014
14/5/2014
Script syntax and chart functions - Qlik Sense, February 2022 555

5 Script functions
13/6/2014
7/7/2014
4/8/2014
];
InvoiceData:
LOAD *,
YearName(InvDate, 0, 4) AS YrName
Resident TempTable;
Drop table TempTable;
The resulting table contains the original dates and a column with the return value of the yearname()function.
InvDate YrName
28/03/2012 2011-2012
10/12/2012 2012-2013
5/2/2013 2012-2013
31/3/2013 2012-2013
19/5/2013 2013-2014
15/9/2013 2013-2014
11/12/2013 2013-2014
2/3/2014 2013-2014
14/5/2014 2014-2015
13/6/2014 2014-2015
7/7/2014 2014-2015
4/8/2014 2014-2015
Results table
yearstartThis function returns a timestamp corresponding to the start of the first day of the yearcontaining date. The default output format will be the DateFormat set in the script.
Syntax:YearStart(date[, period_no[, first_month_of_year]])
Script syntax and chart functions - Qlik Sense, February 2022 556
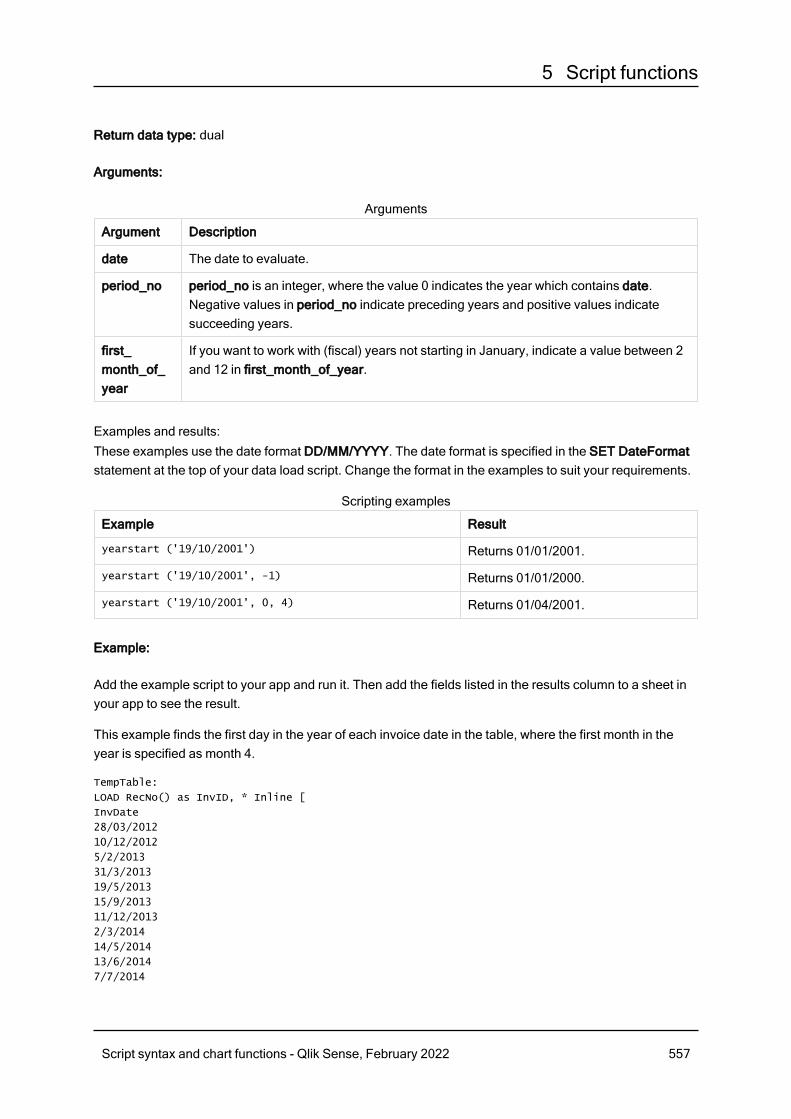
5 Script functions
Return data type: dual
Arguments:
Argument Description
date The date to evaluate.
period_no period_no is an integer, where the value 0 indicates the year which contains date.Negative values in period_no indicate preceding years and positive values indicatesucceeding years.
first_month_of_year
If you want to work with (fiscal) years not starting in January, indicate a value between 2and 12 in first_month_of_year.
Arguments
Examples and results:These examples use the date format DD/MM/YYYY. The date format is specified in the SET DateFormatstatement at the top of your data load script. Change the format in the examples to suit your requirements.
Example Result
yearstart ('19/10/2001') Returns 01/01/2001.
yearstart ('19/10/2001', -1) Returns 01/01/2000.
yearstart ('19/10/2001', 0, 4) Returns 01/04/2001.
Scripting examples
Example:
Add the example script to your app and run it. Then add the fields listed in the results column to a sheet inyour app to see the result.
This example finds the first day in the year of each invoice date in the table, where the first month in theyear is specified as month 4.
TempTable:
LOAD RecNo() as InvID, * Inline [
InvDate
28/03/2012
10/12/2012
5/2/2013
31/3/2013
19/5/2013
15/9/2013
11/12/2013
2/3/2014
14/5/2014
13/6/2014
7/7/2014
Script syntax and chart functions - Qlik Sense, February 2022 557
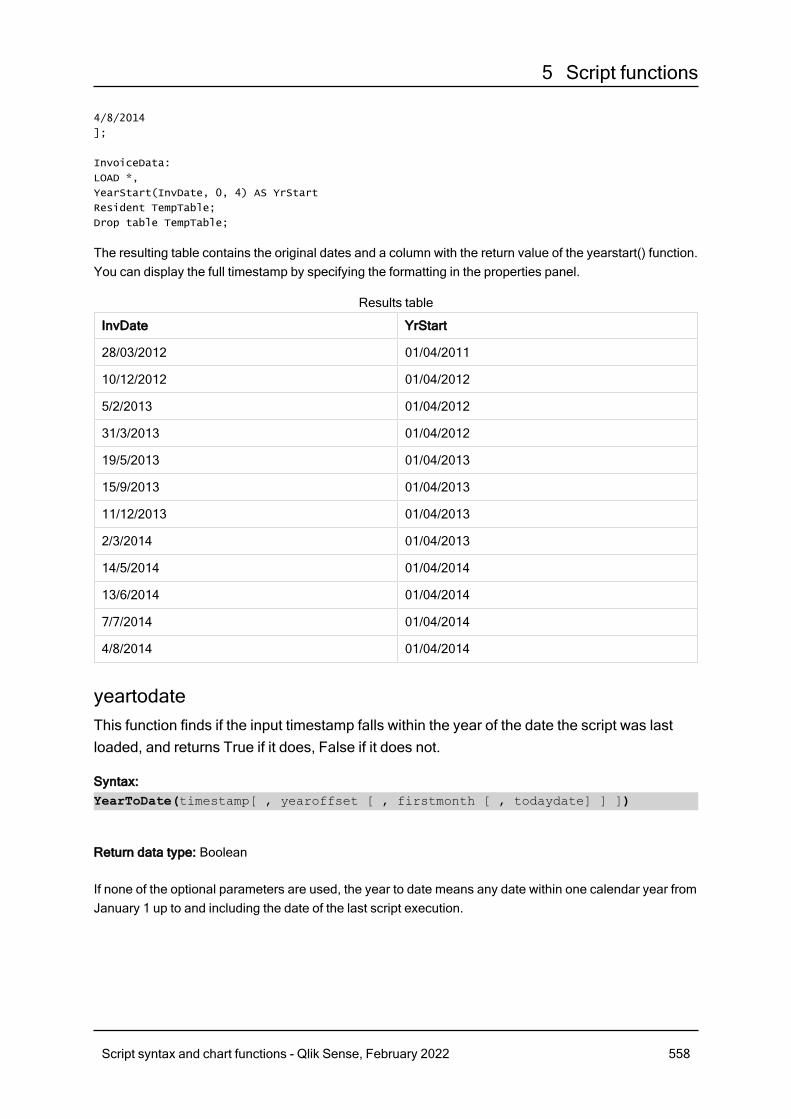
5 Script functions
4/8/2014
];
InvoiceData:
LOAD *,
YearStart(InvDate, 0, 4) AS YrStart
Resident TempTable;
Drop table TempTable;
The resulting table contains the original dates and a column with the return value of the yearstart() function.You can display the full timestamp by specifying the formatting in the properties panel.
InvDate YrStart
28/03/2012 01/04/2011
10/12/2012 01/04/2012
5/2/2013 01/04/2012
31/3/2013 01/04/2012
19/5/2013 01/04/2013
15/9/2013 01/04/2013
11/12/2013 01/04/2013
2/3/2014 01/04/2013
14/5/2014 01/04/2014
13/6/2014 01/04/2014
7/7/2014 01/04/2014
4/8/2014 01/04/2014
Results table
yeartodateThis function finds if the input timestamp falls within the year of the date the script was lastloaded, and returns True if it does, False if it does not.
Syntax:YearToDate(timestamp[ , yearoffset [ , firstmonth [ , todaydate] ] ])
Return data type: Boolean
If none of the optional parameters are used, the year to date means any date within one calendar year fromJanuary 1 up to and including the date of the last script execution.
Script syntax and chart functions - Qlik Sense, February 2022 558
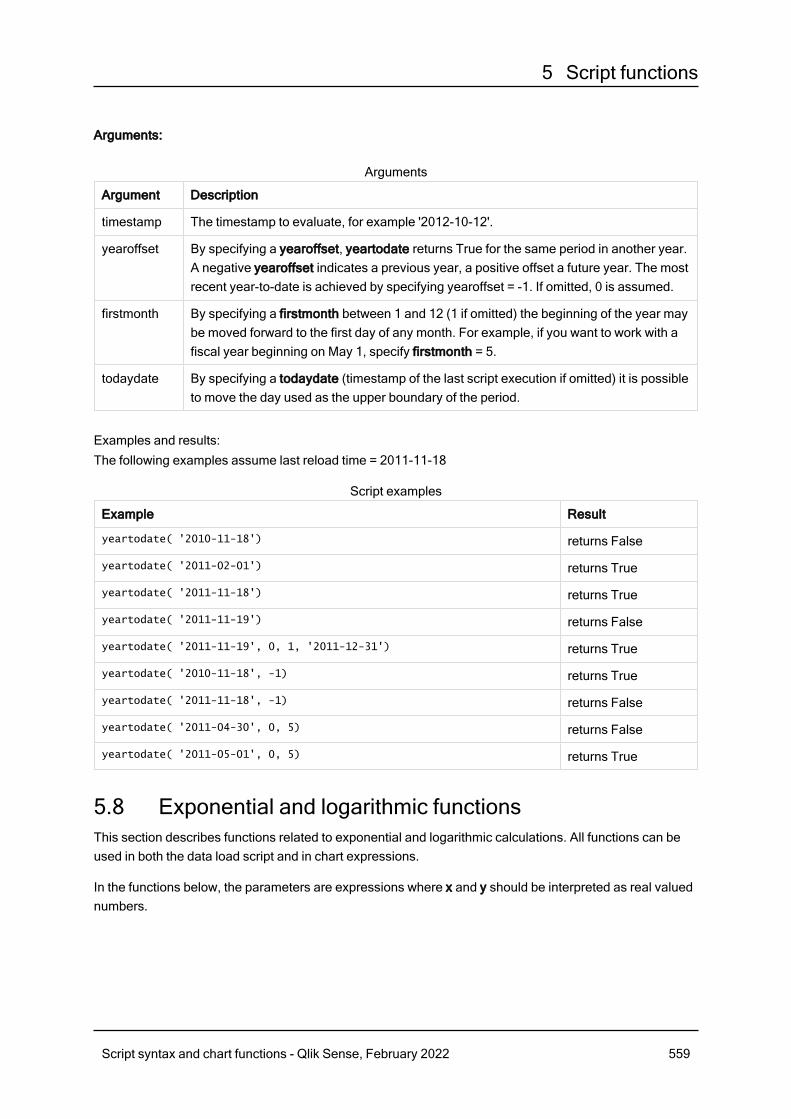
5 Script functions
Arguments:
Argument Description
timestamp The timestamp to evaluate, for example '2012-10-12'.
yearoffset By specifying a yearoffset, yeartodate returns True for the same period in another year.A negative yearoffset indicates a previous year, a positive offset a future year. The mostrecent year-to-date is achieved by specifying yearoffset = -1. If omitted, 0 is assumed.
firstmonth By specifying a firstmonth between 1 and 12 (1 if omitted) the beginning of the year maybe moved forward to the first day of any month. For example, if you want to work with afiscal year beginning on May 1, specify firstmonth = 5.
todaydate By specifying a todaydate (timestamp of the last script execution if omitted) it is possibleto move the day used as the upper boundary of the period.
Arguments
Examples and results:The following examples assume last reload time = 2011-11-18
Example Result
yeartodate( '2010-11-18') returns False
yeartodate( '2011-02-01') returns True
yeartodate( '2011-11-18') returns True
yeartodate( '2011-11-19') returns False
yeartodate( '2011-11-19', 0, 1, '2011-12-31') returns True
yeartodate( '2010-11-18', -1) returns True
yeartodate( '2011-11-18', -1) returns False
yeartodate( '2011-04-30', 0, 5) returns False
yeartodate( '2011-05-01', 0, 5) returns True
Script examples
5.8 Exponential and logarithmic functionsThis section describes functions related to exponential and logarithmic calculations. All functions can beused in both the data load script and in chart expressions.
In the functions below, the parameters are expressions where x and y should be interpreted as real valuednumbers.
Script syntax and chart functions - Qlik Sense, February 2022 559
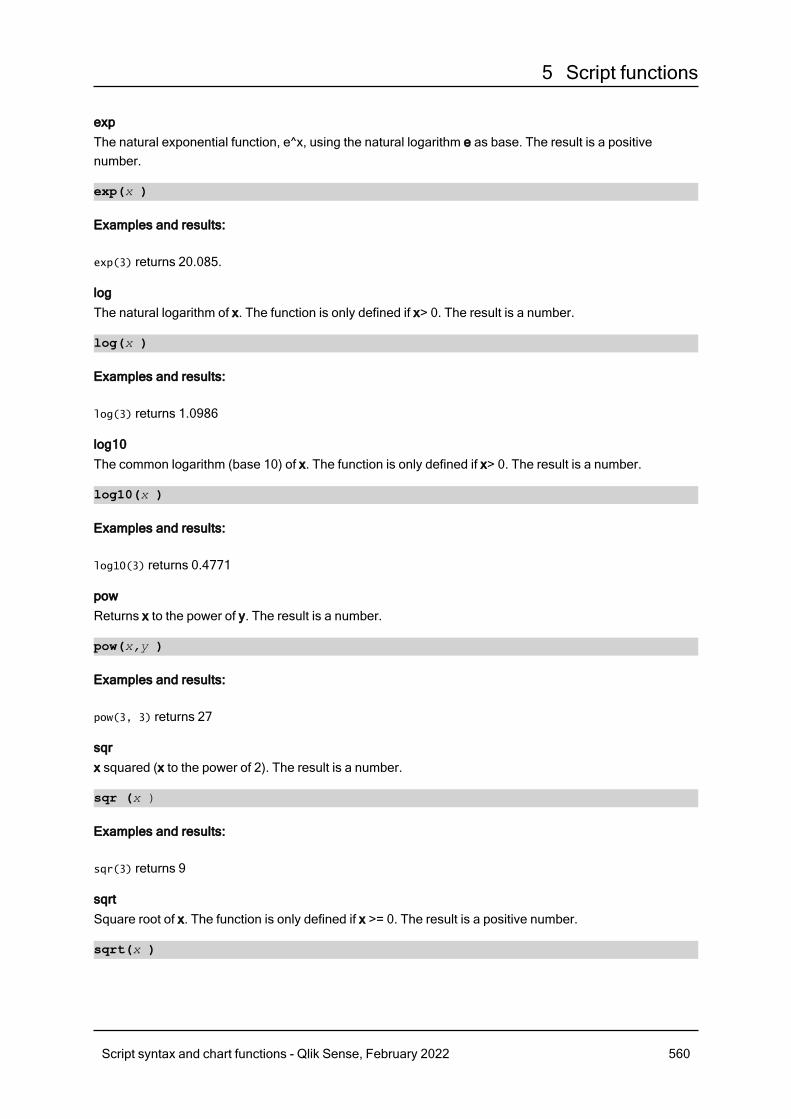
5 Script functions
expThe natural exponential function, e^x, using the natural logarithm e as base. The result is a positivenumber.
exp(x )
Examples and results:
exp(3) returns 20.085.
logThe natural logarithm of x. The function is only defined if x> 0. The result is a number.
log(x )
Examples and results:
log(3) returns 1.0986
log10The common logarithm (base 10) of x. The function is only defined if x> 0. The result is a number.
log10(x )
Examples and results:
log10(3) returns 0.4771
powReturns x to the power of y. The result is a number.
pow(x,y )
Examples and results:
pow(3, 3) returns 27
sqrx squared (x to the power of 2). The result is a number.
sqr (x )
Examples and results:
sqr(3) returns 9
sqrtSquare root of x. The function is only defined if x >= 0. The result is a positive number.
sqrt(x )
Script syntax and chart functions - Qlik Sense, February 2022 560
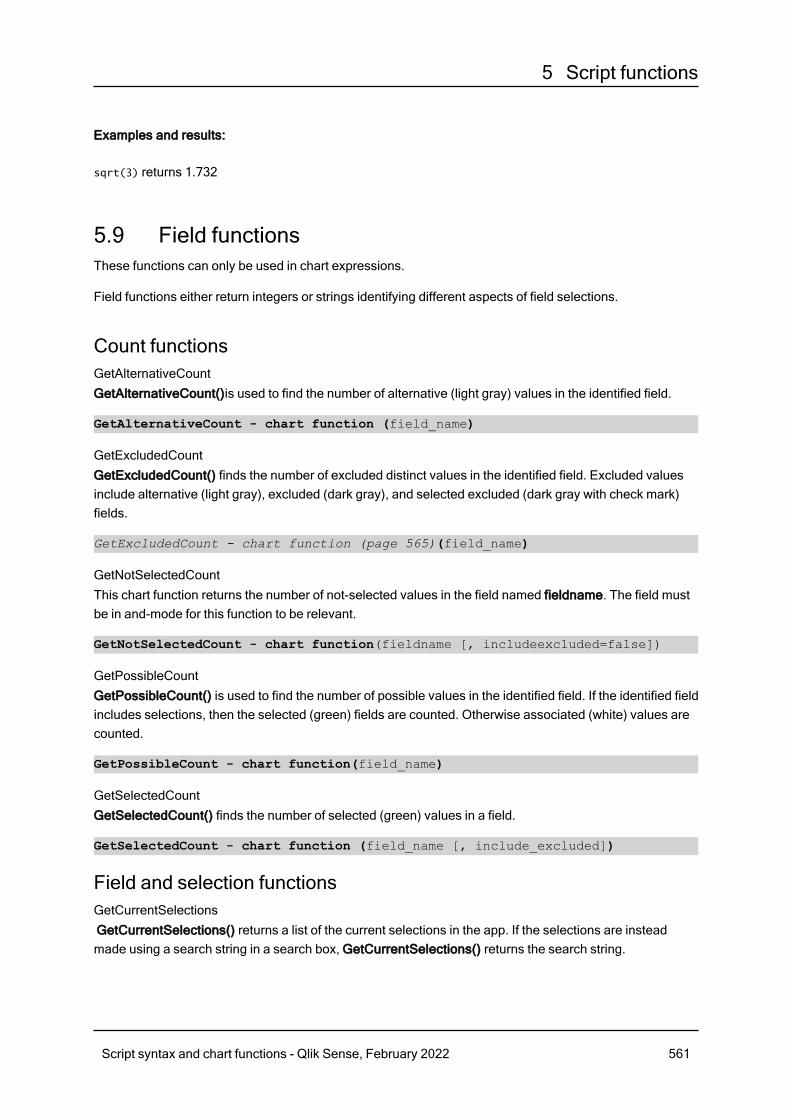
5 Script functions
Examples and results:
sqrt(3) returns 1.732
5.9 Field functionsThese functions can only be used in chart expressions.
Field functions either return integers or strings identifying different aspects of field selections.
Count functionsGetAlternativeCountGetAlternativeCount()is used to find the number of alternative (light gray) values in the identified field.
GetAlternativeCount - chart function (field_name)
GetExcludedCountGetExcludedCount() finds the number of excluded distinct values in the identified field. Excluded valuesinclude alternative (light gray), excluded (dark gray), and selected excluded (dark gray with check mark)fields.
GetExcludedCount - chart function (page 565)(field_name)
GetNotSelectedCountThis chart function returns the number of not-selected values in the field named fieldname. The field mustbe in and-mode for this function to be relevant.
GetNotSelectedCount - chart function(fieldname [, includeexcluded=false])
GetPossibleCountGetPossibleCount() is used to find the number of possible values in the identified field. If the identified fieldincludes selections, then the selected (green) fields are counted. Otherwise associated (white) values arecounted.
GetPossibleCount - chart function(field_name)
GetSelectedCountGetSelectedCount() finds the number of selected (green) values in a field.
GetSelectedCount - chart function (field_name [, include_excluded])
Field and selection functionsGetCurrentSelectionsGetCurrentSelections() returns a list of the current selections in the app. If the selections are insteadmade using a search string in a search box, GetCurrentSelections() returns the search string.
Script syntax and chart functions - Qlik Sense, February 2022 561

5 Script functions
GetCurrentSelections - chart function([record_sep [,tag_sep [,value_sep
[,max_values]]]])
GetFieldSelectionsGetFieldSelections() returns a string with the current selections in a field.
GetFieldSelections - chart function ( field_name [, value_sep [, max_
values]])
GetObjectDimensionGetObjectDimension() returns the name of the dimension. Index is an optional integer denoting thedimension that should be returned.
GetObjectDimension - chart function ([index])
GetObjectFieldGetObjectField() returns the name of the dimension. Index is an optional integer denoting the dimensionthat should be returned.
GetObjectField - chart function ([index])
GetObjectMeasureGetObjectMeasure() returns the name of the measure. Index is an optional integer denoting the measurethat should be returned.
GetObjectMeasure - chart function ([index])
GetAlternativeCount - chart functionGetAlternativeCount()is used to find the number of alternative (light gray) values in the identified field.
Syntax:GetAlternativeCount (field_name)
Return data type: integer
Arguments:
Argument Description
field_name The field containing the range of data to be measured.
Arguments
Examples and results:
The following example uses the First name field loaded to a filter pane.
Script syntax and chart functions - Qlik Sense, February 2022 562
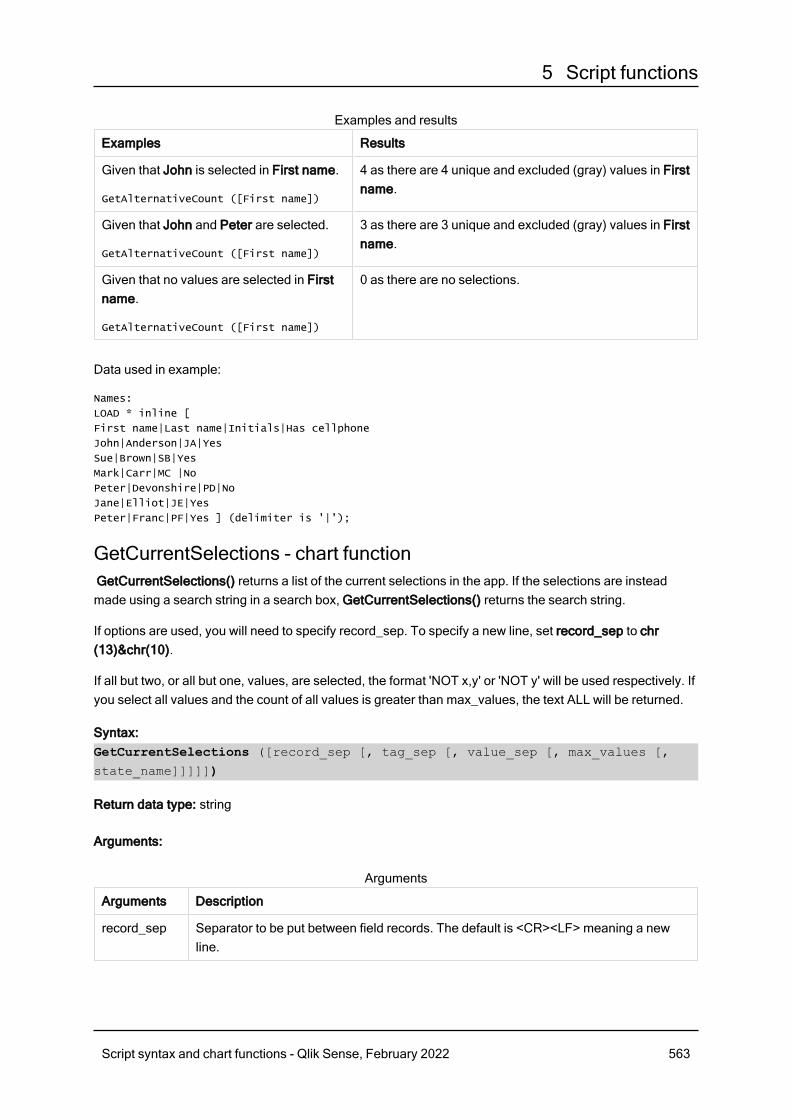
5 Script functions
Examples Results
Given that John is selected in First name.
GetAlternativeCount ([First name])
4 as there are 4 unique and excluded (gray) values in Firstname.
Given that John and Peter are selected.
GetAlternativeCount ([First name])
3 as there are 3 unique and excluded (gray) values in Firstname.
Given that no values are selected in Firstname.
GetAlternativeCount ([First name])
0 as there are no selections.
Examples and results
Data used in example:
Names:
LOAD * inline [
First name|Last name|Initials|Has cellphone
John|Anderson|JA|Yes
Sue|Brown|SB|Yes
Mark|Carr|MC |No
Peter|Devonshire|PD|No
Jane|Elliot|JE|Yes
Peter|Franc|PF|Yes ] (delimiter is '|');
GetCurrentSelections - chart functionGetCurrentSelections() returns a list of the current selections in the app. If the selections are insteadmade using a search string in a search box, GetCurrentSelections() returns the search string.
If options are used, you will need to specify record_sep. To specify a new line, set record_sep to chr(13)&chr(10).
If all but two, or all but one, values, are selected, the format 'NOT x,y' or 'NOT y' will be used respectively. Ifyou select all values and the count of all values is greater than max_values, the text ALL will be returned.
Syntax:GetCurrentSelections ([record_sep [, tag_sep [, value_sep [, max_values [,
state_name]]]]])
Return data type: string
Arguments:
Arguments Description
record_sep Separator to be put between field records. The default is <CR><LF> meaning a newline.
Arguments
Script syntax and chart functions - Qlik Sense, February 2022 563
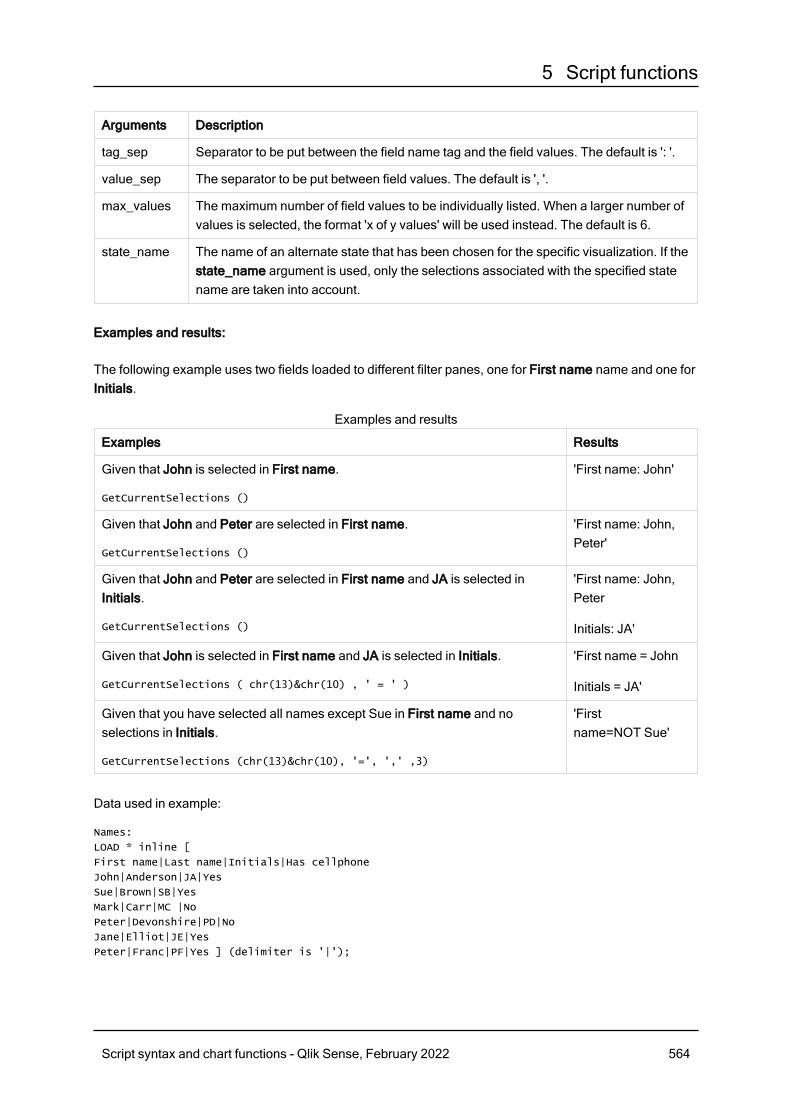
5 Script functions
Arguments Description
tag_sep Separator to be put between the field name tag and the field values. The default is ': '.
value_sep The separator to be put between field values. The default is ', '.
max_values The maximum number of field values to be individually listed. When a larger number ofvalues is selected, the format 'x of y values' will be used instead. The default is 6.
state_name The name of an alternate state that has been chosen for the specific visualization. If thestate_name argument is used, only the selections associated with the specified statename are taken into account.
Examples and results:
The following example uses two fields loaded to different filter panes, one for First name name and one forInitials.
Examples Results
Given that John is selected in First name.
GetCurrentSelections ()
'First name: John'
Given that John and Peter are selected in First name.
GetCurrentSelections ()
'First name: John,Peter'
Given that John and Peter are selected in First name and JA is selected inInitials.
GetCurrentSelections ()
'First name: John,Peter
Initials: JA'
Given that John is selected in First name and JA is selected in Initials.
GetCurrentSelections ( chr(13)&chr(10) , ' = ' )
'First name = John
Initials = JA'
Given that you have selected all names except Sue in First name and noselections in Initials.
GetCurrentSelections (chr(13)&chr(10), '=', ',' ,3)
'Firstname=NOT Sue'
Examples and results
Data used in example:
Names:
LOAD * inline [
First name|Last name|Initials|Has cellphone
John|Anderson|JA|Yes
Sue|Brown|SB|Yes
Mark|Carr|MC |No
Peter|Devonshire|PD|No
Jane|Elliot|JE|Yes
Peter|Franc|PF|Yes ] (delimiter is '|');
Script syntax and chart functions - Qlik Sense, February 2022 564
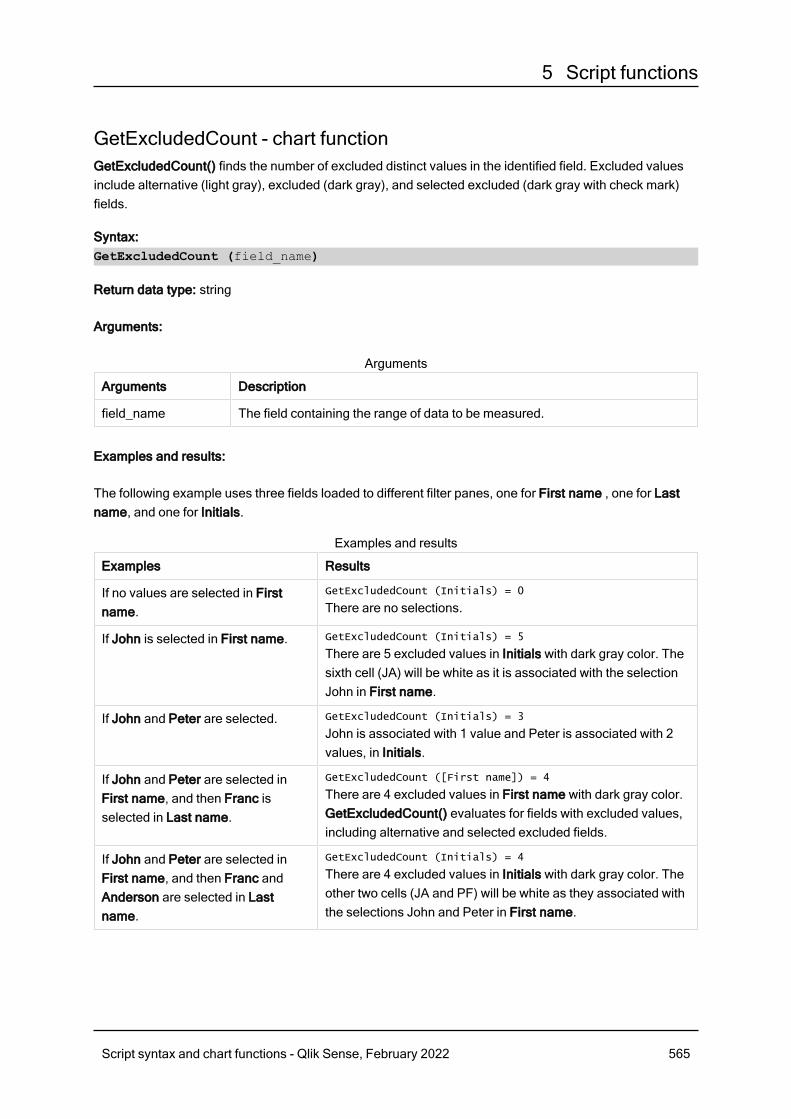
5 Script functions
GetExcludedCount - chart functionGetExcludedCount() finds the number of excluded distinct values in the identified field. Excluded valuesinclude alternative (light gray), excluded (dark gray), and selected excluded (dark gray with check mark)fields.
Syntax:GetExcludedCount (field_name)
Return data type: string
Arguments:
Arguments Description
field_name The field containing the range of data to be measured.
Arguments
Examples and results:
The following example uses three fields loaded to different filter panes, one for First name , one for Lastname, and one for Initials.
Examples Results
If no values are selected in Firstname.
GetExcludedCount (Initials) = 0
There are no selections.
If John is selected in First name. GetExcludedCount (Initials) = 5
There are 5 excluded values in Initials with dark gray color. Thesixth cell (JA) will be white as it is associated with the selectionJohn in First name.
If John and Peter are selected. GetExcludedCount (Initials) = 3
John is associated with 1 value and Peter is associated with 2values, in Initials.
If John and Peter are selected inFirst name, and then Franc isselected in Last name.
GetExcludedCount ([First name]) = 4
There are 4 excluded values in First name with dark gray color.GetExcludedCount() evaluates for fields with excluded values,including alternative and selected excluded fields.
If John and Peter are selected inFirst name, and then Franc andAnderson are selected in Lastname.
GetExcludedCount (Initials) = 4
There are 4 excluded values in Initials with dark gray color. Theother two cells (JA and PF) will be white as they associated withthe selections John and Peter in First name.
Examples and results
Script syntax and chart functions - Qlik Sense, February 2022 565
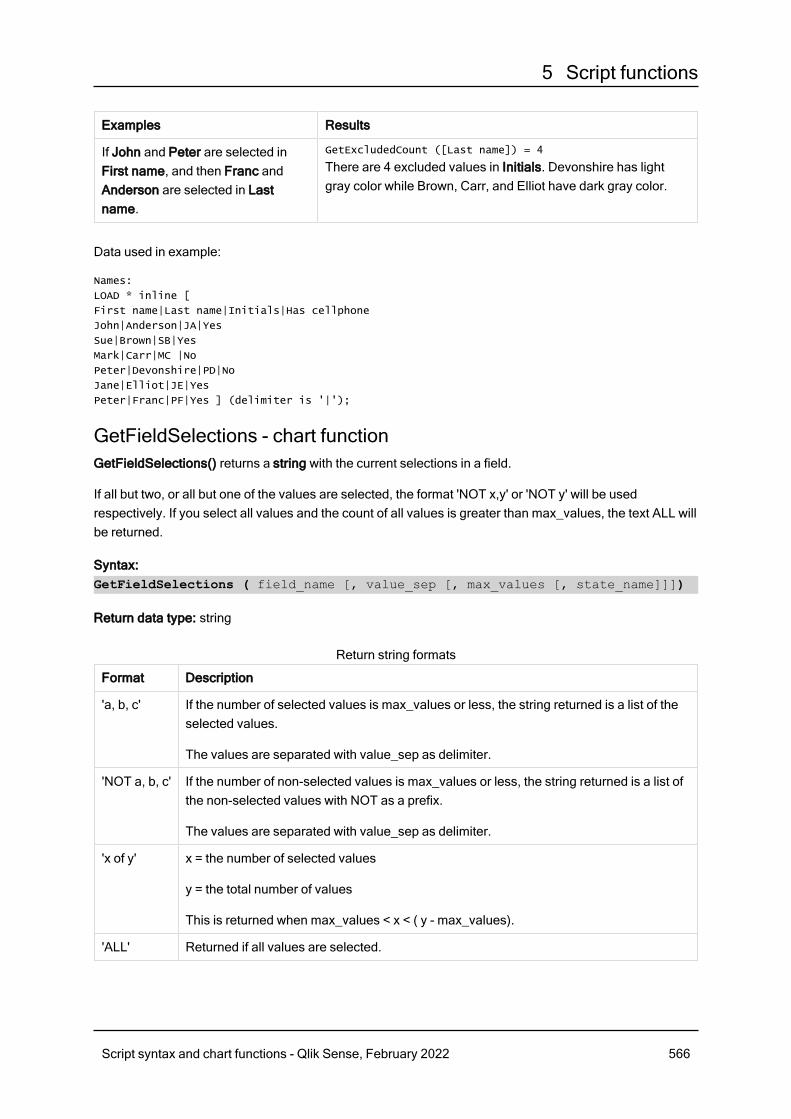
5 Script functions
Examples Results
If John and Peter are selected inFirst name, and then Franc andAnderson are selected in Lastname.
GetExcludedCount ([Last name]) = 4
There are 4 excluded values in Initials. Devonshire has lightgray color while Brown, Carr, and Elliot have dark gray color.
Data used in example:
Names:
LOAD * inline [
First name|Last name|Initials|Has cellphone
John|Anderson|JA|Yes
Sue|Brown|SB|Yes
Mark|Carr|MC |No
Peter|Devonshire|PD|No
Jane|Elliot|JE|Yes
Peter|Franc|PF|Yes ] (delimiter is '|');
GetFieldSelections - chart functionGetFieldSelections() returns a string with the current selections in a field.
If all but two, or all but one of the values are selected, the format 'NOT x,y' or 'NOT y' will be usedrespectively. If you select all values and the count of all values is greater than max_values, the text ALL willbe returned.
Syntax:GetFieldSelections ( field_name [, value_sep [, max_values [, state_name]]])
Return data type: string
Format Description
'a, b, c' If the number of selected values is max_values or less, the string returned is a list of theselected values.
The values are separated with value_sep as delimiter.
'NOT a, b, c' If the number of non-selected values is max_values or less, the string returned is a list ofthe non-selected values with NOT as a prefix.
The values are separated with value_sep as delimiter.
'x of y' x = the number of selected values
y = the total number of values
This is returned when max_values < x < ( y - max_values).
'ALL' Returned if all values are selected.
Return string formats
Script syntax and chart functions - Qlik Sense, February 2022 566
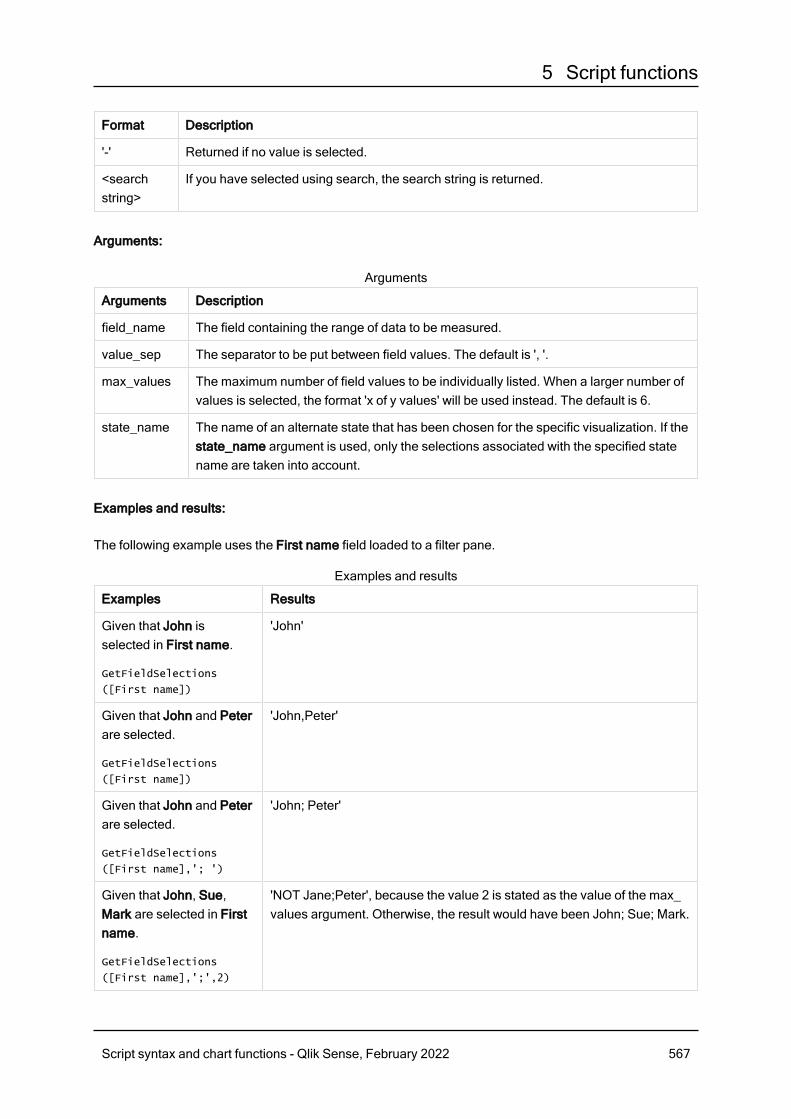
5 Script functions
Format Description
'-' Returned if no value is selected.
<searchstring>
If you have selected using search, the search string is returned.
Arguments:
Arguments Description
field_name The field containing the range of data to be measured.
value_sep The separator to be put between field values. The default is ', '.
max_values The maximum number of field values to be individually listed. When a larger number ofvalues is selected, the format 'x of y values' will be used instead. The default is 6.
state_name The name of an alternate state that has been chosen for the specific visualization. If thestate_name argument is used, only the selections associated with the specified statename are taken into account.
Arguments
Examples and results:
The following example uses the First name field loaded to a filter pane.
Examples Results
Given that John isselected in First name.
GetFieldSelections
([First name])
'John'
Given that John and Peterare selected.
GetFieldSelections
([First name])
'John,Peter'
Given that John and Peterare selected.
GetFieldSelections
([First name],'; ')
'John; Peter'
Given that John, Sue,Mark are selected in Firstname.
GetFieldSelections
([First name],';',2)
'NOT Jane;Peter', because the value 2 is stated as the value of the max_values argument. Otherwise, the result would have been John; Sue; Mark.
Examples and results
Script syntax and chart functions - Qlik Sense, February 2022 567
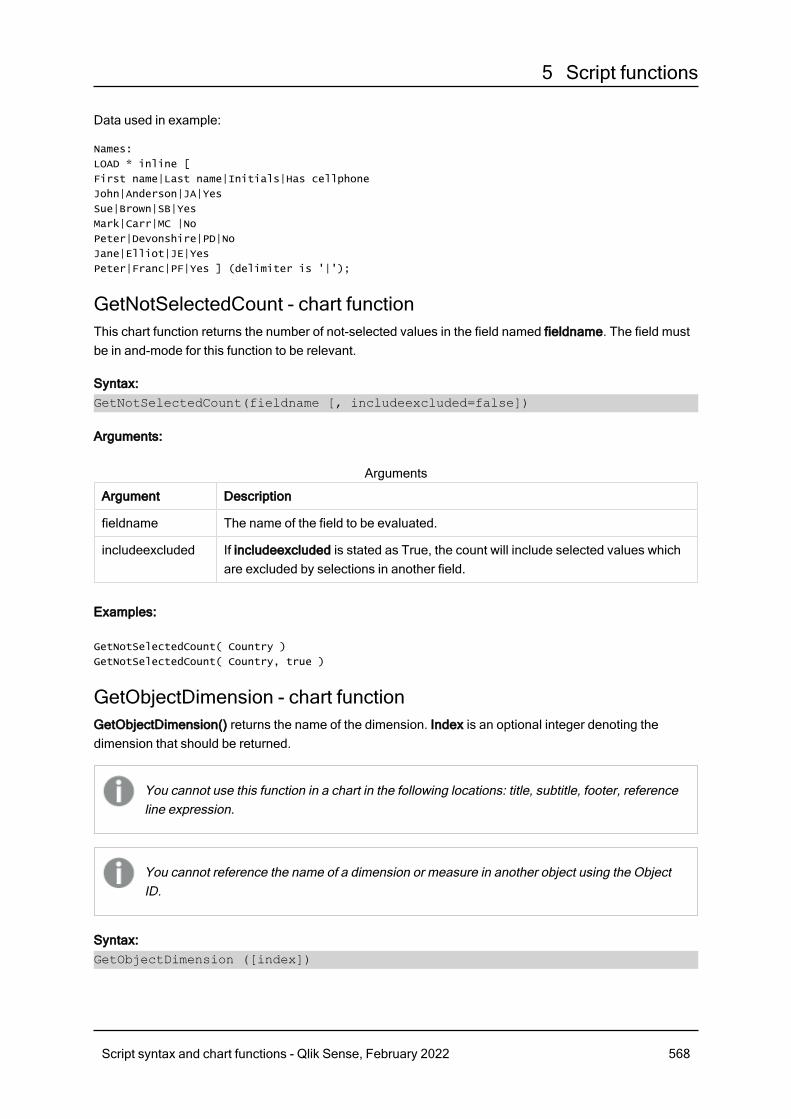
5 Script functions
Data used in example:
Names:
LOAD * inline [
First name|Last name|Initials|Has cellphone
John|Anderson|JA|Yes
Sue|Brown|SB|Yes
Mark|Carr|MC |No
Peter|Devonshire|PD|No
Jane|Elliot|JE|Yes
Peter|Franc|PF|Yes ] (delimiter is '|');
GetNotSelectedCount - chart functionThis chart function returns the number of not-selected values in the field named fieldname. The field mustbe in and-mode for this function to be relevant.
Syntax:GetNotSelectedCount(fieldname [, includeexcluded=false])
Arguments:
Argument Description
fieldname The name of the field to be evaluated.
includeexcluded If includeexcluded is stated as True, the count will include selected values whichare excluded by selections in another field.
Arguments
Examples:
GetNotSelectedCount( Country )
GetNotSelectedCount( Country, true )
GetObjectDimension - chart functionGetObjectDimension() returns the name of the dimension. Index is an optional integer denoting thedimension that should be returned.
You cannot use this function in a chart in the following locations: title, subtitle, footer, referenceline expression.
You cannot reference the name of a dimension or measure in another object using the ObjectID.
Syntax:GetObjectDimension ([index])
Script syntax and chart functions - Qlik Sense, February 2022 568
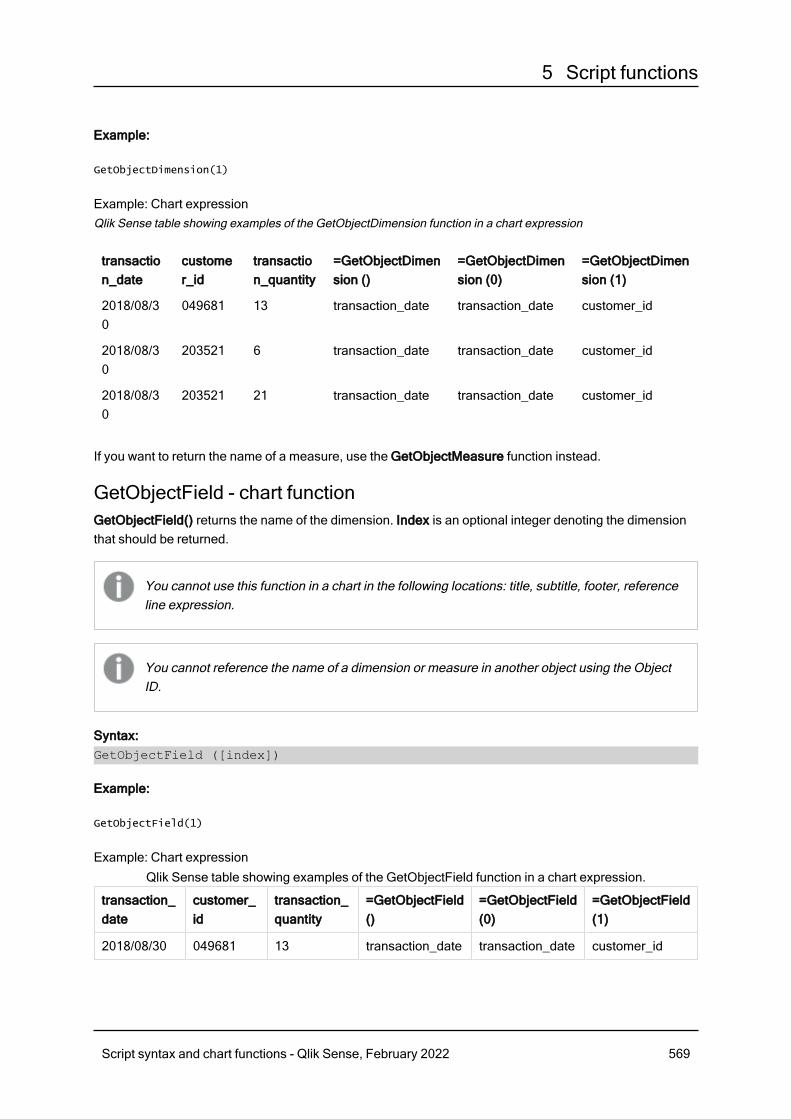
5 Script functions
Example:
GetObjectDimension(1)
Example: Chart expressionQlik Sense table showing examples of the GetObjectDimension function in a chart expression
transaction_date
customer_id
transaction_quantity
=GetObjectDimension ()
=GetObjectDimension (0)
=GetObjectDimension (1)
2018/08/30
049681 13 transaction_date transaction_date customer_id
2018/08/30
203521 6 transaction_date transaction_date customer_id
2018/08/30
203521 21 transaction_date transaction_date customer_id
If you want to return the name of a measure, use the GetObjectMeasure function instead.
GetObjectField - chart functionGetObjectField() returns the name of the dimension. Index is an optional integer denoting the dimensionthat should be returned.
You cannot use this function in a chart in the following locations: title, subtitle, footer, referenceline expression.
You cannot reference the name of a dimension or measure in another object using the ObjectID.
Syntax:GetObjectField ([index])
Example:
GetObjectField(1)
Example: Chart expression
transaction_date
customer_id
transaction_quantity
=GetObjectField()
=GetObjectField(0)
=GetObjectField(1)
2018/08/30 049681 13 transaction_date transaction_date customer_id
Qlik Sense table showing examples of the GetObjectField function in a chart expression.
Script syntax and chart functions - Qlik Sense, February 2022 569

5 Script functions
transaction_date
customer_id
transaction_quantity
=GetObjectField()
=GetObjectField(0)
=GetObjectField(1)
2018/08/30 203521 6 transaction_date transaction_date customer_id
2018/08/30 203521 21 transaction_date transaction_date customer_id
If you want to return the name of a measure, use the GetObjectMeasure function instead.
GetObjectMeasure - chart functionGetObjectMeasure() returns the name of the measure. Index is an optional integer denoting the measurethat should be returned.
You cannot use this function in a chart in the following locations: title, subtitle, footer, referenceline expression.
You cannot reference the name of a dimension or measure in another object using the ObjectID.
Syntax:GetObjectMeasure ([index])
Example:
GetObjectMeasure(1)
Example: Chart expressionQlik Sense table showing examples of the GetObjectMeasure function in a chart expression
customer_id
sum(transaction_quantity)
Avg(transaction_quantity)
=GetObjectMeasure ()
=GetObjectMeasure(0)
=GetObjectMeasure(1)
49681 13 13 sum(transaction_quantity)
sum(transaction_quantity)
Avg(transaction_quantity)
203521 27 13.5 sum(transaction_quantity)
sum(transaction_quantity)
Avg(transaction_quantity)
If you want to return the name of a dimension, use the GetObjectField function instead.
GetPossibleCount - chart functionGetPossibleCount() is used to find the number of possible values in the identified field. If the identified fieldincludes selections, then the selected (green) fields are counted. Otherwise associated (white) values arecounted. .
Script syntax and chart functions - Qlik Sense, February 2022 570
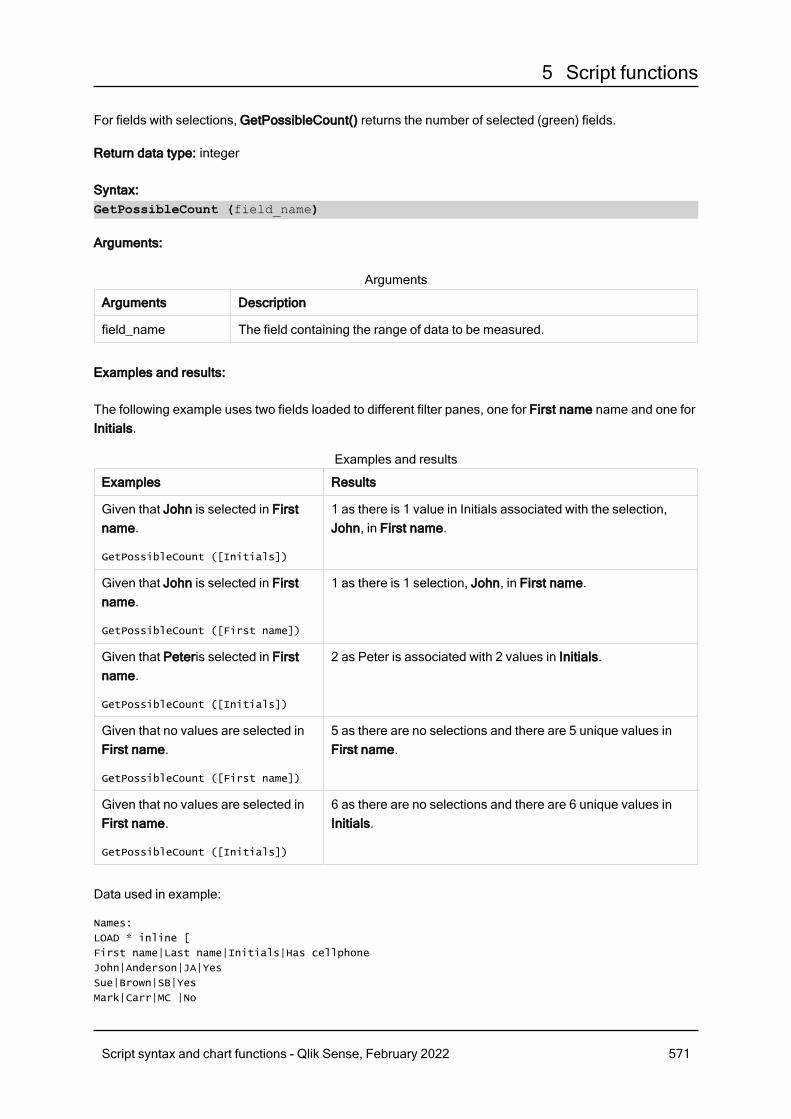
5 Script functions
For fields with selections, GetPossibleCount() returns the number of selected (green) fields.
Return data type: integer
Syntax:GetPossibleCount (field_name)
Arguments:
Arguments Description
field_name The field containing the range of data to be measured.
Arguments
Examples and results:
The following example uses two fields loaded to different filter panes, one for First name name and one forInitials.
Examples Results
Given that John is selected in Firstname.
GetPossibleCount ([Initials])
1 as there is 1 value in Initials associated with the selection,John, in First name.
Given that John is selected in Firstname.
GetPossibleCount ([First name])
1 as there is 1 selection, John, in First name.
Given that Peteris selected in Firstname.
GetPossibleCount ([Initials])
2 as Peter is associated with 2 values in Initials.
Given that no values are selected inFirst name.
GetPossibleCount ([First name])
5 as there are no selections and there are 5 unique values inFirst name.
Given that no values are selected inFirst name.
GetPossibleCount ([Initials])
6 as there are no selections and there are 6 unique values inInitials.
Examples and results
Data used in example:
Names:
LOAD * inline [
First name|Last name|Initials|Has cellphone
John|Anderson|JA|Yes
Sue|Brown|SB|Yes
Mark|Carr|MC |No
Script syntax and chart functions - Qlik Sense, February 2022 571
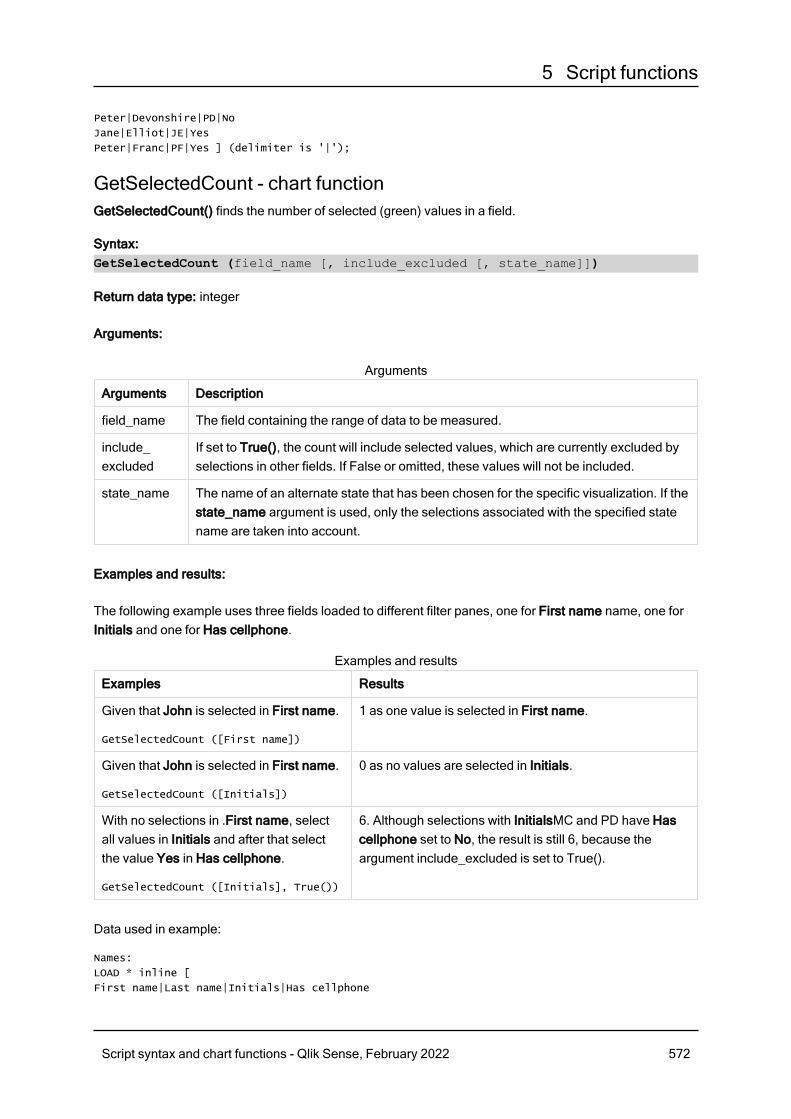
5 Script functions
Peter|Devonshire|PD|No
Jane|Elliot|JE|Yes
Peter|Franc|PF|Yes ] (delimiter is '|');
GetSelectedCount - chart functionGetSelectedCount() finds the number of selected (green) values in a field.
Syntax:GetSelectedCount (field_name [, include_excluded [, state_name]])
Return data type: integer
Arguments:
Arguments Description
field_name The field containing the range of data to be measured.
include_excluded
If set to True(), the count will include selected values, which are currently excluded byselections in other fields. If False or omitted, these values will not be included.
state_name The name of an alternate state that has been chosen for the specific visualization. If thestate_name argument is used, only the selections associated with the specified statename are taken into account.
Arguments
Examples and results:
The following example uses three fields loaded to different filter panes, one for First name name, one forInitials and one for Has cellphone.
Examples Results
Given that John is selected in First name.
GetSelectedCount ([First name])
1 as one value is selected in First name.
Given that John is selected in First name.
GetSelectedCount ([Initials])
0 as no values are selected in Initials.
With no selections in .First name, selectall values in Initials and after that selectthe value Yes in Has cellphone.
GetSelectedCount ([Initials], True())
6. Although selections with InitialsMC and PD have Hascellphone set to No, the result is still 6, because theargument include_excluded is set to True().
Examples and results
Data used in example:
Names:
LOAD * inline [
First name|Last name|Initials|Has cellphone
Script syntax and chart functions - Qlik Sense, February 2022 572

5 Script functions
John|Anderson|JA|Yes
Sue|Brown|SB|Yes
Mark|Carr|MC |No
Peter|Devonshire|PD|No
Jane|Elliot|JE|Yes
Peter|Franc|PF|Yes ] (delimiter is '|');
5.10 File functionsThe file functions (only available in script expressions) return information about the table filewhich is currently being read. These functions will return NULL for all data sources excepttable files (exception: ConnectString( )).
File functions overviewEach function is described further after the overview. You can also click the function name in the syntax toimmediately access the details for that specific function.
AttributeThis script function returns the value of the meta tags of different media files as text. The following fileformats are supported: MP3, WMA, WMV, PNG and JPG. If the file filename does not exist, is not asupported file format or does not contain a meta tag named attributename, NULL will be returned.
Attribute (filename, attributename)
ConnectStringThe ConnectString() function returns the name of the active data connection for ODBC orOLE DB connections. The function returns an empty string if no connect statement has been executed, orafter a disconnect statement.
ConnectString ()
FileBaseNameThe FileBaseName function returns a string containing the name of the table file currently being read,without path or extension.
FileBaseName ()
FileDirThe FileDir function returns a string containing the path to the directory of the table file currently beingread.
FileDir ()
FileExtensionThe FileExtension function returns a string containing the extension of the table file currently being read.
FileExtension ()
Script syntax and chart functions - Qlik Sense, February 2022 573
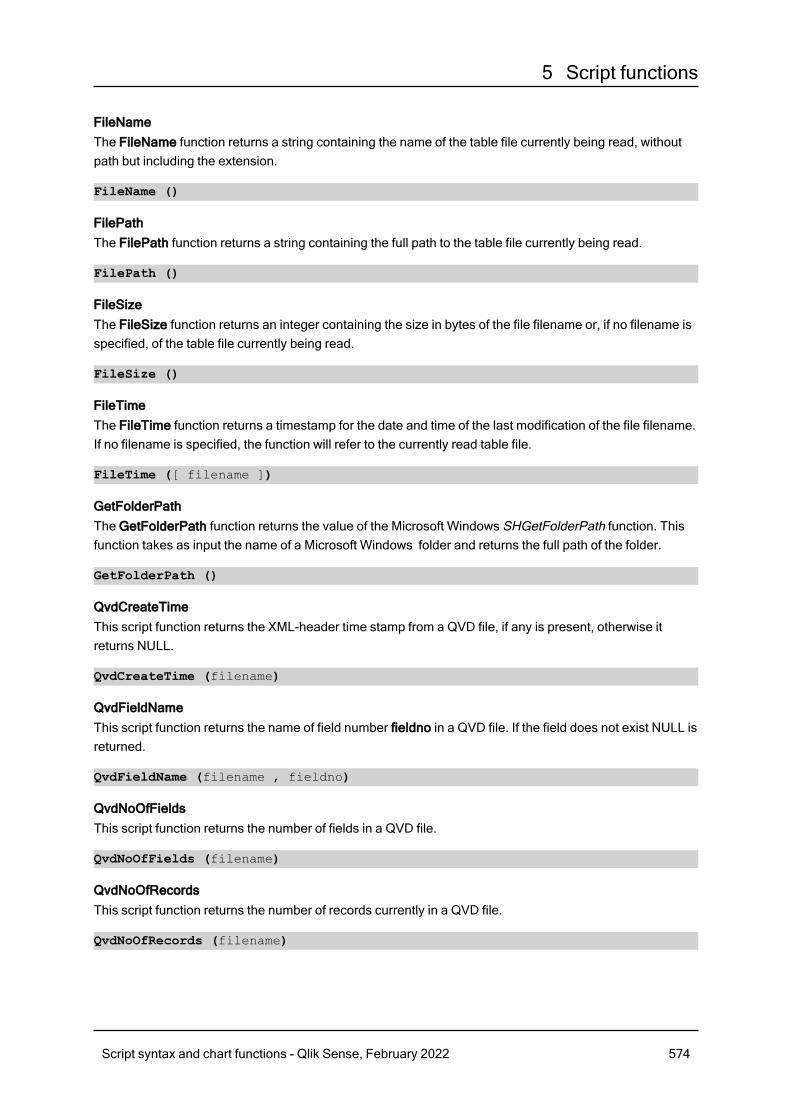
5 Script functions
FileNameThe FileName function returns a string containing the name of the table file currently being read, withoutpath but including the extension.
FileName ()
FilePathThe FilePath function returns a string containing the full path to the table file currently being read.
FilePath ()
FileSizeThe FileSize function returns an integer containing the size in bytes of the file filename or, if no filename isspecified, of the table file currently being read.
FileSize ()
FileTimeThe FileTime function returns a timestamp for the date and time of the last modification of the file filename.If no filename is specified, the function will refer to the currently read table file.
FileTime ([ filename ])
GetFolderPathThe GetFolderPath function returns the value of the Microsoft Windows SHGetFolderPath function. Thisfunction takes as input the name of a Microsoft Windows folder and returns the full path of the folder.
GetFolderPath ()
QvdCreateTimeThis script function returns the XML-header time stamp from a QVD file, if any is present, otherwise itreturns NULL.
QvdCreateTime (filename)
QvdFieldNameThis script function returns the name of field number fieldno in a QVD file. If the field does not exist NULL isreturned.
QvdFieldName (filename , fieldno)
QvdNoOfFieldsThis script function returns the number of fields in a QVD file.
QvdNoOfFields (filename)
QvdNoOfRecordsThis script function returns the number of records currently in a QVD file.
QvdNoOfRecords (filename)
Script syntax and chart functions - Qlik Sense, February 2022 574

5 Script functions
QvdTableNameThis script function returns the name of the table stored in a QVD file.
QvdTableName (filename)
AttributeThis script function returns the value of the meta tags of different media files as text. Thefollowing file formats are supported: MP3, WMA, WMV, PNG and JPG. If the file filenamedoes not exist, is not a supported file format or does not contain a meta tag namedattributename, NULL will be returned.
Syntax:Attribute(filename, attributename)
A large number of meta tags can be read. The examples in this topic show which tags can be read for therespective supported file types.
You can only read meta tags saved in the file according to the relevant specification, forexample ID2v3 for MP3 files or EXIF for JPG files, not meta information saved in the WindowsFile Explorer.
Arguments:
Argument Description
filename The name of a media file including path, if needed, as a folder data connection.
Example: 'lib://Table Files/'
In legacy scripting mode, the following path formats are also supported:
l absolute
Example: c:\data\
l relative to the Qlik Sense app working directory.
Example: data\
attributename The name of a meta tag.
Arguments
The examples use the GetFolderPath function to find the paths to media files. As GetFolderPath is onlysupported in legacy mode, you need to replace the references to GetFolderPath with a lib:// dataconnection path when you use this function in standard mode or in Qlik Sense SaaS.
File system access restriction (page 826)
Script syntax and chart functions - Qlik Sense, February 2022 575
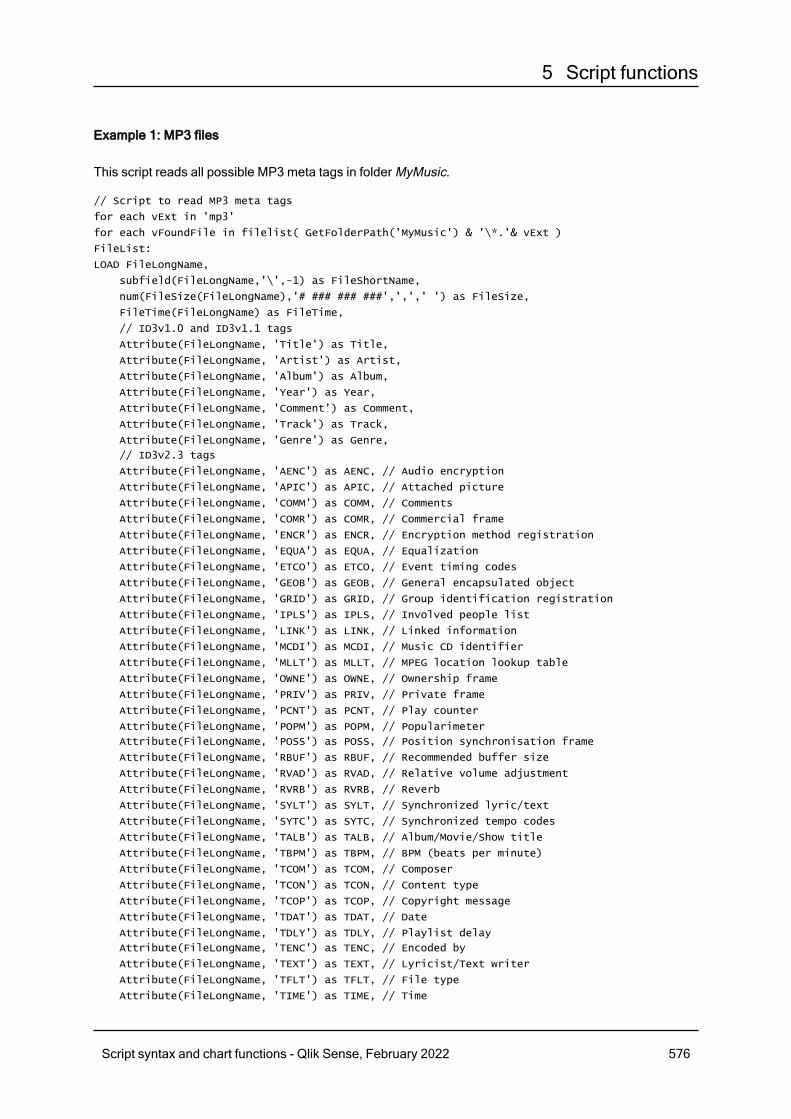
5 Script functions
Example 1: MP3 files
This script reads all possible MP3 meta tags in folder MyMusic.
// Script to read MP3 meta tags
for each vExt in 'mp3'
for each vFoundFile in filelist( GetFolderPath('MyMusic') & '\*.'& vExt )
FileList:
LOAD FileLongName,
subfield(FileLongName,'\',-1) as FileShortName,
num(FileSize(FileLongName),'# ### ### ###',',',' ') as FileSize,
FileTime(FileLongName) as FileTime,
// ID3v1.0 and ID3v1.1 tags
Attribute(FileLongName, 'Title') as Title,
Attribute(FileLongName, 'Artist') as Artist,
Attribute(FileLongName, 'Album') as Album,
Attribute(FileLongName, 'Year') as Year,
Attribute(FileLongName, 'Comment') as Comment,
Attribute(FileLongName, 'Track') as Track,
Attribute(FileLongName, 'Genre') as Genre,
// ID3v2.3 tags
Attribute(FileLongName, 'AENC') as AENC, // Audio encryption
Attribute(FileLongName, 'APIC') as APIC, // Attached picture
Attribute(FileLongName, 'COMM') as COMM, // Comments
Attribute(FileLongName, 'COMR') as COMR, // Commercial frame
Attribute(FileLongName, 'ENCR') as ENCR, // Encryption method registration
Attribute(FileLongName, 'EQUA') as EQUA, // Equalization
Attribute(FileLongName, 'ETCO') as ETCO, // Event timing codes
Attribute(FileLongName, 'GEOB') as GEOB, // General encapsulated object
Attribute(FileLongName, 'GRID') as GRID, // Group identification registration
Attribute(FileLongName, 'IPLS') as IPLS, // Involved people list
Attribute(FileLongName, 'LINK') as LINK, // Linked information
Attribute(FileLongName, 'MCDI') as MCDI, // Music CD identifier
Attribute(FileLongName, 'MLLT') as MLLT, // MPEG location lookup table
Attribute(FileLongName, 'OWNE') as OWNE, // Ownership frame
Attribute(FileLongName, 'PRIV') as PRIV, // Private frame
Attribute(FileLongName, 'PCNT') as PCNT, // Play counter
Attribute(FileLongName, 'POPM') as POPM, // Popularimeter
Attribute(FileLongName, 'POSS') as POSS, // Position synchronisation frame
Attribute(FileLongName, 'RBUF') as RBUF, // Recommended buffer size
Attribute(FileLongName, 'RVAD') as RVAD, // Relative volume adjustment
Attribute(FileLongName, 'RVRB') as RVRB, // Reverb
Attribute(FileLongName, 'SYLT') as SYLT, // Synchronized lyric/text
Attribute(FileLongName, 'SYTC') as SYTC, // Synchronized tempo codes
Attribute(FileLongName, 'TALB') as TALB, // Album/Movie/Show title
Attribute(FileLongName, 'TBPM') as TBPM, // BPM (beats per minute)
Attribute(FileLongName, 'TCOM') as TCOM, // Composer
Attribute(FileLongName, 'TCON') as TCON, // Content type
Attribute(FileLongName, 'TCOP') as TCOP, // Copyright message
Attribute(FileLongName, 'TDAT') as TDAT, // Date
Attribute(FileLongName, 'TDLY') as TDLY, // Playlist delay
Attribute(FileLongName, 'TENC') as TENC, // Encoded by
Attribute(FileLongName, 'TEXT') as TEXT, // Lyricist/Text writer
Attribute(FileLongName, 'TFLT') as TFLT, // File type
Attribute(FileLongName, 'TIME') as TIME, // Time
Script syntax and chart functions - Qlik Sense, February 2022 576
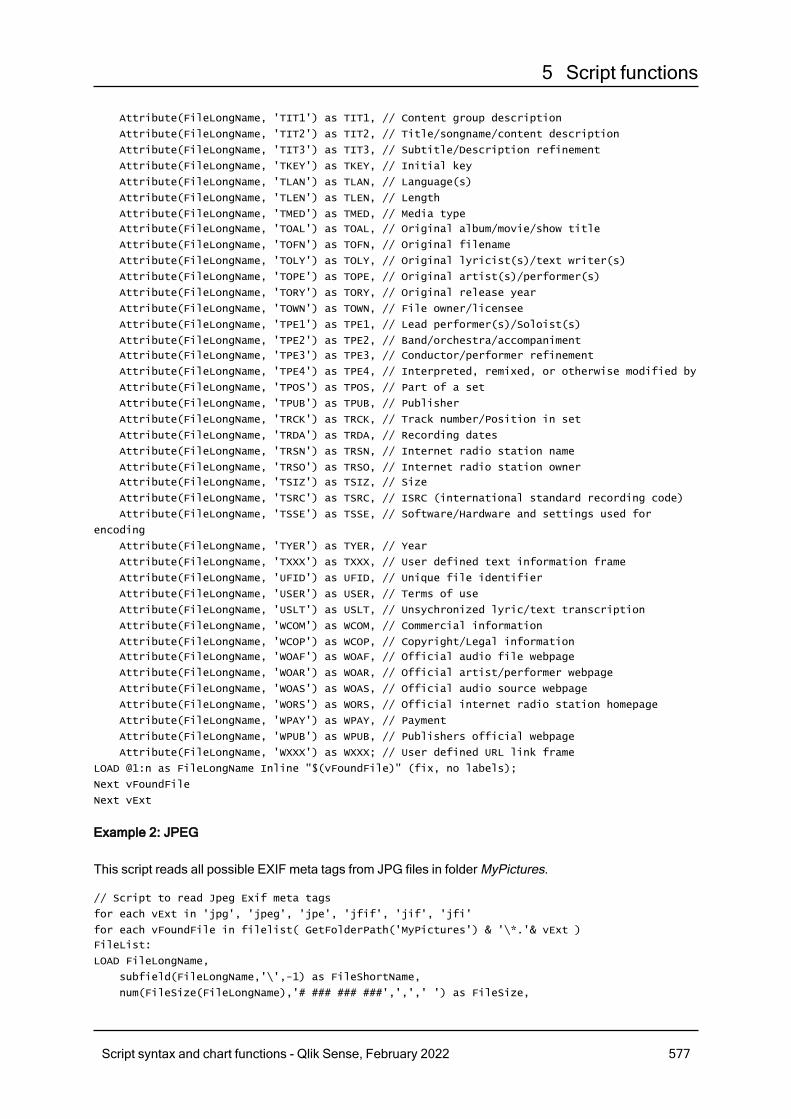
5 Script functions
Attribute(FileLongName, 'TIT1') as TIT1, // Content group description
Attribute(FileLongName, 'TIT2') as TIT2, // Title/songname/content description
Attribute(FileLongName, 'TIT3') as TIT3, // Subtitle/Description refinement
Attribute(FileLongName, 'TKEY') as TKEY, // Initial key
Attribute(FileLongName, 'TLAN') as TLAN, // Language(s)
Attribute(FileLongName, 'TLEN') as TLEN, // Length
Attribute(FileLongName, 'TMED') as TMED, // Media type
Attribute(FileLongName, 'TOAL') as TOAL, // Original album/movie/show title
Attribute(FileLongName, 'TOFN') as TOFN, // Original filename
Attribute(FileLongName, 'TOLY') as TOLY, // Original lyricist(s)/text writer(s)
Attribute(FileLongName, 'TOPE') as TOPE, // Original artist(s)/performer(s)
Attribute(FileLongName, 'TORY') as TORY, // Original release year
Attribute(FileLongName, 'TOWN') as TOWN, // File owner/licensee
Attribute(FileLongName, 'TPE1') as TPE1, // Lead performer(s)/Soloist(s)
Attribute(FileLongName, 'TPE2') as TPE2, // Band/orchestra/accompaniment
Attribute(FileLongName, 'TPE3') as TPE3, // Conductor/performer refinement
Attribute(FileLongName, 'TPE4') as TPE4, // Interpreted, remixed, or otherwise modified by
Attribute(FileLongName, 'TPOS') as TPOS, // Part of a set
Attribute(FileLongName, 'TPUB') as TPUB, // Publisher
Attribute(FileLongName, 'TRCK') as TRCK, // Track number/Position in set
Attribute(FileLongName, 'TRDA') as TRDA, // Recording dates
Attribute(FileLongName, 'TRSN') as TRSN, // Internet radio station name
Attribute(FileLongName, 'TRSO') as TRSO, // Internet radio station owner
Attribute(FileLongName, 'TSIZ') as TSIZ, // Size
Attribute(FileLongName, 'TSRC') as TSRC, // ISRC (international standard recording code)
Attribute(FileLongName, 'TSSE') as TSSE, // Software/Hardware and settings used for
encoding
Attribute(FileLongName, 'TYER') as TYER, // Year
Attribute(FileLongName, 'TXXX') as TXXX, // User defined text information frame
Attribute(FileLongName, 'UFID') as UFID, // Unique file identifier
Attribute(FileLongName, 'USER') as USER, // Terms of use
Attribute(FileLongName, 'USLT') as USLT, // Unsychronized lyric/text transcription
Attribute(FileLongName, 'WCOM') as WCOM, // Commercial information
Attribute(FileLongName, 'WCOP') as WCOP, // Copyright/Legal information
Attribute(FileLongName, 'WOAF') as WOAF, // Official audio file webpage
Attribute(FileLongName, 'WOAR') as WOAR, // Official artist/performer webpage
Attribute(FileLongName, 'WOAS') as WOAS, // Official audio source webpage
Attribute(FileLongName, 'WORS') as WORS, // Official internet radio station homepage
Attribute(FileLongName, 'WPAY') as WPAY, // Payment
Attribute(FileLongName, 'WPUB') as WPUB, // Publishers official webpage
Attribute(FileLongName, 'WXXX') as WXXX; // User defined URL link frame
LOAD @1:n as FileLongName Inline "$(vFoundFile)" (fix, no labels);
Next vFoundFile
Next vExt
Example 2: JPEG
This script reads all possible EXIF meta tags from JPG files in folder MyPictures.
// Script to read Jpeg Exif meta tags
for each vExt in 'jpg', 'jpeg', 'jpe', 'jfif', 'jif', 'jfi'
for each vFoundFile in filelist( GetFolderPath('MyPictures') & '\*.'& vExt )
FileList:
LOAD FileLongName,
subfield(FileLongName,'\',-1) as FileShortName,
num(FileSize(FileLongName),'# ### ### ###',',',' ') as FileSize,
Script syntax and chart functions - Qlik Sense, February 2022 577
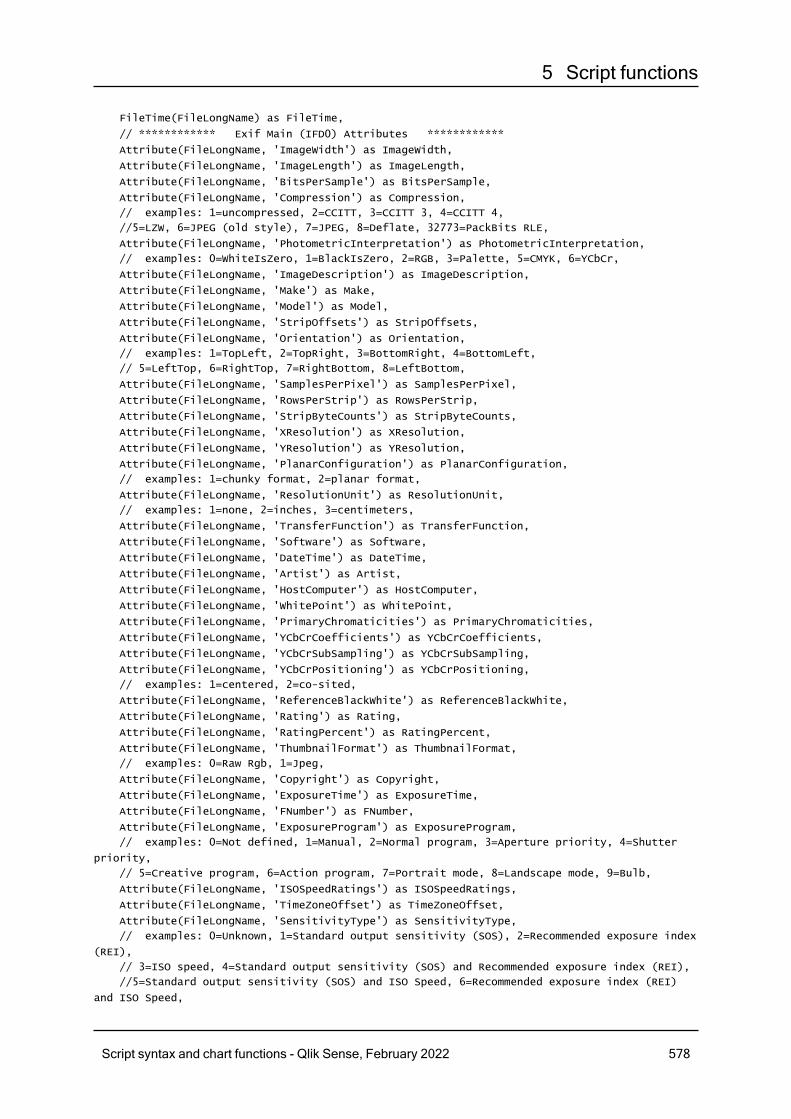
5 Script functions
FileTime(FileLongName) as FileTime,
// ************ Exif Main (IFD0) Attributes ************
Attribute(FileLongName, 'ImageWidth') as ImageWidth,
Attribute(FileLongName, 'ImageLength') as ImageLength,
Attribute(FileLongName, 'BitsPerSample') as BitsPerSample,
Attribute(FileLongName, 'Compression') as Compression,
// examples: 1=uncompressed, 2=CCITT, 3=CCITT 3, 4=CCITT 4,
//5=LZW, 6=JPEG (old style), 7=JPEG, 8=Deflate, 32773=PackBits RLE,
Attribute(FileLongName, 'PhotometricInterpretation') as PhotometricInterpretation,
// examples: 0=WhiteIsZero, 1=BlackIsZero, 2=RGB, 3=Palette, 5=CMYK, 6=YCbCr,
Attribute(FileLongName, 'ImageDescription') as ImageDescription,
Attribute(FileLongName, 'Make') as Make,
Attribute(FileLongName, 'Model') as Model,
Attribute(FileLongName, 'StripOffsets') as StripOffsets,
Attribute(FileLongName, 'Orientation') as Orientation,
// examples: 1=TopLeft, 2=TopRight, 3=BottomRight, 4=BottomLeft,
// 5=LeftTop, 6=RightTop, 7=RightBottom, 8=LeftBottom,
Attribute(FileLongName, 'SamplesPerPixel') as SamplesPerPixel,
Attribute(FileLongName, 'RowsPerStrip') as RowsPerStrip,
Attribute(FileLongName, 'StripByteCounts') as StripByteCounts,
Attribute(FileLongName, 'XResolution') as XResolution,
Attribute(FileLongName, 'YResolution') as YResolution,
Attribute(FileLongName, 'PlanarConfiguration') as PlanarConfiguration,
// examples: 1=chunky format, 2=planar format,
Attribute(FileLongName, 'ResolutionUnit') as ResolutionUnit,
// examples: 1=none, 2=inches, 3=centimeters,
Attribute(FileLongName, 'TransferFunction') as TransferFunction,
Attribute(FileLongName, 'Software') as Software,
Attribute(FileLongName, 'DateTime') as DateTime,
Attribute(FileLongName, 'Artist') as Artist,
Attribute(FileLongName, 'HostComputer') as HostComputer,
Attribute(FileLongName, 'WhitePoint') as WhitePoint,
Attribute(FileLongName, 'PrimaryChromaticities') as PrimaryChromaticities,
Attribute(FileLongName, 'YCbCrCoefficients') as YCbCrCoefficients,
Attribute(FileLongName, 'YCbCrSubSampling') as YCbCrSubSampling,
Attribute(FileLongName, 'YCbCrPositioning') as YCbCrPositioning,
// examples: 1=centered, 2=co-sited,
Attribute(FileLongName, 'ReferenceBlackWhite') as ReferenceBlackWhite,
Attribute(FileLongName, 'Rating') as Rating,
Attribute(FileLongName, 'RatingPercent') as RatingPercent,
Attribute(FileLongName, 'ThumbnailFormat') as ThumbnailFormat,
// examples: 0=Raw Rgb, 1=Jpeg,
Attribute(FileLongName, 'Copyright') as Copyright,
Attribute(FileLongName, 'ExposureTime') as ExposureTime,
Attribute(FileLongName, 'FNumber') as FNumber,
Attribute(FileLongName, 'ExposureProgram') as ExposureProgram,
// examples: 0=Not defined, 1=Manual, 2=Normal program, 3=Aperture priority, 4=Shutter
priority,
// 5=Creative program, 6=Action program, 7=Portrait mode, 8=Landscape mode, 9=Bulb,
Attribute(FileLongName, 'ISOSpeedRatings') as ISOSpeedRatings,
Attribute(FileLongName, 'TimeZoneOffset') as TimeZoneOffset,
Attribute(FileLongName, 'SensitivityType') as SensitivityType,
// examples: 0=Unknown, 1=Standard output sensitivity (SOS), 2=Recommended exposure index
(REI),
// 3=ISO speed, 4=Standard output sensitivity (SOS) and Recommended exposure index (REI),
//5=Standard output sensitivity (SOS) and ISO Speed, 6=Recommended exposure index (REI)
and ISO Speed,
Script syntax and chart functions - Qlik Sense, February 2022 578
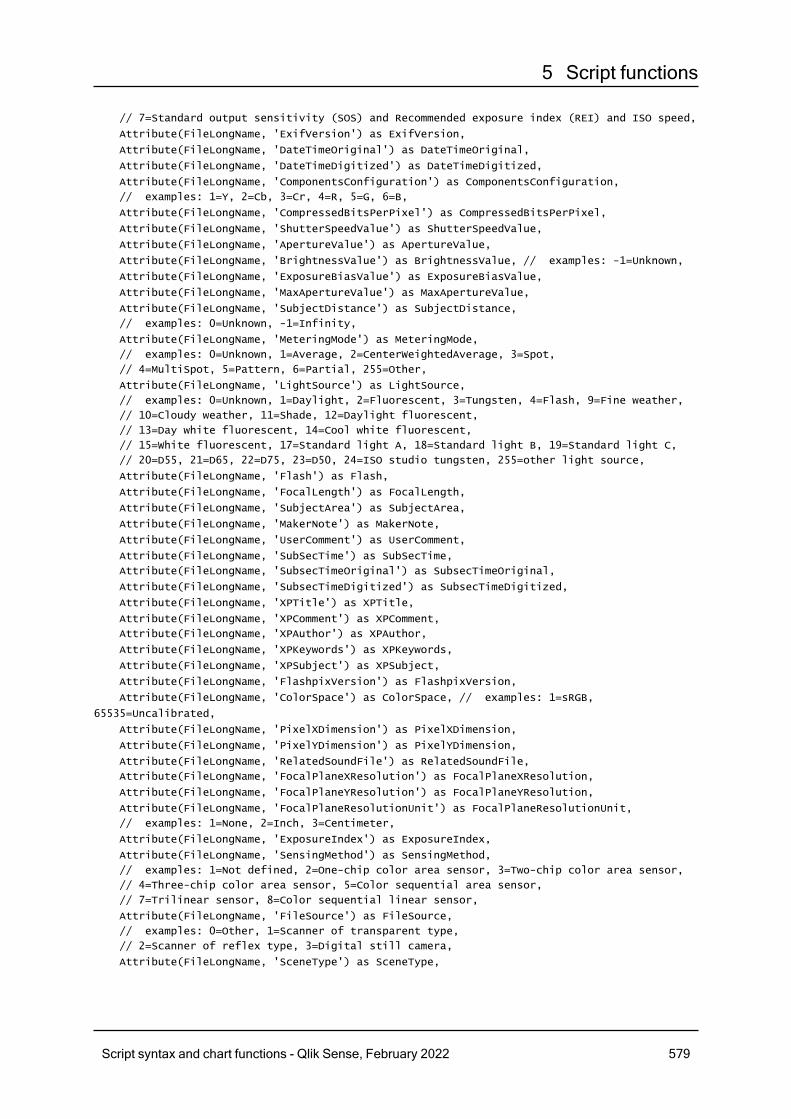
5 Script functions
// 7=Standard output sensitivity (SOS) and Recommended exposure index (REI) and ISO speed,
Attribute(FileLongName, 'ExifVersion') as ExifVersion,
Attribute(FileLongName, 'DateTimeOriginal') as DateTimeOriginal,
Attribute(FileLongName, 'DateTimeDigitized') as DateTimeDigitized,
Attribute(FileLongName, 'ComponentsConfiguration') as ComponentsConfiguration,
// examples: 1=Y, 2=Cb, 3=Cr, 4=R, 5=G, 6=B,
Attribute(FileLongName, 'CompressedBitsPerPixel') as CompressedBitsPerPixel,
Attribute(FileLongName, 'ShutterSpeedValue') as ShutterSpeedValue,
Attribute(FileLongName, 'ApertureValue') as ApertureValue,
Attribute(FileLongName, 'BrightnessValue') as BrightnessValue, // examples: -1=Unknown,
Attribute(FileLongName, 'ExposureBiasValue') as ExposureBiasValue,
Attribute(FileLongName, 'MaxApertureValue') as MaxApertureValue,
Attribute(FileLongName, 'SubjectDistance') as SubjectDistance,
// examples: 0=Unknown, -1=Infinity,
Attribute(FileLongName, 'MeteringMode') as MeteringMode,
// examples: 0=Unknown, 1=Average, 2=CenterWeightedAverage, 3=Spot,
// 4=MultiSpot, 5=Pattern, 6=Partial, 255=Other,
Attribute(FileLongName, 'LightSource') as LightSource,
// examples: 0=Unknown, 1=Daylight, 2=Fluorescent, 3=Tungsten, 4=Flash, 9=Fine weather,
// 10=Cloudy weather, 11=Shade, 12=Daylight fluorescent,
// 13=Day white fluorescent, 14=Cool white fluorescent,
// 15=White fluorescent, 17=Standard light A, 18=Standard light B, 19=Standard light C,
// 20=D55, 21=D65, 22=D75, 23=D50, 24=ISO studio tungsten, 255=other light source,
Attribute(FileLongName, 'Flash') as Flash,
Attribute(FileLongName, 'FocalLength') as FocalLength,
Attribute(FileLongName, 'SubjectArea') as SubjectArea,
Attribute(FileLongName, 'MakerNote') as MakerNote,
Attribute(FileLongName, 'UserComment') as UserComment,
Attribute(FileLongName, 'SubSecTime') as SubSecTime,
Attribute(FileLongName, 'SubsecTimeOriginal') as SubsecTimeOriginal,
Attribute(FileLongName, 'SubsecTimeDigitized') as SubsecTimeDigitized,
Attribute(FileLongName, 'XPTitle') as XPTitle,
Attribute(FileLongName, 'XPComment') as XPComment,
Attribute(FileLongName, 'XPAuthor') as XPAuthor,
Attribute(FileLongName, 'XPKeywords') as XPKeywords,
Attribute(FileLongName, 'XPSubject') as XPSubject,
Attribute(FileLongName, 'FlashpixVersion') as FlashpixVersion,
Attribute(FileLongName, 'ColorSpace') as ColorSpace, // examples: 1=sRGB,
65535=Uncalibrated,
Attribute(FileLongName, 'PixelXDimension') as PixelXDimension,
Attribute(FileLongName, 'PixelYDimension') as PixelYDimension,
Attribute(FileLongName, 'RelatedSoundFile') as RelatedSoundFile,
Attribute(FileLongName, 'FocalPlaneXResolution') as FocalPlaneXResolution,
Attribute(FileLongName, 'FocalPlaneYResolution') as FocalPlaneYResolution,
Attribute(FileLongName, 'FocalPlaneResolutionUnit') as FocalPlaneResolutionUnit,
// examples: 1=None, 2=Inch, 3=Centimeter,
Attribute(FileLongName, 'ExposureIndex') as ExposureIndex,
Attribute(FileLongName, 'SensingMethod') as SensingMethod,
// examples: 1=Not defined, 2=One-chip color area sensor, 3=Two-chip color area sensor,
// 4=Three-chip color area sensor, 5=Color sequential area sensor,
// 7=Trilinear sensor, 8=Color sequential linear sensor,
Attribute(FileLongName, 'FileSource') as FileSource,
// examples: 0=Other, 1=Scanner of transparent type,
// 2=Scanner of reflex type, 3=Digital still camera,
Attribute(FileLongName, 'SceneType') as SceneType,
Script syntax and chart functions - Qlik Sense, February 2022 579
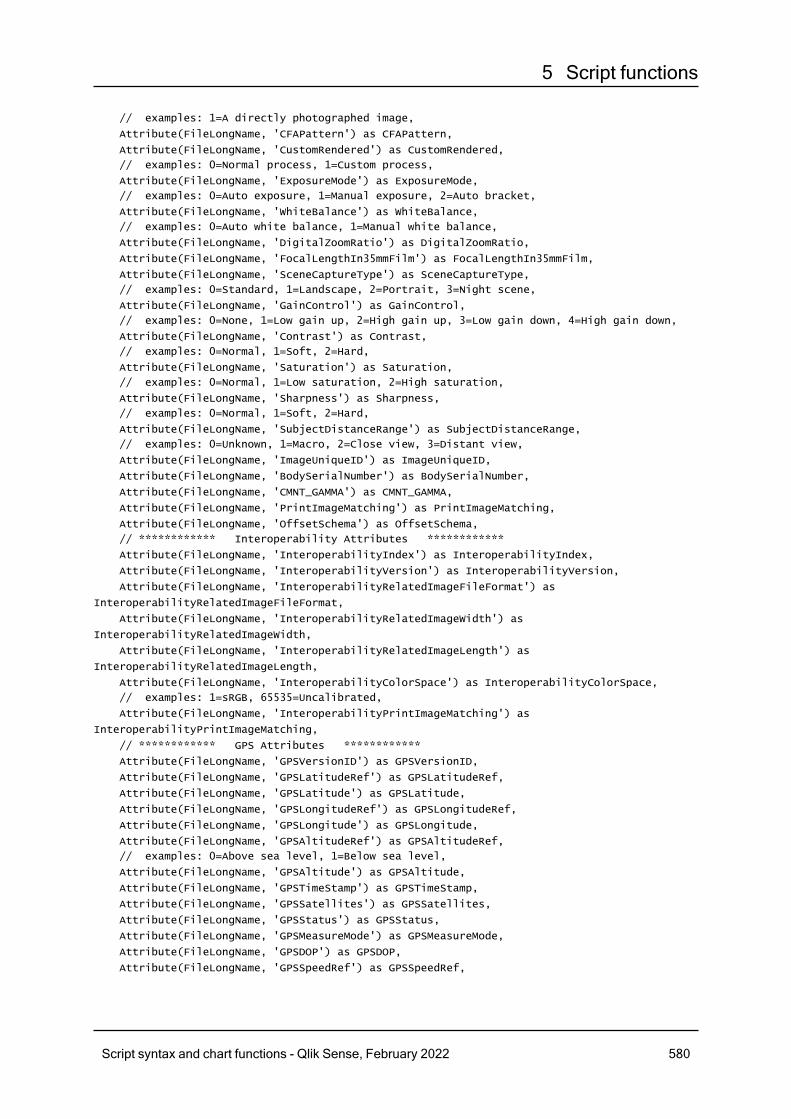
5 Script functions
// examples: 1=A directly photographed image,
Attribute(FileLongName, 'CFAPattern') as CFAPattern,
Attribute(FileLongName, 'CustomRendered') as CustomRendered,
// examples: 0=Normal process, 1=Custom process,
Attribute(FileLongName, 'ExposureMode') as ExposureMode,
// examples: 0=Auto exposure, 1=Manual exposure, 2=Auto bracket,
Attribute(FileLongName, 'WhiteBalance') as WhiteBalance,
// examples: 0=Auto white balance, 1=Manual white balance,
Attribute(FileLongName, 'DigitalZoomRatio') as DigitalZoomRatio,
Attribute(FileLongName, 'FocalLengthIn35mmFilm') as FocalLengthIn35mmFilm,
Attribute(FileLongName, 'SceneCaptureType') as SceneCaptureType,
// examples: 0=Standard, 1=Landscape, 2=Portrait, 3=Night scene,
Attribute(FileLongName, 'GainControl') as GainControl,
// examples: 0=None, 1=Low gain up, 2=High gain up, 3=Low gain down, 4=High gain down,
Attribute(FileLongName, 'Contrast') as Contrast,
// examples: 0=Normal, 1=Soft, 2=Hard,
Attribute(FileLongName, 'Saturation') as Saturation,
// examples: 0=Normal, 1=Low saturation, 2=High saturation,
Attribute(FileLongName, 'Sharpness') as Sharpness,
// examples: 0=Normal, 1=Soft, 2=Hard,
Attribute(FileLongName, 'SubjectDistanceRange') as SubjectDistanceRange,
// examples: 0=Unknown, 1=Macro, 2=Close view, 3=Distant view,
Attribute(FileLongName, 'ImageUniqueID') as ImageUniqueID,
Attribute(FileLongName, 'BodySerialNumber') as BodySerialNumber,
Attribute(FileLongName, 'CMNT_GAMMA') as CMNT_GAMMA,
Attribute(FileLongName, 'PrintImageMatching') as PrintImageMatching,
Attribute(FileLongName, 'OffsetSchema') as OffsetSchema,
// ************ Interoperability Attributes ************
Attribute(FileLongName, 'InteroperabilityIndex') as InteroperabilityIndex,
Attribute(FileLongName, 'InteroperabilityVersion') as InteroperabilityVersion,
Attribute(FileLongName, 'InteroperabilityRelatedImageFileFormat') as
InteroperabilityRelatedImageFileFormat,
Attribute(FileLongName, 'InteroperabilityRelatedImageWidth') as
InteroperabilityRelatedImageWidth,
Attribute(FileLongName, 'InteroperabilityRelatedImageLength') as
InteroperabilityRelatedImageLength,
Attribute(FileLongName, 'InteroperabilityColorSpace') as InteroperabilityColorSpace,
// examples: 1=sRGB, 65535=Uncalibrated,
Attribute(FileLongName, 'InteroperabilityPrintImageMatching') as
InteroperabilityPrintImageMatching,
// ************ GPS Attributes ************
Attribute(FileLongName, 'GPSVersionID') as GPSVersionID,
Attribute(FileLongName, 'GPSLatitudeRef') as GPSLatitudeRef,
Attribute(FileLongName, 'GPSLatitude') as GPSLatitude,
Attribute(FileLongName, 'GPSLongitudeRef') as GPSLongitudeRef,
Attribute(FileLongName, 'GPSLongitude') as GPSLongitude,
Attribute(FileLongName, 'GPSAltitudeRef') as GPSAltitudeRef,
// examples: 0=Above sea level, 1=Below sea level,
Attribute(FileLongName, 'GPSAltitude') as GPSAltitude,
Attribute(FileLongName, 'GPSTimeStamp') as GPSTimeStamp,
Attribute(FileLongName, 'GPSSatellites') as GPSSatellites,
Attribute(FileLongName, 'GPSStatus') as GPSStatus,
Attribute(FileLongName, 'GPSMeasureMode') as GPSMeasureMode,
Attribute(FileLongName, 'GPSDOP') as GPSDOP,
Attribute(FileLongName, 'GPSSpeedRef') as GPSSpeedRef,
Script syntax and chart functions - Qlik Sense, February 2022 580
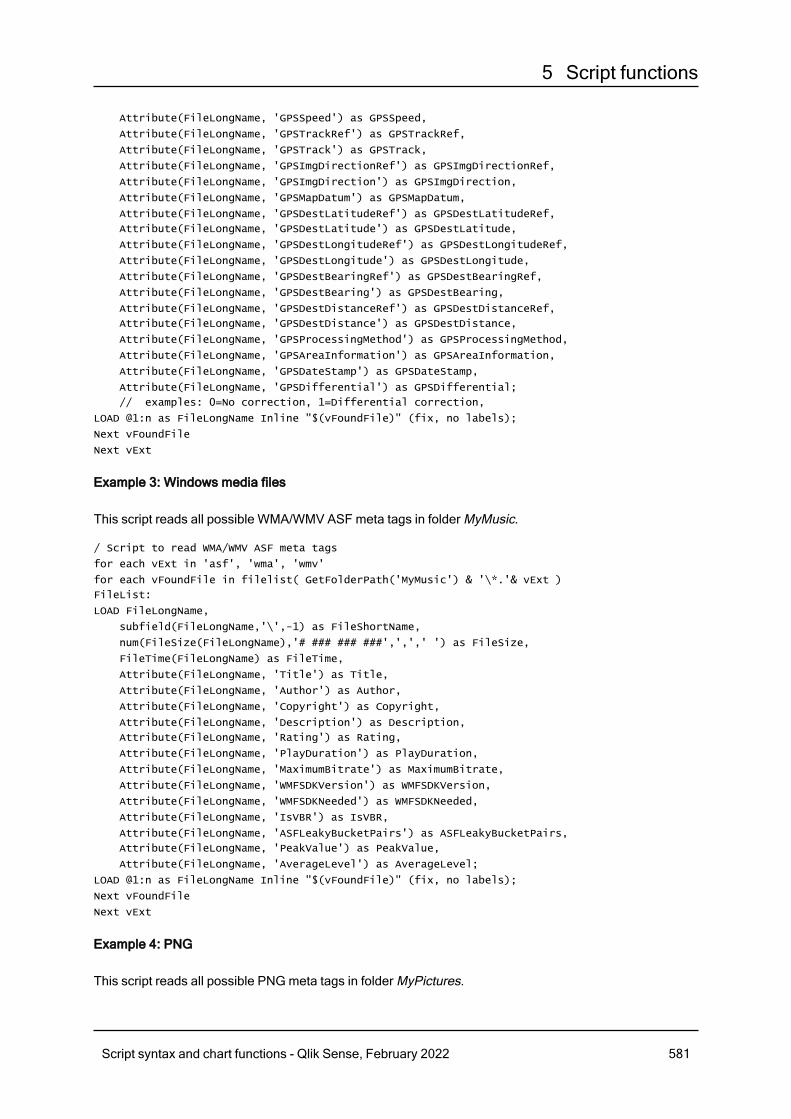
5 Script functions
Attribute(FileLongName, 'GPSSpeed') as GPSSpeed,
Attribute(FileLongName, 'GPSTrackRef') as GPSTrackRef,
Attribute(FileLongName, 'GPSTrack') as GPSTrack,
Attribute(FileLongName, 'GPSImgDirectionRef') as GPSImgDirectionRef,
Attribute(FileLongName, 'GPSImgDirection') as GPSImgDirection,
Attribute(FileLongName, 'GPSMapDatum') as GPSMapDatum,
Attribute(FileLongName, 'GPSDestLatitudeRef') as GPSDestLatitudeRef,
Attribute(FileLongName, 'GPSDestLatitude') as GPSDestLatitude,
Attribute(FileLongName, 'GPSDestLongitudeRef') as GPSDestLongitudeRef,
Attribute(FileLongName, 'GPSDestLongitude') as GPSDestLongitude,
Attribute(FileLongName, 'GPSDestBearingRef') as GPSDestBearingRef,
Attribute(FileLongName, 'GPSDestBearing') as GPSDestBearing,
Attribute(FileLongName, 'GPSDestDistanceRef') as GPSDestDistanceRef,
Attribute(FileLongName, 'GPSDestDistance') as GPSDestDistance,
Attribute(FileLongName, 'GPSProcessingMethod') as GPSProcessingMethod,
Attribute(FileLongName, 'GPSAreaInformation') as GPSAreaInformation,
Attribute(FileLongName, 'GPSDateStamp') as GPSDateStamp,
Attribute(FileLongName, 'GPSDifferential') as GPSDifferential;
// examples: 0=No correction, 1=Differential correction,
LOAD @1:n as FileLongName Inline "$(vFoundFile)" (fix, no labels);
Next vFoundFile
Next vExt
Example 3: Windows media files
This script reads all possible WMA/WMV ASF meta tags in folder MyMusic.
/ Script to read WMA/WMV ASF meta tags
for each vExt in 'asf', 'wma', 'wmv'
for each vFoundFile in filelist( GetFolderPath('MyMusic') & '\*.'& vExt )
FileList:
LOAD FileLongName,
subfield(FileLongName,'\',-1) as FileShortName,
num(FileSize(FileLongName),'# ### ### ###',',',' ') as FileSize,
FileTime(FileLongName) as FileTime,
Attribute(FileLongName, 'Title') as Title,
Attribute(FileLongName, 'Author') as Author,
Attribute(FileLongName, 'Copyright') as Copyright,
Attribute(FileLongName, 'Description') as Description,
Attribute(FileLongName, 'Rating') as Rating,
Attribute(FileLongName, 'PlayDuration') as PlayDuration,
Attribute(FileLongName, 'MaximumBitrate') as MaximumBitrate,
Attribute(FileLongName, 'WMFSDKVersion') as WMFSDKVersion,
Attribute(FileLongName, 'WMFSDKNeeded') as WMFSDKNeeded,
Attribute(FileLongName, 'IsVBR') as IsVBR,
Attribute(FileLongName, 'ASFLeakyBucketPairs') as ASFLeakyBucketPairs,
Attribute(FileLongName, 'PeakValue') as PeakValue,
Attribute(FileLongName, 'AverageLevel') as AverageLevel;
LOAD @1:n as FileLongName Inline "$(vFoundFile)" (fix, no labels);
Next vFoundFile
Next vExt
Example 4: PNG
This script reads all possible PNGmeta tags in folder MyPictures.
Script syntax and chart functions - Qlik Sense, February 2022 581
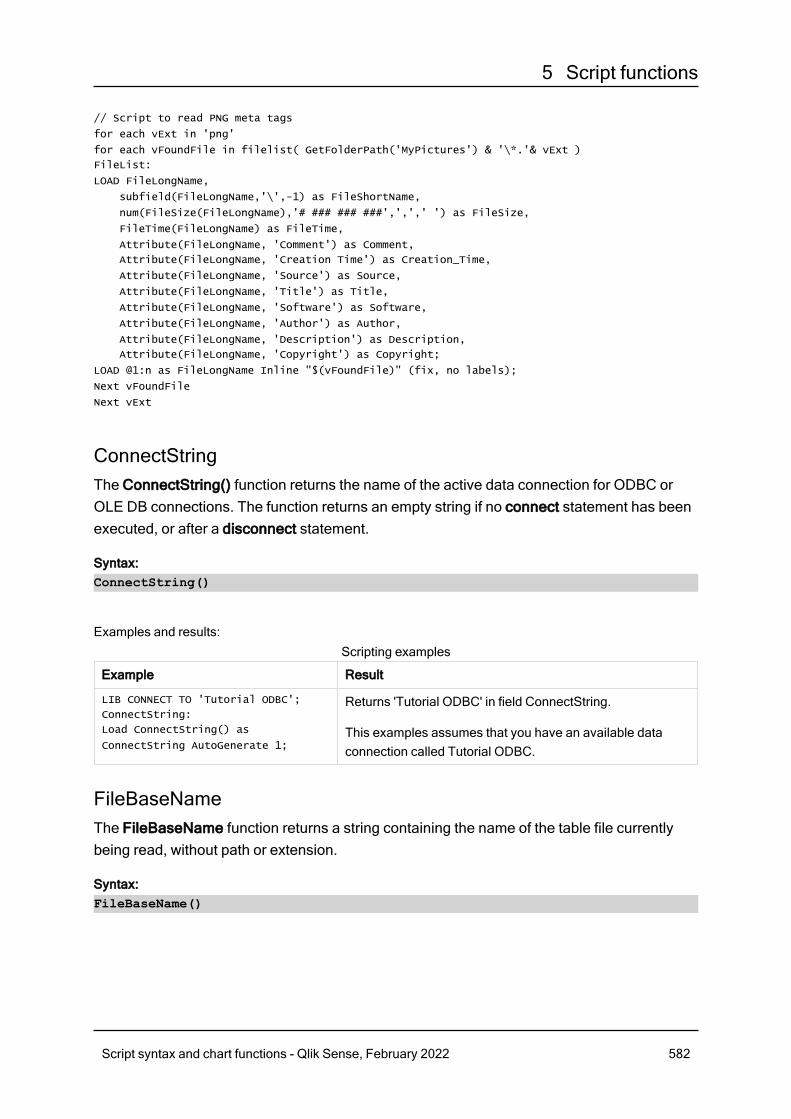
5 Script functions
// Script to read PNG meta tags
for each vExt in 'png'
for each vFoundFile in filelist( GetFolderPath('MyPictures') & '\*.'& vExt )
FileList:
LOAD FileLongName,
subfield(FileLongName,'\',-1) as FileShortName,
num(FileSize(FileLongName),'# ### ### ###',',',' ') as FileSize,
FileTime(FileLongName) as FileTime,
Attribute(FileLongName, 'Comment') as Comment,
Attribute(FileLongName, 'Creation Time') as Creation_Time,
Attribute(FileLongName, 'Source') as Source,
Attribute(FileLongName, 'Title') as Title,
Attribute(FileLongName, 'Software') as Software,
Attribute(FileLongName, 'Author') as Author,
Attribute(FileLongName, 'Description') as Description,
Attribute(FileLongName, 'Copyright') as Copyright;
LOAD @1:n as FileLongName Inline "$(vFoundFile)" (fix, no labels);
Next vFoundFile
Next vExt
ConnectStringThe ConnectString() function returns the name of the active data connection for ODBC orOLE DB connections. The function returns an empty string if no connect statement has beenexecuted, or after a disconnect statement.
Syntax:ConnectString()
Examples and results:
Example Result
LIB CONNECT TO 'Tutorial ODBC';
ConnectString:
Load ConnectString() as
ConnectString AutoGenerate 1;
Returns 'Tutorial ODBC' in field ConnectString.
This examples assumes that you have an available dataconnection called Tutorial ODBC.
Scripting examples
FileBaseNameThe FileBaseName function returns a string containing the name of the table file currentlybeing read, without path or extension.
Syntax:FileBaseName()
Script syntax and chart functions - Qlik Sense, February 2022 582
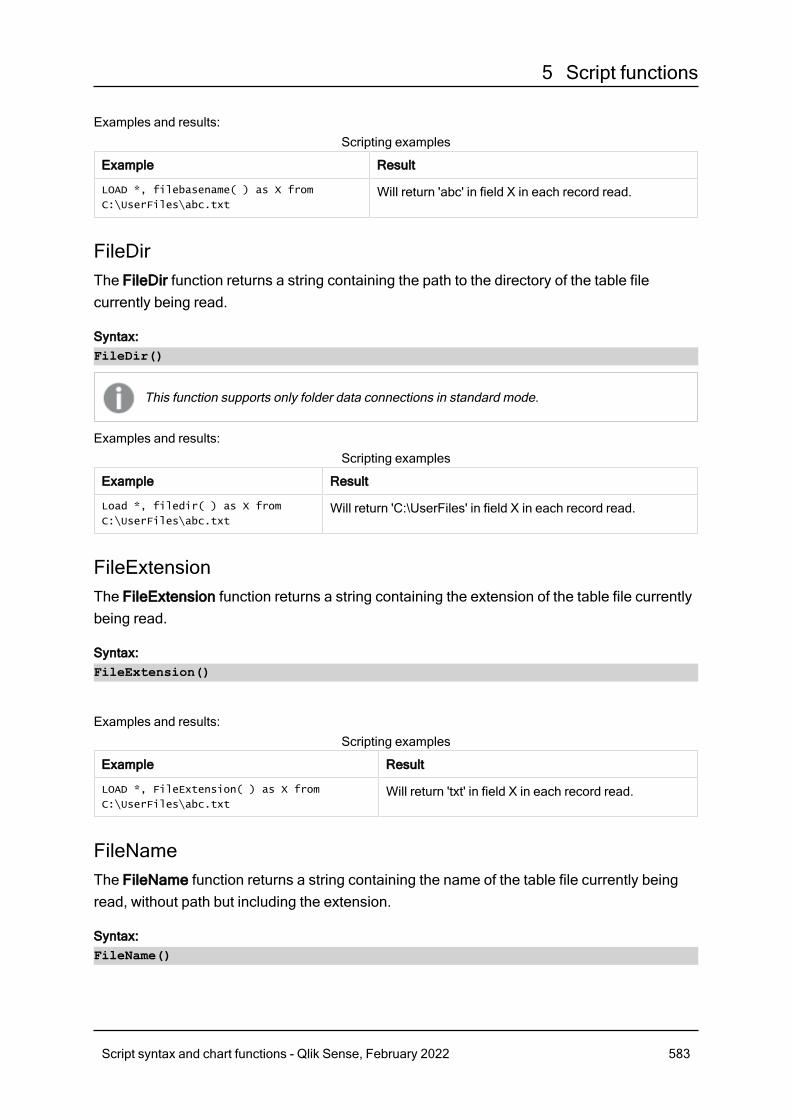
5 Script functions
Examples and results:
Example Result
LOAD *, filebasename( ) as X from
C:\UserFiles\abc.txtWill return 'abc' in field X in each record read.
Scripting examples
FileDirThe FileDir function returns a string containing the path to the directory of the table filecurrently being read.
Syntax:FileDir()
This function supports only folder data connections in standard mode.
Examples and results:
Example Result
Load *, filedir( ) as X from
C:\UserFiles\abc.txtWill return 'C:\UserFiles' in field X in each record read.
Scripting examples
FileExtensionThe FileExtension function returns a string containing the extension of the table file currentlybeing read.
Syntax:FileExtension()
Examples and results:
Example Result
LOAD *, FileExtension( ) as X from
C:\UserFiles\abc.txtWill return 'txt' in field X in each record read.
Scripting examples
FileNameThe FileName function returns a string containing the name of the table file currently beingread, without path but including the extension.
Syntax:FileName()
Script syntax and chart functions - Qlik Sense, February 2022 583
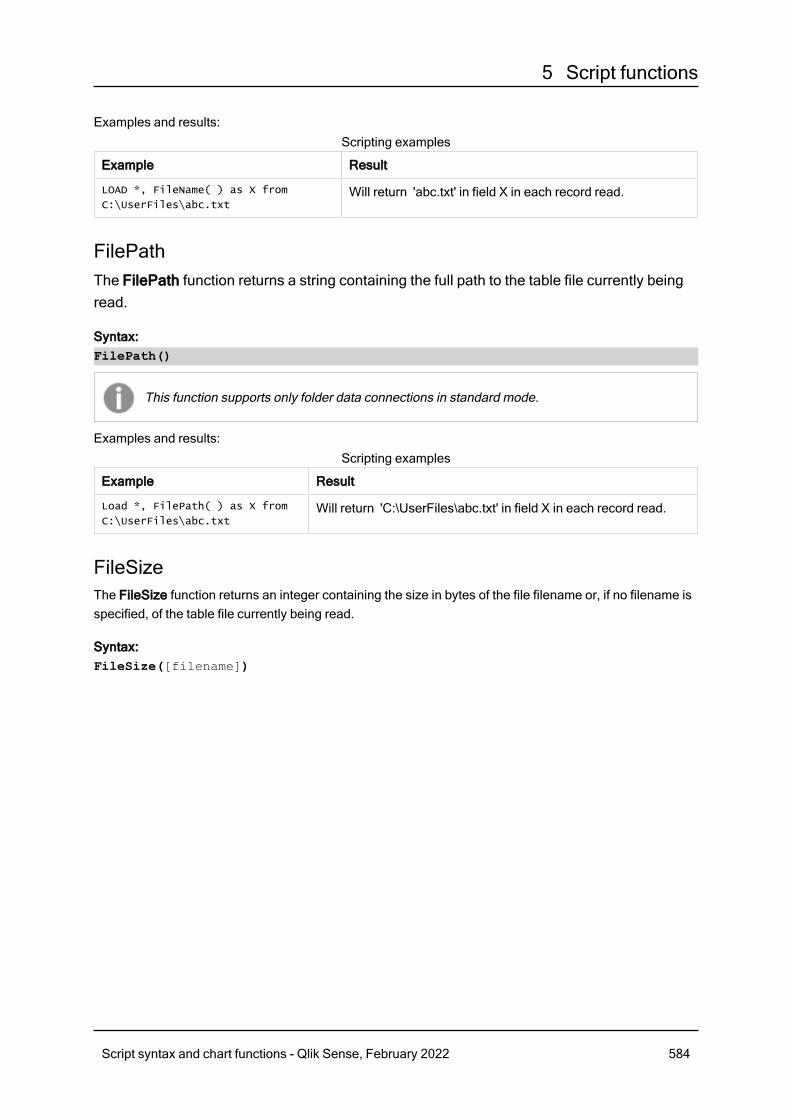
5 Script functions
Examples and results:
Example Result
LOAD *, FileName( ) as X from
C:\UserFiles\abc.txtWill return 'abc.txt' in field X in each record read.
Scripting examples
FilePathThe FilePath function returns a string containing the full path to the table file currently beingread.
Syntax:FilePath()
This function supports only folder data connections in standard mode.
Examples and results:
Example Result
Load *, FilePath( ) as X from
C:\UserFiles\abc.txtWill return 'C:\UserFiles\abc.txt' in field X in each record read.
Scripting examples
FileSizeThe FileSize function returns an integer containing the size in bytes of the file filename or, if no filename isspecified, of the table file currently being read.
Syntax:FileSize([filename])
Script syntax and chart functions - Qlik Sense, February 2022 584
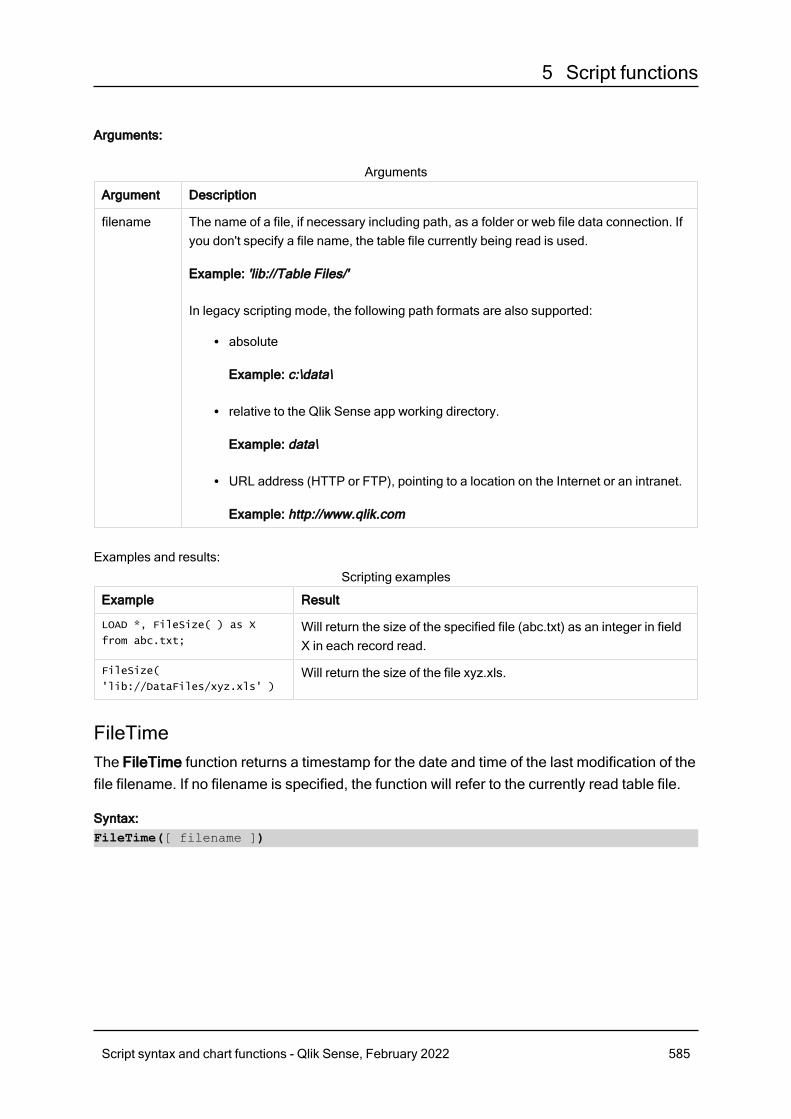
5 Script functions
Arguments:
Argument Description
filename The name of a file, if necessary including path, as a folder or web file data connection. Ifyou don't specify a file name, the table file currently being read is used.
Example: 'lib://Table Files/'
In legacy scripting mode, the following path formats are also supported:
l absolute
Example: c:\data\
l relative to the Qlik Sense app working directory.
Example: data\
l URL address (HTTP or FTP), pointing to a location on the Internet or an intranet.
Example: http://www.qlik.com
Arguments
Examples and results:
Example Result
LOAD *, FileSize( ) as X
from abc.txt;Will return the size of the specified file (abc.txt) as an integer in fieldX in each record read.
FileSize(
'lib://DataFiles/xyz.xls' )Will return the size of the file xyz.xls.
Scripting examples
FileTimeThe FileTime function returns a timestamp for the date and time of the last modification of thefile filename. If no filename is specified, the function will refer to the currently read table file.
Syntax:FileTime([ filename ])
Script syntax and chart functions - Qlik Sense, February 2022 585
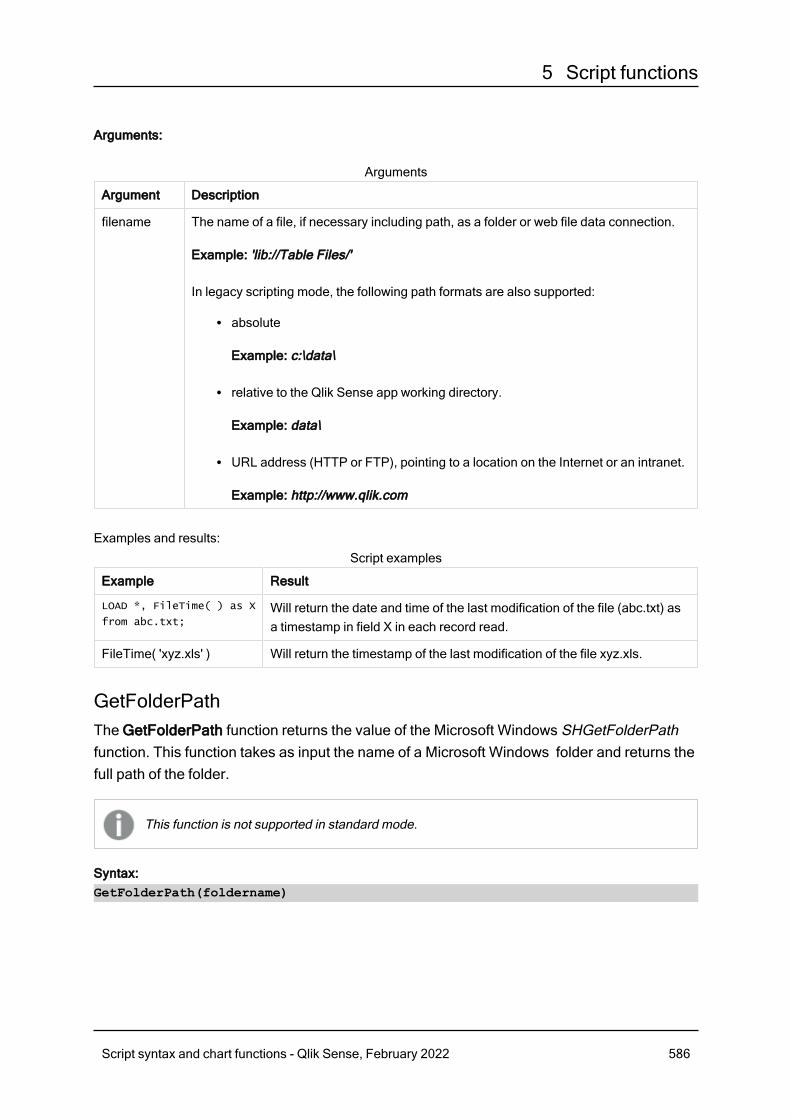
5 Script functions
Arguments:
Argument Description
filename The name of a file, if necessary including path, as a folder or web file data connection.
Example: 'lib://Table Files/'
In legacy scripting mode, the following path formats are also supported:
l absolute
Example: c:\data\
l relative to the Qlik Sense app working directory.
Example: data\
l URL address (HTTP or FTP), pointing to a location on the Internet or an intranet.
Example: http://www.qlik.com
Arguments
Examples and results:
Example Result
LOAD *, FileTime( ) as X
from abc.txt;Will return the date and time of the last modification of the file (abc.txt) asa timestamp in field X in each record read.
FileTime( 'xyz.xls' ) Will return the timestamp of the last modification of the file xyz.xls.
Script examples
GetFolderPathThe GetFolderPath function returns the value of the Microsoft Windows SHGetFolderPathfunction. This function takes as input the name of a Microsoft Windows folder and returns thefull path of the folder.
This function is not supported in standard mode.
Syntax:GetFolderPath(foldername)
Script syntax and chart functions - Qlik Sense, February 2022 586
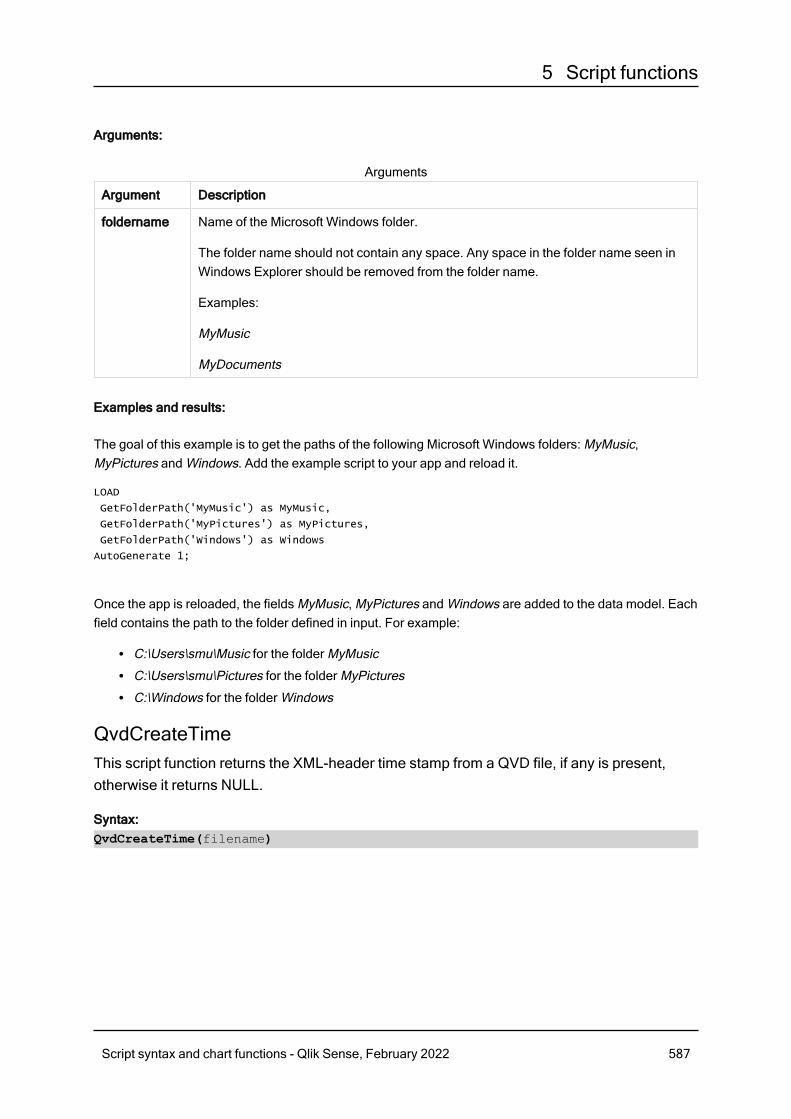
5 Script functions
Arguments:
Argument Description
foldername Name of the Microsoft Windows folder.
The folder name should not contain any space. Any space in the folder name seen inWindows Explorer should be removed from the folder name.
Examples:
MyMusic
MyDocuments
Arguments
Examples and results:
The goal of this example is to get the paths of the following Microsoft Windows folders: MyMusic,MyPictures and Windows. Add the example script to your app and reload it.
LOAD
GetFolderPath('MyMusic') as MyMusic,
GetFolderPath('MyPictures') as MyPictures,
GetFolderPath('Windows') as Windows
AutoGenerate 1;
Once the app is reloaded, the fields MyMusic, MyPictures and Windows are added to the data model. Eachfield contains the path to the folder defined in input. For example:
l C:\Users\smu\Music for the folder MyMusicl C:\Users\smu\Pictures for the folder MyPicturesl C:\Windows for the folder Windows
QvdCreateTimeThis script function returns the XML-header time stamp from a QVD file, if any is present,otherwise it returns NULL.
Syntax:QvdCreateTime(filename)
Script syntax and chart functions - Qlik Sense, February 2022 587
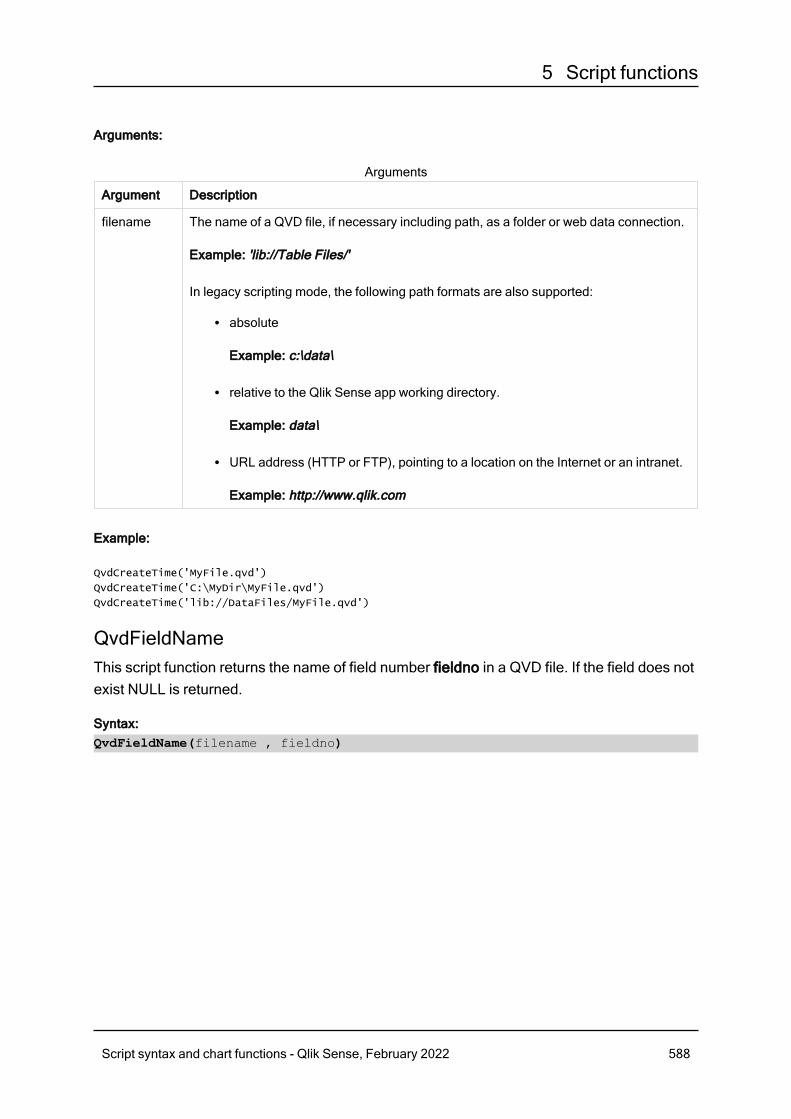
5 Script functions
Arguments:
Argument Description
filename The name of a QVD file, if necessary including path, as a folder or web data connection.
Example: 'lib://Table Files/'
In legacy scripting mode, the following path formats are also supported:
l absolute
Example: c:\data\
l relative to the Qlik Sense app working directory.
Example: data\
l URL address (HTTP or FTP), pointing to a location on the Internet or an intranet.
Example: http://www.qlik.com
Arguments
Example:
QvdCreateTime('MyFile.qvd')
QvdCreateTime('C:\MyDir\MyFile.qvd')
QvdCreateTime('lib://DataFiles/MyFile.qvd')
QvdFieldNameThis script function returns the name of field number fieldno in a QVD file. If the field does notexist NULL is returned.
Syntax:QvdFieldName(filename , fieldno)
Script syntax and chart functions - Qlik Sense, February 2022 588
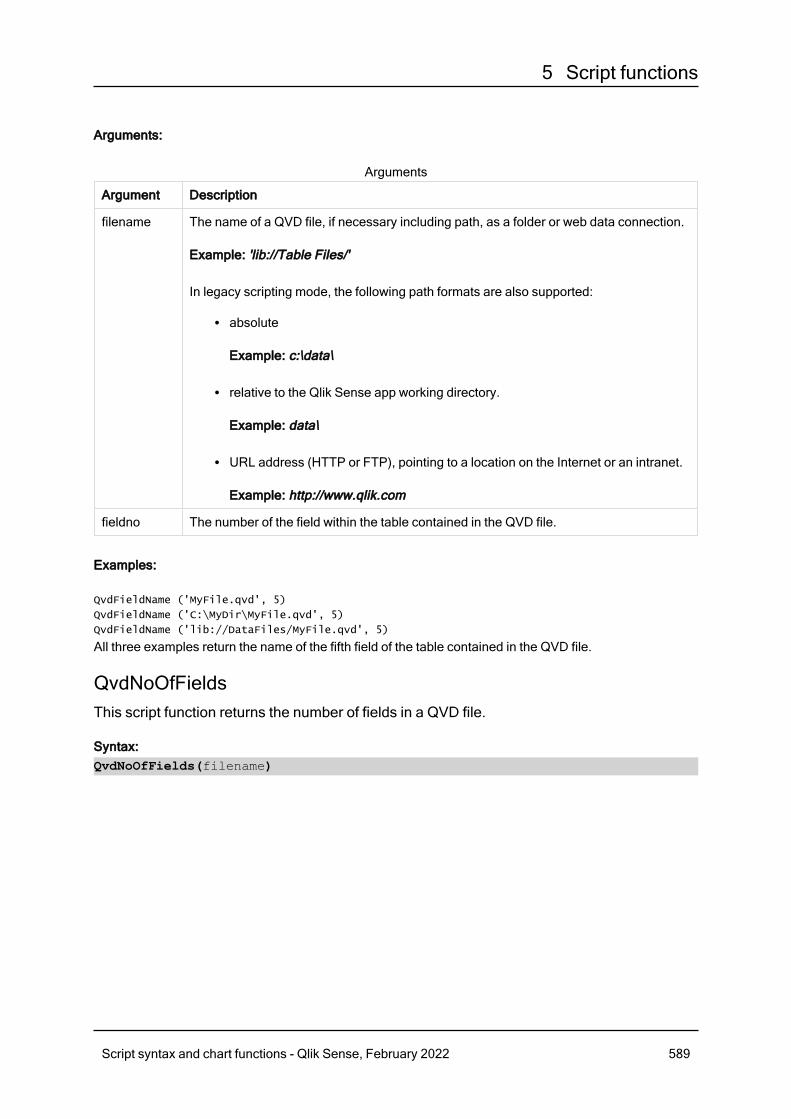
5 Script functions
Arguments:
Argument Description
filename The name of a QVD file, if necessary including path, as a folder or web data connection.
Example: 'lib://Table Files/'
In legacy scripting mode, the following path formats are also supported:
l absolute
Example: c:\data\
l relative to the Qlik Sense app working directory.
Example: data\
l URL address (HTTP or FTP), pointing to a location on the Internet or an intranet.
Example: http://www.qlik.com
fieldno The number of the field within the table contained in the QVD file.
Arguments
Examples:
QvdFieldName ('MyFile.qvd', 5)
QvdFieldName ('C:\MyDir\MyFile.qvd', 5)
QvdFieldName ('lib://DataFiles/MyFile.qvd', 5)
All three examples return the name of the fifth field of the table contained in the QVD file.
QvdNoOfFieldsThis script function returns the number of fields in a QVD file.
Syntax:QvdNoOfFields(filename)
Script syntax and chart functions - Qlik Sense, February 2022 589

5 Script functions
Arguments:
Argument Description
filename The name of a QVD file, if necessary including path, as a folder or web data connection.
Example: 'lib://Table Files/'
In legacy scripting mode, the following path formats are also supported:
l absolute
Example: c:\data\
l relative to the Qlik Sense app working directory.
Example: data\
l URL address (HTTP or FTP), pointing to a location on the Internet or an intranet.
Example: http://www.qlik.com
Arguments
Examples:
QvdNoOfFields ('MyFile.qvd')
QvdNoOfFields ('C:\MyDir\MyFile.qvd')
QvdNoOfFields ('lib://DataFiles/MyFile.qvd')
QvdNoOfRecords
Example: This script function returns the number of records currently in a QVD file.
Syntax:QvdNoOfRecords(filename)
Script syntax and chart functions - Qlik Sense, February 2022 590
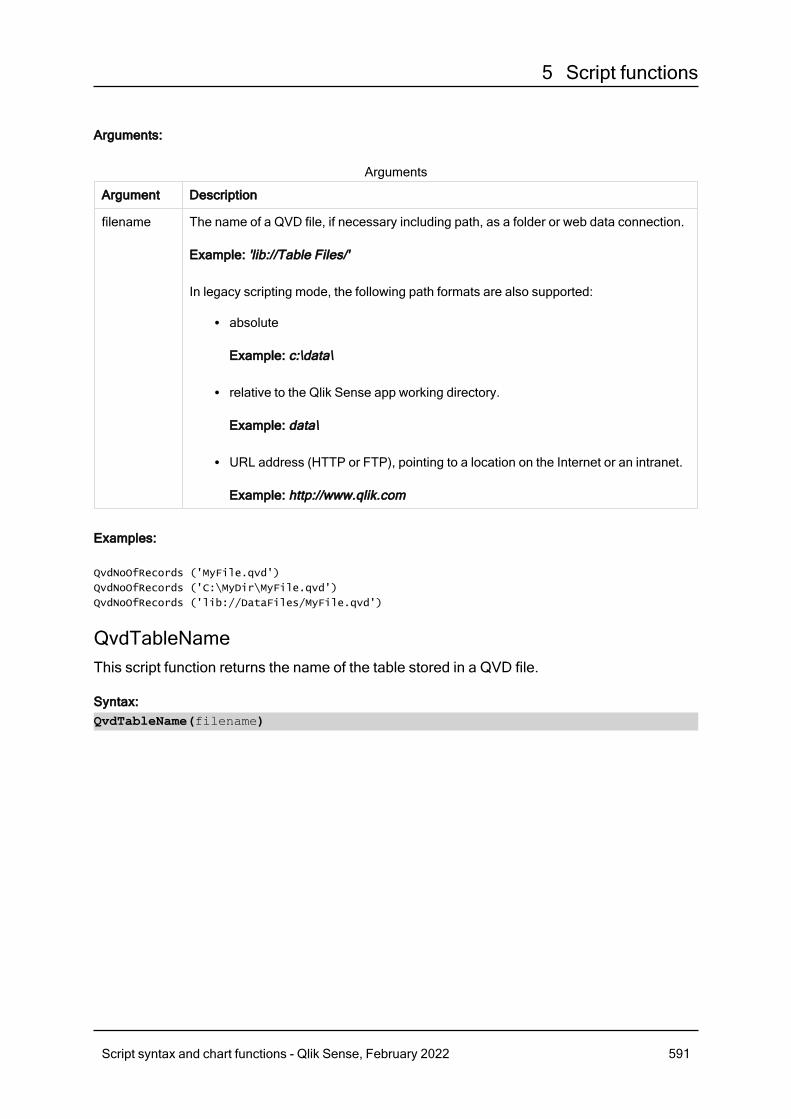
5 Script functions
Arguments:
Argument Description
filename The name of a QVD file, if necessary including path, as a folder or web data connection.
Example: 'lib://Table Files/'
In legacy scripting mode, the following path formats are also supported:
l absolute
Example: c:\data\
l relative to the Qlik Sense app working directory.
Example: data\
l URL address (HTTP or FTP), pointing to a location on the Internet or an intranet.
Example: http://www.qlik.com
Arguments
Examples:
QvdNoOfRecords ('MyFile.qvd')
QvdNoOfRecords ('C:\MyDir\MyFile.qvd')
QvdNoOfRecords ('lib://DataFiles/MyFile.qvd')
QvdTableNameThis script function returns the name of the table stored in a QVD file.
Syntax:QvdTableName(filename)
Script syntax and chart functions - Qlik Sense, February 2022 591
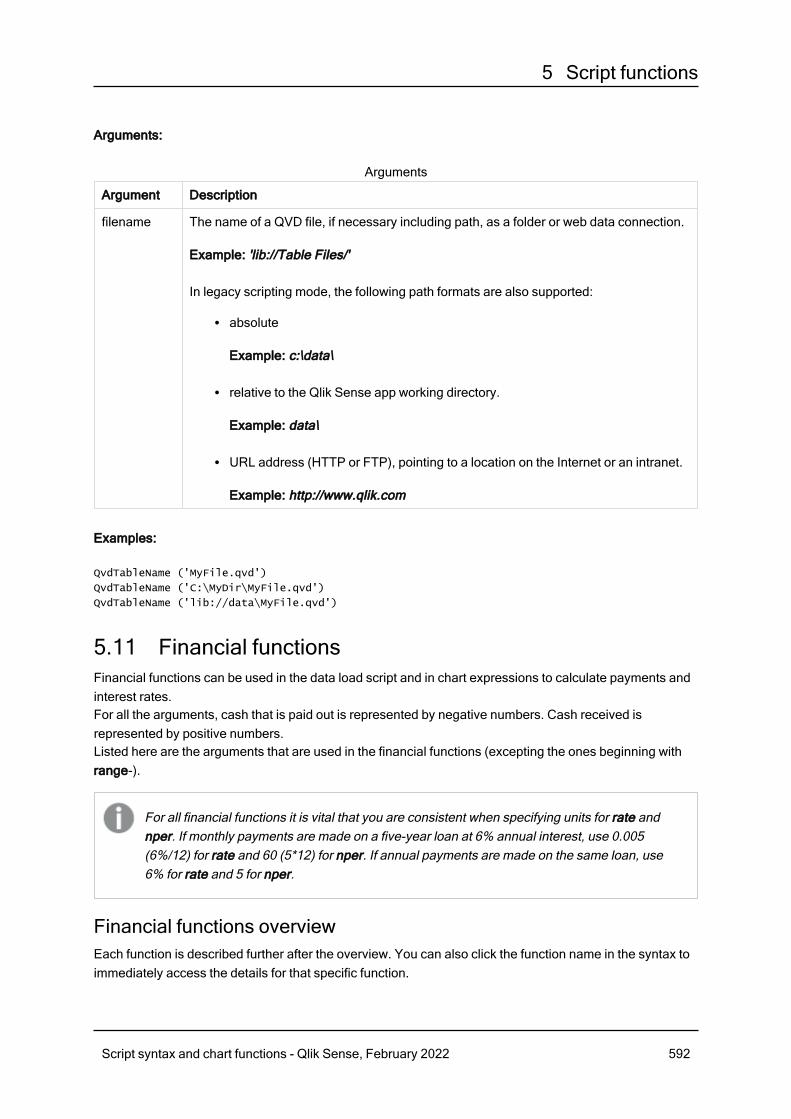
5 Script functions
Arguments:
Argument Description
filename The name of a QVD file, if necessary including path, as a folder or web data connection.
Example: 'lib://Table Files/'
In legacy scripting mode, the following path formats are also supported:
l absolute
Example: c:\data\
l relative to the Qlik Sense app working directory.
Example: data\
l URL address (HTTP or FTP), pointing to a location on the Internet or an intranet.
Example: http://www.qlik.com
Arguments
Examples:
QvdTableName ('MyFile.qvd')
QvdTableName ('C:\MyDir\MyFile.qvd')
QvdTableName ('lib://data\MyFile.qvd')
5.11 Financial functionsFinancial functions can be used in the data load script and in chart expressions to calculate payments andinterest rates.For all the arguments, cash that is paid out is represented by negative numbers. Cash received isrepresented by positive numbers.Listed here are the arguments that are used in the financial functions (excepting the ones beginning withrange-).
For all financial functions it is vital that you are consistent when specifying units for rate andnper. If monthly payments are made on a five-year loan at 6% annual interest, use 0.005(6%/12) for rate and 60 (5*12) for nper. If annual payments are made on the same loan, use6% for rate and 5 for nper.
Financial functions overviewEach function is described further after the overview. You can also click the function name in the syntax toimmediately access the details for that specific function.
Script syntax and chart functions - Qlik Sense, February 2022 592
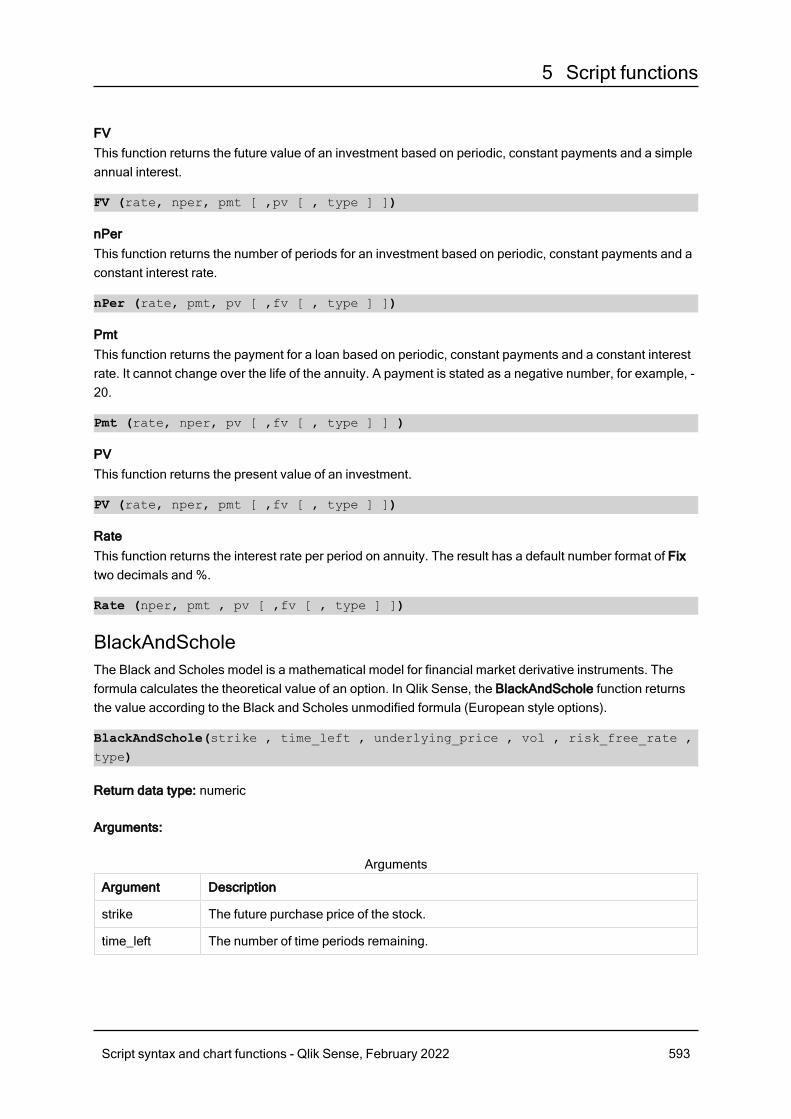
5 Script functions
FVThis function returns the future value of an investment based on periodic, constant payments and a simpleannual interest.
FV (rate, nper, pmt [ ,pv [ , type ] ])
nPerThis function returns the number of periods for an investment based on periodic, constant payments and aconstant interest rate.
nPer (rate, pmt, pv [ ,fv [ , type ] ])
PmtThis function returns the payment for a loan based on periodic, constant payments and a constant interestrate. It cannot change over the life of the annuity. A payment is stated as a negative number, for example, -20.
Pmt (rate, nper, pv [ ,fv [ , type ] ] )
PVThis function returns the present value of an investment.
PV (rate, nper, pmt [ ,fv [ , type ] ])
RateThis function returns the interest rate per period on annuity. The result has a default number format of Fixtwo decimals and %.
Rate (nper, pmt , pv [ ,fv [ , type ] ])
BlackAndScholeThe Black and Scholes model is a mathematical model for financial market derivative instruments. Theformula calculates the theoretical value of an option. In Qlik Sense, the BlackAndSchole function returnsthe value according to the Black and Scholes unmodified formula (European style options).
BlackAndSchole(strike , time_left , underlying_price , vol , risk_free_rate ,
type)
Return data type: numeric
Arguments:
Argument Description
strike The future purchase price of the stock.
time_left The number of time periods remaining.
Arguments
Script syntax and chart functions - Qlik Sense, February 2022 593
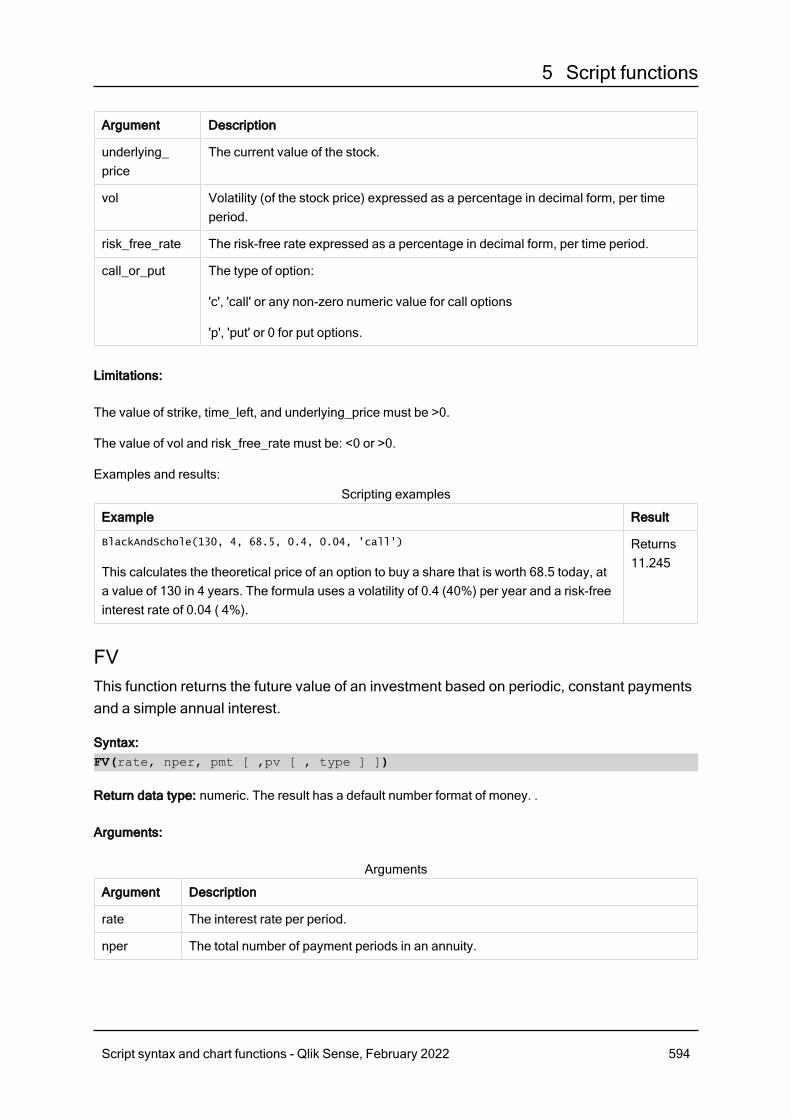
5 Script functions
Argument Description
underlying_price
The current value of the stock.
vol Volatility (of the stock price) expressed as a percentage in decimal form, per timeperiod.
risk_free_rate The risk-free rate expressed as a percentage in decimal form, per time period.
call_or_put The type of option:
'c', 'call' or any non-zero numeric value for call options
'p', 'put' or 0 for put options.
Limitations:
The value of strike, time_left, and underlying_price must be >0.
The value of vol and risk_free_rate must be: <0 or >0.
Examples and results:
Example Result
BlackAndSchole(130, 4, 68.5, 0.4, 0.04, 'call')
This calculates the theoretical price of an option to buy a share that is worth 68.5 today, ata value of 130 in 4 years. The formula uses a volatility of 0.4 (40%) per year and a risk-freeinterest rate of 0.04 ( 4%).
Returns11.245
Scripting examples
FVThis function returns the future value of an investment based on periodic, constant paymentsand a simple annual interest.
Syntax:FV(rate, nper, pmt [ ,pv [ , type ] ])
Return data type: numeric. The result has a default number format of money. .
Arguments:
Argument Description
rate The interest rate per period.
nper The total number of payment periods in an annuity.
Arguments
Script syntax and chart functions - Qlik Sense, February 2022 594
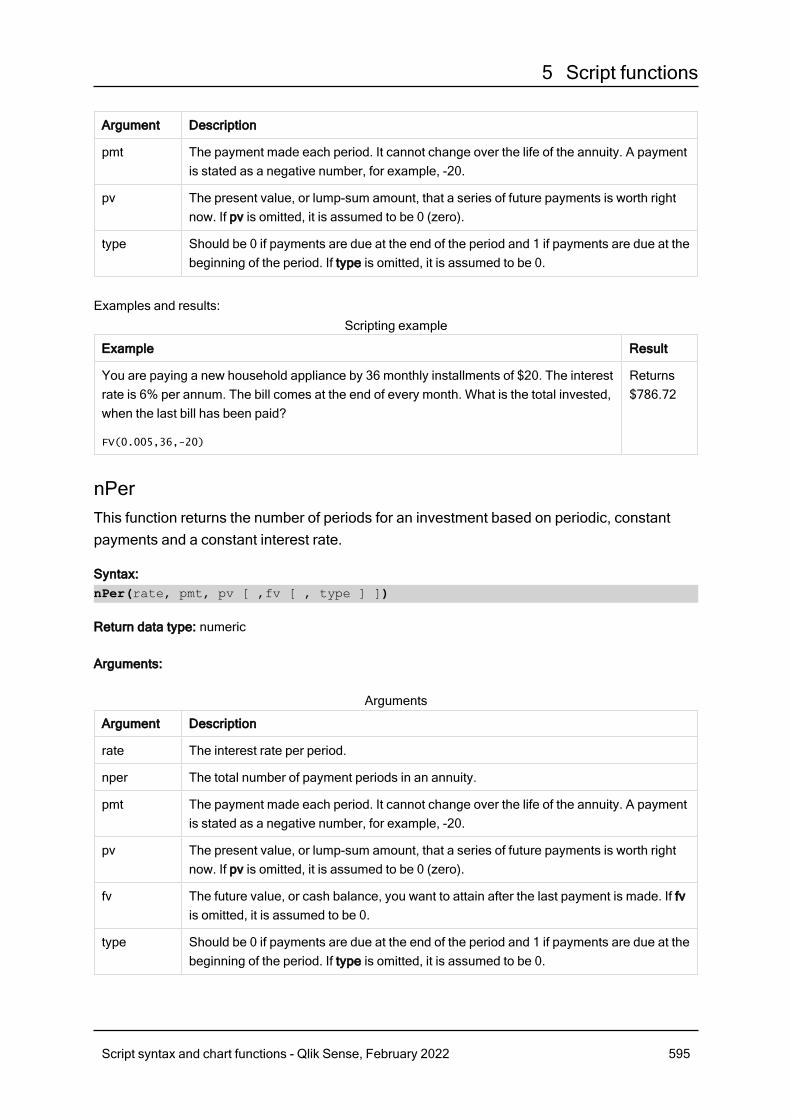
5 Script functions
Argument Description
pmt The payment made each period. It cannot change over the life of the annuity. A paymentis stated as a negative number, for example, -20.
pv The present value, or lump-sum amount, that a series of future payments is worth rightnow. If pv is omitted, it is assumed to be 0 (zero).
type Should be 0 if payments are due at the end of the period and 1 if payments are due at thebeginning of the period. If type is omitted, it is assumed to be 0.
Examples and results:
Example Result
You are paying a new household appliance by 36 monthly installments of $20. The interestrate is 6% per annum. The bill comes at the end of every month. What is the total invested,when the last bill has been paid?
FV(0.005,36,-20)
Returns$786.72
Scripting example
nPerThis function returns the number of periods for an investment based on periodic, constantpayments and a constant interest rate.
Syntax:nPer(rate, pmt, pv [ ,fv [ , type ] ])
Return data type: numeric
Arguments:
Argument Description
rate The interest rate per period.
nper The total number of payment periods in an annuity.
pmt The payment made each period. It cannot change over the life of the annuity. A paymentis stated as a negative number, for example, -20.
pv The present value, or lump-sum amount, that a series of future payments is worth rightnow. If pv is omitted, it is assumed to be 0 (zero).
fv The future value, or cash balance, you want to attain after the last payment is made. If fvis omitted, it is assumed to be 0.
type Should be 0 if payments are due at the end of the period and 1 if payments are due at thebeginning of the period. If type is omitted, it is assumed to be 0.
Arguments
Script syntax and chart functions - Qlik Sense, February 2022 595
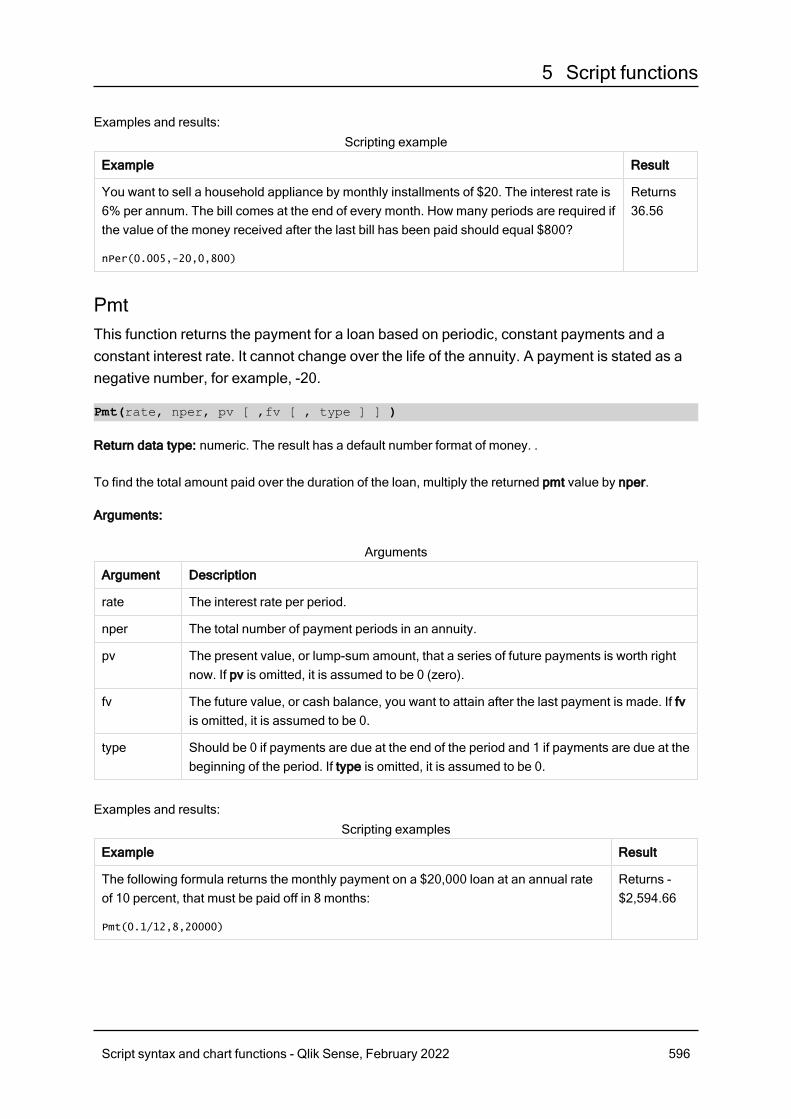
5 Script functions
Examples and results:
Example Result
You want to sell a household appliance by monthly installments of $20. The interest rate is6% per annum. The bill comes at the end of every month. How many periods are required ifthe value of the money received after the last bill has been paid should equal $800?
nPer(0.005,-20,0,800)
Returns36.56
Scripting example
PmtThis function returns the payment for a loan based on periodic, constant payments and aconstant interest rate. It cannot change over the life of the annuity. A payment is stated as anegative number, for example, -20.
Pmt(rate, nper, pv [ ,fv [ , type ] ] )
Return data type: numeric. The result has a default number format of money. .
To find the total amount paid over the duration of the loan, multiply the returned pmt value by nper.
Arguments:
Argument Description
rate The interest rate per period.
nper The total number of payment periods in an annuity.
pv The present value, or lump-sum amount, that a series of future payments is worth rightnow. If pv is omitted, it is assumed to be 0 (zero).
fv The future value, or cash balance, you want to attain after the last payment is made. If fvis omitted, it is assumed to be 0.
type Should be 0 if payments are due at the end of the period and 1 if payments are due at thebeginning of the period. If type is omitted, it is assumed to be 0.
Arguments
Examples and results:
Example Result
The following formula returns the monthly payment on a $20,000 loan at an annual rateof 10 percent, that must be paid off in 8 months:
Pmt(0.1/12,8,20000)
Returns -$2,594.66
Scripting examples
Script syntax and chart functions - Qlik Sense, February 2022 596
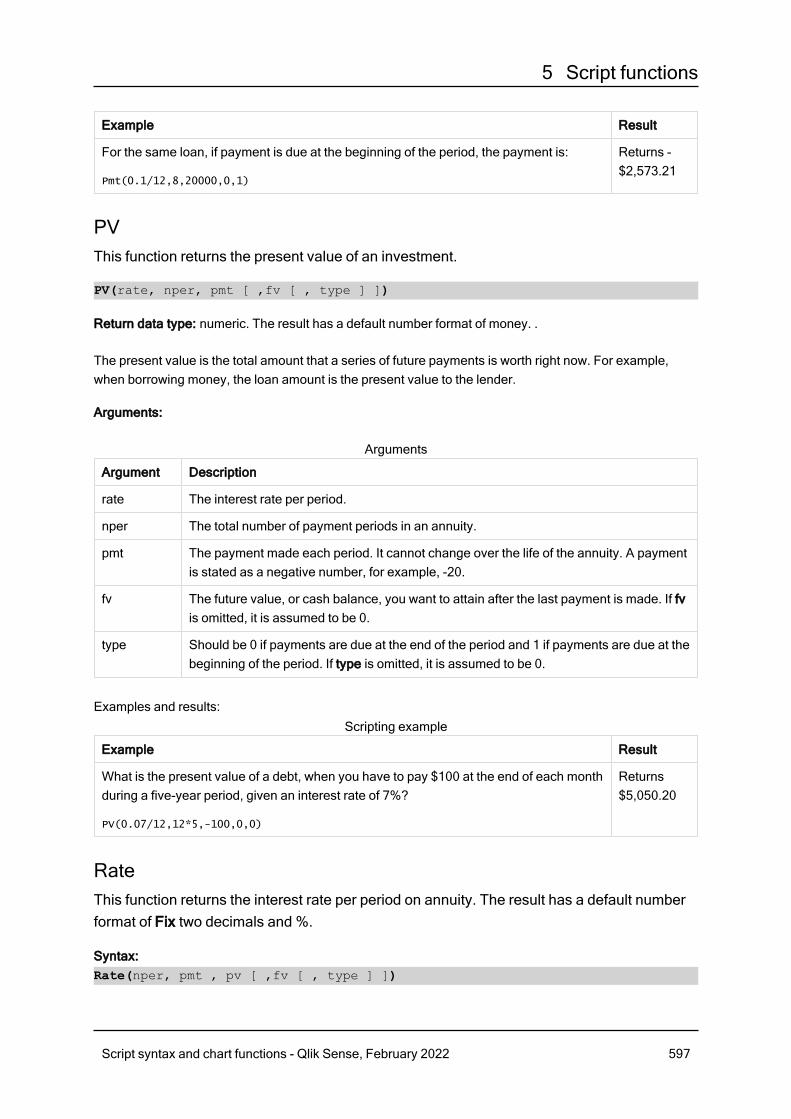
5 Script functions
Example Result
For the same loan, if payment is due at the beginning of the period, the payment is:
Pmt(0.1/12,8,20000,0,1)
Returns -$2,573.21
PVThis function returns the present value of an investment.
PV(rate, nper, pmt [ ,fv [ , type ] ])
Return data type: numeric. The result has a default number format of money. .
The present value is the total amount that a series of future payments is worth right now. For example,when borrowing money, the loan amount is the present value to the lender.
Arguments:
Argument Description
rate The interest rate per period.
nper The total number of payment periods in an annuity.
pmt The payment made each period. It cannot change over the life of the annuity. A paymentis stated as a negative number, for example, -20.
fv The future value, or cash balance, you want to attain after the last payment is made. If fvis omitted, it is assumed to be 0.
type Should be 0 if payments are due at the end of the period and 1 if payments are due at thebeginning of the period. If type is omitted, it is assumed to be 0.
Arguments
Examples and results:
Example Result
What is the present value of a debt, when you have to pay $100 at the end of each monthduring a five-year period, given an interest rate of 7%?
PV(0.07/12,12*5,-100,0,0)
Returns$5,050.20
Scripting example
RateThis function returns the interest rate per period on annuity. The result has a default numberformat of Fix two decimals and %.
Syntax:Rate(nper, pmt , pv [ ,fv [ , type ] ])
Script syntax and chart functions - Qlik Sense, February 2022 597
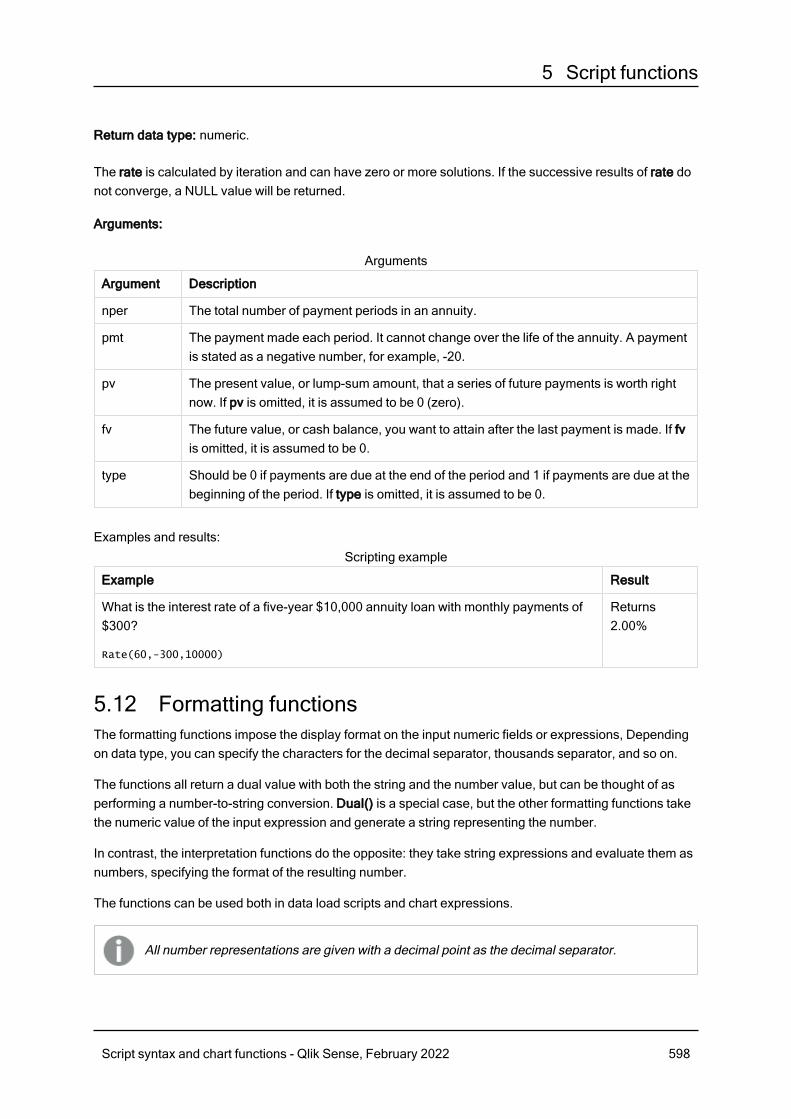
5 Script functions
Return data type: numeric.
The rate is calculated by iteration and can have zero or more solutions. If the successive results of rate donot converge, a NULL value will be returned.
Arguments:
Argument Description
nper The total number of payment periods in an annuity.
pmt The payment made each period. It cannot change over the life of the annuity. A paymentis stated as a negative number, for example, -20.
pv The present value, or lump-sum amount, that a series of future payments is worth rightnow. If pv is omitted, it is assumed to be 0 (zero).
fv The future value, or cash balance, you want to attain after the last payment is made. If fvis omitted, it is assumed to be 0.
type Should be 0 if payments are due at the end of the period and 1 if payments are due at thebeginning of the period. If type is omitted, it is assumed to be 0.
Arguments
Examples and results:
Example Result
What is the interest rate of a five-year $10,000 annuity loan with monthly payments of$300?
Rate(60,-300,10000)
Returns2.00%
Scripting example
5.12 Formatting functionsThe formatting functions impose the display format on the input numeric fields or expressions, Dependingon data type, you can specify the characters for the decimal separator, thousands separator, and so on.
The functions all return a dual value with both the string and the number value, but can be thought of asperforming a number-to-string conversion. Dual() is a special case, but the other formatting functions takethe numeric value of the input expression and generate a string representing the number.
In contrast, the interpretation functions do the opposite: they take string expressions and evaluate them asnumbers, specifying the format of the resulting number.
The functions can be used both in data load scripts and chart expressions.
All number representations are given with a decimal point as the decimal separator.
Script syntax and chart functions - Qlik Sense, February 2022 598
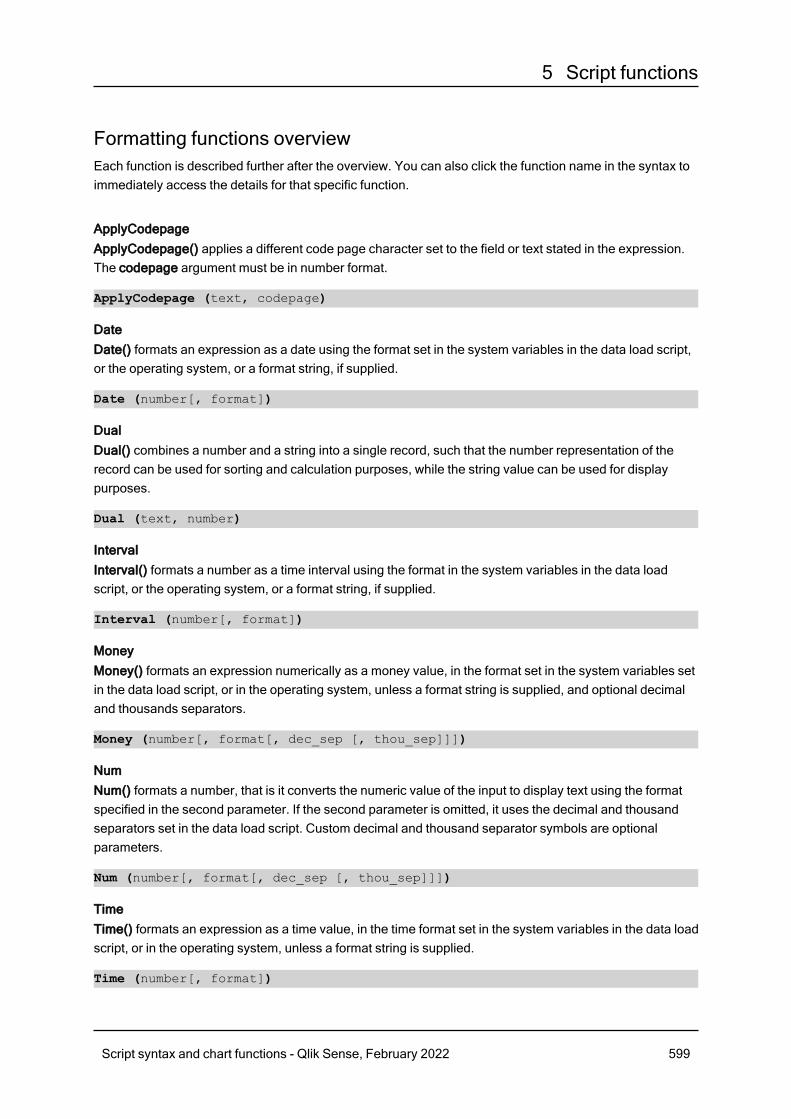
5 Script functions
Formatting functions overviewEach function is described further after the overview. You can also click the function name in the syntax toimmediately access the details for that specific function.
ApplyCodepageApplyCodepage() applies a different code page character set to the field or text stated in the expression.The codepage argument must be in number format.
ApplyCodepage (text, codepage)
DateDate() formats an expression as a date using the format set in the system variables in the data load script,or the operating system, or a format string, if supplied.
Date (number[, format])
DualDual() combines a number and a string into a single record, such that the number representation of therecord can be used for sorting and calculation purposes, while the string value can be used for displaypurposes.
Dual (text, number)
IntervalInterval() formats a number as a time interval using the format in the system variables in the data loadscript, or the operating system, or a format string, if supplied.
Interval (number[, format])
MoneyMoney() formats an expression numerically as a money value, in the format set in the system variables setin the data load script, or in the operating system, unless a format string is supplied, and optional decimaland thousands separators.
Money (number[, format[, dec_sep [, thou_sep]]])
NumNum() formats a number, that is it converts the numeric value of the input to display text using the formatspecified in the second parameter. If the second parameter is omitted, it uses the decimal and thousandseparators set in the data load script. Custom decimal and thousand separator symbols are optionalparameters.
Num (number[, format[, dec_sep [, thou_sep]]])
TimeTime() formats an expression as a time value, in the time format set in the system variables in the data loadscript, or in the operating system, unless a format string is supplied.
Time (number[, format])
Script syntax and chart functions - Qlik Sense, February 2022 599
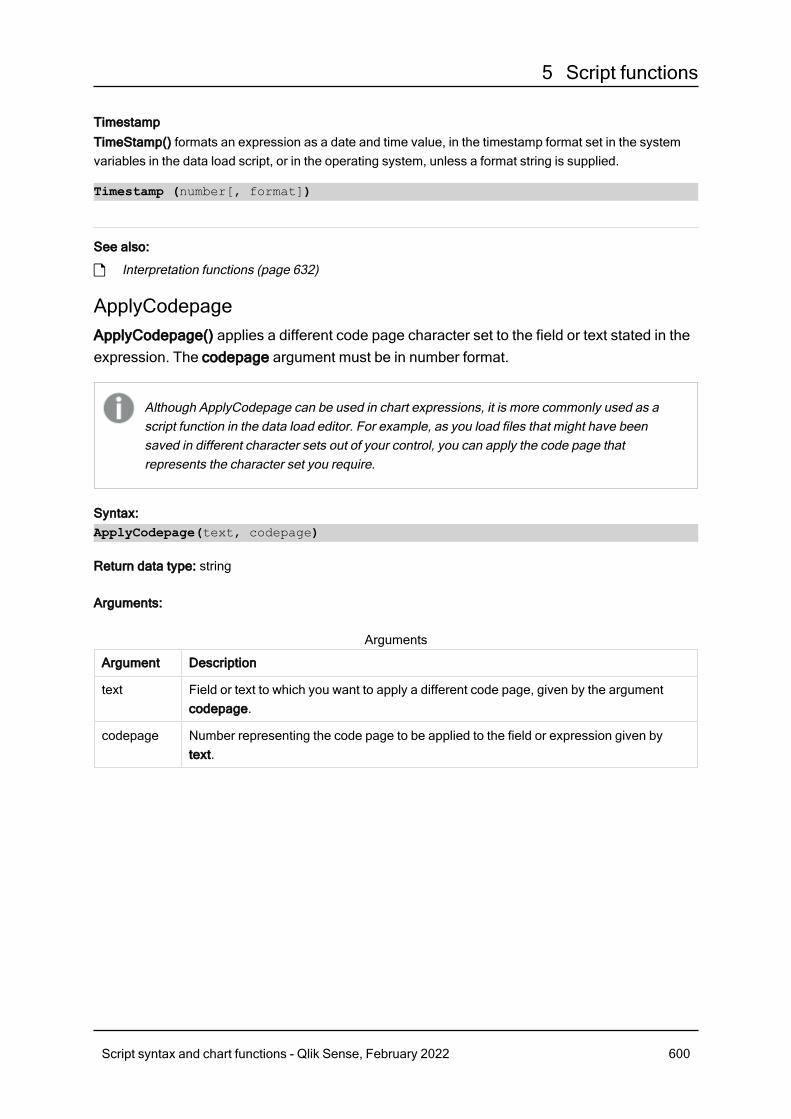
5 Script functions
TimestampTimeStamp() formats an expression as a date and time value, in the timestamp format set in the systemvariables in the data load script, or in the operating system, unless a format string is supplied.
Timestamp (number[, format])
See also:
p Interpretation functions (page 632)
ApplyCodepageApplyCodepage() applies a different code page character set to the field or text stated in theexpression. The codepage argument must be in number format.
Although ApplyCodepage can be used in chart expressions, it is more commonly used as ascript function in the data load editor. For example, as you load files that might have beensaved in different character sets out of your control, you can apply the code page thatrepresents the character set you require.
Syntax:ApplyCodepage(text, codepage)
Return data type: string
Arguments:
Argument Description
text Field or text to which you want to apply a different code page, given by the argumentcodepage.
codepage Number representing the code page to be applied to the field or expression given bytext.
Arguments
Script syntax and chart functions - Qlik Sense, February 2022 600
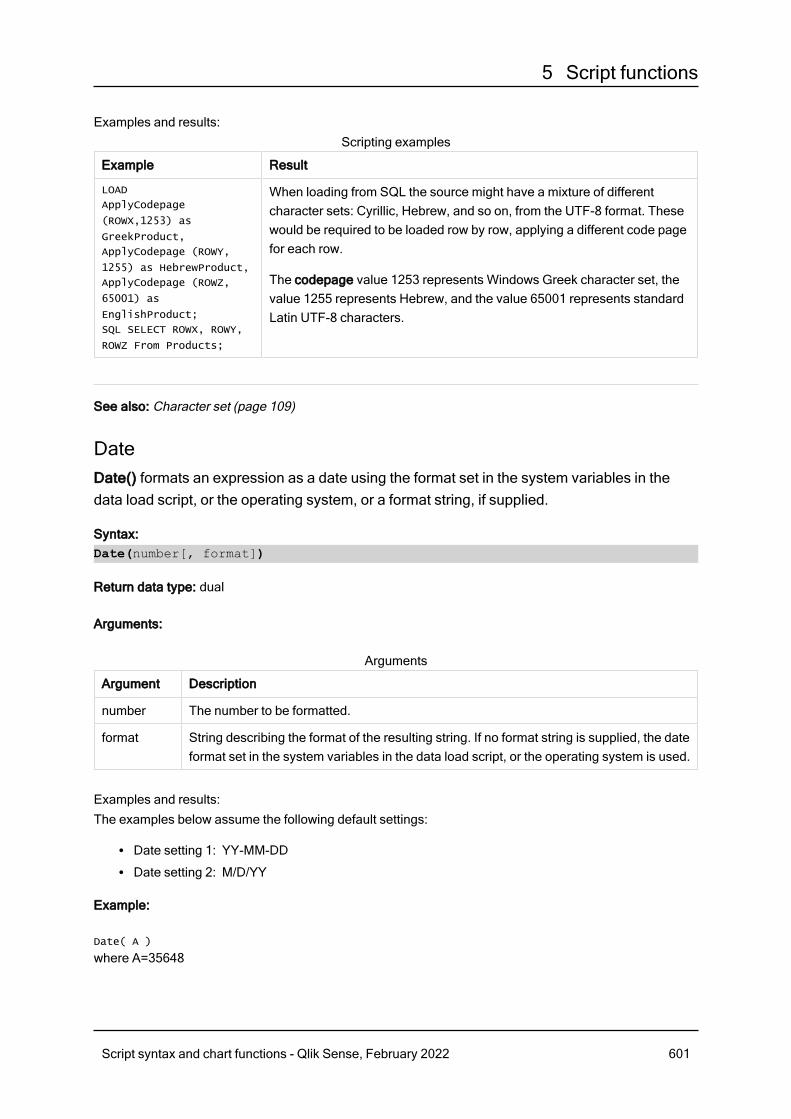
5 Script functions
Examples and results:
Example Result
LOAD
ApplyCodepage
(ROWX,1253) as
GreekProduct,
ApplyCodepage (ROWY,
1255) as HebrewProduct,
ApplyCodepage (ROWZ,
65001) as
EnglishProduct;
SQL SELECT ROWX, ROWY,
ROWZ From Products;
When loading from SQL the source might have a mixture of differentcharacter sets: Cyrillic, Hebrew, and so on, from the UTF-8 format. Thesewould be required to be loaded row by row, applying a different code pagefor each row.
The codepage value 1253 represents Windows Greek character set, thevalue 1255 represents Hebrew, and the value 65001 represents standardLatin UTF-8 characters.
Scripting examples
See also: Character set (page 109)
DateDate() formats an expression as a date using the format set in the system variables in thedata load script, or the operating system, or a format string, if supplied.
Syntax:Date(number[, format])
Return data type: dual
Arguments:
Argument Description
number The number to be formatted.
format String describing the format of the resulting string. If no format string is supplied, the dateformat set in the system variables in the data load script, or the operating system is used.
Arguments
Examples and results:The examples below assume the following default settings:
l Date setting 1: YY-MM-DDl Date setting 2: M/D/YY
Example:
Date( A )
where A=35648
Script syntax and chart functions - Qlik Sense, February 2022 601
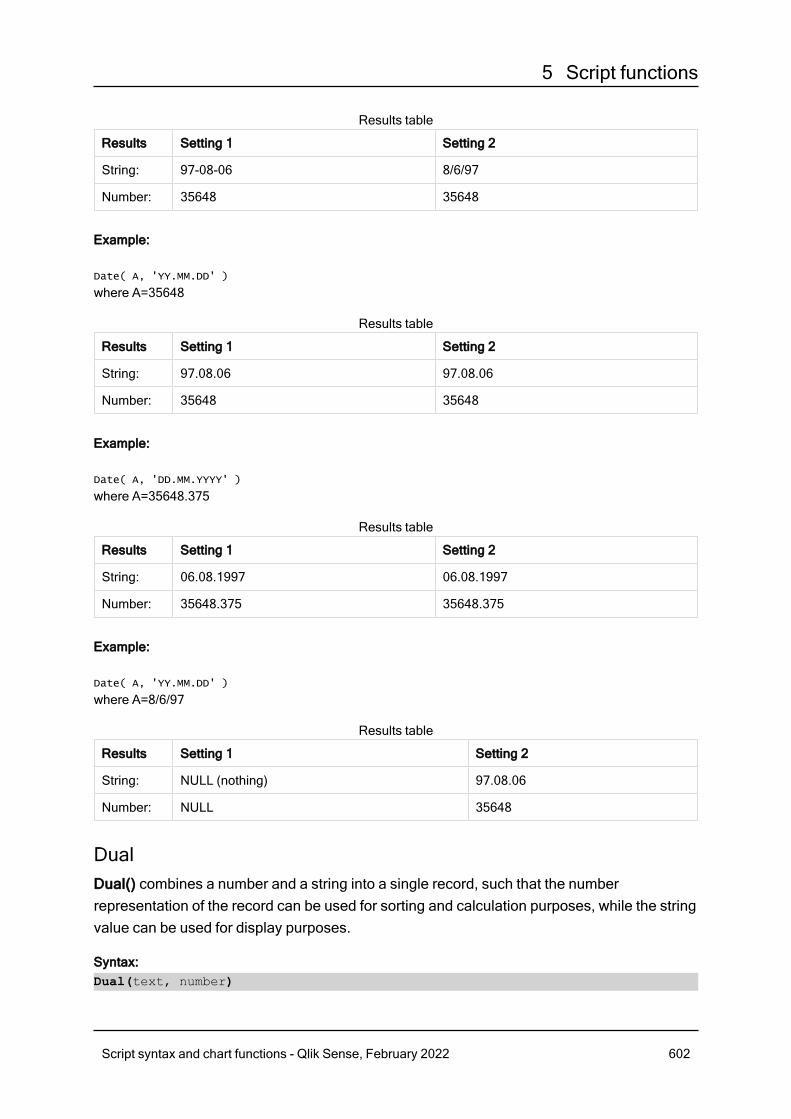
5 Script functions
Results Setting 1 Setting 2
String: 97-08-06 8/6/97
Number: 35648 35648
Results table
Example:
Date( A, 'YY.MM.DD' )
where A=35648
Results Setting 1 Setting 2
String: 97.08.06 97.08.06
Number: 35648 35648
Results table
Example:
Date( A, 'DD.MM.YYYY' )
where A=35648.375
Results Setting 1 Setting 2
String: 06.08.1997 06.08.1997
Number: 35648.375 35648.375
Results table
Example:
Date( A, 'YY.MM.DD' )
where A=8/6/97
Results Setting 1 Setting 2
String: NULL (nothing) 97.08.06
Number: NULL 35648
Results table
DualDual() combines a number and a string into a single record, such that the numberrepresentation of the record can be used for sorting and calculation purposes, while the stringvalue can be used for display purposes.
Syntax:Dual(text, number)
Script syntax and chart functions - Qlik Sense, February 2022 602
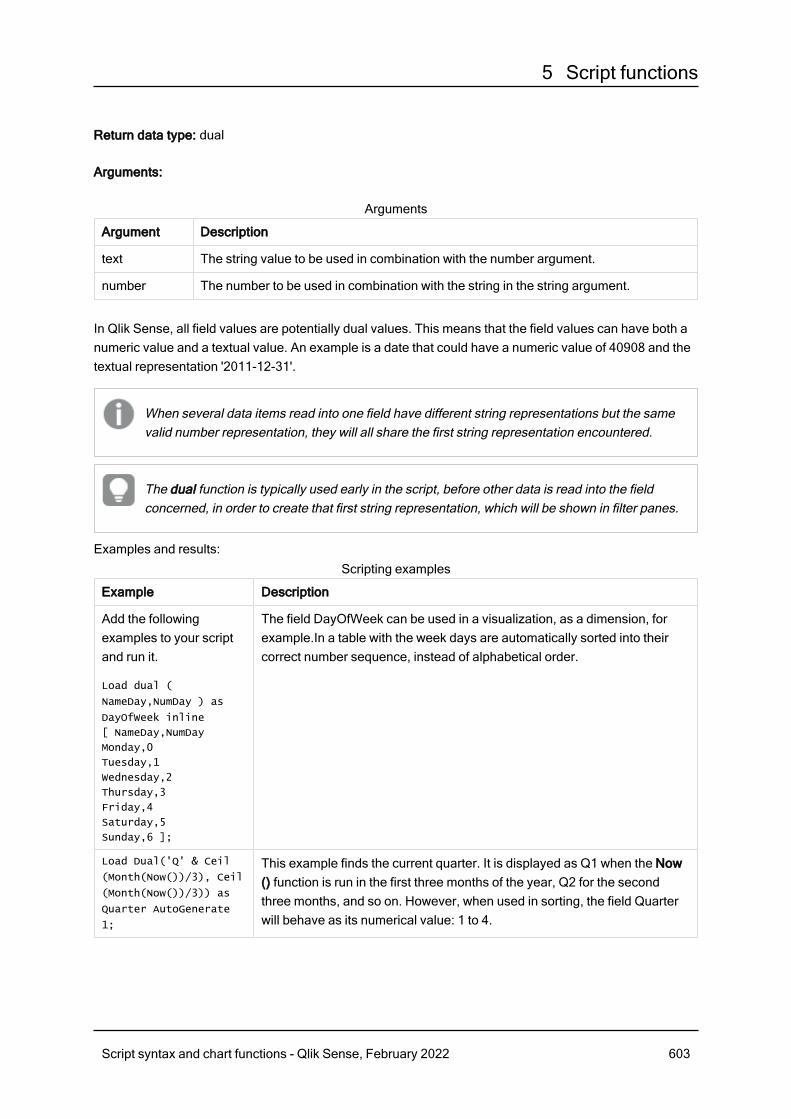
5 Script functions
Return data type: dual
Arguments:
Argument Description
text The string value to be used in combination with the number argument.
number The number to be used in combination with the string in the string argument.
Arguments
In Qlik Sense, all field values are potentially dual values. This means that the field values can have both anumeric value and a textual value. An example is a date that could have a numeric value of 40908 and thetextual representation '2011-12-31'.
When several data items read into one field have different string representations but the samevalid number representation, they will all share the first string representation encountered.
The dual function is typically used early in the script, before other data is read into the fieldconcerned, in order to create that first string representation, which will be shown in filter panes.
Examples and results:
Example Description
Add the followingexamples to your scriptand run it.
Load dual (
NameDay,NumDay ) as
DayOfWeek inline
[ NameDay,NumDay
Monday,0
Tuesday,1
Wednesday,2
Thursday,3
Friday,4
Saturday,5
Sunday,6 ];
The field DayOfWeek can be used in a visualization, as a dimension, forexample.In a table with the week days are automatically sorted into theircorrect number sequence, instead of alphabetical order.
Load Dual('Q' & Ceil
(Month(Now())/3), Ceil
(Month(Now())/3)) as
Quarter AutoGenerate
1;
This example finds the current quarter. It is displayed as Q1 when the Now() function is run in the first three months of the year, Q2 for the secondthree months, and so on. However, when used in sorting, the field Quarterwill behave as its numerical value: 1 to 4.
Scripting examples
Script syntax and chart functions - Qlik Sense, February 2022 603
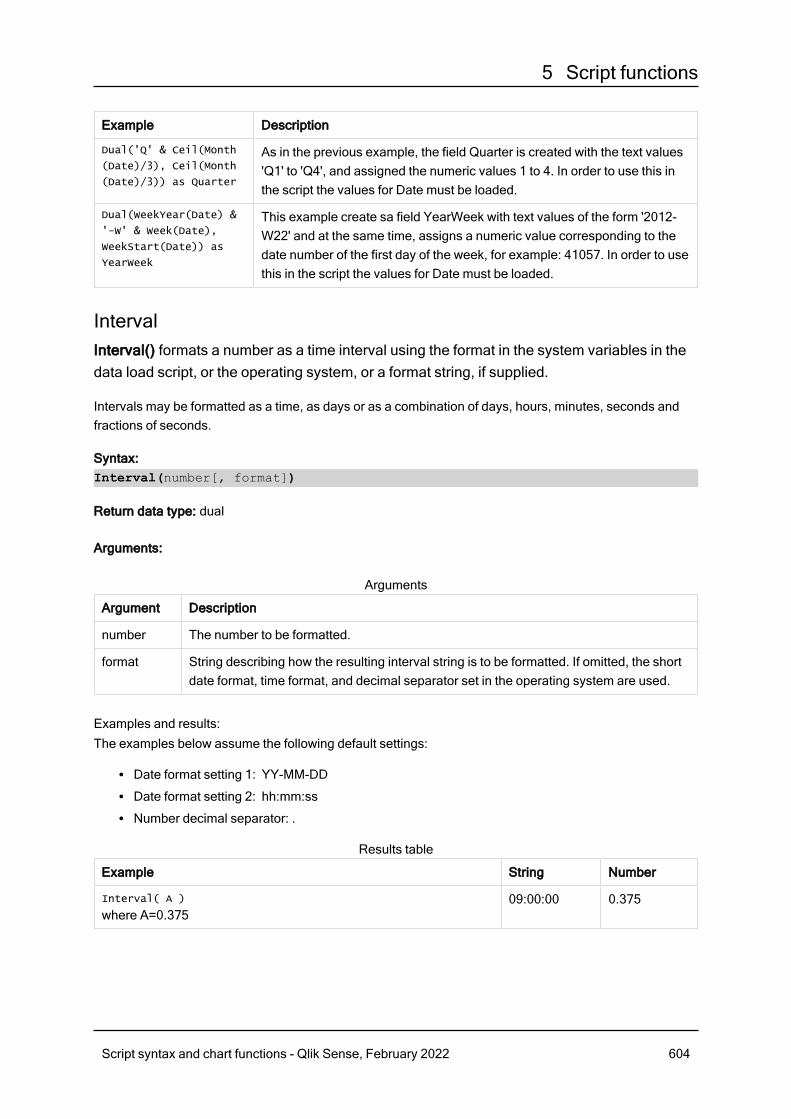
5 Script functions
Example Description
Dual('Q' & Ceil(Month
(Date)/3), Ceil(Month
(Date)/3)) as Quarter
As in the previous example, the field Quarter is created with the text values'Q1' to 'Q4', and assigned the numeric values 1 to 4. In order to use this inthe script the values for Date must be loaded.
Dual(WeekYear(Date) &
'-W' & Week(Date),
WeekStart(Date)) as
YearWeek
This example create sa field YearWeek with text values of the form '2012-W22' and at the same time, assigns a numeric value corresponding to thedate number of the first day of the week, for example: 41057. In order to usethis in the script the values for Date must be loaded.
IntervalInterval() formats a number as a time interval using the format in the system variables in thedata load script, or the operating system, or a format string, if supplied.
Intervals may be formatted as a time, as days or as a combination of days, hours, minutes, seconds andfractions of seconds.
Syntax:Interval(number[, format])
Return data type: dual
Arguments:
Argument Description
number The number to be formatted.
format String describing how the resulting interval string is to be formatted. If omitted, the shortdate format, time format, and decimal separator set in the operating system are used.
Arguments
Examples and results:The examples below assume the following default settings:
l Date format setting 1: YY-MM-DDl Date format setting 2: hh:mm:ssl Number decimal separator: .
Example String Number
Interval( A )
where A=0.37509:00:00 0.375
Results table
Script syntax and chart functions - Qlik Sense, February 2022 604
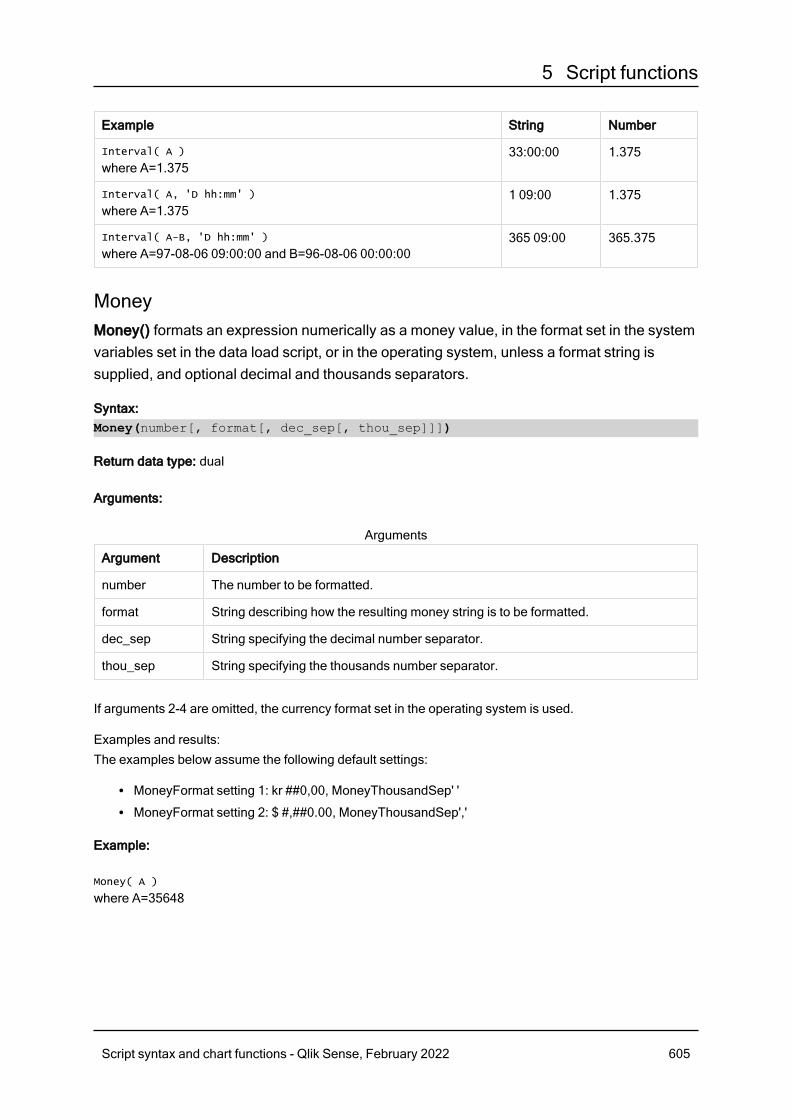
5 Script functions
Example String Number
Interval( A )
where A=1.37533:00:00 1.375
Interval( A, 'D hh:mm' )
where A=1.3751 09:00 1.375
Interval( A-B, 'D hh:mm' )
where A=97-08-06 09:00:00 and B=96-08-06 00:00:00365 09:00 365.375
MoneyMoney() formats an expression numerically as a money value, in the format set in the systemvariables set in the data load script, or in the operating system, unless a format string issupplied, and optional decimal and thousands separators.
Syntax:Money(number[, format[, dec_sep[, thou_sep]]])
Return data type: dual
Arguments:
Argument Description
number The number to be formatted.
format String describing how the resulting money string is to be formatted.
dec_sep String specifying the decimal number separator.
thou_sep String specifying the thousands number separator.
Arguments
If arguments 2-4 are omitted, the currency format set in the operating system is used.
Examples and results:The examples below assume the following default settings:
l MoneyFormat setting 1: kr ##0,00, MoneyThousandSep' 'l MoneyFormat setting 2: $ #,##0.00, MoneyThousandSep','
Example:
Money( A )
where A=35648
Script syntax and chart functions - Qlik Sense, February 2022 605
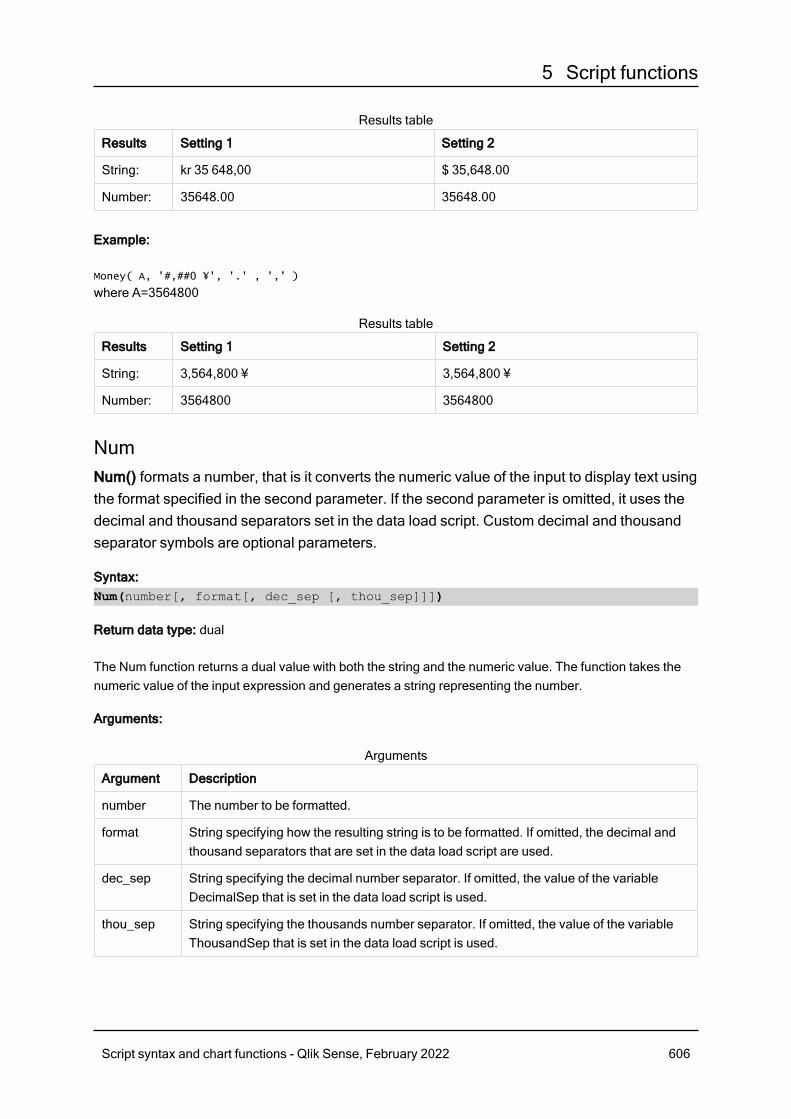
5 Script functions
Results Setting 1 Setting 2
String: kr 35 648,00 $ 35,648.00
Number: 35648.00 35648.00
Results table
Example:
Money( A, '#,##0 ¥', '.' , ',' )
where A=3564800
Results Setting 1 Setting 2
String: 3,564,800 ¥ 3,564,800 ¥
Number: 3564800 3564800
Results table
NumNum() formats a number, that is it converts the numeric value of the input to display text usingthe format specified in the second parameter. If the second parameter is omitted, it uses thedecimal and thousand separators set in the data load script. Custom decimal and thousandseparator symbols are optional parameters.
Syntax:Num(number[, format[, dec_sep [, thou_sep]]])
Return data type: dual
The Num function returns a dual value with both the string and the numeric value. The function takes thenumeric value of the input expression and generates a string representing the number.
Arguments:
Argument Description
number The number to be formatted.
format String specifying how the resulting string is to be formatted. If omitted, the decimal andthousand separators that are set in the data load script are used.
dec_sep String specifying the decimal number separator. If omitted, the value of the variableDecimalSep that is set in the data load script is used.
thou_sep String specifying the thousands number separator. If omitted, the value of the variableThousandSep that is set in the data load script is used.
Arguments
Script syntax and chart functions - Qlik Sense, February 2022 606
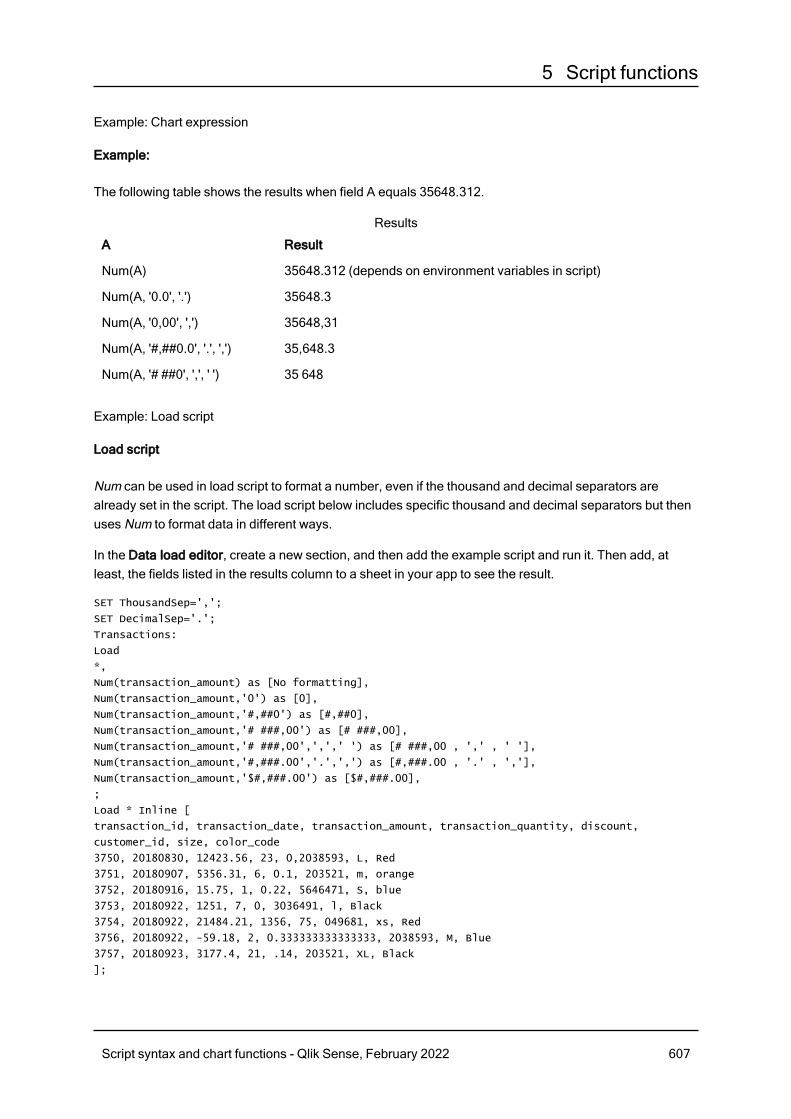
5 Script functions
Example: Chart expression
Example:
The following table shows the results when field A equals 35648.312.
A Result
Num(A) 35648.312 (depends on environment variables in script)
Num(A, '0.0', '.') 35648.3
Num(A, '0,00', ',') 35648,31
Num(A, '#,##0.0', '.', ',') 35,648.3
Num(A, '# ##0', ',', ' ') 35 648
Results
Example: Load script
Load script
Num can be used in load script to format a number, even if the thousand and decimal separators arealready set in the script. The load script below includes specific thousand and decimal separators but thenuses Num to format data in different ways.
In the Data load editor, create a new section, and then add the example script and run it. Then add, atleast, the fields listed in the results column to a sheet in your app to see the result.
SET ThousandSep=',';
SET DecimalSep='.';
Transactions:
Load
*,
Num(transaction_amount) as [No formatting],
Num(transaction_amount,'0') as [0],
Num(transaction_amount,'#,##0') as [#,##0],
Num(transaction_amount,'# ###,00') as [# ###,00],
Num(transaction_amount,'# ###,00',',',' ') as [# ###,00 , ',' , ' '],
Num(transaction_amount,'#,###.00','.',',') as [#,###.00 , '.' , ','],
Num(transaction_amount,'$#,###.00') as [$#,###.00],
;
Load * Inline [
transaction_id, transaction_date, transaction_amount, transaction_quantity, discount,
customer_id, size, color_code
3750, 20180830, 12423.56, 23, 0,2038593, L, Red
3751, 20180907, 5356.31, 6, 0.1, 203521, m, orange
3752, 20180916, 15.75, 1, 0.22, 5646471, S, blue
3753, 20180922, 1251, 7, 0, 3036491, l, Black
3754, 20180922, 21484.21, 1356, 75, 049681, xs, Red
3756, 20180922, -59.18, 2, 0.333333333333333, 2038593, M, Blue
3757, 20180923, 3177.4, 21, .14, 203521, XL, Black
];
Script syntax and chart functions - Qlik Sense, February 2022 607
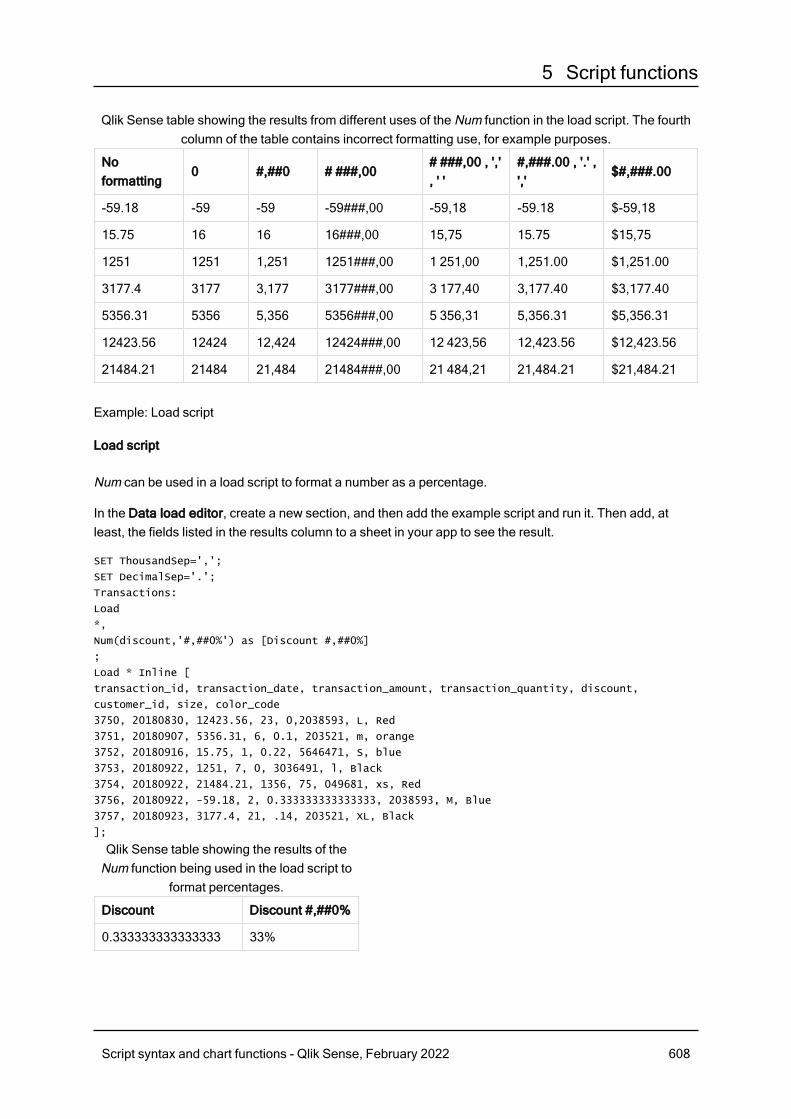
5 Script functions
Noformatting
0 #,##0 # ###,00# ###,00 , ',', ' '
#,###.00 , '.' ,','
$#,###.00
-59.18 -59 -59 -59###,00 -59,18 -59.18 $-59,18
15.75 16 16 16###,00 15,75 15.75 $15,75
1251 1251 1,251 1251###,00 1 251,00 1,251.00 $1,251.00
3177.4 3177 3,177 3177###,00 3 177,40 3,177.40 $3,177.40
5356.31 5356 5,356 5356###,00 5 356,31 5,356.31 $5,356.31
12423.56 12424 12,424 12424###,00 12 423,56 12,423.56 $12,423.56
21484.21 21484 21,484 21484###,00 21 484,21 21,484.21 $21,484.21
Qlik Sense table showing the results from different uses of the Num function in the load script. The fourthcolumn of the table contains incorrect formatting use, for example purposes.
Example: Load script
Load script
Num can be used in a load script to format a number as a percentage.
In the Data load editor, create a new section, and then add the example script and run it. Then add, atleast, the fields listed in the results column to a sheet in your app to see the result.
SET ThousandSep=',';
SET DecimalSep='.';
Transactions:
Load
*,
Num(discount,'#,##0%') as [Discount #,##0%]
;
Load * Inline [
transaction_id, transaction_date, transaction_amount, transaction_quantity, discount,
customer_id, size, color_code
3750, 20180830, 12423.56, 23, 0,2038593, L, Red
3751, 20180907, 5356.31, 6, 0.1, 203521, m, orange
3752, 20180916, 15.75, 1, 0.22, 5646471, S, blue
3753, 20180922, 1251, 7, 0, 3036491, l, Black
3754, 20180922, 21484.21, 1356, 75, 049681, xs, Red
3756, 20180922, -59.18, 2, 0.333333333333333, 2038593, M, Blue
3757, 20180923, 3177.4, 21, .14, 203521, XL, Black
];
Discount Discount #,##0%
0.333333333333333 33%
Qlik Sense table showing the results of theNum function being used in the load script to
format percentages.
Script syntax and chart functions - Qlik Sense, February 2022 608
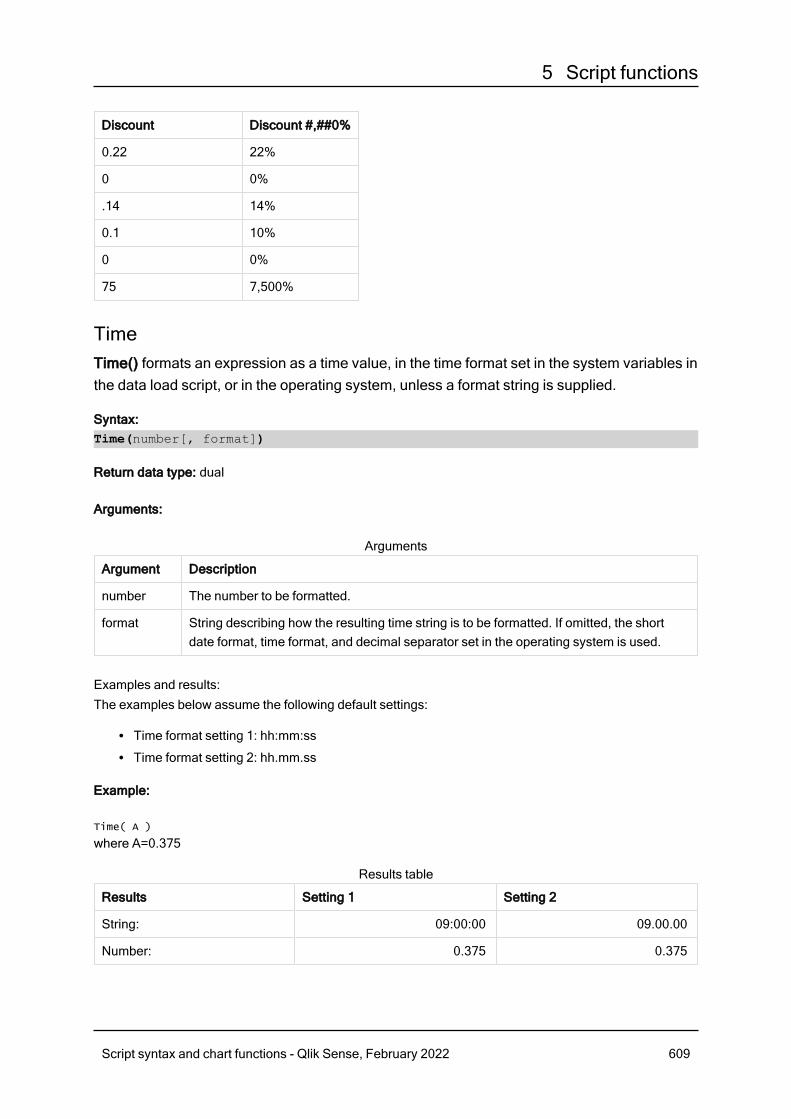
5 Script functions
Discount Discount #,##0%
0.22 22%
0 0%
.14 14%
0.1 10%
0 0%
75 7,500%
TimeTime() formats an expression as a time value, in the time format set in the system variables inthe data load script, or in the operating system, unless a format string is supplied.
Syntax:Time(number[, format])
Return data type: dual
Arguments:
Argument Description
number The number to be formatted.
format String describing how the resulting time string is to be formatted. If omitted, the shortdate format, time format, and decimal separator set in the operating system is used.
Arguments
Examples and results:The examples below assume the following default settings:
l Time format setting 1: hh:mm:ssl Time format setting 2: hh.mm.ss
Example:
Time( A )
where A=0.375
Results Setting 1 Setting 2
String: 09:00:00 09.00.00
Number: 0.375 0.375
Results table
Script syntax and chart functions - Qlik Sense, February 2022 609
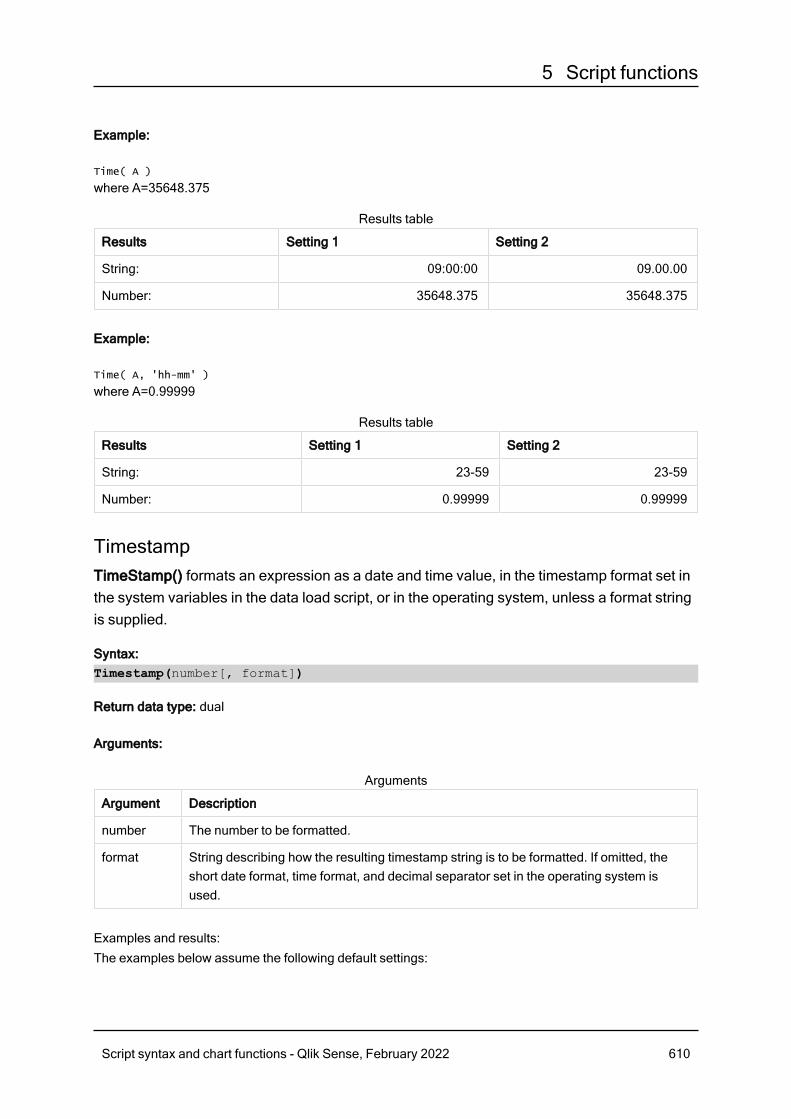
5 Script functions
Example:
Time( A )
where A=35648.375
Results Setting 1 Setting 2
String: 09:00:00 09.00.00
Number: 35648.375 35648.375
Results table
Example:
Time( A, 'hh-mm' )
where A=0.99999
Results Setting 1 Setting 2
String: 23-59 23-59
Number: 0.99999 0.99999
Results table
TimestampTimeStamp() formats an expression as a date and time value, in the timestamp format set inthe system variables in the data load script, or in the operating system, unless a format stringis supplied.
Syntax:Timestamp(number[, format])
Return data type: dual
Arguments:
Argument Description
number The number to be formatted.
format String describing how the resulting timestamp string is to be formatted. If omitted, theshort date format, time format, and decimal separator set in the operating system isused.
Arguments
Examples and results:The examples below assume the following default settings:
Script syntax and chart functions - Qlik Sense, February 2022 610
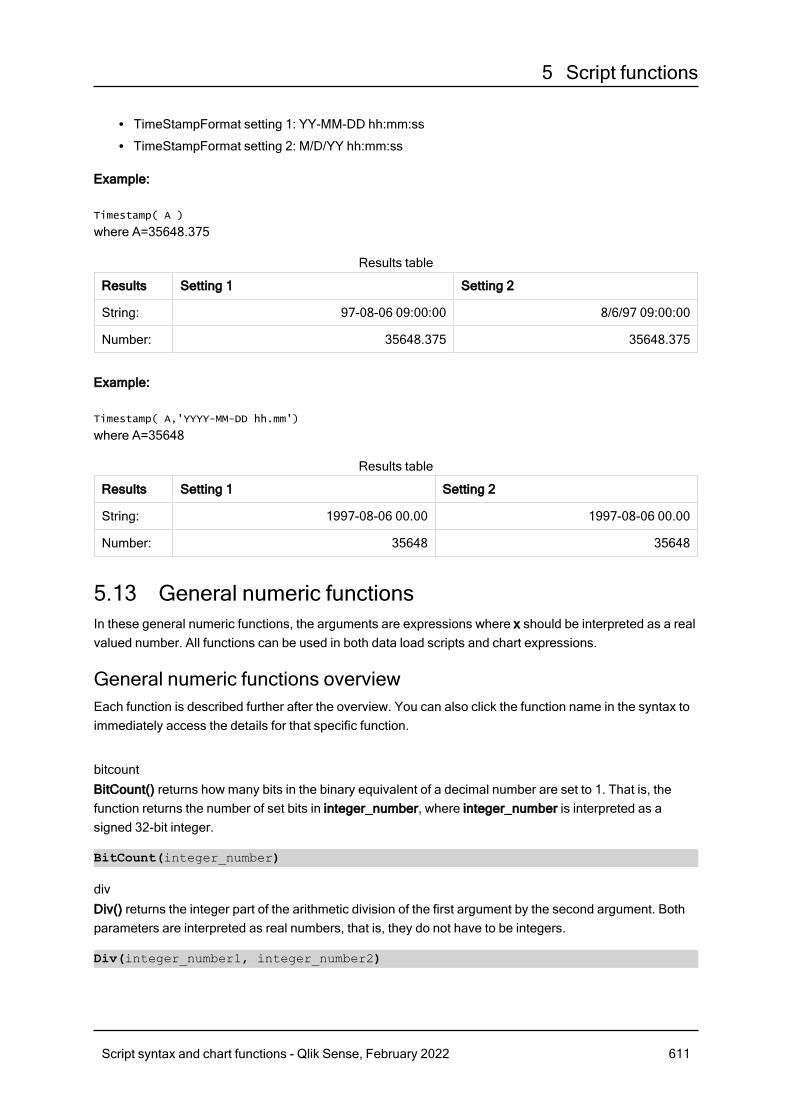
5 Script functions
l TimeStampFormat setting 1: YY-MM-DD hh:mm:ssl TimeStampFormat setting 2: M/D/YY hh:mm:ss
Example:
Timestamp( A )
where A=35648.375
Results Setting 1 Setting 2
String: 97-08-06 09:00:00 8/6/97 09:00:00
Number: 35648.375 35648.375
Results table
Example:
Timestamp( A,'YYYY-MM-DD hh.mm')
where A=35648
Results Setting 1 Setting 2
String: 1997-08-06 00.00 1997-08-06 00.00
Number: 35648 35648
Results table
5.13 General numeric functionsIn these general numeric functions, the arguments are expressions where x should be interpreted as a realvalued number. All functions can be used in both data load scripts and chart expressions.
General numeric functions overviewEach function is described further after the overview. You can also click the function name in the syntax toimmediately access the details for that specific function.
bitcountBitCount() returns how many bits in the binary equivalent of a decimal number are set to 1. That is, thefunction returns the number of set bits in integer_number, where integer_number is interpreted as asigned 32-bit integer.
BitCount(integer_number)
divDiv() returns the integer part of the arithmetic division of the first argument by the second argument. Bothparameters are interpreted as real numbers, that is, they do not have to be integers.
Div(integer_number1, integer_number2)
Script syntax and chart functions - Qlik Sense, February 2022 611
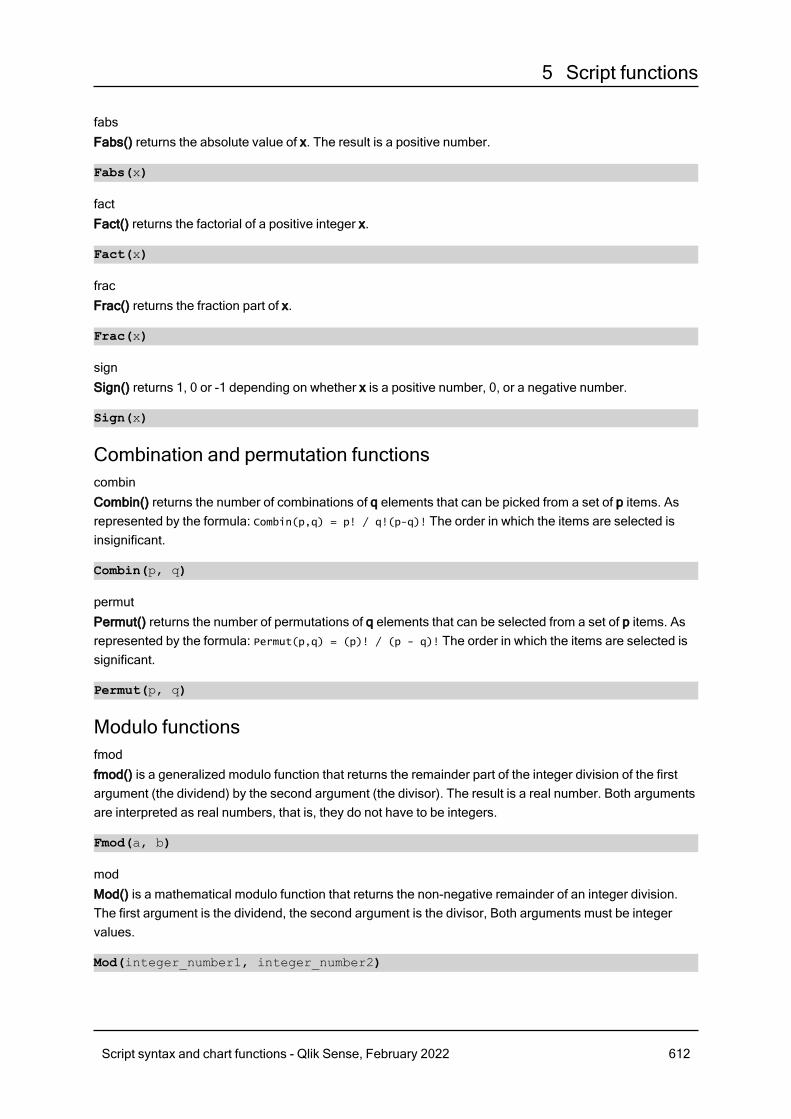
5 Script functions
fabsFabs() returns the absolute value of x. The result is a positive number.
Fabs(x)
factFact() returns the factorial of a positive integer x.
Fact(x)
fracFrac() returns the fraction part of x.
Frac(x)
signSign() returns 1, 0 or -1 depending on whether x is a positive number, 0, or a negative number.
Sign(x)
Combination and permutation functionscombinCombin() returns the number of combinations of q elements that can be picked from a set of p items. Asrepresented by the formula: Combin(p,q) = p! / q!(p-q)! The order in which the items are selected isinsignificant.
Combin(p, q)
permutPermut() returns the number of permutations of q elements that can be selected from a set of p items. Asrepresented by the formula: Permut(p,q) = (p)! / (p - q)! The order in which the items are selected issignificant.
Permut(p, q)
Modulo functionsfmodfmod() is a generalized modulo function that returns the remainder part of the integer division of the firstargument (the dividend) by the second argument (the divisor). The result is a real number. Both argumentsare interpreted as real numbers, that is, they do not have to be integers.
Fmod(a, b)
modMod() is a mathematical modulo function that returns the non-negative remainder of an integer division.The first argument is the dividend, the second argument is the divisor, Both arguments must be integervalues.
Mod(integer_number1, integer_number2)
Script syntax and chart functions - Qlik Sense, February 2022 612
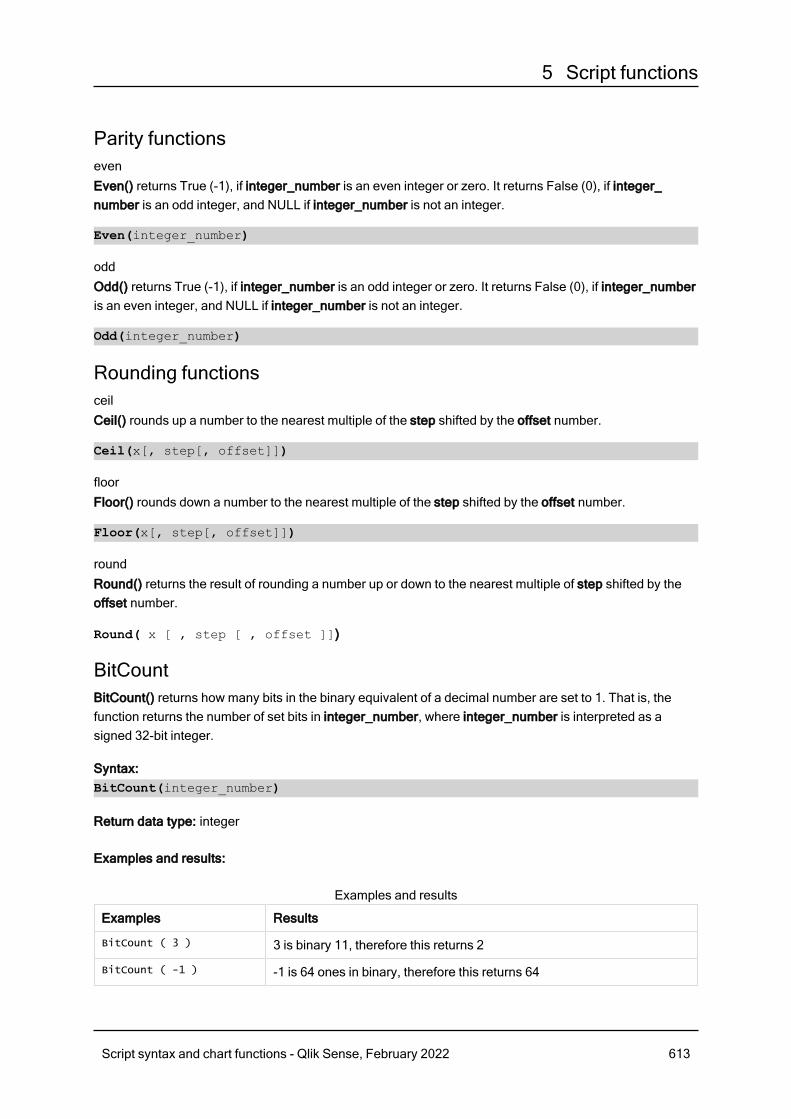
5 Script functions
Parity functionsevenEven() returns True (-1), if integer_number is an even integer or zero. It returns False (0), if integer_number is an odd integer, and NULL if integer_number is not an integer.
Even(integer_number)
oddOdd() returns True (-1), if integer_number is an odd integer or zero. It returns False (0), if integer_numberis an even integer, and NULL if integer_number is not an integer.
Odd(integer_number)
Rounding functionsceilCeil() rounds up a number to the nearest multiple of the step shifted by the offset number.
Ceil(x[, step[, offset]])
floorFloor() rounds down a number to the nearest multiple of the step shifted by the offset number.
Floor(x[, step[, offset]])
roundRound() returns the result of rounding a number up or down to the nearest multiple of step shifted by theoffset number.
Round( x [ , step [ , offset ]])
BitCountBitCount() returns how many bits in the binary equivalent of a decimal number are set to 1. That is, thefunction returns the number of set bits in integer_number, where integer_number is interpreted as asigned 32-bit integer.
Syntax:BitCount(integer_number)
Return data type: integer
Examples and results:
Examples Results
BitCount ( 3 ) 3 is binary 11, therefore this returns 2
BitCount ( -1 ) -1 is 64 ones in binary, therefore this returns 64
Examples and results
Script syntax and chart functions - Qlik Sense, February 2022 613
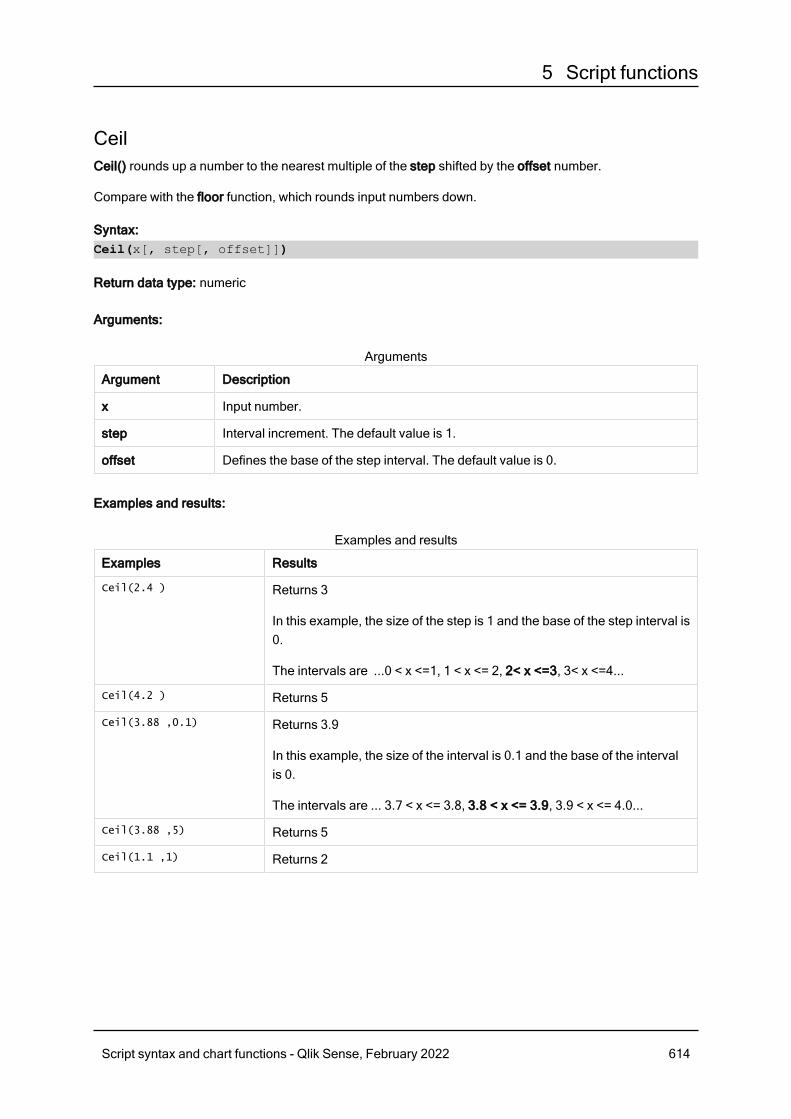
5 Script functions
CeilCeil() rounds up a number to the nearest multiple of the step shifted by the offset number.
Compare with the floor function, which rounds input numbers down.
Syntax:Ceil(x[, step[, offset]])
Return data type: numeric
Arguments:
Argument Description
x Input number.
step Interval increment. The default value is 1.
offset Defines the base of the step interval. The default value is 0.
Arguments
Examples and results:
Examples Results
Ceil(2.4 ) Returns 3
In this example, the size of the step is 1 and the base of the step interval is0.
The intervals are ...0 < x <=1, 1 < x <= 2, 2< x <=3, 3< x <=4...
Ceil(4.2 ) Returns 5
Ceil(3.88 ,0.1) Returns 3.9
In this example, the size of the interval is 0.1 and the base of the intervalis 0.
The intervals are ... 3.7 < x <= 3.8, 3.8 < x <= 3.9, 3.9 < x <= 4.0...
Ceil(3.88 ,5) Returns 5
Ceil(1.1 ,1) Returns 2
Examples and results
Script syntax and chart functions - Qlik Sense, February 2022 614
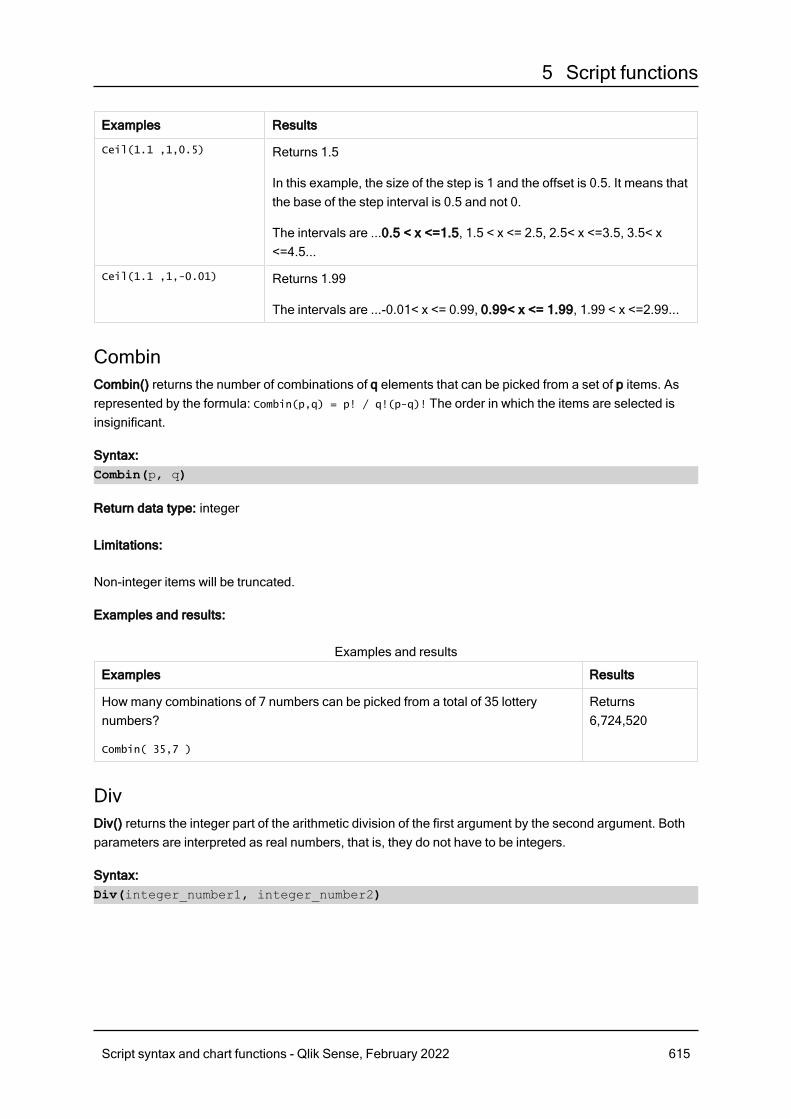
5 Script functions
Examples Results
Ceil(1.1 ,1,0.5) Returns 1.5
In this example, the size of the step is 1 and the offset is 0.5. It means thatthe base of the step interval is 0.5 and not 0.
The intervals are ...0.5 < x <=1.5, 1.5 < x <= 2.5, 2.5< x <=3.5, 3.5< x<=4.5...
Ceil(1.1 ,1,-0.01) Returns 1.99
The intervals are ...-0.01< x <= 0.99, 0.99< x <= 1.99, 1.99 < x <=2.99...
CombinCombin() returns the number of combinations of q elements that can be picked from a set of p items. Asrepresented by the formula: Combin(p,q) = p! / q!(p-q)! The order in which the items are selected isinsignificant.
Syntax:Combin(p, q)
Return data type: integer
Limitations:
Non-integer items will be truncated.
Examples and results:
Examples Results
How many combinations of 7 numbers can be picked from a total of 35 lotterynumbers?
Combin( 35,7 )
Returns6,724,520
Examples and results
DivDiv() returns the integer part of the arithmetic division of the first argument by the second argument. Bothparameters are interpreted as real numbers, that is, they do not have to be integers.
Syntax:Div(integer_number1, integer_number2)
Script syntax and chart functions - Qlik Sense, February 2022 615
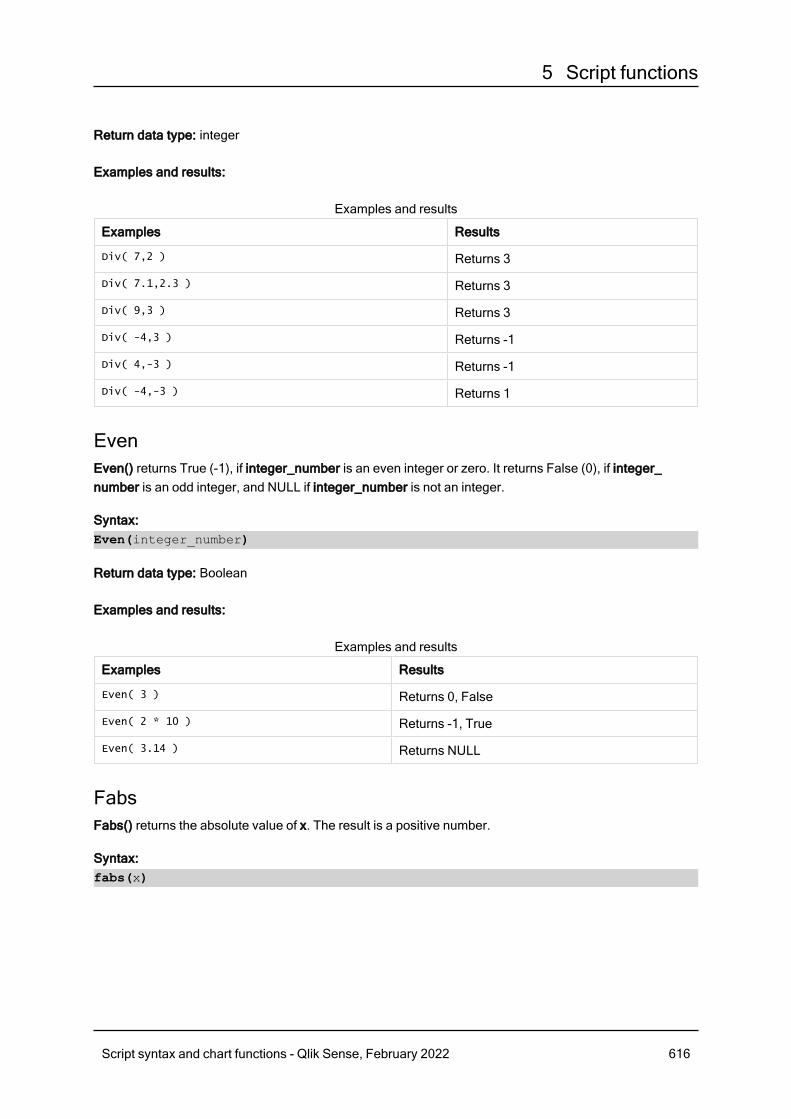
5 Script functions
Return data type: integer
Examples and results:
Examples Results
Div( 7,2 ) Returns 3
Div( 7.1,2.3 ) Returns 3
Div( 9,3 ) Returns 3
Div( -4,3 ) Returns -1
Div( 4,-3 ) Returns -1
Div( -4,-3 ) Returns 1
Examples and results
EvenEven() returns True (-1), if integer_number is an even integer or zero. It returns False (0), if integer_number is an odd integer, and NULL if integer_number is not an integer.
Syntax:Even(integer_number)
Return data type: Boolean
Examples and results:
Examples Results
Even( 3 ) Returns 0, False
Even( 2 * 10 ) Returns -1, True
Even( 3.14 ) Returns NULL
Examples and results
FabsFabs() returns the absolute value of x. The result is a positive number.
Syntax:fabs(x)
Script syntax and chart functions - Qlik Sense, February 2022 616
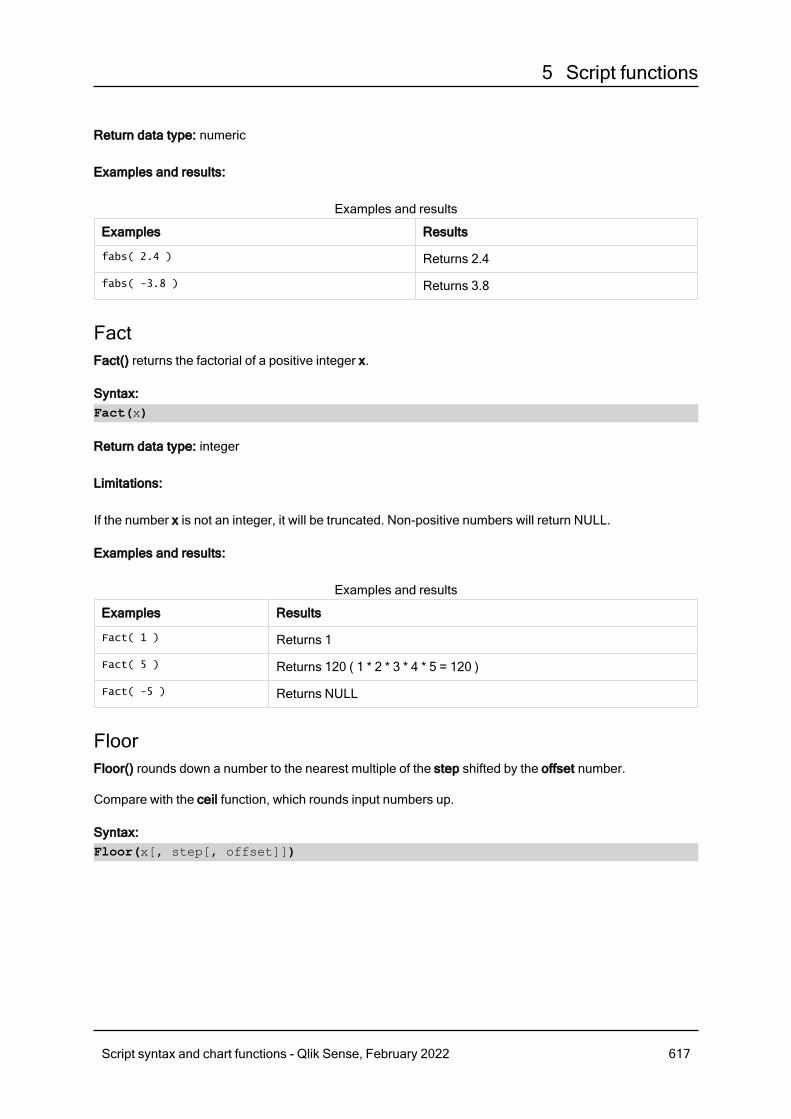
5 Script functions
Return data type: numeric
Examples and results:
Examples Results
fabs( 2.4 ) Returns 2.4
fabs( -3.8 ) Returns 3.8
Examples and results
FactFact() returns the factorial of a positive integer x.
Syntax:Fact(x)
Return data type: integer
Limitations:
If the number x is not an integer, it will be truncated. Non-positive numbers will return NULL.
Examples and results:
Examples Results
Fact( 1 ) Returns 1
Fact( 5 ) Returns 120 ( 1 * 2 * 3 * 4 * 5 = 120 )
Fact( -5 ) Returns NULL
Examples and results
FloorFloor() rounds down a number to the nearest multiple of the step shifted by the offset number.
Compare with the ceil function, which rounds input numbers up.
Syntax:Floor(x[, step[, offset]])
Script syntax and chart functions - Qlik Sense, February 2022 617
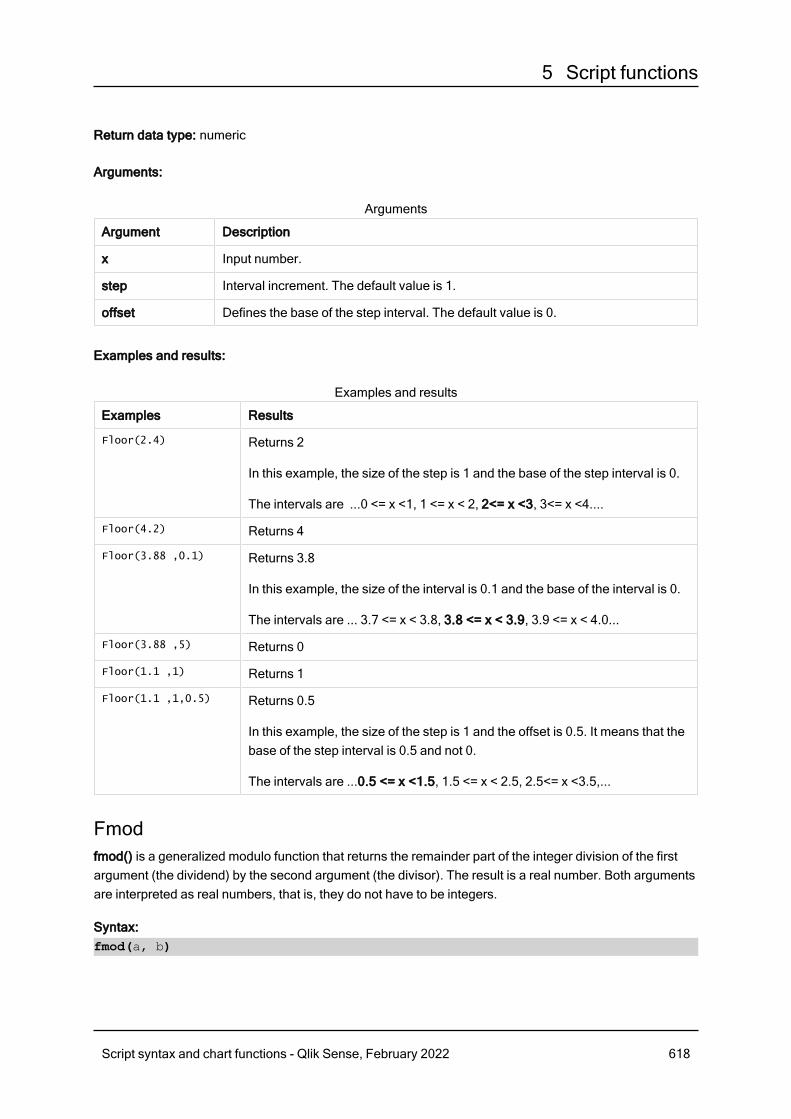
5 Script functions
Return data type: numeric
Arguments:
Argument Description
x Input number.
step Interval increment. The default value is 1.
offset Defines the base of the step interval. The default value is 0.
Arguments
Examples and results:
Examples Results
Floor(2.4) Returns 2
In this example, the size of the step is 1 and the base of the step interval is 0.
The intervals are ...0 <= x <1, 1 <= x < 2, 2<= x <3, 3<= x <4....
Floor(4.2) Returns 4
Floor(3.88 ,0.1) Returns 3.8
In this example, the size of the interval is 0.1 and the base of the interval is 0.
The intervals are ... 3.7 <= x < 3.8, 3.8 <= x < 3.9, 3.9 <= x < 4.0...
Floor(3.88 ,5) Returns 0
Floor(1.1 ,1) Returns 1
Floor(1.1 ,1,0.5) Returns 0.5
In this example, the size of the step is 1 and the offset is 0.5. It means that thebase of the step interval is 0.5 and not 0.
The intervals are ...0.5 <= x <1.5, 1.5 <= x < 2.5, 2.5<= x <3.5,...
Examples and results
Fmodfmod() is a generalized modulo function that returns the remainder part of the integer division of the firstargument (the dividend) by the second argument (the divisor). The result is a real number. Both argumentsare interpreted as real numbers, that is, they do not have to be integers.
Syntax:fmod(a, b)
Script syntax and chart functions - Qlik Sense, February 2022 618
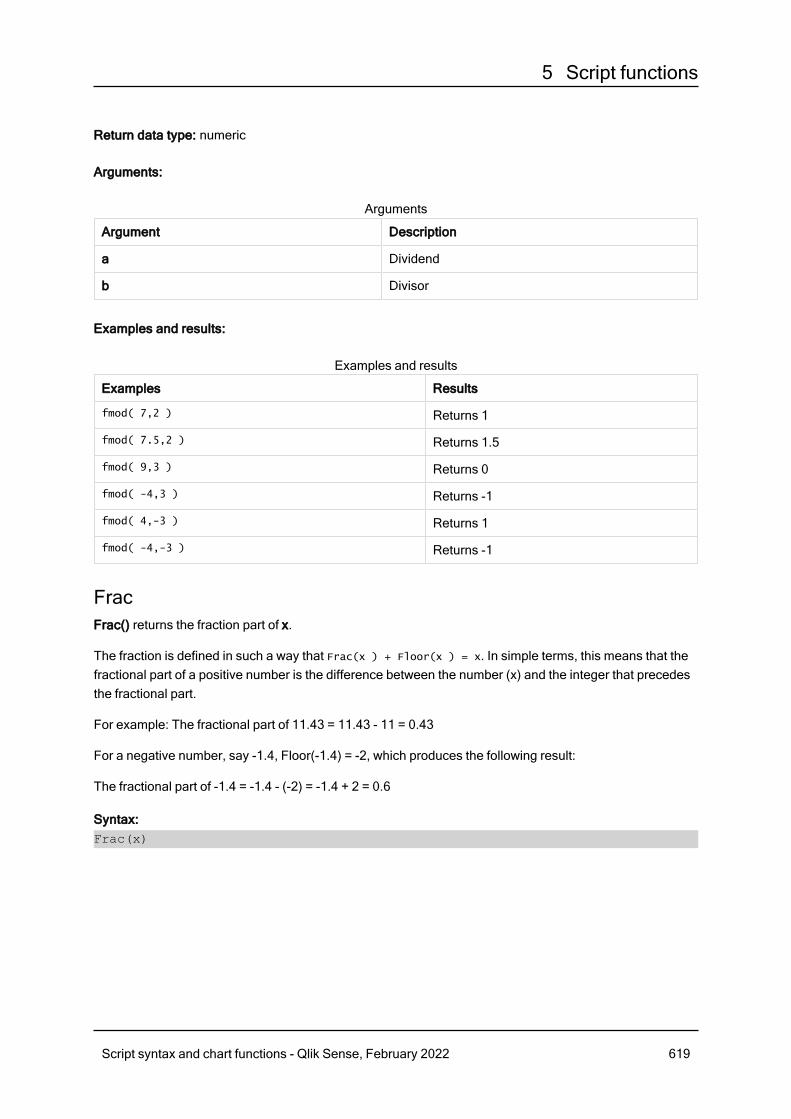
5 Script functions
Return data type: numeric
Arguments:
Argument Description
a Dividend
b Divisor
Arguments
Examples and results:
Examples Results
fmod( 7,2 ) Returns 1
fmod( 7.5,2 ) Returns 1.5
fmod( 9,3 ) Returns 0
fmod( -4,3 ) Returns -1
fmod( 4,-3 ) Returns 1
fmod( -4,-3 ) Returns -1
Examples and results
FracFrac() returns the fraction part of x.
The fraction is defined in such a way that Frac(x ) + Floor(x ) = x. In simple terms, this means that thefractional part of a positive number is the difference between the number (x) and the integer that precedesthe fractional part.
For example: The fractional part of 11.43 = 11.43 - 11 = 0.43
For a negative number, say -1.4, Floor(-1.4) = -2, which produces the following result:
The fractional part of -1.4 = -1.4 - (-2) = -1.4 + 2 = 0.6
Syntax:Frac(x)
Script syntax and chart functions - Qlik Sense, February 2022 619

5 Script functions
Return data type: numeric
Arguments:
Argument Description
x Number to return fraction for.
Arguments
Examples and results:
Examples Results
Frac( 11.43 ) Returns0.43
Frac( -1.4 ) Returns0.6
Extract the time component from the numeric representation of a timestamp, thus omittingthe date.
Time(Frac(44518.663888889))
Returns3:56:00PM
Examples and results
ModMod() is a mathematical modulo function that returns the non-negative remainder of an integer division.The first argument is the dividend, the second argument is the divisor, Both arguments must be integervalues.
Syntax:Mod(integer_number1, integer_number2)
Return data type: integer
Limitations:
integer_number2 must be greater than 0.
Examples and results:
Examples Results
Mod( 7,2 ) Returns 1
Mod( 7.5,2 ) Returns NULL
Examples and results
Script syntax and chart functions - Qlik Sense, February 2022 620
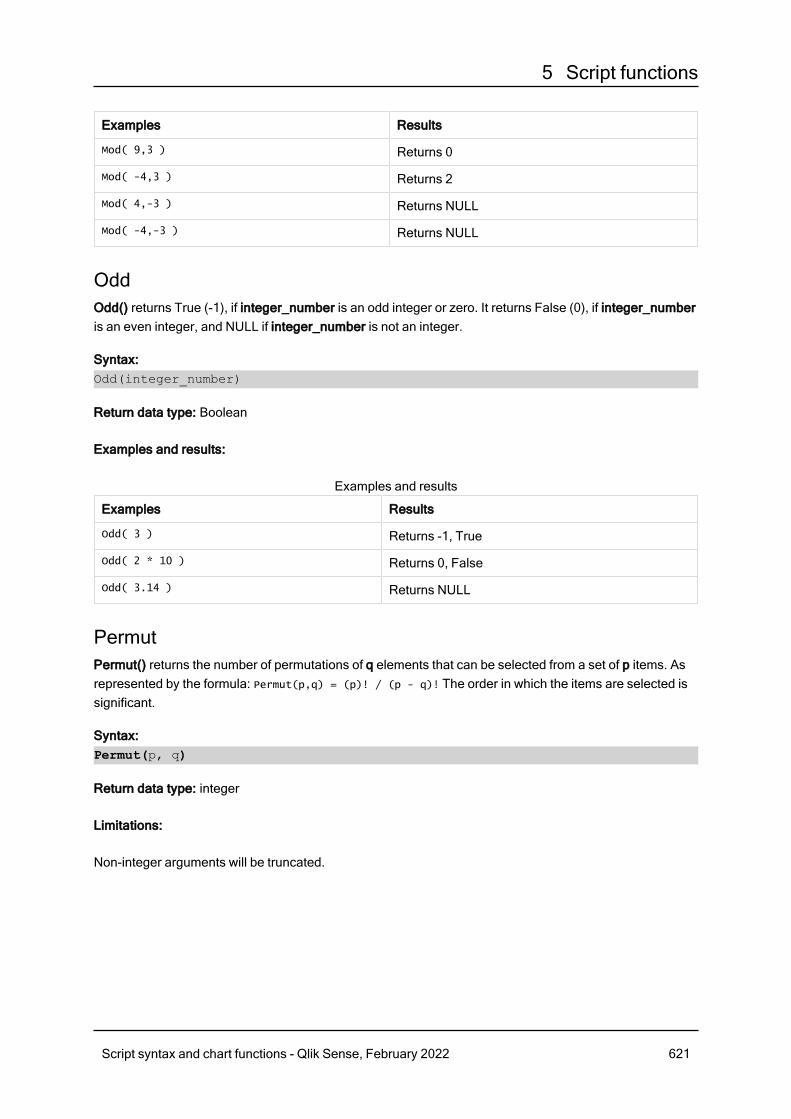
5 Script functions
Examples Results
Mod( 9,3 ) Returns 0
Mod( -4,3 ) Returns 2
Mod( 4,-3 ) Returns NULL
Mod( -4,-3 ) Returns NULL
OddOdd() returns True (-1), if integer_number is an odd integer or zero. It returns False (0), if integer_numberis an even integer, and NULL if integer_number is not an integer.
Syntax:Odd(integer_number)
Return data type: Boolean
Examples and results:
Examples Results
Odd( 3 ) Returns -1, True
Odd( 2 * 10 ) Returns 0, False
Odd( 3.14 ) Returns NULL
Examples and results
PermutPermut() returns the number of permutations of q elements that can be selected from a set of p items. Asrepresented by the formula: Permut(p,q) = (p)! / (p - q)! The order in which the items are selected issignificant.
Syntax:Permut(p, q)
Return data type: integer
Limitations:
Non-integer arguments will be truncated.
Script syntax and chart functions - Qlik Sense, February 2022 621
5 Script functions
Examples and results:
Examples Results
In how many ways could the gold, silver and bronze medals be distributed after a 100 mfinal with 8 participants?
Permut( 8,3 )
Returns336
Examples and results
RoundRound() returns the result of rounding a number up or down to the nearest multiple of step shifted by theoffset number.
If the number to round is exactly in the middle of an interval, it is rounded upwards.
Syntax:Round(x[, step[, offset]])
Return data type: numeric
If you are rounding a floating point number you may observe erroneous results. Theserounding errors occur because floating point numbers are represented by a finite number ofbinary digits. Therefore, results are calculated using a number that is already rounded. If theserounding errors will affect your work, multiply the numbers to convert them to integers beforerounding.
Arguments:
Argument Description
x Input number.
step Interval increment. The default value is 1.
offset Defines the base of the step interval. The default value is 0.
Arguments
Script syntax and chart functions - Qlik Sense, February 2022 622
5 Script functions
Examples and results:
Examples Results
Round(3.8 ) Returns 4
In this example, the size of the step is 1 and the base of the step interval is 0.
The intervals are ...0 <= x <1, 1 <= x < 2, 2<= x <3, 3<= x <4...
Round(3.8,4 ) Returns 4
Round(2.5 ) Returns 3.
In this example, the size of the step is 1 and the base of the step interval is 0.
The intervals are ...0 <= x <1, 1 <= x <2, 2<= x <3...
Round(2,4 ) Returns 4. Rounded up because 2 is exactly half of the step interval of 4.
In this example, the size of the step is 4 and the base of the step interval is 0.
The intervals are ...0 <= x <4, 4 <= x <8, 8<= x <12...
Round(2,6 ) Returns 0. Rounded down because 2 is less than half of the step interval of 6.
In this example, the size of the step is 6 and the base of the step interval is 0.
The intervals are ...0 <= x <6, 6 <= x <12, 12<= x <18...
Round(3.88 ,0.1) Returns 3.9
In this example, the size of the step is 0.1 and the base of the step interval is 0.
The intervals are ... 3.7 <= x <3.8, 3.8 <= x <3.9, 3.9 <= x < 4.0...
Round
(3.88875,1/1000)Returns 3.889
In this example, the size of the step is 0.001, which rounds the number up andlimits it to three decimal places.
Round(3.88 ,5) Returns 5
Round(1.1 ,1,0.5) Returns 1.5
In this example, the size of the step is 1 and the base of the step interval is 0.5.
The intervals are ...0.5 <= x <1.5, 1.5 <= x <2.5, 2.5<= x <3.5...
Examples and results
SignSign() returns 1, 0 or -1 depending on whether x is a positive number, 0, or a negative number.
Syntax:Sign(x)
Script syntax and chart functions - Qlik Sense, February 2022 623
5 Script functions
Return data type: numeric
Limitations:
If no numeric value is found, NULL is returned.
Examples and results:
Examples Results
Sign( 66 ) Returns 1
Sign( 0 ) Returns 0
Sign( - 234 ) Returns -1
Examples and results
5.14 Geospatial functionsThese functions are used to handle geospatial data in map visualizations. Qlik Sense followsGeoJSON specifications for geospatial data and supports the following:
l Pointl Linestringl Polygonl Multipolygon
For more information on GeoJSON specifications, see:≤ GeoJSON.org
Geospatial functions overviewEach function is described further after the overview. You can also click the function name in the syntax toimmediately access the details for that specific function.
There are two categories of geospatial functions: aggregation and non-aggregation.
Aggregation functions take a geometry set (points or areas) as input, and return a single geometry. Forexample, multiple areas can be merged together, and a single boundary for the aggregation can be drawnon the map.
Non-aggregation function take a sinlge geometry and return one geometry. For example, for the functionGeoGetPolygonCenter(), if the boundary geometry of one area is set as input, the point geometry(longitude and latitude) for the center of that area is returned.
The following are aggregation functions:
Script syntax and chart functions - Qlik Sense, February 2022 624
5 Script functions
GeoAggrGeometryGeoAggrGeometry() is used to aggregate a number of areas into a larger area, for example aggregating anumber of sub-regions to a region.
GeoAggrGeometry (field_name)
GeoBoundingBoxGeoBoundingBox() is used to aggregate a geometry into an area and calculate the smallest bounding boxthat contains all coordinates.
GeoBoundingBox (field_name)
GeoCountVertexGeoCountVertex() is used to find the number of vertices a polygon geometry contains.
GeoCountVertex(field_name)
GeoInvProjectGeometryGeoInvProjectGeometry() is used to aggregate a geometry into an area and apply the inverse of aprojection.
GeoInvProjectGeometry(type, field_name)
GeoProjectGeometryGeoProjectGeometry() is used to aggregate a geometry into an area and apply a projection.
GeoProjectGeometry(type, field_name)
GeoReduceGeometryGeoReduceGeometry() is used to reduce the number of vertices of a geometry, and to aggregate anumber of areas into one area, but still displaying the boundary lines from the individual areas.
GeoReduceGeometry (geometry)
The following are non-aggregation functions:
GeoGetBoundingBoxGeoGetBoundingBox() is used in scripts and chart expressions to calculate the smallest geospatialbounding box that contains all coordinates of a geometry.
GeoGetBoundingBox (geometry)
GeoGetPolygonCenterGeoGetPolygonCenter() is used in scripts and chart expressions to calculate and return the center pointof a geometry.
GeoGetPolygonCenter (geometry)
Script syntax and chart functions - Qlik Sense, February 2022 625
5 Script functions
GeoMakePointGeoMakePoint() is used in scripts and chart expressions to create and tag a point with latitude andlongitude.
GeoMakePoint (lat_field_name, lon_field_name)
GeoProjectGeoProject() is used in scripts and chart expressions to apply a projection to a geometry.
GeoProject (type, field_name)
GeoAggrGeometryGeoAggrGeometry() is used to aggregate a number of areas into a larger area, for exampleaggregating a number of sub-regions to a region.
Syntax:GeoAggrGeometry(field_name)
Return data type: string
Arguments:
Argument Description
field_name A field or expression referring to a field containing the geometry to be represented. Thiscould be either a point (or set of points) giving longitude and latitude, or an area.
Arguments
Typically, GeoAggrGeometry() can be used to combine geospatial boundary data. For example, you mighthave postcode areas for suburbs in a city and sales revenues for each area. If a sales person’s territorycovers several postcode areas, it might be useful to present total sales by sales territory, rather thanindividual areas, and show the results on a color-filled map.
GeoAggrGeometry() can calculate the aggregation of the individual suburb geometries and generate themerged territory geometry in the data model. If then, the sales territory boundaries are adjusted, when thedata is reloaded the new merged boundaries and revenues are reflected in the map.
As GeoAggrGeometry() is an aggregating function, if you use it in the script a LOAD statement with aGroup by clause is required.
The boundary lines of maps created using GeoAggrGeometry() are those of the mergedareas. If you want to display the individual boundary lines of the pre-aggregated areas, useGeoReduceGeometry().
Examples:This example loads a KML file with area data, and then loads a table with the aggregated area data.
Script syntax and chart functions - Qlik Sense, February 2022 626
5 Script functions
[MapSource]:
LOAD [world.Name],
[world.Point],
[world.Area]
FROM [lib://Downloads/world.kml]
(kml, Table is [World.shp/Features]);
Map:
LOAD world.Name,
GeoAggrGeometry(world.Area) as [AggrArea]
resident MapSource Group By world.Name;
Drop Table MapSource;
GeoBoundingBoxGeoBoundingBox() is used to aggregate a geometry into an area and calculate the smallestbounding box that contains all coordinates.
A GeoBoundingBox is represented as a list of four values: left, right, top, bottom.
Syntax:GeoBoundingBox(field_name)
Return data type: string
Arguments:
Argument Description
field_name A field or expression referring to a field containing the geometry to be represented. Thiscould be either a point (or set of points) giving longitude and latitude, or an area.
Arguments
GeoBoundingBox() aggregates a set of geometries and returns four coordinates for the smallest rectanglethat contains all the coordinates of that aggregated geometry.
To visualize the result on a map, transfer the resulting string of four coordinates into a polygon format, tagthe transferred field with a geopolygon format, and drag and drop that field into the map object. Therectangular boxes .will then be displayed in the map visualization.
GeoCountVertexGeoCountVertex() is used to find the number of vertices a polygon geometry contains.
Syntax:GeoCountVertex(field_name)
Script syntax and chart functions - Qlik Sense, February 2022 627
5 Script functions
Return data type: integer
Arguments:
Argument Description
field_name A field or expression referring to a field containing the geometry to be represented. Thiscould be either a point (or set of points) giving longitude and latitude, or an area.
Arguments
GeoGetBoundingBoxGeoGetBoundingBox() is used in scripts and chart expressions to calculate the smallestgeospatial bounding box that contains all coordinates of a geometry.
A geospatial bounding box, created by the function GeoBoundingBox() is represented as a list of fourvalues: left, right, top, bottom.
Syntax:GeoGetBoundingBox(field_name)
Return data type: string
Arguments:
Argument Description
field_name A field or expression referring to a field containing the geometry to be represented. Thiscould be either a point (or set of points) giving longitude and latitude, or an area.
Arguments
Do not use the Group by clause in the data load editor with this and other non-aggregatinggeospatial functions, because this will cause an error on load.
GeoGetPolygonCenterGeoGetPolygonCenter() is used in scripts and chart expressions to calculate and return thecenter point of a geometry.
In some cases, the requirement is to plot a dot instead of color fill on a map. If the existing geospatial datais only available in the form of area geometry (for example, a boundary), use GeoGetPolygonCenter() toretrieve a pair of longitude and latitude for the center of area.
Syntax:GeoGetPolygonCenter(field_name)
Script syntax and chart functions - Qlik Sense, February 2022 628
5 Script functions
Return data type: string
Arguments:
Argument Description
field_name A field or expression referring to a field containing the geometry to be represented. Thiscould be either a point (or set of points) giving longitude and latitude, or an area.
Arguments
Do not use the Group by clause in the data load editor with this and other non-aggregatinggeospatial functions, because this will cause an error on load.
GeoInvProjectGeometryGeoInvProjectGeometry() is used to aggregate a geometry into an area and apply theinverse of a projection.
Syntax:GeoInvProjectGeometry(type, field_name)
Return data type: string
Arguments:
Argument Description
type Projection type used in transforming the geometry of the map. This can take one of twovalues: 'unit', (default), which results in a 1:1 projection, or 'mercator', which uses thestandard Mercator projection.
field_name A field or expression referring to a field containing the geometry to be represented. Thiscould be either a point (or set of points) giving longitude and latitude, or an area.
Arguments
Example:
Example Result
In a Load statement:GeoInvProjectGeometry
('mercator',AreaPolygon)
as InvProjectGeometry
The geometry loaded as AreaPolygon is transformed using theinverse transformation of the Mercator projection and stored asInvProjectGeometry for use in visualizations.
Scripting example
Script syntax and chart functions - Qlik Sense, February 2022 629

5 Script functions
GeoMakePointGeoMakePoint() is used in scripts and chart expressions to create and tag a point withlatitude and longitude. GeoMakePoint returns points in the order of longitude and latitude.
Syntax:GeoMakePoint(lat_field_name, lon_field_name)
Return data type: string, formatted [longitude, latitude]
Arguments:
Argument Description
lat_field_name A field or expression referring to a field representing the latitude of the point.
lon_field_name A field or expression referring to a field representing the longitude of the point.
Arguments
Do not use the Group by clause in the data load editor with this and other non-aggregatinggeospatial functions, because this will cause an error on load.
GeoProjectGeoProject() is used in scripts and chart expressions to apply a projection to a geometry.
Syntax:GeoProject(type, field_name)
Return data type: string
Arguments:
Argument Description
type Projection type used in transforming the geometry of the map. This can take one of twovalues: 'unit', (default), which results in a 1:1 projection, or 'mercator', which uses theweb Mercator projection.
field_name A field or expression referring to a field containing the geometry to be represented. Thiscould be either a point (or set of points) giving longitude and latitude, or an area.
Arguments
Do not use the Group by clause in the data load editor with this and other non-aggregatinggeospatial functions, because this will cause an error on load.
Script syntax and chart functions - Qlik Sense, February 2022 630
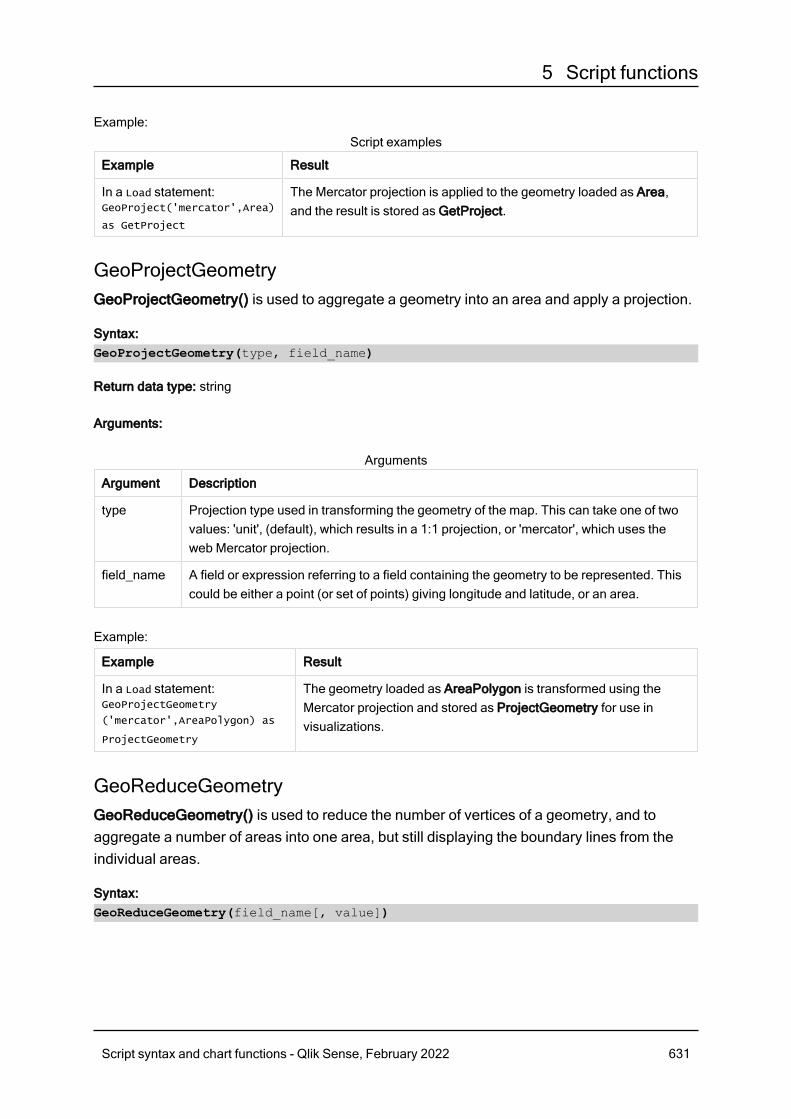
5 Script functions
Example:
Example Result
In a Load statement:GeoProject('mercator',Area)
as GetProject
The Mercator projection is applied to the geometry loaded as Area,and the result is stored as GetProject.
Script examples
GeoProjectGeometryGeoProjectGeometry() is used to aggregate a geometry into an area and apply a projection.
Syntax:GeoProjectGeometry(type, field_name)
Return data type: string
Arguments:
Argument Description
type Projection type used in transforming the geometry of the map. This can take one of twovalues: 'unit', (default), which results in a 1:1 projection, or 'mercator', which uses theweb Mercator projection.
field_name A field or expression referring to a field containing the geometry to be represented. Thiscould be either a point (or set of points) giving longitude and latitude, or an area.
Arguments
Example:
Example Result
In a Load statement:GeoProjectGeometry
('mercator',AreaPolygon) as
ProjectGeometry
The geometry loaded as AreaPolygon is transformed using theMercator projection and stored as ProjectGeometry for use invisualizations.
GeoReduceGeometryGeoReduceGeometry() is used to reduce the number of vertices of a geometry, and toaggregate a number of areas into one area, but still displaying the boundary lines from theindividual areas.
Syntax:GeoReduceGeometry(field_name[, value])
Script syntax and chart functions - Qlik Sense, February 2022 631
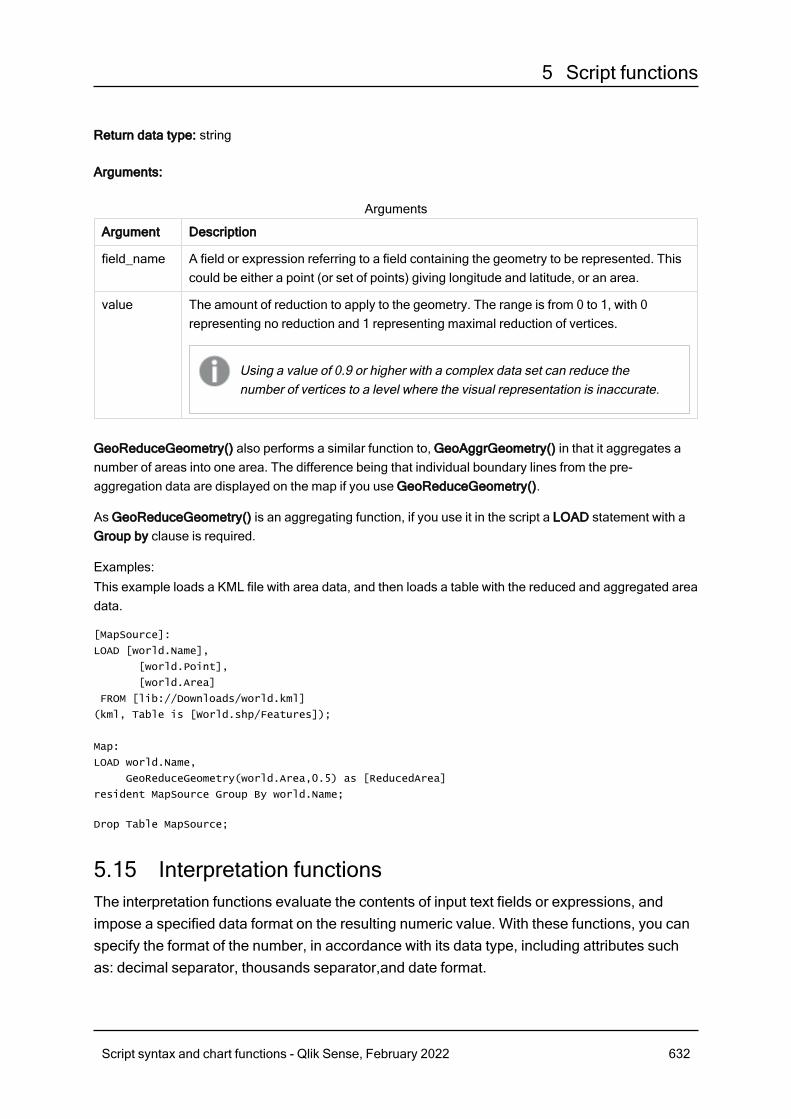
5 Script functions
Return data type: string
Arguments:
Argument Description
field_name A field or expression referring to a field containing the geometry to be represented. Thiscould be either a point (or set of points) giving longitude and latitude, or an area.
value The amount of reduction to apply to the geometry. The range is from 0 to 1, with 0representing no reduction and 1 representing maximal reduction of vertices.
Using a value of 0.9 or higher with a complex data set can reduce thenumber of vertices to a level where the visual representation is inaccurate.
Arguments
GeoReduceGeometry() also performs a similar function to, GeoAggrGeometry() in that it aggregates anumber of areas into one area. The difference being that individual boundary lines from the pre-aggregation data are displayed on the map if you use GeoReduceGeometry().
As GeoReduceGeometry() is an aggregating function, if you use it in the script a LOAD statement with aGroup by clause is required.
Examples:This example loads a KML file with area data, and then loads a table with the reduced and aggregated areadata.
[MapSource]:
LOAD [world.Name],
[world.Point],
[world.Area]
FROM [lib://Downloads/world.kml]
(kml, Table is [World.shp/Features]);
Map:
LOAD world.Name,
GeoReduceGeometry(world.Area,0.5) as [ReducedArea]
resident MapSource Group By world.Name;
Drop Table MapSource;
5.15 Interpretation functionsThe interpretation functions evaluate the contents of input text fields or expressions, andimpose a specified data format on the resulting numeric value. With these functions, you canspecify the format of the number, in accordance with its data type, including attributes suchas: decimal separator, thousands separator,and date format.
Script syntax and chart functions - Qlik Sense, February 2022 632
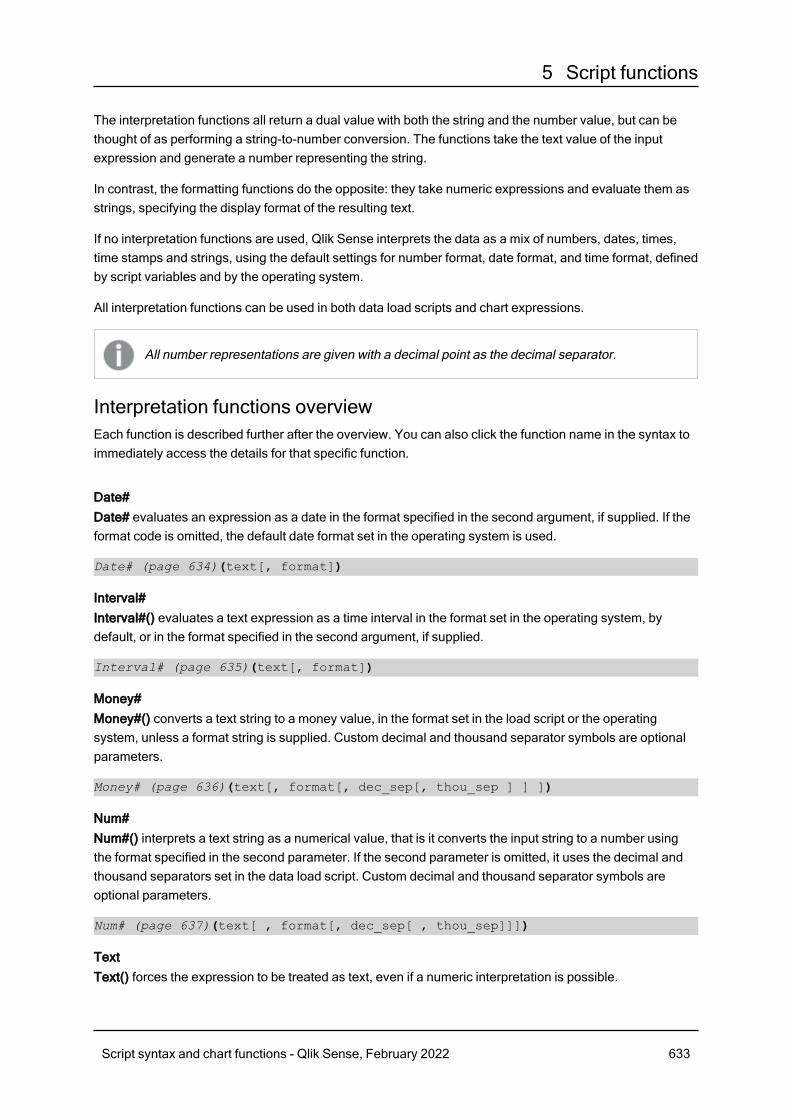
5 Script functions
The interpretation functions all return a dual value with both the string and the number value, but can bethought of as performing a string-to-number conversion. The functions take the text value of the inputexpression and generate a number representing the string.
In contrast, the formatting functions do the opposite: they take numeric expressions and evaluate them asstrings, specifying the display format of the resulting text.
If no interpretation functions are used, Qlik Sense interprets the data as a mix of numbers, dates, times,time stamps and strings, using the default settings for number format, date format, and time format, definedby script variables and by the operating system.
All interpretation functions can be used in both data load scripts and chart expressions.
All number representations are given with a decimal point as the decimal separator.
Interpretation functions overviewEach function is described further after the overview. You can also click the function name in the syntax toimmediately access the details for that specific function.
Date#Date# evaluates an expression as a date in the format specified in the second argument, if supplied. If theformat code is omitted, the default date format set in the operating system is used.
Date# (page 634)(text[, format])
Interval#Interval#() evaluates a text expression as a time interval in the format set in the operating system, bydefault, or in the format specified in the second argument, if supplied.
Interval# (page 635)(text[, format])
Money#Money#() converts a text string to a money value, in the format set in the load script or the operatingsystem, unless a format string is supplied. Custom decimal and thousand separator symbols are optionalparameters.
Money# (page 636)(text[, format[, dec_sep[, thou_sep ] ] ])
Num#Num#() interprets a text string as a numerical value, that is it converts the input string to a number usingthe format specified in the second parameter. If the second parameter is omitted, it uses the decimal andthousand separators set in the data load script. Custom decimal and thousand separator symbols areoptional parameters.
Num# (page 637)(text[ , format[, dec_sep[ , thou_sep]]])
TextText() forces the expression to be treated as text, even if a numeric interpretation is possible.
Script syntax and chart functions - Qlik Sense, February 2022 633
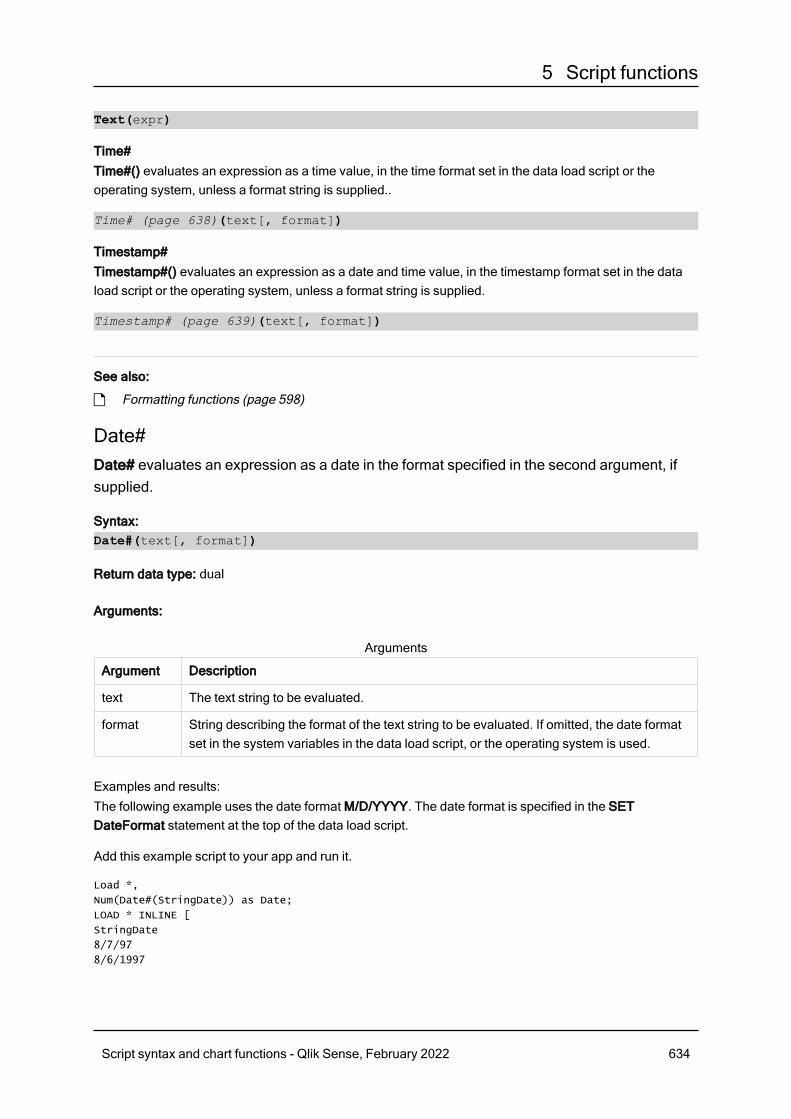
5 Script functions
Text(expr)
Time#Time#() evaluates an expression as a time value, in the time format set in the data load script or theoperating system, unless a format string is supplied..
Time# (page 638)(text[, format])
Timestamp#Timestamp#() evaluates an expression as a date and time value, in the timestamp format set in the dataload script or the operating system, unless a format string is supplied.
Timestamp# (page 639)(text[, format])
See also:
p Formatting functions (page 598)
Date#Date# evaluates an expression as a date in the format specified in the second argument, ifsupplied.
Syntax:Date#(text[, format])
Return data type: dual
Arguments:
Argument Description
text The text string to be evaluated.
format String describing the format of the text string to be evaluated. If omitted, the date formatset in the system variables in the data load script, or the operating system is used.
Arguments
Examples and results:The following example uses the date format M/D/YYYY. The date format is specified in the SETDateFormat statement at the top of the data load script.
Add this example script to your app and run it.
Load *,
Num(Date#(StringDate)) as Date;
LOAD * INLINE [
StringDate
8/7/97
8/6/1997
Script syntax and chart functions - Qlik Sense, February 2022 634
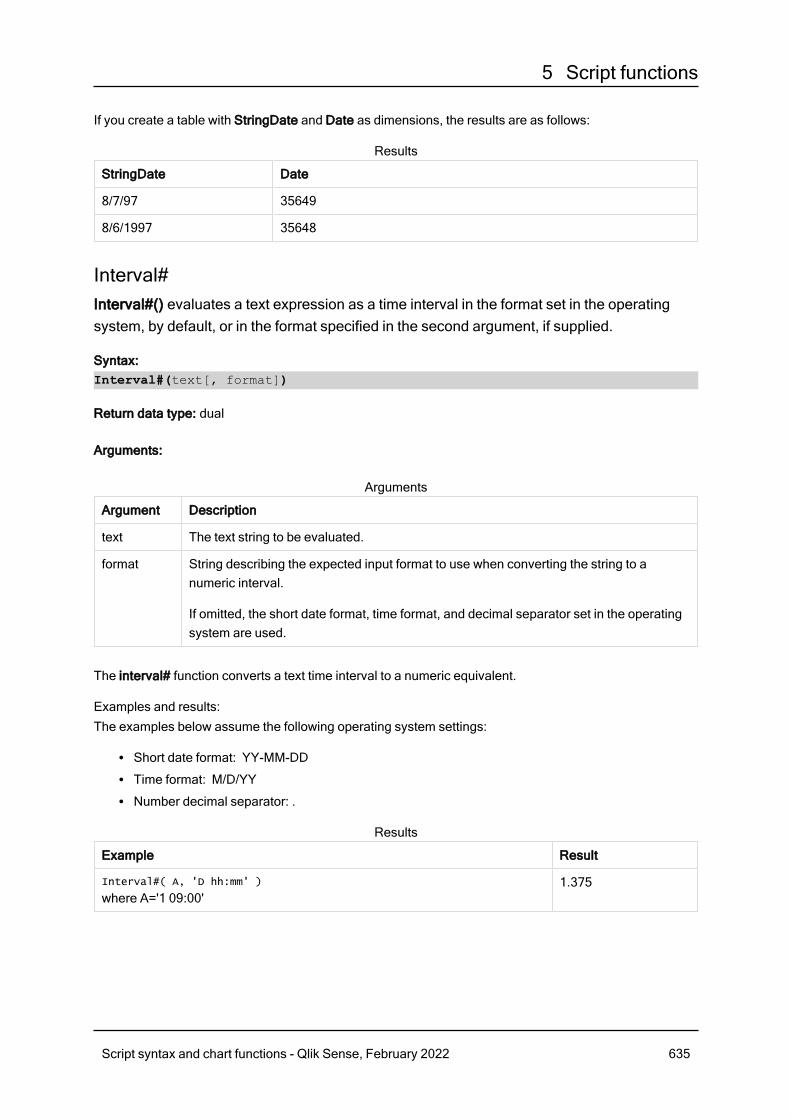
5 Script functions
If you create a table with StringDate and Date as dimensions, the results are as follows:
StringDate Date
8/7/97 35649
8/6/1997 35648
Results
Interval#Interval#() evaluates a text expression as a time interval in the format set in the operatingsystem, by default, or in the format specified in the second argument, if supplied.
Syntax:Interval#(text[, format])
Return data type: dual
Arguments:
Argument Description
text The text string to be evaluated.
format String describing the expected input format to use when converting the string to anumeric interval.
If omitted, the short date format, time format, and decimal separator set in the operatingsystem are used.
Arguments
The interval# function converts a text time interval to a numeric equivalent.
Examples and results:The examples below assume the following operating system settings:
l Short date format: YY-MM-DDl Time format: M/D/YYl Number decimal separator: .
Example Result
Interval#( A, 'D hh:mm' )
where A='1 09:00'1.375
Results
Script syntax and chart functions - Qlik Sense, February 2022 635
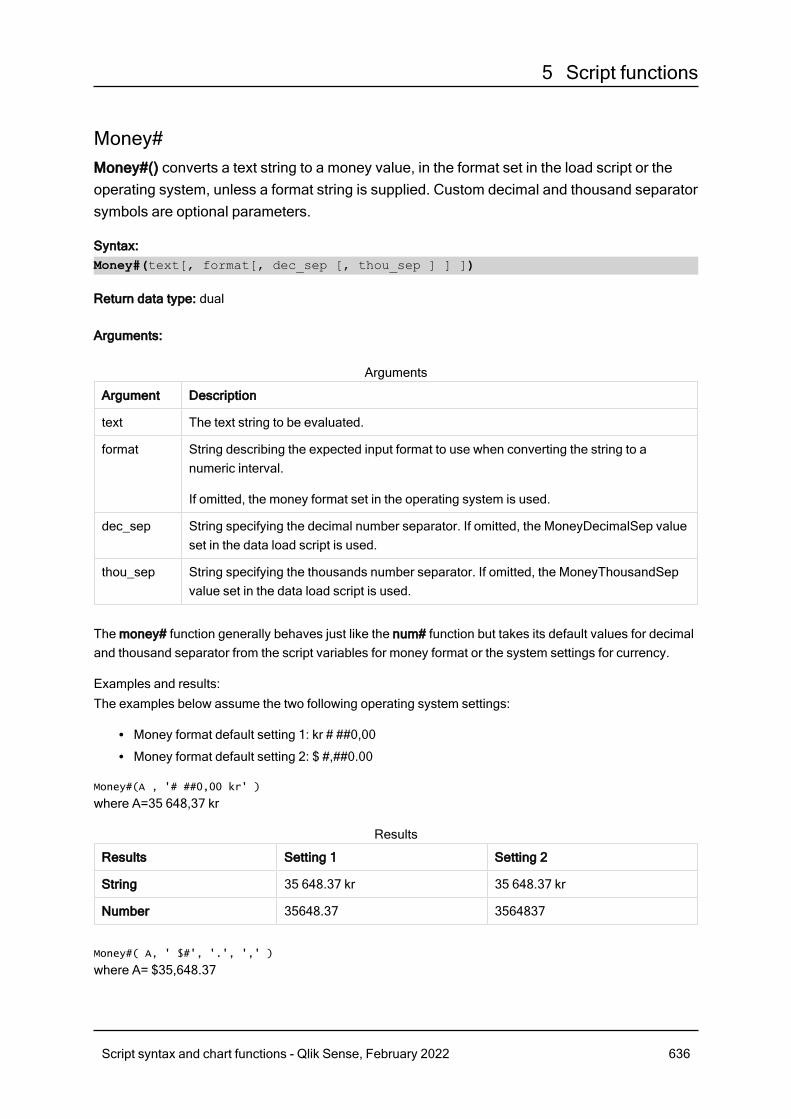
5 Script functions
Money#Money#() converts a text string to a money value, in the format set in the load script or theoperating system, unless a format string is supplied. Custom decimal and thousand separatorsymbols are optional parameters.
Syntax:Money#(text[, format[, dec_sep [, thou_sep ] ] ])
Return data type: dual
Arguments:
Argument Description
text The text string to be evaluated.
format String describing the expected input format to use when converting the string to anumeric interval.
If omitted, the money format set in the operating system is used.
dec_sep String specifying the decimal number separator. If omitted, the MoneyDecimalSep valueset in the data load script is used.
thou_sep String specifying the thousands number separator. If omitted, the MoneyThousandSepvalue set in the data load script is used.
Arguments
The money# function generally behaves just like the num# function but takes its default values for decimaland thousand separator from the script variables for money format or the system settings for currency.
Examples and results:The examples below assume the two following operating system settings:
l Money format default setting 1: kr # ##0,00l Money format default setting 2: $ #,##0.00
Money#(A , '# ##0,00 kr' )
where A=35 648,37 kr
Results Setting 1 Setting 2
String 35 648.37 kr 35 648.37 kr
Number 35648.37 3564837
Results
Money#( A, ' $#', '.', ',' )
where A= $35,648.37
Script syntax and chart functions - Qlik Sense, February 2022 636
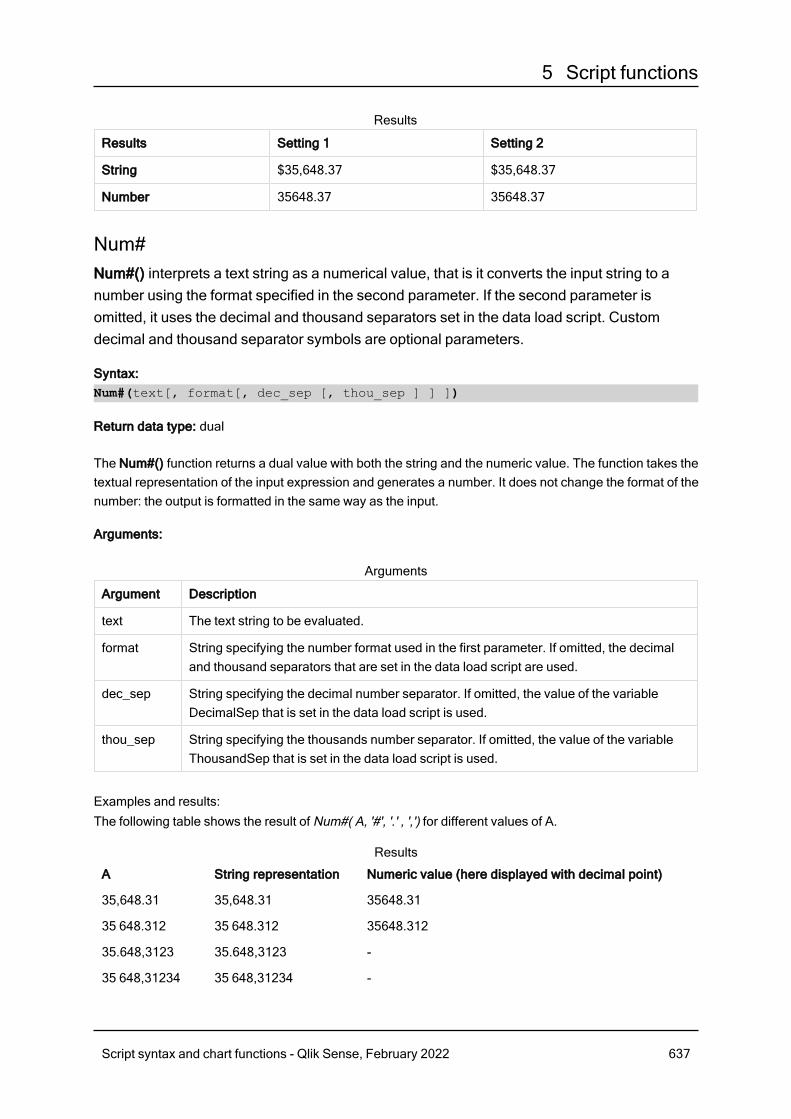
5 Script functions
Results Setting 1 Setting 2
String $35,648.37 $35,648.37
Number 35648.37 35648.37
Results
Num#Num#() interprets a text string as a numerical value, that is it converts the input string to anumber using the format specified in the second parameter. If the second parameter isomitted, it uses the decimal and thousand separators set in the data load script. Customdecimal and thousand separator symbols are optional parameters.
Syntax:Num#(text[, format[, dec_sep [, thou_sep ] ] ])
Return data type: dual
The Num#() function returns a dual value with both the string and the numeric value. The function takes thetextual representation of the input expression and generates a number. It does not change the format of thenumber: the output is formatted in the same way as the input.
Arguments:
Argument Description
text The text string to be evaluated.
format String specifying the number format used in the first parameter. If omitted, the decimaland thousand separators that are set in the data load script are used.
dec_sep String specifying the decimal number separator. If omitted, the value of the variableDecimalSep that is set in the data load script is used.
thou_sep String specifying the thousands number separator. If omitted, the value of the variableThousandSep that is set in the data load script is used.
Arguments
Examples and results:The following table shows the result of Num#( A, '#', '.' , ',') for different values of A.
A String representation Numeric value (here displayed with decimal point)
35,648.31 35,648.31 35648.31
35 648.312 35 648.312 35648.312
35.648,3123 35.648,3123 -
35 648,31234 35 648,31234 -
Results
Script syntax and chart functions - Qlik Sense, February 2022 637
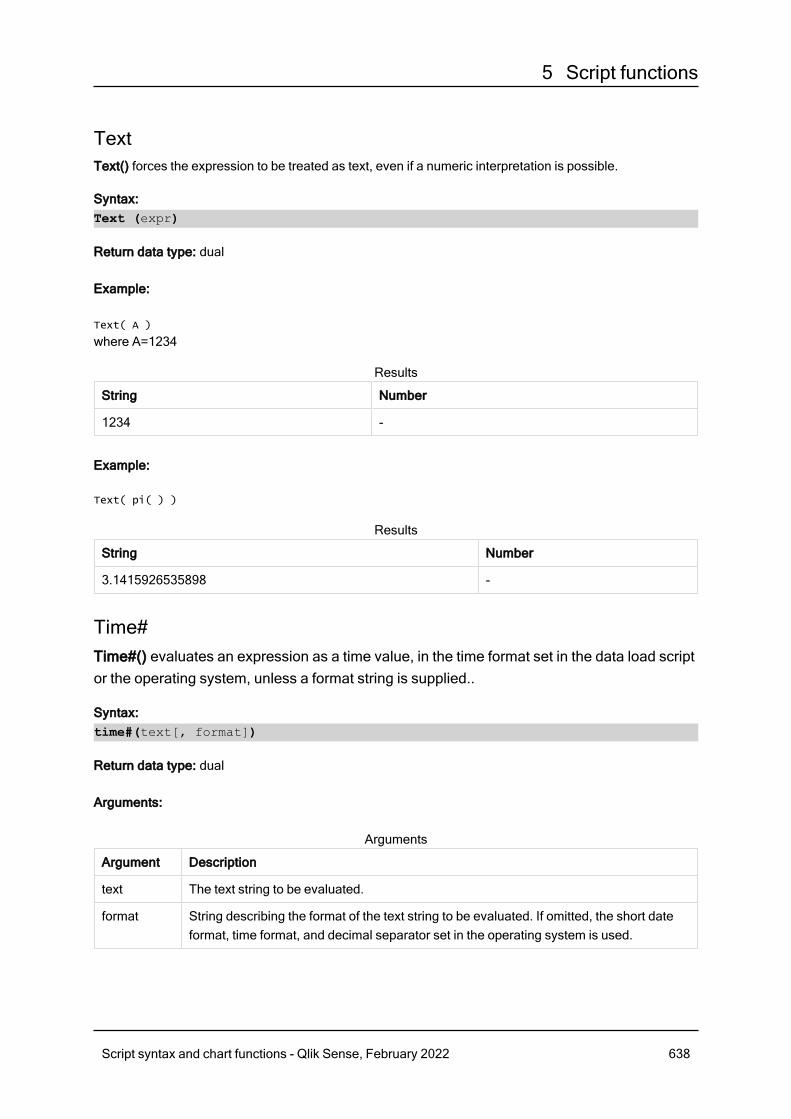
5 Script functions
TextText() forces the expression to be treated as text, even if a numeric interpretation is possible.
Syntax:Text (expr)
Return data type: dual
Example:
Text( A )
where A=1234
String Number
1234 -
Results
Example:
Text( pi( ) )
String Number
3.1415926535898 -
Results
Time#Time#() evaluates an expression as a time value, in the time format set in the data load scriptor the operating system, unless a format string is supplied..
Syntax:time#(text[, format])
Return data type: dual
Arguments:
Argument Description
text The text string to be evaluated.
format String describing the format of the text string to be evaluated. If omitted, the short dateformat, time format, and decimal separator set in the operating system is used.
Arguments
Script syntax and chart functions - Qlik Sense, February 2022 638
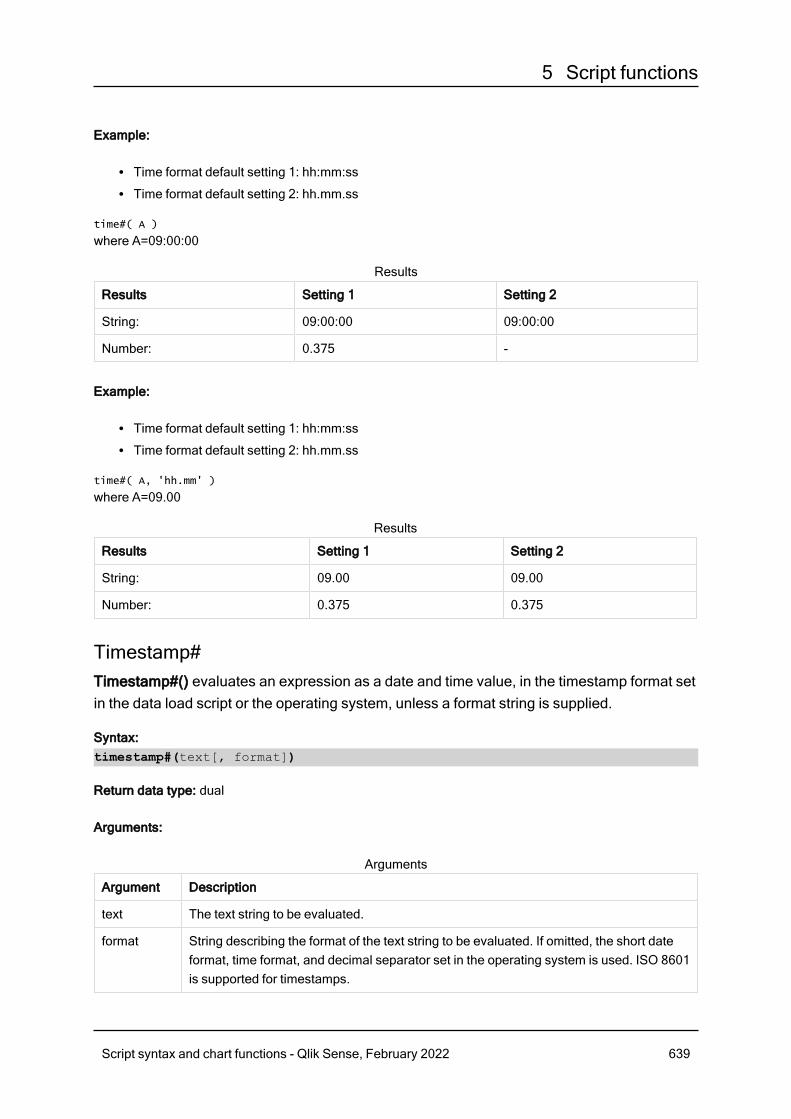
5 Script functions
Example:
l Time format default setting 1: hh:mm:ssl Time format default setting 2: hh.mm.ss
time#( A )
where A=09:00:00
Results Setting 1 Setting 2
String: 09:00:00 09:00:00
Number: 0.375 -
Results
Example:
l Time format default setting 1: hh:mm:ssl Time format default setting 2: hh.mm.ss
time#( A, 'hh.mm' )
where A=09.00
Results Setting 1 Setting 2
String: 09.00 09.00
Number: 0.375 0.375
Results
Timestamp#Timestamp#() evaluates an expression as a date and time value, in the timestamp format setin the data load script or the operating system, unless a format string is supplied.
Syntax:timestamp#(text[, format])
Return data type: dual
Arguments:
Argument Description
text The text string to be evaluated.
format String describing the format of the text string to be evaluated. If omitted, the short dateformat, time format, and decimal separator set in the operating system is used. ISO 8601is supported for timestamps.
Arguments
Script syntax and chart functions - Qlik Sense, February 2022 639
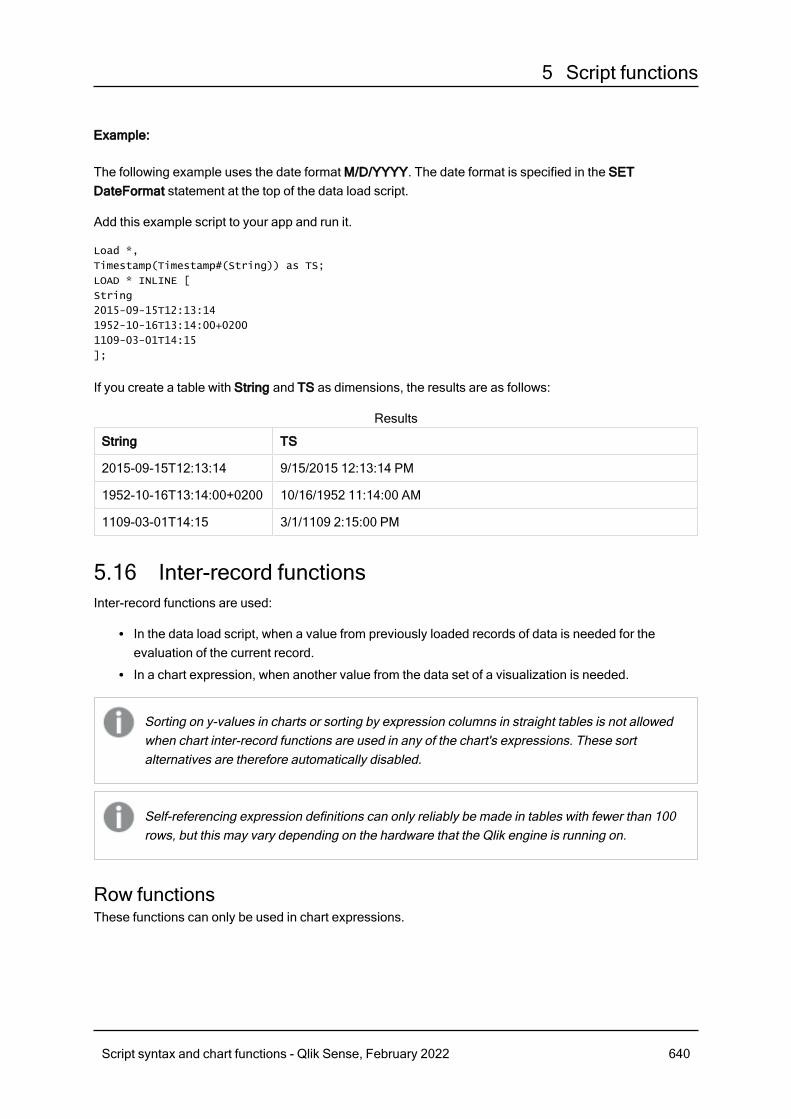
5 Script functions
Example:
The following example uses the date format M/D/YYYY. The date format is specified in the SETDateFormat statement at the top of the data load script.
Add this example script to your app and run it.
Load *,
Timestamp(Timestamp#(String)) as TS;
LOAD * INLINE [
String
2015-09-15T12:13:14
1952-10-16T13:14:00+0200
1109-03-01T14:15
];
If you create a table with String and TS as dimensions, the results are as follows:
String TS
2015-09-15T12:13:14 9/15/2015 12:13:14 PM
1952-10-16T13:14:00+0200 10/16/1952 11:14:00 AM
1109-03-01T14:15 3/1/1109 2:15:00 PM
Results
5.16 Inter-record functionsInter-record functions are used:
l In the data load script, when a value from previously loaded records of data is needed for theevaluation of the current record.
l In a chart expression, when another value from the data set of a visualization is needed.
Sorting on y-values in charts or sorting by expression columns in straight tables is not allowedwhen chart inter-record functions are used in any of the chart's expressions. These sortalternatives are therefore automatically disabled.
Self-referencing expression definitions can only reliably be made in tables with fewer than 100rows, but this may vary depending on the hardware that the Qlik engine is running on.
Row functionsThese functions can only be used in chart expressions.
Script syntax and chart functions - Qlik Sense, February 2022 640
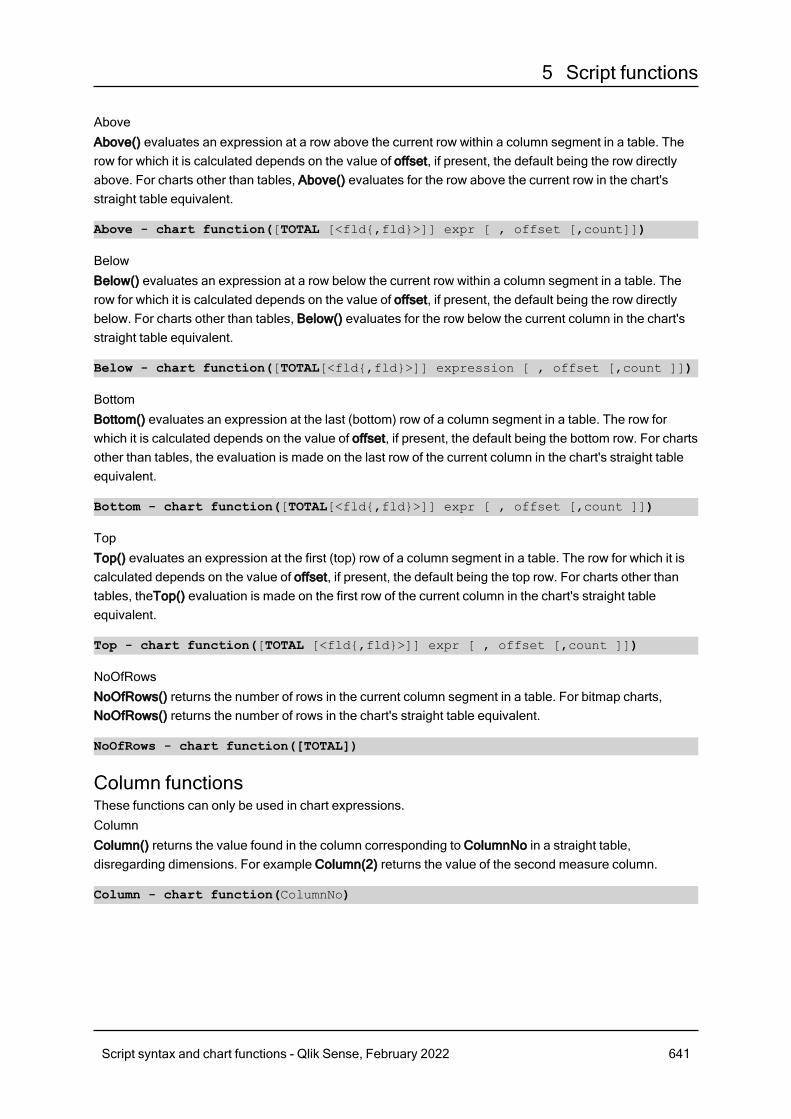
5 Script functions
AboveAbove() evaluates an expression at a row above the current row within a column segment in a table. Therow for which it is calculated depends on the value of offset, if present, the default being the row directlyabove. For charts other than tables, Above() evaluates for the row above the current row in the chart'sstraight table equivalent.
Above - chart function([TOTAL [<fld{,fld}>]] expr [ , offset [,count]])
BelowBelow() evaluates an expression at a row below the current row within a column segment in a table. Therow for which it is calculated depends on the value of offset, if present, the default being the row directlybelow. For charts other than tables, Below() evaluates for the row below the current column in the chart'sstraight table equivalent.
Below - chart function([TOTAL[<fld{,fld}>]] expression [ , offset [,count ]])
BottomBottom() evaluates an expression at the last (bottom) row of a column segment in a table. The row forwhich it is calculated depends on the value of offset, if present, the default being the bottom row. For chartsother than tables, the evaluation is made on the last row of the current column in the chart's straight tableequivalent.
Bottom - chart function([TOTAL[<fld{,fld}>]] expr [ , offset [,count ]])
TopTop() evaluates an expression at the first (top) row of a column segment in a table. The row for which it iscalculated depends on the value of offset, if present, the default being the top row. For charts other thantables, theTop() evaluation is made on the first row of the current column in the chart's straight tableequivalent.
Top - chart function([TOTAL [<fld{,fld}>]] expr [ , offset [,count ]])
NoOfRowsNoOfRows() returns the number of rows in the current column segment in a table. For bitmap charts,NoOfRows() returns the number of rows in the chart's straight table equivalent.
NoOfRows - chart function([TOTAL])
Column functionsThese functions can only be used in chart expressions.ColumnColumn() returns the value found in the column corresponding to ColumnNo in a straight table,disregarding dimensions. For example Column(2) returns the value of the second measure column.
Column - chart function(ColumnNo)
Script syntax and chart functions - Qlik Sense, February 2022 641
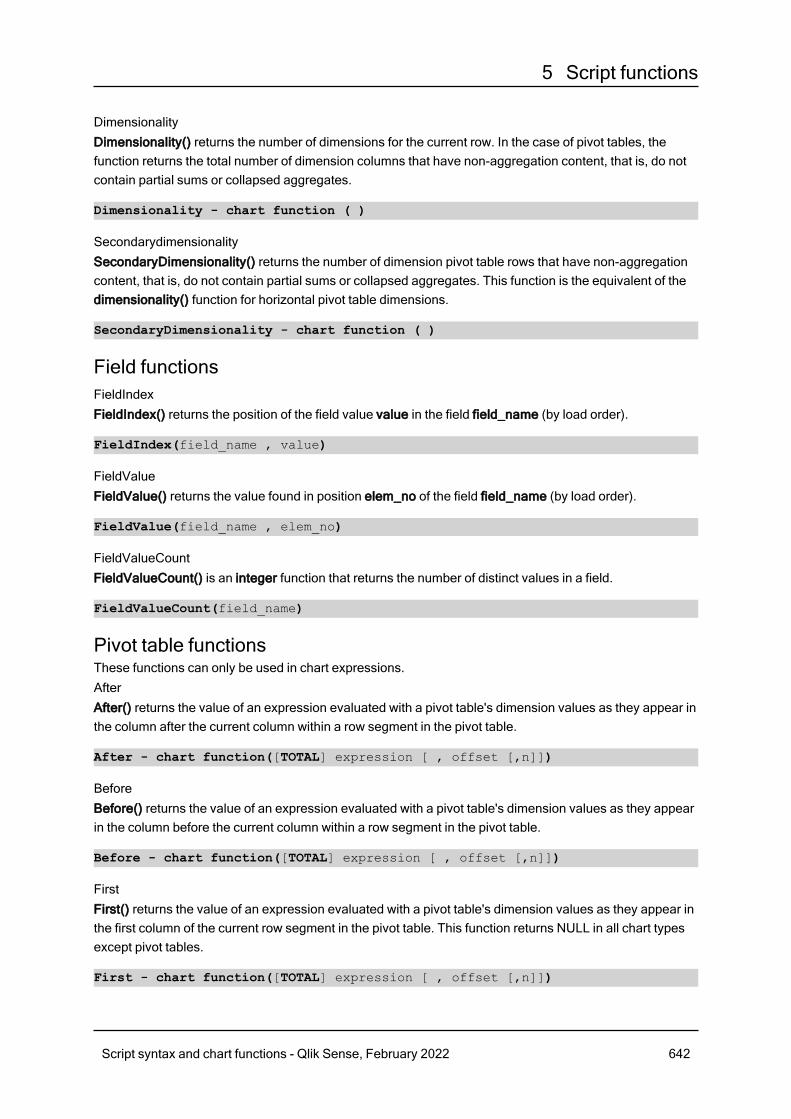
5 Script functions
DimensionalityDimensionality() returns the number of dimensions for the current row. In the case of pivot tables, thefunction returns the total number of dimension columns that have non-aggregation content, that is, do notcontain partial sums or collapsed aggregates.
Dimensionality - chart function ( )
SecondarydimensionalitySecondaryDimensionality() returns the number of dimension pivot table rows that have non-aggregationcontent, that is, do not contain partial sums or collapsed aggregates. This function is the equivalent of thedimensionality() function for horizontal pivot table dimensions.
SecondaryDimensionality - chart function ( )
Field functionsFieldIndexFieldIndex() returns the position of the field value value in the field field_name (by load order).
FieldIndex(field_name , value)
FieldValueFieldValue() returns the value found in position elem_no of the field field_name (by load order).
FieldValue(field_name , elem_no)
FieldValueCountFieldValueCount() is an integer function that returns the number of distinct values in a field.
FieldValueCount(field_name)
Pivot table functionsThese functions can only be used in chart expressions.AfterAfter() returns the value of an expression evaluated with a pivot table's dimension values as they appear inthe column after the current column within a row segment in the pivot table.
After - chart function([TOTAL] expression [ , offset [,n]])
BeforeBefore() returns the value of an expression evaluated with a pivot table's dimension values as they appearin the column before the current column within a row segment in the pivot table.
Before - chart function([TOTAL] expression [ , offset [,n]])
FirstFirst() returns the value of an expression evaluated with a pivot table's dimension values as they appear inthe first column of the current row segment in the pivot table. This function returns NULL in all chart typesexcept pivot tables.
First - chart function([TOTAL] expression [ , offset [,n]])
Script syntax and chart functions - Qlik Sense, February 2022 642
5 Script functions
LastLast() returns the value of an expression evaluated with a pivot table's dimension values as they appear inthe last column of the current row segment in the pivot table. This function returns NULL in all chart typesexcept pivot tables.
Last - chart function([TOTAL] expression [ , offset [,n]])
ColumnNoColumnNo() returns the number of the current column within the current row segment in a pivot table. Thefirst column is number 1.
ColumnNo - chart function([TOTAL])
NoOfColumnsNoOfColumns() returns the number of columns in the current row segment in a pivot table.
NoOfColumns - chart function([TOTAL])
Inter-record functions in the data load scriptExistsExists() determines whether a specific field value has already been loaded into the field in the data loadscript. The function returns TRUE or FALSE, so can be used in the where clause of a LOAD statement oran IF statement.
Exists (field_name [, expr])
LookUpLookup() looks into a table that is already loaded and returns the value of field_name corresponding to thefirst occurrence of the value match_field_value in the field match_field_name. The table can be thecurrent table or another table previously loaded.
LookUp (field_name, match_field_name, match_field_value [, table_name])
PeekPeek() returns the value of a field in a table for a row that has already been loaded or that exists in internalmemory. The row number can be specified, as can the table.
Peek (field_name[, row_no[, table_name ] ])
PreviousPrevious() finds the value of the expr expression using data from the previous input record that has notbeen discarded because of a where clause. In the first record of an internal table, the function will returnNULL.
Previous (page 678)(expr)
See also:
p Range functions (page 698)
Script syntax and chart functions - Qlik Sense, February 2022 643
5 Script functions
Above - chart functionAbove() evaluates an expression at a row above the current row within a column segment in a table. Therow for which it is calculated depends on the value of offset, if present, the default being the row directlyabove. For charts other than tables, Above() evaluates for the row above the current row in the chart'sstraight table equivalent.
Syntax:Above([TOTAL] expr [ , offset [,count]])
Return data type: dual
Arguments:
Argument Description
expr The expression or field containing the data to be measured.
offset Specifying an offsetn, greater than 0, moves the evaluation of the expression n rowsfurther up from the current row.
Specifying an offset of 0 will evaluate the expression on the current row.
Specifying a negative offset number makes the Above function work like the Belowfunction with the corresponding positive offset number.
count By specifying a third argument count greater than 1, the function will return a range ofcount values, one for each of count table rows counting upwards from the original cell.
In this form, the function can be used as an argument to any of the special rangefunctions. Range functions (page 698)
TOTAL If the table is one-dimensional or if the qualifier TOTAL is used as argument, the currentcolumn segment is always equal to the entire column.
Arguments
On the first row of a column segment, a NULL value is returned, as there is no row above it.
A column segment is defined as a consecutive subset of cells having the same values for thedimensions in the current sort order. Inter-record chart functions are computed in the columnsegment excluding the right-most dimension in the equivalent straight table chart. If there isonly one dimension in the chart, or if the TOTAL qualifier is specified, the expression evaluatesacross full table.
If the table or table equivalent has multiple vertical dimensions, the current column segmentwill include only rows with the same values as the current row in all dimension columns, exceptfor the column showing the last dimension in the inter-field sort order.
Script syntax and chart functions - Qlik Sense, February 2022 644
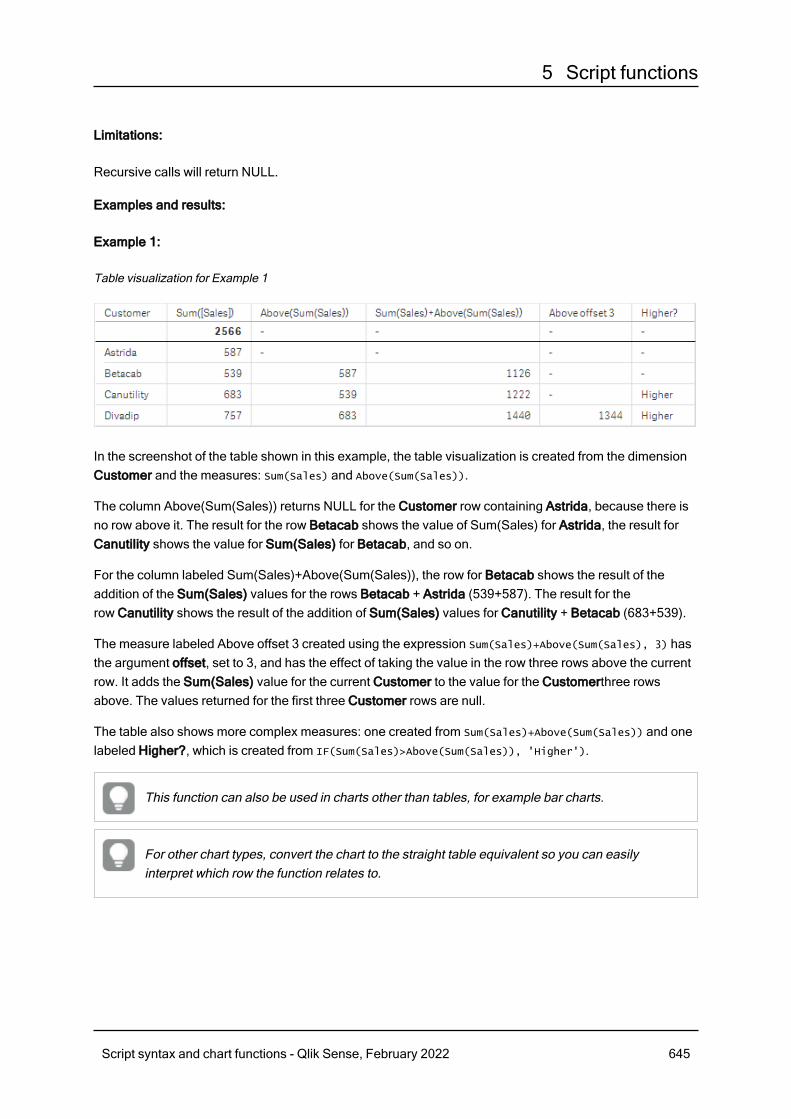
5 Script functions
Limitations:
Recursive calls will return NULL.
Examples and results:
Example 1:
Table visualization for Example 1
In the screenshot of the table shown in this example, the table visualization is created from the dimensionCustomer and the measures: Sum(Sales) and Above(Sum(Sales)).
The column Above(Sum(Sales)) returns NULL for the Customer row containing Astrida, because there isno row above it. The result for the row Betacab shows the value of Sum(Sales) for Astrida, the result forCanutility shows the value for Sum(Sales) for Betacab, and so on.
For the column labeled Sum(Sales)+Above(Sum(Sales)), the row for Betacab shows the result of theaddition of the Sum(Sales) values for the rows Betacab + Astrida (539+587). The result for therow Canutility shows the result of the addition of Sum(Sales) values for Canutility + Betacab (683+539).
The measure labeled Above offset 3 created using the expression Sum(Sales)+Above(Sum(Sales), 3) hasthe argument offset, set to 3, and has the effect of taking the value in the row three rows above the currentrow. It adds the Sum(Sales) value for the current Customer to the value for the Customerthree rowsabove. The values returned for the first three Customer rows are null.
The table also shows more complex measures: one created from Sum(Sales)+Above(Sum(Sales)) and onelabeled Higher?, which is created from IF(Sum(Sales)>Above(Sum(Sales)), 'Higher').
This function can also be used in charts other than tables, for example bar charts.
For other chart types, convert the chart to the straight table equivalent so you can easilyinterpret which row the function relates to.
Script syntax and chart functions - Qlik Sense, February 2022 645
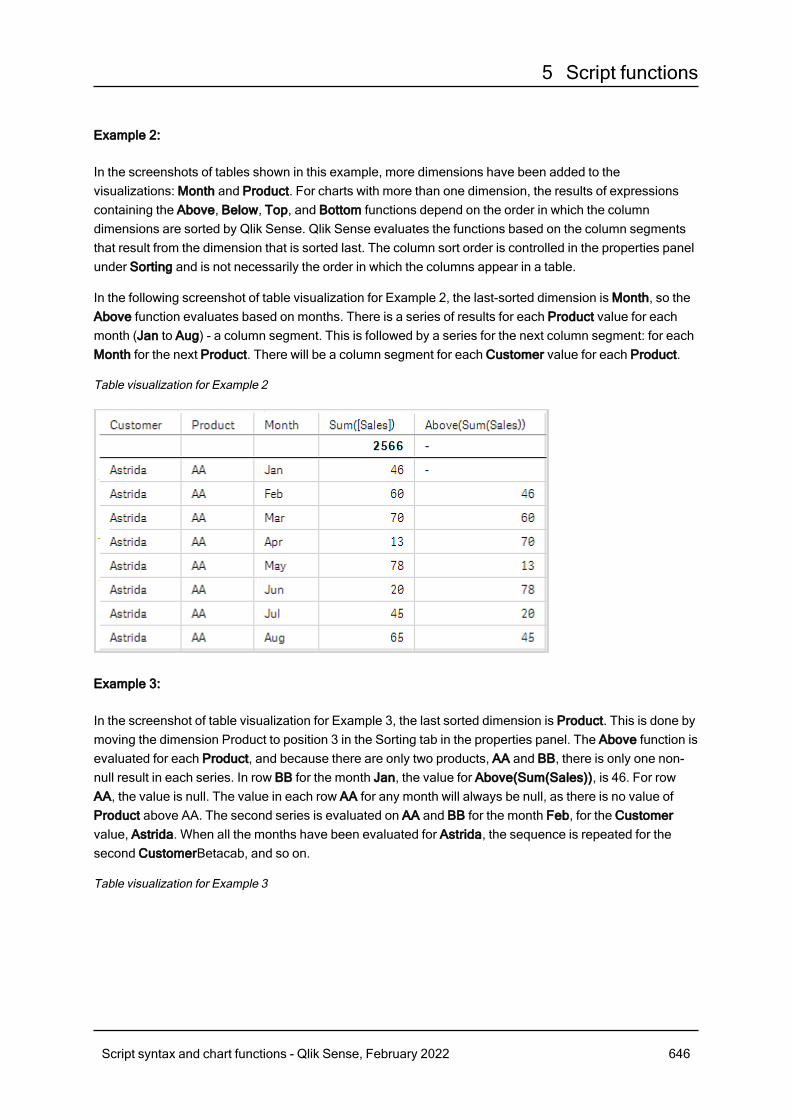
5 Script functions
Example 2:
In the screenshots of tables shown in this example, more dimensions have been added to thevisualizations: Month and Product. For charts with more than one dimension, the results of expressionscontaining the Above, Below, Top, and Bottom functions depend on the order in which the columndimensions are sorted by Qlik Sense. Qlik Sense evaluates the functions based on the column segmentsthat result from the dimension that is sorted last. The column sort order is controlled in the properties panelunder Sorting and is not necessarily the order in which the columns appear in a table.
In the following screenshot of table visualization for Example 2, the last-sorted dimension is Month, so theAbove function evaluates based on months. There is a series of results for each Product value for eachmonth (Jan to Aug) - a column segment. This is followed by a series for the next column segment: for eachMonth for the next Product. There will be a column segment for each Customer value for each Product.
Table visualization for Example 2
Example 3:
In the screenshot of table visualization for Example 3, the last sorted dimension is Product. This is done bymoving the dimension Product to position 3 in the Sorting tab in the properties panel. The Above function isevaluated for each Product, and because there are only two products, AA and BB, there is only one non-null result in each series. In row BB for the month Jan, the value for Above(Sum(Sales)), is 46. For rowAA, the value is null. The value in each row AA for any month will always be null, as there is no value ofProduct above AA. The second series is evaluated on AA and BB for the month Feb, for the Customervalue, Astrida. When all the months have been evaluated for Astrida, the sequence is repeated for thesecond CustomerBetacab, and so on.
Table visualization for Example 3
Script syntax and chart functions - Qlik Sense, February 2022 646
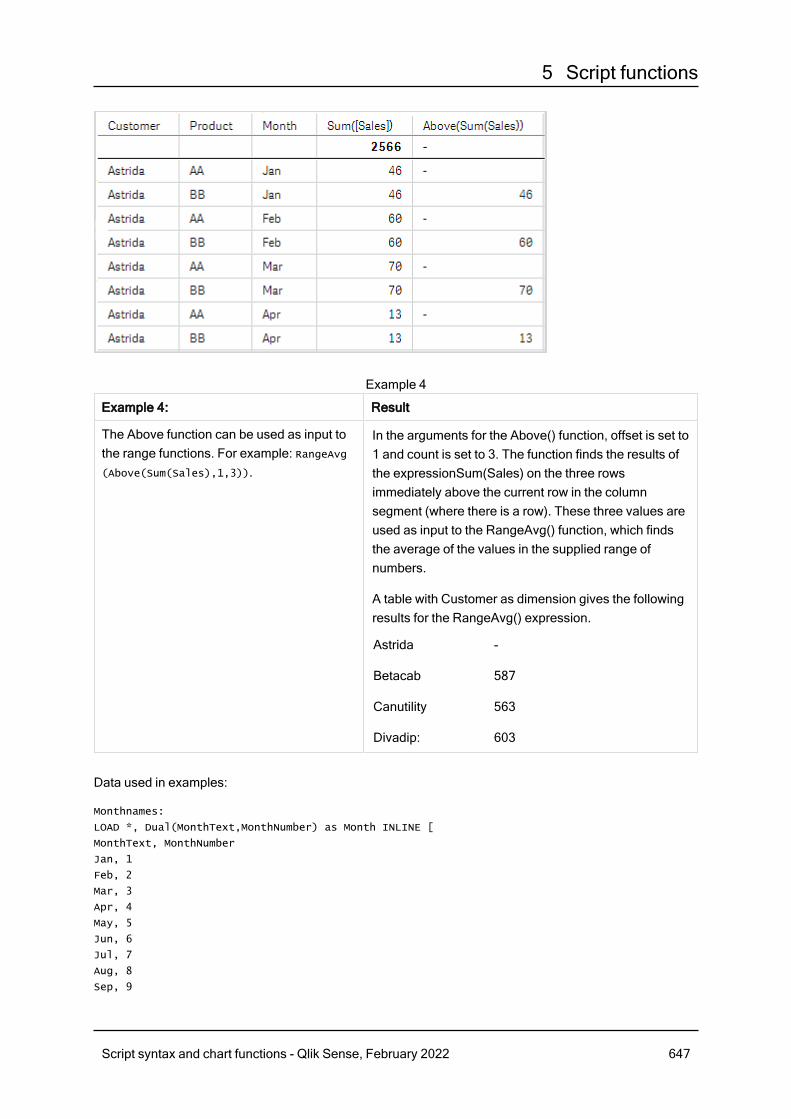
5 Script functions
Example 4: Result
The Above function can be used as input tothe range functions. For example: RangeAvg(Above(Sum(Sales),1,3)).
In the arguments for the Above() function, offset is set to1 and count is set to 3. The function finds the results ofthe expressionSum(Sales) on the three rowsimmediately above the current row in the columnsegment (where there is a row). These three values areused as input to the RangeAvg() function, which findsthe average of the values in the supplied range ofnumbers.
A table with Customer as dimension gives the followingresults for the RangeAvg() expression.
Astrida
Betacab
Canutility
Divadip:
-
587
563
603
Example 4
Data used in examples:
Monthnames:
LOAD *, Dual(MonthText,MonthNumber) as Month INLINE [
MonthText, MonthNumber
Jan, 1
Feb, 2
Mar, 3
Apr, 4
May, 5
Jun, 6
Jul, 7
Aug, 8
Sep, 9
Script syntax and chart functions - Qlik Sense, February 2022 647
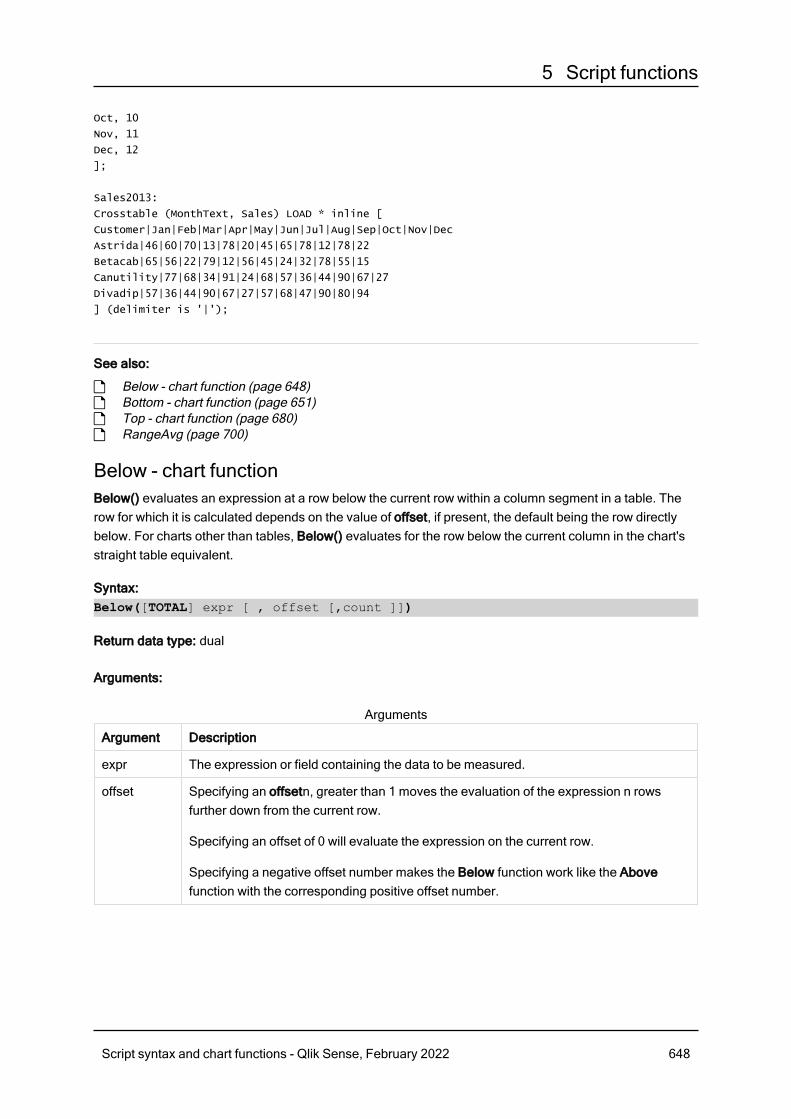
5 Script functions
Oct, 10
Nov, 11
Dec, 12
];
Sales2013:
Crosstable (MonthText, Sales) LOAD * inline [
Customer|Jan|Feb|Mar|Apr|May|Jun|Jul|Aug|Sep|Oct|Nov|Dec
Astrida|46|60|70|13|78|20|45|65|78|12|78|22
Betacab|65|56|22|79|12|56|45|24|32|78|55|15
Canutility|77|68|34|91|24|68|57|36|44|90|67|27
Divadip|57|36|44|90|67|27|57|68|47|90|80|94
] (delimiter is '|');
See also:
p Below - chart function (page 648)p Bottom - chart function (page 651)p Top - chart function (page 680)p RangeAvg (page 700)
Below - chart functionBelow() evaluates an expression at a row below the current row within a column segment in a table. Therow for which it is calculated depends on the value of offset, if present, the default being the row directlybelow. For charts other than tables, Below() evaluates for the row below the current column in the chart'sstraight table equivalent.
Syntax:Below([TOTAL] expr [ , offset [,count ]])
Return data type: dual
Arguments:
Argument Description
expr The expression or field containing the data to be measured.
offset Specifying an offsetn, greater than 1 moves the evaluation of the expression n rowsfurther down from the current row.
Specifying an offset of 0 will evaluate the expression on the current row.
Specifying a negative offset number makes the Below function work like the Abovefunction with the corresponding positive offset number.
Arguments
Script syntax and chart functions - Qlik Sense, February 2022 648
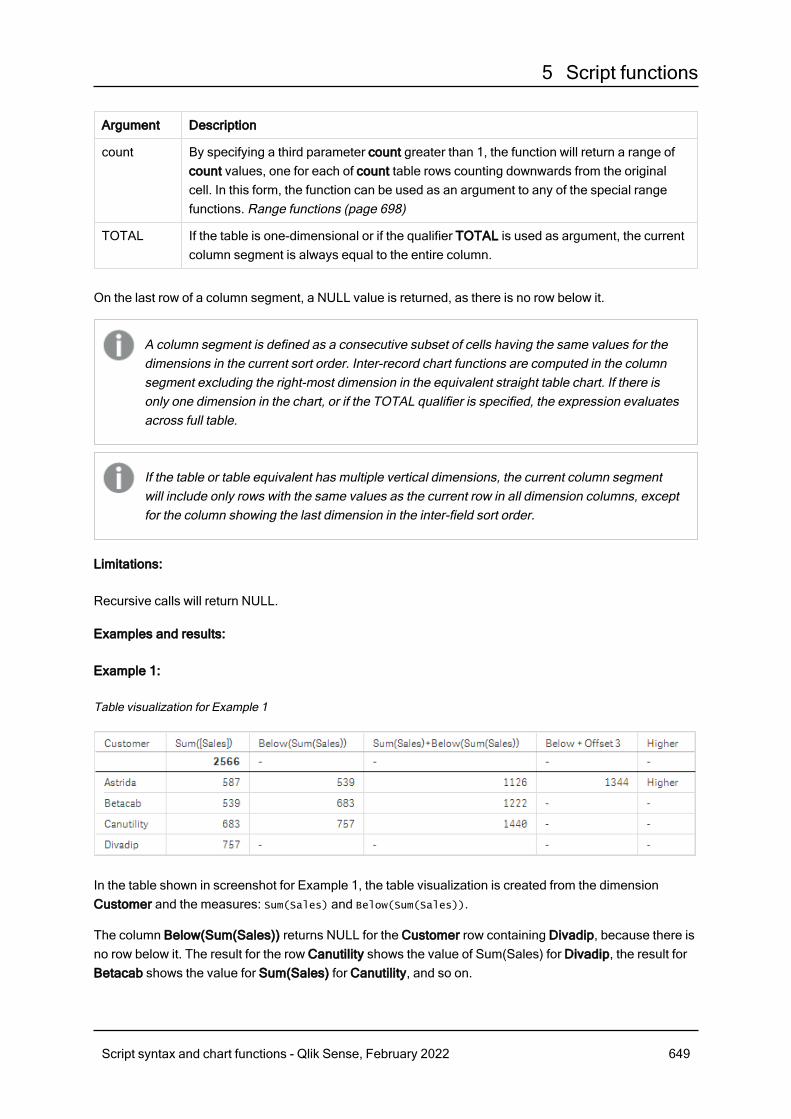
5 Script functions
Argument Description
count By specifying a third parameter count greater than 1, the function will return a range ofcount values, one for each of count table rows counting downwards from the originalcell. In this form, the function can be used as an argument to any of the special rangefunctions. Range functions (page 698)
TOTAL If the table is one-dimensional or if the qualifier TOTAL is used as argument, the currentcolumn segment is always equal to the entire column.
On the last row of a column segment, a NULL value is returned, as there is no row below it.
A column segment is defined as a consecutive subset of cells having the same values for thedimensions in the current sort order. Inter-record chart functions are computed in the columnsegment excluding the right-most dimension in the equivalent straight table chart. If there isonly one dimension in the chart, or if the TOTAL qualifier is specified, the expression evaluatesacross full table.
If the table or table equivalent has multiple vertical dimensions, the current column segmentwill include only rows with the same values as the current row in all dimension columns, exceptfor the column showing the last dimension in the inter-field sort order.
Limitations:
Recursive calls will return NULL.
Examples and results:
Example 1:
Table visualization for Example 1
In the table shown in screenshot for Example 1, the table visualization is created from the dimensionCustomer and the measures: Sum(Sales) and Below(Sum(Sales)).
The column Below(Sum(Sales)) returns NULL for the Customer row containing Divadip, because there isno row below it. The result for the row Canutility shows the value of Sum(Sales) for Divadip, the result forBetacab shows the value for Sum(Sales) for Canutility, and so on.
Script syntax and chart functions - Qlik Sense, February 2022 649
5 Script functions
The table also shows more complex measures, which you can see in the columns labeled: Sum(Sales)+Below(Sum(Sales)), Below +Offset 3, and Higher?. These expressions work as described in thefollowing paragraphs.
For the column labeled Sum(Sales)+Below(Sum(Sales)), the row for Astrida shows the result of theaddition of the Sum(Sales) values for the rows Betacab + Astrida (539+587). The result for therow Betacab shows the result of the addition of Sum(Sales) values for Canutility + Betacab (539+683).
The measure labeled Below +Offset 3 created using the expression Sum(Sales)+Below(Sum(Sales), 3)
has the argument offset, set to 3, and has the effect of taking the value in the row three rows below thecurrent row. It adds the Sum(Sales) value for the current Customer to the value from the Customer threerows below. The values for the lowest three Customer rows are null.
The measure labeled Higher? is created from the expression:IF(Sum(Sales)>Below(Sum(Sales)),'Higher'). This compares the values of the current row in the measure Sum(Sales) with the row below it. Ifthe current row is a greater value, the text "Higher" is output.
This function can also be used in charts other than tables, for example bar charts.
For other chart types, convert the chart to the straight table equivalent so you can easilyinterpret which row the function relates to.
For charts with more than one dimension, the results of expressions containing the Above, Below, Top,and Bottom functions depend on the order in which the column dimensions are sorted by Qlik Sense. QlikSense evaluates the functions based on the column segments that result from the dimension that is sortedlast. The column sort order is controlled in the properties panel under Sorting and is not necessarily theorder in which the columns appear in a table.Please refer to Example: 2 in the Above function for furtherdetails.
Example 2: Result
The Below function can be used as input to therange functions. For example: RangeAvg (Below
(Sum(Sales),1,3)).
In the arguments for the Below() function, offset isset to 1 and count is set to 3. The function finds theresults of the expressionSum(Sales) on the threerows immediately below the current row in thecolumn segment (where there is a row). Thesethree values are used as input to the RangeAvg()function, which finds the average of the values inthe supplied range of numbers.
A table with Customer as dimension gives thefollowing results for the RangeAvg() expression.
Example 2
Script syntax and chart functions - Qlik Sense, February 2022 650
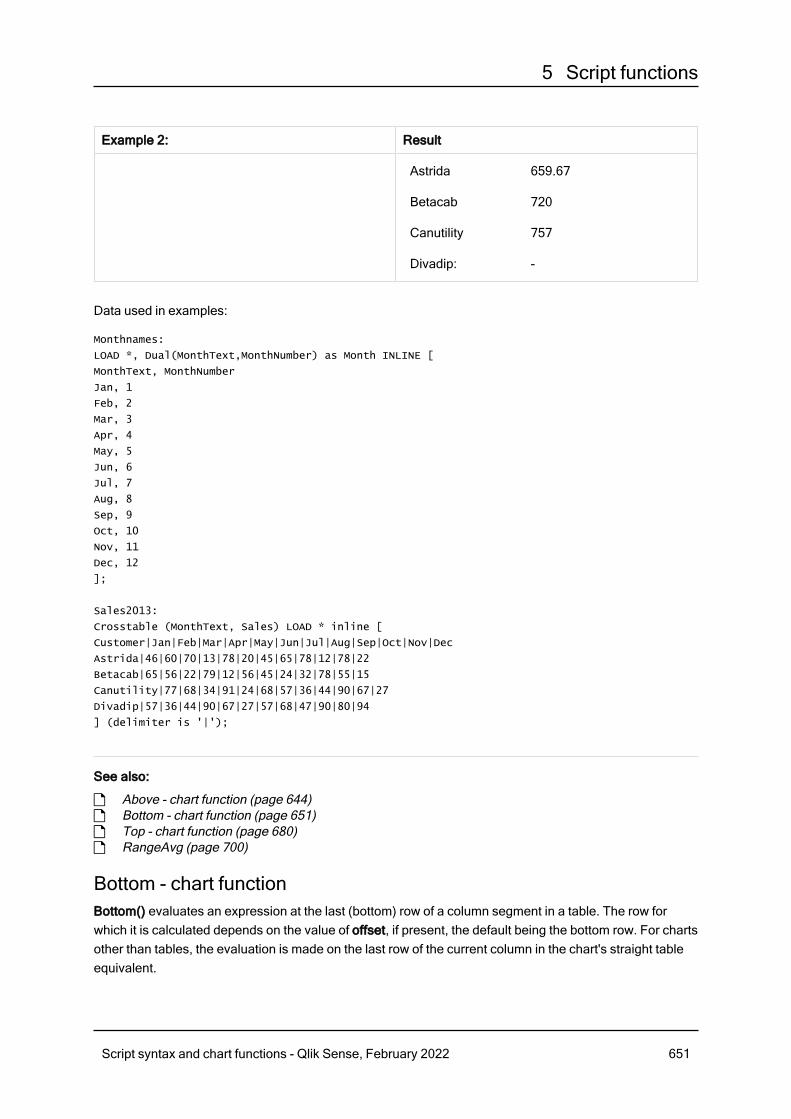
5 Script functions
Example 2: Result
Astrida
Betacab
Canutility
Divadip:
659.67
720
757
-
Data used in examples:
Monthnames:
LOAD *, Dual(MonthText,MonthNumber) as Month INLINE [
MonthText, MonthNumber
Jan, 1
Feb, 2
Mar, 3
Apr, 4
May, 5
Jun, 6
Jul, 7
Aug, 8
Sep, 9
Oct, 10
Nov, 11
Dec, 12
];
Sales2013:
Crosstable (MonthText, Sales) LOAD * inline [
Customer|Jan|Feb|Mar|Apr|May|Jun|Jul|Aug|Sep|Oct|Nov|Dec
Astrida|46|60|70|13|78|20|45|65|78|12|78|22
Betacab|65|56|22|79|12|56|45|24|32|78|55|15
Canutility|77|68|34|91|24|68|57|36|44|90|67|27
Divadip|57|36|44|90|67|27|57|68|47|90|80|94
] (delimiter is '|');
See also:
p Above - chart function (page 644)p Bottom - chart function (page 651)p Top - chart function (page 680)p RangeAvg (page 700)
Bottom - chart functionBottom() evaluates an expression at the last (bottom) row of a column segment in a table. The row forwhich it is calculated depends on the value of offset, if present, the default being the bottom row. For chartsother than tables, the evaluation is made on the last row of the current column in the chart's straight tableequivalent.
Script syntax and chart functions - Qlik Sense, February 2022 651
5 Script functions
Syntax:Bottom([TOTAL] expr [ , offset [,count ]])
Return data type: dual
Arguments:
Argument Description
expr The expression or field containing the data to be measured.
offset Specifying an offsetn greater than 1 moves the evaluation of the expression up n rowsabove the bottom row.
Specifying a negative offset number makes the Bottom function work like the Topfunction with the corresponding positive offset number.
count By specifying a third parameter count greater than 1, the function will return not one buta range of count values, one for each of the last count rows of the current columnsegment. In this form, the function can be used as an argument to any of the specialrange functions. Range functions (page 698)
TOTAL If the table is one-dimensional or if the qualifier TOTAL is used as argument, the currentcolumn segment is always equal to the entire column.
Arguments
A column segment is defined as a consecutive subset of cells having the same values for thedimensions in the current sort order. Inter-record chart functions are computed in the columnsegment excluding the right-most dimension in the equivalent straight table chart. If there isonly one dimension in the chart, or if the TOTAL qualifier is specified, the expression evaluatesacross full table.
If the table or table equivalent has multiple vertical dimensions, the current column segmentwill include only rows with the same values as the current row in all dimension columns, exceptfor the column showing the last dimension in the inter-field sort order.
Limitations:
Recursive calls will return NULL.
Examples and results:
Table visualization for Example 1
Script syntax and chart functions - Qlik Sense, February 2022 652
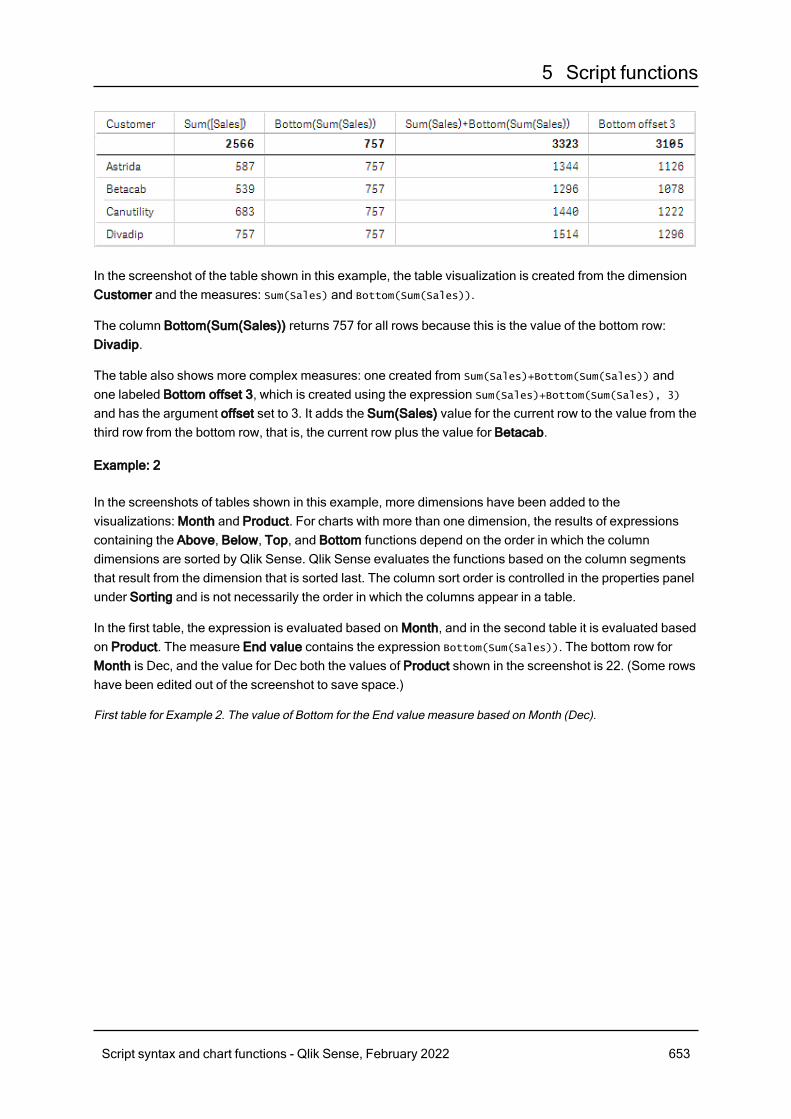
5 Script functions
In the screenshot of the table shown in this example, the table visualization is created from the dimensionCustomer and the measures: Sum(Sales) and Bottom(Sum(Sales)).
The column Bottom(Sum(Sales)) returns 757 for all rows because this is the value of the bottom row:Divadip.
The table also shows more complex measures: one created from Sum(Sales)+Bottom(Sum(Sales)) andone labeled Bottom offset 3, which is created using the expression Sum(Sales)+Bottom(Sum(Sales), 3)
and has the argument offset set to 3. It adds the Sum(Sales) value for the current row to the value from thethird row from the bottom row, that is, the current row plus the value for Betacab.
Example: 2
In the screenshots of tables shown in this example, more dimensions have been added to thevisualizations: Month and Product. For charts with more than one dimension, the results of expressionscontaining the Above, Below, Top, and Bottom functions depend on the order in which the columndimensions are sorted by Qlik Sense. Qlik Sense evaluates the functions based on the column segmentsthat result from the dimension that is sorted last. The column sort order is controlled in the properties panelunder Sorting and is not necessarily the order in which the columns appear in a table.
In the first table, the expression is evaluated based on Month, and in the second table it is evaluated basedon Product. The measure End value contains the expression Bottom(Sum(Sales)). The bottom row forMonth is Dec, and the value for Dec both the values of Product shown in the screenshot is 22. (Some rowshave been edited out of the screenshot to save space.)
First table for Example 2. The value of Bottom for the End value measure based on Month (Dec).
Script syntax and chart functions - Qlik Sense, February 2022 653
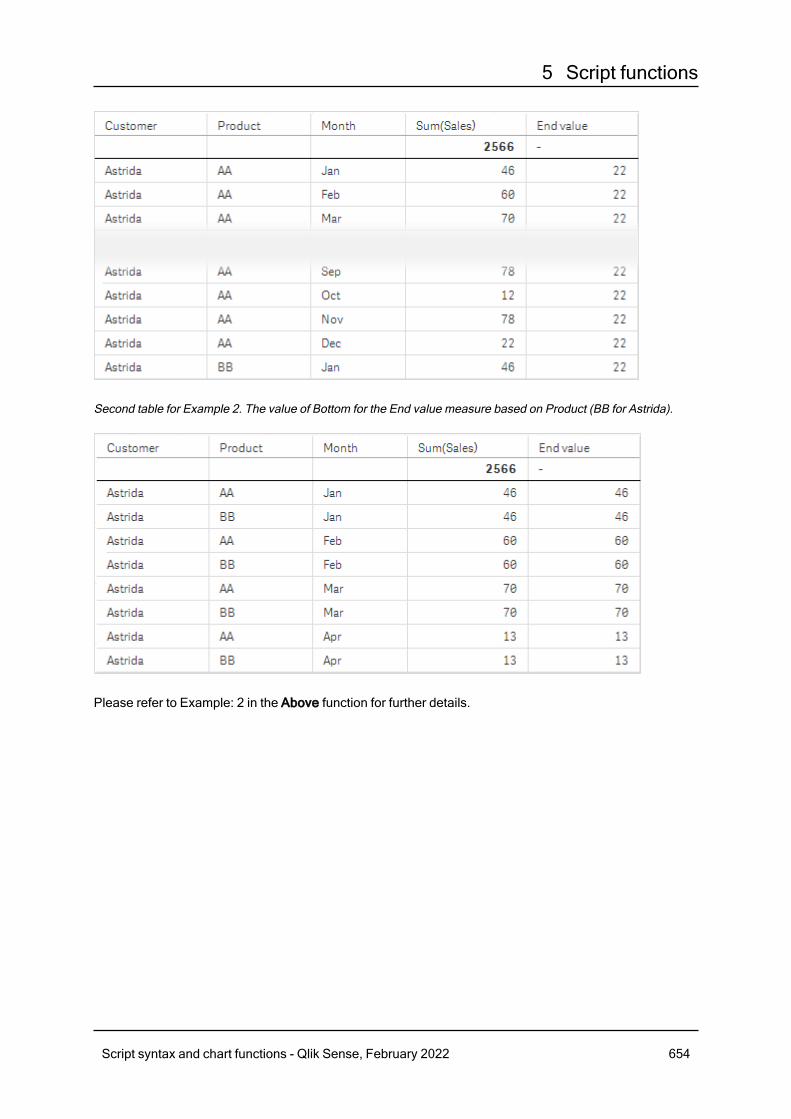
5 Script functions
Second table for Example 2. The value of Bottom for the End value measure based on Product (BB for Astrida).
Please refer to Example: 2 in the Above function for further details.
Script syntax and chart functions - Qlik Sense, February 2022 654
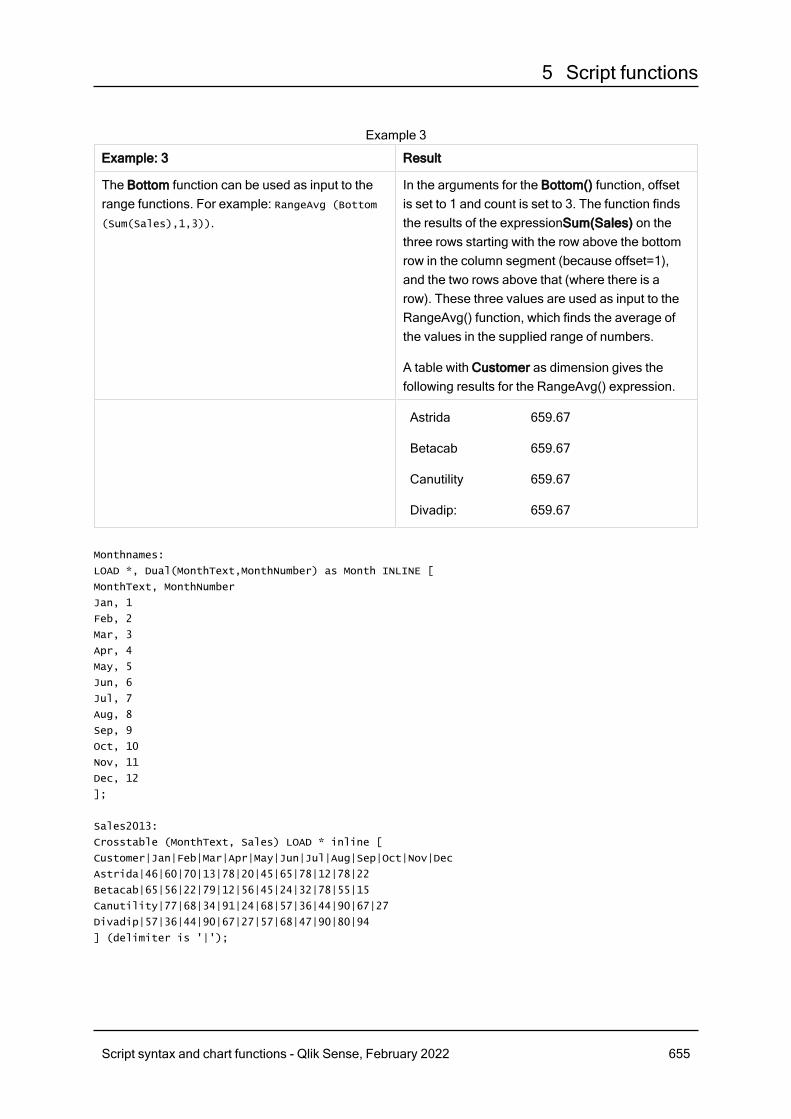
5 Script functions
Example: 3 Result
The Bottom function can be used as input to therange functions. For example: RangeAvg (Bottom
(Sum(Sales),1,3)).
In the arguments for the Bottom() function, offsetis set to 1 and count is set to 3. The function findsthe results of the expressionSum(Sales) on thethree rows starting with the row above the bottomrow in the column segment (because offset=1),and the two rows above that (where there is arow). These three values are used as input to theRangeAvg() function, which finds the average ofthe values in the supplied range of numbers.
A table with Customer as dimension gives thefollowing results for the RangeAvg() expression.
Astrida
Betacab
Canutility
Divadip:
659.67
659.67
659.67
659.67
Example 3
Monthnames:
LOAD *, Dual(MonthText,MonthNumber) as Month INLINE [
MonthText, MonthNumber
Jan, 1
Feb, 2
Mar, 3
Apr, 4
May, 5
Jun, 6
Jul, 7
Aug, 8
Sep, 9
Oct, 10
Nov, 11
Dec, 12
];
Sales2013:
Crosstable (MonthText, Sales) LOAD * inline [
Customer|Jan|Feb|Mar|Apr|May|Jun|Jul|Aug|Sep|Oct|Nov|Dec
Astrida|46|60|70|13|78|20|45|65|78|12|78|22
Betacab|65|56|22|79|12|56|45|24|32|78|55|15
Canutility|77|68|34|91|24|68|57|36|44|90|67|27
Divadip|57|36|44|90|67|27|57|68|47|90|80|94
] (delimiter is '|');
Script syntax and chart functions - Qlik Sense, February 2022 655
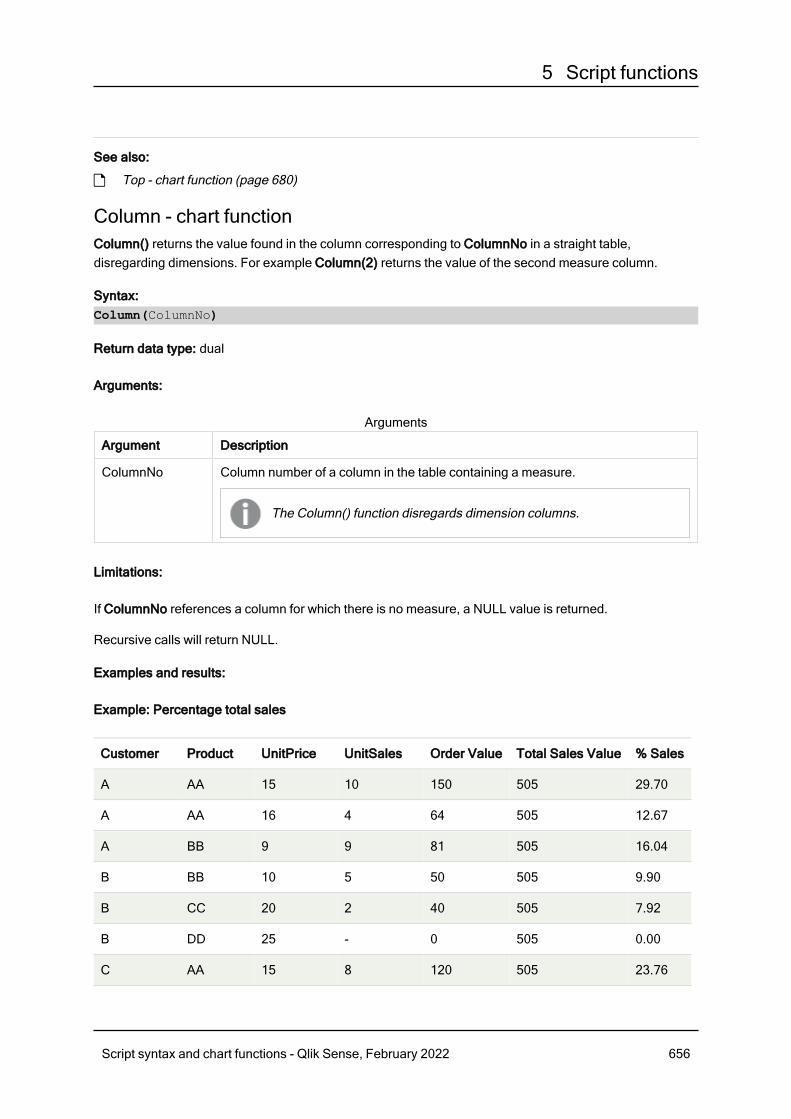
5 Script functions
See also:
p Top - chart function (page 680)
Column - chart functionColumn() returns the value found in the column corresponding to ColumnNo in a straight table,disregarding dimensions. For example Column(2) returns the value of the second measure column.
Syntax:Column(ColumnNo)
Return data type: dual
Arguments:
Argument Description
ColumnNo Column number of a column in the table containing a measure.
The Column() function disregards dimension columns.
Arguments
Limitations:
If ColumnNo references a column for which there is no measure, a NULL value is returned.
Recursive calls will return NULL.
Examples and results:
Example: Percentage total sales
Customer Product UnitPrice UnitSales Order Value Total Sales Value % Sales
A AA 15 10 150 505 29.70
A AA 16 4 64 505 12.67
A BB 9 9 81 505 16.04
B BB 10 5 50 505 9.90
B CC 20 2 40 505 7.92
B DD 25 - 0 505 0.00
C AA 15 8 120 505 23.76
Script syntax and chart functions - Qlik Sense, February 2022 656
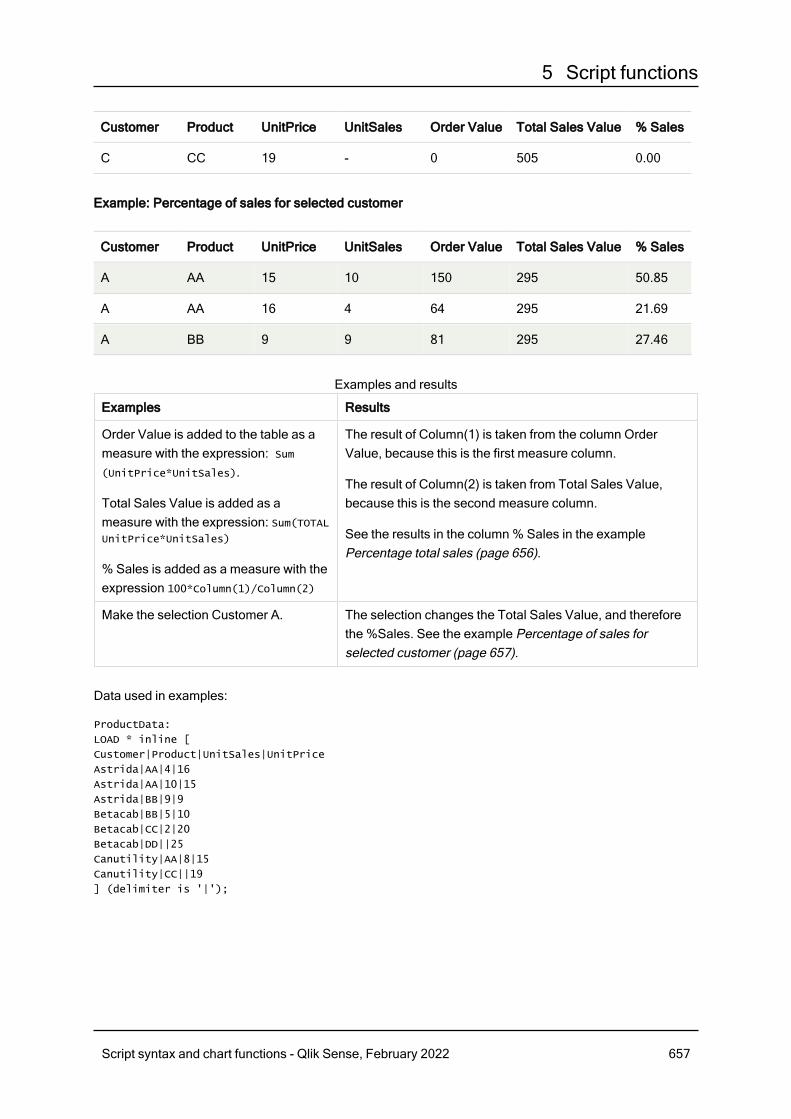
5 Script functions
Customer Product UnitPrice UnitSales Order Value Total Sales Value % Sales
C CC 19 - 0 505 0.00
Example: Percentage of sales for selected customer
Customer Product UnitPrice UnitSales Order Value Total Sales Value % Sales
A AA 15 10 150 295 50.85
A AA 16 4 64 295 21.69
A BB 9 9 81 295 27.46
Examples Results
Order Value is added to the table as ameasure with the expression: Sum(UnitPrice*UnitSales).
Total Sales Value is added as ameasure with the expression: Sum(TOTALUnitPrice*UnitSales)
%Sales is added as a measure with theexpression 100*Column(1)/Column(2)
The result of Column(1) is taken from the column OrderValue, because this is the first measure column.
The result of Column(2) is taken from Total Sales Value,because this is the second measure column.
See the results in the column % Sales in the examplePercentage total sales (page 656).
Make the selection Customer A. The selection changes the Total Sales Value, and thereforethe %Sales. See the example Percentage of sales forselected customer (page 657).
Examples and results
Data used in examples:
ProductData:
LOAD * inline [
Customer|Product|UnitSales|UnitPrice
Astrida|AA|4|16
Astrida|AA|10|15
Astrida|BB|9|9
Betacab|BB|5|10
Betacab|CC|2|20
Betacab|DD||25
Canutility|AA|8|15
Canutility|CC||19
] (delimiter is '|');
Script syntax and chart functions - Qlik Sense, February 2022 657
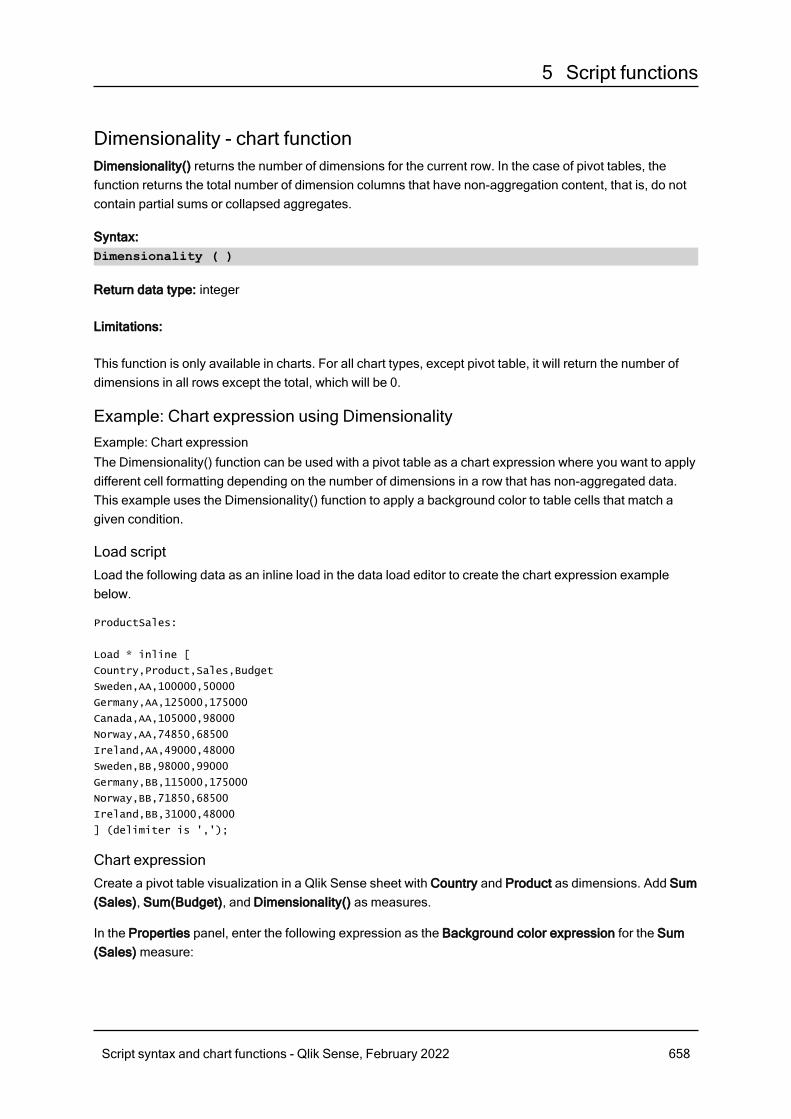
5 Script functions
Dimensionality - chart functionDimensionality() returns the number of dimensions for the current row. In the case of pivot tables, thefunction returns the total number of dimension columns that have non-aggregation content, that is, do notcontain partial sums or collapsed aggregates.
Syntax:Dimensionality ( )
Return data type: integer
Limitations:
This function is only available in charts. For all chart types, except pivot table, it will return the number ofdimensions in all rows except the total, which will be 0.
Example: Chart expression using DimensionalityExample: Chart expressionThe Dimensionality() function can be used with a pivot table as a chart expression where you want to applydifferent cell formatting depending on the number of dimensions in a row that has non-aggregated data.This example uses the Dimensionality() function to apply a background color to table cells that match agiven condition.
Load scriptLoad the following data as an inline load in the data load editor to create the chart expression examplebelow.
ProductSales:
Load * inline [
Country,Product,Sales,Budget
Sweden,AA,100000,50000
Germany,AA,125000,175000
Canada,AA,105000,98000
Norway,AA,74850,68500
Ireland,AA,49000,48000
Sweden,BB,98000,99000
Germany,BB,115000,175000
Norway,BB,71850,68500
Ireland,BB,31000,48000
] (delimiter is ',');
Chart expressionCreate a pivot table visualization in a Qlik Sense sheet with Country and Product as dimensions. Add Sum(Sales), Sum(Budget), and Dimensionality() as measures.
In the Properties panel, enter the following expression as the Background color expression for the Sum(Sales) measure:
Script syntax and chart functions - Qlik Sense, February 2022 658
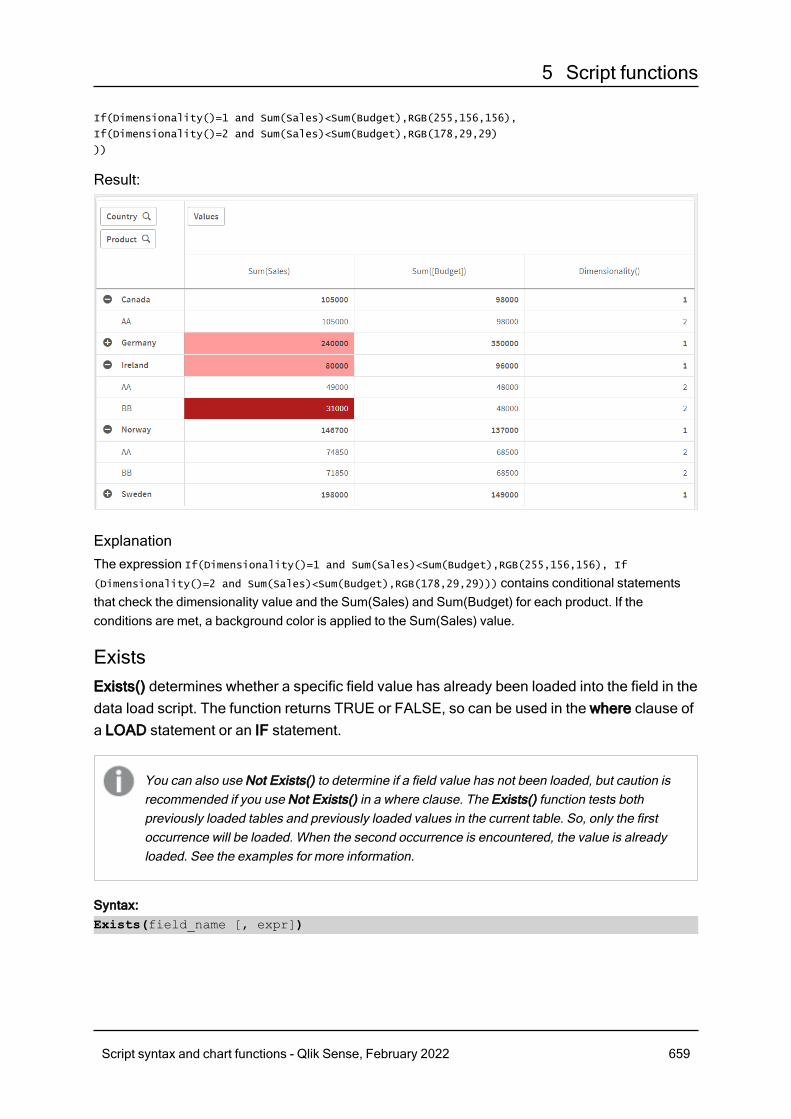
5 Script functions
If(Dimensionality()=1 and Sum(Sales)<Sum(Budget),RGB(255,156,156),
If(Dimensionality()=2 and Sum(Sales)<Sum(Budget),RGB(178,29,29)
))
Result:
ExplanationThe expression If(Dimensionality()=1 and Sum(Sales)<Sum(Budget),RGB(255,156,156), If
(Dimensionality()=2 and Sum(Sales)<Sum(Budget),RGB(178,29,29))) contains conditional statementsthat check the dimensionality value and the Sum(Sales) and Sum(Budget) for each product. If theconditions are met, a background color is applied to the Sum(Sales) value.
ExistsExists() determines whether a specific field value has already been loaded into the field in thedata load script. The function returns TRUE or FALSE, so can be used in the where clause ofa LOAD statement or an IF statement.
You can also use Not Exists() to determine if a field value has not been loaded, but caution isrecommended if you use Not Exists() in a where clause. The Exists() function tests bothpreviously loaded tables and previously loaded values in the current table. So, only the firstoccurrence will be loaded. When the second occurrence is encountered, the value is alreadyloaded. See the examples for more information.
Syntax:Exists(field_name [, expr])
Script syntax and chart functions - Qlik Sense, February 2022 659
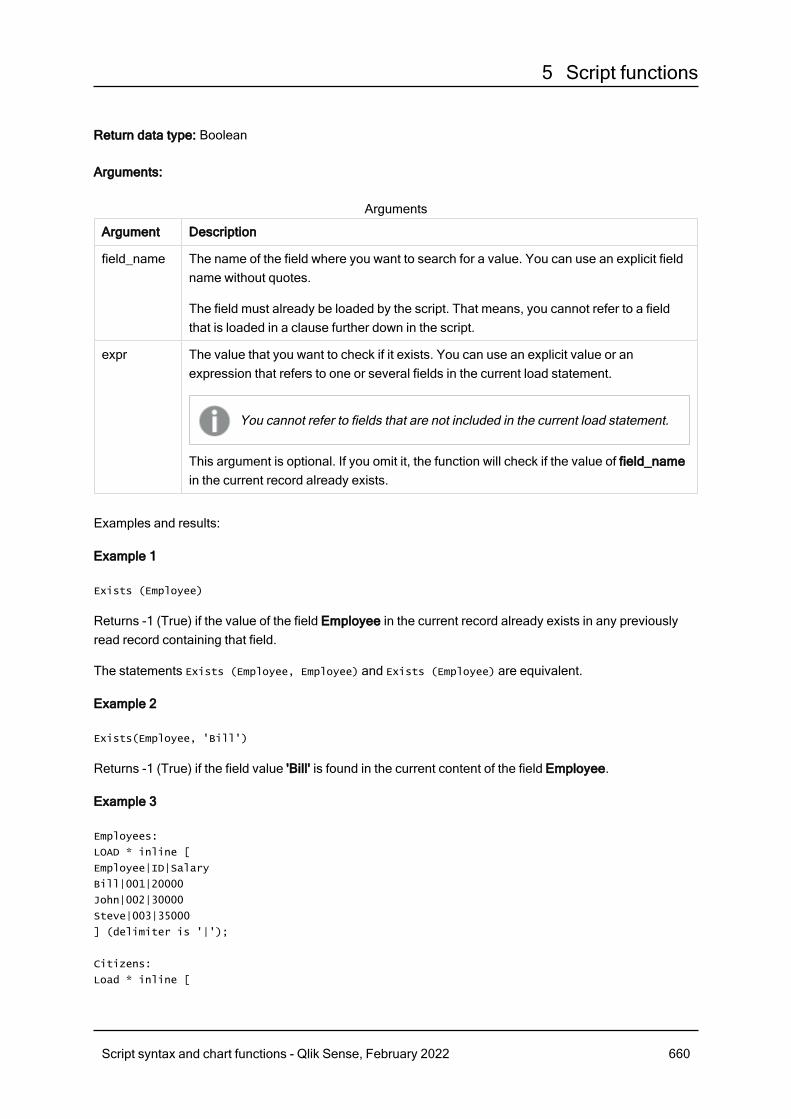
5 Script functions
Return data type: Boolean
Arguments:
Argument Description
field_name The name of the field where you want to search for a value. You can use an explicit fieldname without quotes.
The field must already be loaded by the script. That means, you cannot refer to a fieldthat is loaded in a clause further down in the script.
expr The value that you want to check if it exists. You can use an explicit value or anexpression that refers to one or several fields in the current load statement.
You cannot refer to fields that are not included in the current load statement.
This argument is optional. If you omit it, the function will check if the value of field_namein the current record already exists.
Arguments
Examples and results:
Example 1
Exists (Employee)
Returns -1 (True) if the value of the field Employee in the current record already exists in any previouslyread record containing that field.
The statements Exists (Employee, Employee) and Exists (Employee) are equivalent.
Example 2
Exists(Employee, 'Bill')
Returns -1 (True) if the field value 'Bill' is found in the current content of the field Employee.
Example 3
Employees:
LOAD * inline [
Employee|ID|Salary
Bill|001|20000
John|002|30000
Steve|003|35000
] (delimiter is '|');
Citizens:
Load * inline [
Script syntax and chart functions - Qlik Sense, February 2022 660
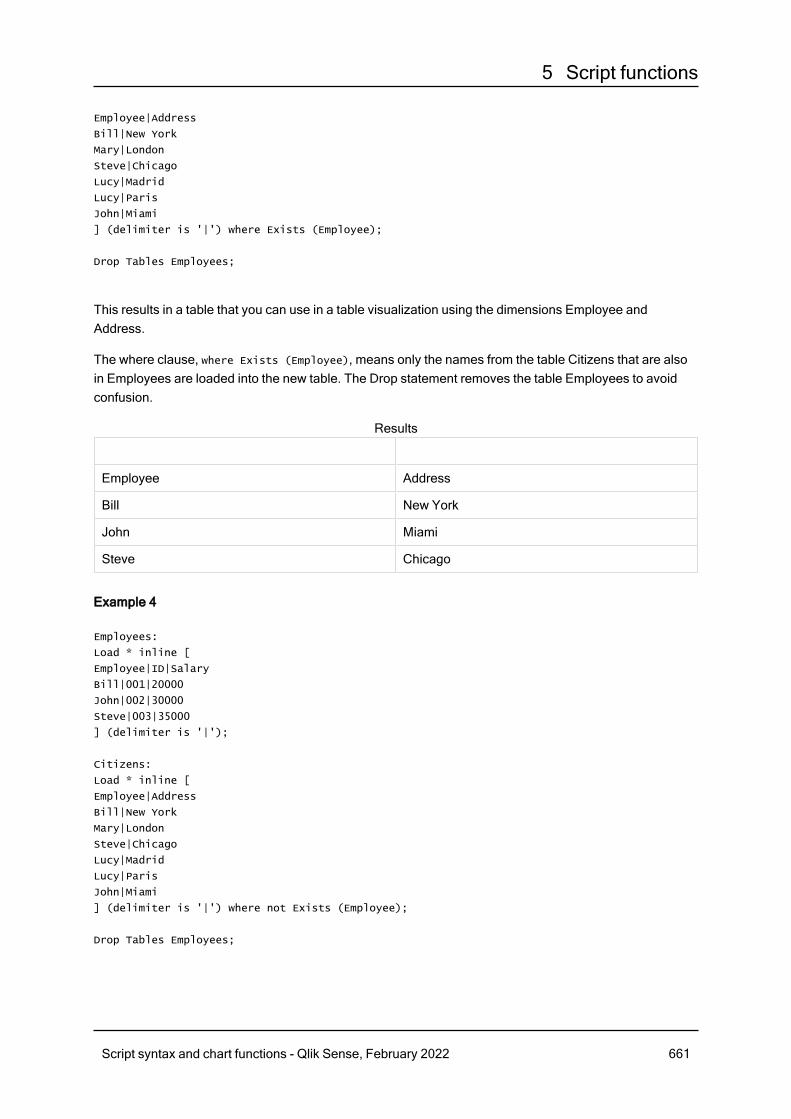
5 Script functions
Employee|Address
Bill|New York
Mary|London
Steve|Chicago
Lucy|Madrid
Lucy|Paris
John|Miami
] (delimiter is '|') where Exists (Employee);
Drop Tables Employees;
This results in a table that you can use in a table visualization using the dimensions Employee andAddress.
The where clause, where Exists (Employee), means only the names from the table Citizens that are alsoin Employees are loaded into the new table. The Drop statement removes the table Employees to avoidconfusion.
Employee Address
Bill New York
John Miami
Steve Chicago
Results
Example 4
Employees:
Load * inline [
Employee|ID|Salary
Bill|001|20000
John|002|30000
Steve|003|35000
] (delimiter is '|');
Citizens:
Load * inline [
Employee|Address
Bill|New York
Mary|London
Steve|Chicago
Lucy|Madrid
Lucy|Paris
John|Miami
] (delimiter is '|') where not Exists (Employee);
Drop Tables Employees;
Script syntax and chart functions - Qlik Sense, February 2022 661
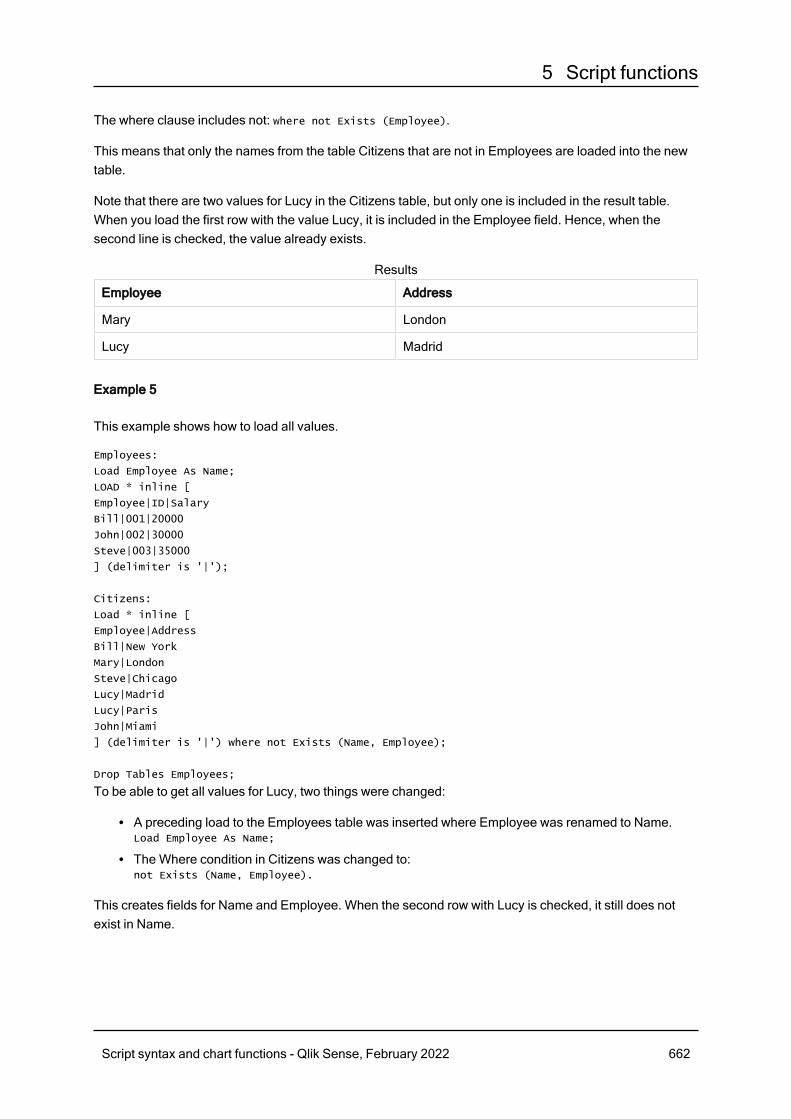
5 Script functions
The where clause includes not: where not Exists (Employee).
This means that only the names from the table Citizens that are not in Employees are loaded into the newtable.
Note that there are two values for Lucy in the Citizens table, but only one is included in the result table.When you load the first row with the value Lucy, it is included in the Employee field. Hence, when thesecond line is checked, the value already exists.
Employee Address
Mary London
Lucy Madrid
Results
Example 5
This example shows how to load all values.
Employees:
Load Employee As Name;
LOAD * inline [
Employee|ID|Salary
Bill|001|20000
John|002|30000
Steve|003|35000
] (delimiter is '|');
Citizens:
Load * inline [
Employee|Address
Bill|New York
Mary|London
Steve|Chicago
Lucy|Madrid
Lucy|Paris
John|Miami
] (delimiter is '|') where not Exists (Name, Employee);
Drop Tables Employees;
To be able to get all values for Lucy, two things were changed:
l A preceding load to the Employees table was inserted where Employee was renamed to Name.Load Employee As Name;
l The Where condition in Citizens was changed to:not Exists (Name, Employee).
This creates fields for Name and Employee. When the second row with Lucy is checked, it still does notexist in Name.
Script syntax and chart functions - Qlik Sense, February 2022 662
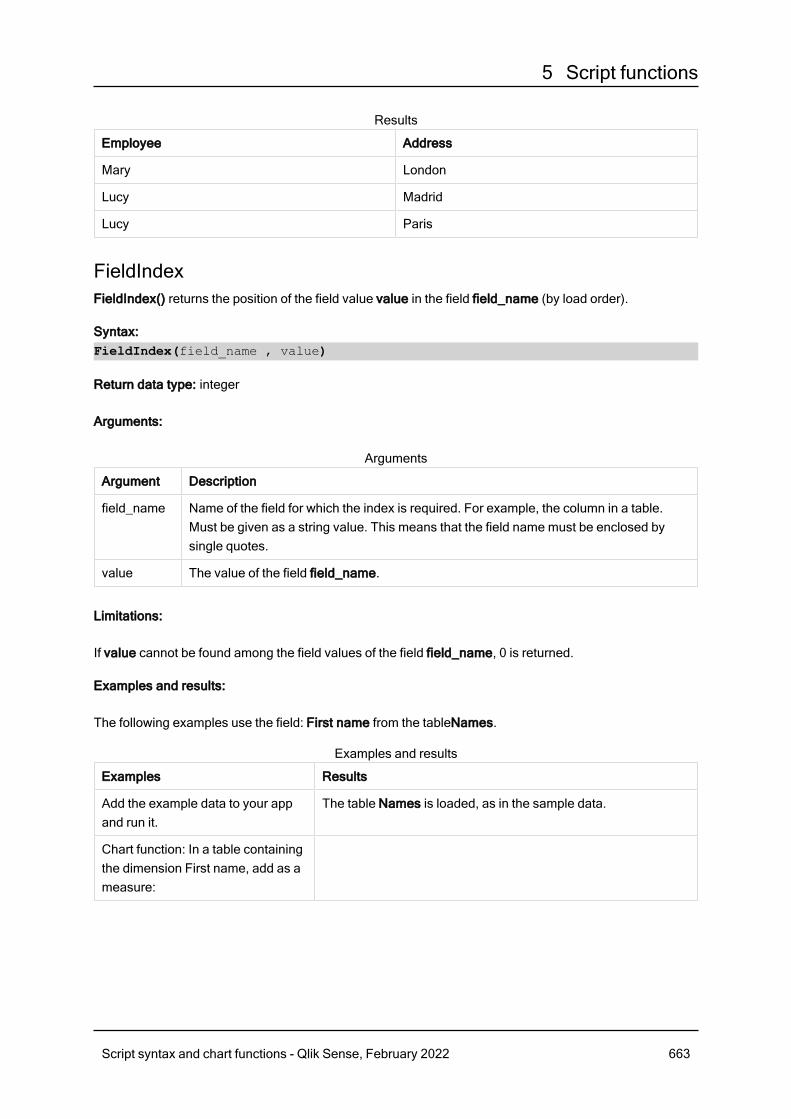
5 Script functions
Employee Address
Mary London
Lucy Madrid
Lucy Paris
Results
FieldIndexFieldIndex() returns the position of the field value value in the field field_name (by load order).
Syntax:FieldIndex(field_name , value)
Return data type: integer
Arguments:
Argument Description
field_name Name of the field for which the index is required. For example, the column in a table.Must be given as a string value. This means that the field name must be enclosed bysingle quotes.
value The value of the field field_name.
Arguments
Limitations:
If value cannot be found among the field values of the field field_name, 0 is returned.
Examples and results:
The following examples use the field: First name from the tableNames.
Examples Results
Add the example data to your appand run it.
The table Names is loaded, as in the sample data.
Chart function: In a table containingthe dimension First name, add as ameasure:
Examples and results
Script syntax and chart functions - Qlik Sense, February 2022 663
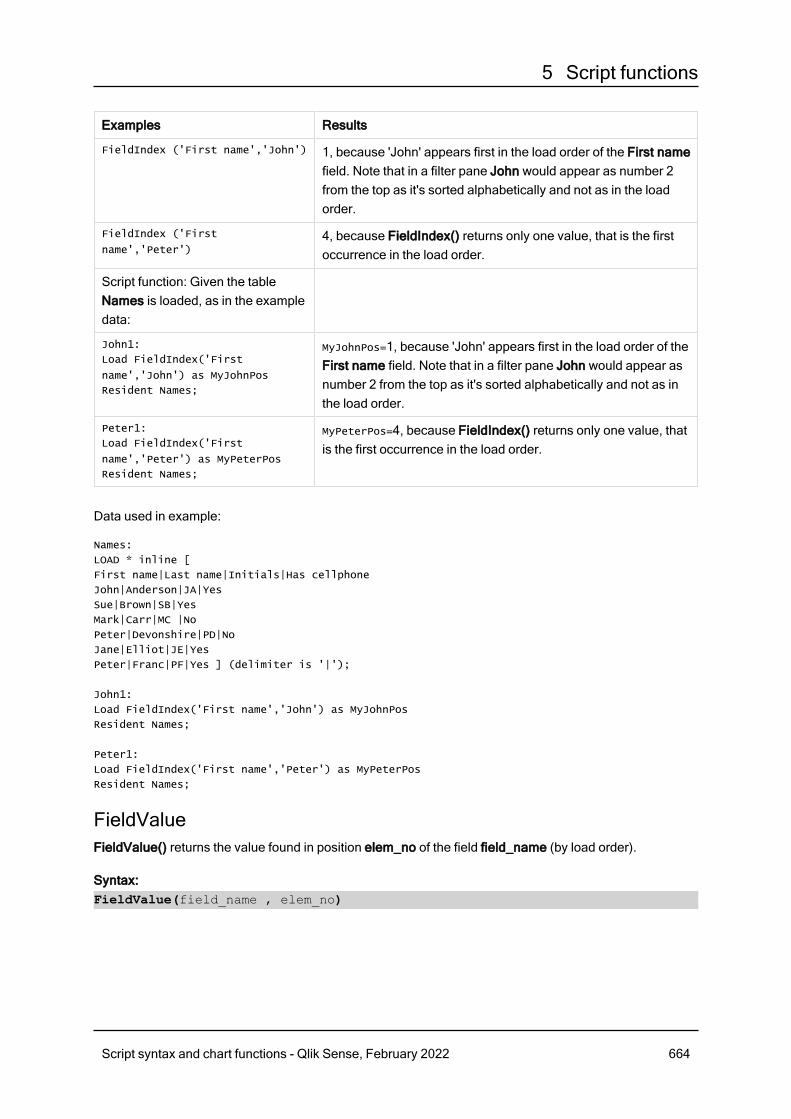
5 Script functions
Examples Results
FieldIndex ('First name','John') 1, because 'John' appears first in the load order of the First namefield. Note that in a filter pane John would appear as number 2from the top as it's sorted alphabetically and not as in the loadorder.
FieldIndex ('First
name','Peter')4, because FieldIndex() returns only one value, that is the firstoccurrence in the load order.
Script function: Given the tableNames is loaded, as in the exampledata:
John1:
Load FieldIndex('First
name','John') as MyJohnPos
Resident Names;
MyJohnPos=1, because 'John' appears first in the load order of theFirst name field. Note that in a filter pane John would appear asnumber 2 from the top as it's sorted alphabetically and not as inthe load order.
Peter1:
Load FieldIndex('First
name','Peter') as MyPeterPos
Resident Names;
MyPeterPos=4, because FieldIndex() returns only one value, thatis the first occurrence in the load order.
Data used in example:
Names:
LOAD * inline [
First name|Last name|Initials|Has cellphone
John|Anderson|JA|Yes
Sue|Brown|SB|Yes
Mark|Carr|MC |No
Peter|Devonshire|PD|No
Jane|Elliot|JE|Yes
Peter|Franc|PF|Yes ] (delimiter is '|');
John1:
Load FieldIndex('First name','John') as MyJohnPos
Resident Names;
Peter1:
Load FieldIndex('First name','Peter') as MyPeterPos
Resident Names;
FieldValueFieldValue() returns the value found in position elem_no of the field field_name (by load order).
Syntax:FieldValue(field_name , elem_no)
Script syntax and chart functions - Qlik Sense, February 2022 664
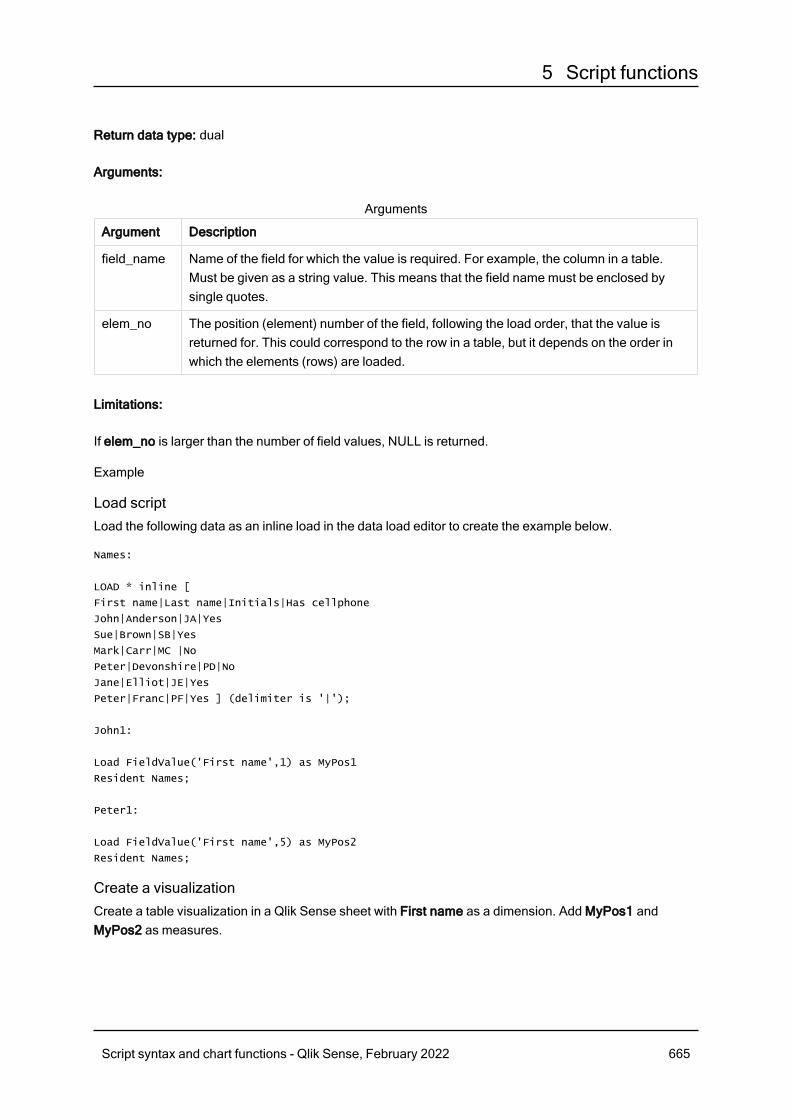
5 Script functions
Return data type: dual
Arguments:
Argument Description
field_name Name of the field for which the value is required. For example, the column in a table.Must be given as a string value. This means that the field name must be enclosed bysingle quotes.
elem_no The position (element) number of the field, following the load order, that the value isreturned for. This could correspond to the row in a table, but it depends on the order inwhich the elements (rows) are loaded.
Arguments
Limitations:
If elem_no is larger than the number of field values, NULL is returned.
Example
Load scriptLoad the following data as an inline load in the data load editor to create the example below.
Names:
LOAD * inline [
First name|Last name|Initials|Has cellphone
John|Anderson|JA|Yes
Sue|Brown|SB|Yes
Mark|Carr|MC |No
Peter|Devonshire|PD|No
Jane|Elliot|JE|Yes
Peter|Franc|PF|Yes ] (delimiter is '|');
John1:
Load FieldValue('First name',1) as MyPos1
Resident Names;
Peter1:
Load FieldValue('First name',5) as MyPos2
Resident Names;
Create a visualizationCreate a table visualization in a Qlik Sense sheet with First name as a dimension. Add MyPos1 andMyPos2 as measures.
Script syntax and chart functions - Qlik Sense, February 2022 665
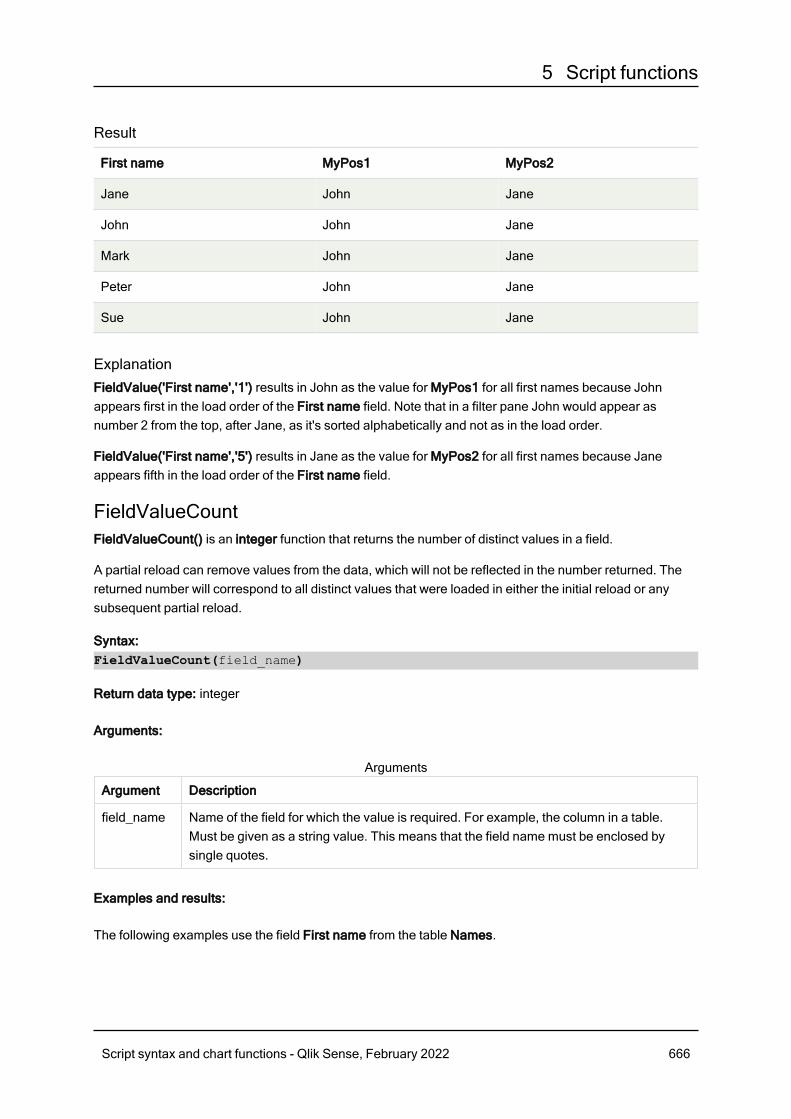
5 Script functions
Result
First name MyPos1 MyPos2
Jane John Jane
John John Jane
Mark John Jane
Peter John Jane
Sue John Jane
ExplanationFieldValue('First name','1') results in John as the value for MyPos1 for all first names because Johnappears first in the load order of the First name field. Note that in a filter pane John would appear asnumber 2 from the top, after Jane, as it's sorted alphabetically and not as in the load order.
FieldValue('First name','5') results in Jane as the value for MyPos2 for all first names because Janeappears fifth in the load order of the First name field.
FieldValueCountFieldValueCount() is an integer function that returns the number of distinct values in a field.
A partial reload can remove values from the data, which will not be reflected in the number returned. Thereturned number will correspond to all distinct values that were loaded in either the initial reload or anysubsequent partial reload.
Syntax:FieldValueCount(field_name)
Return data type: integer
Arguments:
Argument Description
field_name Name of the field for which the value is required. For example, the column in a table.Must be given as a string value. This means that the field name must be enclosed bysingle quotes.
Arguments
Examples and results:
The following examples use the field First name from the table Names.
Script syntax and chart functions - Qlik Sense, February 2022 666
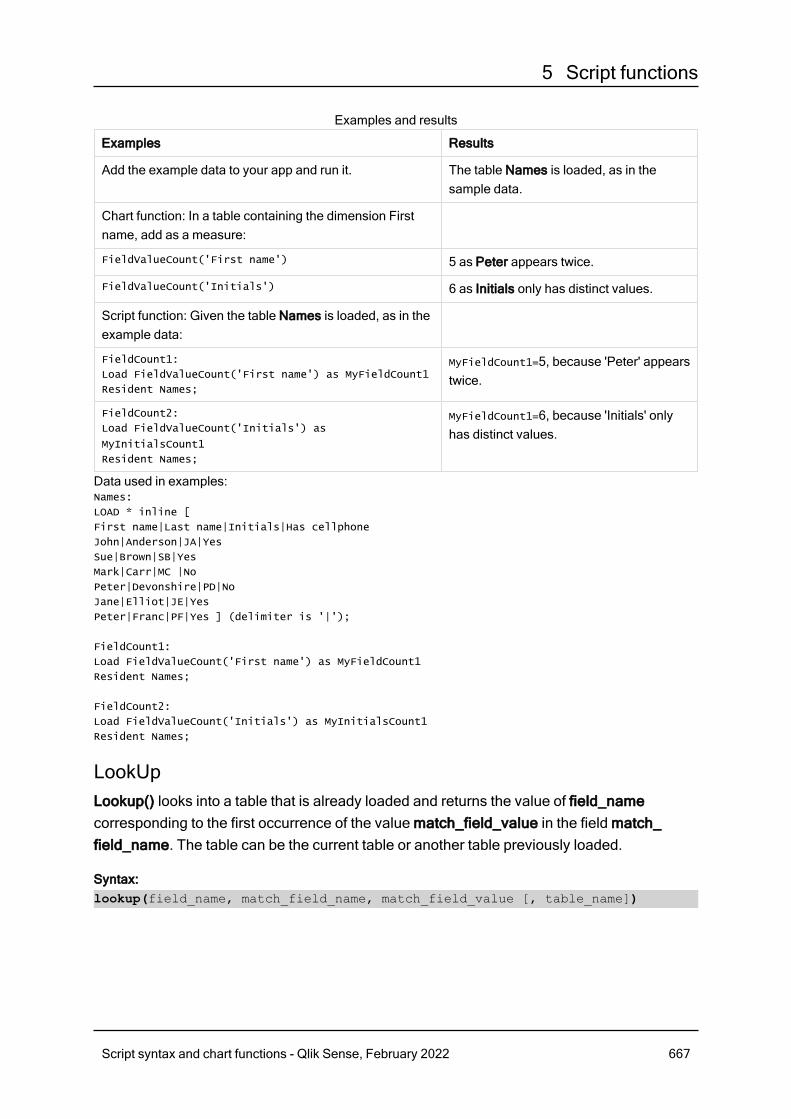
5 Script functions
Examples Results
Add the example data to your app and run it. The table Names is loaded, as in thesample data.
Chart function: In a table containing the dimension Firstname, add as a measure:
FieldValueCount('First name') 5 as Peter appears twice.
FieldValueCount('Initials') 6 as Initials only has distinct values.
Script function: Given the table Names is loaded, as in theexample data:
FieldCount1:
Load FieldValueCount('First name') as MyFieldCount1
Resident Names;
MyFieldCount1=5, because 'Peter' appearstwice.
FieldCount2:
Load FieldValueCount('Initials') as
MyInitialsCount1
Resident Names;
MyFieldCount1=6, because 'Initials' onlyhas distinct values.
Examples and results
Data used in examples:Names:
LOAD * inline [
First name|Last name|Initials|Has cellphone
John|Anderson|JA|Yes
Sue|Brown|SB|Yes
Mark|Carr|MC |No
Peter|Devonshire|PD|No
Jane|Elliot|JE|Yes
Peter|Franc|PF|Yes ] (delimiter is '|');
FieldCount1:
Load FieldValueCount('First name') as MyFieldCount1
Resident Names;
FieldCount2:
Load FieldValueCount('Initials') as MyInitialsCount1
Resident Names;
LookUpLookup() looks into a table that is already loaded and returns the value of field_namecorresponding to the first occurrence of the value match_field_value in the field match_field_name. The table can be the current table or another table previously loaded.
Syntax:lookup(field_name, match_field_name, match_field_value [, table_name])
Script syntax and chart functions - Qlik Sense, February 2022 667
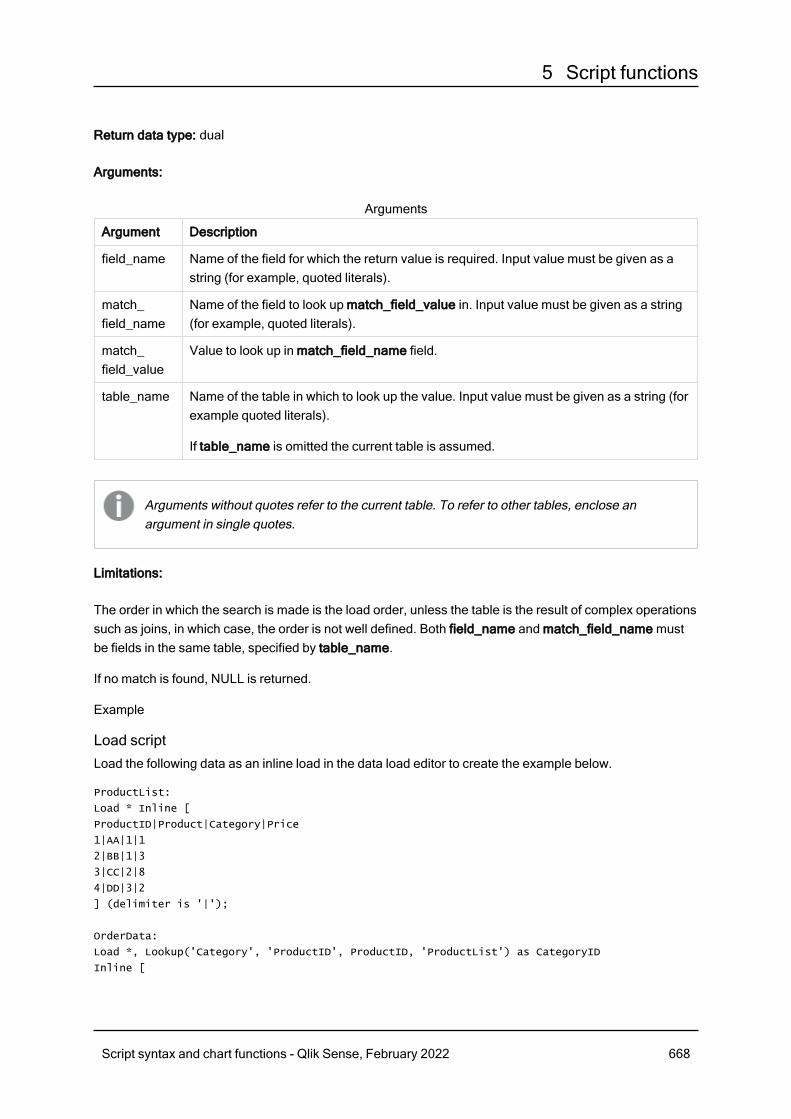
5 Script functions
Return data type: dual
Arguments:
Argument Description
field_name Name of the field for which the return value is required. Input value must be given as astring (for example, quoted literals).
match_field_name
Name of the field to look up match_field_value in. Input value must be given as a string(for example, quoted literals).
match_field_value
Value to look up in match_field_name field.
table_name Name of the table in which to look up the value. Input value must be given as a string (forexample quoted literals).
If table_name is omitted the current table is assumed.
Arguments
Arguments without quotes refer to the current table. To refer to other tables, enclose anargument in single quotes.
Limitations:
The order in which the search is made is the load order, unless the table is the result of complex operationssuch as joins, in which case, the order is not well defined. Both field_name and match_field_name mustbe fields in the same table, specified by table_name.
If no match is found, NULL is returned.
Example
Load scriptLoad the following data as an inline load in the data load editor to create the example below.
ProductList:
Load * Inline [
ProductID|Product|Category|Price
1|AA|1|1
2|BB|1|3
3|CC|2|8
4|DD|3|2
] (delimiter is '|');
OrderData:
Load *, Lookup('Category', 'ProductID', ProductID, 'ProductList') as CategoryID
Inline [
Script syntax and chart functions - Qlik Sense, February 2022 668
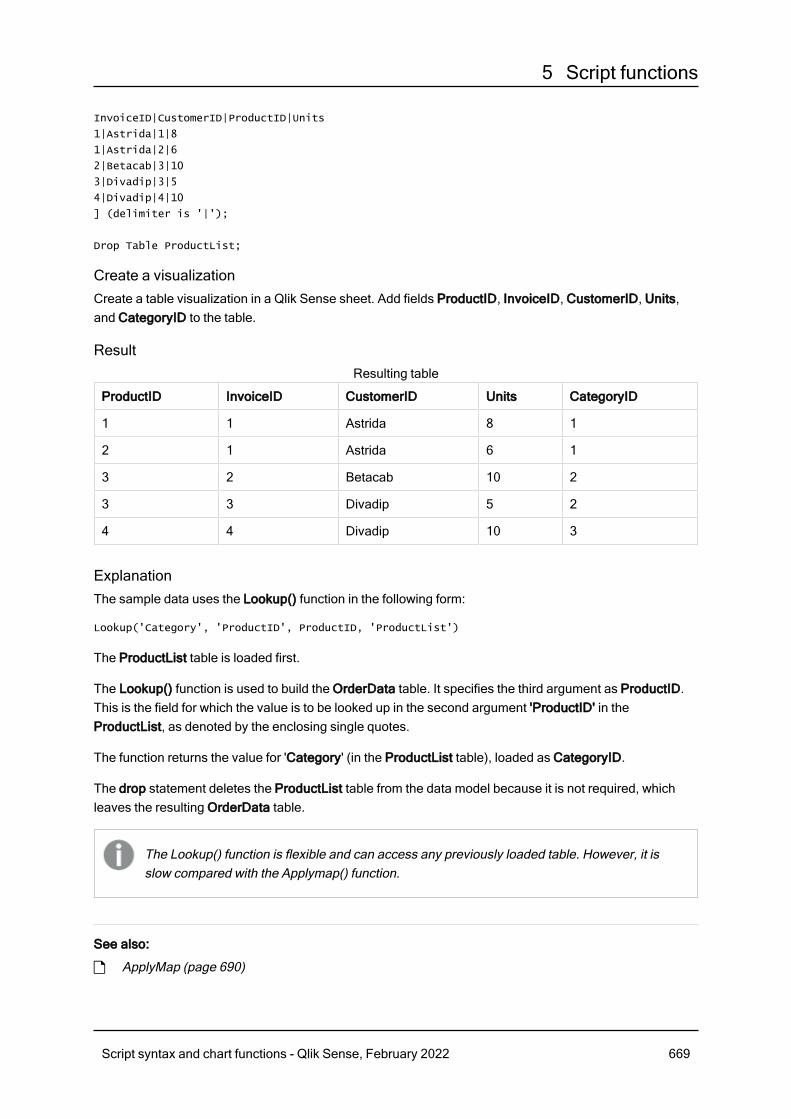
5 Script functions
InvoiceID|CustomerID|ProductID|Units
1|Astrida|1|8
1|Astrida|2|6
2|Betacab|3|10
3|Divadip|3|5
4|Divadip|4|10
] (delimiter is '|');
Drop Table ProductList;
Create a visualizationCreate a table visualization in a Qlik Sense sheet. Add fields ProductID, InvoiceID, CustomerID, Units,and CategoryID to the table.
Result
ProductID InvoiceID CustomerID Units CategoryID
1 1 Astrida 8 1
2 1 Astrida 6 1
3 2 Betacab 10 2
3 3 Divadip 5 2
4 4 Divadip 10 3
Resulting table
ExplanationThe sample data uses the Lookup() function in the following form:
Lookup('Category', 'ProductID', ProductID, 'ProductList')
The ProductList table is loaded first.
The Lookup() function is used to build the OrderData table. It specifies the third argument as ProductID.This is the field for which the value is to be looked up in the second argument 'ProductID' in theProductList, as denoted by the enclosing single quotes.
The function returns the value for 'Category' (in the ProductList table), loaded as CategoryID.
The drop statement deletes the ProductList table from the data model because it is not required, whichleaves the resulting OrderData table.
The Lookup() function is flexible and can access any previously loaded table. However, it isslow compared with the Applymap() function.
See also:
p ApplyMap (page 690)
Script syntax and chart functions - Qlik Sense, February 2022 669
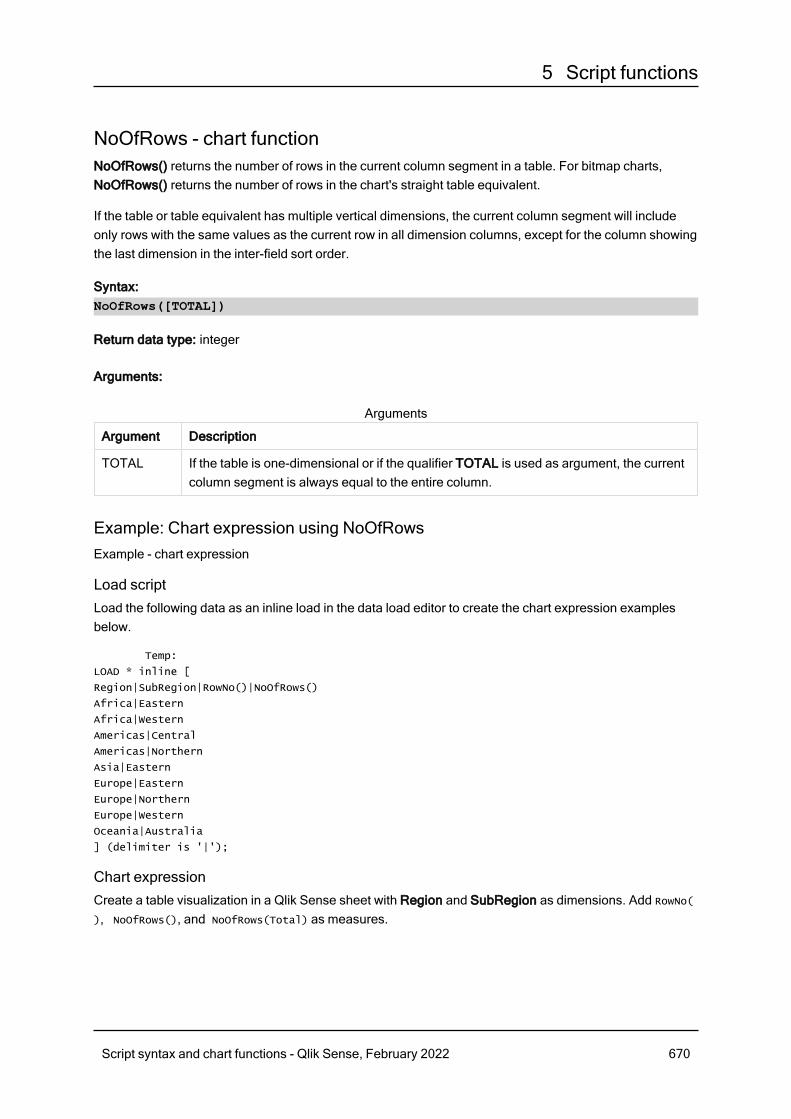
5 Script functions
NoOfRows - chart functionNoOfRows() returns the number of rows in the current column segment in a table. For bitmap charts,NoOfRows() returns the number of rows in the chart's straight table equivalent.
If the table or table equivalent has multiple vertical dimensions, the current column segment will includeonly rows with the same values as the current row in all dimension columns, except for the column showingthe last dimension in the inter-field sort order.
Syntax:NoOfRows([TOTAL])
Return data type: integer
Arguments:
Argument Description
TOTAL If the table is one-dimensional or if the qualifier TOTAL is used as argument, the currentcolumn segment is always equal to the entire column.
Arguments
Example: Chart expression using NoOfRowsExample - chart expression
Load scriptLoad the following data as an inline load in the data load editor to create the chart expression examplesbelow.
Temp:
LOAD * inline [
Region|SubRegion|RowNo()|NoOfRows()
Africa|Eastern
Africa|Western
Americas|Central
Americas|Northern
Asia|Eastern
Europe|Eastern
Europe|Northern
Europe|Western
Oceania|Australia
] (delimiter is '|');
Chart expressionCreate a table visualization in a Qlik Sense sheet with Region and SubRegion as dimensions. Add RowNo(
), NoOfRows(), and NoOfRows(Total) as measures.
Script syntax and chart functions - Qlik Sense, February 2022 670
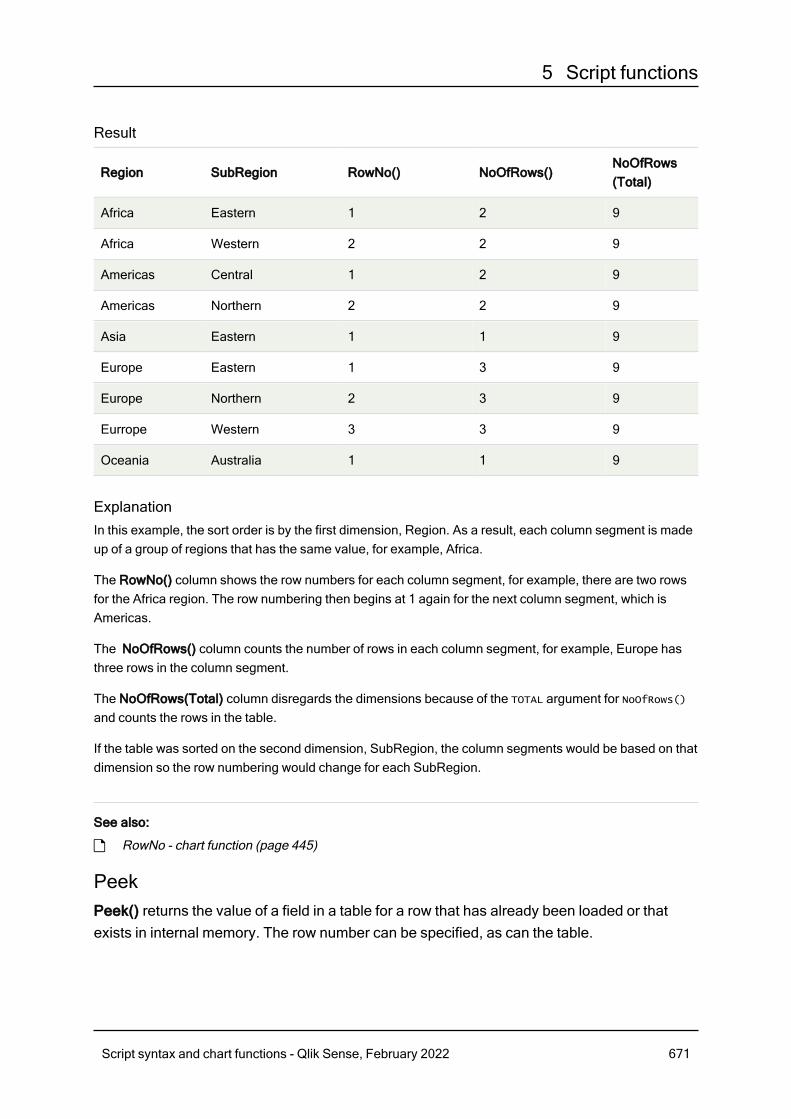
5 Script functions
Result
Region SubRegion RowNo() NoOfRows()NoOfRows(Total)
Africa Eastern 1 2 9
Africa Western 2 2 9
Americas Central 1 2 9
Americas Northern 2 2 9
Asia Eastern 1 1 9
Europe Eastern 1 3 9
Europe Northern 2 3 9
Eurrope Western 3 3 9
Oceania Australia 1 1 9
ExplanationIn this example, the sort order is by the first dimension, Region. As a result, each column segment is madeup of a group of regions that has the same value, for example, Africa.
The RowNo() column shows the row numbers for each column segment, for example, there are two rowsfor the Africa region. The row numbering then begins at 1 again for the next column segment, which isAmericas.
The NoOfRows() column counts the number of rows in each column segment, for example, Europe hasthree rows in the column segment.
The NoOfRows(Total) column disregards the dimensions because of the TOTAL argument for NoOfRows()and counts the rows in the table.
If the table was sorted on the second dimension, SubRegion, the column segments would be based on thatdimension so the row numbering would change for each SubRegion.
See also:
p RowNo - chart function (page 445)
PeekPeek() returns the value of a field in a table for a row that has already been loaded or thatexists in internal memory. The row number can be specified, as can the table.
Script syntax and chart functions - Qlik Sense, February 2022 671
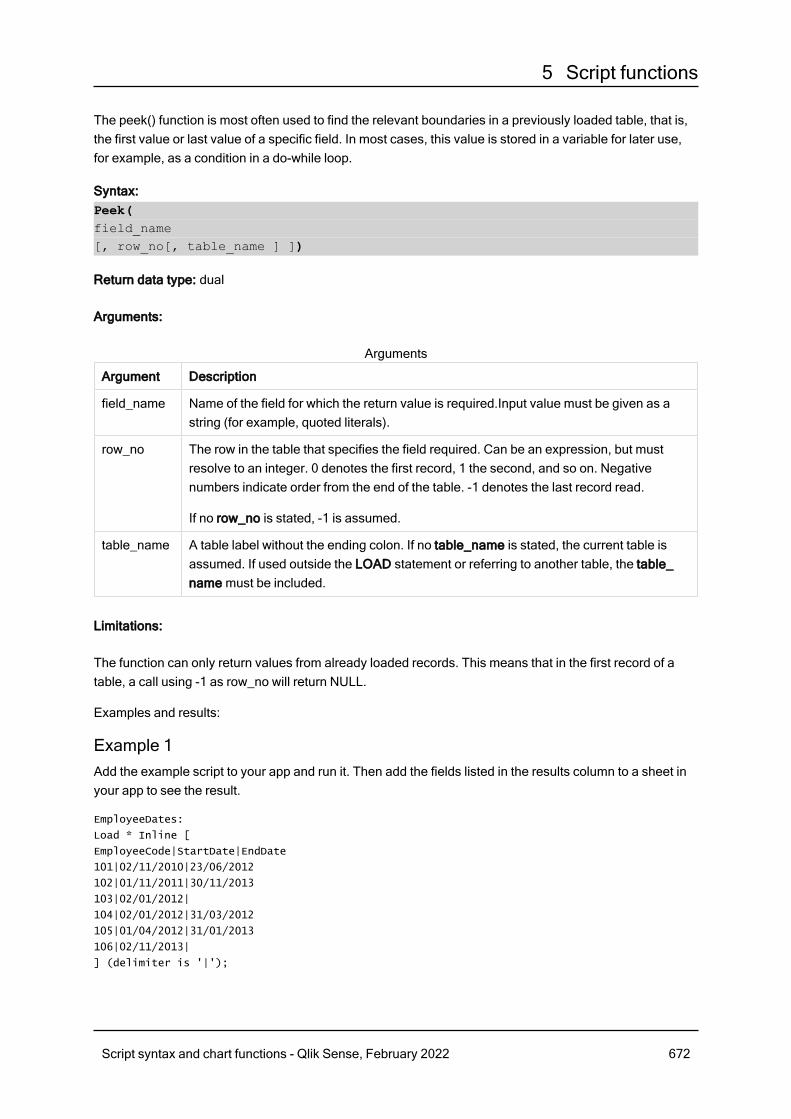
5 Script functions
The peek() function is most often used to find the relevant boundaries in a previously loaded table, that is,the first value or last value of a specific field. In most cases, this value is stored in a variable for later use,for example, as a condition in a do-while loop.
Syntax:Peek(field_name[, row_no[, table_name ] ])
Return data type: dual
Arguments:
Argument Description
field_name Name of the field for which the return value is required.Input value must be given as astring (for example, quoted literals).
row_no The row in the table that specifies the field required. Can be an expression, but mustresolve to an integer. 0 denotes the first record, 1 the second, and so on. Negativenumbers indicate order from the end of the table. -1 denotes the last record read.
If no row_no is stated, -1 is assumed.
table_name A table label without the ending colon. If no table_name is stated, the current table isassumed. If used outside the LOAD statement or referring to another table, the table_name must be included.
Arguments
Limitations:
The function can only return values from already loaded records. This means that in the first record of atable, a call using -1 as row_no will return NULL.
Examples and results:
Example 1Add the example script to your app and run it. Then add the fields listed in the results column to a sheet inyour app to see the result.
EmployeeDates:
Load * Inline [
EmployeeCode|StartDate|EndDate
101|02/11/2010|23/06/2012
102|01/11/2011|30/11/2013
103|02/01/2012|
104|02/01/2012|31/03/2012
105|01/04/2012|31/01/2013
106|02/11/2013|
] (delimiter is '|');
Script syntax and chart functions - Qlik Sense, February 2022 672
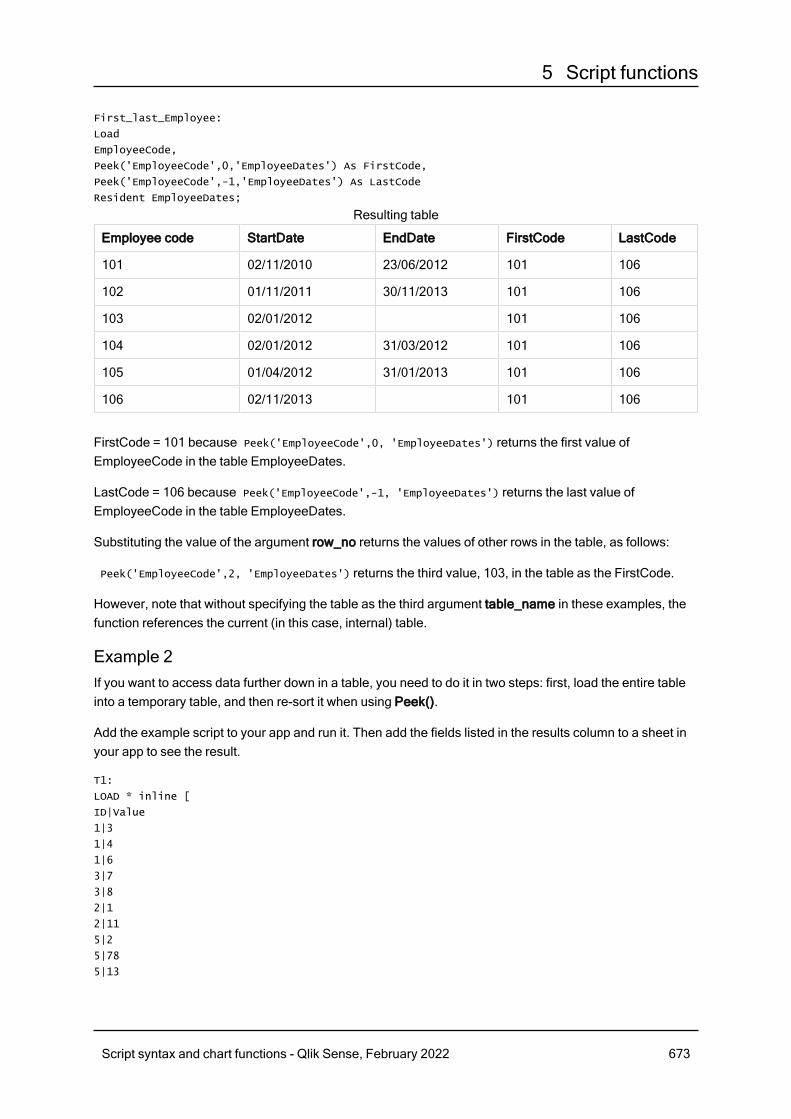
5 Script functions
First_last_Employee:
Load
EmployeeCode,
Peek('EmployeeCode',0,'EmployeeDates') As FirstCode,
Peek('EmployeeCode',-1,'EmployeeDates') As LastCode
Resident EmployeeDates;
Employee code StartDate EndDate FirstCode LastCode
101 02/11/2010 23/06/2012 101 106
102 01/11/2011 30/11/2013 101 106
103 02/01/2012 101 106
104 02/01/2012 31/03/2012 101 106
105 01/04/2012 31/01/2013 101 106
106 02/11/2013 101 106
Resulting table
FirstCode = 101 because Peek('EmployeeCode',0, 'EmployeeDates') returns the first value ofEmployeeCode in the table EmployeeDates.
LastCode = 106 because Peek('EmployeeCode',-1, 'EmployeeDates') returns the last value ofEmployeeCode in the table EmployeeDates.
Substituting the value of the argument row_no returns the values of other rows in the table, as follows:
Peek('EmployeeCode',2, 'EmployeeDates') returns the third value, 103, in the table as the FirstCode.
However, note that without specifying the table as the third argument table_name in these examples, thefunction references the current (in this case, internal) table.
Example 2If you want to access data further down in a table, you need to do it in two steps: first, load the entire tableinto a temporary table, and then re-sort it when using Peek().
Add the example script to your app and run it. Then add the fields listed in the results column to a sheet inyour app to see the result.
T1:
LOAD * inline [
ID|Value
1|3
1|4
1|6
3|7
3|8
2|1
2|11
5|2
5|78
5|13
Script syntax and chart functions - Qlik Sense, February 2022 673
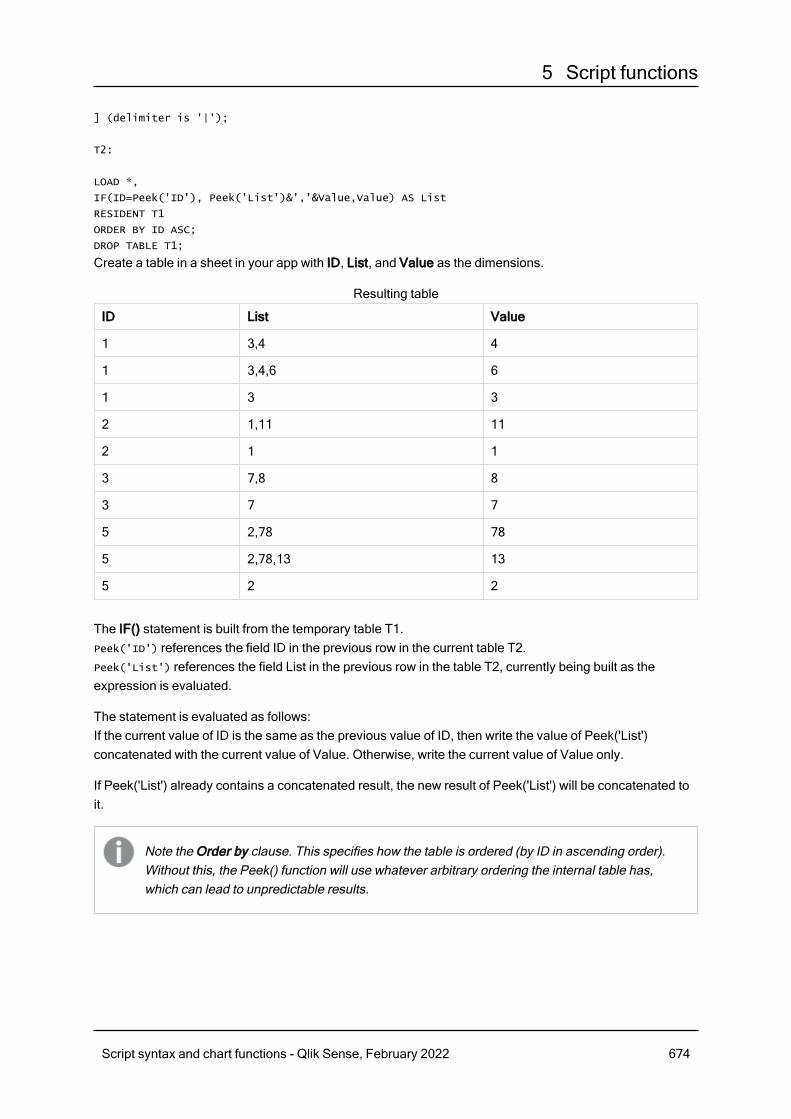
5 Script functions
] (delimiter is '|');
T2:
LOAD *,
IF(ID=Peek('ID'), Peek('List')&','&Value,Value) AS List
RESIDENT T1
ORDER BY ID ASC;
DROP TABLE T1;
Create a table in a sheet in your app with ID, List, and Value as the dimensions.
ID List Value
1 3,4 4
1 3,4,6 6
1 3 3
2 1,11 11
2 1 1
3 7,8 8
3 7 7
5 2,78 78
5 2,78,13 13
5 2 2
Resulting table
The IF() statement is built from the temporary table T1.Peek('ID') references the field ID in the previous row in the current table T2.Peek('List') references the field List in the previous row in the table T2, currently being built as theexpression is evaluated.
The statement is evaluated as follows:If the current value of ID is the same as the previous value of ID, then write the value of Peek('List')concatenated with the current value of Value. Otherwise, write the current value of Value only.
If Peek('List') already contains a concatenated result, the new result of Peek('List') will be concatenated toit.
Note the Order by clause. This specifies how the table is ordered (by ID in ascending order).Without this, the Peek() function will use whatever arbitrary ordering the internal table has,which can lead to unpredictable results.
Script syntax and chart functions - Qlik Sense, February 2022 674
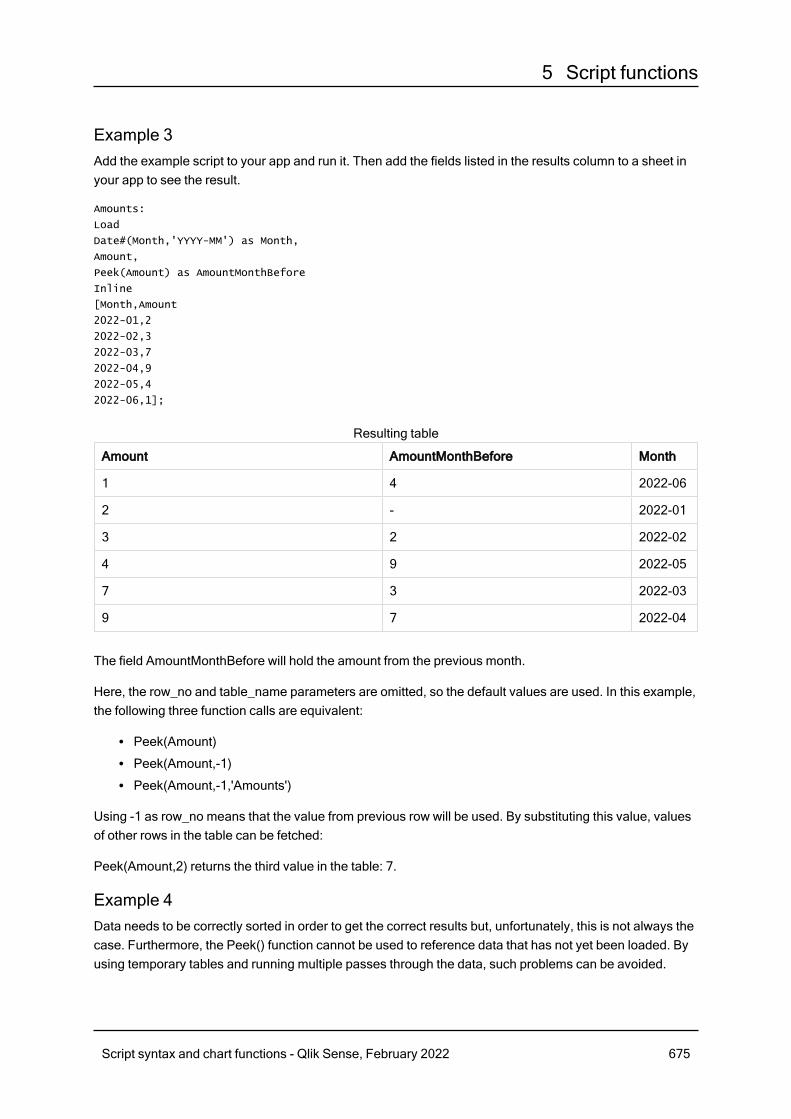
5 Script functions
Example 3Add the example script to your app and run it. Then add the fields listed in the results column to a sheet inyour app to see the result.
Amounts:
Load
Date#(Month,'YYYY-MM') as Month,
Amount,
Peek(Amount) as AmountMonthBefore
Inline
[Month,Amount
2022-01,2
2022-02,3
2022-03,7
2022-04,9
2022-05,4
2022-06,1];
Amount AmountMonthBefore Month
1 4 2022-06
2 - 2022-01
3 2 2022-02
4 9 2022-05
7 3 2022-03
9 7 2022-04
Resulting table
The field AmountMonthBefore will hold the amount from the previous month.
Here, the row_no and table_name parameters are omitted, so the default values are used. In this example,the following three function calls are equivalent:
l Peek(Amount)l Peek(Amount,-1)l Peek(Amount,-1,'Amounts')
Using -1 as row_no means that the value from previous row will be used. By substituting this value, valuesof other rows in the table can be fetched:
Peek(Amount,2) returns the third value in the table: 7.
Example 4Data needs to be correctly sorted in order to get the correct results but, unfortunately, this is not always thecase. Furthermore, the Peek() function cannot be used to reference data that has not yet been loaded. Byusing temporary tables and running multiple passes through the data, such problems can be avoided.
Script syntax and chart functions - Qlik Sense, February 2022 675
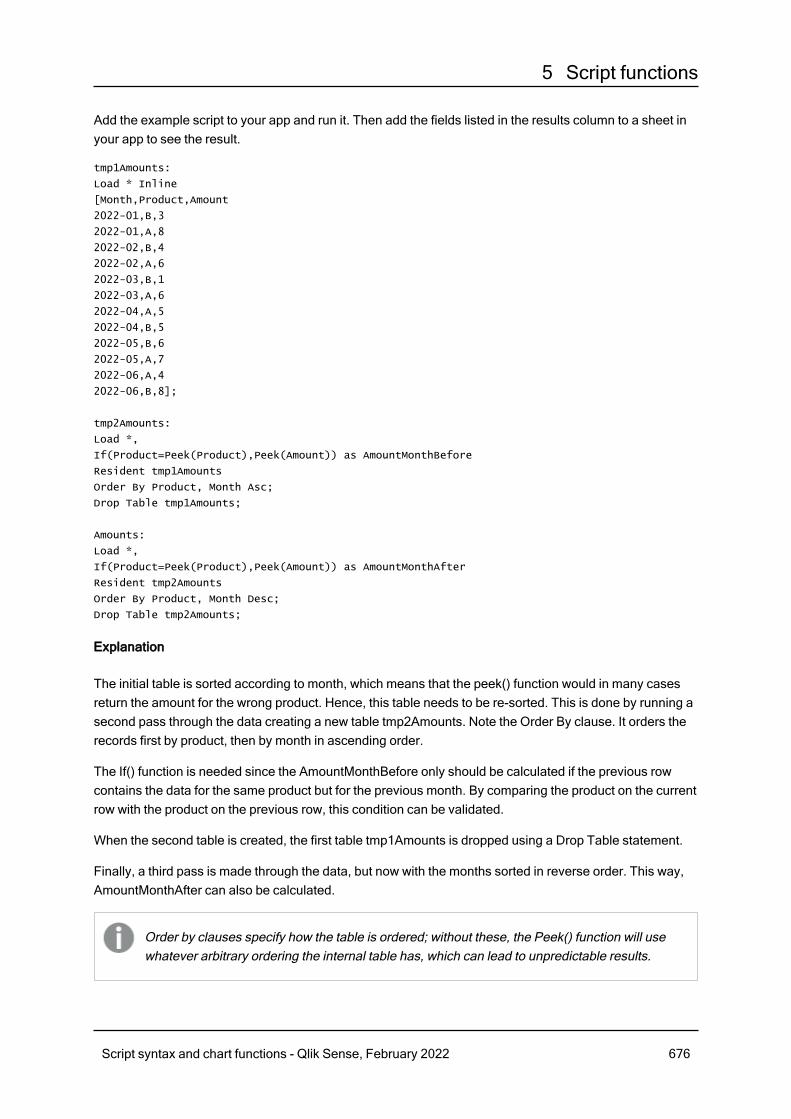
5 Script functions
Add the example script to your app and run it. Then add the fields listed in the results column to a sheet inyour app to see the result.
tmp1Amounts:
Load * Inline
[Month,Product,Amount
2022-01,B,3
2022-01,A,8
2022-02,B,4
2022-02,A,6
2022-03,B,1
2022-03,A,6
2022-04,A,5
2022-04,B,5
2022-05,B,6
2022-05,A,7
2022-06,A,4
2022-06,B,8];
tmp2Amounts:
Load *,
If(Product=Peek(Product),Peek(Amount)) as AmountMonthBefore
Resident tmp1Amounts
Order By Product, Month Asc;
Drop Table tmp1Amounts;
Amounts:
Load *,
If(Product=Peek(Product),Peek(Amount)) as AmountMonthAfter
Resident tmp2Amounts
Order By Product, Month Desc;
Drop Table tmp2Amounts;
Explanation
The initial table is sorted according to month, which means that the peek() function would in many casesreturn the amount for the wrong product. Hence, this table needs to be re-sorted. This is done by running asecond pass through the data creating a new table tmp2Amounts. Note the Order By clause. It orders therecords first by product, then by month in ascending order.
The If() function is needed since the AmountMonthBefore only should be calculated if the previous rowcontains the data for the same product but for the previous month. By comparing the product on the currentrow with the product on the previous row, this condition can be validated.
When the second table is created, the first table tmp1Amounts is dropped using a Drop Table statement.
Finally, a third pass is made through the data, but now with the months sorted in reverse order. This way,AmountMonthAfter can also be calculated.
Order by clauses specify how the table is ordered; without these, the Peek() function will usewhatever arbitrary ordering the internal table has, which can lead to unpredictable results.
Script syntax and chart functions - Qlik Sense, February 2022 676
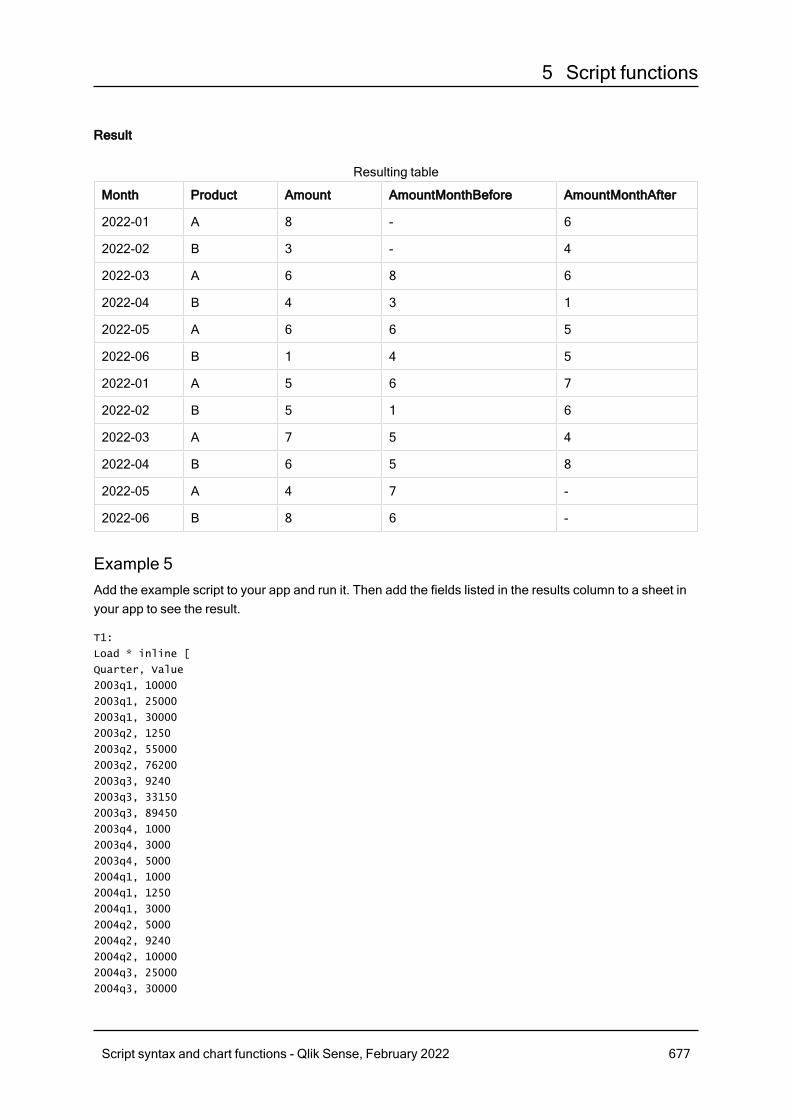
5 Script functions
Result
Month Product Amount AmountMonthBefore AmountMonthAfter
2022-01 A 8 - 6
2022-02 B 3 - 4
2022-03 A 6 8 6
2022-04 B 4 3 1
2022-05 A 6 6 5
2022-06 B 1 4 5
2022-01 A 5 6 7
2022-02 B 5 1 6
2022-03 A 7 5 4
2022-04 B 6 5 8
2022-05 A 4 7 -
2022-06 B 8 6 -
Resulting table
Example 5Add the example script to your app and run it. Then add the fields listed in the results column to a sheet inyour app to see the result.
T1:
Load * inline [
Quarter, Value
2003q1, 10000
2003q1, 25000
2003q1, 30000
2003q2, 1250
2003q2, 55000
2003q2, 76200
2003q3, 9240
2003q3, 33150
2003q3, 89450
2003q4, 1000
2003q4, 3000
2003q4, 5000
2004q1, 1000
2004q1, 1250
2004q1, 3000
2004q2, 5000
2004q2, 9240
2004q2, 10000
2004q3, 25000
2004q3, 30000
Script syntax and chart functions - Qlik Sense, February 2022 677
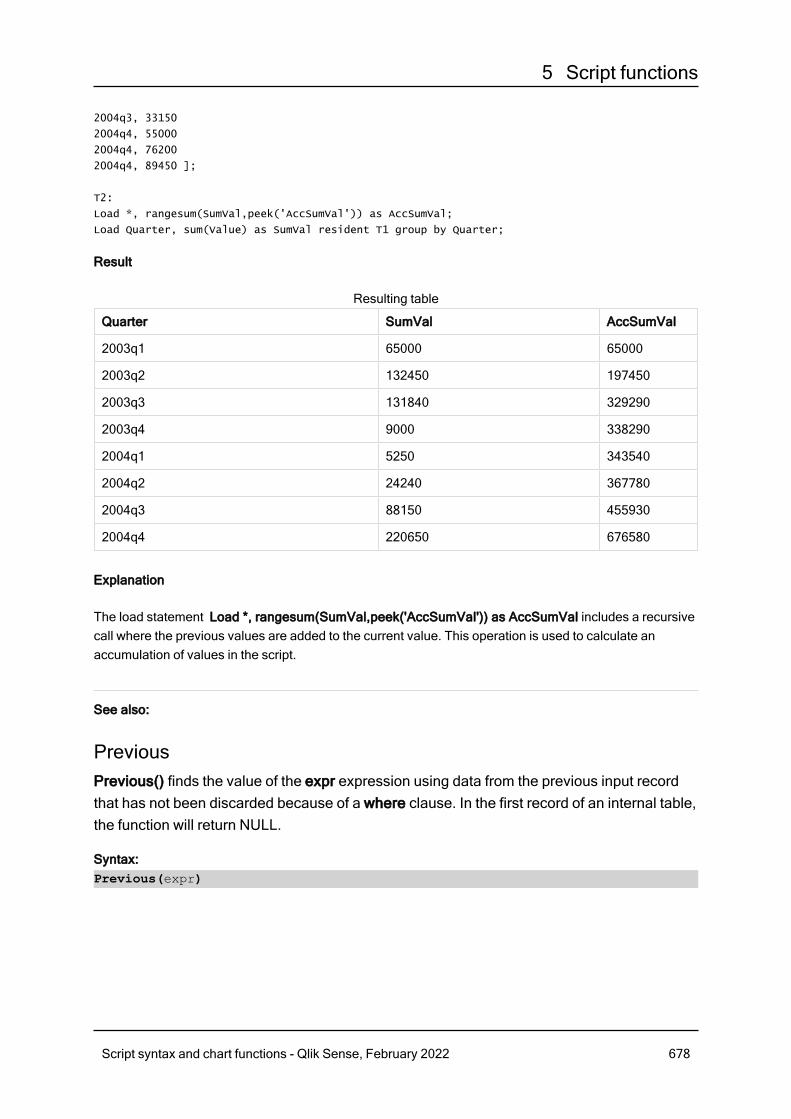
5 Script functions
2004q3, 33150
2004q4, 55000
2004q4, 76200
2004q4, 89450 ];
T2:
Load *, rangesum(SumVal,peek('AccSumVal')) as AccSumVal;
Load Quarter, sum(Value) as SumVal resident T1 group by Quarter;
Result
Quarter SumVal AccSumVal
2003q1 65000 65000
2003q2 132450 197450
2003q3 131840 329290
2003q4 9000 338290
2004q1 5250 343540
2004q2 24240 367780
2004q3 88150 455930
2004q4 220650 676580
Resulting table
Explanation
The load statement Load *, rangesum(SumVal,peek('AccSumVal')) as AccSumVal includes a recursivecall where the previous values are added to the current value. This operation is used to calculate anaccumulation of values in the script.
See also:
PreviousPrevious() finds the value of the expr expression using data from the previous input recordthat has not been discarded because of a where clause. In the first record of an internal table,the function will return NULL.
Syntax:Previous(expr)
Script syntax and chart functions - Qlik Sense, February 2022 678
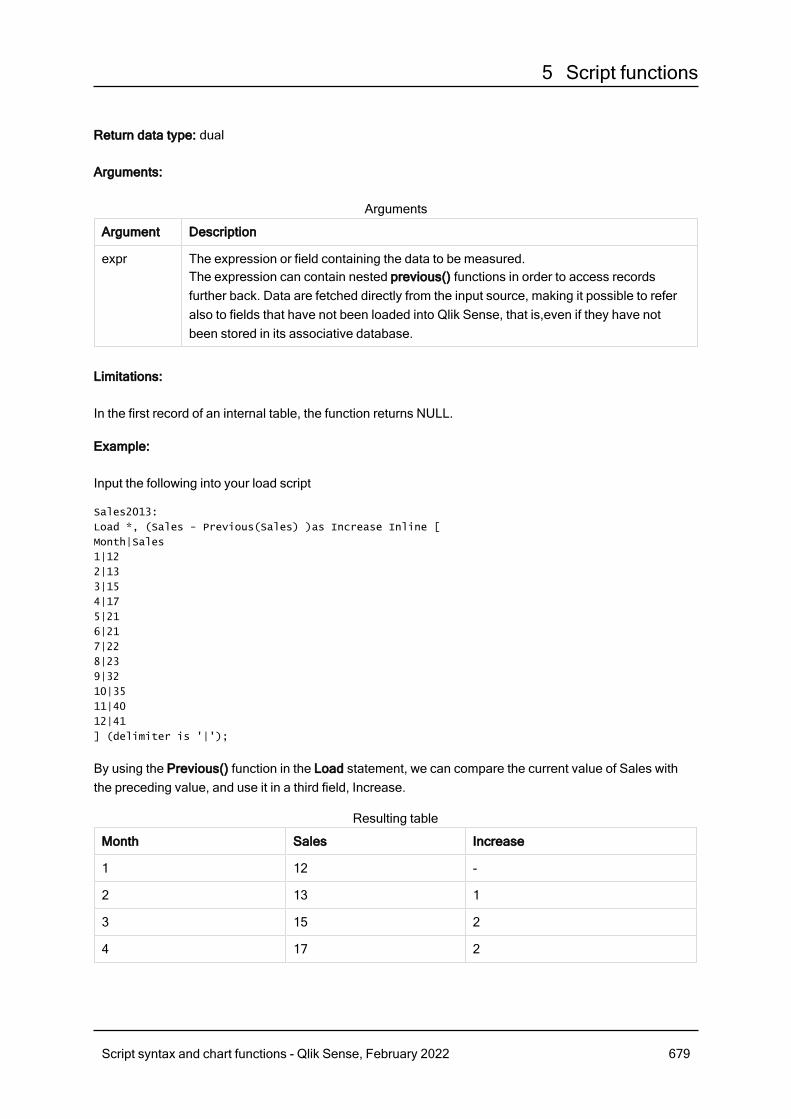
5 Script functions
Return data type: dual
Arguments:
Argument Description
expr The expression or field containing the data to be measured.The expression can contain nested previous() functions in order to access recordsfurther back. Data are fetched directly from the input source, making it possible to referalso to fields that have not been loaded into Qlik Sense, that is,even if they have notbeen stored in its associative database.
Arguments
Limitations:
In the first record of an internal table, the function returns NULL.
Example:
Input the following into your load script
Sales2013:
Load *, (Sales - Previous(Sales) )as Increase Inline [
Month|Sales
1|12
2|13
3|15
4|17
5|21
6|21
7|22
8|23
9|32
10|35
11|40
12|41
] (delimiter is '|');
By using the Previous() function in the Load statement, we can compare the current value of Sales withthe preceding value, and use it in a third field, Increase.
Month Sales Increase
1 12 -
2 13 1
3 15 2
4 17 2
Resulting table
Script syntax and chart functions - Qlik Sense, February 2022 679
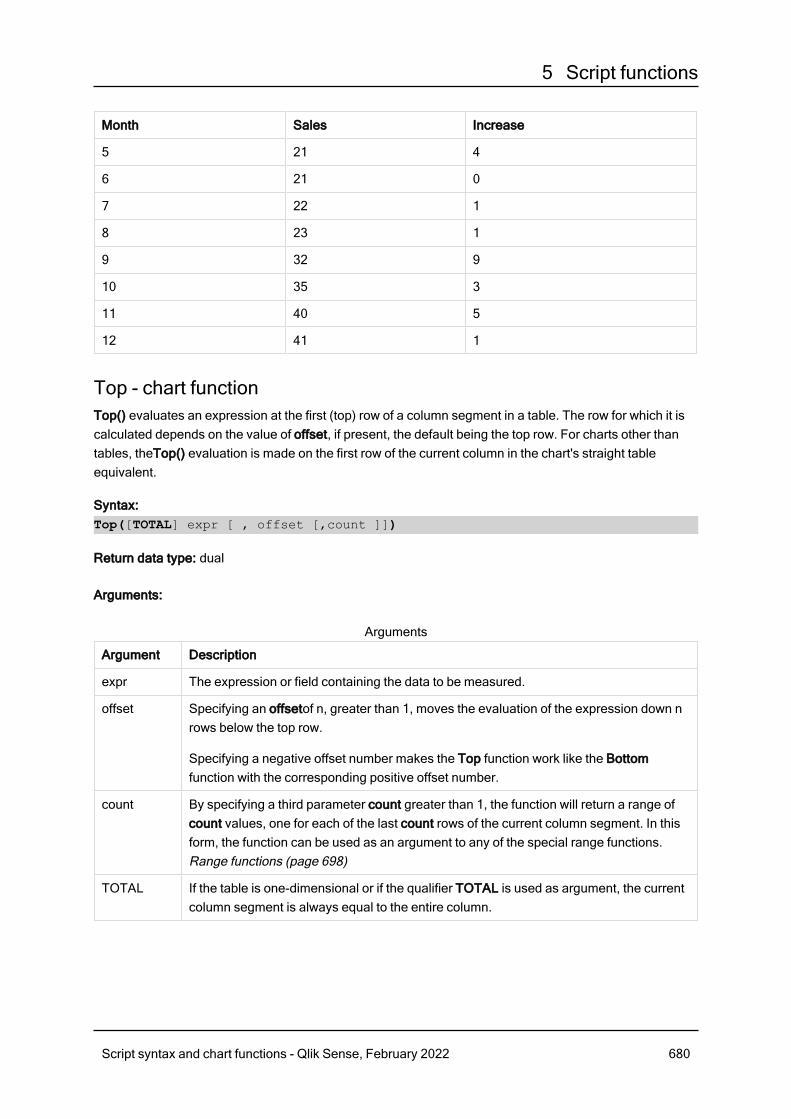
5 Script functions
Month Sales Increase
5 21 4
6 21 0
7 22 1
8 23 1
9 32 9
10 35 3
11 40 5
12 41 1
Top - chart functionTop() evaluates an expression at the first (top) row of a column segment in a table. The row for which it iscalculated depends on the value of offset, if present, the default being the top row. For charts other thantables, theTop() evaluation is made on the first row of the current column in the chart's straight tableequivalent.
Syntax:Top([TOTAL] expr [ , offset [,count ]])
Return data type: dual
Arguments:
Argument Description
expr The expression or field containing the data to be measured.
offset Specifying an offsetof n, greater than 1, moves the evaluation of the expression down nrows below the top row.
Specifying a negative offset number makes the Top function work like the Bottomfunction with the corresponding positive offset number.
count By specifying a third parameter count greater than 1, the function will return a range ofcount values, one for each of the last count rows of the current column segment. In thisform, the function can be used as an argument to any of the special range functions.Range functions (page 698)
TOTAL If the table is one-dimensional or if the qualifier TOTAL is used as argument, the currentcolumn segment is always equal to the entire column.
Arguments
Script syntax and chart functions - Qlik Sense, February 2022 680
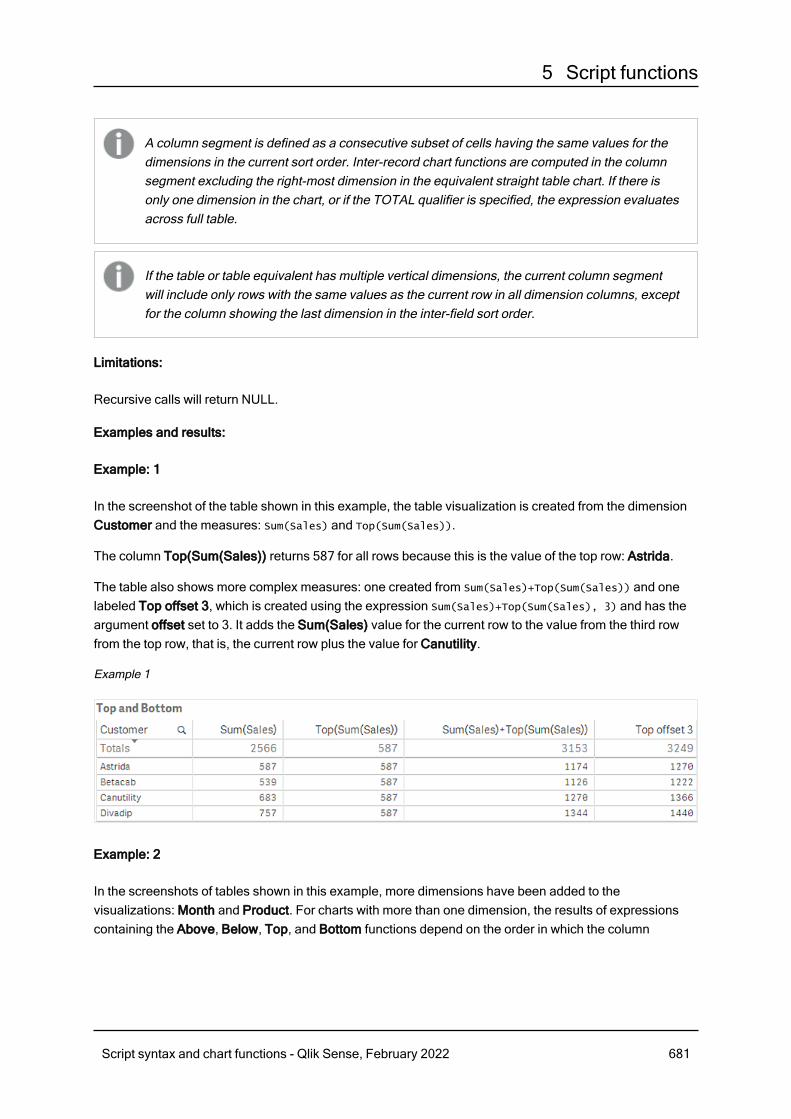
5 Script functions
A column segment is defined as a consecutive subset of cells having the same values for thedimensions in the current sort order. Inter-record chart functions are computed in the columnsegment excluding the right-most dimension in the equivalent straight table chart. If there isonly one dimension in the chart, or if the TOTAL qualifier is specified, the expression evaluatesacross full table.
If the table or table equivalent has multiple vertical dimensions, the current column segmentwill include only rows with the same values as the current row in all dimension columns, exceptfor the column showing the last dimension in the inter-field sort order.
Limitations:
Recursive calls will return NULL.
Examples and results:
Example: 1
In the screenshot of the table shown in this example, the table visualization is created from the dimensionCustomer and the measures: Sum(Sales) and Top(Sum(Sales)).
The column Top(Sum(Sales)) returns 587 for all rows because this is the value of the top row: Astrida.
The table also shows more complex measures: one created from Sum(Sales)+Top(Sum(Sales)) and onelabeled Top offset 3, which is created using the expression Sum(Sales)+Top(Sum(Sales), 3) and has theargument offset set to 3. It adds the Sum(Sales) value for the current row to the value from the third rowfrom the top row, that is, the current row plus the value for Canutility.
Example 1
Example: 2
In the screenshots of tables shown in this example, more dimensions have been added to thevisualizations: Month and Product. For charts with more than one dimension, the results of expressionscontaining the Above, Below, Top, and Bottom functions depend on the order in which the column
Script syntax and chart functions - Qlik Sense, February 2022 681
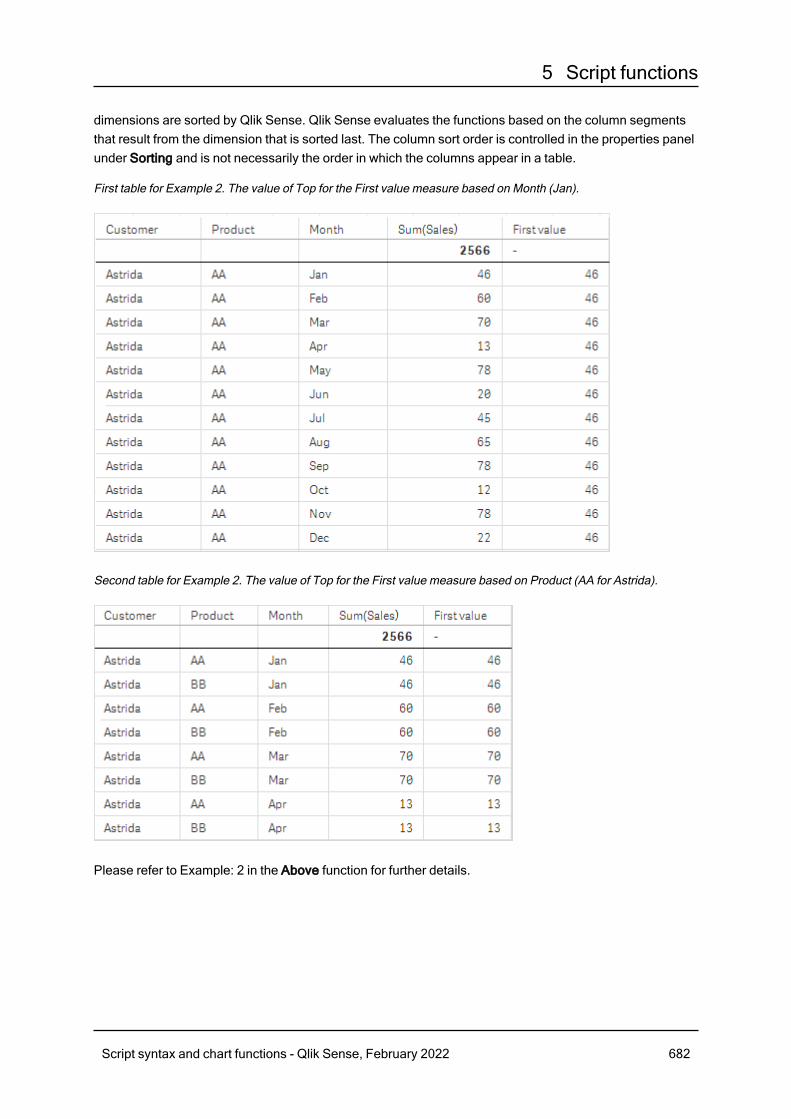
5 Script functions
dimensions are sorted by Qlik Sense. Qlik Sense evaluates the functions based on the column segmentsthat result from the dimension that is sorted last. The column sort order is controlled in the properties panelunder Sorting and is not necessarily the order in which the columns appear in a table.
First table for Example 2. The value of Top for the First value measure based on Month (Jan).
Second table for Example 2. The value of Top for the First value measure based on Product (AA for Astrida).
Please refer to Example: 2 in the Above function for further details.
Script syntax and chart functions - Qlik Sense, February 2022 682
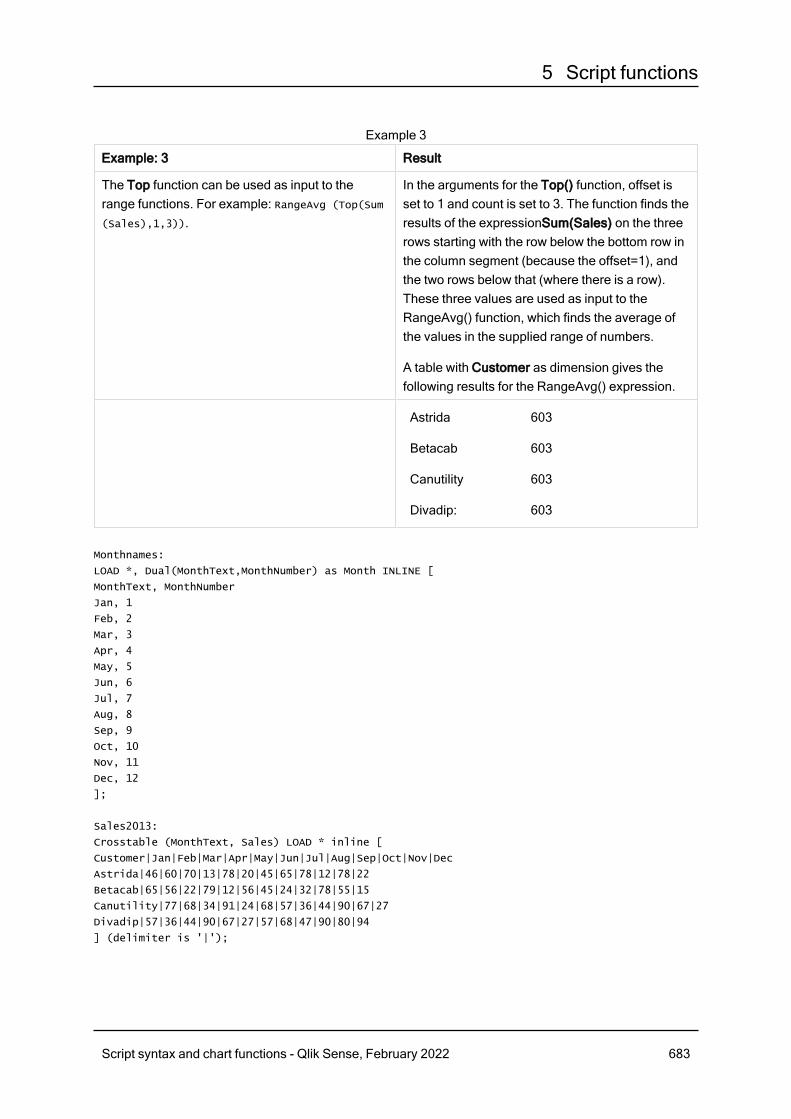
5 Script functions
Example: 3 Result
The Top function can be used as input to therange functions. For example: RangeAvg (Top(Sum
(Sales),1,3)).
In the arguments for the Top() function, offset isset to 1 and count is set to 3. The function finds theresults of the expressionSum(Sales) on the threerows starting with the row below the bottom row inthe column segment (because the offset=1), andthe two rows below that (where there is a row).These three values are used as input to theRangeAvg() function, which finds the average ofthe values in the supplied range of numbers.
A table with Customer as dimension gives thefollowing results for the RangeAvg() expression.
Astrida
Betacab
Canutility
Divadip:
603
603
603
603
Example 3
Monthnames:
LOAD *, Dual(MonthText,MonthNumber) as Month INLINE [
MonthText, MonthNumber
Jan, 1
Feb, 2
Mar, 3
Apr, 4
May, 5
Jun, 6
Jul, 7
Aug, 8
Sep, 9
Oct, 10
Nov, 11
Dec, 12
];
Sales2013:
Crosstable (MonthText, Sales) LOAD * inline [
Customer|Jan|Feb|Mar|Apr|May|Jun|Jul|Aug|Sep|Oct|Nov|Dec
Astrida|46|60|70|13|78|20|45|65|78|12|78|22
Betacab|65|56|22|79|12|56|45|24|32|78|55|15
Canutility|77|68|34|91|24|68|57|36|44|90|67|27
Divadip|57|36|44|90|67|27|57|68|47|90|80|94
] (delimiter is '|');
Script syntax and chart functions - Qlik Sense, February 2022 683
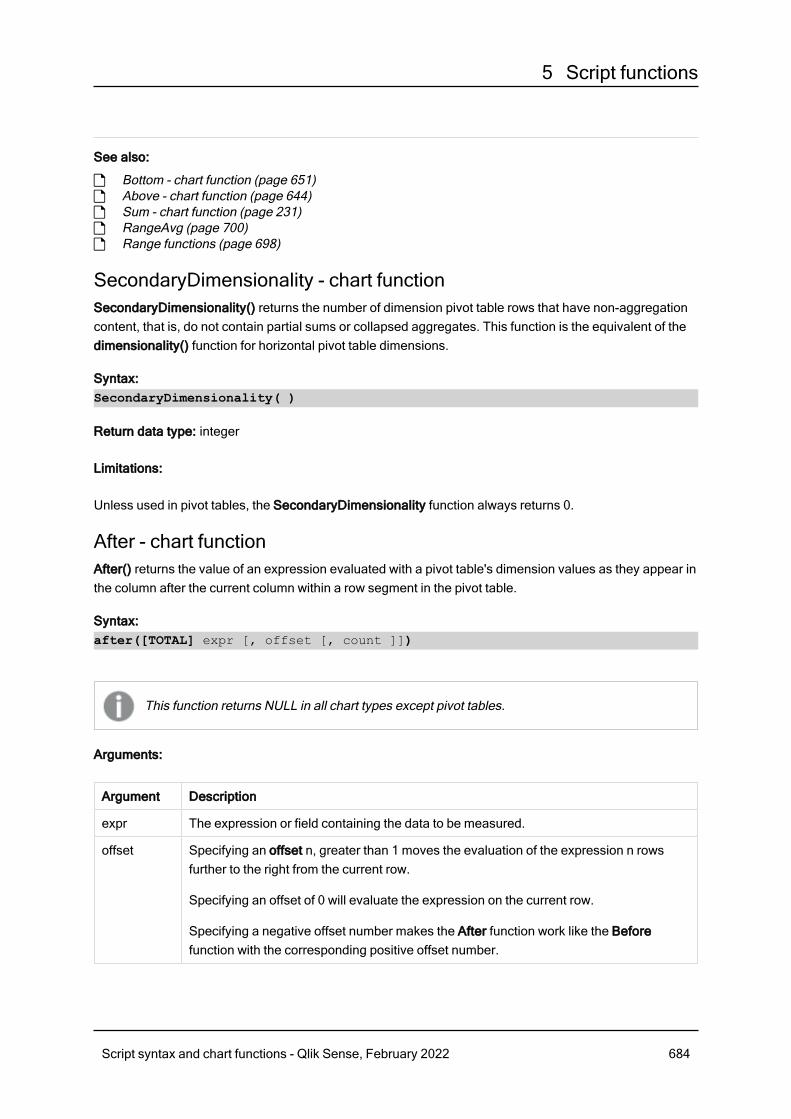
5 Script functions
See also:
p Bottom - chart function (page 651)p Above - chart function (page 644)p Sum - chart function (page 231)p RangeAvg (page 700)p Range functions (page 698)
SecondaryDimensionality - chart functionSecondaryDimensionality() returns the number of dimension pivot table rows that have non-aggregationcontent, that is, do not contain partial sums or collapsed aggregates. This function is the equivalent of thedimensionality() function for horizontal pivot table dimensions.
Syntax:SecondaryDimensionality( )
Return data type: integer
Limitations:
Unless used in pivot tables, the SecondaryDimensionality function always returns 0.
After - chart functionAfter() returns the value of an expression evaluated with a pivot table's dimension values as they appear inthe column after the current column within a row segment in the pivot table.
Syntax:after([TOTAL] expr [, offset [, count ]])
This function returns NULL in all chart types except pivot tables.
Arguments:
Argument Description
expr The expression or field containing the data to be measured.
offset Specifying an offset n, greater than 1 moves the evaluation of the expression n rowsfurther to the right from the current row.
Specifying an offset of 0 will evaluate the expression on the current row.
Specifying a negative offset number makes the After function work like the Beforefunction with the corresponding positive offset number.
Script syntax and chart functions - Qlik Sense, February 2022 684
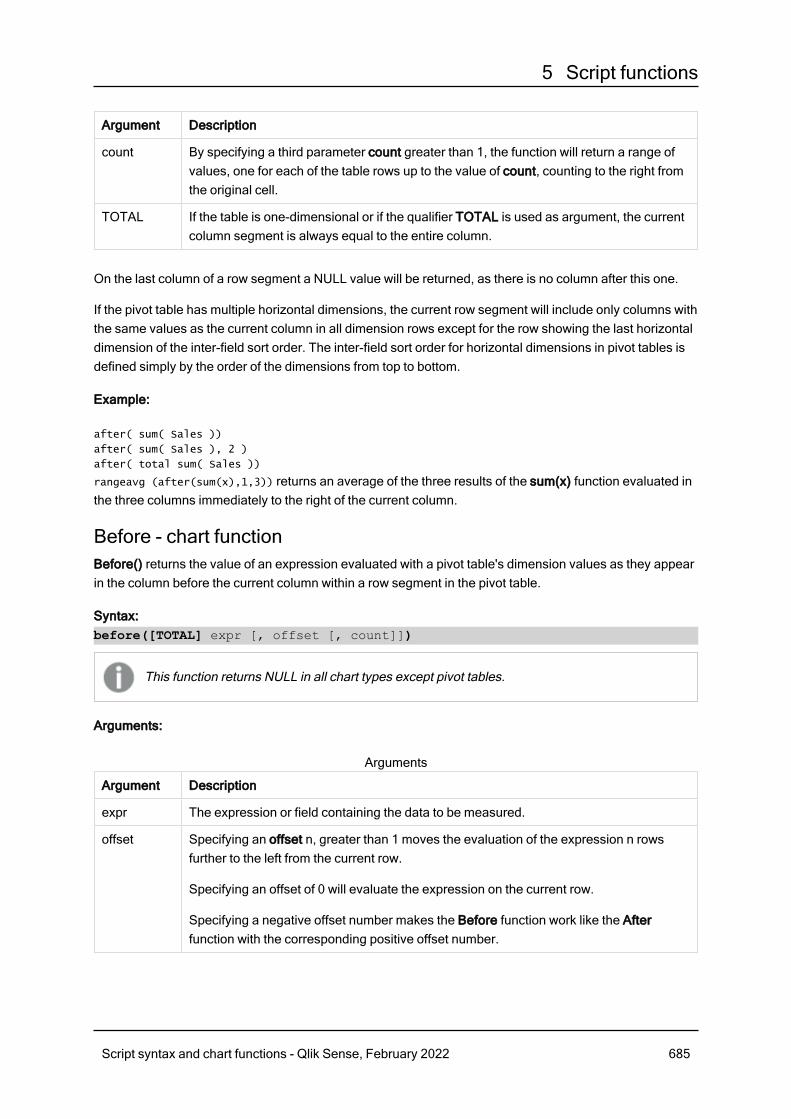
5 Script functions
Argument Description
count By specifying a third parameter count greater than 1, the function will return a range ofvalues, one for each of the table rows up to the value of count, counting to the right fromthe original cell.
TOTAL If the table is one-dimensional or if the qualifier TOTAL is used as argument, the currentcolumn segment is always equal to the entire column.
On the last column of a row segment a NULL value will be returned, as there is no column after this one.
If the pivot table has multiple horizontal dimensions, the current row segment will include only columns withthe same values as the current column in all dimension rows except for the row showing the last horizontaldimension of the inter-field sort order. The inter-field sort order for horizontal dimensions in pivot tables isdefined simply by the order of the dimensions from top to bottom.
Example:
after( sum( Sales ))
after( sum( Sales ), 2 )
after( total sum( Sales ))
rangeavg (after(sum(x),1,3)) returns an average of the three results of the sum(x) function evaluated inthe three columns immediately to the right of the current column.
Before - chart functionBefore() returns the value of an expression evaluated with a pivot table's dimension values as they appearin the column before the current column within a row segment in the pivot table.
Syntax:before([TOTAL] expr [, offset [, count]])
This function returns NULL in all chart types except pivot tables.
Arguments:
Argument Description
expr The expression or field containing the data to be measured.
offset Specifying an offset n, greater than 1 moves the evaluation of the expression n rowsfurther to the left from the current row.
Specifying an offset of 0 will evaluate the expression on the current row.
Specifying a negative offset number makes the Before function work like the Afterfunction with the corresponding positive offset number.
Arguments
Script syntax and chart functions - Qlik Sense, February 2022 685
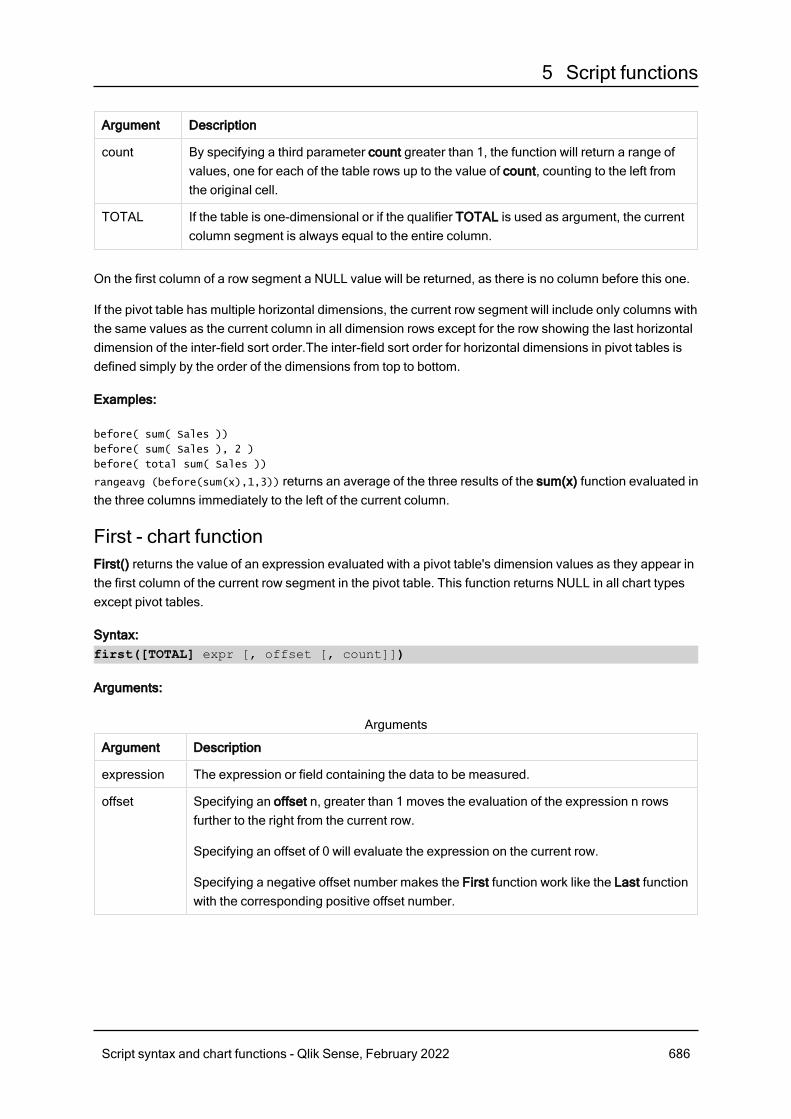
5 Script functions
Argument Description
count By specifying a third parameter count greater than 1, the function will return a range ofvalues, one for each of the table rows up to the value of count, counting to the left fromthe original cell.
TOTAL If the table is one-dimensional or if the qualifier TOTAL is used as argument, the currentcolumn segment is always equal to the entire column.
On the first column of a row segment a NULL value will be returned, as there is no column before this one.
If the pivot table has multiple horizontal dimensions, the current row segment will include only columns withthe same values as the current column in all dimension rows except for the row showing the last horizontaldimension of the inter-field sort order.The inter-field sort order for horizontal dimensions in pivot tables isdefined simply by the order of the dimensions from top to bottom.
Examples:
before( sum( Sales ))
before( sum( Sales ), 2 )
before( total sum( Sales ))
rangeavg (before(sum(x),1,3)) returns an average of the three results of the sum(x) function evaluated inthe three columns immediately to the left of the current column.
First - chart functionFirst() returns the value of an expression evaluated with a pivot table's dimension values as they appear inthe first column of the current row segment in the pivot table. This function returns NULL in all chart typesexcept pivot tables.
Syntax:first([TOTAL] expr [, offset [, count]])
Arguments:
Argument Description
expression The expression or field containing the data to be measured.
offset Specifying an offset n, greater than 1 moves the evaluation of the expression n rowsfurther to the right from the current row.
Specifying an offset of 0 will evaluate the expression on the current row.
Specifying a negative offset number makes the First function work like the Last functionwith the corresponding positive offset number.
Arguments
Script syntax and chart functions - Qlik Sense, February 2022 686

5 Script functions
Argument Description
count By specifying a third parameter count greater than 1, the function will return a range ofvalues, one for each of the table rows up to the value of count, counting to the right fromthe original cell.
TOTAL If the table is one-dimensional or if the qualifier TOTAL is used as argument, the currentcolumn segment is always equal to the entire column.
If the pivot table has multiple horizontal dimensions, the current row segment will include only columns withthe same values as the current column in all dimension rows except for the row showing the last horizontaldimension of the inter-field sort order.The inter-field sort order for horizontal dimensions in pivot tables isdefined simply by the order of the dimensions from top to bottom.
Examples:
first( sum( Sales ))
first( sum( Sales ), 2 )
first( total sum( Sales )
rangeavg (first(sum(x),1,5)) returns an average of the results of the sum(x) function evaluatedon the five leftmost columns of the current row segment.
Last - chart functionLast() returns the value of an expression evaluated with a pivot table's dimension values as they appear inthe last column of the current row segment in the pivot table. This function returns NULL in all chart typesexcept pivot tables.
Syntax:last([TOTAL] expr [, offset [, count]])
Arguments:
Argument Description
expr The expression or field containing the data to be measured.
offset Specifying an offset n, greater than 1 moves the evaluation of the expression n rowsfurther to the left from the current row.
Specifying an offset of 0 will evaluate the expression on the current row.
Specifying a negative offset number makes the First function work like the Last functionwith the corresponding positive offset number.
count By specifying a third parameter count greater than 1, the function will return a range ofvalues, one for each of the table rows up to the value of count, counting to the left fromthe original cell.
TOTAL If the table is one-dimensional or if the qualifier TOTAL is used as argument, the currentcolumn segment is always equal to the entire column.
Arguments
Script syntax and chart functions - Qlik Sense, February 2022 687
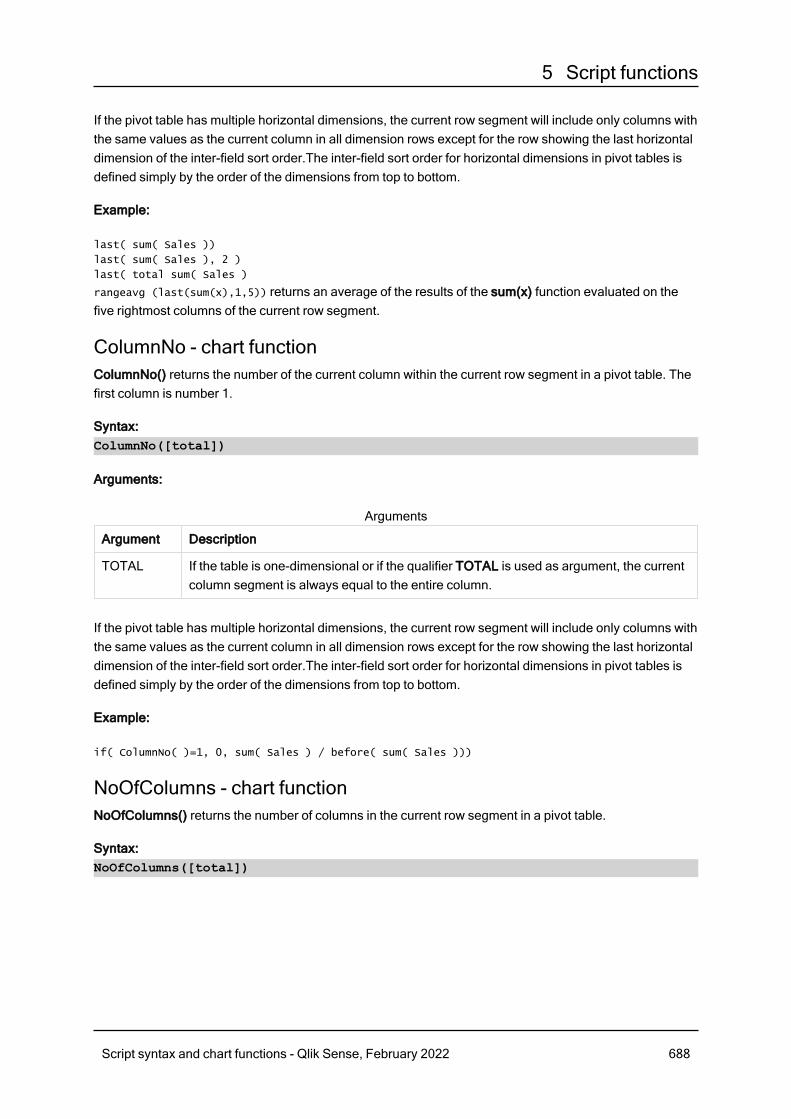
5 Script functions
If the pivot table has multiple horizontal dimensions, the current row segment will include only columns withthe same values as the current column in all dimension rows except for the row showing the last horizontaldimension of the inter-field sort order.The inter-field sort order for horizontal dimensions in pivot tables isdefined simply by the order of the dimensions from top to bottom.
Example:
last( sum( Sales ))
last( sum( Sales ), 2 )
last( total sum( Sales )
rangeavg (last(sum(x),1,5)) returns an average of the results of the sum(x) function evaluated on thefive rightmost columns of the current row segment.
ColumnNo - chart functionColumnNo() returns the number of the current column within the current row segment in a pivot table. Thefirst column is number 1.
Syntax:ColumnNo([total])
Arguments:
Argument Description
TOTAL If the table is one-dimensional or if the qualifier TOTAL is used as argument, the currentcolumn segment is always equal to the entire column.
Arguments
If the pivot table has multiple horizontal dimensions, the current row segment will include only columns withthe same values as the current column in all dimension rows except for the row showing the last horizontaldimension of the inter-field sort order.The inter-field sort order for horizontal dimensions in pivot tables isdefined simply by the order of the dimensions from top to bottom.
Example:
if( ColumnNo( )=1, 0, sum( Sales ) / before( sum( Sales )))
NoOfColumns - chart functionNoOfColumns() returns the number of columns in the current row segment in a pivot table.
Syntax:NoOfColumns([total])
Script syntax and chart functions - Qlik Sense, February 2022 688
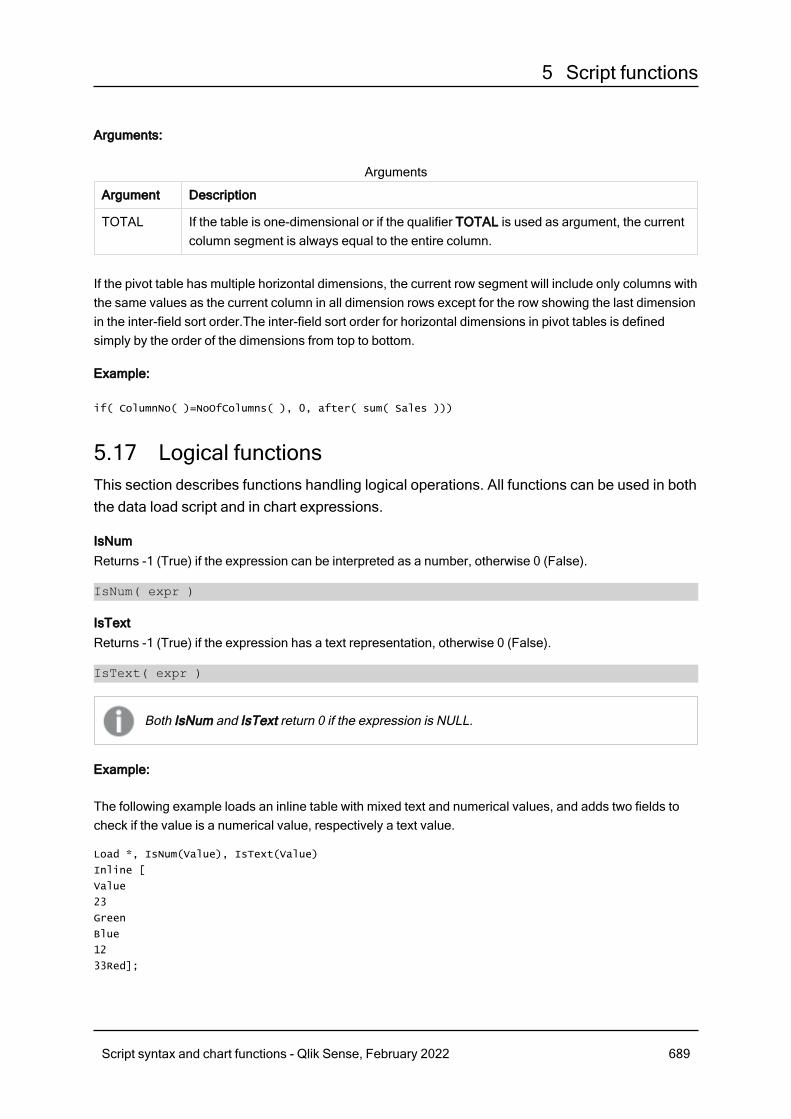
5 Script functions
Arguments:
Argument Description
TOTAL If the table is one-dimensional or if the qualifier TOTAL is used as argument, the currentcolumn segment is always equal to the entire column.
Arguments
If the pivot table has multiple horizontal dimensions, the current row segment will include only columns withthe same values as the current column in all dimension rows except for the row showing the last dimensionin the inter-field sort order.The inter-field sort order for horizontal dimensions in pivot tables is definedsimply by the order of the dimensions from top to bottom.
Example:
if( ColumnNo( )=NoOfColumns( ), 0, after( sum( Sales )))
5.17 Logical functionsThis section describes functions handling logical operations. All functions can be used in boththe data load script and in chart expressions.
IsNumReturns -1 (True) if the expression can be interpreted as a number, otherwise 0 (False).
IsNum( expr )
IsTextReturns -1 (True) if the expression has a text representation, otherwise 0 (False).
IsText( expr )
Both IsNum and IsText return 0 if the expression is NULL.
Example:
The following example loads an inline table with mixed text and numerical values, and adds two fields tocheck if the value is a numerical value, respectively a text value.
Load *, IsNum(Value), IsText(Value)
Inline [
Value
23
Green
Blue
12
33Red];
Script syntax and chart functions - Qlik Sense, February 2022 689
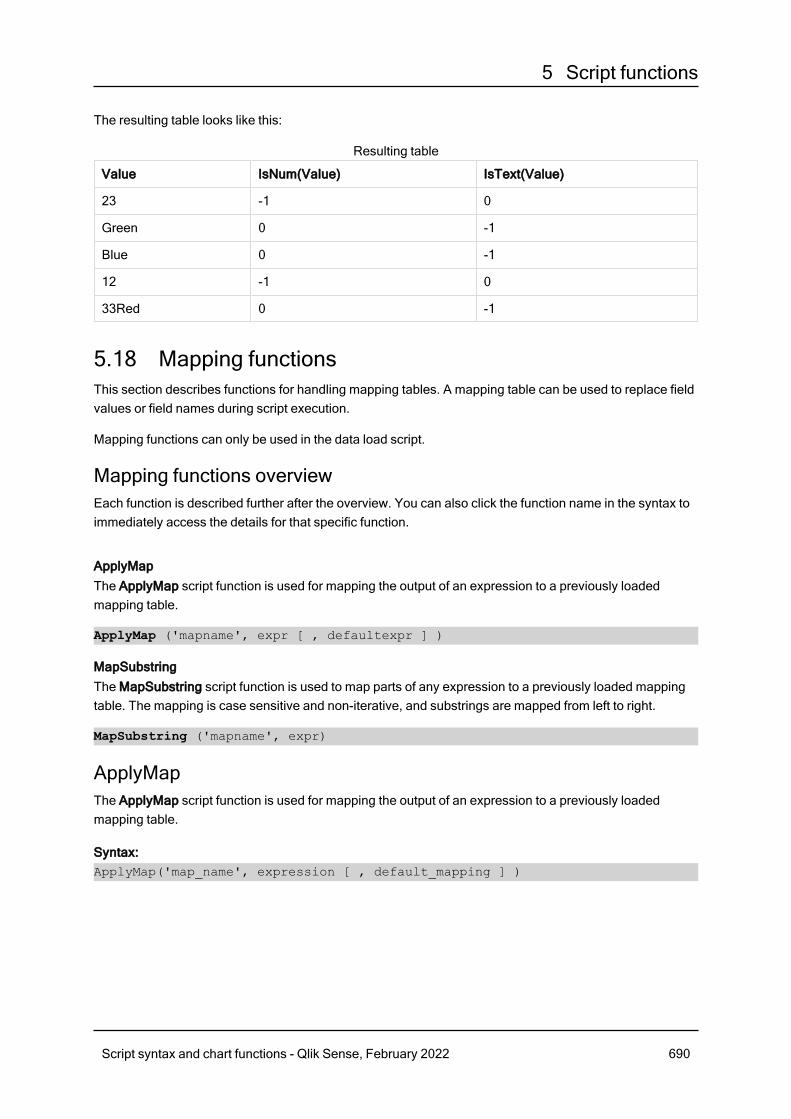
5 Script functions
The resulting table looks like this:
Value IsNum(Value) IsText(Value)
23 -1 0
Green 0 -1
Blue 0 -1
12 -1 0
33Red 0 -1
Resulting table
5.18 Mapping functionsThis section describes functions for handling mapping tables. A mapping table can be used to replace fieldvalues or field names during script execution.
Mapping functions can only be used in the data load script.
Mapping functions overviewEach function is described further after the overview. You can also click the function name in the syntax toimmediately access the details for that specific function.
ApplyMapThe ApplyMap script function is used for mapping the output of an expression to a previously loadedmapping table.
ApplyMap ('mapname', expr [ , defaultexpr ] )
MapSubstringThe MapSubstring script function is used to map parts of any expression to a previously loaded mappingtable. The mapping is case sensitive and non-iterative, and substrings are mapped from left to right.
MapSubstring ('mapname', expr)
ApplyMapThe ApplyMap script function is used for mapping the output of an expression to a previously loadedmapping table.
Syntax:ApplyMap('map_name', expression [ , default_mapping ] )
Script syntax and chart functions - Qlik Sense, February 2022 690
5 Script functions
Return data type: dual
Arguments:
Argument Description
map_name The name of a mapping table that has previously been created through the mappingload or the mapping select statement. Its name must be enclosed by single, straightquotation marks.
If you use this function in a macro expanded variable and refer to a mappingtable that does not exist, the function call fails and a field is not created.
expression The expression, the result of which should be mapped.
default_mapping
If stated, this value will be used as a default value if the mapping table does not containa matching value for expression. If not stated, the value of expression will be returnedas is.
Arguments
The output field of ApplyMap should not have the same name as one of its input fields. Thismay cause unexpected results. Example not to use: ApplyMap('Map', A) as A.
Example:
In this example we load a list of salespersons with a country code representing their country of residence.We use a table mapping a country code to a country to replace the country code with the country name.Only three countries are defined in the mapping table, other country codes are mapped to 'Rest of theworld'.
// Load mapping table of country codes:
map1:
mapping LOAD *
Inline [
CCode, Country
Sw, Sweden
Dk, Denmark
No, Norway
] ;
// Load list of salesmen, mapping country code to country
// If the country code is not in the mapping table, put Rest of the world
Salespersons:
LOAD *,
ApplyMap('map1', CCode,'Rest of the world') As Country
Inline [
CCode, Salesperson
Sw, John
Script syntax and chart functions - Qlik Sense, February 2022 691
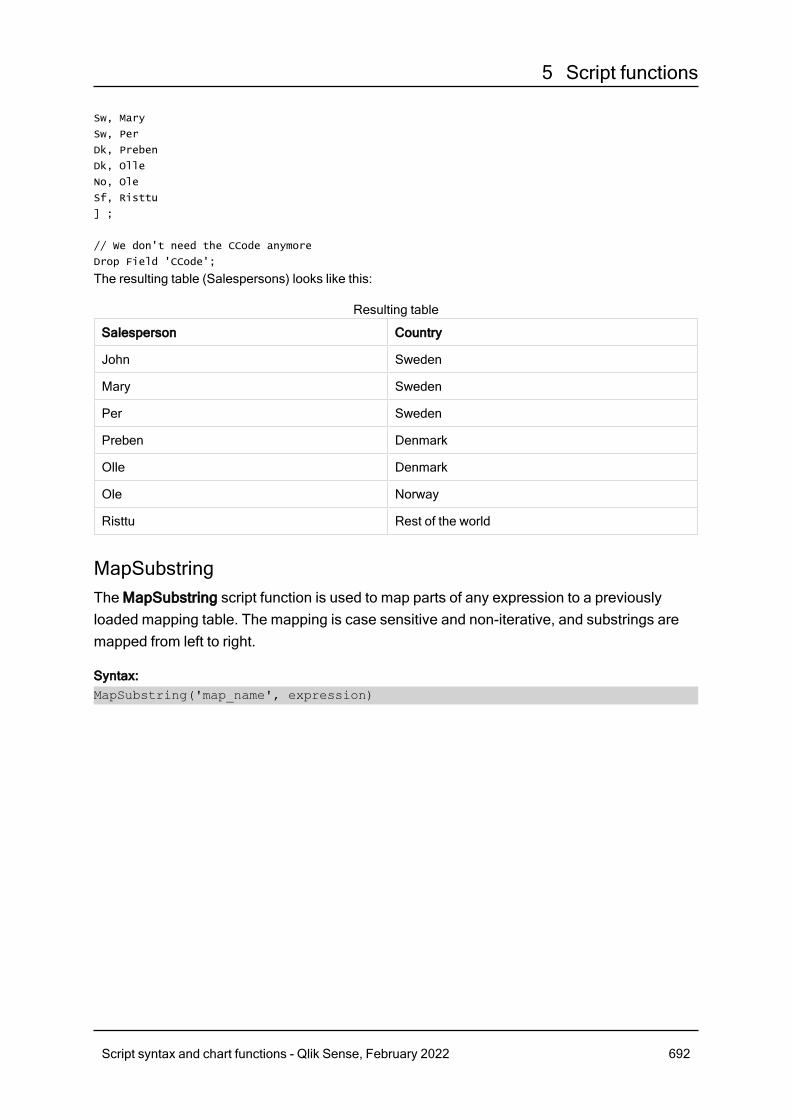
5 Script functions
Sw, Mary
Sw, Per
Dk, Preben
Dk, Olle
No, Ole
Sf, Risttu
] ;
// We don't need the CCode anymore
Drop Field 'CCode';
The resulting table (Salespersons) looks like this:
Salesperson Country
John Sweden
Mary Sweden
Per Sweden
Preben Denmark
Olle Denmark
Ole Norway
Risttu Rest of the world
Resulting table
MapSubstringThe MapSubstring script function is used to map parts of any expression to a previouslyloaded mapping table. The mapping is case sensitive and non-iterative, and substrings aremapped from left to right.
Syntax:MapSubstring('map_name', expression)
Script syntax and chart functions - Qlik Sense, February 2022 692
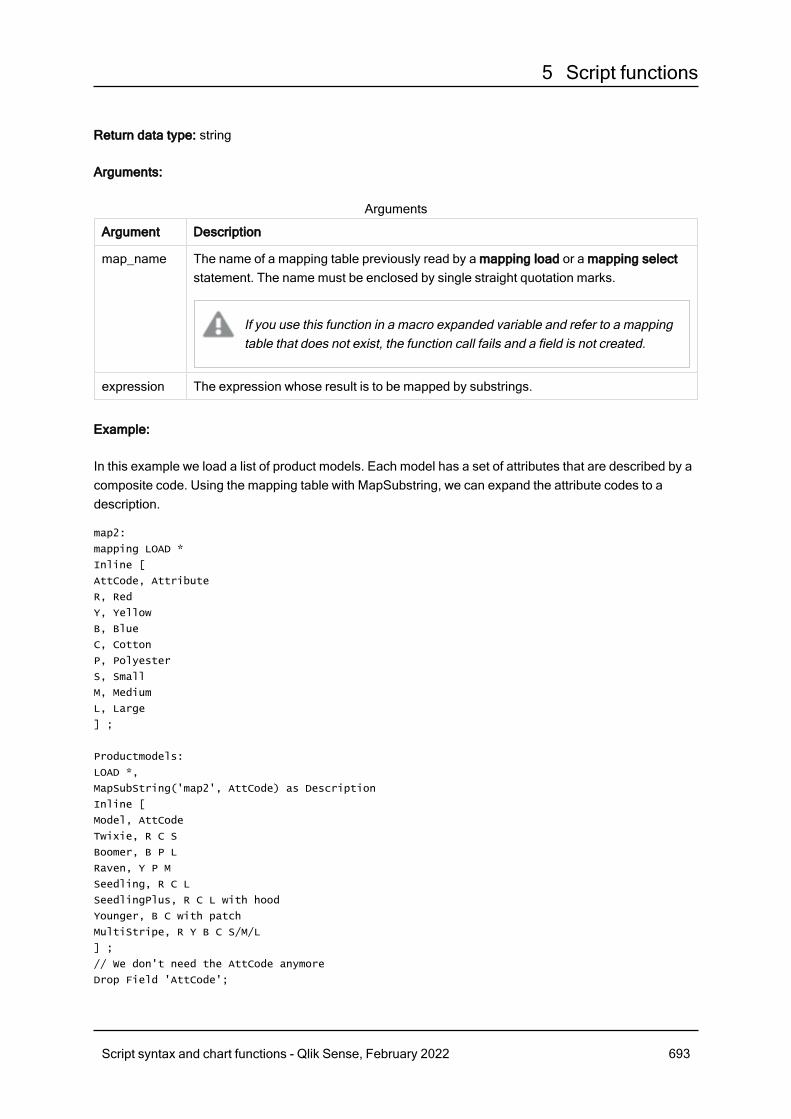
5 Script functions
Return data type: string
Arguments:
Argument Description
map_name The name of a mapping table previously read by a mapping load or a mapping selectstatement. The name must be enclosed by single straight quotation marks.
If you use this function in a macro expanded variable and refer to a mappingtable that does not exist, the function call fails and a field is not created.
expression The expression whose result is to be mapped by substrings.
Arguments
Example:
In this example we load a list of product models. Each model has a set of attributes that are described by acomposite code. Using the mapping table with MapSubstring, we can expand the attribute codes to adescription.
map2:
mapping LOAD *
Inline [
AttCode, Attribute
R, Red
Y, Yellow
B, Blue
C, Cotton
P, Polyester
S, Small
M, Medium
L, Large
] ;
Productmodels:
LOAD *,
MapSubString('map2', AttCode) as Description
Inline [
Model, AttCode
Twixie, R C S
Boomer, B P L
Raven, Y P M
Seedling, R C L
SeedlingPlus, R C L with hood
Younger, B C with patch
MultiStripe, R Y B C S/M/L
] ;
// We don't need the AttCode anymore
Drop Field 'AttCode';
Script syntax and chart functions - Qlik Sense, February 2022 693
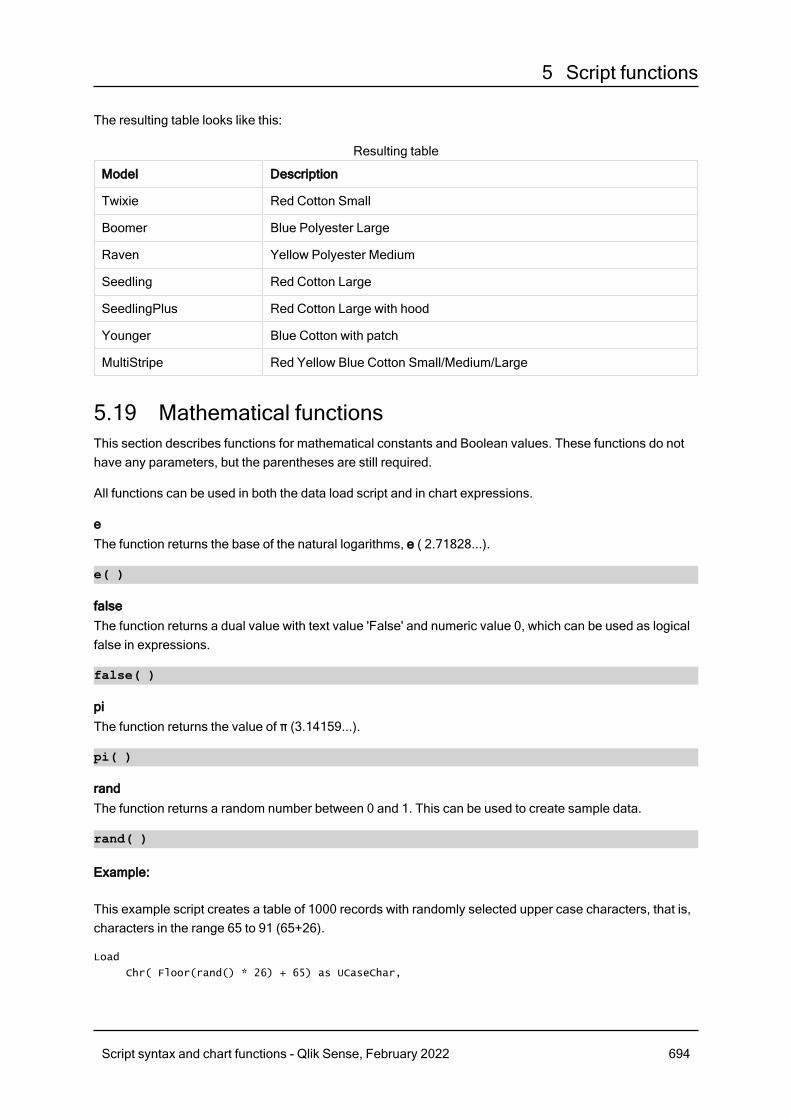
5 Script functions
The resulting table looks like this:
Model Description
Twixie Red Cotton Small
Boomer Blue Polyester Large
Raven Yellow Polyester Medium
Seedling Red Cotton Large
SeedlingPlus Red Cotton Large with hood
Younger Blue Cotton with patch
MultiStripe Red Yellow Blue Cotton Small/Medium/Large
Resulting table
5.19 Mathematical functionsThis section describes functions for mathematical constants and Boolean values. These functions do nothave any parameters, but the parentheses are still required.
All functions can be used in both the data load script and in chart expressions.
eThe function returns the base of the natural logarithms, e ( 2.71828...).
e( )
falseThe function returns a dual value with text value 'False' and numeric value 0, which can be used as logicalfalse in expressions.
false( )
piThe function returns the value of π (3.14159...).
pi( )
randThe function returns a random number between 0 and 1. This can be used to create sample data.
rand( )
Example:
This example script creates a table of 1000 records with randomly selected upper case characters, that is,characters in the range 65 to 91 (65+26).
Load
Chr( Floor(rand() * 26) + 65) as UCaseChar,
Script syntax and chart functions - Qlik Sense, February 2022 694
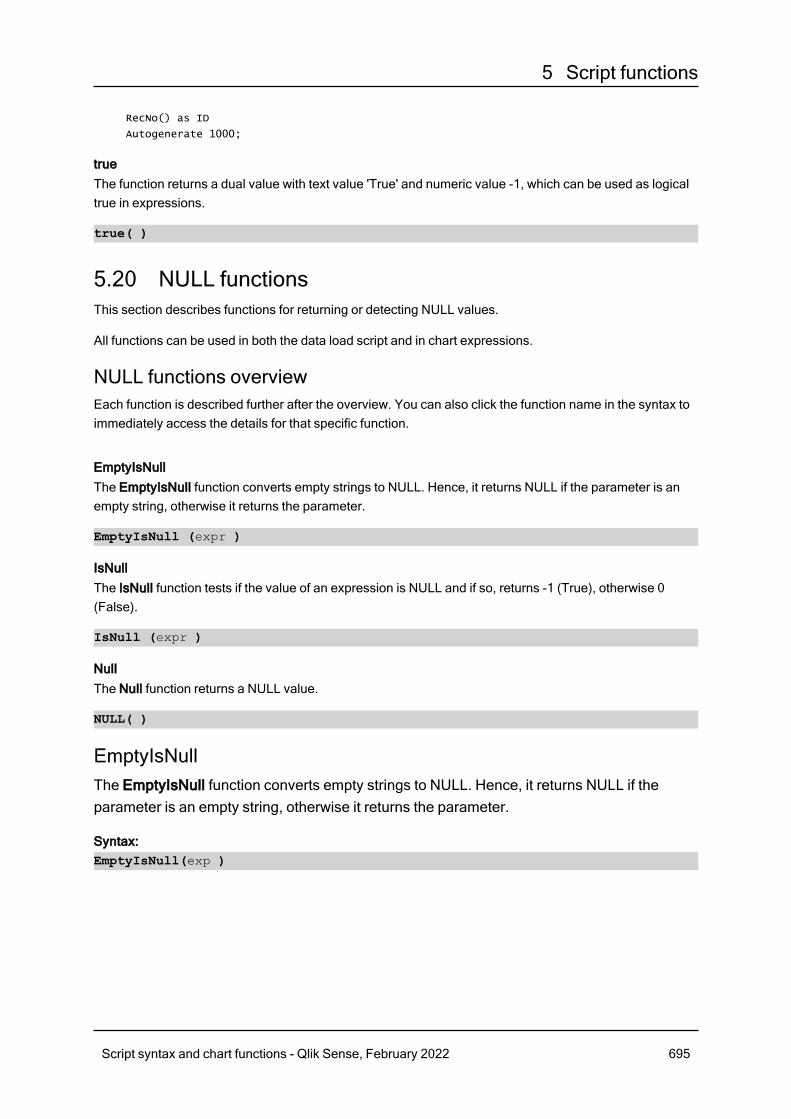
5 Script functions
RecNo() as ID
Autogenerate 1000;
trueThe function returns a dual value with text value 'True' and numeric value -1, which can be used as logicaltrue in expressions.
true( )
5.20 NULL functionsThis section describes functions for returning or detecting NULL values.
All functions can be used in both the data load script and in chart expressions.
NULL functions overviewEach function is described further after the overview. You can also click the function name in the syntax toimmediately access the details for that specific function.
EmptyIsNullThe EmptyIsNull function converts empty strings to NULL. Hence, it returns NULL if the parameter is anempty string, otherwise it returns the parameter.
EmptyIsNull (expr )
IsNullThe IsNull function tests if the value of an expression is NULL and if so, returns -1 (True), otherwise 0(False).
IsNull (expr )
NullThe Null function returns a NULL value.
NULL( )
EmptyIsNullThe EmptyIsNull function converts empty strings to NULL. Hence, it returns NULL if theparameter is an empty string, otherwise it returns the parameter.
Syntax:EmptyIsNull(exp )
Script syntax and chart functions - Qlik Sense, February 2022 695
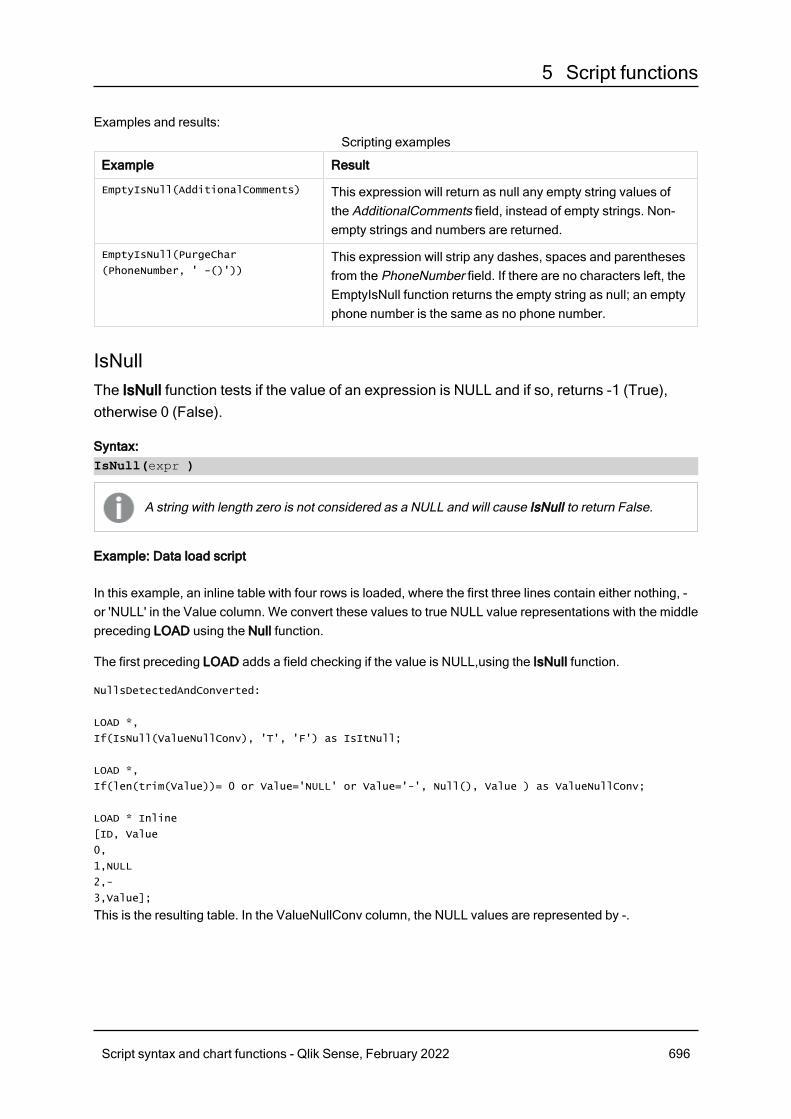
5 Script functions
Examples and results:
Example Result
EmptyIsNull(AdditionalComments) This expression will return as null any empty string values ofthe AdditionalComments field, instead of empty strings. Non-empty strings and numbers are returned.
EmptyIsNull(PurgeChar
(PhoneNumber, ' -()'))This expression will strip any dashes, spaces and parenthesesfrom the PhoneNumber field. If there are no characters left, theEmptyIsNull function returns the empty string as null; an emptyphone number is the same as no phone number.
Scripting examples
IsNullThe IsNull function tests if the value of an expression is NULL and if so, returns -1 (True),otherwise 0 (False).
Syntax:IsNull(expr )
A string with length zero is not considered as a NULL and will cause IsNull to return False.
Example: Data load script
In this example, an inline table with four rows is loaded, where the first three lines contain either nothing, -or 'NULL' in the Value column. We convert these values to true NULL value representations with the middlepreceding LOAD using the Null function.
The first preceding LOAD adds a field checking if the value is NULL,using the IsNull function.
NullsDetectedAndConverted:
LOAD *,
If(IsNull(ValueNullConv), 'T', 'F') as IsItNull;
LOAD *,
If(len(trim(Value))= 0 or Value='NULL' or Value='-', Null(), Value ) as ValueNullConv;
LOAD * Inline
[ID, Value
0,
1,NULL
2,-
3,Value];
This is the resulting table. In the ValueNullConv column, the NULL values are represented by -.
Script syntax and chart functions - Qlik Sense, February 2022 696
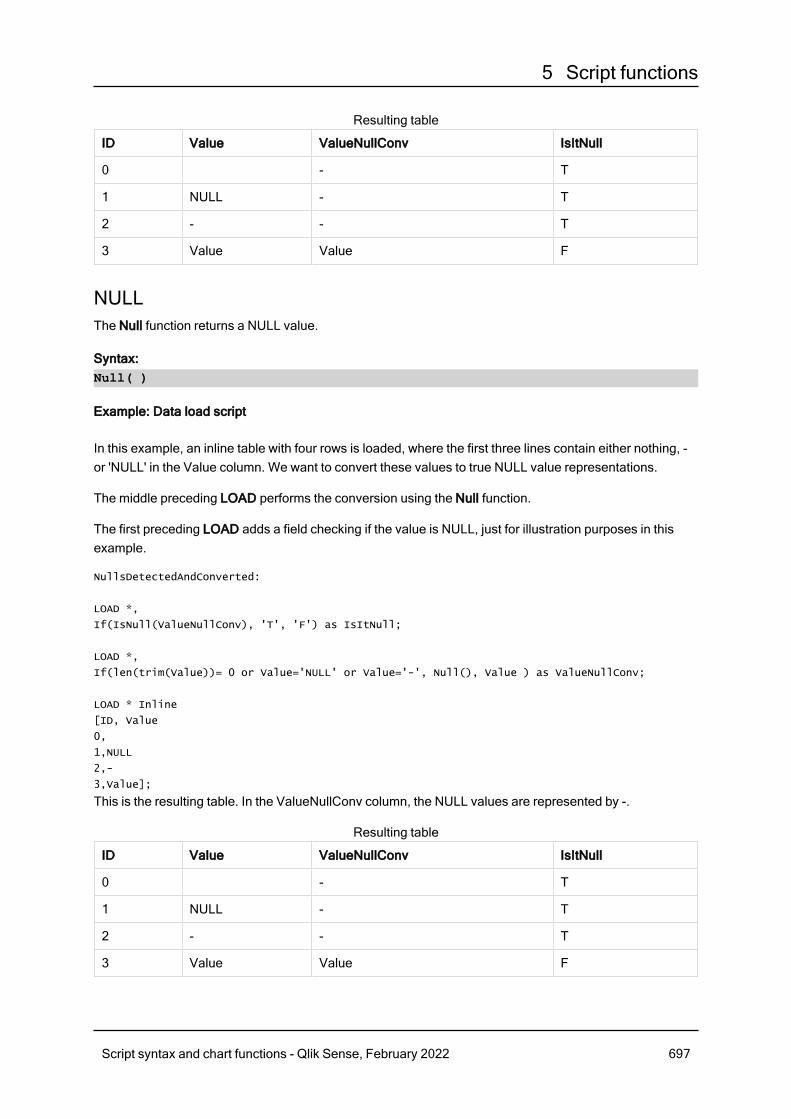
5 Script functions
ID Value ValueNullConv IsItNull
0 - T
1 NULL - T
2 - - T
3 Value Value F
Resulting table
NULLThe Null function returns a NULL value.
Syntax:Null( )
Example: Data load script
In this example, an inline table with four rows is loaded, where the first three lines contain either nothing, -or 'NULL' in the Value column. We want to convert these values to true NULL value representations.
The middle preceding LOAD performs the conversion using the Null function.
The first preceding LOAD adds a field checking if the value is NULL, just for illustration purposes in thisexample.
NullsDetectedAndConverted:
LOAD *,
If(IsNull(ValueNullConv), 'T', 'F') as IsItNull;
LOAD *,
If(len(trim(Value))= 0 or Value='NULL' or Value='-', Null(), Value ) as ValueNullConv;
LOAD * Inline
[ID, Value
0,
1,NULL
2,-
3,Value];
This is the resulting table. In the ValueNullConv column, the NULL values are represented by -.
ID Value ValueNullConv IsItNull
0 - T
1 NULL - T
2 - - T
3 Value Value F
Resulting table
Script syntax and chart functions - Qlik Sense, February 2022 697

5 Script functions
5.21 Range functionsThe range functions are functions that take an array of values and produce a single value as a result. Allrange functions can be used in both the data load script and in chart expressions.
For example, in a visualization, a range function can calculate a single value from an inter-record array. Inthe data load script, a range function can calculate a single value from an array of values in an internaltable.
Range functions replace the following general numeric functions: numsum, numavg,numcount, nummin and nummax, which should now be regarded as obsolete.
Basic range functionsRangeMaxRangeMax() returns the highest numeric values found within the expression or field.
RangeMax(first_expr[, Expression])
RangeMaxStringRangeMaxString() returns the last value in the text sort order that it finds in the expression or field.
RangeMaxString(first_expr[, Expression])
RangeMinRangeMin() returns the lowest numeric values found within the expression or field.
RangeMin(first_expr[, Expression])
RangeMinStringRangeMinString() returns the first value in the text sort order that it finds in the expression or field.
RangeMinString(first_expr[, Expression])
RangeModeRangeMode() finds the most commonly occurring value (mode value) in the expression or field.
RangeMode(first_expr[, Expression])
RangeOnlyRangeOnly() is a dual function that returns a value if the expression evaluates to one unique value. If thisis not the case then NULL is returned.
RangeOnly(first_expr[, Expression])
RangeSumRangeSum() returns the sum of a range of values. All non-numeric values are treated as 0.
Script syntax and chart functions - Qlik Sense, February 2022 698
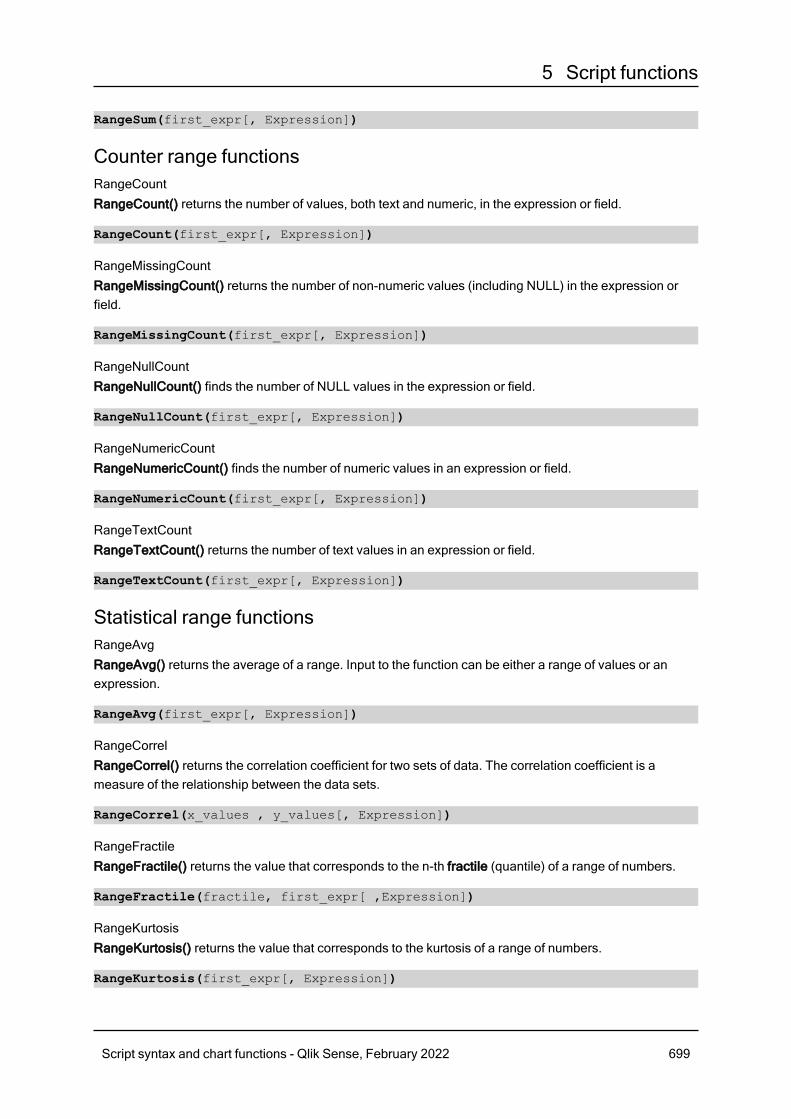
5 Script functions
RangeSum(first_expr[, Expression])
Counter range functionsRangeCountRangeCount() returns the number of values, both text and numeric, in the expression or field.
RangeCount(first_expr[, Expression])
RangeMissingCountRangeMissingCount() returns the number of non-numeric values (including NULL) in the expression orfield.
RangeMissingCount(first_expr[, Expression])
RangeNullCountRangeNullCount() finds the number of NULL values in the expression or field.
RangeNullCount(first_expr[, Expression])
RangeNumericCountRangeNumericCount() finds the number of numeric values in an expression or field.
RangeNumericCount(first_expr[, Expression])
RangeTextCountRangeTextCount() returns the number of text values in an expression or field.
RangeTextCount(first_expr[, Expression])
Statistical range functionsRangeAvgRangeAvg() returns the average of a range. Input to the function can be either a range of values or anexpression.
RangeAvg(first_expr[, Expression])
RangeCorrelRangeCorrel() returns the correlation coefficient for two sets of data. The correlation coefficient is ameasure of the relationship between the data sets.
RangeCorrel(x_values , y_values[, Expression])
RangeFractileRangeFractile() returns the value that corresponds to the n-th fractile (quantile) of a range of numbers.
RangeFractile(fractile, first_expr[ ,Expression])
RangeKurtosisRangeKurtosis() returns the value that corresponds to the kurtosis of a range of numbers.
RangeKurtosis(first_expr[, Expression])
Script syntax and chart functions - Qlik Sense, February 2022 699
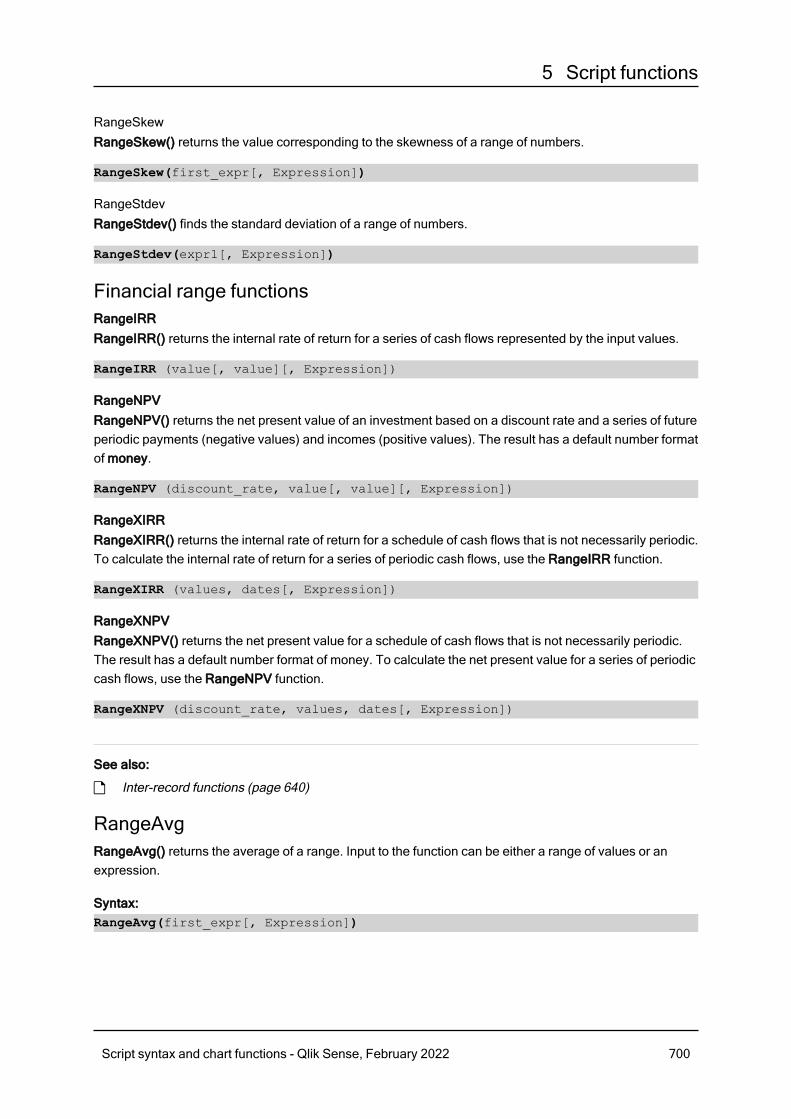
5 Script functions
RangeSkewRangeSkew() returns the value corresponding to the skewness of a range of numbers.
RangeSkew(first_expr[, Expression])
RangeStdevRangeStdev() finds the standard deviation of a range of numbers.
RangeStdev(expr1[, Expression])
Financial range functionsRangeIRRRangeIRR() returns the internal rate of return for a series of cash flows represented by the input values.
RangeIRR (value[, value][, Expression])
RangeNPVRangeNPV() returns the net present value of an investment based on a discount rate and a series of futureperiodic payments (negative values) and incomes (positive values). The result has a default number formatof money.
RangeNPV (discount_rate, value[, value][, Expression])
RangeXIRRRangeXIRR() returns the internal rate of return for a schedule of cash flows that is not necessarily periodic.To calculate the internal rate of return for a series of periodic cash flows, use the RangeIRR function.
RangeXIRR (values, dates[, Expression])
RangeXNPVRangeXNPV() returns the net present value for a schedule of cash flows that is not necessarily periodic.The result has a default number format of money. To calculate the net present value for a series of periodiccash flows, use the RangeNPV function.
RangeXNPV (discount_rate, values, dates[, Expression])
See also:
p Inter-record functions (page 640)
RangeAvgRangeAvg() returns the average of a range. Input to the function can be either a range of values or anexpression.
Syntax:RangeAvg(first_expr[, Expression])
Script syntax and chart functions - Qlik Sense, February 2022 700
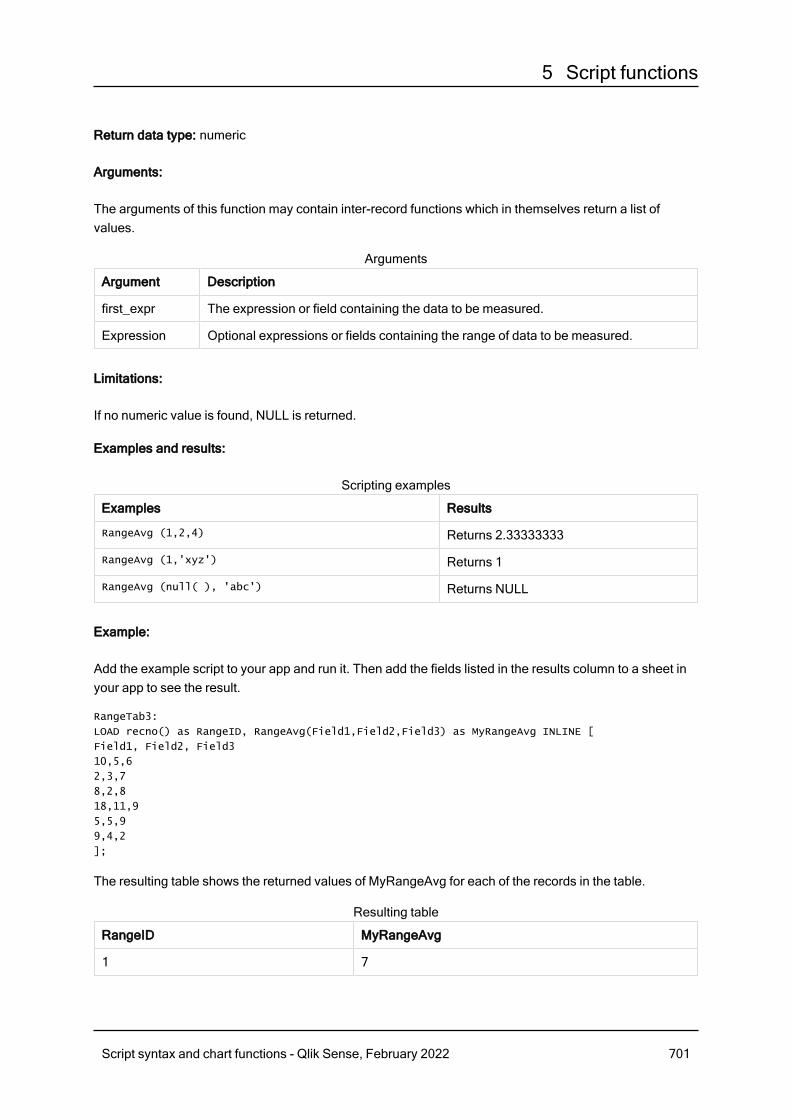
5 Script functions
Return data type: numeric
Arguments:
The arguments of this function may contain inter-record functions which in themselves return a list ofvalues.
Argument Description
first_expr The expression or field containing the data to be measured.
Expression Optional expressions or fields containing the range of data to be measured.
Arguments
Limitations:
If no numeric value is found, NULL is returned.
Examples and results:
Examples Results
RangeAvg (1,2,4) Returns 2.33333333
RangeAvg (1,'xyz') Returns 1
RangeAvg (null( ), 'abc') Returns NULL
Scripting examples
Example:
Add the example script to your app and run it. Then add the fields listed in the results column to a sheet inyour app to see the result.
RangeTab3:
LOAD recno() as RangeID, RangeAvg(Field1,Field2,Field3) as MyRangeAvg INLINE [
Field1, Field2, Field3
10,5,6
2,3,7
8,2,8
18,11,9
5,5,9
9,4,2
];
The resulting table shows the returned values of MyRangeAvg for each of the records in the table.
RangeID MyRangeAvg
1 7
Resulting table
Script syntax and chart functions - Qlik Sense, February 2022 701
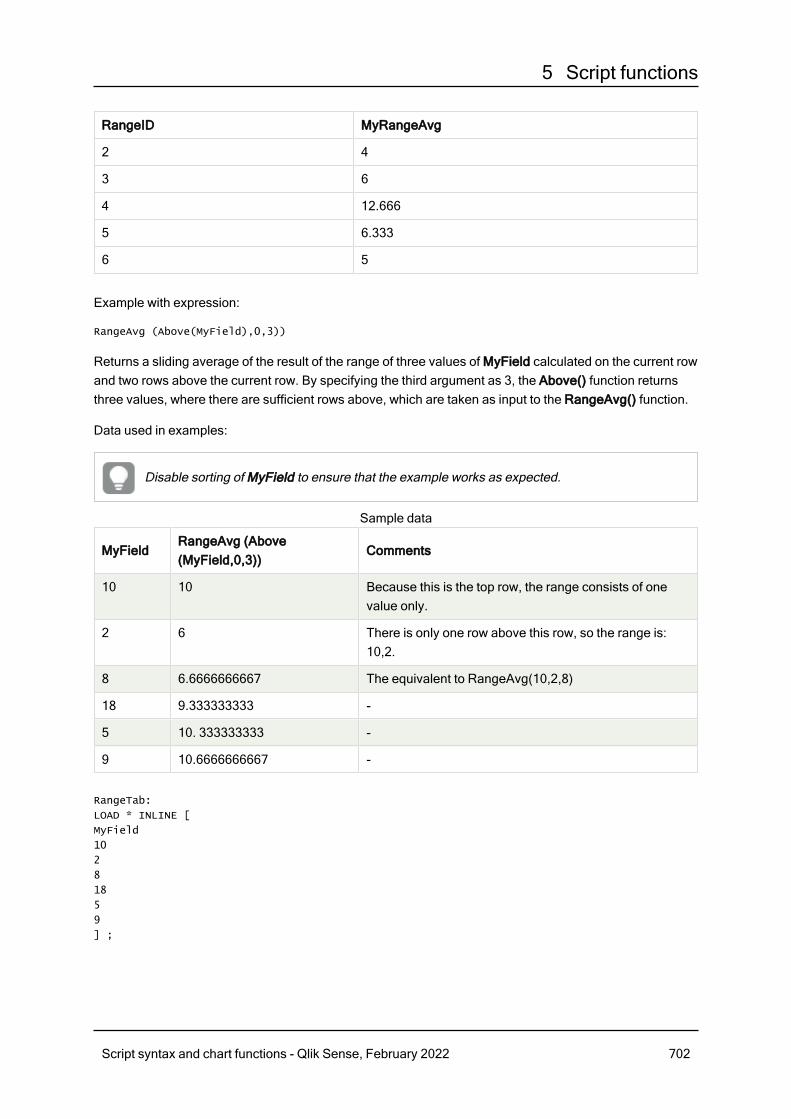
5 Script functions
RangeID MyRangeAvg
2 4
3 6
4 12.666
5 6.333
6 5
Example with expression:
RangeAvg (Above(MyField),0,3))
Returns a sliding average of the result of the range of three values of MyField calculated on the current rowand two rows above the current row. By specifying the third argument as 3, the Above() function returnsthree values, where there are sufficient rows above, which are taken as input to the RangeAvg() function.
Data used in examples:
Disable sorting of MyField to ensure that the example works as expected.
MyFieldRangeAvg (Above(MyField,0,3))
Comments
10 10 Because this is the top row, the range consists of onevalue only.
2 6 There is only one row above this row, so the range is:10,2.
8 6.6666666667 The equivalent to RangeAvg(10,2,8)
18 9.333333333 -
5 10. 333333333 -
9 10.6666666667 -
Sample data
RangeTab:
LOAD * INLINE [
MyField
10
2
8
18
5
9
] ;
Script syntax and chart functions - Qlik Sense, February 2022 702
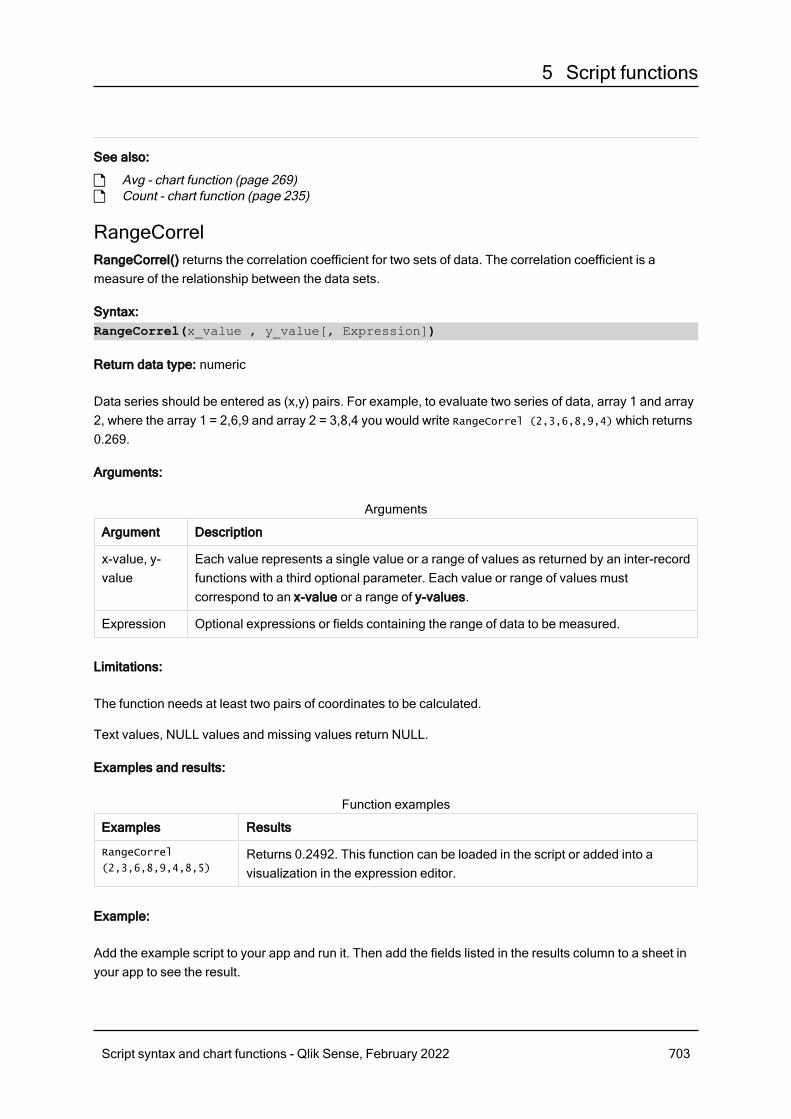
5 Script functions
See also:
p Avg - chart function (page 269)p Count - chart function (page 235)
RangeCorrelRangeCorrel() returns the correlation coefficient for two sets of data. The correlation coefficient is ameasure of the relationship between the data sets.
Syntax:RangeCorrel(x_value , y_value[, Expression])
Return data type: numeric
Data series should be entered as (x,y) pairs. For example, to evaluate two series of data, array 1 and array2, where the array 1 = 2,6,9 and array 2 = 3,8,4 you would write RangeCorrel (2,3,6,8,9,4) which returns0.269.
Arguments:
Argument Description
x-value, y-value
Each value represents a single value or a range of values as returned by an inter-recordfunctions with a third optional parameter. Each value or range of values mustcorrespond to an x-value or a range of y-values.
Expression Optional expressions or fields containing the range of data to be measured.
Arguments
Limitations:
The function needs at least two pairs of coordinates to be calculated.
Text values, NULL values and missing values return NULL.
Examples and results:
Examples Results
RangeCorrel
(2,3,6,8,9,4,8,5)Returns 0.2492. This function can be loaded in the script or added into avisualization in the expression editor.
Function examples
Example:
Add the example script to your app and run it. Then add the fields listed in the results column to a sheet inyour app to see the result.
Script syntax and chart functions - Qlik Sense, February 2022 703
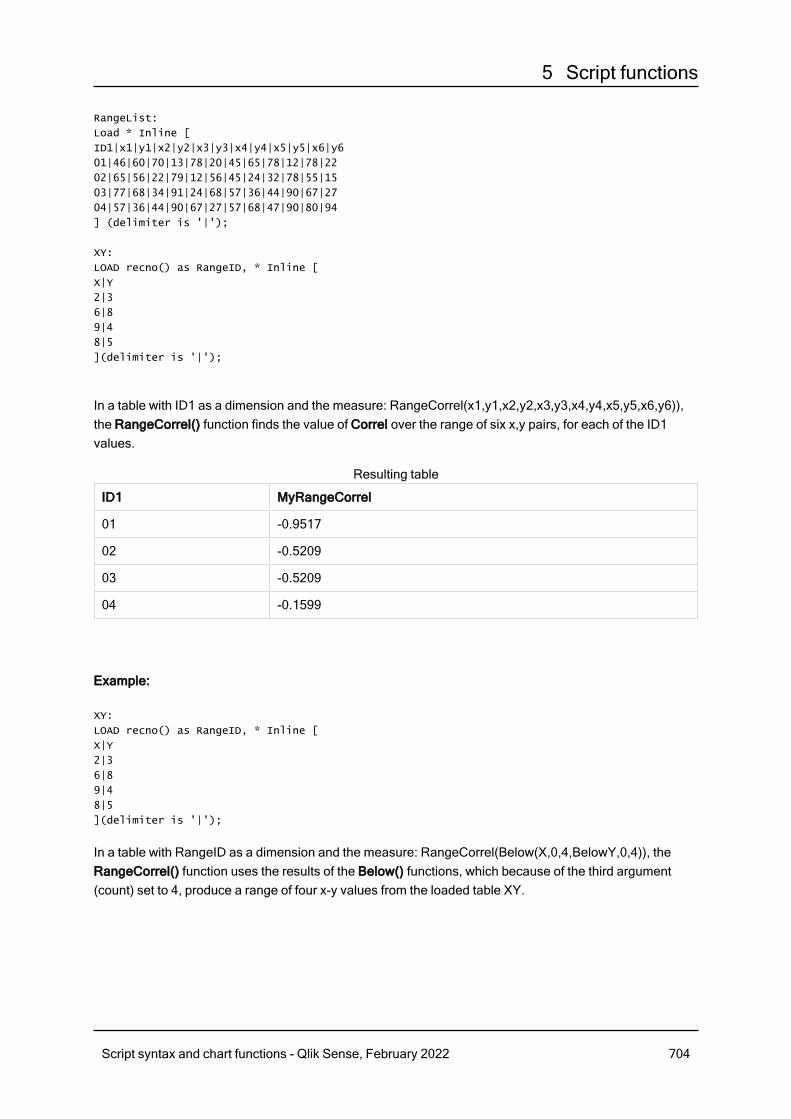
5 Script functions
RangeList:
Load * Inline [
ID1|x1|y1|x2|y2|x3|y3|x4|y4|x5|y5|x6|y6
01|46|60|70|13|78|20|45|65|78|12|78|22
02|65|56|22|79|12|56|45|24|32|78|55|15
03|77|68|34|91|24|68|57|36|44|90|67|27
04|57|36|44|90|67|27|57|68|47|90|80|94
] (delimiter is '|');
XY:
LOAD recno() as RangeID, * Inline [
X|Y
2|3
6|8
9|4
8|5
](delimiter is '|');
In a table with ID1 as a dimension and the measure: RangeCorrel(x1,y1,x2,y2,x3,y3,x4,y4,x5,y5,x6,y6)),the RangeCorrel() function finds the value of Correl over the range of six x,y pairs, for each of the ID1values.
ID1 MyRangeCorrel
01 -0.9517
02 -0.5209
03 -0.5209
04 -0.1599
Resulting table
Example:
XY:
LOAD recno() as RangeID, * Inline [
X|Y
2|3
6|8
9|4
8|5
](delimiter is '|');
In a table with RangeID as a dimension and the measure: RangeCorrel(Below(X,0,4,BelowY,0,4)), theRangeCorrel() function uses the results of the Below() functions, which because of the third argument(count) set to 4, produce a range of four x-y values from the loaded table XY.
Script syntax and chart functions - Qlik Sense, February 2022 704
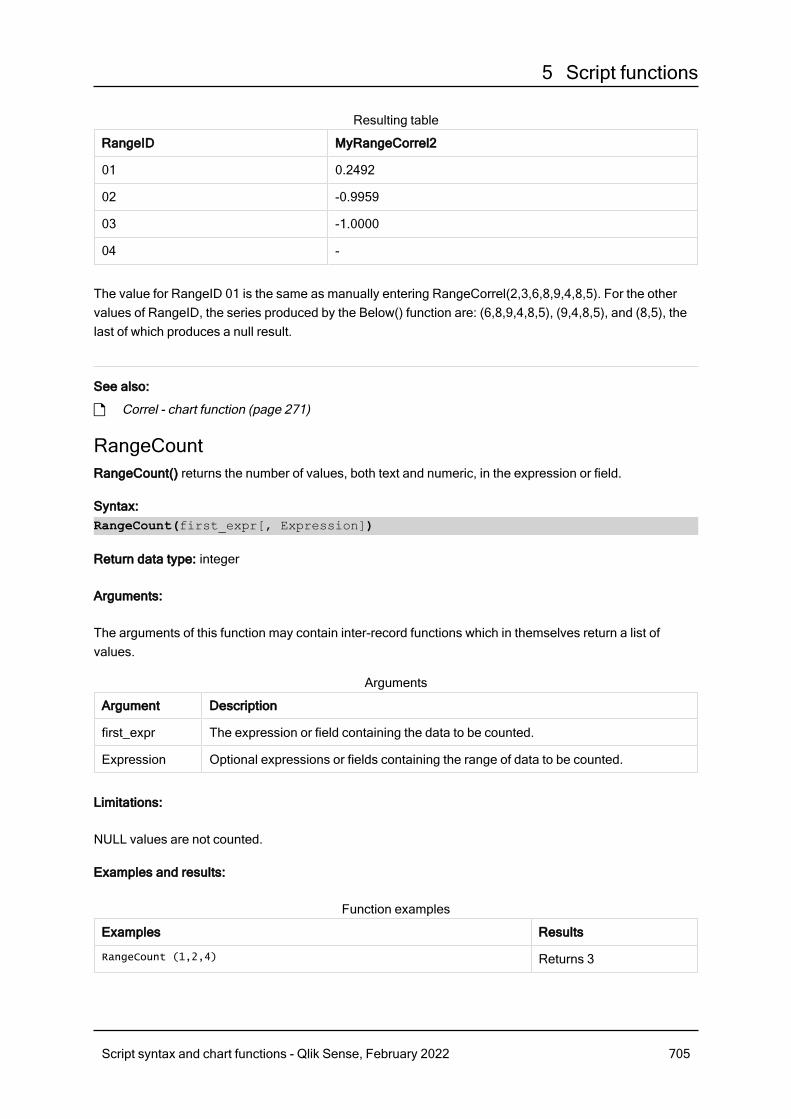
5 Script functions
RangeID MyRangeCorrel2
01 0.2492
02 -0.9959
03 -1.0000
04 -
Resulting table
The value for RangeID 01 is the same as manually entering RangeCorrel(2,3,6,8,9,4,8,5). For the othervalues of RangeID, the series produced by the Below() function are: (6,8,9,4,8,5), (9,4,8,5), and (8,5), thelast of which produces a null result.
See also:
p Correl - chart function (page 271)
RangeCountRangeCount() returns the number of values, both text and numeric, in the expression or field.
Syntax:RangeCount(first_expr[, Expression])
Return data type: integer
Arguments:
The arguments of this function may contain inter-record functions which in themselves return a list ofvalues.
Argument Description
first_expr The expression or field containing the data to be counted.
Expression Optional expressions or fields containing the range of data to be counted.
Arguments
Limitations:
NULL values are not counted.
Examples and results:
Examples Results
RangeCount (1,2,4) Returns 3
Function examples
Script syntax and chart functions - Qlik Sense, February 2022 705
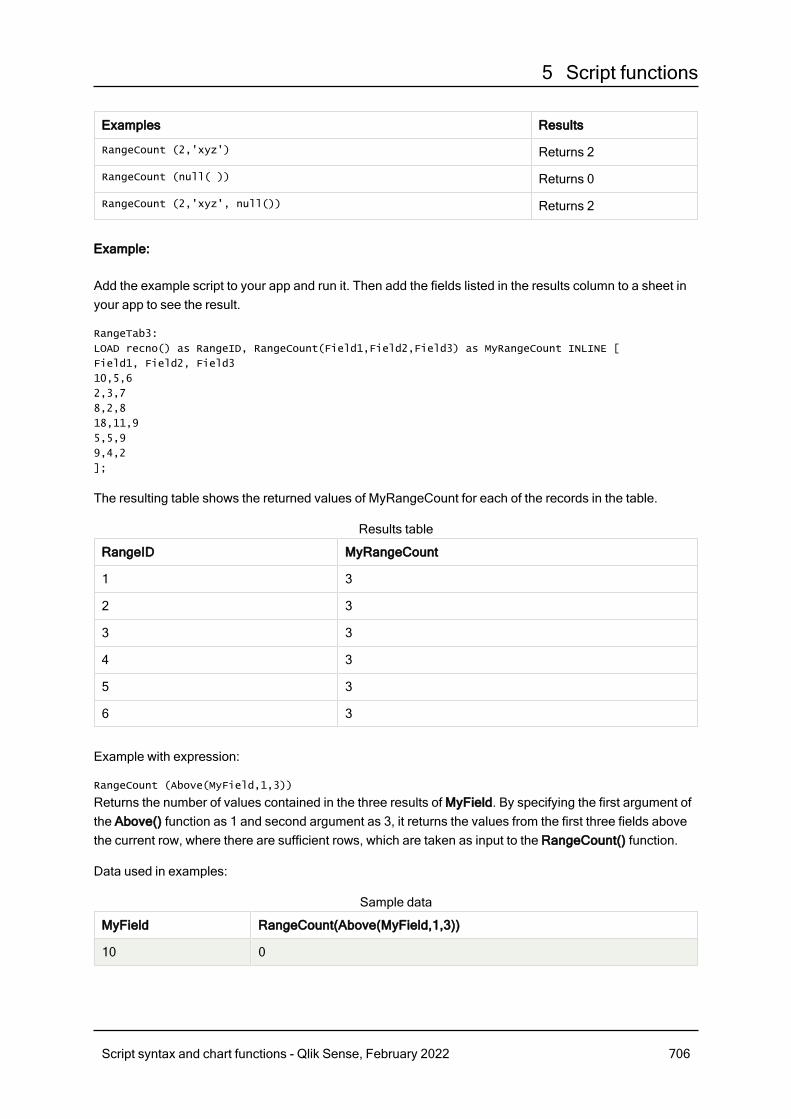
5 Script functions
Examples Results
RangeCount (2,'xyz') Returns 2
RangeCount (null( )) Returns 0
RangeCount (2,'xyz', null()) Returns 2
Example:
Add the example script to your app and run it. Then add the fields listed in the results column to a sheet inyour app to see the result.
RangeTab3:
LOAD recno() as RangeID, RangeCount(Field1,Field2,Field3) as MyRangeCount INLINE [
Field1, Field2, Field3
10,5,6
2,3,7
8,2,8
18,11,9
5,5,9
9,4,2
];
The resulting table shows the returned values of MyRangeCount for each of the records in the table.
RangeID MyRangeCount
1 3
2 3
3 3
4 3
5 3
6 3
Results table
Example with expression:
RangeCount (Above(MyField,1,3))
Returns the number of values contained in the three results of MyField. By specifying the first argument ofthe Above() function as 1 and second argument as 3, it returns the values from the first three fields abovethe current row, where there are sufficient rows, which are taken as input to the RangeCount() function.
Data used in examples:
MyField RangeCount(Above(MyField,1,3))
10 0
Sample data
Script syntax and chart functions - Qlik Sense, February 2022 706
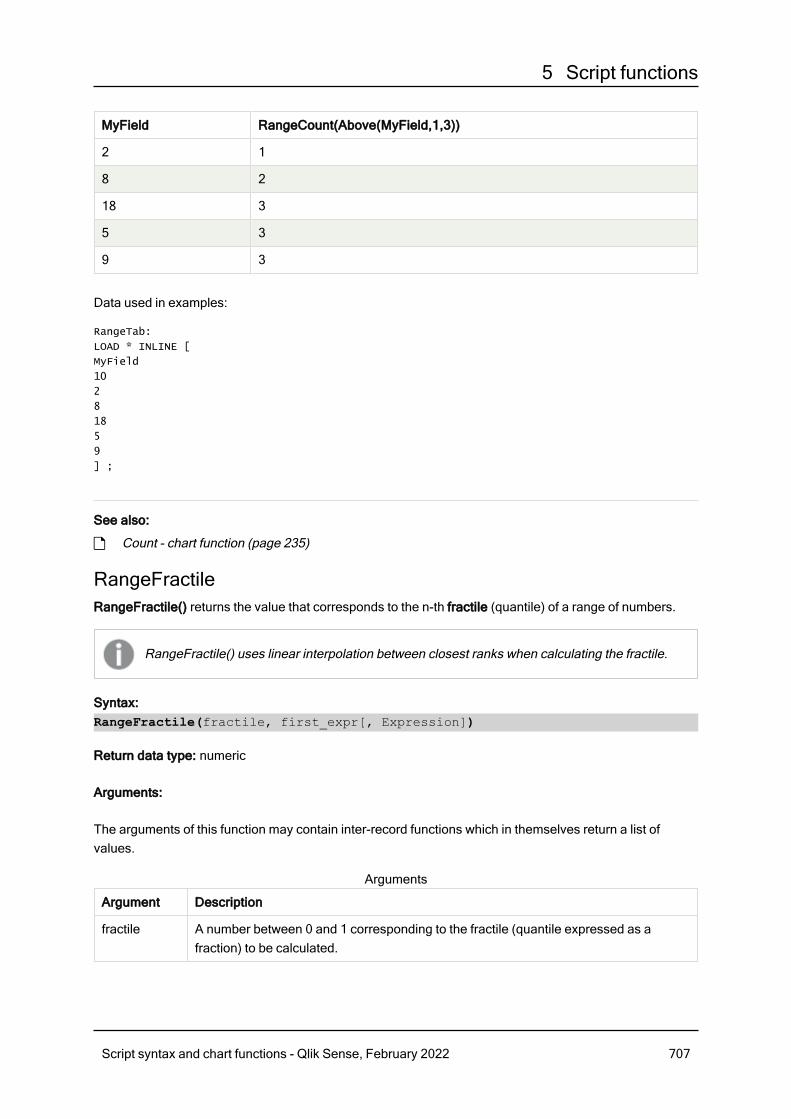
5 Script functions
MyField RangeCount(Above(MyField,1,3))
2 1
8 2
18 3
5 3
9 3
Data used in examples:
RangeTab:
LOAD * INLINE [
MyField
10
2
8
18
5
9
] ;
See also:
p Count - chart function (page 235)
RangeFractileRangeFractile() returns the value that corresponds to the n-th fractile (quantile) of a range of numbers.
RangeFractile() uses linear interpolation between closest ranks when calculating the fractile.
Syntax:RangeFractile(fractile, first_expr[, Expression])
Return data type: numeric
Arguments:
The arguments of this function may contain inter-record functions which in themselves return a list ofvalues.
Argument Description
fractile A number between 0 and 1 corresponding to the fractile (quantile expressed as afraction) to be calculated.
Arguments
Script syntax and chart functions - Qlik Sense, February 2022 707
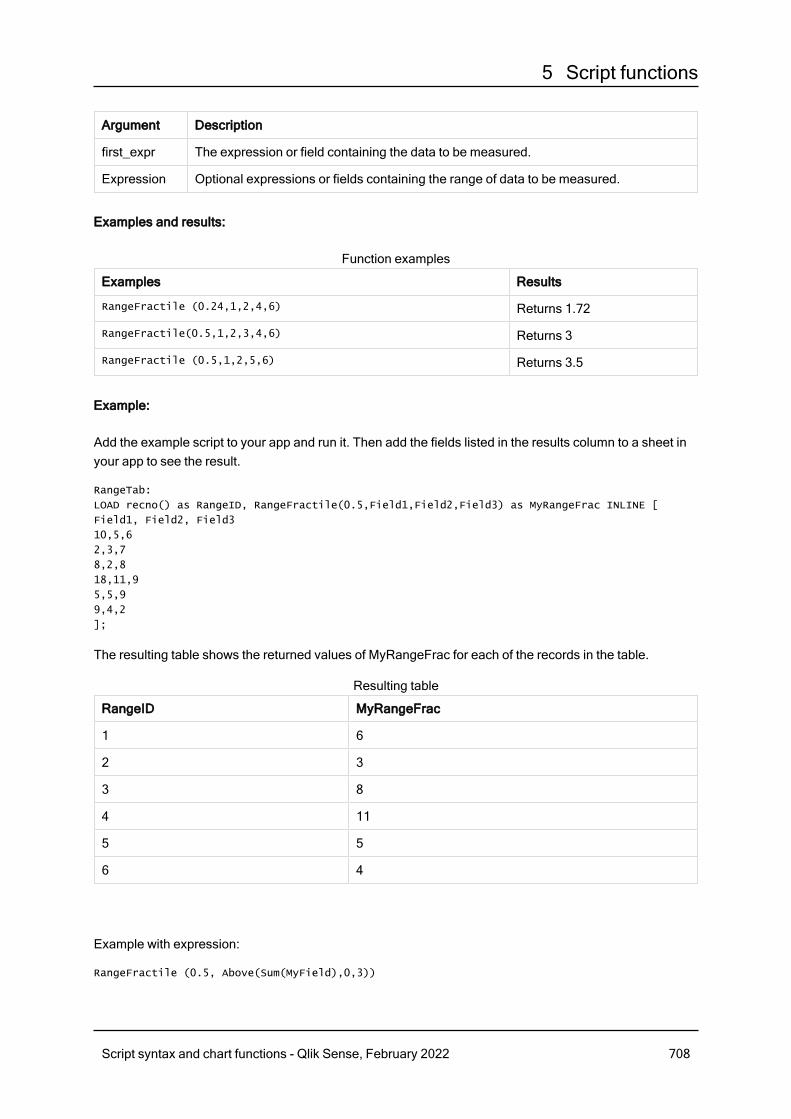
5 Script functions
Argument Description
first_expr The expression or field containing the data to be measured.
Expression Optional expressions or fields containing the range of data to be measured.
Examples and results:
Examples Results
RangeFractile (0.24,1,2,4,6) Returns 1.72
RangeFractile(0.5,1,2,3,4,6) Returns 3
RangeFractile (0.5,1,2,5,6) Returns 3.5
Function examples
Example:
Add the example script to your app and run it. Then add the fields listed in the results column to a sheet inyour app to see the result.
RangeTab:
LOAD recno() as RangeID, RangeFractile(0.5,Field1,Field2,Field3) as MyRangeFrac INLINE [
Field1, Field2, Field3
10,5,6
2,3,7
8,2,8
18,11,9
5,5,9
9,4,2
];
The resulting table shows the returned values of MyRangeFrac for each of the records in the table.
RangeID MyRangeFrac
1 6
2 3
3 8
4 11
5 5
6 4
Resulting table
Example with expression:
RangeFractile (0.5, Above(Sum(MyField),0,3))
Script syntax and chart functions - Qlik Sense, February 2022 708
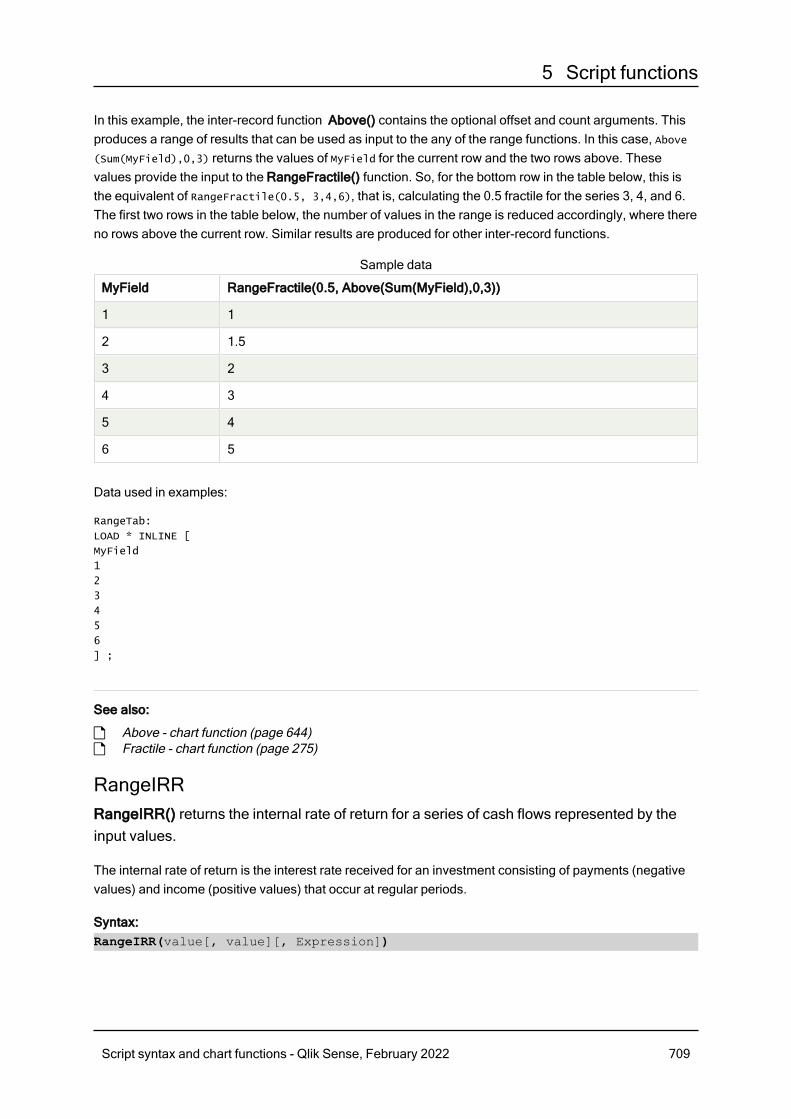
5 Script functions
In this example, the inter-record function Above() contains the optional offset and count arguments. Thisproduces a range of results that can be used as input to the any of the range functions. In this case, Above(Sum(MyField),0,3) returns the values of MyField for the current row and the two rows above. Thesevalues provide the input to the RangeFractile() function. So, for the bottom row in the table below, this isthe equivalent of RangeFractile(0.5, 3,4,6), that is, calculating the 0.5 fractile for the series 3, 4, and 6.The first two rows in the table below, the number of values in the range is reduced accordingly, where thereno rows above the current row. Similar results are produced for other inter-record functions.
MyField RangeFractile(0.5, Above(Sum(MyField),0,3))
1 1
2 1.5
3 2
4 3
5 4
6 5
Sample data
Data used in examples:
RangeTab:
LOAD * INLINE [
MyField
1
2
3
4
5
6
] ;
See also:
p Above - chart function (page 644)p Fractile - chart function (page 275)
RangeIRRRangeIRR() returns the internal rate of return for a series of cash flows represented by theinput values.
The internal rate of return is the interest rate received for an investment consisting of payments (negativevalues) and income (positive values) that occur at regular periods.
Syntax:RangeIRR(value[, value][, Expression])
Script syntax and chart functions - Qlik Sense, February 2022 709
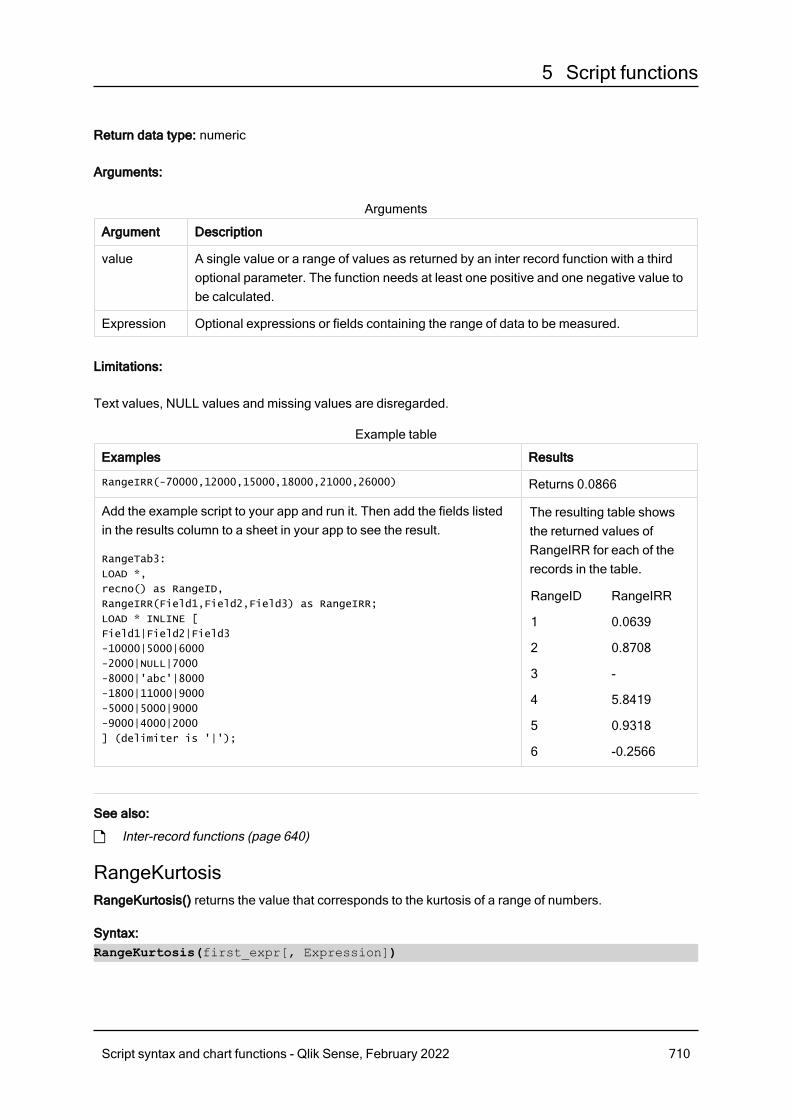
5 Script functions
Return data type: numeric
Arguments:
Argument Description
value A single value or a range of values as returned by an inter record function with a thirdoptional parameter. The function needs at least one positive and one negative value tobe calculated.
Expression Optional expressions or fields containing the range of data to be measured.
Arguments
Limitations:
Text values, NULL values and missing values are disregarded.
Examples Results
RangeIRR(-70000,12000,15000,18000,21000,26000) Returns 0.0866
Add the example script to your app and run it. Then add the fields listedin the results column to a sheet in your app to see the result.
RangeTab3:
LOAD *,
recno() as RangeID,
RangeIRR(Field1,Field2,Field3) as RangeIRR;
LOAD * INLINE [
Field1|Field2|Field3
-10000|5000|6000
-2000|NULL|7000
-8000|'abc'|8000
-1800|11000|9000
-5000|5000|9000
-9000|4000|2000
] (delimiter is '|');
The resulting table showsthe returned values ofRangeIRR for each of therecords in the table.
RangeID RangeIRR
1 0.0639
2 0.8708
3 -
4 5.8419
5 0.9318
6 -0.2566
Example table
See also:
p Inter-record functions (page 640)
RangeKurtosisRangeKurtosis() returns the value that corresponds to the kurtosis of a range of numbers.
Syntax:RangeKurtosis(first_expr[, Expression])
Script syntax and chart functions - Qlik Sense, February 2022 710
5 Script functions
Return data type: numeric
Arguments:
The arguments of this function may contain inter-record functions which in themselves return a list ofvalues.
Argument Description
first_expr The expression or field containing the data to be measured.
Expression Optional expressions or fields containing the range of data to be measured.
Arguments
Limitations:
If no numeric value is found, NULL is returned.
Examples and results:
Examples Results
RangeKurtosis (1,2,4,7) Returns -0.28571428571429
Function examples
See also:
p Kurtosis - chart function (page 282)
RangeMaxRangeMax() returns the highest numeric values found within the expression or field.
Syntax:RangeMax(first_expr[, Expression])
Return data type: numeric
Arguments:
Argument Description
first_expr The expression or field containing the data to be measured.
Expression Optional expressions or fields containing the range of data to be measured.
Arguments
Script syntax and chart functions - Qlik Sense, February 2022 711
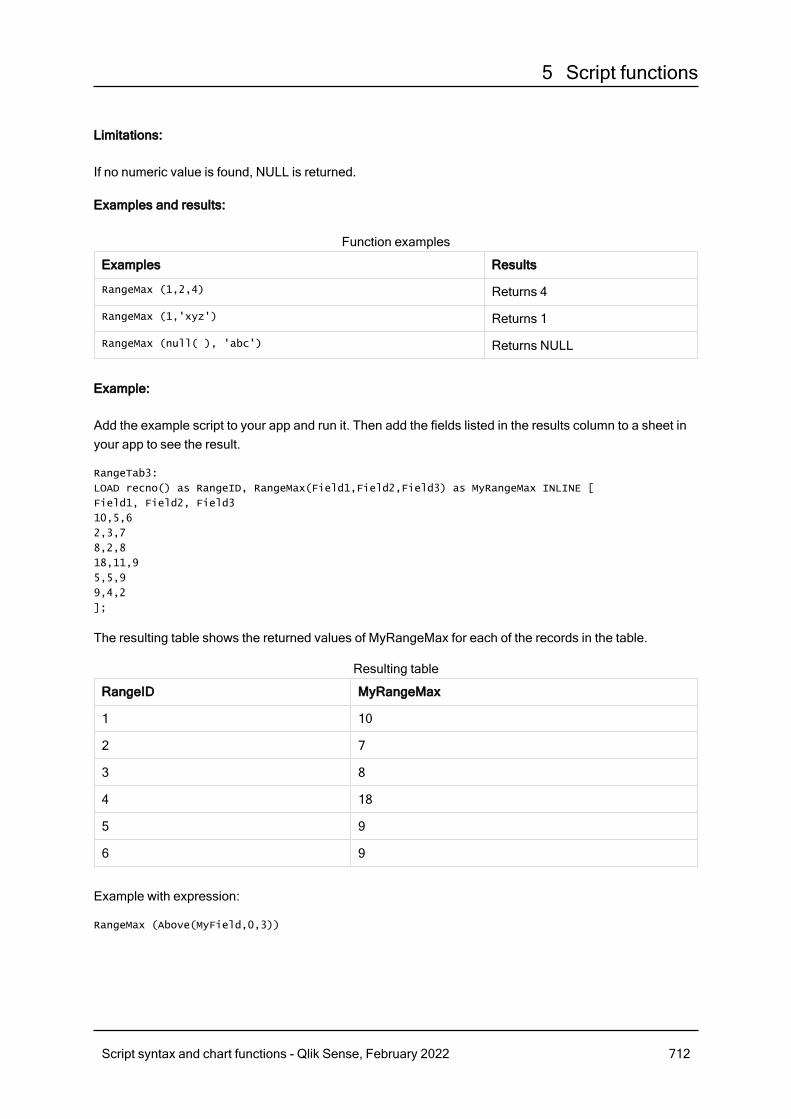
5 Script functions
Limitations:
If no numeric value is found, NULL is returned.
Examples and results:
Examples Results
RangeMax (1,2,4) Returns 4
RangeMax (1,'xyz') Returns 1
RangeMax (null( ), 'abc') Returns NULL
Function examples
Example:
Add the example script to your app and run it. Then add the fields listed in the results column to a sheet inyour app to see the result.
RangeTab3:
LOAD recno() as RangeID, RangeMax(Field1,Field2,Field3) as MyRangeMax INLINE [
Field1, Field2, Field3
10,5,6
2,3,7
8,2,8
18,11,9
5,5,9
9,4,2
];
The resulting table shows the returned values of MyRangeMax for each of the records in the table.
RangeID MyRangeMax
1 10
2 7
3 8
4 18
5 9
6 9
Resulting table
Example with expression:
RangeMax (Above(MyField,0,3))
Script syntax and chart functions - Qlik Sense, February 2022 712
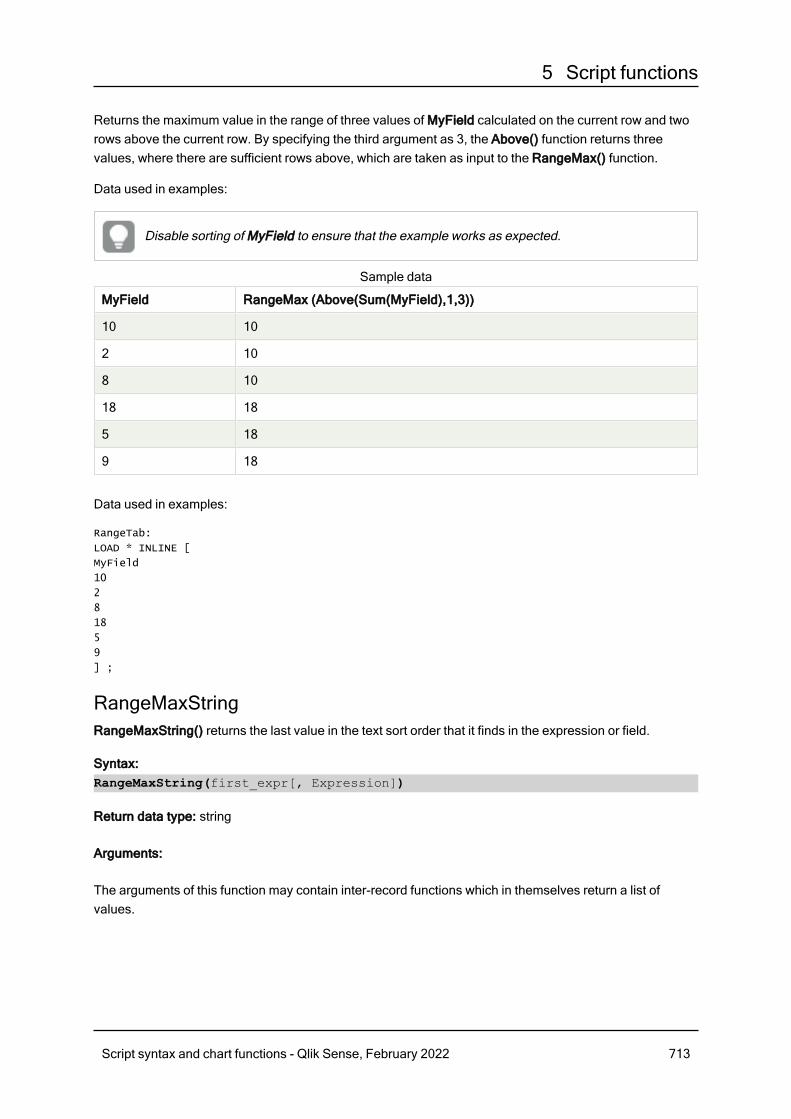
5 Script functions
Returns the maximum value in the range of three values of MyField calculated on the current row and tworows above the current row. By specifying the third argument as 3, the Above() function returns threevalues, where there are sufficient rows above, which are taken as input to the RangeMax() function.
Data used in examples:
Disable sorting of MyField to ensure that the example works as expected.
MyField RangeMax (Above(Sum(MyField),1,3))
10 10
2 10
8 10
18 18
5 18
9 18
Sample data
Data used in examples:
RangeTab:
LOAD * INLINE [
MyField
10
2
8
18
5
9
] ;
RangeMaxStringRangeMaxString() returns the last value in the text sort order that it finds in the expression or field.
Syntax:RangeMaxString(first_expr[, Expression])
Return data type: string
Arguments:
The arguments of this function may contain inter-record functions which in themselves return a list ofvalues.
Script syntax and chart functions - Qlik Sense, February 2022 713

5 Script functions
Argument Description
first_expr The expression or field containing the data to be measured.
Expression Optional expressions or fields containing the range of data to be measured.
Arguments
Examples and results:
Examples Results
RangeMaxString (1,2,4) Returns 4
RangeMaxString ('xyz','abc') Returns 'xyz'
RangeMaxString (5,'abc') Returns 'abc'
RangeMaxString (null( )) Returns NULL
Function examples
Example with expression:
RangeMaxString (Above(MaxString(MyField),0,3))
Returns the last (in text sort order) of the three results of the MaxString(MyField) function evaluated on thecurrent row and two rows above the current row.
Data used in examples:
Disable sorting of MyField to ensure that the example works as expected.
MyField RangeMaxString(Above(MaxString(MyField),0,3))
10 10
abc abc
8 abc
def def
xyz xyz
9 xyz
Sample data
Data used in examples:
RangeTab:
LOAD * INLINE [
MyField
10
'abc'
8
'def'
Script syntax and chart functions - Qlik Sense, February 2022 714
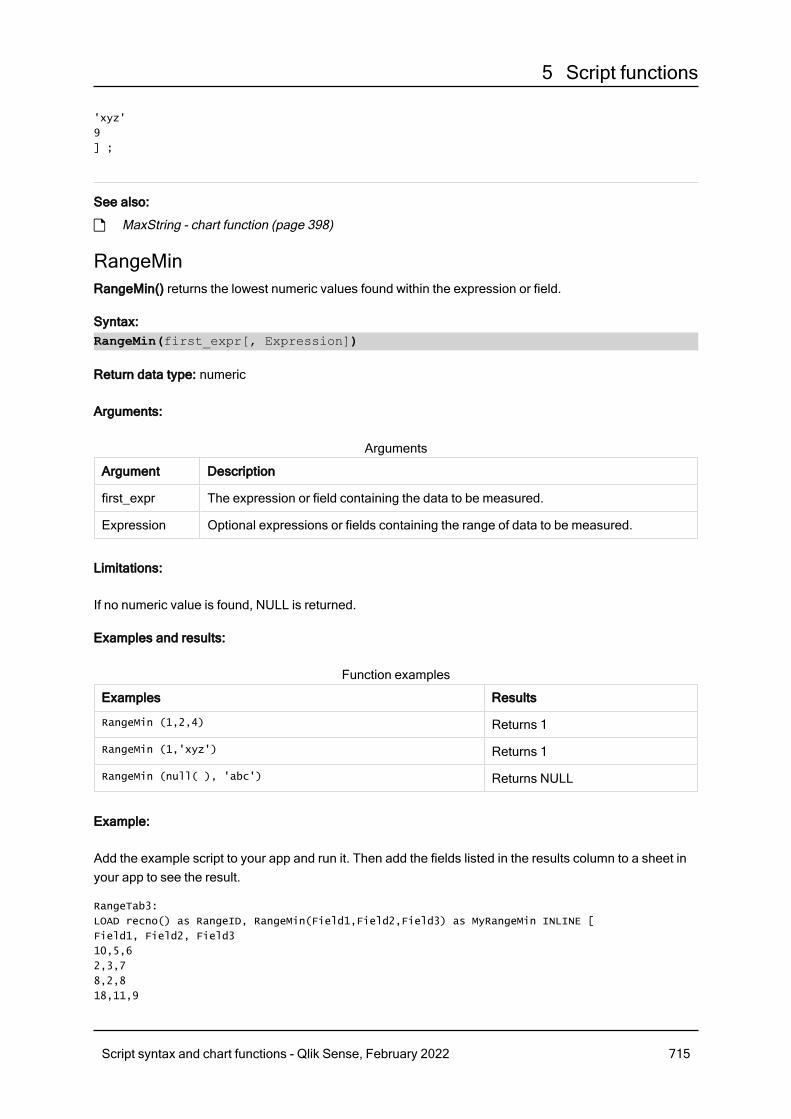
5 Script functions
'xyz'
9
] ;
See also:
p MaxString - chart function (page 398)
RangeMinRangeMin() returns the lowest numeric values found within the expression or field.
Syntax:RangeMin(first_expr[, Expression])
Return data type: numeric
Arguments:
Argument Description
first_expr The expression or field containing the data to be measured.
Expression Optional expressions or fields containing the range of data to be measured.
Arguments
Limitations:
If no numeric value is found, NULL is returned.
Examples and results:
Examples Results
RangeMin (1,2,4) Returns 1
RangeMin (1,'xyz') Returns 1
RangeMin (null( ), 'abc') Returns NULL
Function examples
Example:
Add the example script to your app and run it. Then add the fields listed in the results column to a sheet inyour app to see the result.
RangeTab3:
LOAD recno() as RangeID, RangeMin(Field1,Field2,Field3) as MyRangeMin INLINE [
Field1, Field2, Field3
10,5,6
2,3,7
8,2,8
18,11,9
Script syntax and chart functions - Qlik Sense, February 2022 715
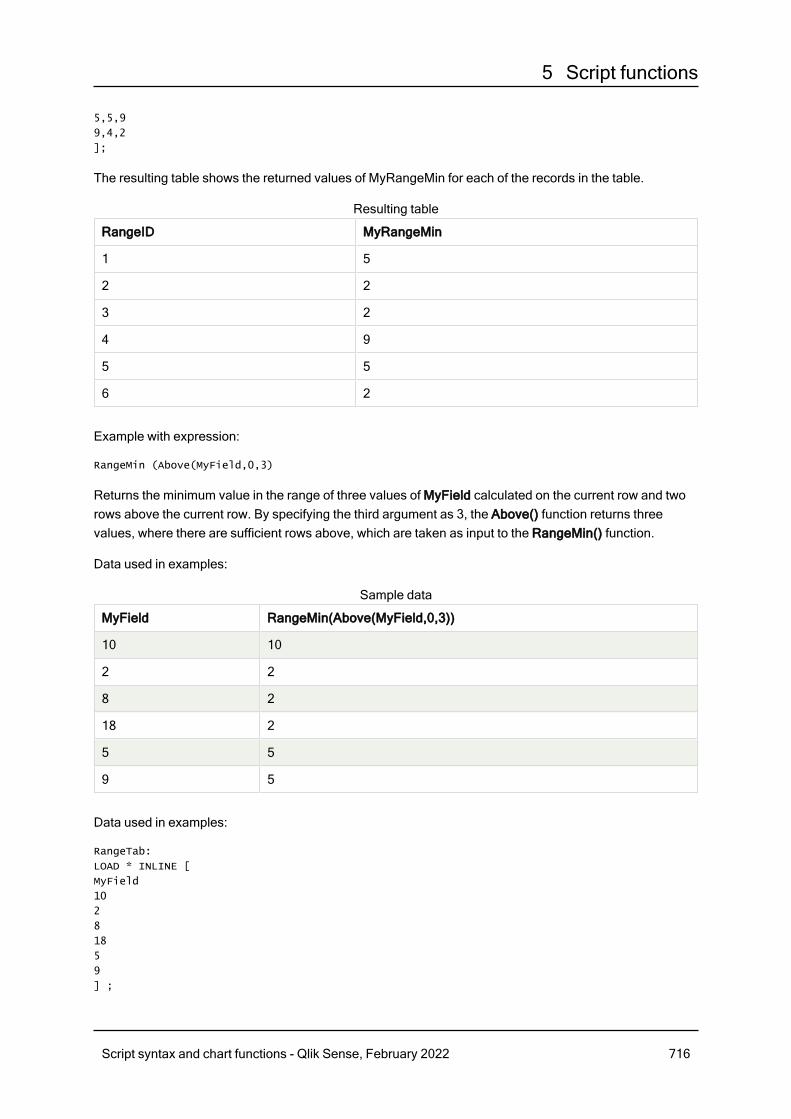
5 Script functions
5,5,9
9,4,2
];
The resulting table shows the returned values of MyRangeMin for each of the records in the table.
RangeID MyRangeMin
1 5
2 2
3 2
4 9
5 5
6 2
Resulting table
Example with expression:
RangeMin (Above(MyField,0,3)
Returns the minimum value in the range of three values of MyField calculated on the current row and tworows above the current row. By specifying the third argument as 3, the Above() function returns threevalues, where there are sufficient rows above, which are taken as input to the RangeMin() function.
Data used in examples:
MyField RangeMin(Above(MyField,0,3))
10 10
2 2
8 2
18 2
5 5
9 5
Sample data
Data used in examples:
RangeTab:
LOAD * INLINE [
MyField
10
2
8
18
5
9
] ;
Script syntax and chart functions - Qlik Sense, February 2022 716
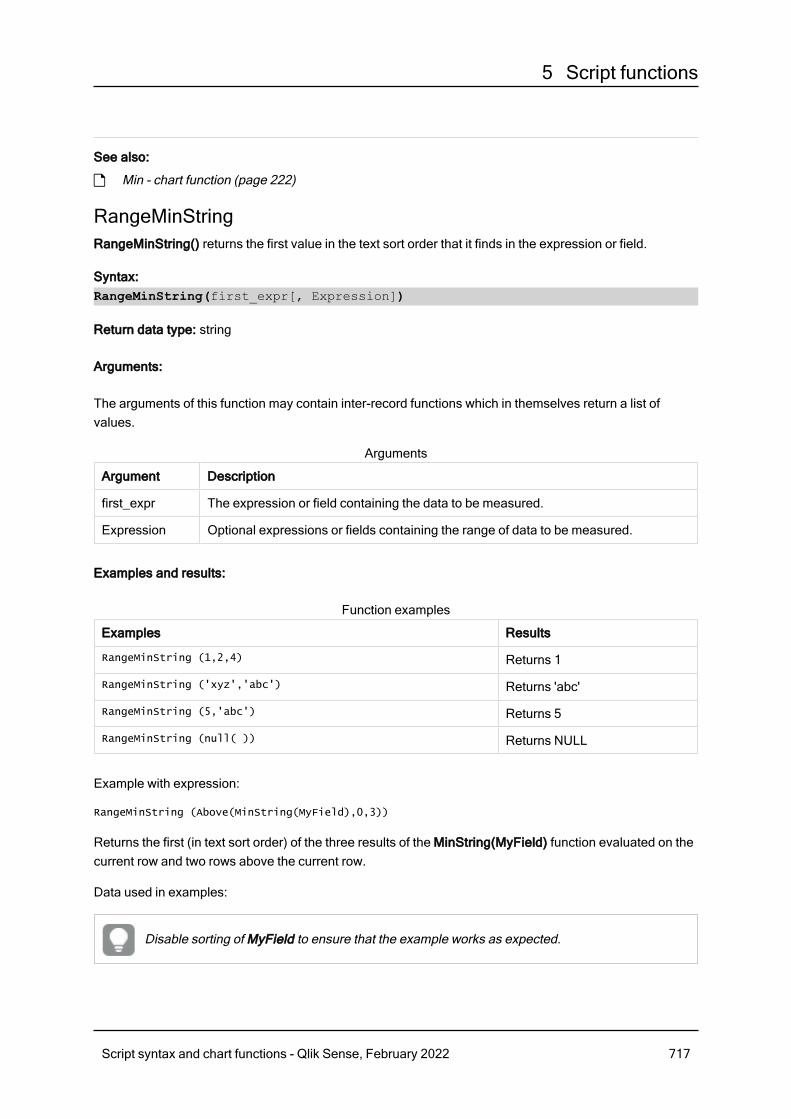
5 Script functions
See also:
p Min - chart function (page 222)
RangeMinStringRangeMinString() returns the first value in the text sort order that it finds in the expression or field.
Syntax:RangeMinString(first_expr[, Expression])
Return data type: string
Arguments:
The arguments of this function may contain inter-record functions which in themselves return a list ofvalues.
Argument Description
first_expr The expression or field containing the data to be measured.
Expression Optional expressions or fields containing the range of data to be measured.
Arguments
Examples and results:
Examples Results
RangeMinString (1,2,4) Returns 1
RangeMinString ('xyz','abc') Returns 'abc'
RangeMinString (5,'abc') Returns 5
RangeMinString (null( )) Returns NULL
Function examples
Example with expression:
RangeMinString (Above(MinString(MyField),0,3))
Returns the first (in text sort order) of the three results of the MinString(MyField) function evaluated on thecurrent row and two rows above the current row.
Data used in examples:
Disable sorting of MyField to ensure that the example works as expected.
Script syntax and chart functions - Qlik Sense, February 2022 717
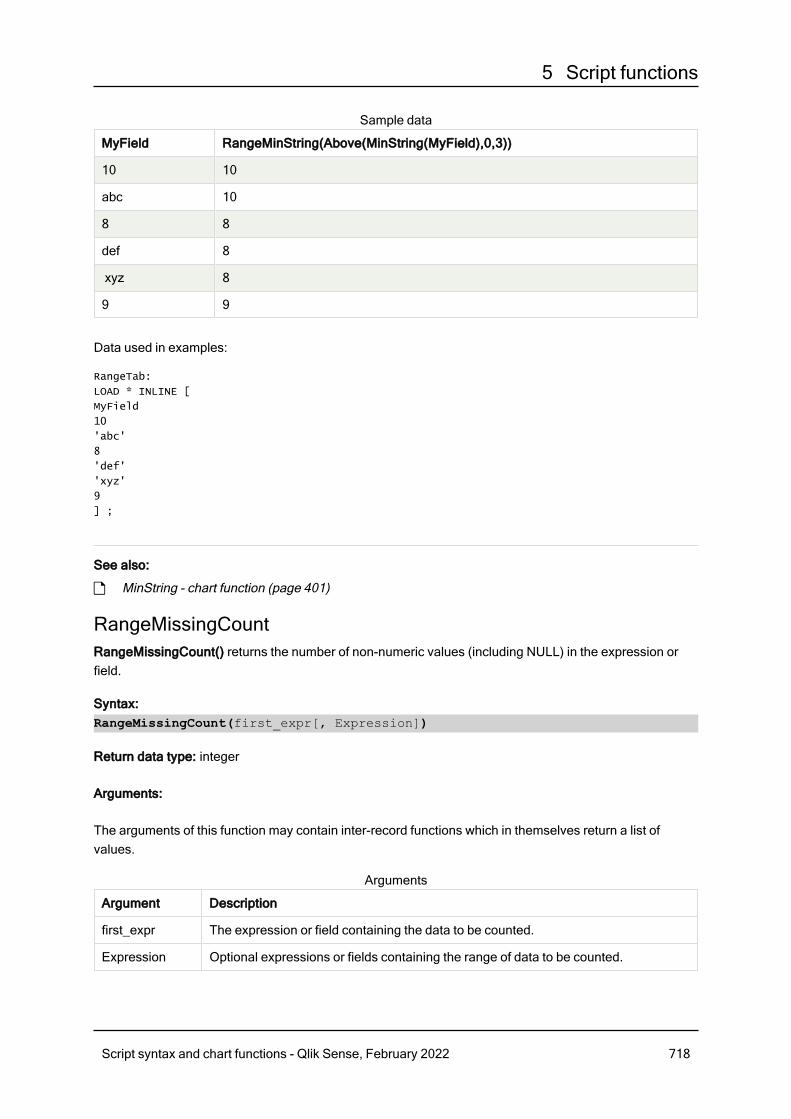
5 Script functions
MyField RangeMinString(Above(MinString(MyField),0,3))
10 10
abc 10
8 8
def 8
xyz 8
9 9
Sample data
Data used in examples:
RangeTab:
LOAD * INLINE [
MyField
10
'abc'
8
'def'
'xyz'
9
] ;
See also:
p MinString - chart function (page 401)
RangeMissingCountRangeMissingCount() returns the number of non-numeric values (including NULL) in the expression orfield.
Syntax:RangeMissingCount(first_expr[, Expression])
Return data type: integer
Arguments:
The arguments of this function may contain inter-record functions which in themselves return a list ofvalues.
Argument Description
first_expr The expression or field containing the data to be counted.
Expression Optional expressions or fields containing the range of data to be counted.
Arguments
Script syntax and chart functions - Qlik Sense, February 2022 718
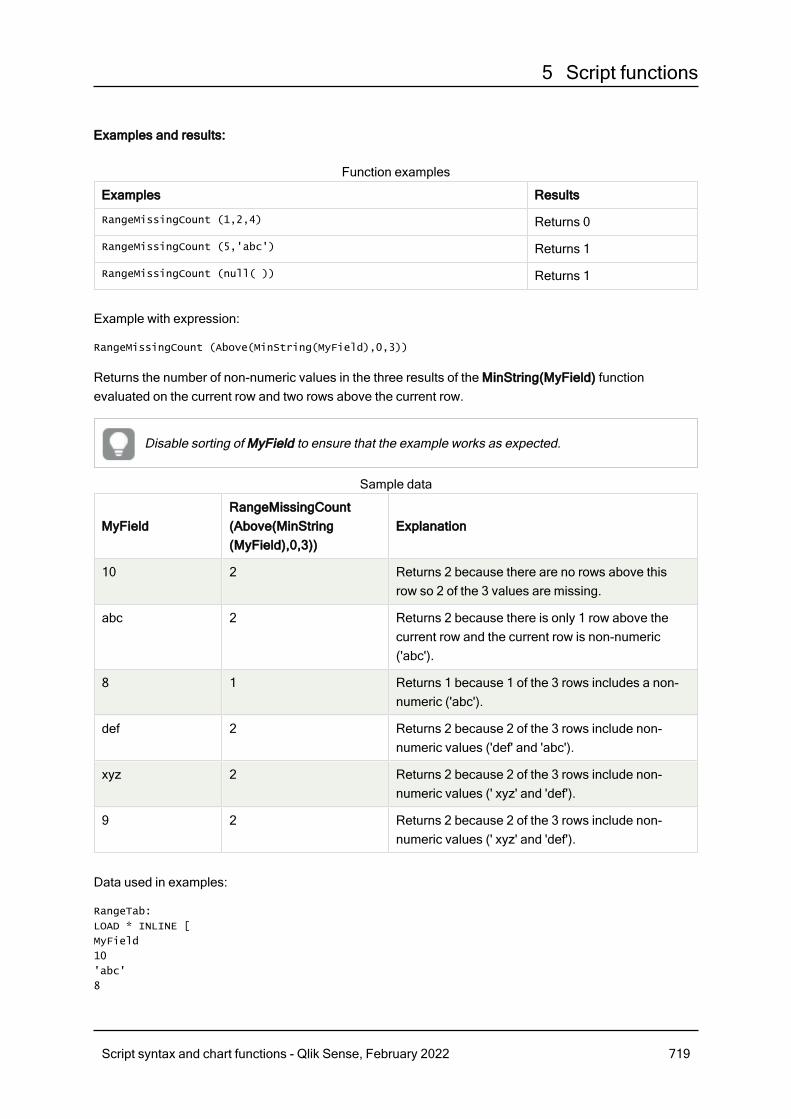
5 Script functions
Examples and results:
Examples Results
RangeMissingCount (1,2,4) Returns 0
RangeMissingCount (5,'abc') Returns 1
RangeMissingCount (null( )) Returns 1
Function examples
Example with expression:
RangeMissingCount (Above(MinString(MyField),0,3))
Returns the number of non-numeric values in the three results of the MinString(MyField) functionevaluated on the current row and two rows above the current row.
Disable sorting of MyField to ensure that the example works as expected.
MyFieldRangeMissingCount(Above(MinString(MyField),0,3))
Explanation
10 2 Returns 2 because there are no rows above thisrow so 2 of the 3 values are missing.
abc 2 Returns 2 because there is only 1 row above thecurrent row and the current row is non-numeric('abc').
8 1 Returns 1 because 1 of the 3 rows includes a non-numeric ('abc').
def 2 Returns 2 because 2 of the 3 rows include non-numeric values ('def' and 'abc').
xyz 2 Returns 2 because 2 of the 3 rows include non-numeric values (' xyz' and 'def').
9 2 Returns 2 because 2 of the 3 rows include non-numeric values (' xyz' and 'def').
Sample data
Data used in examples:
RangeTab:
LOAD * INLINE [
MyField
10
'abc'
8
Script syntax and chart functions - Qlik Sense, February 2022 719
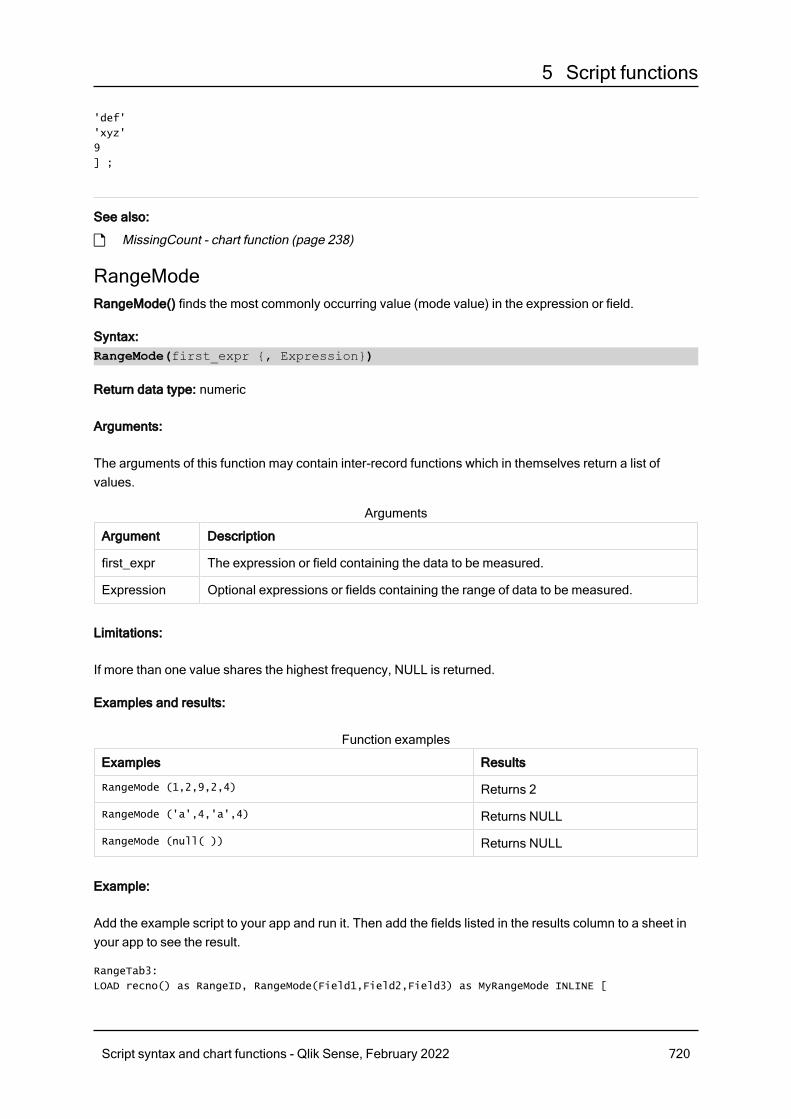
5 Script functions
'def'
'xyz'
9
] ;
See also:
p MissingCount - chart function (page 238)
RangeModeRangeMode() finds the most commonly occurring value (mode value) in the expression or field.
Syntax:RangeMode(first_expr {, Expression})
Return data type: numeric
Arguments:
The arguments of this function may contain inter-record functions which in themselves return a list ofvalues.
Argument Description
first_expr The expression or field containing the data to be measured.
Expression Optional expressions or fields containing the range of data to be measured.
Arguments
Limitations:
If more than one value shares the highest frequency, NULL is returned.
Examples and results:
Examples Results
RangeMode (1,2,9,2,4) Returns 2
RangeMode ('a',4,'a',4) Returns NULL
RangeMode (null( )) Returns NULL
Function examples
Example:
Add the example script to your app and run it. Then add the fields listed in the results column to a sheet inyour app to see the result.
RangeTab3:
LOAD recno() as RangeID, RangeMode(Field1,Field2,Field3) as MyRangeMode INLINE [
Script syntax and chart functions - Qlik Sense, February 2022 720
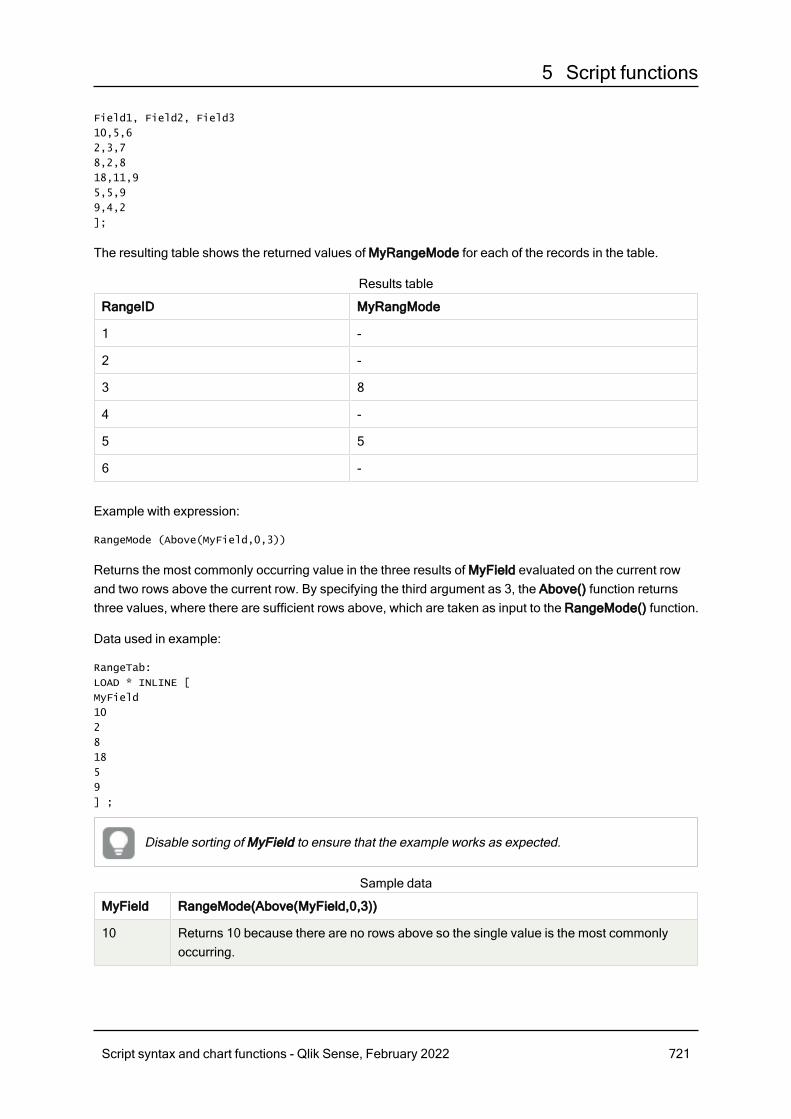
5 Script functions
Field1, Field2, Field3
10,5,6
2,3,7
8,2,8
18,11,9
5,5,9
9,4,2
];
The resulting table shows the returned values of MyRangeMode for each of the records in the table.
RangeID MyRangMode
1 -
2 -
3 8
4 -
5 5
6 -
Results table
Example with expression:
RangeMode (Above(MyField,0,3))
Returns the most commonly occurring value in the three results of MyField evaluated on the current rowand two rows above the current row. By specifying the third argument as 3, the Above() function returnsthree values, where there are sufficient rows above, which are taken as input to the RangeMode() function.
Data used in example:
RangeTab:
LOAD * INLINE [
MyField
10
2
8
18
5
9
] ;
Disable sorting of MyField to ensure that the example works as expected.
MyField RangeMode(Above(MyField,0,3))
10 Returns 10 because there are no rows above so the single value is the most commonlyoccurring.
Sample data
Script syntax and chart functions - Qlik Sense, February 2022 721
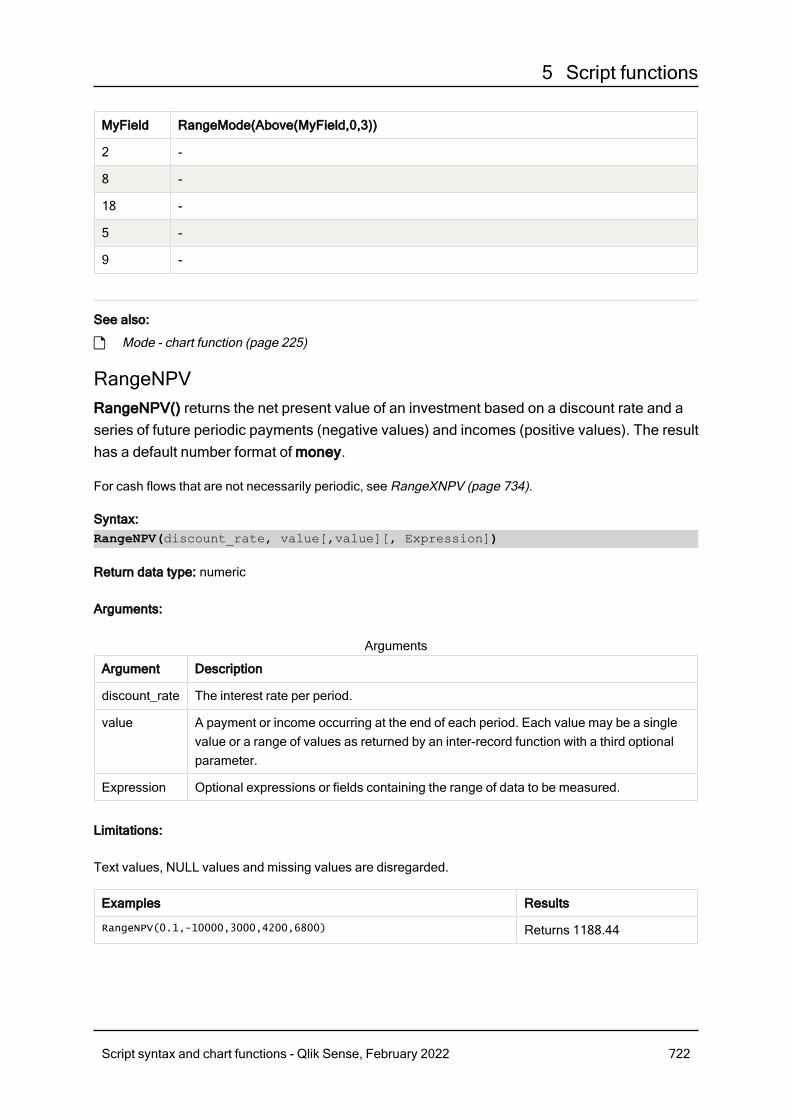
5 Script functions
MyField RangeMode(Above(MyField,0,3))
2 -
8 -
18 -
5 -
9 -
See also:
p Mode - chart function (page 225)
RangeNPVRangeNPV() returns the net present value of an investment based on a discount rate and aseries of future periodic payments (negative values) and incomes (positive values). The resulthas a default number format of money.
For cash flows that are not necessarily periodic, see RangeXNPV (page 734).
Syntax:RangeNPV(discount_rate, value[,value][, Expression])
Return data type: numeric
Arguments:
Argument Description
discount_rate The interest rate per period.
value A payment or income occurring at the end of each period. Each value may be a singlevalue or a range of values as returned by an inter-record function with a third optionalparameter.
Expression Optional expressions or fields containing the range of data to be measured.
Arguments
Limitations:
Text values, NULL values and missing values are disregarded.
Examples Results
RangeNPV(0.1,-10000,3000,4200,6800) Returns 1188.44
Script syntax and chart functions - Qlik Sense, February 2022 722
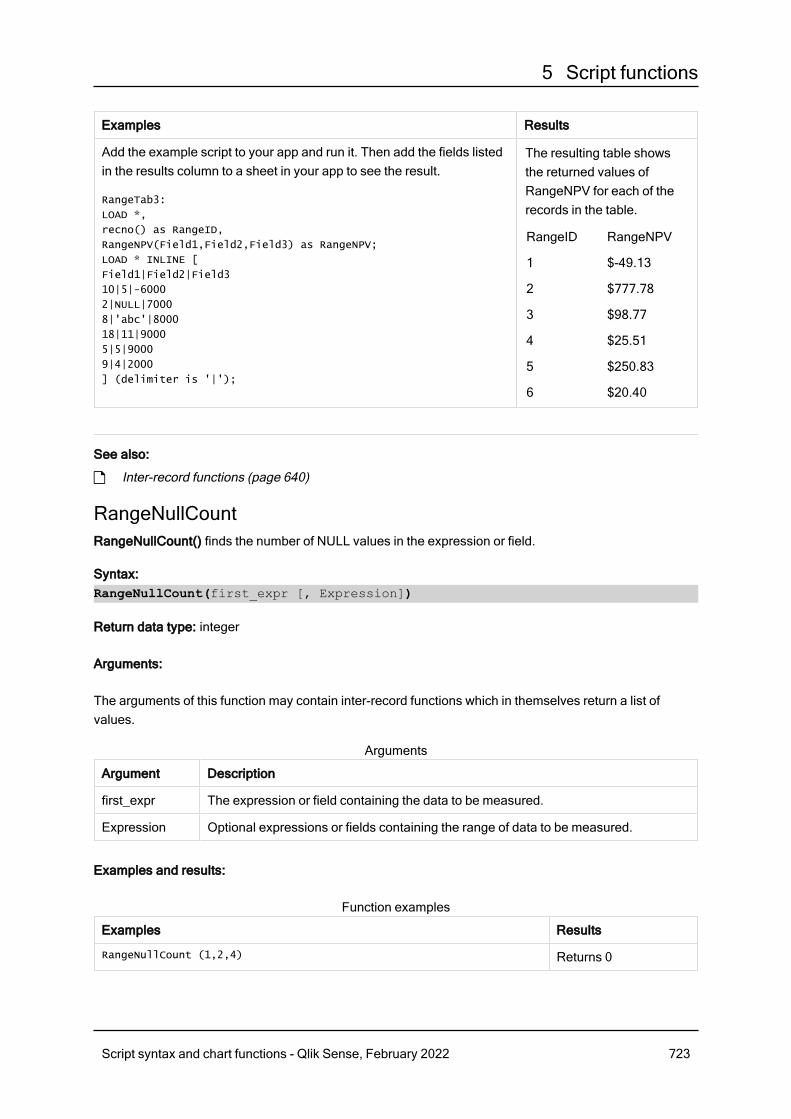
5 Script functions
Examples Results
Add the example script to your app and run it. Then add the fields listedin the results column to a sheet in your app to see the result.
RangeTab3:
LOAD *,
recno() as RangeID,
RangeNPV(Field1,Field2,Field3) as RangeNPV;
LOAD * INLINE [
Field1|Field2|Field3
10|5|-6000
2|NULL|7000
8|'abc'|8000
18|11|9000
5|5|9000
9|4|2000
] (delimiter is '|');
The resulting table showsthe returned values ofRangeNPV for each of therecords in the table.
RangeID RangeNPV
1 $-49.13
2 $777.78
3 $98.77
4 $25.51
5 $250.83
6 $20.40
See also:
p Inter-record functions (page 640)
RangeNullCountRangeNullCount() finds the number of NULL values in the expression or field.
Syntax:RangeNullCount(first_expr [, Expression])
Return data type: integer
Arguments:
The arguments of this function may contain inter-record functions which in themselves return a list ofvalues.
Argument Description
first_expr The expression or field containing the data to be measured.
Expression Optional expressions or fields containing the range of data to be measured.
Arguments
Examples and results:
Examples Results
RangeNullCount (1,2,4) Returns 0
Function examples
Script syntax and chart functions - Qlik Sense, February 2022 723
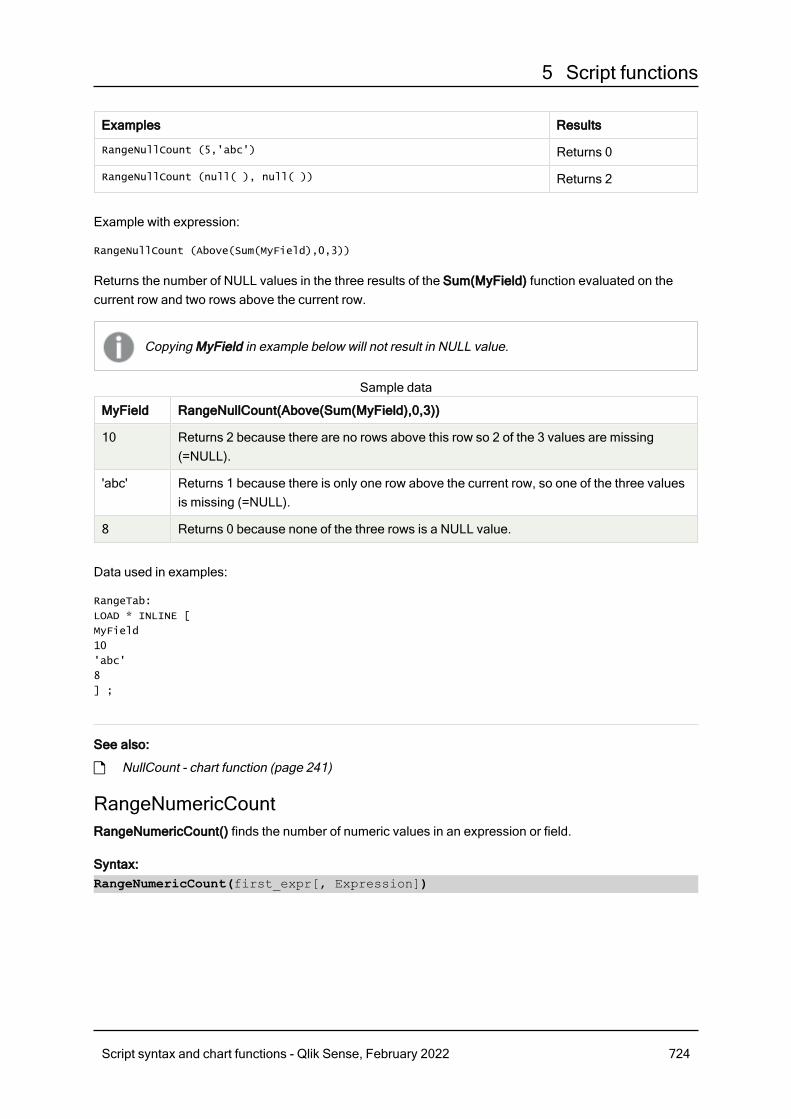
5 Script functions
Examples Results
RangeNullCount (5,'abc') Returns 0
RangeNullCount (null( ), null( )) Returns 2
Example with expression:
RangeNullCount (Above(Sum(MyField),0,3))
Returns the number of NULL values in the three results of the Sum(MyField) function evaluated on thecurrent row and two rows above the current row.
Copying MyField in example below will not result in NULL value.
MyField RangeNullCount(Above(Sum(MyField),0,3))
10 Returns 2 because there are no rows above this row so 2 of the 3 values are missing(=NULL).
'abc' Returns 1 because there is only one row above the current row, so one of the three valuesis missing (=NULL).
8 Returns 0 because none of the three rows is a NULL value.
Sample data
Data used in examples:
RangeTab:
LOAD * INLINE [
MyField
10
'abc'
8
] ;
See also:
p NullCount - chart function (page 241)
RangeNumericCountRangeNumericCount() finds the number of numeric values in an expression or field.
Syntax:RangeNumericCount(first_expr[, Expression])
Script syntax and chart functions - Qlik Sense, February 2022 724
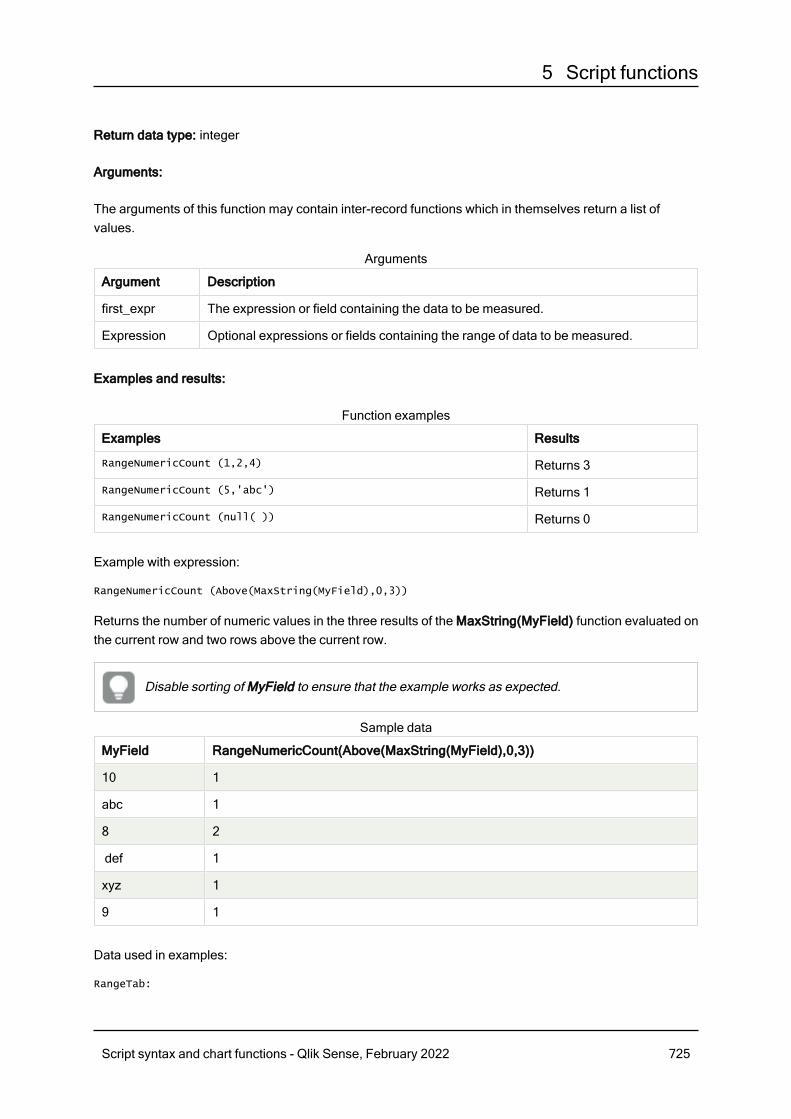
5 Script functions
Return data type: integer
Arguments:
The arguments of this function may contain inter-record functions which in themselves return a list ofvalues.
Argument Description
first_expr The expression or field containing the data to be measured.
Expression Optional expressions or fields containing the range of data to be measured.
Arguments
Examples and results:
Examples Results
RangeNumericCount (1,2,4) Returns 3
RangeNumericCount (5,'abc') Returns 1
RangeNumericCount (null( )) Returns 0
Function examples
Example with expression:
RangeNumericCount (Above(MaxString(MyField),0,3))
Returns the number of numeric values in the three results of the MaxString(MyField) function evaluated onthe current row and two rows above the current row.
Disable sorting of MyField to ensure that the example works as expected.
MyField RangeNumericCount(Above(MaxString(MyField),0,3))
10 1
abc 1
8 2
def 1
xyz 1
9 1
Sample data
Data used in examples:
RangeTab:
Script syntax and chart functions - Qlik Sense, February 2022 725
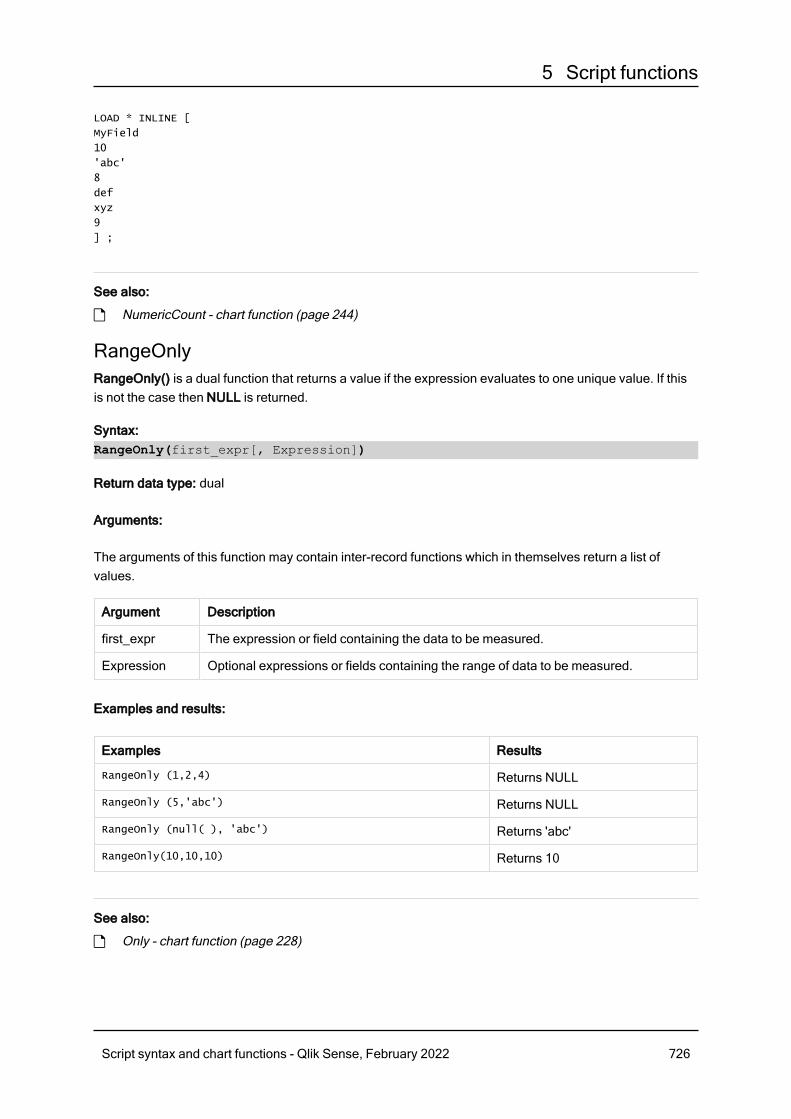
5 Script functions
LOAD * INLINE [
MyField
10
'abc'
8
def
xyz
9
] ;
See also:
p NumericCount - chart function (page 244)
RangeOnlyRangeOnly() is a dual function that returns a value if the expression evaluates to one unique value. If thisis not the case then NULL is returned.
Syntax:RangeOnly(first_expr[, Expression])
Return data type: dual
Arguments:
The arguments of this function may contain inter-record functions which in themselves return a list ofvalues.
Argument Description
first_expr The expression or field containing the data to be measured.
Expression Optional expressions or fields containing the range of data to be measured.
Examples and results:
Examples Results
RangeOnly (1,2,4) Returns NULL
RangeOnly (5,'abc') Returns NULL
RangeOnly (null( ), 'abc') Returns 'abc'
RangeOnly(10,10,10) Returns 10
See also:
p Only - chart function (page 228)
Script syntax and chart functions - Qlik Sense, February 2022 726
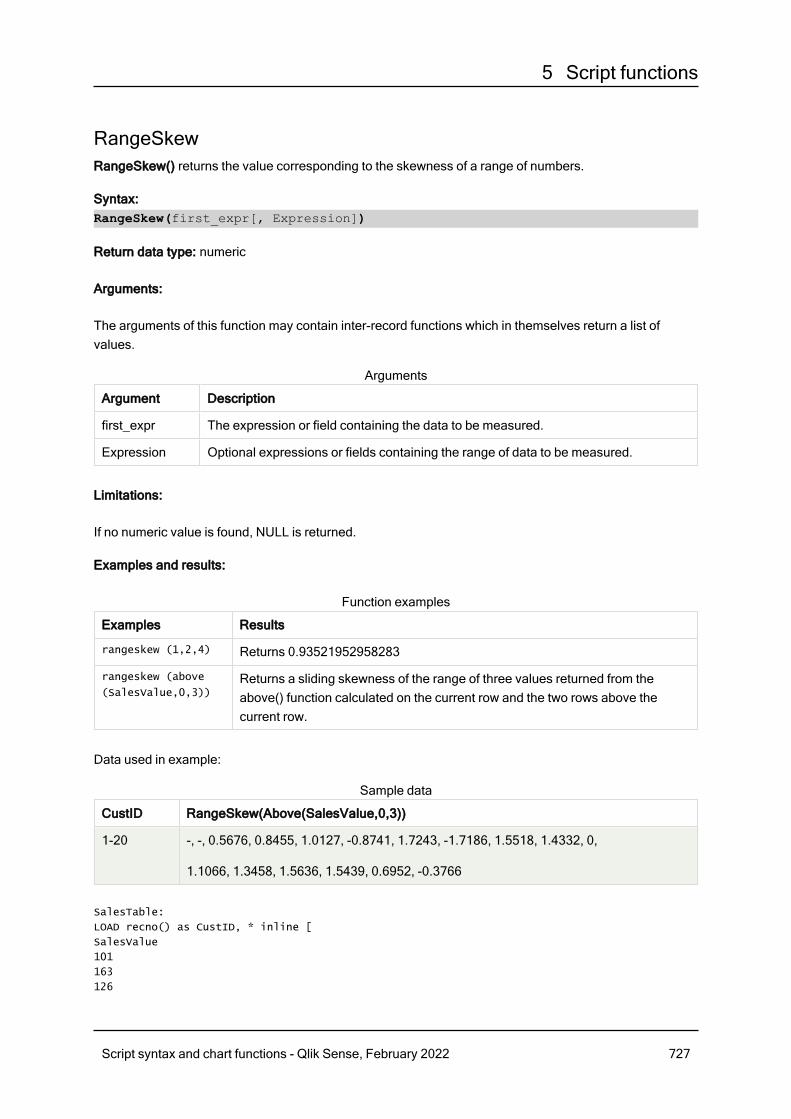
5 Script functions
RangeSkewRangeSkew() returns the value corresponding to the skewness of a range of numbers.
Syntax:RangeSkew(first_expr[, Expression])
Return data type: numeric
Arguments:
The arguments of this function may contain inter-record functions which in themselves return a list ofvalues.
Argument Description
first_expr The expression or field containing the data to be measured.
Expression Optional expressions or fields containing the range of data to be measured.
Arguments
Limitations:
If no numeric value is found, NULL is returned.
Examples and results:
Examples Results
rangeskew (1,2,4) Returns 0.93521952958283
rangeskew (above
(SalesValue,0,3))Returns a sliding skewness of the range of three values returned from theabove() function calculated on the current row and the two rows above thecurrent row.
Function examples
Data used in example:
CustID RangeSkew(Above(SalesValue,0,3))
1-20 -, -, 0.5676, 0.8455, 1.0127, -0.8741, 1.7243, -1.7186, 1.5518, 1.4332, 0,
1.1066, 1.3458, 1.5636, 1.5439, 0.6952, -0.3766
Sample data
SalesTable:
LOAD recno() as CustID, * inline [
SalesValue
101
163
126
Script syntax and chart functions - Qlik Sense, February 2022 727
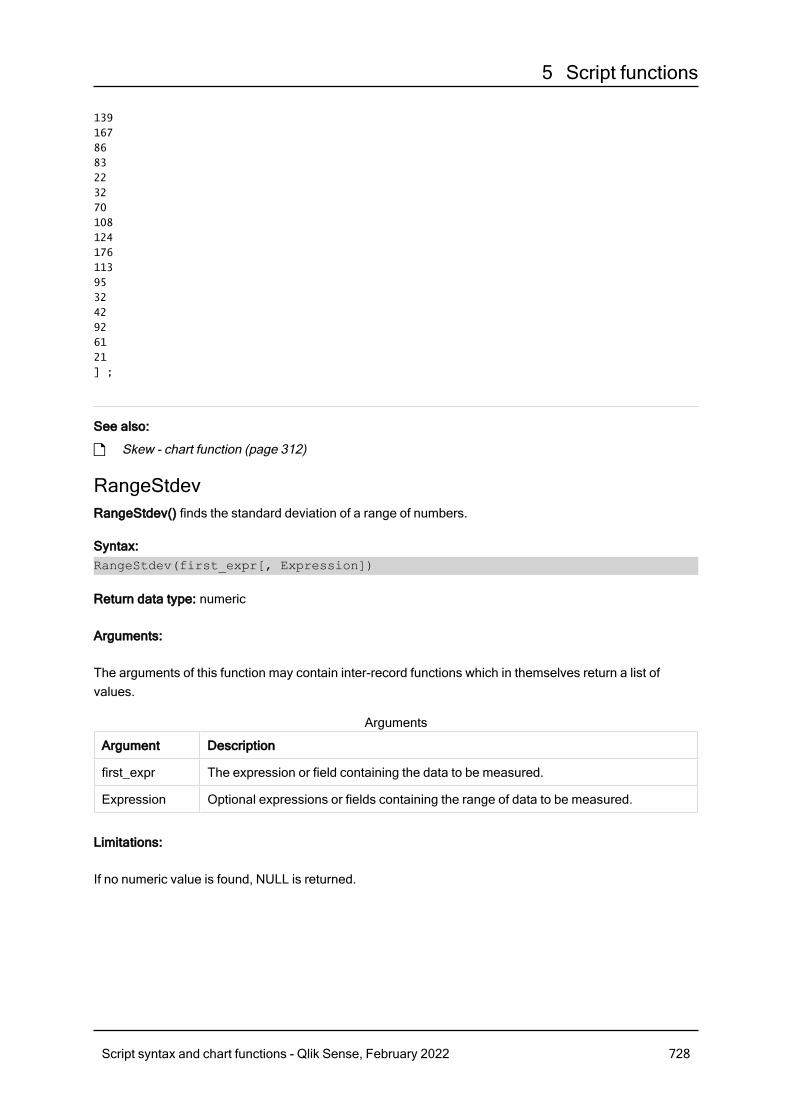
5 Script functions
139
167
86
83
22
32
70
108
124
176
113
95
32
42
92
61
21
] ;
See also:
p Skew - chart function (page 312)
RangeStdevRangeStdev() finds the standard deviation of a range of numbers.
Syntax:RangeStdev(first_expr[, Expression])
Return data type: numeric
Arguments:
The arguments of this function may contain inter-record functions which in themselves return a list ofvalues.
Argument Description
first_expr The expression or field containing the data to be measured.
Expression Optional expressions or fields containing the range of data to be measured.
Arguments
Limitations:
If no numeric value is found, NULL is returned.
Script syntax and chart functions - Qlik Sense, February 2022 728
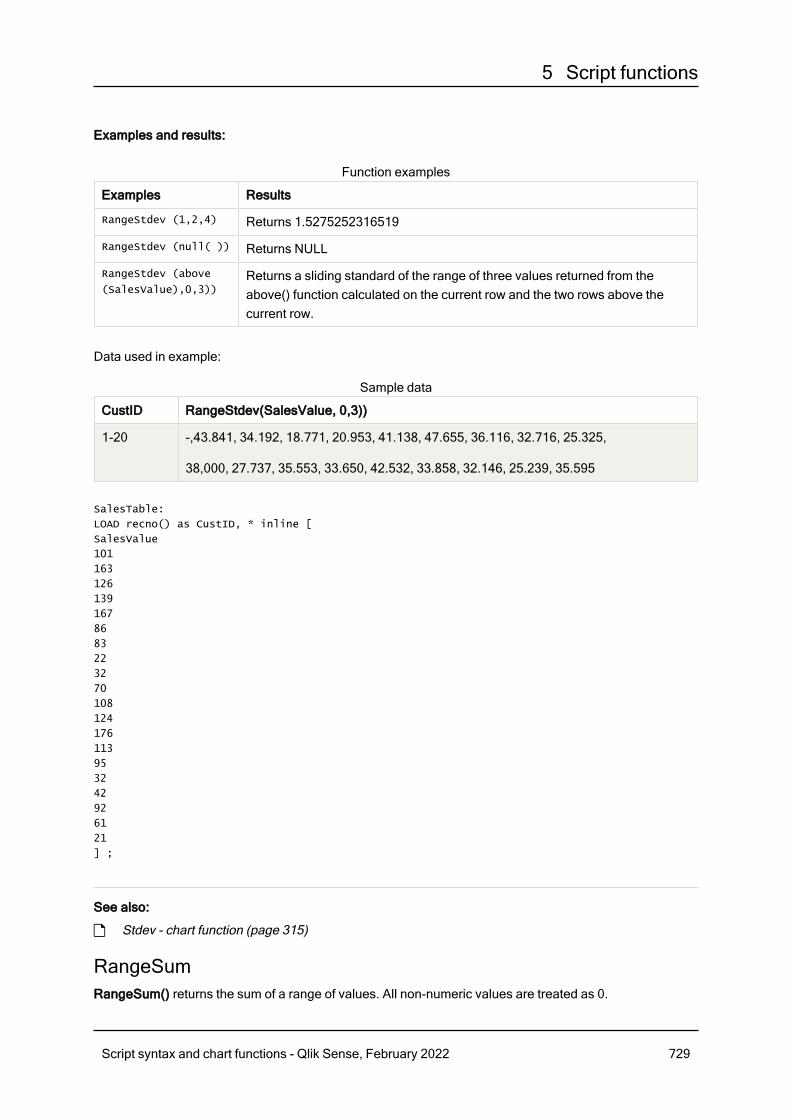
5 Script functions
Examples and results:
Examples Results
RangeStdev (1,2,4) Returns 1.5275252316519
RangeStdev (null( )) Returns NULL
RangeStdev (above
(SalesValue),0,3))Returns a sliding standard of the range of three values returned from theabove() function calculated on the current row and the two rows above thecurrent row.
Function examples
Data used in example:
CustID RangeStdev(SalesValue, 0,3))
1-20 -,43.841, 34.192, 18.771, 20.953, 41.138, 47.655, 36.116, 32.716, 25.325,
38,000, 27.737, 35.553, 33.650, 42.532, 33.858, 32.146, 25.239, 35.595
Sample data
SalesTable:
LOAD recno() as CustID, * inline [
SalesValue
101
163
126
139
167
86
83
22
32
70
108
124
176
113
95
32
42
92
61
21
] ;
See also:
p Stdev - chart function (page 315)
RangeSumRangeSum() returns the sum of a range of values. All non-numeric values are treated as 0.
Script syntax and chart functions - Qlik Sense, February 2022 729

5 Script functions
Syntax:RangeSum(first_expr[, Expression])
Return data type: numeric
Arguments:
The arguments of this function may contain inter-record functions which in themselves return a list ofvalues.
Argument Description
first_expr The expression or field containing the data to be measured.
Expression Optional expressions or fields containing the range of data to be measured.
Arguments
Limitations:
The RangeSum function treats all non-numeric values as 0.
Examples and results:
Examples Results
RangeSum (1,2,4) Returns 7
RangeSum (5,'abc') Returns 5
RangeSum (null( )) Returns 0
Examples
Example:
Add the example script to your app and run it. Then add the fields listed in the results column to a sheet inyour app to see the result.
RangeTab3:
LOAD recno() as RangeID, Rangesum(Field1,Field2,Field3) as MyRangeSum INLINE [
Field1, Field2, Field3
10,5,6
2,3,7
8,2,8
18,11,9
5,5,9
9,4,2
];
The resulting table shows the returned values of MyRangeSum for each of the records in the table.
Script syntax and chart functions - Qlik Sense, February 2022 730
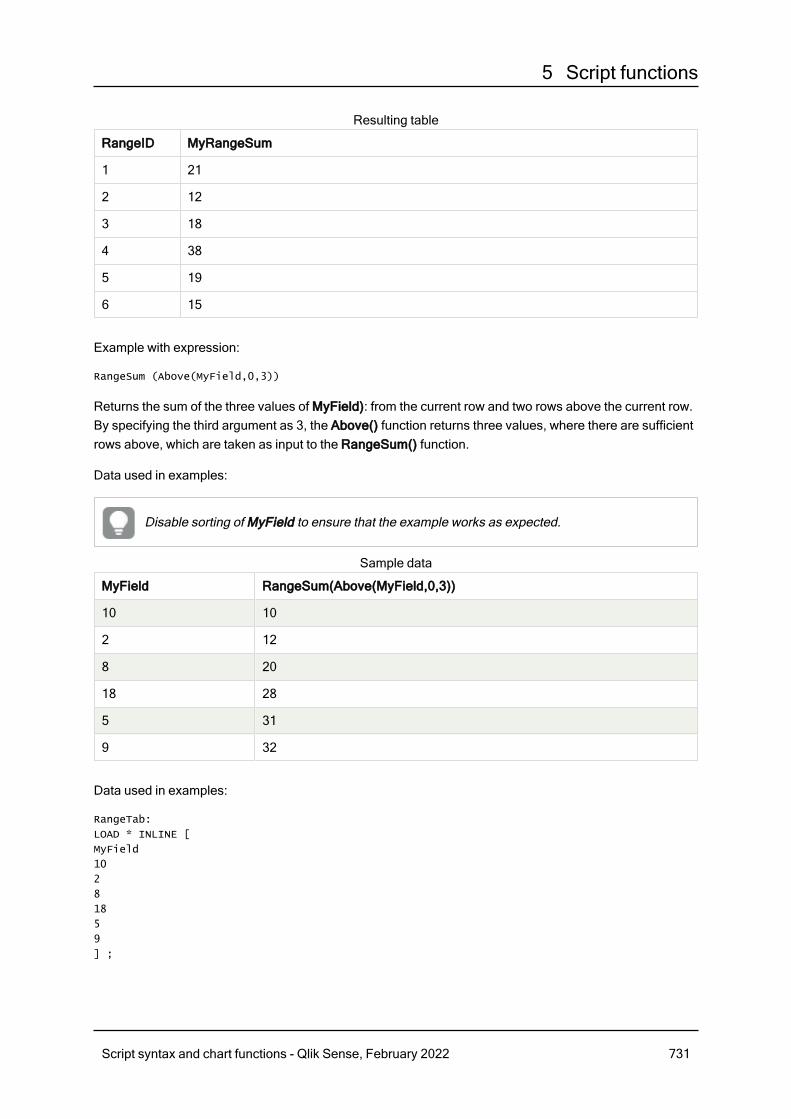
5 Script functions
RangeID MyRangeSum
1 21
2 12
3 18
4 38
5 19
6 15
Resulting table
Example with expression:
RangeSum (Above(MyField,0,3))
Returns the sum of the three values of MyField): from the current row and two rows above the current row.By specifying the third argument as 3, the Above() function returns three values, where there are sufficientrows above, which are taken as input to the RangeSum() function.
Data used in examples:
Disable sorting of MyField to ensure that the example works as expected.
MyField RangeSum(Above(MyField,0,3))
10 10
2 12
8 20
18 28
5 31
9 32
Sample data
Data used in examples:
RangeTab:
LOAD * INLINE [
MyField
10
2
8
18
5
9
] ;
Script syntax and chart functions - Qlik Sense, February 2022 731
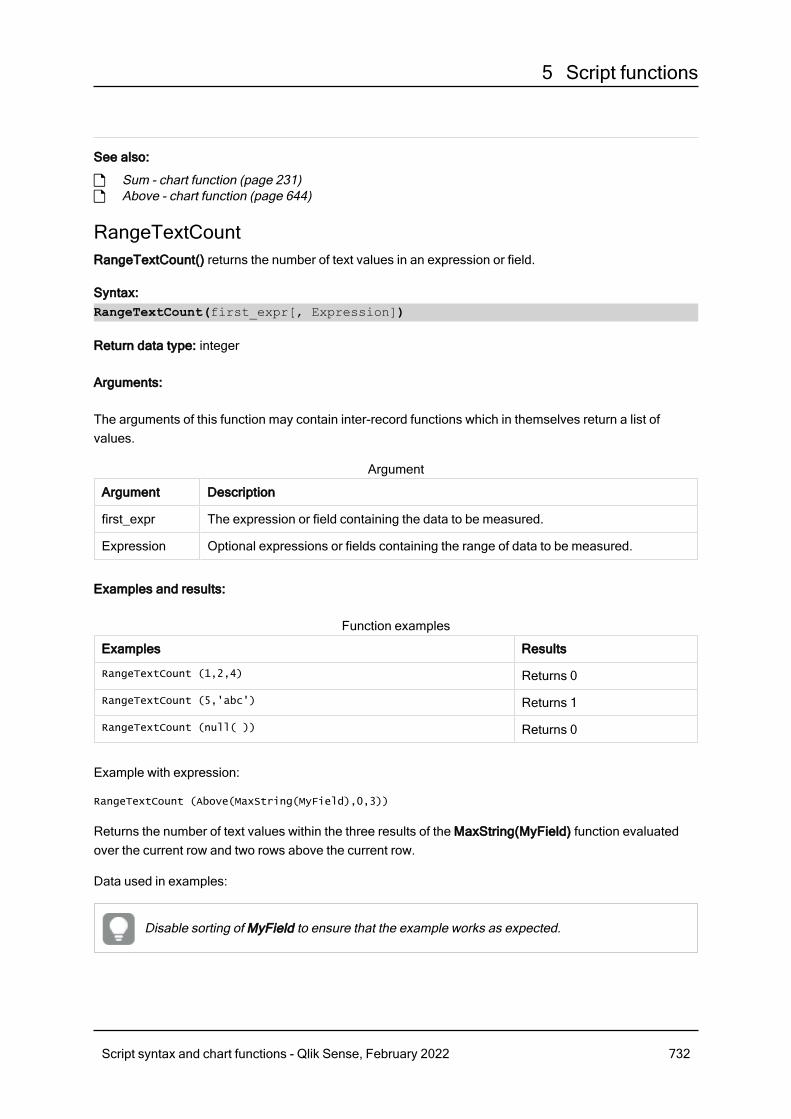
5 Script functions
See also:
p Sum - chart function (page 231)p Above - chart function (page 644)
RangeTextCountRangeTextCount() returns the number of text values in an expression or field.
Syntax:RangeTextCount(first_expr[, Expression])
Return data type: integer
Arguments:
The arguments of this function may contain inter-record functions which in themselves return a list ofvalues.
Argument Description
first_expr The expression or field containing the data to be measured.
Expression Optional expressions or fields containing the range of data to be measured.
Argument
Examples and results:
Examples Results
RangeTextCount (1,2,4) Returns 0
RangeTextCount (5,'abc') Returns 1
RangeTextCount (null( )) Returns 0
Function examples
Example with expression:
RangeTextCount (Above(MaxString(MyField),0,3))
Returns the number of text values within the three results of the MaxString(MyField) function evaluatedover the current row and two rows above the current row.
Data used in examples:
Disable sorting of MyField to ensure that the example works as expected.
Script syntax and chart functions - Qlik Sense, February 2022 732
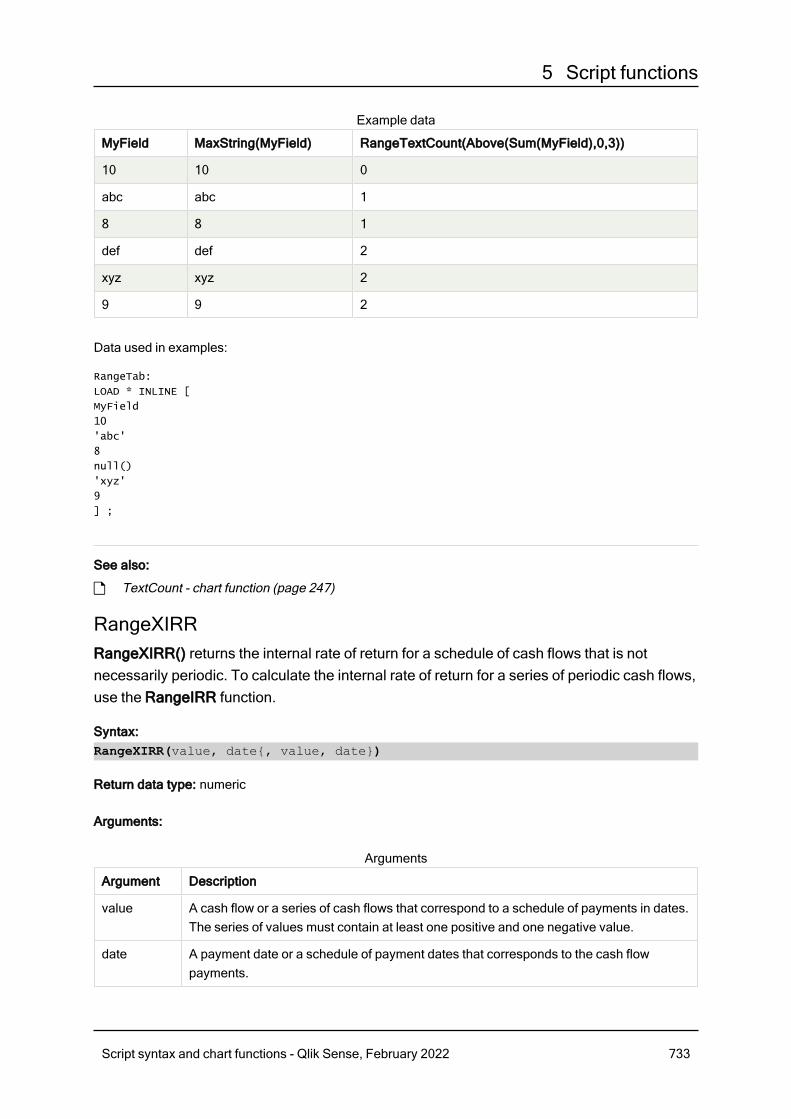
5 Script functions
MyField MaxString(MyField) RangeTextCount(Above(Sum(MyField),0,3))
10 10 0
abc abc 1
8 8 1
def def 2
xyz xyz 2
9 9 2
Example data
Data used in examples:
RangeTab:
LOAD * INLINE [
MyField
10
'abc'
8
null()
'xyz'
9
] ;
See also:
p TextCount - chart function (page 247)
RangeXIRRRangeXIRR() returns the internal rate of return for a schedule of cash flows that is notnecessarily periodic. To calculate the internal rate of return for a series of periodic cash flows,use the RangeIRR function.
Syntax:RangeXIRR(value, date{, value, date})
Return data type: numeric
Arguments:
Argument Description
value A cash flow or a series of cash flows that correspond to a schedule of payments in dates.The series of values must contain at least one positive and one negative value.
date A payment date or a schedule of payment dates that corresponds to the cash flowpayments.
Arguments
Script syntax and chart functions - Qlik Sense, February 2022 733
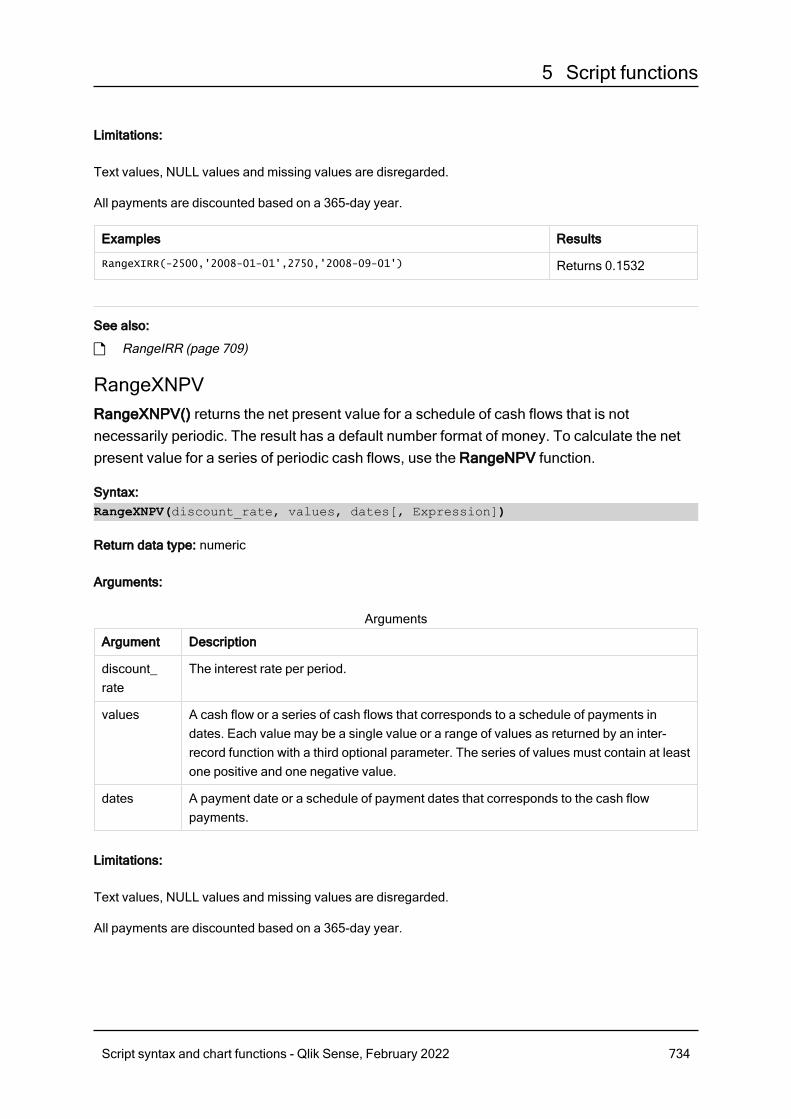
5 Script functions
Limitations:
Text values, NULL values and missing values are disregarded.
All payments are discounted based on a 365-day year.
Examples Results
RangeXIRR(-2500,'2008-01-01',2750,'2008-09-01') Returns 0.1532
See also:
p RangeIRR (page 709)
RangeXNPVRangeXNPV() returns the net present value for a schedule of cash flows that is notnecessarily periodic. The result has a default number format of money. To calculate the netpresent value for a series of periodic cash flows, use the RangeNPV function.
Syntax:RangeXNPV(discount_rate, values, dates[, Expression])
Return data type: numeric
Arguments:
Argument Description
discount_rate
The interest rate per period.
values A cash flow or a series of cash flows that corresponds to a schedule of payments indates. Each value may be a single value or a range of values as returned by an inter-record function with a third optional parameter. The series of values must contain at leastone positive and one negative value.
dates A payment date or a schedule of payment dates that corresponds to the cash flowpayments.
Arguments
Limitations:
Text values, NULL values and missing values are disregarded.
All payments are discounted based on a 365-day year.
Script syntax and chart functions - Qlik Sense, February 2022 734
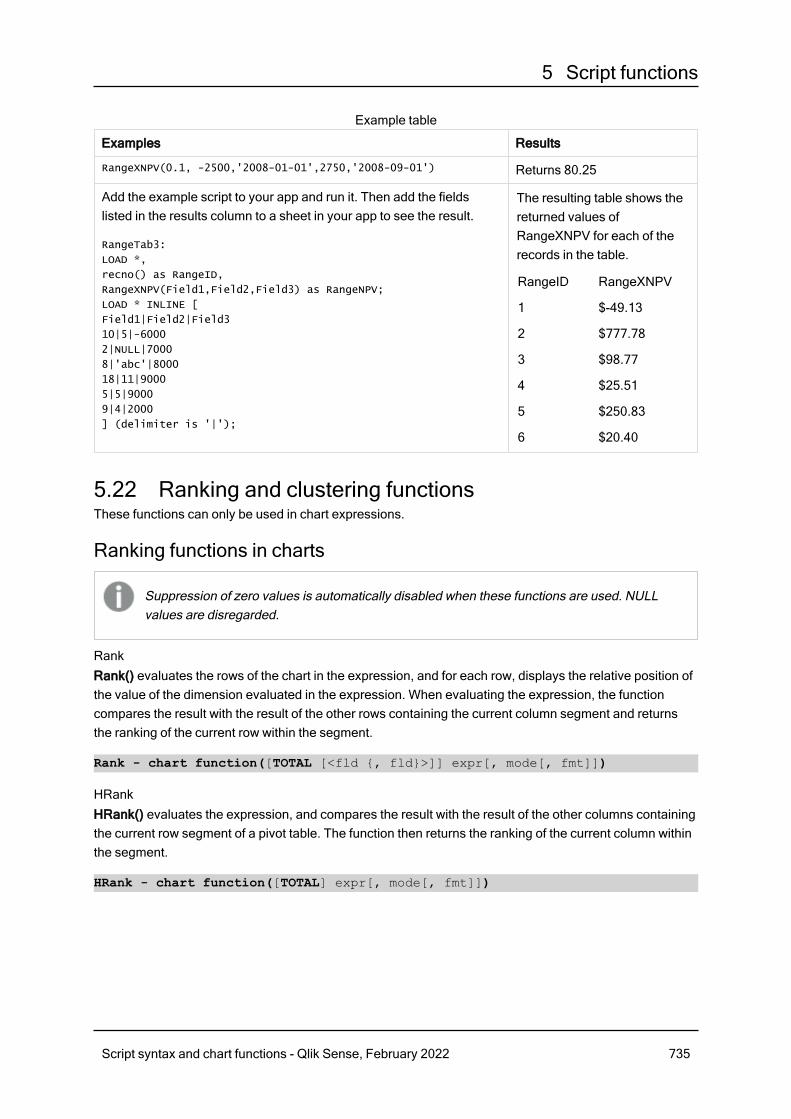
5 Script functions
Examples Results
RangeXNPV(0.1, -2500,'2008-01-01',2750,'2008-09-01') Returns 80.25
Add the example script to your app and run it. Then add the fieldslisted in the results column to a sheet in your app to see the result.
RangeTab3:
LOAD *,
recno() as RangeID,
RangeXNPV(Field1,Field2,Field3) as RangeNPV;
LOAD * INLINE [
Field1|Field2|Field3
10|5|-6000
2|NULL|7000
8|'abc'|8000
18|11|9000
5|5|9000
9|4|2000
] (delimiter is '|');
The resulting table shows thereturned values ofRangeXNPV for each of therecords in the table.
RangeID RangeXNPV
1 $-49.13
2 $777.78
3 $98.77
4 $25.51
5 $250.83
6 $20.40
Example table
5.22 Ranking and clustering functionsThese functions can only be used in chart expressions.
Ranking functions in charts
Suppression of zero values is automatically disabled when these functions are used. NULLvalues are disregarded.
RankRank() evaluates the rows of the chart in the expression, and for each row, displays the relative position ofthe value of the dimension evaluated in the expression. When evaluating the expression, the functioncompares the result with the result of the other rows containing the current column segment and returnsthe ranking of the current row within the segment.
Rank - chart function([TOTAL [<fld {, fld}>]] expr[, mode[, fmt]])
HRankHRank() evaluates the expression, and compares the result with the result of the other columns containingthe current row segment of a pivot table. The function then returns the ranking of the current column withinthe segment.
HRank - chart function([TOTAL] expr[, mode[, fmt]])
Script syntax and chart functions - Qlik Sense, February 2022 735
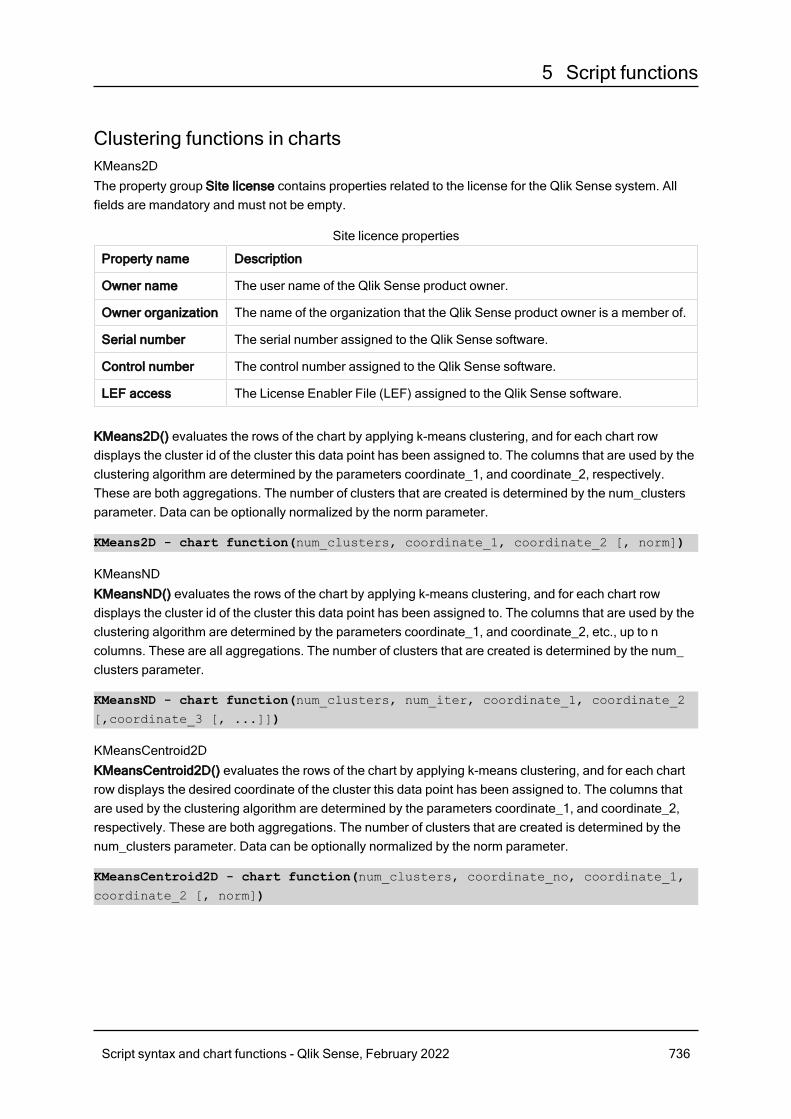
5 Script functions
Clustering functions in chartsKMeans2DThe property group Site license contains properties related to the license for the Qlik Sense system. Allfields are mandatory and must not be empty.
Property name Description
Owner name The user name of the Qlik Sense product owner.
Owner organization The name of the organization that the Qlik Sense product owner is a member of.
Serial number The serial number assigned to the Qlik Sense software.
Control number The control number assigned to the Qlik Sense software.
LEF access The License Enabler File (LEF) assigned to the Qlik Sense software.
Site licence properties
KMeans2D() evaluates the rows of the chart by applying k-means clustering, and for each chart rowdisplays the cluster id of the cluster this data point has been assigned to. The columns that are used by theclustering algorithm are determined by the parameters coordinate_1, and coordinate_2, respectively.These are both aggregations. The number of clusters that are created is determined by the num_clustersparameter. Data can be optionally normalized by the norm parameter.
KMeans2D - chart function(num_clusters, coordinate_1, coordinate_2 [, norm])
KMeansNDKMeansND() evaluates the rows of the chart by applying k-means clustering, and for each chart rowdisplays the cluster id of the cluster this data point has been assigned to. The columns that are used by theclustering algorithm are determined by the parameters coordinate_1, and coordinate_2, etc., up to ncolumns. These are all aggregations. The number of clusters that are created is determined by the num_clusters parameter.
KMeansND - chart function(num_clusters, num_iter, coordinate_1, coordinate_2
[,coordinate_3 [, ...]])
KMeansCentroid2DKMeansCentroid2D() evaluates the rows of the chart by applying k-means clustering, and for each chartrow displays the desired coordinate of the cluster this data point has been assigned to. The columns thatare used by the clustering algorithm are determined by the parameters coordinate_1, and coordinate_2,respectively. These are both aggregations. The number of clusters that are created is determined by thenum_clusters parameter. Data can be optionally normalized by the norm parameter.
KMeansCentroid2D - chart function(num_clusters, coordinate_no, coordinate_1,
coordinate_2 [, norm])
Script syntax and chart functions - Qlik Sense, February 2022 736
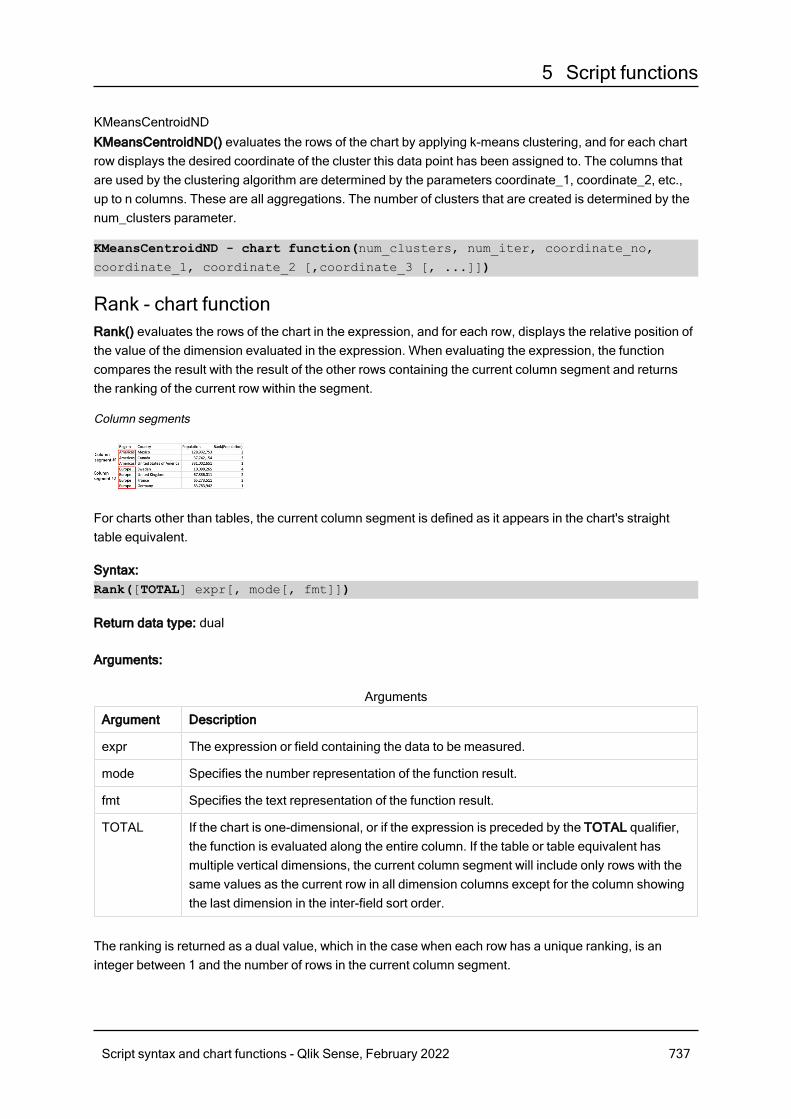
5 Script functions
KMeansCentroidNDKMeansCentroidND() evaluates the rows of the chart by applying k-means clustering, and for each chartrow displays the desired coordinate of the cluster this data point has been assigned to. The columns thatare used by the clustering algorithm are determined by the parameters coordinate_1, coordinate_2, etc.,up to n columns. These are all aggregations. The number of clusters that are created is determined by thenum_clusters parameter.
KMeansCentroidND - chart function(num_clusters, num_iter, coordinate_no,
coordinate_1, coordinate_2 [,coordinate_3 [, ...]])
Rank - chart functionRank() evaluates the rows of the chart in the expression, and for each row, displays the relative position ofthe value of the dimension evaluated in the expression. When evaluating the expression, the functioncompares the result with the result of the other rows containing the current column segment and returnsthe ranking of the current row within the segment.
Column segments
For charts other than tables, the current column segment is defined as it appears in the chart's straighttable equivalent.
Syntax:Rank([TOTAL] expr[, mode[, fmt]])
Return data type: dual
Arguments:
Argument Description
expr The expression or field containing the data to be measured.
mode Specifies the number representation of the function result.
fmt Specifies the text representation of the function result.
TOTAL If the chart is one-dimensional, or if the expression is preceded by the TOTAL qualifier,the function is evaluated along the entire column. If the table or table equivalent hasmultiple vertical dimensions, the current column segment will include only rows with thesame values as the current row in all dimension columns except for the column showingthe last dimension in the inter-field sort order.
Arguments
The ranking is returned as a dual value, which in the case when each row has a unique ranking, is aninteger between 1 and the number of rows in the current column segment.
Script syntax and chart functions - Qlik Sense, February 2022 737
5 Script functions
In the case where several rows share the same ranking, the text and number representation can becontrolled with the mode and fmt parameters.
mode
The second argument, mode, can take the following values:
Value Description
0 (default) If all ranks within the sharing group fall on the low side of the middle value ofthe entire ranking, all rows get the lowest rank within the sharing group.
If all ranks within the sharing group fall on the high side of the middle value ofthe entire ranking, all rows get the highest rank within the sharing group.
If ranks within the sharing group span over the middle value of the entireranking, all rows get the value corresponding to the average of the top andbottom ranking in the entire column segment.
1 Lowest rank on all rows.
2 Average rank on all rows.
3 Highest rank on all rows.
4 Lowest rank on first row, then incremented by one for each row.
mode examples
fmt
The third argument, fmt, can take the following values:
Value Description
0 (default) Low value - high value on all rows (for example 3 - 4).
1 Low value on all rows.
2 Low value on first row, blank on the following rows.
fmtexamples
The order of rows for mode 4 and fmt 2 is determined by the sort order of the chart dimensions.
Examples and results:
Create two visualizations from the dimensions Product and Sales and another from Product and UnitSales.Add measures as shown in the following table.
Script syntax and chart functions - Qlik Sense, February 2022 738
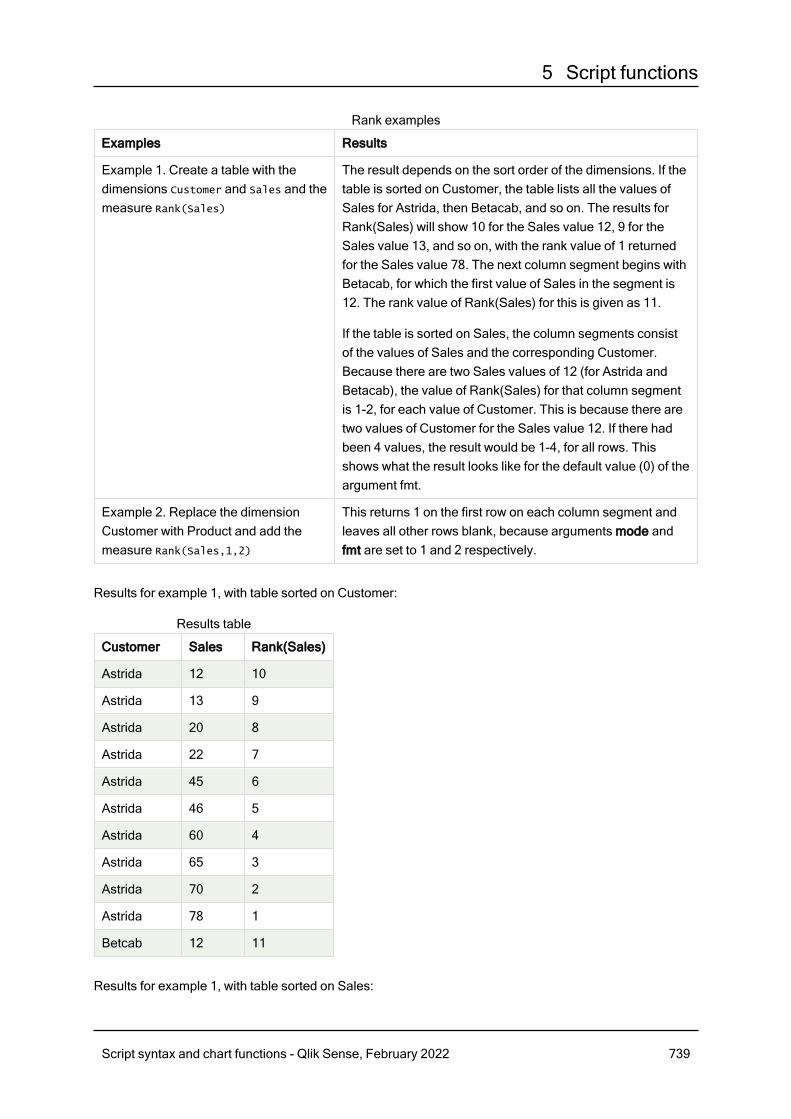
5 Script functions
Examples Results
Example 1. Create a table with thedimensions Customer and Sales and themeasure Rank(Sales)
The result depends on the sort order of the dimensions. If thetable is sorted on Customer, the table lists all the values ofSales for Astrida, then Betacab, and so on. The results forRank(Sales) will show 10 for the Sales value 12, 9 for theSales value 13, and so on, with the rank value of 1 returnedfor the Sales value 78. The next column segment begins withBetacab, for which the first value of Sales in the segment is12. The rank value of Rank(Sales) for this is given as 11.
If the table is sorted on Sales, the column segments consistof the values of Sales and the corresponding Customer.Because there are two Sales values of 12 (for Astrida andBetacab), the value of Rank(Sales) for that column segmentis 1-2, for each value of Customer. This is because there aretwo values of Customer for the Sales value 12. If there hadbeen 4 values, the result would be 1-4, for all rows. Thisshows what the result looks like for the default value (0) of theargument fmt.
Example 2. Replace the dimensionCustomer with Product and add themeasure Rank(Sales,1,2)
This returns 1 on the first row on each column segment andleaves all other rows blank, because arguments mode andfmt are set to 1 and 2 respectively.
Rank examples
Results for example 1, with table sorted on Customer:
Customer Sales Rank(Sales)
Astrida 12 10
Astrida 13 9
Astrida 20 8
Astrida 22 7
Astrida 45 6
Astrida 46 5
Astrida 60 4
Astrida 65 3
Astrida 70 2
Astrida 78 1
Betcab 12 11
Results table
Results for example 1, with table sorted on Sales:
Script syntax and chart functions - Qlik Sense, February 2022 739
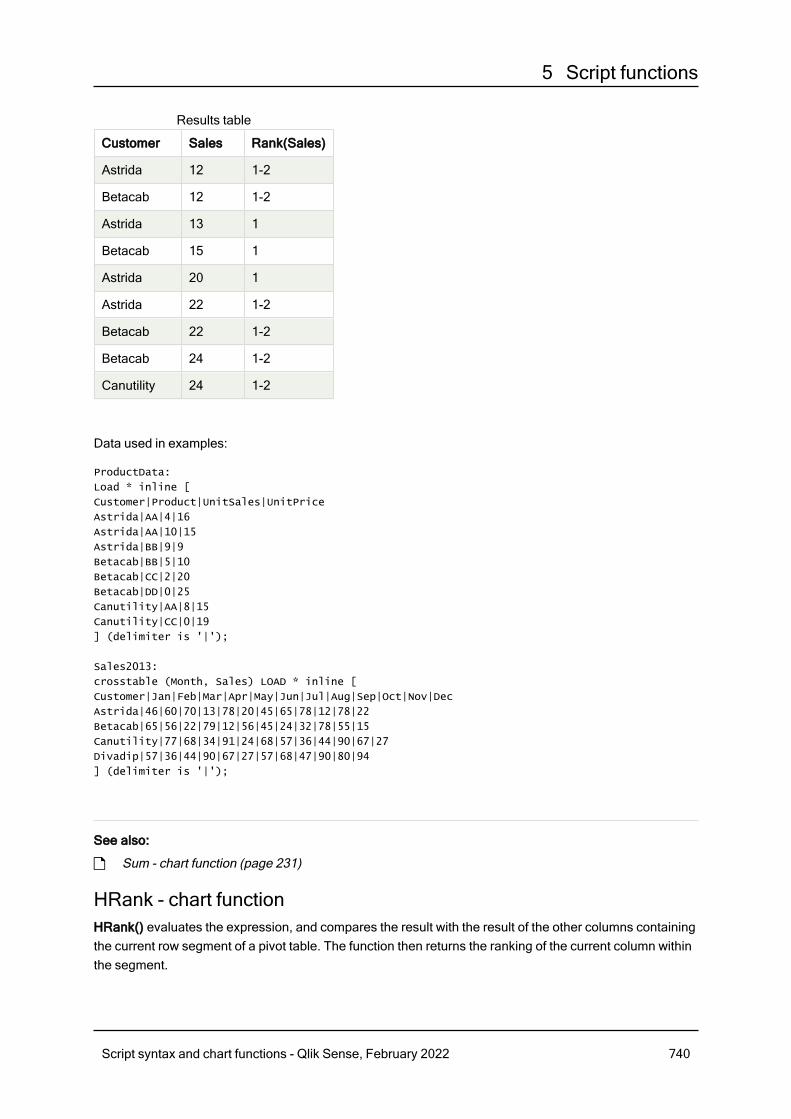
5 Script functions
Customer Sales Rank(Sales)
Astrida 12 1-2
Betacab 12 1-2
Astrida 13 1
Betacab 15 1
Astrida 20 1
Astrida 22 1-2
Betacab 22 1-2
Betacab 24 1-2
Canutility 24 1-2
Results table
Data used in examples:
ProductData:
Load * inline [
Customer|Product|UnitSales|UnitPrice
Astrida|AA|4|16
Astrida|AA|10|15
Astrida|BB|9|9
Betacab|BB|5|10
Betacab|CC|2|20
Betacab|DD|0|25
Canutility|AA|8|15
Canutility|CC|0|19
] (delimiter is '|');
Sales2013:
crosstable (Month, Sales) LOAD * inline [
Customer|Jan|Feb|Mar|Apr|May|Jun|Jul|Aug|Sep|Oct|Nov|Dec
Astrida|46|60|70|13|78|20|45|65|78|12|78|22
Betacab|65|56|22|79|12|56|45|24|32|78|55|15
Canutility|77|68|34|91|24|68|57|36|44|90|67|27
Divadip|57|36|44|90|67|27|57|68|47|90|80|94
] (delimiter is '|');
See also:
p Sum - chart function (page 231)
HRank - chart functionHRank() evaluates the expression, and compares the result with the result of the other columns containingthe current row segment of a pivot table. The function then returns the ranking of the current column withinthe segment.
Script syntax and chart functions - Qlik Sense, February 2022 740
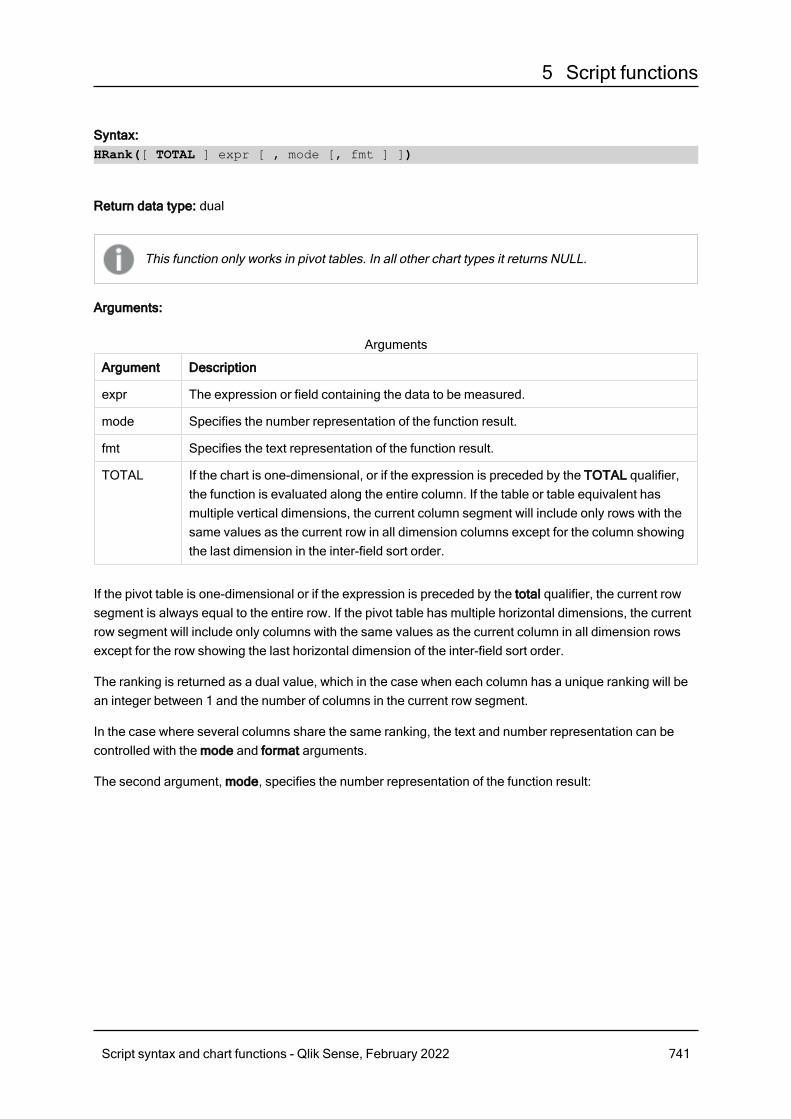
5 Script functions
Syntax:HRank([ TOTAL ] expr [ , mode [, fmt ] ])
Return data type: dual
This function only works in pivot tables. In all other chart types it returns NULL.
Arguments:
Argument Description
expr The expression or field containing the data to be measured.
mode Specifies the number representation of the function result.
fmt Specifies the text representation of the function result.
TOTAL If the chart is one-dimensional, or if the expression is preceded by the TOTAL qualifier,the function is evaluated along the entire column. If the table or table equivalent hasmultiple vertical dimensions, the current column segment will include only rows with thesame values as the current row in all dimension columns except for the column showingthe last dimension in the inter-field sort order.
Arguments
If the pivot table is one-dimensional or if the expression is preceded by the total qualifier, the current rowsegment is always equal to the entire row. If the pivot table has multiple horizontal dimensions, the currentrow segment will include only columns with the same values as the current column in all dimension rowsexcept for the row showing the last horizontal dimension of the inter-field sort order.
The ranking is returned as a dual value, which in the case when each column has a unique ranking will bean integer between 1 and the number of columns in the current row segment.
In the case where several columns share the same ranking, the text and number representation can becontrolled with the mode and format arguments.
The second argument, mode, specifies the number representation of the function result:
Script syntax and chart functions - Qlik Sense, February 2022 741
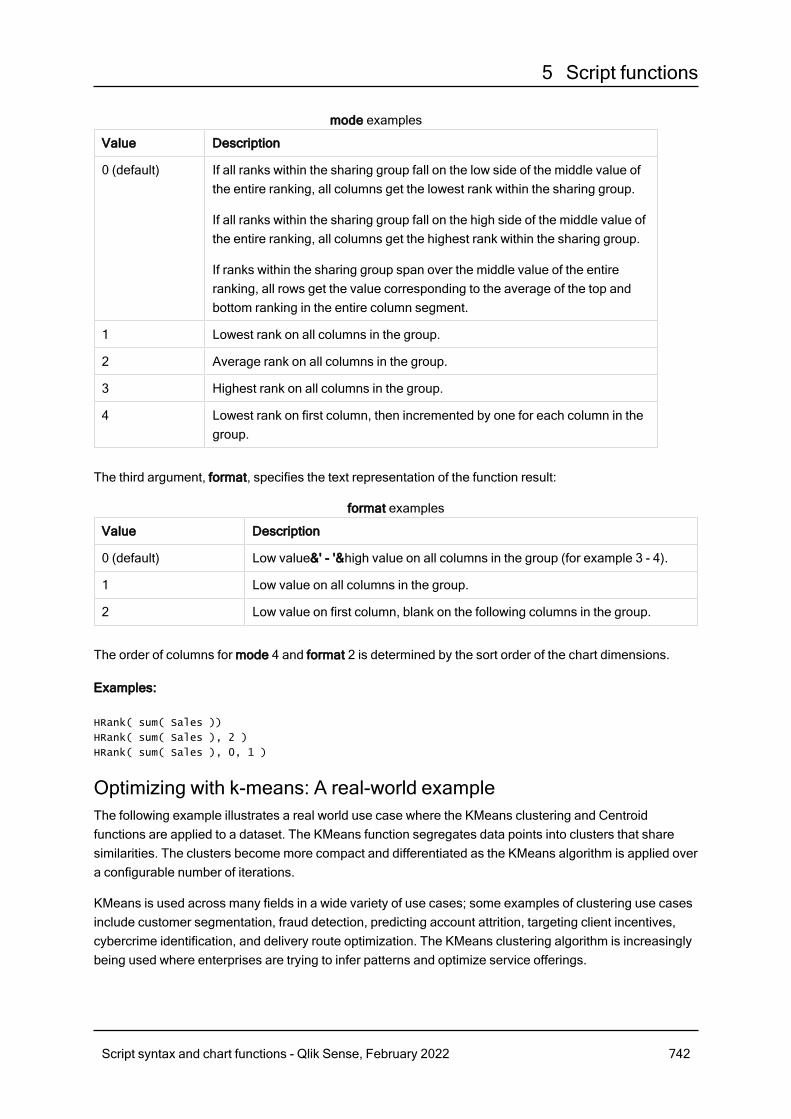
5 Script functions
Value Description
0 (default) If all ranks within the sharing group fall on the low side of the middle value ofthe entire ranking, all columns get the lowest rank within the sharing group.
If all ranks within the sharing group fall on the high side of the middle value ofthe entire ranking, all columns get the highest rank within the sharing group.
If ranks within the sharing group span over the middle value of the entireranking, all rows get the value corresponding to the average of the top andbottom ranking in the entire column segment.
1 Lowest rank on all columns in the group.
2 Average rank on all columns in the group.
3 Highest rank on all columns in the group.
4 Lowest rank on first column, then incremented by one for each column in thegroup.
mode examples
The third argument, format, specifies the text representation of the function result:
Value Description
0 (default) Low value&' - '&high value on all columns in the group (for example 3 - 4).
1 Low value on all columns in the group.
2 Low value on first column, blank on the following columns in the group.
format examples
The order of columns for mode 4 and format 2 is determined by the sort order of the chart dimensions.
Examples:
HRank( sum( Sales ))
HRank( sum( Sales ), 2 )
HRank( sum( Sales ), 0, 1 )
Optimizing with k-means: A real-world exampleThe following example illustrates a real world use case where the KMeans clustering and Centroidfunctions are applied to a dataset. The KMeans function segregates data points into clusters that sharesimilarities. The clusters become more compact and differentiated as the KMeans algorithm is applied overa configurable number of iterations.
KMeans is used across many fields in a wide variety of use cases; some examples of clustering use casesinclude customer segmentation, fraud detection, predicting account attrition, targeting client incentives,cybercrime identification, and delivery route optimization. The KMeans clustering algorithm is increasinglybeing used where enterprises are trying to infer patterns and optimize service offerings.
Script syntax and chart functions - Qlik Sense, February 2022 742
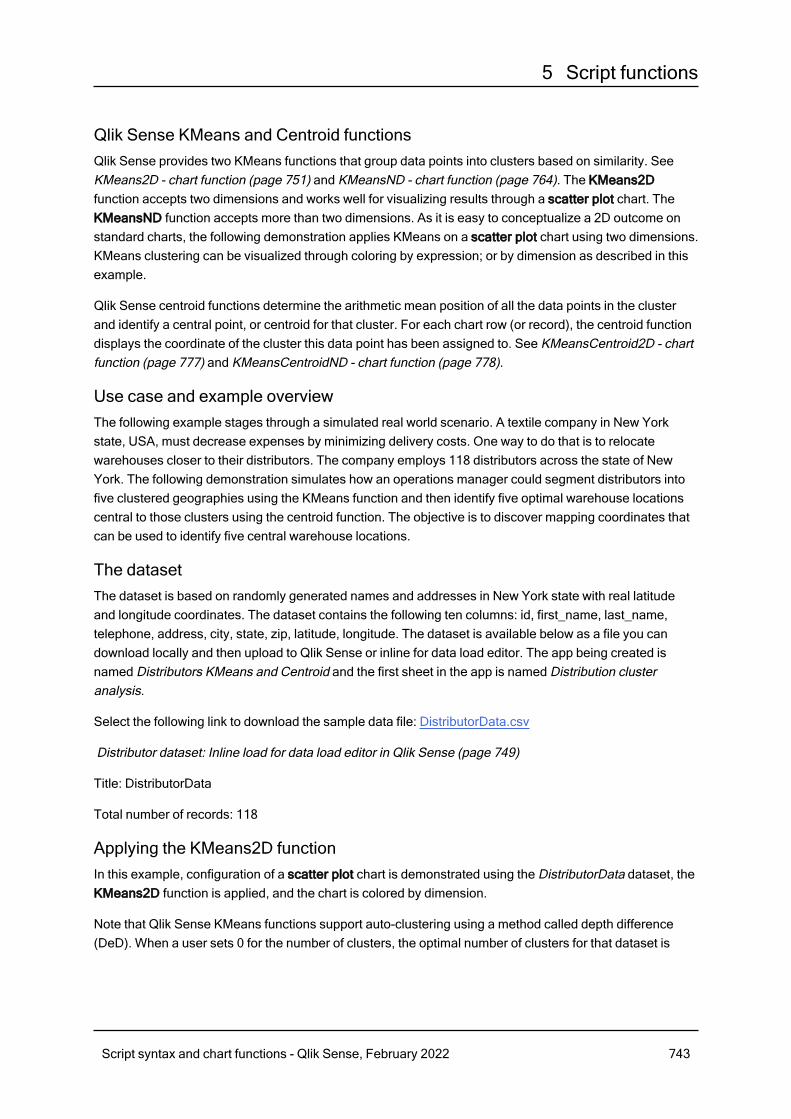
5 Script functions
Qlik Sense KMeans and Centroid functionsQlik Sense provides two KMeans functions that group data points into clusters based on similarity. SeeKMeans2D - chart function (page 751) and KMeansND - chart function (page 764). The KMeans2Dfunction accepts two dimensions and works well for visualizing results through a scatter plot chart. TheKMeansND function accepts more than two dimensions. As it is easy to conceptualize a 2D outcome onstandard charts, the following demonstration applies KMeans on a scatter plot chart using two dimensions.KMeans clustering can be visualized through coloring by expression; or by dimension as described in thisexample.
Qlik Sense centroid functions determine the arithmetic mean position of all the data points in the clusterand identify a central point, or centroid for that cluster. For each chart row (or record), the centroid functiondisplays the coordinate of the cluster this data point has been assigned to. See KMeansCentroid2D - chartfunction (page 777) and KMeansCentroidND - chart function (page 778).
Use case and example overviewThe following example stages through a simulated real world scenario. A textile company in New Yorkstate, USA, must decrease expenses by minimizing delivery costs. One way to do that is to relocatewarehouses closer to their distributors. The company employs 118 distributors across the state of NewYork. The following demonstration simulates how an operations manager could segment distributors intofive clustered geographies using the KMeans function and then identify five optimal warehouse locationscentral to those clusters using the centroid function. The objective is to discover mapping coordinates thatcan be used to identify five central warehouse locations.
The datasetThe dataset is based on randomly generated names and addresses in New York state with real latitudeand longitude coordinates. The dataset contains the following ten columns: id, first_name, last_name,telephone, address, city, state, zip, latitude, longitude. The dataset is available below as a file you candownload locally and then upload to Qlik Sense or inline for data load editor. The app being created isnamed Distributors KMeans and Centroid and the first sheet in the app is named Distribution clusteranalysis.
Select the following link to download the sample data file: DistributorData.csv
Distributor dataset: Inline load for data load editor in Qlik Sense (page 749)
Title: DistributorData
Total number of records: 118
Applying the KMeans2D functionIn this example, configuration of a scatter plot chart is demonstrated using the DistributorData dataset, theKMeans2D function is applied, and the chart is colored by dimension.
Note that Qlik Sense KMeans functions support auto-clustering using a method called depth difference(DeD). When a user sets 0 for the number of clusters, the optimal number of clusters for that dataset is
Script syntax and chart functions - Qlik Sense, February 2022 743

5 Script functions
determined. For this example however, a variable is created for the num_clusters argument ( refer toKMeans2D - chart function (page 751) for syntax). Therefore, the desired number of clusters (k=5) isspecified by a variable.
1. A scatter plot chart is dragged onto the sheet and named Distributors (by dimension).
2. A variable is created to specify the number of clusters. The variable is named vDistClusters. Forthe variable Definition, 5 is entered.
3. Data configuration for the chart:
a. Under Dimensions, id field is selected for Bubble. Cluster id is entered for the Label.
b. Under Measures, Avg([latitude]) is the expression for X-axis.
c. Under Measures, Avg([longitude]) is the expression for Y-axis.
4. Appearance configuration:
a. Under Colors and legend, Custom is chosen for Colors.
b. By dimension is selected for coloring the chart.
c. The following expression is entered: =pick(aggr(KMeans2D(vDistClusters,only(latitude),only(longitude)),id)+1, 'Cluster 1', 'Cluster 2', 'Cluster 3', 'Cluster 4', 'Cluster 5')
d. The checkbox for Persistent colors is selected.
Scatter plot before KMeans coloring by dimension is applied
Scatter plot after KMeans coloring by dimension is applied
Script syntax and chart functions - Qlik Sense, February 2022 744
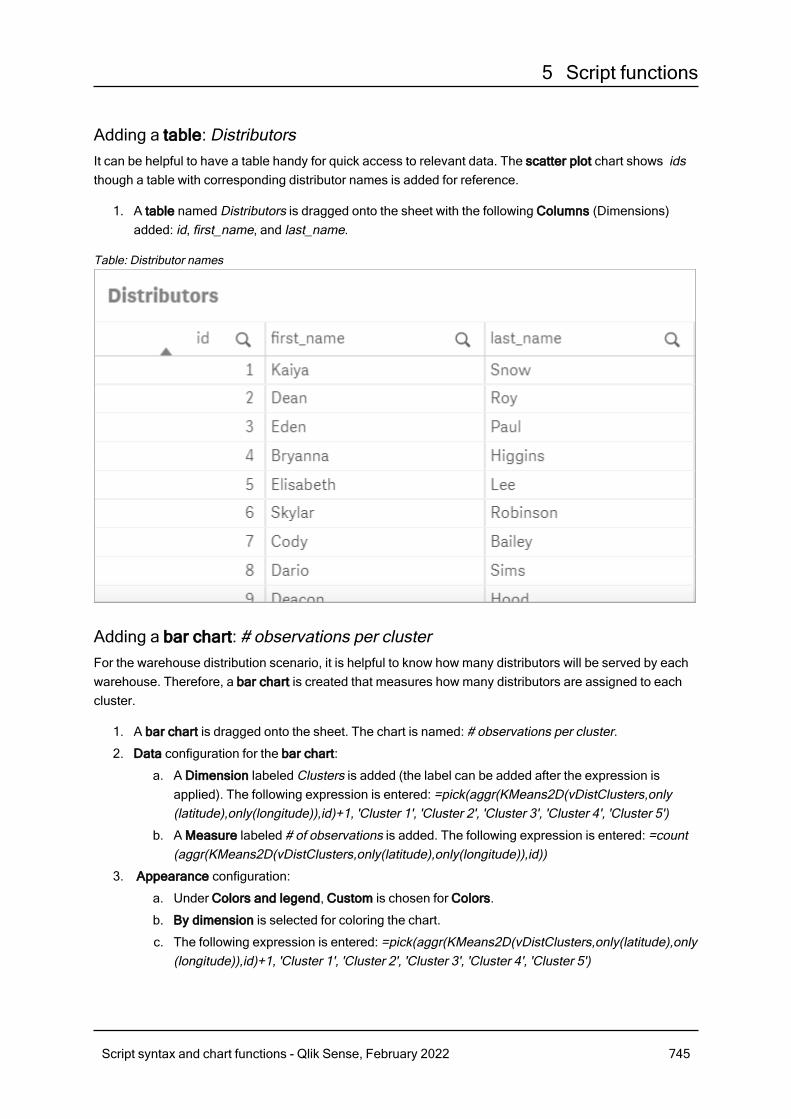
5 Script functions
Adding a table: DistributorsIt can be helpful to have a table handy for quick access to relevant data. The scatter plot chart shows idsthough a table with corresponding distributor names is added for reference.
1. A table named Distributors is dragged onto the sheet with the following Columns (Dimensions)added: id, first_name, and last_name.
Table: Distributor names
Adding a bar chart: # observations per clusterFor the warehouse distribution scenario, it is helpful to know how many distributors will be served by eachwarehouse. Therefore, a bar chart is created that measures how many distributors are assigned to eachcluster.
1. A bar chart is dragged onto the sheet. The chart is named: # observations per cluster.
2. Data configuration for the bar chart:
a. A Dimension labeled Clusters is added (the label can be added after the expression isapplied). The following expression is entered: =pick(aggr(KMeans2D(vDistClusters,only(latitude),only(longitude)),id)+1, 'Cluster 1', 'Cluster 2', 'Cluster 3', 'Cluster 4', 'Cluster 5')
b. A Measure labeled # of observations is added. The following expression is entered: =count(aggr(KMeans2D(vDistClusters,only(latitude),only(longitude)),id))
3. Appearance configuration:
a. Under Colors and legend, Custom is chosen for Colors.
b. By dimension is selected for coloring the chart.
c. The following expression is entered: =pick(aggr(KMeans2D(vDistClusters,only(latitude),only(longitude)),id)+1, 'Cluster 1', 'Cluster 2', 'Cluster 3', 'Cluster 4', 'Cluster 5')
Script syntax and chart functions - Qlik Sense, February 2022 745
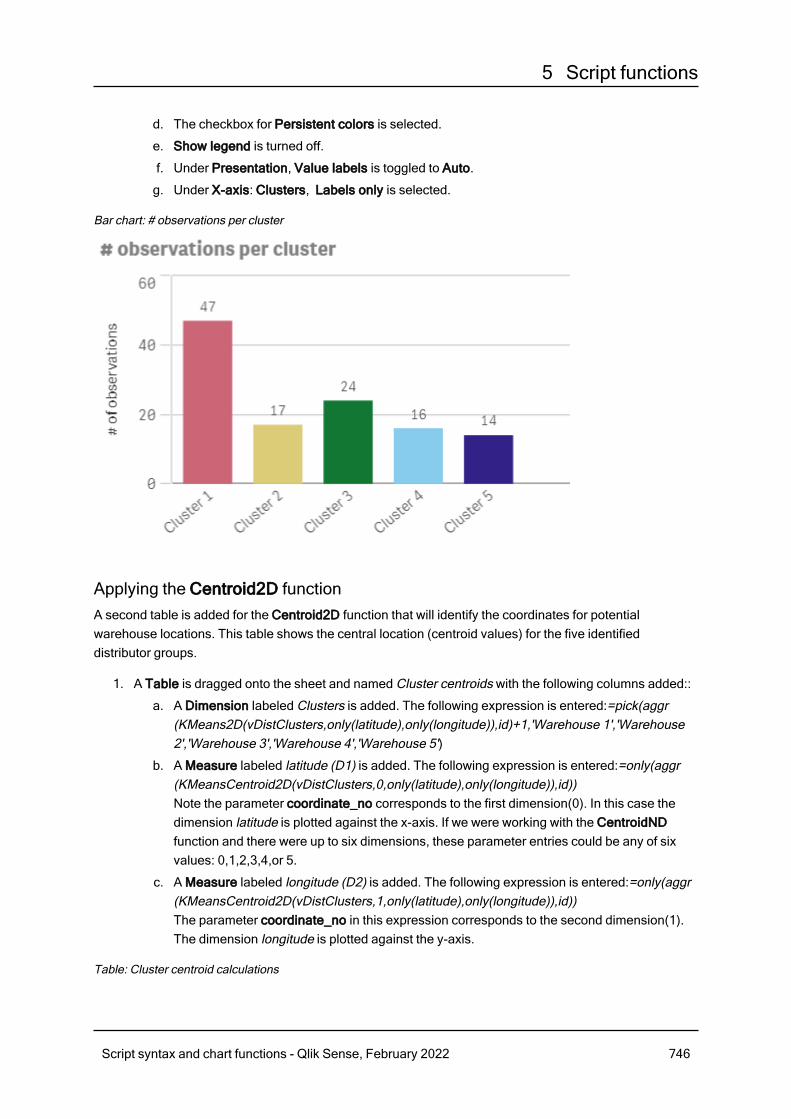
5 Script functions
d. The checkbox for Persistent colors is selected.
e. Show legend is turned off.
f. Under Presentation, Value labels is toggled to Auto.
g. Under X-axis: Clusters, Labels only is selected.
Bar chart: # observations per cluster
Applying the Centroid2D functionA second table is added for the Centroid2D function that will identify the coordinates for potentialwarehouse locations. This table shows the central location (centroid values) for the five identifieddistributor groups.
1. A Table is dragged onto the sheet and named Cluster centroids with the following columns added::
a. A Dimension labeled Clusters is added. The following expression is entered:=pick(aggr(KMeans2D(vDistClusters,only(latitude),only(longitude)),id)+1,'Warehouse 1','Warehouse2','Warehouse 3','Warehouse 4','Warehouse 5')
b. A Measure labeled latitude (D1) is added. The following expression is entered:=only(aggr(KMeansCentroid2D(vDistClusters,0,only(latitude),only(longitude)),id))Note the parameter coordinate_no corresponds to the first dimension(0). In this case thedimension latitude is plotted against the x-axis. If we were working with the CentroidNDfunction and there were up to six dimensions, these parameter entries could be any of sixvalues: 0,1,2,3,4,or 5.
c. A Measure labeled longitude (D2) is added. The following expression is entered:=only(aggr(KMeansCentroid2D(vDistClusters,1,only(latitude),only(longitude)),id))The parameter coordinate_no in this expression corresponds to the second dimension(1).The dimension longitude is plotted against the y-axis.
Table: Cluster centroid calculations
Script syntax and chart functions - Qlik Sense, February 2022 746
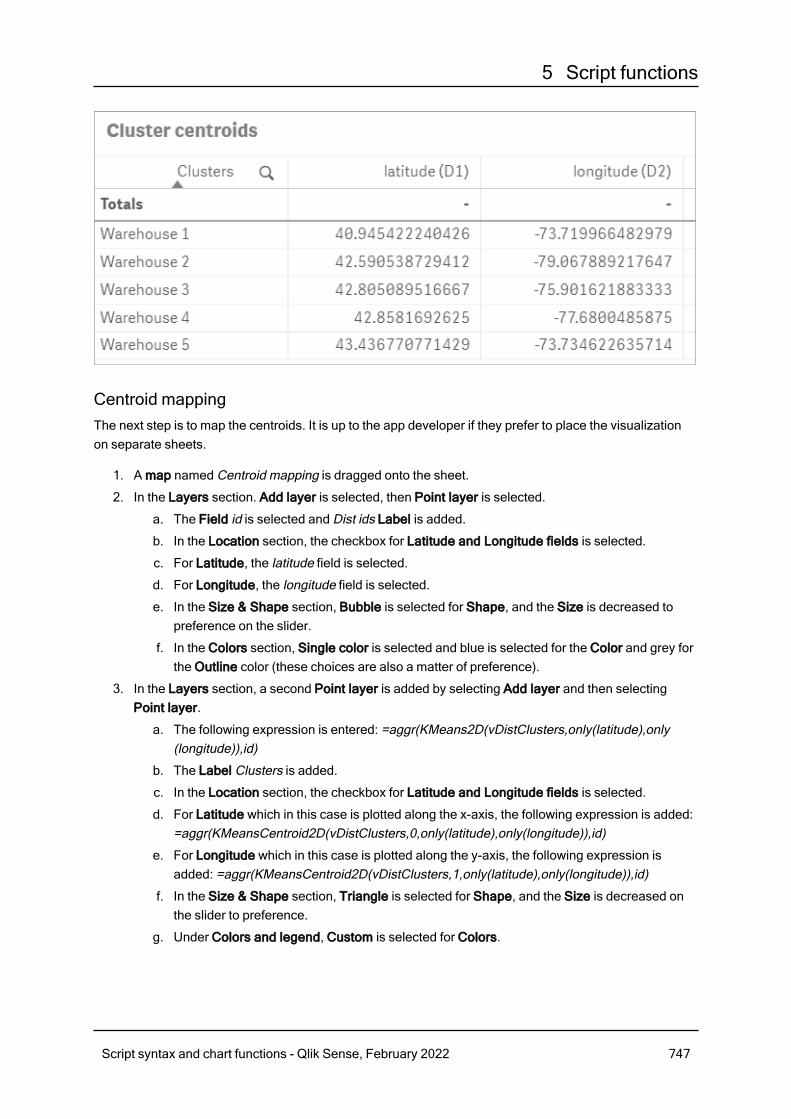
5 Script functions
Centroid mappingThe next step is to map the centroids. It is up to the app developer if they prefer to place the visualizationon separate sheets.
1. A map named Centroid mapping is dragged onto the sheet.
2. In the Layers section. Add layer is selected, then Point layer is selected.
a. The Field id is selected and Dist ids Label is added.
b. In the Location section, the checkbox for Latitude and Longitude fields is selected.
c. For Latitude, the latitude field is selected.
d. For Longitude, the longitude field is selected.
e. In the Size & Shape section, Bubble is selected for Shape, and the Size is decreased topreference on the slider.
f. In the Colors section, Single color is selected and blue is selected for the Color and grey forthe Outline color (these choices are also a matter of preference).
3. In the Layers section, a second Point layer is added by selecting Add layer and then selectingPoint layer.
a. The following expression is entered: =aggr(KMeans2D(vDistClusters,only(latitude),only(longitude)),id)
b. The Label Clusters is added.
c. In the Location section, the checkbox for Latitude and Longitude fields is selected.
d. For Latitude which in this case is plotted along the x-axis, the following expression is added:=aggr(KMeansCentroid2D(vDistClusters,0,only(latitude),only(longitude)),id)
e. For Longitude which in this case is plotted along the y-axis, the following expression isadded: =aggr(KMeansCentroid2D(vDistClusters,1,only(latitude),only(longitude)),id)
f. In the Size & Shape section, Triangle is selected for Shape, and the Size is decreased onthe slider to preference.
g. Under Colors and legend, Custom is selected for Colors.
Script syntax and chart functions - Qlik Sense, February 2022 747
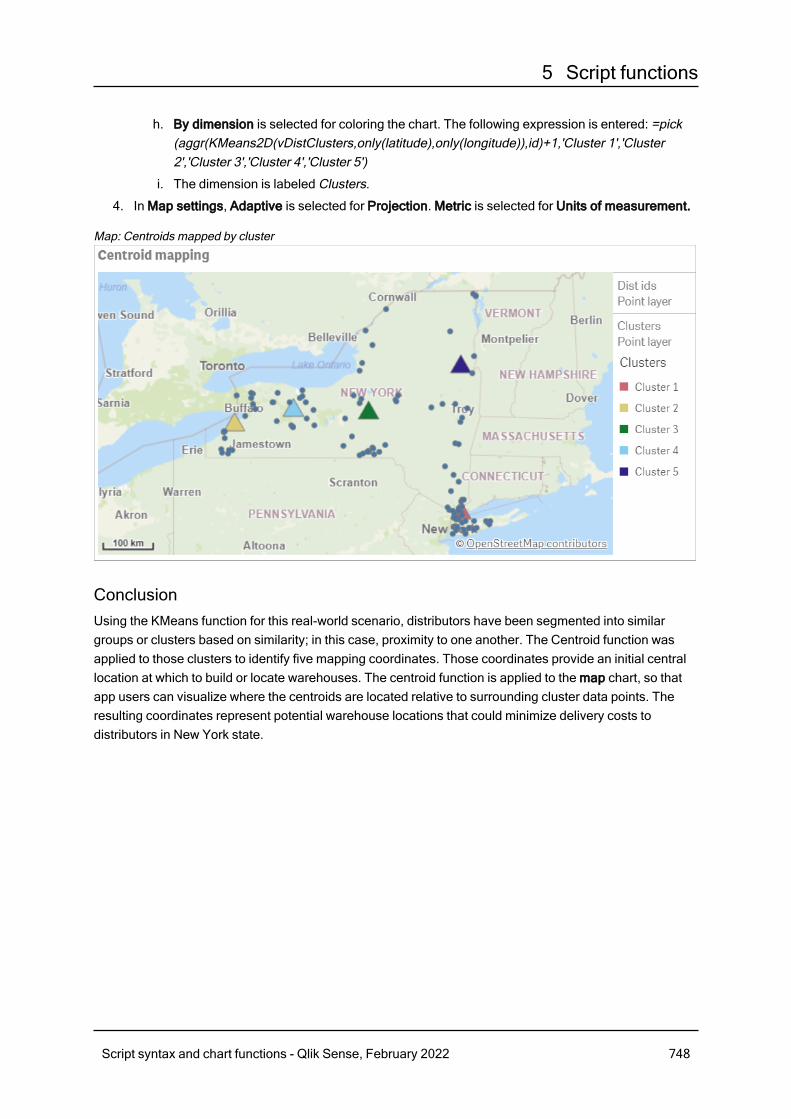
5 Script functions
h. By dimension is selected for coloring the chart. The following expression is entered: =pick(aggr(KMeans2D(vDistClusters,only(latitude),only(longitude)),id)+1,'Cluster 1','Cluster2','Cluster 3','Cluster 4','Cluster 5')
i. The dimension is labeled Clusters.
4. In Map settings, Adaptive is selected for Projection. Metric is selected for Units of measurement.
Map: Centroids mapped by cluster
ConclusionUsing the KMeans function for this real-world scenario, distributors have been segmented into similargroups or clusters based on similarity; in this case, proximity to one another. The Centroid function wasapplied to those clusters to identify five mapping coordinates. Those coordinates provide an initial centrallocation at which to build or locate warehouses. The centroid function is applied to the map chart, so thatapp users can visualize where the centroids are located relative to surrounding cluster data points. Theresulting coordinates represent potential warehouse locations that could minimize delivery costs todistributors in New York state.
Script syntax and chart functions - Qlik Sense, February 2022 748
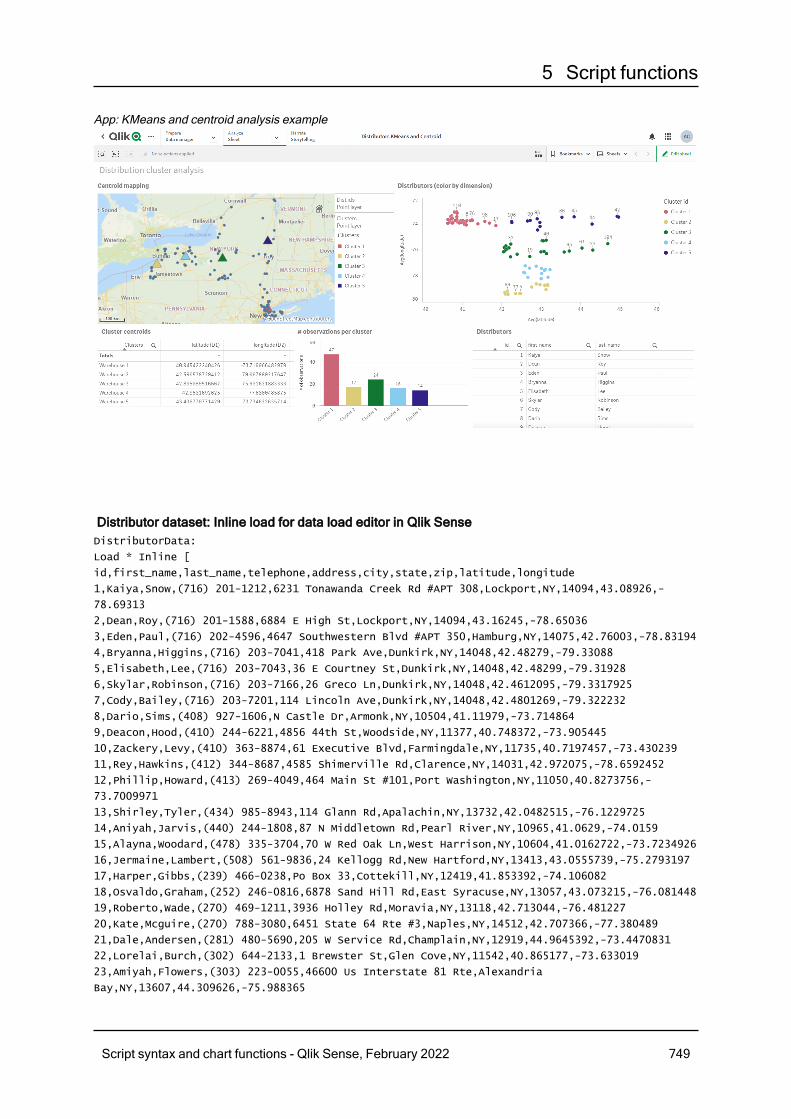
5 Script functions
App: KMeans and centroid analysis example
Distributor dataset: Inline load for data load editor in Qlik SenseDistributorData:
Load * Inline [
id,first_name,last_name,telephone,address,city,state,zip,latitude,longitude
1,Kaiya,Snow,(716) 201-1212,6231 Tonawanda Creek Rd #APT 308,Lockport,NY,14094,43.08926,-
78.69313
2,Dean,Roy,(716) 201-1588,6884 E High St,Lockport,NY,14094,43.16245,-78.65036
3,Eden,Paul,(716) 202-4596,4647 Southwestern Blvd #APT 350,Hamburg,NY,14075,42.76003,-78.83194
4,Bryanna,Higgins,(716) 203-7041,418 Park Ave,Dunkirk,NY,14048,42.48279,-79.33088
5,Elisabeth,Lee,(716) 203-7043,36 E Courtney St,Dunkirk,NY,14048,42.48299,-79.31928
6,Skylar,Robinson,(716) 203-7166,26 Greco Ln,Dunkirk,NY,14048,42.4612095,-79.3317925
7,Cody,Bailey,(716) 203-7201,114 Lincoln Ave,Dunkirk,NY,14048,42.4801269,-79.322232
8,Dario,Sims,(408) 927-1606,N Castle Dr,Armonk,NY,10504,41.11979,-73.714864
9,Deacon,Hood,(410) 244-6221,4856 44th St,Woodside,NY,11377,40.748372,-73.905445
10,Zackery,Levy,(410) 363-8874,61 Executive Blvd,Farmingdale,NY,11735,40.7197457,-73.430239
11,Rey,Hawkins,(412) 344-8687,4585 Shimerville Rd,Clarence,NY,14031,42.972075,-78.6592452
12,Phillip,Howard,(413) 269-4049,464 Main St #101,Port Washington,NY,11050,40.8273756,-
73.7009971
13,Shirley,Tyler,(434) 985-8943,114 Glann Rd,Apalachin,NY,13732,42.0482515,-76.1229725
14,Aniyah,Jarvis,(440) 244-1808,87 N Middletown Rd,Pearl River,NY,10965,41.0629,-74.0159
15,Alayna,Woodard,(478) 335-3704,70 W Red Oak Ln,West Harrison,NY,10604,41.0162722,-73.7234926
16,Jermaine,Lambert,(508) 561-9836,24 Kellogg Rd,New Hartford,NY,13413,43.0555739,-75.2793197
17,Harper,Gibbs,(239) 466-0238,Po Box 33,Cottekill,NY,12419,41.853392,-74.106082
18,Osvaldo,Graham,(252) 246-0816,6878 Sand Hill Rd,East Syracuse,NY,13057,43.073215,-76.081448
19,Roberto,Wade,(270) 469-1211,3936 Holley Rd,Moravia,NY,13118,42.713044,-76.481227
20,Kate,Mcguire,(270) 788-3080,6451 State 64 Rte #3,Naples,NY,14512,42.707366,-77.380489
21,Dale,Andersen,(281) 480-5690,205 W Service Rd,Champlain,NY,12919,44.9645392,-73.4470831
22,Lorelai,Burch,(302) 644-2133,1 Brewster St,Glen Cove,NY,11542,40.865177,-73.633019
23,Amiyah,Flowers,(303) 223-0055,46600 Us Interstate 81 Rte,Alexandria
Bay,NY,13607,44.309626,-75.988365
Script syntax and chart functions - Qlik Sense, February 2022 749
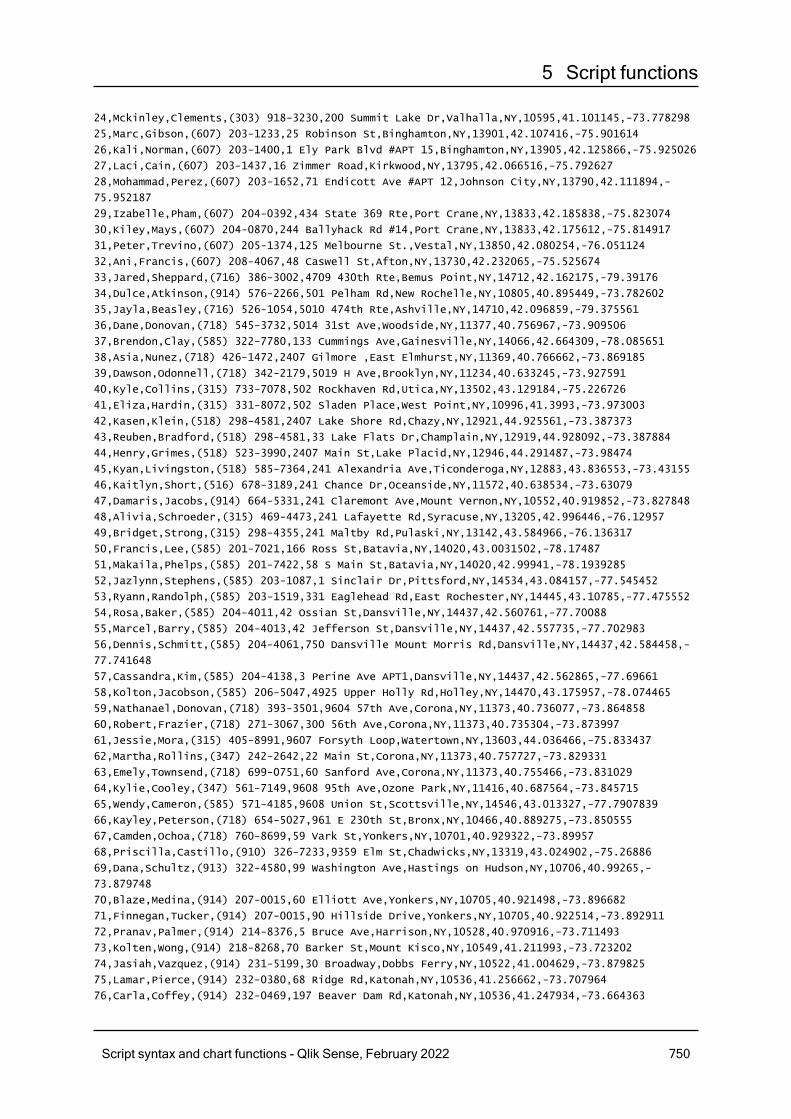
5 Script functions
24,Mckinley,Clements,(303) 918-3230,200 Summit Lake Dr,Valhalla,NY,10595,41.101145,-73.778298
25,Marc,Gibson,(607) 203-1233,25 Robinson St,Binghamton,NY,13901,42.107416,-75.901614
26,Kali,Norman,(607) 203-1400,1 Ely Park Blvd #APT 15,Binghamton,NY,13905,42.125866,-75.925026
27,Laci,Cain,(607) 203-1437,16 Zimmer Road,Kirkwood,NY,13795,42.066516,-75.792627
28,Mohammad,Perez,(607) 203-1652,71 Endicott Ave #APT 12,Johnson City,NY,13790,42.111894,-
75.952187
29,Izabelle,Pham,(607) 204-0392,434 State 369 Rte,Port Crane,NY,13833,42.185838,-75.823074
30,Kiley,Mays,(607) 204-0870,244 Ballyhack Rd #14,Port Crane,NY,13833,42.175612,-75.814917
31,Peter,Trevino,(607) 205-1374,125 Melbourne St.,Vestal,NY,13850,42.080254,-76.051124
32,Ani,Francis,(607) 208-4067,48 Caswell St,Afton,NY,13730,42.232065,-75.525674
33,Jared,Sheppard,(716) 386-3002,4709 430th Rte,Bemus Point,NY,14712,42.162175,-79.39176
34,Dulce,Atkinson,(914) 576-2266,501 Pelham Rd,New Rochelle,NY,10805,40.895449,-73.782602
35,Jayla,Beasley,(716) 526-1054,5010 474th Rte,Ashville,NY,14710,42.096859,-79.375561
36,Dane,Donovan,(718) 545-3732,5014 31st Ave,Woodside,NY,11377,40.756967,-73.909506
37,Brendon,Clay,(585) 322-7780,133 Cummings Ave,Gainesville,NY,14066,42.664309,-78.085651
38,Asia,Nunez,(718) 426-1472,2407 Gilmore ,East Elmhurst,NY,11369,40.766662,-73.869185
39,Dawson,Odonnell,(718) 342-2179,5019 H Ave,Brooklyn,NY,11234,40.633245,-73.927591
40,Kyle,Collins,(315) 733-7078,502 Rockhaven Rd,Utica,NY,13502,43.129184,-75.226726
41,Eliza,Hardin,(315) 331-8072,502 Sladen Place,West Point,NY,10996,41.3993,-73.973003
42,Kasen,Klein,(518) 298-4581,2407 Lake Shore Rd,Chazy,NY,12921,44.925561,-73.387373
43,Reuben,Bradford,(518) 298-4581,33 Lake Flats Dr,Champlain,NY,12919,44.928092,-73.387884
44,Henry,Grimes,(518) 523-3990,2407 Main St,Lake Placid,NY,12946,44.291487,-73.98474
45,Kyan,Livingston,(518) 585-7364,241 Alexandria Ave,Ticonderoga,NY,12883,43.836553,-73.43155
46,Kaitlyn,Short,(516) 678-3189,241 Chance Dr,Oceanside,NY,11572,40.638534,-73.63079
47,Damaris,Jacobs,(914) 664-5331,241 Claremont Ave,Mount Vernon,NY,10552,40.919852,-73.827848
48,Alivia,Schroeder,(315) 469-4473,241 Lafayette Rd,Syracuse,NY,13205,42.996446,-76.12957
49,Bridget,Strong,(315) 298-4355,241 Maltby Rd,Pulaski,NY,13142,43.584966,-76.136317
50,Francis,Lee,(585) 201-7021,166 Ross St,Batavia,NY,14020,43.0031502,-78.17487
51,Makaila,Phelps,(585) 201-7422,58 S Main St,Batavia,NY,14020,42.99941,-78.1939285
52,Jazlynn,Stephens,(585) 203-1087,1 Sinclair Dr,Pittsford,NY,14534,43.084157,-77.545452
53,Ryann,Randolph,(585) 203-1519,331 Eaglehead Rd,East Rochester,NY,14445,43.10785,-77.475552
54,Rosa,Baker,(585) 204-4011,42 Ossian St,Dansville,NY,14437,42.560761,-77.70088
55,Marcel,Barry,(585) 204-4013,42 Jefferson St,Dansville,NY,14437,42.557735,-77.702983
56,Dennis,Schmitt,(585) 204-4061,750 Dansville Mount Morris Rd,Dansville,NY,14437,42.584458,-
77.741648
57,Cassandra,Kim,(585) 204-4138,3 Perine Ave APT1,Dansville,NY,14437,42.562865,-77.69661
58,Kolton,Jacobson,(585) 206-5047,4925 Upper Holly Rd,Holley,NY,14470,43.175957,-78.074465
59,Nathanael,Donovan,(718) 393-3501,9604 57th Ave,Corona,NY,11373,40.736077,-73.864858
60,Robert,Frazier,(718) 271-3067,300 56th Ave,Corona,NY,11373,40.735304,-73.873997
61,Jessie,Mora,(315) 405-8991,9607 Forsyth Loop,Watertown,NY,13603,44.036466,-75.833437
62,Martha,Rollins,(347) 242-2642,22 Main St,Corona,NY,11373,40.757727,-73.829331
63,Emely,Townsend,(718) 699-0751,60 Sanford Ave,Corona,NY,11373,40.755466,-73.831029
64,Kylie,Cooley,(347) 561-7149,9608 95th Ave,Ozone Park,NY,11416,40.687564,-73.845715
65,Wendy,Cameron,(585) 571-4185,9608 Union St,Scottsville,NY,14546,43.013327,-77.7907839
66,Kayley,Peterson,(718) 654-5027,961 E 230th St,Bronx,NY,10466,40.889275,-73.850555
67,Camden,Ochoa,(718) 760-8699,59 Vark St,Yonkers,NY,10701,40.929322,-73.89957
68,Priscilla,Castillo,(910) 326-7233,9359 Elm St,Chadwicks,NY,13319,43.024902,-75.26886
69,Dana,Schultz,(913) 322-4580,99 Washington Ave,Hastings on Hudson,NY,10706,40.99265,-
73.879748
70,Blaze,Medina,(914) 207-0015,60 Elliott Ave,Yonkers,NY,10705,40.921498,-73.896682
71,Finnegan,Tucker,(914) 207-0015,90 Hillside Drive,Yonkers,NY,10705,40.922514,-73.892911
72,Pranav,Palmer,(914) 214-8376,5 Bruce Ave,Harrison,NY,10528,40.970916,-73.711493
73,Kolten,Wong,(914) 218-8268,70 Barker St,Mount Kisco,NY,10549,41.211993,-73.723202
74,Jasiah,Vazquez,(914) 231-5199,30 Broadway,Dobbs Ferry,NY,10522,41.004629,-73.879825
75,Lamar,Pierce,(914) 232-0380,68 Ridge Rd,Katonah,NY,10536,41.256662,-73.707964
76,Carla,Coffey,(914) 232-0469,197 Beaver Dam Rd,Katonah,NY,10536,41.247934,-73.664363
Script syntax and chart functions - Qlik Sense, February 2022 750
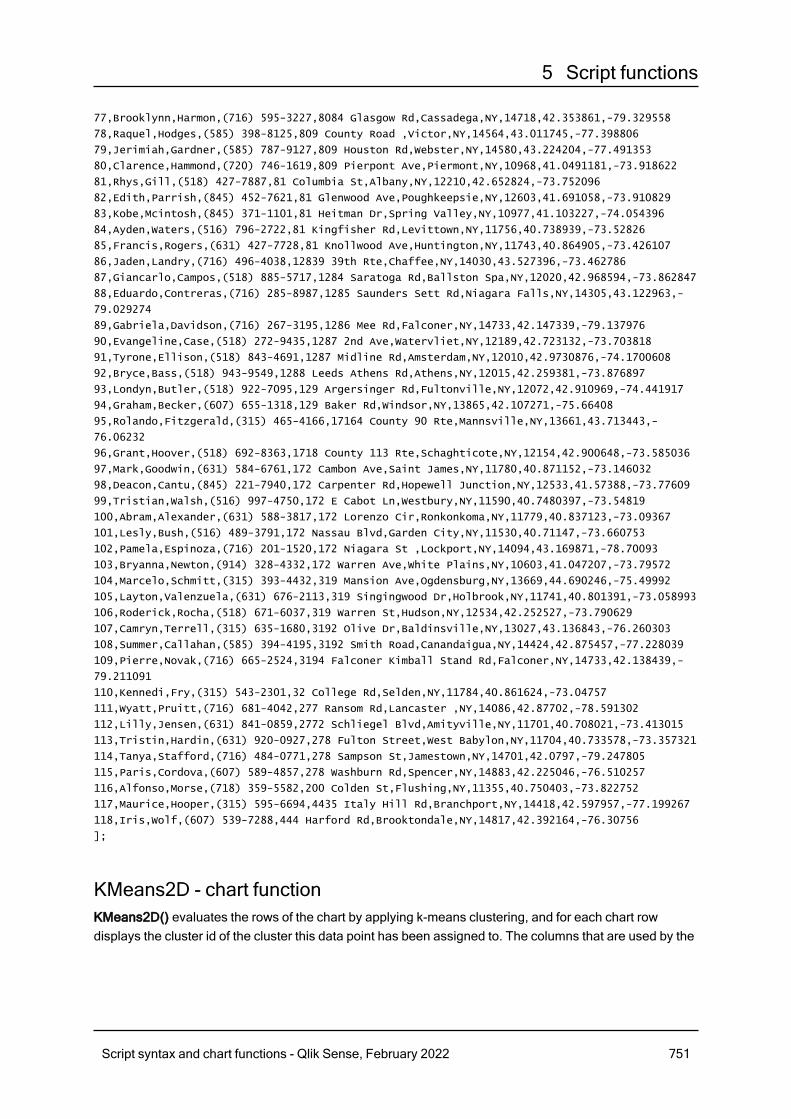
5 Script functions
77,Brooklynn,Harmon,(716) 595-3227,8084 Glasgow Rd,Cassadega,NY,14718,42.353861,-79.329558
78,Raquel,Hodges,(585) 398-8125,809 County Road ,Victor,NY,14564,43.011745,-77.398806
79,Jerimiah,Gardner,(585) 787-9127,809 Houston Rd,Webster,NY,14580,43.224204,-77.491353
80,Clarence,Hammond,(720) 746-1619,809 Pierpont Ave,Piermont,NY,10968,41.0491181,-73.918622
81,Rhys,Gill,(518) 427-7887,81 Columbia St,Albany,NY,12210,42.652824,-73.752096
82,Edith,Parrish,(845) 452-7621,81 Glenwood Ave,Poughkeepsie,NY,12603,41.691058,-73.910829
83,Kobe,Mcintosh,(845) 371-1101,81 Heitman Dr,Spring Valley,NY,10977,41.103227,-74.054396
84,Ayden,Waters,(516) 796-2722,81 Kingfisher Rd,Levittown,NY,11756,40.738939,-73.52826
85,Francis,Rogers,(631) 427-7728,81 Knollwood Ave,Huntington,NY,11743,40.864905,-73.426107
86,Jaden,Landry,(716) 496-4038,12839 39th Rte,Chaffee,NY,14030,43.527396,-73.462786
87,Giancarlo,Campos,(518) 885-5717,1284 Saratoga Rd,Ballston Spa,NY,12020,42.968594,-73.862847
88,Eduardo,Contreras,(716) 285-8987,1285 Saunders Sett Rd,Niagara Falls,NY,14305,43.122963,-
79.029274
89,Gabriela,Davidson,(716) 267-3195,1286 Mee Rd,Falconer,NY,14733,42.147339,-79.137976
90,Evangeline,Case,(518) 272-9435,1287 2nd Ave,Watervliet,NY,12189,42.723132,-73.703818
91,Tyrone,Ellison,(518) 843-4691,1287 Midline Rd,Amsterdam,NY,12010,42.9730876,-74.1700608
92,Bryce,Bass,(518) 943-9549,1288 Leeds Athens Rd,Athens,NY,12015,42.259381,-73.876897
93,Londyn,Butler,(518) 922-7095,129 Argersinger Rd,Fultonville,NY,12072,42.910969,-74.441917
94,Graham,Becker,(607) 655-1318,129 Baker Rd,Windsor,NY,13865,42.107271,-75.66408
95,Rolando,Fitzgerald,(315) 465-4166,17164 County 90 Rte,Mannsville,NY,13661,43.713443,-
76.06232
96,Grant,Hoover,(518) 692-8363,1718 County 113 Rte,Schaghticote,NY,12154,42.900648,-73.585036
97,Mark,Goodwin,(631) 584-6761,172 Cambon Ave,Saint James,NY,11780,40.871152,-73.146032
98,Deacon,Cantu,(845) 221-7940,172 Carpenter Rd,Hopewell Junction,NY,12533,41.57388,-73.77609
99,Tristian,Walsh,(516) 997-4750,172 E Cabot Ln,Westbury,NY,11590,40.7480397,-73.54819
100,Abram,Alexander,(631) 588-3817,172 Lorenzo Cir,Ronkonkoma,NY,11779,40.837123,-73.09367
101,Lesly,Bush,(516) 489-3791,172 Nassau Blvd,Garden City,NY,11530,40.71147,-73.660753
102,Pamela,Espinoza,(716) 201-1520,172 Niagara St ,Lockport,NY,14094,43.169871,-78.70093
103,Bryanna,Newton,(914) 328-4332,172 Warren Ave,White Plains,NY,10603,41.047207,-73.79572
104,Marcelo,Schmitt,(315) 393-4432,319 Mansion Ave,Ogdensburg,NY,13669,44.690246,-75.49992
105,Layton,Valenzuela,(631) 676-2113,319 Singingwood Dr,Holbrook,NY,11741,40.801391,-73.058993
106,Roderick,Rocha,(518) 671-6037,319 Warren St,Hudson,NY,12534,42.252527,-73.790629
107,Camryn,Terrell,(315) 635-1680,3192 Olive Dr,Baldinsville,NY,13027,43.136843,-76.260303
108,Summer,Callahan,(585) 394-4195,3192 Smith Road,Canandaigua,NY,14424,42.875457,-77.228039
109,Pierre,Novak,(716) 665-2524,3194 Falconer Kimball Stand Rd,Falconer,NY,14733,42.138439,-
79.211091
110,Kennedi,Fry,(315) 543-2301,32 College Rd,Selden,NY,11784,40.861624,-73.04757
111,Wyatt,Pruitt,(716) 681-4042,277 Ransom Rd,Lancaster ,NY,14086,42.87702,-78.591302
112,Lilly,Jensen,(631) 841-0859,2772 Schliegel Blvd,Amityville,NY,11701,40.708021,-73.413015
113,Tristin,Hardin,(631) 920-0927,278 Fulton Street,West Babylon,NY,11704,40.733578,-73.357321
114,Tanya,Stafford,(716) 484-0771,278 Sampson St,Jamestown,NY,14701,42.0797,-79.247805
115,Paris,Cordova,(607) 589-4857,278 Washburn Rd,Spencer,NY,14883,42.225046,-76.510257
116,Alfonso,Morse,(718) 359-5582,200 Colden St,Flushing,NY,11355,40.750403,-73.822752
117,Maurice,Hooper,(315) 595-6694,4435 Italy Hill Rd,Branchport,NY,14418,42.597957,-77.199267
118,Iris,Wolf,(607) 539-7288,444 Harford Rd,Brooktondale,NY,14817,42.392164,-76.30756
];
KMeans2D - chart functionKMeans2D() evaluates the rows of the chart by applying k-means clustering, and for each chart rowdisplays the cluster id of the cluster this data point has been assigned to. The columns that are used by the
Script syntax and chart functions - Qlik Sense, February 2022 751
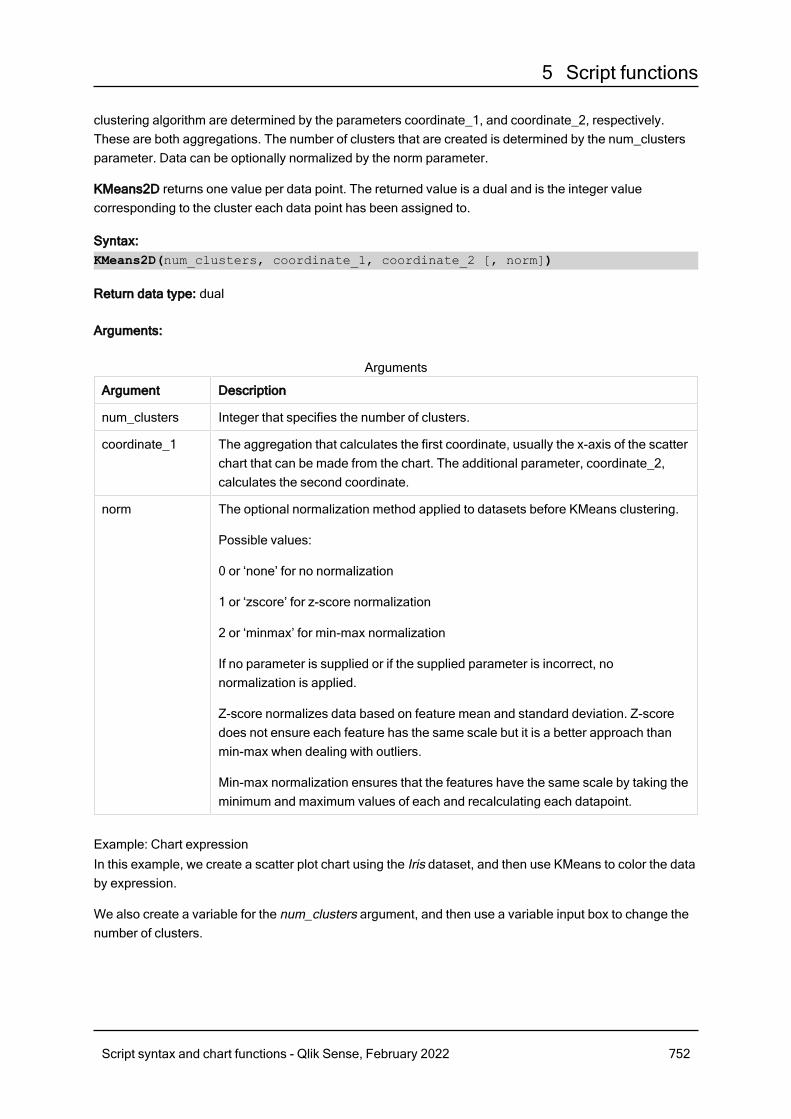
5 Script functions
clustering algorithm are determined by the parameters coordinate_1, and coordinate_2, respectively.These are both aggregations. The number of clusters that are created is determined by the num_clustersparameter. Data can be optionally normalized by the norm parameter.
KMeans2D returns one value per data point. The returned value is a dual and is the integer valuecorresponding to the cluster each data point has been assigned to.
Syntax:KMeans2D(num_clusters, coordinate_1, coordinate_2 [, norm])
Return data type: dual
Arguments:
Argument Description
num_clusters Integer that specifies the number of clusters.
coordinate_1 The aggregation that calculates the first coordinate, usually the x-axis of the scatterchart that can be made from the chart. The additional parameter, coordinate_2,calculates the second coordinate.
norm The optional normalization method applied to datasets before KMeans clustering.
Possible values:
0 or ‘none’ for no normalization
1 or ‘zscore’ for z-score normalization
2 or ‘minmax’ for min-max normalization
If no parameter is supplied or if the supplied parameter is incorrect, nonormalization is applied.
Z-score normalizes data based on feature mean and standard deviation. Z-scoredoes not ensure each feature has the same scale but it is a better approach thanmin-max when dealing with outliers.
Min-max normalization ensures that the features have the same scale by taking theminimum and maximum values of each and recalculating each datapoint.
Arguments
Example: Chart expressionIn this example, we create a scatter plot chart using the Iris dataset, and then use KMeans to color the databy expression.
We also create a variable for the num_clusters argument, and then use a variable input box to change thenumber of clusters.
Script syntax and chart functions - Qlik Sense, February 2022 752
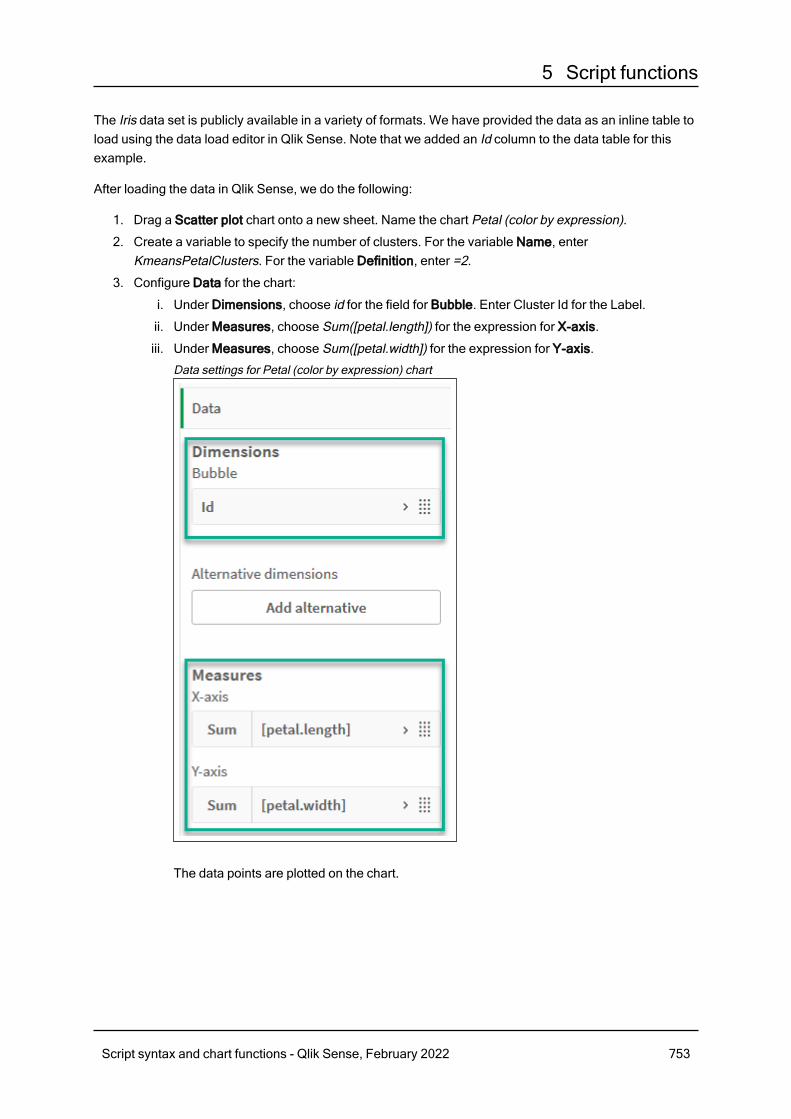
5 Script functions
The Iris data set is publicly available in a variety of formats. We have provided the data as an inline table toload using the data load editor in Qlik Sense. Note that we added an Id column to the data table for thisexample.
After loading the data in Qlik Sense, we do the following:
1. Drag a Scatter plot chart onto a new sheet. Name the chart Petal (color by expression).
2. Create a variable to specify the number of clusters. For the variable Name, enterKmeansPetalClusters. For the variable Definition, enter =2.
3. Configure Data for the chart:
i. Under Dimensions, choose id for the field for Bubble. Enter Cluster Id for the Label.
ii. Under Measures, choose Sum([petal.length]) for the expression for X-axis.
iii. Under Measures, choose Sum([petal.width]) for the expression for Y-axis.
Data settings for Petal (color by expression) chart
The data points are plotted on the chart.
Script syntax and chart functions - Qlik Sense, February 2022 753
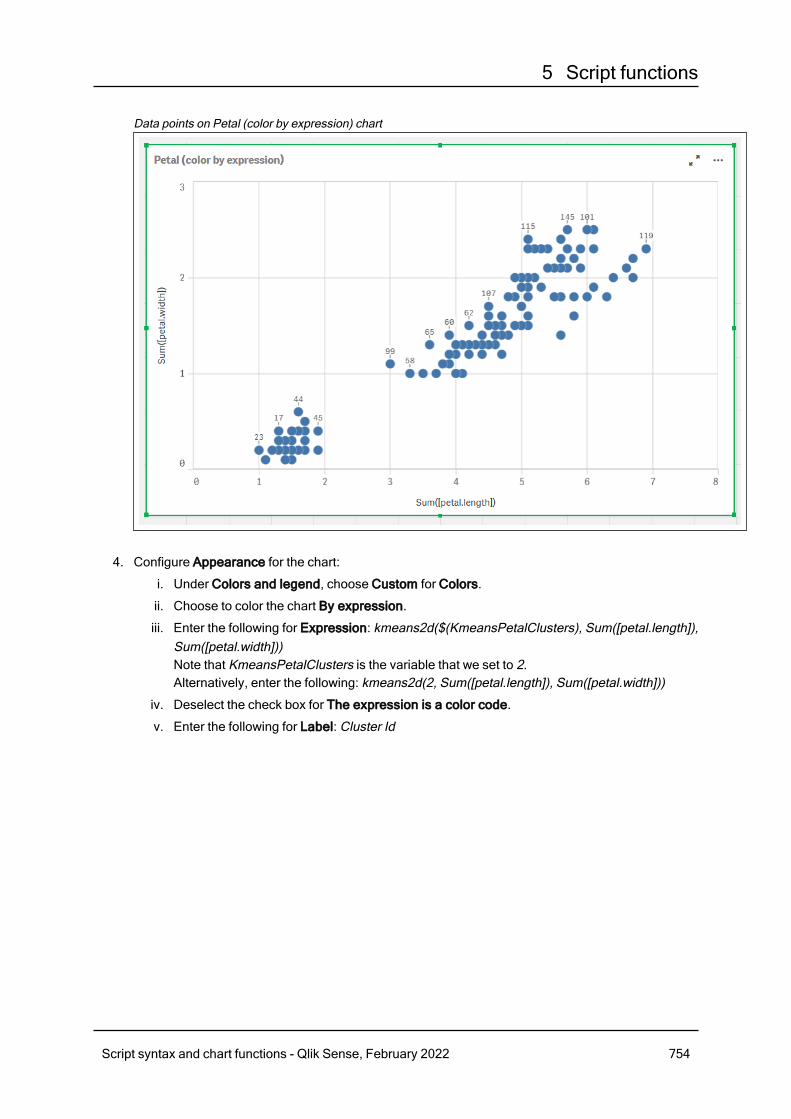
5 Script functions
Data points on Petal (color by expression) chart
4. Configure Appearance for the chart:
i. Under Colors and legend, choose Custom for Colors.
ii. Choose to color the chart By expression.
iii. Enter the following for Expression: kmeans2d($(KmeansPetalClusters), Sum([petal.length]),Sum([petal.width]))Note that KmeansPetalClusters is the variable that we set to 2.Alternatively, enter the following: kmeans2d(2, Sum([petal.length]), Sum([petal.width]))
iv. Deselect the check box for The expression is a color code.
v. Enter the following for Label: Cluster Id
Script syntax and chart functions - Qlik Sense, February 2022 754

5 Script functions
Appearance settings for Petal (color by expression) chart
Script syntax and chart functions - Qlik Sense, February 2022 755
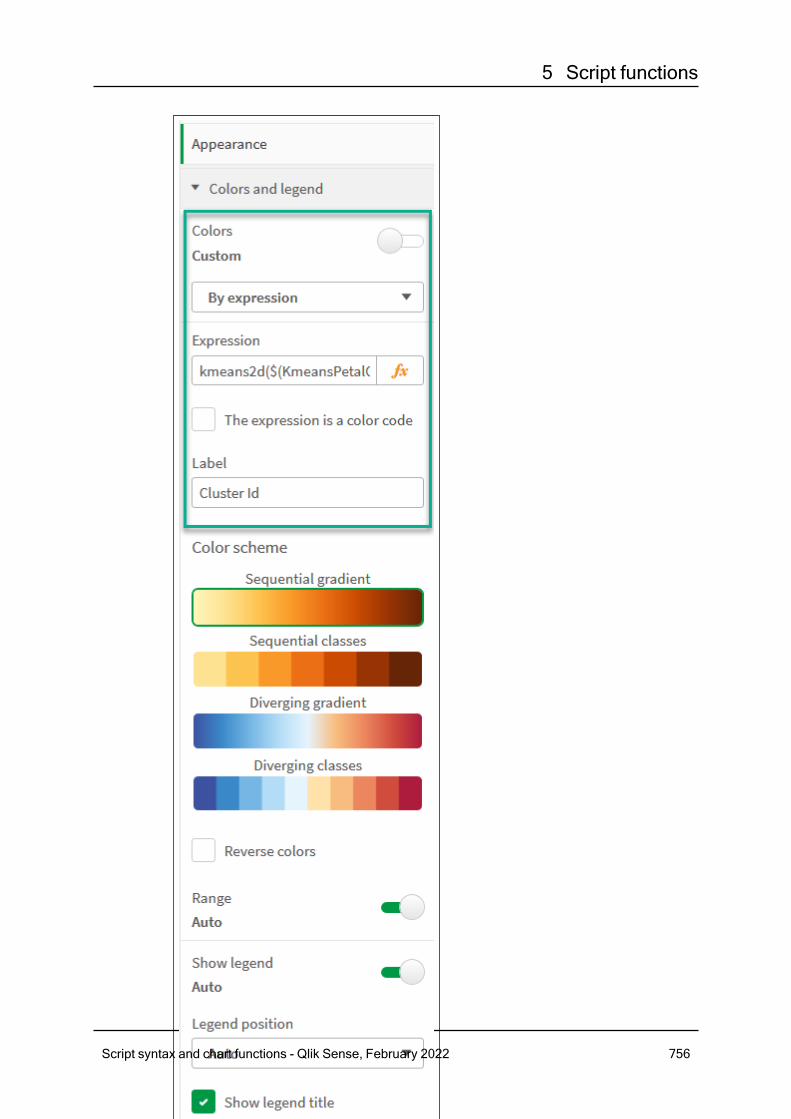
5 Script functions
Script syntax and chart functions - Qlik Sense, February 2022 756
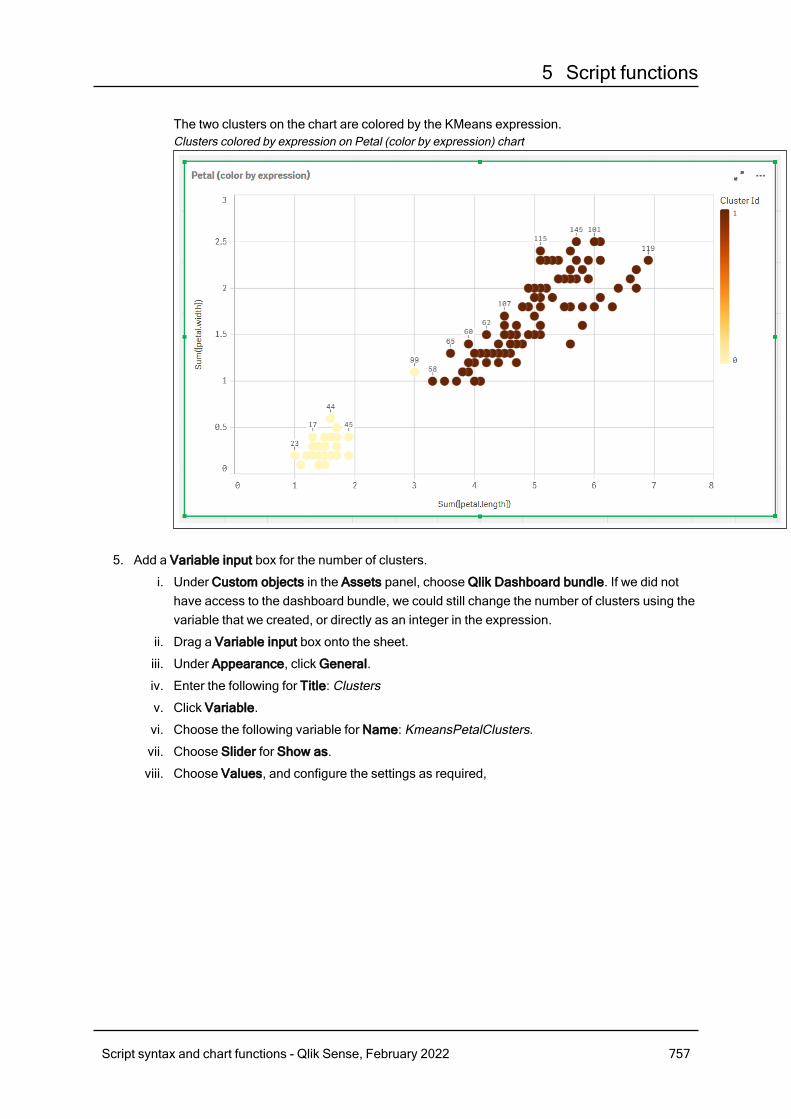
5 Script functions
The two clusters on the chart are colored by the KMeans expression.Clusters colored by expression on Petal (color by expression) chart
5. Add a Variable input box for the number of clusters.
i. Under Custom objects in the Assets panel, choose Qlik Dashboard bundle. If we did nothave access to the dashboard bundle, we could still change the number of clusters using thevariable that we created, or directly as an integer in the expression.
ii. Drag a Variable input box onto the sheet.
iii. Under Appearance, click General.
iv. Enter the following for Title: Clusters
v. Click Variable.
vi. Choose the following variable for Name: KmeansPetalClusters.
vii. Choose Slider for Show as.
viii. Choose Values, and configure the settings as required,
Script syntax and chart functions - Qlik Sense, February 2022 757

5 Script functions
Appearance for Clusters variable input box
Script syntax and chart functions - Qlik Sense, February 2022 758
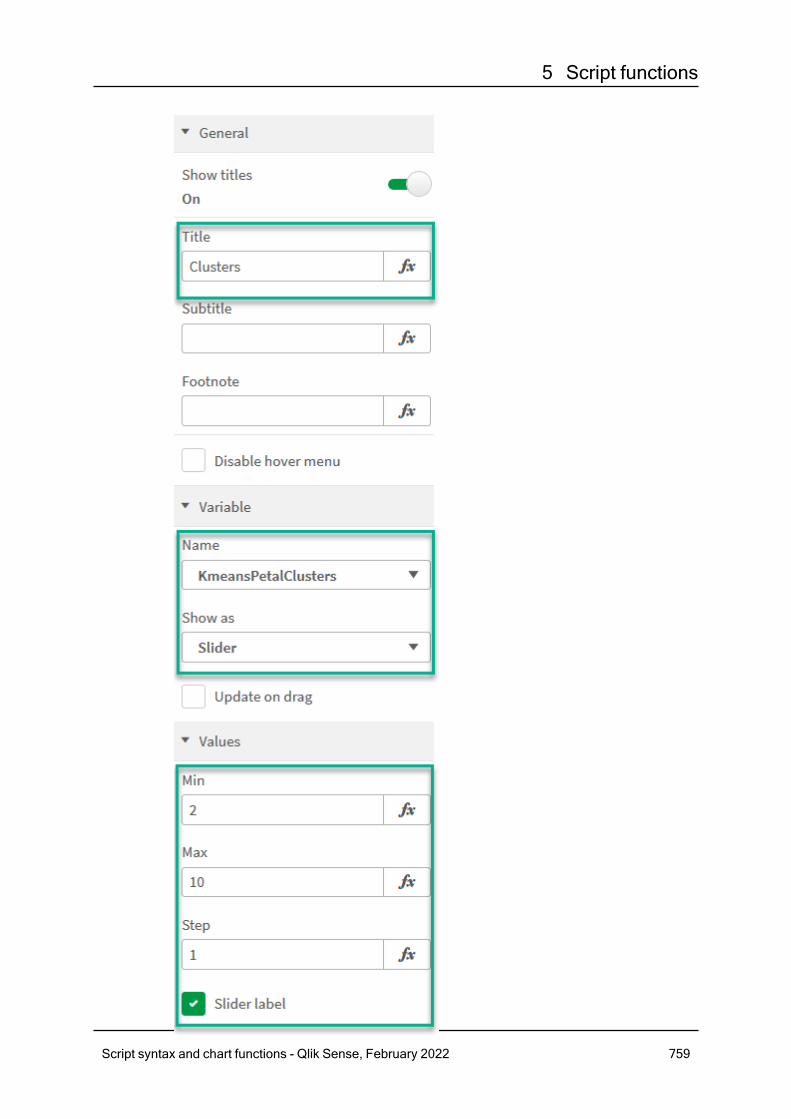
5 Script functions
Script syntax and chart functions - Qlik Sense, February 2022 759
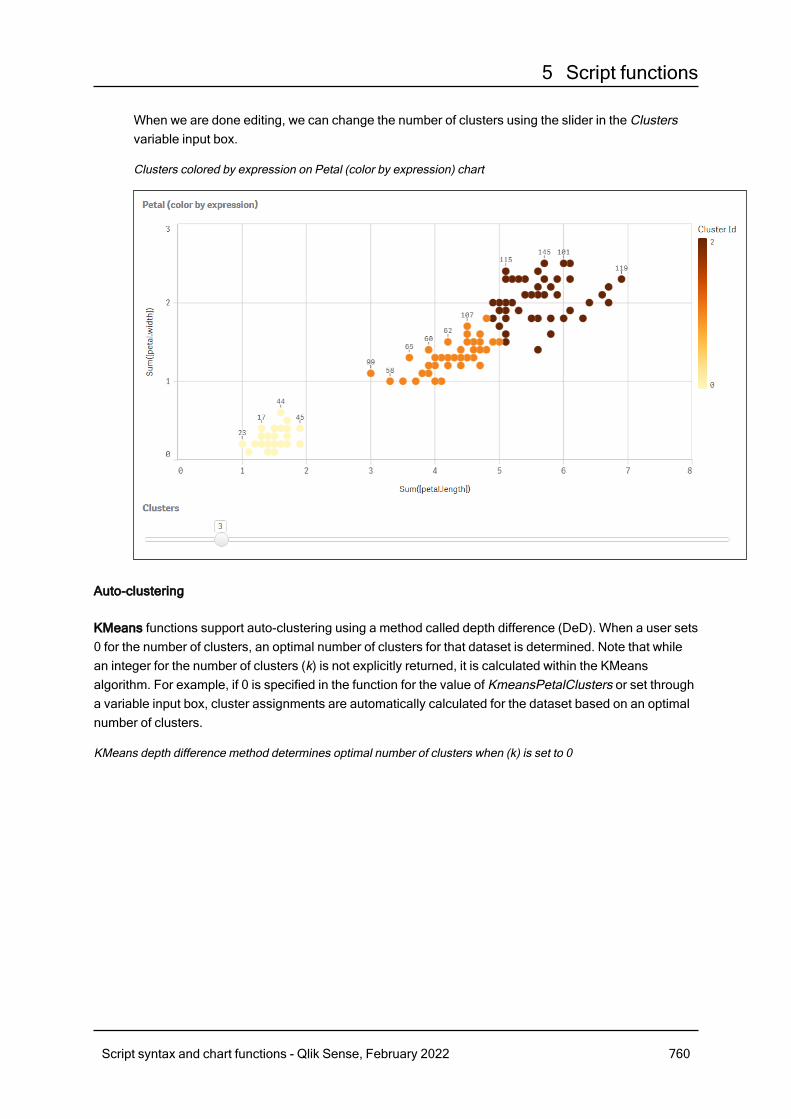
5 Script functions
When we are done editing, we can change the number of clusters using the slider in the Clustersvariable input box.
Clusters colored by expression on Petal (color by expression) chart
Auto-clustering
KMeans functions support auto-clustering using a method called depth difference (DeD). When a user sets0 for the number of clusters, an optimal number of clusters for that dataset is determined. Note that whilean integer for the number of clusters (k) is not explicitly returned, it is calculated within the KMeansalgorithm. For example, if 0 is specified in the function for the value of KmeansPetalClusters or set througha variable input box, cluster assignments are automatically calculated for the dataset based on an optimalnumber of clusters.
KMeans depth difference method determines optimal number of clusters when (k) is set to 0
Script syntax and chart functions - Qlik Sense, February 2022 760
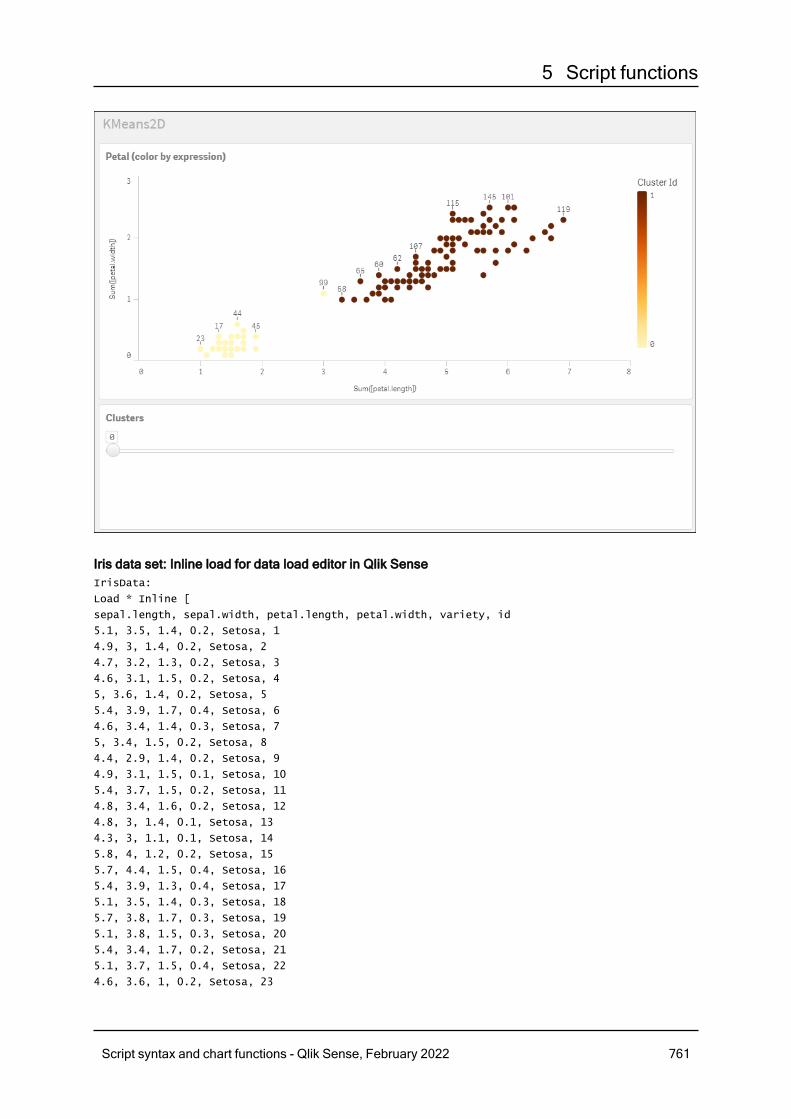
5 Script functions
Iris data set: Inline load for data load editor in Qlik SenseIrisData:
Load * Inline [
sepal.length, sepal.width, petal.length, petal.width, variety, id
5.1, 3.5, 1.4, 0.2, Setosa, 1
4.9, 3, 1.4, 0.2, Setosa, 2
4.7, 3.2, 1.3, 0.2, Setosa, 3
4.6, 3.1, 1.5, 0.2, Setosa, 4
5, 3.6, 1.4, 0.2, Setosa, 5
5.4, 3.9, 1.7, 0.4, Setosa, 6
4.6, 3.4, 1.4, 0.3, Setosa, 7
5, 3.4, 1.5, 0.2, Setosa, 8
4.4, 2.9, 1.4, 0.2, Setosa, 9
4.9, 3.1, 1.5, 0.1, Setosa, 10
5.4, 3.7, 1.5, 0.2, Setosa, 11
4.8, 3.4, 1.6, 0.2, Setosa, 12
4.8, 3, 1.4, 0.1, Setosa, 13
4.3, 3, 1.1, 0.1, Setosa, 14
5.8, 4, 1.2, 0.2, Setosa, 15
5.7, 4.4, 1.5, 0.4, Setosa, 16
5.4, 3.9, 1.3, 0.4, Setosa, 17
5.1, 3.5, 1.4, 0.3, Setosa, 18
5.7, 3.8, 1.7, 0.3, Setosa, 19
5.1, 3.8, 1.5, 0.3, Setosa, 20
5.4, 3.4, 1.7, 0.2, Setosa, 21
5.1, 3.7, 1.5, 0.4, Setosa, 22
4.6, 3.6, 1, 0.2, Setosa, 23
Script syntax and chart functions - Qlik Sense, February 2022 761
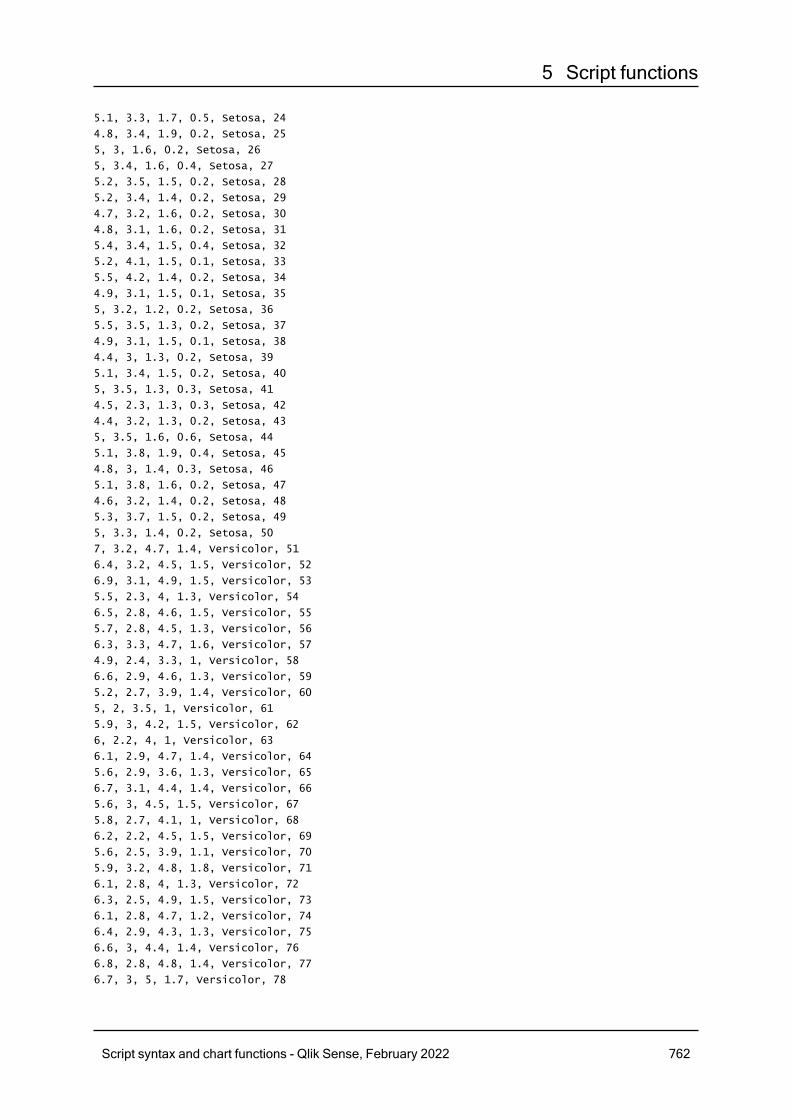
5 Script functions
5.1, 3.3, 1.7, 0.5, Setosa, 24
4.8, 3.4, 1.9, 0.2, Setosa, 25
5, 3, 1.6, 0.2, Setosa, 26
5, 3.4, 1.6, 0.4, Setosa, 27
5.2, 3.5, 1.5, 0.2, Setosa, 28
5.2, 3.4, 1.4, 0.2, Setosa, 29
4.7, 3.2, 1.6, 0.2, Setosa, 30
4.8, 3.1, 1.6, 0.2, Setosa, 31
5.4, 3.4, 1.5, 0.4, Setosa, 32
5.2, 4.1, 1.5, 0.1, Setosa, 33
5.5, 4.2, 1.4, 0.2, Setosa, 34
4.9, 3.1, 1.5, 0.1, Setosa, 35
5, 3.2, 1.2, 0.2, Setosa, 36
5.5, 3.5, 1.3, 0.2, Setosa, 37
4.9, 3.1, 1.5, 0.1, Setosa, 38
4.4, 3, 1.3, 0.2, Setosa, 39
5.1, 3.4, 1.5, 0.2, Setosa, 40
5, 3.5, 1.3, 0.3, Setosa, 41
4.5, 2.3, 1.3, 0.3, Setosa, 42
4.4, 3.2, 1.3, 0.2, Setosa, 43
5, 3.5, 1.6, 0.6, Setosa, 44
5.1, 3.8, 1.9, 0.4, Setosa, 45
4.8, 3, 1.4, 0.3, Setosa, 46
5.1, 3.8, 1.6, 0.2, Setosa, 47
4.6, 3.2, 1.4, 0.2, Setosa, 48
5.3, 3.7, 1.5, 0.2, Setosa, 49
5, 3.3, 1.4, 0.2, Setosa, 50
7, 3.2, 4.7, 1.4, Versicolor, 51
6.4, 3.2, 4.5, 1.5, Versicolor, 52
6.9, 3.1, 4.9, 1.5, Versicolor, 53
5.5, 2.3, 4, 1.3, Versicolor, 54
6.5, 2.8, 4.6, 1.5, Versicolor, 55
5.7, 2.8, 4.5, 1.3, Versicolor, 56
6.3, 3.3, 4.7, 1.6, Versicolor, 57
4.9, 2.4, 3.3, 1, Versicolor, 58
6.6, 2.9, 4.6, 1.3, Versicolor, 59
5.2, 2.7, 3.9, 1.4, Versicolor, 60
5, 2, 3.5, 1, Versicolor, 61
5.9, 3, 4.2, 1.5, Versicolor, 62
6, 2.2, 4, 1, Versicolor, 63
6.1, 2.9, 4.7, 1.4, Versicolor, 64
5.6, 2.9, 3.6, 1.3, Versicolor, 65
6.7, 3.1, 4.4, 1.4, Versicolor, 66
5.6, 3, 4.5, 1.5, Versicolor, 67
5.8, 2.7, 4.1, 1, Versicolor, 68
6.2, 2.2, 4.5, 1.5, Versicolor, 69
5.6, 2.5, 3.9, 1.1, Versicolor, 70
5.9, 3.2, 4.8, 1.8, Versicolor, 71
6.1, 2.8, 4, 1.3, Versicolor, 72
6.3, 2.5, 4.9, 1.5, Versicolor, 73
6.1, 2.8, 4.7, 1.2, Versicolor, 74
6.4, 2.9, 4.3, 1.3, Versicolor, 75
6.6, 3, 4.4, 1.4, Versicolor, 76
6.8, 2.8, 4.8, 1.4, Versicolor, 77
6.7, 3, 5, 1.7, Versicolor, 78
Script syntax and chart functions - Qlik Sense, February 2022 762
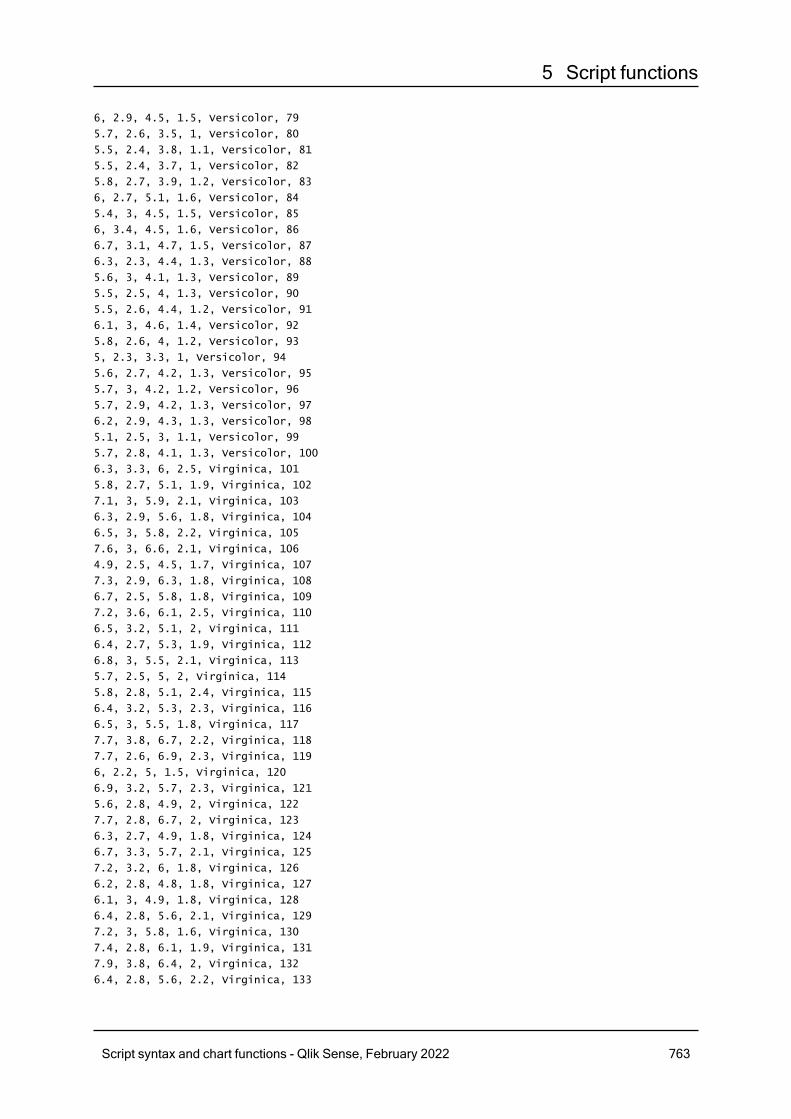
5 Script functions
6, 2.9, 4.5, 1.5, Versicolor, 79
5.7, 2.6, 3.5, 1, Versicolor, 80
5.5, 2.4, 3.8, 1.1, Versicolor, 81
5.5, 2.4, 3.7, 1, Versicolor, 82
5.8, 2.7, 3.9, 1.2, Versicolor, 83
6, 2.7, 5.1, 1.6, Versicolor, 84
5.4, 3, 4.5, 1.5, Versicolor, 85
6, 3.4, 4.5, 1.6, Versicolor, 86
6.7, 3.1, 4.7, 1.5, Versicolor, 87
6.3, 2.3, 4.4, 1.3, Versicolor, 88
5.6, 3, 4.1, 1.3, Versicolor, 89
5.5, 2.5, 4, 1.3, Versicolor, 90
5.5, 2.6, 4.4, 1.2, Versicolor, 91
6.1, 3, 4.6, 1.4, Versicolor, 92
5.8, 2.6, 4, 1.2, Versicolor, 93
5, 2.3, 3.3, 1, Versicolor, 94
5.6, 2.7, 4.2, 1.3, Versicolor, 95
5.7, 3, 4.2, 1.2, Versicolor, 96
5.7, 2.9, 4.2, 1.3, Versicolor, 97
6.2, 2.9, 4.3, 1.3, Versicolor, 98
5.1, 2.5, 3, 1.1, Versicolor, 99
5.7, 2.8, 4.1, 1.3, Versicolor, 100
6.3, 3.3, 6, 2.5, Virginica, 101
5.8, 2.7, 5.1, 1.9, Virginica, 102
7.1, 3, 5.9, 2.1, Virginica, 103
6.3, 2.9, 5.6, 1.8, Virginica, 104
6.5, 3, 5.8, 2.2, Virginica, 105
7.6, 3, 6.6, 2.1, Virginica, 106
4.9, 2.5, 4.5, 1.7, Virginica, 107
7.3, 2.9, 6.3, 1.8, Virginica, 108
6.7, 2.5, 5.8, 1.8, Virginica, 109
7.2, 3.6, 6.1, 2.5, Virginica, 110
6.5, 3.2, 5.1, 2, Virginica, 111
6.4, 2.7, 5.3, 1.9, Virginica, 112
6.8, 3, 5.5, 2.1, Virginica, 113
5.7, 2.5, 5, 2, Virginica, 114
5.8, 2.8, 5.1, 2.4, Virginica, 115
6.4, 3.2, 5.3, 2.3, Virginica, 116
6.5, 3, 5.5, 1.8, Virginica, 117
7.7, 3.8, 6.7, 2.2, Virginica, 118
7.7, 2.6, 6.9, 2.3, Virginica, 119
6, 2.2, 5, 1.5, Virginica, 120
6.9, 3.2, 5.7, 2.3, Virginica, 121
5.6, 2.8, 4.9, 2, Virginica, 122
7.7, 2.8, 6.7, 2, Virginica, 123
6.3, 2.7, 4.9, 1.8, Virginica, 124
6.7, 3.3, 5.7, 2.1, Virginica, 125
7.2, 3.2, 6, 1.8, Virginica, 126
6.2, 2.8, 4.8, 1.8, Virginica, 127
6.1, 3, 4.9, 1.8, Virginica, 128
6.4, 2.8, 5.6, 2.1, Virginica, 129
7.2, 3, 5.8, 1.6, Virginica, 130
7.4, 2.8, 6.1, 1.9, Virginica, 131
7.9, 3.8, 6.4, 2, Virginica, 132
6.4, 2.8, 5.6, 2.2, Virginica, 133
Script syntax and chart functions - Qlik Sense, February 2022 763
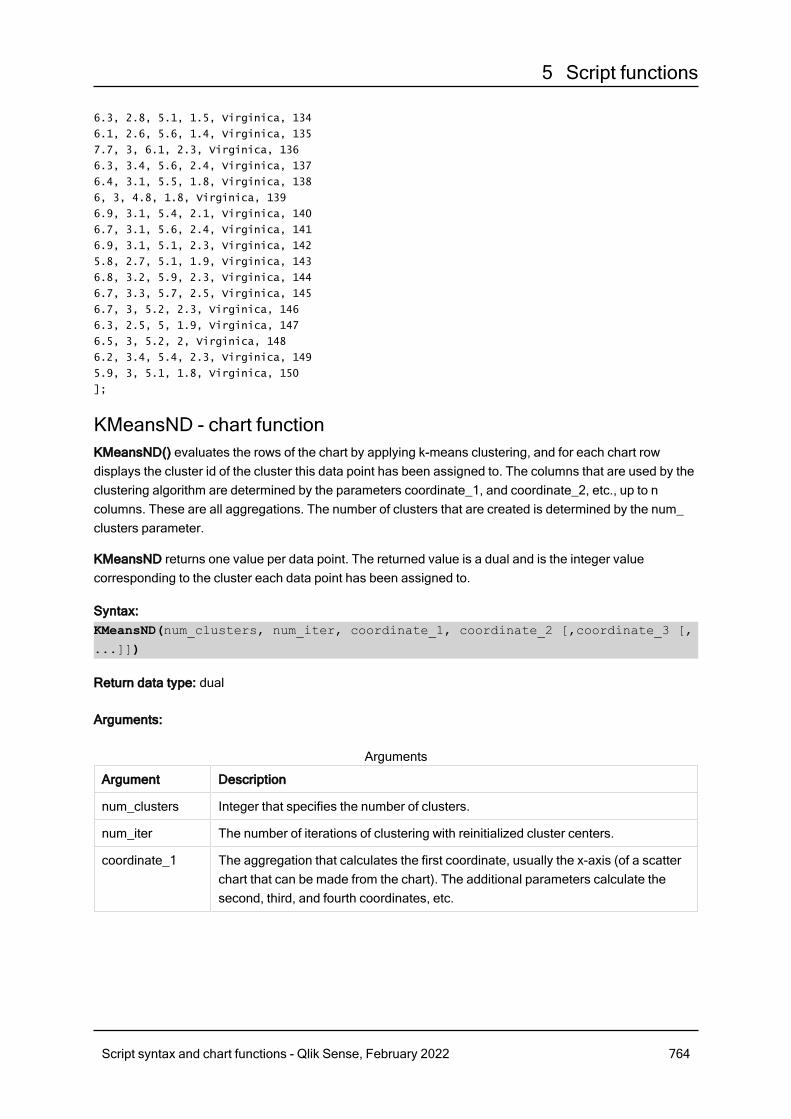
5 Script functions
6.3, 2.8, 5.1, 1.5, Virginica, 134
6.1, 2.6, 5.6, 1.4, Virginica, 135
7.7, 3, 6.1, 2.3, Virginica, 136
6.3, 3.4, 5.6, 2.4, Virginica, 137
6.4, 3.1, 5.5, 1.8, Virginica, 138
6, 3, 4.8, 1.8, Virginica, 139
6.9, 3.1, 5.4, 2.1, Virginica, 140
6.7, 3.1, 5.6, 2.4, Virginica, 141
6.9, 3.1, 5.1, 2.3, Virginica, 142
5.8, 2.7, 5.1, 1.9, Virginica, 143
6.8, 3.2, 5.9, 2.3, Virginica, 144
6.7, 3.3, 5.7, 2.5, Virginica, 145
6.7, 3, 5.2, 2.3, Virginica, 146
6.3, 2.5, 5, 1.9, Virginica, 147
6.5, 3, 5.2, 2, Virginica, 148
6.2, 3.4, 5.4, 2.3, Virginica, 149
5.9, 3, 5.1, 1.8, Virginica, 150
];
KMeansND - chart functionKMeansND() evaluates the rows of the chart by applying k-means clustering, and for each chart rowdisplays the cluster id of the cluster this data point has been assigned to. The columns that are used by theclustering algorithm are determined by the parameters coordinate_1, and coordinate_2, etc., up to ncolumns. These are all aggregations. The number of clusters that are created is determined by the num_clusters parameter.
KMeansND returns one value per data point. The returned value is a dual and is the integer valuecorresponding to the cluster each data point has been assigned to.
Syntax:KMeansND(num_clusters, num_iter, coordinate_1, coordinate_2 [,coordinate_3 [,
...]])
Return data type: dual
Arguments:
Argument Description
num_clusters Integer that specifies the number of clusters.
num_iter The number of iterations of clustering with reinitialized cluster centers.
coordinate_1 The aggregation that calculates the first coordinate, usually the x-axis (of a scatterchart that can be made from the chart). The additional parameters calculate thesecond, third, and fourth coordinates, etc.
Arguments
Script syntax and chart functions - Qlik Sense, February 2022 764
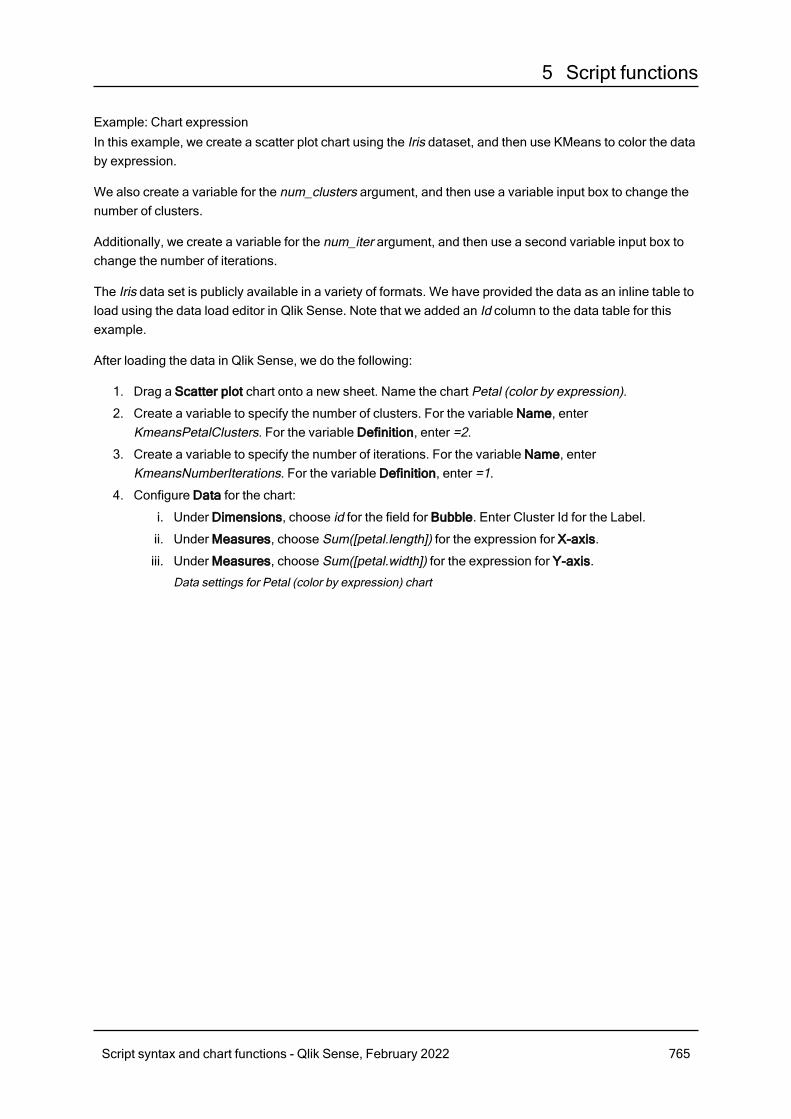
5 Script functions
Example: Chart expressionIn this example, we create a scatter plot chart using the Iris dataset, and then use KMeans to color the databy expression.
We also create a variable for the num_clusters argument, and then use a variable input box to change thenumber of clusters.
Additionally, we create a variable for the num_iter argument, and then use a second variable input box tochange the number of iterations.
The Iris data set is publicly available in a variety of formats. We have provided the data as an inline table toload using the data load editor in Qlik Sense. Note that we added an Id column to the data table for thisexample.
After loading the data in Qlik Sense, we do the following:
1. Drag a Scatter plot chart onto a new sheet. Name the chart Petal (color by expression).
2. Create a variable to specify the number of clusters. For the variable Name, enterKmeansPetalClusters. For the variable Definition, enter =2.
3. Create a variable to specify the number of iterations. For the variable Name, enterKmeansNumberIterations. For the variable Definition, enter =1.
4. Configure Data for the chart:
i. Under Dimensions, choose id for the field for Bubble. Enter Cluster Id for the Label.
ii. Under Measures, choose Sum([petal.length]) for the expression for X-axis.
iii. Under Measures, choose Sum([petal.width]) for the expression for Y-axis.
Data settings for Petal (color by expression) chart
Script syntax and chart functions - Qlik Sense, February 2022 765

5 Script functions
The data points are plotted on the chart.Data points on Petal (color by expression) chart
Script syntax and chart functions - Qlik Sense, February 2022 766
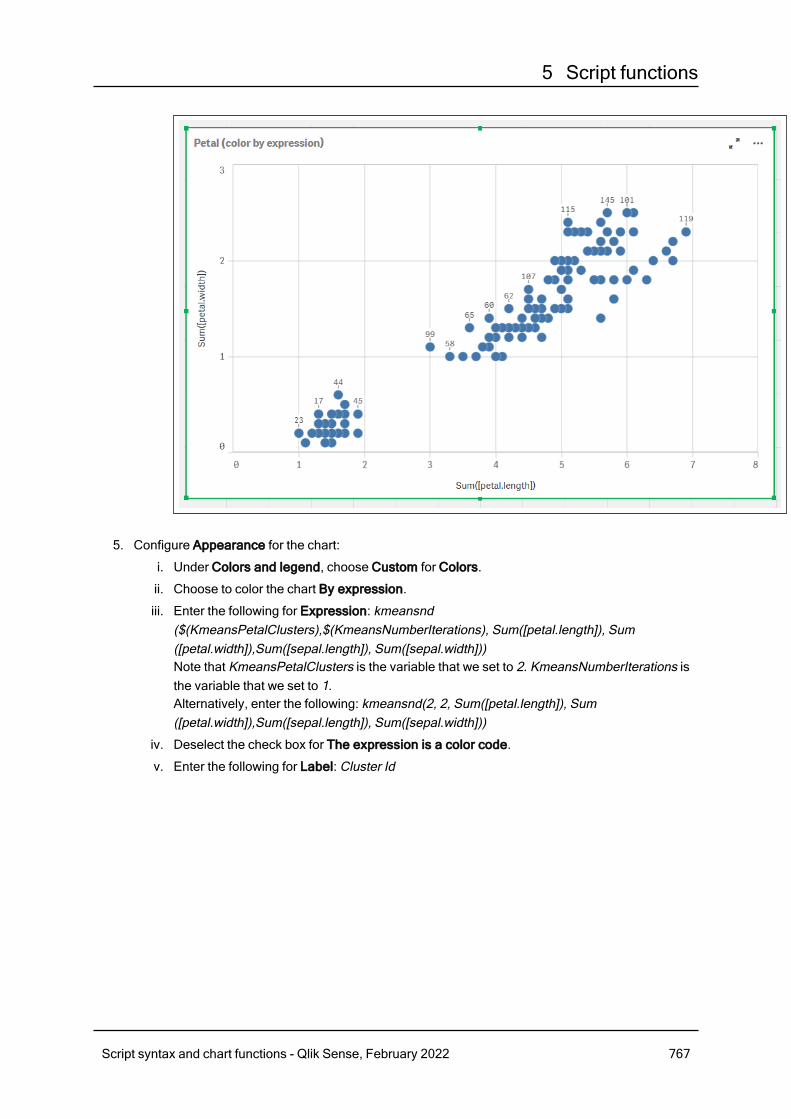
5 Script functions
5. Configure Appearance for the chart:
i. Under Colors and legend, choose Custom for Colors.
ii. Choose to color the chart By expression.
iii. Enter the following for Expression: kmeansnd($(KmeansPetalClusters),$(KmeansNumberIterations), Sum([petal.length]), Sum([petal.width]),Sum([sepal.length]), Sum([sepal.width]))Note that KmeansPetalClusters is the variable that we set to 2. KmeansNumberIterations isthe variable that we set to 1.Alternatively, enter the following: kmeansnd(2, 2, Sum([petal.length]), Sum([petal.width]),Sum([sepal.length]), Sum([sepal.width]))
iv. Deselect the check box for The expression is a color code.
v. Enter the following for Label: Cluster Id
Script syntax and chart functions - Qlik Sense, February 2022 767
5 Script functions
Appearance settings for Petal (color by expression) chart
Script syntax and chart functions - Qlik Sense, February 2022 768
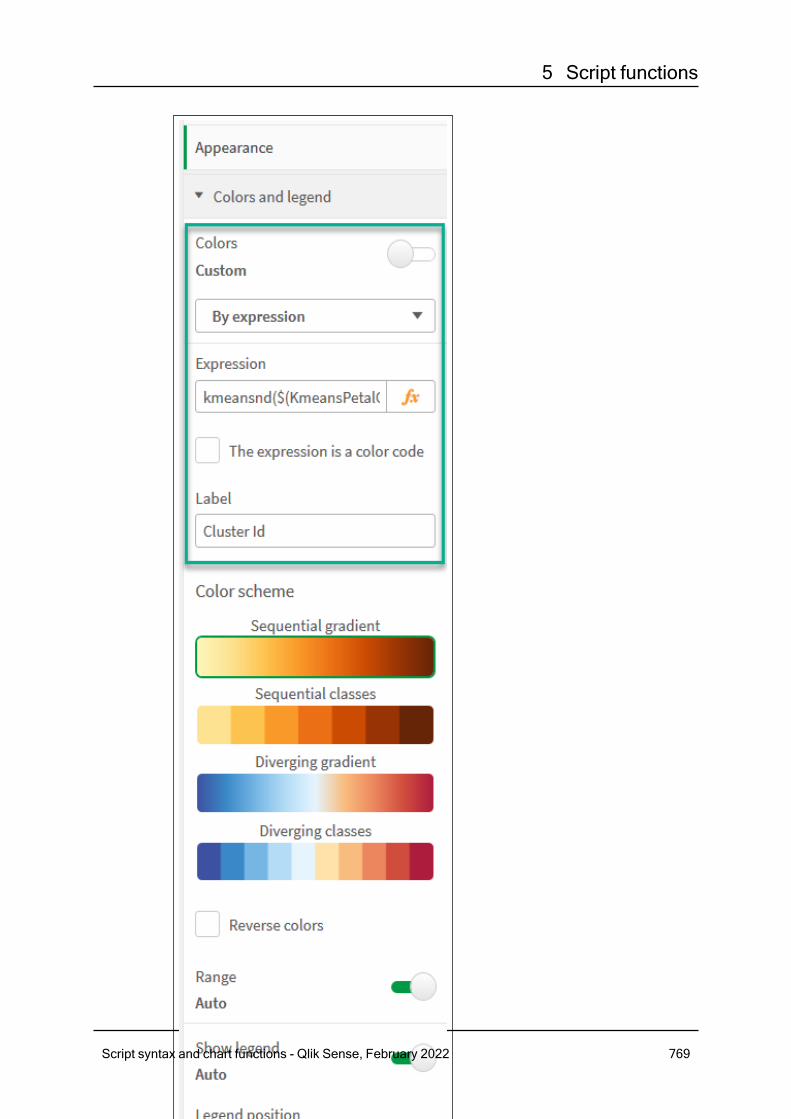
5 Script functions
Script syntax and chart functions - Qlik Sense, February 2022 769
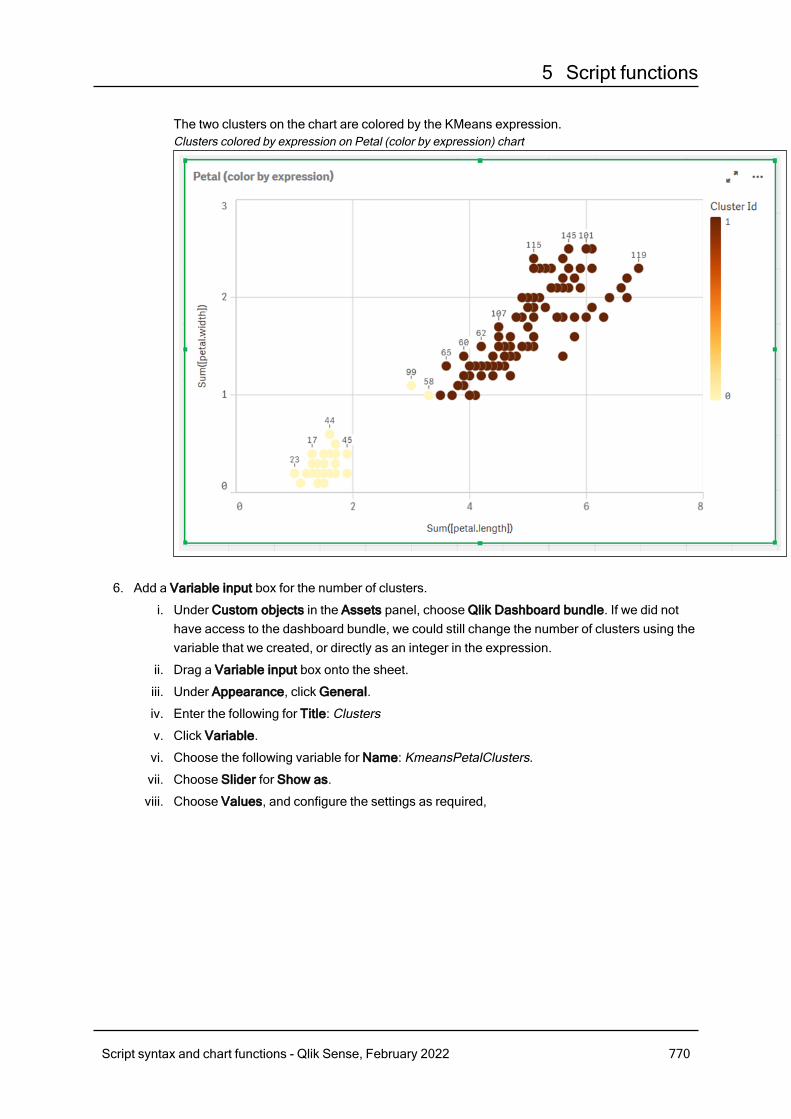
5 Script functions
The two clusters on the chart are colored by the KMeans expression.Clusters colored by expression on Petal (color by expression) chart
6. Add a Variable input box for the number of clusters.
i. Under Custom objects in the Assets panel, choose Qlik Dashboard bundle. If we did nothave access to the dashboard bundle, we could still change the number of clusters using thevariable that we created, or directly as an integer in the expression.
ii. Drag a Variable input box onto the sheet.
iii. Under Appearance, click General.
iv. Enter the following for Title: Clusters
v. Click Variable.
vi. Choose the following variable for Name: KmeansPetalClusters.
vii. Choose Slider for Show as.
viii. Choose Values, and configure the settings as required,
Script syntax and chart functions - Qlik Sense, February 2022 770

5 Script functions
Appearance for Clusters variable input box
Script syntax and chart functions - Qlik Sense, February 2022 771

5 Script functions
Script syntax and chart functions - Qlik Sense, February 2022 772
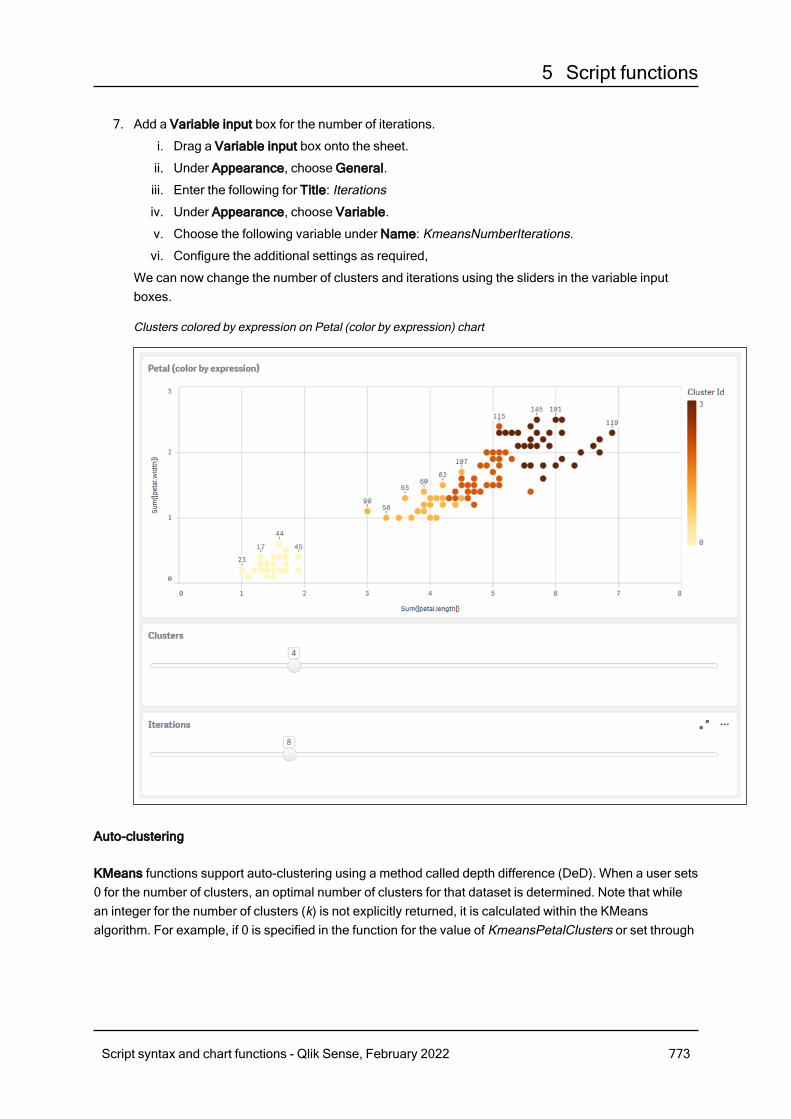
5 Script functions
7. Add a Variable input box for the number of iterations.
i. Drag a Variable input box onto the sheet.
ii. Under Appearance, choose General.
iii. Enter the following for Title: Iterations
iv. Under Appearance, choose Variable.
v. Choose the following variable under Name: KmeansNumberIterations.
vi. Configure the additional settings as required,
We can now change the number of clusters and iterations using the sliders in the variable inputboxes.
Clusters colored by expression on Petal (color by expression) chart
Auto-clustering
KMeans functions support auto-clustering using a method called depth difference (DeD). When a user sets0 for the number of clusters, an optimal number of clusters for that dataset is determined. Note that whilean integer for the number of clusters (k) is not explicitly returned, it is calculated within the KMeansalgorithm. For example, if 0 is specified in the function for the value of KmeansPetalClusters or set through
Script syntax and chart functions - Qlik Sense, February 2022 773
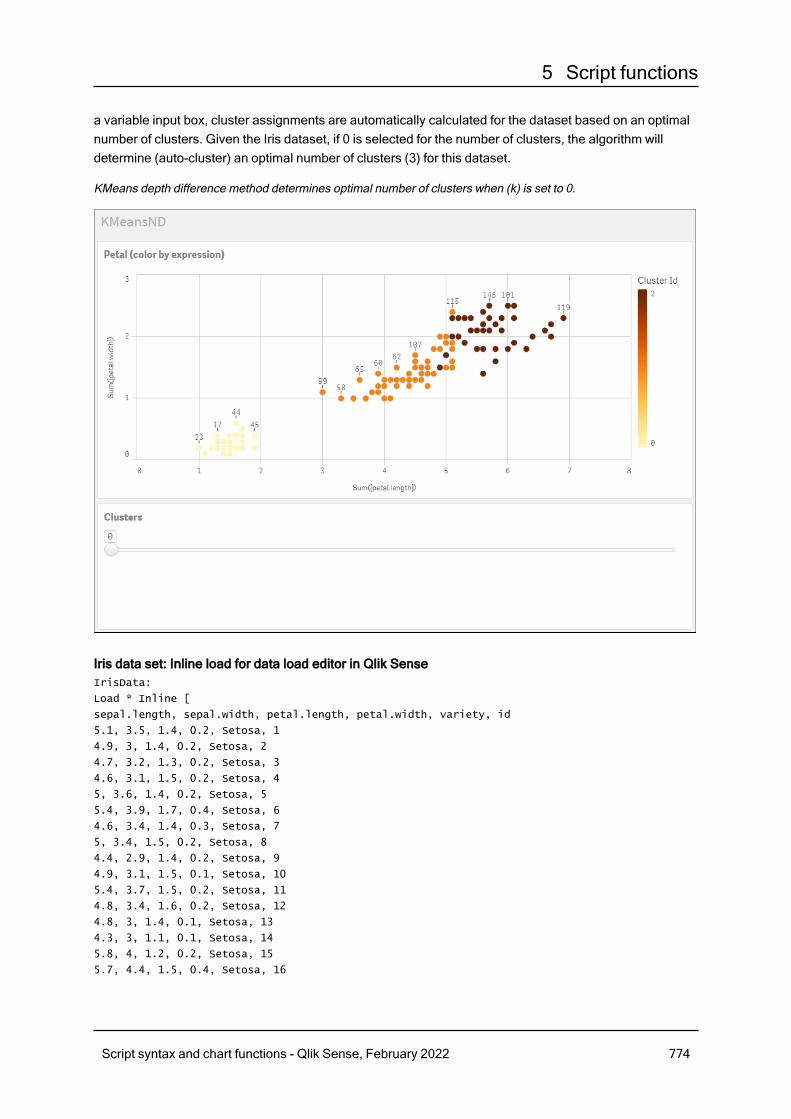
5 Script functions
a variable input box, cluster assignments are automatically calculated for the dataset based on an optimalnumber of clusters. Given the Iris dataset, if 0 is selected for the number of clusters, the algorithm willdetermine (auto-cluster) an optimal number of clusters (3) for this dataset.
KMeans depth difference method determines optimal number of clusters when (k) is set to 0.
Iris data set: Inline load for data load editor in Qlik SenseIrisData:
Load * Inline [
sepal.length, sepal.width, petal.length, petal.width, variety, id
5.1, 3.5, 1.4, 0.2, Setosa, 1
4.9, 3, 1.4, 0.2, Setosa, 2
4.7, 3.2, 1.3, 0.2, Setosa, 3
4.6, 3.1, 1.5, 0.2, Setosa, 4
5, 3.6, 1.4, 0.2, Setosa, 5
5.4, 3.9, 1.7, 0.4, Setosa, 6
4.6, 3.4, 1.4, 0.3, Setosa, 7
5, 3.4, 1.5, 0.2, Setosa, 8
4.4, 2.9, 1.4, 0.2, Setosa, 9
4.9, 3.1, 1.5, 0.1, Setosa, 10
5.4, 3.7, 1.5, 0.2, Setosa, 11
4.8, 3.4, 1.6, 0.2, Setosa, 12
4.8, 3, 1.4, 0.1, Setosa, 13
4.3, 3, 1.1, 0.1, Setosa, 14
5.8, 4, 1.2, 0.2, Setosa, 15
5.7, 4.4, 1.5, 0.4, Setosa, 16
Script syntax and chart functions - Qlik Sense, February 2022 774
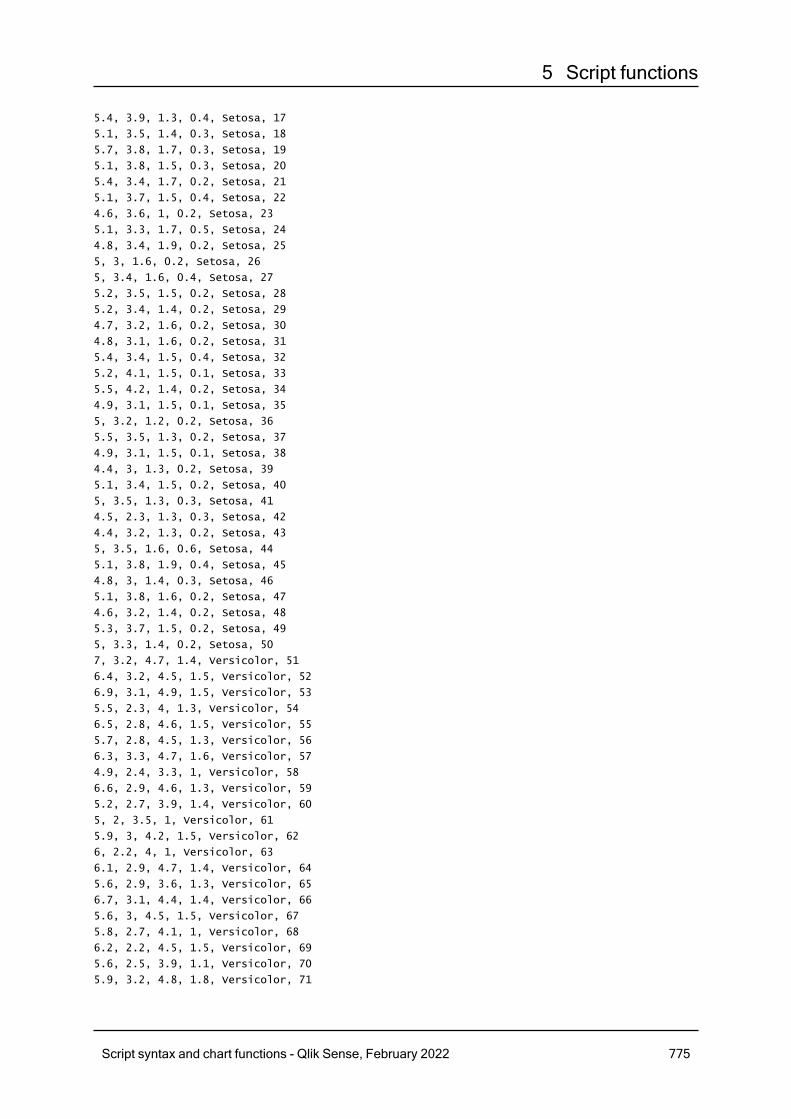
5 Script functions
5.4, 3.9, 1.3, 0.4, Setosa, 17
5.1, 3.5, 1.4, 0.3, Setosa, 18
5.7, 3.8, 1.7, 0.3, Setosa, 19
5.1, 3.8, 1.5, 0.3, Setosa, 20
5.4, 3.4, 1.7, 0.2, Setosa, 21
5.1, 3.7, 1.5, 0.4, Setosa, 22
4.6, 3.6, 1, 0.2, Setosa, 23
5.1, 3.3, 1.7, 0.5, Setosa, 24
4.8, 3.4, 1.9, 0.2, Setosa, 25
5, 3, 1.6, 0.2, Setosa, 26
5, 3.4, 1.6, 0.4, Setosa, 27
5.2, 3.5, 1.5, 0.2, Setosa, 28
5.2, 3.4, 1.4, 0.2, Setosa, 29
4.7, 3.2, 1.6, 0.2, Setosa, 30
4.8, 3.1, 1.6, 0.2, Setosa, 31
5.4, 3.4, 1.5, 0.4, Setosa, 32
5.2, 4.1, 1.5, 0.1, Setosa, 33
5.5, 4.2, 1.4, 0.2, Setosa, 34
4.9, 3.1, 1.5, 0.1, Setosa, 35
5, 3.2, 1.2, 0.2, Setosa, 36
5.5, 3.5, 1.3, 0.2, Setosa, 37
4.9, 3.1, 1.5, 0.1, Setosa, 38
4.4, 3, 1.3, 0.2, Setosa, 39
5.1, 3.4, 1.5, 0.2, Setosa, 40
5, 3.5, 1.3, 0.3, Setosa, 41
4.5, 2.3, 1.3, 0.3, Setosa, 42
4.4, 3.2, 1.3, 0.2, Setosa, 43
5, 3.5, 1.6, 0.6, Setosa, 44
5.1, 3.8, 1.9, 0.4, Setosa, 45
4.8, 3, 1.4, 0.3, Setosa, 46
5.1, 3.8, 1.6, 0.2, Setosa, 47
4.6, 3.2, 1.4, 0.2, Setosa, 48
5.3, 3.7, 1.5, 0.2, Setosa, 49
5, 3.3, 1.4, 0.2, Setosa, 50
7, 3.2, 4.7, 1.4, Versicolor, 51
6.4, 3.2, 4.5, 1.5, Versicolor, 52
6.9, 3.1, 4.9, 1.5, Versicolor, 53
5.5, 2.3, 4, 1.3, Versicolor, 54
6.5, 2.8, 4.6, 1.5, Versicolor, 55
5.7, 2.8, 4.5, 1.3, Versicolor, 56
6.3, 3.3, 4.7, 1.6, Versicolor, 57
4.9, 2.4, 3.3, 1, Versicolor, 58
6.6, 2.9, 4.6, 1.3, Versicolor, 59
5.2, 2.7, 3.9, 1.4, Versicolor, 60
5, 2, 3.5, 1, Versicolor, 61
5.9, 3, 4.2, 1.5, Versicolor, 62
6, 2.2, 4, 1, Versicolor, 63
6.1, 2.9, 4.7, 1.4, Versicolor, 64
5.6, 2.9, 3.6, 1.3, Versicolor, 65
6.7, 3.1, 4.4, 1.4, Versicolor, 66
5.6, 3, 4.5, 1.5, Versicolor, 67
5.8, 2.7, 4.1, 1, Versicolor, 68
6.2, 2.2, 4.5, 1.5, Versicolor, 69
5.6, 2.5, 3.9, 1.1, Versicolor, 70
5.9, 3.2, 4.8, 1.8, Versicolor, 71
Script syntax and chart functions - Qlik Sense, February 2022 775
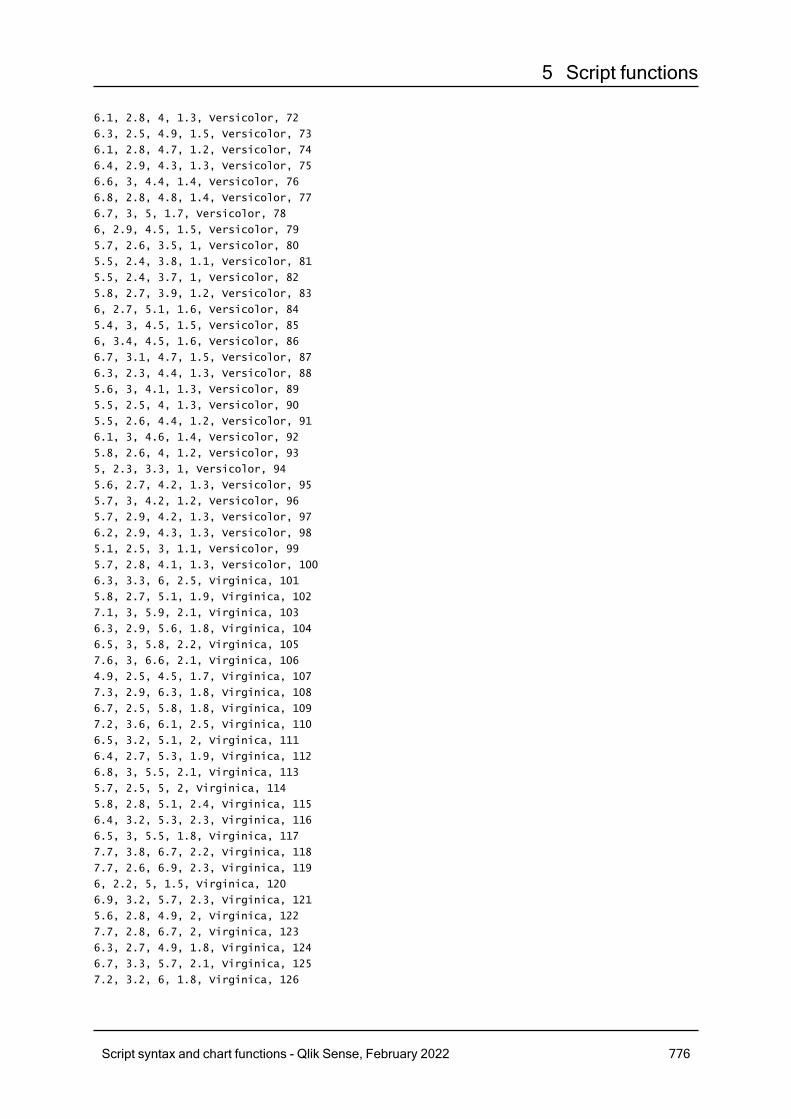
5 Script functions
6.1, 2.8, 4, 1.3, Versicolor, 72
6.3, 2.5, 4.9, 1.5, Versicolor, 73
6.1, 2.8, 4.7, 1.2, Versicolor, 74
6.4, 2.9, 4.3, 1.3, Versicolor, 75
6.6, 3, 4.4, 1.4, Versicolor, 76
6.8, 2.8, 4.8, 1.4, Versicolor, 77
6.7, 3, 5, 1.7, Versicolor, 78
6, 2.9, 4.5, 1.5, Versicolor, 79
5.7, 2.6, 3.5, 1, Versicolor, 80
5.5, 2.4, 3.8, 1.1, Versicolor, 81
5.5, 2.4, 3.7, 1, Versicolor, 82
5.8, 2.7, 3.9, 1.2, Versicolor, 83
6, 2.7, 5.1, 1.6, Versicolor, 84
5.4, 3, 4.5, 1.5, Versicolor, 85
6, 3.4, 4.5, 1.6, Versicolor, 86
6.7, 3.1, 4.7, 1.5, Versicolor, 87
6.3, 2.3, 4.4, 1.3, Versicolor, 88
5.6, 3, 4.1, 1.3, Versicolor, 89
5.5, 2.5, 4, 1.3, Versicolor, 90
5.5, 2.6, 4.4, 1.2, Versicolor, 91
6.1, 3, 4.6, 1.4, Versicolor, 92
5.8, 2.6, 4, 1.2, Versicolor, 93
5, 2.3, 3.3, 1, Versicolor, 94
5.6, 2.7, 4.2, 1.3, Versicolor, 95
5.7, 3, 4.2, 1.2, Versicolor, 96
5.7, 2.9, 4.2, 1.3, Versicolor, 97
6.2, 2.9, 4.3, 1.3, Versicolor, 98
5.1, 2.5, 3, 1.1, Versicolor, 99
5.7, 2.8, 4.1, 1.3, Versicolor, 100
6.3, 3.3, 6, 2.5, Virginica, 101
5.8, 2.7, 5.1, 1.9, Virginica, 102
7.1, 3, 5.9, 2.1, Virginica, 103
6.3, 2.9, 5.6, 1.8, Virginica, 104
6.5, 3, 5.8, 2.2, Virginica, 105
7.6, 3, 6.6, 2.1, Virginica, 106
4.9, 2.5, 4.5, 1.7, Virginica, 107
7.3, 2.9, 6.3, 1.8, Virginica, 108
6.7, 2.5, 5.8, 1.8, Virginica, 109
7.2, 3.6, 6.1, 2.5, Virginica, 110
6.5, 3.2, 5.1, 2, Virginica, 111
6.4, 2.7, 5.3, 1.9, Virginica, 112
6.8, 3, 5.5, 2.1, Virginica, 113
5.7, 2.5, 5, 2, Virginica, 114
5.8, 2.8, 5.1, 2.4, Virginica, 115
6.4, 3.2, 5.3, 2.3, Virginica, 116
6.5, 3, 5.5, 1.8, Virginica, 117
7.7, 3.8, 6.7, 2.2, Virginica, 118
7.7, 2.6, 6.9, 2.3, Virginica, 119
6, 2.2, 5, 1.5, Virginica, 120
6.9, 3.2, 5.7, 2.3, Virginica, 121
5.6, 2.8, 4.9, 2, Virginica, 122
7.7, 2.8, 6.7, 2, Virginica, 123
6.3, 2.7, 4.9, 1.8, Virginica, 124
6.7, 3.3, 5.7, 2.1, Virginica, 125
7.2, 3.2, 6, 1.8, Virginica, 126
Script syntax and chart functions - Qlik Sense, February 2022 776
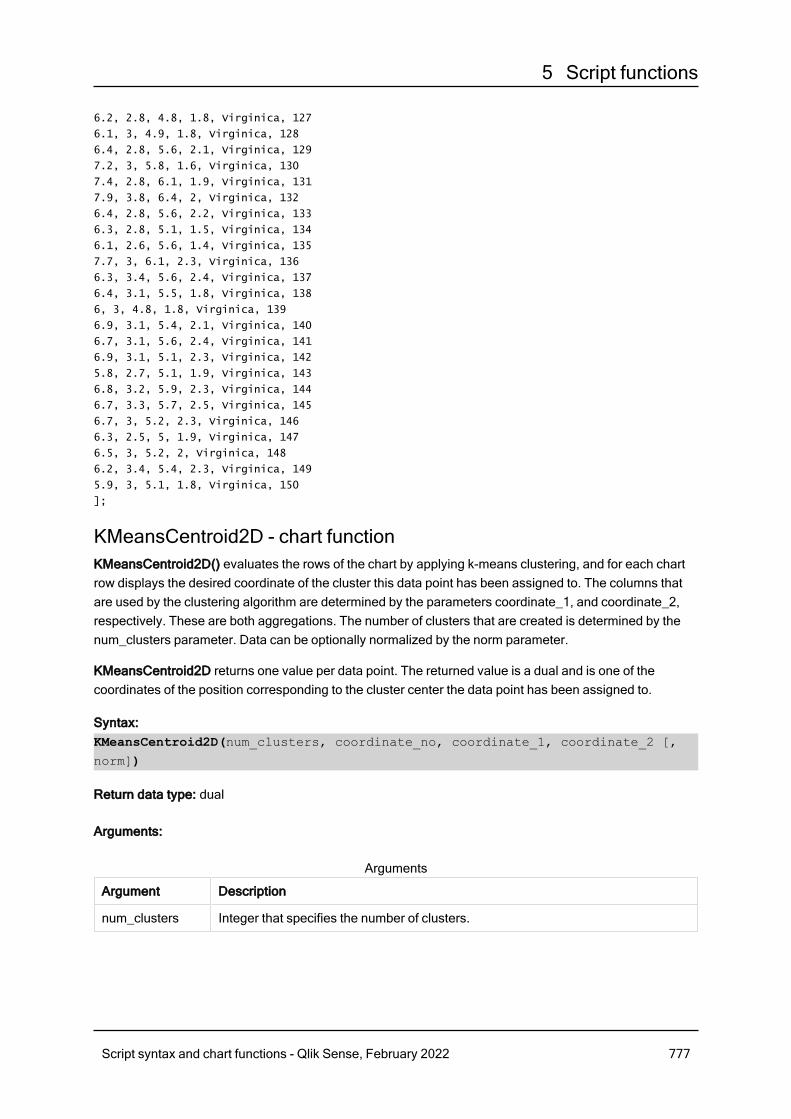
5 Script functions
6.2, 2.8, 4.8, 1.8, Virginica, 127
6.1, 3, 4.9, 1.8, Virginica, 128
6.4, 2.8, 5.6, 2.1, Virginica, 129
7.2, 3, 5.8, 1.6, Virginica, 130
7.4, 2.8, 6.1, 1.9, Virginica, 131
7.9, 3.8, 6.4, 2, Virginica, 132
6.4, 2.8, 5.6, 2.2, Virginica, 133
6.3, 2.8, 5.1, 1.5, Virginica, 134
6.1, 2.6, 5.6, 1.4, Virginica, 135
7.7, 3, 6.1, 2.3, Virginica, 136
6.3, 3.4, 5.6, 2.4, Virginica, 137
6.4, 3.1, 5.5, 1.8, Virginica, 138
6, 3, 4.8, 1.8, Virginica, 139
6.9, 3.1, 5.4, 2.1, Virginica, 140
6.7, 3.1, 5.6, 2.4, Virginica, 141
6.9, 3.1, 5.1, 2.3, Virginica, 142
5.8, 2.7, 5.1, 1.9, Virginica, 143
6.8, 3.2, 5.9, 2.3, Virginica, 144
6.7, 3.3, 5.7, 2.5, Virginica, 145
6.7, 3, 5.2, 2.3, Virginica, 146
6.3, 2.5, 5, 1.9, Virginica, 147
6.5, 3, 5.2, 2, Virginica, 148
6.2, 3.4, 5.4, 2.3, Virginica, 149
5.9, 3, 5.1, 1.8, Virginica, 150
];
KMeansCentroid2D - chart functionKMeansCentroid2D() evaluates the rows of the chart by applying k-means clustering, and for each chartrow displays the desired coordinate of the cluster this data point has been assigned to. The columns thatare used by the clustering algorithm are determined by the parameters coordinate_1, and coordinate_2,respectively. These are both aggregations. The number of clusters that are created is determined by thenum_clusters parameter. Data can be optionally normalized by the norm parameter.
KMeansCentroid2D returns one value per data point. The returned value is a dual and is one of thecoordinates of the position corresponding to the cluster center the data point has been assigned to.
Syntax:KMeansCentroid2D(num_clusters, coordinate_no, coordinate_1, coordinate_2 [,
norm])
Return data type: dual
Arguments:
Argument Description
num_clusters Integer that specifies the number of clusters.
Arguments
Script syntax and chart functions - Qlik Sense, February 2022 777
5 Script functions
Argument Description
coordinate_no The desired coordinate number of the centroids (corresponding, for example, to thex, y, or z axis).
coordinate_1 The aggregation that calculates the first coordinate, usually the x-axis of the scatterchart that can be made from the chart. The additional parameter, coordinate_2,calculates the second coordinate.
norm The optional normalization method applied to datasets before KMeans clustering.
Possible values:
0 or ‘none’ for no normalization
1 or ‘zscore’ for z-score normalization
2 or ‘minmax’ for min-max normalization
If no parameter is supplied or if the supplied parameter is incorrect, nonormalization is applied.
Z-score normalizes data based on feature mean and standard deviation. Z-scoredoes not ensure each feature has the same scale but it is a better approach thanmin-max when dealing with outliers.
Min-max normalization ensures that the features have the same scale by taking theminimum and maximum values of each and recalculating each datapoint.
Auto-clusteringKMeans functions support auto-clustering using a method called depth difference (DeD). When a user sets0 for the number of clusters, an optimal number of clusters for that dataset is determined. Note that whilean integer for the number of clusters (k) is not explicitly returned, it is calculated within the KMeansalgorithm. For example, if 0 is specified in the function for the value of KmeansPetalClusters or set througha variable input box, cluster assignments are automatically calculated for the dataset based on an optimalnumber of clusters.
KMeansCentroidND - chart functionKMeansCentroidND() evaluates the rows of the chart by applying k-means clustering, and for each chartrow displays the desired coordinate of the cluster this data point has been assigned to. The columns thatare used by the clustering algorithm are determined by the parameters coordinate_1, coordinate_2, etc.,up to n columns. These are all aggregations. The number of clusters that are created is determined by thenum_clusters parameter.
KMeansCentroidND returns one value per row. The returned value is a dual and is one of the coordinatesof the position corresponding to the cluster center the data point has been assigned to.
Syntax:
Script syntax and chart functions - Qlik Sense, February 2022 778
5 Script functions
KMeansCentroidND((num_clusters, num_iter, coordinate_no, coordinate_1,
coordinate_2 [,coordinate_3 [, ...]])
Return data type: dual
Arguments:
Argument Description
num_clusters Integer that specifies the number of clusters.
num_iter The number of iterations of clustering with reinitialized cluster centers.
coordinate_no The desired coordinate number of the centroids (corresponding, for example, to thex, y, or z axis).
coordinate_1 The aggregation that calculates the first coordinate, usually the x-axis (of a scatterchart that can be made from the chart). The additional parameters calculate thesecond, third, and fourth coordinates, etc.
Arguments
Auto-clusteringKMeans functions support auto-clustering using a method called depth difference (DeD). When a user sets0 for the number of clusters, an optimal number of clusters for that dataset is determined. Note that whilean integer for the number of clusters (k) is not explicitly returned, it is calculated within the KMeansalgorithm. For example, if 0 is specified in the function for the value of KmeansPetalClusters or set througha variable input box, cluster assignments are automatically calculated for the dataset based on an optimalnumber of clusters.
5.23 Statistical distribution functionsThe statistical distribution DIST functions measure the probability of the distribution functionat the point in the distribution given by the supplied value. The INV functions calculate thevalue, given the probability of the distribution. In contrast, the groups of statistical aggregationfunctions calculate the aggregated values of series of statistical test values for variousstatistical hypothesis tests.
The statistical distribution functions described below are all implemented in Qlik Sense using the Cephesfunction library. For references and details on algorithms used, accuracy, and so on, see:≤ Cepheslibrary. The Cephes function library is used by permission.
All functions can be used in both the data load script and in chart expressions.
Statistical distribution functions overviewEach function is described further after the overview. You can also click the function name in the syntax toimmediately access the details for that specific function.
Script syntax and chart functions - Qlik Sense, February 2022 779
5 Script functions
CHIDISTCHIDIST() returns the one-tailed probability of the chi2 distribution. The chi2 distribution is associated witha chi2 test.
CHIDIST (value, degrees_freedom)
CHIINVCHIINV() returns the inverse of the one-tailed probability of the chi2 distribution.
CHIINV (prob, degrees_freedom)
NORMDISTNORMDIST() returns the cumulative normal distribution for the specified mean and standard deviation. Ifmean = 0 and standard_dev = 1, the function returns the standard normal distribution.
NORMDIST (value, mean, standard_dev)
NORMINVNORMINV() returns the inverse of the normal cumulative distribution for the specified mean and standarddeviation.
NORMINV (prob, mean, standard_dev)
TDISTTDIST() returns the probability for the Student's t-distribution where a numeric value is a calculated valueof t for which the probability is to be computed.
TDIST (value, degrees_freedom, tails)
TINVTINV() returns the t-value of the Student's t-distribution as a function of the probability and the degrees offreedom.
TINV (prob, degrees_freedom)
FDISTFDIST() returns the F-probability distribution.
FDIST (value, degrees_freedom1, degrees_freedom2)
FINVFINV() returns the inverse of the F-probability distribution.
FINV (prob, degrees_freedom1, degrees_freedom2)
See also:
p Statistical aggregation functions (page 261)
Script syntax and chart functions - Qlik Sense, February 2022 780
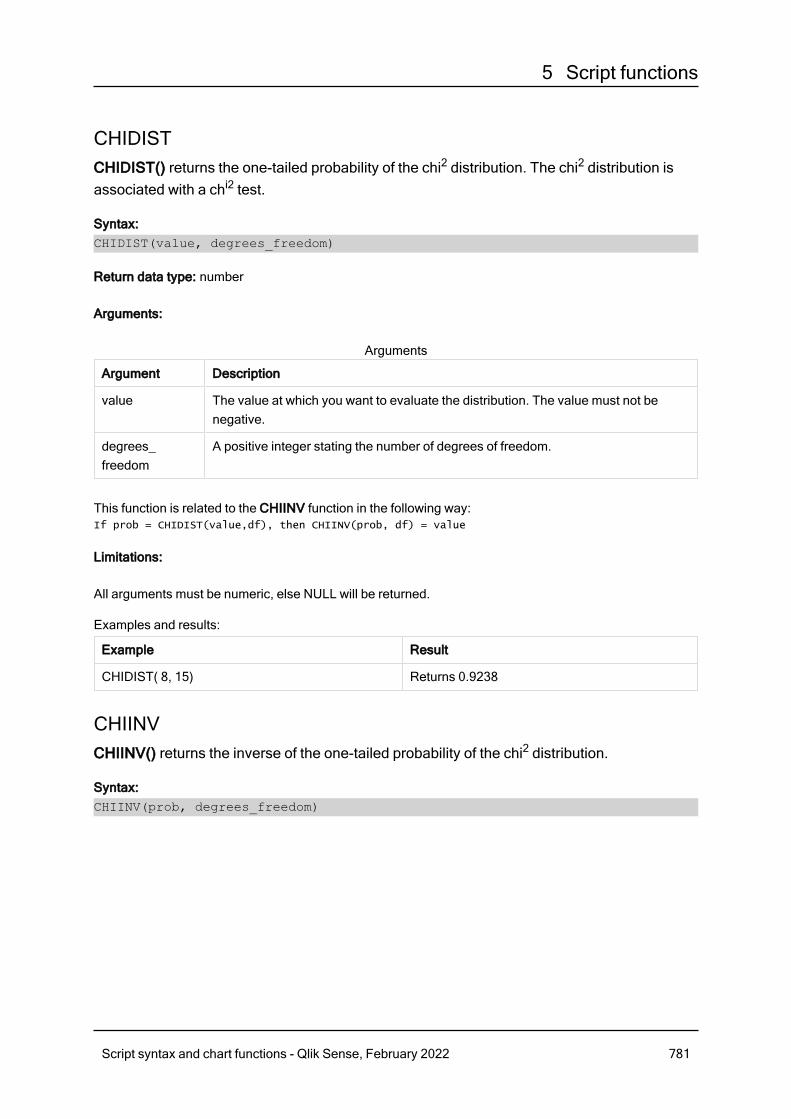
5 Script functions
CHIDISTCHIDIST() returns the one-tailed probability of the chi2 distribution. The chi2 distribution isassociated with a chi2 test.
Syntax:CHIDIST(value, degrees_freedom)
Return data type: number
Arguments:
Argument Description
value The value at which you want to evaluate the distribution. The value must not benegative.
degrees_freedom
A positive integer stating the number of degrees of freedom.
Arguments
This function is related to the CHIINV function in the following way:If prob = CHIDIST(value,df), then CHIINV(prob, df) = value
Limitations:
All arguments must be numeric, else NULL will be returned.
Examples and results:
Example Result
CHIDIST( 8, 15) Returns 0.9238
CHIINVCHIINV() returns the inverse of the one-tailed probability of the chi2 distribution.
Syntax:CHIINV(prob, degrees_freedom)
Script syntax and chart functions - Qlik Sense, February 2022 781
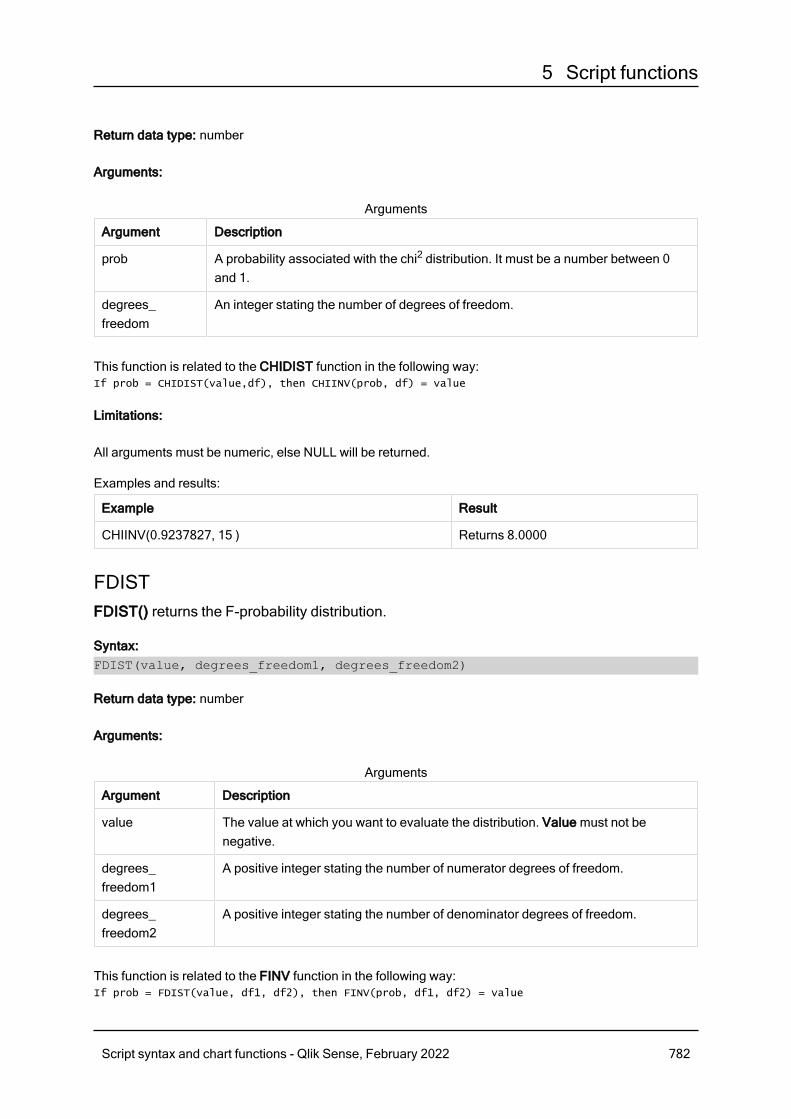
5 Script functions
Return data type: number
Arguments:
Argument Description
prob A probability associated with the chi2 distribution. It must be a number between 0and 1.
degrees_freedom
An integer stating the number of degrees of freedom.
Arguments
This function is related to the CHIDIST function in the following way:If prob = CHIDIST(value,df), then CHIINV(prob, df) = value
Limitations:
All arguments must be numeric, else NULL will be returned.
Examples and results:
Example Result
CHIINV(0.9237827, 15 ) Returns 8.0000
FDISTFDIST() returns the F-probability distribution.
Syntax:FDIST(value, degrees_freedom1, degrees_freedom2)
Return data type: number
Arguments:
Argument Description
value The value at which you want to evaluate the distribution. Value must not benegative.
degrees_freedom1
A positive integer stating the number of numerator degrees of freedom.
degrees_freedom2
A positive integer stating the number of denominator degrees of freedom.
Arguments
This function is related to the FINV function in the following way:If prob = FDIST(value, df1, df2), then FINV(prob, df1, df2) = value
Script syntax and chart functions - Qlik Sense, February 2022 782

5 Script functions
Limitations:
All arguments must be numeric, else NULL will be returned.
Examples and results:
Example Result
FDIST(15, 8, 6) Returns 0.0019
FINVFINV() returns the inverse of the F-probability distribution.
Syntax:FINV(prob, degrees_freedom1, degrees_freedom2)
Return data type: number
Arguments:
Argument Description
prob A probability associated with the F-probability distribution and must be a numberbetween 0 and 1.
degrees_freedom
An integer stating the number of degrees of freedom.
Arguments
This function is related to the FDIST function in the following way:If prob = FDIST(value, df1, df2), then FINV(prob, df1, df2) = value
Limitations:
All arguments must be numeric, else NULL will be returned.
Examples and results:
Example Result
FINV( 0.0019369, 8, 6) Returns 15.0000
NORMDISTNORMDIST() returns the cumulative normal distribution for the specified mean and standarddeviation. If mean = 0 and standard_dev = 1, the function returns the standard normaldistribution.
Syntax:NORMDIST(value, [mean], [standard_dev], [cumulative])
Script syntax and chart functions - Qlik Sense, February 2022 783
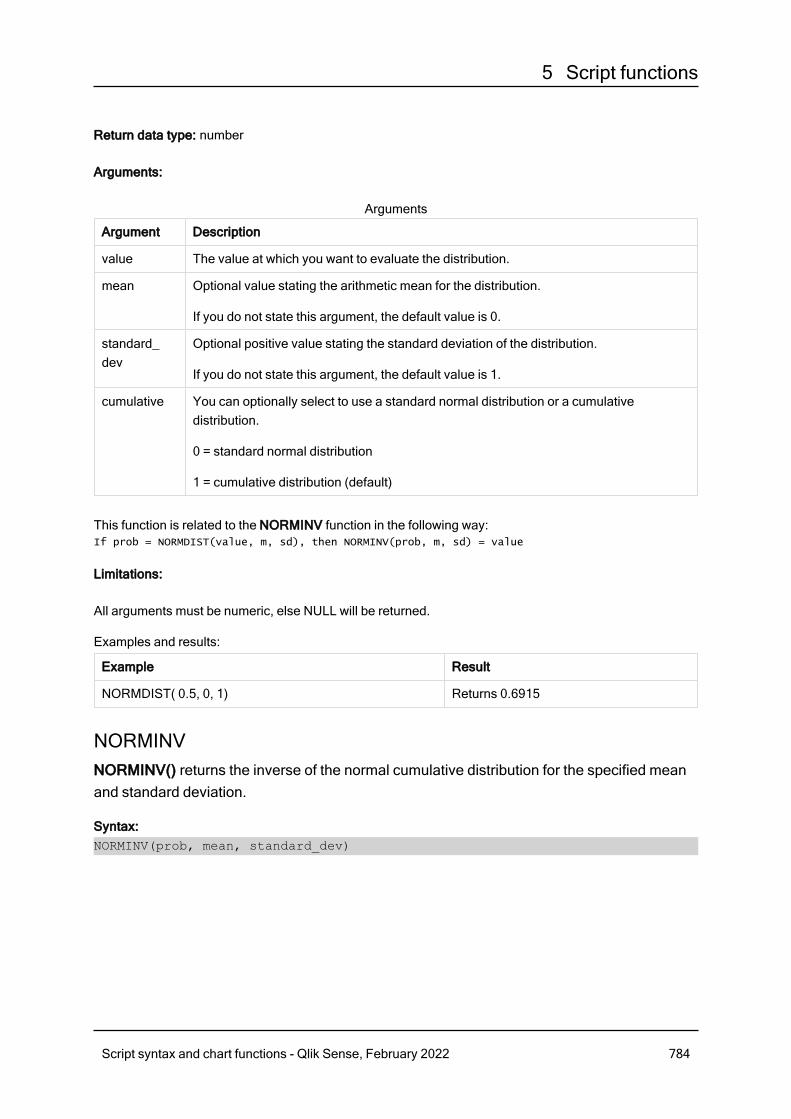
5 Script functions
Return data type: number
Arguments:
Argument Description
value The value at which you want to evaluate the distribution.
mean Optional value stating the arithmetic mean for the distribution.
If you do not state this argument, the default value is 0.
standard_dev
Optional positive value stating the standard deviation of the distribution.
If you do not state this argument, the default value is 1.
cumulative You can optionally select to use a standard normal distribution or a cumulativedistribution.
0 = standard normal distribution
1 = cumulative distribution (default)
Arguments
This function is related to the NORMINV function in the following way:If prob = NORMDIST(value, m, sd), then NORMINV(prob, m, sd) = value
Limitations:
All arguments must be numeric, else NULL will be returned.
Examples and results:
Example Result
NORMDIST( 0.5, 0, 1) Returns 0.6915
NORMINVNORMINV() returns the inverse of the normal cumulative distribution for the specified meanand standard deviation.
Syntax:NORMINV(prob, mean, standard_dev)
Script syntax and chart functions - Qlik Sense, February 2022 784
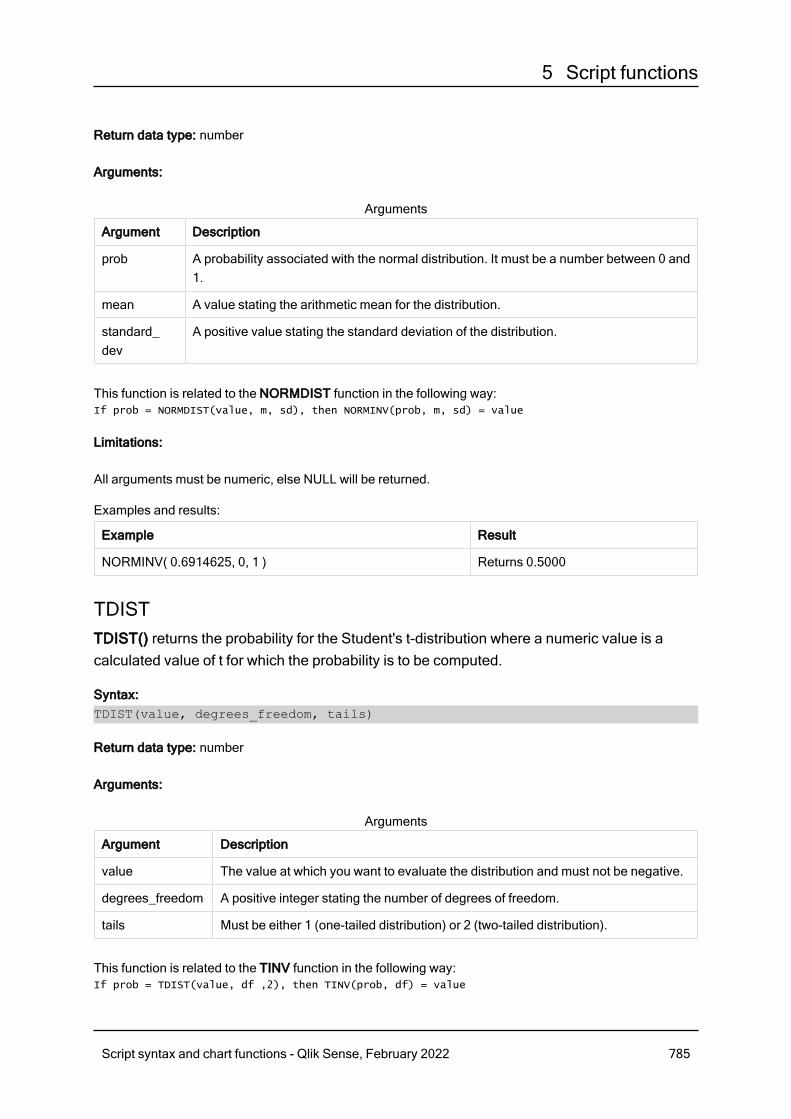
5 Script functions
Return data type: number
Arguments:
Argument Description
prob A probability associated with the normal distribution. It must be a number between 0 and1.
mean A value stating the arithmetic mean for the distribution.
standard_dev
A positive value stating the standard deviation of the distribution.
Arguments
This function is related to the NORMDIST function in the following way:If prob = NORMDIST(value, m, sd), then NORMINV(prob, m, sd) = value
Limitations:
All arguments must be numeric, else NULL will be returned.
Examples and results:
Example Result
NORMINV( 0.6914625, 0, 1 ) Returns 0.5000
TDISTTDIST() returns the probability for the Student's t-distribution where a numeric value is acalculated value of t for which the probability is to be computed.
Syntax:TDIST(value, degrees_freedom, tails)
Return data type: number
Arguments:
Argument Description
value The value at which you want to evaluate the distribution and must not be negative.
degrees_freedom A positive integer stating the number of degrees of freedom.
tails Must be either 1 (one-tailed distribution) or 2 (two-tailed distribution).
Arguments
This function is related to the TINV function in the following way:If prob = TDIST(value, df ,2), then TINV(prob, df) = value
Script syntax and chart functions - Qlik Sense, February 2022 785
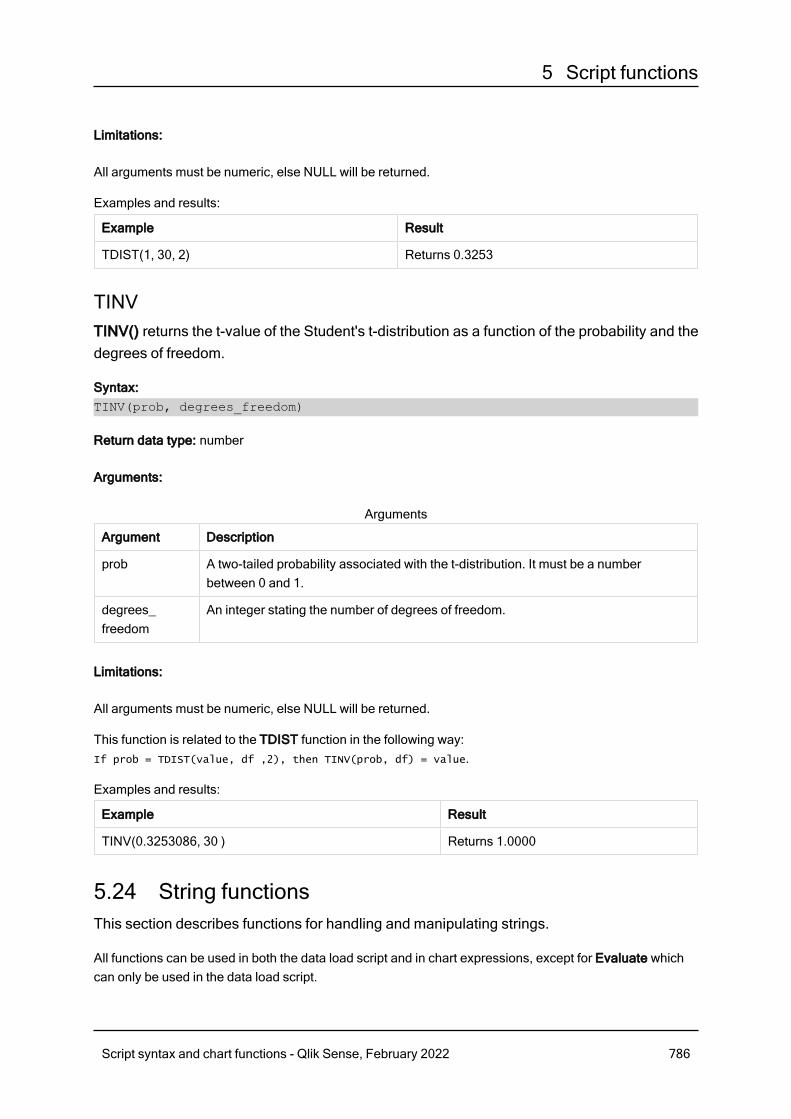
5 Script functions
Limitations:
All arguments must be numeric, else NULL will be returned.
Examples and results:
Example Result
TDIST(1, 30, 2) Returns 0.3253
TINVTINV() returns the t-value of the Student's t-distribution as a function of the probability and thedegrees of freedom.
Syntax:TINV(prob, degrees_freedom)
Return data type: number
Arguments:
Argument Description
prob A two-tailed probability associated with the t-distribution. It must be a numberbetween 0 and 1.
degrees_freedom
An integer stating the number of degrees of freedom.
Arguments
Limitations:
All arguments must be numeric, else NULL will be returned.
This function is related to the TDIST function in the following way:If prob = TDIST(value, df ,2), then TINV(prob, df) = value.
Examples and results:
Example Result
TINV(0.3253086, 30 ) Returns 1.0000
5.24 String functionsThis section describes functions for handling and manipulating strings.
All functions can be used in both the data load script and in chart expressions, except for Evaluate whichcan only be used in the data load script.
Script syntax and chart functions - Qlik Sense, February 2022 786
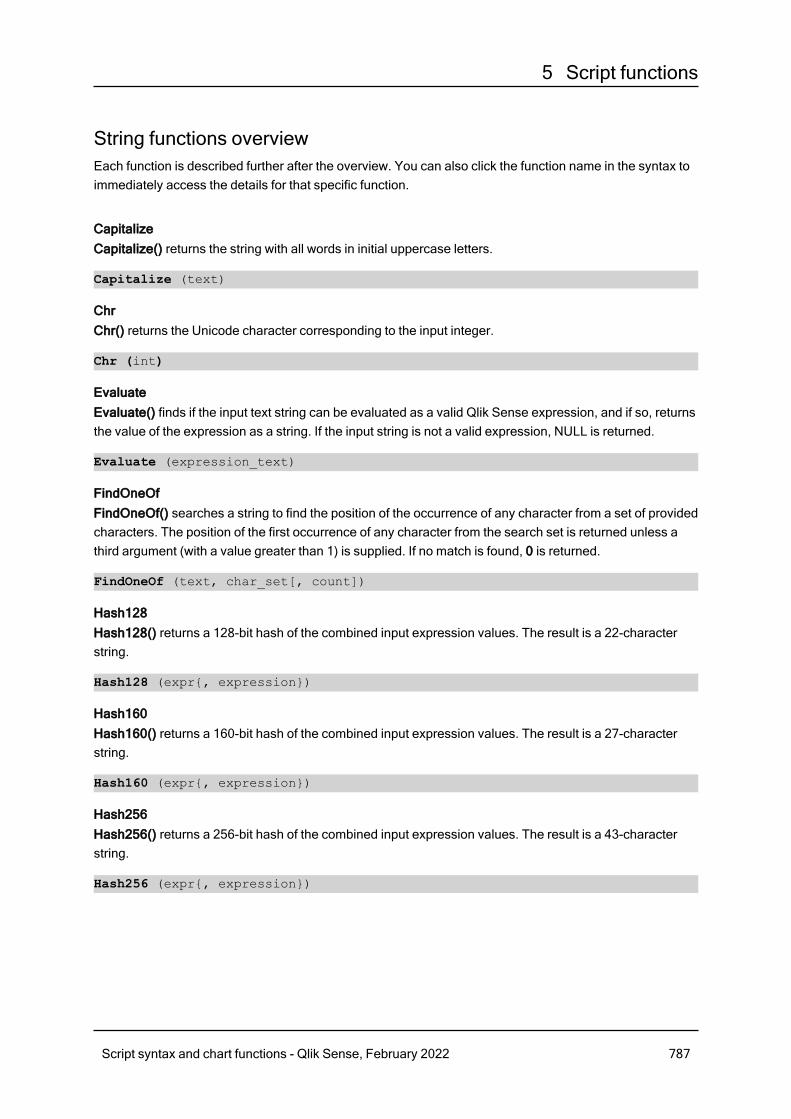
5 Script functions
String functions overviewEach function is described further after the overview. You can also click the function name in the syntax toimmediately access the details for that specific function.
CapitalizeCapitalize() returns the string with all words in initial uppercase letters.
Capitalize (text)
ChrChr() returns the Unicode character corresponding to the input integer.
Chr (int)
EvaluateEvaluate() finds if the input text string can be evaluated as a valid Qlik Sense expression, and if so, returnsthe value of the expression as a string. If the input string is not a valid expression, NULL is returned.
Evaluate (expression_text)
FindOneOfFindOneOf() searches a string to find the position of the occurrence of any character from a set of providedcharacters. The position of the first occurrence of any character from the search set is returned unless athird argument (with a value greater than 1) is supplied. If no match is found, 0 is returned.
FindOneOf (text, char_set[, count])
Hash128Hash128() returns a 128-bit hash of the combined input expression values. The result is a 22-characterstring.
Hash128 (expr{, expression})
Hash160Hash160() returns a 160-bit hash of the combined input expression values. The result is a 27-characterstring.
Hash160 (expr{, expression})
Hash256Hash256() returns a 256-bit hash of the combined input expression values. The result is a 43-characterstring.
Hash256 (expr{, expression})
Script syntax and chart functions - Qlik Sense, February 2022 787

5 Script functions
IndexIndex() searches a string to find the starting position of the nth occurrence of a provided substring. Anoptional third argument provides the value of n, which is 1 if omitted. A negative value searches from theend of the string. The positions in the string are numbered from 1 and up.
Index (text, substring[, count])
KeepCharKeepChar() returns a string consisting of the first string ,'text', less any of the characters NOT contained inthe second string, "keep_chars".
KeepChar (text, keep_chars)
LeftLeft() returns a string consisting of the first (leftmost) characters of the input string, where the number ofcharacters is determined by the second argument.
Left (text, count)
LenLen() returns the length of the input string.
Len (text)
LevenshteinDistLevenshteinDist() returns the Levenshtein distance between two strings. It is defined as the minimumnumber of single-character edits (insertions, deletions, or substitutions) required to change one string intothe other. The function is useful for fuzzy string comparisons.
LevenshteinDist (text1, text2)
LowerLower() converts all the characters in the input string to lower case.
Lower (text)
LTrimLTrim() returns the input string trimmed of any leading spaces.
LTrim (text)
MidMid() returns the part of the input string starting at the position of the character defined by the secondargument, 'start', and returning the number of characters defined by the third argument, 'count'. If 'count' isomitted, the rest of the input string is returned. The first character in the input string is numbered 1.
Mid (text, start[, count])
OrdOrd() returns the Unicode code point number of the first character of the input string.
Ord (text)
Script syntax and chart functions - Qlik Sense, February 2022 788
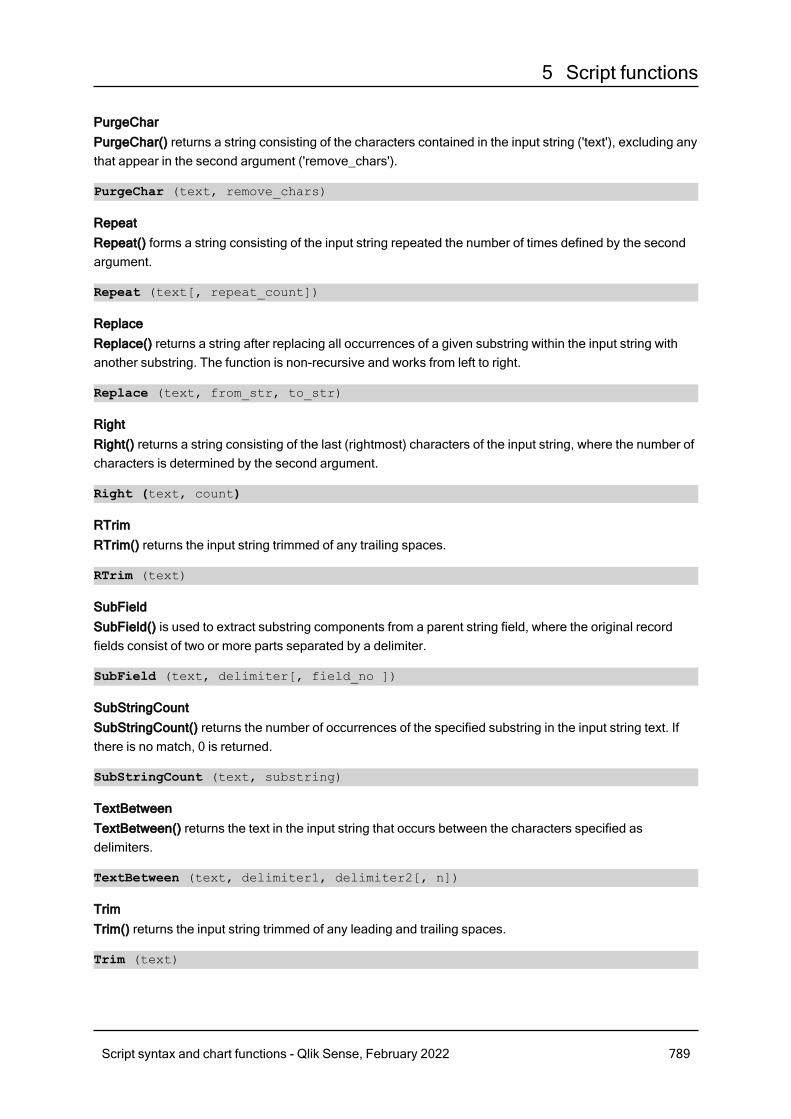
5 Script functions
PurgeCharPurgeChar() returns a string consisting of the characters contained in the input string ('text'), excluding anythat appear in the second argument ('remove_chars').
PurgeChar (text, remove_chars)
RepeatRepeat() forms a string consisting of the input string repeated the number of times defined by the secondargument.
Repeat (text[, repeat_count])
ReplaceReplace() returns a string after replacing all occurrences of a given substring within the input string withanother substring. The function is non-recursive and works from left to right.
Replace (text, from_str, to_str)
RightRight() returns a string consisting of the last (rightmost) characters of the input string, where the number ofcharacters is determined by the second argument.
Right (text, count)
RTrimRTrim() returns the input string trimmed of any trailing spaces.
RTrim (text)
SubFieldSubField() is used to extract substring components from a parent string field, where the original recordfields consist of two or more parts separated by a delimiter.
SubField (text, delimiter[, field_no ])
SubStringCountSubStringCount() returns the number of occurrences of the specified substring in the input string text. Ifthere is no match, 0 is returned.
SubStringCount (text, substring)
TextBetweenTextBetween() returns the text in the input string that occurs between the characters specified asdelimiters.
TextBetween (text, delimiter1, delimiter2[, n])
TrimTrim() returns the input string trimmed of any leading and trailing spaces.
Trim (text)
Script syntax and chart functions - Qlik Sense, February 2022 789
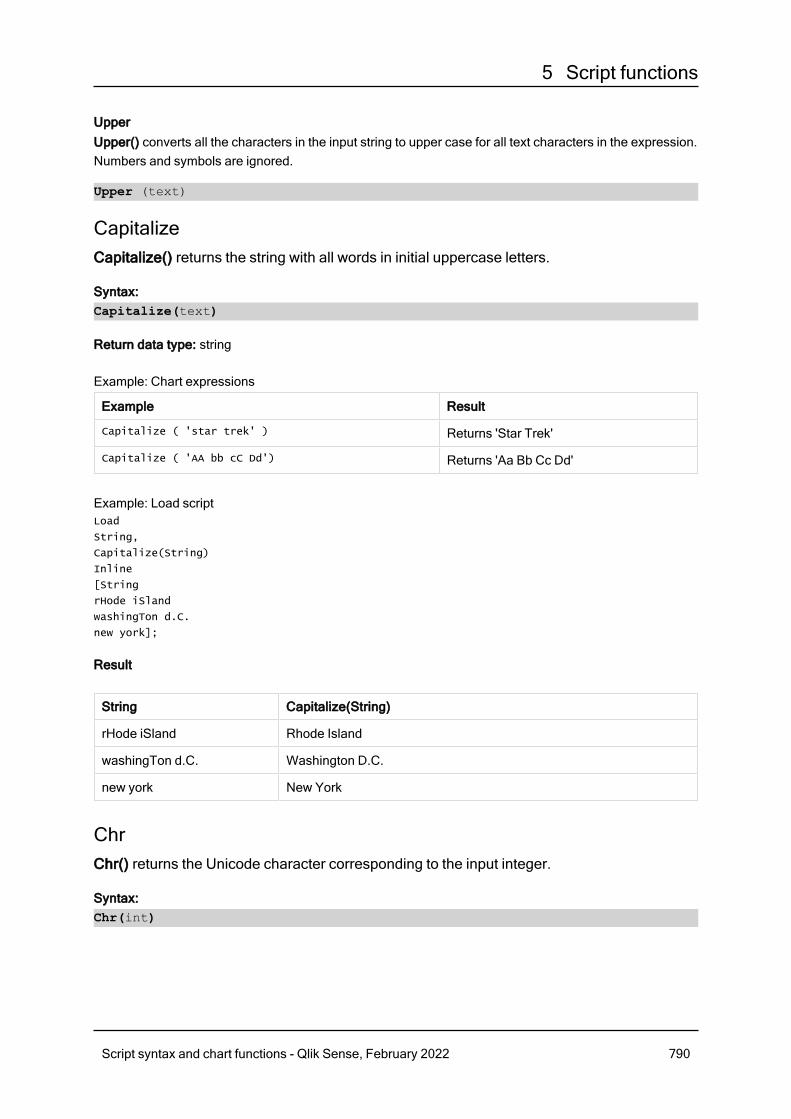
5 Script functions
UpperUpper() converts all the characters in the input string to upper case for all text characters in the expression.Numbers and symbols are ignored.
Upper (text)
CapitalizeCapitalize() returns the string with all words in initial uppercase letters.
Syntax:Capitalize(text)
Return data type: string
Example: Chart expressions
Example Result
Capitalize ( 'star trek' ) Returns 'Star Trek'
Capitalize ( 'AA bb cC Dd') Returns 'Aa Bb Cc Dd'
Example: Load scriptLoad
String,
Capitalize(String)
Inline
[String
rHode iSland
washingTon d.C.
new york];
Result
String Capitalize(String)
rHode iSland Rhode Island
washingTon d.C. Washington D.C.
new york New York
ChrChr() returns the Unicode character corresponding to the input integer.
Syntax:Chr(int)
Script syntax and chart functions - Qlik Sense, February 2022 790

5 Script functions
Return data type: string
Examples and results:
Example Result
Chr(65) Returns the string 'A'
Chr(163) Returns the string '£'
Chr(35) Returns the string '#'
EvaluateEvaluate() finds if the input text string can be evaluated as a valid Qlik Sense expression, andif so, returns the value of the expression as a string. If the input string is not a validexpression, NULL is returned.
Syntax:Evaluate(expression_text)
Return data type: dual
This string function cannot be used in chart expressions.
Examples and results:
Function example Result
Evaluate ( 5 * 8 ) Returns '40'
Load script example
Load
Evaluate(String) as Evaluated,
String
Inline
[String
4
5+3
0123456789012345678
Today()
];
Script syntax and chart functions - Qlik Sense, February 2022 791
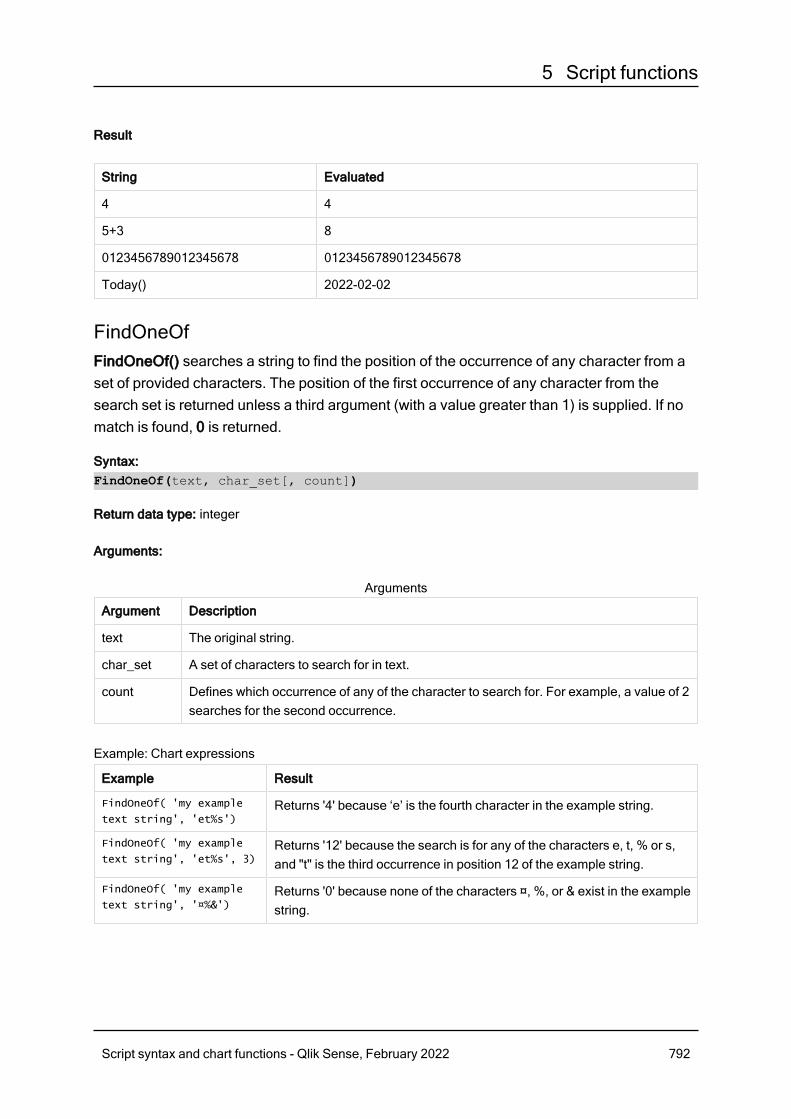
5 Script functions
Result
String Evaluated
4 4
5+3 8
0123456789012345678 0123456789012345678
Today() 2022-02-02
FindOneOfFindOneOf() searches a string to find the position of the occurrence of any character from aset of provided characters. The position of the first occurrence of any character from thesearch set is returned unless a third argument (with a value greater than 1) is supplied. If nomatch is found, 0 is returned.
Syntax:FindOneOf(text, char_set[, count])
Return data type: integer
Arguments:
Argument Description
text The original string.
char_set A set of characters to search for in text.
count Defines which occurrence of any of the character to search for. For example, a value of 2searches for the second occurrence.
Arguments
Example: Chart expressions
Example Result
FindOneOf( 'my example
text string', 'et%s')Returns '4' because ‘e’ is the fourth character in the example string.
FindOneOf( 'my example
text string', 'et%s', 3)Returns '12' because the search is for any of the characters e, t, % or s,and "t" is the third occurrence in position 12 of the example string.
FindOneOf( 'my example
text string', '¤%&')Returns '0' because none of the characters ¤, %, or & exist in the examplestring.
Script syntax and chart functions - Qlik Sense, February 2022 792
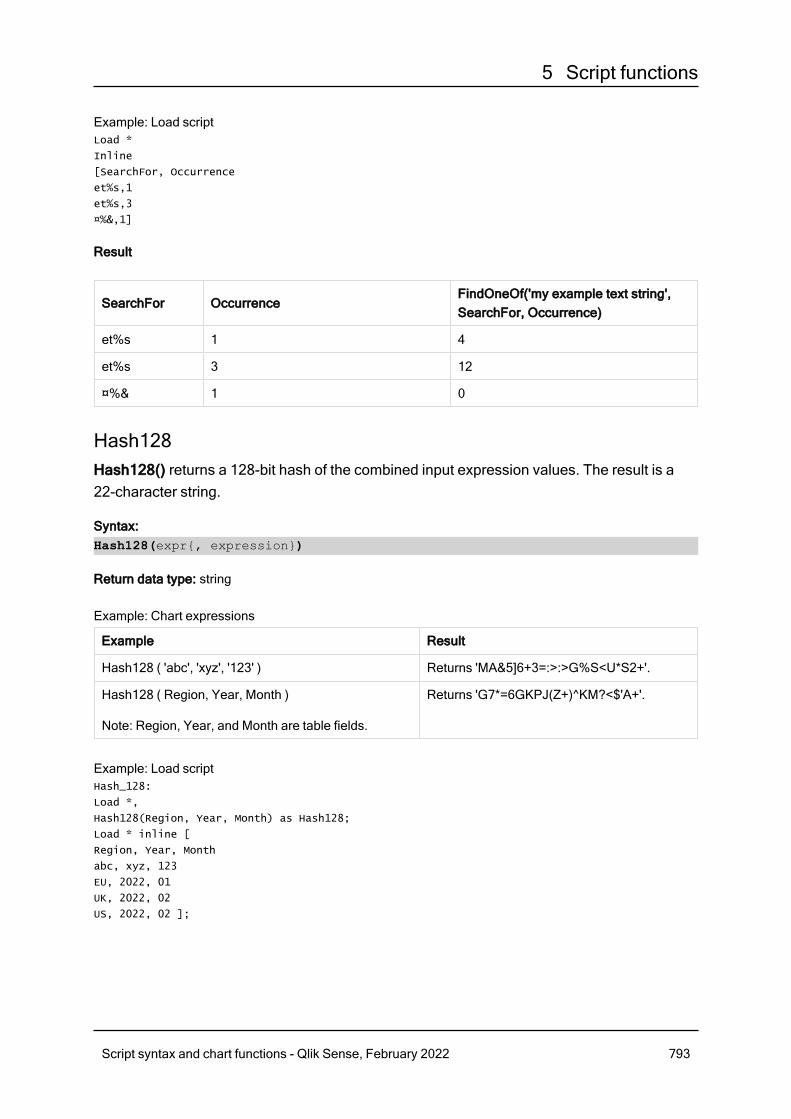
5 Script functions
Example: Load scriptLoad *
Inline
[SearchFor, Occurrence
et%s,1
et%s,3
¤%&,1]
Result
SearchFor OccurrenceFindOneOf('my example text string',SearchFor, Occurrence)
et%s 1 4
et%s 3 12
¤%& 1 0
Hash128Hash128() returns a 128-bit hash of the combined input expression values. The result is a22-character string.
Syntax:Hash128(expr{, expression})
Return data type: string
Example: Chart expressions
Example Result
Hash128 ( 'abc', 'xyz', '123' ) Returns 'MA&5]6+3=:>:>G%S<U*S2+'.
Hash128 ( Region, Year, Month )
Note: Region, Year, and Month are table fields.
Returns 'G7*=6GKPJ(Z+)^KM?<$'A+'.
Example: Load scriptHash_128:
Load *,
Hash128(Region, Year, Month) as Hash128;
Load * inline [
Region, Year, Month
abc, xyz, 123
EU, 2022, 01
UK, 2022, 02
US, 2022, 02 ];
Script syntax and chart functions - Qlik Sense, February 2022 793
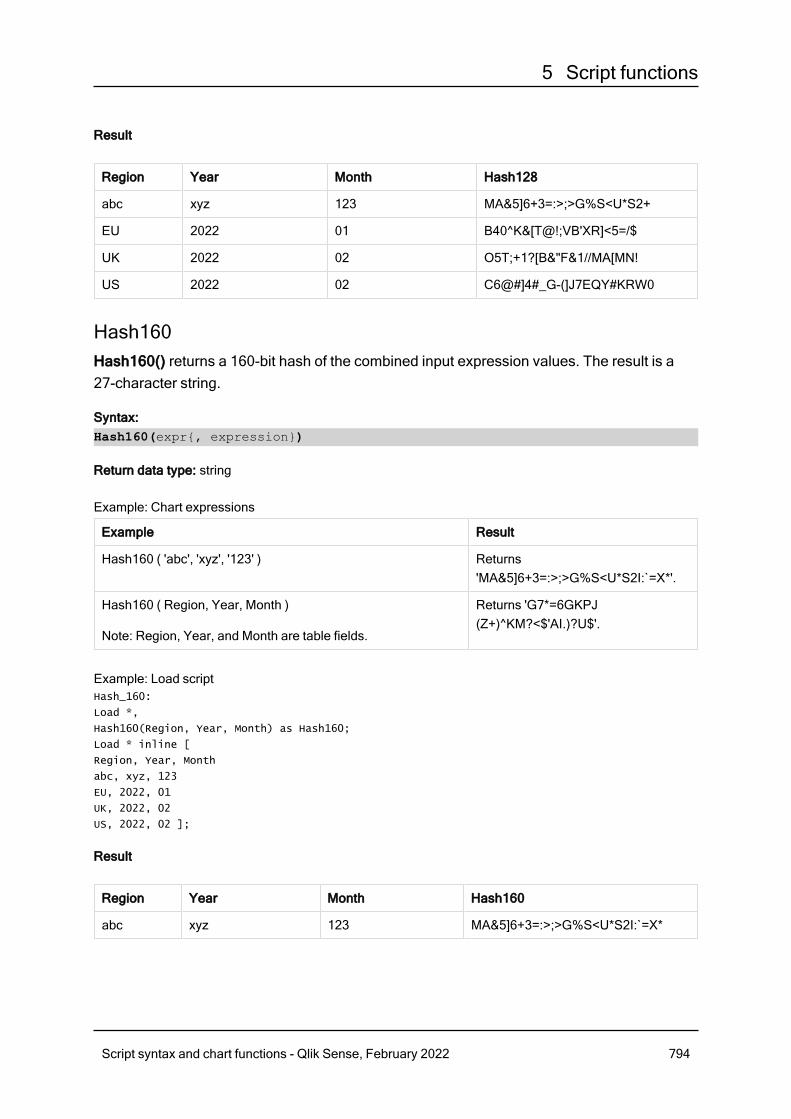
5 Script functions
Result
Region Year Month Hash128
abc xyz 123 MA&5]6+3=:>;>G%S<U*S2+
EU 2022 01 B40^K&[T@!;VB'XR]<5=/$
UK 2022 02 O5T;+1?[B&"F&1//MA[MN!
US 2022 02 C6@#]4#_G-(]J7EQY#KRW0
Hash160Hash160() returns a 160-bit hash of the combined input expression values. The result is a27-character string.
Syntax:Hash160(expr{, expression})
Return data type: string
Example: Chart expressions
Example Result
Hash160 ( 'abc', 'xyz', '123' ) Returns'MA&5]6+3=:>;>G%S<U*S2I:`=X*'.
Hash160 ( Region, Year, Month )
Note: Region, Year, and Month are table fields.
Returns 'G7*=6GKPJ(Z+)^KM?<$'AI.)?U$'.
Example: Load scriptHash_160:
Load *,
Hash160(Region, Year, Month) as Hash160;
Load * inline [
Region, Year, Month
abc, xyz, 123
EU, 2022, 01
UK, 2022, 02
US, 2022, 02 ];
Result
Region Year Month Hash160
abc xyz 123 MA&5]6+3=:>;>G%S<U*S2I:`=X*
Script syntax and chart functions - Qlik Sense, February 2022 794
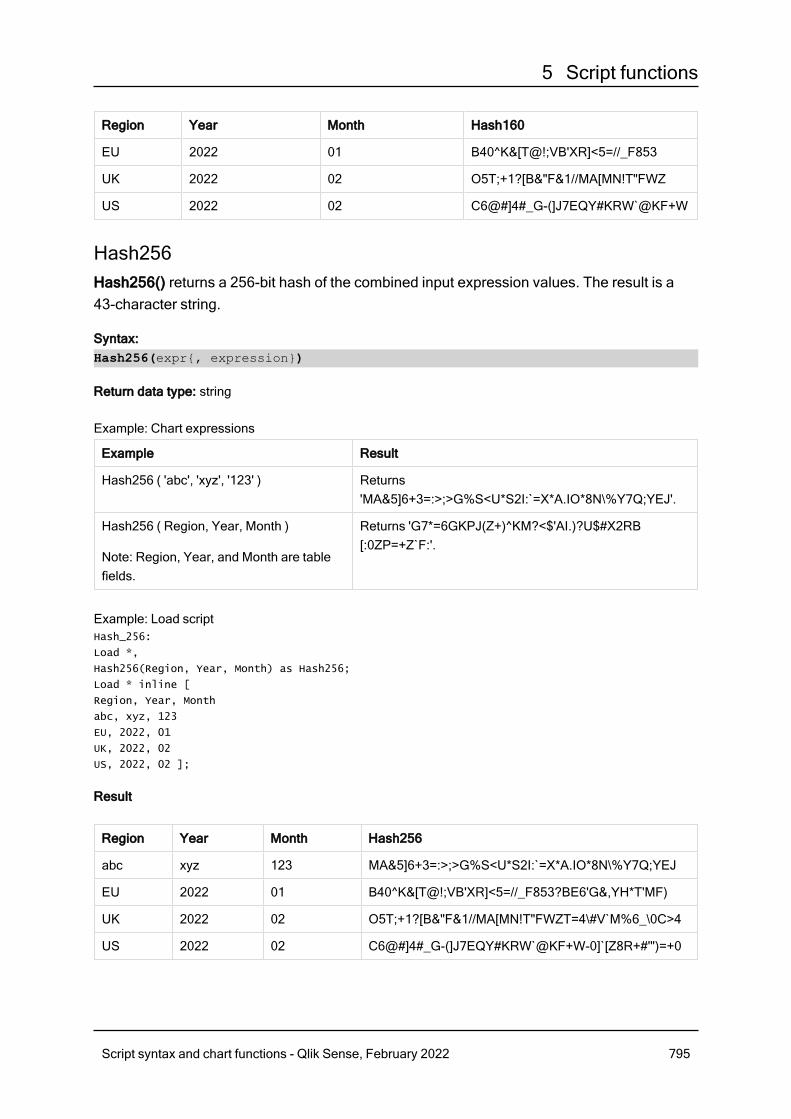
5 Script functions
Region Year Month Hash160
EU 2022 01 B40^K&[T@!;VB'XR]<5=//_F853
UK 2022 02 O5T;+1?[B&"F&1//MA[MN!T"FWZ
US 2022 02 C6@#]4#_G-(]J7EQY#KRW`@KF+W
Hash256Hash256() returns a 256-bit hash of the combined input expression values. The result is a43-character string.
Syntax:Hash256(expr{, expression})
Return data type: string
Example: Chart expressions
Example Result
Hash256 ( 'abc', 'xyz', '123' ) Returns'MA&5]6+3=:>;>G%S<U*S2I:`=X*A.IO*8N\%Y7Q;YEJ'.
Hash256 ( Region, Year, Month )
Note: Region, Year, and Month are tablefields.
Returns 'G7*=6GKPJ(Z+)^KM?<$'AI.)?U$#X2RB[:0ZP=+Z`F:'.
Example: Load scriptHash_256:
Load *,
Hash256(Region, Year, Month) as Hash256;
Load * inline [
Region, Year, Month
abc, xyz, 123
EU, 2022, 01
UK, 2022, 02
US, 2022, 02 ];
Result
Region Year Month Hash256
abc xyz 123 MA&5]6+3=:>;>G%S<U*S2I:`=X*A.IO*8N\%Y7Q;YEJ
EU 2022 01 B40^K&[T@!;VB'XR]<5=//_F853?BE6'G&,YH*T'MF)
UK 2022 02 O5T;+1?[B&"F&1//MA[MN!T"FWZT=4\#V`M%6_\0C>4
US 2022 02 C6@#]4#_G-(]J7EQY#KRW`@KF+W-0]`[Z8R+#'")=+0
Script syntax and chart functions - Qlik Sense, February 2022 795
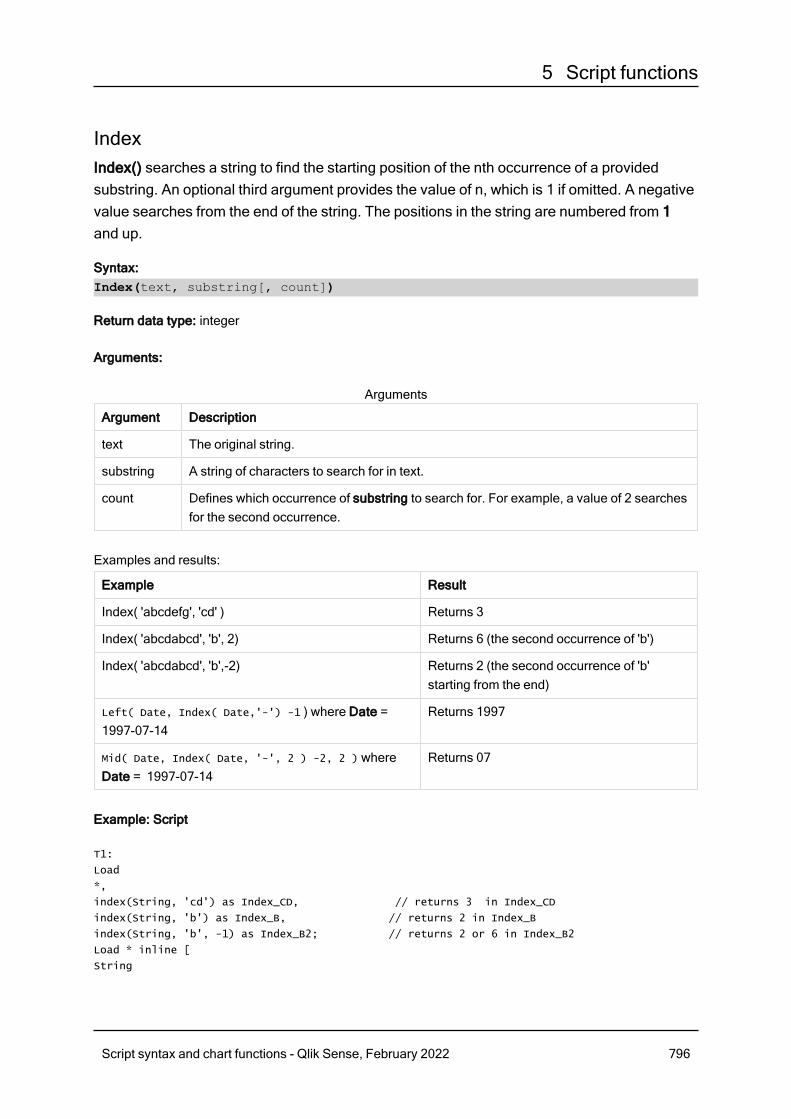
5 Script functions
IndexIndex() searches a string to find the starting position of the nth occurrence of a providedsubstring. An optional third argument provides the value of n, which is 1 if omitted. A negativevalue searches from the end of the string. The positions in the string are numbered from 1and up.
Syntax:Index(text, substring[, count])
Return data type: integer
Arguments:
Argument Description
text The original string.
substring A string of characters to search for in text.
count Defines which occurrence of substring to search for. For example, a value of 2 searchesfor the second occurrence.
Arguments
Examples and results:
Example Result
Index( 'abcdefg', 'cd' ) Returns 3
Index( 'abcdabcd', 'b', 2) Returns 6 (the second occurrence of 'b')
Index( 'abcdabcd', 'b',-2) Returns 2 (the second occurrence of 'b'starting from the end)
Left( Date, Index( Date,'-') -1 ) where Date = 1997-07-14
Returns 1997
Mid( Date, Index( Date, '-', 2 ) -2, 2 ) whereDate = 1997-07-14
Returns 07
Example: Script
T1:
Load
*,
index(String, 'cd') as Index_CD, // returns 3 in Index_CD
index(String, 'b') as Index_B, // returns 2 in Index_B
index(String, 'b', -1) as Index_B2; // returns 2 or 6 in Index_B2
Load * inline [
String
Script syntax and chart functions - Qlik Sense, February 2022 796
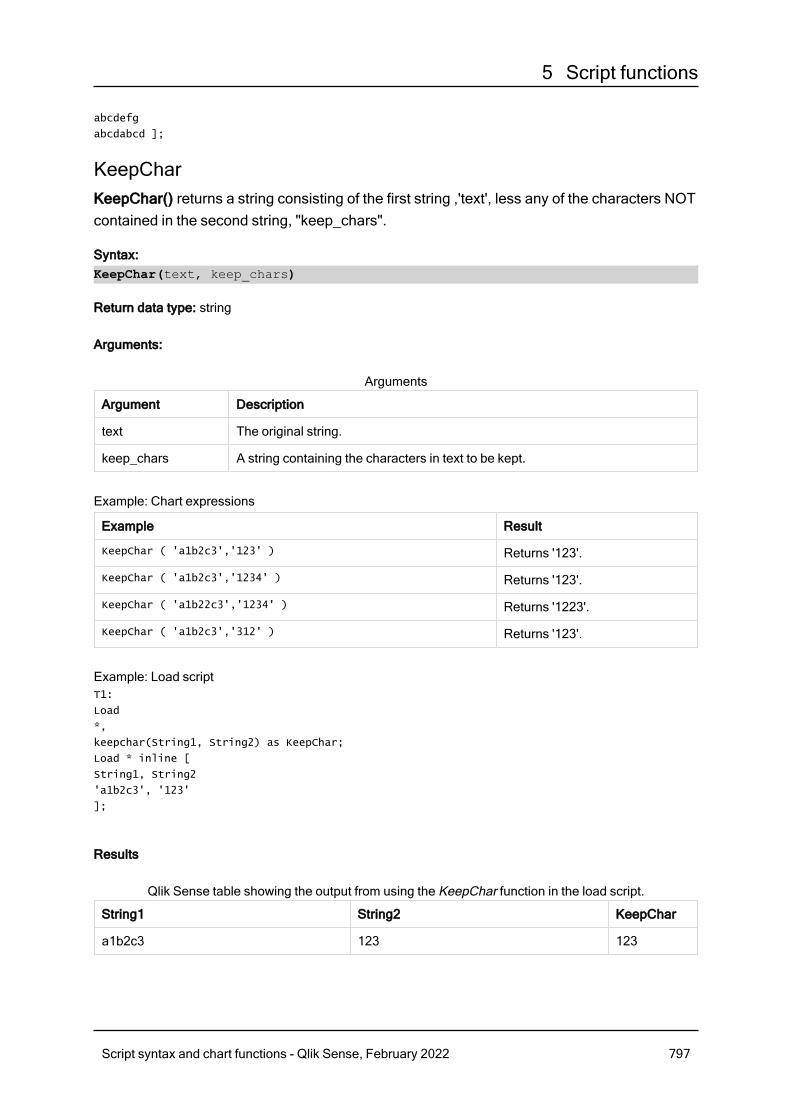
5 Script functions
abcdefg
abcdabcd ];
KeepCharKeepChar() returns a string consisting of the first string ,'text', less any of the characters NOTcontained in the second string, "keep_chars".
Syntax:KeepChar(text, keep_chars)
Return data type: string
Arguments:
Argument Description
text The original string.
keep_chars A string containing the characters in text to be kept.
Arguments
Example: Chart expressions
Example Result
KeepChar ( 'a1b2c3','123' ) Returns '123'.
KeepChar ( 'a1b2c3','1234' ) Returns '123'.
KeepChar ( 'a1b22c3','1234' ) Returns '1223'.
KeepChar ( 'a1b2c3','312' ) Returns '123'.
Example: Load scriptT1:
Load
*,
keepchar(String1, String2) as KeepChar;
Load * inline [
String1, String2
'a1b2c3', '123'
];
Results
String1 String2 KeepChar
a1b2c3 123 123
Qlik Sense table showing the output from using the KeepChar function in the load script.
Script syntax and chart functions - Qlik Sense, February 2022 797
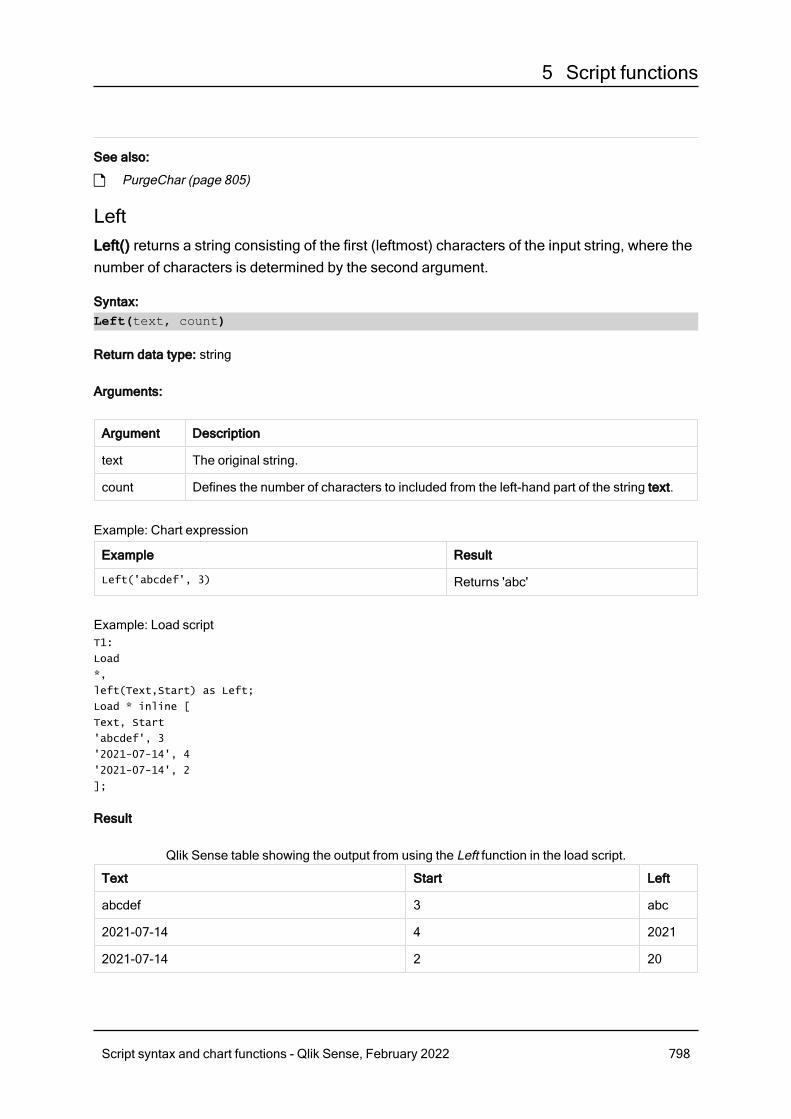
5 Script functions
See also:
p PurgeChar (page 805)
LeftLeft() returns a string consisting of the first (leftmost) characters of the input string, where thenumber of characters is determined by the second argument.
Syntax:Left(text, count)
Return data type: string
Arguments:
Argument Description
text The original string.
count Defines the number of characters to included from the left-hand part of the string text.
Example: Chart expression
Example Result
Left('abcdef', 3) Returns 'abc'
Example: Load scriptT1:
Load
*,
left(Text,Start) as Left;
Load * inline [
Text, Start
'abcdef', 3
'2021-07-14', 4
'2021-07-14', 2
];
Result
Text Start Left
abcdef 3 abc
2021-07-14 4 2021
2021-07-14 2 20
Qlik Sense table showing the output from using the Left function in the load script.
Script syntax and chart functions - Qlik Sense, February 2022 798

5 Script functionsp See also Index (page 796), which allows more complex string analysis.
LenLen() returns the length of the input string.
Syntax:Len(text)
Return data type: integer
Example: Chart expression
Example Result
Len('Peter') Returns '5'
Example: Load scriptT1:
Load String, First&Second as NewString;
Load *, mid(String,len(First)+1) as Second;
Load *, upper(left(String,1)) as First;
Load * inline [
String
this is a sample text string
capitalize first letter only ];
Result
String NewString
this is a sample text string This is a sample text string
capitalize first letter only Capitalize first letter only
LevenshteinDistLevenshteinDist() returns the Levenshtein distance between two strings. It is defined as theminimum number of single-character edits (insertions, deletions, or substitutions) required tochange one string into the other. The function is useful for fuzzy string comparisons.
Syntax:LevenshteinDist(text1, text2)
Return data type: integer
Script syntax and chart functions - Qlik Sense, February 2022 799
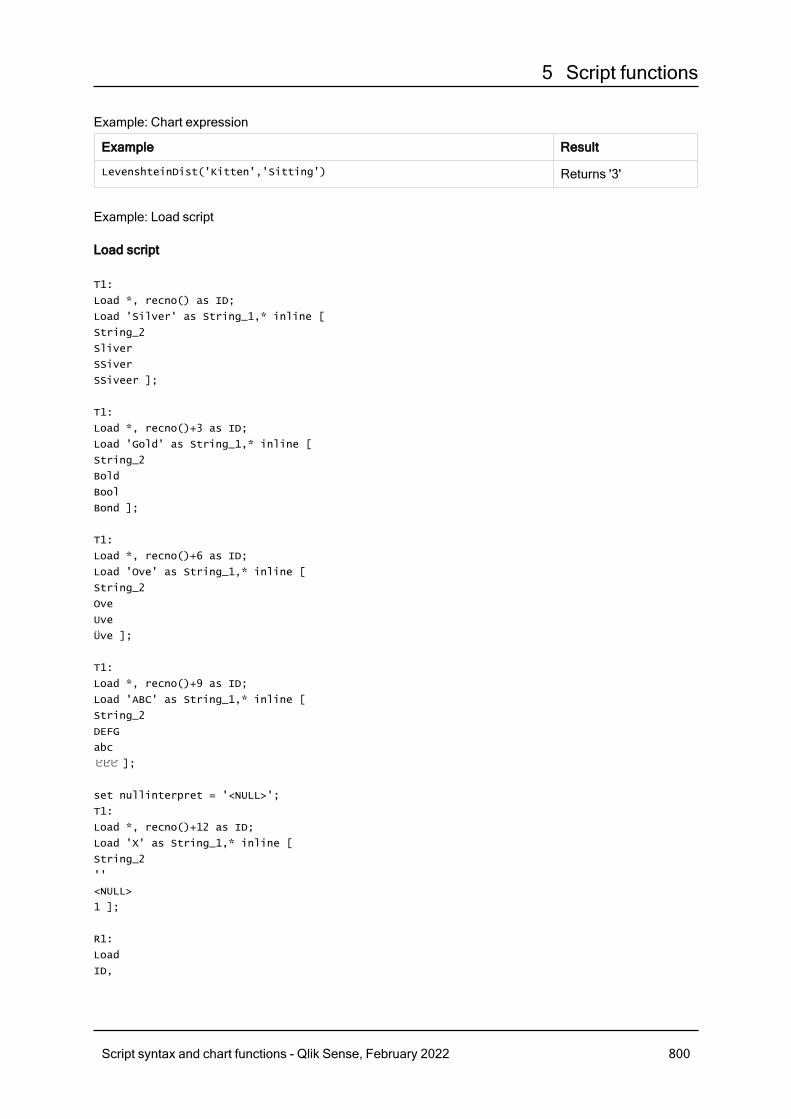
5 Script functions
Example: Chart expression
Example Result
LevenshteinDist('Kitten','Sitting') Returns '3'
Example: Load script
Load script
T1:
Load *, recno() as ID;
Load 'Silver' as String_1,* inline [
String_2
Sliver
SSiver
SSiveer ];
T1:
Load *, recno()+3 as ID;
Load 'Gold' as String_1,* inline [
String_2
Bold
Bool
Bond ];
T1:
Load *, recno()+6 as ID;
Load 'Ove' as String_1,* inline [
String_2
Ove
Uve
Üve ];
T1:
Load *, recno()+9 as ID;
Load 'ABC' as String_1,* inline [
String_2
DEFG
abc
ビビビ ];
set nullinterpret = '<NULL>';
T1:
Load *, recno()+12 as ID;
Load 'X' as String_1,* inline [
String_2
''
<NULL>
1 ];
R1:
Load
ID,
Script syntax and chart functions - Qlik Sense, February 2022 800
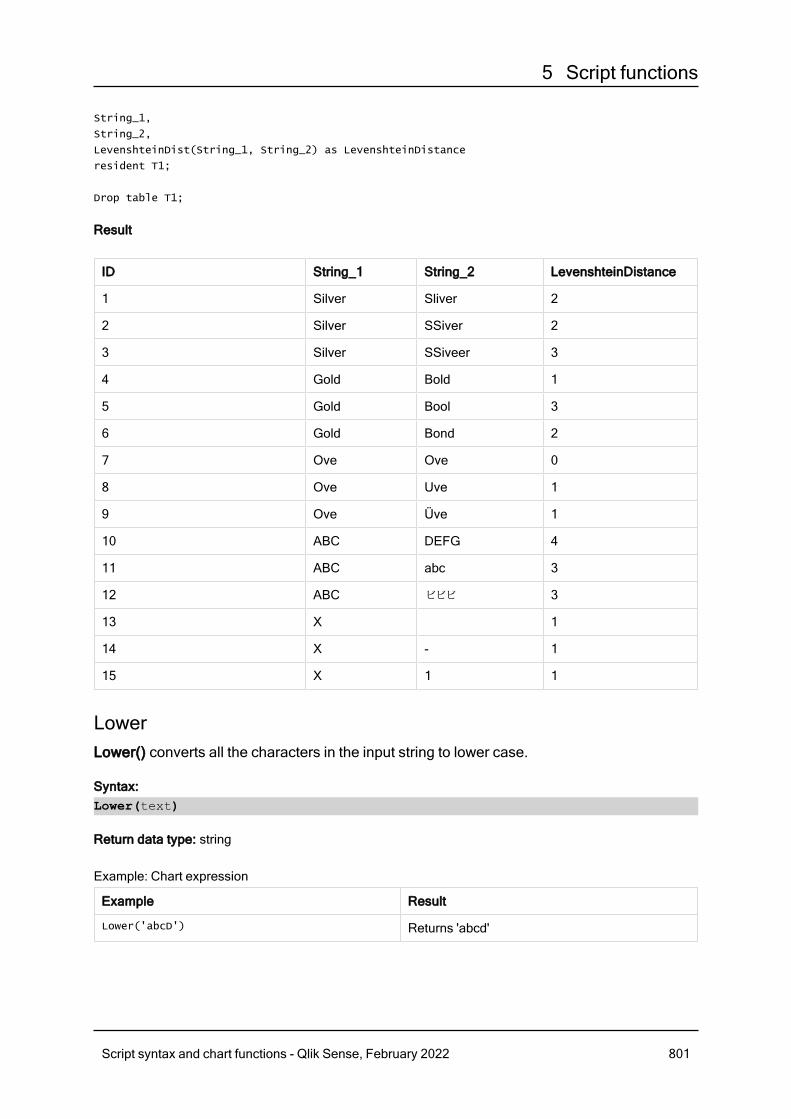
5 Script functions
String_1,
String_2,
LevenshteinDist(String_1, String_2) as LevenshteinDistance
resident T1;
Drop table T1;
Result
ID String_1 String_2 LevenshteinDistance
1 Silver Sliver 2
2 Silver SSiver 2
3 Silver SSiveer 3
4 Gold Bold 1
5 Gold Bool 3
6 Gold Bond 2
7 Ove Ove 0
8 Ove Uve 1
9 Ove Üve 1
10 ABC DEFG 4
11 ABC abc 3
12 ABC ビビビ 3
13 X 1
14 X - 1
15 X 1 1
LowerLower() converts all the characters in the input string to lower case.
Syntax:Lower(text)
Return data type: string
Example: Chart expression
Example Result
Lower('abcD') Returns 'abcd'
Script syntax and chart functions - Qlik Sense, February 2022 801
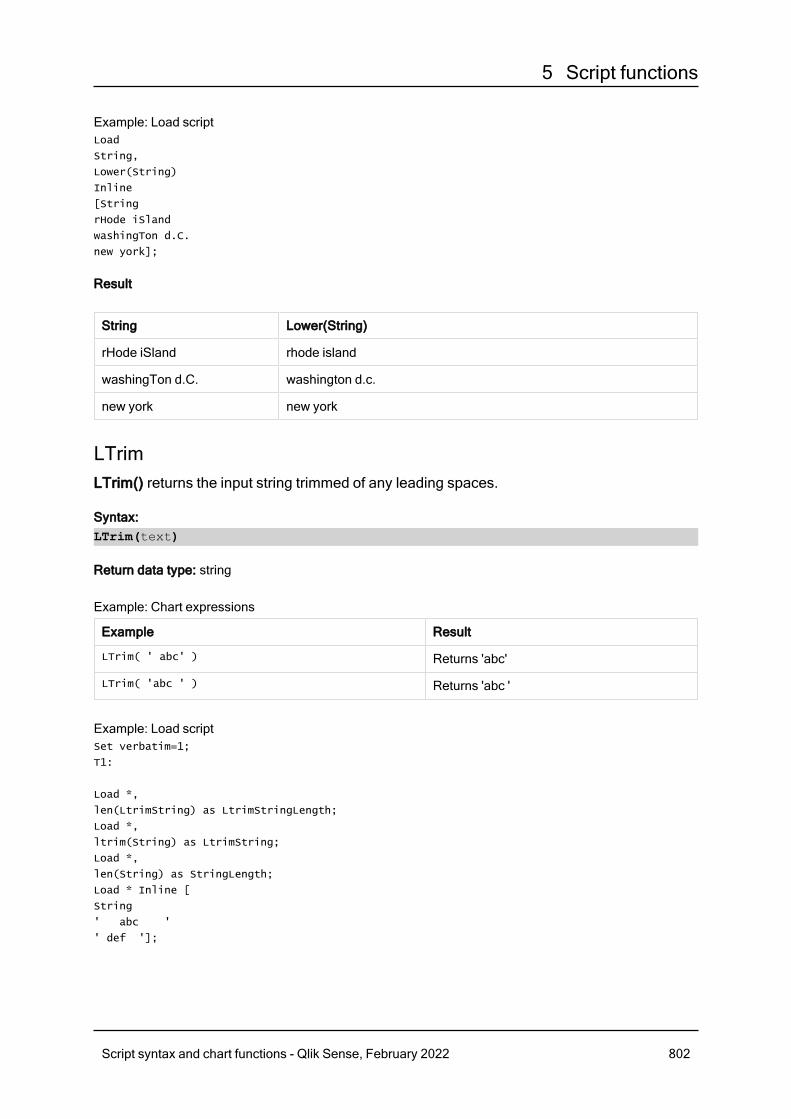
5 Script functions
Example: Load scriptLoad
String,
Lower(String)
Inline
[String
rHode iSland
washingTon d.C.
new york];
Result
String Lower(String)
rHode iSland rhode island
washingTon d.C. washington d.c.
new york new york
LTrimLTrim() returns the input string trimmed of any leading spaces.
Syntax:LTrim(text)
Return data type: string
Example: Chart expressions
Example Result
LTrim( ' abc' ) Returns 'abc'
LTrim( 'abc ' ) Returns 'abc '
Example: Load scriptSet verbatim=1;
T1:
Load *,
len(LtrimString) as LtrimStringLength;
Load *,
ltrim(String) as LtrimString;
Load *,
len(String) as StringLength;
Load * Inline [
String
' abc '
' def '];
Script syntax and chart functions - Qlik Sense, February 2022 802
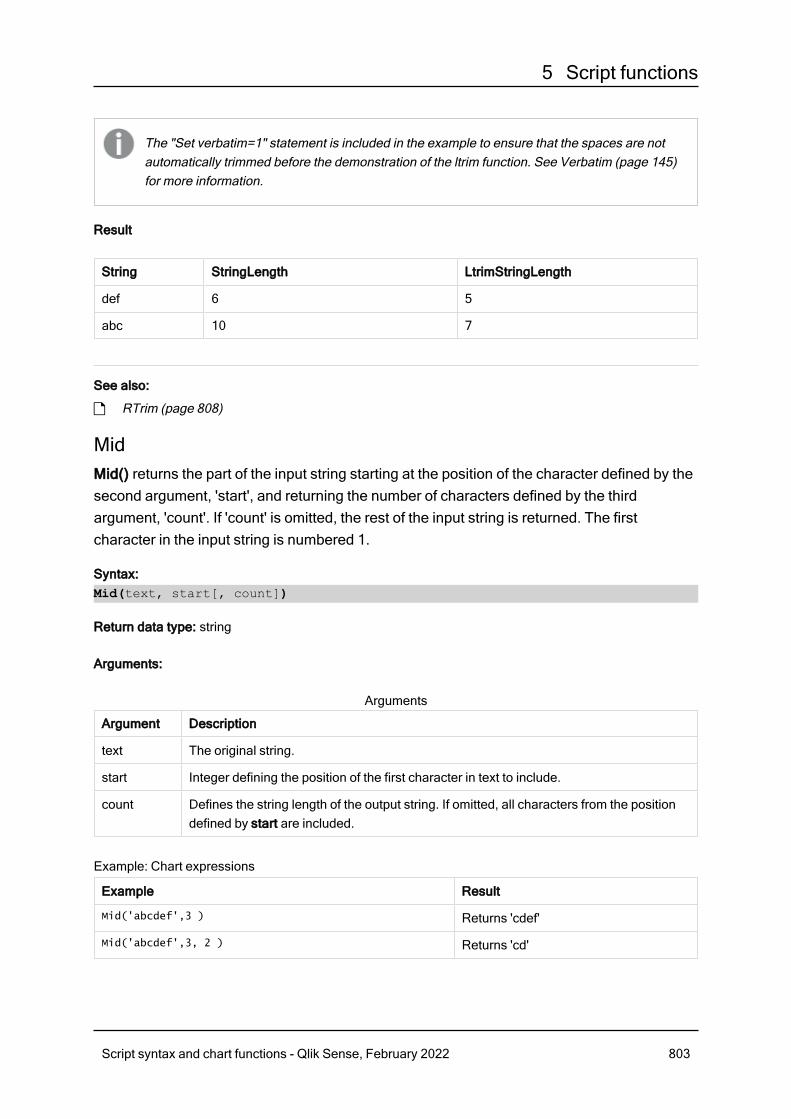
5 Script functions
The "Set verbatim=1" statement is included in the example to ensure that the spaces are notautomatically trimmed before the demonstration of the ltrim function. See Verbatim (page 145)for more information.
Result
String StringLength LtrimStringLength
def 6 5
abc 10 7
See also:
p RTrim (page 808)
MidMid() returns the part of the input string starting at the position of the character defined by thesecond argument, 'start', and returning the number of characters defined by the thirdargument, 'count'. If 'count' is omitted, the rest of the input string is returned. The firstcharacter in the input string is numbered 1.
Syntax:Mid(text, start[, count])
Return data type: string
Arguments:
Argument Description
text The original string.
start Integer defining the position of the first character in text to include.
count Defines the string length of the output string. If omitted, all characters from the positiondefined by start are included.
Arguments
Example: Chart expressions
Example Result
Mid('abcdef',3 ) Returns 'cdef'
Mid('abcdef',3, 2 ) Returns 'cd'
Script syntax and chart functions - Qlik Sense, February 2022 803
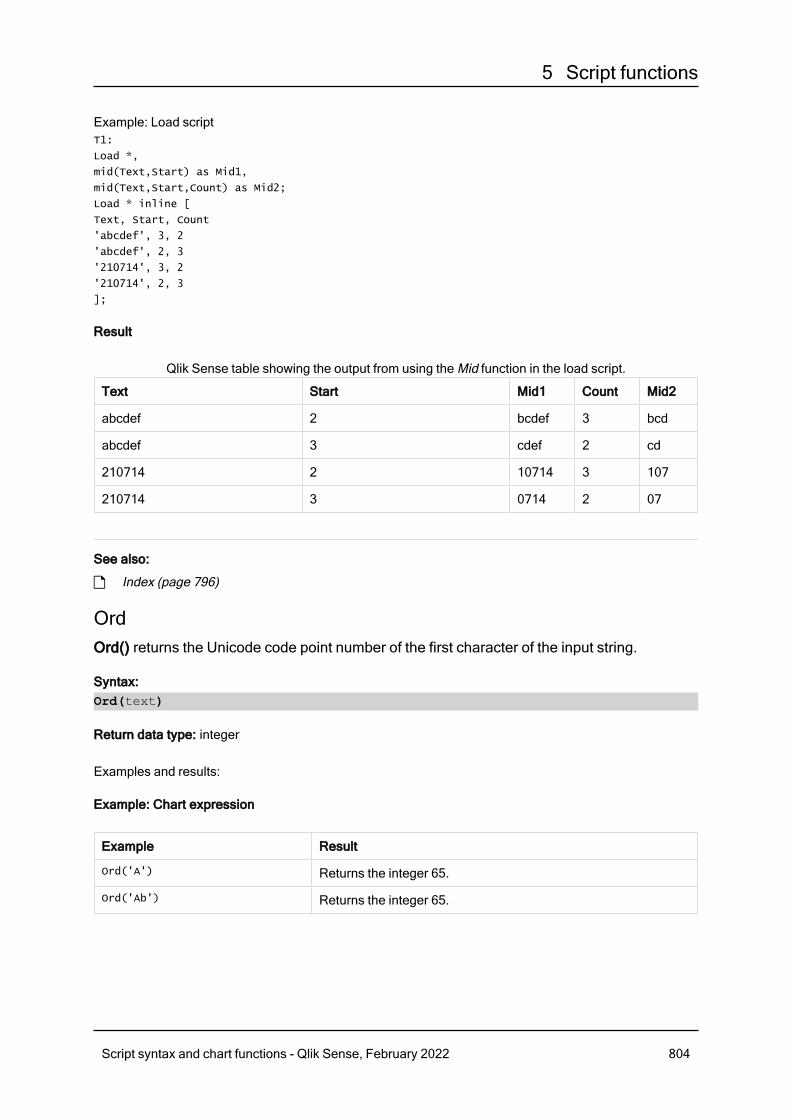
5 Script functions
Example: Load scriptT1:
Load *,
mid(Text,Start) as Mid1,
mid(Text,Start,Count) as Mid2;
Load * inline [
Text, Start, Count
'abcdef', 3, 2
'abcdef', 2, 3
'210714', 3, 2
'210714', 2, 3
];
Result
Text Start Mid1 Count Mid2
abcdef 2 bcdef 3 bcd
abcdef 3 cdef 2 cd
210714 2 10714 3 107
210714 3 0714 2 07
Qlik Sense table showing the output from using the Mid function in the load script.
See also:
p Index (page 796)
OrdOrd() returns the Unicode code point number of the first character of the input string.
Syntax:Ord(text)
Return data type: integer
Examples and results:
Example: Chart expression
Example Result
Ord('A') Returns the integer 65.
Ord('Ab') Returns the integer 65.
Script syntax and chart functions - Qlik Sense, February 2022 804
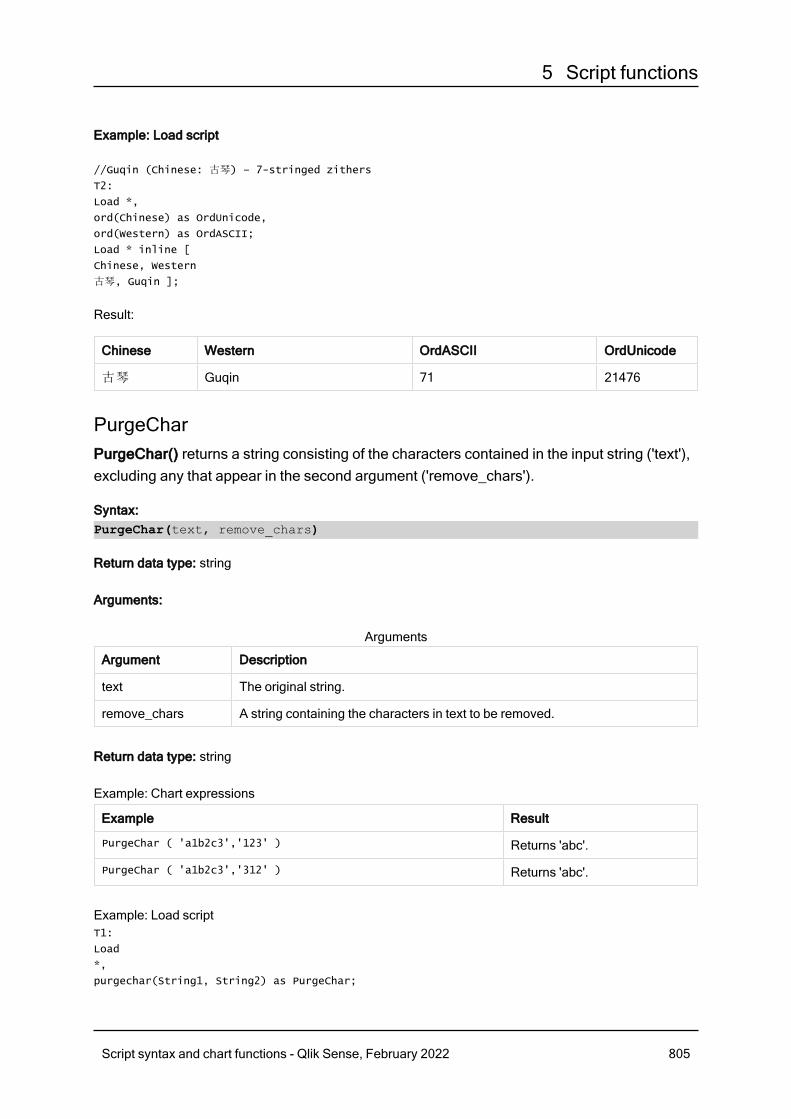
5 Script functions
Example: Load script
//Guqin (Chinese: 古琴) – 7-stringed zithers
T2:
Load *,
ord(Chinese) as OrdUnicode,
ord(Western) as OrdASCII;
Load * inline [
Chinese, Western
古琴, Guqin ];
Result:
Chinese Western OrdASCII OrdUnicode
古琴 Guqin 71 21476
PurgeCharPurgeChar() returns a string consisting of the characters contained in the input string ('text'),excluding any that appear in the second argument ('remove_chars').
Syntax:PurgeChar(text, remove_chars)
Return data type: string
Arguments:
Argument Description
text The original string.
remove_chars A string containing the characters in text to be removed.
Arguments
Return data type: string
Example: Chart expressions
Example Result
PurgeChar ( 'a1b2c3','123' ) Returns 'abc'.
PurgeChar ( 'a1b2c3','312' ) Returns 'abc'.
Example: Load scriptT1:
Load
*,
purgechar(String1, String2) as PurgeChar;
Script syntax and chart functions - Qlik Sense, February 2022 805
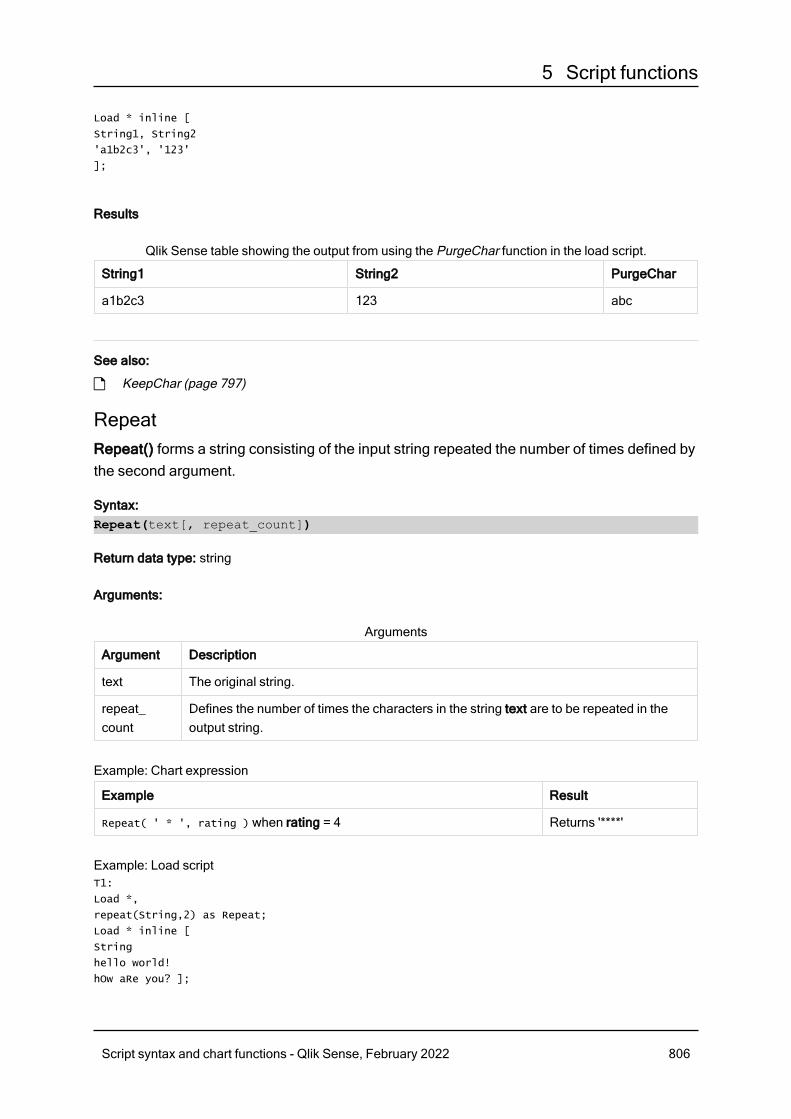
5 Script functions
Load * inline [
String1, String2
'a1b2c3', '123'
];
Results
String1 String2 PurgeChar
a1b2c3 123 abc
Qlik Sense table showing the output from using the PurgeChar function in the load script.
See also:
p KeepChar (page 797)
RepeatRepeat() forms a string consisting of the input string repeated the number of times defined bythe second argument.
Syntax:Repeat(text[, repeat_count])
Return data type: string
Arguments:
Argument Description
text The original string.
repeat_count
Defines the number of times the characters in the string text are to be repeated in theoutput string.
Arguments
Example: Chart expression
Example Result
Repeat( ' * ', rating ) when rating = 4 Returns '****'
Example: Load scriptT1:
Load *,
repeat(String,2) as Repeat;
Load * inline [
String
hello world!
hOw aRe you? ];
Script syntax and chart functions - Qlik Sense, February 2022 806
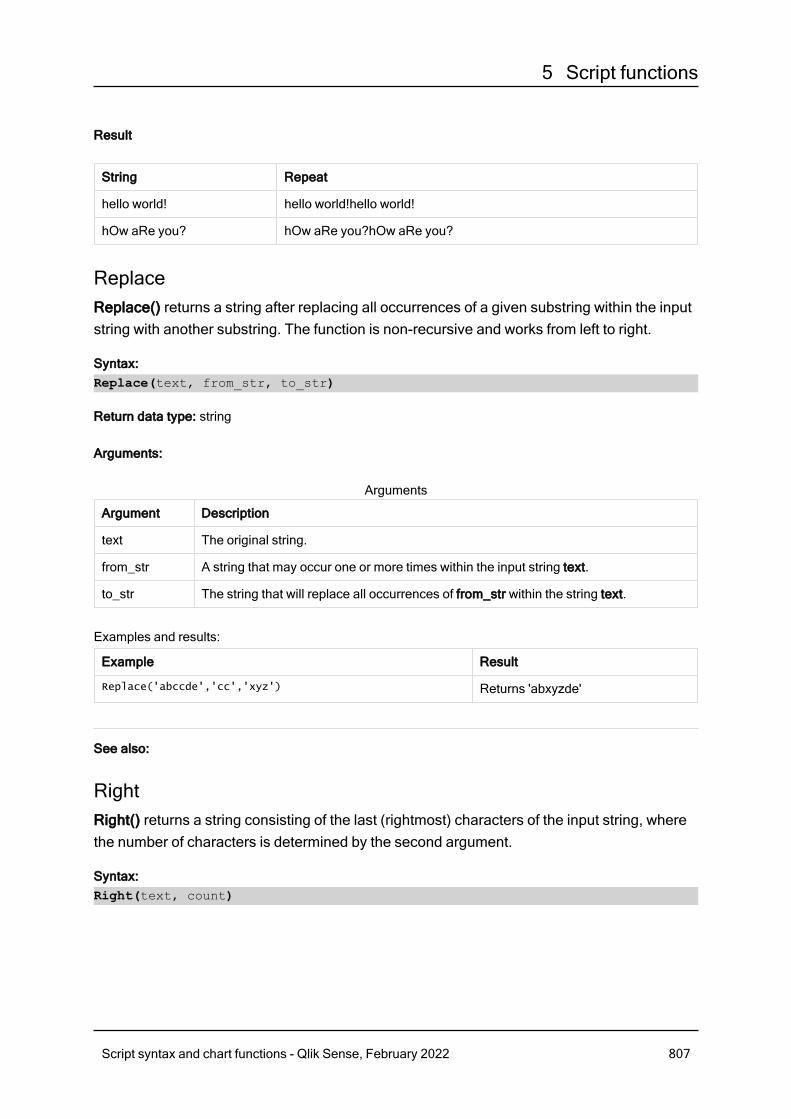
5 Script functions
Result
String Repeat
hello world! hello world!hello world!
hOw aRe you? hOw aRe you?hOw aRe you?
ReplaceReplace() returns a string after replacing all occurrences of a given substring within the inputstring with another substring. The function is non-recursive and works from left to right.
Syntax:Replace(text, from_str, to_str)
Return data type: string
Arguments:
Argument Description
text The original string.
from_str A string that may occur one or more times within the input string text.
to_str The string that will replace all occurrences of from_str within the string text.
Arguments
Examples and results:
Example Result
Replace('abccde','cc','xyz') Returns 'abxyzde'
See also:
RightRight() returns a string consisting of the last (rightmost) characters of the input string, wherethe number of characters is determined by the second argument.
Syntax:Right(text, count)
Script syntax and chart functions - Qlik Sense, February 2022 807

5 Script functions
Return data type: string
Arguments:
Argument Description
text The original string.
count Defines the number of characters to be included from the rightmost part of the stringtext.
Arguments
Example: Chart expression
Example Result
Right('abcdef', 3) Returns 'def'
Example: Load scriptT1:
Load
*,
right(Text,Start) as Right;
Load * inline [
Text, Start
'abcdef', 3
'2021-07-14', 4
'2021-07-14', 2
];
Result
Text Start Right
abcdef 3 def
2021-07-14 4 7-14
2021-07-14 2 14
Qlik Sense table showing the output from using the Right function in the load script.
RTrimRTrim() returns the input string trimmed of any trailing spaces.
Syntax:RTrim(text)
Script syntax and chart functions - Qlik Sense, February 2022 808
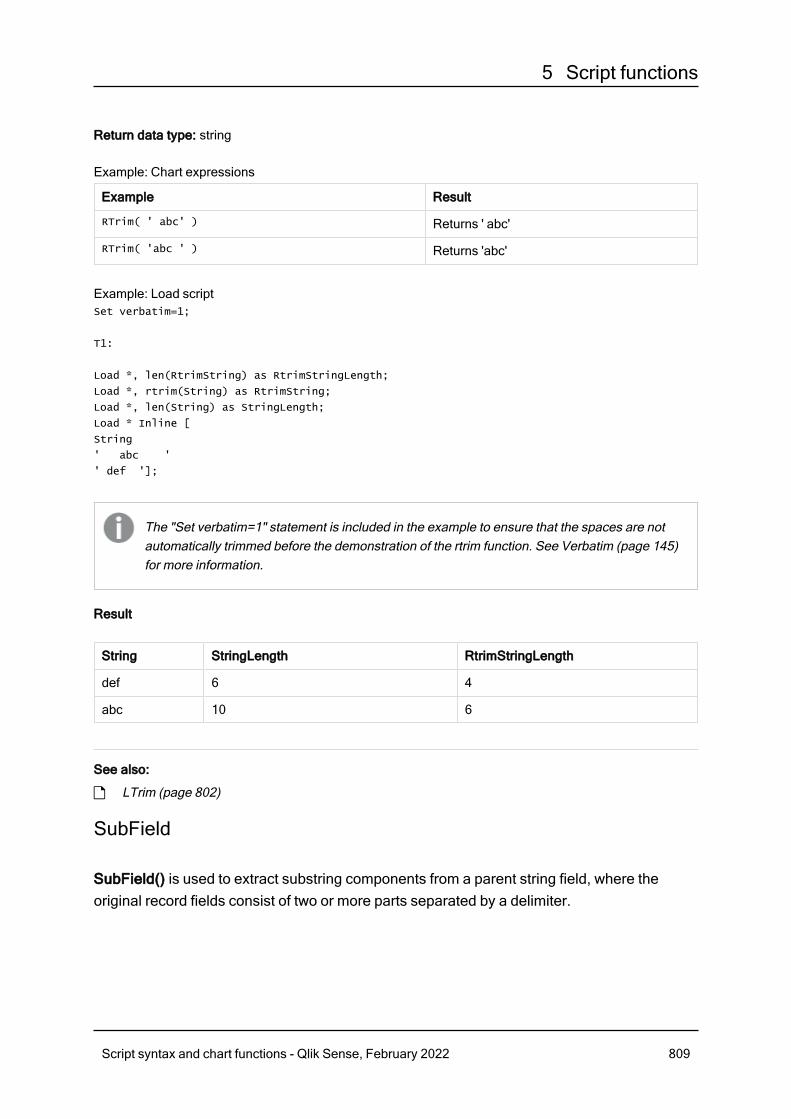
5 Script functions
Return data type: string
Example: Chart expressions
Example Result
RTrim( ' abc' ) Returns ' abc'
RTrim( 'abc ' ) Returns 'abc'
Example: Load scriptSet verbatim=1;
T1:
Load *, len(RtrimString) as RtrimStringLength;
Load *, rtrim(String) as RtrimString;
Load *, len(String) as StringLength;
Load * Inline [
String
' abc '
' def '];
The "Set verbatim=1" statement is included in the example to ensure that the spaces are notautomatically trimmed before the demonstration of the rtrim function. See Verbatim (page 145)for more information.
Result
String StringLength RtrimStringLength
def 6 4
abc 10 6
See also:
p LTrim (page 802)
SubField
SubField() is used to extract substring components from a parent string field, where theoriginal record fields consist of two or more parts separated by a delimiter.
Script syntax and chart functions - Qlik Sense, February 2022 809
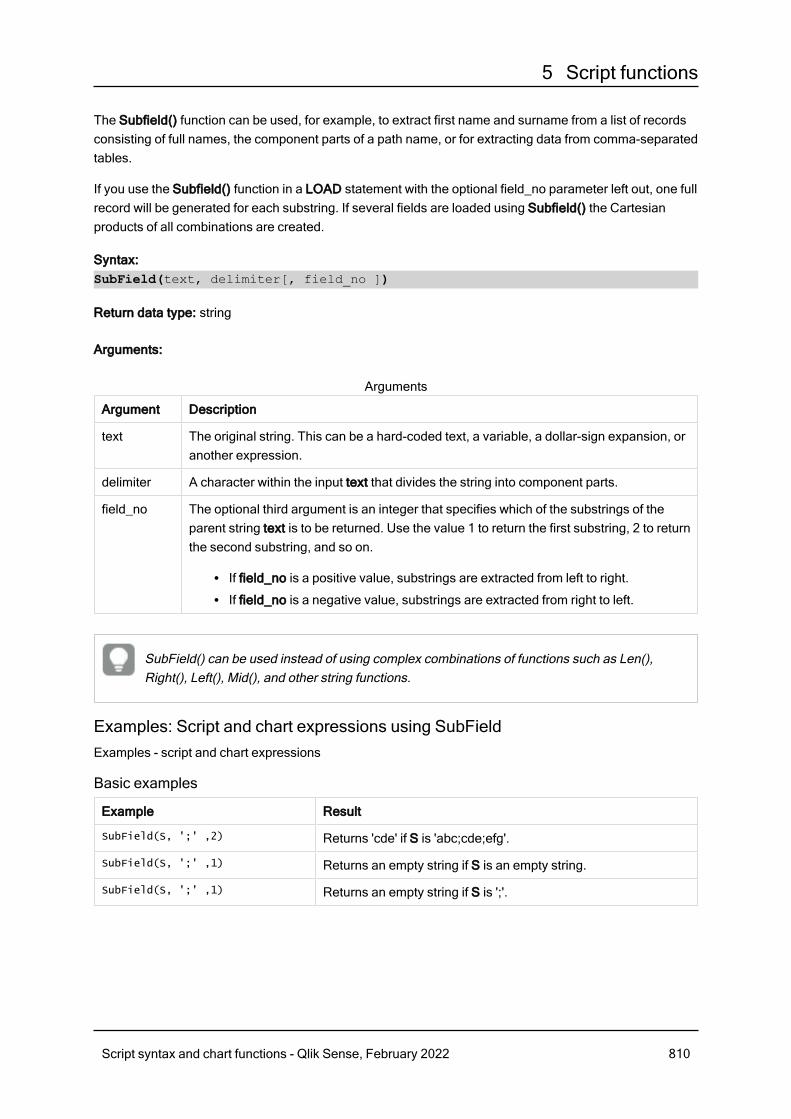
5 Script functions
The Subfield() function can be used, for example, to extract first name and surname from a list of recordsconsisting of full names, the component parts of a path name, or for extracting data from comma-separatedtables.
If you use the Subfield() function in a LOAD statement with the optional field_no parameter left out, one fullrecord will be generated for each substring. If several fields are loaded using Subfield() the Cartesianproducts of all combinations are created.
Syntax:SubField(text, delimiter[, field_no ])
Return data type: string
Arguments:
Argument Description
text The original string. This can be a hard-coded text, a variable, a dollar-sign expansion, oranother expression.
delimiter A character within the input text that divides the string into component parts.
field_no The optional third argument is an integer that specifies which of the substrings of theparent string text is to be returned. Use the value 1 to return the first substring, 2 to returnthe second substring, and so on.
l If field_no is a positive value, substrings are extracted from left to right.l If field_no is a negative value, substrings are extracted from right to left.
Arguments
SubField() can be used instead of using complex combinations of functions such as Len(),Right(), Left(), Mid(), and other string functions.
Examples: Script and chart expressions using SubFieldExamples - script and chart expressions
Basic examples
Example Result
SubField(S, ';' ,2) Returns 'cde' if S is 'abc;cde;efg'.
SubField(S, ';' ,1) Returns an empty string if S is an empty string.
SubField(S, ';' ,1) Returns an empty string if S is ';'.
Script syntax and chart functions - Qlik Sense, February 2022 810
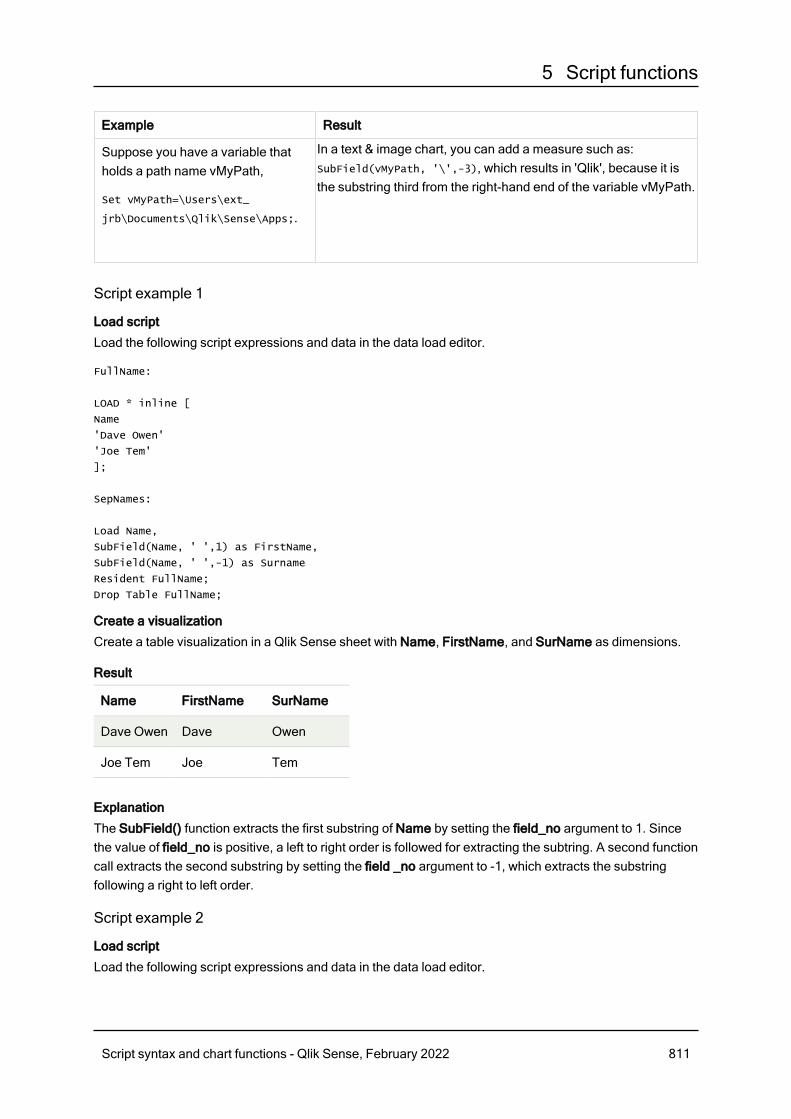
5 Script functions
Example Result
Suppose you have a variable thatholds a path name vMyPath,
Set vMyPath=\Users\ext_
jrb\Documents\Qlik\Sense\Apps;.
In a text & image chart, you can add a measure such as:SubField(vMyPath, '\',-3), which results in 'Qlik', because it isthe substring third from the right-hand end of the variable vMyPath.
Script example 1
Load script
Load the following script expressions and data in the data load editor.
FullName:
LOAD * inline [
Name
'Dave Owen'
'Joe Tem'
];
SepNames:
Load Name,
SubField(Name, ' ',1) as FirstName,
SubField(Name, ' ',-1) as Surname
Resident FullName;
Drop Table FullName;
Create a visualization
Create a table visualization in a Qlik Sense sheet with Name, FirstName, and SurName as dimensions.
Result
Name FirstName SurName
Dave Owen Dave Owen
Joe Tem Joe Tem
Explanation
The SubField() function extracts the first substring of Name by setting the field_no argument to 1. Sincethe value of field_no is positive, a left to right order is followed for extracting the subtring. A second functioncall extracts the second substring by setting the field _no argument to -1, which extracts the substringfollowing a right to left order.
Script example 2
Load script
Load the following script expressions and data in the data load editor.
Script syntax and chart functions - Qlik Sense, February 2022 811
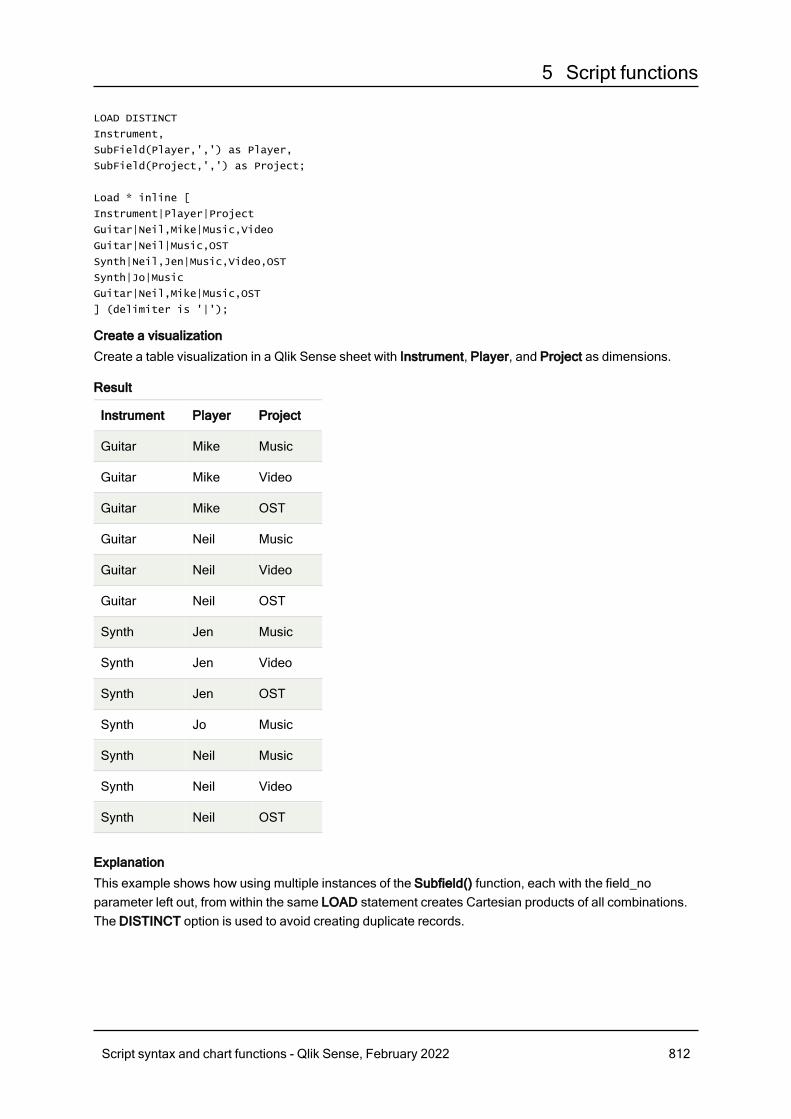
5 Script functions
LOAD DISTINCT
Instrument,
SubField(Player,',') as Player,
SubField(Project,',') as Project;
Load * inline [
Instrument|Player|Project
Guitar|Neil,Mike|Music,Video
Guitar|Neil|Music,OST
Synth|Neil,Jen|Music,Video,OST
Synth|Jo|Music
Guitar|Neil,Mike|Music,OST
] (delimiter is '|');
Create a visualization
Create a table visualization in a Qlik Sense sheet with Instrument, Player, and Project as dimensions.
Result
Instrument Player Project
Guitar Mike Music
Guitar Mike Video
Guitar Mike OST
Guitar Neil Music
Guitar Neil Video
Guitar Neil OST
Synth Jen Music
Synth Jen Video
Synth Jen OST
Synth Jo Music
Synth Neil Music
Synth Neil Video
Synth Neil OST
Explanation
This example shows how using multiple instances of the Subfield() function, each with the field_noparameter left out, from within the same LOAD statement creates Cartesian products of all combinations.The DISTINCT option is used to avoid creating duplicate records.
Script syntax and chart functions - Qlik Sense, February 2022 812
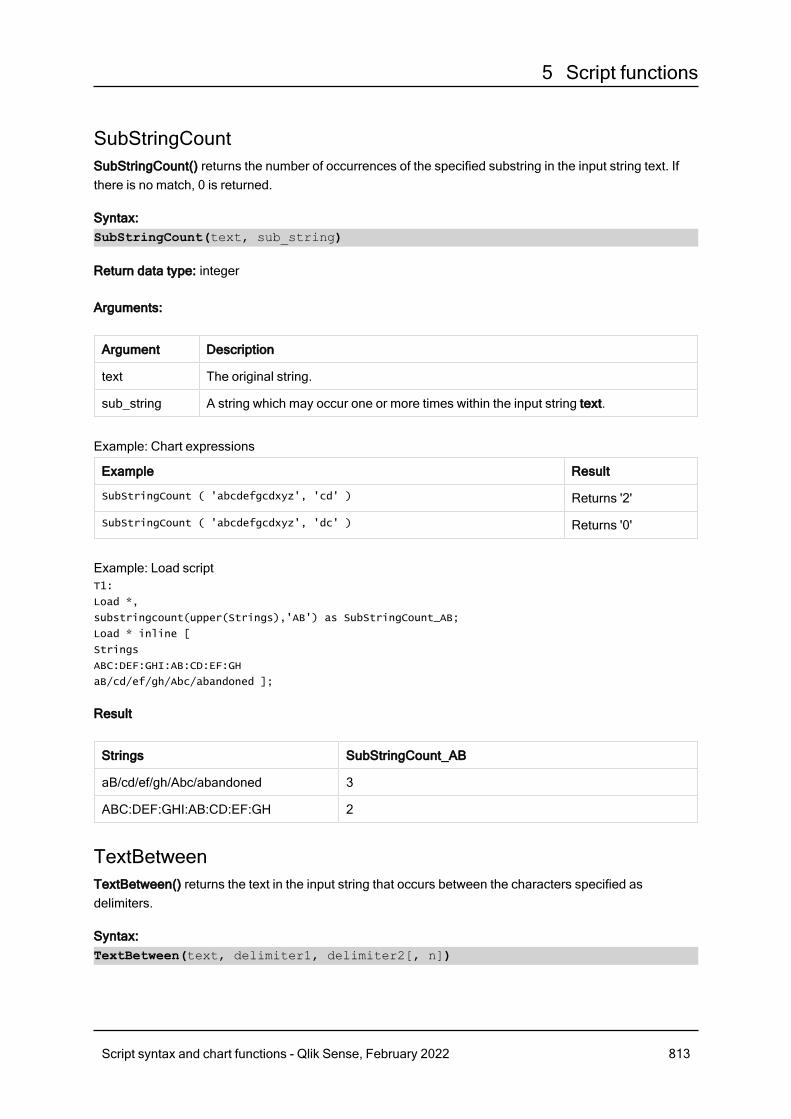
5 Script functions
SubStringCountSubStringCount() returns the number of occurrences of the specified substring in the input string text. Ifthere is no match, 0 is returned.
Syntax:SubStringCount(text, sub_string)
Return data type: integer
Arguments:
Argument Description
text The original string.
sub_string A string which may occur one or more times within the input string text.
Example: Chart expressions
Example Result
SubStringCount ( 'abcdefgcdxyz', 'cd' ) Returns '2'
SubStringCount ( 'abcdefgcdxyz', 'dc' ) Returns '0'
Example: Load scriptT1:
Load *,
substringcount(upper(Strings),'AB') as SubStringCount_AB;
Load * inline [
Strings
ABC:DEF:GHI:AB:CD:EF:GH
aB/cd/ef/gh/Abc/abandoned ];
Result
Strings SubStringCount_AB
aB/cd/ef/gh/Abc/abandoned 3
ABC:DEF:GHI:AB:CD:EF:GH 2
TextBetweenTextBetween() returns the text in the input string that occurs between the characters specified asdelimiters.
Syntax:TextBetween(text, delimiter1, delimiter2[, n])
Script syntax and chart functions - Qlik Sense, February 2022 813
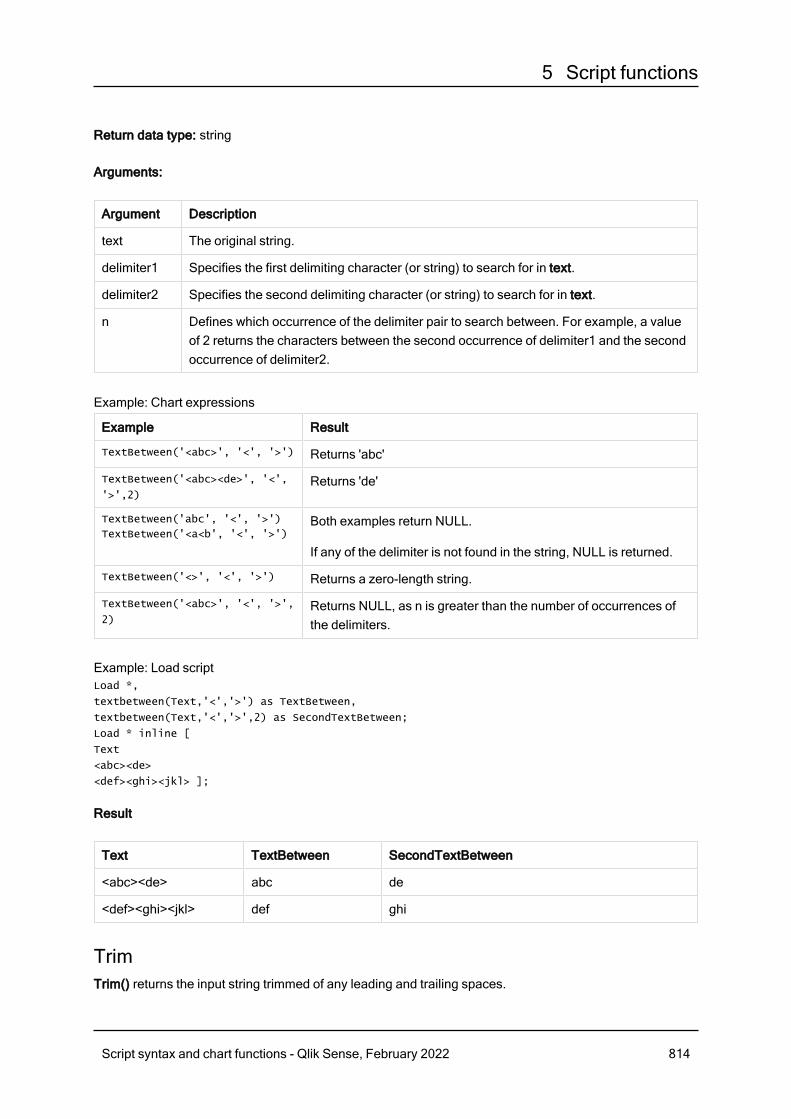
5 Script functions
Return data type: string
Arguments:
Argument Description
text The original string.
delimiter1 Specifies the first delimiting character (or string) to search for in text.
delimiter2 Specifies the second delimiting character (or string) to search for in text.
n Defines which occurrence of the delimiter pair to search between. For example, a valueof 2 returns the characters between the second occurrence of delimiter1 and the secondoccurrence of delimiter2.
Example: Chart expressions
Example Result
TextBetween('<abc>', '<', '>') Returns 'abc'
TextBetween('<abc><de>', '<',
'>',2)Returns 'de'
TextBetween('abc', '<', '>')
TextBetween('<a<b', '<', '>')Both examples return NULL.
If any of the delimiter is not found in the string, NULL is returned.
TextBetween('<>', '<', '>') Returns a zero-length string.
TextBetween('<abc>', '<', '>',
2)Returns NULL, as n is greater than the number of occurrences ofthe delimiters.
Example: Load scriptLoad *,
textbetween(Text,'<','>') as TextBetween,
textbetween(Text,'<','>',2) as SecondTextBetween;
Load * inline [
Text
<abc><de>
<def><ghi><jkl> ];
Result
Text TextBetween SecondTextBetween
<abc><de> abc de
<def><ghi><jkl> def ghi
TrimTrim() returns the input string trimmed of any leading and trailing spaces.
Script syntax and chart functions - Qlik Sense, February 2022 814
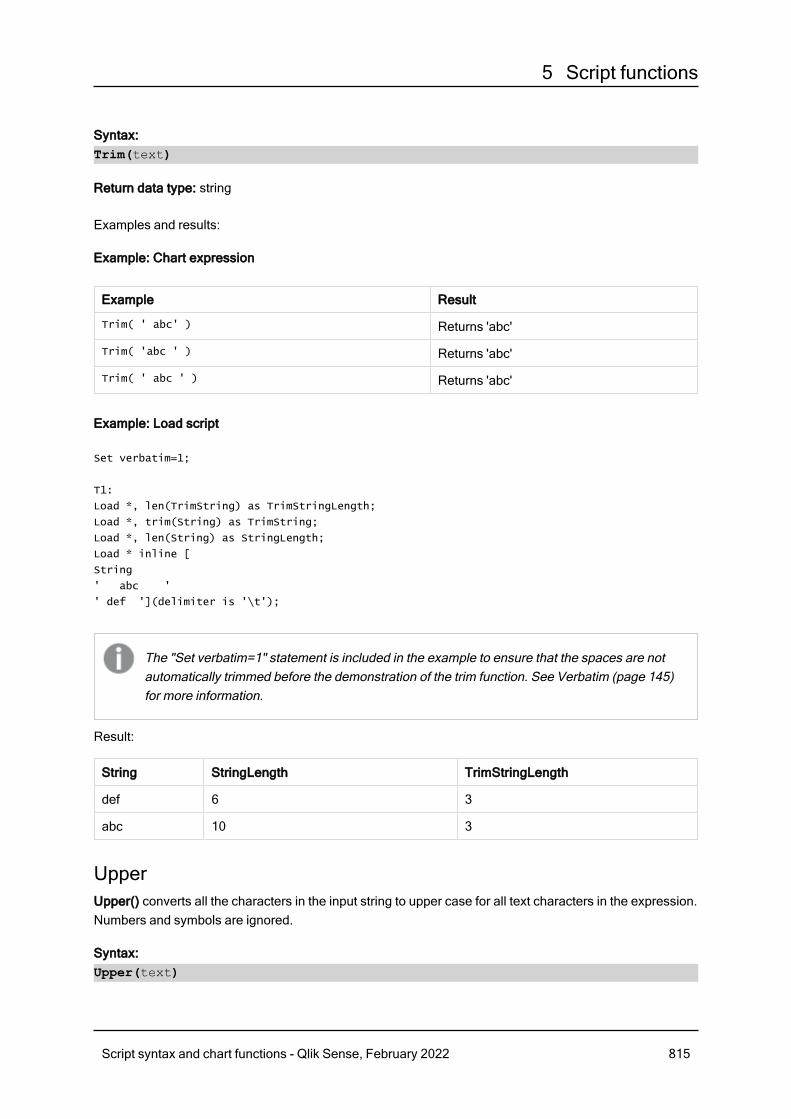
5 Script functions
Syntax:Trim(text)
Return data type: string
Examples and results:
Example: Chart expression
Example Result
Trim( ' abc' ) Returns 'abc'
Trim( 'abc ' ) Returns 'abc'
Trim( ' abc ' ) Returns 'abc'
Example: Load script
Set verbatim=1;
T1:
Load *, len(TrimString) as TrimStringLength;
Load *, trim(String) as TrimString;
Load *, len(String) as StringLength;
Load * inline [
String
' abc '
' def '](delimiter is '\t');
The "Set verbatim=1" statement is included in the example to ensure that the spaces are notautomatically trimmed before the demonstration of the trim function. See Verbatim (page 145)for more information.
Result:
String StringLength TrimStringLength
def 6 3
abc 10 3
UpperUpper() converts all the characters in the input string to upper case for all text characters in the expression.Numbers and symbols are ignored.
Syntax:Upper(text)
Script syntax and chart functions - Qlik Sense, February 2022 815
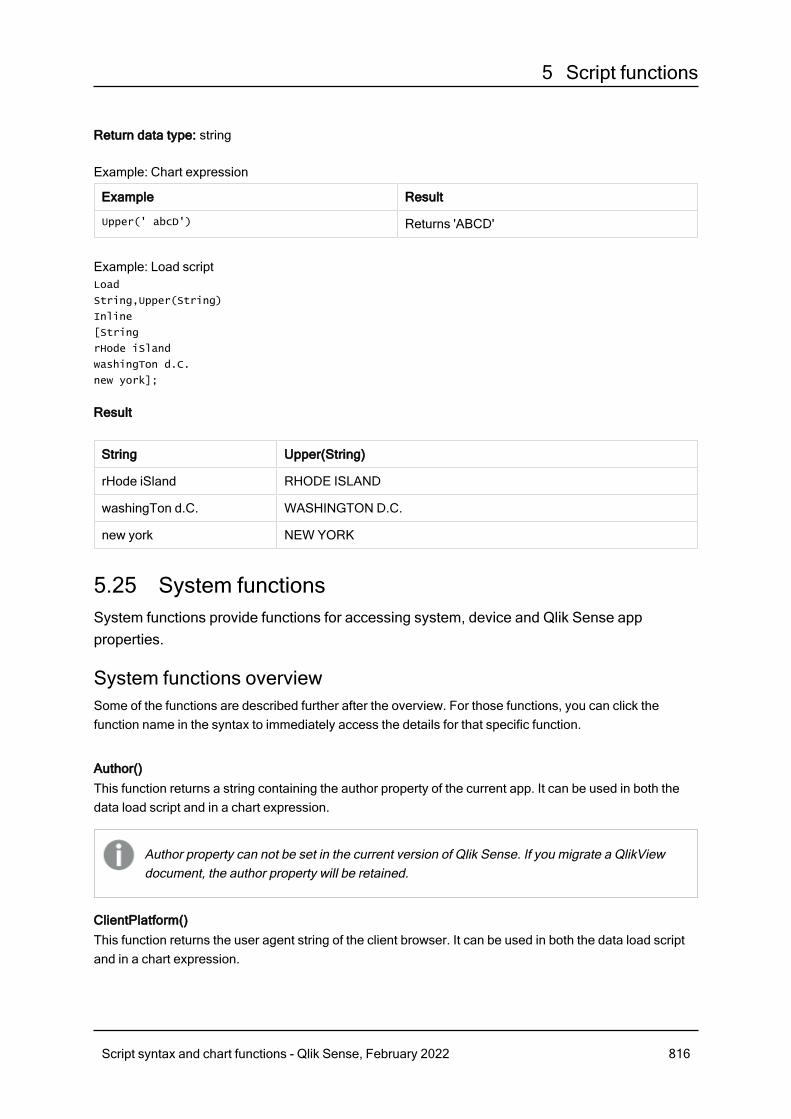
5 Script functions
Return data type: string
Example: Chart expression
Example Result
Upper(' abcD') Returns 'ABCD'
Example: Load scriptLoad
String,Upper(String)
Inline
[String
rHode iSland
washingTon d.C.
new york];
Result
String Upper(String)
rHode iSland RHODE ISLAND
washingTon d.C. WASHINGTON D.C.
new york NEW YORK
5.25 System functionsSystem functions provide functions for accessing system, device and Qlik Sense appproperties.
System functions overviewSome of the functions are described further after the overview. For those functions, you can click thefunction name in the syntax to immediately access the details for that specific function.
Author()This function returns a string containing the author property of the current app. It can be used in both thedata load script and in a chart expression.
Author property can not be set in the current version of Qlik Sense. If you migrate a QlikViewdocument, the author property will be retained.
ClientPlatform()This function returns the user agent string of the client browser. It can be used in both the data load scriptand in a chart expression.
Script syntax and chart functions - Qlik Sense, February 2022 816
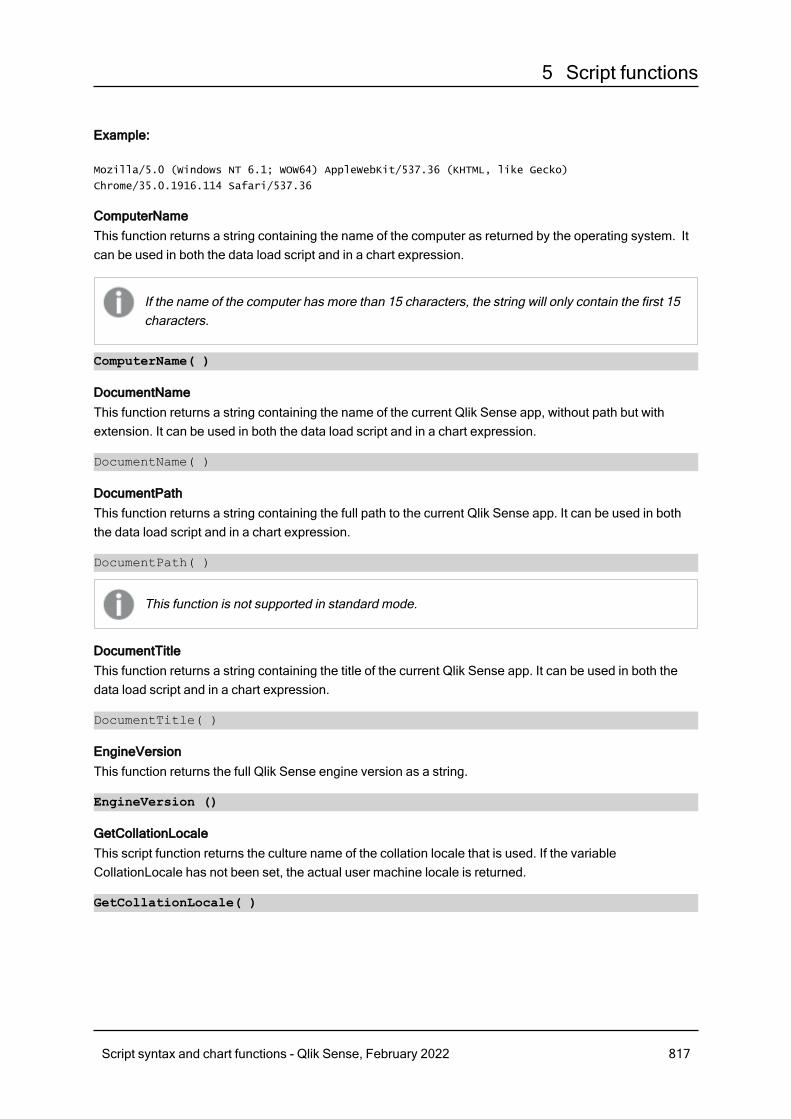
5 Script functions
Example:
Mozilla/5.0 (Windows NT 6.1; WOW64) AppleWebKit/537.36 (KHTML, like Gecko)
Chrome/35.0.1916.114 Safari/537.36
ComputerNameThis function returns a string containing the name of the computer as returned by the operating system. Itcan be used in both the data load script and in a chart expression.
If the name of the computer has more than 15 characters, the string will only contain the first 15characters.
ComputerName( )
DocumentNameThis function returns a string containing the name of the current Qlik Sense app, without path but withextension. It can be used in both the data load script and in a chart expression.
DocumentName( )
DocumentPathThis function returns a string containing the full path to the current Qlik Sense app. It can be used in boththe data load script and in a chart expression.
DocumentPath( )
This function is not supported in standard mode.
DocumentTitleThis function returns a string containing the title of the current Qlik Sense app. It can be used in both thedata load script and in a chart expression.
DocumentTitle( )
EngineVersionThis function returns the full Qlik Sense engine version as a string.
EngineVersion ()
GetCollationLocaleThis script function returns the culture name of the collation locale that is used. If the variableCollationLocale has not been set, the actual user machine locale is returned.
GetCollationLocale( )
Script syntax and chart functions - Qlik Sense, February 2022 817
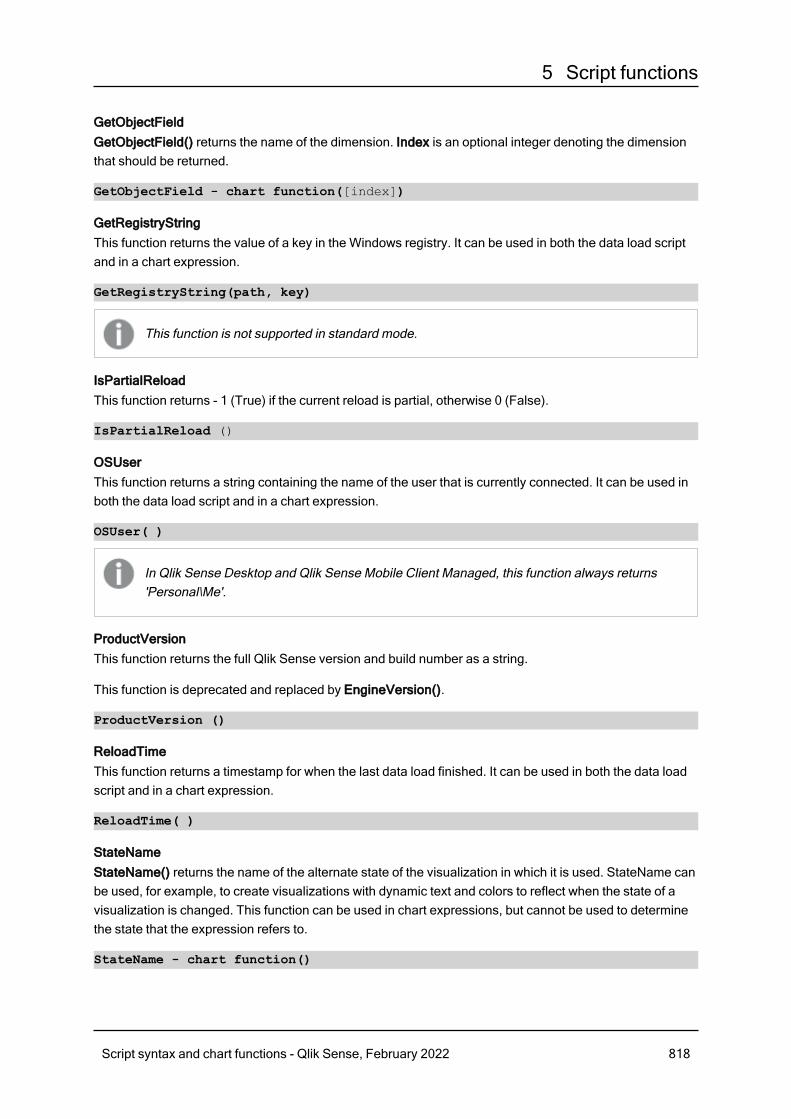
5 Script functions
GetObjectFieldGetObjectField() returns the name of the dimension. Index is an optional integer denoting the dimensionthat should be returned.
GetObjectField - chart function([index])
GetRegistryStringThis function returns the value of a key in the Windows registry. It can be used in both the data load scriptand in a chart expression.
GetRegistryString(path, key)
This function is not supported in standard mode.
IsPartialReloadThis function returns - 1 (True) if the current reload is partial, otherwise 0 (False).
IsPartialReload ()
OSUserThis function returns a string containing the name of the user that is currently connected. It can be used inboth the data load script and in a chart expression.
OSUser( )
In Qlik Sense Desktop and Qlik Sense Mobile Client Managed, this function always returns'Personal\Me'.
ProductVersionThis function returns the full Qlik Sense version and build number as a string.
This function is deprecated and replaced by EngineVersion().
ProductVersion ()
ReloadTimeThis function returns a timestamp for when the last data load finished. It can be used in both the data loadscript and in a chart expression.
ReloadTime( )
StateNameStateName() returns the name of the alternate state of the visualization in which it is used. StateName canbe used, for example, to create visualizations with dynamic text and colors to reflect when the state of avisualization is changed. This function can be used in chart expressions, but cannot be used to determinethe state that the expression refers to.
StateName - chart function()
Script syntax and chart functions - Qlik Sense, February 2022 818
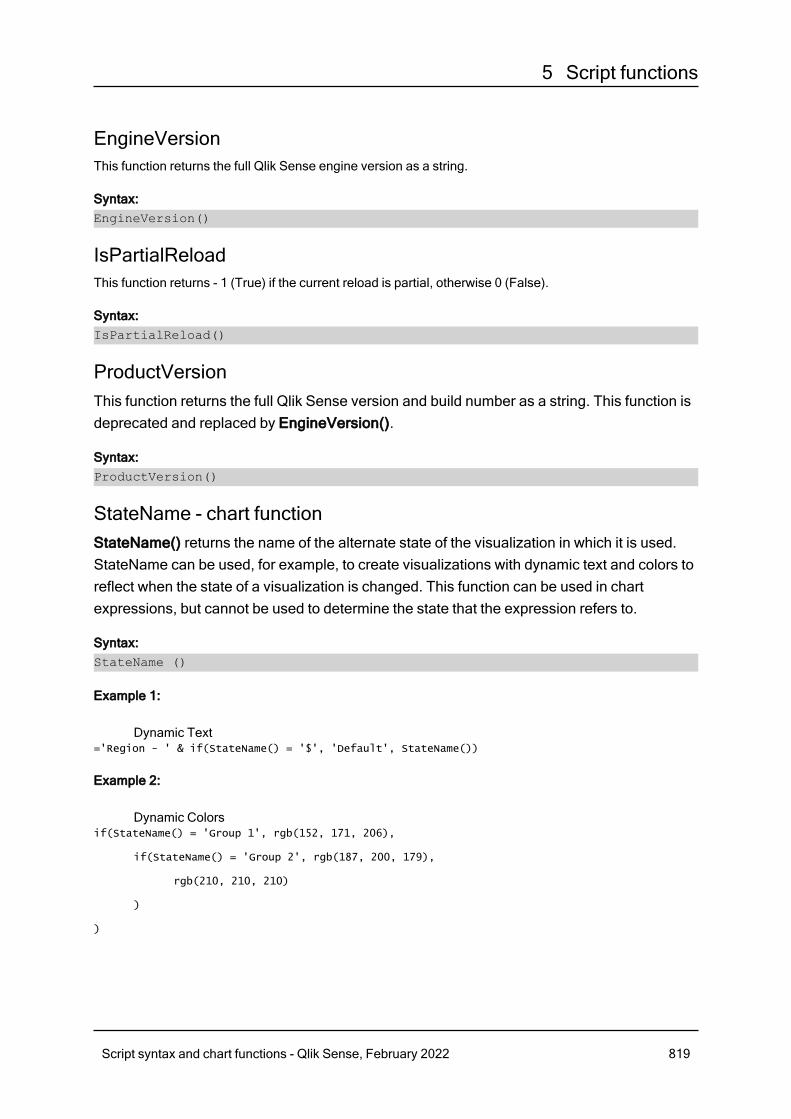
5 Script functions
EngineVersionThis function returns the full Qlik Sense engine version as a string.
Syntax:EngineVersion()
IsPartialReloadThis function returns - 1 (True) if the current reload is partial, otherwise 0 (False).
Syntax:IsPartialReload()
ProductVersionThis function returns the full Qlik Sense version and build number as a string. This function isdeprecated and replaced by EngineVersion().
Syntax:ProductVersion()
StateName - chart functionStateName() returns the name of the alternate state of the visualization in which it is used.StateName can be used, for example, to create visualizations with dynamic text and colors toreflect when the state of a visualization is changed. This function can be used in chartexpressions, but cannot be used to determine the state that the expression refers to.
Syntax:StateName ()
Example 1:
Dynamic Text='Region - ' & if(StateName() = '$', 'Default', StateName())
Example 2:
Dynamic Colorsif(StateName() = 'Group 1', rgb(152, 171, 206),
if(StateName() = 'Group 2', rgb(187, 200, 179),
rgb(210, 210, 210)
)
)
Script syntax and chart functions - Qlik Sense, February 2022 819
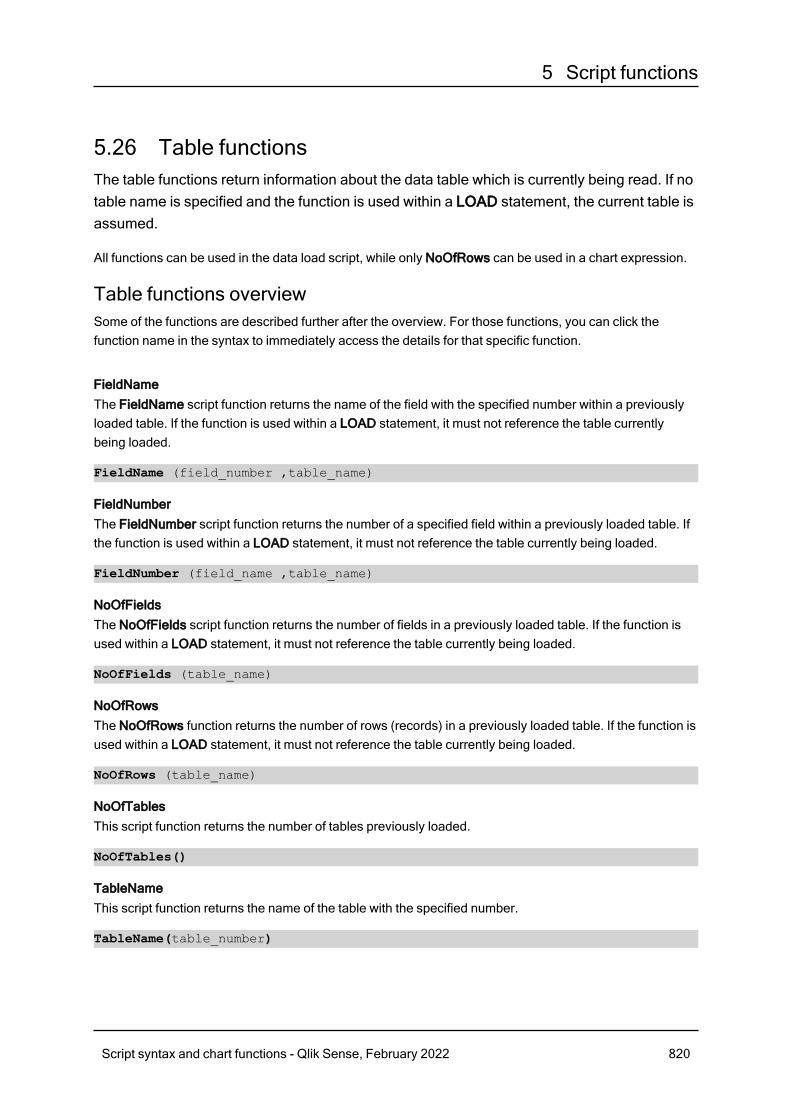
5 Script functions
5.26 Table functionsThe table functions return information about the data table which is currently being read. If notable name is specified and the function is used within a LOAD statement, the current table isassumed.
All functions can be used in the data load script, while only NoOfRows can be used in a chart expression.
Table functions overviewSome of the functions are described further after the overview. For those functions, you can click thefunction name in the syntax to immediately access the details for that specific function.
FieldNameThe FieldName script function returns the name of the field with the specified number within a previouslyloaded table. If the function is used within a LOAD statement, it must not reference the table currentlybeing loaded.
FieldName (field_number ,table_name)
FieldNumberThe FieldNumber script function returns the number of a specified field within a previously loaded table. Ifthe function is used within a LOAD statement, it must not reference the table currently being loaded.
FieldNumber (field_name ,table_name)
NoOfFieldsThe NoOfFields script function returns the number of fields in a previously loaded table. If the function isused within a LOAD statement, it must not reference the table currently being loaded.
NoOfFields (table_name)
NoOfRowsThe NoOfRows function returns the number of rows (records) in a previously loaded table. If the function isused within a LOAD statement, it must not reference the table currently being loaded.
NoOfRows (table_name)
NoOfTablesThis script function returns the number of tables previously loaded.
NoOfTables()
TableNameThis script function returns the name of the table with the specified number.
TableName(table_number)
Script syntax and chart functions - Qlik Sense, February 2022 820
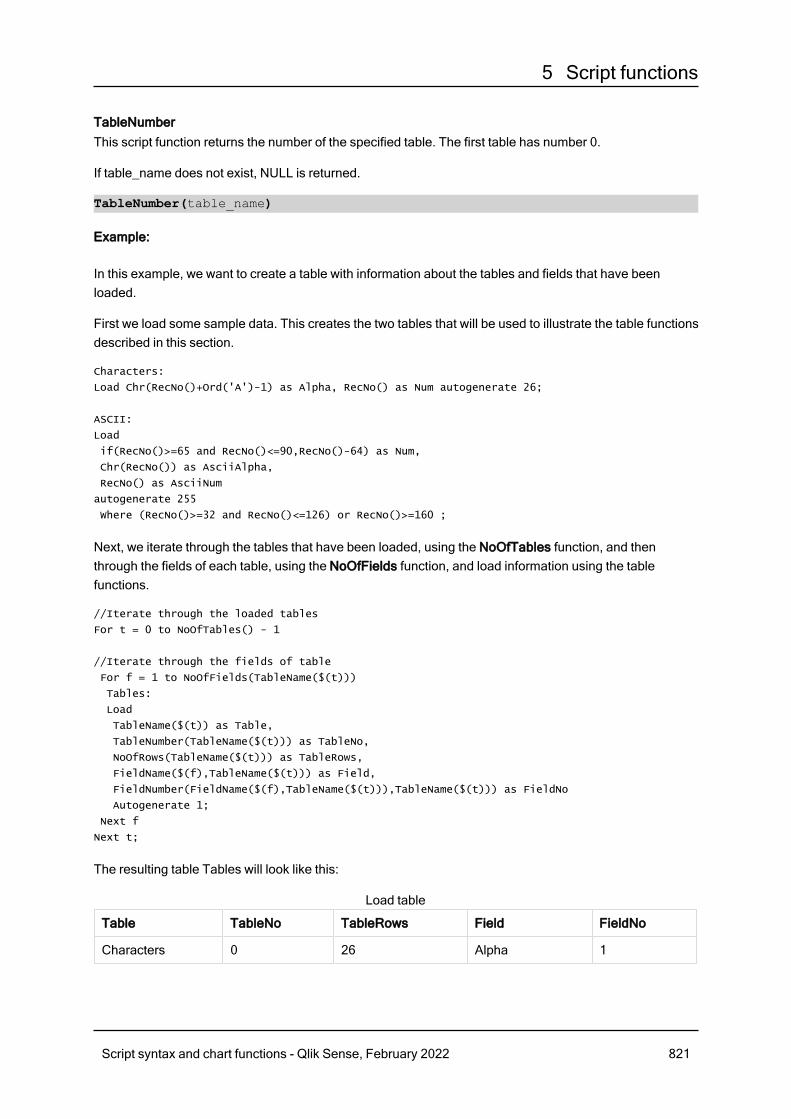
5 Script functions
TableNumberThis script function returns the number of the specified table. The first table has number 0.
If table_name does not exist, NULL is returned.
TableNumber(table_name)
Example:
In this example, we want to create a table with information about the tables and fields that have beenloaded.
First we load some sample data. This creates the two tables that will be used to illustrate the table functionsdescribed in this section.
Characters:
Load Chr(RecNo()+Ord('A')-1) as Alpha, RecNo() as Num autogenerate 26;
ASCII:
Load
if(RecNo()>=65 and RecNo()<=90,RecNo()-64) as Num,
Chr(RecNo()) as AsciiAlpha,
RecNo() as AsciiNum
autogenerate 255
Where (RecNo()>=32 and RecNo()<=126) or RecNo()>=160 ;
Next, we iterate through the tables that have been loaded, using the NoOfTables function, and thenthrough the fields of each table, using the NoOfFields function, and load information using the tablefunctions.
//Iterate through the loaded tables
For t = 0 to NoOfTables() - 1
//Iterate through the fields of table
For f = 1 to NoOfFields(TableName($(t)))
Tables:
Load
TableName($(t)) as Table,
TableNumber(TableName($(t))) as TableNo,
NoOfRows(TableName($(t))) as TableRows,
FieldName($(f),TableName($(t))) as Field,
FieldNumber(FieldName($(f),TableName($(t))),TableName($(t))) as FieldNo
Autogenerate 1;
Next f
Next t;
The resulting table Tables will look like this:
Table TableNo TableRows Field FieldNo
Characters 0 26 Alpha 1
Load table
Script syntax and chart functions - Qlik Sense, February 2022 821
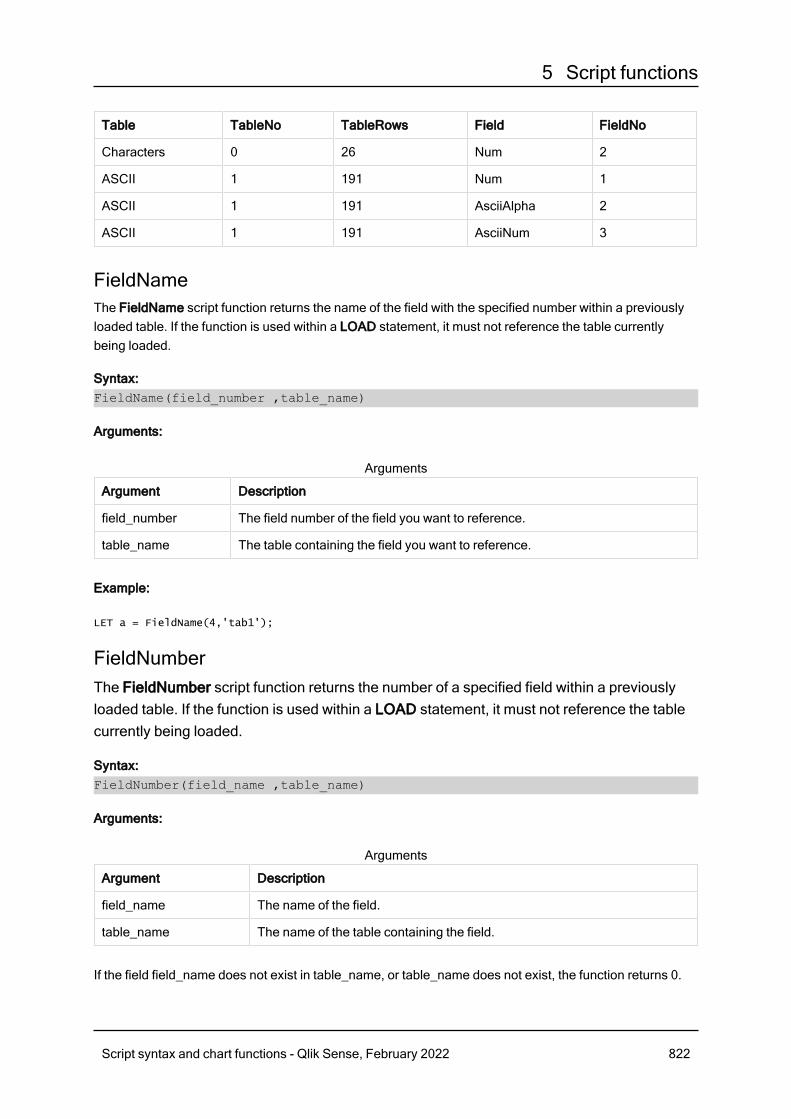
5 Script functions
Table TableNo TableRows Field FieldNo
Characters 0 26 Num 2
ASCII 1 191 Num 1
ASCII 1 191 AsciiAlpha 2
ASCII 1 191 AsciiNum 3
FieldNameThe FieldName script function returns the name of the field with the specified number within a previouslyloaded table. If the function is used within a LOAD statement, it must not reference the table currentlybeing loaded.
Syntax:FieldName(field_number ,table_name)
Arguments:
Argument Description
field_number The field number of the field you want to reference.
table_name The table containing the field you want to reference.
Arguments
Example:
LET a = FieldName(4,'tab1');
FieldNumberThe FieldNumber script function returns the number of a specified field within a previouslyloaded table. If the function is used within a LOAD statement, it must not reference the tablecurrently being loaded.
Syntax:FieldNumber(field_name ,table_name)
Arguments:
Argument Description
field_name The name of the field.
table_name The name of the table containing the field.
Arguments
If the field field_name does not exist in table_name, or table_name does not exist, the function returns 0.
Script syntax and chart functions - Qlik Sense, February 2022 822
5 Script functions
Example:
LET a = FieldNumber('Customer','tab1');
NoOfFieldsThe NoOfFields script function returns the number of fields in a previously loaded table. If thefunction is used within a LOAD statement, it must not reference the table currently beingloaded.
Syntax:NoOfFields(table_name)
Arguments:
Argument Description
table_name The name of the table.
Arguments
Example:
LET a = NoOfFields('tab1');
NoOfRowsThe NoOfRows function returns the number of rows (records) in a previously loaded table. Ifthe function is used within a LOAD statement, it must not reference the table currently beingloaded.
Syntax:NoOfRows(table_name)
Arguments:
Argument Description
table_name The name of the table.
Arguments
Example:
LET a = NoOfRows('tab1');
Script syntax and chart functions - Qlik Sense, February 2022 823
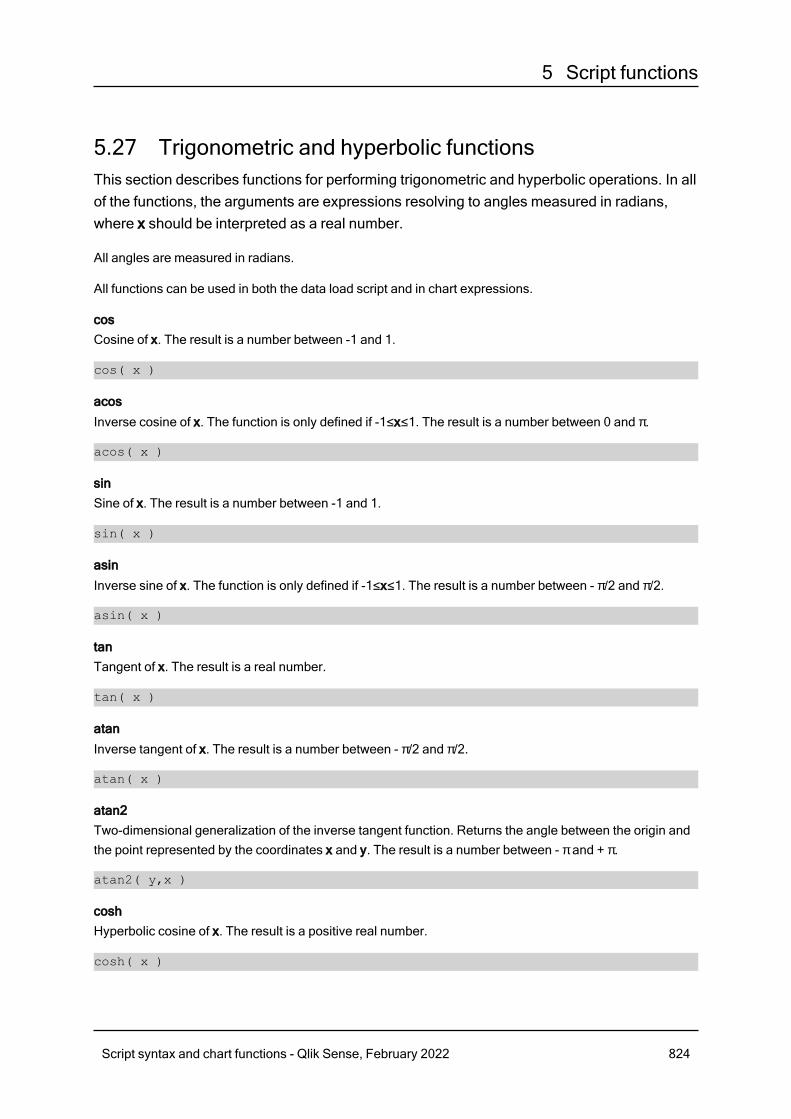
5 Script functions
5.27 Trigonometric and hyperbolic functionsThis section describes functions for performing trigonometric and hyperbolic operations. In allof the functions, the arguments are expressions resolving to angles measured in radians,where x should be interpreted as a real number.
All angles are measured in radians.
All functions can be used in both the data load script and in chart expressions.
cosCosine of x. The result is a number between -1 and 1.
cos( x )
acos
Inverse cosine of x. The function is only defined if -1≤x≤1. The result is a number between 0 and π.
acos( x )
sinSine of x. The result is a number between -1 and 1.
sin( x )
asin
Inverse sine of x. The function is only defined if -1≤x≤1. The result is a number between - π/2 and π/2.
asin( x )
tanTangent of x. The result is a real number.
tan( x )
atan
Inverse tangent of x. The result is a number between - π/2 and π/2.
atan( x )
atan2Two-dimensional generalization of the inverse tangent function. Returns the angle between the origin andthe point represented by the coordinates x and y. The result is a number between - π and + π.
atan2( y,x )
coshHyperbolic cosine of x. The result is a positive real number.
cosh( x )
Script syntax and chart functions - Qlik Sense, February 2022 824
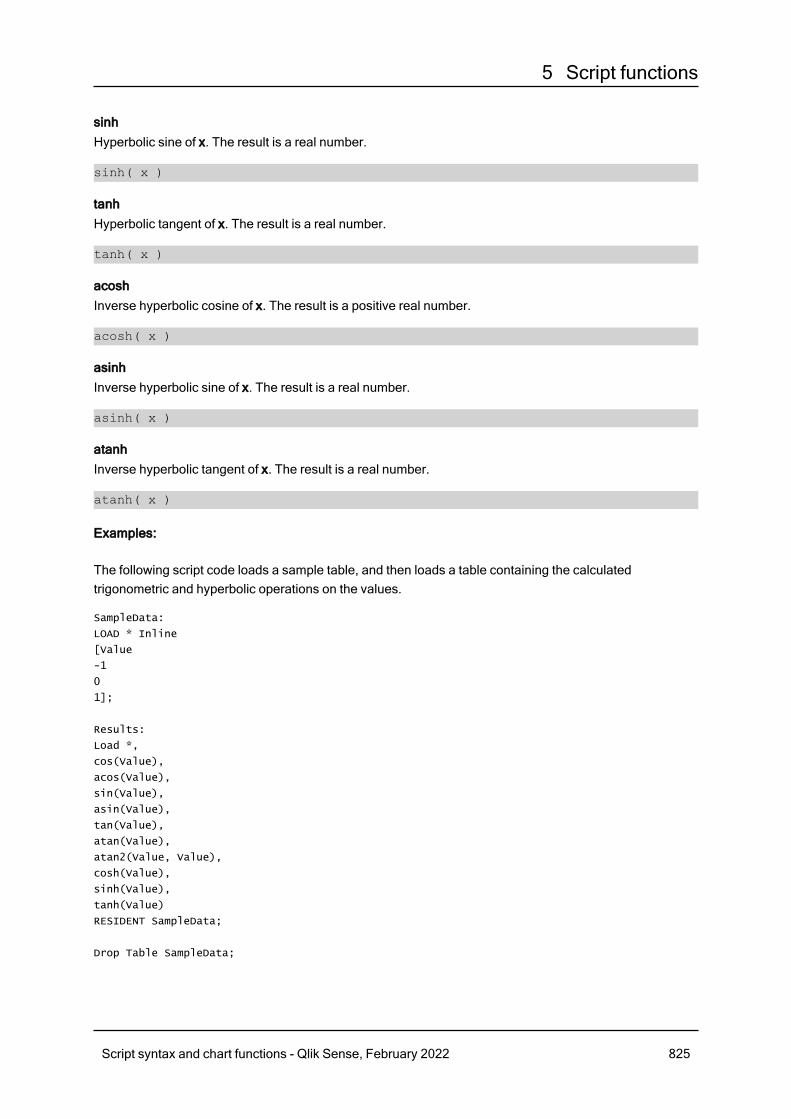
5 Script functions
sinhHyperbolic sine of x. The result is a real number.
sinh( x )
tanhHyperbolic tangent of x. The result is a real number.
tanh( x )
acoshInverse hyperbolic cosine of x. The result is a positive real number.
acosh( x )
asinhInverse hyperbolic sine of x. The result is a real number.
asinh( x )
atanhInverse hyperbolic tangent of x. The result is a real number.
atanh( x )
Examples:
The following script code loads a sample table, and then loads a table containing the calculatedtrigonometric and hyperbolic operations on the values.
SampleData:
LOAD * Inline
[Value
-1
0
1];
Results:
Load *,
cos(Value),
acos(Value),
sin(Value),
asin(Value),
tan(Value),
atan(Value),
atan2(Value, Value),
cosh(Value),
sinh(Value),
tanh(Value)
RESIDENT SampleData;
Drop Table SampleData;
Script syntax and chart functions - Qlik Sense, February 2022 825
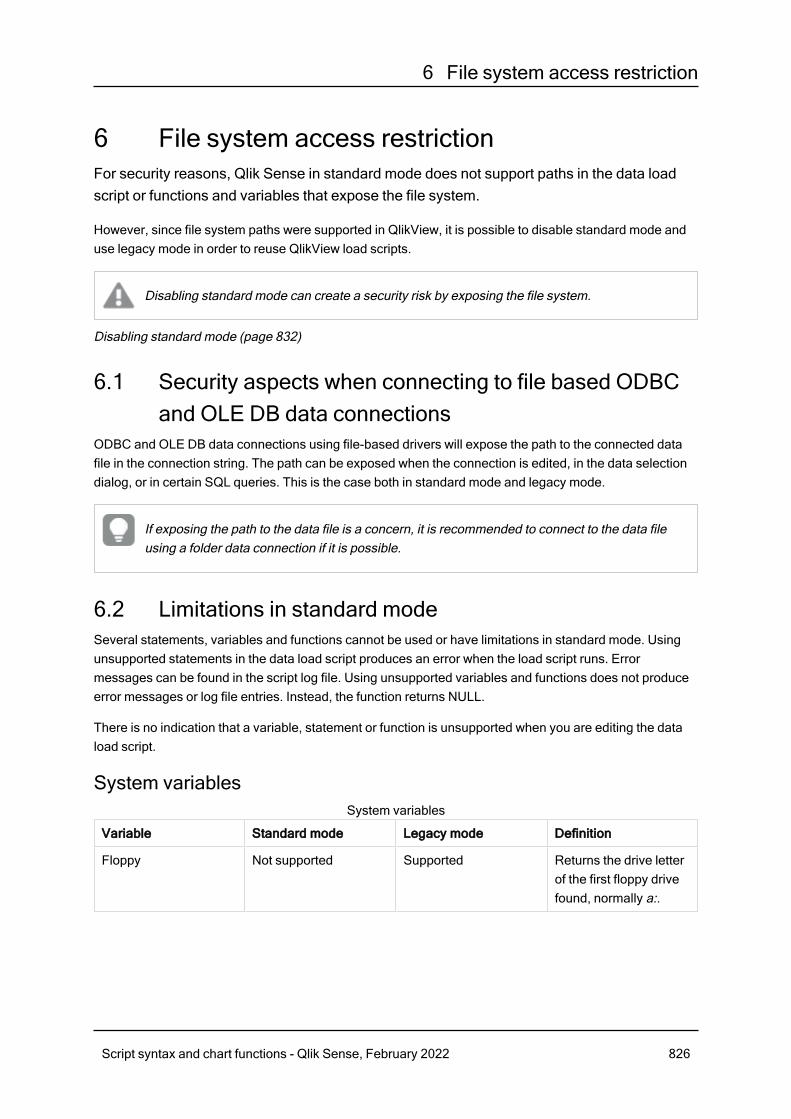
6 File system access restriction
6 File system access restrictionFor security reasons, Qlik Sense in standard mode does not support paths in the data loadscript or functions and variables that expose the file system.
However, since file system paths were supported in QlikView, it is possible to disable standard mode anduse legacy mode in order to reuse QlikView load scripts.
Disabling standard mode can create a security risk by exposing the file system.
Disabling standard mode (page 832)
6.1 Security aspects when connecting to file based ODBCand OLE DB data connections
ODBC and OLE DB data connections using file-based drivers will expose the path to the connected datafile in the connection string. The path can be exposed when the connection is edited, in the data selectiondialog, or in certain SQL queries. This is the case both in standard mode and legacy mode.
If exposing the path to the data file is a concern, it is recommended to connect to the data fileusing a folder data connection if it is possible.
6.2 Limitations in standard modeSeveral statements, variables and functions cannot be used or have limitations in standard mode. Usingunsupported statements in the data load script produces an error when the load script runs. Errormessages can be found in the script log file. Using unsupported variables and functions does not produceerror messages or log file entries. Instead, the function returns NULL.
There is no indication that a variable, statement or function is unsupported when you are editing the dataload script.
System variables
Variable Standard mode Legacy mode Definition
Floppy Not supported Supported Returns the drive letterof the first floppy drivefound, normally a:.
System variables
Script syntax and chart functions - Qlik Sense, February 2022 826
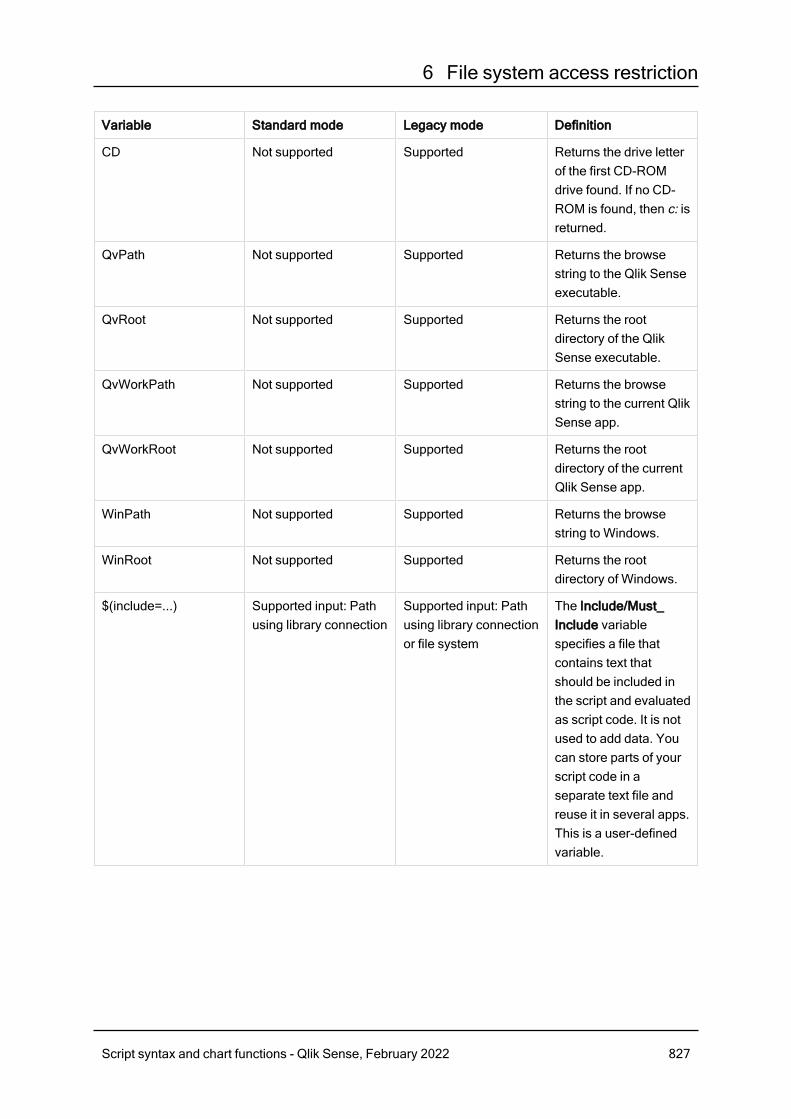
6 File system access restriction
Variable Standard mode Legacy mode Definition
CD Not supported Supported Returns the drive letterof the first CD-ROMdrive found. If no CD-ROM is found, then c: isreturned.
QvPath Not supported Supported Returns the browsestring to the Qlik Senseexecutable.
QvRoot Not supported Supported Returns the rootdirectory of the QlikSense executable.
QvWorkPath Not supported Supported Returns the browsestring to the current QlikSense app.
QvWorkRoot Not supported Supported Returns the rootdirectory of the currentQlik Sense app.
WinPath Not supported Supported Returns the browsestring to Windows.
WinRoot Not supported Supported Returns the rootdirectory of Windows.
$(include=...) Supported input: Pathusing library connection
Supported input: Pathusing library connectionor file system
The Include/Must_Include variablespecifies a file thatcontains text thatshould be included inthe script and evaluatedas script code. It is notused to add data. Youcan store parts of yourscript code in aseparate text file andreuse it in several apps.This is a user-definedvariable.
Script syntax and chart functions - Qlik Sense, February 2022 827
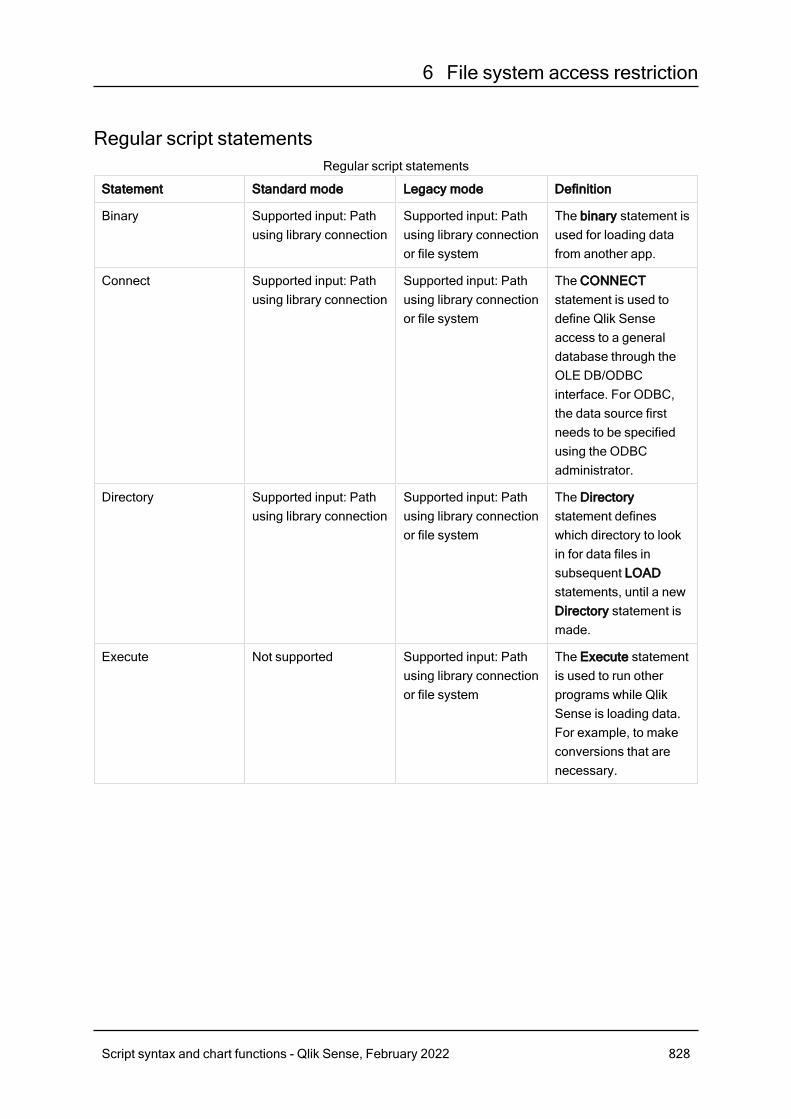
6 File system access restriction
Regular script statements
Statement Standard mode Legacy mode Definition
Binary Supported input: Pathusing library connection
Supported input: Pathusing library connectionor file system
The binary statement isused for loading datafrom another app.
Connect Supported input: Pathusing library connection
Supported input: Pathusing library connectionor file system
The CONNECTstatement is used todefine Qlik Senseaccess to a generaldatabase through theOLE DB/ODBCinterface. For ODBC,the data source firstneeds to be specifiedusing the ODBCadministrator.
Directory Supported input: Pathusing library connection
Supported input: Pathusing library connectionor file system
The Directorystatement defineswhich directory to lookin for data files insubsequent LOADstatements, until a newDirectory statement ismade.
Execute Not supported Supported input: Pathusing library connectionor file system
The Execute statementis used to run otherprograms while QlikSense is loading data.For example, to makeconversions that arenecessary.
Regular script statements
Script syntax and chart functions - Qlik Sense, February 2022 828
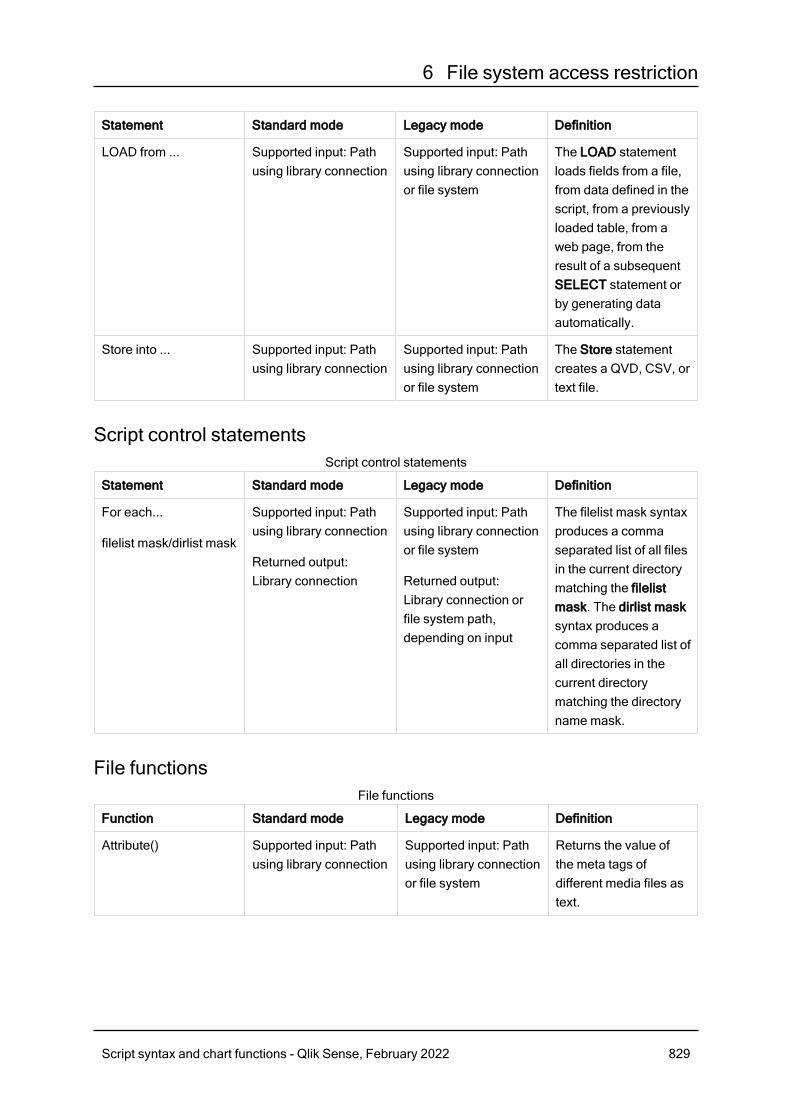
6 File system access restriction
Statement Standard mode Legacy mode Definition
LOAD from ... Supported input: Pathusing library connection
Supported input: Pathusing library connectionor file system
The LOAD statementloads fields from a file,from data defined in thescript, from a previouslyloaded table, from aweb page, from theresult of a subsequentSELECT statement orby generating dataautomatically.
Store into ... Supported input: Pathusing library connection
Supported input: Pathusing library connectionor file system
The Store statementcreates a QVD, CSV, ortext file.
Script control statements
Statement Standard mode Legacy mode Definition
For each...
filelist mask/dirlist mask
Supported input: Pathusing library connection
Returned output:Library connection
Supported input: Pathusing library connectionor file system
Returned output:Library connection orfile system path,depending on input
The filelist mask syntaxproduces a commaseparated list of all filesin the current directorymatching the filelistmask. The dirlist masksyntax produces acomma separated list ofall directories in thecurrent directorymatching the directoryname mask.
Script control statements
File functions
Function Standard mode Legacy mode Definition
Attribute() Supported input: Pathusing library connection
Supported input: Pathusing library connectionor file system
Returns the value ofthe meta tags ofdifferent media files astext.
File functions
Script syntax and chart functions - Qlik Sense, February 2022 829
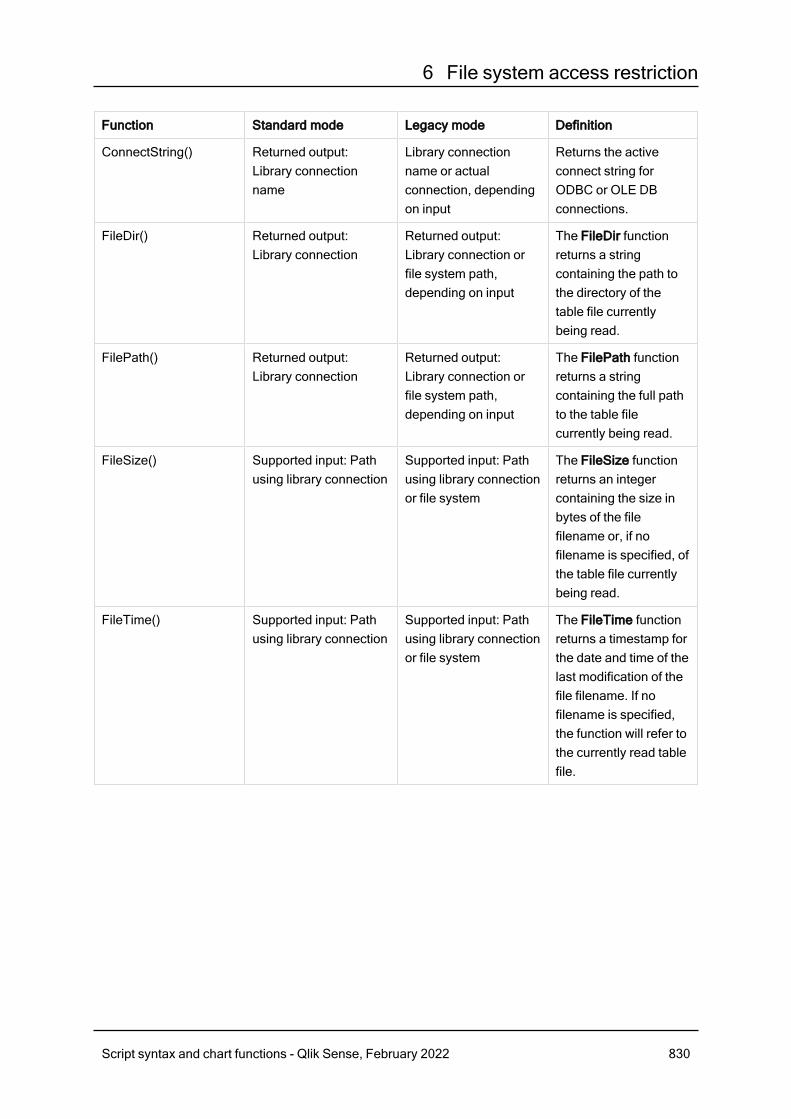
6 File system access restriction
Function Standard mode Legacy mode Definition
ConnectString() Returned output:Library connectionname
Library connectionname or actualconnection, dependingon input
Returns the activeconnect string forODBC or OLE DBconnections.
FileDir() Returned output:Library connection
Returned output:Library connection orfile system path,depending on input
The FileDir functionreturns a stringcontaining the path tothe directory of thetable file currentlybeing read.
FilePath() Returned output:Library connection
Returned output:Library connection orfile system path,depending on input
The FilePath functionreturns a stringcontaining the full pathto the table filecurrently being read.
FileSize() Supported input: Pathusing library connection
Supported input: Pathusing library connectionor file system
The FileSize functionreturns an integercontaining the size inbytes of the filefilename or, if nofilename is specified, ofthe table file currentlybeing read.
FileTime() Supported input: Pathusing library connection
Supported input: Pathusing library connectionor file system
The FileTime functionreturns a timestamp forthe date and time of thelast modification of thefile filename. If nofilename is specified,the function will refer tothe currently read tablefile.
Script syntax and chart functions - Qlik Sense, February 2022 830
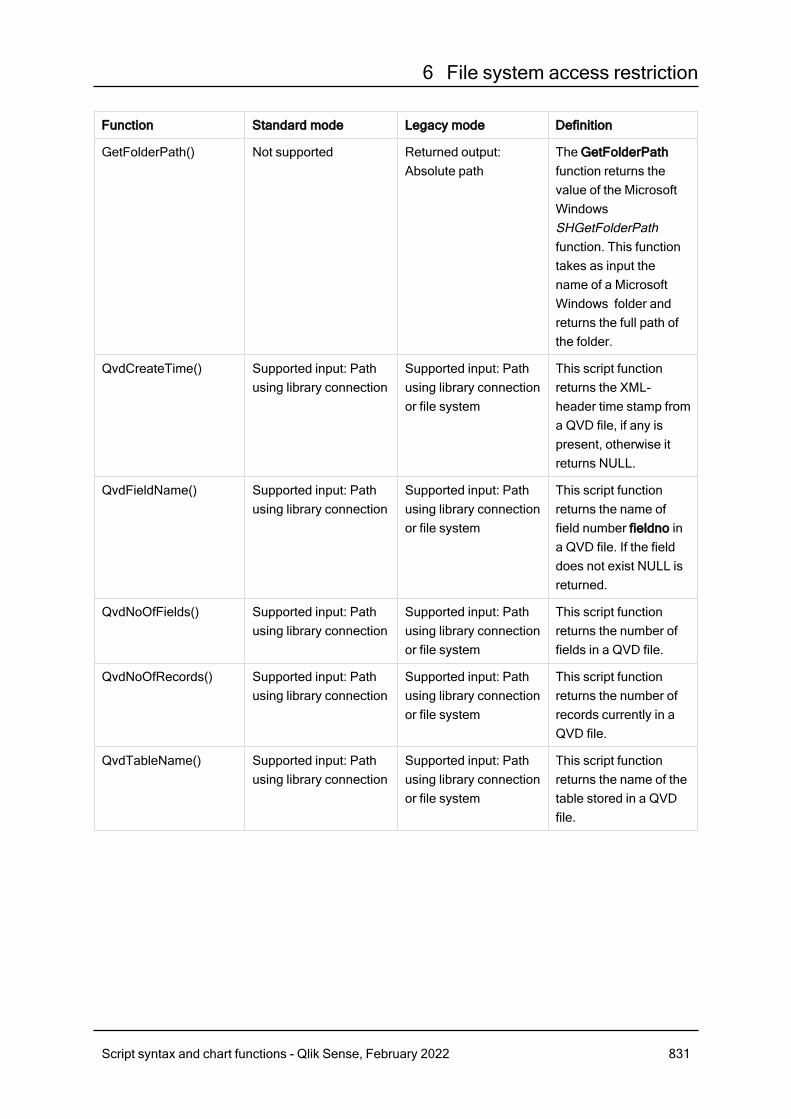
6 File system access restriction
Function Standard mode Legacy mode Definition
GetFolderPath() Not supported Returned output:Absolute path
The GetFolderPathfunction returns thevalue of the MicrosoftWindowsSHGetFolderPathfunction. This functiontakes as input thename of a MicrosoftWindows folder andreturns the full path ofthe folder.
QvdCreateTime() Supported input: Pathusing library connection
Supported input: Pathusing library connectionor file system
This script functionreturns the XML-header time stamp froma QVD file, if any ispresent, otherwise itreturns NULL.
QvdFieldName() Supported input: Pathusing library connection
Supported input: Pathusing library connectionor file system
This script functionreturns the name offield number fieldno ina QVD file. If the fielddoes not exist NULL isreturned.
QvdNoOfFields() Supported input: Pathusing library connection
Supported input: Pathusing library connectionor file system
This script functionreturns the number offields in a QVD file.
QvdNoOfRecords() Supported input: Pathusing library connection
Supported input: Pathusing library connectionor file system
This script functionreturns the number ofrecords currently in aQVD file.
QvdTableName() Supported input: Pathusing library connection
Supported input: Pathusing library connectionor file system
This script functionreturns the name of thetable stored in a QVDfile.
Script syntax and chart functions - Qlik Sense, February 2022 831
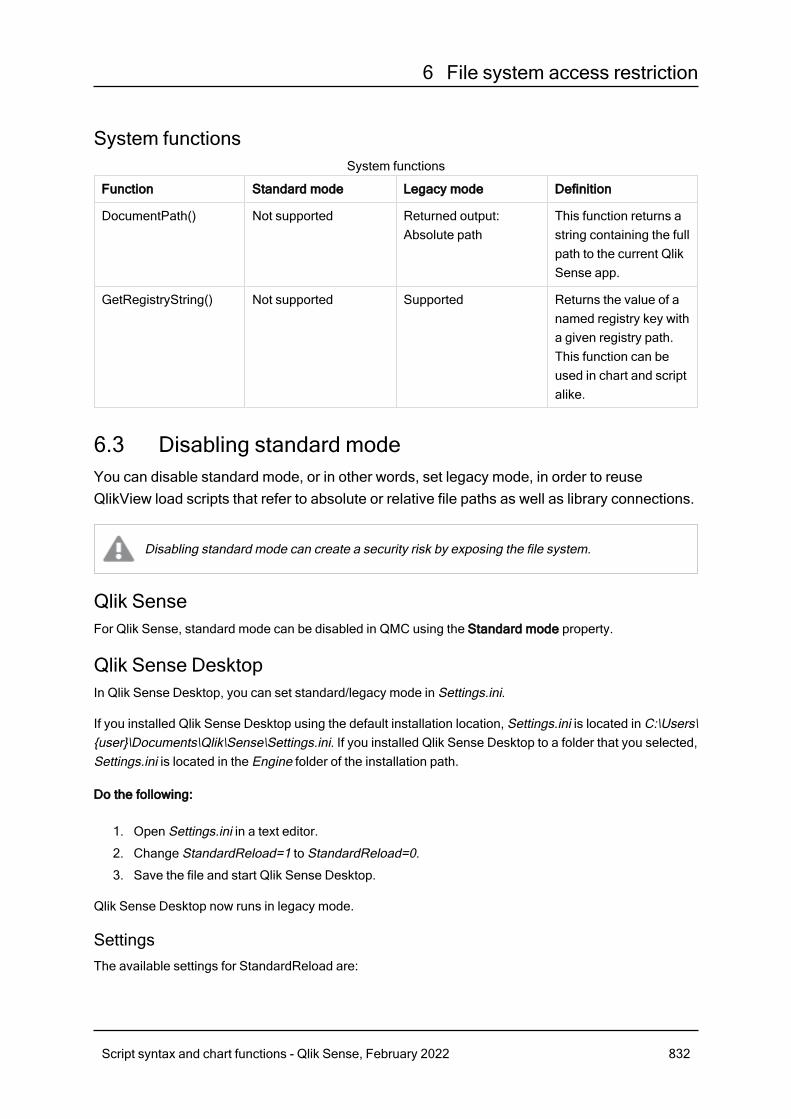
6 File system access restriction
System functions
Function Standard mode Legacy mode Definition
DocumentPath() Not supported Returned output:Absolute path
This function returns astring containing the fullpath to the current QlikSense app.
GetRegistryString() Not supported Supported Returns the value of anamed registry key witha given registry path.This function can beused in chart and scriptalike.
System functions
6.3 Disabling standard modeYou can disable standard mode, or in other words, set legacy mode, in order to reuseQlikView load scripts that refer to absolute or relative file paths as well as library connections.
Disabling standard mode can create a security risk by exposing the file system.
Qlik SenseFor Qlik Sense, standard mode can be disabled in QMC using the Standard mode property.
Qlik Sense DesktopIn Qlik Sense Desktop, you can set standard/legacy mode in Settings.ini.
If you installed Qlik Sense Desktop using the default installation location, Settings.ini is located in C:\Users\{user}\Documents\Qlik\Sense\Settings.ini. If you installed Qlik Sense Desktop to a folder that you selected,Settings.ini is located in the Engine folder of the installation path.
Do the following:
1. Open Settings.ini in a text editor.
2. Change StandardReload=1 to StandardReload=0.
3. Save the file and start Qlik Sense Desktop.
Qlik Sense Desktop now runs in legacy mode.
SettingsThe available settings for StandardReload are:
Script syntax and chart functions - Qlik Sense, February 2022 832
6 File system access restriction
l 1 (standard mode)l 0 (legacy mode)
Script syntax and chart functions - Qlik Sense, February 2022 833
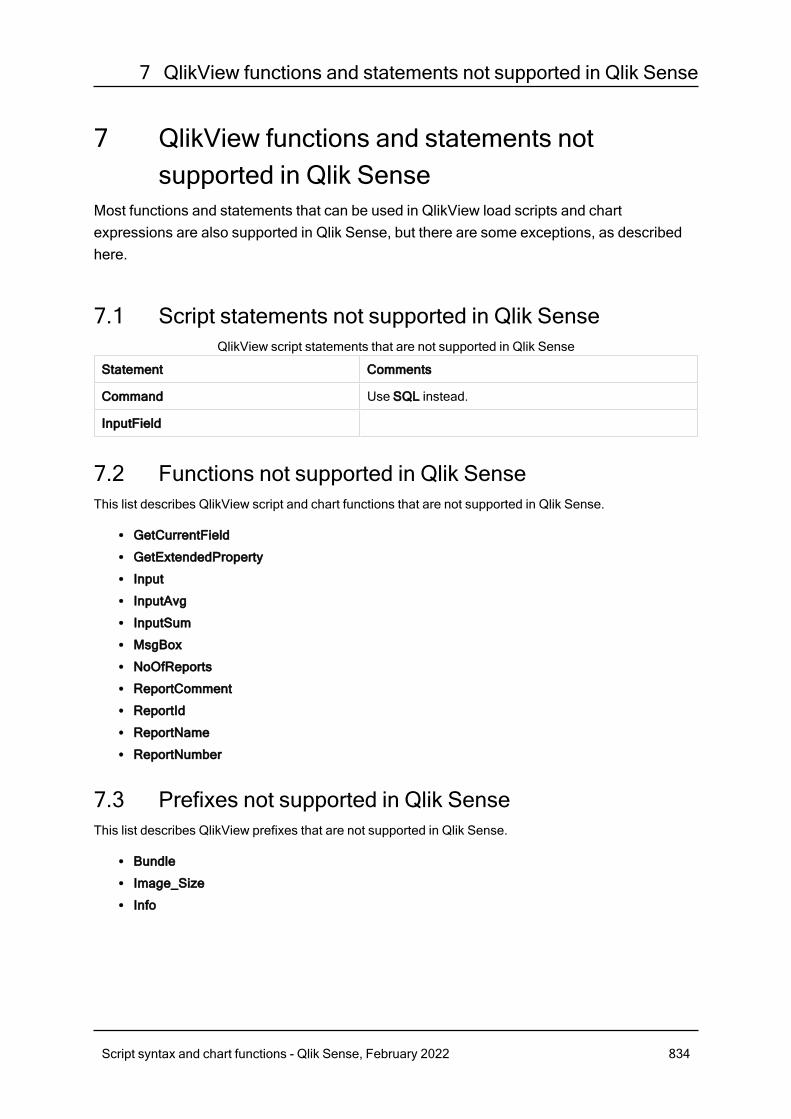
7 QlikView functions and statements not supported in Qlik Sense
7 QlikView functions and statements notsupported in Qlik Sense
Most functions and statements that can be used in QlikView load scripts and chartexpressions are also supported in Qlik Sense, but there are some exceptions, as describedhere.
7.1 Script statements not supported in Qlik Sense
Statement Comments
Command Use SQL instead.
InputField
QlikView script statements that are not supported in Qlik Sense
7.2 Functions not supported in Qlik SenseThis list describes QlikView script and chart functions that are not supported in Qlik Sense.
l GetCurrentFieldl GetExtendedPropertyl Inputl InputAvgl InputSuml MsgBoxl NoOfReportsl ReportCommentl ReportIdl ReportNamel ReportNumber
7.3 Prefixes not supported in Qlik SenseThis list describes QlikView prefixes that are not supported in Qlik Sense.
l Bundlel Image_Sizel Info
Script syntax and chart functions - Qlik Sense, February 2022 834
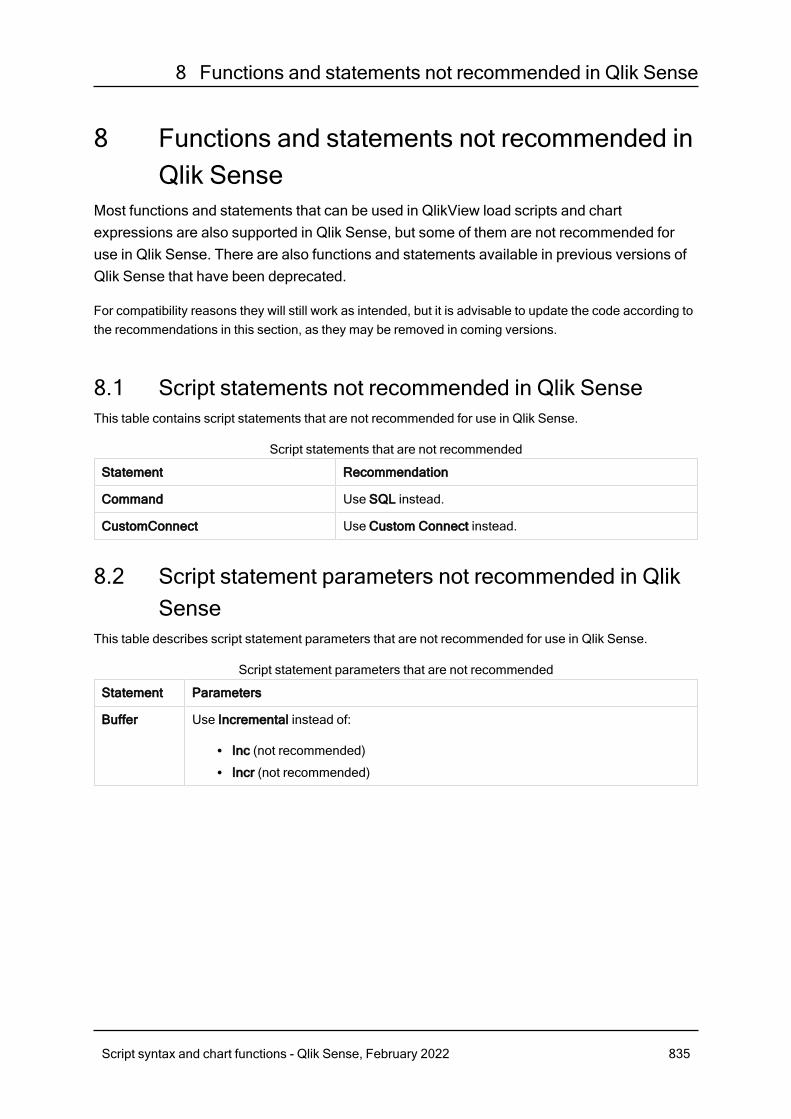
8 Functions and statements not recommended in Qlik Sense
8 Functions and statements not recommended inQlik Sense
Most functions and statements that can be used in QlikView load scripts and chartexpressions are also supported in Qlik Sense, but some of them are not recommended foruse in Qlik Sense. There are also functions and statements available in previous versions ofQlik Sense that have been deprecated.
For compatibility reasons they will still work as intended, but it is advisable to update the code according tothe recommendations in this section, as they may be removed in coming versions.
8.1 Script statements not recommended in Qlik SenseThis table contains script statements that are not recommended for use in Qlik Sense.
Statement Recommendation
Command Use SQL instead.
CustomConnect Use Custom Connect instead.
Script statements that are not recommended
8.2 Script statement parameters not recommended in QlikSense
This table describes script statement parameters that are not recommended for use in Qlik Sense.
Statement Parameters
Buffer Use Incremental instead of:
l Inc (not recommended)l Incr (not recommended)
Script statement parameters that are not recommended
Script syntax and chart functions - Qlik Sense, February 2022 835
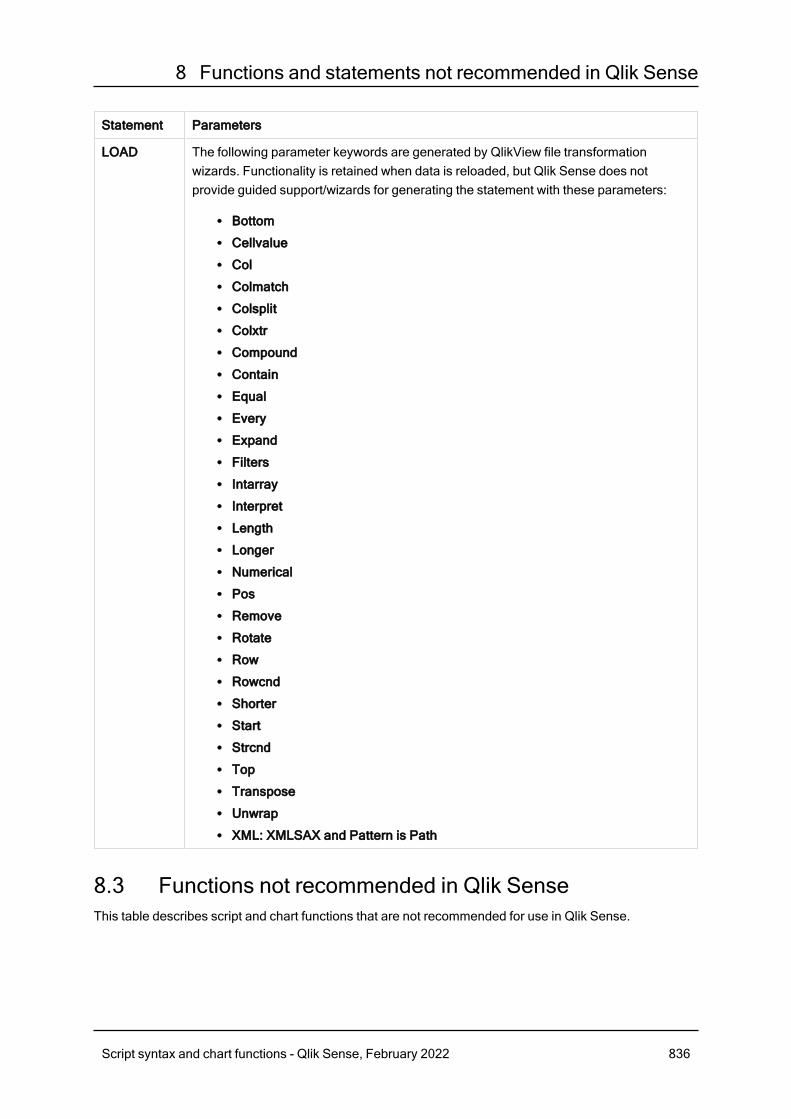
8 Functions and statements not recommended in Qlik Sense
Statement Parameters
LOAD The following parameter keywords are generated by QlikView file transformationwizards. Functionality is retained when data is reloaded, but Qlik Sense does notprovide guided support/wizards for generating the statement with these parameters:
l Bottoml Cellvaluel Coll Colmatchl Colsplitl Colxtrl Compoundl Containl Equall Everyl Expandl Filtersl Intarrayl Interpretl Lengthl Longerl Numericall Posl Removel Rotatel Rowl Rowcndl Shorterl Startl Strcndl Topl Transposel Unwrapl XML: XMLSAX and Pattern is Path
8.3 Functions not recommended in Qlik SenseThis table describes script and chart functions that are not recommended for use in Qlik Sense.
Script syntax and chart functions - Qlik Sense, February 2022 836
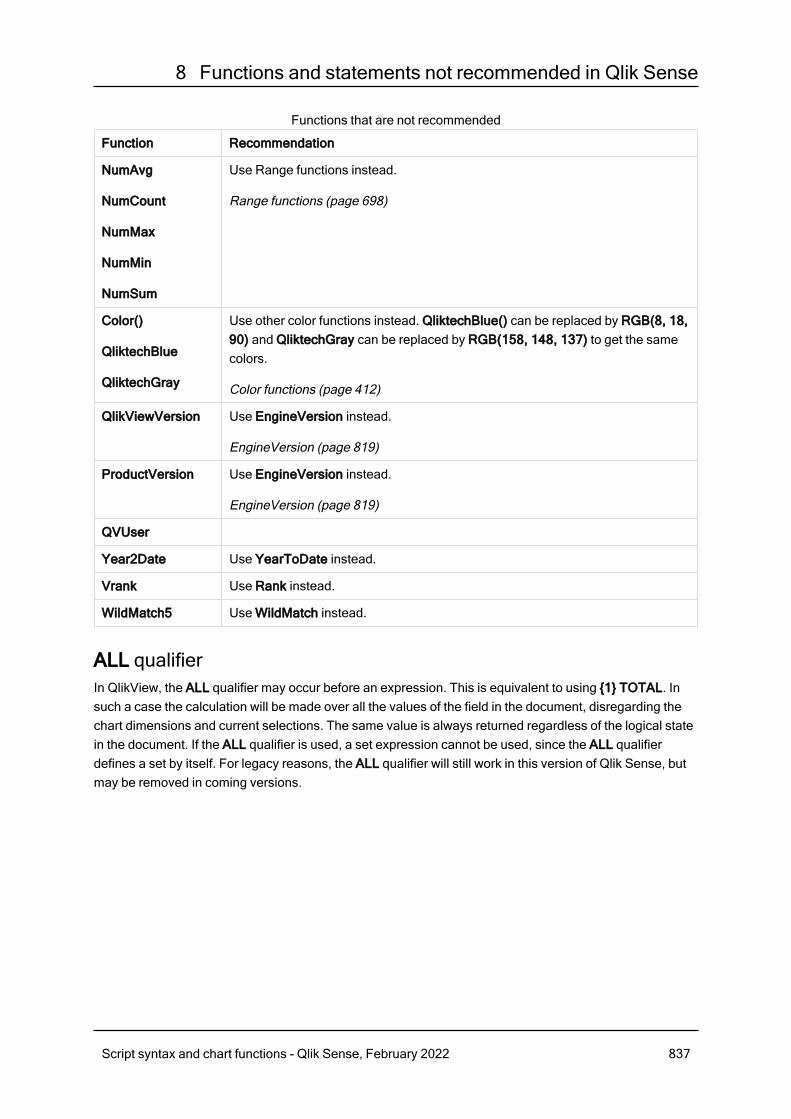
8 Functions and statements not recommended in Qlik Sense
Function Recommendation
NumAvg
NumCount
NumMax
NumMin
NumSum
Use Range functions instead.
Range functions (page 698)
Color()
QliktechBlue
QliktechGray
Use other color functions instead. QliktechBlue() can be replaced by RGB(8, 18,90) and QliktechGray can be replaced by RGB(158, 148, 137) to get the samecolors.
Color functions (page 412)
QlikViewVersion Use EngineVersion instead.
EngineVersion (page 819)
ProductVersion Use EngineVersion instead.
EngineVersion (page 819)
QVUser
Year2Date Use YearToDate instead.
Vrank Use Rank instead.
WildMatch5 Use WildMatch instead.
Functions that are not recommended
ALL qualifierIn QlikView, the ALL qualifier may occur before an expression. This is equivalent to using {1} TOTAL. Insuch a case the calculation will be made over all the values of the field in the document, disregarding thechart dimensions and current selections. The same value is always returned regardless of the logical statein the document. If the ALL qualifier is used, a set expression cannot be used, since the ALL qualifierdefines a set by itself. For legacy reasons, the ALL qualifier will still work in this version of Qlik Sense, butmay be removed in coming versions.
Script syntax and chart functions - Qlik Sense, February 2022 837