
Barclays Bank UK PLC Pillar 3 Report 2021 YE - DOC
153
Barclays Bank UK PLC Pillar 3 Report 31 December 2021
-
Upload
khangminh22 -
Category
Documents
-
view
3 -
download
0
Transcript of Barclays Bank UK PLC Pillar 3 Report 2021 YE - DOC

Barclays Bank UK PLC Pillar 3 Report
31 December 2021

Barclays Bank UK PLC Pillar 3 Report
Introduction
Notes on Basis of Preparation 3
Linkage between financial statement and regulatory risk 6
Risk and capital position review
Analysis of treasury and capital risk 8
Analysis of credit risk 21
Analysis of counterparty credit risk 62
Analysis of market risk 69
Analysis of securitisation exposures 70
Analysis of operational risk 78
Barclays approach to managing risks
Risk management strategy, governance and risk culture 80
Management of credit risk and the internal ratings-based approach 89
Management of counterparty credit risk and credit risk mitigation techniques 111
Management of market risk 115
Management of securitisation exposures 120
Management of treasury and capital risk 123
Management of operational risk 130
Management of model risk 135
Management of conduct risk 137
Management of reputation risk 139
Management of legal risk 140
Appendix A – Probabilities of Default (PD), Loss Given Default (LGD), Risk Weighted Asset (RWA) and exposure by country 142
Appendix B – Analysis of impairment 143
Appendix C – Countercyclical buffer 144
Appendix D – Disclosure on asset encumbrance 145
Appendix E – Disclosures on remuneration 146
A glossary of terms and remuneration disclosures can be found at: home.barclays/investor-relations/reports-and-events/latest-financial-results
Contents
barclays.com/annualreport Barclays Bank UK PLC Pillar 3 Report 2021 >2

Pillar 3 disclosures complement those disclosed in the Barclays Bank UK PLC 2021 Annual Report and provide additional information about Barclays Bank UK Group’s risk profile, including its regulatory capital, risk weighted assets (RWAs), liquidity and leverage exposures.
Pillar 3 report regulatory framework
The Pillar 3 report is prepared in accordance with the Capital Requirements Regulation and Capital Requirements Directive (‘CRR’ and ‘CRD IV’, also known as the ‘CRD IV legislative package’) as amended by CRR II and CRD V as at the applicable reporting date. In particular, articles 431 to 455 of the CRR specify the Pillar 3 framework requirements. The CRD IV legislative package came into force on 1 January 2014. The Pillar 3 disclosures have also been prepared in accordance with the European Banking Authority (EBA) “Guidelines on materiality, proprietary and confidentiality and on disclosure frequency under Articles 432(1), 432(2) and 433 of CRR” and the EBA “Guidelines on disclosure requirements under Part Eight of Regulation (EU) No 575/2013”.
Key changes in the 2021 Pillar 3 Report
Regulatory Updates
Following the withdrawal of the UK from the EU, any references to CRR as amended by CRR II mean, unless otherwise specified, CRR as amended by CRR II, as it forms part of UK law pursuant to the European Union (Withdrawal) Act 2018 and subject to the temporary transitional powers (TTP) available to UK regulators to delay or phase-in on-shoring changes to UK regulatory requirements arising at the end of the transition period until 31 March 2022, as at the applicable reporting date.
Post year-end updates
The Prudential Regulation Authority (PRA) has implemented several regulatory changes impacting the calculation of the CET1 ratio within the UK. Changes have also been implemented following the review of the UK Leverage framework. All changes took effect from 1 January 2022.
Capital and RWAs
On 19 July 2019, the EBA published a report on the implementation of IRB roadmap changes. These have subsequently been implemented by the PRA via several Policy Statements. Key changes include revisions to the criteria for definition of default, probability of default (PD) and loss given default (LGD) estimation to ensure supervisory consistency and increase transparency of Internal Ratings-Based (IRB) models.
On 14 October 2021, the PRA finalised their implementation of Basel standards through Policy Statement 22/21. The finalised requirements included the introduction of the Standardised Approach for Counterparty Credit Risk (SA-CCR) which replaces the Current Exposure Method (CEM) for Standardised derivative exposures as a more risk sensitive approach.
UK Leverage Ratio Framework
The Barclays Bank UK Group is required to disclose an average UK leverage ratio which is based on capital on the last day of each month in the quarter and an exposure measure for each day in the quarter. The Barclays Bank UK Group is also required to disclose a UK leverage ratio based on capital and exposure on the last day of the quarter. On 8 October 2021, the PRA published its Policy Statement on the UK leverage ratio framework. The Policy Statement confirms that UK banks will be subject to a single UK leverage ratio requirement meaning that the CRR leverage ratio will no longer apply for UK banks from 1 January 2022. Whilst largely upholding the existing framework, technical changes generally align to the Basel III standards. Minimum requirements for the Barclays Bank UK Group will remain the same.
IntroductionNotes on Basis of Preparation
barclays.com/annualreport Barclays Bank UK PLC Pillar 3 Report 2021 >3

Policy, validation and sign off
Throughout the year ended 31 December 2021, and to date, Barclays Bank UK Group has operated a framework of disclosure controls and procedures to ensure the completeness and accuracy of the Pillar 3 disclosure.
Barclays Bank UK Group is committed to operating within a strong system of internal controls. A framework of disclosure controls and procedures are in place to support the approval of the external regulatory disclosures. Specific governance committees are responsible for examining the Barclays Bank UK Group’s external reports and disclosures to ensure they have been subject to adequate verification and comply with applicable standards and legislation. These committees report their conclusions to the Barclays Bank UK PLC Board Audit Committee (BAC).
This governance process is in place to provide both management and the Board with sufficient opportunity to debate andchallenge the Barclays Bank UK Group’s disclosures before they are made public.
“We confirm that Barclays Bank UK PLC’s Pillar 3 disclosures, to the best of our knowledge, comply with Part Eight of the CRRand have been prepared in compliance with Barclays’ internal control framework.”
James Mack Matthew StevensChief Financial Officer, Barclays Bank UK PLC Chief Risk Officer, Barclays Bank UK PLC
IntroductionNotes on Basis of Preparation
barclays.com/annualreport Barclays Bank UK PLC Pillar 3 Report 2021 >4

Overview
Barclays Bank UK PLC is a wholly-owned subsidiary of Barclays PLC. The consolidation of Barclays Bank UK PLC and its subsidiaries is referred to as the Barclays Bank UK Group. The term Barclays refers to Barclays PLC and Barclays Group refers to Barclays PLC, together with its subsidiaries.
Barclays Bank UK PLC is the ring-fenced bank within the Barclays Group. The Barclays Bank UK Group contains the majority of the Barclays Group’s Barclays UK division, including the Personal Banking, Business Banking and Barclaycard Consumer UK businesses other than the Barclays Partner Finance business.
Barclays Bank UK PLC serves retail customers in the UK across the entire spectrum of their banking needs.Barclays Bank UK PLC also supports small and medium-sized businesses, providing the financing, saving and transactional products and services they need to grow.
Our structure
Barclays is one of the most recognisable brands in the UK. Barclays Bank UK Group serves customers across a wide range of retail banking needs, from credit card users, to start-up businesses, to homebuyers getting on the property ladder for the first time.
Personal BankingOffers retail solutions to help customers with their day-to-day banking needs.
Business BankingServes business clients, from high growth start-ups to small and medium-sized enterprises, with specialist advice for their business banking needs.
Barclaycard Consumer UKA leading credit card provider, offering flexible borrowing and payment solutions, while delivering a leading customer experience.
Barclays Bank UK PLC is supported by the Barclays Group service company, Barclays Execution Services Limited (BX) which provides technology, operations and functional services to businesses across the Barclays Group.
IntroductionNotes on Basis of Preparation
barclays.com/annualreport Barclays Bank UK PLC Pillar 3 Report 2021 >5

Table 1: LI1– Differences between accounting and regulatory scopes of consolidation and the mapping of financial statement categories with regulatory risk categories
This table outlines the differences in the basis of consolidation for accounting and regulatory purposes. It provides an allocation of the balance sheet line items reported under the scope of regulatory consolidation between the different regulatory risk frameworks. Information regarding the market risk valuation methodologies, independent price verifications process and procedures for valuation adjustments or reserves can be found in the Management of market risk section from page 115.
Carrying values as
reported in published
financial statements
Carrying values under
scope of regulatory
consolidation
Subject to the credit risk
framework
Subject to the CCR
framework
Subject to the securitisation
frameworka
Subject to the market risk framework
Not subject to capital
requirements or subject to
deduction from capitalb
As at 31 December 2021 £m £m £m £m £m £m £m
AssetsCash and balances at central banks 69,488 69,415 69,415 — — — — Cash collateral and settlement balances 5,067 5,067 3,981 811 — — 275 Loans and advances at amortised cost 220,271 220,351 213,005 — 7,346 — — Reverse repurchase agreements and other similar secured lending 65 65 — 65 — — — Trading portfolio assets 169 169 — — — 169 — Financial assets at fair value through the income statement 2,767 2,767 2,767 — — — — Derivative financial instruments 890 890 — 890 — — — Financial assets at fair value through other comprehensive income 14,945 14,945 14,945 — — — — Investments in associates and joint ventures — 129 129 — — — — Goodwill and intangible assets 3,526 3,526 — — — — 3,526 Property, plant and equipment 562 562 562 — — — — Current tax assets — — — — — — — Deferred tax assets 1,368 1,368 1,279 — — — 89 Retirement benefit assets — — — — — — — Other assets 577 550 550 — — — — Total assets 319,695 319,804 306,632 1,766 7,346 169 3,890 LiabilitiesDeposits at amortised cost 260,732 260,733 — — — — 260,733 Cash collateral and settlement balances 774 774 — 627 — — 147 Repurchase agreements and other similar secured borrowing 18,160 18,160 — 3,156 — — 15,004 Debt securities in issue 8,684 8,684 — — — — 8,684 Subordinated liabilities 9,516 9,516 — — — — 9,516 Trading portfolio liabilities 878 878 — — — 878 — Financial liabilities designated at fair value — — — — — — — Derivative financial instruments 814 814 — 814 — — — Current tax liabilities 377 374 — — — — 374 Deferred tax liabilities — — — — — — — Retirement benefit liabilities — — — — — — — Other liabilities 1,824 1,840 — — — — 1,840 Provisions 536 531 — — — — 531 Total liabilities 302,295 302,304 — 4,596 — 878 296,830
NotesThe following points should be considered in conjunction with table LI1:
a The column “subject to securitisation framework” includes non-trading book positions only. b For liabilities, balances shown in column “Not subject to capital requirements or subject to deduction from capital” are residual balances so that “Carrying
values under scope of regulatory consolidation” equals to the sum of those in the columns relating to the regulatory framework.
Risk and capital position reviewLinkage between financial statement and regulatory risk
barclays.com/annualreport Barclays Bank UK PLC Pillar 3 Report 2021 >6

Table 2: LI2 – Main sources of differences between regulatory exposure amounts and carrying values in financial statements
This table provides a reconciliation between assets carrying values under the regulatory scope of consolidation as per Table 1 and the exposures used for regulatory purposes, split as per the regulatory risk framework.
Off-balance-sheet amounts: Under the credit risk framework, these balances principally consist of undrawn credit facilities after the application of credit conversion factors (CCF). Under the counterparty credit risk (CCR) framework, the off balance sheet items principally consist of the exposure due to collateral given in Securities Financing Transactions (SFTs).
Difference due to netting rules: This reflects the effects of master netting agreements in addition to the netting permitted under International Accounting Standards (IAS) framework.
Differences due to consideration of provisions: The assets carrying values are net of impairment. The regulatory exposure calculated under Advanced Internal Rating Based (AIRB) approach adds back the impairment.
Differences between input balance and modelled regulatory output: The assets carrying values as defined per IFRS differ from the values used for regulatory reporting purposes, this primarily reflects the modelling of exposure for retail AIRB positions.
Totala
Subject to the credit risk
framework
Subject to the CCR
framework
Subject to the securitisation
frameworkAs at 31 December 2021 £m £m £m £m
Assets carrying value amount under the scope of regulatory consolidation (as per template LI1) 315,746 306,632 1,767 7,346 Liabilities carrying value amount under the regulatory scope of consolidation (as per template EU LI1) (4,596) — (4,596) — Total net amount under the regulatory scope of consolidation 311,150 306,632 (2,829) 7,346 Off-balance-sheet amountsb 103,316 48,907 12,069 — Differences in valuations — — — — Differences due to different netting rules (6,096) — (6,096) — Differences due to consideration of provisions 1,987 1,987 — — Differences due to prudential filters — — — — Differences between input balance and modelled regulatory output 11,563 11,563 — — Credit Enhancement Exposure for Sponsor trades — — — — Exposures of Synthetic Securitisation trades 682 — — 682 Exposure amounts considered for regulatory purposes 422,602 369,089 3,144 8,028
NotesThe following points should be considered in conjunction with table LI2:
a The total column cannot be directly reconciled back to the carrying values under scope of consolidation shown in table 1 - LI1, as it excludes balances “subject to the market risk framework” and items “not subject to capital requirements or subject to deduction from capital”.
b In line item “Off-balance sheet amounts”, the amounts shown in the Total column, which relates to exposures pre-CCF, do not equal the sum of the amounts shown in the remaining columns, as these are post-CCF.
Table 3: LI3 Outline of the differences in the scopes of consolidation (entity by entity)
Method of regulatory consolidation
Description of the entityName of the entity
Method of accounting consolidation
Full consolidation
Proportional consolidation
Neither consolidated nor deducteda Deducted
Barclays Insurance Services Company Limited
Fully consolidated Y Activities auxiliary to financial services and insurance activities
Vaultex UK Limited Proportionally consolidated
Y Activities auxiliary to financial services and insurance activities
Note
a Column “neither consolidated nor deducted”: Exposure to and/or equity investment in these entities are risk weighted or deducted from capital subject to thresholds.
Risk and capital position reviewLinkage between financial statement and regulatory risk
barclays.com/annualreport Barclays Bank UK PLC Pillar 3 Report 2021 >7

IFRS 9 transitional capital arrangements
On 1 January 2018, IFRS 9 transitional capital arrangements were implemented by Regulation (EU) 2017/2395. Barclays elected to apply the transitional arrangements at both consolidated and individual entity levels and will disclose both transitional and fully loaded CET1 ratios until the end of the transitional period. On 27 June 2020, the CRR was further amended to extend the transitional period by two years and to introduce a new modified calculation.
The transitional arrangements, implemented under a modified static approach, allow for transitional relief on the “day 1” impact on adoption of IFRS 9 (static element) and for the increase in provisions between “day 1” and the reporting date (modified element), subject to eligibility.
The transitional relief applied to the static element is phased out over a 5 year period with 95% applicable for 2018; 85% for 2019; 70% for 2020; 50% for 2021; 25% for 2022 and with no transitional relief from 2023.
The transitional relief applied to the modified element for increases between “day 1” and 31 December 2019 is phased out in line with the static element. From 27 June 2020, under new legislation, the transitional relief applied to the modified element for increases between 1 January 2020 and the reporting date is phased out over a 5 year period with 100% applicable for 2020 and 2021; 75% for 2022; 50% for 2023; 25% for 2024 and with no transitional relief from 2025.
For the static element, Stage 1, Stage 2 and Stage 3 provisions are eligible for transition, whereas for the modified elements, Stage 3 provisions are excluded.
Total increases in impairment allowances as a result of IFRS 9, net of tax, decreases shareholders’ equity through retained earnings and decreases standardised RWAs due to the increase in impairment being offset against the standardised credit risk exposures. This is somewhat reversed by the transitional relief applied on eligible impairment.
Separate calculations are performed for standardised and AIRB portfolios, reflecting the different ways these frameworks take account of provisions.
Under the standardised approach, increases in provisions for both the static and modified elements are eligible for transition. When recalculating the requirements in CRR, as amended by CRR II, under the standardised approach, a risk weight of 100% is assigned to the eligible impairment.
For AIRB exposures, the calculation of capital takes account of the expected loss via a comparison with the impairment allowances. Where regulatory expected losses exceed impairment allowances, the shortfall is deducted from CET1 capital. Where the impairment allowance is higher than expected loss, the excess is added back to tier 2 capital and capped at an amount of 0.6% of AIRB RWAs. For both the static and modified elements, provisions are only eligible for transitional relief to the extent that they exceed regulatory expected loss.
The deferred tax assets (DTAs) created from the increase of impairment are also accounted for in the CET1 ratio. When DTAs arising from temporary differences are above the 10% CET1 capital threshold, any excess above the threshold is deducted and those below the threshold are risk weighted at 250% up to the point they reach threshold. DTAs that rely on future profitability excluding temporary differences are deducted from CET1 capital. To the extent that DTAs have arisen as a result of increases in eligible impairment, the impacts may also be reversed by the transitional relief applied.
Risk and capital position reviewAnalysis of treasury and capital risk
barclays.com/annualreport Barclays Bank UK PLC Pillar 3 Report 2021 >8

Table 4: Key Metrics (KM1 / IFRS 9-FL / Article 468-FLa)
Barclays Bank UK Group’s capital, RWAs and leverage is calculated applying transitional relief for IFRS 9, no other transitional provisions in CRR as amended by CRR II applicable as at the reporting date are applicable. The table below therefore represents both transitional and fully loaded capital metrics which is equal to transitional capital and capital as if IFRS 9 or analogous Expected Credit Losses (ECLs) transitional arrangements had not been applied.
KM1 Ref
IFRS9-FL Ref
31 Dec 2021
30 June 2021
31 Dec 2020
30 Jun 2020
£m £m £m £mAvailable capital (amounts)
1 1 Common Equity Tier 1 (CET1)b 10,828 11,330 11,247 10,834 1a 2 Fully loaded Expected Credit Loss (ECL) accounting modelc 10,572 11,029 10,517 10,181 2 3 Tier 1b 13,388 13,890 13,807 13,394 2a 4 Fully loaded ECL accounting model Tier 1c 13,132 13,589 13,077 12,741 3 5 Total capitalb 16,442 17,088 17,178 17,537 3a 6 Fully loaded ECL accounting model total capitalc 16,359 16,951 16,677 17,153
Risk-weighted assets (amounts)4 7 Total risk-weighted assets (RWA)b 71,213 71,014 72,025 76,039 4a 8 Fully loaded ECL accounting model total risk-weighted assets (RWA)c 71,116 70,984 72,039 76,054
Risk-based capital ratios as a percentage of RWA5 9 Common Equity Tier 1 ratio (%)b 15.2% 16.0% 15.6% 14.2% 5a 10 Fully loaded ECL accounting model Common Equity Tier 1 (%)c 14.9% 15.5% 14.6% 13.4% 6 11 Tier 1 ratio (%)b 18.8% 19.6% 19.2% 17.6% 6a 12 Fully loaded ECL accounting model Tier 1 ratio (%)c 18.5% 19.1% 18.2% 16.8% 7 13 Total capital ratio (%)b 23.1% 24.1% 23.9% 23.1% 7a 14 Fully loaded ECL accounting model total capital ratio (%)c 23.0% 23.9% 23.1% 22.6%
Additional CET1 buffer requirements as a percentage of RWA8 Capital conservation buffer requirement (%) 2.5% 2.5% 2.5% 2.5% 9 Countercyclical buffer requirement (%) 0.0% 0.0% 0.0% 0.0%
Other systemically important institutions (O-SII) requirements (%) 1.0% 1.0% 1.0% 1.0% 11 Total of bank CET1 specific buffer requirements(%) (row 8 + 9 + O-SII) 3.5% 3.5% 3.5% 3.5% 12 CET1 available after meeting the bank’s minimum capital requirements (%) 10.7% 11.5% 11.1% 9.7%
CRR leverage ratiob,d
13 15 Total CRR leverage ratio exposure measure 324,899 315,029 294,242 293,287 14 16 Transitional CRR leverage ratio (%) 4.1 % 4.4% 4.7% 4.6%
17 Leverage ratio as if IFRS 9 or analogous ECLs transitional arrangement had not been applied
4.0 % 4.3% 4.5% 4.4%
Average UK leverage ratio (Transitional)b,e,f
13a Total average UK leverage ratio exposure measure 246,849 247,213 245,992 247,894 14a Transitional average UK leverage ratio (%) 5.5 % 5.6% 5.6% 5.3%
UK leverage ratio (Transitional)b,d,e
13b Total UK leverage ratio exposure measure 241,173 247,974 245,176 245,609 14b Transitional UK leverage ratio (%) 5.6 % 5.6% 5.6% 5.5%
Liquidity Coverage Ratio15 Total HQLA 85,092 77,723 58,035 62,100 16 Total net cash outflows 41,690 38,354 36,246 36,390 17 LCR ratio (%) 204% 203% 160% 171%
Notes
a As at 31 December 2021, Barclays Bank UK PLC had not elected to apply the temporary treatment specified in Article 468 of the CRR, amended by Regulation EU 2020/873, resulting in the capital and leverage ratios reflecting the full impact of unrealised gains and losses measured at fair value through other comprehensive income.
b Transitional capital, RWAs and leverage ratios are calculated applying the IFRS 9 transitional arrangements of the CRR as amended by CRR II.c Fully loaded capital and RWAs are calculated without applying the IFRS 9 transitional arrangements of the CRR as amended by CRR II.d The difference between CRR leverage ratio and UK leverage ratio is driven by the exclusion of qualifying central bank claims and bounce back loans from the
UK leverage exposure.e Fully loaded average UK leverage ratio was 5.4%, with £246.5bn of leverage exposure. Fully loaded UK leverage ratio was 5.5%, with £240.9bn of leverage
exposure. Fully loaded UK leverage ratios are calculated without applying the IFRS 9 transitional arrangements of the CRR as amended by CRR II.f Average UK leverage ratio uses capital based on the last day of each month in the quarter and an exposure measure for each day in the quarter.
Risk and capital position reviewAnalysis of treasury and capital risk
barclays.com/annualreport Barclays Bank UK PLC Pillar 3 Report 2021 >9

Table 5: CC1 – Composition of regulatory capital
This table shows the components of regulatory capital presented on both a transitional and fully loaded basis as at 31 December 2021.
As at 31 December
2021Transitional
position
As at 31 December
2021Fully loaded
position
Ref† £m £mCommon Equity Tier 1 capital: instruments and reserves
1 Directly issued qualifying common share (and equivalent for non-joint stock companies) capital plus related stock surplus a 5 5
2 Retained earnings b 15,201 15,201 3 Accumulated other comprehensive income (and other reserves) c (366) (366)
Adjustment to retained earnings for foreseeable dividends (1,016) (1,016) Scope of consolidation adjustment 101 101
6 Common Equity Tier 1 capital before regulatory adjustments 13,925 13,925 111 111 Common Equity Tier 1 capital: regulatory adjustments
7 Prudent valuation adjustments (67) (67) 8 Goodwill (net of related tax liability) d,e (3,628) (3,628) 9 Other intangibles other than mortgage servicing rights (net of related tax liability) f 0 0 11 Cash flow hedge reserve g 431 431 21 Deferred tax assets arising from temporary differences (amount above 10% threshold, net of related tax liability) h (31) (89)
Adjustment under IFRS 9 transitional arrangementsk 198 — 28 Total regulatory adjustments to Common Equity Tier 1 (3,097) (3,353) 29 Common Equity Tier 1 (CET1) capital 10,828 10,572
Additional Tier 1 capital: instruments
30 Directly issued qualifying additional Tier 1 instruments plus related stock surplus i 2,560 2,560 31 Of which: classified as equity under applicable accounting standards i 2,560 2,560 36 Additional Tier 1 capital before regulatory adjustments 2,560 2,560 44 Additional Tier 1 (AT1) capital 2,560 2,560
45 Tier 1 capital (T1 = CET1 + AT1) 13,388 13,132
Tier 2 capital: instruments and provisions
46 Directly issued qualifying Tier 2 instruments plus related stock surplus j 2,909 2,909 50 Provisions 145 318 51 Tier 2 capital before regulatory adjustments 3,054 3,227 58 Tier 2 Capital (T2) 3,054 3,227
59 Total regulatory capital (TC = T1 + T2) 16,442 16,359 60 Total risk-weighted assets 71,213 71,116
Capital ratios and buffers
61 Common Equity Tier 1 (as a percentage of risk-weighted assets) 15.2% 14.9% 62 Tier 1 (as a percentage of risk-weighted assets) 18.8% 18.5% 63 Total capital (as a percentage of risk-weighted assets) 23.1% 23.0% 64 Institution-specific buffer requirement (capital conservation buffer plus countercyclical buffer requirements plus higher
loss absorbency requirement plus O-SII buffer, expressed as a percentage of risk-weighted assets) 3.5% 3.5% 65 of which: capital conservation buffer requirement 2.5% 2.5% 66 of which: countercyclical buffer requirement 0.0% 0.0% 67a of which: Global Systemically Important Institution (G-SII) or Other Systemically Important Institution (O-SII) buffer 1.0% 1.0% 68 Common Equity Tier 1 (as a percentage of risk-weighted assets) available after meeting the bank’s minimum capital
requirements 10.7% 10.4% Amounts below the thresholds for deduction (before risk weighting)
73 Significant investments in the common stock of financial entities 20 20 75 Deferred tax assets arising from temporary differences (net of related tax liability) 1,086 1,066
Applicable caps on the inclusion of provisions in Tier 2
78 Provisions eligible for inclusion in Tier 2 in respect of exposures subject to internal ratings-based approach (prior to application of cap) 145 349
79 Cap for inclusion of provisions in Tier 2 under internal ratings-based approach 319 318
Notes
† The references (a) – (j) identify balance sheet components in Table 6: CC2 – Reconciliation of regulatory capital to balance sheet which are used in the calculation of regulatory capital.
k Of which static nil, modified £198m. For more information, see page 8.
Risk and capital position reviewAnalysis of treasury and capital risk
barclays.com/annualreport Barclays Bank UK PLC Pillar 3 Report 2021 >10

Table 6: CC2 – Reconciliation of regulatory capital to balance sheet
This table shows the reconciliation between Barclays Bank UK Group’s balance sheet for statutory and regulatory purposes. Please note that the amount shown under the regulatory scope of consolidation is not a risk weighted asset measure; it is based on an accounting measure and cannot be directly reconciled to other tables in this report.
Accounting balance sheet per published
financial statements
Deconsolidation of insurance/other entities
Balance sheet per regulatory
scope of consolidation
As at 31 December 2021 Ref† £m £m £mAssetsCash and balances at central banks 69,488 (73) 69,415 Cash collateral and settlement balances 5,067 — 5,067 Loans and advances at amortised cost 220,271 80 220,351 Reverse repurchase agreements and other similar secured lending 65 — 65 Trading portfolio assets 169 — 169 Financial assets at fair value through the income statement 2,767 — 2,767 Derivative financial instruments 890 — 890 Financial assets at fair value through other comprehensive income 14,945 — 14,945 Investments in subsidiaries, associates and joint ventures d — 129 129 Goodwill and intangible assets 3,526 — 3,526
Of which: goodwill e 3,526 — 3,526 Of which: other intangibles (excluding MSRs) f — — —
Property, plant and equipment 562 — 562 Current tax assets — — — Deferred tax assets h 1,368 — 1,368 Other assets 577 (26) 551 Total assets 319,695 110 319,805 LiabilitiesDeposits at amortised cost 260,732 30 260,762 Cash collateral and settlement balances 774 — 774 Repurchase agreements and other similar secured borrowing 18,160 — 18,160 Debt securities in issue 8,684 — 8,684 Subordinated liabilities j 9,516 — 9,516 Trading portfolio liabilities 878 — 878 Derivative financial instruments 814 — 814 Current tax liabilities 377 (3) 374 Other liabilities 1,824 (13) 1,811 Provisions 536 (5) 531 Total liabilities 302,295 9 302,304 EquityCalled up share capital and share premium 5 — 5
Of which: amount eligible for CET1 a 5 — 5 Other equity instruments i 2,560 — 2,560 Other reserves c,g (366) 103 (263) Retained earnings b 15,201 (2) 15,199 Total equity 17,400 101 17,501 Total liabilities and equity 319,695 110 319,805
Note
† The references (a) – (j) identify balance sheet components that are used in the calculation of regulatory capital in Table 5: CC1 – Composition of regulatory capital on page 9.
Risk and capital position reviewAnalysis of treasury and capital risk
barclays.com/annualreport Barclays Bank UK PLC Pillar 3 Report 2021 >11

Table 7: Risk weighted assets by risk type
This table shows RWAs by risk type.
Risk weighted assets (RWAs) by risk type and approachCredit risk Counterparty credit risk Market risk
Operational risk
Total RWAs
Std AIRB Std AIRBSettlement
risk CVA Std IMAAs at 31 December 2021 £m £m £m £m £m £m £m £m £m £mRisk weighted assets 5,326 53,687 829 — — 379 100 — 10,892 71,213
As at 31 December 2020 £m £m £m £m £m £m £m £m £m £mRisk weighted assets 5,559 54,260 536 — — 251 72 — 11,347 72,025
Credit risk portfolios subject to
Standardised approach Advanced Internal Ratings Based (AIRB) approach• Minor UK Cards portfolio• Further Education and Local Authority portfolios• High quality liquidity pool assets• Minor unsecured loan portfolios (closed books in run off)• UK Wealth Portfolio
• UK managed retail and wholesale portfolios• UK cards
Barclays Bank UK AIRB roll-out plans are discussed with regulators and updated based on an agreed schedule.
Risk and capital position reviewAnalysis of treasury and capital risk
barclays.com/annualreport Barclays Bank UK PLC Pillar 3 Report 2021 >12

Table 8: OV1 - Overview of risk weighted assets by risk type and capital requirements
The table shows RWAs and minimum capital requirements split by risk type and approach.
Please see additional disclosures for each risk type in the Analysis of Credit Risk (page 21), Counterparty Credit Risk (page 62), Market Risk (page 69), Securitisation Exposures (page 70) and Operational Risk sections (page 78).
RWAMinimum Capital
Requirements
As at 31 December
2021
As at 31 December
2020
As at 31 December
2021
As at 31 December
2020£m £m £m £m
1 Credit risk (excluding counterparty credit risk) (CCR) 54,981 56,891 4,398 4,551 2 Of which standardised approach 4,598 5,072 368 405 3 Of which the foundation IRB (FIRB) approach — — — — 4 Of which the advanced IRB (AIRB) approach 50,383 51,819 4,031 4,146 5 Of which Equity IRB under the Simple risk-weight or the
internal models approach — — — — 6 CCR 1,208 787 97 63 7 Of which mark to market 260 192 21 16 8 Of which original exposure — — — — 9 Of which standardised approach — — — — 9a Of which financial collateral comprehensive method 388 140 31 11 10 Of which internal model method — — — — 11 Of which risk exposure amount for contributions to the default
fund of a CCP 181 204 14 16 12 Of which CVA 379 251 30 20 13 Settlement risk — — — — 14 Securitisation exposures in banking book (after cap) 1,268 737 101 59 14c Sec - External Ratings Based Approach 123 169 10 14 14d Sec - Internal Assessment Approach — — — — 14e Sec - Standardised Approach 556 268 44 21 14f Sec - Internal Ratings Based Approach 589 300 47 24 19 Market risk 100 72 8 6 20 Of which the standardised approach 100 72 8 6 21 Of which IMA — — — — 22 Large exposures — — — — 23 Operational risk 10,892 11,347 871 908 24 Of which basic indicator approach — — — — 25 Of which standardised approach 10,892 11,347 871 908 26 Of which advanced measurement approach — — — — 27 Amounts below the thresholds for deduction (subject to 250%
risk weight) 2,764 2,191 221 175 28 Floor Adjustments — — — — 29 Total 71,213 72,025 5,696 5,762
Risk and capital position reviewAnalysis of treasury and capital risk
barclays.com/annualreport Barclays Bank UK PLC Pillar 3 Report 2021 >13

Table 9: CR8 - RWA flow statement of credit risk exposures under the AIRB approach
RWA amount
Capital requirements
£m £m1 As at 1 January 2021 54,260 4,340 2 Asset size 82 7 3 Asset quality (21) (2) 4 Model updates (384) (31) 5 Methodology and policy 38 3 6 Acquisitions and disposals (288) (23) 7 Foreign exchange movements — — 8 Other — — 9 As at 31 December 2021 53,687 4,295
Basis of preparation for movements in risk weighted assetsSeven categories of drivers have been identified and are described below. Not all the drivers are applicable, however all categories have been listed below for completeness.
Asset/book sizeCredit risk and counterparty risk (including CVA)This represents RWA movements driven by changes in the size and composition of underlying positions, measured using Exposure at Default (EAD) values for existing portfolios over the period. This includes, but is not exclusive to:• new business and maturing loans• changes in product mix and exposure growth for existing portfolios• book size reductions owing to risk mitigation and write-offs
Asset/book qualityCredit risk and counterparty risk (including CVA)This represents RWA movements driven by changes in the underlying credit quality and recoverability of portfolios and reflected through model calibrations or realignments where applicable. This includes, but is not exclusive to:• Probability of Default (PD) migration and Loss Given Default (LGD) changes driven by economic conditions• ratings migration for standardised exposures
Model updatesCredit risk and counterparty risk (including CVA)This is the movement in RWAs as a result of both internal and external model updates. This includes, but is not exclusive to:• updates to existing model inputs driven by both internal and external review• model enhancements to improve models performance
Methodology and policyCredit risk and counterparty risk (including CVA)This is the movement in RWAs as a result of both internal and external methodology, policy and regulatory changes. This includes, but is not exclusive to:• updates to RWA calculation methodology, communicated by the regulator• the implementation of credit risk mitigation to a wider scope of portfolios
Acquisitions and disposalsThis is the movement in RWAs as a result of the disposal or acquisition of business operations impacting the size of banking and trading portfolios.
Foreign exchange movements
This is the movement in RWAs as a result of changes in the exchange rate between the functional currency of the Barclays business area or portfolio and our presentational currency for consolidated reporting. It should be noted that foreign exchange movements shown in Table 9 do not include the impact of foreign exchange for the counterparty credit risk or market risk RWAs.
OtherThis is the movement in RWAs driven by items that cannot be reasonably assigned to the other driver categories.
Risk and capital position reviewAnalysis of treasury and capital risk
barclays.com/annualreport Barclays Bank UK PLC Pillar 3 Report 2021 >14

Leverage ratio and exposures
The following leverage tables show the components of the leverage ratio using the CRR definition for the leverage exposure and the Tier 1 capital on a transitional basis as at 31 December 2021.a
Barclays Bank UK Group manages the risk associated with leverage exposures through the Barclays Bank UK Group’s capital risk management process. Leverage ratio forecasts are regularly monitored against early warning indicators and internal limits which trigger actions to mitigate risk. Barclays Bank UK Group leverage ratio is also subject to regular external and internal stress testing as applicable as part of Barclays Group.
Table 10: Summary reconciliation of accounting assets and leverage ratio exposures
This table is a summary of the total leverage exposure and comprises total IFRS assets used for statutory purposes, regulatory consolidation and other leverage adjustments.
As at 31 December
2021
As at 31 December
2020£m £m
1 Total assets as per published financial statements 319,695 287,498 2 Adjustment for entities which are consolidated for accounting purposes but are outside the
scope of regulatory consolidation 110 115 4 Adjustments for derivative financial instruments 49 132 5 Adjustments for securities financing transactions (SFTs) 0 1 6 Adjustment for off-balance sheet items (i.e. conversion to credit equivalent amounts of off-
balance sheet exposures) 8,563 9,475 7 Other adjustments (asset amounts deducted in determining tier 1 capital) (3,430) (2,979)
EU-7a Adjustment for regular-way purchases and sales of financial assets subject to trade date accounting (88) —
8 Total leverage ratio exposure 324,899 294,242
Note
a Capital and leverage measures are calculated applying the IFRS 9 transitional arrangements of the CRR as amended by CRR II.
Risk and capital position reviewAnalysis of treasury and capital risk
barclays.com/annualreport Barclays Bank UK PLC Pillar 3 Report 2021 >15

Table 11: Leverage ratio common disclosure
This table shows the leverage ratio calculation and includes additional breakdowns for the leverage exposure measure.
As at 31 December
2021
As at 31 December
2020£m £m
On-balance sheet exposures (excluding derivatives and SFTs)1 On-balance sheet items (excluding derivatives, SFTs and fiduciary assets, but including
collateral) 318,949 286,930 EU- 1a Adjustment for regular-way purchases and sales of financial assets subject to trade date
accounting (88) — 2 Asset amounts deducted in determining tier 1 capital (3,529) (2,979) 3 Total on-balance sheet exposures (excluding derivatives, SFTs and fiduciary assets) 315,332 283,951
Derivative exposures4 Replacement cost associated with all derivatives transactions (i.e. net of eligible cash
variation margin) 120 150 5 Add-on amounts for PFE associated with all derivatives transactions (mark-to-market
method) 1,318 1,088 7 Deductions of receivables assets for cash variation margin provided in derivatives
transactions (499) (556) 11 Total derivative exposures 939 682
Securities financing transaction exposures12 Gross SFT assets (with no recognition of netting), after adjusting for sales accounting
transactions 6,333 1,384 13 Netted amounts of cash payables and cash receivables of gross SFT assets (6,268) (1,251) 14 Counterparty credit risk exposure for SFT assets 0 1 16 Total securities financing transaction exposures 65 134
Other off-balance sheet exposures17 Off-balance sheet exposures at gross notional amount 60,272 66,832 18 Adjustments for conversion to credit equivalent amounts (51,709) (57,357) 19 Other off-balance sheet exposures 8,563 9,475
Capital and total exposures20 Tier 1 capital 13,388 13,807 21 Total leverage ratio exposures 324,899 294,242
Leverage ratio22 Leverage ratio 4.1 % 4.7%
Choice on transitional arrangements and amount of derecognised fiduciary itemsEU- 23 Choice on transitional arrangements for the definition of the capital measure Transitional Transitional
Risk and capital position reviewAnalysis of treasury and capital risk
barclays.com/annualreport Barclays Bank UK PLC Pillar 3 Report 2021 >16

Table 12: Split-up of on balance sheet exposures (excluding derivatives, SFTs, and exempted exposures)
The table shows a breakdown of the on-balance sheet exposures excluding derivatives, SFTs and exempted exposures, by regulatory asset class.
As at 31 December
2021
As at 31 December
2020£m £m
EU-1 Total on-balance sheet exposures (excluding derivatives, SFTs, and exempted exposures), of which: 318,339 286,024
EU-2 Trading book exposures 495 298 EU-3 Banking book exposures, of which: 317,844 285,726 EU-4 Covered bonds 1,110 1,827 EU-5 Exposures treated as sovereigns 92,096 66,399 EU-6 Exposures to regional governments, MDB, international organisations and PSE NOT treated
as sovereigns 7,999 8,920 EU-7 Institutions 2,270 1,897 EU-8 Secured by mortgages of immovable properties 157,801 147,486 EU-9 Retail exposures 25,637 28,658 EU-10 Corporate 12,711 15,883 EU-11 Exposures in default 3,989 3,388 EU-12 Other exposures (e.g. equity, securitisations, and other non-credit obligation assets) 14,231 11,268
Risk and capital position reviewAnalysis of treasury and capital risk
barclays.com/annualreport Barclays Bank UK PLC Pillar 3 Report 2021 >17

Table 13: LIQ1 - Liquidity Coverage ratio
This table shows the level and components of the Liquidity Coverage Ratio. This disclosure has been prepared in accordance with the requirements set out in the ‘Guidelines on LCR disclosure to complement the disclosure of liquidity risk under Article 435 of Regulation (EU) No 575/2013’ as specified in Annexure II which complements Article 435(1)(f) of Regulation (EU) No 575/2013.
Liquidity coverage ratio (period end)
Total period end value
As at 31.12.21
As at 30.06.21
As at 31.12.20
As at 30.06.20
£m £m £m £mLiquidity buffer 85,092 77,723 58,035 62,100Total net cash outflows 41,690 38,354 36,246 36,390Liquidity coverage ratio (%) (period end) 204% 203% 160% 171%
LIQ1 - Liquidity coverage ratio (average)
Total unweighted value (average) Total weighted value (average)
As at 31.12.21
As at 30.06.21
As at 31.12.20
As at 30.06.20
As at 31.12.21
As at 30.06.21
As at 31.12.20
As at 30.06.20
Number of data points used in calculation of averagesa 12 12 12 12 12 12 12 12
High-quality liquid assets £m £m £m £m £m £m £m £m
1 Total high-quality liquid assets (HQLA) 77,863 69,557 57,090 46,706Cash outflows2 Retail deposits and deposits from small
business customers, of which: 221,275 212,691 195,891 177,592 16,512 15,548 14,292 13,2373 Stable deposits 138,702 134,491 124,900 114,868 6,935 6,725 6,245 5,7434 Less stable deposits 76,856 71,595 65,642 60,888 9,568 8,818 8,042 7,4875 Unsecured wholesale funding, of which: 35,634 32,690 27,707 23,696 16,399 15,277 12,659 10,4986 Operational deposits (all counterparties) and
deposits in networks of cooperative banks 6,529 5,820 4,853 3,533 1,496 1,332 1,112 8287 Non-operational deposits (all counterparties)b 25,193 22,793 19,898 18,798 10,991 9,868 8,591 8,3058 Unsecured debt 3,912 4,077 2,956 1,365 3,912 4,077 2,956 1,3659 Secured wholesale funding 4 4 458 45810 Additional requirements, of which: 19,343 20,118 20,067 19,439 5,525 6,007 6,066 5,63911 Outflows related to derivative exposures and
other collateral requirements4,472 4,817 4,734 4,342 4,472 4,817 4,734 4,342
12 Outflows related to loss of funding on debt products 83 169 301 279 83 169 301 279
13 Credit and liquidity facilities 14,788 15,132 15,032 14,818 970 1,021 1,031 1,01814 Other contractual funding obligations 219 252 276 245 0 0 2 215 Other contingent funding obligations 47,881 50,280 50,707 50,608 3,899 3,696 3,144 2,92916 Total cash outflows 42,339 40,532 36,621 32,764Cash inflows17 Secured lending (e.g. reverse repos) 2,738 2,150 3,030 3,154 0 0 456 45718 Inflows from fully performing exposures 1,870 1,868 1,882 1,818 939 939 945 91219 Other cash inflowsc 2,009 1,964 2,149 2,470 432 402 439 50720 Total cash inflows 6,617 5,982 7,061 7,442 1,371 1,341 1,840 1,876
Fully exempt inflows — — — — — — — —Inflows subject to 90% cap — — — — — — — —Inflows subject to 75% cap 6,617 5,983 7,060 7,442 1,371 1,341 1,840 1,876
21 Liquidity buffer 77,863 69,557 57,090 46,70622 Total net cash outflows 40,968 39,191 34,781 30,88923 Liquidity coverage ratio (%) (average) 190% 177% 164% 151%
Notes
a Trailing average of 12 month-end observations to the reporting date.b Non-operational deposits row 7 include excess deposits as defined in the Delegated Act Article 27(4).c Difference between total weighted inflows and total weighted outflows arising from transactions in third countries where there are transfer restrictions or which
are denominated in non-convertible currencies.
Risk and capital position reviewAnalysis of treasury and capital risk
barclays.com/annualreport Barclays Bank UK PLC Pillar 3 Report 2021 >18

Analysis of net interest income and equity sensitivity
Equity sensitivity measures the overall impact of a +/- 25bps movement in interest rates on retained earnings, Fair Value through Other Comprehensive Income (FVOCI), and cash flow hedge reserves. For non-net interest income items a DV01 metric is used, which is an indicator of the shift in value for a 1bp movement in the yield curve.
Net interest income (NII) sensitivity is calculated for non-trading financial assets and liabilities, including the effect of any hedging. This analysis is intended as a quantification of risk exposure and not a forward guidance on NII. The sensitivity has been measured using the Annual Earnings at Risk (AEaR) metric. Note that this metric assumes an instantaneous parallel change to forward interest rate curves. The model does not apply floors to shocked market rates, but does recognize contractual product specific interest rate floors where relevant. The main model assumptions are: (i) one-year ahead time horizon; (ii) balances are adjusted for customer behaviour (i.e. considers that customers may prepay before the contractual maturity or withdraw their deposits); and (iii) behavioural assumptions are kept unchanged in all rate scenarios.Table 14: Analysis of equity sensitivity
Analysis of equity sensitivity 2021 2020
+25 basispoints
-25 basispoints
+25 basispoints
-25 basispoints
£m £m £m £mNet interest income (2) (54) 10 (141) Taxation effects on the above 1 15 (3) 38 Effect on profit for the year (1) (39) 7 (103) As percentage of net profit after tax (0.1%) (2.1%) 2.0% (27.1%)
Effect on profit for the year (per above) (1) (39) 7 (103) Fair value through other comprehensive income reserve (29) 29 (20) 20 Cash flow hedge reserve (271) 271 (186) 186 Taxation effects on the above 81 (81) 56 (56) Effect on equity (220) 180 (143) 47 As percentage of equity (1.3%) 1.0% (0.8%) 0.3%
NII sensitivity asymmetry arises due to the current low level of interest rates as some customer products have embedded floors. NII sensitivity to a -25bp shock to rates has decreased year on year due to reduced margin compression exposure driven by actual and expected central bank rate increases and deposit hedging. Movements in the FVOCI reserve impact CET1 capital, however the movement in the cash flow hedge reserve does not impact CET1 capital.
Volatility of the FVOCI portfolio in the liquidity pool
Changes in the value of FVOCI exposures flow directly through equity via the FVOCI reserve. The volatility of the value of the FVOCI investments in the liquidity pool is captured and managed through a value measure rather than an earning measure, i.e. non-traded market risk Value at Risk (VaR). Although the underlying methodology to calculate the non-traded VaR is identical to the one used in traded management VaR, the two measures are not directly comparable. The non-traded VaR represents the volatility to capital driven by the FVOCI exposures. These exposures are in the banking book and do not meet the criteria for trading book treatment.
Analysis of volatility of the FVOCI portfolio in the liquidity pool2021 2020
Average High Low Average High LowFor the year ended 31 December £m £m £m £m £m £mNon-traded market value at risk (daily, 95%) 7 10 5 7 9 4
Risk and capital position reviewAnalysis of treasury and capital risk
barclays.com/annualreport Barclays Bank UK PLC Pillar 3 Report 2021 >19

Table 15: PV1 - Prudent valuation adjustment
This table below provides a granular breakdown of the Prudent Valuation Adjustment (PVA). PVA is a Common Equity Tier 1 capital deduction.
EU CRR Articles 34 and 105 define regulatory principles that are applied to all fair valued assets and liabilities in order to determine a prudent valuation. The Prudent Valuation Adjustment is the difference between the financial statement fair valuation and the prudent valuation.
EquityInterest
rates FX Credita Commodities Totala
Of which in the trading
book
Of which in the banking
book£m £m £m £m £m £m £m £m
As at 31 December 20211 Closeout uncertainty, of which: — 15 — 2 — 17 15 2 2 Mid-market valueb — 14 — 2 — 16 14 2 3 Closeout costb — 1 — — — 1 1 — 4 Concentration — — — — — — — — 5 Early termination — — — — — — — — 6 Model risk — — — — — — — — 7 Operational risk — 2 — 4 — 6 2 4 8 Investing and funding costsb — — — 44 — 44 — 44 9 Unearned credit spreads — — — — — — — — 10 Future administrative costs — — — — — — — — 11 Other — — — — — — — — 12 Total adjustment — 17 — 50 — 67 17 50
As at 31 December 20201 Closeout uncertainty, of which: — 5 — 2 — 7 5 2 2 Mid-market valueb — 4 — 2 — 6 4 2 3 Closeout costb — 1 — — — 1 1 — 4 Concentration — — — — — — — — 5 Early termination — — — — — — — — 6 Model risk — — — — — — — — 7 Operational risk — — — 7 — 7 — 7 8 Investing and funding costsb — — — 66 — 66 — 66 9 Unearned credit spreads — — — — — — — — 10 Future administrative costs — — — — — — — — 11 Other — — — — — — — — 12 Total adjustment — 5 — 75 — 80 5 75
Notes
a The most significant contributor to Barclays Bank UK Group’s PVA is the ESHLA portfolio. ESHLA is a portfolio of longer dated non-asset backed loans made to Education, Social Housing and Local Authority (ESHLA) counterparties. The ESHLA PVA numbers are classified as banking book.
b A diversification reduction factor of 50% (2020: 66%) is applied to uncertainty after all regulatory exclusions and offsets, where permitted by CRR.
Risk and capital position reviewAnalysis of treasury and capital risk
barclays.com/annualreport Barclays Bank UK PLC Pillar 3 Report 2021 >20

Analysis of capital requirements and exposures for credit risk
Table 16: Credit risk exposures – Note on post-credit risk mitigation (CRM) EAD, RWA and minimum capital requirements
This table summarises credit risk information presented in the rest of this report and shows EAD post-CRM, RWA and minimum capital requirements. In accordance with regulatory requirements, credit mitigation is either reflected in regulatory measures for EAD, or in the risk inputs: PD and LGD. For the majority of Barclays Bank UK Group’s exposures, in particular mortgages and those under the AIRB treatment, the impact of CRM is primarily reflected in the PD or LGD rather than EAD measures.
RWAs and post-CRM exposures are analysed in the table below. Information on the impact of CRM on EAD is set out on page 29.
Credit exposure classAs at 31 December 2021 As at 31 December 2020
EAD post-CRM RWA
Minimum Capital
RequirementsEAD post-
CRM1 RWA
Minimum Capital
Requirements
£m £m £m £m £m £mStandardised approachCentral governments or central banks 129,483 — — 108,974 — — Regional governments or local authorities 8,672 1,470 118 10,273 1,647 132 Public sector entities 1,803 126 10 2,616 137 11 Multilateral development banks 1,542 — — 2,352 — — International organisations 80 — — 131 — — Institutions 1,929 395 32 1,485 299 24 Corporates 1,625 433 35 1,634 473 37 Retail 668 499 40 784 588 47 Secured by mortgages 2,563 977 78 2,722 1,020 82 Exposures in default 196 211 17 177 191 15 Items associated with high risk 8 12 1 7 11 1 Covered bonds 1,110 115 9 1,827 198 16 Securitisation positions 4,099 679 54 2,289 439 35 Collective investment undertakings — — — — — — Equity positions 20 49 4 20 49 4 Other items 1,119 360 29 1,327 507 41 Total standardised approach 154,917 5,326 426 136,618 5,559 445 Advanced IRB approachCentral governments or central banks — — — — — — Institutions 34 29 2 37 38 3 Corporates 12,310 7,223 578 15,530 8,594 687 Retail — — — — — — – Small and medium-sized enterprises (SMEs) 7,229 3,176 254 7,644 3,366 269 – Secured by real estate collateral 163,879 24,841 1,987 153,837 20,771 1,662 – Qualifying revolving retail 28,725 10,946 876 31,750 14,250 1,140 – Other retail 3,987 3,637 291 4,561 4,048 324 Equity — — — — — — Securitisation positions 3,929 589 47 1,999 300 24 Non-credit obligation assets 1,659 3,246 260 1,609 2,893 231 Total advanced IRB 221,752 53,687 4,295 216,967 54,260 4,340 Total 376,669 59,013 4,721 353,585 59,819 4,785
Risk and capital position reviewAnalysis of credit risk
barclays.com/annualreport Barclays Bank UK PLC Pillar 3 Report 2021 >21

Table 17: CRB-B - Total and average net amount of exposures
This table provides the total and the average amount of net exposures over the period by exposure class.The “Net value of exposure” column represents gross exposures pre-CRM and CCF.
As at 31 December 2021 As at 31 December 2020
Net value of exposures
Average net exposuresa
Net value of exposures
Average net exposuresa
£m £m £m £m1 Central governments or central banks — — — — 2 Institutions 32 32 36 32 3 Corporates 13,302 13,433 16,641 18,357 4 Of Which: Specialised Lending 924 930 1,105 1,090 5 Of Which: SMEs 7,236 7,413 8,013 8,706 6 Retail 229,885 229,377 228,135 227,774 7 Secured by real estate property 167,724 164,904 158,173 154,098 8 SME — — — — 9 Non-SMEs 167,724 164,904 158,173 154,098 10 Qualifying Revolving 50,979 53,041 57,653 60,688 11 Other Retail 11,182 11,432 12,309 12,988 12 SME 7,194 7,358 7,746 7,717 13 Non-SMEs 3,988 4,074 4,563 5,271 14 Equity — — — — 15 Total IRB approach 243,219 242,842 244,812 246,163 16 Central governments or central banks 111,931 106,560 89,049 84,977 17 Regional governments or local authorities 8,673 8,453 10,273 9,771 18 Public sector entities 1,809 2,154 2,620 2,902 19 Multilateral development banks 1,542 1,811 2,352 2,338 20 International organisations 80 73 131 229 21 Institutions 2,704 2,473 2,383 2,409 22 Corporates 3,215 3,210 3,169 2,935 23 Of Which: SMEs 357 413 454 346 24 Retail 11,594 12,744 13,541 10,470 25 Of Which: SMEs 8,013 8,998 9,345 6,007 26 Secured by mortgages on immovable property 2,565 2,641 2,723 2,778 27 Of Which: SMEs 49 55 63 66 28 Exposures in default 1,365 893 462 303 29 Items associated with particularly high risk 8 8 7 7 30 Covered bonds 1,110 1,270 1,827 1,864 31 Claims on institutions and corporates with a short-term credit
assessment — — — — 32 Collective investments undertakings — — — — 33 Equity exposures 20 20 20 20 34 Other exposures 1,119 1,092 1,327 1,431 35 Total standardised approach 147,735 143,402 129,884 122,434 36 Total 390,954 386,244 374,696 368,597
Note
a Average net exposure values are calculated based on the last four quarters.
Risk and capital position reviewAnalysis of credit risk
barclays.com/annualreport Barclays Bank UK PLC Pillar 3 Report 2021 >22

Table 18: CRB-C - Geographic analysis of credit exposure
This table shows exposure at default pre-CCF and pre-CRM, broken down by credit exposure class and geographic location of the counterparty.
UK Europe Germany AmericasUnited States Asia Japan
Africa and Middle East Total
As at 31 December 2021 £m £m £m £m £m £m £m £m £m
Central governments or central banks — — — — — — — — — Institutions 32 — — — — — — — 32 Corporates 13,295 — — 8 — — — — 13,303 Retail 229,884 — — — — — — — 229,884 Equity — — — — — — — — — Total IRB approach 243,211 — — 8 — — — — 243,219 Central governments or central banks 101,397 751 116 3,471 3,124 6,311 6,195 — 111,930 Regional governments or local authorities 7,060 102 90 1,151 — 360 — — 8,673 Public sector entities 402 1,197 889 209 — — — — 1,808 Multilateral development banks 39 473 — 670 670 323 — 37 1,542 International organisations — 80 — — — — — — 80 Institutions 331 770 — 1,028 — 576 7 — 2,705 Corporates 2,242 253 — 695 8 14 — 11 3,215 Retail 11,583 2 — 4 1 3 — 2 11,594 Secured by mortgages on immovable property 2,532 9 — 7 3 8 — 9 2,565 Exposures in default 1,309 6 1 39 2 3 — 9 1,366 Items associated with particularly high risk 8 — — — — — — — 8 Covered bonds 456 654 70 — — — — — 1,110 Claims on institutions and corporates with a short-term credit assessment — — — — — — — — — Collective investment undertakings — — — — — — — — — Equity positions 20 — — — — — — — 20 Other items 1,119 — — — — — — — 1,119 Total standardised approach 128,498 4,297 1,166 7,274 3,808 7,598 6,202 68 147,735 Total 371,709 4,297 1,166 7,282 3,808 7,598 6,202 68 390,954
Risk and capital position reviewAnalysis of credit risk
barclays.com/annualreport Barclays Bank UK PLC Pillar 3 Report 2021 >23

UK Europe Germany AmericasUnited States Asia Japan
Africa and Middle East Total
As at 31 December 2020 £m £m £m £m £m £m £m £m £m
Central governments or central banks — — — — — — — — — Institutions 36 — — — — — — — 36 Corporates 16,633 — — 8 — — — — 16,641 Retail 228,135 — — — — — — — 228,135 Equity — — — — — — — — — Total IRB approach 244,804 — — 8 — — — — 244,812 Central governments or central banks 70,708 1,649 5 4,466 4,371 12,226 12,100 — 89,049 Regional governments or local authorities 8,180 282 282 1,482 — 329 — — 10,273 Public sector entities 472 2,056 1,591 92 — — — — 2,620 Multilateral development banks 77 927 — 1,034 1,034 291 — 23 2,352 International organisations — 131 — — — — — — 131 Institutions 414 769 — 857 — 343 8 — 2,383 Corporates 2,204 397 — 543 1 16 — 9 3,169 Retail 13,526 2 — 6 1 4 — 3 13,541 Secured by mortgages on immovable property 2,654 16 — 22 4 11 — 20 2,723 Exposures in default 407 4 1 46 — — — 5 462 Items associated with particularly high risk 7 — — — — — — — 7 Covered bonds 751 1,076 128 — — — — — 1,827
Claims on institutions and corporates with a short-term credit assessment — — — — — — — — — Collective investment undertakings — — — — — — — — — Equity positions 20 — — — — — — — 20 Other items 1,327 — — — — — — — 1,327 Total standardised approach 100,747 7,309 2,007 8,548 5,411 13,220 12,108 60 129,884 Total 345,551 7,309 2,007 8,556 5,411 13,220 12,108 60 374,696
Risk and capital position reviewAnalysis of credit risk
barclays.com/annualreport Barclays Bank UK PLC Pillar 3 Report 2021 >24

Table 19: CRB-D - Concentration of exposures by industry
This table shows exposure at default pre-CCF and pre-CRM, broken down by credit exposure class and the industrial sector associated with the counterparty.
Agr
icul
ture
, for
estr
y an
d fis
hing
Min
ing
and
quar
ryin
g
Man
ufac
turin
g
Elec
tric
ity, g
as, s
team
and
air
cond
ition
ing
supp
ly
Wat
er s
uppl
y
Con
stru
ctio
n
Who
lesa
le a
nd re
tail
trad
e
Tran
spor
t and
sto
rage
Acc
omm
odat
ion
and
food
ser
vice
act
iviti
es
Info
rmat
ion
and
com
mun
icat
ion
Rea
l est
ate
activ
ities
Prof
essi
onal
, sci
entif
ic a
nd te
chni
cal a
ctiv
ities
Adm
inis
trat
ive
and
supp
ort s
ervi
ce a
ctiv
ities
Publ
ic a
dmin
istr
atio
n an
d de
fenc
e, c
ompu
lsor
y so
cial
sec
urity
Educ
atio
n
Hum
an h
ealth
ser
vice
s an
d so
cial
wor
k ac
tiviti
es
Art
s, e
nter
tain
men
t and
recr
eatio
n
Oth
er s
ervi
ces
Tota
l
As at 31 December 2021 £m £m £m £m £m £m £m £m £m £m £m £m £m £m £m £m £m £m £m1 Central Governments or
central banks — — — — — — — — — — — — — — — — — — —
2 Institutions — — — 1 — — — 4 — — 3 — — — 1 23 — — 32 3 Corporates 3,023 3 217 22 15 75 380 64 285 57 8,006 168 109 — 156 452 108 162 13,302 4 Retail 1,519 21 396 2 16 504 960 155 437 163 1,412 402 305 — 120 392 157 222,924 229,885 5 Equity — — — — — — — — — — — — — — — — — — — 6 Total IRB approach 4,542 24 613 25 31 579 1,340 223 722 220 9,421 570 414 — 277 867 265 223,086 243,219 7 Central governments or
central banks — — — — — — — — — — — — — 14,244 — — — 97,685 111,929
8 Regional governments or local authorities
— — — — — — — — — — — — — 8,673 — — — — 8,673 9 Public sector entities — — — — — — — 24 — — 209 — — 297 316 7 — 956 1,809 10 Multilateral development
banks — — — — — — — — — — — — — — — — — 1,542 1,542
11 International organisations — — — — — — — — — — — — 80 — — — — — 80 12 Institutions — — — — — — — — — — — — — — — — — 2,704 2,704 13 Corporates 50 — 22 4 2 86 50 73 20 8 109 19 30 — 9 28 17 2,688 3,215 14 Retail 213 3 369 6 29 1,353 1,458 446 709 333 655 770 627 — 100 278 181 4,065 11,595 15 Secured by mortgages on
immovable property 9 — 8 — — — 27 — — — 63 — 1 — 7 3 — 2,449 2,567
16 Exposures in default 22 — 35 1 4 145 157 59 106 39 73 76 78 — 13 30 20 507 1,365 17 Items associated with
particularly high risk — — — — — — — — — — — — — — — — — 7 7
18 Covered bonds — — — — — — — — — — — — — — — — — 1,110 1,110 19 Claims on institutions and
corporate with a short-term credit assessment
— — — — — — — — — — — — — — — — — — — 20 Collective investments
undertakings(CIU) — — — — — — — — — — — — — — — — — — —
21 Equity exposures — — — — — — — — — — — — — — — — — 20 20 22 Other exposures — — — — — — — — — — — — — — — — — 1,119 1,119 23 Total standardised
approach294 3 434 11 35 1,584 1,692 602 835 380 1,109 865 816 23,214 445 346 218 114,852 147,735
24 Total 4,836 27 1,047 36 66 2,163 3,032 825 1,557 600 10,530 1,435 1,230 23,214 722 1,213 483 337,938 390,954
Risk and capital position reviewAnalysis of credit risk
barclays.com/annualreport Barclays Bank UK PLC Pillar 3 Report 2021 >25

Table 19: CRB-D - Concentration of exposures by industry continued
Agr
icul
ture
, for
estr
y an
d fis
hing
Min
ing
and
quar
ryin
g
Man
ufac
turin
g
Elec
tric
ity, g
as, s
team
and
air
cond
ition
ing
supp
ly
Wat
er s
uppl
y
Con
stru
ctio
n
Who
lesa
le a
nd re
tail
trad
e
Tran
spor
t and
sto
rage
Acc
omm
odat
ion
and
food
ser
vice
act
iviti
es
Info
rmat
ion
and
com
mun
icat
ion
Rea
l est
ate
activ
ities
Prof
essi
onal
, sci
entif
ic a
nd te
chni
cal a
ctiv
ities
Adm
inis
trat
ive
and
supp
ort s
ervi
ce a
ctiv
ities
Publ
ic a
dmin
istr
atio
n an
d de
fenc
e, c
ompu
lsor
y so
cial
sec
urity
Educ
atio
n
Hum
an h
ealth
ser
vice
s an
d so
cial
wor
k ac
tiviti
es
Art
s, e
nter
tain
men
t and
recr
eatio
n
Oth
er s
ervi
ces
Tota
l
As at 31 December 2020 £m £m £m £m £m £m £m £m £m £m £m £m £m £m £m £m £m £m £m1 Central Governments or
central banks — — — — — — — — — — — — — — — — — — —
2 Institutions — — — 2 — — — 4 — — — — — — 3 27 — — 36 3 Corporates 3,063 3 233 25 22 81 408 75 279 58 11,121 198 115 — 172 484 107 197 16,641 6 Retail 1,620 30 423 3 19 540 1,084 168 501 176 1,429 440 335 — 134 406 169 220,658 228,135 5 Equity — — — — — — — — — — — — — — — — — — — 6 Total IRB approach 4,683 33 656 30 41 621 1,492 247 780 234 12,550 638 450 — 309 917 276 220,855 244,812 7 Central governments or
central banks — — — — — — — — — — — — — 21,535 — — — 67,514 89,049
8 Regional governments or local authorities
— — — — — — — — — — — — — 10,273 — — — — 10,273 9 Public sector entities — — — — — — — 103 — — 92 — — 318 374 8 — 1,725 2,620 10 Multilateral development
banks — — — — — — — — — — — — — — — — — 2,352 2,352
11 International organisations — — — — — — — — — — — — 121 — — — — 10 131 12 Institutions — — — — — — — — — — — — — — — — — 2,383 2,383 13 Corporates 63 — 29 5 3 108 67 68 23 9 110 44 182 — 10 29 14 2,405 3,169 14 Retail 220 4 426 7 34 1,551 1,743 503 894 395 760 912 751 — 115 330 205 4,691 13,541 15 Secured by mortgages on
immovable property 7 — 2 — — — 18 — — — 57 — — — 7 3 — 2,629 2,723
16 Exposures in default 18 — 12 — 1 38 63 13 38 13 48 21 21 — 5 9 8 154 462 17 Items associated with
particularly high risk — — — — — — — — — — — — — — — — — 7 7
18 Covered bonds — — — — — — — — — — — — — — — — — 1,827 1,827 19 Claims on institutions and
corporate with a short-term credit assessment
— — — — — — — — — — — — — — — — — — — 20 Collective investments
undertakings(CIU) — — — — — — — — — — — — — — — — — — —
21 Equity exposures — — — — — — — — — — — — — — — — — 20 20 22 Other exposures — — — — — — — — — — — — — — — — — 1,327 1,327 23 Total standardised
approach 308 4 469 12 38 1,697 1,891 687 955 417 1 1,067 977 1,075 32,126 511 379 227 87,044 129,884
24 Total 4,991 37 1,125 42 79 2,318 3,383 934 1,735 651 1 13,617 1,615 1,525 32,126 820 1,296 503 307,899 374,696
Risk and capital position reviewAnalysis of credit risk
barclays.com/annualreport Barclays Bank UK PLC Pillar 3 Report 2021 >26

Table 20: CRB–E - Residual maturity analysis credit exposures
This table shows exposure at default pre-CCF and pre-CRM, broken down by credit exposure class and residual maturity. Residual maturity is the remaining number of years before an obligation becomes due according to the existing terms of the agreement.
Net Exposure Value
On Demand < = 1 year> 1 year < =
5 years > 5 yearsNo stated
maturity TotalAs at 31 December 2021 £m £m £m £m £m £m1 Central Governments or central banks — — — — — — 2 Institutions 3 4 4 21 — 32 3 Corporates 895 1,595 3,144 7,668 — 13,302 4 Retail 53,297 1,368 13,811 161,409 — 229,885 5 Equity — — — — — — 6 Total IRB approach 54,195 2,967 16,959 169,098 — 243,219 7 Central governments or central banks 74,521 4,651 29,660 3,100 — 111,931 8 Regional governments or local
authorities — 299 1,015 7,359 — 8,673 9 Public sector entities — 441 886 482 — 1,809 10 Multilateral development banks — 372 1,001 169 — 1,542 11 International organisations — 64 — 16 — 80 12 Institutions 134 961 1,267 342 — 2,704 13 Corporates 1,088 913 897 317 — 3,215 14 Retail 3,557 71 4,870 3,096 — 11,594 15 Secured by mortgages on immovable
property — 117 483 1,965 — 2,565 16 Exposures in default 15 420 660 270 — 1,365 17 Items associated with particularly high
risk — — — — 8 8 18 Covered bonds — 330 331 449 — 1,110 19 Claims on institutions and corporate with
a short-term credit assessment — — — — — — 20 Collective investments undertakings — — — — — — 21 Equity exposures — — — — 20 20 22 Other exposures — — — — 1,119 1,119 23 Total standardised approach 79,315 8,638 41,070 17,565 1,147 147,735 24 Total 133,510 11,605 58,029 186,663 1,147 390,954
Risk and capital position reviewAnalysis of credit risk
barclays.com/annualreport Barclays Bank UK PLC Pillar 3 Report 2021 >27

Net Exposure Value
On Demand < = 1 year> 1 year < =
5 years > 5 yearsNo stated
maturity TotalAs at 31 December 2020 £m £m £m £m £m £m1 Central Governments or central banks — — — — — — 2 Institutions 4 2 7 23 — 36 3 Corporates 969 1,316 3,702 10,654 — 16,641 4 Retail 60,240 1,457 13,890 152,548 — 228,135 5 Equity — — — — — — 6 Total IRB Approach 61,213 2,775 17,599 163,225 — 244,812 7 Central governments or central banks 52,673 19,681 13,567 3,128 — 89,049 8 Regional governments or local authorities — 112 1,174 8,987 — 10,273 9 Public sector entities 1 803 1,114 702 — 2,620 10 Multilateral development banks — 711 1,423 218 — 2,352 11 International organisations — — 85 46 — 131 12 Institutions 34 886 1,284 179 — 2,383 13 Corporates 961 802 834 572 — 3,169 14 Retail 4,164 12 12 9,353 — 13,541 15 Secured by mortgages on immovable
property — 160 522 2,041 — 2,723 16 Exposures in default 33 78 9 342 — 462 17 Items associated with particularly high risk — — — — 7 7 18 Covered bonds — 379 814 634 — 1,827 19 Claims on institutions and corporate with a
short-term credit assessment — — — — — — 20 Collective investments undertakings — — — — — — 21 Equity exposures — — — — 20 20 22 Other exposures — — — — 1,327 1,327 23 Total standardised approach 57,866 23,624 20,838 26,202 1,354 129,884 24 Total 119,079 26,399 38,437 189,427 1,354 374,696
Risk and capital position reviewAnalysis of credit risk
barclays.com/annualreport Barclays Bank UK PLC Pillar 3 Report 2021 >28

Credit risk mitigation
Barclays Bank UK Group employs a range of techniques and strategies to actively mitigate credit risks. Within the regulatory framework this is commonly referred to as credit risk mitigation (CRM) with further details on page 111 of this document. In the case of collateral, the recognition of the mitigant is reflected through regulatory calculations in several different ways, depending on the nature of the collateral and the regulatory approach applied to the exposure.
Financial collateral includes, but is not exclusive of: cash, debt securities, equities and gold, that can be used to directly reduce credit exposures subject to the standardised approach. The impact of financial collateral CRM can be observed on page 21 as a component of the difference between EAD pre-CRM and EAD-post CRM.
Table 21: Exposures covered by guarantees and credit derivatives
This table shows the proportion of credit risk exposures, covered by funded credit protection and unfunded credit protection in the form of guarantees or credit derivatives.
Under the standardised approach, the risk weight of the underlying exposure covered is substituted by that of the credit protection provider. Any uncovered exposure is risk weighted using the normal framework. For the standardised approach, the table below has been populated post-substitution effect.
Under the AIRB approach, the table is designed to show exposures for which the credit protection impact is not reflected though the loss given default (LGD), for example where it is applied directly to the EAD metric such as for exposures related to the Coronavirus Business Interruption Loan Scheme (CBILS). Where Barclays recognises AIRB eligible collateral by reducing the modelled downturn loss given default metric, the AIRB values in the table below are “nil”.
Credit exposure class
Exposures covered by unfunded credit protection
Exposures covered by
funded credit protection
Standardised Advanced IRB Advanced IRB£m £m £m
As at 31 December 2021Central governments or central banks — — — Institutions 339 2 — Corporates 260 293 — Retail 7,997 546 — Exposures in default 1,168 — — Items associated with high risk — — — Equity — — — Securitisation positions — — — Non-credit obligation assets — — — Total 9,764 841 —
As at 31 December 2020Central governments or central banks — — — Institutions 378 1 — Corporates 320 306 — Retail 9,324 562 — Exposures in default 281 — — Items associated with high risk — — — Equity — — — Securitisation positions — — — Non-credit obligation assets — — — Total 10,303 869 —
Risk and capital position reviewAnalysis of credit risk
barclays.com/annualreport Barclays Bank UK PLC Pillar 3 Report 2021 >29

Table 22: CR3 - CRM techniques
This table shows the use of CRM techniques broken down by loans and debt securities. This table includes unsecured and secured exposures including collateral, financial guarantees and credit derivatives for both standardised and AIRB approach.
Exposures unsecured –
Carrying amount
Exposures secured – Carrying amount
Exposures secured by
collateral
Exposures secured by
financial guarantees
Exposures secured by
credit derivatives
As at 31 December 2021 £m £m £m £m £m1 Total loans 102,638 179,056 168,641 10,415 — 2 Total debt securities 22,729 338 — 338 — 3 Total exposures 125,367 179,394 168,641 10,753 — 4 Of which defaulted 997 2,992 1,824 1,168 —
As at 31 December 20201 Total loans 71,149 171,973 160,996 10,976 — 2 Total debt securities 32,314 376 — 376 — 3 Total exposures 103,463 172,349 160,996 11,352 — 4 Of which defaulted 1,222 2,166 1,885 281 —
Risk and capital position reviewAnalysis of credit risk
barclays.com/annualreport Barclays Bank UK PLC Pillar 3 Report 2021 >30

Table 23: CR4 Standardised - Credit risk exposure and CRM effect
This table shows the impact of CRM and credit conversion factors (CCF) on exposure values, broken down by regulatory exposure class. This table includes exposures subject to the standardised approach only.
The term ‘before CCF and CRM’ means the original gross exposures before the application of credit conversion factor and before the application of risk mitigation techniques.
Exposures before CCF and CRM Exposures post-CCF and CRM RWA and RWA density
On-balance sheet amount
Off-balance sheet amount
On-balance sheet amount
Off-balance sheet amount RWA
RWA density
£m £m £m £m £m £m
As at 31 December 20211 Central governments or central banks 87,981 23,949 98,586 30,897 — 0% 2 Regional governments or local authorities 8,671 2 8,671 1 1,470 17% 3 Public sector entities 1,797 12 1,797 6 126 7% 4 Multilateral development banks 1,542 — 1,542 — — 0% 5 International organisations 80 — 80 — — 0% 6 Institutions 2,268 436 1,929 — 395 20% 7 Corporates 1,770 1,445 1,174 451 433 27% 8 Retail 8,665 2,930 667 1 499 75% 9 Secured by mortgages on immovable property 2,563 3 2,563 — 977 38% 10 Exposures in default 1,365 — 196 — 211 108% 11 Items associated with particularly high risk 8 — 8 — 12 150% 12 Covered bonds 1,110 — 1,110 — 115 10% 13 Claims on institutions and corporate with a
short-term credit assessment — — — — — 0% 14 Claims in the form of CIU — — — — — 0% 15 Equity exposures 20 — 20 — 49 250% 16 Other items 1,119 — 1,119 — 360 32% 17 Total 118,959 28,777 119,462 31,356 4,647 3%
Exposures before CCF and CRM Exposures post-CCF and CRM RWA and RWA density
On-balancesheet amount
Off-balancesheet amount
On-balancesheet amount
Off-balancesheet amount RWA
RWAdensity
£m £m £m £m £m £m
As at 31 December 20201 Central governments or central banks 59,952 29,097 71,122 37,852 — 0% 2 Regional governments or local authorities 10,273 — 10,273 — 1,647 16% 3 Public sector entities 2,612 8 2,612 4 137 5% 4 Multilateral development banks 2,352 — 2,352 — — 0% 5 International organisations 131 — 131 — — 0% 6 Institutions 1,868 515 1,470 15 299 20% 7 Corporates 1,872 1,297 1,217 417 473 29% 8 Retail 10,108 3,433 783 1 588 75% 9 Secured by mortgages on immovable property 2,722 1 2,722 — 1,020 37% 10 Exposures in default 462 — 177 — 191 108% 11 Items associated with particularly high risk 7 — 7 — 11 150% 12 Covered bonds 1,827 — 1,827 — 198 11% 13 Claims on institutions and corporate with a
short-term credit assessment — — — — — 0% 14 Claims in the form of CIU — — — — — 0% 15 Equity exposures 20 — 20 — 49 250% 16 Other items 1,327 — 1,327 — 507 38% 17 Total 95,533 34,351 96,040 38,289 5,120 4%
Risk and capital position reviewAnalysis of credit risk
barclays.com/annualreport Barclays Bank UK PLC Pillar 3 Report 2021 >31

Table 24: CR7 - Effect on RWA of credit derivatives used as CRM techniques (AIRB)
This table shows the effect of credit derivatives on the AIRB credit risk approach.
Pre-credit derivatives RWAs Actual RWAs
As at 31 December 2021
As at 31 December 2020
As at 31 December 2021
As at 31 December 2020
£m £m £m £m1 Exposures under Foundation IRB — — — — 2 Central governments and central banks — — — — 3 Institutions — — — — 4 Corporates - SME — — — — 5 Corporates - Specialised Lending — — — — 6 Corporates - Other — — — — 7 Exposures under Advanced IRB 53,098 53,960 53,098 53,960 8 Central governments and central banks — — — — 9 Institutions 29 38 29 38 10 Corporates - SME 4,593 5,073 4,593 5,073 11 Corporates - Specialised Lending 500 631 500 631 12 Corporates - Other 2,130 2,890 2,130 2,890 13 Retail - Secured by real estate SME — — — — 14 Retail - Secured by real estate non-SME 24,841 20,771 24,841 20,771 15 Retail - Qualifying revolving 10,946 14,250 10,946 14,250 16 Retail - Other SME 3,176 3,366 3,176 3,366 17 Retail - Other non-SME 3,637 4,048 3,637 4,048 18 Equity IRB — — — — 19 Other non-credit obligation assets 3,246 2,893 3,246 2,893 20 Total 53,098 53,960 53,098 53,960
Risk and capital position reviewAnalysis of credit risk
barclays.com/annualreport Barclays Bank UK PLC Pillar 3 Report 2021 >32

Credit quality analysis of standardised exposures
Credit rating agenciesUnder the standardised approach, ratings assigned by External Credit Assessment Institutions (ECAIs) are used in the calculation of RWAs. Ratings from an ECAI may be used where the ECAI is a rating agency that:
• Has been recognised as an ECAI per the list published by the Financial Conduct Authority (FCA); and
• Has been nominated for use by Barclays.
Barclays uses ratings assigned by the following agencies for credit risk calculations:
• Standard & Poor’s• Moody’s• Fitch• DBRS• Kroll Bond Rating Agency
These ratings are used in the calculation of risk weights for the central governments and central banks, institutions, corporate and securitisation exposure classesa.
Rated and unrated counterpartiesThe following section summarises the rules governing standardised calculations for non-securitised exposures.
Each exposure must be assigned to one of six credit quality steps if a rating is available, as defined in the table belowb. After being assigned to a specific quality step, exposure class and maturity are then used to determine the risk weight percentage. The following table is a simplified version of the risk weight allocation process.
Table 25: Relationship of long-term external credit ratings to credit quality steps under the standardised approach for non-securitised exposures
Credit Quality Step
Standard and Poor's Moody's FitchCredit Quality Step 1 AAA+ to AA- Aaa1 to Aa3 AAA+ to AA-Credit Quality Step 2 A+ to A- A1 to A3 A+ to A-Credit Quality Step 3 BBB+ to BBB- Baa1 to Baa3 BBB+ to BBB-Credit Quality Step 4 BB+ to BB- Ba1 to Ba3 BB+ to BB-Credit Quality Step 5 B+ to B- B1 to B3 B+ to B-Credit Quality Step 6 CCC+ and below Caa1 and below CCC+ and below
Notes
a DBRS and Kroll Bond Rating Agency are used to calculate risk weights for securitisation exposures only. Please see page 120 for further details.b The mapping of external ratings to credit quality steps applicable as at year-end 2021 are found in Commission Implementing Regulation (EU) 2016/1799 as
amended (for non-securitisation exposures) and PRA Supervisory Statement SS10/18 (for securitisation positions).
Risk and capital position reviewAnalysis of credit risk
barclays.com/annualreport Barclays Bank UK PLC Pillar 3 Report 2021 >33

Table 26: Credit quality steps and risk weights under the standardised approach
This table shows the prescribed risk weights associated with credit quality steps.
Credit Quality StepInstitutions (includes banks)
Central governments
or central banks
Sovereign method Credit assessment method
CorporatesSovereign
methodMaturity > 3
months
Maturity 3 months or
lessCredit Quality Step 1 20% 20% 20% 20% 0% Credit Quality Step 2 50% 50% 50% 20% 20% Credit Quality Step 3 100% 100% 50% 20% 50% Credit Quality Step 4 100% 100% 100% 50% 100% Credit Quality Step 5 150% 100% 100% 50% 100% Credit Quality Step 6 150% 150% 150% 150% 150%
Exposures to international organisations are assigned a 0% risk weight.
Exposures fully and completely secured by residential property (which considers, amongst other criteria, the size of the loan relative to the value of the property) are generally assigned a risk weight of 35%. Other retail exposures are assigned a risk weight of 75%.
The unsecured portion of a past due exposure is assigned a risk weight of either 150% or 100%, depending on the specific credit risk adjustments recognised.
High risk items are assigned a risk weight of 150%.
Other items are generally assigned a risk weight of 100%, unless they relate to cash in hand (0%) or items in the course of collection (20%).
Risk and capital position reviewAnalysis of credit risk
barclays.com/annualreport Barclays Bank UK PLC Pillar 3 Report 2021 >34

Table 27: CR5-A - Analysis of exposures by asset classes and risk weight pre-CCF and CRM under the standardised approach
This table shows exposure at default pre-CRM, broken down by Credit Exposure Class and risk weight. This table includes exposures subject to the standardised approach only.
EAD by asset classes and risk weights pre-CCF and CRM
0% 2% 4% 10% 20% 35% 50% 70% 75% 100% 150% 250% 370% 1250% Other Deducted Totalof which:
Unrated
£m £m £m £m £m £m £m £m £m £m £m £m £m £m £m £m £m £m
As at 31 December 2021
1 Central governments or central banks
111,930 — — — — — — — — — — — — — — — 111,930 — 2 Regional
governments or local authorities 1,320 — — — 7,353 — — — — — — — — — — — 8,673 7,060
3 Public sector entities 1,173 — — — 636 — — — — — — — — — — — 1,809 612 4 Multilateral
development banks 1,542 — — — — — — — — — — — — — — — 1,542 —
5 International Organisations
80 — — — — — — — — — — — — — — — 80 — 6 Institutions — — — — 2,674 — 30 — — — — — — — — — 2,704 89 7 Corporates 690 — — — 931 — 63 — — 1,523 8 — — — — — 3,215 2,221 8 Retail — — — — — — — — 11,595 — — — — — — — 11,595 11,594 9 Secured by
mortgages on immovable property — — — — — 2,426 — — 6 134 — — — — — — 2,566 2,565
10 Exposures in default — — — — — — — — — 166 1,199 — — — — — 1,365 1,365 11 Items associated with
particularly high risk — — — — — — — — — — 8 — — — — — 8 8
12 Covered Bonds — — — 1,071 39 — — — — — — — — — — — 1,110 — 13 Claims on institutions
and corporate with a short-term credit assessment
— — — — — — — — — — — — — — — — — — 14 Claims in the form of
CIU — — — — — — — — — — — — — — — — — —
15 Equity exposures — — — — — — — — — — — 20 — — — — 20 20 16 Other items 589 — — — 212 — — — — 318 — — — — — — 1,119 1,119 17 Total 117,324 — — 1,071 11,845 2,426 93 — 11,601 2,141 1,215 20 — — — — 147,736 26,653
Risk and capital position reviewAnalysis of credit risk
barclays.com/annualreport Barclays Bank UK PLC Pillar 3 Report 2021 >35

Table 27: CR5-A - Analysis of exposures by asset classes and risk weight pre-CCF and CRM under the standardised approach continued
EAD by asset classes and risk weights pre-CCF and CRM
0% 2% 4% 10% 20% 35% 50% 70% 75% 100% 150% 250% 370% 1250% Other Deducted Totalof which:
Unrated
£m £m £m £m £m £m £m £m £m £m £m £m £m £m £m £m £m £m
As at 31 December 2020
1 Central governments or central banks
89,049 — — — — — — — — — — — — — — — 89,049 — 2 Regional governments or
local authorities 2,036 — — — 8,237 — — — — — — — — — — — 10,273 8,180
3 Public sector entities 1,929 — — — 691 — — — — — — — — — — — 2,620 564 4 Multilateral development
banks 2,352 — — — — — — — — — — — — — — — 2,352 —
5 International Organisations
131 — — — — — — — — — — — — — — — 131 — 6 Institutions — — — — 2,375 — 8 — — — — — — — — — 2,383 137 7 Corporates 610 — — — 944 — — — — 1,607 8 — — — — — 3,169 2,225 8 Retail — — — — — — — — 13,541 — — — — — — — 13,541 13,541 9 Secured by mortgages
on immovable property — — — — — 2,598 — — 10 115 — — — — — — 2,723 2,723
10 Exposures in default — — — — — — — — — 148 314 — — — — — 462 462 11 Items associated with
particularly high risk — — — — — — — — — — 7 — — — — — 7 7
12 Covered Bonds — — — 1,790 — — 37 — — — — — — — — — 1,827 — 13 Claims on institutions
and corporate with a short-term credit assessment
— — — — — — — — — — — — — — — — — — 14 Claims in the form of CIU — — — — — — — — — — — — — — — — — — 15 Equity exposures — — — — — — — — — — — 20 — — — — 20 20 16 Other items 678 — — — 177 — — — — 472 — — — — — — 1,327 1,327 17 Total 96,785 — — 1,790 12,424 2,598 45 — 13,551 2,342 329 20 — — — — 129,884 29,186
Risk and capital position reviewAnalysis of credit risk
barclays.com/annualreport Barclays Bank UK PLC Pillar 3 Report 2021 >36

Table 28: CR5-B - Analysis of exposures by asset classes and risk weight post-CCF and CRM under the standardised approach
The difference between exposure at default pre-CRM set out in Table 27 and exposure at default post-CRM below is the impact of financial collateral and CCF as described in Table 23.
0% 2% 4% 10% 20% 35% 50% 70% 75% 100% 150% 250% 370% 1250% Total
of which:
Unrated
£m £m £m £m £m £m £m £m £m £m £m £m £m £m £m £m
As at 31 December 2021
1 Central governments or central banks
129,483 — — — — — — — — — — — — — 129,483 — 2 Regional governments or local
authorities 1,320 — — — 7,352 — — — — — — — — — 8,672 7,058
3 Public sector entities 1,173 — — — 630 — — — — — — — — — 1,803 606 4 Multilateral development banks 1,542 — — — — — — — — — — — — — 1,542 — 5 International Organisations 80 — — — — — — — — — — — — — 80 — 6 Institutions — — — — 1,899 — 30 — — — — — — — 1,929 2 7 Corporates 423 — — — 931 — 13 — — 258 — — — — 1,625 680 8 Retail — — — — — — — — 668 — — — — — 668 668 9 Secured by mortgages on
immovable property — — — — — 2,423 — — 6 134 — — — — 2,563 2,563
10 Exposures in default — — — — — — — — — 166 30 — — — 196 196 11 Items associated with particularly
high risk — — — — — — — — — — 8 — — — 8 8
12 Covered Bonds — — — 1,071 39 — — — — — — — — — 1,110 — 13 Claims on institutions and
corporate with a short-term credit assessment
— — — — — — — — — — — — — — — — 14 Claims in the form of CIU — — — — — — — — — — — — — — — — 15 Equity exposures — — — — — — — — — — — 20 — — 20 20 16 Other items 589 — — — 213 — — — — 317 — — — — 1,119 1,119 17 Total 134,610 — — 1,071 11,064 2,423 43 — 674 875 38 20 — — 150,818 12,920
Risk and capital position reviewAnalysis of credit risk
barclays.com/annualreport Barclays Bank UK PLC Pillar 3 Report 2021 >37

Table 28: CR5-B - Analysis of exposures by asset classes and risk weight post-CCF and CRM under the standardised approach continued
0% 2% 4% 10% 20% 35% 50% 70% 75% 100% 150% 250% 370% 1250% Total
of which:
Unrated
£m £m £m £m £m £m £m £m £m £m £m £m £m £m £m £mAs at 31 December 2020
1 Central governments or central banks
108,974 — — — — — — — — — — — — — 108,974 — 2 Regional governments or local
authorities 2,036 — — — 8,237 — — — — — — — — — 10,273 8,179
3 Public sector entities 1,929 — — — 687 — — — — — — — — — 2,616 560 4 Multilateral development banks 2,352 — — — — — — — — — — — — — 2,352 — 5 International Organisations 131 — — — — — — — — — — — — — 131 — 6 Institutions — — — — 1,477 — 8 — — — — — — — 1,485 37 7 Corporates 386 — — — 944 — — — — 304 — — — — 1,634 690 8 Retail — — — — — — — — 784 — — — — — 784 784 9 Secured by mortgages on
immovable property — — — — — 2,598 — — 8 116 — — — — 2,722 2,722
10 Exposures in default — — — — — — — — — 148 29 — — — 177 177 11 Items associated with
particularly high risk — — — — — — — — — — 7 — — — 7 7
12 Covered Bonds — — — 1,790 — — 37 — — — — — — — 1,827 — 13 Claims on institutions and
corporate with a short-term credit assessment — — — — — — — — — — — — — — — —
14 Claims in the form of CIU — — — — — — — — — — — — — — — — 15 Equity exposures — — — — — — — — — — — 20 — — 20 20 16 Other items 678 — — — 178 — — — — 471 — — — — 1,327 1,327 17 Total 116,486 — — 1,790 11,523 2,598 45 — 792 1,039 36 20 — — 134,329 14,503
Risk and capital position reviewAnalysis of credit risk
barclays.com/annualreport Barclays Bank UK PLC Pillar 3 Report 2021 >38

Credit quality analysis of AIRB exposures
The following section provides breakdowns of inputs into risk weighted asset calculations. Please note that risk weights and risk factors may be volatile in granular breakdowns of wholesale exposures, especially in categories that are more sparsely populated. This is often due to the addition or removal of a relatively large exposure to or from narrow categories when its risk factors are different to the category average. This happens in the normal course of business, for instance, following new lending, repayments, or syndications. See page 101 for further details on AIRB models.
Table 29: Internal default grade probabilities and mapping to external ratings
The table below illustrates the approximate relationship between external rating agency grades and the PD bands for wholesale exposures. The EBA and internal Default Grade (DG) bands are based on through the cycle (TTC) PD. Note that this relationship is dynamic, and therefore, varies over time, region and industry.
EBA PD Range %Internal DG Band
Default ProbabilityFinancial statements description Moody's
Standard and Poor’s>Min Mid <=Max
0.00 to < 0.15
1 0.00% 0.01% 0.02%
Strong
Aaa, Aa1, Aa2 AAA, AA+, AA2 0.02% 0.03% 0.03% Aa3 AA-3 0.03% 0.04% 0.05% A1 A+4 0.05% 0.08% 0.10% A2, A3 A, A-5 0.10% 0.13% 0.15% Baa1 BBB+
0.15 to < 0.256 0.15% 0.18% 0.20%
StrongBaa2 BBB
7 0.20% 0.23% 0.25% Baa2 BBB
0.25 to < 0.508 0.25% 0.28% 0.30%
StrongBaa3 BBB-
9 0.30% 0.35% 0.40% Baa3 BBB-10 0.40% 0.45% 0.50% Ba1 BB+
0.50 to < 0.7511 0.50% 0.55% 0.60%
StrongBa1 BB+
12 0.60% 0.00% 0.00% Ba2 BB
0.75 to < 2.50
12 0.00% 0.90% 1.20%
Satisfactory
Ba2 BB13 1.20% 1.38% 1.55% Ba3 BB-14 1.55% 1.85% 2.15% Ba3 B+15 2.15% 0.00% 0.00% B1 B+
2.50 to < 10.00
15 0.00% 2.60% 3.05%
Satisfactory
B1 B+16 3.05% 3.75% 4.45% B2 B+17 4.45% 5.40% 6.35% B3, Caa1 B18 6.35% 7.50% 8.65% B3, Caa1 B-19 8.65% 10.00% 0.00% B3, Caa1 CCC+
10.00 to < 100.0019 0.00% 0.00% 11.35%
Higher riskCaa2 CCC+
20 11.35% 15.00% 18.65% Caa2 CCC21 18.65% 30.00% 99.99% Caa3, Ca, C CCC-, CC+ ,CC, C
100.00 (Default) D D
Risk and capital position reviewAnalysis of credit risk
barclays.com/annualreport Barclays Bank UK PLC Pillar 3 Report 2021 >39
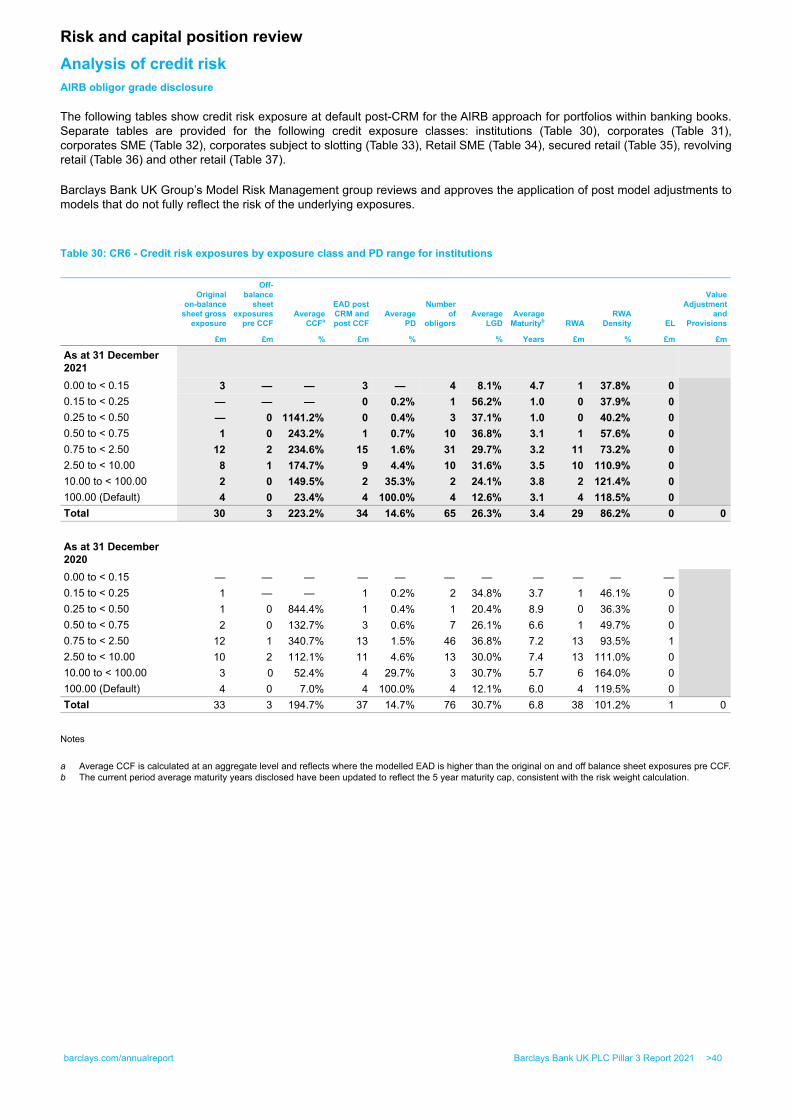
AIRB obligor grade disclosure
The following tables show credit risk exposure at default post-CRM for the AIRB approach for portfolios within banking books. Separate tables are provided for the following credit exposure classes: institutions (Table 30), corporates (Table 31), corporates SME (Table 32), corporates subject to slotting (Table 33), Retail SME (Table 34), secured retail (Table 35), revolving retail (Table 36) and other retail (Table 37).
Barclays Bank UK Group’s Model Risk Management group reviews and approves the application of post model adjustments to models that do not fully reflect the risk of the underlying exposures.
Table 30: CR6 - Credit risk exposures by exposure class and PD range for institutions
Originalon-balance
sheet gross exposure
Off-balance
sheetexposures
pre CCFAverage
CCFa
EAD post CRM and post CCF
Average PD
Number of
obligorsAverage
LGDAverage
Maturityb RWARWA
Density EL
Value Adjustment
and Provisions
£m £m % £m % % Years £m % £m £m
As at 31 December 20210.00 to < 0.15 3 — — 3 — 4 8.1% 4.7 1 37.8% 0 0.15 to < 0.25 — — — 0 0.2% 1 56.2% 1.0 0 37.9% 0 0.25 to < 0.50 — 0 1141.2% 0 0.4% 3 37.1% 1.0 0 40.2% 0 0.50 to < 0.75 1 0 243.2% 1 0.7% 10 36.8% 3.1 1 57.6% 0 0.75 to < 2.50 12 2 234.6% 15 1.6% 31 29.7% 3.2 11 73.2% 0 2.50 to < 10.00 8 1 174.7% 9 4.4% 10 31.6% 3.5 10 110.9% 0 10.00 to < 100.00 2 0 149.5% 2 35.3% 2 24.1% 3.8 2 121.4% 0 100.00 (Default) 4 0 23.4% 4 100.0% 4 12.6% 3.1 4 118.5% 0 Total 30 3 223.2% 34 14.6% 65 26.3% 3.4 29 86.2% 0 0
As at 31 December 20200.00 to < 0.15 — — — — — — — — — — — 0.15 to < 0.25 1 — — 1 0.2% 2 34.8% 3.7 1 46.1% 0 0.25 to < 0.50 1 0 844.4% 1 0.4% 1 20.4% 8.9 0 36.3% 0 0.50 to < 0.75 2 0 132.7% 3 0.6% 7 26.1% 6.6 1 49.7% 0 0.75 to < 2.50 12 1 340.7% 13 1.5% 46 36.8% 7.2 13 93.5% 1 2.50 to < 10.00 10 2 112.1% 11 4.6% 13 30.0% 7.4 13 111.0% 0 10.00 to < 100.00 3 0 52.4% 4 29.7% 3 30.7% 5.7 6 164.0% 0 100.00 (Default) 4 0 7.0% 4 100.0% 4 12.1% 6.0 4 119.5% 0 Total 33 3 194.7% 37 14.7% 76 30.7% 6.8 38 101.2% 1 0
Notes
a Average CCF is calculated at an aggregate level and reflects where the modelled EAD is higher than the original on and off balance sheet exposures pre CCF.b The current period average maturity years disclosed have been updated to reflect the 5 year maturity cap, consistent with the risk weight calculation.
Risk and capital position reviewAnalysis of credit risk
barclays.com/annualreport Barclays Bank UK PLC Pillar 3 Report 2021 >40

Table 31: CR6 - Credit risk exposures by exposure class and PD range for corporates
Originalon-balance
sheet gross exposure
Off-balance
sheetexposures
pre CCFAverage
CCFa
EAD post CRM and post CCF
Average PD
Number of
obligorsAverage
LGDAverage
Maturityb RWARWA
Density EL
Value Adjustment
and Provisions
£m £m % £m % % Years £m % £m £m
As at 31 December 20210.00 to < 0.15 5,449 576 61.1% 5,813 0.1% 582 10.7% 4.7 2,276 39.2% 4 0.15 to < 0.25 35 3 45.3% 35 0.2% 142 18.9% 4.2 12 33.2% 0 0.25 to < 0.50 290 56 35.2% 303 0.4% 495 18.4% 4.0 139 45.8% 0 0.50 to < 0.75 308 60 39.2% 311 0.6% 1,077 25.4% 3.5 125 40.2% 1 0.75 to < 2.50 2,435 350 27.7% 2,390 1.5% 3,723 24.4% 3.4 1,317 55.1% 11 2.50 to < 10.00 1,507 119 32.0% 1,467 4.7% 1,480 27.6% 3.2 1,290 87.9% 26 10.00 to < 100.00 333 14 24.7% 323 20.3% 316 26.3% 3.0 374 115.8% 23 100.00 (Default) 795 48 0.8% 774 100.0% 322 12.2% 2.9 1,190 153.8% 27 Total 11,152 1,226 43.7% 11,416 8.3% 8,137 16.9% 4.0 6,723 58.9% 92 (247)
As at 31 December 20200.00 to < 0.15 7,834 801 73.3% 8,353 0.1% 670 10.7% 21.3 2,660 31.8% 4 0.15 to < 0.25 68 1 142.0% 71 0.2% 212 14.8% 15.3 29 40.6% 0 0.25 to < 0.50 220 41 74.2% 235 0.4% 436 26.5% 9.0 117 49.8% 0 0.50 to < 0.75 245 32 39.0% 240 0.6% 579 27.2% 6.8 97 40.5% 0 0.75 to < 2.50 2,060 320 29.2% 2,003 1.6% 5,222 25.7% 6.4 1,281 63.9% 11 2.50 to < 10.00 2,248 208 22.1% 2,194 4.5% 2,253 23.0% 8.6 1,934 88.2% 31 10.00 to < 100.00 525 33 16.7% 519 21.9% 695 26.1% 5.5 580 111.8% 37 100.00 (Default) 840 60 0.5% 828 100.0% 438 14.6% 5.0 1,265 152.7% 56 Total 14,040 1,496 52.1% 14,443 7.5% 10,505 16.0% 15.3 7,963 55.1% 139 (213)
Notes
a Average CCF is calculated at an aggregate level and reflects where the modelled EAD is higher than the original on and off balance sheet exposures pre- CCF.
b The current period average maturity years disclosed have been updated to reflect the 5 year maturity cap, consistent with the risk weight calculation.
Risk and capital position reviewAnalysis of credit risk
barclays.com/annualreport Barclays Bank UK PLC Pillar 3 Report 2021 >41

Table 32: CR6 - Credit risk exposures by exposure class and PD range for corporate of which: SMEs
Originalon-
balancesheet gross
exposure
Off-balance
sheetexposures
pre CCFAverage
CCFa
EAD post CRM
and post CCF
Average PD
Number of
obligorsAverage
LGDAverage
Maturityb RWARWA
Density EL
Value Adjustment
and Provisions
£m £m % £m % % Years £m % £m £m
As at 31 December 20210.00 to < 0.15 778 240 61.9% 928 0.1% 351 11.2% 4.4 312 33.6% 1 0.15 to < 0.25 33 3 24.8% 33 0.2% 72 17.5% 4.4 9 28.9% 0 0.25 to < 0.50 290 56 32.5% 302 0.4% 393 18.2% 4.0 113 37.5% 0 0.50 to < 0.75 302 60 31.5% 301 0.6% 781 25.2% 3.6 120 39.9% 1 0.75 to < 2.50 2,399 348 25.5% 2,342 1.5% 3,269 24.4% 3.4 1,287 54.9% 11 2.50 to < 10.00 1,469 112 26.7% 1,421 4.6% 1,281 27.7% 3.2 1,247 87.8% 25 10.00 to < 100.00 321 14 20.4% 311 20.4% 274 26.2% 3.0 354 113.8% 22 100.00 (Default) 763 48 0.7% 742 100.0% 272 12.0% 2.9 1,151 155.1% 25 Total 6,355 881 34.9% 6,380 14.3% 6,693 21.6% 3.5 4,593 72.0% 85 (236)
As at 31 December 20200.00 to < 0.15 1,379 161 65.0% 1,490 0.1% 433 10.8% 13.5 391 26.2% 1 0.15 to < 0.25 68 1 116.5% 70 0.2% 180 14.7% 15.4 24 33.8% 0 0.25 to < 0.50 210 41 72.0% 224 0.4% 336 26.7% 9.2 111 49.5% 0 0.50 to < 0.75 243 32 34.2% 237 0.6% 463 27.1% 6.9 95 40.3% 0 0.75 to < 2.50 2,047 318 24.8% 1,975 1.6% 4,213 25.6% 6.4 1,258 63.7% 11 2.50 to < 10.00 1,907 209 19.4% 1,846 4.8% 1,977 25.2% 5.8 1,427 77.3% 30 10.00 to < 100.00 499 32 13.8% 492 21.9% 565 26.0% 5.4 540 109.7% 36 100.00 (Default) 807 59 0.4% 795 100.0% 380 14.5% 5.0 1,227 154.3% 53 Total 7,160 853 43.3% 7,129 14.4% 8,547 21.2% 7.7 5,073 71.2% 131 (179)
Notes
a Average CCF is calculated at an aggregate level and reflects where the modelled EAD is higher than the original on and off balance sheet exposures pre CCF.b The current period average maturity years disclosed have been updated to reflect the 5 year maturity cap, consistent with the risk weight calculation.
Risk and capital position reviewAnalysis of credit risk
barclays.com/annualreport Barclays Bank UK PLC Pillar 3 Report 2021 >42

Table 33: CR10 - Corporate exposures subject to the slotting approach
Slotting, also known as specialised lending, is an approach that is applied to financing of individual projects where the repayment is highly dependent on the performance of the underlying pool or collateral. It uses a standard set of rules for the calculation of RWAs, based upon an assessment of factors such as the financial strength of the counterparty. The requirements for the application of the Slotting approach are detailed in CRR article 153.
Regulatory categories Remaining maturityOn-balance
sheet amountOff-balance
sheet amountRisk
weightExposure
amount RWAExpected
losses
As at 31 December 2021 £m £m % £m £m £m
Category 1 StrongLess than 2.5 years 99 17 50% 106 41 — Equal to or more than 2.5 years 210 — 70% 210 117 1
Category 2 GoodLess than 2.5 years 170 29 70% 179 97 1 Equal to or more than 2.5 years 262 — 90% 263 184 1
Category 3 SatisfactoryLess than 2.5 years 16 0 115% 16 15 0 Equal to or more than 2.5 years 29 — 115% 29 27 1
Category 4 WeakLess than 2.5 years 2 0 250% 2 5 0 Equal to or more than 2.5 years 7 0 250% 7 14 1
Category 5 DefaultLess than 2.5 years 29 0 — 29 — 15 Equal to or more than 2.5 years 53 — — 53 — 27
TotalLess than 2.5 years 316 46 332 158 16 Equal to or more than 2.5 years 561 0 562 342 31
As at 31 December 2020
Category 1 StrongLess than 2.5 years 172 16 50% 180 78 — Equal to or more than 2.5 years 323 — 70% 324 201 1
Category 2 GoodLess than 2.5 years 162 10 70% 165 89 1 Equal to or more than 2.5 years 249 — 90% 249 175 2
Category 3 SatisfactoryLess than 2.5 years 22 1 115% 22 19 1 Equal to or more than 2.5 years 43 — 115% 43 41 1
Category 4 WeakLess than 2.5 years 3 — 250% 3 6 0 Equal to or more than 2.5 years 11 — 250% 11 22 1
Category 5 DefaultLess than 2.5 years 36 2 — 36 — 18 Equal to or more than 2.5 years 54 — — 54 — 27
TotalLess than 2.5 years 395 29 406 192 20 Equal to or more than 2.5 years 680 — 681 439 32
Risk and capital position reviewAnalysis of credit risk
barclays.com/annualreport Barclays Bank UK PLC Pillar 3 Report 2021 >43

Table 34: CR6 - Credit risk exposures by exposure class and PD range for retail SME
Originalon-balance
sheet gross exposure
Off-balance sheet
exposurespre CCF
Average CCFa
EAD post CRM and post CCF
Average PD
Number of obligors
Average LGD RWA
RWA Density EL
Value Adjustment
and Provisions
£m £m % £m % % £m % £m £m
As at 31 December 2021
0.00 to < 0.15 16 2 14526.7% 286 0.1% 166,585 46.2% 25 8.8% 0 0.15 to < 0.25 40 14 256.1% 74 0.2% 17,454 33.1% 9 11.9% 0 0.25 to < 0.50 248 88 153.3% 366 0.4% 63,189 30.3% 63 17.2% 0 0.50 to < 0.75 413 137 190.7% 623 0.6% 109,566 34.9% 158 25.3% 1 0.75 to < 2.50 2,289 767 112.8% 2,846 1.5% 441,668 37.9% 1,048 36.8% 16 2.50 to < 10.00 1,649 500 99.8% 2,015 4.7% 249,277 37.5% 942 46.7% 36 10.00 to < 100.00 388 46 199.3% 467 23.1% 60,987 37.3% 303 65.0% 39 100.00 (Default) 558 39 36.8% 552 100.0% 34,320 21.1% 628 113.8% 66 Total 5,601 1,593 136.8% 7,229 11.1% 1,143,046 36.1% 3,176 43.9% 158 (148)
As at 31 December 2020
0.00 to < 0.15 15 2 15008.4% 313 0.1% 184,025 47.1% 31 9.9% 0
0.15 to < 0.25 66 17 276.3% 109 0.2% 21,824 30.4% 12 10.8% 0
0.25 to < 0.50 419 89 55.8% 444 0.4% 22,140 22.0% 52 11.7% 0
0.50 to < 0.75 581 97 129.4% 645 0.6% 58,789 31.6% 147 22.8% 1
0.75 to < 2.50 2,203 564 174.4% 2,882 1.5% 504,619 39.2% 1,121 38.9% 17
2.50 to < 10.00 1,585 809 77.1% 2,063 4.8% 303,282 35.8% 942 45.7% 36
10.00 to < 100.00 518 148 59.5% 589 24.8% 61,165 35.5% 371 62.9% 52
100.00 (Default) 590 43 36.8% 599 100.0% 26,800 24.0% 690 115.2% 89
Total 5,977 1,769 126.0% 7,644 11.7% 1,182,644 35.4% 3,366 44.0% 195 (161)
Note
a Average CCF is calculated at an aggregate level and reflects where the modelled EAD is higher than the original on and off balance sheet exposures pre CCF.
Risk and capital position reviewAnalysis of credit risk
barclays.com/annualreport Barclays Bank UK PLC Pillar 3 Report 2021 >44

Table 35: CR6 - Credit risk exposures by exposure class and PD range for secured retail
Original on-balance
sheet gross exposure
Off-balance sheet
exposures pre CCF
Average CCFa
EAD post CRM and post CCF Average PD
Number of obligors
Average LGD RWA
RWA Density EL
Value Adjustment
and Provisions
£m £m % £m % % £m % £m £m
As at 31 December 20210.00 to < 0.15 16,854 1,662 97.4% 18,028 0.1% 54,201 10.4% 418 2.3% 2 0.15 to < 0.25 9,826 1,282 95.5% 10,607 0.2% 62,707 12.1% 545 5.1% 3 0.25 to < 0.50 28,597 2,452 96.8% 30,058 0.4% 167,942 10.2% 1,996 6.6% 11 0.50 to < 0.75 39,855 2,274 97.6% 41,134 0.6% 258,184 10.1% 3,980 9.7% 26 0.75 to < 2.50 46,177 2,904 98.5% 48,357 1.2% 285,802 13.8% 10,216 21.1% 85 2.50 to < 10.00 9,705 591 98.8% 10,176 4.4% 58,739 14.8% 4,679 46.0% 63 10.00 to < 100.00 4,259 146 99.5% 4,382 28.3% 27,145 9.2% 2,124 48.5% 106 100.00 (Default) 1,137 3 99.7% 1,137 100.0% 8,185 8.9% 883 77.6% 43 Total 156,410 11,314 97.7% 163,879 2.3% 922,905 11.6% 24,841 15.2% 339 (78)
As at 31 December 20200.00 to < 0.15 18,872 4,131 93.4% 21,485 0.1% 77,637 12.1% 509 2.4% 2 0.15 to < 0.25 13,746 2,111 93.7% 14,864 0.2% 105,799 9.8% 632 4.3% 3 0.25 to < 0.50 34,848 3,096 96.5% 36,598 0.4% 223,228 9.6% 2,396 6.5% 14 0.50 to < 0.75 34,731 1,059 99.9% 35,754 0.6% 222,624 11.2% 3,803 10.6% 24 0.75 to < 2.50 30,813 1,569 98.7% 31,949 1.2% 197,878 14.1% 6,874 21.5% 57 2.50 to < 10.00 7,221 155 100.0% 7,378 4.6% 42,898 13.5% 3,176 43.0% 44 10.00 to < 100.00 4,592 127 99.8% 4,707 30.1% 28,687 9.8% 2,422 51.5% 134 100.00 (Default) 1,101 2 99.8% 1,101 100.0% 8,166 9.4% 959 87.1% 32 Total 145,924 12,250 97.3% 153,836 2.4% 906,917 11.5% 20,771 13.5% 310 (91)
Note
a Average CCF is calculated at an aggregate level and reflects where the modelled EAD is higher than the original on and off balance sheet exposures pre CCF.
Risk and capital position reviewAnalysis of credit risk
barclays.com/annualreport Barclays Bank UK PLC Pillar 3 Report 2021 >45
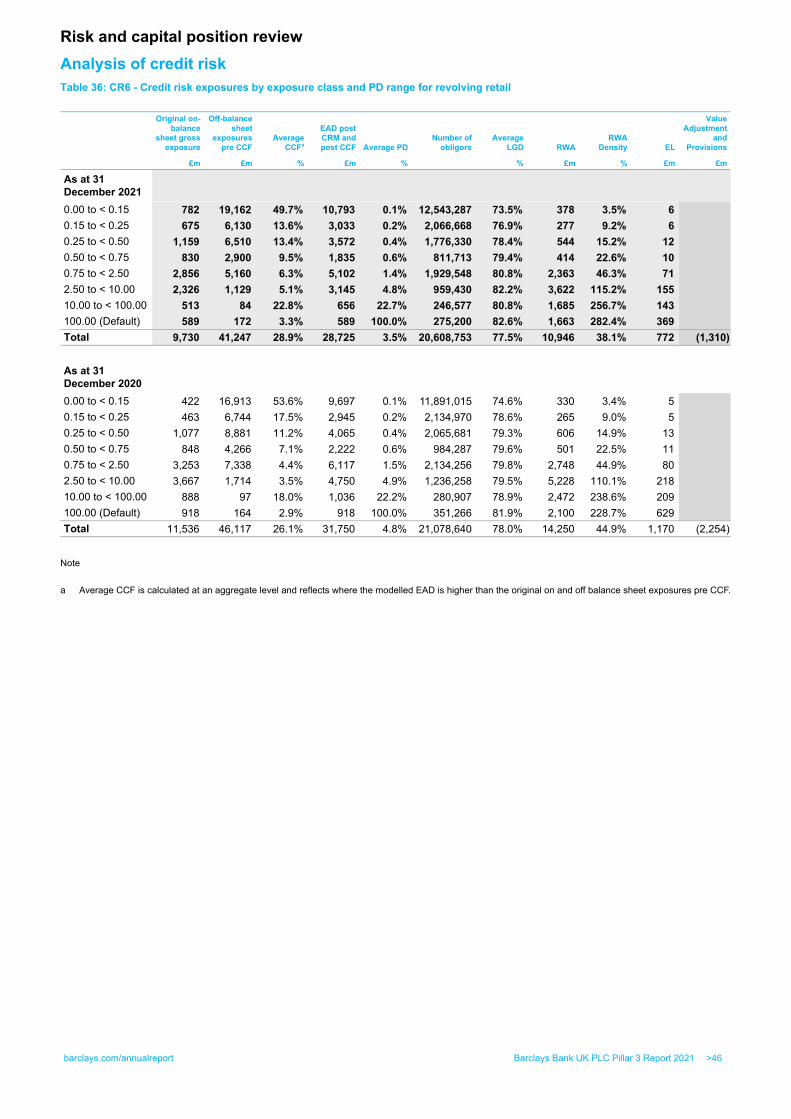
Table 36: CR6 - Credit risk exposures by exposure class and PD range for revolving retail
Original on-balance
sheet gross exposure
Off-balance sheet
exposures pre CCF
Average CCFa
EAD post CRM and post CCF Average PD
Number of obligors
Average LGD RWA
RWA Density EL
Value Adjustment
and Provisions
£m £m % £m % % £m % £m £m
As at 31 December 20210.00 to < 0.15 782 19,162 49.7% 10,793 0.1% 12,543,287 73.5% 378 3.5% 6 0.15 to < 0.25 675 6,130 13.6% 3,033 0.2% 2,066,668 76.9% 277 9.2% 6 0.25 to < 0.50 1,159 6,510 13.4% 3,572 0.4% 1,776,330 78.4% 544 15.2% 12 0.50 to < 0.75 830 2,900 9.5% 1,835 0.6% 811,713 79.4% 414 22.6% 10 0.75 to < 2.50 2,856 5,160 6.3% 5,102 1.4% 1,929,548 80.8% 2,363 46.3% 71 2.50 to < 10.00 2,326 1,129 5.1% 3,145 4.8% 959,430 82.2% 3,622 115.2% 155 10.00 to < 100.00 513 84 22.8% 656 22.7% 246,577 80.8% 1,685 256.7% 143 100.00 (Default) 589 172 3.3% 589 100.0% 275,200 82.6% 1,663 282.4% 369 Total 9,730 41,247 28.9% 28,725 3.5% 20,608,753 77.5% 10,946 38.1% 772 (1,310)
As at 31 December 20200.00 to < 0.15 422 16,913 53.6% 9,697 0.1% 11,891,015 74.6% 330 3.4% 5 0.15 to < 0.25 463 6,744 17.5% 2,945 0.2% 2,134,970 78.6% 265 9.0% 5 0.25 to < 0.50 1,077 8,881 11.2% 4,065 0.4% 2,065,681 79.3% 606 14.9% 13 0.50 to < 0.75 848 4,266 7.1% 2,222 0.6% 984,287 79.6% 501 22.5% 11 0.75 to < 2.50 3,253 7,338 4.4% 6,117 1.5% 2,134,256 79.8% 2,748 44.9% 80 2.50 to < 10.00 3,667 1,714 3.5% 4,750 4.9% 1,236,258 79.5% 5,228 110.1% 218 10.00 to < 100.00 888 97 18.0% 1,036 22.2% 280,907 78.9% 2,472 238.6% 209 100.00 (Default) 918 164 2.9% 918 100.0% 351,266 81.9% 2,100 228.7% 629 Total 11,536 46,117 26.1% 31,750 4.8% 21,078,640 78.0% 14,250 44.9% 1,170 (2,254)
Note
a Average CCF is calculated at an aggregate level and reflects where the modelled EAD is higher than the original on and off balance sheet exposures pre CCF.
Risk and capital position reviewAnalysis of credit risk
barclays.com/annualreport Barclays Bank UK PLC Pillar 3 Report 2021 >46

Table 37: CR6 - Credit risk exposures by exposure class and PD range for other retail exposures
Original on-balance
sheet gross exposure
Off-balance sheet
exposures pre CCF
Average CCFa
EAD post CRM and post CCF Average PD
Number of obligors
Average LGD RWA
RWA Density EL
Value Adjustment
and Provisions
£m £m % £m % % £m % £m £m
As at 31 December 20210.00 to < 0.15 374 1 99.7 % 375 0.1 % 66,911 74.2 % 73 19.6 % 0 0.15 to < 0.25 317 — — 317 0.2 % 52,575 74.4 % 104 32.9 % 1 0.25 to < 0.50 652 — — 652 0.4 % 91,002 75.3 % 319 48.9 % 3 0.50 to < 0.75 425 — — 425 0.6 % 57,279 75.7 % 305 71.8 % 4 0.75 to < 2.50 1,111 — — 1,111 1.4 % 142,440 76.4 % 1,068 96.1 % 15 2.50 to < 10.00 669 — — 669 4.6 % 85,845 77.1 % 918 137.2 % 33 10.00 to < 100.00 249 — — 249 26.4 % 35,318 77.3 % 648 260.4 % 70 100.00 (Default) 190 — — 190 100.0 % 27,895 77.0 % 202 106.3 % 136 Total 3,987 1 97.9 % 3,988 7.7 % 559,265 76.0 % 3,637 91.2 % 262 (236)
As at 31 December 20200.00 to < 0.15 102 1 98.7% 102 0.1% 34,138 71.2% 20 19.8% — 0.15 to < 0.25 242 — — 242 0.2% 46,064 73.5% 77 31.9% — 0.25 to < 0.50 604 — — 604 0.4% 93,225 74.7% 288 47.7% 2 0.50 to < 0.75 510 — — 510 0.6% 70,562 75.5% 334 65.4% 2 0.75 to < 2.50 1,510 — — 1,510 1.4% 197,887 76.3% 1,385 91.7% 16 2.50 to < 10.00 936 — — 936 4.6% 118,970 77.2% 1,137 121.4% 33 10.00 to < 100.00 341 — — 341 26.9% 44,707 77.6% 598 175.2% 72 100.00 (Default) 317 — — 317 100.0% 45,413 78.0% 209 66.1% 240 Total 4,562 1 100.0% 4,562 10.5% 650,966 76.1% 4,048 88.7% 365 (439)
Note
a Average CCF is calculated at an aggregate level and reflects where the modelled EAD is higher than the original on and off balance sheet exposures pre CCF.
Risk and capital position reviewAnalysis of credit risk
barclays.com/annualreport Barclays Bank UK PLC Pillar 3 Report 2021 >47

Table 38: CR1-A - Credit quality of exposures by exposure class and instrument
This table provides a comprehensive picture of the credit quality of Barclays Bank UK Group’s on balance sheet and off balance sheet exposures.
Defaulted exposures
Non-defaulted exposure
Specific credit risk
adjustment
General credit risk
adjustment
Credit risk adjustment charges in the perioda Net values
Accumulated write-offs
As at 31 December 2021 £m £m £m £m £m £m £m1 Central governments or central banks — — — — — — — 2 Institutions 4 29 — — — 32 — 3 Corporates 925 12,377 248 — 32 13,055 25 4 Of which Specialised lending 82 841 — — (2) 923 — 5 Of which SMEs 811 6,425 236 — 57 7,000 — 6 Retail 2,688 227,196 1,772 — (1,173) 228,112 572 7 Secured by real estate property 1,140 166,584 78 — (13) 167,646 4 8 SMEs — — — — — — — 9 Non-SMEs 1,140 166,584 78 — (13) 167,646 4 10 Qualifying revolving 761 50,217 1,310 — (944) 49,667 454 11 Other retail 787 10,395 384 — (216) 10,798 115 12 SMEs 597 6,597 148 — (12) 7,046 — 13 Non-SMEs 190 3,798 236 — (204) 3,753 115 14 Equity — — — — — — — 15 Total IRB approach 3,617 239,602 2,020 — (1,141) 241,199 597 16 Central governments or central banks — 111,930 — — — 111,930 — 17 Regional governments or local authorities — 8,673 1 — 1 8,673 — 18 Public sector entities 6 1,816 8 — (3) 1,814 — 19 Multilateral development banks — 1,542 — — — 1,542 — 20 International organisations — 80 — — — 80 — 21 Institutions — 2,704 — — (1) 2,704 — 22 Corporates 34 3,228 18 — 5 3,245 25 23 Of which: SMEs — 360 2 — — 357 — 24 Retail 1,251 11,690 172 — (99) 12,767 29 25 Of which: SMEs — 8,013 — — (28) 8,013 — 26 Secured by mortgages on immovable property 158 2,565 — — — 2,723 — 27 Of which: SMEs — 49 — — — 49 — 28 Exposures in default 1,449 — 84 — (20) 1,365 29 29 Items associated with particularly high risk — 8 — — — 8 — 30 Covered bonds — 1,110 — — (1) 1,110 — 31 Claims on institutions and corporates with a
short-term credit assessment — — — — — — — 32 Collective investments undertakings — — — — — — — 33 Equity exposures — 20 — — — 20 — 34 Other exposures — 1,119 — — — 1,119 — 35 Total standardised approach 1,449 146,485 199 — (98) 147,735 54 36 Total 5,066 386,087 2,219 — (1,239) 388,934 651 37 Of which: Loans 4,804 279,071 2,182 — (982) 281,693 651 38 Of which: Debt securities — 23,067 — — — 23,067 — 39 Of which: Off-balance-sheet exposures 262 83,949 37 — (257) 84,174 —
Risk and capital position reviewAnalysis of credit risk
barclays.com/annualreport Barclays Bank UK PLC Pillar 3 Report 2021 >48

Table 38: CR1-A - Credit quality of exposures by exposure class and instrument continued
Defaulted exposures
Non-defaulted exposure
Specific credit risk
adjustment
General credit risk
adjustment
Credit risk adjustment charges in the perioda Net values
Accumulated write-offs
As at 31 December 2020 £m £m £m £m £m £m £m1 Central governments or central banks — — — — — — — 2 Institutions 4 32 — — — 36 — 3 Corporates 991 15,650 216 — 63 16,425 27 4 Of which Specialised lending 92 1,013 3 — — 1,102 — 5 Of which SMEs 866 7,147 179 — 43 7,834 — 6 Retail 3,139 224,996 2,945 — 627 225,190 526 7 Secured by real estate property 1,103 157,070 91 — 20 158,082 5 8 SMEs — — — — — — — 9 Non-SMEs 1,103 157,070 91 — 20 158,082 5 10 Qualifying revolving 1,086 56,567 2,254 — 450 55,399 392 11 Other retail 950 11,359 600 — 156 11,709 129 12 SMEs 633 7,113 161 — 68 7,585 — 13 Non-SMEs 317 4,246 439 — 89 4,124 129 14 Equity — — — — — — — 15 Total IRB approach 4,134 240,678 3,161 — 690 241,651 553 16 Central governments or central banks — 89,048 — — — 89,048 — 17 Regional governments or local authorities — 10,273 — — — 10,273 — 18 Public sector entities 1 2,631 11 — 2 2,621 — 19 Multilateral development banks — 2,353 — — — 2,353 — 20 International organisations — 131 — — — 131 — 21 Institutions — 2,384 1 — 1 2,383 — 22 Corporates 37 3,180 13 — 10 3,204 22 23 Of which: SMEs — 457 3 — 2 454 — 24 Retail 381 13,710 271 — 72 13,820 31 25 Of which: SMEs — 9,373 28 — 28 9,345 — 26 Secured by mortgages on immovable
property 146 2,723 — — — 2,869 — 27 Of which: SMEs — 63 — — — 63 — 28 Exposures in default 566 — 104 — (2) 462 31 29 Items associated with particularly high risk — 7 — — — 7 — 30 Covered bonds — 1,829 1 — 1 1,828 — 31 Claims on institutions and corporates with a
short-term credit assessment — — — — — — — 32 Collective investments undertakings — — — — — — — 33 Equity exposures — 20 — — — 20 — 34 Other exposures — 1,327 — — — 1,327 — 35 Total standardised approach 565 129,616 297 — 86 129,884 54 36 Total 4,699 370,294 3,458 — 776 371,535 607 37 Of which: Loans 4,424 241,861 3,164 — 702 243,121 607 38 Of which: Debt securities — 32,690 — — — 32,690 — 39 Of which: Off-balance-sheet exposures 275 95,743 294 — 74 95,724 —
Note
a Credit risk adjustment charges in the period represent the movements in impairment stock between the reporting periods.
Risk and capital position reviewAnalysis of credit risk
barclays.com/annualreport Barclays Bank UK PLC Pillar 3 Report 2021 >49

Table 39: CR1-B - Credit quality of exposures by industry or counterparty types
This table provides a comprehensive picture of the credit quality of Barclays Bank UK Group’s on balance sheet and off balance sheet exposures by industry types.
Defaulted exposures
Non-defaulted
exposures
Specific credit risk
adjustment
General credit risk
adjustment
Credit risk adjustment charges in the perioda Net values
Accumulated write-offs
As at 31 December 2021 £m £m £m £m £m £m £m1 Agriculture, forestry and fishing 589 4,251 11 — (108) 4,829 — 2 Mining and quarrying 19 9 — — — 28 — 3 Manufacturing 92 971 22 — 13 1,041 — 4 Electricity, gas, steam and air conditioning
supply 9 28 1 — — 36 — 5 Water supply 7 61 2 — 1 66 — 6 Construction 242 1,992 47 — 40 2,187 — 7 Wholesale and retail trade 310 2,786 76 — 61 3,020 — 8 Transport and storage 106 749 33 — 24 822 — 9 Accommodation and food service activities 283 1,325 56 — 50 1,552 — 10 Information and communication 65 551 19 — 12 597 — 11 Real estate activities 392 10,162 27 — (56) 10,527 — 12 Professional, scientific and technical activities 144 1,323 40 — 26 1,427 — 13 Administrative and support service activities 149 1,113 39 — 26 1,223 — 14 Public administration and defence,
compulsory social security — 23,215 1 — — 23,214 — 15 Education 53 680 12 — (4) 721 — 16 Human health services and social work
activities 108 1,116 15 — 5 1,209 — 17 Arts, entertainment and recreation 66 424 12 — 5 478 — 18 Other services 2,432 335,331 1,806 — (1,334) 335,957 651 19 Total 5,066 386,087 2,219 — (1,239) 388,934 651
Risk and capital position reviewAnalysis of credit risk
barclays.com/annualreport Barclays Bank UK PLC Pillar 3 Report 2021 >50

Table 39: CR1-B - Credit quality of exposures by industry or counterparty types continued
Defaulted exposures
Non-defaulted
exposures
Specific credit risk
adjustment
General credit risk
adjustment
Credit risk adjustment charges in the perioda Net values
Accumulated write-offs
As at 31 December 2020 £m £m £m £m £m £m £m1 Agriculture, forestry and fishing 625 4,368 120 — 24 4,873 — 2 Mining and quarrying 27 10 — — — 37 — 3 Manufacturing 54 1,074 8 — 2 1,120 — 4 Electricity, gas, steam and air conditioning
supply 6 35 — — — 41 — 5 Water supply 9 71 1 — — 79 — 6 Construction 62 2,255 8 — (5) 2,309 — 7 Wholesale and retail trade 173 3,208 15 — (8) 3,366 — 8 Transport and storage 37 900 8 — 4 929 — 9 Accommodation and food service activities 165 1,565 6 — (3) 1,724 — 10 Information and communication 29 625 7 — 2 647 — 11 Real estate activities 368 13,258 83 — 25 13,543 — 12 Professional, scientific and technical activities 68 1,552 14 — 4 1,606 — 13 Administrative and support service activities 60 1,472 13 — 6 1,519 — 14 Public administration and defence,
compulsory social security — 32,126 — — — 32,126 — 15 Education 57 774 16 — 3 815 — 16 Human health services and social work
activities 90 1,208 10 — 4 1,288 — 17 Arts, entertainment and recreation 50 455 7 — 2 498 — 18 Other services 2,819 305,338 3,142 — 716 305,015 607 19 Total 4,699 370,294 3,458 — 776 371,535 607
Note
a Credit risk adjustment charges in the period represent the movements in impairment stock between the reporting periods.
Risk and capital position reviewAnalysis of credit risk
barclays.com/annualreport Barclays Bank UK PLC Pillar 3 Report 2021 >51

Table 40: CR1-C - Credit quality of exposures by geography
This table provides a comprehensive picture of the credit quality of Barclays Bank UK Group’s on balance sheet and off balance sheet exposures by geography.
Defaulted exposures
Non-defaulted
exposures
Specific credit risk
adjustment
General credit risk
adjustment
Credit risk adjustment charges of the perioda Net values
Accumulated write-offs
As at 31 December 2021 £m £m £m £m £m £m £mUnited Kingdom 5,007 366,897 2,215 — (1,236) 369,689 651 Europe 6 4,292 1 — (2) 4,297 — Germany 1 1,165 — — — 1,165 — Asia 3 7,595 — — — 7,598 — Japan — 6,203 — — — 6,203 — Americas 41 7,244 3 — (1) 7,282 — United States 2 3,806 1 — (1) 3,807 — Africa and Middle East 9 59 — — — 68 — Total 5,066 386,087 2,219 — (1,239) 388,934 651
Defaulted exposures
Non-defaulted
exposures
Specific credit risk
adjustment
General credit risk
adjustment
Credit risk adjustment charges of the perioda Net values
Accumulated write-offs
As at 31 December 2020 £m £m £m £m £m £m £mUK 4,642 341,199 3,451 — 772 342,390 607 Europe 5 7,307 3 — 2 7,309 — Germany 1 2,007 — — — 2,008 — Asia — 13,220 — — — 13,220 — Japan — 12,108 — — — 12,108 — Americas 47 8,513 4 — 2 8,556 — United States 1 5,412 2 — 2 5,411 — Africa and Middle East 5 55 — — — 60 — Total 4,699 370,294 3,458 — 776 371,535 607
Note
a Credit risk adjustment charges in the period represent the movements in impairment stock between the reporting periods.
Risk and capital position reviewAnalysis of credit risk
barclays.com/annualreport Barclays Bank UK PLC Pillar 3 Report 2021 >52

Table 41: Credit quality of forborne exposures
This table provides an overview of the quality of forborne exposures.
Gross carrying amount/nominal amount of exposures with forbearance measures
Accumulated impairment,
accumulated negative changes in fair value due
to credit risk and provisions
Collateral received and financial guarantees received
on forborne exposures
Performing forborne
Non Performing forborne
Total
Of which collateral and financial
guarantees received on non-
performing exposures with
forbearance measuresTotal
Of which defaulted
Of which impaired
On performing forborne
exposures
On non-performing
forborne exposures
As at 31 December 2021a £m £m £m £m £m £m £m £m
1 Loans and Advances 707 923 837 815 (86) (288) 583 257 2 Central banks — — — — — — — — 3 General governments — — — — — — — — 4 Credit institutions — — — — — — — — 5 Other financial corporations 1 — — — — — 1 — 6 Non-financial corporations 379 246 225 212 (24) (26) 291 105 7 Households 327 677 612 603 (62) (262) 291 152 8 Debt securities — — — — — — — — 9 Loan commitments given 134 60 49 48 — — 4 1 10 Total 841 983 886 863 (86) (288) 587 258
Gross carrying amount/nominal amount of exposures with forbearance measures
Accumulated impairment,
accumulated negative changes in fair value due
to credit risk and provisions
Collateral received and financial guarantees received
on forborne exposures
Performing forborne
Non Performing forborne
Total
Of which collateral and financial
guarantees received on non-
performing exposures with
forbearance measuresTotal
Of which defaulted
Of which impaired
On performing
forborne exposures
On non-performing
forborne exposures
As at 31 December 2020 £m £m £m £m £m £m £m £m
1 Loans and Advances 321 833 833 833 (99) (143) 483 438 2 Central banks — — — — — — — — 3 General governments — — — — — — — — 4 Credit institutions — — — — — — — — 5 Other financial corporations — — — — — — — — 6 Non-financial corporations 38 509 509 509 (3) (52) 318 284 7 Households 283 324 324 324 (96) (91) 165 154 8 Debt securities — — — — — — — — 9 Loan commitments given 90 17 17 17 — — 6 6 10 Total 411 850 850 850 (99) (143) 489 444
Note
a Forbearance balances have increased, following a standardisation of the definition of forbearance in line with EBA guidelines, for further details see pages 257-259 in the Barclays PLC Annual Report 2021.
Risk and capital position reviewAnalysis of credit risk
barclays.com/annualreport Barclays Bank UK PLC Pillar 3 Report 2021 >53

Table 42: Credit quality of performing and non-performing exposures by past due days
This table follows the regulatory defined measures rather than the IFRS definition and it cannot be reconciled to the tables disclosed in the Barclays Bank UK PLC Annual Report 2021. For example, loans and advances in the tables below include cash balances at central banks, cash collateral and settlement balances and reverse repos that are not part of the “loans and advances at amortised cost” disclosed in the Barclays Bank UK PLC Annual Report 2021.
Gross carrying amount/nominal amount
Performing exposures Non-performing exposures
Total
Not past due or past
due ≤ 30 days
Past due >
30 days ≤ 90 days Total
Unlikely to pay that are
not past due or are past
due ≤ 90 days
Past due > 90 days
≤ 180 days
Past due >
180 days ≤ 1
year
Past due > 1 year
<= 2 years
Past due >
2 years
<= 5 years
Past due >
5 years
<= 7 years
Past due >
7 years
Of which defaulted
As at 31 December 2021 £m £m £m £m £m £m £m £m £m £m £m £m
1 Loans and advances 283,116 282,536 580 3,963 1,408 1,024 731 323 271 60 146 3,961 2 Central banks 74,254 74,254 — — — — — — — — — — 3 General governments 7,058 7,058 — — — — — — — — — — 4 Credit institutions 1,023 1,023 — — — — — — — — — — 5 Other financial corporations 604 604 — 18 5 1 8 1 3 — — 17 6 Non-financial corporations 28,884 28,879 5 1,863 546 762 205 156 119 43 32 1,863 7 Of which SMEs 19,633 19,628 5 1,850 543 762 203 148 119 43 32 1,850 8 Households 171,293 170,718 575 2,082 857 261 518 166 149 17 114 2,081 9 Debt securities 27,687 27,687 — — — — — — — — — — 10 Central banks 55 55 — — — — — — — — — — 11 General governments 16,141 16,141 — — — — — — — — — — 12 Credit institutions 5,136 5,136 — — — — — — — — — — 13 Other financial corporations 6,047 6,047 — — — — — — — — — — 14 Non-financial corporations 308 308 — — — — — — — — — — 15 Off-balance-sheet exposures 59,582 246 246 16 Central banks 590 — — 17 General governments 2 — — 18 Credit institutions 100 — — 19 Other financial corporations 27 — — 20 Non-financial corporations 2,909 58 58 21 Households 55,954 188 188 22 Total 370,385 310,223 580 4,209 1,408 1,024 731 323 271 60 146 4,207
Risk and capital position reviewAnalysis of credit risk
barclays.com/annualreport Barclays Bank UK PLC Pillar 3 Report 2021 >54

Table 42: Credit quality of performing and non-performing exposures by past due days- continued
Gross carrying amount/nominal amount
Performing exposures Non-performing exposures
Total
Not past due or past
due ≤ 30 days
Past due >
30 days ≤ 90
days Total
Unlikely to pay that are
not past due or are past
due ≤ 90 days
Past due > 90 days
≤ 180 days
Past due >
180 days ≤ 1
year
Past due > 1 year
<= 2 years
Past due >
2 years
<= 5 years
Past due >
5 years <= 7
years
Past due >
7 years
Of which defaulted
As at 31 December 2020 £m £m £m £m £m £m £m £m £m £m £m £m
1 Loans and advances 244,880 244,053 827 3,956 1,293 660 1,092 358 356 42 155 3,956 2 Central banks 39,013 39,013 — — — — — — — — — — 3 General governments 8,180 8,180 — — — — — — — — — — 4 Credit institutions 816 816 — — — — — — — — — — 5 Other financial corporations 851 851 — 10 2 2 2 2 1 — 1 10 6 Non-financial corporations 32,374 32,299 75 1,431 422 292 275 158 234 26 24 1,431 7 Of which SMEs 21,236 21,232 4 1,379 413 273 260 149 234 26 24 1,379 8 Households 163,646 162,894 752 2,515 869 366 815 198 121 16 130 2,515 9 Debt securities 35,075 35,075 — — — — — — — — — — 10 Central banks 28 28 — — — — — — — — — — 11 General governments 23,843 23,843 — — — — — — — — — — 12 Credit institutions 6,631 6,631 — — — — — — — — — — 13 Other financial corporations 4,120 4,120 — — — — — — — — — — 14 Non-financial corporations 453 453 — — — — — — — — — — 15 Off-balance-sheet
exposures 66,380 264 264
16 Central banks 650 — — 17 General governments — — — 18 Credit institutions 185 — — 19 Other financial corporations 27 — — 20 Non-financial corporations 3,304 66 66 21 Households 62,214 198 198 22 Total 346,335 279,128 827 4,220 1,293 660 1,092 358 356 42 155 4,220
Risk and capital position reviewAnalysis of credit risk
barclays.com/annualreport Barclays Bank UK PLC Pillar 3 Report 2021 >55

Table 43: Performing and non-performing exposures and related provisions
This table provides an overview of the credit quality of non-performing exposures and related impairments, provisions and valuation adjustments by portfolio and exposure class.
Gross carrying amount/nominalAccumulated impairment, accumulated negative changes in fair value
due to credit risk and provisions
Accumulated partial write-off
Collateral and financial guarantees received
Performing exposures Non-performing exposures
Performing exposures - accumulated impairment and
provisions
Non-performing exposures - accumulated impairment,
accumulated negative changes in fair value due to credit risk and
provisionsOn
performing exposures
On non-performing exposuresTotal
Of which stage 1
Of which stage 2 Total
Of which stage 2
Of which stage 3 Total
Of which stage 1
Of which stage 2 Total
Of which stage 2
Of which stage 3
As at 31 December 2021 £m £m £m £m £m £m £m £m £m £m £m £m £m £m £m
1 Loans and advances 283,116 258,588 24,528 3,963 109 3,854 (1,364) (395) (969) (815) (3) (812) — 188,198 2,611 2 Central banks 74,254 74,254 — — — — — — — — — — — — — 3 General governments 7,058 7,034 24 — — — (3) (2) (1) — — — — 7,058 — 4 Credit institutions 1,023 1,023 — — — — — — — — — — — 65 — 5 Other financial corporations 604 585 19 18 — 18 (2) (2) — (2) — (2) — 133 14 6 Non-financial corporations 28,884 25,945 2,939 1,863 — 1,863 (236) (180) (56) (188) — (188) — 23,515 1,386 7 Of which SMEs 19,633 17,255 2,378 1,850 — 1,850 (224) (176) (48) (185) — (185) 16,800 634 8 Households 171,293 149,747 21,546 2,082 109 1,973 (1,123) (211) (912) (625) (3) (622) — 157,427 1,212 9 Debt securities 27,687 27,597 90 — — — — — — — — — — 338 — 10 Central banks 55 55 — — — — — — — — — — — — — 11 General governments 16,141 16,141 — — — — — — — — — — — — — 12 Credit institutions 5,136 5,059 77 — — — — — — — — — — 338 — 13 Other financial corporations 6,047 6,047 — — — — — — — — — — — — — 14 Non-financial corporations 308 295 13 — — — — — — — — — — — — 15 Off-balance-sheet exposures 59,582 56,442 3,140 246 — 246 (37) (7) (30) — — — 4,850 16 16 Central banks 590 590 — — — — — — — — — — 150 — 17 General governments 2 2 — — — — — — — — — — — — 18 Credit institutions 100 100 — — — — — — — — — — — — 19 Other financial corporations 27 27 — — — — — — — — — — — — 20 Non-financial corporations 2,909 2,761 148 58 — 58 — — — — — — 197 13 21 Households 55,954 52,962 2,992 188 — 188 (37) (7) (30) — — — 4,503 3 22 Total 370,385 342,627 27,758 4,209 109 4,100 (1,401) (402) (999) (815) (3) (812) — 193,386 2,627
Risk and capital position reviewAnalysis of credit risk
barclays.com/annualreport Barclays Bank UK PLC Pillar 3 Report 2021 >56

Table 43: Performing and non-performing exposures and related provisions continued
Gross carrying amount/nominalAccumulated impairment, accumulated negative changes in fair value due
to credit risk and provisions
Accumulated partial write-off
Collateral and financial guarantees received1
Performing exposures Non-performing exposures
Performing exposures - accumulated impairment and
provisions
Non-performing exposures - accumulated impairment,
accumulated negative changes in fair value due to credit risk and
provisionsOn
performing exposures
On non-performing exposuresTotal
Of which stage 1
Of which stage 2 Total
Of which stage 2
Of which stage 3 Total
Of which stage 1
Of which stage 2 Total
Of which stage 2
Of which stage 3
As at 31 December 2020 £m £m £m £m £m £m £m £m £m £m £m £m £m £m £m
1 Loans and advances 244,880 217,105 27,775 3,956 145 3,811 (1,925) (322) (1,603) (1,223) (3) (1,220) — 181,601 2,095 2 Central banks 39,013 39,013 — — — — — — — — — — — — — 3 General governments 8,180 8,180 — — — — — — — — — — — 8,261 — 4 Credit institutions 816 816 — — — — — — — — — — — 133 — 5 Other financial corporations 851 828 23 10 — 10 (1) — (1) (1) — (1) — 77 7 6 Non-financial corporations 32,374 27,481 4,893 1,431 — 1,431 (197) (35) (162) (222) — (222) — 25,508 861 7 Of which SMEs 21,236 19,058 2,178 1,379 — 1,379 (100) (32) (68) (217) — (217) — 18,341 815 8 Households 163,646 140,787 22,859 2,515 145 2,370 (1,727) (287) (1,440) (1,000) (3) (997) — 147,622 1,227 9 Debt securities 35,075 34,343 732 — — — (4) (3) (1) — — — — 320 — 10 Central banks 28 28 — — — — — — — — — — — — — 11 General governments 23,843 23,623 220 — — — (2) (1) (1) — — — — — — 12 Credit institutions 6,631 6,154 477 — — — (1) (1) — — — — — 320 — 13 Other financial corporations 4,120 4,099 21 — — — (1) (1) — — — — — — — 14 Non-financial corporations 453 439 14 — — — — — — — — — — — — 15 Off-balance-sheet exposures 66,380 59,210 7,170 264 — 264 (294) (17) (277) — — — 4,800 16 16 Central banks 650 650 — — — — — — — — — — — — 17 General governments — — — — — — — — — — — — — — 18 Credit institutions 185 185 — — — — — — — — — — — — 19 Other financial corporations 27 24 3 — — — — — — — — — — — 20 Non-financial corporations 3,304 2,476 828 66 — 66 (2) — (2) — — — 203 14 21 Households 62,214 55,875 6,339 198 — 198 (292) (17) (275) — — — 4,597 2 22 Total 346,335 310,658 35,677 4,220 145 4,075 (2,223) (342) (1,881) (1,223) (3) (1,220) — 186,721 2,111
Risk and capital position reviewAnalysis of credit risk
barclays.com/annualreport Barclays Bank UK PLC Pillar 3 Report 2021 >57

Table 44: CR2-B - Changes in the stock of defaulted and impaired loans and debt securities
This table provides an overview of the stock of defaulted and impaired loans and debt securities.
Gross carrying value defaulted
exposuresa
£m1 As at 1 January 2021 3,9562 Loans and debt securities that have defaulted or impaired since the last reporting period 2,505 3 Returned to non-defaulted status (699) 4 Amounts written off (644) 5 Other changes (1,157) 6 As at 31 December 2021 3,961
Note
a Defaulted exposures are defined as all loans unlikely to pay and therefore assessed as Stage 3 ECLs under IFRS 9, plus any additional loans greater than 90 days past due.
Table 45: CR2-A - Changes in the stock of general and specific credit risk adjustments
This table shows the movement in the impairment allowance during 2021. Please refer to pages 94-97 of this document and Note 7 of the Barclays Bank UK PLC Annual report 2021 for further information on impairment.
Accumulated specific credit
risk adjustmenta
Accumulated general credit
risk adjustment
£m £m1 As at 1 January 2021 3,446 — 2 Increases due to amounts set aside for estimated loan losses during the periodb (585) — 3 Decreases due to amounts reversed for estimated loan losses during the periodc (644) — 4 Decreases due to amounts taken against accumulated credit risk adjustments — — 5 Transfers between credit risk adjustments — — 6 Impact of exchange rate differences — — 7 Business combinations, including acquisitions and disposals of subsidiaries — — 9 Other adjustments — —
10 As at 31 December 2021 2,217 — 11 Recoveries on credit risk adjustments recorded directly to the statement of profit or lossd (19) — 12 Specific credit risk adjustments directly recorded to the statement of profit or loss — —
Notes
a Excludes other assets impairment £2m.b Increases due to amounts set aside for estimated loan losses during the period includes the net impact of changes made to parameters (such as PD,EAD and
LGD), changes in macro-economic variables, new assets originated, repayments and drawdowns.c Represents amounts written off.d Recoveries include post write off recoveries of £35m and a net loss in relation to reimbursements from financial guarantee contracts held with third parties of
£16m.
Risk and capital position reviewAnalysis of credit risk
barclays.com/annualreport Barclays Bank UK PLC Pillar 3 Report 2021 >58

Regulatory adjustments to statutory Impairment
The IFRS impairment allowance is adjusted to reflect a regulatory view, which is used to calculate the provision misalignment adjustment to regulatory capital. The primary differences are detailed below:
• Scope of consolidation - adjustments driven by differences between the IFRS and regulatory consolidation, as highlighted on page 11. These include, but are not exclusive to, associates and impairments relating to securitisation vehicles.
Table 46: Regulatory adjustments to statutory Impairment
As at 31 December 2021 £mIFRS allowance for impairment 2,219 Scope of consolidation — Regulatory impairment allowance 2,219
Risk and capital position reviewAnalysis of credit risk
barclays.com/annualreport Barclays Bank UK PLC Pillar 3 Report 2021 >59

Loss analysis – regulatory expected loss (EL) versus actual losses
The following table compares Barclays Bank UK Group’s regulatory expected loss (EL) measure against the view of actual loss for those portfolios where credit risk is calculated using the AIRB approach.
As expected loss best estimate (ELBE) represents a charge for assets already in default, it has been separately disclosed from total EL. This facilitates comparison of actual loss during the period to the expectation of future loss or EL, as per AIRB models in the prior period.
The following should be considered when comparing EL and actual loss metrics:– The purpose of EL is not to represent a prediction of future impairment charges– Whilst the impairment charge and the EL measure respond to similar drivers, they are not directly comparable– The EL does not reflect growth of portfolios or changes in the mix of exposures. In forecasting and calculating
impairment, balances and trends in the cash flow behaviour of customer accounts are considered
Regulatory Expected Loss
EL is an input to the capital adequacy calculation which can be seen as an expectation of average future loss based on AIRB models over a one year period as follows:
– Non defaulted assets: EL is calculated using probability of default, downturn loss given default estimates and exposures at default.
– Defaulted assets: EL is based upon an estimate of likely recovery levels for each asset and is generally referred to as ELBE.
Table 47: Analysis of expected loss versus actual losses for AIRB exposures
AIRB Exposure Class
EL ELBE
Total expected loss at 31
December 2020
Total actual loss at 31
December 2021
£m £m £m £mCentral governments or central banks — — — — Institutions 1 — 1 0 Corporates 90 101 191 60 Retail — — — — – SME 106 89 195 36 – Secured by real estate collateral 278 32 310 (12) – Qualifying revolving retail 542 628 1,170 (372) – Other retail 125 239 364 (7) Equity — — — — Securitisation positions — — — — Non-credit obligation assets — — — — Total AIRB 1,142 1,089 2,231 (295)
EL ELBE
Total expected loss at 31
December 2019
Total actual loss at 31
December 2020
£m £m £m £mCentral governments or central banks — — — — Institutions 1 — 1 — Corporates 70 60 130 100 Retail– SME 128 90 218 75 – Secured by real estate collateral 264 41 305 24 – Qualifying revolving retail 650 555 1,205 887 – Other retail 183 217 400 208 Equity — — — — Securitisation positions — — — — Non-credit obligation assets — — — — Total AIRB 1,296 963 2,259 1,294
Risk and capital position reviewAnalysis of credit risk
barclays.com/annualreport Barclays Bank UK PLC Pillar 3 Report 2021 >60

Non-trading book equity investments
Table 48: Fair value of gains and losses on equity investments
This table shows the fair value of non trading book equity positions subject to credit risk calculations, plus associated gains and losses.
Non trading book equity positionsAs at 31 December 2021 As at 31 December 2020
Fair Value RWAs Fair Value RWAs£m £m £m £m
Exchange Traded — — — — Private Equity 27 61 27 60 Other — — — — Total 27 61 27 60 Realised gains / (losses) from sale and liquidations of equity investments — — — — Unrealised gains — — — — Unrealised gains included in PRA transitional CET1 Capital — — — —
Risk and capital position reviewAnalysis of credit risk
barclays.com/annualreport Barclays Bank UK PLC Pillar 3 Report 2021 >61

Counterparty credit risk exposuresCounterparty credit risk is the risk related to a counterparty defaulting before the final transaction settlement. Barclays Bank UK Group’s calculates the exposures subject to CCR using two methods: Financial Collateral Comprehensive Method (FCCM), and Mark to Market Method (MTM).
The following tables analyse counterparty credit risk exposures and risk weighted assets split by regulatory exposure classes.
Table 49: Exposure at default, RWA and capital requirements associated with counterparty credit risk
This table summarises EAD post-credit risk mitigation, risk weighted assets and capital requirements by exposure class for counterparty credit risk. It should be noted that the disclosure below excludes credit valuation adjustment (CVA) which is shown separately in Table 55.
As at 31 December 2021 As at 31 December 2020
Post-CRM EAD RWA
Capital Requirements
Post-CRM EAD RWA
Capital Requirements
£m £m £m £m £m £mCounterparty credit risk exposure classStandardised approachCentral governments or central banks — — — — — — Regional governments or local authorities — — — — — — Public sector entities — — — — — — Multilateral development banks — — — — — — International organisations — — — — — — Institutions 3,047 642 51 1,860 330 26 Corporates 7 6 — 9 2 — Retail — — — — — — Secured by mortgages — — — — — — Exposures in default — — — — — — Items associated with high risk — — — — — — Covered bonds — — — — — — Securitisation positions — — — — — — Collective investment undertakings — — — — — — Equity positions — — — — — — Other items — — — — — — Total standardised approach 3,054 648 51 1,869 332 26 Advanced IRB approachCentral governments or central banks — — — — — — Institutions — — — — — — Corporates — — — — — — Retail — — — — — — – Small and medium enterprises (SME) — — — — — — – Secured by real estate collateral — — — — — — – Qualifying revolving retail — — — — — — – Other retail — — — — — — Equity — — — — — — Securitisation positions — — — — — — Non-credit obligation assets — — — — — — Total advanced IRB approach — — — — — — Default fund contributions 90 181 14 147 204 16 Total 3,144 829 65 2,016 536 42
Risk and capital position reviewAnalysis of counterparty credit risk
barclays.com/annualreport Barclays Bank UK PLC Pillar 3 Report 2021 >62

Table 50: CCR1 - Analysis of CCR exposure by approach
This table provides the CCR regulatory requirements split between the method and main parameters used.
This table excludes default fund contribution and as such cannot be directly reconciled to Table 49.
Notional
Replacement cost/current
market value
Potential future credit
exposure EEPE MultiplierEAD post
CRM RWAsAs at 31 December 2021 £m £m £m £m £m £m1 Mark to market 657 2,791 1,383 259 2 Original exposure — — — 3 Standardised approach — — — 4 IMM (for derivatives and SFTs) — — — — 5 Of which securities financing
transactions — — — — 6 Of which derivatives and long settlement
transactions — — — — 7 Of which from contractual cross-product
netting — — — 8 Financial collateral simple method (for
SFTs) — — 9 Financial collateral comprehensive
method (for SFTs) 1,671 389 10 VaR for SFTs — — 11 Total 648
As at 31 December 20201 Mark to market 363 2,339 1,463 192 2 Original exposure — — — 3 Standardised approach — — — 4 IMM (for derivatives and SFTs) — — — — 5 Of which securities financing
transactions — — — — 6 Of which derivatives and long settlement
transactions — — — — 7 Of which from contractual cross-product
netting — — — 8 Financial collateral simple method (for
SFTs) — — 9 Financial collateral comprehensive
method (for SFTs) 406 140 10 VaR for SFTs — — 11 Total 332
Risk and capital position reviewAnalysis of counterparty credit risk
barclays.com/annualreport Barclays Bank UK PLC Pillar 3 Report 2021 >63

Table 51: CCR3 - Counterparty credit risk exposures by exposure classes and risk weight under the standardised approach
This table shows exposure at default, broken down by exposure class and risk weight. This table includes exposures subject to the standardised approach only.
Exposures by regulatory portfolio and risk
0% 2% 4% 10% 20% 35% 50% 70% 75% 100% 150% 250% 370% 1250% Others Deducted Totalof which:
UnratedAs at 31 December 2021
1 Central governments or central banks — — — — — — — — — — — — — — — — — — 2 Regional governments or local authorities — — — — — — — — — — — — — — — — — — 3 Public sector entities — — — — — — — — — — — — — — — — — — 4 Multilateral development banks — — — — — — — — — — — — — — — — — — 5 International organisations — — — — — — — — — — — — — — — — — — 6 Institutions — 873 — — 1,540 — 634 — — — — — — — — — 3,047 35 7 Corporates — — — — 3 — — — — 4 — — — — — — 7 4 8 Retail — — — — — — — — — — — — — — — — — — 9 Secured by mortgages on immovable
property — — — — — — — — — — — — — — — — — — 10 Exposures in default — — — — — — — — — — — — — — — — — — 11 Items associated with particularly high risk — — — — — — — — — — — — — — — — — — 12 Covered bonds — — — — — — — — — — — — — — — — — — 13 Claims on institutions and corporate with a
short-term credit assessment — — — — — — — — — — — — — — — — — — 14 Claims in the form of CIU — — — — — — — — — — — — — — — — — — 15 Equity exposures — — — — — — — — — — — — — — — — — — 16 Other items — — — — — — — — — — — — — — — — — — 17 Total — 873 — — 1,543 — 634 — — 4 — — — — — — 3,054 39
Risk and capital position reviewAnalysis of counterparty credit risk
barclays.com/annualreport Barclays Bank UK PLC Pillar 3 Report 2021 >64

Table 51: CCR3 - Counterparty credit risk exposures by exposure classes and risk weight under standardised approach continued
Exposures by regulatory portfolio and risk
0% 2% 4% 10% 20% 35% 50% 70% 75% 100% 150% 250% 370% 1250% Others Deducted Totalof which:
UnratedAs at 31 December 2020
1 Central governments or central banks — — — — — — — — — — — — — — — — — — 2 Regional governments or local authorities — — — — — — — — — — — — — — — — — — 3 Public sector entities — — — — — — — — — — — — — — — — — — 4 Multilateral development banks — — — — — — — — — — — — — — — — — — 5 International organisations — — — — — — — — — — — — — — — — — — 6 Institutions — 1,145 — — 168 — 547 — — — — — — — — — 1,860 28 7 Corporates — — — — 9 — — — — — — — — — — — 9 — 8 Retail — — — — — — — — — — — — — — — — — — 9 Secured by mortgages on immovable
property — — — — — — — — — — — — — — — — — — 10 Exposures in default — — — — — — — — — — — — — — — — — — 11 Items associated with particularly high risk — — — — — — — — — — — — — — — — — — 12 Covered bonds — — — — — — — — — — — — — — — — — — 13 Claims on institutions and corporate with a
short-term credit assessment — — — — — — — — — — — — — — — — — — 14 Claims in the form of CIU — — — — — — — — — — — — — — — — — — 15 Equity exposures — — — — — — — — — — — — — — — — — — 16 Other items — — — — — — — — — — — — — — — — — — 17 Total — 1,145 — — 177 — 547 — — — — — — — — — 1,869 28
Risk and capital position reviewAnalysis of counterparty credit risk
barclays.com/annualreport Barclays Bank UK PLC Pillar 3 Report 2021 >65

Table 52: CCR5-A - Impact of netting and collateral held on exposure values
This table shows the impact on exposure from netting and collateral held for derivatives and SFTs.
Gross positive fair value or net carrying amount
Netting benefits
Netted current credit exposure Collateral held
Net credit exposure
As at 31 December 2021 £m £m £m £m £m1 Derivatives 12,439 11,781 658 790 120 2 SFTs 15,838 15,638 200 — 201 3 Cross-product netting — — — — — 4 Total 28,277 27,419 858 790 321
Gross positive fair value or net carrying amount
Netting benefits
Netted current credit exposure Collateral held
Net credit exposure
As at 31 December 2020 £m £m £m £m £m1 Derivatives 10,513 10,150 363 400 149 2 SFTs 9,251 9,222 29 — 29 3 Cross-product netting — — — — — 4 Total 19,764 19,372 392 400 178
Table 53: CCR5-B - Composition of collateral for exposures to CCR
This table shows the types of collateral posted or received to support or reduce CCR exposures relating to derivative transactions or SFTs, including transactions cleared through a central counterparty (CCP).
Collateral used in derivative transactions Collateral used in SFTsFair value of collateral received Fair value of posted collateral Fair value of
collateral received
Fair value of posted
collateralSegregated Unsegregated Segregated Unsegregated
As at 31 December 2021 £m £m £m £m £m £m1 Cash — 537 — 7,044 — 62 2 Debt 167 86 1,682 — — — 3 Equity — — — — — — 4 Others — — — — — —
Total 167 623 1,682 7,044 — 62
Collateral used in derivative transactions Collateral used in SFTsFair value of collateral received Fair value of posted collateral Fair value of
collateral received
Fair value of posted
collateralSegregated Unsegregated Segregated Unsegregated
As at 31 December 2020 £m £m £m £m £m £m1 Cash — 214 — 8,061 — — 2 Debt 186 — 1,819 — — — 3 Equity — — — — — — 4 Others — — — — — —
Total 186 214 1,819 8,061 — —
Risk and capital position reviewAnalysis of counterparty credit risk
barclays.com/annualreport Barclays Bank UK PLC Pillar 3 Report 2021 >66

Table 54: CCR8 - Exposures to CCPs
This table provides a breakdown of the exposures and RWAs to a central counterparty (CCP).
As at 31 December 2021 As at 31 December 2020EAD post CRM RWAs EAD post CRM RWAs
£m £m £m £m1 Exposures to QCCPs (total) 198 227 2 Exposures for trades at QCCPs (excluding initial margin and
default fund contributions); of which 873 17 794 16 3 (i) OTC derivatives 843 16 712 14 4 (ii) Exchange-traded derivatives — — — — 5 (iii) SFTs 30 1 82 2 6 (iv) Netting sets where cross-product netting has been
approved — — — — 7 Segregated initial margin 1,514 1,633 8 Non-segregated initial margin — — 351 7 9 Prefunded default fund contributions 90 181 147 204 10 Alternative calculation of own funds requirements for exposures — — 11 Exposures to non-QCCPs (total) — — 12 Exposures for trades at non-QCCPs (excluding initial margin
and default fund contributions); of which — — — — 13 (i) OTC derivatives — — — — 14 (ii) Exchange-traded derivatives — — — — 15 (iii)SFTs — — — — 16 (iv)Netting sets where cross-product netting has been approved — — — — 17 Segregated initial margin — — 18 Non-segregated initial margin — — — — 19 Prefunded default fund contributions — — — — 20 Unfunded default fund contributions — — — —
Risk and capital position reviewAnalysis of counterparty credit risk
barclays.com/annualreport Barclays Bank UK PLC Pillar 3 Report 2021 >67

Credit valuation adjustments
The Credit Valuation Adjustment measures the risk from MTM losses due to deterioration in the credit quality of a counterparty to over-the-counter derivative transactions with Barclays Bank UK Group. It is a complement to the counterparty credit risk charge, which accounts for the risk of outright default of a counterparty.
Table 55: CCR2 - Credit valuation adjustment capital charge
Barclays Bank UK Group uses the standardised approach to calculate CVA capital charge: This approach takes account of the external credit rating of each counterparty, EAD from the calculation of the CCR and the effective maturity.
Credit valuation adjustment (CVA) capital charge
Exposure value RWA
£m £mAs at 31 December 20211 Total portfolios subject to the Advanced Method — — 2 (i) VaR component (including the 3x multiplier) — 3 (ii) Stressed VaR component (including the 3x multiplier) — 4 All portfolios subject to the Standardised Method 533 379 EU4 Based on original exposure method — — 5 Total subject to the CVA capital charge 533 379
As at 31 December 20201 Total portfolios subject to the Advanced Method — — 2 (i) VaR component (including the 3x multiplier) — 3 (ii) Stressed VaR component (including the 3x multiplier) — 4 All portfolios subject to the Standardised Method 400 251 EU4 Based on original exposure method — — 5 Total subject to the CVA capital charge 400 251
Risk and capital position reviewAnalysis of counterparty credit risk
barclays.com/annualreport Barclays Bank UK PLC Pillar 3 Report 2021 >68

Capital requirements for market risk
The table below shows the elements of capital requirements and risk weighted assets under the market risk framework as defined in the CRR. Barclays Bank UK Group is required to hold capital for the market risk exposures arising from regulatory trading books.
Table 56: Market risk own funds requirements
RWA Capital requirements
As at 31 December
2021
As at 31 December
2020
As at 31 December
2021
As at 31 December
2020£m £m £m £m
1 Internal models approach — — — — 2 VaR — — — — 3 SVaR — — — — 4 Incremental risk charge — — — — 5 Comprehensive risk measure — — — — 6 Risks not in VaR — — — — 7 Standardised approach 100 72 8 6 8 Interest rate risk (general and specific) 48 10 4 1 9 Equity risk (general and specific) — — — —
10 Foreign exchange risk 52 62 4 5 11 Commodity risk — — — — 12 Specific interest rate risk of securitisation position — — — — 13 Total 100 72 8 6
Table 57: MR1 - Market risk under standardised approach
This table shows the RWAs and capital requirements for standardised market risk split between outright products, options and securitisation. This table includes exposures subject to the standardised approach only.
RWA Capital requirements
As at 31 December
2021
As at 31 December
2020
As at 31 December
2021
As at 31 December
2020£m £m £m £m
Outright products1 Interest rate risk (general and specific) 48 10 4 1 2 Equity risk (general and specific) — — — — 3 Foreign exchange risk 52 62 4 5 4 Commodity risk — — — —
Options — — — — 5 Simplified approach — — — — 6 Delta-plus method — — — — 7 Scenario approach — — — — 8 Securitisation (specific risk) — — — — 9 Total 100 72 8 6
Risk and capital position reviewAnalysis of market risk
barclays.com/annualreport Barclays Bank UK PLC Pillar 3 Report 2021 >69

Analysis of securitisation exposures
As securitisation exposures are subject to a distinct regulatory framework, additional securitisation disclosures are provided separate to the credit, counterparty and market risk disclosures.
This table shows a reconciliation of securitisation exposures in the following section and where the balance can be found in the relevant credit, counterparty and market risk sections.
Table 58: Reconciliation of exposures and capital requirements relating to securitisations
Table number in this document
Exposure value RWAs Capital requirementAs at 31 December 2021 £m £m £mBanking book
Standardised approachCredit risk Table 16 4,099 679 54Total standardised approacha 4,099 679 54
Advanced IRBCredit risk Table 16 3,929 589 47Total IRB approacha 3,929 589 47Total banking book 8,028 1,268 101
Note
a The new securitisation Regulation (EU) 2017/2402 (the Securitisation Regulation) and Regulation (EU) 2017/2401 (amendments to Capital Requirements Regulation or CRR) took effect on 1 January 2020 for all transactions. In accordance with this, risk weights for securitisation exposures have been calculated per the following approaches: Internal ratings based approach (Sec IRBA), Standardised approach (Sec SA), External ratings based approach/internal assessment approach (Sec ERBA/Sec IAA) or 1250% if these approaches are not applicable.
Risk and capital position reviewAnalysis of securitisation positions
barclays.com/annualreport Barclays Bank UK PLC Pillar 3 Report 2021 >70

Table 59: Securitisation activity during the year
This table discloses a summary of the securitisation activity during 2021, including the amount of exposures securitised and recognised gain or loss on sale in the banking book and trading book. Barclays Bank UK Group is involved in the origination of traditional and synthetic securitisations. A securitisation is considered to be synthetic where the transfer of risk is achieved through the use of credit derivatives or guarantees and the exposure remains on balance sheet. A securitisation is considered to be traditional where the transfer of risk is achieved through the actual transfer of exposures to a Special Purpose Vehicle (SPV).
Banking bookTraditional Synthetic Total banking book Gain/loss on sale
£m £m £m £mAs at 31 December 2021OriginatorResidential Mortgages — — — — Commercial Mortgages — — — — Credit Card Receivables — — — — Leasing — — — — Loans to Corporates or SMEs — — — — Consumer Loans — — — — Trade Receivables — — — — Securitisations/Re-securitisations — — — — Other Assets — 2,000 2,000 — Total — 2,000 2,000 —
Banking bookTraditional Synthetic Total banking book Gain/loss on sale
£m £m £m £mAs at 31 December 2020OriginatorResidential Mortgages — — — — Commercial Mortgages — — — — Credit Card Receivables — — — — Leasing — — — — Loans to Corporates or SMEs — — — — Consumer Loans — — — — Trade Receivables — — — — Securitisations/Re-securitisations — — — — Other Assets — 2,071 2,071 — Total — 2,071 2,071 —
Risk and capital position reviewAnalysis of securitisation positions
barclays.com/annualreport Barclays Bank UK PLC Pillar 3 Report 2021 >71

Table 60: Securitisation positions - by exposure class
The table below discloses the aggregate amount of securitisation positions held, which is consistent with Table 61 and 62.
For invested and sponsored positions, the table below presents the aggregate amount of positions purchased.
Banking booka
Originator Sponsor InvestorTotal banking
bookAs at 31 December 2021 £m £m £m £mOn-balance sheetResidential Mortgages — — 4,099 4,099 Commercial Mortgages — — — — Credit Card Receivables — — — — Leasing — — — — Loans to Corporates or SMEs — — — — Consumer Loans — — — — Trade Receivables — — — — Securitisations/Re-securitisations — — — — Other Assets 3,929 — — 3,929 Total On-balance sheet 3,929 — 4,099 8,028
Off-balance sheetResidential Mortgages — — — — Commercial Mortgages — — — — Credit Card Receivables — — — — Leasing — — — — Loans to Corporates or SMEs — — — — Consumer Loans — — — — Trade Receivables — — — — Securitisations/Re-securitisations — — — — Other Assets — — — — Total Off-balance sheet — — — — Total 3,929 — 4,099 8,028
Risk and capital position reviewAnalysis of securitisation positions
barclays.com/annualreport Barclays Bank UK PLC Pillar 3 Report 2021 >72

Banking booka
Originator Sponsor InvestorTotal banking
bookAs at 31 December 2020 £m £m £m £mOn-balance sheetResidential Mortgages — — 2,289 2,289 Commercial Mortgages — — — — Credit Card Receivables — — — — Leasing — — — — Loans to Corporates or SMEs — — — — Consumer Loans — — — — Trade Receivables — — — — Securitisations/Re-securitisations — — — — Other Assets 1,999 — — 1,999 Total On-balance sheet 1,999 — 2,289 4,288
Off-balance sheetResidential Mortgages — — — — Commercial Mortgages — — — — Credit Card Receivables — — — — Leasing — — — — Loans to Corporates or SMEs — — — — Consumer Loans — — — — Trade Receivables — — — — Securitisations/Re-securitisations — — — — Other Assets — — — — Total Off-balance sheet — — — — Total 1,999 — 2,289 4,288
Note
a The exposure type is based on the asset class of underlying positions.
Table 61: Securitisation positions - by capital approach
This table discloses the total exposure value and associated capital requirement of securitisation positions held by the approach adopted in accordance with the Basel framework. The 2021 disclosure incorporates Sec Internal Ratings Based approach (IRBA), Sec standardised approach (SA), Sec External Ratings Based approach (ERBA) and Sec Internal Assessment approach (IAA) in accordance with new Securitisation framework. The total population is as per Tables 60 and 62.
Exposure values Capital requirementsOriginator Sponsor Investor Total Originator Sponsor Investor Total
As at 31 December 2021 £m £m £m £m £m £m £m £mBanking bookNew securitisation framework approaches (Sec IRBA, Sec SA, Sec ERBA/Sec IAA)<= 10% — — 820 820 — — 6 6 > 10% <= 20% 3,929 — 3,164 7,093 47 — 38 85 > 20% <= 50% — — — — — — — — > 50% <= 100% — — 47 47 — — 3 3 >100% <= 650% — — 68 68 — — 7 7 > 650% < 1250% — — — — — — — — =1250% / Look through — — — — — — — — Internal Assessment Approach — — — — — — — — Supervisory Formula Method — — — — — — — — Sub-total IRB 3,929 — 3,929 47 — — 47 Sub-total standardised approach — — 4,099 4,099 — — 54 54 Total banking book 3,929 — 4,099 8,028 47 — 54 101
Risk and capital position reviewAnalysis of securitisation positions
barclays.com/annualreport Barclays Bank UK PLC Pillar 3 Report 2021 >73

Exposure values Capital requirementsOriginator Sponsor Investor Total Originator Sponsor Investor Total
As at 31 December 2020 £m £m £m £m £m £m £m £mBanking bookNew securitisation framework approaches (Sec IRBA, Sec SA, Sec ERBA/Sec IAA)<= 10% — — 1,041 1,041 — — 8 8 > 10% <= 20% 1,999 — 1,091 3,090 24 — 13 37 > 20% <= 50% — — — — — — — — > 50% <= 100% — — 89 89 — — 6 6 >100% <= 650% — — 68 68 — — 8 8 > 650% < 1250% — — — — — — — — = 1250% / Look through — — — — — — — — Internal Assessment Approach — — — — — — — — Supervisory Formula Method — — — — — — — — Sub-total IRB 1,999 — 1,999 24 — — 24 Sub-total standardised approach — — 2,289 2,289 — — 35 35 Total banking book 1,999 — 2,289 4,288 24 — 35 59
Risk Weighted BandNew securitisation Regulation (EU) 2017/2401&2 S&P Equivalent Rating (STS)
New securitisation Regulation (EU) 2017/2401&2 S&P Equivalent Rating (Non STS)
<= 70%AAA to BBB- (Senior Position Only) / AAA to A (Base Case)
AAA to A- (Senior Position Only) / AAA to A+ (Base Case)
> 70% <= 160%BBB to BB (Senior Position Only) / AA- to BBB+ (Base Case)
BBB+ to BB (Senior Position Only) / AA+ to A- (Base Case)
> 160% <= 280%BB- to B (Senior Position Only) / A- to BBB- (Base Case)
BB to B+ (Senior Position Only) / A+ to BBB (Base Case)
> 280% <= 420%B to CCC- (Senior Position Only) / BBB- to BB+ (Base Case)
B+ to B- (Senior Position Only) / BBB to BBB- (Base Case)
> 420% <= 860%CCC+ to CCC- (Senior Position Only) / BB+ to B+ (Base Case)
B- to CCC- (Senior Position Only) / BBB- to BB- (Base Case)
> 860% <=1130% B to B- (Base Case) BB- to B- (Base Case) = 1250% / deduction Below CCC-/Below B- (Base Case) Below CCC-/ Below B- (Base Case)
Risk and capital position reviewAnalysis of securitisation positions
barclays.com/annualreport Barclays Bank UK PLC Pillar 3 Report 2021 >74

Table 62: Aggregate amount of securitised positions retained or purchased by geography - banking book
This table presents total banking book securitised exposure type by geography, based on location of the counterparty.
Exposure Type
United Kingdom Total
£m £mAs at 31 December 2021Residential Mortgages 4,099 4,099Commercial Mortgages — — Credit Card Receivables — — Leasing — — Loans to Corporates or SMEs — — Consumer Loans — — Trade Receivables — — Securitisations/Re-securitisations — — Other Assets 3,929 3,929Total 8,028 8,028
As at 31 December 2020Residential Mortgages 2,289 2,289 Commercial Mortgages — — Credit Card Receivables — — Leasing — — Loans to Corporates or SMEs — — Consumer Loans — — Trade Receivables — — Securitisations/Re-securitisations — — Other Assets 1,999 1,999 Total 4,288 4,288
Risk and capital position reviewAnalysis of securitisation positions
barclays.com/annualreport Barclays Bank UK PLC Pillar 3 Report 2021 >75

Table 63: Outstanding amount of exposures securitised - Asset value and impairment charges
This table presents the asset values and impairment charges relating to securitisation programmes where Barclays Bank UK Group is the originator or sponsor. For programmes where Barclays Bank UK Group contributed assets to a securitisation alongside third parties, the amount represents the entire asset pool. Please note that Table 63 will not reconcile to Table 59, as Table 63 shows outstanding amount of exposure for the positions held or retained by Barclays Bank UK Group. Table 59 shows the total position originated by Barclays Bank UK Group in 2021.
Banking book
Traditional SyntheticTotal banking
bookOf which past
dueRecognised
lossesAs at 31 December 2021 £m £m £m £m £mOriginatorResidential Mortgages — — — — — Commercial Mortgages — — — — — Credit Card Receivables — — — — — Leasing — — — — — Loans to Corporates or SMEs — — — — — Consumer Loans — — — — — Trade Receivables — — — — — Securitisations/Re-securitisations — — — — — Other Assets — 4,071 4,071 — — Total (Originator) — 4,071 4,071 — —
SponsorResidential Mortgages — — — — — Commercial Mortgages — — — — — Credit Card Receivables — — — — — Leasing — — — — — Loans to Corporates or SMEs — — — — — Consumer Loans — — — — — Trade Receivables — — — — — Securitisations/Re-securitisations — — — — — Other Assets — — — — — Total (Sponsor) — — — — — Total — 4,071 4,071 — —
Risk and capital position reviewAnalysis of securitisation positions
barclays.com/annualreport Barclays Bank UK PLC Pillar 3 Report 2021 >76

Banking book
Traditional SyntheticTotal banking
bookOf which past
dueRecognised
lossesAs at 31 December 2020 £m £m £m £m £mOriginatorResidential Mortgages — — — — — Commercial Mortgages — — — — — Credit Card Receivables — — — — — Leasing — — — — — Loans to Corporates or SMEs — — — — — Consumer Loans — — — — — Trade Receivables — — — — — Securitisations/Re-securitisations — — — — — Other Assets — 2,071 2,071 — — Total (Originator) — 2,071 2,071 — —
SponsorResidential Mortgages — — — — — Commercial Mortgages — — — — — Credit Card Receivables — — — — — Leasing — — — — — Loans to Corporates or SMEs — — — — — Consumer Loans — — — — — Trade Receivables — — — — — Securitisations/Re-securitisations — — — — — Other Assets — — — — — Total (Sponsor) — — — — — Total — 2,071 2,071 — —
Risk and capital position reviewAnalysis of securitisation positions
barclays.com/annualreport Barclays Bank UK PLC Pillar 3 Report 2021 >77

Operational risk - risk weighted assets
The following table details the Barclays Bank UK Group’s operational risk RWAs. Barclays Bank UK Group has approval from the PRA to calculate its operational risk capital requirement using the Standardised Approach (TSA).
See pages 130-134 for information on operational risk management.
Table 64: Risk weighted assets for operational risk
As at 31 December 2021 £mOperational RiskBasic Indicator Approach — Standardised Approach 10,892 Advanced Measurement Approach — Total operational risk RWAs 10,892
As at 31 December 2020Operational RiskBasic Indicator Approach — Standardised Approach 11,347 Advanced Measurement Approach — Total operational risk RWAs 11,347
Operational risk profile
During 2021, total operational risk lossesa remained stable at £103m (2020: £103m) while the number of recorded events for 2021 increased to 2,129 from 1,380 events recorded during the prior year. The total operational risk losses for the year were mainly driven by events falling within the Execution, Delivery & Process Management and External Fraud categories, which tend to be high volume but low impact events.
Within operational risk, there are a large number of smaller value risk events. In 2021, 88% (2020: 82%) of the Barclays Bank UK Group’s reportable operational risk events by volume had a value of less than £50,000 each. Cumulatively, events under this £50,000 threshold accounted for only 36% (2020: 22%) of the Barclays Bank UK Group’s total net operational risk losses. A small proportion of operational risk events have a material impact on the financial results of the Barclays Bank UK Group.
Note
a The data disclosed includes operational risk losses for reportable events having net impact of > £10,000 and excludes events that are conduct or legal risk, aggregate and boundary events. A boundary event is an operational risk event that results in a credit risk impact.
Risk and capital position reviewAnalysis of operational risk
barclays.com/annualreport Barclays Bank UK PLC Pillar 3 Report 2021 >78

The analysis below presents the Barclays Bank UK Group’s operational risk events by Basel event categorya:
Note
a The data disclosed includes operational risk losses for reportable events having net impact of > £10,000 and excludes events that are conduct or legal risk, aggregate and boundary events. A boundary event is an operational risk event that results in a credit risk impact.
• External Fraud remains the category with the highest frequency of events at 96% of total events in 2021 (2020: 92%) with number of events increasing to 2,044 (2020: 1,271). Losses increased to £71m accounting for 69% of total losses (2020: £42m / 41%). In this category, high volume, low value events are driven by transactional fraud often related to debit and credit card usage.
• Execution, Delivery and Process Management impacts decreased to £30m (2020: £57m), accounting for 30% of overall operational risk losses (2020: 55%). The events in this category are typical of the banking industry as a whole where high volumes of transactions are processed on a daily basis, mapping mainly to Barclays Transaction Operations risk type. The volume of events in this category fell year-on-year to 74 (2020: 88), accounting for 4% of total events (2020: 6%).
Investment continues to be made in improving the control environment across the Barclays Bank UK Group. Particular areas of focus include new and enhanced fraud prevention systems and tools to combat the increasing level of fraud attempts being made whilst minimising disruption to genuine transactions. Fraud remains an industry wide threat and the Barclays Bank UK Group continues to work closely with external partners on various prevention initiatives.
Operational Resilience remains a key area of focus for the Barclays Bank UK Group. The COVID-19 pandemic is the most severe global health emergency the World Health Organization (WHO) has ever declared. While overall, the Barclays Bank UK Group has continued to prove resilient and actual losses have not materially increased due to the effects of the pandemic, the COVID-19 pandemic has caused disruption to the Barclays Bank UK Group’s customers, suppliers, and staff globally. The COVID-19 pandemic has reinforced our focus on resilience and the Barclays Bank UK Group continues to monitor potential operational disruptions associated with both the Barclays Bank UK Group’s and its suppliers’ transition to a Work-from-Home environment and in response to initially high market volatility. The Barclays Bank UK Group continues to strengthen its resilience approach across its most important business services to improve recoverability and assurance thereof.
Operational risk associated with cybersecurity remains a top focus for the Barclays Bank UK Group. The sophistication of threat actors continues to grow as noted by multiple external risk events observed throughout the year. Ransomware attacks across the global Barclays supplier base were observed and we worked closely with the affected suppliers to manage potential impacts to the Barclays Bank UK Group and its clients and customers. The Barclays Bank UK Group’s cybersecurity events were managed within its risk tolerances and there were no material loss events associated with cybersecurity recorded within the event categories above.
For further information, refer to the operational risk management section.
Risk and capital position reviewAnalysis of operational risk
barclays.com/annualreport Barclays Bank UK PLC Pillar 3 Report 2021 >79

The Barclays Bank UK Group’s risk management strategy
This section introduces Barclays Bank UK Group’s approach to managing and identifying risks, and for fostering a strong risk culture.
Enterprise Risk Management Framework (ERMF)The ERMF outlines the highest level principles for risk management by setting out standards, objectives and key responsibilities of different groups of employees of the Barclays Group. It is approved by the Barclays PLC Board on recommendation of the Group Board Risk Committee and the Barclays Group Chief Risk Officer (CRO); it is then adopted by the Barclays Bank UK Group with modifications where needed. It supports senior management in effective risk management and developing a strong risk culture.
The ERMF sets out:• Principal risks faced by the Barclays Bank UK Group which guides the organisation of the risk management function.• Risk appetite requirements: This helps define the level of risk we are willing to undertake in our business.• Risk management and segregation of duties: The ERMF defines a Three Lines of Defence model.• Roles and responsibilities for key risk management and governance structure.
The ERMF is complemented by frameworks, policies and standards that are mainly aligned to individual principal risks:• Frameworks cover the management processes for a collection of related activities and define the associated policies used
to govern them.• Policies set out principles, controls objectives and other core requirements for the activities of the Barclays Bank UK Group.
Policies describe “what” must be done.• Standards set out the key control requirements that describe how the requirements set out in the policy are met.
Segregation of duties - the "Three Lines of Defence" modelThe ERMF sets out a clear lines of defence model. All colleagues are responsible for understanding and managing risks within the context of their individual roles and responsibilities, as set out below:
• The First line comprises all employees engaged in the revenue generating and client facing areas of the Barclays Bank UK Group and all associated support functions, including Finance, Operations, Treasury, and Human Resources etc. The first line is responsible for identifying and managing the risks in which they are engaged in, developing a control framework, and escalating risk events to Risk and Compliance.
• The Second line is comprised of the Risk and Compliance functions. The role of the second line is to establish the limits, rules and constraints, policies and standards under which first line activities shall be performed, consistent with the risk appetite of the Barclays Bank UK Group, and to monitor the performance of the first line against these limits and constraints. Controls for first line activities, especially those related to operational risk, will ordinarily be established by the control officers operating within the control framework of the firm. These will remain subject to supervision by the second line.
• The Third line of defence is Internal Audit, who are responsible for providing independent assurance over the effectiveness of governance, risk management and control over current, systemic and evolving risks.
• The Legal function provides support to all areas of the bank and is not formally part of any of the three lines, However, it is subject to second line oversight with respect to operational and conduct risks.
Principal risksThe ERMF identifies nine principal risks (see managing risk in the strategic report section) namely: credit risk, market risk, treasury and capital risk, climate risk, operational risk, model risk, conduct risk, reputation risk and legal risk. Note that climate risk was added in January 2022; see page 85 for more information.
Each of the principal risks is overseen by an accountable executive within the Barclays Group who is responsible for the framework, policies and standards that set out associated responsibilities and expectations, and detail the related requirements around risk management. In addition, certain risks span across more than one principal risk.
Risk appetite Risk appetite is defined as the level of risk which the Barclays Group is prepared to accept in the conduct of their activities. It provides a basis for ongoing dialogue between management and Board with respect to the current and evolving risk profile, allowing strategic and financial decisions to be made on an informed basis.
Risk appetite is approved by the Barclays PLC Board in aggregate and disseminated across legal entities and businesses, including the Barclays Bank UK Group. The Barclays Bank UK Board cannot approve a higher risk appetite than that determined by the Group Board without the approval of the Group Board but may choose to operate at a lower level of risk appetite than that approved by the Barclays Group. The Barclays Group total risk appetite and its allocation to the Barclays Bank UK Group are supported by limits to enable and control specific exposures and activities that have material concentration risk implications.
Barclays’ approach to managing risksRisk management strategy, governance and risk culture
barclays.com/annualreport Barclays Bank UK PLC Pillar 3 Report 2021 >80

Risk committeesThe Barclays Bank UK Group product/risk type committees consider risk matters relevant to their business, and escalate as required to the Barclays UK Risk Committee, whose Chairman, in turn, escalates to the Barclays Group Risk Committee, Barclays Bank UK PLC Board Committees and the Barclays Bank UK PLC Board.
The Barclays Bank UK PLC Board receives regular information on the risk profile of the Barclays Bank UK Group, and has ultimate responsibility for risk appetite and capital plans, within the parameters set by the Barclays PLC Board. The Barclays Bank UK PLC Board is also responsible for the adoption of the ERMF.
Further, there are two Board-level committees which oversee the application of the ERMF and review and monitor risk across the Barclays Bank UK Group. These are: the Barclays Bank UK PLC Board Risk Committee and the Barclays Bank UK PLC Board Audit Committee. Additionally, the Barclays Bank UK PLC Board Remuneration Committee oversees pay practices focusing on aligning pay to sustainable performance.
• The Barclays Bank UK PLC Board Risk Committee (BRC): The BRC monitors Barclays Bank UK Group’s risk profile against the agreed appetite. Where actual performance differs from expectations, the actions taken by management are reviewed to ascertain that the Committee is comfortable with them. The Barclays Bank UK Group CRO regularly presents a report to the BRC summarising developments in the risk environment and performance trends in the key portfolios. The BRC also reviews certain key risk methodologies, the effectiveness of risk management, and Barclays Bank UK Group's risk profile, including the material issues affecting each business portfolio and forward risk trends. The Committee also commissions in-depth analyses of significant risk topics, which are presented by the Barclays Bank UK Group CRO or senior risk managers in the business.
• The Barclays Bank UK PLC Board Audit Committee (BAC): receives regular reports on the effectiveness of internal control systems, on material control issues of significance and on accounting judgements (including impairment), and a quarterly review of the adequacy of impairment allowances, relative to the risk inherent in the portfolios, the business environment, and Barclays policies and methodologies.
• The Barclays Bank UK PLC Board Remuneration Committee (RemCo): receives proposals on ex-ante and ex-post risk adjustments to variable remuneration based on risk management performance including events, issues and the wider risk profile. These inputs are considered in the setting of performance incentives.
Barclays’ approach to managing risksRisk management strategy, governance and risk culture
barclays.com/annualreport Barclays Bank UK PLC Pillar 3 Report 2021 >81

Coverage of risk reports to executive and Board risk committees
Chairs of Risk Committees at executive and Board levels specify the information they require to discharge their duties. Advance committee calendars are agreed with the committee chairs. Topics that are regularly covered include:
• Risk profile;• Risk perspective on medium-term plans and strategy;• Risk Appetite;• Results of stress tests;• Risk and Conduct inputs into remuneration decisions; and• Other technical topics, e.g. Model risk.
In addition to regular topics, committees consider ad hoc papers on current risk topics, such as:
• Political events and their potential impacts on the Bank and its customers;• Economic developments in major economies or sectors; and• Impacts of key market developments on the risk management of the Bank.
Reports are generally presented by the CRO or other accountable executives. Occasionally subject matter experts are delegated to present specific topics of interest. Report presenters are responsible for following processes for creating reports that include appropriate controls and that these controls are operated effectively.
Roles and responsibilities in the management of risk
Certain roles within Barclays Bank UK carry specific responsibilities and accountabilities with respect to risk management and the ERMF.
Barclays Bank UK PLC Chief Executive Officer (CEO)
The Barclays Bank UK CEO is accountable for leading the development of the Barclays Bank UK’s strategy and business plans that align to the Purpose, Values and Mindset within the approved risk appetite, and for managing and organising executive management to drive their execution. Managing the Bank’s financial and operational performance within the approved Risk Appetite is ultimately the CEO’s responsibility.
Specifically, a crucial role of the CEO is to appoint the most senior risk owners at the executive level including the Barclays Bank UK PLC Chief Risk Officer and the Barclays Bank UK PLC General Counsel. They must work with them to embed a strong risk culture within the legal entity, with particular regard to the identification, escalation and management of risk matters.
Barclays Bank UK PLC Chief Risk Officer (CRO)
Barclays Bank UK PLC CRO leads the Risk Function across the legal entity. Specific accountabilities include:
• providing accurate, transparent and timely reporting of the actual Risk Profile of the legal entity relative to the set risk appetite to the Board;
• bringing a risk perspective to compensation decisions;• reporting to all the relevant stakeholders on the legal entity’s’ risk positions, adherence to Risk Appetite and enterprise wide
risks and controls; and• arranging for the adoption and overseeing the application of the ERMF in the entity.
Barclays Bank UK PLC Chief Compliance Officer
The Barclays Bank UK PLC Chief Compliance Officer is accountable to the Barclays Bank UK PLC CEO to lead the Compliance Function. Oversight specific accountabilities include:
• managing the Barclays Bank UK’s conduct and reputation risks and escalating to the Board where appropriate;• monitoring compliance with breaches, especially for conduct and reputation risks and financial crime;• inputting into compensation structures, objectives and performance management of employees who can expose the
Barclays Bank UK to significant risk;• implementing a robust and effectively managed whistleblowing process; and• using mandate to access any part of the legal entity and any information, bringing to the attention of line and senior
management or the Board, as appropriate, any situation that is of concern from a conduct or reputation risk management perspective that could materially violate the approved risk appetite guidelines.
Barclays’ approach to managing risksRisk management strategy, governance and risk culture
barclays.com/annualreport Barclays Bank UK PLC Pillar 3 Report 2021 >82
Barclays Bank UK PLC General Counsel
The Barclays Bank UK PLC General Counsel provides legal advice and guidance to Barclays Bank UK on the adoption of the Group legal risk framework. Policies and entity risk appetite for legal risk through non-financial legal risk tolerances aligned to the Group-wide legal risk appetite.
Barclays Bank UK PLC Chief Controls Officer
The Barclays Bank UK PLC Chief Controls Officer, reporting to the Barclays Bank UK PLC Chief Operating Officer, is responsible for overseeing the practical implementation of operational, conduct and reputation risk controls and control methodologies across the Barclays Bank UK. The Chief Controls Office has the following key responsibilities:
• Reviewing tolerances for non-financial operational risk exposures set by the business, and maintaining their appropriateness.
• Maintaining the standard for the creation and maintenance of all control documentation in the Barclays Bank UK.• Overseeing the execution of control framework requirements consistently across the Barclays Bank UK. Execution
includes recording risk events, issues, and the completion of risk and control self-assessments.
Frameworks, Policies and Standards
Frameworks, policies and standards set out the governance around Barclays Bank UK's activities:
• Frameworks cover the management processes for a collection of related activities and define the associated policies used to govern them.
• Policies set out control objectives, principles and other core requirements for the activities of the Barclays Bank UK Group. Policies describe “what” must be done.
• Standards set out the key control requirements that describe how the requirements set out in the Policy to be met.
Frameworks, Policies and Standards are owned by the area responsible for performing the described activity.
The Barclays Bank UK Group CRO is accountable for the development and implementation of frameworks, policies and associated standards for credit, market, treasury and capital, climate, operational and model risks. The Barclays Bank UK CRO is responsible for embedding the frameworks, policies and associated standards within Barclays Bank UK PLC.
The Barclays Bank UK Group Chief Compliance Officer is likewise accountable for conduct risk and reputation risk, and the Barclays Bank UK Group General Counsel for legal risk. Similar to the Barclays Bank UK CRO, the Barclays Bank UK Chief Compliance Officer and the Barclays Bank UK Head of Legal are accountable for ensuring their respective frameworks, policies and associated standards are embedded within their functions and throughout Barclays Bank UK as appropriate. The Barclays Bank UK Group CRO and Barclays Bank UK Group Chief Compliance Officer have the right to require amendments to any frameworks, policies or standards in the Barclays Bank UK Group, for any reason, including inconsistencies or contradictions among them.
Frameworks, policies and standards are subject to minimum annual review, and challenge by the Risk and/or Compliance functions.
AssuranceAssurance is undertaken to assess the control environment. The Controls Assurance Standard defines the requirements for controls assurance and controls testing.
In addition, the risk function carry out conformance reviews to assess the implementation of, and adherence to, principal risk framework and component policies. This activity is undertaken independently of the business
Internal Audit is responsible for the independent review of risk management and the control environment. Its objective is to provide reliable, valued and timely assurance to the Board and executive management over the effectiveness of controls, mitigating current and evolving material risks and thus enhancing the control culture within the Barclays Bank UK Group. The Board Audit Committee reviews and approves Internal Audit’s plans and resources, and evaluates the effectiveness of Internal Audit. An assessment by independent external advisers is also carried out periodically.
Effectiveness of risk management arrangementsThe embedding of the ERMF is monitored by executive and board committees as described above. The ERMF and its component Principal Risks are subject to control testing assurance reviews to confirm its effectiveness or identify issues to be mitigated. Management and the Board are satisfied that the design of the ERMF and its components are appropriate given the risk profile of the Barclays Bank UK Group.
Barclays’ approach to managing risksRisk management strategy, governance and risk culture
barclays.com/annualreport Barclays Bank UK PLC Pillar 3 Report 2021 >83

Learning from our mistakesLearning from mistakes is central to Barclays’ culture and values, demonstrating a commitment to excellence, service and stewardship and taking accountability for failure as well as success. The Barclays Bank UK Group seeks to learn lessons on a continuous basis to support achievement of strategic objectives, increase operational excellence and to meet commitments to stakeholders, including colleagues, customers, shareholders and regulators. Barclays has implemented a Barclays Bank UK Group Lessons Learned process, setting out requirements for the completion of lessons learned assessments in response to internal and external risk events. The approach is aligned to the Three Lines of Defence model (see page 80), with businesses and functions accountable for undertaking lessons learned assessments; the Second Line providing oversight and challenge; and independent review by Internal Audit.
Core components of the Lessons Learned approach include:
• Defined triggers for when Lessons Learned Assessments must be completed.• Requirements and guidance for the completion of root cause analysis to identify the causes of risk events impacting the
Barclays Bank UK Group.• Standardised Templates to report conclusions consistently to relevant management fora and committees.• Use of a central system to record completed Lessons Learned Assessments and to facilitate sharing across the Barclays
Bank UK Group.
Barclays’ risk cultureRisk culture can be defined as the norms, attitudes and behaviours related to risk awareness, risk taking and risk management. This is reflected in how the Barclays Bank UK Group identifies, escalates and manages risk matters.The Barclays Bank UK Group is committed to maintaining a robust risk culture in which:
• management expect, model and reward the right behaviours from a risk and control perspective; and• colleagues identify, manage and escalate risk and control matters, and meet their responsibilities around risk management.The CEO works with the Executive Management to embed a strong risk culture within the Bank, with particular regard to the identification, escalation and management of risk matters, in accordance with the ERMF. Specifically, all employees regardless of their positions, functions or locations must play their part in the Barclays Bank UK Group’s risk management. Employees are required to be familiar with risk management policies which are relevant to their responsibilities, know how to escalate actual or potential risk issues, and have a role-appropriate level of awareness of the risk management process as defined by the ERMF.
Our Code of Conduct – the Barclays WayGlobally, all colleagues must attest to the “Barclays Way”, our Code of Conduct, and comply with all frameworks, policies and standards applicable to their roles.The Code of Conduct outlines the Purpose, Values and Mindset which govern our ‘Barclays Way’ of working across our business globally. It constitutes a reference point covering all aspects of colleagues’ working relationships, and provides guidance on working with other Barclays employees, customers and clients, governments and regulators, business partners, suppliers, competitors and the broader community.
Barclays Bank UK Group risk management toolsTo support Barclays Bank UK Group’s management of risks, the Barclays Bank UK PLC Board uses risk appetite, mandate and scale, and stress testing as key inputs in the annual planning cycle, including setting of its strategy. The following describes in further detail the risk management tools used as part of this process.
Risk appetiteRisk appetite is defined as the level of risk which Barclays Bank UK Group is prepared to accept in the conduct of its activities.
Risk appetite provides a basis for ongoing dialogue between management and Board with respect to Barclays Bank UK Group’s current and evolving risk profile and enables strategic and financial decisions to be made on an informed basis. Thus the risk appetite setting process aims to consider the material risks Barclays Bank UK Group is exposed to under its business plans.
The risk appetite of Barclays Bank UK Group aims to:
• Specify the level of risk we are willing to take to enable specific risk taking activities.• Consider all Principal Risks individually and, where appropriate, in aggregate.• Consistently communicate the acceptable level of risk for different risk types.
Risk appetite is approved by the Board and must be formally reviewed at least annually in conjunction with the Medium Term Planning (MTP) process.
Barclays’ approach to managing risksRisk management strategy, governance and risk culture
barclays.com/annualreport Barclays Bank UK PLC Pillar 3 Report 2021 >84

Risk appetite is formally expressed by the Barclays Bank UK PLC Board as the acceptable level of deterioration in a set of key financial parameters under a severe but plausible stress scenario defined as the internal stress test. For 2021, the key financial parameters are listed below.
Measure relevant to strategy and risk Link between strategy and risk profile
Profit after tax Fundamental performance of Barclays Bank UK Group and underpins its capacity to make capital distributions to Barclays Group.
Common Equity Tier 1 (CET1) Monitors capital adequacy in relation to capital plan, targets and regulatory hurdle rates.
Liquidity Risk Appetite Monitors and protects liquidity position of the bank and its ability to meet financial obligations under normal conditions and in a stress.
Based on the specified risk appetite, Barclays Bank UK Group develops both stress loss and mandate & scale limits to control specific activities.
Reflecting the increasing risks associated with climate change and following the Board Risk Committee’s decision that climate risk would become a principal risk from 2022, a further risk appetite constraint has been introduced establishing a direct link between our strategic plans and risk appetite supporting Barclays' ambition to reduce emissions to net zero by 2050.
Measure relevant to strategy and risk Link between strategy and risk profile
Climate Risk Protects the long term climate ambitions of the bank and its ability to meet disclosed targets.
Stress loss limitsStress loss limits are derived from the results of the internal stress test. Limits are a reflection of the losses absorbed by the stressed capital plans within risk appetite and provide a crucial link between the strategic planning process and risk appetite. Stress loss limits are conservatively assumed to be additive but in practice stresses may not happen at the same time. Risk management may over-allocate stress loss limits where they deem it unlikely all businesses will require full limit utilisation at the same time. Aggregate utilisation across all risk types is monitored against both the aggregate of stress loss limits and losses absorbed by the stressed capital plan. It is the role of Risk to manage the over-allocation within capital constraints.
Mandate and scaleMandate and scale is a risk management approach that seeks to formally review and control business activities to make sure that they are within mandate (i.e. aligned with expectations), and are of an appropriate scale (relative to the risk and reward of the underlying activities) based on an appropriately detailed system of limits. The use of limits and triggers helps mitigate the risk of concentrations that could be out of line with expectations, and which may lead to unexpected losses of a scale detrimental to the stability of the relevant business line or Barclays Bank UK Group. There are, for example, individual limits for High Loan to Value and Buy to Let mortgages, and limits on the concentration of lower credit quality unsecured products, for example the access product in Barclaycard UK.
The most material stress loss and mandate and scale limits are designated as A-level (Barclays PLC Board level) and B-Level (Barclays Group level). All B-level and lower limits are set by the Risk function. Barclays Bank UK Group limits are approved by the Barclays Bank UK Group CRO and are reportable to the Barclays UK Risk Committee. Unapproved excesses of limits may result in performance management and disciplinary consequences. All limits are subject to escalation and governance requirements.
There is explicit identification of the exposures that are captured by limits and any material exclusion must be agreed. Limits are reviewed at least annually. The factors taken into consideration when setting the limit include:
• Barclays Group and Barclays Bank UK Group Risk Appetite.• Current exposure/MTP forecasts.• Risk return considerations.• Senior risk management judgement.
Barclays’ approach to managing risksRisk management strategy, governance and risk culture
barclays.com/annualreport Barclays Bank UK PLC Pillar 3 Report 2021 >85

Internal stress testingBarclays Bank UK Group-wide stress tests are integrated within the MTP process and annual review of risk appetite, forming part of a Barclays Group-wide approach to stress testing. They aim to check that Barclays Bank UK Group’s financial position and risk profile provide sufficient resilience to withstand the impact of severe economic stress, allowing Barclays Bank UK to make changes to plans as necessary. Barclays Bank UK Group-wide stress testing process is supported by a Capital Stress Testing Standard which sets out the minimum control requirements and defines clear roles and responsibilities across businesses and central functions. The results also feed into our internal capital adequacy assessment process (ICAAP).
The following diagram outlines the key steps in Barclays Bank UK Group-wide stress testing process, which are described below.
Barclays Bank UK Group-wide stress testing process begins with a detailed scenario setting process, with the Barclays Group Risk Committee and Barclays Board Risk Committee agreeing the range of scenarios to be tested. The scenarios are designed to be severe but plausible, and relevant to the business. A wide range of macroeconomic parameters are defined (such as GDP, unemployment, house prices, FX and interest rates), which allows the impact of the scenarios across the wide range of products and portfolios to be assessed across Barclays Bank UK Group.
Businesses prepare detailed MTP business plans which form the baseline for the stress test assessment. The stress test process aims to support this level of complexity, using bottom-up analysis across all of our businesses including both on- and off-balance sheet positions, and combines running statistical models with expert judgement. An overview of the stress testing approach by Principal Risk is provided in the table below. As part of their stress test assessments, businesses are also required to identify potential management actions that could be taken to mitigate the impact of stress and document these within their results.
The governance process in place includes a detailed review of stress testing methodology, assumptions, judgements, results and management actions within each business (including sign-off by business CROs and CFOs) and by central functions.
The relevant businesses stress test results are consolidated to form a Barclays Bank UK Group view which is used to assess the stress impact on both Barclays Bank UK Group’s and Barclays Group’s capital plans both of which consider capital management actions such as reducing dividends or redeeming certain capital instruments. Barclays Bank UK Group also maintains recovery plans which take into consideration actions to facilitate recovery from severe stress or an orderly resolution. These actions are additional to those included in Barclays Bank UK Group-wide stress testing results.
The overall stress testing results are reviewed and signed off by the Barclays Bank UK PLC Board, following review by the Barclays Bank UK PLC Board Risk Committee while also feeding into the Barclays Group level reviews with the Stress Testing Steering Committee, the Barclays Group Risk Committee and the Barclays BRC.
Barclays’ approach to managing risksRisk management strategy, governance and risk culture
barclays.com/annualreport Barclays Bank UK PLC Pillar 3 Report 2021 >86

Summary of methodologies for Barclays Bank UK Group-wide stress testing by risk typePrincipal Risk Stress testing approach
Credit risk
▪ Credit risk impairment: For retail portfolios businesses use IFRS9 impairment forecast models to estimate stressed levels, leveraging the relationships between macroeconomic parameters such as unemployment, inflation, GDP etc. that are embedded in those models. In addition, house price reductions (for mortgages), increased customer drawdowns (for revolving facilities) and higher interest rates impacting customer affordability lead to higher losses which also contribute to increased impairment levels. For wholesale portfolios the stress shocks on credit risk drivers PD, LGD and EAD are primarily calibrated using historical and expected relationships with key macro-economic parameters.
▪ Counterparty credit risk losses: The scenarios include market risk shocks that are applied to determine the market value under stress of contracts that give rise to CCR. Counterparty losses, including from changes to the Credit Valuation Adjustment and from defaults, are modelled based on the impact of these shocks as well as using stressed credit risk drivers (PDs and LGDs). The same approach is used to stress the market value of assets held as available for sale or at fair value in the banking book.
▪ Credit risk weighted assets: The impact of the scenarios is calculated via a combination of business volumes and using similar factors to impairment drivers above, with consideration of the portfolio-specific requirements for the calculation of regulatory capital.
Treasury and Capital Risk
▪ The analysis of treasury and capital risk also contributes to the estimate of stressed income and costs:– Stress impact on non-interest income is primarily driven by lower projected business volumes and hence
lower income from fees and commissions.
– Impact on net interest income is driven by stressed margins, which depend on the level of interest rates under stress as well as funding costs, and on stressed balance sheet volumes. This can be partly mitigated by management actions that may include repricing of variable rate products, taking into account interbank lending rates under stress.
– The impact on costs is mainly driven by business volumes and exchange rates with management actions to partly offset profit reductions (due to impairment increases and decreases in income) such as headcount reductions and lower performance costs.
▪ Capital Risk: is assessed by taking all modelled risk impacts as part of the stress test (as listed above) into consideration when assessing Barclays Bank UK Group’s ability to withstand a severe stress. The stressed results are considered against internally agreed risk appetite levels but also regulatory minima and perceived market expectations. The MTP can only be agreed by the Board if this is within the agreed risk appetite levels under stress.
▪ Liquidity risk: is assessed through internal liquidity stress testing (Liquidity Risk Appetite (LRA) and regulatory stress testing of Barclays Bank UK Group’s Liquidity Coverage Ratio (“LCR”). The Bank analyses specific liquidity risk drivers such as wholesale funding and contingent funding needs based on the below scenarios:
– Barclays idiosyncratic scenario: Barclays Bank UK Group faces a loss of market confidence while the market overall is not impacted.
– Market wide scenario: Market wide stress leading to increased market volatility and loss of confidence.– Combined scenario: A simultaneous Barclays Bank UK Group idiosyncratic and Market wide liquidity
stress scenario.– Liquidity Coverage Ratio: Regulatory prescribed 30-day liquidity metric.
▪ Interest Rate Risk in the Banking Book (IRRBB):– Risk assessment for interest rate risk in the banking book is driven by the economic risk of the underlying
positions but also considers the accounting treatment.– Earnings based measures are used to assess risk to net interest income from positions in customer
banking books, hedging portfolios (held to mitigate those risks), and Treasury investment and funding activities.
– Value based measures are used to assess risk to the fair value of assets held as part of investments in the liquid asset portfolio and associated risk management portfolios.
▪ Risk under stress is assessed by considering:– The impact on net interest income resulting from stressed product margins and volumes, which are
dependent on the level of interest rates and funding costs under stress conditions. This can be partly mitigated by management actions which may include repricing of variable rate products taking into account interbank lending rates under stress.
– Securities in the liquid asset portfolio are subject to several market risk stresses designed to estimate potential losses in various scenarios. This includes, but is not limited to, an annual internal stress test, regulatory stress tests as well as various ad hoc exploratory exercises.
Operational risk▪ Operational risk loss projections include the effect of the stressed macroeconomic scenario as well as the impact
of forward-looking idiosyncratic risk events under stress. Operational risk is also part of the reverse stress testing framework through scenario assessments of such idiosyncratic events.
Model risk
▪ The Independent Valuation Unit (IVU) reviews and approve models for use in stress tests. IVU may require compensating controls, in the form of overlays to address model deficiencies. IVU may also reject a model that is not conceptually sound, or for which the marginal impact of findings (in aggregate or on a stand-alone basis) on model output is ≥ 30%.
Barclays’ approach to managing risksRisk management strategy, governance and risk culture
barclays.com/annualreport Barclays Bank UK PLC Pillar 3 Report 2021 >87

Conduct risk
▪ Redress/Remediation: Businesses review existing provisions and include additional provisions in MTP if required.
▪ Litigation: Irrespective of whether a provision had been recognised, stress projections of future losses for conduct risk matters managed by legal are estimated by exercising expert judgment on a case by case basis (material matters) or on a portfolio basis (non-material matters) in accordance with the methodology provided by regulators ( PRA).
Reputation risk ▪ Reputation risk is not quantified or stressed.
Legal risk ▪ Legal risk is not quantified or stressed.
In 2021, the internal Barclays Group-wide stress testing exercise, of which the Barclays Bank UK Group was a participant, ran as part of the MTP process, assessing the impact of a severe but plausible scenario based on the following narrative this year: stagflation scenario, i.e. negative GDP growth, high unemployment coupled with high inflation and a high base rate environment as central banks fight against inflation. Climate transition is also modelled adding inflationary pressures and disturbing the supply chain.
The Barclays Group-wide stress testing framework also includes reverse stress testing techniques, which aim to identify the circumstances under which Barclays Bank UK Group’s business model would no longer be viable, leading to a significant change in business strategy and to the identification of appropriate mitigating actions. Examples include extreme macroeconomic downturn (‘severely adverse’) scenarios, or specific idiosyncratic events, covering both operational risk and capital/liquidity events but also the implication of a failure of Barclays Group non-ring fenced bank. Reverse stress testing is used to help support ongoing risk management and is an input to our Recovery Planning process.
Business and risk type specific stress testsStress testing techniques at portfolio and product level are also used to support risk management. For example, portfolio management in the UK Cards business employs stressed assumptions of loss rates to determine profitability hurdles for new accounts. In the UK Mortgage portfolios, affordability thresholds incorporate stressed estimates of interest rates. Stress testing is also conducted on positions in particular asset classes, including interest rates and credit.
Regulatory stress testingIn addition to running internal Barclays Group-wide stress tests, Barclays Group also runs regulatory stress tests for which Barclays Bank UK Group is a sub-component. In 2021, Barclays ran a BoE (Bank of England) Biennial Exploratory Scenario that involved a climate stress test.
Risk management in the setting of strategyThe risk appetite and internal stress testing processes described above form the basis of the risk review of the MTP, performed annually. The MTP embeds Barclays Bank UK Group’s objectives into detailed business plans taking into account the likely business and macroeconomic environment. The strategy is informed by the risk review process, which includes reviewing Barclays Bank UK Group’s risk profile and setting of risk appetite.
• The risk review process includes a review of business plans under stress which is used to inform the MTP.• If the business’ plans entail too high a level of risk, management can challenge them. This assessment is based on a
comparison of the businesses’ own risk appetite assessment reflected in their business plans (‘bottom-up’ risk appetite) with the central risk team’s view (‘top-down’ risk appetite) based on the financial constraints set by the Board for Barclays Bank UK Group.
• Businesses may be asked to update their business plans until the bottom-up risk appetite is within top-down appetite. There is also a detailed review of the stressed estimates and the methodology used to translate the economic scenario to these stressed estimates, as well as the management actions included in the businesses’ results to verify that these are appropriate and realistic in a stressed environment.
• Risk review meetings are held with each business, where they present their business plans to Barclays Bank UK Group’s CRO. The findings from the risk reviews are discussed, including the risk appetite proposals and stress testing results. Businesses may be required to change their business plans as a result of these meetings.
• Interim internal capital adequacy assessments inform the capital planning process and are reviewed during the meetings. These assessments are refreshed based on year-end positions and reflected in the ICAAP.
The Barclays Bank UK PLC Board has overall responsibility for reviewing Barclays Bank UK Group’s risk profile and making appropriate recommendations to the Board. The Board is ultimately responsible for approving the MTP and Barclays Bank UK Group’s risk appetite. The risk appetite process allows senior management and the Board to understand the MTP’s sensitivities by risk type, and includes a set of limits to help the Barclays Bank UK Group stay within its risk appetite, as described above.
Barclays’ approach to managing risksRisk management strategy, governance and risk culture
barclays.com/annualreport Barclays Bank UK PLC Pillar 3 Report 2021 >88

Credit risk
The risk of loss to the Barclays Bank UK Group from the failure of clients, customers or counterparties, including sovereigns, to fully honour their obligations to the Barclays Bank UK Group, including the whole and timely payment of principal, interest, collateral and other receivables.
Overview
The credit risk that Barclays Bank UK Group faces arises from retail and wholesale loans and advances together with the counterparty credit risk arising from derivative contracts with market counterparties; trading activities, including: debt securities, settlement balances with market counterparties, FVOCI assets and reverse repurchase loans. Wholesale lending in Barclays Bank UK Group includes Business Banking, ESHLA and Wealth UK portfolios.
Credit risk management objectives are to:
• maintain a framework of controls to oversee credit risk;• identify, assess and measure credit risk clearly and accurately across the Barclays Bank UK Group and within each
separate business, from the level of individual facilities up to the total portfolio;• control and plan credit risk taking in line with external stakeholder expectations and avoiding undesirable concentrations;
and• monitor credit risk and adherence to agreed controls.
Organisation and structure
Wholesale and retail portfolios are managed separately to reflect the differing nature of the assets; wholesale balances tend to be larger and are managed on an individual basis, while retail balances are greater in number but lesser in value and are, therefore, managed in aggregated segments.
Barclays’ approach to managing risksManagement of credit risk and the internal ratings-based approach
barclays.com/annualreport Barclays Bank UK PLC Pillar 3 Report 2021 >89

Barclays’ approach to managing risksManagement of credit risk and the internal ratings-based approach
barclays.com/annualreport Barclays Bank UK PLC Pillar 3 Report 2021 >90

Roles and responsibilities
The first line of defence has primary responsibility for managing credit risk within the risk appetite and limits set by the Risk function, supported by a defined set of policies, standards and controls. In Barclays Bank UK Group, business risk committees (attended by the first line) monitor and review the credit risk profile of each business unit where the most material issues are escalated to the Retail Credit Risk Management Committee, Wholesale Credit Risk Management Committee and Barclays UK Risk Committee.
The responsibilities of the credit risk management teams in the businesses, the sanctioning team and other shared services include: sanctioning new credit agreements (principally wholesale); setting strategies for approval of transactions (principally retail); setting risk appetite; monitoring risk against limits and other parameters; maintaining robust processes, data gathering, quality, storage and reporting methods for effective credit risk management; performing effective turnaround and workout scenarios for wholesale portfolios via dedicated restructuring and recoveries teams; maintaining robust collections and recovery processes/units for retail portfolios; and review and validation of credit risk measurement models. The credit risk management teams in Barclays Bank UK Group are accountable to the Barclays Bank UK Group CRO who, in turn, reports to the Barclays Group CRO.
For the wholesale portfolios, credit risk managers are organised in sanctioning teams by client portfolio. In wholesale portfolios, credit risk approval is undertaken by experienced credit risk professionals operating within a clearly defined delegated authority framework, with only the most senior credit officers entrusted with the higher levels of delegated authority. The largest credit exposures require the support of the Barclays Bank UK PLC Senior Credit Officer. For exposures in excess of the Barclays Bank UK PLC Senior Credit Officer’s authority, approval by the Barclays Bank UK PLC CRO is also required. Where exposures are also of Barclays Group level significance, the Barclays Group Credit Risk Committee, attended by the Barclays Bank UK PLC Senior Credit Officer, provides a formal mechanism for the Barclays Group Senior Credit Officer to exercise the highest level of credit authority.
The role of the Central Risk function is to provide Barclays Group-wide direction, oversight and challenge of credit risk taking. Central Risk sets the Credit Risk Control Framework, which provides the structure within which credit risk is managed, together with supporting credit risk policies and standards.
Reporting
The Barclays Bank UK Group dedicates considerable resources to gaining a clear and accurate understanding of credit risk across the business and maintaining that its balance sheet correctly reflects the value of the assets in accordance with applicable accounting principles. This process can be summarised in five broad stages:
• Measuring exposures and concentrations.• Monitoring performance and asset quality.• Monitoring for weaknesses in portfolios.• Raising allowances for impairment and other credit provisions.• Returning assets to a performing status or writing off assets when the whole or part of a debt is considered irrecoverable.
Measuring exposures and concentrationsLoans and advances to customers provide the principal source of credit risk to the Barclays Bank UK Group although it is also exposed to other forms of credit risk through, for example, loans and advances to banks, loan commitments and debt securities. Risk management policies and processes are designed to identify and analyse risk, to set appropriate risk appetite, limits and controls, and to monitor the risks and adherence to limits by means of reliable and timely data.
One area of particular review is concentration risk. A concentration of credit risk exists when a number of counterparties or customers are engaged in similar activities or geographies, and have similar economic characteristics that would cause their ability to meet contractual obligations to be similarly affected by changes in economic and other conditions. As a result, the Barclays Bank UK Group constantly reviews its concentration in a number of areas including, for example, geography, maturity and industry.
Mandate and scale limits are used to maintain concentrations at appropriate levels, which are aligned with the businesses’ stated risk appetite. Limits are typically based on the nature of the lending and the amount of the portfolio meeting certain standards of underwriting criteria. Diversification, to reduce concentration risk, is achieved through setting maximum exposure limits to individual counterparties’ exposures. Excesses are reported to the BRC.
Monitoring performance and asset qualityTrends in the quality of Barclays Bank UK Group’s loan portfolio are monitored in a number of ways including tracking loan loss rate and coverage ratios.
Barclays’ approach to managing risksManagement of credit risk and the internal ratings-based approach
barclays.com/annualreport Barclays Bank UK PLC Pillar 3 Report 2021 >91

Loan loss rateThe loan loss rate (LLR) provides a way of consistently monitoring trends in loan portfolio quality at Barclays Bank UK Group, business and product levels. The LLR represents the annualised impairment charges on loans and advances to customers and other credit provisions as a percentage of the total, period-end loans and advances to customers, gross of impairment allowances. Details of the LLR for the current period may be found in the Credit Risk Performance section on page 62 of the Barclays Bank UK PLC Annual Report 2021.
Loans and advances total impairment coverageTotal coverage ratios will vary according to the type of product. The increase in 2017 reflects the transition to the new accounting standard IFRS 9. Overall, coverage ratios would therefore be expected to remain fairly steady over a defined period of time but in principle, a number of factors may affect Barclays Bank UK Group’s overall coverage ratios, including:
• The mix of products: coverage ratios will tend to be lower when there is a high proportion of secured retail and wholesale balances. This is due to the fact that the recovery outlook on these types of exposures is typically higher than retail unsecured products, with the result that they will have lower impairment requirements;
• The stage in the economic cycle: coverage ratios will tend to be lower in the earlier stages of deterioration in credit conditions. At this stage, retail delinquent balances will be predominantly in the early delinquency cycles and wholesale names will have only recently shown signs of deterioration;
• Staging: coverage ratios will tend to be higher when there is a high proportion of balances that have met the criteria for significant increase in credit risk with associated expected credit losses (ECL) moving from a 12-month to a lifetime assessment; and
• Write-off policies: the speed with which defaulted assets are written off will affect coverage ratios. The more quickly assets are written off, the lower the ratios will be, since stock with 100% coverage will tend to roll out more quickly.
Monitoring weaknesses in portfoliosWhile the basic principles for monitoring weaknesses in wholesale and retail exposures are broadly similar, they reflect the differing nature of the assets. As a matter of policy, all facilities granted to wholesale counterparties are subject to a review on, at least, an annual basis, even when they are performing satisfactorily. retail exposures are monitored to identify customers exhibiting signs of potential financial difficulty. Identified customers are included in the High Risk Account Management (HRAM) population. Businesses have a contact strategy for their HRAM populations and they are excluded from credit expansion activities and, where appropriate, also considered for credit reduction activities or other mitigating actions.
Wholesale portfoliosa
Within the wholesale portfolios, the Basel definitions of default are used as default indicators. A default is deemed to have occurred with regard to a particular obligor if one or both of the following applies:
• the obligor is considered unlikely to pay its credit obligations to the Barclays Bank UK Group in full without recourse to actions such as the realisation of collateral;
• the obligor is 90 days or more past due on any material credit obligation to the Barclays Bank UK Group.
Examples of unlikeliness to pay include:
• The Barclays Bank UK Group puts the credit obligation on a non-accrued status;• The Barclays Bank UK Group makes a charge-off or account specific identified impairment resulting from a significant
perceived decline in credit quality;• The Barclays Bank UK Group sells the credit obligation at a material credit-related economic loss;• The Barclays Bank UK Group triggers a petition for obligor’s bankruptcy or similar order;• The Barclays Bank UK Group becomes aware of the obligor having sought or having been placed in bankruptcy or similar
protection where this would avoid or delay repayment of the credit obligation to the Group;• The Barclays Bank UK Group becomes aware of an acceleration of an obligation by a firm.
Note
a Includes certain Business Banking facilities which are recorded as retail for management purposes.
Barclays’ approach to managing risksManagement of credit risk and the internal ratings-based approach
barclays.com/annualreport Barclays Bank UK PLC Pillar 3 Report 2021 >92
Wholesale accounts that are deemed to contain heightened levels of risk are recorded on Watch Lists (WL) comprising four categories graded in line with the perceived severity of the risk attached to the lending, and its probability of default. Examples of heightened levels of risk may include:
• a material reduction in profits;• a material reduction in the value of collateral held;• a decline in net tangible assets in circumstances which are not satisfactorily explained; or• periodic waiver requests or changes to the terms of the credit agreement over an extended period of time.
These lists are updated monthly and circulated to the relevant risk control points. Once an account has been placed on WL, the exposure is monitored and, where appropriate, exposure reductions are effected. While all counterparties, regardless of financial health, are subject to a full review of all facilities on at least an annual basis, more frequent interim reviews may be undertaken should circumstances dictate. The Business Support team deal with defaulted counterparties in higher levels of WL and default. Their priority is working intensively with the counterparty to help them to return to financial health or, in the cases of insolvency, obtain the orderly and timely recovery of impaired debts in order to maximise shareholder value. Where a counterparty’s financial health gives grounds for concern, it is immediately placed into the appropriate category.
Retail portfoliosWithin the retail portfolios, which tend to comprise homogeneous assets, statistical techniques more readily allow potential credit weaknesses to be monitored on a portfolio basis. Retail accounts can be classified according to specified categories of arrears status (or 30-day cycle), which reflects the level of contractual payments which are overdue. An outstanding balance is deemed to be delinquent when it is one day or “one penny” down.
Once a loan has passed through a prescribed number of cycles, it will be charged-off and enter recovery status. Charge-off refers to the point in time when collections activity changes from the collection of arrears to the recovery of the full balance. In most cases, charge-off will result in the account moving to a legal recovery function or debt sale and on unsecured assets will typically occur between 5 and 7 contractual payments in arrears. This may be accelerated or occur directly from a performing status, such as in the case of insolvency or death.
Mortgage assets are not subject to charge-off but move through to litigation.
Returning assets to a performing status
Wholesale portfoliosIn wholesale portfolios, an account may only be returned to a performing status when it ceases to have any actual or perceived financial stress and no longer meets any of the WL criteria, or once facilities have been fully repaid or cancelled. In Barclays Bank UK Group, the decision to return an account to performing status may only be made by the Credit Sanctioning team or Business Support team.
Retail portfoliosRetail forbearance exposures are classified as either Performing Forbearance (PF) or Non-Performing Forbearance (NPF) at the point the programme is agreed.An up-to-date (i.e. not in arrears in relation to the agreed Forbearance programme) NPF may be reclassified as PF upon receipt (on-time) of all due payments (at current agreed repayment amount), over a 12 month period.An up-to-date (i.e. not in arrears in relation to the agreed Forbearance programme) PF may be reclassified to the 'in order' book when the customer completes a minimum probation period of 24 months from the point of entering PF, even if they are no longer on a Forbearance programme. They must also meet the following criteria:
• 12 consecutive on-time payments have been made during the probation period at the agreed repayment amount (i.e. the forbearance amount while forbearance is continuing or the contractual monthly payment once forbearance has concluded).
• Arrears must not have been >30 days past due during the probation period.• Account is not past due at the point of exit.
If a performing forborne contract under probation is granted additional forbearance measures or becomes more than 30 days past-due, it is classified as non-performing.
Barclays’ approach to managing risksManagement of credit risk and the internal ratings-based approach
barclays.com/annualreport Barclays Bank UK PLC Pillar 3 Report 2021 >93

Recovery unitsRecovery units are responsible for exposures where deterioration of the counterparty/customer credit profile is severe, to the extent that timely or full recovery of exposure is considered unlikely and default has occurred or is likely in the short term. Recovery teams set and implement strategies to recover Barclays Bank UK Group’s exposure through realisation of assets and collateral, in co-operation with counterparties/customers and where this is not possible through insolvency and legal procedures.
In wholesale, for a case to be transferred to a recovery unit, it must be in default and have ceased to actively trade or be in insolvency. In retail, the timings of the charge-off points to recovery units are established based on the type of loan. In most cases, charge-off will result in the account moving to a legal recovery function or debt sale and on unsecured assets will typically occur between 5 and 7 contractual payments in arrears, unless a Forbearance programme is agreed. Early points are prescribed for unsecured assets. For example, in case of customer bankruptcy or insolvency, associated accounts are charged off within 60 days of notification.
Mortgage assets are not subject to charge off but move through to litigation.
See recovery information included in Analysis of Specific Portfolio and Asset Types section on page 100 in the Barclays Bank UK PLC Annual Report 2021.
Foreclosures in process and properties in possessionForeclosure is the process where Barclays Bank UK Group initiates legal action against a customer, with the intention of terminating the loan agreement whereby Barclays Bank UK Group may repossess the property subject to local law and recover amounts it is owned. This process can be initiated by Barclays Bank UK Group independent of the impairment treatment and it is therefore possible that the foreclosure process may be initiated while the account is still in collections (delinquent) or in recoveries (post charge-off) where the customer has not agreed a satisfactory repayment schedule with Barclays Bank UK Group.
Properties in possession include properties held as ‘loans and advances to customers’ and properties held as ‘other real estate owned’.
Held as ’loans and advances to customers’ refers to the properties where the customer continues to retain legal title but where Barclays Bank UK Group has enforced the possession order as part of the foreclosure process to allow for the disposal of the asset, or the court has ordered the auction of the property.
Writing off assetsWrite-off refers to the point where it is determined that the asset is irrecoverable, it is no longer considered economically viable to try and recover the asset, it is deemed immaterial, or full and final settlement is reached and a shortfall remains. In the event of write-off, the customer balance is removed from the balance sheet and the impairment reserve held against the asset is released.
The timing and extent of write-offs may involve some element of subjective judgement. Nevertheless, a write-off will often be prompted by a specific event, such as the inception of insolvency proceedings or other formal recovery action, which makes it possible to establish that some or the entire advance is beyond realistic prospect of recovery. The position of impaired loans is also reviewed at least quarterly to make sure that irrecoverable advances are being written off in a prompt and orderly manner and in compliance with any local regulations.
For retail portfolios, the timings of the write-off points are established based on the type of loan. For unsecured, assets are written off based on contractual payment criteria or accelerated criteria. Assets in the recovery book will be written-off if the required qualifying repayments are not made within a rolling twelve-month period. In certain circumstances accounts will be eligible for accelerated write off (e.g. deceased, insolvency, inappropriate to pursue (medical, vulnerable, small balance) or settlement is accepted in lieu of the full balance). For secured loans, any shortfall after the receipt of the proceeds from the disposal of the collateral is written off within three months of that date if a repayment schedule has not been agreed with the borrower/estate. Such assets are only written off once all the necessary procedures have been completed and the amount of the loss has been determined.
Subsequent recoveries of amounts previously written off are written back and hence decrease the amount of the reported loan impairment charge in the income statement.
In 2021, write-offs of impaired financial assets totalled £651m.
Assessment of Impairment Under IFRS 9Under the IFRS 9 accounting standard, businesses are required to assess and recognise Expected Credit Losses (ECL) on financial assets from the point of origination or purchase, and to update said assessment at each reporting date, reflecting changes in the credit risk of the financial asset.
Barclays’ approach to managing risksManagement of credit risk and the internal ratings-based approach
barclays.com/annualreport Barclays Bank UK PLC Pillar 3 Report 2021 >94

ECL represents present value measure of the credit losses expected to result from default events that may occur during a specified period of time. ECLs must reflect the present value of cash shortfalls, i.e. the difference between cash flows due under the contract and the cash flows that the business now expects to receive. Given ECLs take into account both the amount and the timing of payments, a credit loss may result if a contractual payment is missed or received late, even if the debt is ultimately paid in full. ECL assessments must reflect an unbiased and probability weighted assessment of a range of possible outcomes, including reasonable and supportable information about future economic conditions.
Exposures must be assessed and assigned to one of the following populations at each reporting point:
• Stage 1: Performing risk assetsIn scope items classified as stage 1 exposure for IFRS 9 purposes are those assets performing in line with expectations in place at the point of origination/acquisition. This includes new originations or purchased assets (from the point of initial origination), but excludes exposures deemed credit impaired at point of origination.
Businesses must recognise an impairment allowance equal to 12 months expected credit losses. This allowance must be raised at point of initial reporting of an asset and the assessment updated at each subsequent reporting point.
• Stage 2: Significant Increase in Credit Risk (SICR) assetsAssets classified as stage 2 exposures for IFRS 9 purposes are those where credit risk has significantly increased compared with expectations at point of origination/acquisition, but which are not yet considered ‘Credit Impaired’.
In order to maintain that individual exposures or groups of assets are correctly classified as stage 2 assets, businesses must undertake regular assessments to identify whether a significant increase in credit risk has occurred since initial recognition. This must take the form of the following:
– Quantitative TestWhere the residual annualised weighted average lifetime PD for an individual exposure at the latest reporting date shows a material deterioration compared with that at the origination/acquisition point, then the assets must be classified under stage 2 as having significantly increased credit risk.
The assessment of materiality, i.e. at what point the PD increase is deemed ‘significant’, is based upon analysis of the portfolios risk profile against a common set of defined principles and key performance metrics.
– Qualitative TestFor personal banking assets managed under retail portfolios, accounts meeting the portfolios ‘high risk’ criteria (i.e. within the last 12 months reclassified from forbearance, rehabilitated from charge-off or subject to either re-age or collections arrangement; and external behavioural metric indicate an increased probability of financial difficulty, for example excessive or increasing indebtedness and/or missed or late payments recorded at credit bureau), must be classified under stage 2 as having significantly increased credit risk. For wholesale portfolios and Business Banking assets managed under retail portfolios where accounts are managed under the WL framework, then customers on WL 2/3, not breaching the quantitative test must be classified under stage 2 as having SICR (Significant Increase in Credit Risk). Obligors on WL1 may be classified as stage 1 for a maximum period of 6 months. In exceptional circumstances for an obligor on WL2 where it can be proven that a specific exposure is not deteriorated e.g. it is newly originated and therefore cannot have deteriorated, stage 1 ECL may be applied.
– Backstop CriteriaFor retail portfolios, adverse changes in payment status must be considered within the assessment, and accounts 1 or more contractual payment in arrears (more than 1 contractual payment in arrears for the UK cards) at reporting date classified under stage 2, except where:
– The missed payment is a result of a bank error or technical issue;– The arrears can be analytically proven not to represent deterioration from risk performance
expectations at point of origination/acquisition, e.g. where there is a very small period between cycle point and reporting date. Such exceptions must be approved by the Group Credit Risk Director (GCRD) or nominated delegate. Exposures at 30 days or more past contractual payment due date at the reporting date must be classified as stage 2 assets without exception.
For wholesale portfolios adverse changes in payment status must be considered within the assessment, and accounts with contractual payment 30 days or more in arrears at reporting date are included within the entry criteria for stage 2, except where the missed payment is a result of a proven bank error or administrative issue. Where 30 days is used it must be proven that this is a backstop, not a lead driver of exposure moving to stage 2.
Barclays’ approach to managing risksManagement of credit risk and the internal ratings-based approach
barclays.com/annualreport Barclays Bank UK PLC Pillar 3 Report 2021 >95

Where the assessment of SICR is undertaken on a collective basis, assets must be grouped on the basis of similar risk characteristics, taking into account asset type, industry, geographical location, collateral type, past-due status and other relevant factors.
Businesses must raise an impairment allowance equivalent to the latest assessment of lifetime expected credit losses. This increased allowance must be recognised at the first reporting point following entry to stage 2 and the assessment updated at each subsequent reporting date.
The assessment of lifetime ECLs for stage 2 (and stage 3) assets must consider the maximum contractual period over which the business is exposed to credit risk, including the impact of permitted extensions and pre-payments, i.e. those available at the option of the borrower to which the business must agree.
For loan commitments, the lifetime assessment period is normally the maximum contractual life, i.e. the period from the point the loan commitment is established to closure/full repayment of the exposure. However, where customer use of contractually available pre-payments and/or extension has a material impact on the expected life of the asset, then use of behavioural life may be justified.
For revolving credit facilities, the lifetime assessment period is set to the period over which the business is expected to be exposed to credit risk, based on historical experience i.e. an assessment of the average time to default, closure or withdrawal of the facility.
Assets may be removed from stage 2 and re-assigned to stage 1 once there is objective evidence that the criteria used to indicate a significant increase in credit risk are no longer met.
• Stage 3: Credit impaired risk assetsAssets classified as stage 3 exposures for IFRS 9 purposes are those where credit risk has increased to a point where they are now considered ‘Credit Impaired’. For retail portfolios, this incorporates all defaulted accounts as defined under the Regulatory Definition of Default. For wholesale portfolios cases of forbearance not captured by stage 3 (i.e. those not meeting the regulatory definition of default - EBA classification of non-performing) must be classified as stage 2 until such time as the relevant forbearance probation period has been completed.
Businesses must raise an impairment allowance equivalent to the latest assessment of lifetime expected credit losses, i.e. on the same basis as for stage 2 assets.
For single name wholesale assets, a threshold approach is taken with stage 3 impairment calculated individually. A discounted cash flow is completed establishing a base estimated impairment allowance, derived from the difference between asset carrying values and the recoverable amount.
Where the base allowance is greater than £10m, a bespoke assessment is performed reflecting individual work out strategies. The assessment is clearly and specifically articulated including how general economic scenarios and downside analyses have been applied.
Interest and fee income on stage 3 assets is recognised based on the net amortised value, i.e. the gross carrying amount adjusted for the loss allowance in line with IFRS principles.
For exposures that are considered credit-impaired on purchase or origination, lifetime ECLs must be taken into account within the estimated cash flows at point of initial recognition, and the asset classified as stage 3.
In subsequent reporting periods, businesses must recognise cumulative changes in lifetime ECLs since initial recognition as a loss allowance, i.e. the amount of change in lifetime ECLs is treated as an impairment gain or loss. Assets may only exit stage 3 and be reclassified into stage 1 or stage 2 once the original default trigger event no longer applies. In addition, the following criteria must be met:
– the customer has demonstrated consistently good payment behaviour by making a minimum of 12 months of consecutive contractual payments;
– for forborne exposures, a minimum of 12 months has passed since the date the most recent forbearance concession was granted, and payments have been made in line with plan during this period;
– no other regulatory default ‘unlikely to pay’ triggers are identified;– the performance conditions defined and approved by the regulator as part of an existing IRB waiver for the specific
portfolio have been met.
To fully embed this standard into businesses, management requires frequent periodic reviews of ECL performance across Barclays Bank UK Group both in isolation and, more importantly, in comparison to the underlying performance of portfolios and product types.
Barclays’ approach to managing risksManagement of credit risk and the internal ratings-based approach
barclays.com/annualreport Barclays Bank UK PLC Pillar 3 Report 2021 >96

Review and challenge is carried out through a hierarchy of committees confirming both the adequacy of provisions under the ECL requirements and that all policies, standards and processes have been adhered to (see below) and that appropriate controls are evidenced.
Governance and oversight of impairment under IFRS 9Barclays Bank UK Group relies on Barclays Group processes in overseeing the estimation of ECL, including: i) setting requirements in policy, including key assumptions and the application of key judgements; and ii) the design and execution of models.
– Impairment policy requirements are set and reviewed regularly by Barclays Group, at a minimum annually, to maintain adherence to accounting standards. Key judgements inherent in policy, including the estimated life of revolving credit facilities and the quantitative criteria for assessing SICR, are separately supported by analytical study. In particular, the quantitative thresholds used for assessing SICR are subject to a number of internal validation criteria, particularly in retail portfolios where thresholds decrease as the origination PD of each facility increases. Key policy requirements are also typically aligned to Barclays Bank UK Group’s credit risk management strategy and practices, for example, wholesale customers that are risk managed on an individual basis are assessed for ECL on an individual basis upon entering Stage 3; furthermore, key internal risk management indicators of high risk are used to set SICR policy, for example, retail customers identified as High Risk Account Management are automatically deemed to have met the SICR criteria.
– ECL is estimated in line with internal policy requirements using models which are validated by a qualified independent party to the model development area, the Independent Validation Unit (IVU), before first use and at a minimum semi-annually thereafter. The IVU is a Barclays Group function. Each model is designated an owner who is responsible for:
– Monitoring the performance of the model, which includes comparing predicted ECL versus flow into Stage 3 and coverage ratios; and
– Proposing post-model adjustments (PMA) to address model weaknesses or to account for situations where known or expected risk factors and information have not been considered in the modelling process. All PMAs relating to model deficiencies, regardless of value are approved by IVU for a set time period. PMAs representing Expert Judgement are validated by Risk, as the second line of defence and approved for a set time period. PMAs must also be approved by the Barclays Bank UK PLC Chief Risk Officer, with the most material also requiring approval from the Barclays Group Credit Risk Director or Barclays Group Chief Risk Officer.
Models must also assess ECL across a range of future economic conditions. These economic scenarios are generated via an independent model and ultimately set by the Senior Scenario Review Committee, run by Barclays Group. Economic scenarios are regenerated at a minimum annually, to align with Barclays medium term planning exercise, but also if the external consensus of the UK or US economy materially worsen. The scenario probability weights are also updated when scenarios are regenerated and reviewed by the Senior Scenario Committee. Each model used in the estimation of ECL, including key inputs, are governed by a series of internal controls, which include the validation of completeness and accuracy of data in golden source systems, documented data transformations and documented lineage of data transfers between systems.
– The Barclays Bank UK Group’s organisational structure and internal governance processes oversee the review of impairment results. The Barclays Bank UK Group Impairment Committee, formed of members from both Finance and Risk, is responsible for overseeing impairment policy and practice across Barclays Bank UK Group and will approve impairment results. Reported results and key messages are communicated to the Barclays Bank UK PLC Board Audit Committee, which has an oversight role and provides challenge of key assumptions, including the basis of the scenarios adopted. Impairment results are then factored into management decision making. Including but not limited to, business planning, risk appetite setting and portfolio management.
Forbearance and other concession programmes
Forbearance programmesForbearance takes place when a concession is made on the contractual terms of a facility in response to an obligor’s financial difficulties. Barclays Bank UK Group offers forbearance programmes to assist customers and clients in financial difficulty through agreements that may include accepting less than contractual amounts due where financial distress would otherwise prevent satisfactory repayment within the original terms and conditions of the contract. These agreements may be initiated by the customer, Barclays Bank UK Group or a third party.
In line with regulatory guidance, the use of payment holidays and/or similar schemes developed specifically in response to the COVID-19 pandemic, does not necessitate reclassification of assets as forborne.
Barclays’ approach to managing risksManagement of credit risk and the internal ratings-based approach
barclays.com/annualreport Barclays Bank UK PLC Pillar 3 Report 2021 >97

Forbearance programmes for wholesale portfoliosThe majority of wholesale client relationships are individually managed, with lending decisions made with reference to specific circumstances and on bespoke terms.
Forbearance measures consist of concessions made towards a debtor that is experiencing or about to experience difficulties in meeting their financial commitments.
A concession is a sanctioned action, outside of market terms that is beneficial to the debtor. The concession arises solely due to the financial distress of the debtor and the terms are more favourable than those which would be offered to a new or existing obligor with a similar risk profile. Concessions are represented by:
• A change or alteration to the previous terms and conditions of a contract;• A total or partial refinancing of a troubled debt contract.
The following are some examples of concessions which would be deemed forbearance (where granted to debtors in financial difficulties and outside of market terms):
• A restructuring of the contractual terms of a credit facility (such as a reduction in the interest rate).• An extension to the maturity date.• Change to the collateral structure (typically resulting in a net reduction in collateral).• Favourable adjustment to covenants where repayment profile changes, or non-enforcement of material covenant breach.• Repayment in some form other than cash (e.g. equity).• Capitalisation of accrued interest.• Any other concession made which is designed to alleviate actual or apparent financial stress e.g. a capital repayment
holiday.
Where a concession is granted that is not a result of financial difficulty and/or is within Barclays Bank UK Group’s current market terms, the concession would not amount to forbearance. For example, a commercially balanced restructure within the Barclays Bank UK Group’s current terms which involves the granting of concessions and receiving risk mitigation/structural enhancement of benefit to Barclays Bank UK Group would not be indicative of forbearance.
Forbearance is not deemed to have occurred in the following situations:
• There is a pending maturity event anticipated at the onset of lending i.e. the loan was never structured to amortise to zero.• A maturity extension or a temporary covenant waiver (e.g. short term standstill) is granted to support a period of
negotiation, subject to Barclays Bank UK Group being satisfied that:
– the debtor is actively pursuing refinancing or the sale of an asset enabling full repayment at expiry of the extended term;
– no loss is anticipated;– payments of interest and capital continues as originally scheduled; and– there is a high probability of a successful outcome within a “reasonable” time scale (6 months for bilateral facilities, 9
months for multi-lender).
• Immaterial amendments to lending terms are agreed, including changes to non-financial internal risk triggers that are only used for internal monitoring purposes.
Forbearance is considered evidence of a Significant Increase in Credit Risk and all forborne debtors are impaired as IFRS 9 stage 2 (Lifetime Expected Credit Loss) regardless of WL category as a minimum for the lifetime of the forbearance. Those forbearance cases in regulatory default will attract stage 3 impairment treatment.
Debtors granted forbearance are classified on WL for the duration of the forbearance. Counterparties placed on WL status are subject to increased levels of credit risk oversight.
Forborne debtors are classified for reporting as either Performing or Non-Performing.
Non-Performing debtors are defined as:
• More than 90 days past due at the point concession was granted.• Assessed as unlikely to pay credit obligations in full without realisation of collateral, regardless of the existence of any past
due amount or of the number of days past due.• Credit impaired.• Performing forborne debtors granted additional forbearance measures or becoming more than 30 days past-due on a
facility obligation.
Barclays’ approach to managing risksManagement of credit risk and the internal ratings-based approach
barclays.com/annualreport Barclays Bank UK PLC Pillar 3 Report 2021 >98

Performing debtors are classified as debtors that were less than 90 days past due at the point the concession was granted, are less than 30 days past due under their revised terms and are without risk of non-payment.
Non-performing status remains in force for a minimum 12 months from the date of classification before the debtor can be considered for performing status. Performing debtors remain forborne for a minimum 24 months before forborne status may be reviewed. The minimum time spent in forbearance for a case that is Non-Performing at the point forbearance is granted is therefore 36 months.
A control framework exists along with regular sampling so that policies for WL and impairment are enforced as defined and all assets have suitable levels of impairment applied. Portfolios are subject to independent assessment.
Aggregate data for wholesale forbearance cases is reviewed by the Wholesale Credit Risk Management Committee.
Forbearance programmes for retail portfoliosRetail forbearance is available to customers experiencing financial difficulties. Forbearance solutions take a number of forms depending on individual customer circumstances. It is imperative that the solution agreed is both appropriate to that customer and sustainable, with a clear demonstration from the customer of both willingness and ability to repay. Affordability assessments are undertaken before any permanent programme of forbearance is granted, to understand the customer duration of financial difficulty and agree an affordable payment amount. Short-term solutions focus on temporary reductions to contractual payments and may suppress interest, or change from capital and interest payments to interest only. Long term solutions focus on full amortisation of the balance, and may also include an interest rate concession.
When an account is placed into a programme of forbearance, the asset will be classified as such until a defined cure period has been successfully completed, incorporating a successful track record of payment in line with the revised terms, upon which it will be returned to the up-to-date book. When Barclays Group agrees a forbearance programme with a customer, impairment allowances recognise the impact on cash flows of the agreement to receive less than the original contractual payments. The Retail Impairment Policy prescribes the methodology for the impairment of forbearance assets, in line with the IFRS 9 methodology adopted in January 2018. Forborne exposures are classified as stage 3 (credit impaired) assets under IFRS 9, until such time as the prescribed stage 3 cure criteria have been met, resulting in higher impairment than for fully performing assets, reflecting the additional credit risk attached to loans subject to forbearance.
When customers exit forbearance, the accounts are ring-fenced as High Risk within the up-to-date book for a period of at least twelve months.
Barclays has continued to assist customers in financial difficulty through the use of forbearance programmes. However, the extent of forbearance offered by Barclays Bank UK Group to customers and clients remains small in comparison to the overall size of the loan book.
The level of forbearance extended to customers in other retail portfolios is not material and, typically, does not currently play a significant part in the way customer relationships are managed. However, additional portfolios will be added to this disclosure should the forbearance in respect of such portfolios become material.
A retail loan is not considered to be renegotiated where the amendment is at the request of the customer, there is no evidence of actual or imminent financial difficulty and the amendment meets with all underwriting criteria. In this case it would be treated as a new loan. In the normal course of business, customers who are not in financial difficulties frequently apply for new loan terms, for example to take advantage of a lower interest rate or to secure a further advance on a mortgage product. Where these applications meet our underwriting criteria and the loan is made at market interest rates, the loan is not classified as being in forbearance. Only in circumstances where a customer has requested a term extension, interest rate reduction or further advance and there is evidence of financial difficulty is the loan classified as forbearance and included in the disclosures on forbearance on page 258 of the Barclays PLC Annual Report 2021.
Please see the credit risk performance section on page 258 of the Barclays PLC Annual Report 2021 for details of principal wholesale and retail assets currently in forbearance.
Barclays’ approach to managing risksManagement of credit risk and the internal ratings-based approach
barclays.com/annualreport Barclays Bank UK PLC Pillar 3 Report 2021 >99

Other programmes
Retail re-aging activityRe-aging refers to the placing of an account into an up-to-date position without the requisite repayment of arrears. The re-age policy applies to revolving products that have a minimum payment requirement only. No reduction is made to the minimum due payment amounts which are calculated, as a percentage of balance, with any unpaid principal included in the calculation of the following month's minimum due payment.
The changes in timing of cash flows following re-aging do not result in any additional cost to Barclays Bank UK Group. The following are the conditions required to be met before a re-age may occur:
• the account must not have been previously charged off or written off• the borrower cannot be bankrupt, subject to an Individual Voluntary Arrangement (a UK contractual arrangement with
creditors for individuals wishing to avoid bankruptcy), or deceased• the borrower must show a renewed willingness and ability to repay the debt. This will be achieved by the borrower making
at least three consecutive contractual monthly payments or the equivalent cumulative amount. Contractual monthly payment is defined as the contractual minimum due. Funds may not be advanced for any part of this
• the account cannot exceed cycle 3 arrears at the time of the final qualifying payment• no account should be re-aged more than twice within any twelve-month period, or more than four times in a five-year period
Re-aged assets are included in portfolios High Risk population, and are classified as stage 2 assets (i.e. as having significantly increases credit risk) for IFRS 9 impairment purposes. This results in an appropriately higher impairment allowance being recognised on the assets.
Retail small arrears capitalisationAll small arrears capitalisations are now considered a form of Forbearance, based on the European Banking Authority's requirements for Supervisory Reporting on Forbearance and Non-Performing exposures.
Refinancing riskThis is the risk that the borrower or group of correlated borrowers may be unable to repay bullet-repayment loans at expiry, and will therefore need refinancing.
Refinancing risk is taken into account on a case by case basis as part of the credit review and approval process for each individual loan. The review will consider factors such as the strength of the business model and sustainability of the cash flows; and for bridge loans, the certainty of the sources of repayment and any associated market risk.
Commercial real estate loans may incorporate a bullet repayment element at maturity. Where this is the case, deals are sized and structured to enable Barclays Bank UK Group to term out the loan if the client were unable to refinance the loan at expiry. Credit review will incorporate an examination of various factors that are central to this consideration, such as tenant quality, tenancy agreement (including break clauses), property quality and interest rate sensitivity. Loans to small and medium enterprises (SMEs) will typically be either revolving credit lines to cover working capital needs or amortising exposures, with periodic refinancing to give the opportunity to review structure, pricing, etc.
Environmental riskEnvironmental risk is recognised as a credit risk driver and Barclays Group has a dedicated Environmental Risk Management team, as part of the as part of the Treasury, Enterprise, Credit and Climate Risk Transaction Cycle. Environmental issues are considered in credit risk assessment, and environmental risk standards are included in the Wholesale Credit Risk Control Framework.
Barclays Group’s approach to environmental credit risk management addresses risk under two categories, namely Direct risk and Indirect risk, which are covered below.
Direct risk can arise when Barclays Group takes commercial land as collateral. In many jurisdictions, enforcement of a commercial mortgage by Barclays Group, leading to possession, potentially renders Barclays Group liable for the costs of remediating a site under Direct Lender Liability, if deemed by the regulator to be contaminated. In the UK, Barclays Group’s approach requires commercial land, if being pledged as collateral, to be subject to a screening mechanism. Where required, a further assessment of the commercial history of a piece of land or an asset and its potential for environmental contamination helps reflect any potential environmental degradation in the value ascribed to that security. It also identifies potential liabilities which may be incurred by Barclays Group, if realisation of the security were to become likely.
Indirect risk can arise when environmental issues may impact the creditworthiness of the borrower. For instance, incremental costs may be incurred in upgrading a business’ operations to meet emerging environmental regulations or tightening standards, including those associated with managing the impacts of climate change. In other circumstances, failure to meet those standards may lead to fines. Environmental impacts on businesses may also include shifts in the market demand for
Barclays’ approach to managing risksManagement of credit risk and the internal ratings-based approach
barclays.com/annualreport Barclays Bank UK PLC Pillar 3 Report 2021 >100

goods or services generated by our customers, or changing supply chain pressures. Environmental considerations affecting our clients can be varied. Barclays Group has developed a series of environmental risk briefing notes, covering ten broad industry headings ranging from Agriculture and Fisheries to Oil and Gas, from Mining and Metals to Utilities and Waste Management. These briefing notes are available to colleagues in business development and credit risk functions across the organisation, outlining the nature of environmental and social risks of which to be aware, as well as the factors which mitigate those risks
Climate change is an increasing driver of environmental risk. More information on our approach to managing risks associated with climate change can be found on page 49 of Barclays Bank UK PLC Annual Report 2021.
Internal ratings based (IRB) approach
The IRB approach largely relies on internal models to derive the risk parameters/components used in determining the capital requirement for a given exposure. The main risk components include measures of the PD, LGD and the EAD. The IRB approach is divided into three alternative applications: Own-Estimates, Supervisory Estimates and Specialised Lending:
Own-Estimates IRB (OEIRB): Barclays Bank UK Group uses its own models to estimate PD, LGD and EAD to calculate given risk exposures for various asset classes and the associated Risk Weighted Assets (RWAs).Supervisory IRB (SIRB): Barclays uses its own PD estimates, but relies on supervisory estimates for other risk components. The SIRB approach is particularly used to floor risk parameters for wholesale credit exposures where default data scarcity may impact the robustness of the model build process.
Specialised Lending IRB: For specialised lending exposures for which PD cannot be modelled reliably, Barclays uses a set of risk weights defined in the relevant regulation, and takes into account a range of prescribed risk factors.While in the past the industry has used the terms ‘Advanced’, ‘Foundation’ and ‘Slotting’ IRB, the current enforcing regulation (the Capital Requirements Regulation) does not use these terms.
The IRB calculation for credit riskFor both OEIRB and SIRB approaches, Barclays Bank UK Group uses the regulatory prescribed risk-weight functions for the purposes of deriving capital requirements.In line with regulatory requirements, Long Run Average PD and downturn LGD and CF (Conversion Factor) estimates are used for each customer/facility to determine regulatory capital for all exposures in scope.For the purpose of pricing and existing customer management, point in time (PIT) PD, LGD and EAD are generally used as these represent the best estimates of risk given the current position in the credit cycle. Whilst Long Run Average PDs are always tested at grade/pool level, PIT PDs are also used for the calculation of capital on certain retail unsecured products, in line with regulation.
Applications of internal ratingsThe three components – PD, LGD and CF – are the building blocks used in a variety of applications that measure credit risk across the entire portfolio:
• Credit approval: PD models are used in the approval process in both retail and wholesale portfolios. In high-volume retail portfolios, application and behaviour scorecards are frequently used as decision-making tools. In wholesale, PD models are used to direct applications to an appropriate credit-sanctioning level
• Credit grading: this was originally introduced in the early 1990s to provide a common measure of risk across Barclays Group. Barclays now employs a 21-point scale of default probabilities. In some applications, grades in this scale are divided further to permit more detailed analysis. These are shown in Table 29 on page 39
• Risk-reward and pricing: RWA derived from the PD, LGD and CF estimates is used to assess the profitability of deals and portfolios and to facilitate risk-adjusted pricing and strategy decisions
• Risk appetite: estimates are used to calculate the expected loss and the potential volatility of loss in Barclays Group’s risk appetite framework. See page 84
• Impairment calculation: under IFRS 9, ECL outputs are produced based on PD, EAD and LGD IRB feeder models, with different economic scenarios used on a probability-weighted basis. See pages 93-96.
• Collections and recoveries: PD model outputs are used to identify segments of the portfolio where collection and recovery efforts should be prioritised
• Economic capital (EC) calculation: EC models for most portfolios use inputs from the IFRS9 impairment models• Risk management information: Risk generate reports to inform senior management on issues such as business
performance, risk appetite and EC consumption. Model outputs are used as key indicators in those reports. Risk also generates regular reports on model risk, which covers model accuracy, model use, input data integrity and regulatory compliance among other issues
Barclays’ approach to managing risksManagement of credit risk and the internal ratings-based approach
barclays.com/annualreport Barclays Bank UK PLC Pillar 3 Report 2021 >101

Ratings processes and models for credit exposures
Wholesale creditTo construct ratings for wholesale customers, including financial institutions, corporations, specialised lending, purchased corporate receivables and equity exposures, Barclays complements its internal models suite with external models and rating agencies’ information. A model hierarchy is in place requiring users/credit officers to adopt a consistent approach/model to rate each counterparty based on the asset class type and the nature of the transaction.
Wholesale PD modelsBarclays Bank UK Group employs a range of methods in the construction of these models:
• statistical models are used for our high volume portfolios such as small or medium enterprises (SME). The models are typically built using large amounts of internal data, combined with supplemental data from external data suppliers where available. Wherever external data is sourced to validate or enhance internally held data, similar data quality standards to those applicable to the internal data management are enforced
• structural models incorporate, in their specification, the elements of the industry-accepted Merton framework to identify the distance to default for a counterparty. This relies upon the modeller having access to specific time series data or data proxies for the portfolio. Data samples used to build and validate these models are typically constructed by appropriately combining data sets from internal default observations with comparable externally obtained data sets from commercial providers such as rating agencies and industry data gathering consortia
• expert lender models are used for those parts of the portfolio where there is insufficient internal or external data to support the construction of a statistically robust model. These models utilise the knowledge and in-depth expertise of the senior credit officers dealing with the specific customer type being modelled. For all portfolios with a low number of default observations, Barclays Group adopts specific regulatory rules, methodologies and floors in its estimates so that the calibration of the model meets the current regulatory criteria for conservatism
Wholesale LGD modelsThe LGD models typically rely on statistical analysis to derive the model drivers (including seniority of claim, collateral coverage, recovery periods, industry and costs) that best explain Barclays Group’s historical loss experience, often supplemented with other relevant and representative external information where available. The models are calibrated to downturn conditions for regulatory capital purposes and, where internal and external data is scarce, they are subject to SIRB floors so that the calibration of the model meets the current regulatory criteria for conservatism.
Wholesale CF modelsThe wholesale CF models estimate the potential utilisation of the currently available headroom based on statistical analysis of the available internal and external data and past client behaviour. As is the case with the LGD models, the CF models are subject to downturn calibration for regulatory capital purposes and to floors where data is scarce.
Retail creditRetail banking and cards operations have long and extensive experience of using credit models in assessing and managing risks. As a result, models play an integral role in customer approval and management decisions. Most retail portfolios are data rich; consequently, most models are built in-house using statistical techniques and internal data. Exceptions are some expert lender models (similar to those described in the wholesale context) where data scarcity precludes the statistically robust derivation of model parameters. In these cases, appropriately conservative assumptions are typically used, and wherever possible these models are validated/benchmarked against external data.
Retail PD modelsApplication and behavioural scorecards are most commonly used for retail PD modelling:
• application scorecards are derived from historically observed performance of new clients. They are built using customer demographic and financial information, supplemented by credit bureau information where available. Through statistical techniques, the relationship between these candidate variables and the default marker is quantified to produce output scores reflecting a PD. These scores are used primarily for new customer decisioning but are, in some cases, also used to allocate a PD to new customers for the purpose of capital calculation
• behavioural scorecards differ from application scorecards in that they rely on the historically observed performance of existing clients. The statistically derived output scores are used for existing customer management activities as well as for the purpose of capital calculation
Retail LGD modelsRetail LGD models are built using bespoke methods chosen to best model the operational recovery process and practices. In a number of secured portfolios, LGD drivers are parameterised with market factors (e.g. house price indices, haircut of the property value) to capture market trends. For unsecured portfolios, where recoveries are not based on collateral, statistical models of cash flows are used to estimate ultimate recoveries and LGDs. In all instances, cash flows are discounted to the
Barclays’ approach to managing risksManagement of credit risk and the internal ratings-based approach
barclays.com/annualreport Barclays Bank UK PLC Pillar 3 Report 2021 >102

point of default by using bespoke country and product level factors. For capital calculations, customised economic downturn adjustments, taking into account loss and default dependency, are made to adjust losses to stressed conditions.
Retail CF modelsCF models within retail portfolios are split into two main methodological categories. The general methodology is to derive product level credit conversion factors (CCFs) from historical balance migrations, typically for amortising product, such as mortgages, consumer loans. These are frequently further segmented at a bucket level (e.g. by delinquency). The most sophisticated CF models are based on behavioural factors, determining customer level CCFs from characteristics of the individual facility, typically for overdrafts and credit cards. For capital calculations, customised downturn adjustments, taking into account loss and default dependency, are made to adjust for stressed conditions.
The control mechanisms for the rating systemModel risk is a risk managed under the ERMF. Consequently, Barclays Group Model Risk Policy (GMRP) and its supporting standards covering the end-to-end model life cycle are in place to support the management of risk models.
Key controls captured by the GMRP cover:
• model governance is anchored in assigning accountabilities and responsibilities to each of the main stakeholders:– model owner – each model must have an owner who has overall accountability for the model– model developers – support the model owner and drive development according to the model owner’s defined scope/
purpose– Independent Validation Unit (IVU) – responsible for independent review, challenge and approval of all models
• externally developed models are subject to the same governance standards as internal models• models are classified by materiality (high/low) and complexity (complex/non-complex)• all models must be validated and approved by IVU before initial implementation/use• models are subject to annual review by the model owner and periodic validation and approval by IVU• all models must be recorded in Barclays Group Models Database (GMD), which records model owners and developers• model owners must evidence that model implementation is accurate and tested
If a model is found to perform sub-optimally, it may be rejected and/or subjected to a Post Model Adjustment (PMA) before approval for continued use is granted.
The IVU reporting line is separate from that of the model developers. IVU is part of Model Risk Management (MRM), and the head of MRM reports to Barclays Group Chief Risk Officer (GCRO). The model development teams have separate reporting lines to the Group Head of Quantitative Analytics, who in turn reports to the Barclays Group CRO.
Under the Three Lines of Defence approach stated in the ERMF, the actions of all parties with responsibilities under the GMRP are subject to independent review by Barclays Internal Audit.
Validation processes for credit exposuresValidation of credit models covers observed model performance but also the scope of model use, interactions between models, data use and quality, the model’s theoretical basis, regulatory compliance and any remediation to model risk that are proposed or in place. The following sections provide more detail on processes for validating the performance of each model type (covered as part of an annual validation and self assessment).
Wholesale PD modelsTo assess model calibration, the IVU compares the model predicted default rate to the observed default rate over the latest year and over all available model history. On low default portfolios the relative infrequency of default of large wholesale obligors means a long-run perspective on default risk is vital. For these portfolios, default rates are also compared to external benchmarks where these are relevant and available, such as default rates in rating-agency data.
To assess model discrimination performance, the IVU compares the rank-ordering of internal ratings with the pattern of defaults, if any, to construct the industry-standard Gini statistic or similar. The ordering of internal ratings is also compared to the ordering of internal and external comparator ratings where these are available.
Measures of grade stability and the degree to which PD tracks default rates over time are also routinely calculated to infer relevant aspects of model performance.
Wholesale LGD modelsTo assess model calibration, model outputs are compared to the LGD observed on facilities that entered default. Comparisons are performed by individual model component, and at overall level. Model outputs are also compared to the long-run average of observed LGD. The time-lapse between facility default and the closure of recovery is varied and may be long. In the construction of observed LGD, recoveries are discounted back to the date of default at a conservative interest rate, following
Barclays’ approach to managing risksManagement of credit risk and the internal ratings-based approach
barclays.com/annualreport Barclays Bank UK PLC Pillar 3 Report 2021 >103
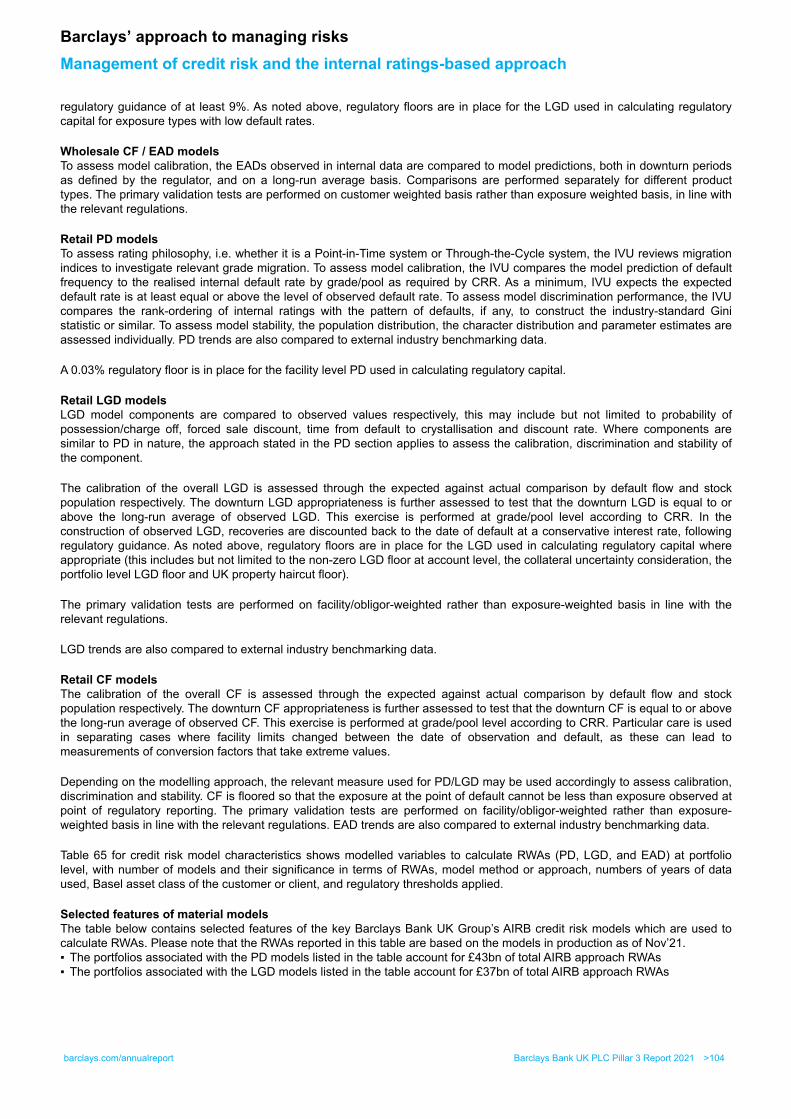
regulatory guidance of at least 9%. As noted above, regulatory floors are in place for the LGD used in calculating regulatory capital for exposure types with low default rates.
Wholesale CF / EAD modelsTo assess model calibration, the EADs observed in internal data are compared to model predictions, both in downturn periods as defined by the regulator, and on a long-run average basis. Comparisons are performed separately for different product types. The primary validation tests are performed on customer weighted basis rather than exposure weighted basis, in line with the relevant regulations.
Retail PD modelsTo assess rating philosophy, i.e. whether it is a Point-in-Time system or Through-the-Cycle system, the IVU reviews migration indices to investigate relevant grade migration. To assess model calibration, the IVU compares the model prediction of default frequency to the realised internal default rate by grade/pool as required by CRR. As a minimum, IVU expects the expected default rate is at least equal or above the level of observed default rate. To assess model discrimination performance, the IVU compares the rank-ordering of internal ratings with the pattern of defaults, if any, to construct the industry-standard Gini statistic or similar. To assess model stability, the population distribution, the character distribution and parameter estimates are assessed individually. PD trends are also compared to external industry benchmarking data.
A 0.03% regulatory floor is in place for the facility level PD used in calculating regulatory capital.
Retail LGD modelsLGD model components are compared to observed values respectively, this may include but not limited to probability of possession/charge off, forced sale discount, time from default to crystallisation and discount rate. Where components are similar to PD in nature, the approach stated in the PD section applies to assess the calibration, discrimination and stability of the component.
The calibration of the overall LGD is assessed through the expected against actual comparison by default flow and stock population respectively. The downturn LGD appropriateness is further assessed to test that the downturn LGD is equal to or above the long-run average of observed LGD. This exercise is performed at grade/pool level according to CRR. In the construction of observed LGD, recoveries are discounted back to the date of default at a conservative interest rate, following regulatory guidance. As noted above, regulatory floors are in place for the LGD used in calculating regulatory capital where appropriate (this includes but not limited to the non-zero LGD floor at account level, the collateral uncertainty consideration, the portfolio level LGD floor and UK property haircut floor).
The primary validation tests are performed on facility/obligor-weighted rather than exposure-weighted basis in line with the relevant regulations.
LGD trends are also compared to external industry benchmarking data.
Retail CF modelsThe calibration of the overall CF is assessed through the expected against actual comparison by default flow and stock population respectively. The downturn CF appropriateness is further assessed to test that the downturn CF is equal to or above the long-run average of observed CF. This exercise is performed at grade/pool level according to CRR. Particular care is used in separating cases where facility limits changed between the date of observation and default, as these can lead to measurements of conversion factors that take extreme values.
Depending on the modelling approach, the relevant measure used for PD/LGD may be used accordingly to assess calibration, discrimination and stability. CF is floored so that the exposure at the point of default cannot be less than exposure observed at point of regulatory reporting. The primary validation tests are performed on facility/obligor-weighted rather than exposure-weighted basis in line with the relevant regulations. EAD trends are also compared to external industry benchmarking data.
Table 65 for credit risk model characteristics shows modelled variables to calculate RWAs (PD, LGD, and EAD) at portfolio level, with number of models and their significance in terms of RWAs, model method or approach, numbers of years of data used, Basel asset class of the customer or client, and regulatory thresholds applied.
Selected features of material modelsThe table below contains selected features of the key Barclays Bank UK Group’s AIRB credit risk models which are used to calculate RWAs. Please note that the RWAs reported in this table are based on the models in production as of Nov’21.▪ The portfolios associated with the PD models listed in the table account for £43bn of total AIRB approach RWAs▪ The portfolios associated with the LGD models listed in the table account for £37bn of total AIRB approach RWAs
Barclays’ approach to managing risksManagement of credit risk and the internal ratings-based approach
barclays.com/annualreport Barclays Bank UK PLC Pillar 3 Report 2021 >104

Table 65: IRB credit risk models’ selected features
Size of associated portfolio (RWAs)
Component modelled Portfolio BUK (£m)
Model description and methodology
Number of years loss data
Basel asset classes measured
Applicable industry-wide regulatory thresholds
PD
SME customers with turnover < £20m
7,693
Statistical models that uses regression techniques to derive relationship between observed default experience and a set of behavioural variables.
> 10 Years Corporate SME, SME
Regulatory PD floor of 0.03%
PD UK Home Finance 24,924
Statistical scorecards estimated using regression techniques, segmented along arrears status and portfolio type.
>10 Years
Secured By Real Estate (residential and buy-to-let mortgages)
Regulatory PD floor of 0.03%
PD Barclaycard UK 10,145
Statistical scorecards estimated using regression techniques, segmented along arrears status and portfolio type.
6 - 10 Years Qualifying Revolving Retail (QRRE)
PD floor of 0.03%
LGD
All business customers (excluding certain specialized sectors)
2,324
Model is based on a function estimated using actual recoveries experience. It takes account of collateral value and an allowance for non-collateral recovery.
> 10 Years Corporate LGD floor of 5%
LGD UK Home Finance 24,924 Data driven estimates of loss and
probability of possession 6 - 10 Years
Secured By Real Estate (residential and buy-to-let mortgages)
The portfolio average downturn LGD is floored at 10%
LGD Barclaycard UK 10,145
Statistical models combining segmented regression and other forecasting techniques
6 - 10 Years Qualifying Revolving Retail (QRRE) -
Credit Risk IRB models performance back testing - estimated versus actualThe following tables compare the PDs and LGDs estimated by the BBUK’s IRB models with the actual default and loss rates respectively. Comparisons are based on the assets in IRB approach portfolios and are used to assess performance of the models. The estimates and actual figures represent direct outputs from the models rather than outputs used in regulatory capital calculations that may be adjusted to apply more conservative assumptions.
Risk models are subject to the Group Model Risk Policy which contains detailed guidance on the minimum standards for model risk management. For example, PDs must be estimated over a sufficient period, show sufficient differentiation in predictions for different customers, show conservatism where data limitations exist, and follow prescriptive techniques. These standards are achieved via an independent validation process through appropriately independent experts. Once validated and correctly implemented, models are subject to regular monitoring to ensure they can still be used. Comparing model estimates with actual default rates for PD and loss rates for LGD form part of this monitoring. Such analysis is used to assess and enhance the performance of the models.
Further detail is provided in the management of model risk on page 135.
Barclays’ approach to managing risksManagement of credit risk and the internal ratings-based approach
barclays.com/annualreport Barclays Bank UK PLC Pillar 3 Report 2021 >105

PD measures
▪ The model estimated PiT PDs are compared with the actual default rates by PD ranges within each IRB exposure class. PD ranges, estimated PDs and actual default rates are based on the existing models default definitions. UK Cards, UK Home Finance, UK Current Account, Barclayloan and SME are the only CRD IV compliant portfolio as of the reference month (Nov’21), for the remaining portfolios, compliant models are either currently under PRA approval process or will be submitted as per the EBA IRB Repair roll out plan periodically reviewed with the PRA.
▪ The estimated PDs are forward-looking average PD by the model at the beginning of the twelve-month period, i.e. average PD of the Nov’20 non-defaulted obligors including inactive and non-borrowers. Both EAD weighted and simple average PDs have been reported.
▪ The estimated PDs are compared with the simple average of historical annual default rates over the past 5 years, starting Nov’16.
▪ The PiT PD is used as a predicted measure in internal monitoring and annual validation of the models. In contrast, the capital calculation uses TTC or Regulatory PDs (not shown on the following tables), calibrated to long-run default averages with additional adjustments where modelled outputs display evidence of risk understatement (including credit expert overrides, regulatory adjustments etc.). The PiT measure is subject to under or over prediction depending on the relative position of the portfolio to the credit cycle.
▪ A mapping has been provided between external ratings and internal PD ranges based on the published reports from the two rating agencies - Moody's and S&P.
▪ For the wholesale models, the average default probabilities in the tables have been determined from the full scope of clients graded by BUK ESHLA IRB model suite, which may include some clients that have either zero exposure or zero limits marked at the time of calculation.
LGD measures
▪ The model estimated PiT LGDs, unadjusted for regulatory floors and for downturn adjustments, are compared with the actual LGDs within each IRB exposure class.
▪ The estimated LGDs are derived from a simple average of LGDs at beginning of the year in which the default event occurred for the set of cases resolved over the twelve-month period (i.e., between Dec’20 to Nov’21).
▪ The actual LGD rate is the simple average observed loss rate for the set of cases resolved over the twelve-month period, regardless of the time of default.
▪ The LGD measures are used as a predicted measure in internal monitoring and annual validation of the models. The capital calculation uses Downturn LGDs with additional adjustments and regulatory floors where modelled outputs display evidence of risk understatement.
Barclays’ approach to managing risksManagement of credit risk and the internal ratings-based approach
barclays.com/annualreport Barclays Bank UK PLC Pillar 3 Report 2021 >106

Table 66: Analysis of expected performance versus actual results
This table provides an overview of credit risk model performance, assessed by the analysis of average PDs and average LGDs. Please note these tables exclude exposures calculated under the supervisory slotting approach and the straddling obligors between BUK and BI have been classified under BUK.
The table compares the raw model output to the actual experience in our portfolios. Such analysis is used to assess and enhance the adequacy and accuracy of models. The raw outputs are subject to a number of adjustments before they are used in the calculation of capital, for example to allow for the position in the credit cycle and the impact of stress on recovery rates.
Asset Class
EBA PD Range
(%)
Weighted Average
PD
Arithmetic Average PD by
obligors
Number of obligorsDefaulted obligors
in the year
of which: new
defaulted in the year
Average historical
annual defaultExternal Ratings Equivalent
As at Nov'20
As at Nov'21
Wholesale Moody's S&P % % # # # # %
Corporate
0.00 to <0.15
Aaa,Aa1,Aa2,Aa3,A1,A2,A3,Baa1
AAA, AA+,AA,AA-,A+,A,A-,BBB+ 0.05% 0.05% 137 127 0 0 0.00%
0.15 to <0.25 Baa2 BBB 0.18% 0.18% 1 2 0 0 0.00%
0.25 to <0.50 Baa3,Ba1 BBB-,BB+ 0.28% 0.28% 1 2 0 0 0.00%
0.50 to <0.75 Ba1,Ba2 BB+,BB 0.00% 0.00% — — 0 0 0.00%
0.75 to <2.50 Ba2,Ba3,B1 BB,BB-,B+ 0.00% 0.00% — — 0 0 0.00%
2.50 to <10.00 B1,B2,B3,Caa1 B+,B,B-,CCC+ 2.60% 2.60% 1 1 0 0 0.00%
10.00 to <100.00 Caa2,Caa3,Ca,C
CCC,CCC+,CCC-,CC+,CC,C 0.00% 0.00% — — 0 0 0.00%
100.00 (default) D D 0.00% 0.00% — —
SME
0.00 to <0.15
Aaa,Aa1,Aa2,Aa3,A1,A2,A3,Baa1
AAA, AA+,AA,AA-,A+,A,A-,BBB+ 0.13% 0.10% 113,669 78,548 40 38 0.11%
0.15 to <0.25 Baa2 BBB 0.21% 0.19% 174,776 41,765 1,290 1,279 0.36%
0.25 to <0.50 Baa3,Ba1 BBB-, BB+ 0.39% 0.37% 326,725 191,900 3,019 2,966 0.49%
0.50 to <0.75 Ba1,Ba2 BB+,BB 0.62% 0.61% 151,052 153,802 3,370 3,259 0.96%
0.75 to <2.50 Ba2,Ba3,B1 BB,BB-,B+ 1.47% 1.26% 250,826 384,327 9,501 7,442 1.84%
2.50 to <10.00 B1,B2,B3,Caa1 B+,B,B-,CCC+ 4.37% 4.20% 45,420 164,149 3,495 1,069 5.47%
10.00 to <100.00 Caa2,Caa3,Ca,C
CCC,CCC+,CCC-,CC+,CC,C 23.49% 26.36% 8,995 21,122 2,321 21 26.32%
100.00 (default) D D 100.00% 100.00% 12,863 28,917 — — —
Barclays’ approach to managing risksManagement of credit risk and the internal ratings-based approach
barclays.com/annualreport Barclays Bank UK PLC Pillar 3 Report 2021 >107

Asset Class
EBA PD Range
(%)
Weighted Average
PD
Arithmetic Average PD by
obligors
Number of obligorsDefaulted obligors
in the year
of which: new
defaulted in the year
Average historical
annual defaultExternal Ratings Equivalent
As at Nov'20
As at Nov'21
Wholesale Moody's S&P % % # # # # %
Secured by Real Estate
0.00 to <0.15 Aaa,Aa1,Aa2,Aa3,
A1,A2,A3,Baa1
AAA, AA+,AA,AA-,A+,A,A-,BBB+ 0.07% 0.08% 700,788 600,771 774 — 0.08%
0.15 to <0.25 Baa2 BBB 0.19% 0.19% 80,524 161,739 265 — 0.22%
0.25 to <0.50 Baa3,Ba1 BBB-,BB+ 0.34% 0.34% 33,990 67,601 199 — 0.52%
0.50 to <0.75 Ba1,Ba2 BB+,BB 0.61% 0.61% 9,172 14,505 81 — 0.87%
0.75 to <2.50 Ba2,Ba3,B1 BB,BB-,B+ 1.60% 1.53% 17,012 18,132 236 — 1.22%
2.50 to <10.00 B1,B2,B3,Caa1 B+,B,B-,CCC+ 5.15% 4.88% 12,784 13,690 689 — 4.78%
10.00 to <100.00 Caa2,Caa3,Ca,C
CCC,CCC+,CCC-,CC+,CC,C 30.21% 30.19% 6,356 6,455 2,083 — 30.77%
100.00 (default) D D 100.00% 100.00% 8,081 8,369 — — —
Qualifying Revolving Retail
0.00 to <0.15 Aaa,Aa1,Aa2,Aa3,
A1,A2,A3,Baa1
AAA, AA+,AA,AA-,A+,A,A-,BBB+ 0.08% 0.05% 12,202,466 12,604,697 6,008 858 0.05%
0.15 to <0.25 Baa2 BBB 0.20% 0.19% 2,199,714 1,847,456 3,689 704 0.17%
0.25 to <0.50 Baa3,Ba1 BBB-, BB+ 0.36% 0.36% 1,872,647 1,714,913 6,678 929 0.32%
0.50 to <0.75 Ba1,Ba2 BB+,BB 0.62% 0.61% 905,693 850,989 5,631 516 0.58%
0.75 to <2.50 Ba2,Ba3,B1 BB,BB-,B+ 1.43% 1.39% 1,885,908 1,822,254 26,536 995 1.38%
2.50 to <10.00 B1,B2,B3,Caa1 B+,B,B-,CCC+ 4.62% 4.61% 1,030,902 813,609 50,611 454 4.85%
10.00 to <100.00 Caa2,Caa3,Ca,C
CCC,CCC+,CCC-,CC+,CC,C 27.37% 26.35% 237,176 201,903 62,158 66 25.19%
100.00 (default) D D 100.00% 100.00% 389,435 273,385 — — —
Barclays’ approach to managing risksManagement of credit risk and the internal ratings-based approach
barclays.com/annualreport Barclays Bank UK PLC Pillar 3 Report 2021 >108

Asset Class
EBA PD Range
(%)
Weighted Average
PD
Arithmetic Average PD by
obligors
Number of obligorsDefaulted obligors
in the year
of which: new
defaulted in the year
Average historical
annual defaultExternal Ratings Equivalent
As at Nov'20
As at Nov'21
Wholesale Moody's S&P % % # # # # %
Other Retail
0.00 to <0.15 Aaa,Aa1,Aa2,Aa3,
A1,A2,A3,Baa1
AAA, AA+,AA,AA-,A+,A,A-,BBB+ 0.11% 0.10% 34,073 75,674 35 — 0.13%
0.15 to <0.25 Baa2 BBB 0.20% 0.20% 42,374 46,550 64 — 0.21%
0.25 to <0.50 Baa3,Ba1 BBB-, BB+ 0.38% 0.37% 89,362 89,745 253 — 0.36%
0.50 to <0.75 Ba1,Ba2 BB+,BB 0.62% 0.62% 71,353 56,670 332 — 0.59%
0.75 to <2.50 Ba2,Ba3,B1 BB,BB-,B+ 1.43% 1.42% 215,355 146,640 2,454 — 1.42%
2.50 to <10.00 B1,B2,B3,Caa1 B+,B,B-,CCC+ 4.68% 4.67% 130,003 91,207 5,884 — 5.14%
10.00 to <100.00
Caa2,Caa3,Ca,CCCC,CCC+,CCC-,CC+,CC,C 28.22% 28.75% 33,995 26,310 10,003 — 28.00%
100.00 (default) D D 100.00% 100.00% 45,861 28,502 — — —
Asset Class
Number of resolved cases over last one year (Dec'20 to Nov'21)
Predicted LGD(Simple Average)
Actual LGD(Simple Average)
Wholesale # % %SME 6,277 43% 50%
RetailSecured by Real Estate 3,387 0.48% 0.14% Qualifying Revolving Retail 254,661 73% 72% Other Retail 29,901 64% 79%
2021 AIRB models back testing summary
The section below provides AIRB model performance summary based on the above back testing results, along with the remediation plans.
Wholesale
– For Corporate Bank (Social Housing)
– There are no defaults observed in Social Housing portfolio over last one year. Therefore, Corporate exposure class related to ESHLA IRB shows zero default rates across IRB exposure.
• For SME– The back testing report is based on the CRD IV complaint models implemented in 2017. Oct’21 data has been
used, due to unavailability of Nov’21 data. A historical average has been calculated using 5 years of data. BBUK was stood up in April 2018 due to ring fencing, so Oct'16 and Oct'17 are based on proxy BUK/BI split based on Sales Turnover and Oct'18, Oct'19 & Oct'20 are based on implemented legal identifier. LGD back testing is reported on the basis of proxy BUK/BI split and SRP implemented legal identifier.
– The PiT PD model under-estimates the default rate at an overall level (0.94% expected vs. 2.15% actual). Default rates are increasing due to Bounce Back Loans (BBLs). BBLs began to come to term in this outcome window. This along with an issue around extension of terms and calculation of days past due (the loans booking system has a constraint in accounting for circumstances where the payment terms have changed) has resulted in an increase in default rate. As per the latest monitoring, excluding BBL, PiT PD model over-estimates the default rate.
Barclays’ approach to managing risksManagement of credit risk and the internal ratings-based approach
barclays.com/annualreport Barclays Bank UK PLC Pillar 3 Report 2021 >109

– The LGD model under-estimates (42.71% estimated vs. 49.88% actual) on a PiT basis due to operational issues and changes that affect underlying data. Downturn LGD adds buffer on PiT LGD reducing the non-conservatism and there is additional RWA through an adjustment to further bridge the non-conservatism observed.
– The models to be revised as per the EBA IRB Repair roll out plan, which is periodically reviewed with the PRA. Interim Post Model Adjustments (PMAs) are in place to address model weaknesses.
Secured by Real Estate
• This covers the Mortgage portfolios for UK. Rank ordering is maintained across PD ranges.• For UK Mortgages, the PiT PD model under-estimates at an overall level (0.43% expected vs. 0.50% actual). However, the
TTC PD model that is used in the reported RWA calculation continues to maintain conservatism. The portfolio maintains low PiT LGD and the PiT LGD model over-estimates (0.48% estimated vs. 0.14% actual). For accounts where actual sale cost was not available, an average sale cost is used while calculating actual LGD. The low actual LGD is being driven by the drop in the number of sold cases (due to Covid19 and a litigation moratorium which was in place between Mar'20-Mar'21), leading to higher proportion of cure being assigned zero actual LGD. Downturn LGD adds further conservatism.
• The new set of models will be submitted for UK Mortgage portfolio as per the EBA IRB Repair roll out plan, which is periodically reviewed with the PRA.
Qualifying Revolving Retail
• This constitutes UK Cards and UK Current Account portfolios. The estimated PDs rank order well across both the portfolios and at an overall level.
• For UK Cards, there is marginal under-estimation in the PiT PD model (1.62% estimated vs. 1.66% actual), however the regulatory PD remains conservative at an overall level. The reduction in default rate observed has been largely driven by various support schemes and lower spend due to Covid19. The PiT LGD model under-estimates (73.05% estimated vs. 75.68% actual), which is primarily driven by the stoppage of forward-flow debt sale in the recovery window. However, Downturn LGD used for capital calculation is conservative.
• For UK Current Account, there is marginal over-estimation in the PiT PD model at an overall level (0.31% estimated vs. 0.30% actual). The PiT LGD model over-estimates (73.39% estimated vs. 55.66% actual).
• The new set of models will be submitted for both the portfolios as per the EBA IRB Repair roll out plan, which is periodically reviewed with the PRA. Interim Post Model Adjustments (PMAs) are in place to address existing models’ deficiencies for both the portfolios.
Other Retail
• This covers UK Barclayloan portfolio. The back-testing report is based on new CRD IV compliant models, approved by the PRA and implemented in Jul’19.
• The PD model over-estimates (3.21% estimated vs. 3.09% actual) on PiT basis at an overall level; rank ordering is maintained.
• The LGD model under-estimates (63.83% expected vs. 78.79% actual) on a PiT basis at an overall level. Downturn adjustment adds further buffer and continues to be within 2.5% of actual LGD.
• The new set of models will be submitted as per the EBA IRB Repair roll out plan, which is periodically reviewed with the PRA. Interim Post Model Adjustments (PMAs) are in place to account for changes in customer behaviour under current pandemic.
Barclays’ approach to managing risksManagement of credit risk and the internal ratings-based approach
barclays.com/annualreport Barclays Bank UK PLC Pillar 3 Report 2021 >110

Credit risk mitigationThe Barclays Bank UK Group employs a range of techniques and strategies to actively mitigate credit risks. These can broadly be divided into three types:
• netting and set-off• collateral• risk transfer
Barclays Bank UK Group has detailed policies in place to maintain that credit risk mitigation is appropriately recognised and recorded. The recognition of credit risk mitigation is subject to a number of considerations including legal certainty of enforceability and effectiveness, that the valuation and liquidity of the collateral is adequately monitored, and that the value of the collateral is not materially correlated with the credit quality of the counterparty.
All three types of credit risk mitigation may be used by different areas of Barclays Bank UK Group for exposures with a full range of counterparties. For instance, businesses may take property, cash or other physical assets as collateral for exposures to retailers, property companies or other client types.
Netting and set-offIn most jurisdictions in which the Barclays Bank UK Group operates, credit risk exposures can be reduced by applying netting and set-off. In exposure terms, this credit risk mitigation technique has the largest overall impact on net exposure to derivative transactions, compared with other risk mitigation techniques.
For derivative transactions, the Barclays Bank UK Group’s normal practice is to enter into standard master agreements with counterparties (e.g. ISDAs). These master agreements typically allow for netting of credit risk exposure to a counterparty resulting from derivative transactions against the obligations to the counterparty in the event of default, and so produce a lower net credit exposure. These agreements may also reduce settlement exposure (e.g. for foreign exchange transactions) by allowing payments on the same day in the same currency to be set-off against one another.
Under IFRS, netting is permitted only if both of the following criteria are satisfied:
• the entity currently has a legally enforceable right to set off the recognised amounts• the entity intends either to settle on a net basis, or to realise the asset and settle the liability simultaneously
CollateralThe Barclays Bank UK Group has the ability to call on collateral in the event of default of the counterparty, comprising:
• home loans: a fixed charge over residential property in the form of houses, flats and other dwellings. The value of collateral is impacted by property market conditions which drive demand and therefore value of the property. Other regulatory interventions on ability to repossess, longer period to repossession and granting of forbearance may also affect the collateral value
• wholesale lending: a fixed charge over commercial property and other physical assets, in various forms• other retail lending: includes second lien charges over residential property, which are subordinate to first charges held
either by the Barclays Bank UK Group or by another party; and finance lease receivables, for which typically the Barclays Bank UK Group retains legal title to the leased asset and has the right to repossess the asset on the default of the borrower
• derivatives: the Barclays Bank UK Group also often seeks to enter into a margin agreement (e.g. Credit Support Annex) with counterparties with which the Barclays Bank UK Group has master netting agreements in place. These annexes to master agreements provide a mechanism for further reducing credit risk, whereby collateral (margin) is posted on a regular basis (typically daily) to collateralise the mark to market exposure of a derivative portfolio measured on a net basis. The Barclays Bank UK Group may additionally negotiate the receipt of an independent amount further mitigating risk by collateralising potential mark to market exposure moves
• reverse repurchase agreements: collateral typically comprises highly liquid securities which have been legally transferred to the Barclays Bank UK Group subject to an agreement to return them for a fixed price
• financial guarantees and similar off-balance sheet commitments: cash collateral may be held against these arrangements
Risk transferA range of instruments including guarantees can be used to transfer credit risk from one counterparty to another. These mitigate credit risk in two main ways:
• if the risk is transferred to a counterparty which is more creditworthy than the original counterparty, then overall credit risk is reduced;
• where recourse to the first counterparty remains, both counterparties must default before a loss materialises. This is less likely than the default of either counterparty individually so credit risk is reduced
Barclays’ approach to managing risksManagement of counterparty credit risk and credit risk mitigation techniques
barclays.com/annualreport Barclays Bank UK PLC Pillar 3 Report 2021 >111

Risk transfer can also be used to reduce risk concentrations within portfolios lowering the impact of stress events.
Risk transfer transactions are undertaken with consideration to whether the collateral provider is correlated with the exposure, the credit worthiness of the collateral provider and legal certainty of enforceability and effectiveness. Where credit risk mitigation is deemed to transfer credit risk, this exposure is appropriately recorded against the credit risk mitigation provider.
In exposure terms, risk transfer is used most extensively as a credit risk mitigation technique for wholesale loans and derivative financial instruments.
Off-balance sheet risk mitigationBarclays Bank UK Group applies fundamentally the same risk management policies for off-balance sheet risks as it does for its on-balance sheet risks. In the case of commitments to lend, counterparties/customers will be subject to the same credit management policies as for loans and advances. Collateral may be sought depending on the strength of the counterparty and the nature of the transaction.
Recognition of credit risk mitigation in capital calculationsCredit risk mitigation is used to reduce credit risk associated with an exposure, which may reduce potential losses in the event of obligor default or other specified credit events.
Credit risk mitigation that meets certain regulatory criteria may be used to improve risk parameters and reduce RWA consumption against a given obligor. Collateral that meets these regulatory conditions is referred to as eligible collateral. Eligibility criteria are specified in articles 195 to 204 of the CRR.
Barclays Bank UK Group’s policies and standards set out criteria for the recognition of collateral as eligible credit risk mitigation and are designed to be fully consistent with all applicable local regulations and regulatory permissions.
Where regulatory capital is calculated under AIRB regulations, the benefit of collateral is generally taken by adjusting LGDs. For standardised portfolios, the benefit of collateral is taken using the financial collateral comprehensive method: supervisory volatility adjustments approach.
For instruments that are deemed to transfer credit risk, in AIRB portfolios the protection is generally recognised by using the PD and LGD of the protection provider.
For exposures treated under the standardised approach, the impact of eligible credit risk mitigation is primarily recognised by reducing the EAD associated with the exposure that benefits from the mitigation.
Managing concentrations within credit risk mitigationCredit risk mitigation taken by Barclays Bank UK Group to reduce credit risk may result in credit or market risk concentrations.
Guarantees that are treated as eligible credit risk mitigation are marked as an exposure against the guarantor and aggregated with other credit exposure to the guarantor. Limit monitoring at the counterparty level is then used for monitoring of concentrations in line with Barclays Bank UK Group policy.
Commercial real estate lending is another potential source of concentration risk arising from the use of credit risk mitigation. The portfolio is regularly reviewed to assess whether a concentration type exists, and portfolio limits are in place to control the level of exposure to commercial, residential, investment and development activity. See page 113 for more information on collateral, valuation and monitoring of concentrations.
Barclays’ approach to managing risksManagement of counterparty credit risk and credit risk mitigation techniques
barclays.com/annualreport Barclays Bank UK PLC Pillar 3 Report 2021 >112

Counterparty credit risk
Counterparty credit exposures for derivatives and securities financing transactionsBarclays Bank UK Group enters into financial instruments through Barclays Bank UK Group Treasury that are traded or cleared on an exchange, including interest rate swaps, futures and options on futures. Holders of exchange traded instruments provide daily margins with cash or other securities at the exchange, to which the holders look for ultimate settlement. Barclays Bank UK Group Treasury enters into financial instruments taking into account regulatory exemption rules for the ring-fenced bank to manage predominantly hedging of interest rate in the banking book and cross currency exposures, with market counterparties.
Barclays Bank UK Group also enters into financial instruments that are traded over the counter, rather than on a recognised exchange. These instruments arise mainly from standardised transactions in derivative markets. In most cases, industry standard documentation is used, most commonly in the form of a master agreement, with individual transaction confirmations. The existence of a signed master agreement is intended to give Barclays Bank UK Group protection in situations where Barclays Bank UK Group’s counterparty is in default.
Counterparty credit exposure arises from the risk that parties are unable to meet their payment obligations under certain financial contracts such as derivatives, securities financing transactions (SFTs) (e.g. repurchase agreements), or long settlement transactions.
A Monte Carlo simulation engine is used to estimate the Potential Future Exposure (PFE) to derivative and securities financing counterparties. The exposure simulation model simulates future market states and the MTM of the derivative transactions under those states. Simulated exposures including the effect of credit mitigants such as netting, collateral and mandatory break clauses can then be generated.
Credit limits for CCR are assessed and allocated using the PFE measure. A number of factors are taken into account when setting credit limits for individual counterparties, including but not limited to the credit quality and nature of the counterparty, the rationale for the trading activity entered into and any wrong-way risk considerations.
The expected exposures generated by this engine are also used as an input into both internal and regulatory capital calculations covering CCR.
‘Wrong-way risk’ in a derivative or SFT exposure arises when there is significant correlation between the underlying asset and the counterparty, which in the event of default would lead to a significant MTM loss to the counterparty. Specific wrong-way risk trades, which are self-referencing or reference to other entities within the same counterparty group, require approval by a senior credit officer. The exposure to the counterparty will reflect the additional risk generated by these transactions (the exposure will be consistent with jump-to-default of the reference asset assuming zero recovery).
Derivative CCR (credit value adjustments)As Barclays Bank UK Group participates in derivative transactions it is exposed to CCR, which is the risk that a counterparty will fail to make the future payments agreed in the derivative contract. This is considered as a separate risk to the volatility of the MTM payment flows.
The counterparty risk arising under derivative transactions is taken into account when reporting the fair value of derivative positions. The adjustment to the value is known as credit value adjustment (CVA). It is the difference between the value of a derivative contract with a risk-free counterparty and that of a contract with the actual counterparty. This is equivalent to the cost of hedging the counterparty risk in the Credit Default Swap (CDS) market.
Barclays Bank UK Group uses the standardised approach to calculate CVA capital charge: This approach takes account of the external credit rating of each counterparty, and incorporates the effective maturity and EAD from the calculation of the CCR.
Netting and collateral arrangements for derivatives and SFTsCredit risk from derivatives and securities financing transactions (SFTs) is mitigated where possible through netting agreements whereby assets and liabilities with the same counterparty can be offset. Barclays Bank UK Group policy requires all netting arrangements to be legally documented. The ISDA Master Agreement is Barclays Bank UK Group’s preferred agreement for documenting Over the Counter (OTC) derivatives. It provides the contractual framework within which dealing activities across a full range of OTC products are conducted, and contractually binds both parties to apply close-out netting across all outstanding transactions covered by an agreement if either party defaults or other predetermined events occur. The majority of Barclays Bank UK Group’s OTC derivative exposures are covered by ISDA master netting and ISDA CSA collateral agreements. SFTs are documented under Global Master Repurchase agreement.
Barclays’ approach to managing risksManagement of counterparty credit risk and credit risk mitigation techniques
barclays.com/annualreport Barclays Bank UK PLC Pillar 3 Report 2021 >113

Collateral may be obtained against derivative and SFTs, depending on the creditworthiness of the counterparty and/or nature of the transaction. Any non-cash collateral taken in respect of OTC trading exposures will be subject to a ‘haircut’, which is negotiated at the time of signing the collateral agreement. A haircut is the valuation percentage applicable to each type of collateral and will be largely based on liquidity and price volatility of the underlying security. The collateral obtained for derivatives is predominantly either cash, direct debt obligation government (G14+) bonds denominated in the domestic currency of the issuing country or debt issued by supranationals. Where Barclays Bank UK Group has ISDA master agreements, the collateral document will be the ISDA CSA. The collateral document must give Barclays Bank UK Group the power to realise any collateral placed with it in the event of the failure of the counterparty.
Barclays’ approach to managing risksManagement of counterparty credit risk and credit risk mitigation techniques
barclays.com/annualreport Barclays Bank UK PLC Pillar 3 Report 2021 >114

Market risk
The risk of loss arising from potential adverse changes in the value of the Barclays Bank UK Group’s assets and liabilities from fluctuation in market variables including, but not limited to, interest rates, foreign exchange, credit spreads, implied volatilities and asset correlations.
Overview
Market Risk within Barclays Bank UK Group arises from the risk management of the assets held within the liquidity pool. As a result, the market risk in Barclays Bank UK Group is minimal. Transactions carrying market risk are executed by the Barclays Bank UK Group Treasury function.
Organisation and structure
Roles and responsibilities
The objectives of market risk management are to:
• understand and control market risk by robust measurement, limit setting, reporting and oversight• control market risk within the allocated appetite
To meet the above objectives, a governance structure is in place to manage these risks consistent with the ERMF. See page 80 on risk management strategy, governance and risk culture.
The Barclays Bank UK PLC Board Risk Committee recommends market risk appetite to the Barclays Bank UK PLC Board for their approval, within the parameters set by the Barclays PLC Board. The Barclays Bank UK Group CRO confirms the Barclays Bank UK Group market risk appetite with the Barclays Group CRO.
The Market Risk Committee (MRC) reviews and makes recommendations concerning the Barclays Group-wide market risk profile to the Barclays Group Risk Committee. This includes overseeing the operation of the Market Risk Framework and associated standards and policies; reviewing market or regulatory issues and limits and utilisation. The committee is chaired by the Market Risk Principal Risk Lead and attendees include the business heads of market risk and business aligned market risk managers.
The Barclays Bank UK Group Treasurer is accountable for all market risks associated with its activities, whilst the Barclays Bank UK Group CRO is the Senior Manager accountable for the oversight of market risk, in line with the Barclays Group Framework.
Barclays’ approach to managing risksManagement of market risk
barclays.com/annualreport Barclays Bank UK PLC Pillar 3 Report 2021 >115

Risk management in the setting of strategyMarket risk limits are set to control levels of market risk and maintain the Barclays Bank UK Group remains within the BRC approved risk appetite. The Barclays Bank UK Group participates in an annual Barclays Group-wide stress testing exercise which aims to simulate the dynamics of exposures across the Barclays Bank UK Group and cover all risk factors. The exercise is also designed to measure the impact to the Barclays Bank UK Group’s fundamental business plan, and is used to manage the wider Group’s strategy.
See page 88 for more detail on the role of risk in the setting of strategy.
Market risk cultureMarket risk managers are independent from the businesses they cover, and their line management reports into the CRO. This embeds a risk culture with strong adherence to limits that support the Barclays Bank UK Group-wide risk appetite. See page 80 for more detail on risk culture.
Management of market risk, mitigation and hedging policies
The governance structure helps maintain all market risks that the Barclays Bank UK Group is exposed to are well managed and understood. Traded market risk is generated primarily as a result of liquidity buffer management activities. Barclays Bank UK Group Treasury supports the businesses in managing their interest rate risk. Positions will contribute both to market risk limits and regulatory capital.
As part of the continuous monitoring of the risk profile, Market Risk meets with the businesses to discuss the risk profile on a regular basis. The outcome of these reviews includes further detailed assessments of event risk via stress testing, risk mitigation and risk reduction.
Market risk measurement
Market risk measuresA range of complementary approaches to measure market risk are used which aim to capture the level of losses that the Barclays Bank UK Group is exposed to due to unfavourable changes in asset prices. The primary tools to control Barclays Bank UK Plc’s exposures are:
Measure Description
Management Value at Risk (VaR)
An estimate of the potential losses that might arise due to liquid risk factors from extreme market moves or scenarios.
Primary stress tests An estimate of the potential losses that might arise due to liquid risk factors from extreme market moves or scenarios.
Secondary stress tests An estimate of the potential losses that might arise due to illiquid risk factors from extreme market moves of scenarios.
Business scenario stresses Multi-asset scenario analysis of severe, but plausible events that may simultaneously impact Market Risk exposures across all primary and secondary stresses.
The scope of Management VaR is what the Barclays Bank UK Group deems as material market risk exposures which may have a detrimental impact on the performance of the Barclays Bank UK Group Treasury business.
Stress testing and scenario analysis are also an important part of the risk management framework, to capture potential risk that may arise in severe but plausible events.
Barclays’ approach to managing risksManagement of market risk
barclays.com/annualreport Barclays Bank UK PLC Pillar 3 Report 2021 >116

Management VaRManagement VaR estimates the potential loss arising from unfavourable market movements, over one day for a given confidence level. VaR is an estimate of the potential loss arising from unfavourable market movements if the current positions were to be held unchanged for one business day. For internal market risk management purposes, a historical simulation methodology with a one-year equally weighted historical period, at the 95% confidence level is used for all trading books and some banking books. Risk factors driving VaR are grouped into key risk types as summarised below:
Risk factor Description
Interest rate
Risk arises from changes in the level or shape of interest rate curves can impact the price of interest rate sensitive assets, such as bonds and derivatives instruments. For example, the price of an interest rate swap will vary due to changes in the absolute level of interest rates and/or in the shape of the yield curve.
Foreign exchange Risk arises from changes in foreign exchange rates and volatilities.
The output of the management VaR model can be readily tested through back testing. This checks instances where actual losses exceed the predicted potential loss estimated by the VaR model. If the number of instances is higher than expected, where actual losses exceed the predicted potential loss estimated by the VaR model, this may indicate limitations with the VaR calculation, for example, a risk factor that would not be adequately captured by the model.
Within Barclays Bank UK Group, market risk arises from assets with readily observable prices. As such, the management VaR model is an appropriate internal measure for market risk exposures.
When reviewing VaR estimates, the following considerations are taken into account:
• the historical simulation uses the most recent year of past data to generate possible future market moves, but the past may not be a good indicator of the future
• the one-day time horizon may not fully capture the market risk of positions that cannot be closed out or hedged within one day
• VaR is based on positions as at close of business and consequently, it is not an appropriate measure for intra-day risk arising from a position bought and sold on the same day
• VaR does not indicate the potential loss beyond the VaR confidence level
Limits are applied at the total level as well as by risk factor type, which are then cascaded down to particular desks and businesses by the market risk management function.
Primary stress testsPrimary stress tests are key tools used by management to measure liquid market risks from extreme market movements or scenarios in each major trading asset class.
Stress testing provides an estimate of potential significant future losses that might arise from extreme market moves or scenarios. Primary stress tests apply stress moves to key liquid risk factors for each of the major trading asset classes, namely:
• interest rates: shock to the level and structure of interest rates and inflation across currencies• foreign exchange: impact of unfavourable moves in currency prices and volatility
Primary stresses apply moves to liquid assets incorporating up to 10 days holding period. Shock scenarios are determined by a combination of observed extreme historical moves and forward looking elements as appropriate.
Primary stresses are calculated for each asset class on a standalone basis. Risk managers calculate several stress scenarios and communicate the results to senior managers to highlight concentrations and the level of exposures. Primary stress loss limits are applied across the trading businesses and is a key market risk control.
Secondary stress testsSecondary stress tests are key tools used by management to measure illiquid, directional or concentrated market risks from extreme market movements or scenarios in each major asset class.
Barclays’ approach to managing risksManagement of market risk
barclays.com/annualreport Barclays Bank UK PLC Pillar 3 Report 2021 >117

Secondary stress tests are used in measuring potential losses arising from market risks that are not captured in the primary stress tests. These may relate to financial instruments or risk exposures which are not readily or easily tradable or markets that are naturally sensitive to a rapid deterioration in market conditions.
For each asset class, secondary stresses are aggregated to a single stress loss which allows the business to manage its illiquid risk factors. Limits against secondary stress losses are also applied, which allows the Group to manage and control the level of illiquid risk factors.
Stresses are specific to the exposure held and are calibrated on both observed extreme moves and some forward-looking elements as appropriate. Given the liquid nature of the Barclays Bank UK Group market risk exposures, secondary stress results are minimal.
Business scenario stressesBusiness scenario stresses are key tools used by management to measure aggregated losses across the entire trading book as a result of extreme forward-looking scenarios encompassing simultaneous shocks to multiple asset classes.
Business scenario stresses apply simultaneous shocks to all risk factors assessed by applying changes to foreign exchange rates, interest rates, credit spreads, commodities and equities to the entire portfolio, for example, the impact of a rapid and extreme slowdown in the global economy. The measure shows results on a multi-asset basis across all trading exposures. Business scenarios are used for risk appetite monitoring purposes and are useful in identifying concentrations of exposures and highlighting areas that may provide some diversification.
The estimated impacts on market risk exposures are calculated and reported by the market risk management function on a frequent and regular basis. The stress scenario and the calibration on the shocks are also reviewed by market risk managers periodically for its relevance considering any market environment.
Scenarios focusing on adverse global recession, deterioration in the availability of liquidity, contagion effects of a slowdown in one of the major economies, easing of global growth concerns, and a historical event scenario are examples of business scenarios. If necessary, market event-specific scenarios are also calculated, such as:
• a unilateral decision to exit the Eurozone by a member country;• the impact of a large financial institution collapse; or• a disorderly exit of quantitative easing programmes, including unexpected rapid and continuous interest rate rises as a
result.
Regulatory view of traded positionsFor the purposes of calculating capital requirements, Barclays Bank UK adopts a standardised approach and in contrast to other Group entities does not apply a regulatory VaR model.
For regulatory purposes, the trading book is defined as one that consists of all positions in CRD financial instruments held in order to hedge risks within Barclays Bank UK Group. A CRD financial instrument is defined as a contract that gives rise to both a financial asset of one party and a financial liability or equity instrument of another party.
All of the below regulatory measures, including the standardised approach, generate market risk capital requirements, in line with the regulatory requirements set out in the Capital Requirements Directive and Regulation. Positions which cannot be included in the trading book are included within the banking book and generate risk capital requirements in line with this treatment.
Inclusion of exposures in the regulatory trading bookThe Barclays Bank UK Group adheres to the Barclays Group Trading Book Policies, which define the minimum requirements a business must meet to run trading positions and the process by which positions are allocated to trading or banking books. For Barclays Bank UK Group, the trading book is used primarily for short term hedging of risk.
Positions in the trading book are subject to market risk capital, is calculated using standard rules as defined in the Capital Requirement Regulation (CRR). If any of the criteria specified in the policy are not met for a position, then that position must be allocated to the banking book.
As a ring-fenced body (RFB), the Barclays Bank UK Group is prohibited from conducting certain regulated activities (‘excluded activities’) and is subject to a number of ‘prohibitions’, including the participation in traded activities. One or more exceptions to an excluded activity and/or prohibition may be available. The use of exceptions must however be documented and reported to the PRA. The Barclays Bank UK Group manages the process via the Excluded Activities and Prohibitions Order (EAPO) Policy and the Excluded Activities and Prohibitions Order (EAPO) Standard, and associated addenda.
Barclays’ approach to managing risksManagement of market risk
barclays.com/annualreport Barclays Bank UK PLC Pillar 3 Report 2021 >118

Valuation standardsCRR article 105 defines regulatory principles which need to be applied to fair value assets and liabilities, in order to determine a prudent valuation.
The PVA is applied to accounting fair values where there are a range of plausible alternative valuations. It is calculated in accordance with Article 105 of the CRR, and includes (where relevant) adjustments for the following factors: unearned credit spreads, close-out costs, operational risk, market price uncertainty, early termination, investing and funding costs, future administrative costs and model risk. The PVA includes adjustment for all fair valued financial instruments and commodities, irrespective of whether they are in the trading or banking book.
Page 169 of the Barclays Bank UK PLC Annual Report 2021 sets out the valuation control framework for accounting valuations and the related responsibilities of the Finance-product control valuations function and the Valuation Committee. This function and committee are also responsible for the oversight of the PVA and maintaining compliance with article 105 of the CRR.
Market risk controlThe metrics that are used to measure market risk are controlled through the implementation of appropriate limit frameworks. Limits are set at the total Barclays Bank UK Group level, asset class level, for example, interest rate risk. Stress limits and book limits, such as foreign exchange and interest rate sensitivity limits, are also used to control risk appetite.
Barclays Bank UK Group-wide limits are reported to the Barclays Bank UK Group BRC and are termed B-level limits for total management VaR, primary stress and secondary stresses and business scenarios. These are then cascaded down by risk managers in order to meet the Barclays Bank UK Group-wide risk appetite.
Throughout 2021, Barclays Bank UK Group Market Risk continued its ongoing programme of control testing and conformance testing on the trading businesses’ market risk management practices. These reviews are intended to verify the business’s conformance with the Market Risk Control Framework and best practices.
Market risk reportingMarket risk managers produce a number of detailed and summary market risk reports daily, weekly, fortnightly and monthly for business and risk managers. Where relevant on a Barclays Bank UK Group-wide basis, these are sent to Barclays Bank UK Group Risk Committee for review and a risk summary is presented at Barclays Bank UK Group Market Risk Committee. The overall market risk profile is also presented to Barclays Bank UK Group BRC on a regular basis.
Barclays’ approach to managing risksManagement of market risk
barclays.com/annualreport Barclays Bank UK PLC Pillar 3 Report 2021 >119

Management of Securitisation Exposures
This section discloses information about the Barclays Bank UK Group’s securitisation activities distinguishing between the various functions performed in supporting its customers and managing its risks. It includes traditional securitisations as well as synthetic transactions effected through the use of guarantees.
For the purposes of Pillar 3 disclosures on pages 70-77, a securitisation is defined as a transaction or scheme where the payments are dependent upon the performance of a single exposure or pool of exposures and where the subordination of tranches determines the distribution of losses during the ongoing life of the transaction or scheme. Certain transactions undertaken by the Barclays Bank UK Group are not disclosed in the quantitative section (pages 70-77) as they do not fall under the regulatory securitisation framework as retained in UK regulation through the Securitisation (Amendment) (EU Exit) Regulations 2019 (“UK CRR”) and the Securitisation (Amendment) (EU Exit) Regulations 2019 (“UK Securitisation Regulation”). These include funding transactions for the purposes of generating term liquidity, and certain government guaranteed transactions.
Objectives of securitisation activities
In the course of its business, the Barclays Bank UK Group has undertaken securitisations of its own originated assets.
The Barclays Bank UK Group has securitised its own originated assets in order to manage the Barclays Bank UK Group’s credit risk position and to generate term funding for the Barclays Bank UK Group balance sheet.
The role and involvement of the Barclays Bank UK Group in securitisations in 2021
Barclays Bank UK Group adopts the following roles in the securitisation processes in which it is involved:
Originator of assets prior to securitisation
The Barclays Bank UK Group securitises assets originated in the ordinary course of business including residential mortgages and credit card receivables and social housing loans.
Purchaser of third party securitisations
The Barclays Bank UK Group may purchase third party securitisations as part of the management of its liquidity buffer. The Barclays Bank UK Group also funds on its own balance sheet securitisations.
Funding transactions to generate term liquidity
Secured funding forms one of the key components of the Barclays Bank UK Group’s diversified funding sources providing access to the secured wholesale market and complementing the diversification of funding by maturity, currency and geography. The Barclays Bank UK Group issues ABS and covered bonds secured primarily by customer loans and advances.
The Barclays Bank UK Group currently manages three key, on-balance sheet asset backed funding programmes to obtain term financing for mortgage loans and credit card receivables. Retained issuances from these programmes also support Barclays Bank UK Group’s to access central bank liquidity and funding. The UK regulated covered bond and the residential mortgage master trust securitisation programmes both utilise assets originated by the Barclays Bank UK Group’s UK residential mortgage business. The third programme is a credit card master trust securitisation and uses receivables from the Barclays Bank UK Group’s UK credit card business.
Other ancillary transaction roles to securitisation
The Barclays Bank UK Group remain as the servicer of the securitised assets, and in most cases, acting as the cash manager and account bank provider for its own secured funding programmes.
The Barclays Bank UK Group provides most of the derivative transactions to its own secured funding programmes.
Securitisation risks, monitoring and hedging policies
Capital requirements against securitisation exposures are subject to a separate Securitisation Regulation framework to account for the particular characteristics of this asset class. For risk management purposes, however, a securitisation is aligned to the risk type to which it gives rise.
Barclays’ approach to managing risksManagement of securitisation exposures
barclays.com/annualreport Barclays Bank UK PLC Pillar 3 Report 2021 >120

Credit risks
In a securitisation structure, the payments are dependent upon the performance of a single exposure or pool of exposures. As these underlying exposures are usually credit instruments, the performance of the securitisation is exposed to credit risk.
Securitisation exposures are subject to the Barclays Bank UK Group credit risk policies and standards and business level procedures and to oversight by internal committees. This includes the requirement to review in detail each transaction at a minimum on an annual basis. As collateral risk is the primary driver the analysis places a particular focus on the underlying collateral performance, key risk drivers, servicer due diligence and cash flows, and the impact of these risks on the securitisation notes. The risk is addressed through the transaction structure and by setting an appropriate modelled tolerance level. Structural features incorporate wind-down triggers set against factors including, but not limited to, defaults/charge-offs, delinquencies, excess spread, dilution, payment rates and yield, all of which help to mitigate potential credit deterioration. Qualitative aspects such as counterparty risk and ancillary issues (operational and legal risk) are also considered. Changes to the credit risk profile of securitisation exposures will also be identified through ongoing transaction performance monitoring. In addition, periodic stress tests of the portfolio as part of ongoing risk management are conducted as well as in response to Barclays Bank UK Group-wide or regulatory requests.
Market and liquidity risks
Market risk for securitised products is measured, controlled and limited through a suite of VaR, non-VAR and stress metrics in accordance with the Barclays Bank UK Group’s market risk policies and procedures. The key risks of securitisation structures are interest rate, credit, spread, prepayment and liquidity risk. Interest rate and spread risk are hedged with standard liquid interest rate instruments (including interest rate swaps and futures). The universe of hedging instruments for credit and prepayment risk is limited and relatively illiquid, resulting in basis risks.
Hedging
The Barclays Bank UK Group provides most of the derivative transactions to its own secured funding programmes to mitigate any interest rate and/or FX risks within the securitisation structure so the target bond rating can be achieved.
Securitisation related swaps exposures benefit from the relative seniority of the exposure in the capital structure and the Barclays Bank UK Group as swap provider will have secured claim on the assets within the structure.
Operational risks
Operational risks are incurred in all of the Barclays Bank UK Group’s operations. In particular, all securitised (and re-securitised) assets are subject to a degree of risk associated with documentation and the collection of cash flows.
Rating methodologies, ECAIs and RWA calculations
RWAs reported for securitised and re-securitised banking book and trading book assets at 31 December 2021 are calculated in line with CRR and UK PRA rules and guidance.
The Barclays Bank UK Group employs eligible ratings issued by nominated External Credit Assessment Institutions (ECAIs) to risk weight its securitisation and re- securitisation exposure where their use is permitted. Ratings are considered eligible for use based on their conformance with the internal rating standard which is compliant with both CRR and European Credit Rating Agency regulation. The ECAIs nominated by Barclays Bank UK Group for this purpose are Standard & Poor’s, Moody’s, Fitch, DBRS and Kroll.
As required by CRR, the Barclays Bank UK Group uses credit ratings issued by these ECAIs consistently for all exposures within the securitisation exposure class. For that reason, there is no systematic assignment of particular agencies to types of transactions within the securitisation exposure class.
Summary of the accounting policies for securitisation activities
Certain Barclays Bank UK Group-sponsored entities have issued debt securities or have entered into funding arrangements with lenders in order to finance specific assets. An entity is consolidated by the Barclays Bank UK Group when the Barclays Bank UK Group has control over the entity. The Barclays Bank UK Group controls an entity if it has all of the three elements of control which are i) power over the entity; and ii) exposure, or rights, to variable returns from its involvement with the entity; iii) the ability to use its power over the entity to affect the amount of the Barclays Bank UK Group returns. The consolidation treatment must be initially assessed at inception and is reassessed if facts and circumstances indicate that there are changes to one or more of the three elements of control.
Barclays’ approach to managing risksManagement of securitisation exposures
barclays.com/annualreport Barclays Bank UK PLC Pillar 3 Report 2021 >121

The accounting measurement of assets initially recognised for the purpose of securitisation will depend on whether the securitisation entity is consolidated by the Barclays Bank UK Group and whether the assets transferred to the securitisation entity meet the accounting derecognition test, meaning whether the transfer will be accounted for as a sale.
• Where assets on initial recognition are expected to be securitised by a transfer to an unconsolidated Barclays Bank UK Group entity, the accounting will depend on whether the transfer is expected to meets the accounting derecognition test. Assets will remain on the Barclays Bank UK Group balance sheet, and consideration received will be treated as financings, unless the following criteria apply:
– substantially all the risks and rewards associated with the assets have been transferred, in which case, they are derecognised in full; or
– if substantially all the risks and rewards have not been transferred or retained, the assets are derecognised in full if the transferee has the practical ability to sell the financial asset, otherwise the assets continue to be recognised only to the extent of the Barclays Bank UK Group’s continuing involvement
• Where assets acquired for securitisation are expected to be derecognised in full as a result of pending securitisation, those assets will typically be measured at fair value through the income statement.
• Where a securitisation entity is consolidated by the Barclays Bank UK Group or the assets fail to meet the derecognition test, such that the Barclays Bank UK Group balance sheet includes the assets held for securitisation prior to and post transfer to the securitisation entity, the assets will generally be part of a ‘Hold to Collect’ business model, and if the contractual cash flows characteristics are solely payments of principal and interest (SPPI), the assets will be measured at amortised cost.
Any financial support or contractual arrangements provided to unconsolidated entities, over securitised assets, would be recognised as a financial liability on balance sheet if it met the relevant IFRS criteria, or a commitment under IAS 37, and have to be disclosed (see Note 31 in the Barclays Bank UK PLC Annual Report 2021). Note, however, that the Barclays Bank UK Group has a Significant Risk Transfer policy that does not allow for any support to be provided to any transactions that fall under the securitisation framework.
Where the transfer applies to a fully proportionate share of all or specifically identified cash flows, the relevant accounting treatment is applied to that proportion of the asset.
When the above criteria support the case that the securitisation should not be accounted for as financing, the transaction will result in sale treatment or partial continued recognition of the assets to the extent of the Barclays Bank UK Group’s continuing involvement in those assets. Gains are recognised to the extent that proceeds that can be measured using observable market data exceed the carrying value of assets derecognised.
Any retained interests, which will consist of loans and/or securities depending on the nature of the transaction, are valued in accordance with the Barclays Bank UK Group’s Accounting Policies, as set out in the Barclays Bank UK PLC Annual Report 2021. To the extent that these interests are measured at fair value, they will be included within the fair value disclosures in the financial statements in the Barclays Bank UK PLC Annual Report 2021. As outlined in these disclosures, key valuation assumptions for retained interests of this nature will include spreads to discount rates, default and recovery rates and prepayment rates that may be observable or unobservable.
In a synthetic securitisation transaction, the underlying assets are not sold into the relevant Special Purpose Entity (SPE). Instead, their performance is transferred into the vehicle through a synthetic instrument, a credit linked note or a financial guarantee. The accounting policies outlined above will apply to synthetic securitisations..
Barclays’ approach to managing risksManagement of securitisation exposures
barclays.com/annualreport Barclays Bank UK PLC Pillar 3 Report 2021 >122

Treasury and capital risk
Liquidity risk: The risk that the Barclays Bank UK Group is unable to meet its contractual or contingent obligations or that it does not have the appropriate amount, tenor and composition of funding and liquidity to support its assets.
Capital risk: The risk that the Barclays Bank UK Group has an insufficient level or composition of capital to support its normal business activities and to meet its regulatory capital requirements under normal operating environments and stressed conditions (both actual and as defined for internal planning or regulatory testing purposes). This also includes the risk from the Barclays Bank UK Group’s pension plans.
Interest rate risk in the banking book: The risk that the Barclays Bank UK Group is exposed to capital or income volatility because of a mismatch between the interest rate exposures of its (non-traded) assets and liabilities.
Overview
Barclays Bank UK Group Treasury manages Treasury and Capital Risk exposure on a day-to-day basis with the Barclays Bank UK PLC Asset and Liability Committee (ALCO) acting as the principal management body. The Treasury and Capital Risk function is responsible for oversight and provide insight into key capital, liquidity and interest rate risk in the banking book (IRRBB) activities.
Organisation and structure
Liquidity risk management
OverviewThe efficient management of liquidity is essential to Barclays Bank UK Group in order to retain the confidence of the financial markets and maintain the sustainability of the business. Treasury and Capital Risk have created a framework to manage all liquidity risk exposures under both normal and stressed conditions. The framework is designed to maintain liquidity resources that are sufficient in amount, quality and funding tenor profile to remain within the liquidity risk appetite as expressed by the Barclays Bank UK PLC Board. The liquidity risk appetite is monitored against both internal and regulatory liquidity metrics.
Roles and responsibilitiesThe Barclays Bank UK Treasury and Capital Risk function is responsible for the management and governance of the liquidity risk framework, consistently with Barclays PLC Group policies and framework and with Barclays Bank UK CRO mandates. Treasury has the primary responsibility for managing liquidity risk within the set risk appetite. Both Risk and Treasury contribute to the production of the ILAAP.
The framework established by Treasury and Capital Risk is designed to deliver the appropriate term and structure of funding, consistent with the liquidity risk appetite set by the BBUK Board.
Barclays’ approach to managing risksManagement of treasury and capital risk
barclays.com/annualreport Barclays Bank UK PLC Pillar 3 Report 2021 >123

The control framework incorporates a range of ongoing business management tools to monitor, limit and stress test Barclays Bank UK Group’s balance sheet and contingent liabilities. Limit setting and transfer pricing are tools that are designed to control the level of liquidity risk taken and drive the appropriate mix of funds. In addition, Barclays Group maintains a Group Recovery Plan which includes application to Barclays Bank UK Group. Together, these tools reduce the likelihood that a liquidity stress event could lead to an inability to meet Barclays Bank UK Group’s obligations as they fall due. The control framework is subject to internal conformance testing and internal audit review.
The Barclays Bank UK Board approves the Barclays Bank UK Group funding plan, internal stress tests, regulatory stress test results, and Barclays Bank UK contribution to the Barclays Group Recovery Plan. The Barclays Bank UK PLC Asset Liability Committee is responsible for monitoring and managing liquidity risk in line with Barclays Bank UK Group’s funding management objectives, funding plan and risk framework. The Barclays UK Risk Committee monitors and reviews the liquidity risk profile and control environment, providing second line oversight of the management of liquidity risk. The Barclays Bank UK PLC Board Risk Committee reviews the risk profile, and annually reviews risk appetite and the impact of stress scenarios on the Barclays Bank UK Group funding plan/forecast in order to agree Barclays Bank UK Group’s projected funding abilities.
Barclays Bank UK Group maintains a range of management actions for use in a liquidity stress. These are documented in the Barclays Group Recovery Plan. Since the precise nature of any stress event cannot be known in advance, the actions are designed to be flexible to the nature and severity of the stress event and provide a menu of options that can be drawn upon as required. The Barclays Group recovery plan also contains more severe recovery options to generate additional liquidity in order to facilitate recovery in a severe stress. Any stress event would be regularly monitored and reviewed using key management information by Treasury, Risk and business representatives.
Risk Appetite and planning
Barclays has established a liquidity risk appetite (LRA) stress test to quantify the level of liquidity risk Barclays Bank UK Group is exposed to in pursuit of its business objectives and in ensuring compliance with its regulatory obligations. The key expression of the liquidity risk is through internal and regulatory stress tests. It is measured with reference to the liquidity pool compared to anticipated net stressed outflows for each of four stress scenarios outlined in the box below.
Barclays Bank UK PLC adopted the LRA stress test framework set by the Barclays PLC. The BBUK LRA stress test results are reviewed by the Barclays Bank UK PLC Board. The LRA is monitored daily and is subject to formal review at least annually as part of the ILAAP.
Statement of LRA: For 2021, the Barclays Bank UK PLC Board has approved that Barclays Bank UK Group will maintain an amount of available liquidity resources to meet modelled and prescribed regulatory liquidity stress outflows over a period of time (minimum buffer duration):
• 30 days in a Barclays specific stress• 90 days in a market wide stress• 30 days in a combined stress• LCR 30 days minimum ratio 100% (Pillar 2 basis)
The Barclays Bank UK Group LRA stress outflows are used to determine the minimum size of Barclays Bank UK Group Liquidity Pool. The Liquidity Pool represents those resources immediately available to meet outflows in a liquidity stress. In addition to holding a liquidity pool against stressed outflows the Group reviews available management actions that could be used to raise additional liquidity. Management actions are assessed to determine their suitability, effectiveness and time to delivery.
Barclays’ approach to managing risksManagement of treasury and capital risk
barclays.com/annualreport Barclays Bank UK PLC Pillar 3 Report 2021 >124

Liquidity limitsBarclays Bank UK Group manages limits on a variety of on and off-balance sheet exposures, a sample of which is shown in the table below. These limits serve to control the overall extent and composition of liquidity risk taken by managing exposure to each risk driver.
Examples of liquidity limits
Liquidity Risk Appetite Limits Liquidity Coverage Ratio Limits Currency Mismatch Limits
Early warning indicatorsBarclays Treasury monitor a range of market indicators for early signs of liquidity risk. Both market indicators and Barclays specific indicators are tracked, a sample of which is shown in the table below. These are designed to immediately identify the emergence of increased liquidity risk in order to maximise the time available to execute appropriate mitigating management actions. Early Warning Indicators (EWIs) are used as part of the assessment of whether to invoke the Barclays Group Recovery Plan, which provides a framework for how a liquidity stress would be managed.
Recovery & resolution planningBarclays maintains a Group Recovery Plan (GRP) designed to provide a framework to effectively manage a severe financial stress. The GRP is proportionate to the nature, scale and complexity of the business and is tested to ensure it is operationally robust. The GRP details the escalation and invocation process for the plan, including integration with i) BAU monitoring of capital and liquidity EWIs to detect signs of approaching financial stress, ii) existing processes within Barclays Treasury and Risk to respond to mild/moderate stress and iii) the governance process for formally invoking the GRP. The Plan would be formally invoked by Barclays Group Board and would be overseen and executed by the Barclays Crisis Leadership Team (BCLT), a flexible committee of senior management used to respond to all types of stress events. In invoking and executing the plan, the BCLT (in consultation with Barclays Group Board) would assess the likely impact of the stress event on Barclays Group and its subsidiaries and determine the appropriate response given the nature and severity of the stress. The GRP includes a range of recovery options to respond to financial stresses of varying severity and includes detailed information on financial and non-financial impacts of exercising the recovery options.
Liquidity risk governance
The Barclays Bank UK Treasury function operates within the bounds of the framework established by Treasury and Capital Risk. The framework describes liquidity risk management processes, associated policies, controls and how Barclays Group have implemented controls. This framework is used to manage liquidity risk within the Liquidity Risk Appetite. The framework is reviewed annually and supported by the internal architecture used to record and measure group wide liquidity metrics.
The Barclays Bank UK Board sets the Liquidity Risk Appetite based on the internal liquidity stress test (LRA) and external regulatory requirements, namely the Liquidity Coverage Ratio (LCR). The Liquidity Risk Appetite quantifies level of risk Barclays Group is exposed to in pursuit of its business objectives and ensuring compliance with its regulatory obligations. The approved Liquidity Risk Appetite is implemented in line with the Enterprise Risk Management Framework.
Barclays’ approach to managing risksManagement of treasury and capital risk
barclays.com/annualreport Barclays Bank UK PLC Pillar 3 Report 2021 >125

Capital risk management
OverviewCapital risk is managed through ongoing monitoring and management of the capital position, regular stress testing and a robust capital governance framework. The objectives of the framework are to maintain adequate capital for Barclays Bank UK Group to withstand the impact of the risks that may arise under normal and stressed conditions, and maintain adequate capital to cover current and forecast business needs and associated risks to provide a viable and sustainable business offering.
Organisation, roles and responsibilitiesThe management of capital risk is integral to Barclays Bank UK Group’s approach to financial stability, and is embedded in the way Barclays Bank UK Group and its businesses operate. Treasury has the primary responsibility for managing and monitoring capital adequacy. The Barclays Bank UK Group Treasury and Capital Risk function provides oversight of capital risk. Production of the Barclays Bank UK PLC ICAAP is the responsibility of Barclays Bank UK Group Treasury.
Capital risk management is underpinned by a control framework and policies. Capital plans reflect the capital management strategy and are implemented to deliver on Barclays Bank UK Group’s objectives, which are aligned to those of Barclays Group. Barclays Bank UK Group-specific capital plans are developed in conformance with the Barclays Group control framework and policies for capital risk.
The Barclays Bank UK PLC Board approves the Barclays Bank UK Group capital plan, internal stress tests and results of regulatory stress tests. The Barclays Bank UK PLC Board also approves the recovery options documented in the Barclays Group recovery plan pertaining to Barclays Bank UK. The Barclays Bank UK PLC Asset and Liability Committee (ALCO) is responsible for monitoring and managing capital risk in line with Barclays Bank UK Group’s capital management objectives, capital plan and risk frameworks. The Barclays UK Risk Committee monitors and reviews the capital risk profile and control environment, providing Second Line oversight of the management of capital risk. The Barclays Bank UK PLC Board Risk Committee reviews the risk profile, and annually reviews risk appetite and the impact of stress scenarios on the Barclays Bank UK Group capital plan/forecast in order to agree Barclays Bank UK Group’s projected capital resources.
Capital risk management strategy
Barclays Bank UK Group’s capital management strategy is driven by the strategic aims of Barclays Bank UK Group and the risk appetite set by the Barclays Bank UK PLC Board. Barclays Bank UK Group’s objectives are achieved through well embedded capital management practices.
Capital planning and allocationBarclays Bank UK Group assesses its capital requirements on multiple bases, with Barclays Bank UK Group’s capital plan set in consideration of Barclays Bank UK Group’s risk profile and appetite, strategic and performance objectives, regulatory requirements, international financial reporting standards (including IFRS 9), and market and internal factors, including the results of stress testing. The capital plan is managed on a top-down and bottom-up basis through both short-term and medium-term financial planning cycles, and is developed with the objective that Barclays Bank UK Group maintains an adequate level of capital in line with internal and regulatory requirements. The planning process captures the impact of IFRS 9 to the capital plan, both including and excluding the impacts of transitional regulatory adjustments.
The PRA determines the regulatory capital requirements for the consolidated Barclays Bank UK Group. Under these regulatory frameworks, capital requirements are set in consideration of the level of risk that Barclays Bank UK Group is exposed to and the factors described above, and are measured through both risk-based Risk Weighted Assets (RWAs) and leverage-based metrics. An internal assessment of Barclays Bank UK Group’s capital adequacy is undertaken through the ICAAP and is used to inform the capital requirements of Barclays Bank UK Group.
Barclays Bank UK Group expects to meet the minimum requirements for capital and leverage at all times and also holds an internal buffer sized according to Barclays Bank UK Group’s assessment of capital risk.
Monitoring and reportingCapital is managed and monitored to maintain that Barclays Bank UK Group’s capital plans remain appropriate and that risks to the plans are considered. Limits are set by Risk to control the level of capital risk within Barclays Bank UK Group. Barclays Bank UK Treasury are responsible for complying with these limits as the first line of deference for the management of capital risk. Limits are monitored through appropriately governed forums in the first and second line of defence.
To support compliance with risk limits, Barclays Bank UK Treasury monitor capital risks against firm-specific and macroeconomic early warning indicators and report on these to Barclays Bank UK PLC ALCO. This enables a consistent and objective approach to monitoring the capital outlook against the capital plan, and supports the early identification when outlooks deteriorate.
Barclays’ approach to managing risksManagement of treasury and capital risk
barclays.com/annualreport Barclays Bank UK PLC Pillar 3 Report 2021 >126

Capital management information is readily available to support Senior Management’s strategic and day-to-day business decision making.
Stress testing and risk mitigationInternal group-wide stress testing is undertaken to quantify and understand the impact of sensitivities on the capital plan and capital ratios arising from stressed macroeconomic conditions. Recent economic, market and peer institution stresses are used to inform the assumptions developed for internal stress tests and to assess the effectiveness of mitigation strategies.
Barclays Bank UK Group participates in the Barclays Group stress tests prescribed by the Bank of England (BoE) and will undertake these stress tests from 2022 onwards. These stress tests will inform decisions on the size and quality of the internal capital buffer required and the results will be incorporated into Barclays Bank UK Group capital plan to maintain adequacy of capital under normal and severe, but plausible stressed conditions.
Actions are identified as part of the stress tests that can be taken to mitigate the risks that may arise in the event of material adverse changes in the current economic and business outlook. As an additional layer of protection, Barclays Group Recovery Plan defines the actions and implementation strategies available to Barclays Bank UK Group to increase or preserve capital resources in the situation that a stress occurs that is more severe than anticipated.
Capitalisation of legal entitiesBarclays Bank UK Group and regulated legal entities are subject to prudential requirements from the PRA and/or local regulators. Sufficient capital needs to be available to meet these requirements both at a consolidated Group and individual legal entity level.
The capitalisation of legal entities is reviewed annually as part of the capital planning process and monitored on an ongoing basis.
Transferability of capitalSurplus capital held in Barclays Bank UK Group entities is required to be repatriated to the immediate parent in the form of dividends and/or capital repatriation, subject to local regulatory requirements, exchange controls and tax implications. This approach provides optimal flexibility on the re-deployment of capital across legal entities. At Barclays Group, capital is managed as a whole as well as for its operating subsidiaries to allow fungibility and redeployment of capital while meeting relevant internal and regulatory targets at entity levels.
Foreign exchange riskBarclays Bank UK Group equity is held in Sterling. However, some capital resources (e.g. MREL) are denominated in foreign currencies. Changes in foreign currency exchange rates result in changes in the Sterling equivalent value of foreign currency denominated capital resources. As a result, some Barclays Bank UK Group’s regulatory capital ratios are sensitive to foreign currency movements. Failure to appropriately manage Barclays Bank UK Group’s balance sheet to take account of foreign currency movements could result in an adverse impact on regulatory capital.
Pension riskBarclays Bank UK PLC is a participating employer in the UK Retirement Fund (UKRF), whose assets and liabilities are currently held on the Barclays Bank PLC balance sheet. This participation is expected to cease in 2025. The nature of pension risk for Barclays Bank UK PLC is contingent, specifically on a Barclays Bank PLC default. Refer to Note 28 Staff Costs of the Barclays Bank UK PLC Annual Report for further detail.
Interest rate risk in the banking book management
OverviewInterest rate risk in the banking book is driven by customer deposit taking and lending activities, investments in the liquid asset portfolio and funding activities. As per the Barclays Bank UK Group’s policy to remain within the defined risk appetite, hedging strategies are executed to mitigate the IRRBB risks that result from these activities. However, the Barclays Bank UK Group remains susceptible to interest rate risk and other non-traded market risks from the following key sources:
• interest rate and repricing risk: the risk that net interest income could be adversely impacted by a change in interest rates, differences in the timing of interest rate changes between assets and liabilities, and other constraints on interest rate changes as per product terms and conditions
• customer behavioural risk: the risk that net interest income could be adversely impacted by the discretion that customers and counterparties may have in respect of being able to vary their contractual obligations with the Barclays Bank UK Group. This risk is often referred to by industry regulators as ‘embedded option risk’
• investment risks in the liquid asset portfolio: the risk that the fair value of assets held in the liquid asset portfolio and associated risk management portfolios could be adversely impacted by market volatility, creating volatility in capital directly
Barclays’ approach to managing risksManagement of treasury and capital risk
barclays.com/annualreport Barclays Bank UK PLC Pillar 3 Report 2021 >127

Organisation, roles and responsibilitiesThe Barclays Bank UK Group Asset and Liability Committee, together with the Barclays Group Treasury Committee, are responsible for monitoring and managing IRRBB risk in line with the Barclays Bank UK Group’s management objectives and risk frameworks. The Barclays UK Risk Committee and Treasury and Capital Risk Committee monitors and reviews the IRRBB risk profile and control environment, providing Second Line oversight of the management of IRRBB. The Barclays Bank UK PLC Board Risk Committee reviews the interest rate risk profile, including annual review of the risk appetite and the impact of stress scenarios on the interest rate risk of the Barclays Bank UK Group’s banking books.
In addition, the Barclays Bank UK Group’s IRRBB Policy sets out the processes and key controls required to identify all IRRBB risks arising from banking book operations, to monitor the risk exposures via a set of metrics with a frequency in line with the risk management horizon, and to manage these risks within agreed risk appetite and limits.
Management of IRRBB
The Barclays Bank UK Group executes hedging strategies to minimise IRRBB and maintain it within the agreed risk appetite, whilst actively managing the trade-off between return and associated risks in liquid asset portfolio. Therefore, the primary control for IRRBB is calculating the risk metrics described in the table below and monitoring risk exposure vs. defined limits. Limits are set at an aggregate business level and then cascaded down.
These measures of risk are typically dependent on an assumption of expected customer behaviour, to the extent that actual behaviour may vary from expectation this variation is measured using a supplementary set of behavioural stress measures.
Summary of measures for non-traded market risk
Measure Definition
Earnings at risk (EaR) A measure of the potential change in Net Interest Income (NII) due to an adverse interest rate movement over a predefined time horizon.
Economic value of equity (EVE)
A measure of the potential change in the present value of expected future cash flows due to an adverse interest rate movement, based on the existing balance sheet expected run-off profile.
Value at risk (VaR) A measure of the potential loss of value arising from unfavourable market movements at a specific confidence level, if current non-traded positions were to be held unchanged for the predefined holding period.
Stress Loss A measure of the potential loss from an adverse shock to market variables
Annual Earnings at Risk (AEaR)AEaR measures the sensitivity of net interest income over a one-year period. It is calculated as the difference between the estimated income using the expected rate forecast and the lowest estimated income following a parallel increase or decrease in interest rates.
The main model assumptions are:
• The balance sheet is kept at the current level, i.e. no growth is assumed, and run-off balances are reinvested to maintain a constant balance sheet
• Contractual positions are adjusted for an assumed behavioural profile, to align with the expected product life-cycle
AEaR sensitivity is calculated on a monthly basis for the entire banking book, including the investments in liquid asset portfolio. The metric provides a measure of how interest rate risk may impact the Barclays Bank UK Group’s earnings, providing a simple comparison between risk and returns. As AEaR provides a view on the next year’s earnings impacts of interest rate risk, the Barclays Bank UK Group also monitors economic value metrics to complement the view as this captures the IRRBB impact of risk exposures beyond one year.
See page 19 for a review of AEaR in 2021.
Barclays’ approach to managing risksManagement of treasury and capital risk
barclays.com/annualreport Barclays Bank UK PLC Pillar 3 Report 2021 >128

Economic Value of Equity (EVE)EVE calculates the change in the present value of the Barclays Bank UK Group’s expected future cash-flows from a parallel upward or downward interest rate shock. Note that the EVE calculation measures sensitivity in terms of present value, while AEaR measures income sensitivity, and as such are complimentary.
The EVE measure is calculated on a monthly basis and is applied to the full life of transactions and hedges allowing the risk over the whole life of positions to be considered. It does not capture the impact of business growth or management actions, and is based on the expected balance sheet run-off profile.
Value at Risk (VaR)VaR is an estimate of the potential loss arising from unfavourable market movements if the current position were to be held unchanged for a set period. For internal market risk management purposes, a historical simulation methodology is used with a one-year equally weighted historical period, at a 95% confidence level.
Daily VaR is used to measure residual interest and foreign exchange risks within certain banking book portfolios.
Quarterly scaled VaR is used to measure risk in the liquid asset portfolio. The calculation uses a one-year historical period, a 95% confidence level and is scaled from daily to quarterly using a constant factor.
VaR is calculated on a daily basis and exposure is reported versus defined limits.
Stress LossSecurities in the liquidity buffer are subject to several market risk stresses designed to estimate potential losses in various scenarios. This includes, but is not limited to, an annual internal stress test, regulatory stress tests as well as various ad hoc exploratory exercises
Barclays’ approach to managing risksManagement of treasury and capital risk
barclays.com/annualreport Barclays Bank UK PLC Pillar 3 Report 2021 >129

Operational risk
The risk of loss to the Barclays Bank UK Group from inadequate or failed processes or systems, human factors or due to external events (for example fraud) where the root cause is not due to credit or market risks.
Overview
The management of operational risk has three key objectives:
• Deliver an operational risk capability owned and used by business leaders• Provide the frameworks and policies to enable management to meet their risk management responsibilities while the
second line of defence provides robust, independent, and effective oversight and challenge• Deliver a consistent and aggregated measurement of operational risk that will provide clear and relevant insights, so that
the right management actions can be taken to keep the operational risk profile consistent with Barclays Bank UK Group’s strategy, the stated risk and stakeholder needs
Barclays Bank UK Group is committed to operating within a strong system of internal controls that enables business to be transacted and risk taken without exposing Barclays Bank UK Group to unacceptable potential losses or reputational damages. Barclays Group has an overarching Enterprise Risk Management Framework (ERMF) that sets out the approach to internal governance which Barclays Bank UK Group has adopted.
Barclays’ approach to managing risksManagement of operational risk
barclays.com/annualreport Barclays Bank UK PLC Pillar 3 Report 2021 >130

Organisation and structure
Barclays’ approach to managing risksManagement of operational risk
barclays.com/annualreport Barclays Bank UK PLC Pillar 3 Report 2021 >131

Operational Risk Categories
Operational risks are grouped into risk categories to support effective risk management, measurement and reporting. Operational risk comprises a number of specific risk categories. These operational risk categories are defined below defined as follow:
• Data Management Risk: The risk that Barclays Data and Records are not defined, captured, stored or managed in accordance with their value, and legal and regulatory requirements
• Financial Reporting Risk: The risk of a material misstatement or omission within the Group’s external financial reporting, regulatory reporting or internal financial management reporting
• Fraud Risk: The risk of financial loss when an internal or external party acts dishonestly with the intent to obtain an undue benefit, cause a loss to, or to expose either the Group or its customers and clients to a risk of loss
• Information Security Risk: The risk that Barclays information is not protected against potential unauthorised access, use, modification, disruption or destruction
• Operational Resilience Planning Risk: The risk that is introduced as a consequence of inadequate or ineffective (i) Front to Back Process Planning, (ii) Business Recovery Planning, or (iii) Crisis Management Planning, thereby impacting service provision to customer, clients and / or financial infrastructure
• Payments Process Risk: The risk of payments being processed inaccurately, with delays, without appropriate authentication and authorisation. It also covers the risk associated with ineffective management associated with Payment/Card Scheme membership
• People Risk: The set of risks associated with employing and managing people, including compliance with regulations, appropriate resourcing for requirements, recruitment and development risks
• Premises Risk: The risk of business detriment or harm to people due to premises and infrastructure issues• Physical Security Risk: The risk of business detriment, financial loss or harm to people as a result of any physical security
incident impacting the Group or a Group employee - relating to harm to people, unauthorised access, intentional damage to premises or theft or intentional damage to moveable assets
• Strategic Investment Change Management Risk: the risk of failing to deliver and implement the agreed initiatives, priorities and outcomes required to deliver the Group strategy, within agreed timelines. Strategic Investment Change Management Risk exists whenever there is ‘change' underway
• Supplier Risk: The risk that is introduced to the firm or entity as a consequence of obtaining services or goods from another legal entity or entities whether External or Internal as a result of inappropriate and/or inadequate selection, management, or exit management
• Tax Risk: The risk of unexpected tax cost in relation to any tax for which Barclays is liable, or of reputational damage on tax matters with key stakeholders such as tax authorities, regulators, shareholders or the public. Tax cost includes tax, interest or penalties levied by a taxing authority
• Technology Risk: The risk to Barclays that comes about through its dependency on Technological solutions• Transaction Operations Risk: The risk of an unintentional error in the execution of a customer transaction resulting in
delayed or inaccurate processing
In addition to the above, operational risk encompasses risks associated with prudential regulation. This includes the risk of failing to: adhere to prudential regulatory requirements; provide regulatory submissions; or monitor and manage adherence to new prudential regulatory requirements.
These risks may result in financial and/or non-financial impacts including legal/regulatory breaches or reputational damage.
Risk Themes
Barclays Bank UK Group also recognises that there are certain threats/risk drivers that are more thematic and have the potential to impact Barclays Bank UK Group’s strategic objectives. These are Enterprise Risk Themes which require an overarching and integrated risk management approach. Including:
• Cyber: The potential loss or detriment to Barclays Bank UK Group caused by individuals or groups (threat actors) with the capabilities and intention to cause harm or to profit from attacks committed via network information systems against us, our suppliers, or customers/clients
• Data: Aligned to the Data Strategy of the firm and encompassing Data risks to the firm from multiple risk categories, including Data Management, Data Architecture, Data Security & Protection, Data Resilience, Data Retention and Data Privacy
• Resilience: The risk of the organisation’s ability to anticipate, prevent, adapt, respond to, recover and learn from internal or external disruption, continuing to provide important business services to customers and clients, and minimise any impact on the wider financial system
Barclays’ approach to managing risksManagement of operational risk
barclays.com/annualreport Barclays Bank UK PLC Pillar 3 Report 2021 >132

Roles and responsibilities
The prime responsibility for the management of operational risk and the compliance with control requirements rests with the business and functional units where the risk arises. The operational risk profile and control environment is reviewed by business management through business risk committees and control committees. Operational risk issues escalated from these meetings are considered through the second line of defence review meetings. Depending on their nature, the outputs of these meetings are presented to the Operational Risk Profile Forum, the Operational Risk Committee, the Barclays UK Operational Risk Committee, the Barclays UK Risk Committee, the Barclays Bank UK PLC Board Risk Committee or the Barclays Bank UK PLC Board Audit Committee. In addition, specific reports are prepared by Operational Risk on a regular basis for the Group Risk Committee and the Barclays Bank UK PLC Board Risk Committee. The new Barclays UK Operational Risk Committee was established in 2021 to strengthen governance and oversight of Operational Risk.
Businesses and functions are required to report their operational risks on both a regular and an event-driven basis. The reports include a profile of the material risks that may threaten the achievement of their objectives and the effectiveness of key controls, operational risk events and a review of scenarios. Specific reports are prepared by the business and Barclays Bank UK Group Operational Risk on a regular basis for the Barclays UK Operational Risk Committee, the Barclays UK Risk Committee, and the BRC.
The Barclays Group Head of Operational Risk is responsible for establishing, owning and maintaining an appropriate Barclays Group-wide Operational Risk Framework, meanwhile the Barclays Bank UK PLC Head of Operational Risk is responsible for overseeing the portfolio of operational risk across all Barclays Bank UK Group businesses.
The Operational Risk function acts in a second line of defence capacity, and is responsible for defining and overseeing the implementation of the framework and monitoring the Barclays Bank UK Group’s operational risk profile. The Operational Risk function alerts management when risk levels exceed acceptable tolerance in order to drive timely decision making and actions by the first line of defence.
Operational Risk Framework
The Operational Risk Framework comprises a number of elements which allow Barclays Bank UK Group to manage and measure its operational risk profile and to calculate the amount of operational risk capital that Barclays Bank UK Group needs to hold to absorb potential losses. The minimum, mandatory requirements for each of these elements are set out in the Operational Risk Framework and supporting policies. This framework is implemented across Barclays Bank UK Group with all legal entities, businesses and functions required to implement and operate an Operational Risk Framework that meets, as a minimum, the requirements detailed in the operational risk policies.
The Operational Risk Framework is a key component of the ERMF and has been designed to improve risk management and meet a number of external governance requirements including the Basel Capital Accord, the Capital Requirements Directive and Turnbull guidance as an evaluation framework for the purposes of Section 404(a) of the Sarbanes-Oxley Act. It also supports the Sarbanes-Oxley requirements.
The Operational Risk Framework includes the following elements:
Risk and Control Self-AssessmentsRisk and control self-assessments (RCSAs) are the way in which Barclays Bank UK Group identifies and assesses the risks which are inherent in the material processes operated by Barclays Bank UK Group. Managers in the business use the RCSA approach to evaluate the controls in place to mitigate those risks and assess the residual risk exposure to Barclays Bank UK Group. The businesses / functions are then able to make decisions on what action, if any, is required to reduce the level of residual risk to Barclays Bank UK Group. These risk assessments are monitored on a regular basis to maintain that each business understands the risks it faces.
Risk EventsAn operational risk event is any circumstance where, through the lack or failure of a control, Barclays Bank UK Group has actually, or could have, made a loss. The definition includes situations in which Barclays Bank UK Group could have made a loss, but in fact made a gain, as well as incidents resulting in reputational damage or regulatory impact only.
A standard threshold is used across Barclays Bank UK Group for reporting risk events and part of the analysis includes the identification of improvements to processes or controls, to reduce the recurrence and/or magnitude of risk events. For significant events, both financial and non-financial, this analysis includes the completion of a formal lessons learned report.
Barclays Bank UK Group also maintains a record of external risk events which are publicly available and is a member of the Operational Riskdata eXchange (ORX), a not-for-profit association of international banks formed to share anonymous loss data information. This external loss information is used to support and inform risk identification, assessment and measurement.
Barclays’ approach to managing risksManagement of operational risk
barclays.com/annualreport Barclays Bank UK PLC Pillar 3 Report 2021 >133

Operational Risk AppetiteThe Barclays Bank UK PLC Board approves an Operational Risk Appetite Statement on an annual basis, establishing the level of operational risk that is acceptable in pursuit of Barclays Bank UK Group’s strategic objectives.
Operational risks are assessed and monitored against the Board approved Operational Risk Appetite, with Risk Reduction Plans established for any risks that are above the acceptable level.
The Operational Risk Profile is monitored through Risk Committees and Board level in the context of Operational Risk Appetite.
Key IndicatorsKey indicators (KIs) are metrics which allow the Operational Risk Profile to be measured and monitored against Management’s Risk Appetite. KIs include defined thresholds and performance is reported regularly to Management to drive action when risk exceeds acceptable limits.
Risk ScenariosRisk scenarios are a summary of the extreme potential risk exposures for Barclays Bank UK Group covering the complete range of risks. The scenarios include an assessment of the key drivers for the exposure, occurrence and impact of the scenario and a review of the corresponding control environment. The risk scenario assessments are a key input to the calculation and benchmarking of economic capital requirements (see following section on operational risk measurement). The assessment considers analysis of internal and external loss experience, Key Risk Indicators, Risk and Control Self-Assessments and other relevant information. The businesses and functions analyse potential extreme scenarios, considering the:
• circumstances and contributing factors that could lead to an extreme event;• potential financial impacts;• controls that seek to limit the likelihood of such an event occurring; and• the mitigating actions that would be taken if the event were to occur (for example crisis management procedures, business
continuity or disaster recovery plans)
Management then determine whether the potential risk exposure is acceptable or whether changes in risk management control or business strategy are required. The risk scenarios are regularly re-assessed, taking into account trends in risk factors.
Reporting The ongoing monitoring and reporting of operational risk is a key component of the Operational Risk Framework. Reports and management information are used by the Operational Risk function and by legal entity and business management to understand, monitor, manage and control operational risks and losses.
The operational risk profile is reviewed by senior management at legal entity Risk Committee meetings as well as the Operational Risk Profile Forum, Operational Risk Committee and BRC, BAC and the Board.
Operational Risk MeasurementBarclays Bank UK Group assesses its Operational Risk Capital requirements using the Standardised Approach (TSA).
InsuranceAs part of its risk management approach, Barclays Bank UK Group also uses insurance to mitigate the impact of some operational risks.
Barclays’ approach to managing risksManagement of operational risk
barclays.com/annualreport Barclays Bank UK PLC Pillar 3 Report 2021 >134

Model risk
The potential for adverse consequences from decisions based on incorrect or misused model outputs and reports.
Overview
Barclays Bank UK Group uses models to support a broad range of activities, including informing business decisions and strategies, measuring and limiting risk, valuing exposures, conducting stress testing, assessing capital adequacy, managing client assets, and meeting reporting requirements.
Since models are imperfect and incomplete representations of reality, they may be subject to uncertainty, errors and inappropriate use affecting the accuracy of their output. This can result in inappropriate business decisions being made, financial loss, regulatory risk, reputational risk and/or inadequate capital reporting. Models may also be misused, for instance applied to products that they were not intended for, or not adjusted, where fundamental changes to their environment would justify re-evaluating their core assumptions.
Robust model risk management is crucial to assessing and managing model risk within a defined risk appetite. Strong model risk culture, appropriate technology environment, and adequate focus on understanding and resolving model limitations are crucial components.
Organisation and structure
Barclays allocates substantial resources to identify and record models and their usage, document and monitor the performance of models, validate models and adequately address model limitations. Barclays manages model risk as an enterprise level risk similar to other Principal Risks.
Barclays Group has a dedicated Model Risk Management (MRM) function that consists of four teams: (i) Independent Validation Unit, responsible for model validation and approval; (ii) Model Governance (MG), responsible model risk governance, controls and reporting, including ownership of Model Risk Framework, the Group Model Risk Policy, and the associated standards (iii) Strategy and Transformation responsible for inventory, strategy, communications and business management and (iv) Model Risk Measurement and Quantification (MRMQ), responsible for the design of the framework and methodology to measure and, where possible, quantify model risk. It is also responsible for the strategic Validation Center of Excellence (VCoE), which is an independent quality assurance function within MRM with the mandate to review and challenge validation outcomes. .
The model risk management framework consists of the model risk policy and standards. The policy prescribes group-wide, end-to-end requirements for the identification, measurement and management of model risk, covering model documentation, development, monitoring, annual review, independent validation and approval, change and reporting processes. The policy is supported by global standards covering model inventory, documentation, validation, complexity and materiality, testing and monitoring, overlays, risk appetite, as well as vendor models and stress testing challenger models.
Barclays’ approach to managing risksManagement of model risk
barclays.com/annualreport Barclays Bank UK PLC Pillar 3 Report 2021 >135

The function reports to the Barclays Group CRO and operates a global framework. Implementation of best practice standards is a central objective of Barclays Group. Model risk reporting flows to senior management as depicted below.
Roles and responsibilities
The key model risk management activities include:
– Correctly identifying models across all relevant areas of Barclays Bank UK Group, and recording models in the Barclays Group Models Database (GMD), the Barclays Group-wide model inventory. The heads of the relevant model ownership areas (typically, the Barclays Bank UK PLC Chief Risk Officer, Chief Executive Officer, Chief Financial Officer, Treasurer etc.) annually attest to the completeness and accuracy of the model inventory.
– Enforcing that every model has a model owner who is accountable for the model. The model owner must sign off models prior to submission to IVU for validation. The model owner works with the relevant technical teams (model developers, implementation, monitoring, data services, regulatory) to maintain that the model presented to IVU is and remains fit for purpose
– Overseeing that every model is subject to validation and approval by IVU, prior to being used and on a continual basis. While all models are reviewed and re-approved for continued use each year, the validation frequency and the level of review and challenge applied by IVU is tailored to the materiality and complexity of each model. Validation includes a review of the model assumptions, conceptual soundness, data, design, performance testing, compliance with external requirements if applicable, as well as any limitations, proposed remediation and overlays with supporting rationale. Material model changes are subject to prioritised validation and approval
– Defining model risk appetite in terms of risk tolerance, and qualitative metrics which are used to track and report model risk
– Maintaining specific standards that cover model risk management activities relating to stress testing challenger models, model overlays, vendor models, and model complexity and materiality
Barclays’ approach to managing risksManagement of model risk
barclays.com/annualreport Barclays Bank UK PLC Pillar 3 Report 2021 >136

Conduct risk
The risk of poor outcomes for, or harm to, customers, clients and markets, arising from the delivery of the Barclays Bank UK Group's products and services.
Overview
The Barclays Bank UK Group defines, manages and mitigates conduct risk with the objective of providing good customer and client outcomes, protecting market integrity and promoting effective competition.
Conduct Risk incorporates market integrity, customer protection, financial crime and product and design and review risks.
Organisation and Structure
The governance of Conduct Risk within the Barclays Bank UK Group is fulfilled through management committees and forums operated by the first and second lines of defence, with clear escalation and reporting lines to the Barclays Bank UK PLC Board Risk Committee.
The Barclays Bank UK Group Risk Committee is the primary second line governance committee for the oversight of the conduct risk profile. The risk committees’ responsibilities include the identification and discussion of any emerging conduct risk exposures. The committee also safeguards the independence of, and oversees the performance of, the Barclays Bank UK Group Compliance Function.
Roles and ResponsibilitiesThe Conduct Risk Management Framework (CRMF) outlines how the Barclays Bank UK Group manages and measures its Conduct Risk Profile. The Group Chief Compliance Officer is accountable for developing, maintaining and overseeing a group-wide CRMF. The Barclays Bank UK Group Chief Compliance Officer is responsible for providing effective oversight, management and escalation of Conduct Risk in line with the CRMF at the entity and subsidiary level. This includes overseeing the development and maintenance of the relevant Conduct Risk policies and standards including monitoring and reporting on the consistent application and effectiveness of the implementation of controls to manage Conduct Risk. It is the responsibility of the first line of defence to establish controls to manage its performance and assess conformance to these policies and controls.
Senior managers are accountable within their areas of responsibility for owning and managing Conduct Risk in accordance with the CRMF, as defined within their regulatory Statement of Responsibilities.
Compliance as an independent second line function is designed to help prevent, detect and manage breaches of applicable laws, rules, regulations and procedures and has a key role in helping Barclays achieve the right conduct outcomes and evolve a conduct-focused culture.
Barclays’ approach to managing risksManagement of conduct risk
barclays.com/annualreport Barclays Bank UK PLC Pillar 3 Report 2021 >137

The governance of Conduct Risk within the Barclays Bank UK Group is fulfilled through management committees and forums operated by the first and second lines of defence with clear escalation and reporting lines into Board Level Committees. The Barclays Bank UK Group Risk Committee is the primary second line governance committee for the oversight of the Conduct Risk Profile. The Barclays Bank UK risk committee’s responsibilities include the identification and discussion of any emerging conduct risks exposures in the Barclays Bank UK Group.
Barclays’ approach to managing risksManagement of conduct risk
barclays.com/annualreport Barclays Bank UK PLC Pillar 3 Report 2021 >138

Reputation risk
The risk that an action, transaction, investment, event, decision, or business relationship will reduce trust in the Barclays Bank UK Group’s integrity and/or competence.
Overview
A reduction of trust in the Barclays Bank UK Group’s integrity and competence may reduce the attractiveness of Barclays Bank UK Group to stakeholders and could lead to negative publicity, loss of revenue, regulatory or legislative action, loss of existing and potential client business, reduced workforce morale and difficulties in recruiting talent. Ultimately it may destroy shareholder value.
Organisation and structure
The Barclays UK Risk Committee is the most senior executive body responsible for reviewing and monitoring the effectiveness of the Barclays Bank UK Group’s management of reputation risk.
Roles and responsibilities
The Barclays Bank UK Group Chief Compliance Officer is responsible for overseeing the management of reputation risk for Barclays Bank UK Group, and Head of Public Policy and Corporate Responsibility is responsible for developing a reputation risk policy and associated standards, including tolerances against which data is monitored, reported on and escalated, as required. Reputation risk is by nature pervasive and can be difficult to quantify, requiring more subjective judgement than many other risks. The Reputation Risk Management Framework sets out what is required to manage reputation risk across the Barclays Bank UK Group.
The primary responsibility for identifying and managing reputation risk and adherence to the control requirements sits with the business and support functions where the risk arises.
The Barclays Bank Group and the Barclays Bank UK Group are required to operate within established reputation risk appetite, and their component businesses prepare reports highlighting their most significant current and potential reputation risks and issues and how they are being managed. These reports are a key internal source of information for the quarterly reputation risk reports which are prepared for the Barclays UK Risk Committee and Barclays Bank UK PLC Board.
Barclays’ approach to managing risksManagement of Reputation Risk
barclays.com/annualreport Barclays Bank UK PLC Pillar 3 Report 2021 >139

Legal risk
The risk of loss or imposition of penalties, damages or fines from the failure of the Barclays Bank UK Group to meet its legal obligations, including regulatory or contractual requirements.
Overview
The Barclays Bank UK Group has no tolerance for wilful breaches of laws, regulations or other legal obligations. However, the multitude of laws and regulations that the Barclays Bank UK Group is subject to are highly dynamic and their application to particular circumstances is often unclear. This results in a high level of inherent legal risk which Barclays Bank UK Group seeks to mitigate through the operation of a Barclays Group-wide legal risk management framework, including the implementation of Barclays Group-wide legal risk policies requiring the engagement of legal professionals in situations that have the potential for legal risk. Notwithstanding these mitigating actions, Barclays Bank UK Group operates with a level of residual legal risk, for which the Barclays Bank UK Group has limited tolerance.
Organisation, roles and responsibilities
The Barclays Bank UK Group’s businesses and functions have primary responsibility for identifying and escalating legal risk in their area as well as responsibility for adherence to minimum control requirements.
The Legal Function organisation and coverage model aligns legal expertise to businesses, functions, products, activities and geographic locations so that the Barclays Bank UK Group receives support from appropriate legal professionals, working in partnership to manage legal risk. The senior management of the Legal Function oversees, challenges and monitors the legal risk profile and effectiveness of the legal risk control environment across the Barclays Group. The Legal Function does not sit in any of the Three Lines of Defence but supports them all.
The Barclays Group General Counsel is responsible for developing and maintaining a Barclays Group-wide legal risk management framework. This includes defining the relevant legal risk policies, developing Barclays Group-wide risk appetite for legal risk and oversight of the implementation of controls to manage and escalate legal risk.
The legal risk profile and control environment is reviewed by management through business risk committees and control committees. The Barclays Bank UK Group Risk Committee is the most senior executive body responsible for reviewing and monitoring the effectiveness of risk management across the Barclays Bank UK Group. Escalation paths from this committee exist to the Barclays Group Risk Committee and Barclays Bank UK PLC Board Risk Committee.
Barclays’ approach to managing risksManagement of legal risk
barclays.com/annualreport Barclays Bank UK PLC Pillar 3 Report 2021 >140

Barclays’ approach to managing risksManagement of legal risk
barclays.com/annualreport Barclays Bank UK PLC Pillar 3 Report 2021 >141

The following tables show total AIRB RWA and exposures by country and asset classes.
Table 67: PD, LGD, RWA and exposure values by country for IRB - all asset classes
CountryPD LGD RWA Exposure% % £m £m
United Kingdom 3.24% 22.7% 49,821 216,101
Table 67a: PD, LGD, RWA and exposure values by country for IRB - central governments and central banks
CountryPD LGD RWA Exposure% % £m £m
United Kingdom — — — —
Table 67b: PD, LGD, RWA and exposure values by country for IRB - institutions
CountryPD LGD RWA Exposure% % £m £m
United Kingdom 14.56% 26.4% 29 34
Table 67c: PD, LGD, RWA and exposure values by country for IRB - corporates
CountryPD LGD RWA Exposure% % £m £m
United Kingdom 8.64% 17.3% 7,192 12,249
Table 67d: PD, LGD, RWA and exposure values by country for IRB - SME retail
CountryPD LGD RWA Exposure% % £m £m
United Kingdom 11.11% 36.1% 3,176 7,229
Table 67e: PD, LGD, RWA and exposure values by country for IRB - secured retail
CountryPD LGD RWA Exposure% % £m £m
United Kingdom 2.33% 11.6% 24,841 163,879
Table 67f: PD, LGD, RWA and Exposure values by country for IRB - revolving retail
CountryPD LGD RWA Exposure% % £m £m
United Kingdom 3.48% 77.5% 10,946 28,725
Table 67g: PD, LGD, RWA and exposure values by country for IRB - other retail exposures
CountryPD LGD RWA Exposure% % £m £m
United Kingdom 7.73% 76.0% 3,637 3,987
AppendicesAppendix A – PD, LGD, RWA and Exposure by country
barclays.com/annualreport Barclays Bank UK PLC Pillar 3 Report 2021 >142

IFRS Impairment
The following tables are presented using the IFRS consolidation rather than the regulatory consolidation basis. See pages 94-97 for background on impairment, and Table 3 explaining the scope of regulatory consolidation.
Table 68: Analysis of impaired and past due exposures and allowance for impairment by exposure type
This table shows total gross loans and advances analysed by balances past due and not past due. It also shows gross exposure assessed for impairment in accordance with IFRS 9 and the resulting allowance for impairment.
Not past due Past due Total
Gross exposure
assessed for impairment
Allowance for
Impairment£m £m £m £m
As at 31 December 2021Traded loans — — — — — Financial assets designated at fair value through the income statement 2,767 — 2,767 — — Financial assets designated at fair value through other comprehensive income — — — — — Cash collateral and settlement balances 5,067 — 5,067 5,067 — Gross loans and advances at amortised cost: — — — — — Home Loans 154,594 3,715 158,309 158,309 89 Credit cards, unsecured and other retail lending 14,319 770 15,089 15,089 1,664 Corporate loans 47,239 1,813 49,052 49,052 426 Total Gross loans and advances at amortised cost 216,152 6,298 222,450 222,450 2,179 Totala 223,986 6,298 230,284 227,517 2,179
Note
a Other financial assets subject to impairment not included in the Loans and Advances table above include financial assets at fair value through other comprehensive income and other assets. These have a total gross exposure of £15.2bn and impairment allowance of £3m.
Table 69: Geographic analysis of impaired and past due exposures and allowance for impairment
This table shows total gross loans and advances analysed by balances past due and not past due, and gross exposures assessed for impairment in accordance with IFRS 9 and the resulting impairment allowance, split by geographic location of the counterparty.
Not past due Past due Total
Gross exposure
assessed for impairment
Allowance for
Impairment£m £m £m £m £m
As at 31 December 2021UK 215,540 6,164 221,704 218,937 2,167 Europe 804 26 830 830 4 Americas 1,032 50 1,082 1,082 5 Africa and Middle East 247 33 280 280 1 Asia 6,363 25 6,388 6,388 2 Total 223,986 6,298 230,284 227,517 2,179
AppendicesAppendix B – Analysis of impairment
barclays.com/annualreport Barclays Bank UK PLC Pillar 3 Report 2021 >143

Table 70: Countercyclical capital buffer
The below table shows the geographical distribution of credit exposures relevant to the calculation of the countercyclical buffer in line with CRR Article 440.
Note that exposures in the below table are prepared in accordance with CRD, Article 140. Hence exclude exposures to central governments/banks, regional governments, local authorities, public sector entities, multilateral development banks, international organisations and institutions and as such the exposure values differ to those found in the Analysis of credit risk section.
General Credit Exposures
Trading book exposures
Securitisation exposures Own Funds requirements
Barclays Bank UK Group
Exposure Value for SA
Exposure Value for IRB
Sum of long and short positions for trading book exposures for SA
Value of trading book exposures for internal models
Exposure Value for Non-Trading book
Of which: General credit exposures
Of which: Trading book exposures
Of which: Securitisation exposures Total
Own Funds Requirements weights
Counter- cyclical capital buffer rate
Breakdown by Country £m £m £m £m £m £m £m £m £m % %
Hong Kong (HK) — — — — — — — — — 1.00% Norway (NO) 234 — — — — 2 — — 2 0.06% 1.00% Slovakia (SK) — — — — — — — — — 1.00% Bulgaria (BG) — — — — — — — — — 0.50% Czech Republic (CZ) — — — — — — — — — 0.50% Luxembourg (LU) — — — — — — — — — 0.50% Total (countries with existing CCyB rate) 234 — — — — 2 — — 2 0.06% United kingdom (GB) 5,724 216,067 — — 8,028 4,175 — 101 4,276 99.43% n/a
Total (countries with own funds requirements weights 1% or above) 5,724 216,067 — — 8,028 4,175 — 101 4,276 99.43%
Total (rest of the world less than 1% requirement) 1,357 63 30 — — 23 — — 23 0.51% n/a
Total 7,315 216,130 30 — 8,028 4,200 — 101 4,301 100%
Amount of institution-specific countercyclical capital bufferTotal risk weighted assets £71,213m Institution specific countercyclical buffer rate 0.00% Institution specific countercyclical buffer requirement —
AppendicesAppendix C – Countercyclical Capital Buffer
barclays.com/annualreport Barclays Bank UK PLC Pillar 3 Report 2021 >144
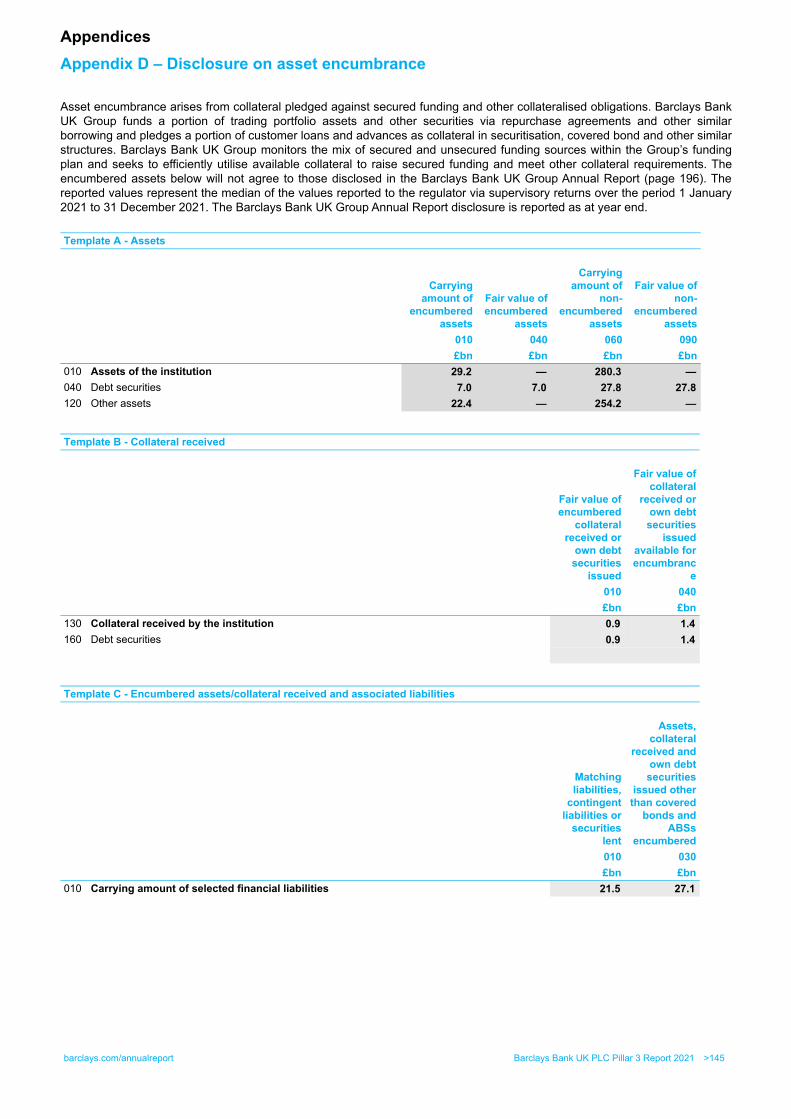
Asset encumbrance arises from collateral pledged against secured funding and other collateralised obligations. Barclays Bank UK Group funds a portion of trading portfolio assets and other securities via repurchase agreements and other similar borrowing and pledges a portion of customer loans and advances as collateral in securitisation, covered bond and other similar structures. Barclays Bank UK Group monitors the mix of secured and unsecured funding sources within the Group’s funding plan and seeks to efficiently utilise available collateral to raise secured funding and meet other collateral requirements. The encumbered assets below will not agree to those disclosed in the Barclays Bank UK Group Annual Report (page 196). The reported values represent the median of the values reported to the regulator via supervisory returns over the period 1 January 2021 to 31 December 2021. The Barclays Bank UK Group Annual Report disclosure is reported as at year end.
Template A - Assets
Carrying amount of
encumbered assets
Fair value of encumbered
assets
Carrying amount of
non-encumbered
assets
Fair value of non-
encumbered assets
010 040 060 090£bn £bn £bn £bn
010 Assets of the institution 29.2 — 280.3 — 040 Debt securities 7.0 7.0 27.8 27.8 120 Other assets 22.4 — 254.2 —
Template B - Collateral received
Fair value of encumbered
collateral received or
own debt securities
issued
Fair value of collateral
received or own debt
securities issued
available for encumbranc
e010 040£bn £bn
130 Collateral received by the institution 0.9 1.4 160 Debt securities 0.9 1.4
Template C - Encumbered assets/collateral received and associated liabilities
Matching liabilities,
contingent liabilities or
securities lent
Assets, collateral
received and own debt
securities issued other than covered
bonds and ABSs
encumbered010 030£bn £bn
010 Carrying amount of selected financial liabilities 21.5 27.1
AppendicesAppendix D – Disclosure on asset encumbrance
barclays.com/annualreport Barclays Bank UK PLC Pillar 3 Report 2021 >145

Barclays Bank UK PLC remuneration
The following disclosures are made in accordance with Article 450 of the Capital Requirements Regulation, the Basel Committee on Banking Supervision (‘BCBS’) Pillar 3 disclosure requirements standard (December 2018) and the 2015 EBA Guidelines on sound remuneration policies.
Remuneration GovernanceThe mandate and responsibilities of the Barclays Bank UK PLC (“BBUKPLC”) Board Remuneration Committee (the ‘Committee’) are included in the 2021 BBUKPLC Annual Report. No external consultants provide services to the Committee.
The Committee held five meetings during 2021 and all members were present at each meeting:
Member Meetings attendedMichael Jary (Chair) 5/5Avid Larizadeh Duggan 5/5Sir John Timpson (until 8 July 2021) 3/3Kathryn Matthews (from 8 July 2021 onwards) 2/2
The Committee has adopted the overarching principles and parameters of the remuneration policy set by the Barclays PLC Remuneration Committee, as disclosed in the Remuneration Report within the Barclays PLC 2021 Annual Report.
Performance management and remunerationBarclays’ remuneration philosophy (set out below) links remuneration to achieving sustained high performance and creating long-term value. The remuneration philosophy applies to all employees of Barclays PLC globally (including those individuals identified as material risk takers (‘MRTs’)) and aims to reinforce our belief that effective performance management is critical to enabling the delivery of our business strategy in line with our Values. Employees who adhere to the Barclays’ Values and contribute to Barclays’ success are rewarded accordingly.
This is achieved by basing performance assessment on clear standards of delivery and behaviour, which starts with employees aligning their objectives (‘what’ they will deliver) to business and team goals in order to support the delivery of the business strategy and good client/customer outcomes. Behavioural expectations (‘how’ people will achieve their objectives) are set in the context of our Values and Mindset.
Performance is assessed against both financial and non-financial criteria. Other factors are also taken into consideration within the overall performance assessment, including core job responsibilities, behaviours towards risk and control, colleague and stakeholder feedback as well as input from the Risk and Compliance functions, where appropriate.
Through our approach to performance, the equal importance of both what an individual has delivered and how the individual has achieved this is emphasised, encouraging balanced consideration of each dimension. Both of these elements are assessed and rated independently of each other. There is no requirement to have an overall rating. This allows for more robust and reflective conversations between managers and team members on the individual components of performance.
AppendicesAppendix E – Disclosures on remuneration
barclays.com/annualreport Barclays Bank UK PLC Pillar 3 Report 2021 >146

Barclays’ remuneration philosophy
The remuneration philosophy below sets out the basis upon which Barclays made remuneration decisions and set remuneration policies during 2021. Barclays’ remuneration philosophy applies to all employees globally.
Attract and retain talent needed to deliver Barclays’ strategy
Long-term success depends on the talent of our employees. This means attracting and retaining an appropriate range of talent to deliver against our strategy, and paying the right amount for that talent
Align pay with investor and other stakeholder interests
Remuneration should be designed with appropriate consideration of the views, rights and interests of stakeholders. This means listening to our shareholders, other investors, regulators, government, customers and employees and ensuring their views are appropriately considered in remuneration decision-making
Reward sustainable performance Sustainable performance means making a positive and enduring difference to investors, customers and communities, taking pride in leaving things better than we found them, and playing a valuable role in society
Support Barclays’ Values and culture Results must be achieved in a manner consistent with our Values. Our Values, culture and Mindset should drive the way that business is conducted
Align with risk appetite, risk exposure and conduct expectations
Designed to reward employees for achieving results in line with the Group’s risk appetite and conduct expectations
Be fair, transparent and as simple as possible We are committed to ensuring pay is fair, simple and transparent for all our stakeholders. This means all employees and stakeholders should understand how we reward our employees and fairness should be a lens through which we make remuneration decisions
Risk adjustment and remunerationAnother key feature of our remuneration philosophy is the alignment of remuneration with our risk appetite and with the conduct expectations of Barclays, our regulators and other stakeholders. The Committee takes risk and conduct events very seriously and ensures that there are appropriate adjustments to individual remuneration and, where necessary, the incentive pool.
The Remuneration Review Panel (the “Panel”) supports the Committee in this process. The Panel is chaired by the Group HR Director and includes the Group Heads of Risk, Compliance, Legal and Internal Audit as well as the CEO of Barclays Bank UK PLC and the President of Barclays Bank PLC. It applies Barclays’ policies and processes for assessing compensation adjustments for risk and conduct events.
We have robust processes for considering risk and conduct as part of individual performance management with outcomes reflected in individual remuneration decisions. Line managers have primary accountability for ensuring that risk and conduct issues are considered when assessing performance and making remuneration decisions. In addition, there is a secondary review by the control functions, for individuals involved in significant failures of risk management, conduct issues, regulatory actions or other major incidents that impact either the Group or business, to ensure these issues are also considered. When considering individual responsibility, a variety of factors are taken into account, such as whether an individual was directly responsible, or whether the individual could be deemed indirectly responsible by virtue of seniority, including staff who drive BBUKPLC’s culture and set its strategy.
AppendicesAppendix E – Disclosures on remuneration
barclays.com/annualreport Barclays Bank UK PLC Pillar 3 Report 2021 >147

Actions that may be taken where risk management and conduct falls below required standards include:
Adjustment Current year annual bonuses may be adjusted downwards where individuals are found to be involved (either directly or indirectly) in a risk or misconduct event.
Malus Unvested deferred bonuses from prior years are subject to malus provisions which enable the Committee to reduce the vesting level of deferred bonuses (including to nil) at its discretion. Events that may lead the Committee to do this include, but are not limited to, employee misconduct or a material failure of risk management.
Clawback Clawback applies to any variable remuneration awarded to a MRT on or after 1 January 2015 in respect of years for which they were a MRT. Barclays may apply clawback if, at any time during the seven-year period from the date on which variable remuneration is awarded to a MRT:
(i) there is reasonable evidence of employee misbehaviour or material error, and/or(ii) the firm or the business unit suffers a material failure of risk management, taking account of the individual’s proximity to and responsibility for that incident.
Clawback may be extended to 10 years for PRA/FCA Senior Managers where there are outstanding internal or regulatory investigations at the end of the seven-year clawback period.
In addition to reductions to individuals’ bonuses, the Committee considers collective adjustments to the incentive pool for specific risk and conduct events. Adjustments to the incentive pool also take account of an assessment of a wide range of future risks including conduct, non-financial factors that can support the delivery of a strong risk management, control and conduct culture and other factors including reputation and impact on customers, markets and other stakeholders. The Committee is supported in its consideration of this adjustment by the BBUKPLC Board Risk Committee.
Remuneration structureEmployees receive salary, pension and other benefits and are eligible to be considered for an annual bonus. Some employees, including some MRTs, also receive Role Based Pay (RBP). Remuneration of all MRTs is subject to the 2:1 maximum ratio of variable to fixed remuneration.
The remuneration of employees engaged in control functions is set independently from the business and for certain senior employees is approved by the Committee. Remuneration for control function employees is less weighted towards variable remuneration compared to front-office employees, with the value of variable remuneration typically limited to one times fixed remuneration.
Fixed remunerationSalary Salaries reflect individuals’ skills and experience and are reviewed annually.
They are increased where justified by role change, increased responsibility or a change in the appropriate market rate. Salaries may also be increased in line with local statutory requirements and union and works council commitments.
Role Based Pay Some MRTs receive a class of fixed pay called RBP to recognise the seniority, scale and complexity of their role.
RBP may be adjusted where justified by a role or responsibility change or a change in the appropriate market rate.
Pension and benefits The provision of a competitive package of benefits is important to attracting and retaining the talented staff needed to deliver Barclays’ strategy. Employees have access to a range of country-specific company-funded benefits, including pension schemes, healthcare, life assurance and Barclays’ share plans as well as other voluntary employee funded benefits. The cost of providing these benefits is defined and controlled.
AppendicesAppendix E – Disclosures on remuneration
barclays.com/annualreport Barclays Bank UK PLC Pillar 3 Report 2021 >148

Variable remunerationAnnual bonus Annual bonuses incentivise and reward the achievement of Group, business and individual objectives, and
reward employees for demonstrating individual behaviours in line with Barclays’ Values and Mindset.
The ability to recognise performance through variable remuneration enables the Group and BBUKPLC to control their cost base flexibly and to react to events and market circumstances. Bonuses remain a key feature of remuneration practice in the highly competitive and mobile market for talent in the financial services sector.
Awards of guaranteed variable remuneration are only made in exceptional circumstances in the context of hiring and typically only when a new hire starts in the last quarter of the year.
Bonus deferral
The Committee is careful to control the proportion of variable to fixed remuneration paid to individuals and also to ensure an appropriate amount is deferred to future years.
The typical deferral structures are:
For MRTs: For de minimis MRTs/non-MRTsIncentive award Amount deferred Incentive award Amount deferred< £500,000 40% of total award Up to £65,000 0%£500,000 to £1,000,000
60% of total award > £65,000 Graduated level of deferral
> £1,000,000 60% up to £1,000,000100% above £1,000,000
Deferred bonuses are generally delivered in equal portions as deferred cash and deferred shares subject to the rules of the deferred cash and share plans (as amended from time to time) and to continued service. Deferred bonuses are subject to either a 3, 4, 5 or 7-year deferral period in line with regulatory requirements.
Where dividend equivalents cannot be delivered on deferred bonus shares, the number of deferred bonus shares awarded will be calculated using a share price discounted to reflect the absence of dividend equivalents during the vesting period.
Share plans Alignment of MRTs with shareholders is achieved through deferral of incentive pay. Additional shareholding is encouraged through the all-employee share plans.
Total Remuneration in respect of the financial year
Total Remuneration for the financial year
All Employees
Number of individuals 21,865Fixed remuneration (£m) 953 Variable remuneration (£m) 105 Total remuneration (£m) 1,058
Remuneration of MRTs in respect of the financial yearOn 15 November 2018, the Board of Barclays PLC as shareholder of Barclays Bank UK PLC approved the resolution that Barclays Bank UK PLC and any of its current and future subsidiaries be authorised to apply a ratio of fixed to variable components of total remuneration of their MRTs that exceeds 1:1, provided the ratio does not exceed 1:2.
MRTs are members of the BBUKPLC Board, BBUKPLC employees and employees of other Barclays Group entities whose professional activities could have a material impact on BBUKPLC’s risk profile. A total of 108 individuals were MRTs in 2021 (2020: 115). ‘Senior management’ as referred to in the tables below means members of the BBUKPLC Board (Executive Directors and Non-Executive Directors) and members of the BBUKPLC Executive Committee in accordance with Article 3(9) of CRDIV.
BBUKPLC’s major business areas are Personal Banking, Barclaycard Consumer UK and Business Banking. ‘BBUKPLC Other’ includes internal control functions and corporate functions. Barclaycard Consumer UK has only two individuals who were MRTs in 2021 and so the remuneration for these individuals is not disclosed separately due to confidentiality and data protection
AppendicesAppendix E – Disclosures on remuneration
barclays.com/annualreport Barclays Bank UK PLC Pillar 3 Report 2021 >149

considerations. Instead, these individuals are included in the sections of the tables below that are headed “Personal Banking and Barclaycard Consumer UK”. The amount of these individuals' remuneration is not material to BBUKPLC.
The following set of tables set out the remuneration disclosures for individuals identified as MRTs for BBUKPLC.
Remuneration for the financial year
Senior managementa
Other MRTs
Personal Banking and Barclaycard
Consumer UKBusiness Banking
BBUKPLC Other
Fixed remuneration b
Number of individuals 22 21 10 55Total fixed remuneration (£m) 11.6 5.4 2.5 13.8
Fixed cash remuneration (£m) c 11.4 5.4 2.5 13.8 Fixed remuneration in shares (£m) 0.2 — — —
of which subject to holding period (£m) 0.2 — — —
Variable remuneration b
Number of individuals 14 15 7 45Total variable remuneration (£m) 9.4 2.6 0.7 6.3
Total cash bonus (£m) 4.7 1.4 0.3 3.6 of which deferred (£m) 2.8 0.5 0.1 1.2
Total share bonus (£m) 4.7 1.2 0.4 2.7 of which deferred or subject to holding period (£m) 4.7 1.2 0.4 2.7
Total remuneration (£m) 21.0 8.0 3.2 20.1
Notes
a As senior management is comprised of members of the Barclays Bank UK PLC Board and members of the Barclays Bank UK PLC Executive Committee, it is not appropriate to separate by business area.
b Fixed remuneration takes the form of cash and/or shares and pensions and benefits in line with policy. Variable remuneration takes the form of cash and/or shares and there are no other forms of variable remuneration.
c Fixed cash remuneration includes an estimate for pensions and benefits during the year. Fixed cash remuneration is not subject to holding periods.
Deferred remuneration - Senior managementAll figures in £m Total Cash SharesBalance as at 1 January 2021 12.3 4.4 7.9 Awarded in year 5.5 1.5 4.0 Adjusted through
ex post explicit adjustments a — — — ex post implicit adjustments b 2.7 — 2.7
Forfeited — — — Paid in year (4.8) (1.3) (3.5) Balance as at 31 December 2021 c 15.7 4.6 11.1
of which vested 1.8 — 1.8 of which unvested 13.9 4.6 9.3
AppendicesAppendix E – Disclosures on remuneration
barclays.com/annualreport Barclays Bank UK PLC Pillar 3 Report 2021 >150

Deferred Remuneration - Other MRTs Personal Banking and Barclaycard Consumer UK
All figures in £m Total Cash SharesBalance as at 1 January 2021 2.4 0.8 1.6 Awarded in year 1.0 0.3 0.7 Adjusted through
ex post explicit adjustments a — — — ex post implicit adjustments b 0.4 — 0.4
Forfeited (0.2) (0.1) (0.1) Paid in year (1.3) (0.3) (1.0) Balance as at 31 December 2021 c 2.3 0.7 1.6
of which vested 0.3 — 0.3 of which unvested 2.0 0.7 1.3
Deferred Remuneration - Other MRTs Business BankingAll figures in £m Total Cash SharesBalance as at 1 January 2021 1.4 0.5 0.9 Awarded in year 0.4 0.1 0.3 Adjusted through
ex post explicit adjustments a — — — ex post implicit adjustments b 0.3 — 0.3
Forfeited — — — Paid in year (0.7) (0.1) (0.6) Balance as at 31 December 2021 c 1.4 0.5 0.9
of which vested 0.1 — 0.1 of which unvested 1.3 0.5 0.8
Deferred Remuneration - Other MRTs BBUKPLC OtherAll figures in £m Total Cash SharesBalance as at 1 January 2021 6.3 2.3 4.0 Awarded in year 2.1 0.6 1.5 Adjusted through
ex post explicit adjustments a — — — ex post implicit adjustments b 1.1 — 1.1
Forfeited (0.1) (0.1) — Paid in year (2.8) (0.6) (2.2) Balance as at 31 December 2021 c 6.6 2.2 4.4
of which vested 0.6 — 0.6 of which unvested 6.0 2.2 3.8
Notes
a Total reduction due to direct adjustments such as malus and clawback.b Total change in remuneration due to movements in share price or exchange rate during the year.c All outstanding awards are exposed to ex post explicit and/or implicit adjustment.
AppendicesAppendix E – Disclosures on remuneration
barclays.com/annualreport Barclays Bank UK PLC Pillar 3 Report 2021 >151

Joining and Severance Payments
Senior management
Other MRTs
Personal Banking and Barclaycard
Consumer UKBusiness Banking
BBUKPLC Other
Sign-on awardsNumber of beneficiaries — — — —Made during the year (£m) — — — —
Buy-out awards Number of beneficiaries — — — 2Made during the year (£m) — — — 1.3 Severance awards a
Number of beneficiaries — — 3 5Made during the year (£m) — — 0.5 0.5
of which paid during the year (£m) — — 0.5 0.5 of which deferred (£m) — — — —
Highest individual award (£m) — — 0.2 0.2
Note
a Any severance awards that fall outside of paragraph 154 (a) – (c) of the 2015 EBA Guidelines are counted for the purposes of the 2:1 pay ratio for the year in which they are paid.
Number of MRTs by banda
2021
Remuneration band Number of MRTs
€1,000,001 to €1,500,000 2€1,500,001 to €2,000,000 6€2,000,001 to €2,500,000 2€2,500,001 to €3,000,000 2
Note
a The table is prepared in Euros in accordance with Article 450 of the Capital Requirements Regulation. Data has been converted into Euros using the rates published by the European Commission for financial programming and budget for December of the reported year.
barclays.com/annualreport Barclays Bank UK PLC Pillar 3 Report 2021 >152

Barclays Bank UK Group refers to Barclays Bank UK PLC together with its subsidiaries. The abbreviations ‘£m’ and ‘£bn’ represent millions and thousands of millions of Pounds Sterling respectively.
There are a number of key judgement areas, for example impairment calculations, which are based on models and which are subject to ongoing adjustment and modifications. Reported numbers reflect best estimates and judgements at the given point in time.
Relevant terms that are used in this document but are not defined under applicable regulatory guidance or International Financial Reporting Standards (IFRS) are explained in the results glossary that can be accessed at home.barclays/investor-relations/reports-and-events/latest-financial-results.
Forward-looking statements
This document contains certain forward-looking statements with respect to the Barclays Bank UK Group. Barclays Bank UK Group cautions readers that no forward-looking statement is a guarantee of future performance and that actual results or other financial condition or performance measures could differ materially from those contained in the forward-looking statements. These forward-looking statements can be identified by the fact that they do not relate only to historical or current facts. Forward-looking statements sometimes use words such as ‘may’, ‘will’, ‘seek’, ‘continue’, ‘aim’, ‘anticipate’, ‘target’, ‘projected’, ‘expect’, ‘estimate’, ‘intend’, ‘plan’, ‘goal’, ‘believe’, ‘achieve’ or other words of similar meaning. Forward-looking statements can be made in writing but also may be made verbally by members of the management of the Barclays Bank UK Group (including, without limitation, during management presentations to financial analysts) in connection with this document. Examples of forward-looking statements include, among others, statements or guidance regarding or relating to the Barclays Bank UK Group’s future financial position, income growth, assets, impairment charges, provisions, business strategy, capital, leverage and other regulatory ratios, capital distributions (including dividend payout ratios and expected payment strategies), projected levels of growth in the banking and financial markets, projected costs or savings, any commitments and targets, estimates of capital expenditures, plans and objectives for future operations, projected employee numbers, IFRS impacts and other statements that are not historical fact. By their nature, forward-looking statements involve risk and uncertainty because they relate to future events and circumstances. The forward-looking statements speak only as at the date on which they are made. Forward-looking statements may be affected by: changes in legislation; the development of standards and interpretations under IFRS, including evolving practices with regard to the interpretation and application of accounting and regulatory standards; the outcome of current and future legal proceedings and regulatory investigations; future levels of conduct provisions; the policies and actions of governmental and regulatory authorities; the Barclays Bank UK Group’s ability along with government and other stakeholders to manage and mitigate the impacts of climate change effectively; geopolitical risks; and the impact of competition. In addition, factors including (but not limited to) the following may have an effect: capital, leverage and other regulatory rules applicable to past, current and future periods; macroeconomic and business conditions in the UK and any systemically important economy which impacts the UK; the effects of any volatility in credit markets; market related risks such as changes in interest rates and foreign exchange rates; effects of changes in valuation of credit market exposures; changes in valuation of issued securities; volatility in capital markets; changes in credit ratings of any entity within the Barclays Bank UK Group or any securities issued by such entities; direct and indirect impacts of the coronavirus (COVID-19) pandemic; instability as a result of the UK’s exit from the European Union (EU), the effects of the EU-UK Trade and Cooperation Agreement and the disruption that may subsequently result in the UK; the risk of cyber-attacks, information or security breaches or technology failures on the Barclays Bank UK Group’s business or operations; and the success of future acquisitions, disposals and other strategic transactions. A number of these influences and factors are beyond the Barclays Bank UK Group’s control. As a result, the Barclays Bank UK Group’s actual financial position, future results, capital distributions, capital, leverage or other regulatory ratios or other financial and non-financial metrics or performance measures may differ materially from the statements or guidance set forth in the Barclays Bank UK Group’s forward-looking statements.
Subject to our obligations under the applicable laws and regulations of any relevant jurisdiction, (including, without limitation, the UK), in relation to disclosure and ongoing information, we undertake no obligation to update publicly or revise any forward-looking statements, whether as a result of new information, future events or otherwise.
barclays.com/annualreport Barclays Bank UK PLC Pillar 3 Report 2021 >153