Bank of England Quarterly Bulletin Summer 2006
145
Bank of England Volume 46 Number 2 Quarterly Bulletin Summer 2006
-
Upload
khangminh22 -
Category
Documents
-
view
1 -
download
0
Transcript of Bank of England Quarterly Bulletin Summer 2006

Bank of England Volume 46 Number 2
QuarterlyBulletinSummer 2006

i
Foreword
Every three months, the Bank of England publishes economic research and marketreports in its Quarterly Bulletin. This quarter, the Bulletin explores the relationshipbetween house prices and consumer spending. It also examines companies’ motivesfor investing in inventories. And, as usual, it reviews the latest movements in sterlingfinancial markets.
House prices and consumer spending have often moved together in the past. But asthe Monetary Policy Committee has noted in the Inflation Report and the Minutes ofpast policy meetings, the relationship between the housing market and spending ismore subtle than is often supposed. It depends on causal links, such as the impact ofhouse prices on the amount that people can borrow to finance spending. And itdepends on common influences that affect both house prices and consumption, suchas people’s expectations about their future income.
This relationship is explored in House prices and consumer spending, by Andrew Benito,Jamie Thompson, Matt Waldron and Rob Wood. The authors explain how the strengthof the links between the housing market and spending can vary over time. Causallinks are affected by factors such as the amount of housing equity that householdsalready have available and the extent to which credit constraints are inhibitingspending. The reasons why house prices move are also important. Sometimescommon factors drive changes in both house prices and consumer spending. Atother times, house prices may shift on account of developments that are of limitedsignificance for spending. In general, the implications of a rise in house pricestherefore rest on why the rise has occurred.
In the past few years, house prices and consumption have moved together less closely.One explanation is that the causal links between the housing market and spendinghave weakened. An alternative hypothesis is that recent fluctuations in house priceshave not been the result of movements in common influences like expected income,but reflect a different set of factors that have had a more limited impact on consumerspending. The article concludes that both explanations have played a part in therecent weakening of the association between house prices and consumer spending.
Investment in inventories accounts for a much smaller proportion of total spendingthan consumption. But it is much more volatile, and fluctuations in inventories oftenhave a noticeable impact on GDP growth. Investing in inventories, by Rob Elder andJohn Tsoukalas, examines companies’ motives for holding inventories and assesses theimpact of inventory investment on the volatility of output. It also considers thecontribution of changing stock management behaviour to the stability of the UKeconomy in recent years.
The regular Markets and operations article describes financial market developmentssince the previous Bulletin. In May, there was a pickup in financial market volatilityand substantial falls in some asset prices, particularly in commodity and equitymarkets. In common with other countries, UK short-term and long-term interest rates

ii
Bank of England Quarterly Bulletin: Summer 2006
increased over the review period, while the effective exchange rate for sterlingappreciated. But despite the rise in interest rates and falls in equity prices, creditspreads did not widen significantly. This suggests that any repricing of risk has beenlimited only to certain asset classes. Finally, the article records the introduction, on18 May, of fundamental reforms to the way that the Bank implements the MPC’sinterest rate decisions in the sterling money markets. The changes are designed tokeep overnight interest rates in line with the official Bank rate and also to improve themanagement of banking system liquidity in both normal and stressed times.
Charles BeanChief Economist and Executive Director for Monetary Policy, Bank of England.
This edition of the Quarterly Bulletin also includes:
� Cost-benefit analysis of monetary and financial statistics (by Andrew Holder). Data collected by the Bank of England from UK banks are used in compiling a range of economic statistics that contribute to meeting the inflation target and maintaining financial stability. But data collection inevitably imposes some costs on those supplying the information. This article describes a cost-benefit analysis framework that has been developed to help balance the demands on data suppliers with the needs of users;
� Public attitudes to inflation (by Colin Ellis). Over the past six and a half years, GfK NOP has carried out surveys of public attitudes to inflation on behalf of the Bank of England. This article analyses the results of the surveys from May 2005 to February 2006, a period in which there was an increase in public perceptions of past inflation as well as expectations of future inflation;
� The Centre for Central Banking Studies (by Gill Hammond). The Centre for Central Banking Studies at the Bank of England organises seminars, workshops and conferences in London and abroad. These are attended by central bankers from all over the world. This article describes the Centre’s origins and current activities; and
� A review of the work of the London Foreign Exchange Joint Standing Committee in 2005. The Foreign Exchange Joint Standing Committee was established in 1973, under the auspices of the Bank of England, as a forum for bankers and brokers to discuss broad market issues. This note reviews thework undertaken by the Committee during 2005.
Research work published by the Bank is intended to contribute to debate, anddoes not necessarily reflect the views of the Bank or of MPC members.

Bank of England Quarterly BulletinSummer 2006
Recent economic and financial developments
Markets and operations 125Box on equity variance swaps 127Box on forward rates and economists’ expectations 129Box on using option prices to derive a probability distribution for the sterling exchange rate index 130Box on hedging inflation exposures by swap dealers 133Box on decomposing changes in annuity rates 134Box on the work of the Securities Lending and Repo Committee 136
Research and analysis
House prices and consumer spending 142Box on how important are the different channels from house prices to consumer spending? 145Box on the role of mortgage equity withdrawal 146Box on estimating the role of housing 151
Investing in inventories 155
Cost-benefit analysis of monetary and financial statistics 161Box on cost-benefit analysis in other institutions 163Box on case study: review of information collected on the industrialcomposition of banks’ business with UK residents (forms AD and AL) 167
Summaries of recent Bank of England working papersDefined benefit company pensions and corporate valuations: simulation and empirical evidence from the United Kingdom 170UK monetary regimes and macroeconomic stylised facts 171Affine term structure models for the foreign exchange risk premium 172Switching costs in the market for personal current accounts: some evidencefor the United Kingdom 173Resolving banking crises — an analysis of policy options 174How does the down-payment constraint affect the UK housing market? 175

Productivity growth, adjustment costs and variable factor utilisation: the UK case 176Sterling implications of a US current account reversal 177Optimal monetary policy in a regime-switching economy: the response to abrupt shifts in exchange rate dynamics 178Optimal monetary policy in Markov-switching models with rationalexpectations agents 179Optimal discretionary policy in rational expectations models with regime switching 180
Reports
Public attitudes to inflation 181Box on the Bank of England/GfK NOP survey on Inflation Attitudes 182
The Centre for Central Banking Studies 190
A review of the work of the London Foreign Exchange Joint Standing Committee in 2005 196
Speeches and papers
Uncertainty, the implementation of monetary policy, and themanagement of riskSpeech by Paul Tucker, Executive Director for Markets and a member of the Monetary Policy Committee,
to the Association of Corporate Treasurers in Newport on 19 May 2006 202
Reflections on operating inflation targetingSpeech by Paul Tucker, Executive Director for Markets and a member of the Monetary Policy Committee,
delivered at the Chicago Graduate School of Business on 25 May 2006 212
Cost pressures and the UK inflation outlookSpeech by Kate Barker, member of the Monetary Policy Committee, delivered at the CBI West Midlands
Economic Dinner in Birmingham on 21 March 2006 225
The UK current account deficit and all thatSpeech by Stephen Nickell, member of the Monetary Policy Committee, delivered on 25 April 2006 231
A shift in the balance of risksSpeech by David Walton, member of the Monetary Policy Committee, given at a lunch organised by
the Bank of England’s Central Southern Agency on 18 May 2006 240
What do we now know about currency unions?Paper by Michael Artis, George Fellow, Bank of England, presenting the text of an inaugural lecture
given at the Bank of England in December 2005 in memory of John Flemming 243
The contents page, with links to the articles in PDF, is available atwww.bankofengland.co.uk/publications/quarterlybulletin/index.htm. Authors of articles can be contacted at [email protected] speeches contained in the Bulletin can be found atwww.bankofengland.co.uk/publications/speeches/index.htm.Except where otherwise stated, the source of the data used in charts and tables is the Bank ofEngland or the Office for National Statistics (ONS) and all data, apart from financial marketsdata, are seasonally adjusted.
Volume 46 Number 2

125
During May, sterling markets were caught up in a global increase in asset price volatility. Commodities,equities and emerging market asset prices fell sharply.
These developments might have reflected a reappraisal of the global macroeconomic outlook. Butconsensus projections for economic growth in the major industrialised countries remained firm and there were few signs of slowing in corporate profitgrowth.
Some market commentators have highlighted a possiblerise in global inflationary pressures as a reason for theasset price adjustment. Others have attributed it tochanges in investors’ perceptions of risk. According tocontacts, some speculative investors have reducedtheir positions. Higher asset price volatility may haveadded to perceptions of somewhat greater risk, forexample, through increased Value-at-Risk measures oftraders’ positions.
Equity markets
In the United Kingdom, the rise in financial marketvolatility was manifested in a sharp fall in equity indices.The FTSE All-Share declined 5.4% from its recent peakon 21 April, and around 1% over the period as a whole(Chart 1). Mid-cap stocks fell by more in mid-May,although the FTSE 250 ended the period more than 8%higher than at the start of 2006. At the same time,expected future volatility implied by option pricesincreased, especially at short horizons (Chart 2).
Long-term sterling real interest rates rose, which otherthings being equal might have been expected toreduce equity prices via higher discount rates.But whereas long-term real interest rates increasedfairly steadily over the period, the equity price fallswere sudden and concentrated toward the end of theperiod.
The equity price falls could have been amplified byhedging of some over-the-counter equity derivatives.
Markets and operations
This article reviews developments since the Spring Quarterly Bulletin in sterling financial markets,UK market structure and the Bank’s official operations.(1)
� Volatility picked up in a number of asset markets towards the end of the period. In particular,emerging market asset prices and some commodity prices fell sharply. This seemed to reflect anadjustment in investors’ perceptions of risk, at least in these markets.
� There was a more moderate pickup in volatility in sterling interest rate markets. Short-term nominalsterling interest rates rose over the period as a whole.
� Long-term nominal sterling rates also increased, on account of higher real rates and a pickup ininflation expectations and/or inflation risk premia. The rise in real rates was common acrosscurrencies.
� Despite higher interest rates and lower equity prices, corporate bond spreads did not widen much.
� The Bank implemented fundamental reforms to modernise its operations in the sterling moneymarkets.
(1) This article focuses on sterling markets. The period under review in this article is 17 February (the data cut-off for theprevious Quarterly Bulletin) to 26 May.

126
Bank of England Quarterly Bulletin: Summer 2006
For example, as explained in the box on page 127,hedging of equity variance swaps might have added tovolatility. The pay-off from a variance swap is typicallycomputed using closing prices, so a trader’s overallposition may not be known until late in the day. As aresult, hedging may be delayed until just before themarket closes. This may have been the case on 17 Maywhen the FTSE 100 index fell sharply in late trading(Chart 3). However, some market contacts believe thisamplification effect was modest.
Commodities
Realised and implied volatility also rose sharply in somecommodity markets, especially industrial and precious
metals (Chart 4). At the same time, the prices ofsome commodities fell sharply, following a period ofrapid rises.
These earlier rises might have reflected pension fundsincreasing their exposure to commodities with the aimof increasing asset diversification and/or boostingoverall returns. This has been facilitated by newinvestment vehicles such as exchange-traded funds(ETFs), commodity indices, and more sophisticatedbespoke structured products. For example, the firstsilver ETF, launched in April 2006, accumulated anamount equivalent to more than 5% of total globalinventories of silver in its first week of trading. Greaterinvolvement of speculative investors might also havecontributed to recent volatility.
Chart 2FTSE 100 equity index implied volatility(a)
Jan. May Sep. Jan. May Sep. Jan.
Per cent
2005
26 May 2006
06
17 February 2006
07
6
8
10
12
14
16
18
20
0
Sources: Bank of England and Euronext.liffe.
(a) The solid line shows three-month (constant maturity) implied volatility. The dots indicate three-month volatility, three, six and nine months ahead respectively.
Chart 1UK and international equity indices
90
100
110
120
130
140
150
160
170
Jan. Mar. May July Sep. Nov. Jan. Mar. May
FTSE All-Share
FTSE 100MSCI World(b)
MSCI Emerging Markets(a)
Indices: 3 Jan. 2005 = 100
06
17 February
2005
FTSE 250
Sources: Bloomberg, Morgan Stanley Capital International Inc. (MSCI) and Bank calculations.
(a) The MSCI Emerging Markets index is a capitalisation-weighted index that monitors the performance of stocks in emerging markets.
(b) The MSCI World index is a capitalisation-weighted index that monitors the performance of stocks from around the world.
Chart 4Three-month implied volatilities on selected commodity indices
0
10
20
30
40
50
60
Jan. Mar. May July Sep. Nov. Jan. Mar. May2005 06
Copper
Aluminium
Per cent
17 February
Oil
Gold
Sources: Bloomberg, COMEX, NYMEX and Bank calculations.
Chart 3Change in FTSE 100 on 17 May
3.5
3.0
2.5
2.0
1.5
1.0
0.5
0.0
8.00 10.00 12.00 14.00 16.00Time
Per cent
–
Source: Bloomberg.

Markets and operations
127
Variance swaps are instruments that allow investorsto trade and hedge the volatility of asset prices. Atmaturity, the pay-off of the swap is equal to thedifference between the realised variance in theunderlying asset price over the life of the swap andthe pre-agreed ‘strike’ variance (Chart A).
Variance swaps provide a straightforward exposureto asset price volatility. To obtain a similarexposure using a ‘vanilla’ option would be morecomplicated because it is exposed to both thevolatility and the level of the underlying asset price.Moreover, the sensitivity of the price of a vanillaoption to changes in volatility depends upon thelevel of the underlying asset price. By contrast, avariance swap can provide a more stable exposureto volatility as its value does not depend directly onthe price of the underlying asset.
Pricing and hedging
In principle, a variance swap is straightforward toprice because its pay-off can be replicated with anappropriately weighted portfolio of vanillaoptions across a range of strike prices. Such aportfolio also provides a good hedge for a positionin a variance swap. But to ensure that thisportfolio remains a good hedge over time, it needsto be adjusted dynamically to neutralise the effecton its value of any changes in the underlying assetprice. This is typically achieved by buying orselling an appropriate amount of the underlyingasset, and is known as ‘delta-hedging’; theso-called delta measures the sensitivity of anoption price to changes in the price of theunderlying asset.
In practice, even a delta-hedged portfolio of vanillaoptions is not a perfect hedge for a position in a
variance swap. First, an investor seeking to hedge aposition in a variance swap may be restricted ifoptions across a wide range of strike prices are notactively traded and/or if the cost of constructingthe ideal hedge is prohibitive.
Second, the investor is exposed to so-called ‘jumprisk’, ie the risk of sharp discontinuous jumps inthe underlying asset price. The theoretical hedgeassumes the underlying asset price evolvesaccording to a continuous process. In the presenceof jumps, there may be a mismatch between theimpact on the variance swap and the hedge. Forexample, a jump downward in the underlying assetprice would cause an investor hedging a longposition in a variance swap with a short position ina portfolio of options to realise an overall loss —the gain on the swap would be less than the loss onthe hedge.
Variance swaps and recent moves in equity indices
Some contacts have suggested that delta-hedgingcould have amplified recent falls in equity indices.More specifically, it has been reported that sometraders, including hedge funds, sold a largeamount of equity index variance swaps over thepast year or so, as a way of maintaining returns inan environment of generally low financial marketvolatility. The counterpart was that equityderivative dealers bought volatility, which theymay have hedged by selling vanilla equity options.
Selling vanilla options leaves a dealer ‘shortgamma’. Gamma measures the sensitivity of thedelta to changes in the price of the underlyingasset. Being ‘short gamma’ means that todelta-hedge a position, an investor should sell theunderlying asset as its price declines.(1) For smallprice falls, only small adjustments are required forthe position to remain delta-neutral. But whenprice moves are large, as was the case on some daysduring the review period, more material changesmay be required. In turn, the additional sellingpressure exerted by the hedges may amplify theinitial price falls.
Equity variance swaps
(1) For more information on ‘short-gamma’ option positions see the box entitled ‘Market dynamics and optionsselling’, Bank of England Financial Stability Review, June 2005, pages 60–61.
Chart AIllustrative variance swap
CounterpartyA
CounterpartyB
[Realised variance] x [notional]
[Strike variance] x [notional]

128
Bank of England Quarterly Bulletin: Summer 2006
Short-term interest rates
Alongside the sharp rise in financial market volatility,short-term market interest rates in most developedeconomies declined towards the end of the period(Chart 5). Nonetheless, over the period as a whole,forward rates implied by short sterling futurescontracts had increased. That occurred against abackground of rising short-term market interest rates inthe other major currencies and reflected furtherevidence of the continuing strength of globalmacroeconomic conditions and some signs of a slightpickup in inflationary pressure.
On 26 May, the profile for forward sterling interest rates(derived from instruments that settle on Libor) impliedthat, broadly, the market expected two 25 basis pointincreases in the official Bank rate over the next two years(Chart 6).
In contrast to information from financial markets, theMay Reuters survey of UK economists’ expectationssuggested that the majority of economists expected theofficial Bank rate to remain at 4.5% until at least theend of 2007. As explained in the box on page 129, thereare several possible reasons for the divergence betweeneconomists’ expectations and market-based forwardrates.
Measures of uncertainty surrounding short-term sterlinginterest rates increased over the period, and the skew ofthe implied distribution of future sterling interest ratesbecame less negative (Chart 7). Early in the reviewperiod, market participants had assigned a higherprobability to a large downward move in short-term
interest rates than a comparable upward move. By theend of May, option prices suggested a roughly balancedprobability that sterling forward rates would rise or fall.
Exchange rates
Accompanying higher short-term sterling market interestrates, the sterling effective exchange rate index (ERI)rose by around 2% over the period, with most of theappreciation occurring towards the end of the reviewperiod (Chart 8). This largely reflected an increase inthe value of sterling against the dollar of around 61/2%.
The dollar also depreciated against other currencies —its ERI fell by around 5%. Most of the fall occurred inthe final month of the review period and, in particular,following the publication of a G7 communiqué in late
Chart 5Cumulative changes in June 2007 interest rate futurescontracts since 17 February
20
10
0
10
20
30
40
50
60
70
80
Feb. Mar. Apr. May
Basis points
US dollar
Euro
Yen
Sterling
2006
+
–
Sources: Bloomberg and Euronext.liffe.
Chart 6Sterling official and forward market interest ratesplus survey expectations
3.00
3.25
3.50
3.75
4.00
4.25
4.50
4.75
5.00
5.25
5.50
2003 04 05 06 07 08
Official Bank rate
26 May bank liability curve(a)
May survey of economists’ forecasts(b)
February survey of economists’ forecasts(b)
17 February bank liability curve(a)
Per cent
0.00
Sources: Bank of England, Bloomberg, Euronext.liffe and Reuters.
(a) One-day nominal forward rates implied by a curve fitted to a combination of instruments that settle on Libor.
(b) Survey expectations based on mean of end-of-quarter forecasts.
Chart 7Six-month implied volatility and skew from interestrate options
25
30
35
40
45
50
55
60
65
Jan. Mar. May July Sep. Nov. Jan. Mar. May0.9
0.8
0.7
0.6
0.5
0.4
0.3
0.2
0.1
0.0
0.1
0.2Basis points
Implied volatility (left-hand scale)
Skew (right-hand scale)
2005
17 February
06
+
–
Sources: Bank of England and Euronext.liffe.

April, which called for greater exchange rate flexibility inemerging economies, and especially China, to helpreduce global imbalances.
Information from option prices suggests thatuncertainty about the future level of the major dollarbilateral exchange rates increased slightly, particularlyfrom early May onwards (Chart 9). But despite a rise inimplied dollar-sterling volatility, based on techniquesexplained in the box on pages 130–31, the derivedimplied volatility for the sterling ERI fell slightly overrecent months.
Moreover, the same information from option pricessuggested that even if the dollar were to fall by a further10% against the euro, the mean expectation was for arelatively small change in the sterling ERI. This reflects
Markets and operations
129
Chart 8Cumulative change in sterling exchange rates
96
98
100
102
104
106
108
110
Jan. Feb. Mar. Apr. May
17 Feb. 2006 = 100
2006
$ per £
€ per £
£ ERI
17 February
¥ per £
Source: Bloomberg.
Forward rates and economists’expectations
In general, market-based sterling forward rates tend totrack closely the mean expectation for the futureofficial Bank rate from surveys of economists (Chart A).Since 2000, the average gap between the series hasbeen only 6 basis points. In early May, the gap was60 basis points, equivalent to nearly two standarddeviations from the mean.
There are several possible reasons for the unusuallylarge divergence observed recently, although theirrelative importance is unclear. First, economists mayhave had different views from financial marketparticipants about the economic outlook and hencethe path for future interest rates.
Second, the two groups may update expectations atdifferent times. Financial market prices typicallyadjust quickly in response to new information, whereasthe economists surveyed may update their forecastsless regularly. This might imply a tendency for themarket-based measure to lead mean surveyexpectations, for which there is some evidence,particularly during 2003 and 2004 H1.
Third, unlike survey expectations, market rates arelikely to incorporate term premia that compensateinvestors for the uncertainty surrounding the path offuture short-term interest rates.
Chart ASurvey expectations and sterling forward interestrates(a)
Per cent
3.5
4.0
4.5
5.0
5.5
6.0
6.5
7.0
7.5
2000 01 02 03 04 05 06
Market-based forward rates
Reuters’ survey
0.0
Sources: Bank of England, Bloomberg, Euronext.liffe and Reuters.
(a) Breaks in each series occur where the data refer to a different calendar year. Thechart shows mean interest rate expectations for the end of the full calendar yearfollowing the survey date. Forward interest rates are taken from the Bank’sinterbank liability curve, with rates adjusted downwards by a moving average ofthe spread between six-month Libor rates and six-month GC repo rates toaccount crudely for the credit risk implicit in Libor rates.
Chart 9Three-month implied volatility from foreign exchange options
5
6
7
8
9
10
11Per cent
17 February
Jan. Mar. May July Sep. Nov. Jan. Mar. May2005 06
Sterling/dollar
Sterling/euro
Sterling ERI(a)
Dollar/euro
40
Sources: Bank of England and British Bankers’ Association.
(a) Based on a simplified sterling ERI as discussed in the box on pages 130–31.

130
Bank of England Quarterly Bulletin: Summer 2006
Foreign currency option prices contain informationabout market participants’ expectations of futuremovements in exchange rates. This box outlines atechnique that uses option prices to gaugeexpectations about the future path of the sterlingexchange rate index (ERI).(1)
A ‘simplified’ sterling ERI probability distribution
As there is no actively traded market in options onthe sterling ERI, the risks to the future value of theindex cannot be inferred directly. An indirectapproach is to model the probability distribution ofa ‘simplified’ sterling ERI based solely on the pricesof options on euro-sterling and dollar-sterling, whichare the key bilateral exchange rates in the sterlingERI.(2)
A statistical tool (known as a copula function) can beused to map the euro-sterling and dollar-sterlingimplied distributions onto a joint distribution. Theprocess by which this is done can be explained in thefollowing steps:
Step one — Use option prices to estimate(risk-neutral) probability distributions foreuro-sterling and dollar-sterling.(3) Then construct ajoint distribution using (arbitrary) initial values forthe copula function parameters.
Step two — From this joint distribution, back out theimplied marginal distribution for the euro-dollarexchange rate and compare it with a distributionestimated directly from euro-dollar option prices.
Step three — Update the parameters of the copulafunction so that they reduce the difference betweenthe directly and indirectly inferred distributions foreuro-dollar.
Step four — Repeat steps two and three until thedifference between the two euro-dollar distributionsis negligible.
An example of the resulting joint distribution for theeuro-sterling and dollar-sterling exchange rates isshown in Chart A.
From the joint distribution, an estimate of the impliedprobability distribution for the simplified sterling ERIcan be constructed. More specifically, using weightsof 0.7 for euro-sterling and 0.3 for dollar-sterling, it ispossible to back out an implied probabilitydistribution for the sterling ERI.(4) Chart B shows the
Using option prices to derive a probability distributionfor the sterling exchange rate index
Chart AJoint probability distribution
1.20 1.25 1.30 1.35 1.40 1.45 1.50 1.55 1.60 1.65
1.61.71.81.92.02.12.2
0
2
4
6
8
10
12
14
16
18
$ per £
€ per £
Probability
Source: Bank calculations.
(1) For a more in-depth discussion of this topic see Hurd, M, Salmon, M and Schleicher, C (2005), ‘Using copulas to construct bivariate foreign exchangedistributions with an application to the sterling exchange rate index’, CEPR Discussion Paper no. 5114.
(2) The euro-sterling exchange rate has a weight of around 55% and the dollar-sterling exchange rate a weight of around 20% in the sterling ERI.(3) For more details on risk-neutral distributions see Clews, R, Panigirtzoglou, N and Proudman, J (2000), ‘Recent developments in extracting information from
options markets’, Bank of England Quarterly Bulletin, February, pages 50–60.(4) These weights were found by regressing euro-sterling and dollar-sterling against the overall ERI index.
Chart BTwelve-month sterling ERI probability distribution
0
1
2
3
4
5
6
7
8
9
10
75 80 85 90 95 100 105 110 115 120 125
Probability, per cent(a)
Index level
Source: Bank calculations.
(a) Probability of the sterling ERI being within ±0.5 index points of any given level. For example, the probability of the ERI being at 100 (between 99.50 and 100.50 in a year’s time was around 9%.

Markets and operations
131
distribution of the twelve-month ahead sterling ERIon 26 May 2006.
Given the probability distribution for the sterling ERI,it is possible to construct synthetic measures ofimplied volatility and risk-reversal statistics. Chart 9in the main text shows that the implied volatility ofthe sterling ERI has declined a little over recentmonths. And, as shown in Chart C, the probabilitydistribution has recently become less negativelyskewed — on 26 May the perceived risks to thesterling ERI were broadly balanced.
Estimating conditional probabilities
Another use of the joint distribution is to calculateconditional probabilities. For example, it is possibleto construct an implied distribution for the sterlingERI over the next twelve months given an assumedchange in the euro-dollar exchange rate.
Chart D shows an aerial view of the joint probabilitydistribution for the simplified sterling ERI shown inChart A. Essentially, a conditional distribution takesa vertical ‘slice’ of the joint distribution.(5) Thelocation of the ‘slice’ is determined by thecombination of dollar-sterling and euro-sterlingexchange rates that are consistent with the assumedfall in the euro-dollar exchange rate. The diagonallines in Chart D correspond to the locations of theconditional distributions (or ‘slices’) for a 10% or
20% appreciation (+) or depreciation (-) of the dollarversus the euro.
Chart E shows the conditional distributions for thesterling ERI in the event of a 10% fall/rise in thevalue of the dollar against the euro at thetwelve-month horizon, as well as the unconditionaldistribution. At face value, the distributions indicatethat option market participants perceived that evenrelatively large bilateral movements in the value of thedollar against the euro would tend have a relativelymodest impact on the probability distribution of the(‘simplified’) sterling ERI.
Chart CTwelve-month ‘synthetic’ risk reversal for the sterling ERI
0.3
0.2
0.1
0.0
0.1
0.2
0.3
2002 03 04 05 06
Percentage points
+
–
Sources: Bank of England and British Bankers’ Association.
Chart DContour ‘map’ of joint probability distribution
€ per £
$ p
er £
1.1 1.2 1.3 1.4 1.5 1.6 1.7
1.4
1.6
1.8
2.0
2.2
2.4
+20%
+10%
-20%-10%
Source: Bank calculations.
(5) More precisely, the conditional probabilities are calculated by applying Bayes’ Law. See Hurd, Salmon and Schleicher (2005) for more details.
Chart ETwelve-month unconditional and conditionalsterling ERI probability distributions(a)
0
1
2
3
4
5
6
7
8
9
10
75 80 85 90 95 100 105 110 115 120 125
Conditional on a 10% rise in the dollar versus the euro
Conditional on a 10% fall in the dollar versus the euro
Unconditional
Probability, per cent
Index level
Source: Bank calculations.
(a) Probability of the sterling ERI being within ±0.5 index points of any given level.

132
an expected appreciation of sterling against the dollarroughly offsetting an anticipated depreciation in sterlingagainst the euro. And the risks around that conditionalprojection appeared to be broadly balanced (Chart E inthe box on pages 130–31).
Long-term interest rates
Looking along the yield curve, sterling nominal forwardrates rose (Chart 10). Out to around a five-year horizon,that predominantly reflected an increase in inflationexpectations and/or inflation risk premia. Some marketcontacts reported that the move was consistent with thepossibility of higher energy and commodity pricesfeeding through into consumer price inflation.
Sterling real forward rates rose across the curve. Muchof the rise was in line with international long-term realrates, which increased steadily from mid-January untilmid-May (Chart 11). However, towards the end of thereview period long real forward rates fell slightly,perhaps reflecting some ‘flight to quality’ as financialmarket volatility rose and equity indices fell.
The increase in real forward rates over the period partlyreversed the steady falls observed during the previoustwo years.(1) But just as it was difficult to be categoricalabout what had pushed them lower, so it is hard to becertain about the reasons for the recent rise.
It is possible that a change in sentiment among bondinvestors may have pushed up term premia onlong-dated bonds over the review period. However,
implied volatilities derived from long-datedswaptions prices provided little evidence of a sharppickup in uncertainty surrounding long-term interestrates.
Alternatively, sterling long real forward rates may havebeen influenced by the rise in short-term market interestrates. In principle, long real forward rates should berelated to the equilibrium real interest rate, which islikely to be fairly stable over time. But over the past fewyears, movements in long-term real and short-termnominal interest rates have been highly correlated(Chart 12). One possible explanation is that marketparticipants might have been updating their beliefsabout the long-run equilibrium real rate based onobserved moves in short-term rates.
Chart 10Changes in sterling forward curves since 17 February(a)
20
10
0
10
20
30
40
50
60
70
80Basis points
0 5 10 15 20 25
Inflation
Nominal
Real
Years ahead
+
–
(a) Instantaneous forward rates derived from the Bank’s government liability curves.
(1) Previous Bulletins have identified several possible explanations for the gradual drift down in long real forward rates,which began in late 2003. For example, see page 6 of the Spring 2006 Quarterly Bulletin.
Chart 11International nine-year real forward rates(a)
0.0
0.5
1.0
1.5
2.0
2.5
3.0
3.5
4.0
Jan. Apr. July Oct. Jan. Apr. July Oct. Jan. Apr.
17 February
US dollar
Euro
Sterling
2004 05 06
Per cent
(a) Real component of euro rates implied by nominal government bond yields less inflation swap rates. Sterling and dollar real rates derived from the Bank’s government liability curves.
Bank of England Quarterly Bulletin: Summer 2006
Chart 12Comovement of one-year nominal forward rates withten-year nominal, real and inflation forward rates(a)(b)
0.2
0.0
0.2
0.4
0.6
0.8
1997 98 99 2000 01 02 03 04 05 06
Nominal
Inflation
Real
+
–
(a) Instantaneous forward rates derived from the Bank’s government liability curve.(b) Coefficient from 260-day rolling regression of changes in ten-year nominal, real
and inflation forwards on one-year nominal forward rates.

133
Despite the rise in long real forward rates, thesterling curve remained inverted. As discussed inprevious Bulletins, the inversion may indicate continuedrobust demand, relative to available supply, forlong-maturity index-linked bonds from defined-benefitpension funds.
Over the review period, there were announcements bythe UK Debt Management Office and by the UKPensions Regulator (summarised on pages 135),which had the potential to affect the balance ofanticipated supply of, and demand for, long-datedgilts. However, there were no obvious significantreactions in implied forward rates around the time ofthe announcements.
In addition to demand for long-dated gilts fromdefined-benefit pension funds, defined-contributionpension schemes may add to demand for long-datedgilts if scheme members purchase annuities onretirement and the annuity-provider then hedges itsexposure in the bond market. The relationship betweenannuity prices and long-term interest rates is describedin the box on this page.
Previous Bulletins have also noted that a large part ofthe demand for ultra-long dated sterling assets hasbeen in the form of interest rate or inflation swapstailored to match the future liabilities of pension funds.The providers of such swaps subsequently haveexposure to inflation risk. Some ways in which theymight seek to hedge this risk are outlined in the box onthis page.
Credit markets and the search for yield
Despite the rise in long-term interest rates and falls inequity and other prices, spreads on sterling-denominatedcorporate bonds ended the period narrower, althoughthey did widen a little around the middle of May(Chart 13).
Elsewhere, there was some evidence of a slight repricingof risk. For example, spreads on emerging marketcorporate debt widened by around 50 basis pointsduring May, although they still remained quite close tohistorical lows recorded earlier in the year. Primaryissuance also slowed in some corporate credit markets,and a few initial public offerings (IPOs) were postponed.But more generally, credit conditions did not appear tohave changed significantly in the wake of the recentpickup in financial market volatility.
Hedging inflation exposuresby swap dealers
Dealers providing inflation swaps can hedge theirexposure by isolating the inflation-linked cash flowson index-linked bonds using so-called asset swaps.
More specifically, having entered an inflation swaptransaction, a dealer can convert fixed payments intofloating (Libor-linked) payments using an interest rateswap (Chart A). The dealer can then borrow cash, onwhich it pays floating (Libor-linked) payments, which itinvests in an index-linked bond to provideinflation-linked cash flows. Dealers may enter intoasset swaps themselves or receive inflation-linked cashflows from hedge funds that undertake the asset swap.To the extent that these hedge funds are locatedoverseas, this highlights the need for care ininterpreting statistics on the location of gilt holdings,as the interest rate and inflation risk exposures on thegilts may have been transferred to a different locationthrough the swap market.
Dealers can sometimes find hedges for theirinflation-linked exposures in other parts of theirbusiness, such as making inflation-linked loans tocompanies, private finance initiative (PFI) projects orcommercial property leases, although they may stillneed to retain exposures until they can find a suitablehedge. Alternatively, they can use non-governmentsterling-denominated inflation-linked bonds, issuanceof which picked up recently. Over the review period,more than £1 billion of bonds linked to PFI projectswere issued. There has also been a steady stream ofindex-linked bond issuance from utilities companiesand other corporates, for example retailers.
Chart AHedging using an inflation-linked bond asset swap
INFLATIONSWAP
INTERESTRATE SWAP
INFLATION-LINKEDBOND
(Purchased usingborrowed funds)
DEALER
Provides inflationswap to pension fund
Hedges cash flowsvia index-linked
asset swap
Floating inflation-linked cash flows
Fixed cash flows
Floating Libor-linked cash flows
Markets and operations

134
Bank of England Quarterly Bulletin: Summer 2006
On retirement, an individual with a defined-contribution
(DC) pension scheme will usually purchase an annuity, to
provide a future income stream.(1) Providers of annuities
typically purchase bonds in order to hedge this exposure,
implying a link between bond yields and annuity rates.
In recent years, annuity rates have fallen steadily, and at the
end of 2005 had reached the lowest levels observed in
several decades (around 7%). In part, these falls reflected
declines in long-term interest rates (Chart A). However,
annuity prices are determined by a number of factors.
Annuity rates fall as discount rates fall; as life expectancy
increases; and as the ‘mark-up factor’ (ie the expected
compensation to the annuity provider) rises.
To see how these factors can affect annuity rates, it is
informative to consider a simple model of fixed annuities
with the price of an annuity equal to the present value of
the expected future cash flows paid to the pensioner
(adjusted to provide some expected profit to the annuity
provider). Using the Bank’s government liability yield
curves, together with mortality data from the ONS,(2) it is
possible to decompose changes in annuity rates into
changes in these underlying components (Chart B).
Approximately 35% of the decline in annuity rates since
1985 can be attributed to a fall in breakeven inflation, with
the largest falls following Bank operational independence in
1997. A further 27% of the decline is attributed to lower
real interest rates. Twenty nine per cent of the decline
reflects increased life expectancy, while the remainder
appears to be attributable to an increase in the mark-up
factor, estimated here as a residual.
One explanation for the rise in the mark-up is that annuity
providers may have become more risk-averse as a result of
unanticipated upward revisions to life expectancy.
Increased life expectancy and a higher mark-up factor are
likely to reduce pensioners’ expected retirement income. In
response, DC scheme members may choose to increase their
age of retirement and/or increase their pension saving.
Lower inflation expectations do not neccessarily reduce the
expected real retirement income of DC scheme members. At
the same time, lower real interest rates should only reduce
expected real retirement income if they are perceived to be
permanent. And to some extent this effect may be offset by
a rise in the value of these members’ pension funds. For
example, a simple dividend discount model of equity prices
would predict a rise in the value of equities when real
interest rates fall.
Decomposing changes in annuity rates
(1) Although there are a variety of annuity products on the market, this box focuses on a simple annuity that provides a fixed nominal payment each period untildeath, with a five-year guarantee, purchased by a male who retires aged 65.
(2) These data provide estimated survival probabilities for the general population. The analysis also assumes that changes in general population life expectancyproxy changes in the life expectancy of the annuity holder.
Chart ASterling annuity and long-term interest ratessince 1957
0
2
4
6
8
10
12
14
16
18
20
1960 65 70 75 80 85 90 95 2000 05
Annuity rate — male aged 65
Long spot rate(a)
Per cent
Sources: Bank of England, Edmond Cannon (Bristol University), GlobalFinancialData.com, William Burrows Annuities.
(a) 21/2% consol yield until 1980 then 15-year spot rate. Spot rates derived from theBank’s government liability curve.
Chart BContributions to cumulative changes in annuityrates (1985–05)(a)
8
7
6
5
4
3
2
1
0
1
1985 87 89 91 93 95 97 99 2001 03 05
Percentage pointsAnnuity mark-up factor
Real interest rateBreakeven inflationLife expectancy
Annuity rate
+
–
Sources: Bank of England, Edmond Cannon (Bristol University), GlobalFinancialData.com, ONS, William Burrows Annuities and Bankcalculations.
(a) Decomposition is a linear approximation of a non-linear relationship. As a result, the components of the chart do not sum exactly to the observed annuity rate.

Against a generally benign global macroeconomicbackdrop, it is perhaps too early to tell whether therecent increase in financial market volatility and thegradual withdrawal of monetary accommodation isprompting a widespread repricing of risk.
Anecdotal evidence suggests that some marketparticipants, especially hedge funds and others in thespeculative community, have either reappraised theamount of financial risk associated with particular assetclasses or reassessed their overall attitude towards risk.However, there are as yet few signs that other investorswith longer investment horizons (for example pensionfunds and insurance companies) have significantlyincreased their required compensation for taking onrisk.
Moreover, a number of the key elements of the ‘searchfor yield’ — described in previous Bulletins and in theBank’s recent Financial Stability Reviews — would appearto have remained largely intact over recent months. Inparticular, the repackaging of credit risk throughcollateralised debt obligations backed by assets such asleveraged loans, commercial real estate loans, homeequity loans and investment-grade bonds continuedapace. And credit conditions for leveraged buyouts ofcompanies remained favourable.
Developments in market structure
Over the review period, there were two significantdevelopments affecting the supply of and demand forlong-dated sterling-denominated bonds. In addition, theBank launched fundamental reforms to modernise theway in which the MPC’s interest rate decisions areimplemented in the sterling money markets. The box on
pages 136–37 describes the work of the SecuritiesLending and Repo Committee over the past year.
DMO funding remit
On 22 March, HM Treasury announced the UK DebtManagement Office (DMO) financing remit for the2006–07 financial year. It stated that, of a totalplanned £63 billion of gilt issuance, there would be aminimum core programme of £53 billion comprising atleast £10 billion in short conventional gilts (up to sevenyears’ maturity), £10 billion in medium conventionalgilts (7 to 15 years), £17 billion in long conventionalgilts (over 15 years) and £16 billion in index-linked gilts.As well as the core programme, a £10 billion programmeof supplementary issuance was introduced to allow theDMO to respond to changes in market conditions andthe pattern of demand for gilts within the financial year.The supplementary issuance will be allocated on aquarterly basis, with the first quarter’s £2.5 billion shareallocated to long conventional gilts. The secondquarter’s share, announced on 31 May, will be split bythe DMO between £1.25 billion of long conventionalgilts and £1.25 billion of index-linked gilts.
The pensions regulator’s approach to funding ofdefined-benefit pension schemes
On 4 May, the Pensions Regulator announced how itwould regulate the funding of defined-benefit (DB)pension schemes, following a consultation exercise thatbegan in October 2005. The main points noted bymarket commentators were: the increased emphasis onSection 179 and FRS17/IAS19 valuations for deficitmeasurements (which discount liabilities using marketinterest rates), rather than valuations on a buyoutbasis (which is the payment required by an insurer totake on the liabilities); that triggers should not beseen as standards or targets against which DB schemeswould be measured; and that there would be norequirement for schemes sponsored by companies ingood financial health to change their investmentstrategy.
Money market reform
The new framework for the implementation of UKmonetary policy launched by the Bank on 18 May hasfour objectives:
� Overnight market interest rates to be in line withthe official Bank rate, so that there is a flat moneymarket yield curve, consistent with the official
135
Chart 13Option-adjusted corporate bond spreads
200
250
300
350
400
450
500
550
600
Jan. May Sep. Jan. May Sep. Jan. May
40
50
60
70
80
90
100
Sterling high-yield (right-hand scale)
Global emerging market corporate (right-hand scale)
Sterling investment-grade (left-hand scale)
2004 05 06
Basis points Basis points
17 February
00
Source: Merrill Lynch.
Markets and operations

136
Bank of England Quarterly Bulletin: Summer 2006
The Securities Lending and Repo Committee (SLRC),chaired by the Bank, was formed in 1990. It providesa forum for discussion of market, infrastructure andlegal developments in securities lending and repomarkets and, where appropriate, makesrecommendations to market participants and relevantauthorities. It typically meets quarterly andcomprises representatives from repo and securitieslending practitioners, trade associations,infrastructure providers and UK authorities (the FSA,DMO and HM Revenue and Customs). SLRCmembership has recently been widened to ensure abroader representation of market practitioners andtrade associations. The minutes of SLRC meetings areavailable on the Bank’s website.(1)
Over the past year, the SLRC has discussed proposedchanges to the infrastructure supporting the UKsecurities lending and repo markets, including:
� Euroclear’s consultation on securities financing on itsfuture Single Platform, to which it is planned thatthe current national central securitiesdepositories in the Euroclear group (includingCREST in the United Kingdom) will migrate.SLRC members emphasised that the SinglePlatform should include the best features of thecurrent national systems, including CREST. Inparticular, delivery-by-value (DBV), or somethinganalogous, should be available on the newplatform to enable bundles of securities to befinanced overnight, or for a longer period, in astraightforward way. Relatedly, the Bank hasbeen pressing for any DBV facility to be not justovernight, as at present in CREST, but also toinclude provision for term transactions toremain ‘intact’ during the day in order to reducethe intraday liquidity required to unwind DBVsat the start of each day.
� LCH.Clearnet gilt DBV repo clearing project,scheduled to be introduced in 2006, which aimsto introduce the benefits of a centralcounterparty, including netting, for reposagainst bundles of gilts selected using the DBVservice offered in CREST. In particular, SLRC
members have discussed the proposed standardsize (shape) for trades sent to LCH for clearing,favouring no compulsory size on the basis thatfailed trades were rare in the gilt DBV market.
The SLRC’s market participant members have alsodiscussed the impact of proposed regulatory changesaffecting securities lending and repo markets, inparticular two new EU directives:
� The Transparency Directive, due forimplementation in January 2007, and inparticular its requirements regardingnotification of interests in shares in securitieslending transactions. SLRC practitionermembers had raised concerns about the limitedvalue of this information and the potentialreporting burden on securities lending marketparticipants. SLRC has discussed further howthese requirements might be implemented in away that meets the requirements of the Directivewhile being workable and cost-effective formarket participants.
� The Market in Financial Instruments Directive(MiFID), due for implementation in November2007. It seems that MiFID’s implications forrepo and securities lending will be limited; forexample, the best execution requirement will notapply to repo and security lending transactionsconducted between Eligible Counterparties (over90% of the total securities lending market). TheCommittee has also discussed whetheradditional reporting requirements to the FSAwould apply to securities lending and repo.
The SLRC has worked to improve understanding ofthe securities lending and repo markets and explaintheir important role at the heart of the modernfinancial system. For example, the Committee hascontributed to debates about how lenders of sharescan meet their corporate governance responsibilities.To this end, in conjunction with a number of tradeassociations representing the various participants inthe market and the London Stock Exchange, the SLRChas sponsored two publications:
The work of the Securities Lending and Repo Committee
(1) www.bankofengland.co.uk/markets/gilts/slrc.htm.

Markets and operations
137
� An Introduction to Securities Lending, which aimsto describe the modern markets for anon-expert; and
� Securities Lending and Corporate Governance.
Both publications are available on the SLRC pages onthe Bank of England website.(1)
One important function of the SLRC is to maintainvoluntary codes of market conduct for the gilt repo,securities lending and equity repo markets. TheSecurities Borrowing and Lending Code and the UKAnnex to the Code were first published in December2000 and updated in December 2004. The Gilt andEquity Repo Codes are currently being updated andnew versions should be issued later in 2006 or early2007.
Other issues recently discussed by the SLRC included:
� Basel II requirements, in particular relating to thedisclosure of underlying principals in securitiesloans. Except where borrowing is undertakenthrough what is classed as a ‘centralcounterparty’, this requirement will requireborrowers to identify the individual lenders ofsecurities and to identify what collateral is beingallocated to the lender.
� The ESCB/CESR(2) standards on clearing andsettlement, which aim to promote the safety andefficiency of European clearing and settlementsystems and to create a level playing fieldthrough the provision of a harmonisedregulatory framework. Standards relevant tosecurities lending include a dedicatedstandard on securities lending and a standardon risk controls to address participants’failures to settle. The finalisation andsubsequent implementation of the ESCB/CESRstandards will continue to be monitored bySLRC.
� Amendments to the FSA rules to allow securitieslending through Euroclear’s automated lendingprogramme by UK insurance companies.Securities lending is ‘approved’ if certainconditions are met concerning the assets lent,the counterparty and the collateral provided.Approval means the securities lent are stilltreated as being the lending company’s assetsfor solvency purposes.
� The 2003 Giovannini group report on EUcross-border clearing and settlement arrangements,setting out a process to overcome 15 barriers toefficiency. Current issues include work underway to harmonise national rules relating tocorporate actions processing, which could havean impact on securities lending.
An SLRC subgroup, comprising trade associationrepresentatives and legal advisers, is responsible forobtaining legal opinions on the effectiveness of theclose-out netting provisions in the Global MasterSecurities Lending Agreement (GMSLA), the OverseasSecurities Lender’s Agreement (OSLA) and the MasterGilt Edged Stock Lending Agreement (GESLA) underdifferent jurisdictions around the world. UKauthorised firms are required to obtain these legalopinions in order to support the reporting ofsecurities lending exposures to the FSA (on a netbasis) for capital adequacy purposes.
Recently the subgroup has been discussing thepotential to harmonise this exercise in gathering legalopinion with the similar process organised by theInternational Capital Markets Association (ICMA) andThe Bond Market Association (TBMA) for repotransactions under the Global Master RepoAgreement (GMRA). That would probably yield costsavings and efficiency gains for participating firms.Further work will be carried out to finalise the format,timing and funding of combined opinions, as well asestablishing the appropriate committee structures toreview them.
(1) Available at www.bankofengland.co.uk/markets/gilts/securitieslending.pdf andwww.bankofengland.co.uk/markets/gilts/skgjun05.pdf.
(2) European System of Central Banks/Committee of European Securities Regulators.

138
Bank of England Quarterly Bulletin: Summer 2006
Bank rate, out to the next MPC decision date, withvery limited day-to-day or intraday volatility inmarket interest rates at maturities out to thathorizon.
� An efficient, safe and flexible framework forbanking system liquidity management — both incompetitive money markets and, whereappropriate, using central bank money — inroutine and stressed, or otherwise extraordinary,conditions.
� A simple, straightforward and transparentoperational framework.
� Competitive and fair sterling money markets.
The framework is based on a system of voluntaryremunerated reserves with a period-averagemaintenance requirement, together with standingborrowing and deposit facilities available on demandthroughout the banking day to a wide range ofcommercial banks.
Reserve accounts are current accounts with the Bankthat are remunerated at the official Bank rate decided bythe MPC. Banks target average balances with the Bankover the periods between the MPC’s monthly interestrate decisions rather than having to ‘square up’ at closeof business every day, making it easier for them tomanage day-to-day cash flows. In the interests ofsimplicity, it has therefore been possible to discontinuetwo facilities previously used by banks to manage theirend-of-day payments flows.
Specifically, the Bank of England Late Transfer Scheme(BELTS) End-of-Day Transfer Scheme (EoDTS) facilitiesended on 17 May. There is, however, still a short windowfor settlement banks to make payments to each otherafter the payment system has closed on the last day ofeach maintenance period (when banks need to achievetheir average reserve targets). This is in addition to theovernight standing facilities.
The averaging mechanism for reserves allows banks torun their balances at the Bank up or down in responseto changes in market interest rates. Arbitrage shouldsmooth overnight market interest rates so that they do
not deviate materially from the rate expected to prevailon the final day of the monthly maintenance period.And on the final day of the maintenance period, thestanding facilities perform a rate-setting function,setting a narrower ±25 basis points corridor for marketrates.
The standing facilities provide liquidity insurance tofinancial institutions. A wide range of banks andbuilding societies can borrow (against collateral) from,or deposit money with, the Bank in unlimited amounts.Except on the final day, the penalty rates are ±100 basispoints (around the official Bank rate).
The Bank has also changed its open market operations(OMOs). The purpose of OMOs is to finance banknotesin circulation and ensure that the banking system canachieve its aggregate reserves target over themaintenance period. The Bank’s short-term OMOs havechanged to weekly repo operations for one-weekmaturity. A routine overnight fine-tuning operation isconducted on the final day of the maintenance period.
To reduce the size of the weekly short-term OMOs,monthly long-term repo OMOs were introduced inJanuary 2006. These provide financing at market rates,at maturities of three, six, nine and twelve months. TheBank also plans to purchase conventional gilts andhigh-quality foreign currency bonds swapped intofixed-rate sterling to back the enduring part of thebanknote issue;(1) further details will be announcedfollowing consultation with OMO counterparties, andliaison with the DMO.
The Bank’s new framework is set out in more detail inits ‘Red Book’ issued on 15 May.(2)
Bank of England official operations
Changes in the sterling components of the Bank ofEngland balance sheet
The size of the sterling components of the Bank’sbalance sheet grew following the reforms to the Bank’ssterling monetary operations (Table A). To reflectbetter the structure of the balance sheet following thelaunch of the new framework, the Bank has revised theweekly Bank Return published on its website.(3)
(1) A joint statement by the Bank and the DMO was issued on 15 May and is available atwww.bankofengland.co.uk/markets/money/documentation/boe_dmo.pdf.
(2) ‘The Framework for the Bank of England’s Operations in the Sterling Money Markets’ is available atwww.bankofengland.co.uk/markets/money/publications/redbook0506.pdf.
(3) Available at www.bankofengland.co.uk/publications/bankreturn/index.htm.
Markets and operations
139
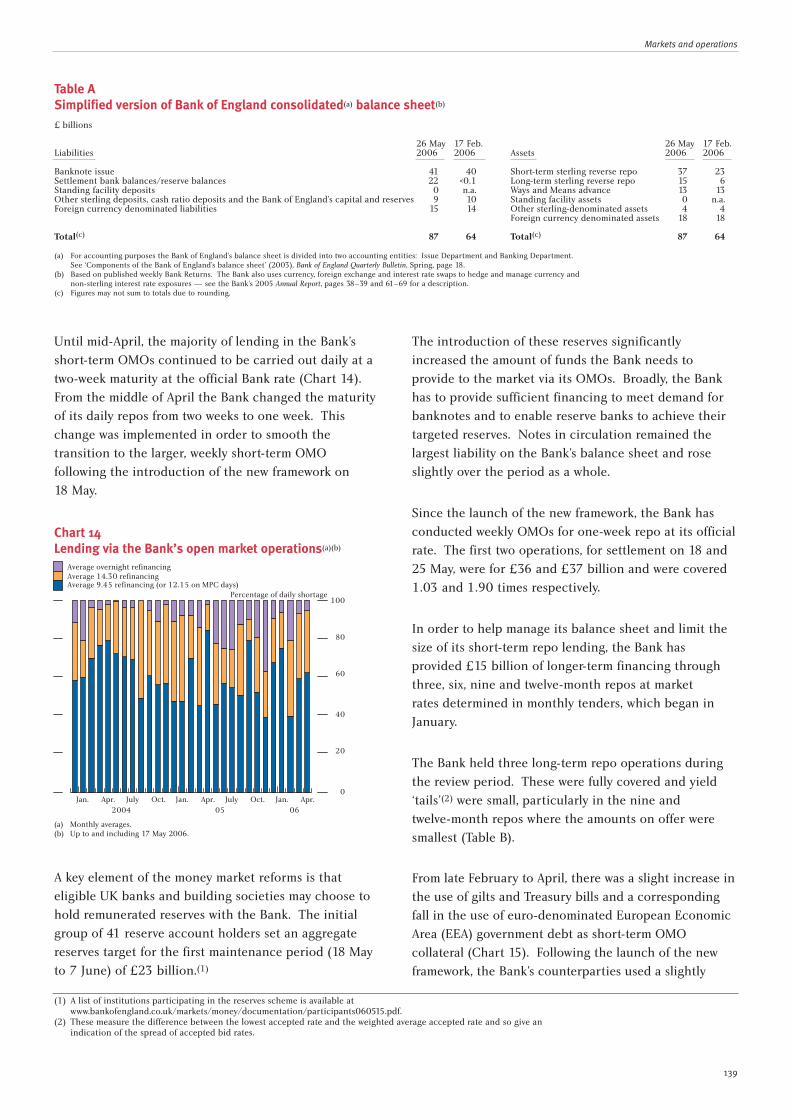
Until mid-April, the majority of lending in the Bank’sshort-term OMOs continued to be carried out daily at atwo-week maturity at the official Bank rate (Chart 14).From the middle of April the Bank changed the maturityof its daily repos from two weeks to one week. Thischange was implemented in order to smooth thetransition to the larger, weekly short-term OMOfollowing the introduction of the new framework on18 May.
A key element of the money market reforms is thateligible UK banks and building societies may choose tohold remunerated reserves with the Bank. The initialgroup of 41 reserve account holders set an aggregatereserves target for the first maintenance period (18 Mayto 7 June) of £23 billion.(1)
The introduction of these reserves significantlyincreased the amount of funds the Bank needs toprovide to the market via its OMOs. Broadly, the Bankhas to provide sufficient financing to meet demand forbanknotes and to enable reserve banks to achieve theirtargeted reserves. Notes in circulation remained thelargest liability on the Bank’s balance sheet and roseslightly over the period as a whole.
Since the launch of the new framework, the Bank hasconducted weekly OMOs for one-week repo at its officialrate. The first two operations, for settlement on 18 and25 May, were for £36 and £37 billion and were covered1.03 and 1.90 times respectively.
In order to help manage its balance sheet and limit thesize of its short-term repo lending, the Bank hasprovided £15 billion of longer-term financing throughthree, six, nine and twelve-month repos at marketrates determined in monthly tenders, which began inJanuary.
The Bank held three long-term repo operations duringthe review period. These were fully covered and yield‘tails’(2) were small, particularly in the nine andtwelve-month repos where the amounts on offer weresmallest (Table B).
From late February to April, there was a slight increase inthe use of gilts and Treasury bills and a correspondingfall in the use of euro-denominated European EconomicArea (EEA) government debt as short-term OMOcollateral (Chart 15). Following the launch of the newframework, the Bank’s counterparties used a slightly
Table ASimplified version of Bank of England consolidated(a) balance sheet(b)
£ billions
26 May 17 Feb. 26 May 17 Feb.Liabilities 2006 2006 Assets 2006 2006
Banknote issue 41 40 Short-term sterling reverse repo 37 23Settlement bank balances/reserve balances 22 <0.1 Long-term sterling reverse repo 15 6Standing facility deposits 0 n.a. Ways and Means advance 13 13Other sterling deposits, cash ratio deposits and the Bank of England’s capital and reserves 9 10 Standing facility assets 0 n.a.Foreign currency denominated liabilities 15 14 Other sterling-denominated assets 4 4
Foreign currency denominated assets 18 18
Total(c) 87 64 Total(c) 87 64
(a) For accounting purposes the Bank of England’s balance sheet is divided into two accounting entities: Issue Department and Banking Department. See ‘Components of the Bank of England’s balance sheet’ (2003), Bank of England Quarterly Bulletin, Spring, page 18.
(b) Based on published weekly Bank Returns. The Bank also uses currency, foreign exchange and interest rate swaps to hedge and manage currency and non-sterling interest rate exposures — see the Bank’s 2005 Annual Report, pages 38–39 and 61–69 for a description.
(c) Figures may not sum to totals due to rounding.
Chart 14Lending via the Bank’s open market operations(a)(b)
0
20
40
60
80
100
Jan.2004
Apr. July Oct. Jan.05
Apr. July Oct. Jan.06
Apr.
Percentage of daily shortage
Average overnight refinancingAverage 14.30 refinancing Average 9.45 refinancing (or 12.15 on MPC days)
(a) Monthly averages.(b) Up to and including 17 May 2006.
(1) A list of institutions participating in the reserves scheme is available atwww.bankofengland.co.uk/markets/money/documentation/participants060515.pdf.
(2) These measure the difference between the lowest accepted rate and the weighted average accepted rate and so give anindication of the spread of accepted bid rates.

140
higher proportion of gilts in short-term OMOs than inthe period running up to the reforms. In the longer-termrepo operations, counterparties used a slightly largerproportion of euro-collateral relative to that used in theshort-term operations. Contacts suggested that this wasmainly due to cost considerations.
Late transfer schemes
The relatively low level of flows in the end-of-dayschemes continued (Chart 16). Average daily paymentsin the Bank of England Late Transfer Scheme (BELTS)were less than £50 million on average, while averagedaily flows in the End-of-Day Transfer Scheme (EoDTS)were generally less than £150 million. As reported
above, these facilities are not needed in the modernisedsystem and have been withdrawn.
Changes in the foreign-currency components of theBank of England balance sheet
As part of the new monetary regime introduced in 1997,the Bank has been able to hold its own foreign exchangereserves. These, and other assets used to facilitateparticipation in the euro area’s TARGET payment system,are financed by issuing foreign-currency securities.
On 28 March 2006, the Bank auctioned €1 billion ofthe 2009 note as part of its euro-denominated notesprogramme; the first €2 billion tranche had beenauctioned on 24 January 2006. Cover in the auction ofthe second tranche was 2.8 and the average acceptedyield was 3.393%, approximately 13.2 basis points belowthe euro swaps curve at the time. This was the secondand final auction of the 2009 note and increased thevalue outstanding in the market to €3 billion. The totalnominal value of Bank euro notes outstanding in themarket rose to €7 billion.
On 24 April, the Bank of England announced it wouldissue no further euro bills, with the April 2006 euro billauction being the last in the series. The final euro billwill mature on 12 October 2006.
Employment of the Bank of England’s capital
As set out in previous Bulletins, the Bank holds aninvestment portfolio of gilts (currently around£2 billion) and other high-quality sterling-denominateddebt securities (currently £1.1 billion) of approximately
Bank of England Quarterly Bulletin: Summer 2006
Chart 15Instruments used as OMO collateral in short-termoperations(a)
Gilts and Treasury bills Euro-denominated EEA securitiesEligible bank bills Bank of England euro billsSterling-denominated EEA securities
0
20
40
60
80
100
Jan.2004
Apr. July Oct. Jan.05
Apr. July Oct. Jan.06
Apr.
Per cent
(a) Monthly averages.
Chart 16Bank of England Late Transfer Scheme and End-of-Day Transfer Scheme(a)(b)
Bank of England Late Transfer Scheme
£ millions
0
50
100
150
200
250
300
350
400
450
Jan.2004
May Sep. Jan.05
May Sep. Jan.06
May
End-of-Day Transfer Scheme
(a) Monthly averages.(b) Up to 17 May 2006.
Table BLong-term repo operations
Three-month Six-month Nine-month Twelve-month
14 March 2006On offer (£ millions) 2,850 750 400 200Cover 2.67 5.12 3.25 5.15Weighted average rate(a) 4.417 4.457 4.515 4.565Highest accepted rate(a) 4.430 4.460 4.515 4.565Lowest accepted rate(a) 4.410 4.455 4.455 4.565Tail(b) (basis points) 0.7 0.2 0 0
18 April 2006On offer (£ millions) 2,850 750 400 200Cover 2.34 3.35 3.25 3.75Weighted average rate(a) 4.468 4.513 4.575 4.64Highest accepted rate(a) 4.48 4.515 4.575 4.64Lowest accepted rate(a) 4.46 4.505 4.575 4.64Tail(b) (basis points) 0.8 0.8 0 0
16 May 2006On offer (£ millions) 2,850 750 400 200Cover 3.16 2.48 2.31 4Weighted average rate(a) 4.548 4.65 4.755 4.845Highest accepted rate(a) 4.57 4.65 4.755 4.845Lowest accepted rate(a) 4.541 4.65 4.755 4.845Tail(b) (basis points) 0.7 0 0 0
(a) Per cent.(b) The yield tail measures the difference between the weighted average accepted bid rate
and the lowest accepted rate.

141
the same size as its capital and reserves and aggregatecash ratio deposits with the Bank. These investmentsare generally held to maturity. Over the current reviewperiod, gilt purchases were made in accordance with thepublished screen announcements: £37.6 million of4.75% 2020 in March, £37.6 million of 4.75% 2015 inApril and £37.6 million of 5% 2014 in May. A screenannouncement on 1 June 2006 detailed the purchasesto be made over the following three months.
Markets and operations

142
Introduction
In a famous experiment, Pavlov showed how a pastassociation between two events could be mistaken for acausal link between the two. In his experiment, a bellwas rung as his dogs were provided with food. Overtime, the dogs learned to associate the two, believingthat the ringing of a bell would be accompanied by thearrival of food. Of course, that was not necessarily thecase. It is an example of the fact that correlation is notcausation.
A similar point applies to the interpretation ofcorrelations among many macroeconomic time series.The link between consumer spending and house pricesis a good example. The two series have tended to movetogether in the past. In part, that is because houseprice movements can cause changes in spending. Butthe correlation also reflects the influence of commonfactors, like expectations of future income, that affectboth house prices and consumption.
More recently, the empirical association between houseprices and spending has waned (Chart 1). That mightreflect a weakening in the causal links between them.Or it could be the case that, in contrast with the past,recent fluctuations in house prices have not been drivenby common factors like expected income. Instead, adifferent set of factors might have been important. Theycould have boosted house prices, but had a more limitedimpact on consumer spending. This illustrates that theimplications of a rise in house prices for consumerspending depend on why house prices have risen.
This article starts by discussing the common factors andcausal links that lie behind the association between
house prices and consumer spending. It then examineshow changes in the strength of these different channels,and the impact of other influences, might account forthe apparent weakness of that relationship in recentyears. Throughout the article, a common theme is thatthe linkages between house prices and consumerspending are more subtle — and rather less stable overtime — than is often supposed.
What explains the past empirical association?
Common factors
There are a number of factors that affect both houseprices and consumer spending. For example, areduction in interest rates, an increase in people’s accessto credit, and an improvement in income expectationswould all tend to boost demand for consumer goods and
House prices and consumer spending
This article explores the complex relationship between house prices and consumer spending. It explainsthat the strength of the relationship can vary considerably over time. And it highlights the key roles thatboth common factors and causal links have played in the weakening association between house pricesand consumer spending in recent years.
By Andrew Benito, Jamie Thompson, Matt Waldron and Rob Wood of the Bank’s Monetary Analysisarea.
Chart 1Real house prices(a) and consumer spending
6
4
2
0
2
4
6
8
10
12
1971 76 81 86 91 96 2001 0630
20
10
0
10
20
30
40Percentage change on a year earlier Percentage change on a year earlier
Consumer spending (right-hand scale)
Real house prices (left-hand scale)
+
_ +
_
Sources: Nationwide and ONS.
(a) Nationwide house price index deflated by the consumer expenditure deflator.

House prices and consumer spending
143
services, as well as demand for housing. In such cases,there might appear to be a direct relationship betweenhigher house price inflation and higher consumerspending growth. But, in reality, both outcomes aredriven by a common influence.
The key common factor is probably expected income(see King (1990) and Attanasio and Weber (1994)). Ifthere is an increase in the income households expect toearn in the future, that would lead them to plan higherspending — both now and in the years ahead.Households would demand more consumer goods andservices, and their demand for housing would rise too.The increase in future expected income would thereforelead to a rise in both consumer spending and houseprices.
Evidence suggests that income expectations have attimes played an important role in the comovementbetween house prices and consumer spending. Forexample, changes in income expectations should affectthe behaviour of renters as well as homeowners. So ifincome expectations had played a key role, we mightexpect the spending of renters to have moved with houseprices — even though they do not own a home. Basedon evidence from household surveys, that appears tohave been the case (Chart 2).
Similarly, if income expectations have been important,then house price movements would tend to be moreclosely related to the spending of the young than theold. Younger households have more years of work ahead
of them and should benefit most from a general rise inthe wages that people expect to earn in future. Chart 3 shows that the spending of younger householdsdid indeed appear to move more closely with risinghouse prices in the late 1980s and late 1990s, as well aswith the fall in house prices in the early 1990s. As thebox on page 145 explains, however, some studies havealso pointed to a strong link between house prices andthe spending of older households. So evidence on thespending behaviour of different age groups is not clear-cut.
House prices and household wealth
Wealth and consumer spending are closely linked. Theamount that a household can spend over its lifetime islimited by the wealth it can accumulate. And, in general,a household is likely to respond to an increase in wealthby spending more both now and in the future.
As a result, it is often supposed that house pricesinfluence consumer spending because housing is amajor part of households’ wealth. Housing accounts foraround 40% of total household assets. More people ownhomes than shares (see Banks and Smith (2000)). And,for many households, housing is the most valuable assetthey own (see Barwell et al (2006)).
But, in reality, the link between house prices andaggregate wealth cannot explain the historicalassociation between house prices and consumerspending (see Aoki et al (2001)). That is because of akey characteristic of housing.
Chart 2House prices and consumer spending by tenure group
6
3
0
3
6
9
12
1977 81 85 89 93 97 2001
Renters’ spending
Homeowners’ spending
House prices Percentage changes on a year earlier(a)
+
–
Chart 3House prices and consumer spending by age group
6
3
0
3
6
9
12
1977 81 85 89 93 97 2001
Under 35s’ spending
35–60s’ spending
Over 60s’ spending
House pricesPercentage changes on a year earlier(a)
-
+
–
Sources: Attanasio et al (2005) and the ONS Family Expenditure Survey.
(a) In order to smooth year-on-year fluctuations, annual data are averaged over periods of high or low consumption growth: 1977–79, 1980–85, 1986–90, 1991–95, and 1996–2001. Underlying data are for calendar years until 1992 and for financial years thereafter.
Sources and footnote: see Chart 2.

144
Bank of England Quarterly Bulletin: Summer 2006
What makes housing different?
Housing is very different from other assets, such asshares. People not only own houses, they obtain aservice from them — they live in them. By contrast,households only own shares; they do not ‘consume’them.
This characteristic means that house price movementsaffect people in two key ways. First, they affect the valueof the houses that people own. Second, they affect thecost of living in them. When house prices rise, typicallyrents do too — so renters face higher housing costs.(1)
And even though homeowners’ mortgage payments donot necessarily change, they have to pay more for theirhousing as well. A homeowner who intends to movehouse will have to pay more to live in the new home.Those staying put will also pay more, albeit implicitly, bycontinuing to stay in their now more expensive house.(2)
The overall impact on the wealth accumulated by anindividual — and hence their spending — depends onthe balance of these two effects. For some households,they will roughly cancel each other out. The rise in thevalue of their home is matched by the rise in their futurehousing costs. But an increase in house prices can alsogenerate winners and losers.
Broadly speaking, homeowners planning to ‘trade down’to a cheaper home, or sell for the last time, are likely tobe better off following a rise in house prices. Their gainfrom the increased value of their home should exceedtheir loss from the increased housing costs they face inthe future. By contrast, renters or homeowners who planto ‘trade up’ tend to be worse off.
In aggregate, gains in household wealth would beslightly larger than losses, to the extent that some part ofthe increase in future housing costs is borne by futuregenerations. However, when forming their spendingplans, people may take into account the cost of higherhouse prices to be faced by their children andgrandchildren. Some will plan to leave them money (oreven a home) to assist with their future housing costs.
Such households may not perceive any change at all inthe resources that they have available for spending overtheir lifetimes.
Housing is therefore very different from other assets.(3)
In particular, house price rises cannot provide asignificant boost to consumer spending by raisingaggregate wealth. But housing has a number of othercharacteristics, such as its role as collateral againstwhich people can borrow to finance spending. As thenext section highlights, this means that house priceincreases can stimulate spending in ways that manyother assets cannot.
Causal links between house prices and consumerspending
Redistribution of wealth
Changes in house prices redistribute wealth. Whenhouse prices rise, those who plan to trade down gainwhile those who intend to trade up lose (see above). Ifthese groups respond differently to changes in theirwealth, that redistribution of wealth could be asignificant influence on aggregate spending.
In practice, households planning to trade up tend to beyounger households and those planning to trade downare often older homeowners. Older households do notneed to spread any change in wealth over as much timeas younger households, which could lead them to reactmore strongly to a change in wealth than youngerhouseholds.
However, other factors may dampen that redistributionalimpact. First, the extent to which house price changesredistribute wealth may be limited by bequests (seeabove). Second, constraints on borrowing may meanthat younger households’ spending is more closelyrelated to changes in disposable income than that ofolder households.(4) So when house prices and rentsincrease, they may be forced to cut back on theirconsumption in line with the increase in their housingcosts. That could lead them to react more strongly to achange in wealth than older households.(5)
(1) Weeken (2004) discusses developments, such as falls in real interest rates, that can lead to higher house prices relative to rents. (2) This cost is often referred to as an opportunity cost. The opportunity cost of living in a house as an owner-occupier is the rent that
would be received if the house were let to a tenant. As house prices and rents rise, so too does the opportunity cost of being ahomeowner or the implicit cost of living in that home.
(3) A further reason is that housing is not traded internationally. As a result, UK households in aggregate cannot realise their capitalgains on housing when house prices rise.
(4) Younger households, and particularly renters, are more likely than older households to face constraints on their ability to borrow. Thismay make it difficult for these households to maintain their current level of consumer spending as housing costs rise. See Flemming(1973) for a broader discussion of the implications of borrowing constraints for consumption.
(5) Other factors could have a dampening effect. For example, some households may be so uncertain about their future housing needs, orabout future movements in house prices, that they are unwilling to adjust their spending plans when house prices change.

House prices and consumer spending
145
Overall, redistributional effects may help to explain thepositive relationship between house prices andconsumer spending shown in Chart 1. But the influenceof the factors discussed above is very uncertain and islikely to vary from time to time — for example, as theborrowing constraints faced by households change. Assuch, there is no reason to expect the strength of thischannel to be stable over time.
Housing as collateral
Unlike many other assets, housing can be used ascollateral for loans. When house prices rise, there is anincrease in the amount of housing equity and hencecollateral at homeowners’ disposal. That can boostspending because lenders are usually prepared to lend
more, and at a lower interest rate, when there is morecollateral. (It also implies a link between mortgageequity withdrawal and consumer spending. The strengthof that link is examined in the box on page 146.)
This affects the spending of two different sorts ofhousehold. The first are households who wanted toborrow and spend more prior to a rise in house prices,but were unable to do so because they did not own anyequity in their homes and lenders refused to extendthem credit. A rise in house prices would allow these households to borrow where they previously couldnot.
More homeowners probably fall into a second category.They already have access to credit of some form. But the
Aggregate data may not be sufficiently informative toexplain why house prices affect consumer spending.That is because different theories predict broadlysimilar behaviour in aggregate. But the same theoriesmake distinct predictions for how households withcertain characteristics should respond to changes inhouse prices. This box considers what we can learnfrom the spending behaviour of those individualhouseholds.
If the links between house prices and consumerspending reflect a common influence like incomeexpectations, then house prices should have astronger impact on the spending of the young thanthe old (see page 143). By contrast, a causal link likewealth redistribution points to a stronger effect onthe spending of older households — those mostlikely to trade down in the future and benefit fromhouse price rises.
The different theories also have implications for the behaviour of renters and homeowners. On the one hand, higher income expectations would affect renters and homeowners, so thespending of both of these groups might rise withhouse prices (see page 143). On the other hand, the collateral and precautionary savings channelsshould affect only those who own their homes. That implies a closer relationship between houseprices and spending for homeowners than renters.
Two recent studies have attempted to use theseinsights to explore the practical importance of theexplanations for the comovement between houseprices and consumer spending. Both use data fromthe Family Expenditure Survey, a survey of UKhouseholds that provides information about theirspending behaviour, income and family demographicsover the past few decades. But they adopt differentmethodological approaches.
The study by Attanasio et al (2005), using data from1978 to 2001/02, provides evidence that incomeexpectations have in the past played a crucial role inaccounting for aggregate variation in consumptionand house prices. The authors find that theassociation between house prices and consumerspending was stronger for the young than for the old,and broadly similar for homeowners and renters. Astudy by Campbell and Cocco (2005), using datafrom 1988 to 2000/01, is also consistent with incomeexpectations being important. But it providesevidence of a strong link between house prices andconsumer spending for older households as well. Thereason why the studies’ results differ is not clear.
Existing studies do not provide a definitive guide tothe links between house prices and spending.Nonetheless, analysis of the behaviour of individualhouseholds appears to be key to gauging the relativeimportance of the various links between house pricesand consumer spending.
How important are the different channels from house prices to consumer spending?
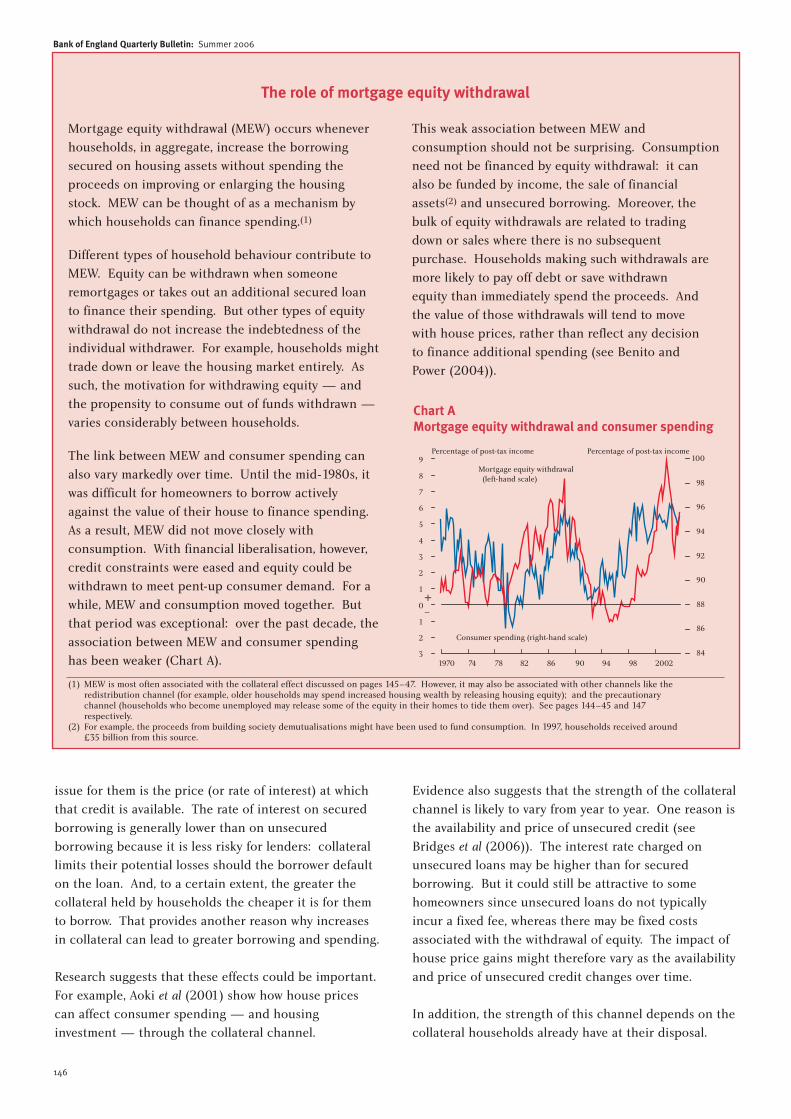
146
Bank of England Quarterly Bulletin: Summer 2006
issue for them is the price (or rate of interest) at whichthat credit is available. The rate of interest on securedborrowing is generally lower than on unsecuredborrowing because it is less risky for lenders: collaterallimits their potential losses should the borrower defaulton the loan. And, to a certain extent, the greater thecollateral held by households the cheaper it is for themto borrow. That provides another reason why increasesin collateral can lead to greater borrowing and spending.
Research suggests that these effects could be important.For example, Aoki et al (2001) show how house pricescan affect consumer spending — and housinginvestment — through the collateral channel.
Evidence also suggests that the strength of the collateralchannel is likely to vary from year to year. One reason isthe availability and price of unsecured credit (seeBridges et al (2006)). The interest rate charged onunsecured loans may be higher than for securedborrowing. But it could still be attractive to somehomeowners since unsecured loans do not typicallyincur a fixed fee, whereas there may be fixed costsassociated with the withdrawal of equity. The impact ofhouse price gains might therefore vary as the availabilityand price of unsecured credit changes over time.
In addition, the strength of this channel depends on thecollateral households already have at their disposal.
Mortgage equity withdrawal (MEW) occurs wheneverhouseholds, in aggregate, increase the borrowingsecured on housing assets without spending theproceeds on improving or enlarging the housingstock. MEW can be thought of as a mechanism bywhich households can finance spending.(1)
Different types of household behaviour contribute toMEW. Equity can be withdrawn when someoneremortgages or takes out an additional secured loanto finance their spending. But other types of equitywithdrawal do not increase the indebtedness of theindividual withdrawer. For example, households mighttrade down or leave the housing market entirely. Assuch, the motivation for withdrawing equity — andthe propensity to consume out of funds withdrawn —varies considerably between households.
The link between MEW and consumer spending canalso vary markedly over time. Until the mid-1980s, itwas difficult for homeowners to borrow activelyagainst the value of their house to finance spending.As a result, MEW did not move closely withconsumption. With financial liberalisation, however,credit constraints were eased and equity could bewithdrawn to meet pent-up consumer demand. For awhile, MEW and consumption moved together. Butthat period was exceptional: over the past decade, theassociation between MEW and consumer spendinghas been weaker (Chart A).
This weak association between MEW andconsumption should not be surprising. Consumptionneed not be financed by equity withdrawal: it canalso be funded by income, the sale of financialassets(2) and unsecured borrowing. Moreover, thebulk of equity withdrawals are related to trading down or sales where there is no subsequent purchase. Households making such withdrawals aremore likely to pay off debt or save withdrawn equity than immediately spend the proceeds. And the value of those withdrawals will tend to move with house prices, rather than reflect any decision to finance additional spending (see Benito and Power (2004)).
The role of mortgage equity withdrawal
Chart AMortgage equity withdrawal and consumer spending
84
86
88
90
92
94
96
98
100
1970 74 78 82 86 90 94 98 20023
2
1
0
1
2
3
4
5
6
7
8
9Percentage of post-tax income Percentage of post-tax income
Consumer spending (right-hand scale)
Mortgage equity withdrawal (left-hand scale)
+_
(1) MEW is most often associated with the collateral effect discussed on pages 145–47. However, it may also be associated with other channels like theredistribution channel (for example, older households may spend increased housing wealth by releasing housing equity); and the precautionarychannel (households who become unemployed may release some of the equity in their homes to tide them over). See pages 144–45 and 147respectively.
(2) For example, the proceeds from building society demutualisations might have been used to fund consumption. In 1997, households received around£35 billion from this source.

House prices and consumer spending
147
When levels of housing equity are low (or even negativeas they were for a significant number of households inthe early 1990s), then house price rises that increase the level of equity and collateral could provide arelatively large boost to consumer spending. But whenborrowing is already supported by the widespreadavailability of collateral — most notably, following a period of sustained house price rises — then the impact on consumer spending should be morelimited.
Finally, the collateral effect of house prices on spendingis complicated by its impact on future, as well as current,spending. An increase in the amount of collateralavailable to homeowners does not, by itself, increasehousehold wealth. So rather than implying an increasein overall lifetime consumption, the collateral channelimplies a change in the timing of consumption. Bywithdrawing equity, a homeowner boosts currentspending at the expense of lower spending in thefuture.(1)
Precautionary saving
House prices can also affect consumer spending viaprecautionary saving. This is saving by households as aresponse to uncertainty about their future financialsituation. For example, if it is difficult or costly to takeout insurance against unanticipated future events likeredundancy, households can instead save as a form of‘self-insurance’ (see Benito (2006a)).
Housing wealth can form part of households’precautionary savings. For instance, if homeowners fallill and this affects their earnings, they may be able towithdraw equity from the home to tide them over untiltheir earnings recover. As house prices and housingequity rise, the need to hold other forms of wealth forprecautionary reasons may be reduced.(2) That canprovide further support to spending.(3)
Research suggests that households may respond toincome uncertainty by leaving housing equity in thehome, instead of extracting it, as well as accumulatingliquid savings (see Carroll et al (2003)). That suggests
that households look to their housing equity as fulfillingsome kind of precautionary savings role.
The strength of this channel would vary in response tochanges in perceived uncertainty. For example,households may be less willing to run down theirprecautionary savings if they became more uncertainabout their future job prospects.
In common with the collateral channel, the strength ofthe precautionary savings channel is also likely todepend on the amount of housing equity thathouseholds have at their disposal. When householdsalready have a sufficient amount of equity in their homesto satisfy the need for precautionary saving, furtherincreases in equity provide no further insurance. Insuch cases, homeowners are less likely to run downfinancial balances of precautionary saving and consumerspending is less likely to increase.
But the precautionary saving channel is distinct fromthe collateral channel. To the extent that householdswere saving to provide a cushion against unexpectedevents like redundancy, a higher home value means thatsaving is no longer so important. And rather thanrespond to that increased home value by borrowingmore, they may just save less instead.
Housing market activity and spending
Another way in which housing market developments cancause changes in consumption is through spendingrelated to moving home. Housing transactions may beassociated with consumer spending if households aremore likely to purchase some goods and services whenthey move home (Chart 4). And, in the past, housingtransactions have tended to move closely with houseprices (see Benito (2006b)). That could explain some ofthe observed comovement between house prices andconsumer spending.
But any effect on consumer spending from this channelis likely to be small and short-lived.(3) The types ofgoods and services that are closely related to movinghouse account for a relatively small proportion of totalconsumption. And the number of households that move
(1) The effect on current spending could be quite large if the homeowner were credit constrained prior to the rise inhouse prices. By contrast, the effect on spending in any particular period in the future is likely to be much smaller asthat lower future spending is spread out over time.
(2) Housing equity is an imperfect substitute for other types of precautionary savings, such as bank deposits, because itsfuture value is more uncertain and it is more costly to access. As a result, households may not wish to hold a highproportion of precautionary savings in the form of housing equity — notwithstanding recent innovations in mortgagemarkets that allow households to draw on equity when required (see Smith and Ford (2002)).
(3) In common with the collateral channel, this represents a change in the timing of consumption: any additional currentspending comes at the expense of future expenditure.

148
Bank of England Quarterly Bulletin: Summer 2006
home each year typically constitutes only a smallproportion of all households (see Benito and Wood(2005)).
Why did the empirical relationship weaken?
The previous section highlighted the likely factorsbehind the historical association between house pricesand consumer spending. Common factors are likely tohave played a key role. Certain causal links, such as thecollateral channel, may have been important too. Butwhy should these channels have weakened in recentyears?
Common factors
The influence of common factors can vary considerablyover time. But, in many cases, these factors cannot be directly observed. That is the case for perhaps themost important common influence — incomeexpectations.
Fortunately, a number of measures provide an indirectindication of households’ perceptions of future incomeprospects. Recent income growth can be informative ifhouseholds use past developments as a guide to futureincome growth. The pattern of consumer spending mayalso be telling. Any change in household perceptions offuture income prospects would tend to affect the shareof durable spending in overall consumption, as adjustingthe stock of durable goods to a new desired levelrequires a large initial swing in expenditure (see Power(2004)). Finally, surveys of consumer confidence might
provide a rather more direct read on households’perceptions (see Berry and Davey (2004)).
Over recent decades, marked movements in house pricesand consumption have typically been accompanied bysimilar fluctuations in these indicators of expectedincome. That would be consistent with this commoninfluence playing an important role in drivingmovements in both house prices and consumerspending.
But the indicators have remained relatively stable overthe past few years, at or around the average levels of thepast 30 years (Table A). That is illustrated by Chart 5,which presents a simple proxy for income expectations— the average difference of each indicator from itsmean. The relative stability of the proxy contrastsmarkedly with the pickup, and subsequent fall, in realhouse price inflation over this period.
Chart 4Consumer spending and moving house(a)
0
5
10
15
20
25
Freezer Washingmachine
Colour TV Tumble dryer Dishwasher
Percentage of house movers that purchased:Percentage of other households that purchased: Per cent
Source: British Household Panel Survey 1992–2002.
(a) Refers to purchases and house moves over the past year.
Table AIndicators of income expectations(a)
Average 2001 2002 2003 2004 2005since 1975
Percentage changes on a year earlierReal post-tax labour income(b) 2.4 4.2 2.8 1.9 2.6 1.5
Percentage of total nominal spendingSpending on durables 12.0 12.2 12.1 12.3 12.4 12.0
BalanceGfK consumer confidence -6.3 1.1 3.1 -4.4 -3.4 -3.1
Memo: Percentage changes on a year earlierHousehold consumption(c) 2.8 3.0 3.5 2.6 3.5 1.7
Sources: GfK and ONS.
(a) Averages of quarterly data.(b) Deflated by consumer expenditure deflator.(c) Chained volume measure.
Chart 5Real house price inflation and a simple proxy for income expectations
30
20
10
0
10
20
30
40
1975 80 85 90 95 2000 05
Real house price inflation(a)
Income expectations proxy(b)
Per cent
+
_
Sources: Bank of England, GfK, Nationwide and ONS.
(a) Four-quarter rate. Real house prices were calculated by deflating the Nationwide house price index by the consumer expenditure deflator.
(b) Simple average of the Table A indicators’ deviation from mean. The indicators differ in their variability so, for comparability, each series was normalised by dividing by its standard deviation relative to house price inflation.

House prices and consumer spending
149
The evidence suggests that, in contrast with the past,recent fluctuations in house prices have not been drivenby common influences like expected income. Thatappears to be a key reason why consumer spendinggrowth remained relatively stable as house prices surged.Indeed, the relative stability of spending growth is, initself, an indication that income expectations had notrisen sharply.
Instead, it seems likely that a different range of factorshas driven house prices higher in recent years. Demandfor housing has been boosted by the rate of householdformation, which has tended to exceed the limitedresponse of supply. A further source of increaseddemand may have been investment demand. And otherdevelopments, like the decline in long-term real interestrates, may have been important too.
Such factors are likely to have had a less markedinfluence on consumer spending than on house prices.And that should explain some of the divergence between house prices and consumer spending in recentyears.
Causal links
Redistribution of wealth
The earlier discussion noted that a rise in house pricescould increase aggregate spending by redistributingwealth from younger to older households. It also notedthat the size of this wealth redistribution would besmaller if older households transferred some of theirincreased wealth to their children. Such transfers mightbe more likely to occur when house prices rise sharply,as they have in recent years. Indeed, Tatch (2006)estimates that the proportion of first-time buyers underthe age of 30 receiving assistance with their depositincreased from less than 10% in 1995 to almost 50% in2005. Correspondingly, the amount of wealthredistributed from younger to older generations overthis period is likely to have been smaller than itotherwise would have been.
Housing as collateral
The strength of the collateral channel depends cruciallyon the extent to which households are prevented frombringing forward spending by borrowing against thevalue of their homes. Those constraints may have beenparticularly binding prior to the rapid rise in houseprices of the late 1980s, given that lenders only began to
offer equity withdrawal in the mid-1980s (see the box onpage 146). But there are a number of reasons to believethat such constraints on households were relatively weakat the beginning of this decade.
House prices rose significantly in the latter half of the1990s. That had a large impact on the amount of equity at homeowners’ disposal. By 2000, housingequity was twice as large as annual household income —above the average of recent decades (Chart 6). So at thestart of the current decade, the aggregate amount ofcollateral at homeowners’ disposal was alreadysubstantial.
The large amount of collateral available could indicatethat households were generally not prevented frombringing forward spending. However, the aggregateamount of collateral can be a poor guide when equity isunevenly distributed. As such, it is also important toconsider the disaggregate picture.
The British Household Panel Survey (BHPS) and theSurvey of Mortgage Lenders (SML) provide informationabout the distribution of housing equity (see Hancockand Wood (2004)). According to the BHPS, theproportion of homeowners with a large mortgage andhence low equity, relative to the value of their house, fellsharply in the latter half of the 1990s (Chart 7). TheSML, which covers only those taking out a newmortgage, reports similar findings. It suggests that, bythe beginning of the current decade, high loan to valueratios were less prevalent than they had beenthroughout the previous 20 years. Some of that declinemight be related to more cautious bank lending policies.But it is also consistent with a broadly based rise in thecollateral at households’ disposal.
Chart 6Housing equity
100
150
200
250
300
350
1970 75 80 85 90 95 2000 05
Percentage of annual post-tax income
1970–2000
average

150
Bank of England Quarterly Bulletin: Summer 2006
Moreover, homeowners (and non-homeowners) wouldalso have benefited from greater access to unsecuredcredit during the 1990s. Households appear to havetaken increasing advantage of more flexible types ofunsecured debt, such as credit cards (see May et al(2004)). And that could also have weakened theirdependence on house price gains to facilitate spending(see Bridges et al (2006)).
Overall, it seems likely that households were rather lessconstrained at the beginning of this decade than theyhad been prior to previous periods of rapid house pricerises. That points to a less important role for houseprices in loosening spending constraints. And itsuggests that, over the past few years, the collateralchannel should have been weaker.
Precautionary savings
Precautionary savings provide a type of self-insuranceagainst unanticipated future events. So the strength ofthis channel depends on both households’ desire forsuch insurance and the role of further house price gainsin providing it.
It is possible that households’ desire for precautionarysavings has declined in recent years. The economicenvironment has been much more stable since theinflation-targeting framework was introduced (see
Benati (2005)). That increased stability might havelowered households’ perceptions of the probability offuture adverse developments, like redundancy.(1) And, inturn, that could have reduced households’ desiredprecautionary savings.
It also seems likely that recent house price gains haveplayed a less important role in providing insurance. Asdiscussed above, housing equity had already reachedhigh levels by the beginning of the current decade. Somany households would already have had more thanenough equity in their homes to satisfy the need forprecautionary savings — especially if they required lessinsurance on account of the more stable economicenvironment. In addition, housing equity may havebecome a less important provider of precautionarysavings in recent years because of the easier availabilityof unsecured credit on favourable terms. Thesedevelopments would point to a weaker impact of houseprices on consumer spending through this channel.
Additional influences
Consumption is affected by a range of factors other thanhouse prices. So the looser empirical associationbetween house prices and consumer spending might notonly reflect weaker causal links and the limited role ofcommon factors like income expectations. It could alsobe related to other determinants of consumption, suchas financial wealth. Direct and indirect holdings ofshares account for around a third of household netassets. And the FTSE All-Share index fell by around 40%between 2000 Q1 and 2003 Q1.
The implications of that decline in financial wealth arenot straightforward. Share prices are much more volatilethan house prices, so households may look throughsome share price movements in case they are quicklyreversed. Two thirds of households’ equity wealth is heldindirectly, for example in pension funds. The value ofthat wealth might not be as easily observed, or indeedaccessed, as directly held equity wealth (see Davey (2001)). And, crucially, the implications forconsumer spending of any change in share pricesdepend on its cause.(2)
Moreover, share prices affect both consumption andhouse prices.(3) By lowering household wealth, a fall in
Chart 7Loan to value (LTV) ratios
0
10
20
30
40
50
60
70
1980 83 86 89 92 95 98 2001 04
0
2
4
6
8
10
12
14
LTV >0.8
LTV >0.9
LTV >1
Percentage of new mortgagesfor house purchasePercentage of homeowners
SML (right-hand scale)BHPS (left-hand scale)
Sources: British Household Panel Survey (BHPS) and Survey of Mortgage Lenders (SML).
(1) This might not have lowered overall earnings uncertainty if earnings at the household level have become more variable.There is evidence that earnings were more uncertain in the early 1990s than they had been in the late 1970s and1980s (see Dickens (2000)).
(2) See Labhard et al (2005), Millard and Power (2004), and Millard and Wells (2003).(3) The factors that cause movements in share prices — such as changes in expected future economic prospects — can
also affect house prices and consumption (see pages 142–43).

House prices and consumer spending
151
The relationship between house prices and consumerspending appears to have weakened in recent years.This box examines the extent to which the associationhas waned.
A common way of quantifying the relationshipbetween house prices and consumption is to estimatean economic model. One such model is the Bank ofEngland Quarterly Model (see Harrison et al (2005)).The Bank model maintains that, in the long run,aggregate consumption depends on financial wealthlike shares and non-financial wealth such ashouseholds’ lifetime earnings. Consumption doesnot depend on house prices in the long run,(1) giventhe special characteristics of housing described onpage 144. In the short run, consumption growthdepends on changes in housing wealth, income,employment, interest rates, how much consumptionand net financial wealth differ from their long-run or‘core’ values, and an error term.(2)
The coefficient on housing wealth provides a guide tohow closely house prices move with consumption,when we allow for other factors that also influencespending. It conflates a variety of links betweenhouse prices and consumption. It captures theimpact of causal links, like the collateral channel.And it may also reflect the influence of commonfactors like income expectations.(3)
To assess whether the association between housingwealth and consumption has changed over time, weestimated the short-run equation over rolling 20-yearperiods.(4) In other words, we estimated the equationover the first 20 years of data, and moved that samplewindow forward one quarter at a time. As we did so,we recorded how the estimated coefficient on thehousing variable changed. This is shown in Chart A.
The chart shows that the housing wealth coefficientvaries considerably. That is consistent with the ideathat the implications of a house price rise for
spending depend on the factors behind the houseprice rise, and those factors are likely to differ fromperiod to period. It is also consistent with markedchanges over time in the strength of causal linksbetween house prices and spending.
Further, the chart shows that the coefficient onhousing wealth tends to decline as we use morerecent data.(5) We obtained similar results whenestimating the coefficient in a more conventionalerror-correction consumption function, similar tothat estimated by the IMF (2006). This suggests thatthe empirical relationship between house prices andconsumption has indeed weakened.(6)
Overall, the empirical association between houseprices and consumer spending appears to havedeclined, even when we allow for additionalinfluences like income and financial wealth. Thataccords with the idea that causal links may have beenweaker, and common factors less influential, in therecent past. But, as the box on page 145 discusses,there is a limit to what aggregate models can tell usabout the factors behind the waning associationbetween house prices and spending.
Estimating the role of housing
Chart ARolling estimates of housing wealth coefficientin Bank of England Quarterly Model(a)
0.0
0.1
0.2
0.3
0.4
0.5
1998 99 2000 01 02 03 04 05
Coefficient
(a) Each data point represents the housing wealth coefficient obtained when the short-run equation was estimated over the 20-year period to that quarter. Thedotted lines show the 95% confidence interval.
(1) Note that changes in the value of the housing stock that are caused by home improvements or the building of new homes, rather than changes in thegeneral price of housing, do affect consumption in the long run.
(2) The core values are from the theoretical part of the Bank of England Quarterly Model, which can be thought of as an organising framework for analysingeconomic issues. See Harrison et al (2005) for more details.
(3) The model directly controls for the common influence of interest rates, by including it as an explanatory variable. It may also indirectly control forsome of the influence of common factors like income expectations, to the extent that they are captured in the core part of the model or proxied byother variables in the equation such as current income.
(4) This included the variables listed above as well as a constant.(5) The Wald coefficient test suggests that this decline is statistically significant: the coefficient estimated over the first 20-year period is significantly
different to the coefficient estimated over the most recent 20-year period.(6) In practice, the Bank of England Quarterly Model includes an additional variable that allows the incorporation of judgements that change the size of the
effect on consumption of changes in the value of housing (see pages 203–04 of Harrison et al (2005)).

152
Bank of England Quarterly Bulletin: Summer 2006
share prices would lead households to demand fewerconsumer goods and services and less housing. So thedecline in share prices earlier this decade should havedepressed not only consumption but also houseprices.(1)
Overall, the decline in share prices is likely to havedepressed spending growth in the early part of thisdecade. But even allowing for such additionalinfluences, the empirical association between houseprices and consumer spending appears to have declined(see the box on page 151).
Conclusion
House prices and consumer spending have often movedtogether in the past. But that relationship is unlikely tobe driven by the impact of house prices on aggregatewealth. Instead, it is more subtle. The relationshipdepends on causal links, such as the impact of houseprices on the equity that people can withdraw from theirhomes to finance spending. And, crucially, it dependson common factors — influences that affect both houseprices and consumer spending.
The strength of these channels can vary considerablyover time. For example, collateral effects dependimportantly on the amount of equity already available tohouseholds. The causes of house price movements arealso important. Sometimes common factors can drivechanges in both house prices and consumer spending.At other times, house prices may shift on account ofhousing market developments that are of limitedsignificance for spending. In general, the implicationsof any rise in house prices rest on why house prices haverisen.
The evidence suggests that causal links have beenweaker, and common factors less influential, in therecent past. To what extent is unclear. Unfortunately,controlled experiments, such as those by Pavlov, are notfeasible when examining the economy and attempting toquantify such effects. But, overall, it seems likely thatboth common factors and causal links are key to theweaker association between house prices and consumerspending of the past few years.
(1) This effect could have been mitigated by a shift in investors’ preferences from equities to housing.

House prices and consumer spending
153
References
Aoki, K, Proudman, J and Vlieghe, G (2001), ‘Why house prices matter’, Bank of England Quarterly Bulletin, Winter,pages 460–68.
Attanasio, O, Blow, L, Hamilton, R and Leicester, A (2005), ‘Consumption, house prices and expectations’, Bank ofEngland Working Paper no. 271.
Attanasio, O and Weber, G (1994), ‘The UK consumption boom of the late 1980s: aggregate implications ofmicroeconomic evidence’, Economic Journal, Vol. 104, pages 1,269–302.
Banks, J and Smith, S (2000), ‘UK household portfolios’, Institute for Fiscal Studies Working Paper no. 00/14.
Barwell, R, May, O and Pezzini, S (2006), ‘The distribution of assets, income and liabilities across UK households:results from the 2005 NMG Research survey’, Bank of England Quarterly Bulletin, Spring, pages 35–44.
Benati, L (2005), ‘The inflation-targeting framework from an historical perspective’, Bank of England Quarterly Bulletin,Summer, pages 160–68.
Benito, A (2006a), ‘Does job insecurity affect household consumption?’, Oxford Economic Papers, Vol. 58(1), pages 157–81.
Benito, A (2006b), ‘How does the down-payment constraint affect the UK housing market?’, Bank of England WorkingPaper no. 294.
Benito, A and Power, J (2004), ‘Housing equity and consumption: insights from the Survey of English Housing’, Bankof England Quarterly Bulletin, Autumn, pages 302–09.
Benito, A and Wood, R (2005), ‘How important is housing market activity for durables spending?’, Bank of EnglandQuarterly Bulletin, Summer, pages 153–59.
Berry, S and Davey, M (2004), ‘How should we think about consumer confidence?’, Bank of England Quarterly Bulletin,Autumn, pages 282–90.
Bridges, S, Disney, R and Gathergood, J (2006), ‘Housing collateral and household indebtedness: is there ahousehold financial accelerator’, paper presented at the Consumption, Credit and the Business Cycle workshop inFlorence on 17–18 March.
Campbell, J and Cocco, J (2005), ‘How do house prices affect consumption? Evidence from micro data’, NBERWorking Paper no. 11534.
Carroll, C, Dynan, K and Krane, S (2003), ‘Unemployment risk and precautionary wealth: evidence from households’balance sheets’, Review of Economics and Statistics, Vol. 85(3), pages 586–604.
Davey, M (2001), ‘Saving, wealth and consumption’, Bank of England Quarterly Bulletin, Spring, pages 91–99.
Dickens, R (2000), ‘The evolution of individual male earnings in Great Britain: 1975–95’, Economic Journal, Vol. 110(460), pages 27–49.
Flemming, J S (1973), ‘The consumption function when capital markets are imperfect: the permanent incomehypothesis reconsidered’, Oxford Economic Papers, Vol. 25(2), pages 160–72.
Hancock, M and Wood, R (2004), ‘Household secured debt’, Bank of England Quarterly Bulletin, Autumn, pages 291–301.
Harrison, R, Nikolov, K, Quinn, M, Ramsay, G, Scott, A and Thomas, R (2005), The Bank of England Quarterly Model,Bank of England.

154
Bank of England Quarterly Bulletin: Summer 2006
IMF (2006), ‘United Kingdom: selected issues’, IMF Country Report No. 06/87.
King, M (1990), ‘Discussion’, Economic Policy, October, pages 383–87.
Labhard, V, Sterne, G and Young, C (2005), ‘Wealth and consumption: an assessment of the international evidence’,Bank of England Working Paper no. 275.
May, O, Tudela, M and Young, G (2004), ‘British household indebtedness and financial stress: a household-levelpicture’, Bank of England Quarterly Bulletin, Winter, pages 414–28.
Millard, S and Power, J (2004), ‘The effects of stock market movements on consumption and investment: does theshock matter?’, Bank of England Working Paper no. 236.
Millard, S and Wells, S (2003), ‘The role of asset prices in transmitting monetary and other shocks’, Bank of EnglandWorking Paper no. 188.
Power, J (2004), ‘Durable spending, relative prices and consumption’, Bank of England Quarterly Bulletin, Spring, pages 21–31.
Smith, S and Ford, J (2002), ‘Home ownership: flexible and sustainable?’, CML Housing Finance.
Tatch, J (2006), ‘Will the real first-time buyers please stand up?’, CML Housing Finance.
Weeken, O (2004), ‘Asset pricing and the housing market’, Bank of England Quarterly Bulletin, Spring, pages 32–41.

155
What are inventories?
Investment in inventories occurs when a firm putsgoods on one side to hold in reserve, rather thanimmediately sell them or use them in production. Forexample, if a manufacturer buys steel to use inproduction that is classed as an input. If the steel is notused, but rather kept in a warehouse in case the supplyof steel is interrupted in the future, then it is aninventory.
As defined by the ONS, inventories include manydifferent goods and services. They include stocks of rawmaterials, and of finished goods, held by manufacturers.They also cover stocks of goods held by retailers andwholesalers, including the produce held on shop shelves.Inventories also include ‘work in progress’ which cancover either goods or services. For example, if asolicitor’s firm puts in hundreds of hours of work on acase, but has not billed the client because the case hasnot been completed, then that output is measured as anincrease in inventories.
The ONS typically refers to ‘changes in inventories’when it presents the expenditure components of GDP.That is what we mean by ‘investing in inventories’.‘Stockbuilding’ is also used by some commentators todenote the same thing. In this article we will use thoseterms interchangeably. The concept covers increases ininventories, whether due to purchase or internal transfer(ie when a firm allocates some goods it has produced to
stocks). It also includes disposals whether due to sales,internal transfers or if they are simply used up. So,investment in inventories can be negative if firms allowtheir stocks to run down over a period. Inventories aremeasured before the deduction of any depreciation,consistent with other types of investment. They aremeasured by asking firms to assess the change in theirinventories in nominal terms, and then deflating thosenumbers with the appropriate price index to arrive at avolumes measure. In the National Accounts, inventoryinvestment includes the so-called ‘alignmentadjustment’, which is the ONS’s residual category usedto align different measures of GDP growth. Becausethat adjustment is not a direct measure of investmentin inventories, we remove it from any measures reportedhere.
Investing in inventories
As well as investing in capital, firms invest in inventories or stocks. For some businesses, investing instocks is crucial for their profitability. Shops are better able to attract consumers if their shelves are fulland they can offer a wide variety of products. Manufacturers are more likely to win contracts if theircustomers can trust them to cope with sudden swings in their orders by holding sufficient stocks.Nevertheless, investment in stocks is actually a very small proportion of total spending in theUnited Kingdom. On average between 2000 and 2005 it was just 0.4% of GDP. But it is volatile. Forexample, annual GDP growth slowed from 3.1% in 2004 to 1.8% in 2005. Weaker investment instocks can account for 0.4 percentage points (or a third) of that slowdown. This article examines firms’motives for investing in inventories in order to understand the role it plays in swings in whole-economyoutput.
By Rob Elder and John Tsoukalas of the Bank’s Structural Economic Analysis Division.
Chart 1Sectoral breakdown of stocks
Manufacturing (34%)
Retail (17%)
Wholesale (18%)
Other (31%)

156
Bank of England Quarterly Bulletin: Summer 2006
Stock holdings are concentrated in the manufacturingand distribution sectors. Broadly speaking, themanufacturing sector and the distribution sector eachaccount for about a third of all stocks (Chart 1). Buteach only accounts for a sixth or less of whole-economyoutput. The remaining two thirds of the economyaccounts for just a third of all stock holdings.
Has investment in stocks reduced the volatilityof output?
Although investment in inventories is the smallestexpenditure component of GDP, it often has a noticeableimpact on aggregate GDP growth, because it can bevolatile. Chart 2 shows the contribution to four-quarterGDP growth from investment in inventories, comparedwith the contribution from all other elements of demand(‘final demand’). The inventories contribution hasvaried significantly: between -2.6 and +2.1 percentagepoints since 1955.
Another feature of Chart 2 is the apparent tendency forthe contribution from stockbuilding to be sharplynegative during downturns in final demand. That isapparent in the downturns of 1975, 1980 and 1991 inChart 2. It would suggest that stockbuilding hasexacerbated the volatility of output growth, relative tofinal demand. To check that more precisely, Table Ashows the standard deviation of growth rates ofwhole-economy final demand and output. For bothquarterly and four-quarter growth rates, output has beenmore volatile than final demand. The only differencebetween output growth and final demand growth is thecontribution from stockbuilding. So that would suggestthat movements in inventories have increased thevolatility of output. This is true for the manufacturing
and distribution sectors, and for periods of above andbelow average growth.
Motives for holding stocks
The fact that investment in inventories has added to thevolatility of output seems puzzling. But it is moreexplicable once one considers all of the motives firmsmight have for holding stocks. The three main motives,as set out by Blinder and Maccini (1991), are consideredbelow. Firms may place weight on all three motives.
(a) Firms can hold stocks of inputs to ensure that theyhave adequate materials for their productionneeds. That offers protection against disruption tosupplies, or price volatility, and also against anyshortages that might arise from a need to increaseproduction sharply.
(b) Firms can hold stocks of finished goods to avoidhaving to change production levels. For this to bethe motive, the firm must find changingproduction rates expensive. That might be true if,for example, it is necessary to pay overtime inorder to raise production levels.
(c) Firms can have a target stock level. They holdstocks of finished goods to ensure that they alwayshave adequate supplies to meet demand. Theyreact strongly if actual stocks move too far belowor above their target level. If stock levels fall toolow, firms face the risk of not being able to meettheir customers’ demands and possibly losing thatcustom altogether. But if stock levels rise too high,then firms’ stock holding costs will becomeexcessive.
If the predominant motive is to avoid changingproduction levels, then we would expect stockbuilding toreduce the volatility of output relative to the volatility offinal demand. Whereas if firms have a target stock level,they might be willing to see sharp changes in outputrates to ensure their stock levels do not depart too far
Chart 2Final demand and stockbuilding
5
0
5
10
1955 65 75 85 95 2005
Final demandStockbuilding
Percentage point contributionsto annual GDP growth
+
–
Table AVolatility of growth ratesStandard deviations (percentage points)
Output Final demand(GDP) (GDP excluding stockbuilding)
Quarterly 0.98 0.92Annual 2.12 1.77
Sample: 1960–2005.

Investing in inventories
157
from their desired levels. For aggregate behaviour allthree motives could be important, in which case actualstockbuilding might represent some compromisebetween reducing the volatility of output and of stocklevels.
The weight given to each motive will depend upon thecost of changing output versus the cost of allowing stocklevels to deviate too far from desired levels. There areseveral factors that will affect the flexibility of output:does the firm use skilled staff that are difficult to recruitand train?; is there a high overtime premium?; isproduction capital intensive and does that place anupper bound on output? But there are also variousfactors that will affect how costly it is for stock levels todiverge from desired levels: how variable does demandtend to be (as that determines the risk in allowing stocklevels to fall)?; how costly are the materials to store?;how likely is it that the customer will go elsewhere iftheir demand cannot be met instantly?
Another key factor that will affect the dynamics of stockadjustment is the degree to which any change indemand is expected to persist. If demand picks up andis expected to stay strong, a company is more likely toraise output. They will judge that the adjustment cost ofchanging production cannot be avoided, and that it isworth paying that adjustment cost to ensure demandcan be met. But if the rise in demand is only expectedto be temporary, the stronger demand is more likely tobe met out of stocks. The desired stock level is alsolikely to be affected by a company’s financial position,just like any other form of investment. Other thingsbeing equal, higher interest rates should put downwardspressure on desired stock levels, because some firms mayjudge that at the higher rate of interest they would bebetter off investing their capital in financial assets ratherthan in inventories. And if the general corporatefinancial position were to worsen, say due to a fall inprofits or a credit crunch, that would also push down onthe desired stock level. Both of these factors might helpto explain why stockbuilding has tended to followprotracted upturns and downturns in final demand,rather than moving in the opposite direction.
Evidence on the importance of differentmotives
The standard deviations reported in Table A suggest atendency for inventory investment to increase thevolatility of output. That would seem to imply that firmsare reluctant to let their stock levels deviate too far from
desired levels. Firms’ desired stock levels will reflect thelevel of their expected demand: they will effectively havea target for the ratio of stocks to expected demand. Butthat target will change over time, for example inresponse to changes in the cost of investing in stocksand trends in production technologies. Chart 3 showsthe actual ratio of whole-economy stocks to finaldemand, compared with a fitted trend. Chart 4 showsthe gap between the two. If the fitted trend picks upmovements in the target stock/demand ratio, thendeviations from that trend would show undesiredchanges in stock levels.
Chart 4 also compares the deviations of stocks from thisestimated target with final demand growth. Deviationsof stocks have tended to be countercyclical. Thecorrelation coefficient between the two series in Chart 4is -0.5. So when demand growth has been aboveaverage, stocks have tended to fall relative to target.Similarly, when demand has been weak, stocks have
Chart 3The ratio of stocks to final demand
45
50
55
60
65
70
1970 80 90 2000
Per cent of quarterly final demand
Actual
Hodrick-Prescott trend
0
Chart 4Final demand and deviations of the stock/demand ratio from trend
10
8
6
4
2
0
2
4
6
8
10
1970 80 90 20004
3
2
1
0
1
2
3
4Percentage points
Final demand (right-hand scale)
Stocks/demand deviation from trend (left-hand scale)
Percentage changeon a year earlier
+
–
+
–

158
Bank of England Quarterly Bulletin: Summer 2006
tended to rise above target levels. That evidencesuggests that investment in inventories reflects a balancebetween stabilising output growth, and maintaining adesired level of stocks. Stockbuilding has not beensufficiently countercyclical to reduce the volatility ofproduction relative to final demand. But neither has itbeen sufficiently procyclical to stabilise the ratio ofstocks to demand.
As a further illustration of that point, we can calculatehow volatile GDP growth might have been if stock levelshad always been kept at their target level (as proxied bythe fitted trend in Chart 4). Table B compares thestandard deviation of annual and quarterly GDP growthfrom such an experiment with the actual standarddeviations of output and final demand. It shows that ifcompanies had put 100% weight on achieving a targetratio of stocks to demand, then the volatility of GDPgrowth (especially at the quarterly frequency) mighthave been considerably higher than the actual outturn.Again that demonstrates that some companies putsignificant weight on reducing the volatility of theiroutput when choosing how much to invest ininventories.
Tsoukalas (2005) reports an attempt to estimate thedifferent weights that firms place on the costs of volatilestock levels and of volatile production. That involvesconstructing a detailed model of inventory investmentfor the manufacturing sector and estimating adjustmentcosts explicitly. Inventory accumulation of inputs and ofoutputs are modelled separately, which is shown toimprove the ability of the model to fit the data. Theresults suggest that manufacturing firms face significantcosts of adjusting production levels. But it is also costlyfor inventory levels to deviate far from desired levels. Asa result the inventory decision reflects a compromisebetween reducing the volatility of output and avoidinglarge deviations of the stock level from target. Thatresult is consistent with the standard deviationsreported in Table B. Similar research has been carriedout for the United States (for example Humphreys,
Maccini and Schuh (2001)) and reaches broadly thesame conclusions.
Has stock management behaviour changed overtime?
The UK economy appears to have become more stableover the past decade or so (see for exampleBenati (2004)). As an example, the standard deviationof four-quarter GDP growth rates between 1993 and2005 was two thirds lower than between 1960 and 1992(Table C). Is there any evidence that changes in stockmanagement have contributed to that greater stability?
The ratio of whole-economy stocks to GDP declinedthrough the 1980s (Chart 5). Recognising the cost ofholding stocks, management practices seized on socalled ‘lean production techniques’ that attempted toreduce stock levels. That was achieved by increasing thefrequency of deliveries into and out of the company, byreorganising production to minimise the need for stocksusing so-called ‘just-in-time’ inventory operations, andby making greater use of information and
Table BVolatility of growth ratesStandard deviations (percentage points)
Counterfactual (stocks Output Final demand (GDPalways held at desired (GDP) excluding stockbuilding)levels)
Quarterly 1.69 0.98 0.92Annual 2.24 2.12 1.77
Sample: 1960–2005.
Table CVolatility of growth ratesStandard deviations (percentage points)
Output Final demand(GDP) (GDP excluding stockbuilding)
Quarterly1960–92 1.15 1.061993–2005 0.30 0.34Change -0.84 -0.72
Annual1960–92 2.44 2.031993–2005 0.81 0.72Change -1.62 -1.32
Sample: 1960–2005.
Chart 5Stock levels relative to output
0
10
20
30
40
50
60
1965 75 85 95 200510
11
12
13
14
15
16
17
18
19
20Per cent of annual outputPer cent of annual output
Manufacturing (right-hand scale)
Whole-economy (left-hand scale) Distribution(a)
(left-hand scale)
(a) Volume of distribution stocks divided by volume measure of household spendingon goods.

Investing in inventories
159
communication technology to manage stocks (see forexample McConnell, Mosser and Perez-Quiros (1999)).The drive to economise on stock holdings may havereflected the increase in real interest rates thatcompanies faced from the early 1980s. Since the early1990s the aggregate stock/output ratio has picked up alittle, but remains below the levels in much of the 1970s.
The decline in the ratio of whole-economy stocks toGDP in part reflected the restructuring of the UKeconomy away from manufacturing. That reducedaggregate inventory levels relative to GDP becausemanufacturing firms tend to hold more stocks, relative totheir output, than other types of firms. But even withinmanufacturing there was a sharp reduction in the stockto output ratio (Chart 5). The distribution sector alsoeconomised on stocks through that period, although theratio of stocks to sales has picked up modestly since themid-1990s.
In theory, it is not clear whether the trend to economiseon stocks would increase or reduce output volatility.The lower the desired stock to output ratio is, the lessstockbuilding has to increase when demand rises inorder to maintain the ratio of stocks to demand. So thatmight suggest that lower stock levels reduce thevolatility of output. But that logic only applies if the fallin the ratio of stocks to demand reflected animprovement in stock management techniques. If thedesired stock to sales ratio falls because of a higher costof investing in or holding stocks, then that would
suggest that companies were willing to accept greatervolatility of output for the sake of economising on theirstock holdings. Clearly, if that has been the case wewould not expect to see lower output volatility.
Table C shows the volatility of final demand and ofoutput, over the period 1960–92 and 1993–2005. Forboth quarterly and annual growth rates, output volatilityhas declined more than final demand volatility. Thatindicates that stockbuilding has played a role inreducing the volatility of output growth since the early1990s, suggesting that firms have improved theirinventories management. However as is also clear fromTable C, stockbuilding has only played a small part inthe decline in overall volatility. Much of the reductionin output volatility reflects the decline in the volatility offinal demand.
Conclusions
One reason for firms to hold inventories is to allow themto meet fluctuations in demand without adjustingproduction rates. But firms are also unwilling to seestock levels move too far from their desired levels. As aresult, in aggregate at least, inventory adjustments havenot acted to reduce output volatility. Since the early1980s, there has been a marked reduction instockholdings relative to output levels. That largelyreflected an improvement in stock managementtechniques and appears to have been responsible for asmall part of the reduction in GDP volatility evidentsince the early 1990s.

160
Bank of England Quarterly Bulletin: Summer 2006
References
Benati, L (2004), ‘Evolving post-World War II UK economic performance’, Bank of England Working Paper no. 232.
Blinder, A and Maccini, L (1991), ‘Taking stock: a critical assessment of recent research on inventories’, Journal ofEconomic Perspectives, Vol. 5, pages 73–96.
Humphreys, B, Maccini, L and Schuh, S (2001), ‘Input and output inventories’, Journal of Monetary Economics, Vol. 47,pages 347–75.
McConnell, M, Mosser, P and Perez-Quiros, G (1999), ‘A decomposition of the increased stability of GDP growth’,Current Issues in Economics and Finance, Federal Reserve Bank of New York, Vol. 5, No. 13.
Tsoukalas, J (2005), ‘Modelling manufacturing inventories’, Bank of England Working Paper no. 284.
161
Introduction
The Bank of England’s Monetary and Financial StatisticsDivision (MFSD) collects monetary and financial datafrom all banks operating in the United Kingdom. Thesedata are used by the Bank of England in compiling themonetary aggregates and other banking data;(1) by theOffice for National Statistics (ONS) for estimating thecontribution of the banking sector to the NationalAccounts and the balance of payments; and by a rangeof national and international organisations.
The data contribute to the Bank’s analyses of economicand financial conditions used in ensuring monetarystability and in contributing to the maintenance offinancial stability. For instance, information on bankdeposits and lending can help in assessing the strengthof demand in the economy or the vulnerability of UKbanks to shocks affecting particular sectors or countries.More generally, MFSD data provide policymakers andeconomists with information about the behaviour of thebanking sector and, through their contribution to keyONS economic indicators, the economy as a whole.
The banking sector accounts for 3% to 4% of UK GDP,and provides key services to other sectors of theeconomy. There are around 350 banks operating in theUnited Kingdom, although the market is highlyconcentrated: the top ten banks, for example, accountfor 55% of total banking sector assets. Banks provide
statistical data to the Bank of England;(2) some ofthese are passed on to the ONS or to the banks’supervisory body, the Financial Services Authority.The ONS does not collect monetary or financial datadirectly from banks.
Many of the statistics produced by MFSD are basedon information covering a very high proportion ofthe banking sector: a quarterly balance sheetsummary return is required from all banks; andmonthly returns are made by 216 banks covering99.3% of total assets. So the data are likely to behigh quality and less prone both to error and torevision than statistics based on a samplingframework.(3) A system of reporting thresholdsmeans that the largest banks complete all of themain forms, while the smallest banks completerather fewer. Almost all forms require informationthat is taken from banks’ accounting systems. Mostforms are returned electronically to the Bank ofEngland, which reduces the scope for processing orscanning errors.
Data collection inevitably imposes some costs uponreporting institutions. For the banks, this means ITset-up costs for systems to produce the requiredinformation; and ongoing costs to compile and checkreturns, and to deal with any follow-up questions. Thescale of these costs will reflect factors such as thedifficulty of extracting information and how closely the
Cost-benefit analysis of monetary and financial statistics
Data collected by the Bank of England from UK banks are used in compiling a range of economicstatistics published by the Bank, the Office for National Statistics and other organisations. These datahelp the Bank maintain monetary and financial stability, and contribute to many other economicanalyses. But data collection inevitably imposes some costs on those supplying the information. Thisarticle describes a cost-benefit analysis (CBA) framework that has been developed to help balance thedemands on data suppliers with the needs of users. It sets out some of the practical solutions employedin applying CBA to monetary and financial statistics and early results of the project.
By Andrew Holder of the Bank’s Monetary and Financial Statistics Division.
(1) Banking data are published in a number of Bank of England statistical releases and in the monthly compilation, Monetary andFinancial Statistics; these are available at www.bankofengland.co.uk/statistics/statistics.htm.
(2) The 1998 Bank of England Act includes a statutory obligation for banks to provide statistical data to the Bank of England.(3) Franklin (2005) examines the reliability of first estimates of key series published by the Bank of England.

162
Bank of England Quarterly Bulletin: Summer 2006
data required by the Bank match concepts that thebanks need for their own management purposes or tomeet statutory financial reporting requirements.
In common with most statistical organisations, the Bankof England does not wish to impose undue burden onreporters. MFSD’s Statistical Code of Practice, which issimilar to the standards required by National Statistics,(1)
includes a requirement that the burden placed onreporting banks is kept to ‘an acceptable level consistentwith legislative requirements and balancing the needs ofusers against the demands on suppliers’.(2)
Overview of MFSD’s work on CBA
As part of MFSD’s aim to balance the burden onreporting banks with the needs of users, the cost-benefitanalysis (CBA) project(3) seeks to develop a frameworkfor assessing whether the benefits that users obtain fromthe statistics justify the costs of producing them. Therehave been three main areas of work, focusing on:
� the extent to which other statistical institutionsuse or are developing CBA;
� how to analyse and estimate banks’ statisticalreporting costs; and
� how to assess the benefits that users obtain fromMFSD statistics.
CBA techniques have not been used frequently in thecontext of statistical provision. The box on page 163discusses the use of CBA by some other institutions;none of these has applied CBA to the full range of theirexisting statistics.
The MFSD project has been designed to apply CBA bothto existing statistics and to any requests for potentialnew statistics. Set-up costs should be considered whenassessing new data requests but not for existing datacollections, because such fixed costs should then betreated as sunk costs. But the costs of changing systemsdo need to be taken into account when considering
changes to existing forms. CBA is being applied toMFSD’s existing data collections primarily through anongoing review of the main statistical forms.
The CBA project aims to consider not only the totalcosts and benefits of a particular statistic, but also someof its key characteristics. In general, greater benefitswould be expected from statistics that are frequent,timely, accurate (eg based on a large sample), detailed(eg totals broken down into their main components) andthat shed light on economic or financial issues ofimportance to users. But most of these features wouldalso be likely to increase the costs of providing thosedata. One of the challenges for CBA is to be able toshed light on such trade-offs.
Measuring costs
There are inevitably costs associated with collectingdata from UK banks. Their information systemscontain a vast amount of information, but this mightnot always correspond well with the specific conceptsrequired for statistical returns. At the start of the CBAproject, MFSD staff visited a number of banks to gain abetter understanding of the main influences onreporting costs; some other banks offered informationby email.(4) While there was considerable commonground, there were also some significant differencesbetween banks, reflecting factors such as size and typeof business, internal organisation, and the structure ofbanks’ information systems.
The recording and provision of information, includingmeeting statutory financial reporting requirements, arepart of banks’ normal business practice and it is notalways easy to identify the additional cost of providingstatistical information to the Bank of England. For thosebanks that did offer estimates of their statisticalreporting costs, these were a very small fraction of totaloperating costs.
In general, banks found balance sheet items less costlyto report than information on flows: information fromthe balance sheet requires only a single reading at theend of the period, while information on flows requires
(1) Data deemed to be National Statistics are produced in accordance with the Framework for National Statistics andcomply with professional principles and standards set out in the National Statistics Code of Practice. Further detailsare set out in Office for National Statistics (2002).
(2) Respondent burden is covered in Section 6 of the Statistical Code, Bank of England (2004). Wright (2004) provides asummary of the Code, the reasons for its introduction and the process planned for implementation.
(3) The project was formally launched in late 2004, and announced in Statistical Notice to reporting banks 2004/07,available at www.bankofengland.co.uk/statistics/reporters/snotice/sn200407/sn200407.doc.
(4) MFSD would like to record its thanks to those banks and their staff who helped through visits or responding to thequestionnaire.

Cost-benefit analysis of monetary and financial statistics
163
keeping track of a potentially large number oftransactions over a reporting period. And balancesheet information tended to be more closely related towhat was available on banks’ own systems. In addition,supplying totals was less costly than disaggregatinginformation, for example by the residency or industryof the counterparty.
While the overall reporting burden is uncertain,the information provided by banks has been usedby MFSD to develop a model of the relative costs toUK banks of different reporting forms. This indicateswhich forms impose high reporting costs relative toother forms. It can be used to estimate each form’sshare of the overall burden imposed by MFSD, as wellas the effect of proposed changes to forms.
The current version of the costs model takes as itsstarting point the number of boxes(1) on each form.Many forms ask for totals to be split into a number ofcomponents — this information is generally treated asadditional to the totals: for example, where an item isdisaggregated by currency, each currency is counted as adifferent box. A slightly different treatment is neededfor country analysis, where the model is based on theaverage number of countries for which non-zero data arereported, rather than the total number of countries onthe form. This approach prevents the cost estimatesbeing dominated by those forms that includeinformation on around 230 countries.
The number of boxes, adjusted in this way, offers a basicmetric for the amount of information contained in a
CBA is an established tool for assessing publicinvestment projects and similar policy proposals.HM Treasury’s approach to CBA in centralgovernment is set out in the ‘Green Book’,(1)
which recommends that ‘all new policies,programmes and projects … should be subjectto comprehensive but proportionate assessment,wherever it is practicable, so as best to promotethe public interest’. In this context, CBA shouldaim to quantify all relevant costs and benefits,where necessary making estimates when pricescannot be observed.
The Financial Services Authority (FSA) is obliged topublish a CBA for all significant changes in policy,providing an estimate of the costs and a qualitativeanalysis of the benefits.(2) The rationale for thisapproach is that a full quantitative evaluation ofcosts and benefits is difficult to achieve and oftenunnecessary; and that undertaking CBA is itselfcostly and should be done in the most practicableand cost-effective manner.
Information on the extent to which CBA has beenapplied to statistical provision was gained from a
questionnaire sent to other central banks andstatistical agencies, and also from an internationalworkshop on CBA of statistics hosted by MFSD inJuly 2005.(3) These showed that so far there has beenlimited use of CBA by institutions responsible forcollecting statistics. One reason suggested by somefor not pursuing CBA was the difficulty of assigningmonetary values to benefits.
The ONS has applied a CBA-based approach tospecific issues, such as the 2011 Census, attempting toestimate benefits from particular collections. Moregenerally, the ONS has a ceiling for the totalcompliance cost of its business surveys,(4) althoughthese estimates mainly reflect the time taken to fill informs rather than the full cost of obtaininginformation.
The European Central Bank (ECB) has developed a‘Merits and Costs’ approach that aims to ensure thatany new data collections are cost-effective and arejustified by the benefits of the new information.(5)
One key difference from the approach adopted withinMFSD is that the ECB procedure currently onlyapplies to new data requests.
Cost-benefit analysis in other institutions
(1) See HM Treasury (2003).(2) See Alfon and Andrews (1999).(3) See Holder (2005) for a report of the international workshop, including the ONS’s use of CBA and the ECB’s ‘Merits and Costs’ approach.(4) See Office for National Statistics (2005).(5) The Council Regulation (EC) no. 2533/98 concerning the collection of statistical information by the ECB requires the ECB to keep the burden placed
on reporting agents to a minimum.
(1) Boxes are broadly equivalent to items of information that can be identified separately.

164
Bank of England Quarterly Bulletin: Summer 2006
form, which can be multiplied by the number ofreporting banks and the frequency of reporting to get acrude estimate of the annual amount of informationrequested from the banking sector in that form. Theseestimates can be calculated for whole forms or forsections of forms.
Such an approach, however, does not recognise thatsome pieces of information are more costly to supplythan others. MFSD’s visits to and responses frombanks gave some indication of relative costs, whichhave been refined through a further survey andinternal discussions. The current model thereforeincreases the estimated cost for some types of morecomplex information:
� information on transactions (ie flows);
� National Accounts sectoral or industrialclassification;
� UK/non-UK resident split;
� items other than own account (eg third-partyholdings);
� consolidated reporting for bank groups;
� more detailed information on financialinstruments; and
� flows in gross rather than net terms.
These factors can be combined — for instance if therewere a UK/non-UK resident split of transactions, thenthe estimated cost would take account of both factors.The model will be refined over the next few months, withthe aim of a finalised version to assess the effect ofreviews on banks’ costs later this year.
No model can accurately capture all of the factors thataffect banks’ statistical reporting costs. The costs modelis designed to be a useful analytical tool, but it rests ona number of assumptions and simplifications. Someinfluences on costs are not amenable to inclusion in thissort of framework. For example, timing can be importantif banks are required to report very recent information,or indeed if many different returns are due in at thesame time. And banks incur costs in dealing withfollow-up questions, which may be asked when thereare large changes or more details of particular
movements are required. A separate exercise is underway within MFSD, aiming to reduce the number of suchquestions asked.
Set-up costs associated with new forms or changes toforms can be significant too; these need to be takeninto account when evaluating new data requests orprospective changes to forms. There might be limitedcosts associated with small changes, such as movinginformation from one form to another. But introducinglarge new forms, or asking for information that banksdid not previously collect, would usually prove morecostly. These costs can be mitigated, however, byintroducing changes gradually and by giving sufficientadvance notice to reporting banks.
Measuring benefits
Any assessment of benefits needs to take account of thewide variety of uses of MFSD data, across a range ofusers. Benefits are more disparate than costs, and aremore difficult to identify and to estimate. Within theBank, MFSD data contribute to meeting the inflationtarget and maintaining financial stability. For example,the behaviour of monetary aggregates and lending canhelp in assessing the pressure of nominal demand in theeconomy; and information on bank lending can indicatewhether the UK banking system is becoming heavilyexposed to particular sectors or countries. MFSD dataare used by the ONS as part of the National Accountsand the balance of payments, and more generally byeconomic policymakers, researchers, analysts andcommentators. And they are also used by internationalorganisations, such as the European Central Bank, theBank for International Settlements, the InternationalMonetary Fund and the Organisation for EconomicCo-operation and Development.
The absence of a market price for MFSD data presentsa challenge for valuing the benefits that users derivefrom these data. A frequent recourse for CBA in suchcases is to survey how much people would be willing topay (in this case for the data), or alternatively whatamount of money would compensate them for any loss(here, if data were discontinued). But this approachmay not offer a reliable guide, given the subjectivenature of such estimates and the limited communityof primary users.
In principle, the benefit from the main uses could beestimated directly by assessing first the contribution ofMFSD statistics to a policy decision or piece of analysis;

Cost-benefit analysis of monetary and financial statistics
165
and second the consequence of wrong decisions (orincomplete analysis). In the case of the Monetary PolicyCommittee’s interest rate decisions, such an exercisewould thus combine estimates of the welfare cost ofcyclical fluctuations,(1) the effect of ‘wrong’ interestrates, and finally the contribution of MFSD data to theparticular policy decision. Overall, these sorts ofestimates are conceptually possible but would be subjectto such wide confidence intervals that they would offerlittle help in the CBA project.
Given the inherent difficulties in putting a monetaryvalue to the benefits, attention has focused on assessingthe relative benefits from different data. As a first step, asurvey of users within the Bank of England sought viewson the relative importance of various uses of MFSD data— in terms of both the importance of an activity andthe contribution made by MFSD data. The mostimportant uses were believed to be monetary andfinancial stability and the direct contribution to theNational Accounts.
The information from the survey does not, however, givea complete picture of the overall benefits from thesestatistics. A simple benefit assessment form has beendeveloped to enable a fuller assessment of the relativebenefits of MFSD data.(2) It calculates an overallsummary score based on the following criteria:(3)
� Policy use. This is based on the internal survey,with the highest marks given to data thatcontribute to the assessment and maintenance ofmonetary and financial stability, or that are useddirectly in the National Accounts.
� Policy relevance. A judgement of how importantthese data are to the principal policy use(s) anddecisions identified under the previous criterion.
� Value added. A high mark is given where noalternative data source is available, a low markwhere there is only a marginal improvement overthe alternative.
� Quality. This is concerned with statistical quality— a high mark is given here for data with high
sampling accuracy and a low number/magnitudeof revisions.
� Meeting international standards and additional uses.These are given additional marks to capture theincremental benefit.(4)
Table A shows the full list of criteria and their weights inthe overall score.
The benefits assessment form can be used to arrive at aninitial view of the relative benefits of particular data. Itcan help focus discussions, but it is not a substitute fordialogue with users. The latter is essential fordeveloping an accurate understanding of how data areused and their benefits relative to other sources.
Bringing costs and benefits together
The assessment of costs and benefits described abovedelivers a view of the relative costs and relative benefitsof data. Chart 1 summarises some of the key questionsto be asked, depending on the balance of costs andbenefits.
Where the assessment of costs and benefits shows thatdata have relatively low benefits but high costs, there isa need to investigate whether continued data collectionis justified. That would have to be established inconjunction with users, not least to ensure that thebenefit assessment is fair and that ceasing anycollections would not cause undue difficulty. Wheredata are still needed, it may be possible to obtain
(1) See, for example, Lucas (2003) and Canzoneri et al (2004).(2) The European Central Bank’s ‘Merits and Costs’ procedure for new data also uses a form to assess overall benefits,
though with some differences in the factors included and the relative weights.(3) The categories on the form relate to some of the wider definitions of data ‘quality’ that can be found in the literature.
Brackstone (1999), for example, lists six dimensions of data quality: relevance, accuracy, timeliness, accessibility,interpretability and coherence.
(4) The benefit of data to researchers may be longer lasting than for other uses, given the value of long time series of datafor econometric estimation of key economic relationships.
Table AComponents of the benefit assessmentForm Percentage weight
Policy use up to 25
Policy relevance up to 25
Value added up to 15
Statistical quality up to 10
Additional benefits:(a) up to 25Meets legal obligationMeets international standardHelps international comparisonsHelps outside researchHelps inform general public/mediaHelps other economic policiesPublished, eg as Statistical ReleaseHelps consistency check or
selection of reporting panel
(a) In broadly descending order of marks awarded.

166
Bank of England Quarterly Bulletin: Summer 2006
satisfactory estimates at lower costs from alternativesources.
For most collections, there is likely to be a more evenbalance of costs and benefits. Even so, there may besmaller changes to the form or to reporting practicesthat could reduce banks’ reporting costs, withoutsignificantly diluting the benefits and ensuring thatdata remain ‘fit for purpose’. Close consultation withusers and providers is necessary to ensure thattheoretical gains are translated into practical ones.The next section discusses how CBA is applied inpractice through a review of MFSD’s statistical forms.
CBA can also be applied to any requests for new datathat fall outside of the review timetable. In these cases,the benefits assessment form is used to judge the meritsof the new collection relative to other MFSD data, in thelight of discussions with potential users. The overalljudgement on whether to proceed will need to takeaccount of the potential set-up costs to banks if the dataare to be collected, as well as recurrent reporting costs.
The application of CBA has also focused attention onother aspects of banks’ reporting costs and, inparticular, the rationale for follow-up questions asked ofbanks. For instance, if the aim of questions were toimprove the accuracy of the estimated totals across allUK banks, then responses should not be queried if anyresulting change would not be expected to have asignificant effect on the total.(1) But there are otherreasons for asking questions — these include seekingexplanation for particularly large changes, which can
help the economic interpretation of observedmovements. A better understanding of the expectedbenefits from asking such questions will help MFSD’swork to reduce the overall number of questions asked ofbanks, as part of its concern to keep banks’ statisticalreporting costs to an acceptable level.
Putting CBA into practice
The main vehicle for putting CBA into practice is areview of the 20 or so main forms that MFSD uses tocollect information from banks, to ensure that the datacollected are still required and could not be providedmore cost effectively from a different source.(2) Tospread the workload, the programme of reviews istaking place over a period of five years. The overarchingaim of the review is to ensure that MFSD statisticsremain fit for purpose without placing an unnecessaryburden on reporting institutions. CBA plays a key rolein delivering that. In some cases, the content of a formis sufficiently homogeneous to allow CBA to beundertaken for that form as a whole. More complex ordiverse forms are likely to require separate analyses fordifferent sections.
One of the first steps in reviewing a form is to identifyusers, both internal and external. Discussions are thenheld to establish both how the information is used andusers’ requirements from the data. These allow thereviewer to complete the benefits assessment form, andcompare the results with information on the relativecosts of data collection. Where the costs of data appearhigh relative to benefits, users are consulted on optionsincluding alternative data sources, estimation and simplyceasing to collect the data. Where information is valuedby users, the aim is to continue to provide data that arefit for purpose, though reducing the burden onreporting banks where possible. Proposals for amendingdata collections are discussed with the British Bankers’Association before implementation and are also madeavailable on the Bank of England website.(3) If theoutcome of the review is a recommendation forsignificant changes to data collection (includingdiscontinuations or introductions), the approval of theGovernor or appropriate Deputy Governor must besought. Public consultation will be undertaken wheresignificant changes are proposed.
Chart 1Balancing relative costs and benefitsCosts
Benefits
High cost, low benefit
Are data still required?Is there an alternative?Can collection cease?
High cost, high benefit
Can reporting panel be reduced?Are all sections needed?
Low cost, low benefit
Are data still needed?Can costs be reduced? (lower priority)
Low cost, high benefit
Can costs be reduced without diluting benefits? (lowest priority)
(1) This practice is often known as selective editing. Engström and Granquist (2005) give a good overall summary of theapproach.
(2) MFSD’s Statistical Code requires that existing forms be reviewed every five years, see Section 6.1.2 of Bank of England(2004). The review started in 2004, and was announced in Statistical Notice to reporting banks 2005/01, available atwww.bankofengland.co.uk/statistics/reporters/snotice/sn200501/sn200501.doc.
(3) Available at www.bankofengland.co.uk/statistics/about/BBAlist.pdf.

Cost-benefit analysis of monetary and financial statistics
167
A number of forms have already been discontinued as aresult of the review. These were cases where the relativebenefits did not appear to justify the costs, includingsome where data of satisfactory quality could beestimated using other sources. For other forms, theremay be scope to reduce the number of boxes on forms,so that less information is required from reportingbanks. The box above presents a case study of a reviewcurrently under way: that of the information providedon the industrial composition of banks’ business withUK residents.
There may also be scope to reduce banks’ reportingcosts further by revisiting the number of banks that arerequired to return a particular form, or the frequency of
returns, while aiming to maintain data quality — interms of Chart 1 above, this would represent adownward shift. The concentration of the bankingsector means that many of the smaller banks havelittle effect on the overall aggregates, so there may bescope to obtain good quality estimates with smallerreporting panels.(1) Although there will be no directcost saving to banks that remain in the reporting panel,the savings for those banks removed from the panel canbe significant.
Table B presents results from those form reviews whereproposals for change have been finalised. Takingpreliminary results from the model of banks’ costs that isbeing developed, these forms together are estimated to
(1) Boyle (1997) discusses the criteria for selecting reporting panels, given the structure of the UK banking sector, andillustrates these with recommendations for panels of planned balance sheet forms.
Quarterly information on the industrial compositionof banks’ business with UK residents is collected informs AD (deposits) and AL (lending) and publishedin a quarterly Bank of England Statistical Release,Analysis of bank deposits from and lending to UKresidents.(1) The two forms were introduced followingthe 1997 Review of Banking Statistics and they haverecently been reviewed as part of MFSD’s ongoingprogramme of form reviews. The Bank of England isconsulting over proposed changes to the forms and topublished data.(2)
The review included consultation with users in theBank, the ONS and the Financial Services Authority toestablish the main uses of the data. Within the Bank,the data are used by economists in Monetary Analysisand Financial Stability to analyse trends in the UKeconomy and the financial sector, for example to showwhich sectors of the economy have been relyingheavily on bank lending and which have beenbuilding up (or running down) bank deposits. TheONS uses some of the data in calculating privatenon-financial companies’ profits and their industrialallocation.
The review and consultations identified some areas ofthe industrial dataset where data offer relatively lowbenefits compared with costs, and one area where a
modest expansion seems justified. The proposalsinclude:
� ceasing to collect and publish a quarterlyindustrial breakdown of bank holdings ofcommercial paper and of acceptances granted,which are both very small in relation tooutstanding loans and deposits;
� amending the industrial categories collected: aless detailed breakdown is required in a numberof cases, though the ‘transport, storage andcommunication’ category would be split into‘transport and storage’ and ‘communication’ asthese behave quite differently; and
� removing data on deposits from and lending toindividuals from the industrial data set, as theseare available more extensively and with widercoverage elsewhere in the Bank’s monetarystatistics publications.
These changes would cut the number of boxes on thetwo forms by over 40%, which should reduce banks’recurrent reporting costs. Comments on theseproposals are invited by the end of June and theresults will be summarised in the July edition ofMonetary and Financial Statistics.
Case study: review of information collected on the industrial compositionof banks’ business with UK residents (forms AD and AL)
(1) Westley (1999) discusses the data collected on these two forms. (2) Weldon (2006) invites comments from users of the data and sets out the proposed changes more fully.

168
Bank of England Quarterly Bulletin: Summer 2006
have accounted for over 10% of banks’ recurrentstatistical reporting costs in 2004. In three cases, thereview found that the data collected on these forms wereno longer required or could be provided from othersources (though some of the forms were actively selectedfor early review because it was already believed thatthere was little continuing need for them). For example,form P1 collected banks’ own account transactions insecurities issued by non-residents and overseasresidents’ transactions in UK equities; these data wereused in balance of payments estimates. However, banksfound such transactions data costly to provide and theform involved a significant workload for them. Researchwithin MFSD showed that these flows could be estimatedusing stock data from another form, and the ONS hasagreed that switching to these alternative estimateswould be acceptable.
Of the other reviews, the proposals for informationcollected on the industrial composition of banks’business with UK residents (forms AD and AL) wouldreduce the number of boxes by over 40%. Further costsavings to the banking sector may result from theforthcoming panel review for those forms. The review ofinformation on the country composition of banks’payments to and from non-UK residents (form BG),however, resulted in a greater number of forms needingto be completed each year, because European regulationrequires information from that form on a quarterlyrather than annual basis.
Overall, MFSD’s data collection is equivalent to around71/2 million data cells a year.(1) Including provisionalproposals from form reviews that are under way but notyet completed, over half of the annual data collectionhas been reviewed. The proposed reduction in datacollection corresponds to around 13/4 million datacells (approximately one quarter of the annualdata collection).
Conclusion
MFSD data contribute to meeting the inflation target,maintaining financial stability and understanding thebehaviour of the UK economy. The CBA project hasdeveloped ways of assessing the costs and benefits ofMFSD data. Monetary valuation of both costs andbenefits has proved elusive, but estimation of relativecosts and benefits has been more tractable. Amethodology has been established for assessing benefitsand work on costs is advancing well.
A key aim of the project has been to develop a frameworkand tools that can be used as part of the ongoing reviewof forms. The benefits assessment tool has been used inreviews since the second half of 2005 and it is hopedthat a finalised relative costs model will be ready for usein reviews later this year. Over and above these formalmethods, however, the review of forms has alreadyembraced the principles underlying CBA; namelyseeking a better balance between benefits and costs,rather than the highest possible quality of data,regardless of cost.
So far, application of CBA through the form reviewshas resulted in the withdrawal of four forms andproposals for significant simplification of two more.These changes should reduce statistical reporting costsfor all banks that return these forms. The reviews alsoaim to ensure that any data from discontinued formsthat are valued by users can be estimated or replacedfrom alternative sources. Over the course of this year,reviews currently close to completion are expected topropose changes to other forms that should result infurther reductions in banks’ reporting burden.
MFSD will continue to develop tools to bring CBA tobear on its statistical data collection. Over time, theCBA framework should help the Bank to focus its effortson those data that are most important to users, whilebearing down on the burdens imposed on data providers.
Table BChanges from forms already reviewed
Form
A2/CH: 21/2 Forms dropped -100(b) -100 -21/2
custody holdingson behalf ofnon-residents
AD/AL: 4 Simpler -43 – -11/2
industrial decompositionanalysis(c) and some cuts
B1: 4 Form dropped -100 -100 -4country exposurefor UK branches of foreign banks
BG: 11/2 Moved to – +87 +11/2
country analysis quarterly to meetof payments EU regulation(d)
P1: 1 Form dropped -100 -100 -1securitiestransactions
(a) Estimated share of banks’ recurrent reporting costs from preliminary version of MFSD’scosts model, rounded to nearest 1/2%.
(b) Removing these forms required a few boxes to be added to form CL.(c) These proposals are subject to public consultation, as described in the box on page 167.(d) A European Council and European Parliament regulation passed in early 2005 requires a
limited geographic breakdown of the quarterly balance of payments. The increase inreporting panel is because of larger banks moving to quarterly reporting. The cost of thismay be an overestimate, as consultations during the review indicated that banks may notincur much cost in moving from annual to quarterly reporting for this information.
Percentageof estimatedcosts in2004(a)
Estimatedchange asper centof 2004costsMain changes
Percentagechanges in
Numberof boxes
Reportingpanel
(1) This estimate is based on 2004 figures and the same assumptions as the costs model for country analysis.

Cost-benefit analysis of monetary and financial statistics
169
References
Alfon, I and Andrews, P (1999), ‘Cost-benefit analysis in financial regulation’, FSA Occasional Paper no. 3.
Bank of England (2004), A Statistical Code of Practice for the Bank of England.
Boyle, M (1997), ‘Reporting panel selection and the cost effectiveness of statistical reporting’, Monetary and FinancialStatistics, May, pages 1–6.
Brackstone, G (1999), ‘Managing data quality in a statistical agency’, Statistics Canada, Survey Methodology, Vol. 25,No. 2, pages 139–49.
Canzoneri, M, Cumby, R and Diba, B (2004), ‘The cost of nominal inertia in NNS models’, National Bureau ofEconomic Research Working Paper no. 10889.
Engström, P and Granquist, L (2005), ‘Improving quality by modern editing’, Paper no. 23 for the United NationsStatistical Commission and Economic Commission for Europe Conference of European Statisticians Work Session onStatistical Data Editing.
Franklin, A (2005), ‘A method for examining revisions to published statistics’, Monetary and Financial Statistics, July,pages 20–21.
HM Treasury (2003), The Green Book, appraisal and evaluation in central government.
Holder, A (2005), ‘Cost-benefit analysis workshop, 14–15 July 2005’, Monetary and Financial Statistics, September,pages 1–3.
Lucas, R (2003), ‘Macroeconomic priorities’, American Economic Review, Vol. 93, No. 1, pages 1–14.
Office for National Statistics (2002), National Statistics Code of Practice Statement of Principles.
Office for National Statistics (2005), Office for National Statistics Compliance Plan 2005–06 to 2007–08.
Weldon, D (2006), ‘Proposed changes to industrial analysis of bank deposits from and lending to UK residents:consultation with users’, Monetary and Financial Statistics, May, pages 16–17.
Westley, K (1999), ‘The new industrial analysis of bank deposits and lending’, Monetary and Financial Statistics, January,pages 1–5.
Wright, C (2004), ‘A new Statistical Code of Practice for the Bank of England’, Monetary and Financial Statistics, March,pages 11–13.

170
Shareholders of sponsoring companies are primarilyresponsible for ensuring the solvency of the definedbenefit (DB) pension schemes that firms offer theirworkers. Hence, even though the assets and liabilities ofsuch pension schemes are distinct from the company’sbalance sheet, corporate sponsors are clearly theresidual claimants or guarantors, and hence they shouldbe analysed together. This paper investigates whetherthis feature of UK company pensions affects howcompany stock prices respond to common shocks. Weconsider two channels through which common shocks tocompanies’ real business values can be amplified. First,to the extent that defined benefit pension liabilities aredebt-like, they add to the overall leverage orindebtedness of companies. For given asset risk, weshould expect that more highly levered stocks are morevolatile. Second, in the United Kingdom pensionscheme assets are largely invested in equities of otherUK companies. These cross-holdings of equity meanthat common shocks to company valuations aretransmitted among each other via their defined benefitpension schemes, and the response of stock prices tosuch a shock can be amplified.
If it does exist, this kind of amplification is clearly ofrelevance to systemic financial stability, since it canrapidly push corporate valuations upwards ordownwards, and there could be corresponding knock-oneffects on the wider macroeconomy. For example, ifcapital investment is sensitive to corporate valuations,through either cost of capital or Tobin’s Q effects, thenthis could exacerbate the real economic cycle. Inaddition, stock return volatility can also be costly forindividual companies and their shareholders. Highervolatility can increase a company’s perceived riskiness,and therefore its cost of external capital. Alternately, asa company’s stock price becomes a less informativesignal of ‘true’ value, stock-based compensation becomesless effective at providing appropriate incentives tomanagers.
To investigate these issues we start with a stylised modelof a company’s balance sheet — in which pension fundassets and liabilities are treated in exactly the same wayas a company’s ordinary, or on balance sheet, liabilities.Using the model we demonstrate how common shockscan be amplified on account of ‘economic leverage’ andequity cross-holdings. We then calibrate this model forabout 90 of the FTSE 100 companies and simulate it toillustrate the possible size of such amplification effects.We perform two simulations where the company’sbusiness value is reduced by 5%. In the first simulationthe total effect of the shock is the sum of the effect fromthe cross-holdings channel and the leverage channel.We compare these effects with a second simulationwhere we switch off any effects from the cross-holdingschannel (consistent with the company’s pension fundequity assets being invested abroad). The comparisonallows us to break down the total impact of the 5% shockinto the part that comes from additional leverage andthe part that comes from cross-holdings. Our mainresult is that on average, the shock causes a 10.5%reduction in market value. Of the additional 5.5%reduction, 1.4% was due to companies holding othercompanies’ equity in their pension funds. Theremainder is due to the higher leverage induced bypension liabilities.
We also examine whether such effects, in fact, exist indata within the framework of a standard Capital AssetPricing Model (CAPM). Empirical analysis usingmatched balance sheet data (from Datastream) andpension scheme data (collected by hand from individualFRS 17 disclosures) suggests that stock return volatilityis systematically related to proxies for the two channelsof amplification discussed above. These effects arestatistically significant and robust to the inclusion ofcontrol variables and the exclusion of outliers.
Defined benefit company pensions and corporatevaluations: simulation and empirical evidence from theUnited KingdomWorking Paper no. 289
Kamakshya Trivedi and Garry Young

171
UK monetary regimes and macroeconomic stylised factsWorking Paper no. 290
Luca Benati
The UK historical experience, with the remarkablevariety of its monetary arrangements over the course ofthe past few centuries — from the de facto silverstandard prevailing until 1717, up to the post-October1992 inflation-targeting regime — and the high qualityof its historical data, provides a unique ‘macroeconomiclaboratory’ for the applied monetary economist. Thispaper exploits the marked changes in UK monetaryarrangements since the metallic standards era toinvestigate continuity and changes across monetaryregimes in key macroeconomic stylised facts in theUnited Kingdom. Our main findings may be summarisedas follows.
First, the post-1992 inflation-targeting regime appears tohave been characterised, to date, by the most stablemacroeconomic environment in recorded UK history.Since 1992, the volatilities of the business-cyclecomponents of real GDP, national accounts aggregates,and inflation measures have been, post-1992,systematically lower than for any of the pre-1992monetary regimes or historical periods, often markedlyso, as in the case of inflation and real GDP. Thecomparison with the period between the floating of thepound vis-à-vis the US dollar (June 1972) and theintroduction of inflation targeting (October 1992) isespecially striking, with the standard deviations of thebusiness-cycle components of real GDP and inflationhaving fallen by about 50% and 70%, respectively.
Second, the so-called Phillips correlation betweenunemployment and inflation at business-cyclefrequencies appears to have been weakest under the goldstandard, and strongest between 1972 and 1992. Underinflation targeting the correlation has exhibited, so far,the greatest extent of stability in recorded history. Inline with Ball, Mankiw and Romer, evidence points,overall, towards a positive correlation between averageinflation and the strength of the Phillips correlation,both across monetary regimes and over time (especiallyover the post-WWII era).
Third, historically inflation persistence — broadlyspeaking, the tendency for inflation to be comparativelyhigh (low) in one period, having been comparativelyhigh (low) in previous periods — appears to have beenthe exception, rather than the rule. Inflation is onlyfound to have been very highly persistent only duringthe period between the floating of the pound and theintroduction of inflation targeting. Under inflationtargeting, inflation exhibits little or no persistence basedon all the price indices we consider. In line with arecent, and growing, literature, in particular the recentwork of Cogley and Sargent, and in contrast with the‘traditional’ position of, eg, Fuhrer and Moore orBlanchard and Gali, our results provide compellingevidence that high inflation persistence is not anintrinsic, structural feature of the economy. Instead, the extent of inflation persistence may crucially depend on the monetary regime in place over the sample period.
Fourth, we document a remarkable stability acrossregimes in the correlation between inflation and therates of growth of both narrow and broad monetaryaggregates at the very low frequencies. The exception isbase money growth under the current inflation-targetingregime, for which the correlation clearly appears to havebeen, so far, negative. Our results, in particular, suggestthat a key finding in Rolnick and Weber, a strongercorrelation between inflation and the rates of growth ofmonetary aggregates under fiat standards than undercommodity standards, may find its origin in theirexclusive focus on the raw data (in other words, in theirfailure to distinguish between the different frequencycomponents of the data).
Finally, we show how Keynes, in his dispute with Dunlop and Tarshis on real wage cyclicality, was entirely right: during the inter-war period, real wageswere strikingly countercyclical. By contrast, underinflation targeting they have been, so far, stronglyprocyclical.

172
Affine term structure models for the foreign exchange riskpremiumWorking Paper no. 291
Luca Benati
The ability to produce reliable estimates of foreignexchange risk premia would be of potentially paramountimportance for policymakers. For example, a givenappreciation of the currency bears markedly differentimplications for monetary policy when it originates froma movement in the risk premium, as opposed to (say) achange in the equilibrium exchange rate. Four decadesago, Fama first called the attention of the economicprofession to the so-called ‘forward discount anomaly’, apuzzling violation of the uncovered interest parity (UIP)hypothesis according to which future foreign exchangerate depreciation should exactly reflect the currentspread between foreign and domestic interest rates.Given that the presence of a time-varying foreignexchange risk premium represents a possible explanationfor the failure of UIP to hold, in the intervening yearseconomists have been trying to estimate risk premiawithin several different econometric frameworks. A firststrand of literature has tried to estimate models basedon strong theoretical restrictions, encountering, as oftoday, near-universal lack of success. Typical problemsfound within this approach include implausibleestimates of the degree of risk aversion and, almostalways, the empirical rejection of key theoreticalimplications of the underlying model.
A second group of studies has reacted to the rejection ofmodels based on strong theoretical restrictions bypursuing a radically alternative strategy, namely byadopting a pure time-series approach that imposes aminimal theoretical structure on the data. While studiesin this vein are capable of identifying a predictablecomponent in the foreign exchange excess return, theytypically suffer from the drawback that, by not imposingenough structure on the data, they cannot guaranteethat such an estimated predictable component truly is arisk premium.
In this paper we adopt an intermediate approach, basedon semi-structural models imposing minimal restrictionson the two countries’ so-called pricing kernels — the
processes on which all of the assets within the twocountries, and the nominal exchange rate between them,can be priced. Such models should be considered as a‘bridge’ between the two previously discussed groups ofstudies, imposing on a time-series structure a set ofrestrictions just sufficient to identify a foreign exchangerisk premium with a reasonable degree of confidence,but otherwise leaving the model largely unconstrained.Although, on strictly logical grounds, it is clearly suboptimal — ideally, we would like to be able to imposea solid theoretical structure capable of generating atime-varying risk premium — at the moment such anapproach is probably the most promising.
We extract historical estimates of foreign exchange riskpremia for the pound with respect to the US dollarbased on two affine (ie linear) term structure models.The term structures of interest rates for the twocountries are estimated jointly, together with thedynamics of the nominal exchange rates between them,via maximum likelihood. The likelihood function iscomputed via the Kalman filter, and is maximised withrespect to unknown parameters. Particular attention ispaid to the robustness of the results across models; tothe overall (filter plus parameter) econometricuncertainty associated with risk premia estimates; andto the ability of estimated structures to replicate Fama’s‘forward discount anomaly’, the key conditional stylisedfact pertaining to the foreign exchange market.
The paper’s main results may be summarised as follows.First, the risk premia estimates generated by the twomodels, although exhibiting a qualitatively similar timeprofile, are numerically quite different, to the point ofcasting doubts about the possibility of using themwithin a policy context. Second, both models fail toreplicate the forward discount anomaly. Third — andnot surprisingly, given the well-known difficulty offorecasting exchange rates — the estimated modelsexhibit virtually no forecasting power for foreignexchange rate depreciation.

173
Switching costs in the market for personal current accounts:some evidence for the United KingdomWorking Paper no. 292
Céline Gondat-Larralde and Erlend Nier
Bank current accounts play a pivotal role in therelationship between a bank and its customers and mayserve as a gateway through which banks can cross-sellother products. This paper analyses the competition inthe market for personal current accounts in the UnitedKingdom. Using the Financial Research Survey (FRS)data collected by National Opinion Poll (NOP), we firstdescribe some stylised facts on market shares and pricesassociated with the current account, such as the interestrate offered on positive balances and the rate charged onoverdraft. While the level of concentration has remainedhigh in this market, the market appears to have becomegradually more competitive, with building societies anddirect banks making some significant inroads during the1996–2001 period. Against this, we find a markeddispersion in price, which appears to persist throughtime.
To assess the level of competition in the current accountmarket more formally, we derive the elasticity — that isthe sensitivity — of bank market shares with respect tothe set of prices that relate to the current accountproduct. This analysis controls for differences in currentaccount characteristics (such as the extent of the branchnetwork) in order to isolate the effect of pricedifferentials on changes in market share. We find amoderate sensitivity of changes in market share todifferences in the current account rate across banks.The elasticity of market share with respect to theoverdraft rate is considerably lower. Overall our findingsare consistent with a moderate degree of imperfectcompetition in the market for personal current accounts.
We proceed to investigate further the type of friction inthis market that best characterises the data. We find apositive relationship between levels of market share andprice — again controlling for non-price characteristics.This finding points to the importance of the cost of
changing banks and is consistent with dynamic modelsof competition with switching costs developed recently.The basic intuition is that each bank faces a trade-off:raising the price increases the profit the bank achieveson its existing customer base, but also implies that thebank might lose some of its present customers and is lesslikely to attract new customers. The bank’s currentmarket share determines how this trade-off is resolved.A bank’s incentive to raise its price is more pronounced,the larger is the bank’s current market share. The model also predicts that the relationship between marketshare and price should be stronger, the lower theelasticity of demand with respect to price. Consistentwith this prediction, we find that the relationshipbetween market share and price is strongest for theoverdraft rate, for which the elasticity of demand islowest.
Since the end of our sample period, there have beenseveral initiatives to facilitate switching. In response tothe Cruickshank report in 2000, the Government askeda group led by DeAnne Julius to review the BankingCode. One set of recommendations in the report thathas since been implemented specifically focuses on waysto facilitate switching accounts. Moreover, the bankshave implemented improvements to the logistics of theswitching process — eg as regards the exchange ofinformation between the switchers’ old and new banks— to improve the speed and the accuracy of the accounttransfer. In addition to initiatives to reduce the cost ofswitching, steps have also been taken to increaseconsumer awareness of the potential benefits ofchanging banks. Even though it may be too early toassess the impact of these initiatives empirically, theresults of this study appear broadly supportive of suchinitiatives, in that they document empirically thepresence of switching costs in the UK market forpersonal current accounts.

174
Resolving banking crises — an analysis of policy optionsWorking Paper no. 293
Misa Tanaka and Glenn Hoggarth
This paper develops a simple but general frameworkwhich can be used to analyse alternative policies torestructure failed banks when the authorities cannotobserve banks’ balance sheets. We demonstrate thatwithout regulatory intervention, weak banks have theincentives to hold on to the non-performing loans(NPLs) and gamble for the small chance of recoveringthese loans (‘gamble for resurrection’). But if theauthorities cannot force weak banks to liquidate theirNPLs because they cannot observe their balance sheets,they may have to rely on financial incentives to inducebanks to liquidate their bad assets. Our paper considersthe optimal design of such financial incentives, takinginto account their impact both on managerial moralhazard and fiscal cost of resolution.
We first examine actual policies used in recent bankingcrises to clarify why certain choices have been made.Subsequently, we use a model to consider five differentpolicy options for resolving banking failures when the
authorities cannot observe the level of non-performingloans held by each bank. When faced with thisasymmetric information, the first-best outcome isachievable when the authorities can close all banks thatfail to raise a minimum level of new capital. But whenthe authorities cannot close banks and must rely instead on financial incentives to induce banks toliquidate their NPLs, equity (Tier 1 capital) injectionwould be the second-best policy, whereas subordinateddebt (Tier 2 capital) injection is suboptimal. If theauthorities do not wish to hold an equity stake in abank, they should subsidise the liquidation of non-performing loans rather than inject subordinateddebt. We also show that the cost of this subsidy can bereduced if it is offered in a menu that includes equityinjection. Thus, our analysis clarifies the conditionsunder which each policy should be used, and provides apractical guidance to policymakers in resolving bankfailures when they cannot immediately assess theproblems at each bank.

175
How does the down-payment constraint affect the UK housing market?Working Paper no. 294
Andrew Benito
Buying a home usually requires a significant amount ofcash. Lenders typically require that a home-buyer hassome equity in the home. There are good reasons forwhy this should be the case. This paper considers theimplications of this borrowing constraint for the UKhousing market.
For the aggregate housing market, the paper shows thatseveral features can be explained by the model whichattaches an important role to the down-paymentconstraint: first, a positive correlation between the rateof change of house prices and transactions; second, thegreater volatility in the rate of change of house pricesamong former owner-occupiers’ properties than for first-time buyers; third, the presence of more formerowner-occupiers relative to first-time buyers in themarket when the rate of change of house prices is high;and fourth, house prices are more sensitive to theincomes of the young than to aggregate income.
An important feature of the model highlighted in thispaper is that it is based on the economic fundamentalsof the housing market. This contrasts with somediscussions of the housing market which draw on theidea of housing market ‘bubbles’ to attempt torationalise outcomes, in particular significant swings inactivity and prices. Any model based on bubbles isdifficult to test. Moreover, used in this paper alsosuggests that there can be episodes of price‘overshooting’ in the housing market, as prices increasebeyond their new equilibrium in response to an increasein income and then decline. Traditional models find thisdifficult to explain. This may be why, by default, somecommentators have attempted to explain house pricefluctuations by appealing to notions of bubbles instead.
Much commentary on the housing market appeals toratios such as the ratio of house prices to incomes orearnings as being a key attractor to which house pricesshould return in the long run. Yet basic economictheory suggests that prices are not determined byaverages, but instead, are set at the margin. If the
marginal buyer is a young first-time buyer then thissuggests that the prices should be more sensitive to theincomes of the young than to average income. Thispaper demonstrates that in the early 1990s, when houseprices declined significantly, there was a notable declinein incomes among young, potential first-time buyersrelative to the wider population, suggesting a greatersensitivity to their income than to the wider population.More generally, higher volatility in the incomes of theyoung than for the population as a whole suggests thathouse prices will be more volatile than if they wererelated to average incomes.
The paper also explores variation across districts.Despite some remarkable movements witnessed in houseprices in recent years, there is much more variationacross districts than over time in the rate of change ofhouse prices. Examining these differences acrossdistricts can also shed light on the behaviour of thehousing market. Market professionals themselves arguethat different districts should be thought of as quitedistinct housing markets: so using aggregate data toexamine changes in house prices could be misleading.But there are few, if any, studies of local housing marketsin the United Kingdom that can be said to cover a largepart of the country.
By focusing on variation in house price inflation acrossdistricts, the paper examines another key implication ofthese down-payment models, namely the role forleverage (loan to value ratios) in influencing theresponse of local house prices to incomes. The paperfinds that a large incidence of households with relativelyhigh loan to value ratios in an area increases theresponse of prices in that area to local incomes andfinancial shocks. This justifies many commentators’focus on loan to value ratios in their discussion of thehousing market. In recent years loan to value ratios havebeen declining in the United Kingdom among first-timebuyers, suggesting a lower sensitivity of house prices toshocks in future.

176
Productivity growth, adjustment costs and variable factorutilisation: the UK caseWorking Paper no. 295
Charlotta Groth, Soledad Nuñez and Sylaja Srinivasan
The aim of monetary policy is to keep inflation low andstable. A key influence on inflationary pressure is thebalance between the demand for and the economy’scapacity to supply goods and services. This capacitydepends both on the quantities and qualities of theinputs into the production process (capital and labour),and on the efficiency with which they are combined.The latter concept is often referred to as total factorproductivity (TFP). A good understanding of past andcurrent TFP growth is thus important for understandingaggregate supply capacity, and so is relevant for theconduct of monetary policy.
During the 1990s, productivity growth did not increasein the United Kingdom while it rose sharply in theUnited States. This diverging performance lookspuzzling, especially when considering that, following the1990–92 recession, the macroeconomic environment inthe two countries was similar. This research tries toestimate underlying productivity growth by accountingfor a number of factors that may bias the standardestimate of productivity growth, and thereby give us adistorted picture of underlying technological progress.By doing so, it tries to assess and account for the lack ofa pickup in UK productivity growth during the 1990s.
The starting point of the analysis is a standard measureof aggregate TFP growth, or the so-called Solow residual.This is calculated as that part of aggregate outputgrowth that cannot be accounted for by the primaryfactors of production, under the assumptions of perfectcompetition, constant returns to scale, no costs toadjusting the factors of production and therefore fullutilisation of available factors.
When any of these assumptions is violated, the Solowresidual may not correctly measure underlyingtechnological progress. For example, increasing returnsto scale in the production of output may cause thismeasure of TFP growth to rise whenever input growthrises. And if firms face adjustment costs when hiringand firing workers or changing the level of capital, theycould respond to short-run fluctuations in demand byadjusting the intensity with which they use labour andcapital. This would cause larger fluctuations in outputthan in capital and labour, and hence procyclicalmovements in measured TFP growth. In addition, iffirms face costs to adjusting capital and labour,
marketable output (which matters for the Solow residual)may be low during periods of rapid investment or hiringgrowth. This is because firms may spend resourcesinternally to install capital or labour, rather thanproducing marketable output. In this paper, we try tocontrol for these types of non-technological factors, tosee whether this affects our conclusions about theUnited Kingdom’s productivity performance during the1990s.
It is not possible to observe how hard companies areworking capital and labour — or their utilisation levels— directly. But by assuming that firms maximise profits,we can derive links between variables such as hoursworked and the amount of intermediate inputs used, andchanges in the rate of utilisation of capital and labour.The paper also tries to account for the amount ofresources that is used by firms to install new capital andhire new labour, instead of producing marketable output.
The results suggest that the aggregate Solow residualunderestimates underlying UK total factor productivitygrowth through the 1990s, since it does not account forfalling utilisation rates and high capital adjustmentcosts. We find, however, that these non-technologicalfactors had a similar impact on the Solow residualduring the first and the second half of the 1990s. Thebroad movement in the aggregate Solow residualthrough the 1990s is therefore similar to that of ourestimate of underlying productivity growth. Thus thepuzzle of the apparent lack of a pickup in UKproductivity growth during the 1990s remains.
In a comparison with the United States, the paper notesthat the US experience of a rise in TFP growth betweenthe first and the second half of the 1990s was, to a largeextent, driven by strong growth in ICT-producingindustries, the distribution sector and financial services.A broadly similar pattern is found for the UnitedKingdom. One difference, however, is that whereas theUS durables manufacturing sector as a wholecontributed to rising rates of TFP growth, UK estimatessuggest that most durables industries did not see anincrease in TFP growth over the same periods. So theresults suggest that the rise in TFP growth appears tohave been more broadly based in the United States thanin the United Kingdom, and this may partly explain thedifference in the aggregate data.

177
Sterling implications of a US current account reversalWorking Paper no. 296
Morten Spange and Pawel Zabczyk
The US current account deficit reached a new high of6.3% of GDP in 2004 Q4. The deficit is large incomparison with the current account balances of othercountries and this has led a number of commentators toquestion its sustainability. This paper explores thepotential implications for sterling of a restoration of theUS current account deficit to balance. The analysis isbased on a model calibrated to represent the UnitedKingdom, the United States and a third region coveringthe rest of the world. Different triggers that might bringabout a realignment of the US current account deficitare considered. We begin by analysing the implicationsof a negative shock to US consumers’ demand. Inaddition, we study a scenario in which such a demandshock is supplemented by a positive productivity shockin the US tradable sector — helping the United Statesbridge its trade deficit and so improving the currentaccount. Finally, we also assess the impact of revaluationeffects on international investment positions and howthis affects the results.
Our analysis suggests that the magnitude of sterlingadjustment depends heavily on (a) the cause of the UScurrent account adjustment, ie the type of shock thatbrings it about; (b) the assumptions made about theassociated adjustments of the United Kingdom and restof the world current account deficits, ie how the
adjustment to the US unwinding is split geographically;and (c) assumptions about key judgements such as thedegree of substitutability between different types ofgoods (tradable and non-tradable) and goods producedin different regions.
Assuming that the UK current account deficitdeteriorates in proportion to sterling’s share in thedollar effective exchange rate index (ERI), we can deriveestimates for movements in the sterling real effective ERI ranging from a depreciation of 1.4% to anappreciation of 4.2%, depending on differentjudgements about substitutability and the cause of theadjustment. If we assume that the dollar pegsmaintained by a number of Asian economies result in alarger proportion of the adjustment falling on theUnited Kingdom, then the model generates estimatesranging from a depreciation of the sterling real ERI of0.7% to an appreciation of 4.9%. However, in the eventthat all current accounts were to move to balance(implying a UK current account improvement) the model predicts a real ERI sterling depreciation in therange of 0.6% to 7.8%. It is important to note that the exchange rate movements presented in this paper are a symptom of rebalancing global demand, and they are not associated with unemployment orrecessions.

178
Optimal monetary policy in a regime-switching economy:the response to abrupt shifts in exchange rate dynamicsWorking Paper no. 297
Fabrizio Zampolli
A common concern among central bankers is that the true orperceived existence of financial imbalances or asset pricemisalignments could at some point in time lead to sudden andlarge adjustments in asset prices, with potentially adverseconsequences for inflation and output. For instance, one ofthe major risks that has worried some members of the Bank ofEngland’s Monetary Policy Committee (MPC) in the past hasbeen the possibility that sterling could suddenly fall by amaterial amount. Other risks routinely debated by actualpolicymakers, including oil price hikes or abrupt changes inkey econometric relationships, may also be asymmetric — thatis, a given change may be more likely to occur in one directionthan in the opposite. Nevertheless, modelling of asymmetricrisks is not very common in the monetary policy literature,possibly because of the lack of readily-applicable technicaltools.
In this paper we examine the trade-offs that the policymakerfaces when the exchange rate can experience sustaineddeviations from its fundamental value (ie the value implied byinterest rates absent any economic shock) and occasionallycollapse. To do so we use a simple method which has rarelybeen applied in the economics literature. The method allowsus to solve for the optimal monetary policy in an economysubject to regime shifts, while retaining the flexibility andsimplicity of more commonly applied methods. The methodcould be applied in other ways that are not considered in thispaper and can be considered as a general tool for studyinguncertainty in monetary policy. In particular, it provides anexample of how policymakers can incorporate judgementalinformation about a potential misalignment (and theuncertainties associated with it) into their macroeconomicmodel, and work out the best policy response based on thatjudgement.
Our analysis is based on a small open economy model,comprising a demand equation, a Phillips curve whichdetermines prices, and an equation linking the real exchangerate to the domestic real interest rate. We modify this model toincorporate regime switching in the exchange rate. In oneregime, which we call the bubble regime, any shock can leadthe exchange rate to increasingly deviate from its fundamentalvalue. Depending on the sign of the shock, the exchange ratecan continue to rise above its fundamental value, or it cancontinue to fall below it. In the other regime, which we callthe no-bubble regime, the exchange rate displays transitory
fluctuations around its fundamental value. The times at whichthe bubble begins and ends are uncertain to the policymaker.Moreover, the size of the correction in the exchange rate,which occurs when the economy switches from the bubble tothe no-bubble regime, will vary over time as it depends on thepast behaviour of the exchange rate as well as the interest rate.
Analysis of the optimal regime-switching policy rule shows theexistence of an intuitive link in the bubble regime between theoptimal response of the interest rate to the exchange rate andthe expected duration of a bubble. When the bubble isexpected to last for at least two years, the optimal interest rateis negatively related to movements in the real exchange rateand becomes more responsive as the expected duration of thebubble lengthens (an increase in the exchange rate being anappreciation). Similarly, in the no-bubble regime there is anintuitive link between the response to the exchange rate andthe probability of the bubble emerging: for lower probabilitiesof bubbles the interest rate is positively correlated withexchange rate fluctuations (reflecting the likely transitorynature of exchange rate movements) but becomes lessresponsive as the probability of a bubble increases. For highprobabilities of the bubble the interest rate respondsnegatively and becomes more reactive to exchange ratefluctuations as the probability rises further (reflecting thelikely onset of a bubble). Another characteristic of the optimalregime-switching interest rate rule is that in both regimes theinterest rate is for the most part less responsive to inflationand output fluctuations than in the absence of regimeuncertainty, with the degree of caution increasing as bothtransition probabilities approach a half.
A key result of the paper concerns the assumptions that thepolicymaker makes about the (unknown) probabilities ofmoving between bubble and no-bubble regimes. Theseprobabilities could be highly uncertain since historicalexperience might provide little or no help in quantifying them.We find that there are ‘robust’ values of the probabilitiescorresponding to more muted policy responses, where by‘robust’ we mean values of the probabilities which can beassumed by the policymaker without fear of causingunnecessary volatility in output and inflation, were they toprove wrong in hindsight. This result is interesting as in therobust control literature uncertainty is often found to lead tomore reactive policy responses than in the absence ofuncertainty.

179
Optimal monetary policy in Markov-switching models withrational expectations agentsWorking Paper no. 298
Andrew P Blake and Fabrizio Zampolli
Uncertainty is one of the major problems faced bypolicymakers. Economic models are simplerepresentations of how the economy works, and mightturn out to be wrong. For example, the way the economyworks might change over time in an unanticipatedmanner which would not be captured by normaleconomic models. This paper focuses particularly onthis type of uncertainty. As interest rates normally affectoutput and inflation with a lag, rates must therefore beset while bearing in mind how the economy mightchange by the time that the interest rates exert influenceon inflation and aggregate output. Unfortunately, thenormal way of modelling the economy is to assume thatit does not change over time and that the onlyuncertainty faced by the policymaker is about the typeand duration of the shocks that hit the economy — forexample, changes in foreign demand. To put itdifferently, the normal way of modelling the economy isto assume that the policymaker knows how economicshocks affect inflation and output (ie the transmissionmechanism), and also to assume that this mechanismwill not change. In this paper, instead, we consider aneconomy in which the transmission mechanism canchange over time in an uncertain manner. For example,aggregate demand may become more sensitive tochanges in interest rates, or the degree to which theexchange rate affects consumer prices can becomelarger. This implies that the shocks hitting the economymight not have always the same impact on the variablestargeted by policymakers. By ignoring these potentialchanges, policymakers might be in danger of missing theinflation target more often than otherwise, or to causeinflation and output to be more volatile than is reallynecessary.
The main contribution of this paper is to develop simplemethods for working out the best interest rate responseto shocks in such an evolving economy. Morespecifically, the economy is modelled as a so-calledMarkov-switching framework. That is, the economy isassumed to alternate over time between a number of
regimes (eg high and low exchange rate pass-throughregimes) according to some given probabilities. It is alsoassumed that in this economy the private sector formsso-called rational expectations. That is, in forming theirviews about the future they understand what thetransmission mechanism is in the different regimes andthey also understand how policymakers set the interestrate in response to shocks. The paper also shows howthe methods for calculating the best interest responsecan be applied to the case in which policymakers andthe private sector differ in their views as to theprobability of the regime change. Another importantfeature we consider in this paper is the possibility ofassuming that uncertainty is asymmetric — that is, agiven change is more likely to occur in one directionthan in the opposite (eg an increase in the sensitivity ofaggregate demand to interest rates is more likely than afall of the same size).
We apply our procedure to a small open economy model in which some of its key features can suddenlychange. In this application we are considering so-calledtime-consistent policies, ie policies which continue to bethe best possible as time passes. With such policies themonetary authority is unable to affect the privatesector’s expectations. In our results, which should bethought of as first steps, we find that for the most partinterest rates are set more cautiously when uncertaintyabout changes in the economy is symmetric. That is, inresponse to shocks the interest rate is varied by less thanwhen such uncertainty is absent or ignored. Being lesscautious would make the economy more volatile withoutthe benefit of an improved trade-off between output andinflation, which would result from the ability ofpolicymakers to affect the private sector’s expectations.We also find that the optimal policy can be significantlyaffected by differences between the policymaker and theprivate sector in their views about the probabilities ofparameter changes. When changes in the economy areasymmetric, the findings about the optimal policyresponse cannot be easily generalised.

180
Optimal discretionary policy in rational expectationsmodels with regime switchingWorking Paper no. 299
Richhild Moessner
Structural change is an important feature of economies.One aspect of such change is that features of themacroeconomy may vary over time — for example,intrinsic inflation and output persistence, the interestelasticity of demand, or the persistence of shocks.Moreover, uncertainty is an important issue facingpolicymakers, including uncertainty about structuralchange, about the best model of the economy, as well asabout shocks hitting it. It is therefore interesting tostudy the implications for policymakers of structuralchanges that are not known with certainty. This paperconsiders policy design in the presence of structuralchange which is not known with certainty, and whichmay take the form of time variation in the parameters ofan economic model. We handle this time variation byassuming there are Markov processes underlying theparameters, so that they can take on several differentvalues and switch between them according to givenprobabilities. Moreover, structural change may takemany different forms, and in particular it may be abrupt,transitory and asymmetric in nature; modellingstructural change as Markov processes also enables us tocapture these features. By contrast, other work onoptimal monetary policy with parameter uncertainty,which assume that policymakers have symmetricuncertainty about parameters, do not capture all ofthese features.
Optimal policy with Markov switching in modelparameters has previously been considered forbackward-looking models. This paper extends theanalysis to forward-looking models of the economy forthe case of discretionary policy, when both the centralbank and the private sector face uncertainty aboutmodel parameters. Deriving the solution for the case offorward-looking models with rational expectations isuseful, since in contrast to purely backward-lookingmodels, such models include forward-looking privatesector expectations. This makes the treatment of privatesector expectations consistent with the forward-lookingbehaviour of the policymaker. The macroeconomic
models currently used for economic policy analysismainly incorporate rational expectations, to ensureconsistency, and to be able to base them — at least inpart — on optimising microeconomic behaviour. Inrelated work at the Bank, Fabrizio Zampolli derivesoptimal policy for the case of Markov switching of model parameters in backward-looking models, whileAndrew Blake and Fabrizio Zampolli consider time-consistent optimal policy in forward-lookingmodels within a semi-structural model representation.In related academic work, Lars Svensson and Noah Williams derive optimal policy with Markovswitching in forward-looking models under bothcommitment and discretion.
As an illustration, we apply our method to study optimalmonetary policy in the presence of structural changes inoutput persistence, within a forward-looking modelestimated for the euro area. The main reason for addingthis output persistence to the basic forward-lookingmodel is to improve the fit with the data. Outputpersistence may change, for example, because of changesin the degree to which firms’ investment decisions areconstrained by cash flow, rather than being purelyforward-looking. We assume there is a Markov processdriving these changes. We find that the coefficients ofthe optimal policy rule depend on the state of theeconomy characterised by different values of outputpersistence, and the coefficients depend on thetransition probabilities of the Markov process governing the structural change. For uncertainty about output persistence, the optimal policy rule is non-linearly related to the transition probabilities. Wefind that if the probability of moving from a state withlow output persistence to a state with high outputpersistence is high, it is optimal for monetary policy inthe former state to respond more aggressively to thelagged output gap, lagged inflation and the two shocks(to output and inflation) we consider, than in theabsence of uncertainty about changes in outputpersistence.

181
Introduction
In May 1997, the Government gave the Bank of Englandoperational responsibility for setting interest rates tomeet its inflation target. The Bank believes thatmonetary policy will be most effective if peopleunderstand and support the goal of price stability, aswell as the use of interest rates to achieve it.
One of the ways the Bank monitors public support forprice stability is via surveys of public opinion andawareness. Such a survey has now been published forfive years: the survey is described in more detail in thebox on page 182. And since 2001, each year there hasbeen an article in the Quarterly Bulletin describing thesurvey results. This article describes the results fromMay 2005 to February 2006.
Economic conditions
The survey questions can loosely be divided into twosections: respondents’ views on economic conditions,including recent and likely outturns for inflation andinterest rates; and their general attitudes to monetarypolicy, covering the inflation target, interest rates, andthe Bank’s performance.(1) This section examines thesurvey responses on economic conditions.
Inflation perceptions (Question 1)
Question 1 asks about people’s perceptions of thecurrent annual inflation rate — that is, how fast theprices of goods and services in the shops have risen over
the past year. However, the precise measure of inflation— for example the consumer prices index (CPI) or theretail prices index (RPI) — is not defined. Respondentsare offered a range of responses, from falling prices toinflation of 5% or more.
The median(2) view of the current annual rate ofinflation was 2.8% in February 2006, the highest sincethe survey’s inception (Chart 1). It also marks a notablerise since May 2005, when the typical respondentbelieved inflation was 2.0%, equal to the CPI inflationtarget. Although the proportion of respondents whothought inflation was between 2% and 3% was
Public attitudes to inflation
Over the past six and a half years, GfK NOP has carried out surveys of public attitudes to inflation onbehalf of the Bank of England. As part of an annual series, this article analyses the results of thesurveys from May 2005 to February 2006. Public perceptions of past and future inflation picked uprecently, while most people thought interest rates had risen over the past year. Public understandingabout the monetary policy framework remained limited, but people were generally satisfied with the waythe Bank has been setting interest rates.
By Colin Ellis of the Bank’s Inflation Report and Bulletin Division.
Chart 1Median survey and official estimates(a)
of inflation
0.5
1.0
1.5
2.0
2.5
3.0
3.5Percentage changes on a year earlier
Survey median
CPIRPIX(b)
Nov.1999
Nov.2000
Nov.01
Nov.02
Nov.03
Nov.04
Nov.05
(a) Official estimates in the months before surveys.(b) The RPI excluding mortgage interest payments.
(1) The precise wording of all the questions is shown in the annex. The data from the survey are available on the Bank’swebsite at www.bankofengland.co.uk/statistics/nop/inflationattitudesfeb06b.xls.
(2) To calculate the median (a type of average), responses are assumed to be evenly distributed within bands, ie a responseof 2% to 3% is assigned a value of 2.5%.

182
Bank of England Quarterly Bulletin: Summer 2006
unchanged, fewer people thought it was lower than 2%,and more thought it was higher than 3%. Most strikingwas the sharp rise in the proportion of people whothought that inflation was over 5% (Chart 2).
The change in respondents’ views of past inflation isstatistically significant — so it is unlikely to be causedby sampling fluctuations. Official estimates of inflationat the time of the February 2006 survey were higherthan a year earlier. But the extent of these rises wasrelatively small, and in the past the match betweenofficial data and the survey responses has beenimprecise at best (Chart 1). Although the question asksabout prices in the shops, it could be that the ‘headline’
announcement of rises in the prices of some goods andservices, such as gas and electricity, have led people tobelieve that prices overall are rising at a faster rate thanwas previously the case.
As in previous years, responses varied across differentdemographic groups. The distribution of responsesacross those demographic groups is normally broadlyunchanged from survey to survey, and the past year wasno exception. In some groups the largest singleproportion of people had ‘no idea’ about what inflationhad been. These included 15–24 year olds and low-skilled workers and those living on benefits.(1) Butin other instances, the largest proportion were those
(1) These are categorised as the ‘DE’ respondent class.
The Monetary Policy Committee (MPC) setsinterest rates to hit the Government’s inflationtarget. The nine members of the MPC use a varietyof methods to explain their interest rate decisions,including speeches and lectures, and publicationssuch as the Inflation Report. Bank staff also spend aconsiderable amount of time explaining monetarypolicy to a wide audience, for example through theannual ‘Target Two Point Zero’ competition forschools. These activities are designed to raisepublic awareness and support for monetary policy.But public support for price stability is hard tomeasure. As such, the Bank decided that one wayto gauge it was to carry out quarterly surveys ofpublic opinion and awareness.
The resulting survey on Inflation Attitudes waspiloted in November 1999, and following trials wasfirst published in February 2001. The surveycovers 14 questions, the precise wording of whichis shown in the annex.(1)
The early trials showed that the results for five ofthe questions varied only a little from quarter toquarter. As a result, these questions are asked onlyonce a year, in February. The questions ask aboutthe relationship between interest rates andinflation, and who actually sets interest rates.
The nine other questions are asked every quarter,so they are also included in the annual survey. The questions cover views of past and futureinterest rates and inflation, the impact of inflationand interest rates on the economy and individuals,and how satisfied people are with the way the Bank of England is doing its job of setting interest rates to meet the inflation target. The quarterly surveys are carried out after thepublication of the Inflation Report in February, May, August and November. The sample size forthe quarterly surveys is around 2,000 people,roughly half the size of the annual February survey.
The February 2006 survey was carried out between 16 February and 14 March, as part of the regular GfK NOP Omnibus surveys. GfK NOPinterviewed 3,939 people aged 15 and over in 350 districts throughout Great Britain. They use a random location sample designed to berepresentative of all adults in Great Britain, and interviewing is carried out face-to-face inhomes. The raw data were then weighted to match the demographic profile of Great Britain as a whole — unless otherwise stated, theseweighted data are the ones reported in this article.
The Bank of England/GfK NOP survey on Inflation Attitudes
(1) Since February 2004, the annual survey has included two extra parts to Question 3, asking respondents about the change in the inflation target madeby the Chancellor of the Exchequer in December 2003.

Public attitudes to inflation
183
who thought inflation had been 5% or higher; theseincluded people aged over 55, people earning between£9,500 and £17,499 a year, and respondents who leftschool before the age of 16.(1)
Inflation expectations (Question 2)
The second survey question asks people about what theythink inflation will be over the next twelve months. Themedian expectation for future inflation also picked uprecently, reaching 2.7% in February 2006 — again, thehighest outturn on record.
Since the survey began, respondents’ expectations offuture inflation have moved closely in line with theirperceptions of past inflation (Chart 3). That correlationbetween past perceptions and future expectations is alsoevident in other surveys, such as the GfK NOP survey ofconsumer confidence (Chart 4).
The link between backward and forward-looking viewscan also be seen in the distribution of responses acrossthe range of options offered to survey respondents(Chart 5) — although intriguingly 29% of thoserespondents who had ‘no idea’ about past inflation didhazard a guess at future inflation. At the same time, therange of responses across demographic groups wassimilar for the backward and forward-looking questions:for example, older respondents’ perceptions of pastinflation and expectations of future inflation tended tobe higher than for younger people, and rose by morebetween the November 2005 and February 2006surveys.
Chart 5The distribution of price changes over the pastand next twelve months(a)
0
5
10
15
20
25
Perceptions
Expectations Percentage of respondents
Down Nochange
0%–1%
1%–2%
2%–3%
3%–4%
4%–5%
No idea≥5%
(a) From the February 2006 survey.
Chart 2The distribution of price changes over the pasttwelve months
0
5
10
15
20
25
February 2005February 2006
Percentage of respondents
Down Nochange
0%–1%
1%–2%
2%–3%
3%–4%
4%–5%
No idea≥5%
Chart 3Median outturns and expectations of inflation
1.4
1.6
1.8
2.0
2.2
2.4
2.6
2.8
3.0
Median perception
Median expectation
Per cent
0.0Nov.1999
Nov.2000
Nov.01
Nov.02
Nov.03
Nov.04
Nov.05
Chart 4Households’ perceptions about the generaleconomic situation
40
30
20
10
0
10
20
30
1997 99 2001 03 05
Percentage balances
Next twelve months
Past twelve months
–
+
Source: GfK NOP.
(1) Note that these demographic groups are overlapping, ie some of the over-55s left school before the age of 16.

184
Bank of England Quarterly Bulletin: Summer 2006
We can also examine whether respondents tend to basetheir individual expectations on their own pastperceptions, using the detailed breakdown from theInflation Attitudes survey. The correlation betweenindividuals’ past perceptions and future expectationswas 0.61 in the February 2006 survey, indicating astatistically significant relationship betweenrespondents’ forward and backward-looking responses.The same was also true for correlations of the medianestimates (0.91, Chart 3) and the distribution ofchanges (0.97, Chart 5). The evidence is consistent withindividuals forming expectations on the basis of theirrecent perceptions.
Interest rate perceptions and expectations (Questions 5and 6)
The survey also asks what people think has happened tointerest rates over the past twelve months. In the past,people’s perceptions have broadly matched the actualchange in the Bank of England’s official interest rate(Chart 6). But in the February 2006 survey, 41% ofrespondents thought rates had risen, and only 11%thought they had fallen; in fact, the Bank’s officialinterest rate was 0.25 percentage points lower than inFebruary 2005.
One reason for this divergence could be thatrespondents’ views reflect their personal experience overthe past year, based on interest rates on any savings,mortgages and loans they may have. These rates do notalways move in line with official rates. Over the pastyear, the interest rates households receive on savingsaccounts, and pay on mortgages, have fallen on average.In contrast, the average rate they pay on credit card billshas risen (Chart 7).
It is possible that people take relatively little notice ofmortgage or savings rates, unless they are looking for anew account. But credit card rates may be morenoticeable, for example if individuals transfer balancesfrom existing cards to new providers offering attractiveintroductory offers. So, to the extent that credit cardrates are more prevalent in individuals’ minds than other interest rates, that could explain the perceived rise in rates. Similarly, more 15–24 year olds thoughtrates had risen than other age groups; these individuals are less likely to have mortgages orsignificant savings, but may hold credit cards. Acrossother demographic groups, those who put most weighton rates having risen included unskilled workers andcouncil tenants.
Over the next year, 47% of respondents expectedinterest rates to rise, and 7% expected a fall. In past surveys, respondents have always expected rates torise, even when official rates have subsequently fallen (Chart 8).
How do individuals’ views on future changes in interestrates compare with their views on other futuredevelopments? The median expected inflation rate fromthe survey is positively correlated with the net balanceof respondents expecting a rise in rates, although therelationship is weak. This could reflect individuals’beliefs that the Bank responds to higher inflation byraising rates.
There is also a loose relationship between individuals’beliefs about future rate changes and their own financialsituation. In particular, when more people expect rates
Chart 6Perceptions of interest rates and actual changesin official rates
80
60
40
20
0
20
40
60
80
2.0
1.5
1.0
0.5
0.0
0.5
1.0
1.5
2.0
Actual change in official interest rates
(right-hand scale)
Percentage pointsNet balance
Perceptions of interest rate changes
(left-hand scale)
–
+
–
+
Nov.1999
Nov.2000
Nov.01
Nov.02
Nov.03
Nov.04
Nov.05
over the past twelve months
over the past twelve months
Chart 7Changes in effective interest rates(a)
0.3
0.2
0.1
0.0
0.1
0.2
0.3
0.4
Savings accounts House purchases Credit cards
Percentage points
–
+
(a) Between February 2005 and February 2006. Effective interest rates are defined as the flow of interest payments divided by the stock of debt (savings). The savings account rate is for so-called time deposits, where savers are unable to access the entire savings balance without penalty within a day.

Public attitudes to inflation
185
to rise, they also tend to be more pessimistic about theoutlook for their own financial situation (Chart 9; thecorrelation between the two series is -0.36). Wheninterest rates rise, some households (savers) will bebetter off, and others (borrowers) worse off. But the netimpact for consumption is likely to be negative, asindebted households are likely to cut back on spendingmore than creditor households increase their spending.The relationship between expected changes in rates andhouseholds’ own financial situation is consistent withthis view that debtors are more affected by changes ininterest rates than creditors.
General attitudes to monetary policy
The remainder of the survey questions cover individuals’attitudes to policy, including the role and performanceof the Bank of England and the response of prices tochanges in rates.
Inflation (Questions 3 and 4)
As in previous years, the majority of respondentsthought that higher inflation had a negative impact onthe economy. The proportion of people who thoughtthis rose to 54% in February 2006, the highest onrecord and up from 48% a year earlier. And just 23% ofrespondents thought higher inflation would make littledifference, down from 27% in February 2005.
Following the introduction of the new inflation target inDecember 2003, two extra parts to Question 3 wereadded to the survey to monitor public awareness of thechange. In February 2006, 22% of people identifiedthat the target was between 1.5% and 2.5%, but almosthalf the respondents (47%) did not know what the targetwas. In addition, 29% of people correctly thought theinflation target was the same as last year — but another29% thought it was higher than last year, and 33% hadno idea. These data suggest that public awareness of theinflation target is still not widespread.
Question 4 asks people whether the target of 2% was too high or too low — as in previous years, the majorityof respondents (56%) thought the target was ‘aboutright’. Around one in ten people saw the current targetas too low, and around one in five thought it was toohigh.
Interest rates (Questions 7 and 8)
The survey asks respondents what they think shouldhappen to interest rates, from the perspective of whatwould be best for the economy, and what would be bestfor them personally. Based on their personal situation,the largest group (36%) of respondents would preferinterest rates to fall. That is consistent with therelationship between future rate changes andhouseholds’ financial situation described earlier (Chart 9). Unsurprisingly, this tendency was particularlypronounced among mortgagors, 51% of whom wouldprefer a cut in rates. And 54% of all respondents aged 25–34 also preferred a cut. Recent evidence fromthe NMG Research survey suggests that 25–34 year oldsare more likely to have unsecured debts than peoplefrom other age groups, and are generally also less likely
Chart 8Expectations of future changes in interest ratesand outturns
0
10
20
30
40
50
60
70
80
2.5
2.0
1.5
1.0
0.5
0.0
0.5
1.0
1.5Percentage pointsNet balance expecting an increase
–
+
Change in official interest rates (right-hand scale)(a)
Nov.1999
Nov.2000
Nov.01
Nov.02
Nov.03
Nov.04
Nov.05
Expectations of interest rate changes over the next twelve months(left-hand scale)
(a) Moved backwards twelve months, to correspond to the survey question.
Chart 9Expectations of future changes in interest ratesand households’ financial situation
10
0
10
20
30
40
50
60
70
80
1999 2000 01 02 03 04 05 06
5
7
9
11
13
15
17
Expected future changes in interest rates (left-hand scale)
Households’ financial position over the next year (right-hand scale)
Net percentage balanceNet percentage balance
(inverted scale)(a)
–
+
Sources: Bank of England and GfK NOP.
(a) The scale has been inverted so that a fall in the pink line reflects an improvement in households’ expectations of their future financial situation. Data are shown for the same months as the Inflation Attitudes survey.
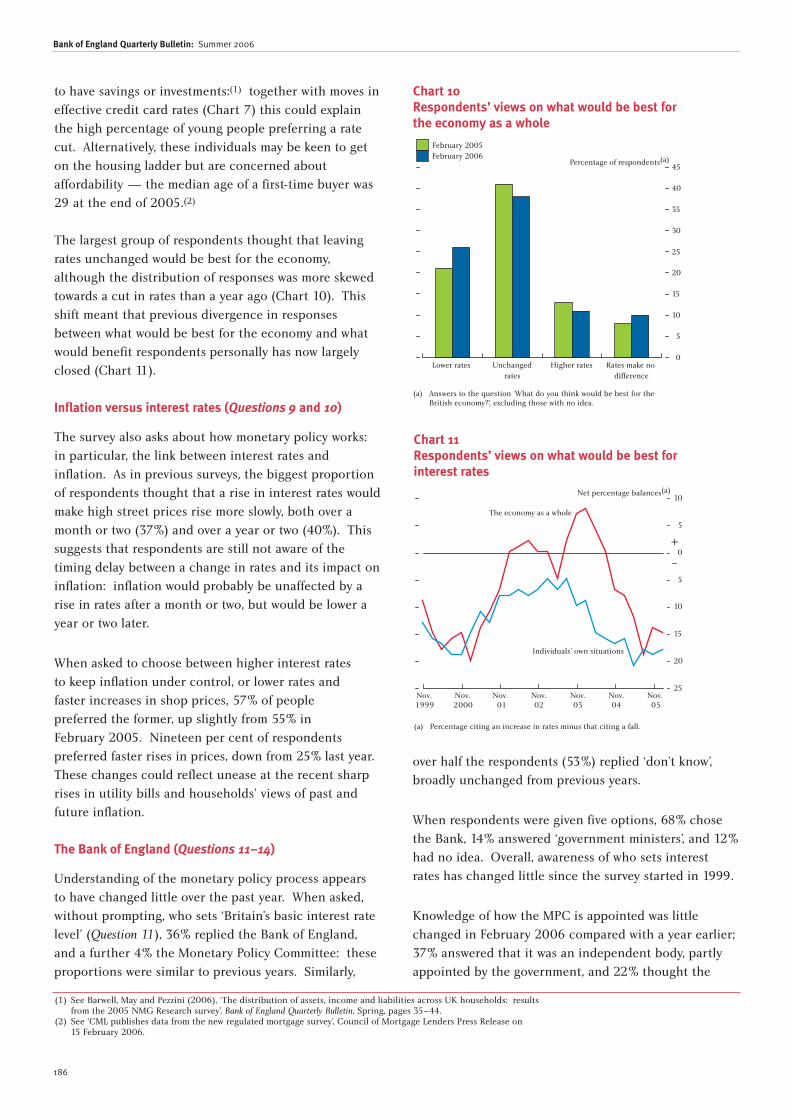
186
Bank of England Quarterly Bulletin: Summer 2006
to have savings or investments:(1) together with moves ineffective credit card rates (Chart 7) this could explainthe high percentage of young people preferring a ratecut. Alternatively, these individuals may be keen to geton the housing ladder but are concerned aboutaffordability — the median age of a first-time buyer was29 at the end of 2005.(2)
The largest group of respondents thought that leavingrates unchanged would be best for the economy,although the distribution of responses was more skewedtowards a cut in rates than a year ago (Chart 10). Thisshift meant that previous divergence in responsesbetween what would be best for the economy and whatwould benefit respondents personally has now largelyclosed (Chart 11).
Inflation versus interest rates (Questions 9 and 10)
The survey also asks about how monetary policy works:in particular, the link between interest rates andinflation. As in previous surveys, the biggest proportionof respondents thought that a rise in interest rates wouldmake high street prices rise more slowly, both over amonth or two (37%) and over a year or two (40%). Thissuggests that respondents are still not aware of thetiming delay between a change in rates and its impact oninflation: inflation would probably be unaffected by arise in rates after a month or two, but would be lower ayear or two later.
When asked to choose between higher interest rates to keep inflation under control, or lower rates and faster increases in shop prices, 57% of people preferred the former, up slightly from 55% in February 2005. Nineteen per cent of respondentspreferred faster rises in prices, down from 25% last year.These changes could reflect unease at the recent sharprises in utility bills and households’ views of past andfuture inflation.
The Bank of England (Questions 11–14)
Understanding of the monetary policy process appearsto have changed little over the past year. When asked,without prompting, who sets ‘Britain’s basic interest ratelevel’ (Question 11), 36% replied the Bank of England,and a further 4% the Monetary Policy Committee: theseproportions were similar to previous years. Similarly,
over half the respondents (53%) replied ‘don’t know’,broadly unchanged from previous years.
When respondents were given five options, 68% chosethe Bank, 14% answered ‘government ministers’, and 12%had no idea. Overall, awareness of who sets interestrates has changed little since the survey started in 1999.
Knowledge of how the MPC is appointed was littlechanged in February 2006 compared with a year earlier;37% answered that it was an independent body, partlyappointed by the government, and 22% thought the
Chart 10Respondents’ views on what would be best for the economy as a whole
0
5
10
15
20
25
30
35
40
45
Lower rates Unchangedrates
Higher rates Rates make nodifference
Percentage of respondents(a)
February 2005February 2006
(a) Answers to the question ‘What do you think would be best for the British economy?’, excluding those with no idea.
Chart 11Respondents’ views on what would be best for interest rates
25
20
15
10
5
0
5
10Net percentage balances(a)
The economy as a whole
Individuals’ own situations
Nov.1999
Nov.2000
Nov.01
Nov.02
Nov.03
Nov.04
Nov.05
–
+
(a) Percentage citing an increase in rates minus that citing a fall.
(1) See Barwell, May and Pezzini (2006), ‘The distribution of assets, income and liabilities across UK households: resultsfrom the 2005 NMG Research survey’, Bank of England Quarterly Bulletin, Spring, pages 35–44.
(2) See ‘CML publishes data from the new regulated mortgage survey’, Council of Mortgage Lenders Press Release on 15 February 2006.

Public attitudes to inflation
187
MPC was completely independent. Seventeen per centhad no idea, while 6% thought the MPC was a quango,wholly appointed by the government.
The final question in the survey asks participantswhether they are satisfied with the way the Bank is doingits job. The proportion of satisfied responses was 57%in February 2006, broadly unchanged from February2005 (56%). This continued the trend of the majority ofindividuals being satisfied with the Bank setting interestrates to control inflation (Chart 12). And within alldemographic groups, the highest proportion ofrespondents was fairly satisfied with the Bank’sperformance.
Conclusion
The GfK NOP survey of public perceptions suggests thatindividuals’ views on past and expected inflation havepicked up recently. A majority believe that interest rateshave risen over the past twelve months, perhapsreflecting the difference between the Bank’s officialinterest rate and the interest rates households face. Asever, respondents expect interest rates to rise over thenext year — there is some evidence that this is
consistent with an expected worsening in their ownfinancial situation. Public understanding of monetarypolicy is little changed from a year earlier, with asignificant number of people being unfamiliar with thepolicy framework. But there is a general understandingthat high inflation is bad for the economy, and peopleare satisfied with the way the job the Bank of England isdoing.
Chart 12Public satisfaction with the Bank of England
0
10
20
30
40
50
60
1999 2000 01 02 03 04 05
Net percentage balance(a)
Nov. Nov. Nov. Nov. Nov. Nov. Nov.
(a) Percentage of satisfied respondents minus percentage of dissatisfied respondents.

188
Bank of England Quarterly Bulletin: Summer 2006
Annex
Wording of questions in the Inflation Attitudes survey
Q1 I would like to ask you some questions about the prices we pay for goods and services ... which of the options onthis card best describes how prices have changed over the last twelve months? (Show card)
Gone down / Not changed / Up by 1% or less / Up by 1% but less than 2% / Up by 2% but less than 3% / Up by3% but less than 4% / Up by 4% but less than 5% / Up by 5% or more / No idea
Q2 And how much would you expect prices in the shops generally to change over the next twelve months? (Showcard)
Gone down / Not changed / Up by 1% or less / Up by 1% but less than 2% / Up by 2% but less than 3% / Up by3% but less than 4% / Up by 4% but less than 5% / Up by 5% or more / No idea
Q3A If prices started to rise faster than they are now, do you think Britain’s economy would end up stronger, or weaker,or would it make little difference?
Q3B The Government sets a target each year for what it thinks inflation should be. What do you think that the targetis for this year?
Q3C Do you think the figure the Government has given for the current target is higher, lower or the same as last year’sfigure?
Q4 The Government has set an inflation target of 2%. That means that prices generally should rise by around 2% ayear. Do you think this target of 2% is too high, and that inflation should be less than 2%, or too low, and itwouldn’t matter if inflation was higher than 2%, or is 2% about right?
Q5 I would now like to ask about interest rates. How would you say interest rates on things such as mortgages, bankloans and savings have changed over the last twelve months? Have they:
Risen a lot / Risen a little / Stayed about the same / Fallen a little / Or fallen a lot / No idea
Q6 And how do you expect interest rates to change over the next twelve months? Do you think they will:
Rise a lot / Rise a little / Stay about the same / Fall a little / Or fall a lot / No idea
Q7 What do you think would be best for the British economy — for interest rates to go up over the next few months,or to go down, or to stay where they are now, or would it make no difference either way?
Q8 And which would be best for you personally — for interest rates to go up over the next few months, or to godown, or to stay where they are now, or would it make no difference either way?
Q9 How strongly do you agree or disagree, using the phrases on this card, with the following statements? (Show card)
A rise in interest rates would make prices in the High Street rise more slowly in the short term — say a month or two
Strongly agree / Agree / Neither agree nor disagree / Disagree / Strongly disagree / Don’t know
A rise in interest rates would make prices in the High Street rise more slowly in the medium term — say a year or two
Strongly agree / Agree / Neither agree nor disagree / Disagree / Strongly disagree / Don’t know
Q10 If a choice had to be made either to raise interest rates to try to keep inflation down, or keep interest rates downand allow prices in the shops to rise faster, which would you prefer — interest rates to rise, or prices to risefaster?

Public attitudes to inflation
189
Q11 Each month a group of people meets to set Britain’s basic interest rate level, do you know what this group is?
Q12 Which of these groups do you think sets the interest rates? (Show card)
Government ministers / Civil servants / Bank of England / High street banks / European Central Bank / No idea
Q13 In fact the decisions are taken by the Monetary Policy Committee of the Bank of England. Which of these do youthink best describes the Monetary Policy Committee? (Show card)
Part of the Government / A quango, wholly appointed by the Government / An independent body, partlyappointed by the Government / A completely independent body / No idea
Q14 Overall, how satisfied or dissatisfied are you with the way the Bank of England is doing its job to set interest ratesin order to control inflation? (Show card)
Very satisfied / Fairly satisfied / Neither satisfied nor dissatisfied / Fairly dissatisfied / Very dissatisfied / No idea

190
Introduction
The CCBS organises seminars, workshops andconferences in London and abroad, attended by centralbanks from all over the world.(1) The subject matter isprimarily the study of key central bank functions such asmonetary policy, money market operations and financialstability, from both theoretical and practical viewpoints.The events are usually fairly specialised, focusing on thelatest thinking and research in topics of current interestto central banks. This article describes the origins andevolution of the CCBS, and its current role in the Bank of England.
Origins of the CCBS
The Bank of England has historically had a stronginternational outlook, and a longstanding tradition ofco-operation with central banks overseas. From early inthe 20th century, it offered advice and assistance toother central banks, including those in the formerBritish colonies as they gained independence, but alsoto several others that requested help at various times.International seminars for overseas central bankers havebeen held by the Bank of England in London regularlysince 1957.
At the start of the 1990s, there was significant demandfrom central banks in former communist countries forassistance in setting up central banking operations inevolving market economies. The Bank of England saw
this as a unique opportunity to help with a transfer ofknowledge to these countries and, at the same time, tofoster a mutually supportive network of central banksworldwide. This recognised the fact that central banksare unique institutions in each country and, while thereis no common set of functions that central banks carryout, there is a huge amount of common ground betweenthem and strong mutual benefit to be gained fromsharing knowledge and experience. The CCBS wasestablished to deliver these twin objectives of sharingknowledge and building relationships. Other centralbanks also provided training, but the Bank of Englandwas the first to set up a separate centre for this purpose.
Formally, the CCBS was established by the Bank ofEngland in 1990 with the following responsibilities andobjectives:
� develop and deliver training in central banking foroverseas central bankers;
� develop for training purposes the comparative studyof the constitutions, functions and methods ofoperation of central banks;
� act as the focal point within the Bank of England forrequests from overseas for training and technicalassistance; and
� co-operate with external organisations inside andoutside the United Kingdom in delivering training
The Centre for Central Banking Studies
This article describes the origins and current activities of the Centre for Central Banking Studies (CCBS)at the Bank of England. The CCBS was set up in 1990 to provide training for central banks overseas.The catalyst for its creation was the increase in demand for such training from former communistcountries in transition to market economies. Since then, the CCBS has evolved and today acts as aforum for the study of the analytical and technical aspects of central banking, in order to promote bestpractice in all central banks. Through the Centre, the Bank of England has relationships with almost allthe other central banks in the world; to date, more than 15,500 delegates from 173 central banks havetaken part in our activities, in London or abroad.
By Gill Hammond of the Bank’s Centre for Central Banking Studies.
(1) Details of events can be found in the appendix. For further details, see the CCBS Prospectus 2006, available on theBank’s website at www.bankofengland.co.uk/education/ccbs/prospectus.pdf.

The Centre for Central Banking Studies
191
and technical assistance both in central banking andbanking and financial services more generally.
The immediate focus was on central banks in transitioncountries in Central and Eastern Europe (CEE) and inthe former Soviet Union (FSU). These central banksfaced huge challenges in bringing inflation undercontrol, and trying to construct solvent, competitivebanking systems. The first three CCBS courses were heldin late 1990, for six countries in this region. The Bank ofEngland’s ability to help these countries in the 1990swas greatly assisted by financial support from the BritishGovernment’s Know How Fund, and the PHARE andTACIS programmes of the European Commission.(1)
In 1991 CCBS ran five courses for CEE central banks andone for central banks from FSU countries. There wasalso a special course for central banks fromCommonwealth countries, one for the People’s Bank ofChina, and one for EC countries. By the end of 1992,representatives from 101 different countries hadattended CCBS courses. Since then, participants frommore than 90 countries have attended CCBS seminars inLondon each year (Chart 1). From the outset, the aim ofthe CCBS was to provide high value-added seminars, forcurrent and future policymakers in central banks, ratherthan going for high volume courses on the basics.
The evolution of the CCBS
From its origins in providing training primarily forcentral banks in Eastern Europe and the FSU, the CCBShas evolved into a forum for the exchange of ideas andbest practice among central banks. It has a global focus
and concentrates on disseminating the latest thinkingon the analytical and technical aspects of centralbanking.
From late 1991, the CCBS began to offer a number oftraining activities abroad, in addition to the programmeof seminars in London. It was recognised that in manycases it was more cost effective for Bank of Englandexperts to go abroad and deliver training on site to thehost central banks, rather than for participants to cometo London. Moreover, the seminar could be tailor-madeto the particular needs of the recipient central bank(s),and a greater number of delegates could benefit fromlocally delivered training than would be possible on aLondon event. By 1995, the CCBS was delivering around20–25 seminars in London and a similar number abroad,attended by a total of around 1,000 participants eachyear. These numbers have remained broadly constantsince then (Charts 2 and 3). Increasingly, CCBS
Chart 1Number of countries participating in CCBS events
0
20
40
60
80
100
120
1990 93 96 99 2002 05
LondonAbroad
Chart 2Number of CCBS seminars
0
10
20
30
1990 93 96 99 2002 05
LondonAbroad
Chart 3Number of participants on CCBS events
0
200
400
600
800
1990 93 96 99 2002 05
LondonAbroad
(1) The PHARE programme provided funding from the European Communities to assist the applicant countries of CentralEurope in their preparations for joining the EU. The TACIS programme provided grant-financed technical assistanceto twelve countries of Eastern Europe and Central Asia mainly aimed at enhancing the transition process in thesecountries.

192
Bank of England Quarterly Bulletin: Summer 2006
seminars abroad tend to be regional events, co-hosted byone central bank and the CCBS, and attended by anumber of other central banks in the region. This allowsthe focus to be on issues of common interest in theregion, and for the sharing of experiences by a numberof central banks.
Although the focus in the early 1990s was on centralbanks in Central and Eastern Europe and the formerSoviet Union, over time the CCBS has evolved into aglobal forum, with a more diverse attendance. In 1996,central banks from Eastern Europe accounted for 26% ofall participants on CCBS events; by 2005 this haddeclined to 14%. Over the same period, the proportionof participants from the EU and other OECD countrieshas risen markedly. There has been an increase in theproportion of participants from the Americas andCaribbean, Asia and the Middle East. African centralbanks have consistently accounted for about 12% ofparticipants. Currently there is a very goodgeographical spread of participants attending CCBSevents, as shown by Chart 4.
The demand for ever more specialist events led the CCBSto change the nature of its programmes of events, and tointroduce workshops to the programme. An increasingnumber of participants had post-graduate degrees as wellas practical experience in their field. The workshops did
not deliver formal teaching; rather, participating centralbanks presented their own work and discussed it witheach other. In 1997, a high-level workshop was held inconjunction with the Annual Symposium for CentralBank Governors, and in 1998 Academic Workshops wereintroduced. At these workshops a panel of internationalacademics was invited, together with participants, toanalyse shared central banking problems from acomparative perspective. The workshops were usuallyfollowed by a joint research project between researchersfrom overseas central banks and the CCBS or other Bankof England researchers.(1)
One of the most successful research projects studied themonetary policy frameworks in central banks around theworld in the 1990s. The project team, led by Gabriel Sterne and Lavan Mahadeva, surveyed 94 centralbanks to investigate which type of monetary policyframeworks had been most successful in achieving lowinflation, and whether this was the same inindustrialised countries as in developing and emergingmarket economies. The project was supported by aResearch Workshop at CCBS, attended by experts from28 countries as well as the IMF and BIS.(2)
As part of the effort to raise the technical level of events,the CCBS has since 2004 organised a special seminaropen only to central bank chief economists. The firstseminar dealt with the relationship between financialstability and monetary stability, and the second withexchange rate regimes and capital flows. This year thetopic was ‘Thirty years of the Lucas critique’, taking as itstheme an influential paper published in 1976 by NobelPrize winner Robert E Lucas Jr. He showed how theconventional analysis of policy problems based ontraditional econometric models could lead to misleadingconclusions. This insight still has important practicaland theoretical implications for central banks today. Forthese workshops, papers are commissioned fromdistinguished international academics as well as thechief economists themselves. Reports on theproceedings are published in the Bulletin.(3) In 2005, theCCBS also hosted a very successful high-level event onexternal communications, attended by the directors ofcommunication or equivalent, from most of the world’smajor central banks. Issues discussed included central
Chart 4Percentage of participants by region on CCBS events, 2005
37%
11%
17%
4%
31%
AfricaEuropeThe Americas and the CaribbeanMiddle EastAsia and the Pacific
(1) Several of the research projects investigated on academic workshops have been published as books. For a full list ofpublications see: www.bankofengland.co.uk/education/ccbs/publications/index.htm.
(2) The results are published in Mahadeva, L and Sterne, G (eds) (2000), Monetary policy frameworks in a global context. (3) For example, see Fisher, C and Lund, M (2004), ‘Perfect partners or uncomfortable bedfellows? On the nature of the
relationship between monetary policy and financial stability’, Bank of England Quarterly Bulletin, Summer, pages 203–09,and Hammond, G and Rummel, O (2005), ‘Chief Economist Workshop April 2005: exchange rate regimes and capitalflows’, Bank of England Quarterly Bulletin, Summer, pages 202–10.

The Centre for Central Banking Studies
193
bank transparency (how to achieve it and whether thereare limits), communicating to the media and to thegeneral public, and use of the internet.
The current role of the CCBS
The CCBS is a department within the Bank of England,not a separate training centre. As such, its objective is tocontribute towards the core purposes of the Bank ofEngland, namely maintaining monetary and financialstability. The CCBS does this by promoting best practiceamong central banks — institutions at the heart of theworld’s financial centres. In addition to the programmeof seminars in London and abroad, CCBS also offersexpert advice and technical co-operation to othercentral banks at their request. Finally, the CCBSproduces research and other written materials in supportof its overall objectives. These three elements arediscussed in turn below.
Promoting international monetary and financial stability
The Bank of England has two Core Purposes:maintaining monetary stability, and maintainingfinancial stability. These are distinct, but related goals.Monetary stability means stable prices and confidence inthe currency. In practice the Government sets a targetfor the rate of inflation — currently 2% as measured bythe consumer prices index — and the Bank has toachieve this by setting interest rates at the appropriatelevel. Financial stability entails detecting risks to thefinancial system as a whole through the Bank’ssurveillance and market intelligence functions andworking alongside other UK public authorities to reducethem.
While the main focus for the Bank is domestic monetaryand financial stability, international developments clearlyhave a major influence on the United Kingdom.Moreover, the increasing integration and globalisation ofmarkets means that shocks in one economy are morerapidly transmitted around the world. There is anincreasing recognition that the domestic monetarypolicies of one country can have an effect on othersaround the world. The Bank therefore works closely withother central banks and international organisations topromote international monetary and financial stability.
The CCBS supports both of the Bank of England’s CorePurposes by encouraging knowledge sharing and the
dissemination of best practice among central banks inmonetary and financial stability. It acts as a forum forexperts from central banks together with academics andprivate sector practitioners to exchange views and shareexperience. CCBS events promote the study of andresearch into the technical and analytical aspects ofcentral banking. This recognises that the developmentof effective monetary and financial policies in centralbanks around the world is one of the best ways to ensureglobal monetary and financial stability.
Technical assistance and expert advice
CCBS can occasionally provide on-site technical adviceand hands-on assistance to a foreign central bank with aparticular technical need. This can involve anythingfrom discussing an issue by telephone or email, tomaking a series of visits to the central bank in question.An extreme version of this was the support provided tothe Central Bank of Iraq from early Summer 2003.Simon Gray, an adviser at the CCBS, spent four monthsin Baghdad, assisting in setting up a new central bank.The early tasks were to provide a currency that thepopulation would trust: good quality notes,(1) a stableexchange rate, and sound central and commercial banklaws that would prevent monetary financing and supportmonetary and financial stability. Overcoming immensechallenges, the introduction of the new Iraqi dinar wasaccomplished on time, and the new currency hasbecome universally accepted around the country. TheCCBS has subsequently supported seminars held in theregion for the Central Bank of Iraq, as well as receivingparticipants in London-based seminars.
In 2004, two advisers from the CCBS helped BancoCentral de Guatemala build a small macro model of theGuatemalan economy for use in forecasting andmonetary policy. They also provided feedback onresearch into modelling conducted at the central bank.The work included providing advice on estimates andcalibrations undertaken by staff in the researchdepartment; estimating and calibrating a small model ofthe Guatemalan economy; and demonstrating how themodel could be used to produce forecasts.
CCBS research and publications
The CCBS places considerable emphasis on excellentacademic research related to all aspects of centralbanking. Seminars and conferences disseminate and
(1) This is described in a book A new currency for Iraq. Details atwww.bankofengland.co.uk/education/ccbs/publications/simongray.htm.
194
Bank of England Quarterly Bulletin: Summer 2006
discuss research from a theoretical point of view, as wellas capturing the lessons learned from country casestudies. CCBS personnel are frequently consulted aboutresearch projects by participants and colleagues in othercentral banks, particularly in the field of model buildingand forecasting in monetary policy. The emphasis at theCCBS, as in the Bank of England more generally, is onapplied research, encompassing many aspects ofeconometrics and economic theory. The CCBS has aparticular interest in cross-country studies and thestudy of different models and approaches to centralbank functions. To this end, CCBS staff undertakecollaborative research with central bankers around theworld, as well as with other Bank of England economistsand academics at leading universities and researchinstitutes.
The production of written materials to aid the study andunderstanding of central bank functions has for manyyears been a core CCBS objective. In 1996, a series ofHandbooks in central banking(1) was initiated. TheseHandbooks cover many of the main central bankfunctions from both a theoretical and practical point of
view. All are freely available on the Bank of Englandwebsite, and have proved enormously popular withreaders around the world. Several are available inSpanish, Russian and Arabic.
In addition to the CCBS Handbooks, more specialistresearch work is published in the research and lectureseries. Recent additions to the series include ‘Unit roottesting to help model building’, ‘Consumption theory’,‘Monetary operations’ and ‘Monetary and financialstatistics’.
Outlook
The CCBS has been in operation now for more than 15 years, continuing a much longer tradition in the Bankof England of co-operation and interaction with othercentral banks. Central banks face common challenges inthe areas of monetary and financial stability and theneed for central banks to exchange views and worktogether to develop best practice is as great as ever. TheCCBS will continue to promote research and facilitatedebate among central bankers from around the world,working and thinking at the frontiers of central banking.
(1) The text of all CCBS Handbooks can be downloaded from our websitewww.bankofengland.co.uk/education/ccbs/handbooks/index.htm.

The Centre for Central Banking Studies
195
(1) Full details of events can be found in the CCBS Prospectus 2006, available on the website atwww.bankofengland.co.uk/education/ccbs/prospectus.pdf.
(2) These events are by invitation only.
AppendixCCBS programme of events in 2006(1)
The CCBS organises seminars, workshops and conferences in London and abroad, attended by central banks from allover the world. The subject matter is primarily the study of key central bank functions such as monetary policy, moneymarket operations and financial stability, from both theoretical and practical viewpoints. The events are usually fairlyspecialised, focusing on the latest thinking and research in topics of current interest to central banks. The programmevaries each year, but aims to reflect the current hot topics among central bankers in their fields of expertise, whilefocusing on those areas where CCBS and the Bank of England possess a comparative advantage in terms of specialistknowledge and experience.
CCBS events are not open to non-central bank personnel.
The following seminars will be held in London in the second half of this year:
July3–6 July Expert Forum: forecasting with calibrated models10–14 July Government debt management17–21 July Senior management seminar: key policy issues for central banks
September4–8 September People’s Bank of China governance seminar(2)
18–21 September Selected Economists’ Research Forum: modelling the financial sector(2)
25–29 September Liquidity forecasting
October2–6 October The structure of financial markets10–12 October Workshop: managing operational risk in a central bank16–20 October Monetary operations23–27 October Financial stability: issues for central bankers 30 October–3 November Exchange rates and capital flows
November6–10 November Practical policy analysis of financial regulation13–16 November Strategic human resources issues
December27 November–8 December Economic modelling and forecasting19–20 December Workshop: enhancing a central bank’s effectiveness through knowledge management
196
Introduction and overview
The Foreign Exchange Joint Standing Committee (FXJSC — ‘the Committee’) was established in 1973,under the auspices of the Bank of England, as a forumfor banks and brokers to discuss broad market issues.The Committee comprises: senior staff from many of the major banks operating in the foreign exchangemarket in London; representatives from brokers; the Association of Corporate Treasurers (ACT), corporate users of the foreign exchange market; theBritish Bankers’ Association (BBA); and the FinancialServices Authority (FSA). A list of the members of theCommittee, as at end-2005, may be found at the end ofthis review.
The Committee met six times during 2005. The mainfocus of the Committee’s work was on updating the Non-Investment Products (NIPs) Code; progress wasalso made on further refining contingency preparations,the establishment of a Chief Dealers’ subgroup andfurther development of the Committee’s semi-annualsurvey of the UK foreign exchange market. Much of theCommittee’s work has been progressed by the legal,operational and other ad hoc working groups.
Non-Investment Products Code — updated in January 2006
The NIPs Code is a voluntary code of good marketpractice drawn up by market practitioners, covering theforeign exchange market in the United Kingdom as wellas wholesale bullion and wholesale deposits. The Codewas first published in its current form in 2001, reflectingchanges to the UK regulatory landscape following theintroduction of the Financial Services and Markets Act(FSMA). A revised Code published in January 2006wholly replaced the 2001 version. Work to update theCode was co-ordinated through the FXJSC, together withthe Sterling Money Markets Liaison Group (MMLG) andthe Management Committee of the London BullionMarket Association (LBMA).
The January 2006 Code incorporates the sections onundisclosed principal trading and best practiceguidelines for foreign exchange settlement in CLS(Continuously Linked Settlement), which were agreedseparately in 2003. There have also been significantchanges to the format of the updated Code; this is nowavailable solely in electronic format on the Bank ofEngland’s website. The number of annexes in the Codehas been reduced and re-ordered to cover the areas ofbusiness the Code covers, ie wholesale sterling deposits,wholesale foreign currency deposits and foreignexchange, and wholesale bullion. It is hoped that thesechanges will make it easier to use and apply to specificareas of the market.
The main changes of substance were to update the Codeto reflect current best practice. A section has beenadded on the use of mobile phones in the dealing room,the chapter on confirmations and settlement has beensignificantly updated, and changes were made on theexchange of Standard Settlement Instructions (SSIs) andthe inclusion of timely deadlines for the exchange ofconfirmations. The FXJSC also took the opportunity toremove outdated language on the settlement ofdifferences in the FX market, and on the Committee’sarbitration role. The new Code also embodies newsterling interest rate conventions following periods ofmarket disruption, developed by a working group of theMMLG. The LBMA provided updated language for thebullion annex to reflect changes such as themodernisation of the gold fixing process.
Going forward, the Code will be updated on a regularsemi-annual basis, and re-published in October andMarch each year. Consultation from the most recentupdate has already identified a number of issues to beconsidered, including best practice in and aroundelectronic trading and settlement in the FX market.Suggestions for any future amendments should be madeto the Secretariat of the FXJSC at PO Box 546
A review of the work of the London Foreign Exchange Joint Standing Committee in 2005
This article reviews the work undertaken by the London Foreign Exchange Joint Standing Committeeduring 2005.

The London Foreign Exchange Joint Standing Committee
197
Threadneedle Street (HO-1), London EC2R 8AH. As iscurrently the case, changes will be made afterconsultation with associations which endorse the Code,including the Association of Corporate Treasurers,British Bankers’ Association, Building SocietiesAssociation, Chartered Institute of Public Finance andAccountancy, London Bullion Market Association,London Investment Banking Association and theWholesale Markets Brokers’ Association.
Contingency planning and work of thecontingency subgroup
As in other markets, there was a good deal of work oncontingency preparations in 2005, involvingcollaboration between all of the FXJSC subgroups andother market committees. Most recently, the FXJSC hasproduced a table showing what the Committee and someof the major pieces of infrastructure in the foreignexchange market would do in a major operationaldisruption. This was drawn up with contributions fromthe contingency subgroup, an operational subgroup andthe main Committee. The table has been published,alongside a similar table produced by the MMLG, on theBank of England’s website.
The legal subgroup also responded on behalf of theFXJSC to questions sent to the Committee by theTripartite Authorities on the adequacy of foreignexchange contracts in a major operational disruption.The group produced a table of answers using thechecklist developed by the Financial Markets LawCommittee and concluded that London foreign exchangemarket contracts contain satisfactory provisions forcontingency situations. Members were encouraged toexamine documentation in their own firms to ensurethat firms’ latest contracts reflect these provisions.
The Committee once again participated in the market-wide test organised by the Tripartite Authorities,on 28 November 2005. The FXJSC and operationssubgroup held conference calls as part of the test andprovided information about the foreign exchange marketto the Authorities and, in turn, passed informationgathered in the call to the Cross Market BusinessContinuity Group (CMBCG) for use in their conferencecall.
The contingency subgroup established last year began toconsider individual contingency scenarios, allowingmembers of the operations subgroup to consider anddiscuss contingency issues in the foreign exchange
market in more detail, particularly the FXJSC’s owncontingency arrangements for individual events. TheChief Dealers’ subgroup has also been providing detailsof contingency scenarios from a front office perspectivefor the operations subgroup to consider. In addition,the contingency subgroup has been assisting in practicalpreparations including dissemination of contactinformation, such as updated contact details.
Work of the legal subgroup
The legal subgroup has been very active this year,making an invaluable contribution through its provisionof legal support to the work of both the FXJSC maincommittee and operations subgroup. During the yearthe legal subgroup has made notable contributionsincluding advising and drafting sections of the update ofthe NIPs Code, creating draft mandate standarddocumentation, considering existing prime brokeragedocumentation, advising on contingency preparednessin standard foreign exchange documentation andgenerally assisting the working groups of the mainCommittee and operations subgroup. The legalsubgroup has also provided assistance in helping thebasis swaps market in preparing an alternative set of ‘fix’exchange rates to replace the 11.00 am page of foreignexchange rates currently published by the Bank ofEngland, which was what that market was previouslyusing as its reference.
Markets in Financial Instruments Directive (MiFID)working group
A new working group was established under thedirection of the FXJSC’s legal subgroup to provideguidance to the main Committee on MiFID and itsimpact on the foreign exchange market, particularly itsimplementation in the United Kingdom and to assist themarket in liaising with the HMT and the FSA. This hasincluded drafting a formal response to HMTconsultation on implementation of MiFID in the UnitedKingdom with regard to its application to the foreignexchange market. The working group will continue tofacilitate liaison between the market and the FSA and theHMT.
Establishment of Chief Dealers’ subgroup
In July 2005 the Chief Dealers’ subgroup met for thefirst time. The group comprised eleven experiencedforeign exchange market professionals active in theLondon foreign exchange market. Meeting quarterly,members discuss conjunctural and structural

198
Bank of England Quarterly Bulletin: Summer 2006
developments in the foreign exchange market and assesstheir impact on its functioning and on related financialmarkets. Market structure topics discussed haveincluded the impact of algorithmic trading and MiFID.
The purpose of the group is to brief the FXJSC and othersubgroups on topical market issues, to respond torequests from the FXJSC for views on issues relating toactivity in the foreign exchange market or its operationas they arise, and to liaise with the FXJSC and itscontingency subgroup on developments in businesscontinuity. The subgroup has contact with andexchanges views with the New York Chief Dealers’ group.
Work of the operations subgroup
The major event in the first half of 2005 was the Global Operational Managers conference, held on20–21 April in London at the Bank of Englandconference centre, sponsored by the FXJSC. Theconference followed on from the first global conferencefor operations managers held in September 2003,hosted by the New York Foreign Exchange Committee(FXC) at the Federal Reserve Bank in New York. The two-day event, involving over 130 delegates from aroundthe world, was structured to allow for presentations,panel discussions and question and answer sessions; thetheme was entitled ‘the challenges facing operations inthe 21st century’. Sessions on continuing challengessuch as contingency, operational risk and the regulatoryenvironment proved as interactive and relevant as theprevious conference in New York in 2003 anddemonstrated that these areas remain a priority foroperations managers globally. However, sessions ondevelopments in CLS, FX prime brokerage and e-commerce were especially topical with significantgrowth in these businesses since the previousconference. The growth in offshoring initiatives formany companies provided an excellent opportunity toshare experiences and lessons learnt, while client panels proved insightful and relevant.(1) The nextconference is scheduled to take place in 2007, hosted bythe ECB Operations Group.
Throughout the year, the operations subgroup workedon updating the NIPs Code, specifically the chapter onConfirmations and Settlement. Much of the work wastaken forward by the Standard Settlement Instructions
(SSIs) and confirmations working groups. Among otherchanges, the SSIs working group concluded that infuture it would be acceptable to use SWIFT(2) broadcastas the electronic mechanism to establish standinginstructions, provided this was followed by aconfirmation. This was a change from previous guidancewhich had suggested it was not best practice. Theconfirmations working group introduced a two-hour bestpractice guideline for the exchange of confirmations.With the assistance of a working group from the legalsubgroup, the mandates working group also made someprogress on issues relating to mandates betweencorporates and banks, and its work is expected to beincluded in the next update of the Code.
The group contributed operations expertise to a numberof other working groups, including prime brokerage ande-commerce. Members also followed up on work inother forums on non-deliverable forwards (NDFs) whichled to the formation of an NDF working group; this is inclose discussion with the FXC group which has beenprogressing work in this area.
Other working groups
There have been a number of issues addressed by theCommittee over the year that members believed couldbe best progressed by working groups composed ofmembers of other FXJSC subgroups, or even marketparticipants from institutions not directly involved asmembers of the Committee or its subgroups. This fitswith a wider aim of the Committee to involve as manyparts of the foreign exchange market as possible in itswork. One area where this has been achieved is theFXJSC’s semi-annual turnover survey, with 30 activeLondon banks now contributing data. Also, the FXJSC,together with the FSA and representatives from thewider market, considered the interpretation andpractical implementation of CP205 (Conflict of Interestin Investment Research) for the foreign exchangemarket.
Work of the prime brokerage/e-commerce group
The prime brokerage and e-commerce subgroup wasestablished to explore the operational risks in primebrokerage and recent developments in e-commerce. Thegroup is drawn from volunteers from the FXJSC mainCommittee, operations subgroup and the wider market.
(1) Details of the discussions and presentations can be accessed at www.bankofengland.co.uk/markets/forex/fxjsc/GOM_conference.htm.
(2) SWIFT provides secure messaging services to financial institutions and market infrastructure including CHAPS, TARGET, CREST and CLS.

The London Foreign Exchange Joint Standing Committee
199
The subgroup met three times in 2005. The firstmeeting established the objectives of the group, itspotential outputs and identified significant themes fordiscussion. The following two meetings were focusedspecifically on prime brokerage and e-commerce,respectively. For prime brokerage, the subgroupdiscussed the implications of the changing tradingmodel prevalent in the market and the operational risksinvolved. The e-commerce discussion looked at marketand technology developments, and potential risks andgrowth areas since the previous FXJSC report on e-commerce in 2003. The preliminary findings of thesubgroup were presented to the main FXJSC in the firsthalf of 2006.
International co-operation
Over the year the Chair and/or Secretariat attendedmeetings of the New York FXC, the Canadian ForeignExchange Committee and the ECB contact group. The Chair also met with a number of members of thenewly re-formed Australian Foreign ExchangeCommittee, the Hong Kong Treasury Markets Association and the Singapore Foreign Exchange MarketCommittee. The meetings involved very usefuldiscussions on issues that impact the global foreignexchange market.
The FXJSC Secretariat have continued to host quarterlyconference calls with the other global foreign exchangecommittee secretaries, to update on the work ofindividual groups and topical issues; these have involvedparticipants from Singapore, Tokyo, New York, the ECB,Toronto, Sydney and Hong Kong. One strand of workwhere there has been much co-operation has been theforeign exchange market turnover surveys. Members ofthese committees also attended and made valuablecontributions to the Global Operations Managersconference in April 2005.
International survey results overview
Thirty banks, drawn from committee members and themost active participants in the foreign exchange market,contributed to the second and third semi-annual surveysof foreign exchange turnover in London conducted bythe FXJSC. The survey showed strong growth in foreignexchange turnover during 2005. Average daily turnoverrecorded in the October 2005 survey was $863 billion,some 31% higher than in October 2004. This wasmirrored by a rise of 28% in the turnover recorded bythe New York FXC in its survey over the same period.The Singapore Committee also decided to publish itssurvey results to the same timetable, starting with theOctober 2005 survey.

200
Bank of England Quarterly Bulletin: Summer 2006
Members of the London Foreign Exchange Joint Standing Committeeas at December 2005
Name Firm/OrganisationIvan Ritossa BarclaysRobert Loewy Bank of ChinaHenri Foch BNP ParibasJeff Feig CitigroupMatthew Spicer Credit SuisseRobert McTamaney Goldman SachsAndrew Brown HSBCAdam Burke JPMorgan ChaseMarcus Browning Merrill LynchPaul Blain Morgan StanleyPeter Nielsen Royal Bank of ScotlandNick Beecroft Standard CharteredMichael Kahn State StreetDarren Coote UBSJack Jeffery EBSPhil Weisberg FXAllJohn Herbert ICAPBrian Welch Association of Corporate TreasurersAlex Merriman British Bankers’ AssociationIan Stevenson Wholesale Markets Brokers’ AssociationDavid Bloom HSBC
Chair, legal subgroupLeigh Meyer Citigroup
Chair, operations subgroupDavid Hacon Financial Services AuthorityPaul Fisher (Chair) Bank of EnglandSumita Ghosh/Howard Jones Bank of England(Secretariat)
Members of the London Foreign Exchange Joint Standing Committee operations subgroup as at December 2005
Name Firm/OrganisationJos Dijsselhof ABN AmroMichael Douglas Bank of AmericaBob Jordan Bank of EnglandDuncan Lord BarclaysLincoln Burkitt CSFBDarryl Webb Deutsche BankSusan Balogh Goldman SachsChris Roberts HSBCGraeme Munro JPMorgan ChaseDerrick Pearson Lloyds TSBKim Surendran Mellon BankIsabelle Dennigan Royal Bank of ScotlandStephen Smith State StreetWilliam Deighton UBSPhil Kenworthy CLS ServicesColin Perry ICAPJohn Moorhouse ReutersElizabeth Swanton SWIFTJohn Whelan Association of Foreign BanksAlex Merriman British Bankers’ AssociationLeigh Meyer (Chair) CitigroupSumita Ghosh/Howard Jones Bank of England(Secretariat)

The London Foreign Exchange Joint Standing Committee
201
Members of the FXJSC legal subgroup
Name Firm/OrganisationJanet Wood Bank of AmericaSahar Kasenally Barclays CapitalJulia Elliott CitigroupUlrike Schefe CSFBDavid Entwistle Deutsche BankAnne Moore-Williams FSAFelicity White HSBCDavid Lewis JPMorgan ChasePania Kouris Lloyds TSBAnnabeth Bates Morgan StanleyAlex Bouchier Royal Bank of ScotlandMartin Oakley ReutersSimone Paul State StreetKate Binions UBSDavid Bloom (Chair) HSBCJacqueline Joyston-Bechal (Secretary) Bank of England
Members of the FXJSC Chief Dealers’ subgroup
Name Firm/OrganisationHiroshi Morioka Bank of Tokyo MitsubishiDanny Wise Barclays CapitalRaymond Ng CitigroupMark Iles The Royal Bank of CanadaMike Leighton CSFBAngus Greig Deutsche BankBernie Kipping Commonwealth Bank of AustraliaChris Freeman State Street Bank and Trust CompanyChris Kreuter UBSKeith Carpenter ABN AmroRoger Hawes Royal Bank of ScotlandChristopher Nicoll Morgan StanleyMartin Mallett (Chair) Bank of England

202
Many of us would probably say that we do not much likeuncertainty, whether at work or home. But we cannotescape it, and it provides opportunities. Rather, we wantto be compensated for the risk, or to mitigate it, or both.
What I think we actively dislike is avoidable uncertainty.And from the point of view of society, we should dislikeuncertainties that are both avoidable and especiallycostly to mitigate for those who bear the consequentrisks.
I am going to discuss some sources of avoidableuncertainty — or volatility — that have affected you ascorporate treasurers. And I will discuss someunavoidable sources of uncertainty, and what they mightmean for risk management, at the level of firms and ofthe financial system as a whole.
Avoidable uncertainties: the monetary regime,and the implementation of monetary policy
For too many years in the United Kingdom, we lived witha large but avoidable element of macroeconomicuncertainty. It was unclear what rate of inflationhouseholds and businesses should expect to prevail over
the medium to long run. In other words, it was unclearwhat policymakers were trying to achieve; whether theirgoals shifted about; and whether policymakers wouldsucceed in delivering those goals. That was resolvedprogressively during the 1990s, culminating in theGovernment’s announcement in 1997 that anoperationally independent Bank of England was chargedwith achieving a clear inflation target. A stable monetaryenvironment has reduced the quite unnecessary risk ofself-induced ‘boom and bust’ flipping about demandconditions across the economy as a whole.
For users of financial markets, the most visible sign ofthe change was the reduction in yields on conventionalgovernment bonds with long maturities, which had
Uncertainty, the implementation of monetary policy, andthe management of risk
In a speech to the Association of Corporate Treasurers, Paul Tucker(1) — Executive Director for Marketsand a member of the Monetary Policy Committee — discussed sources of volatility and uncertaintyfacing firms and financial markets. He explains that undesirable volatility in short-term sterling moneymarket interest rates has, in the past, been a source of avoidable uncertainty for users of the sterlingmoney markets such as banks, asset managers and corporate treasurers. And he outlines how the Bank’snew framework for implementing monetary policy, introduced in May, aims to remove that uncertainty asfar as possible. Turning to less easily avoidable risks facing businesses, he considers how uncertaintyabout how to manage pension fund asset-liability mismatches may have been one of a number of factorsbehind recent weakness in measures of UK business investment. Starting with a discussion of the widereffects on financial markets of funds’ asset-liability management, he reviews arguments on whether ornot risk may have been underpriced in capital markets. To the extent that structural factors may havelowered the price of risk, he notes that the consequent reduction in risk premia would broadly have aone-off effect on ex-post asset returns. Finally, he highlights some possible implications of recentinnovations in structured finance, including whether the trade-off between the demand for financialengineering and for liquidity may switch in stressed conditions; and whether risk could flow back to thebanking system in adverse circumstances.
Table AAnnualised volatility of UK interest and inflation rates
Ten-year Ten-year Ten-year forwardspot yield forward yield inflation rate
1970–92 211 2361985–92 1241993–2006 125 117 851998–2006 98 78 54
Note: Average monthly standard deviation, annualised and expressed in basis points.
Sources: Bloomberg and Bank of England calculations.
(1) My thanks for comments to Peter Andrews, Charles Bean, Roger Clews, Michael Cross, David Rule, Simon Wells and Peter Westaway.For comments and research to Damien Lynch and Robin Windle. And for secretarial support, to Katherine Bradbrook.

Uncertainty, the implementation of monetary policy, and the management of risk
203
previously compensated for high and highly uncertainprospective inflation rates. By ushering in a world with acredible nominal anchor, one source of uncertainty andrisk was significantly reduced. The ex-post annualisedvolatility of ten-year gilt yields has halved: from over200 basis points between 1970 and 1997, to under100 basis points since the current monetary regime wasintroduced (Table A).
That means that, as corporate treasurers, one source ofunavoidable uncertainty about your long-run borrowingcosts has been very significantly reduced.
The introduction of the new monetary regime did not,and of course could not, remove uncertainty about thequarter-to-quarter, or indeed year-to-year, path of theeconomy and inflation. And so there remains a degreeof unavoidable uncertainty about the short-term path ofofficial rates, as the Monetary Policy Committee respondsto cyclical developments. Transparency can reduce thatuncertainty, through our making clear what we think isgoing on in the economy and how, generally, we react tochanges in the outlook. We do that through the minutesof our monthly meetings and the quarterly InflationReport; and, in terms of our individual analyses, throughspeeches, etc. But, like anybody else, we cannot predictwith certainty what will happen in the economy. Thereare always material risks around the central outlook. Wehave to weigh those risks in our policy decisions in muchthe same way as you do in your business and financingdecisions.
In the midst of all this unavoidable uncertainty, however,a few things are not in doubt. The MPC’s official interestrate is certain. So there should be no uncertainty aboutthe general level of overnight rates in the moneymarkets. In fact, though, overnight rates in the UnitedKingdom have historically been highly volatile. Various
steps taken over the past decade or so moderated thatvolatility — with some success; it has for some whilebeen much lower than in the mid-1990s (Chart 1). Butit has remained greater — from day to day, and duringthe day — than overnight rates in dollars, euros, etc(Charts 2 and 3).
Chart 1Volatility of sterling overnight interest rates
10
5
0
5
10
15
1994 96 98 2000 02 04 06
High
Low
Per cent
MMR interim reforms
Extension of BoE lending facilities
+
–
Sources: Bloomberg and Bank of England calculations.
Chart 2Volatility of international overnight interest rates
0
1
2
3
4
5
6
7
1999 2000 01 02 03 04 05 06
Per cent
£
€
$
Chart 3Cumulative folded distributions of overnight/policy ratespreads
Sample period: 2 Jan. 2002–11 Mar. 2005
0
10
20
30
40
50
1.0 0.8 0.6 0.4 0.2 0.0 0.2 0.4 0.6 0.8 1.0
50
60
70
80
90
100
£
$
€
Percentage points
Interquartile
range
Cumulative frequency, per cent Cumulative frequency, per cent
+–
Sample period: 14 Mar. 2005–9 May 2005
0
10
20
30
40
50
1.0 0.8 0.6 0.4 0.2 0.0 0.2 0.4 0.6 0.8 1.0
50
60
70
80
90
100
£
$
€
Percentage points
Interquartile
range
– +
Cumulative frequency, per cent Cumulative frequency, per cent

204
Bank of England Quarterly Bulletin: Summer 2006
That has created uncertainty for users of the sterlingmoney markets — banks, asset managers and, of course,corporate treasurers. Avoidable uncertainty.
It is the Bank of England’s responsibility to remove that uncertainty as much as we possibly can. Andyesterday, after more than three years’ preparationand extensive collaboration with market participants,we introduced a completely modernised system to dojust that.
It provides a new framework for the Bank’simplementation of monetary policy; our operationalengagement with the banking system; and for thesterling money markets.
I shall spare you the details, but I do want to sketch the main features of the system, by way of underliningthat it is directly relevant to you as corporate treasurers.I am keen that you should hear this directly fromthe Bank.
For as long as anyone can remember, a small group ofclearing banks — which these days we call ‘settlementbanks’ — have had to balance their books with theBank at the close of business each evening. Volatilityresulted if the Bank had not provided pretty well exactlythe amount of liquidity the banking system as a wholeneeded each day; or if our money was not distributedin the money markets to those banks that were short.And traders would speculate on that volatility —perhaps a rare instance of financial market activity withlittle social utility.
The new system relaxes the overnight constraint andliberalises access to the Bank. A broader group of banks— initially just over 40, accounting for around 90% ofthe UK banking system’s sterling liabilities — willmaintain a target balance with the Bank on average overeach month. (In the first maintenance period, whichstarted yesterday, the target is just under £23 billion.)These reserve-scheme banks, and other banks who sochoose, also have access to a standing deposit facilityand a standing (secured) lending facility. At a modestpenalty to the Bank’s policy rate, they can use thosefacilities in unlimited amounts, and so can turn to themif the rate in the market threatens to be less attractive.Together, this should keep the market rate in line withour policy rate.
Indeed, our objectives have been fourfold. First, tostabilise overnight market rates in line with the MPC
rate. Second, to improve the efficiency of the frameworkfor banking system liquidity management in normalconditions, and to make it more resilient in stressedconditions. Third, to simplify our method ofimplementing monetary policy. And fourth, to fosterefficient and fair markets.
For too long, too many people have been deterred fromusing the short-term sterling markets as much as theymight because it seemed to require special expertise,and therefore a disproportionate commitment ofresources.
Judging by the ACT’s very positive response to one of theBank’s early consultation papers, the modernisation ofour framework should be helpful to companies, which ofcourse use the money markets to borrow, employ cashbalances, and manage risk.
At the end of last year, firms’ short-term sterlingborrowing in the United Kingdom was around £300 billion. There are no data on how much of that was at very short maturities, but there is anecdotal evidence of overnight volatility acting as adeterrent. For example, when in late 2004 the Bankannounced our intention to introduce reforms, theEuropean treasury department of one of the largestcompanies in the world wrote to me in the followingterms:
‘I write to express our support and appreciation ... Theexcessive volatility in the overnight market precludedhigh-quality issuers ... from participating. ...The steps you are taking will surely increase the depth,stability and overall liquidity of the sterling moneymarket.’
That kind of support has been a great encouragement.
In terms of risk management, many companies swapfixed-rate term borrowing (and other cash flows) intofloating-rate. This can be into a six or three-monthLibor rate of interest, or into a stream of paymentslinked to the overnight money market rate. In theUnited Kingdom, the overnight index swap (OIS) markethas developed rather less than its counterpart in theeuro area, which is used by large non-financialcompanies. One obstacle seems to have been theintraday volatility in the sterling market, which hasentailed uncertainty about the spread between theaverage overnight rate on any particular day (asmeasured by the sterling overnight index average, or

Uncertainty, the implementation of monetary policy, and the management of risk
205
SONIA rate) and the rate actually paid on overnight cashat different times during the day. Many marketparticipants believe that if the reforms introducedyesterday significantly reduce intraday volatility, thesterling OIS swap market will grow, making it a moreuseful risk management tool.
The evidence of corporate treasurers as placers of short-term money is more concrete. For a few years now,UK companies’ domestic operations have beenproducing surplus cash flows: £12 billion, or about 1%of GDP, in 2005. The counterpart has, of course, beenan accumulation of financial assets. A lot of that hasgone in to the money markets — in particular, holdingsof call-deposits with banks (Chart 4) and investments inmoney market funds. In placing that liquidity, youshould be in a position where you need to negotiateonly the spread paid relative to a stable money marketrate, not the underlying rate itself. Our overhaul of thesystem should deliver that.
By taking the noise out of the sterling money markets,we aim to achieve greater stability and greatertransparency. That won’t revolutionise your businesses,but I trust that it will bring a welcome reduction in theavoidable uncertainties you confront.
Business risk management and pension-scheme uncertainties
At an aggregate level, the recent financial managementof the company sector has, in fact, posed some puzzlesabout your assessment of uncertainty and risk. This has been important to our understanding of what is going on in the money markets, and indeed financialmarkets more generally, as part of the backdrop to
our role of promoting monetary and financial stability.
The surplus cash flows I described earlier, in the contextof your treasury management, are a product of UK cashprofits having exceeded, by some margin, businessinvestment (Chart 5).
The same is true across the G7 economies as a whole.Companies have acted to repair balance sheets followingthe excesses of the late 1990s, and may conceivably havebuilt a cushion of financial assets to support themthrough a period of uncertainty as they adjust to thenew competitive forces associated with globalisation.But the UK corporate sector stands out as havingemployed its surplus in ‘cash’ to a far greater extent thanits G7 peers (Chart 6).
Chart 4Outstanding sterling bank deposits by private non-financial companies
0
20
40
60
80
100
120
1998 99 2000 01 02 03 04 05 06
Interest rate bearing sight deposits
Time deposits, repos and CDs
£ billions
Chart 5UK corporate sector retained earnings, investmentand financial balance
40
20
0
20
40
60
80
1987 89 91 93 95 97 99 2001 03 05
Saving(retained earnings)
Financial balance
Investment
+
–
Per cent of gross operating surplus
Chart 6Accumulation of cash by private non-financialcorporate sector (average 2003–04)
0
10
20
30
40
50
60
UnitedKingdom
UnitedStates
France Canada Italy Japan Germany G7
Per cent of gross saving
Note: Gross saving is defined as non-financial corporate profits after net interest and taxes, less dividends paid.
Source: IMF.

206
Bank of England Quarterly Bulletin: Summer 2006
The IMF hypothesise(1) that this may have beenmotivated by a desire to accumulate a precautionary potof liquid savings for managing pension fund deficits. Ido not know whether or not that is so. For example, thebuild-up of deposits has been concentrated in a fewsectors: real estate, and business services, and it is notobvious that these sectors have big pension fund deficits(Chart 7).
But that pensions have been a material component infirms’ cash management is not in doubt. That isapparent in the share of gross corporate savingsaccounted for by employers’ contributions to pensionfunds (Chart 8). Contributions have tripled — or in realterms doubled — since the late 1990s (Chart 9).(2) Partof this reflects ‘special’ or ‘one-off ’ contributions toreduce deficits. But, judging by self-administeredschemes,(3) regular contributions have doubled (Chart 10). What is going on here?
Well, it might have something to do with yourmanagement of risk, bearing in mind avoidable andunavoidable sources of uncertainty.
A corporate sponsor of a defined-benefit pensionscheme is, in effect, providing a guarantee or, broadly,writing a very complex option:(4) one on which the
Source: ONS; data shown are expressed in 2005 prices using RPI inflation.
(1) See footnote 18, Chapter IV ‘Awash with cash: why are corporate savings so high?’, World Economic Outlook, April 2006,page 151.
(2) For the household sector, the effect has been that employer contributions more than account for total net savings. (3) A breakdown of contributions into ‘one-off ’ and ‘regular’ is available only for self-administered schemes. They account
for around half of total employers’ contributions to private pension schemes. (4) It is option-like because of the asymmetry between extracting surpluses from pension funds and making good deficits.
Chart 7Contributions to growth in UK non-financial companysterling deposits
4
2
0
2
4
6
8
10
12
1998 99 2000 01 02 03 04 05
OtherLegal, accountancy and other business activitiesTransport, storage and communicationWholesale and retail trade
Real estate
Construction
Manufacturing
Utilities and primary industries
Total
Percentage point contributions to change on a year ago
+
_
Chart 8Employer pensions contributions
0
10
20
30
40
50
1990 92 94 96 98 2000 02 04
Per cent of gross corporate savings
Chart 9Employer pensions contributions
0
10
20
30
40
50
60
1992 94 96 98 2000 02 04
£ billions, 2005 prices
06
Chart 10One-off and regular employer pension contributions
0
5
10
15
20
25
30
35
1992 94 96 98 2000 02 04
Regular contributions
Special/one-off contributions
Total employer contributions £ billions
Note: Covers self-administered occupational schemes only.

Uncertainty, the implementation of monetary policy, and the management of risk
207
present value of the pay-offs is related to, among otherthings, the future growth in earnings of its workforce,their longevity, and the yield on an equivalent-maturityrisk-free bond. Apart from the design of the schemeitself and the associated balance of wages and pensionsin employee remuneration, the sponsor makes two bigchoices: the level of contributions it makes to the fund,and the asset allocation of the fund. (It may seem oddto say that the sponsor makes a decision about fundasset allocation, because of course that is formally theresponsibility of trustees. But as guarantors, thosedecisions affect the risk run by sponsors who, inprinciple, could make adjustments to their own balance sheet if they regarded trustee choices assuboptimal.)
Past increases in life expectancy entail highercontributions and, other things being equal, add to themarginal cost of a firm’s labour force. An unavoidablesource of uncertainty is future developments inlongevity.
In the asset allocation of a fund, company sponsors face,at one remove, a trade-off. On the one hand, if a fundholds risky assets, it will earn a risk premium but itsvalue will tend to be more volatile, varying with the long-term risk-free rate used to discount its liabilitiesand the value of its risky assets. On the other hand, afund could choose to hold only risk-free assets matchingthe characteristics of the scheme’s liabilities; forexample, buying annuities which can hedge the durationand longevity risk in known pension liabilities. In thatcase, the fund’s expected returns will be lower, and sosponsor contributions will have to be higher in order forthe fund to meet the scheme’s future obligations.
In short, company sponsors face some sources ofavoidable uncertainty about the future value of theirpension funds, with the level of their contributions akinto a premium paid to reduce or remove that uncertainty.(The funds’ trustees face a subtly different risk trade-off,in which they need to weigh the correlation of the risksin the asset-liability mix of their fund with the risks tothe sponsor’s business and net worth, and so to itscapability to meet any future fund shortfall.)
How much risk a company should take in its corebusiness and in the provision of pensions is obviously amatter for its board. A famous paper in corporate
finance(1) finds that, subject to some (admittedly fairlystrong) assumptions about tax etc, the market value of acompany (measured as the sum of the value of all itsfinancial liabilities, equity and debt) should not dependon its capital structure. Rather, its capital structureaffects the risk to equity holders, and so the headlinereturn they should rationally require to compensate forrisk. Within this framework, defined-benefit pensionschemes can be viewed as deferred compensation and soas entailing a form of indebtedness (in many cases, de facto indexed-linked borrowing) for their sponsors, tobe ‘serviced’ alongside their more conventional externalindebtedness. Perhaps that has become most obviouswhen a fund is calculated as being in deficit.
It would seem that in recent years there has been akeener awareness of this way of thinking analyticallyabout pension obligations. If there has been an‘awakening’, maybe it was triggered by a combination ofthe volatility of the value of equities held by funds,especially when they fell sharply a few years ago; thevolatility of the discounted value of their liabilities aslong-maturity real rates fell; regulatory requirementsgoverning the closure of deficits; and fluctuations in the net value of funds having for the first time to be reflected in firms’ capital in their financialaccounts.
Firms may, therefore, have been reviewing theirpreferences between risk-taking in their core businessand risk-taking via pension provision, and for a whilemay have been unusually uncertain about how equitymarkets value those different sources of uncertainty. Ifso, that may conceivably offer part of the explanation forthe measured recovery in UK business investment havingbeen weak, relative to the economy’s total output,compared with past cycles (Charts 11 and 12). Somehave suggested that the need to close deficits may havebeen a factor, via the call on cash flows. The possibility Iam airing is that another factor may be the size of ascheme’s discounted liabilities and the prospectivevolatility of the associated fund’s net value relative to thesponsor’s underlying business and capitalisation.
I do not want to push that too far. There have, of course,been other possible explanations for weak fixed-capitalexpenditure. These include competition from China,India and elsewhere; the rise in oil and commodityprices; and the uncertainty about how both will play
(1) Nobel Prize winner, Modigliani, F and Miller, M (1958), ‘The cost of capital, corporation finance and the theory ofinvestment’, American Economic Review, Vol. 48, pages 261–97.

208
Bank of England Quarterly Bulletin: Summer 2006
out, and thus about prospective demand for UK output.All of this might have been thought to make the externalenvironment unusually risky and so to warrant deferralof investment decisions.
Another possible explanation is, simply, that the level ofinvestment has been underrecorded, and that the datawill be revised up, as they have been frequently in thepast (Chart 13). Indeed, as the share of economicactivity accounted for business and financial servicesincreases, it is even possible that a growing part ofbusiness investment is simply unmeasured. When yourteams spend time developing spreadsheets that will beused for three to five years, do you count that asinvestment?
So it is difficult to know whether or not the managementof risks associated with pension provision has had abearing on the recent measured weakness in businessinvestment.
Financial market uncertainties
It has, though, surely been an important factor infinancial markets in recent years.
The most obvious manifestations have been associatedwith their own jargon: liability driven investment (orLDI), and so-called ‘alpha-generating’ active-management strategies.
LDI involves matching a fund’s assets more closely withits quasi fixed income liabilities, via purchases of long-duration conventional bonds, inflation-indexed (orreal) bonds, interest rate swaps and inflation swaps. Thismay well have amplified the fall in very long maturity realforward rates, which has been such a puzzle in recentyears (Chart 14).
Greater asset-liability matching represents a reduction ofrisk, and so — at least at first blush — does not
Chart 12UK business investment recoveries
0
5
10
15
20
25
30
8 6 4 2 0 2 4 6 8
Current
Quarters relative to trough
Percentage difference from trough in I/Y ratio
Average of past recoveries
+–
Chart 13Revisions to UK business investment
12
9
6
3
0
3
6
9
12
1993 94 95 96 97 98 99 2000 01 02 03 04 05
Latest data
Subsequent estimates
Initial estimates
Percentage change on a quarter earlier
+
–
Chart 14Long-maturity real sterling forward rates
0
1
2
3
4
5
6
1986 91 96 2001 06
Per cent
Sources: Bloomberg and Bank of England calculations.
Chart 11UK business investment
4
6
8
10
12
14
1990 93 96 99 2002 05
Per cent of GDP, constant prices
0

Uncertainty, the implementation of monetary policy, and the management of risk
209
obviously square with a more aggressive approach toactive management via increasingly popular ‘alpha’strategies. But quite what such strategies entail mayneed a bit of unpacking.
Conventionally, in the framework of the Capital AssetPricing Model, ‘alpha’ would refer to excess risk-adjustedreturn (a nice thing if you can get it!). In practice, theterm seems to be deployed rather loosely, being usedvariously to cover allocations to assets whose returnshave in the past been relatively uncorrelated with afund’s liabilities; leveraged — that is to say, risk-enhancing — plays across almost any asset class;and giving greater freedom to fund managers. Forpension funds, one motivation has probably been todiversify asset portfolios, perhaps evidenced by biggerallocations to private equity, commodities etc. Anothermotivation, both here and overseas, seems to be to try toclose deficits partly by earning high investment returnson some proportion of their asset portfolios. Cast inthat light, it appears to be part of the broader ‘searchfor yield’, which has been offered by some ascontributing over the past couple of years to thecompression in credit spreads and other market-basedindicators of risk, such as the price of options on mostasset classes.
Two responses to this have circulated among marketparticipants, both intermediaries and asset managers.One is that falls in implied risk premia truly havereflected a reduction in risk. The other is that, whilethat story might hold up to a point, risk has beenunderpriced.
It is certainly plausible that structural change hascaused risk to decline somewhat over the past decade orso. First, monetary policy regimes have become morecredible. That being so, central banks may be able tostabilise demand and output growth more effectivelythan in the past. Most obviously, cuts in interest ratesare now much more likely to be understood as aresponse to an adverse demand shock rather than asattempts to generate extra demand and jobs in the shortrun at the cost of stoking up higher medium-terminflation. And so it is easier for central banks to cutinterest rates when that would be desirable in order tostabilise demand conditions and so keep inflation in linewith the target. Related to that, greatly increasedtransparency across the central banking world makespolicy surprises — and so outsized market reactions topolicy decisions — somewhat less likely. Second, more
competitive and transparent product markets (partlythanks to the internet), together with more flexiblelabour markets, may have improved the real economy’sability to absorb nasty shocks without persistent largefalls in output. Third, developments in bankingprobably mean that more households have access tocredit to help them to smooth their consumption byborrowing during ‘bad times’. And by routinelydistributing more risk to non-banks, the banking systemmay be less likely to wish or need to conserve capital,refraining from taking risk, when faced with increaseddemand for liquidity from its corporate and householdcustomers. For these reasons, consumption growth maybe less prone to violent lurches than during, say, the1970s and 1980s.
In parallel, new techniques for unbundling anddistributing risk, and possibly also asset managersworking under fewer constraints than in the past, mayhave made financial markets more efficient. For anygiven level of expected volatility in the economy, thatmay have enabled investors to hold more diversifiedportfolios, reducing the excess returns (or risk premia)required for bearing the residual undiversified risk.
Taken together, other things being equal, these factorswould tend to work in the direction of reducing inflationrisk premia and term premia in government bond yields,credit spreads, equity risk premia, and impliedvolatilities derived from options.
But there are important qualifications to this story,especially regarding what it implies looking forward.
First, various cyclical developments, such as corporatesector balance sheet repair, have probably reduced risk.And, of course, growth is currently robust prettyuniformly across the world economy. Those features ofthe environment may have reduced risk premia,cyclically. There is no way to separate out with anyprecision the cyclical and structural, potentially morepersistent, influences on the price of risk. Second, theimportance of some of those structural factors may beexaggerated by market participants. Closest to home forme, I would not want anyone to think that central banksare capable of delivering uninterrupted growthindefinitely. And while central banks no longer seek tospring surprises on the market, our community couldnot rule them out if circumstances were to evolve wherethe market misperceived the implications of a centralbank’s analysis of the outlook.
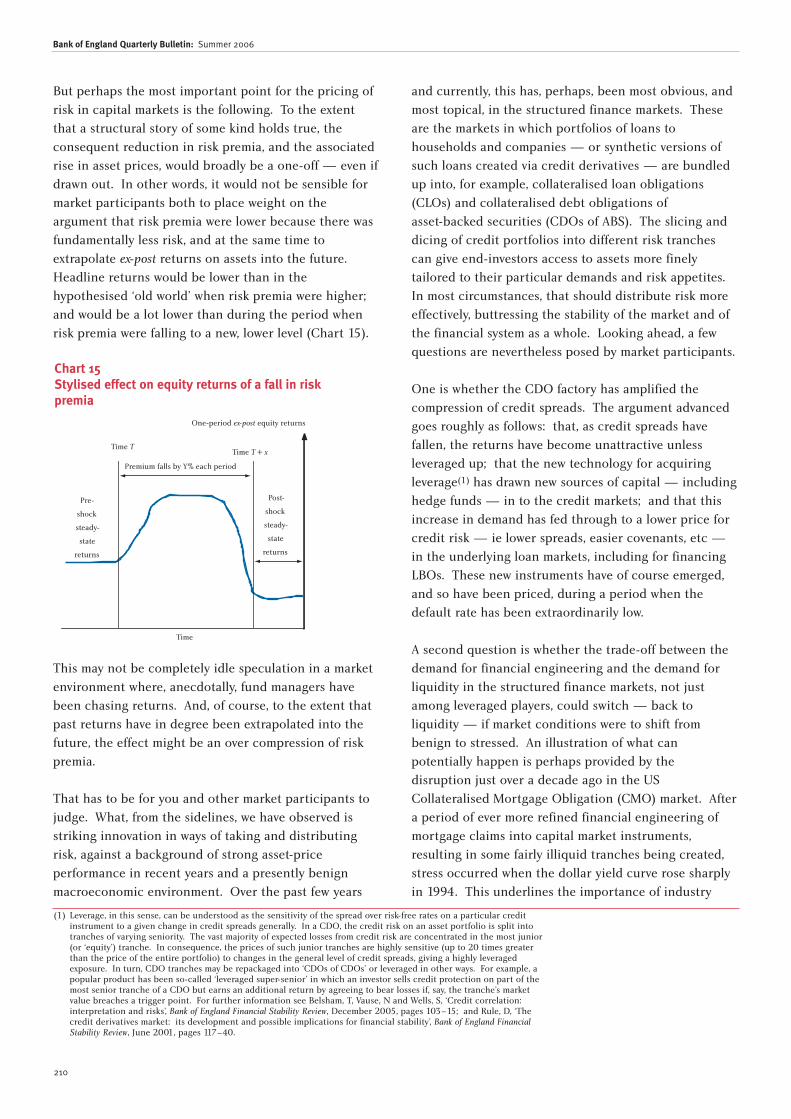
210
Bank of England Quarterly Bulletin: Summer 2006
But perhaps the most important point for the pricing ofrisk in capital markets is the following. To the extentthat a structural story of some kind holds true, theconsequent reduction in risk premia, and the associatedrise in asset prices, would broadly be a one-off — even ifdrawn out. In other words, it would not be sensible formarket participants both to place weight on theargument that risk premia were lower because there wasfundamentally less risk, and at the same time toextrapolate ex-post returns on assets into the future.Headline returns would be lower than in thehypothesised ‘old world’ when risk premia were higher;and would be a lot lower than during the period whenrisk premia were falling to a new, lower level (Chart 15).
This may not be completely idle speculation in a marketenvironment where, anecdotally, fund managers havebeen chasing returns. And, of course, to the extent thatpast returns have in degree been extrapolated into thefuture, the effect might be an over compression of riskpremia.
That has to be for you and other market participants tojudge. What, from the sidelines, we have observed isstriking innovation in ways of taking and distributingrisk, against a background of strong asset-priceperformance in recent years and a presently benignmacroeconomic environment. Over the past few years
and currently, this has, perhaps, been most obvious, andmost topical, in the structured finance markets. Theseare the markets in which portfolios of loans tohouseholds and companies — or synthetic versions ofsuch loans created via credit derivatives — are bundledup into, for example, collateralised loan obligations(CLOs) and collateralised debt obligations of asset-backed securities (CDOs of ABS). The slicing anddicing of credit portfolios into different risk tranchescan give end-investors access to assets more finelytailored to their particular demands and risk appetites.In most circumstances, that should distribute risk moreeffectively, buttressing the stability of the market and ofthe financial system as a whole. Looking ahead, a fewquestions are nevertheless posed by market participants.
One is whether the CDO factory has amplified thecompression of credit spreads. The argument advancedgoes roughly as follows: that, as credit spreads havefallen, the returns have become unattractive unlessleveraged up; that the new technology for acquiringleverage(1) has drawn new sources of capital — includinghedge funds — in to the credit markets; and that thisincrease in demand has fed through to a lower price forcredit risk — ie lower spreads, easier covenants, etc —in the underlying loan markets, including for financingLBOs. These new instruments have of course emerged,and so have been priced, during a period when thedefault rate has been extraordinarily low.
A second question is whether the trade-off between thedemand for financial engineering and the demand forliquidity in the structured finance markets, not justamong leveraged players, could switch — back toliquidity — if market conditions were to shift frombenign to stressed. An illustration of what canpotentially happen is perhaps provided by thedisruption just over a decade ago in the USCollateralised Mortgage Obligation (CMO) market. Aftera period of ever more refined financial engineering ofmortgage claims into capital market instruments,resulting in some fairly illiquid tranches being created,stress occurred when the dollar yield curve rose sharplyin 1994. This underlines the importance of industry
Chart 15Stylised effect on equity returns of a fall in riskpremia
Time TTime T + x
Premium falls by Y% each period
Post-
shock
steady-
state
returns
One-period ex-post equity returns
Time
Pre-
shock
steady-
state
returns
(1) Leverage, in this sense, can be understood as the sensitivity of the spread over risk-free rates on a particular creditinstrument to a given change in credit spreads generally. In a CDO, the credit risk on an asset portfolio is split intotranches of varying seniority. The vast majority of expected losses from credit risk are concentrated in the most junior(or ‘equity’) tranche. In consequence, the prices of such junior tranches are highly sensitive (up to 20 times greaterthan the price of the entire portfolio) to changes in the general level of credit spreads, giving a highly leveragedexposure. In turn, CDO tranches may be repackaged into ‘CDOs of CDOs’ or leveraged in other ways. For example, apopular product has been so-called ‘leveraged super-senior’ in which an investor sells credit protection on part of themost senior tranche of a CDO but earns an additional return by agreeing to bear losses if, say, the tranche’s marketvalue breaches a trigger point. For further information see Belsham, T, Vause, N and Wells, S, ‘Credit correlation:interpretation and risks’, Bank of England Financial Stability Review, December 2005, pages 103–15; and Rule, D, ‘Thecredit derivatives market: its development and possible implications for financial stability’, Bank of England FinancialStability Review, June 2001, pages 117–40.

Uncertainty, the implementation of monetary policy, and the management of risk
211
scenario analysis building in some allowance for thepossibility of system-wide liquidity stresses.
A counterpart to whether market volatility could occur isthe question of whether risk could flow back to thebanking sector in adverse circumstances. Over the pastdecade, many banks have moved towards businessmodels based around originating and distributing creditassets rather than holding them. But no one suggeststhat banks escape the risk completely. They warehouserisk before it can be securitised, and those warehouseswill probably have grown with the volumes flowingthrough the securitisation markets. To a greater orlesser extent, they hold on to loans and securitisedparticipations if they think them attractive, or perhapspunitively expensive to distribute. Through their primebrokerage operations, they finance leveraged holdingsagainst collateral. And they sometimes providecommitted lines of credit. Overall, this is akin to writingdeeply out-of-the-money options, exposing the bankingsystem to tail risk. That should not be too surprisinggiven that commercial banks’ liabilities are money, andso they are in the business of providing liquidityinsurance. But it does make it difficult for marketparticipants to assess, and price for, how much risk thereis, albeit contingently, in the system as a whole.
Conclusion
Many of the developments I have reviewed are, of course,good news. Most obviously, longer life expectancy!Greater macroeconomic stability; financial innovation
distributing risk more efficiently — these are prettygood things too, including for you as corporatetreasurers. As a result, some risks have been reduced orare now easier to manage.
But risk management challenges do unquestionablyremain for you as corporate treasurers. Some, such asthose arising from pension provision, essentially boildown to your appetite for risk and the mix ofbusiness/financial risk you want. Others stem from arange of uncertainties in capital markets. When andhow global imbalances will be resolved. Whether risk isunderpriced. How still-new structured finance marketswould withstand a marked pickup in defaults. You willeach have your own list.
Those uncertainties and risks have to be identified,priced and managed. The official sector cannot makethem go away.
But it is our mission to reduce uncertainties stemmingfrom monetary policy and its implementation. Someimportant sources of uncertainty in the past were, infact, avoidable. For some years now, monetary policydecision-taking has benefited from having a clearframework and from the Bank being transparent aboutits analysis of the economic outlook. Yesterday, bymodernising the sterling money markets, the Bankprovided a similarly clear framework for how weimplement those interest rate decisions. I hope it makesyour jobs a little easier.

212
Next month will be the fourth anniversary of myappointment to the Monetary Policy Committee. It istime to draw together some of my thoughts on operatingan inflation-targeting regime. Very much from theperspective of a practitioner, but engaging with some ofthe academic literature on our mission and, inparticular, policy strategy.(2) At the outset, I shouldmake it absolutely clear that these are my own personalviews, and do not necessarily represent those ofindividual colleagues on the MPC or those of theCommittee as a whole.(3)
Scene setting
The United Kingdom was not quite the first country toadopt inflation targeting — Canada and New Zealandgot there before us. But it has certainly taken off sinceour conversion, in 1992. It is now the explicit frameworkof over 20 countries, including more than 15 in theemerging market world. And the IMF recentlyreported(4) that another 20 have sought technicalassistance on introducing it.
The spread of inflation targeting has coincided with aperiod — pretty well everywhere in the developed world, except Japan — of low, stable inflation, and well-anchored inflation expectations. The GreatModeration cannot plausibly be attributed to inflationtargeting narrowly defined, because the biggestmonetary systems — the United States and the euro area— are not explicit inflation targeters. But somecommentators do attribute the Great Stability — as itgets called in the United Kingdom, since we haveenjoyed stable growth as well as low inflation — toshared ideas about the conduct of monetary policy, ideasthat are embodied in inflation targeting.
Is all this too good to be true? Are there no challengesfacing us? Or have central bankers finally cracked howto do monetary policy after around a century ofmanaging fiat money?
A simple story of what central bankers do
As background, I am going to work within the frameworkof what has become the most commonplace stylised
Reflections on operating inflation targeting
In this speech,(1) Paul Tucker, Executive Director for Markets and a member of the Monetary PolicyCommittee (MPC) — sets out some reflections on the operation of an inflation-targeting regime afterfour years on the MPC. Addressing the key objectives of modern central banking and how they may bemet, the central role of anchoring medium to long-term inflation expectations is emphasised. On thesecond element in the conduct of policy — stabilisation of the path of demand and output, to help meetthe inflation target and as worthwhile in its own right — he argues that ‘rough tuning’ is a more feasibleobjective than attempts at fine tuning, in the face of limited knowledge about structural change in theeconomy and inevitably imperfect data. Turning to four issues of strategy for modern policymakers, heoffers some comments on whether central banks should publish an expected policy path; on whetherthere is a time-consistency problem in their operation of stabilisation policy; on whether price-leveltargeting could make stabilisation policy more effective; and on how central banks should respond toasset prices. A thread running through the speech is that the successful operation of policy requiresstraightforward communication by central banks about policy objectives and the conduct of policy,without glossing over uncertainties and risks.
(1) Delivered at the Chicago Graduate School of Business on 25 May 2006. The speech can be found on the Bank’swebsite at www.bankofengland.co.uk/publications/speeches/2006/speech274.pdf.
(2) Some of the points made here were prefigured in my written submission to the House of Commons’ Treasury SelectCommittee ahead of a confirmation hearing on my reappointment to the MPC. See ‘Treasury Committee Questionnaireahead of appointment hearing for Mr Paul Tucker’, The Monetary Policy Committee of the Bank of England:appointment hearing, First Report of Session 2005–06, Volume II.
(3) My thanks for comments to Peter Andrews, Alex Brazier, Roger Clews, Spencer Dale, Paul Fisher, David Walton andAnthony Yates. For comments and background work to Damien Lynch, Richard Harrison, Tim Taylor and FabrizioZampolli. And for secretarial support to Katherine Bradbrook and Michelle Wright.
(4) ‘Inflation targeting and the IMF’, International Monetary Fund, March 2006.

Reflections on operating inflation targeting
213
account — ie in simple models — of what central banksdo.
Society and/or central bankers are assumed to careabout deviations of inflation from a target, and of thelevel of output from potential, typically represented by aquadratic loss function. That is equivalent to wanting toensure that inflation will not on average be biased awayfrom the target, and to avoid a volatile inflation rate;and similarly for the ‘output gap’.
Given that objective, the determinants of aggregatedemand, and a short-run trade-off between output andinflation, the monetary policy maker is assumed toproceed by setting interest rates in the light of theoutlook for demand relative to supply and for inflation.
The central bank decides a nominal interest rate, which itestablishes in the money markets.(1) As the prices ofmany goods and services are sticky, this has the effect ofenabling the central bank to move around the actualshort-term real rate of interest relative to the ‘natural’ or‘neutral’ real rate(2) that would prevail in the absence ofthose frictions.
Broadly, another consequence of prices and wages beingsticky, together with some inertia in inflation, is thatwhen shocks hit the economy, the central bank cannotget inflation to return to target instantly. So the centralbank needs to take account of the infamous long andvariable lags in the transmission of monetary policydecisions to the things it cares about.(3) In other words,in today’s vernacular the central banker has to beforward looking, in particular about the outlook forinflation. That, essentially, is why some economists referto central banks as undertaking inflation-forecasttargeting.(4)
Under this regime, the central bank needs to formjudgements on some big things. On the current andprospective pressure of demand on the supply (orproductive) capacity of the economy; on the
implications for the outlook of any cost shocks (eg oilprice rises); and on whether medium to long-termexpectations of inflation are well anchored to its (explicitor implicit) target.
Having done that and so formed a view on the outlookfor inflation, the central bank may have to decide howquickly to bring inflation back to target, in the light ofhow much weight it gives to containing volatility inoutput.(5) It then needs to decide whether it should setpolicy so as to restrain or stimulate aggregate demand,or to be neutral. And it therefore needs to judgewhether the current level of interest rates is, in fact,likely to deliver its desired degree of stimulus orrestraint.
Underlying those ‘big picture’ judgements are, at leastimplicitly, views on some fundamental economicvariables. Notably, on the supply capacity of theeconomy and its prospective rate of growth; on the rateof unemployment below which inflation is liable toincrease; on the natural (or neutral) real interest rate.Those judgements are, in truth, formidably difficult tomake, because they need to be regularly updated givenstructural change in the economy; and because each ofthe variables is unobservable!
Perhaps understandably, that leads some policymakers(6)
to the conclusion that these concepts may be useful asjust that — concepts — but not at all in practicaldecision taking. While not wanting to deny theirunobservability, I do not take quite that view. Forexample, the natural real rate may be unobservable, butthere is no ducking the fact that a policymaker needs toform a view on whether its policy stance is stimulating orrestraining demand, which amounts to broadly the samething.
Against that background, I can return to a central bank’sobjectives. To maintain inflation in line with a targetover the medium term. And, typically with less priority,to stabilise the path of output in the face of cyclicalshocks; in the UK Government’s mandate to the Bank of
(1) A completely new framework for doing so in the United Kingdom was introduced last week (18 May). See ‘TheFramework for the Bank of England’s Operations in the Sterling Money Markets’ (the ‘Red Book’), May 2006.
(2) Wicksell, K (1898), Interest and prices, London, Macmillan, 1936. Translation of 1898 edition.(3) A classic reference, in the context of the relationship between money and inflation, is Friedman, M (1961), ‘The lag
effect in monetary policy’, Journal of Political Economy, Vol. 69, No. 5.(4) For example, Svensson, L E O (1997), ‘Inflation forecast targeting: implementing and monitoring inflation targets’,
European Economic Review, Vol. 41, Issue 6.(5) See Batini, N and Nelson, E (2001), ‘Optimal horizons for inflation targeting’, Journal of Economic Dynamics and Control,
Vol. 25, Issue 6–7.(6) A recent example in relation to r* is Weber, A A (2006), ‘The role of interest rates in theory and practice — how useful
is the concept of the natural real rate of interest for monetary policy?’, G L S Shackle Memorial Lecture 2006,Cambridge.

214
Bank of England Quarterly Bulletin: Summer 2006
England,(1) that is expressed in terms of, inter alia, theMPC avoiding ‘undesirable volatility in output’. I shallsay something about both, before going on to discusssome issues concerning monetary policy strategy thathave featured in recent academic commentary.
Medium-term inflation expectations, forecasts,and models: nominal stuff
In terms of the primary objective of delivering stableinflation, it has helped the United Kingdom to have aclear target. In contrast to many inflation-targetingcountries,(2) we have a point target: 2% on theconsumer prices index. That leaves no room for debatein our (one person-one vote) committee about what thetarget is, and that it is symmetric. And there should beno uncertainty among households, firms andparticipants in financial markets about the steady-staterate of inflation being targeted. In other words, a pointtarget makes communication somewhat morestraightforward.
Of course, that is not the same as saying that we canguarantee to deliver inflation outturns consistently inline with the target over an economic cycle. Shocks, andeven policy mistakes, will cause inflation to deviate fromtarget. Explaining such deviations matters.
Especially when being reappointed for a further term,MPC members are typically asked by the House ofCommons’ Treasury Select Committee whether the MPChas made any big mistakes.(3)
In response, we often talk about luck, diligence etc. ButI think that the best test — perhaps the only importanttest — is whether medium to long-term inflationexpectations have been dislodged from the target.
In the United Kingdom, expectations have generallybeen in line with our target since the Bank was givenoperational independence. But as the recent slight tick-up in some measures illustrates, we have to beconstantly vigilant. By contrast, an uncomfortableamount of commentary — academic and in the media— proceeds as if that particular battle is won for alltime; the ‘death of inflation’ school of thought.
Indeed, seductively, these days ‘victory’ tends to beinscribed in to the economic models used by centralbanks as an input to their forecasts. Reflecting theachievements of this university, our models have a well-defined steady-state equilibrium for the realeconomy; well-defined steady-state nominal properties,typically an inflation rate; and forward-looking rationalexpectations, that is to say model-consistentexpectations. The second of these characteristics meansthat a nominal target is always achieved in the mediumto long run. And the third means that the model’sagents know that; ie they know now and behave — setwages and prices — accordingly, so that in thesemainstream models the target is achieved over cyclicalfrequencies too.
Typically, nominal things enter via inflation expectations,and they are pinned down in the stylised, modeleconomy by a policy rule of the kind I sketched earlier,expressed in terms of an official interest rate (the priceof base money). But just in case it were thought that the‘problem’ of models promising the policymaker successstems from the crime of ignoring money quantities, Ishould make it clear that that is not so. It would notmake a fundamental difference in policymakers’ modern-macro models if nominal stuff entered via amoney quantity, with the policy rule being specified as amoney-supply growth rate. So-called velocity shocks tothe demand for money would cause deviations from aninflation target in the short run, but everything wouldultimately settle down nicely — because thatassumption would be built in to the model’s long-runproperties (in this instance via a demand-for-moneyequation that was imposed as stable over the long run).
I’m exaggerating a bit. Forward-looking models can beset up in ways where things go wrong for a while. Inparticular, by allowing agents to learn more or lessgradually that the monetary authority really does meanit about achieving its target for inflation (or some othernominal variable).(4) Everything still turns out okayeventually, but the route can be a bit bumpy.
Experiments of that kind can help policymakers to thinkthrough, in a disciplined way, what might happen ifinflation expectations were to become dislodged. But, so
(1) ‘Remit for the Monetary Policy Committee’, letter from Chancellor of the Exchequer, the Right Hon. Gordon Brown, toMervyn King, Governor of the Bank of England, on 22 March 2006. Available atwww.bankofengland.co.uk/monetarypolicy/pdf/chancellorletter060322.pdf.
(2) For example Australia, Canada and New Zealand.(3) For example, ‘Treasury Committee Questionnaire ahead of appointment hearing for Mr Paul Tucker’, The Monetary
Policy Committee of the Bank of England: appointment hearing, First Report of Session 2005–06, Volume II. (4) Erceg, C J and Levin, A T (2003), ‘Imperfect credibility and inflation persistence’, Journal of Monetary Economics, Vol. 50,
Issue 4.

Reflections on operating inflation targeting
215
far, they do not do much to help us know what to lookfor in identifying whether inflation expectations are inthe process of becoming dislodged. We do not knowenough about how households and firms form theirexpectations — how much forward looking, how muchbackward looking — to be able to model the processrigorously. That is not part of the ‘information set’ ofpolicymakers in today’s world.
What this underlines is that policymakers may well notbe able to rely on their models to help them terriblymuch when the stakes are highest; ie when ourcredibility may be fragile. They are tools to help usthink. But they don’t tell us the answers. Crucially, wehave to make judgements about whether medium-terminflation expectations are, in fact, securely anchored.We need to resist falling into the trap of thinking thatthe nominal side is now, and forever, nicely looked afterby some miracle of credibility.
Notwithstanding the extent to which analysis of realeconomic variables seems to dominate the pages of mostcentral banks’ published analysis, including the Bank ofEngland’s, maintaining real aggregate demand in linewith supply is not a sufficient condition for achieving aninflation target; indeed, it would be consistent with anylevel of inflation. We absolutely have to attend toindicators of medium-term nominal trends. That is whycentral bankers like me look at measures of inflationexpectations from as many sources as we can: bondmarkets, surveys etc. And it is why the ECB and others,including at the Bank of England, track the monetaryaggregates as a cross-check, a potential amber lightalerting us to medium-term risks.
Stabilisation policy and the impracticalities offine tuning: real-side stuff
That brings me to the second element in the conduct ofpolicy: stabilisation of the path of demand and output,in order to keep inflation in line with the target over thecycle, to underline the commitment to medium-termstability, and as something desirable in its own right.
Well-anchored inflation expectations do makestabilisation policy ‘easier’. When a credible central bankcuts its interest rate to offset the adverse effects of a
shock to demand, it will not be perceived as trying toraise demand and employment in the short term (sayover the next year or so), at the expense of higherinflation down the road. Rather it will be understood astrying to avoid deficient demand: as trying to stimulatedemand a bit in the short run in order to bring it backto the economy’s supply capacity and so, precisely, tomaintain inflation in line with its target.
For at least this policymaker, however, there is a risk ofcommentators overstating our capacity to stabilisedemand — understandably perhaps following, in theUnited Kingdom, more than a decade of fairly steadygrowth since inflation targeting was introduced.
To be clear, I do believe that we should be able to putbehind us the self-inflicted economy-wide boom andbust that, miserably, characterised the UK economy for afew decades until the early 1990s.(1) All too frequentlyin the past, aggregate demand was allowed to get out ofcontrol, bringing with it, variously, a credit boom, anasset-price bubble and, sooner or later, runaway wageand consumer price inflation. Belatedly, the monetaryauthority would slam on the brakes, tipping the economyinto recession. Inflation would then slow.
But that we no longer neglect the inflationaryconsequences of excess demand does not mean we cannicely fine tune demand to ensure uninterrupted growth.Why?
I will mention just two reasons. First, we just do notknow enough about the underlying structure andproperties of the economy. Quite apart from the changein monetary regime, the extent and variety of thestructural change underway in the real economy isprofound: for example, labour market reformdomestically, and the opening up of labour marketsacross the European continent, which has materiallyincreased inward migration to the United Kingdom; the new technology and the price transparency it brings; China and India. In consequence, in the United Kingdom for the moment we do not really knowwhether the short-run trade-off between excess (ordeficient) demand and inflation has changed; whetherthe short-run Phillips curve has become flatter (Chart 1).
(1) Balls, E and O’Donnell, G (eds), 2001, ‘Reforming Britain’s economic and financial policy: towards greater stability’,HM Treasury, page 10: ‘Although there are many reasons for the UK’s poor inflation record in recent decades, one keyfactor was poor institutional arrangements. Monetary policy, if set correctly, should be a stabilising force for theeconomy. However, serious mistakes were made, which often meant that inflation was higher and more volatile than itwould otherwise have been. This, in turn, created substantial economic instability that harmed the long-termperformance of the UK economy. Many of these policy mistakes were made because the aims and procedures ofmonetary policy were not properly defined’.

216
Bank of England Quarterly Bulletin: Summer 2006
Second, the data we use give us an unavoidablyimperfect read on what is going on. Not infrequently inmy experience we debate the various possibleexplanations for some puzzle in the data, only to findthat a year or so later the data have been revised and, asit turned out, there was no puzzle (Chart 2). For thatreason, the Bank of England is putting considerableresources into researching data uncertainty.(1)
Where does that leave us? I should like to say that wecan ‘rough tune’ but not fine tune. Rough tuning isimportant, as we do need to keep aggregate demand andsupply broadly in line as a condition for maintainingstable inflation. But that does not mean that we can always smooth out quarter-to-quarter, or even year-to-year, fluctuations in demand and output to theextent some commentary implies. In terms of thepolitical economy of monetary policy making, it is
important for the central banking community to get thatacross and accepted. If we fail in doing so, and thepublic believes that central banks can deliver more thanis realistic, there will at some point down the road bedisappointment, conceivably putting in jeopardy the realachievements of monetary policy in delivering pricestability.
Of course, these strictures apply most of all to ourselves.We try to discipline ourselves not to claim too muchcredit for stable growth. And in forecasting, we have toattend to the uncertainties around our projections ofthe central outlook. Some numbers may serve tounderline that. The MPC’s projections are published asfan charts. The fan chart standard deviation of outputgrowth at around one year is a little under 1 percentagepoint; and of inflation at around two years, roughly 0.5 percentage points. This is not a world in which one should get carried away by fine judgements thatalter the central projection for demand by 0.1 or 0.2 percentage points. Yet, as the Bank hasdocumented,(2) assuming that credibility is maintained,the effect of a surprise change in the official interest rateis judged to be small; maybe less than 0.1 percentagepoint on the annual rate of inflation two years after a 25 basis point surprise change maintained for one year.Of course, we are not in fact in the business of aiming tomake surprise changes in our policy rate. Against abackground of credibility, a lot of practical monetarypolicy making is not about forestalling major lurches inthe economy and inflation via large, abrupt changes inthe policy rate. Instead, it has to involve careful analysisof the conjuncture, with transparency to the market. Butthese numbers do perhaps illustrate the importance ofour not getting drawn into absurd degrees of detail, andthe risk of signalling that we think we can precisely finetune demand conditions.
How can we maintain and underpin credibility? Thefollowing seem to be ingredients. Being very publiclycommitted to anchoring medium-term inflationexpectations in line with a clear target, above all else.Inflation outturns being, on average, in line with thetarget. And being seen to be committed to theessentially technical job of professional economicanalysis of conjunctural conditions and the underlyingstructure of the economy. Typically moving our policyrate in steps of 25 basis points seems to have been usefulin conveying the break with the past. Perhaps because it
(1) For example, Lomax, R (2004), ‘Stability and statistics’, speech to the North Wales Business Club, Bank of EnglandQuarterly Bulletin, Winter, pages 495–501.
(2) Harrison et al (2005), The Bank of England Quarterly Model, pages 128–32.
Chart 2Official estimates of GDP growth
0.2
0.0
0.2
0.4
0.6
0.8
1.0
1.2
1.4
1.6
1993 96 99 2002 05
Percentage changes on previous quarter
Latest data
Range of ONS estimates
–
+
Chart 1Unemployment and inflation
5
0
5
10
15
20
25
30
0 2 4 6 8 10 12
RPIX inflation, per cent
Unemployment, per cent
1990 – present
1970s
1950s
1960s
1980s
–
+
Reflections on operating inflation targeting
217
conveys that things are ‘under control’. The counterpartto that is being understood to be ready to do whatever itis necessary to maintain well-anchored inflationexpectations.
Policy strategy, risk management andcommunication
If the key tasks are anchoring inflation expectations and,with less weight, stabilising demand conditions, how docentral banks go about their policy job?
At the Bank of England, in both our publishedprojections and our policy decisions, we emphasise therisks around the ‘central outlook’. And although some ofthe presentation is different, that is on the same page aswhat former Chairman Greenspan called the ‘riskmanagement’ approach to policy.
In my experience, it is not sensible to respond to allpossible risks, even some that would have a big impact ifthey crystallised. Take, for example, global imbalances.If they were to unravel abruptly, with a big fall in thedollar against the euro, aggregate demand in the euroarea might fall for a while. Depending on what hadhappened to sterling’s bilateral exchange rates, theUnited Kingdom would not be immune from spillovers,as the euro area is by far our largest trading partner. Forsome time, therefore, global imbalances have been a realsource of risk to the United Kingdom as well as to theglobal economy. Should I have been voting to cutinterest rates to head off those risks? I don’t think so. Itwould not have made sense to try to anticipate theeffects of a shock that had not yet occurred and overwhich we had effectively no influence. A number ofexternal ‘tail risks’ are rather like that.
How does that fit with ‘precautionary’ or ‘insurance’policy settings. Individual policymakers differ on theusefulness of this concept. I find it quite useful. But onmy view of what it means, it has to be subject to somequite stringent conditions in practice.
Remembering that we have a highly imperfect line ofsight of what is going on in the economy, assume as athought experiment that some indicators are flashingthe possibility that there has been a material shock todemand. For example, imagine that there has been a bitof bad news but that there are signs that consumerconfidence may be ebbing away by more than we would
have guessed was proportionate. So maybe spendingwill fall materially. The probability is thought to be low,but tangible. In other words, most likely the outlook isfine, but it might not be. A cut in rates might bewarranted in order to guard against the consequences ifthe risk has, in fact, crystallised. The policymaker couldwait for more evidence, but by waiting they risk beingtoo late to avoid some deviation of output from‘potential’ and of inflation from target. This is not a freelunch. In keeping with the insurance metaphor, apremium will have to be paid: in the form of accepting aslightly higher probability of inflation rising above targetin the near term if the (insured-against) risk has not, infact, crystallised. In other words, the policymaker faces atrade-off, based on a judgement of probabilities andcosts.
But, in my view, there is more to it than that.Communication matters too. If the policymaker takesout the insurance, they need to be clear (withthemselves) about the conditions under which it would be withdrawn, ie the cut reversed. And that state-contingent policy analysis needs to becommunicated to the market too.
Some economists do not like the idea of ‘insurance’policy settings, and ask, reasonably, how they squarewith the type of objective (loss) function I set out at thebeginning of my remarks. Alternatively, it is argued thatthey are so obviously consistent with a ‘standard’ lossfunction that it does not really add anything to talkabout ‘insurance’ or ‘precautionary’ settings as a way offraming policy analysis and decisions. These are bothfair points! Possible responses run as follows. First,maybe we (society) are more averse to fairly bad eventsthan to risks that take us just a little distance fromtarget/potential; eg maybe preferences would be betterapproximated by a loss function with a ‘higher power’than a quadratic.(1) Second, maybe what is going on canbe thought of in terms of how heavily or not we discountfuture deviations from target/potential relative to verynear-term deviations; ie a policymaker may accept theprice (premium) of risking slightly higher/lower inflationin the nearish term in order to reduce (insure against)the risk of a bigger or more persistent deviation ofinflation from target a little down the road.
What the insurance/risk management metaphor doesillustrate is that a policymaker has to think beyond theimmediate policy decision. Indeed, it would be odd not
(1) For a discussion of some implications of different loss functions, see Vickers, J (1998), ‘Inflation targeting in practice:the UK experience’, Bank of England Quarterly Bulletin, November, pages 368–75.

218
Bank of England Quarterly Bulletin: Summer 2006
to. In the great scheme of things, fixing the overnightrate for the next month (in the United Kingdom) — or45 days or so (in the United States) — seems neitherhere nor there.
Of course, on both sides of the Atlantic, we have recentexamples of policymakers making their strategy clear,albeit in subtly different ways. In the most recent cycle,the Bank of England’s rate troughed at 3.5%. Some of usmade it clear that, so far as our individual decisions wereconcerned, we expected, other things being equal, tovote for a gradual withdrawal of monetaryaccommodation if/as demand recovered and the slack inthe economy was gradually absorbed.(1) Crucially, thosestatements were state contingent.
Some policy strategy issues
Against that background, I should like briefly to review,without reaching firm conclusions on, four issues thatfeature in the recent literature. Whether central banksshould publish an expected (optimal) path for theirpolicy rate. Second, whether stabilisation policy issubject to a bias, meaning that a central bank will find itoptimal not to deliver on promises and that, inconsequence, its policies to offset shocks will be lesseffective than they could be if it could commit itself.Third, whether stabilisation policy could be moreeffective if the central bank targeted a path for the price level rather than an inflation rate. And, fourth,how central banks should respond to asset priceinflation.
(a) Should central banks publish an expected policypath?
Among others, Lars Svensson(2) and Michael Woodfordhave argued that central banks should publish the paththey expect for the policy rate or the near-term path ofinflation they are aiming for. The Norwegian and New Zealand central banks have been publishing policy rate paths for a short while.(3) The Bank ofEngland does not. What do I — let me stress, personally— think about that?
As others have pointed out,(4) managing a scheme forvoting by nine members on a path of rates would bepretty complex. Proposals have been made (eg forderiving a median path from individual members’paths),(5) but they seem to entertain the possibility ofshifting majorities for different parts of the resultingpath (or implied money market curve). That may add anextra complication to explaining policy.
Indeed, more broadly, there would probably be achallenge in the area of communication. A single pathfor rates would, of course, be a misleading statement ofthe policymaker’s intentions; of its ‘reaction function’.The path policy takes will depend, very obviously, on theshocks that hit the economy in the future. But not onlyon that. Also on whether, even in the absence of newshocks affecting households and firms, the economyevolves on the path the central bank expected, includingagents’ responses to past policy decisions and shocks.On any changes in view about how the economy works(about the ‘model’). And it will depend on whether thecentral bank’s beliefs about agents’ inflationexpectations are (broadly) accurate. In other words, theoutlook for policy is unavoidably state contingent, andthose contingencies include the possibility of thepolicymaker discovering that it had not been as credibleas it had assumed. Communicating that statecontingency in the form of a series of interest rate pathswould be formidably difficult. It is not obvious to methat a fan chart for the interest rate delivers this(6)
unless accompanied by a clear explanation of what statesof the world would take the central bank’s rate todifferent parts of the fan. So the question boils down tohow the policymaker’s reaction function can best beconveyed.
At the Bank of England, we have tackled this bypublishing as complete an account as we can of ouranalysis of the economic outlook, including the risks. Inthe minutes of our meetings, we describe how those risksfeature in our policy judgements. And individually, weexplain the reasoning behind our decisions and our viewof the outlook in Select Committee appearances,
(1) For example, Tucker, P M W, speech at the National Association of Pension Funds Annual Investment Conference,March 2004, Bank of England Quarterly Bulletin, Summer 2004, pages 234–40; and ‘Bank’s market man is ready for raterises’, P M W Tucker interview by D Smith, The Sunday Times, 25 April 2004.
(2) Svensson, L E O (2006), ‘The instrument-rate projection under inflation targeting: the Norwegian example’, presentedat Banco de Mexico conference ‘Stability and Economic Growth: the role of the Central Bank’, Mexico City.
(3) For examples, see Chapter 1 ‘Monetary policy assessments and strategy’, Norges Bank Inflation Report, 3/2005,November 2005, and Section 1 ‘Policy assessment’, Reserve Bank of New Zealand Monetary Policy Statement, March 2006.
(4) For example, Goodhart, C A E (2001), ‘Monetary transmission lags and the formulation of the policy decision oninterest rates’, Federal Reserve Bank of St. Louis Review, (July/August), pages 165–81.
(5) Svensson, L E O (2005), ‘Optimal inflation targeting: further developments of inflation targeting’, prepared for CentralBank of Chile conference on ‘Monetary Policy under Inflation Targeting’, Santiago, October 2005, page 8.
(6) For an example of such a fan chart see Chapter 1 ‘Monetary policy assessments and strategy’, Norges Bank InflationReport 3/2005, November 2005.

Reflections on operating inflation targeting
219
speeches, etc. The underlying question here is whethera more effective communication policy is based onexplaining the underlying analysis or on providing whatmany might wrongly perceive to be the ‘answer’ in theform of a path for rates. In a world where attention toour analysis is limited, it may be preferable to keep our‘audience’ focused on the MPC’s analysis of the outlookfor output and inflation.
Sometimes that analysis lends itself naturally to acontingent statement, by individual members, of apossible path for policy. I have already referred to onesuch example around the end of 2003/beginning of2004.
In a similar vein, circumstances may arise where weexplained the broad path for inflation we were trying todeliver. For example, a shock to the economy might besufficiently nasty that returning inflation to target onthe usual timetable would threaten undesirable volatilityin output. We might then want to set policy in a waythat accepted deviations from the inflation target for aperiod, while committing to achieve the target in themedium run. Related to that, our mandate makesspecific provision for communication if inflationoutturns were to miss our target of 2% by more than 1 percentage point. In those circumstances, theGovernor of the Bank would be obliged, as part of theCommittee’s public accountability, to write an openletter to the Chancellor of the Exchequer explaining why inflation had deviated from target, the Committee’splan for returning to target, and its time horizon fordoing so. Such circumstances have not yet arisen, but they illustrate that provision is made for theCommittee to explain what commentators would call itsstrategy.
The debate is certainly interesting, and it should go without question that, like policymakers everywhere, I am very much in learning mode over these issues.
(b) Is there a stabilisation bias?
Inflation targeting has been characterised as‘constrained discretion’ in the sense that the centralbank makes policy choices, but choices disciplined by aclear objective.(1)
Exploring the implications of discretion, MichaelWoodford and Lars Svensson have argued, in a series ofpapers,(2) that optimal policy suffers from a stabilisationbias, arising from time inconsistency. Any centralbanker’s ears will prick up at this, given the importanceof an earlier literature — associated with Kydland andPrescott, Barro, Fischer(3) — in helping to explain theinflation problems of the past and to make the case forcentral bank independence.
The ‘old’ problem was about the incentive of a monetaryauthority to cheat, or renege on promises, by generatingsurprise inflationary booms in order to secure anincrease in output and jobs. This was, indeed, prettytempting for politicians when they had their hands onthe interest rate lever. In a rational world, the result wasno permanent increase in jobs but a higher-than-desiredsteady-state rate of inflation. And the solutions variouslyoffered by the academy included appointing a‘conservative central banker’ more averse to inflationthan society at large, or writing a ‘contract’ thatincentivises the monetary authority to do the rightthing.(4)
In practice, the solution has amounted to a combinationof central bank independence, clear goals, andtransparency. These real-world central bankers careabout ensuring that nominal magnitudes do not distorteconomic decision taking, and they care about theirreputations. But they are not ‘conservative’ in the senseof being ‘inflation nutters’. Rather they are ‘dutiful’ inthe sense of sticking to a clear, symmetric mandate.That, many would argue, has been a necessary conditionfor achieving credibility.
(1) Bernanke, B S and Mishkin, F S (1997), ‘Inflation targeting: a new framework for monetary policy?’, Journal of EconomicPerspectives, Vol. 11, No. 2; and King, M A K (2004), ‘The institutions of monetary policy’, The Ely Lecture 2004, at theAmerican Economic Association Annual Meeting, San Francisco.
(2) Woodford, M (2003), Interest and prices: foundations of a theory of monetary policy, Princeton University Press, Chapter 7;Dennis, R, ‘Time-inconsistent monetary policies: recent research’, Federal Reserve Bank of San Francisco Economic Letter,April 2003, No. 2003–10; and Svensson, L E O and Woodford, M (2005), ‘Implementing optimal policy throughinflation-forecast targeting’, in Bernanke, B and Woodford, M (eds), The inflation-targeting debate, University of ChicagoPress.
(3) Kydland, F and Prescott, E (1977), ‘Rules rather than discretion: the inconsistency of optimal plans’, Journal of PoliticalEconomy, Vol. 85; Barro, R and Gordon, D (1983), ‘Rules, discretion and reputation in a model of monetary policy’,Journal of Monetary Economics, Vol. 12; Fischer, S (1994), ‘Modern central banking’, in Capie, F, Goodhart, C, Fischer, Sand Schnadt, N (eds), The future of central banking, the Tercentenary Symposium of the Bank of England.
(4) For example Rogoff, K (1985), ‘The optimal degree of commitment to an intermediate monetary target’, Quarterly Journalof Economics, November, Vol. 100, No. 4; and Walsh, C E (1995), ‘Optimal contracts for central bankers’, AmericanEconomic Review, Vol. 85, No. 1.

220
Bank of England Quarterly Bulletin: Summer 2006
But now it is argued that a monetary authority does,after all, still have an incentive to cheat. This time, noton its delivery of price stability in line with a target overthe medium to long run, but rather in how it stabilisesshorter-run fluctuations in demand and inflation in theface of shocks.
As I understand it, broadly the argument runs as follows.Assume that a shock to costs hits the economy; the oilprice rise over the past couple of years might be thekind of thing. In the short run, demand and output willbe pushed below the economy’s ‘trend’ path, andinflation above the authority’s target. In the story, tobring inflation back to target, the central bank raises itspolicy rate and announces that it will keep it higher for awhile. Because it is believed, near-term inflationexpectations drop back in line with the target. Thatbeing so, in order to avoid ‘lost’ output, it is now optimalfor the central bank to reduce its policy rate back towhere it was, ie not to leave it higher. The central bank has therefore not done what it said it would do; ithas been time inconsistent. And, reflectingrational/model-consistent expectations, agents allow forthis, so that central bank stabilisation policy is not aspotent as it could be if credible commitments werefeasible.
For this practitioner at least, the story does not soundvery much like reality. Unlike the inflation problems ofthe past, it is not obvious to me that we are going aboutbreaking promises about how we conduct cyclical policy.I do not mean that in the trivial sense that we do notpublish an intended path for rates, and so there is nopromise to break. Rather, I do not believe that we havepublished analyses of the economic outlook that,notwithstanding the absence of news, we havesubsequently deliberately junked — and so abandonedas an input to our policy judgements — when it suitedus in order to secure a ‘better’ path for output. Forexample, I have mentioned how in late 2003/early 2004,some MPC members explained that, if the economycontinued to recover, we expected to vote for a gradualwithdrawal of monetary accommodation. If the economyhad been knocked off course, speaking for myself I wouldnot have had any difficulty in referring back to myearlier statements and explaining how things hadchanged. It would have been the obvious thing to do.That would not have involved breaking a promise; and Ido not think it would have been misunderstood.
Perhaps more important than that, the model world inthe stabilisation-bias story seems to be better than
reality in one key respect, and therefore to misssomething rather central to the policymaker’s job. In theface of a major cost (or supply) shock, the big questionis whether, as well as a temporary upward impetus toinflation, there will be ‘second-round’ effects via wageearners trying to recover lost purchasing power. Inother words, the big issue is whether medium-terminflation expectations will remain anchored; or moregraphically, whether the central bank will ‘lose control’. Ithink we can see that in the statements of central banksfrom a whole host of countries over the past year or so.The statements amounted to saying: ‘if it looks asthough second-round effects are occurring, andcreeping into rising medium-term inflation expectations,then I shall have to — and believe me, I shall — tightenpolicy’. If the central banker’s commitment to do so isbelieved — ie if it is credible — then it does not have totighten policy for that reason. It is a state-contingentpolicy stance. And the central bank behaves timeconsistently.
Unless we are passing each other in the night, a possibleexplanation for the difference between my practitioner’sview and the time-consistency problem in the modeleconomy is that the latter assumes model-consistentexpectations. In the model economy, the monetaryauthority’s ability to deliver, and its will to stick to, itsinflation target over the medium run is never in anydoubt. Whereas what it feels like, at least to me, is that that kind of credibility needs to be earned and re-earned, over and over again. That does not make us‘inflation nutters’: the target is symmetric. Butmaintaining well-anchored medium-term inflationexpectations is not guaranteed. And, therefore,credibility is not to be taken for granted in the way weseek to stabilise the path of the economy in the face ofshocks. At its broadest, in a world where medium tolong-term inflation expectations are anchoredprincipally by virtue of the central bank conductingpolicy consistent with the declared regime, thepolicymaker has little incentive to ‘cheat’ on stabilisationpolicy. That is because developing a reputation forbeing time inconsistent on that part of its task wouldrisk a perception that it would be time inconsistent onachieving the inflation target over the medium run. Inother words, it would risk undermining the credibility ofthe regime.
A potential area for research is whether a ‘stabilisationbias’ problem would reappear in models that combinecentral bank discretion with persistent deviations ofmedium-term expectations from target stemming from

Reflections on operating inflation targeting
221
imperfect or gradual learning by households and firmsabout the authority’s long-term objectives and itscommitment to them.
(c) Would price-level targeting make stabilisation policy more effective?
It is occasionally argued that stabilisation policy wouldbe more effective if central banks targeted the price levelrather than a rate of inflation (Charts 3 and 4). Thatneed not mean a flat price level. It might mean that thecentral bank committed to deliver a path for the pricelevel with a positive rate of inflation on average. Thedifference from today’s inflation targeting would be thatbygones would not be allowed to be bygones. A periodof overshooting would be followed by a period ofundershooting, and vice versa.(1)
Assuming complete credibility, this would mean thatfollowing an adverse demand shock, households andfirms would expect sufficient policy stimulus to plug thegap left by deficient demand and, on top of that, togenerate a little excess demand in order to raise inflationabove its average and so bring the price level back to itstargeted path. The consequent rise in near-terminflation expectations would, it is argued, make the job of offsetting the initial adverse shock somewhateasier.
I wonder, though, whether price-level targeting might, infact, endanger credibility by the extra complication itwould bring to the formation of inflation expectations.When asked about what rate of inflation we are trying to deliver over the long run or cyclical horizons, theMPC’s answer is virtually always the same: 2% on theCPI (potentially departing from that only on rareoccasions when, after a major supply/cost shock, wewanted to get inflation back to target more graduallythan usual). With price-level targeting, the de factonear-term target would regularly vary according to(recent) inflation outturns and the time horizon foroffsetting them.
That might confuse households and firms about thelong-term objective, making it more difficult for thecentral bank to maintain credibility. By repeating anunchanging and simple message about the inflation ratewe are aiming at (2%), we may make it easier forhouseholds to learn about our aims.
(d) How should central banks respond to asset prices?
Others argue that whether the central bank targetsconsumer price inflation or the price level, they shouldalso target asset prices. On this question, I subscribe tomuch of the current orthodoxy.(2)
(1) A short or a long horizon could be set for ‘correcting’ deviations from the targeted path for the price level. See King, M A (1999), ‘Challenges for monetary policy: new and old’, Symposium on ‘New Challenges for Monetary Policy’,Federal Reserve Bank of Kansas City at Jackson Hole, Wyoming.
(2) For a variety of positions, see Cecchetti, S, Genberg, H and Wadhwani, S (2002), ‘Asset prices in a flexible inflationtargeting framework’, NBER Working Paper no. 8970; Bernanke, B and Gertler, M (2001), ‘Should central banks respondto movements in asset prices?’, American Economic Review, Vol. 91, No. 2; Issing, O (2004), ‘Financial integration, assetprices and monetary policy’; and Posen, A (2006), ‘Why central banks should not burst bubbles’, Institute ofInternational Economics Working Paper 01/2006.
Chart 3Inflation targeting
0.0
0.5
1.0
1.5
2.0
2.5
3.0
3.5
4.0
1 2 3 4 5 6 7 8 9 10 11 121.00
1.05
1.10
1.15
1.20
1.25
1.30
Inflation
Price level
2% price level path
Log price level Inflation rate (per cent)
Periods
Source: Illustrations based on Bank of England estimates.
Chart 4Price-level targeting
0.0
0.5
1.0
1.5
2.0
2.5
3.0
3.5
4.0
1 2 3 4 5 6 7 8 9 10 11 121.00
1.05
1.10
1.15
1.20
1.25
1.30
Inflation
Price level
Drifting price-level target
Log price level Inflation rate (per cent)
Periods
Source: Illustrations based on Bank of England estimates.

222
Bank of England Quarterly Bulletin: Summer 2006
Of course, changes in asset prices feed intopolicymaking as they are an important influence ondemand conditions, through households’ wealth, firms’cost of capital, and the price (exchange rate) at which wetrade with other economies.
But I do not believe we should use interest rates to targetasset prices alongside consumer price inflation. In thefirst place, we just do not know enough about thedetermination of asset prices — especially of risk premia— to have much of an idea about what price to target.Big moves in asset prices do occasionally occur becauseof changes in the underlying economic fundamentals.We could not be relied upon to distinguish betweenthose benign changes and bubbles. But even if wecould, I don’t see how in practice we could use oursingle instrument (the overnight interest rate) to targetboth consumer price inflation and asset prices —especially when one remembers that there are lots ofdifferent asset prices and that questions of disequilibriaabout them may run in different directions.
Having said that, there is no denying that asset pricescan be a serious complication for monetary policy. And Ithink I would want to register just a slight qualificationto a strong version of the proposition that the centralbank should simply — as if it could be simple — ‘mop up’ after a bubble has burst. Policymakers need totake care that the measures they take to offset theimpact on aggregate demand of one type of imbalanceunravelling do not themselves create or exacerbateimbalances elsewhere in the economy, including in otherasset markets. In other words, policymakers need toguard against one imbalance leading to another.
That view is, I believe, quite consistent with inflationtargeting. The simple set-up I described in myintroductory remarks had two relevant features. First,the policymaker’s objective (or loss) function was set as aquadratic in inflation and output. And as I described,that can be unpacked as caring about both systematicbiases from the target and the volatility of inflation.
Second, the policymaker cares not just about today (ortomorrow) but about the future.
Putting these two features of the objective functiontogether, the policymaker places some weight on theprospect of unusual volatility in inflation down the road.This is not just hypothetical. In 2002–03, some of us onthe MPC voted to maintain an unchanged policy raterather than cut partly on the grounds that, by stokingthe embers under household debt and house prices, toogreat a risk would be taken with future output and, mostimportant, inflation variability.(1) Speaking for myself,that was directed at avoiding policy settings that, onbalance, could have increased uncertainty about demandconditions and inflation in the future, and complicatedthe operation of policy down the road, not on somespurious aspiration of steering asset prices along some(unknowable) equilibrium path.(2)
Maybe that would be one way, consistent with focusingon a single objective, to construe the thought-provokingpapers that have come out of the Bank for InternationalSettlements in recent years.(3) Certainly this is an areawhere policymakers still have lots to learn.
Summary
It is next to certain that my views on many of the issuescovered in these remarks will continue to develop as theMPC confronts new challenges. It would be hard to beserious about policymaking without learning.
But for the time being, two key threads run through whatI have said. The first is the absolutely vital task ofanchoring medium to long-term inflation expectations inline with a clear target. That just cannot be taken forgranted. The second is the importance of clear andclean communications about objectives. On that front,we should not kid ourselves that households and firmsare studying our every utterance or examining in detailthe economy in which they live and work. That points, Ithink, to keeping things as straightforward as possible,without glossing over uncertainties and risks.
The two threads are intertwined. We have a betterchance of keeping inflation expectations anchored to thetarget if the target is simple to communicate; and if wedo not over elaborate, or slip in to being overlyambitious about, our conduct of cyclical policy.
(1) For example, the MPC Minutes February 2002, December 2002 and February 2003.(2) So this view is not quite the same as that set out in Kohn, D (2006), ‘Monetary policy and asset prices’, remarks at
‘Monetary policy: a journey from theory to practice’, a ECB colloquium held in honour of O Issing.(3) For example, Borio, C and Lowe, P (2002), ‘Asset price, financial and monetary stability: exploring the nexus’,
BIS Working Paper no. 114.

Reflections on operating inflation targeting
223
AnnexA common model for monetary policy
Policymakers are often characterised as aiming to minimise an objective of the following kind:
where π denotes inflation; superscript T refers to ‘target’; y is a measure of the percentage deviation of the level of realoutput from its natural rate (the rate that would obtain if prices were flexible); β is a discount rate applied to thefuture; λ is the weight given to stabilising output relative to stabilising inflation; and Et is the expectations operator.
Both the inflation and output parts of the objective function can be broken down. For example, for an undiscountedquadratic loss function for inflation, one can obtain:
meaning that the policymaker wants to avoid inflation being expected to diverge from target on average (a bias) andalso wants to minimise expected future volatility of inflation.
Policy seeks to minimise this objective subject to how the structure of the economy affects inflation and the outputgap. That consists of:
(1) a Phillips curve:
πt = α1πt−1 + α2Etπt+1 + α3yt + επ,t ,
where the mean-zero shock term επ,t is sometimes described as a ‘cost push’ shock;
and (2) an equation for aggregate demand:
yt = γ1yt−1 + γ2Etyt+1 + γ3(it−1 – Et−1πt) + εy,t ,
where i is the central bank instrument, the short-term nominal interest rate; and εy,t is a mean-zero demand shock thatcould be, for example, a shock to household preferences over consumption.
The stylised representations of demand and the inflation process are typically derived from studying price-setting byfirms and households, who are taken to try to maximise profits and utility respectively. There is uncertainty, reflected inthe literature, about the relative importance of the forward and backward-looking terms in both equations; and aboutwhether the expectations denoted by the operator E are model-consistent or not.
Central bank policy is often discussed with reference to the following kind of equation:
it = r* + πT + δ1(πt – πT) + δ2(yt), δ1>1,
where r* denotes the natural real rate of interest, the real rate of interest that would obtain if prices were flexible andthere were no shocks in the system. For some model economies within the class above, a simple instrument rule thatmore or less approximates the optimal rule that would result from maximising the objective of policy could be writtenlike this.
E Var biastT
tt t
e( ) ( ) ( ( )π π π π−⎡⎣ ⎤⎦⎧⎨⎩
⎫⎬⎭
= +=
∞
∑ 2
0
))2
0
⎡⎣ ⎤⎦=
∞
∑t
E ytt
tT
tt
β π π λ( ) ( ) ,− +⎡⎣ ⎤⎦⎧⎨⎩
⎫⎬⎭=
∞
∑ 2 2
0

224
Bank of England Quarterly Bulletin: Summer 2006
In practice, uncertainty about the structure of the economy (variable and uncertain lags in the transmissionmechanism for example) and the need for a forward-looking dimension in monetary policy mean that inflation-forecastbased rules provide for alternative stylised descriptions of central bank policy, for example:
it = δ1it−1 + (1–δ1) [rt* + πT + δ2 (Etπt+n – πT) + δ3(yt)],
where the lagged nominal interest rate term allows for potential interest rate smoothing by central banks.
225
It is always a great pleasure to be back speaking to a CBIaudience, and especially in the West Midlands which, asI grew up in Stoke, still feels like home despite my longyears of exile in the South East.
In my remarks this evening, I will want to set out thethinking behind my votes on base rates in recent MPCmeetings, and to look at some of the key questions aboutthe United Kingdom’s economic prospects. This is inpart a response to recent City commentary on the factthat, although concerned about downside risks togrowth, I did not vote for a rate cut at the MPC’sFebruary meeting. The focus will be on one of the topicswhich is right at the core of the issues that the MPCdiscusses when reaching our decision month by month— the cost pressures which firms in the UnitedKingdom are facing now, how these are likely to developover the next couple of years, and how the inflation ratemay respond to these pressures. Recent rises, andcontinuing volatility, in the UK gas price, the sustainedhigh level of oil prices and sharply higher prices for keybase metals means that this topic is probably also on theminds of many of you.
Cost pressures in the global economy
The projection underlying the central case in the MPC’sFebruary Inflation Report, in line with most forecasters,was for world growth to continue over the next two yearsat the pretty robust rate seen over the past two. Thereare risks to this central case, of which the mostsignificant are probably: the enduring concern about
whether and how the United States’ current accountdeficit (estimated at over 6% of GDP in 2005) willunwind, and whether the fall in long-term real interestrates to unusually low levels in major economies mightstart to reverse, with the risk of provoking falls in assetprices. But on the whole recent data have beenencouraging, and despite a slowdown in the fourthquarter of last year the euro area seems set to grow morestrongly, improving the United Kingdom’s exportprospects.
Strong world growth is not just upside news for theUnited Kingdom through the effect on output, but mayalso have implications for inflation — as the continuedstrength of world demand could lead to a tightening ofthe balance of global demand and supply. This is adifficult question to address. Even estimates for worldoutput are fraught with uncertainty. As the weight ofmore recently industrialised countries in world GDP andindustrial production has increased, the question of howto value this output becomes more significant. To someextent this is an issue of the correct exchange rate touse. Generally comparisons are made using purchasingpower parity (PPP) exchange rates — the exchange ratewhich would equalise the price of a similar basket ofgoods in each country. For countries such as China withvery different price structures and consumption patternsfrom the developed world, PPP exchange rates estimatescan cover a wide range. However, the IMF estimate thatthe combined share of China and India in world GDPhas risen from 6% in 1980 to 19% in 2004.
Cost pressures and the UK inflation outlook
(1) Delivered at the CBI West Midlands Economic Dinner, Birmingham Botanical Gardens, Birmingham on 21 March 2006. Thisspeech can be found on the Bank’s website at www.bankofengland.co.uk/publications/speeches/2006/speech270.pdf.
(2) I would like to thank Charlotta Groth and Miles Parker for their great help in preparing this speech; and Peter Andrews,Charlie Bean, Andrew Holder, Sally Reid, Marilyne Tolle, David Walton and Andrew Wardlow for helpful comments. The viewsexpressed are my own and do not necessarily reflect those of the Bank of England or other members of the Monetary PolicyCommittee.
In this speech,(1) Kate Barker,(2) member of the Bank’s Monetary Policy Committee, discusses the impacton UK monetary policy of rising global prices (for energy and metals in particular) and higher exportprice inflation in the United Kingdom’s trading partners. She argues that the outlook for the UnitedKingdom may be that output remains a little below trend in 2006–07, implying a risk of CPI inflationbelow target in two years’ time. But in the short term there are still upward price pressures from energyand import prices, and it is too early to conclude that there will be no upward impact on nominal wagesfrom higher inflation.
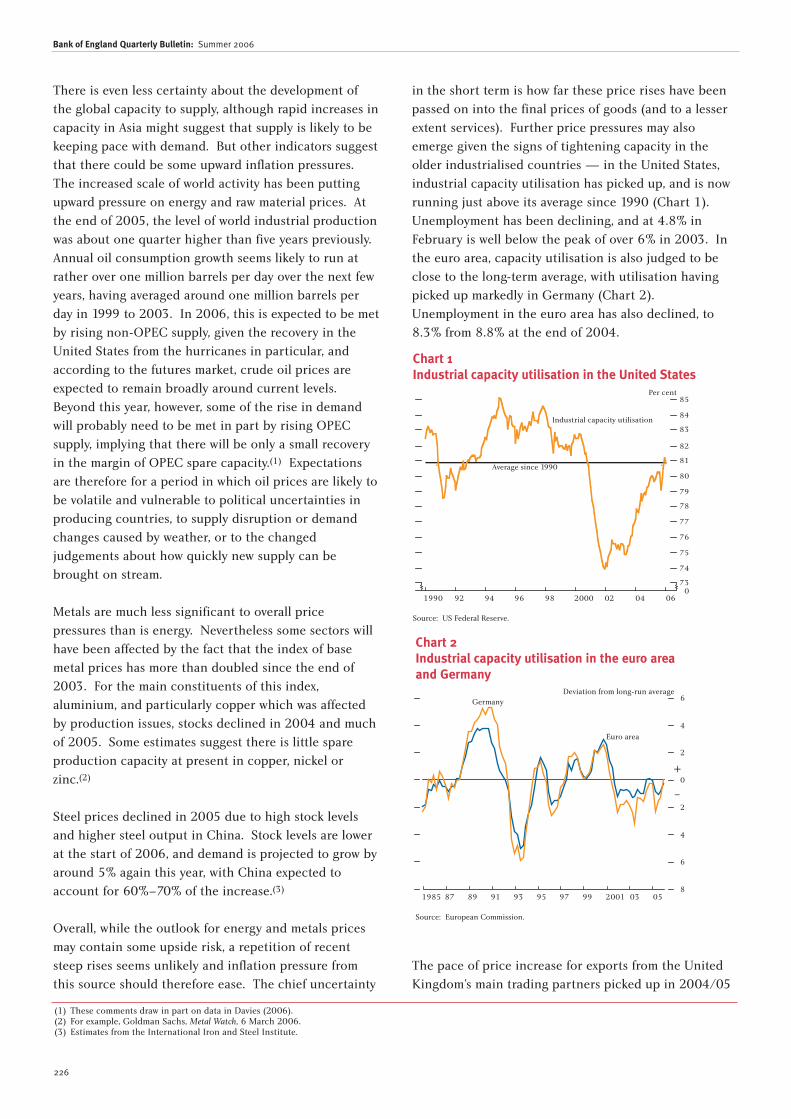
226
Bank of England Quarterly Bulletin: Summer 2006
There is even less certainty about the development ofthe global capacity to supply, although rapid increases incapacity in Asia might suggest that supply is likely to bekeeping pace with demand. But other indicators suggestthat there could be some upward inflation pressures.The increased scale of world activity has been puttingupward pressure on energy and raw material prices. Atthe end of 2005, the level of world industrial productionwas about one quarter higher than five years previously.Annual oil consumption growth seems likely to run atrather over one million barrels per day over the next fewyears, having averaged around one million barrels perday in 1999 to 2003. In 2006, this is expected to be metby rising non-OPEC supply, given the recovery in theUnited States from the hurricanes in particular, andaccording to the futures market, crude oil prices areexpected to remain broadly around current levels.Beyond this year, however, some of the rise in demandwill probably need to be met in part by rising OPECsupply, implying that there will be only a small recoveryin the margin of OPEC spare capacity.(1) Expectationsare therefore for a period in which oil prices are likely tobe volatile and vulnerable to political uncertainties inproducing countries, to supply disruption or demandchanges caused by weather, or to the changedjudgements about how quickly new supply can bebrought on stream.
Metals are much less significant to overall pricepressures than is energy. Nevertheless some sectors willhave been affected by the fact that the index of basemetal prices has more than doubled since the end of2003. For the main constituents of this index,aluminium, and particularly copper which was affectedby production issues, stocks declined in 2004 and muchof 2005. Some estimates suggest there is little spareproduction capacity at present in copper, nickel orzinc.(2)
Steel prices declined in 2005 due to high stock levelsand higher steel output in China. Stock levels are lowerat the start of 2006, and demand is projected to grow byaround 5% again this year, with China expected toaccount for 60%–70% of the increase.(3)
Overall, while the outlook for energy and metals pricesmay contain some upside risk, a repetition of recentsteep rises seems unlikely and inflation pressure fromthis source should therefore ease. The chief uncertainty
in the short term is how far these price rises have beenpassed on into the final prices of goods (and to a lesserextent services). Further price pressures may alsoemerge given the signs of tightening capacity in theolder industrialised countries — in the United States,industrial capacity utilisation has picked up, and is nowrunning just above its average since 1990 (Chart 1).Unemployment has been declining, and at 4.8% inFebruary is well below the peak of over 6% in 2003. Inthe euro area, capacity utilisation is also judged to beclose to the long-term average, with utilisation havingpicked up markedly in Germany (Chart 2).Unemployment in the euro area has also declined, to8.3% from 8.8% at the end of 2004.
The pace of price increase for exports from the UnitedKingdom’s main trading partners picked up in 2004/05
(1) These comments draw in part on data in Davies (2006).(2) For example, Goldman Sachs, Metal Watch, 6 March 2006.(3) Estimates from the International Iron and Steel Institute.
Chart 1Industrial capacity utilisation in the United States
73
74
75
76
77
78
79
80
81
82
83
84
85
1990
Per cent
92 94 96 98 2000 02 04 060
Industrial capacity utilisation
Average since 1990
Source: US Federal Reserve.
Chart 2Industrial capacity utilisation in the euro areaand Germany
8
6
4
2
0
2
4
6
1985 87 89 91 93 95 97 99 2001 03 05
Euro area
GermanyDeviation from long-run average
+
–
Source: European Commission.
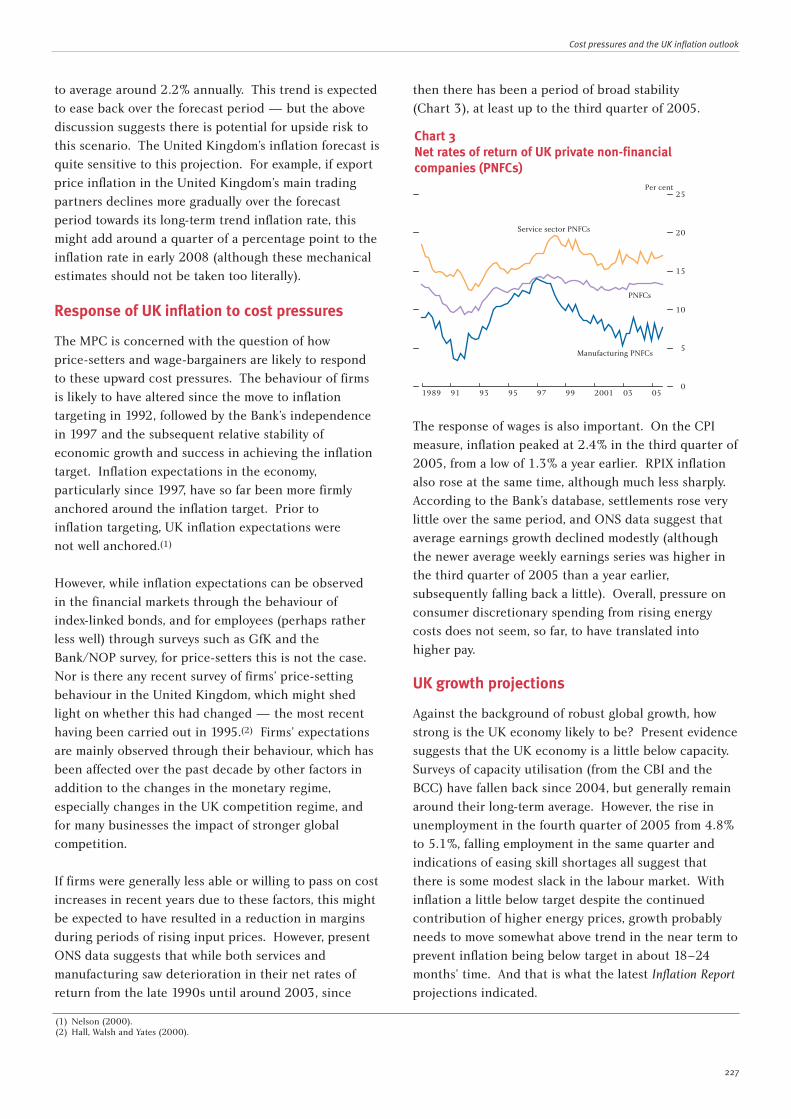
Cost pressures and the UK inflation outlook
227
to average around 2.2% annually. This trend is expectedto ease back over the forecast period — but the abovediscussion suggests there is potential for upside risk tothis scenario. The United Kingdom’s inflation forecast isquite sensitive to this projection. For example, if exportprice inflation in the United Kingdom’s main tradingpartners declines more gradually over the forecastperiod towards its long-term trend inflation rate, thismight add around a quarter of a percentage point to theinflation rate in early 2008 (although these mechanicalestimates should not be taken too literally).
Response of UK inflation to cost pressures
The MPC is concerned with the question of howprice-setters and wage-bargainers are likely to respondto these upward cost pressures. The behaviour of firmsis likely to have altered since the move to inflationtargeting in 1992, followed by the Bank’s independencein 1997 and the subsequent relative stability ofeconomic growth and success in achieving the inflationtarget. Inflation expectations in the economy,particularly since 1997, have so far been more firmlyanchored around the inflation target. Prior toinflation targeting, UK inflation expectations werenot well anchored.(1)
However, while inflation expectations can be observedin the financial markets through the behaviour ofindex-linked bonds, and for employees (perhaps ratherless well) through surveys such as GfK and theBank/NOP survey, for price-setters this is not the case.Nor is there any recent survey of firms’ price-settingbehaviour in the United Kingdom, which might shedlight on whether this had changed — the most recenthaving been carried out in 1995.(2) Firms’ expectationsare mainly observed through their behaviour, which hasbeen affected over the past decade by other factors inaddition to the changes in the monetary regime,especially changes in the UK competition regime, andfor many businesses the impact of stronger globalcompetition.
If firms were generally less able or willing to pass on costincreases in recent years due to these factors, this mightbe expected to have resulted in a reduction in marginsduring periods of rising input prices. However, presentONS data suggests that while both services andmanufacturing saw deterioration in their net rates ofreturn from the late 1990s until around 2003, since
then there has been a period of broad stability(Chart 3), at least up to the third quarter of 2005.
The response of wages is also important. On the CPImeasure, inflation peaked at 2.4% in the third quarter of2005, from a low of 1.3% a year earlier. RPIX inflationalso rose at the same time, although much less sharply.According to the Bank’s database, settlements rose verylittle over the same period, and ONS data suggest thataverage earnings growth declined modestly (althoughthe newer average weekly earnings series was higher inthe third quarter of 2005 than a year earlier,subsequently falling back a little). Overall, pressure onconsumer discretionary spending from rising energycosts does not seem, so far, to have translated intohigher pay.
UK growth projections
Against the background of robust global growth, howstrong is the UK economy likely to be? Present evidencesuggests that the UK economy is a little below capacity.Surveys of capacity utilisation (from the CBI and theBCC) have fallen back since 2004, but generally remainaround their long-term average. However, the rise inunemployment in the fourth quarter of 2005 from 4.8%to 5.1%, falling employment in the same quarter andindications of easing skill shortages all suggest thatthere is some modest slack in the labour market. Withinflation a little below target despite the continuedcontribution of higher energy prices, growth probablyneeds to move somewhat above trend in the near term toprevent inflation being below target in about 18–24months’ time. And that is what the latest Inflation Reportprojections indicated.
(1) Nelson (2000).(2) Hall, Walsh and Yates (2000).
Chart 3Net rates of return of UK private non-financialcompanies (PNFCs)
0
5
10
15
20
25
1989 91 93 95 97 99 2001 03 05
Service sector PNFCs
Manufacturing PNFCs
PNFCs
Per cent
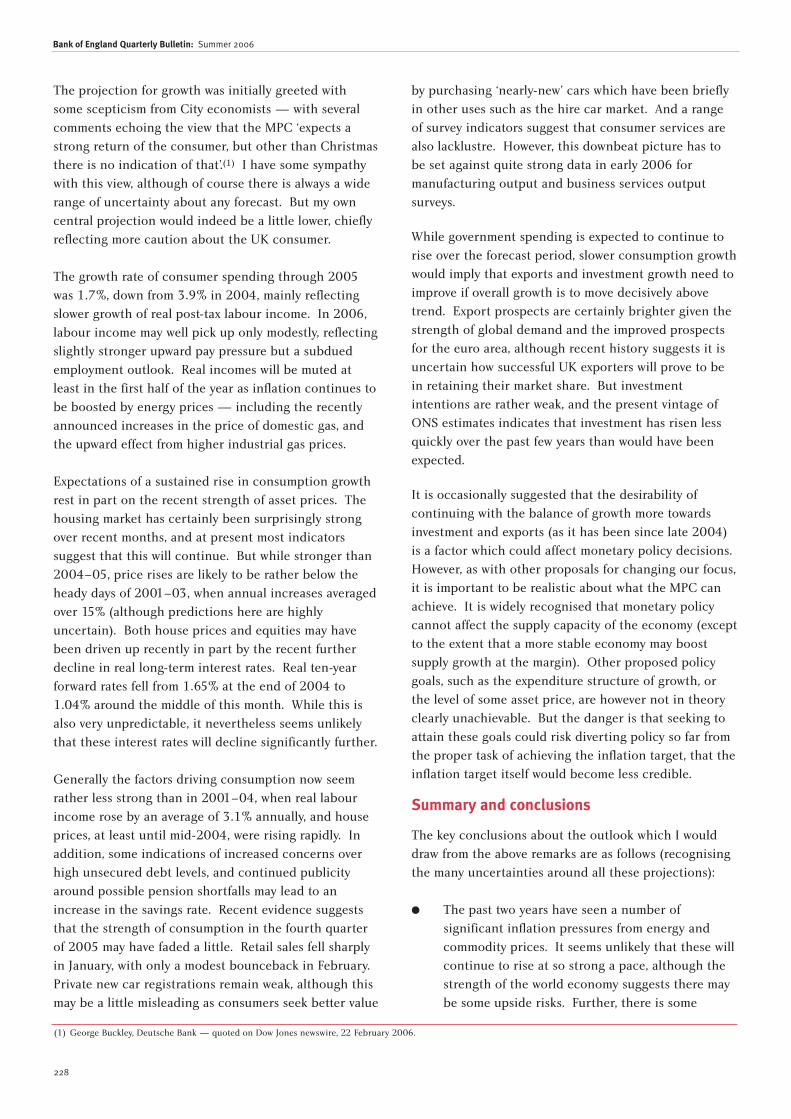
228
Bank of England Quarterly Bulletin: Summer 2006
The projection for growth was initially greeted withsome scepticism from City economists — with severalcomments echoing the view that the MPC ‘expects astrong return of the consumer, but other than Christmasthere is no indication of that’.(1) I have some sympathywith this view, although of course there is always a widerange of uncertainty about any forecast. But my owncentral projection would indeed be a little lower, chieflyreflecting more caution about the UK consumer.
The growth rate of consumer spending through 2005was 1.7%, down from 3.9% in 2004, mainly reflectingslower growth of real post-tax labour income. In 2006,labour income may well pick up only modestly, reflectingslightly stronger upward pay pressure but a subduedemployment outlook. Real incomes will be muted atleast in the first half of the year as inflation continues tobe boosted by energy prices — including the recentlyannounced increases in the price of domestic gas, andthe upward effect from higher industrial gas prices.
Expectations of a sustained rise in consumption growthrest in part on the recent strength of asset prices. Thehousing market has certainly been surprisingly strongover recent months, and at present most indicatorssuggest that this will continue. But while stronger than2004–05, price rises are likely to be rather below theheady days of 2001–03, when annual increases averagedover 15% (although predictions here are highlyuncertain). Both house prices and equities may havebeen driven up recently in part by the recent furtherdecline in real long-term interest rates. Real ten-yearforward rates fell from 1.65% at the end of 2004 to1.04% around the middle of this month. While this isalso very unpredictable, it nevertheless seems unlikelythat these interest rates will decline significantly further.
Generally the factors driving consumption now seemrather less strong than in 2001–04, when real labourincome rose by an average of 3.1% annually, and houseprices, at least until mid-2004, were rising rapidly. Inaddition, some indications of increased concerns overhigh unsecured debt levels, and continued publicityaround possible pension shortfalls may lead to anincrease in the savings rate. Recent evidence suggeststhat the strength of consumption in the fourth quarterof 2005 may have faded a little. Retail sales fell sharplyin January, with only a modest bounceback in February.Private new car registrations remain weak, although thismay be a little misleading as consumers seek better value
by purchasing ‘nearly-new’ cars which have been brieflyin other uses such as the hire car market. And a rangeof survey indicators suggest that consumer services arealso lacklustre. However, this downbeat picture has tobe set against quite strong data in early 2006 formanufacturing output and business services outputsurveys.
While government spending is expected to continue torise over the forecast period, slower consumption growthwould imply that exports and investment growth need toimprove if overall growth is to move decisively abovetrend. Export prospects are certainly brighter given thestrength of global demand and the improved prospectsfor the euro area, although recent history suggests it isuncertain how successful UK exporters will prove to bein retaining their market share. But investmentintentions are rather weak, and the present vintage ofONS estimates indicates that investment has risen lessquickly over the past few years than would have beenexpected.
It is occasionally suggested that the desirability ofcontinuing with the balance of growth more towardsinvestment and exports (as it has been since late 2004)is a factor which could affect monetary policy decisions.However, as with other proposals for changing our focus,it is important to be realistic about what the MPC canachieve. It is widely recognised that monetary policycannot affect the supply capacity of the economy (exceptto the extent that a more stable economy may boostsupply growth at the margin). Other proposed policygoals, such as the expenditure structure of growth, orthe level of some asset price, are however not in theoryclearly unachievable. But the danger is that seeking toattain these goals could risk diverting policy so far fromthe proper task of achieving the inflation target, that theinflation target itself would become less credible.
Summary and conclusions
The key conclusions about the outlook which I woulddraw from the above remarks are as follows (recognisingthe many uncertainties around all these projections):
� The past two years have seen a number ofsignificant inflation pressures from energy andcommodity prices. It seems unlikely that these willcontinue to rise at so strong a pace, although thestrength of the world economy suggests there maybe some upside risks. Further, there is some
(1) George Buckley, Deutsche Bank — quoted on Dow Jones newswire, 22 February 2006.

Cost pressures and the UK inflation outlook
229
evidence of a tighter balance between supply anddemand in some of our major trading partners,which, together with uncertainty about how muchof the energy and raw material price rises has fedthrough, means it is possible that the UnitedKingdom will continue to experience a strongerpace of import price inflation than the averagesince 1997. However, if inflation pressures doincrease abroad then policy responses would beexpected which could slow global demandduring 2007.
� With indications of a soft start to the year for theconsumer, I continue to think that the most likelyoutcome is for a slightly slower pace of UK growthin 2006 than the MPC’s February centralprojection. Of course, the MPC as a whole believedthat there was downside risk to this centralprojection. In fact, over the 20 forecast roundssince I joined the MPC, we have identified adownside risk to the central projection for growthon 14 occasions (and never identified an upsiderisk). However, analysis of the MPC’s forecastingrecord from February 1998 to May 2003, a slightlydifferent period, concluded that the meanprojection, which includes any downward orupward risk, underpredicted GDP growth at thetwo-year horizon by an average of 0.3%.(1) Soperhaps this suggests a tendency to be a little toocautious.
This all adds up to a finely balanced judgement forinterest rates. Taking a forward-looking approach, if
global inflation subsides in 2007 and UK outputremains a little below trend, I believe there could be agreater risk of CPI inflation being below target in aroundtwo years’ time than in the MPC’s forecast. In the shortrun, the timing of the recently announced rises in utilitybills will probably keep CPI inflation a little above targetover coming months, and there may be more upwardpressure from imported goods prices. But these upwardpressures are then likely to drop out of the index inaround 18 months’ time.
But the short-run upward price pressures create anupside risk. I would consider that the base rate atpresent is probably around a broadly neutral level orslightly accommodative. Reducing the rate to a morestimulative level may risk sparking some second-roundeffects on wages. It is encouraging that these have sofar not been much in evidence, and that inflation,excluding energy, has been subdued. Yet it is too earlyto conclude that this lack of pay pressure will endure,given that the immediate prospect is for a period ofsustained slower real consumer income growth andabove target inflation. Further, while inflationexpectations have been stable in financial markets, andin most consumer surveys, yesterday’s Bank ofEngland/NOP poll for individuals’ inflation expectationsshowed a rise which adds a little weight to the case forcaution. In coming months, I will be looking particularlyat global pricing pressures, at UK wages and atconsumer demand, to see to what extent my concernsare being realised. These worries, which imply lessgrowth and more inflation, are of course a little lessPanglossian than is the present central projection.
(1) Elder et al (2005).

230
Bank of England Quarterly Bulletin: Summer 2006
References
Davies, P (2006), ‘Oil markets into 2006’, presentation at the British Institute of Energy Economics, January.
Elder, R, Kapetanios, G, Taylor, T and Yates, T (2005), ‘Assessing the MPC’s fan charts’, Bank of England QuarterlyBulletin, Autumn, pages 326–48.
Hall, S, Walsh, M and Yates, T (2000), ‘Are UK companies’ prices sticky?’, Oxford Economic Papers no. 52,pages 425–46.
Nelson, E (2000), ‘UK monetary policy 1972–97: a guide using Taylor rules’, Bank of England Working Paper no. 120.

231
Introduction
When talking to a variety of audiences about the state ofthe UK economy, it is almost inevitable that one of theolder participants brings up the question of the balanceof payments. In particular they recall that back in the1960s, the balance of payments used to be accordedfront page headlines. By contrast, today, it is barelymentioned at the back of the business section. However,a related issue, the purchase of UK firms by foreigncompanies is currently making waves. As Hamish McRaeremarks, ‘Are we selling the farm to cover the dissoluteson’s losses on the gambling tables of London?’ (TheIndependent, 15 February 2006).
In what follows, I shall try and address some of theseissues. I first consider the structure of the currentaccount and place it into a historical perspective. I thenfocus on the stock position, analysing the compositionof UK assets and liabilities and how this tends togenerate a favourable net income position for the UnitedKingdom. Finally, I analyse the sustainability of thepresent situation.(2)
The balance of payments in 2005
The balance of payments is concerned with the flows ofgoods, services and payments into and out of the
country. To see how it all works, it is best to get down todetail. Start with the current account, defined asfollows:
current account balance = trade balance in goods +trade
balance in services + net income flows + currenttransfers
Next, we must see what each of these categories means.
Trade balance in goods (services) = value of goods(services) exports – value of goods (services) imports.
Net income flow = flow of income (eg interest payments,dividends etc) generated by foreign assets held bydomestic residents – flow of income generated bydomestic assets held by foreign residents.
The UK current account deficit and all that
(1) This speech can be found on the Bank’s website atwww.bankofengland.co.uk/publications/speeches/2006/speech271.pdf. I am most grateful to Chris Shadforth for hisinvaluable assistance and to Kate Barker, Charlie Bean and David Walton for helpful comments on an earlier draft.
(2) Much of this is not new. Reading and Richards (2005) have recently brought some of this material to the attention ofa wider public.
In this speech, Stephen Nickell,(1) member of the Bank’s Monetary Policy Committee, discusses the recenthistory of the UK current account deficit. Over the past 20 years, the average annual deficit has beenaround 2% of GDP and shows no signs of diminishing. Indeed, the trade deficits continues to worsenand only substantial offsetting net income flows have contained the current account deficit withinbounds. To understand what is going on, we need to look at the net asset position. UK foreign assetsare enormous, around four times GDP. UK foreign liabilities are fractionally bigger using officialstatistics. But if we correct for the fact that direct investment assets and liabilities are measured at bookvalue rather than market value, the UK net asset position remains positive. More importantly, UK assetsare biased towards equity type assets and liabilities towards debt type assets. Since the returns on theformer are typically greater than the returns on the latter, this explains the positive net income position.The risks to this situation are detailed in the text.
Table AThe current account in 2005
£ billions
Credit (+ items) Debit (– items) Balance
Goods trade 210.2 275.8 -65.6Services trade 105.7 87.0 18.7Income flows 184.5 157.1 27.4Current transfers 15.9 28.3 -12.4Current account (total) 516.3 548.2 -31.9

232
Bank of England Quarterly Bulletin: Summer 2006
Current transfers = taxes, social contributions receivedfrom non-residents + net social security payments + nettransfers with international origins – foreign aidpayments + other items.
In Table A, we set out the picture for 2005. A number ofpoints arise from this breakdown which is fairly typicalof recent years. First, goods imports exceed goodsexports by a significant amount (£65.6 billion). In fact,goods imports have exceeded goods exports in every year bar five since 1946. But, as a proportion of GDP,this deficit on goods trade has generally been greater inthe past two decades than previously, despite the United Kingdom being a net exporter of oil over most of this period. Furthermore, it continues to rise.Second, services exports, which are now around 50% ofgoods exports, substantially exceed services imports tothe tune of £18.7 billion. Again, this is typical in thesense that services exports have exceeded servicesimports in every year bar two since 1951. As apercentage of GDP, this surplus has been relativelystable for 30 years.
The income flows in 2005 reveal that UK residentsreceived a flow of income generated by foreign assetsconsiderably in excess of the income flow generated byUK assets held by foreign residents (£27.4 billion). This‘net income position’ tends to be a little more variablethan the trade surpluses and deficits, although in recentyears it has generally been positive. However, it wasnegative as recently as 1999 and was significantlynegative in the early 1990s (over 1/2% of GDP in1990–91). Finally, the balance of current transfers issignificantly negative (-£12.4 billion) and this is typicalof recent decades when aid payments and net ECcontributions have been important features. As aproportion of GDP, this element of the current accounthas been relatively stable over the past 30 years.
All these elements add up to a current account deficit of£31.9 billion, around 21/2% of GDP. This is somewhatabove the average current account deficit over the past20 years (1985–2004), and a great deal above theaverage deficit in the previous 30 (1955–84), which wasclose to zero.
So what does it mean to have a current account deficitof £31.9 billion? Essentially foreign residents haveadded a flow of income to their total holdings of UKassets which exceeds the total flow of income which UKresidents have added to their total holdings of foreignassets by £31.9 billion. So foreigners have, in 2005,
added £31.9 billion more to their pile of UK assets thanUK residents have added to their pile of foreign assets.In fact, both foreign residents and UK residents haveadded huge amounts to their respective piles, in excessof £700 billion, but the foreign residents have addedsomewhat more. To look at this in more detail, wepresent, in Table B, a picture of the capital and financialaccount for 2005. In order to understand this, note firstthat the capital account consists of numerous odds andends including land purchases and sales associated withembassies, the transfers of migrants, and EU regionaldevelopment fund payments. It is very small relative tothe other elements. In the financial account, directinvestment refers to the purchase by the residents of onecountry of a significant part (exceeding 10%) of anenterprise in another country. So the credit columnrefers to money spent by foreign residents on directinvestment in UK enterprises and the debit column tomoney spent by UK residents on direct investment inforeign enterprises. So when Banco Santanderpurchased Abbey, this represented a large sum in thedirect investment credit column in 2004 and whenVodafone purchased Mannesmann, this represented aneven larger sum in the direct investment debit column in2000.
Portfolio investment refers to the purchase by residentsof one country of equity and debt securities issued inanother country. So in the credit column appear the netpurchases by foreign residents of UK equities and debtsecurities. In the debit column we see the net purchasesof foreign equity and debt securities by UK residents.Finally, other investment refers to bank deposits made byresidents of one country in banks in another country orto loans made by residents in one country to residents inanother. So in the credit column we find net increasesin deposits made by foreign residents in UK banks or netincreases in loans made by foreign residents to UKresidents. In the debit column, we simply find thereverse.
Turning to Table B, the first striking point is that thetotals under both debit and credit columns are
Table BThe capital and financial account in 2005£ billions
Credit Debit Balance
Capital account 4.2 1.9 2.3Direct investment 90.5 55.6 34.9Portfolio investment 131.1 161.2 -30.1Other investment 523.7 500.5 23.1Other items 3.1 -3.1Total 749.5 722.4 27.1Errors and omissions 4.8Grand total 31.9

The UK current account deficit and all that
233
enormous, around 60% of UK GDP. This is a function ofthe fact that the UK financial sector is highly integratedwith the world economy and plays an importantintermediary role in a high proportion of the world’sfinancial transactions. Thus for example, if a UK bankreceives £10 billion in deposits from foreign residentsand then lends this £10 billion to other foreignresidents, the first transaction contributes £10 billion tothe credit column and the second transactioncontributes £10 billion to the debit column, both in theother investment category. Or, for example, if the banktakes the £10 billion of deposits from foreign residents,lends this to a UK firm which then uses it to buy aforeign company for £10 billion, then this money willappear in the credit column under other investment andin the debit column under direct investment. Becausethese types of transactions are so commonplace, we seehuge totals in both credit and debit columns which tendto differ by proportionately very small amounts. Second,given the relative sizes of the different types oftransaction in each column, it is no surprise that thetotal stocks of foreign assets held by domestic residentsconsist mostly of ‘other investments’, with portfolioinvestments and direct investments coming second andthird in the rankings.
Finally, we may note the errors and omissions entry witha balance of £4.8 billion. As the name indicates, this isthe result of transactions or elements of transactionsthat are not picked up by the ONS.
Having seen how the various cross-border transactionsadd up in 2005, it is worth putting the current accountnumbers into some historical perspective.
The current account: some history
In Table C, we show the different elements of the UKcurrent account as percentages of GDP in five-yearaverages back to 1955 as well as annual data for the pastdecade. A number of features of these data are worthremarking on. Starting with goods trade, we see howthere is typically a deficit with the exception of therecession period of 1980–84. During this periodimports were particularly low and the United Kingdombecame a serious net exporter of oil following thedevelopment of the North Sea oil fields. Aside from thisexceptional period, from the 1970s the deficit on goodstrade has been substantial, rising to over 4% of GDP inthe past five-year period and over 5% in 2005. Bycontrast, from the 1970s, trade in services has generateda steady surplus averaging around 1.4% of GDP. The big
jump in the absolute sizes of the trade deficits (goods)and surpluses (services) after the 1960s was probablyassociated with membership of the EuropeanCommunity in the early 1970s which induced asignificant opening of the UK economy to trade of allkinds. This allowed the apparent comparative advantageof the United Kingdom in the production of servicesrelative to goods to come to the fore.
The changes in net income flows are a little more erratic,the most notable feature being the dramatic increase inthese flows in the 21st century. Why this happened weshall discuss in subsequent sections. It is clear, however,that without this increase, the current account deficit inthe 21st century would have been exceptionally high.Current transfers, by contrast, have been relatively stablesince the mid-1970s.
Turning to the current account as a whole, the key fact isthat prior to 1985, the current account switched backand forth between surplus and deficit and averagedclose to zero. Since 1985, the United Kingdom has seena consistent deficit averaging around 2% of GDP. In2005 it rose to 21/2% of GDP. The important point hereis whether or not such a continuing current accountdeficit is sustainable. It has been going on for 20 yearsbut does it mean we in the United Kingdom are ‘livingbeyond our means’ and that it will end in tears?
As we have seen in the previous section, a currentaccount deficit of 2% of GDP means that over thecourse of the year, foreign residents added to theirholdings of UK assets by more than UK residents addedto their holdings of foreign assets, the difference being
Table CThe UK current account, 1955–2005Per cent of GDP
Goods Services Net income Current Current trade trade flow transfers account
1955–59 -0.3 0.4 0.8 0.0 0.91960–64 -0.9 0.1 0.9 -0.1 -0.11965–69 -0.9 0.4 0.8 -0.3 0.11970–74 -2.5 1.1 1.0 -0.3 -0.71975–79 -1.9 2.0 0.1 -0.7 -0.41980–84 0.0 1.4 -0.2 -0.5 0.61985–89 -3.3 1.3 0.1 -0.8 -2.71990–94 -2.2 0.9 -0.1 -0.7 -2.11995–99 -2.2 1.5 0.4 -0.8 -1.12000–04 -4.3 1.5 1.7 -0.9 -2.0
1995 -1.7 1.2 0.3 -1.1 -1.31996 -1.8 1.4 0.1 -0.6 -1.01997 -1.5 1.6 0.4 -0.7 -0.21998 -2.5 1.6 1.4 -1.0 -0.51999 -3.2 1.5 -0.2 -0.8 -2.72000 -3.5 1.4 0.5 -1.0 -2.62001 -4.1 1.4 1.1 -0.7 -2.22002 -4.5 1.5 2.3 -0.8 -1.62003 -4.3 1.5 2.3 -0.9 -1.42004 -5.2 1.8 2.3 -0.9 -2.02005 -5.4 1.5 2.3 -1.0 -2.6

234
Bank of England Quarterly Bulletin: Summer 2006
2% of UK GDP. Over 20 years, foreign residents addedto their holdings of UK assets to the tune of 40% of UKGDP more than UK residents added to their holdings offoreign assets. So the holdings of UK assets byforeigners must apparently be growing steadily relativeto the holdings of foreign assets by UK residents. Wewould then expect the total income (interest, dividendsetc) generated by the pile of UK assets owned byforeigners to be growing faster than the incomegenerated by the pile of foreign assets owned by UKresidents. The latter minus the former is the net incomeflow which should therefore be falling steadily. But aglance at the third column of Table C shows that farfrom falling, this net income flow has risen dramaticallyin recent years. Furthermore, according to the officialstatistics, despite foreign residents adding 2% of GDPper year more to their pile of UK assets than UKresidents have to their pile of foreign assets in the past20 years, the UK assets of foreign residents have risenrelative to the foreign assets of UK residents by onlyabout 20% of UK GDP over this period.
So what is going on here? Two things. First, the size ofthe piles of assets is influenced not only by the flows ofassets which are added to them but also by the changesin the market value of the existing assets as real assetprices change.(1) Second, returns per pound of assetsdiffer widely across different assets, so the income flowgenerated by different piles of assets can differsignificantly even if the piles are of the same size. Whatthis all means is that in order to investigate questions ofsustainability, we must look more closely at the assetposition of the UK economy rather than simply focusingon income flows. This is known by the ONS as theinternational investment position, but I shall simply callit the net asset position.
The UK net asset position
In Chart 1, we present the values of the gross foreignassets of UK residents and their gross foreign liabilities,which are, of course, the UK assets owned by foreignresidents. First, we see that both foreign assets andforeign liabilities have grown dramatically in the past 15 years, much more rapidly than nominal GDP. By2005, they had reached nearly £5,000 billion, aroundfour times UK GDP. Relative to GDP, the size of thesestocks of foreign assets and liabilities is far higher in theUnited Kingdom than in any other country.
A second point to note is how small the net assetposition (assets less liabilities) is relative to the size ofthe stocks. Since 1995, this net asset position has beennegative, averaging around 8% of GDP. It jumps arounda fair bit, generally because of movements in theexchange rate. For example, if all assets are in foreigncurrency and all liabilities are in sterling,(2) since bothare around 400% of GDP, a 2% appreciation of sterlingwould worsen the net asset position by 8% of GDP. So itis not surprising that revaluations of assets andliabilities have a much bigger impact on year-to-yearfluctuations in the UK net asset position than thedifferential additions to assets and liabilities emergingfrom the current account. Nevertheless, it is true thatthe UK net asset position was positive to the tune of13.6% of GDP in 1980–84, but after 20 years of currentaccount deficits averaging 2% of GDP, the UK net assetposition averaged -8.6% of GDP in 2000–05.
So, in the light of this, why has the UK net incomeposition improved so dramatically in recent years? Aclue to this puzzle is provided by dividing the UK netasset position into its asset components, which are setout in Chart 2. What stands out is the surge in thepositive UK net asset position in direct investment andthe almost equivalent move in the opposite direction ofother investment. Since, in these data, direct investmentis measured at book value, generally lower than marketvalue, this shows clearly how UK residents have beenpurchasing foreign enterprises at a faster rate thanforeign residents have been buying UK enterprises,particularly since the late 1990s. This picture is shown
(1) In fact the errors and omissions in the balance of payments are counted by the ONS as part of the revaluation of the netasset position rather than as part of the income flows into each pile of assets.
(2) In practice this is not the case. UK residents may hold some foreign assets denominated in sterling and foreign residentsmay hold some UK assets denominated in foreign currency.
Chart 1UK gross external assets and liabilities
0
1,000
2,000
3,000
4,000
5,000
6,000
1990 92 94 96 98 2000 02 04
LiabilitiesNominal GDP £ billions
Assets

The UK current account deficit and all that
235
more clearly in Chart 3, where we see that in every yearin the past decade except for 2005, outward directinvestment by UK residents has exceeded inward directinvestment. Indeed, the purchase of Mannesmann byVodafone and of Atlantic Richfield by BP Amoco in 2000represented more outward investment by UK companiesthan the entire total of inward direct investment byforeign companies in the three years 2001–03.However, it is true that for the first time in many years,inward direct investment in the United Kingdom hassignificantly exceeded outward direct investment in thepast year (2005) and this has provoked a heavy volumeof comment.
Looking again at Chart 2, we see that since the late1990s, the United Kingdom has had a strongly positivenet asset position in direct investment with negativepositions in all other assets. Has this anything to dowith the dramatic improvement in the net incomeposition over the same period? The answer to thisquestion appears to be yes. If we look at the incomegenerated by each group of assets and liabilities and
normalise on the stock of assets, we can generateimplied (nominal) rates of return. These we show inChart 4. What stands out is, first, that nominal rates ofreturn are generally falling as inflation and nominalinterest rates fall. Second, we see that rates of return ondirect investment are generally higher than the otherrates of return. One obvious reason for this is thatdirect investment is measured at book value which istypically below market value. A second possibility is thatdirect investment is more risky than other investmentsand the higher average returns are, in part,compensating for this.
Since stocks of direct investment are not measured atmarket value, is it possible to make some corrections tothese data to get closer to the desired market valuemeasures? Pratten (1996) has undertaken the mostextensive investigation of this issue. In 1991, Prattencollected data on 167 companies which accounted for77% of non-bank outward direct investment and afurther 173 overseas companies accounting for 51% ofnon-bank inward direct investment. Analysis of these
Chart 2UK net external positions by component
600
500
400
300
200
100
0
100
200
300
400
1990 92 94 96 98 2000 02 04
£ billions
Direct investment
Debt securities
Other investment
Equity investment
Cumulative current account
IIP
+
–
Chart 3Direct investment
100
50
0
50
100
150
200
1994 96 98 2000 02 04
Net
Inward
Outward
£ billions
+
–
Chart 4Implied rates of return
Assets
0
2
4
6
8
10
12
14
16
1990 92 94 96 98 2000 02 04
Per cent
Direct investment
Debt securities
Other investment
Equity investment
Total
Liabilities
0
2
4
6
8
10
12
14
16
1990 92 94 96 98 2000 02 04
Per cent
Direct investment
Debt securities
Other investment
Equity investment
Total

236
Bank of England Quarterly Bulletin: Summer 2006
data led Pratten to conclude that market:book valueratios were 2.05 for outward investment and 1.25 forinward investment. However, in order to accommodatepotential biases, Pratten suggests that more cautiousestimates of market:book ratios should be used, namely1.75 for outward investment and 1.50 for inwardinvestment. Extending forward Pratten’s analysis byusing changes in stock market indices as a proxy forchanges in market value and adjusting outward directinvestment for exchange rate movements, we find, usingPratten’s cautious estimates, that rates of return on theestimated market values of direct investment are muchcloser to the rates of return on the other assets (seeElliott and Wong Min (2004), and Burnett and Manning(2003), for further details). In Chart 5, we show theoriginal and adjusted rates of return on directinvestment and the comparison rate of return on allother assets (equities, debt securities, otherinvestments). Then, in Chart 6, we show the ‘Prattenadjusted’ net asset position, both in total and dividedinto direct investment and all other assets.
Looking first at the net asset position, we see that oncewe make the market:book adjustment to directinvestment, the overall net asset position remainspositive and is much the same today as it was in 1990.Since the late 1990s, the United Kingdom has developeda strong positive position in direct investment offset by alarge negative position in the remaining assets, most ofwhich are in the other investments category. Lookingback at Chart 5, we see that while the implied return onall assets excluding direct investment has declined sincethe late 1990s, the implied return on direct investmenthas risen since the same date. This combination of thedevelopment of a significant positive position on directinvestment and a sharp rise in the return on directinvestment relative to other assets is the key factorunderlying the dramatic improvement in the UK netincome position in the 21st century.
Is the present position sustainable?
First, let us summarise the present situation. The annualcurrent account deficit is now around 21/2% of GDP,somewhat above the average deficit over the past 20 years. The overall trade deficit has averaged around2.8% of GDP in recent years but is currently (2005)around 3.9% of GDP. This large deficit has beenreinforced by a deficit on current transfers of around 1%of GDP. However, since 2000, the average annual netincome flow has been close to 2% of GDP, providing asignificant offset to the trade deficit. Indeed, currently(2005), the net income flow is running at 2.3% of GDP.So the basic position is that the United Kingdom nowhas a very large trade deficit, a significant portion ofwhich is offset by a substantial positive net incomeposition.
Chart 6UK net external positions by component using Pratten adjustment
600
400
200
0
200
400
600
800
1990 92 94 96 98 2000 02 04
£ billions
Total position (Pratten adjusted)
Pratten adjusted direct investment
Equity investment
All other assets
+
–
Chart 5Implied rates of return on adjusted series
Assets
0
2
4
6
8
10
12
14
16
1990 92 94 96 98 2000 02 04
Per cent
Direct investment at book values
Total, excluding direct investment
Pratten adjusted direct investment
Liabilities
0
2
4
6
8
10
12
1990 92 94 96 98 2000 02 04
Per cent
Direct investment at book values
Total, excluding direct investment
Pratten adjusted direct investment

The UK current account deficit and all that
237
The sustainability of this situation depends on threefactors. First, is the trade deficit likely to continue toworsen? Second, is the net asset position likely toremain close to zero, despite a continuing currentaccount deficit? Third, will this small positive ornegative net asset position continue to be associatedwith a substantial positive net income position?Concerning the first question, it is plain from Table Cthat since the appreciation of sterling in 1996/97, thetrade deficit has risen steadily. Given that domesticdemand growth, and hence import growth, was weak in2005, we might expect a further worsening of the tradedeficit in the short run as domestic demand growthrecovers. But a continued worsening of the trade deficitin the long run is more uncertain. Furthermore, even ifit does worsen, this is not necessarily a threat tosustainability. The key issue in this context is the assetposition. This takes us to the second question whichrelates to the overall net asset position. This is now asmall difference between two enormous stocks. As aconsequence, changes in the net asset position tend tobe dominated by revaluations of the stocks as exchangerates and stock markets move up and down. Thesechanges have tended to offset the impact of thecumulated current account deficits since 1990 (Chart 6). Can this be expected to continue? Lookingat Chart 2 or Chart 6 it is plain that since 1990, the netportfolio of the United Kingdom is strongly positive inequity type investments (direct investment, equityinvestment) and strongly negative in debt typeinvestments (debt securities, other investments).(1)
Historically, average capital gains on the former exceedthose on the latter although they are more variable. Ifthis continues and the balance of the net portfolioremains weighted in favour of equity type assets, we canexpect that on average over long periods, revaluations ofstocks of assets and liabilities will probably continue tooffset a current account deficit at its present level,unless there is a significant and permanent realappreciation of sterling. This latter seems unlikely at thepresent juncture.
Turning to the third question, can we expect thesubstantial positive net income position to continue?This situation also depends crucially on the fact thatwhile the overall net asset position is close to zero, the net external position in direct investment is strongly positive. On top of this, the total returns on this class of asset have been higher than any other class. Indeed recently, with very low long-term
interest rates on fixed-interest securities, this gap hasgot bigger.
There are two overall threats to this state of affairs. First,the return generated by equity type assets may fallsignificantly relative to that generated by debt typeassets. This is certainly possible. As the work of Mehraand Prescott (1985) makes clear, the average differencebetween equity and debt returns within each decade hasvaried wildly from one decade to another throughoutthe 20th century, although it does tend to remainpositive. A second threat is the possibility that the netexternal position in direct investment will reverse. Giventhe speed with which much of the existing positiveposition developed (ie over ten years) and given thesmall reversal of this position in 2005, it is conceivablethat this situation could completely reverse. However,the adjusted positive position in direct investment isnow of the order of £500 billion. To turn this into anegative direct investment position of £200 billion, say,would, at current prices, require foreign residents topurchase all the top UK companies in every marketsector except banking, oil and mining. This wouldinclude BAE, Rolls-Royce, Diageo, BT, Tesco, Unilever,National Grid, Marks and Spencer, Reckitt, BAA, Aviva, B Sky B, Vodafone, Glaxo Smith Kline, Astra Zeneca, BATas well as over 35 other major companies. Despite thecurrent attraction of UK companies to foreign residents,the notion that UK residents would cease foreign directinvestment while foreign residents bought even asignificant proportion of the above-mentionedcompanies seems somewhat improbable.
We may summarise this discussion of sustainability asfollows. We have now reached a position where thestocks of UK assets and liabilities are enormous, at fourtimes GDP, and relative to these stocks, the gap betweenthem is tiny. Furthermore, the asset side is overweightin equity type investment and underweight in debt typeinvestment relative to the liabilities side. If thehistorical pattern of returns on these two different typesof investments continues, then it is probable that theoverall net asset position will not worsen dramaticallyeven if the current account deficit remains at existinglevels. Furthermore, it is also probable that the netincome position will continue to be significantlypositive. Risks to this favourable prognosis are first, thetrade deficit will continue to worsen by enough to dragdown the current account despite a favourable netincome flow. This may eventually undermine the
(1) Not dissimilar to a large bank.

238
Bank of England Quarterly Bulletin: Summer 2006
favourable adjusted net asset position although thiswould probably take a considerable time. Second, thereturns on equity type investments worsen significantlyrelative to the returns on debt type investments. Third,the flows of foreign direct investments into the UnitedKingdom significantly exceed UK direct investmentsabroad for a long period. Fourth, there is a significantreal appreciation of sterling which may generaterevaluations of the stocks leading to a large fall in UKassets relative to liabilities.
Conclusions
The UK current account deficit in 2005 was, at £31.9 billion, around 21/2% of GDP, half a percentagepoint above the average deficit of the past 20 years.This means that foreign residents have added £31.9 billion more to their pile of UK assets than UKresidents added to their pile of foreign assets. Thesepiles of assets are now huge (around four times UK GDP)and the sums added to them each year are alsoenormous (around 60% of UK GDP). Furthermore,relative to the height of the piles, the difference in theirsize is tiny.
A significant feature of these piles of assets is that thepile of foreign assets held by UK residents is weightedmuch more towards equity type assets (direct investmentand equity securities) than the UK assets held by foreign
residents. Historically, equity type assets have hadhigher average returns than debt type assets. This hasled to two outcomes favourable to the United Kingdom.First, the income generated by the foreign assets ownedby UK residents exceeds that generated by UK assetsowned by foreign residents by over 2% of GDP in recentyears. Second, despite the continuing current accountdeficit of around 2% of GDP for the past 20 years, thedifference between UK assets and UK liabilities remainsonly modestly negative compared to the size of each ofthe stocks. Furthermore, if the stocks are adjusted tomarket value, UK assets continue to exceed UKliabilities.
So long as average returns on equity type assets continueto exceed average returns on debt type assets, thecurrent position is probably sustainable. Risks includefirst, a continuing and rapid increase in the trade deficitwhich might eventually undermine the favourableadjusted net asset position. This would probably take along time. Second, a significant fall in the long-termreturns on equity relative to returns on debt. Third, UKassets held by foreign residents become more weightedtowards equity type investments, perhaps by a massivepurchase of UK companies by foreign concerns. Finally,a large and permanent real appreciation of sterlingwhich would significantly reduce UK assets relative toUK liabilities. At present, this seems unlikely.

The UK current account deficit and all that
239
References
Burnett, M and Manning, M (2003), ‘Financial stability and the United Kingdom’s external balance sheet’, Bank ofEngland Quarterly Bulletin, Winter, pages 463–75.
Elliott, J and Wong Min, E (2004), ‘The external balance sheet of the United Kingdom: recent developments’, Bank ofEngland Quarterly Bulletin, Winter, pages 485–94.
Mehra, R and Prescott, E C (1985), ‘The equity premium: a puzzle’, Journal of Monetary Economics, Vol. 15, March, pages 145–61.
Pratten, C (1996), The valuation of outward and inward direct investment, Cambridge University.
Reading, B and Richards, M (2005), ‘Bank magic — City debts that earn interest’, Lombard Street Research, MonthlyEconomic Review, Vol. 196, October/November.
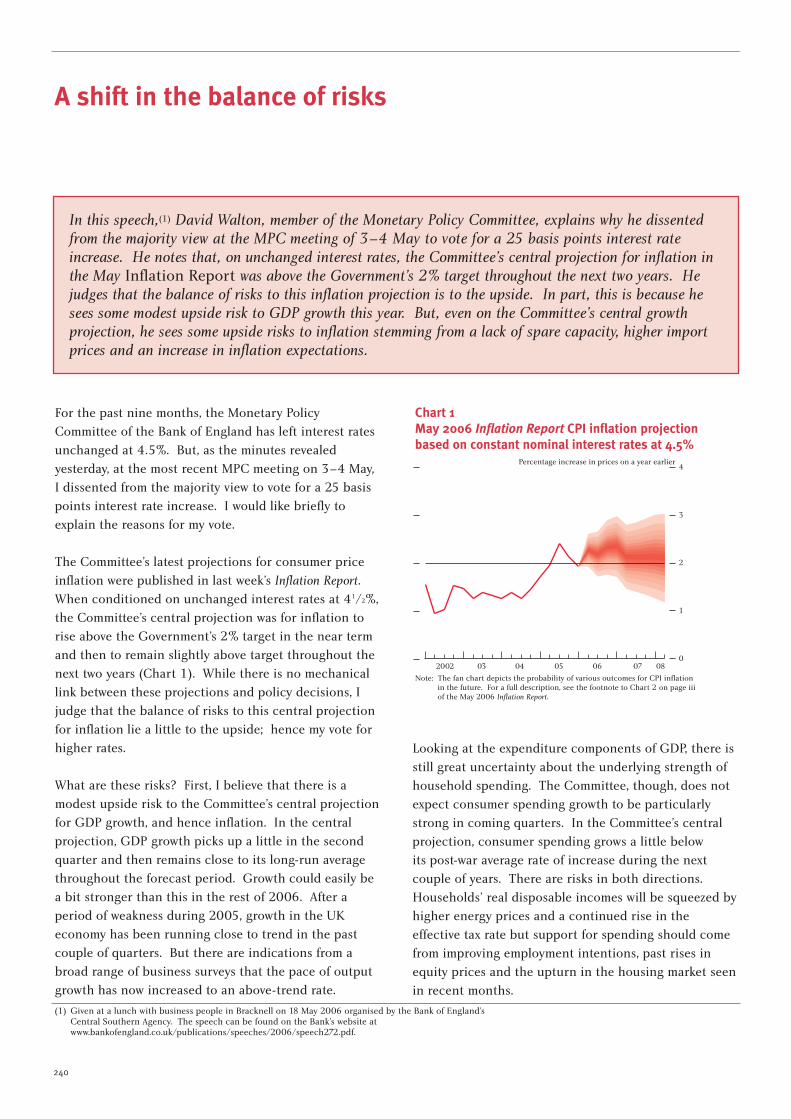
240
For the past nine months, the Monetary PolicyCommittee of the Bank of England has left interest ratesunchanged at 4.5%. But, as the minutes revealedyesterday, at the most recent MPC meeting on 3–4 May,I dissented from the majority view to vote for a 25 basispoints interest rate increase. I would like briefly toexplain the reasons for my vote.
The Committee’s latest projections for consumer priceinflation were published in last week’s Inflation Report.When conditioned on unchanged interest rates at 41/2%,the Committee’s central projection was for inflation torise above the Government’s 2% target in the near termand then to remain slightly above target throughout thenext two years (Chart 1). While there is no mechanicallink between these projections and policy decisions, Ijudge that the balance of risks to this central projectionfor inflation lie a little to the upside; hence my vote forhigher rates.
What are these risks? First, I believe that there is amodest upside risk to the Committee’s central projectionfor GDP growth, and hence inflation. In the centralprojection, GDP growth picks up a little in the secondquarter and then remains close to its long-run averagethroughout the forecast period. Growth could easily bea bit stronger than this in the rest of 2006. After aperiod of weakness during 2005, growth in the UKeconomy has been running close to trend in the pastcouple of quarters. But there are indications from abroad range of business surveys that the pace of outputgrowth has now increased to an above-trend rate.
Looking at the expenditure components of GDP, there isstill great uncertainty about the underlying strength ofhousehold spending. The Committee, though, does notexpect consumer spending growth to be particularlystrong in coming quarters. In the Committee’s centralprojection, consumer spending grows a little below its post-war average rate of increase during the nextcouple of years. There are risks in both directions.Households’ real disposable incomes will be squeezed byhigher energy prices and a continued rise in theeffective tax rate but support for spending should comefrom improving employment intentions, past rises inequity prices and the upturn in the housing market seenin recent months.
A shift in the balance of risks
In this speech,(1) David Walton, member of the Monetary Policy Committee, explains why he dissentedfrom the majority view at the MPC meeting of 3–4 May to vote for a 25 basis points interest rateincrease. He notes that, on unchanged interest rates, the Committee’s central projection for inflation inthe May Inflation Report was above the Government’s 2% target throughout the next two years. Hejudges that the balance of risks to this inflation projection is to the upside. In part, this is because hesees some modest upside risk to GDP growth this year. But, even on the Committee’s central growthprojection, he sees some upside risks to inflation stemming from a lack of spare capacity, higher importprices and an increase in inflation expectations.
(1) Given at a lunch with business people in Bracknell on 18 May 2006 organised by the Bank of England’s Central Southern Agency. The speech can be found on the Bank’s website atwww.bankofengland.co.uk/publications/speeches/2006/speech272.pdf.
Chart 1May 2006 Inflation Report CPI inflation projection based on constant nominal interest rates at 4.5%
0
1
2
3
4
2002 03 04 05 06 07 08
Percentage increase in prices on a year earlier
Note: The fan chart depicts the probability of various outcomes for CPI inflation in the future. For a full description, see the footnote to Chart 2 on page iii of the May 2006 Inflation Report.

A shift in the balance of risks
241
I see upside risks to growth in two areas: exports andinvestment. The world economy continues to grow at arobust rate and, of particular importance from a UKperspective, there are now indications of much greatermomentum in economic activity in the euro area. Thisis reflected in improved export sentiment in UK businesssurveys.
These surveys have also signalled a notablestrengthening in investment intentions recently afterseveral quarters of weak readings. Given healthycorporate cash flow and the historically low cost ofcapital, it would be surprising if UK companiescontinued to stand apart from the strengthening trendin capital spending that is evident worldwide.
Second, I see a small upside risk to inflation stemmingfrom a little less spare capacity in the economy currentlythan implied by the Committee’s central projection. TheUK economy has had to absorb a sizable shock fromhigher energy prices since the end of 2003 and it isquite possible that this has depressed temporarily thegrowth of potential output.(1) Labour productivitygrowth ground to a virtual halt in the year to 2005 Q3.While this may mostly have been cyclical, it could alsohave reflected a slower pace of capital accumulation anda drop in measured total factor productivity growth ifsome capacity had been scrapped. Consistent with this,there has not been much net change in capacityutilisation over the past couple of years according tobusiness surveys, despite below-average recorded GDPgrowth.
The labour market has loosened — the unemploymentrate has risen by 0.5 percentage points since lastsummer — and wage inflation has remained subdued,but this is not conclusive evidence of cyclical weakness.In the face of higher oil prices which raise firms’ costs,the real consumption wage (ie the post-tax wage paid toworkers deflated by consumer prices) must be lower thanit would otherwise have been in the absence of the oilshock, if firms are to maintain employment. Althoughwage inflation has remained stable, and growth in thereal consumption wage has eased (Chart 2), this has notprevented a rise in the growth of the real product wage
(ie the full cost of labour to firms divided by the pricefirms get for their output).(2) This suggests that some ofthe rise in unemployment might have been related tostructural factors.
A third risk relates to commodity and import prices. Inframing its projections, the Committee takes the path foroil prices given by the futures market, which is currentlyfairly flat. The outlook is highly uncertain but in theface of continued strong global growth, and periodicworries about supply, the risks to oil prices are probablystill to the upside. And there are big uncertainties tooabout the future path of gas prices.
After several years in which the level of UK import prices had been broadly stable, import price inflationhas turned positive over the past 18 months. This mirrors trends in export price inflation in the major industrialised economies, as well as China, and itis not just a reflection of higher energy prices. Inmaking its forecasts the Committee assumed a fairlysharp deceleration in non-energy export price inflation in the major economies, and hence in UKimport price inflation. I am concerned that this may notmaterialise to the extent assumed in the centralprojection, without a slowdown in the pace of globalactivity first.
(1) For a detailed analysis of the oil shock and its implications for monetary policy, see ‘Has oil lost the capacity to shock?’,Bank of England Quarterly Bulletin, Spring 2006, pages 105–14.
(2) The extent to which the real consumption wage must fall depends on the size of the oil price change, the shares of oiland labour in gross output and the degree of complementarity between factors of production. Following a doubling inoil prices, estimates of the required fall in the real consumption wage to maintain employment range from 1% to 21/2%.The required fall in the real consumption wage depends on how easily producers can compensate for higher energyprices by substituting away from energy. The smallest fall in the real wage would be generated if energy use could beadjusted flexibly so as to keep the energy share of gross revenue unchanged. The largest fall in the real wage would beimplied if instead the quantity of energy inputs had to be used in a fixed proportion to the output produced. Forfurther details, see reference in footnote 1 above.
Chart 2Growth in real wages
1
0
1
2
3
4
5
6
7
1997 98 99 2000 01 02 03 04 05
Real consumption wage
Real production wage
Percentage changes on a year earlier
+
–
Note: Real production wage uses GDP deflator at basic prices. Real consumption wage uses National Accounts household consumption deflator (including non-profit institutions serving households).

242
Bank of England Quarterly Bulletin: Summer 2006
The Monetary Policy Committee has little influence overany of these external price pressures but they couldnevertheless have an important bearing on the chancesof meeting the inflation target.
A fourth concern relates to the stability of inflationexpectations. These have drifted upwards a little thisyear according to various surveys of households’expectations. There has also been a rise of about 30 basis points over the past six months or so in five-year forward breakeven inflation rates from the giltsmarket (Chart 3). While these movements are notdramatic, they cannot be dismissed either. With growthmoving above trend and a risk of higher importedinflation, there is an increased likelihood of a furthershift upwards in inflation expectations.
Fifth, although difficult to measure with any precision, Ijudge that the stance of monetary policy is currentlysomewhat accommodative. This is suggested by assetprice developments, including the renewed pickup inhouse price inflation since last autumn, rapid broadmoney growth, and a strengthening in the growth ofnominal demand. For the reasons that I have alreadygiven, I do not believe that an accommodative policystance is appropriate at the current time.
I readily accept that there are other risks that couldcause growth to disappoint and inflation to undershootthe target. These arguments were advanced by some ofmy colleagues on the Committee and are summarised inthe latest minutes. But for me, in weighing these various arguments, the balance of risks has shifted alittle too much to the upside on inflation for comfort.And that, I believe, justifies a small tightening inmonetary policy.
Chart 3Inflation expectations
0.0
0.5
1.0
1.5
2.0
2.5
3.0
3.5
4.0
4.5
5.0
1997 98 99 2000 01 02 03 04 05 06
Per cent
Bank of England/NOP public attitudes to inflation
Implied five-year forward inflation rate

243
Introduction
Ladies and gentlemen. The founders of this lectureseries have bestowed on me a very great honour inasking me to give the inaugural address. John Flemmingwas an economist of enormous range and talent.(1) Yethe was one of those people of great accomplishmentwho never denigrates the work of others or passgratuitous judgement. This was one of his mostendearing characteristics. He also had a finely balancedsense of humour; he usually enjoyed his own jokes(always a good sign!), smiling in a gentle way when hedelivered them. John did his profession, and hiscountry, great service not only in the work he did for theBank and afterwards for the EBRD and in publishing,but also by offering his services as Treasurer or Editor toassociations like the British Academy and the RoyalEconomic Society. He did these things out of a desire tobe useful rather than as a stepping stone to some higheroffice. In fact, although he was offered the DrummondChair in Political Economy at Oxford, he turned thisdown to work for the Bank of England. The resultantcommuting trips from Oxford to London producedJohn’s book on Inflation with its intuitive explanation ofhow the focus of expectations of inflation can progressfrom the level to the rate of change; and from the rate ofchange to the rate of change of the rate of change.John’s bent was analytical rather than empirical, thoughanalytical with a point — empirical or policy-related —rather than for its own sake. Relative to the topic onwhich I have chosen to speak tonight I do not thinkJohn is on record with any comment. He was,
apparently, a champion of exchange rate targeting if notespecially of the policy of shadowing the D-mark orsubsequently the entry of sterling into the ExchangeRate Mechanism. Still, it is just the kind of thing thatJohn would have written a pithy comment about; had helived a little longer he might well have been tempted tojoin in the fashion for ‘drawing lessons’ about currencyunions from our recent and ongoing experience of a newone — that of the euro area or euro zone. I do notknow what he would have said had he joined in thisfashion, but I am sure it would have been simultaneouslyenlightening and entertaining. I can only try to emulatethat example.
What do we now know about currency unions?
While what I will say is provoked by our experience ofthe Economic and Monetary Union (EMU), I do notpropose that this should be interpreted in a narrow way.For example, I find the eagerness with which theEuropean Union’s New Member States aspire to join theeuro area, despite some distinctly weak credentials asjudged by traditional theory, notable. Reflecting on thishelps to bring one to a different view of currency unionthan before — as I hope to suggest. And, it is also thecase that some new thinking on currency unions hasemerged which seems to owe only a little to experienceand much more to pure reflection. Treating ourexperience of the euro area as an ‘experiment’ fromwhich to draw lessons has reminded me also of the factthat, before the introduction of the euro itself, there wasan ‘experiment before the experiment’, a trial called
What do we now know about currency unions?
The paper presents the text of an inaugural lecture given at the Bank of England in December 2005 inmemory of John Flemming. It provides a personal view of the lessons that can be drawn about currencyunions from the experience of the European Monetary Union. It argues that business cycle concurrenceis a less important criterion for participation than was once believed. Most important is the integrationof financial markets and the shrinking of financial premia that individual countries face: this opens theway for countries to share risk, thereby enhancing welfare.
By Michael Artis, FBA, Professor of Economics, University of Manchester, Professorial Fellow in the European University Institute, and George Fellow, Bank of England.
(1) I am indebted to Charles Goodhart for some of the following revelations about John’s life and work.

244
Bank of England Quarterly Bulletin: Summer 2006
‘Ecco L’Euro’ which featured the premature introductionof the euro. I shall have a few words to say about thattowards the end of this lecture.
It is standard to start with a rehearsal of the traditionaltheory of optimal currency areas and I will follow thatpath. One of the things that I shall suggest is that thestandard theory can be expressed in a framework whichcan accommodate a number of non-standardpropositions, so that — whatever one may ultimatelyjudge to be the remaining core of truth in thetraditional theory — it is at least useful as a vessel forconveying the impact of some new propositions uponthe core of the traditional theory.
As is well known, the core of traditional optimal currencyarea theory was articulated by Mundell (1961) andelaborated by, among others, McKinnon (1963) andKenen (1969). The initiating idea is that money, as anetwork good, is the more useful the more widely used itis. From this point of view the world would seem to bethe obvious optimal domain of a currency. Thequalification promoted by Mundell was that a currencyoffered a country a means of conducting a distinctivestabilisation policy based on using its own monetarypolicy to offset asymmetric shocks.(1) With a separatecurrency there comes an exchange rate against othercurrencies. It was envisaged that the exchange marketwould participate constructively in a similar stabilisationendeavour, with the exchange rate fluctuating around itsequilibrium in countercyclical fashion. Early discussionof exchange rate dynamics showed that ‘Keynesians’ (like Meade (1955)) and ‘monetarists’ (like Friedman(1953)) shared a degree of agreement that the foreignexchange market might be trusted to hunt for, andspeculate upon, its equilibrium. This component of thetraditional optimum currency area (OCA) argument issufficiently quintessential as to deserve the title of the‘OCA null’.
The flexible framework in which these ideas — and yetothers of relevance — can be demonstrated uses one ofPaul Krugman’s diagrams. This one comes from hispaper ‘Lessons from Massachusetts’ (Krugman (1993)).The diagram (Chart 1) pictures the elements of a cost-benefit analysis for a country contemplating joininga currency union with a partner or a group of partnercountries.
The vertical axis plots the costs or benefits of entry,suitably scaled. The horizontal axis plots the degree oftrade integration of the country concerned with itspotential currency union partners. Since the benefits ofhaving a single currency are identified with theassociated reduction in foreign exchange transactioncosts, it seems clear that the higher level of trade thegreater the benefit of the union. When the EuropeanCommission came to address this issue in its famousreport ‘One market, one money’ (1990), it obtained datadirectly from banks on the margins charged for foreignexchange transactions in order to quantify this effect.Reasonably enough, it appeared that the more efficient acountry’s banking system, the lower the transactions costand the less the benefit of going to the commoncurrency. (For the United Kingdom, as a country with arelatively efficient banking system, the gains impliedwere of the order of 0.1%–0.2% of GDP.) Other gainscan be suggested — in transparency and hence incompetitive pressure, for example. These, too, might besuggested to be a positive function of the amount oftrade. The upshot is that the benefits (BB) scheduleslopes up from left to right.
The stabilisation benefits that result for a country fromretaining its own monetary policy and flexible exchangerate entail a ‘cost schedule’ (CC) that can be depicted inthe diagram for a country contemplating joining amonetary union. The costs of going to a commoncurrency are thought of as the loss of benefit of havingan individual currency and the stabilisation benefitsinvolved — higher, the greater the incidence of
(1) Another much simpler idea is that money offers the benefit of seignorage to the issuer and where formal taxes are hardto collect, this can be a compelling motive for several money-issuers to arise.
Chart 1Optimum currency area theory as a cost-benefitexercise
B
B
C
C
Trade integration
Cos
ts a
nd
ben
efit
s

What do we now know about currency unions?
245
asymmetric shocks requiring a distinctive monetarypolicy (and lower in the opposite case) and lower to theextent that alternative policies or institutional featuresare available (for example, a flexible fiscal policy orflexible labour markets) that reduce the need forstabilisation policy. The cost schedule may also slopedown from right to left if McKinnon’s speculation is true.McKinnon (1963) argued that the more integrated aneconomy is, the larger is likely to be the fraction of theconsumption basket made up by imported or exportablegoods and the less the leverage of nominal exchange ratechanges over the real rate, as unions and price-setterswould match such changes with domestic wage andprice changes.
The resultant diagram shows a crossover of the benefit(BB) schedule and the cost (CC) schedule, at a criticallevel of integration. To the right of this critical level,benefits exceed costs and the country should accede tothe currency union. To the left, costs exceed benefitsand the country should not accede. As drawn, we arejust concerned with current measures, but the cost-benefit framework makes it natural to think in terms of discounted measures. In this case it would benatural to assume that a country would join a unionwhen the discounted benefit exceeds the cost. But, asCottarelli and Escolano (2004) point out, this might not be the best criterion. It might be that by waiting acountry could come by a higher benefit/cost ratio and, in general, choosing a date for entry whichmaximises the discounted benefit/cost ratio seemspreferable.
I want to appeal to this framework to motivate fourquestions that I hope to explore with you.
� First of all, there is the issue of business cycle cross-correlations. The traditional theory suggeststhat a high degree of business cycle convergence(thus, high business cycle cross-correlations) isconducive to a positive currency union decision. Inthe diagram, a higher degree of convergence pushesthe CC schedule to the left and inward. Yet we knowthat several members of the euro area — Finlandand Ireland are prominent examples — had onlyweak business cycle convergence with the corecountries in the Union when they joined. Thequestion is: could such countries expect thatmembership of the Union would, in and of itself,produce a higher degree of convergence? In otherwords, is the position of the CC schedule
endogenous to the entry decision? Some peoplehave thought so. What do we now know about this?
� A second issue that is raised in this frameworkpertains to another possible source of endogeneity.Trade can be expected to increase as a result ofentry into the Union; the reduction in transactionscosts can be analysed as analogous to a cut in tariffrates and as a decline to zero in the volatility of the‘legacy exchange rate’. The question is: will this be asmall effect, as the suggested models imply, or will itbe much larger? Some research — including HM Treasury (2003) — has thrown up very largeeffects. If such estimates are correct, this too couldbe a source of endogeneity of the entry decision:after entry, the growth of trade could be such as toindicate the optimality of an entry decision notindicated before entry. (In the diagram, the positionof the country moves rapidly to the right afterjoining, making it more likely that it will exceed thecritical value of trade integration.) But this is a fast-moving field. After a wave of studies indicatinglarge effects of entry upon trade, there has recentlybeen a wave of studies indicating much smallereffects.
� A third issue is raised by the evident keenness of theNew Member States to join the euro zone despitewhat traditional theory would indicate to beindifferent credentials. One rationale for theirbehaviour is that the ‘OCA null’ fails in their case —so that, so far from complementing the stabilisingactions of the monetary authorities, the foreignexchange market acts to exacerbate shocks and tofrustrate the authorities’ attempt to stabilise theeconomy. In the event that this is the case, the CCschedule should be depicted as having movedsharply in towards the origin: there is noworthwhile stabilisation opportunity afforded to thecountry in isolation from the union and hence noloss of benefit, no cost, from joining the Union. Infact the cost of isolation is the higher interest ratethat the market requires as insurance against thevolatility of the market, and this can be avoided byjoining the Union. Of course, this is not just anissue for the New Member States; it is potentiallyone, also, for countries like the United Kingdom,Sweden and Denmark, not to mention perhapsCanada, New Zealand and Australia. There are anumber of recent studies available that attempt todeal with this very important issue.

246
Bank of England Quarterly Bulletin: Summer 2006
� The fourth issue relates to the stabilisation objectiveand the financial integration of the Union.Although the traditional theory by default suggeststhat the stabilisation objective is one for output,economic theory indicates that the objective isproperly one for consumption. In a financiallyintegrated area, agents are able to offset the effect ofoutput shocks on consumption by holdingdiversified portfolios of assets and in this wayspreading risk. It may seem strange that thepresence of a fluctuating exchange rate is enoughsubstantially to prevent financial integration, but theevidence suggests that it is. To that extent, it is thefinancial integration effects of the Union that arethe most important dimension to consider. To theextent that financial integration follows currencyunion, the benefits are considerable. In terms of thediagram, the CC schedule is again pushed inward tothe left making the Union option a more attractiveone.
These are the four issues where I think the accretion ofknowledge as a result of the EMU experiment, or simplyas the result of more recent reflection, is most salient.But I will finish this lecture by noting anotherexperiment in currency union. Called ‘Ecco L’Euro’, thisis the occasion in which the Italian Comunes ofPontassieve and Fiesole experimented with thepremature introduction of the euro. As I took part inthis trial, I thought it would be instructive to include abrief account of it.
Does membership of a monetary union promotebusiness cycle convergence?
Has EMU brought about a closer convergence of theconstituent economies’ business cycles? From one pointof view, this is a daft question, for the following reason.A stylised minimal length of a business cycle is five years;while EMU has been in existence for six years so we haveone-and-a-fifth observations! But to get around this wecan bundle together some pre-EMU years with the EMUyears on the assumption that late-EMU is ‘like’ EMU anduse this time period in which to examine the issue. Weshall see what happens when we do that.
First, we may consider on what basis it is thatconvergence or non-convergence might be expected.Two avenues for a convergence effect have beenconsidered in the literature. One is the expectation thata growth of international trade would promote aconvergence in exposure to shocks and hence in
business cycles. Another is the idea that policy isadministered with error and the reduction of asymmetricpolicy error exemplified in the adoption of a commonmonetary policy should reduce asymmetric shocks in thepropagation of business cycles. Against thesepresumptions however, it can be argued, first that EMUmight promote specialisation and hence favourasymmetric shocks; and, second, that gross policy errorsaside, individual country policy rules may have produceda greater similarity of final outcome (business cycles) inthe face of idiosyncratic shocks than will be revealedunder a ‘one size fits all’ policy. A priori reasoning seemsinadequate and can only produce ambiguousconclusions. It is not even possible to regard theexperience of other monetary unions as a clear guide.For example, while it remains the case that intranationalbusiness cycle correlations are generally much higher forthe United States than they are for the ensemble ofEuropean countries, there are some striking instances oflow, even negative, business cycle cross-correlations evenin the US experience.
Let us go back to the idea of bundling together somepre-EMU experience with the EMU period. In Artis andZhang (1997), we took data from the OECD’s trade cycledata base and plotted the country cross-correlations ofthese cyclical deviates against Germany against thecorresponding cross-correlations vis-à-vis the UnitedStates. We compared an initial period with a later(‘ERM’) period. Comparing the two periods we foundthat, whereas in the first period there was a relativelywide dispersion of observations suggestive of a looseworld cycle, in the second period countries that weremembers, or apprentice members, of the ERM exhibiteda relatively higher correlation vis-à-vis Germany than theUnited States. Perhaps, by implication, we would findthis trend continued in data for the full EMU period.The paper is still widely — but misleadingly — quotedto that effect.
Charts 2–4 use later, revised OECD trade cycle data.The initial move to a closer correlation with Germanythan with the United States (comparing Charts 2 and 3)appears, as in our earlier data set, for most countries,especially those associated with the ERM. (Japanappears as an ‘honorary member’ of the ERM, itself awarning against a too strong identification with theERM.) But in the EMU (‘post-ERM’) period shown inChart 4, this differentiation falls away. Germany is nowhighly correlated with the United States and it makes nosense to distinguish a European cycle effect.

What do we now know about currency unions?
247
In principle it might still be possible that there is a‘Europeanisation’ effect in the data which is masked bythe global impact of the 2000–01 shock; but if so, thiseffect will only be apparent when some other shockscome along that serve to identify a European cycledistinct from a North American or World cycle.
This rather negative conclusion implied by the data hasreceived confirmation in a handful of other recentstudies: examples are Artis (2003), Camacho et al
(2005), and Bovi (2004). These studies use differentdata and a variety of techniques, implying a degree ofrobustness in the underlying findings.(1) My conclusionfrom all this is that we still do not know whether — letalone over what time span — currency union createsbusiness cycle convergence. But since currency unionsare endogenous, we might hazard that they naturallyarise where there is not only a high level of trade alreadybut also a high level of business cycle convergence. (Ithas often been noted that the core countries of EMU didlittle to analyse the optimality of the move to EMU — allthe exercises in this direction seem to have come fromcountries like the United Kingdom, Sweden, Finland,Poland and the Czech Republic. It is as if the corecountries ‘knew’ that they did not need to perform theseexercises.)
Do currency unions create trade?
It is implicit in our framework that monetary union, bycutting transactions costs (and perhaps by reducingvolatility) will create some trade. But the orders ofmagnitude involved are relatively small; in particular,there does not seem to be reliable evidence that volatileexchange rates deter trade. The profession’s scepticalreaction to Andrew Rose’s early estimates of very largetrade effects (Frankel and Rose (1997), (1998); Rose(2000)) was therefore not surprising. Rose deployedpanel data estimation, with currency union entering as adummy variable and (bilateral) trade as the explicandum.
Chart 2Pre-ERM business cycle affiliations
NLD
BELPRT
JPN
FIN
NOR
ITA
IRL UK
FRA
DNK
CANESP
0.80
1.00
0.60
0.40
0.20
0.00
0.80 1.000.00 0.20 0.40 0.60
With the US cycle
Wit
h t
he
Ger
man
cyc
le
GER
US
Business cycle cross-correlations with the United States and Germany, pre-ERM period 1961:1–1979:3 (OECD trade cycle database).
Country abbreviations are: BEL, Belgium; CAN, Canada; DNK, Denmark; FIN, Finland; FRA, France; GER, Germany; IRL, Ireland; ITA, Italy; JPN, Japan; NLD, Netherlands; NOR, Norway; PRT, Portugal; ESP, Spain; SWE, Sweden; UK, United Kingdom; and US, United States.
Chart 3ERM business cycle affiliations
JPN NLD
ESP
FRA
ITA
BEL
UK
DNK
SWE
NOR
IRL
CAN
0.80
1.00
0.60
0.40
0.20
0.00
0.80 1.000.00 0.20 0.40 0.60
With the US cycle
Wit
h t
he
Ger
man
cyc
le
GER
US
Business cycle cross-correlations with the United States and Germany, ERM period 1979:4–1993:12 (OECD trade cycle database).
Finland and Portugal are not visible because the negative correlations are not shown.
See note to Chart 2 for country abbreviations.
Chart 4Post-ERM business cycle affiliations
ITA
DNK
PRT
NLD
FRAIRL
CAN
SWE
FINBEL
0.80
1.00
0.60
0.40
0.20
0.00
0.80 1.000.00 0.20 0.40 0.60
With the US cycle
Wit
h t
he
Ger
man
cyc
le
GER
US
Business cycle cross-correlations with the United States and Germany, post-ERM period 1994:1–2000:12 (OECD trade cycle database).
Spain, Japan, Norway and the United Kingdom are not visible because the negative correlations are not shown.
See note to Chart 2 for country abbreviations.
(1) Bovi’s contribution is of particular interest because it deploys a measure of group-wise synchronisation where theexisting literature uses only bilateral measures.

248
Bank of England Quarterly Bulletin: Summer 2006
The panels involved a large cross-section, but a ratherweak time dimension. The order of magnitude of theeffect initially detected was of the order of 300%. Butthese estimates were unduly dependent upon monetaryunions between small ‘postage stamp’ countries andlarger neighbours and upon developing economyexperience. More modest later estimates (eg Persson(2001)) continued to be compatible with a large effect,however.
For developed countries the most pertinent exampleappeared to be that of the break-up of the exchange rateunion between the Republic of Ireland and the UnitedKingdom; Thom and Walsh (2001) claimed to find nogreat decline in Anglo-Irish trade as a result of theRepublic joining the euro area. The most influentialadaptation of the Rose approach, however, came with thepaper by Micco et al (2003) which focused on Europeand used data which overlapped with the euro period.Micco and his colleagues also found large effects fromthe introduction of the euro on trade, even if not quite so large as some of Rose’s earliest estimates. HM Treasury (2003) updated and replicated the Miccostudy, reporting a potential increase in trade for theUnited Kingdom following entry into the euro zone of50% in total. Since trade creation is usually associatedwith some growth multiplier, the output growthimplications of this finding were significant.
Since the Treasury’s work there has emerged a number ofstudies critical of the design of the Micco et al study,including: Bun and Klaassen (2004); Gomes et al(2004); de Nardis and Vicarelli (2003); Baldwin (2005);and Berger and Nitsch (2005). The common feature ofthe critical line pursued in these studies is that EMUitself is endogenous to the process of integration, moreso among the core economies of Europe than among theperipheral countries. This might suggest that any datingis largely arbitrary. More constructively, some of thesestudies suggest that the counterfactual — what tradewould have been but for the euro — can bereconstructed or related to a measure of integration.Econometric analysis is not likely to be reliable insettling this matter. Rather, what we have to say is thatthe critics appear to have a good point. And, HMTreasury’s cautious evaluation of its own findings standson firm ground.
A final observation is that we now know more about thescale of the ‘border effect’. It appears that trade betweenpairs of Canadian cities is up to 20 times larger than
between similarly distanced pairs of cities, one of whichis Canadian and one American. It may be a ‘bordereffect’ that Rose has picked up in his very large estimatesof the currency union effect. Currency is only oneelement in what goes to make a border effect, but it maybe the most important. Financial experience suggeststhat it could easily be so, as we discuss below.
How well does the ‘OCA null’ hold?
We earlier identified the ‘OCA null’ as the propositionthat the exchange rate moves in the ‘correct’ way todampen shocks and thus to complement a stabilisingmonetary policy. A number of observers (eg Frankel(2003) and Buiter (2000)) have questioned whether thisis the case, the former for developing and emergingeconomies, the latter for the United Kingdom. Acanonical model for the exploration of the issues is astructural VAR incorporating (at least) output, prices,interest rates and the exchange rate. Such a modelusually requires the imposition of zero restrictions onthe impact of certain shocks (a more agnostic approachsimply imposes sign restrictions, as in Farrant andPeersman (2004) and Peersman (2005)) and seeks toidentify whether the exchange rate responds in the ‘rightway’ to the various shocks and in particular to discoverwhether the exchange rate tends to ‘chase its own tail’,responding simply to shocks arising in the foreignexchange market (as was the verdict of an early study inthis genre by Canzoneri et al (1996)). Specificationshave varied, one strand selecting the real exchange ratefor analysis and relating this to measures of relativeoutput, relative prices and relative interest rates. This isinferior, it seems to me, to the specification in Artis andEhrmann (2006) where the nominal, not the real, rate isthe centre of attention and variables are studied inabsolute, not relative form. The reason for thispreference is that it is variation in the nominal ratewhich joining a monetary union entails the loss of. Theuse of the relative forms of output, prices etc obscureswho does the adjusting; appears to make it a matter ofindifference that transmission mechanisms differbetween countries; and biases the results in the sensethat the formulation already implies that onlyasymmetric shocks will be identified, whereas animportant question is precisely that of the relativefrequency of symmetric versus asymmetric shocks.
The general run of results shows some differencesbetween the modelling approaches and/or between largeand small countries. Approaches that follow Clarida and

What do we now know about currency unions?
249
Gali (1994) — such as Peersman (2005) and Farrant andPeersman (2004) — tend to find evidence in favour ofthe OCA null, while the others find a larger role fornominal shocks (though Farrant and Peersman (2004)find a large role for nominal shocks, suggesting that theexchange rate may be a source of shocks rather than ashock-absorber). There is some suggestion in thestudies to date that smaller countries exhibit lesstendency to confirm the OCA null. For instance, thepaper by Borghijs and Kuijs (2004) examines theexperience of the Central and Eastern Europeancountries using a variant of the SVAR approach andconcludes that ‘the results cast doubt on the usefulnessof the exchange rate as a shock-absorber; the exchangerate appears on average to have served as much or moreas an unhelpful propagator of LM shocks than as a usefulabsorber of IS shocks’, adding that ‘they suggest that thecosts of losing exchange rate flexibility in the CEECs arelimited, if even positive’.
It is not clear that the same scepticism should apply toexchange rate flexibility in larger economies, for whichthere are relatively few comparable studies. In my paperwith Michael Ehrmann (Artis and Ehrmann (2006)), weconcluded that the United Kingdom was an indifferentcandidate for European Monetary Union as nominalshocks played a large role in determining the exchangerate, though the evidence suggested that UK monetarypolicy was effective and the exchange rate, though notresponding to the right signals, did not appear to becapable of damaging the real economy. At the sametime, most shocks were diagnosed as asymmetric shocks.In the period since 1997, there have been intermittentcriticisms that a high exchange rate has undulydampened economic activity. Cobham (2002), forexample, provides a sustained account of monetarypolicy concerns about the exchange rate in this period.One is invited to draw the conclusion that the exchangerate has been buoyed up by unreasonably bullishsentiment and that it has done harm. By contrast, in theTreasury’s EuroReport, the exchange rate was givencredit for having done the right thing — namelyappreciating in the face of an inflationary shock.
There is an argument in the literature that exchange ratepass-through is now so low that exchange rate changescannot be expected to have direct impact on relativeprices. Hence, one possible conclusion is that asexchange rate movements appear to have little effect,monetary union is an easier step (Engel (2002)).
Obstfeld (2002) argues that this line of argument ispremature. In a world of globalised business it may very well be that there is a high degree of pricing tomarket so that prices in the shops are immune toexchange rate changes. But intermediate goods pricesdo change and the consequence of an alteration in theexchange rate may very well be a redirection of thesourcing of the supply of the good in question. Thus theactivity effects of a change in the exchange rate may staymuch the same as in earlier accounts when relativeconsumer prices changed. Furthermore, those activityeffects will likely have price effects too, somewhere downthe line.
What is the bottom line to this discussion? The OCAnull has been held in question and for many countries— predominantly smaller countries with poorlydeveloped domestic capital markets and those with noreputation and little experience of operating in a worldof highly mobile capital flows — that questioning isappropriate. They lose little or nothing in joining amonetary union therefore, as they are unable to operatean effective stabilisation policy. Indeed there may besome clear gains: the real rate of interest will be lower inthe union as the premium for operating an independentmonetary policy disappears and it may even be the casethat some of these countries are well placed in terms ofbusiness cycle convergence to benefit from stabilisationpolicy at union level that they have not been able toimplement for themselves.
As an addendum at this point I note some evidence froma study I carried out into the business cycle convergenceof the New Member States (Artis et al (2005)). Table Ashows the cross-correlations of cyclical deviates ofindustrial production in the CEECs vis-à-vis the euroarea and selected member countries of the area. OnlyHungary, and, to an extent, Poland display highcorrelations; some are even negative.(1)
Table ACross-correlations of business cycle deviates; industrialproduction, band-pass filtered 1993–2002. Central andEastern European countries
CZE SVK POL HUN SVN EST LVA LIT
D 0.17 0.23 0.66 0.92 0.67 0.45 0.03 -0.04A -0.09 0.28 0.57 0.82 0.34 0.12 -0.18 -0.39I 0.27 0.48 0.66 0.70 0.57 0.41 0.00 0.05EURO 0.16 0.32 0.67 0.91 0.65 0.40 -0.02 -0.04
Source: Artis et al (2005); figures in bold are statistically significant.
Country abbreviations are: CZE, Czech Republic; EST, Estonia; HUN, Hungary; LVA, Latvia; LIT, Lithuania; POL, Poland; SVK, Slovakia; and SVN, Slovenia.
(1) As explained in the source from which these data are drawn industrial production cross-correlations are generallyhigher than those involving GDP (see Artis et al (2005)).

250
Bank of England Quarterly Bulletin: Summer 2006
Financial integration
One of the enduring ‘puzzles’ of international economicshas been the persistence and size of what has becomeknown as the ‘home bias’ in portfolio allocation.Investors invest far less than they ‘should’ ininternational assets, diversify overseas far less andcorrespondingly insure themselves against risk byholding overseas assets to a much lesser extent than they‘should’. This bias can help to account for thewidespread violation of the expectation that, as a resultof consumption risk-spreading internationally, growthrates of consumption across nations should display lessvariation than growth rates of output do. And the biascan also help explain why countries often ‘fail’ theFeldstein-Horioka ‘test’ and behave as though theirinvestment opportunities were constrained by domesticsavings.(1) Karen Lewis (1999) provides a comprehensiveaccount of this bias and its ramifications.
In previous work it has never been clear that theexchange rate and exchange rate risk should play morethan a supporting role in accounting for this bias. Afterall, there are plenty of other candidates — differences incommercial law, transport regulations, weights andmeasures etc. McKinnon (2004) makes particularmention of the fact that the exchange rate and exchangerate risk have not generally been given thepredominating role in the list of obstacles that mightlead to a home bias.
The advent of EMU seems to have dented the home biasparadigm considerably. The evidence from the bondmarkets shows that interest rate differentials betweeneuro-area government bonds are negligible, whereasprior to the advent of the euro, those differentials weresometimes large. It is (almost) as if the previous countryplus exchange rate premium has been shown to bealmost all down to an exchange rate premium.Blanchard and Giavazzi (2002) show that while there hasbeen an increase in the spread of current accountdeficits and surpluses throughout the OECD, theexamples of Greece and Portugal seem to indicate thatwithin the euro area, the constraint on current accountdeficits no longer holds at all. Table B is drawn fromtheir paper and shows that estimates of the coefficient
in a regression of the investment ratio on the savingsratio are lower for euro-area countries (whether or notPortugal and Greece are excluded, as in the column‘Euro area minus’).(2) For such countries entry into theeuro would seem to take place against a background inwhich the BB schedule in Chart 1 is lifted upwards. Butthere is more to it than this.
The heart of the traditional OCA argument is that thepossession of an ‘own currency’ allows monetary policyto perform a stabilisation function. By default aimed atoutput in this story, theory suggests that it is reallyconsumption which is the proper object of stabilisation.Now consumption can be smoothed relative to outputeither through a fiscal channel (as tax rates andgovernment spending respond to changes in the level ofactivity) or through private channels. The late Oved Yosha, with various colleagues (as in Asdrubali et al(1996)), did much to delineate these channels and tooperationalise the quantification of different routesthrough which the public and private sectors cansmooth consumption. When these routes are quantifiedit is standard to find (eg Crucini and Hess (2000)) thatthere is a large difference between the amount of risk-sharing that takes place between the regions of acountry and that between countries. The former ismuch larger than the latter, reflecting the operation of ahome bias once again (Tables C and D, drawn from astudy of the United Kingdom by Labhard and Sawicki(2006) underline this strongly). Hence the extent towhich a currency union automatically reduces the homebias is of the greatest importance. In the limit, it couldimply that upon joining a currency union, a country willfind itself better able to stabilise consumption. Hencethe apparatus of output stabilisation through monetaryand fiscal policy is no longer necessary. The CCschedule in Chart 1 thus vanishes towards the origin.Indeed, it can be hazarded that this effect could ‘turn
(1) In their 1980 article Feldstein and Horioka ran a cross-section regression of the investment/GDP ratio on savings(similarly scaled by GDP) as a test for the mobility of capital. They argued that in the presence of perfect capitalmarkets there should essentially be no connection between domestic savings and domestic investment, though theirresults pointed to a high correlation coefficient. Various arguments have been deployed since to explain why the testmay itself be flawed but its intuitive simplicity continues to attract replications.
(2) The column ‘OECD minus’ drops a heterogenous group of countries which the authors felt might not conform to theparadigm of an advanced developed economy.
Table BFeldstein-Horioka coefficients, 1975–2001
OECD OECD EU Euro area Euro areaminus minus
1975–2001 0.58 0.51 0.47 0.35 0.391975–90 0.56 0.55 0.50 0.41 0.491991–2001 0.57 0.38 0.36 0.14 0.26
Source: Blanchard and Giavazzi (2002).

What do we now know about currency unions?
251
OCA upside down’ in the sense that the financialintegration of the currency union could be seen byagents as permitting a degree of specialisation in outputat the national level that would have appeared unwisebefore. With specialisation would come more asymmetricshocks and less business cycle convergence. In short,where traditional theory would look to business cycleconvergence to sustain a currency union, under the newapproach currency union could even lead to lessbusiness cycle convergence.
That the most recent developments in currency uniontheory should lead in this direction is paradoxical inanother way too. Early discussions of the feasibility ofcurrency union stressed that the fiscal channel wasnecessary to promote risk-sharing between regions of acountry. American observers were prone to commentthat, because of their federal income tax andexpenditure system, ‘40 cents in the dollar’ of a primaryincome shock would be automatically offset. As theEMU had then, and still has, no prospect of a centralbudget function of sufficient size, the correspondingfigure for the EMU is very close to zero. However, laterwork has done much to clarify concepts and the stylised‘40 cents in the dollar’ has become according to Melitz (2004), ‘12–15 cents in the dollar’. Moreover inthese early debates the role of the private sector wasentirely overlooked. It is clear that within the euro area,risk-sharing through private channels has not yetreached the levels that are experienced in the United
States (pre-euro studies show that risk-sharing isconsiderably less in Europe) and it is clear that someinstitutional and cultural changes are necessary tocomplete the process of diminishing the home bias. Weall know that retail banking in the euro zone is stillsubject to national protectionist policies, for example,and there are many other shortfalls. Nevertheless, theadvent of the euro has imparted momentum towardschange in the relevant areas.
Broad conclusions
We have learnt several important things about the waythat currency unions work and develop. Thecontribution of traditional theory is still important, butwith respect to the four issues I put on the table at thestart of this lecture:
� It is probably wrong to expect much by way ofinduced business cycle convergence.
� It is probably wrong to think of the euro per se asspurring a vast increase in trade. Trade within theEU and especially within the euro zone and its coremembers is (and would have been) growing fastanyway.
� For some countries, including some prospectivemembers of the euro area, the benefits to be derivedfrom currency union membership are huge. Anyqualification deriving from a lack of business cycleconvergence is probably of second orderimportance.
� The financial aspects of currency union membershiphave been underplayed in the past, whereas theirimplications appear in fact to be highly significant.Indeed they are arguably the most significant factorthat we now know about and didn’t before.
Ecco L’Euro
By way of concluding, I promised to comment onanother experiment in currency union, namely theproject ‘Ecco L’Euro’. This experiment was mounted inthe Comunes of Fiesole and Pontassieve, near Florence.The idea of the experiment was to spread informationabout the euro by a real-time simulation. Thepermission of the Banca d’Italia was obtained for thecirculation within these Comunes of ‘euro symbols’which could be accepted as legal tender by variousenterprises within the Comunes. The exchange rate of
Table CRisk-sharing across UK regionsPer cent(a)
Capital Fiscal Intertemporal Total Totalmarkets transfer smoothed unsmoothed
1975–99 47 -4 37 79 211975–87 47 -8 43 82 181988–99 51 – 25 76 24
Source: Labhard and Sawicki (2006).
(a) The final two columns report the proportion of income shocks that are smoothed (or otherwise) in their impact on consumption. The first three columns distinguish the channels through which smoothing takes place, based on regression evidence.
Table DInternational risk-sharing: the United Kingdom and theOECDPer cent(a)
Factor Depreciation Transfers Savings Total Totalincome smoothed unsmoothed
1971–99 – -1 -1 6 5 951971–87 1 – -1 6 5 951988–99 – -3 -1 6 5 95
Source: Labhard and Sawicki (2006).
(a) The final two columns report the proportion of income shocks that are smoothed (or otherwise) in their impact on consumption. The first four columns distinguish the channels through which smoothing takes place, based on national accounts data.

252
Bank of England Quarterly Bulletin: Summer 2006
the lira to the euro symbol was fixed at a convenient2000:1 (cf the actual rate of 1936.27:1). Shops wereencouraged to adopt dual pricing. The experiment wasmonitored by a scientific committee based in theEuropean University Institute, and monitoring involvedinter alia the circulation and processing ofquestionnaires.
Here are some of the results of this interesting venture:
1. The experiment demonstrated the network nature ofmoney. The geographical and temporal limitationsof the legal tender status of the euro symbols meantthat few people used the symbols, although manyheld them.
2. This might seem also like an instance of Gresham’sLaw: soaring prices of the euro symbols incollectors’ shops in Florence and Rome gave theimpression that the lira was a weak currency. Thetrue model, though, is more like one for a specialphilatelic sale.
3. The problem of lack of use of the new currency wastargeted by the introduction of a ‘points card’.When a transaction was executed in the newcurrency the retailer would stamp a square on thecard. When filled, the card could be exchanged fora watch (big card) or a tiepin (small card). Thetheory of money is concerned with motives forholding money — including the transactions motivesince money has to be held before it is used. Herewe have the ‘watch’ (or ‘tiepin’) motive for holding(using) money!
4. The questionnaires established that rounding wasquite often in the downward direction. But in thisexperiment people could always use either currencyand prices were quoted in both. In the event — ie,when the real new currency was introduced, Italiansexperienced an upwards blip in the price levelassociated with the introduction of the newcurrency in apparent violation of monetaryneutrality.(1)
5. Our questionnaires established that in some cases(mostly, those of older people) the experiment hadcaused confusion even with the convenientexchange rate. Subsequently Dzuida andMastrobuoni (2005) argued that the confusionamounted to a real change, which can be modelledas increasing the monopoly power of retailers.
6. The Comunes added seigniorage (identified as thedifference between the face value and theproduction cost of the symbols) to their coffers inthe order of LIT 20,000 per inhabitant. But this wasmore than offset by other promotional expensesassociated with the project (including the cost ofthe watches and tiepins).
7. It might be argued that a temporally limitedexperiment cannot really stand in for the real thing — simply because it is not the real thing and is known not to be so. Even so the value ofpositive lessons learnt from the experiment wasperhaps disappointingly small, but notably verysmall in relation to the ‘PR’ success of the project asa whole.
(1) In fact the blip was experienced in other euro-area countries too. Eurostat gave an estimate of 0.2% as the size of theblip in the euro-area HCPI associated with the introduction of the physical new currency.

What do we now know about currency unions?
253
References
Artis, M J (2003), ‘Is there a European business cycle?’, Ces-ifo Working Paper no. 1053.
Artis, M J and Ehrmann, M (2006), ‘The exchange rate — a shock-absorber or source of shocks? A study of fouropen economies’, Journal of International Money and Finance, forthcoming.
Artis, M J, Marcellino, M and Proietti, T (2005), ‘Business cycles in the accession countries and their conformitywith the euro area’, Journal of Business Cycle Measurement and Analysis, Vol. 2, pages 7–42.
Artis, M J and Zhang, W (1997), ‘International business cycles and the ERM’, International Journal of Finance andEconomics, Vol. 2, pages 1–16.
Asdrubali, P, Sorenson, B and Yosha, O (1996), ‘Channels of inter-state risk-sharing: United States 1963–1990’,Quarterly Journal of Economics, Vol. 111, pages 1,081–100.
Baldwin, R (2005), ‘The euro’s trade effects’, paper prepared for the ECB workshop ‘What effect is EMU having...?’,Frankfurt, June.
Berger, H and Nitsch, V (2005), ‘Zooming out: the trade effect of the euro in historical perspective’, Ces-ifo WorkingPaper no. 1435.
Blanchard, O and Giavazzi, F (2002), ‘Current account deficits in the euro area: the end of the Feldstein-Horiokapuzzle?’, Brookings Papers in Economic Activity, Vol. 2, pages 147–209.
Borghijs, A and Kuijs, L (2004), ‘Exchange rates in Central Europe: a blessing or a curse?’, IMF Working Paper,WP/04/2.
Bovi, M (2004), Bulletin of the Oxford University of Economics and Statistics.
Buiter, W (2000), ‘Optimal currency areas: why does the exchange rate regime matter?’, Scottish Journal of PoliticalEconomy, Vol. 47, pages 213–50.
Bun, M J G and Klaassen, F J G M (2004), ‘The euro effect on trade is not as large as commonly thought’, revision of‘The importance of accounting for time trends when estimating the euro effect on trade’, Tinbergen Institute DiscussionPaper, DP 03-086/2, University of Amsterdam; downloadable from www1.fee.uva.nl/pp/klaassen/.
Camacho, M, Perez Quiroz, G and Saiz, L (2005), ‘Do European business cycles look like one?’, Bank of Spain WorkingPaper no. 0518.
Canzoneri, M, Valles, M and Vinals, J (1996), ‘Do exchange rates move to address international macroeconomicimbalances?’, CEPR Discussion Paper no. 1498.
Clarida, R and Gali, J (1994), ‘Sources of real exchange rate fluctuations: how important are nominal shocks?’,Carnegie-Rochester Conference on Public Policy, Vol. 41, pages 1–56.
Cobham, D (2002), ‘The exchange rate as a source of disturbances: the UK 1979–2000’, National Institute EconomicReview, No. 181, July, pages 96–112.

254
Bank of England Quarterly Bulletin: Summer 2006
Comission of the European Communities (1990), ‘One market, one money: an evaluation of the potential benefitsand costs of forming an economic and monetary union’, European Economy, No. 44, October.
Cottarelli, C and Escolano, J (2004), ‘Assessing the assessment: a critical look at the June 2003 assessment of theUnited Kingdom’s five tests’, IMF Working Paper, WP 04/116.
Crucini, M and Hess, G (2000), ‘International and intranational risk-sharing’, in Hess, G and Van Wincoop, E (eds),Intranational macroeconomics, Cambridge University Press.
de Nardis, S and Vicarelli, C (2003), ‘The impact of euro on trade: the (early) effect is not so large’, ISAE WorkingPaper 31/03, Rome.
Dzuida, W and Mastrobuoni, G (2005), ‘The euro changeover and its effects on price transparency and inflation.Mission euro, mission accomplished!’, mimeo, available at www.princeton.edu/~gmastrob/pdf/euro.pdf.
Engel, C (2002), ‘The responsiveness of consumer prices to exchange rates and the implications for exchange ratepolicy: a survey of a few recent new open economy macro models’, NBER Working Paper no. 8725.
Farrant, K and Peersman, G (2004), ‘Is the exchange rate a shock absorber or a source of shocks? New empiricalevidence’, Journal of Money, Credit and Banking.
Feldstein, M and Horioka, C (1980), ‘Domestic saving and international capital flows’, Economic Journal, Vol. 90, pages 314–29.
Frankel, J (2003), ‘Experience of and lessons from exchange rate regimes in emerging economies’, NBER Working Paper no. 10032.
Frankel, J and Rose, A (1997), ‘Is EMU more justifiable ex-post than ex-ante?’, European Economic Review, Vol. 41, pages 753–60.
Frankel, J and Rose, A (1998), ‘The endogeneity of the optimum currency area criteria’, Economic Journal, Vol. 108,pages 1,009–25.
Friedman, M (1953), ‘The case for flexible exchange rates’, in Essays in Positive Economics, University of Chicago Press,pages 157–203.
Gomes, T, Graham, C, Helliwell, J, Kano, T, Murray, J and Schembri, L (2004), ‘The euro and trade: is there apositive effect?’, unpublished, International Department, Bank of Canada.
HM Treasury (2003), UK membership of the single currency — an assessment of the five economic tests, CM 5776, London,HMSO, June.
Kenen, P B (1969), ‘The theory of optimum currency areas: an eclectic view’, in Mundell R A and Swoboda, A (eds),Problems of the international economy, Cambridge University Press.
Krugman, P (1993), ‘Lessons from Massachusetts for EMU’, in Torres, F and Giavazzi, F (eds), Adjustment and growth inthe European Monetary Union, Cambridge University Press.
Labhard, V and Sawicki, M (2006), ‘International and intranational consumption risk sharing: the evidence for theUK and OECD’, Bank of England Working Paper, forthcoming.

What do we now know about currency unions?
255
Lewis, K (1999), ‘Trying to explain the home bias in equities and consumption’, Journal of Economic Literature, Vol. 37,pages 571–608.
McKinnon, R A (1963), ‘Optimum currency areas’, American Economic Review, Vol. 53, September, pages 717–25.
McKinnon, R I (2004), ‘Optimum currency areas and key currencies: Mundel I versus Mundell II’, Journal of CommonMarket Studies, Vol. 42, pages 689–715.
Meade, J (1955), ‘The case for variable exchange rates’, The Three Banks Review.
Melitz, J (2004), ‘Risk-sharing and EMU’, Journal of Common Market Studies, Vol. 42, pages 815–40.
Micco, A, Stein, E and Ordonez, G (2003), ‘The currency union effect on trade: early evidence from EMU’, EconomicPolicy, Vol. 37, pages 317–56.
Mundell, R A (1961), ‘A theory of optimum currency areas’, American Economic Review, Vol. 51, September, pages 657–65.
Obstfeld, M (2002), ‘Exchange rates and adjustment: perspectives from the new open macroeconomics’, NBER WorkingPaper no. 9118.
Peersman, G (2005), ‘The relative importance of symmetric and asymmetric shocks and the determination of theexchange rate’, mimeo.
Persson, T (2001), ‘Currency unions and trade: how large is the treatment effect?’, Economic Policy, Vol. 16, pages 433–48.
Rose, A K (2000), ‘One money, one market: estimating the effect of common currencies on trade’, Economic Policy, Vol. 30, April, pages 7–45.
Thom, R and Walsh, F (2001), ‘The effect of a common currency on trade: Ireland before and after the sterling link’,mimeo, University College, Dublin.

Speeches made by Bank personnel since publication of the previous Bulletin are listed below.
Are Europeans lazy? Or Americans crazy?Remarks delivered by Stephen Nickell at the Annual Conference of the Fondazione Rodolfo DeBenedetti at Portovenere, La Spezia on27 May 2006 (this makes reference to the ‘Patterns of work across the OECD’ paper below).www.bankofengland.co.uk/publications/speeches/2006/speech275.pdf.
Patterns of work across the OECD.Joint paper by Guilia Faggio of the Centre for Economic Performance, London School of Economics and Stephen Nickell on 27 May 2006. www.bankofengland.co.uk/publications/speeches/2006/speech276.pdf.
Reflections on operating inflation targeting. Paper delivered by Paul Tucker at the Graduate School of Business of the University of Chicago on 25 May 2006.www.bankofengland.co.uk/publications/speeches/2006/speech274.pdf. Reproduced on pages 212–24 of this Bulletin.
Uncertainty, the implementation of monetary policy, and the management of risk.Speech by Paul Tucker to the Association of Corporate Treasurers in Newport on 19 May 2006.www.bankofengland.co.uk/publications/speeches/2006/speech273.pdf. Reproduced on pages 202–11 of this Bulletin.
A shift in the balance of risks. Speech by David Walton at a lunch organised by the Bank of England’s Central Southern Agency on 18 May 2006.www.bankofengland.co.uk/publications/speeches/2006/speech272.pdf. Reproduced on pages 240–42 of this Bulletin.
The UK current account deficit and all that.Paper by Stephen Nickell delivered on 25 April 2006. www.bankofengland.co.uk/publications/speeches/2006/speech271.pdf.Reproduced on pages 231–39 of this Bulletin.
Speech by Kate Barker.At a CBI West Midlands 2006 Economic Dinner in Birmingham on 21 March 2006.www.bankofengland.co.uk/publications/speeches/2006/speech270.pdf. Reproduced on pages 225–30 of this Bulletin.
The Budget of 1981 was over the top.Speech by Stephen Nickell delivered at an Institute of Economic Affairs panel discussion in London on 16 March 2006.www.bankofengland.co.uk/publications/speeches/2006/speech269.pdf.
Bank of England speeches

Contents of recent Quarterly Bulletins
The articles and speeches that have been published recently in the Quarterly Bulletin are listed below.Articles from November 1998 onwards are available on the Bank’s website atwww.bankofengland.co.uk/publications/quarterlybulletin/index.htm.
Articles and speeches (indicated S)
Spring 2004Durable spending, relative prices and consumptionAsset pricing and the housing marketThe relationship between the overnight interbank
unsecured loan market and the CHAPS Sterling system
How much does bank capital matter?Measuring total factor productivity for the United
KingdomThe Governor’s speech at the annual Birmingham
Forward/CBI business luncheon (S)Inflation targeting—achievement and challenges (S)Risk, uncertainty and monetary policy regimes (S)E-commerce and the foreign exchange market—have the
promises been met? (S)
Summer 2004Assessing the stability of narrow money demand in the
United KingdomDeriving a market-based measure of interest rate
expectationsThe economics of retail banking—an empirical analysis
of the UK market for personal current accountsThe financing of smaller quoted companies:
a surveyRecent developments in surveys of exchange rate
forecastsSterling money market fundsThe new Bank of England Quarterly ModelPublic attitudes to inflationPerfect partners or uncomfortable bedfellows? On the
nature of the relationship between monetary policy andfinancial stability
A review of the work of the London Foreign Exchange Joint Standing Committee in 2003
Reform of the Bank of England’s operations in the sterling money markets
Puzzles in today’s economy—the build-up of household debt (S)
Speech at the National Association of Pension Funds Annual Investment Conference (S)
Boring bankers—should we listen? (S)Speech at CBI Yorkshire and the Humber annual dinner
(S)
Autumn 2004How should we think about consumer confidence?Household secured debtHousing equity and consumption: insights from the
Survey of English HousingWhy has world trade grown faster than world output?The institutions of monetary policy (S)The Governor’s speech to the CBI Scotland dinner
(S)The Governor’s speech at the Mansion House (S)Keeping the party under control—anniversary
comments on monetary policy (S)Some current issues in UK monetary policy (S)Managing the central bank’s balance sheet: where
monetary policy meets financial stability (S)Household debt, house prices and consumption
growth (S)
Winter 2004British household indebtedness and financial stress: a
household-level pictureThe new sterling ERIUsing option prices to measure financial market views
about balances of risk to future asset pricesThe foreign exchange and over-the-counter derivatives
markets in the United KingdomThe external balance sheet of the United Kingdom:
recent developmentsStability and statistics (S)Why is inflation so low? (S)Monetary policy, data uncertainty and the supply side:
living with the statistical fog (S)
Spring 2005Dealing with data uncertaintyIndicators of short-term movements in business
investmentDivisia moneyInside the MPCThe role of central banks in payment systems oversightThe Governor’s speech to the CBI Dinner in Manchester
(S)The Governor’s speech on the International Monetary
System (S)
Spring 2005 (continued)Why monetary stability matters to Merseyside (S)Monetary policy in an uncertain world (S)Why has inflation been so low since 1999? (S)The housing market and the wider economy (S)
Summer 2005The impact of government spending on demand
pressureHow important is housing market activity for durables
spending?The inflation-targeting framework from an historical
perspectiveMonetary policy news and market reaction to the
Inflation Report and MPC MinutesAddendum to Report on modelling and forecasting at the
Bank of EnglandPublic attitudes to inflationChief Economist Workshop April 2005: exchange rate
regimes and capital flowsImplementing monetary policy: reforms to the Bank of
England’s operations in the money marketA review of the work of the London Foreign Exchange
Joint Standing Committee in 2004Monetary policy: practice ahead of theory
The Mais Lecture 2005: speech by the Governor (S)Inflation targeting in practice: models, forecasts and
hunches (S)Monetary policy, stability and structural change (S)How much spare capacity is there in the UK economy? Communicating monetary policy in practice (S)Monetary policy in the United Kingdom — the
framework and current issues (S)A matter of no small interest: real short-term interest
rates and inflation since the 1990s (S)
Autumn 2005Assessing the MPC’s fan chartsLong-run evidence on money growth and inflationThe determination of UK corporate capital gearingPublication of narrow money data: the implications of
money market reformThe Governor’s speech at Salts Mill, Bradford (S)The Governor’s speech at the Mansion House (S)Monetary policy making: fact and fiction (S)
Winter 2005Introducing the Agents’ scoresDo financial markets react to Bank of England
communication?Financial stability, monetary stability and public policyShare prices and the value of workersStabilising short-term interest ratesThe Governor’s speech to the CBI North East annual
dinner (S)UK monetary policy: the international context (S)Economic stability and the business climate (S)Challenging times for monetary policy (S)Monetary policy challenges facing a new MPC member
(S)
Spring 2006New information from inflation swaps and index-linked
bondsThe distribution of assets, income and liabilities across
UK households: results from the 2005 NMG Research survey
Understanding the term structure of swap spreadsThe information content of aggregate data on financial
futures positionsThe forward market for oilThe Governor’s speech in Ashford, Kent (S)Reform of the International Monetary Fund (S)Global financial imbalances (S)Monetary policy, demand and inflation (S)Has oil lost the capacity to shock? (S)
Summer 2006House prices and consumer spendingInvesting in inventoriesCost-benefit analysis of monetary and financial statisticsPublic attitudes to inflationThe Centre for Central Banking StudiesA review of the work of the London Foreign Exchange
Joint Standing Committee in 2005Uncertainty, the implementation of monetary policy, and
the management of risk (S)Reflections on operating inflation targeting (S)Cost pressures and the UK inflation outlook (S)The UK current account deficit and all that (S)A shift in the balance of risks (S)What do we now know about currency unions? (S)

Bank of England publications
Working papers
An up-to-date list of working papers is maintained on the Bank of England’s website atwww.bankofengland.co.uk/publications/workingpapers/index.htm, where abstracts of all papers may be found. Papers published since January 1997 are available in full, in portable document format (PDF).
No. Title Author
274 The substitution of bank for non-bank corporate finance: evidence for the United Kingdom Ursel Baumann(September 2005) Glenn Hoggarth
Darren Pain
275 Wealth and consumption: an assessment of the international evidence Vincent Labhard(October 2005) Gabriel Sterne
Chris Young
276 Corporate expenditures and pension contributions: evidence from UK company accounts Philip Bunn(October 2005) Kamakshya Trivedi
277 When is mortgage indebtedness a financial burden to British households? A dynamic Orla Mayprobit approach (October 2005) Merxe Tudela
278 Misperceptions and monetary policy in a New Keynesian model Jarkko Jääskelä (October 2005) Jack McKeown
279 Monetary policy and private sector misperceptions about the natural level of output Jarkko Jääskelä(October 2005) Jack McKeown
280 A quality-adjusted labour input series for the United Kingdom (1975–2002) Venetia Bell(October 2005) Pablo Burriel-Llombart
Jerry Jones
281 Monetary policy and data uncertainty (November 2005) Jarkko Jääskelä Tony Yates
282 Stress tests of UK banks using a VAR approach (November 2005) Glenn HoggarthSteffen SorensenLea Zicchino
283 Measuring investors’ risk appetite (November 2005) Prasanna GaiNicholas Vause
284 Modelling manufacturing inventories (December 2005) John D Tsoukalas
285 The New Keynesian Phillips Curve in the United States and the euro area: Bergljot Barkbuaggregation bias, stability and robustness (December 2005) Vincenzo Cassino
Aileen Gosselin-LotzLaura Piscitelli
286 Modelling the cross-border use of collateral in payment systems (January 2006) Mark J ManningMatthew Willison
287 Assessing central counterparty margin coverage on futures contracts using Raymond KnottGARCH models (January 2006) Marco Polenghi
288 The price puzzle: fact or artefact? (January 2006) Efrem CastelnuovoPaolo Surico
289 Defined benefit company pensions and corporate valuations: simulation and empirical Kamakshya Trivedievidence from the United Kingdom (March 2006) Garry Young
290 UK monetary regimes and macroeconomic stylised facts (March 2006) Luca Benati
291 Affine term structure models for the foreign exchange risk premium (March 2006) Luca Benati
The Bank of England publishes information on all aspects of its work in many formats. Listed below are some of themain Bank of England publications. For a full list, please refer to our websitewww.bankofengland.co.uk/publications/index.htm.

292 Switching costs in the market for personal current accounts: some evidence for the Céline Gondat-LarraldeUnited Kingdom (March 2006) Erlend Nier
293 Resolving banking crises — an analysis of policy options (March 2006) Misa TanakaGlenn Hoggarth
294 How does the down-payment constraint affect the UK housing market? (March 2006) Andrew Benito
295 Productivity growth, adjustment costs and variable factor utilisation: the UK case Charlotta Groth(April 2006) Soledad Nuñez
Sylaja Srinivasan
296 Sterling implications of a US current account reversal (June 2006) Morten SpangePawel Zabczyk
297 Optimal monetary policy in a regime-switching economy: the response to abrupt shifts Fabrizio Zampolliin exchange rate dynamics (June 2006)
298 Optimal monetary policy in Markov-switching models with rational expectations agents Andrew P Blake(June 2006) Fabrizio Zampolli
299 Optimal discretionary policy in rational expectations models with regime switching Richhild Moessner(June 2006)
External MPC Unit discussion papers
The MPC Unit discussion paper series reports on research carried out by, or under supervision of, the external members of the Monetary Policy Committee. Papers are available from the Bank’s website atwww.bankofengland.co.uk/publications/other/externalmpcpapers/index.htm. The following papers have beenpublished recently.
No. Title Author
9 The pricing behaviour of UK firms (April 2002) Nicoletta BatiniBrian JacksonStephen Nickell
10 Macroeconomic policy rules in theory and in practice (October 2002) Christopher Allsopp
11 The exchange rate and inflation in the UK (October 2002) Amit KaraEdward Nelson
12 Measuring the UK short-run NAIRU (April 2003) Nicoletta BatiniJennifer Greenslade
13 UK consumers’ habits (May 2003) Ryan BanerjeeNicoletta Batini
14 National Accounts revisions and output gap estimates in a model of monetary policy Lavan Mahadevawith data uncertainty (May 2005) Alex Muscatelli
15 Do financial markets react to Bank of England communication? (December 2005) Rachel ReevesMichael Sawicki
Monetary and Financial Statistics
Monetary and Financial Statistics (Bankstats) contains detailed information on money and lending, monetary andfinancial institutions’ balance sheets, banks’ income and expenditure, analyses of bank deposits and lending, externalbusiness of banks, public sector debt, money markets, issues of securities, financial derivatives, interest and exchangerates, explanatory notes to tables and occasional related articles.
Bankstats is published monthly on the internet but paper copies are available on a twice-yearly basis. Publication datesfor the paper copies, for the January and July editions, are Wednesday 1 February 2006 and Tuesday 1 August 2006respectively. The price per annum in the United Kingdom is £40, or £20 per copy. As a result of user feedback, whichvalued on-line availability over the traditional hard copy, the July edition will be the last to be made available in paperformat. Bankstats continues to be made available on a monthly basis free of charge from the Bank’s website atwww.bankofengland.co.uk/statistics/ms/current/index.htm.
Further details are available from: Mark Thompson, Monetary and Financial Statistics Division, Bank of England:telephone 020 7601 4014; fax 020 7601 3208; email [email protected].

The following articles have been published in recent issues of Monetary and Financial Statistics. They can also be foundon the Bank of England’s website at www.bankofengland.co.uk/statistics/ms/articles.htm.
Title Author Month of issue Page numbers
Seasonal adjustment of UK monetary aggregates: Mhairi Burnett February 2006 1–3direct versus indirect approach
Suspense items — allocations within aggregate banks’ data Sue Docker February 2006 4–5
The treatment of securitisations and loan transfers when Martin Daines March 2006 6–7seasonally adjusting using X-12-ARIMA
Update of new effective interest rates data Rob Spillet March 2006 8–10Michelle Rowe
A work programme in financial statistics Nick Davey April 2006 11–15
Proposed changes to industrial analysis of bank deposits Duncan Weldon May 2006 16–17from and lending to UK residents: consultation with users
Financial Stability Report
The Financial Stability Review is published twice a year. Its purpose is to encourage informed debate on financialstability; survey potential risks to financial stability; and analyse ways to promote and maintain a stable financialsystem. The Bank of England intends this publication to be read by those who are responsible for, or have interest in,maintaining and promoting financial stability at a national or international level. It is of especial interest topolicymakers in the United Kingdom and abroad; international financial institutions; academics; journalists; marketinfrastructure providers; and financial market participants. It is available from Financial Stability Review, Bank ofEngland HO-3, Threadneedle Street, London, EC2R 8AH and on the Bank’s website atwww.bankofengland.co.uk/publications/fsr/index.htm.
Payment Systems Oversight Report
The Payment Systems Oversight Report provides an account of how the Bank is discharging its responsibility for oversightof UK payment systems. Published annually, the Oversight Report sets out the Bank’s assessment of key systems against the benchmark standards for payment system risk management provided by the internationally adopted Core Principles for Systemically Important Payment Systems, as well as current issues and priorities in reducingsystemic risk in payment systems. Copies are available on the Bank’s website atwww.bankofengland.co.uk/publications/psor/index.htm.
Practical issues arising from the euro
This is a series of booklets providing a London perspective on the development of euro-denominated financial marketsand the supporting financial infrastructure, and describing the planning and preparation for possible future UK entry.Recent editions have focused on the completion of the transition from the former national currencies to the euro inearly 2002, and the lessons that may be drawn from it. Copies are available from Public Information and EnquiriesGroup, Bank of England, Threadneedle Street, London, EC2R 8AH and on the Bank’s website atwww.bankofengland.co.uk/publications/practicalissues/index.htm.
Handbooks in central banking
The series of Handbooks in central banking provide concise, balanced and accessible overviews of key central bankingtopics. The Handbooks have been developed from study materials, research and training carried out by the Bank’sCentre for Central Banking Studies (CCBS). The Handbooks are therefore targeted primarily at central bankers, but arelikely to be of interest to all those interested in the various technical and analytical aspects of central banking. Theseries also includes Lecture and Research publications, which are aimed at the more specialist reader. All the Handbooksare available via the Bank’s website at www.bankofengland.co.uk/education/ccbs/handbooks/index.htm.
The framework for the Bank of England’s operations in the sterling money markets (the ‘Red Book’)
The ‘Red Book’ describes the Bank of England’s framework for its operations in the sterling money markets, which isdesigned to implement the interest rate decisions of the Monetary Policy Committee (MPC) while meeting the liquidityneeds, and so contributing to the stability of, the banking system as a whole. It also sets out the Bank’s specificobjectives for the framework, and how it delivers those objectives. The framework was introduced in May 2006.

The Bank of England Quarterly Model
The Bank of England Quarterly Model, published in January 2005, contains details of the new macroeconomic modeldeveloped for use in preparing the Monetary Policy Committee’s quarterly economic projections, together with acommentary on the motivation for the new model and the economic modelling approaches underlying it. The price ofthe book is £10.
Quarterly Bulletin
The Quarterly Bulletin provides regular commentary on market developments and UK monetary policy operations. It alsocontains research and analysis and reports on a wide range of topical economic and financial issues, both domestic andinternational.
Summary pages of the Bulletin from February 1994, giving a brief description of each of the articles, are available on theBank’s website at www.bankofengland.co.uk/publications/quarterlybulletin/index.htm. Individual articles from May1994 are also available at the same address.
The Bulletin is also available from National Archive Publishing Company: enquiries from customers in Japan and Northand South America should be addressed to ProQuest Information and Learning, 300 North Zeeb Road, Ann Arbor, Michigan 48106, United States of America; customers from all other countries should apply to The Quorum, Barnwell Road, Cambridge, CB5 8SW, telephone 01223 215512.
An index of the Quarterly Bulletin is also available to customers free of charge. It is produced annually, and listsalphabetically terms used in the Bulletin and articles written by named authors. It is also available atwww.bankofengland.co.uk/publications/quarterlybulletin/contentsandindex.htm.
Bound volumes of the Quarterly Bulletin (in reprint form for the period 1960–85) can be obtained from SchmidtPeriodicals GmbH, Ortsteil Dettendorf, D-83075 Bad Feilnbach, Germany, at a price of €105 per volume or €2,510 per set.
Inflation Report
The Bank’s quarterly Inflation Report sets out the detailed economic analysis and inflation projections on which theBank’s Monetary Policy Committee bases its interest rate decisions, and presents an assessment of the prospects for UKinflation over the following two years. The Inflation Report is available atwww.bankofengland.co.uk/publications/inflationreport/index.htm.
The Report starts with an overview of economic developments; this is followed by five sections:
� analysis of money and asset prices;� analysis of demand;� analysis of output and supply;� analysis of costs and prices; and� assessment of the medium-term inflation prospects and risks.
Publication dates
Copies of the Quarterly Bulletin and Inflation Report can be bought separately, or as a combined package for a discountedrate. Current prices are shown overleaf. Publication dates for 2006 are as follows:
Quarterly Bulletin Inflation Report
Spring 13 March February 15 FebruarySummer 19 June May 10 MayAutumn 25 September August 9 AugustWinter 11 December November 15 November

Copies of the Quarterly Bulletin and Inflation Report can be bought separately, or as a combined package for adiscounted rate. Subscriptions for a full year are also available at a discount. The prices are set out below:
Destination 2006
Quarterly Bulletin Quarterly Bulletin only Inflation Report onlyand Inflation Reportpackage
Annual Single Annual Single Annual Single
United Kingdom,by first-class mail(1) £27.00 £7.50 £21.00 £6.00 £10.50 £3.00
Academics, UUKK oonnllyy £18.00 £5.00 £14.00 £4.00 £7.00 £2.00Students, UUKK oonnllyy £9.00 £2.50 £7.00 £2.00 £3.50 £1.00
European countriesincluding the Republic ofIreland, by letter service £33.00 £9.00 £25.00 £7.00 £13.00 £4.00
Countries outside Europe:Surface mail £33.00 £9.00 £25.00 £7.00 £13.00 £4.00
Air mail £43.00 £12.00 £34.00 £9.00 £17.00 £5.00
(1) Subscribers who wish to collect their copy (copies) of the Bulletin and/or Inflation Report may make arrangements to do so by writing to the address given below. Copies will be available to personal callers at the Bank from 10.30 am on the day of issue and from 8.30 am on the following day.
Readers who wish to become regular subscribers, or who wish to purchase single copies, should send to the Bank, atthe address given below, the appropriate remittance, payable to the Bank of England, together with full address details,including the name or position of recipients in companies or institutions. If you wish to pay by Visa, MasterCard,Maestro or Delta, please telephone +44 (0)20 7601 4030. Existing subscribers will be invited to renew theirsubscriptions automatically. Copies can also be obtained over the counter at the Bank’s front entrance.
The concessionary rates for the Quarterly Bulletin and Inflation Report are noted above in italics. Academics at UKinstitutions of further and higher education are entitled to a concessionary rate. They should apply on theirinstitution’s notepaper, giving details of their current post. Students and secondary schools in the United Kingdomare also entitled to a concessionary rate. Requests for concessionary copies should be accompanied by an explanatoryletter; students should provide details of their course and the institution at which they are studying.
These publications are available from Publications Group, Bank of England, Threadneedle Street, London, EC2R 8AH; telephone +44 (0)20 7601 4030; fax +44 (0)20 7601 3298; email [email protected].
General enquiries about the Bank of England should be made to +44 (0)20 7601 4878.The Bank of England’s website is at www.bankofengland.co.uk.
Issued by the Bank of England Publications Group.
Quarterly Bulletin and Inflation Report subscription details

© Bank of England 2006ISSN 0005-5166
Printed by Park Communications Limited
Printed on recycled paper