Bank Muscat SAOG - AWS
10
Page 1 of 10 Bank Muscat SAOG TP: OMR 0.530 / share Upside/ (Downside): 10% Source: Bloomberg 8 th November 2021 Ayisha Zia Deputy Head of Research [email protected] Tel: +968 24 94 90 36 • Annualized Cost of risk for 9M21 at about 53bps warranting an estimate change for FY21e to 50bps from our earlier assumption of 70bps • Net interest margin to improve as interest rates are expected to increase earlier than previously forecasted, while loan growth to pick up as macroeconomic situation improves • Cash dividend per share expected to be increased to OMR 0.030 for FY21e as compared to OMR 0.25 per share in FY20. We revise our 12-month target price (TP) for Bank Muscat (BKMB) to OMR 0.530 per share from our earlier TP of OMR 0.470 per share on revision in cost of equity as well as a reduced cost of risk expectation for FY21e and onwards. However, due to the recent improvement in the stock price, we maintain its rating as ACCUMULATE. Our TP implies a P/E’22e of 9.3x and a P/B’22e of 0.9x that is still about 20% lower than a multiple of 1.1x seen prior to the Great Oil Price Decline of 2014 despite an anticipation of Oman Government’s future fiscal surpluses vs. deficits over the last few years (see page 2 of this report). The bank continues to boast capital strength and an improving earnings profile amidst strengthening macroeconomic indicators. In our view, oil price recovery, together with a structural shift in Oman’s finances through expedited reforms in lieu of the pandemic, warrant the bank to trade at higher multiples. Recap of 9M21 performance… The bank posted a 24%YoY increase in its net profit for 9M21, largely on account of a 28% drop in net ECL charges for the year as it had front-loaded provision for impairment during FY20 in anticipation of pandemic-related delinquencies. Operationally, the bank’s performance remained sound, with operating income growth outpacing operating expense growth, resulting in an operating profit growth of 7%YoY. The bank’s cost-to-income ratio for 9M’21 stood at 40.3% vs. 40.7% a year ago. Its annualized cost of risk stood at 54bps, vs. 72bps during FY20. It must be noted, however, that the deadline to end loan moratoria and regulatory forbearance measures has been extended, given the difficulties due to covid. These difficulties have been further compounded by the recent cyclone Shaheen. Outlook & Valuation We expect the bank’s top-line to grow on the back of better overall sector credit growth prospects. We believe that given the anticipated rising global interest rate environment coupled with elevated oil prices, the bank’s net interest margin (NIM) is expected to improve in the short to medium term, given its large low-cost deposit base (65% at end-1H21). We anticipate a conservative operating income growth of 4.3% (CAGR) over 2021-2025F. Operating expenses are expected to grow at slower pace helping to boost operating profit. We expect expected credit loss (ECL) allowance charges to taper as the pandemic related delinquencies come to an end as the country reaps it vaccination dividend. We have built in a growth expectation for net profit at a CAGR of 7.3% over 2021-2025F. Recommendation Accumulate Bloomberg Ticker BKMB OM Current Market Price (OMR) 0.480 52wk High / Low (OMR) 0.500/0.330 12m Average Vol. (000) 1,173.1 Mkt. Cap. (USD/OMR mn) 4,461/1,716 Shares Outstanding (mn) 3,574.5 Free Float (%) 70% 3m Avg Daily Turnover (OMR'000) 513.0 6m Avg Daily Turnover (OMR'000) 515.8 P/E'22e (x) 8.4 P/B'22e (x) 0.8 Cash Dividend Yield '21e (%) 6.3% Price Performance: 1 month (%) 2.6 3 month (%) 8.1 12 month (%) 46.7 Source: Bloomberg - 2,000 4,000 6,000 8,000 10,000 12,000 14,000 16,000 18,000 0.290 0.340 0.390 0.440 0.490 0.540 Nov-20 Jan-21 Mar-21 May-21 Jul-21 Sep-21 Nov-21 Price-Volume Performance Vol, '000 (RHS) Px, OMR (LHS) Key Indicators Year FY18 FY19 FY20 FY21e FY22e FY23e Total Net Loans (OMR mn) 8,938.9 8,878.0 8,937.4 9,250.2 9,620.2 10,101.2 Total Customer Deposits (OMR mn) 8,462.7 8,043.7 8,377.3 8,802.7 8,996.9 9,414.2 Operating Income (OMR mn) 446.7 472.2 456.5 475.6 492.0 509.2 Net Profit (OMR mn) 179.6 185.6 163.4 188.0 203.7 214.8 Diluted EPS (OMR) 0.061 0.060 0.050 0.055 0.057 0.057 Diluted BVPS (OMR) 0.610 0.605 0.589 0.596 0.597 0.594 P/E (x) 6.73 7.24 7.84 8.71 8.44 8.41 P/BVPS (x) 0.67 0.72 0.67 0.81 0.80 0.81 Dividend Yield (%) 8.5% 8.1% 6.3% 6.3% 7.3% 7.3% Source: Company Financials, U Capital Research
-
Upload
khangminh22 -
Category
Documents
-
view
1 -
download
0
Transcript of Bank Muscat SAOG - AWS
Page 1 of 10
Bank Muscat SAOG TP: OMR 0.530 / share
Upside/ (Downside): 10%
Source: Bloomberg
8th November 2021 Ayisha Zia Deputy Head of Research [email protected] Tel: +968 24 94 90 36
• Annualized Cost of risk for 9M21 at about 53bps warranting an estimate change for FY21e to 50bps from our earlier assumption of 70bps • Net interest margin to improve as interest rates are expected to increase earlier than previously forecasted, while loan growth to pick up as macroeconomic situation improves • Cash dividend per share expected to be increased to OMR 0.030 for FY21e as compared to OMR 0.25
per share in FY20.
We revise our 12-month target price (TP) for Bank Muscat (BKMB) to OMR 0.530 per share from our earlier TP of OMR 0.470 per share on revision in cost of equity as well as a reduced cost of risk expectation for FY21e and onwards. However, due to the recent improvement in the stock price, we maintain its rating as ACCUMULATE. Our TP implies a P/E’22e of 9.3x and a P/B’22e of 0.9x that is still about 20% lower than a multiple of 1.1x seen prior to the Great Oil Price Decline of 2014 despite an anticipation of Oman Government’s future fiscal surpluses vs. deficits over the last few years (see page 2 of this report). The bank continues to boast capital strength and an improving earnings profile amidst strengthening macroeconomic indicators. In our view, oil price recovery, together with a structural shift in Oman’s finances through expedited reforms in lieu of the pandemic, warrant the bank to trade at higher multiples. Recap of 9M21 performance… The bank posted a 24%YoY increase in its net profit for 9M21, largely on account of a 28% drop in net ECL charges for the year as it had front-loaded provision for impairment during FY20 in anticipation of pandemic-related delinquencies. Operationally, the bank’s performance remained sound, with operating income growth outpacing operating expense growth, resulting in an operating profit growth of 7%YoY. The bank’s cost-to-income ratio for 9M’21 stood at 40.3% vs. 40.7% a year ago. Its annualized cost of risk stood at 54bps, vs. 72bps during FY20. It must be noted, however, that the deadline to end loan moratoria and regulatory forbearance measures has been extended, given the difficulties due to covid. These difficulties have been further compounded by the recent cyclone Shaheen. Outlook & Valuation We expect the bank’s top-line to grow on the back of better overall sector credit growth prospects. We believe that given the anticipated rising global interest rate environment coupled with elevated oil prices, the bank’s net interest margin (NIM) is expected to improve in the short to medium term, given its large low-cost deposit base (65% at end-1H21). We anticipate a conservative operating income growth of 4.3% (CAGR) over 2021-2025F. Operating expenses are expected to grow at slower pace helping to boost operating profit. We expect expected credit loss (ECL) allowance charges to taper as the pandemic related delinquencies come to an end as the country reaps it vaccination dividend. We have built in a growth expectation for net profit at a CAGR of 7.3% over 2021-2025F.
Recommendation AccumulateBloomberg Ticker BKMB OMCurrent Market Price (OMR) 0.48052wk High / Low (OMR) 0.500/0.33012m Average Vol. (000) 1,173.1 Mkt. Cap. (USD/OMR mn) 4,461/1,716Shares Outstanding (mn) 3,574.5 Free Float (%) 70%3m Avg Daily Turnover (OMR'000) 513.0 6m Avg Daily Turnover (OMR'000) 515.8 P/E'22e (x) 8.4 P/B'22e (x) 0.8 Cash Dividend Yield '21e (%) 6.3%
Price Performance: 1 month (%) 2.6 3 month (%) 8.1 12 month (%) 46.7
Source: Bloomberg
-
2,000
4,000
6,000
8,000
10,000
12,000
14,000
16,000
18,000
0.290
0.340
0.390
0.440
0.490
0.540
Nov
-20
Jan-
21
Mar
-21
May
-21
Jul-2
1
Sep-
21
Nov
-21
Price-Volume Performance
Vol, '000 (RHS) Px, OMR (LHS)
Key IndicatorsYear FY18 FY19 FY20 FY21e FY22e FY23eTotal Net Loans (OMR mn) 8,938.9 8,878.0 8,937.4 9,250.2 9,620.2 10,101.2Total Customer Deposits (OMR mn) 8,462.7 8,043.7 8,377.3 8,802.7 8,996.9 9,414.2Operating Income (OMR mn) 446.7 472.2 456.5 475.6 492.0 509.2Net Profit (OMR mn) 179.6 185.6 163.4 188.0 203.7 214.8Diluted EPS (OMR) 0.061 0.060 0.050 0.055 0.057 0.057Diluted BVPS (OMR) 0.610 0.605 0.589 0.596 0.597 0.594P/E (x) 6.73 7.24 7.84 8.71 8.44 8.41P/BVPS (x) 0.67 0.72 0.67 0.81 0.80 0.81Dividend Yield (%) 8.5% 8.1% 6.3% 6.3% 7.3% 7.3%Source: Company Financials, U Capital Research

Page 2 of 10
The structural shift in Oman’s economy warrants a shift in Bank Muscat’s valuations…
Oman’s finances are set to improve with the recovery in oil & gas prices. The question is whether this oil price increase is here to stay (see the section below). Oman’s economy is also structured differently since before the Global Financial Crisis of 2008. Oman has always prioritized revenue diversification (away from hydrocarbons), however, it expedited its efforts markedly during covid, with rapid implementation of its Medium-Term Fiscal Plan (MFTP). The country has enacted a Value-Added-Tax on most goods and services, while at the same time, it has reduced subsidies for oil & gas and electricity. Furthermore, it has rationalized its public sector expenditure and has re-organized its public sector through consolidation of entities and/or abolishment of redundant ones. For more details, please see our report on Oman’s economy, Oman in Focus.
Given this backdrop, we believe that Bank Muscat, which commands a large share in the banking space of Oman, may warrant higher valuation multiples (than seen over the last couple of years), assuming that oil prices sustain at elevated levels.
Note: For 2021e and 2022e, current market price has been used for calculating multiples, U Capital Research estimates
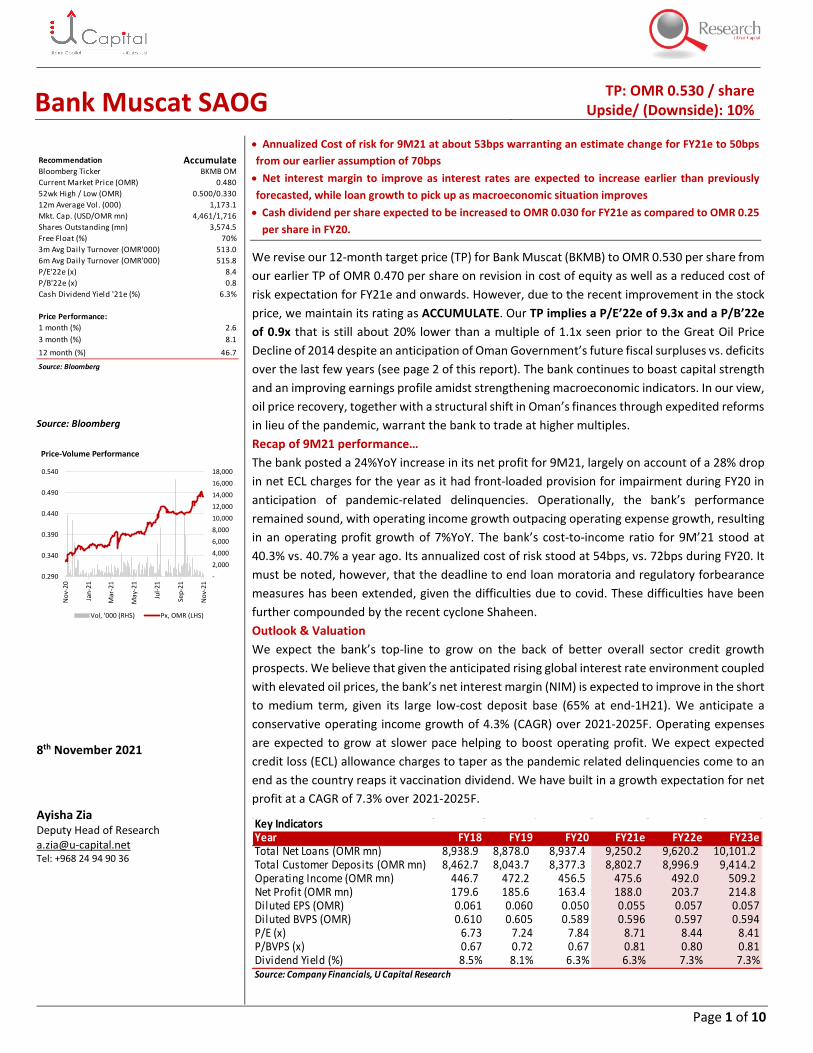
Reduced CAPEX in the oil & gas industry over the years poses rising risks in the world energy markets…
Over the years, oil & gas companies have been reducing CAPEX as Governments pushed for energy source diversification given the forbidding outlook as the world awoke to the dangers to environment, especially climate change. This reduction in capex has now resulted in a gloomy outlook for meeting the world’s energy needs. While oil demand may reduce structurally, as cited by the International Energy Agency (IEA) as being driven by behavioral changes in the post-pandemic world, the IEA is warning of lack of capability to meet the world energy demand in the near term. These sharp spending cuts and project delays are already constraining supply growth across the globe, with world oil production capacity now set to increase by 5 mb/d by 2026. In the absence of stronger policy action for shifting to renewables, global oil production would need to rise 10.2 mb/d by 2026 to meet the expected rebound in demand.1 Stated differently, transition from non-renewables to renewables will take some time; it is during this time that fossil fuel prices may stay elevated.
Further compounding the problem is the heightened uncertainty in the oil demand outlook causing producers to weigh capex decisions carefully as “investment decisions made today could either bring on too much capacity that is left unused or too little oil to meet demand”2. Refer to Appendix A, B & C for more information.
1 IEA’s Oil Report, 2021 2 IEA press release, “Oil markets face uncertain future after rebound from historic Covid-19 shock”
2006 2007 … 2012 2013 2014 … 2018 2019 2020 2021e 2022eP/E (x) 15.9 21.4 8 8.8 7.7 6.7 7.2 7.8 8.7 8.4P/B (x) 3.0 3.3 1.1 1.1 1.1 0.7 0.7 0.7 0.8 0.8ROE (%) 19.9 17.8 14.3 13.3 12.9 10.3 10.1 8.6 9.5 9.8NPL (%) 4.8 2.7 3.3 2.5 2.8 3.1 3.3 3.6 3.5 3.6Provision Coverage Ratio (%) 126.8 145.9 110.6 95.1 125.6 114.8 105.5 117.2 135.4 118.9
Avg. Brent Crude Price (USD/bbl) 65.1 72.5 111.6 108.6 99.0 71.3 64.3 42.0 66.25* -Fiscal Breakeven Oil Price (USD/bbl) 39.1 42.1 103.0 102.1 101.5 80.2 67.9 87.6 70.9 60.5
Oman's Fiscal Deficit (% of GDP)** 11.2% 10.4% 5.6% 3.7% -2.1% -8.1% -5.7% -16.2% -2.8% 1.2%Non-hydrocarbon Revenue to non-hydrocarbon GDP Ratio (%)
14.7% 16.5% 14.2% 12.3% 11.3% 10.8% 15.6% 12.7% 16.2% 16.9%
Non-hydrocarbon GDP growth (%) 13.3% 15.7% 14.8% 9.3% 4.4% -1.6% -2.8% -3.9% 2.3% 2.4%*Average brent crude price from Bloomberg for 2021, the rest from Statista
**IMF's Regional Economic Outlook Database (Updated 19-Oct-2021)
Source: World Economic Outlook Database October 2021, U Capital Research, Statista, Bloomberg
Pre-Global Financial Crisis
Prior to the Great Oil Price Collapse of 2014
Covid & Post-Covid eraPre-covid

Page 3 of 10
Valuation Assumptions & Sensitivity Analysis
We have used a risk-free rate of 5.0% (previous in March’21: 5.25%, May’20: 7.3%) US risk premium of 8.5% (previously 7.9%), and a 3-yr weekly adjusted Beta of 1.12 (Source: Bloomberg). Our base case cost of risk assumption for the year 2021e is 50bps, while P/B ratio assumption is 0.92x for 2022e (premium to sector average of 0.71x). A terminal growth rate of 5% has been assumed based on retention ratio and terminal ROE assumption.
We have assigned a weightage of 80% to excess return methodology and 20% to P/B multiple-based approach.
Our TP moves about +/- 1% with every +/- 10bps change in base case cost of risk assumption, while it moves about +/- 2% with every +/- 0.5% change in cost of equity. Our TP changes about +/-2% with every +/- 0.05x change in P/B’22e multiple. Between 0.92x and 0.97x, our TP remains the same, if cost of equity doesn’t change.
Beginning book value of Equity invested currently 1,971,798 FY21e FY22e FY23e FY24e FY25e
OMR'000
Net Income 187,971 203,677 214,782 229,579 246,878 Less: Equity Cost 279,330 296,819 312,286 326,149 341,302 Excess Equity Return (91,358) (93,142) (97,504) (96,570) (94,425) Present value of Excess Equity Return (89,544) (79,664) (72,772) (62,895) (53,664) Sum of present value of Excess Return (358,539)
Terminal value projectionsBook value of equity at start of year 6 2,453,035 Net income in Stable period 332,386 Less equity cost 294,364 Excess return 38,022 Terminal Value 436,789 PV of Terminal Value 248,240 Total Equity value , OMR'000 1,861,498 Total shares out, '000 3,574,480 Target price, OMR 0.521
Historical Multiple ValuationExpected P/B (x) '22e 0.92BVPS'22e 0.597Fair Value, OMR 0.550
Weighted Average Fair Value (OMR) 0.530 Current price , OMR 0.480 Upside / (downside), % 10.4%
0.530 30 40 50 60 70 0.530 0.82 0.87 0.92 0.97 1.02 13.6% 0.570 0.560 0.550 0.550 0.540 12.6% 0.570 0.580 0.580 0.590 0.59014.1% 0.550 0.550 0.540 0.530 0.530 13.6% 0.540 0.550 0.550 0.560 0.56014.6% 0.540 0.530 0.530 0.520 0.510 14.6% 0.510 0.520 0.530 0.530 0.54015.1% 0.530 0.520 0.510 0.510 0.500 15.6% 0.490 0.500 0.500 0.510 0.51015.6% 0.510 0.510 0.500 0.500 0.490 16.6% 0.470 0.480 0.480 0.490 0.490Co
st o
f Equ
ity
Cost
of E
quity
Expected P/B'21e MultipleBKMB
Cost of Risk'21e, bps

Page 4 of 10
Key Risks
The key downside risks to our valuation are: (1) lingering uncertainty surrounding the duration of the coronavirus impact, especially on oil prices (2) Deterioration in macroeconomic indicators warranting a rise in cost of equity. (3) event risks as concentrations exist both on assets as well as deposits side. (5) A large proportion of borrowers on payment holiday (deferred payment schedules) to be unable to resume their scheduled payments at the end of the forbearance period resulting in steep rise in NPLs and impairment draws.
Key Estimate Changes
OMR mn Old FY21e Old FY22e New FY21e Change (%) New FY22e Change (%)Net Interest & Islamic Income 335 363 336 0% 340 -6%Other operating income 134 140 140 4% 152 9%Total Operating Income 469 503 476 1% 492 -2%Operating Expenses -190 -203 -193 2% -197 -3%Operating Profit 279 300 283 1% 295 -1%Total Impairment Charge -73 -77 -58 -21% -51 -34%Net Profit 172 186 188 9% 204 10%
165 179 181 10% 197 10%
Net Loans & Islamic Financing 9,563 10,567 9,250 -3% 9,620 4%Customer Deposits 8,947 9,815 8,803 -2% 8,997 2%
Source: U Capital Research
Net profit after Interest on Tier 1 perpetual securitites

Page 5 of 10
Peer Group Valuation
BKMB BKDB NBOB BKSB ABOB HBMO SNB RIBL BSFR QNBK CBQK NBK FAB EMIRATES ADCB NBB Simple Average
Median
Asset size (USD bn) 34 11.5 10.2 10.4 8.0 6.2 240.7 85.0 56.9 294.9 45.0 107.8 267.6 190.3 117.6 12.1 97.6 56.9
Growth Metrics
Loan Growth, YoY (%) 3.5 3.3 4.0 -7.2 10.1 0.2 49.2 10.1 8.2 6.5 11.9 11.2 4.0 -0.2 -0.3 7.1 7.9 6.5
Deposit Growth, YoY (%) -0.2 11.7 6.7 -5.1 15.0 -0.5 44.2 1.3 5.7 9.6 10.3 1.6 0.7 1.9 5.0 6.9 7.7 5.7
Profitability
ROA (%) 1.5 0.8 0.7 0.7 0.9 0.2 1.7 1.7 1.2 1.2 1.5 1.1 1.3 1.2 1.1 1.3 1.1 1.2
ROE (%) 9.7 4.0 3.8 4.8 9.3 1.6 11.4 11.9 7.5 15.4 11.1 9.2 12.7 10.7 9.2 11.1 8.9 9.3
NIM (%) 2.9 2.7 2.7 2.3 2.1 2.4 3.2 3.0 2.8 2.3 2.6 2.7 1.8 2.8 2.4 3.0 2.6 2.7
Capital & Liquidity Ratios
CAR (%) 20.5 17.4 15.4 19.3 15.9 21.3 19.1 19.3 21.0 18.6 18.3 18.1 15.9 19.2 16.3 22.3 18.5 18.6
CET1 Ratio (%) 18.0 16.1 14.6 18.3 15.0 20.6 18.2 16.0 19.8 17.5 16.2 15.6 14.8 18.1 15.0 21.4 17.2 16.2
LCR (%) 279.0 - 170.8 202.7 156.0 225.0 178.0 176.0 194.0 165.0 100.8 111.5 124.0 157.2 131.7 - 161.0 165.0
Asset Quality
Provision Cover (%) 120.0 110.8 97.0 73.9 94.2 129.7 134.5 116.4 122.9 137.9 115.9 220.0 100.0 126.8 65.8 75.9 114.8 115.9
NPL Ratio (%) 3.5 4.1 5.5 7.0 3.1 3.0 1.6 1.6 60.1 2.3 3.9 1.7 3.9 6.1 6.1 4.9 7.7 3.9
Cost of Risk, (%) 0.5 0.3 0.7 0.8 0.6 0.5 0.3 0.5 0.3 0.8 0.1 0.7 0.0 0.2 1.5 0.1 0.5 0.5
Efficiency
Cost to Income Ratio (%) 40 48 50 43 39 71 35 35 32 23 29 42 25 34 35 50 39.4 35.3
Valuation
P/E Ratio 8.7 17.0 19.4 15.3 7.4 33.9 19.8 16.8 23.4 16.4 12.5 23.6 16.5 11.2 12.2 21.0 17.8 16.8
P/B Ratio 0.8 0.7 0.7 0.8 0.7 0.5 2.0 1.9 1.6 2.4 1.4 2.1 2.0 1.2 1.1 2.2 1.4 1.4
Div Yield (%) 6.3 3.0 3.8 3.3 4.5 5.7 2.0 3.4 2.8 2.2 1.6 1.9 4.0 2.8 3.3 2.9 3.1 3.0Source: U Capital Research, BloombergAll figures as at the end of 9M21 and annualized if necessary, prior period values if unavailable. Valuation as at Nov 7th, 2021Highlighted cells indicate values above or below the median values
GCC BanksOman Banks

Page 6 of 10
Key Financials (OMR mn) FY18 FY19 FY20 FY21e FY22e FY23eIncome StatementInterest/Financing Income 478.6 518.1 506.0 523.5 540.2 563.8 Interest Expense/Payment to Depos i tors (174.4) (201.1) (183.9) (187.6) (200.0) (212.6) Net Interest/Financing Income 304.3 317.0 322.1 335.9 340.2 351.2 Fee & Commiss ion Income 96.5 102.3 90.3 93.9 102.0 106.2 Other Income 46.0 52.9 44.1 45.8 49.8 51.8 Total Non-Interest/Financing Income 142.4 155.2 134.4 139.8 151.9 158.0
Total Operating Income 446.7 472.2 456.5 475.6 492.0 509.2 Operating Expenses (190.3) (195.9) (179.9) (193.0) (196.7) (200.5) Operating Profit 256.4 276.2 276.7 282.6 295.3 308.7 Provis ions expense (43.2) (56.1) (81.0) (57.8) (51.4) (51.5) Profit Before Taxation 213.2 220.1 195.6 224.8 243.9 257.2 Taxation & others (33.5) (34.6) (32.3) (36.8) (40.3) (42.5) Net Profit Attributable to Parent 179.6 185.6 163.4 188.0 203.7 214.8 Interest of Tier 1 Perpetual Securi ties (7.2) (7.2) (7.2) (7.2) (7.2) (7.2) Net Profit Attributable to shareholders 172.5 178.4 156.2 180.8 196.5 207.6 check - - Balance SheetCash Balances 1,307 782 657 835 699 650 Depos i ts with Banks & FIs 476 870 574 628 637 677
Gross Loans (Conventional) 8,136 8,001 8,069 8,352 8,686 9,120 Loan Loss Reserve (Conventionl) (308) (289) (362) (375) (390) (409)
Net Loans (Conventional) 7,828 7,712 7,707 7,977 8,296 8,711 Gross Islamic Financing 1,132 1,192 1,264 1,308 1,361 1,429 Loan Loss Reserve (Islamic) (21) (26) (34) (35) (37) (38)
Net Islamic Financing 1,110 1,166 1,230 1,273 1,324 1,390 Gross Loans & Islamic financing 9,268 9,193 9,333 9,660 10,047 10,549 Loan Loss Reserve (Conventional + Islamic) (329) (315) (396) (410) (426) (448)
Net Loans & Islamic financing 8,939 8,878 8,937 9,250 9,620 10,101 Investments 1,270 1,445 1,835 1,900 1,976 2,074 Investment in Associates - - - - - - Investment Properties - - - - - - Net Fixed Assets 70 79 71 73 75 73 Other Assets 227 237 379 392 408 428 Total Assets 12,288 12,291 12,454 13,078 13,414 14,004
Depos i ts from Banks & FIs 952 1,173 938 986 1,007 1,054 Islamic Deposits 958 1,032 1,013 1,087 1,140 1,189 Conventional Deposits 7,504 7,011 7,364 7,716 7,857 8,225
Total Customer Deposits 8,463 8,044 8,377 8,803 8,997 9,414 Other Borrowings 469 502 490 491 491 492 Other Liabi l i ties 477 569 605 636 650 680 Tota l l iabi l i ties 10,360 10,288 10,410 10,915 11,145 11,640
Pa id-up Capita l 295 309 325 341 358 376 Reta ined Earnings 485 526 538 609 665 707 Other Reserves 1,018 1,037 1,051 1,083 1,117 1,151 Shareholders ' Equi ty 1,798 1,873 1,914 2,033 2,139 2,234 Minori ty Interest, Tier 1 Perpetual Notes 130 130 130 130 130 130 Total Equity & Liabilities 12,288 12,291 12,454 13,078 13,414 14,004 Cash Flow StatementCash from operations 554 (437) 2 247 (37) 69 Cash from investing activi ties (3) 10 (8) 2 1 (2) Cash from financing (185) (78) (135) (67) (97) (119) Net changes in cash 372 (525) (125) 178 (136) (49) Cash at the end of period 1,307 782 657 835 699 650 Key RatiosReturn on Average Assets 1.5% 1.5% 1.3% 1.5% 1.5% 1.6%Return on Average Equity 10.3% 10.1% 8.6% 9.5% 9.8% 9.8%Net Interest Income & Is lamic Finance Income/ Operating Incom 68.1% 67.1% 70.6% 70.6% 69.1% 69.0%Other Operating Income/Operating Income 31.9% 32.9% 29.4% 29.4% 30.9% 31.0%Net fee income/Operating Income 21.6% 21.7% 19.8% 19.7% 20.7% 20.9%Interest Earning/Finance Asset Yield 4.6% 4.7% 4.5% 4.5% 4.5% 4.5%Cost of Funds 1.9% 2.1% 1.9% 1.9% 1.9% 2.0%Net Spread 2.8% 2.7% 2.6% 2.6% 2.6% 2.5%Cost to Income Ratio 42.6% 41.5% 39.4% 40.6% 40.0% 39.4%Net Loans & Is lamic Financing to Customer Depos i ts (Tota l LTD) 106% 110% 107% 105% 107% 107%Non Performing Loans , OMR mn 287 299 338 342 359 377 NPLs to Gross Loans & Is lamic Financing, % 3.1% 3.2% 3.6% 3.5% 3.6% 3.6%NPL Coverage, % 114.8% 105.5% 117.2% 135.4% 118.9% 118.9%Cost of Risk (bps) 48.9 60.8 87.5 60.9 52.2 44.3 Shareholders 'Equity to Tota l Loans & Is lamic Financing, x 0.19 0.20 0.21 0.21 0.21 0.21Shareholders ' Equi ty to Tota l Assets , x 0.15 0.15 0.15 0.16 0.16 0.16Capita l Adequacy Ratio, % 19.4% 19.8% 20.8% 20.3% 20.5% 20.4%EPS (OMR) 0.061 0.060 0.050 0.055 0.057 0.057 BVPS (OMR) 0.610 0.605 0.589 0.596 0.597 0.594 Market Price (OMR) * 0.410 0.434 0.394 0.480 0.480 0.480 Cash Dividend Payout Ratio, % 57.4% 58.4% 49.7% 54.5% 61.6% 61.3%Cash Dividend Yield, % 8.5% 8.1% 6.3% 6.3% 7.3% 7.3%P/E Ratio (x) 6.7 7.2 7.8 8.7 8.4 8.4 P/BV Ratio (x) 0.7 0.7 0.7 0.8 0.8 0.8 *Market price for current year and subsequent years as per the closing price on 07-Nov-2021
Source: Company Financials, U Capital Research

Page 7 of 10
Appendix A
Source: IEA Oil Outlook 2021, OPEC's supply sourced from World Oil Outlook 2021
IEA cites OPEC producing at full capacity in order to meet demand
80
85
90
95
100
105
110
2019 2020 2021e 2022e 2023e 2024e 2025e 2026e
World Oil Balance (mb/d)
Total Oil Demand Total Oil Supply
Page 8 of 10
Appendix B
Source: Bloomberg Intelligence
0
50
100
150
200
250
300
350
400
1985
1986
1987
1988
1989
1990
1991
1992
1993
1994
1995
1996
1997
1998
1999
2000
2001
2002
2003
2004
2005
2006
2007
2008
2009
2010
2011
2012
2013
2014
2015
2016
2017
2018
2019
2020
USD
bn
Global Oil Capex (USD bn)

Page 9 of 10
Appendix C
Source: IEA, Announced revisions to 2020 capital expenditure by selected oil and gas companies, IEA, Paris https://www.iea.org/data-and-statistics/charts/announced-revisions-to-2020-capital-expenditure-by-selected-oil-and-gas-companies
-60%
-50%
-40%
-30%
-20%
-10%
0%
0
5
10
15
20
25
30
35
40
Shel
l
Chev
ron
Tota
l
BP ENI
Cono
coPh
ilips
Saud
i Ara
mco
Petr
obra
s
Equi
nor
EcoP
etro
l
EOG
Reso
urce
s
Sunc
or E
nerg
y
Oxy
Reps
ol
Cana
dian
Nat
ural
Res
ourc
es
Phili
ps 6
6
Announced revisions to 2020 capital expenditure by selected oil and gas companies
FY19 FY20 YoY (RHS)
Page 10 of 10 P.O.BOX 1137, PC 111 – CPO, Sultanate of Oman l CR No. 1279406 l Tel: +968 2494 9000 l Fax: +968 2494 9099 l Email: [email protected] l Web: www.u-capital.net
Ubhar Capital SAOC (U Capital)
Website: www.u-capital.net
PO Box 1137 PC 111, Sultanate of Oman
Tel: +968 2494 9000 Fax: +968 2494 9099
Email: [email protected]
Disclaimer: This report has been prepared by Ubhar Capital (U Capital) Research and is provided for information purposes only. Under no circumstances is it to be used or considered as an offer to sell or solicitation of any offer to buy. While all reasonable care has been taken to ensure that the information contained therein is not untrue or misleading at the time of publication, we make no representation as to its accuracy or completeness and it should not be relied upon as such. The company accepts no responsibility whatsoever for any direct or indirect consequential loss arising from any use of this report or its contents. All opinions and estimates included in this document constitute U Capital Research team’s judgment as at the date of production of this report and are subject to change without notice. This report may not be reproduced, distributed or published by any recipient for any other purpose.
Recommendation
BUY Greater than 20%
ACCUMULATE Between +10% and +20%
HOLD Between +10% and -10%
REDUCE Between -10% and -20%
SELL Lower than -20%