Baeissa, Hanadi.pdf - Sussex Research Online
265
A University of Sussex PhD thesis Available online via Sussex Research Online: http://sro.sussex.ac.uk/ This thesis is protected by copyright which belongs to the author. This thesis cannot be reproduced or quoted extensively from without first obtaining permission in writing from the Author The content must not be changed in any way or sold commercially in any format or medium without the formal permission of the Author When referring to this work, full bibliographic details including the author, title, awarding institution and date of the thesis must be given Please visit Sussex Research Online for more information and further details
-
Upload
khangminh22 -
Category
Documents
-
view
0 -
download
0
Transcript of Baeissa, Hanadi.pdf - Sussex Research Online

A University of Sussex PhD thesis
Available online via Sussex Research Online:
http://sro.sussex.ac.uk/
This thesis is protected by copyright which belongs to the author.
This thesis cannot be reproduced or quoted extensively from without first obtaining permission in writing from the Author
The content must not be changed in any way or sold commercially in any format or medium without the formal permission of the Author
When referring to this work, full bibliographic details including the author, title, awarding institution and date of the thesis must be given
Please visit Sussex Research Online for more information and further details

Identifying driver mutations in cancers
A thesis submitted to the University of Sussex for the
degree of Doctor of Philosophy
By
Hanadi Baeissa
October 2018

2
Declaration
I hereby declare that this thesis has not been and will not be, submitted in whole or in
part to another University for the award of any other degree.
Hanadi Baeissa
/ / 2018

3
Preface
The research presented in this thesis has been submitted for publication as follows:
Chapter 2
Baeissa HM, Benstead-Hume G, Richardson CJ, Pearl FM. Mutational patterns in
oncogenes and tumour suppressors. Biochemical Society Transactions. 2016; 44:925–
31.
Author contributions: F.M.G.P. conceived the project and designed the analysis; H.B.,
C.R., G.B.-H. and F.M.G.P. implemented the informatics; and H.B. and F.M.G.P.
undertook the data analysis and wrote the paper.
Chapter 3
Baeissa HM, Benstead-Hume, G., Richardson, CJ. & Pearl, FM. Identification and
analysis of mutational hotspots in oncogenes and tumour suppressors. Oncotarget.
2017; 8; 21290–304.
Author contributions: F.M.G.P. conceived the project and designed the analysis; H.B.,
C.R., G.B.-H. and F.M.G.P. implemented the informatics; and H.B. and F.M.G.P.
undertook the data analysis and wrote the paper.
Chapter 4
Hanadi M Baeissa, Sarah K. Wooller, Chris J Richardson and Frances M G Pearl.
Predicting loss of function and gain of function driver missense mutations in cancer.
Submitted
Author contributions: F.M.G.P. and H.M.B conceived the project and designed the
analysis; H.B., C.R., and S.W. implemented the informatics; and H.B. undertook the
data analysis. H.B and FMGP wrote the paper.

4
Chapter 5
Hanadi M Baeissa and Frances M G Pearl. Identifying the impact of inframe insertions
and deletions on protein function in cancer. Submitted
Author contributions: F.M.G.P. and H.B conceived the project and designed the
analysis; H.B. implemented the informatics, undertook the data analysis and wrote the
paper under the supervision of FMGP.
Chapter 6
Hanadi M Baeissa, Sarah K Wooller and Frances M Pearl. Identifying actionable
mutated proteins as targets for personalised medicine in lung cancer. In preparation
Author contributions: F.M.G.P. and H.M.B conceived the project and designed the
analysis; H.B., GB-H and S.W implemented the informatics. H.B undertook the data
analysis and wrote the paper under the supervision of FMGP.

5
Acknowledgements
This thesis would not have been possible without the constant help and guidance of my
wonderful supervisor Dr. Frances Pearl. Her understanding and support are really
appreciated. I have benefited from her knowledge, insight and enthusiasm. Also, I wish
to thank my second supervisor Prof Laurence Pearl for the help.
I am grateful to my friend Sarah Wooller for the warm support and caring that helped
me through my most difficult period during the PhD. I wish to thank members of
bioinformatics group: Graeme Benstead-Hume and Tina Chen for all the assistance,
encouragement and friendship and to everyone who has been involved in the
underlying work of this thesis.
Most of all, I would like to thank my parents Mohammed and Noor. Their constant
support and unwavering confidence that I can do anything and everything that I desire
made me who I am today. My warmest thank also go out to my sister, my brothers, my
kids for their support and opening my eyes to the future. Special thanks are owed to my
husband Adel. His easy going attitude, understanding and love took the weight of life
outside the research world off my shoulders so I could breathe a little easier.
For the generous financial support through the years, thanks goes to King Abdulaziz
University, Ministry of education in Saudi Arabia and Royal Embassy of Saudi Arabia
Cultural Bureau in London.

6
Abstract
All cancers depend upon mutations in critical genes, which confer a selective
advantage to the tumour cell. The key to understanding the contribution of a disease-
associated mutation to the development and progression of cancer comes from an
understanding of the consequences of that mutation on the function of the affected
protein, and the impact on the pathways in which that protein is involved.
Using data from over 30 different cancers from whole-exome sequencing cancer
genomic projects, I analysed over one million somatic mutations. I identified
mutational hotspots within domain families by mapping small mutations to equivalent
positions in multiple sequence alignments of protein domains. I found that gain of
function mutations from oncogenes and loss of function mutations from tumour
suppressors are normally found in different domain families and when observed in the
same domain families, hotspot mutations are located at different positions within the
multiple sequence alignment of the domain.
Next, I investigated the ability of seven prediction algorithms to discriminate between
driver missense mutations in oncogenes and tumour suppressors. Using 19 features to
describe these mutations, I then developed a random forest classifier, MOKCaRF, to
distinguish between gain of function and loss of function missense mutations in cancer.
MOKCaRF performs significantly better than existing algorithms.
I then evaluated the ability of six existing prediction tools to distinguish between
pathogenic and neutral mutations for both inframe insertion and inframe deletion
mutations. I developed my own classifiers using 11 features that perform better than
the current algorithms.

7
Finally, using the algorithms that I developed, as well as changes in copy number and
expression data for each gene, I analysed samples from 50 lung cancer patients to
identify the actionable targets and potential new drug targets for each tumour.

8
List of Contents
Chapter 1. Introduction ............................................................................................ 19
1.1 Cancer ................................................................................................................ 20
1.1.1 The Hallmarks of Cancer ............................................................................. 21
1.2 Genes involved in the development of cancer................................................. 23
1.2.1 Oncogenes .................................................................................................... 24
1.2.2 Tumour suppressor genes ............................................................................ 24
1.2.3 Therapeutically targeting driver genes ......................................................... 25
1.3 Mutations that arise in cancer ......................................................................... 26
1.3.1 Large-scale mutations .................................................................................. 26
1.3.2 Small-scale mutations .................................................................................. 27
1.3.2.1 Point Mutations ..................................................................................... 27
1.3.2.2. Indels .................................................................................................... 28
1.4 Functional consequence of small-scale mutations .......................................... 28
1.4.1 Loss of function mutations........................................................................... 28
1.4.2 Gain of function mutations .......................................................................... 30
1.5 Biological databases .......................................................................................... 31
1.5.1.Ensembl........................................................................................................ 31
1.5.2 The Universal Protein Resource .................................................................. 32
1.5.3 Protein Data Bank ........................................................................................ 33
1.5.4. CATH .......................................................................................................... 33
1.5.5 Pfam ............................................................................................................. 34
1.6 Cancer databases .............................................................................................. 36
1.6.1 Catalogue of Somatic Mutations in Cancer ................................................. 36
1.6.2 Cancer Gene Census .................................................................................... 37
1.6.3 ClinVar ......................................................................................................... 37
1.6.4 The Cancer Genome Atlas ........................................................................... 38
1.6.5 International Cancer Genome Consortium .................................................. 38
1.6.6 The Pan Cancer Analysis of Whole Genomes ............................................. 39
1.6.7 MOKCa ........................................................................................................ 39
1.6.8 CanSAR ....................................................................................................... 40
1.7 Prediction Algorithms to assess the impact of mutations .............................. 40
1.7.1 Missense mutations ...................................................................................... 40
1.7.2 Indel mutations............................................................................................. 45
1.8 Algorithms applied in this work ...................................................................... 49
1.8.1 Multiple sequence alignments...................................................................... 49
1.8.2 Machine learning ......................................................................................... 51
1.8.3 Models.......................................................................................................... 52
1.8.3.1 Random forest ....................................................................................... 52
1.8.3.2 Support vector machine ........................................................................ 55
1.8.4 Cross validation ........................................................................................... 57
1.8.5 Features ........................................................................................................ 57
1.9 Objectives of this thesis .................................................................................... 58
1.9.1 Mutational patterns in oncogenes and tumour suppressors ......................... 58
1.9.2 Identification and analysis of mutational hotspots in oncogenes and tumour
suppressors ............................................................................................................ 58
1.9.3 Predicting loss of function and gain of function driver missense mutations in
cancer .................................................................................................................... 59
9
1.9.4 Identifying the impact of in-frame insertions and deletions on protein
function in cancer .................................................................................................. 59
1.9.5 Identifying actionable mutated proteins as targets for personalised medicine
in lung cancer ........................................................................................................ 60
Chapter 2. Mutational patterns in oncogenes and tumour suppressors ............... 61
2.1 Introduction ....................................................................................................... 61
2.2 Identifying driver genes .................................................................................... 62
2.3 Characteristics of tumour suppressors and oncogenes ................................. 63
2.3.1 Identifying driver mutations ........................................................................ 64
2.3.2 Approaches to distinguish between tumour suppressors and oncogenes. 65
2.4 MOKCa database.............................................................................................. 65
2.4.1 Structural mapping of mutations .................................................................. 66
2.4.2 Development of web-interface ..................................................................... 67
2.5 Activating mutations in oncogenes .................................................................. 67
2.5.1 Activating mutations in protein kinases ....................................................... 69
2.5.2 Oncogenic mutations in isocitrate dehydrogenases ................................. 72
2.6 Domain-based approaches for identifying mutational hotspots ................... 73
Chapter 3. Identification and analysis of mutational hotspots in oncogenes and
tumour suppressors ................................................................................................... 75
3.1 Introduction ....................................................................................................... 75
3.2 Materials and Methods ..................................................................................... 79
3.2.1 Mutation mapping ........................................................................................ 79
3.2.2 Functional classification of TS and OG ....................................................... 80
3.2.3 Enriched domains......................................................................................... 80
3.2.4 Hotspot identification................................................................................... 81
3.2.5 MoKCA database ......................................................................................... 82
3.2.6 Populating the database with mutational data .............................................. 82
3.2.7 Functional annotation of protein sequences and mutations ......................... 83
3.2.8 Structural mapping of mutations .................................................................. 83
3.2.9 Development of web-interface ..................................................................... 84
3.3 Results and Discussion ...................................................................................... 84
3.3.1 Functional characterisation of tumour suppressors and oncogenes ............. 84
3.3.2 Domain characterisation of tumour suppressors and oncogenes ................. 85
3.3.3 Identifying tumour suppressors and oncogenes using domain biases ......... 87
3.3.4 Mutational characterisation of domains in tumour suppressors and
oncogenes .............................................................................................................. 88
3.3.5 Mutational enrichment in tumour suppressors ............................................. 88
3.3.6 Mutational enrichment in oncogenes ........................................................... 89
3.3.7 Genome-wide mutational enrichment .......................................................... 91
3.3.8 Detecting domain hotspots ........................................................................... 93
3.3.9 Hotspot mutations in tumour suppressors .................................................... 94
3.3.10 Hotspots in oncogenes ............................................................................... 98
3.3.11 Hotspots in tumour suppressors and oncogenes occur in different positions
in the domains ..................................................................................................... 101
3.3.12 Genome wide hotspots ............................................................................. 104
3.4 Conclusions ...................................................................................................... 105
Chapter 4. Predicting loss of function and gain of function driver missense
mutations in cancer .................................................................................................. 108
4.1 Introduction ..................................................................................................... 108

10
4.2 Methods ............................................................................................................ 110
4.2.1 Datasets ...................................................................................................... 110
4.2.1.1 Identification of hotspot driver mutations from COSMIC data .......... 110
4.2.1.2 Identification of pathogenic mutations from ClinVar ......................... 112
4.2.1.3 Neutral mutation dataset ..................................................................... 113
4.2.2 Comparison of prediction algorithms ........................................................ 113
4.2.3 Feature selection ........................................................................................ 114
4.2.4 Machine learning ....................................................................................... 114
4.2.5 Validation of the algorithm ........................................................................ 115
4.2.6 Prediction of functional consequences of missense mutations in the MOKCa
database ............................................................................................................... 115
4.3 Results .............................................................................................................. 116
4.3.1 Data sets ..................................................................................................... 116
4.3.2 Cut-offs ...................................................................................................... 116
4.3.3 Comparison of Prediction Algorithms ....................................................... 117
4.3.4 Classifiers ................................................................................................... 120
4.3.5 Evaluation test sets ..................................................................................... 123
4.3.6 Feature importance..................................................................................... 124
4.3.7 Identifying LOF and GOF missense mutations in MOKCa ...................... 127
4.4 Discussion and Conclusion ............................................................................. 129
Chapter 5. Identifying the impact of inframe insertions and deletions on protein
function in cancer. .................................................................................................... 133
5.1 Introduction ..................................................................................................... 133
5.2 Methods ............................................................................................................ 136
5.2.1 Data ............................................................................................................ 136
5.2.2 Identification of hotspot indel mutations ................................................... 137
5.2.3 Comparison of prediction algorithms ........................................................ 137
5.2.4 Feature selection ........................................................................................ 137
5.2.5 Feature Importance .................................................................................... 137
5.2.6 Machine learning ....................................................................................... 138
5.2.7 Validation of algorithms ............................................................................ 138
5.2.8 Prediction of functional consequences of indel mutations in the MOKCa
database ............................................................................................................... 139
5.3 Results and Discussion .................................................................................... 139
5.3.1 Identification of recurrent indels ................................................................ 139
5.3.2 Comparison of Prediction Algorithms ....................................................... 140
5.3.2.1 Ease of use .......................................................................................... 140
5.3.2.2 Are recurrent mutations pathogenic? .................................................. 140
5.3.2.3 Definition of optimal somatic cancer pathogenic indel datasets ........ 143
5.3.3 Development of a cancer specific indel classifier...................................... 143
5.3.4 Feature importance..................................................................................... 145
5.3.5 Evaluation test set ...................................................................................... 147
5.3.6 Identifying pathogenic in-frame indel mutations in MOKCa .................... 148
5.3.7 Analysis of pathogenic mutations .............................................................. 148
5.4 Conclusions ...................................................................................................... 151
Chapter 6. Identifying actionable mutated proteins as targets for personalised
medicine in lung cancer ........................................................................................... 152
6.1 Introduction ..................................................................................................... 152
6.2 Methods ............................................................................................................ 154

11
6.3 Results .............................................................................................................. 157
6.3.1 Genetic Landscape of Lung Cancer Samples ............................................ 157
6.3.2 Mutated druggable GOF targets................................................................. 159
6.3.3 Highly expressed druggable GOF targets .................................................. 161
6.3.4 Using SSL to identify additional druggable targets ................................... 162
6.3.5 Drug Combinations .................................................................................... 164
6.4 Discussion......................................................................................................... 165
Chapter 7. Discussion and conclusion .................................................................... 167
7.1 Discussion......................................................................................................... 167
7.2 Limitations ....................................................................................................... 171
7.3 Future Work .................................................................................................... 172
7.4 Conclusions ...................................................................................................... 172
Appendices ................................................................................................................ 174
Appendix 1: Supporting Information for Chapter 2 ......................................... 174
Appendix 2: Supporting Information for Chapter 3 ......................................... 175
S3.1 Methods ...................................................................................................... 175
Appendix 3: Supporting Information for Chapter 4 ......................................... 188
S4.1 Methods ...................................................................................................... 188
Appendix 4: Supporting Information for Chapter 5 ......................................... 203
S5.1 Methods ...................................................................................................... 203
Appendix 5: Supporting Information for Chapter 6 ......................................... 225
References ................................................................................................................. 239

12
List of Figures
Figure 1.1: The hallmarks of cancer. ............................................................................ 22 Figure 1.2: Multiple sequence alignment of Histone H1. ............................................. 50 Figure 1.3: A simple decision tree. ............................................................................... 54 Figure 1.4: A linear SVM versus non-linear SVM. ...................................................... 56 Figure 2.1: This is an illustration of the data visualization available on the different
webpages on MOKCa web-interface. ................................................................... 68 Figure 2.2: This is a schematic illustration of the change in the equilibrium of the
active and inactive conformational states of protein kinases. ............................... 70 Figure 2.3: Structural impact of the B-Raf V600E mutation. ....................................... 71 Figure 3.1: Distribution of molecular function for the 44 domains types found in both
oncogenes and tumour suppressors. ...................................................................... 86 Figure 3.2: Domains enriched in mutations in oncogenes and tumour suppressors. .... 92 Figure 3.3: Domain hotspots. ........................................................................................ 95 Figure 3.4: WD40 domain. ........................................................................................... 99 Figure 3.5: Positional analysis of domain hotspots. ................................................... 103 Figure 4.1. Prediction accuracies compared between seven web-accessible prediction
tools. .................................................................................................................... 119 Figure 4.2. Common driver genes between MOKCaRF, Mutation Assessor and
CHASM algorithms. ........................................................................................... 121 Figure 4.3. MOKaRF ROC curves for COSMIC, ClinVar and TP53. ....................... 125 Figure 4.4: The importance of the features across all three binary classification
decisions. ............................................................................................................. 128 Figure 4.5: The flowchart of LOF/GOF assignment of missense mutations in MOKCa.
............................................................................................................................. 130 Figure 5.1. Common pathogenic mutations between six algorithms in inframe indels.
............................................................................................................................. 141 Figure 5.2. The importance features across insertions and deletions. ........................ 146 Figure 5.3: The flowchart of pathogenic assignment of indel mutations in MOKCa. 149 Figure 6.1: Flowchart of assignment of missense mutations in 50 lung cancer pateints.
............................................................................................................................. 156 Figure 6.2: This figure shows the number of missense mutations, truncation, and other
mutations, and CNAs in each sample. ................................................................ 158 Figure 6.3: The number of druggable targets for each type of mutation. ................... 160 Figure 6.4: The number of cancer-specific drugs for each sample. ............................ 163 Figure 6.5: The distribution of possible drugs in total number of mutations from the
genes in each sample. .......................................................................................... 166 Figure S2.1: This figure outlines the steps required to populate the MoKCA database.
............................................................................................................................. 174 Figure S3.1: The functional analysis of cancer proteins in oncogenes and tumour
suppressors. ......................................................................................................... 185 Figure S3.2: Domains enriched in mutations within whole genome. ......................... 186 Figure S3.3: Common domains and position between missense, truncation and indel
mutations. ............................................................................................................ 187 Figure S4.1. The distribution of proteins and domains in oncogenes set of hotspot
COSMIC dataset. ................................................................................................ 195 Figure S4.2. The distribution of proteins and domains in tumour suppressor set of
hotspot COSMIC dataset. ................................................................................... 196

13
Figure S4.3. The distribution of proteins and domains in neutral set of hotspot
COSMIC data...................................................................................................... 197 Figure S4.4. Cut off score of seven prediction algorithms in TS/Neutral class. ......... 198 Figure S4.5. Cut off score of seven prediction algorithms in TS/OG class. ............... 199 Figure S4.6. Cut off score of seven prediction algorithms in OG/Neutral class. ....... 200 Figure S4.7. Common driver mutations in MOCKa using the FATHMM and CHASM
algorithms. .......................................................................................................... 201 Figure S4.8. Actionable drugs for 1392 driver proteins with GOF mutation. ............ 202 Figure S5.1 Commonality in successful prediction outputs for inframe indels mutations
compared between between six algorithms. ....................................................... 224 Figure S6.1: The number of possible drugs for each sample. ..................................... 238

14
List of Tables
Table 1.1: Summary of computational tools for identifying driver mutations in cancer
genomes. ............................................................................................................... 44 Table 1.2: Summary of computational tools for identifying pathogenic mutations in
indels. .................................................................................................................... 48 Table 3.1: This table describes the number of recorded and significant mutational
hotspots identified in each datasets; tumour suppressor, oncogene and whole
genome. ................................................................................................................. 96 Table 4.1: Prediction sensitivities, specificities, accuracies and AUC values compared
between methods for pairs of classes in COSMIC dataset. ................................ 118 Table 4.2: Prediction AUC values compared between methods for GOF v LOF class in
ClinVar dataset.................................................................................................... 124 Table 5.1. Comparing the performance of in-frame insertion and deletion with
previously published results. ............................................................................... 142 Table 5.2. Prediction accuracies compared between methods for four ClinVar test sets
in indels. .............................................................................................................. 147 Table S3.1: Domain based prediction of oncogenes and tumour suppressors. ........... 176 Table S3.2: Significant domains for missense mutation in tumour suppressors. ....... 177 Table S3.3: Significant domains for truncation mutation in tumour suppressors....... 178 Table S3.4: Significant domains for indels mutation in tumour suppressors. ............ 178 Table S3.5: Significant domains for missense mutation in oncogenes. ...................... 180 Table S3.6: Significant domains for truncation mutation in oncogenes. .................... 182 Table S3.7: Significant domains for indels mutation in oncogenes............................ 182 Table S3.8: Significant domains for missense mutation in whole genome. ............... 183 Table S3.9: Significant domains for truncation mutation in whole genome. ............. 183 Table S3.10: Significant domains for indels mutation in whole genome. .................. 183 Table S3.11: The significantly enriched missense hotspots of mutations in the whole
genome (WG), tumour suppressors (TS) and oncogenes (OG). ......................... 183 Table S3.12: The significantly enriched truncation hotspots of mutations in the whole
genome (WG), tumour suppressors (TS) and oncogenes (OG). ......................... 184 Table S3.13: The significantly enriched indel hotspots of mutations in the whole
genome (WG), tumour suppressors (TS) and oncogenes (OG). ......................... 184 Table S4.1: Pairwise cut-offs for each algorithm. ..................................................... 190 Table S4.2. Description of the 19 features included in the classifiers. ...................... 191 Table S4.3: This table shows the classification accuracy across all 10 folds for when
both the depth and number of trees were altered in the random forest (TS v
Neutral). .............................................................................................................. 192 Table S4.4: This table shows the classification accuracy across all 10 folds for when
both the depth and number of trees were altered in the random forest (TS v OG).
............................................................................................................................. 192 Table S4.5: This table shows the classification accuracy across all 10 folds for when
both the depth and number of trees were altered in the random forest (OG v
Neutral). .............................................................................................................. 192 Table S4.6: This table shows the classification accuracy across all 10 folds when both
the kernel and c value were altered in the SVM (TS v Neutral). ........................ 193 Table S4.7: This table shows the classification accuracy across all 10 folds when both
the kernel and c value were altered in the SVM (TS v OG). .............................. 193 Table S4.8: This table shows the classification accuracy across all 10 folds when both
the kernel and c value were altered in the SVM (OG v Neutral). ....................... 193

15
Table S4.9: This table shows the average of top five features in (TS v Neutral) class.
............................................................................................................................. 194 Table S4.10: This table shows the average of top five features in (TS v OG) class. .. 194 Table S4.11: This table shows the average of top five features in (OG v Neutral) class.
............................................................................................................................. 194 Table S5.1. Description of the 11 features included in the calssifiers. ....................... 204 Table S5.2. The results of six prediction programs that show whether the mutations
were pathogenic, neutral or they did not work using the prediction programs for
inframe insertion. ................................................................................................ 205 Table S5.3. The results of six prediction programs that show whether the mutations
were pathogenic, neutral or they did not work using the prediction programs for
inframe deletion. ................................................................................................. 205 Table S5.4. This table shows the average of top five features in in-frame insertions. 206 Table S5.5. This table shows the average of top five features in in-frame deletions. 206 Table S5.6. This table shows the classification accuracy across all 10 folds when both
depth and the number of tree were altered in the random forest in insertion. .... 207 Table S5.7: This table shows the classification accuracy across all 10 folds when both
depth and the number of tree were altered in the random forest in Deletion...... 207 Table S5.8. This table shows the classification accuracy across all 10 folds when both
kernel and c value were altered in the SVM in insertion. ................................... 208 Table S5.9. This table shows the classification accuracy across all 10 folds when both
kernel and c value were altered in the SVM in deletion. .................................... 208 Table S5.10. Oncogenes and their mutations for deletion in MOKCa. ...................... 212 Table S5.11. Tumour suppressor genes and their mutations for deletion in MOKCa. 217 Table S5.12. Oncogenes and their mutations for insertion in MOKCa. ..................... 220 Table S5.13. Tumour suppressor genes and their mutations for insertion in MOKCa.
............................................................................................................................. 223 Table S6.1. Oncogenes that have approved drugs, sample ID, mutations, drugs and the
indication of drugs. ............................................................................................. 227 Table S6.2. List of unique GOF genes with High CNA and expression that have
approved drugs, number of samples, drugs and the indication of drug. ............. 234 Table S6.3. Synthetic lethal partner genes that have approved drugs, number of
samples, drugs and the indication of drugs. ........................................................ 237

16
Abbreviations
AML Acute Myeloid Leukaemia
AUC Area Under the Curve
CADD Combined Annotation Dependent Depletion
CCP Complement Control Protein
CGC Cancer Gene census
CHASM Cancer-specific High-throughput Annotation of Somatic Mutations
Chr Chromosome
CNA Copy Number Altration
CNV Copy Number Variation
COSMIC Catalogue of Somatic Mutations in Cancer
CPAT Cancer Protein Annotation Tool
CV Cross validation
DDIG-in Detecting DIsease-causing Genetic variations-indels
DDR Damage Response
DNA DeoxyriboNucleic Acid
EBI European Bioinformatics Institute
EGFR Epidermal growth factor receptor
ENA European Nucleotide Archive
ENSP Ensembl Protein
ENST Ensembl Transcript
ESP Exome Sequencing Project
FATHMM Functional Analysis through Hidden Markov Model
FDA Food and Drug Administration
FI Functional Impact
FIS Functional Impact Score
GIST GastroIntestinal Stromal Tumours
GO Gene Ontology
GOF Gain Of Function
HGMD Human Gene Mutation Database
HMM Hidden Markov Model
IARC International Agency for Research on Cancer
ICGC International Cancer Genome Consortium

17
INSDC The International Nucleotide Sequence Database Collaboration
KIRC kidney renal clear cell carcinoma
LOF Loss Of Function
MSA Multiple Sequence Alignment
MUSCLE MUltiple Sequence Comparison by Log-Expectation
NCBI National Center for Biotechnology Information
NCI National Cancer Institute
NHGRI National Human Genome Research Institute
NMR Nuclear Magnetic Resonance
NSCLCs Non-Small-Cell Lung Cancers
OG Oncogene
PCAWG Pan Cancer Analysis of Whole Genomes
PDB Protein Data Bank
PinPor Predicting pathogenic micro-insertions and deletions affecting post-
transcriptional regulation
PIR Protein Information Resource
PO proto-oncogene
PSIC Position-Specific Independent Counts
PV Polycythemia Vera
RBF Radial Basis Function
RCSB Research Collaboratory for Structural Bioinformatics
RF Random Forest
RNA RiboNucleic Acid
ROC Receiver Operating Characteristic
SIFT Sorting Intolerant From Tolerant
SIFTS Structure integration with function, taxonomy and sequence
SNP Single Nucleotide Polymorphism
SNV Single Nucleotide Variants
SSL Synthetic lethality
SVM Support Vector Machine
TCGA The Cancer Genome Atlas
TS Tumour Suppressor
UCH Ubiquitin Carboxyl-Terminal Hydrolase
UPI Unique Identifier

18
VEP Variant Effect Predictor
VEST Variant Effect Scoring Tool
VHL Von Hippel-Lindau
WGS Whole Genome Sequencing

19
Chapter 1. Introduction
Despite on going global efforts to develop effective therapies for cancer, it is still
responsible for approximately 15% of annual deaths globally. More than 12 million
cases are diagnosed per annum, and this figure continues to grow (Varmus and Kumar,
2013).
There are common treatments of cancer such as surgical intervention, radiation, and
chemotherapy and, although chemotherapy is commonly used as an adjuvant to
surgery, these therapies often cause damage to both cancer and normal cells with
multiple undesirable side effects such as infertility and nerve damage. Fortunately, new,
targeted therapies are emerging that effectively target specific biomarkers and these
have helped in the treatment of a range of cancers (Schrank et al., 2018). However,
many patients remain without options for personalised medicines and resistance to
drugs is an ongoing problem (Esplin, Oei and Snyder, 2014).
As part of the movement towards the establishment of personalised medicines, this
thesis describes the development of a suite of algorithms designed to identify the
somatic cancer mutations within protein coding genes that may lead to the protein
product to be actionable therapeutically. In particular, I have focused on new ways to
distinguish between those proteins that can be inhibited directly and those that create
weaknesses in the cell that need to be tackled indirectly by inhibiting other known
proteins.
In Section 1.1 of the introduction, I give a brief introduction to the ‘Hallmarks of
Cancer’ (Hanahan and Weinberg, 2011). In Section 1.2, I focus on the types of genes
important in the development of cancer. I then move on to describe the types of
somatic mutations that commonly arise in cancer in sections 1.3 and 1.4. In section 1.5,

20
I introduce the biological databases that I have used in my analyses. Section 1.6 is an
overview of the cancer databases that contained the mutational data required for the
analyses. A summary of the previously published algorithms developed to determine
the significance of mutations is given in sections 1.7 for both missense and insertion
and deletion mutations (indels). In section 1.8 I briefly describe the theoretical
background theory of the algorithms that I have used in this thesis. Finally in section
1.9 I describe the work presented in my thesis.
1.1 Cancer
Cancer is a disease that results from damage to genetic material. The human body
consists of around 1013 cells and normally cell division takes place under carefully
controlled conditions. However, following genetic and epigenetic damage cells can
begin to divide abnormally, forming lump or growths called tumours. Many tumours
are benign, meaning that they do not spread into new tissues and do not come back
when removed. However, malignant tumours can metastasize, travelling to distant
places within the body, through the lymph system or the blood, to form tumours at
other sites (Sudhakar, 2009).
The genetic changes that eventually lead to cancer may be inherited from parents
(termed germline mutations), form spontaneously in germline cells (de novo mutations)
or arise during one’s lifetime as a result of damage to DNA caused by environmental
factors and as a result of normal cell processes (somatic mutations).
There are different risk factors for developing cancer including; obesity, age, smoking,
drinking alcohol and prolonged exposure to the sun (Vaughan et al., 1995). The
mechanism for each mutagen is different (Alexandrov and Stratton, 2014) and together
they give rise to a profoundly heterogeneous disease, which differs notably both

21
between different types of cancer and between patients (Lawrence et al., 2013). The
damage to the DNA can take a number of forms but typically includes many small-
scale DNA mutations that prevent protein formation or lead to misformed proteins, as
well larger chromosomal abnormalities and changes to the epigenetic packaging that
cause major changes in the profile of protein expression.
1.1.1 The Hallmarks of Cancer
Despite its complexity, in 2000, Hanahan and Weinberg proposed that cancer could be
reduced to six underlying principles, which they termed the “Hallmarks of Cancer”
(Hanahan and Weinberg, 2000). These hallmarks reflect the cellular changes that are
required to transform a normal cell into a cancer cell and include; self-sufficiency in
growth signals, insensitivity to growth-inhibitory (antigrowth) signals, evasion of
programmed cell death (apoptosis), limitless replicative potential, sustained
angiogenesis, and tissue invasion and metastasis (Hanahan and Weinberg, 2000).
In 2011, they updated their list by adding four more new hallmarks; abnormal
metabolic pathways, evasion of the immune system, genomic instability and
inflammation (Figure 1.1) (Hanahan and Weinberg, 2011).
Cells that have genetic and epigenetic abnormalities giving rise to a subset of these
properties may form benign tumours or may simply fail to thrive. However, when
changes have occurred promoting tumorigenic behaviours in each of these areas of
study the cell may then go on to become a tumour.

22
Figure 1.1: The hallmarks of cancer.
An image showing the 10 major hallmarks of cancer; sustaining proliferative signalling,
evading growth suppressors, avoiding immune destruction, enabling replicative
immortality, tumour promoting inflammation, activating invasion and metastasis,
inducing angiogenesis, genome instability and mutation, resisting cell death and
deregulating cellular energetics. Figure adapted from (Hanahan and Weinberg, 2011).

23
1.2 Genes involved in the development of cancer
Most cancers arise due to pathogenic mutations in genes that play a critical role in
these hallmark pathways. The exploitation of each pathway gives an additional
selective advantage to the tumour cell. These genes that when altered give the cell a
selective advantage are collectively known as driver genes (Stratton, Campbell and
Futreal, 2009).
The vast majority of genes mutated in cancer are far less important. They often make
the cell marginally less viable, and the mutations are the consequence of the cancer
rather its cause (Greenman et al., 2007). Together these genes are called passenger
genes. Distinguishing between passenger genes and driver genes remains an important
first step for both understanding the cause of cancer and then to guide therapeutic
interventions (Vogelstein et al., 2013, Stratton, Campbell and Futreal, 2009).
There are several statistical approaches (e.g. (Lawrence et al., 2013, Greenman et al.,
2006)) that detect driver genes within tumours. These methods are very good at
detecting high frequency mutated genes. However, the data sets are not large enough to
have the statistical power to detect low frequency mutated genes that contribute to the
initiation and progression of cancer. This can pose a problem because although a few
driver genes are highly mutated, the majority of somatic mutations occur in driver
genes that are infrequently mutated (Garraway and Lander, 2013, Stephens et al.,
2012). An alternative approach is to identify cancer-associated driver mutations from
passenger mutations directly (e.g. (Shihab et al., 2013a, Reva, Antipin and Sander,
2011, Gonzalez-Perez, Deu-Pons and Lopez-Bigas, 2012, Espinosa et al., 2014))
(Douville et al., 2013, Douville et al., 2016).

24
There are two main forms of driver genes that play important role in cancer
development. These are termed oncogenes and tumour suppressors, depending on
whether the mechanism by which they lead to cancer is via a gain of function or loss of
function.
1.2.1 Oncogenes
Oncogenes (OG) are genes that can cause cancer. They are formed when normal proto-
oncogenes (PO) become activated by genetic changes affecting either protein
expression or structure. Most proto-oncogenes help to regulate cell growth and
proliferation and, when mutated, further tumourigenesis by deregulating cell
proliferation (Anderson et al., 1992). Oncogenes are generally dominant because one
mutated allele gives the cancerous behaviour (Kopnin, 2000). Activation of oncogenes
by chromosomal rearrangement, gene duplication or mutations gives a growth
advantage or increased survival properties to the cell (Lee and Muller, 2010).
1.2.2 Tumour suppressor genes
Tumor suppressor genes (TS) are normal genes that suppress cell proliferation and
repair DNA mistakes. When the tumour suppressor suffers mutations causing loss of
function to both alleles, protection against cancer is loss. Tumour suppressor mutations
are normally recessive in that both alleles of a tumour suppressor gene must be
inactivated to promote tumour development (Klein, 2009, Yarbro, 1992).

25
1.2.3 Therapeutically targeting driver genes
The important difference between oncogenes and tumour suppressor genes is that
oncogenes result from the activation of proto-oncogenes whilst tumour suppressor
genes must be inactivated to cause cancer.
Therapeutically, activated oncogenes and inactivated tumour suppressors require two
distinctive approaches. Many oncogenes can be drugged directly in order to prevent
oncogenic over-activity. Where the cell has become reliant on the oncogene this leads
to cell death. For instance, the FDA has approved a limited range of targeted therapies
for lung cancer patients that target specific oncogenes present in subsets of the tumours.
These include: ALK inhibitors such as alectinib for the treatment of patients with
oncogenic mutations in the ALK gene (Larkins et al., 2016); EFGR inhibitors such as
gefitinib for patients with EGFR exon 19 deletions or exon 21 (L858R) substitution
mutations as detected by an FDA-approved test (Kazandjian et al., 2016) and BRAF
inhibitors such as dabrafenib and trametinib for patients with BRAF V600E mutations
(Odogwu et al., 2018). This direct approach does not work as a method of combatting
cells with deficiencies in tumour suppressors. The loss of tumour suppressor genes
may be more important than oncogenes for the formation of many cancer cells
(Weinberg, 2014) which can pose a therapeutic problem.
Fortunately, mutations to tumour suppressor or proto-oncogenes genes often have a
dual nature, both driving tumorigenesis but also introducing new vulnerabilities to the
cell (Shen, Shi and Wang, 2018). In particular, there are a number of examples where a
cell can tolerate inactivation of either of two genes, but cannot tolerate inactivation of
both. This phenomena is known as synthetic lethality, and it provides a way of killing

26
cells that have mutated tumour suppressor genes (Hartwell et al., 1997).
Therapeutically, the aim here is to inhibit proteins that are synthetically lethal with the
inactivated tumour suppressor. PARP inhibitors have been approved as the first
targeted therapy to exploit synthetic lethality (Lord and Ashworth, 2017) in a variety of
BRCA1 and BRCA2 deficient tumours including breast, ovarian and pancreatic.
From a therapeutic view point, it is important not only to identify driver genes for a
cancer, but it is vital to identify whether the mutations impacting on the protein
functions results in a loss of function or gain of function of that driver.
1.3 Mutations that arise in cancer
1.3.1 Large-scale mutations
Most cancer cells include large-scale mutations, which affect a substantial portion of
one or several chromosomes. Chromosomal abnormalities involve copy number
variation (CNV), amplification, deletion of large chromosomal regions, chromosomal
inversions and loss of heterozygosity.
CNV is a type of mutation occur when a large segment of DNA are inserted, repeated
or removed. Amplification or gene duplications are mutations lead to increase in the
number of copies of gene. Deletions of large chromosomal regions are mutations
involving the loss of genes within those regions. Chromosomal inversions change the
physical orientation and the genes are flipped.
Translocations, interstitial deletions or chromosomal inversion can result in activated
fusion genes. For instance, the Philadelphia Chromosome is a translocation of
chromosomes 9 and 22, and results in the formation of the BCR-ABL fusion gene. This
fusion causes the tyrosine kinase activity of ABL to be constitutively active and results
in uncontrollable cell division (Wapner, 2014).

27
Large-scale changes are important in their own right resulting in major phenotypic
consequences, but they can also work together with smaller scale mutations. For
example, many tumour suppressors are inactivated because the first copy of the gene is
lost through mutation whilst the second copy of the gene becomes lost when a
heterozygous stretch of DNA is deleted and subsequently replaced by the mutated gene
(Lodish et al., 2000).
1.3.2 Small-scale mutations
Small-scale mutations involve the substitution, insertion or deletion of one or a few
nucleotides and complex mixes of the two. The manufacture of protein from the DNA
template involves both transcription of the DNA into messenger RNA and then the
translation of the RNA three nucleotides at a time (codons) into individual amino acids.
It is this process of decoding nucleotide strings and the redundancy in the amino acid
code that leads to many different types of mutations with varied phenotypic
consequences (Lodish et al., 2000).
1.3.2.1 Point Mutations
If a single nucleotide base is changed in a DNA sequence, it is called point mutations.
The consequences of this mutation can be missense, nonsense or silent
mutations. When this results in the substitution of one amino acid for another it is
called a missense mutation. If the resulting codon is a stop codon then the resulting,
shortened RNA transcript will generally be selected for nonsense mediated decay so no
polypeptide chain will form (Chang et al., 2007). Finally, if the resulting codon codes
for the same amino acid it is said to be a silent mutation. For example, if the codon
TGT (coding for cysteine) is mutated to TGG (tryptophan) then it is a missense
28
mutation. If it is mutated to TGA (a stop codon) then it is a nonsense mutation, and if
mutated to TGC (also cysteine) then the mutation is silent. Although it is easy classify
nonsense and silent mutations as not tolerated and tolerated respectively, missense
mutations are much harder to classify. Moreover a missense mutation may lead to
either a loss of function or a gain of function (see below).
1.3.2.2. Indels
Indels occur when small runs of DNA bases are deleted from or inserted into the DNA.
A frame shift mutation is caused by deletion or insertion of a number of bases that is
not divisible by three. For example, if the original transcribed DNA sequence is GCA
ACG GCG CGA and two base pairs (AC) are added between the third and forth
groupings, the reading frame will be altered. Frame shift mutations alter all of the
amino acids that would be added from that point onwards and generally result in a
premature stop codon, and no polypeptide production. When the reading frame remains
unchanged this is known an inframe indel (Mullaney et al., 2010).
1.4 Functional consequence of small-scale mutations
Mutations can also be classified by their effect on the function of the resultant protein
product into loss of function (LOF) and gain of function (GOF). Distinguishing
between LOF mutations and GOF mutations is significant importance as it impacts on
therapeutic decisions (Odogwu et al., 2018).
1.4.1 Loss of function mutations
Loss of function mutations are inactivating mutations can result in the gene product
having less function in a variety of manner including loss of the protein stability or the
disruption of protein or DNA binding site. Missense, indels and truncation mutations

29
can all lead to LOF of the protein (Baeissa et al., 2017). Usually these mutations are
molecularly recessive, both defective alleles of gene are required to promote tumour
development (Griffiths et al., 2000).
Small-scale mutations that make alterations to protein structure such as missense and
inframe indels can alter the protein structure in a variety of ways. For instance, the
replacement of a large amino acid with a smaller one could introduce a void into a
protein’s core and hence decrease the protein’s thermostability (Hubbard, Gross and
Argos, 1994).
Similarly, replacing a small residue with a larger one within the core can cause a
stearic clash, again reducing the stability of the protein (Al-Numair and Martin,
2013).
Changes to the hydrogen bonding capability of a mutated residue can also have a
detrimental effect on protein stability (Alber et al., 1987) for example, found that
replacing threonine with other residues not capable of contributing to a hydrogen-bond
resulted in the destabilization of the protein. Therefore, introducing or removing a
hydrophilic residue in the hydrophobic core could destabilize the native protein fold as
that the vast majority of hydrogen bonding capable side chains are found to participate
in hydrogen bonding (McDonald and Thornton, 1994).
Electrostatics are also important in protein folding and stability: interactions around
‘‘charge centres’’ in protein structures improve the stability of protein architecture
(Torshin and Harrison, 2001). Disrupting the net charge of such structurally critical
regions could destabilize the protein and affect function (Al-Numair and Martin, 2013).
Mutations from a cysteine participating in a disulphide bond could disrupt native
protein structure [e.g., (Lavergne et al., 1992)]. Mutations on the surfaces of a protein

30
can also be detrimental. For example, if a residue is critical in the assembly of a
protein complex [e.g., (Thomas and Scopes, 1998); (Steward et al., 2008)] or in a
transitory protein-protein interaction. A mutation could cause the complex not forming
or a change in a signalling pathway. Introducing a hydrophobic residue on the surface
could result in protein aggregation.
Finally, changes to functional residues in the active site can result in complete loss of
function of the protein.
1.4.2 Gain of function mutations
Gain of function mutations are activating mutations that increase the activity or change
the function of protein. Both missense mutations and indels can lead to GOF of the
protein (Baeissa et al., 2017). These mutations are usually molecularly dominant, with
only one mutated copy of the gene is required to cause cancer (Griffiths et al., 2000).
There are several known mechanisms in which mutations can result in a GOF. Firstly,
changes to the residues in the active site can result in changes to substrate or product
(Yang et al., 2010) making a change to the protein’s enzymatic reaction. Changes to
surface residues, can likewise cause constitutive dimerization (Harding et al., 2009)
causing permanent activation of downstream signally. The most common way of
activating a protein by mutation is when there is more than one protein conformation
(active/inactive). The mutation results in the active conformation being stabilised or
the inactive conformation desatbilised (eg. Kinase domain) resulting in constitutive
activation of the protein.

31
1.5 Biological databases
This section provides a brief overview of the most important biological databases used
in this work: Ensembl (Zerbino et al., 2018), UniProt (The UniProt, 2017), the Protein
Data Bank (PDB) (Berman et al., 2000), CATH (Orengo, Pearl and Thornton, 2003,
Ashford et al., 2018) and Pfam (Bateman et al., 2004).
1.5.1.Ensembl
The Ensembl project is a database and genome browser that acts as a single point of
access, providing a resource for researchers studying the genomes of vertebrate species.
Each species has its own home page (Hubbard et al., 2002, Zerbino et al., 2018) and
genetic information can be retrieved at the genome, gene and protein level. In this
thesis data for humans was utilized.
Ensembl Human provides detailed annotation for the human genome. Sequence
variants are imported from projects such as dbSNP (Sherry et al., 2001), ENA (Toribio
et al., 2017) and INSDC (Cochrane et al., 2016). Transcriptional regulatory features
result from analysis of data from several projects including ENCODE (Consortium,
2012) and Blueprint (Adams et al., 2012). Comparative genomic analyses provide
whole genome alignments and homology assignments of genes and proteins with those
in other species. Ensembl also provides annotations for genetic disease from a range of
resources including Online Mendelian Inheritance in Man (OMIM) (Hamosh et al.,
2002) and COSMIC (Forbes et al., 2017).
Ensembl provides a number of tools, including the Variant effect predictor (VEP) that
analyses and predict the functional consequences of mutations.
Ensembl can be queried using gene names, a range of identifiers, genomic regions,
mutations and diseases or phenotypes. A BLAST/BLAT (Altschul et al., 1990)

32
interface allows the user to search genome for the input sequences of DNA or protein
and the BioMart tool enables the user to export custom datasets (Zerbino et al., 2018).
Ensembl is available at https://www.ensembl.org/index.html. The user can access
directly to the databases through MySQL queries or by using the Perl API.
1.5.2 The Universal Protein Resource
The Universal Protein Resource (UniProt) is a large, freely accessible resource of
protein sequences and annotation data, providing a comprehensive body of protein
information (The UniProt, 2017). It is maintained by the UniProt consortium; a
collaboration between three institutes; the SIB Swiss Institute of Bioinformatics
(Members, 2016), European Bioinformatics Institute (EMBL-EBI) (Brooksbank,
Cameron and Thornton, 2010), and the Protein Information Resource (PIR) (Wu et al.,
2003).
This resource collects, interprets and organises protein information to generate a
wealth of data. It is used for several tasks. You can use it to find out about a query
protein, compare protein sequence with other proteins or map a list of data from other
database to UniProtKB or vice versa.
There are several core databases in UniProt; UniProt KB, UniRef, UniParc and
proteomes. UniProt Knowledgebase (UniProtKB) is a protein database that collects
functional information of protein with appropriate and rich annotation. It consists of
two sections: UniProtKB/Swiss-Prot and UniProtKB/TrEMBL (UniProt, 2010).
UniProtKB/Swiss-Prot contains non-redundant sequences with high quality manually
annotated whereas UniProtKB/TrEMBL contains sequences associated with
computationally analysed records and large-scale functional annotation (Apweiler,
Bairoch and Wu, 2004).

33
The UniProt Reference Cluster (UniRef) consist of three clustered sets of protein
sequences UniProtKB and selected UniProt Archive records; UniRef100, UniRef90
and UniRef50 (Suzek et al., 2007). UniProt Archive (UniParc) is a non-redundant
database, which contains most of the protein sequences that available publicly in the
world (Leinonen et al., 2004). Proteins may appear in different source databases, or in
various copies in the same database. UniParc stores each unique sequence to avoid
redundancy and give it a stable and unique identifier (UPI). UniParc contains only
protein sequences, with no information.
1.5.3 Protein Data Bank
The Protein Data Bank (PDB) is a public database that stores, organizes and annotates
three-dimensional structural data of biological macromolecules such as proteins and
nucleic acids from all organisms (Berman et al., 2000). The structures are determined
using several methods including X-ray crystallography, NMR spectroscopy and cryo-
electron microscopy (Dutta et al., 2009). These data are submitted to be freely
available website to the public by members from Research Collaboratory for Structural
Bioinformatics (RCSB) (Dutta, H and W, 2007).
1.5.4. CATH
Proteins are comprised of basic units called domains, which are well conserved in both
structure and sequence. The majority of proteins contain at least two domains, and any
one domain will appear in a variety of different proteins. Domains and the nature of
their interactions determine protein functions (Vogel et al., 2004).
A protein domain family is a group of domains that shares a common evolutionary
origin, reflected by their related functions and similarities in sequence or structure.

34
Families are sometimes grouped together into larger clades called superfamilies based
on structural and sequence similarity (Han et al., 2007).
The CATH Protein Structure Classification is hierarchical classification of protein
domains in the PDB based not only on sequence information, but also on structural and
functional properties of the domains (Knudsen and Wiuf, 2010). The four main levels
of the CATH hierarchy are Class (C), Architecture (A), Topology (T) (fold family) and
Homologous superfamily (H) (Orengo et al., 1997). At the C-level, protein domains
are grouped according to their secondary structure content, i.e. mainly-alpha, mainly-
beta, a mixture of alpha and beta, or low secondary structure content. The A-level
discriminate structures in the same class using information on the secondary structure
arrangement in 3D space for example, the number of layers of a sandwich in the
class. Structures are grouped at the T-level or fold level according to the information
on how secondary structure elements are arranged and connected. Assignments are
made to the H-level if there is similar function and high structural similarity and they
may have diverged from a common ancestor (Orengo et al., 1997).
1.5.5 Pfam
Pfam database is a large assembly of protein domain families (Sammut, Finn and
Bateman, 2008). For each Pfam domain family, representative subsets of protein
sequences are aligned to make a ‘seed’ alignment. This seed alignment is then used to
construct a hidden Markov model (HMM) profile. The HMM profile is then searched
against sequence databases, with all sequences matching a certain score being
considered as true members of the family. These members are then aligned to the
HMM profile to generate the ‘full’ alignment of all members of the family (Bateman et
al., 2004, Finn et al., 2006). Each family then is represented by a multiple sequence

35
alignment (MSA) and hidden Markov model (HMM) (Bateman et al., 2004, Finn et al.,
2006). Pfam also generates ‘clans’ that group two or more related Pfam families that
are likely to be homologous (Finn et al., 2006).
Pfam users can search the database by submitting DNA or protein sequences, retrieve
annotations for a query family, obtain multiple sequence alignment or the information
of protein structure of a family or see relationship between families in a clan. The latest
version of Pfam (v.31.0) consists of more than 16000 families and around 559 clans. It
is freely available at https://pfam.xfam.org (Finn et al., 2016).
It is worth mentioning that there are some distinct differences between sequence based
and structure based domain classifications. For instance a single structural domain may
comprise two sequence domains or a single sequence domain is structurally more than
one domains (Zhang et al., 2005). Structure-based methods often recognize more
remote relationships between families where relationships may be visible only from
structural similarity lack of any recognizable sequence similarity (Tress et al., 2005).
Pfam families provide high quality annotation of evolutionary relationships and group
related proteins for domains that have varied functions. A domain family with no
structure is available in Pfam and also the families that do not have experimental
characterisation of function. There are several studies that used Pfam domains to detect
enrichment domains (Miller et al., 2015, Porta-Pardo et al., 2015, Tokheim et al.,
2016).
Although Pfam has often been used to increase the power of the detection of the driver
gene by accumulating mutation information among relatives in a Pfam family, this is
also likely to present commotion as Pfam families are not specifically classified for

36
functional coherence and can contain relatives with quite different functions. Mutations
in these domains can have different effects, since genes can operate in different
pathways or cell contexts and include different protein interfaces or active site residues.
1.6 Cancer databases
This section provides a brief overview of the most important cancer databases that used
in this thesis: COSMIC (Forbes et al., 2017), Cancer Gene Census (Sondka et al.,
2017), ClinVar (Landrum et al., 2018), The Cancer Genome Atlas (Tomczak,
Czerwinska and Wiznerowicz, 2015), The International Cancer Genome Consortium
(International Cancer Genome et al., 2010) and MOKCa (Richardson et al., 2009).
1.6.1 Catalogue of Somatic Mutations in Cancer
The Catalogue of Somatic Mutations in Cancer (COSMIC) is an online database that
collects and integrates somatic mutation data (Forbes et al., 2017). It combines data
derived from two parallel process; expert manual literature curation of the most
important genes in cancer and expert curation of genome-wide tumour analyses from
large-scale, multi-platform, sequencing initiatives including The Cancer Genome Atlas
(TCGA) (Collins and Barker, 2007) and the International Cancer Genome Consortium
(ICGC) (International Cancer Genome et al., 2010).
COSMIC comprises several related resources, each presenting a separate dataset;
COSMIC, the Cell Line Project, COSMIC-3D and Cancer Gene Census (CGC).
COSMIC is the core project of the collation and annotation of somatic mutations from
human cancer samples. The Cell Line project includes mutation profiles from 1020
cancer cell lines. COSMIC-3D maps mutations onto protein structures and provides
functional and druggability information. The CGC currently describes 699 genes that
have be proven to cause human cancers (Sondka et al., 2018).

37
The data for each sample is curated at four levels; individual, tumour and tissue,
sample and mutation. The individual level describes patient information; age, gender,
ethnicity, environmental variables and disease history. The tumour/tissue level contains
the source of tumour, the site, stage, grade, drug response and cytogenetic data. The
third level involves sample information including sample source and therapy
relationship. Finally, the mutation level contains details about the mutation and somatic
status.
COSMIC is available at http://cancer.sanger.ac.uk/cosmic and is updated four times
annually.
1.6.2 Cancer Gene Census
The Cancer Gene Census (CGC) is a catalogue of genes that have been associated with
specific cancers. The genes are annotated with the type of mutation observed and
whether mutations are molecularly dominant, molecularly recessive or both (Futreal et
al., 2004). They genes are also classified as tumour suppressors or oncogenes (Sondka
et al., 2017).
1.6.3 ClinVar
ClinVar is a public archive of human mutations and interpretations of their clinical
significant to health. It collates somatic and germline mutations of different sizes, types
and genome positions (Landrum et al., 2014). User groups participate and submit their
interpretation of the clinical significant of mutations. These user groups include
research laboratories, UniProt, expert panels, and clinical testing laboratories
(Landrum et al., 2016, Landrum et al., 2018). ClinVar is available at
https://www.ncbi.nlm.nih.gov/clinvar/.

38
1.6.4 The Cancer Genome Atlas
The Cancer Genome Atlas (TCGA) was a public project to catalogue and discover
genetic mutations responsible for cancer in a large cohort of human tumours using
genome sequencing and bioinformatics. The ultimate goal being to generate new
cancer therapies, diagnostic techniques and preventive strategies (Chin, Andersen and
Futreal, 2011).
The techniques used to characterize the tumours included gene expression profiling,
copy number variation (CNV) profiling, micro RNA profiling, genome wide DNA
methylation profiling, exon sequencing and single nucleotide polymorphism (SNP)
genotyping (Wang, Jensen and Zenklusen, 2016).
The TCGA cancer genomic database includes over 11000 samples derived from 33
different tumour types and is managed by the National Cancer Institute (NCI) and
National Human Genome Research Institute (NHGRI) (Tomczak, Czerwinska and
Wiznerowicz, 2015). It is a freely available at https://cancergenome.nih.gov.
1.6.5 International Cancer Genome Consortium
The International Cancer Genome Consortium (ICGC) is a scientific organization that
coordinates a large number of cancer genome research projects present in 50 different
forms of cancer that are of main importance throughout the world. It integrates data
from TCGA and the Sanger Cancer Genome Project. The goal of ICGC is to provide a
comprehensive catalogue of somatic genomic abnormalities associated with human
tumours (International Cancer Genome et al., 2010).
Each type or stage of cancer has specific genomic changes. ICGC provides these
genomic knowledge of more than 25000 cancer genome that can help researchers to
develop new cancer therapy. It is available at https://icgc.org.

39
1.6.6 The Pan Cancer Analysis of Whole Genomes
The Pan Cancer Analysis of Whole Genomes (PCAWG) is a collaboration project to
identify differences and similarities between cancer types in more than 2000 tumours.
It combines whole genome sequencing data from ICGC and TCGA to provide clear
understanding of the molecular mechanism of cancer (Yung et al., 2017).
1.6.7 MOKCa
The MoKCa database annotates the structure and function of somatically acquired
cancer mutations that play a key role in the carcinogenesis of a large portion of known
cancers. Although the database originally focused on the protein kinase family
(Richardson et al., 2009), it was expanded to include all the proteins from the human
genome that are mutated in cancer. Somatic mutation data from the COSMIC database
(Forbes et al., 2015) were mapped to their position in UniProt sequences (Boutet et al.,
2016). Each mutation is described by its alteration to the protein structure, e.g. V600E.
When a mutation has been reported on more one occasion, it is stored as an aggregate
mutation and the number of observations of the aggregate mutation is recorded.
Different genetic changes that result in the same protein coding mutation are presented
together at the protein level and each disease type in which this mutation has been
recorded is also presented on the protein overview page.
Functional annotations for each protein are displayed. These include the identification
and position of Pfam domain assignments within the protein sequence (Finn et al.,
2016), and the positions of residues effected by post-translational modifications
including phosphorylation, glycosylation and ubiquitination (Hornbeck et al., 2015).
Gene Ontology (GO) annotations have also been obtained for each protein (Gene
Ontology, 2015).

40
1.6.8 CanSAR
canSAR is a cancer-focused knowledgebase that integrates multidisciplinary data
including chemistry, biology, structural biology, pharmacology, druggability data and
cellular networks. It developed machine-learning approaches to predict drugs.
canSAR’s goal is aim to provide multidisciplinary explanation for genes and biological
systems to enable cancer translational research and drug discovery. It is available at
http://cansar.icr.ac.uk.
1.7 Prediction Algorithms to assess the impact of mutations
Currently with over 6 million coding mutations reported in the COSMIC database it is
clearly impossible to experimentally determine the functional consequence of each
individual mutations and to ascertain whether it has a driver role in cancer. To
overcome this a multitude of in silico approaches have been applied to somatic cancer
mutational data. Initially, algorithms developed to analyse the impact of genetic
differences between mutations in that caused disease and genetic variants well
tolerated in the human population were applied to somatic cancer mutation data. More
recently a range of algorithms have been developed specifically for use on somatic
cancer mutations to assess their driver status (Tamborero, Gonzalez-Perez and Lopez-
Bigas, 2013, Gonzalez-Perez and Lopez-Bigas, 2012, Getz et al., 2007). Algorithms
investigated during this work are briefly described below.
1.7.1 Missense mutations
Many computational tools have been developed to predict the effect of missense
mutation on protein function and structure (Choi et al., 2012). Table 1.1 summarizes
the computational tools used in this study to identify driver missense mutations in

41
cancer genomes (SIFT (Kumar, Henikoff and Ng, 2009), PolyPhen-2 (Adzhubei,
Jordan and Sunyaev, 2013), FATHMM (Shihab et al., 2013b), CHASM (Carter et al.,
2009) and Mutation Assessor (Reva, Antipin and Sander, 2011)). These resources
were chosen as they have been well validated, are commonly used and each provide a
user-friendly web interface.

Tool’s name Description Input format
CHASM
Cancer-specific High-throughput Annotation of Somatic Mutations (CHASM).
Random Forest classifier trained with 49 predictive features to discriminate between
driver and passenger somatic missense mutations.
Availability: http://www.cravat.us.
Reference: (Carter et al., 2009).
The input is separated by tab or a space:
(Protein identifier can be from either NCBI
Refseq or ENST accessions, amino acid
substitution)
E.g.: VAR1 ENST00000469930 V600E
VAR1 NM_004333 V600E
SIFT
The Sorting Intolerant From Tolerant (SIFT) algorithm.
SIFT identifies potentially deleterious variations using similarity between closely
related proteins. This tool computes probabilities for each possible amino acid
substitution based on the degree of conservation of amino acids in sequence
alignments derived from the closely related sequences. It discriminates between
functionally neutral and deleterious amino acid substitution in human genome and
nonhuman organisms.
Availability: http://blocks.fhcrc.org/sift/SIFT.html.
Reference: (Kumar, Henikoff and Ng, 2009).
The input is comma separated:
(Protein identifier can be from either
UniProt accession or ENSP accessions,
amino acid substitution).
E.g.: Q13878,V600E
ENSP00000420119,V600E

43
Mutation-
Assessor
MutationAssessor (MAssessor).
Mutation Assessor distinguishes between known functionally deleterious mutations
and neutral mutations. It computes a functional impact score (FIS) for amino acid
residue changes using evolutionary conservation patterns that are derived from
aligned families and subfamilies of sequence homologs within and between species.
Availability: http://mutationassessor.org/r3/.
Reference: (Reva, Antipin and Sander, 2011).
The input is separated by tab or a space:
(Protein identifier can be from either
UniProt accession or ENSP accessions,
amino acid substitution).
E.g.: Q13878 V600E
EGFR_HUMAN T790M
PolyPhen-2
Polymorphism Phenotyping version2 (Polyhen2)
Polyphen2 is an automatic tool for prediction the effect of amino acid change on the
function of a human protein. It is based on various sequence and structural features of
the substitution site (Adzhubei et al., 2010). Also, the user can select the Classifier
models, which are HumDiv- and HumVar-trained PolyPhen-2 models. Human
Disease Variant model (HumDiv) was collected from all damaging alleles that have
known impact on the molecular function causing human Mendelian diseases existing
in the UniProtKB database and divergence from close mammalian homologs of
human proteins. The second model, Human Variant (HumVar) consisted of all human
variants associated with some disease except cancer mutations with common human
nsSNPs without associated with a disease (non-damaging). PolyPhen-2 algorithm is
available at
Availability: http://genetics.bwh.harvard.edu/pph2/bgi.shtml.
The input is separated by tab or a space:
(Protein identifier can be from either
UniProt accession or RefSeq protein
accession, position, reference and amino
acid substitution).
E.g.: Q13878 600 V E
BRAF_HUMAN 600 V E
NP_004324 600 V E

44
Reference: (Adzhubei, Jordan and Sunyaev, 2013).
FATHMM
Functional Analysis through Hidden Markov Model (FATHMM)
FATHMM predicts the functional effect of coding mutations and non-coding
mutations based on hidden Markov models (HMMs). It discriminates between cancer-
associated mutations from passenger mutation by integrating the homologous
sequences alignment and conserved domain information. There are several options in
this tool including inherited disease and cancer. Inherited disease uses to distinguish
between disease-causing variations and neutral polymorphisms. While, cancer option
uses to discriminate driver mutations from other germline mutations. Hidden Markov
models (HMMs) (Krogh et al., 1994) are a sequence models that compute a
probability distribution over possible sequences of labels and choose the best label
sequence.
Availability: http://fathmm.biocompute.org.uk/index.html.
Reference: (Shihab et al., 2013b).
The input is tab or a space separated:
(Protein identifier can be from either
uniprot accession or ENSP accessions,
amino acid substitution).
E.g.: Q13878 V600E
ENSP00000420119 V600E
Table 1.1: Summary of computational tools for identifying driver mutations in cancer genomes.

45
1.7.2 Indel mutations
Several computational tools have been developed to predict the functional and
structural effect of in-frame indels on the protein. In this study, six algorithms were
used to provide functional predictions for coding in-frame indels including: VEST
(Douville et al., 2016), SIFT-Indel (Hu and Ng, 2013), DDIG-in (Zhao et al., 2013),
PinPor (Zhang et al., 2014), PaPI (Limongelli, Marini and Bellazzi, 2015) and CADD
(Kircher et al., 2014a). Table 1.2 summarizes six different computational tools for
identifying pathogenic in-frame indel mutations.

46
Tool’s name Description Input format
VEST
The Variant Effect Scoring Tool (VEST).
The VEST is one of the frequently used algorithms to predict
the functional impact of missense mutations on proteins. It was
extended by adding predictions for indels.
VEST-indel predicts the impact of insertions/deletions with an
importance on discriminating between disease-causing indels
and benign. This tool contains features based on PubMed
search results for the gene of interest, which has a recognised
significance to human health.
Availability: http://www.cravat.us/CRAVAT/.
Reference: (Douville et al., 2016).
The input is separated by tab or a space:
(UID, Chromosome in which the variant is located, coordinate,
strand, reference base, alternative base, sample ID (optional)).
Deletion: Delx chrx (1st coordinate) strand (Ref base) (Alt.
base)
e.g.: Del1 chr9 98278959 - TTC –
Insertion: Insx chrx (2nd coordinate) strand (Ref base) (Alt.
base)
e.g.: Ins1 chr 5 156479568 - - GTT
UID: is a unique identifier that give to each variant.
SIFT-indel
The Sorting Intolerant From Tolerant (SIFT).
SIFT is one of the widely used algorithms that predict the effect
of amino acid substitution on protein function. It was exyemded
tp predict the impact on indels.
It is based on a decision tree that uses sequence homology and
the physical properties of amino acids as features.
Availability: http://sift-dna.org/.
Reference: (Hu and Ng, 2013).
The input is comma separated:
(Chromosome, coordinates, strand, alleles)
Deletion: chr,(1st coordinate-1),(2nd coordinate),strand,
Alt.base
e.g.: 9,98278958,98278961,-1,/
Insertion: chr,(1st coordinate),(1st coordinate), strand, (Alt.
base)
e.g.: 5,156479567,156479567,-1,GTT

47
DDIG-in
Detecting DIsease-causing Genetic variations (DDIG-in).
It is machine-learning method that predicts the functional
significance of protein-coding non-frameshifting indels,
frameshifting indels, nonsense and synonymous mutations
based on the probability that they are deleterious. It uses a
support vector machine model trained on a dataset of putatively
neutral mutation from the 1000 Genomes Project and disease-
associated mutations from the Human Gene Mutation Database
(HGMD).
Availability: http://sparks-lab.org/ddig.
Reference: (Zhao et al., 2013).
The input is separated by tab or a space:
(Chromosome, coordinate, reference base, alternative base).
Deletion: chrx (1st coordinate) . (Ref. bases) (Alternative bases)
e.g: chr 9 98278959 . TTCT T
Insertion: chrx (2nd coordinate) . (Ref. bases) (Alternative
bases)
e.g.: chr5 156479568 . C AACC
PinPor
Predicting pathogenic micro-insertions and deletions
affecting post-transcriptional regulation (PinPor).
It is a machine learning method to assist which indels are likely
to be pathogenic. This tool compared the differences between
neutral indels from the 1000 genomes project and disease-
associated indels from HGMD.
Availability: http://watson.compbio.iupui.edu/pinpor/.
Reference: (Zhang et al., 2014).
The input is separated by tab or a space:
(Chromosome, coordinate, reference base, alternative base).
Deletion: chr. (1st coordinate) . (Ref. bases) (Alternative bases)
e.g.: 9 98278959 . TTTC T
Insertion: chr. (1st coordinate) . (Ref. bases) (Alternative bases)
e.g: 5 156479567 . T TAAC

48
Table 1.2: Summary of computational tools for identifying pathogenic mutations in indels.
PaPI
Pseudo Amino Acid Composition (PaPI).
It is a machine-learning predictor to score the functional effect
of human coding mutation. It integrates pseudo amino acid
composition and two other predictors; plyphen2 and sift to deal
with mutations such as single nucleotide variants, insertions or
deletions of several nucleotides.
Availability: http://papi.unipv.it.
Reference: (Limongelli, Marini and Bellazzi, 2015).
The input is separated by tab or a space:
(Chromosome, coordinate, reference base, alternative base).
Deletion: chr. (1st coordinate) (2ndcoordinate) (Ref. bases)
(Alternative bases)
e.g.: 9 98278959 98278961 TTC –
Insertion: chr. (1st coordinate) (2ndcoordinate) (Ref. bases)
(Alternative bases)
e.g.: 5 156479567 156479568 T TAAC
CADD
Combined Annotation Dependent Depletion (CADD).
It is a method for prediction deleterious mutations and scoring
any missense or small indel mutations. This tool developed a
support vector machine that trained to distinguish fixed or
nearly fixed derived allele in humans from those of simulated
variants.
Availability: http://cadd.gs.washington.edu/.
Reference: (Kircher et al., 2014).
The input is separated by tab or a space:
(Chromosome, coordinate, reference base, alternative base).
Deletion: chr. (1st coordinate) 0 (Ref. bases) (Alternative bases)
e.g.: 9 98278959 0 TTTC T
Insertion: chr .(1st coordinate) 0 (Ref. bases) (Alternative
bases)
e.g.: 5 156479567 0 T TAAC

49
1.8 Algorithms applied in this work
1.8.1 Multiple sequence alignments
A multiple sequence alignment (MSA) is an alignment of three or more related sequences
obtained by inserting gaps (-) into sequences to achieve maximal matching between them
(Kaya, Sarhan and Alhajj, 2014). From the resulting MSA, homology can be inferred and
the evolutionary relationships between the sequences can be explored. The resulting
sequences have all length L and can be arranged in a matrix of N rows and L columns
where each column represents a homologous position. A MSA can be used to assess
sequence conservation of protein domains, tertiary and secondary structures, and
individual amino acids or nucleotides (Bacon and Anderson, 1986) (Figure 1.2).
Many excellent multiple sequence alignment tools (eg T-Coffee (Notredame, Higgins
and Heringa, 2000), MUSCLE (Edgar, 2004) and MAFFT (Katoh et al., 2005)) are
available. In this study MUltiple Sequence Comparison by Log-Expectation (MUSCLE)
was used which is suitable for medium length alignments.
The MUSCLE algorithm comprises the following three stages: First, in the draft
progressive stage, a draft multiple alignment is produced emphasising speed over
accuracy. The second stage is the improved progressive stage that re-estimates the
evolutionary tree to produce a more accurate multiple alignment. Finally, the
refinement stage refines the alignment made in the second step (Edgar, 2004). The
MUSCLE software is available at: http://www.drive5.com/muscle.

50
Figure 1.2: Multiple sequence alignment of Histone H1.
This figure shows part of an alignment of Histone H1 from human, mouse rat, cow and
chimpanzee. * indicates fully conserved positions in the alignment. : indicates positions
in the alignment where there is conservation with groups of amino acids that have
strongly similar properties. . indicates groups of amino acids with weakly similar
properties.

51
1.8.2 Machine learning
In computer science, technology has evolved to a great extent. This evolution has
transformed predictive modeling into an increasingly important aspect of scientific
analysis. With this advancement in technology, the ability of predictive models to finish
complex tasks with ease has also increased. Predictive modeling is a tool that uses
probability and data mining in order to forecast outcomes (Glymour et al., 1997). It
creates, tests, and validates a model to anticipate the outcomes in future. Predictive
modeling is generally achieved via machine learning.
Machine learning algorithms execute statistical analysis and data mining thereby
determining patterns and trends in data (Ratner, 2011).
There are broadly two classes of machine learning model: classification and regression.
Classification is about predicting a label while regression is about predicting a quantity.
Classification is an approach of learning in which the program of the computer receives
input and learns from the data provided in it on the basis of which observations are
classified (Sebastiani, 2002). A distinct class is assigned to the data points depending
upon their individual characteristic. For instance: refining of spam emails. A model
would build up a picture of what constitutes as a spam email and those emails that
correspond to that model are classified as spam. Random forest (RF) and support vector
machine (SVM) are examples of classification algorithms.
Regression is the other process of predicting the relationship between different variables
(Dietterich, 2000). A simple regression analysis would be the prediction of the time an
athlete could run 100 meters based on the weight, height and training time.

52
Machine learning tasks are classified into two major concepts; supervised and
unsupervised learning. When the model of machine learning uses unlabeled data to
categories sets of input data then it is known as unsupervised learning (Liu, Chen and
Deng, 2017). This task is trying to find hidden structure in unlabeled data. Clustering is
an example of unsupervised learning.
Supervised learning analyses training data by using known label data to create a model
then produces target class for the input data. To classify the data under supervised
learning, training is required by the model (Kotsiantis, 2007). Random forest and support
vector machine are two examples of supervised learning.
In some cases, multiple models will be used on the same data to see which the best
suitable model can be used in order to achieve the most desirable outcome.
1.8.3 Models
For this project: two machine-learning models were selected to be used: random forest
(RF) and support vector machine (SVM). They have been selected because they are both
generally accurate and easy to interpret. They are compared in this project as they have
distinct features. The random forest model is a simple and popular machine learning
model based on probabilistic learning and decision tree models. On the other hand,
support vector machine is defined in terms of instant space geometry, which is based on a
linear model.
1.8.3.1 Random forest
Random forest (RF) is an easily interpretable machine learning method and an effective
tool for classification comprising a set of decision trees (Breiman, 2001).

53
Decision tree learning is a test of logic commonly used in data mining. It aims to create a
classification model based on input variables (Quinlan, 1987). Figure 1.3 shows an
example of a decision tree. The process of decision starts from the top (root node) and
subsequently moves down to the leaf node. Each leaf represents a value of the target
variable given the values of the input variables represented by the path from the root to
the leaf.
Decision trees can also be characterised as the combination of mathematical and
computational methods to assist the description, categorization and generalization of a
given set of data.
For example in this form: (x,Y) = (x1,x2,…,xn,Y)
The vector x consist of several features x1, x2, x3 etc., that are used for the task to classify
the target variable (Y).
There are two main types of decision trees used in data mining; classification trees and
regression trees. When the predicted result is the class to which the data belongs that is
called classification tree. If the predicted result is a real number that is named regression
tree (Svetnik et al., 2003).
Algorithms for building decision trees usually work top to down. Variables are selected at
each step based on best splits the set of data (Rokach and Maimon, 2005).
Decision trees have several advantages among other data mining methods. It is easy for a
non expert to understand and interpret, able to analyse both numerical and categorical
data (Gareth et al., 2015) and perform well with large amount of data. However,
individual decision trees are not suitable for prediction and suffer from overfitting and
small variances in the data.

54
Figure 1.3: A simple decision tree.
The blue square represents a feature to split on. The green dots represent classification
decisions.

55
The shortcoming of a single decision tree can be overcome by constructing lots of them
and take the consensus prediction. Several different trees are possible, depending on
which variables are used first. The most effective are those that provide the most
information gain (i.e. the decrease in entropy) at each step.
Random forests are an aggregated machine learning technique based on picking the most
commonly outputted answer from a number of decision trees.
The random forest has two major parameters that affect its classification performance,
that is the number of trees used in the forest and the depth which is determine the level of
interaction between variables (Breiman, 2001).
1.8.3.2 Support vector machine
Support vector machines SVM solve the simple task of binary linear classification
separating defined classes using a hyperplane. During supervised learning, given labelled
training data, the algorithm outputs an optimal hyperplane, which can be used classify new
examples. In two-dimensional space, a hyperplane can be visualised as a line that splits the
input variable space into two parts (Campbell and Ying, 2011). This line called the
decision boundary (Figure 1.4).
The distance between the hyperplane and the closest class point from either set is called
the margin. A good margin occurs when this separation is maximised for both
classes. For SVMs, the best hyperplanes are where the distance to the nearest point of each
class is the largest (Campbell and Ying, 2011).
SVMs can perform a non-linear classification using kernels, implicitly mapping inputs
into high-dimensional feature spaces. The Kernel is considered to be an important

56
Figure 1.4: A linear SVM versus non-linear SVM.

57
parameter of SVM defining the shape of SVM decision boundary (Cristianini and Shawe-
Taylor, 2000). There are different types of kernel such as linear, radial basis function
(RBF), sigmoid and polynomial (Yekkehkhany, Homayouni and Hasanlou, 2014).
1.8.4 Cross validation
Cross validation (CV) is a technique to evaluate predictive models by splitting the data
into a training set to train the model, and a test set to evaluate it.
The data is randomly splitting into k equal size subsets called folds. Of the k subsets, a
single subset is retained as the validation data for testing the model, and the remaining k-
1 subsets are used as training data. This process is repeated k times with each of the k
subset used exactly once as the validation data. The average of K result on each of the
folds produces a final validation metrics for the model (Kohavi, 1995).
For this project, each model was run with 10-fold cross validation, which means that the
classification model is run ten times with different segments of the original data used as
training and testing data in each fold.
1.8.5 Features
For any machine learning task, the features used in the models are key. They define how
the model will be created and give information about the individual instances in the
dataset. Selecting the features is important to make sure that the chosen features are
relevant. Some models of machine learning can entail ample numbers of features without
damaging their performance. On the other hand, models such as random forest can be
negatively affected if features are not chosen wisely. (Campbell and Ying, 2011).
58
1.9 Objectives of this thesis
The aim of this thesis is to develop methods to identify mutated proteins in cancer that
are therapeutically actionable.
1.9.1 Mutational patterns in oncogenes and tumour suppressors
In this chapter I examine the mutation patterns observed in oncogenes and tumour
suppressors, and discuss different approaches that have been developed to identify driver
mutations within cancers that contribute to the disease progress. I also discuss the
MOKCa database where we have developed an automatic pipeline that structurally and
functionally annotates all proteins from the human proteome that are mutated in cancer,
and where the results from my thesis are recorded. Finally I analyse some of the
mechanisms that cause mutations to activate oncogenes.
1.9.2 Identification and analysis of mutational hotspots in oncogenes and tumour
suppressors
Protein domains encapsulate function and position-specific domain based analysis of
mutations have been shown to help elucidate their phenotypes. In this chapter I examine
the domain biases in oncogenes and tumour suppressors. Using data from over 30
different cancers from whole-exome sequencing cancer genomic projects we mapped
over one million mutations to their respective Pfam domains to identify which domains
are enriched in any of three different classes of mutation; missense, indels or truncations.
Next, I identified the mutational hotspots within domain families by mapping small
mutations to equivalent positions in multiple sequence alignments of protein domains.

59
1.9.3 Predicting loss of function and gain of function driver missense mutations in
cancer
Missense mutations are the most common cancer mutations that change the protein
product. Understanding the functional impact of these mutations remains a significant
challenge. Driver missense mutations can cause loss of the protein’s native function (loss
of function, LOF) usually in proteins termed tumour suppressors. Alternatively, a driver
missense mutation can increase a protein’s activity or enable it to gain a new function
(gain of function, GOF) in proteins termed oncogenes. Here, I investigate the ability of
seven prediction algorithms to discriminate between driver missense mutations in tumour
suppressors and oncogenes. Next, I implement a new algorithm (MOKCaRF) to
discriminate between LOF and GOF driver missense mutations in known cancer genes.
Finally, I use MOKCaRF to classify genome-wide driver missense mutations in the
MOKCa database.
1.9.4 Identifying the impact of in-frame insertions and deletions on protein function
in cancer
In cancers, approximately 1% of reported mutations are inframe indels of which a small
proportion will be driver mutations giving a selective advantage to the tumour cell. Here,
I evaluate the ability of six popular prediction tools to distinguish between recurrent
somatic cancer indels and neutral indels. Although these algorithms predict the
pathogenicity of indels on the function of proteins, they have generally developed using
hereditary and evolutionary datasets. Next, I developed a new algorithm (IndelRF) that
discriminates between recurrent indels in known cancer genes and indels not associated

60
with disease using data from somatic cancers. Finally, IndelRF is used to classify the in-
frame indel cancer mutations in the MOKCa database.
1.9.5 Identifying actionable mutated proteins as targets for personalised medicine in
lung cancer
In this final chapter I take the mutational data from 50 TCGA lung cancer patients to
ascertain whether they would benefit from targeted treatment. To identify potential drug
targets I analysed which genes have driver missense mutations using standard methods
(CHASM) and then used MOKCaRF to see which have LOF/GOF mutations. I also
analysed which genes were over and under-expressed, and those with copy number
alterations.
Having identified the driver genes for each patient. I then analysed their potential of their
cancer to be amenable to personalised treatment regimes using known drugs from DGIdb
(Cotto et al., 2018) and CanSAR (Tym et al., 2016). Activated proteins could be targeted
directly; where as inactivated proteins were targeted using a synthetic lethality approach.

61
Chapter 2. Mutational patterns in oncogenes and tumour suppressors
2.1 Introduction
In most diseases of genetic origin, the disease phenotype can usually be attributed to a
small number of defined mutations, which once located are readily distinguished from the
essentially wild-type genetic background (Amberger et al., 2015). Cancer is also
fundamentally a genetic disease, with the phenotype arising by somatic acquisition of a
set of defined ‘hallmark’ mutations (Hanahan and Weinberg, 2000). These exert their
effect by activating oncogenes and/or inactivating tumour suppressors, one or more of
which may already be mutated in the germline in inherited cancer predisposition
syndromes.
Acquisition of the genetic changes that confer hallmark traits of invasive cancer depends
on loss of genetic stability early in the tumour cell lineage typically initiated by a defect
in the DNA damage response (DDR) (Jeggo, Pearl and Carr, 2016). Paradoxically, the
inherent genetic instability that gives tumours their evolutionary plasticity underlies their
sensitivity to the genotoxic drugs and radiation that constitute many first- line cancer
therapies. An important consequence of this genetic instability is the presence of large
numbers of mutational changes in the genomes of tumours as compared with
untransformed cells from the same individual (Stratton, Campbell and Futreal, 2009). The
overwhelming majority of these changes may be inconsequential in terms of driving the
cancer phenotype, but generate a high level of mutational ‘noise’ within which the
significant driving mutations may be very difficult to identify.

62
There has been a substantial increase in understanding of the many pathways that can
drive the hallmark traits of cancer in the last few years (Hanahan and Weinberg, 2011),
and many specific inhibitors of the proteins that constitute those pathways have been
developed. Together with the development of rapid and low-cost genome sequencing,
there is now the real prospect of ‘personalized’ drug therapies precisely targeted to the
idiosyncratic regulatory malfunctions resulting from the mutations that drive an
individual cancer (Yap and Workman, 2012), so long as these can be distinguished from
the substantial background of irrelevant ‘passenger’ mutations, so that the genotype can
be used to predict the phenotype.
Given the large numbers of mutations typically observed (Forbes et al., 2015)
experimental determinations of the consequences on protein function of the individual
mutations observed in a cancer genome are not realistic, and computational approaches
are required.
2.2 Identifying driver genes
These are several statistical approaches (e.g. (Lawrence et al., 2013, Greenman et al.,
2006)) that identify significantly mutated genes within large cohorts of sequenced
tumours. These approaches are very good at identifying highly recurrent mutated genes
but as yet, the data sets are not large enough to have the statistical power to detect low
frequency mutated genes that contribute to the initiation and progression of cancer. This
can pose a problem because although a few genes are highly mutated, the majority of
somatic mutations occur in genes that are infrequently mutated (Stephens et al., 2012,
Garraway and Lander, 2013).

63
2.3 Characteristics of tumour suppressors and oncogenes
Driver genes are classified by the manner in which, when mutated, they contribute to the
disease process. Tumour suppressors contribute to the development of cancer when
mutations (or in some instances epigenetic silencing) result in their loss of function
(LOF). The alterations to these genes are generally molecularly recessive where both
copies of the gene require a LOF defect to cause disease (Futreal et al., 2004). For
instance, this may be a truncation or missense mutation on one allele, combined with a
complete loss of the second. This commonly occurs in kidney renal clear cell carcinoma
(KIRC), where the loss of the chromosome arm 3p in KIRC combined with concurrent
mutations on the remaining allele results in complete ablation of functioning von Hippel-
Lindau tumor suppressor (VHL) (Brauch et al., 1994).
In oncogenes, an increase in activity, or a change of function is required for
tumorigenesis. They tend to exhibit a molecularly dominant mode of action, and usually
only one defective copy of the gene is required to provide an oncogenic phenotype. This
is exhibited in BRAF where V600E activating mutations constitutively activates B-Raf in
malignant melanoma (Wan et al., 2004), or in BCR-ABL in chronic myelogenous
leukaemia where a translocation constitutively activates Abl-kinase.
Missense mutations in tumour suppressors can result in its LOF in a variety of manners
including loss of stability of the protein or the disruption of a crucial
ligand/DNA/protein- binding site (Al-Numair and Martin, 2013). In cohorts of tumours,
these mutations are often liberally dispersed along the length of the gene, as protein
function can be disrupted by mutations at a multitude of positions (Vogelstein et al.,

64
2013). Conversely, in oncogenes, driver missense mutations tend to cluster at distinct
locations in the amino acid sequence impacting on sites of protein– protein interaction,
allosteric regulation, post-translational modification or ligand binding. Often only a very
few, specific mutations can lead to activation of the protein product or a change of a
protein function (Vogelstein et al., 2013).
2.3.1 Identifying driver mutations
Sequence and structural data have been utilized to predict whether a missense mutation or
a small insertion or deletion could be disease causing using a variety of approaches.
Sequence conservation is used to predict which mutations can be tolerated within a
protein structure, and similarly, protein structures have been used for estimating how
disruptive a missense mutation may be (Al-Numair and Martin, 2013, Ng and Henikoff,
2001, Pires, Ascher and Blundell, 2014a, Yates et al., 2014). Techniques originally
developed to predict the consequences of amino acid changes observed in single
nucleotide polymorphisms (SNPs) and Mendelian genetic diseases, have been applied to
cancer mutations, but have often failed to provide sufficiently reliable prediction.
More recently algorithms have been specifically developed to distinguish cancer-
associated somatic driver mutations from passenger mutations. These include profile-
based methods for assessing missense mutations (e.g. (Shihab et al., 2013a, Reva,
Antipin and Sander, 2011, Gonzalez-Perez, Deu-Pons and Lopez-Bigas, 2012, Espinosa
et al., 2014)), and machine learning algorithms for assessing the pathogenicity of
missense mutations (Douville et al., 2013) and indels (Douville et al., 2016).

65
2.3.2 Approaches to distinguish between tumour suppressors and oncogenes
As the mutational patterns observed in cohorts of tumour samples clearly differ between
tumour suppressor and oncogenes, several groups have used this information to
automatically distinguish between them. For instance, Vogelstein’s 20:20 rule
(Vogelstein et al., 2013) states that if 20 % of all mutations observed in a gene within a
cohort of tumour samples are truncations, then that gene is likely to be a tumour
suppressor, where as if 20% of all missense mutations occur at a single position in the
sequence, the gene is predicted to be an oncogene. These types of patterns have also been
included in machine learning algorithms to automatically distinguish between tumour
suppressors and oncogenes (e.g. (Schroeder et al., 2014)) using data from whole exome
sequencing.
2.4 MOKCa database
The MOKCa database (Richardson et al., 2009) (http://strubiol.icr.ac.uk/ extra/mokca/)
was developed to structurally and functionally annotate, and where possible predict, the
phenotypic consequences of disease-associated mutations in protein kinases implicated in
cancer. We have recently extended the database to include all the proteins from the
human genome that are mutated in cancer (see Figure A2.1).
Somatic mutation data from the COSMIC database (Forbes et al., 2015) have been
mapped to their position in UniProt sequences (Boutet et al., 2016). Each mutation is
described by its alteration to the protein structure, e.g. V600E. When a mutation has been
reported on more one occasion, it is stored as an ‘aggregate’ mutation and the number of
observations of the aggregate mutation is recorded. Different genetic changes that result

66
in the same protein coding mutation are presented together at the protein level and each
disease type in which this mutation has been recorded is also presented on the protein
overview page.
Functional annotations for each protein are displayed. These include the identification
and position of Pfam domain assignments within the protein sequence (Finn et al., 2016),
and the positions of residues effected by post-translational modifications including
phosphorylation, glycosylation and ubiquitination (Hornbeck et al., 2015). Gene
Ontology (GO) annotations have also been obtained for each protein (Gene Ontology,
2015).
Dr Christopher Richardson, from the Institute of Cancer Research, developed the
MOKCa database, and implemented the informatics required to map cancer mutations
onto protein structures (see below).
2.4.1 Structural mapping of mutations
The amino acid sequence for every Pfam-annotated domain for which COSMIC records a
cancer-associated mutation has been scanned against the Protein Data Bank (PDB)
(Berman et al., 2012) using BLAST/PSI-BLAST (cut-off value of 0.001) (Altschul et al.,
2009), to map the mutation on to the protein structure of the affected human protein
domains where the structure has been experimentally determined, or on to the most
closely related homologous structure where the experimental structure is not known.
The positions of the individual mutations can be viewed on the mutation web page using
the Jmol application (McMahon and Hanson, 2008), and the multiple sequence alignment

67
between the query domain and the PDB template is displayed using Jalview (Waterhouse
et al., 2009).
2.4.2 Development of web-interface
The new web-interface for MOKCa database can accessed at
http://strubiol.icr.ac.uk/extra/mokca/ (see Figure 2.1) and can be searched by gene name
or by UniProt accession (Boutet et al., 2016).
Users can also browse the data using gene names either exploring the complete genome
or our curated sets of genes that are implicated in cancer.
These include, protein kinases, oncogenes and tumour suppressors, proteins involved in
the DDR (Pearl et al., 2015) and those proteins that are current targets of chemotherapy
and personalized cancer medicine regimes (drug targets) (Mitsopoulos et al., 2015).
2.5 Activating mutations in oncogenes
Analysis of data in the MOKCa database suggests that although there are a large number
of ways to inactivate the protein product of a gene, there are probably only a limited
number of ways that small mutations (missense, truncations, indels) are able to activate
them. We have identified several common mechanisms of activation – some of these are
highlighted below.

68
Figure 2.1: This is an illustration of the data visualization available on the different
webpages on MOKCa web-interface.
Figure (a) shows sets of cancer-related genes that can be browsed by gene name. Figure
(b) shows a schematic diagram of the domain architecture of the protein (BRAF) with the
positions of somatic mutations mapped to the protein sequence. Blue lines indicate
missense mutations, dotted black lines indicate silent mutations and triangles are used to
show insertions (pointing down) or deletions (pointing up). In frame indels are coloured
blue, and frame shift indels are coloured green, solid black lines indicate nonsense
mutations. Figure (c) is an extract from the summary table for mutation aggregates. As
well as describing the mutations and their frequency it also indicates which domain the
mutation is in, whether it is near any post-translational modifications and highlights
which cancers it is found in. Figure (d) shows in more detail the post-translational
modifications near the mutation. Figure (e) highlights the position of the mutation within
a protein structure. In the example shown, the domain containing the mutation, a protein
kinase domain (Pkinase), is coloured in red, and the mutated residue is displayed as a
space-filling model. Figure (f) displays the distinct number of protein coding mutations
(aggregates) found in each gene.

69
2.5.1 Activating mutations in protein kinases
Protein kinases can be thought of being in equilibrium between the active and inactive
conformations. Usually, other protein kinases phosphorylate the activating residues
(S/T/Y) moving the conformational equilibrium towards the, active conformation (see
Figure 2.2), whereas protein phosphatases remove the phosphate groups shifting the
conformational equilibrium back to the inactive conformation. These processes lead to
highly regulated control of the conformation and activation of kinase domains.
One of the most frequently reported mutations is the activating mutation V600E in B-Raf,
a driver missense mutation in malignant melanoma. Examination of V600E mutation
models using the SAAPdat tool (Al-Numair and Martin, 2013) (Figure 2.3), clearly
shows that the structural impact of the mutation differs in the active and inactive
conformations of the protein. The mutation is predicted to be structurally tolerated when
the BRAF kinase domain is in the active conformation, yet in the inactive conformation
the mutation is predicted to introduce a hydrophilic residue and a buried charge into the
core of the protein. This would result in the destabilization of the inactive conformation,
moving the equilibrium of the protein towards the active conformation where the
mutation is better tolerated.
Recent molecular dynamic simulations support this model, suggesting that the V600E
mutation increases the energy barrier of the transition from the active to inactive
conformation, trapping B-Raf in the active state. They also suggest that an increase in the
flexibility of the activation loop may also speed-up phosphorylation (Marino, Sutto and
Gervasio, 2015).

70
Figure 2.2: This is a schematic illustration of the change in the equilibrium of the
active and inactive conformational states of protein kinases.
Figure (a) shows the default equilibrium of a protein kinase. When the activation loop is
phosphorylated, the active conformer is stabilized and the equilibrium moves towards the
active conformation. This is illustrated in figure (b). Activating mutations have a
tendency to destabilize the inactive conformation also moving the equilibrium towards
the active conformation. This is illustrated in figure (c).

71
Figure 2.3: Structural impact of the B-Raf V600E mutation.
Figures (a) and (b) show the structural impact of the V600E mutation in the protein
product of BRAF as predicted by the SAAP (Adzhubei, Jordan and Sunyaev) algorithm.
The predicted impact of the mutation differs significantly dependent on whether the
protein is in the (a) active or (b) inactive protein kinase conformation. Figures (c) and (d)
show the predicted positions of the V600E mutation within the protein structure. The
position of the mutated residue also differs significantly depending on whether the
protein is in the (c) active or (d) inactive protein kinase conformation. Figure (c) is
modelled on the PDB template 3PSD, chain B and figure (d) on 3SKC chain B.

72
Dependent on their location within the kinase domain, missense mutations will often be
better tolerated in one or other conformation of the protein kinase resulting in an alter-
ation of the conformational equilibrium and constitutive ac- tivation (or in some cases
deactivation) of the protein kinase.
Another observed mechanism for the constitutive activation of protein kinases is the loss
of inhibitory phosphorylation sites. These include the auto inhibitory phosphorylation
sites in KIT at position Tyr823 (D/C/N mutations) and the S259A mutation in the PKC
phosphorylation site in Raf1, that mediates inhibitory 14-3-3 protein (Dhillon et al.,
2003). Tyrosine receptor kinases can also be activated by dimerization of the
extracellular domains resulting in ligand-independent activation of the receptor. This is
observed in FGFR2 by mutations R203C and W290C in the immunoglobulin-like (Ig-like)
domains (Reintjes et al., 2013, Lajeunie et al., 2006).
2.5.2 Oncogenic mutations in isocitrate dehydrogenases
Mutations in isocitrate dehydogenases are also thought to contribute to the progression of
cancer by altering the conformation of the protein. IDH1 and IDH2 catalyse the oxidative
carboxylation of isocitrate to α-oxoglutarate. Mutational hotspots at R132H in IDH1, and
R140Q and R172K in IDH2 alter the progression of this reaction. Recent structural work
suggests that the R132H IDH1 mutation hampers the conformational change from the
initial isocitrate binding state to the pre-transition state, thus causing an impairment of
enzyme function (Yang et al., 2010). This alters the pro- gression of this reaction causing
the oncometabolite R( − )- 2-hydroxyglutarate to be formed. R( − )-2-Hydroxyglutarate is

73
implicated in genomic hypermethylation, leading to histone methylation, genomic
instability and finally malignant transformation (Kato, 2015).
2.6 Domain-based approaches for identifying mutational hotspots
Although most of the analysis of cancer mutations is based around a gene centric view, a
few studies have focused on domain-based analyses (Nehrt et al., 2012, Porta-Pardo and
Godzik, 2014, Miller et al., 2015) and they may be particularly fruitful when studying
mechanisms of activation of proteins. Larger proteins comprise recognizable smaller
sequence domains, which recur in other proteins in various combinations. These domains
may be thought of as units of evolution, creating protein domain families, and have
evolved from a common ancestor. As a domain can exist across multiple proteins with
conserved function and structure, it follows that similarly located mutations across
different proteins in the same domain should have similar effects on the function of that
domain.
Proteome-wide analyses have been performed to identify domains enriched in missense
mutations (Nehrt et al., 2012, Peterson et al., 2012, Miller et al., 2015) and to identify
domain-centric positions of hotspot missense mutations (Peterson et al., 2010, Yue et al.,
2010, Miller et al., 2015). These studies focused exclusively on missense mutation and as
yet, little attempt was to use these data to distinguish between activating and LOF
mutations in the majority of cases.
We are currently mapping all simple small mutations (missense, truncations and indels)
from over 30 different types of cancer to equivalent positions in multiple sequence

74
alignments of protein domains. These data are being used to identify domain-centric
mutational hotspots and can be accessed through the MOKCa database.
Using the biological knowledge associated with protein domains, such as structural
information and evolutionary conservation, will enable us to understand the functional
consequences of infrequent mutations in well-characterized domain families and will
facilitate additional insights into the roles of these mutations in cancer.
75
Chapter 3. Identification and analysis of mutational hotspots in oncogenes and
tumour suppressors
3.1 Introduction
All cancers depend on mutations in critical genes that confer a selective advantage to the
tumour cell. Knowledge of these mutations is fundamental to understanding the biology
of cancer initiation and progression, and to the development of targeted therapeutic
strategies. The genes that harbour the driver mutations that contribute to the disease
process are traditionally classified as either as ‘tumour suppressors’ or as oncogenes,
dependent on their role in cancer development.
When mutations (or epigenetic silencing) of the protein products of tumour suppressors
result in their loss of function (LOF), cancer progression occurs. Driver alterations in
these genes are typically molecularly recessive in nature, with both copies of the gene
requiring a LOF defect. In oncogenes, an increase in activity, or a change of function is
required for tumorigenesis. These genes tend to exhibit a molecularly dominant mode of
action, and usually only one faulty copy of the gene is required to provide an oncogenic
phenotype (Futreal et al., 2004).
When mutations from cohorts of patients are sequenced and the alterations mapped to a
single genome, the mutational spectra in tumour suppressors and oncogenes tend to differ.
In tumour suppressors small mutations are often liberally dispersed along the length of
the gene. This is because the protein products can be disrupted with damaging mutations
at a multitude of positions (Vogelstein et al., 2013, Baeissa et al., 2016). Driver missense
mutations within a tumour suppressor can result in its loss of function in a variety of

76
ways, including loss of stability of the protein or the disruption of a crucial
ligand/DNA/protein-interaction site. Conversely, in oncogenes often only a very few,
specific mutations in specific locations can lead to activation of the protein product or a
change of protein function. Driver missense mutations consequently tend to cluster at
distinct locations within a protein (Richardson et al., 2009, Tokheim et al., 2016),
impacting on functional sites such as ligand-binding, protein-protein interactions,
allosteric regulation and post-translational modifications.
Several groups have used the differences in these mutational patterns to automatically
distinguish between tumour suppressor and oncogenes (Schroeder et al., 2014). For
instance, Vogelstein’s 20:20 rule (Vogelstein et al., 2013) can be applied to cohorts of
tumour samples. Within a cohort: if 20% of all mutations observed within a gene are
truncations, then the gene is likely to be a tumour suppressor. Similarly, if 20% of all
missense mutations occur at a single position in the sequence, the gene is predicted to be
an oncogene.
As well as discriminating between tumour suppressors and oncogenes, there are several
approaches to detect which genes are likely to be drivers, irrespective of their biological
function: Statistical methods have been successfully applied to identify recurrently
mutated genes within large cohorts of sequenced tumours (eg (Lawrence et al., 2013,
Greenman et al., 2006)). However, the data sets are not yet large enough to have the
statistical power to detect low frequency mutated genes that contribute to the disease
process. This poses a problem as most somatic mutations in tumours occur in genes that
are rarely mutated (Garraway and Lander, 2013, Stephens et al., 2012).
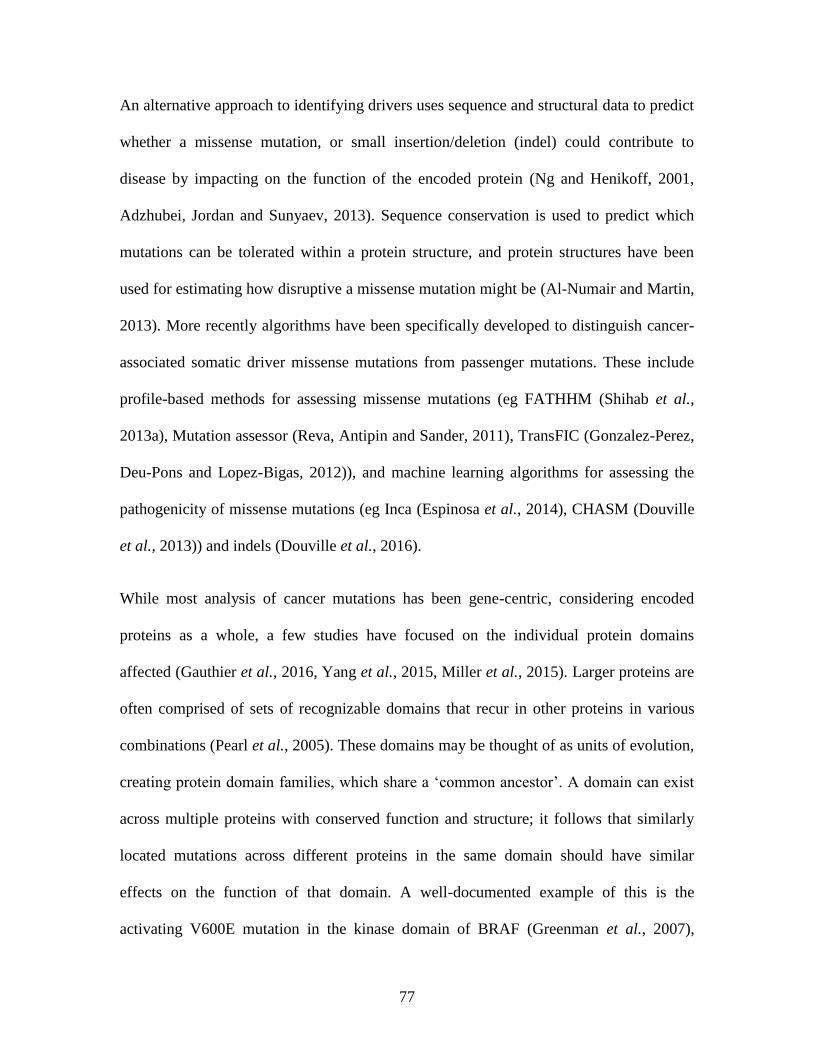
77
An alternative approach to identifying drivers uses sequence and structural data to predict
whether a missense mutation, or small insertion/deletion (indel) could contribute to
disease by impacting on the function of the encoded protein (Ng and Henikoff, 2001,
Adzhubei, Jordan and Sunyaev, 2013). Sequence conservation is used to predict which
mutations can be tolerated within a protein structure, and protein structures have been
used for estimating how disruptive a missense mutation might be (Al-Numair and Martin,
2013). More recently algorithms have been specifically developed to distinguish cancer-
associated somatic driver missense mutations from passenger mutations. These include
profile-based methods for assessing missense mutations (eg FATHHM (Shihab et al.,
2013a), Mutation assessor (Reva, Antipin and Sander, 2011), TransFIC (Gonzalez-Perez,
Deu-Pons and Lopez-Bigas, 2012)), and machine learning algorithms for assessing the
pathogenicity of missense mutations (eg Inca (Espinosa et al., 2014), CHASM (Douville
et al., 2013)) and indels (Douville et al., 2016).
While most analysis of cancer mutations has been gene-centric, considering encoded
proteins as a whole, a few studies have focused on the individual protein domains
affected (Gauthier et al., 2016, Yang et al., 2015, Miller et al., 2015). Larger proteins are
often comprised of sets of recognizable domains that recur in other proteins in various
combinations (Pearl et al., 2005). These domains may be thought of as units of evolution,
creating protein domain families, which share a ‘common ancestor’. A domain can exist
across multiple proteins with conserved function and structure; it follows that similarly
located mutations across different proteins in the same domain should have similar
effects on the function of that domain. A well-documented example of this is the
activating V600E mutation in the kinase domain of BRAF (Greenman et al., 2007),

78
which is found in thyroid cancer and malignant melanoma. Comparable activating
mutations occur at the equivalent position in the kinase domain of c-KIT (D816V) in
gastrointestinal stromal tumours (GIST) and acute myeloid leukaemia (AML), and in the
kinase domain of FLT3 (D835Y) in AML (Richardson et al., 2009, Dixit et al., 2009).
Similarly, KRAS, NRAS, HRAS all have highly recurrent activating mutations at
position G12 (KRAS) in the Ras domain in a large variety of cancers (Richardson et al.,
2009, Yang et al., 2015).
Proteome-wide analyses have previously been performed to identify domains enriched in
missense mutations (Gauthier et al., 2016, Yang et al., 2015, Nehrt et al., 2012, Peterson
et al., 2012) and to identify hotspot positions in missense mutations (Tokheim et al., 2016,
Miller et al., 2015, Peterson et al., 2010, Yue et al., 2010, Chang et al., 2016). In these
studies all missense mutations were analysed concurrently rather than segregated into
those that would likely result in a loss of function and for those that would result in a gain.
Here we examine the domain biases in oncogenes and tumour suppressors, and have also
compared them with genes not assigned to these roles and find that their domain
compositions substantially differ. We have mapped over 1 million mutations from whole-
exome sequencing cancer genomic projects including data from over 30 different types of
cancer and identified which domains are recurrently mutated in tumour suppressors,
oncogenes and throughout the genome. We have divided the mutations into three
different classes; missense, truncations or indels. Finally we identified the mutational
hotspots within domain families by mapping small mutations to equivalent positions in
multiple sequence alignments of protein domains. Examining the differences in the
distribution of the positions of domain hotspots, between tumour suppressors and

79
oncogenes, has enabled us to identify key positions of activating mutations in a variety of
domain types. This has enabled us to identify putative gain of function mutations in
proteins previously unassociated with cancer that may be actionable with current
therapies. The results of this analysis can be accessed through the MOKCa database
(Mutations, Oncogenes and Knowledge in Cancer, http://strubiol.icr.
ac.uk/extra/MOKCa).
3.2 Materials and Methods
3.2.1 Mutation mapping
Protein sequences from COSMIC v71 (Forbes et al., 2017) were mapped to UniProt (The
UniProt, 2017) protein sequences using MD5 hashes and BLAST (Altschul et al., 1997)
using the MOKCa update protocol. Pfam domain boundaries were assigned to each
protein and Fasta sequence files generated for each domain.
Somatic mutation data was extracted from the “Whole Genome Sequencing” (WGS)
version of the COSMIC database V71 and processed using the MOKCa update protocol.
2,399,998 mutations from 15051 patient samples in 30 cancer types were mapped to the
UniProt protein sequences. In total, 1,077,825 (45%) mutations could be mapped to
conserved Pfam domains (Finn et al., 2016).
The mutations were classified into three subsets. Missense mutations, where usually a
single base substitution changes the protein product by a single amino acid. Truncating
mutations, which incorporate nonsense mutations and frameshift insertions and deletions.
Truncations may just disrupt a single domain or result in complete destruction of the
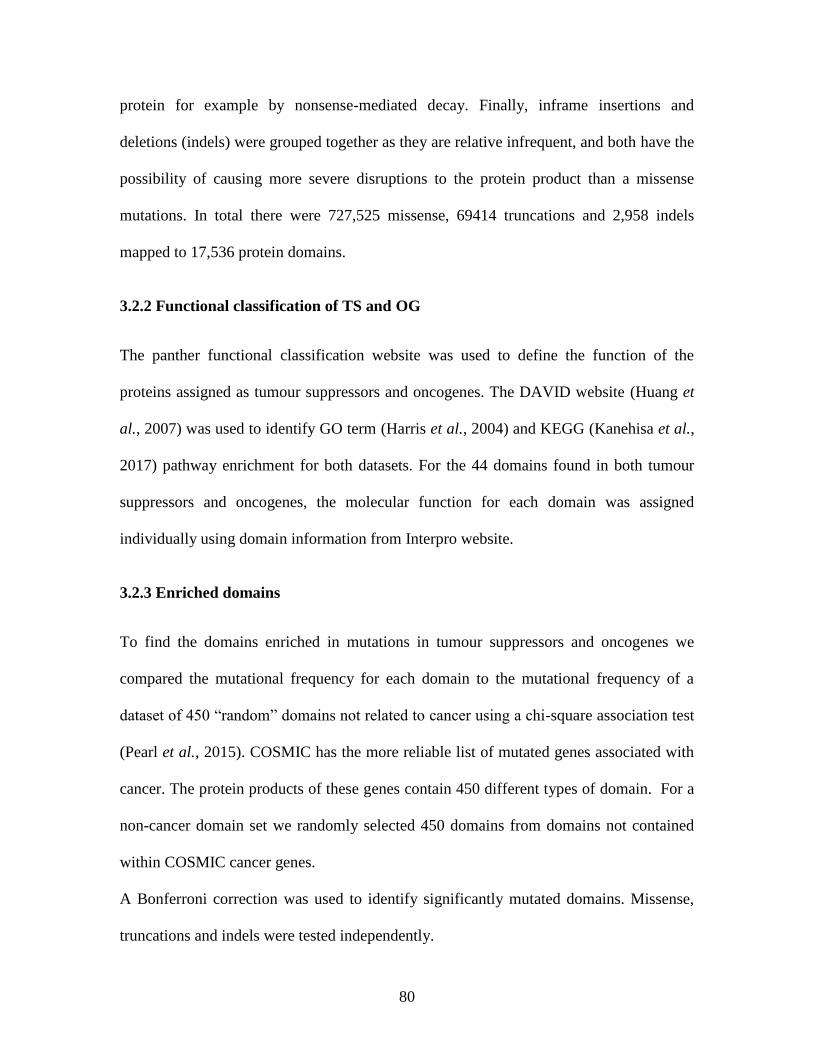
80
protein for example by nonsense-mediated decay. Finally, inframe insertions and
deletions (indels) were grouped together as they are relative infrequent, and both have the
possibility of causing more severe disruptions to the protein product than a missense
mutations. In total there were 727,525 missense, 69414 truncations and 2,958 indels
mapped to 17,536 protein domains.
3.2.2 Functional classification of TS and OG
The panther functional classification website was used to define the function of the
proteins assigned as tumour suppressors and oncogenes. The DAVID website (Huang et
al., 2007) was used to identify GO term (Harris et al., 2004) and KEGG (Kanehisa et al.,
2017) pathway enrichment for both datasets. For the 44 domains found in both tumour
suppressors and oncogenes, the molecular function for each domain was assigned
individually using domain information from Interpro website.
3.2.3 Enriched domains
To find the domains enriched in mutations in tumour suppressors and oncogenes we
compared the mutational frequency for each domain to the mutational frequency of a
dataset of 450 “random” domains not related to cancer using a chi-square association test
(Pearl et al., 2015). COSMIC has the more reliable list of mutated genes associated with
cancer. The protein products of these genes contain 450 different types of domain. For a
non-cancer domain set we randomly selected 450 domains from domains not contained
within COSMIC cancer genes.
A Bonferroni correction was used to identify significantly mutated domains. Missense,
truncations and indels were tested independently.

81
For the genome-wide study, the mutational burden in each single domain type was
compared to that in all other domain types using a chi-square association test. Data was
normalized by domain frequency, number of samples and domain length.
3.2.4 Hotspot identification
A suite of Perl programs was used to generate and analyse hotspot domain positions. A
multiple sequence alignment (MSA) was generated for all human domain fasta sequences,
for each Pfam family using the MUSCLE (v3.8.31) alignment program (Edgar, 2004).
Each mutation from each domain was mapped to a consensus position generated from the
MSA and a consensus count was generated.
A binomial test was used to identify which positions had a significant number of
mutations. If each individual mutation were to affect a random residue across the domain
the frequency of mutations at each site would follow a binomial distribution. As such our
null model states that there is an equal probability of a mutation occurring at each residue
on the given domain.
Where n is the total number of mutations in the domain, k is the number of mutations
falling at a specific residue and p the probability of any mutation affecting a specific
residue we can find the probability of observing k mutations falling at any specific point
in the domain by calculating the probability of a minimum of k mutations at that point
and comparing it to our null model.
Missense, truncations and indels were tested independently and only positions where
mutations occurred at least two were analysed. The results were amended by a Bonferroni

82
correction. The overlap of hotspots between different mutational types were visualised
with jvenn web application (Bardou et al., 2014).
3.2.5 MoKCA database
The MOKCa database (Mutations, Oncogenes and Knowledge in Cancer,
http://strubiol.icr.ac.uk/extra/ MOKCa) was developed to structurally and functionally
annotate, and where possible predict, the phenotypic consequences of disease-associated
mutations in proteins implicated in cancer. The initial database focused on protein
kinases, but has now been extended include all the proteins from the human genome that
are mutated in cancer.
3.2.6 Populating the database with mutational data
Somatic mutation data from tumours from the COSMIC database (v71) have been
mapped to their position in UniProt sequences. COSMIC use their own reference
sequences (Ensembl transcripts), and although most COSMIC protein sequences (~17000)
match perfectly when mapped to UniProt sequences, for the remaining ~4000 sequences
the relationship is more complicated. Each COSMIC sequence was aligned with their
corresponding UniProt sequence and when the sequences are not identical the alignment
was stored in the database. This allows us to identify the position of the mutation with
regard to the UniProt sequence, which provides the authoritative reference.
Each mutation is described by its alteration to the protein structure, eg V600E. When this
mutation has been reported on more one occasion each mutation is stored as the same
aggregate and an aggregate count given. Different genetic changes that result in the same

83
mutation are presented together at the protein level. Each disease type in which this
mutation has been recorded is also presented on the protein overview page.
3.2.7 Functional annotation of protein sequences and mutations
Functional annotations for each protein using a variety of databases have incorporated
this into the new MOKCa database. These annotations include the identification and
position of Pfam domain assignments within the protein sequence, and the positions of
residues known or predict to be affected by post-translational modifications including
phosphorylation, glycosylation, and ubiquitination. Gene Ontology (GO) annotations and
Prosite patterns (Sigrist et al., 2013) have also been obtained for each sequence.
3.2.8 Structural mapping of mutations
The amino acid sequence for every Pfam-annotated domain for which COSMIC records a
cancer-associated mutation has been scanned against the Protein Data Bank (PDB)
(Edgar, 2004) using PSI-BLAST, to map the mutation onto the protein structure of the
affected human protein domains where the structure has been experimentally determined,
or onto the most closely related homologous structure where the experimental structure is
not known.
To identify which mutations mapped onto residues with structural density in the PDB file,
PDB sequence to structure alignments from the SIFTS (Structure integration with
function, taxonomy and sequence) initiative were utilized.

84
3.2.9 Development of web-interface
The new web-interface for MOKCa database can access at
http://strubiol.icr.ac.uk/extra/mokca/ and can be searched by gene name or by UniProt
accession. Users can also “browse the data from the gene data. To help identify those
proteins we have identified subsets of proteins that are frequently mutated in cancer this
includes, protein kinases (Richardson et al., 2009), oncogenes and tumour suppressors
(Futreal et al., 2004), proteins involved in the DNA damage response (DDR) and those
proteins that are current targets of chemotherapy and personalised cancer medicine
regimes (drug targets) (Mitsopoulos et al., 2015).
3.3 Results and Discussion
3.3.1 Functional characterisation of tumour suppressors and oncogenes
Using the Cancer Gene Census classification we assigned 133 molecularly recessive
genes as tumour suppressors and 481 molecularly dominant genes as oncogenes. Genes
that were labelled as both molecularly dominant and recessive were included in both data
sets.
First we analysed the biological pathways. Pathway enrichment analysis showed that
tumour suppressors and oncogenes usually cluster in different molecular pathways. We
found 79 pathways enriched with tumour suppressors, notably those involved in the cell
cycle, response to cellular stresses and the DNA damage response. The 306 pathways
enriched in oncogenes include those involved in the regulation of biosynthetic process,
regulation of transcription and those involved in protein amino acid phosphorylation.
Only 14 pathways were enriched in tumour suppressors and oncogenes. These included

85
immune system development, regulation of macromolecule metabolic process, and
regulation of cell proliferation and apoptosis.
Although generally segregating onto different pathways, the functions of the large
majority of the proteins in oncogenes and tumour suppressors were somewhat similar
(see Supplementary Figure 1), with the largest class of proteins being enzymes, (TS: 32%
OG: 18%), transcription factors (TS: 11%, OG: 21%) and nucleic acid binding proteins
(TS: 32%, OG: 24%) with tumour suppressor comprising of significantly more enzymes
(P = 0.000082) and oncogenes of more transcription factors (P = 0.0023).
3.3.2 Domain characterisation of tumour suppressors and oncogenes
Next we analysed the domain compositions within tumour suppressors and oncogenes. In
total 5523 Pfam domain families were identified within the 17537 proteins analysed.
Tumour suppressor proteins contained 197 different types of Pfam domains with the most
frequently observed domains including Helicase_C (7), DEAD (4), SET (4), HMG-box
(Kantarjian et al.), F-box-like (Kantarjian et al.), ARID (Kantarjian et al.), and PHD
finger (zf-HC5HC2H, 3) domains and the C-terminal domain from DNA mismatch repair
proteins (DNA_mis_ repair, 3). Of the 310 Pfam domain types found in our set of
oncogenes the most frequently observed were Pkinase_ Tyr (26), Homeobox (16), HLH
(14), Ets (9), and SH2 (9) domains.
We only found 44 domain types common to tumour suppressor and oncogenes. The
majority of these were either protein binding modules (Ank, WD40, C2, PHD and SET
domains) or modules evolved to bind to nucleic acids (Homeobox, ARID, zf-C2H2, MH1
domains, see Figure 3.1).

86
Figure 3.1: Distribution of molecular function for the 44 domains types found in
both oncogenes and tumour suppressors.
The outer ring shows each Pfam domain type. The inner ring groups the Pfam domains
by function.

87
3.3.3 Identifying tumour suppressors and oncogenes using domain biases
As the domain compositions between these cancer genes differed substantially, we
decided to investigate whether a gene could be classified as a tumour suppressor or an
oncogene based on their domain composition alone, using a machine learning approach.
Our training set comprised a list of oncogenes and a list of tumour suppressors derived
from the Cancer Gene Census (CGC). Using a support vector machine classifier and a
10-fold cross validation protocol, we achieved a ROC AUC sore of 0.72 (see S3.1
Methods) suggesting that the classifier has some predictive value.
We ran the classifier on 37 genes labelled as both oncogene and tumour suppressor in the
CGC. We found that 17 of the genes were predicted to be tumour suppressors with
probabilities greater than 0.78, including DDB2, TP53 and DAXX. Nine genes were
classified as oncogenes with probabilities greater than 0.83, including ERBB4, BCL10
and BTK. We could not resolve the classification of 11 genes using this approach (see
Supplementary Table S3.1).
Although this classification approach may give a guide to the gene’s predominant cancer
role within the cell, there is increasing evidence in the literature that depending on cell
type and cancer type, many genes can function as both a tumour suppressor and as an
oncogene dependent on the alteration in question.

88
3.3.4 Mutational characterisation of domains in tumour suppressors and oncogenes
To define the mutational ‘load’ that the different domain types are subjected to in cancers,
we mapped mutations from COSMIC v71 (WGS) whole genome sequencing cancer
studies onto the Pfam domains identified above. Mutations were grouped into three
subsets; missense, truncating (nonsense or frameshift), and indels (inframe insertion and
deletions). In total, 727,525 missense, 69,414 truncation and 2,958 indel mutations from
over 30 different types of cancer were mapped to Pfam domains within the human
genome.
3.3.5 Mutational enrichment in tumour suppressors
The most frequently reported mutational event that changes the protein product of tumour
suppressors (62%) is the missense substitution. However, only 15 domain families were
significantly enriched in missense mutations (see Figure 3.2A and Supplementary Table
S3.2). The majority of these were from single members of a domain family, observed
within one of the frequently mutated and very well studied tumour suppressor genes.
These included the P53 DNA binding domain (P53) in TP53, the dual specificity
phosphatase catalytic domain (DSPc) in PTEN and the von Hippel-Lindau disease
tumour suppressor protein domain (VHL) in VHL. Single amino acids substitutions
usually destabilise a protein fold (DePristo, Weinreich and Hartl, 2005, Tokuriki and
Tawfik, 2009), and wild type TP53, PTEN and VHL are only marginally stable at
physiological temperatures (Johnston and Raines, 2015, Sutovsky and Gazit, 2004,
Bullock et al., 1997), which make them particularly sensitive to missense mutations.

89
Only WD40 domains had multiple members affected with mutations found in DDB2,
FBXW7 and TBL1XR1.
15 domains found in tumour suppressors were enriched in truncations, again many being
singleton domains from the commonly mutated major tumour suppressors where a
truncation wipes out the complete function of the protein. These included domains from
the protein products of in TP53, VHL, PTEN, RB1 and APC. Several domain families
including WD40, Bromodomain and F-box-like domains displayed truncations in
multiple members. Only 2 tumour suppressor domains were enriched with indels;
RhoGAP (PIK3R1) and P53 (TP53) each from a single protein (see Figure 3.2B and 3.2C
and Supplementary Tables S3.3 and S3.4).
3.3.6 Mutational enrichment in oncogenes
Amino acid changes due to missense mutation are also the most frequently reported
mutational event in oncogenes (85% of all reported mutations). We detected 37 domains
from our set of oncogenes that were significantly enriched in missense mutations (see
Figure 3.2D and Supplementary Table S3.5). These include the classic oncogene tyrosine
kinase (Pkinase_Tyr) domain, the Ras domain and the isocitrate dehydrogenase domain
family (Iso_dh), where multiple members of these domain families are known to contain
highly recurrent gain/change of function activating missense mutations.
Single genes with significantly high densities of missense mutations included PIK3CA
where the phosphatidylinositide 3-kinase, the gamma adapter protein p101 subunit and
the accessory domains are all enriched in mutations. Mutations in these domains are
thought to facilitate allosteric motions that stimulate lipid kinase activity required for

90
catalysis on membranes (Burke et al., 2012). The zinc finger domain (zf-CCCH) in
U2AF1 was also enriched in mutations. U2AF1, a U2 auxiliary factor protein, recognises
the AG splice acceptor dinucleotide at the 3′ end of introns. Mutations in its zinc finger
domains have been found to promote enhanced splicing and exon skipping in reporter
assays in vitro and may have a similar effect in vivo (Graubert et al., 2011).
Domains that were mutated in more than one gene included both furin-like domains,
which are involved in cellular signaling, and immunoglobulin I-set domains, which are
involved in cellular communication. Missense mutations in these domains have been
shown to disrupt protein interaction surfaces, causing disregulation and activation of
these processes.
Of the 57 domains in oncogenes enriched in truncations the majority are derived from a
single protein (see Figure 3.2E and Supplementary Table S3.6). They also tend to be
present in oncogenes activated via a translocation into a fusion protein. It is not clear
whether these truncations are actually miscalls, and are actually translocations that have
not been identified by the analysis software or whether these truncations could cause
activation of the protein by removal of a regulatory or binding domain. Alternatively, it
may be that when not part of a fusion protein the proteins containing these domains
behave as tumour suppressors rather than oncogenes. Examples of domains frequently
truncated domains include the DNA-binding zinc finger (zf- H2C2_2) domains in
BCL11A, BCL6, PLAG1, ZBTB16, ZNF278 and ZNF331. The protein products of these
genes are thought to repress transcription so disrupting the DNA binding domains may
result in the expression of different subsets of target genes. Again the sparsity of indel
data (see Figure 3.2F and Supplementary Table S3.7) resulted in only 5 domains being

91
identified as mutationally enriched, zf-C2H2, IL6Ra-bind, bZIP_2, PI3K_p85B and
Myb_ DNA-bind_6.
3.3.7 Genome-wide mutational enrichment
We compared the domains observed in tumour suppressors and oncogenes with those
enriched in mutations within the whole genome to see if we could identify novel domain
families not previously associated with annotated cancer driver genes. In total, we
detected 373 domains that were significantly enriched in missense mutations, of which
340 were not present in our tumour suppressor and oncogene datasets (see Supplementary
Table S3.8).
This suggests that the cancer community may be missing mutated genes that contribute to
cancer progression but may not be the typical cancer genes analysed.
For example, we observed enrichment in mutations in the sushi domain also known as
known as complement control protein (CCP) modules. These are small beta- sandwiches
and function in proteins that are part of the innate immune system. Several sushi
containing proteins have been implicated in the development of tumour cells and their
loss correlates with poor prognosis (Cheng et al., 2016, Zhang and Song, 2014).
Similarly, in the 225 domains showing enrichment in truncations, 196 were not present in
the current cancer gene set documented in the Cancer Gene Census (see Supplementary
Table S3.9). Sushi domains were also significantly enriched in truncation mutations
suggesting that the phenotypic role of the missense mutations may be loss of function
mutations.

92
Figure 3.2: Domains enriched in mutations in oncogenes and tumour suppressors.
The number of domains in the dataset is plotted against the estimated mutational
enrichment for that domain. Only domains with significant mutational enrichment (see
methods) are shown. Missense, truncation and indel mutational enrichments are
calculated independently for tumour suppressors and oncogenes. Enrichments in tumour
suppressors are coloured in blue, those found in oncogenes in red. (A) Missense
mutations in tumour suppressors, (B) truncation mutations in tumour suppressors (C)
indel mutations in tumour suppressors, (D) missense mutations in oncogenes, (E)
truncation mutations in oncogenes, (F) indel mutations in oncogenes.

93
Of the 38 domains significantly enriched in indels, 31 were not present in our cancer gene
lists (Supplementary Table S3.10).
3.3.8 Detecting domain hotspots
As well as identifying which domain families were enriched in mutations, we also wanted
to identify the key positions within a domain, that when mutated, were particularly suited
to causing a loss or change in function of the protein the domain occurs in. To achieve
this we created multiple sequence alignments for each domain family and counted the
mutations at each position in the alignment (see Figure 3.3). Notably, multiple sequence
alignment is often complicated to perform with high accuracy, and errors in alignments
can have an essential impact on the downstream analyses and that may lead to miss some
hotspots (Wang et al., 2011, Karin et al., 2014, Philippe et al., 2017). A binomial test was
applied to determine which positions had accrued a significant number of mutations.
Again we analysed tumour suppressors and oncogenes, and the different mutation types
independently.
Table 3.1 show that there are differences in significantly hotspot regions found in tumour
suppressors and oncogenes. Oncogene regions are smaller, less mutationally diverse,
more solvent accessible and more evolutionarily conserved than tumour suppressor gene
regions. Tumour suppressors regions are more likely to harbor mutations that may affect
protein stability through alters in volume and hydrophobicity. There are several ways to
lose the function of a protein than to gain function (Nikolaev et al., 2014). Loss of
function can occur at many residue positions and involve many kinds of amino acid

94
residue substitutions, while oncogene mutations occur at a few functionally important
positions and involve fewer substitution types.
3.3.9 Hotspot mutations in tumour suppressors
Within the annotated tumour suppressors we identified 119 missense hotspots within 42
domain families, 11 indel hotspots within 7 domain families and 73 truncation hotspots in
39 domain families (see Supplementary Tables S3.11–S3.13). The positions of the
hotspots were dependent on the type of mutation with little overlap in the positions of
mutations between the different types of mutational alterations (see Supplementary
Figure S3.3A).
The mutational burden of several of the hotspots was accrued from a single gene, in
particular those found in TP53 and VHL. Others were derived from multiple tumour
suppressor domain family members including the Pkinase and WD40 domains. Missense
mutations in the protein kinase domains from CHEK2 (K373E) and MAP2K4 (G252R)
have mutations co-located with the CDK12 R882L/Q mutations. The CDK12 R882L
mutation has been shown to impair kinase activity, possibly by breaking critical
interactions in the active conformation of the kinase between phosphorylated threonine
893 and the activation loop (Dixon-Clarke et al., 2015), CHEK2 K373E has been
implicated as a LOF mutation leading to hereditary cancer predisposition syndrome. For
these two mutations there is evidence that they result in a loss of kinase activity,
suggesting that the mutations occur at a critical position in the protein structure when the
kinase is in its active conformation; the co-located G252R mutation in MAP2K4 may
also result in a LOF.

95
Figure 3.3: Domain hotspots.
To calculate a domain hotspot all the members of the domain family were aligned using
MUSCLE. The position of the mutation was mapped to the multiple sequence alignment,
and the number of mutations at that position summed. For the position to be considered a
hotspot, at least two mutations of the same class (missense, truncation or indel) had to be

96
recorded at the same position.
Gene Type Mutation type #Hotspots #Significant
Tumour suppressors
Missense 3720 119
Indels 105 11
Truncations 1206 73
Oncogenes
Missense 7195 85
Indels 63 10
Truncations 1121 42
Whole genome
Missense 65491 954
Indels 1006 113
Truncations 27620 506
Table 3.1: This table describes the number of recorded and significant mutational
hotspots identified in each datasets; tumour suppressor, oncogene and whole
genome.
Missense, indel and truncation mutations were analysed independently.
Co-located mutations in the WD40 tumour suppressors FBXW7 (T385K) and TBL1XR1
(Y395H) are also likely to be loss of function. The WD40 domain is especially sensitive
to position specific disruption by missense mutations because the way in which its fold is
stabilized. WD40 domains consist of a β-propeller structure containing between six to
eight propeller ‘blades’. These blades are each formed by a four-stranded antiparallel β-

97
sheet, which are joined by β-hairpins. The blades are arranged symmetrically about a
central axis, and the inside edge of each propellers comprise side chains that form a
network of hydrogen bonds with each other, and internal water molecules that maintain
the domain’s stability (see Figure 3.4). Mutating any residue that contributes to
stabilisation of this central core could be catastrophic to the overall fold. In FBXW7,
threonine 385 is located on the first propeller blade of the WD40, forming a hydrogen
bond with arginine 674 via a water molecule sealing the propeller structure. The
replacement side chain would be unable to maintain this hydrogen bond causing
destabilisation of the internal water structure and hence the overall fold.
Laskowski et al. study WD40 domain in rare disease not in cancer (Laskowski et al.,
2016). The locations of the missense mutations differ from those that I found linked to
cancer.
Co-located hotspot mutations were also observed in the SNF2 family N-terminal domain
(SMARC4;T1747K and ATRX;T910M) and the Helicase_C domains (ERRC3;R645Q,
ATRX;R2153C, SMARCA4; R1192H/ G/C).
The sparsity of both truncation and indel data meant that almost all the tumour suppressor
hotspots were derived from single proteins. Truncation hotspots were observed in VHL
and P53, in the RhoGAP domain in PIK3R1, and the RB_A domain in retinoblastoma
associated protein. Several protein kinase domains had truncating mutations at position
14 in the domain multiple sequence alignment, which would result in complete loss of
function of the kinase in BUB1B (E813*), MAP3K1 (Q1247fs*26) and STK11
(D53fs*11).

98
TP53 exhibited the most indel hotspots with hotpots observed in DNA binding domains
(P53) and the P53_ tetramer tetramerisation motif. In several cases multiple variants were
observed at the same hotspot. This included the P53 domain where there was a deletion
of residue 113 F or several residues FLH, and at position 155 there was an insertion of
DSTPPPGT and a deletion of residues TR recorded.
3.3.10 Hotspots in oncogenes
Within oncogenes we identified 85 missense hotspots in 46 domain families, 10 indel
hotspots within 9 domains and 42 truncation hotspots in 30 domain families (see
Supplementary Tables S3.11–S3.13). Again, the hotspots were category dependent with
only 5 positions of mutations in common between the different mutational alterations (see
Supplementary Figure S3.3B). Far fewer hotspots were observed per domain than in the
case for tumour suppressors, which supports the conjecture there are only certain
positions in a domain where a mutation can lead to the gain of function or activation that
is typically found in oncogenes. We observed the well known, high frequency mutations
in the Ras (KRAS, HRAS, NRAS), isocitrate dehydrogenase (IDH1, IDH2) and tyrosine
protein kinase domains (BRAF V600E etc). These highly recurrent mutations have been
extensively analysed and are thought to cause a gain/change of function of the protein by
changing the canonical conformation of the protein.
The small GTPases (K-RAS, N-RAS and H-RAS) are molecular switches cycling
between the GTP-bound active and GDP-bound inactive conformations. They have co-
located hotspots that are implicated in a large variety of cancers. When mutated at
position 12, the bulky side chain of the mutants is thought to lower the GTPase activity

99
Figure 3.4: WD40 domain.
This illustrates the WD40 domain of FBXW7. Threonine 385 is located on the first
propeller blade of the WD40, (shown in blue) forming a hydrogen bond with arginine
674 in the final propeller blade (shown in red) via a water molecule (shown as a green
ball) helping to stabilise the propeller structure. Replacing the side chain with arginine
would mean this hydrogen bond could not be formed destabilisation of the internal water
structure of the WD40 and hence the overall fold.

100
through a steric interference of the catalytic process (Muraoka et al., 2012). This leads to
stabilisation of the active conformation leading to constitutive activation of downstream
effectors such as phosphoinositide 3-kinases and Raf kinases. IDH1 and IDH2 catalyse
the oxidative carboxylation of isocitrate to α-ketoglutarate. Mutational hotspots at R132H
in IDH1, and R140Q and R172K in IDH2 alter the progression of this reaction. Recent
structural work suggests that the R132H IDH1 mutation hampers the conformational
change from the initial isocitrate binding state to the pre-transition state, thus causing an
impairment of enzyme function (Yang et al., 2010). This alters the progression of this
reaction causing the oncometabolite R(-)-2- hydroxyglutarate to be formed. R(-)-2-
hydroxyglutarate is implicated in genomic hypermethylation, leading to histone
methylation, genomic instability, and finally malignant transformation (Kato, 2015).
Other less will documented co-located missense hotspot mutations were found in the
guanine nucleotide binding protein domains (G_alpha). GNAS R201H somatic mutation
is an activating mutation resulting in constitutively activated G-alpha protein and the
downstream cAMP cascade, independent of TSH signalling (Lu et al., 2016). This results
in the autonomously functioning thyroid nodules. The co-located with activating R183
mutations observed in GNA11 and GNAQ in uveal melanaoma (Metz et al., 2013).
In the rhodopsin seven transmembrane helix domain family the (7tm_1) the thyrotropin
receptor (TSHR) A623V activating mutations (Aycan et al., 2010) are co-located with
R251 mutations from the atypical chemokine receptor 3 (ACKR3). Other domain
families with co-located missense mutations include the trypsin, 14-3-3, sema, frizzled,
yeats and jun domain families.

101
Few of the truncation hotspots in oncogenes were observed in more than one protein,
suggesting that truncating mutations, if they result in a consequence, may be specific to
the context of the domain within the larger protein, rather than to the domain itself.
Although the indel data was sparse there was still some evidence that co-located indel
hotspot mutations in oncogenes are activating. Co-located deletions
E746_A750delELREA and E746_T751delELREAT both cause activation of EGFR
(Molina-Vila et al., 2014), and are also co-located deletion in BRAF (M484_
N486delMLN) (see Supplementary Tables S3.11–S3.13).
3.3.11 Hotspots in tumour suppressors and oncogenes occur in different positions in
the domains
In total we identified 341 mutational hotspots within 66 domains in our cancer gene set.
The hotspots in tumour suppressors and oncogenes occurred in different domain types
except in 6 domains (Pkinase, SET, Pkinase_Tyr, Tet_JBP, PI3_PI4_kinase, RhoGAP)
and when they were observed in the same domain type, they were found with in different
locations in the domain (see Figure 3.5A–3.5C). Only in 1 position was a hotspot
mutation observed (of the same category) in both a tumour suppressors and an oncogene
(see Figure 3.5D–3.5F). This was MSA position 117 in the tyrosine protein kinase
domain (Pkinase_Tyr).
Protein kinases (Pkinase and Pkinase_Tyr) can be thought of being in equilibrium
between the open and closed conformations. Usually, other protein kinases phosphorylate
the activating residues (S/T/Y) - moving the conformational equilibrium towards the
open, active conformation, whereas protein phosphatases remove the phosphate groups

102
shifting the conformational equilibrium back to the closed, inactive conformation. These
processes leads to highly regulated control of the conformation and activation of kinase
domains.
Dependant on their location within the kinase domain, missense mutations will often be
better tolerated in one or other conformation of the protein kinase resulting in an
alteration of the conformational equilibrium and constitutive activation (or in some cases
deactivation) of the protein kinase. This is reflected in that the positions of the hotspots
are generally different in the oncogenes and tumour suppressor flavours of this domain.
This may not be the case in position 117 of the Pkinase_Tyr domain. Ten oncogene
kinases have a mutation in this position, including the documented activating mutations
FGFR2 N549S/K/H, the FGFR1 N546K and EGFR R776H mutations. However, the
tumour suppressor MAP3K13 has an A218T mutation of unknown consequence at this
position, which suggests that it may be possible to have a driver mutation that deactivates
the protein at this position alternatively A218T may be an activating mutation.

103
Figure 3.5: Positional analysis of domain hotspots.
Analysis of the overlap in the positions of the significant hotspots in oncogenes and
tumour suppressors compared with those found within the whole genome. (A–C) These
venn diagrams illustrate that significant hotspots can occur in the same domain family in
oncogenes (pink), tumour suppressors (blue) and in the whole genome (purple). Each
circle represents the number of domains that contains a hotspot mutation, intersections
illustrate when the same domain is found in more than one data set. (A) missense
mutations (B) truncation mutations and (C) indels mutations. (D–F) These venn diagrams
illustrate that significant hotspots occur in the same position in domain families in
oncogenes, tumour suppressors and within the whole genome; (D) missense mutations,
(E) truncations (F) indels mutations.

104
3.3.12 Genome wide hotspots
The final part of our analysis was to assess how many of the genome–wide hotspots we
could putatively assign as activating/gain of function, or as loss of function. In total there
were 954 missense hotspots in 423 domain families, 113 indels in 93 domain families and
506 truncations in 382 domain families of which ~11% were co-located with an
oncogene or tumour suppressor hotspot.
We were able to identify mutations in genes not previously related to cancer that aligned
with well- established cancer hotspots. These included 14 tyrosine protein kinase
domains that had missense mutations co- located with activating BRAF V600E mutation
including kinase suppressor of ras 2 (KSR2) p.R724W (117) (Fernandez, Henry and
Lewis, 2012), mixed lineage kinase domain like (MLKL) p.R264H (117) (Chen, Yu and
Zhang, 2016) lemour tyrosine kinase 3 (lmtk3) p.L195F (117) (Xu et al., 2015) and HCK
P405S (343) (Kim et al., 2016). Mutations at this position usually activate the kinase
domain, suggesting that these proteins may be cancer gain of function drivers in rare
cases. Similarly, 32 receptors from the 7tm_1 family that had mutations co-located with
the A623V activating mutation in the thyrotropin receptor (TSHR) (Aycan et al., 2010).
These included four chemokine receptors including three c-c chemokine receptors CCR3
(I238V), CCR6 (I253M), CCR8 (237T) and the CX3X chemokine receptor 1, CX3CR1,
(I230N). Chemokines are small-secreted proteins with an ability to prompt the migration
of leucocytes. Both cell migration and metastasis show some similarities to leucocyte
trafficking, which have lead to suggestions that chemokine receptors expressed on cancer
cells may play a role in cancer development (Koizumi et al., 2007).
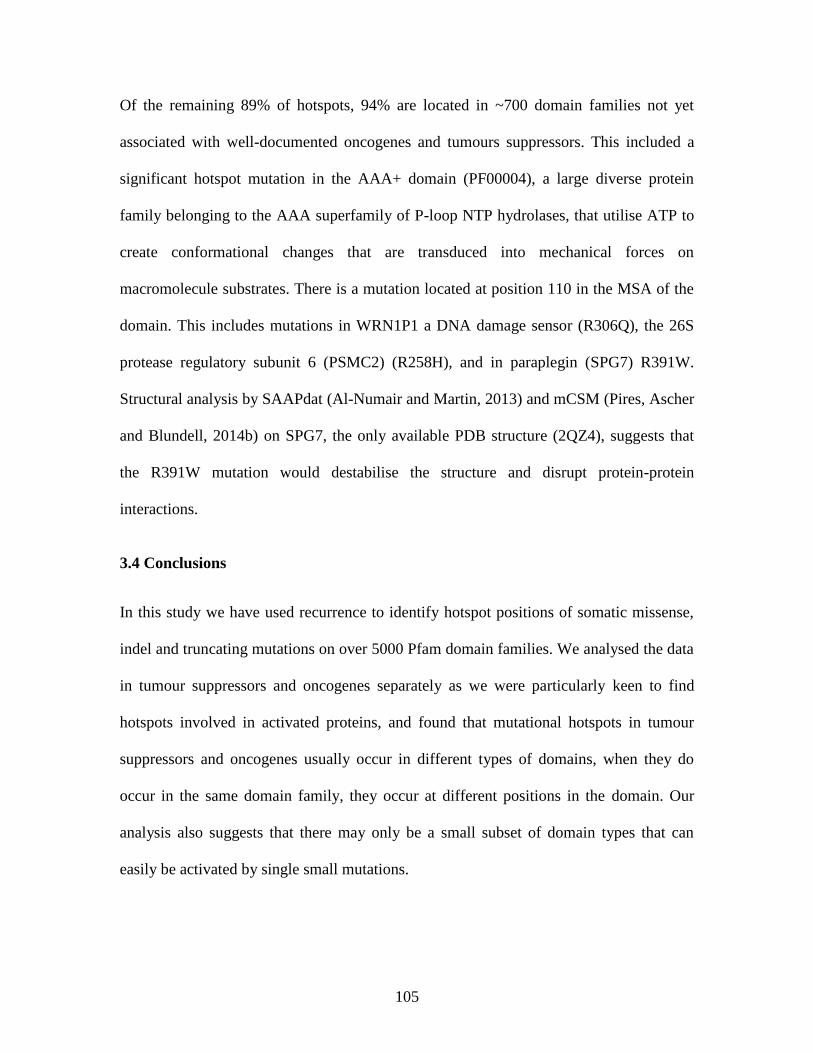
105
Of the remaining 89% of hotspots, 94% are located in ~700 domain families not yet
associated with well-documented oncogenes and tumours suppressors. This included a
significant hotspot mutation in the AAA+ domain (PF00004), a large diverse protein
family belonging to the AAA superfamily of P-loop NTP hydrolases, that utilise ATP to
create conformational changes that are transduced into mechanical forces on
macromolecule substrates. There is a mutation located at position 110 in the MSA of the
domain. This includes mutations in WRN1P1 a DNA damage sensor (R306Q), the 26S
protease regulatory subunit 6 (PSMC2) (R258H), and in paraplegin (SPG7) R391W.
Structural analysis by SAAPdat (Al-Numair and Martin, 2013) and mCSM (Pires, Ascher
and Blundell, 2014b) on SPG7, the only available PDB structure (2QZ4), suggests that
the R391W mutation would destabilise the structure and disrupt protein-protein
interactions.
3.4 Conclusions
In this study we have used recurrence to identify hotspot positions of somatic missense,
indel and truncating mutations on over 5000 Pfam domain families. We analysed the data
in tumour suppressors and oncogenes separately as we were particularly keen to find
hotspots involved in activated proteins, and found that mutational hotspots in tumour
suppressors and oncogenes usually occur in different types of domains, when they do
occur in the same domain family, they occur at different positions in the domain. Our
analysis also suggests that there may only be a small subset of domain types that can
easily be activated by single small mutations.

106
Missense hotspots were frequently conserved in multiple members of Pfam domain
families, however truncations were conserved far less frequently with many truncational
hotspots occurring only in individual proteins. This may be because truncations often
obliterate the functioning protein due to processing of the transcript by nonsense-
mediated decay, so its position within a domain is far less crucial than for missense
mutations. The large number of truncation hotspots observed in the whole genome
dataset, suggest that there may be a large number of tumour suppressors not yet
documented. Current statistical methods for analysing cohorts of cancer patients are
designed to identify statistically significant mutations in single genes. Many of the
tumour suppressors are part of large protein complexes where failure of any single
component will result in loss of function of the complex as a whole. The mutational
burden is thus distributed over all components of the complex, with no individual subunit
being affected at a sufficient level to generate a statistically detectable signal.
Using the Cosmic v71 (WGS) we identified several indel mutations conserved in multiple
member of domain families. As more genome sequencing studies are undertaken and the
algorithms used to detect indels improve, it is likely that more indel hotspots will be
identified.
We have also used our oncogene and tumour suppressor hotspots to identify co-located
hotspots in 167 proteins as yet, not associated with cancer. This information enables us to
assign putative gain or loss of function mutations in these proteins that may contribute to
cancer progression. Using the biological knowledge associated with protein domains,
such as structural information and evolutionary conservation, enables the transfer of
knowledge from well studied oncogenes to less well studies homologues can lead to

107
testable hypotheses of the effect of rare mutations in large cancer genomics datasets, and
may lead to tractable therapeutic intervention points.
The domain hotspots identified within this study are available though the MOKCa
database where mutations are annotated by driver types (http://strubiol.icr.ac.uk/
extra/MOKCa).

108
Chapter 4. Predicting loss of function and gain of function driver missense
mutations in cancer
4.1 Introduction
Cancers depend upon critical mutations in gene sequences that give a selective advantage
to the cancer cell. These mutations cause an alteration in the genomic composition that
leads to changes in the function of the constituent proteins. Mutations can either be
somatic, referring to a change in the genetic structure of a somatic cell, or inherited
through genetic alterations that are present in germline cells (Hanahan and Weinberg,
2011).
Driver mutations contribute to the disease process, whereas passenger mutations occur
due to the inherent genetic instability of the tumour but do not add to the tumour’s
disease potential (Greenman et al., 2007). The genes that contain the driver mutations
that contribute to the disease process are traditionally classified either as ‘tumour
suppressors’ (TS) or as oncogenes (OG), depending on their role in cancer development.
When mutations result in the loss of function (LOF) of the protein products of tumour
suppressors, cancer progression occurs. Driver alterations in these genes are typically
molecularly recessive in nature, with both copies of the gene requiring a LOF defect. In
oncogenes, an increase in activity, or a change of function is required for tumorigenesis.
These genes tend to exhibit a molecularly dominant mode of action, and usually only one
faulty copy of the gene is required to provide an oncogenic phenotype (Futreal et al.,
2004).
Driver missense mutations within a tumour suppressor can result in its loss of function in
a variety of ways. These include causing loss of stability of the protein or the disruption

109
of a crucial ligand/DNA/protein- interaction site. These mutations are often liberally
dispersed along the length of the protein, although clustering of mutations at distinct
positions can be observed (Baeissa et al., 2016, Vogelstein et al., 2013). Conversely, in
oncogenes often only a very few, specific mutations in particular locations can lead to
activation of the protein product or a change of protein function (Baeissa et al., 2016,
Reva, Antipin and Sander, 2011). In the COSMIC database (Bamford et al., 2004), the
most frequently reported mutational event that changes the protein product of tumour
suppressors (62%) and oncogenes (85%) is the missense substitution and it is often
difficult to predict their functional consequences (Baeissa et al., 2017, Vogelstein et al.,
2013).
There have been various efforts to predict the impact of missense mutations on protein
function or structure using computational methods (see (Gnad et al., 2013)) often by
estimating whether the mutations will be tolerated within the protein structure. Popular
prediction algorithms that are freely available as web-based servers in current usage
include PolyPhen-2 (Adzhubei, Jordan and Sunyaev, 2013) and Sorted Intolerant From
Tolerant (SIFT) (Sim et al., 2012) for general disease associated mutations. Those that
are designed to specifically assess the impact of cancer-associated somatic mutations
include Functional Analysis Through Hidden Markov Models (FATHMM) (Shihab et al.,
2013a), Cancer-specific High-throughput Annotation of Somatic Mutations (CHASM)
(Carter et al., 2009) and Mutation Assessor (Reva, Antipin and Sander, 2011). However,
none of these algorithms are designed to distinguish whether a missense mutation will
result in a loss (LOF) or a gain (GOF) of protein function.

110
In this study, we identified sets of driver missense mutations in tumour suppressors (LOF
mutations) and sets of driver missense mutations in oncogenes (GOF mutations). Next we
investigated the ability of current prediction algorithms to distinguish between these
mutations and also to distinguish them from a set of well-documented neutral mutations
that have little or no impact on protein function. An automated classifier was then
developed to distinguish between LOF and GOF driver mutations using 19 features to
describe each mutation. Finally, we selected a random forest classifier that achieved the
best result to classify all the predicted driver missense mutations in the MOKCa database
into GOF and LOF mutation types.
4.2 Methods
4.2.1 Datasets
4.2.1.1 Identification of hotspot driver mutations from COSMIC data
Based on the cancer gene classification in the Cancer Gene Census (Futreal et al., 2004)
we identified a set of 481 oncogenes and 133 tumour suppressors. We then identified the
driver missense mutations that they contained using established methods (Baeissa et al.,
2017, Miller et al., 2015, Tamborero, Gonzalez-Perez and Lopez-Bigas, 2013, Gonzalez-
Perez and Lopez-Bigas, 2012, Getz et al., 2007). In ‘cancer genes’ not all the mutations
observed are driver mutations, a fair proportion will be passenger mutations that do not
contribute to the disease process. We have made the assumption that recurrent mutations
found in many patients are likely to be causal so we have used recurrence to assign driver
status to individual mutations. This is one of the strands of evidence that is used to
determine pathogenic mutations in somatic cancer in the ClinVar database (Landrum et

111
al., 2014).
We have also made the assumption that in general, statistically significant or ‘hotspot’
mutations in tumour suppressors will confer a loss of function to the protein whereas
‘hotspot’ mutations in oncogenes will cause activation or a gain of function to the protein.
Missense mutations were downloaded from the COSMIC database v71 (Bamford et al.,
2004). Mutations from each gene were mapped onto a single representative UniProt
protein sequence as described in the MOKCa database update protocol (Richardson et al.,
2009). Mutations are grouped into aggregates at the amino acid level i.e. if there are two
different DNA changes that cause the same change to the protein sequence they are
included in the same aggregate.
When identifying driver genes it is essential to take into account distance to origin of
replication and gene expression (see for example (Lawrence et al., 2013)). Here we work
with an established set of driver cancer genes and look at the mutational hotspots within
them. Thus distance to origin of replication is similar across the whole gene and
expression level is constant. A binomial test was used to identify which of these
aggregates contained mutations that were over represented i.e. were hotspot driver
mutations.
If each individual mutation were to affect a random residue across a protein the
frequency of mutations at each site would follow a binomial distribution. As such our
null model states that there is an equal probability of a mutation occurring at each
residue on the given protein.

112
Where n is the total number of mutations in the protein, k is the number of mutations
falling at a specific residue and p the probability of any mutation affecting a specific
residue, we can find the probability of observing k mutations falling at any specific
point in the domain by calculating the probability of a minimum of k mutations at that
point and comparing it to our null model.
The results were amended using a Bonferroni correction.
We also identified domain-based driver hotspot mutations (Baeissa et al., 2017). A
multiple sequence alignment (MSA) was generated for all human Pfam domain families
(Finn et al., 2016) using the MUSCLE (v3.8.31) alignment program (Edgar, 2004).
Missense mutations were mapped onto each domain onto a consensus position
generated from the MSA. Mutations from tumour suppressors and those from
oncogenes were analysed separately to give two sets of hotspots. A binomial test was
used to identify which mutations were significant and the results were amended by a
Bonferroni correction (Baeissa et al., 2016, Miller et al., 2015, Mao et al., 2013).
In total using both methods we identified 570 LOF driver mutations from 68 tumour
suppressor genes and 782 GOF driver mutations contained in 138 oncogenes.
4.2.1.2 Identification of pathogenic mutations from ClinVar
ClinVar aggregates information about genomic variation and its relationship to human
health (Landrum et al., 2014). In total, 373 somatic cancer missense mutations from 31

113
tumour suppressor genes and 693 mutations from 66 oncogenes were labelled as
pathogenic or probably pathogenic. We assumed that pathogenic mutations in tumour
suppressors act by causing a loss of function of the protein. Whereas pathogenic
mutations in oncogenes conferring a gain of function or activation to the oncogene. In
contrast, within the whole genome, only 26 cancer missense somatic mutations were
reported as benign in ClinVar.
4.2.1.3 Neutral mutation dataset
For the neutral set of mutations we wanted to identify a set of mutations that were likely
to have little impact on protein structure or function. They are derived from a set of
germline single nucleotide polymorphisms from dbSNP (Coordinators, 2016) with a
minor allele frequency from 0.25 to 0.5 (Gnad et al., 2013).
4.2.2 Comparison of prediction algorithms
We assessed seven algorithms that have been developed to predict the impact of missense
mutations on the function or structure of a protein on their ability to distinguish between
driver mutations in tumour suppressors and oncogenes and with a set of neutral mutations.
This was not to assess their ability to identify driver missense mutations within a tumour
background as there are many highly effective programs that do this (e.g. (Bailey et al.,
2018, Gnad et al., 2013)) but our aim was to identify which algorithms utilised the
optimal features that were able to detect the subtle differences between LOF and GOF
mutations.
These algorithms investigated were: FATHMM cancer, FATHMM disease, CHASM
(ovarian), Mutation Assessor, PolyPhen2 (HumDiv), PolyPhen2 (HumVar) and SIFT.

114
We generated prediction outputs for each tool using the public web servers and compared
the performance of each algorithm using the area under the curve (AUC) of a Receiver
Operating Characteristic (ROC) curve. We compared the programs using both the hotspot
and ClinVar datasets.
We optimised cut-off scores that generated the highest accuracy for each of the different
prediction tools when comparing pairs of classes. When calculating the ROC curve for
comparing the predictions for mutations in tumour suppressors and oncogenes directly,
we defined driver missense mutations in tumour suppressors to be true positives and
oncogene mutations false positives.
4.2.3 Feature selection
To develop our own classifier we derived features from four existing prediction
algorithms: FATHMM cancer, FATHMM disease, Mutation Assessor and PolyPhen-2
(PPH2) (Adzhubei et al., 2010). We also used the NetSurfP server (Petersen et al., 2009)
to predict the alteration in the surface accessibility and the secondary structure of the
amino acid substitutions. Initially, I selected 27 features from these algorithms and when
I removed some of these features the result was the best. In total 19 features were
calculated for each mutation (Supp. Table S4.2).
4.2.4 Machine learning
First, we compared the performance of two different classifiers to discriminate between
the different classes of COSMIC hotspot missense mutations: random forest (RF,
randomForest) and support vector machine (SVM, e1071) using R version 3.2.3. They

115
were run with ten fold cross validation and the parameters optimised for each model.
Binary classifications were calculated for LOF/Neutral LOF/GOF and GOF/Neutral
classes. We then used the best random forest models to identify the importance of the 19
features when discriminating between pairs of classes of missense mutations. Mean
decrease accuracy (Archer & Kimes, 2008) was measured to identify the variable
importance using the random forest package. The classifier with the highest accuracy at
discriminating between LOF/GOF missense mutations was a random forest classifier that
we have named MOKCaRF.
The RF classifier was also run with ten fold cross validation for the ClinVar datasets.
Binary classifications were calculated for LOF/Neutral LOF/GOF and GOF/Neutral
classes.
4.2.5 Validation of the algorithm
We assessed the algorithm using a set of 158 experimentally validated missense
mutations from the TP53 ACIR database (Petitjean et al., 2007). Although TP53 is a
major tumour suppressor, TP53 missense mutations in cancer can result in both GOF and
LOF phenotype (Oren & Rotter, 2010) (see Supp. Methods, Validation of MOKCaRF
classifier on experimental data).
4.2.6 Prediction of functional consequences of missense mutations in the MOKCa
database
One million missense mutations were downloaded from MOKCa database v21
(Richardson et al., 2009) and classified into driver and passenger mutations using
FATHMM (cancer) and CHASM web server. MOKCaRF was run on the driver missense

116
mutations to predict whether the mutations would result in a GOF or LOF. The canSAR
protein annotation tool (Tym et al., 2016) was run on proteins predicted to contain GOF
driver mutations.
4.3 Results
4.3.1 Data sets
To make sure that our datasets were balanced, no more than 10% of the mutations were
taken from a single protein and no more than 10% from a domain family (Supp. Figures
S4.1-S4.3) within a class. For the COSMIC hotspot mutations 300 mutations were
selected for each class where as for the ClinVar somatic pathogenic datasets, 150
missense mutations were selected for each class. The smaller size of the ClinVar dataset
was due to the smaller number of tumour suppressor and oncogene proteins with
documented pathogenic mutations, limiting the number of mutations that could be
included. It is worth noting that 69 of the LOF and 140 of the GOF COSMIC hotspot
mutations have been documented in ClinVar, (they were all assigned as pathogenic), so
alternative mutations were chosen for inclusion in the ClinVar dataset.
4.3.2 Cut-offs
To compare prediction algorithms to allow us to select sensitive features, we plotted ROC
curves using cut-off scores that discriminate between mutations in the three different
pairs of classes (LOF/Neutral, LOF/GOF, GOF/Neutral) (Figure 4.1). The performance
accuracy was calculated based on the prediction results from each algorithm. For
Mutation Assessor, PPH2-HumDiv and PPH2-HumVar, missense substitutions at each
position with scores more than the selected cut-off score are predicted to be damaging

117
and those less than or equal to the cut-off are predicted to be neutral. Whereas in the other
tools, the mutations with scores less than or equal to the cut-off are predicted to be
damaging and those more than to the cut-off are predicted to be neutral. Generally, the
derived optimal cut-offs were different to the thresholds suggested by the developers of
the tools (Supp. Table S4.1; Figures S4.4-S4.6). When deriving the cut-offs for the
LOF/GOF classifier, we generally used the more damaging score to identify LOF driver
missense mutations.
4.3.3 Comparison of Prediction Algorithms
When using the algorithms to distinguish between driver LOF mutations and neutral
mutations, all the algorithms performed very well with accuracy scores ranging from
0.754 to 0.998 for the COSMIC dataset (Table 4.1; Figure 4.1) and similar results for the
ClinVar dataset (0.773-0.986). The Mutation Assessor and CHASM algorithms
performed the best, discriminating well between mutations that cause a loss of function
with neutral missense mutations. FATHMM-disease, designed to detect inherited disease
causing mutations rather than cancer mutations specifically and SIFT designed to identify
mutations that were least tolerated, that is also trained predominantly on genetically
inherited disease mutations, proved to be the least accurate.
Similarly, all seven algorithms performed well when used to classify GOF mutations
against neutral mutations with accuracy scores ranging from 0.770 to 0.981 for the
COSMIC data again with similar results for the ClinVar data (0.773 to 0.980) (Table 4.1;
Figure 4.1). Mostly, their accuracy dropped slightly (in the range of 0.003-0.021) with the
programs being marginally better at discriminating between mutations that cause a LOF

118
from neutral mutations than those that cause a GOF from neutral mutations. The
exception was FATHMM Cancer, which showed a slight improvement when
discriminating GOF from neutral mutations rather than LOF from neutral mutations.
Mutation Assessor algorithm performed the best, discriminating well between mutations
that cause a gain of function from neutral missense mutations.
Table 4.1: Prediction sensitivities, specificities, accuracies and AUC values
compared between methods for pairs of classes in COSMIC dataset. * Sen.: Sensitivity, Spe.: Specificity, Acc.: Accuracy, AUC: Area under ROC curve.
It was reassuring that the programs could easily distinguish both GOF and LOF cancer
driver mutations from fairly neutral mutations. The negligible differences in performance
between the COSMIC hotspot and the ClinVar dataset reaffirms that recurrence is a
reliable method to identify driver mutations from large scale somatic mutation data in
both tumour suppressors and oncogenes.
When comparing the programs’ ability to discriminate between driver missense
mutations in tumour suppressors and oncogenes, all the algorithms performed less well
Prediction
methods
(LOF v Neutral) (GOF v LOF) (GOF v Neutral)
*Sen. *Spe. *Acc. *AUC *Sen. *Spe. *Acc. *AUC *Sen. *Spe. *Acc. *AUC
FATHMM-C 0.823 0.900 0.867 0.925 0.710 0.366 0.513 0.520 0.789 0.900 0.844 0.930
FATHMM-D 0.951 0.783 0.754 0.830 0.720 0.366 0.543 0.610 0870 0.670 0.770 0.810
CHASM 0.996 1.000 0.998 1.000 0.856 0.220 0.535 0.540 0.953 1.000 0.977 0.997
MAssessor 0.986 1.000 0.993 0.994 0.723 0.533 0.628 0.710 0.963 1.000 0.981 0.990
PPH2-Div 0.926 0.970 0.948 0.986 0.810 0.240 0.525 0.600 0.933 0.970 0.951 0.980
PPH2-Var 0.880 0.986 0.933 0.988 0.763 0.343 0.553 0.680 0.903 0.976 0.935 0.980
SIFT 0. 763 0.880 0.821 0.882 0.846 0.183 0.515 0.521 0.853 0.763 0.808 0.870

119
Figure 4.1. Prediction accuracies compared between seven web-accessible prediction
tools.
a) The prediction of driver LOF tumour suppressor missense mutations from a neutral set
in COSMIC and ClinVar dataset. b) The prediction of driver GOF mutations from
oncogenes from a neutral set of missense mutations in COSMIC and ClinVar dataset. c)
The prediction of driver tumour suppressor LOF mutations from driver GOF mutations
from oncogenes in COSMIC and ClinVar dataset.

120
with accuracies between 0.513 - 0.628 for COSMIC data and 0.506-0.590 for ClinVar
data (Tables 4.1 & 4.2; Figure 4.1). This is a much harder task as both LOF and GOF
mutations disrupt the native functioning of the protein. Mutation Assessor showed the
highest ability in discriminating between LOF and GOF mutations but it must be made
clear that none of these algorithms has been designed for this task, but the fact that there
was some differential signal made us optimistic that a reliable classifier was possible.
Moreover, We compare the driver genes that used in our training set against driver genes
from CHASM (Carter et al., 2009) and Mutation Assessor (Reva, Antipin and Sander,
2011). 54 driver genes are common between them (Figure 4.2).
4.3.4 Classifiers
Our aim was to design a reliable classifier that could distinguish between cancer driver
LOF missense mutations and cancer driver GOF missense mutations. To make sure our
predictions were accurate we first chose a model for classification that would best fit our
data set. Two different models, random forest and support vector machine classifiers,
were trialed and compared. Binary classifications were calculated for LOF/Neutral,
LOF/GOF and GOF/Neutral classes of mutations and were run on balanced data sets
using COSMIC hotspot data and the ClinVar data set independently.
For the COSMIC hotspot data, we used a random forest classifier using 10-fold cross-
validation to optimise classifier hyperparameters and assess performance for each class.
The random forest classifier has two parameters, depth and number of trees that affect on

121
Figure 4.2. Common driver genes between MOKCaRF, Mutation Assessor and
CHASM algorithms.

122
the accuracy of a classifier (Bosch et al., 2007). The results show how the changing of
both the number of trees and the depth of these trees affect the accuracy (Supp. Tables
S4.3-S4.5) however the classification accuracy is generally high. The highest accuracy is
0.992 when the depth is 5 and the number of trees is 100 when classifying LOF/Neutral
mutations and 0.979 with a depth of 5 and 10 trees for classifying GOF/Neutral mutations.
Although our classifier had a reasonable performance in both these cases it did not
perform quite as well as CHASM or Mutation Assessor. CHASM is a machine learning
algorithm that has been trained on a much larger data set of cancer mutations including
the majority of mutation contained within our dataset, which explains its superior
performance. Mutation Assessor also does well as the score was optimised for the
datasets.
Our best performing RF classifier that discriminated between the LOF/GOF classes for
the Cosmic hotspot dataset had an accuracy of 0.87 with a depth of 10 and the number of
trees 1000 (Figure 4.3). The drop in performance from the previous test sets, is due to the
fact it is a much harder computational problem both LOF and GOF missense mutations
disrupt protein structure, just in different ways. LOF missense mutations often
completely wipe out a protein’s function, GOF mutations can be thought of as
detrimental to the protein’s optimal nascent function. For instance, they can destabilise an
inactive confirmation of a protein as in the case in protein kinases. This pushes the
protein’s equilibrium into the active confirmation leading to a constituently active protein.
To ensure that our LOF and GOF mutations were truly different we also scrambled the
datasets. The resulting accuracy for the LOF/GOF scrambled dataset was 0.400. This
gave us even more confidence that there are distinguishable features between LOF and

123
GOF driver missense mutations. We also trialed a support vector machine classifier
(SVM) (see Supp.4 Methods, SVM classifier), however all our random forest classifier
performed better than our SVM classifier for classifying LOF/GOF mutations.
MOKCaRF is freely available on the web at (https://github.com/Hanadi-
Baeissa/Identification-LOF-and-GOF) and is implemented in R.
We also optimized a RF classifier with ten fold cross validation using the ClinVar dataset.
The best classifier had an accuracy of 0.853 when classifying LOF/GOF mutations,
which was named ClinVarRF.
4.3.5 Evaluation test sets
We first tested MOKCaRF on the ClinVar dataset, which gave an accuracy of 0.81
(Figure 4.2). This demonstrated that MOKCaRF distinguished between LOF mutations
within tumour suppressors and GOF mutations in oncogenes, outperforming the existing
algorithms (see Table 4.2). Next we used a test set of experimentally validated mutations
from the IARC TP53 Database (Bouaoun et al., 2016) to evaluate MOKCaRF which gave
an accuracy of 0.75 (Figure 4.2), whereas the ClinVasRF gave an accuracy of 0.62. The
slightly poorer performance of ClinVarRF is probably due to limitations in the number of
mutations in the ClinVar training set. Although TP53 is one of the most highly mutated
tumour suppressors reported in cancer, it has also been reported as contributing to cancer
with a GOF phenotype (Muller & Vousden, 2013). The consequence of this is that
missense mutations in TP53 can confer a LOF or GOF phenotype to the protein product
for example, with either preventing or promoting apoptosis of the cell (Bouaoun et al.,
2016). Analysis of the TP53 results demonstrates that MOKCaRF is not assigning

124
mutations as being contained within a tumour suppressor or oncogene, but distinguishing
between LOF and GOF driver cancer mutations within the same protein.
Table 4.2: Prediction AUC values compared between methods for GOF v LOF class
in ClinVar dataset.
* AUC: Area under ROC curve.
4.3.6 Feature importance
Having successfully designed an algorithm that could reliably distinguish between LOF
and GOF driver missense mutations we decided to identify the important features. Mean
decrease accuracy is one of the popular feature selection methods that directly measure
the effect of each feature on the accuracy of random forest. It permutes the values of one
feature while others are left unchanged and measure how much the permutation reduces
the accuracy (Archer & Kimes, 2008) (see Supp. Methods, Feature selection). Figure 4.4
shows that the functional impact (FI) score from the Mutation Assessor prediction
algorithm was selected as the most important feature in each of the three algorithms.
Prediction methods *AUC
FATHMM-C 0.550
FATHMM-D 0.626
CHASM 0.647
MAssessor 0.635
PPH2-Div 0.512
PPH2-Var 0.528
SIFT 0.532

125
Figure 4.3. MOKaRF ROC curves for COSMIC, ClinVar and TP53.

126
The FI score is based on the evolutionary conservation of a mutated residue in a
particular position in a multiple sequence alignment of a protein family and, separately,
in each of the protein subfamilies, i.e. if a residue is very conserved in evolution,
mutations to this residue are likely to have a high impact on its protein product. It reflects
the tolerance to a mutation within a functional or optimally an orthologous family of
proteins as well as within the more generalised homologous superfamily.
The other variables identified as most important for each pairs of classes differed. When
discriminating between GOF and neutral mutations, three of the top five features were
based on evolutionary measures that reflect how well the mutation would be tolerated in a
particular location in a protein structure. They included the FI score from mutation
assessor, dscore and PSIC score from the Polyphen-2 tool (see Supp. Table S4.2).
PolyPhen-2 identifies multiple alignments with homologous sequences via BLAST and
computes PSIC (Position-Specific Independent Count) scores of the sequence in the
profile matrix. The PSIC score is given by the log-likelihood of the given amino acid
occurring at a particular position. The dScore represents the absolute value of the
difference between the PSIC scores of both wild type amino acid residue and mutant
amino acid residue for a specific position. The other two most important features were
FATHMM (cancer); weight O and weight D. These terms provide an estimate of how
many neutral mutations (weight O) or cancer-causing mutations (weight D) can be
accommodated in a domain family. These measures each give an estimate of how well a
domain family can or cannot tolerate mutations without damaging the 3D structure.
Similarly, when comparing LOF versus neutral mutations, evolutionary measures were
also important, in this case the FI score, dscore and PSIC score from the Polyphen-2 tool.

127
The other two most important features were HMM Probability W and HMM Weights D
from FATHMM cancer.
For our LOF/GOF classifier, the top features were the FI score from Mutation Assessor.
The other most important features were HMM Probability W, HMM Weights O and
HMM Weights D from FATHMM cancer and HMM Weights D from FATHMM disease.
4.3.7 Identifying LOF and GOF missense mutations in MOKCa
Finally, we predicted which of the driver missense mutations in the MOKCa database
were LOF/GOF using MOKCaRF (Supp. Methods, Applying random forest to missense
mutations in MOKCa). Of the one million unique missense mutations in the MOKCa
database, 26570 were predicted to be driver mutations using both the FATHMM-cancer
and CHASM algorithms (Figure 4.5; Supp. Figure S4.7) in 3958 proteins. Of these 14331
were predicted to be LOF mutations in 3529 genes and 7008 GOF mutations in 1392
genes. This included 3,705 proteins that were predicted to contain driver cancer
mutations that are not as yet classified as cancer associated in the Cancer Gene Census.
Of these, 399 proteins contained exclusively GOF mutations, 2453 proteins contained
exclusively LOF mutations, and 853 proteins a mixture of both. Predictions are available
in the MOKCa database (http://strubiol.icr.ac.uk/extra/MOKCa/).

Figure 4.4: The importance of the features across all three binary
classification decisions.
The features are ranked according to LOF v GOF classification with the
corresponding key at the side.
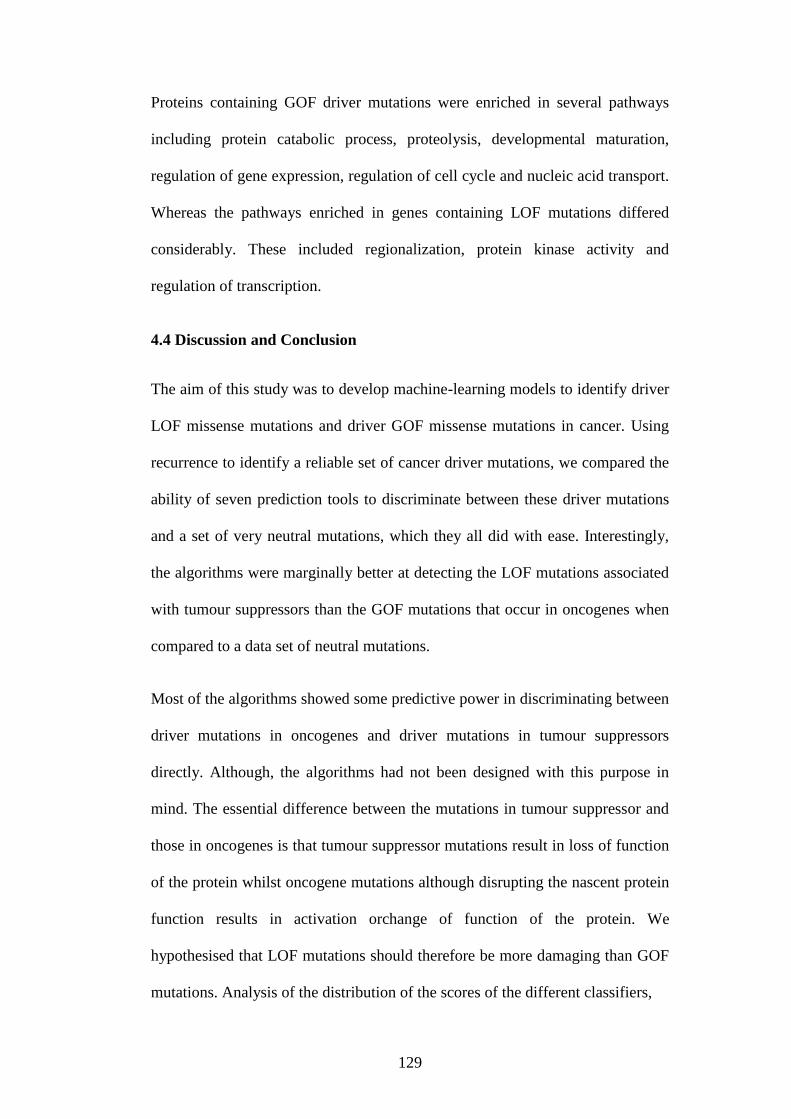
129
Proteins containing GOF driver mutations were enriched in several pathways
including protein catabolic process, proteolysis, developmental maturation,
regulation of gene expression, regulation of cell cycle and nucleic acid transport.
Whereas the pathways enriched in genes containing LOF mutations differed
considerably. These included regionalization, protein kinase activity and
regulation of transcription.
4.4 Discussion and Conclusion
The aim of this study was to develop machine-learning models to identify driver
LOF missense mutations and driver GOF missense mutations in cancer. Using
recurrence to identify a reliable set of cancer driver mutations, we compared the
ability of seven prediction tools to discriminate between these driver mutations
and a set of very neutral mutations, which they all did with ease. Interestingly,
the algorithms were marginally better at detecting the LOF mutations associated
with tumour suppressors than the GOF mutations that occur in oncogenes when
compared to a data set of neutral mutations.
Most of the algorithms showed some predictive power in discriminating between
driver mutations in oncogenes and driver mutations in tumour suppressors
directly. Although, the algorithms had not been designed with this purpose in
mind. The essential difference between the mutations in tumour suppressor and
those in oncogenes is that tumour suppressor mutations result in loss of function
of the protein whilst oncogene mutations although disrupting the nascent protein
function results in activation orchange of function of the protein. We
hypothesised that LOF mutations should therefore be more damaging than GOF
mutations. Analysis of the distribution of the scores of the different classifiers,

130
Figure 4.5: The flowchart of LOF/GOF assignment of missense mutations in
MOKCa.
Missense mutations were downloaded from the MOKCa database and assigned
as driver using the FATHMM-C, CHASM algorithms. MOKCaRF was used to
assign the driver mutations as LOF or GOF.

131
also suggest that the LOF mutations are generally perceived to be more
‘damaging’ by the algorithms than the GOF mutations. We then developed our
own classifier MOKCaRF that could discriminate between LOF/GOF driver
mutations with accuracy of 0.873. The most important feature in all of our
classifiers was the FI score whereas the other important features varied between
the pairs of classes of mutations being compared.
We also developed an algorithm ClinVarRF using data from somatic mutations
documented as pathogenic in the ClinVar database. Its performance on the TP53
test set was less reliable than MOKCaRF. Although ClinVar is an excellent
resource for the documentation of somatic cancer mutations, entries are biased
towards a small set of well-documented clinically important proteins. As the
number of entries in ClinVar rises, the accuracy of classifiers based on these
data should improve.
Finally using published methods (Carter et al., 2009; Shihab et al., 2013) we
identified 3705 proteins that contain putative driver mutations. These proteins
may not be the Mut-Driver genes as defined by Vogelstein et al. (2013), i.e.
those genes that are highly mutated in a large number of tumours, but may still
be drivers in that they are still able to give a selective growth advantage to the
cancer cell and are important in the development of individual tumours.
Of the 1392 proteins with GOF mutations and therefore those that maybe
directly actionable by therapeutic interventions, 36 have FDA approved drugs
that target them (Supp. Figure S4.8). The cancers with mutations in the proteins
and the treatment of these cancers may benefit from a personalised medicine
approach. Furthermore, analysis of the proteins that contain GOF mutations

132
using the Cansar CPAT tool (Tym et al., 2016), show that over 200 mutated
proteins are close homologues to known drug targets of FDA approved drugs.
These proteins may be worthy of further analysis as novel tractable targets of for
the drug discovery process.
Finally, we have used our algorithm to predict the functional consequence of
21,339 putative driver mutations documented in the MOKCa database.
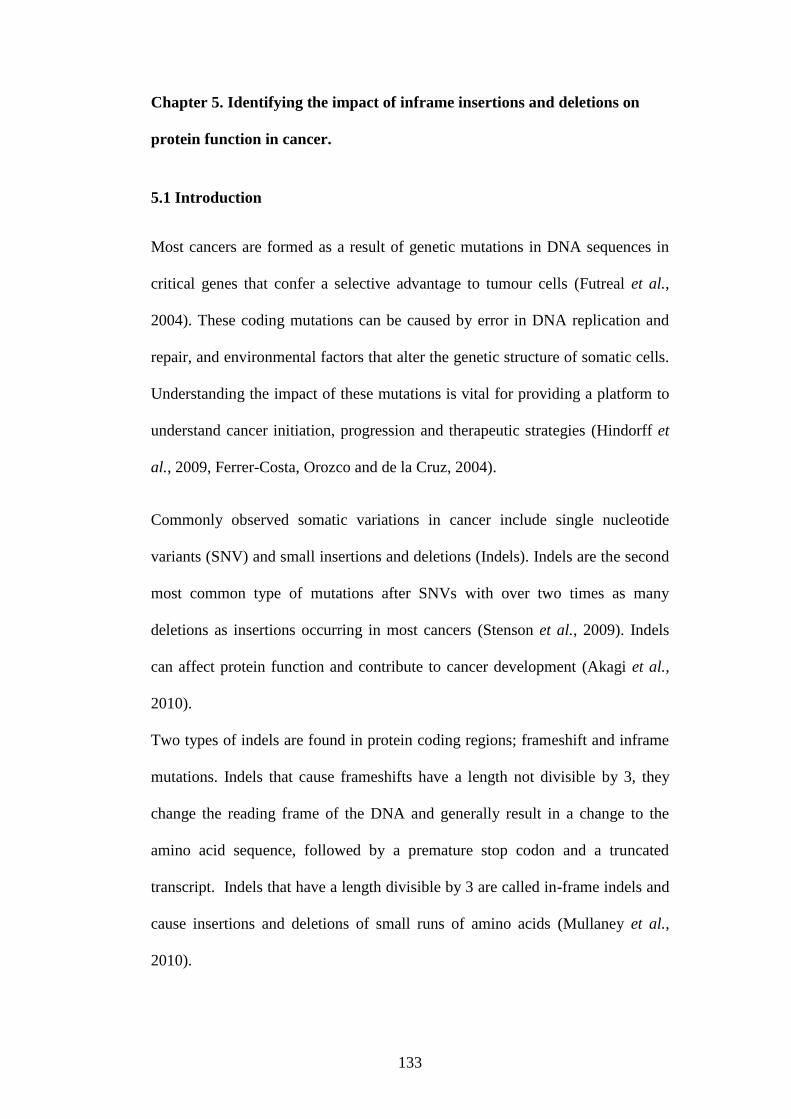
133
Chapter 5. Identifying the impact of inframe insertions and deletions on
protein function in cancer.
5.1 Introduction
Most cancers are formed as a result of genetic mutations in DNA sequences in
critical genes that confer a selective advantage to tumour cells (Futreal et al.,
2004). These coding mutations can be caused by error in DNA replication and
repair, and environmental factors that alter the genetic structure of somatic cells.
Understanding the impact of these mutations is vital for providing a platform to
understand cancer initiation, progression and therapeutic strategies (Hindorff et
al., 2009, Ferrer-Costa, Orozco and de la Cruz, 2004).
Commonly observed somatic variations in cancer include single nucleotide
variants (SNV) and small insertions and deletions (Indels). Indels are the second
most common type of mutations after SNVs with over two times as many
deletions as insertions occurring in most cancers (Stenson et al., 2009). Indels
can affect protein function and contribute to cancer development (Akagi et al.,
2010).
Two types of indels are found in protein coding regions; frameshift and inframe
mutations. Indels that cause frameshifts have a length not divisible by 3, they
change the reading frame of the DNA and generally result in a change to the
amino acid sequence, followed by a premature stop codon and a truncated
transcript. Indels that have a length divisible by 3 are called in-frame indels and
cause insertions and deletions of small runs of amino acids (Mullaney et al.,
2010).

134
Cancer mutations, including indels are considered driver mutations if they give
the cells a selective growth advantage and contribute to the initiation or
progression of the disease. Passenger mutations do not contribute to the disease
progression per se, but occur due to the inherent genetic instability of the tumour
(Greenman et al., 2007). Driver mutations that contribute in tumorigenesis are
normally found in genes described as oncogenes or tumour suppressor genes
depending on their role in cancer development (Futreal et al., 2004).
Although the majority of computational tools developed for assessing genetic
mutations have focused on missense mutations, more recently, there have been
several efforts to predict the impact of in-frame indel mutations on protein
function or structure using a variety of strategies. Commonly used algorithms
that predict the pathogenicity of impact of indels include; PROVEAN (Choi and
Chan, 2015) SIFT (Hu and Ng, 2013), VEST-Indel (Douville et al., 2016),
CADD (Kircher et al., 2014b), DDIG-In (Zhao et al., 2013), PaPI (Limongelli,
Marini and Bellazzi, 2015) and PinPor (Zhang et al., 2014).
Most of these methods classify each mutation according to two state categories;
neutral or pathogenic using a variety of machine learning techniques including a
J48 Decision Tree (SIFT-indel), Random Forest and Logistic Regression (PaPi)
and Bayesian networks (PinPor), with reported AUC ROC accuracies varying
from 0.75 to 0.9 on a variety of datasets (see Table 5.1).
The pathogenic mutations are generally derived from The Human Gene
Mutation Database (HGMD) (Stenson et al., 2009) a catalogue of gene lesions
responsible for human inherited disease (e.g. SIFT-indel, VEST-indel, DDID-In,
PaPI, PinPor) or from UniProt (PROVEAN). Neutral mutations are generally
derived from the 1,000 Genomes Project (Genomes Project et al., 2010), the

135
Exome Sequencing Project (Schmidt et al.) (Tennessen et al., 2012) or by
identifying tolerated mutations from the sequence alignment of human
sequences with other mammalian species (e.g. SIFT-indel). CADD uses a
slightly alternative approach that discriminates fixed or nearly fixed derived
alleles in human from a set of simulated mutations. This method was developed
to predict deleterious mutations rather than the functional effect on protein or
variant pathogenicity using a support vector machine classifier (Kircher et al.,
2014b).
In this study, rather than studying genetic mutations from model organisms and
inherited disease genes, we wanted to develop a method for determining driver
indel mutations specifically for somatic mutations in cancer. However, few
insertion and deletion mutations have been clinically documented as pathogenic
in cancer. For instance in the ClinVar database (Landrum et al., 2014), only 20
inframe insertions and 108 inframe deletions are described as pathogenic and
there even fewer reported somatic driver mutations (8 and 26, respectively).
Recurrence is often used to imply clinical driver status to cancer mutations
(Landrum et al., 2014). So to identify set of somatic indel mutations that were
likely to contribute to the development of cancer we decided to use recurrence.
We identified a set of recurrent somatic indels found in exome sequencing of
documented cancer genes. We investigated the ability of current prediction
algorithms to distinguish between these recurrent mutations and neutral indel
mutations found to have little or no effect on protein function. We then defined
an ‘optimal’ training set of cancer mutations that could be used in algorithms
that predict whether an indel is contributing to the development of cancer.

136
An automated classifier was developed to distinguish between deleterious and
neutral mutations using 11 features to describe each mutation. We selected a
random forest classifier that achieved the best result to classify pathogenic and
neutral mutations for insertions and deletions respectively. We validated our
approach by testing our algorithm using indels clinically identified as disease
causing deposited in the ClinVar database. Finally, we ran our algorithm
(IndelRF) classifier to classify the predicted in-frame indels in the MOKCa
database into pathogenic or neutral mutations.
5.2 Methods
5.2.1 Data
To identify recurrent mutations, in-frame insertions and deletions (indels) were
extracted from the COSMIC database v82 using annotations form the Ensembl
human genome build hg38 (Bamford et al., 2004). Mutations were also extracted
for the hg37 build of the Ensembl database for use with the PaPI, DDIG-in and
PinPor algorithms.
Clinically determined cancer mutations were downloaded from the ClinVar
database (Landrum et al., 2014) with indels that were labelled as pathogenic or
probably pathogenic considered pathogenic.
For the neutral set of mutation we identified a set of indels that derived from the
1000 Genomes Project and the Exome Sequencing Project (Schmidt et al.) that
are commonly observed in the human population (Hu and Ng, 2013). To make
sure that our trained datasets were balanced, no more than 10% of the mutations
within a class were taken from a single protein or a domain type.

137
5.2.2 Identification of hotspot indel mutations
To identify indels that were likely to be pathogenic, we identified hotspot
mutations. For each protein in the human exome, we computed the total number
of mutations it contained and the frequency of mutation at each position. A
binomial test was used to identify which positions had a significant number of
mutations (See supplementary S5 Methods). Insertion and deletion were tested
independently and only positions where mutations occurred at least twice were
analysed.
5.2.3 Comparison of prediction algorithms
We assessed six different algorithms that have been developed to predict the
impact of in-frame indel mutations on the protein function and structure. These
algorithms were: CADD (Kircher et al., 2014b), DDIG-In (Zhao et al., 2013),
PaPI (Limongelli, Marini and Bellazzi, 2015), PinPor (Zhang et al., 2014),
SIFT-indel (Hu and Ng, 2013) and VEST (Douville et al., 2016).
5.2.4 Feature selection
We derived features from four existing prediction algorithms: VEST, PinPor,
CADD and Pseudo Amino Acid Variant Predictor (PaPI). In total, we calculated
11 features for each mutation (See supplementary Table S5.1). These features
describe the evolutionary conservation of the sequence where the insertion or
deletion occurs, in a variety of ways, or the pathogenicity of the mutation.
5.2.5 Feature Importance
Mean decrease accuracy was measured to identify the variable importance using
the random forest package (Archer and Kimes, 2008). The values of each of the

138
variables in turn are randomly permuted for the out-of-bag observations, and
then the modified data are passed down the tree to get new predictions. The
importance of the variable is the difference in misclassification rate for the
modified and original data, divided by the standard error (See supplementary S5
Methods).
5.2.6 Machine learning
All datasets were balanced to remove protein and domain biases in the data set.
No more than 10% of mutations were allowed from a single protein or a domain
family. A random forest classifier was trained to classify pathogenic and neutral
indel mutations using R version 3.2.3. Binary classifications were calculated for
in-frame insertion and in-frame deletion, independently. It was run with ten fold
cross validation and the parameters optimised for each model.
We also trained a support vector machine classifier (SVM) using 10-fold cross
validation to optimise the hyperparameter C, used to trade off between variable
minimization and margin maximization, and choose the kernel type that best fit
our data.
The classifier with the best accuracy at discriminating between pathogenic and
neutral mutations for both insertion and deletions was a random forest machine
classifier that we have named IndelRF.
5.2.7 Validation of algorithms
We validated the performance of IndelRF and compared it to exisiting
algorithms using test sets from ClinVar database (Landrum et al., 2016).
Predictions were generated using standard settings and the public web servers.

139
Sensitivity (TP/TP+FN), specificity (TN/TN+FP) and accuracy
(TP+TN/TP+TN+FP+FN) were measured to compare the performance of
methods. We also calculated area under the curve (AUC) of receiver Operating
Characteristic (ROC) curve for insertions and deletions separately.
5.2.8 Prediction of functional consequences of indel mutations in the
MOKCa database
5437 in-frame indel mutations were downloaded from MOKCa database v21
(Richardson et al., 2009). 1167 of them were insertions and 4270 deletion
mutations. IndelRF was used to predict whether the mutations were pathogenic
and likely to be cancer drivers. We also identified the pathogenic mutations
found in oncogenes and tumour suppressors as described by the Cancer Gene
Census (Futreal et al., 2004).
5.3 Results and Discussion
5.3.1 Identification of recurrent indels
4435 in-frame insertion mutations and 14456 in-frame deletion mutations were
reported in the COSMIC database. This led to 909 recurrently mutated positions
having inframe insertions and 2587 inframe deletions. As more than one indel
could be reported at each amino acid position in total, there were 1856 inframe
insertions and 2766 inframe mutations that we used to compare the
performances of the six published algorithms.

140
5.3.2 Comparison of Prediction Algorithms
5.3.2.1 Ease of use
The number of results successfully calculated by the prediction algorithms for
each of the insertion and deletion mutations, are shown in supplementary Tables
S5.2 and S5.3. Clearly, the algorithms did not work on all COSMIC annotations
of the mutations. Often the reason was incomplete nomenclature. For instance,
missing bases in the input sequences for deletions caused some algorithms to
falter. The entries CTNNB1, c.14_241del228, FOXP1 c.1553_1564del12 did not
give results, as the sequence of the deleted DNA was absent from the entry.
There may have also been discrepancies in genomic location of the mutation that
was required for the programs due to differences in versions of the genome build
used to define the mutation and that the prediction algorithm used.
5.3.2.2 Are recurrent mutations pathogenic?
In total pathogenicity values could be calculated for 898 inframe insertions and
962 inframe deletions predictions for all 6 programs available (See
supplementary Figure S5.1). The algorithms predicted between 27%-62%
insertion mutations and between 33%-73% deletion mutations as pathogenic. In
total 74 inframe insertions and 109 inframe deletions mutations were predicted
as pathogenic by all 6 algorithms (Figure 5.1). DDIG-in predicted the least
number of the indels to be pathogenic whereas PaPI identified the most number
of indels to be pathogenic.

141
Figure 5.1. Common pathogenic mutations between six algorithms in
inframe indels.
a) Insertion mutations b) Deletion mutations

Prediction methods
Previously published Insertion Deletion
*Sen. *Spe. *Acc. *AUC *Sen. *Spe. *Acc. *AUC *Sen. *Spe. *Acc. *AUC
CADD NA NA NA 0.88 0.853 0.653 0.753 0.845 0.883 0.715 0.799 0.895
DDIG-in 0.89 NA 0.83 0.89 1.00 0.976 0.988 0.991 1.00 0.936 0.967 0.975
PaPI 0.86 0.86 0.86 0.92 0.915 0.653 0.784 0.841 0.883 0.837 0.860 0.914
PinPor NA NA 0.75 0.83 0.830 0.238 0.534 0.533 0.680 0.389 0.534 0.553
SIFT-Indel 0.81 0.82 0.82 0.87 0.892 0.768 0.830 0.730 0.964 0.578 0.771 0.654
VEST-indel 0.90 0.90 0.90 0.91 0.923 0.700 0.811 0.886 0.982 0.872 0.927 0.973
Table 5.1. Comparing the performance of in-frame insertion and deletion with previously published results. *Sen.: Sensitivity, Spe.: Specificity, Acc: Accuracy, AUC: Area under ROC curve, NA: not applicable.

H.Baeissa et al.
143
5.3.2.3 Definition of optimal somatic cancer pathogenic indel datasets
To compare the variation between the algorithms, we selected 98 recurrent insertion
mutations and 155 recurrent deletion mutations that had been predicted to be pathogenic
by at least four of the 6 programs, as our putative pathogenic driver indel datasets. This
reduction in the number of mutations was to remove protein and domain biases in the
data set so that no more than 10% of mutations within a dataset were allowed from a
single protein or a domain family.
When using the algorithms to distinguish between our somatic driver pathogenic indels
and a neutral set of mutations, most of the algorithms performed well with accuracy
scores ranging from 0.753 to 0.988, and similarly to their published performances on
indels linked to hereditary disease. (see Table 5.1). The DDIG-in algorithm performed
the best on these examples, discriminating well between the recurrent somatic cancer
mutations and the neutral mutations for both in-frame indels. Hu and Ng (2013). The
only exception was PinPor that had accuracy scores of 0.534 for insertions and 0.553 for
deletions. PinPor differs to the other prediction algorithms as it predicts the
pathogenicity of indels by assessing the impact of mutations on post-transcriptional
regulation rather than impact on the protein structures.
5.3.3 Development of a cancer specific indel classifier
Evaluation of our datasets by existing algorithms suggests that the recurrent somatic
cancer mutations are pathogenic and therefore may be drivers in cancer. We then used
these cancer specific datasets to train machine algorithms to enable us to detect other
driver indel mutations.

H.Baeissa et al.
144
Two different models, random forest and support vector machine classifiers, were trialed
and compared. Binary classifications were calculated for pathogenic/neutral classes in in-
frame insertion and deletion, independently.
We used a random forest classifier using 10-fold cross-validation to optimise classifier
hyperparameters and assess performance for each class.
The random forest classifier has two parameters, depth and number of trees that affect on
the accuracy of a classifier (Bosch, Zisserman and Munoz, 2007). The results show how
the changing of both the number of trees and the depth of these trees affect the accuracy
(See supplementary Tables S5.6 & S5.7) however the classification accuracy is generally
high. The highest accuracy is 0.995 when the depth is 100 and the number of trees is 100
in insertion and 0.968 with a depth of 10 and 1000 tree for deletion mutations.
We also trialled a support vector machine classifier however all our random forest
classifier performed better than our SVM classifier for insertion and deletion mutations.
We found the highest accuracy of 0.983 and 0.962 with a radial basis function (RBF)
kernel for insertion and deletion, respectively. The RBF kernel is the simplest kernel that
can be used and generalizes good results (Suykens and Vandewalle, 1999, Keerthi and
Lin, 2003) SVM classifier yielded the best result using RBF kernel.
The results for the SVM hyperparameter optimisation show that different values of
hyperparameters in insertion and deletion mutations do not significantly change accuracy
scores except when the polynomial kernel is used which caused the classifier to have a
lower accuracy of 0.658 and 0.654, respectively (See supplementary Tables S5.8 &
S5.9).
However, the classifier with the highest accuracy at discriminating pathogenic and

H.Baeissa et al.
145
neutral classes in insertions and deletions was a random forest classifier.
5.3.4 Feature importance
Having successfully designed an algorithm that could reliably distinguish between
recurrent somatic cancer mutations and neutral insertion/deletion mutations we decided to
identify the important features. Mean decrease accuracy is one of the popular feature
selection methods that directly measure the effect of each feature on the accuracy of
random forest. It permutes the values of one feature while others are left unchanged and
measure how much the permutation reduces the accuracy (Cutler et al., 2007).
Figure 5.2 shows that VEST p-value, priPhCons, Phylop and Gerp++ were the four best
performing features for insertion and deletion. VEST p-value score, from VEST
prediction algorithm, is the probability that benign mutation is misclassified as
pathogenic. Primate PhastCons conservation score(priPhCons) was one of the top five
features from CADD. Phylop and Gerp++ scores, from PaPI algorithm, are two of the
evolutionary conservation score that apply different and complementary methods to
weight nucleotide conservation among different species (Garber et al., 2009).
Moreover, the distance of indel mutation to the exon’s 3’ end was one of the most
important features for insertions. Similaritly, when comparing pathogenic versus neutral

H.Baeissa et al.
146
Figure 5.2. The importance features across insertions and deletions.
The features are ranked according to insertion mutations with the corresponding key at
the side.

H.Baeissa et al.
147
mutation for deletions, one of the top five features was the distance of indel to exon’s 5’
end.
5.3.5 Evaluation test set
We applied our algorithms to the pathogenic insertions/deletions identified in the ClinVar
databases as an independent evaluation set. For somatic insertion indels, 18 pathogenic
mutations and seven somatic-pathogenic mutations were evaluated using (IndelRF) with
accuracies of 0.833 and 1.000, respectively. IndelRF was also evaluated on cancer
deletion mutations; 72 pathogenic mutations 19 somatic-pathogenic mutations and gave
accuracies of 0.972 and 1.000, respectively. IndelRF outperformed the existing
algorithms in these datasets (see Table 5.2).
Insertion Deletion
Pathogenic Somatic Pathogenic Somatic
CADD 0.28 1.00 0.88 0.84
DDIG-in 0.56 1.00 0.86 0.84
PaPI 0.77 0.75 0.97 1.00
PinPor 0.72 1.00 0.71 0.79
SIFT-indel 0.83 1.00 0.82 0.84
VEST-indel 0.77 1.00 0.95 0.94
IndelRF 0.83 1.00 0.97 1.00
Table 5.2. Prediction accuracies compared between methods for four ClinVar test
sets in indels.

H.Baeissa et al.
148
5.3.6 Identifying pathogenic in-frame indel mutations in MOKCa
We applied IndelRF to the in-frame indels identified in the MOKCa database. 844 unique
insertions and 1790 deletion mutations were identified. Of these (46%) 392 insertions
were predicted to be pathogenic in 251 genes, and 848 (47%) deletions across 611 genes
(Figure 5.3).
5.3.7 Analysis of pathogenic mutations
Based on the cancer gene classification in the Cancer Gene Census (Futreal et al., 2004)
we identified a set of 98 deletions in 37 oncogenes (OG) and 134 deletions across 31
tumour suppressors (TS) that were predicted to be pathogenic deletions (see
supplementary Tables S5.10 & S5.11). This suggests that indels can be both activating in
oncogenes, as well as causing gene disruption in tumour suppressors.
We also detected 80 putative activating insertions across 26 oncogenes and 69
inactivating insertions across 18 tumour suppressors (See supplementary Tables S5.12 &
S5.13).
Below are some of the indels predicted to be pathogenic, confirmed by reports in the
literature:
EGFR p.L747_E749delLRE
Epidermal growth factor receptor (EGFR) is an oncogene that regulates cell proliferation.
Mutations in EGFR activate the EGFR signaling pathway and promote EGFR-mediated
pro-survival and anti-apoptotic signals through down-stream targets such as RAS, RAF

H.Baeissa et al.
149
Figure 5.3: The flowchart of pathogenic assignment of indel mutations in MOKCa.
Indel mutations were downloaded from the MOKCa database. IndelRF was used to
assign the indel mutations as pathogenic or neutral.

H.Baeissa et al.
150
and MEK (Zhang et al., 2010). The most abundant EGFR mutations are deletions in the
kinase domain in exon 19 (residues 747 - 752) and constitute about 45% of all EGFR
mutations (Zhang et al., 2010). These mutations are thought to produce a
conformational predisposition for the kinase to prefer its active conformation, and hence
become constitutively active.
JAK2 p.E543_D544del
Similarly Janus kinase 2 (Jak2) is an oncogene that promotes the growth and division of
cells. Jak2 mutations define a distinct myeloproliferative syndrome that affects patients
with a diagnosis of polycythemia vera (PV) (Scott et al., 2007). A small faction of
polycythemia vera (PV) patients (<5%) carry usually deletions mutations in JAK2 at exon
12 (Cazzola and Kralovics, 2014, Tefferi and Pardanani, 2015) at residues E543 (Scott et
al., 2007).
KRAS p.G10_A11insG
KRAS is one of the RAS superfamily that act as oncogenes. It helps regulate cell growth.
When mutated cell signaling is disrupted leading to uncontrolled cell proliferation and the
development of cancer. KRAS insertion mutations have been observed between codons
10 and 11 (KRAS p.G10_A11insG) in one pateint with colorectal cancer (Tong et al.,
2014) and also in one myeloid leukaemia patient (Bollag et al., 1996).
ARIA1A p.Q1334delQ

H.Baeissa et al.
151
AT-rich interactive domain 1A (ARID1A) is a tumour suppressor that has been
recognised in several types of human cancers. About 5% of ARID1A somatic mutations
are in-frame indels (Guan et al., 2012). Deletion mutations at position Q1334del were
found two tumours; gastric carcinoma (Jones et al., 2012) and prostate carcinoma (Wang
et al., 2011).
5.4 Conclusions
In this study, we sought to develop machine-learning models to identify pathogenic in-
frame indels. We compared the ability of six prediction tools to discriminate between
these pathogenic mutations and a set of neutral mutations, which they all did with ease.
We then developed our own classifiers that could discriminate pathogenic mutations with
an accuracy of 0.995 and 0.968 for insertions and deletions, respectively. The most four
important features of our classifiers were the VEST p-value, priPhCons, Phylop and
Gerp++ of in-frame insertion and deletion mutations.
Finally, we have used our algorithms to predict the functional consequence of 844
insertion mutations and 1790 deletion mutations documented in the MOKCa database.

H.Baeissa et al.
152
Chapter 6. Identifying actionable mutated proteins as targets for personalised
medicine in lung cancer
6.1 Introduction
Lung cancer is a malignant lung tumour caused by uncontrolled cell growth. The World
Health Organisation estimated that in 2018 that there would be 2.09 million cases of lung
cancer with 1.76 million deaths (World Health Organization, 2018). Lung cancer causes
more deaths than the three other most common cancers (breast, colon and prostate)
combined, accounting for about 25% of all cancer deaths in both men and women
(Schrank et al., 2018).
The main primary types of lung cancers are small-cell lung cancer (SCLC) and non-
small-cell lung cancer (NSCLC). SCLS comprises around 15% of all lung cancer (Sher,
Dy and Adjei, 2008) and almost always begins in the bronchi, whereas NSCLC accounts
for about 80-85% of lung cancers (Sher, Dy and Adjei, 2008). It consists of three types of
cancer including: adenocarcinomas (LUAD) (Noguchi et al., 1995), squamous cell
carcinoma (Kenfield et al., 2008) and large cell carcinoma (Muscat et al., 1997).
Adenocarcinoma is the most common type of lung cancer in both smokers and
nonsmokers (Couraud et al., 2012). It accounts for 40% of all lung cancer and usually
occurs in the periphery or outside the lung area (Stellman et al., 1997). It is slow growing
cancer compared to other types of lung cancer. However analysis from multi-platform
high throughput sequencing analysis by The Cancer Genome atlas (TCGA) (Cancer
Genome Atlas Research, 2014) and others (Imielinski et al., 2012, Rizvi et al., 2015,
Ding et al., 2008) show that these tumours have one of the highest rate of mutations

H.Baeissa et al.
153
(Helland et al., 2017).
Standard treatments for LUAD are dependent on the stage of the tumour, but generally
involve surgery, radiotherapy and cytotoxic chemotherapy. More recently, the molecular
characteristics of lung cancers are being used to guide treatment (eg ((Brodie, Li and
Brandes, 2015)). For instance, the FDA has approved a limited range of targeted
therapies for lung cancer patients that target specific oncogenes present in subsets of the
tumours. These include: ALK inhibitors such as alectinib for the treatment of patients
with oncogenic mutations in the ALK gene (Larkins et al., 2016); EFGR inhibitors such
as gefitinib for patients with EGFR exon 19 deletions or exon 21 (L858R) substitution
mutations as detected by an FDA-approved test (Kazandjian et al., 2016) and BRAF
inhibitors such as dabrafenib and trametinib for patients with BRAF V600E mutations
(Odogwu et al., 2018).
The advantages of targeted therapies include that they are often effective when standard
chemotherapy drugs are not, and they often have less severe side effects because they
selectively target the differences between cancerous and non-cancerous cells (Lim et al.,
2016). Their mechanisms of action include inhibiting proteins that the cancerous cell has
become dependent on, either as a result of oncogene addiction or because the gene has a
synthetically lethal relationship with another gene that is missing or pathogenically
altered in the cancerous cell (Torti and Trusolino, 2011).
Synthetic lethality (SSL) arises when a combination of deficiencies in the expression of
two or more genes leads to cell death, whereas a deficiency in only one of these genes
does not. These deficiencies can arise through mutations, epigenetic alterations or

H.Baeissa et al.
154
inhibitors of one of the protein products of the genes, and provides a strategy for
therapeutically targeting tumour suppressors (Hartwell et al., 1997).
However, targeted therapies are only suitable for the subsection of patients that exhibit
the relevant mutations in specific genes. Moreover patients can acquire resistance to
inhibitors resulting in the need for a change of therapy (Zhang et al., 2012).
In this paper we take the mutational data from 50 lung cancer patients to ascertain
whether they would benefit from targeted treatment. To identify potential drug targets we
assigned a GOF/LOF or ‘neutral’ status to the protein product of each gene. This was
done by consideration of mutational status, the copy number alteration (CNA) and the
RNA expression level for each gene.
For proteins predicted to exhibit a gain of function phenotype we use the canSAR CPAT
tool (Tym et al., 2016) to identify possible inhibitors. For proteins predicted to exhibit a
loss of function, direct inhibition of the resulting protein would be counterproductive.
Instead we identified their synthetic lethal partners using the SLORTH (Benstead-Hume,
Wooller and Pearl, 2017) and BioGRID database (Chatr-Aryamontri et al., 2017).
Possible inhibitors of these SSL partners were then identified using the canSAR CPAT
tool. Finally, each cancer sample was assigned a panel of drugs for possible personalised
therapies.
6.2 Methods
Mutational data for 50 lung adenocarcinoma cancer samples were downloaded from the
COSMIC database. They contained 3903 missense and 243 truncating (stop and
frameshift indel) mutations. We then determined which of the genes in each sample

H.Baeissa et al.
155
contained putative driver missense mutations using the cancer-specific high-throughput
annotation of somatic mutations (CHASM) program. Next, we predicted loss of function
(LOF) and gain of function mutation (GOF) phenotypes of the resulting protein products
of the genes with these mutations using the MOKCaRF algorithm (Figure 6.1).
Truncating mutations were automatically assigned as causing loss of function to the
protein products.
Gene expression information was retrieved for each sample from the COSMIC database
together with a list of genes that were under-regulated or over-regulated. Cutoffs of 0.2/-
0.2 were used to determine whether the copy number was high or low.
In order to identify gain of function of a gene we separately tested for increases in CNA,
RNA-expression and the presence of GOF missense mutations. Genes were assigned as
being GOF is they had a GOF missense driver mutation or that both their CNA and
expression levels were high. On occasion the signal from all three of these tests was in
agreement.
To determine if a gene exhibited a loss of function, we separately tested for decreases in
CNA, low RNA-expression, the presence of a LOF driver missense mutation, or a
presence of a truncation (stop or frameshift) mutation. Genes were assigned as being LOF
is they either had driver LOF missense mutations, a truncation mutation or both their
CNA and expression levels were low.
For genes assigned as GOF we directly identified the actionable targets using a cancer
research and drug discovery knowledgebase (canSAR) (Tym et al., 2016). We also
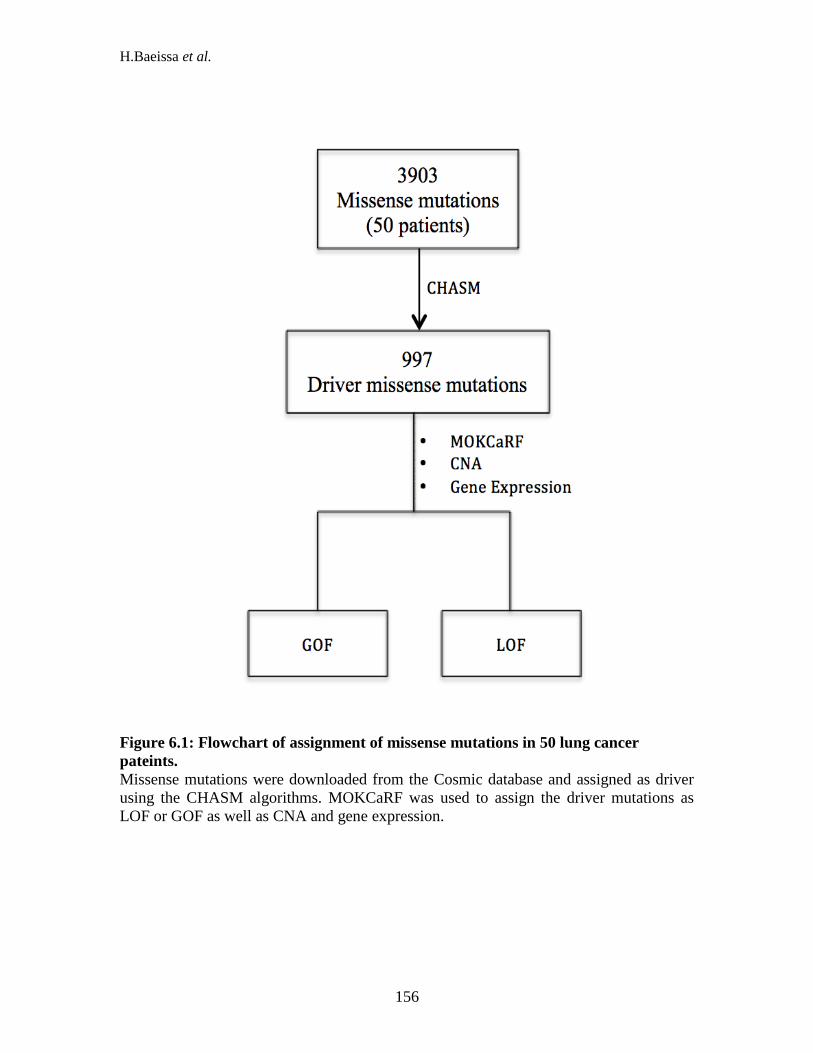
H.Baeissa et al.
156
Figure 6.1: Flowchart of assignment of missense mutations in 50 lung cancer
pateints.
Missense mutations were downloaded from the Cosmic database and assigned as driver
using the CHASM algorithms. MOKCaRF was used to assign the driver mutations as
LOF or GOF as well as CNA and gene expression.

H.Baeissa et al.
157
analysed the GOF proteins’ potential to be amenable to personalized treatment regimes
using known drugs from Drug Gene Interaction database (DGIdb) (Cotto et al., 2018).
For LOF genes, we predicted their synthetic lethal partners using the SLORTH database.
We then identified if the protein product of these SSL partners were therapeutically
actionable.
6.3 Results
6.3.1 Genetic Landscape of Lung Cancer Samples
For each sample, we identified the number and types of mutations, genes with copy
number alterations (CNA) and high and low expressing genes. In total, the samples
contained 5769 mutations ranging from 17 to 443 mutations per sample, of which 67.65%
were missense mutations. 21455 genes had high CNA and expression values, ranging
from 24 to 1159 genes per sample. Similarly, there were 14851 genes with low CNA and
expression values, ranging from 24 to 1051 per sample. Figure 6.2 illustrates the
mutational landscape for each sample.
DAVID analysis suggests that LOF genes were concentrated in regulation of
transcription, acetylation and protein kinase activity pathways, whereas GOF genes were
found in regulation of cell cycle and protein catabolic process pathways.

H.Baeissa et al.
158
Figure 6.2: This figure shows the number of missense mutations, truncation, and other mutations, and CNAs in each sample.
The x-axis is the 50 LUAD sample IDs, which are sorted from high number to low number of gene alterations.

H.Baeissa et al.
159
6.3.2 Mutated druggable GOF targets
In total, we identified 997 missense mutations as driver mutations using CHASM. Of
these 410 could reliably be assigned as having a GOF in 370 genes in 49 patients. Of the
370 protein products predicted to exhibit a gain for function mutation, 11 had licensed
drugs that targeted them (Figure 6.3); five of which were licensed for a treatment of
cancer. Due to several of the same genes mutated in multiple samples, this resulted in 15
patients that could potentially be treated with a personalised approach (see
Supplementary Table S6.1).
BRAF V600E mutations were present in two different samples that could be targeted
with Vemurafenib or Dabrafenib. One sample had BRAF D594H mutations, which has
been shown not to be activating. One sample had a BRAF G649L mutation (Nguyen-
Ngoc et al., 2015), and although this mutation has been shown to be an activating
mutation, it is unresponsive to either Vemurafenib or Dabrafenib. Three-dimension
structural modelling of BRAF G469L suggests that the mutation induces a
conformational change that impairs the binding of these inhibitors (Gautschi et al., 2013).
The EGFR L858R mutation was observed in three samples and several drugs that are
licensed to treat this mutation in advanced NSCLC (Cardarella et al., 2013, Domvri et al.,
2013). An EGFR L62R mutation was in a separate sample. This mutation lies within the
extracellular domain of the EGFR protein and although it has not been biochemically
characterized, in one of two cell lines, EGFR L62R increased cell proliferation and cell
viability as compared to wild-type EGFR (Ng et al., 2018). Consequently, it may be

H.Baeissa et al.
160
Figure 6.3: The number of druggable targets for each type of mutation.
GOF targets were calculated directly (see methods). For LOF genes, it is the number of
druggable SSL partners that are shown.
Missense-GOF,11
High-CNA/Expression,146
Missense-LOF,18
Trunca on,28
Low-CNA/Expression,28

H.Baeissa et al.
161
worth exploring whether EGFR L62R may also be a possible target for EGFR L858R
inhibitors.
Of the other nine genes predicted to have activating mutations, three of them EPHA7,
PDGFRB and RAF1 have specific drugs for other cancer indications, which could
possibly be repurposed to treat lung cancer in these cases. Fostamatinib a drug licensed
for the treatment of Rheumatoid Arthritis and Immune Thrombocytopenic Purpura (ITP)
targets EPHA7. Sunitinib is a small molecule that inhibits multiple receptor tyrosine
kinase RTKs, including PDGFRB; It is used for the treatment of advanced renal cell
carcinoma (Chan et al., 2018). Sorafenib is a small molecular inhibitor that developed as
an inhibitor of RAF1 mutations. It has been approved for the treatment of advanced renal
cell carcinoma (primary kidney cancer) (Cheng et al., 2009). It has also received "Fast
Track" designation by the FDA for the treatment of advanced hepatocellular carcinoma
(primary liver cancer), and has since performed well in Phase III trials (Ben Mousa,
2008).
The other genes with activating mutations are targets for drugs of other indications such
as epilepsy (GRIN2A) and seizures (DPYSL2) and may of use in a cancer setting.
6.3.3 Highly expressed druggable GOF targets
In total, 9845 genes were identified as being potential GOF through their CNA and
expression data, of which 146 had licensed drugs (Figure 6.3), 61 for the treatment of
cancer. This meant that 47 samples had possible therapies (see Supplementary Table
S6.2; Figure S6.1). For example, two samples had high copy number and expression of
the ALK gene, which may be susceptible to Alectinib. Two other samples had high copy

H.Baeissa et al.
162
number and expression of the FGFR2 gene, which may be susceptible to Dovitinib,
which is licensed for the treatment of multiple myeloma and solid tumors (Scheid et al.,
2015).
6.3.4 Using SSL to identify additional druggable targets
This direct approach does not work as a method of combatting cells with deficiencies in
tumour suppressors and loss of tumour suppressor genes may be more important than
oncogenes for the formation of many cancer cells (Weinberg, 2014). This can pose a
therapeutic problem as it limits the number of therapeutic targets.
In our 50 samples, 275 genes were predicted to have a LOF missense mutation, 185
genes had a truncating mutation and 968 genes had low CNA and expression values. In
total, that gave us 1380 unique LOF genes, spread over all 50 samples.
As these 1380 genes could not be targeted directly we identified their putative synthetic
lethal partners unique genes using SLORTH (Benstead-Hume, Wooller and Pearl, 2017)
and BioGRID (Chatr-Aryamontri et al., 2017). This gave a total of 438 unique genes that
were predicted or had been experimentally determined to be SSL with at least one of the
LOF genes in 43 samples. 38 of the protein products for these genes had approved
chemical modulators enabling us to possibly therapeutically target 26 samples (Figure
S6.1).
Most of synthetic lethal partners genes have a cancer-specific drug (Figure 6.4; see
Supplementary Table S6.3).
Two samples showed LOF of the BRCA genes, a LOF missense mutation in BRCA1 and
a truncation mutation in BRCA2, giving the opportunity of these samples to be treated by
PARP inhibitors, such as Olaparib.
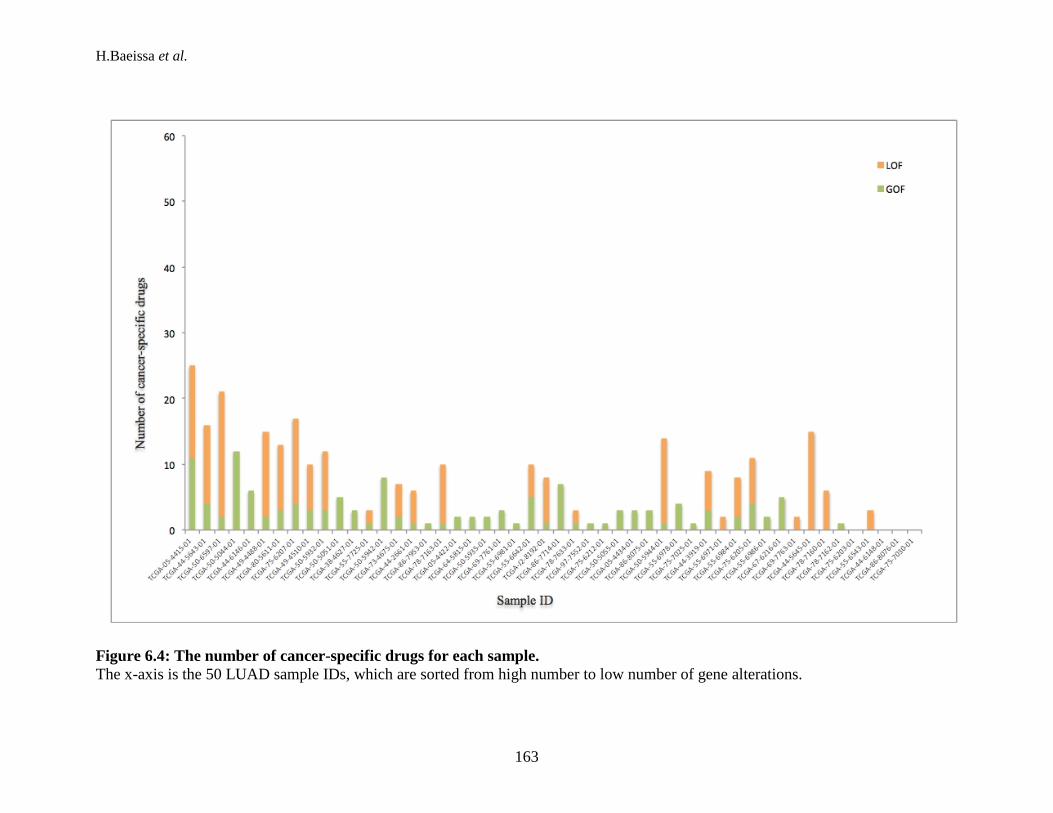
H.Baeissa et al.
163
Figure 6.4: The number of cancer-specific drugs for each sample.
The x-axis is the 50 LUAD sample IDs, which are sorted from high number to low number of gene alterations.

H.Baeissa et al.
164
A combinatorial CRISPR-cas9 screen (Shen et al., 2017) showed that HDAC2 has a SSL
relationship with both VHL and SMARCA4 in a lung cancer cell line (A549) driven by a
KRAS G12S mutation. Four of the LUAD samples were predicted to have LOF of the
genes VHL (1) or SMARCA4 (Kantarjian et al.). Belinostat targets HDAC2 is licensed
for the treatment for relapsed or refractory peripheral T-cell lymphoma (Lee et al., 2015)
and may have been of utility in these cases.
Similarly, STK11 was predicted to have a LOF in eight samples and has been shown to
have a SSL relationship with MAP2K1 in a HeLa cell line (Srivas et al., 2016).
Cobimetinib is an orally active, potent and highly selective small molecule inhibiting
mitogen-activated protein kinase kinase 1 (MAP2K1 or MEK1), licensed for use in
BRAF V600E mutation-positive melanoma in combination with Vemurafenib, and may
be of utility in this sample. Other possible targetable SSL partners of STK11 are
CSNK2A1 also reported as SSL in HeLa a cell line (Srivas et al., 2016) or IKBKB,
HSP90AA1 both predicted as SSL partners by SLORTH (Benstead-Hume, Wooller and
Pearl, 2017) and BioGRID (Chatr-Aryamontri et al., 2017).
6.3.5 Drug Combinations
In total, of the 50 LUAD samples analysed, 7 had a personalized therapy currently
licensed for the treatment of lung cancer. The analysis of licensed therapies for other
cancers showed that another 34 samples were predicted to have at least one GOF gene
that could be targeted with a licensed drug. When expanded for LOF genes, all but 3 of
the samples had possible targeted therapy.

H.Baeissa et al.
165
On average, each sample had 12 possible targets, which means that multiple targeting and
drug combinations are a possible therapeutic strategy for these hard to treat cancers. Our
data also suggests that as the number of mutation and copy number alterations increase,
the number of therapeutic vulnerabilities also increase (Figure 6.5).
6.4 Discussion
In the foreseeable future drug treatment regime for a tumour will be dependent on the
results of sequencing of the tumour. Here we present a pilot, yet retrospective analysis
on 50 LUAD tumours sequenced by the TCGA, whose data are available in the COSMIC
database.
The patterns of mutations in lung cancer are particularly diverse, because as well as the
mutations that occur after the tumour has been established, many mutations occur due
both before and during tumour development to the carcinogens present in smoke. This
leads to a diverse range of mutations that make the tumour hard to treat, yet may add
surprising vulnerabilities.
In the 50 samples study and using current licensed therapies, 7 for lung cancer samples
could have been treated in a personalised manner. However, when expanding the range
of drugs for other indications we identified potential druggable vulnerabilies in all but 3
of the samples.
Our analysis also suggests that by targeting SSL partners of “tumour suppressors” or
genes that have a loss of function in the specific tumour almost double the number of
available targets.
The data also suggest that there are multiple possible targets for each tumour and that a
combination of drugs may be of therapeutic benefit in a large number of cases.
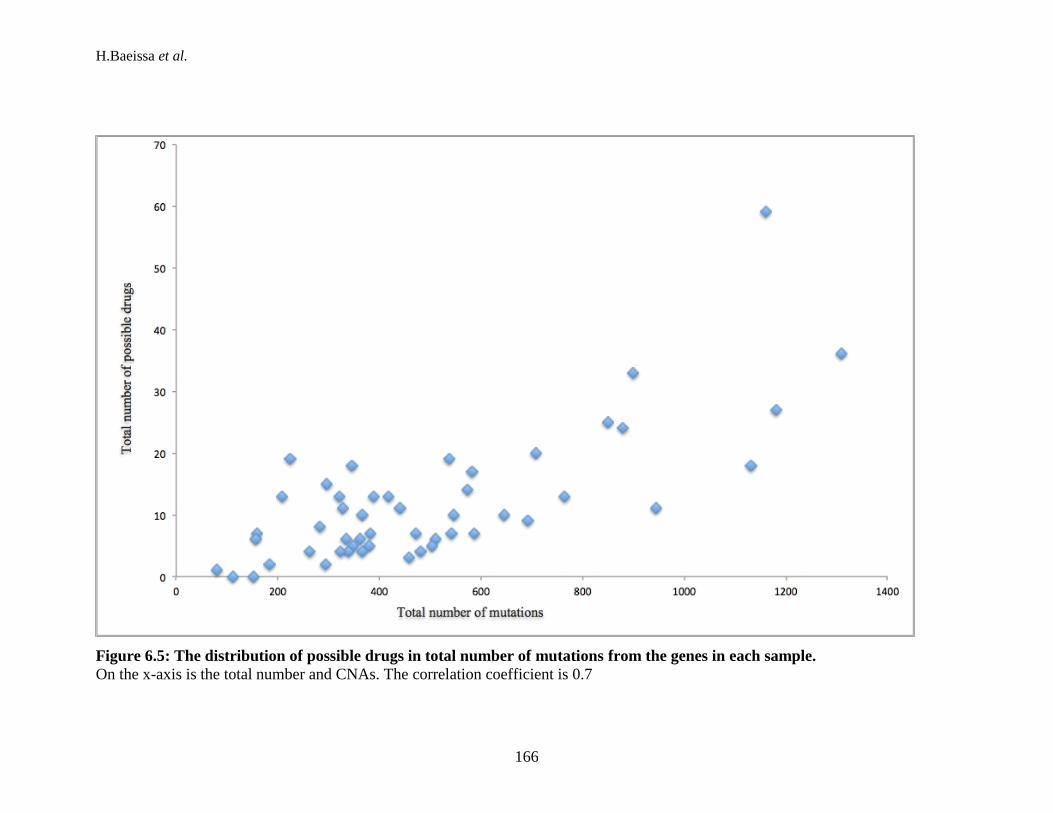
H.Baeissa et al.
166
Figure 6.5: The distribution of possible drugs in total number of mutations from the genes in each sample.
On the x-axis is the total number and CNAs. The correlation coefficient is 0.7

Chapter 7. Discussion and conclusion
7.1 Discussion
Most cancers depend upon mutations in critical genes, which then confer a
selective advantage to the tumour cell (Greenman et al., 2007). Understanding
how a mutation changes the function of the resultant protein product is key to
understanding the biology of cancer initiation and progression. It is also vital
information required for the application and development of targeted therapeutic
strategies.
In this thesis, rather than classifying genes and mutations solely as drivers and
passengers, I have been comparing gain of function mutations with loss of
function mutations in known and predicted driver genes. This is because the
therapeutic strategies for genes activated by a gain of function mutation, which
can often be targeted directly, differ from those that have a loss of function
mutation that usually have to be targeted indirectly.
In chapter 2, I examined the pattern of mutations observed in oncogenes and
tumour suppressors when all reported mutations in a gene are mapped onto a
single protein sequence. In oncogenes, the predominant type of mutation is the
missense mutation, often clustered at key “hotspot” positions in the protein. In
tumour suppressors, although missense mutations are predominantly found, there
are also large numbers of truncation mutations; these may result in total loss of the
protein product due to nonsense mediated decay. The mutations are liberally
dispersed along the length of the protein, but for both missense and truncation
mutations lower frequency hotspots are still observed. I also introduced the
MOKCa database (Richardson et al., 2009), which is maintained at the Institute of
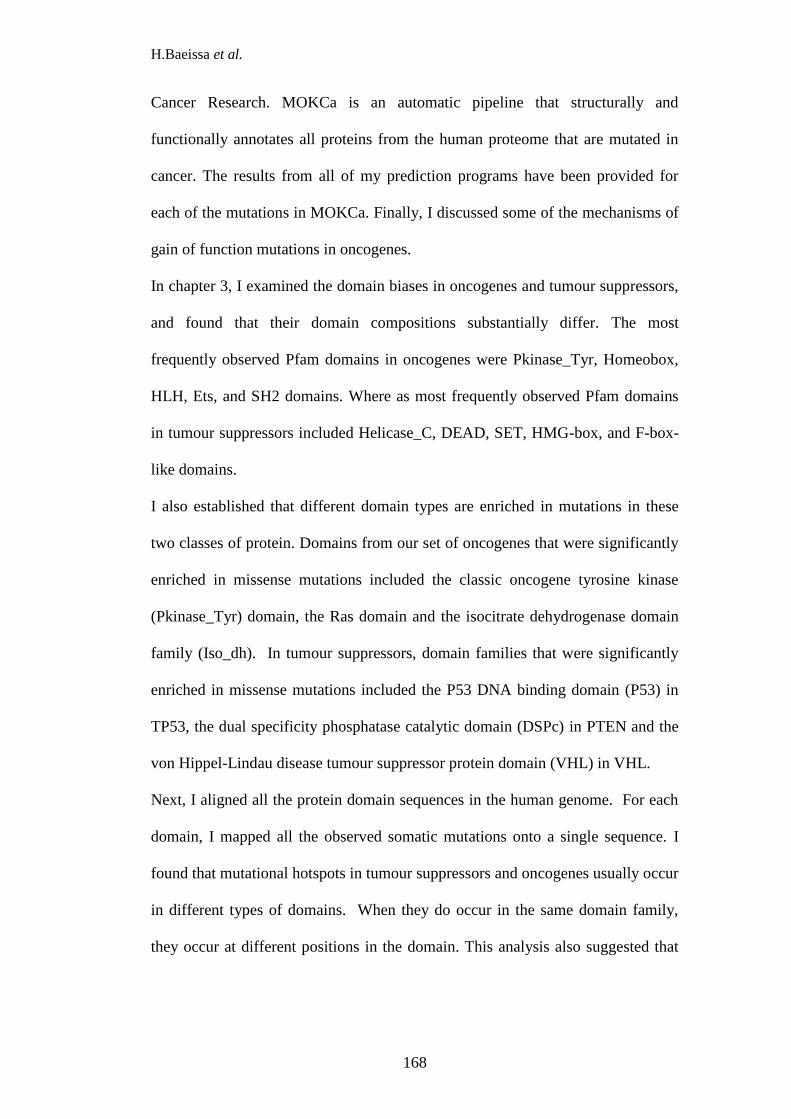
H.Baeissa et al.
168
Cancer Research. MOKCa is an automatic pipeline that structurally and
functionally annotates all proteins from the human proteome that are mutated in
cancer. The results from all of my prediction programs have been provided for
each of the mutations in MOKCa. Finally, I discussed some of the mechanisms of
gain of function mutations in oncogenes.
In chapter 3, I examined the domain biases in oncogenes and tumour suppressors,
and found that their domain compositions substantially differ. The most
frequently observed Pfam domains in oncogenes were Pkinase_Tyr, Homeobox,
HLH, Ets, and SH2 domains. Where as most frequently observed Pfam domains
in tumour suppressors included Helicase_C, DEAD, SET, HMG-box, and F-box-
like domains.
I also established that different domain types are enriched in mutations in these
two classes of protein. Domains from our set of oncogenes that were significantly
enriched in missense mutations included the classic oncogene tyrosine kinase
(Pkinase_Tyr) domain, the Ras domain and the isocitrate dehydrogenase domain
family (Iso_dh). In tumour suppressors, domain families that were significantly
enriched in missense mutations included the P53 DNA binding domain (P53) in
TP53, the dual specificity phosphatase catalytic domain (DSPc) in PTEN and the
von Hippel-Lindau disease tumour suppressor protein domain (VHL) in VHL.
Next, I aligned all the protein domain sequences in the human genome. For each
domain, I mapped all the observed somatic mutations onto a single sequence. I
found that mutational hotspots in tumour suppressors and oncogenes usually occur
in different types of domains. When they do occur in the same domain family,
they occur at different positions in the domain. This analysis also suggested that

H.Baeissa et al.
169
there might only be a small subset of domain types that can easily be activated by
single small mutations.
I then used our oncogene and tumour suppressor domain hotspots to identify co-
located hotspots in 167 proteins not as yet associated with cancer. This
information enabled us to assign putative gain or loss of function mutations in
these proteins that may be found to contribute to cancer progression.
The aim of Chapter 4 was to capture features that described the GOF and LOF
missense mutations and to develop a reliable classifier that could discriminate
between them. I first investigated the ability of seven prediction algorithms to
discriminate between driver missense mutations in oncogenes and tumour
suppressors. Of the algorithms tested, Mutation Assessor (Reva, Antipin and
Sander, 2011) and PolyPhen2 (Adzhubei, Jordan and Sunyaev, 2013) showed the
greatest ability to discriminate between GOF and LOF driver missense mutations
in cancer genes. Then, I developed a new algorithm called MOKCaRF to
distinguish between GOF and LOF driver missense mutations in cancer.
MOKCaRF was then used to classify the entire driver missense mutations
reported in the MOKCa database.
Classifying driver mutations according to whether they lead to a gain of function
or a loss of function, provided a way of shedding light onto the functions of less
well-studied driver genes, as well as improving understanding of the dual nature
of some highly studied tumour suppressors, such as TP53, in which some
mutations can exhibit GOF properties.
The original aim of Chapter 5 was to produce an algorithm that could discriminate
between GOF and LOF indel mutations. However, initial analyses showed that
there are not as yet enough reported indels in cancer genes to create a dataset large

H.Baeissa et al.
170
enough for a reliable classifier. Instead I implemented a cancer-specific indel
driver prediction algorithm. First, I tested whether six of the popular prediction
tools could be adapted to test for cancer driver mutations and then I developed a
new algorithm (IndelRF) that discriminated between recurrent indels in known
cancer genes and indels not associated with disease. Finally, I used IndelRF to
classify the in-frame indel cancer mutations in the MOKCa database.
Chapter 6 was exploratory in nature where I analysed 50 lung cancer samples
from the TCGA (Tomczak, Czerwinska and Wiznerowicz, 2015) to ascertain
whether they would benefit from targeted treatments. Lung cancer causes more
deaths than the three other most common cancers, accounting for about 25% of all
cancer deaths in both men and women (Schrank et al., 2018). Standard
chemotherapies are rarely successful in ameliorating the disease and there are few
targeted therapies.
To identify potential drug targets I analysed which genes have driver missense
mutations using standard methods and then used MOKCaRF to see which have
GOF/LOF mutations. I also analysed which genes were over and under-expressed,
and those with copy number alterations. Having identified the driver genes for
each patient, I then analysed their potential of their cancer to be amenable to
personalised treatment regimes using known drugs. Activated proteins could be
targeted directly; where as inactivated proteins were targeted using a synthetic
lethality approach.
Several of the samples had the classical EFGR L858R (e.g. gefitinib) and BRAF
V600E (e.g dabrafenib) mutations for which tailored therapies already exist
(Odogwu et al., 2018). Other samples had other activating mutations in these
genes that might also be targeted by these drugs. Encouragingly, there was a range

H.Baeissa et al.
171
of other proteins that were predicted to be activated, that were close homologues
to proteins targeted by licensed drugs. It may be from these that we get the next
tranche of cancer targets.
7.2 Limitations
My thesis relies to a large extent on available algorithms which distinguish
between mutations that make little difference to the function of the eventual
protein and those which inactivate the protein, or go on to cause disease. As the
data sets have expanded so too these algorithms are improving. However the
algorithms are themselves still limited with plenty of disagreement between the
different models, and subtle differences in what they are trying to achieve. It is to
be hoped that as the datasets continue to expand so it becomes clearer how best to
model both the link between genetic changes and eventual protein structural
changes, as well as the ways that protein structural changes go on to change
protein function, and the final step from protein function to carcinogenesis.
The differences between each chromosomal build continue to be large and I have
found the mapping offered between the different builds to be insufficient when
making large-scale use of driver prediction algorithms. Whilst those that rely on
protein identifiers remain relatively stable, changes of chromosome build are a
real problem. This means that algorithms that assess the impact of mutation on
protein structure and function need ongoing, detailed, upkeep.
Finally, the genetic data that underpins this thesis, and the study of cancer more
generally increases monthly. Despite the necessary difficulties in handling such
personal data we now have freely available access to excellent data sources for
legitimate research purposes. Yet the clinical data that should be accompanying

H.Baeissa et al.
172
this information is usually missing or of such poor quality that it cannot be used to
any great effect.
7.3 Future Work
The majority of the work in this has been the analysis of somatic mutations and
the development of algorithms to assess their contribution to the causation of
cancer. The outputs of my prediction algorithms have been added to the MOKCa
database. In the future, I would like to develop the MOKCa database further.
Currently, mutations in MOKCa are mapped onto a human structure, or onto a
close relative if no human structure is available. I would like to develop a
computational pipeline to generate models of proteins for which the human
structure has not been determined, but for which homology models can reliably
generated and onto which cancer associated mutations have been successfully
mapped. I would then like to provide structural analysis of impact of the
mutations. The SAAPdb (Hurst et al., 2009) automatic pipeline would be used to
determine the structural impact of mutations in these proteins to identify
mutations leading to structural stress or instability. LIGPlot (Wallace, Laskowski
and Thornton, 1995) would be used to plot difference in protein ligand
interactions on mutation.
7.4 Conclusions
With the wealth of cancer data still being generated and the likelihood that in the
future each tumour will be individually sequenced, we still need to develop robust
computational tools to assess the contributions of low-frequency driver genes and
mutations to the causation of cancer. We also need algorithms to assess which of
these mutations are therapeutically actionable.

H.Baeissa et al.
173
In this thesis I have analysed the differences in mutations in oncogenes and
tumour suppressors, and used this information to create a range of algorithms to
help identify activating mutations that may be therapeutically actionable.

H.Baeissa et al.
174
Appendices
Appendix 1: Supporting Information for Chapter 2
Figure S2.1: This figure outlines the steps required to populate the MoKCA
database.
Mutation mapping: All Cosmic mutations are analysed at the protein level and
clustered into aggregate mutations. The positions of these mutations are then re-
mapped onto the UniProt protein sequence using a Cosmic to UniProt pairwise
protein sequence alignment.
Sequence Alignments: Protein sequences downloaded from the COSMIC database
are scanned against all human UniProt sequences. A pairwise sequence alignment
is obtained for each Cosmic sequence to the nearest UniProt sequence found.
Pfam domain assignments: Domain boundaries for UniProt sequences are
extracted from the Pfam database and domain sequence files constructed. Each
domain sequence is then scanned against the PDB sequence library and the best
ten matches are then realigned using a dynamic programming algorithm. These
domain sequence alignments are used to map both the Pfam and mutational data
onto the PDB structures for visualisation on the web pages.
Posttranslational modifications are directly mapped onto UniProt protein
sequences. Other functional annotation is extracted from external databases using
the UniProt accession code.

H.Baeissa et al.
175
Appendix 2: Supporting Information for Chapter 3
S3.1 Methods
Using the caret library in R we applied a 10-fold cross validation on a polynomial
kernel support vector machine (SVM) to optimise and train a classifier to predict
whether a known cancer driver gene is an oncogene or a tumour suppressor. We
used the domains in the gene's protein product as the features. This feature space
is not exclusive: 44 protein domains are observed in tumour suppressors and
oncogenes. The number of oncogenes and tumour suppressors were balanced in
the training set.
A gridsearch for optimised hyperparameters at cross validation found the
optimised model (Degree=2, scale=1, C=4) achieved a ROC AUC score of 0.72.
Using the optimised model we made predictions for a set of genes that have been
reported to act as both tumour suppressor and oncogenes We found that 17 of the
genes were predicted to be tumour suppressors, including TP53, DAXX and
DDB2 with probabilities of greater than 0.94. Nine genes were classified as
oncogenes including ERBB4, BCL10 and BTK with probabilities around 0.90,
and 11 could not be resolved using this approach.

H.Baeissa et al.
176
Gene
Tumour
Suppressor
Oncogene
Molecular
Genetics
Mutation Type
APOBEC3B 0.55929247 0.44070753 Dom T
ARNT 0.095102486 0.904897514 Rec D
ATP1A1 0.095098218 0.904901782 Dom Mis, O
BCL10 0.095224618 0.904775382 Dom T
BCL11B 0.095203935 0.904796065 Dom T
BCORL1 0.806008175 0.193991825 Mis, N, F
BIRC3 0.095130035 0.904869965 Dom D, F, N, T, Mis
BMPR1A 0.938376942 0.061623058 Rec Mis, N, F
BTK 0.094104958 0.905895042 Dom Mis
CARS 0.095202325 0.904797675 Dom T
CBL 0.928809629 0.071190371 Dom/Rec T, Mis, S, O
CBLC 0.938424388 0.061575612 Rec M
CIC 0.938338612 0.061661388 Rec Mis, F, S,T
CREBBP 0.89078437 0.10921563 Dom/Rec T, N, F, Mis, O
CUX1 0.710284168 0.289715832 Dom N,F,S,Mis,O,T
DAXX 0.938425004 0.061574996 Rec Mis, F, N
DDB2 0.938416133 0.061583867 Rec Mis, N
EPAS1 0.162013776 0.837986224 Dom Mis
ERBB4 0.112293069 0.887706931 Dom Mis, N
EZH2 0.796672637 0.203327363 Dom Mis
FOXO1 0.559292713 0.440707287 Dom T
FOXO3 0.559292049 0.440707951 Dom T
FOXO4 0.559292065 0.440707935 Dom T
GATA1 0.805997986 0.194002014 Dom Mis, F
GATA3 0.938376083 0.061623917 Rec F, N, S
IRF4 0.559292759 0.440707241 Dom T
KLF4 0.65729295 0.34270705 Dom Mis
LEF1 0.889684833 0.110315167 Mis, N
NOTCH1 0.936183145 0.063816855 Dom/Rec T, Mis, O
NOTCH2 0.806010712 0.193989288 Dom/Rec N, F, Mis
PTK6 0.346988219 0.653011781 Dom Mis, N
QKI 0.729998966 0.270001034 Dom Mis, F, T
RUNX1 0.55931142 0.44068858 Dom T
TBX3 0.559318969 0.440681031 Dom Mis, N, F, O
TET1 0.806006076 0.193993924 Dom T
TP53 0.93836402 0.06163598 Rec Mis, N, F, T
TP63 0.796034669 0.203965331 Mis, N, T
Table S3.1: Domain based prediction of oncogenes and tumour suppressors.
This table shows the results for each of the 37 genes labelled as both OG/TS in the
Cancer Gene Census (CGC). For each gene it describes the probability that the
gene is a tumour suppressor, the probability the gene is an oncogene, the

H.Baeissa et al.
177
molecular genetics as described by CGC, and the type of mutation that is
commonly found within the gene in cancer samples.
Abbreviations: D, dominant; R, Recessive; M, Missense mutation; T,
Translocation; D, large deletion; N, Nonsense mutation; F, Frameshift mutation;
S, splice site mutation; O, other;
Domains No of
domains
Enrichment
score e-value Genes
P53 1 7108.33 0 TP53
WD40 3 1061.49 0 DDB2, FBXW7,
TBL1XR1
DSPc 1 447.59 9.253E-197* PTEN
VHL 1 324.28 7.4782E-143* VHL
MH2 1 297.32 6.2691E-131* SMAD4
PTEN_C2 1 235.49 2.0893E-103* PTEN
P53_tetramer 1 228.79 2.0875E-100* TP53
HLH 1 96.67 9.43726E-41* MAX
RhoGAP 1 11.37 1.01375E-53* PIK3R1
RB_B 1 6.69 1.60402E-29* RB1
Sterol-sensing 1 3.65 2.68495E-16* PTCH1
DED 1 2.72 2.59859E-07* CASP8
MATH 1 2.61 0.00022429* SPOP
Patched 1 2.23 0.007075266* PTCH1
FERM_M 1 1.34 0.000495019* NF2
Table S3.2: Significant domains for missense mutation in tumour suppressors.
The significant domains in tumour suppressors are listed by the Pfam domain
name, the number of domains, the mutation enrichment expressed as the ratio of
the observed number of domain mutations to the expected number of mutation,
the Bonferroni corrected p-value and the gene names. The list sorted by
enrichment score followed by the number of domains.
* Calculate e-value using fisher test.

H.Baeissa et al.
178
Domains No of
domains
Enrichment
score e-value Genes
P53 1 639.27 1.2247E-40* TP53
P53_tetramer 1 115.85 3.24858E-06* TP53
PTEN_C2 1 7.56 7.581E-108* PTEN
APC_crr 1 6.16 5.50276E-71 APC
DSPc 1 4.46 4.36254E-58 PTEN
RB_A 1 4.44 1.34185E-60 RB1
F-box-like 2 4.24 5.95979E-25 ECT2L, FBXW7
VHL 1 3.60 3.8446E-42 VHL
GATA 1 3.01 3.63272E-07 GATA3
WD40 2
2.56 2.021E-25 FBXW7,
TBL1XR1
BAH 1 2.45 7.54557E-21 PBRM1
DUF3452 1 2.27 3.0659E-05 RB1
Bromodomain 2
1.98 9.05182E-20 PBRM1,
SMARCA4
RhoGAP 1 1.95 0.0019881 PIK3R1
SH2 1 1.88 0.001241721 PIK3R1
Table S3.3: Significant domains for truncation mutation in tumour
suppressors.
The significant domains in tumour suppressors are listed by the Pfam domain
name, the number of domains, the mutation enrichment expressed as the ratio of
the observed number of domain mutations to the expected number of mutation,
the Bonferroni corrected p-value and the gene names. The list sorted by
enrichment score followed by the number of domains.
* Calculate e-value using fisher test.
Domains No of
domains
Enrichment
score e-value Genes
RhoGAP 1 16.32 6.87324E-68 PIK3R1
P53 1 9.65 6.4868E-103* TP53
Table S3.4: Significant domains for indels mutation in tumour suppressors.
The significant domains in tumour suppressors are listed by the Pfam domain
name, the number of domains, the mutation enrichment expressed as the ratio of
the observed number of domain mutations to the expected number of mutation,
the Bonferroni corrected p-value and the gene names. The list sorted by
enrichment score followed by the number of domains.
* Calculate e-value using fisher test.

Domains No of
domains
Enrichment
score e-value Genes
Ras 6 13664.85 0* HRAS, KRAS, NRAS, RAC1, RHOA, RHOH
PI3Ka 1 3670.16 2.4386E-
102* PIK3CA
PI3K_p85B 1 1037.69 7.23744E-
28* PIK3CA
zf-CCCH 1 393.19 1.24196E-
08* U2AF1
BH4 1 208.25 0.00308045* BCL2
Histone 4 44.93 2.07463E-
08* H3F3A, H3F3B, HIST1H3B, HIST1H4I
Iso_dh 2 8.27 6.91183E-
32* IDH1, IDH2
Bcl-2 1 7.21 8.84728E-
05* BCL2
Furin-like 3 7.13 3.11395E-
30* EGFR, ERBB2, ERBB3
TAFH 2 4.95 1.04416E-
30* CBFA2T3, RUNX1T1
Microtub_assoc 1 4.71 4.09619E-33 PDE4DIP
DUF1220 1 4.36 2.69383E-26 PDE4DIP
Neuregulin 1 3.33 2.22182E-83 NRG1
TIR 1 3.27 1.07297E-25 MYD88
zf-MYND 2 3.02 2.8473E-11 CBFA2T3, RUNX1T1
FAM131 1 2.84 7.35245E-41 FAM131B
PDGF_N 1 2.67 4.25168E-08 PDGFB
Pkinase_Tyr 26 2.60 0*
ALK, BRAF, EGFR, ERBB2, ERBB3, FGFR1, FGFR2,
FGFR3, FGFR4, FLT3, ITK, JAK1, JAK2, JAK3, KDR, KIT,
LCK, MET, NTRK1, NTRK3, PDGFRA, PDGFRB, RAF1,

H.Baeissa et al.
180
RET, ROS1, SYK
HIT 1 2.40 1.50197E-07 FHIT
Recep_L_domain 3 2.38 2.01787E-59 EGFR, ERBB2, ERBB3
COX6C 1 2.26 0.000309265 COX6C
I-set 10 2.25 0* FGFR1, FGFR2, FGFR3, FGFR4 ,KDR, LRIG3, NRG1,
NTRK3, PDGFRA, PDGFRB
RUN 1 2.21 3.16879E-08 RUNDC2A
Hydrolase 2 2.15 5.16284E-42 ATP1A1, ATP2B3
GF_recep_IV 3 2.07 7.69983E-21 EGFR, ERBB2, ERBB3
Metallophos 1 2.05 2.65408E-09 PPP6C
HMG_box 3 2.00 3.57783E-08 SOX2, TCF7L2, WHSC1,
Cadherin 2 1.94 2.59655E-19 CDH11, RET
DUF3583 1 1.94 2.49134E-13 PML
Runt 1 1.89 0.000370223 RUNX1
Cadherin_C 1 1.80 0.001079945 CDH11
PI3_PI4_kinase 2 1.78 1.91699E-20 PIK3CA, TRRAP
CTNNB1_binding 1 1.73 5.2494E-06 TCF7L2
ig 5 1.64 1.47248E-05 FGFR3, FLT3, KIT, NTRK3, PDGFRB
7tm_1 2 1.54 1.19787E-06 P2RY8, TSHR
E1-E2_ATPase 2 1.41 0.001335636 ATP1A1, ATP2B3
zf-C2H2 9 1.33 0.022647173 BCL11A, BCL11B, MECOM, PLAG1, PRDM16, ZBTB16,
ZNF278, ZNF384, ZNF521
Table S3.5: Significant domains for missense mutation in oncogenes.
The significant domains in oncogenes are listed by the Pfam domain name, the number of domains, the mutation enrichment expressed as the
ratio of the observed number of domain mutations to the expected number of mutation, the Bonferroni corrected p-value and the gene names.

H.Baeissa et al.
181
Domains No of
domains
Enrichment
score e-value Genes
hEGF 1 160.55 1.02E-10* WIF1
Activin_recp 1 35.64 5.04E-46* ACVR1
Hairy_orange 1 24.31 4.96096E-68 HEY1
Ig_3 1 23.02 6.23E-27* KIT
NHR2 1 22.31 3.51145E-75 RUNX1T1
HMG_box 1 21.73 2.58E-58 TCF7L2
Topo_C_assoc 1 20.19 3.65738E-79 TOP1
zf-MYND 1 19.78 9.82542E-31 RUNX1T1
FOP_dimer 1 19.42 2.43729E-83 FGFR1OP
AT_hook 1 18.83 2.31732E-10 HMGA1
ITAM 2 14.57 1.48941E-21 CD79A, CD79B
BTG 1 13.45 8.8208E-55 BTG1
MHCassoc_trimer 1 12.89 1.25516E-30 CD74
zf-RING_5 1 12.88 1.4557E-18 CCNB1IP1
TSP_1 1 11.99 3.25985E-19 RSPO3
RBD 2 11.71 1.12095E-50 BRAF, RAF1
IL2 1 11.30 1.71079E-46 IL2
Lep_receptor_Ig 1 11.17 9.02978E-28 CSF3R
MHC2-interact 1 10.11 4.22037E-28 CD74
SSXT 1 9.74 9.24142E-15 SS18L1
Fip1 1 9.65 2.04841E-09 FIP1L1
BTK 1 9.21 1.53426E-05 ITK
COX6C 1 8.90 4.15347E-13 COX6C
DUF1903 1 8.79 2.37765E-11 MTCP1
SH3_9 1 8.47 7.65367E-08 LASP1
Calreticulin 1 8.15 2.71743E-48 CALR
PH 2 7.86 2.1782E-29 AKT1, ITK
Pkinase 6 7.30 1.56E-83*
ACVR1, AKT2,
CDK6, IKBKB,
MAP2K1, PIM1
Pkinase_C 1 7.20 5.98808E-05 AKT2
zf-C2H2_6 1 6.91 0.001798111 ZNF521
eIF3_N 1 6.83 1.99578E-13 EIF3E
Tropomyosin 1 6.63 2.75126E-22 TPM3
SWIB 1 6.54 2.42072E-06 MDM4
V-set 4 5.94 1.27502E-36 CD274, CD79A,
CD79B, KDR
HIT 1 5.89 3.00854E-06 FHIT
SRC-1 1 5.84 0.000236723 NCOA2
zf-H2C2_2 6 5.78 3.8107E-19
BCL11A, BCL6,
PLAG1, ZBTB16,
ZNF278, ZNF331
Cation_ATPase_N 2 5.73 1.36642E-08 ATP1A1, ATP2B3
COLFI 1 5.49 6.70854E-13 COL1A1
Death 1 5.46 0.000767025 MYD88
RRM_5 2 5.17 5.39726E-05 RBM15, U2AF1

H.Baeissa et al.
182
DIL 1 5.13 4.16087E-10 MLLT4
IMD 1 5.10 5.01306E-10 ARHGAP26
NAP 1 5.03 4.39945E-09 SET
TIR 1 4.91 3.14411E-05 MYD88
RunxI 1 4.90 5.39697E-08 RUNX1
PAS_11 2 4.45 2.35956E-07 ARNT, NCOA2
PD-C2-AF1 1 4.41 2.2028E-08 POU2AF1
STAT6_C 1 3.99 0.000183502 STAT6
zf-B_box 2 3.87 0.003255112 TRIM24, TRIM27
Nucleoplasmin 1 3.82 0.001320811 NPM1
WD40 2 3.71 0.018462408 STRN, TRAF7
zf-C2H2 6 3.71 0.00665852
BCL11B, MECOM,
PLAG1, PRDM16,
ZBTB16, ZNF384
Ran_BP1 1 3.50 1.65198E-08 RANBP2
Ribophorin_I 1 3.25 6.4007E-06 RPN1
Gly_rich 1 3.08 0.022956872 ALK
DUF3827 1 2.32 0.014229016 KIAA1549
Table S3.6: Significant domains for truncation mutation in oncogenes.
The significant domains in oncogenes are listed by the Pfam domain name, the
number of domains, the mutation enrichment expressed as the ratio of the observed
number of domain mutations to the expected number of mutation, the Bonferroni
corrected p-value and the gene names. The list sorted by enrichment score followed
by the number of domains.
* Calculate e-value using fisher test.
Domains No of
domains
Enrichment
score e-value Genes
zf-C2H2 2 34.93 2.90451E-
68 MECOM, ZNF384
IL6Ra-bind 1 13.24 3.17974E-
21 IL6ST
bZIP_2 1 10.91 7.43484E-
17 CEBPA
PI3K_p85B 1 7.28 4.67624E-
10 PIK3CA
Myb_DNA-
bind_6 1 6.18
2.54389E-
05 MYB
Table S3.7: Significant domains for indels mutation in oncogenes.
The significant domains in oncogenes are listed by the Pfam domain name, the
number of domains, the mutation enrichment expressed as the ratio of the observed
number of domain mutations to the expected number of mutation, the Bonferroni

H.Baeissa et al.
183
corrected p-value and the gene names. The list sorted by enrichment score followed
by the number of domains.
The table is available at
https://www.ncbi.nlm.nih.gov/pmc/articles/PMC5400584/#SD6
Table S3.8: Significant domains for missense mutation in whole genome.
The significant domains in whole genome are listed by the Pfam domain name, the
number of domains, the mutation enrichment expressed as the ratio of the observed
number of domain mutations to the expected number of mutation, the Bonferroni
corrected p-value and the gene names. The list sorted by enrichment score followed
by the number of domains.
* Calculate e-value using fisher test.
The table is available at
https://www.ncbi.nlm.nih.gov/pmc/articles/PMC5400584/#SD6
Table S3.9: Significant domains for truncation mutation in whole genome.
The significant domains in whole genome are listed by the Pfam domain name, the
number of domains, the mutation enrichment expressed as the ratio of the observed
number of domain mutations to the expected number of mutation, the Bonferroni
corrected p-value and the gene names. The list sorted by enrichment score followed
by the number of domains.
* Calculate e-value using fisher test.
The table is available at
https://www.ncbi.nlm.nih.gov/pmc/articles/PMC5400584/#SD6
Table S3.10: Significant domains for indels mutation in whole genome.
The significant domains in whole genome are listed by the Pfam domain name, the
number of domains, the mutation enrichment expressed as the ratio of the observed
number of domain mutations to the expected number of mutation, the Bonferroni
corrected p-value and the gene names. The list sorted by enrichment score followed
by the number of domains.
* Calculate e-value using fisher test.
The excel table is available at
https://www.ncbi.nlm.nih.gov/pmc/articles/PMC5400584/#SD6
Table S3.11: The significantly enriched missense hotspots of mutations in the
whole genome (WG), tumour suppressors (TS) and oncogenes (OG).
The detected enriched domain hotspots are listed by their Pfam domain identifier, the
number of mutations in the hotspots, the position in MSA, the corrected p-value, the
mutation enrichment score expressed as the ratio of the observed number of domain
mutations to the expected number of mutation, the UniProt id, mutated position and
the amino acid mutation. The lists sorted by enrichment score followed by the number
of mutations.

H.Baeissa et al.
184
The excel table is available at
https://www.ncbi.nlm.nih.gov/pmc/articles/PMC5400584/#SD6
Table S3.12: The significantly enriched truncation hotspots of mutations in the
whole genome (WG), tumour suppressors (TS) and oncogenes (OG).
The detected enriched domain hotspots are listed by their Pfam domain identifier, the
number of mutations in the hotspots, the position in MSA, the corrected p-value, the
mutation enrichment score expressed as the ratio of the observed number of domain
mutations to the expected number of mutation, the UniProt id, mutated position and
the amino acid mutation. The lists sorted by enrichment score followed by the number
of mutations.
The excel table is available at
https://www.ncbi.nlm.nih.gov/pmc/articles/PMC5400584/#SD6
Table S3.13: The significantly enriched indel hotspots of mutations in the whole
genome (WG), tumour suppressors (TS) and oncogenes (OG).
The detected enriched domain hotspots are listed by their Pfam domain identifier, the
number of mutations in the hotspots, the position in MSA, the corrected p-value, the
mutation enrichment score expressed as the ratio of the observed number of domain
mutations to the expected number of mutation, the UniProt id, mutated position and
the amino acid mutation. The lists sorted by enrichment score followed by the number
of mutations.

H.Baeissa et al.
185
Figure S3.1: The functional analysis of cancer proteins in oncogenes and tumour
suppressors.
The distribution of the protein functions a) in 481 oncogenes, b) in 131 tumour
suppressors as determined by the DAVID functional annotation website.
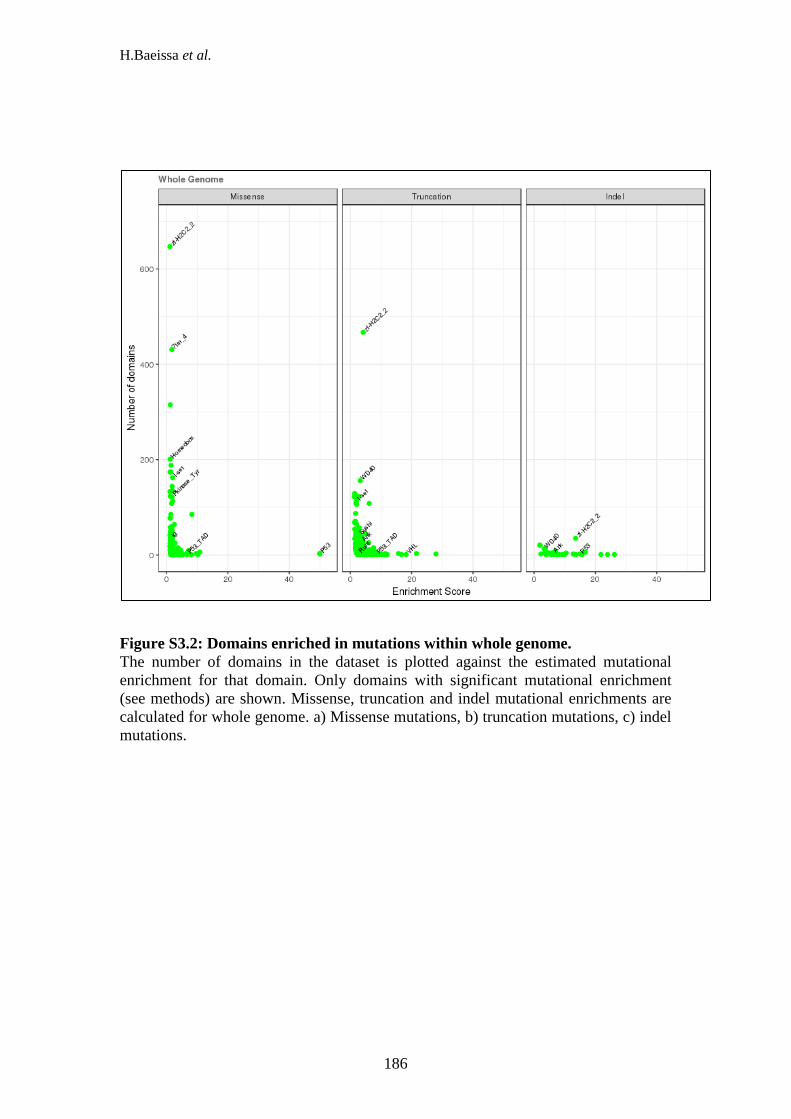
H.Baeissa et al.
186
Figure S3.2: Domains enriched in mutations within whole genome.
The number of domains in the dataset is plotted against the estimated mutational
enrichment for that domain. Only domains with significant mutational enrichment
(see methods) are shown. Missense, truncation and indel mutational enrichments are
calculated for whole genome. a) Missense mutations, b) truncation mutations, c) indel
mutations.

H.Baeissa et al.
187
Figure S3.3: Common domains and position between missense, truncation and
indel mutations.
Figure a) hotspots in tumour suppressors, b) hotspots in oncogenes. Analysis of the
overlap in the position of the significant hotspots in indels and truncation mutations
compared with missense mutations. The venn diagrams illustrate the significant
hotspots can occur in the same position in domain family in indels mutation (blue),
truncation mutations (pink) and in missense mutation (purple). Each circle represents
the number of position in domains that contains a hotspot mutation, intersections
illustrate when the same position in domain family is found with more than one class
of mutation.

H.Baeissa et al.
188
Appendix 3: Supporting Information for Chapter 4
S4.1 Methods
SVM classifier
We also trialed a support vector machine classifier (SVM) using 10-fold cross
validation to optimise the hyperparameter C, used to trade off between variable
minimization and margin maximization, and choose the kernel type that best fit our
data. We found the highest accuracy of 0.978, 0.776 and 0.973 in TS v Neutral, TS v
OG and OG v Neutral class, respectively (Supplementary Tables 6, 7 & 8) with a
radial basis function (RBF) kernel. The RBF kernel is the simplest kernel that can be
used and generalizes good results (Suykens and Vandewalle, 1999, Keerthi and Lin,
2003) SVM classifier yielded the best result using RBF kernel. The results for the
SVM hyperparameter optimisation show that different values of hyperparameters in
TS/Neutral and OG/Neutral class do not significantly change accuracy scores except
when the polynomial kernel is used which caused the classifier to have a lower
accuracy of 0.629 and 0.658, respectively (Supplementary Table 6 - 8). In TS/OG,
the accuracies are similar for all different kernel types (~0.669) except when a
sigmoid kernel is used in which case accuracy is decreased to 0.526 (Supplementary
Table 7).
Feature selection
Mean decrease accuracy (Archer and Kimes, 2008) was measured to identify the
variable importance using the random forest package. The values of the variables are
randomly permuted for the out-of-bag observations, and then the modified out-of-bag
data are passed down the tree to get new predictions. Therefore, there are differences
between the misclassification rate for the modified and original out-of-bag data. The

H.Baeissa et al.
189
importance of the variable was measured using these differences divided by the
standard error (see Supp. Tables S9-S11).
Validation of MOKCaRF classifier on experimental data
TP53 mutants in cancer can result in both ‘loss of function’ and ‘gain of function’
phenotype (Oren and Rotter, 2010). The systematicFunctionalAssessment table (R18)
from the IARC TP53 Database records functional assessment data from
experimentally mutated TP53 cell lines. We used the measure SubG1nWT_Saos2
“induction of apoptosis by overexpression in Saos-2 cells expressed as percent of
wild-type activity” as a proxy to determine whether a missense mutation would cause
a GOF (more apoptosis) or LOF (less apoptosis) phenotype in a cancer. This allowed
us to assign GOF/LOF for 158 TP53 mutations. The mutations were then analysed
using the MOKCaRF classfier.
Applying random forest to missense mutations in MOKCa
One million missense mutations were downloaded from MOKCa database v21
(Richardson et al., 2009) and classified into driver and passenger mutations using the
FATHMM (cancer) and CHASM web servers. Our best performing RF classifier that
discriminated between the TS/OG classes using 12 features has an accuracy of 0.832
with a depth of 10 and the number of trees 1000. MOKCaRF was run on the driver
missense mutations to predict whether the mutations would result in a LOF or GOF.
We derived features from four existing prediction algorithms: FATHMM cancer,
FATHMM disease, Mutation Assessor and PolyPhen-2 (PPH2) (Adzhubei et al.,
2010). In total 12 features were calculated for each mutation.

H.Baeissa et al.
190
Of 21339 driver missense mutations, (67.15%) 14331 were predicted to be LOF and
(32.84%) 7008 GOF mutations. Predictions are available in the MOKCa database
(http://strubiol.icr.ac.uk/extra/MOKCa/).
Prediction
methods
(TS v Neutral) (TS v OG) (OG v Neutral)
Developer’s
Cut-off
Cut-off
for the
test
Developer’s
Cut-off Cut-off for
the test
Developer’s
Cut-off Cut-off for
the test
FATHMM-C 1.0 0.0 1.0 0.0 1.0 0.0
FATHMM-D 1.0 0.0 1.0 0.0 1.0 0.0
CHASM 0.5 0.6 0.5 0.2 0.5 0.6
MAssessor 0.8 0.0 0.8 3.0 0.8 0.0
PPH2-HumDiv 0.45 0.2 0.432 0.9 0.45 0.2
PPH2-HumVar 0.45 0.2 0.432 0.9 0.45 0.2
SIFT 0.05 0.2 0.05 0.1 0.05 0.2
Table S4.1: Pairwise cut-offs for each algorithm.
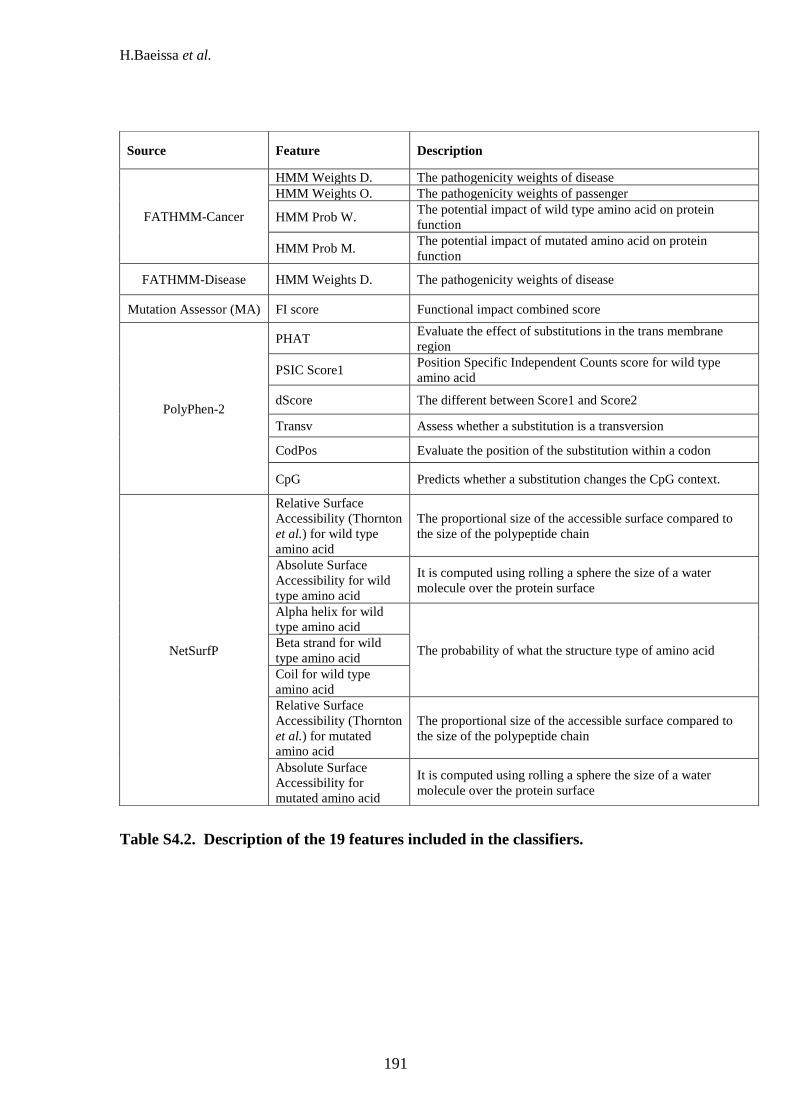
H.Baeissa et al.
191
Table S4.2. Description of the 19 features included in the classifiers.
Source Feature Description
FATHMM-Cancer
HMM Weights D. The pathogenicity weights of disease
HMM Weights O. The pathogenicity weights of passenger
HMM Prob W. The potential impact of wild type amino acid on protein
function
HMM Prob M. The potential impact of mutated amino acid on protein
function
FATHMM-Disease HMM Weights D. The pathogenicity weights of disease
Mutation Assessor (MA) FI score Functional impact combined score
PolyPhen-2
PHAT Evaluate the effect of substitutions in the trans membrane
region
PSIC Score1 Position Specific Independent Counts score for wild type
amino acid
dScore The different between Score1 and Score2
Transv Assess whether a substitution is a transversion
CodPos Evaluate the position of the substitution within a codon
CpG Predicts whether a substitution changes the CpG context.
NetSurfP
Relative Surface
Accessibility (Thornton
et al.) for wild type
amino acid
The proportional size of the accessible surface compared to
the size of the polypeptide chain
Absolute Surface
Accessibility for wild
type amino acid
It is computed using rolling a sphere the size of a water
molecule over the protein surface
Alpha helix for wild
type amino acid
The probability of what the structure type of amino acid Beta strand for wild
type amino acid
Coil for wild type
amino acid
Relative Surface
Accessibility (Thornton
et al.) for mutated
amino acid
The proportional size of the accessible surface compared to
the size of the polypeptide chain
Absolute Surface
Accessibility for
mutated amino acid
It is computed using rolling a sphere the size of a water
molecule over the protein surface

H.Baeissa et al.
192
Table S4.3: This table shows the classification accuracy across all 10 folds for
when both the depth and number of trees were altered in the random forest (TS
v Neutral). Both the accuracies and the standard deviation are shown.
Depth
No.
of tree
5 10 50 100 500
1 0.869 ± 0.035 0.872 ± 0.040 0.871 ± 0.036 0.871 ± 0.031 0.868 ± 0.042
10 0.864 ± 0.038 0.871 ± 0.036 0.863 ± 0.043 0.872 ± 0.038 0.867 ± 0.034
100 0.858 ± 0.047 0.866 ± 0.044 0.866 ± 0.033 0.865 ± 0.04 0.869 ± 0.037
1000 0.861 ± 0.035 0.873 ± 0.037 0.871 ± 0.038 0.868 ± 0.046 0.872 ± 0.038
Table S4.4: This table shows the classification accuracy across all 10 folds for
when both the depth and number of trees were altered in the random forest (TS
v OG). Both the accuracies and the standard deviation are shown.
Depth
No.
of tree
5 10 50 100 500
1 0.975 ± 0.007 0.977 ± 0.008 0.977 ± 0.007 0.978 ± 0.008 0.978 ± 0.007
10 0.979 ± 0.008 0.978 ± 0.008 0.977 ± 0.008 0.976 ± 0.007 0.978 ± 0.009
100 0.979 ± 0.009 0.978 ± 0.008 0.978 ± 0.008 0.978 ± 0.006 0.978 ± 0.007
1000 0.976 ± 0.007 0.976 ± 0.007 0.976 ± 0.008 0.978 ± 0.008 0.979 ± 0.007
Table S4.5: This table shows the classification accuracy across all 10 folds for
when both the depth and number of trees were altered in the random forest (OG
v Neutral). Both the accuracies and the standard deviation are shown.
Depth
No.
of tree
5 10 50 100 500
1 0.990 ± 0.001 0.991 ± 0.001 0.990 ± 0.002 0.992 ± 0.002 0.991 ± 0.001
10 0.990 ± 0.002 0.990 ± 0.001 0.990 ± 0.001 0.991 ± 0.001 0.990 ± 0.002
100 0.992 ± 0.001 0.990 ± 0.002 0.991 ± 0.001 0.990 ± 0.002 0.988 ± 0.001
1000 0.991 ± 0.002 0.991 ± 0.002 0.991 ± 0.001 0.991 ± 0.000 0.991 ± 0.002

H.Baeissa et al.
193
c
Kernel
5 10 50 100 500
Kernel 0.974 ± 0.018 0.978 ± 0.016 0.971 ± 0.015 0.971 ± 0.016 0.971 ± 0.013
Radial (RBF) 0.974 ± 0.015 0.978 ± 0.011 0.974 ± 0.011 0.974 ± 0.012 0.975 ± 0.011
Sigmoid 0.973 ± 0.018 0.977 ± 0.014 0.975 ± 0.012 0.975 ± 0.014 0.975 ± 0.012
Polynomial 0.656 ± 0.232 0.631 ± 0.206 0.596 ± 0.192 0.621 ± 0.193 0.642 ± 0.192
Table S4.6: This table shows the classification accuracy across all 10 folds when
both the kernel and c value were altered in the SVM (TS v Neutral). Both the accuracies and the standard deviation are shown.
c
Kernel
5 10 50 100 500
Kernel 0.704 ± 0.016 0.693 ± 0.017 0.695 ± 0.035 0.699 ± 0.036 0.696 ± 0.035
Radial (RBF) 0.776 ± 0.048 0.760 ± 0.040 0.746 ± 0.030 0.746 ± 0.031 0.744 ± 0.033
Sigmoid 0.526 ± 0.026 0.528 ± 0.041 0.523 ± 0.033 0.524 ± 0.037 0.529 ± 0.041
Polynomial 0.693 ± 0.046 0.695 ± 0.038 0.699 ± 0.037 0.704 ± 0.036 0.704 ± 0.038
Table S4.7: This table shows the classification accuracy across all 10 folds when
both the kernel and c value were altered in the SVM (TS v OG). Both the accuracies and the standard deviation are shown.
c
Kernel
5 10 50 100 500
Kernel 0.961 ± 0.012 0.967 ± 0.012 0.962 ± 0.012 0.963 ± 0.014 0.964 ± 0.013
Radial (RBF) 0.970 ± 0.011 0.973 ± 0.009 0.966 ± 0.012 0.967 ± 0.013 0.968 ± 0.012
Sigmoid 0.964 ± 0.005 0.969 ± 0.007 0.965 ± 0.013 0.967 ± 0.013 0.967 ± 0.013
Polynomial 0.614 ± 0.180 0.686 ± 0.224 0.642 ± 0.212 0.675 ± 0.217 0.676 ± 0.202
Table S4.8: This table shows the classification accuracy across all 10 folds when
both the kernel and c value were altered in the SVM (OG v Neutral). Both the accuracies and the standard deviation are shown.

H.Baeissa et al.
194
Top five Features Average-TS Average- Neutral p-values
FI Score 2.508 ± 1.146 -1.223 ± 0.932 1.705E-186
dScore 2.120 ± 1.042 -0.904 ± 1.094 0.999
PSICScore -1.202 ± 0.753 -2.761 ± 0.863 2.634E-31
HMM. Prob.W.(C) 0.303 ± 0.241 0.077 ± 0.065 4.892E-172
HMM.Weights.D.(C) 160.693 ± 305.488 16.757 ± 55.795 0.853
Table S4.9: This table shows the average of top five features in (TS v Neutral)
class.
Top five Features Average-OG Average-TS p-values
FI Score 2.508 ± 1.146 -1.223 ± 0.932 0.999
HMM. Prob.W.(C) 0.303 ± 0.241 0.188 ± 0.181 0.999
HMM. Weights.O.(C) 43.520 ± 101.065 132.873 ± 285.847 0.984
HMM.Weights.D.(C) 160.693 ± 305.488 16.757 ± 55.795 0.424
HMM.Weights.D.(D) 85.303 ± 122.687 97.449 ± 180.679 0.997
Table S4.10: This table shows the average of top five features in (TS v OG) class.
Top five Features Average-OG Average-Neutral p-values
FI Score 1.765 ± 0.895 -1.223 ± 0.932 1.725E-148
dScore 1.924 ± 0.878 -0.904 ± 1.094 0.998
HMM.Weights.D.(C) 116.484 ± 181.830 16.757 ± 55.795 0.580
PSICScore -1.371 ± 0.390 -2.761 ± 0.863 2.341E-99
HMM. Weights.O.(C) 55.762 ± 146.457 132.873 ± 285.847 0.986
Table S4.11: This table shows the average of top five features in (OG v Neutral)
class.

H.Baeissa et al.
195
Figure S4.1. The distribution of proteins and domains in oncogenes set of hotspot
COSMIC dataset.

H.Baeissa et al.
196
Figure S4.2. The distribution of proteins and domains in tumour suppressor set
of hotspot COSMIC dataset.

H.Baeissa et al.
197
Figure S4.3. The distribution of proteins and domains in neutral set of hotspot
COSMIC data

H.Baeissa et al.
198
Figure S4.4. Cut off score of seven prediction algorithms in TS/Neutral class.
The blue line represents the frequency of the scores of neutral mutations. The red line
represents the frequency of the scores of driver mutations in tumour suppressor genes.

H.Baeissa et al.
199
Figure S4.5. Cut off score of seven prediction algorithms in TS/OG class.
The blue line represents the frequency of the scores of driver mutations in oncogenes.
The red line represents the frequency of the scores of driver mutations in tumour
suppressors.
Mutation Assessor
Mutation Assessor

H.Baeissa et al.
200
Figure S4.6. Cut off score of seven prediction algorithms in OG/Neutral class.
The blue line represents the frequency of the scores of neutral mutations. The red line
represents the frequency of the scores of driver mutations in oncogenes.

H.Baeissa et al.
201
Figure S4.7. Common driver mutations in MOCKa using the FATHMM and
CHASM algorithms.

H.Baeissa et al.
202
Figure S4.8. Actionable drugs for 1392 driver proteins with GOF mutation.

H.Baeissa et al.
203
Appendix 4: Supporting Information for Chapter 5
S5.1 Methods
Identification of hotspot indel mutations
If each individual mutation were to affect a random residue across the domain the
frequency of mutations at each site would follow a binomial distribution. As such
our null model states that there is an equal probability of a mutation occurring at
each residue on the given protein.
Where n is the total number of mutations in the protein, k is the number of
mutations falling at a specific residue and p the probability of any mutation
affecting a specific residue, we can find the probability of observing k mutations
falling at any specific point in the domain by calculating the probability of a
minimum of k mutations at that point and comparing it to our null model.
The results were amended by a Bonferroni correction.
Feature Selection
Mean decrease accuracy (Archer and Kimes, 2008) was measured to identify the
variable importance using the random forest package. The values of the variables are
randomly permuted for the out-of-bag observations, and then the modified out-of-bag
data are passed down the tree to get new predictions. Therefore, there are differences
between the misclassification rate for the modified and original out-of-bag data. The

H.Baeissa et al.
204
importance of the variable was measured using these differences divided by the
standard error (See supplementary Tables S5.4 & S5.5).
Source Feature Description
PinPor
5' proximity The distance of INDEL to exon's 5'end
3' proximity The distance of INDEL to exon's 3'end
GC_mut The GC content of mutated sequence
PaPI
Evolutionary
conservation
scores
Phylop Score (Pollard KS et al., 2010).
Gerp++ Score (Davydov EV et al., 2010).
VEST VEST p-value
Empirical p-value
CADD
priPhCons Primate PhastCons conservation score
GerpN Neutral evolution score defined by GERP++
bStatistic Background selection score
mutIndex Mutability index
fitCons fitCons score
Table S5.1. Description of the 11 features included in the calssifiers.

H.Baeissa et al.
205
CADD DDIG-In PaPI PinPor SIFT VEST
Pthogenic 300 238 639 370 486 344
Neutral 750 671 382 653 565 694
Failed 806 947 835 833 805 818
Table S5.2. The results of six prediction programs that show whether the
mutations were pathogenic, neutral or they did not work using the prediction
programs for inframe insertion.
CADD DDIG-In PaPI PinPor SIFT VEST
Pthogenic 1315 672 1457 1018 1289 571
Neutral 948 1179 397 1225 1065 621
Failed 503 915 912 523 412 1574
Table S5.3. The results of six prediction programs that show whether the
mutations were pathogenic, neutral or they did not work using the prediction
programs for inframe deletion.

H.Baeissa et al.
206
Top five Features Average-
Pathogenic Average- Neutral p-values
VEST p-value score 0.018 ± 0.030 0.532 ± 0.270 2.51772E-83
priPhCons 0.928 ± 0.149 0.344 ± 0.347 5.14793E-62
Phylop 2.309 ± 0.472 1.108 ± 0.958 1.99104E-17
Gerp++ 5.174 ± 0.689 2.457 ± 2.002 3.55702E-08
3' proximity 109.629 ± 46.818 282.123 ± 325.789 0.987456298
Table S5.4. This table shows the average of top five features in in-frame
insertions.
Top five Features Average-
Pathogenic Average-Neutral p-values
VEST p-value score 0.026 ± 0.030 0.490 ± 0.251 1.3082E-134
priPhCons 0.921 ± 0.159 0.285 ± 0.328 1.706E-107
Phylop 2.415 ± 0.403 1.102 ± 0.868 3.80469E-39
Gerp++ 5.260 ± 0.609 2.541 ± 1.979 5.29964E-13
5' proximity 161.283 ± 515.233 330.961 ± 487.757 0.996657056
Table S5.5. This table shows the average of top five features in in-frame deletions.

H.Baeissa et al.
207
Depth
No.
of tree
5 10 50 100
1 0.994 ± 0.001 0.994 ± 0.001 0994 ± 0.001 0.994 ± 0.001
10 0.994 ± 0.000 0.989 ± 0.005 0.994 ± 0.000 0.992 ± 0.002
100 0.994 ± 0.000 0.994 ± 0.000 0.994 ± 0.000 0.995 ± 0.000
1000 0.993 ± 0.002 0.994 ± 0.001 0.991 ± 0.004 0.994 ± 0.000
Table S5.6. This table shows the classification accuracy across all 10 folds when
both depth and the number of tree were altered in the random forest in insertion.
Both the accuracies and the standard deviation are shown.
Depth
No.
of tree
5 10 50 100
1 0.965 ± 0.007 0.967 ± 0.007 0.965 ± 0.008 0.965 ± 0.005
10 0.965 ± 0.007 0.964 ± 0.011 0.966 ± 0.004 0.965 ± 0.009
100 0.964 ± 0.006 0.962 ± 0.003 0.967 ± 0.006 0.963 ± 0.005
1000 0.965 ± 0.009 0.968 ± 0.006 0.963 ± 0.008 0.963 ± 0.011
Table S5.7: This table shows the classification accuracy across all 10 folds when
both depth and the number of tree were altered in the random forest in Deletion.
Both the accuracies and the standard deviation are shown.

H.Baeissa et al.
208
Table S5.8. This table shows the classification accuracy across all 10 folds when
both kernel and c value were altered in the SVM in insertion.
Both the accuracies and the standard deviation are shown.
c
Kernel
5 10 50 100
Kernel 0.953 ± 0.007 0.959 ± 0.012 0.952 ± 0.022 0.954 ± 0.022
Radial (RBF) 0.961 ± 0.022 0.961 ± 0.020 0.962 ± 0.017 0.962 ± 0.020
Sigmoid 0.953 ± 0.017 0.953 ± 0.021 0.952 ± 0.022 0.951 ± 0.022
Polynomial 0.698 ± 0.227 0.684 ± 0.228 0.614 ± 0.142 0.622 ± 0.151
Table S5.9. This table shows the classification accuracy across all 10 folds when
both kernel and c value were altered in the SVM in deletion.
Both the accuracies and the standard deviation are shown.
c
Kernel
5 10 50 100
Kernel 0.967 ± 0.030 0.961 ± 0.024 0.969 ± 0.023 0.966 ± 0.026
Radial (RBF) 0.983 ± 0.017 0.975 ± 0.021 0.969 ± 0.028 0.970 ± 0.026
Sigmoid 0.979 ± 0.014 0.965 ± 0.021 0.968 ± 0.025 0.961 ± 0.030
Polynomial 0.685 ± 0.209 0.653 ± 0.213 0.656 ± 0.210 0.641 ± 0.208

H.Baeissa et al.
209
Gene names Mutation genome position Mutation CDs Mutation a.a.
ABL1 9:133589742-133589744 c.36_38delAAG p.R14delR
ABL1 9:133759490-133759492 c.1813_1815delAAG p.K609delK
ABL1 9:133759503-133759505 c.1826_1828delAGA p.K609delK
ATP1A1 1:116946544-116946546 c.2990_2992delTCA p.I998delI
CCND1 11:69466027-69466035 c.865_873delGACGTGCGG p.R291_V293delRDV
CNTRL 9:123904505-123904507 c.2828_2830delAGA p.K944delK
CTNNB1 3:41266097-41266099 c.94_96delGAC p.D32del
CTNNB1 3:41266115-41266120 c.112_117delGGTGCC p.G38_A39del
CTNNB1 3:41266130-41266132 c.127_129delGCT p.A43del
CTNNB1 3:41266133-41266135 c.130_132delCCT p.P44del
CTNNB1 3:41266133-41266138 c.130_135delCCTTCT p.P44_S45del
CTNNB1 3:41266134-41266136 c.131_133delCTT p.S45del
CTNNB1 3:41266135-41266143 c.132_140delTTCTCTGAG p.S45_S47delSLS
CTNNB1 3:41266136-41266138 c.133_135delTCT p.S45del
CTNNB1 3:41266136-41266141 c.133_138delTCTCTG p.S45_L46del
CTNNB1 3:41266137-41266139 c.134_136delCTC p.S45del
CTNNB1 3:41266139-41266144 c.136_141delCTGAGT p.L46_S47del
EGFR 7:55242464-55242466 c.2234_2236delAGG p.E746delE
EGFR 7:55242469-55242477 c.2239_2247delTTAAGAGAA p.L747_E749delLRE
EIF4A2 3:186502466-186502468 c.189_191delTAT p.I65delI
EIF4A2 3:186503785-186503787 c.462_464delTAT p.I155delI
ERBB3 12:56493709-56493714 c.3025_3030delCTAGAC p.D1014_L1015delDL
ERBB3 12:56495462-56495464 c.3652_3654delGAG p.E1219delE
ESR1 6:152382133-152382141 c.1243_1251delGGAAAATGT p.G415_C417delGKC
ESR1 6:152382152-152382154 c.1262_1264delTGG p.V422delV
ESR1 6:152382240-152382245 c.1350_1355delTATTAT p.I451_I452delII

H.Baeissa et al.
210
EWSR1 22:29694725-29694733 c.1420_1428delCCAGGAGGC p.G481_P483delGGP
FGFR3 4:1803564-1803569 c.742_747delCGCTCC p.R248_S249delRS
HERPUD1 16:56973841-56973843 c.586_588delCCA p.P198delP
HSP90AB1 6:44219919-44219921 c.1646_1648delAGA p.K552delK
HSP90AB1 6:44219976-44219978 c.1703_1705delAAG p.E569delE
JAK2 9:5070023-5070025 c.1612_1614delCAC p.H538del
JAK2 9:5070023-5070028 c.1612_1617delCACAAA p.H538_K539del
JAK2 9:5070038-5070043 c.1627_1632delGAAGAT p.E543_D544del
KCNJ5 11:128781635-128781637 c.467_469delTCA p.I157del
KCNJ5 11:128781638-128781640 c.470_472delTCA p.I157del
KIT 4:55593585-55593587 c.1651_1653delCCC p.P551del
KIT 4:55593587-55593592 c.1653_1658delCATGTA p.M552_Y553del
KIT 4:55593597-55593602 c.1663_1668delGTACAG p.V555_Q556del
KIT 4:55593600-55593605 c.1666_1671delCAGTGG p.Q556_W557del
KIT 4:55593601-55593606 c.1667_1672delAGTGGA p.W557_K558del
KIT 4:55593602-55593607 c.1668_1673delGTGGAA p.W557_K558del
KIT 4:55593603-55593608 c.1669_1674delTGGAAG p.W557_K558del
KIT 4:55593606-55593611 c.1672_1677delAAGGTT p.K558_V559del
KIT 4:55593609-55593611 c.1675_1677delGTT p.V559del
KIT 4:55593613-55593615 c.1679_1681delTTG p.V560del
KIT 4:55593615-55593617 c.1681_1683delGAG p.E561del
KIT 4:55593657-55593659 c.1723_1725delCAA p.Q575del
KIT 4:55593660-55593662 c.1726_1728delCTT p.L576del
KIT 4:55593661-55593663 c.1727_1729delTTC p.L576del
KIT 4:55593663-55593665 c.1729_1731delCCT p.P577del
KIT 4:55593663-55593668 c.1729_1734delCCTTAT p.P577_Y578del
KIT 4:55593669-55593671 c.1735_1737delGAT p.D579del
KIT 4:55593671-55593673 c.1737_1739delTCA p.H580del

H.Baeissa et al.
211
KIT 4:55595620-55595625 c.2110_2115delAAGAAT p.K704_N705del
MAP2K1 15:66729094-66729099 c.302_307delTGGAGA p.E102_I103delEI
MAP2K1 15:66729095-66729100 c.303_308delGGAGAT p.E102_I103del
MAP2K1 15:66729096-66729101 c.304_309delGAGATC p.E102_I103del
MET 7:116340219-116340221 c.1081_1083delGCC p.A361delA
MET 7:116418874-116418876 c.3439_3441delATC p.I1148delI
MITF 3:70014172-70014180 c.1033_1041delGATGGCACC p.D345_T347delDGT
MLLT10 10:21903785-21903787 c.535_537delGAA p.E181delE
MLLT4 6:168271149-168271151 c.385_387delAAG p.K129delK
MLLT4 6:168323616-168323618 c.2920_2922delCTT p.L975delL
MPL 1:43814993-43814995 c.1528_1530delCTG p.L513delL
MYB 6:135510953-135510955 c.238_240delCAC p.H80delH
MYB 6:135511005-135511007 c.290_292delAAG p.E99delE
MYC 8:128752673-128752675 c.789_791delTGT p.V265delV
NFKB2 10:104160110-104160118 c.1660_1668delGCTCTGCTG p.A554_L556delALL
PCM1 8:17817566-17817574 c.2084_2092delATTTGGATG p.L696_D698delLDD
PCM1 8:17867106-17867108 c.5013_5015delTCT p.L1673delL
PDGFRA 4:55141013-55141018 c.1659_1664delGAGGTA p.R554_Y555delRY
PDGFRA 4:55152089-55152094 c.2521_2526delAGAGAC p.R841_D842delRD
PDGFRA 4:55152091-55152099 c.2523_2531delAGACATCAT p.D842_M844delDIM
PDGFRA 4:55152092-55152094 c.2524_2526delGAC p.D842delD
PDGFRA 4:55152092-55152100 c.2524_2532delGACATCATG p.D842_M844delDIM
PIK3CA 3:178916920-178916925 c.307_312delGAACCA p.E103_P104delEP
PIK3CA 3:178916928-178916933 c.315_320delAGGCAA p.G106_N107delGN
PIK3CA 3:178916934-178916936 c.321_323delCCG p.R108del
PIK3CA 3:178916938-178916940 c.325_327delGAA p.E109del
PIK3CA 3:178916944-178916946 c.331_333delAAG p.K111delK
PIK3CA 3:178916944-178916952 c.331_339delAAGATCCTC p.K111_L113delKIL

H.Baeissa et al.
212
PIK3CA 3:178916945-178916947 c.332_334delAGA p.K111del
PIK3CA 3:178916948-178916950 c.335_337delTCC p.L113delL
PIK3CA 3:178916950-178916952 c.337_339delCTC p.L113del
PLCG1 20:39792456-39792458 c.993_995delCTC p.S334delS
RET 10:43607550-43607558 c.1526_1534delTGGCCGAGG p.V509_E511delVAE
RET 10:43609942-43609947 c.1894_1899delGAGCTG p.E632_L633del
RNF213 17:78320780-78320785 c.2864_2869delTGGGCA p.G956_I957delGI
SETBP1 18:42533110-42533112 c.3805_3807delGAT p.D1269delD
SETBP1 18:42533278-42533286 c.3973_3981delAGTTCTTAT p.S1325_Y1327delSSY
TAL2 9:108424874-108424876 c.97_99delCCT p.P34delP
TCF7L2 10:114710595-114710597 c.80_82delAGG p.E29delE
TCF7L2 10:114917783-114917785 c.1204_1206delAAG p.K405delK
TFG 3:100447666-100447668 c.379_381delGGA p.G127delG
TRIM24 7:138268659-138268661 c.2858_2860delAAG p.E954delE
TSHR 14:81610257-81610259 c.1855_1857delGAT p.D619delD
Table S5.10. Oncogenes and their mutations for deletion in MOKCa.
The oncogenes in deletion are listed by the gene names, the genomic coordinates of the mutation, the change that has occurred in the nucleotide
sequence and the change that has occurred in the amino acid sequence. The list is sorted by gene names alphabetically.

H.Baeissa et al.
213
Gene names Mutation genome position Mutation CDs Mutation a.a.
ARID1A 1:27087894-27087899 c.2181_2186delGCCACC p.P728_P729delPP
ARID1A 1:27093013-27093015 c.2944_2946delAAC p.N982del
ARID1A 1:27100193-27100195 c.3989_3991delAGC p.Q1334delQ
ARID1A 1:27106407-27106409 c.6018_6020delGCT p.L2007del
ARID1A 1:27106792-27106797 c.6403_6408delATTCTG p.I2135_L2136del
ARID1A 1:27106961-27106969 c.6572_6580delGTATCGGCA p.S2191_G2193delSIG
ARID1A 1:27107089-27107091 c.6700_6702delGCT p.A2235delA
ARID2 12:46245109-46245111 c.3203_3205delGTG p.G1069delG
ASXL1 20:31022493-31022495 c.1978_1980delGGC p.G660del
ATM 11:108155090-108155092 c.3883_3885delCTT p.L1295del
ATM 11:108205764-108205766 c.8079_8081delAGG p.G2695delG
ATM 11:108224553-108224555 c.8732_8734delCCA p.T2911delT
ATM 11:108236091-108236093 c.9027_9029delCTT p.L3010delL
BLM 15:91293258-91293263 c.760_765delGAAAGT p.E254_S255delES
CASP8 2:202136260-202136262 c.423_425delAGA p.E143delE
CASP8 2:202149772-202149774 c.1087_1089delCCT p.P363delP
CDH1 16:68842676-68842684 c.612_620delCTTTATTAT p.F205_I207delFII
CDK12 17:37676281-37676289 c.3036_3044delACAGACCCT p.T1014_Q1016del
CIC 19:42791744-42791746 c.630_632delCAG p.S211del
CIC 19:42791964-42791966 c.768_770delGAA p.K257del
CIC 19:42798848-42798850 c.4420_4422delGTC p.V1474del
CIC 19:42799063-42799065 c.4547_4549delAGA p.K1517delK
CIC 19:42799066-42799068 c.4550_4552delAGA p.K1517del
CYLD 16:50816275-50816277 c.1724_1726delCTC p.P577delP
DNM2 19:10930663-10930665 c.1679_1681delAGA p.K562delK
DNM2 19:10935765-10935767 c.1926_1928delCTT p.F643delF
EP300 22:41566495-41566500 c.4372_4377delCCCAAG p.P1460_K1461delPK

H.Baeissa et al.
214
GATA3 10:8111502-8111504 c.991_993delAGG p.R331del
HNF1A 12:121431491-121431493 c.695_697delTAG p.V233delV
MAP3K1 5:56180586-56180588 c.3915_3917delCAT p.I1307delI
MAP3K1 5:56181812-56181814 c.3547_3549delGTT p.V1183delV
MAP3K1 5:56183243-56183248 c.3664_3669delAGAATT p.R1222_I1223delRI
MLH1 3:37089070-37089072 c.1792_1794delACA p.T598delT
MLH1 3:37089123-37089125 c.1845_1847delGAA p.K618delK
MLH1 3:37089130-37089132 c.1852_1854delAAG p.K618del
MSH2 2:47656937-47656939 c.1133_1135delAAG p.E378del
MSH6 2:48033455-48033457 c.3759_3761delAGA p.E1254delE
NF1 17:29553530-29553538 c.2079_2087delGTTTCTGTG p.F694_W696delFLW
NF1 17:29665084-29665086 c.6746_6748delTTG p.V2250del
NF1 17:29670123-29670128 c.7159_7164delAACTTT p.N2387_F2388del
NF2 22:30035126-30035128 c.288_290delCTT p.F96del
NF2 22:30035190-30035192 c.352_354delTTC p.F118del
NF2 22:30035195-30035197 c.357_359delCTT p.F119del
PIK3R1 5:67589150-67589152 c.1138_1140delTTA p.L380del
PIK3R1 5:67589223-67589225 c.1211_1213delTAA p.I405delI
PIK3R1 5:67589550-67589552 c.1313_1315delAAG p.E439delE
PIK3R1 5:67589582-67589584 c.1345_1347delTTA p.L449del
PIK3R1 5:67589588-67589590 c.1351_1353delGAA p.E451delE
PIK3R1 5:67589588-67589593 c.1351_1356delGAATAT p.E451_Y452del
PIK3R1 5:67589607-67589609 c.1370_1372delAAG p.E458delE
PIK3R1 5:67589610-67589612 c.1373_1375delAAA p.K459del
PIK3R1 5:67591031-67591033 c.1624_1626delAGA p.R542del
PIK3R1 5:67591124-67591129 c.1717_1722delCTGAGA p.L573_R574delLR
PIK3R1 5:67591126-67591128 c.1719_1721delGAG p.R574delR
PIK3R1 5:67591126-67591134 c.1719_1727delGAGAAAGAC p.K575_R577delKTR

H.Baeissa et al.
215
PIK3R1 5:67591127-67591129 c.1720_1722delAGA p.R574delR
PIK3R1 5:67591130-67591135 c.1723_1728delAAGACG p.K575_T576delKT
PIK3R1 5:67591132-67591134 c.1725_1727delGAC p.T576delT
PIK3R1 5:67591132-67591137 c.1725_1730delGACGAG p.T576_R577delTR
PIK3R1 5:67591134-67591136 c.1727_1729delCGA p.T576del
PIK3R1 5:67591136-67591141 c.1729_1734delAGAGAC p.R577_D578delRD
PIK3R1 5:67591259-67591261 c.1757_1759delAAA p.K587delK
PIK3R1 5:67591276-67591278 c.1774_1776delAAG p.K593delK
PTEN 10:89624254-89624256 c.28_30delAGC p.S10delS
PTEN 10:89624264-89624266 c.38_40delAAA p.K13del
PTEN 10:89624275-89624277 c.49_51delCAA p.Q17del
PTEN 10:89624295-89624300 c.69_74delAGACTT p.D24_L25del
PTEN 10:89653796-89653798 c.94_96delATT p.I32del
PTEN 10:89653799-89653801 c.97_99delATT p.I33del
PTEN 10:89653853-89653855 c.151_153delGAT p.D51del
PTEN 10:89653856-89653858 c.154_156delGAT p.D52del
PTEN 10:89653859-89653861 c.157_159delGTA p.V54delV
PTEN 10:89653860-89653862 c.158_160delTAG p.V53del
PTEN 10:89685293-89685298 c.188_193delACCATT p.H64_Y65delHY
PTEN 10:89685304-89685306 c.199_201delATA p.I67del
PTEN 10:89690819-89690821 c.226_228delTAT p.Y76del
PTEN 10:89692817-89692819 c.301_303delATC p.I101del
PTEN 10:89692916-89692918 c.400_402delATG p.M134delM
PTEN 10:89692919-89692921 c.403_405delATA p.I135del
PTEN 10:89711892-89711897 c.510_515delTCAGAG p.S170_Q171del
PTEN 10:89711908-89711910 c.526_528delTAT p.Y176del
PTEN 10:89711913-89711915 c.531_533delTTA p.Y178del
PTEN 10:89711959-89711961 c.577_579delCTG p.L193del

H.Baeissa et al.
216
PTEN 10:89711974-89711976 c.592_594delATG p.M198del
PTEN 10:89711976-89711978 c.594_596delGAT p.M199del
PTEN 10:89711977-89711979 c.595_597delATG p.M199del
PTEN 10:89717737-89717739 c.762_764delAGT p.V255delV
PTEN 10:89720804-89720806 c.955_957delACT p.T319del
PTEN 10:89720817-89720819 c.968_970delATG p.D324delD
RB1 13:49037873-49037881 c.2113_2121delATGTGTTCC p.C706_M708delCSM
SMAD4 18:48591923-48591925 c.1086_1088delTTG p.C363delC
SMAD4 18:48591944-48591949 c.1107_1112delTGTCCA p.V370_H371del
SMAD4 18:48604786-48604791 c.1608_1613delAGACGA p.D537_E538delDE
SMARCA4 19:11129644-11129652 c.2450_2458delACTGGGCGT p.W818_Y820delWAY
SMARCA4 19:11144049-11144051 c.3630_3632delGGA p.E1212delE
SMARCB1 22:24175857-24175859 c.1085_1087delAGA p.K364delK
SPEN 1:16264330-16264332 c.10533_10535delCCT p.L3513delL
STK11 19:1220451-1220453 c.544_546delCTG p.L182del
TET2 4:106180824-106180826 c.3852_3854delCTT p.F1285del
TET2 4:106180826-106180828 c.3854_3856delTCT p.F1285del
TET2 4:106180862-106180864 c.3890_3892delGAT p.C1298del
TET2 4:106197332-106197337 c.5665_5670delCCCAAT p.P1889_N1890del
TSC2 16:2106712-2106714 c.716_718delTCA p.I240delI
TSC2 16:2136792-2136794 c.4909_4911delAAG p.K1638delK
VHL 3:10183726-10183728 c.195_197delGGT p.V66del
VHL 3:10183736-10183738 c.205_207delCGC p.R69del
VHL 3:10183755-10183757 c.224_226delTCT p.F76del
VHL 3:10183757-10183759 c.226_228delTTC p.F76del
VHL 3:10183758-10183760 c.227_229delTCT p.F76del
VHL 3:10183759-10183761 c.228_230delCTG p.C77del
VHL 3:10183790-10183795 c.259_264delGTATGG p.V87_W88del

H.Baeissa et al.
217
VHL 3:10183799-10183801 c.268_270delAAC p.N90del
VHL 3:10183801-10183803 c.270_272delCTT p.F91del
VHL 3:10183807-10183809 c.276_278delCGG p.G93del
VHL 3:10183816-10183818 c.285_287delGCA p.Q96del
VHL 3:10183832-10183837 c.301_306delCTGCCG p.L101_P102del
VHL 3:10183837-10183839 c.306_308delGCC p.P103del
VHL 3:10183852-10183854 c.321_323delCCG p.R108del
VHL 3:10183859-10183864 c.328_333delCACAGC p.H110_S111del
VHL 3:10183862-10183867 c.331_336delAGCTAC p.S111_Y112del
VHL 3:10188200-10188202 c.343_345delCAC p.H115del
VHL 3:10188218-10188220 c.361_363delGAT p.D121del
VHL 3:10188218-10188223 c.361_366delGATGCA p.D121_A122del
VHL 3:10188263-10188265 c.406_408delTTT p.F136del
VHL 3:10188296-10188301 c.439_444delATTTTT p.I147_F148del
VHL 3:10188299-10188301 c.442_444delTTT p.F148del
VHL 3:10188307-10188312 c.450_455delTATCAC p.I151_T152del
VHL 3:10191479-10191484 c.472_477delCTGAAA p.L158_K159del
VHL 3:10191483-10191485 c.476_478delAAG p.E160del
VHL 3:10191488-10191490 c.481_483delCGA p.R161del
VHL 3:10191511-10191516 c.504_509delCCTAGT p.L169_V170del
VHL 3:10191519-10191524 c.512_517delAGCCTG p.P172_E173del
VHL 3:10191542-10191547 c.535_540delGACATC p.D179_I180del
VHL 3:10191568-10191570 c.561_563delTCT p.D187_L188del
Table S5.11. Tumour suppressor genes and their mutations for deletion in MOKCa.
The tumour suppressors in deletion are listed by the gene names, the genomic coordinates of the mutation, the change that has occurred in the
nucleotide sequence and the change that has occurred in the amino acid sequence. The list is sorted by gene names alphabetically.

H.Baeissa et al.
218
Gene names Mutation genome position Mutation CDs Mutation a.a.
ABL1 9:133747575-133747576 c.882_883insCAC p.H295_P296insH
ABL1 9:133748407-133748408 c.1068_1069insAAG p.K357_N358insK
ALK 2:29445271-29445272 c.3453_3454insACG p.T1151_L1152insT
BRAF 7:140453137-140453138 c.1797_1798insACA p.T599_V600insT
BRAF 7:140453138-140453139 c.1796_1797insTAC p.T599_V600insT
BRAF 7:140453140-140453141 c.1794_1795insGTT p.A598_T599insV
BRAF 7:140477800-140477801 c.1507_1508insAGTACTCAG p.V502_G503insEYS
CCND1 11:69466031-69466032 c.869_870insGCG p.R291_D292insR
CTNNB1 3:41266102-41266103 c.99_100ins9 p.S33_G34insGTS
CTNNB1 3:41266128-41266129 c.125_126insCAGCTC p.T42_A43insSS
CTNNB1 3:41266134-41266135 c.131_132insAGCTCC p.P44_S45insAP
EGFR 7:55249000-55249001 c.2298_2299insGCCATA p.A767_S768insIA
EGFR 7:55249004-55249005 c.2302_2303insCGCTGGCCA p.A767_S768insTLA
EGFR 7:55249013-55249014 c.2311_2312insGCGTGGACA p.D770_N771insSVD
EGFR 7:55249012-55249013 c.2310_2311insTAC p.D770_N771insY
EGFR 7:55249022-55249023 c.2320_2321insCCCACG p.H773_V774insAH
EGFR 7:55249021-55249022 c.2319_2320insAACCCCCAC p.H773_V774insNPH
EGFR 7:55249020-55249021 c.2318_2319insCCCCCA p.H773_V774insPH
EGFR 7:55242500-55242501 c.2270_2271insCAA p.N756_K757insN
EGFR 7:55249016-55249017 c.2314_2315insACC p.N771_P772insH
EGFR 7:55249015-55249016 c.2313_2314insAAC p.N771_P772insN
EGFR 7:55249018-55249018 c.2316C>AACCCCT p.P772_H773insTP
EGFR 7:55248998-55248999 c.2296_2297insTGGCCAGCG p.V769_D770insASV
EGFR 7:55249005-55249006 c.2303_2304insTGTGGCCAG p.V769_D770insASV
EGFR 7:55249009-55249010 c.2307_2308insGCCAGCGTG p.V769_D770insASV
EGFR 7:55249010-55249011 c.2308_2309insCCAGCGTGG p.V769_D770insASV
EGFR 7:55249017-55249018 c.2315_2316insCCACGT p.V774_C775insHV

H.Baeissa et al.
219
EGFR 7:55249023-55249024 c.2321_2322insCCACGT p.V774_C775insHV
EGFR 7:55249024-55249024 c.2322G>CCACGTG p.V774_C775insHV
ERBB2 17:37881002-37881003 c.2331_2332insTGTGGG p.V777_G778insCG
ERBB2 17:37881004-37881005 c.2333_2334insGGG p.G778_S779insG
ERBB2 17:37881010-37881011 c.2339_2340insGGGCTCCCC p.P780_Y781insGSP
ERBB2 17:37881011-37881012 c.2340_2341insGGCTCCCCA p.P780_Y781insGSP
FLT3 13:28592624-28592625 c.2520_2521insGGATCC p.S840_N841insGS
FLT3 13:28608280-28608281 c.1775_1776insTGG p.V592_D593insG
GATA2 3:128202765-128202766 c.954_955insTCC p.A318_C319insS
HOXC13 12:54332733-54332734 c.43_44insTTA p.L15_M16insI
HRAS 11:534285-534286 c.37_38insCCGGCG p.G12_G13insAG
HRAS 11:534292-534293 c.30_31insGGC p.G10_A11insG
IL7R 5:35874570-35874571 c.726_727ins15 p.L242_L243insFCRKD
IL7R 5:35874571-35874572 c.727_728insGGTTGC p.L242_L243insRL
IL7R 5:35874602-35874603 c.758_759insGGTTCTCTG p.V253_A254insVLC
JAK1 1:65313222-65313223 c.1891_1892insGAGGGA p.D630_I631insRG
JAK2 9:5078360-5078361 c.2047_2048insCAGGGA p.I682_R683insTG
KCNJ5 11:128781614-128781615 c.446_447insAAC p.T149_I150insT
KIT 4:55592180-55592181 c.1504_1505insCTTCTG p.A502_Y503insSA
KIT 4:55592181-55592182 c.1505_1506insTTCTGC p.A502_Y503insSA
KIT 4:55592182-55592183 c.1506_1507insTCTGCC p.A502_Y503insSA
KIT 4:55592183-55592184 c.1507_1508insCTGCCT p.Y503_F504insSA
KIT 4:55592185-55592186 c.1509_1510insGCCTAT p.Y503_F504insAY
KIT 4:55593662-55593663 c.1728_1729insCAACTT p.L576_P577insQL
KIT 4:55594244-55594245 c.1947_1948insAAT p.N649_H650insN
KIT 4:55599319-55599320 c.2445_2446insGTCATA p.R815_D816insVI
KRAS 12:25398259-25398260 c.48_49insTGG p.K16_S17insW
KRAS 12:25398279-25398280 c.39_40insGGC p.G13_V14insG

H.Baeissa et al.
220
KRAS 12:25398282-25398283 c.36_37insGGT p.G12_G13insG
KRAS 12:25398283-25398284 c.35_36insAGCTGG p.G12_G13insAG
KRAS 12:25398285-25398286 c.33_34insGGAGCT p.A11_G12insGA
KRAS 12:25398287-25398288 c.31_32insGAG p.G10_A11insG
KRAS 12:25398288-25398289 c.30_31insGGA p.G10_A11insG
KRAS 12:25398291-25398292 c.27_28insGTA p.V9_G10insV
MKL1 22:40816929-40816930 c.802_803insAGC p.Q267_L268insQ
MUC1 1:155160690-155160691 c.230_231insACC p.E77_D78insP
MYH9 22:36689486-36689487 c.3983_3984insGAG p.L1327_S1328insR
MYH9 22:36696913-36696914 c.2821_2822insAGA p.K940_M941insK
NFE2L2 2:178098808-178098809 c.236_237insAGA p.E79_T80insE
NFE2L2 2:178098950-178098951 c.94_95insGAG p.G31_V32insG
NFE2L2 2:178098969-178098970 c.75_76insAGG p.R25_Q26insR
PDGFRA 4:55141035-55141036 c.1681_1682insGAGAGG p.R560_V561insGE
PIK3CA 3:178916954-178916955 c.341_342insCCTCAA p.N114_R115insLN
RUNX1 21:36164797-36164798 c.1077_1078insTGGGGC p.P359_V360insWG
RUNX1 21:36252867-36252868 c.494_495insCGGGGG p.G165_R166insGG
RUNX1 21:36252915-36252916 c.446_447insTACCGC p.A149_A150insTA
RUNX1 21:36252937-36252938 c.424_425insGGG p.S141_A142insG
RUNX1 21:36252938-36252939 c.423_424insCCC p.S141_A142insP
RUNX1 21:36259156-36259157 c.334_335insCCC p.T111_L112insP
RUNX1 21:36259206-36259207 c.284_285insTGG p.P95_N96insG
SRSF2 17:74732962-74732963 c.283_284insGCC p.R94_P95insR
U2AF1 21:44514769-44514770 c.477_478insTATGAG p.E159_M160insYE
U2AF1 21:44514770-44514771 c.476_477insGTATGA p.E159_M160insYE
Table S5.12. Oncogenes and their mutations for insertion in MOKCa.

H.Baeissa et al.
221
The oncogenes in insertion are listed by the gene names, the genomic coordinates of the mutation, the change that has occurred in the nucleotide
sequence and the change that has occurred in the amino acid sequence. The list is sorted by gene names alphabetically.
Gene names Mutation genome position Mutation CDs Mutation a.a.
APC 5:112176891-112176892 c.5600_5601insTGA p.D1871_V1872insD
APC 5:112177656-112177657 c.6365_6366insTGC p.A2122_C2123insA
ARID1A 1:27100181-27100182 c.3977_3978insGCA p.Q1334_R1335insQ
ARID1A 1:27100205-27100206 c.4001_4002insGCA p.Q1334_R1335insQ
ARID1A 1:27106896-27106897 c.6507_6508insCTG p.L2171_A2172insL
ARID2 12:46243411-46243412 c.1764_1765insAAT p.N589_G590insN
ATM 11:108199911-108199912 c.7253_7254insGAA p.K2418_R2419insK
BAP1 3:52436650-52436651 c.2023_2024insATA p.F674_I675insN
CEBPA 19:33792255-33792256 c.1065_1066insGCC p.G355_N356insA
CEBPA 19:33792351-33792352 c.969_970insGACCGC p.R323_L324insDR
CEBPA 19:33792369-33792370 c.951_952ins15 p.L317_T318insKVLEL
CEBPA 19:33792370-33792371 c.950_951insGTC p.L317_T318insS
CEBPA 19:33792371-33792372 c.949_950insGTC p.E316_L317insR
CEBPA 19:33792375-33792376 c.945_946insCTG p.L315_E316insL
CEBPA 19:33792376-33792377 c.944_945insTGTGCT p.L315_E316insCL
CEBPA 19:33792378-33792379 c.942_943insGTG p.V314_L315insV
CEBPA 19:33792379-33792380 c.941_942insCTT p.L315_E316insL
CEBPA 19:33792380-33792381 c.940_941insAAG p.K313_V314>insE
CEBPA 19:33792381-33792382 c.939_940insAAG p.K313_V314insK
CEBPA 19:33792383-33792384 c.937_938insAGA p.K313_V314insK
CEBPA 19:33792384-33792385 c.936_937insCAG p.Q312_K313insQ
CEBPA 19:33792386-33792387 c.934_935insTTC p.Q311_Q312insL

H.Baeissa et al.
222
CEBPA 19:33792387-33792388 c.933_934insTTC p.Q311_Q312insF
CEBPA 19:33792390-33792391 c.930_931insACG p.T310_Q311insT
CEBPA 19:33792391-33792392 c.929_930ins18 p.T310_Q311>insQRNVET
CEBPA 19:33792392-33792393 c.928_929insAGA p.E309_T310insK
CEBPA 19:33792393-33792394 c.927_928insGAG p.E309_T310insE
CEBPA 19:33792396-33792397 c.924_925insCCC p.V308_E309insP
CEBPA 19:33792399-33792400 c.921_922insAAC p.N307_V308insN
CEBPA 19:33792402-33792403 c.918_919insCAGCGC p.R306_N307insQR
CEBPA 19:33792404-33792405 c.916_917insAGC p.Q305_R306insQ
CEBPA 19:33792407-33792408 c.913_914insTGC p.K304_Q305insL
CEBPA 19:33792408-33792409 c.912_913insTTG p.K304_Q305insL
CEBPA 19:33792413-33792414 c.907_908insTTG p.K302_A303>insV
CEBPA 19:33792417-33792418 c.903_904insCAG p.D301_K302insQ
CEBPA 19:33792429-33792430 c.891_892insATT p.R297_K298insI
FBXW7 4:153332910-153332911 c.45_46insCCT p.T15_G16insP
GATA3 10:8115956-8115957 c.1305_1306insCCC p.H435_P436insP
HNF1A 12:121432051-121432052 c.798_799insAAC p.N266_W267insN
HNF1A 12:121432065-121432066 c.812_813insCGG p.R271_R272insG
MEN1 11:64573771-64573772 c.981_982insAGC p.Y327_H328insS
PIK3R1 5:67589019-67589020 c.1110_1111insACA p.T371_L372insT
PIK3R1 5:67589591-67589592 c.1354_1355insATA p.N453_T454insN
PIK3R1 5:67589595-67589596 c.1358_1359insTAA p.453_454insN
PIK3R1 5:67589601-67589602 c.1364_1365insGTT p.Q455_F456insL
PIK3R1 5:67589611-67589612 c.1374_1375insAAAAGT p.S460_R461insKS
PIK3R1 5:67589619-67589620 c.1382_1383insAGA p.E462_Y463insE
PIK3R1 5:67591111-67591112 c.1704_1705insGAC p.P568_D569insD
PIK3R1 5:67591119-67591120 c.1712_1713insCCG p.I571_Q572insR
PIK3R1 5:67591130-67591131 c.1723_1724insTGAGAA p.R574_K575insMR

H.Baeissa et al.
223
PIK3R1 5:67591136-67591137 c.1729_1730insGAGACC p.D578_Q579insRD
PIK3R1 5:67591144-67591145 c.1737_1738insGACAAA p.Q579_Y580insDK
PIK3R1 5:67593259-67593260 c.2005_2006insTAAAGC p.K668_H669insLK
PTCH1 9:98212199-98212200 c.3472_3473insTCC p.L1159_T1160insL
PTCH1 9:98220333-98220334 c.3129_3130insGTGTGC p.C1043_A1044insVC
PTEN 10:89685306-89685307 c.201_202insTAT p.I67_Y68insY
PTEN 10:89692934-89692935 c.418_419insTAC p.L140_H141insL
PTEN 10:89717712-89717713 c.737_738insGGGCCC p.P246_L247insGP
RB1 13:48954215-48954216 c.1416_1417insAAA p.N472_F473insK
SMAD4 18:48604776-48604777 c.1598_1599insCAG p.L533_Q534insS
SMARCB1 22:24129368-24129369 c.12_13insATG p.M4_A5insM
TP53 17:7576883-7576884 c.962_963insGAA p.K321_P322insK
TP53 17:7577085-7577086 c.852_853insCGGCGCACA p.T284_E285insRRT
TP53 17:7577107-7577108 c.830_831insCTG p.C277_P278insC
TP53 17:7577585-7577586 c.695_696insTGG p.I232_H233insG
VHL 3:10183765-10183766 c.234_235insAAT p.N78_R79insN
VHL 3:10183845-10183846 c.314_315insGCGGCC p.T105_G106insRP
VHL 3:10188307-10188308 c.450_451insTAT p.N150_I151insY
VHL 3:10191500-10191501 c.493_494insTTG p.V165_V166insV
Table S5.13. Tumour suppressor genes and their mutations for insertion in MOKCa.
The tumour suppressors in insertion are listed by the gene names, the genomic coordinates of the mutation, the change that has occurred in the
nucleotide sequence and the change that has occurred in the amino acid sequence. The list is sorted by gene names alphabetically.

H.Baeissa et al.
224
Figure S5.1 Commonality in successful prediction outputs for inframe indels
mutations compared between between six algorithms.
a) Insertion mutations b) Deletion mutations.

H.Baeissa et al.
225
Appendix 5: Supporting Information for Chapter 6
Genes Sample-ID Substitution Drugs Indications
1 BRAF TCGA-50-5942-01 V600E
Vemurafenib and
Dabrafenib
Vemurafenib and Dabrafenib were approved in 2011 and 2013 for the
treatment of metastatic melanoma with a mutation on BRAF in the
valine located in the exon 15 at codon 600 (V600E) (Kalia, 2015).
Vemurafenib approval was extended in 2017, for the treatment of
Erdheim-Chester Disease that caused by BRAF V600 mutation
(Stempel et al., 2017).
Dabrafenib and Trametinib in combination have been approved for the
treatment of anaplastic thyroid cancer that caused by an abnormal
BRAF V600E gene (Odogwu et al., 2018).
2 BRAF TCGA-86-7714-01 V600E
3 BRAF TCGA-50-5044-01 D594H
4 BRAF TCGA-78-7633-01 G469L
5 CPS1 TCGA-86-7953-01 F394L Carglumic Acid
It is used to treatment acute and chronic hyperammonaemia in patients
with N-acetylglutamate synthase (NAGS) deficiency (Daniotti et al.,
2011).
6 DPYSL2 TCGA-69-7761-01 Q91R Erlosamide
It is also called Lacosamide, It is used for the adjunctive treatment of
partial-onset seizures in adults (Ben-Menachem et al., 2007).
7 EGFR TCGA-38-4627-01 L62R
Gefitinib, Erlotinib
and Afatinib
For the treatment of LADC (Wishart et al., 2018, Lynch et al., 2004).
Gefitinib was approved for the treatment of NSCLC with a mutation
on EGFR in the lusein located in the exon 21 at codon 858 (L858R)

H.Baeissa et al.
226
8 EGFR TCGA-38-4627-01 L858R
(Kazandjian et al., 2016).
9 EGFR TCGA-50-5944-01 L858R
10 EGFR TCGA-86-8075-01 L858R
11 EPHA7 TCGA-55-6642-01 R877L Vandetanib and
Fostamatinib
Vandetanib is used for the treatment of unresectable, locally advanced,
or metastatc medullary thyroid cancer in adult patients. The FDA
approved it in 2011 (Thornton et al., 2012).
Fostamatinib is used for the treatment of Rheumatoid Arthritis and
Immune Thrombocytopenic Purpura (ITP). It is approved under the
trade name Tavalisse on April 2018 for use in ITP (Markham, 2018).
12 GRIN2A TCGA-69-7761-01 P435S Felbamate For the treatment of epilepsy (Felbamate Study Group in Lennox-
Gastaut, 1993).
13 ITGA2B TCGA-44-3919-01 G827S Abciximab
Abciximab is a drug for prevention of cardiac ischemic complications
in patients undergoing percutaneous coronary intervention (Abciximab
in Ischemic Stroke, 2000)
14 PDGFRB TCGA-05-4422-01 H393P Pazopanib and
Sunitinib
Pazopanib was FDA approved on October 19, 2009 for the treatment
of advanced renal cell cancer and advanced soft tissue sarcoma
(Sternberg et al., 2010).
Sunitinib is used for the treatment of advanced renal cell carcinoma
The FDA approved it on January 26, 2006 (Chan et al., 2018).
15 RAF1 TCGA-J2-8192-01 P646L
Sorafenib
Regorafenib
Sorafenib is a drug approved for the treatment of unresectable
hepatocellular carcinoma and advanced renal cell carcinoma (Cheng et
al., 2009).

H.Baeissa et al.
227
Regorafenib was FDA approved on September 27, 2012 for the
treatment of metastatic colorectal cancer and later gastrointestinal
stromal tumours and hepatocellular carcinoma (Sirohi et al., 2014,
Rimassa et al., 2017).
16 RYR1 TCGA-50-5935-01 D3587N
Dantrolene sodium Dantrolene sodium inhibits intracellular Ca2+ release from the
sarcoplasmic reticulum (Buyukokuroglu et al., 2001).
17 RYR1 TCGA-44-3919-01 R2985Q
18 SRD5A1 TCGA-75-6207-01 A222V Dutasteride It is used to treat benign prostatic hyperplasia (BPH) in men with an
enlarged prostate (Roehrborn et al., 2002)
Table S6.1. Oncogenes that have approved drugs, sample ID, mutations, drugs and the indication of drugs.

H.Baeissa et al.
228
Genes # of samples Drugs Indications
1 ACE 1 BENAZEPRIL It is used as hypertension therapy (Jamerson et al., 2008).
2 ADA 1 FLUDARABINE
It is used for the treatment of hematological malignancies (Devine et al.,
2001).
3 ADORA1 1 AMINOPHYLLINE It is used to treat bronchospasm due to asthma (Barnes et al., 1982).
4 ADORA2B 2 AMINOPHYLLINE It is used to treat bronchospasm due to asthma (Barnes et al., 1982).
5 ADRA1B 7 CLOZAPINE
It is used for patients with treatment-resistant schizophrenia (Kane et al.,
1988).
6 ADRA2A 2 CABERGOLINE It is used for hyperprolactinemic disorders (Colao et al., 2003).
7 ADRB1 1 CARVEDILOL
It is used as treatment of mild or moderate heart failure of ischemic
(Doughty et al., 1997).
8 AKR1B1 1 TOLRESTAT For the pharmacological of diabetic complications (Kador et al., 1985).
9 ALDH2 1 DISULFIRAM It is used as treatment of chronic alcoholism (Fuller et al., 1986)
10 ALDH5A1 1 VALPROIC ACID For treatment of seizure disorders (Dreifuss et al., 1987).
11 ALK 2 CRIZOTINIB
For the treatment of non-small cell lung cancer (NSCLC). FDA approved
it in 2011 (Kazandjian et al., 2014).
12 ATP1A2 1 DESLANOSIDE
It is used to treat Congestive cardiac insufficiency and heart failure
(Goldsmith et al., 1992).
13 AVPR1A 1 SATAVAPTAN For the treatment of cirrhosis (Wong et al., 2012).
14 AVPR1B 1 SATAVAPTAN For the treatment of cirrhosis (Wong et al., 2012).
15 AVPR2 2 SATAVAPTAN For the treatment of cirrhosis (Wong et al., 2012).
16 BCHE 1 TACRINE
It is used as palliative treatment of mild to moderate dementia of the
Alzheimer's type (Qizilbash et al., 2000).
17 BLK 1 DASATINIB
It use in patients with chronic myeloid leukemia (CML) (Copland et al.,
2006).
18
BRAF 1 SORAFENIB
Sorafenib is a drug approved for the treatment of unresectable
hepatocellular carcinoma and advanced renal cell carcinoma (Cheng et al.,
2009).
19 BTK 1 ACALABRUTINIB
It is used for the treatment of mantle cell lymphoma (MCL) in patients
who have received at least one prior therapy (Wu et al., 2016).

H.Baeissa et al.
229
20 CA2 1 ETHINAMATE It is used to treat insomnia (Gotthelf et al., 2018).
21 CACNA1H 1 ZONISAMIDE
For the treatment of partial seizures in adults with epilepsy (Schmidt et al.,
1993).
22 CCR5 1 MARAVIROC It acts against HIV (Fatkenheuer et al., 2005).
23 CHRM3 2 TOLTERODINE It is used to treat urinary incontinence (Kaplan et al., 2005).
24 CNR1 1 RIMONABANT For patients with a body mass index greater than 30 kg/m2.
25 COMT 1 TOLCAPONE For the treatment of Parkinson's disease (Waters et al., 1998).
26 CSF1R 1 DOVITINIB
For the treatment of multiple myeloma and solid tumors (Scheid et al.,
2015).
27 CYP17A1 1 ABIRATERONE
It is used in combination with prednisone for the treatment of prostate
cancer (de Bono et al., 2011).
28 CYSLTR1 3 ZAFIRLUKAST For the treatment of asthma (Fish et al., 1997).
29 DHFR 1 PYRIMETHAMINE For the treatment of acute malaria (Peterson et al., 1988).
30 DHODH 1 TERIFLUNOMIDE
For the treatment of relapsing forms of multiple sclerosis (O'Connor et al.,
2006)
31 DNMT1 1 DECITABINE
For treatment of patients with myelodysplastic syndrome (MDS)
(Kantarjian et al., 2006).
32 DPP4 3 VILDAGLIPTIN
For reduction hyperglycemia in type 2 diabetes-mellitus (Ferrannini et al.,
2009).
33 DPYD 4 TEGAFUR It is used with uracil for adenocarcinoma of the lung (Kato et al., 2004).
34 DPYSL2 2 ERLOSAMIDE For the maintenance of normal sinus rhythm (Chinnasami et al., 2013).
35 DRD1 1 HALOPERIDOL For patients who have schizophrenia (Chouinard et al., 1993).
36 DRD5 4 HALOPERIDOL For patients who have schizophrenia (Chouinard et al., 1993).
37 EGFR 4 GEFITINIB For the treatment of LADC (Wishart et al., 2018).
38 EPHA2 2 REGORAFENIB
FDA approved it in 2012 for the treatment of metastatic colorectal cancer
(Andre and Dumont, 2013).
39 EPHA3 3 VANDETANIB For the treatment of pancreatic adenocarcinoma (Wells et al., 2010).
40 EPHA4 2 VANDETANIB For the treatment of pancreatic adenocarcinoma (Wells et al., 2010).
41 EPHB1 1 VANDETANIB For the treatment of pancreatic adenocarcinoma (Wells et al., 2010).
42 EPHB2 3 VANDETANIB For the treatment of pancreatic adenocarcinoma (Wells et al., 2010).
43 EPHB4 1 VANDETANIB For the treatment of pancreatic adenocarcinoma (Wells et al., 2010).
44 EPHX1 7
45 ERBB2 1 LAPATINIB
For the treatment of patients with advanced or metastatic breast cancer
(Geyer et al., 2006).

H.Baeissa et al.
230
46 ERBB4 1 VANDETANIB For the treatment of pancreatic adenocarcinoma (Wells et al., 2010).
47 FGFR1 3 REGORAFENIB
FDA approved it in 2012 for the treatment of metastatic colorectal cancer
(Andre and Dumont, 2013).
48 FGFR2 2 DOVITINIB
For the treatment of multiple myeloma and solid tumors (Scheid et al.,
2015).
49 FGFR3 1 DOVITINIB
For the treatment of multiple myeloma and solid tumors (Scheid et al.,
2015).
50 FRK 1 BOSUTINIB
It was approved for the treatment of chronic myeloid leukemia (CML) in
2012 (Amsberg and Schafhausen, 2013).
51 GABRB3 2 ETOMIDATE Using in the induction of general anesthesia (Bergen and Smith, 1997).
52 GABRG2 1 HALOTHANE For the maintenance of general anesthesia (Eger, 2004).
53 GNRHR 1 ELAGOLIX
For the treatment of of moderate to severe pain associated with
endometriosis (Diamond et al., 2014).
54 GRIA1 2 TEZAMPANEL For the treatment of migraine and cluster headaches (Chan et al., 2010).
55 GRIK1 1 TEZAMPANEL For the treatment of migraine and cluster headaches (Chan et al., 2010).
56 GRIN2A 3 FELBAMATE
For the treatment of epilepsy (Felbamate Study Group in Lennox-Gastaut,
1993).
57 HDAC1 1 BELINOSTAT
It was US-approved in 2014 as a treatment for relapsed or refractory
peripheral T-cell lymphoma (Lee et al., 2015).
58 HDAC3 2 BELINOSTAT
It was US-approved in 2014 as a treatment for relapsed or refractory
peripheral T-cell lymphoma (Lee et al., 2015).
59 HPRT1 4 THIOGUANINE For the treatment of of acute leukemia (Gee et al., 1969).
60 HRH2 2 RANITIDINE
For the treatment of gastroesophageal reflux disease (Wiklund et al.,
1998).
61 HSD3B1 1 TRILOSTANE For the treatment of Cushing's syndrome (Komanicky et al., 1978).
62 HTR1B 2 YOHIMBINE It is used for the treatment of impotence (Reid et al., 1987).
63 HTR1F 2 YOHIMBINE It is used for the treatment of impotence (Reid et al., 1987).
64 HTR2A 1 CLOZAPINE
It is used for patients with treatment-resistant schizophrenia (Kane et al.,
1988).
65 HTR2B 1 HALOPERIDOL For patients who have schizophrenia (Chouinard et al., 1993).
66 HTR2C 3 CLOZAPINE
It is used for patients with treatment-resistant schizophrenia (Kane et al.,
1988).
67 IKBKB 2
BARDOXOLONE
METHYL For the treatment of lymphoma (Hong et al., 2012).
68 IMPA2 2 LITHIUM CITRATE For the treatment of depression (Shorter, 2009).

H.Baeissa et al.
231
69 IMPDH1 1 THIOGUANINE For the treatment of of acute leukemia (Gee et al., 1969).
70 IMPDH2 3 THIOGUANINE For the treatment of of acute leukemia (Gee et al., 1969).
71
ITGA2B 1 ABCIXIMAB
Abciximab is a drug for prevention of cardiac ischemic complications in
patients undergoing percutaneous coronary intervention (Abciximab in
Ischemic Stroke, 2000).
72
ITGB3 1 ABCIXIMAB
Abciximab is a drug for prevention of cardiac ischemic complications in
patients undergoing percutaneous coronary intervention (Abciximab in
Ischemic Stroke, 2000).
73 JAK1 3 RUXOLITINIB
For the treatment of myelofibrosis. FDA approved in 2011 (Mascarenhas
and Hoffman, 2012).
74 JAK2 1 RUXOLITINIB
For the treatment of myelofibrosis. FDA approved in 2011 (Mascarenhas
and Hoffman, 2012).
75 KCND3 1 FLECAINIDE
For the prevention of paroxysmal supraventricular tachycardias (PSVT)
(Anderson et al., 1988).
76 KCNH2 1 DOFETILIDE For the treatment of heart failure (Torp-Pedersen et al., 1999).
77 KCNJ11 1 TOLBUTAMIDE For treatment of diabetes (Sartor et al., 1980).
78 KDR 1 VANDETANIB For the treatment of pancreatic adenocarcinoma (Wells et al., 2010).
79 KIT 3 DASATINIB
It use in patients with chronic myeloid leukemia (CML) (Copland et al.,
2006).
80 LCK 1 DASATINIB
It use in patients with chronic myeloid leukemia (CML) (Copland et al.,
2006).
81 LPL 1 LIPASE
82 LYN 1 ACALABRUTINIB
I It is used for the treatment of mantle cell lymphoma (MCL) in patients
who have received at least one prior therapy (Wu et al., 2016).
83 MAOA 2 TRANYLCYPROMINE
It is used for major depressive episode without melancholia (Nolen et al.,
1988).
84 MAOB 5 TRANYLCYPROMINE
It is used for major depressive episode without melancholia (Nolen et al.,
1988).
85
MAP2K1 2 TRAMETINIB
The FDA approved it for the treatment of unresectable or metastatic
melanoma containing BRAF V600E or V600K mutations in 2013 (Wu et
al., 2015).
86 MET 6 CRIZOTINIB
For the treatment of non-small cell lung cancer (NSCLC). FDA approved
it in 2011 (Kazandjian et al., 2014).
87 MS4A1 1 RITUXIMAB For the treatment of chronic lymphocytic leukemia (O'Brien et al., 2001).
88 NR1H4 1 GUGGULSTERONE

H.Baeissa et al.
232
89 NR3C1 2 FLUTICASONE It is is used in some countries to treat nasal symptoms (Foresi et al., 1996).
90 NR3C2 3 SPIRONOLACTONE For the treatment of low-renin hypertension (Chapman et al., 2007).
91 ODC1 1 EFLORNITHINE For the treatment of facial hirsutism (Wolf et al., 2007).
92 OPRL1 1 OFQ-(1-13)-NH2
93 PAH 1 FENCLONINE
94 PARP1 1 NIRAPARIB
FDA was approved it For the treatment of ovarian cancer in 2017 (Scott,
2017).
95 PARP2 1 NIRAPARIB
FDA was approved it For the treatment of ovarian cancer in 2017 (Scott,
2017).
96 PARP3 1 OLAPARIB
For the maintenance treatment of adult patients with recurrent epithelial
ovarian (Audeh et al., 2010).
97 PDE4A 1 AMINOPHYLLINE It is used to treat bronchospasm due to asthma (Barnes et al., 1982).
98 PDGFRB 2 PAZOPANIB
For the treatment of metastatic renal cell carcinoma (Sternberg et al.,
2010).
99 PGR 3 ASOPRISNIL It is used for treatment in uterine fibroids (Chwalisz et al., 2007).
100 POLA1 2 CYTARABINE
It is used to treat acute lymphocytic and non-lymphocytic leukemia
(Bloomfield et al., 1998).
101 PPARA 2 GW6471
102 PPIA 2 CYCLOSPORIN A
For the treatment of transplant (kidney, liver, and heart) rejection,
rheumatoid arthritis, severe psoriasis (Calne et al., 1979)
103 PPP3R1 3 CYCLOSPORINE
For treatment of transplant (kidney, liver, and heart) rejection (Randhawa
et al., 1993).
104
PSMD1 1 BORTEZOMIB
It is used for treatment of multiple myeloma in patients who have not been
successfully treated with at least two previous therapies (Moreau et al.,
2011).
105 PTGER1 1 ALPROSTADIL
For the treatment of erectile dysfunction due to neurogenic (Linet and
Ogrinc, 1996).
106 PTGER2 3 ALPROSTADIL
For the treatment of erectile dysfunction due to neurogenic (Linet and
Ogrinc, 1996).
107 PTGFR 2 AS604872
108 PTGIR 1 MISOPROSTOL For the treatment of ulceration (Graham et al., 1993).
109 PTK6 2 VANDETANIB For the treatment of pancreatic adenocarcinoma (Wells et al., 2010).
110
RAF1 1 SORAFENIB
Sorafenib is a drug approved for the treatment of unresectable
hepatocellular carcinoma and advanced renal cell carcinoma (Cheng et al.,
2009).

H.Baeissa et al.
233
111 RET 2 VANDETANIB For the treatment of pancreatic adenocarcinoma (Wells et al., 2010).
112 RRM1 1 FLUDARABINE
It is used for the treatment of hematological malignancies (Devine et al.,
2001).
113 RRM2 3 FLUDARABINE
It is used for the treatment of hematological malignancies (Devine et al.,
2001).
114 RRM2B 1 HYDROXYUREA For treatment of melanoma (Elford, 1968).
115 RXRA 1 HX 531
116 RXRB 2 BEXAROTENE
For the treatment of skin lesions in early (stage IA and IB) CTCL in
patients (Hurst, 2000).
117 RXRG 3 BEXAROTENE
For the treatment of skin lesions in early (stage IA and IB) CTCL in
patients (Hurst, 2000).
118 S1PR5 1
119 SCN5A 1 ELECLAZINE
It has been used in trials studying the treatment of LQT2 Syndrome (Wilde
and Remme, 2018).
120 SERPINC1 1 SEMULOPARIN SODIUM
121 SIGMAR1 3 PENTAZOCINE It is used for the relief of moderate to severe pain (Gilbert et al., 1976).
122 SLC18A2 3 VALBENAZINE It is used to treat tardive dyskinesia in adults (Hauser et al., 2017).
123 SLC29A1 2 DIPYRIDAMOLE It is used in prevention of angina (Picano et al., 1985).
124 SLC6A3 2 TRIMIPRAMINE
It is used as a therapy for depression and depression accompanied by
anxiety (Ware et al., 1989).
125 SLC6A4 1 ZIPRASIDONE
It is used to treat schizophrenia and related psychotic disorders (Daniel et
al., 1999).
126 SRC 2 VANDETANIB For the treatment of pancreatic adenocarcinoma (Wells et al., 2010).
127 SRD5A1 5 DUTASTERIDE
It is used to treat benign prostatic hyperplasia (BPH) in men with an
enlarged prostate (Roehrborn et al., 2002).
128 SSTR1 1 CYN 154806
129 SSTR2 1 LANREOTIDE For treatment of neuroendocrine tumours (Caplin et al., 2014).
130 TACR1 1 OSANETANT It is a potential therapy for schizophrenia (Kamali, 2001).
131 TH 1 METYROSINE
For use in the treatment of patients with pheochromocytoma (Perry et al.,
1990).
132 THRA 3 LEVOTHYROXINE For the treatment of hypothyroidism (Monzani et al., 2004).
133 THRB 6
134 TNNC1 1
135 TOP2A 3 VALRUBICIN For the treatment of bladder cancer (Steinberg et al., 2000).

H.Baeissa et al.
234
136 TUBA1A 2 VINCRISTINE SULFATE For the treatment of acute leukaemia (Schochet et al., 1968).
137 TUBA1B 1 VINCRISTINE SULFATE For the treatment of acute leukaemia (Schochet et al., 1968).
138 TUBA4A 3 VINFLUNINE
For use as a monotherapy in adults with advanced or transitional cell
carcinoma of the urothelial (Oing et al., 2016).
139 TUBB3 2 VINCRISTINE SULFATE For the treatment of acute leukaemia (Schochet et al., 1968).
140 TUBB6 2 VINFLUNINE
For use as a monotherapy in adults with advanced or transitional cell
carcinoma of the urothelial (Oing et al., 2016).
141 TXNRD1 1 ARSENIC TRIOXIDE
It used to treat leukemia that is unresponsive to first line agents (Shen et
al., 1997).
142 TYMS 3 RALTITREXED It used to treat colorectal cancer (Phan et al., 2001).
143 UGCG 2 MIGLUSTAT It is used to treat Gaucher disease (Cox et al., 2003).
144 VKORC1 3 WARFARIN For the treatment of retinal vascular occlusion (Koizumi et al., 2007).
145 XDH 2 LEPTIN For the treatment in lipodystrophy (Oral et al., 2002).
146 YES1 4 DASATINIB
It use in patients with chronic myeloid leukemia (CML) (Copland et al.,
2006).
Table S6.2. List of unique GOF genes with High CNA and expression that have approved drugs, number of samples, drugs and the
indication of drug.

H.Baeissa et al.
235
Gene-SL partner # of samples
Drugs Indications
1 ABL1 16 BOSUTINIB It was approved for the treatment of chronic myeloid leukemia (CML) in
2012 (Amsberg and Schafhausen, 2013).
2 ALDH2 2 DISULFIRAM It is used as treatment of chronic alcoholism (Fuller et al., 1986)
3 BRAF 8 DASATINIB It use in patients with chronic myeloid leukemia (CML) (Copland et al.,
2006).
4 EGFR 3 ACALABRUTINIB It is used for the treatment of mantle cell lymphoma (MCL) in patients who
have received at least one prior therapy (Wu et al., 2016).
5 ERBB2 10 ACALABRUTINIB It is used for the treatment of mantle cell lymphoma (MCL) in patients who
have received at least one prior therapy (Wu et al., 2016).
6 ERBB4 6 ACALABRUTINIB It is used for the treatment of mantle cell lymphoma (MCL) in patients who
have received at least one prior therapy (Wu et al., 2016).
7 ESR1 11 TAMOXIFEN For the treatment of metastatic breast cancer in women and men (Fisher et
al., 1998).
8 FLT3 1 DOVITINIB For the treatment of multiple myeloma and solid tumors (Scheid et al.,
2015).
9 FYN 1 ACALABRUTINIB It is used for the treatment of mantle cell lymphoma (MCL) in patients who
have received at least one prior therapy (Wu et al., 2016).
10 HDAC1 3 BELINOSTAT It was US-approved in 2014 as a treatment for relapsed or refractory
peripheral T-cell lymphoma (Lee et al., 2015).
11 HDAC2 14 BELINOSTAT It was US-approved in 2014 as a treatment for relapsed or refractory
peripheral T-cell lymphoma (Lee et al., 2015).
12 HDAC3 12 BELINOSTAT It was US-approved in 2014 as a treatment for relapsed or refractory
peripheral T-cell lymphoma (Lee et al., 2015).
13 HDAC6 1 BELINOSTAT It was US-approved in 2014 as a treatment for relapsed or refractory
peripheral T-cell lymphoma (Lee et al., 2015).
14 IKBKB 14 BARDOXOLONE
METHYL
15 JAK1 3 RUXOLITINIB For the treatment of myelofibrosis. FDA approved in 2011 (Mascarenhas
and Hoffman, 2012).
16 JAK2 6 RUXOLITINIB For the treatment of myelofibrosis. FDA approved in 2011 (Mascarenhas
and Hoffman, 2012).
17 KDR 5 DOVITINIB For the treatment of multiple myeloma and solid tumors (Scheid et al.,
2015).

H.Baeissa et al.
236
18 KIT 3 DASATINIB It use in patients with chronic myeloid leukemia (CML) (Copland et al.,
2006).
19 LCK 4 ACALABRUTINIB It is used for the treatment of mantle cell lymphoma (MCL) in patients who
have received at least one prior therapy (Wu et al., 2016).
20 LYN 8 ACALABRUTINIB It is used for the treatment of mantle cell lymphoma (MCL) in patients who
have received at least one prior therapy (Wu et al., 2016).
21 MAP2K1 11 TRAMETINIB
The FDA approved it for the treatment of unresectable or metastatic
melanoma containing BRAF V600E or V600K mutations in 2013 (Wu et al.,
2015).
22 MAP2K2 1 TRAMETINIB
The FDA approved it for the treatment of unresectable or metastatic
melanoma containing BRAF V600E or V600K mutations in 2013 (Wu et al.,
2015).
23 MET 1 CRIZOTINIB For the treatment of non-small cell lung cancer (NSCLC). FDA approved it
in 2011 (Kazandjian et al., 2014).
24 PARP1 17 NIRAPARIB FDA was approved it For the treatment of ovarian cancer in 2017 (Scott,
2017).
25 PARP2 1 NIRAPARIB FDA was approved it For the treatment of ovarian cancer in 2017 (Scott,
2017).
26 PDGFRA 1 DOVITINIB For the treatment of multiple myeloma and solid tumors (Scheid et al.,
2015).
27 PDGFRB 6 DASATINIB It use in patients with chronic myeloid leukemia (CML) (Copland et al.,
2006).
28 POLA1 4 CYTARABINE It is used to treat acute lymphocytic and non-lymphocytic leukemia
(Bloomfield et al., 1998).
29 PPARG 7 BARDOXOLONE
METHYL For the treatment of lymphoma (Hong et al., 2012).
30 RAF1 9 REGORAFENIB FDA approved it in 2012 for the treatment of metastatic colorectal cancer
(Andre and Dumont, 2013).
31 RARA 9 AGN193109
32 RET 8 REGORAFENIB FDA approved it in 2012 for the treatment of metastatic colorectal cancer
(Andre and Dumont, 2013).
33 RRM2 4 FLUDARABINE It is used for the treatment of hematological malignancies (Devine et al.,
2001).
34 TOP1 16 IRINOTECAN For the treatment of advanced pancreatic cancer. It was approved in 2015
(Stylianopoulos and Jain, 2015).

H.Baeissa et al.
237
35 TOP2A 9 VALRUBICIN For the treatment of bladder cancer (Steinberg et al., 2000).
36 TUBA1A 3 VINCRISTINE SULFATE For the treatment of acute leukaemia (Schochet et al., 1968).
37 VDR 6 DOXERCALCIFEROL
For the treatment of secondary hyperparathyroidism in patients with chronic
kidney disease on dialysis, as well as for the treatment of secondary
hyperparathyroidism in patients with Stage 3 or Stage 4 chronic kidney
disease (Coburn et al., 2004).
38 YES1 2 DASATINIB It use in patients with chronic myeloid leukemia (CML) (Copland et al.,
2006).
Table S6.3. Synthetic lethal partner genes that have approved drugs, number of samples, drugs and the indication of drugs.

H.Baeissa et al.
238
Figure S6.1: The number of possible drugs for each sample.
The x-axis is the 50 LUAD sample IDs, which are sorted from high number of mutations to low.

References
ADAMS, D., ALTUCCI, L., ANTONARAKIS, S. E., BALLESTEROS, J., BECK, S., BIRD,
A., BOCK, C., BOEHM, B., CAMPO, E., CARICASOLE, A., DAHL, F.,
DERMITZAKIS, E. T., ENVER, T., ESTELLER, M., ESTIVILL, X., FERGUSON-
SMITH, A., FITZGIBBON, J., FLICEK, P., GIEHL, C., GRAF, T., GROSVELD, F.,
GUIGO, R., GUT, I., HELIN, K., JARVIUS, J., KUPPERS, R., LEHRACH, H.,
LENGAUER, T., LERNMARK, A., LESLIE, D., LOEFFLER, M., MACINTYRE, E.,
MAI, A., MARTENS, J. H., MINUCCI, S., OUWEHAND, W. H., PELICCI, P. G.,
PENDEVILLE, H., PORSE, B., RAKYAN, V., REIK, W., SCHRAPPE, M.,
SCHUBELER, D., SEIFERT, M., SIEBERT, R., SIMMONS, D., SORANZO, N.,
SPICUGLIA, S., STRATTON, M., STUNNENBERG, H. G., TANAY, A.,
TORRENTS, D., VALENCIA, A., VELLENGA, E., VINGRON, M., WALTER, J. &
WILLCOCKS, S. 2012. BLUEPRINT to decode the epigenetic signature written in
blood. Nat Biotechnol, 30, 224-6.
ADZHUBEI, I., JORDAN, D. M. & SUNYAEV, S. R. 2013. Predicting functional effect of
human missense mutations using PolyPhen-2. Curr Protoc Hum Genet, Chapter 7,
Unit7 20.
ADZHUBEI, I. A., SCHMIDT, S., PESHKIN, L., RAMENSKY, V. E., GERASIMOVA, A.,
BORK, P., KONDRASHOV, A. S. & SUNYAEV, S. R. 2010. A method and server for
predicting damaging missense mutations. Nat Methods, 7, 248-9.
AKAGI, K., STEPHENS, R. M., LI, J., EVDOKIMOV, E., KUEHN, M. R., VOLFOVSKY, N.
& SYMER, D. E. 2010. MouseIndelDB: a database integrating genomic indel
polymorphisms that distinguish mouse strains. Nucleic Acids Res, 38, D600-6.
AL-NUMAIR, N. S. & MARTIN, A. C. 2013. The SAAP pipeline and database: tools to
analyze the impact and predict the pathogenicity of mutations. BMC Genomics, 14
Suppl 3, S4.
ALBER, T., SUN, D. P., WILSON, K., WOZNIAK, J. A., COOK, S. P. & MATTHEWS, B. W.
1987. Contributions of hydrogen bonds of Thr 157 to the thermodynamic stability of
phage T4 lysozyme. Nature, 330, 41-6.
ALEXANDROV, L. B. & STRATTON, M. R. 2014. Mutational signatures: the patterns of
somatic mutations hidden in cancer genomes. Curr Opin Genet Dev, 24, 52-60.
ALTSCHUL, S. F., GERTZ, E. M., AGARWALA, R., SCHAFFER, A. A. & YU, Y. K. 2009.
PSI-BLAST pseudocounts and the minimum description length principle. Nucleic Acids
Res, 37, 815-24.

H.Baeissa et al.
240
ALTSCHUL, S. F., GISH, W., MILLER, W., MYERS, E. W. & LIPMAN, D. J. 1990. Basic
local alignment search tool. J Mol Biol, 215, 403-10.
ALTSCHUL, S. F., MADDEN, T. L., SCHAFFER, A. A., ZHANG, J., ZHANG, Z., MILLER,
W. & LIPMAN, D. J. 1997. Gapped BLAST and PSI-BLAST: a new generation of
protein database search programs. Nucleic Acids Res, 25, 3389-402.
AMBERGER, J. S., BOCCHINI, C. A., SCHIETTECATTE, F., SCOTT, A. F. & HAMOSH, A.
2015. OMIM.org: Online Mendelian Inheritance in Man (OMIM(R)), an online catalog
of human genes and genetic disorders. Nucleic Acids Res, 43, D789-98.
ANDERSON, M. W., REYNOLDS, S. H., YOU, M. & MARONPOT, R. M. 1992. Role of
proto-oncogene activation in carcinogenesis. Environ Health Perspect, 98, 13-24.
APWEILER, R., BAIROCH, A. & WU, C. H. 2004. Protein sequence databases. Curr Opin
Chem Biol, 8, 76-80.
ARCHER, K. J. & KIMES, R. V. 2008. Empirical characterization of random forest variable
importance measures. Computational Statistics & Data Analysis, 52, 2249-2260.
ASHFORD, P., PANG, S., MOYA-GARCIA, A., ADEYELU, T. & ORENGO, C. 2018. A
CATH domain functional family based approach to identify putative cancer driver
genes and driver mutations. bioRxiv.
AYCAN, Z., AGLADIOGLU, S. Y., CEYLANER, S., CETINKAYA, S., BAS, V. N. &
KENDIRICI, H. N. 2010. Sporadic nonautoimmune neonatal hyperthyroidism due to
A623V germline mutation in the thyrotropin receptor gene. J Clin Res Pediatr
Endocrinol, 2, 168-72.
BACON, D. J. & ANDERSON, W. F. 1986. Multiple sequence alignment. J Mol Biol, 191,
153-61.
BAEISSA, H., BENSTEAD-HUME, G., RICHARDSON, C. J. & PEARL, F. M. G. 2017.
Identification and analysis of mutational hotspots in oncogenes and tumour suppressors.
Oncotarget, 8, 21290-21304.
BAEISSA, H. M., BENSTEAD-HUME, G., RICHARDSON, C. J. & PEARL, F. M. 2016.
Mutational patterns in oncogenes and tumour suppressors. Biochem Soc Trans, 44, 925-
31.
BAILEY, M. H., TOKHEIM, C., PORTA-PARDO, E., SENGUPTA, S., BERTRAND, D.,
WEERASINGHE, A., COLAPRICO, A., WENDL, M. C., KIM, J., REARDON, B.,
NG, P. K., JEONG, K. J., CAO, S., WANG, Z., GAO, J., GAO, Q., WANG, F., LIU, E.
M., MULARONI, L., RUBIO-PEREZ, C., NAGARAJAN, N., CORTES-CIRIANO, I.,
ZHOU, D. C., LIANG, W. W., HESS, J. M., YELLAPANTULA, V. D.,
TAMBORERO, D., GONZALEZ-PEREZ, A., SUPHAVILAI, C., KO, J. Y.,
KHURANA, E., PARK, P. J., VAN ALLEN, E. M., LIANG, H., GROUP, M. C. W.,
CANCER GENOME ATLAS RESEARCH, N., LAWRENCE, M. S., GODZIK, A.,

H.Baeissa et al.
241
LOPEZ-BIGAS, N., STUART, J., WHEELER, D., GETZ, G., CHEN, K., LAZAR, A.
J., MILLS, G. B., KARCHIN, R. & DING, L. 2018. Comprehensive Characterization of
Cancer Driver Genes and Mutations. Cell, 173, 371-385 e18.
BAMFORD, S., DAWSON, E., FORBES, S., CLEMENTS, J., PETTETT, R., DOGAN, A.,
FLANAGAN, A., TEAGUE, J., FUTREAL, P. A., STRATTON, M. R. & WOOSTER,
R. 2004. The COSMIC (Catalogue of Somatic Mutations in Cancer) database and
website. Br J Cancer, 91, 355-8.
BARDOU, P., MARIETTE, J., ESCUDIE, F., DJEMIEL, C. & KLOPP, C. 2014. jvenn: an
interactive Venn diagram viewer. BMC Bioinformatics, 15, 293.
BATEMAN, A., COIN, L., DURBIN, R., FINN, R. D., HOLLICH, V., GRIFFITHS-JONES, S.,
KHANNA, A., MARSHALL, M., MOXON, S., SONNHAMMER, E. L.,
STUDHOLME, D. J., YEATS, C. & EDDY, S. R. 2004. The Pfam protein families
database. Nucleic Acids Res, 32, D138-41.
BEN MOUSA, A. 2008. Sorafenib in the treatment of advanced hepatocellular carcinoma.
Saudi J Gastroenterol, 14, 40-2.
BENSTEAD-HUME, G., WOOLLER, S. K. & PEARL, F. M. G. 2017. Computational
Approaches to Identify Genetic Interactions for Cancer Therapeutics. J Integr
Bioinform, 14.
BERMAN, H. M., KLEYWEGT, G. J., NAKAMURA, H. & MARKLEY, J. L. 2012. The
Protein Data Bank at 40: reflecting on the past to prepare for the future. Structure, 20,
391-6.
BERMAN, H. M., WESTBROOK, J., FENG, Z., GILLILAND, G., BHAT, T. N., WEISSIG,
H., SHINDYALOV, I. N. & BOURNE, P. E. 2000. The Protein Data Bank. Nucleic
Acids Res, 28, 235-42.
BOLLAG, G., ADLER, F., ELMASRY, N., MCCABE, P. C., CONNER, E., JR., THOMPSON,
P., MCCORMICK, F. & SHANNON, K. 1996. Biochemical characterization of a novel
KRAS insertion mutation from a human leukemia. J Biol Chem, 271, 32491-4.
BOSCH, A., ZISSERMAN, A. & MUNOZ, X. 2007. Image classification using random forests
and ferns. IEEE 11th International Conference on Computer Vision, 23, 1-8.
BOUTET, E., LIEBERHERR, D., TOGNOLLI, M., SCHNEIDER, M., BANSAL, P., BRIDGE,
A. J., POUX, S., BOUGUELERET, L. & XENARIOS, I. 2016. UniProtKB/Swiss-Prot,
the Manually Annotated Section of the UniProt KnowledgeBase: How to Use the Entry
View. Methods Mol Biol, 1374, 23-54.
BRAUCH, H., POMER, S., HIERONYMUS, T., SCHADT, T., LOHRKE, H. &
KOMITOWSKI, D. 1994. Genetic alterations in sporadic renal-cell carcinoma:
molecular analyses of tumor suppressor gene harboring chromosomal regions 3p, 5q,
and 17p. World J Urol, 12, 162-8.

H.Baeissa et al.
242
BREIMAN, L. 2001. Random Forest. Machine Learning, 45, 5-32.
BRODIE, S. A., LI, G. & BRANDES, J. C. 2015. Molecular characteristics of non-small cell
lung cancer with reduced CHFR expression in The Cancer Genome Atlas (TCGA)
project. Respir Med, 109, 131-6.
BROOKSBANK, C., CAMERON, G. & THORNTON, J. 2010. The European Bioinformatics
Institute's data resources. Nucleic Acids Res, 38, D17-25.
BULLOCK, A. N., HENCKEL, J., DEDECKER, B. S., JOHNSON, C. M., NIKOLOVA, P. V.,
PROCTOR, M. R., LANE, D. P. & FERSHT, A. R. 1997. Thermodynamic stability of
wild-type and mutant p53 core domain. Proc Natl Acad Sci U S A, 94, 14338-42.
BURKE, J. E., PERISIC, O., MASSON, G. R., VADAS, O. & WILLIAMS, R. L. 2012.
Oncogenic mutations mimic and enhance dynamic events in the natural activation of
phosphoinositide 3-kinase p110alpha (PIK3CA). Proc Natl Acad Sci U S A, 109,
15259-64.
CAMPBELL, C. & YING, Y. 2011. Learning with Support Vector Machines, California, USA,
Morgan and Claypool.
CANCER GENOME ATLAS RESEARCH, N. 2014. Comprehensive molecular profiling of
lung adenocarcinoma. Nature, 511, 543-50.
CARDARELLA, S., OGINO, A., NISHINO, M., BUTANEY, M., SHEN, J., LYDON, C.,
YEAP, B. Y., SHOLL, L. M., JOHNSON, B. E. & JANNE, P. A. 2013. Clinical,
pathologic, and biologic features associated with BRAF mutations in non-small cell
lung cancer. Clin Cancer Res, 19, 4532-40.
CARTER, H., CHEN, S., ISIK, L., TYEKUCHEVA, S., VELCULESCU, V. E., KINZLER, K.
W., VOGELSTEIN, B. & KARCHIN, R. 2009. Cancer-specific high-throughput
annotation of somatic mutations: computational prediction of driver missense mutations.
Cancer Res, 69, 6660-7.
CAZZOLA, M. & KRALOVICS, R. 2014. From Janus kinase 2 to calreticulin: the clinically
relevant genomic landscape of myeloproliferative neoplasms. Blood, 123, 3714-9.
CHAN, J. K., BRADY, W., MONK, B. J., BROWN, J., SHAHIN, M. S., ROSE, P. G., KIM, J.
H., SECORD, A. A., WALKER, J. L. & GERSHENSON, D. M. 2018. A phase II
evaluation of sunitinib in the treatment of persistent or recurrent clear cell ovarian
carcinoma: An NRG Oncology/Gynecologic Oncology Group Study (GOG-254).
Gynecol Oncol, 150, 247-252.
CHANG, M. T., ASTHANA, S., GAO, S. P., LEE, B. H., CHAPMAN, J. S., KANDOTH, C.,
GAO, J., SOCCI, N. D., SOLIT, D. B., OLSHEN, A. B., SCHULTZ, N. & TAYLOR,
B. S. 2016. Identifying recurrent mutations in cancer reveals widespread lineage
diversity and mutational specificity. Nat Biotechnol, 34, 155-63.

H.Baeissa et al.
243
CHATR-ARYAMONTRI, A., OUGHTRED, R., BOUCHER, L., RUST, J., CHANG, C.,
KOLAS, N. K., O'DONNELL, L., OSTER, S., THEESFELD, C., SELLAM, A.,
STARK, C., BREITKREUTZ, B. J., DOLINSKI, K. & TYERS, M. 2017. The
BioGRID interaction database: 2017 update. Nucleic Acids Res, 45, D369-D379.
CHEN, D., YU, J. & ZHANG, L. 2016. Necroptosis: an alternative cell death program
defending against cancer. Biochim Biophys Acta, 1865, 228-36.
CHENG, A. L., KANG, Y. K., CHEN, Z., TSAO, C. J., QIN, S., KIM, J. S., LUO, R., FENG, J.,
YE, S., YANG, T. S., XU, J., SUN, Y., LIANG, H., LIU, J., WANG, J., TAK, W. Y.,
PAN, H., BUROCK, K., ZOU, J., VOLIOTIS, D. & GUAN, Z. 2009. Efficacy and
safety of sorafenib in patients in the Asia-Pacific region with advanced hepatocellular
carcinoma: a phase III randomised, double-blind, placebo-controlled trial. Lancet Oncol,
10, 25-34.
CHENG, Y., WANG, X., WANG, P., LI, T., HU, F., LIU, Q., YANG, F., WANG, J., XU, T. &
HAN, W. 2016. SUSD2 is frequently downregulated and functions as a tumor
suppressor in RCC and lung cancer. Tumour Biol, 37, 9919-30.
CHIN, L., ANDERSEN, J. N. & FUTREAL, P. A. 2011. Cancer genomics: from discovery
science to personalized medicine. Nat Med, 17, 297-303.
CHOI, Y. & CHAN, A. P. 2015. PROVEAN web server: a tool to predict the functional effect
of amino acid substitutions and indels. Bioinformatics, 31, 2745-7.
CHOI, Y., SIMS, G. E., MURPHY, S., MILLER, J. R. & CHAN, A. P. 2012. Predicting the
functional effect of amino acid substitutions and indels. PLoS One, 7, e46688.
COCHRANE, G., KARSCH-MIZRACHI, I., TAKAGI, T. & INTERNATIONAL
NUCLEOTIDE SEQUENCE DATABASE, C. 2016. The International Nucleotide
Sequence Database Collaboration. Nucleic Acids Res, 44, D48-50.
COLLINS, F. S. & BARKER, A. D. 2007. Mapping the cancer genome. Pinpointing the genes
involved in cancer will help chart a new course across the complex landscape of human
malignancies. Sci Am, 296, 50-7.
CONSORTIUM, E. P. 2012. An integrated encyclopedia of DNA elements in the human
genome. Nature, 489, 57-74.
COORDINATORS, N. R. 2016. Database resources of the National Center for Biotechnology
Information. Nucleic Acids Res, 44, D7-19.
COTTO, K. C., WAGNER, A. H., FENG, Y. Y., KIWALA, S., COFFMAN, A. C., SPIES, G.,
WOLLAM, A., SPIES, N. C., GRIFFITH, O. L. & GRIFFITH, M. 2018. DGIdb 3.0: a
redesign and expansion of the drug-gene interaction database. Nucleic Acids Res, 46,
D1068-D1073.
COURAUD, S., ZALCMAN, G., MILLERON, B., MORIN, F. & SOUQUET, P. J. 2012. Lung
cancer in never smokers--a review. Eur J Cancer, 48, 1299-311.

H.Baeissa et al.
244
CRISTIANINI, N. & SHAWE-TAYLOR, J. 2000. An Introduction to Support Vector Machines,
Cambridge, UK., Cambridge University Press.
CUTLER, D. R., EDWARDS, T. C., BEARD, K. H., CUTLER, A., HESS, K. T., GIBSON, J.
& LAWLER, J. J. 2007. RANDOM FORESTS FOR CLASSIFICATION IN
ECOLOGY. Ecology, 88, 2783-92.
DAVYDOV EV, GOODE DL, SIROTA M, COOPER GM, SIDOW A & S, B. 2010.
Identifying a high fraction of the human genome to be under selective constraint
using GERP++. PLoS Comput Biol, 6, e1001025.
DEPRISTO, M. A., WEINREICH, D. M. & HARTL, D. L. 2005. Missense meanderings in
sequence space: a biophysical view of protein evolution. Nat Rev Genet, 6, 678-87.
DHILLON, A. S., MEIKLE, S., PEYSSONNAUX, C., GRINDLAY, J., KAISER, C., STEEN,
H., SHAW, P. E., MISCHAK, H., EYCHENE, A. & KOLCH, W. 2003. A Raf-1
mutant that dissociates MEK/extracellular signal-regulated kinase activation from
malignant transformation and differentiation but not proliferation. Mol Cell Biol, 23,
1983-93.
DIETTERICH, T. G. 2000. Ensemble methods in machine learning. International workshop on
multiple classifier systems, 1857, 1-15.
DING, L., GETZ, G., WHEELER, D. A., MARDIS, E. R., MCLELLAN, M. D., CIBULSKIS,
K., SOUGNEZ, C., GREULICH, H., MUZNY, D. M., MORGAN, M. B., FULTON, L.,
FULTON, R. S., ZHANG, Q., WENDL, M. C., LAWRENCE, M. S., LARSON, D. E.,
CHEN, K., DOOLING, D. J., SABO, A., HAWES, A. C., SHEN, H., JHANGIANI, S.
N., LEWIS, L. R., HALL, O., ZHU, Y., MATHEW, T., REN, Y., YAO, J., SCHERER,
S. E., CLERC, K., METCALF, G. A., NG, B., MILOSAVLJEVIC, A., GONZALEZ-
GARAY, M. L., OSBORNE, J. R., MEYER, R., SHI, X., TANG, Y., KOBOLDT, D.
C., LIN, L., ABBOTT, R., MINER, T. L., POHL, C., FEWELL, G., HAIPEK, C.,
SCHMIDT, H., DUNFORD-SHORE, B. H., KRAJA, A., CROSBY, S. D., SAWYER,
C. S., VICKERY, T., SANDER, S., ROBINSON, J., WINCKLER, W., BALDWIN, J.,
CHIRIEAC, L. R., DUTT, A., FENNELL, T., HANNA, M., JOHNSON, B. E.,
ONOFRIO, R. C., THOMAS, R. K., TONON, G., WEIR, B. A., ZHAO, X., ZIAUGRA,
L., ZODY, M. C., GIORDANO, T., ORRINGER, M. B., ROTH, J. A., SPITZ, M. R.,
WISTUBA, II, OZENBERGER, B., GOOD, P. J., CHANG, A. C., BEER, D. G.,
WATSON, M. A., LADANYI, M., BRODERICK, S., YOSHIZAWA, A., TRAVIS, W.
D., PAO, W., PROVINCE, M. A., WEINSTOCK, G. M., VARMUS, H. E., GABRIEL,
S. B., LANDER, E. S., GIBBS, R. A., MEYERSON, M. & WILSON, R. K. 2008.
Somatic mutations affect key pathways in lung adenocarcinoma. Nature, 455, 1069-75.

H.Baeissa et al.
245
DIXIT, A., YI, L., GOWTHAMAN, R., TORKAMANI, A., SCHORK, N. J. & VERKHIVKER,
G. M. 2009. Sequence and structure signatures of cancer mutation hotspots in protein
kinases. PLoS One, 4, e7485.
DIXON-CLARKE, S. E., ELKINS, J. M., CHENG, S. W., MORIN, G. B. & BULLOCK, A. N.
2015. Structures of the CDK12/CycK complex with AMP-PNP reveal a flexible C-
terminal kinase extension important for ATP binding. Sci Rep, 5, 17122.
DOMVRI, K., ZAROGOULIDIS, P., DARWICHE, K., BROWNING, R. F., LI, Q., TURNER,
J. F., KIOUMIS, I., SPYRATOS, D., PORPODIS, K., PAPAIWANNOU, A.,
TSIOUDA, T., FREITAG, L. & ZAROGOULIDIS, K. 2013. Molecular Targeted
Drugs and Biomarkers in NSCLC, the Evolving Role of Individualized Therapy. J
Cancer, 4, 736-54.
DOUVILLE, C., CARTER, H., KIM, R., NIKNAFS, N., DIEKHANS, M., STENSON, P. D.,
COOPER, D. N., RYAN, M. & KARCHIN, R. 2013. CRAVAT: cancer-related
analysis of variants toolkit. Bioinformatics, 29, 647-8.
DOUVILLE, C., MASICA, D. L., STENSON, P. D., COOPER, D. N., GYGAX, D. M., KIM,
R., RYAN, M. & KARCHIN, R. 2016. Assessing the Pathogenicity of Insertion and
Deletion Variants with the Variant Effect Scoring Tool (VEST-Indel). Hum Mutat, 37,
28-35.
DUTTA, S., BURKHARDT, K., YOUNG, J., SWAMINATHAN, G. J., MATSUURA, T.,
HENRICK, K., NAKAMURA, H. & BERMAN, H. M. 2009. Data deposition and
annotation at the worldwide protein data bank. Mol Biotechnol, 42, 1-13.
DUTTA, S., H, M. B. & W, F. B. 2007. Using the tools and resources of the RCSB protein data
bank. Curr Protoc Bioinformatics, Chapter 1, Unit1 9.
EDGAR, R. C. 2004. MUSCLE: multiple sequence alignment with high accuracy and high
throughput. Nucleic Acids Res, 32, 1792-7.
ESPINOSA, O., MITSOPOULOS, K., HAKAS, J., PEARL, F. & ZVELEBIL, M. 2014.
Deriving a mutation index of carcinogenicity using protein structure and protein
interfaces. PLoS One, 9, e84598.
ESPLIN, E. D., OEI, L. & SNYDER, M. P. 2014. Personalized sequencing and the future of
medicine: discovery, diagnosis and defeat of disease. Pharmacogenomics, 15, 1771-
1790.
FERNANDEZ, M. R., HENRY, M. D. & LEWIS, R. E. 2012. Kinase suppressor of Ras 2
(KSR2) regulates tumor cell transformation via AMPK. Mol Cell Biol, 32, 3718-31.
FERRER-COSTA, C., OROZCO, M. & DE LA CRUZ, X. 2004. Sequence-based prediction of
pathological mutations. Proteins, 57, 811-9.
FINN, R. D., COGGILL, P., EBERHARDT, R. Y., EDDY, S. R., MISTRY, J., MITCHELL, A.
L., POTTER, S. C., PUNTA, M., QURESHI, M., SANGRADOR-VEGAS, A.,

H.Baeissa et al.
246
SALAZAR, G. A., TATE, J. & BATEMAN, A. 2016. The Pfam protein families
database: towards a more sustainable future. Nucleic Acids Res, 44, D279-85.
FINN, R. D., MISTRY, J., SCHUSTER-BOCKLER, B., GRIFFITHS-JONES, S., HOLLICH,
V., LASSMANN, T., MOXON, S., MARSHALL, M., KHANNA, A., DURBIN, R.,
EDDY, S. R., SONNHAMMER, E. L. & BATEMAN, A. 2006. Pfam: clans, web tools
and services. Nucleic Acids Res, 34, D247-51.
FORBES, S. A., BEARE, D., BOUTSELAKIS, H., BAMFORD, S., BINDAL, N., TATE, J.,
COLE, C. G., WARD, S., DAWSON, E., PONTING, L., STEFANCSIK, R., HARSHA,
B., KOK, C. Y., JIA, M., JUBB, H., SONDKA, Z., THOMPSON, S., DE, T. &
CAMPBELL, P. J. 2017. COSMIC: somatic cancer genetics at high-resolution. Nucleic
Acids Res, 45, D777-D783.
FORBES, S. A., BEARE, D., GUNASEKARAN, P., LEUNG, K., BINDAL, N.,
BOUTSELAKIS, H., DING, M., BAMFORD, S., COLE, C., WARD, S., KOK, C. Y.,
JIA, M., DE, T., TEAGUE, J. W., STRATTON, M. R., MCDERMOTT, U. &
CAMPBELL, P. J. 2015. COSMIC: exploring the world's knowledge of somatic
mutations in human cancer. Nucleic Acids Res, 43, D805-11.
FUTREAL, P. A., COIN, L., MARSHALL, M., DOWN, T., HUBBARD, T., WOOSTER, R.,
RAHMAN, N. & STRATTON, M. R. 2004. A census of human cancer genes. Nat Rev
Cancer, 4, 177-83.
GARBER, M., GUTTMAN, M., CLAMP, M., ZODY, M. C., FRIEDMAN, N. & XIE, X. 2009.
Identifying novel constrained elements by exploiting biased substitution patterns.
Bioinformatics, 25, i54-62.
GARETH, J., WITTEN, D., HASTIE, T. & TIBSHIRANI, R. 2015. An Introduction to
Statistical Learning, New York, Springer.
GARRAWAY, L. A. & LANDER, E. S. 2013. Lessons from the cancer genome. Cell, 153, 17-
37.
GAUTHIER, N. P., REZNIK, E., GAO, J., SUMER, S. O., SCHULTZ, N., SANDER, C. &
MILLER, M. L. 2016. MutationAligner: a resource of recurrent mutation hotspots in
protein domains in cancer. Nucleic Acids Res, 44, D986-91.
GAUTSCHI, O., PETERS, S., ZOETE, V., AEBERSOLD-KELLER, F., STROBEL, K.,
SCHWIZER, B., HIRSCHMANN, A., MICHIELIN, O. & DIEBOLD, J. 2013. Lung
adenocarcinoma with BRAF G469L mutation refractory to vemurafenib. Lung Cancer,
82, 365-7.
GENE ONTOLOGY, C. 2015. Gene Ontology Consortium: going forward. Nucleic Acids Res,
43, D1049-56.

H.Baeissa et al.
247
GENOMES PROJECT, C., ABECASIS, G. R., ALTSHULER, D., AUTON, A., BROOKS, L.
D., DURBIN, R. M., GIBBS, R. A., HURLES, M. E. & MCVEAN, G. A. 2010. A map
of human genome variation from population-scale sequencing. Nature, 467, 1061-73.
GETZ, G., HOFLING, H., MESIROV, J. P., GOLUB, T. R., MEYERSON, M., TIBSHIRANI,
R. & LANDER, E. S. 2007. Comment on "The consensus coding sequences of human
breast and colorectal cancers". Science, 317, 1500.
GLYMOUR, C., MADIGAN, D., PREGIBON, D. & SMYTH, P. 1997. Statistical Themes and
Lessons for Data Mining. Data Mining and Knowledge Discovery, 1, 11-28.
GNAD, F., BAUCOM, A., MUKHYALA, K., MANNING, G. & ZHANG, Z. 2013.
Assessment of computational methods for predicting the effects of missense mutations
in human cancers. BMC Genomics, 14 Suppl 3, S7.
GONZALEZ-PEREZ, A., DEU-PONS, J. & LOPEZ-BIGAS, N. 2012. Improving the
prediction of the functional impact of cancer mutations by baseline tolerance
transformation. Genome Med, 4, 89.
GONZALEZ-PEREZ, A. & LOPEZ-BIGAS, N. 2012. Functional impact bias reveals cancer
drivers. Nucleic Acids Res, 40, e169.
GRAUBERT, T. A., SHEN, D., DING, L., OKEYO-OWUOR, T., LUNN, C. L., SHAO, J.,
KRYSIAK, K., HARRIS, C. C., KOBOLDT, D. C., LARSON, D. E., MCLELLAN, M.
D., DOOLING, D. J., ABBOTT, R. M., FULTON, R. S., SCHMIDT, H., KALICKI-
VEIZER, J., O'LAUGHLIN, M., GRILLOT, M., BATY, J., HEATH, S., FRATER, J.
L., NASIM, T., LINK, D. C., TOMASSON, M. H., WESTERVELT, P., DIPERSIO, J.
F., MARDIS, E. R., LEY, T. J., WILSON, R. K. & WALTER, M. J. 2011. Recurrent
mutations in the U2AF1 splicing factor in myelodysplastic syndromes. Nat Genet, 44,
53-7.
GREENMAN, C., STEPHENS, P., SMITH, R., DALGLIESH, G. L., HUNTER, C., BIGNELL,
G., DAVIES, H., TEAGUE, J., BUTLER, A., STEVENS, C., EDKINS, S., O'MEARA,
S., VASTRIK, I., SCHMIDT, E. E., AVIS, T., BARTHORPE, S., BHAMRA, G.,
BUCK, G., CHOUDHURY, B., CLEMENTS, J., COLE, J., DICKS, E., FORBES, S.,
GRAY, K., HALLIDAY, K., HARRISON, R., HILLS, K., HINTON, J., JENKINSON,
A., JONES, D., MENZIES, A., MIRONENKO, T., PERRY, J., RAINE, K.,
RICHARDSON, D., SHEPHERD, R., SMALL, A., TOFTS, C., VARIAN, J., WEBB,
T., WEST, S., WIDAA, S., YATES, A., CAHILL, D. P., LOUIS, D. N.,
GOLDSTRAW, P., NICHOLSON, A. G., BRASSEUR, F., LOOIJENGA, L., WEBER,
B. L., CHIEW, Y. E., DEFAZIO, A., GREAVES, M. F., GREEN, A. R., CAMPBELL,
P., BIRNEY, E., EASTON, D. F., CHENEVIX-TRENCH, G., TAN, M. H., KHOO, S.
K., TEH, B. T., YUEN, S. T., LEUNG, S. Y., WOOSTER, R., FUTREAL, P. A. &

H.Baeissa et al.
248
STRATTON, M. R. 2007. Patterns of somatic mutation in human cancer genomes.
Nature, 446, 153-8.
GREENMAN, C., WOOSTER, R., FUTREAL, P. A., STRATTON, M. R. & EASTON, D. F.
2006. Statistical analysis of pathogenicity of somatic mutations in cancer. Genetics, 173,
2187-98.
GRIFFITHS, A., MILLER, J., SUZUKI, D., LEWONTIN, R. & GELBART, W. 2000. An
Introduction to Genetic Analysis. Mutant types., New York, W. H. Freeman. Available
from: https://www.ncbi.nlm.nih.gov/books/NBK22011/.
GUAN, B., GAO, M., WU, C. H., WANG, T. L. & SHIH IE, M. 2012. Functional analysis of
in-frame indel ARID1A mutations reveals new regulatory mechanisms of its tumor
suppressor functions. Neoplasia, 14, 986-93.
HAMOSH, A., SCOTT, A. F., AMBERGER, J., BOCCHINI, C., VALLE, D. & MCKUSICK,
V. A. 2002. Online Mendelian Inheritance in Man (OMIM), a knowledgebase of human
genes and genetic disorders. Nucleic Acids Res, 30, 52-5.
HAN, J. H., BATEY, S., NICKSON, A. A., TEICHMANN, S. A. & CLARKE, J. 2007. The
folding and evolution of multidomain proteins. Nat Rev Mol Cell Biol, 8, 319-30.
HANAHAN, D. & WEINBERG, R. A. 2000. The hallmarks of cancer. Cell, 100, 57-70.
HANAHAN, D. & WEINBERG, R. A. 2011. Hallmarks of cancer: the next generation. Cell,
144, 646-74.
HARDING, P. J., ATTRILL, H., BOEHRINGER, J., ROSS, S., WADHAMS, G. H., SMITH,
E., ARMITAGE, J. P. & WATTS, A. 2009. Constitutive dimerization of the G-protein
coupled receptor, neurotensin receptor 1, reconstituted into phospholipid bilayers.
Biophys J, 96, 964-73.
HARRIS, M. A., CLARK, J., IRELAND, A., LOMAX, J., ASHBURNER, M., FOULGER, R.,
EILBECK, K., LEWIS, S., MARSHALL, B., MUNGALL, C., RICHTER, J., RUBIN,
G. M., BLAKE, J. A., BULT, C., DOLAN, M., DRABKIN, H., EPPIG, J. T., HILL, D.
P., NI, L., RINGWALD, M., BALAKRISHNAN, R., CHERRY, J. M., CHRISTIE, K.
R., COSTANZO, M. C., DWIGHT, S. S., ENGEL, S., FISK, D. G., HIRSCHMAN, J.
E., HONG, E. L., NASH, R. S., SETHURAMAN, A., THEESFELD, C. L., BOTSTEIN,
D., DOLINSKI, K., FEIERBACH, B., BERARDINI, T., MUNDODI, S., RHEE, S. Y.,
APWEILER, R., BARRELL, D., CAMON, E., DIMMER, E., LEE, V., CHISHOLM,
R., GAUDET, P., KIBBE, W., KISHORE, R., SCHWARZ, E. M., STERNBERG, P.,
GWINN, M., HANNICK, L., WORTMAN, J., BERRIMAN, M., WOOD, V., DE LA
CRUZ, N., TONELLATO, P., JAISWAL, P., SEIGFRIED, T., WHITE, R. & GENE
ONTOLOGY, C. 2004. The Gene Ontology (GO) database and informatics resource.
Nucleic Acids Res, 32, D258-61.

H.Baeissa et al.
249
HARTWELL, L. H., SZANKASI, P., ROBERTS, C. J., MURRAY, A. W. & FRIEND, S. H.
1997. Integrating genetic approaches into the discovery of anticancer drugs. Science,
278, 1064-8.
HELLAND, A., BRUSTUGUN, O. T., NAKKEN, S., HALVORSEN, A. R., DONNEM, T.,
BREMNES, R., BUSUND, L. T., SUN, J., LORENZ, S., SOLBERG, S. K.,
JORGENSEN, L. H., VODAK, D., MYKLEBOST, O., HOVIG, E. & MEZA-ZEPEDA,
L. A. 2017. High number of kinome-mutations in non-small cell lung cancer is
associated with reduced immune response and poor relapse-free survival. Int J Cancer,
141, 184-190.
HINDORFF, L. A., SETHUPATHY, P., JUNKINS, H. A., RAMOS, E. M., MEHTA, J. P.,
COLLINS, F. S. & MANOLIO, T. A. 2009. Potential etiologic and functional
implications of genome-wide association loci for human diseases and traits. Proc Natl
Acad Sci U S A, 106, 9362-7.
HORNBECK, P. V., ZHANG, B., MURRAY, B., KORNHAUSER, J. M., LATHAM, V. &
SKRZYPEK, E. 2015. PhosphoSitePlus, 2014: mutations, PTMs and recalibrations.
Nucleic Acids Res, 43, D512-20.
HU, J. & NG, P. C. 2013. SIFT Indel: predictions for the functional effects of amino acid
insertions/deletions in proteins. PLoS One, 8, e77940.
HUANG, D. W., SHERMAN, B. T., TAN, Q., KIR, J., LIU, D., BRYANT, D., GUO, Y.,
STEPHENS, R., BASELER, M. W., LANE, H. C. & LEMPICKI, R. A. 2007. DAVID
Bioinformatics Resources: expanded annotation database and novel algorithms to better
extract biology from large gene lists. Nucleic Acids Res, 35, W169-75.
HUBBARD, S. J., GROSS, K. H. & ARGOS, P. 1994. Intramolecular cavities in globular
proteins. Protein Eng, 7, 613-26.
HUBBARD, T., BARKER, D., BIRNEY, E., CAMERON, G., CHEN, Y., CLARK, L., COX,
T., CUFF, J., CURWEN, V., DOWN, T., DURBIN, R., EYRAS, E., GILBERT, J.,
HAMMOND, M., HUMINIECKI, L., KASPRZYK, A., LEHVASLAIHO, H.,
LIJNZAAD, P., MELSOPP, C., MONGIN, E., PETTETT, R., POCOCK, M., POTTER,
S., RUST, A., SCHMIDT, E., SEARLE, S., SLATER, G., SMITH, J., SPOONER, W.,
STABENAU, A., STALKER, J., STUPKA, E., URETA-VIDAL, A., VASTRIK, I. &
CLAMP, M. 2002. The Ensembl genome database project. Nucleic Acids Res, 30, 38-41.
HURST, J. M., MCMILLAN, L. E., PORTER, C. T., ALLEN, J., FAKOREDE, A. & MARTIN,
A. C. 2009. The SAAPdb web resource: a large-scale structural analysis of mutant
proteins. Hum Mutat, 30, 616-24.
IMIELINSKI, M., BERGER, A. H., HAMMERMAN, P. S., HERNANDEZ, B., PUGH, T. J.,
HODIS, E., CHO, J., SUH, J., CAPELLETTI, M., SIVACHENKO, A., SOUGNEZ, C.,
AUCLAIR, D., LAWRENCE, M. S., STOJANOV, P., CIBULSKIS, K., CHOI, K., DE

H.Baeissa et al.
250
WAAL, L., SHARIFNIA, T., BROOKS, A., GREULICH, H., BANERJI, S., ZANDER,
T., SEIDEL, D., LEENDERS, F., ANSEN, S., LUDWIG, C., ENGEL-RIEDEL, W.,
STOELBEN, E., WOLF, J., GOPARJU, C., THOMPSON, K., WINCKLER, W.,
KWIATKOWSKI, D., JOHNSON, B. E., JANNE, P. A., MILLER, V. A., PAO, W.,
TRAVIS, W. D., PASS, H. I., GABRIEL, S. B., LANDER, E. S., THOMAS, R. K.,
GARRAWAY, L. A., GETZ, G. & MEYERSON, M. 2012. Mapping the hallmarks of
lung adenocarcinoma with massively parallel sequencing. Cell, 150, 1107-20.
INTERNATIONAL CANCER GENOME, C., HUDSON, T. J., ANDERSON, W., ARTEZ, A.,
BARKER, A. D., BELL, C., BERNABE, R. R., BHAN, M. K., CALVO, F., EEROLA,
I., GERHARD, D. S., GUTTMACHER, A., GUYER, M., HEMSLEY, F. M.,
JENNINGS, J. L., KERR, D., KLATT, P., KOLAR, P., KUSADA, J., LANE, D. P.,
LAPLACE, F., YOUYONG, L., NETTEKOVEN, G., OZENBERGER, B.,
PETERSON, J., RAO, T. S., REMACLE, J., SCHAFER, A. J., SHIBATA, T.,
STRATTON, M. R., VOCKLEY, J. G., WATANABE, K., YANG, H., YUEN, M. M.,
KNOPPERS, B. M., BOBROW, M., CAMBON-THOMSEN, A., DRESSLER, L. G.,
DYKE, S. O., JOLY, Y., KATO, K., KENNEDY, K. L., NICOLAS, P., PARKER, M.
J., RIAL-SEBBAG, E., ROMEO-CASABONA, C. M., SHAW, K. M., WALLACE, S.,
WIESNER, G. L., ZEPS, N., LICHTER, P., BIANKIN, A. V., CHABANNON, C.,
CHIN, L., CLEMENT, B., DE ALAVA, E., DEGOS, F., FERGUSON, M. L., GEARY,
P., HAYES, D. N., HUDSON, T. J., JOHNS, A. L., KASPRZYK, A., NAKAGAWA,
H., PENNY, R., PIRIS, M. A., SARIN, R., SCARPA, A., SHIBATA, T., VAN DE
VIJVER, M., FUTREAL, P. A., ABURATANI, H., BAYES, M., BOTWELL, D. D.,
CAMPBELL, P. J., ESTIVILL, X., GERHARD, D. S., GRIMMOND, S. M., GUT, I.,
HIRST, M., LOPEZ-OTIN, C., MAJUMDER, P., MARRA, M., MCPHERSON, J. D.,
NAKAGAWA, H., NING, Z., PUENTE, X. S., RUAN, Y., SHIBATA, T.,
STRATTON, M. R., STUNNENBERG, H. G., SWERDLOW, H., VELCULESCU, V.
E., WILSON, R. K., XUE, H. H., YANG, L., SPELLMAN, P. T., BADER, G. D.,
BOUTROS, P. C., CAMPBELL, P. J., et al. 2010. International network of cancer
genome projects. Nature, 464, 993-8.
JEGGO, P. A., PEARL, L. H. & CARR, A. M. 2016. DNA repair, genome stability and cancer:
a historical perspective. Nat Rev Cancer, 16, 35-42.
JOHNSTON, S. B. & RAINES, R. T. 2015. Conformational stability and catalytic activity of
PTEN variants linked to cancers and autism spectrum disorders. Biochemistry, 54,
1576-82.
JONES, S., LI, M., PARSONS, D. W., ZHANG, X., WESSELING, J., KRISTEL, P.,
SCHMIDT, M. K., MARKOWITZ, S., YAN, H., BIGNER, D., HRUBAN, R. H.,
ESHLEMAN, J. R., IACOBUZIO-DONAHUE, C. A., GOGGINS, M., MAITRA, A.,

H.Baeissa et al.
251
MALEK, S. N., POWELL, S., VOGELSTEIN, B., KINZLER, K. W., VELCULESCU,
V. E. & PAPADOPOULOS, N. 2012. Somatic mutations in the chromatin remodeling
gene ARID1A occur in several tumor types. Hum Mutat, 33, 100-3.
KANEHISA, M., FURUMICHI, M., TANABE, M., SATO, Y. & MORISHIMA, K. 2017.
KEGG: new perspectives on genomes, pathways, diseases and drugs. Nucleic Acids Res,
45, D353-D361.
KANTARJIAN, H., ISSA, J. P., ROSENFELD, C. S., BENNETT, J. M., ALBITAR, M.,
DIPERSIO, J., KLIMEK, V., SLACK, J., DE CASTRO, C., RAVANDI, F., HELMER,
R., 3RD, SHEN, L., NIMER, S. D., LEAVITT, R., RAZA, A. & SABA, H. 2006.
Decitabine improves patient outcomes in myelodysplastic syndromes: results of a phase
III randomized study. Cancer, 106, 1794-803.
Karin, E., Susko, E. & Pupko, T. 2014. Alignment errors strongly impact likelihood-based tests
for comparing topologies. Mol. Biol, 31, 3057-67.
KATO, Y. 2015. Specific monoclonal antibodies against IDH1/2 mutations as diagnostic tools
for gliomas. Brain Tumor Pathol, 32, 3-11.
KATOH, K., KUMA, K., TOH, H. & MIYATA, T. 2005. MAFFT version 5: improvement in
accuracy of multiple sequence alignment. Nucleic Acids Res, 33, 511-8.
KAYA, M., SARHAN, A. & ALHAJJ, R. 2014. Multiple sequence alignment with affine gap
by using multi-objective genetic algorithm. Comput Methods Programs Biomed, 114,
38-49.
KAZANDJIAN, D., BLUMENTHAL, G. M., YUAN, W., HE, K., KEEGAN, P. & PAZDUR,
R. 2016. FDA Approval of Gefitinib for the Treatment of Patients with Metastatic
EGFR Mutation-Positive Non-Small Cell Lung Cancer. Clin Cancer Res, 22, 1307-12.
KEERTHI, S. S. & LIN, C.-J. 2003. Asymptotic Behaviors of Support Vector Machines with
Gaussian Kernel. Neural Computation, 15, 1667-89.
KENFIELD, S. A., WEI, E. K., STAMPFER, M. J., ROSNER, B. A. & COLDITZ, G. A. 2008.
Comparison of aspects of smoking among the four histological types of lung cancer.
Tob Control, 17, 198-204.
KIM, J. E., KIM, J. H., LEE, Y., YANG, H., HEO, Y. S., BODE, A. M., LEE, K. W. & DONG,
Z. 2016. Bakuchiol suppresses proliferation of skin cancer cells by directly targeting
Hck, Blk, and p38 MAP kinase. Oncotarget, 7, 14616-27.
KIRCHER, M., WITTEN, D. M., JAIN, P., O'ROAK, B. J., COOPER, G. M. & SHENDURE, J.
2014a. A general framework for estimating the relative pathogenicity of human genetic
variants. Nature Genetics, 46, 310-15.
KIRCHER, M., WITTEN, D. M., JAIN, P., O'ROAK, B. J., COOPER, G. M. & SHENDURE, J.
2014b. A general framework for estimating the relative pathogenicity of human genetic
variants. Nat Genet, 46, 310-5.

H.Baeissa et al.
252
KNUDSEN, M. & WIUF, C. 2010. The CATH database. Hum Genomics, 4, 207-12.
KOHAVI, R. 1995. A study of cross-validation and bootstrap for accuracy estimation and
model selection. In Proceedings of the Fourteenth International Joint Conference on
Artificial Intelligence, 1137-1143.
KOIZUMI, K., HOJO, S., AKASHI, T., YASUMOTO, K. & SAIKI, I. 2007. Chemokine
receptors in cancer metastasis and cancer cell-derived chemokines in host immune
response. Cancer Sci, 98, 1652-8.
KOTSIANTIS, S. B. 2007. Supervised machine learning: A review of classification techniques.
Informatica, 31, 249-268.
KROGH, A., BROWN, M., MIAN, I. S., SJOLANDER, K. & HAUSSLER, D. 1994. Hidden
Markov models in computational biology. Applications to protein modeling. J Mol Biol,
235, 1501-31.
KUMAR, P., HENIKOFF, S. & NG, P. C. 2009. Predicting the effects of coding non-
synonymous variants on protein function using the SIFT algorithm. Nat Protoc, 4,
1073-81.
LAJEUNIE, E., HEUERTZ, S., EL GHOUZZI, V., MARTINOVIC, J., RENIER, D., LE
MERRER, M. & BONAVENTURE, J. 2006. Mutation screening in patients with
syndromic craniosynostoses indicates that a limited number of recurrent FGFR2
mutations accounts for severe forms of Pfeiffer syndrome. Eur J Hum Genet, 14, 289-
98.
LANDRUM, M. J., LEE, J. M., BENSON, M., BROWN, G., CHAO, C., CHITIPIRALLA, S.,
GU, B., HART, J., HOFFMAN, D., HOOVER, J., JANG, W., KATZ, K., OVETSKY,
M., RILEY, G., SETHI, A., TULLY, R., VILLAMARIN-SALOMON, R.,
RUBINSTEIN, W. & MAGLOTT, D. R. 2016. ClinVar: public archive of
interpretations of clinically relevant variants. Nucleic Acids Res, 44, D862-8.
LANDRUM, M. J., LEE, J. M., BENSON, M., BROWN, G. R., CHAO, C., CHITIPIRALLA,
S., GU, B., HART, J., HOFFMAN, D., JANG, W., KARAPETYAN, K., KATZ, K.,
LIU, C., MADDIPATLA, Z., MALHEIRO, A., MCDANIEL, K., OVETSKY, M.,
RILEY, G., ZHOU, G., HOLMES, J. B., KATTMAN, B. L. & MAGLOTT, D. R. 2018.
ClinVar: improving access to variant interpretations and supporting evidence. Nucleic
Acids Res, 46, D1062-D1067.
LANDRUM, M. J., LEE, J. M., RILEY, G. R., JANG, W., RUBINSTEIN, W. S., CHURCH, D.
M. & MAGLOTT, D. R. 2014. ClinVar: public archive of relationships among
sequence variation and human phenotype. Nucleic Acids Res, 42, D980-5.
LARKINS, E., BLUMENTHAL, G. M., CHEN, H., HE, K., AGARWAL, R., GIESER, G.,
STEPHENS, O., ZAHALKA, E., RINGGOLD, K., HELMS, W., SHORD, S., YU, J.,
ZHAO, H., DAVIS, G., MCKEE, A. E., KEEGAN, P. & PAZDUR, R. 2016. FDA

H.Baeissa et al.
253
Approval: Alectinib for the Treatment of Metastatic, ALK-Positive Non-Small Cell
Lung Cancer Following Crizotinib. Clin Cancer Res, 22, 5171-5176.
LASKOWSKI, R., TYAGI, N., JOHNSON, D., JOSS, S., KINNING, E., McWILLIAM, C.,
SPLITT, M., THORNTON, J. M., FIRTH, H., D. D. D. STUDY and WRIGHT, C. 2016.
INTEGRATING POPULATION VARIATION AND PROTEIN STRUCTURAL
ANALYSIS TO IMPROVE CLINICAL INTERPRETATION OF MISSENSE
VARIATION: APPLICATION TO THE WD40 DOMAIN. Hum Mol Genet, 25, 927-
935.
LAVERGNE, J. M., DE PAILLETTE, L., BAHNAK, B. R., RIBBA, A. S., FRESSINAUD, E.,
MEYER, D. & PIETU, G. 1992. Defects in type IIA von Willebrand disease: a cysteine
509 to arginine substitution in the mature von Willebrand factor disrupts a disulphide
loop involved in the interaction with platelet glycoprotein Ib-IX. Br J Haematol, 82, 66-
72.
LAWRENCE, M. S., STOJANOV, P., POLAK, P., KRYUKOV, G. V., CIBULSKIS, K.,
SIVACHENKO, A., CARTER, S. L., STEWART, C., MERMEL, C. H., ROBERTS, S.
A., KIEZUN, A., HAMMERMAN, P. S., MCKENNA, A., DRIER, Y., ZOU, L.,
RAMOS, A. H., PUGH, T. J., STRANSKY, N., HELMAN, E., KIM, J., SOUGNEZ, C.,
AMBROGIO, L., NICKERSON, E., SHEFLER, E., CORTES, M. L., AUCLAIR, D.,
SAKSENA, G., VOET, D., NOBLE, M., DICARA, D., LIN, P., LICHTENSTEIN, L.,
HEIMAN, D. I., FENNELL, T., IMIELINSKI, M., HERNANDEZ, B., HODIS, E.,
BACA, S., DULAK, A. M., LOHR, J., LANDAU, D. A., WU, C. J., MELENDEZ-
ZAJGLA, J., HIDALGO-MIRANDA, A., KOREN, A., MCCARROLL, S. A., MORA,
J., CROMPTON, B., ONOFRIO, R., PARKIN, M., WINCKLER, W., ARDLIE, K.,
GABRIEL, S. B., ROBERTS, C. W. M., BIEGEL, J. A., STEGMAIER, K., BASS, A.
J., GARRAWAY, L. A., MEYERSON, M., GOLUB, T. R., GORDENIN, D. A.,
SUNYAEV, S., LANDER, E. S. & GETZ, G. 2013. Mutational heterogeneity in cancer
and the search for new cancer-associated genes. Nature, 499, 214-218.
LEE, E. Y. & MULLER, W. J. 2010. Oncogenes and tumor suppressor genes. Cold Spring
Harb Perspect Biol, 2, a003236.
LEE, H. Z., KWITKOWSKI, V. E., DEL VALLE, P. L., RICCI, M. S., SABER, H.,
HABTEMARIAM, B. A., BULLOCK, J., BLOOMQUIST, E., LI SHEN, Y., CHEN, X.
H., BROWN, J., MEHROTRA, N., DORFF, S., CHARLAB, R., KANE, R. C.,
KAMINSKAS, E., JUSTICE, R., FARRELL, A. T. & PAZDUR, R. 2015. FDA
Approval: Belinostat for the Treatment of Patients with Relapsed or Refractory
Peripheral T-cell Lymphoma. Clin Cancer Res, 21, 2666-70.
LEINONEN, R., DIEZ, F. G., BINNS, D., FLEISCHMANN, W., LOPEZ, R. & APWEILER, R.
2004. UniProt archive. Bioinformatics, 20, 3236-7.

H.Baeissa et al.
254
LIM, S. H., SUN, J. M., LEE, S. H., AHN, J. S., PARK, K. & AHN, M. J. 2016.
Pembrolizumab for the treatment of non-small cell lung cancer. Expert Opin Biol Ther,
16, 397-406.
LIMONGELLI, I., MARINI, S. & BELLAZZI, R. 2015. PaPI: pseudo amino acid composition
to score human protein-coding variants. BMC Bioinformatics, 16, 123.
LIU, Y., CHEN, J. & DENG, L. 2017. An unsupervised learning method exploiting sequential
output statistics. arXiv, 1702.
LORD, C. J. & ASHWORTH, A. 2017. PARP inhibitors: Synthetic lethality in the clinic.
Science, 355, 1152-1158.
LU, J. Y., HUNG, P. J., CHEN, P. L., YEN, R. F., KUO, K. T., YANG, T. L., WANG, C. Y.,
CHANG, T. C., HUANG, T. S. & CHANG, C. C. 2016. Follicular thyroid carcinoma
with NRAS Q61K and GNAS R201H mutations that had a good (131)I treatment
response. Endocrinol Diabetes Metab Case Rep, 2016, 150067.
MAO, Y., CHEN, H., LIANG, H., MERIC-BERNSTAM, F., MILLS, G. B. & CHEN, K. 2013.
CanDrA: cancer-specific driver missense mutation annotation with optimized features.
PLoS One, 8, e77945.
MARINO, K. A., SUTTO, L. & GERVASIO, F. L. 2015. The effect of a widespread cancer-
causing mutation on the inactive to active dynamics of the B-Raf kinase. J Am Chem
Soc, 137, 5280-3.
MCDONALD, I. K. & THORNTON, J. M. 1994. Satisfying hydrogen bonding potential in
proteins. J Mol Biol, 238, 777-93.
MCMAHON, B. & HANSON, R. M. 2008. A toolkit for publishing enhanced figures. J Appl
Crystallogr, 41, 811-814.
MEMBERS, S. I. B. S. I. O. B. 2016. The SIB Swiss Institute of Bioinformatics' resources:
focus on curated databases. Nucleic Acids Res, 44, D27-37.
METZ, C. H., SCHEULEN, M., BORNFELD, N., LOHMANN, D. & ZESCHNIGK, M. 2013.
Ultradeep sequencing detects GNAQ and GNA11 mutations in cell-free DNA from
plasma of patients with uveal melanoma. Cancer Med, 2, 208-15.
MILLER, M. L., REZNIK, E., GAUTHIER, N. P., AKSOY, B. A., KORKUT, A., GAO, J.,
CIRIELLO, G., SCHULTZ, N. & SANDER, C. 2015. Pan-Cancer Analysis of Mutation
Hotspots in Protein Domains. Cell Syst, 1, 197-209.
MITSOPOULOS, C., SCHIERZ, A. C., WORKMAN, P. & AL-LAZIKANI, B. 2015.
Distinctive Behaviors of Druggable Proteins in Cellular Networks. PLoS Comput Biol,
11, e1004597.
MOLINA-VILA, M. A., NABAU-MORETO, N., TORNADOR, C., SABNIS, A. J., ROSELL,
R., ESTIVILL, X., BIVONA, T. G. & MARINO-BUSLJE, C. 2014. Activating

H.Baeissa et al.
255
mutations cluster in the "molecular brake" regions of protein kinases and do not
associate with conserved or catalytic residues. Hum Mutat, 35, 318-28.
MULLANEY, J. M., MILLS, R. E., PITTARD, W. S. & DEVINE, S. E. 2010. Small insertions
and deletions (INDELs) in human genomes. Hum Mol Genet, 19, R131-6.
MURAOKA, S., SHIMA, F., ARAKI, M., INOUE, T., YOSHIMOTO, A., IJIRI, Y., SEKI, N.,
TAMURA, A., KUMASAKA, T., YAMAMOTO, M. & KATAOKA, T. 2012. Crystal
structures of the state 1 conformations of the GTP-bound H-Ras protein and its
oncogenic G12V and Q61L mutants. FEBS Lett, 586, 1715-8.
MUSCAT, J. E., STELLMAN, S. D., ZHANG, Z. F., NEUGUT, A. I. & WYNDER, E. L. 1997.
Cigarette smoking and large cell carcinoma of the lung. Cancer Epidemiol Biomarkers
Prev, 6, 477-80.
NEHRT, N. L., PETERSON, T. A., PARK, D. & KANN, M. G. 2012. Domain landscapes of
somatic mutations in cancer. BMC Genomics, 13 Suppl 4, S9.
NG, P. C. & HENIKOFF, S. 2001. Predicting deleterious amino acid substitutions. Genome Res,
11, 863-74.
NG, P. K., LI, J., JEONG, K. J., SHAO, S., CHEN, H., TSANG, Y. H., SENGUPTA, S.,
WANG, Z., BHAVANA, V. H., TRAN, R., SOEWITO, S., MINUSSI, D. C.,
MORENO, D., KONG, K., DOGRULUK, T., LU, H., GAO, J., TOKHEIM, C., ZHOU,
D. C., JOHNSON, A. M., ZENG, J., IP, C. K. M., JU, Z., WESTER, M., YU, S., LI, Y.,
VELLANO, C. P., SCHULTZ, N., KARCHIN, R., DING, L., LU, Y., CHEUNG, L. W.
T., CHEN, K., SHAW, K. R., MERIC-BERNSTAM, F., SCOTT, K. L., YI, S., SAHNI,
N., LIANG, H. & MILLS, G. B. 2018. Systematic Functional Annotation of Somatic
Mutations in Cancer. Cancer Cell, 33, 450-462 e10.
NGUYEN-NGOC, T., BOUCHAAB, H., ADJEI, A. A. & PETERS, S. 2015. BRAF Alterations
as Therapeutic Targets in Non-Small-Cell Lung Cancer. J Thorac Oncol, 10, 1396-403.
Nikolaev, S., Santoni, F., Garieri, M., Makrythanasis, P., Falconnet, E., Guipponi, M., Vannier,
A., Radovanovic, I., Bena, F., Forestier, F., Schaller, K., Dutoit, V., Clement-Schatlo,
V., Dietrich, P. & Antonarakis, S. 2014. Extrachromosomal driver mutations in
glioblastoma and low-grade glioma. Nat Commun, 5, 5690.
NOGUCHI, M., MORIKAWA, A., KAWASAKI, M., MATSUNO, Y., YAMADA, T.,
HIROHASHI, S., KONDO, H. & SHIMOSATO, Y. 1995. Small adenocarcinoma of
the lung. Histologic characteristics and prognosis. Cancer, 75, 2844-52.
NOTREDAME, C., HIGGINS, D. G. & HERINGA, J. 2000. T-Coffee: A novel method for fast
and accurate multiple sequence alignment. J Mol Biol, 302, 205-17.
ODOGWU, L., MATHIEU, L., BLUMENTHAL, G., LARKINS, E., GOLDBERG, K. B.,
GRIFFIN, N., BIJWAARD, K., LEE, E. Y., PHILIP, R., JIANG, X., RODRIGUEZ, L.,
MCKEE, A. E., KEEGAN, P. & PAZDUR, R. 2018. FDA Approval Summary:

H.Baeissa et al.
256
Dabrafenib and Trametinib for the Treatment of Metastatic Non-Small Cell Lung
Cancers Harboring BRAF V600E Mutations. Oncologist, 23, 740-745.
OREN, M. & ROTTER, V. 2010. Mutant p53 gain-of-function in cancer. Cold Spring Harb
Perspect Biol, 2, a001107.
ORENGO, C. A., MICHIE, A. D., JONES, S., JONES, D. T., SWINDELLS, M. B. &
THORNTON, J. M. 1997. CATH--a hierarchic classification of protein domain
structures. Structure, 5, 1093-108.
ORENGO, C. A., PEARL, F. M. & THORNTON, J. M. 2003. The CATH domain structure
database. Methods Biochem Anal, 44, 249-71.
PEARL, F., TODD, A., SILLITOE, I., DIBLEY, M., REDFERN, O., LEWIS, T., BENNETT,
C., MARSDEN, R., GRANT, A., LEE, D., AKPOR, A., MAIBAUM, M., HARRISON,
A., DALLMAN, T., REEVES, G., DIBOUN, I., ADDOU, S., LISE, S., JOHNSTON,
C., SILLERO, A., THORNTON, J. & ORENGO, C. 2005. The CATH Domain
Structure Database and related resources Gene3D and DHS provide comprehensive
domain family information for genome analysis. Nucleic Acids Res, 33, D247-51.
PEARL, L. H., SCHIERZ, A. C., WARD, S. E., AL-LAZIKANI, B. & PEARL, F. M. 2015.
Therapeutic opportunities within the DNA damage response. Nat Rev Cancer, 15, 166-
80.
PETERSEN, B., PETERSEN, T. N., ANDERSEN, P., NIELSEN, M. & LUNDEGAARD, C.
2009. A generic method for assignment of reliability scores applied to solvent
accessibility predictions. BMC Struct Biol, 9, 51.
PETERSON, T. A., ADADEY, A., SANTANA-CRUZ, I., SUN, Y., WINDER, A. & KANN,
M. G. 2010. DMDM: domain mapping of disease mutations. Bioinformatics, 26, 2458-9.
PETERSON, T. A., NEHRT, N. L., PARK, D. & KANN, M. G. 2012. Incorporating molecular
and functional context into the analysis and prioritization of human variants associated
with cancer. J Am Med Inform Assoc, 19, 275-83.
Philippe, H., Vienne, D., Ranwez, V., Roure, B., Baurain, D. & Delsuc, F. 2017. Pitfalls in
supermatrix phylogenomics. Eur. J. Taxon, 283:1–25.
PIRES, D. E., ASCHER, D. B. & BLUNDELL, T. L. 2014a. DUET: a server for predicting
effects of mutations on protein stability using an integrated computational approach.
Nucleic Acids Res, 42, W314-9.
PIRES, D. E., ASCHER, D. B. & BLUNDELL, T. L. 2014b. mCSM: predicting the effects of
mutations in proteins using graph-based signatures. Bioinformatics, 30, 335-42.
POLLARD KS, HUBISZ MJ, ROSENBLOOM KR & A, S. 2010. Detection of nonneutral
substitution rates on mammalian phylogenies. Genome Res, 20, 110-121.
PORTA-PARDO, E. & GODZIK, A. 2014. e-Driver: a novel method to identify protein regions
driving cancer. Bioinformatics, 30, 3109-14.

H.Baeissa et al.
257
Porta-Pardo, E., Garcia-Alonso, L., Hrabe, T., Dopazo, J. & Godzik, A. 2015. A Pan-Cancer
Catalogue of Cancer Driver Protein Interaction Interfaces. PLoS Comput Biol, 11,
e1004518.
QUINLAN, J. R. 1987. Simplifying decision trees. International Journal of Man-Machine
Studies, 27, 221-34.
RATNER, B. 2011. Statistical and Machine-learning Data Mining : Techniques for Better
Predictive Modeling and Analysis of Big Data., Chapman and Hall/CRC.
REINTJES, N., LI, Y., BECKER, A., ROHMANN, E., SCHMUTZLER, R. & WOLLNIK, B.
2013. Activating somatic FGFR2 mutations in breast cancer. PLoS One, 8, e60264.
REVA, B., ANTIPIN, Y. & SANDER, C. 2011. Predicting the functional impact of protein
mutations: application to cancer genomics. Nucleic Acids Res, 39, e118.
RICHARDSON, C. J., GAO, Q., MITSOPOULOUS, C., ZVELEBIL, M., PEARL, L. H. &
PEARL, F. M. 2009. MoKCa database--mutations of kinases in cancer. Nucleic Acids
Res, 37, D824-31.
RIZVI, N. A., HELLMANN, M. D., SNYDER, A., KVISTBORG, P., MAKAROV, V.,
HAVEL, J. J., LEE, W., YUAN, J., WONG, P., HO, T. S., MILLER, M. L.,
REKHTMAN, N., MOREIRA, A. L., IBRAHIM, F., BRUGGEMAN, C., GASMI, B.,
ZAPPASODI, R., MAEDA, Y., SANDER, C., GARON, E. B., MERGHOUB, T.,
WOLCHOK, J. D., SCHUMACHER, T. N. & CHAN, T. A. 2015. Cancer immunology.
Mutational landscape determines sensitivity to PD-1 blockade in non-small cell lung
cancer. Science, 348, 124-8.
ROKACH, L. & MAIMON, O. 2005. Top-down induction of decision trees classifiers-a survey.
IEEE Transactions on Systems, Man, and Cybernetics, Part C, 35, 476-87.
SAMMUT, S. J., FINN, R. D. & BATEMAN, A. 2008. Pfam 10 years on: 10,000 families and
still growing. Brief Bioinform, 9, 210-9.
SCHEID, C., REECE, D., BEKSAC, M., SPENCER, A., CALLANDER, N., SONNEVELD, P.,
KALIMI, G., CAI, C., SHI, M., SCOTT, J. W. & STEWART, A. K. 2015. Phase 2
study of dovitinib in patients with relapsed or refractory multiple myeloma with or
without t(4;14) translocation. Eur J Haematol, 95, 316-24.
SCHMIDT, D., JACOB, R., LOISEAU, P., DEISENHAMMER, E., KLINGER, D.,
DESPLAND, A., EGLI, M., BAUER, G., STENZEL, E. & BLANKENHORN, V. 1993.
Zonisamide for add-on treatment of refractory partial epilepsy: a European double-blind
trial. Epilepsy Res, 15, 67-73.
SCHRANK, Z., CHHABRA, G., LIN, L., IDERZORIG, T., OSUDE, C., KHAN, N.,
KUCKOVIC, A., SINGH, S., MILLER, R. J. & PURI, N. 2018. Current Molecular-
Targeted Therapies in NSCLC and Their Mechanism of Resistance. Cancers (Basel), 10.

H.Baeissa et al.
258
SCHROEDER, M. P., RUBIO-PEREZ, C., TAMBORERO, D., GONZALEZ-PEREZ, A. &
LOPEZ-BIGAS, N. 2014. OncodriveROLE classifies cancer driver genes in loss of
function and activating mode of action. Bioinformatics, 30, i549-55.
SCOTT, L. M., TONG, W., LEVINE, R. L., SCOTT, M. A., BEER, P. A., STRATTON, M. R.,
FUTREAL, P. A., ERBER, W. N., MCMULLIN, M. F., HARRISON, C. N.,
WARREN, A. J., GILLILAND, D. G., LODISH, H. F. & GREEN, A. R. 2007. JAK2
exon 12 mutations in polycythemia vera and idiopathic erythrocytosis. N Engl J Med,
356, 459-68.
SEBASTIANI, F. 2002. Machine learning in automated text categorization. ACM Computing
Surveys (CSUR), 34, 1-47.
SHEN, J. P., ZHAO, D., SASIK, R., LUEBECK, J., BIRMINGHAM, A., BOJORQUEZ-
GOMEZ, A., LICON, K., KLEPPER, K., PEKIN, D., BECKETT, A. N., SANCHEZ, K.
S., THOMAS, A., KUO, C. C., DU, D., ROGUEV, A., LEWIS, N. E., CHANG, A. N.,
KREISBERG, J. F., KROGAN, N., QI, L., IDEKER, T. & MALI, P. 2017.
Combinatorial CRISPR-Cas9 screens for de novo mapping of genetic interactions. Nat
Methods, 14, 573-576.
SHEN, L., SHI, Q. & WANG, W. 2018. Double agents: genes with both oncogenic and tumor-
suppressor functions. Oncogenesis, 7, 25.
SHER, T., DY, G. K. & ADJEI, A. A. 2008. Small cell lung cancer. Mayo Clin Proc, 83, 355-
67.
SHERRY, S. T., WARD, M. H., KHOLODOV, M., BAKER, J., PHAN, L., SMIGIELSKI, E.
M. & SIROTKIN, K. 2001. dbSNP: the NCBI database of genetic variation. Nucleic
Acids Res, 29, 308-11.
SHIHAB, H. A., GOUGH, J., COOPER, D. N., DAY, I. N. & GAUNT, T. R. 2013a. Predicting
the functional consequences of cancer-associated amino acid substitutions.
Bioinformatics, 29, 1504-10.
SHIHAB, H. A., GOUGH, J., COOPER, D. N., STENSON, P. D., BARKER, G. L.,
EDWARDS, K. J., DAY, I. N. & GAUNT, T. R. 2013b. Predicting the functional,
molecular, and phenotypic consequences of amino acid substitutions using hidden
Markov models. Hum Mutat, 34, 57-65.
SIGRIST, C. J., DE CASTRO, E., CERUTTI, L., CUCHE, B. A., HULO, N., BRIDGE, A.,
BOUGUELERET, L. & XENARIOS, I. 2013. New and continuing developments at
PROSITE. Nucleic Acids Res, 41, D344-7.
SIM, N. L., KUMAR, P., HU, J., HENIKOFF, S., SCHNEIDER, G. & NG, P. C. 2012. SIFT
web server: predicting effects of amino acid substitutions on proteins. Nucleic Acids Res,
40, W452-7.

H.Baeissa et al.
259
SONDKA, Z., BAMFORD, S., COLE, C., DAWSON, E., PONTING, L., STEFANCSIK, R.,
WARD, S., JUBB, H., THOMPSON, S., BEARE, D., BINDAL, N., BOUTSELAKIS,
C., FISH, P., HARSHA, B., KOK, C., RAMSHAW, C., RYE, C., TATE, J., WANG, S.,
CAMPBELL, P. & FORBES, S. 2018. Abstract 3284: COSMIC: Integrating and
interpreting the world's knowledge of somatic mutations in cancer. Cancer Res, 3284.
SONDKA, Z., BAMFORD, S., COLE, C., DAWSON, E., PONTING, L., STEFANCSIK, R.,
WARD, S., TATE, J., CAMPBELL, P. & FORBES, S. 2017. Abstract 2599: COSMIC
Cancer Gene Census: expert descriptions across genes in oncogenesis. Cancer Res,
2599.
SRIVAS, R., SHEN, J. P., YANG, C. C., SUN, S. M., LI, J., GROSS, A. M., JENSEN, J.,
LICON, K., BOJORQUEZ-GOMEZ, A., KLEPPER, K., HUANG, J., PEKIN, D., XU,
J. L., YEERNA, H., SIVAGANESH, V., KOLLENSTART, L., VAN ATTIKUM, H.,
AZA-BLANC, P., SOBOL, R. W. & IDEKER, T. 2016. A Network of Conserved
Synthetic Lethal Interactions for Exploration of Precision Cancer Therapy. Mol Cell, 63,
514-25.
STELLMAN, S. D., MUSCAT, J. E., HOFFMANN, D. & WYNDER, E. L. 1997. Impact of
filter cigarette smoking on lung cancer histology. Prev Med, 26, 451-6.
STENSON, P. D., MORT, M., BALL, E. V., HOWELLS, K., PHILLIPS, A. D., THOMAS, N.
S. & COOPER, D. N. 2009. The Human Gene Mutation Database: 2008 update.
Genome Med, 1, 13.
STEPHENS, P. J., TARPEY, P. S., DAVIES, H., VAN LOO, P., GREENMAN, C., WEDGE,
D. C., NIK-ZAINAL, S., MARTIN, S., VARELA, I., BIGNELL, G. R., YATES, L. R.,
PAPAEMMANUIL, E., BEARE, D., BUTLER, A., CHEVERTON, A., GAMBLE, J.,
HINTON, J., JIA, M., JAYAKUMAR, A., JONES, D., LATIMER, C., LAU, K. W.,
MCLAREN, S., MCBRIDE, D. J., MENZIES, A., MUDIE, L., RAINE, K., RAD, R.,
CHAPMAN, M. S., TEAGUE, J., EASTON, D., LANGEROD, A., OSLO BREAST
CANCER, C., LEE, M. T., SHEN, C. Y., TEE, B. T., HUIMIN, B. W., BROEKS, A.,
VARGAS, A. C., TURASHVILI, G., MARTENS, J., FATIMA, A., MIRON, P., CHIN,
S. F., THOMAS, G., BOYAULT, S., MARIANI, O., LAKHANI, S. R., VAN DE
VIJVER, M., VAN 'T VEER, L., FOEKENS, J., DESMEDT, C., SOTIRIOU, C.,
TUTT, A., CALDAS, C., REIS-FILHO, J. S., APARICIO, S. A., SALOMON, A. V.,
BORRESEN-DALE, A. L., RICHARDSON, A. L., CAMPBELL, P. J., FUTREAL, P.
A. & STRATTON, M. R. 2012. The landscape of cancer genes and mutational
processes in breast cancer. Nature, 486, 400-4.
STEWARD, W. T., HEREK, G. M., RAMAKRISHNA, J., BHARAT, S., CHANDY, S.,
WRUBEL, J. & EKSTRAND, M. L. 2008. HIV-related stigma: adapting a theoretical
framework for use in India. Soc Sci Med, 67, 1225-35.

H.Baeissa et al.
260
STRATTON, M. R., CAMPBELL, P. J. & FUTREAL, P. A. 2009. The cancer genome. Nature,
458, 719-24.
SUTOVSKY, H. & GAZIT, E. 2004. The von Hippel-Lindau tumor suppressor protein is a
molten globule under native conditions: implications for its physiological activities. J
Biol Chem, 279, 17190-6.
SUYKENS, J. & VANDEWALLE, J. 1999. Least Squares Support Vector Machine Classifiers.
Neural Processing Letters, 9, 293-300.
SUZEK, B. E., HUANG, H., MCGARVEY, P., MAZUMDER, R. & WU, C. H. 2007. UniRef:
comprehensive and non-redundant UniProt reference clusters. Bioinformatics, 23, 1282-
8.
SVETNIK, V., LIAW, A., TONG, C., CULBERSON, J. C., SHERIDAN, R. P. & FEUSTON,
B. P. 2003. Random Forests: a classification and regression tool for compound
classification and QSAR modeling. J Chem Inf Comput Sci, 43, 1947-58.
TAMBORERO, D., GONZALEZ-PEREZ, A. & LOPEZ-BIGAS, N. 2013. OncodriveCLUST:
exploiting the positional clustering of somatic mutations to identify cancer genes.
Bioinformatics, 29, 2238-44.
TEFFERI, A. & PARDANANI, A. 2015. Myeloproliferative Neoplasms: A Contemporary
Review. JAMA Oncol, 1, 97-105.
TENNESSEN, J. A., BIGHAM, A. W., O'CONNOR, T. D., FU, W., KENNY, E. E., GRAVEL,
S., MCGEE, S., DO, R., LIU, X., JUN, G., KANG, H. M., JORDAN, D., LEAL, S. M.,
GABRIEL, S., RIEDER, M. J., ABECASIS, G., ALTSHULER, D., NICKERSON, D.
A., BOERWINKLE, E., SUNYAEV, S., BUSTAMANTE, C. D., BAMSHAD, M. J.,
AKEY, J. M., BROAD, G. O., SEATTLE, G. O. & PROJECT, N. E. S. 2012. Evolution
and functional impact of rare coding variation from deep sequencing of human exomes.
Science, 337, 64-9.
THE UNIPROT, C. 2017. UniProt: the universal protein knowledgebase. Nucleic Acids Res, 45,
D158-D169.
THOMAS, T. M. & SCOPES, R. K. 1998. The effects of temperature on the kinetics and
stability of mesophilic and thermophilic 3-phosphoglycerate kinases. Biochem J, 330
( Pt 3), 1087-95.
THORNTON, K., KIM, G., MAHER, V. E., CHATTOPADHYAY, S., TANG, S., MOON, Y.
J., SONG, P., MARATHE, A., BALAKRISHNAN, S., ZHU, H., GARNETT, C., LIU,
Q., BOOTH, B., GEHRKE, B., DORSAM, R., VERBOIS, L., GHOSH, D., WILSON,
W., DUAN, J., SARKER, H., MIKSINSKI, S. P., SKARUPA, L., IBRAHIM, A.,
JUSTICE, R., MURGO, A. & PAZDUR, R. 2012. Vandetanib for the treatment of
symptomatic or progressive medullary thyroid cancer in patients with unresectable

H.Baeissa et al.
261
locally advanced or metastatic disease: U.S. Food and Drug Administration drug
approval summary. Clin Cancer Res, 18, 3722-30.
TOKHEIM, C., BHATTACHARYA, R., NIKNAFS, N., GYGAX, D. M., KIM, R., RYAN, M.,
MASICA, D. L. & KARCHIN, R. 2016. Exome-Scale Discovery of Hotspot Mutation
Regions in Human Cancer Using 3D Protein Structure. Cancer Res, 76, 3719-31.
TOKURIKI, N. & TAWFIK, D. S. 2009. Stability effects of mutations and protein evolvability.
Curr Opin Struct Biol, 19, 596-604.
TOMCZAK, K., CZERWINSKA, P. & WIZNEROWICZ, M. 2015. The Cancer Genome Atlas
(TCGA): an immeasurable source of knowledge. Contemp Oncol (Pozn), 19, A68-77.
TONG, J. H., LUNG, R. W., SIN, F. M., LAW, P. P., KANG, W., CHAN, A. W., MA, B. B.,
MAK, T. W., NG, S. S. & TO, K. F. 2014. Characterization of rare transforming KRAS
mutations in sporadic colorectal cancer. Cancer Biol Ther, 15, 768-76.
TORIBIO, A. L., ALAKO, B., AMID, C., CERDENO-TARRAGA, A., CLARKE, L.,
CLELAND, I., FAIRLEY, S., GIBSON, R., GOODGAME, N., TEN HOOPEN, P.,
JAYATHILAKA, S., KAY, S., LEINONEN, R., LIU, X., MARTINEZ-VILLACORTA,
J., PAKSERESHT, N., RAJAN, J., REDDY, K., ROSELLO, M., SILVESTER, N.,
SMIRNOV, D., VAUGHAN, D., ZALUNIN, V. & COCHRANE, G. 2017. European
Nucleotide Archive in 2016. Nucleic Acids Res, 45, D32-D36.
TORSHIN, I. Y. & HARRISON, R. W. 2001. Charge centers and formation of the protein
folding core. Proteins, 43, 353-64.
TORTI, D. & TRUSOLINO, L. 2011. Oncogene addiction as a foundational rationale for
targeted anti-cancer therapy: promises and perils. EMBO Mol Med, 3, 623-36.
TRESS, M., TAI, C. H., WANG, G., EZKURDIA, I., LOPEZ, G., VALENCIA, A., LEE, B. &
DUNBRACK, R. L., JR. 2005. Domain definition and target classification for CASP6.
Proteins, 61 Suppl 7, 8-18.
TYM, J. E., MITSOPOULOS, C., COKER, E. A., RAZAZ, P., SCHIERZ, A. C., ANTOLIN, A.
A. & AL-LAZIKANI, B. 2016. canSAR: an updated cancer research and drug
discovery knowledgebase. Nucleic Acids Res, 44, D938-43.
UNIPROT, C. 2010. The Universal Protein Resource (UniProt) in 2010. Nucleic Acids Res, 38,
D142-8.
VAUGHAN, T. L., DAVIS, S., KRISTAL, A. & THOMAS, D. B. 1995. Obesity, alcohol, and
tobacco as risk factors for cancers of the esophagus and gastric cardia: adenocarcinoma
versus squamous cell carcinoma. Cancer Epidemiol Biomarkers Prev, 4, 85-92.
VOGEL, C., BASHTON, M., KERRISON, N. D., CHOTHIA, C. & TEICHMANN, S. A. 2004.
Structure, function and evolution of multidomain proteins. Curr Opin Struct Biol, 14,
208-16.

H.Baeissa et al.
262
VOGELSTEIN, B., PAPADOPOULOS, N., VELCULESCU, V. E., ZHOU, S., DIAZ, L. A.,
JR. & KINZLER, K. W. 2013. Cancer genome landscapes. Science, 339, 1546-58.
WALLACE, A. C., LASKOWSKI, R. A. & THORNTON, J. M. 1995. LIGPLOT: a program to
generate schematic diagrams of protein-ligand interactions. Protein Eng, 8, 127-34.
WAN, P. T., GARNETT, M. J., ROE, S. M., LEE, S., NICULESCU-DUVAZ, D., GOOD, V.
M., JONES, C. M., MARSHALL, C. J., SPRINGER, C. J., BARFORD, D., MARAIS,
R. & CANCER GENOME, P. 2004. Mechanism of activation of the RAF-ERK
signaling pathway by oncogenic mutations of B-RAF. Cell, 116, 855-67.
WANG, K., KAN, J., YUEN, S. T., SHI, S. T., CHU, K. M., LAW, S., CHAN, T. L., KAN, Z.,
CHAN, A. S., TSUI, W. Y., LEE, S. P., HO, S. L., CHAN, A. K., CHENG, G. H.,
ROBERTS, P. C., REJTO, P. A., GIBSON, N. W., POCALYKO, D. J., MAO, M., XU,
J. & LEUNG, S. Y. 2011. Exome sequencing identifies frequent mutation of ARID1A
in molecular subtypes of gastric cancer. Nat Genet, 43, 1219-23.
Wang, L., Leebens-Mack, J., Wall, P., Beckmann, K., de Pamphilis, C.& Warnow, T. 2011. The
impact of multiple protein sequence alignment on phylogenetic estimation. IEEE/ACM
Trans. Comput. Biol. Bioinform, 8,1108-19.
WANG, Z., JENSEN, M. A. & ZENKLUSEN, J. C. 2016. A Practical Guide to The Cancer
Genome Atlas (TCGA). Methods Mol Biol, 1418, 111-41.
WAPNER, J. 2014. The Philadelphia Chromosome: A Genetic Mystery, a Lethal Cancer, and
the Improbable Invention of a Lifesaving Treatment, The Experiment.
WATERHOUSE, A. M., PROCTER, J. B., MARTIN, D. M., CLAMP, M. & BARTON, G. J.
2009. Jalview Version 2--a multiple sequence alignment editor and analysis workbench.
Bioinformatics, 25, 1189-91.
WEINBERG, R. A. 2014. The biology of cancer, Garland Science.
WORLD HEALTH ORGANIZATION. 2018. Cancer [Online]. Available:
http://www.who.int/news-room/fact-sheets/detail/cancer [Accessed 8 Oct 2018].
WU, C. H., YEH, L. S., HUANG, H., ARMINSKI, L., CASTRO-ALVEAR, J., CHEN, Y., HU,
Z., KOURTESIS, P., LEDLEY, R. S., SUZEK, B. E., VINAYAKA, C. R., ZHANG, J.
& BARKER, W. C. 2003. The Protein Information Resource. Nucleic Acids Res, 31,
345-7.
XU, Y., ZHANG, H., NGUYEN, V. T., ANGELOPOULOS, N., NUNES, J., REID, A.,
BULUWELA, L., MAGNANI, L., STEBBING, J. & GIAMAS, G. 2015. LMTK3
Represses Tumor Suppressor-like Genes through Chromatin Remodeling in Breast
Cancer. Cell Rep, 12, 837-49.
YANG, B., ZHONG, C., PENG, Y., LAI, Z. & DING, J. 2010. Molecular mechanisms of "off-
on switch" of activities of human IDH1 by tumor-associated mutation R132H. Cell Res,
20, 1188-200.

H.Baeissa et al.
263
YANG, F., PETSALAKI, E., ROLLAND, T., HILL, D. E., VIDAL, M. & ROTH, F. P. 2015.
Protein domain-level landscape of cancer-type-specific somatic mutations. PLoS
Comput Biol, 11, e1004147.
YAP, T. A. & WORKMAN, P. 2012. Exploiting the cancer genome: strategies for the discovery
and clinical development of targeted molecular therapeutics. Annu Rev Pharmacol
Toxicol, 52, 549-73.
YATES, C. M., FILIPPIS, I., KELLEY, L. A. & STERNBERG, M. J. 2014. SuSPect: enhanced
prediction of single amino acid variant (SAV) phenotype using network features. J Mol
Biol, 426, 2692-701.
YEKKEHKHANY, B., HOMAYOUNI, A. & HASANLOU, M. 2014. A comparison study of
different kernel functions for SVM-based classification multi-temporal polarimetry
SAR DATA. International Conference on Geospa- tial Information Research, 281–285.
YUE, P., FORREST, W. F., KAMINKER, J. S., LOHR, S., ZHANG, Z. & CAVET, G. 2010.
Inferring the functional effects of mutation through clusters of mutations in homologous
proteins. Hum Mutat, 31, 264-71.
YUNG, C., O'CONNOR, B., YAKNEEN, S., ZHANG, J., ELLROTT, K., KLEINHEINZ, K.,
MIYOSHI, N., RAINE, K., ROYO, R., SAKSENA, G., SCHLESNER, M., SHORSER,
S., VAZQUEZ, M., WEISCHENFELDT, J., YUEN, D., BUTLER, A., DAVIS-
DUSENBERY, B., EILS, R., FERRETTI, V., GROSSMAN, R., HARISMENDY, O.,
KIM, Y., NAKAGAWA, H., NEWHOUSE, S., TORRENTS, D., STEIN, L. & GROUP,
P. T. W. 2017. Large-Scale Uniform Analysis of Cancer Whole Genomes in Multiple
Computing Environments. bioRxiv.
ZERBINO, D. R., ACHUTHAN, P., AKANNI, W., AMODE, M. R., BARRELL, D., BHAI, J.,
BILLIS, K., CUMMINS, C., GALL, A., GIRON, C. G., GIL, L., GORDON, L.,
HAGGERTY, L., HASKELL, E., HOURLIER, T., IZUOGU, O. G., JANACEK, S. H.,
JUETTEMANN, T., TO, J. K., LAIRD, M. R., LAVIDAS, I., LIU, Z., LOVELAND, J.
E., MAUREL, T., MCLAREN, W., MOORE, B., MUDGE, J., MURPHY, D. N.,
NEWMAN, V., NUHN, M., OGEH, D., ONG, C. K., PARKER, A., PATRICIO, M.,
RIAT, H. S., SCHUILENBURG, H., SHEPPARD, D., SPARROW, H., TAYLOR, K.,
THORMANN, A., VULLO, A., WALTS, B., ZADISSA, A., FRANKISH, A., HUNT,
S. E., KOSTADIMA, M., LANGRIDGE, N., MARTIN, F. J., MUFFATO, M., PERRY,
E., RUFFIER, M., STAINES, D. M., TREVANION, S. J., AKEN, B. L.,
CUNNINGHAM, F., YATES, A. & FLICEK, P. 2018. Ensembl 2018. Nucleic Acids
Res, 46, D754-D761.
ZHANG, R. & SONG, C. 2014. Loss of CSMD1 or 2 may contribute to the poor prognosis of
colorectal cancer patients. Tumour Biol, 35, 4419-23.

H.Baeissa et al.
264
ZHANG, X., LIN, H., ZHAO, H., HAO, Y., MORT, M., COOPER, D. N., ZHOU, Y. & LIU, Y.
2014. Impact of human pathogenic micro-insertions and micro-deletions on post-
transcriptional regulation. Hum Mol Genet, 23, 3024-34.
ZHANG, Y., CHANDONIA, J. M., DING, C. & HOLBROOK, S. R. 2005. Comparative
mapping of sequence-based and structure-based protein domains. BMC Bioinformatics,
6, 77.
ZHANG, Z., LEE, J. C., LIN, L., OLIVAS, V., AU, V., LAFRAMBOISE, T., ABDEL-
RAHMAN, M., WANG, X., LEVINE, A. D., RHO, J. K., CHOI, Y. J., CHOI, C. M.,
KIM, S. W., JANG, S. J., PARK, Y. S., KIM, W. S., LEE, D. H., LEE, J. S., MILLER,
V. A., ARCILA, M., LADANYI, M., MOONSAMY, P., SAWYERS, C., BOGGON, T.
J., MA, P. C., COSTA, C., TARON, M., ROSELL, R., HALMOS, B. & BIVONA, T. G.
2012. Activation of the AXL kinase causes resistance to EGFR-targeted therapy in lung
cancer. Nat Genet, 44, 852-60.
ZHANG, Z., STIEGLER, A. L., BOGGON, T. J., KOBAYASHI, S. & HALMOS, B. 2010.
EGFR-mutated lung cancer: a paradigm of molecular oncology. Oncotarget, 1, 497-514.
ZHAO, H., YANG, Y., LIN, H., ZHANG, X., MORT, M., COOPER, D. N., LIU, Y. & ZHOU,
Y. 2013. DDIG-in: discriminating between disease-associated and neutral non-
frameshifting micro-indels. Genome Biol, 14, R23.