Mitochondrial DNA deletions are associated with non-B DNA conformations
Upload
independentCategory
view
3download
0
REPORT
AZFc Deletions and Spermatogenic Failure:A Population-Based Survey of 20,000 Y Chromosomes
Steven G. Rozen,1,2 Janet D. Marszalek,1,3 Kathryn Irenze,4 Helen Skaletsky,1,3 Laura G. Brown,1,3
Robert D. Oates,5 Sherman J. Silber,6 Kristin Ardlie,4,7 and David C. Page1,3,8,*
Deletions involving the Y chromosome’s AZFc region are the most common known genetic cause of severe spermatogenic failure (SSF).
Six recurrent interstitial deletions affecting the region have been reported, but their population genetics are largely unexplored. We
assessed the deletions’ prevalence in 20,884 men in five populations and found four of the six deletions (presented here in descending
order of prevalence): gr/gr, b2/b3, b1/b3, and b2/b4. One of every 27 men carried one of these four deletions. The 1.6 Mb gr/gr deletion,
found in one of every 41 men, almost doubles the risk of SSF and accounts for ~2% of SSF, although <2% of men with the deletion are
affected. The 1.8Mb b2/b3 deletion, found in one of every 90men, does not appear to be a risk factor for SSF. The 1.6 Mb b1/b3 deletion,
found in one of every 994men, appears to increase the risk of SSF by a factor of 2.5, although<2% of men with the deletion are affected,
and it accounts for only 0.15% of SSF. The 3.5 Mb b2/b4 deletion, found in one of every 2,320 men, increases the risk of SSF 145 times
and accounts for ~6% of SSF; the observed prevalence should approximate the rate at which the deletion arises anew in each generation.
We conclude that a single rare variant of major effect (the b2/b4 deletion) and a single common variant of modest effect (the gr/gr
deletion) are largely responsible for the AZFc region’s contribution to SSF in the population.
The 4.5 Mb AZFc region (MIM 41500; Figure 1) of the
Y chromosome is remarkable for its structural complexity
(including the largest known palindrome in any genome
sequenced to date), its propensity to suffer massive dele-
tion, and the contribution of those deletions to sper-
matogenic failure while apparently sparing all other body
functions.1–7 This last characteristic suggests a regional
functional specialization that is uncommon in eukaryotic
genomes. In fact, deletions affecting the AZFc region are
the most common known genetic cause of severe sper-
matogenic failure (SSF), defined by a sperm count of less
than five million per milliliter of semen in the absence of
physical obstruction.
The complex structure of the AZFc region, which is com-
posed of massive, near-perfect amplicons, posed special
challenges for sequencing the regionand thereby character-
izing deletions that affect it. To achieve the required level of
accuracy and completeness, we previously developed a
method (SHIMS, or single-haplotype iterativemapping and
sequencing) toassemble its referenceDNAsequence.1,8 This
AZFc-inspired strategy was subsequently employed for
assembling the DNA sequences of the male-specific regions
of thehuman, chimpanzee, and rhesusY chromosomesand
the chicken Z chromosome.9–12 Sequencing of the AZFc
region enabled our laboratory to identify and molecularly
define six recurrent interstitial deletions that remove large
portions of the region.1–3,5,6 Most of these recurrent dele-
tions are the consequence ofnonallelichomologous recom-
bination between near-identical amplicons found within
and near the AZFc region (Figure 1).1,2,5–7
1Whitehead Institute for Biomedical Research, Cambridge, MA 02142, USA; 2D
Hughes Medical Institute, Chevy Chase, MD 20815, USA; 4Genomics Collabo
Urology, Boston University School of Medicine, Boston Medical Center, Bost
Louis, MO 63017, USA; 7Broad Institute of MIT and Harvard, Cambridge, MA 0
Cambridge, MA 02139, USA
*Correspondence: [email protected]
http://dx.doi.org/10.1016/j.ajhg.2012.09.003. �2012 by The American Societ
890 The American Journal of Human Genetics 91, 890–896, Novemb
Although numerous studies have examined the relation-
ship between SSF and deletions affecting the AZFc
region,3–6,13–17 the frequencies of the various deletions in
any general population, and hence their precise popula-
tion contributions to SSF, have remained unknown. In
this regard, the chief limitation of previous studies is that
they were focused on men who were studied because of
clinically ascertained infertility. In addition, sample sizes
have been small: almost always <1,000 men.
With the goal of understanding the population frequen-
cies of the six recurrent, interstitial deletions affecting the
AZFc region, we undertook a screen for these six deletions
in 20,884 men from five populations: India (city of Pune),
Poland (city of Katowice), Tunisia (city of Monastir), the
United States (multiple sites), and Vietnam (cities of Hanoi
and Hue). We used anonymized DNA samples collected by
Genomics Collaborative for disease studies. The DNA
donors included healthy controls and men with osteoar-
thritis, rheumatoid arthritis, asthma, hypertension, coro-
nary artery disease, myocardial infarction, hyperlipidemia,
stroke, type 2 diabetes, or osteoporosis. Table 1 shows the
numbers of DNA samples screened and their geographic
origins. This study was approved by the institutional
review board at the Massachusetts Institute of Tech-
nology, and proper informed consent was obtained from
participants.
We screened for interstitial deletions involving AZFc in
two stages (Figure 2). In stage 1, we tested for the presence
or absence of the sequence tagged sites (STSs) sY1191 and
sY1291, one or both of which are deleted in all known
uke-NUS Graduate Medical School, Singapore 169857, Singapore; 3Howard
rative, SeraCare Life Sciences, Cambridge, MA 02139, USA; 5Department of
on, MA 02118, USA; 6Infertility Center of St. Louis, St. Luke’s Hospital, St.
2142, USA; 8Department of Biology, Massachusetts Institute of Technology,
y of Human Genetics. All rights reserved.
er 2, 2012

C
b2/b3 deletion on b2/b3-inverted organization
b2/b3 deletion on gr/rg-inverted organization
B
b1 b4b3b2 g2 g3g1 r2 r4r3r1
sY11
89sY
1291
sY25
4
sY25
4
sY11
92sY
1191
* *
sY11
92sY
1191
*
sY11
92sY
1191
**
sY11
89sY
1291
sY11
89sY
1291
*
gr/gr deletion
A
sY14
Yp Yqcen
Male-specific region (MSY)= Heterochromatic region
sY11
92
sY14
2
sY14
b1/b3b2/b3gr/gr
- --- -- -- -
- -- -
b2/b4
E
sY11
89
*
sY12
91
*
sY11
91
sY12
01
sY25
4
D
sY11
89sY
1291
sY25
4
sY25
4
sY11
92sY
1191
* *
b1/b3 deletion
b2/b4 deletion
sY12
01
sY14
2
(3.5 Mb)b2/b4
gr/gr
b1/b3b2/b3
Figure 1. The AZFc Region of the Y Chromosome and DeletionsAffecting It(A) Overview of the Y chromosome, including the male-specificregion (MSY). The AZFc region is located in the euchromaticportion of the long arm. STS sY14, located in the sex-determininggene SRY (MIM 480000), served as a positive control for thepresence of detectable Y chromosome DNA. The four deletionsobserved in the present study are schematized here and in thepanels below.(B) Sequence organization of the AZFc region and STSs used fordetecting and categorizing deletions involving AZFc. Coloredarrows indicate large, nearly identical segmental duplications,termed ‘‘amplicons’’ in this context. Arrows of the same colorare >99.82% identical to each other.1 Table S1 provides assaydetails for STSs.We used STSs sY1191 and sY1291,marked by aster-isks, in stage 1 of the screen. STS sY254 detects multiple sites in theAZFc region. A green ‘‘bow’’ indicates amplicons involved inectopic crossing over in the gr/gr deletion and regions and STSsaffected; the gr/gr deletion results in loss of only sY1291 andsY1189.
The American
recurrent deletions involving AZFc (Figure 1 and Table S1,
available online). In stage 2, we further tested the Y chro-
mosomes that appeared to lack sY1191 and/or sY1291. In
this stage, we confirmed the results for sY1191 and
sY1291 both by testing these STSs on new aliquots of
DNA and by testing different STSs (sY1192 and sY1189)
that detect the same sites (Figure 2). In this stage, we also
classified deletions on the basis of the patterns of positive
and negative results of STSs at additional sites: sY14,
sY142, sY254, and sY1201 (Figures 1 and 2 and Table S1).
When the patterns of positive and negative STS results
did not correspond to one of the recurrent deletion classes
(Figure 1E), we repeated the STS assays to confirm results.
After this repeated testing, we determined that two
samples bore deletions different from any of the six previ-
ously described recurrent interstitial deletions (Figure 2
and Table S2). We used additional STSs to further charac-
terize these deletions (Tables S1 and S2), one of which
most likely represents an isodicentric Y chromosome.18
To our knowledge, the other deletion has not been
reported previously.
As summarized in Table 1, we detected four of the six
previously described interstitial deletions in one or more
of the five study populations. Among the total 20,884
men studied, 773 men (or one in every 27 men tested) dis-
played one of these four deletions.We found the gr/gr dele-
tion to be the most common (2.4% or 1/41 men; 95%
confidence interval [CI] ¼ 2.2%–2.7%); it was followed
by the b2/b3 deletion (1.1% or 1/90 men; 95% CI ¼1.0%–1.3%), the b1/b3 deletion (0.1% or 1/994 men;
95% CI ¼ 0.064%–0.16%), and the b2/b4 deletion
(0.043% or 1/2,320 men; 95% CI ¼ 0.021%–0.085%;
Table S3). The estimate for the prevalence of the b2/b4
deletion is statistically consistent with, but higher than,
a previous estimate of 0.025%. (The prior estimate was
based on the prevalence of the b2/b4 deletion among
men with nonobstructive azoospermia [no spermatozoa
in semen], as well as estimates of the prevalence of nonob-
structive azoospermia1). Notably, our survey of these pop-
ulations did not identify any Y chromosome with either of
the two largest recurrent interstitial deletions affecting the
AZFc region—that is, the previously described P5/P1 and
P4/P1 deletions.5 In our laboratory’s published studies of
men with SSF, the number of P5/P1 or P4/P1 deletions
(C) The b2/b3 deletion can arise on the two inverted variants ofthe AZFc region shown, but not on the reference organization;2
the b2/b3 deletion arising on either of the two inverted variantsresults in the same organization of amplicons and results in theloss of only sY1192 and sY1191.(D) Ectopic crossing over and the extents of the b1/b3 and b2/b4deletions. The b1/b3 deletion (upper bow) results in loss of allcopies of STSs sY1192, sY1191, sY1291, and sY1189 but sparestwo copies of sY254, as well as sY142 and sY1201. The b2/b4deletion (lower bow) has a similar pattern but removes all copiesof sY254.(E) Patterns of PCR positives and negatives used for identifyingfour types of recurrent deletion. Black indicates the presence ofSTS PCR product, and ‘‘�’’ indicates absence.
Journal of Human Genetics 91, 890–896, November 2, 2012 891

Table 1. Proportions of Deletions by Study Population
Number of Samples
India Poland Tunisia United States Vietnam All Populations
Total samples 404 4,671 578 15,124 107 20,884
No deletion 373 (92%) 4,445 (95%) 533 (92%) 14,668 (97%) 90 (84%) 20,109 (96%)
Any deletion 31 (7.7%) 226 (4.8%) 45 (7.8%) 456 (3%) 17 (16%) 775 (3.7%)
gr/gr 27 (6.7%) 115 (2.5%) 41 (7.1%) 312 (2.1%) 16 (15%) 511 (2.4%)
b2/b3 2 (0.5%) 105 (2.2%) 3 (0.52%) 121 (0.8%) 1 (0.93%) 232 (1.1%)
b1/b3 2 (0.5%) 2 (0.043%) 1 (0.17%) 16 (0.11%) 0 21 (0.10%)
b2/b4a 0 2 (0.043%) 0 7 (0.046%) 0 9 (0.043%)
P5/P1 0 0 0 0 0 0
P4/P1 0 0 0 0 0 0
Unusualb 0 2 (0.043%) 0 0 0 2 (0.0096%)
aEnumerated in Table S3.bDeletions not falling into one of the categories of recurrent deletions; see Table S2 for details.
was about one fourth of the number of b2/b4 deletions.5
The present study would have detected P5/P1 or P4/P1
deletions had they been present, but we found none in
the 20,884 men tested (95% CI ¼ 0%–0.014%). This is
fewer than expected but is still statistically consistent
with our published work.5
There are two previously reported instances in which the
prevalence of an AZFc-region deletion varies strongly by
population: (1) the high prevalence of the b2/b3 deletion
around the Baltic Sea is due to the prevalence of hap-
logroup N1 chromosomes, all of which contain the
21,261samples
+ + 19,168
+ - 787
- + 726
- - 580
Stage 1 Stage 2
Unusable DNA 377
278
492 171
355 148
16
7
225
495
sY11
92sY
142
sY14
- -- -
- -
- -
Unusual (See Table
- --- -
sY11
89
sY12
91sY
1191 *
sY12
91*
sY11
91
sY25
4
1
1
892 The American Journal of Human Genetics 91, 890–896, Novemb
b2/b3 deletion,2,7 and (2) the high prevalence of the
gr/gr deletion in Japan is due to the prevalence of hap-
logroup D2a chromosomes,6 all of which contain the
gr/gr deletion. Motivated by these examples, we examined
variation in the prevalence of each of the AZFc-region dele-
tions across the five populations studied. We found that
prevalence varies significantly for two of the AZFc-region
deletions: gr/gr and b2/b3 (Table 1). Prevalence of the
gr/gr deletion ranges from 2% (in the United States) to
15% (in Vietnam) (p < 10�20 for the proportions of gr/gr-
deleted versus non-gr/gr-deleted chromosomes by Fisher’s
20,109Notdeleted
21b1/b3
232b2/b3
511gr/gr
2S2)
9b2/b4
sY12
01
Total 20,884
Sam
ple
coun
t
Sam
ple
stat
us
Figure 2. Workflow for Detecting andCategorizing Deletions Involving AZFcIn stage 1, we tested 21,261 DNA samplesfor the presence of STSs sY1191 andsY1291; 19,168 samples were scored posi-tive for both STSs. The 2,093 samples thatwere scored negative for one or both STSswere subject to further testing in stage 2with the use of the STSs shown. Also,sY1191 and sY1291, marked by asterisks,were retested. This allowed us to categorizethedeletions as shown.As expected, stage 2retesting revealed that some STSs deemedabsent in stage 1 were in fact present. Forexample, 492 samples that were scorednegative for sY1191 in stage 1 were scoredpositive in stage 2. This was because weset a liberal threshold in stage 1 for scoringsY1191 absence to avoidmissing deletions.We also determined in stage 2 that 377DNA samples were not usable; we couldnot reliably amplify positive control STSsin these samples. Thus, the total numberof samples assayed was 20,884.
er 2, 2012
SRY1
0831
M96
M89
M9
M20
7SR
Y108
31
LLY2
2G
DE*
xE E
F*xK
K*xN
1,R
N1
(ex
clud
ed)
R1a
R*x
R1a
M20
3
Y*xB
F
BC*x
DEF
{{
{* b2/b3 (n
=21)Not
deleted (n=190)
* gr/gr (n
=115)
b1/b3 (n=1)
Poland
USA
Not
deleted (n=478)
gr/gr (n
=310)
* b1/b3 (n=14)
* b2/b3 (n=43)
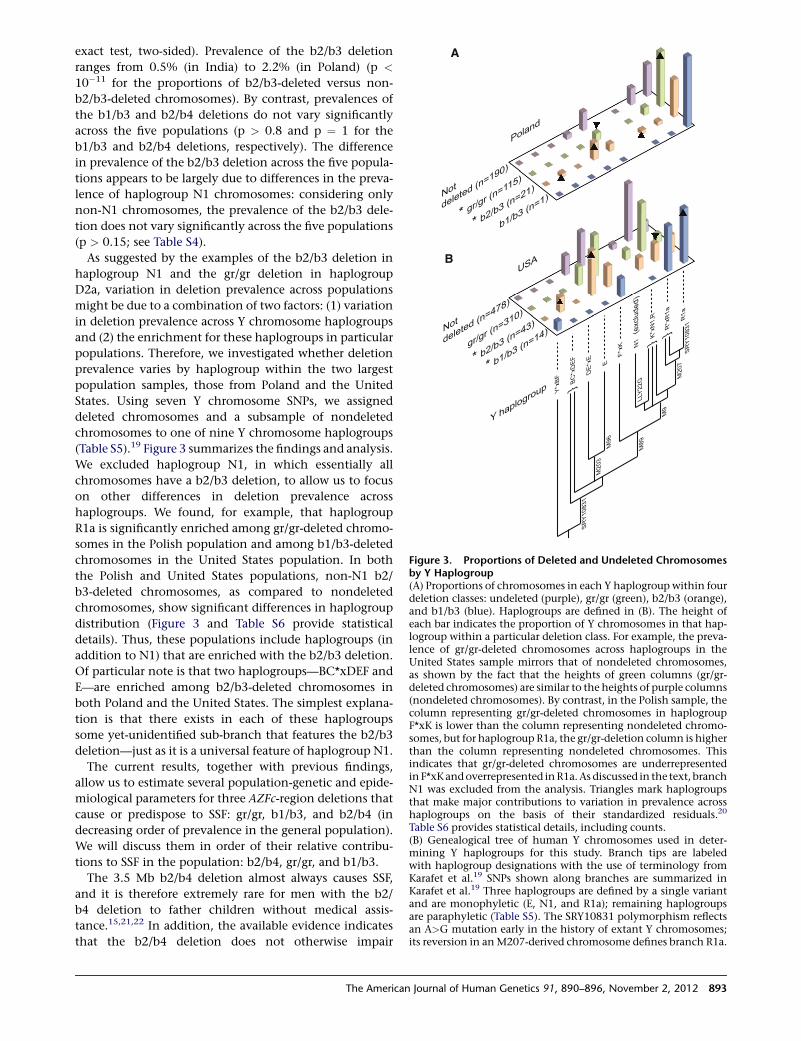
Y haplogroup
A
B
Figure 3. Proportions of Deleted and Undeleted Chromosomesby Y Haplogroup(A) Proportions of chromosomes in each Y haplogroup within fourdeletion classes: undeleted (purple), gr/gr (green), b2/b3 (orange),and b1/b3 (blue). Haplogroups are defined in (B). The height ofeach bar indicates the proportion of Y chromosomes in that hap-logroup within a particular deletion class. For example, the preva-lence of gr/gr-deleted chromosomes across haplogroups in theUnited States sample mirrors that of nondeleted chromosomes,as shown by the fact that the heights of green columns (gr/gr-deleted chromosomes) are similar to the heights of purple columns(nondeleted chromosomes). By contrast, in the Polish sample, thecolumn representing gr/gr-deleted chromosomes in haplogroupF*xK is lower than the column representing nondeleted chromo-somes, but for haplogroup R1a, the gr/gr-deletion column is higherthan the column representing nondeleted chromosomes. Thisindicates that gr/gr-deleted chromosomes are underrepresentedin F*xKandoverrepresented inR1a.As discussed in the text, branchN1 was excluded from the analysis. Triangles mark haplogroupsthat make major contributions to variation in prevalence acrosshaplogroups on the basis of their standardized residuals.20
Table S6 provides statistical details, including counts.(B) Genealogical tree of human Y chromosomes used in deter-mining Y haplogroups for this study. Branch tips are labeledwith haplogroup designations with the use of terminology fromKarafet et al.19 SNPs shown along branches are summarized inKarafet et al.19 Three haplogroups are defined by a single variantand are monophyletic (E, N1, and R1a); remaining haplogroupsare paraphyletic (Table S5). The SRY10831 polymorphism reflectsan A>G mutation early in the history of extant Y chromosomes;its reversion in anM207-derived chromosome defines branch R1a.
exact test, two-sided). Prevalence of the b2/b3 deletion
ranges from 0.5% (in India) to 2.2% (in Poland) (p <
10�11 for the proportions of b2/b3-deleted versus non-
b2/b3-deleted chromosomes). By contrast, prevalences of
the b1/b3 and b2/b4 deletions do not vary significantly
across the five populations (p > 0.8 and p ¼ 1 for the
b1/b3 and b2/b4 deletions, respectively). The difference
in prevalence of the b2/b3 deletion across the five popula-
tions appears to be largely due to differences in the preva-
lence of haplogroup N1 chromosomes: considering only
non-N1 chromosomes, the prevalence of the b2/b3 dele-
tion does not vary significantly across the five populations
(p > 0.15; see Table S4).
As suggested by the examples of the b2/b3 deletion in
haplogroup N1 and the gr/gr deletion in haplogroup
D2a, variation in deletion prevalence across populations
might be due to a combination of two factors: (1) variation
in deletion prevalence across Y chromosome haplogroups
and (2) the enrichment for these haplogroups in particular
populations. Therefore, we investigated whether deletion
prevalence varies by haplogroup within the two largest
population samples, those from Poland and the United
States. Using seven Y chromosome SNPs, we assigned
deleted chromosomes and a subsample of nondeleted
chromosomes to one of nine Y chromosome haplogroups
(Table S5).19 Figure 3 summarizes the findings and analysis.
We excluded haplogroup N1, in which essentially all
chromosomes have a b2/b3 deletion, to allow us to focus
on other differences in deletion prevalence across
haplogroups. We found, for example, that haplogroup
R1a is significantly enriched among gr/gr-deleted chromo-
somes in the Polish population and among b1/b3-deleted
chromosomes in the United States population. In both
the Polish and United States populations, non-N1 b2/
b3-deleted chromosomes, as compared to nondeleted
chromosomes, show significant differences in haplogroup
distribution (Figure 3 and Table S6 provide statistical
details). Thus, these populations include haplogroups (in
addition to N1) that are enriched with the b2/b3 deletion.
Of particular note is that two haplogroups—BC*xDEF and
E—are enriched among b2/b3-deleted chromosomes in
both Poland and the United States. The simplest explana-
tion is that there exists in each of these haplogroups
some yet-unidentified sub-branch that features the b2/b3
deletion—just as it is a universal feature of haplogroup N1.
The current results, together with previous findings,
allow us to estimate several population-genetic and epide-
miological parameters for three AZFc-region deletions that
cause or predispose to SSF: gr/gr, b1/b3, and b2/b4 (in
decreasing order of prevalence in the general population).
We will discuss them in order of their relative contribu-
tions to SSF in the population: b2/b4, gr/gr, and b1/b3.
The 3.5 Mb b2/b4 deletion almost always causes SSF,
and it is therefore extremely rare for men with the b2/
b4 deletion to father children without medical assis-
tance.15,21,22 In addition, the available evidence indicates
that the b2/b4 deletion does not otherwise impair
The American Journal of Human Genetics 91, 890–896, November 2, 2012 893

Table 2. Population Genetic and Epidemiological Parameters for AZFc-Related Deletions that Cause or Might Predispose to SSF
Deletion Type
b2/b4 gr/gr b1/b3
Prevalence in Population
Total number of men tested 20,884 19,113a 20,884
Number of men with deletion 9 427a 21
Percentage of men with deletion (95% CI) 0.043 (0.021–0.085) 2.2 (2.0–2.5) 0.10 (0.064–0.16)
Prevalence among Men with SSF
Total number of men tested 713 4,685 3,956
Number of men with deletion 42 194 10
Percentage of men with deletion (95% CI) 5.9 (4.3–7.9) 4.1 (3.6–4.8) 0.25 (0.13–0.48)
Source of data Oates et al.15 new data and literature (Table S7) new data and literature (Table S7)
Calculated Parameters
Relative risk of SSF (95% CI) 145 (85–310) 1.9 (1.6–2.2) 2.5 (1.2–4.6)
Percentage of deletion-bearing menwho have SSF (bootstrap 95% CI)
100 (assumed 100) 1.4 (0.63–2.3) 1.8 (0.63–4.1)
Attributable risk percentage of SSFb
(bootstrap 95% CI)99 (99–100) 47 (39–54) 60 (17–78)
Population-attributable risk percentageof SSFc (bootstrap 95% CI)
5.9 (4.4–7.4) 2.0 (1.4–2.5) 0.15 (0.022–0.29)
m (95% CI) 4.3 3 10�4 (¼ prevalence)(2.1 3 10�4 to 8.5 3 10�4)
We estimated parameters from prevalences in unselected populations and prevalences amongmen with SSF as discussed in the text and the Supplementary Note.The following abbreviations are used: CI, confidence interval; SSF, severe spermatogenic failure; and m, mutation rate per father-to-son transmission of a Y chro-mosome.aFor gr/gr deletions, we considered only the Polish and United States populations, which best matched the bulk of the data in the literature on gr/gr-deletionprevalence among men with SSF (Table S7).bIn men with a given deletion, the percentage of SSF that is due to that deletion. Supplemental Data provide details of calculations.cThe percentage of SSF due to the given deletion in the population.
viability or health. Accordingly, the prevalence of the b2/
b4 deletion in the current study (one out of every 2,320
men; Table 2) should approximate the rate at which the
deletion arises anew, by mutation, in each father-to-son
transmission of a Y chromosome. We estimate that the
b2/b4 deletion increases a man’s risk of SSF by a factor
of 145 and that it accounts for about 5.9% of SSF cases
in the population (Table 2). Given the present estimate
of the prevalence of the b2/b4 deletion in the general
population (9 deletions in 20,884 men tested) and an esti-
mate of its prevalence among men with SSF (42/713),15
we can also estimate the prevalence of SSF in the popula-
tion as (9/20,884) / (42/713) ¼ 0.0073 (95% CI ¼ 0.0034–
0.013 by bootstrap resampling).
We now compare and contrast these b2/b4 parameters
with those for the 1.6 Mb gr/gr deletion. As with the
b2/b4 deletion, accumulated evidence from multiple
studies indicates that the gr/gr deletion increases risk of
SFF.13,14,16,17 But here, the contrasts between the gr/gr
and b2/b4 deletions begin. Using the prevalence results
from the current study, together with previously pub-
lished data (Table S7), we estimate that the gr/gr deletion
increases a man’s risk of SSF by only a factor of 1.9
(Table 2) and that only about 1.4% of men with the
894 The American Journal of Human Genetics 91, 890–896, Novemb
gr/gr deletion are affected by SSF. Nonetheless, the high
prevalence of the gr/gr deletion in the general population
results in its accounting for about 2.0% of SFF cases
(Table 2). We calculate that new gr/gr deletions arise at
a rate of roughly 1.4 3 10�4 per father-to-son transmis-
sion of the Y chromosome (Supplementary Note).
We also performed parallel analyses of the 1.6 Mb b1/b3
deletion. In this case, we analyzed data from 15 published
studies, along with our own unpublished data as detailed
in Tables S7 and S8. Among a total of 3,956 men
with SSF, there were ten with the b1/b3 deletion. Table 2
shows estimates of population-genetic and epidemiolog-
ical parameters based on these data. The confidence inter-
vals are wider than for the gr/gr deletion because the b1/b3
deletion is much rarer, but the analysis nevertheless indi-
cates that the b1/b3 deletion increases a man’s risk of SSF
by a factor of about 2.5, (p ¼ 0.023 by Fisher’s exact test,
two sided). Even so, only 1.8% of men with the b1/b3
deletion are affected by SSF, and the b1/b3 deletion
accounts for only 0.15% of SSF (Table 2). The low preva-
lence of the b1/b3 deletion (0.1%, Table 2) appears to
stem primarily from the relatively low rate at which it
arises: 1.1 3 10�5 per father-to-son transmission of the Y
chromosome (Supplementary Note).
er 2, 2012

In contrast to the b2/b4, gr/gr, and b1/b3 deletions, the
b2/b3 deletion has not been shown to increase the risk
of SSF above the population average in either published
literature on populations of European ancestry or our
own data.
In conclusion, the six previously described deletions
that affect the AZFc region vary dramatically in prevalence
in the general population—this prevalence ranges from
undetectability of the P5/P1 and P4/P1 deletions in our
sample of 20,884 men to a prevalence of 15% in the case
of the gr/gr deletion in the Vietnamese population.
On the basis of present and previous findings, we conclude
that five of these six previously described deletions—
including the b1/b3 deletion—increase a man’s risk of
SSF. With regard to SSF and its occurrence in the popula-
tion, we conclude that one rare variant of major
effect (the b2/b4 deletion) and one common variant of
modest effect (the gr/gr deletion) together account for
about 8% of cases; these two deletions are largely respon-
sible for the AZFc region’s contribution to SSF in the
population.
On a broader scale, our findings raise important ques-
tions about the mutability of structurally complex regions
on the X chromosome and autosomes. The high rates at
which the gr/gr and b2/b4 deletions arise anew on the Y
chromosome suggest that, aggregated across the entirety
of the genome, large-scale deletions or amplifications
might contribute substantially to the load of deleterious
new mutations. Indeed, investigators have already re-
ported that large-scale copy-number mutations often
underlie intellectual disability, schizophrenia, develop-
mental delay, and congenital anomalies,23–27 consistent
with the fact that these types of mutations contribute
substantially to mutational load. The picture remains far
from complete, however, partly because of the difficulty
of comprehensively identifying, on a genome-wide scale,
regions that are prone to massive structural change. In
fact, regions that are rich in segmental duplications or
structural polymorphism might be missing from, or misas-
sembled in, the human reference sequence.28–30 It will be
important to generate more accurate reference sequence
for such regions, which is possible with the use of
approaches such as the SHIMS technique that we used to
sequence the AZFc region.1,8
Supplemental Data
Supplemental Data include eight tables and a supplemental note
and can be found with this article online at http://www.cell.
com/AJHG.
Acknowledgments
We thank Gail Farino for many contributions to the bench work
for this study; Michael C. Summers for DNA and blood samples;
Jennifer Hughes for help in assembling the manuscript; and
Winston Bellott, Gregoriy Dokshin, Alexander Godfrey, Yueh-
Chiang Hu, Mina Kojima, Julian Lange, Amanda Larracuente,
The American
Tatyana Pyntikova, and Shirleen Soh for helpful comments. This
work was supported by the National Institutes of Health, the
Howard Hughes Medical Institute, and the Singapore Ministry of
Health and Agency for Science, Technology, and Research.
Received: July 13, 2012
Revised: August 27, 2012
Accepted: September 4, 2012
Published online: October 25, 2012
Web Resources
The URL for data presented herein is as follows:
Online Mendelian Inheritance in Man (OMIM), http://www.
omim.org
References
1. Kuroda-Kawaguchi, T., Skaletsky, H., Brown, L.G., Minx, P.J.,
Cordum, H.S., Waterston, R.H., Wilson, R.K., Silber, S., Oates,
R., Rozen, S., and Page, D.C. (2001). The AZFc region of the
Y chromosome features massive palindromes and uniform
recurrent deletions in infertile men. Nat. Genet. 29,
279–286.
2. Repping, S., van Daalen, S.K., Korver, C.M., Brown, L.G.,
Marszalek, J.D., Gianotten, J., Oates, R.D., Silber, S., van der
Veen, F., Page, D.C., and Rozen, S. (2004). A family of human
Y chromosomes has dispersed throughout northern Eurasia
despite a 1.8-Mb deletion in the azoospermia factor c region.
Genomics 83, 1046–1052.
3. Reijo, R., Lee, T.Y., Salo, P., Alagappan, R., Brown, L.G., Rosen-
berg, M., Rozen, S., Jaffe, T., Straus, D., Hovatta, O., et al.
(1995). Diverse spermatogenic defects in humans caused by
Y chromosome deletions encompassing a novel RNA-binding
protein gene. Nat. Genet. 10, 383–393.
4. Vogt, P.H., Edelmann, A., Kirsch, S., Henegariu, O., Hirsch-
mann, P., Kiesewetter, F., Kohn, F.M., Schill, W.B., Farah, S.,
Ramos, C., et al. (1996). Human Y chromosome azoospermia
factors (AZF) mapped to different subregions in Yq11. Hum.
Mol. Genet. 5, 933–943.
5. Repping, S., Skaletsky, H., Lange, J., Silber, S., Van Der Veen, F.,
Oates, R.D., Page, D.C., and Rozen, S. (2002). Recombination
between palindromes P5 and P1 on the human Y chromo-
some causes massive deletions and spermatogenic failure.
Am. J. Hum. Genet. 71, 906–922.
6. Repping, S., Skaletsky, H., Brown, L., van Daalen, S.K.M.,
Korver, C.M., Pyntikova, T., Kuroda-Kawaguchi, T., de Vries,
J.W.A., Oates, R.D., Silber, S., et al. (2003). Polymorphism for
a 1.6-Mb deletion of the human Y chromosome persists
through balance between recurrent mutation and haploid
selection. Nat. Genet. 35, 247–251.
7. Fernandes, S., Paracchini, S., Meyer, L.H., Floridia, G.,
Tyler-Smith, C., and Vogt, P.H. (2004). A large AZFc deletion
removes DAZ3/DAZ4 and nearby genes from men in Y
haplogroup N. Am. J. Hum. Genet. 74, 180–187.
8. Hughes, J.F., and Rozen, S. (2012). Genomics and genetics of
human and primate y chromosomes. Annu. Rev. Genomics
Hum. Genet. 13, 83–108.
9. Skaletsky, H., Kuroda-Kawaguchi, T., Minx, P.J., Cordum, H.S.,
Hillier, L., Brown, L.G., Repping, S., Pyntikova, T., Ali, J., Bieri,
T., et al. (2003). The male-specific region of the human
Journal of Human Genetics 91, 890–896, November 2, 2012 895

Y chromosome is a mosaic of discrete sequence classes. Nature
423, 825–837.
10. Hughes, J.F., Skaletsky, H., Pyntikova, T., Graves, T.A., van
Daalen, S.K., Minx, P.J., Fulton, R.S., McGrath, S.D., Locke,
D.P., Friedman, C., et al. (2010). Chimpanzee and human Y
chromosomes are remarkably divergent in structure and
gene content. Nature 463, 536–539.
11. Hughes, J.F., Skaletsky, H., Brown, L.G., Pyntikova, T., Graves,
T., Fulton, R.S., Dugan, S., Ding, Y., Buhay, C.J., Kremitzki, C.,
et al. (2012). Strict evolutionary conservation followed rapid
gene loss on human and rhesus Y chromosomes. Nature 483,
82–86.
12. Bellott, D.W., Skaletsky, H., Pyntikova, T., Mardis, E.R., Graves,
T., Kremitzki, C., Brown, L.G., Rozen, S., Warren, W.C.,
Wilson, R.K., and Page, D.C. (2010). Convergent evolution
of chicken Z and human X chromosomes by expansion and
gene acquisition. Nature 466, 612–616.
13. Krausz, C., and Giachini, C. (2007). Genetic risk factors in
male infertility. Arch. Androl. 53, 125–133.
14. Nuti, F., and Krausz, C. (2008). Gene polymorphisms/
mutations relevant to abnormal spermatogenesis. Reprod.
Biomed. Online 16, 504–513.
15. Oates, R.D., Silber, S., Brown, L.G., and Page, D.C. (2002).
Clinical characterization of 42 oligospermic or azoospermic
men with microdeletion of the AZFc region of the Y chromo-
some, and of 18 children conceived via ICSI. Hum. Reprod.
17, 2813–2824.
16. Tuttelmann, F., Rajpert-De Meyts, E., Nieschlag, E., and
Simoni, M. (2007). Gene polymorphisms and male infer-
tility—A meta-analysis and literature review. Reprod. Biomed.
Online 15, 643–658.
17. Visser, L., Westerveld, G.H., Korver, C.M., van Daalen, S.K.,
Hovingh, S.E., Rozen, S., van der Veen, F., and Repping, S.
(2009). Y chromosome gr/gr deletions are a risk factor for
low semen quality. Hum. Reprod. 24, 2667–2673.
18. Lange, J., Skaletsky, H., van Daalen, S.K., Embry, S.L., Korver,
C.M., Brown, L.G., Oates, R.D., Silber, S., Repping, S., and
Page, D.C. (2009). Isodicentric Y chromosomes and sex
disorders as byproducts of homologous recombination that
maintains palindromes. Cell 138, 855–869.
19. Karafet, T.M., Mendez, F.L., Meilerman, M.B., Underhill, P.A.,
Zegura, S.L., and Hammer, M.F. (2008). New binary polymor-
phisms reshape and increase resolution of the human Y
chromosomal haplogroup tree. Genome Res. 18, 830–838.
20. Sheskin, D.J. (2007). Handbook of Parametric and Non-
parametric Statistical Procedures, Fourth Edition (New York:
Chapman and Hall/CRC).
896 The American Journal of Human Genetics 91, 890–896, Novemb
21. Jiang, M.C., Lien, Y.R., Chen, S.U., Ko, T.M., Ho, H.N., and
Yang, Y.S. (1999). Transmission of de novo mutations of the
deleted in azoospermia genes from a severely oligozoospermic
male to a son via intracytoplasmic sperm injection. Fertil.
Steril. 71, 1029–1032.
22. Kamischke, A., Gromoll, J., Simoni, M., Behre, H.M., and
Nieschlag, E. (1999). Transmission of a Y chromosomal
deletion involving the deleted in azoospermia (DAZ) and
chromodomain (CDY1) genes from father to son through intra-
cytoplasmic sperm injection: Case report. Hum. Reprod. 14,
2320–2322.
23. Sebat, J., Lakshmi, B., Malhotra, D., Troge, J., Lese-Martin, C.,
Walsh, T., Yamrom, B., Yoon, S., Krasnitz, A., Kendall, J., et al.
(2007). Strong association of de novo copy number mutations
with autism. Science 316, 445–449.
24. Stefansson, H., Rujescu, D., Cichon, S., Pietilainen, O.P., Inga-
son, A., Steinberg, S., Fossdal, R., Sigurdsson, E., Sigmundsson,
T., Buizer-Voskamp, J.E., et al.; GROUP. (2008). Large recurrent
microdeletions associated with schizophrenia. Nature 455,
232–236.
25. Greenway, S.C., Pereira, A.C., Lin, J.C., DePalma, S.R., Israel,
S.J., Mesquita, S.M., Ergul, E., Conta, J.H., Korn, J.M.,
McCarroll, S.A., et al. (2009). De novo copy number variants
identify new genes and loci in isolated sporadic tetralogy of
Fallot. Nat. Genet. 41, 931–935.
26. Itsara, A., Wu, H., Smith, J.D., Nickerson, D.A., Romieu, I.,
London, S.J., and Eichler, E.E. (2010). De novo rates and
selection of large copy number variation. Genome Res. 20,
1469–1481.
27. Cooper, G.M., Coe, B.P., Girirajan, S., Rosenfeld, J.A., Vu, T.H.,
Baker, C.,Williams, C., Stalker, H., Hamid, R., Hannig, V., et al.
(2011). A copy number variation morbidity map of develop-
mental delay. Nat. Genet. 43, 838–846.
28. Kidd, J.M., Sampas, N., Antonacci, F., Graves, T., Fulton, R.,
Hayden, H.S., Alkan, C., Malig, M., Ventura, M., Giannuzzi,
G., et al. (2010). Characterization of missing human genome
sequences and copy-number polymorphic insertions. Nat.
Methods 7, 365–371.
29. Sudmant, P.H., Kitzman, J.O., Antonacci, F., Alkan, C., Malig,
M., Tsalenko, A., Sampas, N., Bruhn, L., Shendure, J., and Eich-
ler, E.E.; 1000 Genomes Project. (2010). Diversity of human
copy number variation and multicopy genes. Science 330,
641–646.
30. Church, D.M., Schneider, V.A., Graves, T., Auger, K., Cunning-
ham, F., Bouk, N., Chen, H.C., Agarwala, R., McLaren, W.M.,
Ritchie, G.R., et al. (2011). Modernizing reference genome
assemblies. PLoS Biol. 9, e1001091.
er 2, 2012
Copyright © 2022 FDOKUMEN