Automating a 96-well microtiter plate assay for identification of AGEs inhibitors or inducers:...
12
ORIGINAL PAPER Automating a 96-well microtiter plate assay for identification of AGEs inhibitors or inducers: application to the screening of a small natural compounds library Séverine Derbré & Julia Gatto & Aude Pelleray & Laurie Coulon & Denis Séraphin & Pascal Richomme Received: 18 June 2010 / Accepted: 23 July 2010 / Published online: 3 September 2010 # Springer-Verlag 2010 Abstract Advanced glycation end-products (AGEs) are involved in the pathogenesis of numerous affections such as diabetes and neurological diseases. AGEs are also implied in various changes in tissues and organs. Therefore, compounds able to break them or inhibit their formation may be considered as potential drugs, dietary supplements, or bioactive additives. In this study, we have developed a rapid and reliable (Z′ factor calculation) anti-AGEs activity screening based on the overall fluorescence of AGEs. This method was successfully evaluated on known AGEs inhibitors and on a small library of natural compounds, yielding coherent results when compared with literature data. Keywords Advanced glycation end-products . Aging . Automation . Diabetes . Natural products . Biological screening Introduction The Maillard reaction mainly consists of successive non- enzymatic glycations, also known as browning reactions [1]. Indeed, a complex cascade of reactions involving reducing sugars and proteins (or amino acids) leads to a multitude of by-products, the so-called advanced glycation end-products (AGEs). In more details, the Maillard reaction is divided in two stages, i.e., the early and late Maillard reactions. At the beginning, a non-enzymatic reaction between the carbonyl group of a reducing sugar and the primary amino groups of a protein (lysine and arginine) [2, 3] produces the corresponding Schiff base, which under- goes an Amadori rearrangement. Then, complex reactions of oxidation, dehydrogenation, and condensation lead, via intra- and intermolecular crosslinkage of the proteins, to AGEs, some of which exhibit fluorescent properties (Fig. 1). Protein reorganization leads to structure degrada- tion and thus to functionality loss [4]. AGEs are involved in the pathogenesis of diabetes [5, 6] and neurological diseases like the Alzheimer's disease [7]. They also contribute to the development of atherosclerosis [8] and joint diseases [9], and cause aging of many tissues [10]. Molecules able to break AGEs or inhibit their formation may thus be considered as potential drugs, dietary supplements, or bioactive additives [11–13]. These considerations have then prompted the scientific community to identify and develop new advanced glycation end-product inhibitors or breakers (AGEIBs), acting either via trapping of reactive dicarbonyl species, preventing oxidation using transition metal chelators or free radical scavengers, or breaking AGEs cross-linking [11]. Besides vitamins (pyridoxamin), the most promising AGEIBs today under evaluation are of synthetic origin, including guanidine (aminoguanidine or metformin), thiazolidine (OPB-9195), ureido- or carboxamidophenoxy-isobutyric acids (LR-90), quinolinoxy propionic acids (LR-74), or N-phenylthiazolium derivatives (PTB or ALT-711), and also commercially available drugs such as aspirin, carnosine, or metformin [11, 14]. In fact, a wide variety of synthetic molecules have already been tested [15], but the chemodiversity of natural S. Derbré (*) : J. Gatto : A. Pelleray : L. Coulon : D. Séraphin : P. Richomme Laboratoire des Substances d’Origine Naturelle et Analogues Structuraux, UPRES-EA 921, IFR 149 QUASAV, UFR des Sciences pharmaceutiques et ingénierie de la santé, Université d’Angers, 16 Bd Daviers, 49045 Angers Cedex, France e-mail: [email protected] Anal Bioanal Chem (2010) 398:1747–1758 DOI 10.1007/s00216-010-4065-1
-
Upload
independent -
Category
Documents
-
view
3 -
download
0
Transcript of Automating a 96-well microtiter plate assay for identification of AGEs inhibitors or inducers:...

ORIGINAL PAPER
Automating a 96-well microtiter plate assay for identificationof AGEs inhibitors or inducers: application to the screeningof a small natural compounds library
Séverine Derbré & Julia Gatto & Aude Pelleray &
Laurie Coulon & Denis Séraphin & Pascal Richomme
Received: 18 June 2010 /Accepted: 23 July 2010 /Published online: 3 September 2010# Springer-Verlag 2010
Abstract Advanced glycation end-products (AGEs) areinvolved in the pathogenesis of numerous affections such asdiabetes and neurological diseases. AGEs are also impliedin various changes in tissues and organs. Therefore,compounds able to break them or inhibit their formationmay be considered as potential drugs, dietary supplements,or bioactive additives. In this study, we have developed arapid and reliable (Z′ factor calculation) anti-AGEs activityscreening based on the overall fluorescence of AGEs. Thismethod was successfully evaluated on known AGEsinhibitors and on a small library of natural compounds,yielding coherent results when compared with literaturedata.
Keywords Advanced glycation end-products . Aging .
Automation . Diabetes . Natural products .
Biological screening
Introduction
The Maillard reaction mainly consists of successive non-enzymatic glycations, also known as browning reactions[1]. Indeed, a complex cascade of reactions involvingreducing sugars and proteins (or amino acids) leads to a
multitude of by-products, the so-called advanced glycationend-products (AGEs). In more details, the Maillard reactionis divided in two stages, i.e., the early and late Maillardreactions. At the beginning, a non-enzymatic reactionbetween the carbonyl group of a reducing sugar and theprimary amino groups of a protein (lysine and arginine) [2,3] produces the corresponding Schiff base, which under-goes an Amadori rearrangement. Then, complex reactionsof oxidation, dehydrogenation, and condensation lead, viaintra- and intermolecular crosslinkage of the proteins, toAGEs, some of which exhibit fluorescent properties(Fig. 1). Protein reorganization leads to structure degrada-tion and thus to functionality loss [4]. AGEs are involved inthe pathogenesis of diabetes [5, 6] and neurologicaldiseases like the Alzheimer's disease [7]. They alsocontribute to the development of atherosclerosis [8] andjoint diseases [9], and cause aging of many tissues [10].Molecules able to break AGEs or inhibit their formation maythus be considered as potential drugs, dietary supplements,or bioactive additives [11–13].
These considerations have then prompted the scientificcommunity to identify and develop new advanced glycationend-product inhibitors or breakers (AGEIBs), acting eithervia trapping of reactive dicarbonyl species, preventingoxidation using transition metal chelators or free radicalscavengers, or breaking AGEs cross-linking [11]. Besidesvitamins (pyridoxamin), the most promising AGEIBs todayunder evaluation are of synthetic origin, including guanidine(aminoguanidine or metformin), thiazolidine (OPB-9195),ureido- or carboxamidophenoxy-isobutyric acids (LR-90),quinolinoxy propionic acids (LR-74), orN-phenylthiazoliumderivatives (PTB or ALT-711), and also commerciallyavailable drugs such as aspirin, carnosine, or metformin[11, 14]. In fact, a wide variety of synthetic molecules havealready been tested [15], but the chemodiversity of natural
S. Derbré (*) : J. Gatto :A. Pelleray : L. Coulon :D. Séraphin :P. RichommeLaboratoire des Substances d’Origine Naturelle et AnaloguesStructuraux, UPRES-EA 921, IFR 149 QUASAV,UFR des Sciences pharmaceutiques et ingénierie de la santé,Université d’Angers,16 Bd Daviers,49045 Angers Cedex, Francee-mail: [email protected]
Anal Bioanal Chem (2010) 398:1747–1758DOI 10.1007/s00216-010-4065-1

products, especially when dealing with secondary metabo-lites of vegetal origin, still needs to be explored morethoroughly [16].
Several methods have been explored to identify novelmolecules acting as anti-AGEs. Immunochemical assays(e.g., ELISA) [17–19] require an expensive antibodies andare not really suitable for a rapid screening, whereasmethods based upon AGEs fluorescence are more wide-spread [20]. However, because of a very slow reactionbetween proteins and sugars, these techniques are timeconsuming and they generally last for several days orweeks. In order to shorten the fluorescence assays, differentprotein and/or sugar concentrations, reaction temperatures,and incubation times have already been evaluated (Table 1).However, it seems that optimal parameters are still to befound. Recently, to accelerate the rate of AGEs formationwithout protein degradation, Fatima et al. described a testbased on the functionality of the chosen protein. Indeed,1 mg/mL of bovine pancreatic ribonuclease (RNase) wasmixed with high concentrations of ribose (0.5 M) at 60 °Cduring 2 days, then the residual activity of RNase wasmeasured. Nevertheless, though as quick and as efficient,this method would be quite expensive when applied to highthroughput screening (HTS) purposes.
Therefore, we have embarked upon the development ofnew and efficient tools for the screening of AGEIBs
activities of natural compounds as well as crude extracts.As mentioned above, fluorescence is extremely useful asthe detection process of AGEIBs. A fluorescence-basedevaluation would then follow the Vinson and Howardapproach [20], but the major drawback of such a spectro-fluorimetric assay is its length, usually several days, whichmakes it incompatible with a HTS. Furthermore, targetproducts or extracts are often tested at a single concentration,and fluorescence quenching may complicate interpretations[21, 22]. There was thus a need for an automated evaluationof anti-AGEs activities compatible with HTS necessity.
Materials and methods
Materials
Bovine serum albumin (BSA, fraction V), potassiumphosphate monobasic, potassium phosphate dibasic trihy-drate, sodium azide, aminoguanidine hydrochloride, cou-marin (coumarin A), 7-hydroxy-4-(trifluoromethyl)coumarin (coumarin B), 5,6-benzocoumarin-3-carbonylchloride (coumarin C), and dimethylsulfoxide (DMSO)were purchased from Sigma-Aldrich (St Quentin Fallavier,France). Glucose, fructose, and ribose were from AlfaAesar (Schiltigheim, France). Known anti-AGEs and
Fig. 1 Schematic representation of the non-enzymatic Maillard reaction
Protein Sugar Incubation length Temperature (°C) Ref.
BSA 7 mg/mL Glucose 25 mM 37 [20]
Fructose 25 mM 3 to 30 days
BSA 10 mg/mL Glucose 200 mM 14 days 37 [28]
Fructose 200 mM
BSA 50 mg/mL Glucose 800 mM 7 days 37 [17]
BSA 0.8 mg/mL Glucose 200 mM 30 h 60 [22]
BSA 10 mg/mL Ribose 50 mM 7 days 37 [29]
BSA 10 mg/mL Glucose 500 mM 7 to 21 days 37 [37]a
Ribose 50 mM
Table 1 Different incubatingconditions used for AGEs mea-surement through fluorescenceas described in literature
a Free sugars in excess were thereremoved by dialysis
1748 S. Derbré et al.
commercially natural products were purchased from Sigma-Aldrich and Extrasynthèse (Genay, France).
Ninety-six-well black bottom plates and their silicone lidwere fromGreiner bio-one (Fisher Scientific, Illkirch, France).AGEs fluorescence (λexc 370 nm; λem 440 nm) was measuredusing a microplate spectrofluorometer Infinite M200 (Tecan,Lyon, France) and the software Magellan (Tecan).
Study of AGEs formation in 96-well microtiter platesusing a manual assay
Nature and concentration of the reducing sugar,and incubation time
The protein model BSA (1 or 10 mg/mL) was incubatedwith D-glucose, D-fructose, or D-ribose (0.01 to 0.5 M) in aphosphate buffer 50 mM pH 7.4 (NaN3 0.02%) to obtainpositive controls, i.e., optimum AGEs formation. Negativecontrol, i.e., 100% inhibition of AGEs formation, consistedof BSA alone. Solutions (100 μL) were incubated at 37 °Cin 96-well microtiter plates closed with their silicon lids for1 to 14 days before AGEs fluorescence measurement.
Validation by AGEIB activity measurement of referencesand fluorescent products
BSA (10 mg/mL) was incubated with D-ribose (0.5 M) andthe tested compound (10−5 to 10−2 M) in a phosphate buffer50 mM pH 7.4 (NaN3 0.02%). Solutions (100 μL) wereincubated in 96-well microtiter plates at 37 °C for 24 hbefore AGEs fluorescence measurement. In order to takeinto consideration the intrinsic fluorescence of testedproduct, the fluorescence resulting from the incubation ofBSA (10 mg/mL) and the tested compound (10−5 to10−2 M) in the same conditions was subtracted for eachmeasurement. Tests were performed in triplicate. Negativecontrol, i.e., 100% inhibition of AGEs formation, consistedof wells with the sole BSA. Positive control (i.e., noinhibition of AGEs formation) consisted of wells containingBSA (10 mg/mL) and D-ribose (0.5 M). The final volumeassay was 100 μL. Results are expressed as 50% inhibitionconcentration (IC50) values.
Optimization in an automated environment
Automation of the assay and comparison of assayperformance
The automated 96-well microtiter plate assay was con-ducted on a Freedom Evo® 100 liquid handling workstation(Tecan). The liquid handling (LiHa) arm was equipped withtwo LiHa standard, fixed, washable tips (Teflon®-coatedstainless steel, resistant to DMSO, Tecan). Dispensing
steps, i.e., liquid class parameters, were optimized andprogrammed using the Evoware software® (Tecan).
Automated screening of a commercial available naturalcompound library
An automated screening of 81 commercially availablenatural products, including known anti-AGEs, was per-formed. Compounds were prepared in DMSO stocksolutions (10−1 M) and stored at −20 °C in deepwellpolypropylene plates (3959) covered with their Corningcostar® lids (Fisher Scientific). Using the automated liquidhandling facility, aliquots were further diluted in 96-wellround bottom plates (3363) (Corning costar®, FisherScientific) in phosphate buffer to reach concentrationsranging from 3×10⁻⁵ to 3×10⁻² M. The automated testwas partially adapted from the manual test except thatmixtures were extemporaneously manually prepared toallow only one pipetting and save time: Solution I wascomposed of BSA 100 mgmL–1/ribose 1 M/phosphatebuffer 50 mM pH 7.4 (1:5:3) and solution II of BSA100 mgmL–1/phosphate buffer 50 mM pH 7.4 (1:8). Pre-screening of the 3×10⁻³ M final concentration for eachproduct was done. In order to take into consideration theintrinsic fluorescence of tested product, AGEs formationwas calculated by subtracting fluorescence resulting fromthe incubation of the component and solution II from that ofthe same component and solution I. Compounds inducinglower AGEs formation than aminoguanidine (56±4%), thereference compound, were selected for further dose–response experiments (from 3×10⁻⁶ to 3×10⁻³ M), andIC50 were calculated towards the validation of this protocol.
Natural compound library
The library of 81 natural products belonging to the majorclasses of secondarymetabolites (i.e., terpenoids, polyphenols,and alkaloids) [23, 24] was automatically screened for anti-AGEs activities. Prior to this screening and for each testedcompound, the purity was checked through TLC/HPLCanalysis and 1H-NMR (270 MHz) spectroscopy.
Data processing and statistical analysis
Plates containing positive controls (BSA 10 mg/mL andribose 0.5 M) were prepared in order to evaluate plate-to-plate and day-to-day variations. The plate-to-plate variabilitywas established by comparing the mean of the maximaobtained in three plates made the same day, while the day-to-day variability was identically performed with three platesfrom three different days. In all cases, the standard deviations(SD) of the signals maxima were calculated. Statisticalvalues associated with the overall performance of the
AGEs inhibitors or inducers identification 1749
screening assay were then determined to optimize theprotocol parameters [25, 26]. With the purpose of identify-ing active compounds (hits) from a HTS, a high degree ofaccuracy and sensitivity is indeed required. However,factors such as instrumental errors, human-associatedmistakes, or even the nature of the assay in itself mayinduce a strong variability in the measurements and thusrepresent a major impediment to the detection of reliablehits. To circumvent this, the necessity for a proper “signalwindow”, i.e., a number of SD discriminating componentresponses from the background noise, was suggested bySittampalam et al. [27]. This parameter is evaluated by theseparation band, defined as the mean ±3 SD. In addition,two guides are widely used to indicate the quality of anassay, namely the signal-to-background ratio (S/B) [25] andsignal-to-noise (S/N) ratio [26]. However, S/B ratio does nottake into account data variations, whereas S/N ratio givesonly an indication about the degree of confidence a signalcan be regarded as real, i.e., different from the associatedbackground. Therefore, Zhang et al. considered thoseparameters as useful but insufficient ones to evaluate theoverall quality or performance of any screening assay. Theyproposed instead to determine the so-called Z′ factor sincethis statistical parameter takes into account both the
separation band and the signal dynamic range in the assay[25]:
Separation band ¼ mcþ � mc���
��� 3� scþ þ 3� sc�ð Þ
S=B ¼ mcþ=mc�S=N ¼ mcþ � mc�
� �
= s2cþ þ s2
c�� �1=2
Z 0 ¼ 1� 3� scþ þ 3� sc�ð Þ= mcþ�� � mc�j
where σc+, μc+, σc−, and μc− represent the standarddeviations (σ) and means (μ) of the maximal (c+) andminimal (c−) signals.
-8.00
-7.00
-6.00
-5.00
-4.00
-3.00
-2.00
-1.00
0.00
1.00
Glucose 0.5 M Glucose 0.01 M Glucose 0.05 M Fructose 0.5 M Fructose 0.1 M Fructose 0.05 M Ribose 0.5 M Ribose 0.1 M Ribose 0.05 M Ribose 0.01 M
Sugar type and concentration
Z' f
acto
r va
lues
0.00
10.00
20.00
30.00
40.00
50.00
60.00
70.00
80.00
S/N
rat
io v
alu
es
J1 J2 J3 J7 J14 J1 S/N J2 S/N J3 S/N J7 S/N J14 S/N
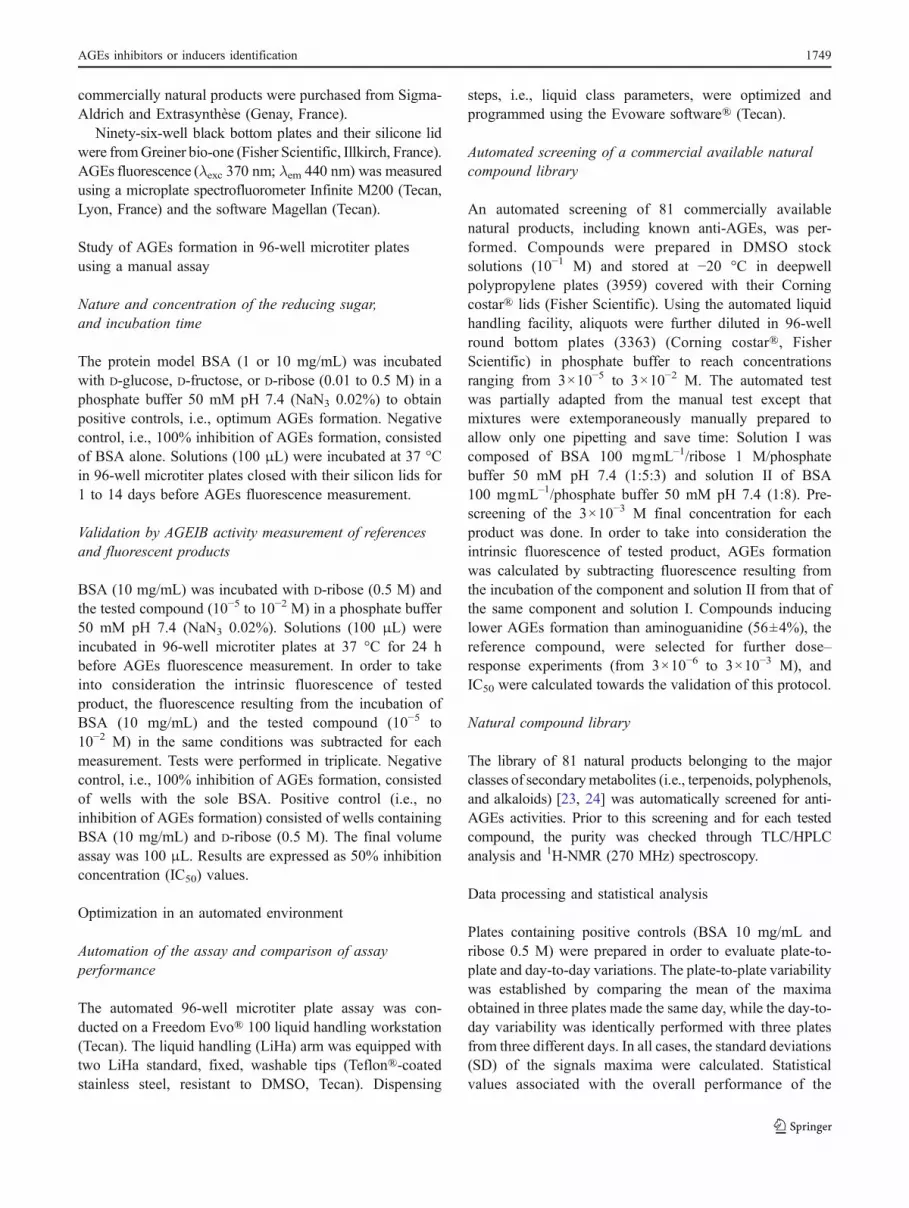
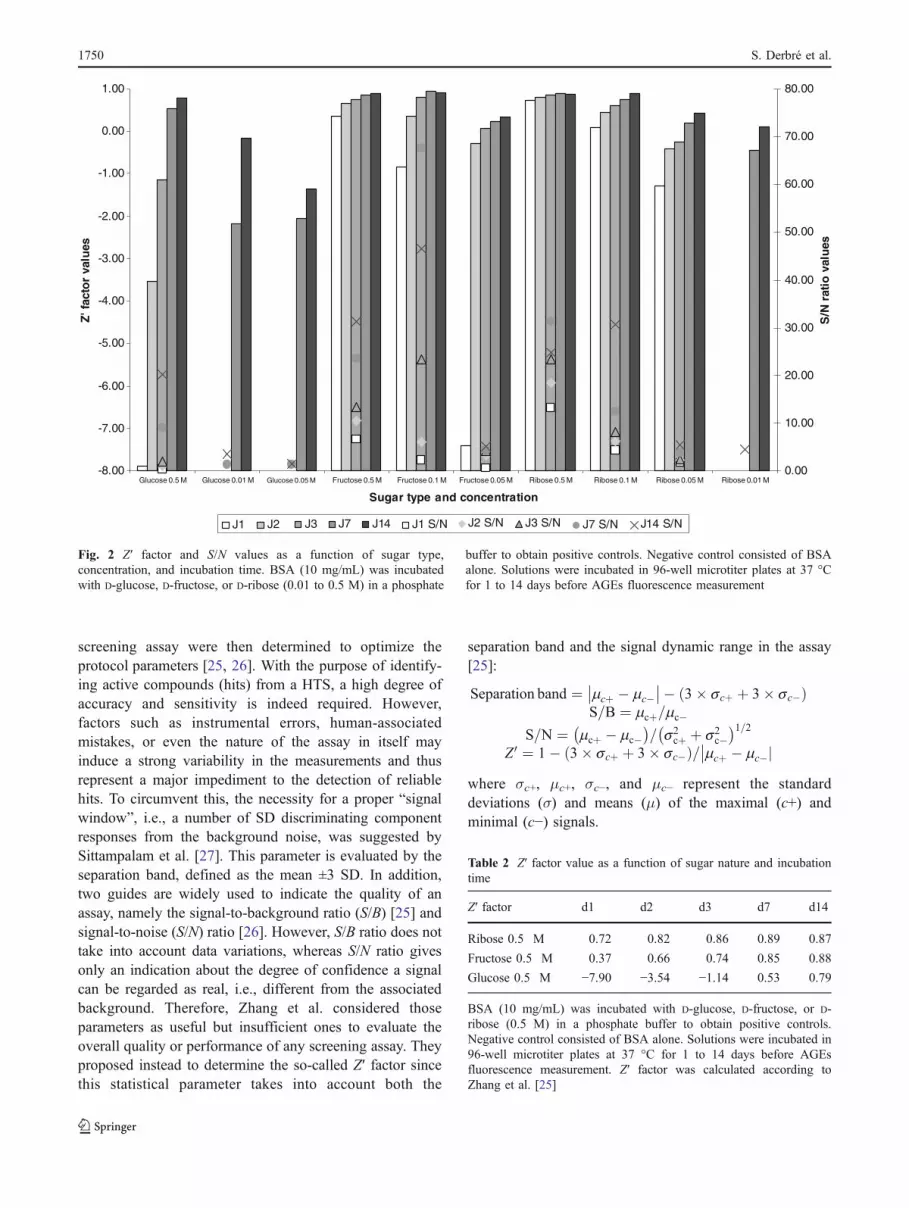
Fig. 2 Z′ factor and S/N values as a function of sugar type,concentration, and incubation time. BSA (10 mg/mL) was incubatedwith D-glucose, D-fructose, or D-ribose (0.01 to 0.5 M) in a phosphate
buffer to obtain positive controls. Negative control consisted of BSAalone. Solutions were incubated in 96-well microtiter plates at 37 °Cfor 1 to 14 days before AGEs fluorescence measurement
Table 2 Z′ factor value as a function of sugar nature and incubationtime
Z′ factor d1 d2 d3 d7 d14
Ribose 0.5 M 0.72 0.82 0.86 0.89 0.87
Fructose 0.5 M 0.37 0.66 0.74 0.85 0.88
Glucose 0.5 M −7.90 −3.54 −1.14 0.53 0.79
BSA (10 mg/mL) was incubated with D-glucose, D-fructose, or D-ribose (0.5 M) in a phosphate buffer to obtain positive controls.Negative control consisted of BSA alone. Solutions were incubated in96-well microtiter plates at 37 °C for 1 to 14 days before AGEsfluorescence measurement. Z′ factor was calculated according toZhang et al. [25]
1750 S. Derbré et al.

Results and discussion
Manual assay
The optimal conditions for AGEs formation in 96-wellmicrotiter plates were first manually determined. BSA was
chosen as a cheap and easily available protein. The formationof AGEs with two different concentrations of BSA (1 and10 mg/mL) [22, 28, 29] and three different sugars (D-glucose,D-fructose, and D-ribose) at four different concentrations (0.01to 0.5 M) [22, 28–30] during 1 to 14 days was monitored bymeasuring their fluorescence. The quality of the screening aswell as the homogeneity of the signal was then evaluatedthrough Z′ factor calculation provided that a value between0.5 and 1 is associated to an efficient assay [25]. After 24 h,only one set of parameters met this condition: BSA 10 mg/mL and ribose 0.5 M (Z′=0.72) (Fig. 2). As illustrated inFig. 5, S/N ratio was high, and the standard deviations of bothpositive and negative signals were small enough to give thisexcellent result. Increasing the incubation time then onlyslightly improved the overall quality of the test (Table 2). Theexpected higher reactivity of ribose when compared withfructose or glucose [31, 32] was confirmed by our experi-ments, as well as the need for a longer incubation time aslong as weak sugar concentrations were used [33, 34]. A setof 80 data points (columns 2–11 of a 96-well plate; Table 3)finally allowed us to statistically evaluate the best screeningconditions at 37 °C (BSA 10 mg/mL; ribose 0.5 M; 24 h).
O
N
S
Br
N-phenylthiazolium bromide
N
N
N S
NH2
OH
ClHCl
Thiamine hydrochloride
N
NHHCl
HNH2N
NH
Metformin hydrochloride
N NH2
O
Nicotinamide
H2NHN
OH
O
O
HNN
L-carnosine
N
OHHO
NH22 HCl
O O
HO OH
HO
OH
H2N NH
NHNH2
HCl
Pyridoxamin
Ascorbic acid
Aminoguanidine hydrochloride
0
20
40
60
80
100
120
140
-5.5 -5.0 -4.5 -4.0 -3.5 -3.0 -2.5
log [M]
% A
GE
s
Thiamine
L-carnosine
Metformin
Ascorbic acid
N-phenyltetrazolium bromide
Nicotinamide
Pyridoxamin
Aminoguanidine
Fig. 3 Structures andevaluation of AGEs inhibitionby known anti-AGEs. BSA(10 mg/mL) was incubated withD-ribose (0.5 M) and the testedcompound (3×10⁻⁶ to3×10−3 M) in a phosphatebuffer. Solutions were incubatedin 96-well microtiter plates at37 °C for 24 h before AGEsfluorescence measurement. Inorder to take into considerationthe intrinsic fluorescence oftested product, the fluorescenceresulting from the incubation ofBSA and the tested compoundwas subtracted foreach measurement
Table 3 Comparison of manual and automated assay as measuredthrough quality control parameters from screening assays (n=3)
Manual(mean ± SD)
Automated(mean ± SD)
Z′ factor 0.76±0.04 0.62±0.05
S/N 14.0±2.5 8.7±1.7
S/B 9.9±0.2 10.4±0.6
Separation band 6,759±793 5,509±405
Plate-to-plate variability (%) 4.0 4.4
Day-to-day variability (%) 6.8 4.4
BSA (10 mg/mL) was incubated with D-ribose (0.5 M) in a phosphatebuffer to obtain positive controls. Negative control consisted of BSAalone. Solutions were incubated in 96-well microtiter plates at 37 °Cfor 24 h before AGEs fluorescence measurement
AGEs inhibitors or inducers identification 1751

A.
0
2000
4000
6000
8000
10000
12000
14000
1Assay number
Flu
ore
scen
ce (R
FU
)
BSA 10 mg/mL BSA 10 mg/mL + ribose 0.5 M
B.
0
2000
4000
6000
8000
10000
12000
14000
16000
18000
1Assay number
Flu
ore
scen
ce (R
FU
)
BSA 10 mg/mL BSA 10 mg/mL + ribose 0.5 M
Fig. 5 Overall quality of AGEsscreening conditions (non-automated (A) and automated(B)) illustrated by the largesignal window obtained betweenthe highest and the lowestsignals. BSA (10 mg/mL) wasincubated with D-ribose (0.5 M)in a phosphate buffer to obtainpositive controls (diamonds).Negative control (circles)consisted of BSA alone.Solutions were incubated in96-well microtiter plates at37 °C for 24 h before AGEsfluorescence measurement
Fig. 4 Manual evaluation of AGEs inhibition by fluorescent compounds.BSA (10 mg/mL) was incubated with D-ribose (0.5 M) and the testedcompound (10−5 to 10−2 M) in a phosphate buffer. Solutions wereincubated in 96-well microtiter plates at 37 °C for 24 h before AGEs
fluorescence measurement. In order to take into consideration theintrinsic fluorescence of tested product, the fluorescence resulting fromthe incubation of BSA and the tested compound was subtracted for eachmeasurement. Data are mean of three independent experiments
1752 S. Derbré et al.

1
OH O
O OO
OH OH O
O
OHO
O
2 3 4 5 6 78 9 10
11 12
OH
O H OH
HH
OO
O
O
OH
OH
HO
OOH
HO
OH
OH1314 15 16
17O
OO18
OO
O
OO
HOH
H
O
OHO
HO
O
O
HHH
O
OH
O
HOOH
Oses-OR1
O
O O
R2
OHOH
H
19
20
21 22
23
24
O
OOH
HO
OHO
HOO
HOOC
OHO
HOOH
HOOC OOH
O O
OH
OO
OH
OO
OH
OHO
OH
2526
O
OHC
OH
O O
OHO
O
H
OH
27
N
O
H
O
HOH
N
O
H
O
HOH
Br
H
O
N
O
O
O
O
N
HO
O
OOH
28 29 30 31
N
O
O
O
OO
H
Cl
N
NO
HOH H
NH
N
O NH
N
N
NH
H
HH
H
H
SO42-
OO
N
N
H H
HCl
32
33
34 35 36 37
N
NH
N
O
O
N
OO
H
H HHHH
H
Cl
Cl
OMeMeO
MeO
O
NH
O
OMe
N O
O
H
N
H
N O
O
H
N
H
O
O
38
39 40
41
42
NH
N
HH
OHMeOOC
H
HCl
43
O
HON
O
OH
OCOCH3
O
O
OH
O
O
OHOH
COOH
OH
OO
HO
HO
OH
OH
OH
OH
O
O
HOHOOC OH
OH
O O
OHHO
O O
44
45
46
4748
Fig. 6 Structures of the 81 commercially available natural compounds of the in-house library tested and aminoguanidine 82
AGEs inhibitors or inducers identification 1753

NH
O
O
HO
O O
O OHO
O OO
O
O OHO
GlcO
O
OOH
HOO
OOH
O
OHOH
49
50
51
52
53
54
O
O
OMeOMe
MeO
O
O
OH
O
OOH
HO
OH
O
OOH
HOGlc
OHO
OOH
HO
OHOH
OH 2 H2O O
OOH
HO
OHOH
OGal
5556
57 58
59
O
OOH
HO
OHOH
O-Glc-Rha
O
OOH
HO
OH
O
OOH
O
OH
Rha-Glc
O
OH
HO
OHOH
OH60
6162
63
O
OH
HO
OH
OH
Cl
64
O
OOH
HO
OH
O
OO
OO
H
H
H
O
O
OHO
OH
OHO
O
OGlc
OH O
O OH65 66
67
68
69 70 71
O
O
OHOH
OH O S NO
SOKO
O
OH
OH
OHHOO H
CN
OHO
HOOH
O
OHO
HOOH
OH
72
73
74
75
OHO
OHO
N
NN
N
OH
O
OHOH
HO NH
HN
O
O
HNH2N
O
N
NHN
N
H2N
O
HN
O
HN
COOH
COOH
N
OHHO
NH22 HCl
O O
HO OH
HO
OH
H2N NH
NHNH2
HCl
76
77
78
7980
8182
Fig. 6 (continued)
-100
0
100
200
300
400
500
0 10 20 30 40 50 60 70 80 90
Compounds
AG
Es
(%)
Fig. 7 Anti-AGEs screening us-ing the automated assay. A totalof 81 commercial naturalcompounds were screened.Using the automated liquidhandling facility, pre-screeningof AGEIB activity of the3×10−3 M final concentrationfor each product was done. Thehit limit is indicated by thebroken line parallel to the x-axisand corresponds to the AGEsformation using aminoguanidine3×10−3 M as an inhibitor.Seventeen products (triangles)were AGEs inhibitors. Twocomponents (circles) were stronginductors of AGEs formation.Three products (diamonds)generated negative results
1754 S. Derbré et al.

The solvent effects in AGEs formation were also evaluat-ed. DMSO did not influence AGEs amounts for concen-trations below 10% v/v meanwhile, 30% DMSO inducedAGEs formation (data not shown). To select the bestreference compound, dose–response curves of well-knownanti-AGEs (thiamine, L-carnosine, metformin, ascorbic acid,N-phenylthiazolium bromide, nicotinamide, pyridoxamin, aswell as aminoguanidine) were determined using experimen-tal conditions as previously defined. As depicted on Fig. 3,acid ascorbic, N-phenylthiazolium bromide, nicotinamide,pyridoxamin, and aminoguanidine were the best inhibitorsof AGEs formation. Their anti-AGEs potential seemed quite
similar. Our results were in agreement with previouslypublished data. Therefore, as published elsewhere, amino-guanidine was chosen as the reference compound [11, 35].Coumarins A–C were also evaluated to ensure that naturallyfluorescent compounds could be evaluated through afluorescence measurement of AGEs. As shown in Fig. 4,results for coumarins A–C appeared as satisfactory andreproducible, and the test was then estimated efficient evenwith fluorescent molecules. IC50 values were calculated,allowing a direct comparison of the anti-AGEs activitiesobserved between the natural compounds from the libraryand aminoguanidine (IC50=5±3 mM).
A.
0102030405060708090
100
-6.0 -5.0 -4.0 -3.0 -2.0
log [C] (M)
% A
GE
s
B.
0102030405060708090
100
-6.0 -5.0 -4.0 -3.0 -2.0
log [C] (M)
% A
GE
s
C.
0
20
40
60
80
100
-6.0 -5.0 -4.0 -3.0 -2.0
log [C] (M)
% A
GE
s
D.
-1600-1400-1200-1000-800-600-400-200
0200400600800
-6.0 -5.0 -4.0 -3.0 -2.0
log [C] (M)
% A
GE
s
E.
0
50
100
150
200
250
300
-6.0 -5.0 -4.0 -3.0 -2.0
log [C] (M)
% A
GE
s
Fig. 8 Dose–response curves illustrating the influence of different types of natural compounds on AGEs production: hyperoside 59 as type A (A),caffeic acid 45 as type B (B), emodin 72 as type C (C), umbelliferone 51 as type D (D), and emetine 39 as type E (E)
AGEs inhibitors or inducers identification 1755

Automated assay
The automated approach was then conducted. Our methodwas elaborated as follows: Firstly, DMSO stock solutions ofnatural compounds (0.1 M) in deepwell mother plate (oneplate; 82 products) were diluted with phosphate buffer (3×10⁻⁵ to 3×10⁻² M) in daughter plates (seven plates; 12products per plate) using an appropriate program (step 1).Then, a pre-screening was done for anti-AGEs activity at3×10−3 M (two plates; two wells per product; 48 productsper plate). Compounds inducing less AGEs formation thanaminoguanidine (56±4%) were considered as potentialanti-AGEs agents (step 2) and were selected for dose–response experiments (IC50 determination). To validate ourprotocol, dose–response curves (3×10⁻⁶ to 3×10⁻³ M) ofall compounds were further determined (14 plates; twocolumns per products; six products per plate) (step 3). Foreach step, programming of the aspirating and dispensingsteps was optimized, in particular parameters for liquidclasses (DMSO, phosphate buffer, and solutions I and II).To check if the dispersion of the signal was acceptable,aminoguanidine was first used in each well of a deepwellmother plate (data not shown).
The automated assay performance, in terms of statisticalparameters, was compared with the manual approach(Table 3). As illustrated in Fig. 5, as far as the automatedversion was concerned, the separation band decreased aswell as the dispersion of the signal. Thus, the Z′ factor valuewas maintained. This value (0.62) can be regarded as anindicator of a very good screening assay, allowing measure-ments after a single experiment [25]. The other statisticalfactors (S/N and S/B) were similar between the manual andthe automated approaches. Dealing with repeatability, theplate-to-plate variability was low and similar in theautomated and manual approaches. In terms of reproduc-ibility, a significant improvement was registered as the day-to-day variability factor was lower in the automated assay.
Natural compound library screening
In order to establish the reliability of this automated anti-AGEs assay, the screening of a small library of commercialnatural compounds, including known anti-AGEs secondarymetabolites (Fig. 6), was finally undergone using theautomated approach. As shown in Fig. 7, at a concentrationof 3×10⁻³ M matching the IC50 of aminoguanidine andamong 81 compounds tested, 17 appeared as better AGEsinhibitors or breakers than the reference. A contrario, twoalkaloids, namely harmine 34 and emetine 39, significantlyincreased the amounts of AGEs [35]. These results thusindicated that this kind of screening could characterizeeither inducers, inhibitors, or breakers of the AGEs. It mustbe noticed that unexpected negative percentages were
obtained in the case of umbelliferone 51, (+)-catechin 63,and resveratrol 68. This will be discussed later. With theaim of understanding these results and validating theinterest of our pre-screening at 3×10⁻³ M, dose–responsecurves were established for all compounds of the libraryfollowing the same automated approach. As depicted inFig. 8, five different dose–response curves (A–E) wereobtained. Among them, only type A is a typical S-shapecurve that permits IC50 determination. This value wastherefore calculated for hyperoside 59 and 15 other naturalproducts showing also a type A dose–response curve(Table 4). Those products were all detected as hits duringthe screening step (step 2). Podophyllotoxin 55 was alsodetected as a potential anti-AGEs at this stage. But, as atype B dose–response curve was obtained (Fig. 8 b), IC50
could not be calculated. Indeed, as caffeic acid 45 andchlorogenic acid 47 (ester of caffeic acid), this productshowed a U-shape dose–response curve with the lowestAGEs production for concentrations between 10−4 and10−3 M. Quenching effect of the fluorescence of the testedcompounds at higher concentrations could lead to anapparent increased AGEs production. However, an oppositeeffect at different concentrations, i.e., AGEs inhibitor at lowconcentration and AGEs initiator at higher concentration,
Table 4 IC50 determination for 16 hit compounds
Products IC50 (M)
Friedeline 22 1×10⁻³
Berberine 30 2×10⁻⁴
Boldine 31 2×10⁻⁴
Colchicine 40 2×10⁻⁴
Curcumine 48 3×10⁻³
Apigenin 56 1×10⁻³
Vitexine 57 2×10⁻³
Quercetin 58 6×10⁻⁴
Hyperoside 59 1×10⁻⁴
Rutin 60 2×10⁻³
Naringenin 61 2×10⁻³
(+)-Catechin 63 6×10⁻⁵
Pelargonidin chloride 64 2×10⁻⁴
Genistein 65 3×10⁻³
Resveratrol 68 3×10⁻⁴
p-Benzoquinone 69 6×10⁻⁴
Juglone 71 6×10⁻⁴
Emodine 72 1×10⁻⁴
BSA (10 mg/mL) was incubated with D-ribose (0.5 M) and the testedcompound (3×10⁻⁶ to 3×10⁻³ M) in a phosphate buffer using theautomating approach except for compounds 68 and 72. Solutions wereincubated in 96-well microtiter plates at 37 °C for 24 h before AGEsfluorescence measurement. The product concentration for a 50 %inhibition (IC50) was calculated from the corresponding dose–responsecurve. IC50 of aminoguanidine 82 (reference): 5±3×10⁻³ M
1756 S. Derbré et al.

may not be ruled out [35, 36]. Then, as previouslydescribed [37], emodine 72 (3×10⁻³ M) was detected asan AGEs inhibitor during the screening step (Fig. 7); but noIC50 could be calculated as the dose–response curve(Fig. 8c) suggested problems during the dilution steps.The same phenomena occurred with resveratrol 68. Toconfirm our hypothesis, dose–response curve for bothproducts were manually made. Those compounds areactually poorly soluble in phosphate buffer and even tendto precipitate for higher concentrations. Careful solubiliza-tion using ultrasonic allowed us to dilute properly eachproduct and to establish proper dose–response curves. IC50
values were deduced (Table 4) and found in agreement withthe screening step. Other unexpected dose–response curves(Fig. 8d) were observed for fluorescent coumarines 51–53.Although initial non-automated investigations were consis-tent for this group of molecules (Fig. 4), compounds 51–53with an aberrant dose–response curve have to be withdrawnfrom further evaluation. Finally, among all the testedcompounds, the last type of dose–response curve wasobserved for harmine 34 and emetine 39 (Fig. 8e), forminga fifth class of potential AGEs inducers [36]. Their dose–response curves were in agreement with the screening;those results indicated either potential AGEs inducers or areaction between those alkaloids and ribose to givefluorescent products.
As far as anti-AGEs activity was concerned, phenolicacid 45 and 47 were previously described as potent AGEsinhibitors [38] as well as numbers of flavonoids [39–43].Note that our screening indicated that among polyphenoliccompounds, best AGEs inhibitors were the more polarflavonoids sensu lato as hyperoside 59, (+)-catechin 63,and pelargonidin chloride 64. A link with their antioxidantproperties, i.e., free radicals scavenging, reactivity withnon-radical reactive oxygen species, or/and metal ionscomplexation was suggested [14, 41].
To summarize, most of our results were consistent withthe data described in the literature, and our screening in thestate was efficient to detect the better AGEs inhibitors. Inits HTS version, the test will be carried on diluted stocksolutions (0.01 M) to improve the solubility of the testedcompounds and avoid inconsistent results. Moreover, it willbe conducted at a final dose of 3×10⁻⁴ M, a concentrationable to select the more interesting AGEs inhibitors.
Conclusion
At the end of this study, we have demonstrated that anaffordable anti-AGEs screening could be quickly performedon pure compounds with sufficient quality, repeatability,and reproducibility. This automated test allowed thescreening for anti-AGEs activities of a small library of
commercially available natural products over a short periodwhen compared with other tests described in literature [15,28, 29]. A second advantage of this method resides in itsability to discriminate between inhibitors or inducers of theAGEs formation, and the results are in perfect agreementwith literature data. We have also shown that a first-stepsingle-dose screening based on the fluorescence propertiesof AGEs should be followed by a calculation of dose–response curves for the best hits. Indeed, quenchingphenomena as well as reactions of tested products withBSA or ribose could distort the fluorescence measurements.Further improvement of the method should allow todistinguish AGEs inhibitors and AGEs breakers.
Acknowledgements The authors wish to thank VALINOV (11 rueA. Fleming, 49066 ANGERS Cedex 01, France) for access to theliquid handling workstation as well as fruitful technical discussions.
References
1. Maillard LC (1912) C R Acad Sci 154:66–672. Biemel KM, Lederer MO (2003) Bioconjug Chem 14:619–6283. Nagaraj RH, Shipanova IN, Faust FM (1996) J Biol Chem
271:19338–193454. Cho S-J, Roman G, Yeboah F et al (2007) Curr Med Chem
14:1653–16715. Singh R, Barden A, Mori T et al (2001) Diabetologia 44:129–1466. Brownlee M (2001) Nature 414:813–8207. Takeuchi M, Yamagishi S-I (2008) Curr Pharm Des 14:973–9788. Jandeleit-Dahm K, Cooper ME (2008) Curr Pharm Des 14:979–9869. DeGroot J (2004) Curr Opin Pharmacol 4:301–305
10. Grillo M (2008) A, Colombatto, S. Amino Acids 35:29–3611. Reddy VP, Beyaz A (2006) Drug Discov Today 11:646–65412. Khalifah RG, Baynes JW, Hudson BG (1999) Biochem Biophys
Res Commun 257:251–25813. Monnier VM (2003) Arch Biochem Biophys 419:1–1514. Peyroux J, Sternberg M (2006) Pathol Biol 54:405–41915. Yeboah F, Konishi Y, Cho S-J, et al (2003) Anti-glycation agents
for preventing age-, diabetes-, and smoking-related complications.Int. C.I. A61K 31/137, Canada, Application patent PCT/CA02/01552
16. Dobson CM (2004) Nature 432:824–82817. Rahbar S, Yerneni KK, Scott S et al (2000) Mol Cell Biol Res
Comm 3:360–36618. Nagai R, Fujiwara Y, Mera K et al (2008) J Immunol Methods
332:112–12019. Motomura K, Fujiwara Y, Kiyota N et al (2009) J Agric Food
Chem 57:7666–767220. Vinson JA, Howard TB (1996) J Nutr Biochem 7:659–66321. Morimitsu Y, Yoshida K, Esaki S et al (1995) Biosci Biotechnol
Biochem 59:2018–202122. Matsuura N, Aradate T, Sasaki C et al (2002) J Health Sci
48:520–52623. Dewick PM (2006) Essentials of organic chemistry: for students
of pharmacy, medicinal chemistry and biological chemistry.Wiley, Chichester
24. Bruneton J (2009) Pharmacognosie-Phytochimie-Plantes médici-nales. Editions Tec & Doc Lavoisier, Paris
25. Zhang J-H, Chung TDY, Oldenburg KR (1999) J Biomol Screen4:67–73
AGEs inhibitors or inducers identification 1757

26. Bollini S, Herbst JJ, Gaughan GT et al (2002) J Biomol Screen7:526–530
27. Sittampalam GS, Iversen PW, Boadt JA et al (1997) J BiomolScreen 2:159–169
28. Jang DS, Lee GY, Kim YS et al (2007) Biol Pharm Bull 30:2207–2210
29. Culbertson SM, Enright GD, Ingold KU (2003) Org Lett 5:2659–266230. Suarez G, Rajaram R, Oronsky AL et al (1989) J Biol Chem
264:3674–367931. Syrový I (1994) J Biochem Biophys Methods 28:115–12132. Fatima S, Jairajpuri DS, Saleemuddin M (2008) J Biochem
Biophys 70:958–96533. Wondrak GT, Cervantes-Laurean D, Roberts MJ et al (2002)
Biochem Pharmacol 63:361–37334. Khalifah RG, Todd P, Booth AA et al (1996) Biochemistry
35:4645–4654
35. Sasaki NA, Garcia-Alvarez MC, Wang Q et al (2009) Bioorg MedChem 17:2310–2320
36. Yukio F, Naoko K, Keita M et al (2008) Ann NY Acad Sci1126:152–154
37. Jang DS, Kim JM, Kim J et al (2008) Chem Biodivers 5:2718–272338. Gugliucci A, Bastos DHM, Schulze J et al (2009) Fitoterapia
80:339–34439. Wu CH, Yen GC (2005) J Agric Food Chem 53:3167–317340. Jang DS, Kim JM, Lee YM et al (2006) Chem Pharm Bull
54:1315–131741. Urios P, Grigorova-Borsos A-M, Sternberg M (2007) Eur J Nutr
46:139–14642. Urios P, Grigorova-Borsos A-M, Peyroux J et al (2007) J Soc Biol
201:189–19843. Ardestani A, Yazdanparast R (2007) Food Chem Toxicol
45:2402–2411
1758 S. Derbré et al.