AUTHOR COPY - Jung Wook Park
22
AUTHOR COPY Journal of Ambient Intelligence and Smart Environments 5 (2013) 381–402 381 DOI 10.3233/AIS-130217 IOS Press Physical activity recognition using a single triaxial accelerometer and a barometric sensor for baby and child care in a home environment Yunyoung Nam a,* and Jung Wook Park b a Department of Biomedical Engineering, Worcester Polytechnic Institute, MA, USA E-mail: [email protected] b U-Healthcare Department, BIT Computer Co., Ltd, Seoul, South Korea E-mail: [email protected] Abstract. In this paper, we describe and evaluate an activity recognition system using a single 3-axis accelerometer and a barometric sensor worn on a waist of the body. The purpose of this work is to prevent child accidents such as unintentional injuries at home. In order to prevent child accidents in the home and reduce efforts of parents, we present a new safety management system for babies and children. We collected labeled accelerometer data from babies as they performed daily activities which are standing still, standing up, sitting down, walking, toddling, crawling, climbing up, climbing down, stopping, wiggling, and rolling. In order to recognize daily activities, mean, standard deviation, and slope of time-domain features are calculated over sliding windows. In addition, the FFT analysis is adopted to extract frequency-domain features of the aggregated data, and then energy and correlation of acceleration data are calculated. We used the resulting training data to induce a predictive model for activity recognition. Naive Bayes, Bayes Net, Support Vector Machine, k-Nearest Neighbor, Decision Tree, Decision Table, Multilayer Perceptron, Logistic classifiers are tested on these features. Classification results using training and eight classifiers were compared. The overall accuracy of activity recognition was 96.2% using only a single wearable triaxial accelerometer sensor with the k-Nearest Neighbor. Keywords: Activity recognition, accelerometer, wearable device, baby care, child care 1. Introduction Early work in ubiquitous computing dealt with any- where and anytime communication with smart ob- jects [1]. However its focus has been shifted to con- cerns over topics such as how it will change our lives [2]. Numerous studies have attempted to eval- uate how computing works in various fields such as sensor-based abnormal activity detection for health care [3], the mobile sensing platform for diabetics, and a personal-fuel gauge [4]. Most of the previous stud- * Corresponding author. ies have concentrated on human activity recognition as an essential technology for wellness applications. In this paper, we propose a human activity recogni- tion method for accident prevention in the home envi- ronment. Since the activities of child are quite unpre- dictable, a parent should keep an eye on their child 24 hours a day. However, this may not always be practi- cal. With this motivation, an assistive device would be a sensible solution to prevent home accidents without demanding absolute attention from parents. Although numerous researchers have proposed var- ious activity recognition methods, studies on human activity recognition, pervasive safety management sys- 1876-1364/13/$27.50 c 2013 – IOS Press and the authors. All rights reserved
-
Upload
khangminh22 -
Category
Documents
-
view
0 -
download
0
Transcript of AUTHOR COPY - Jung Wook Park

AUTHOR COPY
Journal of Ambient Intelligence and Smart Environments 5 (2013) 381–402 381DOI 10.3233/AIS-130217IOS Press
Physical activity recognition using a singletriaxial accelerometer and a barometric sensorfor baby and child care in a homeenvironmentYunyoung Nam a,* and Jung Wook Park b
a Department of Biomedical Engineering, Worcester Polytechnic Institute, MA, USAE-mail: [email protected] U-Healthcare Department, BIT Computer Co., Ltd, Seoul, South KoreaE-mail: [email protected]
Abstract. In this paper, we describe and evaluate an activity recognition system using a single 3-axis accelerometer and abarometric sensor worn on a waist of the body. The purpose of this work is to prevent child accidents such as unintentional injuriesat home. In order to prevent child accidents in the home and reduce efforts of parents, we present a new safety managementsystem for babies and children. We collected labeled accelerometer data from babies as they performed daily activities whichare standing still, standing up, sitting down, walking, toddling, crawling, climbing up, climbing down, stopping, wiggling, androlling. In order to recognize daily activities, mean, standard deviation, and slope of time-domain features are calculated oversliding windows. In addition, the FFT analysis is adopted to extract frequency-domain features of the aggregated data, and thenenergy and correlation of acceleration data are calculated. We used the resulting training data to induce a predictive model foractivity recognition. Naive Bayes, Bayes Net, Support Vector Machine, k-Nearest Neighbor, Decision Tree, Decision Table,Multilayer Perceptron, Logistic classifiers are tested on these features. Classification results using training and eight classifierswere compared. The overall accuracy of activity recognition was 96.2% using only a single wearable triaxial accelerometersensor with the k-Nearest Neighbor.
Keywords: Activity recognition, accelerometer, wearable device, baby care, child care
1. Introduction
Early work in ubiquitous computing dealt with any-where and anytime communication with smart ob-jects [1]. However its focus has been shifted to con-cerns over topics such as how it will change ourlives [2]. Numerous studies have attempted to eval-uate how computing works in various fields such assensor-based abnormal activity detection for healthcare [3], the mobile sensing platform for diabetics, anda personal-fuel gauge [4]. Most of the previous stud-
*Corresponding author.
ies have concentrated on human activity recognitionas an essential technology for wellness applications.In this paper, we propose a human activity recogni-tion method for accident prevention in the home envi-ronment. Since the activities of child are quite unpre-dictable, a parent should keep an eye on their child 24hours a day. However, this may not always be practi-cal. With this motivation, an assistive device would bea sensible solution to prevent home accidents withoutdemanding absolute attention from parents.
Although numerous researchers have proposed var-ious activity recognition methods, studies on humanactivity recognition, pervasive safety management sys-
1876-1364/13/$27.50 c© 2013 – IOS Press and the authors. All rights reserved
AUTHOR COPY
382 Y. Nam and J.W. Park / Physical activity recognition using a single triaxial accelerometer and a barometric sensor
tem and multi-sensor fusion are challenging issues interms of accurate recognition. In general, a pervasivesafety management system aims to reduce risk fac-tors of injuries to prevent accidents by using smart de-vices such as cameras and multiple sensors. In partic-ular, some researchers attempted to assist child safetycare based on activity recognition. Na et al. [5,6] pro-posed a smart vision sensor for detecting risk factorsof a falling accident in a home environment. Theyused image-processing methods, namely clutter detec-tion and toddler tracking, to recognize risk factors.Nishida et al. [7] conducted infant behavior simulationfor safety management. This computational approachis taken in order to comprehensively understand thebehavior of infants and children. This approach couldalso be utilized for the clarification of the dynamics ofa system that includes behavior-related accidents.
The pursuit of low power distributed sensing un-der the user’s natural physiological conditions has im-posed significant challenges on integrating informa-tion from what is often heterogeneous, incomplete, anderror-prone sensor data. Multi-sensor fusion, therefore,is essential to maximize information content and re-duce both systematic and random errors when a lotof sensors are used for human activity recognition.Zouba et al. [8] proposed multi-sensor fusion usingvideo cameras and environmental sensors for monitor-ing elderly activities. They choose to perform fusionat the event-level twelve household activities includ-ing: using the fridge, using the cupboards, using themicrowave, preparing a mail, and so on. Zhu et al. [9]also suggested human activity recognition by fusingtwo wearable inertial sensors attached to one foot andthe waist of a human subject, respectively.
In general, the nature of information interaction in-volved in sensor fusion can be classified as competi-tive, complementary, and cooperative fusion [10–12].In competitive fusion, each sensor provides equivalentinformation about the process being monitored. It typ-ically involves the handling of redundant, but some-times inconsistent, measurement. The nature of com-petitive sensing means that it is ideally suited for multi-sensor calibration, consistency maximization, and faulttolerant sensing. In complementary fusion, sensors donot depend on each other directly, as each sensor cap-tures different aspects of the physical process. Themeasured information is merged to form a more com-plete picture of the phenomenon. For example, multi-ple accelerometers could be attached to body parts forrecognizing bowing activity. Each sensor observes dis-joint motions such as inclined upper body, motionless
hands and legs, and nodding head. More attached ac-celerometers lead to a more complete recognition re-sult.
In cooperative fusion, sensors work together togather complex information that is difficult to obtainfrom the sensors individually. For example, in the caseof a climbing up activity, an accelerometer could onlyrecognize the activity as standing up and sitting downcontinuously. A barometric sensor could measure avariation of the height of the sensor from the ground,not the activity. Cooperative fusion of the two sensorsenables recognition of the activity that could not bedetected by each single sensor. Due to the compound-ing effect, the accuracy and reliability of cooperativefusion is sensitive to inaccuracies in all simple sensorcomponents used. In this paper, we select the cooper-ative fusion model to combine information from sen-sors to capture data with improved reliability, preci-sion, fault tolerance, and reasoning power to a degreethat is beyond the capacity of each sensor.
In [13], eWatch devices were placed on the belt,shirt pocket, trouser pocket, backpack, and neck torecognize six activities. Each eWatch consisted ofa biaxial accelerometer and a light sensor. In [4],they used a multimodal sensor device consisting ofseven different types of sensors to recognize activitiessuch as walking, sitting, standing, ascending stairs, de-scending stairs, riding an elevator up and down, andbrushing one’s teeth. Yang et al. [14] proposed a dis-tributed sparsity classifier to recognize human activ-ities using five wireless motion sensors. They repre-sented and classified thirteen action classes using a setof 40-D locality preserving projection features accu-rately. Kasteren et al. [15] compared four probabilisticmodels such as hidden Markov model, hidden semi-Markov models, conditional random fields, and semi-Markov conditional random fields to validate the im-portance of duration modeling. They found that dura-tion modeling could lead to significantly better perfor-mance.
In our previous work [16], we used a single tri-axialaccelerometer, along with an embedded image sensorworn at the user’s waist, to identify nine activities.In our previous work [17], we proposed an incremen-tal statistical method to determine conflicts and to in-fer user intentions through analyzing the daily humanactivity patterns collected from physical sensors. Al-though these multi-sensor approaches do indicate thegreat potential of mobile sensor data as more types ofsensors are being incorporated into devices, our ap-proach shows that only one single unit of sensor nodes

AUTHOR COPY
Y. Nam and J.W. Park / Physical activity recognition using a single triaxial accelerometer and a barometric sensor 383
will collect multiple types of information and recog-nize most daily activities for baby and child in a homeenvironment.
This paper is organized as follows. Section 2 ex-plains patterns of home accidents by statistical dataand observation and presents an overview of the ap-plication model. Section 3 presents the outline of theproposed system, data collection, and data preprocess-ing. Section 4 describes the process for addressing theactivity recognition task, including the activity recog-nition method. Section 5 describes the design of theproposed wearable device and shows our experimentalresults. Finally, we conclude the paper in Section 6.
2. Problem description and approach
2.1. Problem description and motivation
According to the statistical records [18,19] of USand UK, child home accidents occurred more fre-quently in the home environment. Based on survey in2005, in South Korea, an average of 20.9% of chil-dren aged under 14 died as a result of falls [20]. Otherleading accidents reported in this survey were poison-ing, burns, and slipping. According to the child acci-dent facts [21], which are surveyed by the CAPT inthe UK, falls accounted for over 40% of all home ac-cidents of children. It is unrealistic to ask parents keeptheir eyes on babies 24 hours a day, 7 days a week. Inorder to prevent child home accidents and reduce theefforts of parents, a new safety management methodis required. Also early detection is needed to preventunintentional injury at home. We have monitored be-havioral characteristics when a child is in danger orin trouble by observing the child in a real home en-vironment. As expected, the activities of a child werequite unpredictable. In the case of adults, their activi-ties did not include unnecessary movement. If the childtries to reach somewhere, he moved with walking, tod-dling and sitting randomly, which makes child activityrecognition more complicated.
From the observations in Fig. 1, one of most dan-gerous activities in our observation is climbing up ontables or windows ledges, since a child can be injuredif he or she hits his or her head when falling from achair or a table. As shown in Fig. 1c, the child usedlow chairs or large toys as a stool to climb up on a ta-ble. The mother was cleaning up a veranda while hewas climbing up and she could not recognize the dan-gerous activity of her child. After playing, an activity
Fig. 1. Activities of a child in a living room.
of climbing down was observed in Fig. 1d. However,since no accurate tool has been developed for observ-ing the wide variety of behaviors that occur in a livingroom, we lack quantitative data on this. This results indifficulty in comprehensively understanding baby ac-tivities. The behaviors addressed in this field are verylimited when compared with the diversity of baby ac-tivities.
A baby performed various physical activities: wig-gle, roll, crawl, climb, rock, bounce, rest, eat, makenoise, grasp or mouth or drop things. As a baby learnsto roll over, sit and crawl, his muscles will continue tostrengthen. Between 8 and 10 months, he will probablystart trying to pull himself up to stand while holdingonto furniture. At this time, they are at risk of fallingfrom furniture and raised surfaces, like changing ta-bles and counter-tops. As older babies learn to crawland walk, they are at risk of falling on the stairs. Astoddlers learn to climb, they are at risk of falling outof windows and from furniture like bookcases. Sincethe major causes of fall-related injuries change as achild grows and develops, fall prevention needs to beaddressed. These prevention strategies are not meantto take away physical activity opportunities, but ratherto create a safe environment in which physical activitycan take place.
2.2. Approach
In order to solve the problems as mentioned in theprevious section, we have developed a wearable sen-sor device and a monitoring application to gather in-formation and to recognize baby activities. We classi-fied baby activities into eleven daily activities whichare wiggling, rolling, standing still, standing up, sit-ting down, walking, toddling, crawling, climbing up,climbing down, and stopping. Vision-based activityrecognition approaches [18,22] are not applicable ina home environment, since cameras present a privacyproblem. The progress of an advanced sensor and SoC

AUTHOR COPY
384 Y. Nam and J.W. Park / Physical activity recognition using a single triaxial accelerometer and a barometric sensor
Fig. 2. Application environment of proposed framework and processflow.
technologies allows a feasible constraint monitoringtool, such as a small size sensor platform. The multi-sensor device that we used in this work provided tri-axial acceleration data and air pressure data. Multiplesensors embedded in a wearable device are more accu-rate for collecting different types of sensing informa-tion [23], but would be very inconvenient for the user.For this reason, we present only one single unit of sen-sor nodes, which collects multiple types of informa-tion.
Figure 2a shows a flow chart of our proposed sys-tem including four main components: i) the wearablesensor node to measure movement and height fromground by using a 3-axis accelerometer and a pres-sure sensor, ii) the wireless receiver to receive the mea-sured data over Nordic wireless protocol and transmitit to PC over USB connection, iii) the activity moni-tor and analyzer working on the PC to aggregate themeasured raw data and to analyze behavioral charac-teristics using features and classifiers, iv) the speakerto broadcast emergency alerts to their parents or aguardian.
As shown in Fig. 2b, the proposed activity recogni-tion method using a 3-axis accelerometer and a pres-sure sensor comprises the following three steps: i) col-lecting and preprocessing the sensor data from anaccelerometer, ii) extracting features, and iii) train-ing and classification. In order to process, we haveto remove the noise with a moving-average filter be-cause errors made in the early steps may increase theclassification error and the uncertainty on each fur-ther step. After preprocessing the sensors signals, itis necessary to choose the adequate features whichwe take as time-domain and frequency-domain fea-tures.
3. System overview
3.1. System architecture
The developed wearable device basically consistsof three layers: (i) communication layer, (ii) process-ing layer, and (iii) sensing layer. The communica-tion layer enables ultra-low power wireless commu-nication using a nRF24LE1 that is a dual-core com-munication chip of the wearable sensor device. ThenRF24LE1 uses 2.4 GHz GFSK RF transceiver withembedded protocol engine, the Enhanced ShockBurstthat enables data packet communication and supportsautonomous protocol operation. This layer handlesthe transfer of collected and preprocessed data overthe wireless network. The processing layer is wherethe preliminary activity recognition logic is appliedto minimize network traffic and increase the lifespanof battery-powered nodes. This layer also manipulatesraw data into a pre-defined data packet.
The sensing layer collects the context informationsuch as child activities and object names around thechild. In order to recognize various dangerous activi-ties, we adopt multiple sensors as follows:
• A 3-axis accelerometer measures the movement,which consists of three signal-processing chan-nels where it is low-pass filtered.
• A pressure sensor measures pressure enabling ameasurement of distance between the groundsand the wearable sensor device that also couldmeasure the temperature around the child. Thepressure and temperature output data are cali-brated and compensated internally.
• A RFID(SkyeModule M1-mini) is selected toread/write tags and smart labels, which has com-patibility with most industry standard 13.56 MHz.This sensor allows us to recognize objects andspace of a potentially dangerous situation.
The temperature sensor is internally equipped withthe absolute pressure sensor for temperature compen-sation to measure more accurate pressure sensing. Thetemperature output data should be considered an im-portant factor to detect different types of injuries in fu-ture work. However, the information is not utilized inour current research, since the scope of the paper ismainly focused on activity recognition.
From the data processing model, sensor fusion isgrouped into three different levels of fusion which aredirect data fusion, feature-level fusion, and decision-level fusion. If the sensors are measuring the same

AUTHOR COPY
Y. Nam and J.W. Park / Physical activity recognition using a single triaxial accelerometer and a barometric sensor 385
Fig. 3. Raw data and segmentation of 3-axis acceleration data.
physical parameter with the data acquired commen-surately, raw sensor data can be directly combined.Otherwise, the data needs to be fused at the featureor decision level. For feature-level fusion, features arefirst extracted from the sensor data to form a multi-dimensional feature vector so that general patternrecognition can be applied. We adopted this feature-level fusion to process our multi-sensor data from thewearable sensor device.
3.2. Data acquisition and segmentation
The embedded triaxial accelerometer can contin-uously sample the experienced accelerations at eachsampling interval and produce 3-D acceleration read-ings, which are measures of the acceleration experi-enced in the three orthogonal axes: X-axis, Y -axis andZ-axis. Figure 3a shows the X-axis, Y -axis, and Z-axis readings for the different activities. The data for
AUTHOR COPY
386 Y. Nam and J.W. Park / Physical activity recognition using a single triaxial accelerometer and a barometric sensor
our experiment was gathered in an experimental set-ting in which a sensor, with a sampling frequency of95 Hz, was mounted at the waist of 3 healthy subjectsof different age, weight, and height to collect eleventypes of activity patterns. The time-domain featureswere computed from the most recent 255 samples andthe frequency-domain features were computed fromthe same samples for efficient fast Fourier transform(FFT) implementation with 256 samples. We madethe dataset available at https://sites.google.com/site/yynams/baby-activity/.
Let X , Y and Z denote the infinite data stream ofmeasured acceleration values of the three space dimen-sions:
X = (x1, x2, . . .), Y = (y1, y2, . . .),(1)
Z = (z1, z2, . . .).
The corresponding data stream M of the magnitude isdefined as:
M = (m1,m2, . . .),(2)
where mi =√
x2i + y2i + z2i .
The magnitude of the force vector is calculated bycombining the measurements from all 3 axes usingEq. (2) to derive acceleration independent of orienta-tion. A sliding window of the size n is pushed throughthe values of the incoming data stream with a specifiedoffset. Suppose that X ′ = (x′
1, . . . , x′n) refers to the
acceleration signals in the direction of the x-axis ob-served in the sliding window at a certain time. Y ′, Z ′
and M ′ are defined analogously. A metric δ is appliedto the data, which is then used to decide whether a statechange occurred.
Basically, for segmentation of acceleration values,we used two segmentation approaches: energy-basedsegmentation as well as distance-based segmentation.The two segmentation approaches only differ in thetype of metric that is applied. The energy-based ap-proach uses as metric the variance of the magnitudevalues in the current sliding window, which can be de-termined as follows:
δe(X′, Y ′, Z ′,M ′) = var(M ′)
(3)
=1
n
n∑i=1
(m′i − m′)2,
where m′ is mean value of the magnitude values.
On the other hand, the distance-based approach usesas metric the distance of the pattern observed in thesliding window to a rest position. The rest position hasto be recorded beforehand with time and is representedthrough the vector (rx, ry, rz), where rx is mean valueof the acceleration on the x-axis and so on. Then, thecomputation of the distance metric is as follows:
δd(X′, Y ′, Z ′,M ′)
= |(x′1 − rx, . . . , x
′n − rx)|
(4)+ |(y′1 − ry, . . . , y
′n − ry)|
+ |(z′1 − rz, . . . , z′n − rz)|.
Figure 3b shows examples of the energy-based seg-mentation and the distance-based segmentation froman accelerometer are plotted in Fig. 3a. However, itis difficult to discriminate different types of the dy-namic activities based on the DC component, energy,and distance features. In the next section, we will de-scribe methods to extract features from 3-axis acceler-ation data for discriminating between different activi-ties.
4. Feature extraction and activity recognition
4.1. Feature extraction
In general, signal feature could be analyzed in twodomains; time-domain and frequency-domain. To ex-tract features of the experimental data, we set windowsize to 256 and sample overlapping between consecu-tive windows to 128 at 95 Hz sampling frequency.
4.1.1. Time-domain featureFor time-domain features, each reading of acceler-
ometer sensor consists of 3-D accelerations along X-axis, Y -axis and Z-axis according to local coordinatesystem of current orientation. For example, samplesof (x, y, z) readings from an accelerometer are plot-ted in Fig. 4 while a baby sleeps on a bed. Basically,if the device is placed on a table, x and y should bezero since there is no acceleration at all, and z shouldbe measured as −g (where g represents accelerationdue to gravity: 9.81 m/s2). However, a baby does notlie straight on his/her back during sleeping. In addi-tion, every time a baby breathes, sensor reading er-rors can affect data quality. There is a jittering noisein accelerometer data. We can reduce the effect of thejittering noise by scaling down (x′, y′, z′) readings,

AUTHOR COPY
Y. Nam and J.W. Park / Physical activity recognition using a single triaxial accelerometer and a barometric sensor 387
Fig. 4. Accelerometer data from a 3-axis accelerometer for sleeping.
followed by a smoothing technique using a moving-average filter mv-filter of span L, as follows:
(x′′, y′′, z′′) = mv-filter((x′, y′, z′), L). (5)
The moving-average filter smooths data by replac-ing each data with the average of the neighboring datadefined within L. The moving-average filter operatesby averaging a number of points from the input sig-nal to produce each point in the output signal. Afterselecting L = 5, a new series of readings are gener-ated as shown in Fig. 4a. It can be seen that the pro-posed smoothing technique greatly removes the jitter-ing noise and smooths out data by more significantstandard deviation reduction than mean reduction. Theeffect of proposed smoothing effect on an accelerom-eter is shown in Fig. 4a. The de-noising process is im-portant for building a recognition model using meanand standard deviation.
In [24,25], they have shown the signal average oneach axis over a reasonable time period can producea good estimate of the gravity-related component. Wetake a similar approach here to estimate the gravitycomponent from each segment of (x′, y′, z′) readings.Our estimation internal is set to the same as sampleduration, which is to estimate the vertical accelera-tion vector v corresponding to gravity. Therefore, v =(mx′,my′,mz′), where mx′,my′, and mz′ are meansof respective axes for the sampling period. v is normal-ized to vnorm. Let ai = (x′
i, y′i, z
′i), i = 1, 2, . . . , N ,
be the vector at a given point in the sampling interval,where N is the length of sample points in the sam-ple duration. The projection of ai onto the vertical axisvnorm can be computed as the vertical component in-side ai. Let pini be the inner product and pi be the pro-jection vector, as follows:
pini = 〈ai, vnorm〉, (6a)
pi = pini · vnorm , (6b)
then the horizontal component hi of the accelerationvector ai can be computed as vector subtraction, as fol-lows:
hi = ai − pi. (7)
However, it is impossible to know the direction ofhi relative to the horizontal axis in global 3-axis co-ordinate system. We only know hi lies in the horizon-tal plane that is orthogonal to estimated gravity vec-tor v. So we simply take the magnitude of hi, denotedby ‖hi‖, as a measure of horizontal movement. Theresults of above algorithm generate two waveforms of{pini , i = 1, 2, . . . , N} and {‖hi‖, i = 1, 2, . . . , N},which are amplitude of the vertical components andmagnitude of the horizontal components, respectively.Each waveform is almost independent of orientationtaking instant accelerometer samples. As illustrated inFig. 4b, the vertical and horizontal components of ac-celerometer data in Fig. 4a are plotted according toabove algorithm.
We mainly considered features including mean,standard deviation, energy, and correlation as Bao et al.[23] and Ravi et al. [26] selected. Four features wereextracted from each of the three axes of the accelerom-eter as well as the vertical and the horizontal com-ponents, giving a total of nineteen attributes. The DCcomponent of the signal over the window is the meanacceleration value. In order to show that activities
AUTHOR COPY
388 Y. Nam and J.W. Park / Physical activity recognition using a single triaxial accelerometer and a barometric sensor
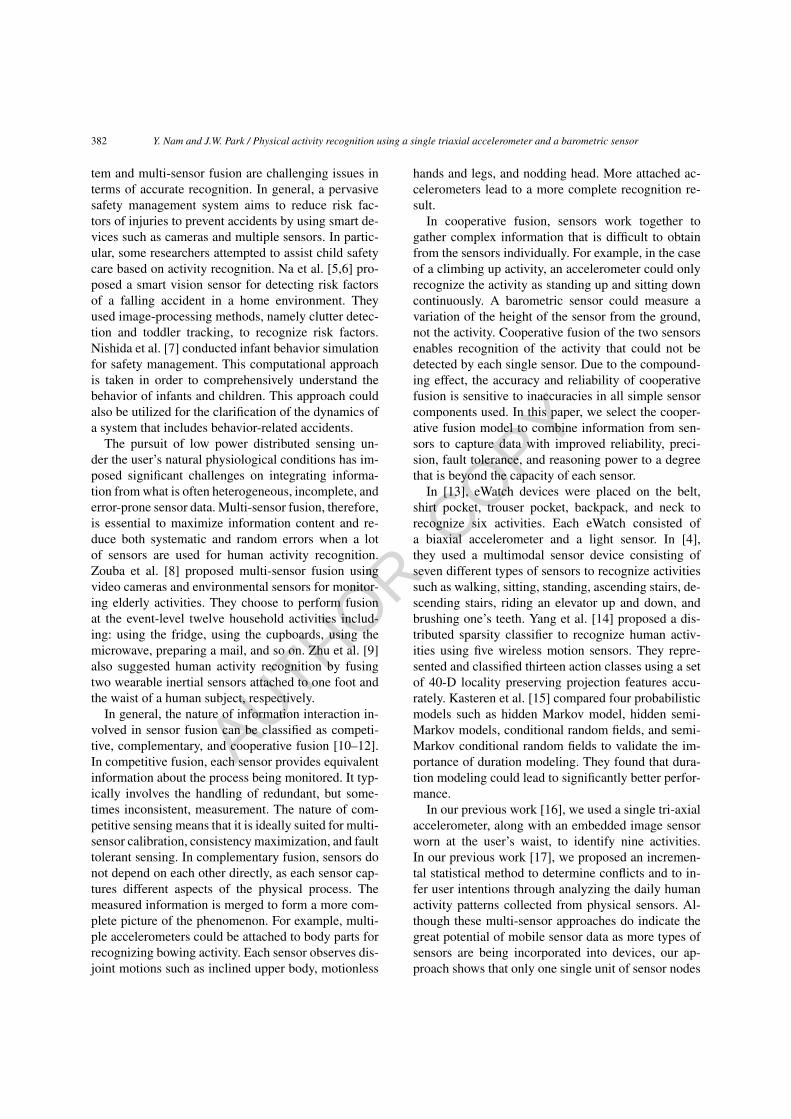
Fig. 5. Accelerometer data from a 3-axis accelerometer for walking.
cause the device to change orientation and this is eas-ily detected from the accelerometer data, we presentexamples extracted from one baby. Standard deviationwas used to capture the fact that the range of possibleacceleration values differ for different activities suchas walking and crawling as shown in Figs 5 and 6. Ina comparison between walking and crawling, statis-tics of an accelerometer in walking, such as mean andstandard deviation, are
(mx′′,my′′,mz′′,meanV ,meanH )
= (113.84, 217.38, 240.06, 344.30, 7.35)
and
(σx′′ , σy′′ , σz′′ , σV, σH)
= (18.63, 10.55, 12.17, 20.42, 6.43).
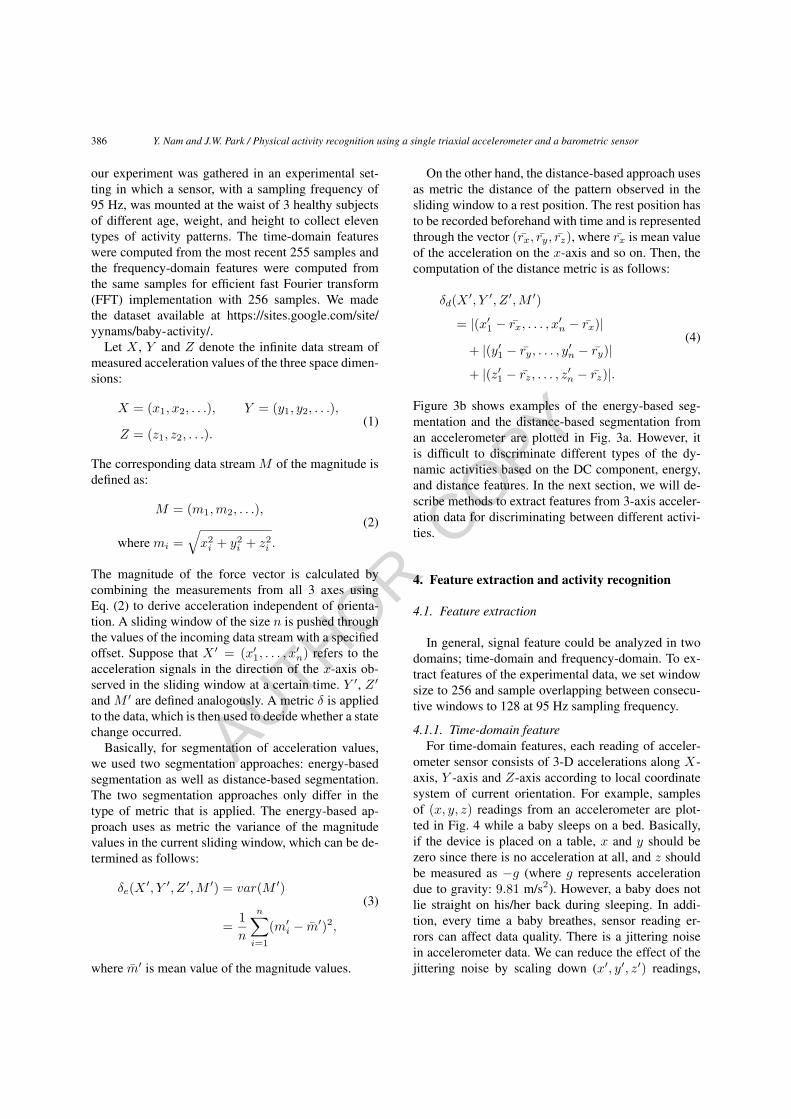
Fig. 6. Accelerometer data from a 3-axis accelerometer for crawling.
On the other hand, statistics of an accelerometer incrawling, such as mean and standard deviation, are
(mx′′,my′′,mz′′,meanV ,meanH )
= (209.50, 271.42, 313.88, 464.81, 3.41)
and
(σx′′ , σy′′ , σz′′ , σV, σH)
= (8.34, 5.81, 5.33, 11.01, 4.47).
With respect to the smoothed accelerometer data andvertical components, standard deviation of walking isgreater than that of crawling.
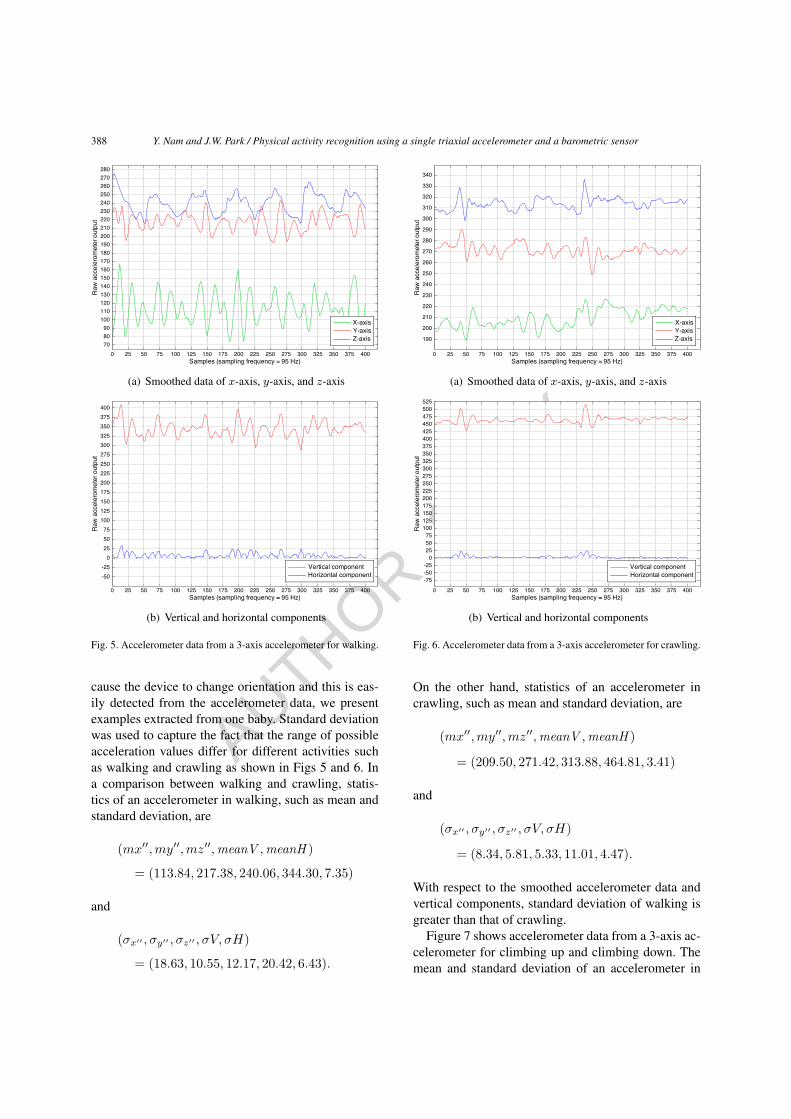
Figure 7 shows accelerometer data from a 3-axis ac-celerometer for climbing up and climbing down. Themean and standard deviation of an accelerometer in
AUTHOR COPY
Y. Nam and J.W. Park / Physical activity recognition using a single triaxial accelerometer and a barometric sensor 389
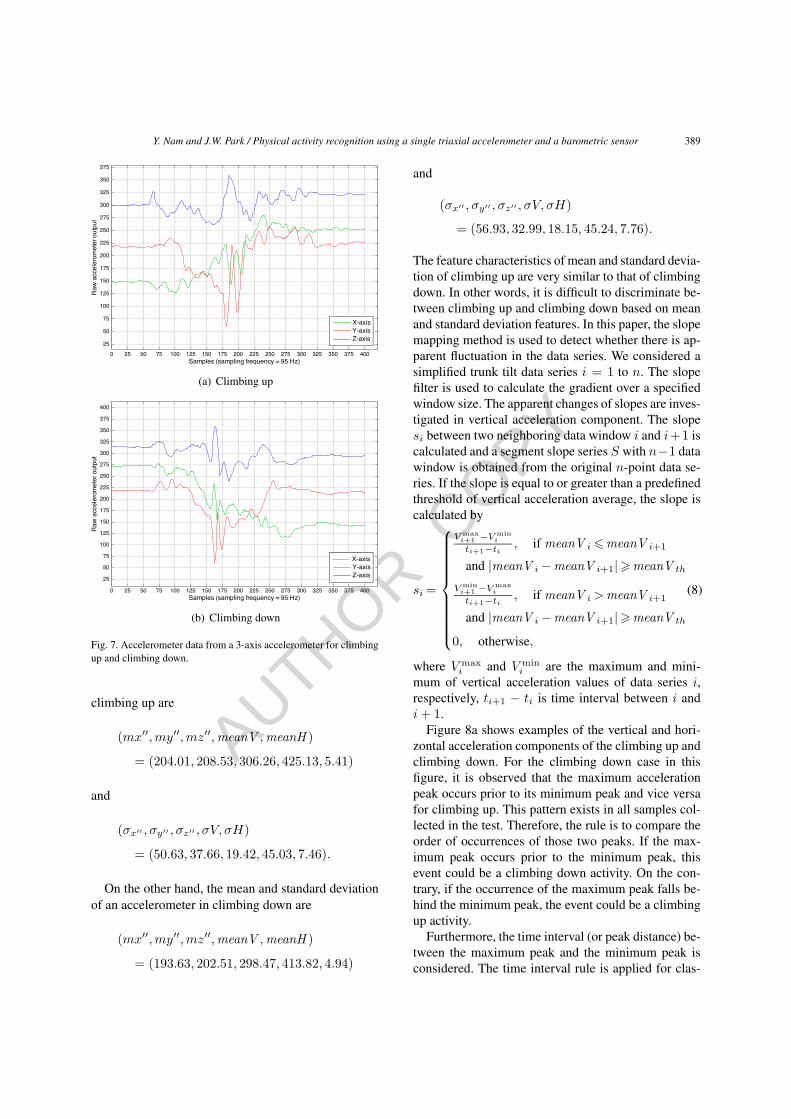
Fig. 7. Accelerometer data from a 3-axis accelerometer for climbingup and climbing down.
climbing up are
(mx′′,my′′,mz′′,meanV ,meanH )
= (204.01, 208.53, 306.26, 425.13, 5.41)
and
(σx′′ , σy′′ , σz′′ , σV, σH)
= (50.63, 37.66, 19.42, 45.03, 7.46).
On the other hand, the mean and standard deviationof an accelerometer in climbing down are
(mx′′,my′′,mz′′,meanV ,meanH )
= (193.63, 202.51, 298.47, 413.82, 4.94)
and
(σx′′ , σy′′ , σz′′ , σV, σH)
= (56.93, 32.99, 18.15, 45.24, 7.76).
The feature characteristics of mean and standard devia-tion of climbing up are very similar to that of climbingdown. In other words, it is difficult to discriminate be-tween climbing up and climbing down based on meanand standard deviation features. In this paper, the slopemapping method is used to detect whether there is ap-parent fluctuation in the data series. We considered asimplified trunk tilt data series i = 1 to n. The slopefilter is used to calculate the gradient over a specifiedwindow size. The apparent changes of slopes are inves-tigated in vertical acceleration component. The slopesi between two neighboring data window i and i+1 iscalculated and a segment slope series S with n−1 datawindow is obtained from the original n-point data se-ries. If the slope is equal to or greater than a predefinedthreshold of vertical acceleration average, the slope iscalculated by
si =
⎧⎪⎪⎪⎪⎪⎪⎪⎪⎪⎨⎪⎪⎪⎪⎪⎪⎪⎪⎪⎩
V maxi+1 −V min
i
ti+1−ti, if meanV i �meanV i+1
and |meanV i −meanV i+1|�meanV th
V mini+1 −V max
i
ti+1−ti, if meanV i >meanV i+1
and |meanV i −meanV i+1|�meanV th
0, otherwise,
(8)
where V maxi and V min
i are the maximum and mini-mum of vertical acceleration values of data series i,respectively, ti+1 − ti is time interval between i andi+ 1.
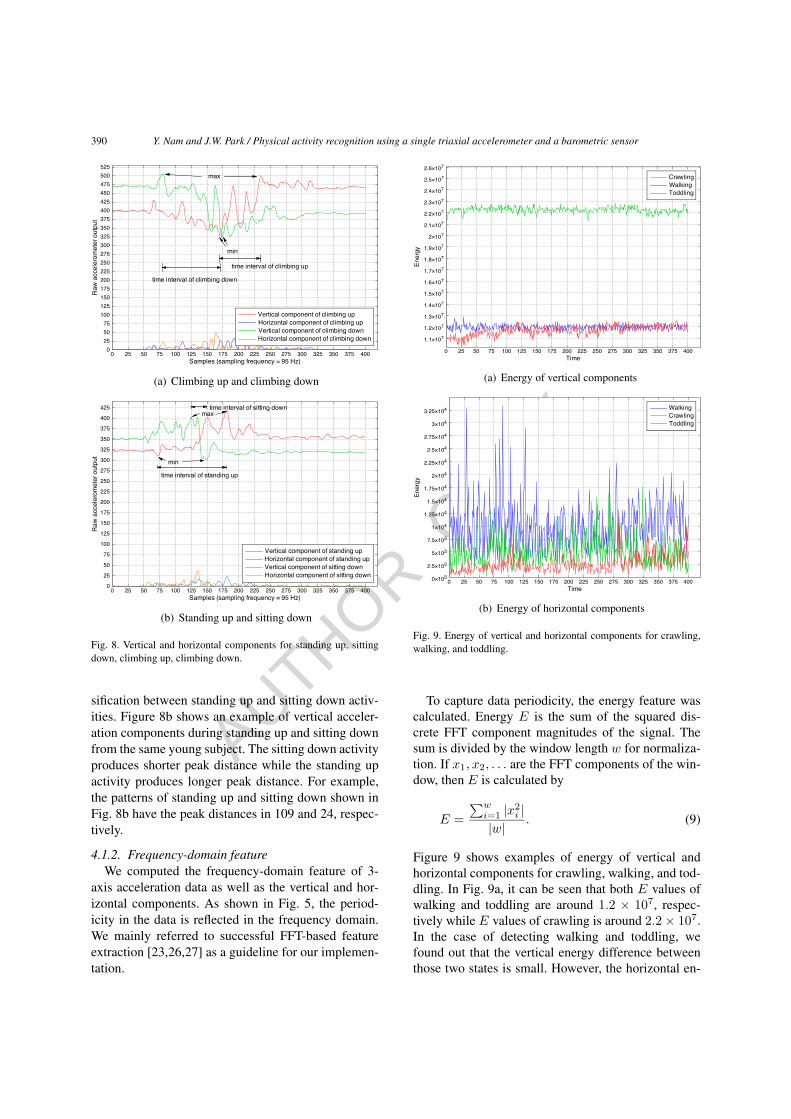
Figure 8a shows examples of the vertical and hori-zontal acceleration components of the climbing up andclimbing down. For the climbing down case in thisfigure, it is observed that the maximum accelerationpeak occurs prior to its minimum peak and vice versafor climbing up. This pattern exists in all samples col-lected in the test. Therefore, the rule is to compare theorder of occurrences of those two peaks. If the max-imum peak occurs prior to the minimum peak, thisevent could be a climbing down activity. On the con-trary, if the occurrence of the maximum peak falls be-hind the minimum peak, the event could be a climbingup activity.
Furthermore, the time interval (or peak distance) be-tween the maximum peak and the minimum peak isconsidered. The time interval rule is applied for clas-
AUTHOR COPY
390 Y. Nam and J.W. Park / Physical activity recognition using a single triaxial accelerometer and a barometric sensor
Fig. 8. Vertical and horizontal components for standing up, sittingdown, climbing up, climbing down.
sification between standing up and sitting down activ-ities. Figure 8b shows an example of vertical acceler-ation components during standing up and sitting downfrom the same young subject. The sitting down activityproduces shorter peak distance while the standing upactivity produces longer peak distance. For example,the patterns of standing up and sitting down shown inFig. 8b have the peak distances in 109 and 24, respec-tively.
4.1.2. Frequency-domain featureWe computed the frequency-domain feature of 3-
axis acceleration data as well as the vertical and hor-izontal components. As shown in Fig. 5, the period-icity in the data is reflected in the frequency domain.We mainly referred to successful FFT-based featureextraction [23,26,27] as a guideline for our implemen-tation.
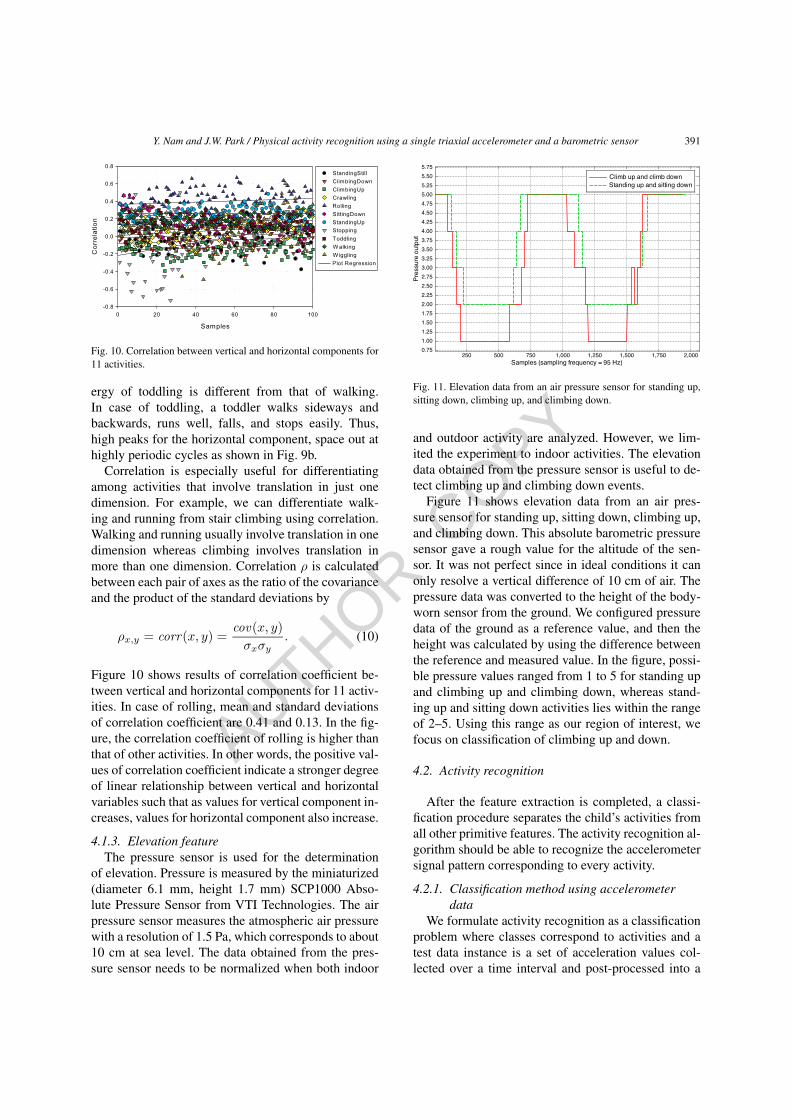
Fig. 9. Energy of vertical and horizontal components for crawling,walking, and toddling.
To capture data periodicity, the energy feature wascalculated. Energy E is the sum of the squared dis-crete FFT component magnitudes of the signal. Thesum is divided by the window length w for normaliza-tion. If x1, x2, . . . are the FFT components of the win-dow, then E is calculated by
E =
∑wi=1 |x2
i ||w| . (9)
Figure 9 shows examples of energy of vertical andhorizontal components for crawling, walking, and tod-dling. In Fig. 9a, it can be seen that both E values ofwalking and toddling are around 1.2 × 10⁷, respec-tively while E values of crawling is around 2.2× 10⁷.In the case of detecting walking and toddling, wefound out that the vertical energy difference betweenthose two states is small. However, the horizontal en-
AUTHOR COPY
Y. Nam and J.W. Park / Physical activity recognition using a single triaxial accelerometer and a barometric sensor 391
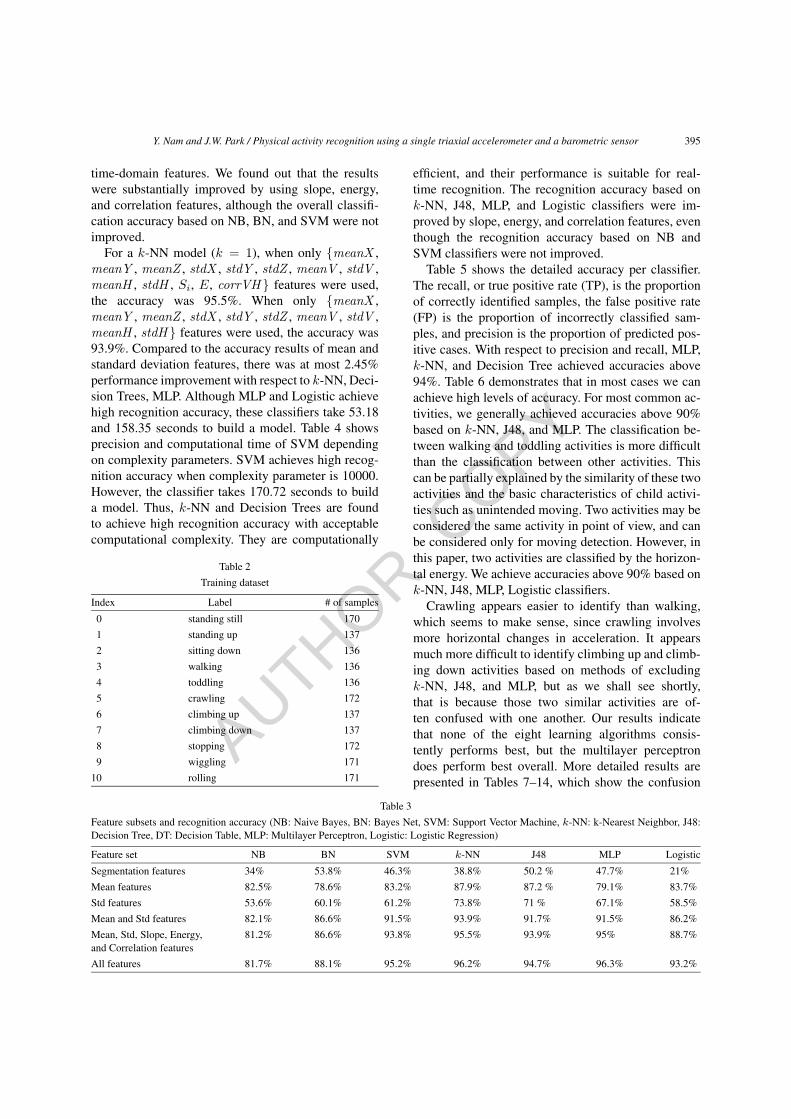
Fig. 10. Correlation between vertical and horizontal components for11 activities.
ergy of toddling is different from that of walking.In case of toddling, a toddler walks sideways andbackwards, runs well, falls, and stops easily. Thus,high peaks for the horizontal component, space out athighly periodic cycles as shown in Fig. 9b.
Correlation is especially useful for differentiatingamong activities that involve translation in just onedimension. For example, we can differentiate walk-ing and running from stair climbing using correlation.Walking and running usually involve translation in onedimension whereas climbing involves translation inmore than one dimension. Correlation ρ is calculatedbetween each pair of axes as the ratio of the covarianceand the product of the standard deviations by
ρx,y = corr(x, y) =cov(x, y)
σxσy. (10)
Figure 10 shows results of correlation coefficient be-tween vertical and horizontal components for 11 activ-ities. In case of rolling, mean and standard deviationsof correlation coefficient are 0.41 and 0.13. In the fig-ure, the correlation coefficient of rolling is higher thanthat of other activities. In other words, the positive val-ues of correlation coefficient indicate a stronger degreeof linear relationship between vertical and horizontalvariables such that as values for vertical component in-creases, values for horizontal component also increase.
4.1.3. Elevation featureThe pressure sensor is used for the determination
of elevation. Pressure is measured by the miniaturized(diameter 6.1 mm, height 1.7 mm) SCP1000 Abso-lute Pressure Sensor from VTI Technologies. The airpressure sensor measures the atmospheric air pressurewith a resolution of 1.5 Pa, which corresponds to about10 cm at sea level. The data obtained from the pres-sure sensor needs to be normalized when both indoor
Fig. 11. Elevation data from an air pressure sensor for standing up,sitting down, climbing up, and climbing down.
and outdoor activity are analyzed. However, we lim-ited the experiment to indoor activities. The elevationdata obtained from the pressure sensor is useful to de-tect climbing up and climbing down events.
Figure 11 shows elevation data from an air pres-sure sensor for standing up, sitting down, climbing up,and climbing down. This absolute barometric pressuresensor gave a rough value for the altitude of the sen-sor. It was not perfect since in ideal conditions it canonly resolve a vertical difference of 10 cm of air. Thepressure data was converted to the height of the body-worn sensor from the ground. We configured pressuredata of the ground as a reference value, and then theheight was calculated by using the difference betweenthe reference and measured value. In the figure, possi-ble pressure values ranged from 1 to 5 for standing upand climbing up and climbing down, whereas stand-ing up and sitting down activities lies within the rangeof 2–5. Using this range as our region of interest, wefocus on classification of climbing up and down.
4.2. Activity recognition
After the feature extraction is completed, a classi-fication procedure separates the child’s activities fromall other primitive features. The activity recognition al-gorithm should be able to recognize the accelerometersignal pattern corresponding to every activity.
4.2.1. Classification method using accelerometerdata
We formulate activity recognition as a classificationproblem where classes correspond to activities and atest data instance is a set of acceleration values col-lected over a time interval and post-processed into a

AUTHOR COPY
392 Y. Nam and J.W. Park / Physical activity recognition using a single triaxial accelerometer and a barometric sensor
Fig. 12. Decision Tree generated from mean and standard deviation features of V/H.
single instance of mean, standard deviation, energy,correlation. In previous work to recognize activities,Decision Table [28], Decision Tree [29], Support Vec-tor Machine (SVM) [30,31], and Nearest Neighbors[32], and Naive Bayes [33] classifiers were tested foractivity recognition using the feature vector. Decision-based approaches [34] have been used in past workto recognize activities. Naive Bayes is a computation-ally efficient algorithm that has been used for patternclassification in a variety of applications. In addition,some studies have also focused on combining multi-ple types of sensors in addition to accelerometers foractivity recognition.
In this paper, we evaluated the performance of NaiveBayes, Bayes Net, SVM, k-Nearest Neighbor (k-NN),Decision Table, Decision Tree, Multilayer Perceptron,and Logistic Regression classifiers, available in theWeka toolkit [35]. The Decision Tree learning methodis one of the most widely used and practical techniquesfor inductive inference. The constructed tree first per-forms a binary split on the most salient feature (e.g.the X-axis acceleration energy from the sensor), di-viding into two branches, then recursively constructstrees for each branch. The predictive values (e.g. walk-ing, crawling, etc.) are assigned to the resulting leaves.To avoid over fitting to the data, which occurs aftermany tree subdivisions since each leaf then representsonly a small number of samples, the tree is pruned.The Decision Tree classifier detects errors in classi-fication of the training samples, as well as to errorsin the attribute values of the samples, which providesa good balance between accuracy and computationalcomplexity. A well-pruned Decision Tree model gen-
erated from simple V/H features for seven activities ispresented in Fig. 12.
The purpose of distance-based clustering is to grouplarge sets of data S = {ui}Ni=1 into clusters, each ofwhich is represented by its mean X = {ci}Ki=1. Re-cently, the use of SVM has attracted significant re-search interest for accurate pattern classification as oneof distance-based clustering methods [36]. An SVMmodel could represent aggregated data as points inspace that is separated by optimal separating hyper-plane. The 10-fold cross-validation is used to evalu-ate the SVM models. We put all the test cases in onedataset and then randomly divide it into 10 equal-sizedpieces. Each time we choose one fold as the test datasetand the rest as the training dataset. We train the SVMmodel with the training dataset, evaluate it with thetest dataset and get the precision p, recall r and theF −Measure weighted harmonic mean for each activ-ity. After each fold is tested, we compute the averageF −Measure of all the folds as the overall results forthe activities. The definition is as following:
F −Measure =(α+ 1)rp
r + αp(11)
where α is the ‘recall bias’, a weighting of recall rel-ative to precision declared in each scenario definition.In this paper, α is set to 1 for performance evaluation.
4.2.2. Classification method using elevation dataThe pressure sensor signal is low-pass filtered us-
ing Butterworth filter and up-sampled using linear in-terpolation to the sampling rate of 95 Hz. The result-ing signal is used to calculate the differential pressure

AUTHOR COPY
Y. Nam and J.W. Park / Physical activity recognition using a single triaxial accelerometer and a barometric sensor 393
parameter (ΔP [k]). The kth sample of ΔP signal isobtained considering the average pressure during Tw
(we set to 2 seconds) before and Tw after each sample(overlapping the windows):
ΔP [k] =Ts
Tw
(k+TwTs∑
i=k
p[i]−k∑
i=k−TwTs
p[i]
), (12)
where p[i] is the ith sample of the barometric signaland Ts is the sampling period. The ΔP signal is thennormalized by dividing by the height of the subject.
If the thresholding of ΔP (with a heuristically deter-mined threshold) indicates that the device altitude hassignificantly changed, the event is classified as stand-ing up, sitting down, climbing up, and climbing down.If the system recognizes that no pressure change hasoccurred during Tth interval, then the classification isupgraded to non-moving status. If the system recog-nizes that the device altitude is significantly changed,even without detecting an activity based accelerationdata, but the ΔP exceeds a high threshold ΔPth, theevent is classified as standing up, sitting down, climb-ing up, and climbing down. Although a 3-axis ac-celerometer is mainly used to detect activities includ-ing climbing up and climbing down, it is difficult tofind the start and stop points of such activity in clas-sifying it. In complementary sensor fusion, an event-driven reactive engine is adopted. We will discuss theevent-driven reactive engine in the next section.
4.3. Event detection
In complementary fusion, each sensor captures dif-ferent aspects and submits the information which isfurther merged. In cooperative fusion, sensors work to-gether to gather complex information that is difficultto obtain from the sensors individually. In this paper,cooperative sensor fusion is applied to recognize activ-ities such as climbing up and down. An accelerometercould only recognize the climbing activity as standingup and sitting down. A barometric sensor could onlymeasure a variation of the height of the sensor from theground. However, cooperative fusion of the two sen-sors enables recognition of the activity.
In order to achieve highly accurate results, weadopted an event-driven reactive engine based on anEvent/Condition/Action (ECA) paradigm and con-structed the decision rule about whether they can bea cause of home accidents or not. Depending on de-cision rule, the event detection method will signal an
alarm to give parents advance warning when the ac-tivity that can lead to an accident are detected. In thispaper, the type of event is the result of the accelerationclassification that mainly considered as a critical pointof dangerous activity.
Conditions included the values of RFID tag, pres-sure, and temperature. The same condition may partic-ipate in more than one rule. We only considered an ap-propriate action as triggering alarm to the parents be-fore the child faces dangerous situations. This in turnwill alert and warn the parents in time to see what ishappening with their babies and react to the situationimmediately. The early warning system will give theparents enough time to save their babies and thus min-imize any instances of falling accidents or sudden in-fant death syndrome (SIDS).
5. Experiments
5.1. Implementation
We used multiple sensors embedded in a wearabledevice as shown in Table 1. We used the SCA3000that is a 3-axis accelerometer for applications requir-ing high performance with low power consumption. Itconsists of three signal-processing channels where itis low-pass filtered and communicates with the pro-cessing layer is based on SPI bus that is a full duplexsynchronous 4-wire serial interface. We also used theSCP1000 as a pressure sensor that measures absolutepressure to measure distance between the grounds andthe sensor. The pressure and temperature output dataare calibrated and compensated internally. The sensorcommunicates with the processing layer through SPIbus.
The SkyeModule M1-mini is selected to read andwrite tags, which has compatibility with most industrystandard 13.56 MHz. It has a read/write distance that
Table 1Multiple sensors embedded in a wearable device
Sensor type Sensor name Features
3-axis acceler-ometer
SCA3000 Measuring range is −2 g to+2 g and its sensitivity is280 counts/g
Absolute pres-sure sensor
The SCP1000 Measuring range of the sensoris 30 kPa to 120 kPa
RFID SkyeModuleM1-mini
Compatibility with most indus-try standard 13.56 MHz such asISO 15693, ISO 14443A, andISO 18000-3

AUTHOR COPY
394 Y. Nam and J.W. Park / Physical activity recognition using a single triaxial accelerometer and a barometric sensor
Fig. 13. Engineering prototype of the wearable sensor device and ascreenshot of the monitoring application.
is typically greater than or equal to two inches for anISO15693 RFID inlay. The sensor allows us to recog-nize objects and space that may cause dangerous sit-uations. Finally, we developed the prototype wearablesensor device (size of 65 mm × 25 mm) including thedual-core processor and sensors as shown in Fig. 13a.Figure 13b shows the developed monitoring applica-tion to aggregate sensing data and obtained annota-tions according to activities. It allows a visualizationof sensing data in a real-time environment.
5.2. Experimental setup
Our observation was participatory with three volun-teer families and conducted under the following con-ditions: i) the baby and child did not wear any devicesand spent his/her leisure time with his/her mother,ii) the mother managed the housework as usual duringthe observation, iii) the experiments were conducted in32.98 m2 living room and 16.44 m2 kitchen as shownin Fig. 14a. We recorded the experiments as videosthat are synchronized with the monitoring application,
Fig. 14. Floor plan of an experimental environment and a child hav-ing the sensor device on the waist of the body.
and then annotated the raw data by comparing with thevideo. The experiments were performed in single-floorhouses with one wearable sensor device for the childand the monitoring application operated on a laptopcomputer.
5.3. Experimental results
Accelerometer data was collected from three babyboys who are 16, 17 and 20 months old. There weretotal 1538 samples collected from one baby as train-ing data, which are listed in Table 2. The other sam-ples collected by the other baby were used as testdataset. We evaluated and compared several classifiersas mentioned in Section 4.2.1. 10-fold cross-validationwas also used for testing. Different feature subsets arelisted in Table 3. From the accuracy results, mean andstandard deviation features contained more motion in-formation than segmentation features because verti-cal and horizontal features can detect movement bet-ter than segmentation features. Although time-domainfeatures are sufficient for different daily physical ac-tivities, the Decision Tree classifier using all featurescan better distinguish activities than that of using only
AUTHOR COPY
Y. Nam and J.W. Park / Physical activity recognition using a single triaxial accelerometer and a barometric sensor 395
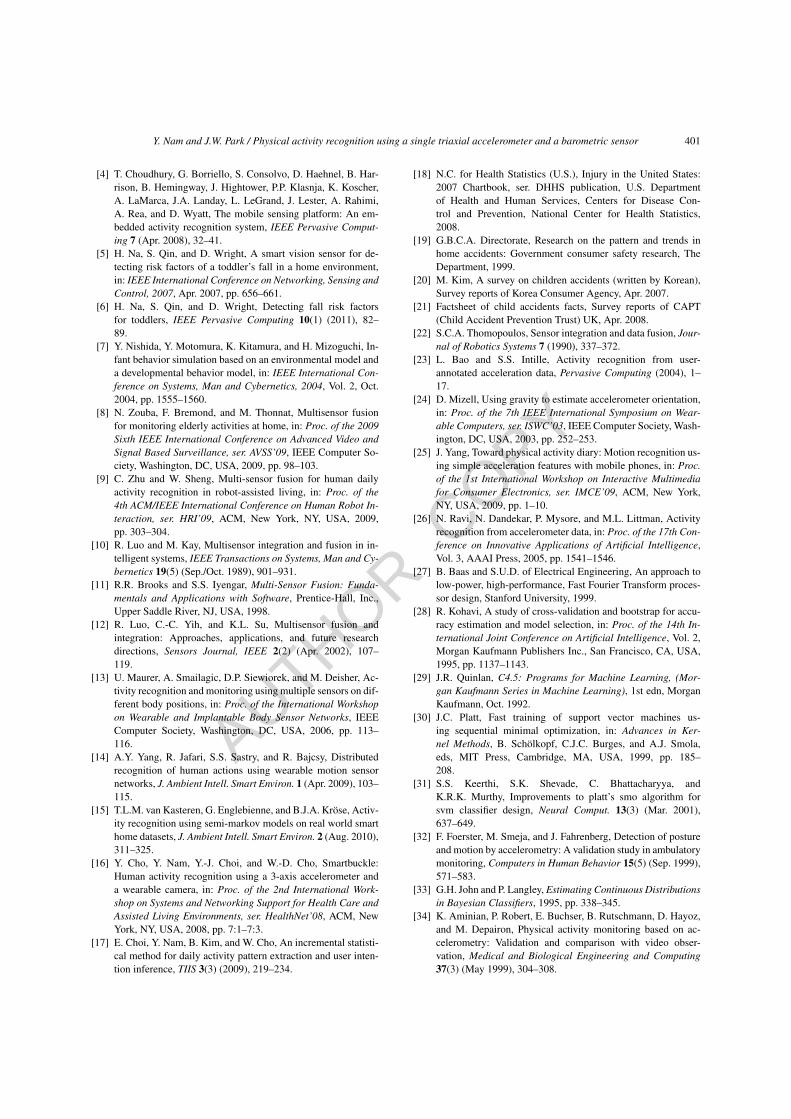
time-domain features. We found out that the resultswere substantially improved by using slope, energy,and correlation features, although the overall classifi-cation accuracy based on NB, BN, and SVM were notimproved.
For a k-NN model (k = 1), when only {meanX ,meanY , meanZ , stdX , stdY , stdZ , meanV , stdV ,meanH , stdH , Si, E, corrVH } features were used,the accuracy was 95.5%. When only {meanX ,meanY , meanZ , stdX , stdY , stdZ , meanV , stdV ,meanH , stdH } features were used, the accuracy was93.9%. Compared to the accuracy results of mean andstandard deviation features, there was at most 2.45%performance improvement with respect to k-NN, Deci-sion Trees, MLP. Although MLP and Logistic achievehigh recognition accuracy, these classifiers take 53.18and 158.35 seconds to build a model. Table 4 showsprecision and computational time of SVM dependingon complexity parameters. SVM achieves high recog-nition accuracy when complexity parameter is 10000.However, the classifier takes 170.72 seconds to builda model. Thus, k-NN and Decision Trees are foundto achieve high recognition accuracy with acceptablecomputational complexity. They are computationally
Table 2Training dataset
Index Label # of samples
0 standing still 1701 standing up 1372 sitting down 1363 walking 1364 toddling 1365 crawling 1726 climbing up 1377 climbing down 1378 stopping 1729 wiggling 171
10 rolling 171
efficient, and their performance is suitable for real-time recognition. The recognition accuracy based onk-NN, J48, MLP, and Logistic classifiers were im-proved by slope, energy, and correlation features, eventhough the recognition accuracy based on NB andSVM classifiers were not improved.
Table 5 shows the detailed accuracy per classifier.The recall, or true positive rate (TP), is the proportionof correctly identified samples, the false positive rate(FP) is the proportion of incorrectly classified sam-ples, and precision is the proportion of predicted pos-itive cases. With respect to precision and recall, MLP,k-NN, and Decision Tree achieved accuracies above94%. Table 6 demonstrates that in most cases we canachieve high levels of accuracy. For most common ac-tivities, we generally achieved accuracies above 90%based on k-NN, J48, and MLP. The classification be-tween walking and toddling activities is more difficultthan the classification between other activities. Thiscan be partially explained by the similarity of these twoactivities and the basic characteristics of child activi-ties such as unintended moving. Two activities may beconsidered the same activity in point of view, and canbe considered only for moving detection. However, inthis paper, two activities are classified by the horizon-tal energy. We achieve accuracies above 90% based onk-NN, J48, MLP, Logistic classifiers.
Crawling appears easier to identify than walking,which seems to make sense, since crawling involvesmore horizontal changes in acceleration. It appearsmuch more difficult to identify climbing up and climb-ing down activities based on methods of excludingk-NN, J48, and MLP, but as we shall see shortly,that is because those two similar activities are of-ten confused with one another. Our results indicatethat none of the eight learning algorithms consis-tently performs best, but the multilayer perceptrondoes perform best overall. More detailed results arepresented in Tables 7–14, which show the confusion
Table 3Feature subsets and recognition accuracy (NB: Naive Bayes, BN: Bayes Net, SVM: Support Vector Machine, k-NN: k-Nearest Neighbor, J48:Decision Tree, DT: Decision Table, MLP: Multilayer Perceptron, Logistic: Logistic Regression)
Feature set NB BN SVM k-NN J48 MLP Logistic
Segmentation features 34% 53.8% 46.3% 38.8% 50.2 % 47.7% 21%Mean features 82.5% 78.6% 83.2% 87.9% 87.2 % 79.1% 83.7%Std features 53.6% 60.1% 61.2% 73.8% 71 % 67.1% 58.5%Mean and Std features 82.1% 86.6% 91.5% 93.9% 91.7% 91.5% 86.2%Mean, Std, Slope, Energy,and Correlation features
81.2% 86.6% 93.8% 95.5% 93.9% 95% 88.7%
All features 81.7% 88.1% 95.2% 96.2% 94.7% 96.3% 93.2%

AUTHOR COPY
396 Y. Nam and J.W. Park / Physical activity recognition using a single triaxial accelerometer and a barometric sensor
matrices associated with each of the eight learning al-gorithms.
The most important activities to analyze are theclimbing up and climbing down activities. The con-fusion matrices indicate that many of the predictionerrors are due to confusion between these two activi-ties. If we focus on the results for the J48 decision treemodel in Table 11, we see that when they are climb-ing up, the most common incorrect classification oc-curs when we predict climbing down, which occurs30 times and accounts for a decrease in accuracy of3.64% (20 errors out of 548). When the actual activityis climbing down, climbing up slightly outpaces wig-gling in terms of the total number of errors (31 vs. 25).
Table 4Precision and computational time of SVM
Complexityparameter
Precision Time taken to build model (sec)
100 89.4% 0.83101 92.2% 1.14102 93.9% 3.65103 94.9% 23.15104 95.2% 170.72
Table 5Detailed accuracy per classifier
Classifier TP rate FP rate Precision Recall F-measure
NB 81.5% 1.8% 81.7% 81.5% 81.3%BN 87.3% 1.12% 88.1% 87.3% 87.3%SVM 95.2% 0.5% 95.2% 95.2% 95.2%k-NN 96.2% 0.4% 96.2% 96.2% 96.2%J48 94.7% 0.5% 94.7% 94.7% 94.7%DT 74.9% 2.5% 75.8% 74.9% 74.7%MLP 96.3% 0.4% 96.3% 96.3% 96.3%Logistic 93.2% 0.6% 93.2% 93.2% 93.2%
On the other hand, using air pressure data, the ac-tivities of standing up, sitting down, climbing up, andclimbing down have been recognized with more than99% of accuracy as shown in Table 6. Such high accu-racy is required for building safety applications basedon for instance, falling and climbing up detection. Fig-ure 15 illustrates clustering of the classes using classi-fier errors (J48); these were generated using the Wekamachine learning explorer. It shows that most activ-ities form separate clusters, while walking and tod-dling as well as climbing up and climbing down arecloser together since these activities are very simi-lar.
In addition to Fig. 15, Table 15 shows a summaryof classifier errors (J48) including the mean absoluteerror, root mean squared error, relative absolute er-ror, and root relative squared error. However, the mostcommonly reported errors are the mean absolute errorand root mean squared error. In order to measure aver-age model-performance errors, we chose the mean ab-solute error and root mean squared error as the stan-dard error model in all the following analysis. Table 16shows the error in accurately predicting class by dif-ferent classifiers.
6. Conclusions
We have presented the activity recognition methodfor baby and child using only one triaxial accelerome-ter and a barometric sensor. We extracted time-domainand frequency-domain features for categorizing bodypostures such as standing still and wiggling as well aslocomotion such as toddling and crawling. In order toimprove the performance of the child activity recogni-tion system, six features including magnitude, mean,standard deviation, slope, energy, and correlation are
Table 6Recognition result comparison, a) standing still, b) standing up, c) sitting down, d) walking, e) toddling, f) crawling, g) climbing up, h) climbingdown, i) stopping, j) wiggling, and k) rolling
Classifier a b c d e f g h i j k
NB 85.2% 75.3% 78.1% 91.6% 92.4% 98.8% 57.5% 54.6% 76.5% 85.7% 94.9%BN 86.6% 77.1% 90.4% 91.5% 91.5% 97.4% 77.3% 61.7% 97.5% 93.9% 96.3%SVM 95.1% 97.2% 95.4% 96.9% 95.7% 99.3% 87.8% 85.5% 96.3% 95.9% 99.4%k-NN 98.2% 95.3% 96.5% 92.4% 92% 98% 95.5% 94.5% 96.4% 97.5% 99.4%J48 98.5% 93.3% 94% 93.3% 90.8% 98.7% 93% 89.4% 97.1% 92.7% 97.8%DT 70.5% 66.7% 77.8% 80.7% 75.9% 76.8% 57.5% 56.2% 85.4% 83.7% 94.5%MLP 97.2% 95.6% 94.7% 95.4% 94.6% 98.3% 96.5% 93.3% 97.1% 95.6% 99.3%Logistic 95.1% 94.2% 94.6% 96.1% 95.3% 99.6% 82.3% 75.1% 95.5% 94.2% 99.3%ΔP – 99% 100% – – – 99% 99% – – –

AUTHOR COPY
Y. Nam and J.W. Park / Physical activity recognition using a single triaxial accelerometer and a barometric sensor 397
Table 7Confusion matrix for Naive Bayes, a) standing still, b) standing up, c) sitting down, d) walking, e) toddling, f) crawling, g) climbing up,h) climbing down, i) stopping, j) wiggling, and k) rolling
Predicted classa b c d e f g h i j k
Actual class a 669 0 1 0 0 0 0 0 12 0 0b 0 277 104 0 4 0 0 17 147 0 0c 0 83 454 0 0 0 0 0 9 0 0d 0 0 3 513 30 0 0 0 0 0 0e 0 0 3 47 496 0 0 0 0 0 0f 0 0 0 0 0 678 2 0 0 9 0g 0 2 0 0 0 0 326 206 0 14 0h 0 6 0 0 0 0 154 343 0 42 3i 116 0 16 0 7 0 1 0 547 2 0j 0 0 0 0 0 8 84 60 0 499 33k 0 0 0 0 0 0 0 2 0 16 666
Precision 0.817 0.852 0.753 0.781 0.916 0.924 0.988 0.575 0.546 0.765 0.857 0.949
Table 8Confusion matrix for Bayes Net
Predicted classa b c d e f g h i j k
Actual class a 675 0 0 0 0 0 0 0 7 0 0b 0 482 36 0 4 0 0 20 7 0 0c 0 91 452 3 0 0 0 0 0 0 0d 0 1 2 508 35 0 0 0 0 0 0e 0 6 0 43 497 0 0 0 0 0 0f 0 0 0 0 0 680 2 0 0 7 0g 0 8 0 0 0 0 341 195 0 4 0h 0 6 0 0 0 0 87 439 0 14 2i 104 29 9 1 7 0 0 0 539 0 0j 0 2 1 0 0 18 11 55 0 573 24k 0 0 0 0 0 0 0 2 0 12 670
Precision 0.881 0.866 0.771 0.904 0.915 0.915 0.974 0.773 0.617 0.975 0.939 0.963
Table 9Confusion matrix for SVM
Predicted classa b c d e f g h i j k
Actual class a 659 0 1 0 0 0 0 0 22 0 0b 0 526 17 0 1 0 2 2 1 0 0c 0 7 537 0 0 0 0 0 2 0 0d 0 0 1 523 22 0 0 0 0 0 0e 0 1 0 16 529 0 0 0 0 0 0f 0 0 0 0 0 686 0 0 0 3 0g 0 2 1 0 1 0 477 64 0 3 0h 0 3 1 0 0 0 60 471 0 13 0i 34 2 5 1 0 0 0 0 647 0 0j 0 0 0 0 0 5 3 14 0 658 4k 0 0 0 0 0 0 1 0 0 9 674
Precision 0.952 0.951 0.972 0.954 0.969 0.957 0.993 0.878 0.855 0.963 0.959 0.994

AUTHOR COPY
398 Y. Nam and J.W. Park / Physical activity recognition using a single triaxial accelerometer and a barometric sensor
Table 10Confusion matrix for k-NN
Predicted classa b c d e f g h i j k
Actual class a 660 0 0 0 1 0 0 0 21 0 0b 0 525 14 0 2 0 2 3 3 0 0c 0 13 531 0 1 0 0 0 1 0 0d 0 0 0 509 37 0 0 0 0 0 0e 0 0 0 41 505 0 0 0 0 0 0f 0 0 0 0 0 686 0 0 0 3 0g 0 2 1 0 0 0 529 14 0 2 0h 0 8 0 0 0 0 22 511 0 7 0i 12 3 4 1 3 0 0 0 666 0 0j 0 0 0 0 0 14 1 13 0 652 4k 0 0 0 0 0 0 0 0 0 5 679
Precision 0.962 0.982 0.953 0.965 0.924 0.92 0.98 0.955 0.945 0.964 0.975 0.994
Table 11Confusion matrix for Decision Tree
Predicted classa b c d e f g h i j k
Actual class a 671 0 0 0 1 0 0 0 10 0 0b 0 514 20 1 4 0 2 6 2 0 0c 0 21 519 3 1 0 0 0 2 0 0d 0 0 3 503 39 0 0 0 1 0 0e 0 4 0 32 505 0 0 0 5 0 0f 0 0 0 0 0 683 0 0 0 6 0g 0 5 3 0 0 0 503 30 0 6 1h 0 6 2 0 0 0 31 482 0 25 2i 10 1 5 0 6 0 0 1 666 0 0j 0 0 0 0 0 9 4 20 0 639 12k 0 0 0 0 0 0 1 0 0 13 670
Precision 0.947 0.985 0.933 0.94 0.933 0.908 0.987 0.93 0.894 0.971 0.927 0.978
Table 12Confusion matrix for Decision Table
Predicted classa b c d e f g h i j k
Actual class a 652 0 0 0 1 3 0 0 26 0 0b 15 396 76 4 17 15 5 8 10 0 3c 26 143 337 6 3 18 0 0 12 0 1d 15 6 2 413 93 15 0 0 2 0 0e 26 19 13 89 371 24 0 0 4 0 0f 4 0 0 0 0 685 0 0 0 0 0g 13 6 0 0 0 2 347 156 4 17 3h 9 11 0 0 0 4 188 289 9 36 2i 86 10 5 0 4 28 0 0 556 0 0j 44 0 0 0 0 49 58 60 19 431 23k 35 3 0 0 0 49 5 1 9 31 551
Precision 0.758 0.705 0.667 0.778 0.807 0.759 0.768 0.575 0.562 0.854 0.837 0.945

AUTHOR COPY
Y. Nam and J.W. Park / Physical activity recognition using a single triaxial accelerometer and a barometric sensor 399
Table 13Confusion matrix for Multilayer Perceptron
Predicted classa b c d e f g h i j k
Actual class a 651 3 3 0 3 0 0 0 19 3 0b 0 524 15 0 4 0 1 5 0 0 0c 0 20 523 2 0 0 0 0 1 0 0d 0 0 2 524 20 0 0 0 0 0 0e 0 0 1 23 522 0 0 0 0 0 0f 0 0 0 0 0 685 1 0 0 3 0g 0 4 2 0 1 0 521 16 0 4 0h 0 6 0 0 0 1 13 516 0 12 0i 19 1 6 0 1 0 0 0 661 1 0j 0 0 1 1 0 11 3 16 0 647 5k 0 0 0 0 0 0 1 0 0 7 676
Precision 0.963 0.972 0.956 0.947 0.954 0.946 0.983 0.965 0.933 0.971 0.956 0.993
Table 14Confusion matrix for Logistic regression
Predicted classa b c d e f g h i j k
Actual class a 658 0 0 0 0 0 0 0 24 0 0b 0 519 22 0 2 0 1 3 2 0 0c 0 20 523 2 0 0 0 0 1 0 0d 0 0 0 523 23 0 0 0 0 0 0e 0 0 0 19 526 0 0 0 1 0 0f 0 0 0 0 0 687 0 0 0 2 0g 0 1 1 0 1 0 442 100 0 2 1h 0 6 1 0 0 0 90 423 0 28 0i 34 5 6 0 0 0 0 0 644 0 0j 0 0 0 0 0 3 4 37 2 634 4k 0 0 0 0 0 0 0 0 0 7 677
Precision 0.932 0.951 0.942 0.946 0.961 0.953 0.996 0.823 0.751 0.955 0.955 0.993
extracted from the preprocessed signals. We comparedmultiple feature sets to find an optimized classificationmethod, and showed how well they performed on abody. We found that activities can be recognized withfairly high accuracy using a single triaxial accelerome-ter. In addition, we defined rules for a dangerous situa-tion to utilize ECA-based reactive engine in the actualdeployment in a home environment.
Using only a single wearable triaxial accelerome-ter sensor, the average overall accuracy of the k-NNand Decision Tree is 95.45% with acceptable compu-tational complexity, which is better than we expected.Compared to only a single triaxial accelerometer sen-sor, our developed system, which included the pressureinformation, demonstrated an improved performancein detecting climbing up and down activities. Results
showed that using a barometric pressure sensor couldreduce the incidence of false alarms. This work is sig-nificant because the activity recognition model permitsus to gain useful knowledge about the habits of ba-bies and children. Our work has a wide range of appli-cations, including automatic customization of the mo-bile device’s behavior based upon activities and gen-erating a daily/weekly activity profile to determine ifan obese child is performing a healthy amount of ex-ercise. In future work, we plan to migrate the moni-toring application into an embedded platform that canexecute classification methods and ECA reactive en-gine at once. We will extend the application of the pro-posed system that will cover different floor levels byadding multiple bases and the function of air pressureduring calibration. Furthermore, we will test how the

AUTHOR COPY
400 Y. Nam and J.W. Park / Physical activity recognition using a single triaxial accelerometer and a barometric sensor
Fig. 15. Class clustering.
Table 15Summary of classifier errors
Predicted values
Correctly Classified Instances 6355 (94.6953%)Incorrectly Classified Instances 356 (5.3047%)Kappa statistic 0.9416Mean absolute error 0.011Root mean squared error 0.0956Relative absolute error 6.6447%Root relative squared error 33.2769%Coverage of cases (0.95 level) 95.4999 %Mean rel. region size (0.95 level) 9.4607%
Table 16Mean absolute error and root mean squared error shown by differentclassifiers on predicting class
Classifier Mean absolute error Root mean squared error
NB 0.0339 0.1738BN 0.0236 0.1421SVM 0.1492 0.2642k-NN 0.0073 0.0835J48 0.011 0.0956DT 0.0885 0.1904MLP 0.0095 0.0745Logistic 0.0208 0.0977
proposed method and system affect in daily life withits usability test.
Acknowledgment
The authors would like to thank all the volun-teers who participated in our experiments. They wouldalso like to thank Dianne Greco for previewing ourmanuscript. This research is supported by the Interna-tional Collaborative R&D Program of the Ministry ofKnowledge Economy (MKE), the Korean government,as a result of Development of Security Threat Con-trol System with Multi-Sensor Integration and ImageAnalysis Project, 2010-TD-300802-002.
References
[1] M. Weiser, Ubiquitous computing, Computer 26 (Oct. 1993),71–72.
[2] K. Watanabe, Y. Kurihara, and H. Tanaka, Ubiquitous healthmonitoring at home – sensing of human biosignals on floor-ing, on tatami mat, in the bathtub, and in the lavatory, SensorsJournal, IEEE 9(12) (Dec. 2009), 1847–1855.
[3] J. Yin, Q. Yang, and J.J. Pan, Sensor-based abnormal human-activity detection, IEEE Trans. on Knowl. and Data Eng. 20(Aug. 2008), 1082–1090.
AUTHOR COPY
Y. Nam and J.W. Park / Physical activity recognition using a single triaxial accelerometer and a barometric sensor 401
[4] T. Choudhury, G. Borriello, S. Consolvo, D. Haehnel, B. Har-rison, B. Hemingway, J. Hightower, P.P. Klasnja, K. Koscher,A. LaMarca, J.A. Landay, L. LeGrand, J. Lester, A. Rahimi,A. Rea, and D. Wyatt, The mobile sensing platform: An em-bedded activity recognition system, IEEE Pervasive Comput-ing 7 (Apr. 2008), 32–41.
[5] H. Na, S. Qin, and D. Wright, A smart vision sensor for de-tecting risk factors of a toddler’s fall in a home environment,in: IEEE International Conference on Networking, Sensing andControl, 2007, Apr. 2007, pp. 656–661.
[6] H. Na, S. Qin, and D. Wright, Detecting fall risk factorsfor toddlers, IEEE Pervasive Computing 10(1) (2011), 82–89.
[7] Y. Nishida, Y. Motomura, K. Kitamura, and H. Mizoguchi, In-fant behavior simulation based on an environmental model anda developmental behavior model, in: IEEE International Con-ference on Systems, Man and Cybernetics, 2004, Vol. 2, Oct.2004, pp. 1555–1560.
[8] N. Zouba, F. Bremond, and M. Thonnat, Multisensor fusionfor monitoring elderly activities at home, in: Proc. of the 2009Sixth IEEE International Conference on Advanced Video andSignal Based Surveillance, ser. AVSS’09, IEEE Computer So-ciety, Washington, DC, USA, 2009, pp. 98–103.
[9] C. Zhu and W. Sheng, Multi-sensor fusion for human dailyactivity recognition in robot-assisted living, in: Proc. of the4th ACM/IEEE International Conference on Human Robot In-teraction, ser. HRI’09, ACM, New York, NY, USA, 2009,pp. 303–304.
[10] R. Luo and M. Kay, Multisensor integration and fusion in in-telligent systems, IEEE Transactions on Systems, Man and Cy-bernetics 19(5) (Sep./Oct. 1989), 901–931.
[11] R.R. Brooks and S.S. Iyengar, Multi-Sensor Fusion: Funda-mentals and Applications with Software, Prentice-Hall, Inc.,Upper Saddle River, NJ, USA, 1998.
[12] R. Luo, C.-C. Yih, and K.L. Su, Multisensor fusion andintegration: Approaches, applications, and future researchdirections, Sensors Journal, IEEE 2(2) (Apr. 2002), 107–119.
[13] U. Maurer, A. Smailagic, D.P. Siewiorek, and M. Deisher, Ac-tivity recognition and monitoring using multiple sensors on dif-ferent body positions, in: Proc. of the International Workshopon Wearable and Implantable Body Sensor Networks, IEEEComputer Society, Washington, DC, USA, 2006, pp. 113–116.
[14] A.Y. Yang, R. Jafari, S.S. Sastry, and R. Bajcsy, Distributedrecognition of human actions using wearable motion sensornetworks, J. Ambient Intell. Smart Environ. 1 (Apr. 2009), 103–115.
[15] T.L.M. van Kasteren, G. Englebienne, and B.J.A. Kröse, Activ-ity recognition using semi-markov models on real world smarthome datasets, J. Ambient Intell. Smart Environ. 2 (Aug. 2010),311–325.
[16] Y. Cho, Y. Nam, Y.-J. Choi, and W.-D. Cho, Smartbuckle:Human activity recognition using a 3-axis accelerometer anda wearable camera, in: Proc. of the 2nd International Work-shop on Systems and Networking Support for Health Care andAssisted Living Environments, ser. HealthNet’08, ACM, NewYork, NY, USA, 2008, pp. 7:1–7:3.
[17] E. Choi, Y. Nam, B. Kim, and W. Cho, An incremental statisti-cal method for daily activity pattern extraction and user inten-tion inference, TIIS 3(3) (2009), 219–234.
[18] N.C. for Health Statistics (U.S.), Injury in the United States:2007 Chartbook, ser. DHHS publication, U.S. Departmentof Health and Human Services, Centers for Disease Con-trol and Prevention, National Center for Health Statistics,2008.
[19] G.B.C.A. Directorate, Research on the pattern and trends inhome accidents: Government consumer safety research, TheDepartment, 1999.
[20] M. Kim, A survey on children accidents (written by Korean),Survey reports of Korea Consumer Agency, Apr. 2007.
[21] Factsheet of child accidents facts, Survey reports of CAPT(Child Accident Prevention Trust) UK, Apr. 2008.
[22] S.C.A. Thomopoulos, Sensor integration and data fusion, Jour-nal of Robotics Systems 7 (1990), 337–372.
[23] L. Bao and S.S. Intille, Activity recognition from user-annotated acceleration data, Pervasive Computing (2004), 1–17.
[24] D. Mizell, Using gravity to estimate accelerometer orientation,in: Proc. of the 7th IEEE International Symposium on Wear-able Computers, ser. ISWC’03, IEEE Computer Society, Wash-ington, DC, USA, 2003, pp. 252–253.
[25] J. Yang, Toward physical activity diary: Motion recognition us-ing simple acceleration features with mobile phones, in: Proc.of the 1st International Workshop on Interactive Multimediafor Consumer Electronics, ser. IMCE’09, ACM, New York,NY, USA, 2009, pp. 1–10.
[26] N. Ravi, N. Dandekar, P. Mysore, and M.L. Littman, Activityrecognition from accelerometer data, in: Proc. of the 17th Con-ference on Innovative Applications of Artificial Intelligence,Vol. 3, AAAI Press, 2005, pp. 1541–1546.
[27] B. Baas and S.U.D. of Electrical Engineering, An approach tolow-power, high-performance, Fast Fourier Transform proces-sor design, Stanford University, 1999.
[28] R. Kohavi, A study of cross-validation and bootstrap for accu-racy estimation and model selection, in: Proc. of the 14th In-ternational Joint Conference on Artificial Intelligence, Vol. 2,Morgan Kaufmann Publishers Inc., San Francisco, CA, USA,1995, pp. 1137–1143.
[29] J.R. Quinlan, C4.5: Programs for Machine Learning, (Mor-gan Kaufmann Series in Machine Learning), 1st edn, MorganKaufmann, Oct. 1992.
[30] J.C. Platt, Fast training of support vector machines us-ing sequential minimal optimization, in: Advances in Ker-nel Methods, B. Schölkopf, C.J.C. Burges, and A.J. Smola,eds, MIT Press, Cambridge, MA, USA, 1999, pp. 185–208.
[31] S.S. Keerthi, S.K. Shevade, C. Bhattacharyya, andK.R.K. Murthy, Improvements to platt’s smo algorithm forsvm classifier design, Neural Comput. 13(3) (Mar. 2001),637–649.
[32] F. Foerster, M. Smeja, and J. Fahrenberg, Detection of postureand motion by accelerometry: A validation study in ambulatorymonitoring, Computers in Human Behavior 15(5) (Sep. 1999),571–583.
[33] G.H. John and P. Langley, Estimating Continuous Distributionsin Bayesian Classifiers, 1995, pp. 338–345.
[34] K. Aminian, P. Robert, E. Buchser, B. Rutschmann, D. Hayoz,and M. Depairon, Physical activity monitoring based on ac-celerometry: Validation and comparison with video obser-vation, Medical and Biological Engineering and Computing37(3) (May 1999), 304–308.

AUTHOR COPY
402 Y. Nam and J.W. Park / Physical activity recognition using a single triaxial accelerometer and a barometric sensor
[35] I.H. Witten and E. Frank, Data Mining: Practical MachineLearning Tools and Techniques, 2nd edn, Morgan KaufmannSeries in Data Management Systems, Morgan Kaufmann Pub-lishers Inc., San Francisco, CA, USA, 2005.
[36] N. Cristianini and J. Shawe-Taylor, An Introduction to SupportVector Machines: And Other Kernel-Based Learning Methods,Cambridge University Press, New York, NY, USA, 2000.