Attraction, Affiliation and Disenchantment in a New Religious ...
Upload
independentCategory
view
0download
0
8th International Conference on Population Geographies The University of Queensland, Brisbane – 30th June to 3rd July 2015.
Attraction, retention and return: migration histories of a
regional work force in Australia
By Fiona McKenzie1 and Trevor Budge2
Abstract
Migration data for Australia show net losses of young people from regional to metropolitan area, yet relatively little is known about patterns of return migration. Despite the availability of longitudinal data such as the Longitudinal Survey of Australian Youth (LSAY) and the Victorian On Track school leaver destination data, both sources finish at around age 23. Aggregate data shows that this age falls within the cohort of greatest net loss from regional Victoria. Whether individuals from regional areas are more likely to return to regional areas at a later date remains anecdotal. To overcome this knowledge gap, research was undertaken using a sample survey of professional workers in the Victorian regional city of Bendigo. Migration histories from these workers provided insights about the factors which attract and retain workers toregional locations. The paper presents findings from the survey within the context of wider analysis of migration patterns of young adults in Australia.
1 Fiona McKenzie, Senior Researcher, Department of Environment, Land Water and Planning, Melbourne Australia. Email:[email protected]
2 Trevor Budge, Manager Strategy, City of Greater Bendigo, Email [email protected]
1

AcknowledgementsThis survey forms part of a wider project funded by the Australian Research Council(ARC), University of Queensland and Victorian Government namely, ARC Linkage Project LP120100212: Attraction and Retention: The Role of Mobility in Educational Pathways and Human Capital Development. Researchers on that project have provided data and feedback for this conference paper, notably, Martin Bell, Jonathan Corcoran and Francisco Rowe Gonzalez from the University of Queensland. Support from Joshua Pell on behalf of Bendigo Bank and survey assistance from Melissa Kennedy at Latrobe University Bendigo is also acknowledged. Quantitative estimates of age specific migration were developed from ABS census data by the Forward Policy& Research Branch of DELWP in Melbourne, Victoria.
DisclaimerThe views expressed in this paper are those of the authors and should not be regarded as representing the views of Bendigo City Council, Bendigo Bank, or the Victorian Department of Environment, Land, Water and Planning.
2

Introduction: regional migration patterns
Migration data for Australia show net losses of young people from
regional to metropolitan areas. Although regional areas often
display a net gain of population in other age groups, it is the loss
of young adults which has often been the source of concern for local
areas and for policy makers. While the reasons for outmigration,
notably seeking higher education, employment opportunities and
social experiences contribute to the individuals wellbeing and
economic capacities, areas of population loss may be left with
ageing populations and a loss of human capital.
In the case of Victoria, as in other parts of Australia, these
population trends are long-standing (figure 1). The age groups 15-19
and 20-24 are the most common ages at which young adults move from
regional Victoria to Melbourne. The data show large net gains to
Melbourne over the past 40 years and the differential rates of
movement between the two locations.
Figure 1: Migration rates by selected age groups, 1976 to 2011
Source: University of Queensland AIM database based on ABS Census data
3

Despite the availability of time-series data, such as that from the
Australian Bureau of Statistics (ABS) upon which the charts in
figure 1 are derived, we have limited understanding about patterns
of return migration. Whether individuals from regional areas are
more likely to return to regional areas at a later date remains
anecdotal and their motivations for moving remain under-researched.
For regional policy makers, these uncertainties make it difficult to
develop effective attraction and retention strategies.
4

Longitudinal data sources and their limitations
In 2012, the Australian Research Council (ARC) funded a Linkage
Grant for a 3-year project entitled Attraction and Retention: The role of
mobility in educational pathways and human capital development.
This project involved the University of Queensland, several
Victorian government agencies, Graduate Careers Australia and
Latrobe University Bendigo. The research proposal arose from earlier
work undertaken by McKenzie (2010) and Corcoran et al (2010) which
examined the spatial implications of educational and employment
pathways chosen by young adults.
For Victorian government, the research had two key attractors. The
first related to the regional policy context in Victoria which (as
in other States) gives high priority to the retention and attraction
of people to non-metropolitan areas. The second related to the On
Track database managed by the Victorian Department of Education.
This Department has been collecting information on school leaver
destinations for more than 10 years and, while many analyses had
focussed on education concerns, there had been little if any spatial
analysis of the data to explore the locational outcomes of youth
migration.
As with many administrative datasets, there turned out to be an
issue of data quality, reflecting the disjunct between the purpose
for data collection (educational policy development) with the
alternative focus of the research in question (spatial analysis of
migration pathways). The On Track database was found to have
inconsistent recording of place of residence over the years being
considered. While a metropolitan/non-metropolitan split can be made
for particular years, there is a problem in analysing migration
patterns which require the identification of year to year changes.
5

The dataset recorded information on place of residence for years 1,
3 and 4 in the period being investigated, with no information for
years 2 and 5. These missing years meant that the data did not
capture migration information during two critical transitions of the
life course (entry into higher education, and entry into the labour
market), which are closely associated with mobility.
In order to overcome this data limitation, the research team moved
to another longitudinal dataset – the Longitudinal Survey of
Australian Youth (LSAY) – to undertake the pathway analysis. A
cohort of 847 Victorians was available for analysis. Mobility
sequences were followed as this group aged from 15 to 24 with the
spatial outcomes shown in figure 2.
6

Figure 2: Spatial patterns of longitudinal migration pathways, 2003-2011
Source: ARC Linkage Project analysis of LSAY data
It can be seen that the regional students are much more mobile than
Melbourne students in the years covering school, tertiary education
and labour force entry. There is an ongoing flow from regional
Victoria to Melbourne for ages covering both education and entry
into the workplace. This backs up earlier findings indicating that
many regional students who undertake tertiary studies in the regions
will still move to Melbourne for employment afterwards (McKenzie
2010, p. 12). The lack of movement from Melbourne to regions is
notable.
Using LSAY data to examine return migration
Drawing on data from the 2003 LSAY, some insights can be gained in
relation to return migration, although the fact that the LSAY stops
at age 23 greatly limits the findings which may be drawn.
Nevertheless, using the national sample from LSAY Wave 1, the
researchers were able to extract a large enough sample (1,037
persons) for some basic analysis of early return migration among
those who recorded a regional location at the start of the period3. 3 Regional youth are defined as young people who reported their place of residence in a non-metropolitan Statistical Area Level 4 at the age of 15,
7

Around half of these (532 persons) moved to metropolitan areas after
leaving school. Of those who moved to a metropolitan area, 29% (153
persons) had made a return move to a regional area by age 23 (figure
3).
Most returning school leavers appear to remain in metropolitan areas
for between 1 to 4 years which would presumably represent the length
of most university degrees. Nearly half (48%) of those returning did
so at ages 22 and 23.
i.e. at the first wave of the 2003 LSAY cohort.
8

Figure 3: Pattern of return migration to regional locations using Australia-wide sample of LSAY
Source: ARC Linkage Project analysis of LSAY data 2015
The major limitation of the LSAY data is that it stops when
respondents are 23 years of age. Census data indicate that metro to
regional migration is more likely when people are in their mid to
late 20s than in earlier adult cohorts (figure 4).
Figure 4: Implied net migration by age, selected regions, 2006 to 2011
Source: DELWP unpublished data
Earlier work by McKenzie (2010) used qualitative work collected by
Sweeney Research Ltd to examine the motivations behind moves between
regional Victoria and Melbourne for university. The findings of this
research are relevant to the question of whether the return
9

migration shown in the LSAY data is likely to continue in subsequent
age groups. The qualitative research showed that those who grew up
in regional Victoria indicated that, once they reached their
thirties, they would settle down in regional Victoria to raise
children of their own. However, older students and graduates
suggested that such early intentions had been complicated by the
pathways that their metropolitan stay had created. These were
affected by career opportunities arising in Melbourne and/or
relationships developing with people who had grown up in Melbourne.
Both factors created an anchor which could increase in strength the
longer people stayed.
“The longer I stay, the harder it is to move.” ex-regional student based in Melbourne
cited in McKenzie 2010, p. 13.
On the whole, students from regional backgrounds who had undertaken
a professional degree were more willing to live in the city than
vocational students, despite personal preferences to reside
regionally. They recognise that the city is where the majority of
job and career opportunities are located and they are willing to
move to where the jobs are.
“Career drives location more than location driving career.” ex-regional student based in Melbourne
cited in McKenzie 2010, p. 11.
While retirement was a very long way off for those in the study,
there was agreement among alumni who had grown up in the country
that retirement was a life stage to be spent in the country. Almost
all pictured an idyllic seaside lifestyle – far enough away from the
hustle and bustle yet still within easy reach of the medical
facilities of Geelong or Melbourne. Surprisingly, only a handful
suggested that they would consider retiring to their regional
hometown, suggesting that return migration may still lead to areas
of regional depopulation in more remote areas, while the
10

redistribution of population would favour areas near Melbourne and
the major regional centres. Analysis of Bendigo survey data
presented in this paper supports this pattern of return migration to
a regional centre rather than regional place of birth.
Comparing the qualitative and quantitative data presents questions
and speculation. Who are the people contributing to the net gain in
population in regional Victoria in the age groups 25 to 40? This is
the data gap that remains after a great deal of research effort has
been expended. We might assume that the intentions voiced in the
qualitative work – returning to regional Victoria to raise children
– are in fact being played out as the quantitative picture shows net
gains in late 20s and early 30s. Alternatively, the net gain may be
affected by people from Melbourne moving to regional areas (ie. not
regional returners).
The quantitative data in figure 3 show another element of the story
which is that a regional city like Bendigo actually has a net loss
in the 25-29 age group, something noted in the qualitative study as
potentially representing a ‘staging post’ role of some regional
cities with people staying there for tertiary education but then
subsequently completing studies or gaining employment in Melbourne.
Again, the data do not reveal whether such people would be more or
less likely to return to regional Victoria than other groups.
Despite the net loss in this age group, Bendigo shows net gains in
the subsequent cohorts suggesting a balance between losses and gains
of the working age population. The situation for regional Victoria
overall, shows a deeper net loss of the young working age which is
not balanced by gains in subsequent age groups until near-retirement
ages.
11

Insights on return migration using a regional
workforce sample
Faced with the problematic ‘data gap’ for return migration, the
research team decided to undertake a pilot survey of a regional
workforce with a view to mapping migration histories. This
retrospective approach may prove to be a way in which the pathways
of those who end up living in regional areas can be tracked over a
longer period. The significance of capital cities in human capital
development for a regional workforce can then be examined.
The Research Method
A sample of professional workers in a regional location was sought
for this survey. As Latrobe University Bendigo was represented on
the ARC Linkage Research team, the Bendigo Bank was identified as a
potential source for such a sample. The opportunity was aided by the
fact that the Bank runs regular staff surveys on various topics, so
the workforce was familiar with responding to web-based survey
requests. Being a large organisation (c. 1200 workers in Bendigo)
and employing a range of skilled staff from officer level up to
senior management, it was seen as a suitable organisation for
piloting a survey on migration histories. It is hoped to follow up
the study with a number of other organisations to determine whether
different enterprises have different employee profiles in terms of
their locational histories.
The survey aimed to collect information about the spatial histories
of people currently working in a regional location to see whether
there were typical patterns of migration for education and
employment between regional and metropolitan locations. The web-
based survey, conducted over two weeks in in February 2015, included12

19 questions. The final sample included 440 respondents – a response
rate of 37 per cent. Key questions included:
- Did workers originate from the local area?
- Did they train in the local area or did they train elsewhere and
return?
- What have been the motivations for various migration decisions?
13

General characteristics of the sample
Of the 369 respondents who answered the question on gender, 57% were
female and 43% male. Half were living in a family household with
spouse/partner and dependents while a quarter were living with a
spouse/partner but no dependents.
The age profile of the group is shown in Figure 5 below. The chart
reveals that the majority of the Bank sample are in age groups from
25 through to 54. Compared to the wider working age population of
Bendigo, the Bank sample has fewer workers aged 55plus and fewer
younger than 25.
Figure 5: Age profile of Bendigo Bank sample and Bendigo working age population
Sources: Bendigo Bank Survey 2015; ABS Census 2011 using TableBuilder
Locational backgrounds of the respondents
Regional Victoria is prominent in the background of those working at
Bendigo Bank. Of the 440 respondents to the survey, 171 (39%) were
born in Bendigo, 134 (31%) in other parts of regional Victoria and
70 (16%) in Melbourne (table 1). The combined proportion of people
14

with non-metropolitan Australian backgrounds is 74% of the
respondent sample.
15

Table 1: Birthplace of respondents
Where were you born? No %Bendigo 171 38.9Melbourne 70 15.9Other Australian capital city 11 2.5Other regional Australia (outside Victoria)
21 4.8
Other regional Victoria 134 30.5Overseas 32 7.3Not stated 1 0.2TOTAL 440 100Source: Bendigo Bank Survey 2015
When stratified by role at the bank, the Bendigo-born are dominant at
the officer level. Interestingly, senior roles are still
overwhelmingly dominated by people with regional backgrounds (figure
6). The assumption that more senior roles require higher levels of
education and experience may hold, but the degree to which these
skills need to be acquired in metropolitan areas is challenged by the
findings. The regional community profile of the bank may explain this
dominance or it may be a feature of many regional businesses –
further workforce samples would be needed to determine this.
Figure 6: Birthplace profile by workplace role
16
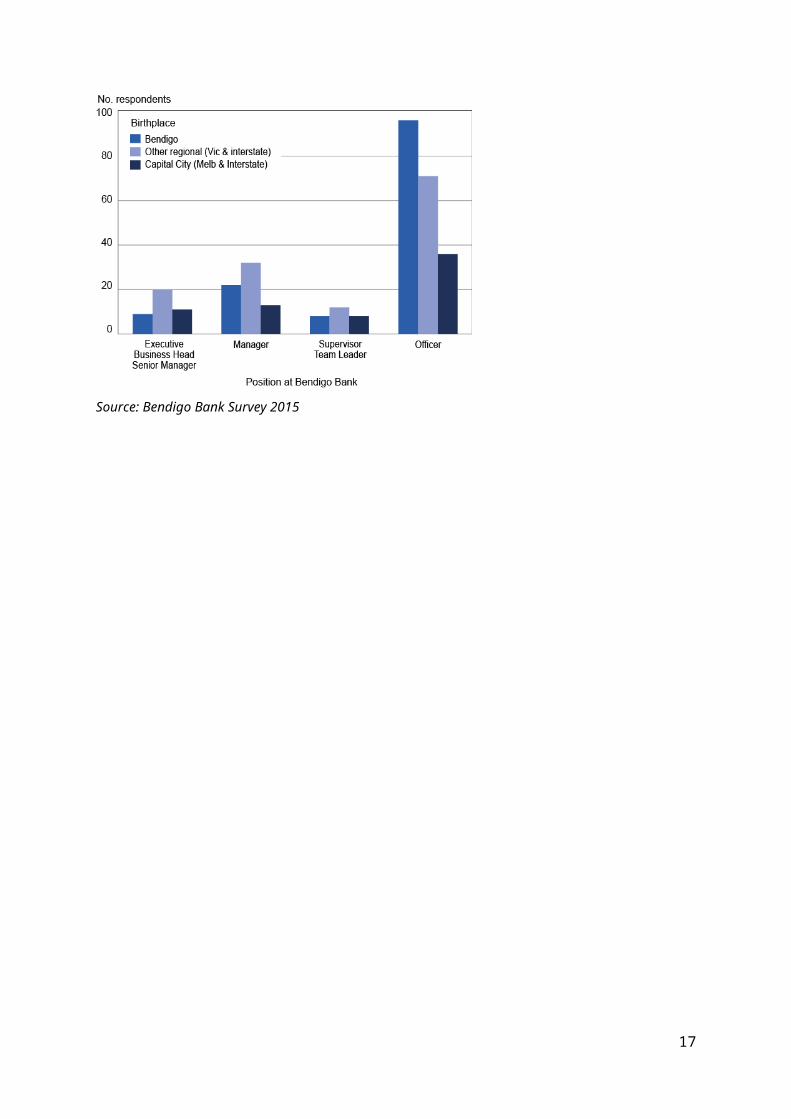
Source: Bendigo Bank Survey 2015
17

Locational histories of respondents
The survey gathered information on migration histories, not just
birthplace. The key stages of life for which locational information
was asked included:
Up until the age of 15;
Period of secondary schooling; and,
Period of post-school education and training.
A summary of findings are shown in Figure 7. The chart shows the
location of respondents at time of birth and at the three stages
listed above. Bendigo becomes increasingly represented as the
location for bank employees as they moved through primary, secondary
and tertiary schooling while regional Victoria becomes less
prominent with higher ages/qualifications. This aligns with our
understanding of aggregate migration moves of young people from
rural areas to larger regional centres to access educational
opportunities. While overseas is a birthplace of some, there appears
to be relatively little influence of overseas experience or training
in the Bank workforce. Although Melbourne becomes more important as
a location during the attainment of higher qualifications, it is not
of greater prominence than Bendigo. Combining the three regional
categories (Bendigo, regional Victoria and interstate regional) it
can be seen that regional locations accounted for 75% of respondents
at birth, 82% and 81% during childhood and secondary years
respectively and 75% during the attainment of their highest
qualification.
Figure 7: Locational background of Bendigo Bank respondents
18

Source: Bendigo Bank Survey 2015
Figure 7 presents the longitudinal locational pattern for those
survey respondents where the data were useable for this purpose (ie.
all locational questions were answered unambiguously. This reduced
the sample of 440 to 367 useable responses. Forty-four combinations
were identified from a simplified location categorisation: Bendigo
(B); other regional (R); metropolitan (M) and overseas (O). For
example, a pattern of “MRBB” would indicate a respondent who had
been born in Melbourne, spent their childhood mostly in a regional
location but secondary school and gaining post-school qualifications
in Bendigo. A pattern of MMMM would be someone who had spent all of
these points of time in Melbourne and was now in Bendigo as part of
the Bendigo Bank workforce. Migration history patterns accounting
for more than 5 respondents are shown in figure 8, and are presented
in descending order of significance.
Figure 8: Simplified migration histories
19

Source: Bendigo Bank Survey 2015
The dominance of the ‘Bendigo only’ pattern can be seen with 108 of
the 367 usable responses being in this category (29.4%). Forty-four
respondents had moved to Bendigo from regional areas to gain their
highest qualification. The patterns of metro only and regional only
accounted for 34 responses respectively highlighting that qualified
workers are attracted to Bendigo from both metro and non-metro
locations.
Detailed analysis of the responses also reveals a total of 247 (67%)
had patterns which only included regional (including Bendigo)
locations, that is, there was no indication of metropolitan or
overseas locations in their migration history. Another pattern
evident from the sample is a move to Bendigo at an early age. 34
(9%) had moved to Bendigo before the age of 15: twenty from regional
areas, 12 from metropolitan and 2 from overseas.
Evidence of returnee migration can be seen in regional-metro-
regional type patterns, for example the patterns of BBBM and RRRM in
20

figure 8. The latter pattern shows a return to the regional centre
of Bendigo rather than a return to regional area of origin, a
pattern noted earlier from previous qualitative research. There is
an important caveat to the data on these returnees. The survey
questions asked respondents to state where they had attained their
highest level of qualification. The 15 respondents showing the BBBM
pattern had attained their highest qualification in Melbourne,
however cross tabulation of their response with an earlier question
“After the age of 15, have you lived outside the City of Greater
Bendigo?” reveals 5 respondents who had not lived outside Bendigo
after age 15 but had a post-school qualification from Melbourne,
presumably through distance education or commuting. This pattern did
not occur among the 12 respondents with the RRRM pattern.
Reasons for moving to Bendigo
The respondents (n=332) who had moved to Bendigo at some point in
their lives were asked about their reasons for doing so – up to 3
reasons could be selected from a list of 8 options. Figure 9 shows
that family reasons are the predominant reason for moving, either as
a primary reason or as part of a group of factors. Family reasons
accounted for 84 responses (26%). Moving for employment is
important, especially if the Bendigo Bank (17%) and other employment
category (10%) is combined. Although the survey did not request
that reasons be listed in order of priority, it is nevertheless
interesting to see the patterns of whether choices were selected in
any particular order. For example, employment and training appear to
be primary drivers in the migration decision as they are not
prominent as second or third selections. Conversely, housing appears
not to be a primary driver but is more prominent as a third
21

selection. Amenity and lifestyle factors appear consistently across
the three.
22

Figure 9: Reasons for moving to Bendigo
Source: Bendigo Bank Survey 2015
An examination of responses based on the location prior to moving to
Bendigo reveals the degree to which metropolitan and regional in-
movers reported different reasons for moving. Table 2 presents these
data with the Metropolitan category comprising Melbourne (n=131) and
other capital cities (n=18) and the Regional category including both
regional Victoria (n=139) and other regional Australia (n=23).
Respondents who moved from overseas have been excluded due to small
numbers (n=9).
Table 2: Reasons for moving to Bendigo by prior location
Reason for moving to Bendigo
Location prior to moving to BendigoMetropolitan RegionalNo % No %
Family reasons 32 21.5 48 29.6To join Bendigo Bank 34 22.8 16 9.9Education or Training 8 5.4 36 22.2Returning to region of birth 19 12.8 4 2.5To follow spouse or partner 15 10.1 14 8.6Employment (other than 10 6.7 20 12.4
23

Bendigo Bank)Amenity / lifestyle 20 13.4 8 4.9Housing choice / affordability
7 4.7 5 3.1
Other 4 2.7 11 6.8TOTAL 149 100 162 100Source: Bendigo Bank Survey 2015
People who had moved to Bendigo from a regional location were most
likely to have moved to Bendigo for family reasons or education /
training. Those moving from Melbourne were more likely to have moved
specifically for the job with Bendigo Bank, however family reasons
were also prominent. It should be kept in mind that there are many
elements that may be included in this category of ‘family reasons’,
for example: people moving to be closer to parents or other
relatives; Melbourne people seeking a quieter place to raise
children, or more remote regional areas seeking a larger city with
educational and employment opportunities for their children.
Interestingly, returning to the region of birth was a factor for 19
metro respondents and a further 4 regional respondents.
Not surprisingly, amenity and lifestyle are more important for those
coming from a metropolitan area than for those moving from another
regional location where a similar lifestyle is more likely to have
existed.
Housing choice and affordability appears to have little significance
as drivers of migration, although subsequent survey questions shows
that they were listed by many as advantages of being in Bendigo. This
highlights an important point for regional policy makers – drivers of
migration are not the same as a locational advantage or asset. Just
because a place has a key advantage (like affordable housing), it may
not act as a driver to attract in-migration. In fact, affordable
24

house prices are a very poor indicator of migration potential as some
of the most expensive cities still attract in-migration.
Reported advantages and disadvantages of living in Bendigo
The survey offered open-ended questions about the advantages and
disadvantages of living in Bendigo. Up to three items could be
recorded and these were then categorised into broad categories for
ease of analysis. These are presented in tables 3 and 4.
General accessibility, proximity to work and ease of travel was a
commonly reported advantage of Bendigo accounting for 16% of
responses. Similar categories related to access to Melbourne (9%)
and access to services and activities (8%). Many respondents
highlighted the quality and availability of services and facilities
as key advantages (10%). While family reasons had been an important
driver of migration to Bendigo, being close to family and friends
accounted for fewer responses to the advantage question (8%), again
highlighting that migration drivers may differ from the advantages
of living in a region.
25

Table 3: Advantages of living in Bendigo, as reported by respondents
Advantages Examples No. ofrespons
es
%
Accessibility/Ease of travel
Short drive to almost anything; ease of getting around; short distance between home and work.
121 16.0
Good place to raisefamily
Comfortable safe place to live and raise a family.
84 11.1
Quality services/facilities
High quality facilities - health care, education; sporting venues; arts; shops.
75 9.9
Employment Big enough city to provide good employment opportunities; Bank provides career opportunities.
70 9.3
Access to Melbourne Accessible to Melbourne. 69 9.1Close to family/friends
Family here; close to my family/extended family.
60 7.9
Access to services/activities
Access to facilities and services - medical, sporting, education.
58 7.7
Location (nfd**) Central location in Victoria; central to Melbourne or the Murray River; central to mostthings.
47 6.2
Lifestyle/Environment
Pleasant place to live; bush; climate; parks andgardens; relaxed atmosphere; slower lifestyle.
43 5.7
Friendly community Community focus; community spirit. 41 5.4Less congestion/Good size
Size of city makes it easy to commute; lack of traffic congestion compared to capital cities.
39 5.2
Affordability Cheaper housing costs; affordable acreage; cheaper cost of living.
31 4.1
Other 17 2.3TOTAL* 755 100.0* Up to 3 responses were allowed hence the number of responses is higher than the number of participants.** nfd = not further defined
Source: Bendigo Bank Survey 2015
The sample of responses to the “disadvantages of living in Bendigo”
question is smaller (n=645) than for advantages (n=755). In fact
several respondents wrote that there were no disadvantages. Of those
reported, jobs and income were important (19%) and included issues
of lower pay in regional areas compared to metropolitan and limited
local job opportunities in specialist fields outside Bendigo Bank
26

itself. The additional category of “economic” relates more to the
broad economic environment such as limited business opportunities or
lower capital appreciation on housing assets. Again, these comments
tend to be made in comparison to metropolitan areas.
Sixty-five responses (10%) related to the natural environment of the
region. The overwhelming focus of these responses related to water
or, more accurately, the lack of it. Lack of, or distance from, the
beach or other waterbody accounted for 38 responses, followed by the
hot/dry climate (13 responses), and water supply limitations or
restrictions (11 responses).
The disadvantage of ‘Location/Distance’ is of interest when compared
to the advantages of access and proximity reported earlier. The
perception of distance is one that can vary widely and what is
proximate for one person may be distant for another (McKenzie 2014,
p. 60).
Table 4: Disadvantages of living in Bendigo, as reported by respondents
Theme Examples No. ofresponses
%
Jobs/Income Can be difficult to find work; limited employment opportunities for young adults; lower salaries; lack of senior professional roles.
120 18.6
Services Limited choice of schools; lack of medical specialists; childcare expensive and hard to find.
96 14.9
Economic Inability to attract large scale businesses; house price appreciation low.
70 10.9
Environment No beach; no river/lake; too hot/dry. 65 10.1Location/Distance Distance to Melbourne. 62 9.6Infrastructure Lack of car parking; public transport. 51 7.9Lack of activity Lack of shopping; don’t get big events;
boredom.44 6.8
Culture Old boys clubs; small town mentality; anti multicultural attitude.
40 6.2
Council Hard to obtaining approvals; rates too high; lack of funding for sport.
38 5.9
Cost of living Cost of living too high / rising. 21 3.3
27

Congestion Traffic. 16 2.5Other 12 1.9Social issues Growing drug culture; crime. 10 1.6TOTAL* 645 100.0* Up to 3 responses were allowed hence the number of responses is higher than the number of participants.
Source: Bendigo Bank Survey 2015
Future migration intentions
Given the Bendigo-focus of most of the migration histories of
respondents, it was not surprising to find that 85% had no intention
to move away from the city in the near future (Table 5). Another
group for whom staying in Bendigo was the preferred intention were
those with the MMMM pattern. This shows that many of those with
metropolitan backgrounds are not just relocating to Bendigo for a
temporary or short term stay. The age profile of these ex-metro
migrants is notable for its older age profile (two thirds of whom
are in the 45+ age brackets). This accords with general patterns of
net migration loss from metro to regional areas at later age groups.
The group may be categorised as ‘late-career tree-changers’.
28

Table 5: Migration histories of those intending to stay in Bendigo in the foreseeable future
Do you intend to move outside the City of Greater Bendigo over the next 2 years?Response = “No” (n=315)
Migration history*
Age group (years)
18-24 25-34 35-44 45-54 55+ All ages
BBBB 12 26 23 17 12 90RRRB 3 10 14 8 2 37MMMM 1 4 5 13 7 30RRRR 1 4 7 13 5 30RBBB 1 6 6 3 0 16RRBB 1 5 4 4 1 15BBBM 1 4 4 3 2 14MBBB 1 4 3 2 0 10RRRM 0 1 2 6 1 10Other** 3 14 22 19 5 63All histories
24 78 90 88 35 315
* NOTE: Each letter refers to a location (B=Bendigo; M=metro; R= regional other than Bendigo) at 4 points in time: birth, childhood, secondary school years and tertiary training years. Hence BBBB would indicate a Bendigo location at each of these points in time.
** NOTE: The category of ‘Other’ includes migration history patterns with fewer than 10 respondents.
Source: Bendigo Bank Survey 2015
In contrast to this are the migration histories of those intending
to leave Bendigo in the next 2 years (table 6). Only one migration
history accounts for more than 10 respondents – this is the BBBB
pattern shared by 18 individuals. The younger profile of those with
this pattern suggests a staging post effect of Bendigo - people who
have lived their life there, through schooling, tertiary education
and employment may have aspirations to move elsewhere at some point,
presumably to gain further experience in other labour markets.
29

Table 6: Migration histories of those intending to leave Bendigo in the foreseeable future
Do you intend to move outside the City of Greater Bendigo over the next 2 years?Response = “Yes” (n=53)
Migration history*
Age group (years)
18-24 25-34 35-44 45-54 55+ All ages
BBBB 6 8 3 1 0 18Other** 4 8 8 9 6 35All
histories
10 16 11 10 6 53
* NOTE: Each letter refers to a location (B=Bendigo; M=metro; R= regional other than Bendigo) at 4 points in time: birth, childhood, secondary school years and tertiary training years. Hence BBBB would indicate a Bendigo location at each of these points in time.
** NOTE: The category of ‘Other’ includes migration history patterns with fewer than 10 respondents.
Source: Bendigo Bank Survey 2015
Of the 53 respondents who indicated that they were intending to
move, nearly half (26) indicated that they would move to a capital
city, notably Melbourne which accounted for 22 responses. (Table 7).
This aligns with the previous finding of Bendigo being able to
retain young people through higher education and initial labour
force work stages but not providing the breadth or depth of career
experience (or social experience) that may be found in a larger,
metropolitan area. Although the move to a metropolitan centre
accounts for most responses, intentions to move to regional areas
are still notable, with 17 respondents being in this category. The
data do not reveal whether such moves would be to regional centres
or rural areas.
30

Table 7: Locational intentions of those indicating they would leave Bendigo in the next 2
years
Intended destination Number ofrespondent
sMelbourne 22Other Australian capital city 4 Total metropolitan 26Other regional Victoria 14Other regional Australia (outside Victoria) 3 Total regional 17Overseas 3Unsure 7Total 53Source: Bendigo Bank Survey 2015
31

Conclusion
Key findings
Quantitative data show ongoing net loss of young adults from
regional to metropolitan areas at the aggregate level. While this
trend has been recognised for many decades, there has been
relatively little analysis of patterns of return migration.
Understanding the likelihood and timing of return is important for
policy makers and local authorities seeking to attract or retain
young adults in regional areas.
Despite the power of longitudinal data sets, those available have
limited coverage of young adults in the most mobile age groups.
Nevertheless, analysis of the Longitudinal Survey of Australian
Youth (LSAY) data suggests that, of those who moved to a
metropolitan area after leaving school, 29 percent had made a return
move to a regional area by age 23.
The use of a regional workforce sample allows for a different
approach in understanding return migration. By reviewing the
migration histories of a workforce sample, insights can be gained in
relation to the age at which particular moves were made and for what
reason, as well as the pathways that led individuals to be located
in a regional centre like Bendigo.
The high proportion of respondents who had lived all or most of
their life in Bendigo was an interesting finding from the survey of
Bendigo Bank employees. Even among senior executives in the sample,
there was strong regional representation. This may reflect the
particular character of Bendigo Bank which began in the regional
city and has a regional community focus. Nevertheless, it shows that
professional career paths and human capital development do not rely
on spending time in a metropolitan location.
32

Most respondents had no intention to move away from Bendigo in the
foreseeable future. Some people in this group had lived in
metropolitan areas for most of their lives and were in older age
groups thus fitting the characteristic pattern of ‘late-career tree-
changers’. In contrast to this is the younger age profile of those
who had lived in Bendigo all their lives but were intending to leave
Bendigo in the next 2 years. This pattern suggests a staging-post
effect of Bendigo: people who have lived their life there, through
schooling, tertiary education and employment who have aspirations to
move elsewhere, presumably to gain further experience in other
labour markets.
The research findings highlight the difference between drivers of
migration (eg. family and employment) and the reported advantages of
living in a particular location (eg. cheaper housing, accessibility
and ease of travel). This is important for policy makers at both
local and state levels because it is often assumed that the
advantages of a place will inherently act as an attractor for
population growth objectives. Such an assumption needs to critically
reviewed.
Future research needs
The Bendigo case study sample provides information for a single
company in a single location. Expanding the survey instrument to
other enterprises is already planned with the Bendigo hospital and
council workforces having been selected. This will test whether the
insights findings from the Bendigo Bank reflect the culture and
decision making of that particular organisation wr whether it is
reflected in other large employers in the city.
In the future it is hoped to test the survey in another location
such as Ballarat. While having similarities to Bendigo in terms of
size, it is somewhat closer to Melbourne (114 kilometres from
33

Melbourne CBD compared to Bendigo being 153 kilometres). This could
reveal whether the levels of ‘self-containment’ found in Bendigo (in
terms of proportions having lived, trained and been employed
locally) is affected by distance from Melbourne.
References
Corcoran, J., Faggian, A. and McCann, P. 2010, “Human capital in remote and rural Australia: the role of graduate migration”, Growth and Change, vol. 41, no. 2, pp. 192-220.
McKenzie, F. 2010, “The influence of tertiary institutions on regional youth migration in Victoria”, Australia and New ZealandRegional Science Association, Proceedings 34th Annual Conference, 7-10December 2010.
McKenzie, F 2014, , Prosperous Futures: Understanding the potential of Australia’s regional cities – Case Studies: Goulburn and Orange, New South Wales, report prepared for the Regional Australia Institute and Victorian Department of Transport, Planning and Local Infrastructure, RAI Canberra.
34
Copyright © 2022 FDOKUMEN


![cnn.p - (° 3Puli. - V.JU - [Pennsylvania county histories]](https://static.fdokumen.com/doc/165x107/632108b4b71aaa142a040f63/cnnp-3puli-vju-pennsylvania-county-histories.jpg)