Attitudes towards politics in Latin America - United Nations ...
33
Attitudes towards politics in Latin America A review of regional perception data
-
Upload
khangminh22 -
Category
Documents
-
view
0 -
download
0
Transcript of Attitudes towards politics in Latin America - United Nations ...

Attitudes towards politics in Latin AmericaA review of regional perception data
Attitudes towards politics in Latin America a review of regional perception data
July 2020
UNDP partners with people at all levels of society to help build nations that can withstand crisis and drive and sustain the kind of growth that improves the quality of life for everyone On the ground in nearly 170 countries and territories we offer global perspective and local insight to help empower lives and build resilient nations
Copyright copy UNDP 2020 All rights reserved
United Nations Development Programme
wwwlatinaamericaundporg | United Nations Development Programme | 2020 3
Acknowledgements
This document was prepared by UNDPacutes Regional Hub for Latin America and the Caribbean The drafting was led by Emanuele Sapienza Policy Advisor Governance under the guidance of Joseacute Cruz-Osorio Regional Hub Manager and Jairo Acuntildea-Alfaro Governancersquos Team Leader Guidance and support from Linda Maguire Regional Hub Supervisor and Sarah Lister Head of Governance Bureau for Policy and Pro-gramme Support are gratefully acknowledged Thanks are also due to the publication peer reviewers Daniel Barraez Senior Economist UNDP Venezuela Miguel Cereceda Coordinator SIGOB and Mark Orkin
wwwlatinaamericaundporg | United Nations Development Programme | 2020 4
The following analysis draws on regional perception data to provide an overview of attitudes towards politics in Latin America together with an indication of how these attitudes have evolved over time and how they may relate to regional developments in other spheres of life with a primary focus on the eco-nomic sphere
The study utilizes statistical tools to investigate trends and drivers of satisfaction with political regime performance in the region as well as the ways in which relevant dynamics may differ across demographic and socio-economic groups An analysis is provided of the relative impact of ldquoeconomicrdquo versus ldquopoliticalrdquo factors on political regime performance satisfaction together with a discussion of the explanatory potential of ldquoobjectively measuredrdquo indicators versus that of ldquoperceptionrdquo indicators
The perception data utilized in the analysis come principally from surveys conducted starting from the mid 90acutes by Latinobarometro a private non-profit organization based in Chile which carries out an annu-al public opinion survey involving some 20000 interviews in 18 Latin American countries representing more than 600 million people1 Other data sources used in the analysis are referenced as relevant in the following sections
The analysis in the paper is structured into six sections
bull Views of politics and democracybull Sex and age dimensions of support for democracybull The age of protestsbull Drivers of satisfaction with political system performancebull Evolution over time of satisfaction with the economybull A middle-class perspective
The remainder of this section provides an overview of the main focus and findings for each of the above sections
Attitudes towards politics in Latin America A review of regional perception data
1 More information on Latinobarometro can be found here along with Latinobarometrorsquos extensive datasets and an online analysis tool
1 Introduction
2 Executive Summary
wwwlatinaamericaundporg | United Nations Development Programme | 2020 5
Views of politics and democracy
Main focus
Investigates evolution over time of satisfaction with political regime performance and its impact on over-all support for democracy as a form of government
Main findings
bull Satisfaction with the functioning of the political system in Latin America reached an all-time low in 2018 with 3 in 4 people expressing a negative judgment about political life in their country
bull There is evidence that this generalized dissatisfaction may have already started to affect general support for democracy as a form of government in most countries The proportion of people who would describe themselves as indifferent between authoritarian and democratic regimes has reached its highest-ever point at 28 percentage
bull A different dynamic is observed however in Venezuela and ndash to a lesser extent ndash in Nicaragua where lower-than-average satisfaction with the functioning of the political system is associated with higher-than-aver-age support for democracy
bull These trends matter beyond Latin America In two of the three Latin American G20 countries (Brazil and Mexico) only one in three people believes that democracy is preferable to other forms of government under all circumstances These two countries account for over half of the total population of Latin America
Sex and age dimensions of support for democracy
Main focus
Investigates of perceptions of politics and support for democracy varies between man and women as well as across age cohorts
bull Over the period for which data is available women and young people have been consistently less likely to express satisfaction with the functioning of the political system and less likely to express unconditional support for democracy as a form of government than the rest of the population
bull The sex and age gap in support for democracy has remained fairly stable over time and up to the last year for which data is available there is no evidence that it may be widening
bull There is strong evidence however that young people hold very distinct views regarding the role of the state particularly in relation to existential regional challenges such as economic inequality and citizen security
The age of protests
Main focus
Investigates changes in political culture ndash particularly attitudes of deference towards authority ndash that may be associated with the observed rise of protest movements around the world
Main findings
bull There is evidence that attitudes of deference towards authority may be softening globally This trend has been referred to as the ldquodeath of deferencerdquo although such terminology implies a much more radical shift than supported by data ndash at least up to the period for which information is available
wwwlatinaamericaundporg | United Nations Development Programme | 2020 6
bull Latin America is very much part of this trend However it should be noted that despite the recent decline deference towards authority remains fairly high in the region compared to the global average
bull It is unclear how the decline in deference towards authority may be related to trends in people`s predis-position to join demonstrations in part because such predisposition seems to follow much more local dynamics
bull The Latin American country which experienced the strongest increase in peoplersquos predisposition to join demonstrations during the period under consideration is Chile The countries that experienced the strongest decrease are Mexico and Brazil
Drivers of satisfaction with political system performance
Main focus
Investigates different factors that may explain variations in satisfaction with political system performance in-cluding perceptions about the economy corruption and insecurity as well as the strength of key democratic safeguards
Main findings
bull Perceived economic performance and perceived corruption appear to be major drivers of satisfaction with political system performance These two factors combined explain approximately 80 percent of the variation in satisfac-tion with the functioning of the political system across Latin American countries for the year 2018
bull There has not always been a strong correlation between perceived economic performance and perceived corruption on one hand and satisfaction with political system performance on the other hand In fact the analysis of time series reveals that this link only starts to consolidate after 2008 possibly as a result of shifts in perceptions and expectations caused by the 2007-2008 financial crisis
bull Comparing levels of satisfaction with the political system and levels of satisfaction with the functioning of the eco- nomy can help us investigate political system resilience Based on this methodology the countries characterized by the greatest resilience in 2018 were Costa Rica Uruguay and Argentina The countries with the lowest resilience were Bolivia Peru and Mexico
bull The strength of democratic safeguards such as free and fair elections the existence of checks and balances on the exercise of the power of the state opportunities for meaningful citizen participation and a pluralistic but constructive public debate plays at best a moderate role in explaining variations in satisfaction with political sys-tem performance based on 2018 data
Evolution over time of satisfaction with the economy
Main focus
Investigates different factors that may explain variations in satisfaction with the economy including macro-economic indicators such as per capita GDP growth unemployment rates and the Gini index of income inequality as well as perception about the distributional fairness of the economy
Main findings
bull Some of the most commonly used macroeconomic indicators ndash such as per capita GDP growth and un-employment rate ndash do not appear to be especially useful in predicting the historical evolution of peoplersquos satisfaction with the functioning of the economy There may be value however in further country-specific analysis of the relation between commodity prices and the evolution of economic sentiment
bull There is virtually no correlation between the historical evolution of income inequality as measured by the Gini coefficient and the historical evolution of peoplersquos satisfaction with the functioning of the economy
wwwlatinaamericaundporg | United Nations Development Programme | 2020 7
There is however a very strong correlation between perceived inequality and satisfaction with the func-tioning of the economy for the period 2007-2018
bull The relationship between measured inequality and perceived inequality appears to be a very complex and dynamic one While data is too sparse to draw firm conclusions there are indications that this relation may have significantly changed starting from 2007
A middle-class perspective
Main focus
Investigates the specificities of the perspectives of people self-identifying as ldquomiddle classrdquo as well as how these views differ between ldquolower-middle classrdquo and ldquoupper-middle classrdquo groups
Main findings
bull There are significant differences in perceptions between people who self-identity as ldquolower-middlerdquo class and people who self-identify as ldquoupper-middlerdquo class A nuanced understanding of the concept of ldquomiddle classrdquo is needed to account for these differences
bull Support for democracy as a form of government is highest among people who describe themselves as belonging to the ldquolower-middlerdquo class or the ldquomiddlerdquo class These groups express higher-than-average support for democracy as a form of government despite lower-than-average satisfaction with the actual functioning of democracy in their countries
bull People describing themselves as belonging to the ldquoupper-middlerdquo class appear less likely to believe that democracy is the best form of governance under all circumstances than people describing themselves as part of the ldquomiddle-lowerrdquo or ldquo middlerdquo class
bull On economic matters such as the performance of the economy and the fairness of income distribution the perspective of people who self-identity as ldquolower-middlerdquo class is much closer to that of those who consider themselves as ldquolowerrdquo class than to that of those who consider themselves as ldquoupper-middlerdquo class
bull A significant portion of people who identify as belonging to the lower-middle class live in a situation of serious economic vulnerability At the same time taking into account levels of dissatisfaction with the func-tioning of politics and propensity to demonstrate they are the group that appears most likely to mobilize outside of formal political institutions
A basic distinction
The analysis in this section is based on a basic distinction between ldquoperformance-based supportrdquo and ldquoregime-based supportrdquo Performance-based support is defined as satisfaction with the actual performance of a certain political regime at a given point in time Regime-based support is defined as the belief that a certain political regime is in general preferable to others Based on this distinction we analyze separately peoplersquos satisfaction with the functioning of democracy in their countries and peoplersquos support for democracy as a form of government
Satisfaction with the functioning of democracy
We use the following Latinobarometro question (P13STGBSA) to assess the level of satisfaction with the functioning of democracy (DEM SAT)
3 Views of politics and democracy
wwwlatinaamericaundporg | United Nations Development Programme | 2020 8
Support for democracy as a form of government
We use the following Latinobarometro question (P24ST-26ST) to assess the level of support for democracy as a form of government (DEM SUP)
With which of the following statements are you most in agreement ldquoDemocracy is preferable to all other forms of governmentrdquo ldquoUnder certain circumstances an authoritarian government may be preferablerdquo ldquoFor people like me democratic and undemocratic regimes are no differentrdquo3
Figure 2 Variation in satisfaction with the functioning of democracy in Latin American countries
In general would you say you are very satisfied rather satisfied not very satisfied not satisfied at all with the functioning of democracy in (COUNTRY)2
We consider respondents who gave ldquovery satisfiedrdquo or ldquorather satisfiedrdquo as ldquosatisfied with the functioning of democracy in their countryrdquo
As illustrated in Figure 1 satisfaction with the functioning of democracy in Latin America has been histori-cally fluctuating within a rather low band (29-45 percent) However in 2018 for the first time it went below the historical fluctuation band to reach its lowest-ever value at 25 percent
2 En general iquestDiriacutea Ud que estaacute muy satisfecho maacutes bien satisfecho no muy satisfecho o nada satisfecho con el funcionamiento de la democracia en (PAIacuteS) 3 iquestCon cuaacutel de las siguientes frases estaacute Ud maacutes de acuerdo ldquoLa democracia es preferible a cualquier otra forma de gobiernordquo ldquoEn algunas circunstancias un gobierno autoritario puede ser preferiblerdquo ldquoA la gente como uno nos da lo mismo un reacutegimen democraacutetico que uno no democraacuteticordquo
Figure 1 Satisfaction with the functioning of democracy has reached an all-time low
wwwlatinaamericaundporg | United Nations Development Programme | 2020 9
Figure 3 Support for democracy has been softening as well
Figure 4 shows the variation in support for democracy across Latin American countries as of 2018 A key point that should be highlighted here is that weakening support for democracy in Latin America matters globally In two of the three G20 countries from Latin America (Brazil and Mexico) only one in three people believes that democracy is preferable to other forms of government These two countries account for over half of the total population of Latin America
Figure 4 Variation in support for democracy as a form of government in Latin American countries
Support for democracy has been historically fairly high in Latin America (fluctuating between 52 and 65 percent) and remains by a very large margin the predominant position in the region However it has been steadily declining since 2010 and in 2018 for the first time went below the 50 percent threshold Support for authoritarianism has remained fairly stable over the years (hovering around 15 percent) but the proportion of people that are indifferent between democratic and undemocratic alternatives has grown significantly and at 28 percent is almost double than what observed in the 90s
4 Pew (2017) ldquoGlobally Broad Support for Representative and Direct Democracy But many also endorse nondemocratic alternativesrdquo Available here
wwwlatinaamericaundporg | United Nations Development Programme | 2020 10
Based on Latinobarometro question P14ST ldquoGenerally speaking would you say that (country) is governed by a few powerful groups for their own benefit or that it is governed for the benefit of everybodyrdquo (iquestEn teacuterminos generales iquestdiriacutea usted que (paiacutes) estaacute gobernado por unos cuantos grupos poderosos en su propio beneficio o que estaacute gobernado para el bien de todo el pueblordquo)
Figure 5 Declining trust in government in Latin America
Figure 6 Satisfaction with democracy and openness to other governance systems globally
What observed in relation to satisfaction with and support for democracy is consistent with trends related to trust in government Figure 5 for instance shows how the percentage of people who believe their country is being governed ldquofor the benefit of everybodyrdquo as opposed to the ldquobenefit of a powerful fewrdquo has been increasing steadily since 2013 and has reached its highest point ever in 2018 at 79 percent It should also be noted that what observed in Latin America is consistent with global trends as illustrated in Figure 6 summarizing the results of research conducted by Pew Research Centre
wwwlatinaamericaundporg | United Nations Development Programme | 2020 11
Figure 7 Spill-over effect of dissatisfaction
Relationship between performance-based and regime-based support for democracy Overall support for a certain regime type is largely (although not exclusively) grounded in the daily experience of how that regime is functioning in practice Based on the historical evolution of perception data it would appear that growing dissatisfaction with the actual functioning of democracy is starting to spill over onto general support for de-mocracy as a form of government Figure 7 illustrates the close relation between performance-based and regime-based support for democracy confirmed by the rather high correlation coefficient of 0777
However at least two different stories can be observed in the region For most countries higher satisfaction with the functioning of the political system corresponds to greater support for democracy But as illustrated in Figure 8 for Venezuela and to a lesser degree for Nicaragua lower-than-average satisfaction with the functioning of the political system is associated with higher-than-average support for democracy Figure 9 shows the evo-lution of satisfaction with politics and support for democracy in these two countries over time highlighting the historical moments in which these two indicators start to evolve in opposite directions
CORREL (DEM SAT DEM SUPP - Latin America average) 0777
wwwlatinaamericaundporg | United Nations Development Programme | 2020 12
Figure 8 Satisfaction with political system functioning and support for democracy across countries in 2018
CORREL (DEM SAT DEM SUPP - All countries) 0497
CORREL (DEM SAT DEM SUPP - wo VEN NIC) 0807
Figure 9 The specificity of Venezuela and Nicaragua
wwwlatinaamericaundporg | United Nations Development Programme | 2020 13
4 Sex and age dimensions of support for democracySex dimension of support for democracy
As illustrated in figures 10 and 11 women respondents are less likely to describe themselves as satisfied with the functioning of democracy compared to men respondents and less likely to state that democracy is the best form of government under all circumstances
Figure 10 Sex dimension of satisfaction with the functioning of democracy
Figure 11 Sex dimension of support for democracy as a form of government
Age dimension of support for democracy
Based on the available data young people appear more likely to identify politics as the main problem in their country than older cohorts (Figure 12) They are also less likely than people in older cohorts to express unconditional commitment to democracy as a form of government (Figure 13) Building on similar data from around the world a lot has been written about ldquoyoung people losing faith in democracyrdquo5 The analysis of time series however reveals a more nuanced picture at least for Latin America
5 See for instance this World Economic Forum article reporting on Munk and Foarsquos paper ldquoThe signs of democratic deconsolidationrdquo published in the Journal of Democracy
wwwlatinaamericaundporg | United Nations Development Programme | 2020 14
As illustrated in Figure 14 over the last 20 years there has been a fairly consistent generational gap in support for democracy with respondents in the age bracket 15-25 systematically less likely to view democra-cy as preferable to all other forms of government under all circumstances There appears therefore to be a distinct lifecycle effect when it comes to commitment to democracy There is no particular evidence however that the generational gap in support for democracy may be widening at least at regional level
Figure 12 People identifying politics as the primary problem in their country in 2018
Based on Latinobarometro question P3STGBSC ldquoBased on your opinion what would you consider to be the main problem in the countryrdquo (En su opinioacuten iquestCuaacutel considera Ud que es el problema maacutes importante en el paiacutes)
Figure 13a Age differences in support for democracy (2018 data)
Based on Latinobarometro question P24ST-26ST
Figure 13b Age differences in support for democracy
wwwlatinaamericaundporg | United Nations Development Programme | 2020 15
Different expectations regarding the role of the state
Research conducted by the Latin America Public Opinion Project at Vanderbilt University shows some evidence of a generational gap with respect to expectations regarding the role of the state with younger people supporting a more ldquoproactiverdquo approach to critical issues (Figure 14) For instance age seems to a very significant predictor of support for redistributive economic policies as well as harsher criminal punishment in the face of violent crime On the other hand sex ndash in and of itself ndash appears to be a much less decisive factor
Figure 14 Support for a more proactive role of the state
Socioeconomic and demographic predictors of support for redistributive policies
Source LAPOP Insights Series Note No 132 ldquoReducing Inequality in the Americas What Factors Predict Public Support for Redistribu-tionrdquo Based on agreement with the statement ldquoThe (country) government should implement strong policies to reduce income inequality between the rich and the poorrdquo
Source LAPOP Insights Series Note No 132 ldquoReducing Inequality in the Americas What Factors Predict Public Support for Redistributionrdquo Based on agreement with the statement ldquoThe (country) government should implement strong policies to reduce income inequality between the rich and the poorrdquo
wwwlatinaamericaundporg | United Nations Development Programme | 2020 16
5 The age of protests
The ldquodeath of deferencerdquo
Several analysts have been linking the increase in protest movements observed during the last few years with a deep structural shift in peoplersquos attitudes towards authority ndash a shift that is sometimes referred to as the ldquodeath of deference
These are for instance Duncan Greenrsquos observations in article entitled ldquoThe How Change Happens of Cli-mate Changerdquo
Irsquove been thinking a lot about the lsquodeath of deferencersquo recently ndash it is really striking how little faith people have in political (or any other) leaders and how unwilling they are to trust them to do the right thing6
And here some additional observations in another article entitled ldquoWhy so many uprisings Why nowrdquo
I am intrigued by the whole question of the death of deference and erosion of what I think of as political absorptive capacity or resilience There are always people who are unhappy with their situation or the way they are treated My impression is that in the past they were readier to channel their grievances through formal political processes ndash wait for the next election or express their views through their social organizations (unions professional associations faith groups) That enabled the system to absorb and respond to discontent But now more and more people think lsquotheyrsquore all the same just in it for them-selvesrsquo They are less prepared to channel grievance through politics Fuses are shorter protest more attractive Even small grievances can generate big angry responses7
We use the following question from the World Values Survey (WVS V69) to assess support for the level of deference prevailing in a given society
Im going to read out a list of various changes in our way of life that might take place in the near fu-ture Please tell me for each one if it were to happen whether you think it would be a good thing a bad thing or you dont mind [Greater respect for authority]
We define ldquoSupport for greater deferencerdquo as the percentage of people who believe ldquogreater respect for authorityrdquo would be a good thing minus the percentage of people who believe ldquogreater respect for authorityrdquo would be a bad thing8 We then proceed to compare levels of support in the last WVS waves for which data is available (Wave 5 ndash 2005-2009 and Wave 6 ndash 2010-2014) in order to get a sense of trends in the different countries surveyed In cases where ldquoSupport for greater deferencerdquo is a negative number (ie there are more people who believe greater respect for authority would be a bad thing than people who believe it would be a good thing) we talk about ldquoOpposition to greater deferencerdquo
As shown in Figure 15 the available data on country-level trends seems to confirm the notion that attitudes towards authority may be changing The average support for greater deference in the 44 countries considered went from 524 percent to 426 percent between Wave 5 and Wave 6 (corresponding to a reduction of 187 percent) Furthermore a significant plurality of countries for which a comparison between waves is possible (50 percent) experienced a reduction in support for greater deference It should be noted however that this support has increased in about a third of the countries considered
6 From poverty to power 30 August 2019 ldquoThe How Change Happens of Climate Changerdquo7 From poverty to power 26 November 2019 ldquoWhy so many uprisings Why nowrdquo8 Along similar lines Christian Welzel uses responses to this question to generate an ldquoInverse respect for authorityrdquo index which is used in combination with measures of national pride and devoutness to build a ldquoDefiancerdquo index in the context of an analysis of secular and emancipative values More information
wwwlatinaamericaundporg | United Nations Development Programme | 2020 17
Figure 15a A weakening of support for greater deference
In almost all Latin American countries for which a comparison between Wave 5 and Wave 6 is possible support for greater deference has declined (Figure 16) The only exception is Uruguay which started at a much lower level than the other countries and corrected upwards toward the regional average It should be noted however that the regional level of support for grater deference as measured by Wave 6 remains signifi-cantly higher than the global average for the same wave The only Caribbean country for which information is available ndash Trinidad and Tobago ndash experienced a minimal drop but remains characterized by one of the highest levels of support for greater deference among all countries
Figure 15b Declining but still high support for greater deference in Latin America and the Caribbean
Propensity to engage in demonstrations
We use the following question from the World Values Survey (WVS V87) to investigate peoplersquos propensity to engage in demonstrations
Now Irsquod like you to look at this card Irsquom going to read out some different forms of political action that people can take and Irsquod like you to tell me for each one whether you have actually done any of these things whether you might do it or would never under any circumstances do it [Attended lawfulpeaceful demonstrations]
We define ldquoPropensity to demonstraterdquo as the percentage of people who have attended a peaceful and lawful demonstration plus the percentage of those who might minus the percentage of those who would never do it Figure 16 illustrates the average results based on 44 countries for which a comparison between Wave 5 and Wave 6 is possible
wwwlatinaamericaundporg | United Nations Development Programme | 2020 18
Figure 16 No obvious global trend in propensity to demonstrate
While global data point to a general softening of deference the propensity to engage in demonstration has remained ndash on balance ndash almost unchanged It is important to note however that more recent data once they become available may of course provide a different picture Furthermore as illustrated in Figure 17 regional and global averages may be hiding very different country trends
While the regional average in ldquoPropensity to demonstraterdquo for Latin America has not changed much a coun-try-by-country analysis reveals very different experiences Some countries ndash especially Chile ndash had a very steep increase in the propensity to demonstrate between Wave 5 and Wave 6 Others ndash particularly Mexico and Brazil ndash had a sharp decline Trinidad and Tobago had a decline too although ndash once again ndash there appears to be a significantly different dynamic in the Caribbean (as evidenced by the much higher number of people who may be
prepared to demonstrate in comparison with Latin American countries)
Figure 17 Significant country variations in propensity to demonstrate across Latin American countries
wwwlatinaamericaundporg | United Nations Development Programme | 2020 19
6 Drivers of satisfaction with political system per-formance
Identifying potential drivers
In this section we investigate the relation between satisfaction with the performance of the political system and a countryrsquos perceived economic performance In addition we analyze the relation between views on the functioning of the political system and two factors that opinion polls reveal to be of major concern for the Latin American public corruption and citizen security We use the following strategies to operationalize these concepts
bull Perceived economic performance
We use Latinobarometrorsquos question P13STGBSB ldquoIn general would you say you are very satisfied rather satisfied rather dissatisfied or very dissatisfied with the functioning of the economy in your countryrdquo We con-sider respondents that gave ldquovery satisfiedrdquo or ldquorather satisfiedrdquo as an answer as ldquosatisfied with the economyrdquo
bull Perceived corruption
We use Transparency Internationalrsquos Corruption Perception Index ndash which measures ldquoperceived levels of public sector corruption as determined by expert assessments and opinion surveysrdquo9 and the World Bankrsquos World Governance Indicator on Control of Corruption which summarizes ldquoperceptions of the extent to which public power is exercised for private gain [hellip] [based on inputs provided] by a large number of enterprise citi-zen and expert survey respondentsrdquo10
bull Perceived insecurity
We use Latinobarometrorsquos question P70ST ldquoHow frequently do you worry that you may end up being the victim of a violent crime All or almost all the time sometimes occasionally neverrdquo We consider respondents that gave ldquoall or almost all the timerdquo and ldquosometimesrdquo as answers as ldquoworried about violent crimerdquo
Investigating potential links
The following diagrammes illustrate that both perceived economic performance and perceived corruption are strongly correlated with overall satisfaction with the performance of the political system (with correlation coefficients of 0656 and 0623 respectively) Together these two factors appear to account for a very large part of variations in satisfaction with the functioning of the political system across 18 Latin American countries in 2018 as illustrated in Figure 22 It is important to note however that this correlation has not always been there Remarkably ndash for both perceived economic performance and perceived corruption ndash it only starts to appear after 2008 as illustrated by the significant increase of the correlation coefficients if only the period 2008-2018 is considered (0864 and 0741 respectively) While this would need to be investigated further it could certainly be hypothesized that something deep may have changed in peoplersquos perspectives and priorities as a result of the 2008 financial crisis
Perceived insecurity ndash operationalized as the percentage of people worried about violent crime ndash seems to have a less direct correlation with satisfaction with the functioning of the political system across the region both in terms of historical trends and in terms of variation across countries based on available data for 2018
9 More information on the Corruption Perception Risk is available here
10 More information on the World Bank Governance Indicators is available here
wwwlatinaamericaundporg | United Nations Development Programme | 2020 20
Figure 18 Perceived economic performance and satisfaction with politics
Figure 19 Perceived corruption and satisfaction with politics
CORREL (POL SAT ECO SAT ndash All countries ndash 2002-2018) 0656CORREL (POL SAT ECO SAT ndash All countries ndash 2008 and onwards) 0864CORREL (POL SAT ECO SAT ndash All countries ndash before 2008) 0459
wwwlatinaamericaundporg | United Nations Development Programme | 2020 21
Inverted so that a higher value corresponds to greater perceived corruptionCORREL (POL SAT PERC CORR ndash All countries ndash 1996-2018) 0623CORREL (POL SAT PERC CORR ndash All countries ndash 2008 and onwards) 0741
Figure 20 Perceived insecurity and satisfaction with politics
CORREL (POL SAT PERC INSEC - All countries - 2018) 0 492
wwwlatinaamericaundporg | United Nations Development Programme | 2020 22
Figure 21a Satisfaction with economics and satisfaction with politics
Democratic safeguards and satisfaction with the functioning if politics
The Liberal Democracy Index developed by the Varieties of Democracy (V-DEM) Institute at Gothenburg Univer-sity seeks to measure the strength of key components of democracy such as free and fair elections the existence of checks and balances on the exercise of the power of the state opportunities for meaningful citizen participation and a pluralistic but constructive public debate11 As illustrated in Figure 21 there appears to be only a moderate correlation between the value of this index and the percentage of people who described themselves as satisfied with the state of politics in their country Or in other words the available data shows only a tenuous link between strength of democratic safeguards and peoplersquos satisfaction with the functioning of the political system
Investigating political system resilience
Comparing levels of satisfaction with the political system and levels of satisfaction with the functioning of the economy can help us investigate the resilience of a certain political system (Figure 21) Based on country level data for 2018 we can draw a linear trendline (in red in the diagramme below) This trendline can be interpreted as representing the ldquotypicalrdquo relationship between satisfaction with the economy and satisfaction with politicsThe countries above the trendline can be considered ldquooverperformersrdquo ndash ie countries where satisfaction with the political system is higher than it could be ldquoexpectedrdquo given current satisfaction with the economy Con-versely countries under the trendline can be considered ldquounderperformersrdquo ldquoOverperformingrdquo political systems could be assumed in principle to be more resilient to economic downturns than ldquounderperformingrdquo ones
Figure 21b Strength of democratic safeguards and satisfaction with the functioning of the political system
wwwlatinaamericaundporg | United Nations Development Programme | 2020 23
Analysis of multiple correlation
In order to assess levels of multiple correlation between satisfaction with the functioning of politics and the variables mentioned above we perform a simple regression analysis (Ordinary Least Squares with 95 percent confidence interval) While caution should be taken in interpreting the results of a regression analysis based on so few data points it can be noted that the model with perceived economic performance and perceived corruption accounts for close to 80 percent of the variation in the number of people satisfied with the func-tioning of the political system across countries in 2018 Adding measures of perceived insecurity and strength of democratic institutions on the other hand produces only a marginal improvement of the modelrsquos overall fit
Figure 22 Regression results for satisfaction with the functioning of the political system
7 Evolution over time of satisfaction with the economyMacroeconomic indicators
Some of the most commonly used macroeconomic indicators do not appear to be especially useful in predicting the historical evolution of peoplersquos satisfaction with the functioning of the economy Figure 23 for instance shows a very limited correlation between satisfaction with the functioning of the economy on the one hand and per capita GDP growth and unemployment rates on the one other hand
11 More information on V-DEMrsquos indexes is available here
Standard errors are reported in parentheses
indicates significance at the 90 95 and 99 level respectively
wwwlatinaamericaundporg | United Nations Development Programme | 2020 24
Figure 23 Per capita GDP growth unemployment and satisfaction with the functioning of the economy
CORREL (ECO SAT PC GDP GROWTH) 0242
CORREL (ECO SAT UNEMP) 0064
wwwlatinaamericaundporg | United Nations Development Programme | 2020 25
Economic inequality
In order to investigate the relationship between economic inequality and satisfaction with the functioning of the economy we first look at the relation between the Gini coefficient of income inequality and the percentage of people who declare to be dissatisfied with the state of the economy As shown in Figure 24 there is virtually no correlation between these two variables
Figure 24 Measured income inequality and satisfaction with the functioning of the economy
It is well known that the Gini coefficient has several limitations as a measure of income inequality It is also well known that what the Gini index says may or may not match what people perceive In order to address this issue we use the following Latinobarometro question (P23ST) to assess perceptions regarding income inequality
How fair do you think is the distribution of income in (COUNTRY) Would you say it is very fair fair unfair very unfair
We calculate a ldquoPerceived unfairness scorerdquo using the following formula ldquovery unfairrdquo responses x 15 + ldquounfairrdquo responses - ldquofairrdquo responses - ldquovery fairrdquo responses x 15 Since this question was not included for all years of the Latinobarometro survey the score can only be calculated for 2002 2007 and all other years starting from 2009
As illustrated in the following diagramme the relation between measured and perceived inequality is a complex and dynamic one
During the period 2002-2007 the average Gini coefficient of income inequality for Latin America and the Caribbean dropped from 557 to 533 corresponding to a 7 reduction During the same time the perceived unfairness score dropped from 85 to 655 corresponding to a 23 reduction (Figure 25)
wwwlatinaamericaundporg | United Nations Development Programme | 2020 26
Figure 25 Concurrent trajectories of measured and perceived inequality
From 2007 to 2018 the average Gini index of income inequality for Latin America and the Caribbean continued by and large to go down - from 533 to 516 corresponding to a further 3 reduction However the perceived unfairness score moved in the opposite direction ndash rising by almost 20 from 655 to 78 (Figure 26)
12 iquestCuaacuten justa cree Ud que es la distribucioacuten del ingreso en (PAIacuteS) Muy justa justa injusta muy injusta
Figure 26 Opposing trajectories of measured and perceived inequality
wwwlatinaamericaundporg | United Nations Development Programme | 2020 27
There is a very strong correlation between views on income distribution and views on the overall state of the economy for the period 2007-2018 As the Gini coefficient of income inequality was slowly inching downwards the perception of distributional unfairness rose rapidly and with it a feeling of dissatisfaction with respect to the overall performance of the economy (Figure 27)
Figure 27 Perceived inequality and dissatisfaction with the state of the economy (2007-2018)
wwwlatinaamericaundporg | United Nations Development Programme | 2020 28
8 A middle class perspectiveMiddle class as a ldquonaturalrdquo democratic constituency
The middle class often has sufficient education financial time and relations assets to be a powerful political force However it does not have sufficient resources to capture state institutions For this reason many politi-cal economy analyses have argued that middle class should be regarded as a ldquonaturalrdquo champion of democ-racy Nancy Birdsall for instance states that
Middle class is not just an engine of growth It can also be a powerful force for the rule of law and good governance ndash at least once it reaches a critical mass13
It should be noted however that this debate is far from settled According to David Motadel
Middle classes are not a priori engines of political liberalization They can readily become the promoters of repressive authoritarianism if they fear for the loss of influence and wealth The history of the middle-class opposition to the principles of universal freedom equality and civility can be understood as part of the dark side of modernity as described by Max Horkheimer and Theodor Adorno the two main figures of the Frankfurt School in their 1947 classic ldquoDialectic of Enlightenmentrdquo The middle class has always been Janus-faced Whether it embraces liberal models of modernity or not depends on the social economic and political circumstances 14
Latinobarometro data for the years 2011 2013 2015 2017 and 2018 can be stratified by self-ascribed social class using the following question (S1)
People sometimes describe themselves as belonging to a certain social class Would you describe yourself as belonging to a social class that ishellip lower lower-middle middle upper-middle upper
We use this stratification to investigate the middle class perspective on politics and economics in Latin America
As illustrated in Figure 28 people who describe themselves as belonging to the ldquolower-middlerdquo or ldquomiddlerdquo class express higher-than-average support for democracy as a form of government despite lower-than-aver-age satisfaction with the actual functioning of democracy in their country
13 Middle-Class Heroes The Best Guarantee of Good Governance14 The Myth of Middle-Class Liberalism
Figure 28 Self-ascribed social class and attitudes towards democracy
wwwlatinaamericaundporg | United Nations Development Programme | 2020 29
On economic matters the perspective of people describing themselves as ldquolower-middlerdquo class is much-closer to that of those describing themselves as ldquolowerrdquo social class than to that of those who consider them-selves as belonging to the ldquoupper-middlerdquo class (Figure 29)
Figure 29 Self-ascribed social class and attitudes towards the economy
wwwlatinaamericaundporg | United Nations Development Programme | 2020 30
Evolution over time of the size of the ldquomiddle classrdquo
In order to investigate the evolution over time of the size of the middle class we look at two statistics
bull Poverty vulnerability and middle class rates
We use World Bank statistics on the evolution of poverty vulnerability and middle class rates in Latin Amer-ica and the Caribbean based on the World Bank Upper-Middle-Income International Poverty Line (550 USDday 2011 PPP) and the following income brackets for vulnerability 55-13 USDday (2011 PPP) and for middle class 13-70 USDday (2011 PPP)
bull Perceived economic status
We use the following Latinobarometro question (P10NC) to investigate perceived economic status ldquoImagine a scale with 10 steps where 1 corresponds to the poorest people and 10 to the richest people Where would you place yourselfrdquo We then proceed to interpret the responses as follows 1-2 ldquolow-incomerdquo 3-4 ldquomiddle-lower incomerdquo 5-6 ldquomiddle incomerdquo 7-8 ldquomiddle-upper incomerdquo 9-10 ldquoupper incomerdquo
Based on World Bank metrics during the period 2000-2018 poverty has been almost halved in Latin America and the Caribbean while there has been an increase of approximately 50 percent in the size of the middle class (Figure 30) However since 2012 the rate of expansion of the middle class has drastically slowed down In addition vulnerability has also grown in the period under consideration ndash from 326 percent to 366 percent
Figure 30 Evolution of the size of the middle class based on World Bank metrics
At the same time based on Latinobarometro data less people would describe themselves as belonging to the middle class in 2018 than in 2000 (Figure 31) In 2000 out of 100 people 80 would describe themselves as belonging to the lower middle or middle class income bracket In 2018 only 69 would do so At the same time the number of those who would describe themselves as belonging to a lower income bracket has increased from 12 to 19 The number of people who would describe themselves as upper middle class or upper class has increased too but much less from 7 to 9 and less than 1 to 3 respectively
Figure 31 The disappearing middle
wwwlatinaamericaundporg | United Nations Development Programme | 2020 31
By comparing the size of the middle class based on the World Bank statistics and Latinobarometro statis-tics regarding self-ascribed social class we can conclude that a large percentage of people who identify as ldquolower-middlerdquo and even ldquomiddlerdquo class live in situations of serious economic fragility (Figure 32)
Figure 32 Middle class and economic vulnerability
Social class and social mobilization
We combine self-ascribed social class satisfaction with the functioning of politics and propensity to demon-strate in order to assess whether different social groups may be more likely to mobilize outside of formal political processes (Figure 33)
wwwlatinaamericaundporg | United Nations Development Programme | 2020 32
Figure 33 Propensity to demonstrate by self-ascribed social class
As previous argued people who identify as belonging to the lower-middle class live in a situation of serious economic vulnerability In addition taking into account dissatisfaction with politics and propensity to demonstrate they are the group that appears most likely to mobilize outside of formal political institutions
There seems to be some support in the data for what observed by Patricio Navia in relation to the 2019 pro-tests in Chile ldquo[T]he real reasons behind the rage lie in the frustration of a population that was promised access to the promised land of middle-class status but that has been denied such access at the gaterdquo15
15 Chilersquos Riots Frustration at the Gate of the Promised Land Americarsquos Quarterly 21 October 201916 Click here to access the Sway online version with additional audio notes
Figure 34 Sway an interactive and complementary version16
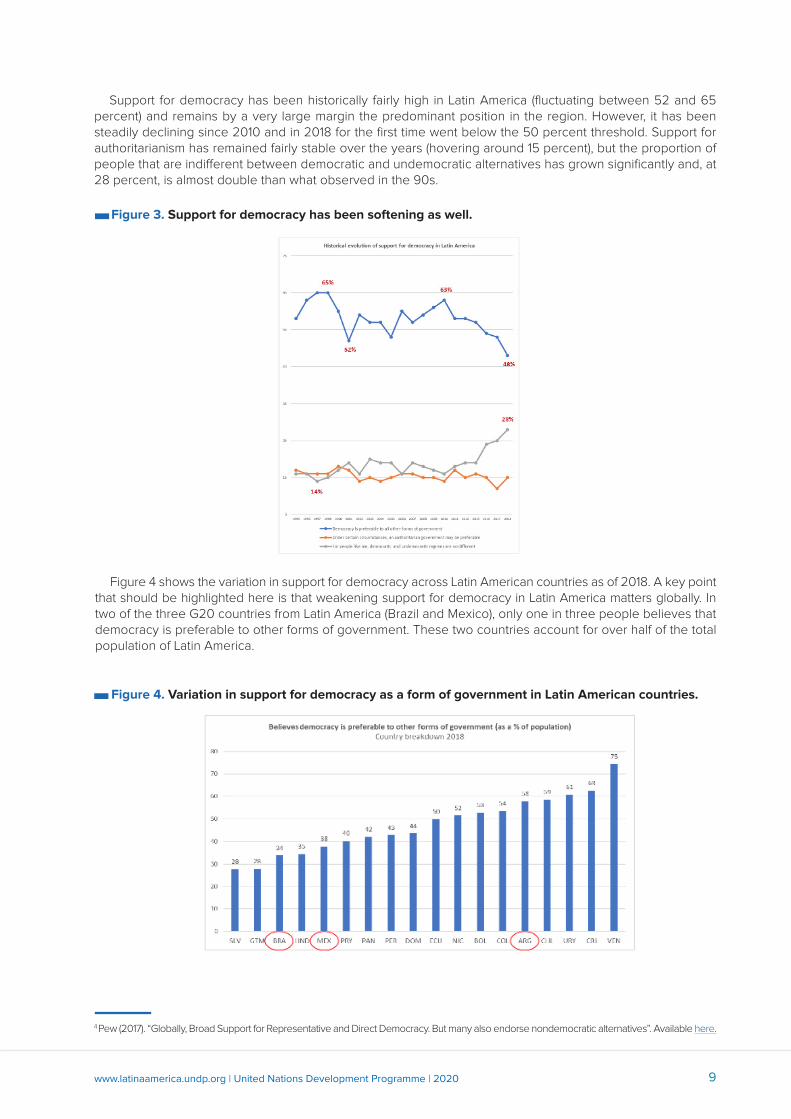
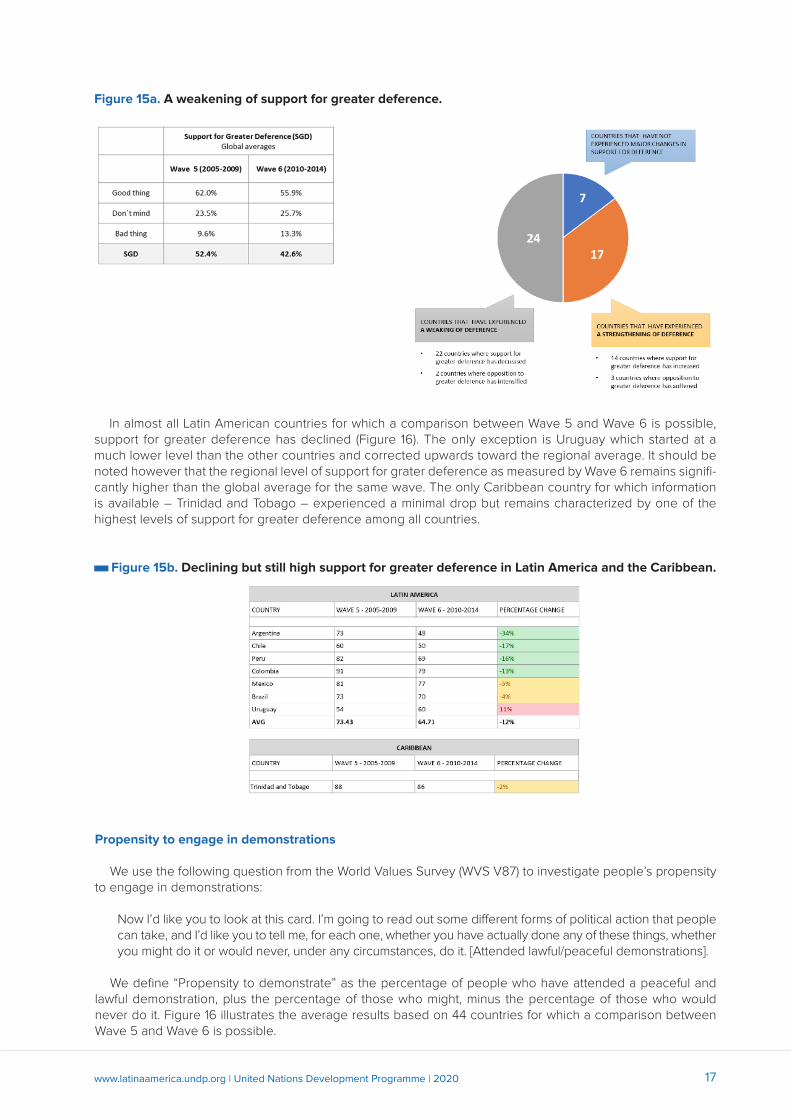
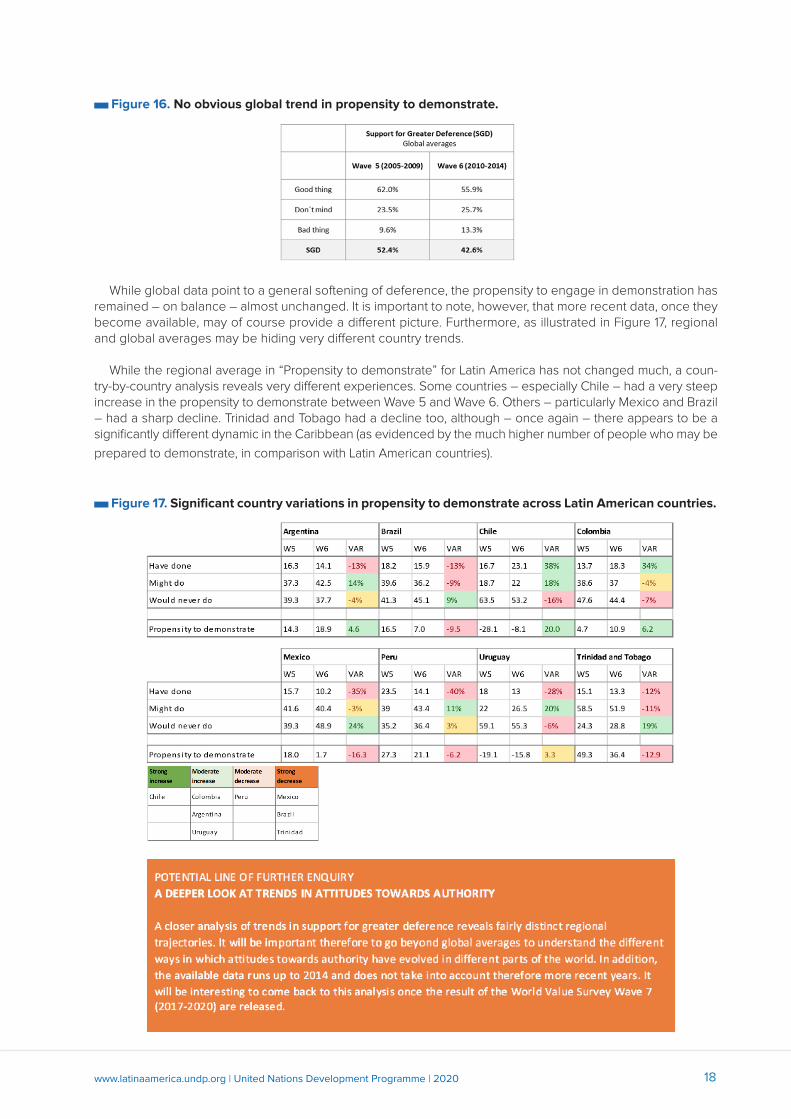
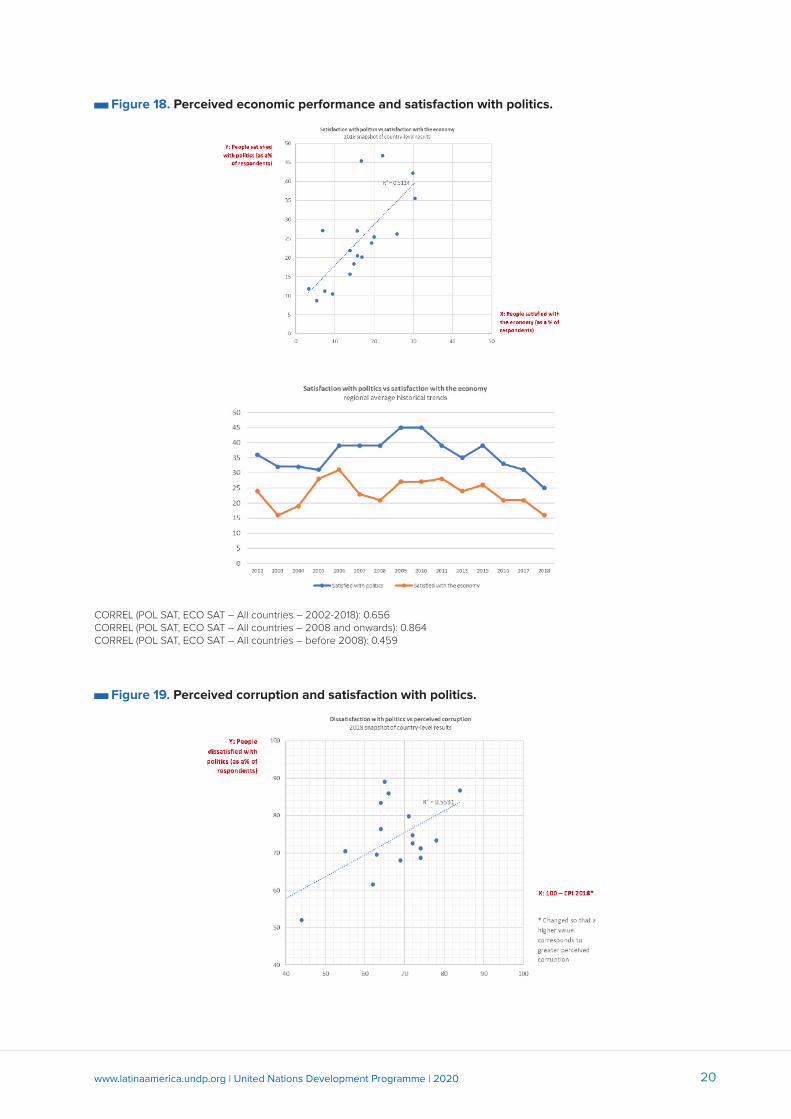
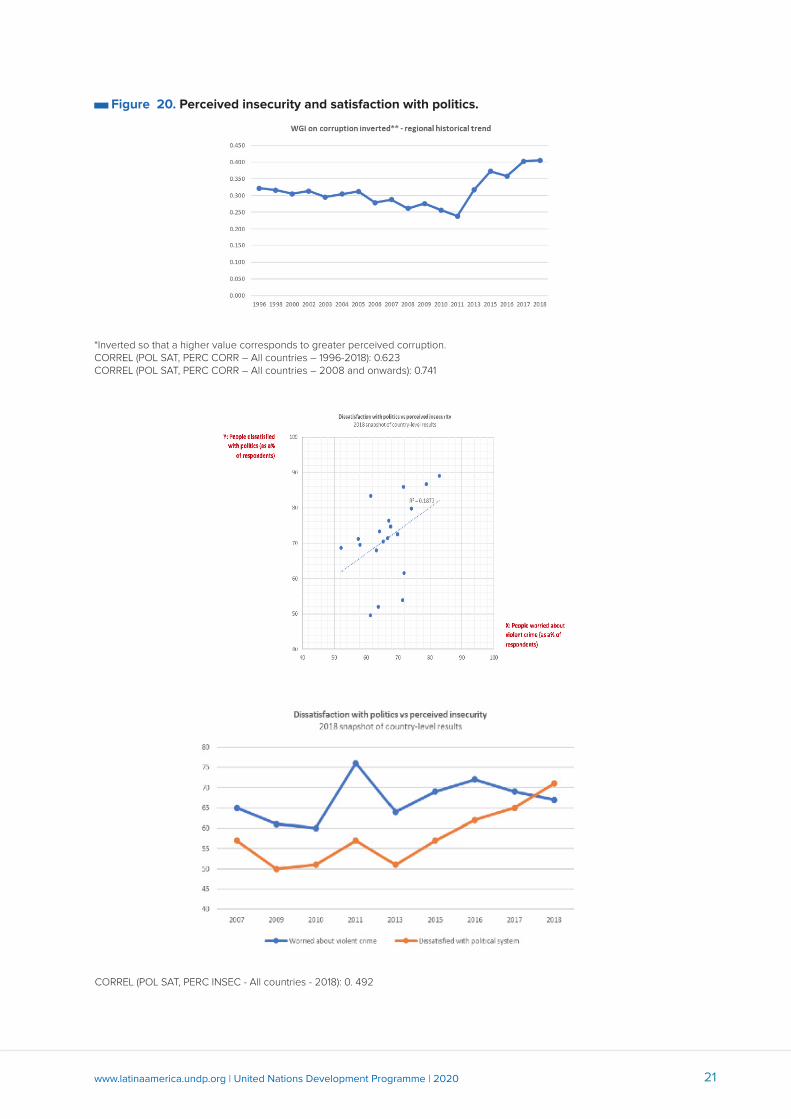
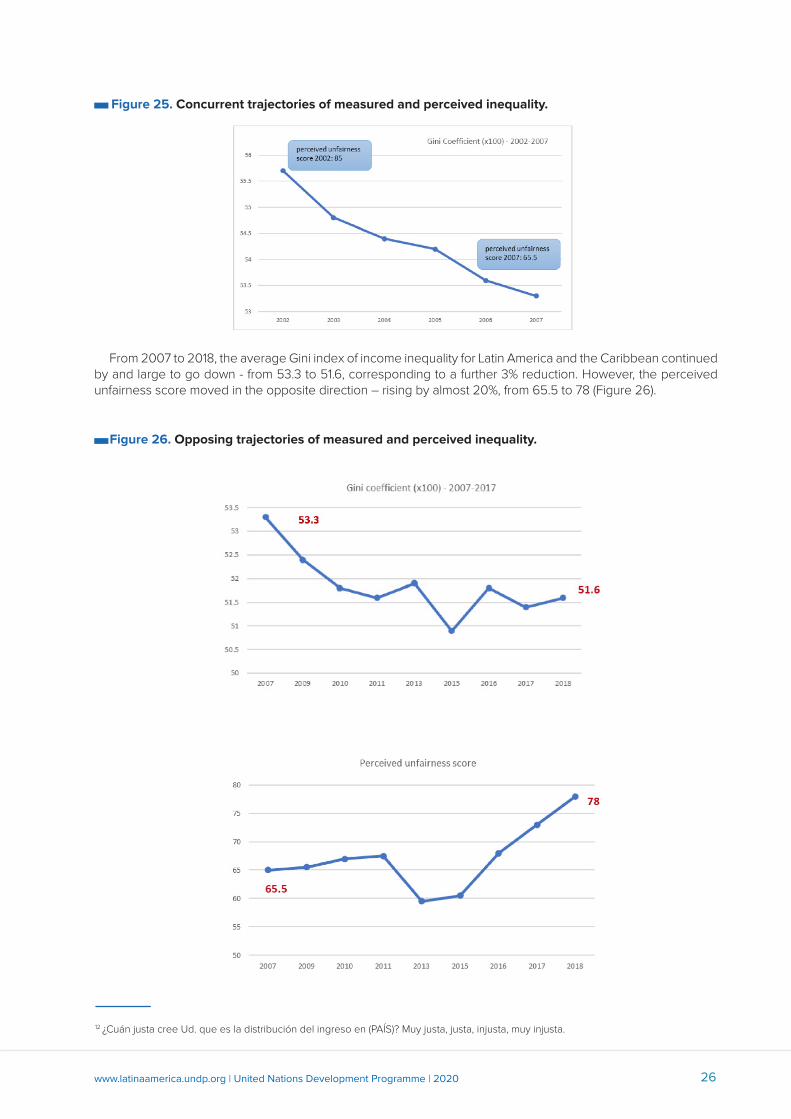
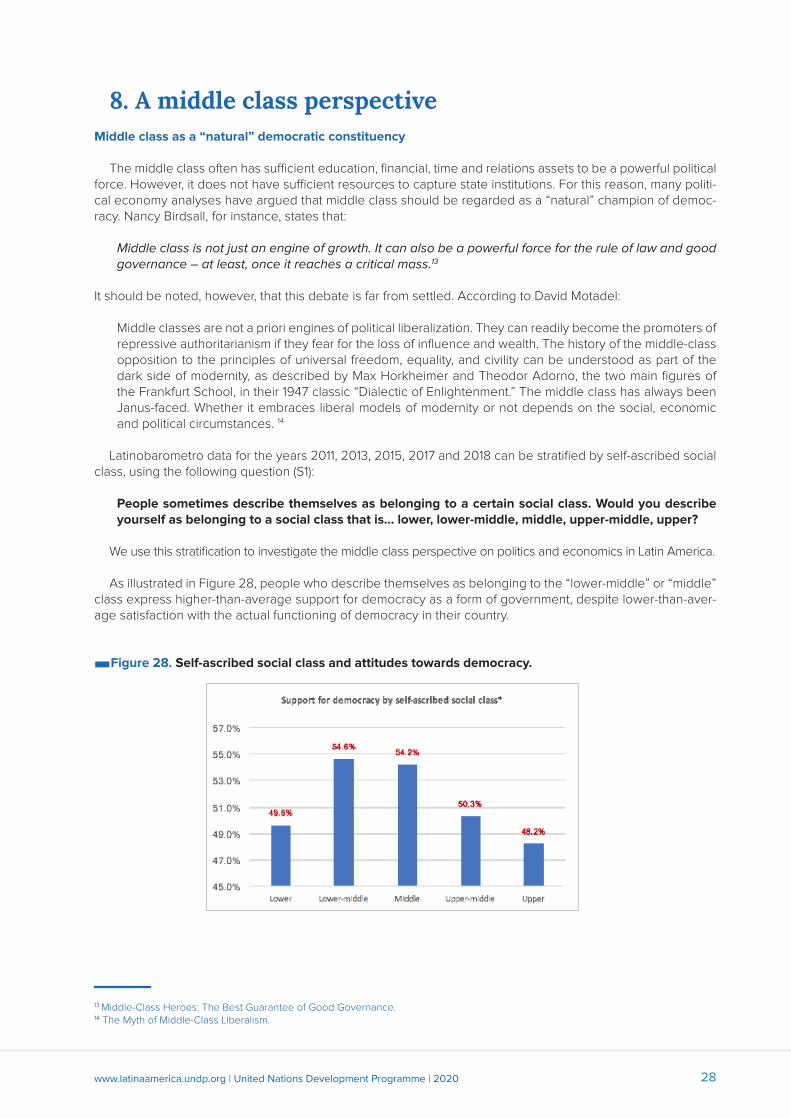
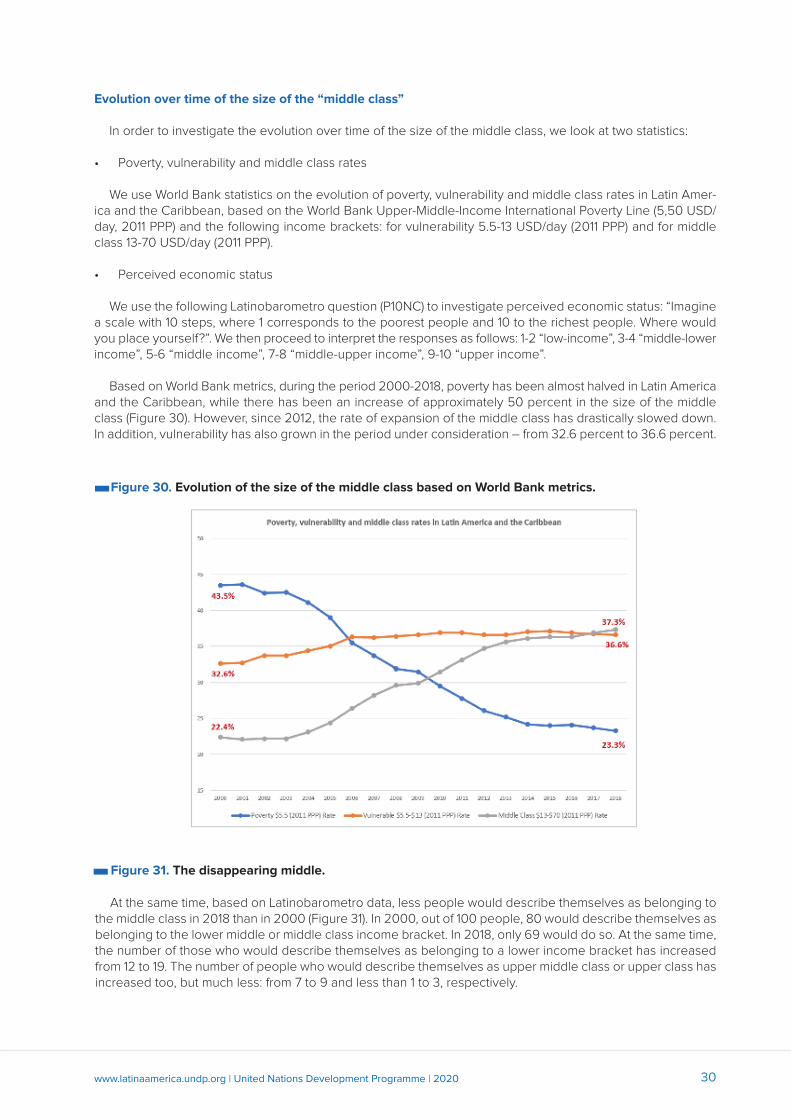


![Latin feliratok a Barbaricumban [Latin inscriptions in the Barbaricum, in Hung.]](https://static.fdokumen.com/doc/165x107/63343a7da1ced1126c0a39db/latin-feliratok-a-barbaricumban-latin-inscriptions-in-the-barbaricum-in-hung.jpg)