Attentional cortical responses to enlarged faces are related to body fat in normal weight subjects:...
10
Attentional cortical responses to enlarged faces are related to body fat in normal weight subjects: An electroencephalographic study Claudio Babiloni a,b, * , Claudio Del Percio c , Mario De Rosas a , Anna Valenzano a , Fabrizio Vecchio c,d , Nicola Marzano e , Carla Rendina a , Claudia Di Santo a , Luisa Ciociola a , Brunello Lecce f , Ciro Mundi f , Fabrizio Eusebi e,g , Giuseppe Cibelli a a Department of Biomedical Sciences, University of Foggia – Foggia, Viale Pinto 7, Foggia I-71100, Italy b Casa di Cura San Raffaele Cassino, Via G. Di Biasio 1, Italy c IRCCS Fatebenefratelli ‘‘San Giovanni di Dio”, Brescia, Italy d Associazione Fatebenefratelli per la ricerca (AFaR), Hospital S. Giovanni Calibita, Rome, Italy e Dipartimento di Fisiologia e Farmacologia, Università ‘‘La Sapienza”, Roma, Italy f Dipartimento di Neuroscienze, Ospedali Riuniti, Foggia, Italy g IRCCS Neuromed, Via Atinense 18, 86077 Pozzilli (Isernia), Italy article info Article history: Accepted 19 March 2009 Available online 19 April 2009 Keywords: Electroencephalography (EEG) Low-resolution electromagnetic brain tomography (LORETA) P300 Body fat abstract Objective: Here we tested the hypothesis that in normal weight subjects, attentional cortical responses to the enlargement of faces are related to features of body weight, as a basis for future studies on the role of neurocognitive mechanisms in eating and weight disorders. Methods: Electroencephalographic data were recorded in 15 normal weight adults during a visual ‘‘oddball” paradigm. The subjects were given frequent (70%) and rare (30%) stimuli depicting faces (FACE), food (FOOD), and landscapes (CONTROL). The task was to click the mouse after the rare stimuli. These stimuli depicted the same frequent stimuli graphically dilated by 25% along the horizontal axis. Analysis of bioelectrical impedance indexed subjects’ body fat percentage. Cortical attentional responses were probed by the difference between positive event-related potentials peaking around 200–600 ms post- stimulus for the frequent minus rare stimuli (P300). LORETA estimated P300 cortical sources. Results: Main results showed that in the FACE condition, there was a negative correlation between the body fat percentage and the reaction time to the rare stimuli, and a positive correlation between the body fat percentage and the amplitude of prefrontal P300 sources (p < 0.05). Conclusions: These results disclose a relationship between body fat and prefrontal attentional processes to body image in normal weight adults. Significance: The present study motivates future research testing the hypothesis that this relationship might be altered in patients with eating and weight disorders. Ó 2009 International Federation of Clinical Neurophysiology. Published by Elsevier Ireland Ltd. All rights reserved. 1. Introduction It is well known that obesity is a pathological condition charac- terized by a body mass index (BMI) exceeding 30 or body weight exceeding 20% from ideal weight. Since it is extremely widespread in developed countries, multidisciplinary research activities have been promoted for neurobiological understanding and care of the disease. Several functional neuroimaging studies using functional magnetic resonance imaging (fMRI), positron emission tomogra- phy (PET) or single photon emission tomography (SPET) have pro- vided support to the idea that obesity is related to the functionality of particular cortical and sub-cortical networks (Karhunen et al., 1997, 2000; Gautier et al., 2001; Del Parigi et al., 2002; Stoeckel et al., 2008). In normal weight subjects, hunger has been associated with an increased regional blood flow (rCBF) within a complex net- work of brain regions (including hypothalamus, thalamus, and sev- eral limbic/paralimbic areas), whereas satiation has been associated with an increased rCBF in prefrontal cortex (Del Parigi et al., 2002). It has been shown that satiation increased rCBF in ventral prefrontal areas and decreased rCBF in paralimbic, frontal, and temporal areas in obese compared with lean subjects (Gautier et al., 2001). Observation of a portion of food has incremented rCBF in right parietal and temporal areas in obese patients compared 1388-2457/$36.00 Ó 2009 International Federation of Clinical Neurophysiology. Published by Elsevier Ireland Ltd. All rights reserved. doi:10.1016/j.clinph.2009.03.013 * Corresponding author. Address: Department of Biomedical Sciences, University of Foggia – Foggia, Viale Pinto 7, Foggia I-71100, Italy. Tel.: +39 0881 713276; fax: +39 0881 711716. E-mail address: [email protected] (C. Babiloni). Clinical Neurophysiology 120 (2009) 922–931 Contents lists available at ScienceDirect Clinical Neurophysiology journal homepage: www.elsevier.com/locate/clinph
-
Upload
independent -
Category
Documents
-
view
2 -
download
0
Transcript of Attentional cortical responses to enlarged faces are related to body fat in normal weight subjects:...
Clinical Neurophysiology 120 (2009) 922–931
Contents lists available at ScienceDirect
Clinical Neurophysiology
journal homepage: www.elsevier .com/locate /c l inph
Attentional cortical responses to enlarged faces are related to body fatin normal weight subjects: An electroencephalographic study
Claudio Babiloni a,b,*, Claudio Del Percio c, Mario De Rosas a, Anna Valenzano a, Fabrizio Vecchio c,d,Nicola Marzano e, Carla Rendina a, Claudia Di Santo a, Luisa Ciociola a, Brunello Lecce f, Ciro Mundi f,Fabrizio Eusebi e,g, Giuseppe Cibelli a
a Department of Biomedical Sciences, University of Foggia – Foggia, Viale Pinto 7, Foggia I-71100, Italyb Casa di Cura San Raffaele Cassino, Via G. Di Biasio 1, Italyc IRCCS Fatebenefratelli ‘‘San Giovanni di Dio”, Brescia, Italyd Associazione Fatebenefratelli per la ricerca (AFaR), Hospital S. Giovanni Calibita, Rome, Italye Dipartimento di Fisiologia e Farmacologia, Università ‘‘La Sapienza”, Roma, Italyf Dipartimento di Neuroscienze, Ospedali Riuniti, Foggia, Italyg IRCCS Neuromed, Via Atinense 18, 86077 Pozzilli (Isernia), Italy
a r t i c l e i n f o
Article history:Accepted 19 March 2009Available online 19 April 2009
Keywords:Electroencephalography (EEG)Low-resolution electromagnetic braintomography (LORETA)P300Body fat
1388-2457/$36.00 � 2009 International Federation odoi:10.1016/j.clinph.2009.03.013
* Corresponding author. Address: Department of Biof Foggia – Foggia, Viale Pinto 7, Foggia I-71100, Italy+39 0881 711716.
E-mail address: [email protected] (C. Babiloni).
a b s t r a c t
Objective: Here we tested the hypothesis that in normal weight subjects, attentional cortical responses tothe enlargement of faces are related to features of body weight, as a basis for future studies on the role ofneurocognitive mechanisms in eating and weight disorders.Methods: Electroencephalographic data were recorded in 15 normal weight adults during a visual‘‘oddball” paradigm. The subjects were given frequent (70%) and rare (30%) stimuli depicting faces (FACE),food (FOOD), and landscapes (CONTROL). The task was to click the mouse after the rare stimuli. Thesestimuli depicted the same frequent stimuli graphically dilated by 25% along the horizontal axis. Analysisof bioelectrical impedance indexed subjects’ body fat percentage. Cortical attentional responses wereprobed by the difference between positive event-related potentials peaking around 200–600 ms post-stimulus for the frequent minus rare stimuli (P300). LORETA estimated P300 cortical sources.Results: Main results showed that in the FACE condition, there was a negative correlation between thebody fat percentage and the reaction time to the rare stimuli, and a positive correlation between the bodyfat percentage and the amplitude of prefrontal P300 sources (p < 0.05).Conclusions: These results disclose a relationship between body fat and prefrontal attentional processesto body image in normal weight adults.Significance: The present study motivates future research testing the hypothesis that this relationshipmight be altered in patients with eating and weight disorders.� 2009 International Federation of Clinical Neurophysiology. Published by Elsevier Ireland Ltd. All rights
reserved.
1. Introduction
It is well known that obesity is a pathological condition charac-terized by a body mass index (BMI) exceeding 30 or body weightexceeding 20% from ideal weight. Since it is extremely widespreadin developed countries, multidisciplinary research activities havebeen promoted for neurobiological understanding and care of thedisease. Several functional neuroimaging studies using functionalmagnetic resonance imaging (fMRI), positron emission tomogra-
f Clinical Neurophysiology. Publish
omedical Sciences, University. Tel.: +39 0881 713276; fax:
phy (PET) or single photon emission tomography (SPET) have pro-vided support to the idea that obesity is related to the functionalityof particular cortical and sub-cortical networks (Karhunen et al.,1997, 2000; Gautier et al., 2001; Del Parigi et al., 2002; Stoeckelet al., 2008). In normal weight subjects, hunger has been associatedwith an increased regional blood flow (rCBF) within a complex net-work of brain regions (including hypothalamus, thalamus, and sev-eral limbic/paralimbic areas), whereas satiation has beenassociated with an increased rCBF in prefrontal cortex (Del Parigiet al., 2002). It has been shown that satiation increased rCBF inventral prefrontal areas and decreased rCBF in paralimbic, frontal,and temporal areas in obese compared with lean subjects (Gautieret al., 2001). Observation of a portion of food has incremented rCBFin right parietal and temporal areas in obese patients compared
ed by Elsevier Ireland Ltd. All rights reserved.
C. Babiloni et al. / Clinical Neurophysiology 120 (2009) 922–931 923
with normal weight subjects (Karhunen et al., 1997). Pictures ofhigh-calorie foods have produced a greater activity in prefrontal,orbitofrontal, insula, and anterior cingulate cortical areas and inamygdala and hippocampus in obese than normal weight subjects(Stoeckel et al., 2008). When non-binge and binge patients wereconsidered separately, the binge ones have been characterized bya greater increase in rCBF in left than right hemisphere, especiallyin frontal and prefrontal regions (Karhunen et al., 2000).
A relationship between brain activity and weighting/eating dis-orders has been confirmed in anorexia (low body weight and bodyimage distortion with an obsessive fear of gaining weight) and inbulimia (compulsive self-induced vomiting after eating). Severalfunctional neuroimaging studies have shown peculiar brain dys-functions in anorexia and bulimia (Wagner et al., 2003, 2007;Frank et al., 2004; Uher et al., 2005; Seeger et al., 2002). Body im-age distortion has induced a greater activity of prefrontal cortexand inferior parietal lobule in anorexic compared with normalweight subjects (Wagner et al., 2003). Food and body image distor-tion has been related to an increase in activity in frontal, temporal,and parietal areas in subjects who had recovered from anorexiacompared with subjects with no previous history of eating disor-ders (Frank et al., 2004). Body shapes in all weight categories havebeen rated as more unpleasant by anorexic and bulimic subjectscompared with normal weight subjects; in anorexic and bulimicsubjects, aversion rating has correlated to event-related responsesin prefrontal cortex (Uher et al., 2005). Stimulation with their ownbody image has induced an activation of brain fear network (i.e.amygdala, right gyrus fusiformis, and brainstem), which was high-er in amplitude in anorexic than in normal weight subjects (Seegeret al., 2002). Compared with pictures illustrating happy situations,pictures with sad situations have induced different responses inlimbic areas in women with no previous history of eating disordersbut not in subjects who had recovered from anorexia (Wagneret al., 2007). Finally, a positive correlation was found in anorexicpatients between Stroop interference score (probing attentional/executive functions) and rCBF in bilateral prefrontal cortex (Ferroet al., 2005).
The mentioned studies suggest that subjects with eating disor-ders (obesity, anorexia, and bulimia) present abnormal brain atten-tional processes related to the perception of food and body images.However, they did not make it clear the relationship among corti-cal processes, perception of face/food images, and features of bodycomposition in normal weight subjects, this relationship being ofinterest in the understanding of the role of neurocognitive mecha-nisms in eating and weight disorders. In normal weight subjects, ithas been shown that pictures with faces evoked a negative peak ofposterior event-related potentials (ERPs) at about 170 ms post-stimulus (N170; Bentin et al., 1996; George et al., 1996; Carmeland Bentin, 2002; Schweinberger et al., 2002). Compared withthe ‘‘neutral” faces, the ‘‘emotional” faces modulated positivepeaks of posterior ERPs including P300 peak (Carretié and Iglesias,1995; Krolak-Salmon et al., 2001; Campanella et al., 2002; Schuppet al., 2004). Furthermore, there were positive correlations be-tween these potentials during the observation of food stimuliand self-reported increase of hunger, suggesting that food-relatedinformation processing depends on physiological drive towardsfood (Nijs et al., 2008). These data support the view that corticalattentional processes underlying the modulation of ERPs affectthe perception of body image (i.e. face) and food, as a function ofemotional and motivational organism states. However, it is unclearif these processes are related to the body composition in normalweight subjects, as a basis for the evaluation of the role of neuro-cognitive processes in eating and weight disorders.
The present electroencephalographic (EEG) study tested thehypothesis that in normal weight subjects, cortical attentional re-sponses to the enlargement of body (face) images are related to
composition of body mass (i.e. fat percentage). Cortical attentionalprocesses were induced by a visual ‘‘oddball” paradigm. In this par-adigm, the subjects were given frequent and rare stimuli depictingfaces, food, and landscapes; the task was to click the mouse imme-diately after the rare stimuli. The rare stimuli depicted the samefrequent stimuli graphically dilated by 25% along the horizontalaxis. Body fat, fat-free mass, and body water were estimated usingbioelectrical impedance analysis (BIA). Cortical attentional re-sponses were probed by the difference between positive event-re-lated EEG potentials peaking around 300–500 ms post-stimulus forthe frequent minus rare stimuli (the so called P300).
2. Methods
2.1. Subjects and ethical approval
Fifteen (9 women) healthy right-handed adult volunteers wererecruited for this study. The subjects’ mean age was of 24.2 years(±0.2 standard error, SE; range: 21–34 years). They had no previouspsychiatric or neurological history and the sight was normal or cor-rected-to-normal. They gave their informed consent according tothe Declaration of Helsinki, and were free to withdraw from thestudy at any time.
2.2. Anthropometric data
For each subject, the following anthropometric measures wereevaluated: weight, height, body fat, fat-free mass, body water, bodymass index (BMI), skinfold thickness (biceps, triceps, subscapular,suprailiacal), and circumferences (arm, wrist, chest, shoulder,waist, hip, gluteus, upper leg, middle leg, lower leg, calf, ankle).
Body composition was evaluated by a standard bioelectricalimpedance analysis (BIA-101 Anniversary, Akern, Italy; 1% errorbased on Codognotto et al., 2008). BIA is considered as a reliableand friendly procedure for the screening of body fat percentagein humans (Maisonneuve et al., 2004; Buchholz et al., 2004; Ricc-iardi and Talbot, 2007; Jaffrin and Morel, 2008). In brief, smalland safe electrical currents are injected through the body. The esti-mation of body fat percentage is based on the assumption thatimpedance is greatest in fat tissue (containing 10–20% of water)when compared to fat-free mass (containing 70–75% of water).Taking into account some body variables (height, weight, bodytype, gender, age, fitness level), we obtained an estimation of thepercentage of body fat, fat-free mass, body water, and other bodycomposition values. Body fat, fat-free mass, and body water wereestimated using bioelectrical impedance analysis (BIA), whereasskinfold thickness was measured using a Holtain caliper. Table 1reports the mean values (±standard error, SE) of the above anthro-pometric measures. Based on these variables, all subjects were cat-egorized as ‘‘normal weight subjects”.
2.3. Experimental design
The subjects comfortably sat on an armchair in front of a com-puter monitor. The distance between subjects and monitor was ofabout 90 cm.
The visual ‘‘oddball” paradigm included the following threeconditions: FACE, FOOD, and CONTROL (Fig. 1). In each condition,the subjects were presented a series of 240 pictures subdividedinto 8 blocks (i.e. 30 pictures for each block). In each block, 2 dif-ferent pictures were presented. In the FACE condition, the first pic-ture depicted a human face and was presented for 21 times (70% ofprobability, frequent stimulus). The second picture depicted thesame face graphically dilated by 25% along the horizontal axis; itwas presented for 9 times (30% of probability, rare stimulus).
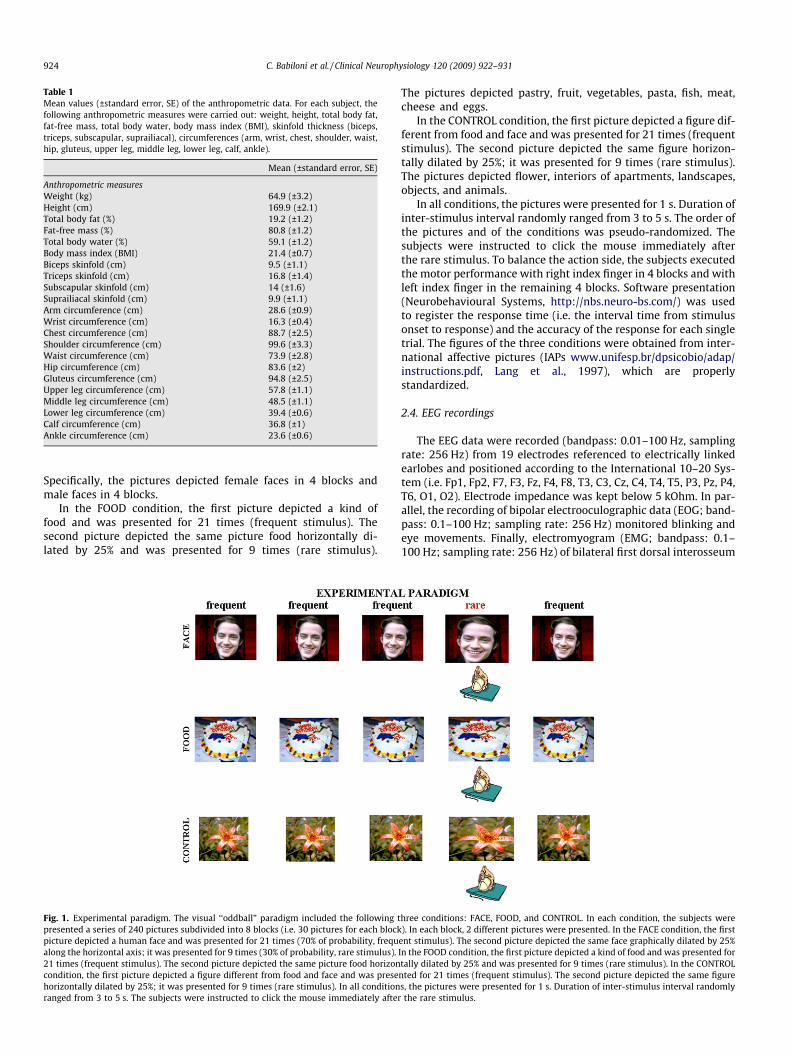
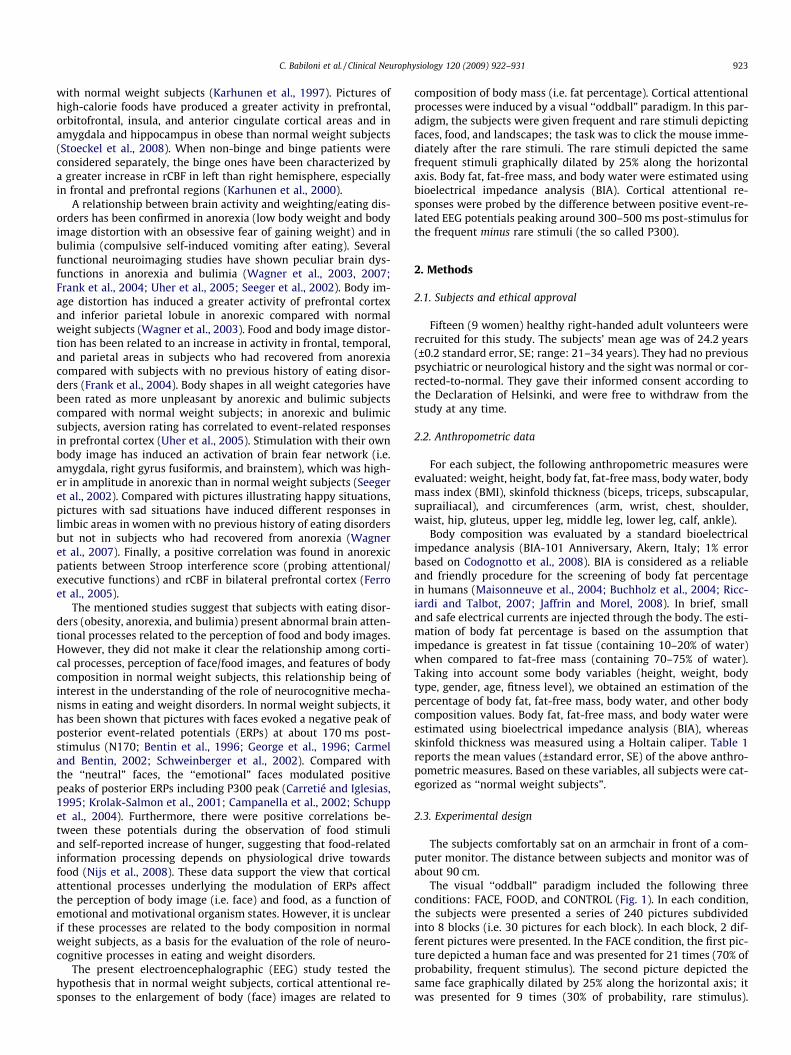
Table 1Mean values (±standard error, SE) of the anthropometric data. For each subject, thefollowing anthropometric measures were carried out: weight, height, total body fat,fat-free mass, total body water, body mass index (BMI), skinfold thickness (biceps,triceps, subscapular, suprailiacal), circumferences (arm, wrist, chest, shoulder, waist,hip, gluteus, upper leg, middle leg, lower leg, calf, ankle).
Mean (±standard error, SE)
Anthropometric measuresWeight (kg) 64.9 (±3.2)Height (cm) 169.9 (±2.1)Total body fat (%) 19.2 (±1.2)Fat-free mass (%) 80.8 (±1.2)Total body water (%) 59.1 (±1.2)Body mass index (BMI) 21.4 (±0.7)Biceps skinfold (cm) 9.5 (±1.1)Triceps skinfold (cm) 16.8 (±1.4)Subscapular skinfold (cm) 14 (±1.6)Suprailiacal skinfold (cm) 9.9 (±1.1)Arm circumference (cm) 28.6 (±0.9)Wrist circumference (cm) 16.3 (±0.4)Chest circumference (cm) 88.7 (±2.5)Shoulder circumference (cm) 99.6 (±3.3)Waist circumference (cm) 73.9 (±2.8)Hip circumference (cm) 83.6 (±2)Gluteus circumference (cm) 94.8 (±2.5)Upper leg circumference (cm) 57.8 (±1.1)Middle leg circumference (cm) 48.5 (±1.1)Lower leg circumference (cm) 39.4 (±0.6)Calf circumference (cm) 36.8 (±1)Ankle circumference (cm) 23.6 (±0.6)
924 C. Babiloni et al. / Clinical Neurophysiology 120 (2009) 922–931
Specifically, the pictures depicted female faces in 4 blocks andmale faces in 4 blocks.
In the FOOD condition, the first picture depicted a kind offood and was presented for 21 times (frequent stimulus). Thesecond picture depicted the same picture food horizontally di-lated by 25% and was presented for 9 times (rare stimulus).
Fig. 1. Experimental paradigm. The visual ‘‘oddball” paradigm included the following tpresented a series of 240 pictures subdivided into 8 blocks (i.e. 30 pictures for each blockpicture depicted a human face and was presented for 21 times (70% of probability, frequalong the horizontal axis; it was presented for 9 times (30% of probability, rare stimulus).21 times (frequent stimulus). The second picture depicted the same picture food horizoncondition, the first picture depicted a figure different from food and face and was presehorizontally dilated by 25%; it was presented for 9 times (rare stimulus). In all conditionranged from 3 to 5 s. The subjects were instructed to click the mouse immediately after
The pictures depicted pastry, fruit, vegetables, pasta, fish, meat,cheese and eggs.
In the CONTROL condition, the first picture depicted a figure dif-ferent from food and face and was presented for 21 times (frequentstimulus). The second picture depicted the same figure horizon-tally dilated by 25%; it was presented for 9 times (rare stimulus).The pictures depicted flower, interiors of apartments, landscapes,objects, and animals.
In all conditions, the pictures were presented for 1 s. Duration ofinter-stimulus interval randomly ranged from 3 to 5 s. The order ofthe pictures and of the conditions was pseudo-randomized. Thesubjects were instructed to click the mouse immediately afterthe rare stimulus. To balance the action side, the subjects executedthe motor performance with right index finger in 4 blocks and withleft index finger in the remaining 4 blocks. Software presentation(Neurobehavioural Systems, http://nbs.neuro-bs.com/) was usedto register the response time (i.e. the interval time from stimulusonset to response) and the accuracy of the response for each singletrial. The figures of the three conditions were obtained from inter-national affective pictures (IAPs www.unifesp.br/dpsicobio/adap/instructions.pdf, Lang et al., 1997), which are properlystandardized.
2.4. EEG recordings
The EEG data were recorded (bandpass: 0.01–100 Hz, samplingrate: 256 Hz) from 19 electrodes referenced to electrically linkedearlobes and positioned according to the International 10–20 Sys-tem (i.e. Fp1, Fp2, F7, F3, Fz, F4, F8, T3, C3, Cz, C4, T4, T5, P3, Pz, P4,T6, O1, O2). Electrode impedance was kept below 5 kOhm. In par-allel, the recording of bipolar electrooculographic data (EOG; band-pass: 0.1–100 Hz; sampling rate: 256 Hz) monitored blinking andeye movements. Finally, electromyogram (EMG; bandpass: 0.1–100 Hz; sampling rate: 256 Hz) of bilateral first dorsal interosseum
hree conditions: FACE, FOOD, and CONTROL. In each condition, the subjects were). In each block, 2 different pictures were presented. In the FACE condition, the first
ent stimulus). The second picture depicted the same face graphically dilated by 25%In the FOOD condition, the first picture depicted a kind of food and was presented fortally dilated by 25% and was presented for 9 times (rare stimulus). In the CONTROLnted for 21 times (frequent stimulus). The second picture depicted the same figures, the pictures were presented for 1 s. Duration of inter-stimulus interval randomlythe rare stimulus.
C. Babiloni et al. / Clinical Neurophysiology 120 (2009) 922–931 925
muscles were recorded to monitor movements required by the taskas well as involuntary mirror movements or other unspecific mus-cle activations.
2.5. Preliminary EEG–EOG–EMG data analysis
The EEG–EOG–EMG data were segmented into single trials of6 s duration, each trial lasting from �2 to +4 s with respect tothe zerotime, defined as the onset of the visual stimulus (i.e. fre-quent or rare stimulus). Data epochs with ocular, muscular, andother types of artifacts were identified by a computerized proce-dure using EEG, EOG, and EMG signals as an input (Moretti et al.,2003). The EEG data affected by ocular artifacts were correctedby an autoregressive method (Moretti et al., 2003). Finally, two ex-pert electroencephalographists (CDP and NM) manually confirmedthis automatic selection and correction, with special attention toresidual contaminations of the EEG epochs due to eye movements,blinking, and mirror movements.
Of note, the same number of trials for frequent and rare stimuliwas selected in each subject and in each condition. The mean num-ber of the artifact-free EEG trials was 59.8 (±1.5 SE) for the FACEcondition, 59.2 (±2 SE) for the FOOD condition, and 56.4 (±1.8 SE)for the CONTROL condition.
2.6. Analysis of P300 at scalp electrodes
For the three conditions (FACE, FOOD, CONTROL), the artifact-free EEG single trials were averaged with respect to the onset ofthe visual stimuli (zerotime), in order to generate 2 classes ofevent-related potentials (ERPs). The first class was constituted byEEG single trials related to the frequent stimuli, while the secondclass was formed by EEG single trials related to the rare stimuli.In the ‘‘oddball” paradigm, the component typically reflecting cor-tical attentional responses is the difference in amplitude betweenpositive ERPs peaking around 300–500 ms post-stimulus for thefrequent minus rare stimuli, the so called P300. The amplitude ofP300 peak was calculated with reference to a baseline taken in apre-stimulus period from 1 s before to the stimulus onset (zero-time). The latency of the P300 peak was measured at Pz electrode,in line with most of the field literature. The P300 peak latency wasdefined as the instant showing the maximum amplitude of the latepositive ERPs in the range from +200 to +600 ms.
2.7. Analysis of P300 cortical sources
A popular technique called ‘‘low-resolution electromagneticbrain topography’’ (LORETA) was used for the cortical sourceanalysis of the P300 (Pascual-Marqui and Michel, 1994; Pasc-ual-Marqui et al., 1999, 2002; http://www.unizh.ch/keyinst/New-LORETA/LORETA01.htm). LORETA is a functional imagingtechnique belonging to a family of procedures in which the cor-tex can be modeled as a collection of volume elements (voxels)in the digitized Talairach atlas of the brain (Talairach and Tour-noux, 1988). LORETA computes 3-D linear solutions for the EEGinverse problem within a three-shell, spherical head modelincluding scalp, skull, and brain compartments. The conductivi-ties for the scalp, skull, and brain compartments are 0.33,0.0042, and 0.33 S/m, respectively (Pascual-Marqui et al., 1999).The brain compartment is restricted to the cortical gray matterand hippocampus. This compartment includes 2394 voxels(7 mm), with each voxel containing an equivalent current dipole.The LORETA solution computed from time–domain scalp ERPs isconstituted by values of current density vector field magnitudesfor each voxel (i.e. dipoles).
Since the current density at each voxel is a vector with 3 com-ponents with respect to orthogonal planes (X, Y and Z moments),
the strength of the dipole moment was defined as the square rootof the sum of squares for the x, y, and z components of the dipole.This was done separately for the 3 conditions (FACE, FOOD, CON-TROL) and for the 2 stimuli (frequent, rare). Afterwards, the differ-ences in amplitude of the P300 LORETA solutions between rare andfrequent stimuli (in the following ‘‘rare minus frequent”) werecalculated.
It should be remarked that the head template of the originalLORETA package cannot account for differences in individualcortical envelope as typically done in the analysis of fMRI (i.e.normalization, coregistering, smoothing). Furthermore, a rela-tively low spatial sampling of P300 was adopted, namely stan-dard 10–20 electrode montage (i.e. 19 channels). Thesemethodological limitations were taken into account by focusingLORETA source analysis on the activity at cortical lobes of inter-est (frontal, central, parietal, occipital, and temporal) rather thanat voxel level (Babiloni et al., 2004, 2006a,b). Within each corti-cal lobe of interest, we identified Brodmann areas (BAs) havingthe highest mean LORETA source amplitude (current densityaveraged across voxels) as revealed by the grand average acrossall subjects, conditions (FACE, FOOD, CONTROL), and stimuli(frequent, rare). Compared with the frequent stimuli, the rarestimuli were expected to be associated with enhanced P300 cor-tical responses.
2.8. Statistical analysis
Statistical analyses were performed by ANOVAs for repeatedmeasures. Mauchley’s test evaluated the sphericity assumption(p < 0.05). Correction of the degrees of freedom was made byGreenhouse–Geisser procedure. Duncan test was used for post-hoc comparisons (p < 0.05).
Four statistical sessions were performed. The first session(behavioral data) verified whether the percentage of correct re-sponses and/or the reaction time were different among the FACE,FOOD and CONTROL conditions. To this aim, we used two ANOVAshaving the factor Condition (FACE, FOOD, CONTROL). The first ses-sion also tested the hypothesis that the reaction time of FACE and/or FOOD conditions was related to body weight. To this aim, weperformed a correlation analysis (Spearman rank-order correla-tion; Bonferroni corrected p < 0.05) between the reaction timeand the body fat percentage for the FACE, FOOD and CONTROLconditions.
The second session (scalp P300) tested the hypothesis that theamplitude of scalp P300 peak was different in the three conditions(FACE, FOOD, CONTROL). To this aim, we used an ANOVA havingthe factors Condition (FACE, FOOD, CONTROL) and Electrode (Fz,Cz, Pz).
The third session (scalp P300) tested the hypothesis thatthe P300 scalp amplitude of FACE and/or FOOD conditionwas related to body weight. To this aim, we performed a cor-relation analysis (Spearman rank-order correlation; Bonferronicorrected p < 0.05) between the body fat percentage and thedifference of P300 amplitude (Pz electrode) rare minus fre-quent stimuli. This was done for the three conditions (FACE,FOOD, CONTROL).
The fourth session (P300 cortical sources) tested the hypothesisthat the amplitude of P300 cortical sources for the FACE and/orFOOD condition was related to body weight. To this aim, we per-formed a correlation analysis (Spearman rank-order correlation;Bonferroni corrected p < 0.05) between the body fat percentageand the difference of P300 LORETA solutions (rare minus frequentstimuli) at BA level. This was done for the three conditions (FACE,FOOD, CONTROL) and for the BAs showing maximum positive dif-ferences of the P300 LORETA solutions between rare and frequentstimuli.
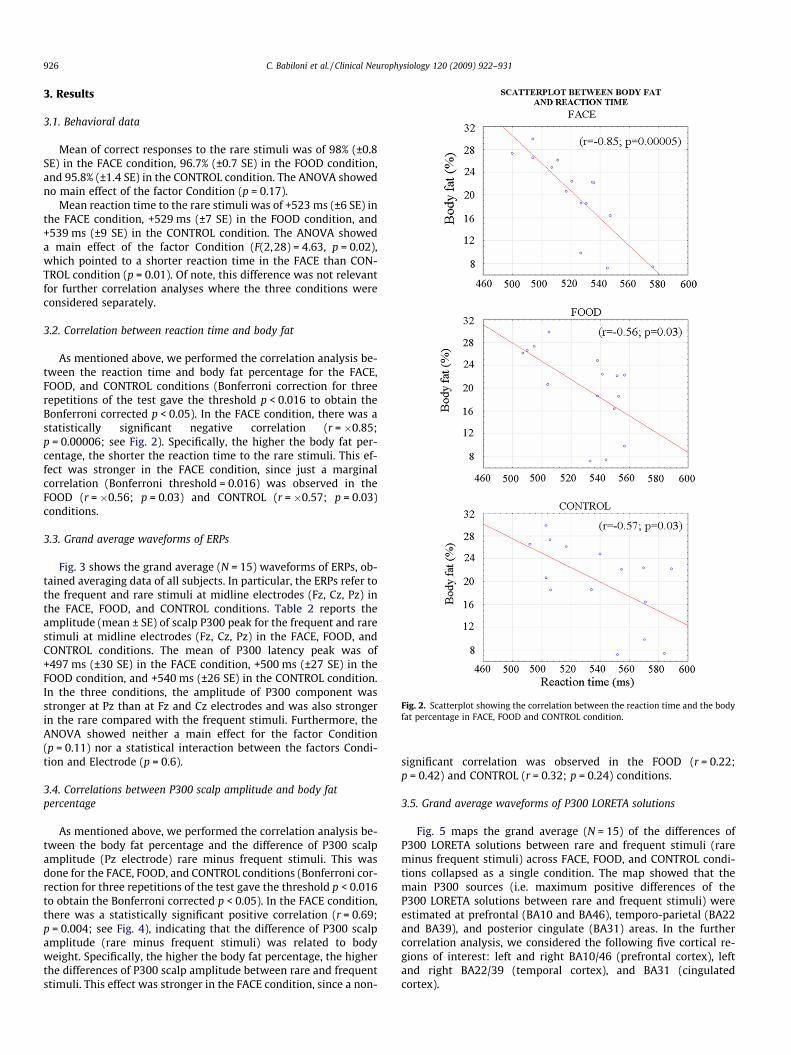
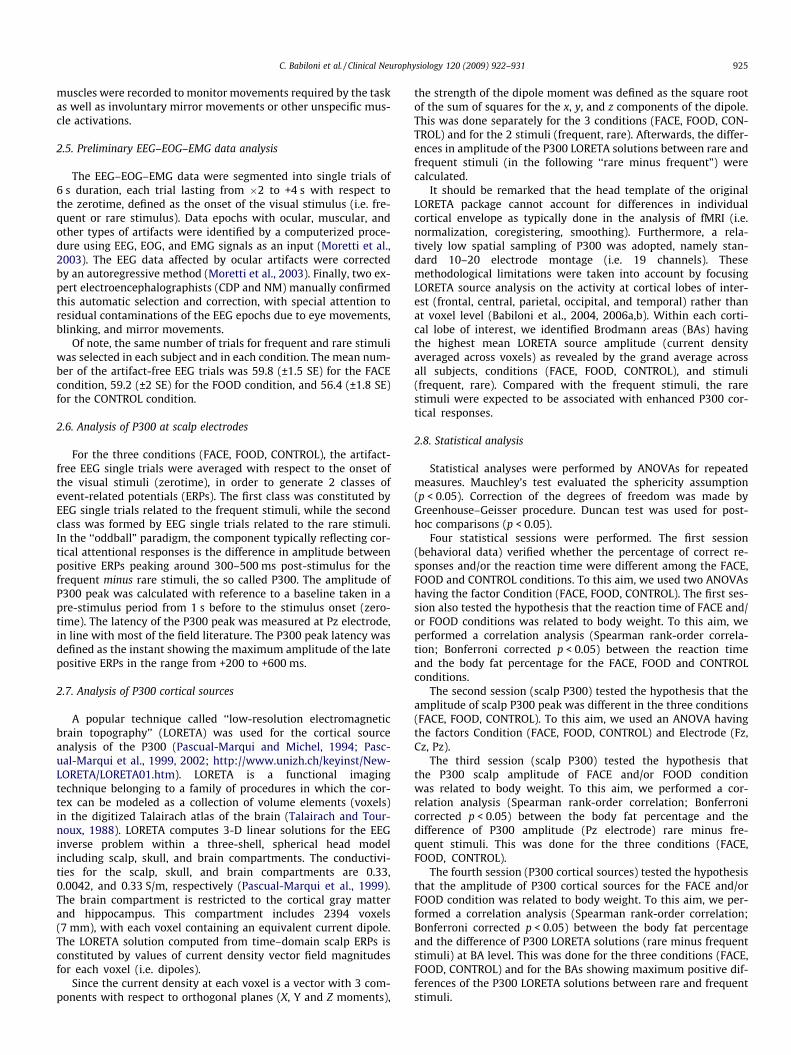
Fig. 2. Scatterplot showing the correlation between the reaction time and the bodyfat percentage in FACE, FOOD and CONTROL condition.
926 C. Babiloni et al. / Clinical Neurophysiology 120 (2009) 922–931
3. Results
3.1. Behavioral data
Mean of correct responses to the rare stimuli was of 98% (±0.8SE) in the FACE condition, 96.7% (±0.7 SE) in the FOOD condition,and 95.8% (±1.4 SE) in the CONTROL condition. The ANOVA showedno main effect of the factor Condition (p = 0.17).
Mean reaction time to the rare stimuli was of +523 ms (±6 SE) inthe FACE condition, +529 ms (±7 SE) in the FOOD condition, and+539 ms (±9 SE) in the CONTROL condition. The ANOVA showeda main effect of the factor Condition (F(2,28) = 4.63, p = 0.02),which pointed to a shorter reaction time in the FACE than CON-TROL condition (p = 0.01). Of note, this difference was not relevantfor further correlation analyses where the three conditions wereconsidered separately.
3.2. Correlation between reaction time and body fat
As mentioned above, we performed the correlation analysis be-tween the reaction time and body fat percentage for the FACE,FOOD, and CONTROL conditions (Bonferroni correction for threerepetitions of the test gave the threshold p < 0.016 to obtain theBonferroni corrected p < 0.05). In the FACE condition, there was astatistically significant negative correlation (r = �0.85;p = 0.00006; see Fig. 2). Specifically, the higher the body fat per-centage, the shorter the reaction time to the rare stimuli. This ef-fect was stronger in the FACE condition, since just a marginalcorrelation (Bonferroni threshold = 0.016) was observed in theFOOD (r = �0.56; p = 0.03) and CONTROL (r = �0.57; p = 0.03)conditions.
3.3. Grand average waveforms of ERPs
Fig. 3 shows the grand average (N = 15) waveforms of ERPs, ob-tained averaging data of all subjects. In particular, the ERPs refer tothe frequent and rare stimuli at midline electrodes (Fz, Cz, Pz) inthe FACE, FOOD, and CONTROL conditions. Table 2 reports theamplitude (mean ± SE) of scalp P300 peak for the frequent and rarestimuli at midline electrodes (Fz, Cz, Pz) in the FACE, FOOD, andCONTROL conditions. The mean of P300 latency peak was of+497 ms (±30 SE) in the FACE condition, +500 ms (±27 SE) in theFOOD condition, and +540 ms (±26 SE) in the CONTROL condition.In the three conditions, the amplitude of P300 component wasstronger at Pz than at Fz and Cz electrodes and was also strongerin the rare compared with the frequent stimuli. Furthermore, theANOVA showed neither a main effect for the factor Condition(p = 0.11) nor a statistical interaction between the factors Condi-tion and Electrode (p = 0.6).
3.4. Correlations between P300 scalp amplitude and body fatpercentage
As mentioned above, we performed the correlation analysis be-tween the body fat percentage and the difference of P300 scalpamplitude (Pz electrode) rare minus frequent stimuli. This wasdone for the FACE, FOOD, and CONTROL conditions (Bonferroni cor-rection for three repetitions of the test gave the threshold p < 0.016to obtain the Bonferroni corrected p < 0.05). In the FACE condition,there was a statistically significant positive correlation (r = 0.69;p = 0.004; see Fig. 4), indicating that the difference of P300 scalpamplitude (rare minus frequent stimuli) was related to bodyweight. Specifically, the higher the body fat percentage, the higherthe differences of P300 scalp amplitude between rare and frequentstimuli. This effect was stronger in the FACE condition, since a non-
significant correlation was observed in the FOOD (r = 0.22;p = 0.42) and CONTROL (r = 0.32; p = 0.24) conditions.
3.5. Grand average waveforms of P300 LORETA solutions
Fig. 5 maps the grand average (N = 15) of the differences ofP300 LORETA solutions between rare and frequent stimuli (rareminus frequent stimuli) across FACE, FOOD, and CONTROL condi-tions collapsed as a single condition. The map showed that themain P300 sources (i.e. maximum positive differences of theP300 LORETA solutions between rare and frequent stimuli) wereestimated at prefrontal (BA10 and BA46), temporo-parietal (BA22and BA39), and posterior cingulate (BA31) areas. In the furthercorrelation analysis, we considered the following five cortical re-gions of interest: left and right BA10/46 (prefrontal cortex), leftand right BA22/39 (temporal cortex), and BA31 (cingulatedcortex).
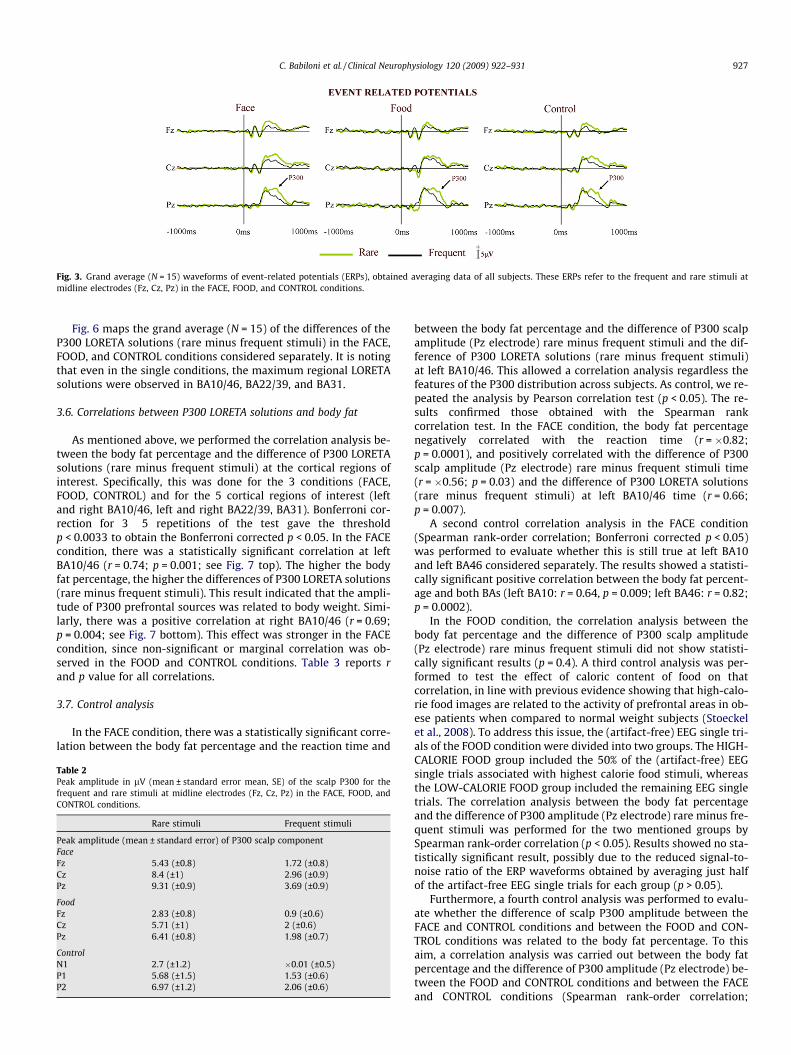
Fig. 3. Grand average (N = 15) waveforms of event-related potentials (ERPs), obtained averaging data of all subjects. These ERPs refer to the frequent and rare stimuli atmidline electrodes (Fz, Cz, Pz) in the FACE, FOOD, and CONTROL conditions.
C. Babiloni et al. / Clinical Neurophysiology 120 (2009) 922–931 927
Fig. 6 maps the grand average (N = 15) of the differences of theP300 LORETA solutions (rare minus frequent stimuli) in the FACE,FOOD, and CONTROL conditions considered separately. It is notingthat even in the single conditions, the maximum regional LORETAsolutions were observed in BA10/46, BA22/39, and BA31.
3.6. Correlations between P300 LORETA solutions and body fat
As mentioned above, we performed the correlation analysis be-tween the body fat percentage and the difference of P300 LORETAsolutions (rare minus frequent stimuli) at the cortical regions ofinterest. Specifically, this was done for the 3 conditions (FACE,FOOD, CONTROL) and for the 5 cortical regions of interest (leftand right BA10/46, left and right BA22/39, BA31). Bonferroni cor-rection for 3 � 5 repetitions of the test gave the thresholdp < 0.0033 to obtain the Bonferroni corrected p < 0.05. In the FACEcondition, there was a statistically significant correlation at leftBA10/46 (r = 0.74; p = 0.001; see Fig. 7 top). The higher the bodyfat percentage, the higher the differences of P300 LORETA solutions(rare minus frequent stimuli). This result indicated that the ampli-tude of P300 prefrontal sources was related to body weight. Simi-larly, there was a positive correlation at right BA10/46 (r = 0.69;p = 0.004; see Fig. 7 bottom). This effect was stronger in the FACEcondition, since non-significant or marginal correlation was ob-served in the FOOD and CONTROL conditions. Table 3 reports rand p value for all correlations.
3.7. Control analysis
In the FACE condition, there was a statistically significant corre-lation between the body fat percentage and the reaction time and
Table 2Peak amplitude in lV (mean ± standard error mean, SE) of the scalp P300 for thefrequent and rare stimuli at midline electrodes (Fz, Cz, Pz) in the FACE, FOOD, andCONTROL conditions.
Rare stimuli Frequent stimuli
Peak amplitude (mean ± standard error) of P300 scalp componentFaceFz 5.43 (±0.8) 1.72 (±0.8)Cz 8.4 (±1) 2.96 (±0.9)Pz 9.31 (±0.9) 3.69 (±0.9)
FoodFz 2.83 (±0.8) 0.9 (±0.6)Cz 5.71 (±1) 2 (±0.6)Pz 6.41 (±0.8) 1.98 (±0.7)
ControlN1 2.7 (±1.2) �0.01 (±0.5)P1 5.68 (±1.5) 1.53 (±0.6)P2 6.97 (±1.2) 2.06 (±0.6)
between the body fat percentage and the difference of P300 scalpamplitude (Pz electrode) rare minus frequent stimuli and the dif-ference of P300 LORETA solutions (rare minus frequent stimuli)at left BA10/46. This allowed a correlation analysis regardless thefeatures of the P300 distribution across subjects. As control, we re-peated the analysis by Pearson correlation test (p < 0.05). The re-sults confirmed those obtained with the Spearman rankcorrelation test. In the FACE condition, the body fat percentagenegatively correlated with the reaction time (r = �0.82;p = 0.0001), and positively correlated with the difference of P300scalp amplitude (Pz electrode) rare minus frequent stimuli time(r = �0.56; p = 0.03) and the difference of P300 LORETA solutions(rare minus frequent stimuli) at left BA10/46 time (r = 0.66;p = 0.007).
A second control correlation analysis in the FACE condition(Spearman rank-order correlation; Bonferroni corrected p < 0.05)was performed to evaluate whether this is still true at left BA10and left BA46 considered separately. The results showed a statisti-cally significant positive correlation between the body fat percent-age and both BAs (left BA10: r = 0.64, p = 0.009; left BA46: r = 0.82;p = 0.0002).
In the FOOD condition, the correlation analysis between thebody fat percentage and the difference of P300 scalp amplitude(Pz electrode) rare minus frequent stimuli did not show statisti-cally significant results (p = 0.4). A third control analysis was per-formed to test the effect of caloric content of food on thatcorrelation, in line with previous evidence showing that high-calo-rie food images are related to the activity of prefrontal areas in ob-ese patients when compared to normal weight subjects (Stoeckelet al., 2008). To address this issue, the (artifact-free) EEG single tri-als of the FOOD condition were divided into two groups. The HIGH-CALORIE FOOD group included the 50% of the (artifact-free) EEGsingle trials associated with highest calorie food stimuli, whereasthe LOW-CALORIE FOOD group included the remaining EEG singletrials. The correlation analysis between the body fat percentageand the difference of P300 amplitude (Pz electrode) rare minus fre-quent stimuli was performed for the two mentioned groups bySpearman rank-order correlation (p < 0.05). Results showed no sta-tistically significant result, possibly due to the reduced signal-to-noise ratio of the ERP waveforms obtained by averaging just halfof the artifact-free EEG single trials for each group (p > 0.05).
Furthermore, a fourth control analysis was performed to evalu-ate whether the difference of scalp P300 amplitude between theFACE and CONTROL conditions and between the FOOD and CON-TROL conditions was related to the body fat percentage. To thisaim, a correlation analysis was carried out between the body fatpercentage and the difference of P300 amplitude (Pz electrode) be-tween the FOOD and CONTROL conditions and between the FACEand CONTROL conditions (Spearman rank-order correlation;
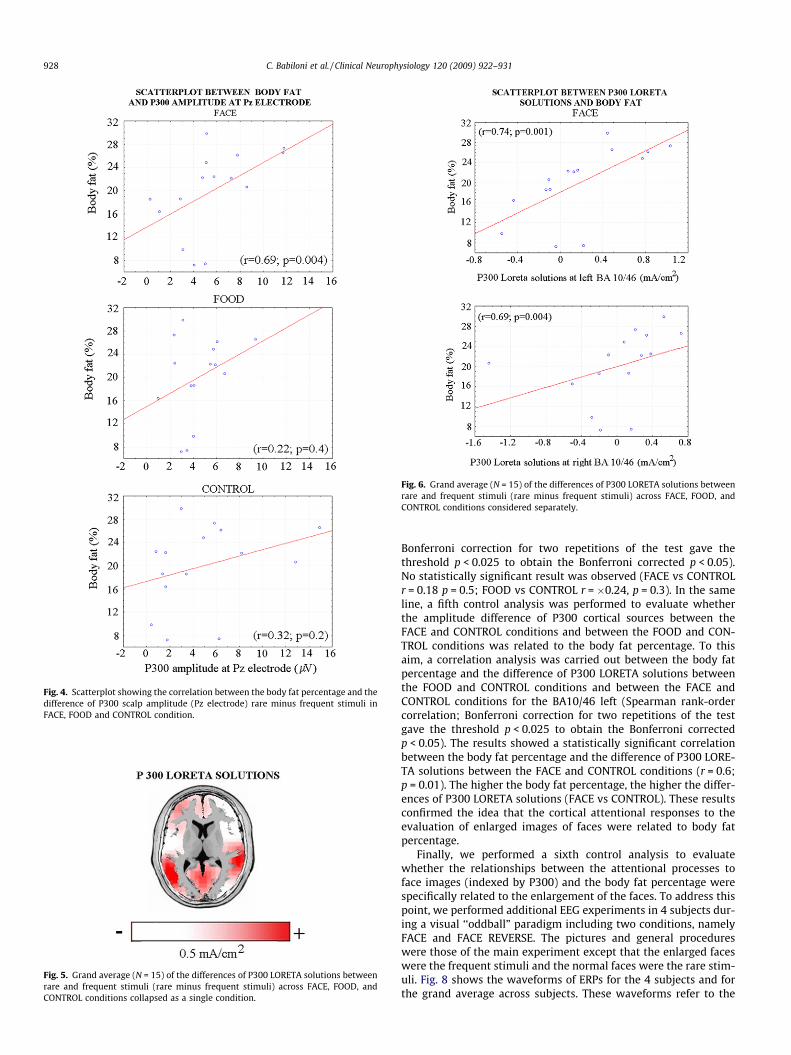
Fig. 4. Scatterplot showing the correlation between the body fat percentage and thedifference of P300 scalp amplitude (Pz electrode) rare minus frequent stimuli inFACE, FOOD and CONTROL condition.
Fig. 5. Grand average (N = 15) of the differences of P300 LORETA solutions betweenrare and frequent stimuli (rare minus frequent stimuli) across FACE, FOOD, andCONTROL conditions collapsed as a single condition.
Fig. 6. Grand average (N = 15) of the differences of P300 LORETA solutions betweenrare and frequent stimuli (rare minus frequent stimuli) across FACE, FOOD, andCONTROL conditions considered separately.
928 C. Babiloni et al. / Clinical Neurophysiology 120 (2009) 922–931
Bonferroni correction for two repetitions of the test gave thethreshold p < 0.025 to obtain the Bonferroni corrected p < 0.05).No statistically significant result was observed (FACE vs CONTROLr = 0.18 p = 0.5; FOOD vs CONTROL r = �0.24, p = 0.3). In the sameline, a fifth control analysis was performed to evaluate whetherthe amplitude difference of P300 cortical sources between theFACE and CONTROL conditions and between the FOOD and CON-TROL conditions was related to the body fat percentage. To thisaim, a correlation analysis was carried out between the body fatpercentage and the difference of P300 LORETA solutions betweenthe FOOD and CONTROL conditions and between the FACE andCONTROL conditions for the BA10/46 left (Spearman rank-ordercorrelation; Bonferroni correction for two repetitions of the testgave the threshold p < 0.025 to obtain the Bonferroni correctedp < 0.05). The results showed a statistically significant correlationbetween the body fat percentage and the difference of P300 LORE-TA solutions between the FACE and CONTROL conditions (r = 0.6;p = 0.01). The higher the body fat percentage, the higher the differ-ences of P300 LORETA solutions (FACE vs CONTROL). These resultsconfirmed the idea that the cortical attentional responses to theevaluation of enlarged images of faces were related to body fatpercentage.
Finally, we performed a sixth control analysis to evaluatewhether the relationships between the attentional processes toface images (indexed by P300) and the body fat percentage werespecifically related to the enlargement of the faces. To address thispoint, we performed additional EEG experiments in 4 subjects dur-ing a visual ‘‘oddball” paradigm including two conditions, namelyFACE and FACE REVERSE. The pictures and general procedureswere those of the main experiment except that the enlarged faceswere the frequent stimuli and the normal faces were the rare stim-uli. Fig. 8 shows the waveforms of ERPs for the 4 subjects and forthe grand average across subjects. These waveforms refer to the
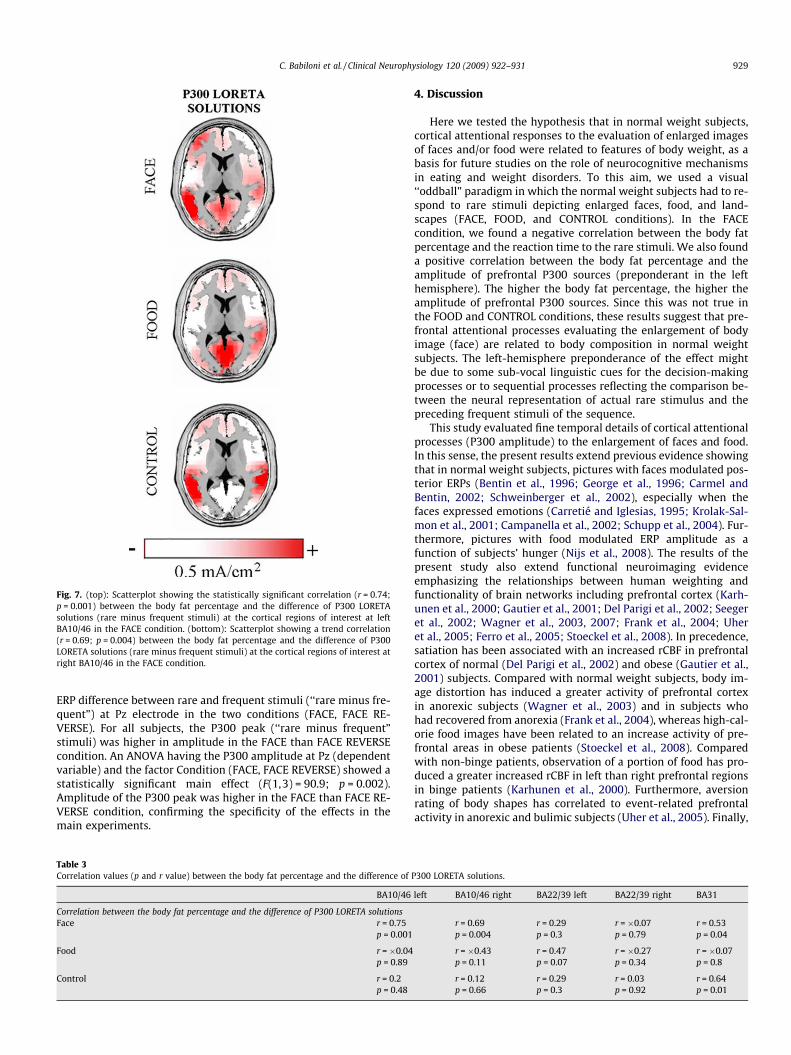
Fig. 7. (top): Scatterplot showing the statistically significant correlation (r = 0.74;p = 0.001) between the body fat percentage and the difference of P300 LORETAsolutions (rare minus frequent stimuli) at the cortical regions of interest at leftBA10/46 in the FACE condition. (bottom): Scatterplot showing a trend correlation(r = 0.69; p = 0.004) between the body fat percentage and the difference of P300LORETA solutions (rare minus frequent stimuli) at the cortical regions of interest atright BA10/46 in the FACE condition.
C. Babiloni et al. / Clinical Neurophysiology 120 (2009) 922–931 929
ERP difference between rare and frequent stimuli (‘‘rare minus fre-quent”) at Pz electrode in the two conditions (FACE, FACE RE-VERSE). For all subjects, the P300 peak (‘‘rare minus frequent”stimuli) was higher in amplitude in the FACE than FACE REVERSEcondition. An ANOVA having the P300 amplitude at Pz (dependentvariable) and the factor Condition (FACE, FACE REVERSE) showed astatistically significant main effect (F(1,3) = 90.9; p = 0.002).Amplitude of the P300 peak was higher in the FACE than FACE RE-VERSE condition, confirming the specificity of the effects in themain experiments.
Table 3Correlation values (p and r value) between the body fat percentage and the difference of
BA10/46
Correlation between the body fat percentage and the difference of P300 LORETA solutionsFace r = 0.75
p = 0.001
Food r = �0.04p = 0.89
Control r = 0.2p = 0.48
4. Discussion
Here we tested the hypothesis that in normal weight subjects,cortical attentional responses to the evaluation of enlarged imagesof faces and/or food were related to features of body weight, as abasis for future studies on the role of neurocognitive mechanismsin eating and weight disorders. To this aim, we used a visual‘‘oddball” paradigm in which the normal weight subjects had to re-spond to rare stimuli depicting enlarged faces, food, and land-scapes (FACE, FOOD, and CONTROL conditions). In the FACEcondition, we found a negative correlation between the body fatpercentage and the reaction time to the rare stimuli. We also founda positive correlation between the body fat percentage and theamplitude of prefrontal P300 sources (preponderant in the lefthemisphere). The higher the body fat percentage, the higher theamplitude of prefrontal P300 sources. Since this was not true inthe FOOD and CONTROL conditions, these results suggest that pre-frontal attentional processes evaluating the enlargement of bodyimage (face) are related to body composition in normal weightsubjects. The left-hemisphere preponderance of the effect mightbe due to some sub-vocal linguistic cues for the decision-makingprocesses or to sequential processes reflecting the comparison be-tween the neural representation of actual rare stimulus and thepreceding frequent stimuli of the sequence.
This study evaluated fine temporal details of cortical attentionalprocesses (P300 amplitude) to the enlargement of faces and food.In this sense, the present results extend previous evidence showingthat in normal weight subjects, pictures with faces modulated pos-terior ERPs (Bentin et al., 1996; George et al., 1996; Carmel andBentin, 2002; Schweinberger et al., 2002), especially when thefaces expressed emotions (Carretié and Iglesias, 1995; Krolak-Sal-mon et al., 2001; Campanella et al., 2002; Schupp et al., 2004). Fur-thermore, pictures with food modulated ERP amplitude as afunction of subjects’ hunger (Nijs et al., 2008). The results of thepresent study also extend functional neuroimaging evidenceemphasizing the relationships between human weighting andfunctionality of brain networks including prefrontal cortex (Karh-unen et al., 2000; Gautier et al., 2001; Del Parigi et al., 2002; Seegeret al., 2002; Wagner et al., 2003, 2007; Frank et al., 2004; Uheret al., 2005; Ferro et al., 2005; Stoeckel et al., 2008). In precedence,satiation has been associated with an increased rCBF in prefrontalcortex of normal (Del Parigi et al., 2002) and obese (Gautier et al.,2001) subjects. Compared with normal weight subjects, body im-age distortion has induced a greater activity of prefrontal cortexin anorexic subjects (Wagner et al., 2003) and in subjects whohad recovered from anorexia (Frank et al., 2004), whereas high-cal-orie food images have been related to an increase activity of pre-frontal areas in obese patients (Stoeckel et al., 2008). Comparedwith non-binge patients, observation of a portion of food has pro-duced a greater increased rCBF in left than right prefrontal regionsin binge patients (Karhunen et al., 2000). Furthermore, aversionrating of body shapes has correlated to event-related prefrontalactivity in anorexic and bulimic subjects (Uher et al., 2005). Finally,
P300 LORETA solutions.
left BA10/46 right BA22/39 left BA22/39 right BA31
r = 0.69 r = 0.29 r = �0.07 r = 0.53p = 0.004 p = 0.3 p = 0.79 p = 0.04
r = �0.43 r = 0.47 r = �0.27 r = �0.07p = 0.11 p = 0.07 p = 0.34 p = 0.8
r = 0.12 r = 0.29 r = 0.03 r = 0.64p = 0.66 p = 0.3 p = 0.92 p = 0.01
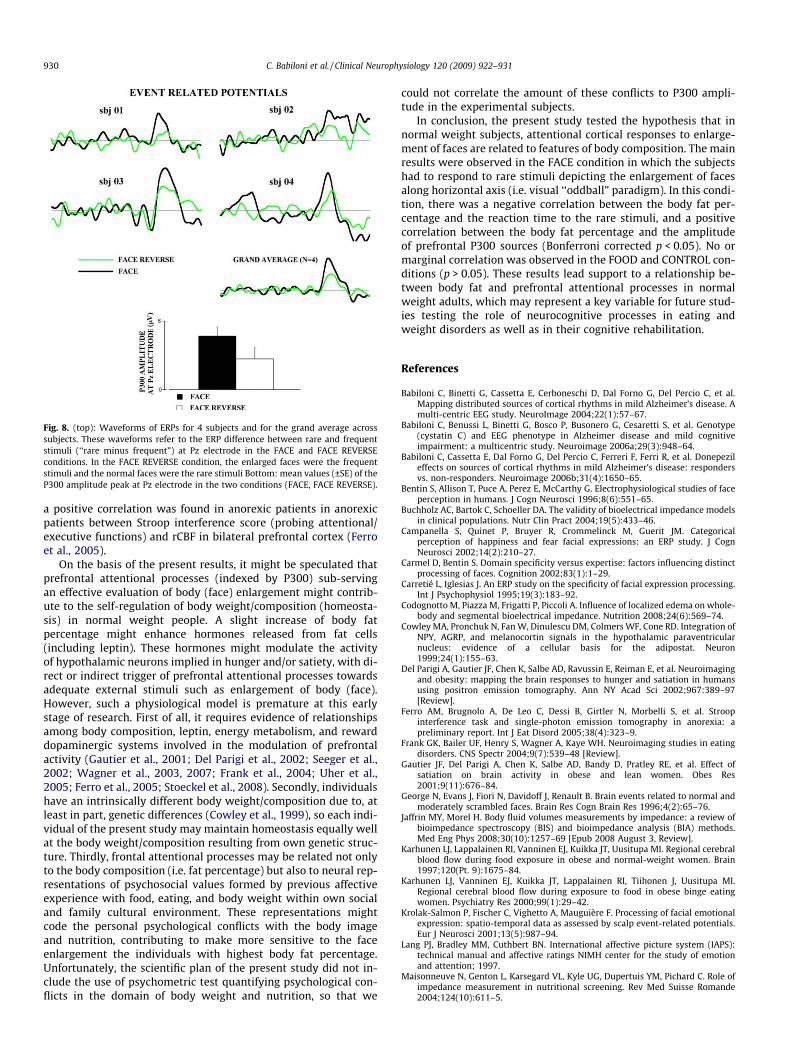
Fig. 8. (top): Waveforms of ERPs for 4 subjects and for the grand average acrosssubjects. These waveforms refer to the ERP difference between rare and frequentstimuli (‘‘rare minus frequent”) at Pz electrode in the FACE and FACE REVERSEconditions. In the FACE REVERSE condition, the enlarged faces were the frequentstimuli and the normal faces were the rare stimuli Bottom: mean values (±SE) of theP300 amplitude peak at Pz electrode in the two conditions (FACE, FACE REVERSE).
930 C. Babiloni et al. / Clinical Neurophysiology 120 (2009) 922–931
a positive correlation was found in anorexic patients in anorexicpatients between Stroop interference score (probing attentional/executive functions) and rCBF in bilateral prefrontal cortex (Ferroet al., 2005).
On the basis of the present results, it might be speculated thatprefrontal attentional processes (indexed by P300) sub-servingan effective evaluation of body (face) enlargement might contrib-ute to the self-regulation of body weight/composition (homeosta-sis) in normal weight people. A slight increase of body fatpercentage might enhance hormones released from fat cells(including leptin). These hormones might modulate the activityof hypothalamic neurons implied in hunger and/or satiety, with di-rect or indirect trigger of prefrontal attentional processes towardsadequate external stimuli such as enlargement of body (face).However, such a physiological model is premature at this earlystage of research. First of all, it requires evidence of relationshipsamong body composition, leptin, energy metabolism, and rewarddopaminergic systems involved in the modulation of prefrontalactivity (Gautier et al., 2001; Del Parigi et al., 2002; Seeger et al.,2002; Wagner et al., 2003, 2007; Frank et al., 2004; Uher et al.,2005; Ferro et al., 2005; Stoeckel et al., 2008). Secondly, individualshave an intrinsically different body weight/composition due to, atleast in part, genetic differences (Cowley et al., 1999), so each indi-vidual of the present study may maintain homeostasis equally wellat the body weight/composition resulting from own genetic struc-ture. Thirdly, frontal attentional processes may be related not onlyto the body composition (i.e. fat percentage) but also to neural rep-resentations of psychosocial values formed by previous affectiveexperience with food, eating, and body weight within own socialand family cultural environment. These representations mightcode the personal psychological conflicts with the body imageand nutrition, contributing to make more sensitive to the faceenlargement the individuals with highest body fat percentage.Unfortunately, the scientific plan of the present study did not in-clude the use of psychometric test quantifying psychological con-flicts in the domain of body weight and nutrition, so that we
could not correlate the amount of these conflicts to P300 ampli-tude in the experimental subjects.
In conclusion, the present study tested the hypothesis that innormal weight subjects, attentional cortical responses to enlarge-ment of faces are related to features of body composition. The mainresults were observed in the FACE condition in which the subjectshad to respond to rare stimuli depicting the enlargement of facesalong horizontal axis (i.e. visual ‘‘oddball” paradigm). In this condi-tion, there was a negative correlation between the body fat per-centage and the reaction time to the rare stimuli, and a positivecorrelation between the body fat percentage and the amplitudeof prefrontal P300 sources (Bonferroni corrected p < 0.05). No ormarginal correlation was observed in the FOOD and CONTROL con-ditions (p > 0.05). These results lead support to a relationship be-tween body fat and prefrontal attentional processes in normalweight adults, which may represent a key variable for future stud-ies testing the role of neurocognitive processes in eating andweight disorders as well as in their cognitive rehabilitation.
References
Babiloni C, Binetti G, Cassetta E, Cerboneschi D, Dal Forno G, Del Percio C, et al.Mapping distributed sources of cortical rhythms in mild Alzheimer’s disease. Amulti-centric EEG study. NeuroImage 2004;22(1):57–67.
Babiloni C, Benussi L, Binetti G, Bosco P, Busonero G, Cesaretti S, et al. Genotype(cystatin C) and EEG phenotype in Alzheimer disease and mild cognitiveimpairment: a multicentric study. Neuroimage 2006a;29(3):948–64.
Babiloni C, Cassetta E, Dal Forno G, Del Percio C, Ferreri F, Ferri R, et al. Donepezileffects on sources of cortical rhythms in mild Alzheimer’s disease: respondersvs. non-responders. Neuroimage 2006b;31(4):1650–65.
Bentin S, Allison T, Puce A, Perez E, McCarthy G. Electrophysiological studies of faceperception in humans. J Cogn Neurosci 1996;8(6):551–65.
Buchholz AC, Bartok C, Schoeller DA. The validity of bioelectrical impedance modelsin clinical populations. Nutr Clin Pract 2004;19(5):433–46.
Campanella S, Quinet P, Bruyer R, Crommelinck M, Guerit JM. Categoricalperception of happiness and fear facial expressions: an ERP study. J CognNeurosci 2002;14(2):210–27.
Carmel D, Bentin S. Domain specificity versus expertise: factors influencing distinctprocessing of faces. Cognition 2002;83(1):1–29.
Carretié L, Iglesias J. An ERP study on the specificity of facial expression processing.Int J Psychophysiol 1995;19(3):183–92.
Codognotto M, Piazza M, Frigatti P, Piccoli A. Influence of localized edema on whole-body and segmental bioelectrical impedance. Nutrition 2008;24(6):569–74.
Cowley MA, Pronchuk N, Fan W, Dinulescu DM, Colmers WF, Cone RD. Integration ofNPY, AGRP, and melanocortin signals in the hypothalamic paraventricularnucleus: evidence of a cellular basis for the adipostat. Neuron1999;24(1):155–63.
Del Parigi A, Gautier JF, Chen K, Salbe AD, Ravussin E, Reiman E, et al. Neuroimagingand obesity: mapping the brain responses to hunger and satiation in humansusing positron emission tomography. Ann NY Acad Sci 2002;967:389–97[Review].
Ferro AM, Brugnolo A, De Leo C, Dessi B, Girtler N, Morbelli S, et al. Stroopinterference task and single-photon emission tomography in anorexia: apreliminary report. Int J Eat Disord 2005;38(4):323–9.
Frank GK, Bailer UF, Henry S, Wagner A, Kaye WH. Neuroimaging studies in eatingdisorders. CNS Spectr 2004;9(7):539–48 [Review].
Gautier JF, Del Parigi A, Chen K, Salbe AD, Bandy D, Pratley RE, et al. Effect ofsatiation on brain activity in obese and lean women. Obes Res2001;9(11):676–84.
George N, Evans J, Fiori N, Davidoff J, Renault B. Brain events related to normal andmoderately scrambled faces. Brain Res Cogn Brain Res 1996;4(2):65–76.
Jaffrin MY, Morel H. Body fluid volumes measurements by impedance: a review ofbioimpedance spectroscopy (BIS) and bioimpedance analysis (BIA) methods.Med Eng Phys 2008;30(10):1257–69 [Epub 2008 August 3, Review].
Karhunen LJ, Lappalainen RI, Vanninen EJ, Kuikka JT, Uusitupa MI. Regional cerebralblood flow during food exposure in obese and normal-weight women. Brain1997;120(Pt. 9):1675–84.
Karhunen LJ, Vanninen EJ, Kuikka JT, Lappalainen RI, Tiihonen J, Uusitupa MI.Regional cerebral blood flow during exposure to food in obese binge eatingwomen. Psychiatry Res 2000;99(1):29–42.
Krolak-Salmon P, Fischer C, Vighetto A, Mauguière F. Processing of facial emotionalexpression: spatio-temporal data as assessed by scalp event-related potentials.Eur J Neurosci 2001;13(5):987–94.
Lang PJ, Bradley MM, Cuthbert BN. International affective picture system (IAPS):technical manual and affective ratings NIMH center for the study of emotionand attention; 1997.
Maisonneuve N, Genton L, Karsegard VL, Kyle UG, Dupertuis YM, Pichard C. Role ofimpedance measurement in nutritional screening. Rev Med Suisse Romande2004;124(10):611–5.
C. Babiloni et al. / Clinical Neurophysiology 120 (2009) 922–931 931
Moretti DV, Babiloni F, Carducci F, Cincotti F, Remondini E, Rossini PM, et al.Computerized processing of EEG–EOG–EMG artifacts for multi-centric studiesin EEG oscillations and event-related potentials. Int J Psychophysiol2003;47(3):199–216.
Nijs IM, Franken IH, Muris P. Food cue-elicited brain potentials in obese and healthy-weight individuals. Eat Behav 2008;9(4):462–70 [Epub 2008 August 15].
Pascual-Marqui RD, Michel CM. LORETA (low resolution brain electromagnetictomography): new authentic 3D functional images of the brain. ISBET NewslISSN 1994;5:4–8.
Pascual-Marqui RD, Lehmann D, Koenig T, Kochi K, Merlo MC, Hell D, et al. Lowresolution brain electromagnetic tomography (LORETA) functional imaging inacute, neuroleptic-naive, first-episode, productive schizophrenia. PsychiatryRes 1999;90(3):169–79.
Pascual-Marqui RD, Esslen M, Kochi K, Lehmann D. Functional imaging with lowresolution brain electromagnetic tomography (LORETA): a review. MethodsFind Exp Clin Pharmacol 2002;24:91–5.
Ricciardi R, Talbot LA. Use of bioelectrical impedance analysis in the evaluation,treatment, and prevention of overweight and obesity. J Am Acad Nurse Pract2007;19(5):235–41 [Review].
Schweinberger SR, Pickering EC, Jentzsch I, Burton AM, Kaufmann JM. Event-relatedbrain potential evidence for a response of inferior temporal cortex to familiarface repetitions. Brain Res Cogn Brain Res 2002;14(3):398–409.
Schupp HT, Junghöfer M, Weike AI, Hamm AO. The selective processing ofbriefly presented affective pictures: an ERP analysis. Psychophysiology2004;41(3):441–9.
Seeger G, Braus DF, Ruf M, Goldberger U, Schmidt MH. Body image distortionreveals amygdala activation in patients with anorexia nervosa. A functionalmagnetic resonance imaging study. Neurosci Lett 2002;326(1):25–8.
Stoeckel LE, Weller RE, Cook 3rd EW, Twieg DB, Knowlton RC, Cox JE. Widespreadreward-system activation in obese women in response to pictures of high-calorie foods. Neuroimage 2008;41(2):636–47.
Talairach J, Tournoux P. Co-planar stereotaxic atlas of the human brain.Stuttgart:Thieme;1988.
Uher R, Murphy T, Friederich HC, Dalgleish T, Brammer MJ, Giampietro V,et al. Functional neuroanatomy of body shape perception in healthy andeating-disordered women. Biol Psychiatry 2005;58(12):990–7 [Epub 2005August 8].
Wagner A, Ruf M, Braus DF, Schmidt MH. Neuronal activity changes and body imagedistortion in anorexia nervosa. Neuroreport 2003;14(17):2193–7.
Wagner A, Aizenstein H, Venkatraman VK, Fudge J, May JC, Mazurkewicz L, et al.Altered reward processing in women recovered from anorexia nervosa. Am JPsychiatry 2007;164(12):1842–9.