Atmospheric circulation and surface temperature in Europe from the 18th century to 1995
13
INTERNATIONAL JOURNAL OF CLIMATOLOGY Int. J. Climatol. 21: 63–75 (2001) ATMOSPHERIC CIRCULATION AND SURFACE TEMPERATURE IN EUROPE FROM THE 18TH CENTURY TO 1995 V.C. SLONOSKY a, *, P.D JONES b and T.D. DAVIES c a Climate Research Branch, Meteorological Ser6ice of Canada, 4905 Dufferin St., Ontario, Canada M3H 5T4 b Climatic Research Unit, Uni6ersity of East Anglia, Norwich, NR47TJ, UK c School of En6ironmental Sciences, Uni6ersity of East Anglia, Norwich, NR47TJ, UK Recei6ed 21 December 1999 Re6ised 27 May 2000 Accepted 29 June 2000 ABSTRACT The relationship between surface atmospheric circulation and temperature in Europe from the 1770s to 1995 is examined using correlation analysis. The atmospheric circulation is represented by six indices: the three leading principal components (PCs) of an empirical orthogonal function (EOF) analysis of 20 European pressure series from 1822 to 1995, which represent the central tendency of European pressure (EOF 1), a zonal circulation pattern (EOF 2) and a meridional pattern (EOF 3), a North Atlantic zonal index constructed from Gibraltar and Reykjavik pressure series for 1821 – 1995; a Western European zonal index constructed from Madrid, Barcelona, Lund and Trondheim for 1786 – 1995; and an index constructed from Paris and London, 1774 – 1995. Eight long temperature series from northwestern and central Europe were correlated with these circulation indices. European temperatures in general had the highest correlations with the zonal circulation indices in winter, with almost 70% of the variability in the temperature records explained by variations in the zonal index. The correlation coefficients between PC 3 (representing meridional circulation) and temperatures were highest in spring and autumn, particularly for Scandinavia. Running correlation series calculated over 25-year windows reveal significant non-stationarities in the relationship between surface temperature and atmospheric circulation on decadal time scales, suggesting caution must be used in extrapolating current relationships between circulation and temperature for future climate predictions based on downscaling or past palaeoclimatic reconstructions. Copyright © 2001 Royal Meteorological Society. KEY WORDS: Europe; North Atlantic Oscillation; temperature; climate variability; early instrumental records; correlation; circulation/climate relationship 1. INTRODUCTION Given the current concerns about climate change, particularly the anthropogenic influence on climate, it is of fundamental importance to investigate past climates and determine the role of natural variability in climate change. In this paper, long monthly series of European temperature and pressure dating back to the 18th century are examined, and the relationships between the atmospheric circulation and temperature over decades to centuries are investigated using historical instrumental data. There exists a great degree of natural variability in the atmospheric circulation and surface climate system, from interannual timescale changes such as those due to the Southern Oscillation and associated El Nin ˜o/La Nin ˜ a events to the changes on the millennial scale related to the Ice Ages. This natural variability is also present on the decadal-to-century timescale. The past five centuries have been dominated by colder and more variable climatic conditions during the 16th – 19th centuries (Lamb, 1995; Jones, 1998) and a recovery during the present century, probably enhanced by anthropogenic warming from the increased emission of greenhouse gases (Jones, 1998; Mann et al., 1998). Natural variability in climate on decadal-to-century timescales is caused by changes in solar output, volcanic activity, and * Correspondence to: Climate Research Branch, Meteorological Service of Canada, 4905 Dufferin St., Ontario, Canada M3H 5T4; e-mail: [email protected] Copyright © 2001 Royal Meteorological Society
Transcript of Atmospheric circulation and surface temperature in Europe from the 18th century to 1995
INTERNATIONAL JOURNAL OF CLIMATOLOGY
Int. J. Climatol. 21: 63–75 (2001)
ATMOSPHERIC CIRCULATION AND SURFACE TEMPERATURE INEUROPE FROM THE 18TH CENTURY TO 1995
V.C. SLONOSKYa,*, P.D JONESb and T.D. DAVIESc
a Climate Research Branch, Meteorological Ser6ice of Canada, 4905 Dufferin St., Ontario, Canada M3H 5T4b Climatic Research Unit, Uni6ersity of East Anglia, Norwich, NR4 7TJ, UK
c School of En6ironmental Sciences, Uni6ersity of East Anglia, Norwich, NR4 7TJ, UK
Recei6ed 21 December 1999Re6ised 27 May 2000
Accepted 29 June 2000
ABSTRACT
The relationship between surface atmospheric circulation and temperature in Europe from the 1770s to 1995 isexamined using correlation analysis. The atmospheric circulation is represented by six indices: the three leadingprincipal components (PCs) of an empirical orthogonal function (EOF) analysis of 20 European pressure series from1822 to 1995, which represent the central tendency of European pressure (EOF 1), a zonal circulation pattern (EOF2) and a meridional pattern (EOF 3), a North Atlantic zonal index constructed from Gibraltar and Reykjavikpressure series for 1821–1995; a Western European zonal index constructed from Madrid, Barcelona, Lund andTrondheim for 1786–1995; and an index constructed from Paris and London, 1774–1995. Eight long temperatureseries from northwestern and central Europe were correlated with these circulation indices. European temperatures ingeneral had the highest correlations with the zonal circulation indices in winter, with almost 70% of the variability inthe temperature records explained by variations in the zonal index. The correlation coefficients between PC 3(representing meridional circulation) and temperatures were highest in spring and autumn, particularly forScandinavia. Running correlation series calculated over 25-year windows reveal significant non-stationarities in therelationship between surface temperature and atmospheric circulation on decadal time scales, suggesting caution mustbe used in extrapolating current relationships between circulation and temperature for future climate predictionsbased on downscaling or past palaeoclimatic reconstructions. Copyright © 2001 Royal Meteorological Society.
KEY WORDS: Europe; North Atlantic Oscillation; temperature; climate variability; early instrumental records; correlation;circulation/climate relationship
1. INTRODUCTION
Given the current concerns about climate change, particularly the anthropogenic influence on climate, itis of fundamental importance to investigate past climates and determine the role of natural variability inclimate change. In this paper, long monthly series of European temperature and pressure dating back tothe 18th century are examined, and the relationships between the atmospheric circulation and temperatureover decades to centuries are investigated using historical instrumental data.
There exists a great degree of natural variability in the atmospheric circulation and surface climatesystem, from interannual timescale changes such as those due to the Southern Oscillation and associatedEl Nino/La Nina events to the changes on the millennial scale related to the Ice Ages. This naturalvariability is also present on the decadal-to-century timescale. The past five centuries have beendominated by colder and more variable climatic conditions during the 16th–19th centuries (Lamb, 1995;Jones, 1998) and a recovery during the present century, probably enhanced by anthropogenic warmingfrom the increased emission of greenhouse gases (Jones, 1998; Mann et al., 1998). Natural variability inclimate on decadal-to-century timescales is caused by changes in solar output, volcanic activity, and
* Correspondence to: Climate Research Branch, Meteorological Service of Canada, 4905 Dufferin St., Ontario, Canada M3H 5T4;e-mail: [email protected]
Copyright © 2001 Royal Meteorological Society
V.C. SLONOSKY ET AL.64
internal interactions between the different components of the climate system (the atmosphere, ocean,cryosphere and biosphere). Periods of cooler conditions have been linked to variations in solar output,manifested by a decrease in sunspot activity, affecting the amount of solar radiation reaching the Earth.Some of the coldest phases of the last 500 years occurred during a period known as the MaunderMinimum when almost no sunspots occurred (Lean et al., 1995). Increased volcanic activity also decreasesglobal temperatures as dust and aerosols emitted to the atmosphere by volcanoes block and scatter theamount of solar radiation reaching the earth, as occurred for example in 1650–1710 (Briffa et al., 1998)or the 1810s (Harrington, 1992). A recent example was in 1992 following the explosion of Mt. Pinatubo.Anthropogenic climate change is due to increasing concentrations of greenhouses gases and sulphates inthe atmosphere and alteration of the Earth’s surface through deforestation or desertification. All of thesefactors affect the radiative balance at the Earth’s surface and the sensible and latent heat exchange andtransport, which in turn influence the temperature and atmospheric circulation at the Earth’s surface.
In addition to these external influences on climate, there is a certain amount of internal variabilitygenerated within the climate system by the relationships between atmospheric circulation and temperatureanomalies on different timescales. Changes in the atmospheric circulation can affect the heat advectioninto a region, while increases or decreases in the global latitudinal temperature gradient influence thestrength of the atmospheric circulation (Lamb and Johnson, 1959; Parker et al., 1994; Lamb, 1995;Nicholls et al., 1996). A weakened circulation allows meridional temperature gradients to increase, whichin turn produces an intensified mid-latitude circulation and increased equator-to-pole heat transport(Lamb and Johnson, 1959). van Loon and Rogers (1978) concluded that regional trends of mean wintertemperatures on timescales of years to decades were so closely related to changes in the atmosphericcirculation that it was unlikely that regional temperatures trends were caused directly by variations inaerosol concentrations, insolation changes or radiative changes.
In this paper, the relationship between the atmospheric circulation and European temperature isexplored over the past two centuries using instrumental observations, the sources of which are listed in thesecond section. In the third section, details of the methods and calculations are given, and the results ofcorrelation analysis between long temperature series and atmospheric circulation indices derived from theinstrumental pressure observations are presented in the fourth section. Conclusions are presented in thefifth section.
2. DATA SOURCES
Pressure data for 51 stations around Europe (figure 1 of Slonosky et al., 2000) were collected as part ofthe European project Annual to Decadal Variability in Climate in Europe (ADVICE, 1998; Jones et al.,1999). Instrumental data from early observers in the 18th and 19th centuries have been collected eitherfrom the original manuscript sources in library archives, from previous publications of data, or in certaincases from special data collections. A detailed list of the sources for each station is available fromADVICE (1998) and Slonosky (1999). The details of the collection and compilation of the Lund recordare given in Barring et al. (1999), and for Gibraltar and Reykjavik in Jones et al. (1997). All pressureseries have been carefully homogenized and adjusted to conform to modern observations, using a methodof iterative comparisons between neighbouring stations and adjustment of identified inhomogeneousperiods to a modern reference period (1981–1995), described in Slonosky et al. (1999).
Extensive analyses of the empirical orthogonal functions (EOFs) obtained from different combinationsof spatial networks, time periods and seasonal representations of the original 51 pressure series haveshown that EOF analysis using monthly data from the 20 series which start by or before 1822 (Figure 1)captures extremely well the variability, both on the monthly and seasonal (particularly winter) scale,contained in the entire data set of all 51 stations (Slonosky, 1999; Slonosky et al., 2000). The EOFspresented here are based on the correlation matrix of the station data which was used to give equalvariance weighting to all parts of the domain. Scree plots (not shown) indicate that the first three EOFsare well separated from noise and so are statistically significant. The principal components (PCs) or timeseries of the EOF amplitudes, give indices of the circulation types represented by the associated EOFs.
Copyright © 2001 Royal Meteorological Society Int. J. Climatol. 21: 63–75 (2001)
EUROPEAN ATMOSPHERIC CIRCULATION AND TEMPERATURE 65
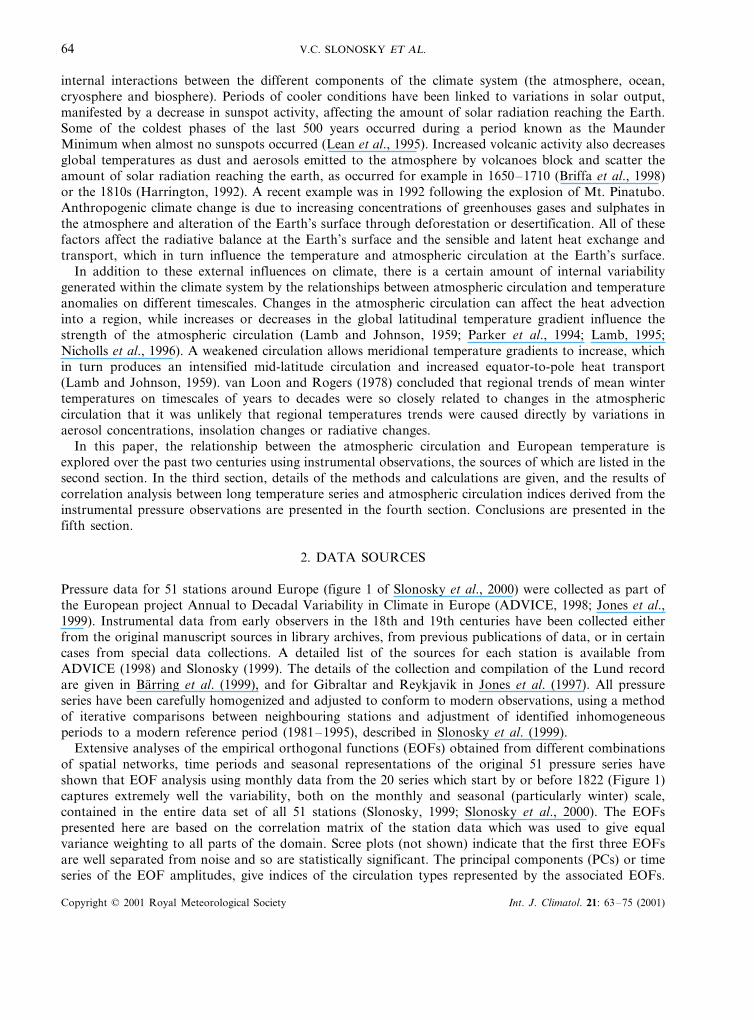
Figure 1. Location of monthly surface pressure series
Table I. Long temperature series
Temperature series Starting date
Berlin, Germany 1701Central England 1659de Bilt, Holland 1706Innsbruck, Austria 1795Kremsmunster, Austria 1767Stockholm, Sweden 1756Uppsala, Sweden 1722Vienna, Austria 1775
Eight long temperature series from northwestern and central Europe, listed in Table I, are also used inthis paper. The series for Innsbruck, Kremsmunster and Vienna have been compiled by the CentralInstitute for Meteorology and Geodynamics, Vienna, Austria. The quality-control and homogenizationprocedures these series have undergone are described in Auer and Boehm (1996). The series for theCentral England temperature (CET) record was obtained from Manley (1974), updated by Parker et al.(1992). The series for Stockholm and Uppsala have been compiled by Moberg and Bergstrom (1997),having been homogenized according to the Standard Normal Homogeneity Test (Alexandersson andMoberg, 1997). The series for Berlin was developed by Schaak (1982), and for de Bilt by van Engelen andNellestijn (1995).
Copyright © 2001 Royal Meteorological Society Int. J. Climatol. 21: 63–75 (2001)
V.C. SLONOSKY ET AL.66
3. METHODS
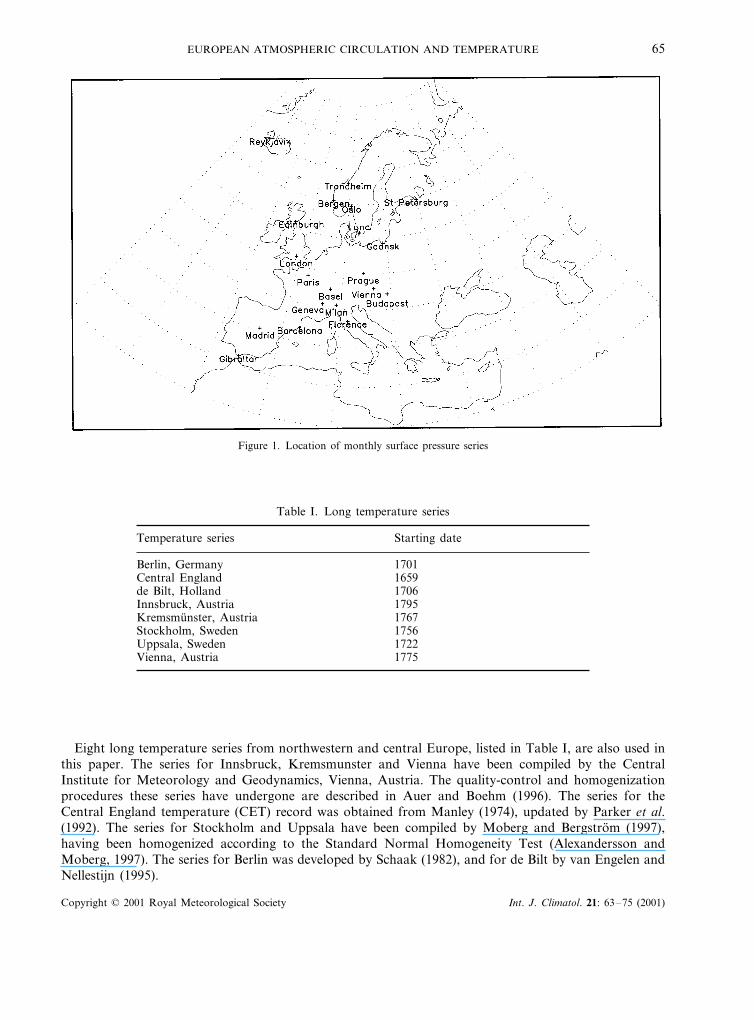
Two methods have been used to obtain atmospheric circulation information from the pressure data; thefirst uses EOF analysis, the second constructs circulation indices based on the geostrophic equation. Thefirst EOF of the station pressure data represents the overall covariance of the stations, or the tendency forthe central stations to have pressures above or below average at the same time, reflecting the prevalenceof high or low pressure synoptic systems in a given month (Figure 2(a)). The second EOF shows a clearlydefined dipole structure with loadings in the northern part of the domain of opposite sign to those in the
Figure 2. Spatial EOF patterns of monthly pressure series 1822–1995, for: (a) EOF 1; (b) EOF 2; (c) EOF 3. Contours representpressure anomalies (units are arbitrary). Station values of the EOF loadings are also printed (small text)
Copyright © 2001 Royal Meteorological Society Int. J. Climatol. 21: 63–75 (2001)
EUROPEAN ATMOSPHERIC CIRCULATION AND TEMPERATURE 67
southern part, consistent with enhanced zonal (westerly) flow in the positive phase and a weakening of thezonal flow in the negative phase (Figure 2(b)). The third EOF (Figure 2(c)) depicts a closed circulationfeature west of the British Isles, associated with either anomalous blocking flow (positive) or increasedcyclonicity (negative) over the eastern Atlantic. The stability of these EOF patterns, as well as a discussionon domain-shape dependence and the effects of rotation, is discussed by Slonosky et al. (2000), in detailby Slonosky (1999).
Three circulation indices were calculated to represent zonal flow (westerly winds) according to thegeostrophic equation (see Table II). The series were first converted to anomaly values using 1871–1995 asthe normal period. The first index (North Atlantic Oscillation (NAO)) is the difference in normalizedpressure between Gibraltar and Iceland, and is similar to the NAO index as defined by Jones et al. (1997),covering the period 1821–1995. Hurrell (1995) and Hurrell and van Loon (1997) used a similar NAOindex calculated as the difference in normalized pressure between Lisbon, Portugal, and Stykkisholmur,Iceland. Luterbacher et al. (1999) have also constructed an NAO index based on reconstructed sea-levelpressure for the Azores and Iceland which extends back to 1675. The second index is a zonal indexconstructed by subtracting Paris from London pressure anomalies and is the longest zonal index series,extending back to 1774. London and Paris are of interest not only because they are at present the longestinstrumental pressure series available, but because there also exist fragmentary records of pressure fromboth sites from the very beginnings of the instrumental period in the late 17th and early 18th centuries(Legrand and LeGoff, 1992; Slonosky et al., 2001). The Western Europe zonal circulation index isconstructed from pressure differences between stations in southern (Madrid and Barcelona) and northern(Trondheim and Lund) Europe and extends back to 1786. All these circulation indices were calculated bysubtracting the northern stations from the southern, so that positive (negative) values indicate anomalouswesterly (easterly) flow components.
Correlation coefficients (r) were calculated between the atmospheric circulation indices (including thefirst three PCs of the 1822–1995 monthly EOF analysis) and the temperature series over their commonperiods. Running correlation coefficients based on overlapping 25-year periods were also calculated. Forthe overall correlations, significance levels were calculated based on the Fisher transform of r-values tonormal Z values (taking account of the autocorrelation in the two series; Wilks, 1995). For the runningcorrelations, error bars corresponding to two standard deviations were also calculated based on the Fishertransform. The error bars represent the upper and lower limits, based on two standard deviations fromthe mean, of the statistical population distribution. Running correlations between any two series may beexpected to vary over time due to the fact that they are calculated using sample populations (in this case,25 values) of the series. The 2−s error bars show the range of expected correlation values given theunderlying correlation of the sample, the autocorrelation of the series, and the sample size. Variations ofthe correlation coefficient from one sample calculation to another which are within the range of the errorbars are statistically insignificant, and the individual correlation values can be considered to fall within thesame population. However, if the error bars of two different sample calculations don’t overlap (that is, theabsolute value of the lower error bar of one sample is larger than the upper error bar of another), the twocorrelation values cannot be considered to fall within the same statistical population, and significantnon-stationarities exist in the correlation between the two series considered (D. Parker, personalcommunication).
All calculations of significance values and error bars account for the underlying autocorrelation of eachof the two series by replacing the sample size N with the effective sample size Neff, according to:
Table II. Constructed circulation indices
Start dateStationsIndex
Gibraltar–Reykjavik1 1821NAO17742 Paris–LondonParis–London zonal1786Madrid+Barcelona–Trondheim+LundWestern Europe zonal3
Copyright © 2001 Royal Meteorological Society Int. J. Climatol. 21: 63–75 (2001)
V.C. SLONOSKY ET AL.68
Neff=N�1−r1(a)r1(b)
1+r1(a)r1(b)�
,
where r1 is the lag-1 autocorrelation coefficient of the series a and b under consideration.
4. RESULTS
4.1. O6erall correlations
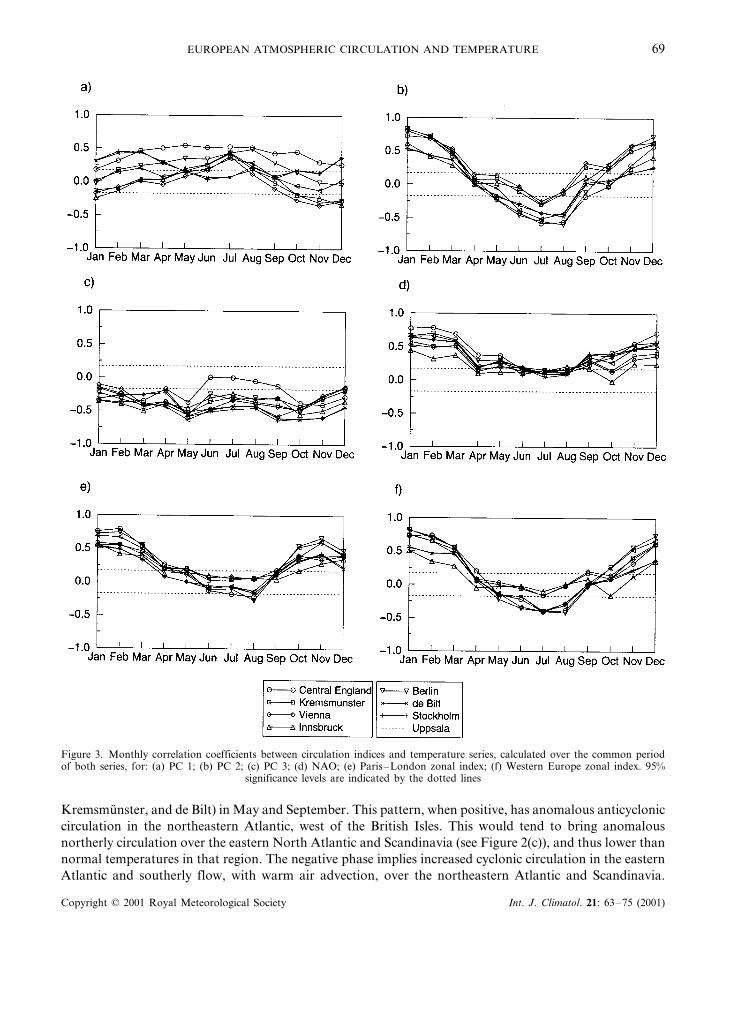
The correlations calculated over the common period of observations for the six circulation indices (thefirst three PCs, the NAO, the Paris–London index, and the zonal index) and the eight temperature series,described in the previous sections, are shown in Figure 3.
The monthly correlations of the temperature series with EOF 1 are mostly weak, with only thecorrelation with Central England temperatures being consistently above the significance level (dottedlines). The more continental series have positive correlations in summer and negative in winter, while theopposite is true for the Scandinavian stations of Uppsala and Stockholm (Figure 3(a)). Positive PC 1values are associated with high-pressure systems and anticyclonic conditions, which imply the maininfluence on temperature is the radiative balance of surface energy fluxes rather than advection ofdifferent air masses into continental Europe, which leads to high (low) temperatures in summer (winter).The low pressure associated with synoptic systems, warm or cold air advection, clouds and rain impliesabove (below) normal temperatures in winter (summer), explaining the slight positive correlations insummer and negative in winter of the continental series, especially at Vienna, Innsbruck andKremsmunster. Central England and Scandinavian temperatures have consistently significant positivecorrelations with EOF 1 during all seasons, suggesting that when the EOF pattern is positive (negative),with anomalous westerly (easterly) flow around the high-pressure anomaly in central Europe, thetemperature is above (below) normal, regardless of season.
There is a high degree of positive correlation between PC 2 and all eight temperature series in the winterhalf of the year (October–March), and a negative correlation in the summer months of June, July andAugust, with the spring and autumn months marking a transition from positive to negative correlation(Figure 3(b)). When the zonal flow pattern (Figure 2(b)) has low (high) pressure anomalies to the northand high (low) pressure anomalies to the south, indicating westerly (easterly) anomalous flow, theassociated temperature series is warmer (colder) than average. Westerly (easterly) flow is thereforeassociated with high (low) temperatures in winter and low (high) temperatures in summer. As Europe issituated downstream from the Atlantic Ocean, these results are logical, in that air advected from theAtlantic Ocean to the west can be expected to bring a moderating influence on temperatures acrossEurope, advecting relatively warmer air in winter and cooler air in summer (Bardossy and Caspary, 1990;Kozuchowski, 1993; Thompson and Wallace, 1998). The opposite also holds for the negative phase of thisEOF pattern; easterly winds from the large continental land mass of Eurasia to the east can be expectedto advect cold air over central and western Europe in winter and warm air from the continental interiorin summer. de Bilt has the highest correlations with PC 2, with up to 68% of the variability in Januarytemperatures and 35% of the variability in August temperatures associated with the variability in thiscirculation pattern. Berlin in winter, and Central England in summer, have the next highest correlations.The zonal atmospheric circulation as described by EOF 2 is clearly an important factor to take intoaccount when considering temperature variability over western and central Europe.
PC 3, strongly correlated with the NAO index (see Slonosky et al., 2000), which has been linked tovariability in temperature and precipitation over Europe (Walker and Bliss, 1932; Lamb and Johnson,1959; Hurrell, 1995), does not show as clear a correlation with the temperature series used here as doesPC 2 (Figure 3(c)). The correlations are all negative, suggesting that seasonality does not play animportant role in the influence of this type of circulation on the temperatures over western and centralEurope. The highest (most negative) correlations are with Uppsala and Stockholm to the north inautumn, although there are two peaks in the correlation curve with stations in central Europe (Berlin,
Copyright © 2001 Royal Meteorological Society Int. J. Climatol. 21: 63–75 (2001)
EUROPEAN ATMOSPHERIC CIRCULATION AND TEMPERATURE 69
Figure 3. Monthly correlation coefficients between circulation indices and temperature series, calculated over the common periodof both series, for: (a) PC 1; (b) PC 2; (c) PC 3; (d) NAO; (e) Paris–London zonal index; (f) Western Europe zonal index. 95%
significance levels are indicated by the dotted lines
Kremsmunster, and de Bilt) in May and September. This pattern, when positive, has anomalous anticycloniccirculation in the northeastern Atlantic, west of the British Isles. This would tend to bring anomalousnortherly circulation over the eastern North Atlantic and Scandinavia (see Figure 2(c)), and thus lower thannormal temperatures in that region. The negative phase implies increased cyclonic circulation in the easternAtlantic and southerly flow, with warm air advection, over the northeastern Atlantic and Scandinavia.
Copyright © 2001 Royal Meteorological Society Int. J. Climatol. 21: 63–75 (2001)
V.C. SLONOSKY ET AL.70
It is not clear why this relationship should be strongest in May (with 40% of the variability in Berlintemperatures associated with variability in PC 3) and in September (with 41% of variations in Uppsalatemperatures associated with PC 3). As the spatial patterns of EOFs are orthogonal, and the correlationswith PC 2 were positive in winter and negative in summer, with transitions (and thus insignificantcorrelations) during spring and autumn, it may be that the circulation patterns associated with PC 3(blocking and meridional flow) explain variations in temperatures better during those times of the yearwhen the circulation patterns of PC 2 (zonal flow) are not significantly associated with temperature.D’Andrea et al. (1998) found European/Atlantic blocking episodes to be most common in late winter andspring, which could also explain the high correlations between EOF 3 and temperature in May.
The correlations of temperature with the NAO (Figure 3(d)) circulation index are stronger than withPC 3. Values are high in winter (October–March), and just about the significance level in summer,although always positive. The areas with variations in temperature most closely associated with variationsof the NAO would appear to be in the maritime middle latitudes of western Europe (Central England, deBilt, and Berlin), followed by Scandinavia (Uppsala and Stockholm), and then continental Europe(Kremsmunster, Vienna, and Innsbruck). The maximum amount of variance in temperature associatedwith variations in the NAO index is 63% for Central England in January. The maximum correlation is inJanuary for all temperature series, in contrast to Chen and Hellstrom (1999) who found the maximumcorrelation between gridded Swedish temperatures and the NAO in March. The reason for the positiveassociations in winter are the same as for EOF 2: positive values imply warm maritime air advection fromthe west (Hurrell, 1995) and negative values cold continental air advection from the east. Thompson andWallace (1998) found that the NAO as defined by Lisbon–Stykkisholmur explained 57% of thewintertime temperature variations over Eurasia, while their Arctic Oscillation explained 65%. However,the NAO index is less informative in that, unlike EOF 2, it does not explain any variations in temperatureoutside winter, and because the correlations diminish further east. As was also found by Tuomenvirta etal. (1998) and Chen and Hellstrom (1999) for Scandinavia, the correlations between temperature and theNAO in summer are not significant, but positive, whereas the correlations between temperatures and PC2 zonal flow are negative and significant in summer. This again shows that the NAO is decoupled fromEuropean zonal flow outside the winter months (Tuomenvirta et al., 1998; Chen and Hellstrom, 1999;Slonosky et al., 2000). The NAO accounts best for variability in western and north-western Europeanwinter temperatures.
The winter correlations between the temperature series and the Paris–London zonal index aresurprisingly good for all the series, perhaps because the two cities are located in the middle latitudes ofEurope and are aligned in a north–south direction on either side of the zero line in EOF 2 (Figure 2(b)).The highest correlations are in the winter months with Central England, Berlin and de Bilt temperatures(Figure 3(e)). A maximum of 64% of the variance in Central England temperatures is associated withvariations in the Paris–London index in February. Correlations are above 0.5 for all temperature seriesin January, and the Paris–London index may explain the variations in winter temperature as well as, oreven better than, the NAO index, particularly for the more eastern stations such as de Bilt, Berlin,Kremsmunster, Innsbruck and Vienna.
The correlation between the Western Europe zonal circulation index and temperatures (Figure 3(f))follows the same pattern as PC 2 and the Paris–London index, with positive correlations in winter andnegative correlations in summer. The wintertime correlations are almost as strong as those for PC 2;variations in the Western Europe zonal index account for 66% of the variability of de Bilt Januarytemperature. The negative associations in summer are not as strong as those for PC 2, with variability ofthe index explaining 17% of the variations in August de Bilt temperature, compared to 35% associatedwith PC 2.
It would appear that the most useful indicators of circulation, in terms of ability to account forvariations in temperature, would be the patterns and PCs associated with EOFs 2 and 3. However, theseare the shortest of the circulation series, starting only in 1822. Following these, the Western Europe zonalindex is the next best at explaining variations in winter temperature at the eight sites with longtemperature series under consideration here. The Paris–London index is the longest index and is
Copyright © 2001 Royal Meteorological Society Int. J. Climatol. 21: 63–75 (2001)
EUROPEAN ATMOSPHERIC CIRCULATION AND TEMPERATURE 71
surprisingly good at explaining variations in temperatures of central and western Europe, given thegeographical proximity of the two stations. As was also suggested by Thompson and Wallace (1998),Chen and Hellstrom (1999) and Luterbacher et al. (1999), the NAO index is not necessarily the bestcirculation representation to use to explain surface temperature variability in central and western Europe,especially outside the winter months. On the whole, indices were best at explaining temperature variationsat places to the east (downstream) of their defining locations.
4.2. Running correlations
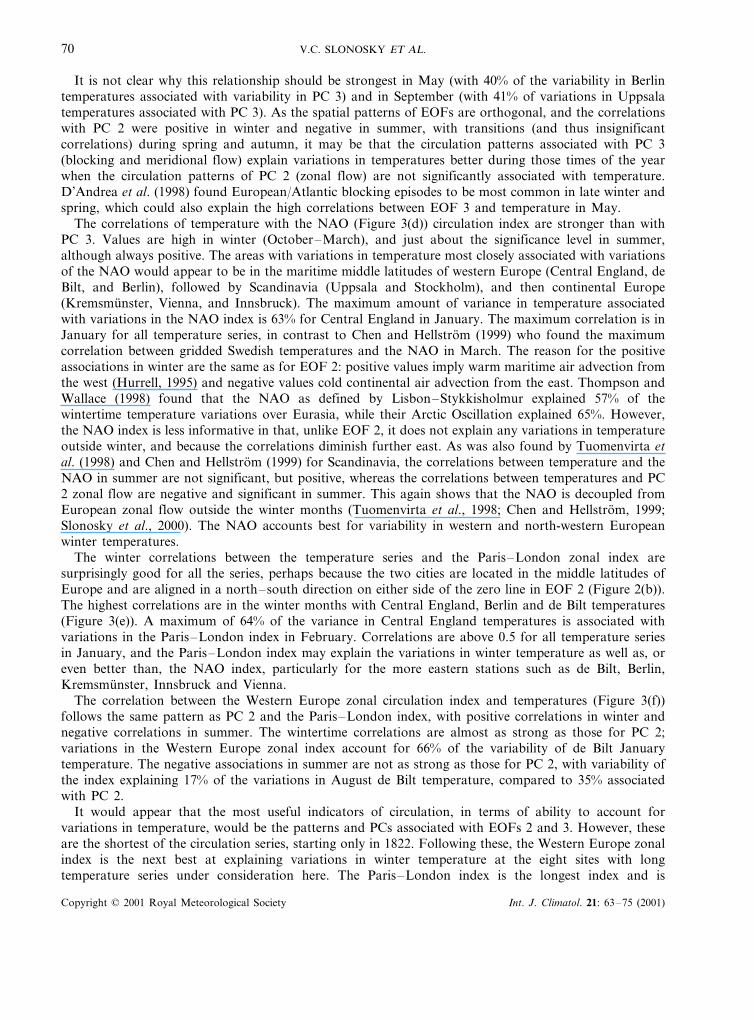
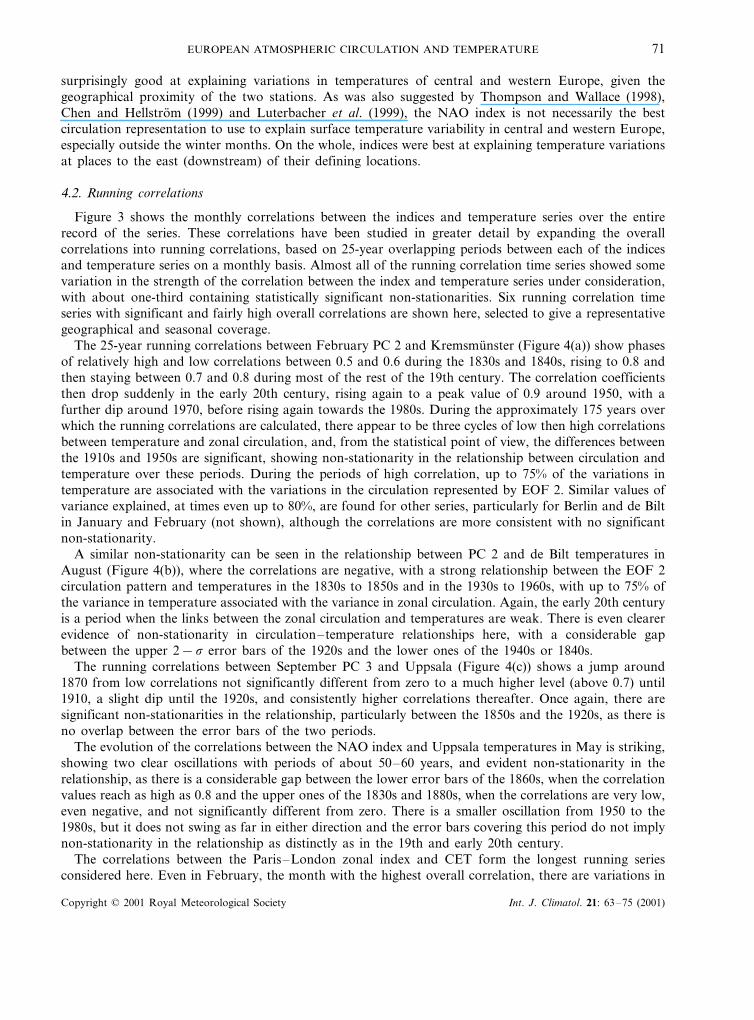
Figure 3 shows the monthly correlations between the indices and temperature series over the entirerecord of the series. These correlations have been studied in greater detail by expanding the overallcorrelations into running correlations, based on 25-year overlapping periods between each of the indicesand temperature series on a monthly basis. Almost all of the running correlation time series showed somevariation in the strength of the correlation between the index and temperature series under consideration,with about one-third containing statistically significant non-stationarities. Six running correlation timeseries with significant and fairly high overall correlations are shown here, selected to give a representativegeographical and seasonal coverage.
The 25-year running correlations between February PC 2 and Kremsmunster (Figure 4(a)) show phasesof relatively high and low correlations between 0.5 and 0.6 during the 1830s and 1840s, rising to 0.8 andthen staying between 0.7 and 0.8 during most of the rest of the 19th century. The correlation coefficientsthen drop suddenly in the early 20th century, rising again to a peak value of 0.9 around 1950, with afurther dip around 1970, before rising again towards the 1980s. During the approximately 175 years overwhich the running correlations are calculated, there appear to be three cycles of low then high correlationsbetween temperature and zonal circulation, and, from the statistical point of view, the differences betweenthe 1910s and 1950s are significant, showing non-stationarity in the relationship between circulation andtemperature over these periods. During the periods of high correlation, up to 75% of the variations intemperature are associated with the variations in the circulation represented by EOF 2. Similar values ofvariance explained, at times even up to 80%, are found for other series, particularly for Berlin and de Biltin January and February (not shown), although the correlations are more consistent with no significantnon-stationarity.
A similar non-stationarity can be seen in the relationship between PC 2 and de Bilt temperatures inAugust (Figure 4(b)), where the correlations are negative, with a strong relationship between the EOF 2circulation pattern and temperatures in the 1830s to 1850s and in the 1930s to 1960s, with up to 75% ofthe variance in temperature associated with the variance in zonal circulation. Again, the early 20th centuryis a period when the links between the zonal circulation and temperatures are weak. There is even clearerevidence of non-stationarity in circulation–temperature relationships here, with a considerable gapbetween the upper 2−s error bars of the 1920s and the lower ones of the 1940s or 1840s.
The running correlations between September PC 3 and Uppsala (Figure 4(c)) shows a jump around1870 from low correlations not significantly different from zero to a much higher level (above 0.7) until1910, a slight dip until the 1920s, and consistently higher correlations thereafter. Once again, there aresignificant non-stationarities in the relationship, particularly between the 1850s and the 1920s, as there isno overlap between the error bars of the two periods.
The evolution of the correlations between the NAO index and Uppsala temperatures in May is striking,showing two clear oscillations with periods of about 50–60 years, and evident non-stationarity in therelationship, as there is a considerable gap between the lower error bars of the 1860s, when the correlationvalues reach as high as 0.8 and the upper ones of the 1830s and 1880s, when the correlations are very low,even negative, and not significantly different from zero. There is a smaller oscillation from 1950 to the1980s, but it does not swing as far in either direction and the error bars covering this period do not implynon-stationarity in the relationship as distinctly as in the 19th and early 20th century.
The correlations between the Paris–London zonal index and CET form the longest running seriesconsidered here. Even in February, the month with the highest overall correlation, there are variations in
Copyright © 2001 Royal Meteorological Society Int. J. Climatol. 21: 63–75 (2001)
V.C. SLONOSKY ET AL.72
Figure 4. Running correlations calculated over 25-year windows for: (a) PC 2 and Kremsmunster temperature, February; (b) PC 2and de Bilt temperatures, August; (c) PC 3 and Uppsala temperatures, September; (d) NAO and Uppsala temperatures, May; (e)Paris–London zonal index and Central England temperatures, February; and (f) Western Europe zonal index and Berlin
temperatures, December. The first values are plotted in year 13 of the first 25-year period
the strength of the relationship over time, with the correlations starting off fairly low in the 1780s and1790s (�0.65), gradually rising to a peak of 0.95 (meaning that over 90% of the variations in temperatureare explained by the variations of circulation) in the 1870s and 1880s (Figure 4(e)). The correlations fallslightly in the 1910s and 1920s to about 0.7, rising again to values of 0.9 in the late 1940s–1950 and the1980s, with another slight fall in the 1960s and early 1970s to 0.75.
The Western Europe zonal index and Berlin temperatures in December (Figure 4(f)) are very highlycorrelated in the late 18th and early 19th centuries, with values of 0.85 around 1800. The relationshipbecomes weak in the 1830s–1850s, barely above the significance level, and then strengthens again towardsthe end of the 19th century. There is another period of low correlations from 1910 to 1935, but thestrength of the correlation is fairly constant thereafter. Both of the last two examples also show significantnon-stationarity in the overall evolution, with periods (the 1790s versus the 1890s for Paris–London zonalindex and CET, the 1810s and 1840s for December Western Zonal and Berlin) where there is no overlapbetween the respective upper and lower error bars.
Clear decadal-scale variability can be seen in the running correlations of circulation indices andtemperature for all parts of Europe in all seasons, with significant non-stationarity over the past 200years. Significant non-stationarities in the circulation–climate relationships in Central Europe were alsofound by Jacobeit et al. (1998) in their study between thermic regions of Central Europe and similar NAO
Copyright © 2001 Royal Meteorological Society Int. J. Climatol. 21: 63–75 (2001)
EUROPEAN ATMOSPHERIC CIRCULATION AND TEMPERATURE 73
and zonal-flow indices. Their running correlations peaked between 1820 and 1850, and again towards theend of the 19th century, with a sudden fall at the beginning of the 20th century, patterns that are broadlyreflected also in Chen and Hellstrom’s (1999) running correlation analysis of annual temperature inScandinavia and the NAO, and in the series presented in Figure 4. It is possible to see some of thevariability in the correlations between temperature and circulation as a switch from temperature beingmainly associated with one type of circulation, such as zonal in the 1890s when the correlations betweentemperature and the zonal indices were high, but low with PC 3, to another, such as meridional in the1920s, when the correlations with the zonal indices were low but with PC 3 were high. There are otherperiods, however, when the correlations with both types of circulation indices are low, such as during the1840s. The periods of high or low correlation do not appear to be systematically associated with the meanstrength or variability of the circulation (Slonosky, 1999); a similar lack of association between correlationand strength of circulation was also found by Chen and Hellstrom (1999) for Sweden. More work needsto be done to determine whether these non-stationarities in the circulation–climate relationships arechaotic or whether they may be related to other aspects of the climate system. The 50–60-year oscillationin the correlation of Uppsala temperatures and the NAO may possibly be related to North Atlanticair–sea dynamics, or variability in the themohaline circulation. Hurrell (1996) has shown that the winterNAO explains 31% of the variability in land temperature north of 20°N from 1935 to 1994; Osborn et al.(1999) in their figure 6(a), show that this relationship varies significantly between 0.6 and 0.0 for running50-year windows over the 1856–1998 period. They further show that similar variability in thecirculation–temperature relationship is produced by a general circulation model (HadCM2) control runover 650 years; changes of the same order occurred in the correlation coefficient, but less rapidly than inthe real world observations. It is possible that the rapid changes in the circulation–climate relationshipsare caused by external climate forcings such as volcanic activity.
5. CONCLUSIONS
The importance of atmospheric circulation as a control on surface temperature in mid-latitude Europe isclearly demonstrated. Over the past 200 years, almost 70% of the variability in winter temperatures atstations such as de Bilt can be explained by variations in the zonal circulation. Even very simple indicesof the zonal circulation, such as the pressure difference between Paris and London, effectively account forover 50% of the variability in winter temperatures in western and central Europe. Considerabledownstream influence of zonal circulation on surface temperature is shown, with zonal circulation indicesbased on European pressure data associated with more variability in European temperatures than themore western NAO.
Despite the high overall correlations between the circulation indices and temperatures, particularly inwinter, the results of the running correlations presented here suggest that clear decadal scale variabilityexists in the correlations between circulation and climate. Moreover, this variability encompasses distinctnon-stationarity in the relationship between circulation and temperature over time, which has implicationsfor both climate forecasting from downscaling methods and paleoclimatic reconstructions. While duringsome periods over the past 200 years a large percentage of the variance in temperature could be explainedby variability in circulation, this has not been constant, and the relationships that exist today do notalways hold true for the past, even the fairly recent past, and may not hold true for the future. Attemptsto reconstruct large-scale circulation indices (such as the NAO) from proxy climatic data (e.g. ice-cores,tree-rings or historical documents, Schumtz et al., 2000) might be compromised as the proxy data areinfluenced by local temperature and precipitation, which do not always respond in the same way to thecirculation, as is seen here. Variations in local climate, as seen in the proxy data, may be responding tochanges in circulation index strength, but may also be due to competing influences from other circulationtypes. Some of the variability in the correlation between temperature and circulation may be due todifferent circulation types influencing temperature; while zonal circulation usually has a dominantinfluence on temperature, there were periods such as the 1920s when meridional circulation appeared to
Copyright © 2001 Royal Meteorological Society Int. J. Climatol. 21: 63–75 (2001)
V.C. SLONOSKY ET AL.74
have greater influence. Some of the correlation series, particularly those with Uppsala temperatures,showed an approximately 50–60-year cycle in the strength of the correlation, an interesting result giventhe 50-year cycles in the model studies of the convective overturning of the thermohaline circulation in thenorthern North Atlantic described by Delworth et al. (1993) and suggested by Lamb (1995) in northernEuropean climate. Further work remains to be done to investigate the circulation dynamics which maycause these non-stationarities, and to determine if statistically significant periodicties exist in the runningcorrelation series.
ACKNOWLEDGEMENTS
Reinald Boehm kindly supplied the temperature series for Austria. Tim Osborn and David Parker gavemany helpful comments, particularly on the statistical determination of non-stationarity in runningcorrelation series. VCS is very grateful for the support provided by the Canadian Natural Sciences andEngineering Research Council, and the Quebec Fonds pour la formation des chercheurs et l’aide a larecherche during the studies that led to this paper. The original pressure data collection was undertakenas part of the European Commission project ADVICE, ENV4-Ct95-0129.
REFERENCES
ADVICE. 1998. Final report of the European Commission project ADVICE: annual to decadal variability in climate in Europe.Climatic Research Unit, University of East Anglia, Norwich, UK, 44 pp.+8 appendices.
Alexandersson H, Moberg A. 1997. Homogenization of Swedish temperature data. Part I: a homogeneity test for linear trends.International Journal of Climatology 17: 25–34.
Auer I, Boehm R. 1996. Data, metadata and the question of homogeneity for the Austrian climate network. In Proceedings of theFirst Seminar for Homogenization of Surface Climate Data, Budapest, Hungary, 6–12 October 1996.
Bardossy A, Caspary HJ. 1990. Detection of climate change in Europe by analyzing European atmospheric circulation patterns from1881 to 1989. Theoretical and Applied Climatology 42: 155–167.
Barring L, Jonsson P, Achberger C, Ekstrom M, Alexandersson H. 1999. The Lund pressure record of meteorological instrumentalobservations: monthly pressure 1780–1997. International Journal of Climatology 19: 1427–1443.
Briffa KR, Jones PD, Schweingruber FH, Osborn TJ. 1998. Influence of volcanic eruptions on Northern Hemisphere summertemperatures over the past 600 years. Nature 393: 450–455.
Chen D, Hellstrom C. 1999. The influence of the North Atlantic Oscillation on the regional temperature variability in Sweden:spatial and temporal variations. Tellus 51A: 505–516.
D’Andrea F, Tibaldi S, Blackburn M, Boer G, Deque M, Dix MR, Dugas B, Ferranti L, Iwasaki T, Kitoh A, Pope V, Randall D,Roeckner E, Straus D, Stern W, van den Dool H, Williamson D. 1998. Northern Hemisphere atmospheric blocking as simulatedby 15 atmospheric general circulation models in the period 1979–1988. Climate Dynamics 14: 385–407.
Delworth T, Manabe S, Stouffer RJ. 1993. Interdecadal variations of the thermohaline circulation in a coupled ocean–atmospheremodel. Journal of Climate 6: 1993–2011.
Harrington CR (ed.). 1992. The Year Without a Summer? World Climate in 1816. Canadian Museum of Nature: Ottawa; 576 pp.Hurrell JW. 1995. Decadal trends in the North Atlantic Oscillation. Regional temperature and precipitation. Science 269: 676–679.Hurrell JW. 1996. Inflluence of variations in extratropical wintertime teleconnections on Northern Hemisphere temperature.
Geophysical Research Letters 23: 665–668.Hurrell JW, van Loon H. 1997. Decadal variations in climate associated with the North Atlantic Oscillation. Climatic Change 36:
301–326.Jacobeit J, Beck C, Philipp A. 1998. Annual to decadal variability on climate in Europe; objectives and results of the German
contribution to the European climate research project ADVICE. Wuerzburger Geographische Manuskipte, Heft 43, Wuerzburg,88 pp.+4 appendices.
Jones P. 1998. It was the best of times, it was the worst of times. Science 280: 544–545.Jones PD, Jonsson T, Wheeler D. 1997. Extension to the North Atlantic Oscillation using early instrumental pressure observations
from Gibraltar and south-west Iceland. International Journal of Climatology 17: 1433–1450.Jones PD, Davies TD, Lister DH, Slonosky V, Jonsson T, Barring L, Jonsson P, Maheras P, Kolyva-Machera F, Barriendos M,
Martin-Vide J, Alcoforado MJ, Wanner H, Pfister C, Schuepbach E, Kaas E, Schmith T, Jacobeit J, Beck C. 1999. Monthly meanpressure reconstructions for Europe. International Journal of Climatology 19: 347–364.
Kozuchowski K. 1993. Variations of hemispheric zonal index since 1899 and its relationships with air temperature. InternationalJournal of Climatology 13: 853–864.
Lamb HH, Johnson AI. 1959. Climatic variations and observed changes in the general circulation, parts I and II. GeographicalAnnals of Stockholm 41: 94–131.
Lamb HH. 1995. Climate, History and the Modern World (2nd edn). Routledge: London; 1995; 433 pp.Lean J, Beer J, Bradley R. 1995. Reconstruction of solar irradiance since 1610: implications for climate change. Geophysical
Research Letters 22: 3195–3198.Legrand J-P, LeGoff M. 1992. Les observations meteorologiques de Louis Morin. Direction de la Meteorologie Nationale, Ministere
de l’Equipement, de Logement et des Transports, monographie No. 6, vol. 1, 41 pp.
Copyright © 2001 Royal Meteorological Society Int. J. Climatol. 21: 63–75 (2001)
EUROPEAN ATMOSPHERIC CIRCULATION AND TEMPERATURE 75
Luterbacher J, Schmutz C, Gyalistras G, Xoplaki E, Wanner H. 1999. Reconstruction of monthly NAO and EU indices back to AD1675. Geophysical Research Letters 26: 2745–2748.
Manley G. 1974. Central England temperature: monthly means 1659 to 1973. Quarterly Journal of the Royal Meteorological Society100: 389–405.
Mann ME, Bradley RS, Hughes MK. 1998. Global-scale temperature patterns and climate forcing over the past six centuries. Nature352: 779–787.
Moberg A, Bergstrom H. 1997. Homogenization of Swedish temperature data. Part III: the long temperature records from Uppsalaand Stockholm. International Journal of Climatology 17: 667–699.
Nicholls N, Gruza GV, Jouzels J, Karl T, Ogallo LA, Parker DE. 1996. Observed climate variability and change. In Climate Change1996. The Science of Climate Change, Houghton J, Meiro Filho LG, Callander BA, Harris N, Kattenberg A, Maskell K (eds).IPCC 1995, Cambridge University Press: Cambridge; 137–181.
Osborn TJ, Briffa KR, Tett SFB, Jones PD, Trigo RM. 1999. Evaluation of the North Atlantic Oscillation as simulated by acoupled climate model. Climate Dynamics 15: 685–702.
Parker DE, Legg TP, Folland CK. 1992. A new daily Central England temperature series, 1772–1991. International Journal ofClimatology 12: 317–342.
Parker DE, Jones PD, Folland CK, Bevan A. 1994. Interdecadal changes of surface temperature since the late nineteenth century.Journal of Geophysical Research 99: 14373–14399.
Schaak P. 1982. Ein Beitrag zum Preussenjahr 1981 en Berlin. Beilage zur Berliner Wetterkarte 38/82, S04/82. Institut furMeteorologie der Freien Universitatat: Berlin.
Schumtz C, Luterbacher J, Gyalistra D, Xoplaki E, Wanner H. 2000. Can we trust proxy-based NAO index reconstructions?Geophysical Research Letters 27: 1135–1138.
Slonosky VC. 1999. Surface circulation variability over Europe, 1822–1995, PhD Thesis, School of Environmental Sciences,University of East Anglia, Norwich UK, 182 pp.
Slonosky VC, Jones PD, Davies TD. 1999. Homogenization techniques for European monthly mean surface pressure series. Journalof Climate 8: 2658–2672.
Slonosky VC, Jones PD, Davies TD. 2000. Variability of the surface atmospheric circulation over Europe, 1774–1995. InternationalJournal of Climatology 20: 1875–1897.
Slonosky VC, Jones PD, Davies TD. 2001. Instrumental pressure observations and atmosphere circulation from the 17th and 18thcenturies: London and Paris. International Journal of Climatology (in press).
Thompson DWJ, Wallace JM. 1998. The Arctic Oscillation signature in the wintertime geopotential height and temperature fields.Geophysical Research Letters 25: 1297–1300.
Tuomenvirta H, Alexandersson H, Drebs A, Frich P, Nordli PØ. 1998. Trends in Nordic and Arctic extreme temperatures. DNMIReport No. 13/98, 37 pp.
van Engelen AFV, Nellestijn JW. 1995. Monthly, seasonal and annual means of the air temperature in tenths of centigrades in deBilt, Netherlands, 1706–1995. KMNI (Dutch Meteorological Service) Report, Climatological Services Division.
van Loon H, Rogers JC. 1978. The seesaw in winter temperature between Greenland and Northern Europe. Part I. Generaldescription. Monthly Weather Re6iew 106: 296–310.
Walker GT, Bliss EM. 1932. World weather V. Memoirs of the Royal Meterological Society 44: 53–84.Wilks DS. 1995. Statistical Methods in the Atmospheric Sciences. Academic Press: San Diego; 464 pp.
Copyright © 2001 Royal Meteorological Society Int. J. Climatol. 21: 63–75 (2001)