Athletic skill level is reflected in body sway: A test case for accelometry in combination with...
6
Athletic skill level is reflected in body sway: A test case for accelometry in combination with stochastic dynamics Claudine J.C. Lamoth a,d, *, Rob C. van Lummel b,c , Peter J. Beek a a Research Institute MOVE, Faculty of Human Movement Sciences, VU University Amsterdam, The Netherlands b McRoberts BV, The Hague, The Netherlands c Haagse Hogeschool Human Kinetic Technology , The Hague, The Netherlands d Center for Human Movement Sciences, University Medical Center Groningen, University of Groningen, The Netherlands 1. Introduction Adequate postural control is essential for normal daily activity and requires the integration of visual, proprioceptive and vestibular information. The degree to which individuals rely on those information sources depends on task difficulty, cognitive load [32], motor skill [2,28] and pathology [19,24,29]. In the clinic, posturography is becoming increasingly important, both for diagnostic and monitoring purposes and for the evaluation of interventions [6,9]. Changes and differences in postural control are typically examined using average scalar parameters such as mean sway path, sway area, sway velocity, or mean frequency. However, precise definitions and optimal selections of discriminative sway parameters are under continuous dispute [1,20]. Alternatively, measures derived from the theory of stochastic dynamics may be usefully employed to quantify the time-varying structure of postural sway patterns. Even without any external perturbation during quiet upright stance, an apparently random and irregular small amplitude body sway is continuously present. The insight that this irregular sway pattern is not simply the product of noise, but rather results from a complex interplay of non-linear deterministic and random components, has become a prominent theme in fundamental studies of postural control [4,5,16,23]. In this approach, sway fluctuations are exploited as a window into underlying control structures. A wide variety of methods has been used for this purpose, including recurrence analysis [23], detrended fluctuation analysis [17], sample entropy [21], diffusion coefficients [5], and Lyapunov exponents [26]. Although conceptually different, all these measures are based on the assumption that the effectiveness of postural control is in some way reflected in the dynamic characteristics of sway patterns, and that differences in those characteristics reflect differences in postural control. This development has led to the application of the aforementioned methods in applied fields such as the clinic and sports medicine, both for diagnostic and prognostic purposes. Postural variability can be scored along a continuum with ‘normal’ or ‘healthy’ variability positioned somewhere between Gait & Posture xxx (2009) xxx–xxx ARTICLE INFO Article history: Received 1 February 2008 Received in revised form 25 September 2008 Accepted 2 December 2008 Keywords: Postural sway Variability Accelerometry Non-linear analysis Athletic skill ABSTRACT Recent studies on postural control have shown that the variability of body sway during quiet standing may provide valuable information to characterize changes in postural control due to age, pathology, skill and task. The aim of the present study was to determine – as spade work for possible clinical applications – whether body sway measured with a three-axial accelerometer at the trunk can differentiate between three healthy young populations that differ in athletic skill level. The three groups in question (group size: n = 22) consisted of regular bachelor students, physical education students and physical education students specialized in gymnastics. Data were recorded during tandem stance with eyes open or closed and while standing on foam. The acceleration time-series were analysed in anteriorposterior and mediolateral direction. Differences in postural control were quantified in terms of variability, spectral properties and stochastic dynamical measures, i.c., regularity (sample entropy, long-range correlations) and local stability (largest Lyapunov exponent). The results were clear-cut. Standing with eyes closed and on foam increased variability. Compared to standing with eyes open, standing with eyes closed resulted in less regular sway patterns but with greater local stability, whereas standing on foam had an opposite effect. With greater gymnastic skills, acceleration time-series were less variable, less regular and more stable. These results imply that quantifying the stochastic-dynamical structure of postural sway using ambulant accelerometry may provide a useful diagnostic tool. ß 2008 Elsevier B.V. All rights reserved. * Corresponding author at: Center for Human Movement Sciences, University Medical Center Groningen, University of Groningen, Ant. Deusinglaan 1, 9713 AV Groninging, The Netherlands. Tel.: +31 50 3639036. E-mail address: [email protected] (Claudine J.C. Lamoth). G Model GAIPOS-2711; No of Pages 6 Please cite this article in press as: Lamoth CJC, et al. Athletic skill level is reflected in body sway: A test case for accelometry in combination with stochastic dynamics. Gait Posture (2009), doi:10.1016/j.gaitpost.2008.12.006 Contents lists available at ScienceDirect Gait & Posture journal homepage: www.elsevier.com/locate/gaitpost 0966-6362/$ – see front matter ß 2008 Elsevier B.V. All rights reserved. doi:10.1016/j.gaitpost.2008.12.006
Transcript of Athletic skill level is reflected in body sway: A test case for accelometry in combination with...

Gait & Posture xxx (2009) xxx–xxx
G Model
GAIPOS-2711; No of Pages 6
Athletic skill level is reflected in body sway: A test case for accelometry incombination with stochastic dynamics
Claudine J.C. Lamoth a,d,*, Rob C. van Lummel b,c, Peter J. Beek a
a Research Institute MOVE, Faculty of Human Movement Sciences, VU University Amsterdam, The Netherlandsb McRoberts BV, The Hague, The Netherlandsc Haagse Hogeschool Human Kinetic Technology, The Hague, The Netherlandsd Center for Human Movement Sciences, University Medical Center Groningen, University of Groningen, The Netherlands
A R T I C L E I N F O
Article history:
Received 1 February 2008
Received in revised form 25 September 2008
Accepted 2 December 2008
Keywords:
Postural sway
Variability
Accelerometry
Non-linear analysis
Athletic skill
A B S T R A C T
Recent studies on postural control have shown that the variability of body sway during quiet standing
may provide valuable information to characterize changes in postural control due to age, pathology, skill
and task. The aim of the present study was to determine – as spade work for possible clinical applications
– whether body sway measured with a three-axial accelerometer at the trunk can differentiate between
three healthy young populations that differ in athletic skill level. The three groups in question (group
size: n = 22) consisted of regular bachelor students, physical education students and physical education
students specialized in gymnastics. Data were recorded during tandem stance with eyes open or closed
and while standing on foam. The acceleration time-series were analysed in anteriorposterior and
mediolateral direction. Differences in postural control were quantified in terms of variability, spectral
properties and stochastic dynamical measures, i.c., regularity (sample entropy, long-range correlations)
and local stability (largest Lyapunov exponent). The results were clear-cut. Standing with eyes closed
and on foam increased variability. Compared to standing with eyes open, standing with eyes closed
resulted in less regular sway patterns but with greater local stability, whereas standing on foam had an
opposite effect. With greater gymnastic skills, acceleration time-series were less variable, less regular
and more stable. These results imply that quantifying the stochastic-dynamical structure of postural
sway using ambulant accelerometry may provide a useful diagnostic tool.
� 2008 Elsevier B.V. All rights reserved.
Contents lists available at ScienceDirect
Gait & Posture
journa l homepage: www.e lsev ier .com/ locate /ga i tpost
1. Introduction
Adequate postural control is essential for normal daily activityand requires the integration of visual, proprioceptive andvestibular information. The degree to which individuals rely onthose information sources depends on task difficulty, cognitiveload [32], motor skill [2,28] and pathology [19,24,29]. In the clinic,posturography is becoming increasingly important, both fordiagnostic and monitoring purposes and for the evaluation ofinterventions [6,9]. Changes and differences in postural control aretypically examined using average scalar parameters such as meansway path, sway area, sway velocity, or mean frequency. However,precise definitions and optimal selections of discriminative swayparameters are under continuous dispute [1,20].
Alternatively, measures derived from the theory of stochasticdynamics may be usefully employed to quantify the time-varying
* Corresponding author at: Center for Human Movement Sciences, University
Medical Center Groningen, University of Groningen, Ant. Deusinglaan 1, 9713 AV
Groninging, The Netherlands. Tel.: +31 50 3639036.
E-mail address: [email protected] (Claudine J.C. Lamoth).
Please cite this article in press as: Lamoth CJC, et al. Athletic skillcombination with stochastic dynamics. Gait Posture (2009), doi:10.
0966-6362/$ – see front matter � 2008 Elsevier B.V. All rights reserved.
doi:10.1016/j.gaitpost.2008.12.006
structure of postural sway patterns. Even without any externalperturbation during quiet upright stance, an apparently randomand irregular small amplitude body sway is continuously present.The insight that this irregular sway pattern is not simply theproduct of noise, but rather results from a complex interplay ofnon-linear deterministic and random components, has become aprominent theme in fundamental studies of postural control[4,5,16,23]. In this approach, sway fluctuations are exploited as awindow into underlying control structures. A wide variety ofmethods has been used for this purpose, including recurrenceanalysis [23], detrended fluctuation analysis [17], sample entropy[21], diffusion coefficients [5], and Lyapunov exponents [26].Although conceptually different, all these measures are based onthe assumption that the effectiveness of postural control isin some way reflected in the dynamic characteristics of swaypatterns, and that differences in those characteristics reflectdifferences in postural control. This development has led to theapplication of the aforementioned methods in applied fieldssuch as the clinic and sports medicine, both for diagnostic andprognostic purposes.
Postural variability can be scored along a continuum with‘normal’ or ‘healthy’ variability positioned somewhere between
level is reflected in body sway: A test case for accelometry in1016/j.gaitpost.2008.12.006

1 Note that filtering may have subtle effects on the non-linear structure detected
in the data; however, the potential effect of low-pass filtering was limited given that
95% of the power of the time-series was located at the lower frequencies.
C.J.C. Lamoth et al. / Gait & Posture xxx (2009) xxx–xxx2
G Model
GAIPOS-2711; No of Pages 6
both extremes. This view is in line with the notion that health ischaracterized by ‘organized’ variability, while disease is definedby loss of complexity, increased regularity, and changes in thestructure of variability [10]. Increased regularity of postural swayhas been reported for several patient groups, including strokepatients [24], athletes with sports related concussions [3],patients with Parkinson’s disease [29], and children with CerebralPalsy [7]. Pathological sway patterns – characterized by higherregularity and reduced local stability and complexity – are locatedat one end of the continuum. In general, such characteristics aredeemed to reflect a less efficient and less automatized form ofpostural control that is less adaptable and more susceptible toexternal perturbations. In contrast, sway patterns obtained fromindividuals with superior balance skills such as gymnasts anddancers are located at the other end of the continuum and are lessregular, locally more stable, and more complex. In general, suchcharacteristics are considered to indicate a more automatized andmore adaptive form of postural control that is resilient to externalperturbations [14,28].
From this conceptual and methodological background, quanti-fication of the stochastic-dynamical structure of postural swaypatterns may well enhance fundamental and clincial posturogra-phy. The most common assessment of balance control is based onthe analysis of centre of pressure (COP) time-series registered witha (single or dual) force plate. In the present study, however, weused accelerometry. The use of body fixed accelerometers tomeasure postural sway is relatively new. Sensors can be attachedto the body close to the centre of body mass in order to measurebody motion. For clinical purposes, accelerometric systems areparticularly useful, as they are small and easy to use. Furthermore,they can be readily used in both controlled (rehabilitationlaboratories) and daily life circumstances with minimal awarenessof the measuring process on the part of the subject. Preliminaryevidence suggests that the root mean square amplitude of anaccelerometer signal can quantify balance during stance, anddiscriminate between normal elderly adults and idiopathic fallers[12,13,15].
The aim of the present study was to examine if stochastic-dynamical analyses of body sway acceleration signals candiscriminate the postural sway patterns of three populations thatdiffer with respect to their athletic skill level. In addition, weexamined if task difficulty had a differential effect in the threegroups, by obtaining sway measures during tandem stance witheyes open (EO), eyes closed (EC), and while standing on foam.Based on previous research examining COP trajectories, weexpected visual deprivation to increase regularity and to decreaselocal stability [8,24], but less so in the physical education groupsthan in the regular student group, because gymnasts are known torely less on visual information than non-gymnasts in unstablestance [31]. Finally, we expected the skilled gymnasts to beaffected less when standing on foam, since gymnasts are particulartrained to use sensory/proprioceptive information [32]. We usedthe same set of dynamic outcome measures as in the clinicalstudy of Roerdink et al. [24], because the study was intended todetermine whether the combination of accelerometry andstochastic-dynamical off-line analyses could provide a usefuldiagnostic tool.
2. Methods
2.1. Participants
Three groups of 22 subjects, differing in athletic skill level,participated in the experiment: regular undergraduate studentswho did not engage for more than 3 h a week in sport activities,physical education undergraduates pursuing a teacher degree not
Please cite this article in press as: Lamoth CJC, et al. Athletic skillcombination with stochastic dynamics. Gait Posture (2009), doi:10.
specifically trained in gymnastics, and physical education studentswho specialized in gymnastics. All subjects were healthy and hadno orthopedic or neurological problems that could affect posturalcontrol. All subjects provided written informed consent toparticipate in the study.
2.2. Instrumentation
Accelerations during standing were measured with a tri-axialpiezo-capacitive accelerometer (DynaPort1MiniMod, McRobertsBV, The Hague, the Netherlands). The acceleration module(64 mm � 64 mm � 13 mm) was fixed to the body with an elasticbelt near the centre of mass at the level of lumbar segment L3. Datawere sampled at 100 Hz and stored on an SD-card. A radiographicremote control unit was used to start and stop the measurement,and to mark off each measurement episode.
2.3. Procedure and data analysis
Participants stood barefoot in a two legged tandem stance on a10 cm wide and 18 mm thick plywood strip. The experimentalconditions were standing with eyes open (EO), standing with eyesclosed (EC), and standing on foam (FO). Data collection wasinitiated when participants indicated they stood stable and wereready to begin. Each trial lasted 30 s.
Anteriorposterior (AP) and mediolateral (ML) accelerationtime-series were analysed. Due to the horizontal tilt of theaccelerometers (e.g., caused by the curvature of the low back) thegravity component may induce variability unrelated to balancecontrol. All data were corrected for this horizontal tilt [15]. Inaddition, a high pass third order Butterworth bidirectional filterwas applied with a cut-off frequency of 0.016 Hz to correct for slowdrifts during standing and a low-pass filter with a cut-off frequency20 Hz to eliminate low amplitude measurement noise [15,24].1
Sway variability was quantified by calculating the root meansquares (RMS) of the AP and ML acceleration time-series. Thefrequency of the time-series was determined by calculating themean power frequency (MPF) from the power frequency spectrum,using a 3000 samples Hamming window without overlap, andlinear trends were removed. Postural sway dynamics wasquantified by means of the sample entropy (SEn) [21], the scalingexponent a [17], and the largest Lyapunov exponent (lmax) [26],which are briefly described below and more extensively in theAppendix.
SEn indexes the regularity or predictability of a time-series andis used to analyse complex stochastic systems, which by definitionis composed of both deterministic and random components [18].SEn is defined as the negative natural logarithm of an estimate ofthe conditional probability that epochs of length m (in this studym = 3) match pointwise within a tolerance r also match at the nextpoint. Small SEn values are associated with great regularity whilelarge SEn values represent a small chance of similar data beingrepeated, that is, great irregularity. Before calculating SEn the datawere first normalized to unit variance, rendering the outcomescale-independent. To quantify the extent to which a recordedtime-series exhibit long-range correlations (i.e., similar patterns ofvariation across multiple time scales) detrended fluctuationsanalysis (DFA) was applied. If the outcome parameter a is between0.5 and 1, this indicates the presence of long-range power-lawcorrelations in the time-series; that is for white noise, alpha is0.5, for 1/f noise it is 1, and for Brownian noise it is 1.5. Finally, thesystem’s resistance to small internal perturbations, such as the
level is reflected in body sway: A test case for accelometry in1016/j.gaitpost.2008.12.006
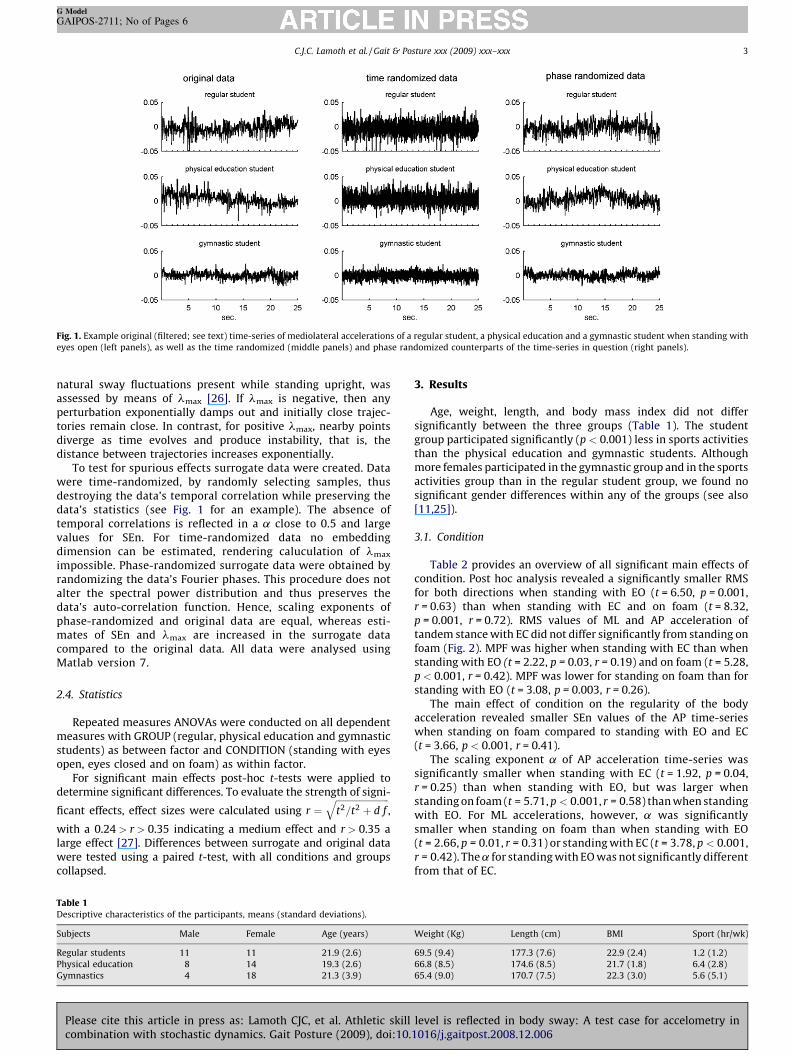
Fig. 1. Example original (filtered; see text) time-series of mediolateral accelerations of a regular student, a physical education and a gymnastic student when standing with
eyes open (left panels), as well as the time randomized (middle panels) and phase randomized counterparts of the time-series in question (right panels).
C.J.C. Lamoth et al. / Gait & Posture xxx (2009) xxx–xxx 3
G Model
GAIPOS-2711; No of Pages 6
natural sway fluctuations present while standing upright, wasassessed by means of lmax [26]. If lmax is negative, then anyperturbation exponentially damps out and initially close trajec-tories remain close. In contrast, for positive lmax, nearby pointsdiverge as time evolves and produce instability, that is, thedistance between trajectories increases exponentially.
To test for spurious effects surrogate data were created. Datawere time-randomized, by randomly selecting samples, thusdestroying the data’s temporal correlation while preserving thedata’s statistics (see Fig. 1 for an example). The absence oftemporal correlations is reflected in a a close to 0.5 and largevalues for SEn. For time-randomized data no embeddingdimension can be estimated, rendering caluculation of lmax
impossible. Phase-randomized surrogate data were obtained byrandomizing the data’s Fourier phases. This procedure does notalter the spectral power distribution and thus preserves thedata’s auto-correlation function. Hence, scaling exponents ofphase-randomized and original data are equal, whereas esti-mates of SEn and lmax are increased in the surrogate datacompared to the original data. All data were analysed usingMatlab version 7.
2.4. Statistics
Repeated measures ANOVAs were conducted on all dependentmeasures with GROUP (regular, physical education and gymnasticstudents) as between factor and CONDITION (standing with eyesopen, eyes closed and on foam) as within factor.
For significant main effects post-hoc t-tests were applied todetermine significant differences. To evaluate the strength of signi-
ficant effects, effect sizes were calculated using r ¼ffiffiffiffiffiffiffiffiffiffiffiffiffiffiffiffiffiffiffiffiffiffiffit2=t2 þ d f
q,
with a 0.24 > r > 0.35 indicating a medium effect and r > 0.35 alarge effect [27]. Differences between surrogate and original datawere tested using a paired t-test, with all conditions and groupscollapsed.
Table 1Descriptive characteristics of the participants, means (standard deviations).
Subjects Male Female Age (years)
Regular students 11 11 21.9 (2.6)
Physical education 8 14 19.3 (2.6)
Gymnastics 4 18 21.3 (3.9)
Please cite this article in press as: Lamoth CJC, et al. Athletic skillcombination with stochastic dynamics. Gait Posture (2009), doi:10.
3. Results
Age, weight, length, and body mass index did not differsignificantly between the three groups (Table 1). The studentgroup participated significantly (p < 0.001) less in sports activitiesthan the physical education and gymnastic students. Althoughmore females participated in the gymnastic group and in the sportsactivities group than in the regular student group, we found nosignificant gender differences within any of the groups (see also[11,25]).
3.1. Condition
Table 2 provides an overview of all significant main effects ofcondition. Post hoc analysis revealed a significantly smaller RMSfor both directions when standing with EO (t = 6.50, p = 0.001,r = 0.63) than when standing with EC and on foam (t = 8.32,p = 0.001, r = 0.72). RMS values of ML and AP acceleration oftandem stance with EC did not differ significantly from standing onfoam (Fig. 2). MPF was higher when standing with EC than whenstanding with EO (t = 2.22, p = 0.03, r = 0.19) and on foam (t = 5.28,p < 0.001, r = 0.42). MPF was lower for standing on foam than forstanding with EO (t = 3.08, p = 0.003, r = 0.26).
The main effect of condition on the regularity of the bodyacceleration revealed smaller SEn values of the AP time-serieswhen standing on foam compared to standing with EO and EC(t = 3.66, p < 0.001, r = 0.41).
The scaling exponent a of AP acceleration time-series wassignificantly smaller when standing with EC (t = 1.92, p = 0.04,r = 0.25) than when standing with EO, but was larger whenstanding on foam (t = 5.71, p < 0.001, r = 0.58) than when standingwith EO. For ML accelerations, however, a was significantlysmaller when standing on foam than when standing with EO(t = 2.66, p = 0.01, r = 0.31) or standing with EC (t = 3.78, p < 0.001,r = 0.42). The a for standing with EO was not significantly differentfrom that of EC.
Weight (Kg) Length (cm) BMI Sport (hr/wk)
69.5 (9.4) 177.3 (7.6) 22.9 (2.4) 1.2 (1.2)
66.8 (8.5) 174.6 (8.5) 21.7 (1.8) 6.4 (2.8)
65.4 (9.0) 170.7 (7.5) 22.3 (3.0) 5.6 (5.1)
level is reflected in body sway: A test case for accelometry in1016/j.gaitpost.2008.12.006
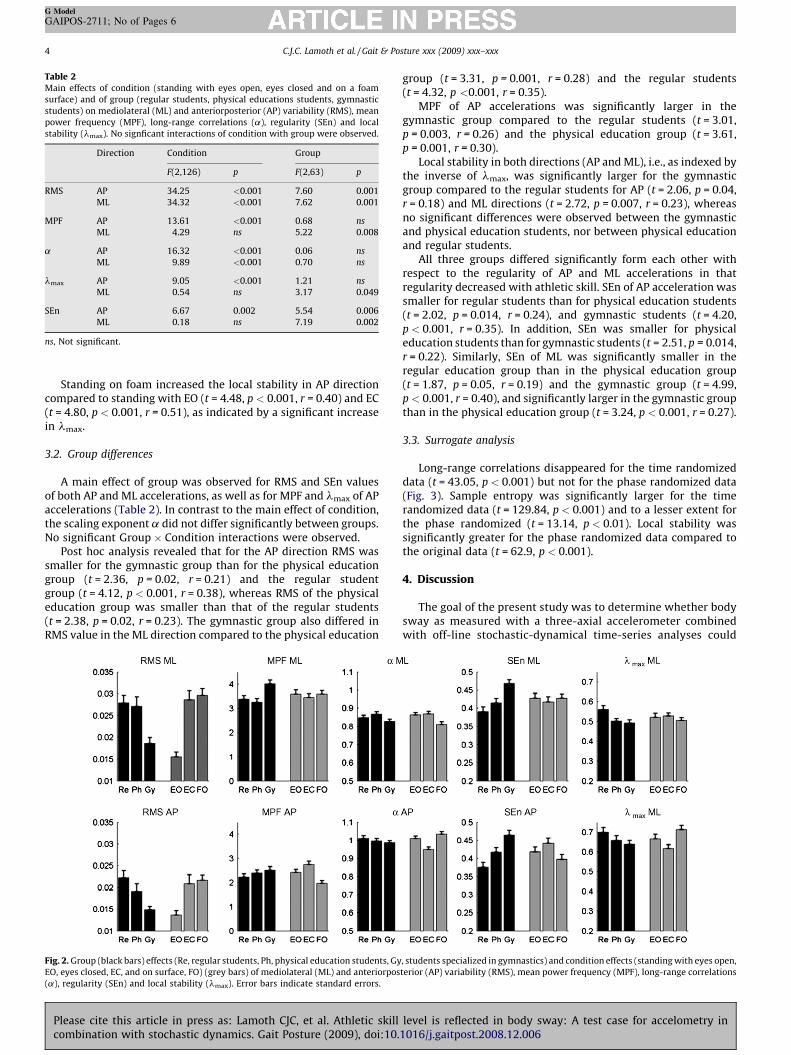
Table 2Main effects of condition (standing with eyes open, eyes closed and on a foam
surface) and of group (regular students, physical educations students, gymnastic
students) on mediolateral (ML) and anteriorposterior (AP) variability (RMS), mean
power frequency (MPF), long-range correlations (a), regularity (SEn) and local
stability (lmax). No signficant interactions of condition with group were observed.
Direction Condition Group
F(2,126) p F(2,63) p
RMS AP 34.25 <0.001 7.60 0.001
ML 34.32 <0.001 7.62 0.001
MPF AP 13.61 <0.001 0.68 ns
ML 4.29 ns 5.22 0.008
a AP 16.32 <0.001 0.06 ns
ML 9.89 <0.001 0.70 ns
lmax AP 9.05 <0.001 1.21 ns
ML 0.54 ns 3.17 0.049
SEn AP 6.67 0.002 5.54 0.006
ML 0.18 ns 7.19 0.002
ns, Not significant.
C.J.C. Lamoth et al. / Gait & Posture xxx (2009) xxx–xxx4
G Model
GAIPOS-2711; No of Pages 6
Standing on foam increased the local stability in AP directioncompared to standing with EO (t = 4.48, p < 0.001, r = 0.40) and EC(t = 4.80, p < 0.001, r = 0.51), as indicated by a significant increasein lmax.
3.2. Group differences
A main effect of group was observed for RMS and SEn valuesof both AP and ML accelerations, as well as for MPF and lmax of APaccelerations (Table 2). In contrast to the main effect of condition,the scaling exponent a did not differ significantly between groups.No significant Group � Condition interactions were observed.
Post hoc analysis revealed that for the AP direction RMS wassmaller for the gymnastic group than for the physical educationgroup (t = 2.36, p = 0.02, r = 0.21) and the regular studentgroup (t = 4.12, p < 0.001, r = 0.38), whereas RMS of the physicaleducation group was smaller than that of the regular students(t = 2.38, p = 0.02, r = 0.23). The gymnastic group also differed inRMS value in the ML direction compared to the physical education
Fig. 2. Group (black bars) effects (Re, regular students, Ph, physical education students, Gy
EO, eyes closed, EC, and on surface, FO) (grey bars) of mediolateral (ML) and anteriorpos
(a), regularity (SEn) and local stability (lmax). Error bars indicate standard errors.
Please cite this article in press as: Lamoth CJC, et al. Athletic skillcombination with stochastic dynamics. Gait Posture (2009), doi:10.
group (t = 3.31, p = 0.001, r = 0.28) and the regular students(t = 4.32, p <0.001, r = 0.35).
MPF of AP accelerations was significantly larger in thegymnastic group compared to the regular students (t = 3.01,p = 0.003, r = 0.26) and the physical education group (t = 3.61,p = 0.001, r = 0.30).
Local stability in both directions (AP and ML), i.e., as indexed bythe inverse of lmax, was significantly larger for the gymnasticgroup compared to the regular students for AP (t = 2.06, p = 0.04,r = 0.18) and ML directions (t = 2.72, p = 0.007, r = 0.23), whereasno significant differences were observed between the gymnasticand physical education students, nor between physical educationand regular students.
All three groups differed significantly form each other withrespect to the regularity of AP and ML accelerations in thatregularity decreased with athletic skill. SEn of AP acceleration wassmaller for regular students than for physical education students(t = 2.02, p = 0.014, r = 0.24), and gymnastic students (t = 4.20,p < 0.001, r = 0.35). In addition, SEn was smaller for physicaleducation students than for gymnastic students (t = 2.51, p = 0.014,r = 0.22). Similarly, SEn of ML was significantly smaller in theregular education group than in the physical education group(t = 1.87, p = 0.05, r = 0.19) and the gymnastic group (t = 4.99,p < 0.001, r = 0.40), and significantly larger in the gymnastic groupthan in the physical education group (t = 3.24, p < 0.001, r = 0.27).
3.3. Surrogate analysis
Long-range correlations disappeared for the time randomizeddata (t = 43.05, p < 0.001) but not for the phase randomized data(Fig. 3). Sample entropy was significantly larger for the timerandomized data (t = 129.84, p < 0.001) and to a lesser extent forthe phase randomized (t = 13.14, p < 0.01). Local stability wassignificantly greater for the phase randomized data compared tothe original data (t = 62.9, p < 0.001).
4. Discussion
The goal of the present study was to determine whether bodysway as measured with a three-axial accelerometer combinedwith off-line stochastic-dynamical time-series analyses could
, students specialized in gymnastics) and condition effects (standing with eyes open,
terior (AP) variability (RMS), mean power frequency (MPF), long-range correlations
level is reflected in body sway: A test case for accelometry in1016/j.gaitpost.2008.12.006

Fig. 3. Randomization effects for long-range correlations (a), local stability (lmax) and regularity (SEn). Asterisks indicate significant effects. ORIG, original acceleration data;
TIME, shuffled (time) randomized data; PHASE, phase-randomized data. Note that for the shuffled data a = 0.5, and the SampEn increases significantly. For lmax no shuffled
counterparts can be calculated. Error bars indicate standard errors.
C.J.C. Lamoth et al. / Gait & Posture xxx (2009) xxx–xxx 5
G Model
GAIPOS-2711; No of Pages 6
differentiate between three healthy young populations thatdiffered in athletic skill level. To this end, we examined thestructure of sway fluctuations during quiet tandem stance undermanipulation of vision and proprioception. We expected thatcondition effects and group differences would be apparent in thestructure of variability of ML and AP accelerations. That is, weexpected that changes in variability would be accompanied bychanges in the regularity of the time-series and local stabilitymeasures, reflecting differences in postural efficiency. Further-more, we expected that accelerations in ML and AP of the regularstudent group would be characterized by greater variability(RMS), less regularity, and smaller local stability in the morechallenging conditions, i.e., standing with eyes closed and onfoam, than in the other two athletic groups. In addition, weexpected the gymnastic group to have smaller RMS values, lowerregularity and higher local stability when standing on an unstablefoam surface than the other two groups.
Overall tandem stance with eyes closed and standing onfoam increased the magnitude of the fluctuations (RMS) of theaccelerations in both AP and ML direction, but manipulating visionor proprioception had no differential effect on the accelerations,i.e., changing proprioceptive information did not result in differentRMS values than removing vision. Similarly, MPF of AP accelera-tions was greater with EC, but lower when standing on foam thanwith eyes closed. In-depth analyses revealed that the variabilityof the ML and AP acceleration time-series was not just randomnoise but contained deterministic components. For all outcomemeasures the estimates of the surrogate data were significantlydifferent from those of the original data. Long-range correlationswere present in all time-series, both with and without vision. InAP direction these correlations decreased, as did regularity (SEnincreased), whereas local stability increased (i.e., lmax decreased).However, the priopiocepsis manipulation, i.e., standing on anunstable surface, had an opposite effect; long-range correlationsincreased while regularity and local stability decreased. For MLonly long-range correlations were significantly smaller than forstanding on foam. These findings are largely in line with the resultsof COP data from the study of Schmit et al. [28] and Riley et al. [22],who applied recurrence quantification analysis to assess COPdynamics, and reported a trend toward increased regularity of theCOP time-series as balance conditions became more challenging.However, they reported no differential effects for vision andproprioception manipulations.
The differential effects of condition for ML and AP accelerationare probably related to the task requirements of tandem stance.Tandem stance especially challenges ML movement as its base ofsupport is very small and constrains postural adaptations.Consequently, condition effects were most prominent in the AP
Please cite this article in press as: Lamoth CJC, et al. Athletic skillcombination with stochastic dynamics. Gait Posture (2009), doi:10.
direction. In addition, tandem stance may require increasedcognitive involvement in postural control, thereby affecting swayregularity and local stability [8], which would befit Roerdink et al.’s[24] suggestion that posture is controlled predominantly in thedirection of the largest sway.
Although the three subject groups differed in athletic skill levelonly, consistent significant group differences were found, withmoderate to very large effect sizes. As gymnastic skill levelincreased, acceleration variability decreased, regularity decreased,and local stability increased, indicating a more automatic and moreefficient postural control, in line with our expectations and thetheoretical notion of a continuum of postural variability. Sincegymnasts are more experienced in balance tasks such as landingand standing still on compliant foam mats, and since standing ondifferent kinds of surfaces is often part of their training, weexpected to find significant group by condition interaction effects.However, the unexpected finding that the observed groupdifferences did not depend on vision or proprioception (i.e, nosignificant group by condition interactions were found) suggestedthat expert gymnastics exhibited differences in the underlyingorganization of postural control which, at least for the presenttask, appear to be independent of the specific form of sensoryinformation used.
In the present study body sway was measured using trunkaccelerometry which has the advantage that a reference point in theproximity of the COM is used. The results clearly show that acombination of accelerometry and off-line stochastic-dynamicalanalysis can discriminate the sway patterns produced by differentsubject groups. Although no clinical conclusions can be drawnfrom this non-clinical finding, it does suggest that quantifyingthe dynamics structure of postural sway using an ambulantaccelerometer bases system may provide a useful diagnostic tool.Notwithstanding the immediate advantages of accelerometricsystems for clinical purposes (i.e., compact and easy-to-use, minimalawareness of the measuring process on the part of the subject), theyalso have several drawbacks such as the, the need to preprocess thedata (to correct for tilt and to eliminate noise), and the translation toclinically understandable outcome measures. These processes arebeing automated and simplified for clinical use (e.g., DynaPort1Mi-niMod, McRoberts BV, The Hague, the Netherlands). Future studiesshould reveal the degree to which this promise holds in pursuingspecific clinical research questions and objectives.
Conflict of interest statement
None of the authors has any financial and/or personalrelationships with other people or organisations that could haveinappropriately influence (bias) the work.
level is reflected in body sway: A test case for accelometry in1016/j.gaitpost.2008.12.006

C.J.C. Lamoth et al. / Gait & Posture xxx (2009) xxx–xxx6
G Model
GAIPOS-2711; No of Pages 6
Appendix A. Appendix
A.1. Sample entropy
Sample entropy (SEn) is defined as the probability that a sequence
of data points, having repeated itself within a tolerance r for a window
length m, will also repeat itself for m + 1 points, without allowing self-
matches. Smaller SEn values are associated with greater regularity. To
optimize the choice of the tolerance parameter r for a given m we
applied the approach described by Lake [17]. For the time-series of all
subjects and trials a range of values was calculated, and r values were
identified with a maximum error of 0.05. This resulted for m = 3 in a
r value of 0.35 for ML accelerations and of 0.30 for AP accelerations.
Note that sample entropy is a scale-independent measure because
data are first normalized to unit variance. Software available at
PhysioNet was used to calculate SEn [33].
A.2. Detrended fluctuation analysis (DFA)
DFA is a technique that characterizes the pattern of variation
across multiple scales (fractal-scaling), and is based on the assump-
tion that variations due to the intrinsic dynamics of the system
exhibit long-rang correlations. First, time-series were integrated and
divided into non-overlapping intervals (boxes) of equal length for
which the local trend was removed and the RMS fluctuations (Fn) of
the residuals were calculated. By performing this procedure for all
values/intervals of n (n = N/total number of boxes), the relationship
between Fn and n can be established. If the dynamics governing the
data follow a power law, then their log–log representation reveals a
straight line within a defined range. Logarithmically spaced intervals
of lengths n from 10 to N/2 samples (N = 3000) were used and the
slope a of the log–log representation of Fn versus n was estimated to
fall between n = 0.25 s and n = 9 s. Values of 0.5 < a < 1 indicate the
presence of long-range power-law correlations in the time-series. For
uncorrelated time-series (e.g., white noise) a = 0.5. When 0 > a > 0.5
a different type of power-law correlation exist such that large and
small values of the time-series are likely to alternate. When a
increases above 1 to 1.5 behavior is no longer determined by power
law [30].
A.2.1. Largest Lypunov exponent
To calculate the largest Lyapunov exponent, lmax, for each
acceleration time-series a phase space reconstruction was calcu-
lated, by creating time-delayed copies of the time-series X(t), that
is x(t), x(ti + t), x(ti + 2t),. . . [30]. The selected t corresponded to
the first minimum of the mutual information function that is,
the time at which the original and time delayed signals are
maximally independent. The number of appropriate embeddings
(m) was determined by means of calculation the correlation
dimension Dm, and applying the criteria m > 2Dm + 1 [24]. The
nearest neighbor was identified as the point closest to Xi with a
temporal separation larger than twice the first minimum in the
mutual information function. Next, distances (di) between neigh-
boring trajectories in state space were calculated as a function of
time ( jDt = 2 s) and averaged over all original pairs of nearest
neighbors i. Finally lmax exponent was estimated by fitting a line
of the logarithmic divergence of pairs of neighboring points over
time j = Dt = 0 to 0.75 s and lmax was estimated form the slope of
yð jÞ ¼ ð1=DtÞð1=NÞPN
i¼1 lndi j.
Please cite this article in press as: Lamoth CJC, et al. Athletic skillcombination with stochastic dynamics. Gait Posture (2009), doi:10.
References
[1] Baratto L, Morasso PG, Re C, Spada G. A new look at posturographic analysis inthe clinical context: sway-density versus other parameterization techniques.Motor Control 2002;6:246–70.
[2] Bressel E, Yonker JC, Kras J, Heath EM. Comparison of static and dynamicbalance in female collegiate soccer, basketball, and gymnastics athletes. J AthlTrain 2007;42:42–6.
[3] Cavanaugh JT, Guskiewicz KM, Stergiou N. A nonlinear dynamic approachfor evaluating postural control: new directions for the management ofsport-related cerebral concussion. Sports Med 2005;35:935–50.
[4] Chiari L, Cappello A, Lenzi D, Della Croce U. An improved technique for theextraction of stochastic parameters from stabilograms. Gait Posture 2000;12:225–34.
[5] Collins JJ, De Luca CJ. Random walking during quiet standing. Phys Rev Lett1994;73:764–7.
[6] de Haart M, Geurts AC, Huidekoper SC, Fasotti L, van Limbeek J. Recovery ofstanding balance in postacute stroke patients: a rehabilitation cohort study.Arch Phys Med Rehabil 2004;85:886–95.
[7] Donker SF, Ledebt A, Roerdink M, Savelsbergh GJ, Beek PJ. Children withcerebral palsy exhibit greater and more regular postural sway than typicallydeveloping children. Exp Brain Res 2008;184:363–70.
[8] Donker SF, Roerdink M, Greven AJ, Beek PJ. Regularity of center-of-pressuretrajectories depends on the amount of attention invested in postural control.Exp Brain Res 2007;181:1–11.
[9] Geurts AC, de Haart M, van Nes IJ, Duysens J. A review of standing balancerecovery from stroke. Gait Posture 2005;22:267–81.
[10] Goldberger AL. Non-linear dynamics for clinicians: chaos theory, fractals, andcomplexity at the bedside. Lancet 1996;347:1312–4.
[11] Hageman PA, Leibowitz JM, Blanke D. Age and gender effects on posturalcontrol measures. Arch Phys Med Rehabil 1995;76:961–5.
[12] Helbostad JL, Askim T, Moe-Nilssen R. Short-term repeatability of body swayduring quiet standing in people with hemiparesis and in frail older adults. ArchPhys Med Rehabil 2004;85:993–9.
[13] Kamen G, Patten C, Du CD, Sison S. An accelerometry-based system for theassessment of balance and postural sway. Gerontology 1998;44:40–5.
[14] Michielsen M, Stins J, Roerdink M, Beek PJ.In: 14th International Conference onPErception and ActionYokohama; 2007.
[15] Moe-Nilssen R, Helbostad JL. Trunk accelerometry as a measure of balancecontrol during quiet standing. Gait Posture 2002;16:60–8.
[16] Newell KM, Emmerik van REA, Lee D, Spraque RL. On postural variability andstability. Gait Posture 1993;4:225–30.
[17] Peng CK, Havlin S, Stanley HE, Goldberger AL. Quantification of scalingexponents and crossover phenomena in nonstationary heartbeat time series.Chaos 1995;5:82–7.
[18] Pincus SM. Approximate entropy as a measure of system complexity. Proc NatlAcad Sci U S A 1991;88:2297–301.
[19] Radebold A, Cholewicki J, Polzhofer GK, Greene HS. Impaired postural controlof the lumbar spine is associated with delayed muscle response times inpatients with chronic ideopathic low back pain. Spine 2001;26:724–30.
[20] Raymakers JA, Samson MM, Verhaar HJ. The assessment of body sway and thechoice of the stability parameter(s). Gait Posture 2005;21:48–58.
[21] Richman JS, Moorman JR. Physiological time-series analysis using approximateentropy and sample entropy. Am J Physiol Heart Circ Physiol 2000;278:H2039–2049.
[22] Riley MA, Baker AA, Schmit JM, Weaver E. Effects of visual and auditory short-term memory tasks on the spatiotemporal dynamics and variability of posturalsway. J mot behav 2005;37:311–24.
[23] Riley MA, Balasubramaniam R, Turvey MT. Recurrence quantification analysisof postural fluctuations. Gait Posture 1999;9:65–78.
[24] Roerdink M, De Haart M, Daffertshofer A, Donker SF, Geurts AC, Beek PJ.Dynamical structure of center-of-pressure trajectories in patients recoveringfrom stroke. Exp Brain Res 2006;174:256–69.
[25] Rogind H, Lykkegaard JJ, Bliddal H, Danneskiold-Samsoe B. Postural swayin normal subjects aged 20–70 years. Clin Physiol Funct Imaging 2003;23:171–6.
[26] Rosenstein MT, Collins JJ, De Luca CJ. A practical method for calculating largestLyapunov exponents from small data sets. Physica D 1993;65:117–34.
[27] Rosnow RL, Rosenthal R, Rubin DB. Contrasts and correlations in effect-sizeestimation. Psychol Sci 2000;11:446–53.
[28] Schmit JM, Regis DI, Riley MA. Dynamic patterns of postural sway in balletdancers and track athletes. Exp Brain Res 2005;163:370–8.
[29] Schmit JM, Riley MA, Dalvi A, Sahay A, Shear PK, Shockley KD, Pun RY.Deterministic center of pressure patterns characterize postural instabilityin Parkinson’s disease. Exp Brain Res 2006;168:357–67.
[30] Theiler J, Eubank S, Longtin A, Galdrikianj B, Farmer JD. Testing for nonlinearityin time series: the method of surrogate data. Physica D 1992;58:77–94.
[31] Vuillerme N, Danion F, Marin L, Boyadjian A, Prieur JM, Weise I, Nougier V. Theeffect of expertise in gymnastics on postural control. Neurosci Lett 2001;303:83–6.
[32] Vuillerme N, Nafati G. How attentional focus on body sway affects posturalcontrol during quiet standing. Psychol Res 2007;71:192–200.
[33] Goldberger AL, Amaral LA, Glass L, Hausdorff JM, Ivanov PC, Mark RG.PhysioBank, PhysioToolkit, and PhysioNet: components of a new researchresource for complex physiologic signals. Circulation 2000;101:E215–22.
level is reflected in body sway: A test case for accelometry in1016/j.gaitpost.2008.12.006