ASVCP Guidelines: Principles of Quality Assurance and ...
77
542 | wileyonlinelibrary.com/journal/vcp Vet Clin Pathol. 2019;48:542–618. © 2019 American Society for Veterinary Clinical Pathology DOI: 10.1111/vcp.12810 ASVCP SPECIAL REPORT ASVCP Guidelines: Principles of Quality Assurance and Standards for Veterinary Clinical Pathology (version 3.0) Developed by the American Society for Veterinary Clinical Pathology's (ASVCP) Quality Assurance and Laboratory Standards (QALS) Committee Jill E. Arnold 1 | Melinda S. Camus 2 | Kathy P. Freeman 3 | Luca Giori 4 | Emma H. Hooijberg 5 | Unity Jeffery 6 | Jérémie Korchia 7 | Mandy J. Meindel 8 | A Russell Moore 9 | Sandra C. Sisson 10 | Linda M. Vap 9 | Jennifer R. Cook 11 1 ZooQuatic Laboratory, Baltimore, MD, USA 2 Department of Pathology, University of Georgia College of Veterinary Medicine, Athens, GA, USA 3 Syn Labs, VPG/Exeter, Exeter, UK 4 Department of Biomedical and Diagnostic Sciences, University of Tennessee College of Veterinary Medicine, Knoxville, TN, USA 5 Department of Companion Animal Clinical Studies, Faculty of Veterinary Science, University of Pretoria, Pretoria, South Africa 6 Department of Veterinary Pathobiology, College of Veterinary Medicine and Biomedical Sciences, Texas A&M University, College Station, TX, USA 7 Texas A&M Veterinary Medical Diagnostic Laboratory, College Station, TX, USA 8 Covance Laboratories, Inc., Madison, WI, USA 9 Department of Microbiology, Immunology and Pathology, College of Veterinary Medicine and Biomedical Sciences, Colorado State University, Fort Collins, CO, USA 10 Cornell University College of Veterinary Medicine, Ithaca, NY, USA 11 Idexx Laboratories, Inc., Bloomfield Hills, MI, USA Correspondence: Jennifer R. Cook, Idexx Laboratories, Inc., Bloomfield Hills, MI, USA. Email: [email protected] TABLE OF CONTENTS 1 PURPOSE/SCOPE References Resources 2 INTRODUCTION: TOTAL QUALITY MANAGEMENT SYSTEM (TQMS) References Appendix 1: Recommended content for a Standard Operating Procedure Figure and Tables Resources Checklist 3 GENERAL PREANALYTICAL FACTORS IMPORTANT IN VETERINARY CLINICAL PATHOLOGY References Figure Resource (Continues) Checklist 4 GENERAL ANALYTICAL FACTORS IMPORTANT IN VETERINARY CLINICAL PATHOLOGY Terms/Definitions References Appendix 1: Design Approach of Statistical QC (SQC) Appendix 2: Six sigma MEDx Interactive Tool Tables and Figures Resources Checklist 5 HEMATOLOGY, INCLUDING MANUAL HEMATOLOGY FOR NON-MAMMALIAN SPECIES Definitions/Acronyms References Checklist 6 HEMOSTASIS TESTING (COAGULATION) (Continued) (Continues)
-
Upload
khangminh22 -
Category
Documents
-
view
2 -
download
0
Transcript of ASVCP Guidelines: Principles of Quality Assurance and ...

542 | wileyonlinelibrary.com/journal/vcp Vet Clin Pathol. 2019;48:542–618.© 2019 American Society for Veterinary Clinical Pathology
DOI: 10.1111/vcp.12810
A S V C P S P E C I A L R E P O R T
ASVCP Guidelines: Principles of Quality Assurance and Standards for Veterinary Clinical Pathology (version 3.0)Developed by the American Society for Veterinary Clinical Pathology's (ASVCP) Quality Assurance and Laboratory Standards (QALS) Committee
Jill E. Arnold1 | Melinda S. Camus2 | Kathy P. Freeman3 | Luca Giori4 | Emma H. Hooijberg5 | Unity Jeffery6 | Jérémie Korchia7 | Mandy J. Meindel8 | A Russell Moore9 | Sandra C. Sisson10 | Linda M. Vap9 | Jennifer R. Cook11
1ZooQuatic Laboratory, Baltimore, MD, USA2Department of Pathology, University of Georgia College of Veterinary Medicine, Athens, GA, USA3Syn Labs, VPG/Exeter, Exeter, UK4Department of Biomedical and Diagnostic Sciences, University of Tennessee College of Veterinary Medicine, Knoxville, TN, USA5Department of Companion Animal Clinical Studies, Faculty of Veterinary Science, University of Pretoria, Pretoria, South Africa6Department of Veterinary Pathobiology, College of Veterinary Medicine and Biomedical Sciences, Texas A&M University, College Station, TX, USA7Texas A&M Veterinary Medical Diagnostic Laboratory, College Station, TX, USA8Covance Laboratories, Inc., Madison, WI, USA9Department of Microbiology, Immunology and Pathology, College of Veterinary Medicine and Biomedical Sciences, Colorado State University, Fort Collins, CO, USA10Cornell University College of Veterinary Medicine, Ithaca, NY, USA11Idexx Laboratories, Inc., Bloomfield Hills, MI, USA
Correspondence: Jennifer R. Cook, Idexx Laboratories, Inc., Bloomfield Hills, MI, USA.Email: [email protected]
TA B L E O F C O N T E N T S
1 PURPOSE/SCOPE
References
Resources
2 INTRODUCTION: TOTAL QUALITY MANAGEMENT SYSTEM (TQMS)
References
Appendix 1: Recommended content for a Standard Operating Procedure
Figure and Tables
Resources
Checklist
3 GENERAL PREANALYTICAL FACTORS IMPORTANT IN VETERINARY CLINICAL PATHOLOGY
References
Figure
Resource
(Continues)
Checklist
4 GENERAL ANALYTICAL FACTORS IMPORTANT IN VETERINARY CLINICAL PATHOLOGY
Terms/Definitions
References
Appendix 1: Design Approach of Statistical QC (SQC)
Appendix 2: Six sigma MEDx Interactive Tool
Tables and Figures
Resources
Checklist
5 HEMATOLOGY, INCLUDING MANUAL HEMATOLOGY FOR NON-MAMMALIAN SPECIES
Definitions/Acronyms
References
Checklist
6 HEMOSTASIS TESTING (COAGULATION)
(Continued)
(Continues)

| 543ARNOLD et AL.
1 | PURPOSE/SCOPE
In the United States, the Centers for Medicare and Medicaid Services (CMS) regulates all human clinical laboratory testing as mandated by federal legislation entitled the Clinical Laboratory Improvement Amendments (CLIA). Other countries have similar regulations. In contrast, veterinary medicine is not uniformly governmentally regu-lated, and to our (contributors) knowledge, instruments marketed for veterinary testing are not required to have independent analysis or approval prior to sale. Although there is not a current global con-sensus for human medicine on standards of laboratory performance, there are various supporting consensus and/or accrediting organi-zations that provide standards and guidelines. Examples include, but are not limited to: Clinical Laboratory Standards Institute (CLSI, formerly NCCLS), International Organization for Standardization (ISO), International Federation of Clinical Chemistry and Laboratory Medicine (IFCC), International Laboratory Accreditation Cooperation (ILAC), International Council for Standardization of Haematology (ICSH), European Federation of Clinical Chemistry and Laboratory Medicine (EFLM), American Association for Laboratory Accreditation (A2LA), American Association for Clinical Chemistry (AACC), College of American Pathologists (CAP), World Organization for Animal Health (OIE), and Joint Committee for Guides in Metrology (JCGM).
Failure of human laboratories to correct issues of non-compliance to federal legislation (CLIA or non-U.S. equivalent) results in lack of accreditation and termination of laboratory function. Limited gov-ernment regulation exists for some aspects of clinical veterinary lab-oratory medicine in the U.S., mainly in place for reportable diseases. Laboratory accreditation is offered by the American Association of Veterinary Laboratory Diagnosticians (AAVLD) and is optional (per their website, this accreditation is “designed for state and national
institutions or organizations such as colleges, departments or lab-oratories, and government agencies”a). ISO certification exists for veterinary laboratories but is also voluntary and is not prescriptive (ie, the certification is a commitment statement from the laboratory, not a top-down assurance of the standards which are provided in the guideline ISO:15189). The American Animal Hospital Association (AAHA) and the Royal College of Veterinary Surgeons (in the United Kingdom) have a laboratory quality section as a component of their overall veterinary hospital accreditation programs.
The imperative for quality control and continuous quality im-provement in veterinary clinical diagnostic laboratories and research organizations is self-evident. Inaccurate data that inform diagnostic/treatment modalities, scholarly research, and pharmaceutical devel-opment result in poor outcomes for individual patients and larger tar-get populations, with corresponding ethical, financial, professional, and legal ramifications. Lack of understanding of causes of the sta-tistical uncertainties that are inherent in all biologic measurements can/does lead to misdiagnosis. This guideline is aimed at advancing the ethos of continuous quality improvement in the veterinary lab-oratory setting, by raising awareness of potential sources of labora-tory error, by providing recommendations for evaluation of current practices/identification of potential areas of improvement, and by providing actionable goals and tools for launching and refining sys-tems of total quality management. The ultimate objective is max-imizing the quality of laboratory output and thus value to clients/users and patients. The sections of this guideline are not intended to be all-inclusive. Rather, they provide a minimum standard for quality assurance in veterinary laboratories. They may augment, but should not substitute for, any applicable licensing/accreditation or good lab-oratory practice (GLP) standards, which are typically more specific per federal/state governing body requirements. This guideline does
References
Checklist
7 CROSSMATCHING
References
Checklist
8 URINALYSIS
References
Checklist
9 CYTOLOGY, FLUID ANALYSIS, AND IMMUNOCYTOCHEMISTRY
References
Figure
Resources
Checklist
10 ENDOCRINOLOGY/IMMUNOASSAYS
References
Table
Resources
Checklist
Supplemental Information on Immunoassay Techniques
11 PROTEIN ELECTROPHORESIS, INCLUDING ELECTROPHORESIS-BASED IMMUNOTYPING
References
Table
Checklist
12 GENERAL POSTANALYTICAL FACTORS IMPORTANT IN VETERINARY CLINICAL PATHOLOGY
References
Tables
Figure
Resources
Checklist
13 CONTRIBUTORS
(Continued)
(Continued)
(Continued)

544 | ARNOLD et AL.
not distinguish quality assurance information and recommendations in relation to larger reference laboratories/academic institutions vs. the private practice setting. For more information on in-clinic labo-ratory quality assurance, please see the ASVCP Guideline: Quality assurance for point-of-care testing in veterinary medicine.
This guideline is a revision of the previous (final ized 2009) document of the same name, American Society for Veterinary Clinical Pathology's Principles of Quality Assurance and Standards for Veterinary Clinical Pathology, developed by the Quality Assurance and Laboratory Standards (QALS) committee (and colloquially known as the “general guideline”), archived on the ASVCP website (www.asvcp.org/page/QALS_Guide lines ), on a newly established Wiley freeware page (https ://onlin elibr ary.wiley.com/page/journ al/19391 65x/homep age/Qals) as published in Veterinary Clinical Pathology in three sectional special reports.1–3 This guideline's in-tended audiences are professional veterinary laboratorians (pathol-ogists, technologists/technicians, research scientists, and pathology residents), operators/users of in-clinic instruments/in-clinic labora-tories, and more broadly, all producers and consumers of clinical veterinary laboratory data, namely the veterinarians/training vet-erinarians who have the responsibility of ordering appropriate tests and properly interpreting results that inform further diagnostic and treatment decisions.
R E FE R E N C E S 1. Flatland B, Freeman KP, Friedrichs KR, et al. ASVCP quality assurance
guidelines: control of general analytical factors in veterinary labora-tories. Vet Clin Pathol. 2010;39:264-277.
2. Vap LM, Harr KE, Arnold JE, et al. ASVCP quality assurance guide-lines: control of preanalytical and analytical factors for hematology for mammalian and nonmammalian species, hemostasis, and cross-matching in veterinary laboratories. Vet Clin Pathol. 2012;41:8-17.
3. Gunn-Christie RG, Flatland B, Friedrichs KR, et al. ASVCP quality assurance guidelines: control of preanalytical, analytical, and pos-tanalytical factors for urinalysis, cytology, and clinical chemistry in veterinary laboratories. Vet Clin Pathol. 2012;41:18-26.
RESOURCES
https ://www.cms.gov/Regul ations-and-Guida nce/Legis latio n/CLIA/index.html CLIA summary
https ://wwwn.cdc.gov/clia CLIA websitewww.clsi.org Clinical Laboratory Standards Institutewww.agric ulture.gov.au/anima l/healt h/syste m/lab-netwo rk#stand
ards-and-accre ditation and www.nata.com.au Information on Australia's accreditation system for veterinary laboratories
www.iso.org International Organization for Standardizationhttps ://www.iso.org/stand ard/56115.html ISO's international stan-
dard 15189: Medical laboratories — Requirements for quality and competence
www.ifcc.org International Federation of Clinical Chemistry and Laboratory Medicine
www.ilac.org International Laboratory Accreditation Cooperation
www.icsh.org International Council for Standardization in Haematology
www.eflm.eu European Federation of Clinical Chemistry and Laboratory Medicine
www.a2la.org American Association for Laboratory Accreditationwww.aacc.org American Association for Clinical Chemistry; also
found here is DACC, Division of Animal Clinical Chemistrywww.cap.org College of American Pathologistswww.oie.int World Organization for Animal Healthwww.sqa.org Society of Quality Assurancewww.isacp.org International Society for Animal Clinical Pathologywww.asvcp.org American Society of Veterinary Clinical Pathologywww.acvp.org American College of Veterinary Pathologywww.esvcp.com European College/Society of Veterinary Clinical
Pathologywww.acute caret esting.org freeware regarding daily issues of acute
care testing; content is provided by healthcare professionals around the world, including external experts, laboratory manag-ers, point-of-care coordinators, physicians and nurses
ht tps ://w w w.bipm.org /ut i l s/ commo n/docum ent s/ jcgm/JCGM_100_2008_E.pdf Guide to the expression of uncertainty in measurement; evaluation of measurement data published by work-ing group of the Joint Committee for Guides in Metrology (JCGM)
awww.aavld.org Association of American Veterinary Laboratory Diagnosticians
www.dropb ox.com/s/x6iti uw1cq bymj8/ AAVLD %20Req uirem ents%20for %20an%20Acc redit ed%20Vet erina ry%20Med ical%20Dia gnost ic%20Lab orato ry%20AC1 %20v%202018-07.final.pdf?dl=0 AAVLD's requirements for an accredited veterinary medical diagnostic laboratory
https ://www.aaha.org/profe ssion al/membe rship/ stand ards.aspx American Animal Hospital Association (AAHA) accreditation program
https ://www.rcvs.org.uk/setti ng-stand ards/pract ice-stand ar-ds-schem e/apply-for-accre ditat ion/ Royal College of Veterinary Surgeons accreditation program
https ://onlin elibr ary.wiley.com/doi/full/10.1111/vcp.12099 ASVCP guideline: Quality assurance for point-of-care testing in veterinary medicine
2 | INTRODUC TION – TOTAL QUALIT Y MANAGEMENT SYSTEM (TQMS)
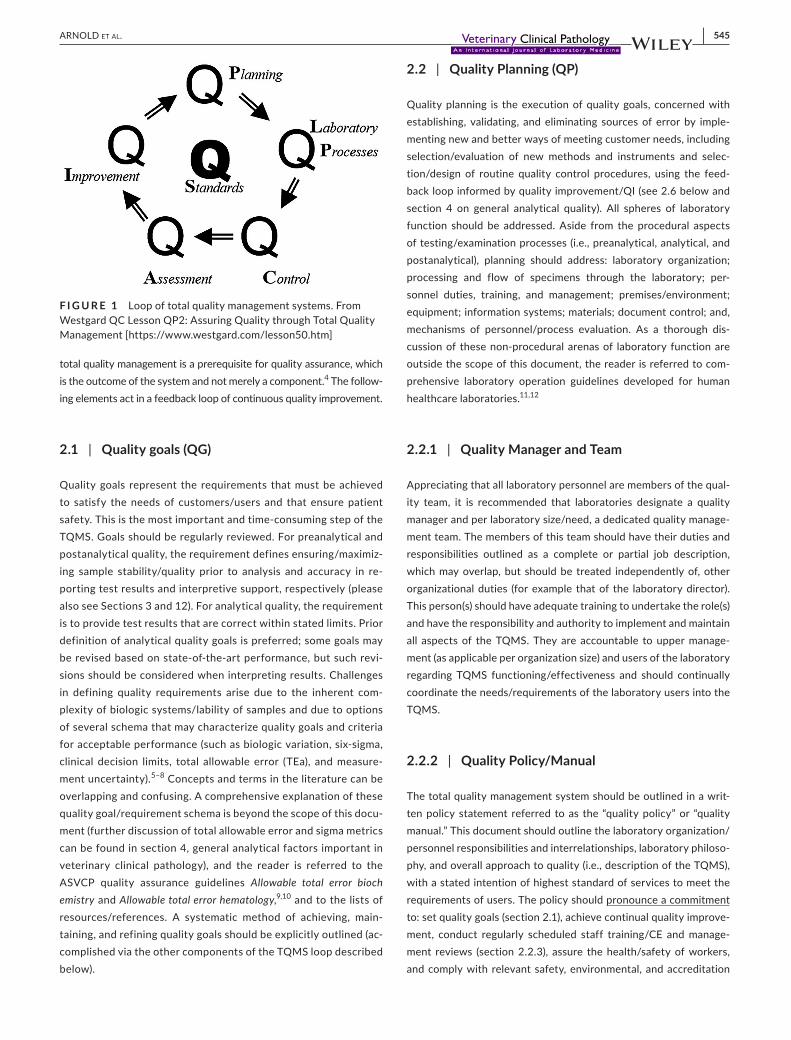
It is useful to think of the veterinary laboratory as operating within a framework of formalized, planned Total Quality Management, which operates as a systematic cycle/loop of components (described below) for continuous improvement (quality improvement models were origi-nally adapted from industry/precision mass production)1,2 (Figure 1). Designing a system of comprehensive quality management reflects a long-term commitment, with participation at all levels of the laboratory organization, and with accountability by upper management (“top-down” approach).3 Having a comprehensive, actionable, and revisable plan for
| 545ARNOLD et AL.
total quality management is a prerequisite for quality assurance, which is the outcome of the system and not merely a component.4 The follow-ing elements act in a feedback loop of continuous quality improvement.
2.1 | Quality goals (QG)
Quality goals represent the requirements that must be achieved to satisfy the needs of customers/users and that ensure patient safety. This is the most important and time-consuming step of the TQMS. Goals should be regularly reviewed. For preanalytical and postanalytical quality, the requirement defines ensuring/maximiz-ing sample stability/quality prior to analysis and accuracy in re-porting test results and interpretive support, respectively (please also see Sections 3 and 12). For analytical quality, the requirement is to provide test results that are correct within stated limits. Prior definition of analytical quality goals is preferred; some goals may be revised based on state-of-the-art performance, but such revi-sions should be considered when interpreting results. Challenges in defining quality requirements arise due to the inherent com-plexity of biologic systems/lability of samples and due to options of several schema that may characterize quality goals and criteria for acceptable performance (such as biologic variation, six-sigma, clinical decision limits, total allowable error (TEa), and measure-ment uncertainty).5–8 Concepts and terms in the literature can be overlapping and confusing. A comprehensive explanation of these quality goal/requirement schema is beyond the scope of this docu-ment (further discussion of total allowable error and sigma metrics can be found in section 4, general analytical factors important in veterinary clinical pathology), and the reader is referred to the ASVCP quality assurance guidelines Allow able total error bioch emistry and Allow able total error hemat ology ,9,10 and to the lists of resources/references. A systematic method of achieving, main-taining, and refining quality goals should be explicitly outlined (ac-complished via the other components of the TQMS loop described below).
2.2 | Quality Planning (QP)
Quality planning is the execution of quality goals, concerned with establishing, validating, and eliminating sources of error by imple-menting new and better ways of meeting customer needs, including selection/evaluation of new methods and instruments and selec-tion/design of routine quality control procedures, using the feed-back loop informed by quality improvement/QI (see 2.6 below and section 4 on general analytical quality). All spheres of laboratory function should be addressed. Aside from the procedural aspects of testing/examination processes (i.e., preanalytical, analytical, and postanalytical), planning should address: laboratory organization; processing and flow of specimens through the laboratory; per-sonnel duties, training, and management; premises/environment; equipment; information systems; materials; document control; and, mechanisms of personnel/process evaluation. As a thorough dis-cussion of these non-procedural arenas of laboratory function are outside the scope of this document, the reader is referred to com-prehensive laboratory operation guidelines developed for human healthcare laboratories.11,12
2.2.1 | Quality Manager and Team
Appreciating that all laboratory personnel are members of the qual-ity team, it is recommended that laboratories designate a quality manager and per laboratory size/need, a dedicated quality manage-ment team. The members of this team should have their duties and responsibilities outlined as a complete or partial job description, which may overlap, but should be treated independently of, other organizational duties (for example that of the laboratory director). This person(s) should have adequate training to undertake the role(s) and have the responsibility and authority to implement and maintain all aspects of the TQMS. They are accountable to upper manage-ment (as applicable per organization size) and users of the laboratory regarding TQMS functioning/effectiveness and should continually coordinate the needs/requirements of the laboratory users into the TQMS.
2.2.2 | Quality Policy/Manual
The total quality management system should be outlined in a writ-ten policy statement referred to as the “quality policy” or “quality manual.” This document should outline the laboratory organization/personnel responsibilities and interrelationships, laboratory philoso-phy, and overall approach to quality (i.e., description of the TQMS), with a stated intention of highest standard of services to meet the requirements of users. The policy should pronounce a commitment to: set quality goals (section 2.1), achieve continual quality improve-ment, conduct regularly scheduled staff training/CE and manage-ment reviews (section 2.2.3), assure the health/safety of workers, and comply with relevant safety, environmental, and accreditation
F I G U R E 1 Loop of total quality management systems. From Westgard QC Lesson QP2: Assuring Quality through Total Quality Management [https ://www.westg ard.com/lesso n50.htm]

546 | ARNOLD et AL.
legislation as applicable. The policy should describe the laboratory environment/facilities, list the clientele and scope of provided ser-vices, and outline working practices such as the management of resources, equipment, client communications, and data/document control/disposal.12 The quality policy is not a convenient place to list the names/numbers of all laboratory standard operating procedures (SOPs; see section 2.3) due to frequency of changes made to the latter (SOPs can be catalogued in a separate procedural manual). Writing and editing of the policy should be performed by the quality manager(s). The format/length of the policy will vary with the size and needs of the facility. Accrediting organizations may have specific requirements. The quality policy/manual will be signed, communi-cated/readily available to all personnel, implemented throughout the laboratory, and reviewed by management regularly (at least annually) for appropriate updates. The document should be incorporated into personnel training/onboarding.
2.2.3 | Management Reviews
Management reviews are strongly recommended to synthesize/spur quality planning and to reinforce the “top-down” requirement of an effective TQMS. These should occur annually or more frequently depending on need, size of laboratory, regulatory requirements, etc. Reviews should be comprehensive evaluations of the TQMS in effectively executing of the needs and requirements of users, and should incorporate all mechanisms of feedback and quality improve-ment indicators/schema (section 2.6), including but not limited to:
• Internal and external statistical routine quality control and quality assessment results (i.e., internal audits and EQA/proficiency test-ing of examination processes, section 2.5)
• Feedback from clients and personnel• Status of any implemented preventive, corrective, and improve-
ment actions for testing• Status of any changes in laboratory organization/management,
resources, staffing, or processes• Follow up of previous management review action items
The findings of management reviews should be recorded and shared with personnel. New action items should be discharged in an appropriate and agreed-upon time frame.
2.3 | Quality laboratory processes (QLP)
Quality laboratory processes refer to the policies, procedures, personnel standards, and physical resources that determine how work is done in the laboratory, directly informed by QG and QP. Integral to this arena is the existence of a cohort of current stand-ard operating procedures (SOPs) for all laboratory tests and re-lated procedures. Creation and editing of laboratory documents should be performed by an identified individual(s), recorded in the
document. SOPs should cover preanalytical and postanalytical processes, the operation of necessary routine quality controls for the test/instrument (either embedded within test SOPs or out-lined in an independent SOP), sample storage/disposal, data stor-age/disposal, and send-out procedures. SOPs should be compiled, stored together in a written or electronic procedures manual (dis-tinct from the quality policy), and easily accessible to all personnel. Upon completion of training new personnel, there should be docu-mented confirmation of observed competency in assay/procedure performance in alignment with all relevant SOPs and their related procedures. This official authorization to perform testing should become part of the individual's training record.1 When documents are revised (review of all documents by quality manager/manage-ment team every 1-2 years is recommended if no intermittent changes have ensued), updates should be systematically reviewed with applicable personnel in a timely fashion, and there should be a system of document control in place whereby only updated cop-ies are used and obsolete versions are destroyed or permanently archived without availability for inadvertent use or circulation. A recommended template for elements to be included in SOPs is provided in Appendix 1.
2.4 | Quality Control (QC)
Quality control refers to procedures for monitoring the day-to-day work processes, detecting problems, and making corrections prior to test reporting. Statistical quality control is commonly employed in monitoring the analytical performance of laboratory methods, to include method validation/verification, selection of control materi-als, control rules, and number/timing of control runs necessary to efficiently detect unstable performance (please refer to section 4, general analytical factors, for further discussion). QC may include monitoring of key quality indicator tests2 (see Table 2 and sec-tion 12, postanalytical quality, for further information on quality indicators), evaluation of control data for trends or shifts that may indicate developing problems, and review of patient data. In the analytical phase, non-conformities identified in control or patient results should result in suspension of result reporting, corrective action(s) taken, and clients contacted as necessary. Non-conformities or other identified problems are documented and
1 Sample Personnel Training Record is included in the Appendices of the ASVCP Guideline: Quality Assurance for Point-Of-Care Testing in Veterinary Medicine.13
2 Quality indicators/key quality indicators (KQI) are select tests/processes that the laboratory has determined to be critical for its clientele, which may potentially have profound repercussions should an unreliable result be reported, and/or which have been found to be problematic previously. Key quality indicators will vary from lab to lab. Examples may include: %/no. specimens of insufficient volume, %/no. of hemolyzed specimens, %/no. unacceptable performances per year in EQA/PT tests, %/no. positive heartworm antigen tests, %/no. high/low calcium measurements, %/no. high/low albumin measurements, %/no. reports delivered outside of turnaround time, %/no. amended reports; no. lab information system downtime incidents per year, etc. In human medicine, the use of QIs has proven effective in the quality improvement strategy, as KQI data are an important source for defining the most up-to-date error rate in the total testing process.14–16 See also Table 2.

| 547ARNOLD et AL.
reviewed at regularly specified intervals by the quality manager(s) to determine and initiate corrective and preventive actions.
2.5 | Quality Assessment (QA)
Quality assessment refers to the broader monitoring of other dimen-sions (aside from statistical QC for the analytic phase) or characteristics of quality. Along with quality control, it is the measure of how well labo-ratory work is being done (example elements in Tables 1 and 2). Pre/postanalytical factors and turnaround time are monitored through QA activities (please see section 3 and section 12, respectively, for more information on preanalytical and postanalytical testing phases). Internal audits/training/continuing education and external quality assessment (EQA)/proficiency testing (PT) are important components. Internal au-dits should be scheduled and conducted using agreed-upon criteria, with recommendations and a suitable time frame for any preventive and corrective actions in response to non-conformities/deficiencies (in turn, these actions must be documented, reviewed, and further acted upon as applicable in an agreed-upon period). EQA/PT provides an external measure of analytical performance. The EQA program should be rel-evant to laboratory test services and ideally encompass preanalytical, analytical, and postanalytical phases. More information on EQA can be found in the ASVCP guideline: External quality assessment and com-parative testing for reference and in-clinic laboratories. As for internal audits, these reports should be recorded, communicated to staff, re-viewed, and acted upon, with action steps re-evaluated in turn.
2.6 | Quality Improvement (QI)
Quality improvement is aimed at determining the root causes/sources of problems/non-conformities identified by any means, with direct feedback into further quality planning (QP) for any necessary corrective and preventive actions. There should be a defined respon-sibility chain and time frame for change implementation. When con-sidering the schema of total quality management/continuous quality improvement, it is important to recognize that non-conformities can occur in all different aspects of the laboratory environment.17 These can be identified in several different ways, to include:
• Monitoring of key quality indicators• User feedback/complaints• Internal quality control statistical data• Failed calibrations• Checking of consumable materials• Staff comments (to this end, laboratory staff should have a sim-
ple mechanism for identifying opportunities for improvement; for example, quality improvement suggestion forms (“improvement opportunity forms” at all laboratory stations)
• Reports checking• Laboratory management reviews• Internal and external audits
The percentage of errors/non-conformities in tracked key quality indicators should be tabulated monthly and annually and compared with predetermined quality goals for these indicators (examples from pre- and postanalytical phases, respectively, may include the percentage of hemolyzed samples and percentage of amended re-ports; admittedly many preanalytical errors are beyond the labora-tory's control, but the laboratory should advise its clients on best practices). These information sources should be incorporated into annual management reviews (section 2.2.1). Preventive and correc-tive actions are to be recorded, made available to all staff, and evalu-ated/re-evaluated at determined time points for effectiveness, with further action steps as deemed appropriate. The results of the QI program should be incorporated into the training/continuing educa-tion of staff members.
2.6.1 | User/client evaluations
User/client evaluations should be encouraged by periodic dissemi-nation of surveys or other instruments to a laboratory's clients and staff. These should encourage identification of positives and nega-tives and section(s) for open-ended comments. The results of these evaluations should be available to all laboratory staff and used to identify suitable prevention and corrective actions. To ensure full transparency, the results of internal and external audits should be available to laboratory clients.
R E FE R E N C E S 1. Deming WE. Out of the Crisis. Cambridge, MA: Massachusetts Institute
of Technology, Center for Advanced Engineering Study; 1986. 2. Juran JM. Quality Control Handbook. 6th ed. New York, NY: McGraw-
Hill; 2010. 3. Theodorsson E. Quality assurance in clinical chemistry: a touch
of statistics and a lot of common sense. J Med Biochem. 2016;35: 103-112.
4. Westgard JO. Basic Planning for Quality. Madison, WI: Westgard QC, Inc.; 2000.
5. Oosterhuis WP, Bayat H, Armbruster D, et al. The use of error and uncertainty methods in the medical laboratory. Clin Chem Lab Med. 2018;56:209-219.
6. Flatland B, Camus MS, Baral RM. Analytical quality goals—a review. Vet Clin Pathol. 2018;28. https ://doi.org/10.1111/vcp.12649
7. Hens K, Berth M, Armbruster D, et al. Sigma metrics used to as-sess analytical quality of clinical chemistry assays: importance of the allowable total error (TEa) target. Clin Chem Lab Med. 2014;52: 973-980.
8. Freeman KP, Baral RM, Dhand NK, et al. Recommendations for de-signing and conducting veterinary clinical pathology biologic varia-tion studies. Vet Clin Pathol. 2017;46:211-220.
9. Harr KE, Flatland B, Nabity M, et al. ASVCP guidelines: allowable total error guidelines for biochemistry. Vet Clin Pathol. 2013;42: 424-436.
10. Nabity MB, Harr KE, Camus MS, et al. ASVCP guidelines: Allowable total error hematology. Vet Clin Pathol. 2018;47:9-21.
11. International Organization for Standardization. ISO 15189 Medical laboratories - Requirements for quality and competence. 3rd ed. Geneva, Switzerland: International Organization for Standardization; 2012.

548 | ARNOLD et AL.
12. Clinical Pathology Accreditation (UK) Ltd. Standards for the Medical Laboratory. Version 2.02. Middlesex, UK: CPA Central Office; 2010.
13. Flatland B, Freeman KP, Vap M, et al. ASVCP guidelines: quality assurance for point-of-care testing in veterinary medicine. Vet Clin Pathol. 2013;42:405-423.
14. Plebani M, Sciacovelli L, Aita A, et al. Performance criterial and quality indicators for the preanalytical phase. Clin Chem Lab Med. 2015;53:943-948.
15. Plebani M, Sciacovelli L, Aita A. Quality indicators for the total test-ing process. Clin Lab Med. 2017;37:187-205.
16. Plebani M, Astion ML, Barth JH, et al. Harmonization of qual-ity indicators in laboratory medicine. A preliminary consensus. Clin Chem Lab Med. 2014;52:951-958. https ://doi.org/10.1515/cclm-2014-0142
17. Hooijberg E, Leidinger E, Freeman KP. An error management sys-tem in a veterinary clinical laboratory. J Vet Diagn Invest. 2012;24: 458-468.
18. Westgard JO. Basic QC Practices: Training in Statistical Quality Control for Medical Laboratories. 4th ed. Madison: Westgard QC, Inc.; 2016.
APPENDIX 1: Recommended content for a Standard Operating Procedure (SOP)Note: all sections will not be applicable to all SOPs; for completeness/docu-ment uniformity, these sections should be named and followed with “N/A”
I Title page Include the title, unique identification number, date of issue, number of pages, issued by/approved by, dept. (if needed), original issue date (if this is a revision), revision number (with state-ment that this version supplants all previous versions), and sched-uled expiration/review date. A title header and cumulative page number should be repeated at the top of each page (page 4 of 10, etc.); this is to ensure that no pages are missing from the document.a. Itemization of specific elements that have been revised from
the last version (table format)—should list the number and applicable section(s) of the previous SOP.
II Scope/purpose/principle and application of the procedure/assay.
TA B L E 1 Example of a total quality assessment plan that identifies control mechanisms, frequency of use, and acceptability criteria [adapted from Figure 15-7, p. 205, Westgard JO. Basic QC Practices. 4th ed. Madison, WI: Westgard QC, Inc.; 2016.]18
Control mechanism Frequency Criteria for acceptance
Preanalytical controls (see also section 3, general preanalytical factors)
Specimen labeling Every specimen Correct name on label (ideally two unique identifiers)
Accession form data Every accession form Clinic ID, patient ID/signalment, test ID, relevant history
Sample inspection Every sample No visible hemolysis or lipemia or appropriate com-ments when present as to potential effect
Analytical operator controls
Standard operating procedure (SOP) Annual SOP review Signed by laboratory supervisor
Operator training Every operator Proficiency by laboratory supervisor
Operator competency Annually Proficiency assessment
Operator checklists (from SOPs) Daily Laboratory supervisor review
System maintenance Manufacturer schedule Laboratory supervisor review
Analytical test system controls (see also section 4)
Sample acceptability Every sample Instrument indices and volume limits
Statistical QC Startup + Monitor Controls within limits
External quality assessment/proficiency testing
At least annually to quarterly, depend-ing on the species/test
Acceptable performance
Analytical test review controls
Plausibility checka Every sample Results reasonable for age, history, and other findings
Postanalytical controls (see also section 12)
Turnaround timeb Each sample Set by laboratory policy
Customer feedback Each complaint Laboratory supervisor review
Key quality indicator reviewc Daily-monthly, depending on the needs of the laboratory
Set by quality management team
aThe plausibility check can be done in several ways, e.g., at the individual animal/profile level or review of data by measurand. bAlthough turnaround time (TAT) is frequently classified as a postanalytical event due to its measurement at this phase, it should be recognized that preanalytical and analytical steps contribute to the TAT and should be evaluated. cKey quality indicators (KQIs) may vary with the type of laboratory, the types of tests conducted, and the problems identified. Tests chosen for KQIs should have the least margin for error for clientele due to the use of these results for clinical decisions of treatment, additional investigation, and/or monitoring. Examples may include no./% high calcium concentrations, no./% positive heartworm tests, no./% positive Coggins tests, etc. Or, if there has been a problem identified previously, the laboratory may want to choose these tests to ensure that corrective and preventive actions are effective.

| 549ARNOLD et AL.
III Frequency/days of the week that the test/procedure is performed and expected turnaround time (TAT) for results reporting.
IV Health/safety issues Include necessary personal protective equipment, handling and disposal of hazardous materials.
V Specimen requirement Include specimen collection/patient preparation (to include any species-specific information and minimum volume required for blood/urine/fluid samples), any additives or special handling requirements, transport, storage/stability, and rejection criteria.
VI Supplies Include reagents (storage/shelf life, preparation, man-ufacturer), materials/control materials, equipment, any other needed supplies/tools to complete the procedure.
VII Routine quality control (eg, calibration, controls, and instru-ment maintenance/performance evaluations) Include basic troubleshooting steps (e.g., rerun, dilutions) and how to doc-ument errors/out of control data. Should state that if controls fail, patient samples should not be run. If extensive, routine QC can be detailed in a separate SOP and referenced in the test SOP. This section should include actions to be taken
when a system/procedure is down (e.g., send-out, acceptable sample storage time)
VIII Procedure List detailed, step-by-step instructions such that a newly trained employee could run the test independently.
IX Interpretation criteria This may include standard comments, reference intervals/reportable ranges, sensitivity/specificity, any interferences (such as hemolysis, lipemia, icterus, antico-agulants, medication effects, etc.), limitations (such as lack of positive titer immediately after infection), or other reasons for test invalidation or possible error in results. List of any relevant calculations performed manually or within the labo-ratory software.
X Resulting/reporting List names/numbers of specific record/forms that are to be utilized. Storage/disposal of samples and generated data.
XI Signature of the approving person(s) and their title(s) [this may be listed on the title page/front of document].
XII Pertinent references This may include an appendix/appendices if applicable, e.g., observations/troubleshooting logs, package in-serts, quick reference guides, etc.
TA B L E 2 Example quality assessment plan to monitor performance and effectiveness of a total quality management plan [adapted with permission from Figure 19-2, p. 249, Westgard JO. Basic QC Practices. 4th ed. Madison, WI: Westgard QC, Inc.; 2016.]18
Quality indicatora Measure Frequency
Workload Review sample log and count total number of patient tests performed At least monthly
Suboptimal samples Review sample log and count numbers of hemolyzed, lipemic, insufficient volume, and improper ID
At least monthly
Test system flags Count device alerts and error flags At least weekly & monthly totals
Runs/tests rejected Review QC log and count runs rejected due to device flags At least monthly
Review QC log and count runs rejected due to control flags At least monthly
Imprecision Calculate mean, standard deviation (SD) and coefficient of variation (CV) of measurements on stable controls
At least monthly
Operator variability Calculate SD of duplicate repeat patient test resultsb At least monthly
Bias from EQA survey Calculate average bias for each survey event At least 3 times per year
Turnaround time (TAT) Tabulate TAT measures At least weekly
Calculate average TAT At least monthly
Customer feedback Count number of complaints At least monthly
Summarize causes
Summarize corrective actions
Operator competency Supervisor observation and review of operator performance At least annually
Laboratory management /supervisor review
Inspection and review of all QA measures and reports At least quarterly
aIn human medicine, the International Organization for Standardization (ISO) mandates that “the laboratory shall establish QIs (quality indicators) to monitor and evaluate performance throughout critical aspects of preexamination, examination and postexamination processes” and that “the process of monitoring QIs shall be planned, which includes establishing the objectives, methodology, interpretation, limits, action plan and duration of measurement.”11,14 bRefers to repeat patient testing for statistical quality control; please see sections 4.1 and 4.7 for more information.

550 | ARNOLD et AL.
RESOURCES
https ://www.westg ard.com/lesso n50.htm. Westgard QC website. Basic Planning for Quality, lesson QP2: Assuring Quality through Total Quality Management (partial lesson/book excerpt from: Westgard, JO. Basic Planning for Quality. Madison, WI: Westgard QC, Inc.; 2000).4
https ://www.westg ard.com/essay 35.htm Essay on Six Sigma Quality (note: many of the Westgard QC website materials require a no-cost registration).
https ://www.westg ard.com/lesso n52.htm. Westgard QC website. Basic Planning for Quality, lesson QP 4: Designing a Practical process (partial lesson/book excerpt available on website).
https ://www.westg ard.com/lesso n57.htm. Westgard QC website. Basic Planning for Quality, lesson QP 9: Practice makes proficient.
https ://www.iso.org/stand ard/56115.html International Standardization Organization (ISO) Guideline 15189 for quality and competence in medical laboratories, published 2012.9
CHECKLIST FOR GUIDELINE SEC TION 2 , TOTAL QUALIT Y MANAGEMENT SYSTEM (TQMS)
The purpose of these checklists is to facilitate guideline implementation/practical application and may be further detailed in laboratory-specific standard operating procedures (SOPs). The numbers in the first column correspond to the section numbers in the guideline.
Guideline Recommendation Compliant?
Additional Comment(s) by Auditor
2.1 Quality Goals for accuracy/ef-fectiveness of laboratory function that will meet the requirements of users, are defined (predeter-mined prior to test evaluation) for the preanalytical, analytical, and postanalytical phases. Goals are evaluated and refined on a prede-termined schedule.
□ Yes □ No
2.2.1 Size dependent, the laboratory has a dedicated quality manager or management team as a complete or partial job description. This person(s) has outlined duties and appropriate training to success-fully execute the lab's Total Quality Management System (TQMS).
□ Yes □ No
2.2.2 There is a written quality policy/manual that specifies a commitment to continuous quality improvement and outlines the tenets of laboratory organization, laboratory function, and the TQMS. The document is available to all workers, updated as needed, and in-corporated into personnel training.
□ Yes □ No
Guideline Recommendation Compliant?
Additional Comment(s) by Auditor
2.2.3 Annual management reviews of the TQMS are scheduled, and results are shared with labora-tory personnel. Time frames for implementation and evaluation of any changes are established.
□ Yes □ No
2.3, Appendix 1 The laboratory has a catalogue of easily accessible standard operating procedures (SOPs) for all laboratory processes and procedures.
□ Yes □ No
2.3, Appendix 1 Laboratory person-nel are required to read/sign off on all SOPs pertaining to their job duties, with scheduled document re-review (mandatory upon any SOP update) and formal demon-stration of SOP knowledge.
□ Yes □ No
2.3 All laboratory SOPs are updated upon any procedure/method/in-strumentation changes and other-wise reviewed every 1-2 years for accuracy and completeness.
□ Yes □ No
2.4 Routine quality control proce-dures are established for all instru-ments/methods (see section 4 for more detailed guidelines). Identified non-conformities initiate corrective/preventive actions, and clients are contacted as necessary if non-conformities have impacted patient results.
□ Yes □ No
2.5, 2.6 Periodic internal and exter-nal audits/assessments are sched-uled, to include enrollment in an external quality assurance (EQA)/proficiency testing (PT) program.
□ Yes □ No
2.1, 2.4, 2.6, Tables 1 and 2 Key quality/performance indicators are established for preanalyti-cal, analytical, and postanalytical phases, with regular calculation of the percentage of errors/non-conformities that are compared against predetermined goals.
□ Yes □ No
2.6 Quality improvement suggestion forms are readily available for all personnel.
□ Yes □ No
2.2, 2.6 Preventive/corrective actions to eliminate/minimize de-tected sources of error are imple-mented continually as necessary and evaluated for effectiveness on a determined schedule. Design and implementation of these actions are made by defined personnel.
□ Yes □ No

| 551ARNOLD et AL.
Guideline Recommendation Compliant?
Additional Comment(s) by Auditor
2.2.3, 2.6.1 Feedback surveys are provided to laboratory personnel and users/clients, and results are shared with laboratory staff and evaluated at management reviews.
□ Yes □ No
3 | GENER AL PRE ANALY TIC AL FAC TORS IMPORTANT IN VETERINARY CLINIC AL PATHOLOGY
3.1 | General considerations
According to the concept of the “brain-to-brain loop” in human laboratory medicine, the generation of any laboratory test result consists of ten steps: ordering, collection, identification (at sev-eral stages), transportation, separation (or preparation), analysis, reporting, interpretation, action, and outcome.1,2 The preanalyti-cal and postanalytical phases (please also see section 12, general postanalytical factors) can be more difficult to monitor for quality assurance than the analytical phase, often because the responsibil-ity overlaps laboratory and clinical departments. Optimization of preanalytical factors is vital to ensure that appropriate, high-quality biologic samples are submitted for testing, and to minimize varia-tion that may result from lack of standardization in specimen collec-tion and handling. Several studies have measured the preanalytical phase as comprising the highest share (up to 77%) of all laboratory error, warranting increased attention to, and documentation of, this phase.3,4
3.2 | Test selection
Sometimes referred to as the “pre-preanalytical” sub-phase,5,6 this is the often-overlooked topic of test selection by the clinician that is based on history, signs, and perceived value of the diagnostic infor-mation3 . Clinical pathologists (with input from other specialists as appropriate) should be directly available to clients/users by tele-phone and email for consultation regarding testing choice(s) based on cost/risk vs. benefit analysis. Variables to consider include patient clinical status/stability, financial resources, potential for additional diagnostic yield, and mapping of useful future clinical decision points for any further indicated diagnostics and/or treatments based on current test results.
3.3 | Specimen collection, handling and transport
For all assays, the laboratory should provide information to clients electronically, in written materials (such as a laboratory services man-ual, special information sheets, journal or newsletter articles), and/or by telephone (if the software is capable, telephone communications should be recorded in the laboratory information software) regarding:
• patient preparation (e.g., fasting/feeding, dynamic challenge test protocols)
• sample type (e.g., whole blood, urine, plasma, serum)/volumes• proper collection (container(s) and proper sample:anticoagulant
ratio, as applicable)• handling/delivery/shipping procedures (to include any special
precautions for handlers)• notification to laboratory when submitting potentially zoonotic
specimens (e.g., CSF from a Rabies suspect)
Laboratory-provided submission guidelines should also contain complete laboratory contact information, hours of operation/any af-ter-hours services, names of the tests which are sent out to a contract-ing laboratory (with names/contacts of these laboratories provided upon request), expected turn-around times, time limits for add-on test requests, and a list of key factors known to affect test performance/interpretation, to include potentially interfering pharmaceuticals, such as bromide or anesthesia during sampling (potential interferences should also be included in test SOPs and reports; see section 2, Appendix 1 and section 4). Samples should be collected according to standard practices. Overnight fasting is ideal for blood testing in mo-nogastric animals to avoid postprandial interferences. Instrument man-ufacturers’ package inserts may have detailed descriptions of appropriate samples, including collection tubes and handling condi-tions. The specimens should be handled carefully and transported to the laboratory in a timely manner under conditions appropriate for the type of sample and its stability4, avoiding temperature and humidity fluctuations. Also important are any necessary personnel precautions for applicable biohazard and/or environmental safety issues (as noted above, to include clear and specific labeling of specimens with poten-tial zoonotic risk). Any incidents during transportation that may affect sample quality or personnel safety should be recorded and reported to the laboratory and by the laboratory to the submitting clinic.
3 Of note, some references use the term pre-preanalytical phase more broadly to include all steps taken before the sample arrives at the laboratory, vs. the preanalytical phase defined as sample preparation steps performed solely in the laboratory prior to analysis, such as data entry, centrifugation, and aliquotting.7
4 Studies are limited in veterinary medicine, and recommendations for maximum sample transport/storage times are made cautiously, with the common sense understanding that minimization of lag time between collection and analysis is best practice. Whole blood for CBC analysis may be stable for 2-3 days at room temperature, but analysis of a either chilled/refrigerated or room temperature sample within 24h of collection is most reliable, with refrigeration beyond 24h if the sample has been at room temperature already and analysis is further delayed.8–10 Non-mammalian species such as birds and sharks have a shorter window of whole blood stability prior to analysis.11,12 Please see section 7 regarding urinalysis specimens. Plasma/serum for biochemistry and endocrinology panels will have varied stability depending on the measurand of interest and can be frozen (<20°C) for long term delayed (>7d) analysis. As for hematology specimens, it is standard practice to analyze plasma/serum specimens within 24h of collection (room temperature or refrigerated), having centrifuged/separated from formed elements of blood promptly after collection (for serum, separation after complete clot forma-tion/~20-30min after collection).

552 | ARNOLD et AL.
3.4 | Specimen identification/accession forms
The patient name/ID, date, and type of specimen (e.g., whole blood, serum, plasma, urine, cavitary fluid, joint fluid, mass aspirate, etc.) should be written on the tube/specimen label. Use of pencil or printed attached label directly on glass cytology slides with anatomic site source is recommended (with care not to wrap labels around the back edges of slides, which can interfere with slide positioning on the microscope stage). Unlabeled slides in a labeled slide container is suboptimal practice, as slides may become separated from their container(s) during accessioning.
Specimens should be identified on the accession/request form with pertinent information as determined by the laboratory, includ-ing but not limited to:
• name/contacts of submitting clinic (to include attending clinician name)
• owner name• complete signalment (to include species, breed, age/estimate, re-
productive status) and weight; the latter is important for inter-preting relative size of space-occupying lesions13)
• date/time of collection• specimen type• gross description and anatomic location as appropriate for the
sample type (cytology, histology, microbiology)• relevant clinical history as appropriate for the sample type (to in-
clude, for lymph node samples, which/how many nodes are en-larged and which/how many have been sampled)
• collection method (urinalysis and cytology interpretation)
Unique and matching identifiers (preferably two identifiers if possible) should be written on both the submission form and the specimen container/slides. Handwritten forms should be clearly legible. Barcodes should not be applied by the submitting clinic un-less supplied by the reference laboratory and co-identified as such with laboratory name. If laboratory personnel must call the client to gather missing information, any additional handwritten information on the accession form should be dated and initialed, as well as added into the laboratory information software.
3.5 | Test identification
The requested test(s) should be clearly marked on the submission form, as well as identification of any priority status. The laboratory should assign a unique identifier/test code for each test or test panel.
3.6 | Specimen accessioning
The specimen information, identification, date/time of receipt into the laboratory, and requested tests should be correctly entered into the laboratory information system (LIS; please see section 3.11
below). Specimen aliquoting and delivery to the appropriate section within the laboratory or between several departments should be co-ordinated. Any problems with sample quality which may affect anal-ysis (including but not limited to hemolysis, lipemia, icterus, gelling/clotting of the sample) should be recorded and reported to the client. If the inaccuracy associated with sample quality is likely to be sig-nificant, testing should not be performed on the sample. If specimen quality is unacceptable, the client should be contacted immediately, and a new specimen requested. Even if a sample is deemed report-able (or if the client requests the test be run regardless of laboratory-recommended rejection), comments concerning the likely effects of suboptimal specimen quality on test results should be communi-cated to the client in the laboratory report.
3.7 | Client communication and education
(note: sections 3.7-3.12 also pertain to the postanalytical phase, and these areas should be outlined in the laboratory's quality policy per section 2.2.2)
Communication between laboratory personnel and clients should be timely and courteous regarding preanalytical factors in-fluencing laboratory test results (e.g., inappropriate test choice for the clinical scenario, incomplete submission form/container labeling, inappropriate sample type or sample handling, poor sample quality, etc.). Feedback from clients to the laboratory should be encouraged to forge a team approach to preanalytical quality control. These procedures should be specifically outlined in a “response to client feedback” SOP.
3.8 | Laboratory environment
The laboratory environment should meet standard require-ments necessary for safe, efficient, and effective performance. Consideration for adequate security and minimization of non-lab-oratory personnel traffic through the laboratory (e.g., limited ac-cess to microbiology section to minimize possible contamination, etc.) should be considered in the laboratory design. The workspace should be well-lit, clean, uncluttered, and organized, to include dedicated areas for specimen reception/accessioning, specimen storage, and supplies. Appropriate sterility, electrical, humidity, and temperature conditions should be maintained, and there should be control of dust, electromagnetic interference/radiation, sound, and vibration. Plants should not be kept in the laboratory due to the potential for contamination of samples with extraneous biologic material.14 Equipment and instrumentation should be in working order. SOPs should be easily accessible for reference when needed. Laboratory facilities and operation should be compliant with ap-propriate government legislation. Breakroom, restroom, protective equipment storage, and any necessary changing/locker facilities should be easily accessible and well-maintained. These non-testing areas should be clearly marked as separated from the clean zones

| 553ARNOLD et AL.
of the laboratory where personal protective equipment/PPE (labo-ratory coats, gloves, and safety glasses) is required and food/drink prohibited.
3.9 | Personnel health and safety
Conditions should be comfortable and appropriate for data entry/transcription, handling of specimens, testing, specimen disposal, and all other tasks. Ergonomic accommodations should be made to miti-gate effects of repetitive work, long-term sitting or standing, and po-tential injury. PPE should be appropriate for handling and operating equipment in all areas of the clinical laboratory. Notices, specialized labeling, and safety procedures for the handling, storage, and dis-posal of all samples, waste, and other supplies should be appropriate for the type of material. Personnel should receive safety and biohaz-ard training regarding exposure to potentially hazardous radiation, chemicals, or infectious pathogens present in reagents and biologic materials, to include basic prevention of bacterial contamination, in-formation on zoonotic diseases, and emergency training in the event of fire/massive contamination. All health/safety training should be documented, and personnel should be aware of their responsibili-ties. Appointment of a health/safety officer is recommended.
3.10 | Personnel requirements
Personnel should meet training requirements as indicated for spe-cific areas of the laboratory. Training, competency assessments with all duty-related SOPs, continuing education (CE), and reevaluation/recertification for specialized tasks should be regularly scheduled and documented. Resources should be available for training and CE. The laboratory should be staffed appropriately to meet the work-load so that delayed processing and specimen deterioration does not occur. Appointment of a training manager is recommended.
3.11 | Laboratory information (management) systems (LIS a.k.a. LIMS)
LIS improve accuracy and efficiency of the laboratory. Prior to im-plementation, a LIS should be thoroughly evaluated and verified for the ability to maintain accurate and secure records. Inefficient and unwieldy LIS should be updated or enhanced based on the needs of the laboratory. LIS should meet all applicable governing legal regula-tions for medical record archives. Problems with sample accession-ing, data backup, or archival storage/retrieval capability should be corrected immediately. Important features include:
• record of date/time of specimen receipt (comparison with sample collection date/time can help improve issues with potential sam-ple degradation; comparison with report release date/time will assess turnaround time)
• identification of expedited submissions• identification of submissions with inherent environmental/zoo-
notic safety concerns• tracking/record of any amended results• tracking the storage location of the sample (e.g., immunology vs.
hematology; frozen vs. refrigerated vs. slide box designation)
3.12 | Identification of Outsourced Tests
Clients should be informed of tests that are referred to other labo-ratories (i.e., “outsourced tests” or “send-outs”). The referral labora-tory should be carefully evaluated for competence in performing the requested measurement(s) and should have documentation of test validation. Expected turn-around times and respective responsibili-ties for interpretation and reporting should be defined/agreed upon by both laboratories. Records documenting specimen referral (including logging dates and tracking numbers for shipped samples), receipt of reports, and forwarding of those reports to the client should be main-tained (please also see section 12, general postanalytical factors).
R E FE R E N C E S 1. Plebani M, Laposata M, Lundberg GD. The brain-to-brain loop con-
cept for laboratory testing 40 years after its introduction. Am J Clin Pathol. 2011;136:829-833.
2. Lundberg GD. Adding outcome as the 10th step in the brain-to-brain laboratory test loop. Am J Clin Pathol. 2014;141:767-769.
3. Plebani M, Sciacovelli L, Aita A, et al. Performance criterial and quality indicators for the preanalytical phase. Clin Chem Lab Med. 2015;53:943-948.
4. Hooijberg E, Leidinger E, Freeman KP. An error management system in a veterinary clinical laboratory. J Vet Diagn Invest. 2012;24:458-468.
5. Braun JP, Bourgès-Abella N, Geffré A, et al. The preanalytic phase in veterinary clinical pathology. Vet Clin Pathol. 2015;44:8-25.
6. Laposata M, Dighe A. “Pre-pre” and “post-post” analytical error: high incidence patient safety hazards involving the clinical laboratory. Clin Chem Lab Med. 2007;45:712-719.
7. Plebani M. Toward a new paradigm in laboratory medicine: the five rights. Clin Chem Lab Med. 2016;54:1881-1891.
8. Médaille C, Briend-Marchal A, Braun JP. Stability of selected hema-tology variables in canine blood kept at room temperature in EDTA for 24 and 48 hours. Vet Clin Pathol. 2006;35:18-23.
9. Lee JM, Kang JS. Changes of hematological references depends on storage period and temperature conditions in rats and dogs. Lab Anim Res. 2016;32:241-248.
10. Furlanello T, Tasca S, Caldin M, et al. Artifactual changes in canine blood following storage, detected using the ADVIA 120 hematology analyzer. Vet Clin Pathol. 2006;35:42-46.
11. Harr KE, Raskin RE, Heard DJ. Temporal effects of 3 commonly used anticoagulants on hematologic and biochemical variables in blood samples from macaws and Burmese pythons. Vet Clin Pathol. 2005;34:383-388.
12. Arnold JE. Hematology of the sandbar shark, Carcharhinus plumbeus: standardization of complete blood count techniques for elasmo-branchs. Vet Clin Pathol. 2005;34:115-123.
13. Pinson DM. Writing diagnostic laboratory requisition form histories. J Amer Vet Med Assoc. 2014;244:408-411.
14. Tarrant J. Organisms in an aspirate from an ulcerated mass: etiologic agent or mass-querade? Vet Clin Pathol. 2005;34:165-168.

554 | ARNOLD et AL.
RESOURCEhttp://www.biost at.envt.fr/pre-analy tical-varia bilit y/ Preanalytical
Variability Advisor, a database that can be searched by analyte, species, specimen, factors of variation, and/or keyword, identify-ing published sources of preanalytical variation with references.
CHECKLIST FOR GUIDELINE SEC TION 3, PRE ANALY TIC AL FAC TORS IMPORTANT IN VETERINARY CLINIC AL PATHOLOGY
The purpose of these checklists is to facilitate guideline implementation/practical application and may be further detailed in laboratory-specific standard operating procedures (SOPs). The numbers in the first column correspond to the section numbers in the guideline.
The N/A option (listed here only for applicable items) should only be employed for items not pertaining to the laboratory, with an explanation in the additional comment box.
Guideline Recommendation Compliant?
Additional Comment(s) by Auditor
3.2 If on staff, a veterinary clinical pathologist and/or other special-ists is/are available to clients to offer input on appropriate test selection(s).
□ Yes □ No □ N/A
3.3 Offsite laboratory clients (i.e., not pertaining to private practice in-clinic labs) are provided with a test submission manual that lists sample requirements, appropriate collection and transport proce-dures, and expected turnaround-time for results.
□ Yes □ No
Guideline Recommendation Compliant?
Additional Comment(s) by Auditor
3.3 Laboratory clients are advised to ideally have monogastric animals fasted overnight (as permissible by clinical status) for routine hematology/biochemistry, with checkboxes to indicate “Y/N fasted” on the laboratory submission form.
□ Yes □ No
3.3 Sample couriers have a means to record and report to the laboratory any incidents during transportation that may affect sample quality or personnel safety. In turn, the laboratory should include this information to the client in the report.
□ Yes □ No
3.4 Laboratory clients are advised to label all tubes/slides directly with specimen type and unique patient ID, plus anatomic location for cytology slides.
□ Yes □ No
3.4, 3.5 Accession forms contain filled out areas for:
• submitting clinic contacts• date/time of collection• patient ID• complete signalment• sample type/site source• collection method (for urinalysis/
cytology)• brief, pertinent history
as indicated by sample type (cytology/ histopathology/microbiology)
• requested test(s)
□ Yes □ No
3.4 Any handwritten information on the accession form should be neatly legible.
□ Yes □ No
3.6 Accession/test information is entered completely into the labo-ratory information management system (LIS/LIMS).
□ Yes □ No
3.6 Any problem with sample quality is recorded and com-municated to offsite clients and appropriate laboratory staff. Testing is not performed on significantly corrupted samples, with repeat submission requested. If testing of a compromised sample is requested by the client after notifi-cation, a disclaimer for extremely cautious interpretation is clearly indicated on the -report.
□ Yes □ No
F I G U R E 1 Schematic of the total testing chain, from the clinical decision to order a test through the value of the test result in ongoing clinical decisions/healthcare process [courtesy of Dr. Emma Hooijberg]
| 555ARNOLD et AL.
Guideline Recommendation Compliant?
Additional Comment(s) by Auditor
3.7 Communication between laboratory personnel and clients should be timely and courteous regarding preanalytical factors influencing laboratory test results (e.g., inappropriate test choice for the clinical scenario, incomplete submission forms/container labe-ling, inappropriate sample type or sample handling, poor sample quality, etc.). Feedback from clients to the laboratory should be encouraged. There is a formal sys-tem for discharging and evaluating any necessary corrective actions in response to client feedback.
□ Yes □ No
3.8, 3.9 The laboratory environ-ment is safe and comfortable, organized for workflow, and com-pliant with biohazard regulations, to include all necessary safety training, posted notices, and per-sonal protective equipment (PPE). Safety training is documented. Appointment of a health/safety officer is recommended.
□ Yes □ No
3.10 Personnel are adequately trained in laboratory SOPs and have ongoing competency evalu-ations at appropriate intervals for their area(s) of specialization, with documentation. Appointment of a training manager is recommended.
□ Yes □ No
3.11 The laboratory information system (LIS) is periodically reeval-uated and updated for maximal efficiency. Records are archived for an appropriate time.
□ Yes □ No
3.12 There is an organized protocol for any send-out testing, to in-clude a clear policy for postana-lytical responsibilities of each lab.
□ Yes □ No
4 | GENER AL ANALY TIC AL FAC TORS IMPORTANT IN VETERINARY CLINIC AL PATHOLOGY*
*Note: this section has been merged with the clinical chemistry section from the previous version (2009) due to content overlap. It is important to note that while the information below is directly applicable to clinical chemistry testing, it is germane to all areas of veterinary clinical pathol-ogy laboratory testing and will be referenced in other sections of these guidelines.
4.1 | Terms/definitions
Please also see these previously published ASVCP guidelines: Allowable total error biochemistry, Allowable total error hematology, and Exter nal quali ty asses sment and compa rativ e testi ng for refer ence and in-clini c labor atories.
Allowable total error (TEa)—A quality goal (see section 2 for more information on setting quality goals/standards) that sets a limit for com-bined imprecision (random error) and bias (inaccuracy, or systematic error) that are tolerable in a single measurement or single test result to ensure clinical usefulness. TEa should be determined before quality as-sessment of a method; although it can be derived mathematically from clinical decision limits and/or known biologic variation, it is not a mea-sured quantity (vs total observed error, below), but rather a set bench-mark. Ideally the TEa is based on clinical experience with the measurand in the species of interest. If a TEa is derived from judgement based on experience with the measurand in other species, it should be considered conditional until proven to be useful in a clinical setting.
Bias—The difference between the measured result and that obtained from a known standard, reference material, or other well-characterized field method. Generally used to describe the inaccuracy (systematic error) of a method relative to a compara-tive method in a method comparison experiment. The term bias in difference plot analysis (expressed in measurand units) equals the difference between the mean values of the two methods being compared or the average of all the differences between the paired results. Bias may also be expressed as a percentage according to the formula bias (%) = ([meanmeasured − meantarget]/meantarget) × 100. This calculation of total systematic error includes constant and propor-tional bias (if present). Constant bias is independent of measurand concentration/activity (i.e., is constant throughout the range of measured values), whereas proportional bias changes as measurand concentration changes (regression analysis allows the quantify the proportional and constant biases via slope and intercept, respec-tively; 4.3.4). An analytical method can have one or both types of bias. Bias should be assessed at several clinical decision limits and can be investigated through comparison of methods, interference, and recovery studies. Along with imprecision/random error, bias/systematic error measurement is used to calculate total observed error (TEo).
Bracketed QC—Describes a continuous laboratory production process with periodic QC runs at predetermined intervals; two con-secutive QC events define (“bracket”) a reporting interval of results (“run size/run length”).
Coefficient of variation (CV)—A representation of imprecision (random error), biologic variation, or other variability in a population; mathematically, CV is standard deviation (SD) divided by the mean and expressed as a percentage. CV can be assessed through short-term and long-term replication studies.
CV(%)=SD
mean×100

556 | ARNOLD et AL.
Commutable/commutability—Equivalence of the mathematical relationships between the results of different measurement proce-dures for a material (such as a reference material or quality control material) and for representative samples from healthy and diseased individuals. In practical terms, the property of commutability refers to the fact that a material interacts with the test system in the same manner as patient samples (i.e., lacks “matrix effects”).1 For a more complete discussion of commutability, please see these ASVCP Guidelines: Allowable total error biochemistry and External quality assessment and compa rativ e testi ng for refer ence and in-clini c labor atories.
Control Rules—“Rules”/guidelines (frequently called “Westgard rules” in tribute to the pioneers of this work in human medicine) which are used to decide whether a measured quality control mate-rial is within expected limits and whether to accept or reject current instrument performance. An example of a common control rule is 1-3s, whereby if one measurement falls outside of three standard deviations of the mean of past control data (the mean can also be adopted from the manufacturer of a commercially available control material), the measurement is deemed “out of control” and trouble-shooting measures are instituted to further investigate sources of systematic and random error(s). Control limits/rules are commonly mapped on a Levey-Jennings chart for visual representation of each control measurement. The process of choosing appropriate control rules for a measurand using a particular instrument/method is called QC validation and will depend on the TEa, measured bias, measured imprecision, desired probability of error detection, and desired prob-ability of false rejection.
Delta Checks—Evaluations in which previously defined differ-ences in serial patient results and the clinical history are used to evaluate if the detected change (usually to exceed the measurement uncertainty, dispersion, reference change value, or other predeter-mined limit) is likely to be of statistical or clinical significance, and if it is anticipated based on the progression of an underlying condition, treatment, or other factors. In human medicine delta checks are typ-ically performed on patients having serial tests in short time inter-vals (i.e., inpatients), using measurands of lower biologic variation; delta check limits are typically set to flag improbable changes (those not based on true patient changes). Use of a Reference Change Value is one method of evaluating if a change in serial results is likely to be of clinical significance.2,3
Diagnostic Sensitivity – The ability of a test to correctly identify patients who have a given disease or disorder; the more sensitive a test, the fewer false negative results it will produce. A diagnostically sensitive test is desirable when seeking to diagnosis a potentially dangerous disease (when the consequence of missing a diagnosis is severe).
Diagnostic Specificity—The ability of a test to correctly identify patients who do not have a given disease or disorder; the more specific a test, the fewer false positive results it will produce. Diagnostically specific tests are used as diagnostic tests or verifica-tion tests if a prior test (of another type) suggests that disease may be present. Highly specific tests are also useful when the therapy for
the condition in question is potentially dangerous or very expensive, helping to ensure that the disease or condition is correctly identified as being present before embarking on a treatment plan.
Difference (Bland-Altman) Plot—A graphical method to compare two measurement techniques. The result of differences (or alterna-tively the ratios) between the two techniques are plotted against the result of the averages of the two techniques. Formulas allow com-putation of the mean of the differences, the agreement limits (lim-its comprising the central 95% of the differences between the two techniques, i.e., mean difference line ±2SD), and the 90% confidence intervals of both the mean of the differences and the agreement lim-its. The difference between the line of equality (black dashed line in figure above) and the mean of the differences (blue line) corresponds with the bias between the two methods. This step alone is not suf-ficient to interpret the commutability of the two methods; the next step consists of comparing the distribution of the results with the limits of agreement (pink lines in this diagram) of the measurand to see if the new method can indeed be used in place of the former method and yield similar clinical conclusions.4
External Quality Assessment (EQA)—Inter-laboratory comparisons and other performance evaluations that may extend throughout all phases of the laboratory testing cycle, including interpretation of results. Types of EQA include peer comparison and comparison with known values of reference materials or standard solutions with agreed upon results based on expert opinions or other harmonization efforts. EQA programs are typically administered by a 3rd party or-ganization but can be implemented within a multi-site/multi-instru-ment laboratory system. The clinical relevance of an EQA program depends on commutability of the result obtained from the compar-ative specimens with that of patient samples and on the method by which the result of the comparative specimen is determined.
Imprecision—The degree to which repeated test analyses/runs on the same sample may give differing results. The lower the im-precision, the smaller the amount of random variation. A precise test method has reliably reproduced results. Imprecision is rep-resented mathematically by standard deviation or coefficient of variation, and along with bias, is used to calculate total observed error (TEo).

| 557ARNOLD et AL.
Key Quality/Performance Indicators—Objective measure for the assessment of performance of laboratory functions; these may in-clude parameters reflecting preanalytical, analytical and postanalyt-ical factors, chosen based on those aspects that have been shown to be of importance for users in general, and/or those aspects that have been identified as problematic for an individual laboratory based on history, client complaints, non-conformities, or internal needs. For example: %/no. received specimens of insufficient volume, %/no. of hemolyzed specimens, %/no. of unacceptable performances per year in EQA/PT, %/no. of positive heartworm antigen tests, %/no.high/low calcium measurements, %/no. high/low albumin mea-surements, %/no. of reports delivered outside of turnaround time, %/no. of amended reports; %/no. lab information system downtime incidents per year, etc.
Levey-Jennings Chart/Graph—A graph that quality control data is plotted on to give a visual indication of the performance of a labora-tory test and the control limits used for quality control. The distance from the mean is measured in standard deviations (SD).
Limit of Blank (LoB)—Highest measurement result that is likely to be observed for a blank sample. Replaces the previous term Lower Limit of Detection (LLD).
Limit of Detection (LoD)—Lowest amount of measurand in a sam-ple that can detected with a stated probability, although perhaps not quantified as an exact value. Replaces the previous term Biological Limit of Detection (BLD).
Limit of Quantification (LoQ)—Lowest amount of measurand that can be quantitatively determined with acceptable precision and trueness. Replaces the previous term Functional Sensitivity (FS).
Max E(Nuf)—A patient risk management technique applied when defining the run size for bracketed QC when the goal is set as one or fewer unreliable results per run or per number of samples analyzed. Max E(Nuf) is a statistical calculation of the Maximum Expected increase in Number of Unreliable Final patient results (i.e., risk of patient harm) that would be reported if unstable performance goes undetected. Unreliable is defined as results that differ from the ref-erence value more than the total allowable analytical error.
Measurand—A quantity subject to measurement under specified conditions (e.g., the enzymatic activity of alkaline phosphatase at 37°C).5 Updated terminology, but similar usage as “analyte.”
Method Validation—Process of determining error associated with a candidate instrument/method in order to determine if the amount of error is acceptable for the intended use of the test. This typically includes, at minimum, evaluation of analytical imprecision and bias. Other procedures that should be considered as part of the method validation process include reportable range, carry over (for hematology, body fluid cell counts), common interferences (hemo-lysis, lipemia, hyperbilirubinemia or other), recovery studies, and limit of detection studies (for measurands where lower limit is of clinical concern). Confirmation of reference interval (by de novo generation or transference validation) and QC procedures to en-sure the ability to detect ongoing stable performance with a high probability of error detection and low probability of false rejection are also be considered as part of the instrument/method validation process. Validation is advised for new methods or those requiring revisions due to changes in instruments, measurands, matrices, or extension of the scope of the method/intended use (e.g., testing on a novel species or specimen); significant changes to the analytic pro-cedure (e.g., reagents, timing, reaction temperatures, etc.) require validation.
Method Verification—Demonstration that a validated method achieves the established performance characteristics in the user's hands according to the manufacturer's claims for the method's spec-ifications (i.e., performance as intended); typically used when a pre-viously validated method is instituted in a new laboratory/for new additional or moved instrumentation units (same model), or when using new reagents. Often verification is accomplished with a subset of the procedures used for validation or specific calculations recom-mended in the literature (Clinical & Laboratory Standards Institute/CLSI and Westgard).
Multirule QC—The process of using a combination of decision criteria/control rules, in a specified sequence, to decide whether an analytical run is in-control or out-of-control. By comparison, a sin-gle-rule QC procedure uses a single criterion or single set of control limits, such as a Levey-Jennings chart with control limits set as either the mean plus or minus a defined number of standard deviations.
Multistage/Multidesign QC—Application of different QC proce-dures during different times in a testing cycle; for example, there may be a startup design for high error detection, using multiple con-trol rules, and a different monitor design (typically using a single con-trol rule and fewer levels of control) during the day/end of shift for low false rejections. The startup design should be used anytime the instrument has gone through a significant change, for example, after trouble-shooting and fixing problems.
Probability of Error Detection (Ped)—The diagnostic sensitivity of a control rule in detecting error; refers to the probability of identi-fying abnormal results. A Ped of 90% or higher is usually used as the recommended level of error detection with statistical quality control procedures. High Ped minimizes the risk of patient harm resulting from undetected errors in laboratory results.

558 | ARNOLD et AL.
Probability of False Rejection (Pfr)—The diagnostic specificity of a control rule in detecting error; refers to the likelihood of a QC fail-ure (rejecting data that are actually acceptable) when the test sys-tem is exhibiting stable performance. Mathematically, Pfr is actually [1-specificity]. A Pfr of less than or equal to 5% (i.e., specificity of 95% or greater) is usually used as a working goal for statistical quality control procedures to minimize “alarm fatigue” due to more frequent false rejections.
Proficiency Testing (PT)—A measure of laboratory competence to assess the capability of conducting a specific diagnostic test. PT is often used synonymously with EQA but may specifically refer to testing performed in compliance with state or federal regulations. PT/EQA in veterinary medicine is often based on peer-comparison testing (grouped by method and/or instrument). For regulatory PT, comparison with the standard set by the regulatory agency is used.
Quality Control (QC)—Refers to procedures for monitoring the day-to-day laboratory work processes, detecting problems, and making corrections prior to test reporting. QC is often used to refer specifically to procedures monitoring analytical error (vs. quality assurance/QA which is used more broadly). Statistical quality con-trol (SQC) is commonly employed in monitoring the analytical per-formance of laboratory methods. It includes method validation/verification, selection of control materials, control rules, and num-ber/timing of control runs necessary to efficiently detect unstable performance. QC includes monitoring of key quality indicator tests, evaluation of control data for trends or shifts, and review of patient data. Many instruments also have internal quality control processes that are operator-independent, but these alone are not adequate for quality assurance. Non-conformities identified in either control or patient results should result in suspension of result reporting, reme-dial actions taken, and clients contacted as necessary.
Quality Control Material (QCM)—A specimen or solution which is analyzed solely for quality control purposes (independent of cal-ibration), whether during an initial instrument performance study (method validation/verification) or to monitor routine analytical performance. These materials are widely available commercially in liquid, frozen, or lyophilized form for most laboratory tests (use of human products is most common due to availability). Manufacturers of these materials are often also the providers of instruments, cal-ibrators, and reagents. Patient samples can also be used as quality control materials.
Quality Control Validation—The selection of QC rules (see con-trol rules, above) for the statistical monitoring of analyzer/method performance. For most automated methods, the control rules are selected to achieve a high desired probability of medically important error detection (Ped) of 90% and a low probability of false rejec-tion (Pfr) of <5%, minimizing the risk of reporting erroneous results. The process of validation/choice of control rule(s) depends on the chosen quality requirement/goal (see allowable total error, above, a common quality goal) and the measured bias and imprecision of the instrument/method.
Repeat Patient Testing (RPT)—Quality control method using pa-tient samples in lieu of, or in addition to, purchased quality control
materials. Customized control limits are calculated from a pilot set of RPT data and a chosen control rule.6 RPT-QC data interpretation is analogous to statistical QC using commercial QCM—data points falling outside the control limits indicate greater-than-expected variability in the data and a potential problem with the test system, warranting further investigation prior to additional patient testing or release of patient results.
Sigma Metric—A ratio which allows comparison of performance between tests/processes which may have significantly different units. It is the calculation of the probable number of defects which may be produced during stable performance in terms of the num-ber of standard deviations (sigmas) that fit between the observed mean and the allowable error. For analytic processes, calculated as Sigma = [(%TEa − %|bias|)/%CV], where TEa is the allowable total error or proficiency testing criterion for acceptable performance, %bias represents the observed inaccuracy or systematic error of the method, and %CV represents the observed imprecision or random error of the method.
Six Sigma—A concept for world-class quality and a goal for pro-cess performance that requires 6 standard deviations (SD) of process variation to fit within the tolerance limit or quality requirement of a process, translating to an error rate of 3.4 errors per one million op-portunities (error free rate of 99.99966%). It is applied in the Sigma Method Decision Chart as a criterion that requires bias + 6 SDs to be less than TEa, the allowable total error for the test.
Standard Deviation (SD)—A measure of variability or diversity as-sociated with random error or imprecision. SD shows how much vari-ation exists relative to the mean (average or other expected value) during repeated measures. A small SD indicates that data points tend to be very close to the mean, whereas a large SD indicates that the data points are spread over a wide range of values. SD is the square root of a dataset's variance.
Total Observed Error (TEo or TEobs)—Measured performance of an instrument/method. Calculated as the sum of bias/systematic error and imprecision/random error: TEo(%) = 2CV(%) + |bias| (%), or 2SD (units of measure) + |bias| (units of measure). TEo is specific to the instrument/method, measurand, and measurand concentration (e.g., the TEo at low hematocrit values may be different from TEo at high hematocrit values).
4.2 | Monitoring
4.2.1 | Internal Monitoring
Internal monitoring of all equipment with regard to electronic safety (to include radiofrequency interference from cell phone antenna systems/wifi), calibration, equipment maintenance, and equipment
s=
�∑(xi− x̄)2
(n−1)

| 559ARNOLD et AL.
performance is recommended.7 The monitoring of automated in-struments/lab equipment should include the following:
• Water quality (as specified by instrumentation and assays)• Stability of electrical power and light sources (as specified by
instrumentation)• Temperatures of water bath, refrigerator, and freezer (recom-
mended daily)○ Large equipment may be wired to an alarm system to alert
users when temperatures are out of a specified range.• Regular cleaning/calibration of analytical balances, pipettes, mi-
croscopes, and centrifuges (annually or as recommended by the instrument manufacturer, whichever is shorter)
• Proper storage, handling, and maintenance of inventory• Manufacturer's instructions for routine maintenance (daily,
weekly, monthly) and calibration should be followed unless labo-ratories have modified these for their own use, with documented satisfactory performance and appropriate instructions.○ An Instrument Performance Log is recommended for each
instrument, to record procedural changes, information about any problems encountered with methods or instruments, their investigation, and actions taken for resolution.
○ Notation of routine or special maintenance/repair and part re-placements or other factors that may influence performance is recommended.
○ All logged entries should be clearly dated and signed by labo-ratory personnel. This function may be maintained electroni-cally for easy access during any regulatory or quality assurance inspection.
• Use of quality control materials for monitoring internal perfor-mance is covered in detail in section 4.7.○ Accumulated quality control results (such as Levey-Jennings
charts) should be reviewed daily, weekly, and monthly to de-termine if trends, shifts or other aspects indicate impending problems, in addition to acceptable performance defined by QC rules.
○ Appropriate actions should be taken when quality controls results exceed the limits or demonstrate undesirable trends.8 Commonly used corrective actions should be outlined for lab-oratory personnel in SOPs.
4.2.2 | External quality assessment (proficiency testing)
External monitoring should include participation in an external qual-ity assessment (EQA) program. Quarterly participation in programs specific to veterinary diagnostic laboratories are preferred but may not always be available or practical. Any laboratory system per-forming testing with multiple instruments from the same or differ-ent manufacturer(s) should have an internal QA program to assess harmonization of instruments running the same tests and using the same reference intervals. A more complete description of external
quality assessment (proficiency testing) can be found in Bellamy and Olexson9 and in the ASVCP guideline: Exter nal quali ty asses sment and compa rativ e testi ng for refer ence and in-clini c labor atories. Regarding EQA:
• All participating laboratories should analyze the same materials from the same lot.
• Results should be tabulated regularly (per exercise frequency cycle) and distributed to participants with statistical summaries expressing the closeness of individual laboratory results to the peer group mean.
• Means should be calculated and analyzed based on identification of the method (same methods compared). If the method is also linked to the instrument, this provides an additional comparison based on instrument and method.
• Each laboratory should carefully assess the validity of their re-ported performance. Performance that differs by more than two standard deviations from the peer group mean (i.e., SDI or z-score >2) or from a predetermined quality goal should prompt an in-quiry. Other standards for EQA performance may include those based on biologic variation or on desirable total error. Lesser deviations from the peer mean may be significant if they repre-sent a difference from the historical performance of a particular instrument/method.
4.2.3 | Procedures manual
Please refer to section 2.3 and Appendix 1 of section 2, Introduction to a Total Quality Management System.
4.3 | Method validation/verification
Confusion exists over the definitions and practical applications of method validation and method verification. The consensus among laboratory standards organizations is that method validation is the process used to confirm that the analytical procedure employed for a specific test is suitable for its intended use, while method veri-fication (or method transfer) confirms that a laboratory is capable of performing a previously validated analytical method reliably and precisely.10 In veterinary medicine, a combination of validation and verification must occur to ensure that the method performs well on animal specimens, to determine the amount of analytical error (contributed to by imprecision and systematic error/bias/inaccuracy) that is associated with a particular instrument/method, and to de-termine if the amount of error is acceptable for the intended use of the results. For the purposes of this document, method validation will be used to describe the appropriate studies recommended prior to adopting a new test procedure or bringing a new instrument/method on-line. Validation studies include: assessment of reportable range/linearity; precision; accuracy; analytical range; limit of blank (LoB)/limit of detection (LoD)/limit of quantification (LoQ) of the

560 | ARNOLD et AL.
method (see section 4.3.8); and, interfering substances. Please see section 4.3.9 for more information on how to choose an appropriate validation/verification plan for the given situation.
Method validation/verification studies are used to:
• Determine whether the proposed instrument/method or change is suitable for its intended purpose for veterinary testing based on predetermined quality goals. These goals will vary for different measurands, depending on the way that the results are used for patient diagnosis, prognosis, monitoring, or management. They also may differ for different species but are generally chosen to accommodate the species with the most stringent requirement.
• Determine the amount of variation (error) associated with a new instrument/method. This will include estimations of imprecision and bias (inaccuracy), including comparison with a reference method (not always available) and/or an existing well-character-ized field instrument/method (more common). This allows for pro-viding the best information to clients about the reliability of the results, the probability/uncertainty distribution associated with them, and how the instrument/method performs compared to an instrument/method previously used.
• Determine whether new reference intervals (RI) need to be gen-erated, or if adjustments to the instrument/method (or statistical adjustment of the RI) may be needed to accommodate common RI used within the laboratory system. Reference interval transfer-ence validation may be considered if the same reagents and meth-ods are being used as those for a previously established RI, and if analytical performance (e.g., precision, bias vs. peer group or vs. control material target values) of the old and new instruments are similar. However, RI transference should only be done once; sub-sequent instrument changes/additions warrant re-establishing RIs.
• Determine the quality control (QC) practices needed to ensure ongoing stable instrument/method performance based on the observed performance of the instrument and method with a high probability of error detection (Ped) and low probability of false rejection (Pfr) (see section 4.7).
• Monitor ongoing harmonization of results when multiple instru-ments are used within the same laboratory/laboratory system.
Reference intervals and quality control procedures for a new method should be determined before patient testing is initiated. If there are limited data available for reference interval determination, this should be explained in an addendum to the test, with the basis for the interpretation explained.11
Quality goals serve as a benchmark for test performance. Analytical quality goals, such as total allowable error (TEa) or bio-logic variation-based goals should be established for each test prior to initiating method or instrument validation studies.12,13 (For more information on TEa, see the ASVCP Guidelines: Allow able total error bioch emist ry and Allow able total error hemat ology ).14,15 The total observed error inherent in a new method or instrument, as deter-mined during validation studies, must fall within these goals; if not,
this suggests that the new method should be rejected.16 Practicality may require that state-of-the-art performance goals prevail, but de-viations from the desired quality goals should be taken into account in interpretation. The appropriate validation studies must be selected to reveal the expected types and magnitudes of errors in assay mea-surements.16 Numerous commercial software programs are available to facilitate the statistical analysis of results collected during method validation studies.a-c Additional information and graphing tools for method validation can be found at www.westg ard.com.
Method validation/verification studies may include any or all of the following:■ Reportable range/linearity study (4.3.1)■ Short-term replication study (repeatability or within-run; 4.3.2)■ Long-term replication study (reproducibility or between-run;
4.3.3)■ Comparison of methods (4.3.4)■ Interference study (4.3.5)■ Recovery study (4.3.6)■ Reference interval determination (4.3.7)■ Detection limit study (4.3.8)■ QC validation (4.7.1)
4.3.1 | Reportable range/linearity study
The reportable range may be different for different species and must be established for each species for which the instrument is used. The need for dilutions during patient testing should be determined based on the reportable range and the expected reference intervals for the species in which the instrument/method is to be used. A manufac-turer representative may perform the linearity studies and assist in determining the reportable range(s). Spiking of high pool samples with a calibrator may be needed if specimens with high results near the upper limit of the reportable range are not available, but atten-tion to maintaining the species matrix is recommended.
(i) A minimum of five levels of solutions are recommended. Solutions with matrices that approximate real samples are preferable to water or saline dilutions.16
Level 1: zero or the lower detection limit of the assayLevel 2: three parts low pool plus one-part high poolLevel 3: two parts low pool and two parts high poolLevel 4: one-part low pool and three parts high poolLevel 5: exceeding the expected upper limit of the reportable
range of assay(ii) Three to four replicate measurements on each specimen are
recommended.16
(iii) The mean value for each specimen is plotted on the y–axis and expected value on the x-axis.16
(iv) The plot is visually inspected for outliers, linearity, and “best fit” line.16 Regression analysis to calculate slope and intercept is ideal, giving a more objective assessment of linearity than visual inspection alone.

| 561ARNOLD et AL.
(v) If the assay is not linear within the manufacturer's recommended working range, the method may be rejected. Alternatively, the reportable range can be changed to lie within the linear region (most common approach).
4.3.2 | Short-term replication study (repeatability or “within-run”)
This is the estimation of the random error (RE), or imprecision, of the method over a short time interval. Conditions of testing should be specified in any documentation (same or different operator, time-frame, etc.). Samples are typically analyzed during a single 8-hour shift or within a single analytical run.16
(i) Standard solutions, commercially available control materials, or pooled fresh patient samples can be used. Pooled patient sam-ples are recommended as the most accurate determination of repeatability of patient results since control materials, calibra-tion materials, or other standards may not be commutable with veterinary patient specimens.
(ii) The level of measurand should approximate important clinical decision levels. A minimum of two levels (normal and high) is recommended if the measurand is clinically significant when in-creased. At least three levels are recommended (low, normal, high) if the measurand is clinically significant when decreased or increased.
(iii) A minimum of 20 replicates for each clinical decision level is recommended during the time interval of interest, as feasible for stable measurands over the run length. For more labile mea-surands exceeding the capability of even a short run time (such as blood gases, ammonium, etc.), control material may be neces-sary to provide the desired number of replicates over the time interval measured.
(iv) Raw data from the short-term replication study should be visually examined for possible outliers. Most short-term im-precision experiments will not have outliers, but sufficient repetitions (n = 22-25) should be considered to allow for pos-sible elimination of outliers in order to achieve n = 20. The cause of outliers should be determined and corrected if pos-sible, as obvious outliers are not truly reflective of stable in-strument performance and therefore should be eliminated from the dataset. with continued analysis as needed to col-lect a minimum of 20 data points for determination of the imprecision.
(v) Analysis of data includes calculation of the mean, standard devi-ation (SD) and coefficient of variation (CV). Commercially avail-able software programs can assist in these calculations.
(vi) Compare the SD and CV) to the laboratory standard (commonly recommended that within-run SD should be < 0.25TEa, ex-pressed in units of the test).16 If the SD exceeds this standard, careful consideration of rejection of the method is indicated. If the imprecision exceeds this guideline, the bias will need to be small in order to achieve the desired total error budget and allow for any additional sources of preanalytical or analytical error.
Additional analyses including bias (determined from the com-parison of methods study 4.3.4, recovery study 4.3.6, and/or com-parison with the manufacturer's target mean for quality control materials) should be conducted after the short-term replication study.
4.3.3 | Long-term replication study (reproducibility or “between-run”)
This is the estimation of the random error (RE), or imprecision, of the method over a longer time interval that reflects day-to-day working conditions. Conditions of testing should be specified in any docu-mentation (same or different operator, timeframe, etc.). Long term replication can be studied using pooled patient samples or with quality control materials (QCM), though patient samples may be pre-ferred as they contain the same matrix, reflecting daily conditions more closely. In the authors’ experience, it is possible to perform long-term replication studies for endocrinology, or for other assays for which stability of frozen specimens may be questionable, using refrigerated pooled patient samples. Ideally, 2-3 pools of samples (low, intermediate, high concentrations) targeting decision limits are used, each with 4-5 replicate measurements daily for five days, pro-viding a between-run CV for each concentration level. Alternatively, a stable QCM (verified stable for 3-4 weeks) is analyzed 20 times during different shifts/runs once daily over 20 days. It is commonly recommended that between-run SD should be < 0.33TEa, expressed in units of the test. Sample selection and data analysis are the same as for the short-term replication experiment. These data are used as the CV in the calculation of total observed error (TEo); please see section 4.3.4.
4.3.4 | Comparison of methods study
This is the estimation of bias, or systematic error (SE), of the can-didate test method as compared to an established “comparison” method. The comparison method may be with a true “gold stand-ard” reference method for analysis or a well-characterized field method.17,18 Both constant and proportional bias may be identified by the comparison of methods study; further definition of any pro-portional bias can be obtained from recovery studies (4.3.6).(i) Choose the comparison method with consideration for known
accuracy and quality. Comparison to external quality assess-ment/proficiency testing data or manufacturer's target mean
SD=
�∑�xi− x̄�2
n−1
CV(%)=SD
mean×100

562 | ARNOLD et AL.
for QCM may be considered; however, careful attention to the known accuracy of such data is recommended since some EQA specimens and QCMs may not be commutable (i.e., exhibit the same performance as patient specimens) and may thus introduce bias.19
(ii) A minimum of 40 independent patient specimens tested by both methods is recommended.16,20 Samples should be free of known interfering substances. Specimens should represent the spec-trum of results expected in clinical application of the method and span the entire working range.20
(iii) Duplicate measurements by each method are desirable, but single measurements are acceptable if cost and/or specimen volume is limiting.20 Results should be examined at the time they are performed. If a significant difference is detected in values obtained by the two methods, immediate retesting should be performed to determine if the discrepancy is re-peatable, and needs further characterization, or if a random error occurred.
(iv) Specimens should be analyzed by the different methods within two hours of each other, if possible, or within a time frame re-flecting measurand stability. If this is not possible (such as analy-sis at different laboratories), all samples should be processed and frozen (serum, plasma) until they can be analyzed within the de-fined time frame. Measurand stability and the type of specimen should be considered since not all specimens (e.g., hematology specimens) will be suitable for delayed analysis. Preanalytical factors should be standardized for all samples and measurements to avoid extraneous variables impacting results. Procedures for specimen handling should be well-defined.
(v) The study should be conducted over 5-20 days with a preference for the longer time; eg, 2-5 specimens per day for 10+ days, if specimen stability allows.
(vi) Analysis of data:1. A comparison plot is recommended for visual inspection with
the test method plotted on the y-axis and the comparative method plotted on the x-axis. Outliers should be investigated immediately and reanalyzed as needed. A “best fit” line can be drawn based on visual assessment of the data.20
2. The calculation of a correlation coefficient (r) is used to deter-mine which statistical regression methods should be used to estimate SE (bias) but is not acceptable as a measure of agree-ment. See Figure 1
• If r ≥ 0.99 for data with a broad range of results (such as enzymes or some metabolites), or >0.975 for data with a narrow range (such as electrolytes or some hormones), stan-dard linear regression statistics can be used to estimate the SE (bias) at medical decision concentrations.16,20,21 The SE (bias) at a particular decision level (Xc) can be determined by calculating the corresponding y-value (Yc) from the regres-sion line:
Yc = result calculated for the candidate (new) method, a = slope, b = y-intercept and Xc is the result obtained with the comparative method:
For measurands that vary over a wide range, regression statistics are typically used to determine SE (bias).16,20
• If r < 0.99 (or <0.975), the data could be improved by collect-ing more data points or decreasing variance by doing replicate measurements, or paired t-test statistics should be used to estimate the SE (bias) as the difference between the means of the results by the two methods.16,20 The paired t-test, how-ever, is not applicable in the presence of proportional error.16 Passing-Bablok or Deming regression analysis are alternate methods that can be used. Subdivision of results into groups (below, within, or above the reference interval) may be used to provide additional insights for means in ranges that are clini-cally significant.20
For measurands that vary over a narrow range (electrolytes), t-test statistics are used to determine SE (bias).16
(vii) Creation of a difference plot (Bland-Altman) is recommended (refer to definitions, section 4.1). The difference between the test and comparative method is plotted on the y-axis, and the mean of both methods is plotted on the x-axis. The line of difference identifies the mean SE (bias). For tests with absent or negligible bias, results are scattered closely around the line of zero difference, with ap-proximately half above and half below this line.4,20,22 It is important to consider both the mean difference and the range of the individ-ual differences (reflected in the agreement limits, or mean differ-ence ±2SD) in determining the clinical importance of the bias.
(viii) Criteria for acceptable performance depend on the TEa for the test, as determined by each laboratory. Observed, or calculated, total error (TEo or TEobs) includes systematic error (bias), as de-termined by the comparison experiment, and random error (SD or CV), as determined by the long-term replication (between-run) experiment. TEo = |bias| (meas) + 2 SD(meas), or, TEo = |bias| (%) + 2CV. Performance is considered acceptable if TEo < TEa. A Method Evaluation Decision Chart, which accounts for TEa, SE, and RE, also can be used to determine method acceptability (Figure 2).16
4.3.5 | Interference study
This is the estimation of systematic error (SE) caused by substances within the specimen being analyzed. These errors are typically, but not always, constant across the range of patient values, with the size of error in proportion to the concentration of the interfering material.16 Common interfering substances include hemoglobin (he-molysis), lipid, and bilirubin.9 Additional comparisons may be made between heparinized plasma vs. serum and serum samples collected
Yc=aXc+b
SE(bias)=Yc−Xc

| 563ARNOLD et AL.
in gel tubes vs. plain tubes or other possible interferents, as indi-cated by the test or instrument of interest.
(i) A minimum of five standard solutions of interferent (of differing concentrations), patient specimens, or pooled patient samples can be used. Patient specimens or pooled patient samples from carefully selected peer groups are preferred because of their ready availability and similar matrix effect. Samples with vary-ing levels of the measurand that at least spans the clinical range should be chosen.16
(ii) The different defined quantities of hemoglobin (from lysed RBCs of the species in question), lipid (commercially avail-able solutions or lipid harvested from clinical specimens) and bilirubin (commercial standard solutions) are added to sam-ples to reach increased concentrations that are anticipated to occur in patient samples.16
(iii) The volume of interferent added should be minimized to avoid changes in the sample matrix introduced by the inter-ferent solution.16 Duplicate measurements on all samples are
recommended. Small differences in the measurand results caused by the interferent may be masked by random error in-herent to the method. Duplicate measurements will help obviate this problem.16
(iv) Measurements should be performed by both the new method and the comparative method. If both methods show similar SE (bias) caused by the interferent, the presence of bias due to inter-fering substances may not be sufficient alone to reject the new method.16
(v) Calculation of bias due to the interferent:16
1. Determine the mean for the duplicates of the interferent-con-taining sample and the control.
2. Calculate the difference (bias) between the interferent-con-taining sample and its control. Repeat for all pairs of samples.
3. Calculate the mean difference (bias) for all specimens with a given concentration of interferent.
(vi) A paired t-test is recommended for comparing the results from the interferent-containing sample and the unadulterated con-trol. Regression statistics are not applicable. A t-test statistic
F I G U R E 1 Two equivalent ways of considering the proper statistical methods for comparison studies depending on the correlation coefficient r and the range of the data

564 | ARNOLD et AL.
with standard cut-off of 2 (1.96) is used. The t-test statistic esti-mates the number of standard deviations that the altered sam-ple differs from the unaltered sample.16
(vii) Criterion for acceptable performance is SEmeas < 0.5TEa; this is based on the premise that random error (RE) recommenda-tion is usually < 0.25 or < 0.33 TEa (for within run and between run imprecision, respectively). This leaves a small “safety mar-gin” of 0.17-0.25 TEa for other sources of error contributing to the TEobserved (TEo) . If the SEmeas > 0.5TEa, the laboratory should decide whether specimens likely to contain interfering substances can be readily identified and whether specimens should be rejected if potential interferents are present or if their effect can be quantitated/semi-quantitated based on additional studies.16 In the authors’ experience, the goal of SEmeas < 0.5 TEa has been shown to work well in clinical practice and, when imprecision is considered in addition to the bias (SE), allows for an additional small “safety margin” for other sources or error.
4.3.6 | Recovery study
This is an estimation of proportional systematic error (SE). Recovery studies are important when there is proportional SE to character-ize at what level proportional SE may become significant/where in-terpretation is affected. Proportional SE occurs when a substance within the sample matrix either reacts with the measurand and/or the reagent, or when there are changes in light transmission or other factors that affect the measurement of the result. The magnitude of proportional SE changes as the concentration of the patient measur-and changes. Proportional SE is determined by calculating the per-cent recovery of a known amount of a standard measurand (such as sodium) which has been added to a patient specimen.16
(i) Standard solutions of high measurand concentration are often used since they can be added in small amounts in order to min-imize specimen dilution but still achieve a recognizable, signif-icant change in the measurand concentration. Dilution of the original specimen should not exceed 10%.
(ii) The amount of measurand added should result in a sample that reaches the next clinical decision level for that measurand. Similar to the interference experiment, small additions will be more affected by the inherent imprecision of the method than large additions. The number of samples used for evaluation of recovery may vary, depending on the measurand and the num-ber of clinical decision levels of interest. Three to five different levels of added measurand are commonly used for this study.
(iii) Replicate measurements of both adulterated and control speci-mens are recommended. Recovery samples should be analyzed by both the test and comparison methods, if the latter exists.
(iv) Data calculation (For an example of the data calculations in-volved in a recovery study, see reference 13 or http://www.westg ard.com/lesso n27.htm#4):
1. Calculate the concentration of the measurand added: Conc. stan-dard added x [ml standard added/(ml standard added + ml sample)]
2. Calculate the mean of the replicate measurements for all samples.3. Calculate the difference between the adulterated sample and
the control.4. Calculate the recovery by dividing the difference by the
amount added.5. Calculate the mean of the recoveries of all the pairs tested.6. Calculate the proportional SE as 100% - recovery%
(v) Criterion for acceptable performance is SEmeas < 0.5TEa or < TEa (depending on the error budget). Small amounts of propor-tional systematic error may be acceptable; however, the method should be rejected if large proportional systematic errors that are greater than the total allowable error are observed.
4.3.7 | Reference interval for new method/instrument
Creation of a new reference interval or validation of an existing ref-erence interval is necessary for clinical decision making. For more information on creating reference intervals, please see the ASVCP Guidelines: Deter minat ion of de novo refer ence inter vals in veter inary speci es and other relat ed topics.23
4.3.8 | Detection limit study
This is the estimation of the lowest concentration of a measurand that can be measured. Detection limit verification is recommended for all assays in which a low value may be of clinical significance, e.g., forensic tests, thera-peutic drug levels, TSH, immunoassays, and cancer markers.16
(i) A “blank” sample that does not contain the measurand of interest and a sample containing a low concentration of the measurand are used. Several samples of different low concentrations, con-taining measurand at the detection concentration claimed by the manufacturer, may be required.
(ii) 20 replicate measurements for each of the samples are recommended.
(iii) The blank solution measurements can be performed “within-run” or “across-run” on the same day. However, the low concentration sample(s) should be analyzed over a longer period to account for day-to-day or between-run variation, if stability permits. Twenty measurements over a minimum of five days is often recommended.16
(iv) Quantitative estimations may be reported as:1. Limit of the Blank (LoB). This is the highest result that is likely
to be observed for a blank sample, typically estimated by the mean value of the blank + 1.65 x SD of the blank.16
2. Limit of Detection (LoD). This is the lowest amount of a mea-surand that can be detected with a stated probability, although perhaps not quantified as an exact value. It is estimated by mean of the blank + 1.65 x SD of a low concentration sample.

| 565ARNOLD et AL.
It may be necessary to prepare several spiked samples with concentrations that are in the analytical range of the expected detection limit. The results may help determine which concen-tration is of clinical interest and can be used for the LoD.
3. Limit of Quantification (LoQ) is the lowest amount of mea-surand that can be quantitatively determined with stated ac-ceptable precision and trueness, under stated conditions; it is estimated by the is the mean of the blank + 2 SD of the low concentration sample. This estimate of error should not ex-ceed the TEa.
4.3.9 | Choosing a validation plan
Which method validation studies are required depend on various factors, such as the budget available, current knowledge of the in-strument/method, whether it is for use in a species in which it has already been characterized vs novel species, and how the results are going to be used/clinical setting. Below are recommendations for the minimum validation studies performed for introduction of a new in-strument/method See Table 1.
4.4 | Comparative testing
(Note: this is a different procedure than “comparison of methods” dis-cussed in 4.3.4). If the laboratory performs the same test by more than one instrument or method, at more than one test site, or by a referral laboratory, comparisons should be run regularly to define the relationships between instruments, methods, and sites. This is a sep-arate procedure that should be done in addition to EQA/PT (4.2.2).
The following steps should be included:
• A minimum of 12 samples during the year (one per month or more frequently, if inadequate performance is identified), including those species commonly encountered in the laboratory. Use of samples whose measurand values cover a range of clinical deci-sion levels is recommended.
• Several approaches for determining comparability of test results exist and may include use of TEa goals, reference intervals, statis-tical criteria, or use of biologic variation data.24
• If individual test results performed on the same patient or material do not fall within specified performance limits, the cause should be investigated, the situation documented, and corrective action taken.
4.5 | Instrumentation
4.5.1 | Instrument performance
The instrumentation and methods used must be capable of provid-ing test results within the laboratory's stated performance charac-teristics.25 These include:
• Analytical range including detection limit and reportable range/linearity
• Imprecision (random error)• Accuracy (bias/systematic error)• Analytical Specificity—Measurement of the target compound.
This should give an estimate and clearly define any interfering substances (see 4.3.5). Because interferences cannot always be avoided, consideration should be given to the development of interferograms that examine the effects of added lipid, bilirubin, and hemoglobin on assay results. Because interferences are spe-cies-specific, ideally interferograms need to be created for each measurand and species tested.
4.5.2 | Function checks
Appropriate function checks of critical operating characteristics should be made on all instruments. (i.e., stray light, zeroing, electrical levels, optical alignment, background checks, etc.). Prior to sample testing, laboratory personnel should calibrate assays according to manufacturer's instructions as needed based on other evaluations and perform QC daily or for each day that a test is run (see also sec-tion 4.7.4 for information on QC frequency). Instruments should be operated per manufacturer instructions.
4.5.3 | Calibration
Instruments generally should be calibrated at least every 6 months. More frequent calibrations may take place16:
1. According to manufacturer's recommendation2. After major service3. When QC values are outside limits or troubleshooting indicates a
need4. When workload, equipment performance, or reagent stability in-
dicate the need for more frequent calibration
After calibration, controls should be run according to SOP to en-sure that stable performance is achieved.
4.6 | Personnel knowledge
Laboratory personnel should have thorough working knowledge of the equipment and its use, including, but not limited to the following topics.(i) Linearity/reportable range differences in animal compared to
human samples(ii) Effects of hemolysis, lipemia, icterus, carotenoid pigments (es-
pecially large animals), and different anticoagulants (if applica-ble) on each assay
(iii) Reportable ranges for veterinary species

566 | ARNOLD et AL.
(iv) Species-specific or strain/breed-specific reference intervals(v) Expected physiologic ranges. Repeat criteria may be estab-
lished that trigger re-analysis of a sample. Criteria for re-peating a test should include any equipment-generated error messages or flags suggesting that re-evaluation is needed, as well as results that are grossly outside of normal physiologic range. For the latter, consider use of “critical/panic values” preprogrammed into the analyzer operating system. Retesting to confirm an abnormal result should be communicated to the client as part of the report (for more information, please see section 12, general postanalytical factors).
(vi) Common problems encountered with veterinary samples and appropriate problem-solving procedures to take with various error messages or flags (troubleshooting).
(vii) Regular instrument maintenance and maintenance schedule (daily, weekly, monthly, and as needed).
(viii) Replacement of inadequate or faulty equipment(ix) Appropriate use of comments and species-specific criteria.
Comments and species-specific criteria may be determined to be of interpretive benefit to clients. Direct communication with clients should be limited to those in the organization who are qualified to provide data interpretation in the context of clinical history and previous therapies.
4.7 | Routine quality control
Calibrators and controls should be identified appropriately (to in-clude expiry dates), and their use and frequency should be docu-mented as part of the quality plan to ensure accuracy of results.8 Documentation and generation of appropriate actions should follow rules and policies established for analysis of the QC materials. These may include confirmation of results and appropriate use of charts, graphs, and data entry, as determined by the laboratory for each department and/or type of equipment. There should be a reporting structure to inform management of QC issues, and problems requir-ing attention should be forwarded to appropriate persons within the organization. When quality control data indicate unacceptable performance, follow-up/monitoring of corrective actions should be in place to evaluate the effectiveness of these actions (see also sec-tion 2, Total Quality Management).
4.7.1 | Selection of QC rules for statistical monitoring of method performance (“QC Validation”)
(i) For most automated methods, the control rules are selected to achieve a high desired probability of medically important error detection (Ped) of 90% and a low probability of false rejection (Pfr) of ≤5%, minimizing the risk of reporting erroneous results. For extremely stable assays with few anticipated problems, a probability of error detection as low as 50% may be acceptable but is generally not recommended for routine veterinary use.
(ii) QC validation utilizes the chosen quality goal for the test (such as TEa, clinical decision limits, or biologic variation) with mea-surements of coefficient of variation (CV/random error) and bias (systematic error). QC validation should be approached using data for CV and bias calculated from a minimum of 20 data points for a control material and information about bias relative to the manufacturer's target mean for the method/instrument. Control products, preferably from the same lot number, should be purchased commercially. If using calibrators as control ma-terials, the lot number used for calibration should be differ-ent from that used for the control material. If pooled patient samples are used, establish the mean value for all measurands (minimum n = 10 to establish a mean). Repeat patient testing also may provide an acceptable method for statistical QC and overcomes limitations based on lack of commutability of some commercially available control/calibration materials, as well as the deterioration of pooled patient samples that may occur over time.6,26 Controls should be assayed in the same manner as pa-tient specimens.
(iii) Relating the quality requirement to the observed bias and preci-sion for designing statistical QC can be quantified by calculation of the sigma metric of a laboratory test process [sigma = (%TEa – %|bias|)/% CV]. The sigma metric is a ratio and allows compar-ison of performance between tests/processes which have dif-ferent units. It reflects the probability of defects during stable performance. A value of 6-sigma indicates world-class quality (<3.4 defects per million or 0.00034% error rate); 3-sigma is generally considered to be a minimum for adequate function in industry (6.7% error rate, or 66,807 defects per million).27 The lower the sigma, the more stringent the statistical and non-sta-tistical QC procedures that are needed to ensure adequate per-formance [Table 2]. Sigma worksheets have also been developed to assess the most cost-effective QC procedure when several candidate rules are identified by QC validation.28
(iv) QC validation can be done manually using normalized method decision/operational process specifications (OPSpecs) charts (Figures 2 and 3). This chart plots the measured imprecision and inaccuracy data (“operating point”) against the TEa that is al-lowable for a method; lines on the graph in relation to the oper-ating point (directly related to the sigma metric of the test) will demonstrate the QC procedures/control rules and number of control measurements necessary to achieve a certain Ped and Pfr. Importantly, these methods do not specify QC frequency (see 4.7.4, below).29
(v) Different QC rules may be required for different levels of a sin-gle measurand or for different measurands measured within the same report profile. For example, more stringent multi-rule QC may be required to detect error at lower measurand levels than at higher measurand levels.
(vi) Different QC rules may be desired during the adoption of a new method or after calibration and maintenance than those re-quired during routine use of an established method (multistage QC). The QC rules used during adoption of a new method or

| 567ARNOLD et AL.
TAB
LE 1
Re
com
men
datio
ns fo
r the
min
imum
val
idat
ion
stud
ies
perf
orm
ed fo
r the
intr
oduc
tion
of a
new
inst
rum
ent/
met
hod
Situ
atio
n
Valid
atio
n St
udy
Repo
rtab
le ra
nge/
linea
rity
Shor
t ter
m
repl
icat
ion
Long
term
re
plic
atio
nCo
mpa
rison
of
met
hods
Inte
rfer
ence
Reco
very
a Re
fere
nce
inte
rval
de
term
inat
ion
Refe
renc
e in
terv
al
tran
sfer
ence
Det
ectio
n lim
it Q
C va
lidat
ionc
Con
side
ring
inst
rum
ent/
met
hod
use
in a
nov
el
spec
ies
✓✓
✓✓
✓✓
✓✓
b✓
Inst
rum
ent/
met
hod
repl
ac-
ing
an e
xist
ing
inst
rum
ent,
whe
ther
repl
acem
ent i
s sa
me
or d
iffer
ent
✓✓
✓✓
✓✓
✓b
✓
Add
ition
al in
stru
men
t(s)
usin
g sa
me
met
hod
in
sam
e la
b/la
b sy
stem
, with
go
al o
f hav
ing
com
mon
re
fere
nce
inte
rval
s
✓✓
✓✓
✓✓
✓
Intr
oduc
tion
of a
n in
stru
-m
ent/
met
hod
that
is
curr
ently
use
d fo
r var
ious
sp
ecie
s
✓✓
✓✓
Eith
er R
I stu
dy is
acc
epta
ble
✓
a Can
be
used
if a
dditi
onal
info
rmat
ion
abou
t pro
port
iona
l bia
s is
des
ired
in a
ny o
f the
list
ed s
ituat
ions
.b If
low
resu
lts a
re o
f clin
ical
impo
rtan
ce.
c See
sect
ion
4.7.
1.

568 | ARNOLD et AL.
after a potentially significant event (i.e., calibration, mainte-nance, change in reagent lot, change in operator) are typically more stringent than those for routine use.
4.7.2 | Reagents and materials
Reagents and materials used for the control procedures should be labeled with date received, date opened, and initialed by the person opening/preparing. Reagents are to be stored according to manu-facturer's recommendations. Expiration dates should be observed, and expired reagents should be discarded appropriately. Measurand concentrations in “abnormal” control materials often represent low or high results with respect to human pathologic abnormalities while those in “normal” control materials reflect normal human concen-trations. If pathologic concentrations from animal species are sig-nificantly divergent from these levels, it may be necessary to include additional control materials or analysis of patient specimens with measurand levels similar to animal pathologic concentrations/activi-ties. Use of repeat patient testing (RPT), which assesses the differ-ence between an initial and repeated evaluation of a patient sample, has shown promise for use as a control for canine hematology and canine and feline endocrinology.6,30,31 Potential advantages of RPT include the presence of species-specific matrix, measurand concen-trations of interest for veterinary species, and obviating the pur-chase of commercially available QCM. Further investigation of this technique is indicated since it may provide a lower cost and higher quality alternative for quality control for veterinary testing.
4.7.3 | The selection of numbers of controls
The selection of numbers of controls is part of the process of QC validation and will depend on the performance of the equipment (options are given under “N” in OPSpecs charts). Traditionally, two to three control materials are used for a given test/panel (a com-bination of low/normal/high clinical values), but additional QC data points may be needed in order to ensure a high probability of error detection and low probability of false rejection with some assays. Of note, the number of control levels used during routine instrument operation may be slightly fewer from that used during initial instrument method validation/verification (section 4.3) but should be enough to adequately monitor for stable performance. Demonstration of reagent stability over the run-length should be done during the method validation/verification process by assay-ing control materials multiple times throughout an entire run-length and comparing the resulting mean and SD with results from “within run” precision experiments (which are usually not conducted over the entire length of the run). At least one level of control material should be run after a reagent lot is changed. More rigorous testing of patient specimens for comparison with results from the previous reagent lot may be needed if significant lot-to-lot variation in rea-gents has been demonstrated.32,33
4.7.4 | Establish QC frequency with the following considerations:
(i) Test frequency and throughput. The analytical “run length/size” (as defined by time or number of specimens) is the period between control evaluations, traditionally a working day or personnel shift. Veterinary and human laboratories that oper-ate as a continuous production process (with periodic side-by-side patient/QC runs) must define a run length bracketed by two QC events (bracketed QC). Recent publications give guid-ance for setting the frequency of QC based on probability of error detection (Ped) and the risk of the Maximum Expected increase in Number of unreliable final patient results (risk of patient harm) if a control error goes undetected (termed Max E(Nuf)), which depends on Ped and is related to the sigma metric. The calculation of run size between QC events can be made using graphical tools/normograms, and the reader is referred to references for further information.34–37 If the cur-rent QC sample results are acceptable, it is assumed that the measurement procedure has remained stable since the last ac-ceptable QC event, and thus, the results for patient specimens measured during that interval are acceptable.
(ii) Consideration of the sigma metric. High sigma processes (≥ 5 sigma) are relatively easy to control with single control rules (such as 1-2.5s) and few control levels, whereas low sigma processes need multiple control rules, higher number of con-trol levels, higher frequency of QC, and shorter run sizes. For high sigma performance, an effective SQC approach is to em-ploy a multistage QC procedure utilizing a “startup” design at the beginning of production and a “monitor” design (simpler control rules and fewer control levels/lower N) periodically throughout production.37 This system can provide flexibility in tailoring QC frequency to laboratory conditions, with bet-ter information for identifying when a control error occurs in continuous operation, and more cost-effective corrective ac-tions which minimize the number of patient samples repeated.
(iii) Measurand and/or reagent stability(iv) Frequency of QC failures—detected and estimated undetected(v) Training and experience of personnel(vi) Cost of QC. With the bracketed SQC design, if the hold time
for results release is too long (depending on the end of the bracket event), or if the number of patient testing results re-quiring retesting due to QC failure are too great (i.e., if the bracket QC event is out of control), the size of the run should be reduced, which increases QC frequency/cost. The various factors informing the practicality of the final SQC strategy should be given careful evaluation.
(vii) Considerations for low throughput laboratories. Laboratories processing fewer samples (many in-clinic laboratories and some university/reference laboratories) should not use Max E(Nuf) and the high sigma metric/high Ped QC rules to justify not performing QC at least once per day that a given test/panel is run. For low throughput labs, more QC is probably

| 569ARNOLD et AL.
needed than for high throughput laboratories. The latter produce larger numbers of patient results for review and detection of developing trends, are likely to have bracketed QC events for continuous production and are likely to look at larger numbers of specimens to determine Key Quality Indicators. Therefore, those labs with lower throughput should carefully consider the costs and benefits of doing multiple statistical and non-statistical QC procedures in order to ensure the production of reliable results. For low throughput laboratories, repeat patient testing may provide a low-cost alternative to commercially available quality con-trol materials.6,31
R E FE R E N C E S 1. Armbruster D, Miller RR. The Joint Committee for Traceability in
Laboratory Medicine (JCTLM): a global approach to promote the standardization of clinical laboratory test results. Clin Biochem Rev. 2007;28:105-113.
2. Ricós C, Cava F, García-Lario JV, et al. The reference change value: a proposal to interpret laboratory reports in serial testing based on biological variation. . Scand J Clin Lab Invest. 2004;64:175-184.
3. Walton RM. Subject-based reference values: biological varia-tion, individuality, and reference change values. Vet Clin Pathol. 2012;41:175-181.
4. Bland JM, Altman DG. Statistical methods for assessing agree-ment between two methods of clinical measurement. Lancet. 1986;327:307-310.
5. Clinical and Laboratory. Standards Institute (CLSI). Using proficiency testing to improve the clinical laboratory; approved guidelines. 2nd ed. (GP27-A2). Wayne, PA: AALA; 2007.
6. Flatland B, Freeman KF. Repeat patient testing shows promise as a quality control method for veterinary hematology testing. Vet Clin Pathol. 2018;47:252-266.
7. Badizadegan ND, Greenberg S, Lawrence H, et al. Radiofrequency in-terference in the clinical laboratory. Am J Clin Pathol. 2019;151:522-528. https ://doi.org/10.1093/ajcp/aqy174 [https ://doi.org/10.1093/ajcp/aqy174]
8. Westgard JO. Basic QC Practices: Training in Statistical Quality Control for Medical Laboratories. 4th ed. Madison: Westgard QC, Inc.; 2016.
9. Bellamy EC, Olexson DW. Quality Assurance Handbook for Veterinary Laboratories. Ames, IA: Iowa State University Press; 2000.
10. Weitzel MLJ, Lee SM, Smoot M, et al. How to Meet ISO 17025 Requirements for Method Verification. Gaithersburg, MD: AOAC International; 2008. http://www.aoac.org/aoac_prod_imis/AOAC_Docs/LPTP/alacc_guide_2008.pdf
11. Linnet K, Boyd JC. Selection and analytical evaluation of methods with statistical techniques. In: Burtis CA, Ashwood ER, Bruns DE, eds. Tietz Textbook of Clinical Chemistry and Molecular Diagnostics. 4th ed. Philadelphia, PA: Elsevier Inc.; 2006:353-407.
12. Westgard JO, Cary RN, Sold S. Criteria for judging precision and accuracy in method development and evaluation. Clinical Chemistry. 1974;20:825-833.
13. Fraser CG. Biologic Variation: From Principles to Practice. Washington, DC: AACC Press; 2001.
14. Harr KE, Flatland B, Nabity M, et al. ASVCP guidelines: allowable total error guidelines for biochemistry. Vet Clin Pathol. 2013;42:424-436.
15. Nabity MB, Harr KE, Camus MS, et al. ASVCP guidelines: allowable total error hematology. Vet Clin Pathol. 2018;47:9-21.
16. Westgard JO. Basic method validation. 3rd ed. Madison, WI: Westgard QC, Inc.; 2008.
17. Flatland B, Friedrichs KR, Klenner S. Differentiating between ana-lytical and diagnostic performance evaluation with a focus on the
method comparison study and identification of bias. Vet Clin Pathol. 2014;43:475-486.
18. Tietz NW. A model for a comprehensive measurement system in clinical chemistry. Clin Chem. 1979;25:833-839.
19. Theodorsson E, Magnusson B. Full method validation in clinical chemistry. Accred Qual Assur. 2017;22:235-246.
20. Jensen AL, Kjelgaard-Hansen M. Method comparison in the clinical laboratory. Vet Clin Pathol. 2006;35:276-286.
21. Stöckl D, Dewitte K, Thienpont M. Validity of linear regression in method comparison studies: limited by the statistical model of the quality of the analytical data? Clinical Chemistry. 1998;44:2340-2346.
22. Hyloft-Peterson P, Stöckl D, Blaabjerg O, et al. Graphical interpre-tation of analytical data from comparison of a field method with a reference method by use of difference plots (opinion). Clin Chem. 1997;43:2039-2046.
23. Friedrichs KR, Harr KE, Freeman KP, et al. ASVCP reference interval guidelines: determination of de novo reference intervals in veterinary species and other related topics. Vet Clin Pathol. 2012;41:441-453.
24. Camus MS, Flatland B, Freeman KP, et al. ASVCP quality assur-ance guidelines: external quality assessment and comparative testing for reference and in-clinic laboratories. Vet Clin Pathol. 2015;44:477-492.
25. Linnet K, Moons KGM, Boyd JC. Statistical methodologies in labora-tory medicine: analytical and clinical evaluation of laboratory tests. In: Rifai N, Horvath AR, Wittwer CT, eds. Tietz Textbook of Clinical Chemistry and Molecular Diagnostics. 6th ed. St. Louis, MO: Elsevier Inc.; 2018:10-60.
26. Baral RM, Dhand NK, Freeman KP. Commutability and interchange-ability of commercial quality control materials with feline plasma for common biochemical analytes. Vet Clin Pathol. 2016;45:300-310.
27. Westgard SA, Westgard JO. Six sigma quality management system and design of risk-based statistical quality control. Clin Lab Med. 2017;37:85-96.
28. Cian F, Villiers E, Archer J, et al. Use of Six Sigma Worksheets for as-sessment of internal and external failure costs associated with can-didate quality control rules for an ADVIA 120 hematology analyzer. Vet Clin Pathol. 2014;43:164-171.
29. Parvin CA, Gronowski AM. Effect of analytical run length on qual-ity-control (QC) performance and the QC planning process. Clin Chem. 1997;43:2149-2154.
30. Vanyo LC, Freeman KP, Meléndez-Lazo A, et al. Comparison of tradi-tional statistical quality control using commercially available control materials and two patient-based quality control procedures for the ADVIA 120 Hematology System. Vet Clin Pathol. 2018;00:1-9. https ://doi.org/10.1111/vcp.12645 .
31. Riond B, Freeman K, Cvejic S, et al. Repeat patient testing as a tool to monitor quality control statistically in veterinary hormone measure-ment. Abstract presented at: 19th Annual Congress of the European Society for Veterinary Clinical Pathology; September 2017, London, United Kingdom.
32. Algeciras-Schimnich A, Bruns DE, Boyd JC, et al. Failure of current laboratory protocols to detect lot-to-lot reagent differences: find-ings and possible solutions. Clin Chem. 2013;59:1187-1194.
33. Miller WG, Erek A, Cunningham TD, et al. Commutability limitations influence quality control results with different reagent lots. Clin Chem. 2011;57:76-83.
34. Parvin CA. Assessing the impact of the frequency of quality con-trol testing on the quality of reported patient results. Clin Chem. 2008;54:2049-2054.
35. Bayat H. Selecting multi-rule quality control procedures based on patient risk. Clin Chem Lab Med. 2017;55:1702-1708.
36. Yago M, Alcover S. Selecting statistical procedures for quality control planning based on risk management. Clin Chem. 2016;62: 959-965.

570 | ARNOLD et AL.
37. Westgard JO, Bayat H, Westgard SA. Planning risk-based SQC schedules for bracketed operation of continuous production analyz-ers. Clin Chem. 2018;64:289-296.
38. Schifman RB, Talbert M, Souers RJ. Delta check practices and out-comes. Arch Pathol Lab Med. 2017;141:813-823.
39. Westgard JO. Risk, Uncertainty, and Error: But The greatest of these is Quality! Presentation at Quality in the Spotlight conference, March 2018, Antwerp Belgium.
APPENDIX 1
Design approach of statistical QC (SQC)[adapted from: Westgard SA, Westgard JO. Six Sigma Quality Management System and Design of Risk-based Statistical Quality Control. Clin Lab Med. 2017;37:85-96 and Westgard JO, Bayat H, Westgard SA. Planning Risk-Based SQC Schedules for Bracketed Operation of Continuous Production Analyzers. Clin Chem. 2018;64:289-296]27,37
• Define total allowable error (TEa) [based on current recommenda-tions14,15 using clinical decision limits and/or biological variation data; define the maximum number of patient samples in a shift or day, and define the desired reporting interval, such as number of specimens for batch production or number of specimens/time interval for a continuous production process with bracketed QC.
• Measure the precision (SD/CV) and bias of the method from data obtained from ongoing quality control material evaluated and/or from performance validation data (see section 4.3). Calculators for these data are available as freeware at www.westg ard.com.
• Calculate the TEo [|bias| (%) + 2CV(%)] from control materials (dif-ferent levels of a given measurand evaluated separately); if TEo > TEa, contact the instrument manufacturer regarding steps to im-prove performance; increase non-statistical QA/QC procedures; consider instrument replacement; and/or consider relaxing the TEa requirement (the latter is less desirable and should be taken into account when interpreting results).
• Calculate the sigma metric for control materials: (%TEa-%|bias|)/%CV.
• Use a power function graph that has a sigma scale or OPSpecs charts to assess Ped and to identify the appropriate control rules and number of control measurements (QC validation). (www.westg ard.com) ○ High throughput laboratories can minimize the cost of statisti-
cal QC for high sigma metric tests (> 5 sigma) by using a simple QC rule (such as 1-2.5s or 1-3s) and N = 2 or 3 for number of quality control materials, with more attention to the lower sigma assays that require more complicated QC (multi-rule and/or larger numbers of data points from running controls more than once). Repeat patient testing can help these larger labs do more frequent QC for the lower sigma assays without adding additional quality control material costs.
○ Lower throughput/in-clinic labs may employ a strategy that in-cludes more intensive non-statistical QC (e.g., review of blood smears to correlate with CBC data points, key quality indica-tor tracking, etc.), and use traditional quality control materials or repeat patient testing for both startup and finish of runs (bracketed QC).
• Determine the number of samples in the analytical run (between control events/bracket run size) to achieve a goal of less than or equal to one erroneous test result per run [Table 4]. Ideally the startup SQC design has a run size as large as the maximum patient workload with a high Ped, and the monitoring SQC design has a run size as large as the reporting interval defined by bracketed QC, with a low Pfr ≤5%.
• Prepare an SQC schedule that identifies the tests and controls to be analyzed for each QC event. This schedule provides the labo-ratory with an operation definition of its QC strategy, combining the quality required for intended use, the observed performance of the measurement procedure, the expected performance of the SQC procedure, and the expected risk of harm to patients from poor quality results. ○ Both high and low throughput labs need to determine what
Key Quality Indicator tests to monitor, which should be those that are relatively easy to evaluate and have high impact on patient outcomes, such as hematocrit, sodium, proteinuria, etc. KQIs may include preanalytical and postanalytical items, such as hemolysis, incomplete accession forms, and turn-around time); review QC data for daily trends and shifts; re-view patient results according to measurand (e.g., examining all the calcium concentration results from a run) and by profile (e.g., do the changes in a serum chemistry panel for a partic-ular patient fit with the history, signs, and expected patterns associated with disease/resolution?) in order to catch possible developing or existing problems.
○ Non-statistical QC items that make sense for the laboratory, in addition to QC validation, are performed to ensure that re-sources spent on quality control materials and/or repeat pa-tient testing are achieving the goal of high Ped and low Pfr. Clinical specimens can be monitored for error via repeat test-ing of the same sample, comparison of test results with pre-vious submissions from same patient (delta checks);38 and/or, investigation of the percentage of abnormal results for various measurands (key quality indicator evaluations; Tables 2 and 3). It is important to note that many items vital to total quality as-surance are non-statistical QC procedures, such as instrument maintenance, use of SOPs, personnel training, proper reagent/QCM storage, etc.
APPENDIX 2An illustration of the Westgard six sigma MEDx Interactive Tool can be downloaded with free account creation at: https ://www.westg ard.com/downl oads/works heets-downl oads/21-six-sigma-medx-chart.html

| 571ARNOLD et AL.
RESOURCES
https ://www.westg ard.com/gloss ary.htm Westgard glossary of quality assurance terminology
https ://onlin elibr ary.wiley.com/doi/abs/10.1111/vcp.12583 ASVCP guideline: Allowable total error hematology
https ://onlin elibr ary.wiley.com/doi/full/10.1111/vcp.12101 ASVCP guideline: Allowable total error guidelines for biochemistry
https ://www.westg ard.com/conso lidat ed-goals-chemi stry.htm Compiled human biochemistry panel allowable total error data from various sources
https ://onlin elibr ary.wiley.com/doi/abs/10.1111/vcp.12299 ASVCP guideline: External quality assessment and comparative testing for reference and in-clinic laboratories
https ://onlin elibr ary.wiley.com/doi/abs/10.1111/vcp.12006 ASVCP guideline: Determination of de novo reference intervals in veteri-nary species and other related topics
ahttps://analyse-it.com/products/method-validation statistical anal-ysis software for method validation/verification
bhttps://validationmanager.com statistical analysis software for method validation/verification
cwww.medcalc.org statistical analysis software including basic sta-tistics, method comparison/evaluation, correlation, reference in-tervals, ROC curve analysis
http://www.westg ard.com/lesso n27.htm#4 Example data calcu-lations for interference and recovery studies (note: many of the Westgard QC website materials require a no-cost registration)
http://vetbi ologi calva riati on.org Data on natural biologic variation in veterinary species
https ://biolo gical varia tion.eu/ Data on human biologic variationhttp://tools.westg ard.com/qccal culat or.html QC calculator for
monthly means, SD, CVhttps ://www.eflm.eu/files/ efcc/Zagreb-Westg ard_2.pdf Lesson on
quality and sigma metricshttps ://www.westg ard.com/six-sigma-calcu lators.htm Sigma calculatorhttps ://www.westg ard.com/lesso n6.htm#1 Explanations and exam-
ples of OPSpecs charts for choosing control rules and number of control levels for desired Ped and Pfr

572 | ARNOLD et AL.
https ://www.westg ard.com/lesso n56.htm Lesson on implementing control rules using normalized OPSpecs charts
dhttps://www.westgard.com/store/software/ez-rules-3-qc-design-software-detail.html EZRules©3 QC design software for selec-tion of control rules and calculation of sigma metrics
ehttps://www.westgard.com/downloads/worksheets-downloads.html Information on Westgard control rules and statistical worksheets
CHECKLIST FOR GUIDELINE SEC TION 4, ANALY TIC AL FAC TORS IMPORTANT IN VETERINARY CLINIC AL PATHOLOGY
The purpose of these checklists is to facilitate guideline implementation/practical application and may be further detailed in laboratory-specific standard operating procedures (SOPs). The numbers in the first column correspond to the section numbers in the guideline.
The N/A option (listed here only for applicable items) should only be employed for items not pertaining to the laboratory, with an explanation in the additional comment box.
Guideline Recommendation Compliant?
Additional Comment(s) by Auditor
4.2.1 Laboratory water quality electrical power stability, and tem-perature (to include refrigerator/freezer)/humidity conditions are monitored on a regular schedule.
□ Yes □ No
4.2.1 Automated balances, pipettes, microscopes, and centrifuges are cleaned/calibrated annually.
□ Yes □ No
TA B L E 2 Priority of analytic controls on basis of sigma quality of the test system [adapted with permission from J.O. Westgard from Figure 15-6, p. 202, Westgard JO. Basic QC Practices. 4th ed. Madison, WI: Westgard QC, Inc.; 2016]8
Control MechanismSigma >5.5
Sigma 3.5-5.5
Sigma <3.5
Analytic operator controls
Standard Operating Procedure High High High
Operator Training and Competency
High High High
Operator Checklists High High High
System Maintenance High High High
Analytic test system controls
Reagent Storage & Expiration Low Medium High
Sample Acceptability High High High
Electronic Checks Low Medium High
Calibration Checks Low Medium High
Statistical QC High High High
External Quality Assessment Low Medium High
Analytic test review controls
Implausible Values High High High
Repeat Patient Tests Low Medium High
Delta Checksa Low Medium High
aDefinition of delta check in section 4.1.
F I G U R E 2 “Normalized” Method Decision Chart where observed inaccuracy is calculated as 100*Bias/TEa and observed imprecision is calculated as 100*CV/TEa, when original parameters are all in units of %. Zones of performance are labeled by performance category. [Adapted from Figure 11-5, p.168 in: Westgard JO, Westgard SA. Basic Quality Management Systems: Essentials for quality management in the medical laboratory. Madison, WI: Westgard QC, Inc.; 2014]
F I G U R E 3 Application of the OPSpecs statistical QC selection tool, indicating the control rules, number of control samples (N), and number of runs (R) over which the control rules are applied, for a given allowable total error (TEa) and test operational point. [From: Westgard, JO. Risk, Uncertainty, and Error: But The greatest of these is Quality! Presentation at Quality in the Spotlight conference, March 2018, Antwerp Belgium]39

| 573ARNOLD et AL.
TA B L E 4 QC-examples of sigma metric/run size matrix for risk of < 1 unreliable final patient result for qc-bracketed patient samples using various control rules and numbers of control material data points. [Adapted from Westgard, JO. Risk, Uncertainty, and Error: But The greatest of these is Quality! Presentation at Quality in the Spotlight conference, March 2018, Antwerp Belgium]39
Candidate QC Rule (Pfr)
Sigma Metric
6.0 5.5 5.0 4.5 4.0 3.5
Multi-rule N = 2 (0.01)
Run Size ≥1000 ≥1000 470 120 40 10
Ped 1.0 0.99 0.94 0.82 0.59 0.35
1-2s, N = 1 (0.05)
Run Size ≥1000 ≥1000 370 140 50 20
Ped 0.98 0.97 0.91 0.80 0.62 0.43
1-3s N = 2 (0.00)
Run Size ≥1000 700 220 70 25 <10
Ped 0.98 0.96 0.86 0.70 0.48 0.25
1-2.5s N = 1 (0.01)
Run Size 1000 400 150 50 20 <10
Ped 0.94 0.92 0.82 0.66 0.44 0.24
1-3s N = 1 (0.00)
Run Size 380 150 50 20 10 <10
Ped 0.85 0.82 0.67 0.46 0.27 0.11
N, Number of control materials; Pfr, probability of false rejection; Ped, probability of error detection.Note: This table should not be used to justify the absence of QC for laboratories with low numbers of patient samples. There may be a need for more frequent QC when the number of patient samples is low, since review of trends or shifts in patient results may not be as apparent as when larger numbers of patient results are available for review. Therefore, careful consideration of the needs of the laboratory and the risk of reporting unreliable patient results in design of a QC schedule is recommended.
TA B L E 3 Important considerations in the application of different control mechanisms [adapted with permission from J.O. Westgard from Figure 17-2, p. 224, Westgard JO. Basic QC Practices. 4th ed. Madison, WI: Westgard QC, Inc.; 2016]8
Recommended QC tool Control objective CoverageAbility to quantify problem detection/prevention
Analyst/operator controls
Standard Operating Procedure Process for Safe Use All Runs Unknown
Operator Training/Competency Correct Performance Total Testing Process Unknown
Operator Checklists Proper Operation Single Runs Unknown
System Maintenance Proper Operation All Runs Unknown
Built-in analyzer controls
Electronic Checks Analyzer Components Single Runs Unknown
Calibration Checks Analyzer Stability Single Runs Unknown
Stable control materials
Statistical QC (SQC) Method Stability Single Runs Knowable
Periodic EQA/PT Method Accuracy All Runs Unknown
Patient data analysis
Plausibility Check Random Errors Single Patients Unknown
Delta Checks Random Errors Single Patients Knowable
Repeat Patient Testing Short Term Stability Single Runs Knowable

574 | ARNOLD et AL.
Guideline Recommendation Compliant?
Additional Comment(s) by Auditor
4.2.1 An Instrument Performance Log is created and maintained for each instrument, recording routine and special maintenance/repairs and any other corrective actions taken.
□ Yes □ No
4.2.2 The laboratory participates in an external quality assessment/proficiency testing program, with results distributed and discussed among laboratory personnel. Inquiry/internal audit is performed if there is an unacceptable devia-tion from the peer group mean.
□ Yes □ No
4.3/4.3.9 Appropriate method validation or method verification/transfer studies are performed prior to adopting a new test proce-dure and/or bringing a new instru-ment on-line; the choice between full validation and verification matches the specific laboratory situation.
□ Yes □ No
4.3.1 A reportable range/lin-earity study is performed for each species to be assayed, if recommended/applicable.
□ Yes □ No □ N/A
4.3.2, 4.3.3 Short-term and long-term replication studies are performed to assess assay imprecision/random error, if recommended/applicable.
□ Yes □ No □ N/A
4.3.4 A comparison of methods study is performed to assess systematic error of the new method compared to the com-parison method, if recommended/applicable.
□ Yes □ No □ N/A
4.3.5 An interference study is performed to assess systematic error caused by potential interfer-ing substances, if recommended/applicable.
□ Yes □ No □ N/A
4.3.6 A recovery study is performed to assess potential systematic error caused by substances within the sample matrix, if recommended/applicable.
□ Yes □ No □ N/A
4.3.7 A reference interval study is performed for creation of refer-ence intervals for each species to be assayed, if recommended/applicable.
□ Yes □ No □ N/A
4.3.8 A detection limit study is performed to determine the lowest concentration that can be measured, if recommended/applicable.
□ Yes □ No □ N/A
Guideline Recommendation Compliant?
Additional Comment(s) by Auditor
4.4 Multisite/multi-instrument laboratories should compare test results among various methods, in-struments, and/or laboratories to monitor performance and identify deficiencies.
□ Yes □ No □ N/A
4.5 Instrument function checks are performed each day of test use, with identification of possible interferences. Calibration should be performed at least every six months and more frequently if indicated.
□ Yes □ No
4.6 Laboratory personnel have thorough working knowledge of instruments and their use/maintenance and can perform basic troubleshooting/can take ap-propriate steps with various error messages/flags (see also section 2 for more information on personnel knowledge/training).
□ Yes □ No
4.7, Appendix 1 A routine quality control (QC) plan is in place (see also following detailed items) to monitor method/instrument performance, with rules and poli-cies established for analysis of QC measurement tools (e.g., Levey-Jennings plots).
□ Yes □ No
4.7.2 There is proper storage and handling of QC reagents and calibrators.
□ Yes □ No
4.7.1 Purchased quality control materials should have low, normal, and high levels that are medically relevant for veterinary species.
□ Yes □ No □ N/A
4.7.1, 4.7.3, 4.7.4, Appendix 1, Figures 2 and 3, Table 4 Statistical QC rules, number of control levels analyzed, and QC frequency are chosen to ensure a high probability of error detection (recommended Ped ≥ 90%), a low probability of false rejection (recommended Pfr ≤5%), and hence a low risk of reporting unreliable final patient results (i.e., results are within quality goals as may be defined by allowable total error/TEa, clinical decision limits, and/or expected biologic variation).
□ Yes □ No □ N/A
4.7.1, 4.7.4, Appendices 1 and 2, Tables 2 and 4 Sigma metrics are calculated for each test from TEa, bias, and coefficient of variation (CV) data, in order to aid determination of which tests require more stringent statistical and non-statistical QC.
□ Yes □ No □ N/A

| 575ARNOLD et AL.
Guideline Recommendation Compliant?
Additional Comment(s) by Auditor
4.7.1, 4.7.4, Appendix 1, Figure 3, Table 4 The potential need for multi-level control rules for individual measurands (with lower sigma), as well as the potential need for multistage QC during a run are assessed.
□ Yes □ No □ N/A
4.7.1, 4.7.4, Appendix 1, Table 2, Figure 2 Non-statistical QC items are employed as applicable for lower throughput labs and/or for any measurands with low sigma performance.
□ Yes □ No
4.2.1 Accumulated QC data are systematically reviewed on a determined regular schedule (e.g., Levey Jennings plot analysis), and appropriate corrective actions are taken when there are undesirable trends/results outside of control rule parameters. Patient samples are not run/reported until quality control materials are assayed as back “in control.”
□ Yes □ No
5 | HEMATOLOGY
Definitions/acronymsHGB: hemoglobin concentrationMCV: mean erythrocyte cell volumeMCH: mean erythrocyte cell hemoglobinMCHC: mean cell hemoglobin concentrationPLT: platelet concentrationWBC: white blood cell concentrationProcedural control: Duplicate aliquots of either an assayed QCM
or a previously assayed specimen from an animal patient.
5.1 | Preanalytical factors important for hematology in veterinary laboratories
5.1.1 | Specimen collection, handling, and transport
General preanalytical guidelines provided in section 3 for collection of samples for whole blood are applicable for hematologic evalu-ation. Blood for hematologic evaluation of mammals is routinely anticoagulated with di- (K2) or tri-potassium (K3) salts of ethylenedi-aminetetraacetic acid (EDTA) due to superior preservation of cells for counting, staining and morphologic evaluation. Either is accept-able if tubes are filled sufficiently and if testing is conducted in a timely fashion. Under-filling tubes containing K3-EDTA produces erroneous results from exposure to high salt content (erythrocyte
shrinkage).1 and potentially from dilution by the liquid anticoagu-lant. Cell shrinkage primarily effects manual packed cell volume (PCV), rather than instrument-derived hematocrit (HCT) due to reduction of osmolality upon introduction of the diluent with automated methods. Inverting tubes at least eight times immedi-ately after filling to avoid in vitro clot formation is recommended. Heparin may be used when EDTA-additive tubes are not availa-ble, or for select species such as reptiles and horses. Variable re-sults may be obtained using heparin with other species, and stain quality and cell preservation may be compromised.2,3 Please see section 5.4 for more information.
Blood films should be prepared directly from the needle immedi-ately after collection, or as soon as possible after collection into an anticoagulant-containing tube, to minimize inevitable deterioration of cellular morphology.
5.1.2 | Specimen identification
Labeling slide containers is acceptable if ancillary to, rather than in lieu of, labeling slides. Hematologic accession forms should include all the information described in section 3.
5.1.3 | Sample shipment
Blood films made in the clinic are stored at room temperature and protected from physical damage, formalin fumes, condensation, and freezing during transport. Staining may prevent some ef-fects described above; however, many laboratories prefer using their own stain and request submitting at least one unstained film. Glass slides are particularly fragile and require encase-ment in shatterproof holders during shipment. Blood films are thoroughly air-dried before staining or packaging for shipment. Whole blood samples destined for shipping should be protected from temperature extremes.
5.1.4 | Sample integrity
Anticoagulated specimens should be inspected visually upon re-ceipt for macroclots that will produce variably erroneous results. Because the degree of inaccuracy is unpredictable, clotted speci-mens should not be analyzed. Samples which are inappropriately stored, or stored for prolonged periods, are of questionable or substandard quality. Significant hemolysis and lipemia may affect results. The submitting clinic should be informed when the speci-men will likely produce erroneous results. Any reports containing possibly inaccurate results should include documentation of the informative process and obvious comments to the clinician that clearly state the nature of the quality issue and the values that may be inaccurate and misleading.

576 | ARNOLD et AL.
5.1.5 | Sample homogeneity
Settling of erythrocytes may not be visible grossly and can sig-nificantly affect quality of results; therefore, samples must be sufficiently mixed immediately prior to any hematologic testing to ensure homogeneity.
5.2 | Analytical factors important for hematology in veterinary laboratories
5.2.1 | Quality control
Hematologic automated assays, calculated indices, and micro-scopic findings should all be included in the quality control (QC) process. Operators should be familiar with methodologies uti-lized by their instrument. Errors in directly measured results, e.g., red blood cell count, volume, and hemoglobin concentration, may adversely affect derived results such as HCT, MCV, MCH, and MCHC.
Microscopic findings may include RBC, WBC, and PLT mor-phologic appearance, number of nRBCs/100 WBCs, estimates of reticulocyte and PLT concentrations, and hemoparasites. Blood smears should be prepared, stained, and retained for microscopic examination at the discretion of the clinical pathologist or other designated individual, with established criteria for situations that require microscopic examination. Suggestions include: confirma-tion of automated cell and differential counts at predetermined concentrations, (eg, total WBC concentration >20 000/L), poorly defined cell populations observed on histograms, results/cyto-grams flagged by the instrument as questionable, and confirma-tion or identification of hemoparasites. High numbers of nRBCs may be included in, and therefore increase, the automated WBC count. Reporting nucleated cell counts (NCC) in lieu of WBC counts, along with differential results that include percent and absolute numbers of nRBCs, is a practical alternative to counting the number of nRBCs/100 WBCs and then correcting the total WBC count (author observation).
Cell counts performed manually (for example, in a field sit-uation) using a hemocytometer should be performed in dupli-cate as a procedural control because commercial quality control material is not available for this method. Results may be com-pared with previously defined, acceptable limits for differences between duplicates. For example, if the difference between cell counts is >10%, one or both chambers should be reloaded, counted again and values matching within specified limits aver-aged. This is the only acceptable procedural control for manual RBC counts.
Measured WBC and PLT concentrations may be compared with a value estimated from a peripheral blood smear.4–7 New methylene blue-stained smears may be evaluated for a micro-scopic reticulocyte count. If the counts are performed in dupli-cate using two blood smears, the results should not differ by
>10%. Automated or manual reticulocyte concentrations should correlate with the proportion of polychromatophilic RBCs ob-served on a stained blood smear.8 The PCV should approximate the HCT calculated by an automated analyzer using values for MCV and RBC concentrations. The laboratory should set the max-imal acceptable difference, which may vary among species. MCHC (100 × HGB (mg/dL)/HCT where HCT = MCV × RBC) provides an index of sample integrity. It may exceed the upper reference interval in the presence of agglutination or significant in vitro or in vivo he-molysis (which falsely reduce the HCT), or in the presence of lipemia or large numbers of Heinz bodies (which falsely increase the HGB).9–
11 In the absence of these conditions, a high MCHC may indicate instrument error. Additional recommendations for QC are addressed in the general analytical section of this guideline (section 4).
If only blood films are submitted for review, CBC results ob-tained from the sample of blood corresponding to the blood film should also be provided, including printouts of the histograms and/or cytograms when feasible.
5.2.2 | Monitoring, method validation, instrumentation, personnel knowledge, procedures manual, and comparison of tests and outsourced tests
Monitoring recommendations and allowable total error for hema-tology are addressed in the ASVCP guideline: Allowable total error hematology12 and should include internal monitoring of all equip-ment with regard to electronic safety, calibration, maintenance, and performance. As not all the method validation procedures listed in the general analytical section of this guideline (section 4) are applicable to evaluation of automated hematology analyzers, select or modify method validation procedures as necessary to en-sure that new methods and analyzers are functioning satisfacto-rily to meet the laboratory's requirements and the manufacturer's specifications for mammalian and non-mammalian hematology. Information about personnel knowledge, procedures manual, com-parison of tests, and outsourced tests are important analytical as-pects and are likewise addressed in sections 2, 4, and 12. Personnel knowledge is further addressed in the non-mammalian section (5.4 below).
5.3 | Postanalytical factors important for hematology in veterinary laboratories (see also section 12)
Specimens should be stored under appropriate conditions for a pre-established period, as determined by specimen stability, laboratory policy, and certification and accreditation requirements. Stained mi-croscopic slides may be held indefinitely, whereas specimens such as whole blood have a limited storage life.13–16 Reports should include statements regarding deviations in sample integrity or testing proce-dures that may affect the quality of results.

| 577ARNOLD et AL.
5.4 | Manual hematology of non-mammalian species
5.4.1 | Preanalytical
Blood smears should be made at the time of blood collection, espe-cially when using heparinized samples because thrombocytes may aggregate rapidly and could skew differential and hemocytometer results. Acceptable transport times for avian blood specimens are shorter than those of mammalian and reptilian samples. A con-trolled study has shown that refrigerated avian blood deteriorates within 12 hours regardless of anticoagulant, whereas reptilian blood specimens are stable for 24 hours.17 Acceptable transport time for avian blood smears on glass slides are like those of other spe-cies. Hematology specimens for shark species are less stable and should be processed within 5 hours due to cellular deterioration.18 Alternatively, fish blood specimens preserved using 10% buffered formalin at the time of collection may be used for hemocytometer counts after ambient storage for at least one month.19 EDTA (7.5% or 1-2 mg/mL of blood) is acceptable for most, but not all, species. Blood from stingrays, some bony fish, and some reptilian and avian species reacts atypically in EDTA, so heparin is commonly used for these species.3,20,21 Blood from elasmobranchs (sharks, skates, and rays) should be placed in a tube containing dry anticoagulant due to their high plasma osmolality values (~1000 mmol/kg); liquid antico-agulants may be used if adjusted for osmolality.
Laboratory personnel should have specific training in handling and preparation of specimens from exotic species. Training should be doc-umented and include basic prevention of bacterial contamination as well as information on zoonotic pathogens, including Chlamydophila, Salmonella spp., West Nile virus, avian influenza, and Giardia. Methods used to document training, continuing education, and periodic pro-ficiency assessment should be at the discretion of the laboratory di-rector (please also see section 2, total quality management systems).
5.4.2 | Analytical
Monitoring, instrumentation, and personnel knowledgeInternal laboratory monitoring should include reagent preparation for the cell-counting diluent (reagent grade water, verification of quality of new lot compared with that of previous lot). Equipment (e.g., hemocytometers, weighted hemocytometer cover slips, hand
tallies, calibrated pipettes, and differential cell counters) used for hematology procedures should be in good working order. Single use disposable hemocytometers are also commercially available. For each piece of equipment, routine monitoring and regular mainte-nance (e.g., annual calibration of pipettes and balances) should be performed and documented. Records of maintenance, malfunction, and repairs should be kept. Laboratory analysts must be proficient in cell identification for the species tested. Comprehensive knowledge of species variation when using flow cytometry is important when verification by manual methods is required.
Method validationThe use of select automated methods for determining cell counts for some non-mammalian species has been evaluated with varied success.22–26
Quality controlManual WBC counts using a hemocytometer are imprecise and have coefficients of variation (CV) ranging from 20% to 40%.17,27 Therefore, QC implementation and statistical analysis may indicate whether the amount of variation is relevant to daily operation. In method validation studies for shark species, CV was comparable to manual hematology for human WBC counts as reported in the B-D product insert for Unopette 365855 (Becton Dickinson and Company, Franklin Lakes, NJ, USA) when the specimen was pro-cessed within 5 hours of collection.18 Currently, commercially pre-pared control materials are not available for non-mammalian blood cell counts. Procedural controls for hemocytometer analysis include duplicate aliquots of a specimen from an animal patient performed within the acceptable time limits for specimen stability and a WBC estimate from the blood smear. Each institution should document a reliable protocol for evaluating the accuracy of hemocytometer counts.28 Estimated total WBC counts may be difficult due to the similar morphologic appearance of lymphocytes and thrombocytes when viewed at the lower magnifications typically used for WBC estimates of mammalian cells.20,29 Performing WBC estimates using higher magnification with immersion oil may improve accuracy.30 Evidence of leukocyte or thrombocyte aggregation in the hemocy-tometer should be reported to indicate erroneous total WBC con-centration and differential cell counts.
Proficiency testing (external QC) for technical staff members should be documented annually or more frequently as determined
TA B L E 1 Common anticoagulant additives for hematology samples
Anticoagulant Suggested species Exceptions Advantages (A)/Disadvantages (D)
EDTA Most mammals Most birds
Horses Some reptiles (e.g., sea turtles, stingrays)
(A) Good cell morphology (D) Serum or heparin vial needed for chemistry
Lithium heparin Most species None (A) A single vial may be used for hematology and chemistry assays (D) Rapid thrombocyte aggrega-tion may skew cell counts and differential

578 | ARNOLD et AL.
by the institution. Testing should include comparison counts from the same blood specimen for total cell concentrations and for leu-kocyte differential counts. Specimen selection should be repre-sentative of the animal patient population such as birds, reptiles, teleosts, and elasmobranchs. Between laboratorians, hemocy-tometer counts should agree to within 15%, and differential per-centage results for each cell type should agree to within the 95% confidence interval.31
Quality control for manual cell count method—thrombocyte/lymphocyte errorDifferentiation of thrombocytes and lymphocytes in the hemocy-tometer may be difficult for newly trained technologists or for ex-perienced technologists when counting cells from certain animal species. A good QC procedure is to count all non-erythrocytes in the 9 large squares of the Neubauer chamber and calculate the total number, sometimes referred to as T-WBC, or thrombocyte – WBC. The T-WBC is not the reported value and must be cor-rected based on the differential count. Perform the differential count twice on stained smears free of thrombocyte clumps: in-clude thrombocytes in the first differential count and exclude them in the second. The latter is reported as the actual differential count. Using the percent thrombocytes from the first differential count and the T-WBC, calculate the absolute value for thrombo-cytes and subtract it from the T-WBC to determine the total WBC concentration.
Example:
• Tally from hemocytometer with a 1:100 dilution = 750 non-eryth-rocyte cells
• T-WBC count = 750 × 1.1 × 100 = 82 500/μL• Differential = 1% monocytes, 9% lymphocytes, 8% heterophils,
and 82% thrombocytes• Absolute value for thrombocytes = 0.82 × 82 500 = 67 650/μL• Calculate absolute values for remaining leukocytes• The corrected total WBC concentration = 82 500–67 650 = 14 850/
μL
Reagents and materialsDocumented protocols for cell counts include methods where all cells are visible in the hemocytometer (sometimes referred to as di-rect methods) using methyl violet,32 toluidine blue,33or no dye,34,35 to determine total RBC, WBC, and thrombocyte concentrations. Partial count methods (sometimes referred to as indirect methods) using phloxine B dye20 for total WBC only are also used, where only the cells containing eosinophilic granules are visible in the hemocy-tometer, and the total WBC concentration is calculated based on the percent heterophils and eosinophils from the differential. Reported method validation studies between the direct and indirect tech-niques are conflicting28,36,37and require further investigation, pref-erably following Westgard guidelines for method validation,38 with a more representative number of animal species. The disparity in results may be due to the imprecision of each method. The diluent
described by Natt and Herrick can be prepared in the laboratory and is suitable for all non-mammalian vertebrate species; however, when this diluent is used for elasmobranchs (sharks, skates and rays), ad-ditional salts are required to adjust the osmolality of the stock so-lution.18 Hawkey's technique utilizing the WBC Unopette (Becton, Dickinson and Company) and the Eosinophil Unopette 5877 (Becton, Dickinson and Company) with phloxine B diluent can be performed using commercial reagents developed to replace the discontinued Unopette products.
R E FE R E N C E S 1. Goossens W, Van Duppen V, Verwilghen RL. K2- or K3-EDTA: the
anticoagulant of choice in routine haematology? Clin Lab Haematol. 1991;13:291-295.
2. Bauer N, Nakagawa J, Dunker C, Failing K, Moritz A. Evaluation of the automated hematology analyzer Sysmex XT-2000iV com-pared to the ADVIA (R) 2120 for its use in dogs, cats, and horses. Part II: Accuracy of leukocyte differential and reticulocyte count, impact of anticoagulant and sample aging. J Vet Diagn Invest. 2012;24:74-89.
3. Muro J, Cuenca R, Pastor J, Vinas L, Lavin S. Effects of lithium hepa-rin and tripotassium EDTA on hematologic values of Hermann's tor-toises (Testudo hermanni). J Zoo Wildl Med. 1998;29:40-44.
4. Tvedten H, Grabski S, Frame L. Estimating platelets and leukocytes on canine blood smears. Vet Clin Pathol. 1988;17:4-6.
5. Norman EJ, Barron RC, Nash AS, Clampitt RB. Prevalence of low automated platelet counts in cats: comparison with prevalence of thrombocytopenia based on blood smear estimation. Vet Clin Pathol. 2001;30:137-140.
6. Brahimi M, Osmani S, Arabi A, et al. The estimation of platelet count from a blood smear on the basis of the red cell: platelet ratio. Turk J Hematol. 2009;26:21-24.
7. Durbin C, Guo K, Hoffman W, Eric Schultze A, White S. Estimating leukocyte, platelet, and erythrocyte counts in rats by blood smear examination. Vet Clin Pathol. 2009;38:157-162.
8. Collicutt NB, Grindem CB, Neel JA. Comparison of manual poly-chromatophilic cell and automated reticulocyte quantification in evaluating regenerative response in anemic dogs. Vet Clin Pathol. 2012;41:256-260.
9. Siemens. AdviaR 120 User's Manual, version 6.3.2-MS. Tarrytown, NY: Siemens Healthcare Diagnostics, Inc.; 2010.
10. Heska. User Manual: HemaTrueR Veteirnary Hematology Analyzer. Loveland, CO: Heska Corporation; 2010.
11. Gilor S, Gilor C. Common laboratory artifacts caused by inappropri-ate sample collection and transport: how to get the most out of a sample. Top Companion Anim Med. 2011;26:109-118.
12. Nabity MB, Harr KE, Camus MS, Flatland B, Vap LM. ASVCP guidelines: allowable total error hematology. Vet Clin Pathol. 2018;47:9-21.
13. Clark P, Mogg TD, Tvedten HW, Korcal D. Artifactual changes in equine blood following storage, detected using the Advia 120 hema-tology analyzer. Vet Clin Pathol. 2002;31:90-94.
14. Furlanello T, Tasca S, Caldin M, et al. Artifactual changes in canine blood following storage, detected using the ADVIA 120 hematology analyzer. Vet Clin Path. 2006;35:42-46.
15. Medaille C, Briend-Marchal A, Braun JP. Stability of selected hema-tology variables in canine blood kept at room temperature in EDTA for 24 and 48 hours. Vet Clin Pathol. 2006;35:18-23.
16. Ihedioha JI, Onwubuche RC. Artifactual changes in PCV, hemoglo-bin concentration, and cell counts in bovine, caprine, and porcine blood stored at room and refrigerator temperatures. Vet Clin Pathol. 2007;36:60-63.

| 579ARNOLD et AL.
17. Harr KE, Raskin RE, Heard DJ. Temporal effects of 3 commonly used anticoagulants on hematologic and biochemical variables in blood samples from macaws and Burmese pythons. Vet Clin Pathol. 2005;34:383-388.
18. Arnold JE. Hematology of the sandbar shark, Carcharhinus plumbeus: standardization of complete blood count techniques for elasmo-branchs. Vet Clin Pathol. 2005;34:115-123.
19. Arnold JE, Matsche MA, Rosemary K. Preserving whole blood in for-malin extends the specimen stability period for manual cell counts for fish. Vet Clin Pathol. 2014;43:613-620.
20. Campbell TW, Ellis CK. Comparative Cytology. In: Campbell TW, Ellis CK, eds. Avian & Exotic Animal Hematology & Cytology. 3rd ed. Ames, IA: Blackwell Publishing Ltd.; 2007:162-168.
21. Hattingh J, Smith EM. Anticoagulants for avian and reptilian blood: heparin and EDTA. Pflugers Arch. 1976;363:267-269.
22. Lilliehook I, Wall H, Tauson R, Tvedten H. Differential leukocyte counts determined in chicken blood using the Cell-Dyn 3500. Vet Clin Pathol. 2004;33:133-138.
23. Seliger C, Schaerer B, Kohn M, et al. A rapid high-precision flow cy-tometry based technique for total white blood cell counting in chick-ens. Vet Immunol Immunopathol. 2012;145:86-99.
24. Burgess SC, Davison TF. Counting absolute numbers of specific leu-kocyte subpopulations in avian whole blood using a single-step flow cytometric technique: comparison of two inbred lines of chickens. J Immunol Methods. 1999;227:169-176.
25. Phalen LJ, Kollner B, Leclair LA, Hogan NS, van den Heuvel MR. The effects of benzo[a]pyrene on leucocyte distribution and anti-body response in rainbow trout (Oncorhynchus mykiss). Aquat Toxicol. 2014;147:121-128.
26. Fazio F, Filiciotto F, Marafioti S, et al. Automatic analysis to assess haematological parameters in farmed gilthead sea bream (Sparus aurata Linnaeus, 1758). Mar Freshw Behav Phy. 2012;45: 63-73.
27. Lumsden JH. Quality control. In: Feldman BF, Zinkl JG, Jain N, eds. Schalm's Veterinary Hematology. Lippincott, Williams & Wilkins: Baltimore, MD; 2000:16-19.
28. Dein FJ, Wilson A, Fischer D, Langenberg P. Avian leukocyte count-ing using the hemocytometer. J Zoo Wildlife Med. 1994;25:432-437.
29. Lane R. Basic techniques in pet avian clinical pathology. Vet Clin North Am Small Anim Pract. 1991;21:1157-1179.
30. Safra N, Christopher MM, Ernest HB, Bandivadekar R, Tell LA. Leukocyte Reference Intervals for Free-Ranging Hummingbirds in Northern California, USA. J Wildl Dis. 2018;54:607-611.
31. Hanson CA. Peripheral blood and bone marrow assessment. In: McClatchey KD, ed. Clinical Laboratory Medicine. 2nd ed. Baltimore, MD: Lippincott, Williams & Wilkins; 2001:810.
32. Natt MP, Herrick CA. A New Blood Diluent for Counting the Erythrocytes and Leucocytes of the Chicken. Poultry Sci. 1952;31: 735-738.
33. Schmidt PL. Veterinary clinics of North America - small animal prac-tice - evidence-based veterinary medicine - preface. Vet Clin N Am-Small. 2007;37:Xi-Xii.
34. Hawkey CM, Samour HJ. Clinical laboratory medicine: the value of clinical hematology in exotic birds. In: Jacobson ER, Kollias GV, eds. Exotic Animals. New York, NY: Churchill Livingstone; 1988:109-141.
35. Howlett JC. Clinical and diagnostic procedures. In: Samour J, ed. Avian Medicine. Philadelphia, PA: Elsevier Health Sciences; 2000:28-42.
36. Arnold JE. White blood cell count discrepancies in Atlantic logger-head seas turtles: Natt-Herrick vs. Eosinophil Unopette. Paper pre-sented at: Zoo Vet Tech. 1994; Cleveland, OH.
37. Arnold JE. Method validation study for total white blood cell counts: Natt-Herrick versus Eosinophil Unopette methods. Paper presented at: Association of Zoo Veterinary Technicians, 2007; Honolulu, HI.
38. Westgard JO. Criteria for judging precision and accuracy in method development and evaluation. Clinical Chemistry. 1974;20:825-833.
CHECKLIST FOR GUIDELINE SEC TION 5, HEMATOLOGY
The purpose of these checklists is to facilitate guideline implementation/practical application and may be further detailed in laboratory-specific standard operating procedures (SOPs). The numbers in the first column correspond to the section numbers in the guideline.
The N/A option (listed here only for applicable items) should only be employed for items not pertaining to the laboratory, with an explanation in the additional comment box.
Guideline Recommendation Compliant?
Additional Comment(s) by Auditor
5.1.1 Blood tube additives are ap-propriate for the species of inter-est. Tubes are appropriately filled and mixed. Films are prepared in a timely fashion.
□ Yes □ No □ N/A
5.1.2 Films and tubes are labeled with 1-2 unique patient IDs and date of collection. Accession forms contain rDVM and clinic info, date of collection, signalment, and rel-evant history, including appropri-ate data (please also see checklist for section 3).
□ Yes □ No □ N/A
5.1.3 Transported whole blood and films are protected from physical damage and extreme temperatures. Films are additionally protected from formalin fumes and condensa-tion. Shipment is expedited to avoid compromising sample integrity.
□ Yes □ No □ N/A
5.1.4 Whole blood and film integrity are inspected prior to testing, and the submitting entity is informed when the specimen is likely to produce erroneous results and/or when resampling is requested.
□ Yes □ No □ N/A
5.1.5 Whole blood samples are mixed to insure homogeneity prior to testing.
□ Yes □ No □ N/A
5.2.1 Quality control policies are established, followed and docu-mented. Hematologic automated assays, calculated indices, and microscopic findings are included in the hematology quality control (QC) process.
□ Yes □ No □ N/A
5.2.1 Hemocytometer-obtained counts are performed in dupli-cate as a procedural control. Predefined goals for agreement are established, with documenta-tion of deviations, and policies in place for mitigation.
□ Yes □ No □ N/A
5.2.1 Manual or instrument-ob-tained results are compared with film-derived estimates.
□ Yes □ No □ N/A

580 | ARNOLD et AL.
Guideline Recommendation Compliant?
Additional Comment(s) by Auditor
5.2.1 Films submitted for review are accompanied by available instrument-derived data.
□ Yes □ No □ N/A
5.2.2 Instruments are monitored for electronic safety, calibration, maintenance and performance, with appropriate documentation. Instrument manuals are readily available.
□ Yes □ No □ N/A
5.3 Specimens are stored under appropriate conditions for a pre-established period, as determined by specimen stability, laboratory policy, and certification/accredita-tion requirements.
□ Yes □ No □ N/A
5.3 Reports include statements doc-umenting any deviations in sample integrity or testing procedures that may affect the quality of results or interpretation thereof.
□ Yes □ No □ N/A
5.4 Non-mammalian species: 5.4.1 Blood smears are made at the time of collection.
□ Yes □ No □ N/A
5.4.1 Blood sample transport times are appropriate for the species.
□ Yes □ No □ N/A
5.4.1 Anticoagulant additives and formulations are appropriate for the species.
□ Yes □ No □ N/A
5.4.2.1 Laboratory personnel are appropriately trained for the spe-cies, and training is documented.
□ Yes □ No □ N/A
5.4.2.1 Reagent preparation for cell-counting diluent includes monitor-ing quality of reagent grade water and new lot compared with that of previous lot.
□ Yes □ No □ N/A
5.4.2.1 Equipment (e.g., reusable hemocytometers, weighted hemo-cytometer cover slips, hand tallies, calibrated pipettes, and differential cell counters) used for hematology procedures are in good working order.
□ Yes □ No □ N/A
5.4.2.3 External QA/Proficiency testing of technical staff is performed and documented, and results are within acceptable limits.
□ Yes □ No □ N/A
5.4.2.5 Documented protocols for cell counts include methods where all cells to be counted are visible in the hemocytometer, e.g., RBCs, WBCs, and/or thrombocytes.
□ Yes □ No □ N/A
6 | HEMOSTA SIS TESTING (COAGUL ATION)
6.1 | Preanalytical factors for hemostatic testing
Laboratories should provide written guidance and be prepared to answer questions regarding sample collection and handling. For viscoelastic testing, samples should be collected and processed according to published recommendations for veterinary species.1 Laboratories offering specialized coagulation testing (e.g., platelet function assays, factor activity testing, anti-Xa monitoring) should evaluate effects of sample collection, handling, and storage on their reagents and instrumentation and use the results of these studies to inform submission guidelines. The following discussion is focused on prothrombin time (PT), activated partial thromboplastin time (aPTT), fibrinogen, and D-dimers.
6.1.1 | Specimen collection
AnticoagulantsTrisodium citrate is generally the preferred anticoagulant, but some point-of-care testing devices are validated for use with unadulter-ated whole blood. Either 3.2% or 3.8% trisodium citrate is accepta-ble, but for some instruments there is a small difference (1-2 seconds prolongation for 3.2% compared with 3.8%) in aPTT results gener-ated using different citrate concentrations.2,3 To ensure reliable de-tection of subtle coagulation deficiencies, it is recommended that laboratories either specify one sodium citrate concentration (prefer-ably 3.2% because of greater clinical availability and reduced impact of underfilled tubes) or investigate the effect of citrate concentra-tion on their aPTT analyzer and reagent, and if necessary generate separate reference intervals for 3.2% and 3.8% citrate.2
Sample volumeThe desired ratio is one-part trisodium citrate to nine parts blood in patients with normal hematocrits, which can be achieved by filling a vacutainer to the fill line. Based on investigations in humans and dogs, the effect of overfilling is minimal.4,5 Human studies report the effect of underfilling is more pronounced for 3.8% than 3.2% citrate tubes and aPTT appears more affected than PT.6–8 Prolongations as-sociated with underfilling are generally subtle, such as a canine study reporting a 0.5 second increase in mean PT and a 0.7 second increase in mean aPTT with a 3.8% citrate to blood ratio of 1:7.5–8 However, occasional greater prolongations have been reported in human pa-tients.8 Therefore, if the laboratory accepts underfilled tubes, results for tubes filled to <90% of the desired fill volume should be released with a warning that false prolongations can occur with underfilling.
Effect of patient PCVIn anemic patients, filling a vacutainer to the fill line results in un-der-anticoagulation (i.e., the ratio of plasma to citrate is increased); hemoconcentrated patients are conversely over-anticoagulated. In
| 581ARNOLD et AL.
anemic human patients (PCV <25%), this alteration does not have a clear, clinically significant effect on PT/aPTT,9 but in hemoconcen-trated (PCV >55%) humans use of a 1:9 blood to citrate ratio results in potentially clinically significant prolongations in PT and aPTT, as well as decreased fibrinogen.10 An in vitro study using dog blood showed that increasing hematocrit to 57-63% had no effect on pro-thrombin time, but led to 2.1 to 4.0 second prolongation of aPTT.11 To avoid this inaccuracy, adjustment of the sodium citrate to blood ratio in hemoconcentrated patients has been suggested, but the risk of errors in performing this adjustment may outweigh the potential improvement in accuracy of coagulation times.9 It is suggested that this adjustment is only necessary in animals whose PCV exceeds 55% when detection of potentially subtle coagulation defect (e.g., hemophilia) is required, or when aPTT is used to monitor heparin (i.e., adjustment is likely unnecessary for detection of severe coagu-lopathies such as rodenticide ingestion).
It is suggested that where possible, laboratory staff should as-sist clinical personnel with any adjustment of citrate volume. The required volume of citrate can be calculated using the equation:
Volume of citrate (mL) = (1.85 × 10–3) × (100 – PCV) × (mL of blood to be added to the tube).10
For example, for a patient with a PCV of 60% using a 2.7 mL vacutainer, (0.00185) × (100-60) × (2.7 mL) = 0.2 mL of trisodium citrate required. The starting volume of citrate in a 2.7 mL tube is 0.3 mL, so 0.1 mL is removed before 2.7 mL of blood is added.
VenipunctureMinimally traumatic venipuncture technique and avoidance of he-matoma sites is essential. Collection should be into siliconized glass or plastic. There is limited evidence to suggest either collection into a non-anticoagulated syringe and immediate transfer to a vacu-tainer or collection directly into citrate is acceptable for PT/aPTT.12 However, based on significant differences between viscoelastic testing results for samples collected directly into vacutainers versus into non-anticoagulated syringes, use of consistent technique for se-rial monitoring is recommended.1
Needle gauges of 25 G and 22 G have been shown to provide clinically acceptable PT and aPTT results for cats13 and 21 G, 23 G and 25 G for dogs.14 Use of butterfly infusion sets with 300mm tubing has been shown to be acceptable in humans15 but based on personal experience, sets with shorter tubing (eg, 90 mm) are often more practical for use with small animal patients. Authors of several studies have considered agreement between samples collected by direct venipuncture compared to intravenous cannulas,12,16 central intravenous catheters (i.e., sampling catheters),12,17 or arterial cath-eters18 as clinically acceptable for PT and aPTT in dogs12,17,18 and horses.16 However, it should be noted that most of these studies did not assess catheters in place for more than 48 hours,12,17 involve only small numbers of patients, and for the canine studies did not evalu-ate hemolysis. In humans, blood collection via intravenous cannulas is associated with hemolysis,19 which may interfere with some coag-ulation tests. In the absence of large studies assessing intravenous cannulas in small animals, blood collection via direct venipuncture or
central venous catheter is preferred in dogs and cats, but where this is impractical or poses an unacceptable risk to the patient, samples collected by intravenous cannulas are considered acceptable.
By extrapolation from a canine study using thromboelastogra-phy, a discard sample is not required for measurement of PT/aPTT in samples collected by atraumatic venipuncture but is advisable if the needle is not inserted directly into the vein on the first attempt.20 Based on human recommendations, for samples collected via an in-travenous cannula, flushing the catheter with saline and drawing a discard sample of at least three times the dead space of the system is recommended to clear tissue factor, cellular debris, intravenous infusion fluids or heparin flush.7 However, there is disagreement in the human literature regarding the discard volume required to ef-fectively remove heparin and other medications, with some studies suggesting larger discard samples are required.21 Therefore, unex-pected isolated prolongations in aPTT (or a markedly increased aPTT with only a mildly increased PT) for samples drawn via heparinized catheters should raise suspicion of unfractionated heparin contam-ination regardless of whether a discard sample was drawn. Use of a discard tube is recommended when using butterfly catheter tubing systems in order to remove air from the tubing, which may lead to improper filling of the first vacutainer.7
6.1.2 | Specimen handling and transport to the laboratory
Samples should be checked for clots immediately after collection and before analysis. This can be performed visually or using an applicator stick. Clotted samples should be rejected, and a re-draw requested.
Time between sample collection and plasma separationNon-anticoagulated whole blood PT/aPTT tests should be performed immediately after sample collection without further processing. For citrated whole blood assays that do not require plasma separation, users should refer to manufacturer's guidelines regarding accept-able delays in analysis or should establish the effects of delay by experimentation. Making firm recommendations regarding accept-able delay before separation of plasma for plasma-based PT/aPTT tests is difficult because there are inconsistencies between canine studies.22,23 As alterations in human aPTT results exceed analytical quality requirements after storage of whole blood at room tempera-ture or 4°C for 24 hours but not 6 hours,24 refrigeration of whole blood and plasma separation within 6 hours is recommended in most settings where plasma separation cannot be performed immediately postcollection. However, longer delays or room temperature storage are considered acceptable if the laboratory has confirmed this does not produce clinically significant alterations using their reagents.22,23
There is some human evidence to suggest that when aPTT is used to monitor unfractionated heparin therapy, storage of whole blood at room temperature results in unacceptably large decreases in aPTT within 4 hours.25 For heparin monitoring, plasma should therefore be separated within one hour. There is also human evidence to suggest

582 | ARNOLD et AL.
that 2 hours transport of whole blood by car before plasma sepa-ration can introduce clinically unacceptable errors in coagulation testing.26 Therefore, for samples that will be tested at a distant site, plasma separation before transport is suggested, even if the delay in analysis will not exceed 6 hours.
Centrifugation and plasma separationCentrifugation at 1500 × g for 15 minutes is traditionally considered optimal. Human studies suggest shorter, higher speed centrifuga-tion times are acceptable for PT/aPTT.27,28 In the absence of vet-erinary evidence, it is suggested that rapid centrifugation protocols be employed only in situations where shorter turnaround time is considered critical for clinical outcome. Shorter centrifugation times increase platelet contamination.29 It is therefore recommended that non-standard centrifugation protocols should be avoided for sam-ples that will be frozen before analysis or used for monitoring un-fractionated heparin.30,31
There are small but statistically significant differences in the re-sults of human routine coagulation testing when plasma is centrifuged at 25°C vs a refrigerated centrifuge, and also when centrifuged with vs. without the centrifuge brake on.32,33 It is therefore recommended that centrifugation conditions be kept consistent between samples. After centrifugation, plasma should be removed without disturbance of the buffy coat using a plastic (not glass) pipette and transferred to an additive-free plastic tube. This secondary tube should be clearly labelled as containing citrated plasma to avoid inadvertent confusion with other sample types (e.g., serum, EDTA).
Storage between plasma separation and analysisMaking definitive recommendations regarding storage of cit-rated plasma before analysis is challenging because veterinary evidence is limited and in some cases contradictory.34–38 The variability of these results may in part reflect differences in the sensitivity of individual reagents to the effects of storage on individual coagulation factors. Therefore, unless the laboratory has investigated the effects of storage using their own reagents, analysis as soon as possible after plasma separation is preferred. Where analysis within one hour of plasma separation is not pos-sible, storage at room temperature or at 4°C for up to 24 hours is likely acceptable for in-house samples.35,37 For samples that will be shipped to an outside lab, refrigeration of plasma until shipping on ice packs is likely acceptable if the delay between sample collection and analysis does not exceed 24 hours.35,37 For samples that cannot be shipped on the day of collection, freezing plasma and shipping overnight preferably on dry ice may be ac-ceptable.34,35,38 Given the variation in published data on storage and lack of veterinary evidence regarding effects of deviations in temperature above room temperature (as may be experienced during shipping), it is suggested that laboratories should confirm the effects of these storage conditions before accepting mail-in specimens. Based on results for fresh frozen plasma it is recom-mended that frozen specimens be thawed in a water bath at 37°C for 5 minutes (or if not thawed by 5 minutes, until fully thawed).39
6.2 | Hemostasis (coagulation) analytical
6.2.1 | Method validation
Specific considerations relevant to coagulation testing include the use of aPTT for monitoring unfractionated heparin. Ideally, labora-tories with users requiring aPTT results for heparin dose adjustment would determine the prolongation that corresponds to the thera-peutic range for unfractionated heparin for their reagent and instru-ment. This involves measurement of aPTT and either anti-Xa activity or heparin by protamine titration for at least 20 samples from pa-tients receiving unfractionated heparin (and a maximum of two sam-ples per patient).31 Regression analysis can then be used to define the aPTT prolongation that corresponds to an anti-Xa activity of 0.3-0.7 IU/mL31 or a heparin concentration of 0.2-0.4 IU/mL. This re-quires samples from heparinized patients that span the therapeutic range.31 Spiking of normal plasma with heparin in vitro is not an ac-ceptable alternative, as this does not adequately mimic in vivo sam-ples.31,40 The therapeutic range should be confirmed with changes in lot number of aPTT reagent.31 Unfortunately, initial definition and subsequent confirmation of therapeutic range is often impractical in veterinary laboratories due to lack of available specimens. If the therapeutic range for unfractionated heparin cannot be defined, lab-oratory users requesting aPTT for unfractionated heparin monitor-ing should be warned that a 1.5 to 2-fold prolongation in aPTT does not necessarily correspond to achieving therapeutic targets.
There are reports of the use of prothrombin time to calculate an international normalized ratio (INR) for warfarin monitoring in veterinary patients.41,42 However, this approach has not been thor-oughly validated.43 Furthermore, calculation of INR also requires local calibration to confirm that the international sensitivity index (ISI) provided by the manufacturer is appropriate, and re-calculation of the geometric mean normal prothrombin time with each reagent lot change.44 These procedures are not routinely performed in vet-erinary laboratories and rely on human calibration plasmas that may not be appropriate for domestic species. Provision of INR values to users is therefore not currently recommended. If users request the ISI of the PT reagent, the laboratory should advise the user that this value has not been locally verified or validated for veterinary species.
6.2.2 | Instrumentation
Laboratories should have a written policy defining the response to out-of-range results and samples with interferences exceeding those established to be acceptable for the method. If the laboratory uses an alternative method (eg, tilt-tube, mechanical, electrochemical testing) to confirm out-of-range prolongations and/or analyzes sam-ples with interferences that prevent the use of optical methods, the relevant SOPs should specify the thresholds that trigger use of the alternative method. Water baths used for coagulation testing should be regularly checked to confirm temperatures are accurate.

| 583ARNOLD et AL.
6.2.3 | Personnel knowledge
For laboratories serving in-house clients or accepting hand delivered specimens, all laboratory personnel should be aware that coagula-tion testing is often requested to guide therapeutic decisions in criti-cally ill animals and results are frequently time sensitive. Providing clinicians the option to “stat” samples is recommended. Similarly, if a redraw is requested for preanalytical or analytical reasons, clinical staff should be informed immediately.
Personnel should be able to provide information about: the ex-tent to which the assays offered are validated for therapeutic drug monitoring (see method validation); the likely magnitude of effect of potential preanalytical errors; the likely causes of abnormalities in coagulation results; and, recommendations for follow up testing. The use of standardized comments can also be useful, particularly to draw the clinician's attention to potential preanalytical issues (e.g., isolated prolonged aPTT due to contamination with unfractionated heparin; marked reduction in fibrinogen and unreportable PT/aPTT when serum is inadvertently submitted as plasma).
6.2.4 | Quality control for coagulation
Distinctions should be made between point of care instruments and bench-top instruments. For point-of-care instruments, the ASVCP guidelines for point-of-care testing should be followed.45 Point-of-care coagulometers typically include electronic QC, but use of liquid external QC is recommended when there is a change in lot number for a cartridge/reagent, change in instrument, software update, pos-sible damage to the instrument, or if results are generated which are not considered clinically likely.45 For benchtop instruments, a mini-mum of one level of control material (and ideally two levels) should be run each shift if a coagulation test is requested. For laboratories with a significant emergency caseload, it may be prudent to run a control material at the start of every shift regardless of whether co-agulation testing is requested, to ensure that processing of stat sam-ples is not delayed by QC failures. Laboratories should define shift length based on experience of the stability of their own instrument's performance; based on human recommendations, a maximum of 8 hours is suggested.
For laboratories performing manual (i.e., tilt tube) testing, at a minimum a normal control should be assayed simultaneously and ideally also an abnormal control. The case and control(s) should be assayed in duplicate, and the laboratory should prespecify the cri-teria used to determine if agreement between the two duplicates is acceptable. For laboratories that usually employ an optical method but that will perform manual, mechanical, or electromechanical test-ing as an alternative for specimens with unacceptable interferences (e.g., lipemia), reference intervals should be established or validated for these methods.
Lot-to-lot variability is a significant concern for aPTT reagents in human medicine.46,47 A canine study investigating lot-to-lot variabil-ity of PT reagents found statistically significant differences between
lots (median inter-lot CVs 2.7%-5%), although the author did not consider these to be clinically significant.48 Results were similar for two aPTT reagents (median inter-lot CV 2.4% and 2.7%), but greater differences were detected for a third reagent.49 Given the limited veterinary data available, it is suggested that laboratories should develop a strategy to verify that previously established reference intervals remain acceptable after a reagent lot change.50–52
For laboratories performing tests that are reported as a per-centage of a pooled normal sample generated in-house, procedures should be developed to confirm that each new pooled sample gen-erates acceptable results. The stability and handling conditions for pooled samples should also be defined based on experimental stud-ies performed using the laboratory's own instrumentation, reagents, and storage conditions.
Due to variability between reagent/instrument combinations, it is recommended that any external quality assurance program com-pares users with the same instrument/reagent combination.
6.2.5 | Outsourced tests
Many outsourced coagulation tests have specific sample collection and handling requirements. It is recommended that the laboratory provide users with advice, and where feasible, assistance to ensure submitted specimens meet these requirements.
6.3 | Procedures manual and reporting/postanalytical considerations
Due to the potential urgency of coagulation testing, batched analysis of clinical specimens is not encouraged, but if this is unavoidable, the timing of batches should be made available to laboratory users.
The procedures manual should specify wording for result report-ing. A potential source of confusion in coagulation testing is the re-porting of out-of-reportable range values, which some instruments report as an error message. These results should be reported to the clinician as more than the upper limit of the reportable range (or in the case of fibrinogen, less than the lower limit of the reportable range) to clearly distinguish marked clinically significant alterations from instrument failures.
For assays in which the patient's result is reported as a per-centage of a normal control, it is not recommended to report the control specimen's result to the clinician, due to the potential for confusion regarding which value represents the patient. In situ-ations where a reference interval is not available and a healthy control is assayed simultaneously with the patient (e.g., unusual species), the control result and the patient's result should be clearly distinguished in the same report or reported separately. In this situation, the laboratory should assist the clinician in inter-pretation of the likely clinical significance of differences between the case and control, including consideration of the analytical variability of the method.

584 | ARNOLD et AL.
6.3.1 | Comparison of tests
There is significant variability between different PT and aPTT rea-gents and different coagulation analyzers.48,53,54 PT/aPTT results generated using one reagent/instrument combination therefore may not be comparable to results generated using a different reagent/instrument combination. If laboratory users have access to results generated using different analyzers (e.g., bench top instrument in core laboratory, point of care analyzer), client education and written guidance should be provided to advise that results and reference in-tervals for each instrument/method are not transferrable.
R E FE R E N C E S 1. Flatland B, Koenigshof AM, Rozanski EA, et al. Systematic evaluation
of evidence on veterinary viscoelastic testing part 2: Sample acquisi-tion and handling. J Vet Emerg Crit Care (San Antonio). 2014;24: 30-36.
2. Stokol T, Brooks MB, Erb HN. Effect of citrate concentration on coagu-lation test results in dogs. J Am Vet Med Assoc. 2000;217: 1672-1677.
3. Morales F, Couto CG, Iazbik MC. Effects of 2 concentrations of sodium citrate on coagulation test results, von Willebrand factor concentra-tion, and platelet function in dogs. J Vet Intern Med. 2007;21: 472-475.
4. Peterson P, Gottfried EL. The effects of inaccurate blood sample volume on prothrombin time (PT) and activated partial thromboplas-tin time (aPTT). Thromb Haemost. 1982;47:101-103.
5. Johnstone IB. The importance of accurate citrate to blood ratios in the collection of canine blood for hemostatic testing. Can Vet J. 1993;34:627-629.
6. Adcock DM, Kressin DC, Marlar RA. Minimum specimen volume re-quirements for routine coagulation testing: dependence on citrate concentration. Am J Clin Pathol. 1998;109:595-599.
7. Lippi G, Salvagno GL, Montagnana M, et al. Quality standards for sample collection in coagulation testing. Semin Thromb Hemost. 2012;38:565-575.
8. Reneke J, Etzell J, Leslie S, et al. Prolonged prothrombin time and activated partial thromboplastin time due to underfilled specimen tubes with 109 mmol/L (3.2%) citrate anticoagulant. Am J Clin Pathol. 1998;109:754-757.
9. Siegel JE, Swami VK, Glenn P, et al. Effect (or lack of it) of severe anemia on PT and APTT results. Am J Clin Pathol. 1998;110:106-110.
10. Marlar RA, Potts RM, Marlar AA. Effect on routine and spe-cial coagulation testing values of citrate anticoagulant adjust-ment in patients with high hematocrit values. Am J Clin Pathol. 2006;126:400-405.
11. O'Brien SR, Sellers TS, Meyer DJ. Artifactual prolongation of the activated partial thromboplastin time associated with hemoconcen-tration in dogs. J Vet Intern Med. 1995;9:169-170.
12. Bauer NB, Er E, Moritz A. Influence of blood collection technique on platelet function and coagulation variables in dogs. Am J Vet Res. 2011;72:64-72.
13. Solbak S, Epstein SE, Hopper K. Influence of needle gauge used for venipuncture on measures of hemostasis in cats. J Feline Med Surg. 2019;21:143-147.
14. Greenwell CM, Epstein SE, Brain PH. Influence of needle gauge used for venipuncture on automated platelet count and coagulation pro-file in dogs. Aust Vet J. 2014;92:71-74.
15. Lippi G, Salvagno GL, Guidi GC. No influence of a butterfly device on routine coagulation assays and D-dimer measurement. Journal of Thrombosis and Haemostasis. 2005;3:389-391.
16. Mackenzie CJ, McGowan CM, Pinchbeck G, et al. Comparison of two blood sampling techniques for the determination of coagulation parameters in the horse: Jugular venipuncture and indwelling intra-venous catheter. Equine Vet J. 2018;50:333-338.
17. Maeckelbergh VA, Acierno MJ. Comparison of prothrombin time, activated partial thromboplastin time, and fibrinogen concentration in blood samples collected via an intravenous catheter versus direct venipuncture in dogs. Am J Vet Res. 2008;69:868-873.
18. Palsgaard-Van Lue A, Jensen AL, Strøm H, Kristensen AT. Comparative analysis of haematological, haemostatic, and inflam-matory parameters in canine venous and arterial blood samples. The Veterinary Journal. 2007;173:664-668.
19. Lippi G, Cervellin G, Mattiuzzi C. Critical review and meta-analysis of spurious hemolysis in blood samples collected from intravenous catheters. Biochem Med (Zagreb). 2013;23:193-200.
20. Garcia-Pereira BL, Scott MA, Koenigshof AM, et al. Effect of veni-puncture quality on thromboelastography. J Vet Emer Crit Care (San Antonio). 2012;22:225-229.
21. Dalton KA, Aucoin J, Meyer B. Obtaining coagulation blood samples from central venous access devices: a review of the literature. Clin J Oncol Nurs. 2015;19:418-423.
22. Smalko D, Johnstone IB, Crane S. Submitting canine blood for pro-thrombin time and partial thromboplastin time determinations. Can Vet J. 1985;26:135-137.
23. Maunder CL, Costa M, Cue SM, et al. Measurement of prothrom-bin time and activated partial thromboplastin time in citrated whole blood samples from clinically ill dogs following storage. J Small Anim Pract. 2012;53:531-535.
24. Salvagno GL, Lippi G, Montagnana M, et al. Influence of temperature and time before centrifugation of specimens for routine coagulation testing. Int J Lab Hematol. 2009;31:462-467.
25. Adcock D, Kressin D, Marlar RA. The effect of time and tempera-ture variables on routine coagulation tests. Blood Coagul Fibrinolysis. 1998;9:463-470.
26. Ergin M, Erdogan S, Akturk O, et al. The effects of transport by car on coagulation tests. Clin Chem Lab Med. 2017;55:1943-1947.
27. Pfaefflin A, Schuster K, Braun R. Short centrifugation to ame-liorate turn-around-time in routine coagulation testing. Clin Lab. 2017;63:1945-1947.
28. Boissier E, Sevin-Allouet M, Le Thuaut A, et al. A 2-min at 4500 g rather than a 15-min at 2200 g centrifugation does not impact the reliability of 10 critical coagulation assays. Clin Chem Lab Med. 2017;55:e118-e121.
29. Dimeski G, Solano C, Petroff MK, et al. Centrifugation protocols: tests to determine optimal lithium heparin and citrate plasma sample quality. Ann Clin Biochem. 2011;48:218-222.
30. Lippi G, Rossi R, Ippolito L, et al. Influence of residual platelet count on routine coagulation, factor VIII, and factor IX testing in post-freeze-thaw samples. Semin Thromb Hemost. 2013;39:834-839.
31. Marlar RA, Clement B, Gausman J. Activated partial thromboplastin time monitoring of unfractionated heparin therapy: issues and rec-ommendations. Semin Thromb Hemost. 2017;43:253-260.
32. Yazar H, Ozdemir F, Kose E. Effect of centrifuge temperature on rou-tine coagulation tests. Acta Haematol. 2018;139:158-163.
33. Daves M, Giacomuzzi K, Tagnin E, et al. Influence of centrifuge brake on residual platelet count and routine coagulation tests in citrated plasma. Blood Coagul Fibrinolysis. 2014;25:292-295.
34. Bateman SW, Mathews KA, Abrams-Ogg AC, Lumsden JH, Johnstone IB. Evaluation of the effect of storage at -70 degrees C for six months on hemostatic function testing in dogs. Can J Vet Res. 1999;63:216-220.
35. Rizzo F, Papasouliotis K, Crawford E, et al. Measurement of pro-thrombin time (PT) and activated partial thromboplastin time (APTT) on canine citrated plasma samples following different storage condi-tions. Res Vet Sci. 2008;85:166-170.
36. Piccione G, Casella S, Giannetto C, et al. Effect of storage condi-tions on prothrombin time, activated partial thromboplastin time and fibrinogen concentration on canine plasma samples. J Vet Sci. 2010;11:121-124.
37. Furlanello T, Caldin M, Stocco A, et al. Stability of stored canine plasma for hemostasis testing. Vet Clin Pathol. 2006;35:204-207.

| 585ARNOLD et AL.
38. Casella S, Giannetto C, Fazio F, et al. Assessment of prothrombin time, activated partial thromboplastin time, and fibrinogen concen-tration on equine plasma samples following different storage condi-tions. J Vet Diagn Invest. 2009;21:674-678.
39. Isaacs MS, Scheuermaier KD, Levy BL, et al. In vitro effects of thaw-ing fresh-frozen plasma at various temperatures. Clin Appl Thromb Hemost. 2004;10:143-148.
40. Gausman JN, Marlar RA. Inaccuracy of a “spiked curve” for monitoring unfractionated heparin therapy. Am J Clin Pathol. 2011;135:870-876.
41. Winter RL, Sedacca CD, Adams A, et al. Aortic thrombosis in dogs: Presentation, therapy, and outcome in 26 cases. J Vet Cardiol. 2012;14:333-342.
42. Arai S, Griffiths LG, Mama K, et al. Bioprosthesis valve replacement in dogs with congenital tricuspid valve dysplasia: Technique and out-come. J Vet Cardiol. 2011;13:91-99.
43. Williams TPE, Shaw S, Porter A, et al. Aortic thrombosis in dogs. J Vet Emerg Crit Care (San Antonio). 2017;27:9-22.
44. Favaloro EJ, Gosselin R, Olson J, et al. Recent initiatives in harmo-nization of hemostasis practice. Clin Chem Lab Med. 2018;56:1608-1619. https ://doi.org/10.1515/cclm-2018-0082
45. Flatland B, Freeman KP, Vap LM, et al. ASVCP guidelines: quality assurance for point-of-care testing in veterinary medicine. Vet Clin Pathol. 2013;42:405-423.
46. Rosborough TK. Comparing different lots of activated partial throm-boplastin time reagent: analysis of two methods. Am J Clin Pathol. 1998;110:173-177.
47. Shojania AM, Tetreault J, Turnbull G. The variations between heparin sen-sitivity of different lots of activated partial thromboplastin time reagent produced by the same manufacturer. Am J Clin Pathol. 1988;89:19-23.
48. Mischke R. Prothrombin time standardisation in canine sam-ples with regard to inter-batch and inter-reagent variability. Vet J. 2011;188:301-306.
49. Mischke R. Effect of reagent batch on activated partial thromboplas-tin time in canine plasma and use of the ratio system for standardiza-tion. Berl Munch Tierarztl Wochenschr. 2002;115:225-229.
50. CLSI. One-Stage Prothrombin Time (PT) Test and Activated Partial Thromboplastin Time (APTT) Test: Approved Guideline. 2nd ed. Wayne, PA: Clinical and Laboratory Standards Institute; 2008.
51. Tate JR, Yen T, Jones GRD. Transference and Validation of Reference Intervals. Clin Chem. 2015;61:1012-1015.
52. Algeciras-Schimnich A, Bruns DE, Boyd JC, et al. Failure of current laboratory protocols to detect lot-to-lot reagent differences: find-ings and possible solutions. Clin Chem. 2013;59:1187-1194.
53. Toulon P, Eloit Y, Smahi M, et al. In vitro sensitivity of different ac-tivated partial thromboplastin time reagents to mild clotting factor deficiencies. Int J Lab Hematol. 2016;38:389-396.
54. Murray D, Pennell B, Olson J. Variability of prothrombin time and activated partial thromboplastin time in the diagnosis of increased surgical bleeding. Transfusion. 1999;39:56-62.
CHECKLIST FOR GUIDELINE SEC TION 6 , HEMOSTA SIS TESTING
The purpose of these checklists is to facilitate guideline implementation/practical application and may be further detailed in laboratory-specific standard operating procedures (SOPs). The numbers in the first column correspond to the section numbers in the guideline.
The N/A option (listed here only for applicable items) should only be employed for items not pertaining to the laboratory, with an explanation in the additional comment box.
Guideline Recommendation Compliant?
Additional Comment(s) by Auditor
6.1 The laboratory provides written guidance to offsite clients and is pre-pared to answer questions regarding sample collection and handling.
□ Yes □ No □ N/A
6.1.1.1 The laboratory either specifies one trisodium citrate concentration or has investigated the effect of trisodium citrate concentration on their analyzer and reagent, and as necessary has generated a separate reference intervals for 3.2% and 3.8% trisodium citrate.
□ Yes □ No □ N/A
6.1.1.2 Results from blood tubes filled to <90% of the desired fill volume are released with a warning that underfilling can cause false prolongations.
□ Yes □ No □ N/A
6.1.2 Samples should be checked for clots and clotted samples rejected.
□ Yes □ No □ N/A
6.1.2.1 For plasma-based assays, cit-rated plasma is separated from whole blood within 6 hours of collection for PT/aPTT, unless aPTT is being used for monitoring of unfractionated heparin, in which case plasma should be separated within one hour.
□ Yes □ No □ N/A
6.1.2.1 Plasma is separated before shipping to a remote laboratory for testing.
□ Yes □ No □ N/A
6.1.2.2 Plasma is separated by centrifu-gation at 1,500 x g for 15 minutes.
□ Yes □ No □ N/A
6.1.2.2 Centrifuge conditions, including temperature and use of the centrifuge brake, are consistent for all samples.
□ Yes □ No □ N/A
6.1.2.2 Plasma is transferred using a plastic pipette to a plastic, addi-tive-free secondary tube, which is clearly identifiable as containing citrated plasma.
□ Yes □ No □ N/A
6.1.2.3 Whenever possible, plasma is analyzed within 1 hour of separa-tion. If this is not achievable, the laboratory may follow storage recommendations established by in-house investigation or the recom-mendations herein. These allow plasma storage for up to 24 hours at room temperature or 4°C for in-house specimens; storage at 4°C and shipping same-day/overnight on ice for mail-in specimens that will be analyzed within 24 hours of patient collection; or, freezing followed by shipping overnight on ice for mail-in specimens that will not be analyzed within 24 hours of patient collection.
□ Yes □ No □ N/A

586 | ARNOLD et AL.
Guideline Recommendation Compliant?
Additional Comment(s) by Auditor
6.1.2.3 If frozen specimens are ac-cepted, plasma is thawed for 5 min-utes (or until full thaw) in a 37°C water bath before analysis.
□ Yes □ No □ N/A
6.2.1 If aPTT is used for unfrac-tionated heparin monitoring, the therapeutic range should be established using at least 20 samples from patients receiv-ing unfractionated heparin. If this cannot be achieved, users requesting aPTT are advised that fold changes in aPTT do not necessarily predict achievement of therapeutic targets.
□ Yes □ No □ N/A
6.2.1 International Normalized Ratio (INR) is not provided (not validated in veterinary species).
□ Yes □ No □ N/A
6.2.2 The laboratory has a written policy defining the responses to out-of-range results and samples with interferences, including the triggers for use of confirmatory or alternative methods.
□ Yes □ No □ N/A
6.2.2 Water baths are regularly checked to ensure the desired temperature is achieved.
□ Yes □ No □ N/A
6.2.3 Personnel are aware of the potential urgency of coagulation test requests and the require-ment to inform clinical staff as soon as possible if a redraw is required.
□ Yes □ No □ N/A
6.2.3 Personnel can provide infor-mation about the extent to which methods have been validated for commonly used therapeutics; likely magnitude of effect of common preanalytical errors; likely causes of abnormalities; and, can provide recommendations for follow up testing.
□ Yes □ No □ N/A
6.2.4 For reference instruments, a minimum of 1 level of control material is assayed in each shift during which a coagulation test is requested. Ideally, two levels of control are assayed in every shift.
□ Yes □ No □ N/A
6.2.4 If manual (i.e., tilt tube) testing is performed, a minimum of one normal control is assayed at the same time as the patient sample. Control(s) and patient samples are assayed in duplicate, and criteria are defined for the acceptable difference between duplicates.
□ Yes □ No □ N/A
Guideline Recommendation Compliant?
Additional Comment(s) by Auditor
6.2.4 If laboratories are reporting assays as a percentage of normal pooled samples, procedures are in place to confirm that new pools generate acceptable results. Stability and handling conditions for pooled plasma are established by in-house experimentation.
□ Yes □ No □ N/A
6.2.5 Users are provided with ad-vice, and where feasible, assistance to ensure correct sample collection and handling for outsourced tests.
□ Yes □ No □ N/A
6.3 If batched analysis is performed, the timing of analysis is available to users.
□ Yes □ No □ N/A
6.3 Wording for results reporting is clearly specified, including report-ing of out-of-reportable range results and as applicable, the clear differentiation of patient results from simultaneously assayed con-trol samples.
□ Yes □ No □ N/A
6.3 If multiple coagulation instru-ments are available within one institution, client education and written guidance are available regarding the variability in coagula-tion results generated by different instrument/reagent combinations.
□ Yes □ No □ N/A
7 | CROSSMATCHING
This section describes quality factors concerned with crossmatch-ing for blood transfusions in dogs and cats. Major crossmatches consist of testing patient serum (or plasma) with a saline suspen-sion of donor RBCs. A minor crossmatch, available when a donor whole blood specimen has been submitted, consists of testing a saline suspension of RBCs from the recipient (animal patient) with donor serum or plasma. This step is uncommonly done in dogs since they lack clinically significant naturally occurring antibodies,1 but it is appropriate if donors have been previously transfused or have an uncertain transfusion history.2 The use of these types of donors is not recommended. The minor crossmatch may also be appropriate if donors are not screened for, but may have, significant naturally occurring antibodies (e.g., for all cats).3 Blood donor management, unit collection and handling, and crossmatching in other species are beyond the scope of this document.
7.1 | Preanalytical factors
Preanalytical factors important for crossmatching in veterinary lab-oratories pertain to collection and handling of appropriate samples

| 587ARNOLD et AL.
with strict adherence to accurate patient and sample identifica-tion and appropriate documentation from collection through post-transfusion. General and specific recommendations for specimen collection, handling, and transportation of hematology specimens should be followed (see section 5). Serum or plasma (ACD, CPDA, or EDTA) may be used for crossmatching in dogs and cats.1,3 Serum (fresh or frozen) can serve as a source of complement in a proce-dure for detection of hemolysins in dogs and cats, but this has not typically been performed.4 Plasma is preferred in human medicine due to potential interference from fibrin clots that may form in non-additive tubes when patients are undergoing heparin treatment.5,6 Anticoagulated (EDTA, ACD, or citrated) whole blood or packed RBCs is necessary for the major crossmatch, from the donor(s) and from the patient (for auto-control erythrocytes). Specimens for minor crossmatch include erythrocytes (anticoagulated whole blood) from the recipient and serum or plasma from the donor(s). Samples described above are appropriate for working up suspected transfusion reactions (repeat typing and crossmatching), and poten-tially for antibody screening. Recipient and donor specimens ideally should be as fresh as possible and free of hemolysis, lipemia, and clots. Clots should be removed from samples prior to testing; fibrin clots in plasma or serum and clotted erythrocytes in cell suspen-sions may interfere with reading for agglutination. Human speci-mens from donor unit segments may be as old as the unit of blood to be crossmatched7; however, use of these aged erythrocytes may be more prone to storage lesions and induce non-specific test reac-tions (author observation).
Studies evaluating the rate of alloimmunization in animals are scant. Anti-DEA 1 antibodies can be detected as early as 9 days after transfusing immunizing blood into a naïve dog.2,8 A DEA 1-negative naïve dog developed strong, persistent alloantibodies more than 16 days after transfusion with weak DEA 1-positive donor cells.9 Crossmatching dogs with a history of transfusion (at least three days previously), and therefore subject to sensitization, has been docu-mented.10 For some crossmatch procedures, whole blood is used, whereas others require a phosphate-buffered-saline washed RBC suspension.11 Washed cells should be prepared fresh from the origi-nal sample for each test run.
Specimens from the recipient and donor(s) should be clearly labeled with name/ID of animal patient and donor(s) with date, time, and spe-cies. At least one, and ideally two unique identifiers should be utilized for each patient specimen submitted.6 Specific forms for submission should be considered to ensure accurate assignment of specimens as recipient and donors. Inclusion of historical information, such as known blood type and prior transfusion date(s), is recommended. Tubing seg-ments are prelabeled with the unit serial number, often submitted as the donor sample and sometimes referred to as a “pigtails.” These numbers provide excellent tracking of the unit of origin and should be recorded when utilized in this manner.
If serum is used for crossmatching, it should be separated from RBCs as soon as possible after the specimen has thoroughly clotted. Harvested serum or plasma should be examined for hemolysis. When present, hemolysis is graded from 1+ to 4+, representing mild to severe,
respectively. Specimens with insufficient intact cells due to hemolysis should be rejected. Hemolyzed serum or plasma may mask an incom-patible hemolytic reaction when hemolysis is an indicator of incompat-ibility in the method being used.6 If not used immediately, specimens should be stored at 1-6ºC for at least 7 days posttransfusion should a transfusion reaction workup become necessary.6
7.2 | Analytical factors important for crossmatching in veterinary laboratories
7.2.1 | Standard operating procedures (SOP)
Standard Operating Procedures (SOP) should be maintained and ac-cessible to all laboratory personnel performing crossmatching (see also Section 2, Appendix 1 for further details on SOPs). Procedures for crossmatch vary with the laboratory and species. While contro-versial, crossmatching is recommended for all12,13 and dogs likely to have strong antibodies induced by prior transfusion.14–17 Specific SOP recommendations are beyond the scope of these guidelines. Establishment of crossmatch procedures or adoption of procedures from another trusted laboratory is recommended when not utilizing commercially available kits.18–20 Instructions supplied with commer-cially available kits should be followed.
7.2.2 | Quality control
Quality control of assays described in this section include major and minor crossmatching.
Autocontrols for the animal patient and donor(s) should be performed to ensure that reagents (such as the diluent) and the equipment are functioning properly, and that the SOP was not only followed, but includes enough detail to insure reliable re-sults. Washing cells by applying a forceful stream of buffered saline to a small volume of erythrocytes in a glass test tube, de-canting after centrifugation for 1 minute, resuspending and re-peating the cycle at least 2 more times, and reconstituting to a final cell suspension of 4% is recommended.2 The autocontrol also screens for autoagglutination due to immune-mediated he-molytic anemia. Autocontrols should be handled in parallel with, and identical to, the major and minor crossmatch specimens. For the animal patient (recipient), the autocontrol consists of sepa-rated serum or plasma and a saline suspension of RBCs from the recipient. When donor whole blood is submitted, the donor auto-control consists of donor serum or plasma and a saline suspension of donor washed RBCs.21
False positive results may occur with:
• Strong rouleaux mimicking true microscopic agglutination; saline replacement step distinguishes rouleaux (dispersed) from aggluti-nation (not dispersed).22
• Inadequate erythrocyte washing.

588 | ARNOLD et AL.
False negative results may occur with:
• Excessively dilute or concentrated RBC suspensions.• Excessive shaking and tapping (tube methods), which may disrupt
fragile agglutinates.
7.2.3 | Monitoring and method validation
Monitoring and method validation are limited in blood bank proce-dures at this time.18,22 Internal monitoring is more commonly per-formed as specimen instability may preclude external monitoring. Not all the method validation procedures listed in section 4 may be applicable to evaluation of crossmatch methods. Method vali-dation procedures should be selected or modified as necessary to ensure that new methods and equipment are performing satisfac-torily to meet the laboratory's requirements and the manufacturer's specifications.
7.3 | Postanalytical factors important for crossmatching in veterinary laboratories
Postanalytical factors Important for Crossmatching in Veterinary Laboratories include clear reporting of date and time of specimen collection, species, and identification of the animal patient and each donor against which a crossmatch was performed. Postanalytical er-rors include clerical errors24 and are, therefore, a potential reason for transfusion reactions. The report should clearly indicate whether the crossmatch with each donor was found compatible or incom-patible with the patient. When incompatible, additional comments describing the type and degree of incompatibility, and emphasizing that unit should not be transfused, should be included. The report should also include the time/date of completion and any techni-cal issues, such as suspected false positive or negative results. Unadulterated samples should be retained under appropriate stor-age conditions in the event that testing after a suspected transfu-sion reaction is requested.
7.4 | Conclusions
Quality assurance and QC throughout all testing phases are essen-tial to providing reliable and accurate results. Preanalytical, ana-lytical, and postanalytical recommendations specifically related to crossmatching are presented here. These and additional guidelines from the QALS Committee are available at www.asvcp.org under “Publications” and are revised and updated at regular intervals. It is hoped that these guidelines and related publications will provide a basis for laboratories to assess their current practices, determine areas for improvement, and guide continuing professional develop-ment and education efforts.
R E FE R E N C E S 1. Goy-Thollot I, Giger U, Boisvineau C, et al. Pre- and post-transfusion
alloimmunization in dogs characterized by 2 antiglobulin-enhanced cross-match tests. J Vet Intern Med. 2017;31:1420-1429.
2. Swisher SN, Young LE. The blood grouping systems of dogs. Physiol Rev. 1961;41:495-520.
3. Weingart C, Giger U, Kohn B. Whole blood transfusions in 91 cats: a clinical evaluation. J Feline Med Surg. 2004;6:139-148.
4. Jain N. Hematologic techniques. In: Jain NC, ed. Schalm's Veterinary Hematology. 4th ed. Philadelphia, PA: Lea & Febiger; 1986:71-74.
5. Kinney J. Tech Tip: the use of EDTA when whole blood samples fail to clot quickly. Immunohematology. 1990;6(1):18-9.
6. Harm SK, Dunbar NM. Transfusion-service-related activities: pre-transfusion testing and storage, monitoring, processing, distribu-tion, and inventory management of blood components. In: Fung MK, Eder AF, Spitalnik SL, Westhoff CM, eds. Technical Manual, AABB. 19th ed. Bethesda, MD: American Association of Blood Banks; 2017:476-484.
7. FDA US. Title 21, Subchapter F–biologics. In: Services HaH, ed. 2018.
8. Young LE, Ervin DM, Yuile CL. Hemolytic reactions produced in dogs by transfusion of incompatible dog blood and plasma. 1. Serologic and hematologic aspects. Blood. 1949;4:1218-1231.
9. Guidetti M, Goy-Thollot I, Boisvineau C, Giger U. Alloimmunization of a dog erythrocyte antigen 1- dog transfused with weakly dog erythrocyte antigen 1+ blood. J Vet Intern Med. 2019;33:2037-2045.
10. Holowaychuk MK, Leader JL, Monteith G. Risk factors for trans-fusion-associated complications and nonsurvival in dogs receiving packed red blood cell transfusions: 211 cases (2008-2011). J Am Vet Med Assoc. 2014;244:431-437.
11. Wardrop KJ. Clinical blood typing and crossmatching. In: Weiss DJ, Wardop KJ, eds. Schalm's Veterinary Hematology. 6th ed. Ames, IA: Blackwell Publishing; 2010:1103-1105.
12. Bucheler J, Giger U. Alloantibodies against A and B blood types in cats. Vet Immunol Immunopathol. 1993;38:283-295.
13. Weinstein NM, Blais MC, Harris K, Oakley DA, Aronson LR, Giger U. A newly recognized blood group in domestic shorthair cats: the Mik red cell antigen. J Vet Intern Med. 2007;21:287-292.
14. Hohenhaus AE. Importance of blood groups and blood group antibodies in companion animals. Transfus Med Rev. 2004;18: 117-126.
15. Melzer KJ, Wardrop KJ, Hale AS, Wong VM. A hemolytic transfu-sion reaction due to DEA 4 alloantibodies in a dog. J Vet Intern Med. 2003;17:931-933.
16. Hurcombe SD, Mudge MC, Hinchcliff KW. Clinical and clinicopatho-logic variables in adult horses receiving blood transfusions: 31 cases (1999-2005). Javma-J Am Vet Med A. 2007;231:267-274.
17. Goulet S, Blais MC. Characterization of anti-Dal alloantibod-ies following sensitization of two Dal-negative dogs. Vet Pathol. 2017;55:108-115.
18. Kessler RJ, Reese J, Chang D, Seth M, Hale AS, Giger U. Dog erythro-cyte antigens 1.1, 1.2, 3, 4, 7, and Dal blood typing and cross-match-ing by gel column technique. Vet Clin Pathol. 2010;39:306-316.
19. Goy-Thollot I, Giger U, Boisvineau C, et al. Pre- and post-transfusion alloimmunization in dogs characterized by 2 antiglobulin-enhanced cross-match tests. J Vet Intern Med. 2017;31:1420-1429.
20. Goy-Thollot I, Nectoux A, Guidetti M, et al. Detection of naturally occurring alloantibody by an in-clinic antiglobulin-enhanced and standard crossmatch gel column test in non-transfused domestic shorthair cats. J Vet Intern Med. 2019;33:588-595.
21. Brown D, Vap LM. Principles of blood tranfusion and crossmatch-ing. In: Thrall MA, Weiser G, Allison R, Campbell TW, eds. Veterinary Hematology and Clinical Chemistry. 2nd ed. Ames, IA: Wiley-Blackwell; 2012:205-222.

| 589ARNOLD et AL.
22. Fung MK, Eder AF, Spitalnik SL, Westhoff CM. Technical Manual. 19th ed. Bethesda, MD: American Association of Blood Banks; 2017.
23. Luethy D, Owens SD, Stefanovski D, Nolen-Walston R, Giger U. Comparison of tube, gel, and immunochromatographic strip meth-ods for evaluation of blood transfusion compatibility in horses. J Vet Intern Med. 2016;30:1864-1871.
24. Hawkins R. Managing the pre- and post-analytical phases of the total testing process. Ann Lab Med. 2012;32:5-16.
CHECKLIST FOR GUIDELINE SEC TION 7, CROSSMATCHING
The purpose of these checklists is to facilitate guideline implementation/practical application and may be further detailed in laboratory-specific standard operating procedures (SOPs). The numbers in the first column correspond to the section numbers in the guideline.
The N/A option (listed here only for applicable items) should only be employed for items not pertaining to the laboratory, with an explanation in the additional comment box.
Guideline Recommendation Compliant?
Additional Comment(s) by Auditor
7.1 Identification information on submission form/orders matches that of sample(s).
□ Yes □ No □ N/A
7.1 Specimens from recipient and donor(s) are clearly labeled with date, species, animal or donor identification, and donor blood type.
□ Yes □ No □ N/A
7.1 History of a prior transfusion date(s) is provided.
□ Yes □ No □ N/A
7.1 Sera and plasma samples are examined for hemolysis upon harvest. Samples hemolyzed beyond accepted limits for the procedure are rejected and documented.
□ Yes □ No □ N/A
7.1 Whole blood and serum/plasma specimens are stored at 1-6°C when not in use.
□ Yes □ No □ N/A
7.2.1 Crossmatching SOP(s) exist and are readily available.
□ Yes □ No □ N/A
7.2.2 Autocontrols and steps to manage or minimize false positive and negative results are included with the crossmatch.
□ Yes □ No □ N/A
7.3 Reports clearly indicate date/time of specimen collection, species, and identification of the animal patient and each donor against which a crossmatch has been performed.
□ Yes □ No □ N/A
Guideline Recommendation Compliant?
Additional Comment(s) by Auditor
7.3 Reports clearly indicate whether each donor was found compatible or incompatible with the patient, type and strength of incompatibility, with the date/time of completion.
□ Yes □ No □ N/A
7.3 Sera/plasma and whole blood or packed red cells are retained for potential follow-up testing.
□ Yes □ No □ N/A
8 | URINALYSIS
8.1 | Urinalysis: preanalytical
8.1.1 | Specimen collection, handling and transport to the laboratory
The submitter should clearly state the method by which the urine was obtained, such as free flow (early or midstream), catheteri-zation, cystocentesis, or from the floor or metabolism cage. This information is important for interpretation of the presence and concentration of potential contaminants including squamous cells, blood, debris and bacteria. Clear specimen containers can be used to facilitate gross examination if urine will be examined within 30 minutes. However, if urinalysis will be delayed, urine must be pro-tected from exposure to ultraviolet light to prevent degradation of urine constituents (e.g., bilirubin). Lids must be secure to prevent evaporation and/or volatilization of urine constituents (e.g., ke-tones). Containers must not be re-used; any traces of detergent will interfere with chemical analysis. If there is a concern for urinary tract disease (inflammation, infection, or neoplasia), non-stained, clearly labeled smears of fresh urine (preferably of the sediment if enough urine is available, otherwise a direct smear) should be sub-mitted along with the urine sample.
8.1.2 | Urine storage
Optimally, urine should be examined within 30 minutes of collec-tion. If immediate examination is not possible, urine must be stored at refrigerated temperatures (2-4°C) to minimize changes in physical and chemical composition and to inhibit bacterial growth. Strict rec-ommendations for duration of refrigerated storage cannot be made because this depends on specific urine components.1 Storage for a maximum of 24 hours in the refrigerator is generally acceptable for the purpose of microbiological examination. Chemical compo-nents tested by the dipstick are also stable up to 24 hours under refrigeration, apart from bilirubin and glucose, and pH if bacteria are

590 | ARNOLD et AL.
present.1,2 Sediment elements like leukocytes and erythrocytes are stable for a maximum of 4 hours in the refrigerator.3,4 Stability of casts and crystals depends on urine pH and concentration. Crystals may form in vitro during storage at either room temperature or under refrigeration.5,6 If crystalluria is a clinical concern, freshly collected urine must be examined immediately. Refrigerated samples must be brought to room temperature prior to analysis. Because urinalysis re-sults may be affected by storage duration and temperature, the time of urine collection, the time of arrival in the laboratory, and method of storage should be recorded. Alternative methods of preservation are available for stabilization of urine chemistry, inhibition of bacte-rial growth, and preservation of formed elements.3 Manufacturer's claims must be followed regarding intended use of particular pre-servatives and duration of storage. Reference laboratories should have documented policies for rejection of urine samples that do not adequately meet transport/storage time requirements, or that do not contain sufficient volume for urinalysis.
8.1.3 | Microbiological culture
Quantitative microbiologic culture is recommended for determin-ing the presence of significant bacteriuria. Urine specimens col-lected by cystocentesis are recommended. Cystocentesis samples from animals with a lower urinary tract infection usually have ≥103 colony forming units/mL, although any growth may be clinically sig-nificant. Bacterial counts of ≥104 in samples collected from male dogs by sterile catheterization and counts of ≥105 in catheter sam-ples from female dogs are considered significant. Regarding the lat-ter, however, repeat culture from a cystocentesis sample should be performed for confirmation. Results from free-catch samples are not considered diagnostic and positive results from these samples must be confirmed on a cystocentesis sample.7 A sterile aliquot of urine must be set aside for possible microbiological culture before the urinalysis procedure. Urine in tubes which have been opened after collection is no longer sterile. Urine samples placed in sterile serum tubes and refrigerated or kept in cool ambient temperatures are acceptable for microbiological culture for up to 24 hours.8 If refrigeration is not available and ambient temperature exceeds 25°C, samples in tubes containing boric acid can be used for up to 24 hours.9
8.2 | Urinalysis analytical
8.2.1 | Monitoring
Equipment, dipsticks, stains and analyzers used for urinalysis must be handled, maintained and calibrated according to general princi-ples as described in the analytical sections of these guidelines. A calibration log should be kept for refractometers and maintenance and performance logs should be kept for automated strip readers and sediment analyzers.
8.2.2 | Method validation
Not all of the method validation experiments listed in the general an-alytical section (section 4) may be applicable to evaluation of urinaly-sis. Method validation experiments should be selected or modified as necessary to ensure that new methods/analyzers are functioning satisfactorily to meet the laboratory's requirements and the manu-facturer's specifications. As dipsticks used in veterinary medicine are generally designed for human use, validation of novel dipsticks (i.e., where no published validation study exists) for the species of interest is necessary. Applicable method validation procedures may include, but are not limited to, comparison of methods, testing for interference (particularly how urine color affects ability to read strip result visually or by automated methods), reproducibility, inter-ob-server agreement, and possibly detection limits.
8.2.3 | Instrumentation
Instrumentation employed in urinalysis includes refractometers, au-tomated strip readers and automated sediment analyzers. Automated strip readers and sediment analyzers must be maintained and oper-ated according to manufacturer's specifications. Applicable function checks and quality control materials should be used to ensure accu-rate and stable instrument performance, within quality specifications.
8.2.4 | Personnel knowledge
PreanalyticalPersonnel should have knowledge of common problems encoun-tered with veterinary urine specimens that may lead to erroneous results, e.g., artifacts and contaminants associated with different collection methods, effects of preservatives on test results, urine specimen incorrectly run on serum settings, and the effects of speci-men condition on various measurands.
Species differencesPersonnel should have knowledge of species variability in urine ap-pearance (e.g., turbidity in horses, pigmenturia in rabbits), specific gravity ranges and dipstick findings (e.g., mild bilirubinuria in healthy dogs) and species-specific expected crystalluria.2,10
AnalyticalPersonnel should have knowledge of dipstick methods used in the laboratory and common interferences for that method.
Appropriate uses of retest/confirmatory test criteriaCriteria should be established by the laboratory, clearly communi-cated to all staff performing the tests, and based on clinical signifi-cance of test values, e.g., crystal identification, protein confirmation by precipitation and/or spectrophotometric methods and glucose confirmation. When intensely pigmented urine interferes with the

| 591ARNOLD et AL.
ability to read a dipstick, either tablet methods may be used to de-termine results, or results should not be reported if other methods are not available. The results of any retested/confirmatory testing should be included in the patient report.
8.2.5 | Quality control and analytical factors important in urinalysis
See also analytic recommendations (section 4). It may not be ap-propriate for personnel with color vision disorders to perform color-change dependent tests.
Organoleptic examinationThe appearance (color, turbidity) and odor of the urine should be consistent with other urinalysis findings.
Urine specific gravity estimation by refractometryHandheld medical refractometers with temperature compensation should be used.11 Refractometers must be calibrated using distilled water or commercial quality control material on a regular basis.11 Different refractometers do not necessarily give equivalent re-sults and the use of a variety of refractometers in one facility, and overly strict adherence to diagnostic cut-offs should be avoided.12 Alternatively, the same refractometer should be used for subse-quent evaluations of a single patient. The use of feline-specific re-fractometers or using a conversion factor for feline urine appears to be associated with a negative bias and is not necessary.12
Dipstick and other chemical testsDipsticks should not be used past their expiry date and should be stored in their original containers with the desiccant and with the lid tightly closed. Exposure to light and humidity must be minimized to prevent oxidation and color changes taking place on the dipstick pads. The manufacturer's guidelines for the dipstick procedure and the tim-ing of reading off results should be followed to ensure accurate results.
Dipstick pads not used in animals. The following pads are inaccurate and must not be used:
• Leukocyte pad: This test is not reliable and cannot be used for leukocyte detection in urine in veterinary species. Both false neg-atives (especially in dogs) and false positives (especially in cats) occur.13,14
• Specific gravity pad: This pad does not give accurate results for specific gravity and cannot be used.14,15
• Nitrate pad: False-negative results are common, and this test is not useful for indicating the presence of bacteriuria.2
• Urobilinogen: Used in humans to screen for bile duct obstruction or hemolysis but is not useful in animals.2
Dipstick pads used in animals. Although the following pads are routinely used, the following limitations should be noted4:
• pH: The pH value obtained with the urine dipstick is an approxi-mation and a pH meter should be used if a highly accurate result is required, particularly in carnivores and other species with acidic urine.16,17
• Protein: False positives may occur with strongly alkaline urine and contamination with chlorhexidine and some detergents. This test is most sensitive to albumin and less sensitive to globulins. As false positive results are common, a positive dipstick reaction should be confirmed by another method, preferably the urine pro-tein:creatinine ratio.18,19
• Glucose: False negative reactions occur in the presence of ascor-bic acid and false positive reactions occur in the presence of some detergents.
• Ketones: Ketones are volatile and can only be detected in fresh urine; pigmenturia may result in a false positive interpretation due to discoloration of the pad. The test only reacts with acetoace-tate, not acetone or beta-hydroxybutyrate.
• Bilirubin: False negative results will occur if the urine has been exposed to excessive ultraviolet light.
• Heme: Some detergents will cause a false positive reaction.
Automated dipstick readers. The use of automated strip readers may reduce inter-operator variability and facilitate rapid transmission of dipstick results to a laboratory information system. False positive results for ketones have been reported.14,15 Operators should familiarize themselves with analyzer functions and performance characteristics and should carry out a method comparison between manual and automated reading before adoption of the reader for clinical use. Automated readers should be subject to regular maintenance as well as calibration and quality control checks as per manufacturer's instructions. Dipstick results must be confirmed by manual reading if results of automated reading are not plausible.
Confirmatory tests. These include tablet tests for confirmation of bilirubinuria and ketonuria. A positive protein reaction on the dipstick should be confirmed with a urine protein:creatinine ratio, once pre- and postrenal causes of proteinuria have been eliminated.
Quality control procedures for dipstick and urine specific gravityUrinalysis control materials for human urine are commercially avail-able for testing accuracy of dipsticks and should be considered for both manual and automated dipstick testing. Quality control testing of each new bottle of dipsticks is recommended; more frequent test-ing may ensure that any deterioration of dipsticks of the same bottle is detected.
Microscopic examination of sediment: standardization of procedureIdentification of elements. Microscopic sediment examination of veterinary urine specimens requires training. Texts, charts and posters from reputable sources of formed elements in urine for a variety of species should be accessible to the analyst. The details of performing this task and the results to be reported must be outlined or detailed in a laboratory SOP.

592 | ARNOLD et AL.
Standardized preparation of the sediment. A standard volume of urine is used for preparing urine sediment (e.g., 5 mL), depending upon the species and the tests requested. Tubes with a conical bottom are preferred. Tubes should be spun at a relative centrifugal force of 400 for 5 minutes. High centrifugal force and excessive centrifugation time destroys casts and cellular elements. The appropriate revolutions per minute (RPM) setting for any centrifuge can be calculated as
where R = radius of centrifuge arm (mm).Supernatant is removed by decanting or pipetting, so that a con-
stant volume (0.5 mL recommended) of supernatant remains with the pellet. Cellular elements are then resuspended by gentle mixing or tapping. A supravital stain may be added to resuspended sedi-ment to facilitate identification of sediment contents. The stain must be kept clean to prevent bacterial or fungal growth and changed/fil-tered regularly to eliminate precipitate which may be confused with bacteria. A consistent number of drops should be added followed by gentle mixing. Additional dilution of cellular elements caused by volume of stain should be factored into final results. Alternatively, a constant sediment volume can be maintained by replacing some of the supernatant volume with stain. A pipette is used to transfer one or two drops of unstained or stained sediment to a glass slide, depending upon the coverslip dimensions. It is important that the sediment volume, the number of drops of sediment and the coverslip size used are constant within a laboratory. A sediment volume of 20 μL is recommended for a 20 × 20 mm coverslip. Alternative methods of standardization of urine sediment are available (e.g., volumetric counting grids), but are not frequently used in veterinary medicine. Adoption of any new methodology should be preceded by method validation studies.
Microscopic examination of sediment: enumeration of elementsThe urine sediment SOP should clearly describe procedures for ex-amining, identifying, quantifying, and reporting sediment contents and must be closely followed to ensure consistency in results for all personnel. The microscope condenser must be lowered when examining unstained sediment. The entire area under the cover-slip should be examined at low magnification (×100 or low power field) followed by high-dry magnification (x400 or high-power field). Several formats have been used for reporting grades and amounts of the formed elements. Absolute numbers of elements per field are preferred. The low and high amounts of each element observed in 10 fields (i.e., the range), or the average, are reported. Alternatively, a 0 to 3+, or 0 to 4+, grading system may be used, if clear criteria are outlined in the standard operating procedure. This information also should be provided to clinicians or customers. Low power field (LPF) is used for enumeration of casts. Casts are reported by type and number per LPF. LPF also can be used for general assessment of the distribution of crystals, epithelial cells and background contents
(mucus, sperm, fat, yeast, etc.). High power field (HPF) is used for re-porting numbers of erythrocytes, leukocytes, and possibly crystals, epithelial cells, and bacteria.
Microscopic examination of sediment: stained air-dried smears or cytocentrifuged preparationsThe examination of a stained sediment smear or cytocentrifuged preparation is indicated when pyuria and/or bacteriuria are de-tected on a wet-mount, or when there is clinical suspicion of a urinary tract infection, even if the sediment is clear. The use of stained sediment smears has a higher specificity and sensitivity for the detection of bacteriuria than the wet-mount.20 Stained smears or cytocentrifuged preparations are also indicated for cytological characterization of inflammation and atypical cell populations. Evaluation of possible neoplasia should be re-ferred to an experienced clinical pathologist. Stained smears are made by placing a drop of urine sediment onto a glass slide, and quickly and gently smearing the drop out using a wedge, pull or coverslip technique. After air- drying, the slide is stained with a Romanowsky stain (methanolic or aqueous).
Automated sediment analysisAutomated urine sediment analysis of human urine samples has greater precision than manual analysis, but some elements may be missed or misclassified.4 Automated urine sediment analyzers have become available for the veterinary market which demonstrate bet-ter precision than manual sediment analysis for canine and feline urine samples.21 Diagnostic accuracy varies depending on the type of formed elements present, however, and further improvement and evaluation of this technology is needed before automated sedi-ment analysis can replace manual microscopy methods.21 As with all novel analytical methods, performance characteristics including accuracy, precision, reportable range/linearity and the effect of in-terferences, should be determined to be acceptable prior to clinical use.
R E FE R E N C E S 1. Rabinovitch A, Arzoumanian L, Curcio K, et al. Urinalysis; Approved
Guideline—Third Edition. CLSI Document GP16-A3. Wayne, PA: Clinical and Laboratory Standards Institute; 2009.
2. Osborne CA, Stevens JB. Urinalysis: A clinical guide to compassionate patient care. Shawnee Mission, USA: Bayer Corporation, Agricultural Division, Animal Health; 1999.
3. Coppens A, Speeckaert M, Delanghe J. The pre-analytical chal-lenges of routine urinalysis. Acta Clinica Belgica. 2010;65:182-189.
4. European Confederation of Laboratory Medicine. European urinaly-sis guidelines. Scand J Clin Lab Invest Suppl. 2000;231:1-86.
5. Albasan H, Lulich JP, Osborne CA, et al. Effects of storage time and temperature on pH, specific gravity, and crystal forma-tion in urine samples from dogs and cats. J Am Vet Med Assoc. 2003;222:176-179.
6. Sturgess CP, Hesford A, Owen H, et al. An investigation into the ef-fects of storage on the diagnosis of crystalluria in cats. J Feline Med Surg. 2001;3:81-85.
7. Weese JS, Blondeau JM, Boothe D, et al. Antimicrobial use guide-lines for treatment of urinary tract disease in dogs and cats:
RPM=
√(400÷1.118R)×1000

| 593ARNOLD et AL.
Antimicrobial Guidelines Working Group of the International Society for Companion Animal Infectious Diseases. Vet Med Int. 2011;2011:263768. https ://doi.org/10.4061/2011/263768.
8. Rowlands M, Blackwood L, Mas A, et al. The effect of boric acid on bacterial culture of canine and feline urine. J Small Anim Pract. 2011;52:510-514.
9. Patterson CA, Bishop MA, Pack JD, et al. Effects of processing delay, temperature, and transport tube type on results of quan-titative bacterial culture of canine urine. J Am Vet Med Assoc. 2016;248: 183-187.
10. Sink CA, Weinstein NM. Practical veterinary urinalysis. Chichester, UK: John Wiley & Sons; 2012.
11. George JW. The usefulness and limitations of hand-held refractom-eters in veterinary laboratory medicine: an historical and technical review. Vet Clin Pathol. 2001;30:201-210.
12. Tvedten HW, Ouchterlony H, Lilliehook IE. Comparison of specific gravity analysis of feline and canine urine, using five refractome-ters, to pycnometric analysis and total solids by drying. N Z Vet J. 2015;63:254-259.
13. Holan KM, Kruger JM, Gibbons SN, Swenson CL. Clinical evaluation of a leukocyte esterase test-strip for detection of feline pyuria. Vet Clin Pathol. 1997;26:126-131.
14. Bauer N, Rettig S, Moritz A. Evaluation the Clinitek status™ auto-mated dipstick analysis device for semiquantitative testing of canine urine. Res Vet Sci. 2008;85:467-472.
15. Defontis M, Bauer N, Failing K, Moritz A. Automated and visual anal-ysis of commercial urinary dipsticks in dogs, cats and cattle. Res Vet Sci. 2013;94:440-445.
16. Athanasiou LV, Katsoulos PD, Katsogiannou EG, et al. Comparison between the urine dipstick and the pH-meter to assess urine pH in sheep and dogs. Vet Clin Pathol. 2018;47:284-288.
17. Johnson KY, Lulich JP, Osborne CA. Evaluation of the reproducibility and accuracy of pH-determining devices used to measure urine pH in dogs. J Am Vet Med Assoc. 2007;230:364-369.
18. Lees GE. Early diagnosis of renal disease and renal failure. Vet Clin North Am Small Anim Pract. 2004;34:867-885.
19. Lyon SD, Sanderson MW, Vaden SL, et al. Comparison of urine dipstick, sulfosalicylic acid, urine protein-to-creatinine ratio, and species-specific ELISA methods for detection of albumin in urine samples of cats and dogs. J Am Vet Med Assoc. 2010;236:874-879.
20. Swenson CL, Boisvert AM, Kruger JM, et al. Evaluation of modified Wright-staining of urine sediment as a method for accurate detection of bacteriuria in dogs. J Am Vet Med Assoc. 2004;224:1282-1289.
21. Hernandez AM, Bilbrough GEA, DeNicola DB, et al. Comparison of the performance of the IDEXX SediVue DX® with manual micros-copy for the detection of cells and 2 crystal types in canine and fe-line urine. J Vet Intern Med. 2019;33:167-177.
CHECKLIST FOR GUIDELINE SEC TION 8 , URINALYSIS
The purpose of these checklists is to facilitate guideline implementation/practical application and may be further detailed in laboratory-specific standard operating procedures (SOPs). The numbers in the first column correspond to the section numbers in the guideline.
The N/A option (listed here only for applicable items) should only be employed for items not pertaining to the laboratory, with an explanation in the additional comment box.
Guideline Recommendation Compliant?
Additional Comment(s) by Auditor
8.1.1 Sample collection, storage and transport recommendations are readily available to offsite clients.
□ Yes □ No □ N/A
8.1.1 Clients are advised to clearly mark the urine collection method in the designated section of the laboratory submission form.
□ Yes □ No □ N/A
8.1.1 Urine is collected into new, clean containers and promptly covered securely.
□ Yes □ No □ N/A
8.1.1, 8.1.2 Urine samples that will be analyzed >30 min. after collec-tion are placed in the refrigerator and protected from UV light.
□ Yes □ No □ N/A
8.1.1 A direct or sediment smear is made from fresh urine and submitted with the urine sample if urinary tract disease is suspected. The smear is specified as direct or concentrated.
□ Yes □ No □ N/A
8.1.2 Urine samples for which crystalluria is a clinical concern are examined within 30 minutes of collection.
□ Yes □ No □ N/A
8.1.2 Refrigerated urine samples are brought to room temperature before analysis.
□ Yes □ No □ N/A
8.1.2 Sediment examination of refrigerated urine samples takes place within 4 hours of sampling.
□ Yes □ No □ N/A
8.1.2 Dipstick examination of refrig-erated urine samples takes place within 24 hours of sampling.
□ Yes □ No □ N/A
8.1.3 Urine samples intended for culture are aliquoted before any other urinalysis procedures take place and are stored in the refrig-erator or at cool ambient tempera-tures in plain or serum tubes for a maximum of 24 hours.
□ Yes □ No □ N/A
8.1.3 Urine samples intended for microbiology which cannot be refrigerated or stored at cool ambient temperatures are placed into boric acid tubes and analyzed within 24 hours.
□ Yes □ No □ N/A
8.2.1, 8.2.3, 8.2.5 Manufacturers’ instructions are followed for all equipment. Calibration, mainte-nance and performance logs are kept (to include refractometer, stainers, centrifuges, dipstick readers, sediment analyzers, and microscopes).
□ Yes □ No □ N/A

594 | ARNOLD et AL.
Guideline Recommendation Compliant?
Additional Comment(s) by Auditor
8.2.2, 8.2.3, 8.2.5 Method valida-tion and routine QC are performed on instruments used in urinalysis. Laboratory personnel are knowl-edgeable regarding the operation, principle of measurement, and the potential errors associated with these measurements.
□ Yes □ No □ N/A
8.2.4.1 Laboratory personnel have knowledge of preanalytical aspects of urinalysis.
□ Yes □ No □ N/A
8.2.4.2 Laboratory personnel are aware of species differences and normal findings for urine appear-ance, specific gravity, dipstick, and sediment findings.
□ Yes □ No □ N/A
8.2.4.3 Laboratory personnel have knowledge of the different ana-lytical methodologies employed in urinalysis and common analytical errors for the methods.
□ Yes □ No □ N/A
8.2.4.4 Laboratory personnel un-derstand when to repeat urinalysis tests or when use a confirmatory method, as detailed in an SOP.
□ Yes □ No □ N/A
8.2.5.1 An organoleptic (gross) urine evaluation, consisting of a descrip-tion of odor, color, and turbidity, should be performed at the start of urinalysis.
□ Yes □ No □ N/A
8.2.5.2 Refractometers are calibrated regularly with distilled water.
□ Yes □ No □ N/A
8.2.5.3 Dipsticks are within expiry date and are kept in their original containers with the desiccant and with the lid firmly sealed.
□ Yes □ No □ N/A
8.2.5.3 Results from the leuko-cyte, specific gravity, nitrate, and urobilinogen dipstick pads are not reported.
□ Yes □ No □ N/A
8.2.5.3 Positive reactions for pro-tein are followed by a UP:C if pre- and postrenal causes of proteinuria have been eliminated.
□ Yes □ No □ N/A
8.2.5.5, 8.2.5.6 Urine sediment is consistently evaluated using standardized methods for prepara-tion, staining, and enumeration of elements.
□ Yes □ No □ N/A
8.2.5.7 A stained, air-dried sample is examined if there is a clinical suspicion of urinary tract infection or neoplasia, or if pyuria, bacteriu-ria, or atypical cells are seen in the sediment.
□ Yes □ No □ N/A
9 | CY TOLOGY, FLUID ANALYSIS , AND IMMUNOCY TOCHEMISTRY (ICC)
9.1 | Preanalytical factors for cytology and immunocytochemistry
9.1.1 | Specimen collection, handling and transport to the laboratory
Client education regarding if/when cytology is the appropriate diag-nostic choice, coupled with appropriate collection of cytologic speci-mens, will increase the likelihood of a meaningful interpretation. Per section 3.1.2 (general preanalytical factors), information regarding best practices for cytologic submissions should be provided to the client. Instructions should address issues such as collection tech-niques, smear preparation, appropriate containers (with or without anticoagulants) (the reader is referred to veterinary cytology texts for more information)1,2 and specimen fixation, if pertinent. For space-occupying superficial lesions, fine needle aspiration/coring is typically of higher diagnostic yield and more representative than samples obtained via surface impression. Gentle horizontal smear-ing technique usually produces higher quality samples than those obtained via vertical pull-apart (i.e., “sandwich”) or needle drag tech-nique. The latter two methods, or lack of any smearing (simple air drying of droplet-form deposited biologic material), usually results in cellular piling/artifactual aggregation, clotting, and lysis, inhibit-ing the ability to appreciate cell size/shape and full cytoplasmic and nuclear details (Figure 1).
Ultrasound/lubricant gel is microscopically opaque and when present in more than very small quantities, obscures cytologic de-tails and can compete for stain uptake. Thus, the amount of this material intermixed in the cytology sample (e.g., ultrasound-guided aspirates, urothelial/prostatic catheterization, nasal swabbing, lubri-cated endotracheal tubes, etc.) should be minimized by wiping the skin/lesion surface or collection instrument tip before insertion. For ultrasound guided aspirates (underlying non-lesional skin), the nee-dle should be entered adjacent to gel, or alcohol may be used as the sole conducting medium. Other practical considerations for prepara-tion of dry-slide cytology samples include avoidance of the following:
• coverslips or tape• labels that extend beyond/wrap around slide margins• deposition of biologic material only at slide edges or on both sides
of the glass• use of ink markings on the slide, excepting the dedicated frosted
edge area or a circular outline of a cytospin deposition area if a specialized cytocentrifugation slide with a pre-made marking is not available)
• exposure to formalin/formalin fumes (to include proximity to sealed jars of formalin), which interfere with adequate staining and evaluation

| 595ARNOLD et AL.
Use of separate shipping boxes for cytology and histopathology samples is preferable, as even separate plastic bags around forma-lin jars and cytology slide cases within the same shipping box can result in formalin contamination. For lesions that contain both fluid and solid portions, smears from latter should be included in the sub-mission, as fluid can be prone to low cellularity/poor representative quality, as well as degeneration in transit (see 9.1.1.1 below for dis-cussion of making pre-prepared slides from fluid). If a fluid-contain-ing lesion completely decompresses upon fluid aspiration, this should be indicated in the gross lesion description on the accession form.
Cytology slides are not to be refrigerated due to the disruptive effect of condensation, and care should be taken in packing and transport to minimize sample exposure to fluctuations in tempera-ture and humidity. The laboratory should have a policy of clearly defined rejection criteria for samples that do not adequately meet preanalytical requirements.
Fluid samplesDuring sampling, if the fluid is pale and then turns red, iatrogenic blood contamination is likely. Conversely, if the sample is red throughout collection, a hemorrhagic fluid should be suspected (in-house PCV measurement of the fluid may be helpful to compare with reported RBC). Because fluid specimens may be affected by in-transit cellular degeneration and other postcollection artifacts such as macrophage phagocytosis, 1-2 direct smears (before any con-centration or fixation procedures are performed) should be made in-clinic, excepting cerebrospinal fluid (which is best prepared by cytocentrifugation techniques at the collection facility or labora-tory). Freshly prepared slides preserve a portion of the sample for estimation of the cell count and proportions of various cell types. Attention should be paid to creation of a feathered edge (fluid not running off edge of the slide) without excessive lysis. A pre-pre-pared smear(s) can be stained or left unstained (if there is more than one slide, it is ideal to leave at least one unstained) and should be submitted with the fresh fluid sample. All pre-prepared/submitted
slides made from fluid samples (e.g., urine, joint fluid, cavitary effu-sions, fluid-containing masses), whether submitted with fluid tubes or for cytologic analysis only, should be clearly labeled as direct or concentrated. Cavity fluid placed in a dry anticoagulant or EDTA is preferred for cell preservation and prevention of clotting and is also acceptable for many biochemical tests (liquid EDTA may affect cell counts and protein measurements). Plain-top or heparin-con-taining tubes may allow for additional testing but do not preserve cell morphology.
Direct smears may provide information useful for cytologic inter-pretation and may be of superior quality to concentrated prepara-tions, e.g., if smears from a concentrated preparation are excessively thick due to viscous background and/or very high cellularity (the laboratory may decide whether to only prepare direct smears if cel-lularity is very high and therefore further concentration is deemed unnecessary/inappropriate for analysis). Direct smears also provide additional quality control by allowing corroboration of automated cell counts or a categorical (non-quantitative) estimated cell count if sample size is insufficient for slide preparation and automated anal-ysis. For patients with a cavitary effusion and an intra-cavitary mass, concurrent cytologic analysis of the solid lesion is recommended as technically feasible, as the fluid sample may not be representative of a primary pathology.
Immunocytochemistry (ICC): specimen collection, handling, and transport to the laboratoryThe preparation and interpretation of a good quality immunocyto-chemistry sample requires a good quality corresponding Romanowsky-stained cytology sample. Specific details for ICC sample handling and preparation are dependent on the method of staining used in the laboratory. In most cases, air-dried slides and cells in transport media containing saline with 5-10% fetal bovine serum or 10% patient serum are most recommended. Cell blocks are a good choice when cells are numerous and can be prepared with immunohistochemistry meth-ods. This preparation technique is especially useful for detection of
F I G U R E 1 Gross images of cytologic preparations. The first four smears are likely to result in lower cellular preservation/readability due to lack of gentle horizontal smearing. The fifth smear is less likely to be diagnostic due to the very small amount of biologic material on the slide (pale purple material located centrally; the remainder of the magenta coloration on this slide is scant stain residue). The final smear is more likely to be of good diagnostic quality due to both the generous quantity of biologic material and gentle smearing technique
A B C ED F

596 | ARNOLD et AL.
nuclear antigens.3–5 Unstained slides can be fixed in neutral buffered formalin or cold paraformaldehyde, protocol-dependent (formalin can alter external epitopes and impair labeling for certain markers, ne-cessitating use of antigen retrieval methods). Romanowsky-stained slides may be used if the laboratory performing the test utilizes anti-gen retrieval methods. Previous staining may complicate fluorescent labeling. Before fixing cells, contact the laboratory to determine the best preservative to use for the antigen of interest. Samples should be transported to the laboratory by a method which will protect against freezing and overheating. Samples should be sent overnight in protec-tive packaging, with a cold pack for fluids (cold packs should be kept out of direct contact with slides to prevent condensation or freezing artifact on slides). Acetone permeabilizes cell membranes and inhibits bacterial growth and is a reasonable transport medium only for those samples that will be processed to completion within 24 hours, due to rapid cell lysis in this medium. Air-dried, unfixed test slides can be stored at 2-8ºC for up to two weeks without detriment before immu-nostaining if stored in a plastic slide box, then placed within a Ziploc® plastic bag with ½ cup of desiccant. After removal from the refrigera-tor, the bag should rise to room temperature for 30 minutes before opening to prevent condensation.6
9.1.2 | Specimen Identification
Glass cytology slides should be directly labeled in pencil or solvent resistant ink with site source and a unique patient identifier (often patient name, owner last name, or client number). This is critical for multi-site submissions to prevent insufficient or mismatched labe-ling of sites when slides are removed from (solely) labeled containers during accessioning. Labeling containers also hampers their recy-cling. Cytology accession forms should contain all the information listed in section 3.4, including:
• anatomic site sources(s), with clearly separated line items (demar-cated by letter or number) for multi-site submissions
• gross description(s)/imaging findings (superficial/internal lesions, respectively)
• exact collection method (e.g., FNA with syringe, needle-only cor-ing/“woodpecker” technique, direct impression, swab, scrape, flush/wash fluid, tissue imprint/roll)
If this information is not provided, a disclaimer should be placed in the report advising its cautious evaluation in the absence of crit-ical background information, with recommendation for inclusion of these data in future submissions. Use of computerized accession forms requiring data entry to execute a cytology submission is ideal. Use of bone or joint anatomic landmark descriptors (such as jaw/man-dibular, scapular, tibial, stifle, carpal, etc.) should be avoided when describing the location of strictly superficial soft tissue lesions un-less clearly modified (e.g., “4cm subcutaneous mass, freely movable, overlying the left lateral tibial area” is acceptable, vs. “carpal swelling”
or “nodular left scapular mass,” which are incomplete/confusing site sources). Appreciating that this can be challenging for sizable lesions, care should be taken to describe the anatomically correct orientation/location (e.g., dermal vs. subcutaneous; rectal vs. perianal skin), as this information can have a direct impact on proper interpretation.7
9.2 | Analytical factors important for cytology
The veterinary cytopathologist should be knowledgeable about how different collection methods, delayed preparation, and improper handling of cytology specimens may affect expected cytologic fea-tures and interpretation.
9.2.1 | Monitoring
Equipment and reagents used for preparation and analysis of cy-tologic specimens (e.g., automated stainers, manual quick stains, (cyto)centrifuges, cell counters, biochemistry instruments for fluids, refractometers, and microscopes) should be maintained (to include regular calibration for measurement instruments) in a manner con-sistent with standard of laboratory practice as detailed in the sec-tion 4. Maintenance and performance logs are recommended for each instrument and should include information about any problems encountered as well as the subsequent corrective actions.
9.2.2 | Method validation
See general analytical recommendations (section 4). Not all the method validation experiments listed in section 4 may be applica-ble to evaluation of cytologic methods. Method validation experi-ments should be selected or modified as necessary to ensure that new methods/analyzers are functioning satisfactorily to meet the laboratory's requirements for quality and workload, and to verify the manufacturer's performance claims (if available).
9.2.3 | Instrumentation and Reagents
Analyzers that perform cell counts and measure various substances (e.g., (micro)protein, glucose, creatinine, bilirubin, lipase, and triglycer-ides) in fluid specimens should provide test results within the labora-tory's stated performance goals as further defined in section 4. The manufacturer's instructions should be followed for operating and main-taining automated stainers as well as for storage of all stains/reagents (e.g., Wright, aqueous Romanowsky, new methylene blue, Prussian blue). Stains should be stored in non-reactive containers in appropriate conditions and labeled with the name, date received, date prepared or opened, expiration date, and name or initials of person who prepared or opened the stain.

| 597ARNOLD et AL.
9.2.4 | Laboratory personnel requirements
Laboratory technical personnelThese persons should be proficient at examining samples grossly (e.g., fluid color, clarity, and viscosity according to proscribed categories de-lineated in an SOP; color blind persons should be exempt from these examinations) and at performing all relevant tests (routine and special, e.g., mucin clot test for joint fluid). Laboratory personnel should have knowledge of common problems encountered in sample preparation and be able to troubleshoot procedures for problem resolution. The cy-topathologist should review technical aspects of sample handling and processing with laboratory personnel and provide guidance as needed.
Personnel requirements for immunocytochemistry. Immunocytochemi cal staining is a specialized test for antigen detection performed in a histology or clinical pathology laboratory. If applied properly, the technique increases diagnostic accuracy. Personnel performing immunocytochemical staining procedures should do so frequently and be familiar with all control tissues and procedures. Veterinary clinical pathologists who interpret the slides should have at least one corresponding Romanowsky stained slide(s) available and should be familiar with the expected staining appearance of controls and tissues for the stains offered by laboratory.
9.2.5 | Cytologic interpretation
The interpreting individual (preferably a person certified in reading cytologic specimens or in an associated training program) should have documented cytopathology training and have knowledge of the cytologic findings from the species and specimen types ex-pected to be assessed by the laboratory. Consultation with other clinical pathologists that have experience with exotic species is rec-ommended for interpretation of cytologic specimens from species that may be rarely encountered. The method of protein measure-ment from fluid samples (e.g., refractometry, biuret, dye-binding, etc.) must be taken into consideration for interpretation, as there are differences in the effects of interferences and linearity at low/high values.8–14 Similarly, interpretation of nucleated cell and RBC counts should take method (automated vs. hemocytometer) and potential interferences (e.g., proteinaceous, flocculent material erroneously counted as intact cells) into consideration.
Cytology reports should be thorough, clear/unambiguous (see 9.2.5.1 below), and concise, with sections for:
• lab ID• lab accession number• requesting clinician/contact• patient ID• date of report [ideally date of collection and date of specimen re-
ceipt into the lab are also logged systemically if not included in the report; having all three dates will help monitor issues of sample degradation and also turnaround time]
• site source and sample type (FNA, brushing, lavage fluid, etc.)
• microscopic description• microscopic interpretation• appropriate interpretive comments• cytopathologist signature/contacts
A short, relevant history with gross or imaging findings (e.g., “acute vomiting; irregular hepatomegaly without a definable mass lesion”) is beneficial for interpretation and for documenting the in-formation that was available to the clinical pathologist at the time of evaluation and interpretation. Additional history or other findings that could change the interpretation may become available later and can be addressed in a further comment or addendum on the report (please see 9.4.1, below). The cytopathologist should be able to com-municate with clients concerning important preanalytical, analytical, and postanalytical factors important for cytologic sampling and in-terpretation. These may include, but are not limited to, information regarding:
• whether cytology is an appropriate test for the sign(s)/lesion(s)/suspected disease process
• specimen adequacy/suggested modifications of techniques for collection/processing for specimen quality improvement
• diagnosis/differential diagnoses• recommendations for monitoring/resampling• discussion of potential additional non-cytologic testing that may
add diagnostic value (to include further biochemical testing on fluid samples)
• indication for consultation(s) with a clinical specialist(s)
If a cytologic specimen is inadequate for evaluation, it is help-ful to list the major obstacle(s) to interpretation, e.g., low cell num-ber, cellular lysis, hemodilution/thick preparation obscuring cellular detail, necrosis, suspicion of non-representative sample (such as impression smear of an ulcerated lesion with heavy inflammation/squamous debris), lubricant gel.
Grammar and use of probability modifiersCorrect grammar is essential to clinical interpretation accuracy, and therefore written cytology reports should be reviewed prior to release for correctness of spelling, punctuation, lack of run-on sentences or fragments, noun-verb agreement, any other errors of dictation soft-ware transcription, etc. Because cytology frequently cannot provide a definitive diagnosis and because language is inherently subjective, communicating diagnostic probabilities consistently and unambigu-ously is critical to users/veterinary practitioners making further di-agnostic, therapeutic, and euthanasia decisions (an example from human medicine uses this rubric for cancer screening interpretation: benign, atypical, suspicious, malignant, or unsatisfactory specimen)15. Veterinary and human studies have shown that clinicians vary signifi-cantly in their interpretation of the implied probability associated with terms used in pathology reports to describe the degree of uncertainty in a diagnosis.16–20 Also, use of similar modifiers such as “consistent with” and “probable” can result in markedly different actions.16 Thus,

598 | ARNOLD et AL.
the cytopathologist should try to minimize the inherent uncertainty and variability in report interpretation by limiting the number of, and clearly defining, probability modifiers to the best of his/her ability by explaining (in comments) the case/cytologic information that led to the particular choice of modifier or phrasing (as well as providing rec-ommendations for appropriate further testing likely to result in diag-nostic/prognostic refinement). Assigning a numeric probability range is another option, though these should be recognized by the reporting cytopathologist and clinician/user as also inherently subjective.16,18
Verbal reportingThis method of reporting is acceptable under certain exigent circum-stances e.g., a critically ill patient, an anesthetized patient, dysfunc-tion in computer reporting system, etc.. Individuals who may give and receive these reports should be agreed upon by the laboratory and user, with dual confirmation of patient ID and cytologic interpreta-tion. Opportunity should be provided for the report recipient to ask questions. Any verbal reporting should be followed with a written re-port in a timely manner, and the exchange should be documented in the LIS if the software has this capability (e.g., “case notes” section).
9.2.6 | Quality control (see also section 4, general analytical factors)
Cytopathologists are critical to quality control, as they see most or all the laboratory's cytologic samples/preparations and depend upon the reliability thereof for interpretations and recommendations. Supervision and review of handling and preparation of specimens are the purview of the cytopathologist. Therefore, the working re-lationship between clients, laboratory staff, and cytopathologists is critical. Quality control should be appropriate for the types of speci-mens, stains, and procedures included as part of cytology preparation and analysis. These may vary with each laboratory, type of cytologic preparations, and preferences of the cytopathologist. Equipment utilized for determining total nucleated cell counts should be moni-tored as for hematologic analysis (see section 5, Hematology). Total nucleated cell counts from an automated analyzer or manual method (hemocytometer) should be compared with the cellular density on any available direct smear(s). Pathologist participation in available internal and/or external quality assurance programs with blind cy-tology cases is recommended (for more information, please refer to the ASVCP guideline: External quality assessment and comparative testing for reference and in-clinic laboratories).21
9.3 | Analytical factors for immunocytochemistry
9.3.1 | Staining method
Staining qualityAll immunocytochemically stained slides sent to the cytopathologist, including patient slides and all control slides, should be examined
for consistency and appropriate staining prior to release of the interpretation.
Method validationPrior to offering a new immunocytochemical stain, the procedure should be tested and optimized until controls stain appropriately without excessive background staining and until consistent re-sults are achieved with replication. Results should be compared with those achieved using other kits or methods for detecting the same antigen(s). Optimal primary antibody dilution, best fixation and antigen retrieval methods, and optimal incubation time must be determined separately within each laboratory performing ICC. Positive controls should contain both positive and negative areas. Negative patient controls in which the primary antibody is replaced with serum from the same species or an unrelated antibody must be negative.22 Validation of existing antibodies in a new species can be performed by simultaneous staining of analogous tissue specimens from a species with known positive reactivity, correlation with other methods such as flow cytometry, histology/immunohistochemistry, and follow up clinical information.23 Use of all these together is best, but the techniques can be used in some combinations, depending on availability, species, and stage of validation.
9.3.2 | Instrumentation and reagents
Automated stainersThe manufacturer's instructions should be followed for operating and maintaining automated stainers.
ReagentsManufacturer's recommendations should be followed for storage of all reagents, and reagents should be stored in non-reactive contain-ers. All reagents and antibodies must be labeled with the name of the reagent or antibody, date received, date prepared or opened, expira-tion date, and name or initials of person who prepared or opened the reagent, as should be required for all reagents used in a histology or clinical pathology laboratory.
ControlsPreparation and storage of control slides should follow standard practices with the histology or clinical pathology laboratory. Control slides for immunocytochemistry should be cytology slides and not formalin fixed tissues. Sample age and fixation technique can cause significant difference in labeling intensity of some antigens, which may make aged samples or formalin-fixed tissue inappropriate for use as a control in all immunocytochemistry settings. The control tis-sue used with each staining procedure should be shown to accurately reflect the behavior of the primary antibody in an ICC setting. In most cases, similarly handled cytologic samples which contain the target of interest will provide adequate controls. Of note, cells within the test sample with known identity and therefore, expected posi-tive labeling, may be available for use as a second “internal” positive

| 599ARNOLD et AL.
control. Examples of this could include morphologically classic stro-mal tissue for vimentin labeling, or small lymphocytes and plasma cells (when they are not the population of concern) for CD3/21/79a and MUM-1 labeling, respectively. ICC controls fixed in acetone will lose antigenicity after several months, whereas formalin fixed con-trols retain antigenicity indefinitely.3,24 Control or test slides stored in the freezer should be placed in a plastic container and then in a Ziploc® bag containing desiccant.
9.3.3 | Quality assurance/quality control and procedures manual
Follow general recommendations for quality control as detailed in the standard operating procedures (SOPs) for the laboratory, includ-ing for the automated stainer, if applicable. Immunocytochemical procedures should, at minimum, follow the recommendations of rea-gent and equipment manufacturers. Use of specific ICC SOPs by the laboratory is recommended.
Biannual internal quality assurance/quality controlEach laboratory should have a quality system in place to ensure the quality of results. Randomly chosen cases may be used for evalu-ation by a second pathologist in the laboratory for completeness and accuracy of immunocytochemical interpretation (internal audit). Selection based on other factors, such as classic or unusual cases, those for which problems have been previously encountered, or those identified by client complaints or lack of clinical correlation, may provide more useful information after a systematic review that a quality audit entails. External QA/QC for immunocytochemistry would be ideal but is not available through most commercial external quality assurance (EQA) providers. Case rounds to include discussion among several experienced pathologists, with or without follow-up via histopathology is also ideal for all cytology and ICC.
Outsourced proceduresIf an external laboratory is performing the desired immunocyto-chemical reaction, interpretation, and reporting, the following should be provided: the original Romanowsky-stained slide(s), the initial cy-tology report, and sufficient biologic material on unstained cytologic slides (for example, direct and cytocentrifuged preparations should be prepared thin enough, and with sufficient numbers of cells, that would be appropriate for a routine cytologic evaluation—at least 1000 non-hyper aggregated cells is a good benchmark. Evenly dis-tributed cytocentrifuged preparations with a minimum of 250 cells/μL and a maximum of 500 cells/μL is another benchmark, with care as to the effect of the total amount of fluid loaded into a cytocen-trifuge chamber upon overall smear density/appearance). The sub-mitting laboratory should ensure that the contracted laboratory is compliant with recommendations in this document, and the testing laboratory name should be clearly identified on the report released to the client (please also see section 12, general postanalytical).
External quality assessmentInterpretation of ICC reactivity may be compared against immuno-histochemistry of similar tissues if the antibody clone is the same and has been validated for performance in paraffin-embedded tis-sues. Similarly, flow cytometry may be used for comparison of re-sults to ICC.
9.4 | Postanalytical factors important for cytology
9.4.1 | Report addenda
Criteria for amending reports should be established (typically due to additional historical/site source or ancillary testing informa-tion provided. It is important to note that additional information provided by the submitting clinician might or might not alter the original cytologic interpretation/comments. Addendums should be clearly identified as such (attached at the beginning or end of the original report, which should remain unaltered/part of the perma-nent medical record), with date/time stamp (this can be incorpo-rated into software), should list the stated reason for the addition, and should be issued and signed by the author (ideally but not nec-essarily the same author of the original report). Amended reports should be archived.
9.4.2 | Second opinion
Appropriate avenues should exist for a second opinion and addi-tional review or consultation with a cytopathologist, if needed or requested by either the client or the cytopathologist. As required by the situation, second opinions may take the form of another for-mal report solely performed by another pathologist, or in the com-ments section of a first report (e.g., “another pathologist has been consulted on this case and agrees with the interpretation”) when the cytopathologist has consulted internally with colleagues during ini-tial analysis.
9.4.3 | Follow-up
Attempts to ascertain diagnostic accuracy of cytologic interpreta-tions should be pursued, with the understanding that the cytologic specimen may or may not be representative of the entire disease process. These may include but are not limited to: peer review of se-lected cytologic specimens by another cytopathologist to determine if there are features that have been overlooked, over-interpreted, or under-interpreted; correlation of findings with histologic or ad-ditional cytologic specimens, to include possible immunostaining; correlation with other diagnostic modalities, e.g., imaging, microbial culture, serology, PCR, flow cytometry, etc.; and/or, follow-up clini-cal information, i.e., knowledge of the “post-post analytical phase,”

600 | ARNOLD et AL.
when test results are interpreted into the clinical context for diag-nostic/treatment considerations and further follow-up.25
R E FE R E N C E S 1. Meyer DJ. The acquisition and management of cytology specimens.
In: Raskin RE, Meyer DJ, eds. Canine and Feline Cytology A Color Atlas and Interpretation Guide. 3rd ed. St. Louis, MO: Elsevier; 2016:1-15.
2. Meinkoth JH, Cowell RL, Tyler RD, et al. Sample collection and preparation. In: Cowell RL, Valenciano AC, eds. Cowell and Tyler's Diagnostic Cytology and Hematology of the Dog and Cat. 4th ed. St. Louis, MO: Elsevier; 2014:1-19.
3. Ramos-Vara JA, Avery PR, Avery AC. Advanced diagnostic tech-niques. In: Raskin RE, Meyer DJ, eds. Canine and Feline Cytology A Color Atlas and Interpretation Guide. 3rd ed. St. Louis, MO: Elsevier; 2016:453-494.
4. Fernandes NC, Guerra JM, Ressio RA, et al. Liquid-based cy-tology and cell block immunocytochemistry in veterinary med-icine: comparison with standard cytology for the evaluation of canine lymphoid samples. Vet Comp Oncol. 2016;14(Suppl 1):107-116.
5. Marcos R, Santos M, Marrinhas C, et al. Cell tube block: a new tech-nique to produce cell blocks from fluid cytology samples. Vet Clin Pathol. 2017;46:195-201.
6. Fetsch PA, Abati A. Ancillary techniques in cytopathology. In: Atkinson BF, ed. Atlas of Diagnostic Cytopathology. 2nd ed. Philadelphia, PA: Saunders; 2004:747-775.
7. Pinson DM. Writing diagnostic laboratory requisition form histories. J Amer Vet Med Assoc. 2014;244:408-411.
8. Braun JP, Guelfi JF, Pagès JP, et al. Comparison of four methods for determination of total protein concentrations in pleural and perito-neal fluid from dogs. Am J Vet Res. 2001;62:294-296.
9. George JW. The usefulness and limitations of hand-held refractom-eters in veterinary laboratory medicine: an historical and technical review. Vet Clin Pathol. 2001;30:201-210.
10. George JW, O'Neill SL. Comparison of refractometer and biuret methods for total protein measurement in body cavity fluids. Vet Clin Pathol. 2001;30:16-18.
11. Papasouliotis K, Murphy K, Dodkin S, et al. Use of the Vet test 8008 and refractometry for determination of total protein, albu-min, and globulin concentrations in feline effusions. Vet Clin Pathol. 2002;31:162-166.
12. Hartmann K, Binder C, Hirschberger J, et al. Comparison of dif-ferent tests to diagnose feline infectious peritonitis. J Vet Int Med. 2003;17:781-790.
13. Hetzel N, Papasouliotis K, Dodkin S, et al. Biochemical assessment of canine body cavity effusions using three bench-top analysers. J Small Anim Pract. 2012;53:459-464.
14. Shelly SM, Scarlett-Kranz J, Blue JT. Protein electrophoresis on ef-fusions from cats as a diagnostic test for feline infectious peritonitis. J Am Anim Hosp Assoc. 1988;24:495-500.
15. Crothers BA, Tench WD, Schwartz MR, et al. Guidelines for the re-porting of nongynecologic cytopathology specimens. Arch Pathol Lab Med. 2009;133:1743-1756.
16. Christopher MM, Hotz CS, Shelly SM, et al. Interpretation by cli-nicians of probability expression in cytology reports and effect on clinical decisions. J Vet Int Med. 2010;24:406-503.
17. Idowu MO, Wiles A, Wan W, et al. Equivocal or ambiguous terminol-ogies in pathology—focus of continuous quality improvement? Am J Surg Pathol. 2013;37:1722-1727.
18. Galloway M, Taiyeb T. The interpretation of phrases used to de-scribe uncertainty in pathology reports. Pathol Res Int, 2011. Article ID 656079 6 pages; https ://doi.org/10.4061/2011/656079; PMID 21876845 [open access web pub]
19. Attanoos RL, Bull AD, Douglas-Jones AG, et al. Phraseology in pa-thology reports: a comparative study of interpretation among pa-thologists and surgeons. J Clin Pathol. 1996;49:79-81.
20. Christopher MM, Hotz CS. Cytologic diagnosis: expression of prob-ability by clinical pathologists. Vet Clin Pathol. 2004;33:84-95.
21. Camus MS, Flatland B, Freeman KP, et al. ASVCP quality assur-ance guidelines: external quality assessment and comparative testing for reference and in-clinic laboratories. Vet Clin Pathol. 2015;44:477-492.
22. Ramos-Vara JA, Kiupel M, Baszler T, et al. Suggested guidelines for immunohistochemical techniques in veterinary diagnostic laborato-ries. J Vet Diagn Invest. 2008;20:393-413.
23. Bricker NK, Raskin RE, Densmore CL. Cytochemical and immu-nocytochemical characterization of blood cells and immuno-histochemical analysis of spleen cells from 2 species of frog, Rana (Aquarana) catesbeiana and Xenopus laevis. Vet Clin Pathol. 2012;41:353-361.
24. Valli V, Peters E, Williams C, et al. Optimizing methods in immu-nocytochemistry: one laboratory's experience. Vet Clin Pathol. 2009;38:261-269.
25. Plebani M. Toward a new paradigm in laboratory medicine: the five rights. Clin Chem Lab Med. 2016;54:1881-1891.
ADDITIONAL REFERENCE MATERIAL FROM VERSION 1 .0 IMMUNOCY TOCHEMISTRY GUIDELINE:
• Key M, ed. Education guide, immunohistochemical staining meth-ods. 4th ed. Carpenteria, CA: DAKO; 2006:1-172.
• Priest HL, Hume KR, Killick D, et al. The use, publication and fu-ture directions of immunocytochemistry in veterinary medicine: a consensus of the Oncology-Pathology Working Group. Vet Comp Oncol. 2016;15:868-880.
• Polak JM, Van Noorden S. Introduction to immunocytochemistry. 3rd ed, Oxford, UK: Garland Science/BIOS Scientific Publishers; 2003.
RESOURCES
https ://www.cytop athol ogy.org/wp-conte nt/dynam ic_uploa ds/54.pdf Human non-gynecological cytology practice guideline, American Society of Cytopathology
http://webap ps.cap.org/apps/docs/labor atory_accre ditat ion/check lists/ cytop athol ogy_sep07.pdf Human cytopathology checklist for laboratory accreditation, College of American Pathologists
https ://www.archi vesof patho logy.org/doi/pdf/10.1043/1543-2165-133.11.1743 Guidelines for reporting of human non-gyne-cologic cytopathology specimens, CAP laboratory improvement program (Reference no.15).
https ://clsi.org/stand ards/produ cts/gener al-labor atory/ docum ents/gp23/ Link for purchase (membership not required for purchase) of the human Clinical & Laboratory Standards Institute (CLSI) stan-dard document GP23-A2: “Nongynecological Cytology Specimens: Preexamnation, Examination, and Postexamination Processes” (2nd ed.).

| 601ARNOLD et AL.
CHECKLIST FOR GUIDELINE SEC TION 9, CY TOLOGY, FLUID ANALYSIS , AND IMMUNOCY TOCHEMISTRY
The purpose of these checklists is to facilitate guideline implementation/practical application and may be further detailed in laboratory-specific standard operating procedures (SOPs). The numbers in the first column correspond to the section numbers in the guideline.
The N/A option (listed here only for applicable items) should only be employed for items not pertaining to the laboratory, with an explanation in the additional comment box.
Guideline Recommendation Compliant?
Additional Comment(s) by Auditor
9.1.1, 9.1.1.2 Cytology submission guidelines are provided to offsite laboratory clients (i.e., not pertain-ing to private practice in-clinic labs), to include optimal sample and fixation technique/transport media for immunocytochemistry (ICC).
□ Yes □ No □ N/A
9.1.1 Submission recommendations include minimizing ultrasound/lubri-cant gel on skin, lesion surface, and/or on/in the collection instrument.
□ Yes □ No □ N/A
9.1.1, 9.1.1.2 Submission recom-mendations include packaging/transport of slides in a manner that minimizes temperature and humid-ity fluctuations.
□ Yes □ No □ N/A
9.1.1 Submission recommendations include adequate protection from formalin fumes (shipping cytol./histol. samples in completely separate packages/mailings and not in different plastic bags within the same box).
□ Yes □ No □ N/A
9.1.1.1 Submission recommenda-tions include providing 1-2 direct smears with any fluid tubes (excepting CSF), labeled as direct on the slide(s).
□ Yes □ No □ N/A
9.1.2 Submission recommendations include directly labeling glass slides with patient ID and site source (avoiding labeled containers with unlabeled slides).
□ Yes □ No □ N/A
9.1.2 (see also 3.4, 3,5) Clients are advised re possible sample rejec-tion if cytology accession form is not legible or does not contain the following:
• Unambiguous/anatomically cor-rect site source
• Gross description/imaging findings
• Method of collection (e.g., nee-dle v. direct impression v. swab)
□ Yes □ No □ N/A
Guideline Recommendation Compliant?
Additional Comment(s) by Auditor
9.2.1, 9.2.3, 9.2.6 Manufacturers’ instructions are followed for all equipment, and instrument performance and maintenance logs are kept (to include stain, stainers, centrifuges, hemocytometers, and microscopes).
□ Yes □ No □ N/A
9.2.2, 9.2.3 Method validation and routine QC are performed on instruments measuring bio-chemical analytes in fluid samples. Laboratory personnel are knowl-edgeable regarding the operation, principle of measurement, and the potential errors associated with these measurements.
□ Yes □ No □ N/A
9.2.4 Laboratory personnel are trained to applicable portions of fluid analysis such as gross interpretation, cell count genera-tion, protein measurement, slide preparation, and/or staining. Lab personnel make direct smears from fluid with an intact feathered edge.
□ Yes □ No □ N/A
9.2.5 Cytology reports are clear and concise, with an explanation of any modifiers regarding interpretive probability, and with comments regarding any recommended course(s) of action as applicable.
□ Yes □ No □ N/A
9.2.6 The laboratory participates in internal and external QA programs with blind cytology cases.
□ Yes □ No □ N/A
9.3 Immunocytochemistry stains are verified with positive and nega-tive controls and are verified for repeatability.
□ Yes □ No □ N/A
9.3.2 Immunocytochemistry rea-gents, antibodies, and strainers are maintained via manufacturers’ instructions.
□ Yes □ No □ N/A
9.3.3 Internal and external audits for immunocytochemistry include comparison of methods/kits for the same antigen, review of select cases by several pathologists, and compar-ison of ICC results with immunohis-tochemistry, flow cytometry, and/or EQA programs as available.
□ Yes □ No □ N/A
9.4 A second opinion option is avail-able as deemed appropriate by the client or by the pathologist.
□ Yes □ No □ N/A
9.4 Cytopathologist pursues case follow up (e.g., any ordered histo-pathology, flow cytometry, PCR, as well as case outcome).
□ Yes □ No □ N/A

602 | ARNOLD et AL.
10 | ENDOCRINOLOGY/IMMUNOA SSAYS
10.1 | Preanalytical factors important for endocrinology
10.1.1 | General considerations
All the considerations listed in section 3 of these guidelines (gen-eral preanalytical factors important in veterinary clinical pathology) apply to endocrinology. However, because of the particular bio-logical/chemical nature of hormones, a single direct measurement is often not enough to properly assess function/dysfunction of an endocrine axis, and dynamic testing and correlation with other tests and clinical signs are often required. Preanalytical factors could be classified as in vivo/physiological or in vitro/non-physi-ological causes.
10.1.2 | In vivo preanalytical factors
Because biological variation, preexisting medical conditions, or treatments can easily influence both the hypothalamic-pituitary-dependent and independent systems, in vivo factors are particularly important to consider for endocrinology testing.
Physiologic hormone fluctuationsHormones have specific patterns of secretion due to cyclical varia-tions (circadian 24h, infradian <24 hours, and ultradian >24 hours) and external conditions. Endocrine gland secretion is subject to precise, intricate control, and its effects are continuously integrated with those of the nervous and immune systems.1
Unfortunately, clinical signs of an endocrinopathy do not always proportionally correlate with abnormal hormone concentrations, complicating the identification of true healthy patients. Moreover, low/high circulating hormone concentrations do not always cor-relate with decreased/increased target tissue response. Dynamic endocrine testing protocols often more accurately reflect the in-vivo situation, providing a more accurate assessment of the function/dys-function of an endocrine axis, and therefore play an important role in clinical decision-making.
Underlying diseasesNon-endocrine disorders or concurrent endocrine disorders can affect the homeostatic environment and hormone concentrations. Clinicians should carefully select patients based on appropriate clini-cal signs before submitting any endocrine test. If a non-endocrine disorder is present/suspected, patients should ideally be tested for a suspected endocrinopathy after resolution of the former, as feasi-ble. At that point, an endocrine test should only be performed if the clinician still has a strong index of suspicion for an endocrinopathy.
Medications/drugsMany medications may affect endocrinology results. Some examples are:
• Treatment effect on hormone concentrations: for example, oral/topical glucocorticoids and ketoconazole can suppress the hypo-thalamus-pituitary-adrenal and thyroid axes, reducing cortisol and thyroid hormone concentrations.
• Potential interference or cross-reactivity with antibodies used in hor-mone concentration measurement: for example, 50% cross reactivity of prednisolone with cortisol antibodies used in chemiluminescence.
• Alternation of the metabolism/catabolism of hormones or sub-stances used for endocrine testing: for example, phenobarbital may alter low dose dexamethasone suppression test (LDDST) re-sults by increasing the hepatic clearance of dexamethasone.
• Exposure to hormone replacement therapy (HRT): Alteration of en-docrine test results (as well as appearance of clinical signs) have been described after accidental exposure of pets to their owners’ topical hormone preparations (estrogens, progestins, and testosterone).
10.1.3 | In-vitro preanalytical factors
Equally frequent and capable of altering results are in-vitro factors such as lack of adherence to test protocol procedures, collection of sample in the wrong tube(s), incorrect labeling of samples, incorrect transport methods, lack of temperature regulation, or delayed de-livery of the sample to the laboratory. Some of the most important factors affecting endocrine results include the following:
Test selectionEndocrine laboratories should provide clear and complete general in-formation about test submission requirements and sample handling/transport to the laboratory. Because diagnostic tests generally have specificities and sensitivities less than 100%, they should only be re-quested when there is a significant pretest probability of disease.2 Because of the increased complexity of many dynamic endocrine tests (in comparison to single timepoint measurement for minimum database), it is recommended that endocrine laboratories develop guidelines and/or flowcharts for both screening for common endo-crinopathies and for monitoring therapy (i.e., type and frequency of testing), with the intent of helping clinicians who may call to ask ques-tions regarding selection of appropriate tests at the right moment.3
Patient preparationFasting, starvation, stress, metabolism, and biological and physiolog-ical variations (to include paraphysiologic conditions such as exercise and pregnancy), are some of the most common factors to consider.4 Clear instructions and guidelines on patient preparation in each spe-cific endocrine test should be provided by the laboratory.

| 603ARNOLD et AL.
Specimen collection and handlingThe type of sample (serum, plasma, urine, etc.), anticoagulants, type of tube (plastic vs glass), presence of clot activators, presence of serum/plasma separator gels [SST (serum separator tubes) or PST (plasma separator tubes)], application of tourniquet, correct labeling of tubes in order of collection (for tests requiring multiple samples), collection volume, hemolysis/lipemia, and the addition of any pre-servatives may cause variability in hormone analysis.5–7 Hormone stability in plasma vs. serum vs. whole blood can be widely differ-ent, depending on the chemical structure of the hormones and the handling of the sample after collection (e.g., temperature and hu-midity fluctuations).8–10 As a rule, polypeptide hormones are more fragile than thyroid hormones and steroids.11,12 Most antibodies and antigens present in the plasma are highly susceptible to alteration by temperature, oxidation, and proteolytic degradation. Appropriate sample storage is fundamental in obtaining accurate results. If the assay cannot be run immediately after blood collection, processed samples (e.g., serum/plasma) should be stored at 4°C for limited amount of time (24h), or frozen at -20°C or less if a longer time in-terval is expected, and if studies have shown that the hormone is stable under the specified conditions. In heavy workload commercial endocrine laboratories, freezers are often equipped with base and remote units that can measure, record, and send (using email/phone via wi-fi) data such as temperature, humidity, and warnings in case of abnormalities. If the laboratory is not equipped with such freez-ers, personnel should regularly control the freezers’ temperature using National Institute of Standards and Technology (NIST) certi-fied thermometers.
Test standardizationAlthough standard procedures for blood collection are widely available, standardized protocols and clear instructions should be provided from the laboratory for each hormone test. These instruc-tions should include: collection temperature (pre-chilled or room temperature tube); desired tube type as applicable (in endocrinol-ogy, most tests are performed on serum or plasma, so that they are ultimately transferred into a plain red top tube before shipment; specifying the sample type becomes important, as it may not match the color of the top of the tube); transport time and maximum al-lowable delay before expected sample degradation; time before separation of plasma/serum from cells; centrifugation conditions; special separation requirements; storage temperature; and, ef-fect of freeze-thaw cycles. Standardization of dynamic endocrine testing procedures (type of injected or administered substance,
modality of administration, delay for blood sampling etc.) is a must for obtaining valid results.
Sample requirementsEndocrine assays are applicable to a variety of matrices, and their performances should be characterized on all samples types for which they are intended. Sample types include fresh and frozen sera or plasma, as well as whole blood, cerebrospinal fluid, urine, saliva and hair.13–17
Specimen identification (please also see section 3, general analytical factors)Incorrect sample tube identification can lead to wrong interpreta-tion of endocrine results, delayed delivery of results, and possibly repetition of the test at additional cost. A common instance is mis-labeling tubes during dynamic tests, for which serial samples from the same individual are required in a specific order (e.g., low dose dexamethasone suppression test, stimulation tests).
Patient Identification (please also see section 3.1.3)Laboratory personnel should check the accession form against the sample(s) for matching identification and verify that the number of tubes matches that required by the requested test (i.e., two tubes for an ACTH stimulation test; three tubes for a LDDST). The animal's gen-der and reproductive status should always be reported on the sub-mission form when endocrine laboratories have established specific reference intervals, especially for the reproductive hormones that will be affected by neutering, pregnancy, or stage of the reproductive cycle.
10.1.4 | Communication
The most important factor in reducing the effect of preanalytical variables on endocrine tests is open communication between clini-cians and clinical pathologists/endocrine laboratory experts. This collaboration should result in:
• Correct selection of the most appropriate direct or dynamic test based on history, physical examination findings, and differential diagnosis provided by the clinician (i.e., hCG stimulation test with analysis of progesterone for suspected ovarian remnant; urine metanephrine/normethaneprhine to creatinine ratio for sus-pected pheochromocytoma, etc.)
TA B L E 1 Main immunoassay categories (source: http://www.snv.jussi eu.fr/bmedi a/lafon t/dosag es/D3.html)
Tracer Competitive IA/ “indirect”(limiting antibody) Non-competitive IA/”direct” (antibody in excess)
Radiolabeled Radioimmunoassay (RIA) Immunoradiometric assay (IRMA)
Enzymatic Enzymoimmunoassay (EIA) Enzyme-labeled immunosorbent assay (ELISA)
Fluorescent Fluoroimmunoassay (FIA) Immunofluorometric assay (IFMA)
Luminescent Luminoimmunoassay (LIA) Immunoluminometric assay (IFLA)

604 | ARNOLD et AL.
• Helpful discussion on whether performing further diagnostic tests is likely to be fruitful, in the event of lack of correlation be-tween test results and the clinical presentation.
10.2 | Analytical factors important for endocrinology
10.2.1 | General considerations
Hormone measurement can be less straightforward than that of other measurands:
• Circulating concentrations of hormones may vary over a wide range of values, including extremely low values that may be chal-lenging to measure. Because of this, accurate measurement of these substances requires sensitive assays, usually in the form of competitive immunoassay (IA).
• Because of the nature of the competitive IA, higher imprecision is typically encountered in comparison to routine biochemistry measurands.
Each endocrine assay should be standardized and validated, and factors influencing the variability of the results should be under-stood. This is especially crucial in veterinary endocrine laboratory medicine, where many assays used to measure hormone antigens are based on anti-human antibodies.
10.2.2 | Characteristics of immunoassays
TechniquesA more detailed discussion of immunoassay (IA) techniques can be found in Section 10S, Supplemental Information on Immunoassay Techniques. In brief, IA comprise a broad category of different tech-niques which all involve antibodies to recognize the substance of interest (Table 1). However, the design of the method (competitive or non-competitive, direct or indirect, heterogeneous or homogene-ous) and the signal (endpoint of quantification of the substance of interest, such as radioactivity, chemiluminescence, fluorescence, en-zymology), are diverse.18 Simpler techniques of quantification (with no labeled antigens or antibodies acting as signal-carrying tracers) like turbidimetry or nephelometry are less commonly used with hor-mone IA due to their lower sensitivity for the quantification of mol-ecules in low concentrations.
Special considerations for radioactive immunoassays (RIA)RIAs are to be used only in approved laboratories and by author-ized personnel who have been trained and who are certified for the use of radioactive materials. Information about harmful preserva-tives used in reagents (i.e., sodium azide) and shelf-life-storage con-ditions should be noted for institution of proper safety protocols. Radioactive materials disposal is performed in accordance with
governmental regulations. Any waste items used in conjunction with radioactive materials must be disposed of as radioactive waste. Waste must be segregated into dry solid waste, liquid waste, sample vials, metal waste, hazardous mixed waste, and liquid scintillation vials. Regardless of the method of disposal, complete records of ra-dioactive receipt, use, storage, and disposal must be maintained for a regulated period of time.19
Information about traceability to certified reference materi-als should be accessible.19 In veterinary endocrinology, a limited number of assays are available that can be traced to a certified reference material (CRM). Therefore, any source of information or physical properties of the substance used as a reference material (comparative material or assay) should be recorded. Radioactivity is measured with gamma or beta scintillation counters, which should be inspected daily by qualified laboratory personnel, and also by manufacturers or qualified contractors in the event that in-depth maintenance is required. Each laboratory should collect and save in a worksheet, written and graphic calculations of the assay performance data such as count rate, percent-binding rate, dose response variable, and analyte concentration, as well as analysis of potential interferences such as background noise and non-specific binding.
Special considerations for chemiluminescent, fluorescent, and enzymatic immunoassaysColorimetric enzyme assays are limited by the working range of the spectrophotometer absorbance. Florescent enzyme assays can be affected by temperature, pH, oxygen content, and natural background florescence. Some luminescence enzyme immunoas-says can emit a weak light that can rapidly decay. To increase the signal to noise ratio, light enhancer compounds can be added to the reaction.
10.2.3 | Immunoassay validation
Regardless of the method/technique and of the signal used, quality requirements for validation remains the same for any IA. The nine steps of the validation process are detailed in the general analytical section of these guidelines (section 4.3).
10.2.4 | Immunoassay analytical performance
Analytical performance and total error goals for veterinary endo-crine testing may vary depending on the species, test, and test in-terpretation. Achievable goals may be limited by the imprecision of endocrine assays and current state of the art for the analytical per-formance. There are no current guidelines provided by ASVCP for total allowable error for endocrine testing. Each laboratory should develop its own analytical performance and total error goals based on the intended use of its tests in each species and the perfor-mance that can be achieved in the laboratory. Total allowable error

| 605ARNOLD et AL.
(TEa) for human endocrinology tests compiled by Data Innovation (DG Rhoads company) can be found at https ://datai nnova tions.com/allow able-total-error-table . It should be noted that many of the total error specifications for humans are based on biologic variation studies. There is little current information about bio-logic variation in veterinary species, and this should be considered when determining quality specifications based on those derived for other species.
10.2.5 | Particular problems of immunoassays
Prozone and postzone effectsSome IA involve immune complexes between antigens and an-tibodies, and they work ideally when the ratio between the two components is balanced. On the other hand, large excess of an-tibody (prozone effect) or antigen (postzone effect), sometimes referred to as “hook effects,” result in an artifactually low sig-nal. The prozone effect (excess of antibodies) is problematic only for IA without tracers (turbidimetry and nephelometry), for which the signal relies purely on the immune complex formation. On the other hand, the postzone effect (excess of antigens) is problematic for both IA without and with tracers. However, only non-competitive tracer-mediated IA (“sandwich”) are affected by the postzone effect; it does not occur in competitive IA. Of note, one-step non-competitive IA (sample contains the Ag of inter-est and the corresponding reagent with the Ab* tracer) are much more affected by the postzone effect than two-step IA (in which the sequential adding of the sample Ag and then the reagent Ab* prevents the competition between Ag and Ag-Ab* for the capture antigen).20
In order to eliminate the hook effect, depending on the mea-surands, different dilutions may be necessary so that the true ana-lyte concentration will fall within the analytical measurement range (AMR) of the assay (see also 10.3.1 Reporting)
Antibody interferenceSome natural antibodies against the assessed substance can inter-fere with the IA. One classic example is the presence of anti-thy-roglobulin (anti-T4) in RIA (a competitive, indirect IA in which the signal is inversely proportional to the concentration of T4). When anti-T4 antibodies are present, they bind the tracer (labelled T4), arti-factually decreasing the signal, and thus yielding an artifactually high T4 concentration of the assessed sample.21
In general, endogenous antibodies may interfere by various mechanisms, and their effect on the signal depends on the step with which they interfere and the competitive or non-competitive nature of the IA.
Cross-reactivityA cross-reaction is the recognition of an antigen by an antibody de-signed to recognize another closely related antigen. It can be the same antigen in a different species (for example T4 in dogs and cats) or two
closely related antigens in a single species (different PTH-related peptides, closely related ACTH peptides etc.). Cross-reactivity can vary from strong (almost 100% of cross reactivity) to weak (about 50% of cross reactivity, sometimes even less). Depending on the sit-uation, cross-reacting can be desirable or not. Examples of desirable cross reactivity are the assessment of the same hormones in dif-ferent species (allowing use of the same assessment kit across spe-cies), or similar hormones in one species, such as PTH-rp (allowing to screen broadly). Examples of non-desirable cross-reactivity are the cross reactivity between endogenous cortisol and prednisolone, or the cross-reactivity between a drug and its metabolites.
10.2.6 | Quality monitoring: quality assurance and quality control
CalibrationCalibrators should be stored according to manufacturer's instruc-tions. The calibration of the assay is designed to match the signal with a concentration in the working range of the IA (in a proportional manner for non-competitive IA and in an inversely proportional manner for competitive IA). Calibrators with known signal activity levels must be used to set counter values before running standards (for dose-response standard curve) and diagnostic samples. The frequency of the calibration depends on the manual or automated process of the IA:
• In manual IA that is run in batches, calibrators are included in every run.
• Whereas in automated IA, calibration is performed less frequently as parameters of the calibration curve are stored by the analyzer. On one hand, the improved process stability of automated IA al-lows this economy of calibration; on the other hand, a drift in the bias is more likely to occur after a break period or a maintenance period, so that more stringent QC rules may be selected for ana-lyzer start-up (for example, increased number of QC specimens in the first run), and recalibration may be done when QC falls out-side of the allowable limits.
Quality control (QC)Quality control goal. The internal quality control (IQC) performed with quality control material (QCM) monitors both the precision of the IA and the proper functioning of the analytical system as a whole (instrument, reagents, and operator) prior to running patient samples. Of note, IQC does not detect poor specimen quality, misidentification of the correct QC materials, errors in calculation, etc.22
Quality control steps. Please see section 4, general analytical factors.
Choice and preparation of QCM. Several options exist for QCM for veterinary endocrine testing with various (sometimes complementary) advantages; they are not mutually exclusive23.

606 | ARNOLD et AL.
Given the wide concentration range of IA, QCM should cover low, medium, and high concentration ranges, targeting the concentrations of interest (within reference interval as well as close to decision limits; of note, often the only commercially available QCM have concentrations based on human decision limits). Several options exist for QCM:
• Pooled plasma or serum: any surplus plasma or serum of interest (having either a high to very high concentration, low concentra-tion, or absence of the hormone of interest) may be kept for use as QCM. Pooled patient samples can be accumulated over a period of known stability. Usually pools sufficient for at least 50 IA runs are preferred, and then the QCM should be frozen in aliquots suf-ficient for analysis and at temperatures at which the measurands have previously been shown to be stable over the period of time during which 50 runs are likely to occur. If deterioration in the pooled patient control is noted over time, another pool can be prepared.
• Lyophilized commercial QCM: these have several advantages, namely: convenience, wide concentration range covered, and preassigned values. However, they are more expensive, they introduce a risk for error in material reconstitution, and the lyo-philization may modify the analyte and/or the matrix, potentially impacting the measured concentration. Furthermore, most com-mercial QCM are designed to contain concentrations of impor-tance for human endocrine testing and may not reflect critical levels for veterinary testing.
• Certified reference material (CRM): these materials are certified to contain a given concentration of a given analyte, measured by the gold standard method. However, they are expensive and es-pecially the available measurands are limited.
• EQA specimens: EQA specimens having a known concentration assigned to a peer group using the same method and analyzer may help assess the accuracy of a new instrument or method.
• Repeat patient testing (RPT) has shown promise for quality con-trol for veterinary endocrine assays. Further research is needed to validate its use in veterinary laboratories.24
The choice of quality control rules and frequency of quality con-trol should be determined by QC validation and consideration of the sigma metric of the assay, as recommended in the general analytical section (section 4).
External Quality Control (EQA)Participation in EQA is recommended for all laboratory tests; please see section 4.2.2. There are a few veterinary-specific EQA pro-grams for endocrinology available from the Society for Comparative Endocrinology (SCE-EQUAS program), the European Society of Veterinary Endocrinology (ESVE), and the Veterinary Laboratory Association (VLA). Please see Resources, below, for additional con-tact information.
10.3 | Postanalytical factors important for endocrinology
10.3.1 | Reporting
Results should be communicated to the right recipient, in a timely manner, and with a format that is clear and useful. As several units exist for hormones, the unit used should clearly appear for each result. Population-based and/or stratified (i.e., by sex, neutered/intact status, or age) reference intervals should ideally be available for each measured hormone. A comment or an interpretation chart may be added depending on the laboratory custom, and if sufficient history and clinical signs have been provided. If any medications or other potentially interfering substances known to affect endocrine results (see 10.2.5.3 cross-reactivity) are mentioned in the history, a warning note to the clinician should be attached to the report. Informational notes should also be provided in case dilutions of a sample have been made in order to allow the (true) measurands con-centration to fall within the analytical measurement range (AMR) of a specific assay, (see 10.2.5.1, prozone and postzone effects).
10.3.2 | Results interpretation
The results should always be interpreted by a veterinarian pos-sessing both a sufficient knowledge of the case (history and clini-cal presentation), as well as sufficient knowledge of the hormone pathophysiology. It is recommended that any interpretive questions be directed to the laboratory endocrinologist/clinical pathologist.
R E FE R E N C E S 1. Eiler H. Endocrine Glands. In: Reece WO, ed. Dukes’ Physiology of
Domestic Animals. 12th ed. Ithaca, NY: Comstock Publications/Cornell University Press; 2004:621-669.
2. Bovens C, Tennant K, Reeve J, et al. Basal serum cortisol concentra-tion as a screening test for hypoadrenocorticism in dogs. J Vet Intern Med. 2014;28:1541-45.
3. Sox HC. The evaluation of diagnostic tests: principles, problems, and new developments. Annu Rev Med. 1996;47:463-71.
4. Plebani M. Appropriateness in programs for continuous qual-ity improvement in clinical laboratories. Clin Chim Acta. 2003;333:131-39.
5. Fraser CG. The nature of biological variation. In: Biological vari-ation from principles to practice. Washington, DC: AACC Press; 2001:1-28.
6. Smets EM, Dijkstra-Lagemaat JE, Blankenstein MA. Influence of blood collection in plastic vs. glass evacuated serum-separator tubes on hormone and tumour marker levels. Clin Chem Lab Med. 2004;42:435-439.
7. Bowen RA, Chan Y, Cohen J, et al. Effect of blood collection tubes on total triiodothyronine and other laboratory assays. Clin Chem. 2005;51:424-33.
8. Bowen RA, Sattayapiwat A, Gounden V, et al. Blood collection tube-related alterations in analyte concentrations in quality control material and serum specimens. Clin Biochem. 2014;47:150-157.

| 607ARNOLD et AL.
9. Oddoze C, Lombard E, Portugal H. Stability study of 81 ana-lytes in human whole blood, in serum and in plasma. Clin Biochem. 2012;45:464-469.
10. Ellis MJ, Livesey JH, Evans MJ. Hormone stability in human whole blood. Clin Biochem. 2003;36:109-12.
11. Evans MJ, Livesey JH, Ellis MJ, et al. Effect of anticoagulants and storage temperatures on stability of plasma and serum hormones. Clin Biochem. 2001;34:107-12.
12. Gislefoss RE, Grimsrud TK, Mørkrid L. Stability of selected serum hormones and lipids after long-term storage in the Janus Serum Bank. Clin Biochem. 2015;48:364-369.
13. Kley HK, Schlaghecke R, Krüskemper HL. [Stability of steroids in plasma over a 10-year period]. J Clin Chem Clin Biochem. 1985;23:875-878. [article in German]
14. Kemppainen RJ, Behrend EN, Busch KA. Use of compounded ACTH for adrenofunction testing in dogs. J Am Anim Hosp Assoc. 2005;41:368-372.
15. Brown DC, Perkowski S. Oxytocin content of the cerebrospinal fluid of dogs and its relationship to pain induced by spinal cord compres-sion. Vet Surg. 1998;27:607-611.
16. Salesov E, Boretti FS, Sieber-Ruckstuhl NS, et al. Urinary and plasma catecholamines and metanephrines in dogs with pheochromocy-toma, hypercortisolism, nonadrenal disease and in healthy dogs. J Vet Intern Med. 2015;29:597-602.
17. Meyer J, Novak M, Hamel A, et al. Extraction and analysis of cortisol from human and monkey hair. J Vis Exp. 2014;83:e50882. https ://doi.org/10.3791/50882
18. Corradini S, Accorsi PA, Boari A, et al. Evaluation of hair corti-sol in the diagnosis of hypercortisolism in dogs. J Vet Intern Med. 2013;27:1268-1272.
19. Benoist JF, Biou D, Chevenne D. Biological Marker Assessment by Immunological Analysis. In: Beaudeux JL, Durand G, eds. Biochimie medicale marqueurs actuels et perspectives [Medical Biochemistry Current Markers and Perspectives]. 2nd ed. Peronnas, France: Lavoisier; 2011:9-38.
20. CLSI. Assessing the quality of immunoassay systems: radioimmuno-assay and enzyme, fluorescence, and luminescence immunoassay; Approved Guidelines. CLSI document I/LA23-A. Wayne, PA: Clinical and Laboratory Standards Institute; 2004.
21. Tate J, Ward G. Interferences in Immunoassay. Clin Biochem Rev. 2004;25:105-120.
22. Abraham R, Chawla R. Interference of Anti-T4 Autoantibodies in the Single Step free T4 Radioimmunoassays. Ind J Clin Biochem. 1998;13:81-86.
23. Seth J. Chapter 10: Quality assurance. In: Gosling JP, ed. Immunoassays Practical Approach. New York, NY: Oxford University Press; 2000:263-293.
24. Riond B, Freeman K, Cvejic S, et al. Repeat Patient Testing as a Tool to Monitor Quality Control Statistically in Veterinary Hormone Measurement. Abstract presented at: 19th Annual Congress of the European Society for Veterinary Clinical Pathology; September 2017, London, United Kingdom.
RESOURCES
https ://datai nnova tions.com/allow able-total-error-table Allowable total error tables for human medicine
http://www.veter inary endoc rinol ogy.org/sce-equas-program External quality assurance program for veterinary endocrinology provided by the Society for Comparative Endocrinology
http://www.vetla bassoc.com/quali ty-assur ance-program External quality assurance program for veterinary endocrinology provided by the Veterinary Laboratory Association
https ://www.esve-payme nts.org/esve/eve-qas External quality as-surance program for veterinary endocrinology provided by the European Society of Veterinary Endocrinology
CHECKLIST FOR GUIDELINE SEC TION 10, ENDOCRINOLOGY AND IMMUNOA SSAYS
The purpose of these checklists is to facilitate guideline implementation/practical application and may be further detailed in laboratory-specific standard operating procedures (SOPs). The numbers in the first column correspond to the section numbers in the guideline.
The N/A option (listed here only for applicable items) should only be employed for items not pertaining to the laboratory, with an explanation in the additional comment box.
Guideline Recommendation Compliant?
Additional Comment(s) by Auditor
10.1.2.1 Clients are advised that a sin-gle hormone measurement is usually insufficient for a clinical endocrinopa-thy diagnosis.
□ Yes □ No □ N/A
10.1.2.2 Clients are advised to order endocrine tests with consideration to index of suspicion for an endo-crinopathy and the presence of any other underlying disease(s); the endocrinology laboratory submis-sion form has a dedicated section(s) for these items (i.e., brief, relevant history).
□ Yes □ No □ N/A
10.1.2.3 Clients are advised that drugs (such as medications and owner-hormone replacement therapy exposure) may impact test results/interpretation; the endocri-nology laboratory submission form has a section asking for listing of current/recent treatment(s) (name, dose, frequency, duration) and potential exposure to topical human hormone replacement therapy.
□ Yes □ No □ N/A
10.1.3 The written/electronic labora-tory test protocols for clients provide:
• the test indication(s) (and desired timing, as applicable)
• product dose/administration for each dynamic test
• sample requirements (serum v. other, minimal volume, etc.)
• number of samples and timing, as applicable
• submission modalities (tubes, han-dling, shipping)
□ Yes □ No □ N/A
608 | ARNOLD et AL.
Guideline Recommendation Compliant?
Additional Comment(s) by Auditor
10.2.2 The client is informed, upon request, of the specific technique(s) employed for each immunoassay (e.g., competitive versus non-competitive) and the signal in-volved (radioactivity, chemiluminescence, fluorescence, or enzymology).
□ Yes □ No □ N/A
10.2.2.2 For radioactive assays, all regulations are posted and followed regarding staff training, protective equipment, radioactivity monitoring, and proper waste disposal.
□ Yes □ No □ N/A
10.2.3 Each immunoassay (IA) used in the laboratory is properly validated in each species for which it is used.
□ Yes □ No □ N/A
10.2.4 The analytical performance goals, expressed separately for imprecision and bias, or as TEa, should be determined for each endocrine immunoassay.
□ Yes □ No □ N/A
10.2.5 Special issues related to IA such as prozone/postzone effects, antibody interference, and cross-reactivity should be investigated in case of a discordant result.
□ Yes □ No □ N/A
10.2.6.1 Each IA is properly calibrated, as needed, based on the assay method and QC results. Calibration materials are properly stored, and daily record of use are maintained for traceability.
□ Yes □ No □ N/A
10.2.6.2 Quality control materials (QCM) are selected/generated, prop-erly stored, and used daily. Records are kept for quality control measure-ments for each IA on a spreadsheet and a Levey-Jennings chart.
□ Yes □ No □ N/A
10.2.6.2 A proper quality control strat-egy (QC rules) and QC Validation are determined and documented for each IA, with criteria for rejection.
□ Yes □ No □ N/A
10.2.6.2 Each failure of QCM for the cho-sen QC rules is recorded, and corrective and preventive actions are implemented and documented. QCM is re-evaluated following corrective actions before test-ing of patient specimens.
□ Yes □ No □ N/A
10.2.6.3 External quality assur-ance (EQA) is ideally performed at a minimum of four times per year, and records of results, as well as any necessary corrective and preventive actions, are kept for a predetermined period of time.
□ Yes □ No □ N/A
10.3.1 Results are communicated to the client in a timely manner, in a clear presentation, with units, reference intervals, and an optional report/inter-pretation chart.
□ Yes □ No □ N/A
Guideline Recommendation Compliant?
Additional Comment(s) by Auditor
10.3.2 Laboratory clients are ad-vised that endocrinology results are interpreted in light of complete case data, potential medication interfer-ences, and knowledge of hormone physiology/pathophysiology.
□ Yes □ No □ N/A
11 | PROTEIN ELEC TROPHORESIS , INCLUDING ELEC TROPHORESIS-BA SED IMMUNOT YPING
This section of the guideline discusses protein electrophoresis and immunoelectrophoretic characterization of immunoglobulin in pe-ripheral blood and urine samples. Evaluation of CSF, lipoprotein electrophoresis, or immunoelectrophoresis of non-immunoglobulin proteins (e.g., hemoglobin isoforms) are outside the scope of this document.
11.1 | Preanalytical factors important for protein electrophoresis
11.1.1 | Specimen collection, handling and transportation to the laboratory
General guidelines available for collection of samples for urine and serum biochemistry are typically sufficient for protein electropho-retic evaluation (see section 3, General Preanalytical Factors, and section 8, Urinalysis). Submission forms should include a history/reason(s) for submission for electrophoresis. Samples should be clearly labeled with sample type and anticoagulant used (if any). Due to the significant differences between serum and plasma electro-phoretic profiles, identification of sample type is crucial for accu-rate interpretation of the electrophoretic study. Whenever possible, serum samples should be used. However, plasma is commonly used for non-mammalian or smaller mammalian patients because sam-ple volume can pose a challenge.1,2 Preferred sample type should be communicated to clients by the laboratory. When possible, pa-tients should be fasted prior to peripheral blood collection and care should be taken to avoid hemolysis (including timely harvesting of serum/plasma), as both lipemia and hemolysis can induce significant changes in the electrophoretic profile.3
Storage, handling and transportation of samples with suspected cryoglobulinemiaTo avoid loss of cryoglobulins during sample handling, the sample should be kept at 37°C from collection through harvest of serum.4,5 If the sample has been cooled, it should be warmed sufficiently to resolubilize any cryoglobulins.4 Clinicians should clearly indicate a

| 609ARNOLD et AL.
clinical suspicion of cryoglobulinemia at the time of submission so that samples will be handled accordingly in the lab.
11.1.2 | Sample storage
Samples for total protein and electrophoretic fraction assessment should be evaluated within 24 hours, with storage at 4°C (see above for cryoglobulinemia exception).6–14 If longer term storage is needed, storage at -80°C is recommended. Frozen samples should be stable for at least one year.
11.2 | Analytical factors important for protein electrophoresis and electrophoresis-based immunotyping
11.2.1 | Monitoring
Equipment, including refractometers, biochemistry analyzers, pi-pettes, stainers, scanners, and protein detection instruments (these components are often packaged together as a single system) should be handled, maintained, and calibrated according to general principles as described in the general analytical sections of these
guidelines (section 4). Maintenance and performance logs should be kept for each instrument.
11.2.2 | Method validation
Not all the method validation experiments listed in section 4 of this document may be applicable for protein electrophoresis and immunotyping. The laboratory should determine the appropriate type and extent of validation/verification needed. Method valida-tion experiments should be selected or modified as necessary to ensure that new methods/analyzers are functioning satisfactorily to meet the laboratory's requirements and the manufacturer's specifications. Applicable method validation procedures may in-clude, but are not limited to, comparison of methods, testing for interference, assessment of inter-run and intra-run variability, and both upper and lower limits of linearity (if quantitative electropho-resis is used).
Validation of fraction demarcationAs most electrophoresis systems are semi-automatic and re-quire laboratory personnel to assign fractions, special attention should be placed on ensuring repeatable demarcation of fractions between species, samples and personnel.5 Comparison with
TA B L E 1 Reported interferents observed in electrophoretic-based assays that are expected to create a factitious monoclonal appearance. [adapted from Booth et al. 2018.20]
Interferent
SPE method affected
IT method affected
Action for resolutionFrequency in human medicine
Observed in veterinary medicineAGE CZE AGE CZE
Fibrinogen + + + + Thrombin treatment, Ethanol precipitation, Pre-absorption of antisera
Common Yes
Contrast Dyes − + − − IT Uncommon Unknown
Antifungal 5-fluorocytosine (5-FC)
− + − − IT Uncommon Unknown
Antibiotics + + − − IT Uncommon Unknown
Hemolysis + + − − IT Common Yes
Heterophilic antibodies + + + + Clinical awareness/ education
Rare Unknown
Polyclonal IgG4 + + + + Clinical awareness/ education
Rare Unknowna
Gelatin-based plasma substitutes
+ + − − IT Very rare Unknown
Hydroxycobalamin − + − − IT Very rare Unknown
Monoclonal therapies + + + + Clinical awareness/ education, migration shift assays, +/− mass spectrometry
Rare, becoming more common
Unknowna
aHas been observed anecdotally by the author Abbreviations: AGE, agarose gel electrophoresis; CZE, capillary zone electrophoresis; IT, immunotyping; SPE, serum protein electrophoresis.

610 | ARNOLD et AL.
species-specific control samples and use of relative migration distance can help increase the accuracy of faction demarcation.15–19
Formatting of resultsHuman-based recommendations suggest several methods to deter-mine the number of digits to report as part of quantitative SPE re-sults. The laboratory should determine which method of addressing or reporting the degree of inherent measurement uncertainty will be used and format the SPE results to follow the lab's general policy. This could include reporting numerical results to the appropriate signifi-cant figure or reporting the expanded measurement uncertainty of a result.5,20
Immunotyping reagentsReagents used for immunotyping should be shown to have appropri-ate reactivity with each species for which they are used and should ideally be free of cross-reactivity.21
11.2.3 | Equipment and reagents
InstrumentationThe manufacturer's recommendations should be followed for oper-ating and maintaining all equipment unless changes to those recom-mendations have been validated within the laboratory (see 11.2.2 above and section 4).
ReagentsPlease see section 4.7.2
11.2.4 | Personnel knowledge
PreanalyticalPersonnel should have knowledge of common problems encountered with veterinary protein electrophoresis specimens that may lead to erro-neous results. Potential concerns should be communicated with the client.
Species and age differencesPersonnel should have knowledge of the normal and abnormal elec-trophoretic profiles of species commonly evaluated within the labo-ratory and the common changes seen with age.6,22–24
AnalyticalAs there are considerable differences in the protocol, performance, and effects of interfering substances (see Table 1) between the vari-ous electrophoretic methods used currently in veterinary medicine, personnel should have knowledge of the methods used in the labo-ratory and common interferences for that method.
Appropriate uses of retest/confirmatory test criteriaAppropriate confirmatory/retest criteria should be established by the laboratory, be clearly communicated to all staff performing the tests, and be based on clinical significance of the resultant data. The performance and results of any retested/confirmatory testing should be included in laboratory records and the patient report.
Total protein concentration. Protein concentrations outside linearity limits should be diluted or concentrated sufficiently to bring the concentration within the linearity limits of the assay.5 Chemically determined (serum chemistry panel) albumin and densitometrically determined (SPE) albumin results should be correlated when possible, to screen for erroneous total protein or albumin results (see also 11.2.5.2 below).
Monoclonal protein detection. Immunotyping by immunofixation or immunosubtraction is recommended to confirm the diagnosis of monoclonal gammopathy in cases with suspected interference, low concentration/small restricted bands, or monoclonal bands hidden by a polyclonal background (see Table 1).25,26
Immunotyping. When the results of immunotyping are inconclusive or do not match well with the clinical picture, further diagnostic inquiry may include correlation with clinical findings, total class-
TA B L E 2 Reported causes and mechanisms of discordant colorimetric (Biochemistry) and densitometric (SPE) albumin measurements.5,37–39
Test Effect Cause/mechanism Confirmation/resolution
Densitometric Albumin (SPE)
Factitious Increase Cryoglobulins or paraproteins remain soluble during total protein assay but precipitate prior to electrophoresis
Warm and/or dilute the sample
Factitious Decrease Non-linear dye binding (can depend on dye chosen); typically occurs at high albumin concentration
Dilute sample into linear-ity range
Change dye
Colorimetric Albumin (Biochemistry)
Factitious Decrease Paraproteins delay albumin dye binding Evaluate albumin reaction curve
Colorimetric Total Protein (Biochemistry)
Factitious Decrease Paraproteins precipitate under assay conditions (pH or ionic strength)
Evaluate refractometric protein
Use different Total pro-tein assay
Abbreviation: SPE, serum protein electrophoresis.
| 611ARNOLD et AL.
specific immunoglobulin quantification, immunohistochemistry, or molecular techniques.5,27,28
11.2.5 | Quality control and analytical factors important in protein electrophoresis, including electrophoresis based immunotyping
General principlesGeneral quality assurance and quality control principles should be followed for protein electrophoretic evaluations, including the es-tablishment of a clearly defined and laboratory validated QA/QC protocol. Given the species-specific nature of the electrophore-togram, available human-based external QA programs may not be applicable to veterinary patients.20,29
Total protein. Recommended quality control procedures for total protein determination are discussed in the general analytical/biochemistry section (section 4) for biochemistry analyzers, and in the hematology section (section 5) for total protein measurement by refractometry.
Electrophoresis. Both non-quantitative and statistical methods are available for quality assurance of the electrophoretic study. If intra-assay imprecision is known to be high, samples should be run in duplicate or triplicate on the same gel. Concurrent electrophoresis of a reference sample from a normal member of the same species is an excellent quality assurance practice that ensures the appropriate distinction of fractions. Commercially available Quality Control Material (QCM) assayed for electrophoretic fractions, commercially available normal serum from veterinary species, or lab-prepared, pooled healthy patient samples for common species should be acquired, assayed if needed, and appropriately stored for use as a reference sample and/or as QCM for statistical QC purposes. Consensus total allowable error recommendations for use in validation of statistical QC protocols are not currently available for quantitative electrophoresis in veterinary species. Therefore, laboratory-derived values should be used.30
Immunotyping. As a qualitative assessment, statistical QC is not appropriate for immunotyping. QA strategies should rely heavily on non-statistical quality assurance practices, including use of well-trained and experienced personnel to perform the test, a regularly reviewed and thorough SOP, correlation of results with clinical and other laboratory results, and evaluation of the study by a qualified pathologist. Maintenance of an archive of normal and pathologic samples with a well-established immunotype profile is recommended to aid any necessary troubleshooting and to confirm the performance of new reagents.
Analytic factors associated with protein determination for electrophoretic evaluationBecause specific health conditions or the effect of non-protein com-ponents can adversely affect the performance of refractometric total
protein measurement for electrophoresis, colorimetric methods are recommended for most settings.31,32 Colorimetric (the bromcresol green method) albumin is expected to be higher than densitometric albumin, due to binding of bromcresol-green to globulins.33–36 If it is not, evaluation for a source of error is recommended, which may include evaluation for lack of linearity in densitometric albumin or effects of paraproteins and/or cryoglobulins on the colorimetric al-bumin or total protein assessments (Table 2).5,37–39
Analytic factors associated with electrophoretic methodsPerformance characteristics can differ significantly between elec-trophoretic methods.20,40–44 Specific measures should be taken to address the potential challenges of the method employed in the lab. This may include (depending on method used):
• Confirmation that cleaning practices prevent sample carry-over in capillary zone electrophoresis (CZE) systems.
• Validation that the buffering system is of appropriate pH for de-tection of monoclonal gammopathies in CZE systems.29,44,45
• Identification and minimization of application point artifact in agarose gel systems which can give the false appearance of a monoclonal protein.46
Low resolution electrophoresis. Methods such as cellulose acetate electrophoresis (CAE) and some forms of agarose gel electrophoresis (AGE) produce low resolution results (incapable of discriminating two beta-globulin peaks). Low resolution techniques are not recommended in most settings because they can lead to misdiagnosis due to an inability to adequately visualize restricted protein bands.5,47,48 Use of low-resolution techniques may be appropriate if they are able to answer the clinical question (eg, determination of A/G ratio).
Analytical factors affecting immunotypingSome methods of immunotyping, including immunofixation, can be highly labor intensive and prone to human error. Strict adherence to the QA recommendations above can help minimize analytical error. Even when using fully validated methodology, comparison studies indicate variable detection of immunoglobulin components between the various methods and platforms.28,41 Potential causes for discord include atypical cross-reactivity of antisera producing fictitious bands, failure to detect components, and interpretation error.
11.3 | Postanalytical factors important for Protein Electrophoresis (see also section 12, general postanalytical considerations)
11.3.1 | Interpretation and reporting of electrophoretic studies
The electrophoretic gel, resulting electrophoretogram, and any de-rived quantitative data should be available for evaluation at the time

612 | ARNOLD et AL.
of interpretation.5,20 Only well-qualified individuals should write in-terpretative reports, which should be clear, concise, and interpreted in light of any available data/case information..
NomenclatureThe nomenclature used to describe electrophoretic findings is not consistently applied in veterinary literature.47,49,50 When a labora-tory employs multiple pathologists, standard interpretation criteria should be defined in a reporting SOP. Nomenclature should be used consistently, with explanation of any modifiers (for further discus-sion of modifier use in cytology reporting, please see section 9.2.5.1).
Report contentsTo help communicate clearly with submitting veterinarians, electro-phoresis/immunotyping reports should include an image of the gel (if gel-based methods are used), electrophoretogram and immuno-typing (if performed), any derived quantitative data, and any appro-priate comments.5,20
R E FE R E N C E S 1. Melillo A. Applications of serum protein electrophoresis in exotic
pet medicine. Vet Clin North Am Exot Anim Pract. 2013;16:211-225. 2. Bayne CJ, Gerwick L. The acute phase response and innate immu-
nity of fish. Dev Comp Immunol. 2001;25:725-743. 3. Giordano A, Paltrinieri S. Interpretation of capillary zone electro-
phoresis compared with cellulose acetate and agarose gel electro-phoresis: reference intervals and diagnostic efficiency in dogs and cats. Vet Clin Pathol. 2010;39:464-473.
4. Motyckova G, Murali M. Laboratory testing for cryoglobulins. Am J Hematol. 2011;86:500-502.
5. Tate J, Caldwell G, Daly J, et al. Recommendations for standardized reporting of protein electrophoresis in Australia and New Zealand. Ann Clin Biochem. 2012;49:242-256.
6. Brandt L, Clegg R, Andrews A. The effect of age and degree of maturity on the serum proteins the chicken. J Biol Chem. 1959;38: 493-506.
7. Thoresen SI, Tverdal A, Havre G, Morberg H. Effects of storage time and freezing temperature on clinical chemical parame-ters from canine serum and heparinized plasma. Vet Clin Pathol. 1995;24: 129-133.
8. Hawkins MG, Kass PH, Zinkl JG, et al. Comparison of biochemical values in serum and plasma, fresh and frozen plasma, and hemolyzed samples from orange-winged Amazon parrots (Amazona amazonica). Vet Clin Pathol. 2006;35:219-225.
9. Cray C, Rodriguez M, Zaias J, Altman NH. Effects of storage tem-perature and time on clinical biochemical parameters from rat serum. J Am Assoc Lab Anim Sci. 2009;48:202-204.
10. Proverbio D, Spada E, Baggiani L, et al. Effects of storage time on total protein and globulin concentrations in bovine fresh fro-zen plasma obtained for transfusion. Scientific World Journal. 2015;2015:752724. https ://doi.org/10.1155/2015/752724
11. Théron M-L, Piane L, Lucarelli L, et al. Effects of storage conditions on results for quantitative and qualitative evaluation of proteins in canine urine. Am J Vet Res. 2017;78:990-999.
12. Tóthova C, Nagy O, Seidel H, Kováč G. The effect of storage on the protein electrophoretic pattern in bovine serum. Iran J Vet Sci Technol. 2010;2:77-84.
13. Proverbio D, de Giorgi GB, Della Pepa A, et al. Preliminary evalu-ation of total protein concentration and electrophoretic protein
fractions in fresh and frozen serum from wild Horned Vipers (Vipera ammodytes ammodytes). Vet Clin Pathol. 2012;41:582-586.
14. Reynolds B, Taillade B, Médaille C, Palenché F, Trumel C, Lefebvre HP. Effect of repeated freeze-thaw cycles on routine plasma biochemi-cal constituents in canine plasma. Vet Clin Pathol. 2006;35:339-340.
15. Osbaldiston GW. Serum protein fractions in domestic animals. Br Vet J. 1972;128:386-393.
16. Kristensen F, Firth EC. Analysis of serum proteins and cerebrospinal fluid in clinically normal horses, using agarose electrophoresis. Am J Vet Res. 1977;38:1089-1092.
17. Kristensen F, Barsanti JA. Analysis of serum proteins in clinically normal pet and colony cats, using agarose electrophoresis. Am J Vet Res. 1977;38:399-402.
18. Hooijberg EH, Miller M, Cray C, et al. Serum protein electrophore-sis in healthy and injured southern white rhinoceros (Ceratotherium simum simum). Eberini I, ed. PLoS One. 2018;13:e0200347. https ://doi.org/10.1371/journ al.pone.0200347
19. Riond B, Wenger-Riggenbach B, Hofmann-Lehmann R, et al. Serum protein concentrations from clinically healthy horses determined by agarose gel electrophoresis. Vet Clin Pathol. 2009;38:73-77.
20. Booth RA, McCudden CR, Balion CM, et al. Candidate recommen-dations for protein electrophoresis reporting from the Canadian Society of Clinical Chemists Monoclonal Gammopathy Working Group. Clin Biochem. 2018;51:10-20.
21. Tvarijonaviciute A, Martínez-Subiela S, Caldin M, Tecles F, Cerón JJ. Evaluation of automated assays for immunoglobulin G, M, and A mea-surements in dog and cat serum. Vet Clin Pathol. 2013;42:270-280.
22. Ahmadi-Hamedani M, Ghazvinian K, Kokhaei P, et al. Comparison of effects of age and sex on serum protein electrophoretic pattern in one-humped camels (Camelus dromedarius) in Semnan, Iran. Open Vet J. 2014;4:4-8.
23. Wolford ST, Schroer RA, Gohs FX, et al. Effect of age on serum chemistry profile, electrophoresis and thyroid hormones in beagle dogs two weeks to one year of age. Vet Clin Pathol. 1988;17:35-42.
24. Nagy O, Tóthová C, Kováč G. Age-related changes in the concentra-tions of serum proteins in calves. J Appl Anim Res. 2014;42:451-458.
25. Rout ED, Shank AMM, Waite AHK, et al. Progression of cutane-ous plasmacytoma to plasma cell leukemia in a dog. Vet Clin Pathol. 2017;46:77-84.
26. Seelig DM, Perry JA, Avery AC, et al. Monoclonal gammopathy with-out hyperglobulinemia in 2 dogs with IgA secretory neoplasms. Vet Clin Pathol. 2010;39:447-453.
27. Keren DF, Schroeder L. Challenges of measuring monoclonal pro-teins in serum. Clin Chem Lab Med. 2016;54:947-961.
28. Pheeha SM, Masters B, Pathology C, et al. Evaluation of Sebia's Capillarys 2 flex-piercing system in comparison with Hydrasys gel system, in identifying low level monoclonal protein in serum and urine of patients with suspected multiple myeloma. Med Technol SA. 2016;30:19-25.
29. Jenkins MA. Quality control and quality assurance aspects of the routine use of capillary electrophoresis for serum and urine proteins in clinical laboratories. Electrophoresis. 2004;25:1555-1560.
30. Cook AM, Moritz A, Freeman KP, Bauer N. Quality requirements for veterinary hematology analyzers in small animals-a survey about vet-erinary experts′ requirements and objective evaluation of analyzer performance based on a meta-analysis of method validation studies: bench top hematology analyzer. Vet Clin Pathol. 2016;45:466-476.
31. Cray C, Rodriguez M, Arheart KL. Use of refractometry for deter-mination of psittacine plasma protein concentration. Vet Clin Pathol. 2008;37:438-442.
32. Hunsaker JJH, Wyness SP, Snow TM, et al. Clinical performance evaluation of total protein measurement by digital refractometry and characterization of non-protein solute interferences. Pract Lab Med. 2016;6:14-24.

| 613ARNOLD et AL.
33. Brackeen GL, Dover JS, Long CL. Serum Albumin. Nutr Clin Pract. 1989;4:203-205.
34. Keay G, Doxey DL. A study of the interaction between bromocre-sol green dye and bovine, ovine and equine serum globulins. Vet Res Commun. 1984;8:25-32.
35. Chorfi Y, Lanevschi-Pietersma A, Girard V, et al. Evaluation of varia-tion in serum globulin concentrations in dairy cattle. Vet Clin Pathol. 2004;33:122-127.
36. Evans GO, Parsons CE. A comparison of two dye-binding methods for the determination of dog, rat and human plasma albumins. J Comp Pathol. 1988;98:453-460.
37. Hill PG. The Measurement of Albumin in Serum and Plasma. Ann Clin Biochem An Int J Biochem Lab Med. 1985;22:565-578.
38. Reed RG. Interference by an IgM paraprotein in the bromcresol green method for determination of serum albumin. Clin Chem. 1987;33:1075-1076.
39. Alberti MO, Drake TA, Song L. The pH of chemistry assays plays an important role in monoclonal immunoglobulin interferences. Pract Lab Med. 2015;3:8-16.
40. Bossuyt X, Schiettekatte G, Bogaerts A, et al. Serum protein electro-phoresis by CZE 2000 clinical capillary electrophoresis system. Clin Chem. 1998;44:749-759.
41. Chartier C, Boularan AM, Dupuy AM, et al. Evaluation of two auto-mated capillary electrophoresis systems for human serum protein analysis. Clin Biochem. 2011;44:1473-1479.
42. Mussap M, Pietrogrande F, Ponchia S, et al. Measurement of serum monoclonal components: comparison between densi-tometry and capillary zone electrophoresis. Clin Chem Lab Med. 2006;44:609-611.
43. Katzmann JA, Clark R, Sanders E, et al. Prospective study of serum protein capillary zone electrophoresis and immunotyping of monoclonal proteins by immunosubtraction. Am J Clin Pathol. 1998;110:503-509.
44. Jenkins MA, Guerin MD. Optimization of serum protein separation by capillary electrophoresis. Clin Chem. 1996;42:1886.
45. Henskens Y, de Winter J, Pekelharing M, et al. Detection and iden-tification of monoclonal gammopathies by capillary electrophoresis. Clin Chem. 1998;44:1184-1190.
46. Strobel SL. the incidence and significance of pseudoparaproteins in a community hospital. Ann Clin Lab Sci. 2000;30:289-294.
47. Facchini RV, Bertazzolo W, Zuliani D, et al. Detection of biclonal gammopathy by capillary zone electrophoresis in a cat and a dog with plasma cell neoplasia. Vet Clin Pathol. 2010;39:440-446.
48. Keren DF, Alexanian R, Goeken JA, et al. Guidelines for clinical and laboratory evaluation of patients with monoclonal gammopathies. Arch Pathol Lab Med. 1999;123:106-107.
49. Tappin SW, Taylor SS, Tasker S, et al. Serum protein electrophoresis in 147 dogs. Vet Rec. 2011;168:456.
50. Tothova C, Nagy O, Kovac G. Serum proteins and their diag-nostic utility in veterinary medicine: a review. Vet Med (Praha). 2016;61:475-496.
CHECKLIST FOR GUIDELINE SEC TION 11, PROTEIN ELEC TROPHORESIS AND ELEC TROPHORESIS-BA SED IMMUNOT YPING
The purpose of these checklists is to facilitate guideline implementation/practical application and may be further detailed in laboratory-specific standard operating procedures (SOPs). The numbers in the first column correspond to the section numbers in the guideline. The N/A option
(listed here only for applicable items) should only be employed for items not pertaining to the laboratory, with an explanation in the additional comment box.
Guideline Recommendation Compliant?
Additional Comment(s) by Auditor
11.1.1 Submission guidelines are provided to client, to include pre-ferred sample type and handling instructions.
□ Yes □ No □ N/A
11.1.1 Submission form is legible and contains the following:
• Complete signalment & relevant history/indication for electro-phoresis testing
• Sample type (serum vs. plasma)
□ Yes □ No □ N/A
11.1.1.1 Sample and submission recommendations for cases with cryoglobulinemia are available in writing or by phone.
□ Yes □ No □ N/A
11.1.2 Samples are stored appro-priately prior to, during, and after testing.
□ Yes □ No □ N/A
11.2.1, 11.2.5 Manufacturers’ instructions are followed for all equipment; instrument perfor-mance and maintenance logs are kept (to include refractometers, biochemistry analyzers, electro-phoresis units, stainers, and scan-ner/detection equipment).
□ Yes □ No □ N/A
11.2.2, 11.2.3 Method validation and routine QA/QC are per-formed on instruments.
□ Yes □ No □ N/A
11.2.4 Laboratory personnel are knowledgeable regarding the preanalytical concerns, species and age differences, principles of method performance and op-eration, and the potential errors associated with these measure-ments, including appropriate retest/confirmatory test policies.
□ Yes □ No □ N/A
11.2.5, 11.1.3 Non-statistical QA practices occur for immunotyping procedures, including perfor-mance of the assay by well-quali-fied individuals and confirmation of results by a pathologist.
□ Yes □ No □ N/A
11.2.5.1.2 Control samples (com-mercial QCM, assayed pooled normal serum/plasma) are included in each electrophoresis run.
□ Yes □ No □ N/A
11.2.5 Employed techniques can be expected to resolve two beta peaks (high resolution electrophoresis).
□ Yes □ No □ N/A

614 | ARNOLD et AL.
Guideline Recommendation Compliant?
Additional Comment(s) by Auditor
11.3 Pathologist-generated reports are clear, concise, and employ nomenclature consistently.
□ Yes □ No □ N/A
11.3 Client reports include appro-priate data, including an image of the gel (if gel-based methods are used), electrophoretogram and immunotyping (if performed), any derived quantitative data, and any appropriate comments.
□ Yes □ No □ N/A
12 | GENER AL POSTANALY TIC AL FAC TORS IMPORTANT IN VETERINARY CLINIC AL PATHOLOGY
Postanalytical phase includes verification of results, entering re-sults manually or automatically into a Laboratory Information Management System (LIS), report delivery, any required consulta-tions with the clinician, and the storage/disposal of test samples and data.1 The incorporation of interpreted test results into a diagnosis by the clinician, recommendations for further testing and treatment, and ultimate patient outcome may be categorized as the “post-post-analytical phase,” or final component in the “brain to brain loop” in a comprehensive model of quality laboratory testing.2,3 (see Figure 1 below and Figures 1 and 2 of section 3, General Preanalytical Factors). There is potential for error at each step, complicated by a shared responsibility (in both preanalytical and postanalytical phases) be-tween laboratory staff and clinicians to minimize errors.
12.1 | Review of data
Includes data verification/validation. The laboratory should estab-lish standard operating procedures for appropriate technical review, supervisor review, and/or pathologist review of specimens (see sec-tion 3.6, preanalytical quality) and results. Review should be aimed at tests which have required recent analytical troubleshooting, any implausible results, data drift, and results with potentially critical clinical significance (e.g., glucose, hematocrit, urine specific gravity). Verification of data may be done manually or by automated statisti-cal algorithms; the latter is less prone to variability.
12.2 | Data entry and reporting
Whether created manually or electronically in a database/LIMS, re-porting accuracy is enhanced when data are presented in a standard format as established by the laboratory, to include an appropriate method of comparison via species-specific validated reference in-tervals, decision limits, and/or previous patient results(s) which are
expressed in standardized units of measure.1 Accepted values (as deemed necessary by the lab, verification is typically accomplished by repeat testing) which are so abnormal as to represent a life-threaten-ing situation should be reported promptly and directly (usually by tel-ephone) to the veterinarian. The percentage of critical values reported and the time to reporting can be used as key quality indicators for the post analytical phase, as well as the number/percentage of reports that are amended postrelease.4 (see Table 2; for more information on key quality indicators, please see section 3, general preanalytical factors).
12.3 | Report generation/delivery
Within the confines of an established turnaround time (see section 3.3), reports must be generated in a timely manner relative to preanalytical and analytical components. Reports should include laboratory-defined identification criteria (similar to accession forms), such as name and address of the laboratory, name and address of the submitting clinic/veterinarian, patient/owner name, date of specimen collection (not cur-rently common on reports but could be incorporated into the LIS from the accession form, considering the importance of monitoring the time difference between collection and analysis vis-a-vis potential preana-lytical error), date the specimen was received in the laboratory, and test-ing/reporting date. Reports should also include unique identification at the beginning of each page (to ensure that all pages are accounted for and recognized as part of the test report) and may include identifica-tion of the method used. Reports should be in a format that is easily understood, giving clear information that is accurate and organized. Appropriate reference intervals and interpretations must be clearly as-sociated with the related result(s). The laboratory should keep a copy of all reports as well as any accompanying hard data for a specified time (for example, five years for clinical, seven years for research, or country-specific legal requirements). If the LIS has the capability, any telephone communication/reporting that may be necessary (e.g., due to critical values, temporary malfunction in reporting software, etc.) should be
F I G U R E 1 The total testing process, from the clinical decision to order a test through the value of the test result in ongoing clinical decisions/healthcare process [courtesy of Dr. Emma Hooijberg]

| 615ARNOLD et AL.
entered into the LIS and followed up with a written report as soon as fea-sible. Results of immunocytochemical/immunohistochemical staining, as well as any additional interpretation or explanation, should be linked to the original cytology/histopathology report and provided to the client.
12.3.1 | Identification of outsourced tests (“send-outs”)
Clients should be informed when test reports contain results of tests performed by subcontractors. A list of send-out tests and the labora-tory to which they are sent should be available to clients upon request.
12.3.2 | Possible inaccuracies
As stated in section 3, it is best to reject/not run samples that appear significantly compromised in the preanalytical phase. Any possibly inaccurate results should have a clear, easily seen comment on the report that states what value(s) may be inaccurate and misleading for clinical interpretation, with an explanation. For any rejected speci-mens/specious results, a request to recollect and resubmit is advised.
12.3.3 | Report delivery
For automated report delivery to external clients (fax, email, website), the LIS should indicate successful report transmission and flag trans-mission failure. The percentage of reports delivered outside of the specified turnaround time (TAT) can be used as a key quality indicator.
12.4 | Result acknowledgement and interpretation
For complex tests, new tests, tests for which there is an unexpected result, or tests for which a specific question has been posed by the clinician, interpretive comments are important for improving out-comes and patient safety.2 In human medicine, data from proficiency testing have detected unacceptable interpretive comments, and EQA programs for these have been established and are recognized
as a continuing professional development activity.2,5–8 Therefore, formal training of laboratory professionals should be provided to maximize the quality of interpretive comments. Periodic review, and adjustments as necessary, of interpretive comments is recom-mended to ensure that these reflect the current status/any improve-ments in testing and interpretation.
12.5 | Storage
Specimens and reports should be stored under appropriate con-ditions for a preestablished time as determined by specimen stability, laboratory policy, and/or certification/accreditation re-quirements. Stained microscopic slides may be held indefinitely, whereas samples such as urine, whole blood, or cavity fluid have limited storage life. Whole blood samples may be frozen to -20ºF for DNA analysis and -70ºF for RNA analysis. Serum/plasma may be similarly frozen for future research purposes.9 Samples in frost-free-freezers may be degraded by repeated freeze-thaw cycles.
12.6 | Disposal
Laboratories should dispose of materials and biologic specimens ap-propriately and safely. This should include regulated procedures for any potential biohazards and timely emptying of all containers and trash bins. Laboratory documents (policies, SOPs, accession/report forms, and patient reports) should be eliminated/permanently ar-chived according to the laboratory's document control policy (please see sections 2.2-2.3) in such a manner that prevents inadvertent cir-culation and use of obsolete operational documents.
12.7 | Personnel Safety
Personnel Requirements, and Laboratory Environment. See sec-tion 3, general preanalytical recommendations for mutual concepts. Upon completion of a procedure, the laboratory work station should be cleaned and organized in preparation for subsequent procedures. Equipment should be well-maintained for perpetual readiness.
TA B L E 1 Categories of postanalytical error
Data Entry/Transcription Error
Errors in validation of analytical data
Failure/delay in reporting critical values
Failure in report transmission
Prolonged reporting time
Prolonged turnaround time (TAT)a
Incorrect Laboratory Interpretation
Missed reaction to a report
Failure to order appropriate follow-up tests
aSummation of potential delays in preanalytical, analytical, and postanalytical phases.
TA B L E 2 Examples of key quality indicators (KQI) for the postanalytical phase
Percentage of reports delivered outside of the specified turnaround time (TAT)
Percentage of critical (life-threating) values reported on an immedi-ate basis
Average time between sample submission and reporting of critical values
Percentage of corrected/amended reports
Number/percentage of reports with interpretive comments that have positive impact on patient outcome (would require client survey and/or a clinical audit to assess)

616 | ARNOLD et AL.
12.8 | Supplies/inventory
Once laboratory analyses are complete, reagent and supply inven-tory should be evaluated, and depleted items should be re-ordered. A well-maintained inventory system and list of approved suppliers ensures that quality materials are always available.
12.9 | Postanalytical quality assessment and continuous quality improvement (see also section 2.5 and section 2.6, total quality management system)
As for the preanalytical and analytical phases of laboratory testing, total quality management depends on error definition, detection/recording, and correction (see Table 1 for examples of postana-lytical errors). To this end, use of quality indicators10,11 to catego-rize/define and record errors is recommended via either manual or electronic means. This process makes use of error recording worksheets, with details of where in the total testing process the error took place, the date, the name of the person detecting the error, a description of the error, and any corrective actions im-plemented.12 Once error recording is in place, regular review of the types and frequency of errors should be performed by man-agement and all staff in order to identify areas for improvement (systems approach).13 These improvements usually result in modi-fications and refinements of laboratory processes which should be documented in revised SOPs. Further recording, monitoring, and periodic evaluation should take place at predetermined time periods to ascertain whether corrective actions have resulted in a decrease in error rates.
R E FE R E N C E S 1. Sikaris K. Performance criteria of the post-analytical phase. Clin
Chem Lab Med. 2015;53:949-958. 2. Plebani M. Toward a new paradigm in laboratory medicine: the five
rights. Clin Chem Lab Med. 2016;54:1881-1891. 3. Plebani M, Laposata M, Lundberg GD. The brain-to-brain loop con-
cept for laboratory testing 40 years after its introduction. Am J Clin Pathol. 2011;136:829-833.
4. Sciacovelli L, Aita A, Padoan A, et al. Performance criteria and quality indicators for the post-analytical phase. Clin Chem Lab Med. 2016;54:1169-1176.
5. Laposata M, Dighe A. “Pre-pre” and “post-post” analytical error: high incidence patient safety hazards involving the clinical laboratory. Clin Chem Lab Med. 2007;45:712-719.
6. Vasikaran SD, Lai LC, Sethi S, et al. Quality of interpretative com-menting on common clinical chemistry results in the Asia-Pacific region and Africa. Clin Chem Lab Med. 2009;47:963-970.
7. Vasikaran SD. Anatomy and history of an external quality assess-ment program for interpretative comments in clinical biochemistry. Clin Biochem. 2015;48:467-471.
8. Bonini P, Plebani M, Ceriotti F, et al. Errors in laboratory medicine. Clin Chem. 2002;48:691-698.
9. Cray C, Rodriguez M, Zaias J, et al. Effects of storage temperature and time on clinical biochemical parameters from rat serum. J Am Assoc Lab Anim Sci. 2009;48:202-204.
10. Hawkins R. Managing the pre- and post-analytical phases of the total testing process. Ann Lab Med. 2012;32:5-16.
11. Sciacovelli L, Plebani M. The IFCC working group on laboratory er-rors and patient safety. Clin Chim Acta. 2009;404:79-85.
12. Hooijberg E, Leidinger E, Freeman KP. An error management system in a veterinary clinical laboratory. J Vet Diag Invest. 2012;24:458-468.
13. Plebani M. The detection and prevention of errors in laboratory medicine. Ann Clin Biochem. 2010;47:101-110.
RESOURCES
http://www.lewin.com/conte nt/dam/Lewin/ Resou rces/Site_Secti ons/Publi catio ns/3993.pdf Laboratory Medicine: A National Status Report—Chapter IV: Quality and the Total Testing Process. The Lewin Group; 2008.
https ://www.dropb ox.com/s/x6iti uw1cq bymj8/ AAVLD %20Req uirem ents%20for %20an%20Acc redit ed%20Vet erina ry%20Med ical%20Dia gnost ic%20Lab orato ry%20AC1 %20v%202018-07.final.pdf?dl=0 Requirements for an Accredited Veterinary Medical Diagnostic Laboratory, version 2018-07; American Association of Veterinary Laboratory Diagnosticians, Inc.; 2018.
http://www.ifcc.org/ifcc-educa tion-divis ion/worki ng-groups-speci al-proje cts/labor atory-errors-and-patie nt-safety-wg-leps/publi catio ns/ List of publications from the Working Group on Laboratory Errors and Patient Safety, International Federation of Clinical Chemistry and Laboratory Medicine (IFCC).
CHECKLIST FOR GUIDELINE SEC TION 12 , POSTANALY TIC AL FAC TORS IMPORTANT IN VETERINARY CLINIC AL PATHOLOGY
The purpose of these checklists is to facilitate guideline implementation/practical application and may be further detailed in laboratory-specific standard operating procedures (SOPs). The numbers in the first column correspond to the section numbers in the guideline.
The N/A option (listed here only for applicable items) should only be employed for items not pertaining to the laboratory, with an explanation in the additional comment box.
Guideline Recommendation Compliant?
Additional Comment(s) by Auditor
12.1 There is an established procedure (SOPs) for appro-priate review of data gener-ated in the laboratory, with particular attention to results from any testing methods which have required recent analytical troubleshooting, implausible results, data drifts, and results with critical clinical significance.
□ Yes □ No

| 617ARNOLD et AL.
Guideline Recommendation Compliant?
Additional Comment(s) by Auditor
12.2, 12.3 Data and reports are presented in a standard format, with appropriate accessioning and contact information, and with appropriate reference intervals/decision limits/previ-ous patient data.
□ Yes □ No
12.2, 12.3 Critical/life threat-ening values (once re-run/validated) are communicated to the clinician immediately, and this communication (or any tel-ephone reporting) is recorded in written/electronic format.
□ Yes □ No
12.3 Report formats are de-signed for each type of test performed and are clearly organized to minimize the possibility of misunderstand-ing. Reports are archived for a specified time.
□ Yes □ No
12.3.1 A list of send-out tests and the laboratory to which they are sent should be avail-able to clients upon request.
□ Yes □ No □ N/A
12.3.2 Suspect inaccuracies have a comment on the report that clearly states which value(s) may be inaccurate/misleading for interpretation, with explanation.
□ Yes □ No
12.3.3 For external clients, reports generated are delivered to the appropriate client in a predefined, timely manner. There is a detection mechanism for report transmission failure.
□ Yes □ No □ N/A
12.4 Any interpretive comments attached to laboratory results are periodically reviewed and updated as needed to reflect any testing or reference inter-val changes/improvements.
□ Yes □ No □ N/A
12.5 Specimens, slides, data, and reports are stored under appropriate conditions and for an established period defined by biologic stability, laboratory policy and/or certificate/ac-creditation requirements.
□ Yes □ No
12.6 Materials and samples will be disposed of appropriately and safely.
□ Yes □ No
Guideline Recommendation Compliant?
Additional Comment(s) by Auditor
12.6 Previous versions of laboratory documents will be eliminated or permanently archived in a way that prevents that prevents in advertent circulation and use of obsolete operational documents.
□ Yes □ No
12.7 Laboratory spaces and equipment are clean, organized, and well-maintained, with logs to record cleaning/maintenance activities.
□ Yes □ No
12.8 The laboratory shall main-tain a complete reagent and supply inventory with approved suppliers.
□ Yes □ No
12.2, 12.9, Table 2 For larger labs, key quality indicators for the postanalytical phase are identified and tracked, with number/percentage of errors/non-conformities evaluated at routine intervals against pre-defined goals. Preventive and corrective actions are taken as appropriate to decrease/minimize errors, with scheduled periodic review to assess their effectiveness. Smaller laborato-ries may keep an incident log.
□ Yes □ No
13 | CONTRIBUTORS
“Many hands make light work” With hearty thanks to all who made these guidelines possible.
Version 3.0 (2019), current members of the QALS Committee
Jill Arnold, Secretary Jeremie Korchia
Melinda Camus Mandy Meindel
Jennifer Cook, Chair A Russell Moore
Kathy Freeman Eric Morissette
Luca Giori Sandra Sisson
Emma Hooijberg Balazs Szladovits
Unity Jeffery Linda Vap
Version 1.0 Immunocytochemistry (2017; incorporated into current Section 9)
Anne Barger Kristen Freidrichs
Melinda Camus Rose Raskin

618 | ARNOLD et AL.
Bente Flatland Raquel Walton
Version 2.0 (2009)
Jill Arnold Deborah Davis
Kirstin Barnhart Bente Flatland
Julia Blanco Kathy Freeman
Rebecca Davies Kristen Friedrichs
Rebekah Gunn-Christie Shannon Pedersen
Kendal Harr Connie Peterson
Helen Kocmarek Kristiina Ruotsala
David Korcal Lynne Shanahan
Jim Matthews Balazs Szladovits
Joanne Messick Linda Vap
Renee Pearson
Version 1.0 (1996)
Jim Bellamy Mike Mahoney
Pat Benson Larry McGill
Karen Curd Joanne Messick
Jean Dodds Pam Miller
Ellen Evans Scott Moroff
Susan Friend Fran Moore
Sue Gallagher Loretta Moore
Karen Getzy Karen Russell
Julie Gruenwaldt Carolyn Sink
James Klaassen Linda Vap
Sally Lester Gail Walter
Peter Lording Ellen Ziemer
John Lumsden
ORCIDJill E. Arnold https://orcid.org/0000-0003-3784-8972 Melinda S. Camus https://orcid.org/0000-0002-9806-2538 Kathy P. Freeman https://orcid.org/0000-0003-1796-0158 Luca Giori https://orcid.org/0000-0002-7329-683X Emma H. Hooijberg https://orcid.org/0000-0002-4367-799X Unity Jeffery https://orcid.org/0000-0002-0495-2741 Jérémie Korchia https://orcid.org/0000-0002-9344-6639 Mandy J. Meindel https://orcid.org/0000-0001-6919-0066 A Russell Moore https://orcid.org/0000-0003-4904-8788 Sandra C. Sisson https://orcid.org/0000-0001-9003-6186 Linda M. Vap https://orcid.org/0000-0002-6853-5226 Jennifer R. Cook https://orcid.org/0000-0001-7139-2353
SUPPORTING INFORMATIONAdditional supporting information may be found online in the Supporting Information section.