ASTAE - Fiscal 2007-09 Business Plan - World Bank Group
116
-
Upload
khangminh22 -
Category
Documents
-
view
12 -
download
0
Transcript of ASTAE - Fiscal 2007-09 Business Plan - World Bank Group
Contents
Acronyms, Abbreviations, and Units of Measure i
Foreword iii
Executive Summary 1
ASTAE at a Glance 1
ASTAE-Supported Activities in Fiscal 2009 2
Overview of Program Outputs and Impacts over the Fiscal 2007–09 Business Plan Period 4
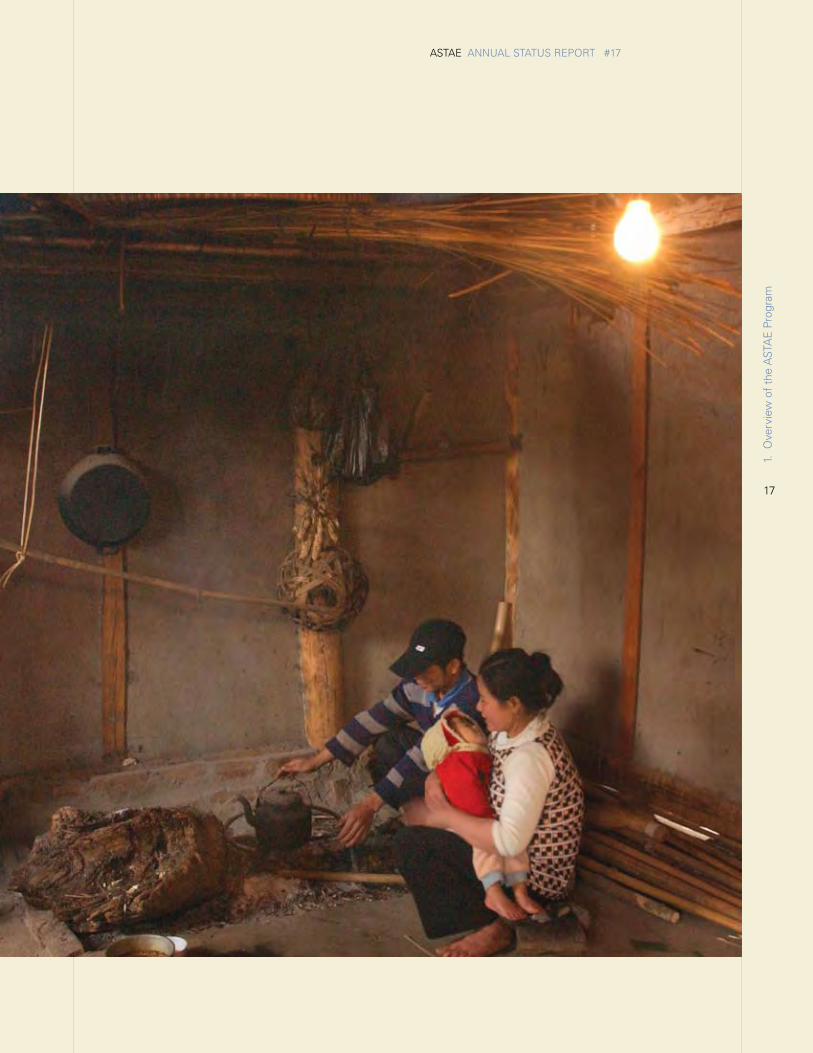
1. Overview of the ASTAE Program 7
Why ASTAE? 7
Objectives and Delivery Mechanisms of ASTAE 10
Performance and Targets 13
2. ASTAE-Supported Activities during Fiscal 2009: Expenditure and Country Updates 19
ASTAE Disbursements and Activities in Fiscal 2009 19
China and Mongolia 27
Cambodia, Lao PDR, Thailand 36
Indonesia 39
The Philippines 43
Vietnam 46
Papua New Guinea, Timor-Leste, and the Pacific Island Countries 49
South Asia Region 56
Regional Projects: Outreach and Knowledge-Sharing Activities 59
3. ASTAE Performance Assessment - Fiscal 2007-09 Business Plan 63
ASTAE Activities and Disbursements in Business Plan Period 2007–09 63
Status of 2007–09 Business Plan Performance Indicators 67
4. Outlook for ASTAE, Fiscal 2010 and Beyond 75
ASTAE Indicative Pipeline for Fiscal 2010 75
Staffing, Funding, and Upcoming Business Plan 97
Appendixes 81
Appendix 1: ASTAE Countries at a Glance: Region Map and Pillar-Related Statistics 83
Appendix 2: Link between Bank Projects and ASTAE Indicators in Fiscal 2009 87Appendix 3: ASTAE Donors, Resource Utilization, and Funding Events 95
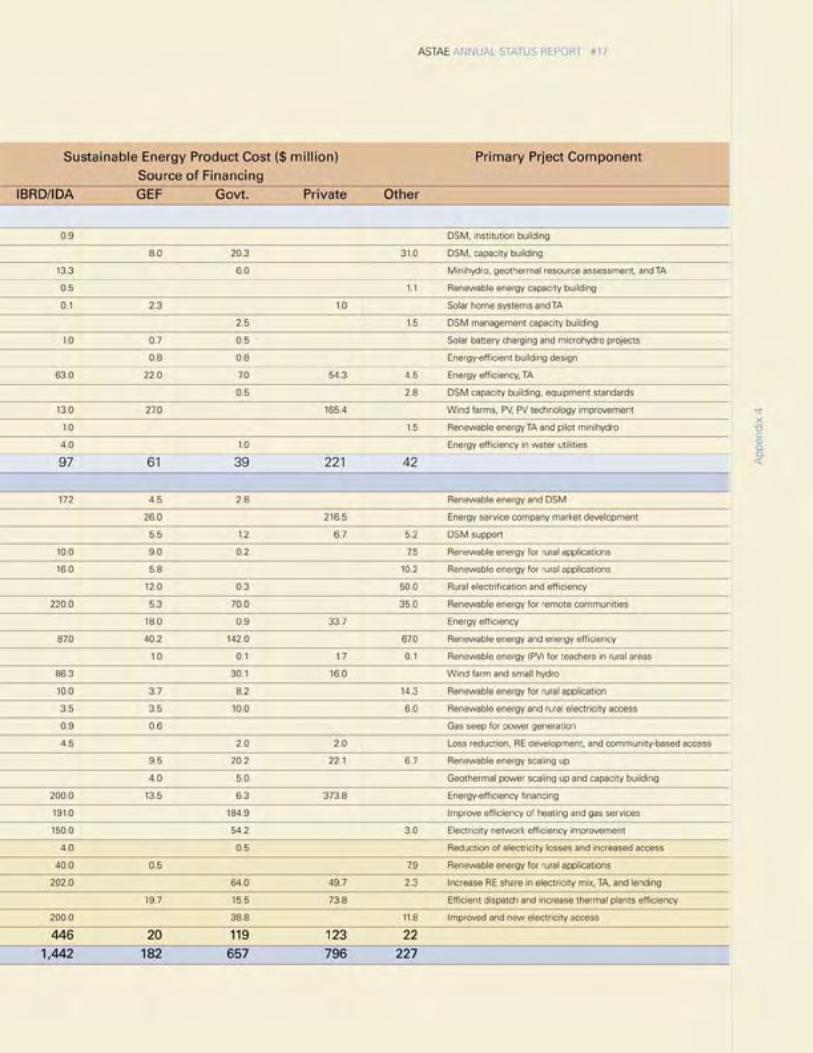
Appendix 4: ASTAE-Supported World Bank Investment Projects in East Asia and the Pacific 101
Boxes
Box 1-1: ASTAE’s Cooperation with Other World Bank Trust Funds 9
Appendix Box 3-1: Extract from Dutch Development Cooperation Policy Note, 2007–2011 96
Tables
Table 2-1: Major Disbursement Categories 20
Table 2-2: Detail of ASTAE Activities and Disbursements, FY2009 33Table 3-1: Disbursements by Countries over the Business Plan Period 25Table 3-2: Cumulative Renewable Electricity Capacity Added, by Country, FY2007–09 64Table 3-3: Cumulative Electricity Savings, by Country, FY2007–09 67Table 3-4: Households with Access to Modern Energy Services, by Country, FY2007–09 70
Table 3-5: CO2 Mitigated, by Country, FY2007–09 71
Table 3-6: Summary of 2007–09 Business Plan Targets, Pledged and Achieved 72
Appendix Table 1-1: Background Data Providing Context to ASTAE Pillars 84
Appendix Table 2-1: Link between Bank Projects and ASTAE Indicators, FY2009 88
Appendix Table 3-1: Resource Utilization, World Bank and Donors, FY1992–2009 96
Appendix Table 3-2: Principal Funding Events since 2001 97
Appendix Table 4-1: ASTAE-Supported World Bank Investment Projects 101
Figures
Figure 1-1: ASTAE Management Structure 13
Figure 1-2: ASTAE Influence and Impacts at Different Levels 15
Figure 2-1: ASTAE Resource Mobilization by Origin of Funding 20
Figure 2-2: Disbursements, by ASTAE Pillar, FY2009 21
Figure 2-3: Disbursements, by ASTAE Function, FY2009 22
Figure 2-4: Disbursements, by World Bank Activity, FY2009 22
Figure 2-5: Disbursements by Country, FY2009 22
Figure 3-1: Evolution of Disbursements and Comparison with Business Plan Budget 63
Figure 3-2: Disbursements, by Country and Financial Year 65
Figure 3-3: Business Plan Disbursements, by ASTAE Pillar 65
Figure 3-4: Renewable Energy Disbursements, by Country 66
Figure 3-5: Energy Efficiency Disbursements, by Country 66
Figure 3-6: Access Disbursements, by Country 66
Figure 3-7: Annual Electricity Generation Linked to ASTAE-Supported World Bank Projects 68
Figure 3-8: Annual Electricity Savings Linked to ASTAE-Supported World Bank Projects 69
Appendix Figure 1-1: Map of East Asia and Pacific Countries 83
Acronyms, Abbreviations, and Units of Measure
AFREA Africa Renewable Energy Access
ASTAE Asia Sustainable and Alternative Energy Program
BEE Bureau of Energy Efficiency
BNPP Bank-Netherlands Partnership Program
CDM Clean Development Mechanism
CHEEF China Energy Efficiency Financing Project
CIDA Canada International Development Agency
CO2 Carbon dioxide
CRESP China Renewable Energy Scale-Up Program
CTF Clean Technology Fund
DFID Department for International Development (UK)
DSM Demand-side management
EC Electric cooperative
EE Energy efficiency
EIA Energy Information Administration (U.S. Department of Energy)
ESMAP Energy Sector Management Assistance Program
FY Fiscal year
GDP Gross domestic product
GE Global Environment Facility Grant (WB internal abbreviation)
GEF Global Environment Facility
GPOBA Global Partnership on Output-Based Aid
GWh Gigawatt-hour
IBRD International Bank for Reconstruction and Development
IDA International Development Association
IEA International Energy Agency
IS Improved services
km Kilometer
i
ASTAE ANNUAL STATUS REPORT #17
Acr
onym
s, A
bbre
viat
ions
, and
Uni
ts o
f M
easu
re
Acronyms, Abbreviations, and Units of Measure
KP Knowledge products
M&E Monitoring and evaluation
MEMR Ministry of Energy and Mineral Resources
Mt Million tons
Mtce Million tons of coal equivalent
MW Megawatt
NSP New suspension precalciner (cement kiln)
O&M Operations and maintenance
OECD Organisation for Economic Co-operation and Development
PIC Pacific Island country
PNG Papua New Guinea
PPIAF Public-Private Infrastructure Advisory Facility
PV Photovoltaic(s)
RE Renewable energy
SEFP Sustainable Energy Finance Project (Pacific Islands)
SIDA Swedish International Development Agency
SIEA Solomon Island Electricity Authority
SKr, SEK Swedish krona
SMEs Small and medium enterprises
t Ton (metric)
TA Technical assistance
tce Tons of coal equivalent
TF Trust fund
TWh Terawatt-hour
USc U.S. cents
VSK Vertical shaft kiln
WB World Bank
ii
Through the 2007–09
business plan period,
ASTAE funded 42
activities that leveraged
13 Word Bank projects
promoting sustainable
energy, for a total
lending envelope of
just over US$2 billion.
iii
ASTAE ANNUAL STATUS REPORT #17
Fore
wor
d
Foreword
Since its creation in 1992, the Asia Sustainable and Alternative Energy Program (ASTAE)
has helped promote, implement, and scale up the use of sustainable energy solutions in
Asia.
ASTAE has developed a strong portfolio of technical assis-tance activities by directly influencing and supporting the effective implementation of large World Bank investment projects. In turn, these projects strongly leveraged client countries’ policies and their choices for the future.
ASTAE’s operational focus on renewable energy, energy efficiency, and access to modern energy remains an impor-tant reason why a successful mainstreaming of alternative and sustainable energy solutions has taken place within the World Bank’s investment portfolio in the East Asia and Pacific Region. Building on the lessons learned over a 17-year engagement with client countries, ASTAE has played a strategic role in advancing policies and programs aimed at promoting cleaner energy investments in East Asia and Pacific countries. We are particularly grateful for the con-tinued support of a core group of forward-looking donors led by the Netherlands and including Sweden, the United Kingdom, and Australia.
According to a recent estimate by the US Energy Information Administration, Asia accounts for 40 percent of the world’s CO2 emissions. Furthermore, as major Asian economies are now growing at more than four times the
pace of OECD country economies, Asia has become the pri-mary region of global engagement in the pursuit of a low-carbon strategy.
In 2009, the EAP Region used ASTAE cofunding to complete a Regional Flagship Report on Energy, with the objective of evaluating options for a sustainable energy future. This report, which will be disseminated in April 2010, builds on relevant ASTAE-supported policy work to demonstrate that a low-carbon growth path is possible for large Asian econo-mies through policies focused on energy-efficiency improve-ments and innovations in renewable energy technologies. A low-carbon path is both technically and economically viable for the region, and if the right decisions are made, coal’s share in power generation could be halved to 37 percent by 2030. The report estimates that about US$85 million a year of additional financing will be required to achieve these am-bitious goals. ASTAE funds have also supported the comple-tion of several country-specific studies evaluating energy access concerns in EAP countries.
Through the current business plan period (covering fiscal years 2007–09), ASTAE funded 42 activities that leveraged 13 Word Bank projects promoting sustainable energy, for a
iviv
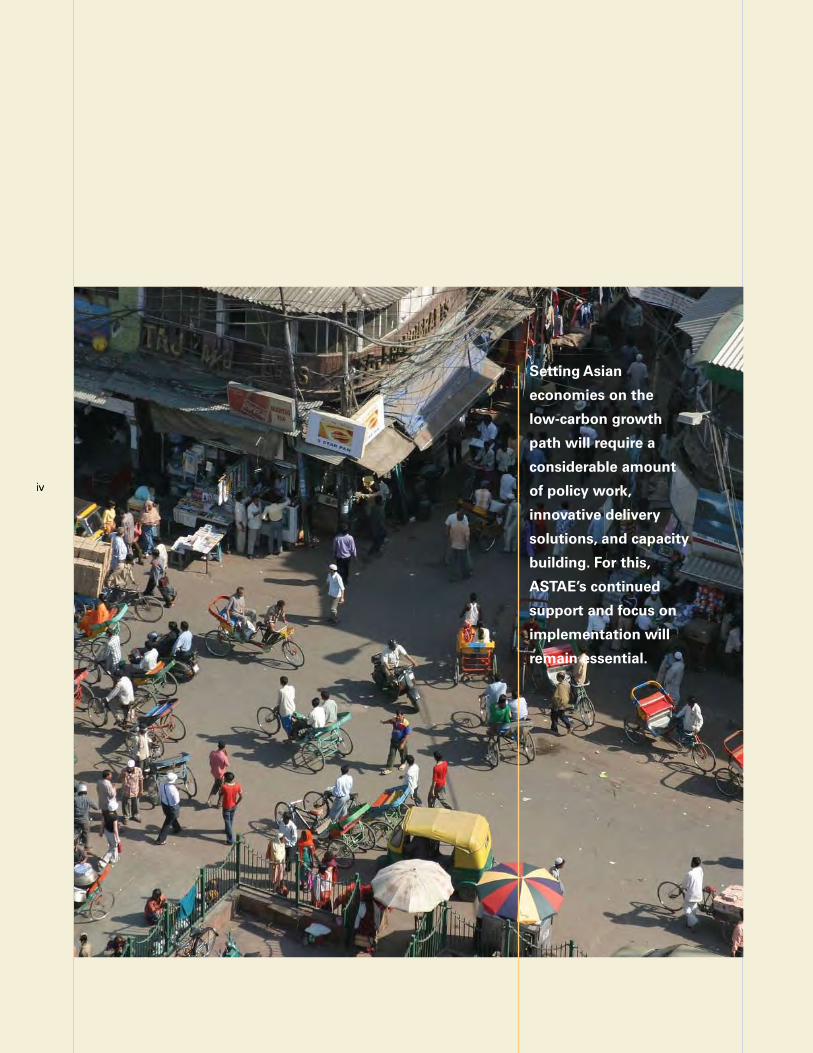
Setting Asian
economies on the
low-carbon growth
path will require a
considerable amount
of policy work,
innovative delivery
solutions, and capacity
building. For this,
ASTAE’s continued
support and focus on
implementation will
remain essential.
v
ASTAE ANNUAL STATUS REPORT #17
Fore
wor
d
total lending envelope of just over US$2 billion. Since 2003, we have also been tracking the direct impacts of ASTAE ac-tivities, as well as indirect impacts, through policy changes leading to improved regulations and better standards and labeling that attract private sector investments. By the end of fiscal 2009, ASTAE had exceeded all its commitments for the 2007–09 period by more than 160 percent in renewable energy and energy efficiency, more than 200 percent in ac-cess to energy, and 130 percent in mitigated CO2 emissions.
Building on these accomplishments, considerably more policy work and pilot-testing of innovative solutions will be necessary in the next few years if the EAP Flagship Report’s recommendations are to be implemented. For this, ASTAE’s continued support will be essential to implement the re-gion’s energy strategy.
Finally, we would like to express our gratitude to the gov-ernment of the Netherlands and the Swedish International Development Cooperation Agency, and look forward to their continued support to meet the daunting challenges of the future years. We also welcome participation of other interested donors in this exciting and topical program as the world grapples with how best to implement a low-carbon strategy.
N.Vijay Jagannathan
ASTAE Program Manager
Sector Manager, Infrastructure Unit
East Asia and Pacific Region
vi
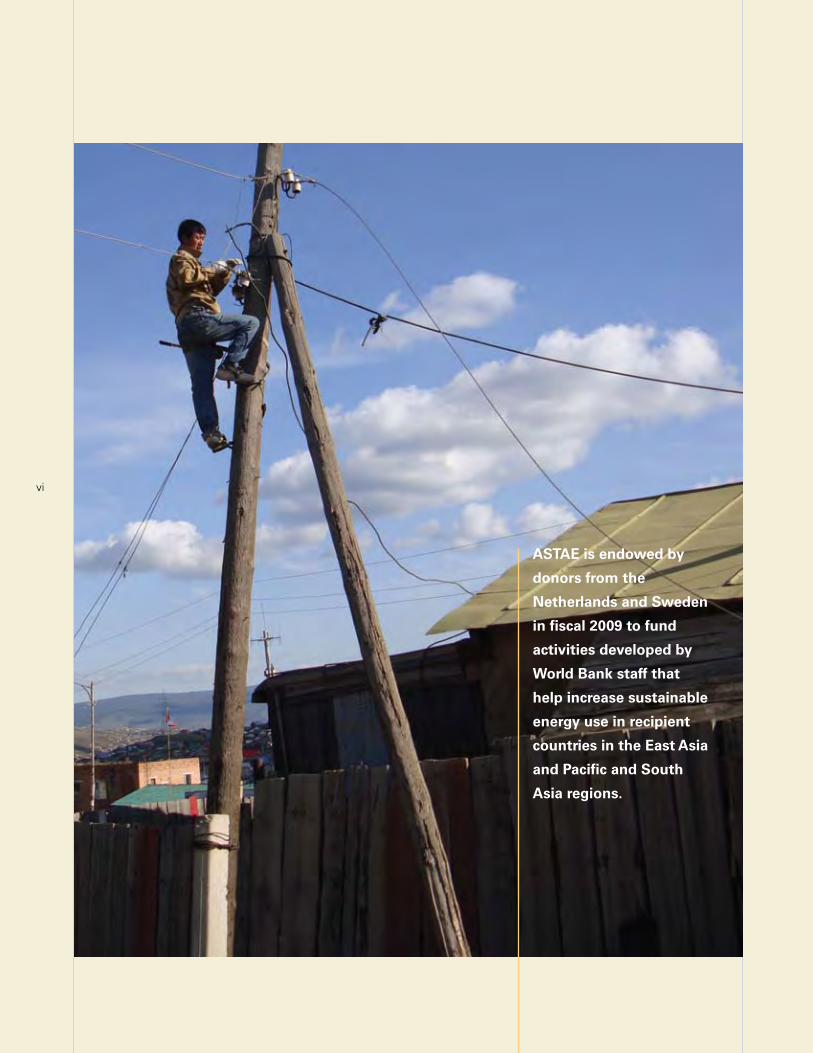
ASTAE is endowed by
donors from the
Netherlands and Sweden
in fiscal 2009 to fund
activities developed by
World Bank staff that
help increase sustainable
energy use in recipient
countries in the East Asia
and Pacific and South
Asia regions.
1
ASTAE ANNUAL STATUS REPORT #17
1
Executive Summary
ASTAE AT A GLANCE
The Asia Sustainable and Alternative Energy Program (ASTAE) was created in 1992. It has been instrumental in moving the World Bank East Asia and Pacific portfolio toward sustainable energy.
ASTAE is imbedded in the East Asia Infrastructure Unit of the Word Bank to maximize its leverage and operational impact. The program covers activities in East Asia countries, with selected engagements in South Asia.
ASTAE also works in close cooperation with ESMAP and other World Bank Trust Funds that provide additional support to World Bank operations.
The ASTAE program rests on three pillars, with their corresponding impact indicators:
Renewable Energy: New MW and GWh renewable energy
Energy Efficiency: GWh avoided through efficiency gains
Access to Energy: Number of connections
Resulting CO2 emission avoided
ASTAE is endowed by donors from the Netherlands and Sweden in fiscal 2009 to fund activities developed by World Bank staff that help increase sustainable energy use in recipient countries in the East Asia and Pacific and South Asia regions.
ASTAE funded 42 activities during the last business plan period (fiscal 2007–09), for a total disbursement of US$5.2 million and remaining commitments of US$0.9 million.
Exe
cutiv
e S
umm
ary
2
ASTAE-SUPPorTEd ACTiviTiES iN FiSCAL 2009
This report focuses its monitoring period on fiscal 2009 (from July 1, 2008, to June 31, 2009). However, chapter 3 of the main report also provides information relative to the past three years, which covers the last ASTAE business plan period.
Overview of Disbursements in Fiscal 2009
During fiscal 2009, ASTAE disbursed a total of US$2,177,200— an increase of 18 percent over the previous year. This provided funding for 25 activities (a 25 percent increase over the pre-vious year) in 12 countries. Half the currently active projects started disbursement this fiscal year.
ASTAE disbursed US$1,622,147 toward activities implemented in fiscal 2009, or 74.5 percent of its total disbursements, and the remainder of the budget was used to cover administrative and reporting costs.
Disbursements showed a strong focus on renewable energy. Fourteen out of 25 activities in fiscal 2009 were centered on renewable energy, and US$1.2 million, 73 percent of total ac-tivity-based disbursement, was disbursed on activities with a primary focus on renewable energy. These renewable energy–related activities have higher allocations than the ones where access and energy efficiency are the primary focuses, which shows ASTAE’s continued commitment to promoting alterna-tive energy in the region.
However, while they were less often the primary focus of ASTAE-supported activities, energy efficiency and access is-sues were not overlooked. These two pillars were present in 12 and 10 of the 25 activities, respectively. Furthermore, access-related activities, which developed the use of new, modern sources of energy or improved the use of existing sources, were often incorporated as subcomponents of en-ergy efficiency or renewable energy-focused activities.
Geography of Disbursements: Focus on Pacific Islands, China, Vietnam, and Indonesia
ujIn fiscal 2009, Pacific Island countries led the way, collec-tively receiving US$288,344, or 18 percent of ASTAE disburse-ments and five ongoing projects.
ASTAE continued its active involvement in its priority coun-tries, with 41 percent of project disbursements going to
China, Vietnam, and Indonesia. China represented the second largest funding at US$288,917—18 percent of total project expenditures—and had four ongoing projects. Vietnam and Indonesia received similar funding support, with 12 percent and 11 percent, respectively. Vietnam has three ongoing ac-tivities, while Indonesia has one.
Activity in the South Asia region remained minimal in fis-cal 2009, with one project representing 3 percent of total expenditures.
Activities Highlights in Fiscal 2009
Of the 25 activities that were funded by ASTAE in fiscal 2009, the following 5 are highlighted to represent the range of ac-tivities supported by the program, and for the relevance of their focus areas in light of ASTAE’s overall mission.
China, Energy Intensity Strategy—Energy Efficiency in the Cement Sector
Energy-efficiency pillar, disbursement US$92,654. China’s cement sector contributes more than 10 percent of all of China’s CO2 emissions. Hence, the sector has significant potential to improve energy efficiency and reduce resource consumption and environmental pollution. One of the pos-sible policies is to replace obsolete cement production tech-nologies, such as the traditional vertical shaft kilns (VSKs), with energy-efficient new suspension preheater rotary kilns with precalciner (NSP). ASTAE, in collaboration with the China Energy Foundation, funded two studies using the case of Shandong Province to identify the key social, environmental, and economic impacts that would result from shutting down the obsolete VSK plants, and to evaluate additional energy-efficiency opportunities that can be found in NSP plants.
The studies show that, while the negative social impacts of closing obsolete plants are not trivial, the negative economic impacts are small and likely to be compensated in other sec-tors because the energy savings and environmental benefits are significant. Overall, the downsizing of the cement sector in Shandong would destroy most jobs permanently, since modern NSP plants produce, on average, only one job for ev-ery 20 older VSK plant jobs. However, the impact on the pro-vincial gross domestic product (GDP) would be low, at about 0.2 percent, and energy consumption would be reduced by 5 millions tons coal equivalent (Mtce) per year in about 30 per-cent of the total energy consumption of the cement sector in the province.
3
ASTAE ANNUAL STATUS REPORT #17
In addition, further efficiency can be achieved in the new NSP plants, with average primary energy savings of 12 percent if all plants operate at domestic best-practice levels, in terms of energy use per ton of cement produced, and savings of 23 percent can be achieved if the plants operate at international best-practice levels.
The ASTAE work will result in a World Bank policy note to recommend ways to address problems that have been iden-tified and implement the switch to such newer and cleaner technologies.
Cambodia, Biodigester Private Sector Development
Access pillar, disbursement US$64,559. Anaerobic bio-digesters, fed with animal dung and other organic waste, produce methane gas, which is used for both cooking and lighting. The Cambodia National Biodigester Program was established to adapt the technique from other countries and has installed 750 biodigesters in the country over two years. However, because the training of masons focused only on technical aspects and did not provide the basic business skills for estimating profit or loss, entrepreneurs considered con-structing biodigesters a risky activity.
ASTAE support was provided in fiscal 2009 to develop a ser-vice delivery model where private construction companies would be established and their staff trained to be respon-sible for the whole business supply chain. It has resulted in the privatization of biogas services in three provinces, the establishment of 15 biodigester construction companies using replicable franchises, the publication of operation manuals, mason training, and business mentoring. This resulted in the installation of up to 5,600 biodigesters by the end of fiscal 2009 and the decision to target 21,800 biodigesters by 2012.
Indonesia, Geothermal Power Support Program
Renewable energy pillar, disbursement US$175,253. In recent years, as the national power demand has begun to outstrip supply, the government of Indonesia established a 10,000 MW coal-based generation “crash program” to meet its obligations. However, Indonesia has the world’s largest geothermal resource that can provide a good local and base-load generation fuel. Although the government has a long-term roadmap to progressively develop a total of 6,000 MW of geothermal power capacity by 2020, the present geother-mal capacity remains at approximately 1,000 MW.
The World Bank is providing support both on the policy side—assisting in undertaking major reforms that will progressively enhance the investment climate in its geothermal sector—and on the financing side, stimulating investments by directly sup-porting geothermal developers.
ASTAE provided technical expertise needed by the govern-ment in support of the overall effort to address regulatory barriers in the geothermal sector. In addition, ASTAE provided expertise during the identification phase of the World Bank investment project, and will continue to fund support tasks as the team prepares the project for submission to the World Bank Board of Executive Directors in 2010. It also assisted the government in establishing a Carbon Finance Framework as a programmatic approach to a Clean Development Mechanism (CDM) project development that aims to streamline and sim-plify geothermal projects for CDM registration and emission reduction transactions.
Vietnam, Assistance to the Renewable Energy Development Project (REDP)
Renewable energy pillar, disbursement US$132,084. ASTAE provided support to the preparation of the REDP in Vietnam, which was approved by the Board in May 2009. The core component of the project is a refinancing facility avail-able to participating commercial banks that in turn provide loans to eligible renewable-based subprojects.
ASTAE support has been used to build capacity within the Ministry of Industry and Trade in charge of developing REDP, to prepare frameworks and guidelines applicable to eligible subprojects with respect to environment safeguards, dam safety, resettlements, and ethnic minority policies. It also pro-vided support to the World Bank team for project preparation and appraisal.
In the future, ASTAE will support the implementation phase of the REDP. It will provide capacity building of the project’s management board and administrative units on policy estab-lishment and implementation methods. It will also provide training of project sponsors in order to help them identify and build a pipeline of potential subprojects, and training to Vietnamese banks that have limited experience with apprais-ing renewable energy projects.
Pacific Islands, Wind Resource Mapping
Renewable energy pillar, disbursement US$128,340. ASTAE funded the preparation of an atlas that provides com-plete data on wind availability to foster the development of
Exe
cutiv
e S
umm
ary
4
wind energy both for utility-scale generation and for commu-nity-based power generation, including other off-grid applica-tions. It covers Fiji, Papua New Guinea, Solomon Islands, and Vanuatu.
Potential users of the atlas include government officials, inter-national aid agencies, and development institutions, as well as private developers. Because of the absence of existing reli-able local wind data, the study was requested and carried out using the Wind Survey system, an advanced wind mapping system that operates without the need for existing surface wind measurements.
The World Bank will now follow up by consulting with the government in each Pacific Island country (PIC) to explore the possibility of long-term wind development programs that could lead to the construction of up to 25 MW of wind power generation capacity.
ovErviEW oF ProGrAm oUTPUTS ANd imPACTS ovEr ThE FiSCAL 2007–09 BUSiNESS PLAN PEriod
By the end of fiscal 2009, the total donor resources engaged by the ASTAE program during the fiscal 2007–09 business plan period reached US$6.2 million, including disbursed funds and committed expenditures. This represented 84 percent of the US$7.4 million budget allocated under the business plan period.
This expenditure supported activities that resulted in World Bank investments in sustainable energy. ASTAE tracks these results by following World Bank project lending that benefited from ASTAE.
World Bank-Approved Projects That Received ASTAE Support
Over the fiscal 2007–09 business plan period, 13 World Bank projects that have benefited from ASTAE support and that promoted sustainable energy were approved. The total lend-ing of these projects amounted to just over US$2 billion. Such lending, focused on developing sustainable energy, was en-abled or facilitated by ASTAE support and therefore illustrates ASTAE’s leverage on World Bank lending. Such leverage is even more important when, as shown below, such projects are deemed so successful that they received a second phase or additional financing to scale up the impacts achieved under the initial project.
Five of these World Bank projects focused on sustainable energy were approved in fiscal 2009 for a total of US$730 million (described briefly below), and the other eight were de-scribed in previous annual reports.
Solomon Islands Sustainable Energy
The Sustainable Energy Project, approved in July 2008 for a total funding of US$4.5 million, aims at increasing the op-erational efficiency, system reliability, and financial sustain-ability of the Solomon Island Electricity Authority (SIEA). This is implemented through improved financial and operational management, reduction of losses, improved reliability of generation and distribution systems, and improved revenue collection.
Philippines Rural Power Additional Financing
This project, approved in April 2009 for a total of US$48.4 million, is the scale-up phase of an earlier project started in 2004. The original project aimed at testing and demonstrat-ing business models that involved private investment for de-centralized electrification; improving and transforming electric cooperatives institutionally and operationally; and avoiding CO2 emissions through wider use of renewable energy. The additional financing project seeks to scale up these activities by supporting increased electrification of rural households and improving risk sharing with the private sector for investment in the generation, transmission, and distribution of electricity.
Vietnam Renewable Energy Development
The REDP in Vietnam was approved by the Board in May 2009. This US$318 million project aims at increasing the sup-ply of electricity to the national grid from renewable sources. The REDP provides regulatory framework strengthening, pipe-line development, and investment support to private sector, renewable-based subprojects not exceeding 30 MW. The core component of the project is a refinancing facility available to participating commercial banks that in turn provide loans to eligible renewable-based subprojects.
China Thermal Power Efficiency
The Thermal Power Efficiency Project, approved in May 2009, allocated US$109 million toward reducing coal consump-tion and greenhouse gas emissions per unit of electricity production in Shanxi, Shandong, and Guangdong Provinces in China. This is done through mitigating the financial barri-ers to closing inefficient, small coal-fired units; demonstrat-ing the viability of investments in efficiency improvements in
5
ASTAE ANNUAL STATUS REPORT #17
existing medium-sized thermal units; and developing effective regulations to encourage and implement efficient generation dispatch.
Vietnam Rural Energy II—Additional Financing
This project, approved in May 2009 for US$250 million, is the continuation of the Rural Energy II Project, which was origi-nally approved in 2004. The proposed additional credit will in part (36 percent) help finance the costs associated with com-pletion of the original project activities as a result of an un-anticipated financing gap linked to fluctuations in exchange rates and commodity prices. The remaining 64 percent of the loan will support scale-up of the project’s impact by increasing the number of communes electrified from 1,200 to 1,500 and reaching an additional 550,000 households without modify-ing the overall design and implementation strategy of the original project.
Indicators and Progress against Business Plan Targets
ASTAE tracks a set of indicators showing the trajectory of its impact in supporting sustainable energy development. The in-dicators were chosen to convey the predominant trend within each pillar. They are usually available from World Bank project documentation and are therefore easily referenced from pub-lished sources. For each new World Bank project that received ASTAE support and that is approved by the Board of Executive Directors, the impacts are cumulated over the business plan period to produce the aggregated indicators described below.
Indicator 1: New capacity and increased generation of renewable electricity.
Through support to projects that directly facilitate investments, ASTAE activities led to increased capacity and generation from renewable sources, primarily wind in China and geothermal in Indonesia. These projects are expected to directly install 1,030 MW of renewable energy that will generate 1,579 GWh ev-ery year, once commissioned, or 158 percent of the original ASTAE target. In addition, support to frameworks, regulations, and investment mechanisms favorable to renewable energy development is expected to contribute indirectly to the instal-lation of 12,400 MW by utilities and private investors, which is likely to result in the generation of 18,000 GWh annually, once commissioned, or 180 percent of the ASTAE target.
Indicator 2: Electricity savings resulting from efficiency improvements
Annual savings estimates are calculated based on direct savings through World Bank loans or indirectly through in-vestments facilitated by World Bank and ASTAE technical support. Business plan targets for both direct and indirect annual electricity savings have been exceeded. Direct savings will be 1,586 GWh annually (150 percent of target), and in-direct savings will be more than twice the target at 26,150 GWh annually. Most of the results were delivered in Vietnam and China.
Indicator 3: Households with access to modern energy services
Access to electricity remains the major component of the indicator, but space heating is also represented in Mongolia, as well as improved cooking stoves and biogas in Cambodia and Timor-Leste. The largest contribution was provided by the rural electricity energy project in Vietnam.
Direct targets have been met, with ASTAE-supported World Bank projects financing improved services to 2 million house-holds (four times the target of 500,000) and new access to modern energy services to an additional 610,750 households (122 percent of the target of 500,000). ASTAE-supported projects fell short (80 percent) of meeting the goal of 250,000 households with indirect improved services, although the new access that resulted was more than nine times the originally modest target of 50,000 households.
Indicator 4: Avoided greenhouse gas emissions
This indicator estimates the quantity of CO2 emissions that would be avoided over 20 years (the conventional lifespan of projects or equipment) through ASTAE-supported World Bank projects. The CO2 targets have been met. The direct impact value is estimated at 99 million tons, or 140 percent of the original target, and the indirect savings were estimated to be 1,003 million tons, or 129 percent of the target.
Indicator 5: Countries benefiting from ASTAE support
This indicator ensures that ASTAE resources are used in a bal-anced manner across all countries of the East Asia region, giv-ing equal funding opportunities to large countries (Indonesia, China, Vietnam), as well as to smaller countries (Pacific Islands). ASTAE provided financial support to activities in 12 countries, as well as to several regional activities.
Exe
cutiv
e S
umm
ary
6 1
7
ASTAE ANNUAL STATUS REPORT #17
1. O
verv
iew
of
the
AST
AE
Pro
gram1. Overview of the ASTAE Program
During the last 16 years, the East Asia and Pacific region recorded exceptional economic
growth, lifting millions out of poverty and becoming one of the economic engines of the
world, side by side with Europe and North America. As a result of this economic growth,
many countries in the region have experienced high and accelerating fossil fuel consump-
tion. This has led to growing carbon dioxide (CO2) emissions, which make up the largest
share of greenhouse gases.
Why ASTAE?
According to the U.S. Department of Energy’s Energy Informa- tion Administration (EIA), which tracks world energy statistics, Asia’s CO2 emissions from the consumption of energy grew twice as fast as the world average between 2002 and 2006. With 75 percent growth during this period, in 2007 China became the world’s largest source of CO2 emissions, ahead of the United States, emitting more than 6 billion tons— 20 percent of the world’s total. While still far behind in abso-lute value, Vietnam, Thailand, and India also had much higher than average growth.
The sources of CO2 emissions are not limited to the consump-tion of energy. CO2 also enters the atmosphere from the burning of wood and waste materials, and from some indus-trial processes. These sources can be significant at the local level; Indonesia is believed to be among the top CO2-emitting countries when deforestation is taken into account. But fossil fuel-based energy consumption remains by far the largest and central cause of emissions.
Brief History, Challenges, Beneficiaries, and Donors
The Asia Sustainable and Alternative Energy Program (ASTAE) was originally established in 1992 by international donors as a three-year pilot program with the objective of “mainstream-ing” alternative energy in the World Bank’s lending and tech-nical assistance operations in the South Asia and East Asia regions.
Leverage on Bank Operations
The original task of ASTAE to promote the use of alternative energy included energy efficiency and renewable energy, which formed the two original pillars of ASTAE.
ASTAE started opportunistically, providing supplemental fund-ing to forward-looking World Bank task team leaders eager to undertake small side tasks to help address alternative energy–related issues encountered during the development
8
of their projects. As these ASTAE-funded activities increased in number and delivered positive impacts on regional develop-ment objectives, they eventually became standalone projects, often supported by Global Environment Facility (GEF) financ-ing. ASTAE’s operational success led the donors to replenish the trust fund at the end of each business plan period.
ASTAE’s original target was to increase the share of alternative energy to 10 percent of the World Bank’s total energy sec-tor lending in Asia. This goal was achieved during the fiscal 1997–2000 business plan period. Alternative energy, a fringe activity when ASTAE was created, has evolved into one of the Bank’s main lending themes, and exceeded 40 percent of en-ergy commitments in fiscal 2009.
Scale-Up and Expansion
In 2002, ASTAE started a scale-up phase. Scaling up entailed continuing its mission of mainstreaming alternative energy, as well as expanding its reach from within the World Bank to the client countries’ stakeholders themselves, and broadening its core business from alternative energy to sustainable energy by adding a third pillar—access to modern energy services—designed to address energy poverty and its impact on the environment. Scaling up also meant departing from project-to-project activities to a more programmatic approach at the scale of a sector or a country. During this transition, ASTAE focused primarily on the East Asia and the Pacific regions, comprising Southeast Asian and Pacific Island countries.
As ASTAE’s funding and scope expanded, measuring its reach and impact became more challenging, and a broad set of in-dicators was designed to assess progress toward fulfilling the three pillars of ASTAE. These sustainable energy indicators of access to modern energy services, increased use of renewable energy, and improved energy efficiency (described later in this chapter) track progress made through ASTAE activities, both as a direct result of related World Bank loans and as the indi-rect results of ASTAE-funded technical assistance to country stakeholders.
Achievements and Beneficiaries
Since its inception, ASTAE has directly contributed, through its leverage on World Bank-funded projects, to installing about 1,900 MW of renewable energy or close to the equivalent of combined installed capacity of the Lao People’s Democratic Republic, Mongolia, and Papua New Guinea (EIA 2006). It helped avoid the generation of about 65 TWh of electricity through energy efficiency, the equivalent of the Vietnam’s to-tal generation in 2007. It also contributed to providing new
access to modern energy to more than 2.5 million house-holds in Asia, or about the equivalent of the population of Cambodia (13.5 million people in an average household size of 5.3). These quantifiable achievements resulted in substan-tial mitigation of global greenhouse gas emissions, as well as significant decreases in local pollutant emissions that di-rectly and adversely affect the health of the local population. Estimates indicate that the projects ASTAE has supported to date will prevent the emission of 345 million tons of CO2 over the projects’ 20-year lifetimes, equivalent to the 2006 emis-sions of Thailand and Vietnam combined.
Furthermore, under the scale-up phase of the last six years, ASTAE’s indirect impact, through its influence on country stakeholders’ investment decisions, had a much wider reach. The recent concerted effort focusing on renewable energy development is leading to an additional 17,000 MW installed in the region, and additional potential energy savings of up to 50 TWh annually—the equivalent of the Philippines’ total installed capacity and annual generation, respectively.
Close Collaboration with Donors
The key to ASTAE’s success is its dual partnership model—partnering with World Bank task team leaders to undertake the operational aspects of its activities and partnering with its donors to establish and fund its strategic goals. The re-sulting synergy allows all parties to exploit their respective comparative advantages to explore and seize opportunities in addressing ASTAE’s three missions. Donor countries, such as the Netherlands and Sweden, but also Australia, Canada, Finland, Switzerland, the United Kingdom, and the United States, have over the years endowed ASTAE with block grant funding that advances the agreed-on themes and targets. In turn, ASTAE provides task team leaders with resources that are then used to support important activities in a timely and flexible way, and ultimately help demonstrate the validity and feasibility of integrating sustainable energy into the Bank’s project portfolio.
Although the ASTAE Trust Fund covers only a small portion of the costs of project preparation or technical assistance to client countries, the strategic use of these funds enables far greater impact on which projects enter the World Bank pipe-line and on the dissemination of operational experience than otherwise would be possible. ASTAE also cooperates with other World Bank donor trust funds, as illustrated in box 1-1, to ensure the best use of donor funding.
9
ASTAE ANNUAL STATUS REPORT #17
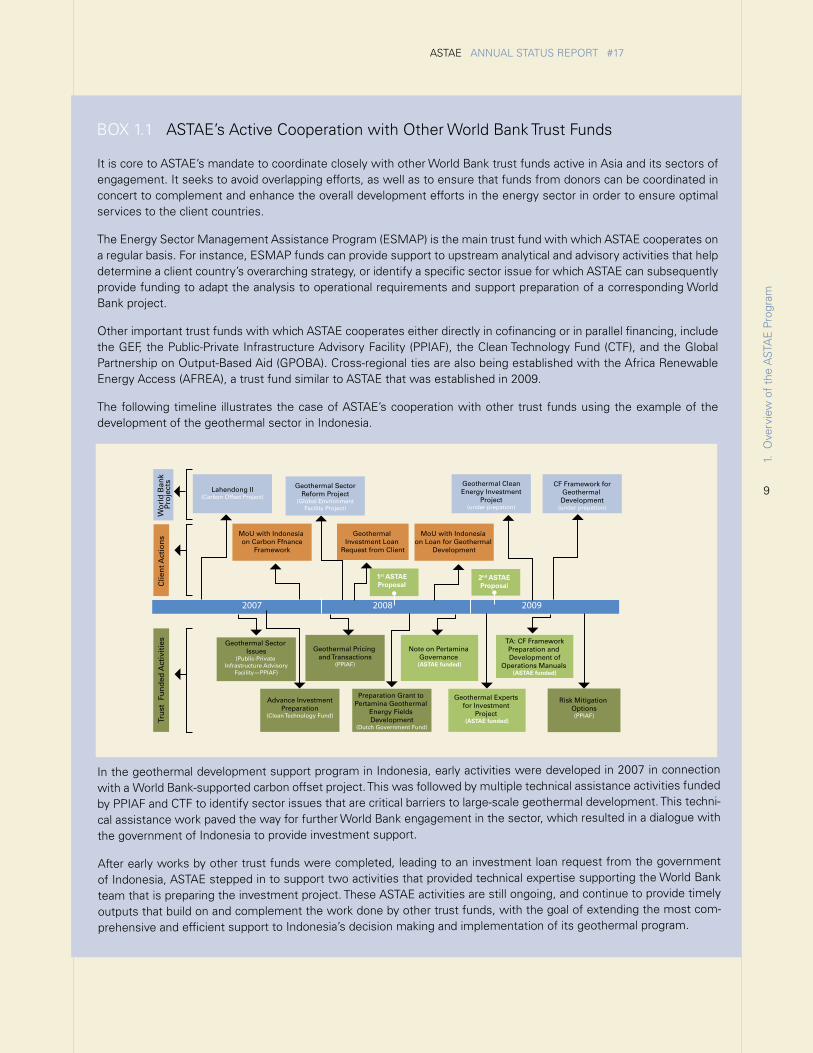
It is core to ASTAE’s mandate to coordinate closely with other World Bank trust funds active in Asia and its sectors of engagement. It seeks to avoid overlapping efforts, as well as to ensure that funds from donors can be coordinated in concert to complement and enhance the overall development efforts in the energy sector in order to ensure optimal services to the client countries.
The Energy Sector Management Assistance Program (ESMAP) is the main trust fund with which ASTAE cooperates on a regular basis. For instance, ESMAP funds can provide support to upstream analytical and advisory activities that help determine a client country’s overarching strategy, or identify a specific sector issue for which ASTAE can subsequently provide funding to adapt the analysis to operational requirements and support preparation of a corresponding World Bank project.
Other important trust funds with which ASTAE cooperates either directly in cofinancing or in parallel financing, include the GEF, the Public-Private Infrastructure Advisory Facility (PPIAF), the Clean Technology Fund (CTF), and the Global Partnership on Output-Based Aid (GPOBA). Cross-regional ties are also being established with the Africa Renewable Energy Access (AFREA), a trust fund similar to ASTAE that was established in 2009.
The following timeline illustrates the case of ASTAE’s cooperation with other trust funds using the example of the development of the geothermal sector in Indonesia.
In the geothermal development support program in Indonesia, early activities were developed in 2007 in connection
with a World Bank-supported carbon offset project. This was followed by multiple technical assistance activities funded
by PPIAF and CTF to identify sector issues that are critical barriers to large-scale geothermal development. This techni-
cal assistance work paved the way for further World Bank engagement in the sector, which resulted in a dialogue with
the government of Indonesia to provide investment support.
After early works by other trust funds were completed, leading to an investment loan request from the government
of Indonesia, ASTAE stepped in to support two activities that provided technical expertise supporting the World Bank
team that is preparing the investment project. These ASTAE activities are still ongoing, and continue to provide timely
outputs that build on and complement the work done by other trust funds, with the goal of extending the most com-
prehensive and efficient support to Indonesia’s decision making and implementation of its geothermal program.
BOX 1.1 ASTAE’s Active Cooperation with Other World Bank Trust Funds
Geothermal CleanEnergy Investment
Project(under prepation)
CF Framework forGeothermal Development
(under prepation)
Geothermal SectorReform Project
(Global EnvrionmentFacility Project)
Lahendong II(Carbon Offset Project)
Wo
rld
Ban
k Pr
oje
cts
Clie
nt A
ctio
ns Geothermal
Investment Loan Request from Client
MoU with Indonesia on Loan for Geothermal
Development
MoU with Indonesia on Carbon Ffnance
Framework
2007 2008 2009
TA: CF FrameworkPreparation and Development of
Operations Manuals (ASTAE funded)
Note on Pertamina Governance (ASTAE funded)
Geothermal Experts for Investment
Project (ASTAE funded)
1st ASTAEProposal
2nd ASTAEProposal
Geothermal Pricing and Transactions
(PPIAF)
Tru
st F
un
ded
Act
ivit
ies
Risk Mitigation Options(PPIAF)
Geothermal Sector Issues
(Public-Private Infrastructure Advisory
Facility—PPIAF)
Preparation Grant to Pertamina Geothermal
Energy Fields Development
(Dutch Government Fund)
Advance InvestmentPreparation
(Clean Technology Fund)
1. O
verv
iew
of
the
AST
AE
Pro
gram
oBjECTivES ANd dELivEry mEChANiSmS oF ASTAE
ASTAE’s stated objective is to scale up the use of sustainable energy options in Asia to protect the environment and reduce energy poverty.
Three Pillars to Support Sustainable Development
A Trend of Unsustainable Development
The East Asia and Pacific region accounted for a large portion of the growth in global demand for energy during the last 16 years, with China’s share of that portion continuously expand-ing. The International Energy Agency (IEA) expects that the region will continue to account for about 30 percent of global energy demand growth until 2020.
In the power sector, coal, with a share of about 75 percent, will likely continue to dominate generation, with oil and gas each at about 10 percent. While China sets the pace, other countries, such as the Philippines, Indonesia, and Vietnam, have rapidly rising, medium-term needs for additional gen-eration capacity to sustain their economic growth. With the dominance of traditional fossil fuels as the primary generation option and the obstacles to positioning renewable energy sources as credible and reliable base-load substitutes, the power sector is expected to remain a large contributor to greenhouse gas emissions. Other energy subsectors, such as heating, also contribute substantially to local and global envi-ronmental issues.
Despite impressive achievements in the East Asia and Pacific region to increase total installed generation capacity (for ex-ample, Vietnam increased its installed capacity by 6,400 MW or 69 percent between 2003 and 2008), a large segment of the population, primarily those living in rural and remote ar-eas, did not benefit from this growth. The region’s unelectri-fied households remain at approximately 12 percent. This is a low percentage compared with Africa, but considering that it affects 200 million people, is still sizable. The consequences go beyond social justice—households without access to mod-ern energy often use fuel substitutes, such as raw coal and wood pellets, with high polluting impacts at the local level. Moreover, population growth can stretch the demand for tra-ditional fuels (wood, charcoal, straw) beyond their regenera-tion capacities.
Countering the Trend
ASTAE has responded to these environmental challenges. Its efforts to champion sustainable development in the East Asian energy sector can be categorized in three pillars.
First Pillar: Renewable EnergySupporting energy generation growth with renewable energy technologies slows the depletion of natural resources, limits global environmental damage, and can contribute to the sub-stitution of domestic resources for imported ones. Renewable energy resources include hydroelectric power, biomass, wind, geothermal, and solar energy. Several countries in the region have set ambitious targets for renewable energy generation, but much remains to be done to reach these targets.
Second Pillar: Energy EfficiencyGiven that most energy today is generated from finite fossil fuels, using less energy to reach the same desired outcome is an effective way to contribute to sustainable develop-ment. Energy intensity per unit of GDP produced is high in most Asian countries, which indicates that room for efficiency improvements exists in all sectors of the economy. Energy-efficiency improvements can be attained in electricity gen-eration, energy demand management, central heating, and individual stove use.
Third Pillar: Access to Modern Energy ServicesAccess encompasses new access (for example, connecting a previously unelectrified household) and improved access (for example, construction of a biogas stove to replace wood for cooking). Access to modern energy can significantly improve the quality of life for end users. Modern energy provides ben-efits, such as light, heat, and power, for electrical appliances and tools in a much more efficient and less polluting fashion than the displaced resources, often at a fraction of the cost. In the past decade, countries such as China and Vietnam made dramatic progress in providing electricity access to their citi-zens, but others lag far behind.
To track the contributions and achievements of ASTAE-funded activities relative to each pillar, pillar-specific indicators have been defined. These indicators, detailed later in this chapter, help monitor annual progress against specific targets defined for each business plan period. Over time, ASTAE has expand-ed its monitoring from input-based-only indicators (linking ASTAE funding to World Bank lending) to encompass output-based indicators (that is, final impacts delivered through ASTAE’s lending, measured in megawatts, gigawatt-hours, or the number of connections).
10
11
ASTAE ANNUAL STATUS REPORT #17
Mode of Operation: Functions, Services, and Structure
Organized to Deliver
To reinforce the effectiveness of its three pillars for sustainable development and achieve substantive results, ASTAE’s over-all strategy is to focus on supporting program development and project implementation in operations, or “downstream” activities.
Three functions—innovative investment delivery mechanisms, improved policy and regulatory frameworks, and effective knowledge sharing—characterize ASTAE’s operational means of implementing its overall strategy.
ASTAE provides a wide range of services, such as early pro-gram and project identification work, quick response or troubleshooting, project-related capacity building, and funds mobilization.
These services are provided by ASTAE staff and World Bank task team leaders. Their constant interaction forms the backbone of ASTAE’s operational structure. Other important elements of the structure include the Consultative Group on World Bank Energy Trust Funds, representing donor countries, and a Technical Advisory Group that evaluates ASTAE activi-ties on an annual basis and reports to the donor community represented in the Consultative Group. Task team leaders also use external specialized consultants to assist with each proj-ect’s implementation challenges.
ASTAE Functions
Financing for sustainable energy is available through many avenues, although the complexities of fund allocation and recipient designation for each financing option make finding the right channel for funding a challenge. Available funds do not always reach the regions and projects most urgently in need because of inadequate delivery mechanisms, institu-tional blockage, or a lack of awareness of feasible options. ASTAE seeks to provide practical and operational solutions to these obstacles.
Innovative Investment Delivery MechanismsASTAE helps introduce innovative financing delivery mecha-nisms. Delivery of financing was a major function of ASTAE’s work during its initial years. Financing mechanisms designed for conventional energy investments did not fit the needs of ASTAE’s intervention areas and had to be adapted. As sus-tainable energy projects became more mainstream, related markets matured and projects became more complex and
sophisticated. ASTAE still provides innovative financing deliv-ery mechanisms, but the share of this function has shrunk to about 10 percent of allocations in the current business plan. This function is carried out either by supporting design, build-up, and testing of new mechanisms from the start, or by helping to introduce existing mechanisms and tailoring them to the specific context of a new host country.
Recent examples of improved investment delivery mecha-nisms include developing onlending guidelines for commercial banks (as was done for an energy-efficiency project in China), structuring onlending funds (for example, renewable energy in Vietnam), and transferring business models between neigh-boring countries (energy efficiency from China to Vietnam). Financing delivery can also be accomplished by the introduc-tion of risk guarantees to leverage private sector financing (access in the Pacific Islands and energy efficiency in Thailand provide examples of recent ASTAE intervention).
Improved Policy and Regulatory FrameworksASTAE supports the development of institutional and regula-tory frameworks. Allocations to this function have grown steadily since initiation of the scale-up phase because frame-work development is well suited to the needs of a program-matic approach. Today, about 40 percent of ASTAE funding is primarily linked to institutional and regulatory framework de-velopment. ASTAE provides an enabling environment through improved policy, financial, and regulatory frameworks to help attract capital from international financial institutions, export credit agencies, and the private sector.
Recent work includes high-level policy dialogues and advi-sory support (renewable energy in China), pricing policy and regulation (access in Mongolia), design and implementation of standards (energy efficiency in Thailand and Vietnam), and assessment of social impacts of reform (access in the heating sector in China).
Knowledge SharingASTAE supports capacity building and knowledge sharing, which are at the core of ASTAE’s mission in the sense that knowledge sharing underpins the success and effectiveness of the other two functions. About 50 percent of ASTAE’s al-locations in the current business plan are focused on knowl-edge sharing. As a result of its positive outcomes in project and program design, implementation, and replication, ASTAE is able to draw from a pool of expertise and consolidate its knowledge base to provide just-in-time advice to other groups engaging in the same activities across the region. The knowl-edge-sharing function can be run as a standalone activity or
1. O
verv
iew
of
the
AST
AE
Pro
gram
12
as an integral part of a project when the need for capacity building or knowledge sharing goes beyond what might nor-mally be expected from operational activities.
Recent work includes training seminars for officials and policy makers (China, Indonesia, Thailand, and Vietnam); workshops to share technical knowledge between countries (China and Vietnam); knowledge products, technical guides, methodolo-gies, and atlases made available nationally and internationally; dialogue facilitation with the nongovernmental organization community; and donor coordination.
ASTAE Services
ASTAE provides depth of knowledge and flexible, just-in-time funding to successfully shape the design of new projects and programs, to help implement them, or to adapt them to rapidly evolving conditions. ASTAE’s presence in most East Asian countries has helped enable cross-fertilization among different operations to develop a strategic, programmatic ap-proach to broadening the impacts of investment projects. This cross-cutting position, in turn, has helped create enabling en-vironments in which ASTAE shares best practices to improve institutional, policy, financial, and regulatory frameworks in recipient countries. These services are often provided in conjunction with other partners, trust funds, and donors so the activity benefits from the comparative advantage of each player.
Early Program and Project Identification WorkRenewable energy is a feasible technology. However, best practices on alternative energy deployment are still being es-tablished, and ASTAE helps support the development of this global knowledge base. Large populations in the East Asia and Pacific region remain without access to electricity. This in-dicates that current business models of delivery cannot service these populations without adaptation. Households’ needs, what they can afford, and their preparedness to adapt to in-novative technologies may be unknown. ASTAE support to task team leaders and stakeholders is critical to assessing and overcoming these barriers.
Quick Response and TroubleshootingASTAE provides just-in-time response to support the urgent needs of task team leaders during project development (for example, responding to stakeholders’ specific issues and identifying market segments) and supervision (for example, troubleshooting unexpected regulatory barriers). ASTAE’s flexibility in taking on such issues on short notice has proven
indispensable to finding solutions that prevent projects from being brought to a halt.
Project-Related Capacity BuildingWhen capacity-building needs go beyond the reasonable ex-pectations of normal project preparation or implementation, ASTAE can provide assistance with training programs, work-shops, consensus-building conferences, twinning, study tours, or access to subject matter advisors.
Global Knowledge InterfaceAn early barrier to a project’s inclusion of a sustainable energy is lack of awareness that an alternative option or technology exists—or lack of understanding of how it can be implement-ed. Providing support to task team leaders or stakeholders to raise awareness is the first step in addressing this barrier. Such support is provided upstream or midstream during the proj-ect cycle when existing expertise is made available through ASTAE’s network of subject matter consultants, and down-stream when the new information generated by the project or the ASTAE activity is analyzed, monitored, and packaged to be imparted to others. ASTAE’s monitoring and evaluation of project or program impacts is becoming an increasingly im-portant task.
Funds MobilizationASTAE provides assistance to task team leaders in mobilizing additional funds by helping to clarify funding requirements for a given sustainable energy project. Careful use of a relatively small amount of ASTAE support can persuade new partners to join, leveraging initial financing levels far beyond the im-pact they would have had in the absence of the additional partners.
ASTAE Structure
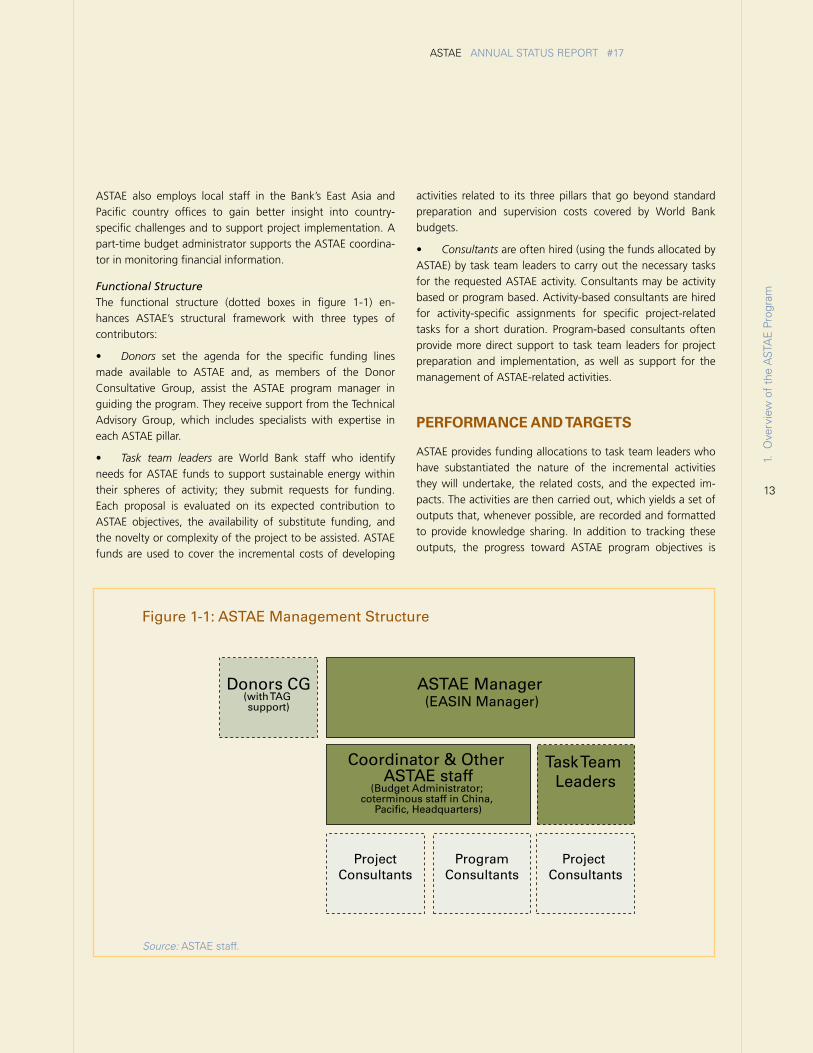
The ASTAE management structure, shown in figure 1-1, in-cludes both functional and hierarchical interactions.
Hierarchical StructureASTAE is embedded within the World Bank East Asia and Pacific Infrastructure Unit (EASIN), so the infrastructure sec-tor manager also serves as the ASTAE program manager. The ASTAE coordinator is a donor-funded World Bank staff mem-ber who provides day-to-day operational and administrative supervision for the ASTAE program, and also supports task team leaders, acts as a liaison with donors, and coordinates with local counterparts.
13
ASTAE ANNUAL STATUS REPORT #17
ASTAE also employs local staff in the Bank’s East Asia and Pacific country offices to gain better insight into country-specific challenges and to support project implementation. A part-time budget administrator supports the ASTAE coordina-tor in monitoring financial information.
Functional StructureThe functional structure (dotted boxes in figure 1-1) en-hances ASTAE’s structural framework with three types of contributors:
• Donors set the agenda for the specific funding lines made available to ASTAE and, as members of the Donor Consultative Group, assist the ASTAE program manager in guiding the program. They receive support from the Technical Advisory Group, which includes specialists with expertise in each ASTAE pillar.
• Task team leaders are World Bank staff who identify needs for ASTAE funds to support sustainable energy within their spheres of activity; they submit requests for funding. Each proposal is evaluated on its expected contribution to ASTAE objectives, the availability of substitute funding, and the novelty or complexity of the project to be assisted. ASTAE funds are used to cover the incremental costs of developing
Figure 1-1: ASTAE Management Structure
activities related to its three pillars that go beyond standard preparation and supervision costs covered by World Bank budgets.
• Consultants are often hired (using the funds allocated by ASTAE) by task team leaders to carry out the necessary tasks for the requested ASTAE activity. Consultants may be activity based or program based. Activity-based consultants are hired for activity-specific assignments for specific project-related tasks for a short duration. Program-based consultants often provide more direct support to task team leaders for project preparation and implementation, as well as support for the management of ASTAE-related activities.
PErFormANCE ANd TArGETS
ASTAE provides funding allocations to task team leaders who have substantiated the nature of the incremental activities they will undertake, the related costs, and the expected im-pacts. The activities are then carried out, which yields a set of outputs that, whenever possible, are recorded and formatted to provide knowledge sharing. In addition to tracking these outputs, the progress toward ASTAE program objectives is
Source: ASTAE staff.
Donors CG(with TAG support)
ASTAE Manager (EASIN Manager)
Task Team Leaders
Coordinator & Other ASTAE staff
(Budget Administrator; coterminous staff in China,
Pacific, Headquarters)
Project Consultants
ProgramConsultants
ProjectConsultants
1. O
verv
iew
of
the
AST
AE
Pro
gram
14
measured against a set of indicators and targets developed to reflect the objectives outlined under the three ASTAE pillars. The collective contribution of all activities to reaching ASTAE targets is measured annually.
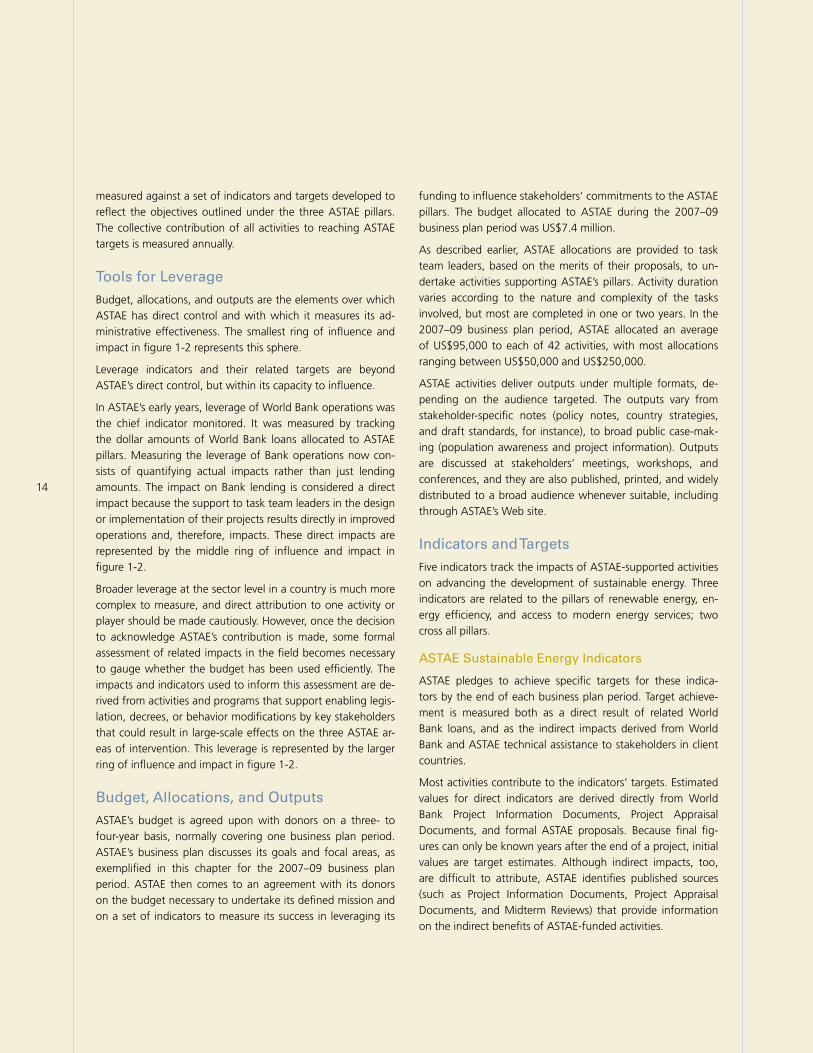
Tools for Leverage
Budget, allocations, and outputs are the elements over which ASTAE has direct control and with which it measures its ad-ministrative effectiveness. The smallest ring of influence and impact in figure 1-2 represents this sphere.
Leverage indicators and their related targets are beyond ASTAE’s direct control, but within its capacity to influence.
In ASTAE’s early years, leverage of World Bank operations was the chief indicator monitored. It was measured by tracking the dollar amounts of World Bank loans allocated to ASTAE pillars. Measuring the leverage of Bank operations now con-sists of quantifying actual impacts rather than just lending amounts. The impact on Bank lending is considered a direct impact because the support to task team leaders in the design or implementation of their projects results directly in improved operations and, therefore, impacts. These direct impacts are represented by the middle ring of influence and impact in figure 1-2.
Broader leverage at the sector level in a country is much more complex to measure, and direct attribution to one activity or player should be made cautiously. However, once the decision to acknowledge ASTAE’s contribution is made, some formal assessment of related impacts in the field becomes necessary to gauge whether the budget has been used efficiently. The impacts and indicators used to inform this assessment are de-rived from activities and programs that support enabling legis-lation, decrees, or behavior modifications by key stakeholders that could result in large-scale effects on the three ASTAE ar-eas of intervention. This leverage is represented by the larger ring of influence and impact in figure 1-2.
Budget, Allocations, and Outputs
ASTAE’s budget is agreed upon with donors on a three- to four-year basis, normally covering one business plan period. ASTAE’s business plan discusses its goals and focal areas, as exemplified in this chapter for the 2007–09 business plan period. ASTAE then comes to an agreement with its donors on the budget necessary to undertake its defined mission and on a set of indicators to measure its success in leveraging its
funding to influence stakeholders’ commitments to the ASTAE pillars. The budget allocated to ASTAE during the 2007–09 business plan period was US$7.4 million.
As described earlier, ASTAE allocations are provided to task team leaders, based on the merits of their proposals, to un-dertake activities supporting ASTAE’s pillars. Activity duration varies according to the nature and complexity of the tasks involved, but most are completed in one or two years. In the 2007–09 business plan period, ASTAE allocated an average of US$95,000 to each of 42 activities, with most allocations ranging between US$50,000 and US$250,000.
ASTAE activities deliver outputs under multiple formats, de-pending on the audience targeted. The outputs vary from stakeholder-specific notes (policy notes, country strategies, and draft standards, for instance), to broad public case-mak-ing (population awareness and project information). Outputs are discussed at stakeholders’ meetings, workshops, and conferences, and they are also published, printed, and widely distributed to a broad audience whenever suitable, including through ASTAE’s Web site.
Indicators and Targets
Five indicators track the impacts of ASTAE-supported activities on advancing the development of sustainable energy. Three indicators are related to the pillars of renewable energy, en-ergy efficiency, and access to modern energy services; two cross all pillars.
ASTAE Sustainable Energy Indicators
ASTAE pledges to achieve specific targets for these indica-tors by the end of each business plan period. Target achieve-ment is measured both as a direct result of related World Bank loans, and as the indirect impacts derived from World Bank and ASTAE technical assistance to stakeholders in client countries.
Most activities contribute to the indicators’ targets. Estimated values for direct indicators are derived directly from World Bank Project Information Documents, Project Appraisal Documents, and formal ASTAE proposals. Because final fig-ures can only be known years after the end of a project, initial values are target estimates. Although indirect impacts, too, are difficult to attribute, ASTAE identifies published sources (such as Project Information Documents, Project Appraisal Documents, and Midterm Reviews) that provide information on the indirect benefits of ASTAE-funded activities.
15
ASTAE ANNUAL STATUS REPORT #17
15
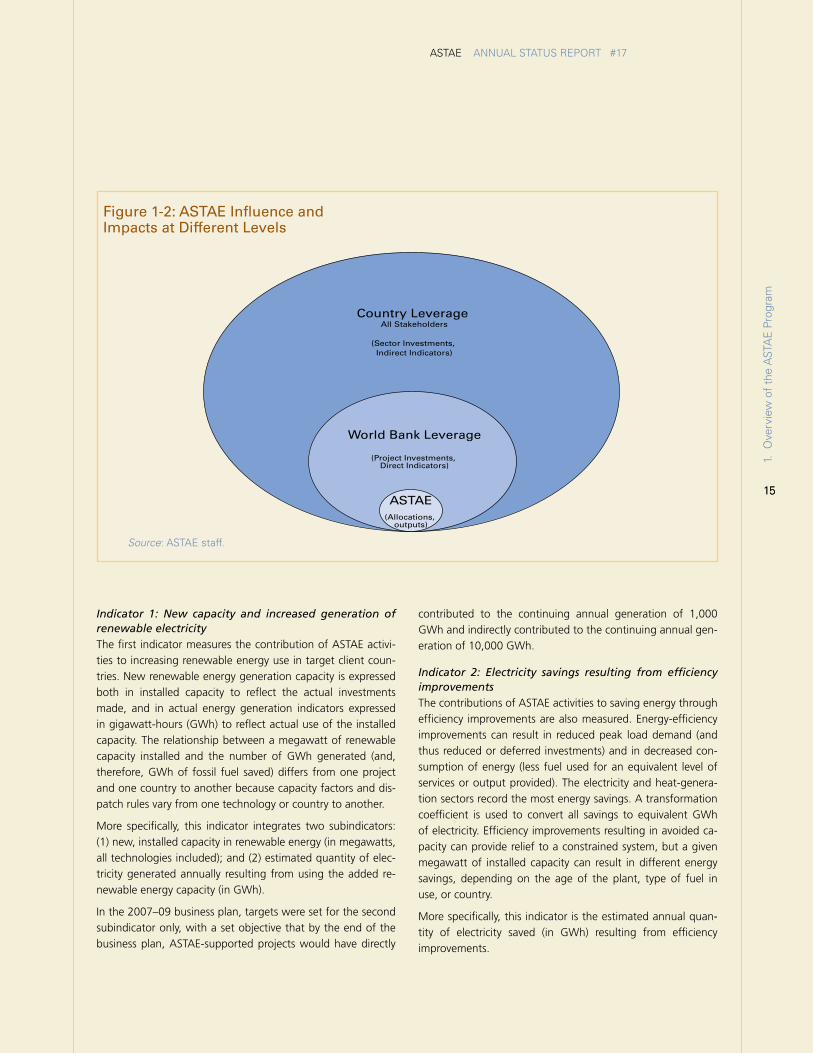
Indicator 1: New capacity and increased generation of renewable electricityThe first indicator measures the contribution of ASTAE activi-ties to increasing renewable energy use in target client coun-tries. New renewable energy generation capacity is expressed both in installed capacity to reflect the actual investments made, and in actual energy generation indicators expressed in gigawatt-hours (GWh) to reflect actual use of the installed capacity. The relationship between a megawatt of renewable capacity installed and the number of GWh generated (and, therefore, GWh of fossil fuel saved) differs from one project and one country to another because capacity factors and dis-patch rules vary from one technology or country to another.
More specifically, this indicator integrates two subindicators: (1) new, installed capacity in renewable energy (in megawatts, all technologies included); and (2) estimated quantity of elec-tricity generated annually resulting from using the added re-newable energy capacity (in GWh).
In the 2007–09 business plan, targets were set for the second subindicator only, with a set objective that by the end of the business plan, ASTAE-supported projects would have directly
Figure 1-2: ASTAE Influence and Impacts at Different Levels
contributed to the continuing annual generation of 1,000 GWh and indirectly contributed to the continuing annual gen-eration of 10,000 GWh.
Indicator 2: Electricity savings resulting from efficiency improvementsThe contributions of ASTAE activities to saving energy through efficiency improvements are also measured. Energy-efficiency improvements can result in reduced peak load demand (and thus reduced or deferred investments) and in decreased con-sumption of energy (less fuel used for an equivalent level of services or output provided). The electricity and heat-genera-tion sectors record the most energy savings. A transformation coefficient is used to convert all savings to equivalent GWh of electricity. Efficiency improvements resulting in avoided ca-pacity can provide relief to a constrained system, but a given megawatt of installed capacity can result in different energy savings, depending on the age of the plant, type of fuel in use, or country.
More specifically, this indicator is the estimated annual quan-tity of electricity saved (in GWh) resulting from efficiency improvements.
Country Leverage All Stakeholders
(Sector Investments, Indirect Indicators)
World Bank Leverage
(Project Investments, Direct Indicators)
ASTAE(Allocations,
outputs)
Source: ASTAE staff.
1. O
verv
iew
of
the
AST
AE
Pro
gram
16
In the 2007–09 business plan, targets were set so that ASTAE-supported projects would contribute to continuing annual savings of 1,000 GWh directly and 10,000 GWh indirectly.
Indicator 3: Households with access to modern energy servicesThe third indicator measures the improvement in quality of life as households transition from traditional fuels (such as charcoal, wood, and dung) or inadequate modern fuels (such as kerosene for lighting). When switching fuels is not pos-sible or desirable, the indicator measures the improvement in delivery of energy services resulting from the project, such as improved quality or reliability of an electricity connection (for example, fewer blackouts and brownouts) or improved effi-ciency of a given activity (for example, using improved stoves to decrease wood consumption).
More specifically, this indicator comprises four subindicators: (1) the number of households receiving direct new access (new access directly resulting from a Bank project that had ASTAE support); (2) the number of households receiving direct improved services; (3) the number of households receiving indirect new access; and (4) the number of households receiv-ing indirect improved services.
In the 2007–09 business plan, targets were set so that ASTAE-supported projects would contribute to (a) 500,000 households receiving direct new access; (b) 500,000 households receiving direct improved services; (c) 50,000 households receiving indi-rect new access; and (d) 250,000 households receiving indirect improved services.
Indicator 4: Avoided greenhouse gas emissionsThe indicator for avoided greenhouse gas emissions cuts across the previous three pillar-specific indicators. Use of renewable energy and implementation of energy-efficiency measures directly decrease greenhouse gas emissions. Access to modern energy services has a more complex effect. In in-creasing access, some renewable fuels (wood, for example) may be displaced by fossil fuels, thus increasing emissions, but at the same time increasing caloric efficiency or improved sustainability of resources (less deforestation, for instance). The two effects may offset one another. As a result of that uncertainty, the indicator of avoided greenhouse gas emis-sions is primarily based on the first two indicators.
More specifically, this indicator estimates the quantity of CO2 emissions, which make up the largest share of greenhouse gases avoided over 20 years (the conventional lifespan of projects or equipment) through renewable energy generation and energy savings registered under indicators 1 and 2.
In the 2007–09 business plan, targets were set so that ASTAE-supported projects would contribute to emissions avoidance of 70 million tons of CO2 directly and 780 million tons of CO2 indirectly over 20 years.
Indicator 5: Countries benefiting from ASTAE supportAn indicator for equitable support was added because the four indicators above can be met most simply by concentrat-ing ASTAE interventions in larger countries. In some countries, however, small-scale project operations are still the norm rather than broader national policy programs. While such projects may not add much quantitatively to the first four indicators, they have a large impact on the quality of life of local populations.
The requirement for this indicator in the 2007–09 business plan was that a minimum of 10 countries receive ASTAE support.
17
ASTAE ANNUAL STATUS REPORT #17
1. O
verv
iew
of
the
AST
AE
Pro
gram
1818 2
19
ASTAE ANNUAL STATUS REPORT #17
19
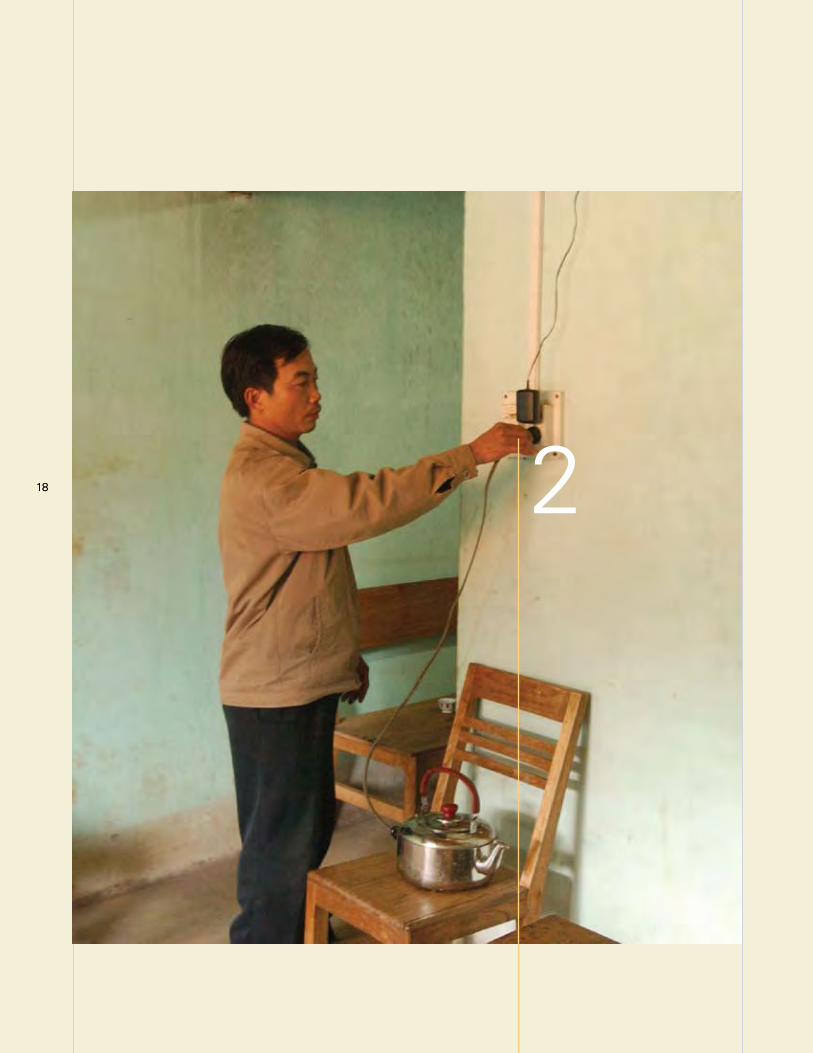
2. ASTAE-Supported Activities During Fiscal 2009:
Expenditure and Country Updates
In fiscal 2009, ASTAE activities were endowed from two trust funds—the government of the
Netherlands and the Swedish International Development Agency (SIDA).
ASTAE diSBUrSEmENTS ANd ACTiviTiES iN FiSCAL 2009
In fiscal 2009, ASTAE activities were endowed from two trust funds:
• The Government of the Netherlands Trust Fund forASTAE from the Bank-Netherlands Partnership Program (BNPP) (TF057088).
• The Swedish International Development Agency (SIDA)Trust Fund for ASTAE (TF091618).
In addition, the Australian Agency for International Development (AusAID) has established, with technical sup-port from ASTAE, a new energy trust fund supporting proj-ects in Cambodia and in Laos. The Mekong AusAID Energy Fund (TF071181) was officially created in May 2009 and is endowed with AU$27.3 million (about US$20 million at signature date). It will allow both Bank-executed and recipient-executed activities in Cambodia and Laos. It will allow funding of consultant costs, as well as investments for access to energy, energy efficiency, and renewable energy related to two major World Bank projects. The eli-gible projects are the Cambodia Rural Electrification and Transmission Project and the Lao PDR Rural Electrification Project.
Although these funds are not directly administered by ASTAE, an administrative and cost recovery budget was set up under ASTAE management to cover staff time and expenses related to the administration of the Mekong Energy Fund. ASTAE staff are actively involved in sourcing, negotiating, and structuring this endowment, which has been central in securing this key trust fund that will benefit two of the poorest countries in the region.
Overview of Disbursements and Budget Leverage
During fiscal 2009, ASTAE disbursements reached a to-tal of US$2,177,200—an increase of 18 percent over the previous year.
Overview of Disbursements
In fiscal 2009, ASTAE provided funding for 25 activities (a 25 percent increase over the prior year) in 12 countries (33 percent increase), thus showing its commitment to expansion and diversification of its activities. Half of these active projects started disbursement this year.
2 A
STA
E-S
uppo
rted
Act
iviti
es d
urin
g FY
09
20
ASTAE funds are primarily allocated to support projects, with the remainder used for administrative and reporting purposes (table 2-1), as stipulated in the agreement with the donors. ASTAE disbursed US$1,622,147 toward project implementation in fiscal 2009, or 74.5 percent of its total disbursements; this is explained in further detail in the next section. The remainder of the budget was used to cover ad-ministrative and reporting costs.
Administrative costs, including ASTAE staff costs and ad-ministrative support provided by World Bank assistants, rose 7 percent to US$391,042. This represents a modest increase compared to the growth in disbursements of up to 18 percent in fiscal 2009.
Reporting costs, which include the service by the Technical Advisory Group, annual reporting, Web site management, and dissemination of reports, rose 26 percent to US$164,091. This growth is in part a result of the reorganization of the re-porting outputs, including updating the Web site, restructur-ing the annual status report, and streamlining the production of technical reports on all activities.
ASTAE Budget Leverage
When ASTAE funds activities, the World Bank Group also contributes from its various budgetary sources to help carry out project tasks. This fund matching shows the budget lever-age that donor funding exercises in influencing World Bank projects.
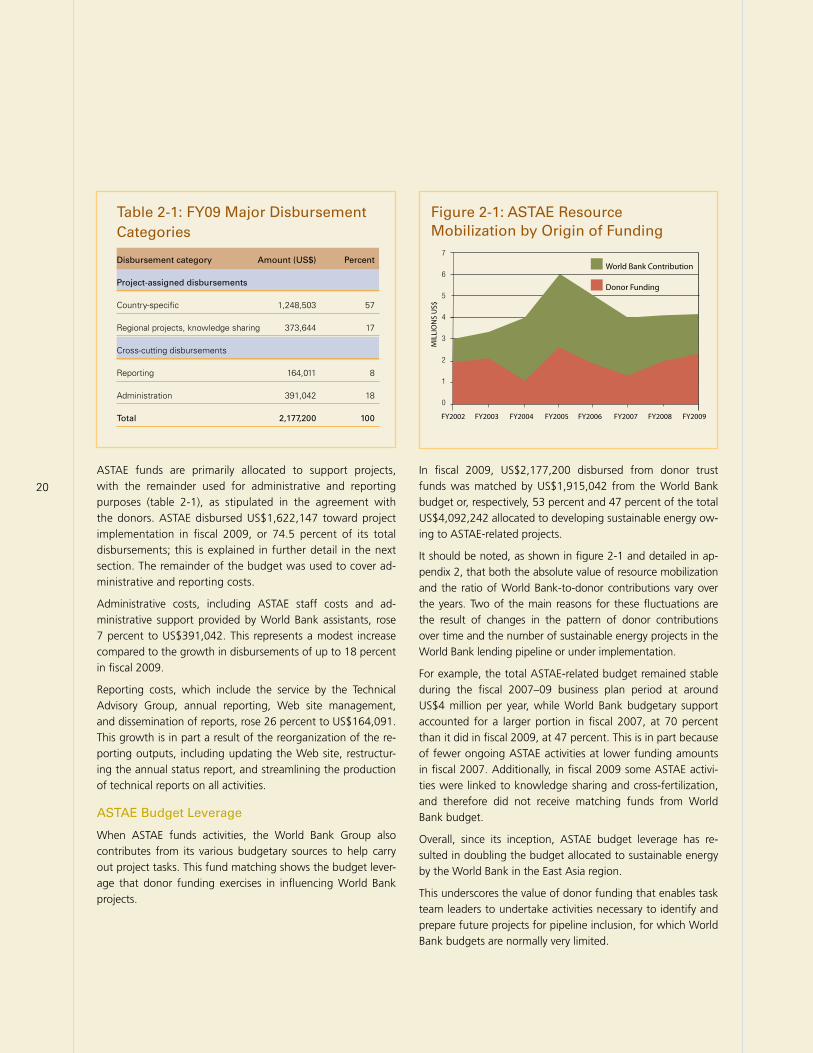
Table 2-1: FY09 Major Disbursement Categories
Disbursement category Amount (US$) Percent
Project-assigned disbursements
Country-specific 1,248,503 57
Regional projects, knowledge sharing 373,644 17
Cross-cutting disbursements
Reporting 164,011 8
Administration 391,042 18
Total 2,177,200 100
In fiscal 2009, US$2,177,200 disbursed from donor trust funds was matched by US$1,915,042 from the World Bank budget or, respectively, 53 percent and 47 percent of the total US$4,092,242 allocated to developing sustainable energy ow-ing to ASTAE-related projects.
It should be noted, as shown in figure 2-1 and detailed in ap-pendix 2, that both the absolute value of resource mobilization and the ratio of World Bank-to-donor contributions vary over the years. Two of the main reasons for these fluctuations are the result of changes in the pattern of donor contributions over time and the number of sustainable energy projects in the World Bank lending pipeline or under implementation.
For example, the total ASTAE-related budget remained stable during the fiscal 2007–09 business plan period at around US$4 million per year, while World Bank budgetary support accounted for a larger portion in fiscal 2007, at 70 percent than it did in fiscal 2009, at 47 percent. This is in part because of fewer ongoing ASTAE activities at lower funding amounts in fiscal 2007. Additionally, in fiscal 2009 some ASTAE activi-ties were linked to knowledge sharing and cross-fertilization, and therefore did not receive matching funds from World Bank budget.
Overall, since its inception, ASTAE budget leverage has re-sulted in doubling the budget allocated to sustainable energy by the World Bank in the East Asia region.
This underscores the value of donor funding that enables task team leaders to undertake activities necessary to identify and prepare future projects for pipeline inclusion, for which World Bank budgets are normally very limited.
World Bank Contribution
Donor Funding
FY2002 FY2003 FY2004 FY2005 FY2006 FY2007 FY2008 FY2009
MIL
LIO
NS
US$
7
6
5
4
3
2
1
0
Figure 2-1: ASTAE Resource Mobilization by Origin of Funding
21
ASTAE ANNUAL STATUS REPORT #17
Distribution of Disbursements
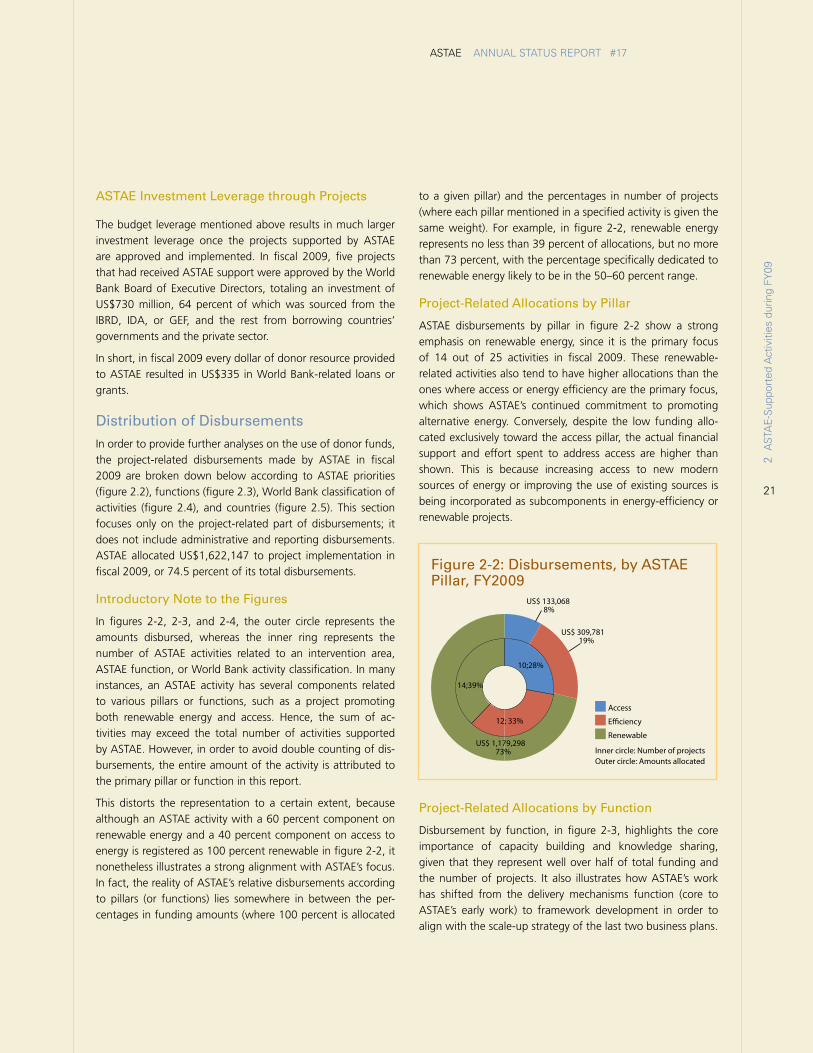
In order to provide further analyses on the use of donor funds, the project-related disbursements made by ASTAE in fiscal 2009 are broken down below according to ASTAE priorities (figure 2.2), functions (figure 2.3), World Bank classification of activities (figure 2.4), and countries (figure 2.5). This section focuses only on the project-related part of disbursements; it does not include administrative and reporting disbursements. ASTAE allocated US$1,622,147 to project implementation in fiscal 2009, or 74.5 percent of its total disbursements.
Introductory Note to the Figures
In figures 2-2, 2-3, and 2-4, the outer circle represents the amounts disbursed, whereas the inner ring represents the number of ASTAE activities related to an intervention area, ASTAE function, or World Bank activity classification. In many instances, an ASTAE activity has several components related to various pillars or functions, such as a project promoting both renewable energy and access. Hence, the sum of ac-tivities may exceed the total number of activities supported by ASTAE. However, in order to avoid double counting of dis-bursements, the entire amount of the activity is attributed to the primary pillar or function in this report.
This distorts the representation to a certain extent, because although an ASTAE activity with a 60 percent component on renewable energy and a 40 percent component on access to energy is registered as 100 percent renewable in figure 2-2, it nonetheless illustrates a strong alignment with ASTAE’s focus. In fact, the reality of ASTAE’s relative disbursements according to pillars (or functions) lies somewhere in between the per-centages in funding amounts (where 100 percent is allocated
to a given pillar) and the percentages in number of projects (where each pillar mentioned in a specified activity is given the same weight). For example, in figure 2-2, renewable energy represents no less than 39 percent of allocations, but no more than 73 percent, with the percentage specifically dedicated to renewable energy likely to be in the 50–60 percent range.
Project-Related Allocations by Pillar
ASTAE disbursements by pillar in figure 2-2 show a strong emphasis on renewable energy, since it is the primary focus of 14 out of 25 activities in fiscal 2009. These renewable-related activities also tend to have higher allocations than the ones where access or energy efficiency are the primary focus, which shows ASTAE’s continued commitment to promoting alternative energy. Conversely, despite the low funding allo-cated exclusively toward the access pillar, the actual financial support and effort spent to address access are higher than shown. This is because increasing access to new modern sources of energy or improving the use of existing sources is being incorporated as subcomponents in energy-efficiency or renewable projects.
Project-Related Allocations by Function
Disbursement by function, in figure 2-3, highlights the core importance of capacity building and knowledge sharing, given that they represent well over half of total funding and the number of projects. It also illustrates how ASTAE’s work has shifted from the delivery mechanisms function (core to ASTAE’s early work) to framework development in order to align with the scale-up strategy of the last two business plans.
Access
Efficiency
Renewable
US$ 133,068 8%
10;28%
14;39%
12; 33%
US$ 1,179,298 73%
US$ 309,781 19%
Inner circle: Number of projects Outer circle: Amounts allocated
Figure 2-2: Disbursements, by ASTAE Pillar, FY2009
2 A
STA
E-S
uppo
rted
Act
iviti
es d
urin
g FY
09
ASTAE Investment Leverage through Projects
The budget leverage mentioned above results in much larger investment leverage once the projects supported by ASTAE are approved and implemented. In fiscal 2009, five projects that had received ASTAE support were approved by the World Bank Board of Executive Directors, totaling an investment of US$730 million, 64 percent of which was sourced from the IBRD, IDA, or GEF, and the rest from borrowing countries’ governments and the private sector.
In short, in fiscal 2009 every dollar of donor resource provided to ASTAE resulted in US$335 in World Bank-related loans or grants.
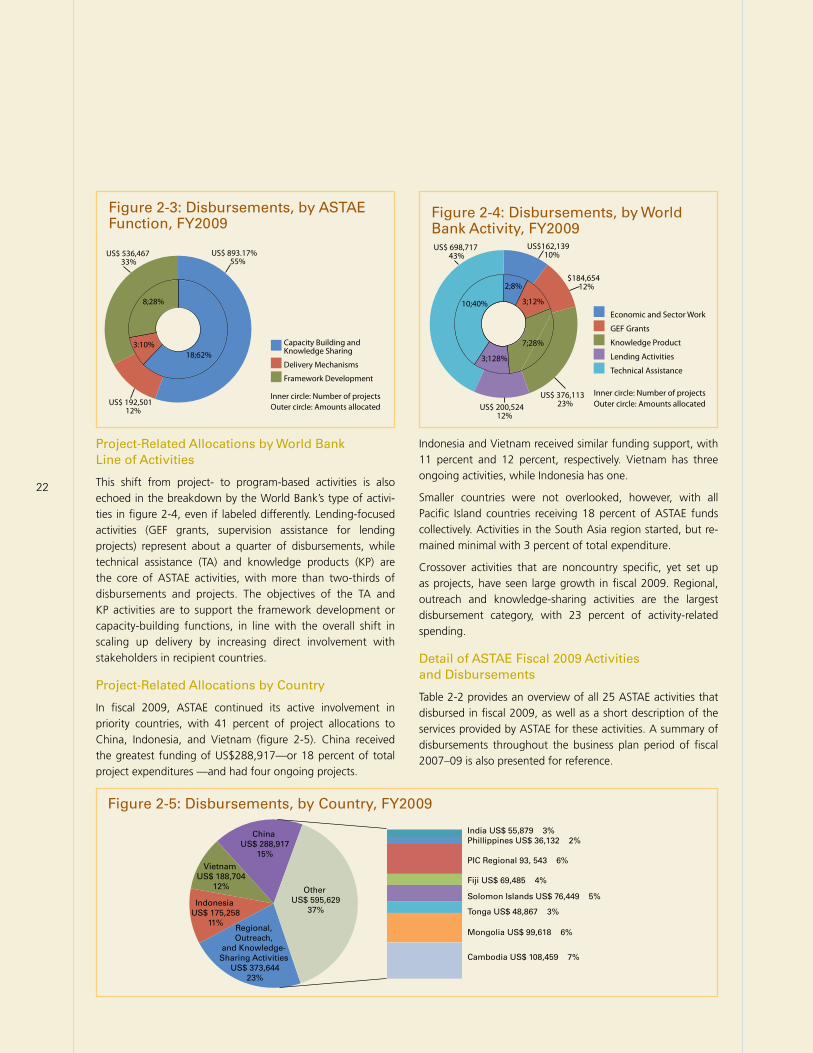
22
Economic and Sector Work
GEF Grants
Knowledge Product
Lending Activities
Technical Assistance
10;40%
3;128%
3;12%
US$ 200,524 12%
US$162,139 10%
Inner circle: Number of projects Outer circle: Amounts allocated
7;28%
US$ 698,717 43%
$184,654 12%
US$ 376,113 23%
2;8%
Figure 2-4: Disbursements, by World Bank Activity, FY2009
Project-Related Allocations by World Bank Line of Activities
This shift from project- to program-based activities is also echoed in the breakdown by the World Bank’s type of activi-ties in figure 2-4, even if labeled differently. Lending-focused activities (GEF grants, supervision assistance for lending projects) represent about a quarter of disbursements, while technical assistance (TA) and knowledge products (KP) are the core of ASTAE activities, with more than two-thirds of disbursements and projects. The objectives of the TA and KP activities are to support the framework development or capacity-building functions, in line with the overall shift in scaling up delivery by increasing direct involvement with stakeholders in recipient countries.
Project-Related Allocations by Country
In fiscal 2009, ASTAE continued its active involvement in priority countries, with 41 percent of project allocations to China, Indonesia, and Vietnam (figure 2-5). China received the greatest funding of US$288,917—or 18 percent of total project expenditures —and had four ongoing projects.
Indonesia and Vietnam received similar funding support, with 11 percent and 12 percent, respectively. Vietnam has three ongoing activities, while Indonesia has one.
Smaller countries were not overlooked, however, with all Pacific Island countries receiving 18 percent of ASTAE funds collectively. Activities in the South Asia region started, but re-mained minimal with 3 percent of total expenditure.
Crossover activities that are noncountry specific, yet set up as projects, have seen large growth in fiscal 2009. Regional, outreach and knowledge-sharing activities are the largest disbursement category, with 23 percent of activity-related spending.
Detail of ASTAE Fiscal 2009 Activities and Disbursements
Table 2-2 provides an overview of all 25 ASTAE activities that disbursed in fiscal 2009, as well as a short description of the services provided by ASTAE for these activities. A summary of disbursements throughout the business plan period of fiscal 2007–09 is also presented for reference.
Other US$ 595,629
37%
China US$ 288,917
15%
Vietnam US$ 188,704
12%
Indonesia US$ 175,258
11%Regional, Outreach,
and Knowledge- Sharing Activities
US$ 373,64423%
India US$ 55,879 3%Phillippines US$ 36,132 2%
PIC Regional 93, 543 6%
Fiji US$ 69,485 4%
Solomon Islands US$ 76,449 5% Tonga US$ 48,867 3%
Mongolia US$ 99,618 6%
Cambodia US$ 108,459 7%
Figure 2-5: Disbursements, by Country, FY2009
Capacity Building and Knowledge Sharing
Delivery Mechanisms
Framework Development
US$ 536,467 33%
18;62%
8;28%
3:10%
US$ 192,501 12%
US$ 893.17% 55%
Inner circle: Number of projects Outer circle: Amounts allocated
Figure 2-3: Disbursements, by ASTAE Function, FY2009
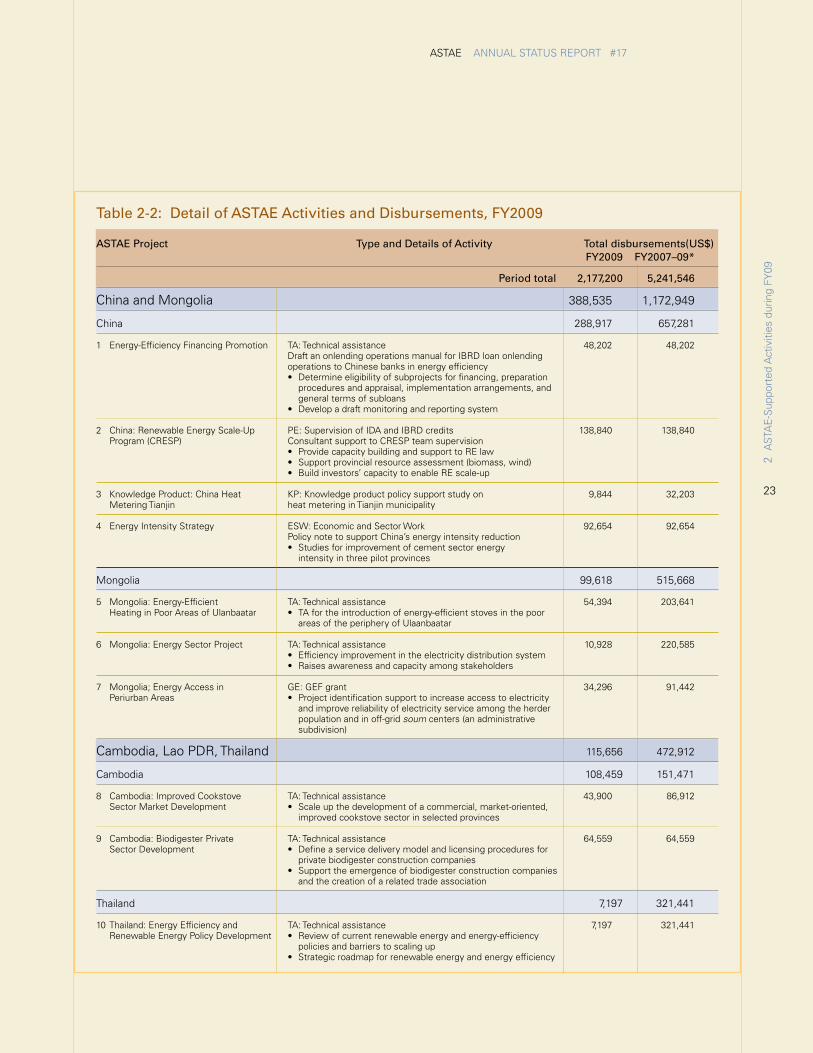
23
ASTAE ANNUAL STATUS REPORT #17
2 A
STA
E-S
uppo
rted
Act
iviti
es d
urin
g FY
09
Table 2-2: Detail of ASTAE Activities and Disbursements, FY2009
ASTAE Project Type and Details of Activity Total disbursements(US$) FY2009 FY2007–09*
Period total 2,177,200 5,241,546
China and Mongolia 388,535 1,172,949
China 288,917 657,281
1 Energy-Efficiency Financing Promotion TA: Technical assistance 48,202 48,202 Draft an onlending operations manual for IBRD loan onlending operations to Chinese banks in energy efficiency • Determineeligibilityofsubprojectsforfinancing,preparation procedures and appraisal, implementation arrangements, and general terms of subloans •Developadraftmonitoringandreportingsystem 2 China: Renewable Energy Scale-Up PE: Supervision of IDA and IBRD credits 138,840 138,840 Program (CRESP) Consultant support to CRESP team supervision •ProvidecapacitybuildingandsupporttoRElaw • Supportprovincialresourceassessment(biomass,wind) •Buildinvestors’capacitytoenableREscale-up
3 Knowledge Product: China Heat KP: Knowledge product policy support study on 9,844 32,203 Metering Tianjin heat metering in Tianjin municipality 4 Energy Intensity Strategy ESW: Economic and Sector Work 92,654 92,654 Policy note to support China’s energy intensity reduction •Studiesforimprovementofcementsectorenergy intensity in three pilot provinces
Mongolia 99,618 515,668
5 Mongolia: Energy-Efficient TA: Technical assistance 54,394 203,641 HeatinginPoorAreasofUlanbaatar •TAfortheintroductionofenergy-efficientstovesinthepoor areas of the periphery of Ulaanbaatar
6 Mongolia: Energy Sector Project TA: Technical assistance 10,928 220,585 •Efficiencyimprovementintheelectricitydistributionsystem •Raisesawarenessandcapacityamongstakeholders
7 Mongolia; Energy Access in GE: GEF grant 34,296 91,442 PeriurbanAreas • Projectidentificationsupporttoincreaseaccesstoelectricity and improve reliability of electricity service among the herder population and in off-grid soum centers (an administrative subdivision)
Cambodia, Lao PDR, Thailand 115,656 472,912
Cambodia 108,459 151,471
8 Cambodia: Improved Cookstove TA: Technical assistance 43,900 86,912 SectorMarketDevelopment •Scaleupthedevelopmentofacommercial,market-oriented, improved cookstove sector in selected provinces
9 Cambodia: Biodigester Private TA: Technical assistance 64,559 64,559 SectorDevelopment •Defineaservicedeliverymodelandlicensingproceduresfor private biodigester construction companies •Supporttheemergenceofbiodigesterconstructioncompanies and the creation of a related trade association
Thailand 7,197 321,441
10 Thailand: Energy Efficiency and TA: Technical assistance 7,197 321,441 RenewableEnergyPolicyDevelopment •Reviewofcurrentrenewableenergyandenergy-efficiency policies and barriers to scaling up •Strategicroadmapforrenewableenergyandenergyefficiency
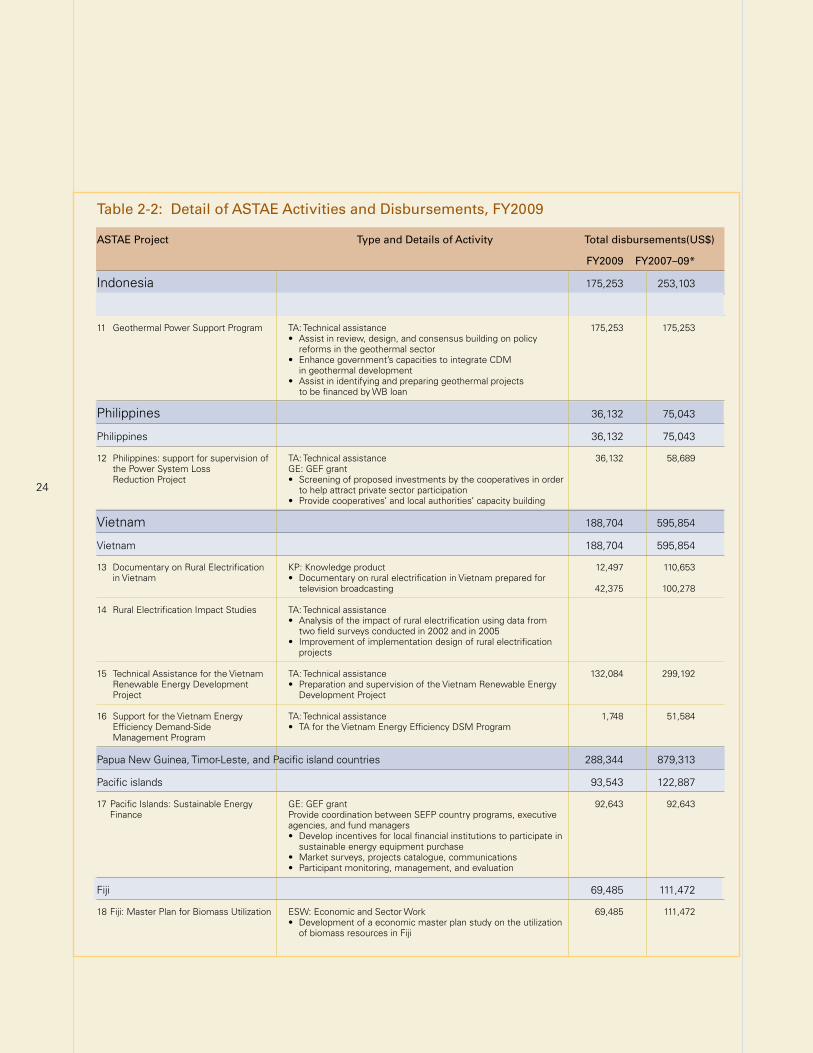
24
Table 2-2: Detail of ASTAE Activities and Disbursements, FY2009
ASTAE Project Type and Details of Activity Total disbursements(US$)
FY2009 FY2007–09*
Indonesia 175,253 253,103
Indonesia 175,253 253,103
11 Geothermal Power Support Program TA: Technical assistance 175,253 175,253 •Assistinreview,design,andconsensusbuildingonpolicy reforms in the geothermal sector •Enhancegovernment’scapacitiestointegrateCDM in geothermal development •Assistinidentifyingandpreparinggeothermalprojects to be financed by WB loan
Philippines 36,132 75,043
Philippines 36,132 75,043
12 Philippines: support for supervision of TA: Technical assistance 36,132 58,689 the Power System Loss GE: GEF grant ReductionProject •Screeningofproposedinvestmentsbythecooperativesinorder to help attract private sector participation •Providecooperatives’andlocalauthorities’capacitybuilding
Vietnam 188,704 595,854
Vietnam 188,704 595,854
13 Documentary on Rural Electrification KP: Knowledge product 12,497 110,653 inVietnam •DocumentaryonruralelectrificationinVietnampreparedfor television broadcasting 42,375 100,278
14 Rural Electrification Impact Studies TA: Technical assistance •Analysisoftheimpactofruralelectrificationusingdatafrom two field surveys conducted in 2002 and in 2005 •Improvementofimplementationdesignofruralelectrification projects
15 Technical Assistance for the Vietnam TA: Technical assistance 132,084 299,192 RenewableEnergyDevelopment •PreparationandsupervisionoftheVietnamRenewableEnergy Project Development Project
16 Support for the Vietnam Energy TA: Technical assistance 1,748 51,584 EfficiencyDemand-Side •TAfortheVietnamEnergyEfficiencyDSMProgram Management Program
Papua New Guinea, Timor-Leste, and Pacific island countries 288,344 879,313
Pacific islands 93,543 122,887
17 Pacific Islands: Sustainable Energy GE: GEF grant 92,643 92,643 Finance Provide coordination between SEFP country programs, executive agencies, and fund managers •Developincentivesforlocalfinancialinstitutionstoparticipatein sustainable energy equipment purchase •Marketsurveys,projectscatalogue,communications •Participantmonitoring,management,andevaluation
Fiji 69,485 111,472
18 Fiji: Master Plan for Biomass Utilization ESW: Economic and Sector Work 69,485 111,472 •Developmentofaeconomicmasterplanstudyontheutilization of biomass resources in Fiji
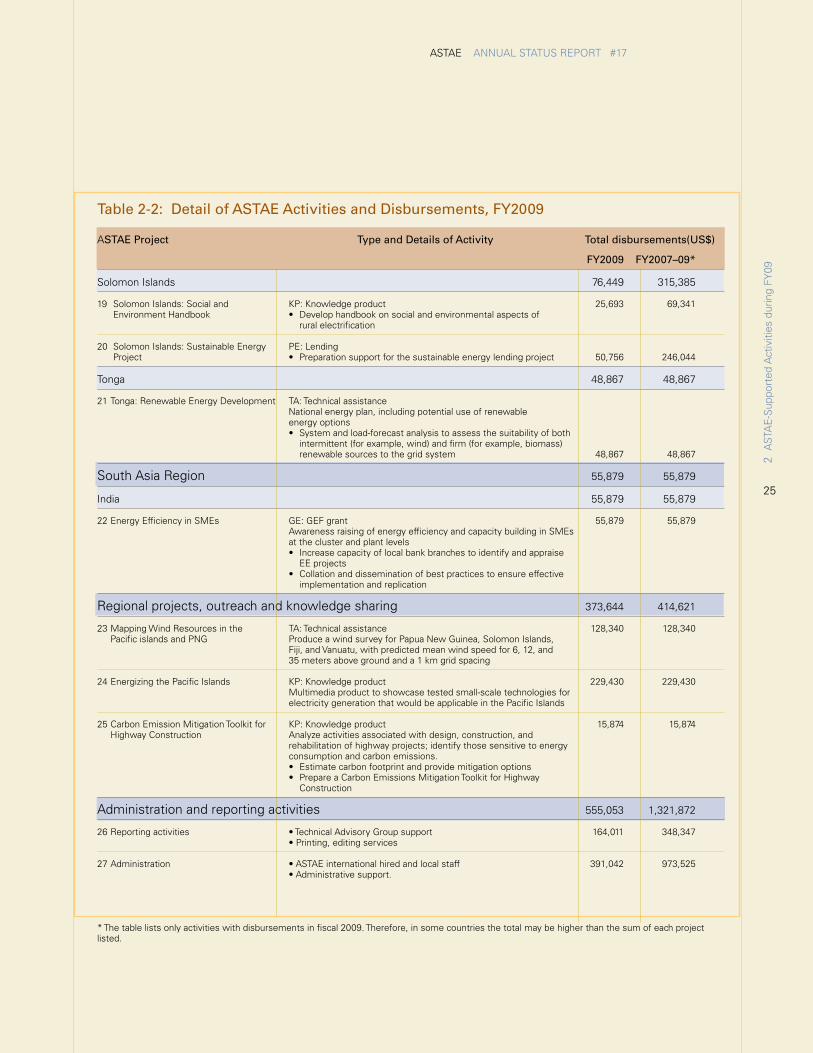
25
ASTAE ANNUAL STATUS REPORT #17
2 A
STA
E-S
uppo
rted
Act
iviti
es d
urin
g FY
09
Table 2-2: Detail of ASTAE Activities and Disbursements, FY2009
ASTAE Project Type and Details of Activity Total disbursements(US$) FY2009 FY2007–09*
Solomon Islands 76,449 315,385
19 Solomon Islands: Social and KP: Knowledge product 25,693 69,341 EnvironmentHandbook •Develophandbookonsocialandenvironmentalaspectsof rural electrification
20 Solomon Islands: Sustainable Energy PE: Lending Project •Preparationsupportforthesustainableenergylendingproject 50,756 246,044
Tonga 48,867 48,867
21 Tonga: Renewable Energy Development TA: Technical assistance National energy plan, including potential use of renewable energy options •Systemandload-forecastanalysistoassessthesuitabilityofboth intermittent (for example, wind) and firm (for example, biomass) renewable sources to the grid system 48,867 48,867
South Asia Region 55,879 55,879
India 55,879 55,879
22 Energy Efficiency in SMEs GE: GEF grant 55,879 55,879 Awareness raising of energy efficiency and capacity building in SMEs at the cluster and plant levels •Increasecapacityoflocalbankbranchestoidentifyandappraise EE projects •Collationanddisseminationofbestpracticestoensureeffective implementation and replication
Regional projects, outreach and knowledge sharing 373,644 414,621
23 Mapping Wind Resources in the TA: Technical assistance 128,340 128,340 Pacific islands and PNG Produce a wind survey for Papua New Guinea, Solomon Islands, Fiji, and Vanuatu, with predicted mean wind speed for 6, 12, and 35 meters above ground and a 1 km grid spacing
24 Energizing the Pacific Islands KP: Knowledge product 229,430 229,430 Multimedia product to showcase tested small-scale technologies for electricity generation that would be applicable in the Pacific Islands
25 Carbon Emission Mitigation Toolkit for KP: Knowledge product 15,874 15,874 Highway Construction Analyze activities associated with design, construction, and rehabilitation of highway projects; identify those sensitive to energy consumption and carbon emissions. •Estimatecarbonfootprintandprovidemitigationoptions •PrepareaCarbonEmissionsMitigationToolkitforHighway Construction
Administration and reporting activities 555,053 1,321,872
26Reportingactivities •TechnicalAdvisoryGroupsupport 164,011 348,347 •Printing,editingservices
27Administration •ASTAEinternationalhiredandlocalstaff 391,042 973,525 •Administrativesupport.
* The table lists only activities with disbursements in fiscal 2009. Therefore, in some countries the total may be higher than the sum of each project listed.
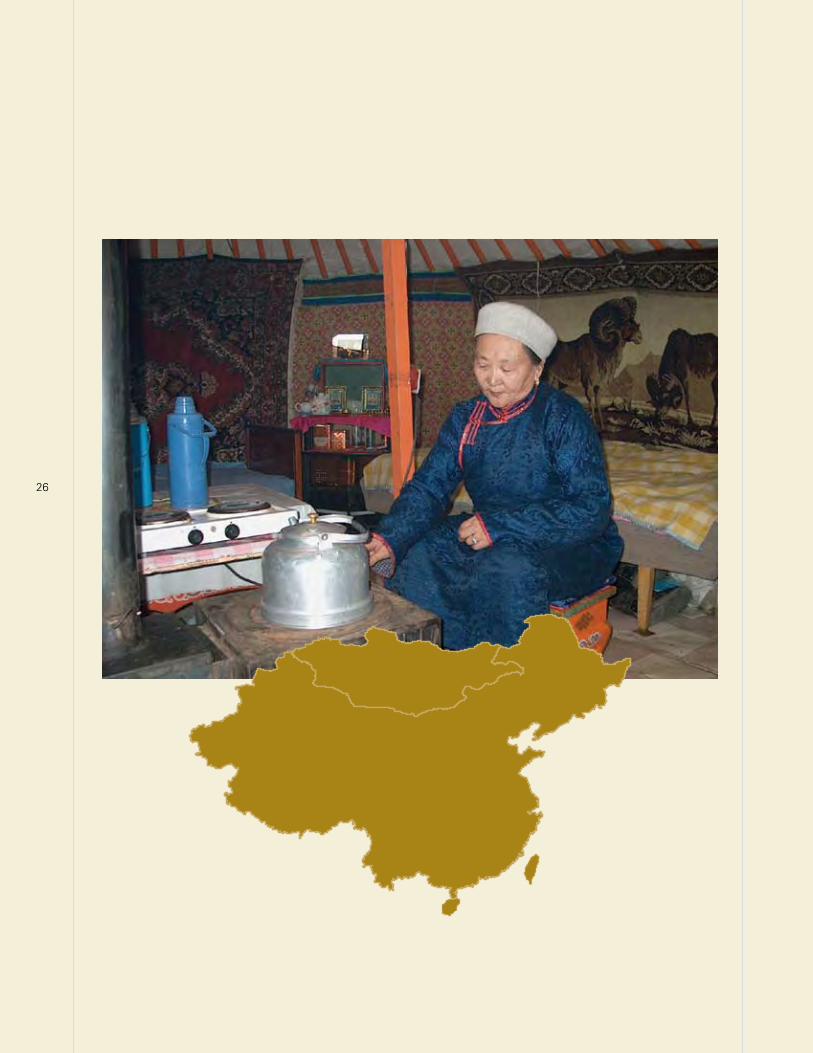
26
27
ASTAE ANNUAL STATUS REPORT #17
ASTAE-SUPPorTEd ACTiviTiES UNdEr imPLEmENTATioN By CoUNTry
The following sections are dedicated to the countries in which ASTAE-supported activities were under implementation in fiscal 2009. In addition, country-specific challenges in the energy sector and a description of the World Bank’s overall strategy to pro-vide lending or technical assistance to address these challenges are also discussed.
Given the diversity of countries in the East Asia and Pacific region, a map and an at-a-glance country-context summary in relation to each of ASTAE’s pillars are provided as a reference in appendix 1, including the following for each country:
• Basicinformation:PopulationandGDP;
• Renewableenergy:Capacity,generation,andmarketshare;
• Energyefficiency:PowerandGDPenergyintensityintermsofCO2 emissions;
• Access:Populationelectrifiedinnumberandrate;and
• Greenhousegasemissions:AnnualCO2 emissions and ranking.
ChiNA ANd moNGoLiA
CHINA: Key Challenges and Focus
China’s accelerated growth in the last three decades has driven a boom in power generation to meet ever-growing needs in energy demand. China has sustained its growth during the present financial crisis, and future growth is expected to be robust. Under current policies, energy use patterns, and economic growth, China’s energy consumption is expected to double in 20 years.
Energy consumption by 2005 had reached two-thirds of the highest government forecasts for 2020. China’s energy inten-sity, defined as energy use per adjusted GDP, started an upward trend after a period of significant decline. Energy elasticity, defined as the change in energy consumption per change in GDP growth, soared to twice that of ratios observed in the last 20 years and is now above 1.0, indicating that energy consumption is growing faster than GDP. Assuming 7.2 per-cent annual average growth and an elasticity of 1, a ratio observed historically in other countries at a similar stage of industrialization, China’s primary energy consumption could reach about 13,000 Mtce by 2030, which is 87 percent of total world energy consumption today.
Industry-led demand growth was an important driver of this observed trend, since the share of secondary industries in the economy is much larger than in OECD countries. The turn of the decade covered by China’s 10th Five-Year Plan saw huge
growth in energy-intensive industry fueled by preferential poli-cies and pulled by demand overseas.
Another driver looming on the horizon is the emergence of the middle class, with demands for more electric appliances and more comfortable housing in urban areas.
Because of a vast natural endowment, the energy that fu-els China’s economy is based on coal. Only a few countries around the world rely so heavily on coal, although it is impor-tant to note that the power sector consumes only 55 percent of total coal consumption, whereas the rest goes for feed-stock to industries.
Although China is already one of the largest energy consum-ers in the world, the headroom for greater energy consump-tion is considerable when one compares its 2005 energy per capita consumption of 1.7 tce to the OECD average of 7.3 tce.
China’s carbon footprint is large; it became the largest GHG emitter in 2008. Yet its per capita CO2 emissions are relatively low compared to high-income countries and even to other middle-income countries. Thus today, China faces multiple sustainable development issues linked to economic growth, efficiency, global and local environmental impacts, and tech-nologies that provide clean, affordable energy services.
2 A
STA
E-S
uppo
rted
Act
iviti
es d
urin
g FY
09
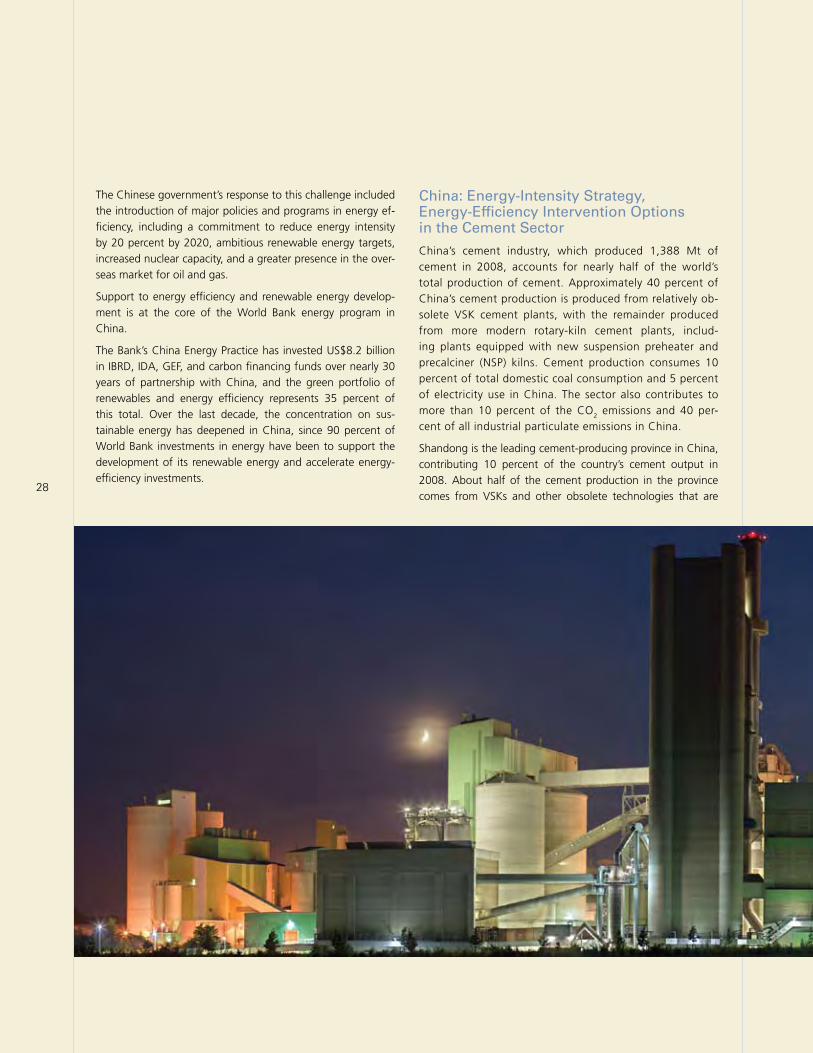
28
The Chinese government’s response to this challenge included the introduction of major policies and programs in energy ef-ficiency, including a commitment to reduce energy intensity by 20 percent by 2020, ambitious renewable energy targets, increased nuclear capacity, and a greater presence in the over-seas market for oil and gas.
Support to energy efficiency and renewable energy develop-ment is at the core of the World Bank energy program in China.
The Bank’s China Energy Practice has invested US$8.2 billion in IBRD, IDA, GEF, and carbon financing funds over nearly 30 years of partnership with China, and the green portfolio of renewables and energy efficiency represents 35 percent of this total. Over the last decade, the concentration on sus-tainable energy has deepened in China, since 90 percent of World Bank investments in energy have been to support the development of its renewable energy and accelerate energy-efficiency investments.
China: Energy-Intensity Strategy, Energy-Efficiency Intervention Options in the Cement Sector
China’s cement industry, which produced 1,388 Mt of cement in 2008, accounts for nearly half of the world’s total production of cement. Approximately 40 percent of China’s cement production is produced from relatively ob-solete VSK cement plants, with the remainder produced from more modern rotary-kiln cement plants, includ-ing plants equipped with new suspension preheater and precalciner (NSP) kilns. Cement production consumes 10 percent of total domestic coal consumption and 5 percent of electricity use in China. The sector also contributes to more than 10 percent of the CO2 emissions and 40 per-cent of all industrial particulate emissions in China.
Shandong is the leading cement-producing province in China, contributing 10 percent of the country’s cement output in 2008. About half of the cement production in the province comes from VSKs and other obsolete technologies that are
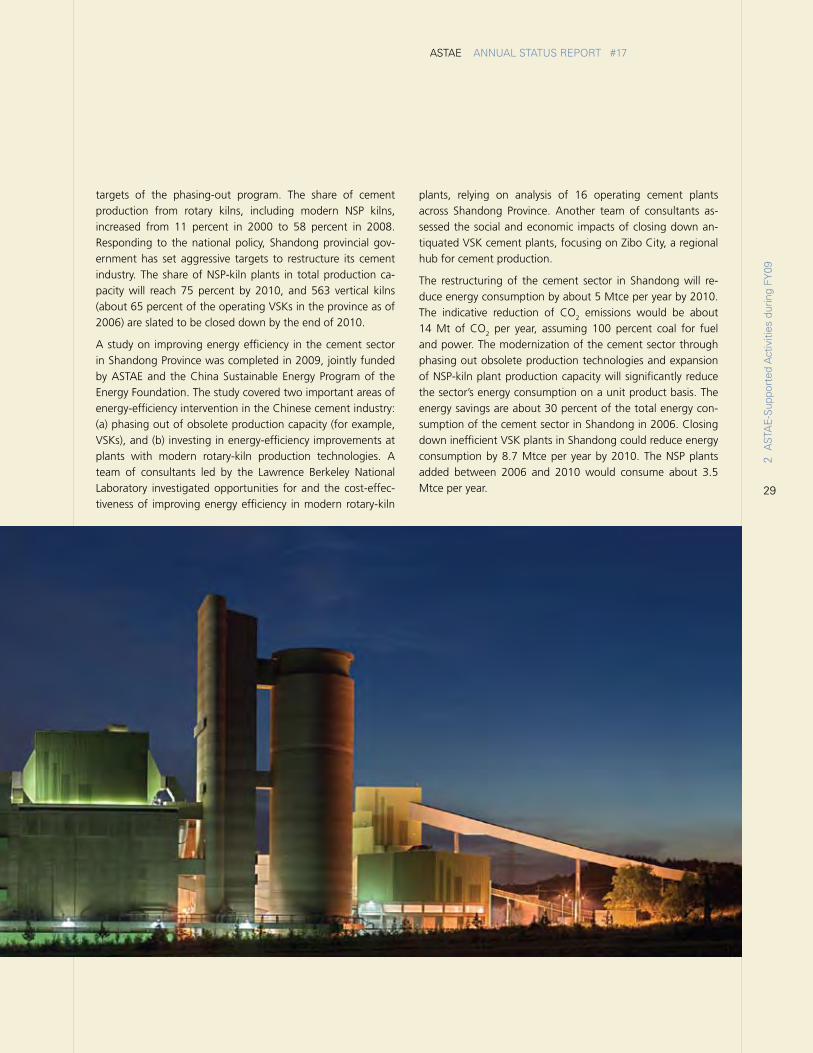
29
ASTAE ANNUAL STATUS REPORT #17
targets of the phasing-out program. The share of cement production from rotary kilns, including modern NSP kilns, increased from 11 percent in 2000 to 58 percent in 2008. Responding to the national policy, Shandong provincial gov-ernment has set aggressive targets to restructure its cement industry. The share of NSP-kiln plants in total production ca-pacity will reach 75 percent by 2010, and 563 vertical kilns (about 65 percent of the operating VSKs in the province as of 2006) are slated to be closed down by the end of 2010.
A study on improving energy efficiency in the cement sector in Shandong Province was completed in 2009, jointly funded by ASTAE and the China Sustainable Energy Program of the Energy Foundation. The study covered two important areas of energy-efficiency intervention in the Chinese cement industry: (a) phasing out of obsolete production capacity (for example, VSKs), and (b) investing in energy-efficiency improvements at plants with modern rotary-kiln production technologies. A team of consultants led by the Lawrence Berkeley National Laboratory investigated opportunities for and the cost-effec-tiveness of improving energy efficiency in modern rotary-kiln
plants, relying on analysis of 16 operating cement plants across Shandong Province. Another team of consultants as-sessed the social and economic impacts of closing down an-tiquated VSK cement plants, focusing on Zibo City, a regional hub for cement production.
The restructuring of the cement sector in Shandong will re-duce energy consumption by about 5 Mtce per year by 2010. The indicative reduction of CO2 emissions would be about 14 Mt of CO2 per year, assuming 100 percent coal for fuel and power. The modernization of the cement sector through phasing out obsolete production technologies and expansion of NSP-kiln plant production capacity will significantly reduce the sector’s energy consumption on a unit product basis. The energy savings are about 30 percent of the total energy con-sumption of the cement sector in Shandong in 2006. Closing down inefficient VSK plants in Shandong could reduce energy consumption by 8.7 Mtce per year by 2010. The NSP plants added between 2006 and 2010 would consume about 3.5 Mtce per year.
2 A
STA
E-S
uppo
rted
Act
iviti
es d
urin
g FY
09
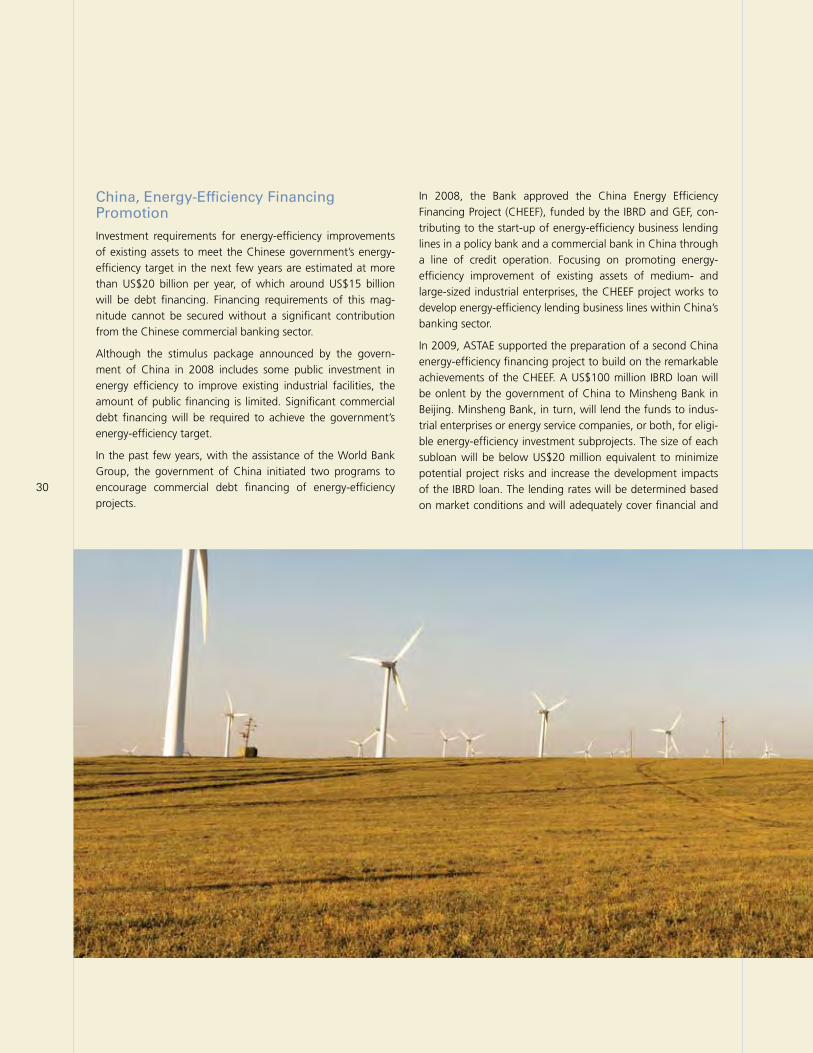
30
China, Energy-Efficiency Financing Promotion
Investment requirements for energy-efficiency improvements of existing assets to meet the Chinese government’s energy-efficiency target in the next few years are estimated at more than US$20 billion per year, of which around US$15 billion will be debt financing. Financing requirements of this mag-nitude cannot be secured without a significant contribution from the Chinese commercial banking sector.
Although the stimulus package announced by the govern-ment of China in 2008 includes some public investment in energy efficiency to improve existing industrial facilities, the amount of public financing is limited. Significant commercial debt financing will be required to achieve the government’s energy-efficiency target.
In the past few years, with the assistance of the World Bank Group, the government of China initiated two programs to encourage commercial debt financing of energy-efficiency projects.
In 2008, the Bank approved the China Energy Efficiency Financing Project (CHEEF), funded by the IBRD and GEF, con-tributing to the start-up of energy-efficiency business lending lines in a policy bank and a commercial bank in China through a line of credit operation. Focusing on promoting energy-efficiency improvement of existing assets of medium- and large-sized industrial enterprises, the CHEEF project works to develop energy-efficiency lending business lines within China’s banking sector.
In 2009, ASTAE supported the preparation of a second China energy-efficiency financing project to build on the remarkable achievements of the CHEEF. A US$100 million IBRD loan will be onlent by the government of China to Minsheng Bank in Beijing. Minsheng Bank, in turn, will lend the funds to indus-trial enterprises or energy service companies, or both, for eligi-ble energy-efficiency investment subprojects. The size of each subloan will be below US$20 million equivalent to minimize potential project risks and increase the development impacts of the IBRD loan. The lending rates will be determined based on market conditions and will adequately cover financial and
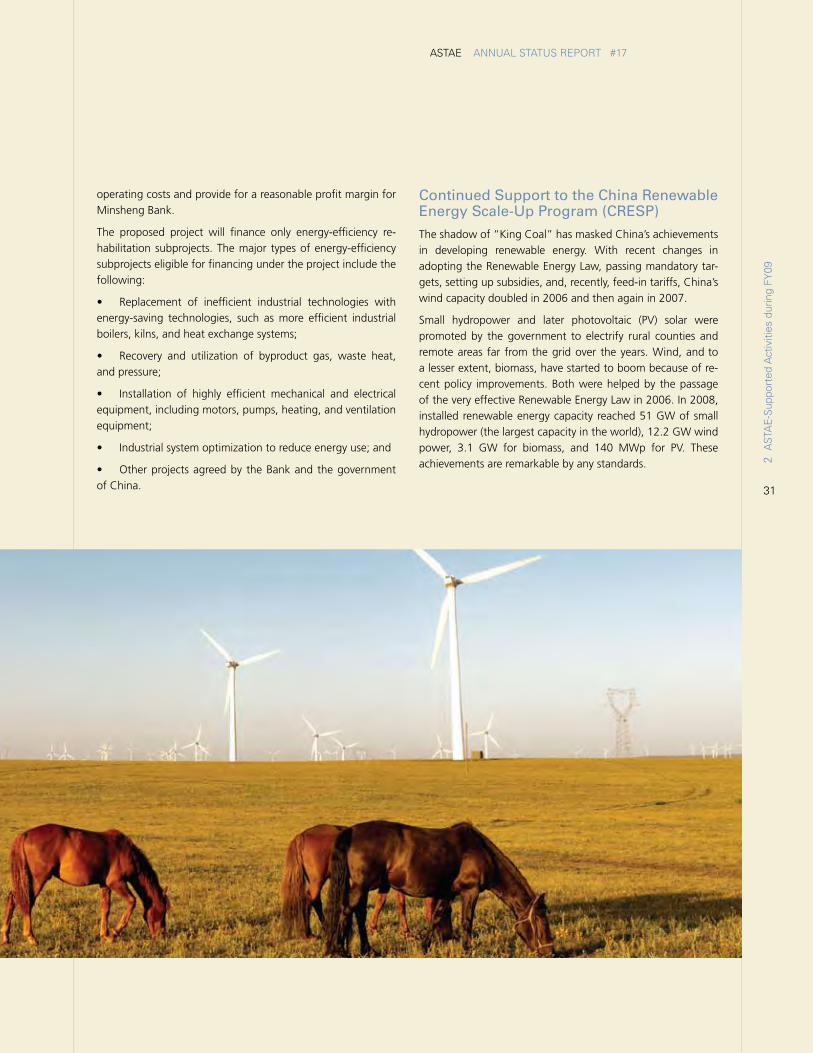
31
ASTAE ANNUAL STATUS REPORT #17
operating costs and provide for a reasonable profit margin for Minsheng Bank.
The proposed project will finance only energy-efficiency re-habilitation subprojects. The major types of energy-efficiency subprojects eligible for financing under the project include the following:
• Replacement of inefficient industrial technologies withenergy-saving technologies, such as more efficient industrial boilers, kilns, and heat exchange systems;
• Recovery and utilization of byproduct gas, waste heat,and pressure;
• Installation of highly efficient mechanical and electricalequipment, including motors, pumps, heating, and ventilation equipment;
• Industrialsystemoptimizationtoreduceenergyuse;and
• Otherprojectsagreedby theBankandthegovernmentof China.
Continued Support to the China Renewable Energy Scale-Up Program (CRESP)
The shadow of “King Coal” has masked China’s achievements in developing renewable energy. With recent changes in adopting the Renewable Energy Law, passing mandatory tar-gets, setting up subsidies, and, recently, feed-in tariffs, China’s wind capacity doubled in 2006 and then again in 2007.
Small hydropower and later photovoltaic (PV) solar were promoted by the government to electrify rural counties and remote areas far from the grid over the years. Wind, and to a lesser extent, biomass, have started to boom because of re-cent policy improvements. Both were helped by the passage of the very effective Renewable Energy Law in 2006. In 2008, installed renewable energy capacity reached 51 GW of small hydropower (the largest capacity in the world), 12.2 GW wind power, 3.1 GW for biomass, and 140 MWp for PV. These achievements are remarkable by any standards. 2
AST
AE
-Sup
port
ed A
ctiv
ities
dur
ing
FY09
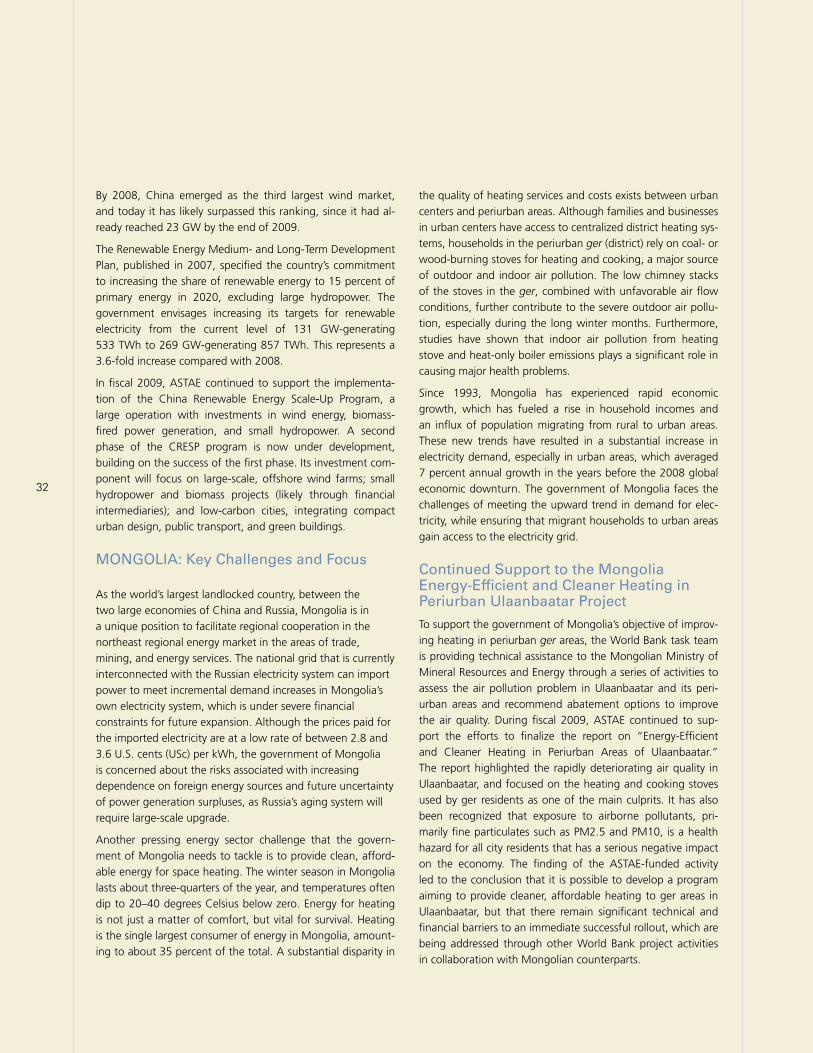
32
By 2008, China emerged as the third largest wind market, and today it has likely surpassed this ranking, since it had al-ready reached 23 GW by the end of 2009.
The Renewable Energy Medium- and Long-Term Development Plan, published in 2007, specified the country’s commitment to increasing the share of renewable energy to 15 percent of primary energy in 2020, excluding large hydropower. The government envisages increasing its targets for renewable electricity from the current level of 131 GW-generating 533 TWh to 269 GW-generating 857 TWh. This represents a 3.6-fold increase compared with 2008.
In fiscal 2009, ASTAE continued to support the implementa-tion of the China Renewable Energy Scale-Up Program, a large operation with investments in wind energy, biomass-fired power generation, and small hydropower. A second phase of the CRESP program is now under development, building on the success of the first phase. Its investment com-ponent will focus on large-scale, offshore wind farms; small hydropower and biomass projects (likely through financial intermediaries); and low-carbon cities, integrating compact urban design, public transport, and green buildings.
MONGOLIA: Key Challenges and Focus
As the world’s largest landlocked country, between the two large economies of China and Russia, Mongolia is in a unique position to facilitate regional cooperation in the northeast regional energy market in the areas of trade, mining, and energy services. The national grid that is currently interconnected with the Russian electricity system can import power to meet incremental demand increases in Mongolia’s own electricity system, which is under severe financial constraints for future expansion. Although the prices paid for the imported electricity are at a low rate of between 2.8 and 3.6 U.S. cents (USc) per kWh, the government of Mongolia is concerned about the risks associated with increasing dependence on foreign energy sources and future uncertainty of power generation surpluses, as Russia’s aging system will require large-scale upgrade.
Another pressing energy sector challenge that the govern-ment of Mongolia needs to tackle is to provide clean, afford-able energy for space heating. The winter season in Mongolia lasts about three-quarters of the year, and temperatures often dip to 20–40 degrees Celsius below zero. Energy for heating is not just a matter of comfort, but vital for survival. Heating is the single largest consumer of energy in Mongolia, amount-ing to about 35 percent of the total. A substantial disparity in
the quality of heating services and costs exists between urban centers and periurban areas. Although families and businesses in urban centers have access to centralized district heating sys-tems, households in the periurban ger (district) rely on coal- or wood-burning stoves for heating and cooking, a major source of outdoor and indoor air pollution. The low chimney stacks of the stoves in the ger, combined with unfavorable air flow conditions, further contribute to the severe outdoor air pollu-tion, especially during the long winter months. Furthermore, studies have shown that indoor air pollution from heating stove and heat-only boiler emissions plays a significant role in causing major health problems.
Since 1993, Mongolia has experienced rapid economic growth, which has fueled a rise in household incomes and an influx of population migrating from rural to urban areas. These new trends have resulted in a substantial increase in electricity demand, especially in urban areas, which averaged 7 percent annual growth in the years before the 2008 global economic downturn. The government of Mongolia faces the challenges of meeting the upward trend in demand for elec-tricity, while ensuring that migrant households to urban areas gain access to the electricity grid.
Continued Support to the Mongolia Energy-Efficient and Cleaner Heating in Periurban Ulaanbaatar Project
To support the government of Mongolia’s objective of improv-ing heating in periurban ger areas, the World Bank task team is providing technical assistance to the Mongolian Ministry of Mineral Resources and Energy through a series of activities to assess the air pollution problem in Ulaanbaatar and its peri-urban areas and recommend abatement options to improve the air quality. During fiscal 2009, ASTAE continued to sup-port the efforts to finalize the report on “Energy-Efficient and Cleaner Heating in Periurban Areas of Ulaanbaatar.” The report highlighted the rapidly deteriorating air quality in Ulaanbaatar, and focused on the heating and cooking stoves used by ger residents as one of the main culprits. It has also been recognized that exposure to airborne pollutants, pri-marily fine particulates such as PM2.5 and PM10, is a health hazard for all city residents that has a serious negative impact on the economy. The finding of the ASTAE-funded activity led to the conclusion that it is possible to develop a program aiming to provide cleaner, affordable heating to ger areas in Ulaanbaatar, but that there remain significant technical and financial barriers to an immediate successful rollout, which are being addressed through other World Bank project activities in collaboration with Mongolian counterparts.
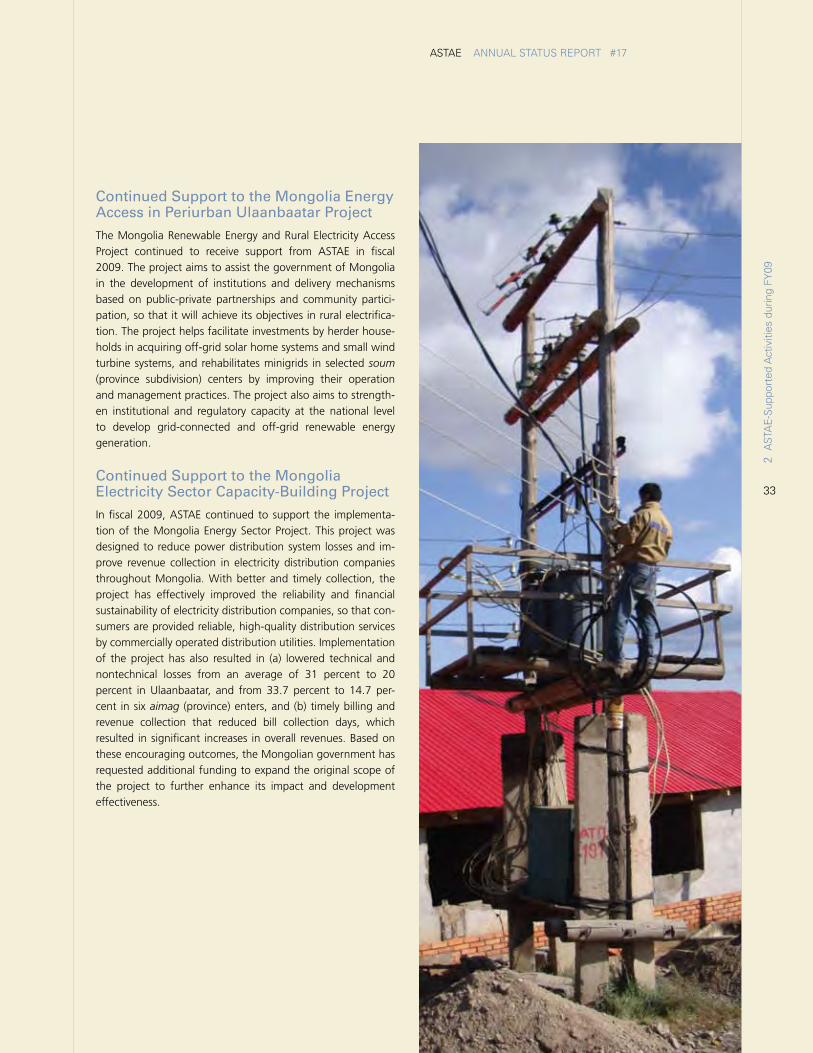
33
ASTAE ANNUAL STATUS REPORT #17
Continued Support to the Mongolia Energy Access in Periurban Ulaanbaatar Project
The Mongolia Renewable Energy and Rural Electricity Access Project continued to receive support from ASTAE in fiscal 2009. The project aims to assist the government of Mongolia in the development of institutions and delivery mechanisms based on public-private partnerships and community partici-pation, so that it will achieve its objectives in rural electrifica-tion. The project helps facilitate investments by herder house-holds in acquiring off-grid solar home systems and small wind turbine systems, and rehabilitates minigrids in selected soum (province subdivision) centers by improving their operation and management practices. The project also aims to strength-en institutional and regulatory capacity at the national level to develop grid-connected and off-grid renewable energy generation.
Continued Support to the Mongolia Electricity Sector Capacity-Building Project
In fiscal 2009, ASTAE continued to support the implementa-tion of the Mongolia Energy Sector Project. This project was designed to reduce power distribution system losses and im-prove revenue collection in electricity distribution companies throughout Mongolia. With better and timely collection, the project has effectively improved the reliability and financial sustainability of electricity distribution companies, so that con-sumers are provided reliable, high-quality distribution services by commercially operated distribution utilities. Implementation of the project has also resulted in (a) lowered technical and nontechnical losses from an average of 31 percent to 20 percent in Ulaanbaatar, and from 33.7 percent to 14.7 per-cent in six aimag (province) enters, and (b) timely billing and revenue collection that reduced bill collection days, which resulted in significant increases in overall revenues. Based on these encouraging outcomes, the Mongolian government has requested additional funding to expand the original scope of the project to further enhance its impact and development effectiveness.
2 A
STA
E-S
uppo
rted
Act
iviti
es d
urin
g FY
09
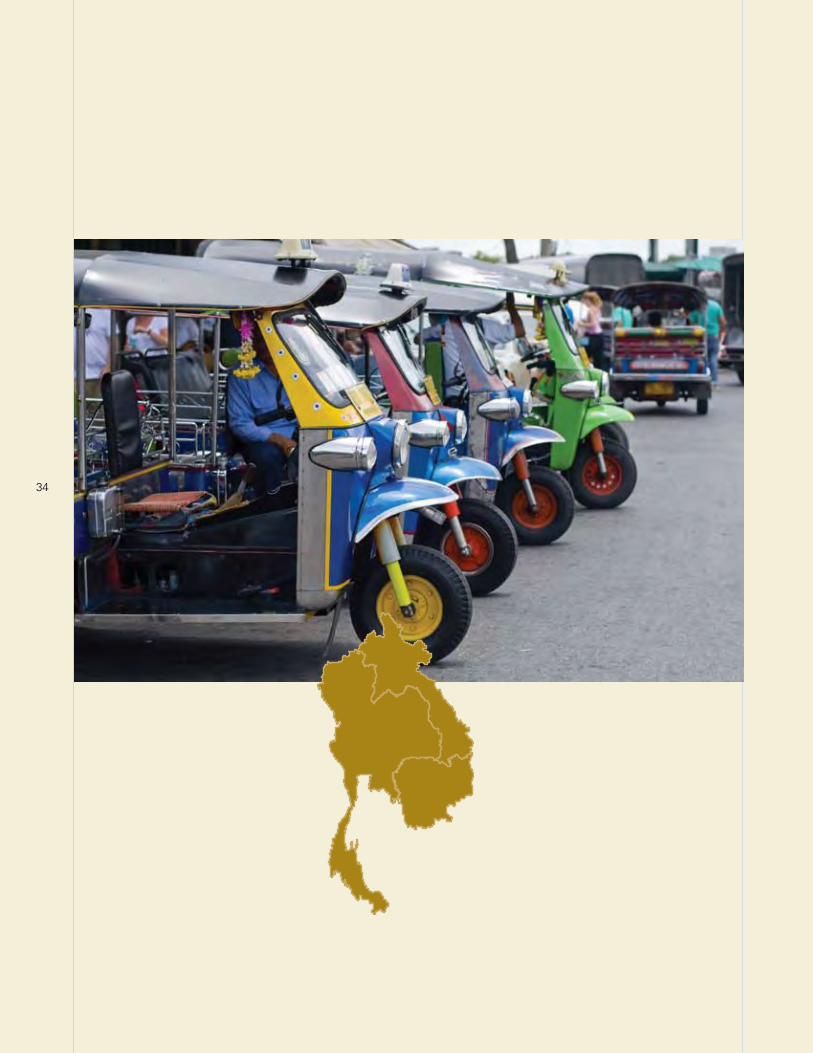
34
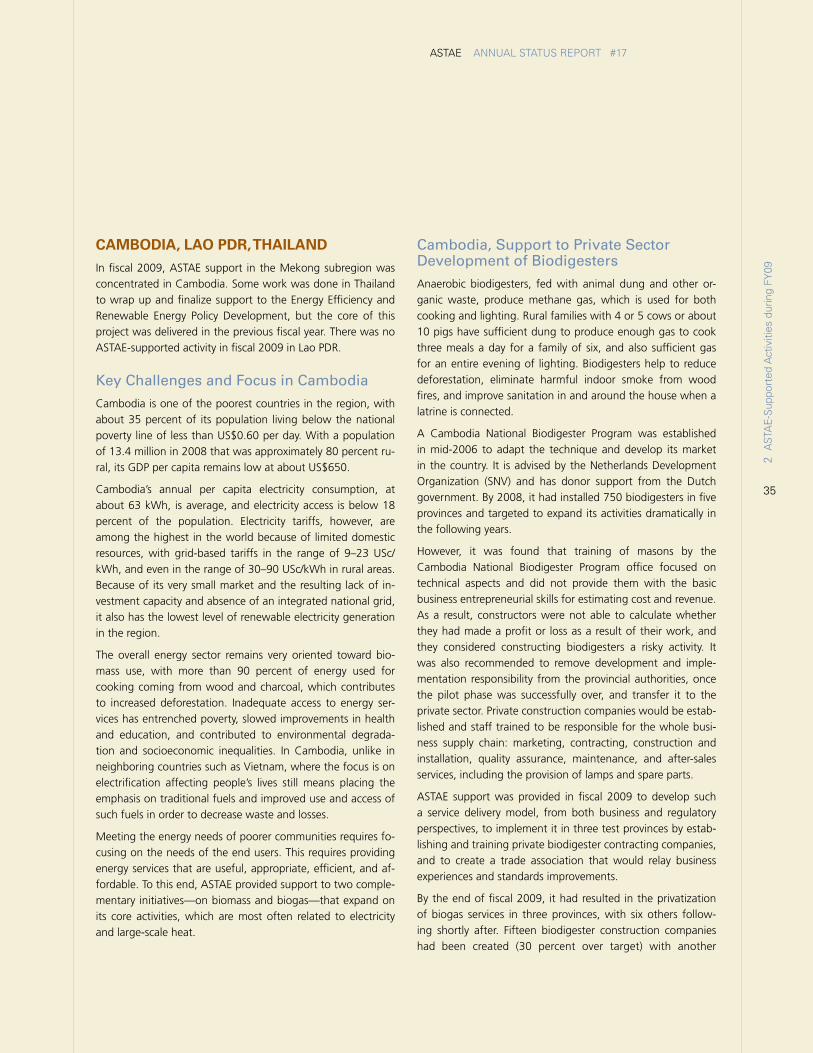
35
ASTAE ANNUAL STATUS REPORT #17
CAmBodiA, LAo Pdr, ThAiLANd
In fiscal 2009, ASTAE support in the Mekong subregion was concentrated in Cambodia. Some work was done in Thailand to wrap up and finalize support to the Energy Efficiency and Renewable Energy Policy Development, but the core of this project was delivered in the previous fiscal year. There was no ASTAE-supported activity in fiscal 2009 in Lao PDR.
Key Challenges and Focus in Cambodia
Cambodia is one of the poorest countries in the region, with about 35 percent of its population living below the national poverty line of less than US$0.60 per day. With a population of 13.4 million in 2008 that was approximately 80 percent ru-ral, its GDP per capita remains low at about US$650.
Cambodia’s annual per capita electricity consumption, at about 63 kWh, is average, and electricity access is below 18 percent of the population. Electricity tariffs, however, are among the highest in the world because of limited domestic resources, with grid-based tariffs in the range of 9–23 USc/kWh, and even in the range of 30–90 USc/kWh in rural areas. Because of its very small market and the resulting lack of in-vestment capacity and absence of an integrated national grid, it also has the lowest level of renewable electricity generation in the region.
The overall energy sector remains very oriented toward bio-mass use, with more than 90 percent of energy used for cooking coming from wood and charcoal, which contributes to increased deforestation. Inadequate access to energy ser-vices has entrenched poverty, slowed improvements in health and education, and contributed to environmental degrada-tion and socioeconomic inequalities. In Cambodia, unlike in neighboring countries such as Vietnam, where the focus is on electrification affecting people’s lives still means placing the emphasis on traditional fuels and improved use and access of such fuels in order to decrease waste and losses.
Meeting the energy needs of poorer communities requires fo-cusing on the needs of the end users. This requires providing energy services that are useful, appropriate, efficient, and af-fordable. To this end, ASTAE provided support to two comple-mentary initiatives—on biomass and biogas—that expand on its core activities, which are most often related to electricity and large-scale heat.
Cambodia, Support to Private Sector Development of Biodigesters
Anaerobic biodigesters, fed with animal dung and other or-ganic waste, produce methane gas, which is used for both cooking and lighting. Rural families with 4 or 5 cows or about 10 pigs have sufficient dung to produce enough gas to cook three meals a day for a family of six, and also sufficient gas for an entire evening of lighting. Biodigesters help to reduce deforestation, eliminate harmful indoor smoke from wood fires, and improve sanitation in and around the house when a latrine is connected.
A Cambodia National Biodigester Program was established in mid-2006 to adapt the technique and develop its market in the country. It is advised by the Netherlands Development Organization (SNV) and has donor support from the Dutch government. By 2008, it had installed 750 biodigesters in five provinces and targeted to expand its activities dramatically in the following years.
However, it was found that training of masons by the Cambodia National Biodigester Program office focused on technical aspects and did not provide them with the basic business entrepreneurial skills for estimating cost and revenue. As a result, constructors were not able to calculate whether they had made a profit or loss as a result of their work, and they considered constructing biodigesters a risky activity. It was also recommended to remove development and imple-mentation responsibility from the provincial authorities, once the pilot phase was successfully over, and transfer it to the private sector. Private construction companies would be estab-lished and staff trained to be responsible for the whole busi-ness supply chain: marketing, contracting, construction and installation, quality assurance, maintenance, and after-sales services, including the provision of lamps and spare parts.
ASTAE support was provided in fiscal 2009 to develop such a service delivery model, from both business and regulatory perspectives, to implement it in three test provinces by estab-lishing and training private biodigester contracting companies, and to create a trade association that would relay business experiences and standards improvements.
By the end of fiscal 2009, it had resulted in the privatization of biogas services in three provinces, with six others follow-ing shortly after. Fifteen biodigester construction companies had been created (30 percent over target) with another
2 A
STA
E-S
uppo
rted
Act
iviti
es d
urin
g FY
09
36
five following. All used the business model developed by the project, which included replicable franchises, opera-tion manuals, mason training, and business mentoring. This resulted in a sixfold increase in the number of biodigesters installed—to 5,600 by the end of fiscal 2009—and the deci-sion to target the installation of 21,800 biodigesters in 12 provinces by 2012. Each biodigester avoids burning about 2 tons of wood and kerosene annually and is estimated to reduce CO2 emissions by 4–6 tons, or about the equivalent of removing a U.S. car’s typical annual emissions (5.5 tons per year according to the U.S. Environmental Protection Agency).
Given the success of this project, ASTAE decided to fund a second phase in fiscal 2010 aimed at expanding the program and ensuring that construction companies be sustainable while ensuring healthy competition in the sector.
Continued Support to the Cambodia Improved Cookstoves Development Project
Efficient cookstoves have been successfully introduced for about 40 percent of the urban population. However, in rural areas most households are still using the traditional “three-stone stove,” even though new, energy-efficient stoves can save up to 60 percent on fuel. Although more energy-efficient stoves cost only one or two dollars more than traditional ones, the poorest households still cannot afford them without a subsidy or installment payment scheme.
In fiscal 2008, ESMAP supported work to scale up the development of a commercial, market-oriented, improved cookstove sector in selected provinces of Cambodia. It provided support to test the mass dissemination of the Neang Kongrey Stove, a simple ceramic cookstove that sells for about US$1.25 and lasts for one–two years. This stove provides better combustion with less heat loss, more complete burning of the wood, and less smoke than the traditional stoves. The significant savings on charcoal and wood provide a payback time of one to three months, and each stove saves about 0.3–0.5 tons of CO2 annually.
The preliminary lesson from the pilot dissemination of 8,000 improved stoves showed that, while these have a large po-tential for broad-scale dissemination, the supply of stoves by producers was not consistent. The stove was produced using traditional techniques by households that fit in production with other activities and could not provide the quantities nec-essary on the schedule required for the project.
Therefore, in fiscal 2009, ASTAE funding was provided to create a model production facility using improved technolo-gies and management practices that could be replicated by small and medium enterprises (SMEs) to produce the Neang Kongrey Stove for broad-scale dissemination. To this end, the Groupe Energies Renouvelables, Environnement et Solidarités (GERES-Cambodia) developed, tested, and intro-duced production technologies and techniques to increase the rate of stove production, such as mechanized clay mix-ing, hydraulic presses, improved molding techniques, and modern kiln firing. It later developed this research into standards for production in cooperation with the Ministry of Industry Mines and Energy. A model production facility was created incorporating the technological improvements, with its workers trained in production techniques, monitoring of standards, and basic management skills, including staff allo-cation, bookkeeping, purchasing, stock control, assessment of the market, and promotion through product branding.
As a result, the model production facility, with 30 potters, could produce about 2,000 stoves a month, a dramatic in-crease from the earlier artisanal outputs. The planned scaling-up phase aims at converting traditional stove makers into improved cookstove producers, as well as opening up new production facilities nationwide using the model production facility business model. Existing distribution channels will also be strengthened and new ones created. By funding the tech-nical research and business model development necessary for this dramatic increase in production, the ASTAE-funded work helped the ESMAP-funded target of replacing 1 million inef-ficient stoves.
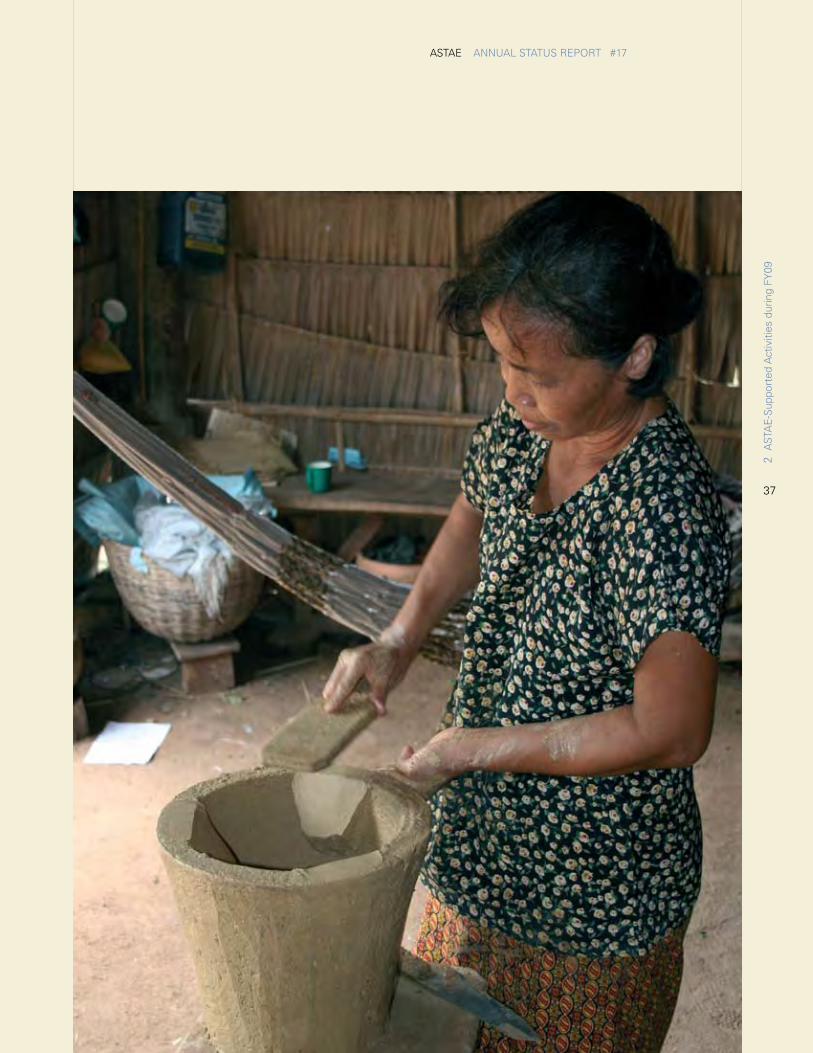
37
ASTAE ANNUAL STATUS REPORT #17
2 A
STA
E-S
uppo
rted
Act
iviti
es d
urin
g FY
09
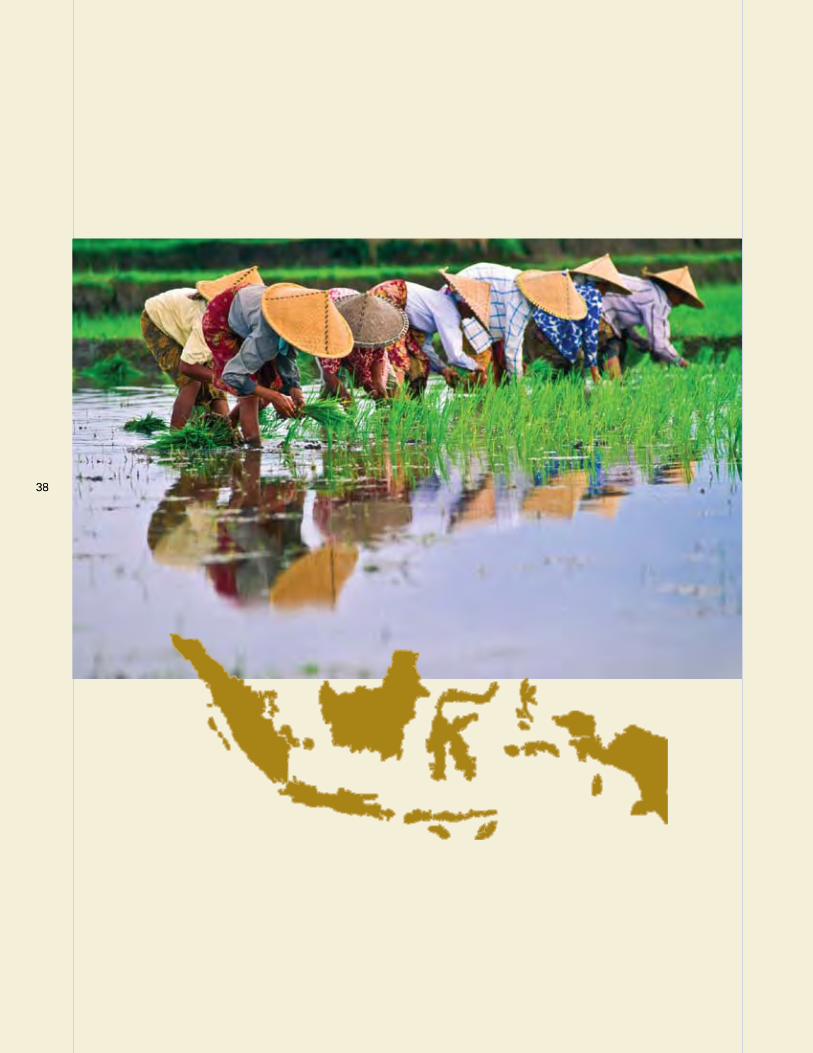
3838
39
ASTAE ANNUAL STATUS REPORT #17
iNdoNESiA
Key Challenges and Focus
Indonesia’s economy has been growing at the rapid pace of 6 percent annually in recent years. With insufficient invest-ment in new power generation capacity, national power demand has begun to outstrip supply. The government of Indonesia responded to this urgent need by devising and implementing a “crash program” to construct 10,000 MW of coal-based generation capacity by 2011, considered to be an immediately available option for expanding generation capac-ity at low investment cost.
Indonesia has the world’s largest geothermal potential, enough to fuel about 27,000 MW of generation capacity. Geothermal power is a clean and efficient alternative that can diversify Indonesia’s electricity generation mix. This largely un-tapped resource can be a good substitute for other base-load generation technologies such as coal, and it is not subject to the intermittency and variability of other renewable energy sources. As an indigenous and nontradable energy source, it can also enhance the country’s energy security and serve as a natural hedge against the volatility of fossil-based commod-ity prices. Currently, geothermal energy makes up only 3.2 percent of Indonesia’s generation capacity, which is just over 1,000 MW, despite the government’s major effort to scale up geothermal development in the 1990s and the issuance of the Geothermal Law in 2003.
Therefore, a second 10,000 MW “crash program” was pro-posed to focus on expanding Indonesia’s national renewable energy portfolio, thus diversifying the energy mix. To facilitate the ambitious goal in geothermal development, the govern-ment has designated geothermal power to make up to nearly 40 percent of the second crash program. This midterm goal to scale up geothermal capacity echoes the 2004 “Blueprint for Geothermal Development in Indonesia,” developed by the Ministry of Energy and Mineral Resources (MEMR) and intended as a long-term roadmap to progressively develop a total of 6,000 MW of geothermal power capacity by 2020. To enhance the regulatory support and oversight required for this major undertaking, MEMR also established a dedicated directorate for geothermal development to take the lead in coordinating various stakeholders to implement the Blueprint.
Despite these ambitious geothermal objectives and recent reform initiatives, Indonesia’s present geothermal capacity of approximately 1,000 MW remains far short of the interim target in the Blueprint. Only a handful of existing geothermal fields in Indonesia have been expanded over the past decade, with no new development in unexplored geothermal fields that are regarded to have greater risks. Major barriers that hinder Indonesia from fully realizing its geothermal potential include the following:
• Needforlarge-scaleinvestmenttoachievetheBlueprinttarget;
• Insufficient policies and regulations to support imple-mentation of the Geothermal Law;
• Inadequate incentivesandpricingmechanism to reflectgeothermal’s environmental benefits and to account for the upfront risks associated with developing unexplored geother-mal fields;
• Limited institutionalcapability toproperlyplangeother-mal development and sufficiently engage suitable developers; and
• Weakdomesticcapacityinresourceexplorationandop-eration and maintenance of geothermal energy facilities.
Indonesia, Geothermal Power Support Program
To support Indonesia’s commitment to a “greener” energy generation mix and its Low Carbon Growth Strategy (cur-rently under development), the World Bank has responded by developing a strategy based on a two-pronged approach. On the policy side, the Bank is assisting the government in under-taking major reforms that will progressively enhance the in-vestment climate in the geothermal sector. At the same time, on the financing side, the Bank is helping to stimulate invest-ments immediately by directly supporting geothermal devel-opers that are at an advanced stage of project preparation.
In fiscal 2009, ASTAE continued to support the GEF-funded policy reform project activities by providing much needed
2 A
STA
E-S
uppo
rted
Act
iviti
es d
urin
g FY
09
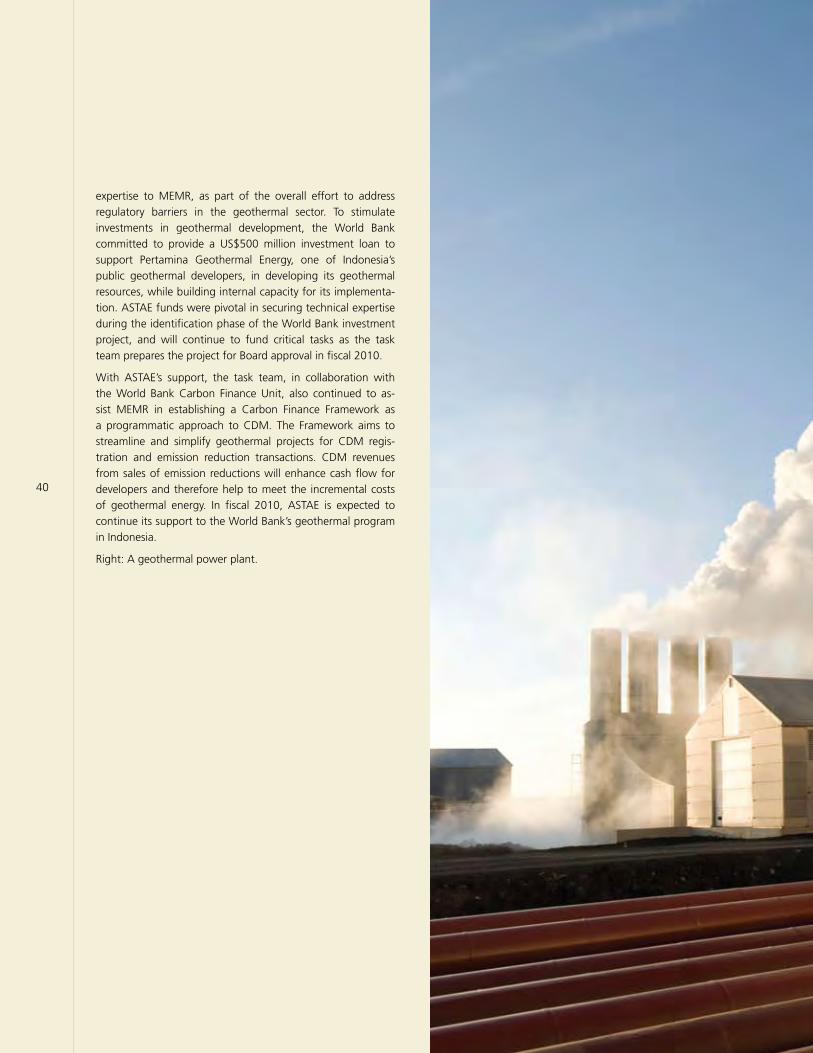
40
expertise to MEMR, as part of the overall effort to address regulatory barriers in the geothermal sector. To stimulate investments in geothermal development, the World Bank committed to provide a US$500 million investment loan to support Pertamina Geothermal Energy, one of Indonesia’s public geothermal developers, in developing its geothermal resources, while building internal capacity for its implementa-tion. ASTAE funds were pivotal in securing technical expertise during the identification phase of the World Bank investment project, and will continue to fund critical tasks as the task team prepares the project for Board approval in fiscal 2010.
With ASTAE’s support, the task team, in collaboration with the World Bank Carbon Finance Unit, also continued to as-sist MEMR in establishing a Carbon Finance Framework as a programmatic approach to CDM. The Framework aims to streamline and simplify geothermal projects for CDM regis-tration and emission reduction transactions. CDM revenues from sales of emission reductions will enhance cash flow for developers and therefore help to meet the incremental costs of geothermal energy. In fiscal 2010, ASTAE is expected to continue its support to the World Bank’s geothermal program in Indonesia.
Right: A geothermal power plant.
41
ASTAE ANNUAL STATUS REPORT #17
2 A
STA
E-S
uppo
rted
Act
iviti
es d
urin
g FY
09
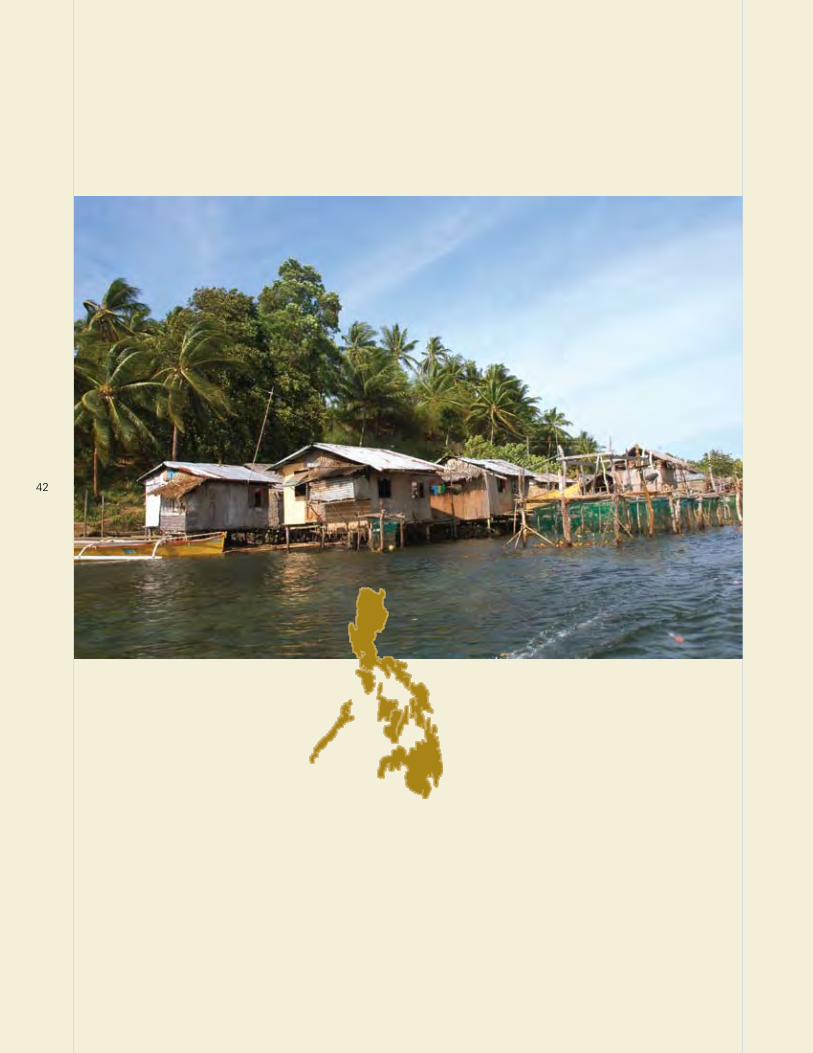
42
43
ASTAE ANNUAL STATUS REPORT #17
ThE PhiLiPPiNES
The Philippines is the world’s second largest archipelago, with a diverse population of 90 million. It is reasonably well endowed with natural resources. It has limited commercial reserves of fossil fuel, mainly natural gas and coal, but com-mercial-scale geothermal energy and hydropower resources are being harnessed to contribute to meeting the country’s power needs. Because of the projected increase in electricity demand, greenhouse gas emissions from the power sector are nonetheless expected to increase dramatically, doubling over the next 10 years under a business-as-usual scenario.
Key Challenges and Focus
The launch of the national Accelerated Barangay Electrification Program (ABEP) in 1999 has helped substantially increase the number of connections to the power grid in rural areas, raising the ratio of electrified barangays (administrative divi-sions equivalent to a district) from 77 percent to 96 percent in 2008. Progress made in rural electrification now represents the majority of new connections in the country, and most of the barangays benefiting from this effort are served by 119 electricity cooperatives (ECs). Still, while access numbers are increasing, per capita electricity consumption is also on the rise, thus putting further strain on an already weak distribu-tion network in rural areas.
Rural power, especially in remote island areas, is characterized as having a high dependence on imported diesel or bunker fuel for generation, resulting in higher carbon intensity than the rest of the energy sector. The financial and operational capacity of the ECs also varies widely. More than half of the 119 existing ECs had insufficient revenues to cover their op-erating and debt service costs, and another 27 percent were not even able to cover their basic operating costs. This lower collection efficiency is compounded by heavy system losses, with 55 percent of the cooperatives reporting system losses above 14 percent.
This significant risk discourages private investors from enter-ing the market and financing both new generation and distri-bution projects.
Continued Support to the Philippines Power System Loss Reduction Project
The World Bank’s Electric Cooperative System Loss Reduction Project was started in fiscal 2005 with a US$12 million grant
from the GEF to test business models that would allow the achievement of operating efficiency improvements in ECs, with the expected outcome being a more reliable and least-cost power supply over the long term. Toward this end, the project established a Partial Credit Guarantee Program to extend commercial loans aimed at developing financial and contractual mechanisms to support private sector involvement in investment, management and operation of the ECs.
The project aimed at piloting the use of investment manage-ment contracts, among others, to attract private investors to manage and operate selected ECs under long-term, perfor-mance-based contracts, and to mobilize private finance with-out having recourse to the government. For those ECs that were still unable to attract private investors, access to afford-able term loans would be facilitated under the Partial Credit Guarantee Program. ASTAE funding, approved in fiscal 2006, was intended to offer access to international expertise and lessons learned, as well as practical knowledge to support the various subproject proposals under the GEF project.
However, for a number of reasons, the Electric Cooperative System Loss Reduction Project did not advance as originally planned. Consequently, while some ASTAE-funded work was done in fiscal 2007, the task team soon halted activities that were to be funded by ASTAE because of a lack of progress in the GEF project.
In fiscal 2009, ASTAE provided support to the mission by un-dertaking the project midterm review, which looked for ways to restructure the project in order to avoid cancellation. As a result, a new road map, involving all key stakeholders, was agreed on.
ASTAE support was critical in restructuring the project and clarifying the way forward, which calls for an increased in-volvement of the National Electrification Agency in project implementation. It will be directly involved in providing advi-sory service to initiating loan applications for creditworthy ECs to enable them to access to commercial financing, while refo-cusing preferential funding to the weakest ECs. Tariff systems will be benchmarked and provide management incentives to investors in order to reduce technical losses to less than14 percent. This would limit the continued weakening of the ECs’ financial standing. Specific results are expected in 2010 and, based on those results, a scale-up program will be dis-cussed and determined with relevant agencies.
2 A
STA
E-S
uppo
rted
Act
iviti
es d
urin
g FY
09
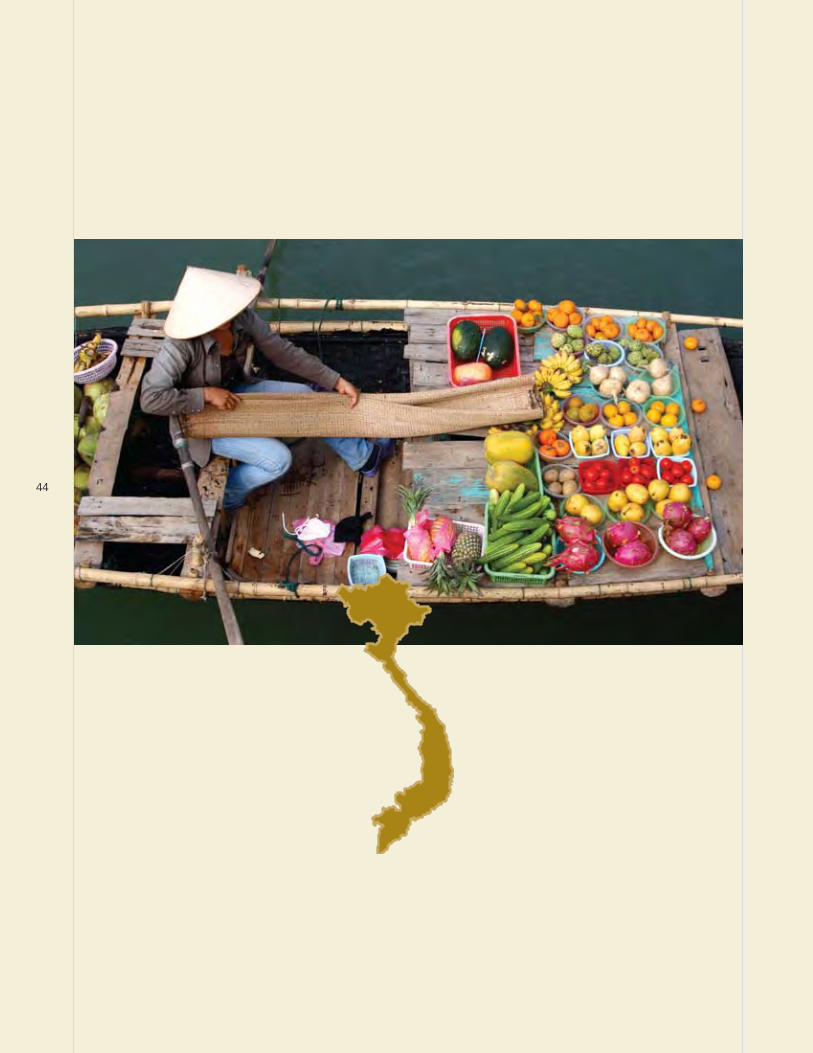
44
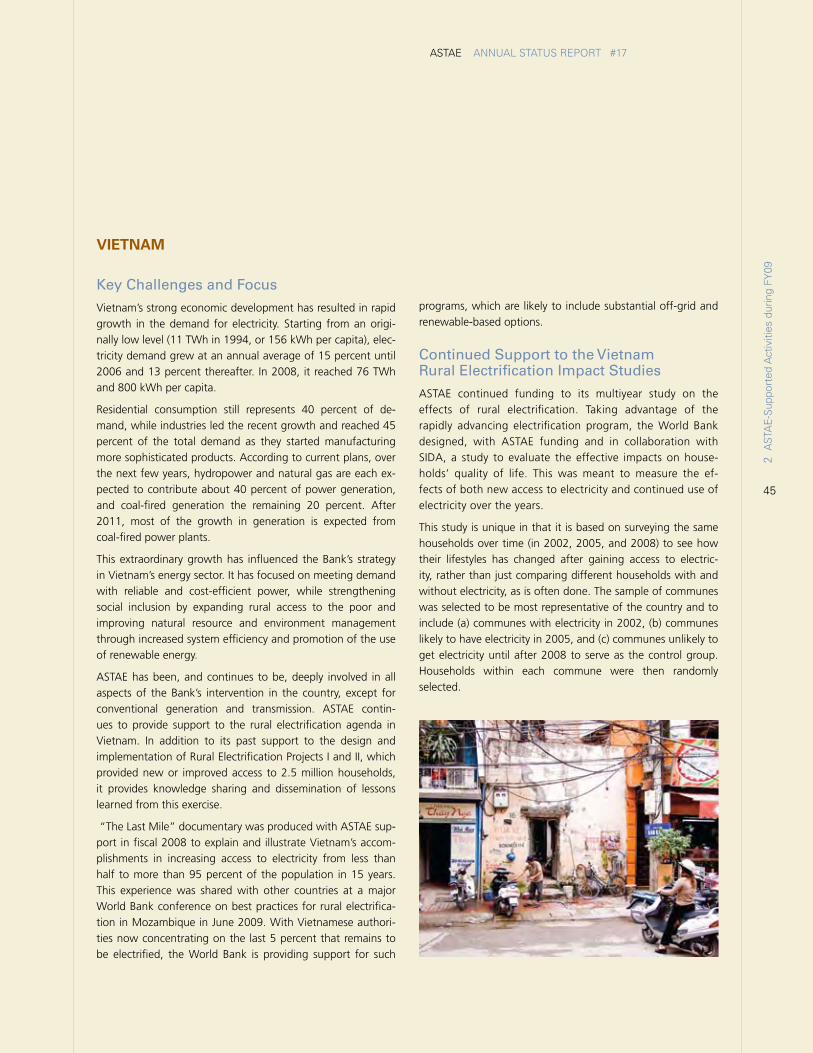
45
ASTAE ANNUAL STATUS REPORT #17
viETNAm
Key Challenges and Focus
Vietnam’s strong economic development has resulted in rapid growth in the demand for electricity. Starting from an origi-nally low level (11 TWh in 1994, or 156 kWh per capita), elec-tricity demand grew at an annual average of 15 percent until 2006 and 13 percent thereafter. In 2008, it reached 76 TWh and 800 kWh per capita.
Residential consumption still represents 40 percent of de-mand, while industries led the recent growth and reached 45 percent of the total demand as they started manufacturing more sophisticated products. According to current plans, over the next few years, hydropower and natural gas are each ex-pected to contribute about 40 percent of power generation, and coal-fired generation the remaining 20 percent. After 2011, most of the growth in generation is expected from coal-fired power plants.
This extraordinary growth has influenced the Bank’s strategy in Vietnam’s energy sector. It has focused on meeting demand with reliable and cost-efficient power, while strengthening social inclusion by expanding rural access to the poor and improving natural resource and environment management through increased system efficiency and promotion of the use of renewable energy.
ASTAE has been, and continues to be, deeply involved in all aspects of the Bank’s intervention in the country, except for conventional generation and transmission. ASTAE contin-ues to provide support to the rural electrification agenda in Vietnam. In addition to its past support to the design and implementation of Rural Electrification Projects I and II, which provided new or improved access to 2.5 million households, it provides knowledge sharing and dissemination of lessons learned from this exercise.
“The Last Mile” documentary was produced with ASTAE sup-port in fiscal 2008 to explain and illustrate Vietnam’s accom-plishments in increasing access to electricity from less than half to more than 95 percent of the population in 15 years. This experience was shared with other countries at a major World Bank conference on best practices for rural electrifica-tion in Mozambique in June 2009. With Vietnamese authori-ties now concentrating on the last 5 percent that remains to be electrified, the World Bank is providing support for such
programs, which are likely to include substantial off-grid and renewable-based options.
Continued Support to the Vietnam Rural Electrification Impact Studies
ASTAE continued funding to its multiyear study on the effects of rural electrification. Taking advantage of the rapidly advancing electrification program, the World Bank designed, with ASTAE funding and in collaboration with SIDA, a study to evaluate the effective impacts on house-holds’ quality of life. This was meant to measure the ef-fects of both new access to electricity and continued use of electricity over the years.
This study is unique in that it is based on surveying the same households over time (in 2002, 2005, and 2008) to see how their lifestyles has changed after gaining access to electric-ity, rather than just comparing different households with and without electricity, as is often done. The sample of communes was selected to be most representative of the country and to include (a) communes with electricity in 2002, (b) communes likely to have electricity in 2005, and (c) communes unlikely to get electricity until after 2008 to serve as the control group. Households within each commune were then randomly selected.
2 A
STA
E-S
uppo
rted
Act
iviti
es d
urin
g FY
09
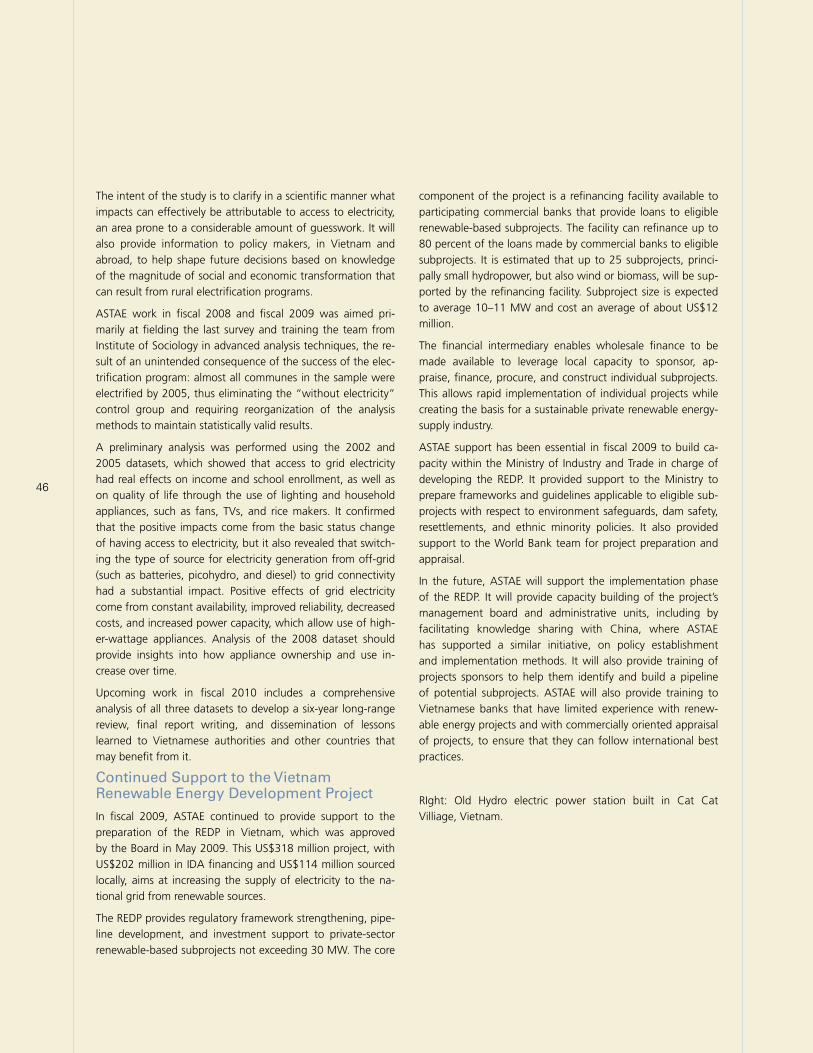
46
The intent of the study is to clarify in a scientific manner what impacts can effectively be attributable to access to electricity, an area prone to a considerable amount of guesswork. It will also provide information to policy makers, in Vietnam and abroad, to help shape future decisions based on knowledge of the magnitude of social and economic transformation that can result from rural electrification programs.
ASTAE work in fiscal 2008 and fiscal 2009 was aimed pri-marily at fielding the last survey and training the team from Institute of Sociology in advanced analysis techniques, the re-sult of an unintended consequence of the success of the elec-trification program: almost all communes in the sample were electrified by 2005, thus eliminating the “without electricity” control group and requiring reorganization of the analysis methods to maintain statistically valid results.
A preliminary analysis was performed using the 2002 and 2005 datasets, which showed that access to grid electricity had real effects on income and school enrollment, as well as on quality of life through the use of lighting and household appliances, such as fans, TVs, and rice makers. It confirmed that the positive impacts come from the basic status change of having access to electricity, but it also revealed that switch-ing the type of source for electricity generation from off-grid (such as batteries, picohydro, and diesel) to grid connectivity had a substantial impact. Positive effects of grid electricity come from constant availability, improved reliability, decreased costs, and increased power capacity, which allow use of high-er-wattage appliances. Analysis of the 2008 dataset should provide insights into how appliance ownership and use in-crease over time.
Upcoming work in fiscal 2010 includes a comprehensive analysis of all three datasets to develop a six-year long-range review, final report writing, and dissemination of lessons learned to Vietnamese authorities and other countries that may benefit from it.
Continued Support to the Vietnam Renewable Energy Development Project
In fiscal 2009, ASTAE continued to provide support to the preparation of the REDP in Vietnam, which was approved by the Board in May 2009. This US$318 million project, with US$202 million in IDA financing and US$114 million sourced locally, aims at increasing the supply of electricity to the na-tional grid from renewable sources.
The REDP provides regulatory framework strengthening, pipe-line development, and investment support to private-sector renewable-based subprojects not exceeding 30 MW. The core
component of the project is a refinancing facility available to participating commercial banks that provide loans to eligible renewable-based subprojects. The facility can refinance up to 80 percent of the loans made by commercial banks to eligible subprojects. It is estimated that up to 25 subprojects, princi-pally small hydropower, but also wind or biomass, will be sup-ported by the refinancing facility. Subproject size is expected to average 10–11 MW and cost an average of about US$12 million.
The financial intermediary enables wholesale finance to be made available to leverage local capacity to sponsor, ap-praise, finance, procure, and construct individual subprojects. This allows rapid implementation of individual projects while creating the basis for a sustainable private renewable energy-supply industry.
ASTAE support has been essential in fiscal 2009 to build ca-pacity within the Ministry of Industry and Trade in charge of developing the REDP. It provided support to the Ministry to prepare frameworks and guidelines applicable to eligible sub-projects with respect to environment safeguards, dam safety, resettlements, and ethnic minority policies. It also provided support to the World Bank team for project preparation and appraisal.
In the future, ASTAE will support the implementation phase of the REDP. It will provide capacity building of the project’s management board and administrative units, including by facilitating knowledge sharing with China, where ASTAE has supported a similar initiative, on policy establishment and implementation methods. It will also provide training of projects sponsors to help them identify and build a pipeline of potential subprojects. ASTAE will also provide training to Vietnamese banks that have limited experience with renew-able energy projects and with commercially oriented appraisal of projects, to ensure that they can follow international best practices.
RIght: Old Hydro electric power station built in Cat Cat Villiage, Vietnam.
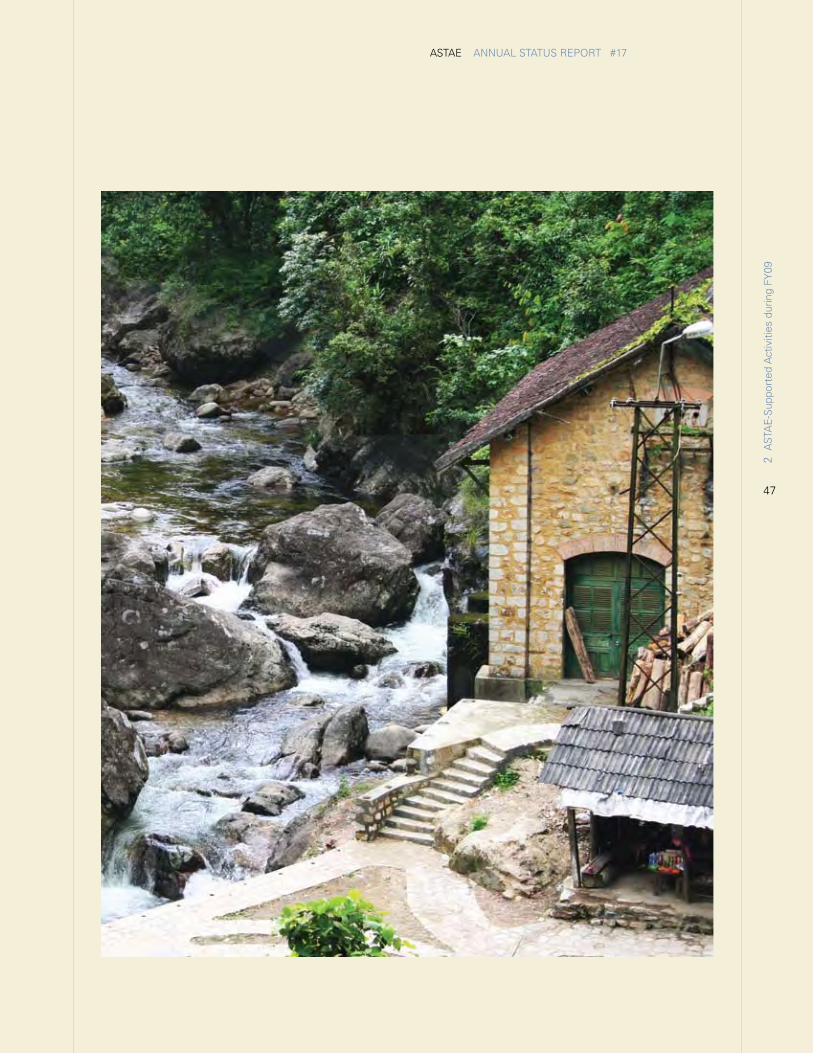
47
ASTAE ANNUAL STATUS REPORT #17
2 A
STA
E-S
uppo
rted
Act
iviti
es d
urin
g FY
09
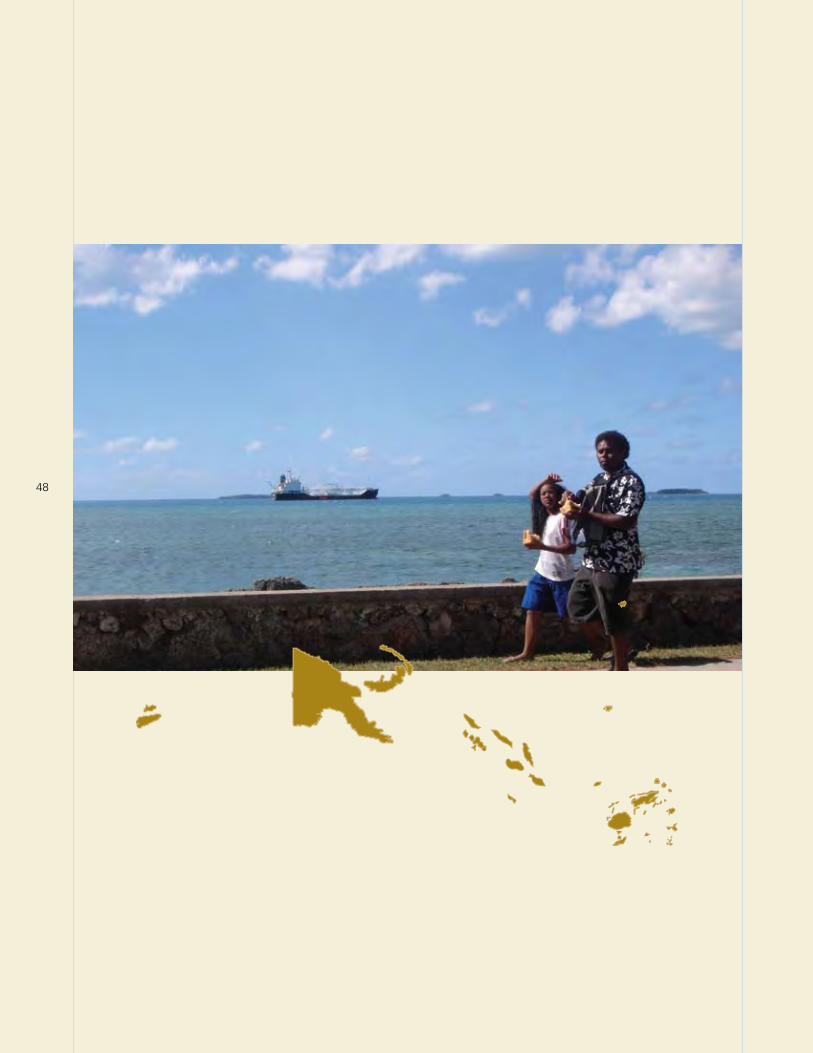
48
49
ASTAE ANNUAL STATUS REPORT #17
PAPUA NEW GUiNEA, Timor-LESTE, ANd ThE PACiFiC iSLANd CoUNTriES
Key Challenges and Focus in the Pacific Island Countries
The Pacific Island countries (PICs) face similar, complex devel-opment challenges, stemming largely from their small, sparse-ly distributed populations and their remoteness. Combined with political instability in some of these countries, the PICs’ unique challenges have resulted in weak economic growth. Even those countries with positive growth in average per capita income have difficulties translating this into sufficient job creation and poverty reduction.
The PICs have some of the world’s most unaffordable, highest-cost energy services. High fuel-price volatility is compounded by fragmented purchasing of relatively small volumes, high transport costs, and expensive storage and distribution charges. Such volatile energy costs contribute to increased poverty, political pressures, and instability. Power utilities in the PICs are the largest national users of imported diesel, are squeezed by fuel costs, and are unable to increase customer prices. Consequently, they are incurring significant losses and draining public finances.
The utilities have limited capacity to invest in energy efficien-cy, system maintenance (up to 80 percent of operations and maintenance [O&M] can be spent on fuel), and expansion of access to electricity. Access to electricity remains very low—ranging from 7 to 9 percent in Papua New Guinea (PNG) to more than 65 percent in Fiji. In addition, affordability on the household level remains a major problem. Reducing electricity cost and increasing its access are vital to promoting economic growth and improving the quality of life of PIC households.
Faced with looming foreign exchange and balance of pay-ments crises, political support is strong in the PICs for urgent action to diversify power supply through an increased use of renewable energy sources, as was expressed in 2007 at the Pacific Energy Ministers Meeting. Avoiding such a crisis is critical to limiting possible adverse effects on currency depre-ciation, and increased costs of servicing foreign-denominated debts, as well as restrictions on further access to funds and related negative effects on private sector investment. Fortunately, the PICs are blessed with rich renewable en-ergy endowments, such as solar, wind, and hydropower, and
considerable energy-efficiency potential to further strengthen their power sectors and reduce reliance on imported fuels.
Pacific Islands: Regional Sustainable Energy Finance Facility
In fiscal 2006–08, ASTAE provided support to the identifica-tion and preparation of the Pacific Islands Sustainable Energy Financing Project (SEFP), financed by a US$9.48 million GEF grant. The project, which was approved by the Board in June 2007, aims to increase the adoption of renewable energy technologies in participating PICs (Fiji, Marshall Islands, PNG, Solomon Islands, and Vanuatu) by developing a package of incentives to encourage local financial institutions to partici-pate in sustainable energy finance.
Energy options supported under this project are solar PV, pi-cohydro, and fuel switching from diesel to locally produced coconut oil for stationary electricity-generating engines. The financing is expected to originate from local financial institu-tions that are willing, with risk guarantees from SEFP, to lend up to US$18 million for qualifying investments to individuals, and micro and small enterprises, including community-based formal institutions, such as schools and churches, and renew-able energy service providers. Individuals buying equipment with loans from the commercial banks for this purpose would receive basic training in installing and maintaining the equip-ment. The capacity of participating banks and nonbank finan-cial institutions to lend to these types of borrowers for such purposes will be enhanced by technical assistance offered under the project. Additional technical assistance will provide training on business planning, international procurement, and equipment identification to retailers and installers of qualify-ing equipment to ensure that they are properly trained in the technologies concerned.
In fiscal 2009, ASTAE continued to support this project as it moved into its implementation phase. A significant portion of the project funds is disbursed toward addressing the institu-tional and personnel capacity constraints, such as shortage of qualified staff, in Fiji, Marshall Islands, PNG, Solomon Islands, and Vanuatu. This is the area where implementation challenges have emerged and for which ASTAE assistance was requested.
2 A
STA
E-S
uppo
rted
Act
iviti
es d
urin
g FY
09
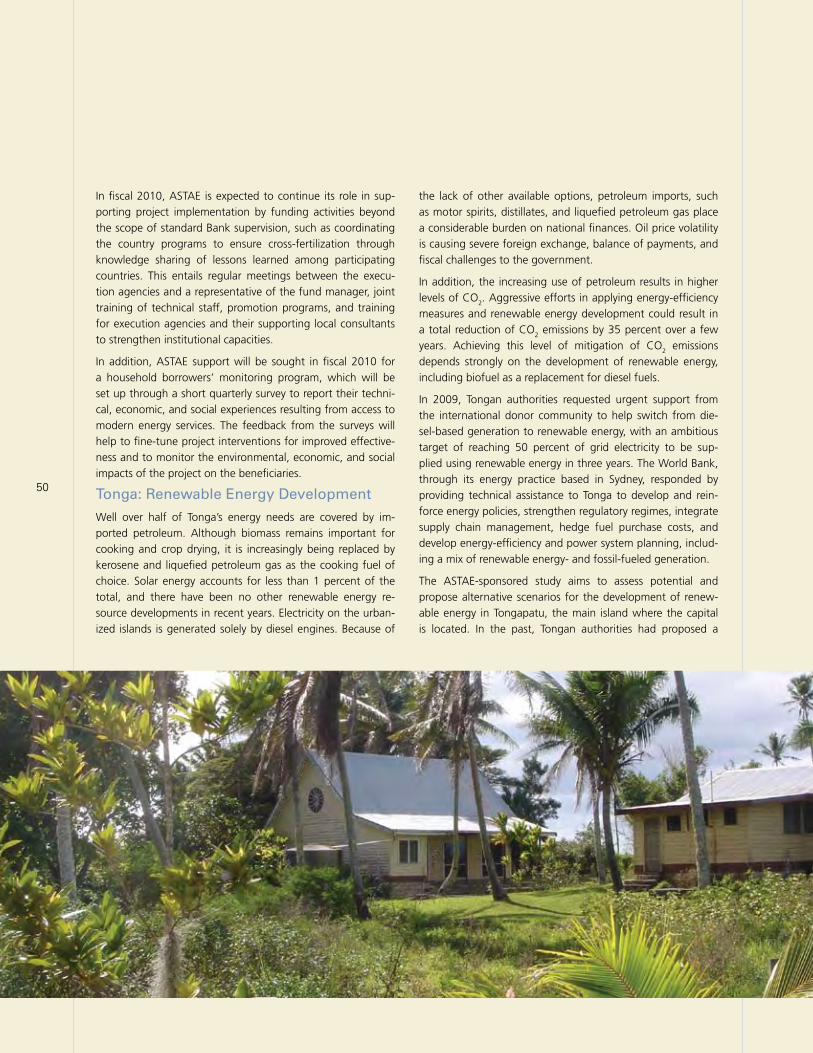
50
In fiscal 2010, ASTAE is expected to continue its role in sup-porting project implementation by funding activities beyond the scope of standard Bank supervision, such as coordinating the country programs to ensure cross-fertilization through knowledge sharing of lessons learned among participating countries. This entails regular meetings between the execu-tion agencies and a representative of the fund manager, joint training of technical staff, promotion programs, and training for execution agencies and their supporting local consultants to strengthen institutional capacities.
In addition, ASTAE support will be sought in fiscal 2010 for a household borrowers’ monitoring program, which will be set up through a short quarterly survey to report their techni-cal, economic, and social experiences resulting from access to modern energy services. The feedback from the surveys will help to fine-tune project interventions for improved effective-ness and to monitor the environmental, economic, and social impacts of the project on the beneficiaries.
Tonga: Renewable Energy Development
Well over half of Tonga’s energy needs are covered by im-ported petroleum. Although biomass remains important for cooking and crop drying, it is increasingly being replaced by kerosene and liquefied petroleum gas as the cooking fuel of choice. Solar energy accounts for less than 1 percent of the total, and there have been no other renewable energy re-source developments in recent years. Electricity on the urban-ized islands is generated solely by diesel engines. Because of
the lack of other available options, petroleum imports, such as motor spirits, distillates, and liquefied petroleum gas place a considerable burden on national finances. Oil price volatility is causing severe foreign exchange, balance of payments, and fiscal challenges to the government.
In addition, the increasing use of petroleum results in higher levels of CO2. Aggressive efforts in applying energy-efficiency measures and renewable energy development could result in a total reduction of CO2 emissions by 35 percent over a few years. Achieving this level of mitigation of CO2 emissions depends strongly on the development of renewable energy, including biofuel as a replacement for diesel fuels.
In 2009, Tongan authorities requested urgent support from the international donor community to help switch from die-sel-based generation to renewable energy, with an ambitious target of reaching 50 percent of grid electricity to be sup-plied using renewable energy in three years. The World Bank, through its energy practice based in Sydney, responded by providing technical assistance to Tonga to develop and rein-force energy policies, strengthen regulatory regimes, integrate supply chain management, hedge fuel purchase costs, and develop energy-efficiency and power system planning, includ-ing a mix of renewable energy- and fossil-fueled generation.
The ASTAE-sponsored study aims to assess potential and propose alternative scenarios for the development of renew-able energy in Tongapatu, the main island where the capital is located. In the past, Tongan authorities had proposed a
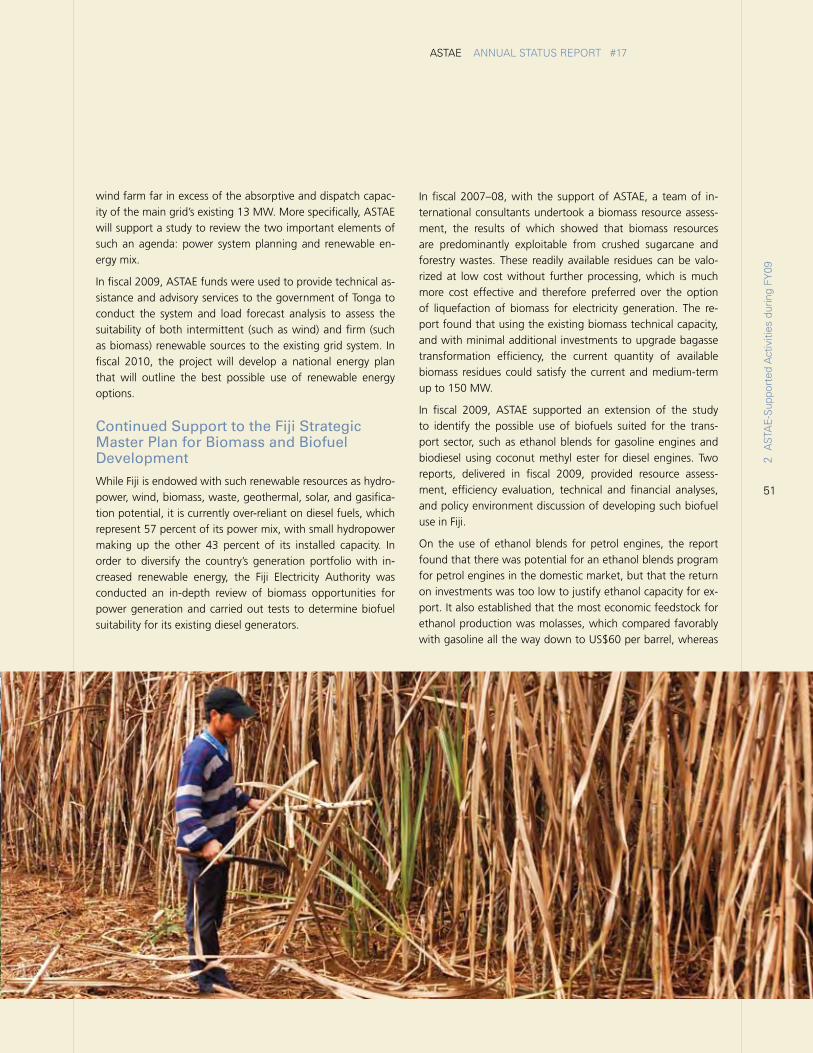
51
ASTAE ANNUAL STATUS REPORT #17
wind farm far in excess of the absorptive and dispatch capac-ity of the main grid’s existing 13 MW. More specifically, ASTAE will support a study to review the two important elements of such an agenda: power system planning and renewable en-ergy mix.
In fiscal 2009, ASTAE funds were used to provide technical as-sistance and advisory services to the government of Tonga to conduct the system and load forecast analysis to assess the suitability of both intermittent (such as wind) and firm (such as biomass) renewable sources to the existing grid system. In fiscal 2010, the project will develop a national energy plan that will outline the best possible use of renewable energy options.
Continued Support to the Fiji Strategic Master Plan for Biomass and Biofuel Development
While Fiji is endowed with such renewable resources as hydro-power, wind, biomass, waste, geothermal, solar, and gasifica-tion potential, it is currently over-reliant on diesel fuels, which represent 57 percent of its power mix, with small hydropower making up the other 43 percent of its installed capacity. In order to diversify the country’s generation portfolio with in-creased renewable energy, the Fiji Electricity Authority was conducted an in-depth review of biomass opportunities for power generation and carried out tests to determine biofuel suitability for its existing diesel generators.
In fiscal 2007–08, with the support of ASTAE, a team of in-ternational consultants undertook a biomass resource assess-ment, the results of which showed that biomass resources are predominantly exploitable from crushed sugarcane and forestry wastes. These readily available residues can be valo-rized at low cost without further processing, which is much more cost effective and therefore preferred over the option of liquefaction of biomass for electricity generation. The re-port found that using the existing biomass technical capacity, and with minimal additional investments to upgrade bagasse transformation efficiency, the current quantity of available biomass residues could satisfy the current and medium-term up to 150 MW.
In fiscal 2009, ASTAE supported an extension of the study to identify the possible use of biofuels suited for the trans-port sector, such as ethanol blends for gasoline engines and biodiesel using coconut methyl ester for diesel engines. Two reports, delivered in fiscal 2009, provided resource assess-ment, efficiency evaluation, technical and financial analyses, and policy environment discussion of developing such biofuel use in Fiji.
On the use of ethanol blends for petrol engines, the report found that there was potential for an ethanol blends program for petrol engines in the domestic market, but that the return on investments was too low to justify ethanol capacity for ex-port. It also established that the most economic feedstock for ethanol production was molasses, which compared favorably with gasoline all the way down to US$60 per barrel, whereas
2 A
STA
E-S
uppo
rted
Act
iviti
es d
urin
g FY
09
52
sugarcane and cassava were either too costly or had better markets in forms other than ethanol. In addition to these favorable returns, the report showed that the sugar industry already produces enough molasses to meet the demand and that it may face challenges to its current export markets of this product because of European Union (EU) reforms. It therefore recommends the introduction of a mandate for a 10 percent blend of molasses-derived ethanol with gasoline in the short term and the possible promotion of a flex-fuel vehicle that can use a higher level of ethanol in the future.
On the use of coconut or jatropha feedstock for biodiesel, the study concluded that jatropha was not viable, while coconut production was insufficient for large-scale use of methyl ester in diesel engines. However, it recommended that this option be further explored for small-scale uses in remote communi-ties where vehicles, boats, and generators run on classic diesel that is purchased at retail price with the added cost of transportation. This could provide a diversification of revenue, as well as a buffer against international price shocks to small island communities. The report recommended setting up small grants for the establishment of the transformation and technical enhancement of such microbiodiesel plants.
Continued Support to the Solomon Islands Sustainable Energy Project and the Social and Environment Handbook
The Solomon Islands consist of a double chain of 992 islands, of which one-third are populated. The estimated population of 500,000 lives primarily on six main islands. Ethnic tensions and rioting had a negative effect on the economy in 2003. The country later enjoyed a strong recovery, but still faces a number of challenges.
The majority of the population remains involved in subsistence cash crop agriculture with less than a quarter of the popula-tion involved in paid work. Exports are commodity based and include timber, fish, cocoa, and copra, but current logging rates are about four times the sustainable rate. The energy sector also faces major issues, primarily linked to high costs and poor reliability of supply, lack of access, and serious inef-ficiencies within the national utility company, the SIEA.
In fiscal 2008, ASTAE provided project preparation support to a potential World Bank-funded investment project. The Solomon Island Sustainable Energy Project aimed to improve management of the SIEA and provide funds to transition electricity generation toward using renewable sources such
as hydropower, biomass, and coconut oil. This project was designed to work in coordination with the Pacific Islands Sustainable Finance Project, which would provide electric-ity access to households in the Solomon Islands using GEF guarantees to private banks to encourage household use of renewable sources such as solar PV and coconut oil instead of diesel generators.
In April 2008, the Sustainable Energy Project was redesigned, shortly before being approved by the Board in June 2008. ASTAE provided just-in-time support to this restructuring. The proposed generation and transmission investments, while crucial, were in contradiction with a postcrisis agreement be-tween the Solomon Islands government and its creditors that limited additional debt increase. ASTAE support to the project reorganization showed that, when faced with the need to prioritize, the most urgent need was for the reorganization of management of SIEA and the implementation of a loss reduc-tion program. These became the new core components of the Sustainable Energy Project.
Sustainable Energy ProjectIn fiscal 2009, ASTAE provided implementation support to the Sustainable Energy Project, which aims to increase operational efficiency, system reliability, and the financial sustainability of SIEA. This is to be implemented through improved financial and operational management, reduction of losses, improved reliability of generation and distribution systems, and im-proved revenue collection. More specifically, ASTAE provided funding to select and hire two experienced experts as line managers to build management capacity within SIEA. Given the relatively small scale of the SIEA operations, the success-ful hiring of the most qualified technical general manager and commercialization manager, with sufficient expertise but able to work on such small systems, was key to a successful turn-around of SIEA. Additional support is expected in fiscal 2010 on this project.
Social and Environment HandbookParallel to preparation for the Sustainable Energy Project in fis-cal 2008, a second ASTAE activity was started to prepare for the hydropower generation component of the project. This activity consisted of a review of the existing framework in the Solomon Islands in order to draft and discuss two handbooks with stakeholders. The first was relative to land use and land access for generation and transmission projects, while the sec-ond was related to community consultations in environmental impact assessments for infrastructure projects.
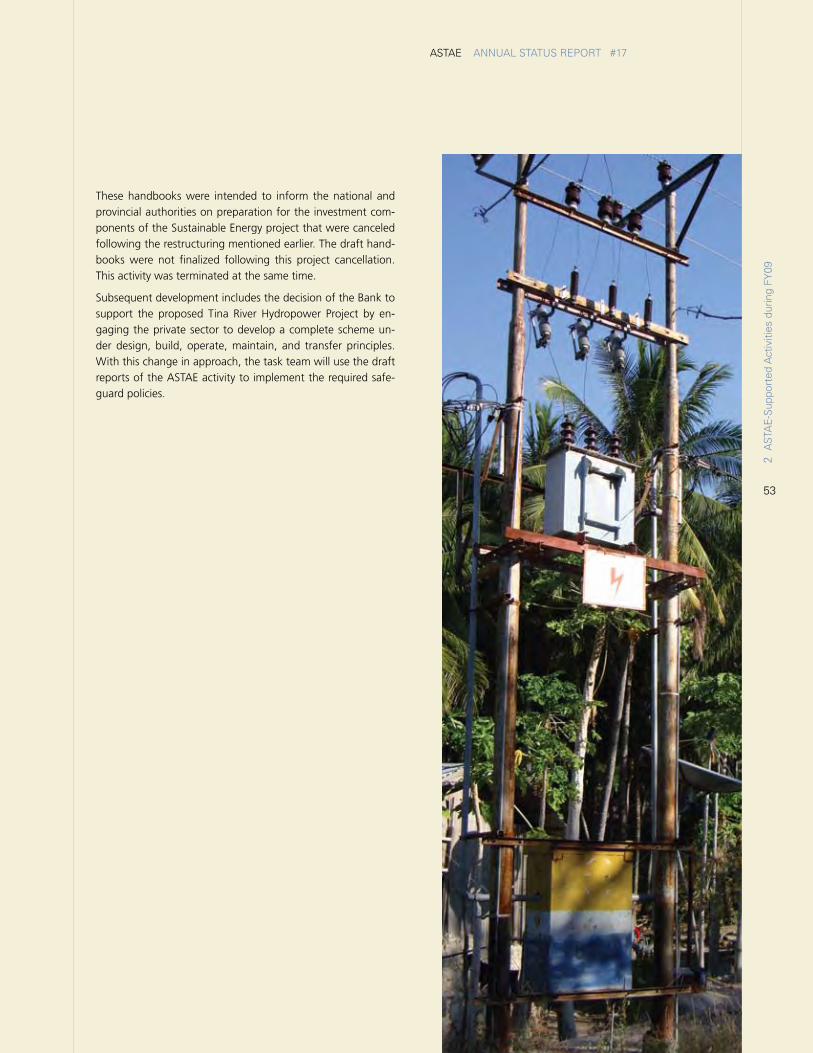
53
ASTAE ANNUAL STATUS REPORT #17
These handbooks were intended to inform the national and provincial authorities on preparation for the investment com-ponents of the Sustainable Energy project that were canceled following the restructuring mentioned earlier. The draft hand-books were not finalized following this project cancellation. This activity was terminated at the same time.
Subsequent development includes the decision of the Bank to support the proposed Tina River Hydropower Project by en-gaging the private sector to develop a complete scheme un-der design, build, operate, maintain, and transfer principles. With this change in approach, the task team will use the draft reports of the ASTAE activity to implement the required safe-guard policies.
2 A
STA
E-S
uppo
rted
Act
iviti
es d
urin
g FY
09
54
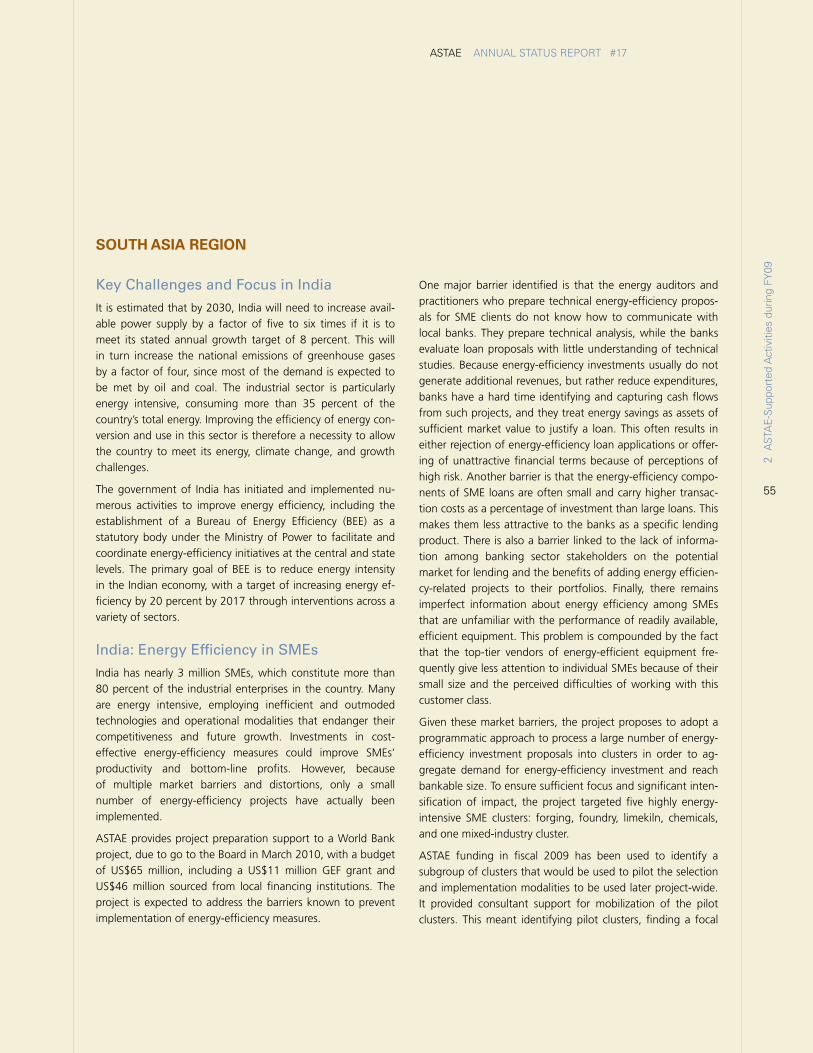
55
ASTAE ANNUAL STATUS REPORT #17
SoUTh ASiA rEGioN
Key Challenges and Focus in India
It is estimated that by 2030, India will need to increase avail-able power supply by a factor of five to six times if it is to meet its stated annual growth target of 8 percent. This will in turn increase the national emissions of greenhouse gases by a factor of four, since most of the demand is expected to be met by oil and coal. The industrial sector is particularly energy intensive, consuming more than 35 percent of the country’s total energy. Improving the efficiency of energy con-version and use in this sector is therefore a necessity to allow the country to meet its energy, climate change, and growth challenges.
The government of India has initiated and implemented nu-merous activities to improve energy efficiency, including the establishment of a Bureau of Energy Efficiency (BEE) as a statutory body under the Ministry of Power to facilitate and coordinate energy-efficiency initiatives at the central and state levels. The primary goal of BEE is to reduce energy intensity in the Indian economy, with a target of increasing energy ef-ficiency by 20 percent by 2017 through interventions across a variety of sectors.
India: Energy Efficiency in SMEs
India has nearly 3 million SMEs, which constitute more than 80 percent of the industrial enterprises in the country. Many are energy intensive, employing inefficient and outmoded technologies and operational modalities that endanger their competitiveness and future growth. Investments in cost-effective energy-efficiency measures could improve SMEs’ productivity and bottom-line profits. However, because of multiple market barriers and distortions, only a small number of energy-efficiency projects have actually been implemented.
ASTAE provides project preparation support to a World Bank project, due to go to the Board in March 2010, with a budget of US$65 million, including a US$11 million GEF grant and US$46 million sourced from local financing institutions. The project is expected to address the barriers known to prevent implementation of energy-efficiency measures.
One major barrier identified is that the energy auditors and practitioners who prepare technical energy-efficiency propos-als for SME clients do not know how to communicate with local banks. They prepare technical analysis, while the banks evaluate loan proposals with little understanding of technical studies. Because energy-efficiency investments usually do not generate additional revenues, but rather reduce expenditures, banks have a hard time identifying and capturing cash flows from such projects, and they treat energy savings as assets of sufficient market value to justify a loan. This often results in either rejection of energy-efficiency loan applications or offer-ing of unattractive financial terms because of perceptions of high risk. Another barrier is that the energy-efficiency compo-nents of SME loans are often small and carry higher transac-tion costs as a percentage of investment than large loans. This makes them less attractive to the banks as a specific lending product. There is also a barrier linked to the lack of informa-tion among banking sector stakeholders on the potential market for lending and the benefits of adding energy efficien-cy-related projects to their portfolios. Finally, there remains imperfect information about energy efficiency among SMEs that are unfamiliar with the performance of readily available, efficient equipment. This problem is compounded by the fact that the top-tier vendors of energy-efficient equipment fre-quently give less attention to individual SMEs because of their small size and the perceived difficulties of working with this customer class.
Given these market barriers, the project proposes to adopt a programmatic approach to process a large number of energy-efficiency investment proposals into clusters in order to ag-gregate demand for energy-efficiency investment and reach bankable size. To ensure sufficient focus and significant inten-sification of impact, the project targeted five highly energy-intensive SME clusters: forging, foundry, limekiln, chemicals, and one mixed-industry cluster.
ASTAE funding in fiscal 2009 has been used to identify a subgroup of clusters that would be used to pilot the selection and implementation modalities to be used later project-wide. It provided consultant support for mobilization of the pilot clusters. This meant identifying pilot clusters, finding a focal
2 A
STA
E-S
uppo
rted
Act
iviti
es d
urin
g FY
09
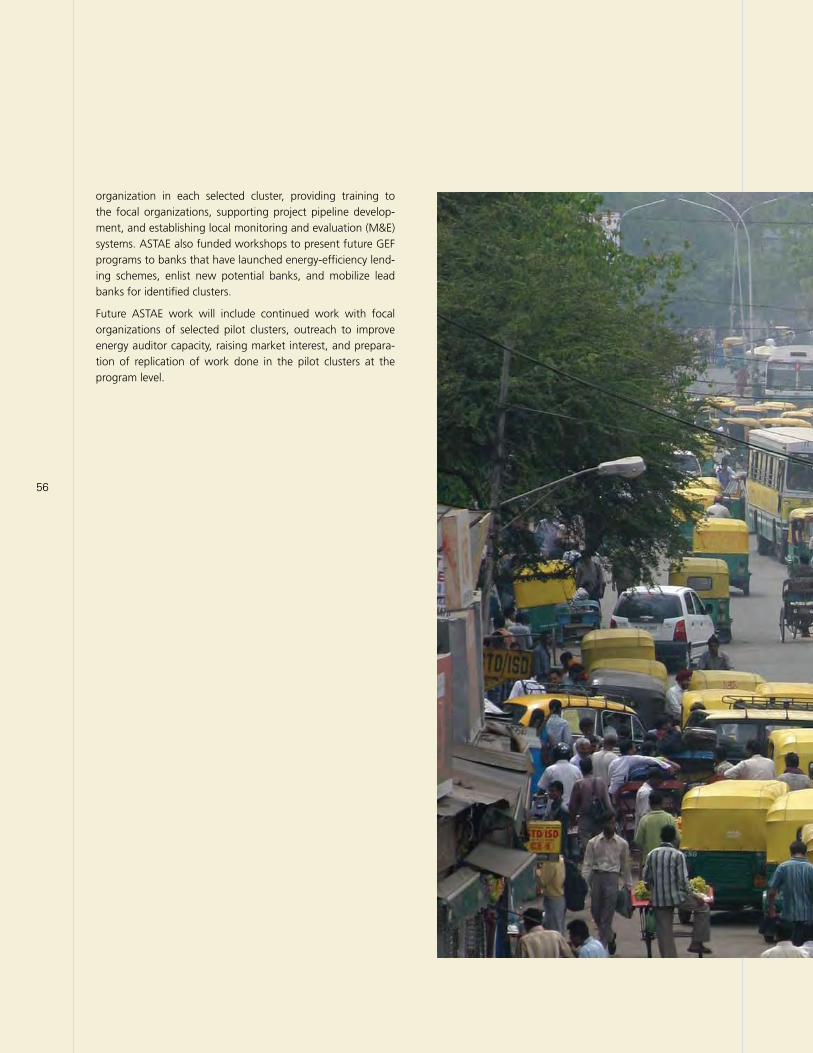
56
organization in each selected cluster, providing training to the focal organizations, supporting project pipeline develop-ment, and establishing local monitoring and evaluation (M&E) systems. ASTAE also funded workshops to present future GEF programs to banks that have launched energy-efficiency lend-ing schemes, enlist new potential banks, and mobilize lead banks for identified clusters.
Future ASTAE work will include continued work with focal organizations of selected pilot clusters, outreach to improve energy auditor capacity, raising market interest, and prepara-tion of replication of work done in the pilot clusters at the program level.
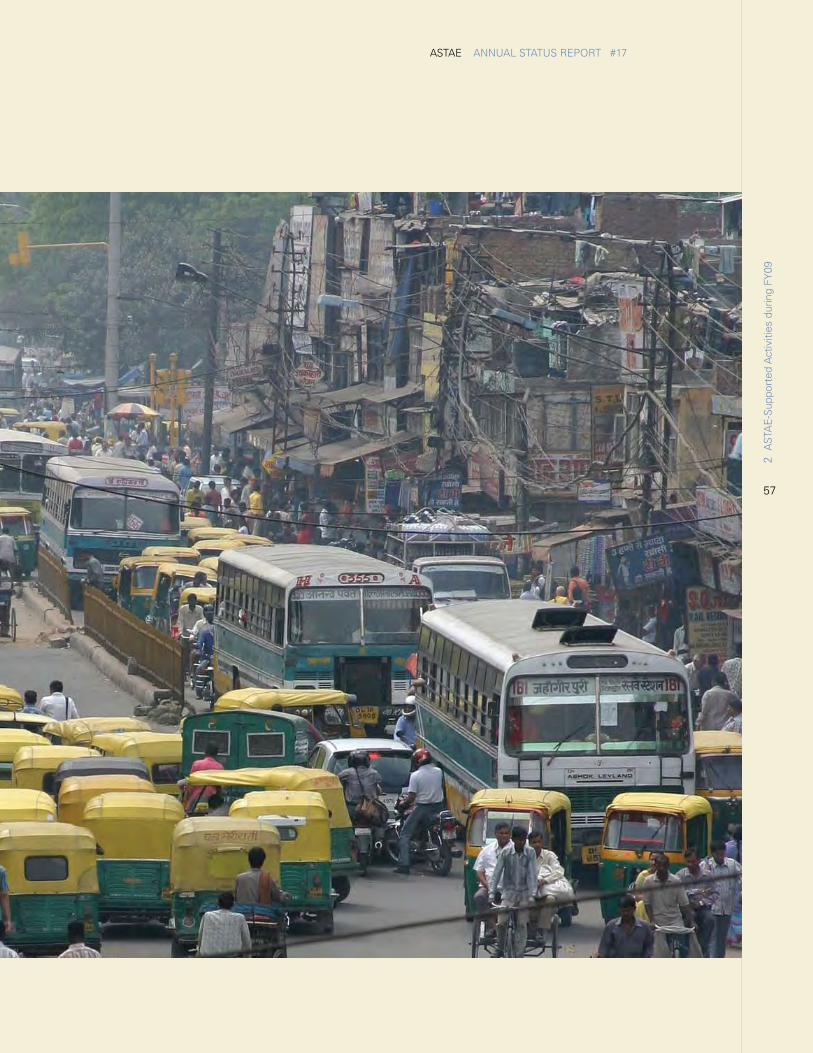
57
ASTAE ANNUAL STATUS REPORT #17
2 A
STA
E-S
uppo
rted
Act
iviti
es d
urin
g FY
09
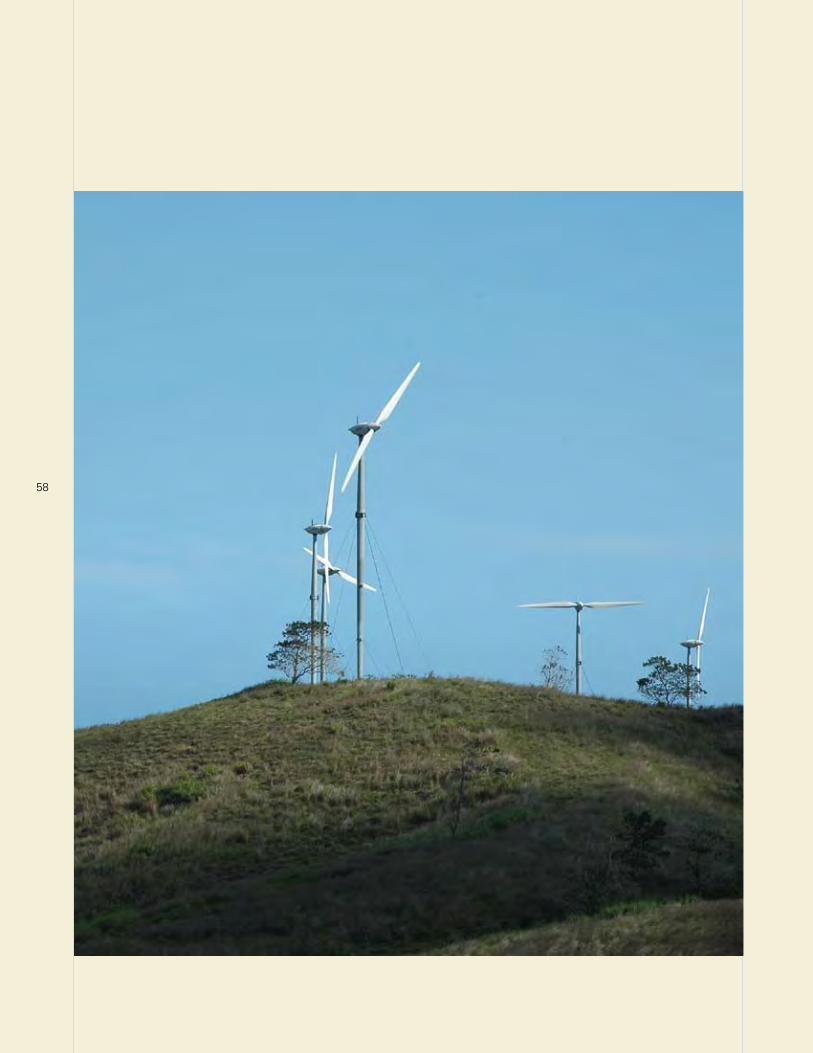
58
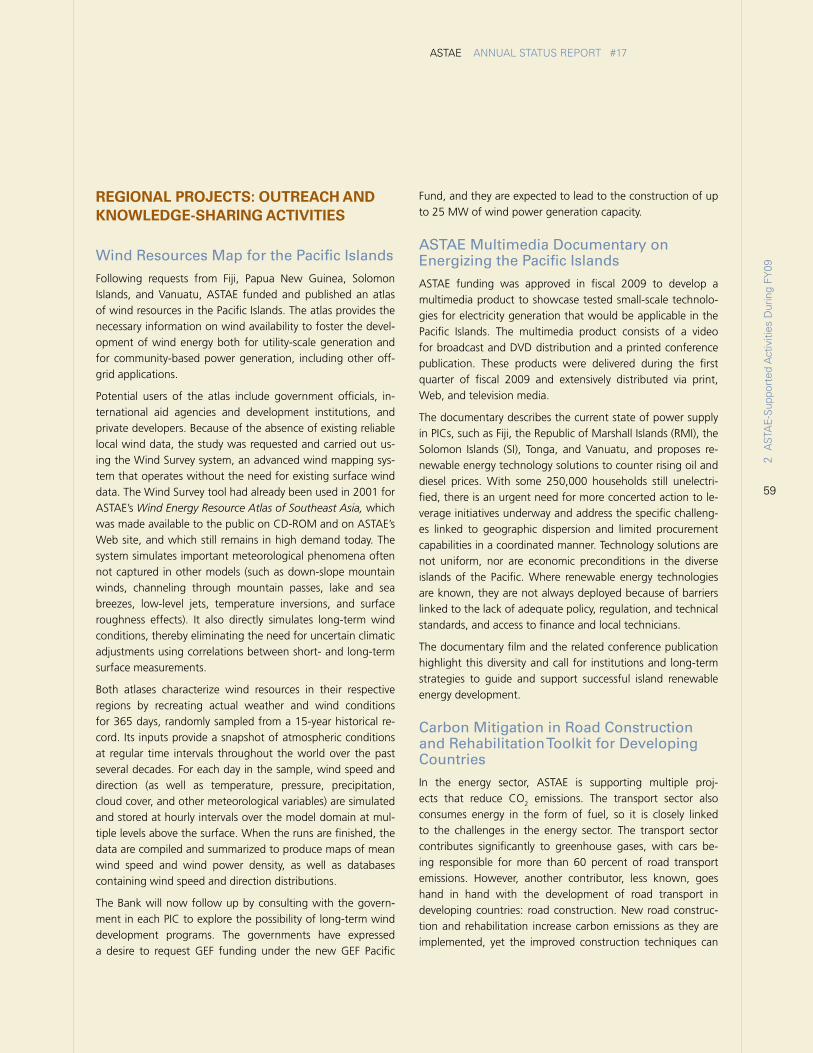
59
ASTAE ANNUAL STATUS REPORT #17
rEGioNAL ProjECTS: oUTrEACh ANd KNoWLEdGE-ShAriNG ACTiviTiES
Wind Resources Map for the Pacific Islands
Following requests from Fiji, Papua New Guinea, Solomon Islands, and Vanuatu, ASTAE funded and published an atlas of wind resources in the Pacific Islands. The atlas provides the necessary information on wind availability to foster the devel-opment of wind energy both for utility-scale generation and for community-based power generation, including other off-grid applications.
Potential users of the atlas include government officials, in-ternational aid agencies and development institutions, and private developers. Because of the absence of existing reliable local wind data, the study was requested and carried out us-ing the Wind Survey system, an advanced wind mapping sys-tem that operates without the need for existing surface wind data. The Wind Survey tool had already been used in 2001 for ASTAE’s Wind Energy Resource Atlas of Southeast Asia, which was made available to the public on CD-ROM and on ASTAE’s Web site, and which still remains in high demand today. The system simulates important meteorological phenomena often not captured in other models (such as down-slope mountain winds, channeling through mountain passes, lake and sea breezes, low-level jets, temperature inversions, and surface roughness effects). It also directly simulates long-term wind conditions, thereby eliminating the need for uncertain climatic adjustments using correlations between short- and long-term surface measurements.
Both atlases characterize wind resources in their respective regions by recreating actual weather and wind conditions for 365 days, randomly sampled from a 15-year historical re-cord. Its inputs provide a snapshot of atmospheric conditions at regular time intervals throughout the world over the past several decades. For each day in the sample, wind speed and direction (as well as temperature, pressure, precipitation, cloud cover, and other meteorological variables) are simulated and stored at hourly intervals over the model domain at mul-tiple levels above the surface. When the runs are finished, the data are compiled and summarized to produce maps of mean wind speed and wind power density, as well as databases containing wind speed and direction distributions.
The Bank will now follow up by consulting with the govern-ment in each PIC to explore the possibility of long-term wind development programs. The governments have expressed a desire to request GEF funding under the new GEF Pacific
2 A
STA
E-S
uppo
rted
Act
iviti
es D
urin
g FY
09
Fund, and they are expected to lead to the construction of up to 25 MW of wind power generation capacity.
ASTAE Multimedia Documentary on Energizing the Pacific Islands
ASTAE funding was approved in fiscal 2009 to develop a multimedia product to showcase tested small-scale technolo-gies for electricity generation that would be applicable in the Pacific Islands. The multimedia product consists of a video for broadcast and DVD distribution and a printed conference publication. These products were delivered during the first quarter of fiscal 2009 and extensively distributed via print, Web, and television media.
The documentary describes the current state of power supply in PICs, such as Fiji, the Republic of Marshall Islands (RMI), the Solomon Islands (SI), Tonga, and Vanuatu, and proposes re-newable energy technology solutions to counter rising oil and diesel prices. With some 250,000 households still unelectri-fied, there is an urgent need for more concerted action to le-verage initiatives underway and address the specific challeng-es linked to geographic dispersion and limited procurement capabilities in a coordinated manner. Technology solutions are not uniform, nor are economic preconditions in the diverse islands of the Pacific. Where renewable energy technologies are known, they are not always deployed because of barriers linked to the lack of adequate policy, regulation, and technical standards, and access to finance and local technicians.
The documentary film and the related conference publication highlight this diversity and call for institutions and long-term strategies to guide and support successful island renewable energy development.
Carbon Mitigation in Road Construction and Rehabilitation Toolkit for Developing Countries
In the energy sector, ASTAE is supporting multiple proj-ects that reduce CO2 emissions. The transport sector also consumes energy in the form of fuel, so it is closely linked to the challenges in the energy sector. The transport sector contributes significantly to greenhouse gases, with cars be-ing responsible for more than 60 percent of road transport emissions. However, another contributor, less known, goes hand in hand with the development of road transport in developing countries: road construction. New road construc-tion and rehabilitation increase carbon emissions as they are implemented, yet the improved construction techniques can
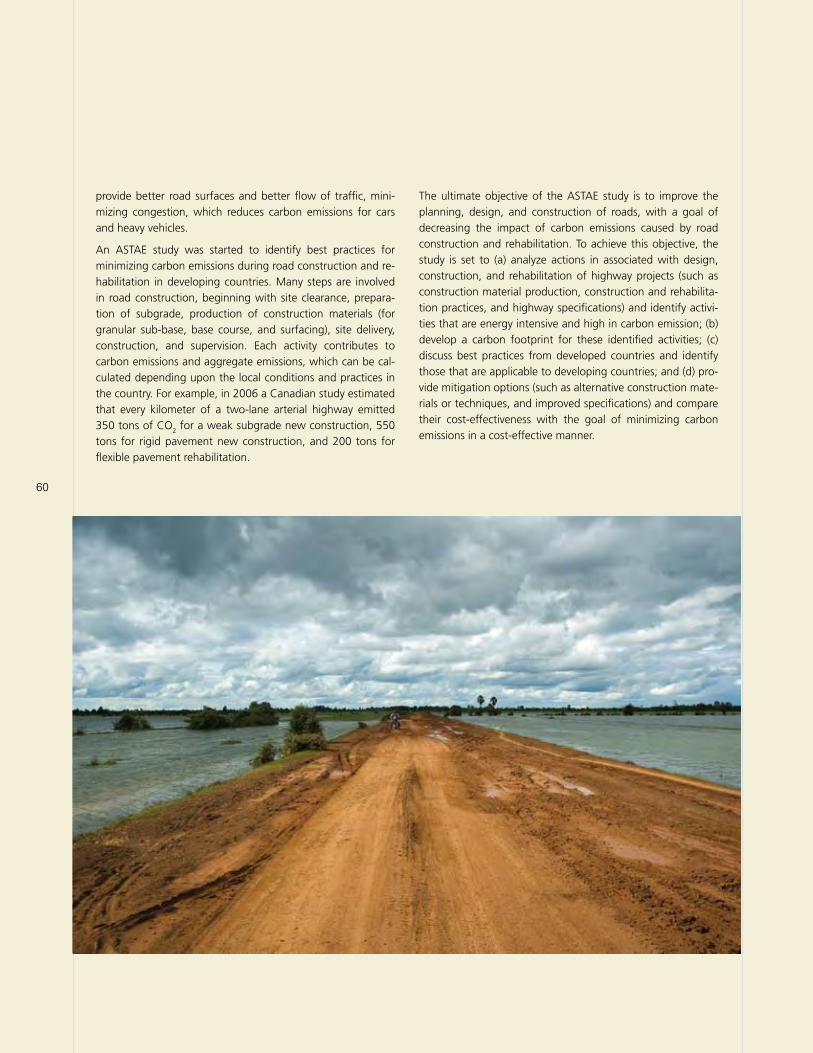
60
The ultimate objective of the ASTAE study is to improve the planning, design, and construction of roads, with a goal of decreasing the impact of carbon emissions caused by road construction and rehabilitation. To achieve this objective, the study is set to (a) analyze actions in associated with design, construction, and rehabilitation of highway projects (such as construction material production, construction and rehabilita-tion practices, and highway specifications) and identify activi-ties that are energy intensive and high in carbon emission; (b) develop a carbon footprint for these identified activities; (c) discuss best practices from developed countries and identify those that are applicable to developing countries; and (d) pro-vide mitigation options (such as alternative construction mate-rials or techniques, and improved specifications) and compare their cost-effectiveness with the goal of minimizing carbon emissions in a cost-effective manner.
provide better road surfaces and better flow of traffic, mini-mizing congestion, which reduces carbon emissions for cars and heavy vehicles.
An ASTAE study was started to identify best practices for minimizing carbon emissions during road construction and re-habilitation in developing countries. Many steps are involved in road construction, beginning with site clearance, prepara-tion of subgrade, production of construction materials (for granular sub-base, base course, and surfacing), site delivery, construction, and supervision. Each activity contributes to carbon emissions and aggregate emissions, which can be cal-culated depending upon the local conditions and practices in the country. For example, in 2006 a Canadian study estimated that every kilometer of a two-lane arterial highway emitted 350 tons of CO2 for a weak subgrade new construction, 550 tons for rigid pavement new construction, and 200 tons for flexible pavement rehabilitation.
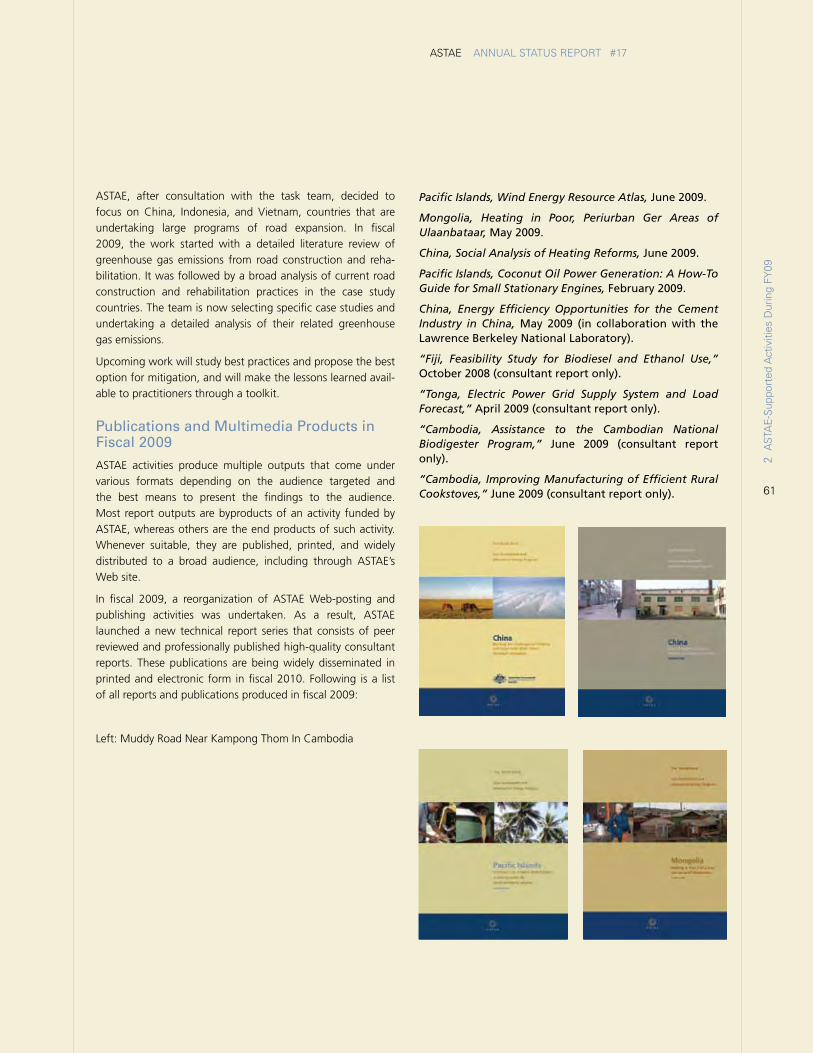
61
ASTAE ANNUAL STATUS REPORT #17
2 A
STA
E-S
uppo
rted
Act
iviti
es D
urin
g FY
09
ASTAE, after consultation with the task team, decided to focus on China, Indonesia, and Vietnam, countries that are undertaking large programs of road expansion. In fiscal 2009, the work started with a detailed literature review of greenhouse gas emissions from road construction and reha-bilitation. It was followed by a broad analysis of current road construction and rehabilitation practices in the case study countries. The team is now selecting specific case studies and undertaking a detailed analysis of their related greenhouse gas emissions.
Upcoming work will study best practices and propose the best option for mitigation, and will make the lessons learned avail-able to practitioners through a toolkit.
Publications and Multimedia Products in Fiscal 2009
ASTAE activities produce multiple outputs that come under various formats depending on the audience targeted and the best means to present the findings to the audience. Most report outputs are byproducts of an activity funded by ASTAE, whereas others are the end products of such activity. Whenever suitable, they are published, printed, and widely distributed to a broad audience, including through ASTAE’s Web site.
In fiscal 2009, a reorganization of ASTAE Web-posting and publishing activities was undertaken. As a result, ASTAE launched a new technical report series that consists of peer reviewed and professionally published high-quality consultant reports. These publications are being widely disseminated in printed and electronic form in fiscal 2010. Following is a list of all reports and publications produced in fiscal 2009:
Left: Muddy Road Near Kampong Thom In Cambodia
Pacific Islands, Wind Energy Resource Atlas, June 2009.
Mongolia, Heating in Poor, Periurban Ger Areas of Ulaanbataar, May 2009.
China, Social Analysis of Heating Reforms, June 2009.
Pacific Islands, Coconut Oil Power Generation: A How-To Guide for Small Stationary Engines, February 2009.
China, Energy Efficiency Opportunities for the Cement Industry in China, May 2009 (in collaboration with the Lawrence Berkeley National Laboratory).
“Fiji, Feasibility Study for Biodiesel and Ethanol Use,” October 2008 (consultant report only).
“Tonga, Electric Power Grid Supply System and Load Forecast,” April 2009 (consultant report only).
“Cambodia, Assistance to the Cambodian National Biodigester Program,” June 2009 (consultant report only).
“Cambodia, Improving Manufacturing of Efficient Rural Cookstoves,” June 2009 (consultant report only).
62 3
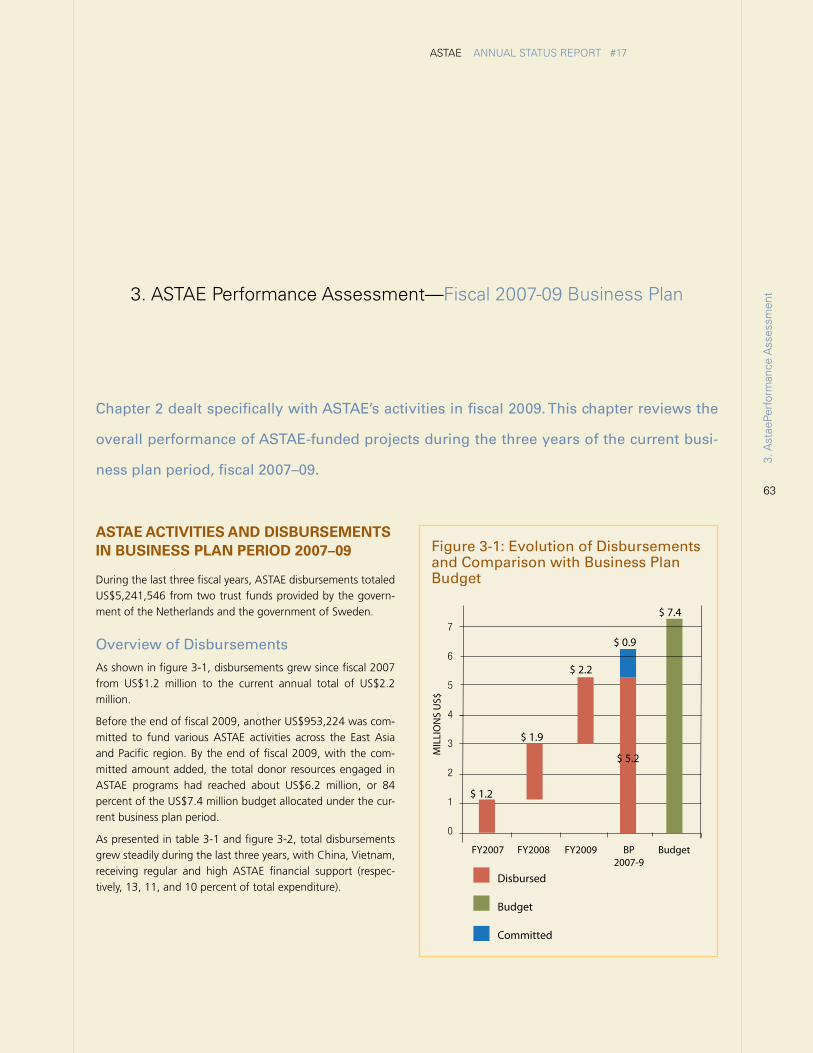
63
ASTAE ANNUAL STATUS REPORT #17
3. A
stae
Perf
orm
ance
Ass
essm
ent3. ASTAE Performance Assessment—Fiscal 2007-09 Business Plan
Chapter 2 dealt specifically with ASTAE’s activities in fiscal 2009. This chapter reviews the
overall performance of ASTAE-funded projects during the three years of the current busi-
ness plan period, fiscal 2007–09.
ASTAE ACTiviTiES ANd diSBUrSEmENTS iN BUSiNESS PLAN PEriod 2007–09
During the last three fiscal years, ASTAE disbursements totaled US$5,241,546 from two trust funds provided by the govern-ment of the Netherlands and the government of Sweden.
Overview of Disbursements
As shown in figure 3-1, disbursements grew since fiscal 2007 from US$1.2 million to the current annual total of US$2.2 million.
Before the end of fiscal 2009, another US$953,224 was com-mitted to fund various ASTAE activities across the East Asia and Pacific region. By the end of fiscal 2009, with the com-mitted amount added, the total donor resources engaged in ASTAE programs had reached about US$6.2 million, or 84 percent of the US$7.4 million budget allocated under the cur-rent business plan period.
As presented in table 3-1 and figure 3-2, total disbursements grew steadily during the last three years, with China, Vietnam, receiving regular and high ASTAE financial support (respec-tively, 13, 11, and 10 percent of total expenditure).
Figure 3-1: Evolution of Disbursements and Comparison with Business Plan Budget
Disbursed
Budget
Committed
FY2007 FY2008 FY2009 BP Budget 2007-9
MIL
LIO
NS
US$
$ 7.4
$ 0.9
$ 5.2
$ 2.2
$ 1.9
$ 1.2
7
6
5
4
3
2
1
0
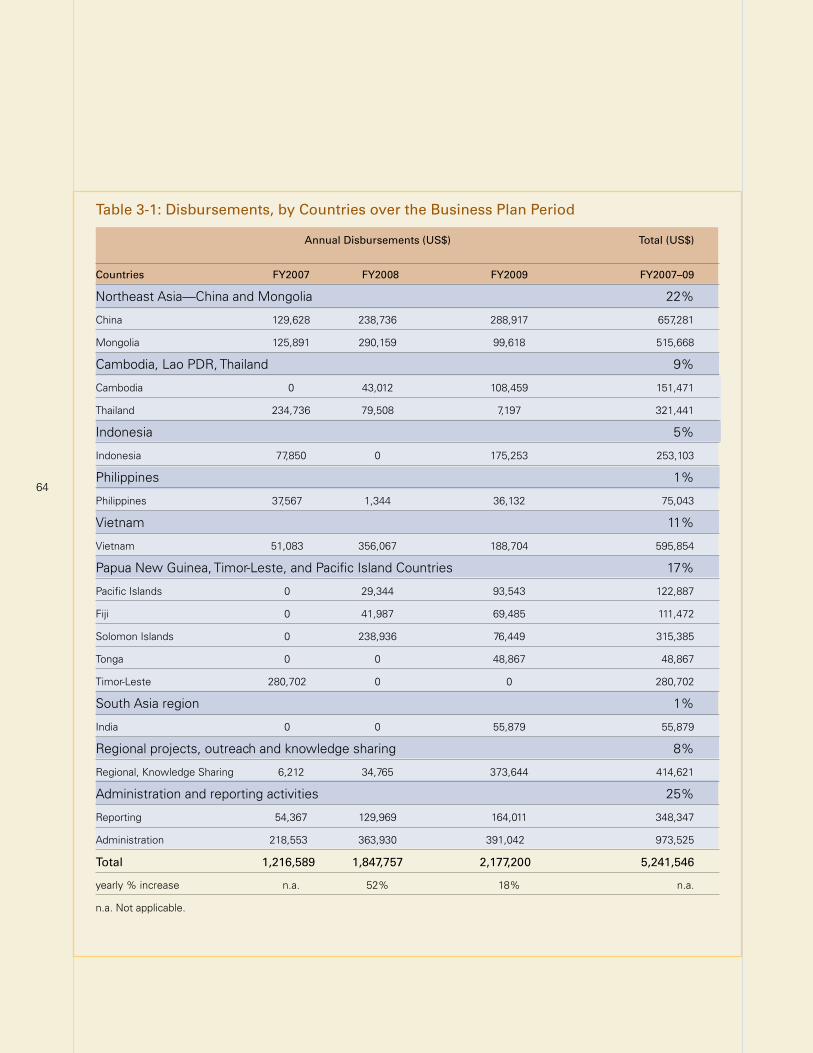
64
Table 3-1: Disbursements, by Countries over the Business Plan Period
Annual Disbursements (US$) Total (US$)
Countries FY2007 FY2008 FY2009 FY2007–09
Northeast Asia—China and Mongolia 22%
China 129,628 238,736 288,917 657,281
Mongolia 125,891 290,159 99,618 515,668
Cambodia, Lao PDR, Thailand 9%
Cambodia 0 43,012 108,459 151,471
Thailand 234,736 79,508 7,197 321,441
Indonesia 5%
Indonesia 77,850 0 175,253 253,103
Philippines 1%
Philippines 37,567 1,344 36,132 75,043
Vietnam 11%
Vietnam 51,083 356,067 188,704 595,854
Papua New Guinea, Timor-Leste, and Pacific Island Countries 17%
Pacific Islands 0 29,344 93,543 122,887
Fiji 0 41,987 69,485 111,472
Solomon Islands 0 238,936 76,449 315,385
Tonga 0 0 48,867 48,867
Timor-Leste 280,702 0 0 280,702
South Asia region 1%
India 0 0 55,879 55,879
Regional projects, outreach and knowledge sharing 8%
Regional, Knowledge Sharing 6,212 34,765 373,644 414,621
Administration and reporting activities 25%
Reporting 54,367 129,969 164,011 348,347
Administration 218,553 363,930 391,042 973,525
Total 1,216,589 1,847,757 2,177,200 5,241,546
yearly % increase n.a. 52% 18% n.a.
n.a. Not applicable.
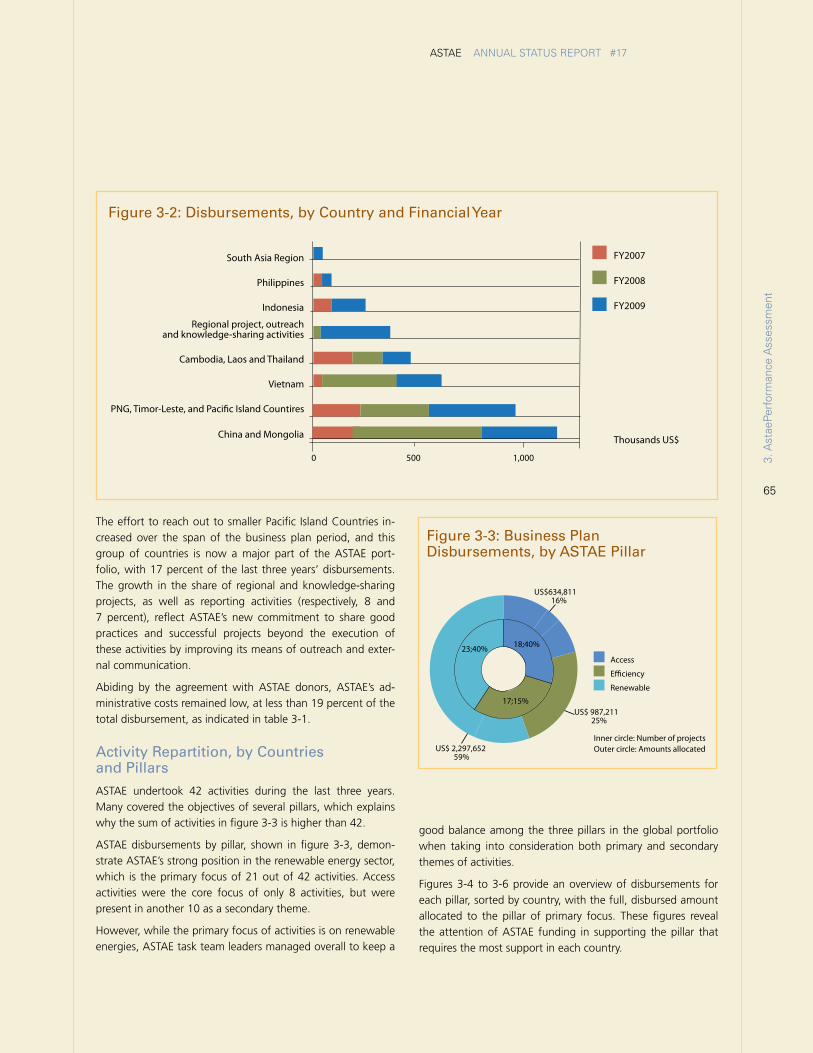
65
ASTAE ANNUAL STATUS REPORT #17
The effort to reach out to smaller Pacific Island Countries in-creased over the span of the business plan period, and this group of countries is now a major part of the ASTAE port-folio, with 17 percent of the last three years’ disbursements. The growth in the share of regional and knowledge-sharing projects, as well as reporting activities (respectively, 8 and 7 percent), reflect ASTAE’s new commitment to share good practices and successful projects beyond the execution of these activities by improving its means of outreach and exter-nal communication.
Abiding by the agreement with ASTAE donors, ASTAE’s ad-ministrative costs remained low, at less than 19 percent of the total disbursement, as indicated in table 3-1.
Activity Repartition, by Countries and Pillars
ASTAE undertook 42 activities during the last three years. Many covered the objectives of several pillars, which explains why the sum of activities in figure 3-3 is higher than 42.
ASTAE disbursements by pillar, shown in figure 3-3, demon-strate ASTAE’s strong position in the renewable energy sector, which is the primary focus of 21 out of 42 activities. Access activities were the core focus of only 8 activities, but were present in another 10 as a secondary theme.
However, while the primary focus of activities is on renewable energies, ASTAE task team leaders managed overall to keep a
Figure 3-2: Disbursements, by Country and Financial Year
FY2007
FY2008
FY2009
Thousands US$
0 500 1,000
South Asia Region
Philippines
Indonesia
Regional project, outreachand knowledge-sharing activities
Cambodia, Laos and Thailand
Vietnam
PNG, Timor-Leste, and Paci�c Island Countires
China and Mongolia
good balance among the three pillars in the global portfolio when taking into consideration both primary and secondary themes of activities.
Figures 3-4 to 3-6 provide an overview of disbursements for each pillar, sorted by country, with the full, disbursed amount allocated to the pillar of primary focus. These figures reveal the attention of ASTAE funding in supporting the pillar that requires the most support in each country.
Access
Efficiency
Renewable
23;40% 3;12%
Inner circle: Number of projects Outer circle: Amounts allocated
7;28%
US$ 2,297,652 59%
US$ 987,211 25%
US$634,811 16%
18;40%
17;15%
Figure 3-3: Business Plan Disbursements, by ASTAE Pillar
3. A
stae
Perf
orm
ance
Ass
essm
ent
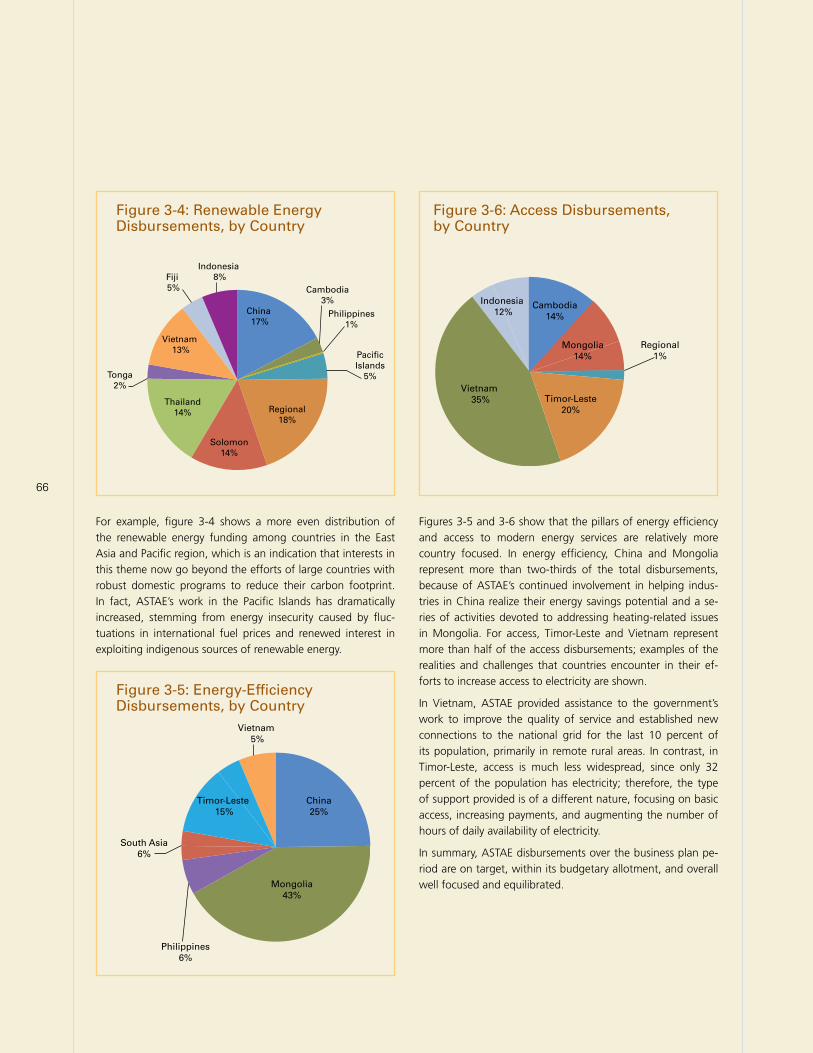
66
Cambodia3%
China 17%
Indonesia 8%Fiji
5%
Vietnam 13%
Regional18%
Thailand14%
Philippines1%
Tonga2%
PacificIslands
5%
Solomon14%
Figure 3-4: Renewable Energy Disbursements, by Country
China 17%
Vietnam 5%
Timor-Leste 15%
Mongolia43%
China25%
Philippines6%
South Asia6%
Figure 3-5: Energy-Efficiency Disbursements, by Country
For example, figure 3-4 shows a more even distribution of the renewable energy funding among countries in the East Asia and Pacific region, which is an indication that interests in this theme now go beyond the efforts of large countries with robust domestic programs to reduce their carbon footprint. In fact, ASTAE’s work in the Pacific Islands has dramatically increased, stemming from energy insecurity caused by fluc-tuations in international fuel prices and renewed interest in exploiting indigenous sources of renewable energy.
Figures 3-5 and 3-6 show that the pillars of energy efficiency and access to modern energy services are relatively more country focused. In energy efficiency, China and Mongolia represent more than two-thirds of the total disbursements, because of ASTAE’s continued involvement in helping indus-tries in China realize their energy savings potential and a se-ries of activities devoted to addressing heating-related issues in Mongolia. For access, Timor-Leste and Vietnam represent more than half of the access disbursements; examples of the realities and challenges that countries encounter in their ef-forts to increase access to electricity are shown.
In Vietnam, ASTAE provided assistance to the government’s work to improve the quality of service and established new connections to the national grid for the last 10 percent of its population, primarily in remote rural areas. In contrast, in Timor-Leste, access is much less widespread, since only 32 percent of the population has electricity; therefore, the type of support provided is of a different nature, focusing on basic access, increasing payments, and augmenting the number of hours of daily availability of electricity.
In summary, ASTAE disbursements over the business plan pe-riod are on target, within its budgetary allotment, and overall well focused and equilibrated.
Vietnam 35%
Regional1%
Indonesia 12%
Cambodia14%
Timor-Leste20%
Mongolia14%
Figure 3-6: Access Disbursements, by Country
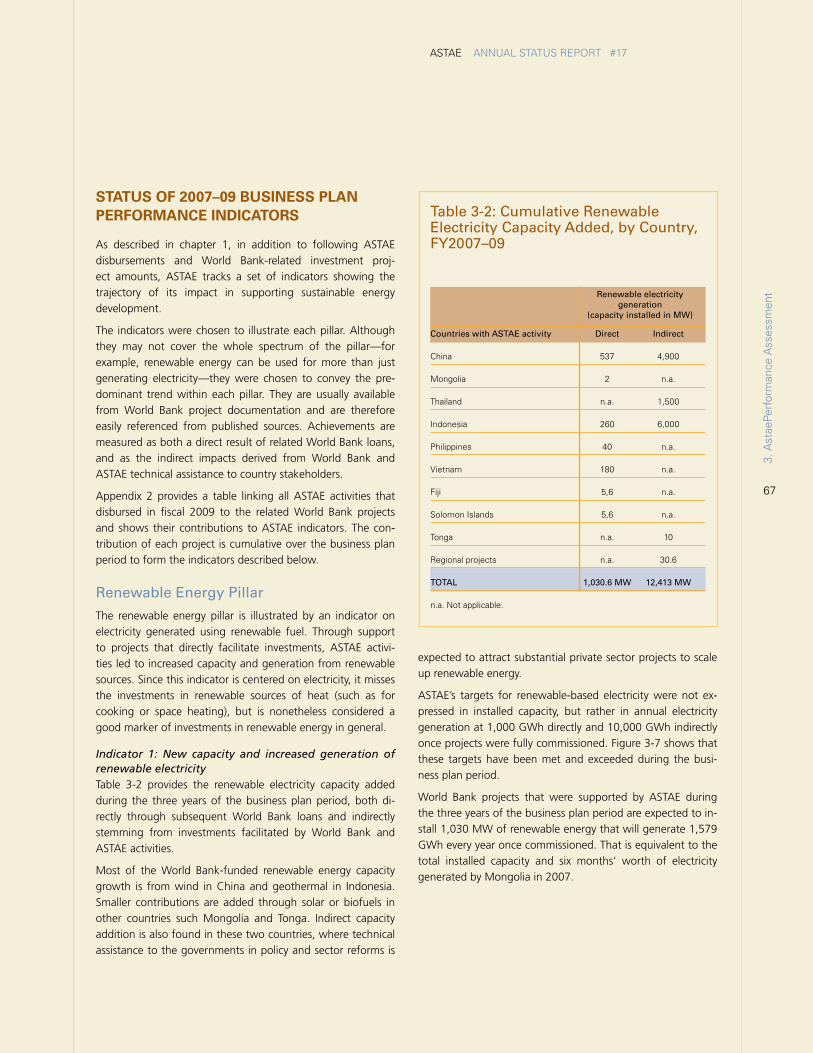
67
ASTAE ANNUAL STATUS REPORT #17
STATUS oF 2007–09 BUSiNESS PLAN PErFormANCE iNdiCATorS
As described in chapter 1, in addition to following ASTAE disbursements and World Bank-related investment proj-ect amounts, ASTAE tracks a set of indicators showing the trajectory of its impact in supporting sustainable energy development.
The indicators were chosen to illustrate each pillar. Although they may not cover the whole spectrum of the pillar—for example, renewable energy can be used for more than just generating electricity—they were chosen to convey the pre-dominant trend within each pillar. They are usually available from World Bank project documentation and are therefore easily referenced from published sources. Achievements are measured as both a direct result of related World Bank loans, and as the indirect impacts derived from World Bank and ASTAE technical assistance to country stakeholders.
Appendix 2 provides a table linking all ASTAE activities that disbursed in fiscal 2009 to the related World Bank projects and shows their contributions to ASTAE indicators. The con-tribution of each project is cumulative over the business plan period to form the indicators described below.
Renewable Energy Pillar
The renewable energy pillar is illustrated by an indicator on electricity generated using renewable fuel. Through support to projects that directly facilitate investments, ASTAE activi-ties led to increased capacity and generation from renewable sources. Since this indicator is centered on electricity, it misses the investments in renewable sources of heat (such as for cooking or space heating), but is nonetheless considered a good marker of investments in renewable energy in general.
Indicator 1: New capacity and increased generation of renewable electricityTable 3-2 provides the renewable electricity capacity added during the three years of the business plan period, both di-rectly through subsequent World Bank loans and indirectly stemming from investments facilitated by World Bank and ASTAE activities.
Most of the World Bank-funded renewable energy capacity growth is from wind in China and geothermal in Indonesia. Smaller contributions are added through solar or biofuels in other countries such Mongolia and Tonga. Indirect capacity addition is also found in these two countries, where technical assistance to the governments in policy and sector reforms is
expected to attract substantial private sector projects to scale up renewable energy.
ASTAE’s targets for renewable-based electricity were not ex-pressed in installed capacity, but rather in annual electricity generation at 1,000 GWh directly and 10,000 GWh indirectly once projects were fully commissioned. Figure 3-7 shows that these targets have been met and exceeded during the busi-ness plan period.
World Bank projects that were supported by ASTAE during the three years of the business plan period are expected to in-stall 1,030 MW of renewable energy that will generate 1,579 GWh every year once commissioned. That is equivalent to the total installed capacity and six months’ worth of electricity generated by Mongolia in 2007.
Table 3-2: Cumulative Renewable Electricity Capacity Added, by Country, FY2007–09
Countries with ASTAE activity Direct Indirect
China 537 4,900
Mongolia 2 n.a.
Thailand n.a. 1,500
Indonesia 260 6,000
Philippines 40 n.a.
Vietnam 180 n.a.
Fiji 5,6 n.a.
Solomon Islands 5,6 n.a.
Tonga n.a. 10
Regional projects n.a. 30.6
TOTAL 1,030.6 MW 12,413 MW
n.a. Not applicable.
3. A
stae
Perf
orm
ance
Ass
essm
entRenewable electricity
generation (capacity installed in MW)
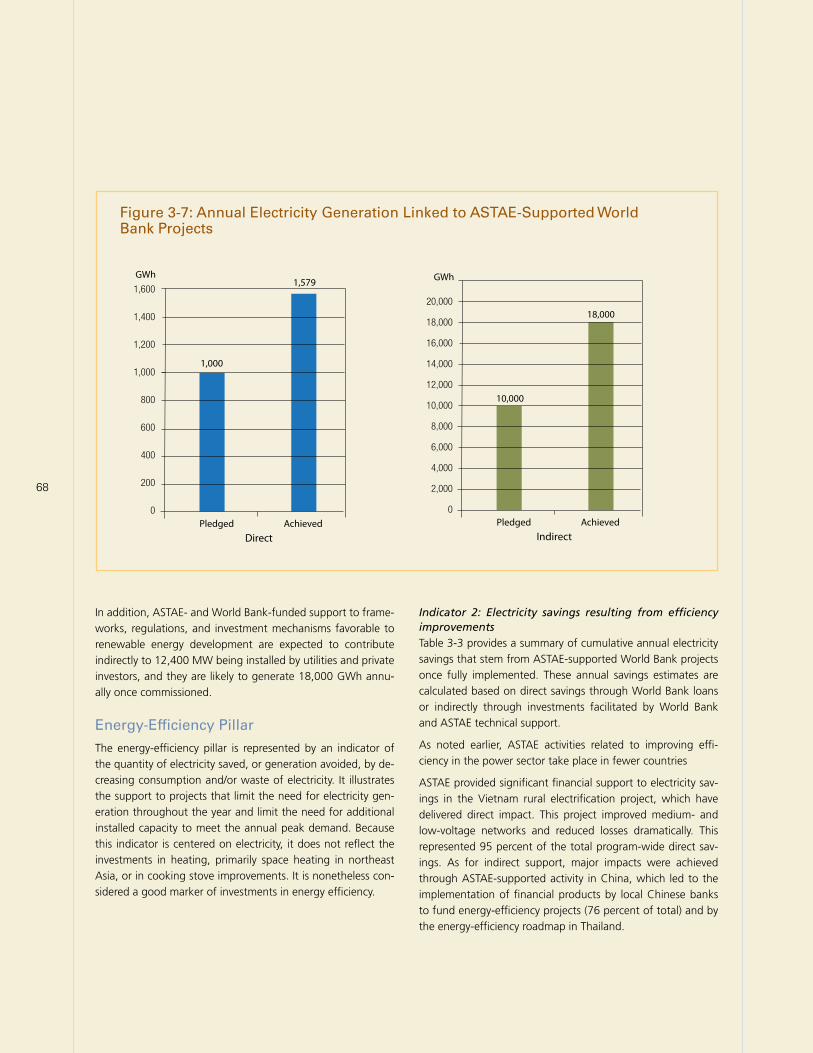
68
Figure 3-7: Annual Electricity Generation Linked to ASTAE-Supported World Bank Projects
DirectPledged Achieved
GWh
Indirect
GWh1,600
1,400
1,200
1,000
800
600
400
200
0Pledged Achieved
20,000
18,000
16,000
14,000
12,000
10,000
8,000
6,000
4,000
2,000
0
1,000
1,579
10,000
18,000
In addition, ASTAE- and World Bank-funded support to frame-works, regulations, and investment mechanisms favorable to renewable energy development are expected to contribute indirectly to 12,400 MW being installed by utilities and private investors, and they are likely to generate 18,000 GWh annu-ally once commissioned.
Energy-Efficiency Pillar
The energy-efficiency pillar is represented by an indicator of the quantity of electricity saved, or generation avoided, by de-creasing consumption and/or waste of electricity. It illustrates the support to projects that limit the need for electricity gen-eration throughout the year and limit the need for additional installed capacity to meet the annual peak demand. Because this indicator is centered on electricity, it does not reflect the investments in heating, primarily space heating in northeast Asia, or in cooking stove improvements. It is nonetheless con-sidered a good marker of investments in energy efficiency.
Indicator 2: Electricity savings resulting from efficiency improvementsTable 3-3 provides a summary of cumulative annual electricity savings that stem from ASTAE-supported World Bank projects once fully implemented. These annual savings estimates are calculated based on direct savings through World Bank loans or indirectly through investments facilitated by World Bank and ASTAE technical support.
As noted earlier, ASTAE activities related to improving effi-ciency in the power sector take place in fewer countries
ASTAE provided significant financial support to electricity sav-ings in the Vietnam rural electrification project, which have delivered direct impact. This project improved medium- and low-voltage networks and reduced losses dramatically. This represented 95 percent of the total program-wide direct sav-ings. As for indirect support, major impacts were achieved through ASTAE-supported activity in China, which led to the implementation of financial products by local Chinese banks to fund energy-efficiency projects (76 percent of total) and by the energy-efficiency roadmap in Thailand.
DirectPledged Achieved
GWh
Indirect
GWh1,600
1,400
1,200
1,000
800
600
400
200
0Pledged Achieved
20,000
18,000
16,000
14,000
12,000
10,000
8,000
6,000
4,000
2,000
0
1,000
1,579
10,000
18,000
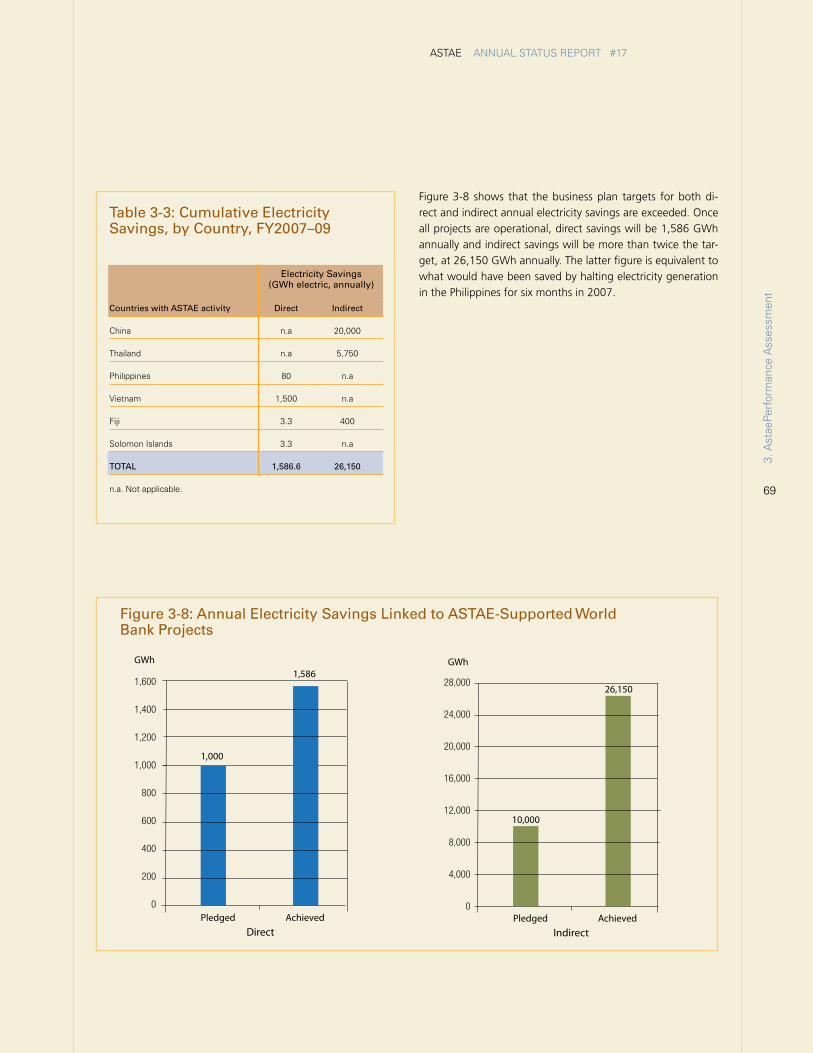
69
ASTAE ANNUAL STATUS REPORT #17
Figure 3-8 shows that the business plan targets for both di-rect and indirect annual electricity savings are exceeded. Once all projects are operational, direct savings will be 1,586 GWh annually and indirect savings will be more than twice the tar-get, at 26,150 GWh annually. The latter figure is equivalent to what would have been saved by halting electricity generation in the Philippines for six months in 2007.
Table 3-3: Cumulative Electricity Savings, by Country, FY2007–09
Countries with ASTAE activity Direct Indirect
China n.a 20,000
Thailand n.a 5,750
Philippines 80 n.a
Vietnam 1,500 n.a
Fiji 3.3 400
Solomon Islands 3.3 n.a
TOTAL 1,586.6 26,150
n.a. Not applicable.
Figure 3-8: Annual Electricity Savings Linked to ASTAE-Supported World Bank Projects
DirectPledged Achieved
Indirect
1,000
1,586
10,000
26,1501,600
1,400
1,200
1,000
800
600
400
200
0Pledged Achieved
28,000
24,000
20,000
16,000
12,000
8,000
4,000
0
GWh GWh
3. A
stae
Perf
orm
ance
Ass
essm
ent
DirectPledged Achieved
Indirect
1,000
1,586
10,000
26,1501,600
1,400
1,200
1,000
800
600
400
200
0Pledged Achieved
28,000
24,000
20,000
16,000
12,000
8,000
4,000
0
GWh GWh
Electricity Savings(GWh electric, annually)
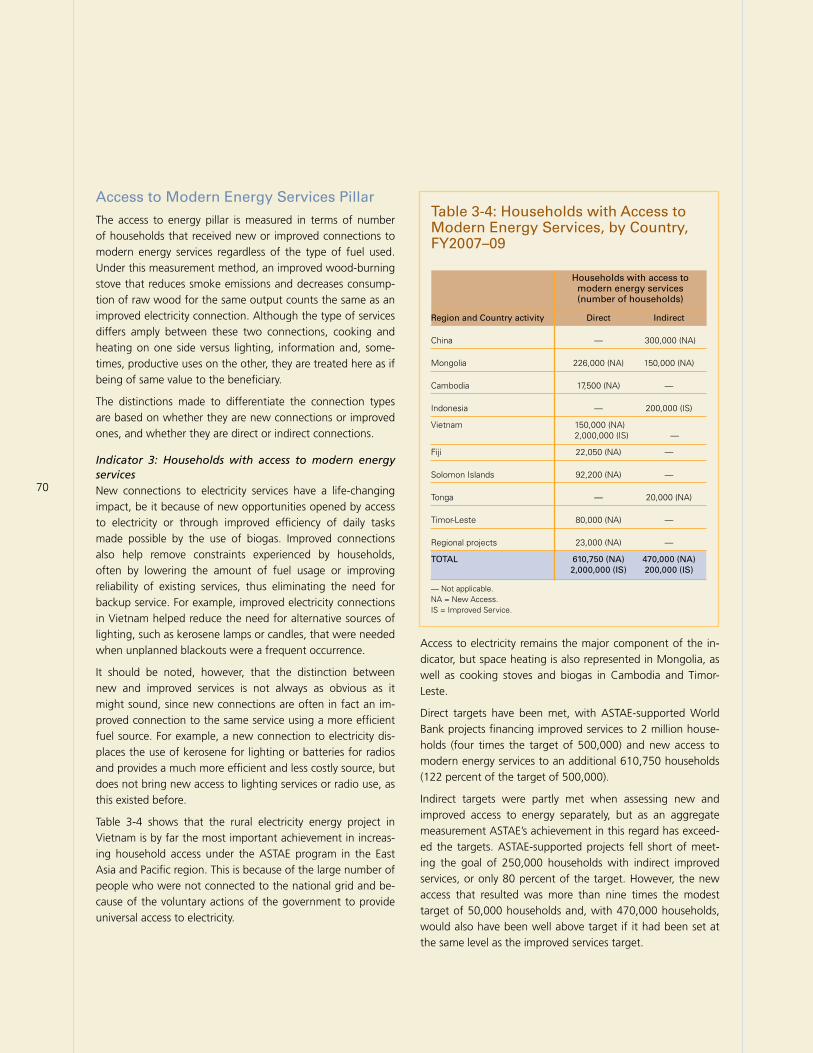
70
Access to Modern Energy Services Pillar
The access to energy pillar is measured in terms of number of households that received new or improved connections to modern energy services regardless of the type of fuel used. Under this measurement method, an improved wood-burning stove that reduces smoke emissions and decreases consump-tion of raw wood for the same output counts the same as an improved electricity connection. Although the type of services differs amply between these two connections, cooking and heating on one side versus lighting, information and, some-times, productive uses on the other, they are treated here as if being of same value to the beneficiary.
The distinctions made to differentiate the connection types are based on whether they are new connections or improved ones, and whether they are direct or indirect connections.
Indicator 3: Households with access to modern energy servicesNew connections to electricity services have a life-changing impact, be it because of new opportunities opened by access to electricity or through improved efficiency of daily tasks made possible by the use of biogas. Improved connections also help remove constraints experienced by households, often by lowering the amount of fuel usage or improving reliability of existing services, thus eliminating the need for backup service. For example, improved electricity connections in Vietnam helped reduce the need for alternative sources of lighting, such as kerosene lamps or candles, that were needed when unplanned blackouts were a frequent occurrence.
It should be noted, however, that the distinction between new and improved services is not always as obvious as it might sound, since new connections are often in fact an im-proved connection to the same service using a more efficient fuel source. For example, a new connection to electricity dis-places the use of kerosene for lighting or batteries for radios and provides a much more efficient and less costly source, but does not bring new access to lighting services or radio use, as this existed before.
Table 3-4 shows that the rural electricity energy project in Vietnam is by far the most important achievement in increas-ing household access under the ASTAE program in the East Asia and Pacific region. This is because of the large number of people who were not connected to the national grid and be-cause of the voluntary actions of the government to provide universal access to electricity.
Access to electricity remains the major component of the in-dicator, but space heating is also represented in Mongolia, as well as cooking stoves and biogas in Cambodia and Timor-Leste.
Direct targets have been met, with ASTAE-supported World Bank projects financing improved services to 2 million house-holds (four times the target of 500,000) and new access to modern energy services to an additional 610,750 households (122 percent of the target of 500,000).
Indirect targets were partly met when assessing new and improved access to energy separately, but as an aggregate measurement ASTAE’s achievement in this regard has exceed-ed the targets. ASTAE-supported projects fell short of meet-ing the goal of 250,000 households with indirect improved services, or only 80 percent of the target. However, the new access that resulted was more than nine times the modest target of 50,000 households and, with 470,000 households, would also have been well above target if it had been set at the same level as the improved services target.
Table 3-4: Households with Access to Modern Energy Services, by Country, FY2007–09
Region and Country activity Direct Indirect
China — 300,000 (NA)
Mongolia 226,000 (NA) 150,000 (NA)
Cambodia 17,500 (NA) —
Indonesia — 200,000 (IS)
Vietnam 150,000 (NA) 2,000,000 (IS) —
Fiji 22,050 (NA) —
Solomon Islands 92,200 (NA) —
Tonga — 20,000 (NA)
Timor-Leste 80,000 (NA) —
Regional projects 23,000 (NA) —
TOTAL 610,750 (NA) 470,000 (NA) 2,000,000 (IS) 200,000 (IS)
— Not applicable.NA = New Access.IS = Improved Service.
Households with access to modern energy services(number of households)
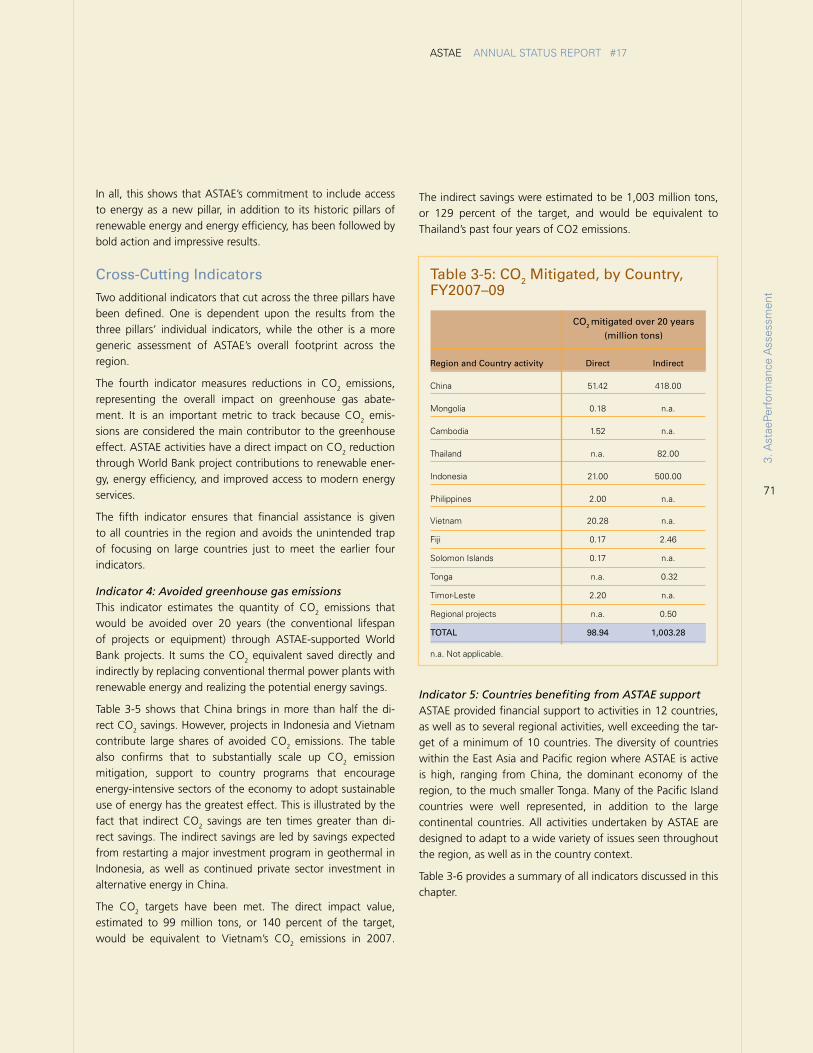
71
ASTAE ANNUAL STATUS REPORT #17
In all, this shows that ASTAE’s commitment to include access to energy as a new pillar, in addition to its historic pillars of renewable energy and energy efficiency, has been followed by bold action and impressive results.
Cross-Cutting Indicators
Two additional indicators that cut across the three pillars have been defined. One is dependent upon the results from the three pillars’ individual indicators, while the other is a more generic assessment of ASTAE’s overall footprint across the region.
The fourth indicator measures reductions in CO2 emissions, representing the overall impact on greenhouse gas abate-ment. It is an important metric to track because CO2 emis-sions are considered the main contributor to the greenhouse effect. ASTAE activities have a direct impact on CO2 reduction through World Bank project contributions to renewable ener-gy, energy efficiency, and improved access to modern energy services.
The fifth indicator ensures that financial assistance is given to all countries in the region and avoids the unintended trap of focusing on large countries just to meet the earlier four indicators.
Indicator 4: Avoided greenhouse gas emissionsThis indicator estimates the quantity of CO2 emissions that would be avoided over 20 years (the conventional lifespan of projects or equipment) through ASTAE-supported World Bank projects. It sums the CO2 equivalent saved directly and indirectly by replacing conventional thermal power plants with renewable energy and realizing the potential energy savings.
Table 3-5 shows that China brings in more than half the di-rect CO2 savings. However, projects in Indonesia and Vietnam contribute large shares of avoided CO2 emissions. The table also confirms that to substantially scale up CO2 emission mitigation, support to country programs that encourage energy-intensive sectors of the economy to adopt sustainable use of energy has the greatest effect. This is illustrated by the fact that indirect CO2 savings are ten times greater than di-rect savings. The indirect savings are led by savings expected from restarting a major investment program in geothermal in Indonesia, as well as continued private sector investment in alternative energy in China.
The CO2 targets have been met. The direct impact value, estimated to 99 million tons, or 140 percent of the target, would be equivalent to Vietnam’s CO2 emissions in 2007.
The indirect savings were estimated to be 1,003 million tons, or 129 percent of the target, and would be equivalent to Thailand’s past four years of CO2 emissions.
Indicator 5: Countries benefiting from ASTAE supportASTAE provided financial support to activities in 12 countries, as well as to several regional activities, well exceeding the tar-get of a minimum of 10 countries. The diversity of countries within the East Asia and Pacific region where ASTAE is active is high, ranging from China, the dominant economy of the region, to the much smaller Tonga. Many of the Pacific Island countries were well represented, in addition to the large continental countries. All activities undertaken by ASTAE are designed to adapt to a wide variety of issues seen throughout the region, as well as in the country context.
Table 3-6 provides a summary of all indicators discussed in this chapter.
Table 3-5: CO2 Mitigated, by Country, FY2007–09
Region and Country activity Direct Indirect
China 51.42 418.00
Mongolia 0.18 n.a.
Cambodia 1.52 n.a.
Thailand n.a. 82.00
Indonesia 21.00 500.00
Philippines 2.00 n.a.
Vietnam 20.28 n.a.
Fiji 0.17 2.46
Solomon Islands 0.17 n.a.
Tonga n.a. 0.32
Timor-Leste 2.20 n.a.
Regional projects n.a. 0.50
TOTAL 98.94 1,003.28
n.a. Not applicable.
3. A
stae
Perf
orm
ance
Ass
essm
ent
CO2 mitigated over 20 years
(million tons)
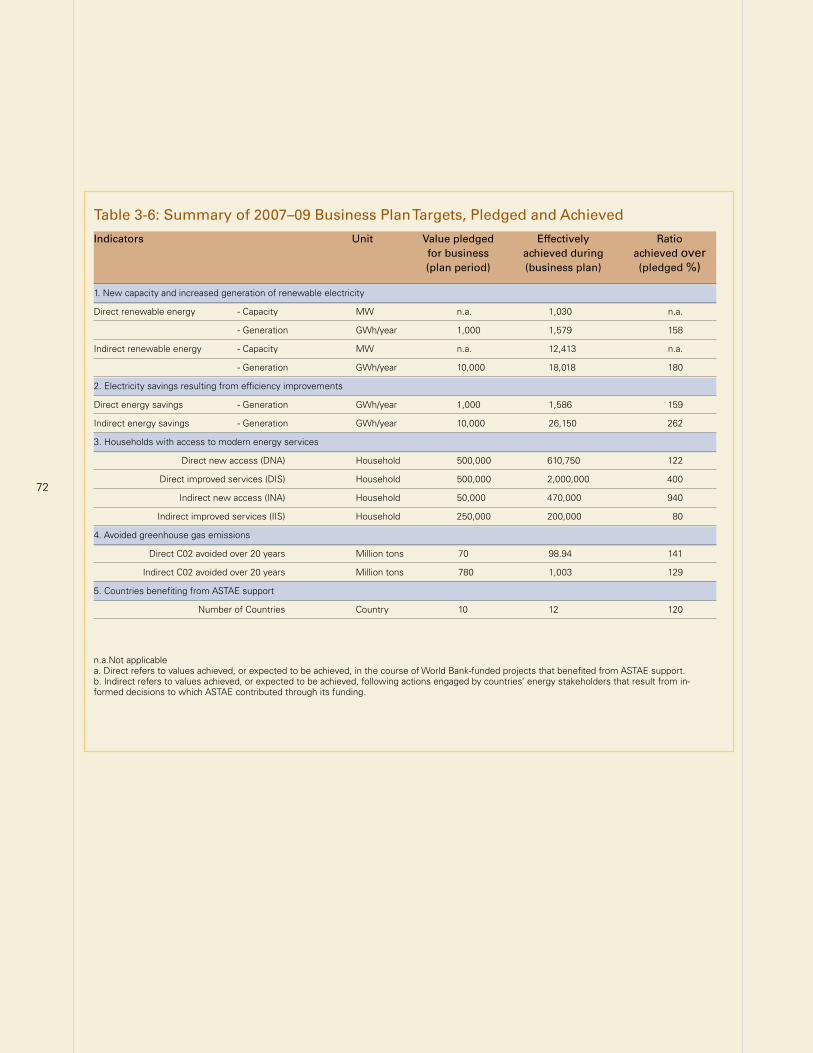
72
Table 3-6: Summary of 2007–09 Business Plan Targets, Pledged and Achieved
Indicators Unit Value pledged Effectively Ratio for business achieved during achieved over (plan period) (business plan) (pledged %)
1. New capacity and increased generation of renewable electricity
Direct renewable energy - Capacity MW n.a. 1,030 n.a.
- Generation GWh/year 1,000 1,579 158
Indirect renewable energy - Capacity MW n.a. 12,413 n.a.
- Generation GWh/year 10,000 18,018 180
2. Electricity savings resulting from efficiency improvements
Direct energy savings - Generation GWh/year 1,000 1,586 159
Indirect energy savings - Generation GWh/year 10,000 26,150 262
3. Households with access to modern energy services
Direct new access (DNA) Household 500,000 610,750 122
Direct improved services (DIS) Household 500,000 2,000,000 400
Indirect new access (INA) Household 50,000 470,000 940
Indirect improved services (IIS) Household 250,000 200,000 80
4. Avoided greenhouse gas emissions
Direct C02 avoided over 20 years Million tons 70 98.94 141
Indirect C02 avoided over 20 years Million tons 780 1,003 129
5. Countries benefiting from ASTAE support
Number of Countries Country 10 12 120
n.a.Not applicablea. Direct refers to values achieved, or expected to be achieved, in the course of World Bank-funded projects that benefited from ASTAE support.b. Indirect refers to values achieved, or expected to be achieved, following actions engaged by countries’ energy stakeholders that result from in-formed decisions to which ASTAE contributed through its funding.
73
ASTAE ANNUAL STATUS REPORT #17
3. A
stae
Perf
orm
ance
Ass
essm
ent
74 4
75
ASTAE ANNUAL STATUS REPORT #17
4. Outlook for Fiscal 2010 and Beyond
In preparation for fiscal 2010, ASTAE kept a steady pace with proposal approval and imple-
mentation to cover all pillars. Renewable energy is covered by support to biogas in Cambo-
dia and small hydropower in the Solomon Islands, energy efficiency is present through an
assessment of current measures in Indonesia, and access is supported in Timor-Leste.
ASTAE iNdiCATivE PiPELiNE For FiSCAL 2010
In preparation for fiscal 2010, ASTAE kept a steady pace with proposal approval and implementation to cover all pil-lars. Renewable energy is covered by support to biogas in Cambodia and small hydropower in the Solomon Islands, energy efficiency is present through an assessment of current measures in Indonesia, and access is supported in Timor-Leste.
In addition, two proposals were approved to continue devel-oping feedback and lessons learned from World Bank projects that benefited from ASTAE support in Lao PDR and Mongolia. ASTAE commitment to continue supporting smaller countries, including the Pacific Islands, is also confirmed in this early fis-cal 2010 program.
The next few paragraphs provide an overview of the projects approved in fiscal 2010 to date.
Lao PDR: Lessons Learned from the National Electrification Program
During the past two decades, Lao PDR has made remarkable progress in increasing its electrification rate, from 16 percent in 1995 to more than 60 percent in 2006. This dramatic
growth in electrification was achieved despite Lao PDR’s status as one of the poorest countries in the world, with an annual gross national income per capita of about US$760 and a low-density population that is three-quarters rural.
Cambodia: National Biodigester Private Sector Development—Phase II
This activity follows on earlier ASTAE support of the first phase of this project detailed in chapter 2. Given its success in developing a service delivery model for biodigester construc-tion, both from the business and regulatory perspective, and in implementing it in three test provinces, ASTAE decided to provide funding to strengthen and expand the initiative.
Phase II of the biodigester program will follow a similar meth-odology to that of Phase I, but will target scaling up. Masons will be identified as part of a process to select high-potential entrepreneurs, and they will be provided intensive training and mentoring in business skills. The selected masons will receive assistance for official business registration to permit compa-nies to enter into legal contracts with customers, and they will be supported with finalizing three-party franchise agreements
4. O
utlo
ok fo
r Fi
scal
201
0 an
d B
eyon
d
76
among the National Biodigester Program, Biodigester Construction Companies, and the Provincial Biodigester Program offices.
The targeted indicators are to establish 30 new companies in two years and obtain a rate of sustainability of 90 percent for the companies created. Lessons learned from the expansion of microfranchise delivery models in Cambodia will also be an input to the development of rural energy service delivery proj-ects in Cambodia and Lao PDR.
Solomon Islands: Support to Tina River Hydropower
As described in chapter 2, following the restructuring of the Sustainable Energy Project, the Bank decided to support the development of the proposed Tina River Hydropower Project by the private sector rather than the government. The aim was to develop the complete scheme (about 10 MW) to pro-vide power to Honiara, capital of the Solomon Islands, under design, build, operate, maintain, and transfer principles.
The immediate result of the project would be replacement of the current, very expensive, diesel-driven generation, leading to increased access to cheap and renewable energy, which would lead to improving the country’s foreign exchange re-serves because fuel imports would decrease significantly, and to supporting development of the private sector by using it to develop, operate, and maintain the hydropower scheme. Over the long term, this would help the Solomon Islands Electricity Authority become more efficient, as finances would become available to sustain the maintenance of the existing infrastruc-ture and increase access.
ASTAE support will assist the Solomon Islands with the overall preparation and implementation of the hydropower scheme by giving the task force access to expert advice. This would include review of the Feasibility Study and Environmental and Resettlement Action Plans, assistance with the procure-ment process, in particular, development of the draft Power Purchase Agreement, negotiations with the successful bidder, and assistance with stakeholder consultations. In addition, short-term assistance may be required from time to time to help ensure that the government is in a stronger position to negotiate and close on a fair power purchase agreement. This ASTAE activity will facilitate the development of an IDA- and donor-financed project.
Mongolia: Energy Project Documentary
Mongolia faces the critical challenge of improving efficiency performance of existing distribution assets, some of which have up to 50 percent electricity losses. The World Bank is supporting this effort through the Mongolia Energy Project (US$30 million IDA), which focuses its efforts on the capital city’s distribution company (UBEDN) and on six additional pro-vincial utilities. The project is under implementation and has had positive results, with a steady decline of losses from a 50 percent maximum in some utilities to 15 percent over a period of two years.
ASTAE has supported the project during both the identifica-tion and implementation stages by procuring services to as-sess and supervise proposed technical and commercial loss reduction programs in selected electricity distribution utilities; following up by organizing and coordinating with national and regional stakeholders to develop consensus for policy improvements, best practices, and knowledge dissemination; and finally by providing contingent advice on both technical and commercial practices and policies.
ASTAE created a documentary to showcase the achievements of the World Bank Energy Project that focused on three cen-tral themes:
• Reduction of electricity system losses and improvementof service reliability in electricity distribution in Ulaanbaatar and selected provincial centers
• Improvementinrevenuecollectionsintheelectricitydis-tribution system
• Achievements in building up institutional capacity tomove toward a more commercial and market-based energy sector.
The TV-ready, 26-minute, high-resolution documentary, presents this success story and will be disseminated to a wide international audience. The printed material consists of a booklet with high-quality images summing up the main achievements. Wide distribution of the documentary is pro-posed. It will be shown on the national television network and made available worldwide, as is will the report, booklet, and DVD products, which will be distributed at international con-ferences and seminars, and electronically on the Web through the World Bank and ASTAE Web sites and YouTube.
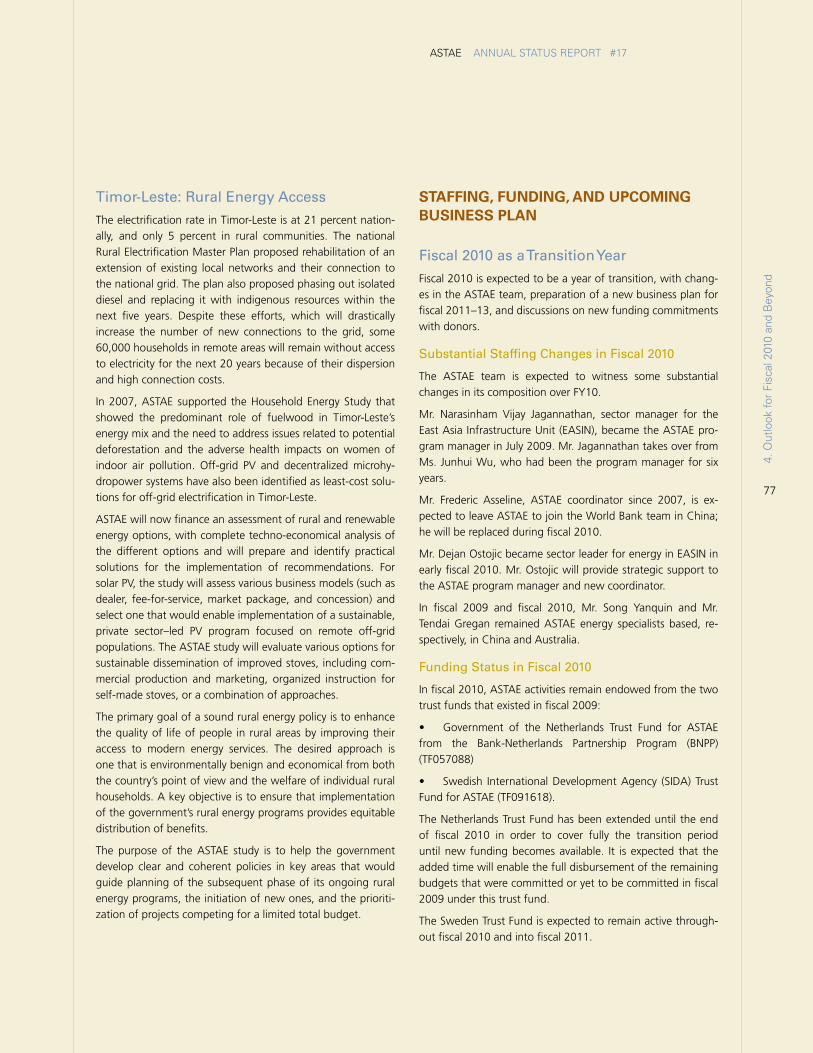
77
ASTAE ANNUAL STATUS REPORT #17
Timor-Leste: Rural Energy Access
The electrification rate in Timor-Leste is at 21 percent nation-ally, and only 5 percent in rural communities. The national Rural Electrification Master Plan proposed rehabilitation of an extension of existing local networks and their connection to the national grid. The plan also proposed phasing out isolated diesel and replacing it with indigenous resources within the next five years. Despite these efforts, which will drastically increase the number of new connections to the grid, some 60,000 households in remote areas will remain without access to electricity for the next 20 years because of their dispersion and high connection costs.
In 2007, ASTAE supported the Household Energy Study that showed the predominant role of fuelwood in Timor-Leste’s energy mix and the need to address issues related to potential deforestation and the adverse health impacts on women of indoor air pollution. Off-grid PV and decentralized microhy-dropower systems have also been identified as least-cost solu-tions for off-grid electrification in Timor-Leste.
ASTAE will now finance an assessment of rural and renewable energy options, with complete techno-economical analysis of the different options and will prepare and identify practical solutions for the implementation of recommendations. For solar PV, the study will assess various business models (such as dealer, fee-for-service, market package, and concession) and select one that would enable implementation of a sustainable, private sector–led PV program focused on remote off-grid populations. The ASTAE study will evaluate various options for sustainable dissemination of improved stoves, including com-mercial production and marketing, organized instruction for self-made stoves, or a combination of approaches.
The primary goal of a sound rural energy policy is to enhance the quality of life of people in rural areas by improving their access to modern energy services. The desired approach is one that is environmentally benign and economical from both the country’s point of view and the welfare of individual rural households. A key objective is to ensure that implementation of the government’s rural energy programs provides equitable distribution of benefits.
The purpose of the ASTAE study is to help the government develop clear and coherent policies in key areas that would guide planning of the subsequent phase of its ongoing rural energy programs, the initiation of new ones, and the prioriti-zation of projects competing for a limited total budget.
STAFFiNG, FUNdiNG, ANd UPComiNG BUSiNESS PLAN
Fiscal 2010 as a Transition Year
Fiscal 2010 is expected to be a year of transition, with chang-es in the ASTAE team, preparation of a new business plan for fiscal 2011–13, and discussions on new funding commitments with donors.
Substantial Staffing Changes in Fiscal 2010
The ASTAE team is expected to witness some substantial changes in its composition over FY10.
Mr. Narasinham Vijay Jagannathan, sector manager for the East Asia Infrastructure Unit (EASIN), became the ASTAE pro-gram manager in July 2009. Mr. Jagannathan takes over from Ms. Junhui Wu, who had been the program manager for six years.
Mr. Frederic Asseline, ASTAE coordinator since 2007, is ex-pected to leave ASTAE to join the World Bank team in China; he will be replaced during fiscal 2010.
Mr. Dejan Ostojic became sector leader for energy in EASIN in early fiscal 2010. Mr. Ostojic will provide strategic support to the ASTAE program manager and new coordinator.
In fiscal 2009 and fiscal 2010, Mr. Song Yanquin and Mr. Tendai Gregan remained ASTAE energy specialists based, re-spectively, in China and Australia.
Funding Status in Fiscal 2010
In fiscal 2010, ASTAE activities remain endowed from the two trust funds that existed in fiscal 2009:
• Government of the Netherlands Trust Fund for ASTAEfrom the Bank-Netherlands Partnership Program (BNPP) (TF057088)
• Swedish InternationalDevelopmentAgency (SIDA)TrustFund for ASTAE (TF091618).
The Netherlands Trust Fund has been extended until the end of fiscal 2010 in order to cover fully the transition period until new funding becomes available. It is expected that the added time will enable the full disbursement of the remaining budgets that were committed or yet to be committed in fiscal 2009 under this trust fund.
The Sweden Trust Fund is expected to remain active through-out fiscal 2010 and into fiscal 2011.
4. O
utlo
ok fo
r Fi
scal
201
0 an
d B
eyon
d
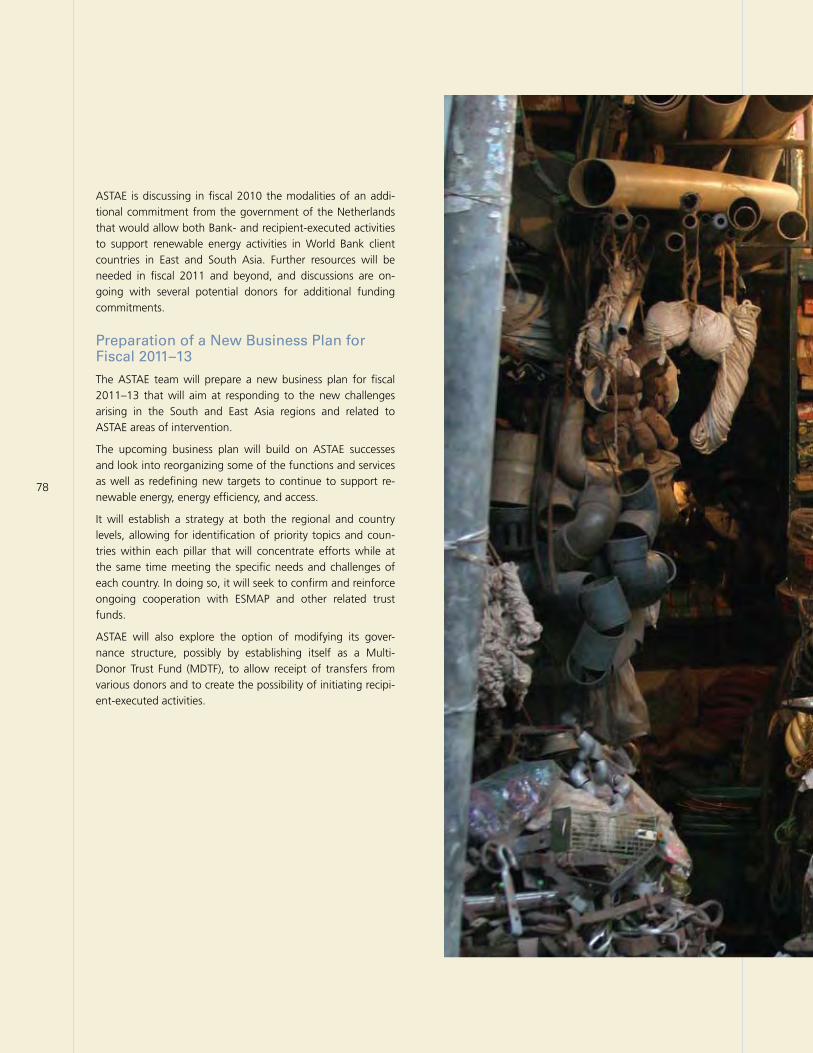
78
ASTAE is discussing in fiscal 2010 the modalities of an addi-tional commitment from the government of the Netherlands that would allow both Bank- and recipient-executed activities to support renewable energy activities in World Bank client countries in East and South Asia. Further resources will be needed in fiscal 2011 and beyond, and discussions are on-going with several potential donors for additional funding commitments.
Preparation of a New Business Plan for Fiscal 2011–13
The ASTAE team will prepare a new business plan for fiscal 2011–13 that will aim at responding to the new challenges arising in the South and East Asia regions and related to ASTAE areas of intervention.
The upcoming business plan will build on ASTAE successes and look into reorganizing some of the functions and services as well as redefining new targets to continue to support re-newable energy, energy efficiency, and access.
It will establish a strategy at both the regional and country levels, allowing for identification of priority topics and coun-tries within each pillar that will concentrate efforts while at the same time meeting the specific needs and challenges of each country. In doing so, it will seek to confirm and reinforce ongoing cooperation with ESMAP and other related trust funds.
ASTAE will also explore the option of modifying its gover-nance structure, possibly by establishing itself as a Multi-Donor Trust Fund (MDTF), to allow receipt of transfers from various donors and to create the possibility of initiating recipi-ent-executed activities.
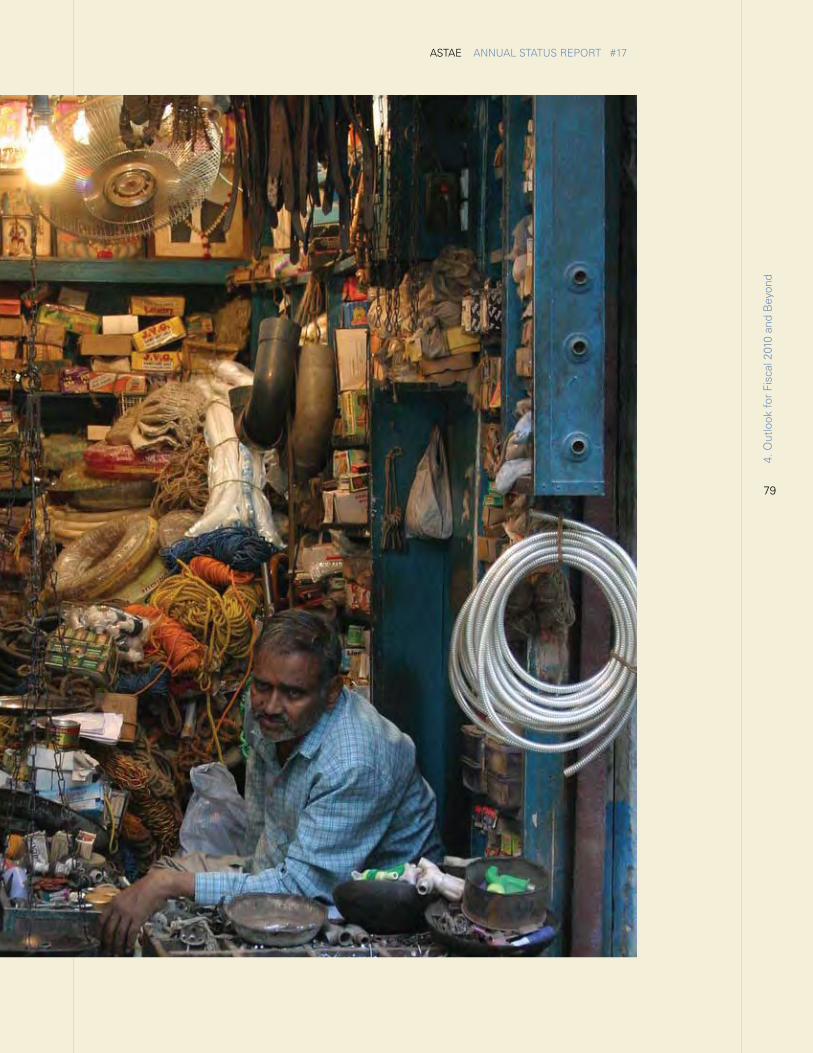
79
ASTAE ANNUAL STATUS REPORT #17
4. O
utlo
ok fo
r Fi
scal
201
0 an
d B
eyon
d
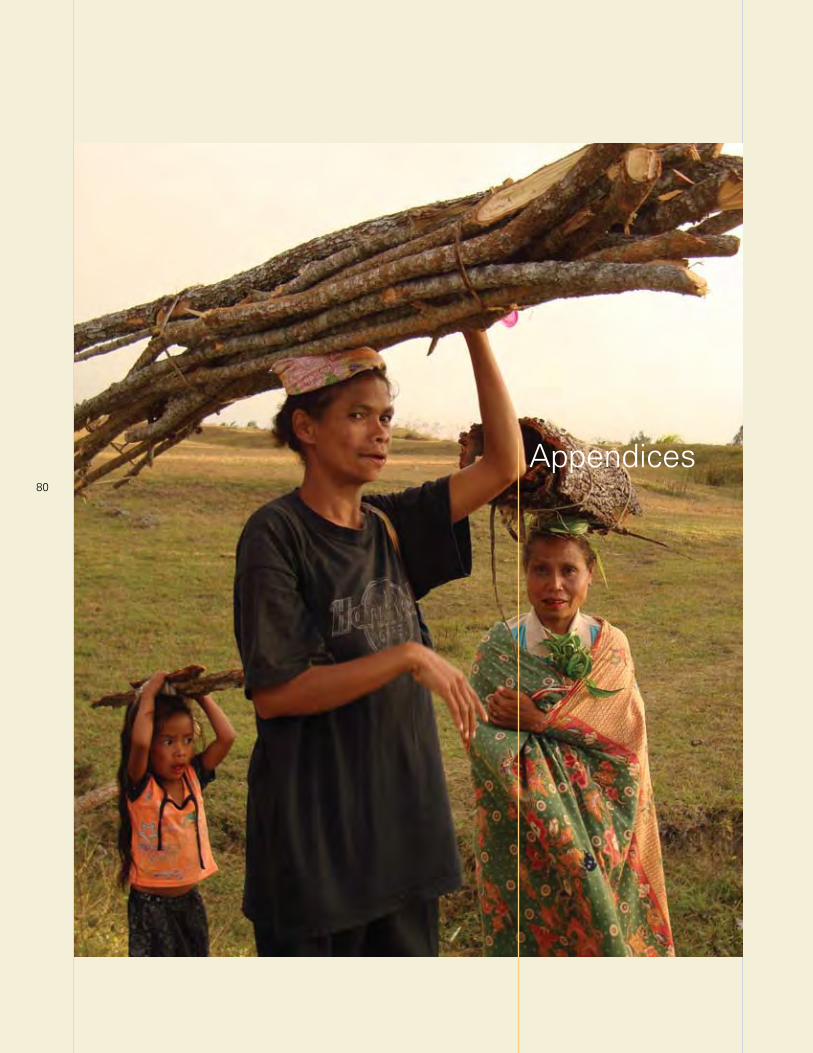
80
Appendices
81
ASTAE ANNUAL STATUS REPORT #17
App
endi
ces
Appendices to Annual Status Report
APPENdix 1
ASTAE CoUNTriES AT A GLANCE, rEGioN mAP, ANd PiLLAr-rELATEd STATiSTiCS
APPENdix 2
LiNKS BETWEEN BANK ProjECTS ANd ASTAE iNdiCATorS iN FiSCAL 2009
APPENdix 3
ASTAE doNorS, rESoUrCE UTiLizATioN, ANd FUNdiNG EvENTS
APPENdix 4
ASTAE-SUPPorTEd WorLd BANK iNvESTmENT ProjECTS iN EAST ASiA ANd ThE PACiFiC
82
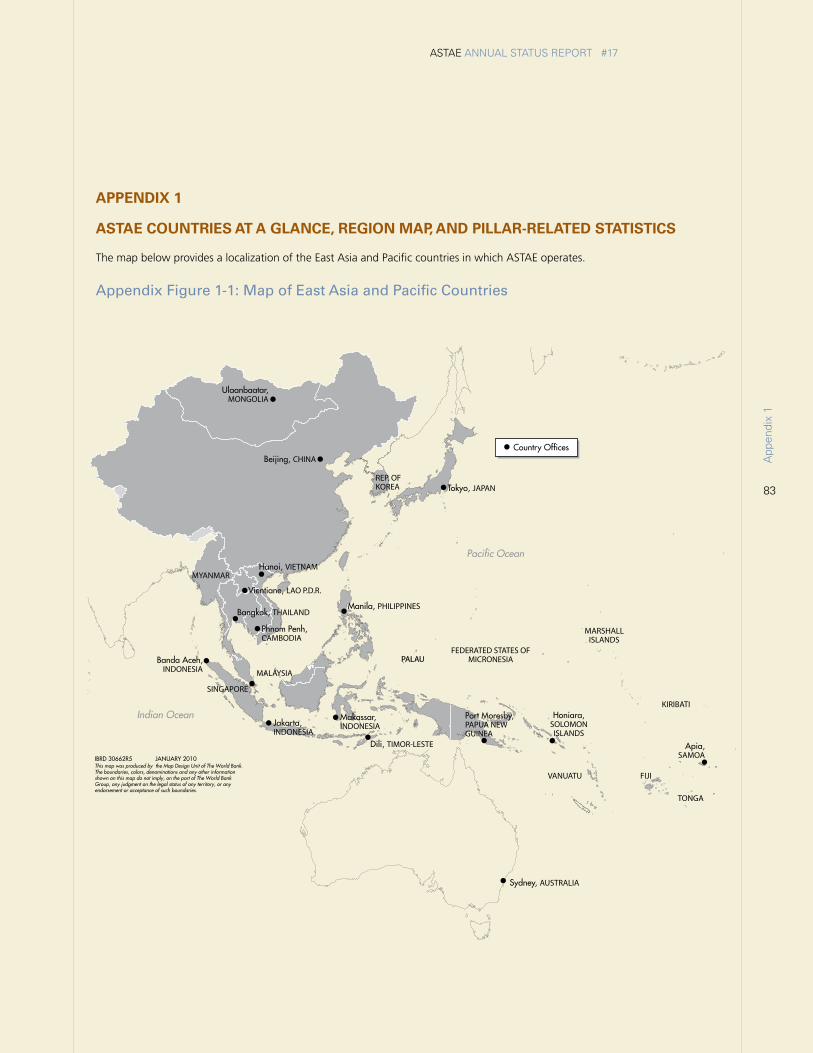
83
ASTAE ANNUAL STATUS REPORT #17
App
endi
x 1
APPENdix 1
ASTAE CoUNTriES AT A GLANCE, rEGioN mAP, ANd PiLLAr-rELATEd STATiSTiCS
The map below provides a localization of the East Asia and Pacific countries in which ASTAE operates.
Appendix Figure 1-1: Map of East Asia and Pacific Countries
Pacific Ocean
Indian Ocean
This map was produced by the Map Design Unit of The World Bank. The boundaries, colors, denominations and any other informationshown on this map do not imply, on the part of The World BankGroup, any judgment on the legal status of any territory, or anyendorsement or acceptance of such boundaries.
IBRD 30662R5 JANUARY 2010
Ulaanbaatar,MONGOLIA
Beijing, CHINA
Phnom Penh,CAMBODIA
Hanoi, VIETNAM
Vientiane, LAO P.D.R.
Bangkok, THAILAND
MYANMAR
MALAYSIA
Manila, PHILIPPINES
Tokyo, JAPAN
Jakarta,INDONESIA
Makassar,INDONESIA
Banda Aceh,INDONESIA
Port Moresby,PAPUA NEWGUINEA
Honiara,SOLOMONISLANDS
VANUATU FIJI
KIRIBATI
FEDERATED STATES OFMICRONESIAPALAU
Apia,SAMOA
TONGA
REP. OFKOREA
SINGAPORE
Dili, TIMOR-LESTE
Country Offices
MARSHALLISLANDS
Sydney, AUSTRALIA
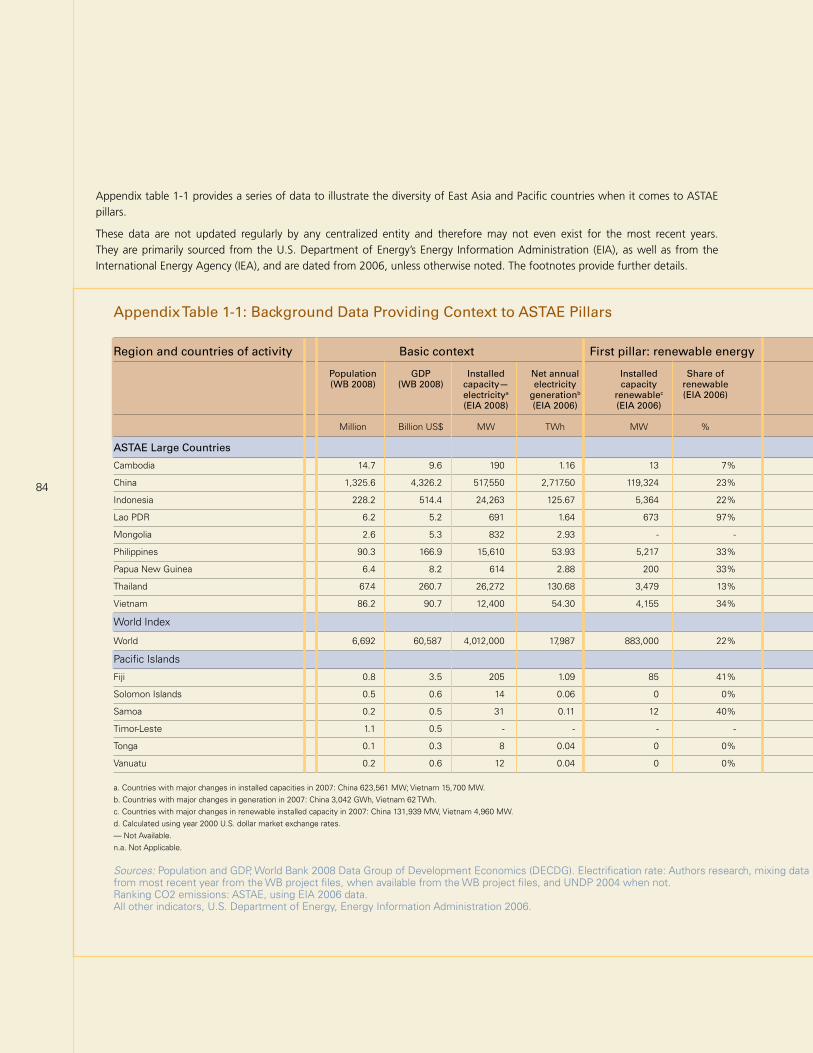
Appendix Table 1-1: Background Data Providing Context to ASTAE Pillars
Region and countries of activity Basic context First pillar: renewable energy Second pillar: energy efficiency Third pillar: access Greenhouse gas emissions Population GDP Installed Net annual Installed Share of Economy Power systems Population Electrification Annual energy-related CO2 Annual per capita energy (WB 2008) (WB 2008) capacity— electricity capacity renewable emission emission without rate emssion and ranking related CO2 emission electricitya generationb renewablec (EIA 2006) intensity intensity electricity (multiple sources) (EIA 2006) and ranking (EIA 2006) (EIA 2008) (EIA 2006) (EIA 2006) (EIA 2006) (EIA 2006) (2008) Million Billion US$ MW TWh MW % tCO2/US$1,000 GDPd tCO2/MWh Million % Million tons 189 countries Tons/capita 189 countries
ASTAE Large Countries
Cambodia 14.7 9.6 190 1.16 13 7% 0.10 1.00 12.1 18% 0.7 165 0.05 183
China 1,325.6 4,326.2 517,550 2,717.50 119,324 23% 2.85 0.79 13.3 99% 6,017.7 1 4.58 7.0
Indonesia 228.2 514.4 24,263 125.67 5,364 22% 1.28 0.68 75.3 67% 280.4 21 1.21 120
Lao PDR 6.2 5.2 691 1.64 673 97% 0.23 - 2.3 63% 0.6 168 0.09 174
Mongolia 2.6 5.3 832 2.93 - - 5.79 0.52 0.9 65% 8.5 100 2.91 96
Philippines 90.3 166.9 15,610 53.93 5,217 33% 0.73 0.44 13.5 85% 72.4 45 0.81 137
Papua New Guinea 6.4 8.2 614 2.88 200 33% 1.19 - 5.8 9% 4.7 121 0.82 136
Thailand 67.4 260.7 26,272 130.68 3,479 13% 1.48 0.51 0.7 99% 245.0 23 3.79 83
Vietnam 86.2 90.7 12,400 54.30 4,155 34% 1.89 0.40 5.5 94% 91.6 41 1.09 122
World Index
World 6,692 60,587 4,012,000 17,987 883,000 22% 0.77 0.51 - 29,195.0 n.a. 4.47 Equivalent 71
Pacific Islands
Fiji 0.8 3.5 205 1.09 85 41% 0.67 - - - 1.3 147 1.47 112
Solomon Islands 0.5 0.6 14 0.06 0 0% 0.62 - - - 0.2 177 0.38 150
Samoa 0.2 0.5 31 0.11 12 40% 0.63 - - - 0.2 181 0.80 138
Timor-Leste 1.1 0.5 - - - - - - - - - - - -
Tonga 0.1 0.3 8 0.04 0 0% 0.92 - - - 0.2 - 1.35 117
Vanuatu 0.2 0.6 12 0.04 0 0% 0.39 - - - 0.1 184 0.51 145
a. Countries with major changes in installed capacities in 2007: China 623,561 MW; Vietnam 15,700 MW.b. Countries with major changes in generation in 2007: China 3,042 GWh, Vietnam 62 TWh.c. Countries with major changes in renewable installed capacity in 2007: China 131,939 MW, Vietnam 4,960 MW.d. Calculated using year 2000 U.S. dollar market exchange rates.— Not Available.n.a. Not Applicable. Sources: Population and GDP, World Bank 2008 Data Group of Development Economics (DECDG). Electrification rate: Authors research, mixing data from most recent year from the WB project files, when available from the WB project files, and UNDP 2004 when not. Ranking CO2 emissions: ASTAE, using EIA 2006 data. All other indicators, U.S. Department of Energy, Energy Information Administration 2006.
84
Appendix table 1-1 provides a series of data to illustrate the diversity of East Asia and Pacific countries when it comes to ASTAE pillars.
These data are not updated regularly by any centralized entity and therefore may not even exist for the most recent years. They are primarily sourced from the U.S. Department of Energy’s Energy Information Administration (EIA), as well as from the International Energy Agency (IEA), and are dated from 2006, unless otherwise noted. The footnotes provide further details.
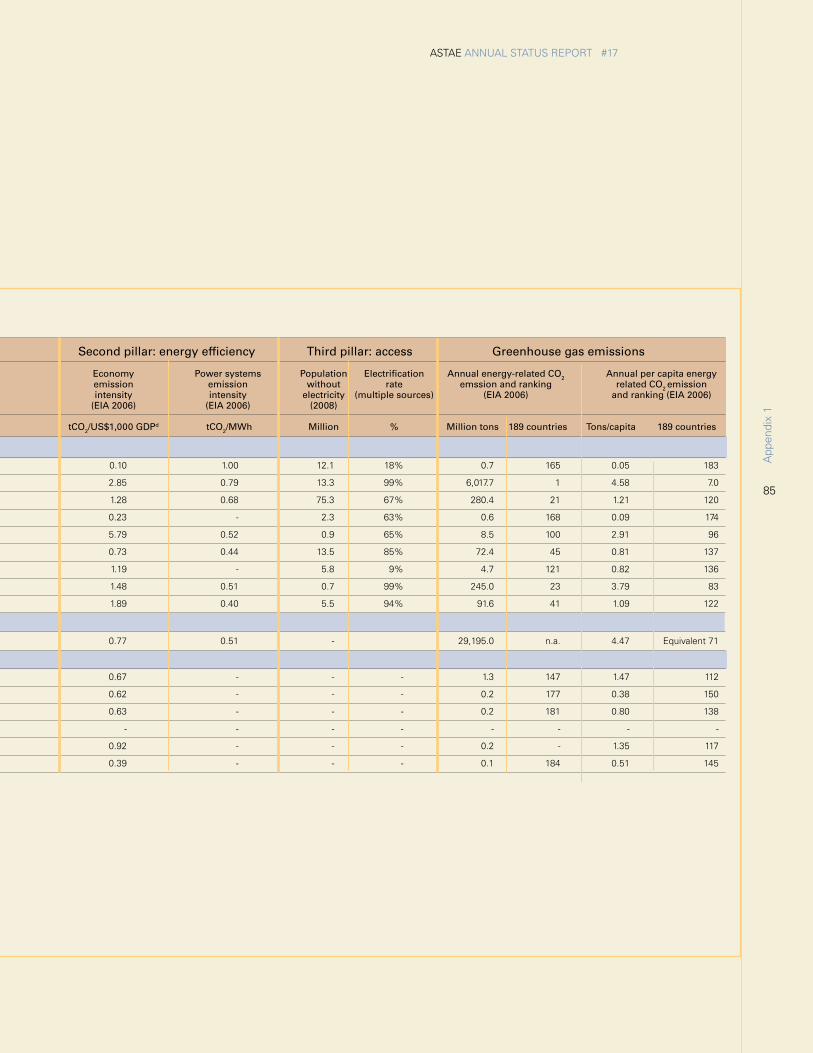
85
ASTAE ANNUAL STATUS REPORT #17
App
endi
x 1
Appendix Table 1-1: Background Data Providing Context to ASTAE Pillars
Region and countries of activity Basic context First pillar: renewable energy Second pillar: energy efficiency Third pillar: access Greenhouse gas emissions Population GDP Installed Net annual Installed Share of Economy Power systems Population Electrification Annual energy-related CO2 Annual per capita energy (WB 2008) (WB 2008) capacity— electricity capacity renewable emission emission without rate emssion and ranking related CO2 emission electricitya generationb renewablec (EIA 2006) intensity intensity electricity (multiple sources) (EIA 2006) and ranking (EIA 2006) (EIA 2008) (EIA 2006) (EIA 2006) (EIA 2006) (EIA 2006) (2008) Million Billion US$ MW TWh MW % tCO2/US$1,000 GDPd tCO2/MWh Million % Million tons 189 countries Tons/capita 189 countries
ASTAE Large Countries
Cambodia 14.7 9.6 190 1.16 13 7% 0.10 1.00 12.1 18% 0.7 165 0.05 183
China 1,325.6 4,326.2 517,550 2,717.50 119,324 23% 2.85 0.79 13.3 99% 6,017.7 1 4.58 7.0
Indonesia 228.2 514.4 24,263 125.67 5,364 22% 1.28 0.68 75.3 67% 280.4 21 1.21 120
Lao PDR 6.2 5.2 691 1.64 673 97% 0.23 - 2.3 63% 0.6 168 0.09 174
Mongolia 2.6 5.3 832 2.93 - - 5.79 0.52 0.9 65% 8.5 100 2.91 96
Philippines 90.3 166.9 15,610 53.93 5,217 33% 0.73 0.44 13.5 85% 72.4 45 0.81 137
Papua New Guinea 6.4 8.2 614 2.88 200 33% 1.19 - 5.8 9% 4.7 121 0.82 136
Thailand 67.4 260.7 26,272 130.68 3,479 13% 1.48 0.51 0.7 99% 245.0 23 3.79 83
Vietnam 86.2 90.7 12,400 54.30 4,155 34% 1.89 0.40 5.5 94% 91.6 41 1.09 122
World Index
World 6,692 60,587 4,012,000 17,987 883,000 22% 0.77 0.51 - 29,195.0 n.a. 4.47 Equivalent 71
Pacific Islands
Fiji 0.8 3.5 205 1.09 85 41% 0.67 - - - 1.3 147 1.47 112
Solomon Islands 0.5 0.6 14 0.06 0 0% 0.62 - - - 0.2 177 0.38 150
Samoa 0.2 0.5 31 0.11 12 40% 0.63 - - - 0.2 181 0.80 138
Timor-Leste 1.1 0.5 - - - - - - - - - - - -
Tonga 0.1 0.3 8 0.04 0 0% 0.92 - - - 0.2 - 1.35 117
Vanuatu 0.2 0.6 12 0.04 0 0% 0.39 - - - 0.1 184 0.51 145
a. Countries with major changes in installed capacities in 2007: China 623,561 MW; Vietnam 15,700 MW.b. Countries with major changes in generation in 2007: China 3,042 GWh, Vietnam 62 TWh.c. Countries with major changes in renewable installed capacity in 2007: China 131,939 MW, Vietnam 4,960 MW.d. Calculated using year 2000 U.S. dollar market exchange rates.— Not Available.n.a. Not Applicable. Sources: Population and GDP, World Bank 2008 Data Group of Development Economics (DECDG). Electrification rate: Authors research, mixing data from most recent year from the WB project files, when available from the WB project files, and UNDP 2004 when not. Ranking CO2 emissions: ASTAE, using EIA 2006 data. All other indicators, U.S. Department of Energy, Energy Information Administration 2006.
8686
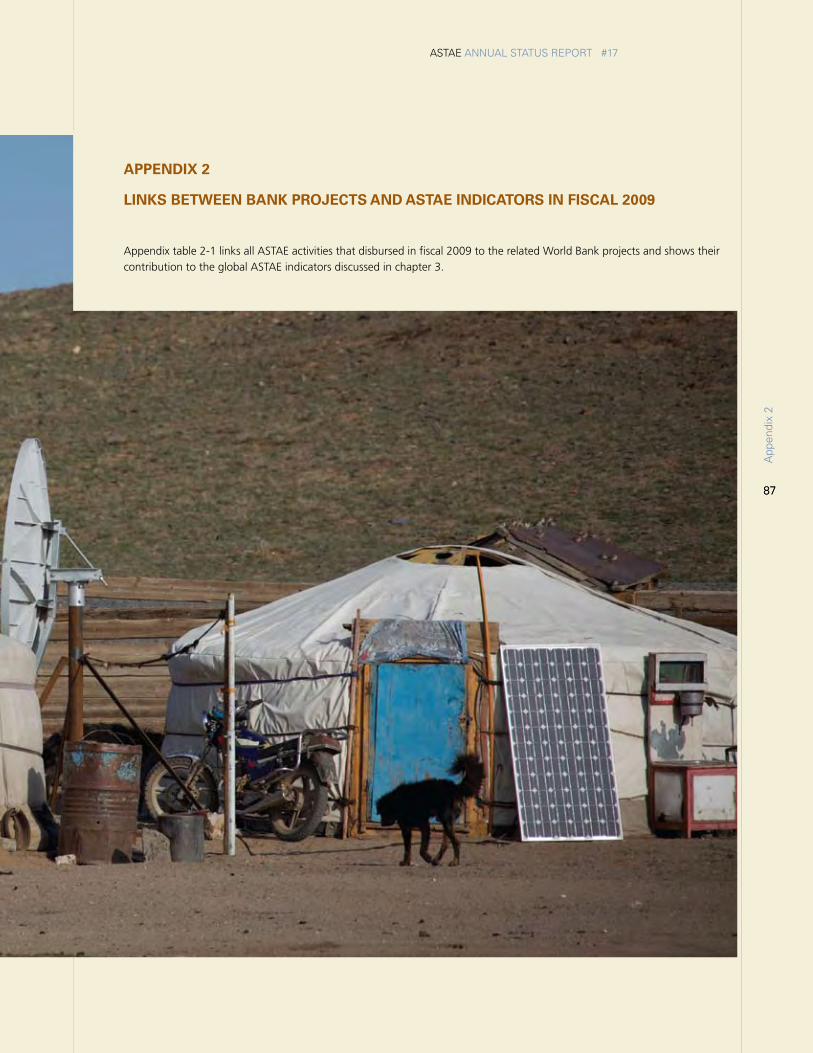
8787
ASTAE ANNUAL STATUS REPORT #17
App
endi
x 2
APPENdix 2
LiNKS BETWEEN BANK ProjECTS ANd ASTAE iNdiCATorS iN FiSCAL 2009
Appendix table 2-1 links all ASTAE activities that disbursed in fiscal 2009 to the related World Bank projects and shows their contribution to the global ASTAE indicators discussed in chapter 3.
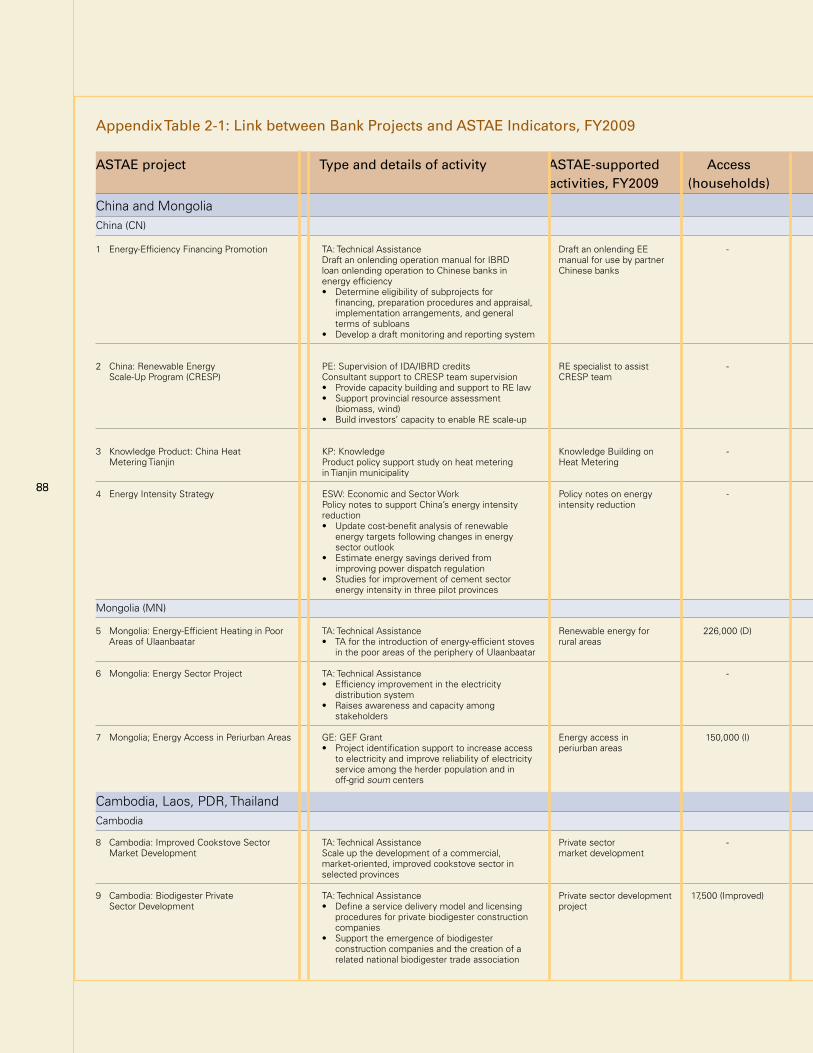
Appendix Table 2-1: Link between Bank Projects and ASTAE Indicators, FY2009
ASTAE project Type and details of activity ASTAE-supported Access Renewable Energy savings CO2 emissions Origin of indicator activities, FY2009 (households) generator capacity (electric) avoided
China and MongoliaChina (CN)
1 Energy-Efficiency Financing Promotion TA: Technical Assistance Draft an onlending EE - - Not yet determined Not yet determined - Draft an onlending operation manual for IBRD manual for use by partner loan onlending operation to Chinese banks in Chinese banks energy efficiency • Determineeligibilityofsubprojectsfor financing, preparation procedures and appraisal, implementation arrangements, and general terms of subloans • Developadraftmonitoringandreportingsystem
2 China: Renewable Energy PE: Supervision of IDA/IBRD credits RE specialist to assist - - - - World Bank Project Information Document Scale-Up Program (CRESP) Consultant support to CRESP team supervision CRESP team •ProvidecapacitybuildingandsupporttoRElaw •Supportprovincialresourceassessment (biomass, wind) •Buildinvestors’capacitytoenableREscale-up
3 Knowledge Product: China Heat KP: Knowledge Knowledge Building on - - - 421,000 t WB PID/Government of China Metering Tianjin Product policy support study on heat metering Heat Metering in Tianjin municipality
4 Energy Intensity Strategy ESW: Economic and Sector Work Policy notes on energy - - - Up to 30 t/GWh World Bank Project Policy notes to support China’s energy intensity intensity reduction Information Document reduction • Updatecost-benefitanalysisofrenewable energy targets following changes in energy sector outlook • Estimateenergysavingsderivedfrom improving power dispatch regulation • Studiesforimprovementofcementsector energy intensity in three pilot provinces
Mongolia (MN) 5 Mongolia: Energy-Efficient Heating in Poor TA: Technical Assistance Renewable energy for 226,000 (D) 2 MW - 9,000 t/year ASTAE Proposal/World Bank AreasofUlaanbaatar • TAfortheintroductionofenergy-efficientstoves ruralareas ProjectAppraisalDocument in the poor areas of the periphery of Ulaanbaatar
6 Mongolia: Energy Sector Project TA: Technical Assistance - - - - - • Efficiencyimprovementintheelectricity distribution system • Raisesawarenessandcapacityamong stakeholders
7 Mongolia; Energy Access in Periurban Areas GE: GEF Grant Energy access in 150,000 (I) - - - ASTAE Proposal • Projectidentificationsupporttoincreaseaccess periurbanareas to electricity and improve reliability of electricity service among the herder population and in off-grid soum centers
Cambodia, Laos, PDR, ThailandCambodia
8 Cambodia: Improved Cookstove Sector TA: Technical Assistance Private sector - - - - World Bank Project Information Document Market Development Scale up the development of a commercial, market development market-oriented, improved cookstove sector in selected provinces
9 Cambodia: Biodigester Private TA: Technical Assistance Private sector development 17,500 (Improved) - - 76,713 t per year ASTAE Proposal/World Bank SectorDevelopment • Defineaservicedeliverymodelandlicensing project ProjectInformationDocument procedures for private biodigester construction companies • Supporttheemergenceofbiodigester construction companies and the creation of a related national biodigester trade association
8888
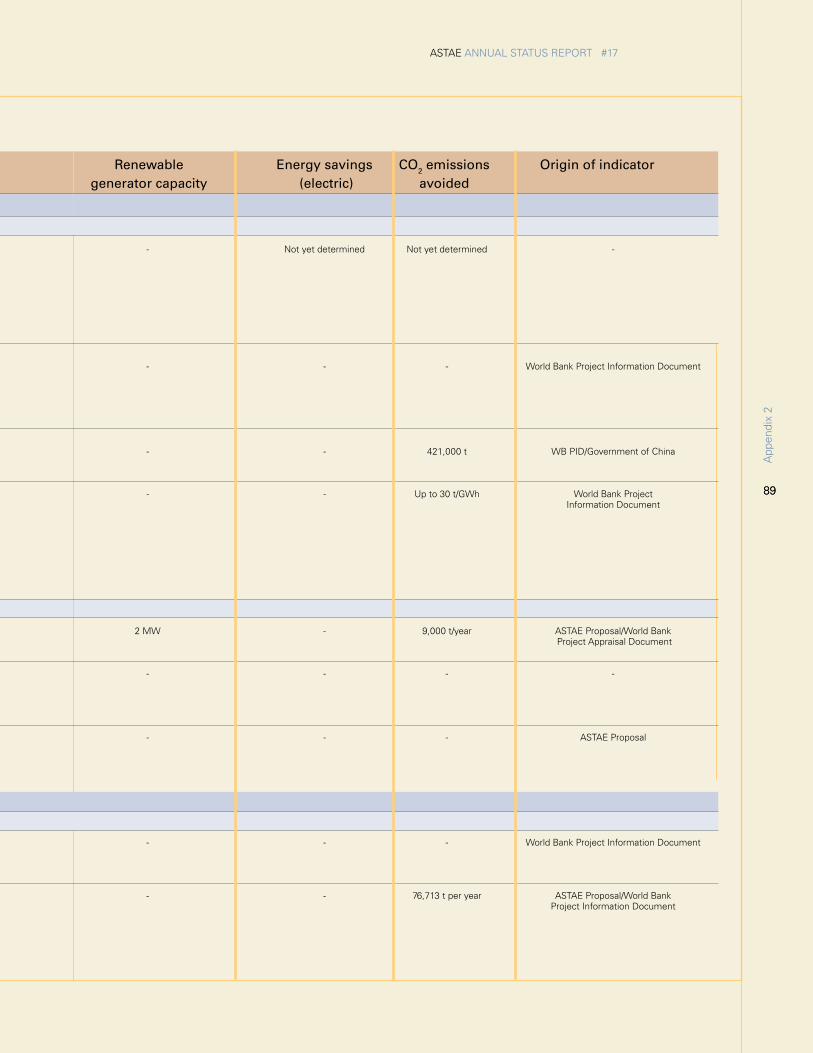
89
ASTAE ANNUAL STATUS REPORT #17
89
App
endi
x 2
Appendix Table 2-1: Link between Bank Projects and ASTAE Indicators, FY2009
ASTAE project Type and details of activity ASTAE-supported Access Renewable Energy savings CO2 emissions Origin of indicator activities, FY2009 (households) generator capacity (electric) avoided
China and MongoliaChina (CN)
1 Energy-Efficiency Financing Promotion TA: Technical Assistance Draft an onlending EE - - Not yet determined Not yet determined - Draft an onlending operation manual for IBRD manual for use by partner loan onlending operation to Chinese banks in Chinese banks energy efficiency • Determineeligibilityofsubprojectsfor financing, preparation procedures and appraisal, implementation arrangements, and general terms of subloans • Developadraftmonitoringandreportingsystem
2 China: Renewable Energy PE: Supervision of IDA/IBRD credits RE specialist to assist - - - - World Bank Project Information Document Scale-Up Program (CRESP) Consultant support to CRESP team supervision CRESP team •ProvidecapacitybuildingandsupporttoRElaw •Supportprovincialresourceassessment (biomass, wind) •Buildinvestors’capacitytoenableREscale-up
3 Knowledge Product: China Heat KP: Knowledge Knowledge Building on - - - 421,000 t WB PID/Government of China Metering Tianjin Product policy support study on heat metering Heat Metering in Tianjin municipality
4 Energy Intensity Strategy ESW: Economic and Sector Work Policy notes on energy - - - Up to 30 t/GWh World Bank Project Policy notes to support China’s energy intensity intensity reduction Information Document reduction • Updatecost-benefitanalysisofrenewable energy targets following changes in energy sector outlook • Estimateenergysavingsderivedfrom improving power dispatch regulation • Studiesforimprovementofcementsector energy intensity in three pilot provinces
Mongolia (MN) 5 Mongolia: Energy-Efficient Heating in Poor TA: Technical Assistance Renewable energy for 226,000 (D) 2 MW - 9,000 t/year ASTAE Proposal/World Bank AreasofUlaanbaatar • TAfortheintroductionofenergy-efficientstoves ruralareas ProjectAppraisalDocument in the poor areas of the periphery of Ulaanbaatar
6 Mongolia: Energy Sector Project TA: Technical Assistance - - - - - • Efficiencyimprovementintheelectricity distribution system • Raisesawarenessandcapacityamong stakeholders
7 Mongolia; Energy Access in Periurban Areas GE: GEF Grant Energy access in 150,000 (I) - - - ASTAE Proposal • Projectidentificationsupporttoincreaseaccess periurbanareas to electricity and improve reliability of electricity service among the herder population and in off-grid soum centers
Cambodia, Laos, PDR, ThailandCambodia
8 Cambodia: Improved Cookstove Sector TA: Technical Assistance Private sector - - - - World Bank Project Information Document Market Development Scale up the development of a commercial, market development market-oriented, improved cookstove sector in selected provinces
9 Cambodia: Biodigester Private TA: Technical Assistance Private sector development 17,500 (Improved) - - 76,713 t per year ASTAE Proposal/World Bank SectorDevelopment • Defineaservicedeliverymodelandlicensing project ProjectInformationDocument procedures for private biodigester construction companies • Supporttheemergenceofbiodigester construction companies and the creation of a related national biodigester trade association
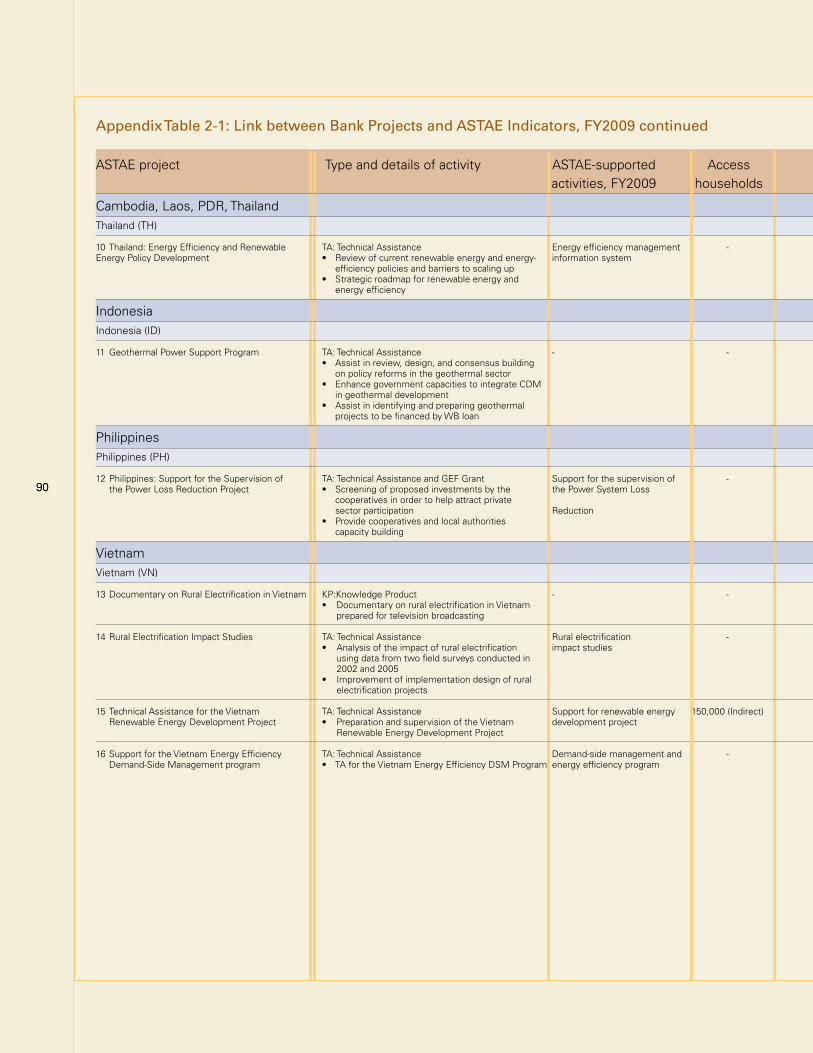
9090
Appendix Table 2-1: Link between Bank Projects and ASTAE Indicators, FY2009 continued
ASTAE project Type and details of activity ASTAE-supported Access Installed new Energy savings CO2 Origin of indicator activities, FY2009 households regeneration capacity (electric)
Cambodia, Laos, PDR, ThailandThailand (TH)
10 Thailand: Energy Efficiency and Renewable TA: Technical Assistance Energy efficiency management - - 5,750 GWh/year - ASTAE Proposal/Task EnergyPolicyDevelopment • Reviewofcurrentrenewableenergyandenergy- informationsystem TeamLeaderAppraisal efficiency policies and barriers to scaling up • Strategicroadmapforrenewableenergyand energy efficiency
Indonesia Indonesia (ID)
11 Geothermal Power Support Program TA: Technical Assistance - - 260 MW (Direct) - 21 million tons (direct) ASTAE Proposal • Assistinreview,design,andconsensusbuilding 6,000MW(indirect) 500milliontons(indirect) on policy reforms in the geothermal sector • EnhancegovernmentcapacitiestointegrateCDM in geothermal development • Assistinidentifyingandpreparinggeothermal projects to be financed by WB loan
Philippines Philippines (PH)
12 Philippines: Support for the Supervision of TA: Technical Assistance and GEF Grant Support for the supervision of - - 80 GWh/yr 40,000 t/yr ASTAE Proposal thePowerLossReductionProject • Screeningofproposedinvestmentsbythe thePowerSystemLoss cooperatives in order to help attract private sector participation Reduction • Providecooperativesandlocalauthorities capacity building
Vietnam Vietnam (VN)
13 Documentary on Rural Electrification in Vietnam KP:Knowledge Product - - - - - - • DocumentaryonruralelectrificationinVietnam prepared for television broadcasting
14 Rural Electrification Impact Studies TA: Technical Assistance Rural electrification - - - - - • Analysisoftheimpactofruralelectrification impactstudies using data from two field surveys conducted in 2002 and 2005 • Improvementofimplementationdesignofrural electrification projects
15 Technical Assistance for the Vietnam TA: Technical Assistance Support for renewable energy 150,000 (Indirect) 180 MW - 8.4 million tons of CO2 World Bank Project Information RenewableEnergyDevelopmentProject • PreparationandsupervisionoftheVietnam developmentproject overthe20years Document/ASTAEProposal Renewable Energy Development Project
16 Support for the Vietnam Energy Efficiency TA: Technical Assistance Demand-side management and - - 275 MW - World Bank Project Information Demand-SideManagementprogram • TAfortheVietnamEnergyEfficiencyDSMProgram energyefficiencyprogram Document/TTLAppraisal
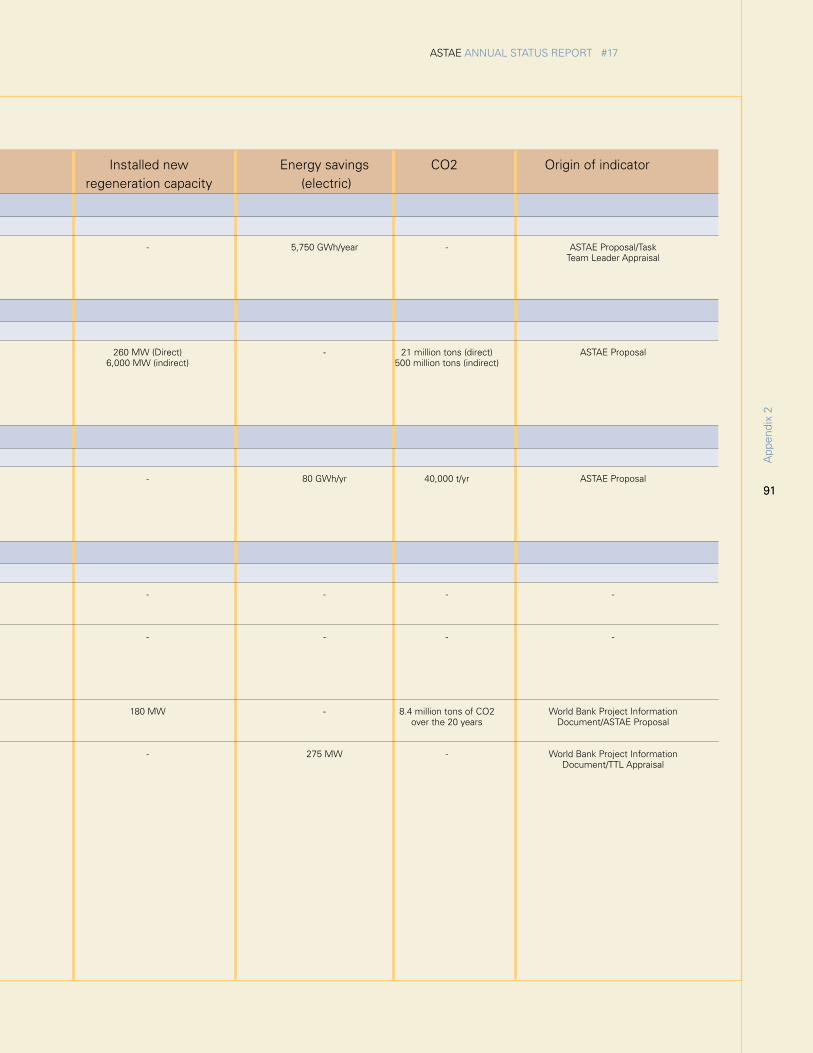
91
ASTAE ANNUAL STATUS REPORT #17
91
App
endi
x 2
Appendix Table 2-1: Link between Bank Projects and ASTAE Indicators, FY2009 continued
ASTAE project Type and details of activity ASTAE-supported Access Installed new Energy savings CO2 Origin of indicator activities, FY2009 households regeneration capacity (electric)
Cambodia, Laos, PDR, ThailandThailand (TH)
10 Thailand: Energy Efficiency and Renewable TA: Technical Assistance Energy efficiency management - - 5,750 GWh/year - ASTAE Proposal/Task EnergyPolicyDevelopment • Reviewofcurrentrenewableenergyandenergy- informationsystem TeamLeaderAppraisal efficiency policies and barriers to scaling up • Strategicroadmapforrenewableenergyand energy efficiency
Indonesia Indonesia (ID)
11 Geothermal Power Support Program TA: Technical Assistance - - 260 MW (Direct) - 21 million tons (direct) ASTAE Proposal • Assistinreview,design,andconsensusbuilding 6,000MW(indirect) 500milliontons(indirect) on policy reforms in the geothermal sector • EnhancegovernmentcapacitiestointegrateCDM in geothermal development • Assistinidentifyingandpreparinggeothermal projects to be financed by WB loan
Philippines Philippines (PH)
12 Philippines: Support for the Supervision of TA: Technical Assistance and GEF Grant Support for the supervision of - - 80 GWh/yr 40,000 t/yr ASTAE Proposal thePowerLossReductionProject • Screeningofproposedinvestmentsbythe thePowerSystemLoss cooperatives in order to help attract private sector participation Reduction • Providecooperativesandlocalauthorities capacity building
Vietnam Vietnam (VN)
13 Documentary on Rural Electrification in Vietnam KP:Knowledge Product - - - - - - • DocumentaryonruralelectrificationinVietnam prepared for television broadcasting
14 Rural Electrification Impact Studies TA: Technical Assistance Rural electrification - - - - - • Analysisoftheimpactofruralelectrification impactstudies using data from two field surveys conducted in 2002 and 2005 • Improvementofimplementationdesignofrural electrification projects
15 Technical Assistance for the Vietnam TA: Technical Assistance Support for renewable energy 150,000 (Indirect) 180 MW - 8.4 million tons of CO2 World Bank Project Information RenewableEnergyDevelopmentProject • PreparationandsupervisionoftheVietnam developmentproject overthe20years Document/ASTAEProposal Renewable Energy Development Project
16 Support for the Vietnam Energy Efficiency TA: Technical Assistance Demand-side management and - - 275 MW - World Bank Project Information Demand-SideManagementprogram • TAfortheVietnamEnergyEfficiencyDSMProgram energyefficiencyprogram Document/TTLAppraisal
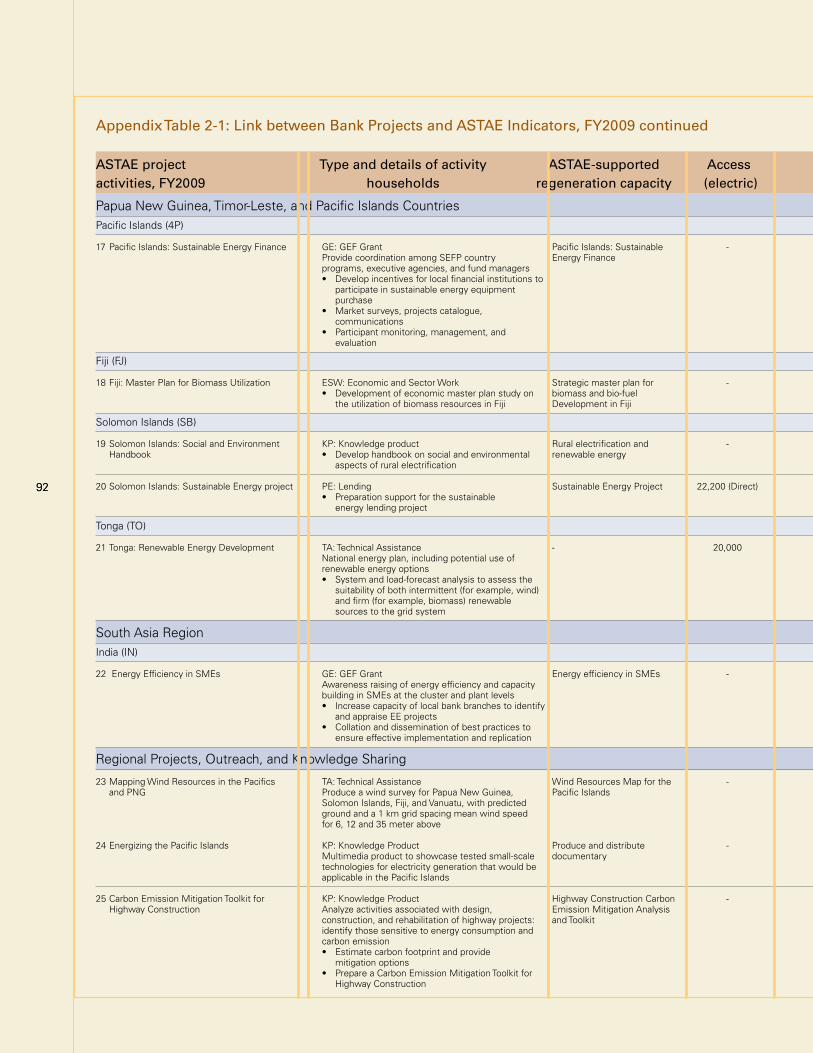
9292
Appendix Table 2-1: Link between Bank Projects and ASTAE Indicators, FY2009 continued
ASTAE project Type and details of activity ASTAE-supported Access Installed new Energy savings CO2 Origin of indicator activities, FY2009 households regeneration capacity (electric)
Papua New Guinea, Timor-Leste, and Pacific Islands Countries Pacific Islands (4P)
17 Pacific Islands: Sustainable Energy Finance GE: GEF Grant Pacific Islands: Sustainable - - - - ASTAE Proposal Provide coordination among SEFP country Energy Finance programs, executive agencies, and fund managers • Developincentivesforlocalfinancialinstitutionsto participate in sustainable energy equipment purchase • Marketsurveys,projectscatalogue, communications • Participantmonitoring,management,and evaluation
Fiji (FJ)
18 Fiji: Master Plan for Biomass Utilization ESW: Economic and Sector Work Strategic master plan for - - 400 GWh (indirect) - ASTAE Proposal • Developmentofeconomicmasterplanstudyon biomassandbio-fuel the utilization of biomass resources in Fiji Development in Fiji
Solomon Islands (SB)
19 Solomon Islands: Social and Environment KP: Knowledge product Rural electrification and - - - - World Bank Project Information Document Handbook • Develophandbookonsocialandenvironmental renewableenergy aspects of rural electrification
20 Solomon Islands: Sustainable Energy project PE: Lending Sustainable Energy Project 22,200 (Direct) 5,600 kW 3,285,000 kWh 8,325 t/year World Bank Project Information Document • Preparationsupportforthesustainable energy lending project
Tonga (TO)
21 Tonga: Renewable Energy Development TA: Technical Assistance - 20,000 10 MW - - World Bank Project Information National energy plan, including potential use of Document/Task Team Leader renewable energy options • Systemandload-forecastanalysistoassessthe suitability of both intermittent (for example, wind) and firm (for example, biomass) renewable sources to the grid system
South Asia Region India (IN)
22 Energy Efficiency in SMEs GE: GEF Grant Energy efficiency in SMEs - - - - World Bank Project Information Document Awareness raising of energy efficiency and capacity building in SMEs at the cluster and plant levels • Increasecapacityoflocalbankbranchestoidentify and appraise EE projects • Collationanddisseminationofbestpracticesto ensure effective implementation and replication
Regional Projects, Outreach, and Knowledge Sharing
23 Mapping Wind Resources in the Pacifics TA: Technical Assistance Wind Resources Map for the - 25 MW ( Indirect) - - ASTAE Proposal Estimate and PNG Produce a wind survey for Papua New Guinea, Pacific Islands Solomon Islands, Fiji, and Vanuatu, with predicted ground and a 1 km grid spacing mean wind speed for 6, 12 and 35 meter above
24 Energizing the Pacific Islands KP: Knowledge Product Produce and distribute - - - - ASTAE Proposal Estimate Multimedia product to showcase tested small-scale documentary technologies for electricity generation that would be applicable in the Pacific Islands
25 Carbon Emission Mitigation Toolkit for KP: Knowledge Product Highway Construction Carbon - - - Up to 200t/km built ASTAE proposal estimate/ Highway Construction Analyze activities associated with design, Emission Mitigation Analysis World Bank Project Information Document construction, and rehabilitation of highway projects: and Toolkit identify those sensitive to energy consumption and carbon emission • Estimatecarbonfootprintandprovide mitigation options • PrepareaCarbonEmissionMitigationToolkitfor Highway Construction
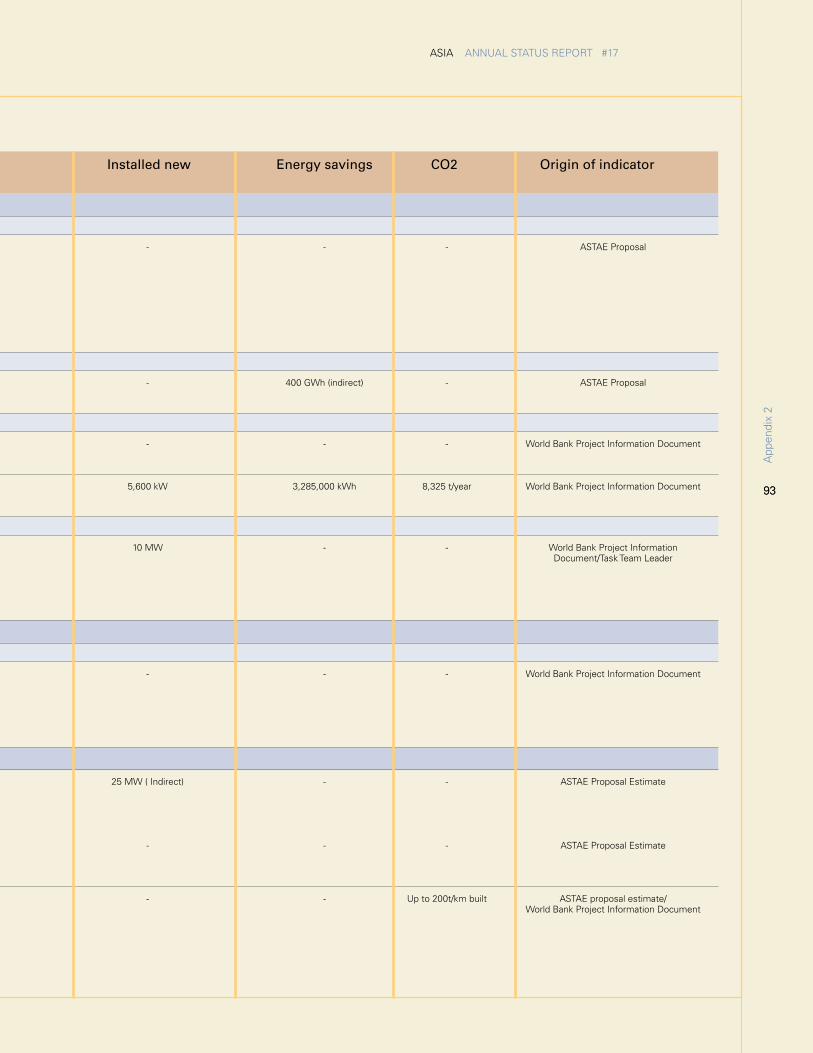
93
ASIA ANNUAL STATUS REPORT #17
93
App
endi
x 2
Appendix Table 2-1: Link between Bank Projects and ASTAE Indicators, FY2009 continued
ASTAE project Type and details of activity ASTAE-supported Access Installed new Energy savings CO2 Origin of indicator activities, FY2009 households regeneration capacity (electric)
Papua New Guinea, Timor-Leste, and Pacific Islands Countries Pacific Islands (4P)
17 Pacific Islands: Sustainable Energy Finance GE: GEF Grant Pacific Islands: Sustainable - - - - ASTAE Proposal Provide coordination among SEFP country Energy Finance programs, executive agencies, and fund managers • Developincentivesforlocalfinancialinstitutionsto participate in sustainable energy equipment purchase • Marketsurveys,projectscatalogue, communications • Participantmonitoring,management,and evaluation
Fiji (FJ)
18 Fiji: Master Plan for Biomass Utilization ESW: Economic and Sector Work Strategic master plan for - - 400 GWh (indirect) - ASTAE Proposal • Developmentofeconomicmasterplanstudyon biomassandbio-fuel the utilization of biomass resources in Fiji Development in Fiji
Solomon Islands (SB)
19 Solomon Islands: Social and Environment KP: Knowledge product Rural electrification and - - - - World Bank Project Information Document Handbook • Develophandbookonsocialandenvironmental renewableenergy aspects of rural electrification
20 Solomon Islands: Sustainable Energy project PE: Lending Sustainable Energy Project 22,200 (Direct) 5,600 kW 3,285,000 kWh 8,325 t/year World Bank Project Information Document • Preparationsupportforthesustainable energy lending project
Tonga (TO)
21 Tonga: Renewable Energy Development TA: Technical Assistance - 20,000 10 MW - - World Bank Project Information National energy plan, including potential use of Document/Task Team Leader renewable energy options • Systemandload-forecastanalysistoassessthe suitability of both intermittent (for example, wind) and firm (for example, biomass) renewable sources to the grid system
South Asia Region India (IN)
22 Energy Efficiency in SMEs GE: GEF Grant Energy efficiency in SMEs - - - - World Bank Project Information Document Awareness raising of energy efficiency and capacity building in SMEs at the cluster and plant levels • Increasecapacityoflocalbankbranchestoidentify and appraise EE projects • Collationanddisseminationofbestpracticesto ensure effective implementation and replication
Regional Projects, Outreach, and Knowledge Sharing
23 Mapping Wind Resources in the Pacifics TA: Technical Assistance Wind Resources Map for the - 25 MW ( Indirect) - - ASTAE Proposal Estimate and PNG Produce a wind survey for Papua New Guinea, Pacific Islands Solomon Islands, Fiji, and Vanuatu, with predicted ground and a 1 km grid spacing mean wind speed for 6, 12 and 35 meter above
24 Energizing the Pacific Islands KP: Knowledge Product Produce and distribute - - - - ASTAE Proposal Estimate Multimedia product to showcase tested small-scale documentary technologies for electricity generation that would be applicable in the Pacific Islands
25 Carbon Emission Mitigation Toolkit for KP: Knowledge Product Highway Construction Carbon - - - Up to 200t/km built ASTAE proposal estimate/ Highway Construction Analyze activities associated with design, Emission Mitigation Analysis World Bank Project Information Document construction, and rehabilitation of highway projects: and Toolkit identify those sensitive to energy consumption and carbon emission • Estimatecarbonfootprintandprovide mitigation options • PrepareaCarbonEmissionMitigationToolkitfor Highway Construction
9494
95
ASTAE ANNUAL STATUS REPORT #17
95
App
endi
x 3
APPENdix 3 ASTAE doNorS, rESoUrCE UTiLizATioN, ANd FUNdiNG EvENTS
ASTAE Donors
ASTAE currently relies on the Netherlands and Sweden as donor countries for its budget, as well as on matching funds from the World Bank (see ASTAE Resource Utilization, below). Previous ASTAE donors also included Australia, Canada, Finland, Switzerland, the United Kingdom, and the United States.
The Netherlands: Ministry of Foreign Affairs (Development Cooperation)
The principal funding source of ASTAE currently is the Netherlands, through its Ministry of Foreign Affairs (Development Cooperation). The Netherlands has been a core donor of ASTAE, and since 1993 has contributed in a very reli-able fashion to provide ASTAE with the capacity to engage in sustained activities. The most recent funding agreement was signed in 2006 for an amount of US$7.4 million to be dis-bursed over a three-year period.
In June 1998, the Ministry of Foreign Affairs created the Bank-Netherlands Partnership Program (BNPP) to strengthen the de-velopment and institutional effectiveness of the World Bank by financing knowledge and capacity development activities at the global, regional, and cross-country levels.
The underlying objective of the BNPP is to finance knowledge and advisory services to help address regional and global is-sues, such as environmental threats, communicable diseases, reproductive health, universal primary education, better gov-ernance through better service delivery, trade facilitation, and regional integration.
The interrelated pillars that underpin the BNPP approach and priorities include creating a climate conducive to investment and providing knowledge and advisory services and capacity building (including gender-specific interventions). Other em-phases include building partnerships to leverage development effectiveness.
ASTAE falls under two of the BNPP’s strategic priorities:
• Environment
The environmental priority encourages government policy dialogue on environmental damage and conservation of natu-ral resources. Grant-funded activities are designed to raise the awareness of government policy makers and the general population on environmental assessment and good practices. They also suggest alternative methods of energy use and build strategies for improving water and sanitation services.
• EnergyandWater
This priority aims to provide clean, safe water and energy to every person. The rural poor are especially disadvantaged because they often live in remote areas that are not served by public water and energy utilities. They also face greater health risks because of poor sanitation and the use of unsafe biofuels. The main areas of concern are reforming water and sanitation utilities, switching to cleaner, modern fuels, and in-creasing electricity access to all citizens.
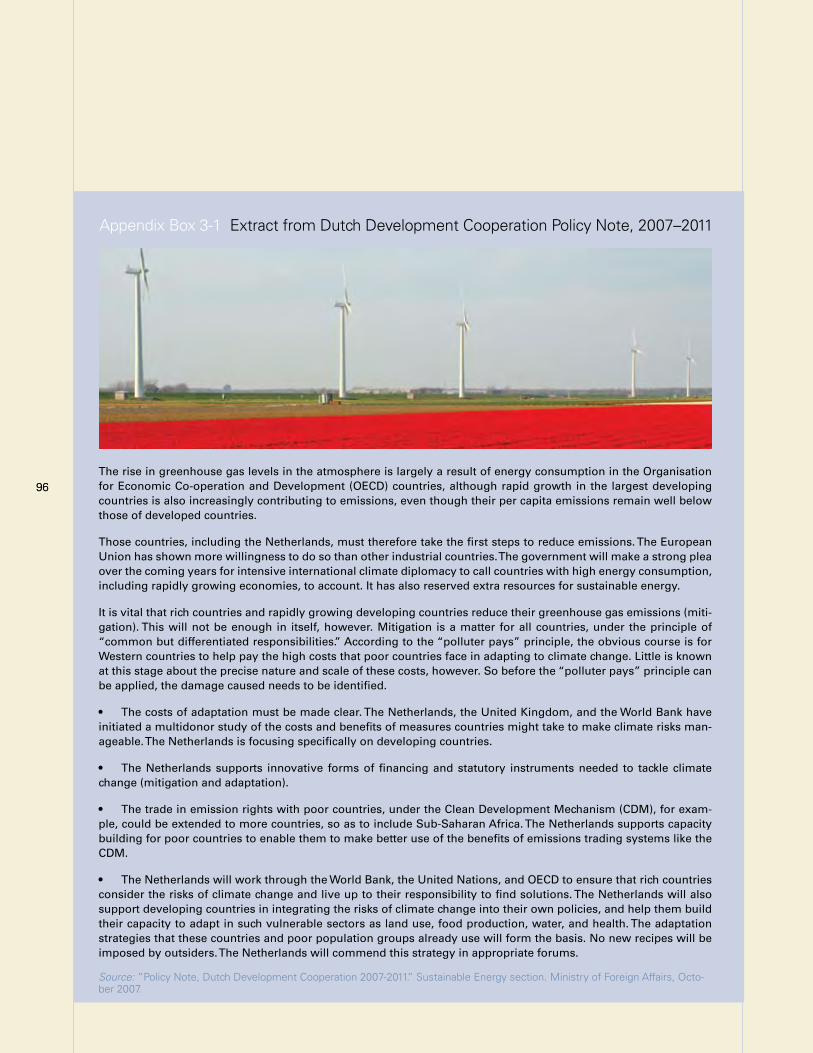
9696The rise in greenhouse gas levels in the atmosphere is largely a result of energy consumption in the Organisation for Economic Co-operation and Development (OECD) countries, although rapid growth in the largest developing countries is also increasingly contributing to emissions, even though their per capita emissions remain well below those of developed countries.
Those countries, including the Netherlands, must therefore take the first steps to reduce emissions. The European Union has shown more willingness to do so than other industrial countries. The government will make a strong plea over the coming years for intensive international climate diplomacy to call countries with high energy consumption, including rapidly growing economies, to account. It has also reserved extra resources for sustainable energy.
It is vital that rich countries and rapidly growing developing countries reduce their greenhouse gas emissions (miti-gation). This will not be enough in itself, however. Mitigation is a matter for all countries, under the principle of “common but differentiated responsibilities.” According to the “polluter pays” principle, the obvious course is for Western countries to help pay the high costs that poor countries face in adapting to climate change. Little is known at this stage about the precise nature and scale of these costs, however. So before the “polluter pays” principle can be applied, the damage caused needs to be identified.
• The costs of adaptation must be made clear. The Netherlands, the United Kingdom, and the World Bank have initiated a multidonor study of the costs and benefits of measures countries might take to make climate risks man-ageable. The Netherlands is focusing specifically on developing countries.
• The Netherlands supports innovative forms of financing and statutory instruments needed to tackle climate change (mitigation and adaptation).
• The trade in emission rights with poor countries, under the Clean Development Mechanism (CDM), for exam-ple, could be extended to more countries, so as to include Sub-Saharan Africa. The Netherlands supports capacity building for poor countries to enable them to make better use of the benefits of emissions trading systems like the CDM.
• The Netherlands will work through the World Bank, the United Nations, and OECD to ensure that rich countries consider the risks of climate change and live up to their responsibility to find solutions. The Netherlands will also support developing countries in integrating the risks of climate change into their own policies, and help them build their capacity to adapt in such vulnerable sectors as land use, food production, water, and health. The adaptation strategies that these countries and poor population groups already use will form the basis. No new recipes will be imposed by outsiders. The Netherlands will commend this strategy in appropriate forums.
Source: “Policy Note, Dutch Development Cooperation 2007-2011.” Sustainable Energy section. Ministry of Foreign Affairs, Octo-ber 2007.
Appendix Box 3-1 Extract from Dutch Development Cooperation Policy Note, 2007–2011
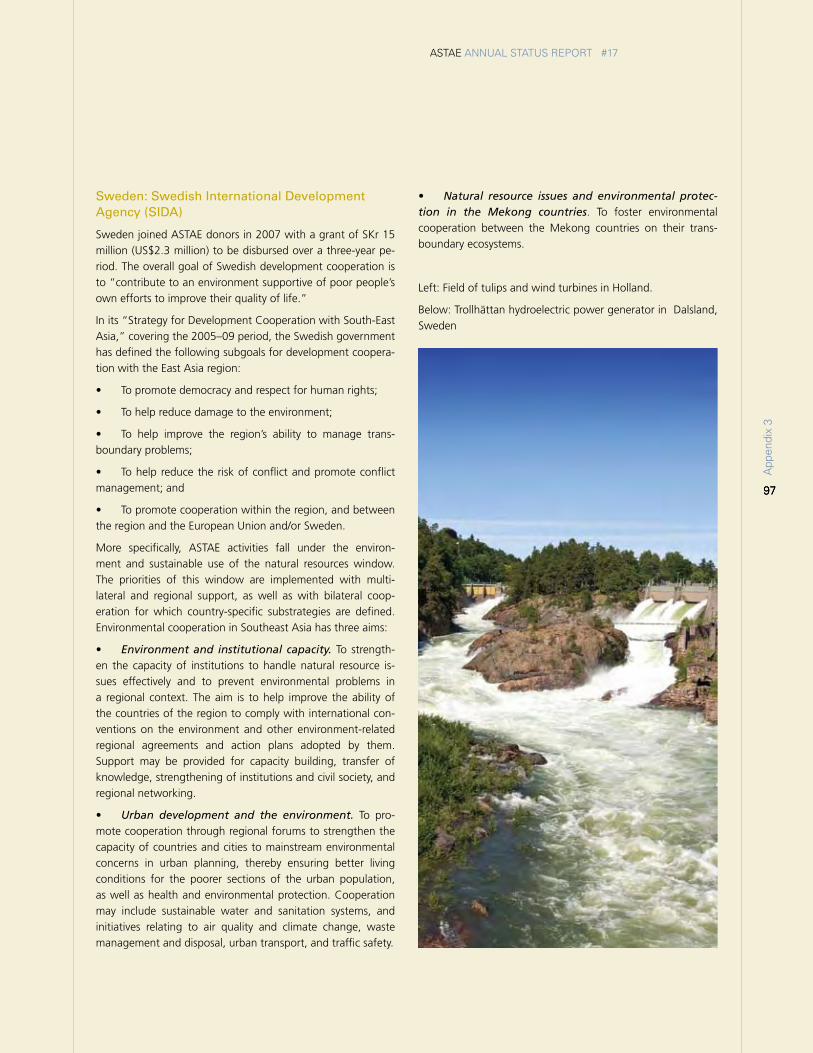
97
ASTAE ANNUAL STATUS REPORT #17
9797
Sweden: Swedish International Development Agency (SIDA)
Sweden joined ASTAE donors in 2007 with a grant of SKr 15 million (US$2.3 million) to be disbursed over a three-year pe-riod. The overall goal of Swedish development cooperation is to “contribute to an environment supportive of poor people’s own efforts to improve their quality of life.”
In its “Strategy for Development Cooperation with South-East Asia,” covering the 2005–09 period, the Swedish government has defined the following subgoals for development coopera-tion with the East Asia region:
• Topromotedemocracyandrespectforhumanrights;
• Tohelpreducedamagetotheenvironment;
• To help improve the region’s ability to manage trans-boundary problems;
• Tohelpreducetheriskofconflictandpromoteconflictmanagement; and
• Topromotecooperationwithintheregion,andbetweenthe region and the European Union and/or Sweden.
More specifically, ASTAE activities fall under the environ-ment and sustainable use of the natural resources window. The priorities of this window are implemented with multi-lateral and regional support, as well as with bilateral coop-eration for which country-specific substrategies are defined. Environmental cooperation in Southeast Asia has three aims:
• Environment and institutional capacity. To strength-en the capacity of institutions to handle natural resource is-sues effectively and to prevent environmental problems in a regional context. The aim is to help improve the ability of the countries of the region to comply with international con-ventions on the environment and other environment-related regional agreements and action plans adopted by them. Support may be provided for capacity building, transfer of knowledge, strengthening of institutions and civil society, and regional networking.
• Urban development and the environment. To pro-mote cooperation through regional forums to strengthen the capacity of countries and cities to mainstream environmental concerns in urban planning, thereby ensuring better living conditions for the poorer sections of the urban population, as well as health and environmental protection. Cooperation may include sustainable water and sanitation systems, and initiatives relating to air quality and climate change, waste management and disposal, urban transport, and traffic safety.
• Natural resource issues and environmental protec-tion in the Mekong countries. To foster environmental cooperation between the Mekong countries on their trans-boundary ecosystems.
Left: Field of tulips and wind turbines in Holland.
Below: Trollhättan hydroelectric power generator in Dalsland, Sweden
App
endi
x 3
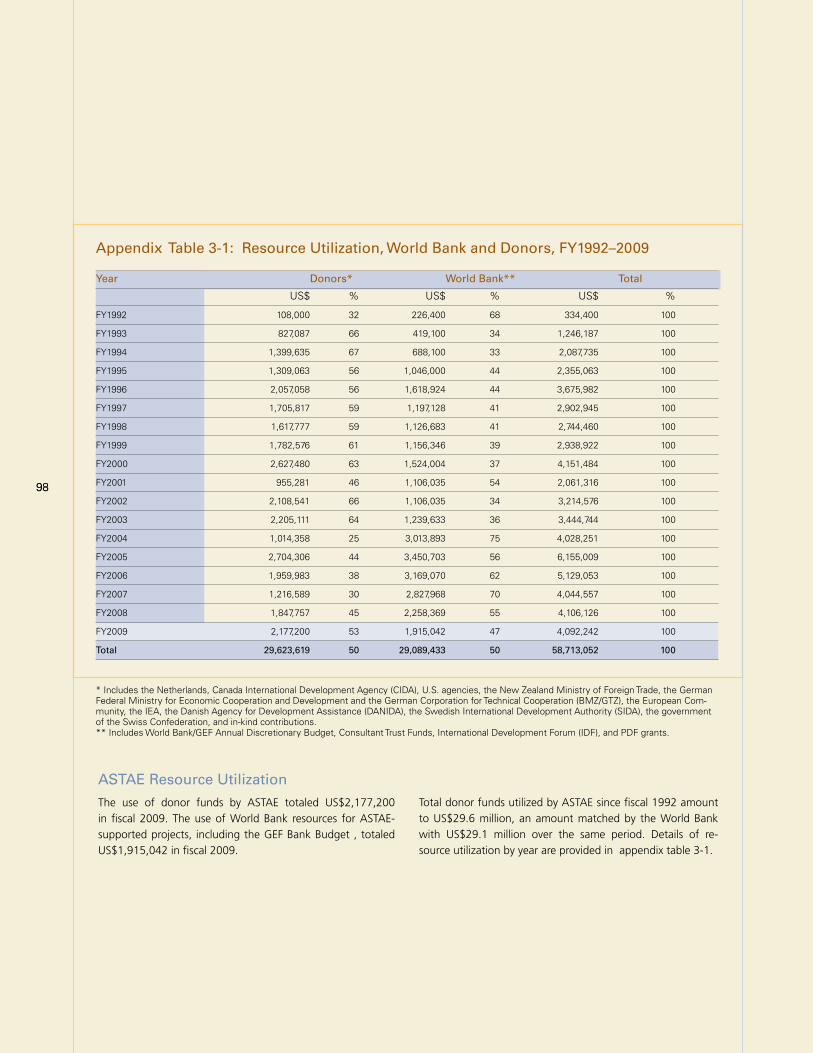
9898
Appendix Table 3-1: Resource Utilization, World Bank and Donors, FY1992–2009
Year Donors* World Bank** Total
US$ % US$ % US$ %
FY1992 108,000 32 226,400 68 334,400 100
FY1993 827,087 66 419,100 34 1,246,187 100
FY1994 1,399,635 67 688,100 33 2,087,735 100
FY1995 1,309,063 56 1,046,000 44 2,355,063 100
FY1996 2,057,058 56 1,618,924 44 3,675,982 100
FY1997 1,705,817 59 1,197,128 41 2,902,945 100
FY1998 1,617,777 59 1,126,683 41 2,744,460 100
FY1999 1,782,576 61 1,156,346 39 2,938,922 100
FY2000 2,627,480 63 1,524,004 37 4,151,484 100
FY2001 955,281 46 1,106,035 54 2,061,316 100
FY2002 2,108,541 66 1,106,035 34 3,214,576 100
FY2003 2,205,111 64 1,239,633 36 3,444,744 100
FY2004 1,014,358 25 3,013,893 75 4,028,251 100
FY2005 2,704,306 44 3,450,703 56 6,155,009 100
FY2006 1,959,983 38 3,169,070 62 5,129,053 100
FY2007 1,216,589 30 2,827,968 70 4,044,557 100
FY2008 1,847,757 45 2,258,369 55 4,106,126 100
FY2009 2,177,200 53 1,915,042 47 4,092,242 100
Total 29,623,619 50 29,089,433 50 58,713,052 100
* Includes the Netherlands, Canada International Development Agency (CIDA), U.S. agencies, the New Zealand Ministry of Foreign Trade, the German Federal Ministry for Economic Cooperation and Development and the German Corporation for Technical Cooperation (BMZ/GTZ), the European Com-munity, the IEA, the Danish Agency for Development Assistance (DANIDA), the Swedish International Development Authority (SIDA), the government of the Swiss Confederation, and in-kind contributions. ** Includes World Bank/GEF Annual Discretionary Budget, Consultant Trust Funds, International Development Forum (IDF), and PDF grants.
ASTAE Resource Utilization
The use of donor funds by ASTAE totaled US$2,177,200 in fiscal 2009. The use of World Bank resources for ASTAE-supported projects, including the GEF Bank Budget , totaled US$1,915,042 in fiscal 2009.
Total donor funds utilized by ASTAE since fiscal 1992 amount to US$29.6 million, an amount matched by the World Bank with US$29.1 million over the same period. Details of re-source utilization by year are provided in appendix table 3-1.
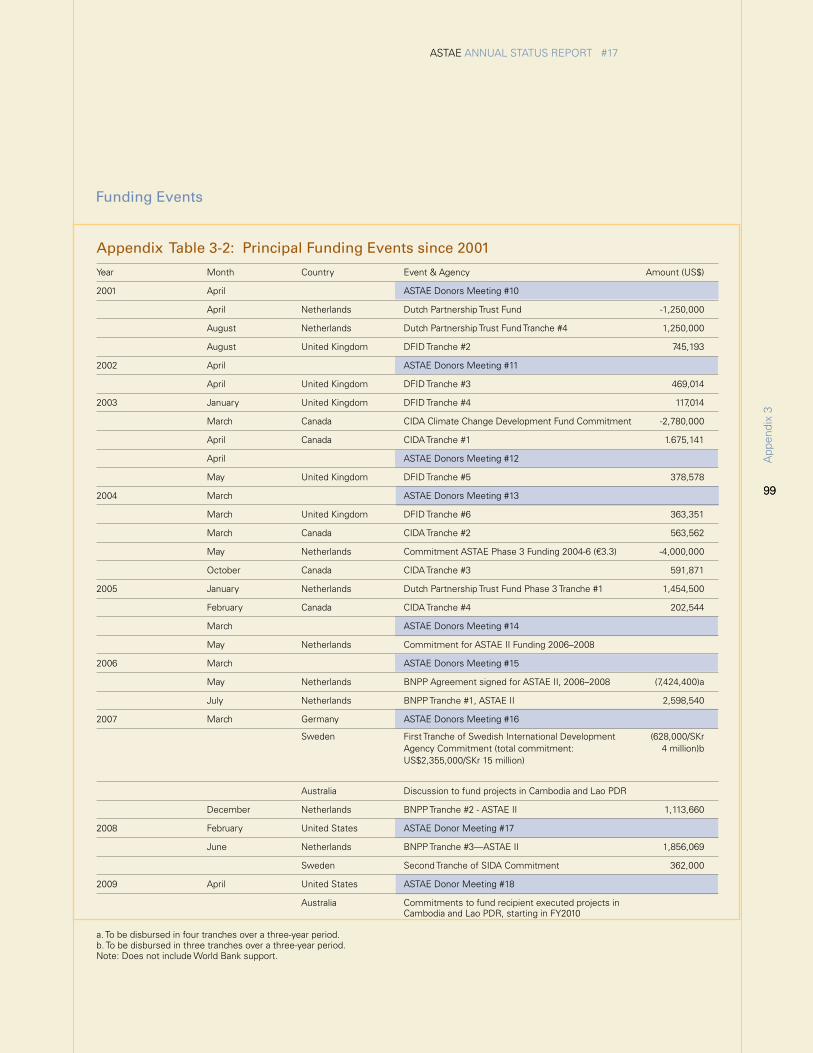
99
ASTAE ANNUAL STATUS REPORT #17
99
App
endi
x 3
Funding Events
Appendix Table 3-2: Principal Funding Events since 2001
Year Month Country Event & Agency Amount (US$)
2001 April ASTAE Donors Meeting #10
April Netherlands Dutch Partnership Trust Fund -1,250,000
August Netherlands Dutch Partnership Trust Fund Tranche #4 1,250,000
August United Kingdom DFID Tranche #2 745,193
2002 April ASTAE Donors Meeting #11
April United Kingdom DFID Tranche #3 469,014
2003 January United Kingdom DFID Tranche #4 117,014
March Canada CIDA Climate Change Development Fund Commitment -2,780,000
April Canada CIDA Tranche #1 1.675,141
April ASTAE Donors Meeting #12
May United Kingdom DFID Tranche #5 378,578
2004 March ASTAE Donors Meeting #13
March United Kingdom DFID Tranche #6 363,351
March Canada CIDA Tranche #2 563,562
May Netherlands Commitment ASTAE Phase 3 Funding 2004-6 (€3.3) -4,000,000
October Canada CIDA Tranche #3 591,871
2005 January Netherlands Dutch Partnership Trust Fund Phase 3 Tranche #1 1,454,500
February Canada CIDA Tranche #4 202,544
March ASTAE Donors Meeting #14
May Netherlands Commitment for ASTAE II Funding 2006–2008
2006 March ASTAE Donors Meeting #15
May Netherlands BNPP Agreement signed for ASTAE II, 2006–2008 (7,424,400)a
July Netherlands BNPP Tranche #1, ASTAE II 2,598,540
2007 March Germany ASTAE Donors Meeting #16
Sweden First Tranche of Swedish International Development (628,000/SKr Agency Commitment (total commitment: 4 million)b US$2,355,000/SKr 15 million)
Australia Discussion to fund projects in Cambodia and Lao PDR
December Netherlands BNPP Tranche #2 - ASTAE II 1,113,660
2008 February United States ASTAE Donor Meeting #17
June Netherlands BNPP Tranche #3—ASTAE II 1,856,069
Sweden Second Tranche of SIDA Commitment 362,000
2009 April United States ASTAE Donor Meeting #18
Australia Commitments to fund recipient executed projects in Cambodia and Lao PDR, starting in FY2010
a. To be disbursed in four tranches over a three-year period.b. To be disbursed in three tranches over a three-year period.Note: Does not include World Bank support.
100
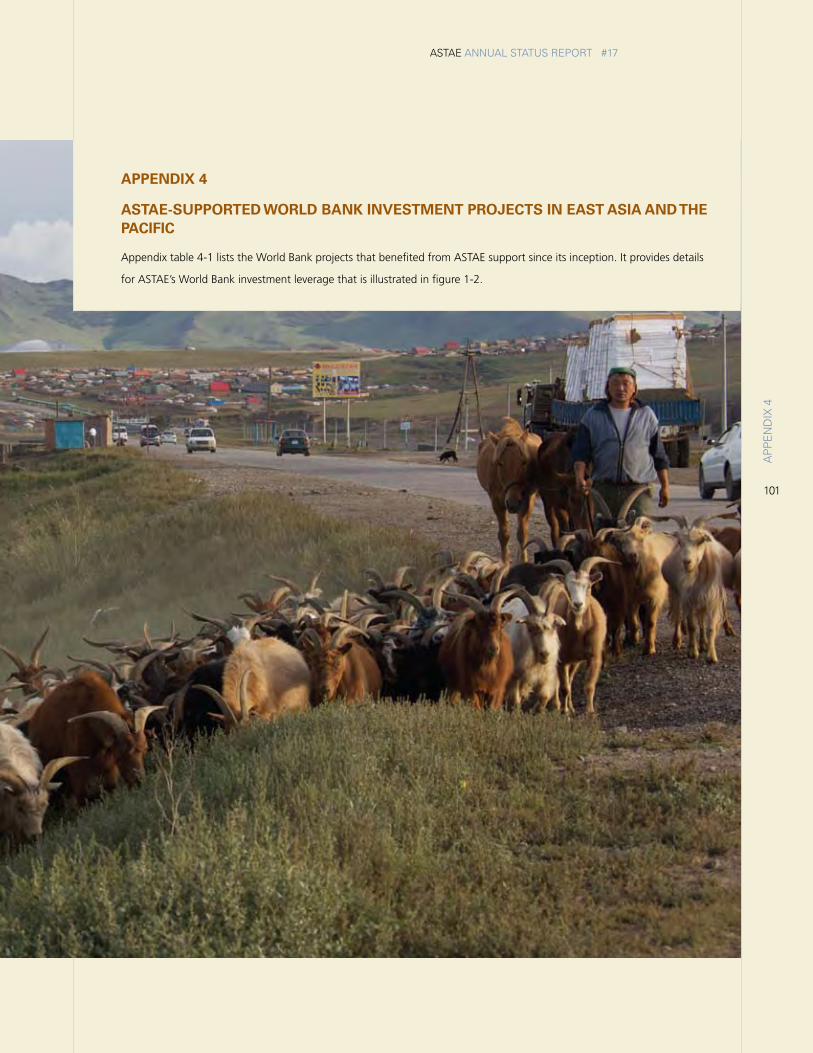
101
ASTAE ANNUAL STATUS REPORT #17
AP
PE
ND
IX 4
APPENdix 4
ASTAE-SUPPorTEd WorLd BANK iNvESTmENT ProjECTS iN EAST ASiA ANd ThE PACiFiC
Appendix table 4-1 lists the World Bank projects that benefited from ASTAE support since its inception. It provides details
for ASTAE’s World Bank investment leverage that is illustrated in figure 1-2.
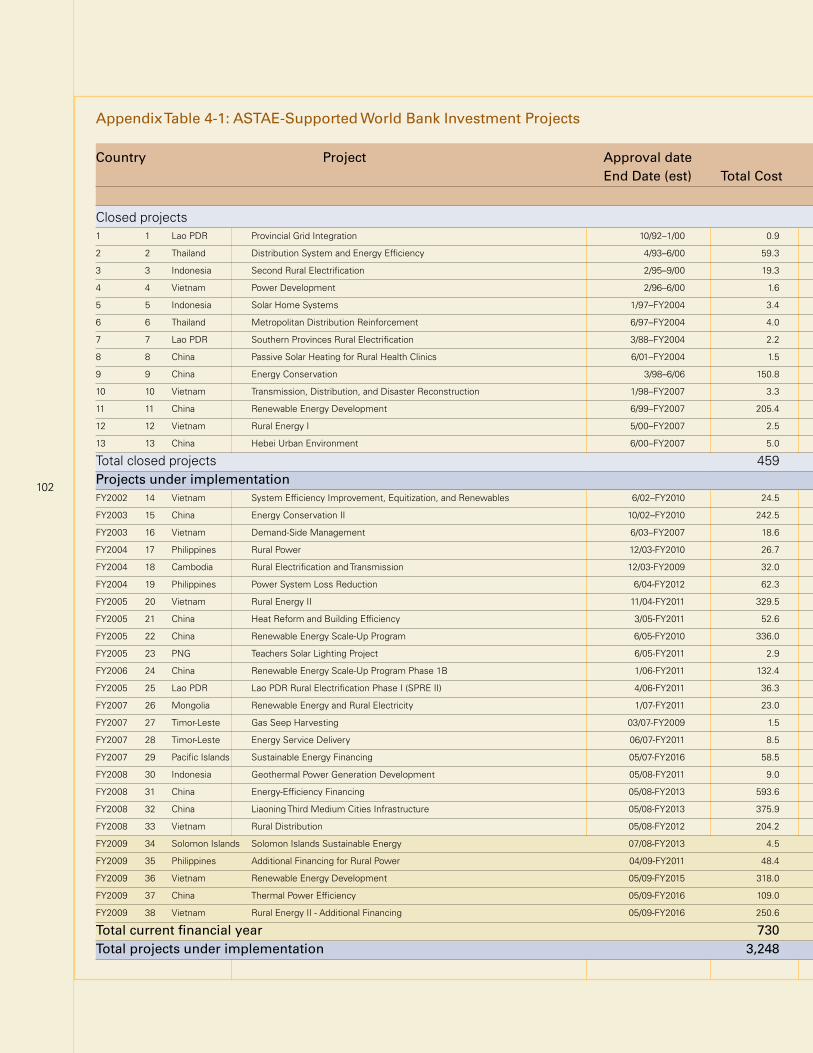
102
Appendix Table 4-1: ASTAE-Supported World Bank Investment Projects
Country Project Approval date Sustainable Energy Product Cost ($ million) Primary Prject Component End Date (est) Total Cost Source of Financing IBRD/IDA GEF Govt. Private Other
Closed projects1 1 Lao PDR Provincial Grid Integration 10/92–1/00 0.9 0.9 DSM, institution building
2 2 Thailand Distribution System and Energy Efficiency 4/93–6/00 59.3 8.0 20.3 31.0 DSM, capacity building
3 3 Indonesia Second Rural Electrification 2/95–9/00 19.3 13.3 6.0 Minihydro, geothermal resource assessment, and TA
4 4 Vietnam Power Development 2/96–6/00 1.6 0.5 1.1 Renewable energy capacity building
5 5 Indonesia Solar Home Systems 1/97–FY2004 3.4 0.1 2.3 1.0 Solar home systems and TA
6 6 Thailand Metropolitan Distribution Reinforcement 6/97–FY2004 4.0 2.5 1.5 DSM management capacity building
7 7 Lao PDR Southern Provinces Rural Electrification 3/88–FY2004 2.2 1.0 0.7 0.5 Solar battery charging and microhydro projects
8 8 China Passive Solar Heating for Rural Health Clinics 6/01–FY2004 1.5 0.8 0.8 Energy-efficient building design
9 9 China Energy Conservation 3/98–6/06 150.8 63.0 22.0 7.0 54.3 4.5 Energy efficiency, TA
10 10 Vietnam Transmission, Distribution, and Disaster Reconstruction 1/98–FY2007 3.3 0.5 2.8 DSM capacity building, equipment standards
11 11 China Renewable Energy Development 6/99–FY2007 205.4 13.0 27.0 165.4 Wind farms, PV, PV technology improvement
12 12 Vietnam Rural Energy I 5/00–FY2007 2.5 1.0 1.5 Renewable energy TA and pilot minihydro
13 13 China Hebei Urban Environment 6/00–FY2007 5.0 4.0 1.0 Energy efficiency in water utilities
Total closed projects 459 97 61 39 221 42Projects under implementation FY2002 14 Vietnam System Efficiency Improvement, Equitization, and Renewables 6/02–FY2010 24.5 17.2 4.5 2.8 Renewable energy and DSM
FY2003 15 China Energy Conservation II 10/02–FY2010 242.5 26.0 216.5 Energy service company market development
FY2003 16 Vietnam Demand-Side Management 6/03–FY2007 18.6 5.5 1.2 6.7 5.2 DSM support
FY2004 17 Philippines Rural Power 12/03-FY2010 26.7 10.0 9.0 0.2 7.5 Renewable energy for rural applications
FY2004 18 Cambodia Rural Electrification and Transmission 12/03-FY2009 32.0 16.0 5.8 10.2 Renewable energy for rural applications
FY2004 19 Philippines Power System Loss Reduction 6/04-FY2012 62.3 12.0 0.3 50.0 Rural electrification and efficiency
FY2005 20 Vietnam Rural Energy II 11/04-FY2011 329.5 220.0 5.3 70.0 35.0 Renewable energy for remote communities
FY2005 21 China Heat Reform and Building Efficiency 3/05-FY2011 52.6 18.0 0.9 33.7 Energy efficiency
FY2005 22 China Renewable Energy Scale-Up Program 6/05-FY2010 336.0 87.0 40.2 142.0 67.0 Renewable energy and energy efficiency
FY2005 23 PNG Teachers Solar Lighting Project 6/05-FY2011 2.9 1.0 0.1 1.7 0.1 Renewable energy (PV) for teachers in rural areas
FY2006 24 China Renewable Energy Scale-Up Program Phase 1B 1/06-FY2011 132.4 86.3 30.1 16.0 Wind farm and small hydro
FY2005 25 Lao PDR Lao PDR Rural Electrification Phase I (SPRE II) 4/06-FY2011 36.3 10.0 3.7 8.2 14.3 Renewable energy for rural application
FY2007 26 Mongolia Renewable Energy and Rural Electricity 1/07-FY2011 23.0 3.5 3.5 10.0 6.0 Renewable energy and rural electricity access
FY2007 27 Timor-Leste Gas Seep Harvesting 03/07-FY2009 1.5 0.9 0.6 Gas seep for power generation
FY2007 28 Timor-Leste Energy Service Delivery 06/07-FY2011 8.5 4.5 2.0 2.0 Loss reduction, RE development, and community-based access
FY2007 29 Pacific Islands Sustainable Energy Financing 05/07-FY2016 58.5 9.5 20.2 22.1 6.7 Renewable energy scaling up
FY2008 30 Indonesia Geothermal Power Generation Development 05/08-FY2011 9.0 4.0 5.0 Geothermal power scaling up and capacity building
FY2008 31 China Energy-Efficiency Financing 05/08-FY2013 593.6 200.0 13.5 6.3 373.8 Energy-efficiency financing
FY2008 32 China Liaoning Third Medium Cities Infrastructure 05/08-FY2013 375.9 191.0 184.9 Improve efficiency of heating and gas services
FY2008 33 Vietnam Rural Distribution 05/08-FY2012 204.2 150.0 54.2 3.0 Electricity network efficiency improvement
FY2009 34 Solomon Islands Solomon Islands Sustainable Energy 07/08-FY2013 4.5 4.0 0.5 Reduction of electricity losses and increased access
FY2009 35 Philippines Additional Financing for Rural Power 04/09-FY2011 48.4 40.0 0.5 7.9 Renewable energy for rural applications
FY2009 36 Vietnam Renewable Energy Development 05/09-FY2015 318.0 202.0 64.0 49.7 2.3 Increase RE share in electricity mix, TA, and lending
FY2009 37 China Thermal Power Efficiency 05/09-FY2016 109.0 19.7 15.5 73.8 Efficient dispatch and increase thermal plants efficiency
FY2009 38 Vietnam Rural Energy II - Additional Financing 05/09-FY2016 250.6 200.0 38.8 11.8 Improved and new electricity access
Total current financial year 730 446 20 119 123 22 Total projects under implementation 3,248 1,442 182 657 796 227