Association of three genetic loci with uric acid concentration and risk of gout: a genome-wide...
20
Association of three genetic loci with uric acid concentration and risk of gout: a genome-wide association study Abbas Dehghan, MD, DSc 1,* , Anna Köttgen, MD, MPH 2,* , Qiong Yang, PhD 3,6,* , Shih-Jen Hwang, PhD 8,9 , W. H. Linda Kao, PhD, MHS 2 , Fernando Rivadeneira, MD, PhD 1 , Eric Boerwinkle, PhD 5,8 , Daniel Levy, MD 8,9 , Albert Hofman, MD, PhD 1 , Brad C. Astor, PhD, MPH 2 , Emelia J. Benjamin, MD, ScM 4 , Cornelia M. van Duijn, PhD 1 , Jacqueline C. Witteman, PhD 1,§ , Josef Coresh, MD, PhD 2,§ , and Caroline S. Fox, MD, MPH 7,8,9,§ 1 Department of Epidemiology & Biostatistics, Erasmus Medical Center, Rotterdam, The Netherlands 2 Department of Epidemiology and the Welch Center for Prevention, Epidemiology & Clinical Research, Johns Hopkins University, Baltimore, USA 3 Department of Biostatistics, School of Public Health, Boston University, Boston, USA 4 Department of School of Medicine, Boston University, Boston, USA 5 Human Genetics Center and Institute of Molecular Medicine, University of Texas Health Science Center, Houston, TX, USA 6 Boston University, Boston, MA, USA 7 Brigham and Women’s Hospital Division of Endocrinology, Hypertension, and Diabetes and Harvard Medical School, Framingham, MA, USA 8 NHLBI’s Framingham Heart Study, and the Center for Population Studies, Framingham, MA, USA 9 the National Heart Lung and Blood Institute, Bethesda, MD, USA Abstract Background—Hyperuricemia, a highly heritable trait, is a key risk factor for gout. We aimed to identify novel genes related to serum uric acid (UA) and gout. Methods—Genome-wide association studies (GWAS) were conducted for serum UA in the Framingham Heart Study (FHS; n=7699) and the Rotterdam Study (RS; n=4148). Genome-wide Addresses for Correspondence: 1) Jacqueline C. Witteman, PhD, Department of Epidemiology & Biostatistics, Erasmus Medical Center, Rotterdam, P.O. Box 2040, 3000 CA Rotterdam, The Netherlands, [email protected]. 2) Josef Coresh, MD, PhD, Welch Center for Prevention, Epidemiology & Clinical Research, 2024 E Monument Street, Suite 2-600, Baltimore, MD 21287, USA, [email protected]. 3) Caroline S. Fox, MD, MPH, NHLBI’s Framingham Heart Study, 73 Mt Wayte Ave Suite #2, Framingham MA 01702, USA, [email protected]. * these authors contributed equally § these authors contributed equally Author Contributions CF, JW, and JC drafted and critically revised the manuscript, contributed to the study design, analysis, and interpretation of the data. EB performed the follow-up genotyping and critically revised the manuscript. CV coordinated the blood collection and storage, the statistical analyses and bioinformatics, critically revised the manuscript, and contributed to the interpretation of the data. FR coordinated the genome- wide association genotyping, bioinformatics, critically revised the manuscript, contributed to the study design, analysis, and interpretation of the data. AK performed the statistical analyses, drafted the manuscript, critically revised the manuscript, and contributed to the study design and interpretation of the data. DL collected the clinical data, contributed to the interpretation of the data, and critically revised the manuscript. SH performed the statistical analyses, coordinated the genome-wide association genotyping, bioinformatics, and contributed to the interpretation of the data. WK contributed to the study design, interpretation of the data, and critically revised the manuscript. EJB contributed to the study design and critically revised the manuscript. AH collected the clinical data, critically revised the manuscript, contributed to the study design, and supervised the research. QY performed the statistical analyses, drafted parts of the manuscript, critically revised the manuscript, contributed to the study design, and interpretation of the data. BA contributed to the interpretation of the data and critically revised the manuscript. AD performed the statistical analyses, drafted the manuscript, and contributed to the study design and interpretation of the data. Publisher's Disclaimer: This is a PDF file of an unedited manuscript that has been accepted for publication. As a service to our customers we are providing this early version of the manuscript. The manuscript will undergo copyediting, typesetting, and review of the resulting proof before it is published in its final citable form. Please note that during the production process errors may be discovered which could affect the content, and all legal disclaimers that apply to the journal pertain. NIH Public Access Author Manuscript Lancet. Author manuscript; available in PMC 2010 January 8. Published in final edited form as: Lancet. 2008 December 6; 372(9654): 1953–1961. doi:10.1016/S0140-6736(08)61343-4. NIH-PA Author Manuscript NIH-PA Author Manuscript NIH-PA Author Manuscript
Transcript of Association of three genetic loci with uric acid concentration and risk of gout: a genome-wide...

Association of three genetic loci with uric acid concentration andrisk of gout: a genome-wide association study
Abbas Dehghan, MD, DSc1,*, Anna Köttgen, MD, MPH2,*, Qiong Yang, PhD3,6,*, Shih-JenHwang, PhD8,9, W. H. Linda Kao, PhD, MHS2, Fernando Rivadeneira, MD, PhD1, EricBoerwinkle, PhD5,8, Daniel Levy, MD8,9, Albert Hofman, MD, PhD1, Brad C. Astor, PhD,MPH2, Emelia J. Benjamin, MD, ScM4, Cornelia M. van Duijn, PhD1, Jacqueline C. Witteman,PhD1,§, Josef Coresh, MD, PhD2,§, and Caroline S. Fox, MD, MPH7,8,9,§
1 Department of Epidemiology & Biostatistics, Erasmus Medical Center, Rotterdam, TheNetherlands 2 Department of Epidemiology and the Welch Center for Prevention, Epidemiology &Clinical Research, Johns Hopkins University, Baltimore, USA 3 Department of Biostatistics, Schoolof Public Health, Boston University, Boston, USA 4 Department of School of Medicine, BostonUniversity, Boston, USA 5 Human Genetics Center and Institute of Molecular Medicine, Universityof Texas Health Science Center, Houston, TX, USA 6 Boston University, Boston, MA, USA 7 Brighamand Women’s Hospital Division of Endocrinology, Hypertension, and Diabetes and Harvard MedicalSchool, Framingham, MA, USA 8 NHLBI’s Framingham Heart Study, and the Center for PopulationStudies, Framingham, MA, USA 9 the National Heart Lung and Blood Institute, Bethesda, MD, USA
AbstractBackground—Hyperuricemia, a highly heritable trait, is a key risk factor for gout. We aimed toidentify novel genes related to serum uric acid (UA) and gout.
Methods—Genome-wide association studies (GWAS) were conducted for serum UA in theFramingham Heart Study (FHS; n=7699) and the Rotterdam Study (RS; n=4148). Genome-wide
Addresses for Correspondence: 1) Jacqueline C. Witteman, PhD, Department of Epidemiology & Biostatistics, Erasmus Medical Center,Rotterdam, P.O. Box 2040, 3000 CA Rotterdam, The Netherlands, [email protected]. 2) Josef Coresh, MD, PhD, Welch Centerfor Prevention, Epidemiology & Clinical Research, 2024 E Monument Street, Suite 2-600, Baltimore, MD 21287, USA, [email protected]) Caroline S. Fox, MD, MPH, NHLBI’s Framingham Heart Study, 73 Mt Wayte Ave Suite #2, Framingham MA 01702, USA,[email protected].*these authors contributed equally§these authors contributed equallyAuthor ContributionsCF, JW, and JC drafted and critically revised the manuscript, contributed to the study design, analysis, and interpretation of the data. EBperformed the follow-up genotyping and critically revised the manuscript. CV coordinated the blood collection and storage, the statisticalanalyses and bioinformatics, critically revised the manuscript, and contributed to the interpretation of the data. FR coordinated the genome-wide association genotyping, bioinformatics, critically revised the manuscript, contributed to the study design, analysis, and interpretationof the data. AK performed the statistical analyses, drafted the manuscript, critically revised the manuscript, and contributed to the studydesign and interpretation of the data. DL collected the clinical data, contributed to the interpretation of the data, and critically revised themanuscript. SH performed the statistical analyses, coordinated the genome-wide association genotyping, bioinformatics, and contributedto the interpretation of the data. WK contributed to the study design, interpretation of the data, and critically revised the manuscript. EJBcontributed to the study design and critically revised the manuscript. AH collected the clinical data, critically revised the manuscript,contributed to the study design, and supervised the research. QY performed the statistical analyses, drafted parts of the manuscript,critically revised the manuscript, contributed to the study design, and interpretation of the data. BA contributed to the interpretation ofthe data and critically revised the manuscript. AD performed the statistical analyses, drafted the manuscript, and contributed to the studydesign and interpretation of the data.Publisher's Disclaimer: This is a PDF file of an unedited manuscript that has been accepted for publication. As a service to our customerswe are providing this early version of the manuscript. The manuscript will undergo copyediting, typesetting, and review of the resultingproof before it is published in its final citable form. Please note that during the production process errors may be discovered which couldaffect the content, and all legal disclaimers that apply to the journal pertain.
NIH Public AccessAuthor ManuscriptLancet. Author manuscript; available in PMC 2010 January 8.
Published in final edited form as:Lancet. 2008 December 6; 372(9654): 1953–1961. doi:10.1016/S0140-6736(08)61343-4.
NIH
-PA Author Manuscript
NIH
-PA Author Manuscript
NIH
-PA Author Manuscript

significant SNPs were replicated among white (n=11024) and black (n=3843) Atherosclerosis Riskin Communities (ARIC) Study participants. The association of these SNPs was evaluated with gout;results in whites were combined using meta-analysis.
Results—Three loci in FHS and two in the RS showed genome-wide significance with UA. TopSNPs in each locus were: missense SNP rs16890979 in SLC2A9 (p=7.0×10−168 [whites];2.9×10⁻¹⁸ [blacks]), missense SNP rs2231142 in ABCG2 (p=2.5×10−60 [whites]; 9.8×10⁻⁴ [blacks]),and rs1165205 in SLC17A3 (p=3.3×10⁻²⁶ [whites]; 0.33 [blacks]). All SNPs showed direction-consistent association with gout in whites: rs16890979 (OR 0.58 per T allele, 95% CI 0.53–0.63,p=1.2×10⁻³¹), rs2231142 (OR=1.74 per T allele, 1.51–1.99, p=3.3×10⁻¹⁵), and rs1165205 (OR=0.85per T allele, 0.77–0.94, p=0.002). In ARIC blacks, rs2231142 showed a direction-consistentassociation with gout (OR=1.71, 1.06–2.77, p=0.028). An additive genetic risk score (0–6) comprisedof high risk alleles at the three loci showed graded associations in each study across scores with UA(from 272–351 μmol/l [FHS], 269–386 μmol/l [RS], and 303–426 μmol/l [ARIC whites]) and gout(prevalence 2–13% [FHS], 2–8% [RS], 1–18% [ARIC whites]).
Conclusions—We identified three genetic loci (two novel including a candidate functional variantQ141K in ABCG2) related to UA and gout. A score based on genes with a putative role in renal uratehandling showed a substantial risk gradient for gout.
Keywordsgenome-wide association; uric acid; gout; epidemiology
IntroductionGout is one of the most common forms of arthritis (1,2). Gout currently affects over 700,000adults in the United Kingdom (2) and nearly 3 million adults in the United States (3), accountingfor almost 4 million annual outpatient visits (4), with a substantial economic burden (5).Epidemiological studies from a range of countries suggest that the prevalence and incidenceof gout are increasing (6). Gout is characterized by joint pain, inflammation, and painful tophi,and can result in joint destruction and disability if untreated (7).
Uric acid is the end product of purine metabolism in humans, and levels are primarilydetermined by endogenous metabolism (synthesis and cell turnover), and the rate of excretionand reabsorption in the kidney (1). Humans lack uricase, the enzyme responsible for convertinguric acid into its more soluble and excretable form. Renal excretion of urate is responsible forthe majority of hyperuricemia and gout (8). Thus, understanding the molecular mechanismsof urate transport in the kidney has potential research and clinical implications.
Known risk factors for gout include hyperuricemia, obesity, hypertension, diuretic use, andalcohol consumption (9). Despite extensive research in the area of renal urate transport, themechanisms influencing serum uric acid levels in humans by contributing to either secretionor reabsorption of urate in the proximal renal tubules have not been fully elucidated (10). Wehave previously shown that the heritability of serum uric acid (UA) levels is 63% (11),suggesting that genetic variation may contribute to UA levels through regulation of UAsynthesis, excretion, or reabsorption. Several recent genome-wide association studies (GWAS)identified significant associations between single nucleotide polymorphisms (SNPs) in thegene SLC2A9 with UA levels and gout (12–16). The gene product of SLC2A9 had notpreviously been implicated in UA metabolism, highlighting the power of GWAS to identifyunknown physiologic mechanisms contributing to disease.
The objective of this study was to identify genetic loci related to UA using GWAS in twopopulation-based studies (11847 participants) and subsequently replicate them in a third
Dehghan et al. Page 2
Lancet. Author manuscript; available in PMC 2010 January 8.
NIH
-PA Author Manuscript
NIH
-PA Author Manuscript
NIH
-PA Author Manuscript

population-based study (14867 participants). Moreover, a meta-analysis of replicated SNPswas performed for UA and gout across studies to combine the results in whites. Finally theassociation of a genetic risk score summarizing the number of risk alleles was tested with bothUA levels and gout risk.
MethodsPhenotype and genotype data for the present study was made available through the GWASinitiatives of the Framingham Heart Study, the Rotterdam Study (RS), and the ARIC Study,which are three large population-based studies initiated to study cardiovascular disease and itsrisk factors, aging, neurologic disease, locomotion, and eye disease.
Framingham Heart Study (FHS)Subjects
The FHS started in 1948 when 5209 participants began undergoing biannual examinations toidentify cardiovascular disease and its risk factors (17,18). In 1971, 5124 participants wereenrolled into the Framingham Offspring Study. Offspring subjects underwent examinationsapproximately every 4 years; the design and methodology have been previously described(19,20). In 2002, the Third Generation, representing the children of the Offspring cohort, wasrecruited (n=4095) (21). Nearly all FHS participants are self-identified white (of Europeandescent). The Original Cohort consisted of 1644 spouse pairs; the Offspring cohort consistedof 2632 individuals with two parents in the Original cohort, 916 with at least one parent in theOriginal Cohort, and 1576 spouse pairs. The Third Generation consisted of 2944 individualswith both parents in the Offspring cohort, and 1146 individuals with at least one parent in theOffspring Cohort. By protocol, spouses were not recruited into the Third Generation Cohort(20). A broad range of phenotypes have been collected, and are publically available at thedbgap website(http://www.ncbi.nlm.nih.gov/projects/gap/cgi-bin/study.cgi?study_id=phs000007.v2.p1).The study was approved by the Institutional Review Board of the Boston University MedicalCenter. All subjects provided written informed consent.
Genotyping and Study Subjects IncludedThe SHARe project (22) genotyped 9274 FHS participants, using the Affymetrix 500Kmapping array and the Affymetrix 50K supplemental array. Of those, 8508 samples weregenotyped successfully (sample call rate ≥97%). Exclusion of individuals with missing UAmeasurements (n = 623) or covariates (n=186) resulted in a final sample size of 7699 (OriginalCohort n=572, Offspring n=3377, Third Generation n=3750). SNPs were excluded for SNPcall rate <95% or Hardy-Weinberg equilibrium p-value <10−6, resulting in a final number of503551 SNPs.
OutcomesUA was measured at the first examination cycle of each cohort using an autoanalyzer with aphosphotungstic acid reagent (23). Gout was ascertained via self-report in the Offspringsubjects during exam cycles 3–7, and the first exam of the Third Generation. Information onUA and gout was available for 7699 and 7386 subjects, respectively.
The Rotterdam Study (RS)Subjects
The RS is a prospective, population-based cohort study on determinants of several chronicdiseases among subjects aged ≥55 years (24,25). In brief, all inhabitants of Ommoord, a district
Dehghan et al. Page 3
Lancet. Author manuscript; available in PMC 2010 January 8.
NIH
-PA Author Manuscript
NIH
-PA Author Manuscript
NIH
-PA Author Manuscript

of Rotterdam in the Netherlands, who were 55 years or over, were invited to participate in thisstudy. Of all 10275 eligible individuals, 7983 agreed to participate (78%). For the baselineexamination (1990 – 1993), participants completed an interview at home and visited theresearch center for blood sampling and examination. Follow-up started at baseline andexaminations were carried out periodically. In addition, participants were continuouslymonitored for major events through automated linkage with files from general practitionersand pharmacies working in the study district of Ommoord. Written informed consent wasobtained from all participants and the Medical Ethics Committee of Erasmus Medical Centerapproved the study.
Genotyping and Study Subjects IncludedPlated DNA was available for 6680 (83.7%) of 7129 participants who visited the researchcenter. Genotyping was conducted using the Illumina 550K array among self-reportedCaucasian individuals, and succeeded in 6240 individuals (sample call rate ≥ 97.5%). Weexcluded subjects for excess autosomal heterozygosity, mismatch between called andphenotypic gender, or being outliers identified by the IBS clustering analysis. The finalpopulation for analysis comprised 5974 subjects. SNPs were excluded for minor allelefrequency ≤1%, Hardy-Weinberg equilibrium p-value<10−5, or SNP call rate ≤90% resultingin data on 530683 SNPs.
Population stratificationThe RS data was examined for potential population stratification after excluding outliersdetected by the IBS clustering analysis (26,27). The genomic inflation factor (based on medianchi-squared) was 1.014 for UA analyses, providing evidence against the presence of significantpopulation stratification affecting the results.
Imputation of SNPs in the RSWe imputed two SNPs, rs16890979 on chromosome 4 and rs1165205 on chromosome 6, whichwere not on the Illumina Infinium II HumanHap550 SNP chip. Imputation was done usingmaximum likelihood method implemented in MACH 1.0 (28). HapMap release 22 CEU phasedgenotypes were used as a reference. The R square estimate of MACH was 0.96 for rs16890979and 0.99 for rs1165205. This estimate is a ratio of observed variation to the expected variationunder Hardy-Weinberg equilibrium and measures above 0.8 indicate acceptable quality of theimputation.
OutcomesUA was measured at baseline with a Kone Diagnostica reagent kit and a Kone autoanalyzer(29). Data on medication prescription were obtained from a computer network of pharmaciesin the study area that registers all prescriptions of drugs used from January 1, 1991, onward.Subjects receiving medication exclusively prescribed for gout (allopurinol, probenecid,benzbromarone and colchicine) were considered gout cases. Information on UA was availablein 4148 individuals, and in 5741 individuals for gout.
Atherosclerosis Risk in Communities (ARIC) StudySubjects
The ARIC Study is an ongoing, population-based, prospective study in four U.S. communities.From 1987–89, 15792 mostly Caucasian and African American study participants aged 45–64years were recruited by probability sampling and underwent the baseline examination (visit 1)and three subsequent examinations scheduled approximately every three years (30). For thecurrent study, participants were excluded for non-consent to genetic research (n=53) or if they
Dehghan et al. Page 4
Lancet. Author manuscript; available in PMC 2010 January 8.
NIH
-PA Author Manuscript
NIH
-PA Author Manuscript
NIH
-PA Author Manuscript

did not self-identify as “black” or “white” (n=47). Of the remaining 11,440 white and 4,252black participants, 8,923 and 2,650, respectively, attended study visit 4. Further exclusion tothe study samples were made for genotyping failure of all SNPs as well as missing outcomesor covariates. The final study sample for association analyses therefore consisted of 11,024white and 3,843 black participants at visit 1, and 8,599 white and 2,392 black participants atvisit 4. Institutional Review Boards of the participating institutions approved the studyprotocols, and each participant provided written informed consent.
Genotyping and Study Subjects IncludedThe ARIC Central DNA Laboratory genotyped SNPs rs16890979, rs2231142, and rs1165205individually using TaqMan assays (Applied Biosystems). The percent agreement of 315 blindduplicate samples was >98.4% for all genotyped SNPs.
OutcomesUA was measured using the uricase method (31) at study visit 1. Repeated measurements ofUA in 40 individuals, taken at least one week apart, yielded a reliability coefficient of 0.91,and the coefficient of variation was 7.2% (32). Gout was defined by self-report at study visit4.
Measurement of covariatesIn all three studies, alcohol consumption was self-reported as drinks per week and convertedto grams/week, and antihypertensive treatment was defined as self-reported intake ofantihypertensive medication or medication reconciliation.
Statistical analysisGWAS of UA
GWAS analyses used cohort- (FHS only) and sex-specific UA residuals, adjusted for age, bodymass index (BMI), alcohol consumption, and hypertension treatment. In FHS, GWAS analysiswas conducted as: 1) linear mixed effects models to account for familial correlation; 2) family-based association testing using FBAT to reduce the chance of false positive findings due topopulation stratification (33,34). In RS, linear regression was performed using PLINK ver.1.01(26,27). Both studies used an additive genetic model.
Replication in ARIC and Association with GoutThe most significant SNP that reached genome-wide significance with UA for each region ineither FHS (p<0.5×10⁻⁸) or RS (p<1.0×10⁻⁷) was selected a priori for follow-up genotypingin ARIC. This criterion was met by rs16890979, rs2231142, and rs1165205 (FHS), andrs6449213 and rs2231142 (RS). rs16890979 and rs6449213 are located in the same geneticregion and in moderate linkage disequilibrium (LD) with each other (r2=0.66 in HapMap CEU).Therefore, only rs16890979, rs2231142, and rs1165205 were genotyped in ARIC. In allstudies, the association with gout was considered significant at p<0.05, as only SNPsconsistently associated with UA across studies were examined in this setting.
Meta-analysis of UA and GoutWe combined the multivariable adjusted measures of beta and OR of replicated SNPs with UAand gout across studies. We used Cochran Q-test to detect heterogeneity across the studies.Since no significant heterogeneity was found with UA levels and gout (all p-values >0.07), afixed-effect model was used for both traits. We used the “meta” (35) package running underR (36) to calculate the combined estimates and p-values.
Dehghan et al. Page 5
Lancet. Author manuscript; available in PMC 2010 January 8.
NIH
-PA Author Manuscript
NIH
-PA Author Manuscript
NIH
-PA Author Manuscript

Genetic Risk Score and Gene-by-Environment InteractionA genetic risk score was generated for each individual by counting the number of allelesassociated with higher UA levels (rs16890979 C, rs2231142 T, rs1165205 A; range 0–6). Gene-by-environment testing was performed for the three selected SNPs with five environmentalfactors; additional details can be found in the supplement. Additional secondary analysesincluding conditional analyses are described in the Supplementary methods.
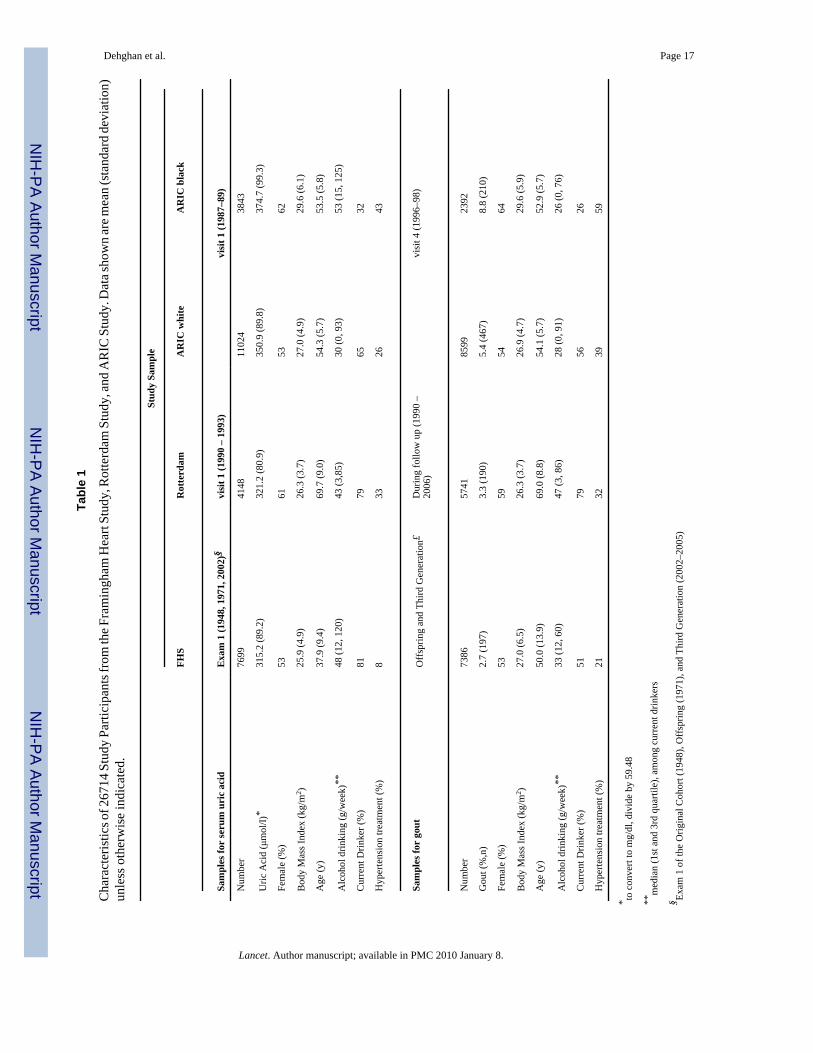
ResultsStudy Sample Characteristics
Characteristics of 26714 participants are shown in Table 1. SNPs genotyped in all three studiesmet quality control standards (Supplementary Table 1).
GWAS Results with UAThree loci manifested SNPs that reached genome-wide significance in FHS: for each locus,the most significant SNPs were rs16890979 (a missense SNP in SLC2A9, p=1.6×10−76),rs2231142 (a missense SNP in ABCG2, p=9.0×10⁻²⁰), and rs1165205 (intron 1 of SLC17A3,p=5.6×10⁻¹⁰; Table 2). Likewise, two loci manifested genome-wide significant SNPs in theRS: rs6449213 (intron 4 of SLC2A9, p=1.15×10⁻²⁹), and rs2231142 in ABCG2(p=3.3×10⁻⁹).
Exploration of LociAll SNPs reaching genome-wide significance at 4p16-p15.3 (SLC2A9), 4q22 (ABCG2), and6p21.3 (SLC17A3) are presented in Supplementary Tables 2 (FHS) and 3 (RS). Figure 1displays the results from ABCG2 locus. The SLC17A3 locus, detailed in Supplementary Figure1, shows extensive LD in Caucasians extending downstream of SLC17A3 to includeSLC17A1 and SLC17A4; the SLC17A3/SLC17A1/SLC17A4 region will be referred to as theSLC17A3 region for the remainder of the paper due to the location of the most associatedvariant.
Replication in ARICBoth rs16890979 and rs2231142 were strongly associated with UA in whites (p=2.3×10−105
and 9.7×10⁻³⁰, respectively) and blacks (p=2.9×10⁻¹⁸ and 9.8×10⁻⁴, respectively). rs1165205was strongly associated with UA among whites only (p=8.4×10⁻¹¹; Table 2).
Meta-analysis, Association with Gout, and Secondary AnalysesAll meta-analysis p-values for UA reached genome-wide significance (Table 2); rs16890979explained the largest variation in UA levels, ranging from 2.8%–5.3% of the variation in UAlevels in white subjects across studies. The total R2 for all 3 SNPs in explaining UA levels was5.8% (ARIC whites), 2.4% (ARIC blacks); 7.1% (FHS); 3.7% (RS).
Conditional on the top SNPs, only SNPs in the SLC2A9 region, one in FHS and two in RS,remained significant (Supplementary Results).
Study-specific results for gout were direction-consistent with the UA associations and arepresented in Table 2. rs16890979 was associated with gout in whites from all three studies(meta-analysis odds ratio [OR] 0.58 per T allele, 95% CI 0.53–0.63, p=1.2×10⁻³¹). Significantresults were also observed for rs2231142 and rs1165205, and for rs6449213 in FHS and RS.Among ARIC blacks, only rs2231142 in ABCG2 showed a marginal association with gout (OR1.71 per T allele, 95% CI 1.06–2.77, p=0.028). There were no genome-wide significant findingsfor gout in either FHS or RS.
Dehghan et al. Page 6
Lancet. Author manuscript; available in PMC 2010 January 8.
NIH
-PA Author Manuscript
NIH
-PA Author Manuscript
NIH
-PA Author Manuscript

Secondary analyses further adjusted UA results for diabetes, systolic blood pressure, andestimated glomerular filtration rate; results were not materially changed. Upon adjustment ofgout results for UA, attenuation of the ORs for gout was observed, although most loci retainedsignificance. In the FHS, only rs2231142 remained associated with gout upon adjustment forUA (OR 1.57, 95% CI 1.14–2.16, p=0.0053); all other loci lost significance. In RS, none ofthe SNPs remained significant after adjustment for serum UA. In the ARIC study, substantialattenuation of the genotypic effect for all three loci on gout risk was observed upon adjustmentfor UA. P-values decreased: for rs16890979 from 1.8×10⁻⁹ to 2.4×10⁻⁴; for rs2231142 from1.9×10−7 to 1.7×10⁻³; and for rs1165205 from 3.0×10⁻³ to 0.015.
Genetic Risk Score for UA and Gout in WhitesThe genetic risk score counting the number of high risk alleles from 0 to 6 showed commonvariation the population (Figure 2a). Mean UA levels increased linearly with the number ofrisk alleles (Figure 2b). For individuals with 0 risk alleles, the crude prevalence of gout was1–2% across the studies and increased to 8–18% for those with 6 risk alleles (Figure 2c). Themultivariable adjusted ORs of gout increased accordingly across the risk scores among thethree studies (Figure 2d).
Gene-by-Environment Interactions for UASignificant gene-by-sex interaction was observed for rs16890979 and rs2231142(Supplementary Table 4). rs16890979 had a stronger relation with UA in women than men inall three studies; data are presented from ARIC in Figure 3 (p-value forinteraction=5.4×10⁻¹¹ in whites). Although this SNP was significantly associated with UAwithin each sex, it explained 7.6% of the variance in UA levels in women compared to 1.7%in men. Results were similar for FHS and RS and for rs6449213 the next most significant SNPin SLC2A9. For rs2231142, the T allele was associated with both higher UA levels and higherodds of gout in men compared to women (Figure 3); the SNP explained 0.6% of the variancein UA levels in women but 2.0% in men. We did not observe significant interactions of anytested SNP with age, BMI, alcohol intake, or hypertension treatment.
DiscussionPrincipal Findings
First, we identified two new loci related to UA levels and gout, ABCG2 and SLC17A3. Amissense SNP in ABCG2 (rs2231142; Q141K) was associated with UA levels and gout in bothwhites and blacks and may be a causal candidate variant. Second, we confirm the previouslyreported association of variation in SLC2A9 with UA and gout in whites and extend the findingsto blacks. Third, we demonstrate sex-specific effects of SNPs in ABCG2 and SLC2A9. Fourth,we show that an additive genetic risk score has strong and graded associations with UA levelsand gout in three population-based studies.
Biologic MechanismsSNPs in SLC2A9 recently have been identified as associated with UA levels (12–15), and wereassociated with low renal fractional excretion of UA (15), the most common cause forhyperuricemia (37). We identified the missense SNP rs16890979 in SLC2A9 as showing thestrongest association with UA levels and gout. This SNP leads to a valine-to-isoleucine aminoacid substitution (V253I); the valine residue is highly conserved across species. Thisassociation was also present in black ARIC participants, where the LD pattern differs.However, sequencing efforts in prior GWAS of UA did not support rs16890979 as the causalSNP in the region, as among 541 individuals from Sardinia, this SNP was minimally associated
Dehghan et al. Page 7
Lancet. Author manuscript; available in PMC 2010 January 8.
NIH
-PA Author Manuscript
NIH
-PA Author Manuscript
NIH
-PA Author Manuscript

with UA levels (p=0.02) (12). Therefore, the potential causal role of this missense SNP remainsunclear.
The apparent importance of renal urate transport influencing UA concentrations andsubsequently gout is supported by the other two genetic loci we identified. ABCG2 encodes atransporter of the ATP-binding cassette (ABC) family (38). Like SLC2A9, ABCG2 isexpressed in the apical membrane of human kidney proximal tubule cells (39), and transportspurine nucleoside analogues, which resemble the molecular structure of UA (40). We observedthe strongest association with UA levels and gout in both white and black individuals with theABCG2 missense SNP rs2231142. This SNP in exon 5 leads to a glutamine-to-lysine aminoacid substitution (Q141K); the glutamine residue is highly conserved across species. Based onthe FHS data, rs2231142 was not grouped into any LD block. Three other SNPs locateddownstream of and in disequilibrium with the Q141K variant were associated with UA, twoof which are located in the PKD2 gene. However, neither these SNPs nor other SNPs in theregion were independently associated with UA conditional on the Q141K variant in either FHSor Rotterdam. Combining this evidence with the relatively weak LD pattern in the ABCG2region in the HapMap Yoruban sample and the significant association in ARIC blacks despitethe low minor allele frequency of 3%, suggests that the ABCG2 Q141K variant (rs2231142)could be causally related to UA levels.
SLC17A3 encodes a sodium phosphate (Na/Pi) transporter (NPT4), the rat homologue of whichlocalizes to the apical membrane of renal proximal tubule cells (41). Several prior studies haveinvestigated the role of SLC17A1, located directly downstream of SLC17A3. SLC17A1 encodesNPT1, which is expressed in the human kidney and has been shown to transport urate in modelsystems (42). In our study, the association of rs1165205 in SLC17A3 was weaker with UAlevels compared to the other loci. In FHS, the missense SNP rs1165196 (T269I) in exon 7 ofSLC17A1 also showed genome-wide significant association with UA levels (p=6.24×10⁻¹⁰ inFHS; p=0.003 in Rotterdam). This SNP was not in the same LD block as rs1165205, but bothSNPs were in high pair-wise LD (r2=0.9 in FHS). Additionally, the observed non-replicationof rs1165205 with UA and gout among the black ARIC participants may allow for some degreeof fine-mapping of the observed association. It is therefore conceivable that one or more causalgenetic variants may be located downstream of SLC17A3, possibly in SLC17A1 or even furtherdownstream in SLC17A4 due to the extensive LD in this region.
Clinical ImplicationsAlthough the gout risk conferred by the individual common genetic variants was modest, theircombination resulted in a large effect on UA and gout prevalence. Further, the minor allelefrequencies were common, suggesting that variants with low effect sizes will impact a largeproportion of the population. Individual risk variants were associated with up to a 70%increased risk of developing gout, with effect sizes similar to that of known environmental riskfactors (1). Our genetic risk score was associated with up to a 40-fold increased risk ofdeveloping gout, substantially higher than environmental risk factors, suggesting thatknowledge of genotype may help identify individuals at risk for developing gout long beforethe onset of clinical disease. This underscores the value of a one-time assessment of the geneticrisk score, whereas the measurement of uric acid is subject to measurement error andphysiologic variability over time.
In additional to risk prediction, knowledge of an individual’s genotype or risk score could beused to help guide clinical decision making, especially with respect to the selection ofmedications known to increase uric acid levels and precipitate gout. Currently, goutprophylaxis for asymptomatic hyperuricemia is not recommended (43), but it is conceivablethat our genetic risk score could be used to identify individuals in which asymptomatichyperuricemia should be treated. Since treatment decisions are best guided by randomized
Dehghan et al. Page 8
Lancet. Author manuscript; available in PMC 2010 January 8.
NIH
-PA Author Manuscript
NIH
-PA Author Manuscript
NIH
-PA Author Manuscript

trials, stored specimens from existing trials should be tested to directly estimate how thisdiscovery of an easily determined strong genetic risk gradient can lead to personalizedmedicine. It is also possible that the genetic risk score, or certain genes that comprise it,differentially associate with gout complications, particularly joint destruction or poor responseto medications.
Although novel agents for lowering UA such as febuxostat (44) are promising, allopurinolremains the mainstay of treatment for gout (45). The efficacy of allopurinol can be limited bydrug dosing and intolerance, drug-drug interactions, and treatment failure (7). Errors arefrequently made in allopurinol use (46), and only 21% of patients randomized to allopurinolin a clinical trial achieved optimal UA levels (44). The genes identified here may provide theopportunity for the identification of novel proteins and molecular mechanisms influencing UAlevels, and the opportunity for the discovery of needed novel drug targets in order to ultimatelyimprove the treatment of gout.
Study LimitationsLimitations to our study include the self-reported ascertainment of gout in FHS and ARIC,which could lead to misclassification and underestimation of the true magnitude of thegenotype-phenotype association. We used slightly different definitions of gout across studies.Nonetheless, the findings remain consistent, highlighting their robustness. Hyperuricemia mayhave influenced the diagnosis of gout in our sample. However, gout was not ascertained at thesame time that UA was measured; therefore, this is unlikely to account for the joint associationof the SNPs with UA levels and gout. We note that the association between the SNPs and goutwas not completely attenuated by adjustment for UA levels, which may be due to the fact thatUA levels were measured before the onset of gout in the majority of cases. Due to the limitedpower for GWAS for gout in this setting, we focused our genetic analyses on UA levels andonly related SNPs for UA to gout. Therefore, there are likely to be additional loci for gout thatwe have not detected. Finally, we assigned identical risk to each allele in creating the geneticrisk score for ease of interpretation, as done previously (47).
SummaryUA levels and gout prevalence are related to genetic variation in SLC2A9, ABCG2 andSLC17A3. The ABCG2 Q141K variant identified is a potential causal candidate for a 70%elevation in gout risk among both whites and blacks with a stronger effect in men than women.Existing functional studies suggest that all three genes are involved with renal urate transport,and their protein products may ultimately be drug targets for uric acid-lowering therapeutics.Independent, moderate risks conferred by common genetic variations can result in a combinedrisk of substantial magnitude for gout, a common and debilitating form of arthritis.
Supplementary MaterialRefer to Web version on PubMed Central for supplementary material.
AcknowledgmentsWe are indebted to the staff and participants in the Framingham Heart Study, the Rotterdam Study, and theAtherosclerosis Risk in Communities Study for their important contributions. We acknowledge the National Heart,Lung, and Blood Institute, who has made the SHARe (SNP Health Association Resource) project possible. Thegenotyping in the Rotterdam study was funded by NWO groot. We acknowledge the individual participating studiesand investigators of the CHARGe Consortium (Cohorts for Heart and Aging Research in Genome Epidemiology).FHS data used in this analysis are publically available to investigators through dbgap; details regarding the breadthof the FHS data and application process can be viewed at the dbgap website(http://www.ncbi.nlm.nih.gov/projects/gap/cgi-bin/study.cgi?study_id=phs000007.v2.p1). ARIC has established
Dehghan et al. Page 9
Lancet. Author manuscript; available in PMC 2010 January 8.
NIH
-PA Author Manuscript
NIH
-PA Author Manuscript
NIH
-PA Author Manuscript

policies for data sharing (http://www.cscc.unc.edu/ARIC/). Information about data sharing policies in the RotterdamStudy is available through the PI of the Rotterdam Study ([email protected]).
Funding: This work was supported by the Netherlands organization for scientific research (NWO) (175.01.2005.011);the National Heart, Lung and Blood Institute’s Framingham Heart Study (N01-HC-25195) and Affymetrix genotypingsupported by contract N02-HL-6-4278. The Atherosclerosis Risk in Communities Study is carried out as acollaborative study supported by National Heart, Lung, and Blood Institute contracts N01-HC-55015, N01-HC-55016,N01-HC-55018, N01-HC-55019, N01-HC-55020, N01-HC-55021, and N01-HC-55022 with ancillary funding byR01DK076770-01. A.K. is supported by a German Research Foundation Fellowship. The project described was partlysupported by Grant Number UL1 RR 025005 from the National Center for Research Resources (NCRR), a componentof the National Institutes of Health (NIH) and NIH Roadmap for Medical Research, and its contents are solely theresponsibility of the authors and do not necessarily represent the official view of NCRR or NIH. Information on NCRRis available at http://www.ncrr.nih.gov/. Information on Re-engineering the Clinical Research Enterprise can beobtained from http://nihroadmap.nih.gov/clinicalresearch/overview-translational.asp.
References1. Choi HK, Mount DB, Reginato AM. Pathogenesis of gout. Ann Intern Med 2005 Oct 4;143(7):499–
516. [PubMed: 16204163]2. Mikuls TR, Farrar JT, Bilker WB, Fernandes S, Schumacher HR Jr, Saag KG. Gout epidemiology:
results from the UK General Practice Research Database, 1990–1999. Ann Rheum Dis 2005 Feb;64(2):267–72. [PubMed: 15647434]
3. Lawrence RC, Felson DT, Helmick CG, Arnold LM, Choi H, Deyo RA, et al. Estimates of theprevalence of arthritis and other rheumatic conditions in the United States. Part II. Arthritis Rheum2008 Jan;58(1):26–35. [PubMed: 18163497]
4. Krishnan E, Lienesch D, Kwoh CK. Gout in ambulatory care settings in the United States. J Rheumatol2008 Mar;35(3):498–501. [PubMed: 18260174]
5. Wu EQ, Patel PA, Yu AP, Mody RR, Cahill KE, Tang J, et al. Disease-related and all-cause healthcare costs of elderly patients with gout. J Manag Care Pharm 2008 Mar;14(2):164–75. [PubMed:18331118]
6. Roddy E, Zhang W, Doherty M. The changing epidemiology of gout. Nat Clin Pract Rheumatol 2007Aug;3(8):443–9. [PubMed: 17664951]
7. Sundy JS, Hershfield MS. Uricase and other novel agents for the management of patients withtreatment-failure gout. Curr Rheumatol Rep 2007 Jun;9(3):258–64. [PubMed: 17531181]
8. Taniguchi A, Kamatani N. Control of renal uric acid excretion and gout. Curr Opin Rheumatol 2008Mar;20(2):192–7. [PubMed: 18349750]
9. Saag KG, Choi H. Epidemiology, risk factors, and lifestyle modifications for gout. Arthritis Res Ther2006;8( Suppl 1):S2. [PubMed: 16820041]
10. Eraly SA, Vallon V, Rieg T, Gangoiti JA, Wikoff WR, Siuzdak G, et al. Multiple Organic AnionTransporters Contribute to Net Renal Excretion of Uric Acid. Physiol Genomics. 2008 Feb 12;
11. Yang Q, Guo CY, Cupples LA, Levy D, Wilson PW, Fox CS. Genome-wide search for genes affectingserum uric acid levels: the Framingham Heart Study. Metabolism 2005 Nov;54(11):1435–41.[PubMed: 16253630]
12. Li S, Sanna S, Maschio A, Busonero F, Usala G, Mulas A, et al. The GLUT9 Gene Is Associatedwith Serum Uric Acid Levels in Sardinia and Chianti Cohorts. PLoS Genet 2007 Nov 9;3(11):e194.[PubMed: 17997608]
13. Wallace C, Newhouse SJ, Braund P, Zhang F, Tobin M, Falchi M, et al. Genome-wide associationstudy identifies genes for biomarkers of cardiovascular disease: serum urate and dyslipidemia. AmJ Hum Genet 2008 Jan;82(1):139–49. [PubMed: 18179892]
14. Doring A, Gieger C, Mehta D, Gohlke H, Prokisch H, Coassin S, et al. SLC2A9 influences uric acidconcentrations with pronounced sex-specific effects. Nat Genet. 2008 Mar 9;
15. Vitart V, Rudan I, Hayward C, Gray NK, Floyd J, Palmer CN, et al. SLC2A9 is a newly identifiedurate transporter influencing serum urate concentration, urate excretion and gout. Nat Genet. 2008Mar 9;
Dehghan et al. Page 10
Lancet. Author manuscript; available in PMC 2010 January 8.
NIH
-PA Author Manuscript
NIH
-PA Author Manuscript
NIH
-PA Author Manuscript

16. Stark K, Reinhard W, Neureuther K, Wiedmann S, Sedlacek K, Baessler A, et al. Association ofcommon polymorphisms in GLUT9 gene with gout but not with coronary artery disease in a largecase-control study. PLoS ONE 2008;3(4):e1948. [PubMed: 18398472]
17. Dawber TR, Kannel WB, Lyell LP. An approach to longitudinal studies in a community: theFramingham Study. Ann N Y Acad Sci 1963 May 22;107:539–56. [PubMed: 14025561]
18. Dawber TR, Meadors GF, Moore FE Jr. Epidemiological approaches to heart disease: the FraminghamStudy. Am J Public Health Nations Health 1951 Mar;41(3):279–81. [PubMed: 14819398]
19. Feinleib M, Kannel WB, Garrison RJ, McNamara PM, Castelli WP. The Framingham OffspringStudy. Design and preliminary data. Prev Med 1975 Dec;4(4):518–25. [PubMed: 1208363]
20. Kannel WB, Feinleib M, McNamara PM, Garrison RJ, Castelli WP. An investigation of coronaryheart disease in families. The Framingham offspring study. Am J Epidemiol 1979 Sep;110(3):281–90. [PubMed: 474565]
21. Splansky GL, Corey D, Yang Q, Atwood LD, Cupples LA, Benjamin EJ, et al. The Third GenerationCohort of the National Heart, Lung, and Blood Institute’s Framingham Heart Study: design,recruitment, and initial examination. Am J Epidemiol 2007 Jun 1;165(11):1328–35. [PubMed:17372189]
22. SNP Health Association Resource.http://www.ncbi.nlm.nih.gov/projects/gap/cgi-bin/study.cgi?study_id=phs000007.v2.p1
23. Crowley LV. Determination of Uric Acid: An Automated Analysis Based on a Carbonate Method.Clin Chem 1964 Sep;10:838–44. [PubMed: 14208728]
24. Hofman A, Breteler MM, van Duijn CM, Krestin GP, Pols HA, Stricker BH, et al. The RotterdamStudy: objectives and design update. Eur J Epidemiol 2007;22(11):819–29. [PubMed: 17955331]
25. Hofman A, Grobbee DE, de Jong PT, van den Ouweland FA. Determinants of disease and disabilityin the elderly: the Rotterdam Elderly Study. Eur J Epidemiol 1991 Jul;7(4):403–22. [PubMed:1833235]
26. Purcell S, Neale B, Todd-Brown K, Thomas L, Ferreira MA, Bender D, et al. PLINK: a tool set forwhole-genome association and population-based linkage analyses. Am J Hum Genet 2007 Sep;81(3):559–75. [PubMed: 17701901]
27. Purcell, S. PLINK. 2008. http://pngu.mgh.harvard.edu/purcell/plink/28. Li YAG. Mach 1.0: rapid haplotype reconstruction and missing genotype inference. Am J Hum Genet
2006;S79:2290.29. Trivedi R, Rebar L, Berta E, Stong L. New enzymatic method for serum uric acid at 500 nm. Clin
Chem November 1;1978 24(11):1908–11. [PubMed: 709818]30. The ARIC investigators. The Atherosclerosis Risk in Communities (ARIC) Study: design and
objectives. Am J Epidemiol 1989 Apr;129(4):687–702. [PubMed: 2646917]31. Iribarren C, Folsom AR, Eckfeldt JH, McGovern PG, Nieto FJ. Correlates of uric acid and its
association with asymptomatic carotid atherosclerosis: the ARIC Study. Atherosclerosis Risk inCommunities. Ann Epidemiol 1996 Jul;6(4):331–40. [PubMed: 8876844]
32. Eckfeldt JH, Chambless LE, Shen YL. Short-term, within-person variability in clinical chemistry testresults. Experience from the Atherosclerosis Risk in Communities Study. Arch Pathol Lab Med 1994May;118(5):496–500. [PubMed: 8192558]
33. Rabinowitz D, Laird N. A unified approach to adjusting association tests for population admixturewith arbitrary pedigree structure and arbitrary missing marker information. Hum Hered 2000 Jul–Aug;50(4):211–23. [PubMed: 10782012]
34. Laird NM, Horvath S, Xu X. Implementing a unified approach to family-based tests of association.Genet Epidemiol 2000;19( Suppl 1):S36–42. [PubMed: 11055368]
35. Schwarzer, G. The Meta package. Vol. 0.8–2. CRAN; 2007.36. Ihaka R. R: a language for data analysis and graphics. J Comput Graph Stat 1996;5:299–314.37. Terkeltaub R, Bushinsky DA, Becker MA. Recent developments in our understanding of the renal
basis of hyperuricemia and the development of novel antihyperuricemic therapeutics. Arthritis ResTher 2006;8( Suppl 1):S4. [PubMed: 16820043]
38. Kusuhara H, Sugiyama Y. ATP-binding cassette, subfamily G (ABCG family). Pflugers Arch 2007Feb;453(5):735–44. [PubMed: 16983557]
Dehghan et al. Page 11
Lancet. Author manuscript; available in PMC 2010 January 8.
NIH
-PA Author Manuscript
NIH
-PA Author Manuscript
NIH
-PA Author Manuscript

39. Huls M, Brown CD, Windass AS, Sayer R, van den Heuvel JJ, Heemskerk S, et al. The breast cancerresistance protein transporter ABCG2 is expressed in the human kidney proximal tubule apicalmembrane. Kidney Int 2008 Jan;73(2):220–5. [PubMed: 17978814]
40. Takenaka K, Morgan JA, Scheffer GL, Adachi M, Stewart CF, Sun D, et al. Substrate overlap betweenMrp4 and Abcg2/Bcrp affects purine analogue drug cytotoxicity and tissue distribution. Cancer Res2007 Jul 15;67(14):6965–72. [PubMed: 17638908]
41. Ishibashi K, Matsuzaki T, Takata K, Imai M. Identification of a new member of type I Na/phosphateco-transporter in the rat kidney. Nephron Physiol 2003;94(1):p10–8. [PubMed: 12806205]
42. Uchino H, Tamai I, Yamashita K, Minemoto Y, Sai Y, Yabuuchi H, et al. p-aminohippuric acidtransport at renal apical membrane mediated by human inorganic phosphate transporter NPT1.Biochem Biophys Res Commun 2000 Apr 2;270(1):254–9. [PubMed: 10733936]
43. Campion EW, Glynn RJ, DeLabry LO. Asymptomatic hyperuricemia. Risks and consequences in theNormative Aging Study. Am J Med 1987 Mar;82(3):421–6. [PubMed: 3826098]
44. Becker MA, Schumacher HR Jr, Wortmann RL, MacDonald PA, Eustace D, Palo WA, et al.Febuxostat compared with allopurinol in patients with hyperuricemia and gout. N Engl J Med 2005Dec 8;353(23):2450–61. [PubMed: 16339094]
45. Underwood M. Diagnosis and management of gout. Bmj 2006 Jun 3;332(7553):1315–9. [PubMed:16740561]
46. Mikuls TR, Farrar JT, Bilker WB, Fernandes S, Saag KG. Suboptimal physician adherence to qualityindicators for the management of gout and asymptomatic hyperuricaemia: results from the UKGeneral Practice Research Database (GPRD). Rheumatology (Oxford) 2005 Aug;44(8):1038–42.[PubMed: 15870145]
47. Kathiresan S, Melander O, Anevski D, Guiducci C, Burtt NP, Roos C, et al. Polymorphisms associatedwith cholesterol and risk of cardiovascular events. N Engl J Med 2008 Mar 20;358(12):1240–9.[PubMed: 18354102]
48. Barrett JC, Fry B, Maller J, Daly MJ. Haploview: analysis and visualization of LD and haplotypemaps. Bioinformatics 2005 Jan 15;21(2):263–5. [PubMed: 15297300]
49. Gabriel SB, Schaffner SF, Nguyen H, Moore JM, Roy J, Blumenstiel B, et al. The structure ofhaplotype blocks in the human genome. Science 2002 Jun 21;296(5576):2225–9. [PubMed:12029063]
Dehghan et al. Page 12
Lancet. Author manuscript; available in PMC 2010 January 8.
NIH
-PA Author Manuscript
NIH
-PA Author Manuscript
NIH
-PA Author Manuscript

Figure 1.ABCG2 locus (Panel A): −log10 p-values of genome-wide association analysis of uric acid forFHS and Rotterdam; (Panel B): −log10 p-values vs. physical position based on NCBI build36.2 for SNPs (minor allele frequency >0.01) within 60Kb of ABCG2 (open diamonds) foruric acid association analysis for FHS (in blue), Rotterdam (in orange, only SNPs withp<10−7 included), and ARIC whites (in green) (only SNPs with p<10−7 included). The topassociated SNP rs2231142 is plotted with solid diamonds with respective colors for the threestudies, and the p-value from the meta-analysis combining the results of the three studies isplotted with a red solid diamond; (Panel C): Plot of linkage disequilibrium pattern in theABCG2 region with all minor allele frequency >0.01 of SNPs typed in FHS. Each diamond
Dehghan et al. Page 13
Lancet. Author manuscript; available in PMC 2010 January 8.
NIH
-PA Author Manuscript
NIH
-PA Author Manuscript
NIH
-PA Author Manuscript
contains a pair-wise r2 value (no value means r2=1) between two SNPs, with a darker shaderepresenting higher correlation. The relative locations of the SNPs are marked on the top panel.SNPs with p-value <10−8 in FHS are in bold font, and the r2 tracks with top associated SNPare outlined by red lines. The LD plot was generated using the program Haploview; haplotypeblocks are defined using the method by Gabriel et al.(48,49)
Dehghan et al. Page 14
Lancet. Author manuscript; available in PMC 2010 January 8.
NIH
-PA Author Manuscript
NIH
-PA Author Manuscript
NIH
-PA Author Manuscript

Figure 2.Additive genetic risk score in the FHS, Rotterdam, and ARIC Studies. (A): prevalence of thegenetic risk score; (B): mean serum uric acid, μmol/l; (C): prevalence of gout, %; (D) Oddsratio (OR) of gout, adjusted for age, sex, BMI, alcohol intake, antihypertensive medication,cohort in FHS and study center in ARIC. Results are presented for white ARIC participantsonly. Error bars present standard errors. Prevalence is period prevalence in the RotterdamStudy.
Dehghan et al. Page 15
Lancet. Author manuscript; available in PMC 2010 January 8.
NIH
-PA Author Manuscript
NIH
-PA Author Manuscript
NIH
-PA Author Manuscript

Figure 3.Interaction of Sex with SLC2A9 rs16890979 and ABCG2 rs2231142 on Uric Acid Levels andGout Risk. Multivariable adjusted (A) difference in mean uric acid levels; (B) odds ratio ofgout. Results are presented for ARIC whites, results from FHS and Rotterdam are presentedin Supplementary Table 5. Error bars represent standard errors. Numbers inside/next to barspresent sample size (uric acid) and number of gout cases/sample size (gout). The sex-specificR2 (proportion of variance explained, [men/women]) was for rs16890979: 2.0%/8.8% [FHS],1.4%/4.1% [Rotterdam], 1.7%/7.6% [ARIC white], 0.5%/3.4% [ARIC black]; for rs2231142:2.1%/0.8% [FHS], 1.6%/0.5% [Rotterdam], 2.0%/0.6% [ARIC white], 0.4%/0.3% [ARICblack].
Dehghan et al. Page 16
Lancet. Author manuscript; available in PMC 2010 January 8.
NIH
-PA Author Manuscript
NIH
-PA Author Manuscript
NIH
-PA Author Manuscript
NIH
-PA Author Manuscript
NIH
-PA Author Manuscript
NIH
-PA Author Manuscript
Dehghan et al. Page 17
Tabl
e 1
Cha
ract
eris
tics o
f 267
14 S
tudy
Par
ticip
ants
from
the F
ram
ingh
am H
eart
Stud
y, R
otte
rdam
Stu
dy, a
nd A
RIC
Stu
dy. D
ata s
how
n ar
e mea
n (s
tand
ard
devi
atio
n)un
less
oth
erw
ise
indi
cate
d.
Stud
y Sa
mpl
e
FHS
Rot
terd
amA
RIC
whi
teA
RIC
bla
ck
Sam
ples
for
seru
m u
ric
acid
Exa
m 1
(194
8, 1
971,
200
2)§
visi
t 1 (1
990
– 19
93)
visi
t 1 (1
987–
89)
Num
ber
7699
4148
1102
438
43
Uric
Aci
d (μ
mol
/l)*
315.
2 (8
9.2)
321.
2 (8
0.9)
350.
9 (8
9.8)
374.
7 (9
9.3)
Fem
ale
(%)
5361
5362
Bod
y M
ass I
ndex
(kg/
m2 )
25.9
(4.9
)26
.3 (3
.7)
27.0
(4.9
)29
.6 (6
.1)
Age
(y)
37.9
(9.4
)69
.7 (9
.0)
54.3
(5.7
)53
.5 (5
.8)
Alc
ohol
drin
king
(g/w
eek)
**48
(12,
120
)43
(3,8
5)30
(0, 9
3)53
(15,
125
)
Cur
rent
Drin
ker (
%)
8179
6532
Hyp
erte
nsio
n tre
atm
ent (
%)
833
2643
Sam
ples
for
gout
Off
sprin
g an
d Th
ird G
ener
atio
n£D
urin
g fo
llow
up
(199
0 –
2006
)vi
sit 4
(199
6–98
)
Num
ber
7386
5741
8599
2392
Gou
t (%
,n)
2.7
(197
)3.
3 (1
90)
5.4
(467
)8.
8 (2
10)
Fem
ale
(%)
5359
5464
Bod
y M
ass I
ndex
(kg/
m2 )
27.0
(6.5
)26
.3 (3
.7)
26.9
(4.7
)29
.6 (5
.9)
Age
(y)
50.0
(13.
9)69
.0 (8
.8)
54.1
(5.7
)52
.9 (5
.7)
Alc
ohol
drin
king
(g/w
eek)
**33
(12,
60)
47 (3
, 86)
28 (0
, 91)
26 (0
, 76)
Cur
rent
Drin
ker (
%)
5179
5626
Hyp
erte
nsio
n tre
atm
ent (
%)
2132
3959
* to c
onve
rt to
mg/
dl, d
ivid
e by
59.
48
**m
edia
n (1
st a
nd 3
rd q
uarti
le),
amon
g cu
rren
t drin
kers
§ Exam
1 o
f the
Orig
inal
Coh
ort (
1948
), O
ffsp
ring
(197
1), a
nd T
hird
Gen
erat
ion
(200
2–20
05)
Lancet. Author manuscript; available in PMC 2010 January 8.

NIH
-PA Author Manuscript
NIH
-PA Author Manuscript
NIH
-PA Author Manuscript
Dehghan et al. Page 18£ Ex
ams 3
–7 o
f Off
sprin
g (1
987–
1999
) and
exa
m 1
of t
he T
hird
Gen
erat
ion
(200
2–20
05)
Lancet. Author manuscript; available in PMC 2010 January 8.

NIH
-PA Author Manuscript
NIH
-PA Author Manuscript
NIH
-PA Author Manuscript
Dehghan et al. Page 19
Tabl
e 2
Ass
ocia
tion
of F
our S
NPs
in T
hree
Loc
i with
Uric
Aci
d an
d G
out
SNP
Info
rmat
ion
Phen
otyp
eFH
S§R
otte
rdam
AR
IC w
hite
AR
IC b
lack
All
Whi
tes
rs16
8909
79C
hr 4
: 953
1265
Gen
e: S
LC2A
9A
llele
s: C
/TV
253I
Min
or A
llele
Fre
quen
cy0.
230.
210.
230.
42
Uric
aci
dp-
valu
e1.
6×10
−76
4.7×
10−2
72.
3×10
−105
2.9×
10−1
87.
0×10
−168
beta
**(s
e)−0
.36
(0.0
2)−0
.29
(0.0
3)−0
.34
(0.0
2)−0
.20
(0.0
2)−0
.34
(0.0
2)
R2
5.3%
2.8%
4.3%
2.0%
-
Gou
tp-
valu
e1.
3×10
−36.
0×10
−31.
8×10
−90.
141.
2×10
−31
OR
***
0.63
0.67
0.56
0.85
0.58
95%
C.I.
0.47
–0.8
40.
50–0
.89
0.47
–0.6
80.
69–1
.05
0.53
–0.6
3
rs64
4921
3C
hr 4
: 960
3313
Gen
e: S
LC2A
9A
llele
s: T
/C
Min
or A
llele
Fre
quen
cy0.
190.
18n/
an/
an/
a
Uric
aci
dp-
valu
e2.
9×10
−68
1.15
×10−
292.
2×10
−104
beta
**(s
e)−0
.37
(0.0
2)−0
.32
(0.0
3)n/
an/
a−0
.35
(0.0
2)
R2
4.5%
3.0%
-
Gou
tp-
valu
e1.
1×10
−20.
060.
001
OR
***
0.66
0.75
n/a
n/a
0.69
95%
C.I.
0.49
–0.9
10.
55–1
.01
0.55
–0.8
6
rs22
3114
2C
hr 4
: 892
7134
7G
ene:
ABC
G2
Alle
les:
G/T
Q14
1K
Min
or A
llele
Fre
quen
cy0.
110.
120.
110.
03-
Uric
aci
dp-
valu
e9.
0×10
−20
3.3×
10−9
9.7×
10−3
09.
8×10
−42.
5×10
−60
beta
**(s
e)0.
25 (0
.03)
0.20
(0.0
3)0.
25 (0
.02)
0.22
(0.0
7)0.
24 (0
.02)
R2
1.3%
0.8%
1.2%
0.3%
-
Gou
tp-
valu
e1.
5×10
−61.
5×10
−42.
0×10
−70.
033.
3×10
−15
Lancet. Author manuscript; available in PMC 2010 January 8.

NIH
-PA Author Manuscript
NIH
-PA Author Manuscript
NIH
-PA Author Manuscript
Dehghan et al. Page 20
SNP
Info
rmat
ion
Phen
otyp
eFH
S§R
otte
rdam
AR
IC w
hite
AR
IC b
lack
All
Whi
tes
OR
***
1.97
1.71
1.68
1.71
1.74
95%
C.I.
1.49
–2.5
91.
30–2
.25
1.38
–2.0
41.
06–2
.77
1.51
–1.9
9
rs11
6520
5C
hr 6
: 259
7852
1G
ene:
SLC
17A3
£A
llele
s: A
/T
Min
or A
llele
Fre
quen
cy0.
460.
470.
470.
13-
Uric
aci
dp-
valu
e5.
6×10
−10
0.01
8.4×
10−1
10.
333.
8×10
−29
beta
**(s
e)−0
.11
(0.0
2)−0
.06
(0.0
2)−0
.09
(0.0
1)−0
.03
(0.0
3)−0
.09
(0.0
1)
R2
0.7%
0.2%
0.4%
<0.1
%-
Gou
tp-
valu
e0.
100.
863.
0×10
−30.
332.
0×10
−3
OR
***
0.83
0.98
0.81
1.16
0.85
95%
C.I.
0.67
–1.0
40.
80–1
.21
0.71
–0.9
30.
86–1
.56
0.77
–0.9
4
* Maj
or/m
inor
alle
les o
n fo
rwar
d st
rand
of h
uman
gen
ome
refe
renc
e se
quen
ce o
f NC
BI b
uild
36.
2, th
e m
inor
alle
le w
as m
odel
ed.
**B
eta c
oeff
icie
nt re
pres
ents
1 st
anda
rd d
evia
tion
chan
ge in
the s
tand
ardi
zed
resi
dual
of u
ric ac
id p
er co
py in
crem
ent i
n th
e min
or al
lele
, adj
ustin
g fo
r age
, sex
, BM
I, al
coho
l con
sum
ptio
n, h
yper
tens
ion
treat
men
t,(c
ohor
t sta
tus i
n FH
S, st
udy
cent
er in
AR
IC)
*** O
R is
the
odds
ratio
for g
out p
er p
er c
opy
incr
emen
t of t
he a
llele
mod
eled
adju
stin
g fo
r age
, sex
, BM
I, al
coho
l con
sum
ptio
n, h
yper
tens
ion
treat
men
t, (c
ohor
t sta
tus i
n FH
S, st
udy
cent
er in
AR
IC)
se is
the
stan
dard
err
or o
f the
bet
a co
effic
ient
§ FHS
resu
lts g
ener
ated
usi
ng li
near
mix
ed e
ffec
ts m
odel
s; F
BA
T re
sults
in F
HS:
rs16
8909
79 (p
=8.3
×10-
23),
rs64
4921
3 (p
=1.9
×10-
24),
rs22
3114
2 (p
=5.6
×10-
11),
rs11
6520
5 (7
.1×1
0-03
)
£ SLC
17A
3 re
fers
to th
e en
tire
SLC
17A
4/SL
C17
A1/
SLC
17A
3 ge
ne c
lust
er
Lancet. Author manuscript; available in PMC 2010 January 8.