Assessment and real time implementation of wireless ... - RUC
183
Assessment and Real Time Implementation of Wireless Communications Systems and Applications in Transportation Systems Ángel Carro Lagoa Doctoral Thesis UDC / 2021 Advisors: Miguel González López José Antonio García Naya PhD Program in Information Technology and Mobile Network Communication
-
Upload
khangminh22 -
Category
Documents
-
view
1 -
download
0
Transcript of Assessment and real time implementation of wireless ... - RUC

Assessment and Real TimeImplementation of WirelessCommunications Systems andApplications in Transportation Systems
Ángel Carro LagoaDoctoral Thesis UDC / 2021
Advisors: Miguel González LópezJosé Antonio García Naya
PhD Program in Information Technology and Mobile Network Communication


Avaliación e Implementación en TempoReal de Sistemas de Comunicacións senFíos e Aplicacións en Sistemas deTransporte
Ángel Carro LagoaTese de Doutoramento UDC / 2021
Directores: Miguel González LópezJosé Antonio García Naya
Programa de Doutoramento en Tecnoloxías da Información e das Comunicacións enRedes Móbiles

Evaluación e Implementación en TiempoReal de Sistemas de ComunicacionesInalámbricos y Aplicaciones en Sistemasde Transporte
Ángel Carro LagoaTesis Doctoral UDC / 2021
Directores: Miguel González LópezJosé Antonio García Naya
Programa de Doctorado en Tecnologías de la Información y de las Comunicaciones enRedes Móviles


Ángel Carro Lagoa
CERTIFICA / CERTIFICA / CERTIFIES
Que a presente memoria é o resultado do meu propio traballo de investigación e que o traballodoutros autores está citado axeitadamente.
Que la presente memoria es el resultado de mi propio trabajo de investigación y que el trabajode otros autores está citado apropiadamente.
That the present report is the result of my own research work and that the work done by otherauthors is appropriately cited.
A Coruña, 19 de abril de 2021 / 19 de abril de 2021 / April 19, 2021
Ángel Carro Lagoa


Miguel González LópezJosé Antonio García Naya
CERTIFICAN / CERTIFICAN / CERTIFY
Que a presente tese titulada “Avaliación e implementación en tempo real de sistemas decomunicacións sen fíos e aplicacións en sistemas de transporte” foi realizada por Ángel CarroLagoa baixo a nosa dirección no Departamento de Enxeñaría de Computadores da Universidadeda Coruña e preséntase para obter o grao de Doutor.
Que la presente tesis titulada “Evaluación e implementación en tiempo real de sistemas decomunicaciones inalámbricos y aplicaciones en sistemas de transporte” fue realizada porÁngel Carro Lagoa bajo nuestra dirección en el Departamento de Ingeniería de Computadoresde la Universidade da Coruña y se presenta para obtener el grado de Doctor.
That the present thesis titled “Assessment and real time implementation of wirelesscommunications systems and applications in transportation systems” was done by Ángel CarroLagoa under our supervision in the Department of Computer Engineering at the University ofA Coruña and it is submitted to obtain the Ph.D. degree.
Os directores da tese / Los directores de la tesis / The Ph.D. supervisors.A Coruña, 19 de abril de 2021 / 19 de abril de 2021 / April 19, 2021.
Dr. Miguel González LópezProfesor Titular de UniversidadeDpto. de Enxeñaría de ComputadoresUniversidade da Coruña
Associate ProfessorDept. of Computer EngineeringUniversity of A Coruña
Dr. José Antonio García NayaProfesor Contratado DoutorDpto. de Enxeñaría de ComputadoresUniversidade da Coruña
Associate ProfessorDept. of Computer EngineeringUniversity of A Coruña

Tese de Doutoramento / Tesis Doctoral / Doctoral Thesis
Título:Avaliación e implementación en tempo real de sistemas decomunicacións sen fíos e aplicacións en sistemas de transporte
Título:Evaluación e implementación en tiempo real de sistemas decomunicaciones inalámbricos y aplicaciones en sistemas de transporte
Title:Assessment and real time implementation of wireless communicationssystems and applications in transportation systems
Autor / Autor / Author: Ángel Carro Lagoa
Directores / Directores Miguel González López/ Supervisors: José Antonio García Naya
Data / Fecha / Date: 19 de abril de 2021 / 19 de abril de 2021 / April 19, 2021
Tribunal / Tribunal / Evaluation Committee
Presidente / Presidente / President: Raquel Barco Moreno
Vogal / Vocal / Member: José Rodríguez Piñeiro
Secretaria / Secretaria / Secretary: Luis Castedo Ribas


AgradecimientosSon muchas las personas a las que me gustaría agradecer su ayuda a lo largo de estos años. Enprimer lugar, quiero agradecer a mis directores de tesis, José Antonio y Miguel, su esfuerzo,dedicación y paciencia. Sus ideas y consejos han hecho posible este trabajo.
También quiero agradecer a Luis Castedo el haberme brindado la oportunidad de pertenecera este grupo de investigación y su apoyo durante tantos años.
Esta tesis tampoco sería posible sin la ayuda y talento de Pedro, con quien tuve la suerte decompartir muchos años de trabajo. Gracias a él, todas las horas dedicadas a pelearnos con lasFPGAs y a desentrañar las misteriosas causas de los problemas que nos íbamos encontrando,fueron mucho más llevaderas y entretenidas.
Igualmente, debo agradecer a Xosé, entre otras cosas, el haber obtenido las medidas depropagación en el metro junto a José Antonio. Quiero agradecer también a Tomás su ayuda enla interpretación y adaptación de estas medidas a las necesidades del simulador.
La paciencia de Tiago con mis constantes consultas e interrupciones ha sido de gran ayuda,sobre todo en mis inicios en el grupo. No me puedo olvidar del apoyo recibido y de losbuenos momentos durante las comidas en el campus con José, Néstor, Tiago y Pedro. Tambiénquiero darle las gracias a Paula, que siempre ha estado ahí para echarme una mano cuando lonecesitaba.
Tampoco me puedo olvidar de los buenos ratos pasados en los descansos (y otros eventossociales) junto a todos los compañeros del GTEC que he ido conociendo durante estos años:Adriano, Aida, Belén, Darian, Diego, Fran Laport, Héctor, Ismael, Iván, Javi, José Francisco,Josmary, Manuel, Marc, Óscar Blanco, Óscar Fresnedo, Santi, Sonia y Valentín. Asimismo,quiero mencionar al resto de profesores del GTEC que he tenido el placer de conocer: Adriana,Carlos, Dani, Fran, José Juan Lamas, Julio, Paula Castro y Roberto. También quiero agradecera Cris toda la ayuda prestada con el papeleo de la Universidad.
Además, me gustaría agradecer a Antonio J. Rodríguez que me permitiera participar en suinvestigación sobre la aceleración con FPGAs de las simulaciones de modelos multicuerpo.
Por último, dedico esta tesis a mi familia y amigos, especialmente a mis padres y hermano,que siempre me han dado ánimos para terminarla, y a Maryem, que ha estado a mi ladoayudándome durante todo este tiempo.
i


ResumoOs sistemas de comunicación sen fíos de cuarta e quinta xeración (4G e 5G) utilizan unha capa física(PHY) baseada en modulacións multiportadora para a transmisión de datos cun gran ancho de banda.Este tipo de modulacións proporcionan unha alta eficiencia espectral á vez que permiten corrixir deforma sinxela os efectos da canle radio.
Estes sistemas utilizan OFDMA como mecanismo para a repartición dos recursos radio dispoñiblesentre os diferentes usuarios. Este repartimento realízase asignando un subconxunto de subportadoras acada usuario nun instante de tempo determinado. Isto aporta unha gran flexibilidade ó sistema que llepermite adaptarse tanto ós requisitos de calidade de servizo dos usuarios como ó estado da canle radio.
A capa de acceso ó medio (MAC) destes sistemas encárgase de configurar os diversos parámetrosproporcionados pola capa física OFDMA, ademais de xestionar os diversos fluxos de información decada usuario, transformando os paquetes de capas superiores en paquetes da capa física.
Neste traballo estúdase o deseño e implementación das capas MAC e PHY de sistemas decomunicación 4G ademais da súa aplicabilidade en sistemas de transporte ferroviarios.
Por unha parte, abórdase o deseño e implementación en tempo real do estándar WiMAX. Estúdanseos mecanismos necesarios para establecer comunicacións bidireccionais entre unha estación base emúltiples dispositivos móbiles. Ademais, estúdase como realizar esta implementación nunha arquitecturahardware baseada en DSPs e FPGAs, na que se implementan as capas MAC e PHY. Dado que estaarquitectura ten uns recursos computacionais limitados, tamén se estudan as necesidades de cada módulodo sistema para poder garantir o funcionamento en tempo real do sistema completo.
Por outra parte, tamén se estuda a aplicabilidade dos sistemas 4G a sistemas de transporte públicos.Os sistemas de comunicacións e sinalización son unha parte vital para os sistemas de transporteferroviario e metro. As comunicacións sen fíos utilizadas por estes sistemas deben ser robustas eproporcionar unha alta fiabilidade para permitir a supervisión, control e seguridade do tráfico ferroviario.
Para levar a cabo esta avaliación de viabilidade realízanse simulacións de redes de comunicaciónsLTE en contornos de transporte ferroviarios, comprobando o cumprimento dos requisitos de fiabilidadee seguridade. Realízanse diferentes simulacións do sistema de comunicacións para poder ser avaliadas eseleccionar a configuración e arquitectura do sistema máis axeitada en función do escenario considerado.Tamén se efectúan simulacións de redes baseadas en Wi-Fi, dado que é a solución máis utilizada nosmetros, para confrontar os resultados cos obtidos para LTE.
Para que os resultados das simulacións sexan realistas débense empregar modelos de propagaciónradio axeitados. Nas simulacións utilízanse tanto modelos deterministas como modelos baseados nosresultados de campañas de medida realizadas nestes escenarios.
Nas simulacións empréganse os diferentes fluxos de información destes escenarios para comprobarque se cumpren os requisitos de calidade de servicio (QoS). Por exemplo, os fluxos críticos para o controlferroviario, como European Train Control System (ETCS) ou Communication-Based Train Control
iii

(CBTC), necesitan unha alta fiabilidade e un retardo mínimo nas comunicacións para garantir o correctofuncionamento do sistema.
iv

ResumenLos sistemas de comunicación inalámbricos de cuarta y quinta generación (4G y 5G) utilizan una capafísica (PHY) basada en modulaciones multiportadora para la transmisión de datos con un gran anchode banda. Este tipo de modulaciones han demostrado tener una alta eficiencia espectral a la vez quepermiten corregir de forma sencilla los efectos del canal radio.
Estos sistemas utilizan OFDMA como mecanismo para el reparto de los recursos radio disponiblesentre los diferentes usuarios. Este reparto se realiza asignando un subconjunto de subportadoras a cadausuario en un instante de tiempo determinado. Esto aporta una gran flexibilidad al sistema que le permiteadaptarse tanto a los requisitos de calidad de servicio de los usuarios como al estado del canal radio.
La capa de acceso al medio (MAC) de estos sistemas se encarga de configurar los diversos parámetrosproporcionados por la capa física OFDMA, además de gestionar los diversos flujos de información decada usuario, transformando los paquetes de capas superiores en paquetes de la capa física.
En este trabajo se estudia el diseño e implementación de las capas MAC y PHY de sistemas decomunicación 4G además de su aplicabilidad en sistemas de transporte ferroviarios.
Por una parte, se aborda el diseño e implementación en tiempo real del estándar WiMAX. Seestudian los mecanismos necesarios para establecer comunicaciones bidireccionales entre una estaciónbase y múltiples dispositivos móviles. Además, se estudia cómo realizar esta implementación en unaarquitectura hardware basada en DSPs y FPGAs, en la que se implementan las capas MAC y PHY. Dadoque esta arquitectura tiene unos recursos computacionales limitados, también se estudian las necesidadesde cada módulo del sistema para poder garantizar el funcionamiento en tiempo real del sistema completo.
Por otra parte, también se estudia la aplicabilidad de los sistemas 4G a sistemas de transportepúblicos. Los sistemas de comunicaciones y señalización son una parte vital para los sistemas detransporte ferroviario y metro. Las comunicaciones inalámbricas utilizadas por estos sistemas deben serrobustas y proporcionar una alta fiabilidad para permitir la supervisión, control y seguridad del tráficoferroviario.
Para llevar a cabo esta evaluación de viabilidad se realizan simulaciones de redes de comunicacionesLTE en entornos de transporte ferroviarios, comprobando si se cumplen los requisitos de fiabilidad yseguridad. Se realizan diferentes simulaciones del sistema de comunicaciones para poder ser evaluados yseleccionar la configuración y arquitectura del sistema más adecuada en función del escenario planteado.También se efectúan simulaciones de redes basadas en Wi-Fi, dado que es la solución más utilizada enlos metros, para comparar los resultados con los obtenidos para LTE.
Para que los resultados de las simulaciones sean realistas se deben utilizar modelos de propagaciónradio apropiados. En las simulaciones se utilizan tanto modelos deterministas como modelos basados enlos resultados de campañas de medida realizadas en estos escenarios.
En las simulaciones se utilizan los diferentes flujos de información de estos escenarios paracomprobar que se cumplen sus requisitos de calidad de servicio. Por ejemplo, los flujos críticos para
v

el control ferroviario, como European Train Control System (ETCS) o Communication-Based TrainControl (CBTC), necesitan una alta fiabilidad y un retardo bajo en las comunicaciones para garantizar elcorrecto funcionamiento del sistema.
vi

AbstractThe fourth and fifth generation wireless communication systems (4G and 5G) use a physical layer (PHY)based on multicarrier modulations for data transmission using high bandwidth. This type of modulationshas shown to provide high spectral efficiency while allowing low complexity radio channel equalization.
These systems use OFDMA as a mechanism for distributing the available radio resources amongdifferent users. This allocation is done by assigning a subset of subcarriers to each user in a given instantof time. This provides great flexibility to the system that allows it to adapt to both the quality of servicerequirements of users and the radio channel state.
The media access layer (MAC) of these systems is in charge of configuring the multiple OFDMAPHY layer parameters, in addition to managing the data flows of each user, transforming the higher layerpackets into PHY layer packets.
This work studies the design and implementation of MAC and PHY layers of 4G communicationsystems as well as their applicability in rail transport systems.
On the one hand, the design and implementation in real time of the WiMAX standard is addressed.The required mechanisms to establish bidirectional communications between a base station and severalmobile devices are also evaluated. Moreover, a MAC layer and PHY layer implementation ispresented, using a hardware architecture based in DSPs and FPGAs. Since this architecture has limitedcomputational resources, the requirements of each processing block of the system are also studied inorder to guarantee the real time operation of the complete system.
On the other hand, the applicability of 4G systems to public transportation systems is also studied.Communications and signaling systems are a vital part of rail and metro transport systems. Thewireless communications used by these systems must be robust and provide high reliability to enablethe supervision, control and safety of rail traffic.
To carry out this feasibility assessment, LTE communications network simulations are performed inrail transport environments to verify that reliability and safety requirements are met. Several simulationsare carried out in order to evaluate the system performance and select the most appropriate systemconfiguration in each case. Simulations of Wi-Fi based networks are also carried out, since it is themost used solution in subways, to compare the results with those obtained for LTE.
To perform the simulations correctly, appropriate radio propagation models must be used. Bothdeterministic models and models based on the results of measurement campaigns in these scenarios areused in the simulations.
The simulations use the different information flows present in the railway transportation systems toverify that its quality of service requirements are met. For example, critical flows for railway control,such as the European Train Control System (ETCS) or Communication-Based Train Control (CBTC),require high reliability and low delay communications to ensure the proper functioning of the system.
vii


Table of Contents
1 Introduction 11.1 Thesis Overview . . . . . . . . . . . . . . . . . . . . . . . . . . . . . . . . . 31.2 Contributions . . . . . . . . . . . . . . . . . . . . . . . . . . . . . . . . . . . 4
1.2.1 Journal Papers . . . . . . . . . . . . . . . . . . . . . . . . . . . . . . 41.2.2 International Conference Papers . . . . . . . . . . . . . . . . . . . . . 41.2.3 Research Projects . . . . . . . . . . . . . . . . . . . . . . . . . . . . . 5
2 OFDMA based PHY and MAC Layers – Mobile WiMAX 92.1 Mobile WiMAX . . . . . . . . . . . . . . . . . . . . . . . . . . . . . . . . . . 102.2 802.16e OFDMA PHY Layer . . . . . . . . . . . . . . . . . . . . . . . . . . . 12
2.2.1 TDD Frame Structure . . . . . . . . . . . . . . . . . . . . . . . . . . 132.2.2 OFDMA Ranging . . . . . . . . . . . . . . . . . . . . . . . . . . . . 172.2.3 Channel Coding . . . . . . . . . . . . . . . . . . . . . . . . . . . . . 18
2.3 802.16e MAC Layer . . . . . . . . . . . . . . . . . . . . . . . . . . . . . . . 182.3.1 MPDU Generation . . . . . . . . . . . . . . . . . . . . . . . . . . . . 192.3.2 ARQ Mechanism . . . . . . . . . . . . . . . . . . . . . . . . . . . . . 212.3.3 Scheduling and QoS . . . . . . . . . . . . . . . . . . . . . . . . . . . 212.3.4 Convergence Sublayer . . . . . . . . . . . . . . . . . . . . . . . . . . 232.3.5 Security Sublayer . . . . . . . . . . . . . . . . . . . . . . . . . . . . . 232.3.6 Network Entry . . . . . . . . . . . . . . . . . . . . . . . . . . . . . . 24
2.4 WirelessMAN-Advanced Air Interface . . . . . . . . . . . . . . . . . . . . . . 252.5 Conclusions . . . . . . . . . . . . . . . . . . . . . . . . . . . . . . . . . . . . 25
3 Real-Time Implementation of TDD Mobile WiMAX 273.1 State of the Art . . . . . . . . . . . . . . . . . . . . . . . . . . . . . . . . . . 283.2 System Architecture Design . . . . . . . . . . . . . . . . . . . . . . . . . . . 30
3.2.1 Development Methodology . . . . . . . . . . . . . . . . . . . . . . . . 313.2.2 Development of FPGA Tasks . . . . . . . . . . . . . . . . . . . . . . . 323.2.3 Hardware Platform . . . . . . . . . . . . . . . . . . . . . . . . . . . . 343.2.4 SDR Architecture . . . . . . . . . . . . . . . . . . . . . . . . . . . . . 35
3.3 Mobile WiMAX Physical Layer Implementation . . . . . . . . . . . . . . . . 36
ix

3.3.1 Digital Up/Down Conversion . . . . . . . . . . . . . . . . . . . . . . 373.3.2 Frame Control and Downlink Synchronization . . . . . . . . . . . . . 383.3.3 Ranging and Uplink Synchronization . . . . . . . . . . . . . . . . . . 393.3.4 Subchannelization and Channel Equalization . . . . . . . . . . . . . . 403.3.5 Channel Coding . . . . . . . . . . . . . . . . . . . . . . . . . . . . . 423.3.6 Physical Layer Control . . . . . . . . . . . . . . . . . . . . . . . . . . 43
3.4 Mobile WiMAX MAC Layer Implementation . . . . . . . . . . . . . . . . . . 443.4.1 Frame Management (BS) . . . . . . . . . . . . . . . . . . . . . . . . . 463.4.2 QoS Scheduler . . . . . . . . . . . . . . . . . . . . . . . . . . . . . . 46
3.5 Resource Utilization . . . . . . . . . . . . . . . . . . . . . . . . . . . . . . . 493.6 Experimental Results . . . . . . . . . . . . . . . . . . . . . . . . . . . . . . . 50
3.6.1 Validation of the Channel Coding Blocks . . . . . . . . . . . . . . . . 533.6.2 ITU-R Channel Emulator . . . . . . . . . . . . . . . . . . . . . . . . . 533.6.3 Uplink Synchronization . . . . . . . . . . . . . . . . . . . . . . . . . 553.6.4 BER and FER in ITU-R Channels . . . . . . . . . . . . . . . . . . . . 563.6.5 Throughput . . . . . . . . . . . . . . . . . . . . . . . . . . . . . . . . 59
3.7 WirelessMAN-Advanced Air Interface . . . . . . . . . . . . . . . . . . . . . . 613.8 Conclusions . . . . . . . . . . . . . . . . . . . . . . . . . . . . . . . . . . . . 62
4 System-Level Simulations of Communications in Transportation Systems 654.1 Introduction . . . . . . . . . . . . . . . . . . . . . . . . . . . . . . . . . . . . 664.2 QoS in Subway Communications . . . . . . . . . . . . . . . . . . . . . . . . . 674.3 ns-3 System-Level Simulator . . . . . . . . . . . . . . . . . . . . . . . . . . . 70
4.3.1 LTE Module . . . . . . . . . . . . . . . . . . . . . . . . . . . . . . . 714.3.2 Wi-Fi Module . . . . . . . . . . . . . . . . . . . . . . . . . . . . . . . 73
4.4 Tunnel Propagation Models . . . . . . . . . . . . . . . . . . . . . . . . . . . . 754.4.1 Deterministic Channel Model . . . . . . . . . . . . . . . . . . . . . . 774.4.2 Channel Model Based on Measurements . . . . . . . . . . . . . . . . . 81
4.5 LTE Three-Stations Deployment . . . . . . . . . . . . . . . . . . . . . . . . . 874.5.1 QoS Configuration . . . . . . . . . . . . . . . . . . . . . . . . . . . . 884.5.2 Frequency Reuse . . . . . . . . . . . . . . . . . . . . . . . . . . . . . 894.5.3 Handover Customization . . . . . . . . . . . . . . . . . . . . . . . . . 894.5.4 Simulation Results . . . . . . . . . . . . . . . . . . . . . . . . . . . . 90
4.6 Complete Subway-Line Deployment . . . . . . . . . . . . . . . . . . . . . . . 924.6.1 Channel Model for LTE Deployment . . . . . . . . . . . . . . . . . . 954.6.2 Channel Model for Wi-Fi Deployment . . . . . . . . . . . . . . . . . . 984.6.3 QoS Configuration . . . . . . . . . . . . . . . . . . . . . . . . . . . . 1014.6.4 LTE Simulations . . . . . . . . . . . . . . . . . . . . . . . . . . . . . 1024.6.5 Wi-Fi Simulations . . . . . . . . . . . . . . . . . . . . . . . . . . . . 108
x

4.7 Conclusions . . . . . . . . . . . . . . . . . . . . . . . . . . . . . . . . . . . . 112
5 Conclusions and Future Work 1155.1 Conclusions . . . . . . . . . . . . . . . . . . . . . . . . . . . . . . . . . . . . 1155.2 Future Work . . . . . . . . . . . . . . . . . . . . . . . . . . . . . . . . . . . . 120
5.2.1 Real-time Hardware Architecture . . . . . . . . . . . . . . . . . . . . 1205.2.2 Wireless Communications in Transportation Systems . . . . . . . . . . 121
Appendices 123
A Resumen de la Tesis 123A.1 Implementación SDR de las capas PHY y MAC de Mobile WiMAX . . . . . . 125A.2 Simulación de redes de comunicaciones en sistemas de transporte . . . . . . . 128
B List of Acronyms 135
References 141
xi


List of Figures
2.1 Block diagram of an IEEE Std 802.16e transmitter. . . . . . . . . . . . . . . . 13
2.2 TDD frame structure example. . . . . . . . . . . . . . . . . . . . . . . . . . . 14
2.3 DL PUSC cluster structure. . . . . . . . . . . . . . . . . . . . . . . . . . . . . 15
2.4 UL PUSC tile structure. . . . . . . . . . . . . . . . . . . . . . . . . . . . . . . 17
2.5 OFDM symbol structure for initial ranging with two symbols. . . . . . . . . . 18
2.6 MPDU packet format. . . . . . . . . . . . . . . . . . . . . . . . . . . . . . . . 20
2.7 Generic MAC header format. . . . . . . . . . . . . . . . . . . . . . . . . . . . 20
3.1 Task template for FPGA. . . . . . . . . . . . . . . . . . . . . . . . . . . . . . 32
3.2 Register configuration message format. . . . . . . . . . . . . . . . . . . . . . 33
3.3 Hardware configuration of a station. . . . . . . . . . . . . . . . . . . . . . . . 34
3.4 Global architecture of the base and mobile stations. . . . . . . . . . . . . . . . 36
3.5 Frame detection and synchronization subsystem implemented in the MS. . . . . 39
3.6 UL PUSC tile structure. . . . . . . . . . . . . . . . . . . . . . . . . . . . . . . 42
3.7 Diagram of the packet processing in MAC layer. . . . . . . . . . . . . . . . . . 45
3.8 Flowchart of the scheduler operations to satisfy the QoS requirements. . . . . . 47
3.9 TBCC BER vs. Eb/N0 over AWGN channel. . . . . . . . . . . . . . . . . . . 54
3.10 Block diagram of the OFDMA-TDD evaluation system configured to test the UL. 54
3.11 Histogram of the channel power gain for the ITU-R channels. . . . . . . . . . . 55
3.12 MSE of the time offset estimation in the uplink with respect to the average SNR. 56
3.13 Coded BER over ITU-R channel using the 8.75 MHz uplink profile. . . . . . . 57
3.14 FER over ITU-R channel using the 8.75 MHz downlink profile. . . . . . . . . . 58
3.15 FER over ITU-R channel using the 8.75 MHz uplink profile. . . . . . . . . . . 58
3.16 Throughput in the downlink. . . . . . . . . . . . . . . . . . . . . . . . . . . . 60
3.17 Throughput in the uplink. . . . . . . . . . . . . . . . . . . . . . . . . . . . . . 60
3.18 Proposed 802.16m architecture. . . . . . . . . . . . . . . . . . . . . . . . . . 62
4.1 Logical Channel Prioritization. . . . . . . . . . . . . . . . . . . . . . . . . . . 73
4.2 Example of arched tunnel cross section. . . . . . . . . . . . . . . . . . . . . . 79
4.3 Received power with the multimode channel model using horizontally polarizedantennas and central frequency 1869.9 MHz. . . . . . . . . . . . . . . . . . . . 81
xiii
4.4 Influence of central frequency in roughness and tilt loss with vertically polarizedantennas. . . . . . . . . . . . . . . . . . . . . . . . . . . . . . . . . . . . . . 82
4.5 Schematic of the measurement scenario at “La Almudena” subway station. . . . 834.6 Received signal power (smoothed) vs distance and the corresponding path loss
model estimation. . . . . . . . . . . . . . . . . . . . . . . . . . . . . . . . . . 844.7 Channel PSD with the path loss model removed for antenna 1. . . . . . . . . . 864.8 DL SINR versus time for an UE performing a handover. . . . . . . . . . . . . 864.9 Stations and LTE deployment with the trains placed at their initial positions. . . 874.10 Throughput for the different UEs for DL and UL. . . . . . . . . . . . . . . . . 914.11 CCDF of packet delay for different flows. . . . . . . . . . . . . . . . . . . . . 914.12 CCDF of packet delay with different configurations. . . . . . . . . . . . . . . . 924.13 Simplified map of the subway line. . . . . . . . . . . . . . . . . . . . . . . . . 934.14 Elevation of the subway line. . . . . . . . . . . . . . . . . . . . . . . . . . . . 934.15 Starting position of the trains in the simulations. . . . . . . . . . . . . . . . . . 954.16 DL received power in a subway segment from one antenna. . . . . . . . . . . . 964.17 DL received signal power along the line if all the antennas are part of a DAS
and transmit the same signal at the same instant. . . . . . . . . . . . . . . . . . 974.18 DL received signal power from each cell along the line using DAS. . . . . . . . 974.19 SINR along the line in Wi-Fi deployment using the same antenna positions as
in the LTE deployment. . . . . . . . . . . . . . . . . . . . . . . . . . . . . . . 994.20 SNR vs. distance for a Wi-Fi signal in the curve with the highest attenuation. . 1004.21 Reception power for a Wi-Fi deployment with APs every 400 m. . . . . . . . . 1004.22 DL SINR during the train trip in LTE deployment. . . . . . . . . . . . . . . . . 1044.23 Number of UEs assigned to each cell during a simulation with ten trains in LTE
deployment. . . . . . . . . . . . . . . . . . . . . . . . . . . . . . . . . . . . . 1064.24 CCDF of packet delay for each application with FFR disabled (NoFR) in LTE
deployment. . . . . . . . . . . . . . . . . . . . . . . . . . . . . . . . . . . . . 1074.25 CCDF of packet delay for each application using FFR in LTE deployment. . . . 1074.26 DL SINR during the train trip in Wi-Fi deployment. . . . . . . . . . . . . . . . 1094.27 CCDF of packet delay for each application in Wi-Fi deployment. . . . . . . . . 111
xiv

List of Tables
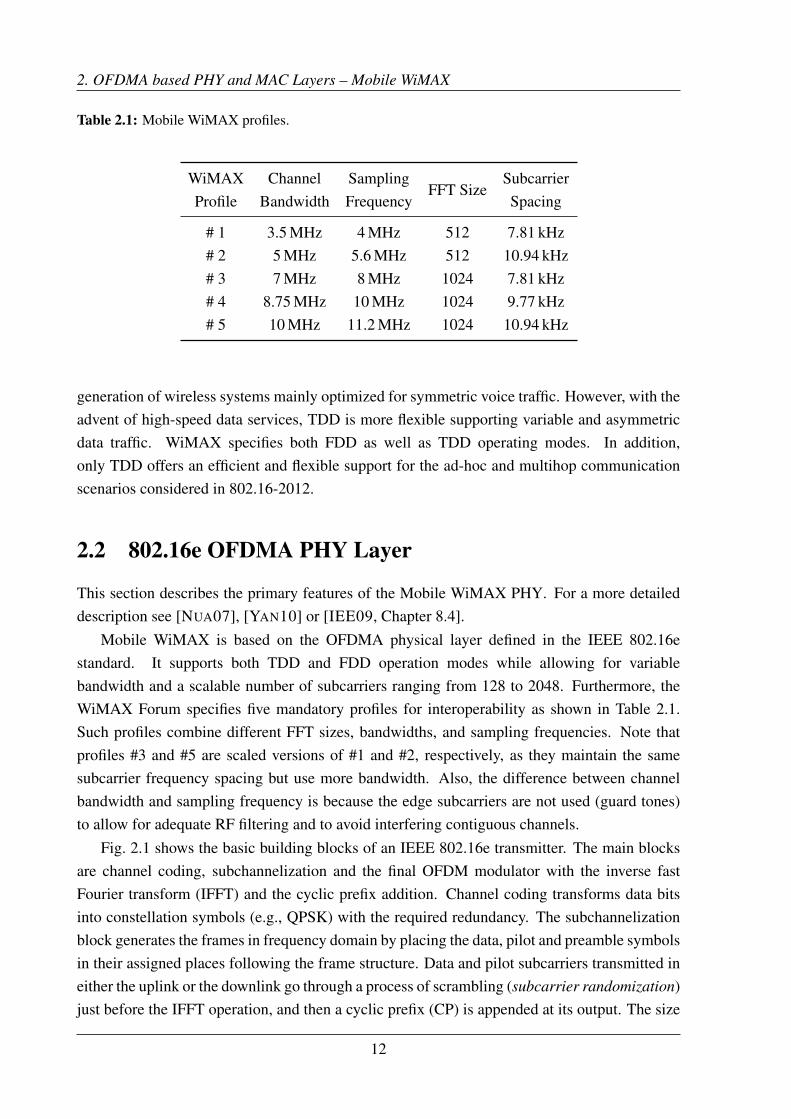
2.1 Mobile WiMAX profiles. . . . . . . . . . . . . . . . . . . . . . . . . . . . . . 122.2 DL and UL PUSC parameters for 512 and 1024 FFT size. . . . . . . . . . . . . 162.3 Subchannels and logical clusters mapping into major groups for 512 and 1024
FFT size. . . . . . . . . . . . . . . . . . . . . . . . . . . . . . . . . . . . . . 162.4 QoS parameters defined for each service class. . . . . . . . . . . . . . . . . . . 22
3.1 DRR parameters for each service class. . . . . . . . . . . . . . . . . . . . . . 483.2 FPGA resource utilization. . . . . . . . . . . . . . . . . . . . . . . . . . . . . 493.3 FPGA resource utilization of each processing block. . . . . . . . . . . . . . . . 513.4 Static analysis of DSP resource utilization. . . . . . . . . . . . . . . . . . . . . 523.5 ITU-R M.1225 channel models. . . . . . . . . . . . . . . . . . . . . . . . . . 553.6 Throughput measurement configuration. . . . . . . . . . . . . . . . . . . . . . 59
4.1 Throughput requirements (for each train) in the literature. . . . . . . . . . . . . 694.2 Maximum delay (one-way) and packet loss rate requirements for CBTC in the
bibliography. . . . . . . . . . . . . . . . . . . . . . . . . . . . . . . . . . . . 694.3 Standardized QCI characteristics [3GP14]. . . . . . . . . . . . . . . . . . . . 714.4 Multimode channel model parameters for Figs. 4.3 and 4.4. . . . . . . . . . . . 804.5 Path loss estimated parameters using Eq. (4.2). . . . . . . . . . . . . . . . . . 844.6 Path loss model configuration using Eq. (4.3). . . . . . . . . . . . . . . . . . . 854.7 Applications configuration for the three-stations deployment. . . . . . . . . . . 884.8 Applications configuration for the complete subway-line deployment. . . . . . 1014.9 Throughput and PER with one train in LTE deployment. . . . . . . . . . . . . 1044.10 Total throughput and PER with ten trains in LTE deployment. . . . . . . . . . . 1054.11 Throughput and PER with one train in Wi-Fi deployment. . . . . . . . . . . . . 1094.12 Throughput and PER with ten trains in Wi-Fi deployment. . . . . . . . . . . . 1104.13 PER for each application with ten trains in Wi-Fi deployment. . . . . . . . . . 112
xv


Chapter I
Introduction
Wireless communications systems have greatly evolved since the emergence of the firstgeneration of wireless cellular technology in the 80s. The following generations provided ahuge increase in data rates, spectral efficiency, security, and coverage. The last 4G and 5Ggenerations use multicarrier modulations given their high spectral efficiency, simple channelequalization and flexible multiple access schemes. The well-known and widely adoptedorthogonal frequency-division multiplexing (OFDM) modulation with cyclic prefix (CP) hasbeen selected because of its multiple advantages such as low implementation complexity thanksto the fast Fourier transform (FFT) algorithm [ZAI+16]. The orthogonal frequency-divisionmultiple access (OFDMA) scheme is also used in these wireless communication standards toprovide flexibility in the radio resource sharing between users with high spectral efficiency.
Worldwide Interoperability for Microwave Access (WiMAX) is the commercial nameadopted for the IEEE 802.16 wireless communication standards. This was one of the competingtechnologies to be selected as the 4G mobile communication standard. Although LongTerm Evolution (LTE) finally became the world’s 4G standard, Mobile WiMAX is a similartechnology based on an OFDMA physical layer (PHY) and a connection-oriented mediumaccess control layer (MAC) with good quality of service (QoS) support. WiMAX is still beingused for broadband wireless access (BWA) and in some specific environments such as airportsurface communications (known as AeroMACS).
Real-time transceiver prototyping is an important tool for testing and verifying systemperformance under real-world conditions. The use of testbeds is a less expensive alternativethan developing a prototype, but the hardware restrictions to achieve real-time operation are notconsidered in the implementation and algorithm selection. Prototype development requires toconsider the usage of alternative low-complexity algorithms to avoid processing bottlenecks andobtain an efficient and realistic implementation. The obtained prototype allows for evaluatingthe total performance loss of the combined low-complexity algorithms in realistic environments.
The implementation of digital radio communication systems is usually carried out indedicated chips or application-specific integrated circuits (ASICs) to minimize the powerrequirements of the device. These implementations are very efficient, but lack the flexibility
1

1. Introduction
needed to support new waveforms or protocols. Software-defined radio (SDR) systems try tominimize the dedicated hardware components in transceivers and substitute them by softwaremodules running in more general processors such as digital signal processors (DSPs). Thisidea was popularized by Joseph Mitola III [MIT92; MIT95; MIT99] in the 90s and has gainedinterest in military and research environments as well as in commercial deployments, thanks tothe great increase in computing power of microprocessors and the advances in heterogeneouscomputing.
Over the last decades, the railway industry has been evolving their conventional signalingsystems to communication-based systems demanding reliable and fault-tolerant infrastructures.The European Rail Traffic Management System (ERTMS) was adopted in all Europeancountries for mainline railway operations using GSM for Railways (GSM-R) as the radiotransmission technology. Other example of these modern communication-based signalingsystems is the communications-based train control (CBTC) standard, which is usually usedin subway and urban rail transport to provide high-resolution train location determination andcontinuous train-to-wayside data communications. CBTC allows for reducing the distancebetween trains, increasing the line capacity. CBTC systems are usually deployed usingproprietary solutions based on IEEE 802.11 (Wi-Fi) technology for radio communications.
In this thesis we focus on subway environments where there are many other services thatdemand wireless connectivity such as video surveillance or passenger information. Separateradio technologies are usually considered to provide these additional services (e.g., TerrestrialTrunked Radio (TETRA) for public safety) which results in increased costs due to thedeployment and maintenance of several network infrastructures. Using only one modernwireless technology for all the services would reduce operational costs and would simplify theinstallation of new applications. This common wireless communication system should supportall the different QoS requirements of these applications, specially the mission critical ones. TheWi-Fi networks used for CBTC include several proprietary modifications to adapt the 802.11standard to the railway environment needs. These enhancements usually focus on using a fasthandover method to support the high mobility of the trains, providing better QoS mechanismsand security. However, Wi-Fi still has problems with the limited transmission range and withpotential interference as it uses unlicensed frequency bands. In fact, after some incidents withinterference in the 2.4 GHz band in Chinese subways, China authorities forced the use of LTEinstead of Wi-Fi for new deployments of CBTC in 2014, assigning the 1.8 GHz band to subwayoperators.
LTE and its 5G evolution has gained several interest for railway applications. GSM-Rwill be replaced by the International Union of Railways (UIC) Future Railway MobileCommunication System (FRMCS) which is included in the latest 5G standards (3GPP releases15 and 16). The 3rd Generation Partnership Project (3GPP) has also included public safetyfeatures into LTE to replace TETRA. CBTC is also being deployed using LTE in countrieswhich provide a licensed band for subway operators such as China and Australia. LTE is better
2

1.1. Thesis Overview
suited for subway environments than Wi-Fi as it provides better mobility support and QoSmechanisms with higher spectral efficiency and range. The major problem for LTE adoptionin subways is the need to use licensed bands, requiring an agreement between subway operatorand the owner of the licensed band rights.
Radio communication deployments in subways require a great effort in planning andconducting measurement campaigns to ensure the coverage along the entire line. Radiatingcable (“leaky feeder”) or distributed antennas can be used to provide radio coverage in tunnels.Although radiating cable solutions provide more stable coverage, distributed antennas solutionsare preferred because of their lower cost. However, radio planning is more complex withantennas. Several factors affect radio propagation inside tunnels such as its dimensions andshape, position of antennas, operating frequency, size of the trains, etc. Measurement campaignsshould be performed before a deployment [TOL15] to correctly adjust the used channel modeland predict the coverage in the tunnel with accuracy. It is also important to perform networksimulations in order to evaluate the performance and prevent possible problems.
Network simulators are very useful to validate, optimize and test the efficiency andperformance of networks under different scenarios and configurations. They allow for studyingthe expected network behavior in complex environments where it is very difficult to conductreal tests. For this reason, modeling and simulating subway network deployments is veryuseful as it helps in the network planning and the parameter configuration. However, thereare some common pitfalls that should be avoided such as using unrealistic or unverifiedmodels with excessive simplifications [SUÁ+15a]. The subway simulations should use verifiedcommunication models with adapted and accurate mobility and channel models. In this way,the simulation results will allow for assessing the feasibility of the network planning with theselected technology.
1.1 Thesis Overview
This work studies the design and implementation of MAC and PHY layers of a 4Gcommunication system (Mobile WiMAX) using an SDR architecture made up of DSPs and fieldprogrammable gate arrays (FPGAs). The applicability of 4G (LTE) in rail transport systems isalso evaluated by using a system-level network simulator customized for subway environments.
Chapter 2 describes the most relevant characteristics of Mobile WiMAX MAC and PHYlayers. The chapter focus on the mandatory features of the IEEE 802.16e standard that need tobe implemented in a Mobile WiMAX transceiver.
Chapter 3 presents the design and real-time implementation of Mobile WiMAX transceivers.The MAC and PHY layers of the mobile and the base stations are implemented allowingreal-time bidirectional communications using time-division duplexing (TDD). A performanceevaluation of the transceivers is also carried out using a channel emulator and the scenariosrecommended by the WiMAX Forum.
3

1. Introduction
Chapter 4 evaluates the suitability of different communication technologies for subwayenvironments. LTE and Wi-Fi deployments are simulated using tunnel propagation channelsbased on deterministic models and real channel measurements. The ns-3 network simulator isenhanced to match the subway scenario conditions. The results of a measurement campaign areused to perform realistic simulations in that scenario. The developed deterministic channelmodel combines several works found in the literature allowing the definition of complexscenarios. This channel model is used to perform simulations on the same subway line withdifferent technologies and deployments.
1.2 Contributions
The work presented in this thesis led to the co-authored publications listed in Sections 1.2.1and 1.2.2. During the research of this thesis, the author also collaborated in the research projectsdescribed in Section 1.2.3.
1.2.1 Journal Papers
1. Ángel Carro-Lagoa, Pedro Suárez-Casal, José A. García-Naya, Paula Fraga-Lamas, LuisCastedo, and Antonio Morales-Méndez. “Design and implementation of an OFDMA-TDD physical layer for WiMAX applications”. EURASIP Journal on WirelessCommunications and Networking, vol. 2013, no. 1, 2013, p. 243. ISSN: 1687-1499.DOI: 10.1186/1687-1499-2013-243
2. Pedro Suárez-Casal, Ángel Carro-Lagoa, José A. García-Naya, Paula Fraga-Lamas, LuisCastedo, and Antonio Morales-Méndez. “A real-time implementation of the MobileWiMAX ARQ and physical layer”. Journal of Signal Processing Systems, vol. 78,no. 3, 2015, pp. 283–297. ISSN: 1939-8115.DOI: 10.1007/s11265-014-0890-3
3. Antonio J. Rodríguez, Roland Pastorino, Ángel Carro-Lagoa, Karl Janssens, and MiguelÁ. Naya. “Hardware acceleration of multibody simulations for real-time embeddedapplications”. Multibody System Dynamics, 2020, pp. 1–19.DOI: 10.1007/s11044-020-09738-w
1.2.2 International Conference Papers
1. Pedro Suárez-Casal, Ángel Carro-Lagoa, José A. García-Naya, and Luis Castedo. “AMulticore SDR Architecture for Reconfigurable WiMAX Downlink”. Proc. of 13thEuromicro Conference on Digital System Design: Architectures, Methods and Tools(DSD), 2010. 2010, pp. 801–804.DOI: 10.1109/DSD.2010.108
4

1.2. Contributions
2. Ángel Carro-Lagoa, Pedro Suárez-Casal, P. Fraga-Lamas, J. A. García-Naya, L. Castedo,and A. Morales-Méndez. “Real-Time Validation of a SDR Implementation of TDDWiMAX Standard”. Proc. of 2013 Wireless Innovation Forum European Conferenceon Communications Technologies and Software Defined Radio (SDR-WInnComm-Europe2013). 2013
3. José Rodríguez-Piñeiro, José A. García-Naya, Ángel Carro-Lagoa, and Luis Castedo. “Atestbed for evaluating LTE in high-speed trains”. Proc. of 16th Euromicro Conferenceon Digital System Design (DSD 2013). 2013, pp. 175–182.DOI: 10.1109/DSD.2013.27
4. Ángel Carro-Lagoa, Tomás Domínguez-Bolaño, José Rodríguez-Piñeiro, MiguelGonzález-López, and José A. García-Naya. “Feasibility of LTE for train control insubway environments based on experimental data”. Proc. of 2019 27th EuropeanSignal Processing Conference (EUSIPCO). 2019, pp. 1–5.DOI: 10.23919/EUSIPCO.2019.8903070
1.2.3 Research Projects
The work performed in this thesis contributed to the following projects:
• SeaMAX (2007-2009): The aim of this project was to study of the feasibility ofWiMAX technology in coastal maritime environments. A real-time channel emulator wasdeveloped on an FPGA-based development kit. This channel emulator was configured totest Fixed WiMAX equipment in coastal maritime environments.
– Funding entity: Wireless Galicia.– Funding: C31 625.– Duration: 1 year and 11 months.
• MoWi (2008-2011): This project was funded by Indra Sistemas S.A. to design andimplement a Mobile WiMAX prototype. The project was performed in three phases.First, the PHY layer was implemented in FPGAs and DSPs. Then, the prototype wasmodified with tactical countermeasures to support military scenarios. Finally, the MAClayer was partially implemented.
• GNUTEST (2010-2013): In this project, the GNU Radio toolkit and the Ettus USRPhardware were tested for several applications. One of the applications was thetransmission and reception of Mobile WiMAX signals.
– Reference: 10TIC003CT.– Funding entity: Galician Economy and Industry Department, Xunta de Galicia.– Funding: C123 343.25.– Duration: 3 years.
• TECRAIL (2011-2014): This project was aimed at adapting IP-based 4G technologiesfor railway environments, centering on railway signaling, automated driving, on-board
5

1. Introduction
communications, and train-to-ground communications. Several simulations with MobileWiMAX signals were performed to test the effects of high-speed environments inthe decoding of OFDM signals. Also, a testbed based on Ettus USRP devices wasdeveloped for performing measurement campaigns on railway environments, focusingon the generation and processing of LTE signals.
– Reference: IPT-2011-1034-370000.– Funding entity: Ministry of Science and Innovation, Government of Spain.– Funding: C245 791.– Duration: 3 years and 3 months.
• INRA-CBTC (2018-2021): The project is intended to develop a set of tools for thevalidation of an LTE network specifically adapted to the railway environment. Thesetools evaluate the fulfillment of the CBTC requirements by measuring the performanceof the deployed network in terms of PER, delay, and jitter.
– Funding entity: CAF Signalling S.L. and the CDTI entity of the Spanish Ministryof Science and Innovation.
– Funding: C262 487.86.– Duration: 2 years and 7 months.
The author also participated in the following projects related with other topics:
• CIUDAD2020 (2011-2014): The objective of this project was to develop new citizen-oriented services in areas such as energy, transportation, and environmental control. Wefocused on the information and communications architecture that should integrate thedifferent services. This architecture was based on an Enterprise Service Bus (ESB).
– Reference: IPT-20111006.– Funding entity: ATOS Origin and the CDTI entity of the Spanish Ministry of
Science and Innovation.– Funding: C120 000.– Duration: 3 years and 3 months.
• SmartMonitor (2013-2014): This project was focused on developing a monitoring datacollection system for enterprise infrastructure management and monitoring. A distributedsystem was developed in two phases to provide fault-tolerant, reliable and scalable datacollection. The system supports several communication protocols to monitor and performactions on the enterprise infrastructure.
• SmartPort Coruña and Smart VIPort (2015-2016): The aim of these projects was to adaptand evolve the monitoring system to the ports of A Coruña and Vigo, Spain. Furthermore,the integration of several systems involved in port operations was addressed.
• PortsPlatform (2018-2019): This project was focused on the improvement andcustomization of the monitoring system to the environment of several ports of Spain.
• Navantia-UDC “The Shipyard of the Future” (2015-2021): This project is carried out bythe mixed research unit Navantia-UDC in two phases. One research line is the integrated
6

1.2. Contributions
services system, which aims to integrate several communications and services inside thevessel with a common infrastructure. We are focused on providing location services forthe crew members using computer vision and deep learning techniques.
– References: IN853A 2015/01 and IN853B 2018/02.– Funding entity: Galician Innovation Agency (GAIN), Xunta de Galicia.– Funding: C387 435.31 and C99 707.45.– Duration: 7 years.
7

Chapter II
OFDMA based PHY and MAC Layers –Mobile WiMAX
Wireless communications systems have to cope with various physical phenomena that theelectromagnetic signal experiences as it propagates. Typical effects of wireless channels arepropagation losses, multipath, fading, doppler, and interference.
Multi-carrier systems make it possible to combat these effects efficiently. Specifically,orthogonal frequency-division multiplexing (OFDM) is the basis for various communicationstandards focused on cellular mobile communications or wireless local area networks.Orthogonal frequency division multiple access (OFDMA) is a very flexible scheme based onOFDM that modern communication systems use to share the radio spectrum between multipleusers.
This chapter shows the mechanisms that need to be implemented in physical and mediumaccess layers (PHY and MAC) of OFDMA based systems. Mobile WiMAX standard is used asreference.
This chapter is based on the following co-authored publications:• Ángel Carro-Lagoa, Pedro Suárez-Casal, José A. García-Naya, Paula Fraga-Lamas, Luis
Castedo, and Antonio Morales-Méndez. “Design and implementation of an OFDMA-TDD physical layer for WiMAX applications”. EURASIP Journal on WirelessCommunications and Networking, vol. 2013, no. 1, 2013, p. 243. ISSN: 1687-1499.DOI: 10.1186/1687-1499-2013-243
• Pedro Suárez-Casal, Ángel Carro-Lagoa, José A. García-Naya, Paula Fraga-Lamas, LuisCastedo, and Antonio Morales-Méndez. “A real-time implementation of the MobileWiMAX ARQ and physical layer”. Journal of Signal Processing Systems, vol. 78,no. 3, 2015, pp. 283–297. ISSN: 1939-8115.DOI: 10.1007/s11265-014-0890-3
This chapter is structured as follows. Section 2.1 introduces WiMAX and 802.16 standards.Sections 2.2 and 2.3 describe the OFDMA-TDD Mobile WiMAX PHY and MAC layers.Section 2.4 shows the changes and enhancements introduced by the WiMAX Advanced Air
9

2. OFDMA based PHY and MAC Layers – Mobile WiMAX
Interface. Finally, Section 2.5 presents the concluding remarks.
2.1 Mobile WiMAX
Worldwide Interoperability for Microwave Access (WiMAX) is a wireless communicationstandard developed to provide broadband wireless access (BWA) over large distances. Theterm WiMAX was adopted by the WiMAX Forum, an organization created to promote theinteroperability between the IEEE 802.16 family of wireless communication standards.
In late 90s, IEEE started the working group IEEE 802.16 to create a point-to-multipoint(PMP) air interface alternative to cable and digital subscriber lines. The original standardwas modified to produce the IEEE 802.16d standard for fixed applications [IEE04b]. IEEE802.16d uses OFDM with time division multiple access (TDMA) as the transmission scheme.In 2005, mobility support was incorporated based on scalable OFDMA (SOFDMA), resultingin the amendment 802.16e [IEE06], also known as Mobile WiMAX. Four years later, thestandard IEEE 802.16-2009 [IEE09] was released to support both fixed and mobile wirelesscommunications. A complete survey of the historical evolution of the standard up to 2010 canbe found in [PAR+12].
In 2011, WiMAX evolved to 802.16m [IEE11], which focuses on providing an advancedair interface to fulfill the requirements of IMT-Advanced while maintaining backwardcompatibility with existing specifications. In 2012, the standard was split in two versions:Air Interface for BWA Standard 802.16-2012 [IEE12a] consolidates material from 802.16j-
2009 for relay-based networks and the amendment 802.16h-2010, which implementscoexistence enhancement for license-exempt operation. Finally, 802.16-2017 [IEE18]was released including several enhancements: support for machine-to-machine (M2M)applications, higher reliability networks, multi-tier networks and operation with channelbandwidth from 100 kHz up to 1.25 MHz.
WirelessMAN-Advanced Air Interface for BWAStandard 802.16.1-2012 [IEE12b] specifies the enhanced air interface designated as“IMT-Advanced” by the ITU-R consolidating the 802.16m amendment. The 802.16.1b-2012 [IEE12c] and 802.16.1a-2013 [IEE13] ammendments were published to addsupport for M2M applications and higher reliability networks, respectively.
Together with Long Term Evolution (LTE), WiMAX was one of the competing radio accesstechnologies to be used by the fourth generation (4G) of mobile communication systems.Although LTE finally became the world’s 4G standard, WiMAX is an interesting modernwireless communication system to be studied. This chapter will focus on IEEE 802.16e (MobileWiMAX) from now on. The most salient technical features of Mobile WiMAX are:Scalable OFDMA PHY Mobile WiMAX PHY layer architecture allows for easily scaling
bandwidth and throughput. The OFDMA PHY chooses the fast Fourier transform (FFT)size based on the available bandwidth so subcarrier spacing is constant. Also, the use of
10

2.1. Mobile WiMAX
OFDM modulation provides resiliency to multipath propagation and allows for operatingin non-line-of-sight (NLoS) conditions.
TDD and FDD support The IEEE standards support both time-division duplexing (TDD) andfrequency-division duplexing (FDD) modes. The initial release of Mobile WiMAX onlyincluded TDD profiles. FDD profiles were added by the WiMAX Forum in release 1.5.However, all existing WiMAX deployments only use TDD.
High throughput As an example, the OFDMA-PHY in SISO TDD mode using 10 MHzbandwidth and 64-QAM 3/4 can provide up to 14.9 Mbit/s in DL and 11.6 Mbit/s in ULwith a 26:21 downlink-to-uplink rate. Better results can be obtained using the FDD mode,higher bandwidth and multiple-antenna techniques.
AMC and dynamic resource allocation WiMAX supports several modulations and codingschemes which can be selected for each user in each frame, based on channel conditions.Resource assignment in uplink (UL) and downlink (DL) is controlled by a scheduler atthe base station. The standard allows for the allocation of available resources in time andfrequency, and has flexible mechanisms for transmitting resource allocation informationframe by frame. In addition, resources can be allocated in the space domain when optionaladaptive antenna systems (AASs) are used.
Mobility Mobile WiMAX supports hard and soft handover so applications such as VoIP canwork seamlessly. The system also integrates energy-saving mechanisms to extend thebattery life of mobile station (MS) devices.
Reliability Automatic repeat request (ARQ) is supported in MAC layer to increase connectionreliability. WiMAX also supports hybrid automatic repeat request (HARQ), which is aneffective combination of forward error correction (FEC) and ARQ.
QoS WiMAX defines five quality of service (QoS) classes to support several application types.Security WiMAX MAC layer contains a security sublayer that supports robust security
algorithms such as EAP-based authentication, AES-CCM encryption, and CMAC andHMAC message authentication.
WiMAX PHY is in charge of multiplexing user and system data together with controlsignaling in order to ensure a proper utilization of the radio resources. The WiMAX physicallayer specifies how to map and how to allocate those resources as either reference signals or toform various physical channels. IEEE 802.16 specifications define three different PHY layers:single-carrier (SC) transmission, OFDM, and OFDMA. Among them OFDMA is the mostattractive given its flexibility and ability to support multiple users at the same time. OFDMA isbased on OFDM modulation and allows a WiMAX base stations (BSs) to divide the availablesubcarriers into subchannels that can be assigned to different users. OFDMA enables a largeflexibility in the radio interface since users can be assigned different bandwidths, time durationsand modulation orders according to their demanded QoS and the available bandwidth.
There exist two basic methods to achieve two-way communication in a wirelesscommunication system: FDD and TDD. The FDD technique has been preferred by the first
11
2. OFDMA based PHY and MAC Layers – Mobile WiMAX
Table 2.1: Mobile WiMAX profiles.
WiMAX Channel SamplingFFT Size
SubcarrierProfile Bandwidth Frequency Spacing
# 1 3.5 MHz 4 MHz 512 7.81 kHz# 2 5 MHz 5.6 MHz 512 10.94 kHz# 3 7 MHz 8 MHz 1024 7.81 kHz# 4 8.75 MHz 10 MHz 1024 9.77 kHz# 5 10 MHz 11.2 MHz 1024 10.94 kHz
generation of wireless systems mainly optimized for symmetric voice traffic. However, with theadvent of high-speed data services, TDD is more flexible supporting variable and asymmetricdata traffic. WiMAX specifies both FDD as well as TDD operating modes. In addition,only TDD offers an efficient and flexible support for the ad-hoc and multihop communicationscenarios considered in 802.16-2012.
2.2 802.16e OFDMA PHY Layer
This section describes the primary features of the Mobile WiMAX PHY. For a more detaileddescription see [NUA07], [YAN10] or [IEE09, Chapter 8.4].
Mobile WiMAX is based on the OFDMA physical layer defined in the IEEE 802.16estandard. It supports both TDD and FDD operation modes while allowing for variablebandwidth and a scalable number of subcarriers ranging from 128 to 2048. Furthermore, theWiMAX Forum specifies five mandatory profiles for interoperability as shown in Table 2.1.Such profiles combine different FFT sizes, bandwidths, and sampling frequencies. Note thatprofiles #3 and #5 are scaled versions of #1 and #2, respectively, as they maintain the samesubcarrier frequency spacing but use more bandwidth. Also, the difference between channelbandwidth and sampling frequency is because the edge subcarriers are not used (guard tones)to allow for adequate RF filtering and to avoid interfering contiguous channels.
Fig. 2.1 shows the basic building blocks of an IEEE 802.16e transmitter. The main blocksare channel coding, subchannelization and the final OFDM modulator with the inverse fastFourier transform (IFFT) and the cyclic prefix addition. Channel coding transforms data bitsinto constellation symbols (e.g., QPSK) with the required redundancy. The subchannelizationblock generates the frames in frequency domain by placing the data, pilot and preamble symbolsin their assigned places following the frame structure. Data and pilot subcarriers transmitted ineither the uplink or the downlink go through a process of scrambling (subcarrier randomization)just before the IFFT operation, and then a cyclic prefix (CP) is appended at its output. The size
12

2.2. 802.16e OFDMA PHY Layer
Channel Coding
ModulationRandomizer RepetitionInterleaverFEC
Subchannelization
Symbolassembly
Subcarrierrandomization
Burstmapping
Pilotgeneration
Preamble
Framegeneration
IFFTCyclic Prefix
Data Bits
Figure 2.1: Block diagram of an IEEE Std 802.16e transmitter.
of this CP is defined as a ratio of the FFT size and can be variable, being valid values 1/4, 1/8,1/16, and 1/32, although the WiMAX Forum only requires the support of the 1/8 value.
2.2.1 TDD Frame Structure
OFDMA is a multi-user version of OFDM to allow users to transmit and receive datasimultaneously. This is done by distributing groups of subcarriers at different times amongusers. These subsets of subcarriers are called subchannels and are dynamically assigned to users(or groups of users) according to their needs. Other basic terms are defined in the standard tospecify the frame structure:Frame The largest structure at the PHY with a fixed duration. The TDD frames contain both
an UL subframe and a DL subframe.Permutation zone A set of adjacent OFDM symbols in which a particular method of subcarrier
assignment and structuring is used. The DL or UL subframes can contain more than onepermutation zone.
Slot The slot unit is the minimum possible data allocation unit and it is used to specify the datatime-frequency regions of the bursts. Depending on the permutation scheme used, a slotis defined in a different way although it always encompasses 48 data subcarriers.
Data region A set of slots defined by a two-dimensional allocation of several adjacentsubchannels in a group of contiguous OFDMA symbols.
Burst The data assigned to one or more users mapped into one data region. The allocated slotsuse the same modulation and coding configuration.
Segment A subdivision of the available OFDMA subchannels (that may include all availablesubchannels). The segments can be assigned to sectors, facilitating the use of frequencyreuse techniques.
13

2. OFDMA based PHY and MAC Layers – Mobile WiMAX
PART 16: AIR INTERFACE FOR BROADBAND WIRELESS ACCESS SYSTEMS IEEE Std 802.16-2009
Copyright © 2009 IEEE. All rights reserved. 701
Figure 222 shows an example of an OFDMA frame (with only mandatory zone) in TDD mode.
8.4.4.2 FDD frame structure
Base stations of OFDMA FDD systems shall operate in full duplex mode. SSs shall be either full duplex (FDD) or half duplex (H-FDD). The FDD frame structure supports both FDD and H-FDD SS types. The frame structure supports a coordinated transmission arrangement of two groups of H-FDD SSs (Group-1 and Group-2) that share the frame at distinct partitions of the frame.
Figure 223 and Figure 224 show the frame structure of an OFDMA FDD system that supports the concurrent operation of H-FDD and FDD SSs. The DL frame contains two subframes. DL Subframe 1 comprises a preamble symbol, a MAP region (MAP1) and data symbols (DL1). DL Subframe 2 comprises a MAP region (MAP2) and data symbols (DL2).
The space between the two DL subframes is occupied by a gap DLGap (see Figure 223), the size of which shall be an integer number of symbols (0, 1, 2, 3). Optionally, as shown in Figure 224, this gap may also include the residual frame time, DLresidue (the frame duration minus the total time occupied by the frame symbols). The number of symbols in DLGap and the location of DLresidue shall be signaled in the DCD, in both DL subframes, using the “FDD DL gap” TLV (see 11.4.1 Table 575). The BS shall not change the location and value of DLresidue during operation.
The UL frame contains two subframes, UL2 and UL1 (in this order). Figure 223 and Figure 224 show the timing relationship of the UL subframes relative to the DL subframes. The four parameters TTG1, TTG2, RTG1 and RTG2 are announced in the DCD messages (see Table 575) and they shall be sufficiently large to accommodate the H-FDD SSs transmit receive switching time plus the round trip propagation delay.
Figure 222—Example of OFDMA frame (with only mandatory zone) in TDD mode
DL UL RTGTTG
k k+1 k+17k+3 k+5 k+7 k+9 k+11 k+13 k+15 k+20 k+26 k+29 k+30k+23s
s+1s+2
s+L
Ranging subchannel
DL-
MA
PDL burst #3
DL burst #4
DL burst #2
DL burst #5
DL burst #6
UL burst #1
UL burst #2
UL burst #3
subc
hann
el lo
gica
l num
ber
OFDMA symbol number t
FCH
DL
burs
t #1
(car
ryin
g th
e U
L M
AP)
Prea
mbl
e
DL-
MA
P
k+32
FCH
Prea
mbl
e
UL burst #4
UL burst #5
Figure 2.2: TDD frame structure example ©2009 IEEE [IEE09].
Fig. 2.2 shows an example of a Mobile WiMAX TDD frame. Each frame contains oneDL subframe and one UL subframe. The first symbol in the DL subframe is a preamblesymbol whose subcarriers are chosen from a predefined set. The first two symbols after thepreamble are reserved to send the frame control header (FCH) and downlink map (DL-MAP)messages, which describe the mapping of the bursts inside the downlink subframe. If an uplinkmap (UL-MAP) message is sent to set the uplink configuration, it should be transmitted on thefirst burst defined in the DL-MAP.
The 802.16e standard allows to use several frame sizes, but the WiMAX Forum onlyspecifies the 5 ms frame size as mandatory. The transmit/receive transition gap (TTG) andreceive/transmit transition gap (RTG) values are set according to the 5 ms frame duration anddepend on the used WiMAX profile. Also note that the total number of OFDM symbols (DLand UL) in a frame also depends on each profile: 47 symbols for 10 and 5 MHz profiles, 42 for8.75 MHz, and 33 for 7 and 3.5 MHz. The downlink-to-uplink ratio can vary from 3:1 to almost1:1.
Uplink resources are shared among MSs, and their allocation and scheduling is centralizedon the BS. The latter decides how many slots are assigned to each MS depending on their QoSparameters and bandwidth requirements. Additionally, ranging regions can be defined in theuplink to allow MSs to perform network entry, improve uplink synchronization parameters, orsend special feedback messages, among other tasks.
As shown in Fig. 2.2, the time-frequency shape of data regions is different in DL and UL. InDL, the data regions are rectangular, being defined by the number of subchannels and OFDMAsymbols they occupy. In UL, only the number of slots is needed to define each data region.They are reserved first in the time axis, using all the available OFDMA symbols of a subchannel
14

2.2. 802.16e OFDMA PHY Layer
subcarrier index
even symbolsodd symbols
data subcarrier
pilot subcarrier
Figure 2.3: DL PUSC cluster structure.
before using the next subchannel. However, the UL ranging regions are rectangular. Finally, thedata mapping on data regions is performed in the frequency axis, first filling all the subchannelsof one OFDMA symbol before using the next symbol.
The standard defines different OFDMA symbol structures that can be used in thepermutation zones: partial usage of subchannels (PUSC), full usage of subchannels (FUSC),optional PUSC, optional FUSC, tile usage of subchannels (TUSC), and adaptive modulationand coding (AMC). With the exception of AMC, all symbol structures are distributed subcarrierpermutations where the subcarriers of each subchannel are distributed over all availablebandwidth. The main advantage of these permutations is the frequency diversity and theinterference averaging between adjacent sectors or cells. The AMC mode uses a contiguoussubcarrier permutation that allows for the choice of the best frequencies for each user.
According to the WiMAX Forum, only the PUSC symbol structure is mandatory as the DLshall contain one PUSC permutation zone at the beginning of the frame.
2.2.1.1 Downlink PUSC
The downlink PUSC symbol structure uses pilot, data and guard subcarriers. Each OFDMAsymbol is divided into clusters, which are sets of pilot and data carriers. A different clusterstructure is defined depending on whether the symbol is odd or even as shown in Fig. 2.3. Thepilot subcarriers are transmitted with a ±4/3 value so they are boosted by 2.5 dB compared tonormal data subcarriers.
For every FFT size (NFFT ), the standard specifies the number of guard subcarriers (left andright guards), the number of used subcarriers including pilots and DC (Nused), and the numberof clusters and subchannels as shown in Table 2.2. One subchannel is made up of two clusters,having a total of 24 data subcarriers (and 4 pilots) in one OFDMA symbol. This way, a slot ina DL PUSC zone is defined as one subchannel over two OFDMA symbols so the slots contains48 data subcarriers.
Every OFDMA symbol is divided into guards, DC subcarrier and physical clusters. Thephysical clusters are mapped to logical clusters using a renumbering sequence that distributesthem among all the available spectrum. The logical clusters are divided into 6 major groups,each of them having a number of subchannels assigned as shown in Table 2.3. The data
15

2. OFDMA based PHY and MAC Layers – Mobile WiMAX
Table 2.2: DL and UL PUSC parameters for 512 and 1024 FFT size.
DL PUSC UL PUSC
NFFT 512 1024 512 1024
Left guards 46 92 52 92Right guards 45 91 51 91Nused 421 841 409 841Clusters/Tiles 30 60 102 210Subchannels 15 30 17 35
Table 2.3: Subchannels and logical clusters mapping into major groups for 512 and 1024 FFT size.
NFFT = 512 NFFT = 1024
Major group Clusters Subchannels Clusters Subchannels
0 0-9 0-4 0-11 0-51 - - 12-19 6-92 10-19 5-9 20-31 10-153 - - 32-39 16-194 20-29 10-14 40-51 20-255 - - 52-59 26-29
subcarriers of a subchannel are distributed among all the assigned major group subcarriersusing a permutation formula defined in the standard.
Each of the major groups is assigned to one of the three segments that can be used. Eachsegment should have at least one major group assigned. This way it is possible to use all orpart of the available spectrum in a segment, adding more flexibility to the sectorization andfrequency reuse configuration [YAN10, Chapter 5.9.2].
2.2.1.2 Uplink PUSC
The uplink PUSC symbol structure differs from the downlink to suit the requirements of uplinktransmissions. Each symbol is divided into a set of tiles, whose structure can be seen in Fig. 2.4.Because contiguous tiles may be transmitted by different users (or there may be no transmissionat all), information from adjacent tiles cannot be used to make channel estimates. Therefore,the pilots are placed in the corner positions of the tiles so that the channel inside the tile canbe estimated from these pilots only. Moreover, one out of every three symbols is transmittedwithout pilots, so it is necessary to perform a two-dimensional channel estimation.
The subchannels are made up of six tiles. This way, a slot is defined as one subchannel
16

2.2. 802.16e OFDMA PHY Layer
subcarrier index
symbol 0symbol 1symbol 2
data subcarrier
pilot subcarrier
Figure 2.4: UL PUSC tile structure.
in three OFDMA symbols, with a total 48 data subcarriers and 24 pilots. The high number ofpilot subcarriers allows for a better channel estimation than in DL PUSC clusters. The OFDMAsymbol structure parameters are summarized in Table 2.2.
The procedure to map the slots data into the data subcarriers is analog to the DL PUSCmethod and also supports the use of up to three segments. The subcarriers are distributedin several steps so the tiles of a subchannel are not physically adjacent. Also, a subchannelrotation scheme is also defined so the assigned subchannels for a data burst changes every threeOFDMA symbols, behaving like a frequency hopping technique. The ranging subchannels arenot affected by these subcarrier permutation mechanisms.
2.2.2 OFDMA Ranging
In multiuser mobile environments, time and frequency estimations obtained at MSs cannot bedirectly used to construct the uplink signal because the relative distance and speed with respectto the BS is not known [MKP07]. In the IEEE 802.16e standard, this problem is solved with theso-called ranging process. In such a process, MSs transmit CDMA code sequences generatedfrom a shift register in specific regions of the uplink, reserved for this purpose by the BS in acontention-based policy. At the receiver side, the BS must detect the arrival of ranging codesand estimate the synchronization parameters from them. Finally, these parameters are sent backto the MSs in a MAC management message and used to construct the synchronized uplinkframes to be transmitted by the MSs.
Two types of ranging regions are defined: initial ranging, used during network entry; andperiodic ranging, used when the MSs are already connected. In the case of initial ranging,OFDM symbols containing ranging codes must be transmitted by MSs in pairs as shown inFig. 2.5: the first symbol with a CP and the second one with a cyclic postfix, hence allowing awider time synchronization window.
Ranging codes are sequences of 144 BPSK symbols generated from the output of apseudorandom binary sequence (PRBS). Different sets of codes are used depending on thepurpose of the MS: initial ranging, periodic ranging, bandwidth requests, or handover. When
17

2. OFDMA based PHY and MAC Layers – Mobile WiMAX
Cyclic prefix Cyclic postfix
IFFT output IFFT output
Figure 2.5: OFDM symbol structure for initial ranging with two symbols.
a MS decides to start a ranging process, it selects a code randomly from the corresponding setand then maps it to a ranging region. This mapping in a PUSC zone is done in a distributedfashion and only groups of four BPSK symbols are guaranteed to be transmitted in contiguoussubcarriers. The BS must identify the ranging code sent by the MS in order to estimate theuplink synchronization errors.
2.2.3 Channel Coding
As shown in Fig. 2.1, the channel coding stage consists of the following steps: datarandomization, channel coding, bit-interleaving, repetition coding, and symbol mapping.
Data randomization is performed in both the uplink and the downlink employing the outputof a maximum-length shift-register sequence initialized at the beginning of every FEC block.Such a FEC block consists of an integer number of slots.
Channel coding is performed on a per-FEC-block basis employing one of the schemesdefined in the standard, namely, tail-biting convolutional code (TBCC), block turbo code (BTC),convolutional turbo code (CTC), or low-density parity check (LDPC). Additionally, variablecoding rate and modulation are supported, thus enabling for AMC capabilities.
In the bit-interleaving phase, each FEC block is processed by a two-step permutation. Inthe first step, the adjacent coded bits are mapped onto nonadjacent subcarriers, which providesfrequency diversity and improves decoder performance. The second permutation distributes thepositions of the bits inside the constellation to avoid long runs of lowly reliable bits.
The FEC blocks can be further processed by repetition coding with factors of 2, 4, or 6,to increase the resilience of important control data. Finally, the coded bits are mapped intoGray-mapped QPSK, 16-QAM, or 64-QAM constellations at the modulation stage.
The TBCC is specified as mandatory in the standard, supporting the following modulationand coding rate configurations: QPSK 1/2, QPSK 3/4, 16-QAM 1/2, 16-QAM 3/4, 64-QAM1/2, 64-QAM 2/3, and 64-QAM 3/4.
2.3 802.16e MAC Layer
The MAC layer provides an interface between the higher-level network and transport layers andthe physical layer. The packets received from the higher-level layers, called MAC service data
18

2.3. 802.16e MAC Layer
units (MSDUs), are reorganized into MAC protocol data units (MPDUs) and sent to the PHYlayer. The reverse operation is done at the receiver side.
The MAC layer is divided into three sublayers: the convergence sublayer (CS), the commonpart sublayer (CPS), and the security sublayer. The CS maps the external network data intoMSDUs allowing the MAC layer to be used with several protocols, such as Internet Protocol (IP)or Ethernet. Therefore, the CS has a set of classification rules which are used to assign theappropriate service flow to the higher-level layer packets. The CS can perform other tasksto reduce the overheads of the higher-level layers like payload header suppression (PHS) orRObust Header Compression (ROHC). The CPS is the core subsystem of the WiMAX MAC,providing all the needed mechanisms for connection establishment and maintenance, bandwidthallocation, QoS provisioning, etc. The security sublayer is embedded inside the CPS to provideauthentication, secure key exchange and encryption functionalities.
The standard provides an example of MAC service access point (SAP), although it isimplementation specific. The purpose of the example is to illustrate the information that shouldbe exchanged between the CS and the CPS.
WiMAX MAC layer is connection-oriented. When a subscriber station (SS) accomplishesthe network entry process, a set of connections is provided to the new node in order tocommunicate with the BS. All the connections have a unique 16-bit connection identifier (CID).There are two kinds of connections, management connections and transport connections. Themanagement connections can be bidirectional and they are used for sending the different MACmanagement messages. The management connections are:
Broadcast Used by the BS to send messages to all the SSs.Ranging Used during the ranging process.Basic Unique for each SS. Used to send time-urgent messages.Primary Used to send delay tolerant messages.Secondary Optional connection that can transport standard-based messages.
Although basic, primary and secondary management connections are unique for each SS,the basic connection is used to identify the SS in the management messages.
The transport connections are unidirectional and they are used for sending the user data.They are always associated with a service flow which defines the QoS parameters and theclassification rules.
2.3.1 MPDU Generation
MSDUs arriving from higher-level layers must be classified on MAC connections beforetransmission. These connections have associated the relevant parameters to packet transmission,such as the QoS requirements and the encryption keys. All information carried into MPDUs isalways linked to a unique connection, but a wide range of possibilities regarding its generationis supported. Fragments of different MSDUs can be packed into a MPDU, and a MSDU can be
19

2. OFDMA based PHY and MAC Layers – Mobile WiMAX
GenericHeader
Extendedsubheaders PN Subheaders + payload
CMAC/HMACtuple CRC
Figure 2.6: MPDU packet format.
0 1 2 3 4 5 6 7 8 9 10 11 12 13 14 15H
T=
0E
C Type
ESF CI EKS R
sv LENMSB
LEN LSB CID MSB
CID LSB HCS
Figure 2.7: Generic MAC header format.
split into several MPDUs. Also, if a group of MPDUs is going to be transmitted under the samephysical modulation and coding, they can be concatenated into the same physical burst, even ifthey come from different MAC connections.
Besides routing traffic from higher-level layers, MPDUs can also carry managementmessages of the MAC layer. These messages are meant to control processes which areexclusive of this layer, such as conveying information about the structure of the downlink anduplink subframes, managing network entry and initialization of new MSs, or completing secureauthentication and key exchanges. In this case dedicated MAC connections are used, whilepacking and fragmentation of messages is not allowed.
The MPDU packet structure is illustrated in Fig. 2.6. All the MPDUs begin with a fixed-length MAC header which can be followed by a set of optional fields and the the payloadwith the information to be transmitted. If the connection associated with the MPDU has anassociated security association (SA), the MPDU should be encrypted and two new fields shouldbe added: packet number (PN) and HMAC/CMAC tuple. This tuple is also used in authenticatedmanagement messages.
In Fig. 2.7, the fields of the fixed-size (6 bytes) generic MAC header are shown. TheCID and the length fields indicate the destination connection of the data and the length ofthe complete MPDU, respectively. The header check sequence (HCS) field is used to verifythe header data fidelity. The remaining fields are mainly used to specify the presence ofoptional fields or subheaders, including the cyclic redundancy check (CRC) field, or the useof encryption.
There are other type of MPDUs with only a header and no payload, such as the bandwidthrequest (BR) header. They are used exclusively in the uplink and their purpose is to signalcontrol information to the BS in a very compact form. These headers have the HT field set to
20

2.3. 802.16e MAC Layer
one to differentiate them from the generic MAC header.WiMAX MAC layer provides three mechanisms to process the MSDUs, generate the
MPDUs, and map them into bursts:Concatenation Several MPDUs can be concatenated in the same burst.Fragmentation One MSDU can be fragmented in several MPDUs.Packing Several MSDUs with the same CID can be packed in one MPDU.
These three mechanisms can be combined in different ways to efficiently share the radioresources between the users. The behavior of these mechanisms is different depending on theconnection configuration, e.g., fixed-length MSDUs can be packed in an more efficient way thanvariable-length MSDUs because there is no need to include packing subheaders in the MPDUs.
The concatenation mechanism allows to send data to different users or connections in thesame burst. To identify when there are no more MPDUs in a burst, the unused bytes can bepadded with stuff bytes (0xFF) or can be formatted with a special MPDU.
2.3.2 ARQ Mechanism
The ARQ mechanism allows for the retransmission of erroneous decoded MPDUs and worksat MAC connection level. To provide this functionality, the MSDUs are divided in fixed-length blocks and numbered by assigning a block sequence number (BSN) to each block. Thetransmitter and receiver sides use a fixed-size window to manage the block states. The receiverside sends ARQ feedback messages to inform the state of its window, so the transmitter knowswhich blocks need to be retransmitted. The ARQ mechanism is managed by the transmitter andreceiver state machines using timers to control the state changes of each block.
The ARQ performance is influenced by several parameters such as block size, window sizeand maximum waiting interval of the timers. These parameters are established on connectioncreation, and they are stored in the service flow associated to the connection. The ARQ feedbackintensity is not specified in the standard and it is left to the designer’s choice.
2.3.3 Scheduling and QoS
Scheduling in 802.16e is centralized in the BS. The BS determines how many slots are assignedto each SS or connection in the DL and in the UL. The SS is limited by the total burstsize assigned in each UL subframe, but it decides which connections can send data in thatspace. These mechanisms are implemented by two different schedulers: outbound transmissionscheduling and UL request/grant scheduling. The former selects the data to be sent in eachbandwidth allocation and is performed by the BS in the DL, and the SS in the UL. Thelatter determines the bandwidth assigned to each SS so they can transmit data or request morebandwidth. These schedulers base their decisions on the QoS information and the schedulingservice of each connection. This information is stored in the service flows associated with eachconnection.
21
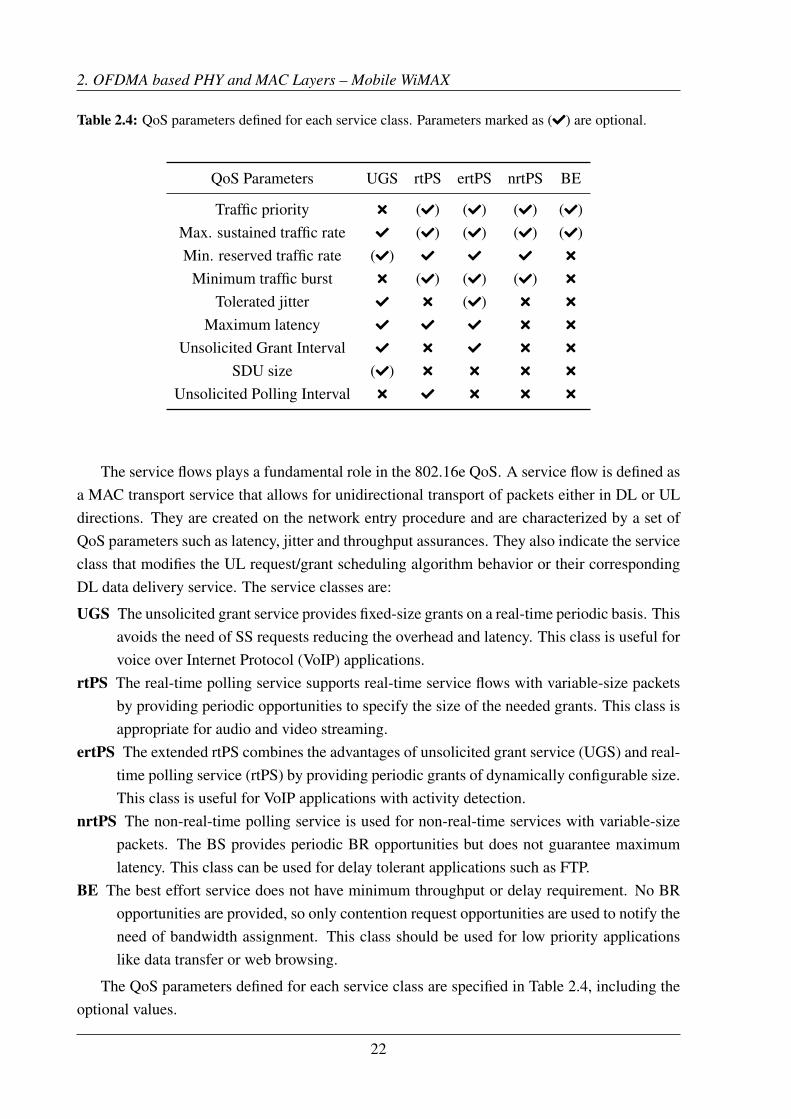
2. OFDMA based PHY and MAC Layers – Mobile WiMAX
Table 2.4: QoS parameters defined for each service class. Parameters marked as (Check) are optional.
QoS Parameters UGS rtPS ertPS nrtPS BE
Traffic priority Times (Check) (Check) (Check) (Check)Max. sustained traffic rate Check (Check) (Check) (Check) (Check)Min. reserved traffic rate (Check) Check Check Check Times
Minimum traffic burst Times (Check) (Check) (Check) Times
Tolerated jitter Check Times (Check) Times Times
Maximum latency Check Check Check Times Times
Unsolicited Grant Interval Check Times Check Times Times
SDU size (Check) Times Times Times Times
Unsolicited Polling Interval Times Check Times Times Times
The service flows plays a fundamental role in the 802.16e QoS. A service flow is defined asa MAC transport service that allows for unidirectional transport of packets either in DL or ULdirections. They are created on the network entry procedure and are characterized by a set ofQoS parameters such as latency, jitter and throughput assurances. They also indicate the serviceclass that modifies the UL request/grant scheduling algorithm behavior or their correspondingDL data delivery service. The service classes are:
UGS The unsolicited grant service provides fixed-size grants on a real-time periodic basis. Thisavoids the need of SS requests reducing the overhead and latency. This class is useful forvoice over Internet Protocol (VoIP) applications.
rtPS The real-time polling service supports real-time service flows with variable-size packetsby providing periodic opportunities to specify the size of the needed grants. This class isappropriate for audio and video streaming.
ertPS The extended rtPS combines the advantages of unsolicited grant service (UGS) and real-time polling service (rtPS) by providing periodic grants of dynamically configurable size.This class is useful for VoIP applications with activity detection.
nrtPS The non-real-time polling service is used for non-real-time services with variable-sizepackets. The BS provides periodic BR opportunities but does not guarantee maximumlatency. This class can be used for delay tolerant applications such as FTP.
BE The best effort service does not have minimum throughput or delay requirement. No BRopportunities are provided, so only contention request opportunities are used to notify theneed of bandwidth assignment. This class should be used for low priority applicationslike data transfer or web browsing.
The QoS parameters defined for each service class are specified in Table 2.4, including theoptional values.
22
2.3. 802.16e MAC Layer
Finally, a SS can use three different mechanisms to request more bandwidth:
Piggyback request Specify the requested increase in bandwidth or the need to be polled in agrant management subheader included in a MPDU of the connection.
Bandwidth stealing Insert a BR header in space assigned to send data.Contention-based Use a ranging slot to send a CDMA code to inform the BS the need to send
a BR. The BS would assign UL space to the SS so it can send its BR.
2.3.4 Convergence Sublayer
The CS maps the different higher layer packets to MSDUs, isolating the MAC CPS from higherlayers. The CS carries out the next tasks:
• Accept packets from higher layer protocols.• Classify the higher layer packets determining the connection to be used to transmit them.• Process the packets if required depending on the classification (e.g. apply PHS).• Deliver and receive the CS protocol data units (PDUs) to/from the MAC CPS.
Depending on the higher layer, these tasks are performed in different ways. Three differentCS specifications are defined in the standard: ATM CS, packet CS, and the Generic Packet CS.Only the packet CS is described as mandatory by the WiMAX Forum.
2.3.4.1 Packet CS
The packet CS provides a interface between the MAC CPS and packet based protocols, suchas IP or Ethernet. The input service data units (SDUs) are processed if PHS or ROHC areactivated, in other case, the generated PDUs are equal to the SDUs.
The most important function of the CS is the classification of the higher layer packets.This task is carried out by applying the classification rules defined in the service flows. Theseclassification rules define the criteria by which a SDU should be accepted by a connection. Theused criteria can be the source or destination IP addresses, as well as the port number, or anyother IP header fields. If several connections accept a SDU, it will be assigned to the higherpriority connection, while if the packet does not match any classification rule, it should bediscarded. The result of the classification process is the CS PDU and the corresponding CID.
When a classification rule is selected, PHS or ROHC can be enabled for that rule. In thiscase, the SDU will be processed using the associated mechanism to generate the resulting PDU.
2.3.5 Security Sublayer
The security sublayer provides authentication and privacy to the SS in the network. To fulfillthe security needs, two protocols are defined: a key management protocol and an encapsulationprotocol.
23

2. OFDMA based PHY and MAC Layers – Mobile WiMAX
2.3.5.1 PKM Protocol
The key management protocol used in the standard is privacy key management (PKM)version 2. The PKM protocol carries out the secure distribution of the keying data to theSS and authentication tasks. The standard allows for using the Extensible AuthenticationProtocol (EAP) authentication protocol, defining messages to carry EAP payloads, butwithout specifying a particular variant of EAP and letting higher layer processes to definethe requirements of this implementation. Once the authentication process is finished, theMAC layer receives as a result an authentication key shared between base station and thesubscriber station, which is used to generate keying material. The PKM protocol also specifiesmanagement messages to define security associations and to distribute traffic keys.
2.3.5.2 Encapsulation Protocol
The encapsulation protocol specifies the rules to encrypt and authenticate the MPDUs usinga set of cryptographic suites. WiMAX Forum selects advanced encryption standard (AES) inCCM mode and cipher-based message authentication code (CMAC) as the required algorithms.
In order to authenticate management messages, CMAC tuples generated with the AESalgorithm can be appended to them, although payloads are always transmitted as clear text.In the case of MPDUs transmitted over traffic connections with a security association enabled,their payloads are ciphered with AES in CCM mode. In this mode two fields are appended tothe encrypted payload: a PN value which is unique for each packet to avoid replay attacks, andan authentication code.
This encapsulation protocol does not cipher headers of MPDUs in any case.
2.3.6 Network Entry
A network entry protocol is defined to allow MSs to attach to the base station. This protocolstarts when a MS sends a ranging code in a region specified for this purpose by the base stationin the uplink (see Section 2.2.2). Once the arrival of a sequence of this type is detected, thebase station can estimate synchronization parameters such as time, frequency or power offset,and send them back to the transmitting MS to improve synchronization. This process can berepeated until the base station considers the synchronization parameters are within acceptablethresholds, and finally a pair of CIDs for the basic and primary management connections areassigned. From this point, both stations can exchange management messages using these CIDs,and to check if some message is lost in this stage, a set of timers is defined.
These timers define a maximum waiting time and a number of retries to restart the networkentry protocol if necessary, until a successful connection is established. This stage performs theexchange of capabilities of both stations, as well as the authentication and registration steps.Optionally, provisioned service flows can be defined at the end of this protocol.
24

2.4. WirelessMAN-Advanced Air Interface
2.4 WirelessMAN-Advanced Air Interface
The IEEE 802.16m standard introduces a completely new definition of MAC and PHY knownas Advanced Air Interface (AAI). The configurability of the parameters is reduced to a largeextent, but additional features such as multiple-input-multiple-output (MIMO) and HARQ arenow mandatory to accomplish the minimum requirements of the standard, and also backwardcompatibility is mandatory. For a more detailed description see [AHM10].
A new profile with a channel bandwidth of 20 MHz and 2048 subcarriers is added while the3.5 MHz profile is discarded. The new frame structure is divided into superframes of 20 ms.Each superframe is made up of four 5 ms frames. The main difference with the old framestructure is the way the frames are subdivided into subframes to increase the flexibility of theallocation of downlink and uplink zones. Each subframe can be dynamically configured fordownlink or uplink transmission.
The synchronization mechanisms have been improved by defining two new preambles: thePA-preamble, with a fixed number of pilot subcarriers regardless the FFT size to be used by theadvanced base station (ABS), and the SA-preamble, with a structure and purpose similar to thepreamble of the previous release. Also, new ranging preambles are added with extended lengthand reduced subcarrier spacing for the initial ranging and handover mechanisms.
The new subchannelization scheme is designed to simplify the channel estimation and toreduce the signaling overhead required for the burst placement, and it only depends on theMIMO scheme at use. The AAI defines new MIMO configurations to support Single UserMIMO (SU-MIMO) and Multiple User MIMO (MU-MIMO) schemes, both with adaptive andnon-adaptive precoding. The WiMAX Forum defines the minimum number of ABS antennasas two, while the advanced mobile station (AMS) can operate with only one antenna.
Channel coding in 802.16m only uses two FEC schemes. On the one hand, CTC is theencoder defined to transmit the data bursts. On the other hand, a TBCC encoder with rate 1/5 isused to encode the control information.
2.5 Conclusions
This chapter describes how OFDMA-based communications systems work. The MobileWiMAX standard is considered as an example to describe the mechanisms used in the PHYand MAC layers to share radio resources efficiently among different users. The evolution ofthe different ammendments of the standard is shown as well as a detailed description of themandatory features of the PHY and MAC layers, which are specified by the WiMAX Forum.Finally, the changes and enhancements introduced in 802.16m AAI are summarized.
The PHY layer has a flexible OFDMA TDD frame structure where only the preamble andthe FCH and DL-MAP bursts have fixed positions in it. Different OFDMA symbol structurescan be configured in the frame, assigning a contiguous or distributed set of subcarriers for each
25

2. OFDMA based PHY and MAC Layers – Mobile WiMAX
user. However, only the DL and UL PUSC symbol structures are mandatory. The DL-MAPand UL-MAP management messages specify the symbol structures used in the DL and ULsubframes as well as the configuration of each burst: position, size, modulation and coding, thedestination connections, etc.
Rectangular regions in the UL subframes can be reserved for the contention-basedtransmission of ranging codes from the MSs. These codes are sent by the MSs to synchronizein time and frequency with the BS during initial, periodic or handover ranging. This contentionmechanism can also be used by the MSs to send bandwidth request ranging codes to obtaintransmission opportunities.
The MAC layer is connection-oriented and made up of three sublayers: the CS, the CPSand the security sublayer. The CS processes and maps upper layer packets (such as IP orEthernet) into MSDUs. These MSDUs are processed by the CPS to generate MPDUs using thefragmentation and packing mechanisms. The PHY layer bursts are filled with these MPDUs.An ARQ protocol is also defined in the MAC layer and can be enabled for each transportconnection.
Regarding QoS, the MAC defines several parameters for each service class that are used bythe scheduler to assign resources to the SSs and to prioritize the packets of each connection. Thescheduling is centralized in the BS, as it determines the resources granted to each SS. However,the SS scheduler still selects what connections are served in each transmission opportunity.
26
Chapter III
Real-Time Implementation of TDD MobileWiMAX
This chapter shows the design and real-time implementation of base station (BS) and mobilestation (MS) transceivers compliant with the Mobile WiMAX standard. Both mobile and basestations include transmission and reception chains to enable real-time concurrent downlink (DL)and uplink (UL) communications. This chapter also addresses the verification and validation ofthe proposed implementation based on the reference scenarios defined by the WiMAX Forum,i.e., the ITU Radiocommunication Sector (ITU-R) M.1225 channel models [ITU97; WIM05].
The time-division duplexing (TDD) version of the orthogonal frequency-division multipleaccess (OFDMA) physical (PHY) and medium access control (MAC) layers are implementedusing an software-defined radio (SDR) architecture. The implementation is limited to themandatory elements of the standard, supporting the following features:
• PHY layer:– Five profiles defined by the WiMAX Forum: 3.5 MHz, 5 MHz, 7.5 MHz, 8.75 MHz,
or 10 MHz.– TDD frame structure with fixed number of OFDMA symbols in DL and UL.– PUSC permutation zone in DL and UL.– Modulation and coding using tail-biting convolutional code (TBCC): QPSK 1/2,
QPSK 3/4, 16-QAM 1/2, 16-QAM 3/4, 64-QAM 1/2, 64-QAM 2/3, and 64-QAM3/4.
• MAC layer:– Convergence sublayer (CS): Packet classification and payload header suppression
(PHS).– Common part sublayer (CPS):
* Management and transport connections.
* Support for automatic repeat request (ARQ).
* QoS scheduler and burst mapper.– Security sublayer: Key management, authentication and encryption algorithms.
27

3. Real-Time Implementation of TDD Mobile WiMAX
This chapter is mainly based on the following co-authored publications:• Pedro Suárez-Casal, Ángel Carro-Lagoa, José A. García-Naya, and Luis Castedo. “A
Multicore SDR Architecture for Reconfigurable WiMAX Downlink”. Proc. of 13thEuromicro Conference on Digital System Design: Architectures, Methods and Tools(DSD), 2010. 2010, pp. 801–804.DOI: 10.1109/DSD.2010.108
• Ángel Carro-Lagoa, Pedro Suárez-Casal, José A. García-Naya, Paula Fraga-Lamas, LuisCastedo, and Antonio Morales-Méndez. “Design and implementation of an OFDMA-TDD physical layer for WiMAX applications”. EURASIP Journal on WirelessCommunications and Networking, vol. 2013, no. 1, 2013, p. 243. ISSN: 1687-1499.DOI: 10.1186/1687-1499-2013-243
• Pedro Suárez-Casal, Ángel Carro-Lagoa, José A. García-Naya, Paula Fraga-Lamas, LuisCastedo, and Antonio Morales-Méndez. “A real-time implementation of the MobileWiMAX ARQ and physical layer”. Journal of Signal Processing Systems, vol. 78,no. 3, 2015, pp. 283–297. ISSN: 1939-8115.DOI: 10.1007/s11265-014-0890-3
• Antonio J. Rodríguez, Roland Pastorino, Ángel Carro-Lagoa, Karl Janssens, and MiguelÁ. Naya. “Hardware acceleration of multibody simulations for real-time embeddedapplications”. Multibody System Dynamics, 2020, pp. 1–19.DOI: 10.1007/s11044-020-09738-w
The structure of the chapter is as follows. Section 3.1 reviews other 802.16 publishedimplementations. Section 3.2 describes the proposed SDR architecture and the useddevelopment methodology. The PHY and MAC implementations are described in Section 3.3and Section 3.4, respectively. Section 3.5 presents the amount of field programmable gatearray (FPGA) and digital signal processor (DSP) resources consumed by the implementationwhile Section 3.6 is devoted to its experimental evaluation over ITU-R wireless channel models.Section 3.7 explains how the proposed hardware architecture can be extended to implement thePHY and MAC of the WirelessMAN-Advanced Air Interface. Finally, Section 3.8 presents theconcluding remarks.
3.1 State of the Art
The experimental validation of prototype baseband systems employing real-time hardwaredemonstrators confronts several challenges such as enormous design complexity, longdevelopment time, high costs and manpower, or dealing with insuperable hardware issues.
Few works exist in the literature that address the complete and real-time implementation ofOFDMA-TDD mobile communication PHY and MAC. Existing works focus on performanceanalysis such as path-loss measurements using Fixed WiMAX commercial equipment in ruralenvironments [ISC07], tests in outdoor scenarios employing commercial Mobile WiMAX
28

3.1. State of the Art
equipment [ZTN08], or evaluations of the IEEE 802.16e OFDMA downlink in vehicularenvironments (ITU-R M.1225) [COL+10]. In this context, references considering simulations[MR10], non-real-time deployments [HU+07; MCR08], and Fixed WiMAX implementations[LB08] were found. However, none of the aforementioned approaches accounts for softwareconstraints or hardware limitations.
Some works consider the real-time implementation of the OFDMA-TDD PHY used inMobile WiMAX but most of them only consider simplex communications, either downlink[FON+11; CLC07] or uplink [WU+09]. Only two papers were found which consider abidirectional OFDMA-TDD PHY: an implementation of 802.16e-2005 carried out in a System-on-Chip (SoC) platform [WU+10], and a SoC baseband implementation integrated in a USBdevice for high mobility scenarios [CHU+11].
Studies that incorporate MAC layer functionalities provide a more realistic evaluationof the actual performance of a wireless communication system, especially when measuringmeaningful metrics such as throughput. A detailed description of the WiMAX ARQ mechanismand a performance analysis using a simulated environment can be found in [SAY+07].Theoretical analysis of the throughput achievable at MAC level taking into account somefeatures of the WiMAX physical layer can be found in [PAR+10]. Some works devoted tostudy the effect of particular parameters of the WiMAX ARQ or hybrid automatic repeat request(HARQ) mechanisms in order to improve specific metrics are [ARH09; LP09; HEM+08].These references usually rely on simulations of the physical layer using simplified channelmodels, thus the behavior of the systems cannot be reliably outlined under more realisticconditions. Implementations of full-featured MAC layers using network processors with adetailed design description and resource utilization can also be found [WWX08].
It is possible to find implementations of individual processing blocks of the standard but notintegrated in a complete system. As an example, the design of a channel encoder prototypedin a reconfigurable hardware architecture is presented in [CKH11]. Another example is anFPGA architecture of a fixed sphere decoder for a WiMAX system presented in [KAH09].There are some implementations that aim to support two standards by extracting commonsignal processing between them and sharing hardware resources, such as the study of a dual-mode baseband receiver for 802.11n and 802.16e [HCC09], and a 802.16m and LTE downlinkimplementation [HSU+11].
The work presented in this chapter differs from existing ones in the literature because itpresents a hardware architecture for the implementation of both the downlink and the uplinkof OFDMA-TDD PHY and MAC for WiMAX applications. We discuss a large number ofpractical issues and show how they can be solved to fit into the proposed hardware architecture.Although most of the work focuses on Mobile WiMAX, we also explain how the proposedarchitecture can be used to implement the WirelessMAN-Advanced Air Interface.
29

3. Real-Time Implementation of TDD Mobile WiMAX
3.2 System Architecture Design
The complexity and different functionalities present in a WiMAX transceiver pose severaltechnical design challenges. Thus, it is more appropriate to implement the transceiver on amulticore SDR hardware architecture where each core is adapted to a specific functionality.This approach is much more energy efficient than attempting to implement the whole systemon a single very flexible core [PAL+10], although there are several SDR implementations thatrely only on a general purpose processor (GPP) such as the OpenLTE implementation basedon an Intel Core i7 processor. The PHY layer implementation requires high computing powerfor the signal processing tasks which is provided by the FPGAs present in the architecture.The WiMAX standard also requires the implementation of other management tasks that are notso compute intensive but they need to be highly reconfigurable or flexible. In these cases, asoftware implementation in a GPP or DSP is more appropriate and will ease the developmentprocess.
The architecture where the transceivers are implemented follows the SDR principles[MIT92] and it is based on the “task” concept. In this case, a task is a set of operations thatcorresponds to a logical block of the system (e.g. I/Q modulation, synchronization, fast Fouriertransform (FFT), etc.) which can be executed in different type of processors. The system isbuilt connecting different tasks in a proper way. The key concept here is the reconfigurability ofthe tasks constituting the system and how to achieve the required flexibility without losingperformance. Reconfigurability denotes the capability of a system to modify its behavioraccording to configuration parameters.
The architecture has to be flexible in order to support both processing operations and high-level control logic required by the distinct elements of the software design. The kernel of thearchitecture is constituted by the DSP. It is responsible of executing the higher-level tasks,which requires the highest degree of freedom and the most complex operations, as well ascontrolling the executions of the remaining elements of the system (mainly the tasks running atdifferent FPGAs). Note that if the architecture does not have a DSP, it is possible to replace itby embedding a processor in the FPGA logic. In fact, there are several FPGAs available in themarket that embed a physical processor core in the FPGA chip.
The FPGAs provide much higher processing power than the DSPs. The main drawback,among the disadvantages of FPGAs, is the implementation difficulty of the dynamic tasksthat require real-time reconfigurability capabilities. Due to the above reason, it is morerecommendable to view the FPGAs as coprocessors of the DSPs. Therefore, those tasksdemanding high processing power (i.e. FFT, pulse-shape filtering, synchronization, etc.)are placed on different FPGAs, while the control logic is carried out by the DSP tasks.Unfortunately, these time-consuming tasks also have to be reconfigurable, making impossibleto delegate all reconfigurability logic to the DSP.
The remaining of this section explains the development methodology used in the design and
30

3.2. System Architecture Design
implementation of the system (Sections 3.2.1 and 3.2.2), and the final SDR architecture of thesystem (Sections 3.2.3 and 3.2.4).
3.2.1 Development Methodology
The use of an appropriate development methodology is essential for a successful systemimplementation. A good methodology should be able to anticipate possible problems at anearly stage. However, this system is composed of two layers with significant differences inits processing requirements and flexibility. On the one hand, the implementation of the MAClayer is purely a software development. On the other hand, the PHY layer is mostly constitutedas signal processing tasks requiring specialized hardware. These differences force the use ofdifferent methodologies for each layer. For the MAC layer traditional software developmentmethodologies can be used while for the PHY layer it is necessary to define a methodologyadapted to its needs.
The MAC layer cannot be implemented independently of the rest of the system since it isstrongly coupled to it, as it must communicate with the tasks of the PHY layer and control itsoperation. For this reason it is necessary to have a software development environment where it ispossible to simulate the operation of the MAC layer in conjunction with the rest of the system, sothat it is as similar as possible to the final execution environment. For this reason, a developmentenvironment has been implemented for the MAC layer that simulates the functionalities of thehardware environment libraries and allows the simulation and debugging of the system in asimpler way in a conventional PC. This simulation environment allows us to perform tests in asimpler and faster way than performing tests on the real hardware, which require a long setupprocess.
The general methodology followed for the development of the physical layer is divided intothe following phases:
1. Theoretical model: division of the system into blocks/tasks specifying its inputs andoutputs.
2. Implementation of reference software.• Testing of blocks in simulation.• Fixed point analysis.• Foreseeing implementation problems.
3. Design of real-time system architecture.4. Implementation of real-time tasks.5. Integration and testing.
The purpose of this methodology is to anticipate the problems of the advanced phases ofsystem implementation that could force the repetition of previous phases. For this reason, areference implementation is created in which the algorithms to be implemented in the finalphases are studied. This methodology is appropriate for physical layer signal processing tasks.
31

3. Real-Time Implementation of TDD Mobile WiMAX
Data Bus FIFO inData
ProcessFIFO out Data Bus
ControlBus
Conf.registers
ControlBus
Figure 3.1: Task template for FPGA.
However, the implementation of the MAC layer is strictly a software development process andthis methodology is not appropriate.
Special care must be taken in the system architecture definition phase (step 3). In this phase,the SDR hardware structure of the system is decided, as well as the flexibility of each task andhow they are mapped to the different modules. In general, the following guidelines should befollowed:
• Identify the time-consuming tasks that will be placed on FPGAs. A good design shouldminimize the number of these tasks.
• Identify the higher level tasks with complex control logic that should be placed on DSPs.• Decouple the tasks and define the communication protocols between them. An
appropriate definition of the tasks yields to the minimization of the dependencies amongthem.
• Minimize the degree of reconfigurability present on the FPGA tasks.The obtained task structure is used for the definition of the hardware architecture. The
architecture must be adapted to the processing and communications needs of each task. Thanksto the flexible SDR architecture, each task can be placed on a DSP or on an FPGA according toits performance requirements.
In the implementation phase it is very useful to use a template for FPGA tasks. This templatedefines the task structure and simplifies the implementation and communication protocols. Thefollowing subsection explains this task template.
3.2.2 Development of FPGA Tasks
To simplify the implementation of the tasks in the FPGA, the task template shown in Fig. 3.1 isused. This template defines the structure of a task, which is constituted by two different paths:one for the data —including the processing steps— and another for the configuration.
The data path has an input first-in-first-out (FIFO) queue followed by the processing blockand, finally, an output FIFO queue. The input queue interacts with the data bus, signaling whenit can receive more data from the bus. The output queue checks whether the data bus is readybefore sending the data. If the output data bus is blocked for a long time, the output queue willfill up quickly. For this reason, the output queue will notify the input queue to stop sending
32
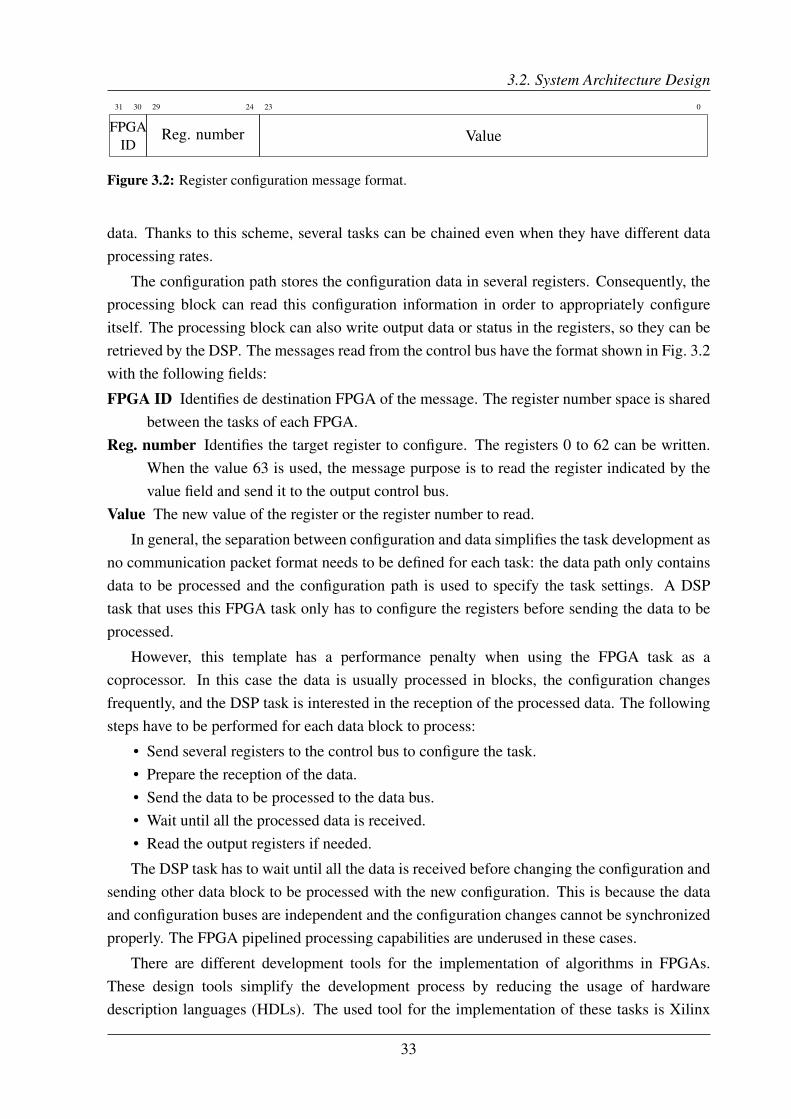
3.2. System Architecture Design
31 30 29 24 23 0
FPGAID
Reg. number Value
Figure 3.2: Register configuration message format.
data. Thanks to this scheme, several tasks can be chained even when they have different dataprocessing rates.
The configuration path stores the configuration data in several registers. Consequently, theprocessing block can read this configuration information in order to appropriately configureitself. The processing block can also write output data or status in the registers, so they can beretrieved by the DSP. The messages read from the control bus have the format shown in Fig. 3.2with the following fields:
FPGA ID Identifies de destination FPGA of the message. The register number space is sharedbetween the tasks of each FPGA.
Reg. number Identifies the target register to configure. The registers 0 to 62 can be written.When the value 63 is used, the message purpose is to read the register indicated by thevalue field and send it to the output control bus.
Value The new value of the register or the register number to read.
In general, the separation between configuration and data simplifies the task development asno communication packet format needs to be defined for each task: the data path only containsdata to be processed and the configuration path is used to specify the task settings. A DSPtask that uses this FPGA task only has to configure the registers before sending the data to beprocessed.
However, this template has a performance penalty when using the FPGA task as acoprocessor. In this case the data is usually processed in blocks, the configuration changesfrequently, and the DSP task is interested in the reception of the processed data. The followingsteps have to be performed for each data block to process:
• Send several registers to the control bus to configure the task.• Prepare the reception of the data.• Send the data to be processed to the data bus.• Wait until all the processed data is received.• Read the output registers if needed.
The DSP task has to wait until all the data is received before changing the configuration andsending other data block to be processed with the new configuration. This is because the dataand configuration buses are independent and the configuration changes cannot be synchronizedproperly. The FPGA pipelined processing capabilities are underused in these cases.
There are different development tools for the implementation of algorithms in FPGAs.These design tools simplify the development process by reducing the usage of hardwaredescription languages (HDLs). The used tool for the implementation of these tasks is Xilinx
33

3. Real-Time Implementation of TDD Mobile WiMAX
Module 1 Module 2 Module 4
PC
I B
US
(H
ost c
onne
ctio
n)
1 MBSRAM
CONTROL BUS (configuration and control data – 20 MB/s)
HOSTCOMM
OUT
TIM CONNECTOR
TIM CONNECTOR
DA
TA
BU
S
FPGA Xilinx
Virtex 4 FF668XC4VSX35
8 MBZBTRAM
8 MBZBTRAM
Xilinx Coolrunner II
CPLD
XC2C128VQ100 on
DA
TA
BU
S
DA
TA
BU
SD
AT
A B
US
SLB
CDCM7005
ADS5500
ADS5500
DAC5686
A1 A2 D2D1
IN
Module 3
TIM CONNECTOR
TIM CONNECTOR
DA
TA
BU
S
FPGA Xilinx
Virtex 4 FF1148XC4VSX55
DA
TA
BU
S
SLB
Xilinx Coolrunner II
CPLD
XC2C128VQ100 on
TIM CONNECTOR
TIM CONNECTOR
DA
TA
BU
S
DA
TA
BU
S
DSPTMS320C6416
@ 600 Mhz
ZBTRAM133MHz
1 MB
TIM CONNECTOR
TIM CONNECTOR
DA
TA
BU
S
DA
TA
BU
S
FPGA Xilinx
Virtex II FF896XC2V2000
DSPTMS320C6416
@ 600 Mhz
ZBTRAM133MHz
1 MB
Data connectors (400 MB/s)
4 MBQDR2SRAM
4 MBQDR2SRAM
4 MBQDR2SRAM
4 MBQDR2SRAM
Figure 3.3: Hardware configuration of a station.
System Generator for DSP [XILd]. This tool is specialized in the implementation of signalprocessing algorithms. It is integrated in the Mathworks Simulink [MAT] software withspecial blocks that are directly mapped in the FPGA hardware. This integration simplifies thesimulation and testing of the designs.
There are other higher level development tools for FPGA design known as high-levelsynthesis (HLS) tools. These tools allow for implementing the algorithms using high-levelprogramming languages such as C/C++ or SystemC. They are able to convert the source code toa low-level hardware design (register transfer level) based on finite-state machines that controlthe execution of the data path operations. The hardware design is optimized using directives thatcustomize the resources used for each operation, e.g., a loop can be pipelined so it outputs onevalue for each clock cycle or it can be unrolled, devoting more hardware to execute all the loopoperations at the same time. These HLS tools accelerate the development process, especiallyof algorithms with complex control code such as a linear equation solver [ROD+20]. However,these tools do not allow for easy configuration of low-level implementation details, leading toincreased resource usage. We decided to use System Generator because it is well suited for theimplementation of signal processing algorithms and also allows for a detailed control over thefinal design.
3.2.3 Hardware Platform
In the proposed design for the bidirectional TDD WiMAX transceivers, MS and BS wereimplemented making use of the same type of hardware elements based on commercial off-the-shelf (COTS) components. As shown in Fig. 3.3, each station makes use of severalinterconnected FPGAs and DSPs. These components are provided by four different modulesplaced on a PCI carrier board and communicated by high-speed and low-latency buses.
The first module contains a Texas Instruments TMS320C6416 DSP. The second module
34

3.2. System Architecture Design
contains another identical DSP together with a Xilinx Virtex-II XC2V2000 FPGA. The thirdmodule has a Xilinx Virtex-4 XC4VSX55 FPGA, while the fourth one is equipped with aVirtex-4 XC4VSX35 FPGA together with an analog add-on module containing a dual digital-to-analog converter (DAC) and a pair of analog-to-digital converters (ADCs). The DACs areTexas Instruments DAC5686 [TEXb], with 16 bits of precision and a maximum samplingrate of 160 Msample/s. The ADCs are Texas Instruments ADS5500 [TEXa], with 14 bits ofprecision and maximum sampling rate of 125 Msample/s. Note that both Virtex-4 FPGAsare equipped with a large number of embedded multipliers, hence enabling intensive signalprocessing operations.
Two kind of buses were used for communications between modules: data buses, which canachieve up to 400 MB/s; and control buses with a throughput of 20 MB/s used exclusively forconfiguration messages. Also, the communications between the host PCs and the carrier boardsare done through the PCI bus.
3.2.4 SDR Architecture
The architecture was designed following the guidelines shown in Section 3.2.1. The blockdiagram of the hardware architecture of each station is shown in Fig. 3.4 with the location ofeach system task and the connections between them. The arrow numbers indicate the numberof bits of the communications between tasks, e.g. 16 × 2 represents complex numbers with 16bits precision for each component.
The first DSP is devoted to the implementation of the MAC layer. The MAC CS andCPS are implemented in two different tasks. The security sublayer is included in the CPS.Communications between CS and CPS are performed using a custom MAC service accesspoint (SAP) protocol. The CS also interacts with the Host PC to allow for sending and receivingIP packets.
The PHY layer uses the remaining modules of the system. The PHY Control task is placedin the second DSP and is the central component of the PHY layer. The remaining PHY tasks areconfigured and controlled by this central block, which uses the Virtex II FPGA as a coprocessorto perform the forward error correction (FEC) processing. Also, the communications with theMAC CPS are performed using a PHY SAP protocol.
All the FPGA tasks of the system are used in the PHY layer to perform the low-level andcompute-intensive processing. The subchannelization tasks (DL/UL PUSC) are placed in theDSP because the flexibility needed for them and they do not require too much processing power.However, the other tasks implemented in the DSP (equalization and ranging) require higherprocessing resources and are hard to implement on an FPGA because they need to supportthe different frame structures and configurations. In this case, the decision was to develop anoptimized implementation of these tasks on the DSP.
The two FPGA-only modules contain the orthogonal frequency-division multiplexing
35

3. Real-Time Implementation of TDD Mobile WiMAX
Base Station
DSP TI C6416
MACCPS
MACCS
DSP TI C6416
Ranging
PHYControl
DL PUSC
UL PUSC&
equalization
Virtex II V2000
TBCCencoder
TBCCdecoder
16×2
Virtex 4 SX55
FFT &CP removal
IFFT &CP insertion
16×2
16×2
Virtex 4 SX35
FrameControl
DUC
DDC
16×2
15×2
Mobile Station
DSP TI C6416
MACCPS
MACCS
Virtex II V2000
TBCCencoder
TBCCdecoder
DSP TI C6416
PHYControl
UL PUSC
DL PUSC&
equalization
16×2
Virtex 4 SX55
FFT &CP removal
IFFT &prefix/postfix
insertion
16×2
16×2
Virtex 4 SX35
DUC
DDC
Synchro&
FrameControl
DAC
ADC
DAC
ADC
16×2
16×2
16
14
16
14
Figure 3.4: Global architecture of the base (top) and mobile (bottom) stations including both the uplinkand the downlink building blocks.
(OFDM) signal processing tasks for the downlink and uplink. They communicate with thePUSC tasks and perform the remaining processing of the physical layer, first performing thefrequency processing tasks (FFT/IFFT), and then performing the signal processing in time.
3.3 Mobile WiMAX Physical Layer Implementation
This section describes the design and implementation of an OFDMA-TDD PHY compliantwith the Mobile WiMAX standard. This implementation is focused on the mandatory partsof the standard for both the BS and the MS, i.e. OFDMA frame structure, partial usageof subchannels (PUSC) permutation scheme in downlink and uplink subframes, ranging, andchannel coding with TBCC.
In the block division of the physical layer shown in Fig. 3.4, the central node of allprocessing is the DSP that uses the blocks located in the FPGAs as coprocessors to performthe most computationally intensive tasks. This allows for high-level logic to be located in theDSP favoring system versatility and reconfigurability.
Most of the signal processing calculations performed in the DSP tasks are done in fixed-point with 16 bits of precision. This is because the architecture of the DSPs is optimized for
36

3.3. Mobile WiMAX Physical Layer Implementation
this precision. However, more bits are used in some intermediate calculations which requiremore precision. In the FPGA tasks, the used bit width can be configured as needed in eachcalculation but it is also common to use 16 bits of precision in these tasks.
3.3.1 Digital Up/Down Conversion
The digital up-converter (DUC) and digital down-converter (DDC) blocks are responsible foradapting the signal to the ADCs and DACs sampling rate and I/Q modulation/demodulation.During upconversion the following tasks are done: upsampling, filtering, and I/Q modulationto a configurable intermediate frequency. The downconverter performs the complementaryoperations in inverse order, i.e. I/Q demodulation, filtering, and downsampling.
The chosen profiles selected by the WiMAX Forum are supported by means of five differentbit streams to the FPGAs, each one with a different up/downsampling factor. Since theconverters sampling frequency is fixed at 80 MHz, the up/downsampling factors for each profileare 20, 100/7, 10, 8, and 50/7 for profiles #1 to #5, respectively (see Table 2.1 in Section 2.2).In order to efficiently implement these sample-rate conversions, each FPGA bit stream has adifferent optimized combination of interpolation/decimation filters.
The different filter banks explained in [SUÁ+10] could be used for these task so the usedprofile could be changed in real-time without the need to update the FPGA bitstream. However,that implementation uses more FPGA resources and provides lower signal quality than using anoptimized filter for a given bandwidth. In the MS transceiver this task has to share the FPGAresources with the synchronization task, forcing the use of the optimized non-reconfigurabledesign.
The add-on module containing the digital converters has a 80 MHz clock used for settingthe sample rate of the converters. This clock is used in the DUC and DDC tasks to correctlycommunicate with the converters. Thanks to the used task template described in Section 3.2.2,the last FIFO queue of the DUC regulates the processing speed of the transmission chain toensure the required data output rate.
Also, the add-on module can be configured to use an external clock source. This allowsfor performing tests sharing the same clock source for both stations, increasing the obtainedsignal quality. Also, an alternative up/downsampling factors could be used by changing theclock frequency. As an example, with a 89.6 MHz clock, the profiles #1 and #4 can be obtainedusing 16 and 8 up/downsampling factors, respectively.
Only one configuration register is used by these blocks when using one bitstream for eachprofile:
fc (UFix_24_19) Intermediate transmission frequency in MHz.
37

3. Real-Time Implementation of TDD Mobile WiMAX
3.3.2 Frame Control and Downlink Synchronization
The frame control tasks coordinate the transmission and reception of downlink and uplinksignals following the standard TDD frame structure. In the BS, this task is in charge of sendingthe downlink subframe every 5 ms and starting the reception of the uplink subframe after thetransmit/receive transition gap (TTG). In the MS this task is integrated with the downlinksynchronization, which notifies when downlink subframes are detected, so that uplink subframecan be sent at the correct time.
The downlink synchronization task performs frame detection and frequency offsetestimation at the MS. This task takes advantage of the correlation properties exhibited by thepreamble defined in the standard as well as those found in OFDM symbols when the cyclicprefix is included. These properties enable the calculation of the subframe start time andthe received signal carrier frequency offset (CFO). Also, a cross-correlation with a quantizedportion of the preamble is used to enhance the subframe detection. A more detailed descriptioncan be found in [CAR+13b].
The general structure of the frame control and downlink synchronization task is shownin Fig. 3.5. Since ADCs are not equipped with a programmable gain amplifier (PGA),normalization of the received signal is performed after the DDC stage. This is done by firstobtaining the average power of the received signal and then calculating a constant scalingfactor that is applied during the whole downlink subframe. This normalization strategy hasbeen selected because it provides a good compromise between clipping and quantization errors.The subframe start time is also notified to the UL transmission control block. This blockschedules the emission of the uplink subframe taking into account the subframe size, the TTGand receive/transmit transition gap (RTG) guard intervals, and the offset set by the BS in theranging process.
These blocks use several configuration registers:
CP_size (UFix_2_0) Selects the cyclic prefix used.Nfft (UFix_1_0) Selects the FFT size used.OFDM_symbols_DL (UFix_16_0) The number of OFDM symbols in the downlink subframe.OFDM_symbols_UL (UFix_16_0) The number of OFDM symbols in the uplink subframe.TTG (UFix_16_0) The length of the TTG.RTG (UFix_16_0) The length of the RTG.synch_threshold (UFix_16_16) The synchronization threshold to detect the subframe start.
Finally, two output registers are also provided by the synchronization task with the energyestimations during the downlink and the RTG guard interval. These registers are read by PHYControl task to estimate the signal-to-noise ratio (SNR).
38

3.3. Mobile WiMAX Physical Layer Implementation
Downlink
FromDDC
Subframenormalization
&CFO correction
Normalization
ToCP removal
Synchronization
scalingfactor
subframestart
CFO
Uplink
ToDUC
UL TxControl
FromPre/post-fix
insertion
subframestart
Figure 3.5: Frame detection and synchronization subsystem implemented in the MS.
3.3.3 Ranging and Uplink Synchronization
Physical layers based on OFDMA require that uplink frames arrive at the BS at the same timeand with a significant accuracy. This can only be achieved if all users are synchronized withthe BS before the communication takes place. WiMAX standard states that the round-trip delaybetween the MS and the BS must be known beforehand by the MS. This is possible thanks tothe so-called ranging step.
As already explained in Section 2.2.2, MSs generate pseudo-noise sequences from a shiftregister that are transmitted in specific regions of the uplink subframe. Such regions have tobe reserved by the BS in a contention-based policy. At the receiver side (in the uplink), theBS detects the arrival of a ranging code and then it estimates the synchronization parameters.Finally, the MS adjusts its synchronization parameters from the base-station estimates sent backto the MS in a MAC management message.
During the initial ranging, OFDM symbols containing ranging codes are transmitted by theMS in pairs, the first one with a cyclic prefix, while the second one also adds a cyclic postfix,hence allowing for a wider time-synchronization margin. In this implementation, the mobilestation has a special cyclic prefix and postfix insertion block to accomplish this requirement.This block receives the pattern of the prefixes and postfixes for the uplink subframe in aconfiguration register.
Code detection and time-offset estimation at the BS takes place at the frequency domainover each received OFDM symbol. Let X(k) represent the 144 BPSK received symbols in aranging subchannel of a single OFDM symbol. An energy threshold is first applied to them toavoid further processing [MAO06]. When the energy threshold is reached, a cross-correlation
39

3. Real-Time Implementation of TDD Mobile WiMAX
of the received symbols, X(k), with all possible ranging codes, pc(k), is used to determine theranging code index c. If we denote tc(k) = X(k)pc(k) the product of the received symbolstimes the c-th ranging code, we can write the lag-one autocorrelation of tc(k) for groups of fourconsecutive subcarriers as follows [ALT06]
R(c) =T−1∑n=0
2∑m=0
tc(l)t∗c(l + 1), l = 4n+m,
where ∗ denotes the complex conjugate and T is the number of tiles of a ranging code1 . Ifwe assume that the channel coefficients are similar in adjacent subcarriers, the effect of thechannel is cancelled in R(c) and only the residual time offset remains. This way, we can defineestimators for the ranging code and the time-offset of the uplink signal as follows
c = argmaxc
{R(c)},
φRNG = angle(R(c)).
Several uplink frequency-offset estimation algorithms can be found in the literature. Thesealgorithms can be divided in three groups, from lower to higher computational complexity:subband, interleaved, and generalized allocation of subcarriers. Ranging in Mobile WiMAX isan example of generalized allocation where the subcarriers reserved to the ranging process cantake up any position in the available spectrum. The algorithms defined for this kind of structuresare based on a Joint Maximum Likelihood (JML) estimation of the channel response and thefrequency offset, but with a very high complexity [MKP07].
The uplink synchronization algorithms selected for this design avoid the complexity of JMLalgorithms by exploiting the redundancy present in the ranging codes. Once the ranging code isknown, frequency-offset can be extracted through reconstruction of the transmitted signal sentby the mobile station. To do so, the received pseudo-noise sequence is mapped back to theOFDM symbol. Since the initial ranging forces mobile stations to transmit the same rangingcode twice in two consecutive symbols, this property can be used to extract the frequency offsetthrough a correlation computation.
All these operations involve a considerable computational load. However, the processingrequirements are reduced considering that the base station has a reasonable time to respond toinitial ranging requests, and will not receive such requests in all frames. Furthermore, this taskneeds to be flexible enough to adapt to the different frame configurations it can receive. For thisreason, it has been decided to perform an optimized implementation of this task in the DSP.
3.3.4 Subchannelization and Channel Equalization
Tasks related with the OFDM modulation are placed in the Virtex-4 SX55 FPGA module. Themost important operations are the FFT and IFFT, which have been implemented using the
1Set to 36 in the IEEE Std. 802.16e.
40

3.3. Mobile WiMAX Physical Layer Implementation
Xilinx LogiCORE IP Fast Fourier Transform [XILc], allowing for run-time configuration ofthe transform point size. The IFFT blocks receive a concatenated sequence of all the OFDMsymbol subcarriers (including data, pilots and guards) of each subframe to output the basebandcomplex signal in time. As this OFDM signal has a high peak-to-average power ratio (PAPR),special care must be taken with the signal peaks which should be clipped to avoid overflowsin the fixed point representation. No other PAPR reduction techniques are used in the currentimplementation.
The FFT and IFFT blocks use these configuration registers:
CP_size (UFix_2_0) Selects the cyclic prefix used.Nfft (UFix_1_0) Selects the FFT size used.OFDM_symbols_UL (UFix_16_0) The number of OFDM symbols in the uplink subframe.
Only needed in the MS IFFT block.postfix_mask (UFix_24_0) Defines the OFDM symbols that should be transmitted with cyclic
postfix. Used when sending ranging requests in the MS IFFT block.
Subchannelization is implemented in the DL/UL PUSC tasks in the DSP to provide themaximum flexibility with respect to the different FFT sizes, burst mapping, and eventual supportof other permutation schemes (see Fig. 3.4). Also, an optimized low-complexity equalization isperformed inside the reception tasks in the DSPs.
The subchannelization process involves three steps: interleaving, pilot insertion, andrandomization of subcarriers according to some permutation scheme. The BS specifies thisstructure for each frame using the dedicated downlink map (DL-MAP) and uplink map(UL-MAP) messages. As shown in Section 2.2.1, these messages are always placed in apredefined position in the downlink subframe. Correct decoding of these messages is necessaryso the MS can obtain the different bursts from the downlink and transmit its assigned bursts inthe uplink.
3.3.4.1 Channel Equalization
Channel estimation and equalization is performed by inverting the pilot subcarriers andlinearly interpolating the computed values for the remainder subcarriers. This zero-forcingmethod has been selected because it offers an acceptable performance with a low-complexityimplementation as shown in the literature [YUC+07; PW10; HK09; SHE+10]. The low-complexity of the algorithms is required as the tasks are implemented in the DSPs.
The downlink symbols are equalized independently in the frequency domain. However, theuplink tiles are equalized with a bilinear interpolation algorithm. The UL PUSC tile structureis shown in Fig. 3.6 with the pilots (Pi) and the needed channel estimations in data subcarriers(Hi). The bilinear interpolation is performed by first interpolating in the frequency domain the
41

3. Real-Time Implementation of TDD Mobile WiMAX
P1 H3 P3
H1 H4 H7
H2 H5 H8
P2 H6 P4
time
frequency
data subcarrier
pilot subcarrier
Figure 3.6: UL PUSC tile structure.
first and third symbols,
H1 =2
3P1 +
1
3P2 H2 =
1
3P1 +
2
3P2
H7 =2
3P3 +
1
3P4 H8 =
1
3P3 +
2
3P4
and then averaging the obtained values to obtain the estimation of the second symbol:
H3 =P1 + P3
2H4 =
H1 +H7
2H5 =
H2 +H8
2H6 =
P2 + P4
2
The final step involves correcting the data subcarriers multiplying them by the inverse of thechannel estimation in each position. To reduce the expensive division operations in the DSP,the Pi values are first inverted so there is no need to perform an inversion of each Hi value. Thissimplification slightly deteriorates the equalization precision.
3.3.5 Channel Coding
As shown in Fig. 2.1, the channel coding blocks in transmission are: randomizer, FEC encoder,interleaver, repetition coder (optional) and modulation (symbol mapper). The decoding stepsare: repetition decoder (averages the received symbols), soft-decisor (symbols to soft-bits),deinterleaver, FEC decoder and randomizer.
These operations are mainly implemented in a Virtex II FPGA (see Fig. 3.4), although theoptional repetition coding step performed over the constellation-mapped data and the processingcontrol are both carried out in the DSP, using the FPGA as a coprocessor.
The proposed design supports a variable-rate TBCC coding scheme with constellation sizesvarying from QPSK to 64-QAM, both in the downlink and the uplink. The implementation isbased on the convolutional encoder [XILa] and Viterbi decoder [XILb] Xilinx IP cores.
42

3.3. Mobile WiMAX Physical Layer Implementation
There are several techniques to design TBCC using standard convolutional encoders andViterbi decoders [CS94]. The chosen technique offers a good trade-off between computationalcomplexity and performance. The encoder is implemented adding a cyclic prefix to each FECblock with a size equal to the constraint length (in the case of WiMAX, such a value is set to 7).On the other hand, the decoder concatenates the first bits of the block at the end, and vice versa,hence removing the additional bits from the decoder output.
The size of the chunks added at the beginning and at the end of the blocks is equal to thetraceback length of the Viterbi decoder. If a block is shorter than the traceback length, it is justsent three times to the decoder and only the output corresponding to the second repetition isconsidered.
The soft-decisor obtains the soft-bits from the constellation symbols. These soft-bitstogether with the puncture pattern are the input to the Viterbi decoder. The soft-decisor usesthe simplified demapper described in [TB02] allowing us to implement the operation with lowFPGA resources. The obtained soft-bits have a width of 3 bits which are enough to obtain goodresults. Increasing the soft-bits width has minimal impact on bit error ratio (BER) performancebut results in a significant increase in resource usage [XILb].
These tasks use the following configuration registers:modulation (UFix_2_0) Selects the modulation: 4-QAM, 16-QAM or 64-QAM.rate (UFix_2_0) Selects the coding rate: 1/2, 2/3 or 3/4.burst_slots (UFix_16_0) The number of slots in the burst.seed (UFix_15_0) The seed to initialize the pseudorandom binary sequence (PRBS) generator
used in the data randomization block.Additionally, the decoder computes the error vector magnitude (EVM) of the received
symbols and sends this value to the PHY Control task. The EVM is obtained employing thesoft-decisor to estimate the transmitted symbols:
EVM [dB] = 10 log10
M∑i=1
|R(i)− I(i)|2
M∑i=1
|I(i)|2
where R(i) are the received IQ symbols and I(i) are the constellations points closest to thereceived symbols, i.e., the decisor output. This metric is used to provide an estimation of thecarrier-to-interference-and-noise ratio (CINR), and it is verified that the algorithm providesaccurate values of the CINR as long as decision errors are low. Otherwise, the CINR isoverestimated.
3.3.6 Physical Layer Control
This task is the central component of the PHY layer. It controls all the operations performedby the remaining PHY tasks, either by setting the configuration registers of each FPGA task
43
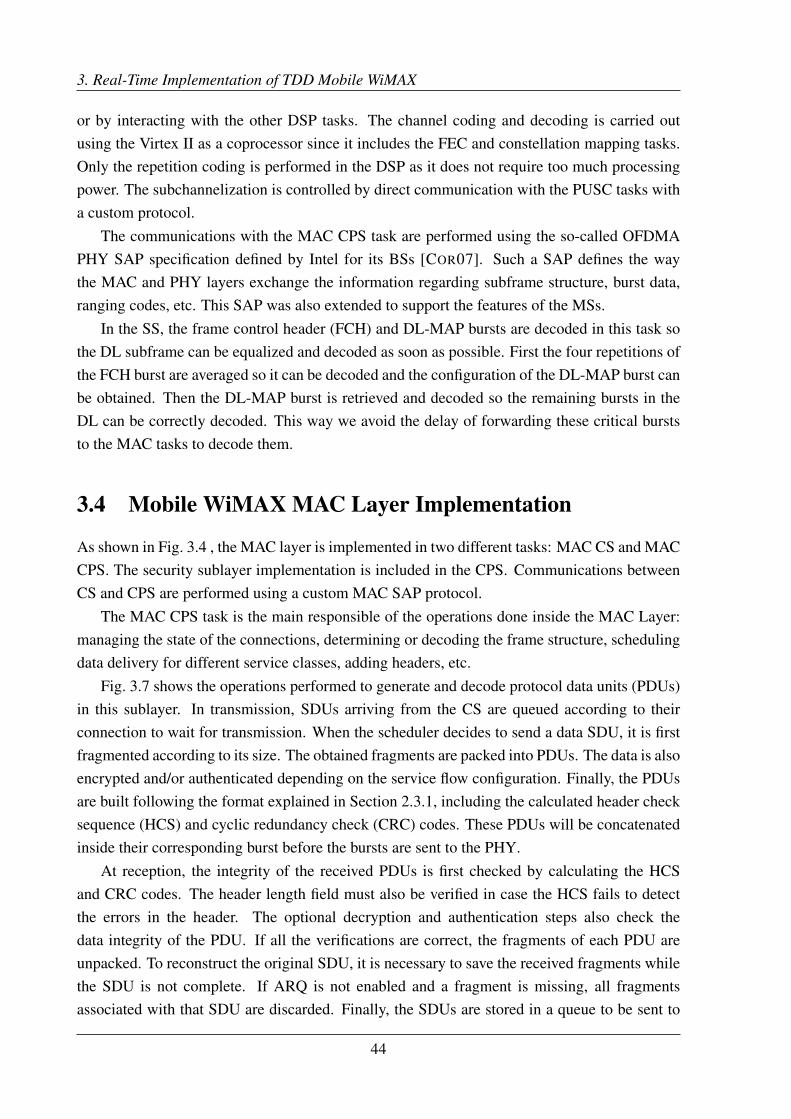
3. Real-Time Implementation of TDD Mobile WiMAX
or by interacting with the other DSP tasks. The channel coding and decoding is carried outusing the Virtex II as a coprocessor since it includes the FEC and constellation mapping tasks.Only the repetition coding is performed in the DSP as it does not require too much processingpower. The subchannelization is controlled by direct communication with the PUSC tasks witha custom protocol.
The communications with the MAC CPS task are performed using the so-called OFDMAPHY SAP specification defined by Intel for its BSs [COR07]. Such a SAP defines the waythe MAC and PHY layers exchange the information regarding subframe structure, burst data,ranging codes, etc. This SAP was also extended to support the features of the MSs.
In the SS, the frame control header (FCH) and DL-MAP bursts are decoded in this task sothe DL subframe can be equalized and decoded as soon as possible. First the four repetitions ofthe FCH burst are averaged so it can be decoded and the configuration of the DL-MAP burst canbe obtained. Then the DL-MAP burst is retrieved and decoded so the remaining bursts in theDL can be correctly decoded. This way we avoid the delay of forwarding these critical burststo the MAC tasks to decode them.
3.4 Mobile WiMAX MAC Layer Implementation
As shown in Fig. 3.4 , the MAC layer is implemented in two different tasks: MAC CS and MACCPS. The security sublayer implementation is included in the CPS. Communications betweenCS and CPS are performed using a custom MAC SAP protocol.
The MAC CPS task is the main responsible of the operations done inside the MAC Layer:managing the state of the connections, determining or decoding the frame structure, schedulingdata delivery for different service classes, adding headers, etc.
Fig. 3.7 shows the operations performed to generate and decode protocol data units (PDUs)in this sublayer. In transmission, SDUs arriving from the CS are queued according to theirconnection to wait for transmission. When the scheduler decides to send a data SDU, it is firstfragmented according to its size. The obtained fragments are packed into PDUs. The data is alsoencrypted and/or authenticated depending on the service flow configuration. Finally, the PDUsare built following the format explained in Section 2.3.1, including the calculated header checksequence (HCS) and cyclic redundancy check (CRC) codes. These PDUs will be concatenatedinside their corresponding burst before the bursts are sent to the PHY.
At reception, the integrity of the received PDUs is first checked by calculating the HCSand CRC codes. The header length field must also be verified in case the HCS fails to detectthe errors in the header. The optional decryption and authentication steps also check thedata integrity of the PDU. If all the verifications are correct, the fragments of each PDU areunpacked. To reconstruct the original SDU, it is necessary to save the received fragments whilethe SDU is not complete. If ARQ is not enabled and a fragment is missing, all fragmentsassociated with that SDU are discarded. Finally, the SDUs are stored in a queue to be sent to
44

3.4. Mobile WiMAX MAC Layer Implementation
SDU Tx
SDU enqueue
PDU Tx
Scheduler
Packing
Encryptionand authentication
Fragmentationand ARQ Tx
HCS + CRC
Frame management (BS)
DL-MAP
UL-MAP
MAC management
Timers
ARQ processing
Networkentry
Connectionmanagement
Managementmessages
SDU Rx
SDU dequeue
PDU
Data SDU
PDU Rx
Rx Queue
Unpacking
Decryptionand authentication
Defragmentationand ARQ Rx
HCS + CRC
PDU
Data SDU
ARQFeedback
Bandwidthrequest
Managementmessages
Figure 3.7: Diagram of the packet processing in MAC layer.
the CS when possible.
When ARQ is enabled for the connection, the fragmentation process in Fig. 3.7 is donefollowing the rules of the ARQ process: fragmentation is done according to the ARQ block sizeand the transmission window is updated. Besides, the received ARQ Feedback messages areused to know whether new or old fragments must be sent, avoiding the retransmission of blocksalready received in the other station.
The frame management module is only present on the base station. It manages the resourcesavailable on the DL and UL and controls the burst layout. It is therefore also responsible forgenerating the DL-MAP and UL-MAP messages. To manage the DL subframe, the PDU Txmodule informs this module of each new PDU to be transmitted along with its burst profile. Inthe case of the UL, the received bandwidth requests are used to distribute the resources amongthe different SS taking into account their quality of service (QoS) requirements.
Since it is the base station that determines the frame structure, the subscriber station usesthe information received on the maps to extract the DL bursts and fill its assigned UL burst.
The MAC management module is the central module of the stations that is responsiblefor following the management protocols specified in the standard. Management messages aregenerated by this module and are sent like conventional SDUs, although ARQ is never used and
45

3. Real-Time Implementation of TDD Mobile WiMAX
messages are not encrypted, only authenticated. Received management messages are processedin an analogous way and sent to the MAC management module.
3.4.1 Frame Management (BS)
The frame management module is responsible for the accounting of the radio resources availablegiven the current profile configuration. During PDU generation, the available space inside thedownlink subframe is checked iteratively, and while it is possible, new fragments are taken fromthe SDU queues and added to the PDUs. As a result of this process, a DL-MAP managementmessage is also generated with the description of the bursts. This message is also inserted intoa PDU, mapped to a burst, and sent to the PHY layer like a regular burst.
Multiple burst-mapping proposals for Mobile WiMAX are presented in [SJT09]. Ourimplementation uses the so-called Ohseki algorithm [OMI07], a reference algorithmconsidering complexity, requested bandwidth, and the shape of the downlink burst. The framemanagement module implements this algorithm and uses information about the burst profileused by the target MS to decide the burst to be used to map its PDUs. Potentially, all userssharing the same burst profile (i.e. modulation and channel coding) would receive all theirPDUs inside the same burst.
Resource management in the uplink is more flexible since it is only necessary to indicatethe number of slots allocated to each station. The size of such allocations should be decided bythe MAC layer considering the QoS constraints and the bandwidth requests received from eachuser. The current implementation equally distributes all the available bandwidth between theusers. The MS manages the available space using a similar scheme in the downlink, but usingonly one burst with the size assigned in the UL-MAP management message by the BS, hencesimplifying the allocation process.
3.4.2 QoS Scheduler
The main function of the scheduler is to select the data to be sent from the connectionsconsidering the QoS requirements of each service flow and the space available in each subframe.Additionally, in the BS, it is necessary to implement an UL resource scheduler so the differentstations can transmit according to their needs and QoS requirements.
The QoS schedulers in BS and SS try to ensure the QoS requirements by processing theservice classes in priority order, in a similar way to the method shown in [SAY+06; BN09].The deficit round robin (DRR) algorithm [SV96] is also used to process the active connectionsof each service class in a fair and efficient way.
Fig. 3.8 shows the mechanism used by the scheduler to ensure QoS requirements. Theconnections are processed in priority order assigning them at least the minimum requiredbandwidth. If starvation is detected in low priority classes, a small amount of resources are
46

3.4. Mobile WiMAX MAC Layer Implementation
Remainingspace in
subframe?
Subframestart
Send managementmessages
Reserve space forstarving connections andbandwidth requests (SS)
Process activeUGS and ertPS
connections
Process activertPS and nrtPS
connections
Remainingspace in
subframe?
Process activeBE connections
Send bandwidthrequests (SS)
Yes
Yes
No
No
Figure 3.8: Flowchart of the scheduler operations to satisfy the QoS requirements.
reserved for them. The space needed for sending bandwidth requests is also reserved in thesubscriber station (SS).
As shown in previous chapter (Table 2.4), the standard defines various QoS parametersdepending on the service class. The following parameters are considered in this implementation:
• Minimum Reserved Traffic Rate (MRTR): It defines the minimum average rate to beguaranteed to the service flow.
• Maximum Sustained Traffic Rate (MSTR): It defines the maximum rate that the serviceflow can reach.
• Traffic Priority: Specifies the priority assigned to a service flow.Latency and jitter parameters are only defined in the highest priority service classes (UGS
and ertPS). The QoS scheduler is designed to minimize the latency in these service classes andtherefore it is not necessary to take these parameters into account.
As shown in Fig. 3.8, the connections are grouped in this way:• Group 0: Management connections.• Group 1: unsolicited grant service (UGS) and extended rtPS (ertPS).• Group 2: real-time polling service (rtPS) and non-real-time polling service (nrtPS).• Group 3: best effort (BE).Therefore, there is a list of active connections for each group, where connections are added
each time data is queued. These lists are then processed using the DRR algorithm, except forGroup 0, where management messages have top priority and are all sent.
47
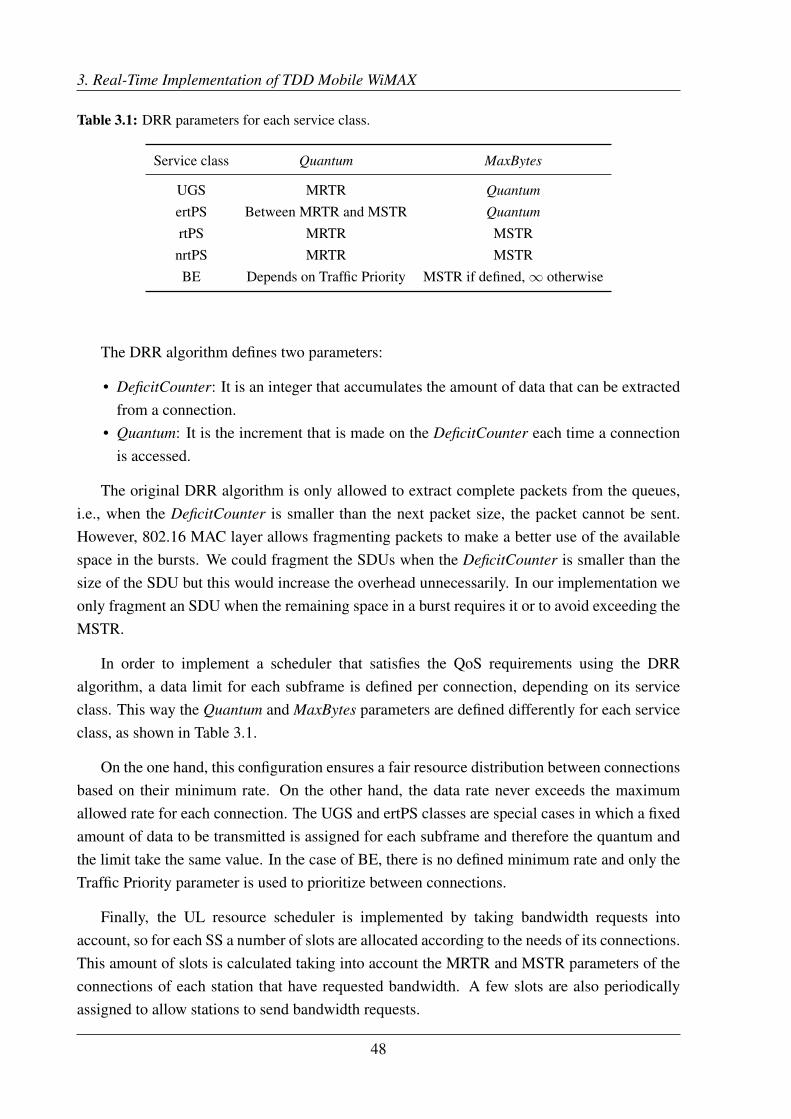
3. Real-Time Implementation of TDD Mobile WiMAX
Table 3.1: DRR parameters for each service class.
Service class Quantum MaxBytes
UGS MRTR QuantumertPS Between MRTR and MSTR QuantumrtPS MRTR MSTR
nrtPS MRTR MSTRBE Depends on Traffic Priority MSTR if defined, ∞ otherwise
The DRR algorithm defines two parameters:
• DeficitCounter: It is an integer that accumulates the amount of data that can be extractedfrom a connection.
• Quantum: It is the increment that is made on the DeficitCounter each time a connectionis accessed.
The original DRR algorithm is only allowed to extract complete packets from the queues,i.e., when the DeficitCounter is smaller than the next packet size, the packet cannot be sent.However, 802.16 MAC layer allows fragmenting packets to make a better use of the availablespace in the bursts. We could fragment the SDUs when the DeficitCounter is smaller than thesize of the SDU but this would increase the overhead unnecessarily. In our implementation weonly fragment an SDU when the remaining space in a burst requires it or to avoid exceeding theMSTR.
In order to implement a scheduler that satisfies the QoS requirements using the DRRalgorithm, a data limit for each subframe is defined per connection, depending on its serviceclass. This way the Quantum and MaxBytes parameters are defined differently for each serviceclass, as shown in Table 3.1.
On the one hand, this configuration ensures a fair resource distribution between connectionsbased on their minimum rate. On the other hand, the data rate never exceeds the maximumallowed rate for each connection. The UGS and ertPS classes are special cases in which a fixedamount of data to be transmitted is assigned for each subframe and therefore the quantum andthe limit take the same value. In the case of BE, there is no defined minimum rate and only theTraffic Priority parameter is used to prioritize between connections.
Finally, the UL resource scheduler is implemented by taking bandwidth requests intoaccount, so for each SS a number of slots are allocated according to the needs of its connections.This amount of slots is calculated taking into account the MRTR and MSTR parameters of theconnections of each station that have requested bandwidth. A few slots are also periodicallyassigned to allow stations to send bandwidth requests.
48
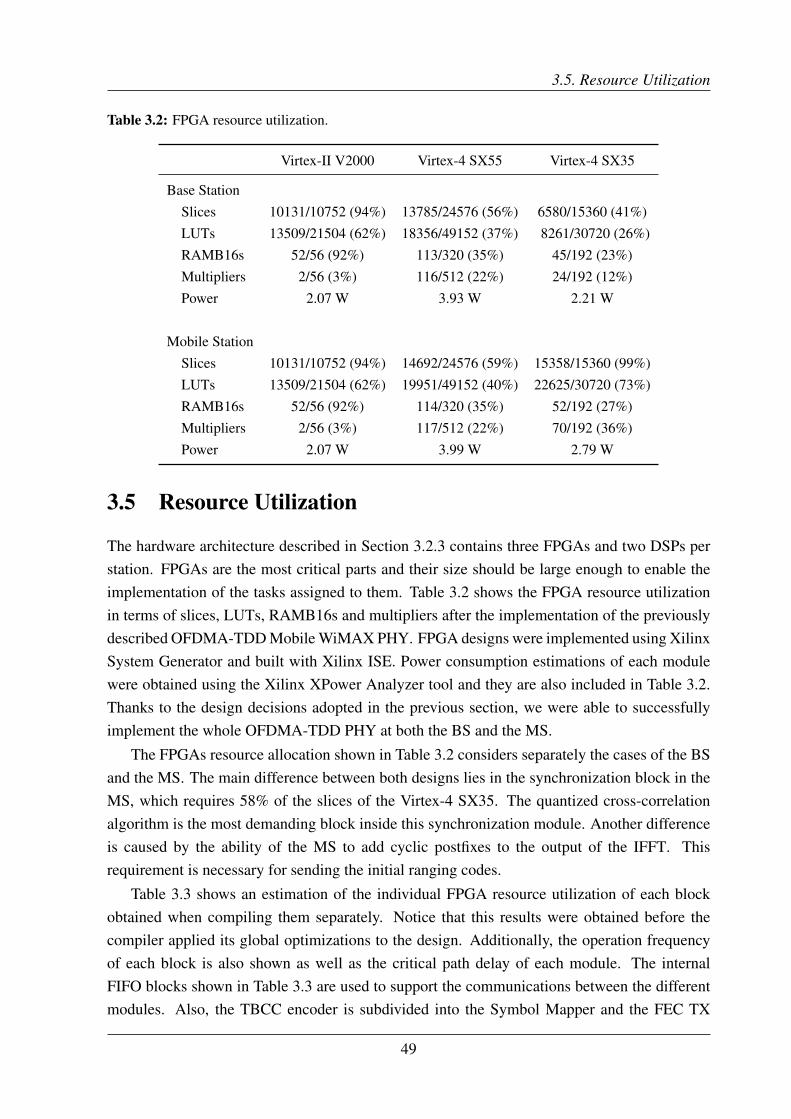
3.5. Resource Utilization
Table 3.2: FPGA resource utilization.
Virtex-II V2000 Virtex-4 SX55 Virtex-4 SX35
Base StationSlices 10131/10752 (94%) 13785/24576 (56%) 6580/15360 (41%)LUTs 13509/21504 (62%) 18356/49152 (37%) 8261/30720 (26%)RAMB16s 52/56 (92%) 113/320 (35%) 45/192 (23%)Multipliers 2/56 (3%) 116/512 (22%) 24/192 (12%)Power 2.07 W 3.93 W 2.21 W
Mobile StationSlices 10131/10752 (94%) 14692/24576 (59%) 15358/15360 (99%)LUTs 13509/21504 (62%) 19951/49152 (40%) 22625/30720 (73%)RAMB16s 52/56 (92%) 114/320 (35%) 52/192 (27%)Multipliers 2/56 (3%) 117/512 (22%) 70/192 (36%)Power 2.07 W 3.99 W 2.79 W
3.5 Resource Utilization
The hardware architecture described in Section 3.2.3 contains three FPGAs and two DSPs perstation. FPGAs are the most critical parts and their size should be large enough to enable theimplementation of the tasks assigned to them. Table 3.2 shows the FPGA resource utilizationin terms of slices, LUTs, RAMB16s and multipliers after the implementation of the previouslydescribed OFDMA-TDD Mobile WiMAX PHY. FPGA designs were implemented using XilinxSystem Generator and built with Xilinx ISE. Power consumption estimations of each modulewere obtained using the Xilinx XPower Analyzer tool and they are also included in Table 3.2.Thanks to the design decisions adopted in the previous section, we were able to successfullyimplement the whole OFDMA-TDD PHY at both the BS and the MS.
The FPGAs resource allocation shown in Table 3.2 considers separately the cases of the BSand the MS. The main difference between both designs lies in the synchronization block in theMS, which requires 58% of the slices of the Virtex-4 SX35. The quantized cross-correlationalgorithm is the most demanding block inside this synchronization module. Another differenceis caused by the ability of the MS to add cyclic postfixes to the output of the IFFT. Thisrequirement is necessary for sending the initial ranging codes.
Table 3.3 shows an estimation of the individual FPGA resource utilization of each blockobtained when compiling them separately. Notice that this results were obtained before thecompiler applied its global optimizations to the design. Additionally, the operation frequencyof each block is also shown as well as the critical path delay of each module. The internalFIFO blocks shown in Table 3.3 are used to support the communications between the differentmodules. Also, the TBCC encoder is subdivided into the Symbol Mapper and the FEC TX
49

3. Real-Time Implementation of TDD Mobile WiMAX
blocks, while the TBCC decoder is made up of the Soft-Decisor and the FEC RX blocks.The Virtex-4 SX55 is a high-resource FPGA that allowed for the implementation of the FFT
blocks without a resource-optimized design, hence a pipelined architecture was used allowingfor continuous data processing. However, the Virtex-II V2000 is resource limited, which forcedus to optimize the FEC design.
Regarding DSP resources, Table 3.4 shows the memory usage of each PHY task and anestimation of the DSP cycles required for the processing performed inside each task. The MACtasks are not shown as they do not perform symbol-level or bit-level operations, which are themost demanding. The DSP cycles estimation is obtained from a static analysis of the assemblycode generated by the compiler. We also present an estimation of the time required to executeeach task in the last column of the table. These time estimations were obtained making thefollowing assumptions:
• The 8.75 MHz profile is used with 1024 subcarriers and a cyclic prefix length of 1/8.• The frame duration is 5 ms, with 25 symbols in the downlink and 18 symbols in the
uplink.• The subframes are used entirely for data transmission.• Data subcarriers are modulated in 64-QAM and convolutional coding with rate 3/4.• Every 16 frames, there is a ranging burst of 30 subchannels and 3 symbols.• The tasks which use the internal DSP memory are executed at 600 MHz, while the tasks
that only use ZBTRAM memory are executed at 100 MHz.• The data copy between the DSP tasks is performed at 800 MB/s. The communication
with the FPGAs does not consume DSP time.The estimation of the total DSP time used is 958.56 µs and 927.89 µs for the BS and MS,
respectively. This is an optimistic estimation since we are not taking into account the timeconsumed by the kernel as well as context switches and interrupt handling. Furthermore, thedelay of the communication with the FPGA and the interdependence between the processingtasks can lead up to long waiting times for FPGA data. This means that a good concurrentprocessing planning is also needed to fulfill the 5 ms frame duration. In fact, to ensure that notiming problems arise during system evaluation, the experimental results were performed witha 15 ms frame duration. The main bottleneck is in the communications with the channel codingtasks, which are used as coprocessors, and the inefficient use of the FPGA pipelined processing,as explained in Section 3.2.2.
3.6 Experimental Results
In this section we present the results of several tests that were conducted to check theperformance of the proposed OFDMA-TDD WiMAX PHY implementation. First, inSection 3.6.1, the results of a unit test of the channel coding tasks are shown to validate theprocessing performed in these tasks. To check the performance of the complete implementation,
50

3.6. Experimental Results
Table 3.3: FPGA resource utilization of each processing block.
Block Slices LUTs RAMB16s MultipliersClock Frequency(critical path)
Virtex-II V2000 10752 21504 56 56TX FIFO 64 93 2 0 80 MHzRX FIFO 88 119 4 0 80 MHzFEC TX 511 827 4 0 80 MHz (12.47 ns)Symbol Mapper 72 41 0 0 80 MHzSoft-Decisor 1500 2597 1 2 80 MHzFEC RX 2260 3591 6 0 80 MHz
Virtex-4 SX35 15360 30720 192 192Synchronization (MS) 9110 16806 39 42 80 MHzFrame Control (BS) 496 1002 25 0 80 MHzDUC 10 MHz 2455 3447 16 26DUC 8.75 MHz 1305 1784 10 13 160 MHzDUC 3.5 MHz 1266 1769 10 11DDC 10 MHz 4567 6901 12 44DDC 8.75 MHz 2466 3904 10 15 160 MHz (12.10 ns)DDC 3.5 MHz 2947 4918 11 13
Virtex-4 SX55 24576 49152 320 512TX FIFO 182 305 15 0 100 MHzRX FIFO 182 305 15 0 100 MHzFFT 7184 9129 19 57 100 MHz (9.47 ns)IFFT (BS) 7551 9799 66 59 100 MHzIFFT (MS) 8381 11436 67 60 100 MHz (9.79 ns)
51

3. Real-Time Implementation of TDD Mobile WiMAX
Table 3.4: Static analysis of DSP resource utilization.
Task DSP Cycles per FrameZBTRAMMemory
DSPMemory
EstimatedTime (µs)
BS+MS: PHY Control (FEC)3000K BS5500K MS
0K BS0K MS
77.11
Repetition codingRep. 2: 56 · nslots
Rep. 4: 83 · nslots
Rep. 6: 134 · nslots
3.32
FEC TX preprocessing 7 + nBunc/2BS 48.67MS 28.42
FEC RX postprocessing 9 + nBunc/2BS 28.44MS 48.69
BS: TX PUSC DL 2000K 618K 168.00Frame initialization 6 +Nfft + (3 +Nfft/4) · nsymb 12.08Add burst to frame 147 · nsubc · nsymb/2 88.20Subcarrier randomization (11 +Nused · 2) · nsymb 67.72
BS: RX PUSC UL 2000K 327K 463.97Subcarrier randomization 8501 + (11 +Nused · 2) · nsymb 64.96Extract burst from frame
(equalization included)6 + nslots · 1140 399.01
BS: RX Ranging 36059 · nsubc/6 · nsrang/3 500K 0K 112.68Energy threshold 82 · nsubc/6 · nsrang/3 0.26Extract ranging code 21504 · nsubc/6 · nsrang/3 67.20Extract pilots 144 · nsubc/6 · nsrang/3 0.45Frequency offset 14329 · nsubc/6 · nsrang/3 44.78
MS: RX PUSC DL 1000K 564K 582.84Subcarrier randomization (11 +Nused · 2) · nsymb 67.72Equalization 425 · nsubc · nsymb 510Extract burst from frame (16 + nsubc · 8) · nsymb/2 5.12
MS: TX PUSC UL 1000K 196K 131.14Frame initialization 14 + nslots · 7 2.47Add burst to frame 6 + nslots · 182 63.71Subcarrier randomization 8501 + (11 +Nused · 2) · nsymb 64.96
52
3.6. Experimental Results
we set up an evaluation system that uses a channel emulator that implements different time-varying channel models. This way, the evaluation can be carried out in a repeatable as well asin a reproducible way. This channel emulator is described in Section 3.6.2, and the results ofthe different tests are shown in the remaining subsections.
3.6.1 Validation of the Channel Coding Blocks
The TBCC encoder and decoder tasks have been tested by using a new AWGN task placed inthe Virtex II FPGA. This task works as a coprocessor to emulate an additive white Gaussiannoise (AWGN) channel. A test program is used in the DSP to measure the error rate with thedifferent modulation and code rate configurations. This test program performs the followingoperations:
• Data bursts are generated with random bytes.• This data is sent to the TBCC encoder task to obtain the constellation mapped symbols.• Noise is added to the symbols using the AWGN task.• The symbols are decoded with the TBCC decoder to obtain the received bytes.• The sent and received bytes are compared to count the number of bit errors.These steps are repeated until a good measurement of the BER is obtained by processing
up to 500 · 106 uncoded bits. This process is performed for each noise level and modulationand coding rate. Fig. 3.9 shows the obtained coded BER results with respect to the Eb/N0. Asexpected, curves move to the right as the spectral efficiency increases. Also, the 4-QAM resultsmatch the BER performance curves in [XILb] for a convolutional code with constraint length 7,showing the correct implementation of the blocks. The 16-QAM and 64-QAM curves achievethe expected performance for a Viterbi decoder with 3 soft-bits, which is about 2 dB better thanhard decision decoding.
3.6.2 ITU-R Channel Emulator
In order to validate the real-time implementation as well as to assess the performance ofthe system, a channel emulator was implemented on a Xilinx Xtreme DSP Development Kitconsisting of a Virtex-4 FPGA plus a couple of DACs and ADCs (see Fig. 3.10).
The channel emulator is made up of a channel coefficient generator, an interpolator, achannel filtering stage, and an AWGN generator. It accepts parameters such as the averagepower and delay of each tap, the noise power, and the intermediate frequency of the inputsignal. The coefficient interpolation factor as well as the Doppler power spectrum are definedat compilation time and they are fixed during the emulation.
The WiMAX Forum [WIM05] recommends the usage of the ITU-R M.1225 [ITU97]channel models for the evaluation of WiMAX solutions. Three channel models are selectedby the WiMAX Forum: Pedestrian A, Pedestrian B, and Vehicular A. The pedestrian channelsassume a speed of 3 km/h, while the Vehicular A channel model can be configured with a speed
53

3. Real-Time Implementation of TDD Mobile WiMAX
Figure 3.9: TBCC BER vs. Eb/N0 over AWGN channel.
MS
ADC
DAC
Emulator
ADC DACdigitaldemodulator
Coefficientgenerator Interpolator
ChannelFilter
digitalmodulator
AWGN
LPF
Uplink15 MHz IF
IF
BBIFBB
BS
DAC
ADC
Downlink15 MHz IF
Uplink15 MHz IF
Figure 3.10: Block diagram of the OFDMA-TDD evaluation system configured to test the UL.
of 60 km/h or 120 km/h. The tapped delay line characteristics of these channels are shown inTable 3.5.
The Pedestrian A channel model only contains four paths with the last two being ratherattenuated, providing low frequency selectivity but also low multipath diversity. This meansthat the channel equalization will be easier for this channel, but the probability of all pathsbeing highly attenuated at the same time becomes higher. This can be seen in Fig. 3.11, wherethe power distribution is shown for a signal that is processed by each channel model. The outputsignal has higher probability of having very low power (-7 dB or less) with Pedestrian A thanwith the other channels. Pedestrian B and Vehicular A models provide richer multipath diversityand higher path delay spread than Pedestrian A. They have six paths with much longer delaysthan Pedestrian A, resulting in higher frequency selectivity, especially Pedestrian B channel.
Doppler spread emulation uses the Jakes Doppler power spectrum density assuming
54

3.6. Experimental Results
Table 3.5: ITU-R M.1225 channel models.
Pedestrian A Pedestrian B Vehicular A
Path Power (dB) Delay (ns) Power (dB) Delay (ns) Power (dB) Delay (ns)
1 0 0 0 0 0 02 -9.7 110 -0.9 200 -1.0 3103 -19.2 190 -4.9 800 -9.0 7104 -22.8 410 -8.0 1200 -10.0 10905 -7.8 2300 -15.0 17306 -23.9 3700 -20.0 2510
Speed (km/h) 3 3 60, 120
-30 -25 -20 -15 -10 -5 0 5 10 15
Power (dB)
0
0.01
0.02
0.03
0.04
0.05
0.06
0.07
0.08
Pro
b.
Ped. A
Ped. B
Veh. A
Figure 3.11: Histogram of the channel power gain for the ITU-R channels.
transmissions at 2.4 GHz. Note also that the maximum channel delay (3.7 µs) does not exceedin any case the default 1/8 cyclic prefix length (11.4 µs). Consequently, the system is immuneto Inter-Symbol Interference (ISI).
These channels are supported by the implemented channel emulator. In order to obtainadequate performance metrics with respect to the average SNR, the AWGN generator includedin the channel emulator is calibrated to match the SNR estimation obtained during thesynchronization process.
3.6.3 Uplink Synchronization
The performance of the uplink timing-offset synchronization module was evaluated using the3.5 MHz profile with 1/8 cyclic prefix (64 samples). The MS was configured to continuously
55

3. Real-Time Implementation of TDD Mobile WiMAX
2 4 6 8 10 12 14 16 18 20 2210
−1
100
101
102
SNR [dB]
MS
E [
∆θ]
AWGN
Ped A
Ped B
Veh A 60 km/h
Veh A 120 km/h
Figure 3.12: MSE of the time offset estimation in the uplink with respect to the average SNR.
send ranging codes in the uplink, and the time-offset estimations computed at the BS werestored. The result of this test is shown in Fig. 3.12 in which the mean squared error (MSE)of the time-offset estimations (expressed in number of samples) is shown with 90% confidenceintervals computed using bootstrapping [EH94]. In this 3.5 MHz profile, each sample has aduration of 0.25 µs. It can be seen that the uplink timing-offset implementation is insensitiveto the features of the different channel models and provides acceptable estimations in all cases,even at low SNR values. The worst results are obtained with Pedestrian A at 2 dB of averageSNR, which achieves a standard deviation of just 6.4 samples.
3.6.4 BER and FER in ITU-R Channels
Several measurements were carried out over the ITU-R channels. In order to measure BER, aknown structure for the subframes was used in the downlink and in the uplink. The purpose wasto enable the measurement of BER even when the FCH or the DL-MAP messages could notbe decoded. However, the undetected frames are ignored, i.e., BER calculation is not affectedwhen the synchronization block fails to detect a preamble. The modulation and coding used inthe following figures are QPSK and TBCC with 1/2 and 3/4 code rates.
Fig. 3.13 presents the coded BER for the uplink with the 8.75 MHz profile when the ITU-Rchannel models are employed. The lack of multipath diversity of Pedestrian A explains that thischannel obtains the worst BER performance for both QPSK 1/2 and 3/4. The uplink channelequalization is able to correct the high selectivity of Pedestrian B as this channel achieves thebest results. The fast fading of the Vehicular A channels affects the BER results, which are
56
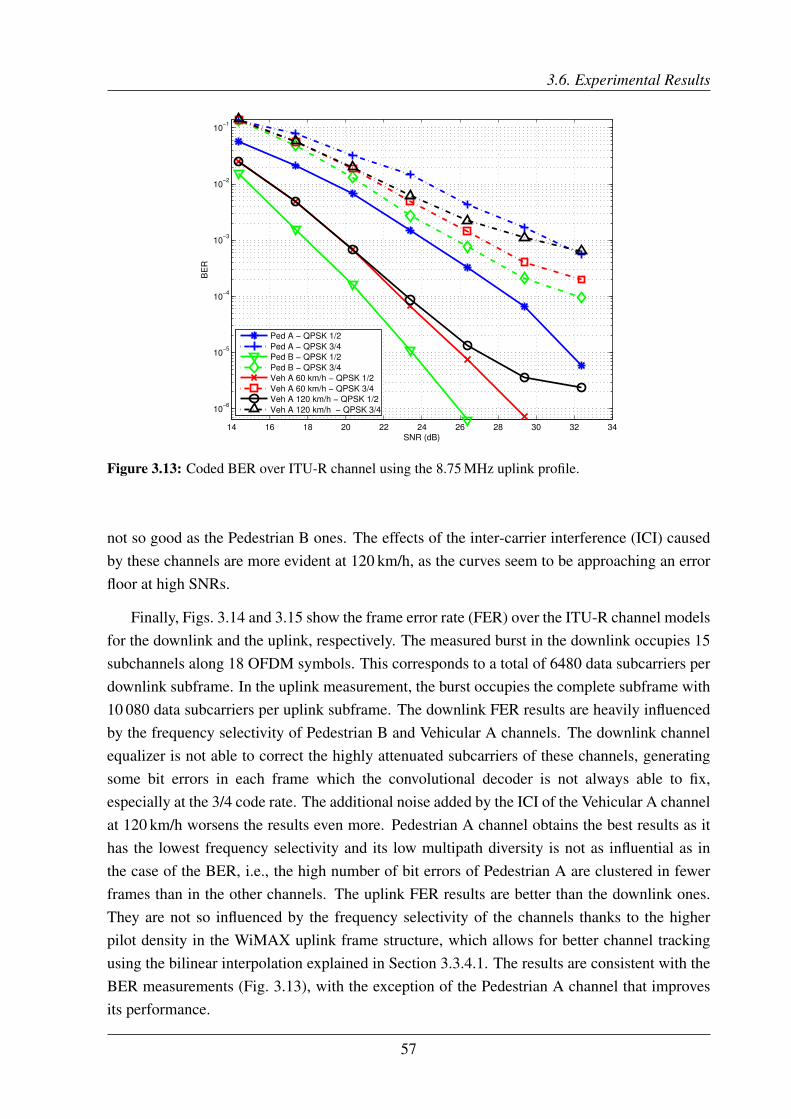
3.6. Experimental Results
14 16 18 20 22 24 26 28 30 32 34
10−6
10−5
10−4
10−3
10−2
10−1
BE
R
SNR (dB)
Ped A − QPSK 1/2
Ped A − QPSK 3/4
Ped B − QPSK 1/2
Ped B − QPSK 3/4
Veh A 60 km/h − QPSK 1/2
Veh A 60 km/h − QPSK 3/4
Veh A 120 km/h − QPSK 1/2
Veh A 120 km/h − QPSK 3/4
Figure 3.13: Coded BER over ITU-R channel using the 8.75 MHz uplink profile.
not so good as the Pedestrian B ones. The effects of the inter-carrier interference (ICI) causedby these channels are more evident at 120 km/h, as the curves seem to be approaching an errorfloor at high SNRs.
Finally, Figs. 3.14 and 3.15 show the frame error rate (FER) over the ITU-R channel modelsfor the downlink and the uplink, respectively. The measured burst in the downlink occupies 15subchannels along 18 OFDM symbols. This corresponds to a total of 6480 data subcarriers perdownlink subframe. In the uplink measurement, the burst occupies the complete subframe with10 080 data subcarriers per uplink subframe. The downlink FER results are heavily influencedby the frequency selectivity of Pedestrian B and Vehicular A channels. The downlink channelequalizer is not able to correct the highly attenuated subcarriers of these channels, generatingsome bit errors in each frame which the convolutional decoder is not always able to fix,especially at the 3/4 code rate. The additional noise added by the ICI of the Vehicular A channelat 120 km/h worsens the results even more. Pedestrian A channel obtains the best results as ithas the lowest frequency selectivity and its low multipath diversity is not as influential as inthe case of the BER, i.e., the high number of bit errors of Pedestrian A are clustered in fewerframes than in the other channels. The uplink FER results are better than the downlink ones.They are not so influenced by the frequency selectivity of the channels thanks to the higherpilot density in the WiMAX uplink frame structure, which allows for better channel trackingusing the bilinear interpolation explained in Section 3.3.4.1. The results are consistent with theBER measurements (Fig. 3.13), with the exception of the Pedestrian A channel that improvesits performance.
57

3. Real-Time Implementation of TDD Mobile WiMAX
14 16 18 20 22 24 26 28 30 32
10−2
10−1
FE
R
SNR (dB)
Ped A − QPSK 1/2
Ped A − QPSK 3/4
Ped B − QPSK 1/2
Ped B − QPSK 3/4
Veh A 60 km/h − QPSK 1/2
Veh A 60 km/h − QPSK 3/4
Veh A 120 km/h − QPSK 1/2
Veh A 120 km/h − QPSK 3/4
Figure 3.14: FER over ITU-R channel using the 8.75 MHz downlink profile. Bursts of 6480 bits forQPSK 1/2 and 9720 bits for QPSK 3/4.
14 16 18 20 22 24 26 28 30 32 34
10−3
10−2
10−1
FE
R
SNR (dB)
Ped A − QPSK 1/2
Ped A − QPSK 3/4
Ped B − QPSK 1/2
Ped B − QPSK 3/4
Veh A 60 km/h − QPSK 1/2
Veh A 60 km/h − QPSK 3/4
Veh A 120 km/h − QPSK 1/2
Veh A 120 km/h − QPSK 3/4
Figure 3.15: FER over ITU-R channel using the 8.75 MHz uplink profile. Bursts of 10 080 bits forQPSK 1/2 and 15 120 bits for QPSK 3/4.
58

3.6. Experimental Results
Table 3.6: Throughput measurement configuration.
Parameter Value Parameter Value
PHY OFDMA SNR values 14, 17, ..., 32WiMAX Profile 8.75-MHz Processed frames per SNR value 40 000Duplexing mode TDD SDU size 1024 bytesCyclic prefix length 1/8 QPSK 1/2 max. UL throughput 2016 kbit/sDL/UL symbols 25/18 QPSK 3/4 max. UL throughput 3024 kbit/sFrame duration 5 msPermutation schemes DL/UL PUSC
DL/UL-MAP MCS QPSK 1/2 ARQ_WINDOW_SIZE 1024 blocksFragmentation ON ARQ_BLOCK_SIZE 32 bytesPacking ON ARQ_RETRY_TIMEOUT 20 msCRC ON ARQ_BLOCK_LIFETIME 50 sPDU size max. 2047 bytes ARQ_RX_PURGE_TIMEOUT 50 sARQ ON ARQ_SYNC_LOSS_TIMEOUT OFFARQ feedback types all ARQ_DELIVER_IN_ORDER ON
3.6.5 Throughput
Throughput measurements were performed over the same ITU-R channels, in this case affectingboth downlink and uplink subframes at the same time. Therefore, the ARQ mechanism iscorrectly evaluated as ARQ feedback messages can also be corrupted. The channel emulatoris shared in both directions in order to simulate the channel reciprocity characteristic of TDDsystems. For each measurement, 40 000 frames were transmitted.
The complete configuration parameters of the experiments are shown in Table 3.6. Duringeach measurement, SDUs of 1024 bytes are continuously added to the transmit queue. ThePDUs are generated with the maximum possible size up to 2047 bytes. This minimizes thenumber of PDUs and the overhead introduced by the PDU header, but increases the errorprobability of the PDU. Furthermore, if some bits within the PDU are corrupted (detected withthe CRC field), all ARQ blocks inside the PDU must be sent again and not only the corruptedpart of the PDU.
Figs. 3.16 and 3.17 show the throughput values obtained with this configuration for both thedownlink and the uplink. It can be seen that the QPSK 1/2 configuration almost achieves themaximum raw throughput of 2016 kbit/s 2. There is some overhead added by the generation ofPDUs and the unused burst space, which cannot always be completely filled, and some paddinghas to be added. In the uplink, the periodical addition of reserved ranging bursts also reducesthe maximum achievable throughput. For QPSK 3/4, it is not possible to achieve the maximum
2This is the maximum raw throughput for the UL. The DL has a higher value but the throughput is limited byconfiguring an UGS service flow with this data rate. The same applies for QPSK 3/4.
59

3. Real-Time Implementation of TDD Mobile WiMAX
14 16 18 20 22 24 26 28 30 320
0.5
1
1.5
2
2.5
3
Th
rou
gh
pu
t (M
bit/s
)
SNR (dB)
PedA QPSK 1/2
PedB QPSK 1/2
VehA60 QPSK 1/2
VehA120 QPSK 1/2
PedA QPSK 3/4
PedB QPSK 3/4
VehA60 QPSK 3/4
VehA120 QPSK 3/4
Figure 3.16: Throughput in the downlink.
14 16 18 20 22 24 26 28 30 320
0.5
1
1.5
2
2.5
Th
rou
gh
pu
t (M
bit/s
)
SNR (dB)
PedA QPSK 1/2
PedB QPSK 1/2
VehA60 QPSK 1/2
VehA120 QPSK 1/2
PedA QPSK 3/4
PedB QPSK 3/4
VehA60 QPSK 3/4
VehA120 QPSK 3/4
Figure 3.17: Throughput in the uplink.
throughput (3024 kbit/s) in the SNR levels tested in these scenarios since the highest measuredthroughput was 2.5 Mbit/s.
All the throughput values obtained are consistent with the FER measurements shown inFigs. 3.14 and 3.15. In the DL, the most favorable channel is Pedestrian A, which yields thehighest throughput for all SNRs with QPSK 3/4. In the UL, Pedestrian A with QPSK 3/4 alsoobtains the best results except for the 18 to 24 dB SNR range, where Pedestrian B with QPSK1/2 offers a higher throughput thanks to the low FER obtained.
60
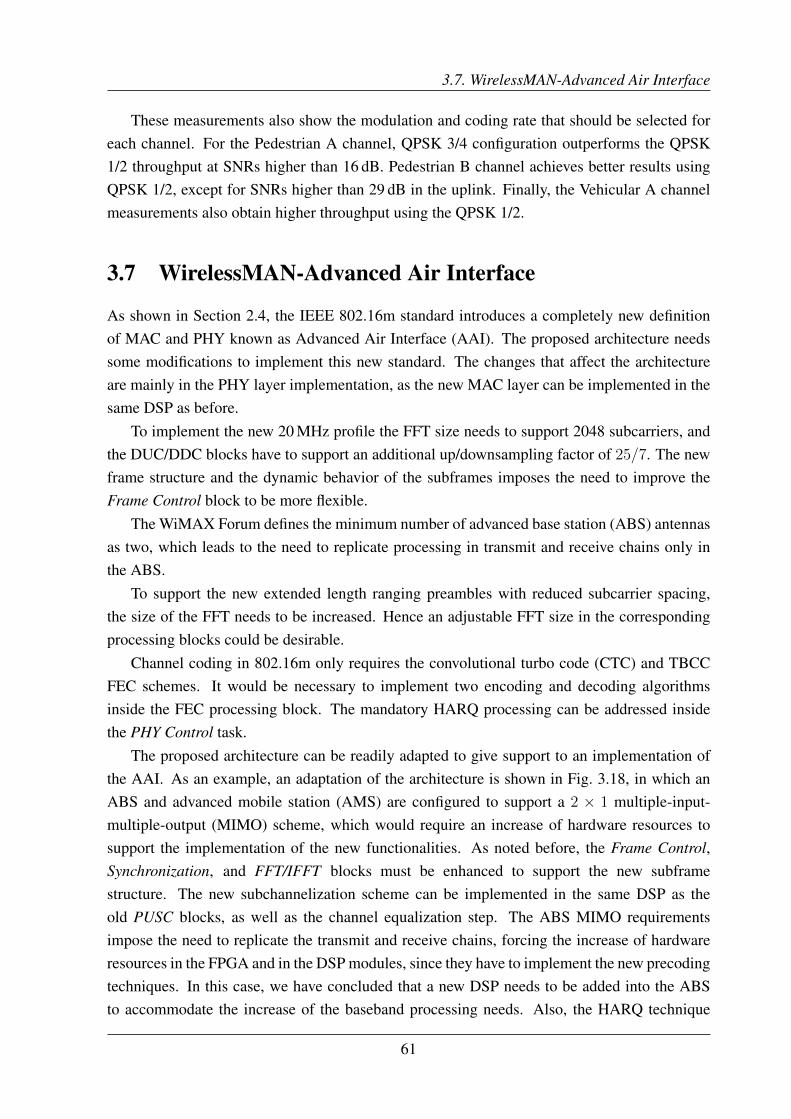
3.7. WirelessMAN-Advanced Air Interface
These measurements also show the modulation and coding rate that should be selected foreach channel. For the Pedestrian A channel, QPSK 3/4 configuration outperforms the QPSK1/2 throughput at SNRs higher than 16 dB. Pedestrian B channel achieves better results usingQPSK 1/2, except for SNRs higher than 29 dB in the uplink. Finally, the Vehicular A channelmeasurements also obtain higher throughput using the QPSK 1/2.
3.7 WirelessMAN-Advanced Air Interface
As shown in Section 2.4, the IEEE 802.16m standard introduces a completely new definitionof MAC and PHY known as Advanced Air Interface (AAI). The proposed architecture needssome modifications to implement this new standard. The changes that affect the architectureare mainly in the PHY layer implementation, as the new MAC layer can be implemented in thesame DSP as before.
To implement the new 20 MHz profile the FFT size needs to support 2048 subcarriers, andthe DUC/DDC blocks have to support an additional up/downsampling factor of 25/7. The newframe structure and the dynamic behavior of the subframes imposes the need to improve theFrame Control block to be more flexible.
The WiMAX Forum defines the minimum number of advanced base station (ABS) antennasas two, which leads to the need to replicate processing in transmit and receive chains only inthe ABS.
To support the new extended length ranging preambles with reduced subcarrier spacing,the size of the FFT needs to be increased. Hence an adjustable FFT size in the correspondingprocessing blocks could be desirable.
Channel coding in 802.16m only requires the convolutional turbo code (CTC) and TBCCFEC schemes. It would be necessary to implement two encoding and decoding algorithmsinside the FEC processing block. The mandatory HARQ processing can be addressed insidethe PHY Control task.
The proposed architecture can be readily adapted to give support to an implementation ofthe AAI. As an example, an adaptation of the architecture is shown in Fig. 3.18, in which anABS and advanced mobile station (AMS) are configured to support a 2 × 1 multiple-input-multiple-output (MIMO) scheme, which would require an increase of hardware resources tosupport the implementation of the new functionalities. As noted before, the Frame Control,Synchronization, and FFT/IFFT blocks must be enhanced to support the new subframestructure. The new subchannelization scheme can be implemented in the same DSP as theold PUSC blocks, as well as the channel equalization step. The ABS MIMO requirementsimpose the need to replicate the transmit and receive chains, forcing the increase of hardwareresources in the FPGA and in the DSP modules, since they have to implement the new precodingtechniques. In this case, we have concluded that a new DSP needs to be added into the ABSto accommodate the increase of the baseband processing needs. Also, the HARQ technique
61
3. Real-Time Implementation of TDD Mobile WiMAX
Advanced Mobile Station
FPGA
DUC
DDC
Synchro &FrameControl
FPGA
CP removalFFT
IFFT Prefix/postfixinsertion
DSP
PHYControl
ResourceAllocator
ResourceDeallocator
Chan. Est.RX Subch.
FPGA
TBCCencoder
TBCCdecoder
CTCencoder
CTCdecoder
DSP
MACControl
Advanced Base Station
FPGA
FrameControl
DUC
DDC
DUC
DDC
FPGA
CP removalFFT
CP insertionIFFT
IFFT CP insertion
CP removalFFT
FPGA
TBCCencoder
TBCCdecoder
CTCencoder
CTCdecoder
DSP
Ranging
PHYControl
ResourceAllocator
ResourceDeallocator
DSP
Chan. Est.RX Subch.
Chan. Est.RX Subch.
TX Subch.
TX Subch.
DSP
MACControl
Figure 3.18: Proposed 802.16m architecture.
requires an increase in memory due to the need to store the received bursts. Finally, the new FECschemes need to be implemented in a larger FPGA as the Virtex-II has not enough resources.
3.8 Conclusions
This chapter details a real-time implementation and validation of full-duplex OFDMA-TDDWiMAX transceivers that contain the complete PHY and MAC layers. The BS and MStransceivers are based on a cost-effective SDR hardware architecture made up of FPGA andDSP modules that allows us to implement all the mandatory functionalities of the WiMAXstandard. A custom development methodology was followed and the different design decisionsadopted were detailed. The final bidirectional implementation was successfully accomplished in
62
3.8. Conclusions
the selected hardware by making the most of the resources and distributing the tasks between theFPGAs and DSPs in a balanced way. The resource usage of each implemented task is shown,including the FPGA components usage and a static estimation of the most time-consumingprocessing in the DSP. The utilization of the proposed hardware architecture to implement theWirelessMAN-Advanced Air Interface is also discussed.
The implementation is validated in a repeatable and reproducible way by means ofperformance measurements carried out with the help of a real-time, custom-made channelemulator. The performance evaluation of the real-time implementations of both PHY andMAC layers is shown based on representative figures of merit such as bit and frame error ratesor throughput and considering the reference scenarios recommended by the WiMAX Forum:Pedestrian A and B, and Vehicular A. These channel models are supported by the customchannel emulator.
Firstly, the implemented TBCC channel coding processing is validated using a customdesign that allows us to obtain the BER performance under an AWGN channel independentlyof the rest of the system. Secondly, BER and FER measurements were carried out for both theuplink and the downlink considering the 8.75-MHz profile. Finally, throughput measurementsincluding the MAC layer processing with the ARQ mechanism enabled are also providedwith the aim of assessing the actual performance of the complete WiMAX system in realisticpropagation conditions. The measurement results confirm that the proposed implementation issuitable for the scenarios modeled with the aforementioned channel models.
63


Chapter IV
System-Level Simulations ofCommunications in TransportationSystems
Modern railway transportation systems need a reliable communication infrastructure providingvery high data rates and low latencies for applications such as communications-based traincontrol (CBTC) or video surveillance. Before the deployment of a network infrastructurefor these applications, it is important to perform network simulations in order to predict itsperformance under different situations and prevent possible problems.
To carry out these simulations it is common practice to use link-level and system-levelsimulators. To perform simulations of a complete system, it is more useful to carry out system-level simulations, in which the higher layer network protocols can be simulated using simplifiedmodels of the radio channel.
In this chapter, the suitability of different communication technologies for subwayenvironments is evaluated. Long Term Evolution (LTE) and Wi-Fi deployments aresimulated using tunnel propagation channels based on deterministic models and real channelmeasurements.
This chapter is mainly based on the following co-authored publication:
• Ángel Carro-Lagoa, Tomás Domínguez-Bolaño, José Rodríguez-Piñeiro, MiguelGonzález-López, and José A. García-Naya. “Feasibility of LTE for train control insubway environments based on experimental data”. Proc. of 2019 27th EuropeanSignal Processing Conference (EUSIPCO). 2019, pp. 1–5.DOI: 10.23919/EUSIPCO.2019.8903070
This chapter is structured as follows. An introduction to the communications systemsin subway scenarios is presented in Section 4.1. The most common services provided insubway scenarios are presented in Section 4.2 with their quality of service (QoS) requirements.The LTE and Wi-Fi modules of the ns-3 simulator are described in Section 4.3, including
65
4. System-Level Simulations of Communications in Transportation Systems
the implemented modifications and enhancements needed to correctly simulate the subwayscenario. In Section 4.4, a deterministic and a measurement-based propagation models fortunnel environments are presented. A deployment with three subway stations is simulated inSection 4.5 using the measurement-based channel model. In Section 4.6, a complete subwayline deployment is detailed and several simulations are performed using the deterministicchannel model. Finally, the conclusions are presented in Section 4.7.
4.1 Introduction
The railway industry is evolving their conventional signaling systems to communication-basedsystems demanding reliable and fault-tolerant infrastructures. Examples of these moderncommunication-based signaling systems are the CBTC system and the European Train ControlSystem (ETCS). In this chapter, we will focus on the CBTC system as it is more common insubway environments.
CBTC systems require a communications infrastructure that gives support to their QoSneeds, being a low latency the most critical one. Also, additional services are being deployedin public transportation systems that demand high data rates, e.g., closed-circuit television(CCTV). However, these throughput demands cannot be satisfied by legacy communicationsystems such as GSM for Railways (GSM-R). The selected communications system must beable to provide all these services fulfilling their QoS requirements.
In subway scenarios, IEEE 802.11 wireless local area network (WLAN) deploymentsare considered as a communication infrastructure for CBTC [FS17] [GRR17]. The mainadvantages of Wi-Fi are its low cost and the usage of the freely available industrial, scientificand medical (ISM) radio bands. However, the usage of this standard has several drawbacksas it was initially designed to replace the cables in local area networks. To support long-range and high-mobility scenarios, Wi-Fi deployments require several access points supportingthe latest standard amendments such as the IEEE 802.11k/r/v. Nonetheless, interoperabilityamong different manufacturers implementing these amendments is still unclear, as it is verycommon to use proprietary modifications of the standard [GRR17]. Additionally, managingthe interference caused by other devices as well as that produced by neighbour access points isyet another issue.
The 3GPP LTE and the LTE-Advanced (LTE-A) standards are good alternatives forcommunications in subway environments. The disadvantages of LTE are its higher equipmentcost and the licensing costs associated to the frequency bands. On the other hand, LTE providesmobility support, flexible QoS configuration, long range communications, etc. Also, LTEallows for sharing the deployed infrastructure with the passengers.
There are two ways of providing wireless coverage in tunnels: using radiating cable (“leakyfeeder”) or distributed antennas. Hybrid solutions are also very common [TOL15]. The leakyfeeders are useful in complex environments as they provide uniform coverage of the area,
66
4.2. QoS in Subway Communications
simplifying the deployment design [GRR17; HED09]. However, they are expensive to installand maintain, specially when used at frequencies higher than 2 GHz. In this chapter we willfocus on antenna deployments because, according to [GUA+12], antennas are ten times cheaperto deploy than leaky feeder solutions and easier to maintain. The main drawback of antennasis the increased complexity in tunnel radio planning. Radio propagation inside tunnels dependsvery much on the characteristics of the tunnel, which makes measurement campaigns mandatory[TOL15].
In this chapter, we study the viability and performance of LTE and Wi-Fi for supporting theneeded services in subway environments. We use Wi-Fi and LTE modules of the ns-3 networksimulator to check if the QoS requirements of all the applications are met [HLR08] [PRO21][PBM11]. Two channel models are used to correctly simulate the subway environment. Onthe one hand, a simplified channel model was developed from measurements carried out in theMadrid Metro [DOM+18]. On the other hand, a channel model based on modal-theory wasenhanced to take into account the curves and slopes of the track.
Although previous works are focused on the simulation of subway scenarios with CBTCtraffic, none of them uses a specific channel model for subway scenarios based on results froma measurement campaign. In [KHA+13], the OPNET simulator was used to study the LTEtime-division duplexing (TDD) performance with different QoS configurations. However, theused channel model is unknown and only the uplink (UL) performance was considered. Zhao etal. [ZHA+14; ZHA+16] presented an integrated train ground communication system based onLTE TDD. They set up a testing environment, to verify that all the defined QoS requirementsare fulfilled. The testing environment includes a commercial channel simulator to evaluate thesystem in an urban rail transit environment with speeds up to 200 km/h. A similar hardwaresetup is employed in [WAN+19] to perform a reliability analysis of the CBTC communicationsusing a 1.4 MHz LTE network. Neglia et al. [NEG+16] evaluated the performance of CBTCin Wi-Fi deployments with an analysis of the probability of emergency brakes. They alsoimplemented new modules for the ns-3 simulator, including a CBTC module, to validate theiranalysis with a Wi-Fi deployment and test the behavior of the handover process. Finally, in[WEN+15], the BRaVE railway simulator is integrated with the OMNeT++ network simulatorto carry out CBTC simulations using a channel model based on [ZHA03].
4.2 QoS in Subway Communications
This section discusses the QoS requirements that the network infrastructure must meet for thecorrect functioning of the railway signaling protocols and other deployed services. Parameterssuch as communication latency or packet loss and their impact on the control protocols areconsidered.
The most common services deployed in a subway environment that use the train-to-groundconnection are the following [ALL18; GRR17; KHA+13; ZHA+14]:
67
4. System-Level Simulations of Communications in Transportation Systems
• Mission critical services.– CBTC: Signaling system to control and monitor the position and speed of the trains.– Voice communication: Public safety service that communicates the train drivers
with the operational control center (OCC) controllers. Currently, this service isusually provided by a separate private mobile radio network such as TerrestrialTrunked Radio (TETRA) or Project 25. However, this service can be provisionedusing the same common Wi-Fi or LTE infrastructure. Moreover, the LTE standardalready includes public safety features.
• Applications for subway operator.– CCTV: On-board video surveillance of the train wagons. The video is sent from the
trains to the OCC or the security center.– Platform TV: Real-time video surveillance of the platforms. This video stream is
sent to the train cabin so the driver can see the platform before the train enters thesubway station.
– Maintenance: This service includes telemetry tasks to monitor the status of on-boardsensors and equipment. Also, other maintenance operations can be considered suchas on-board file update.
• Passenger services.– Passenger information: Two services are usually deployed to inform the passengers.
The Passenger Information System (PIS) transmits multimedia messages fortravelers, such as the next station on the line. The public announcement serviceis usually used by the train drivers to communicate with the passengers, but it canalso be employed by the control center agents when the service supports using thewayside-to-train connection.
– Internet on board: Provides connectivity inside the trains to give internet access topassengers. This can be provided by deploying Wi-Fi access points, or by enhancingthe access to mobile operator services with repeaters when the penetration loss intothe trains is too high [TOL15]. This service is not considered in this thesis.
It is very common that these services are deployed using different technologies withindependent network infrastructures, specially in the case of mission critical applications. Inthis way, crashes and malfunctions in a network will only affect the services that make useof it, allowing the rest of the systems to continue working properly. However, the cost ofmaintaining all the different infrastructures can be very high and expensive. In this thesis weexplore the feasibility of using a common technology for all these services. It is crucial toprovide a redundant and reliable architecture that allows prioritizing mission critical services toensure that their requirements are met.
The QoS requirements of these services differ depending on their configuration. In Table 4.1the throughput requirements defined by different sources are shown. The throughput values arespecified for each train in the downlink (DL) and UL direction. Some works do not consider
68

4.2. QoS in Subway Communications
Table 4.1: Throughput requirements (for each train) in the literature.
Service [ALL18] [MB17] [KHA+13] [NOK16] [ZHA+14]
CBTC (DL/UL) 150 kbit/s 100 kbit/s4.8 kbit/s (DL)8 kbit/s (UL)
50 kbit/s 200 kbit/s
Voice (DL/UL) 150 kbit/s 150 kbit/s 64 kbit/s — 100 kbit/sCCTV (UL) 2–6 Mbit/s 2–6 Mbit/s 2 Mbit/s 6 Mbit/s 1 Mbit/sPlatform TV (DL) 2 Mbit/s 2 Mbit/s — 6 Mbit/s —Maintenance (DL/UL) 100–500 kbit/s 200–500 kbit/s 1 Mbit/s (DL) 50 kbit/s 100 kbit/sPassenger info (DL) 100 kbit/s 100 kbit/s 64 kbit/s 50 kbit/s 2 Mbit/s
Table 4.2: Maximum delay (one-way) and packet loss rate requirements for CBTC in the bibliography.
Max. delay (ms) Packet error rate Throughput (kbit/s)
[IEE04a] 500–2000 — —[GRR17] 800 — 10–50[ALL18] 100 0.1% 150
[KHA+13] 50 0.1% 4.8–8[NOK16] 75 0.1% 50
[ZHA+14] 150 — 200
all the services, but the table provides a general idea of the needed throughput for each service,being CCTV and Platform TV the most demanding services.
The CBTC traffic is the most prioritary in the subway enviroment. Although it haslow throughput requirements, the maximum delay and packet error rate limits can be moredemanding under high load situations. The IEEE standards 1474.1 and 1474.3 [IEE04a;IEE08] define functional requirements for CBTC systems and recommended practice. In[IEE04a, Annex C], the typical communication delay in the train-to-wayside link is definedwithin the range of 0.5 to 2 seconds. However, the maximum delay required in real CBTCsystems is usually lower. These documents describe general guidelines, typical parameters andrecommendations that cannot be used directly as requirements. In fact, the CBTC requirementsare set by the supplier or the transport operator for each CBTC project.
Table 4.2 shows the defined CBTC requirements for several works in the bibliography.According to [GRR17], the required delay for each CBTC packet is less than 800 ms. In[ALL18], the typical maximum delay is 100 ms with an acceptable packet error rate of 0.1%.On the other hand, the requirements set in [KHA+13] are 50 ms of maximum delay and 0.1%of packet loss rate. In [NOK16], the requirements are 75 ms of delay and a packet loss rate of
69

4. System-Level Simulations of Communications in Transportation Systems
0.1%. Finally, Zhao et al. [ZHA+14] indicate a 150 ms maximum delay requirement.Given these diverse requirements, in this chapter we will consider an intermediate maximum
delay of 100 ms and a packet loss of 0.1%. The QoS requirements of the remaining servicesare:
• Voice communication: As CBTC, voice over Internet Protocol (VoIP) requires low delaycommunications with low data rate. ITU-T G.114 [ITU03] recommends a maximumone-way delay (“mouth-to-ear”) of 150 ms to ensure that the users experience transparentinteractivity.
• CCTV and platform TV: These services require a high throughput but tolerate delays upto 500 ms.
• Maintenance: As these operations do not require real-time performance, they can beprovided with low-priority or best-effort transmissions.
• Passenger information: If the PIS does not include infotainment messages, the throughputrequirements will be low. Also, if voice announcement service is not provided, longerdelays are tolerated and the requirements can be satisfied with a best-effort priority.
4.3 ns-3 System-Level Simulator
The ns-3 simulator is an open-source discrete-event network simulator for research andeducation. This software is not an independent progam but a collection of C++ libraries.To use the simulator, a main C++ program is created to define the simulation topology andconfiguration. This program uses the libraries provided by ns-3 to run the simulation. The mainsimulation program can also be implemented in Python, but some features are often lost.
The simulator is made up of a core library and several modules. The core library providesthe basic functionality of the simulator defining classes to manage time, events, configuration,random variables, logging, etc. The ns-3 modules contain models of different protocols, devicesor real-world phenomena that can be simulated. Some relevant modules of the simulator are:
• Network: Defines key concepts such as nodes, network devices (that can be attached tothe nodes), packets, channels, etc.
• Mobility: This model allows for defining the position and motion of the nodes during thesimulation. Custom mobility models can be added, such as a train mobility model.
• Internet: Implements the internet stack protocols: IPv4, IPv6, Address ResolutionProtocol (ARP), User Datagram Protocol (UDP), Transmission Control Protocol (TCP),etc.
• Propagation: Includes several models of radio propagation loss such as the Friis free-space model, log distance propagation model, etc.
• Spectrum module: Provides support for modeling wireless transmissions using thepower spectral density (PSD) representation of the signals. This module allows forimplementing channel models that are frequency selective. Moreover, it provides support
70

4.3. ns-3 System-Level Simulator
Table 4.3: Standardized QCI characteristics [3GP14].
QCI Resource Type Priority Packet Delay PER Example Services
1
GBR
2 100 ms 10−2 Conversational Voice2 4 150 ms 10−3 Conversational Video (Live)3 3 50 ms 10−3 Real Time Gaming4 5 300 ms 10−6 Video (Buffered)
5
Non-GBR
1 100 ms 10−6 IMS Signaling6 6 300 ms 10−6 Video (Buffered), TCP-based services7 7 100 ms 10−3 Voice, Video (Live), Gaming8 8
300 ms 10−6 Video (Buffered), TCP-based services9 9
for signal-to-interference-plus-noise ratio (SINR) calculation based only on the powerreceived at each frequency band.
• Antenna module: Enables the use of antenna models with the desired radiation patterns.The LTE and Wi-Fi modules are explained in detail in the following subsections.
4.3.1 LTE Module
The ns-3 LTE module was first published in 2011 and it has been actively developed andenhanced since then [PBM11; ZBM13]. Although the ns-3 LTE module only supportsfrequency-division duplexing (FDD) operation mode, the whole LTE protocol stack isimplemented, including an Evolved Packet Core (EPC) model providing end-to-end InternetProtocol (IP) connectivity. The model includes design documentation [PRO21] and is opensource, as the rest of the ns-3 simulator.
We had to implement some new features that were not present in the model, most of themrelated with the scheduling and the QoS. We detail these enhancements in Section 4.3.1.1.
In LTE, traffic packets are classified into different bearers based on each packet header. LTEdefines the so-called QoS Class Identifiers (QCIs) to configure QoS requirements of the bearers.Each QCI defines a priority, a packet delay budget, and a tolerated packet error ratio (PER).Also, some QCIs support a guaranteed bit rate (GBR) for each bearer.
The standardized QCI characteristics in LTE Release 8 are shown in Table 4.3. More QCIvalues have been defined in the subsequent LTE releases to support new services such as missioncritical push-to-talk voice. The first QCI values allow for creating GBR bearers with a minimumbit-rate that should be satisfied. The other classes do not have this minimum bit-rate and haveless priority than the first 4 values, with the exception of QCI 5, which has the higher priority.The default bearer is configured with the QCI 9.
The ns-3 simulator allows us to use the nine QCI values defined in LTE Release 8. However,the provided QoS-aware schedulers only consider the assigned GBR value of each bearer and
71

4. System-Level Simulations of Communications in Transportation Systems
ignore the remaining parameters. We have also enhanced the schedulers to take into accountthe priority of each bearer as explained in Section 4.3.1.1.
4.3.1.1 ns-3 LTE Scheduler Enhancements
The LTE module provides several scheduler implementations, such as the well-knownproportional fair (PF) and maximum throughput (MT) opportunistic schedulers as well as otherQoS-aware schedulers [ZBM13]. Only the DL scheduler is currently implemented in ns-3,whereas the UL employs a simple round robin (RR) scheduler. Also, the provided QoS-awareschedulers only prioritize some users over others, but do not consider different flows from thesame user. In our scenario we need to prioritize the CBTC flows over the others, to minimizethe delay of the CBTC traffic.
Given that all of our users have the same priority, our approach consists in modifying the PFscheduler to include a flow prioritization mechanism. First, a resource assignment to each useris performed by a fair algorithm. Then, these resources are shared between the different flowsof each user taking into account the QoS requirements.
We also implemented the PF scheduler for the UL, taking into the account the additionalrestriction that the assignment of resource blocks (RBs) to each user equipment (UE) must becontiguous in frequency, as required by the single-carrier FDMA (SC-FDMA) modulation. Weperform this assignment in an iterative way:
• Calculate the PF metric for each RB and UE that can transmit in that RB.• Select the UE that has the best metric in more contiguous RBs.• Assign some of the adjacent RBs to the UE depending on the UE data requirements.• Go to the first step until no more RBs can be assigned.We also implemented the riding-peaks algorithm with RB grouping [LEE+09], obtaining
results equivalent to the previous method.The LTE standard defines the logical channel prioritization (LCP) procedure that must be
performed by the UEs to prioritize the logical channels (LCs) in a predictable way [3GP18].We implemented this mechanism because the ns-3 implementation performed this process ina non-standard way using a RR algorithm. We also added the LCP procedure to the PF DLscheduler, thus providing the required QoS awareness.
The LCP mechanism is configured with the following parameters for each LC:• priority: The LCs are served in this order. Higher priority values indicate lower priority.• prioritisedBitRate: LCs will be able to transmit with this rate if higher priority LCs leave
enough resources.• bucketSizeDuration: Limits the amount of prioritized data the LCs can transmit
continuously to avoid starving the lower priority LCs.Fig. 4.1 shows an example of the operations performed by the LCP procedure with three
LCs. A MAC protocol data unit (MPDU) is built in two steps: first, the prioritisedBitRate ofeach LC is served in priority order (operations 1, 2, and 3 in Fig. 4.1), and second, the MPDU
72

4.3. ns-3 System-Level Simulator
PB
R
PB
R
Dat
a
Dat
a
Dat
a
PB
R
MAC PDU
Priority 1 Priority 2 Priority 3
1 2 34
Figure 4.1: Logical Channel Prioritization.
is filled with the remaining data in the LCs, also in priority order (operation 4). The payload ofeach LC will be arranged contiguously inside the MPDUs.
The LCP parameters values are set by the Radio Resource Control (RRC) layer. The way theQoS parameters of a bearer are mapped to the LCP parameters is not standardized. Bouchemalet al. [BIT14] evaluated the effects of different configurations of these parameters, concludingthat a correct configuration avoids starvation problems in low priority traffic. We configuredthis values to ensure that the required bit-rate of high priority LCs are always satisfied in oursimulations. The parameters were assigned in the following way:
• The prioritisedBitRate is set to the GBR of the bearer. If the bearer does not have GBR,(9− priority) ∗ 8000 bits/s are used as prioritisedBitRate.
• The bucketSizeDuration parameter is assigned with the following expression:300ms/packetDelayBudget. The packetDelayBudget is the allowed packet delay ofeach QCI as shown in Table 4.3.
4.3.2 Wi-Fi Module
Wi-Fi technology is defined in the IEEE 802.11 standard [IEE16] and has evolved over theyears through various amendments. The most relevant for railway environments are:802.11a (1999) operates in the 5 GHz band using an OFDM PHY with a maximum throughput
of 54 Mbit/s. However, in real systems, this amendment usually achieves a data rate ofaround 25 Mbit/s.
802.11n (2009) improves the performance of previous amendments and has a theoreticalpeak rate of 600 Mbit/s thanks to the use of multiple-input-multiple-output (MIMO)transmissions and 40 MHz bands. It can work in the 2.4 GHz and 5 GHz ISM bands.
802.11ac (2013) works in the 5 GHz bands and improves performance by using MIMO with
73

4. System-Level Simulations of Communications in Transportation Systems
more antennas, 80 MHz and 160 MHz channelization, and 256-QAM modulation.802.11ax is still a draft [IEE20] but it is expected to be approved soon. This amendment
will introduce significant changes to the PHY and MAC layers. It increases the numberof OFDM subcarriers (×4), reducing the separation between them, and increasing theduration of the OFDM symbol. In addition, it uses orthogonal frequency-divisionmultiple access (OFDMA) to reduce interference between stations. Several devicesalready support this amendment, including some industrial-grade equipment that hasrecently come onto the market.
802.11e (2005) adds QoS improvements by defining four types of traffic. Thus, some dataflows can be prioritized and their latency reduced.
802.11f, 802.11k, 802.11r, and 802.11v allow for reducing the roaming time between accesspoints (APs) with different mechanisms.
802.11h (2003) allows for transmission in the U-NII frequency bands (5 GHz) that are alsoused by radar and satellite systems. The ammendment provides Dynamic FrequencySelection (DFS) and Transmit Power Control (TPC) mechanisms to avoid interferencewith other systems.
The Wi-Fi module of the ns-3 simulator has the following characteristics:• The Wi-Fi devices can work in ad-hoc or infrastructure mode. In our case we will use the
infrastructure mode that configures the devices as stations (STAs) or APs, according toWi-Fi terminology.
• It supports several IEEE 802.11 physical layers: 802.11a, 802.11b, 802.11g, 802.11n,and 802.11ac. The 802.11ax version [IEE20] is still under development.
• When using 802.11n or 802.11ac, MAC service data units (MSDUs) and MPDUs can beaggregated to reduce overhead and improve the data rate [BHA+09].
• It implements the QoS defined in 802.11e with separate queues for each access category.• It includes different rate control algorithms that allow for adapting the transmission rate
to the radio channel or the number of interfering nodes.However, the following shortcomings have been found in the Wi-Fi module:• No handover mechanisms between APs are implemented. We had to modify the simulator
and add support for fast handovers as shown in Section 4.3.2.1.• Although the aggregation of MPDUs substantially improves the transmission rate,
we have detected errors in the ns-3 implementation that cause long interruptions intransmissions in certain situations. This has forced us to disable this method and usethe 802.11a standard instead of 802.11ac.
4.3.2.1 ns-3 Wi-Fi Fast Handover Support
In contrast to LTE, in Wi-Fi the mobile device (STA) decides the moment when the changeof AP is made and which AP it decides to connect to. The handover mechanism we haveimplemented in the simulator assumes that the STAs know the details of the Wi-Fi deployment,
74
4.4. Tunnel Propagation Models
i.e., all STAs know their position and the distance to each AP. Moreover, they know theoperating frequency (Wi-Fi channel) of each AP to avoid the need to scan all Wi-Fi channelsbefore performing the handover. This information allows the STAs to perform the handoverswith very short delay.
Three handover methods were implemented in the simulator:• Passive channel scan (PassiveBeaconWait). The STA receives the beacons sent
periodically by the APs. After some time (configurable), the STA connects to the APwhich sent the beacon with the best reception SNR. This method is very slow because itdepends on the beacon interval of the APs, which by default is 102.4 ms.
• Active channel scan (ActiveProbing). The STA sends special packets (probe requests)asking the APs on that channel to reply. After some time, the STA connects to the bestAP or rescans the channel if no AP was found. The time it takes to perform the handoverdepends on the configured timeout, which by default is 50 ms.
• Direct connection without channel scan (FastHandover). The STA already knows whichAP to connect to and connects to it without scanning. The only delay in this method is thetime it takes for the AP to respond to the STA’s association request. If there is no packetloss, the handover with this method usually takes no more than 1 ms.
During the handover process, the transmission queue of the STA is disabled. Therefore,the packets added to the queue during this process are lost. In addition, packets stored in thetransmission queues of the previous AP are lost because they are not forwarded to the new APto which the STA is connecting. In a real infrastructure it is possible that the access points areable to forward these packets to the next AP.
4.4 Tunnel Propagation Models
The radio propagation channel in tunnels is very different from the other channels presentin high-speed train (HST) scenarios such as viaduct, cutting, open space, etc. Conventionalchannel models are suitable for most HST scenarios, but cannot be used in tunnel scenarios[LIU+17]. In [WAN+16] a study is made of the different works in the modeling andcharacterization of the channels for HST, noting the special properties of tunnel propagationchannels.
Radio propagation in tunnels is characterized by the waveguide effect that shows upfrom certain distances. However, the propagation model depends largely on the physicalcharacteristics of the tunnel such as its dimensions, shape, and the material and roughness of thewalls. In addition, the presence of curves and underground stations, as well as the dimensionsof the train wagons, significantly modify the radio channel.
Furthermore, the location of the antennas in the tunnels and in the trains is a very importantfactor in the received signal quality. Normally, the antennas are placed on top of the wagons, asclose as possible to the front of the train to have a better line of sight with the wayside antennas.
75

4. System-Level Simulations of Communications in Transportation Systems
These antennas should be placed as far as possible from the tunnel walls [HKJ14] [SA10],although it is common to place them on the side of the tunnel to facilitate maintenance.
This high number of factors makes it very difficult to simulate radio coverage inside atunnel. For this reason, it is highly recommended to perform measurement campaigns beforea deployment [TOL15] to adjust the selected channel model and the radio propagation can bepredicted accurately.
In the literature there are many articles focused on the study of the radio channel propagationmodel in tunnels (see [HKJ14; FOR+13; LIU+17] and their references). Most of themfocus on the frequencies commonly used in standards such as Global System for MobileCommunications (GSM), Universal Mobile Telecommunications System (UMTS), Wi-Fi andLTE. In general, channel models can be classified into two groups: deterministic and empirical.On the one hand, deterministic channel models simulate the behavior of electromagnetic wavesto predict the power and delay when they reach the receiver. These models can be based onsolving Maxwell’s equations, on analysis of the waveguide effect, or on ray tracing methods(geometric optics model). On the other hand, empirical models are based on the analysis ofmeasurements obtained in tunnels. From these collected data, they try to generalize the behaviorof the channel with mathematical expressions whose parameters depend on the scenario.
An interesting deterministic channel model is described in [SA10] because it producesrealistic results and it does not require as many calculations as other models. This workproposes a hybrid model for rectangular tunnels (known as multimode model) that enhancesthe waveguide model using the geometric optics (GO) model to calculate the contribution ofeach propagation mode. This way, this model can be used both for short and long distances,i.e., near and far propagation regions of the tunnels.
Empirical channel models are based on the results obtained in measurement campaigns.They try to explain and generalize the results by using other deterministic channel modelsor by performing a linear fitting of the measurements and providing the obtained path losscoefficients. These models usually divide the path loss curve into two or more regions andprovide the mechanisms to calculate the position of the breakpoints. Several two-slope channelmodels have been proposed [ZH97; ZHA03; BCA07; DOM+18] where they only considerthe near and far regions, while other works use more breakpoints and can combine differentdeterministic channel models [HKJ10; GUA+12; GUA+13].
Usually, the articles in the literature only consider the channel in straight sections of tunnels.In [AI+16], the additional signal loss caused by curved sections is analyzed for differentfrequencies, radius of curvature and antenna polarization. With these results it is possible tosimulate the presence of curves avoiding the need to use more complex models.
In the following subsections two channel models suitable for system level simulatorsare described. On the one hand, a deterministic channel model is developed combiningseveral models found in the literature to provide maximum flexibility when modeling a tunnelenvironment. On the other hand, a measurement based channel model is detailed bringing
76
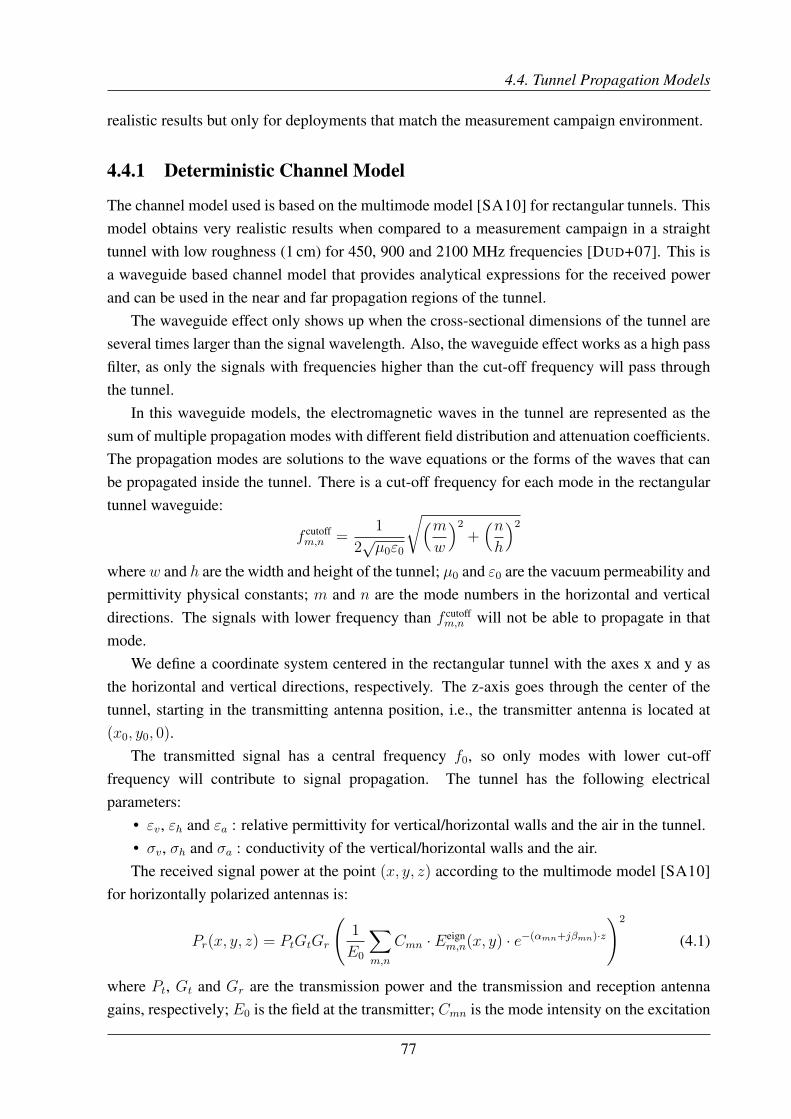
4.4. Tunnel Propagation Models
realistic results but only for deployments that match the measurement campaign environment.
4.4.1 Deterministic Channel Model
The channel model used is based on the multimode model [SA10] for rectangular tunnels. Thismodel obtains very realistic results when compared to a measurement campaign in a straighttunnel with low roughness (1 cm) for 450, 900 and 2100 MHz frequencies [DUD+07]. This isa waveguide based channel model that provides analytical expressions for the received powerand can be used in the near and far propagation regions of the tunnel.
The waveguide effect only shows up when the cross-sectional dimensions of the tunnel areseveral times larger than the signal wavelength. Also, the waveguide effect works as a high passfilter, as only the signals with frequencies higher than the cut-off frequency will pass throughthe tunnel.
In this waveguide models, the electromagnetic waves in the tunnel are represented as thesum of multiple propagation modes with different field distribution and attenuation coefficients.The propagation modes are solutions to the wave equations or the forms of the waves that canbe propagated inside the tunnel. There is a cut-off frequency for each mode in the rectangulartunnel waveguide:
f cutoffm,n =
1
2√µ0ε0
√(mw
)2+(nh
)2where w and h are the width and height of the tunnel; µ0 and ε0 are the vacuum permeability andpermittivity physical constants; m and n are the mode numbers in the horizontal and verticaldirections. The signals with lower frequency than f cutoff
m,n will not be able to propagate in thatmode.
We define a coordinate system centered in the rectangular tunnel with the axes x and y asthe horizontal and vertical directions, respectively. The z-axis goes through the center of thetunnel, starting in the transmitting antenna position, i.e., the transmitter antenna is located at(x0, y0, 0).
The transmitted signal has a central frequency f0, so only modes with lower cut-offfrequency will contribute to signal propagation. The tunnel has the following electricalparameters:
• εv, εh and εa : relative permittivity for vertical/horizontal walls and the air in the tunnel.• σv, σh and σa : conductivity of the vertical/horizontal walls and the air.The received signal power at the point (x, y, z) according to the multimode model [SA10]
for horizontally polarized antennas is:
Pr(x, y, z) = PtGtGr
(1
E0
∑m,n
Cmn · Eeignm,n(x, y) · e−(αmn+jβmn)·z
)2
(4.1)
where Pt, Gt and Gr are the transmission power and the transmission and reception antennagains, respectively; E0 is the field at the transmitter; Cmn is the mode intensity on the excitation
77

4. System-Level Simulations of Communications in Transportation Systems
plane; Eeignm,n is the field distribution of each mode; αmn and βmn are the attenuation and phase
shift coefficients. The results for vertically polarized antennas can be obtained by simplyswapping the x and y axes.
Eeignm,n can be approximated in the form of eigenfunctions:
Eeignm,n(x, y) = sin
(mπ
wx+ ϕx
)cos(nπ
hy + ϕy
)where ϕx = (m mod 2)π/2 and ϕy = (n+ 1 mod 2)π/2.
The αmn and βmn coefficients are obtained with the expressions:
αmn =2
w
(mπ
wk
)2Re
kv√kv − 1
+2
h
(nπhk
)2Re
1√kh − 1
βmn =
√k2 −
(mπ
w
)2−(nπ
h
)2where the constant k is the wave number in the tunnel space obtained as k = 2πf0
√µ0ε0εa.
kv and kh are the relative electrical parameters for vertical and horizontal tunnel walls and areobtained as:
kv = kv/ka kv = ε0εv +σv
j2πf0
kh = kh/ka kh = ε0εh +σh
j2πf0
ka = ε0εa +σa
j2πf0
To obtain Cmn, the mode intensity on the excitation plane, a field analysis with the GOmodel is performed in [SA10] and the sum of rays is converted to the sum of modes. The finalexpression is:
Cmn =4E0π
wh√
1−(mπwk
)2 − (nπhk
)2Eeignm,n(x0, y0)
Note that since this expression is plugged in Eq. (4.1), the E0 constant can be ignored.This model can also be applied to tunnels with different cross sections by calculating the
equivalent rectangular tunnel. Given a tunnel with an arched cross section with radius a andflat base L, there are several methods that obtain the equivalent rectangular tunnel dimensions(width w and height h). A simple method or “rule of thumb” is described in [BCA07]:
w = L
h =√4a2 − w2
However, we use the method proposed in [MAH10; EME17] that uses perturbation theory toensure that the behavior of the first modes is very similar in the original and equivalent tunnels.
78
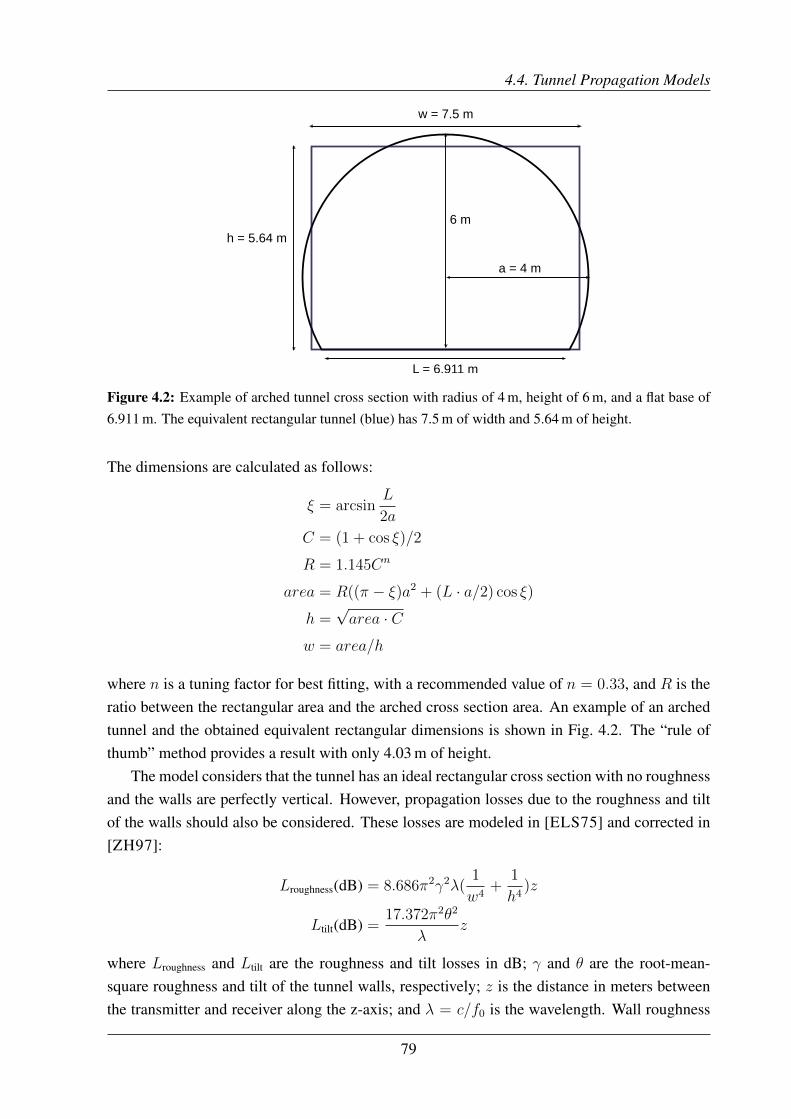
4.4. Tunnel Propagation Models
L = 6.911 m
a = 4 m
6 m
h = 5.64 m
w = 7.5 m
Figure 4.2: Example of arched tunnel cross section with radius of 4 m, height of 6 m, and a flat base of6.911 m. The equivalent rectangular tunnel (blue) has 7.5 m of width and 5.64 m of height.
The dimensions are calculated as follows:
ξ = arcsinL
2a
C = (1 + cos ξ)/2
R = 1.145Cn
area = R((π − ξ)a2 + (L · a/2) cos ξ)h =
√area · C
w = area/h
where n is a tuning factor for best fitting, with a recommended value of n = 0.33, and R is theratio between the rectangular area and the arched cross section area. An example of an archedtunnel and the obtained equivalent rectangular dimensions is shown in Fig. 4.2. The “rule ofthumb” method provides a result with only 4.03 m of height.
The model considers that the tunnel has an ideal rectangular cross section with no roughnessand the walls are perfectly vertical. However, propagation losses due to the roughness and tiltof the walls should also be considered. These losses are modeled in [ELS75] and corrected in[ZH97]:
Lroughness(dB) = 8.686π2γ2λ(1
w4+
1
h4)z
Ltilt(dB) =17.372π2θ2
λz
where Lroughness and Ltilt are the roughness and tilt losses in dB; γ and θ are the root-mean-square roughness and tilt of the tunnel walls, respectively; z is the distance in meters betweenthe transmitter and receiver along the z-axis; and λ = c/f0 is the wavelength. Wall roughness
79
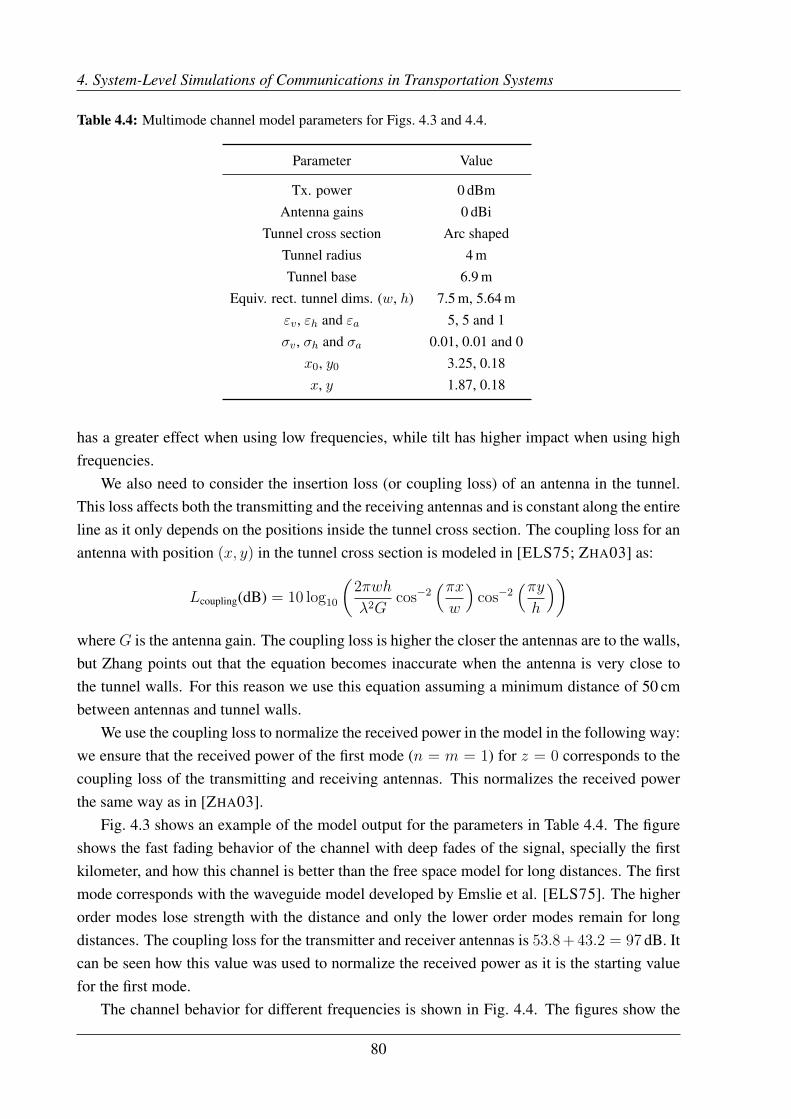
4. System-Level Simulations of Communications in Transportation Systems
Table 4.4: Multimode channel model parameters for Figs. 4.3 and 4.4.
Parameter Value
Tx. power 0 dBmAntenna gains 0 dBi
Tunnel cross section Arc shapedTunnel radius 4 mTunnel base 6.9 m
Equiv. rect. tunnel dims. (w, h) 7.5 m, 5.64 mεv, εh and εa 5, 5 and 1σv, σh and σa 0.01, 0.01 and 0
x0, y0 3.25, 0.18x, y 1.87, 0.18
has a greater effect when using low frequencies, while tilt has higher impact when using highfrequencies.
We also need to consider the insertion loss (or coupling loss) of an antenna in the tunnel.This loss affects both the transmitting and the receiving antennas and is constant along the entireline as it only depends on the positions inside the tunnel cross section. The coupling loss for anantenna with position (x, y) in the tunnel cross section is modeled in [ELS75; ZHA03] as:
Lcoupling(dB) = 10 log10
(2πwh
λ2Gcos−2
(πxw
)cos−2
(πyh
))where G is the antenna gain. The coupling loss is higher the closer the antennas are to the walls,but Zhang points out that the equation becomes inaccurate when the antenna is very close tothe tunnel walls. For this reason we use this equation assuming a minimum distance of 50 cmbetween antennas and tunnel walls.
We use the coupling loss to normalize the received power in the model in the following way:we ensure that the received power of the first mode (n = m = 1) for z = 0 corresponds to thecoupling loss of the transmitting and receiving antennas. This normalizes the received powerthe same way as in [ZHA03].
Fig. 4.3 shows an example of the model output for the parameters in Table 4.4. The figureshows the fast fading behavior of the channel with deep fades of the signal, specially the firstkilometer, and how this channel is better than the free space model for long distances. The firstmode corresponds with the waveguide model developed by Emslie et al. [ELS75]. The higherorder modes lose strength with the distance and only the lower order modes remain for longdistances. The coupling loss for the transmitter and receiver antennas is 53.8+43.2 = 97 dB. Itcan be seen how this value was used to normalize the received power as it is the starting valuefor the first mode.
The channel behavior for different frequencies is shown in Fig. 4.4. The figures show the
80

4.4. Tunnel Propagation Models
Figure 4.3: Received power with the multimode channel model using horizontally polarized antennasand central frequency 1869.9 MHz. The remaining parameters are shown in Table 4.4. The free-spacepath loss channel L(dB) = 20 log10(4πz/λ) is also plotted as a reference.
effect of the roughness and tilt loss. In these examples, the roughness loss is almost unnoticeablewhile the tilt loss is notable, specially for long distances and high frequencies.
This channel model can be enhanced by taking into account the curves of the track andtheir impact on the channel. The model proposed in [AI+16] is very useful for this purpose asit provides the additional propagation loss in a curve regarding the expected received powerin the straight tunnel. They study the measurements obtained in different curved sectionsof tunnels and compare them with ray tracing simulations of the straight tunnels, ensuringthat their simulations provide realistic results for both the straight and curved sections of thetunnels. This extra propagation loss model only requires the knowledge of the curve radius, thesignal frequency, the polarization of the antennas, and the tunnel cross section type. With theseparameters, the model provides the extra loss of the curve in decibels per 100 m. For example,for a 300 m radius curve this model indicates that there is an extra loss of 5.5 dB/100 m for1869.9 MHz and 6.6 dB/100 m for 5.5 GHz.
Finally, the channel is also affected by changes in the slope of the tunnel, but no model hasbeen found in the literature that takes these changes into account. Therefore, these variationshave been modeled as curves using the previous extra loss model [AI+16]. All slope changesare considered to be curves with a radius of 500 m, allowing to calculate the size of theattenuated tunnel section.
4.4.2 Channel Model Based on Measurements
In this subsection we develop a simplified channel model suitable to perform LTE systemlevel simulations from a previous measurement campaign [DOM+18]. Such a measurement
81
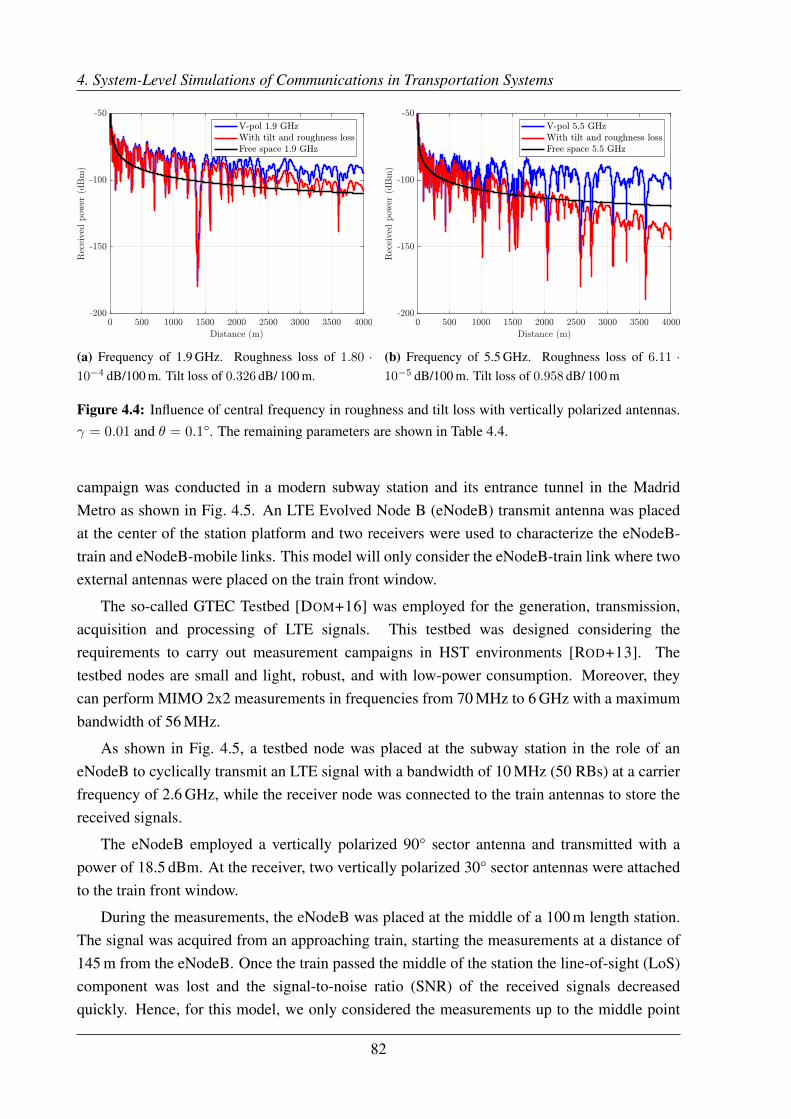
4. System-Level Simulations of Communications in Transportation Systems
(a) Frequency of 1.9 GHz. Roughness loss of 1.80 ·10−4 dB/100 m. Tilt loss of 0.326 dB/ 100 m.
(b) Frequency of 5.5 GHz. Roughness loss of 6.11 ·10−5 dB/100 m. Tilt loss of 0.958 dB/ 100 m
Figure 4.4: Influence of central frequency in roughness and tilt loss with vertically polarized antennas.γ = 0.01 and θ = 0.1°. The remaining parameters are shown in Table 4.4.
campaign was conducted in a modern subway station and its entrance tunnel in the MadridMetro as shown in Fig. 4.5. An LTE Evolved Node B (eNodeB) transmit antenna was placedat the center of the station platform and two receivers were used to characterize the eNodeB-train and eNodeB-mobile links. This model will only consider the eNodeB-train link where twoexternal antennas were placed on the train front window.
The so-called GTEC Testbed [DOM+16] was employed for the generation, transmission,acquisition and processing of LTE signals. This testbed was designed considering therequirements to carry out measurement campaigns in HST environments [ROD+13]. Thetestbed nodes are small and light, robust, and with low-power consumption. Moreover, theycan perform MIMO 2x2 measurements in frequencies from 70 MHz to 6 GHz with a maximumbandwidth of 56 MHz.
As shown in Fig. 4.5, a testbed node was placed at the subway station in the role of aneNodeB to cyclically transmit an LTE signal with a bandwidth of 10 MHz (50 RBs) at a carrierfrequency of 2.6 GHz, while the receiver node was connected to the train antennas to store thereceived signals.
The eNodeB employed a vertically polarized 90° sector antenna and transmitted with apower of 18.5 dBm. At the receiver, two vertically polarized 30° sector antennas were attachedto the train front window.
During the measurements, the eNodeB was placed at the middle of a 100 m length station.The signal was acquired from an approaching train, starting the measurements at a distance of145 m from the eNodeB. Once the train passed the middle of the station the line-of-sight (LoS)component was lost and the signal-to-noise ratio (SNR) of the received signals decreasedquickly. Hence, for this model, we only considered the measurements up to the middle point
82

4.4. Tunnel Propagation Models
TX
Station
MeasurementsStarting point(Train antennas)
55m100m
7.5m
MeasurementsEnd point(Train antennas)
16m
80m
®
0255075100125150175 -25 -50
Brakingpoint
Position of the antennas with respect to the starting point [m]
35m
1 mTrain receiveantennas 1 & 2
Mobile receiveantennas 1 & 2
v
Figure 4.5: Schematic of the measurement scenario at “La Almudena” subway station, Madrid Metro,Spain. Reprinted from Domínguez-Bolaño et al., “Measurement-Based Characterization of Train-to-Infrastructure 2.6 GHz Propagation Channel in a Modern Subway Station”, ©2018 IEEE.
of the station. The considered measurement trajectory can be divided into a tunnel section of90 m, and a station section of 55 m.
By only using the measurements from tunnel and station sections, we are assuming that thetrain antennas are bidirectional, i.e., they receive the signal from the front and rear with thesame strength, and there is no SNR loss when the train passes in front of the eNodeB.
From the measurement campaign results, we obtained a path loss model and a fadingmodel suitable for the system level simulator. These models focus on the simulation of LTEdeployments and only depend on the distance between the eNodeB and the UE. Also, tosimulate FDD transmissions, we need to consider different channel realizations for the DL andUL, as the UL carrier frequency is different from that of the DL. In the measurement campaign,the same carrier frequency was used for both receive antennas. Thus, we decided to use themeasurements from antenna 1 for the DL and those from antenna 2 for the UL.
4.4.2.1 Path Loss Model
The signal propagation characteristics change when the train moves from the tunnel to thestation. Hence, in the previous work [DOM+18], a log-distance path loss model with twobreakpoints was proposed. Note that for obtaining this model, the impact of the antennaradiation patterns was not removed from the measurements. The proposed model is definedas:
PL(d) =
{b1 + 10γ1 log10(d), d0 ≤ d ≤ d1 (station)b2 + 10γ2 log10(d), d1 ≤ d (tunnel),
(4.2)
where d0 is the distance from the eNodeB to the starting point of the measurements, d1 is theestimated distance where the propagation characteristics change. For the station and the tunnelsection, respectively, b1 and b2 are the intercepts, and γ1 and γ2 are the path loss exponents. The
83

4. System-Level Simulations of Communications in Transportation Systems
Table 4.5: Path loss estimated parameters using Eq. (4.2).
Antenna γ1 γ2 b1 b2 d1
1 -0.709 1.773 79.905 41.816 34.2702 -0.329 2.037 74.801 36.433 41.865
Distance (m)
20 40 60 80 100 120 140
Pow
er(dBm)
-70
-65
-60
-55
-50
-45
Received power - ant. 1Received power - ant. 2Path loss model - ant. 1Path loss model - ant. 2
Figure 4.6: Received signal power (smoothed) vs distance and the corresponding path loss modelestimation.
path loss exponents, the intercepts, and the distance d1 are estimated jointly by a least-squaresfitting.
The results obtained are shown in Table 4.5. Note that in this scenario the receive powerdoes not only depends on the distance, but also on the relative angles of the transmit and receiveantennas due to the directivity of the antennas used. Because of this, the estimated values ford1 (34.270 and 41.865 m) does not match the actual distance to the tunnel (55 m).
Fig. 4.6 shows the received power at each antenna and the estimated path loss model appliedto the transmit power. Note that the path loss exponents are negative in the first section due to thedirectivity of the receive antennas and their relative angles with respect to the transmit antenna.
The log-distance path loss propagation model can be implemented in the ns-3simulator configuring the ThreeLogDistancePropagationLossModel path loss
84

4.4. Tunnel Propagation Models
Table 4.6: Path loss model configuration using Eq. (4.3).
Antenna L0 d0 d1 d2 n0 n1 n2
1 90.78 0.0292 34.27 ∞ -0.709 1.773 -2 80.14 0.0239 41.87 ∞ -0.329 2.037 -
model [PRO21], which is defined with respect to the distance d as follows:
PL(d) =
0 d < d0
L0 + 10n0 log10(dd0) d0 ≤ d < d1
L0 + β1,0 + 10n1 log10(dd1) d1 ≤ d < d2
L0 + β1,0 + β2,1 + 10n2 log10(dd2) d2 ≤ d,
(4.3)
where βi,j = 10nj log10(di/dj); d0, d1 and d2 are the distance fields; n0, n1 and n2 are thepath loss exponents; and L0 is the path loss at d0. This formulation is slightly different and theparameters in Table 4.5 had to be adapted. The converted parameters are shown in Table 4.6.
4.4.2.2 Fading Model
The ns-3 simulator includes a fading model based on traces of PSD values with RB granularity.This model was modified so that it does not depend on simulation time but on the distancebetween transmitter and receiver. The channel traces are extracted from the recorded data andare processed to remove the large-scale fading (i.e., the path loss term), hence the average powerof the traces is one for all the path traveled by the train. This way, the path loss model can beapplied to these traces during simulation. Fig. 4.7 shows the processed traces for the antenna 1.The fades in the signal are more deep in the time than in the frequency dimension.
In the measurement campaign, data for the tunnel environment was acquired only for the lastpart of the tunnel environment, before entering the station, with a maximum distance of 145 m.We need to extend these traces to perform simulations with trains that are farther away in thetunnel. In order to do so, we follow a simple approach: when the distance between the UE andthe eNodeB exceeds the maximum distance in the measurement data, we repeat cyclically thetraces of the initial 55 m of the tunnel section. This repetition is performed reading in reverseorder the traces to avoid introducing discontinuities. Note that, as explained before, a path lossdepending on the distance is still applied.
Fig. 4.8 shows the DL SINR for an UE moving from an eNodeB station to another andperforming a handover. The combined path loss and fading effects can be seen with the eNodeBtransmit power being fixed at 18.5 dBm. Also, the noise figure of the receiver is set to 2.07 dBto match the results obtained in the measurements. Notice that the UL SINR results would bedifferent as the power control mechanism would allow for changing the transmit power between-40 and 23 dBm.
85

4. System-Level Simulations of Communications in Transportation Systems
Figure 4.7: Channel PSD with the path loss model removed for antenna 1.
Time (s)
10 20 30 40 50 60 70
SIN
R(dB)
15
20
25
30
35
40
45
50
55
60
Figure 4.8: DL SINR versus time for an UE performing a handover. Blue and red lines represent theSINR for the first and second eNodeBs, respectively. The distance travelled by the UE is 1130 m.
86

4.5. LTE Three-Stations Deployment
SGW/PGWCentral server
eNB 2
UE 3UE 1UE 4 UE 2
eNB 1 eNB 3
Sta�on 1 Sta�on 2 Sta�on 3
1004 m100 m 1422 m
7.5 m 4.5 m
Figure 4.9: Stations and LTE deployment with the trains placed at their initial positions.
4.5 LTE Three-Stations Deployment
In this section, we consider a scenario to test the measurement based channel model ofSection 4.4.2 with a 10 MHz FDD LTE deployment. The scenario has three identical andconsecutive subway stations with a separation of 1104 and 1522 m, respectively. These areapproximately the distances between “La Almudena” station of the Madrid Metro (where themeasurement campaign was conducted [DOM+18]) and the adjacent stations “La Elipa” and“Alsacia”. We consider the same transmitter setup for all the stations, with the eNodeBs locatedat the center of each platform and connected between them through an X2 interface to allowthe handover process. A central server is connected to the simulated packet data networkgateway (PGW) node of the EPC with a point-to-point connection at 100 Gbit/s and withoutdelay. This central server will send all the DL packets and receive the UL packets.
Fig. 4.9 shows the stations and LTE deployment. Four trains and two parallel tracks areconsidered in the simulation scenario. Two trains move on one track departing from the firstand second stations. The other two move on the other track in opposite direction departing fromthe second and third stations. This way, the second station will have two trains leaving and twotrains arriving.
We model a train trip by setting waypoints at different positions with a given velocity, i.e.,train acceleration is constant between two waypoints. Each train performs the following stepsto travel between stations:
• The train starts from the station and accelerates to a speed of 19.44 m/s (≈ 70 km/h).• The speed is maintained until the train approaches the destination station.• The train decelerates to 5.55 m/s (≈ 20 km/h).• Inside the station, the train maintains the speed before stopping at the end of the station.
A constant acceleration of 1 m/s2 is considered between waypoints regardless of whetherthe train accelerates or brakes.
87
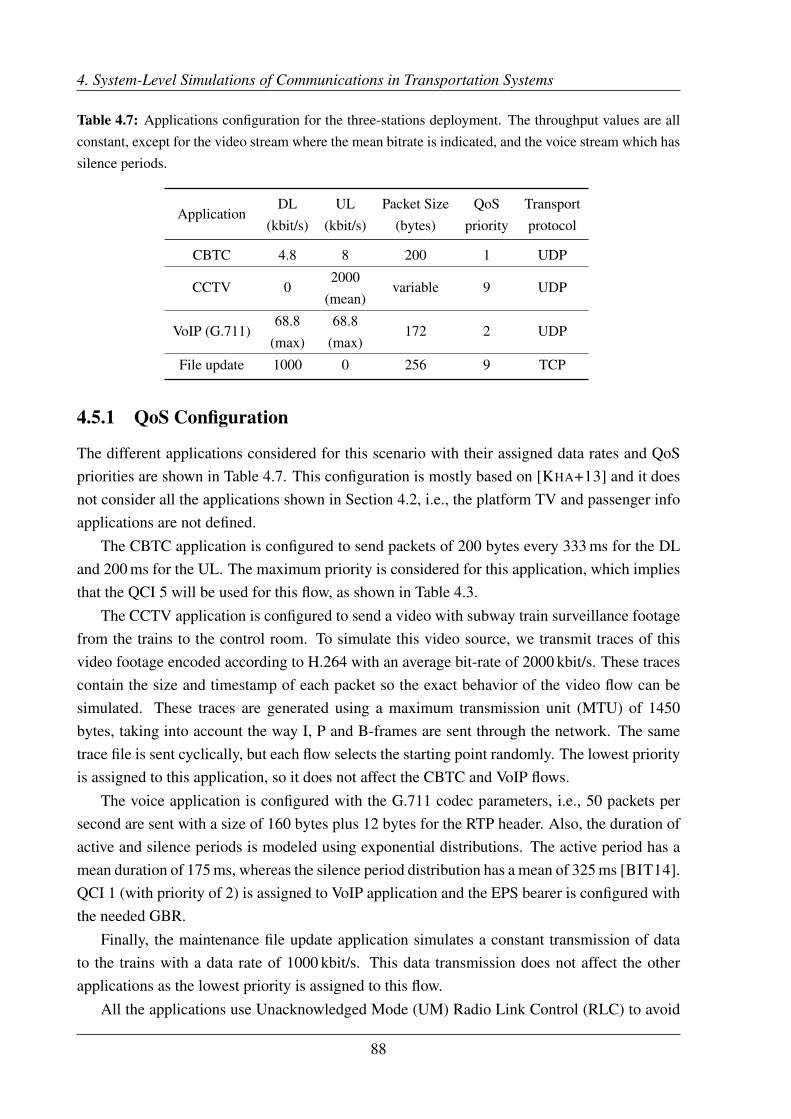
4. System-Level Simulations of Communications in Transportation Systems
Table 4.7: Applications configuration for the three-stations deployment. The throughput values are allconstant, except for the video stream where the mean bitrate is indicated, and the voice stream which hassilence periods.
ApplicationDL
(kbit/s)UL
(kbit/s)Packet Size
(bytes)QoS
priorityTransportprotocol
CBTC 4.8 8 200 1 UDP
CCTV 02000
(mean)variable 9 UDP
VoIP (G.711)68.8
(max)68.8
(max)172 2 UDP
File update 1000 0 256 9 TCP
4.5.1 QoS Configuration
The different applications considered for this scenario with their assigned data rates and QoSpriorities are shown in Table 4.7. This configuration is mostly based on [KHA+13] and it doesnot consider all the applications shown in Section 4.2, i.e., the platform TV and passenger infoapplications are not defined.
The CBTC application is configured to send packets of 200 bytes every 333 ms for the DLand 200 ms for the UL. The maximum priority is considered for this application, which impliesthat the QCI 5 will be used for this flow, as shown in Table 4.3.
The CCTV application is configured to send a video with subway train surveillance footagefrom the trains to the control room. To simulate this video source, we transmit traces of thisvideo footage encoded according to H.264 with an average bit-rate of 2000 kbit/s. These tracescontain the size and timestamp of each packet so the exact behavior of the video flow can besimulated. These traces are generated using a maximum transmission unit (MTU) of 1450bytes, taking into account the way I, P and B-frames are sent through the network. The sametrace file is sent cyclically, but each flow selects the starting point randomly. The lowest priorityis assigned to this application, so it does not affect the CBTC and VoIP flows.
The voice application is configured with the G.711 codec parameters, i.e., 50 packets persecond are sent with a size of 160 bytes plus 12 bytes for the RTP header. Also, the duration ofactive and silence periods is modeled using exponential distributions. The active period has amean duration of 175 ms, whereas the silence period distribution has a mean of 325 ms [BIT14].QCI 1 (with priority of 2) is assigned to VoIP application and the EPS bearer is configured withthe needed GBR.
Finally, the maintenance file update application simulates a constant transmission of datato the trains with a data rate of 1000 kbit/s. This data transmission does not affect the otherapplications as the lowest priority is assigned to this flow.
All the applications use Unacknowledged Mode (UM) Radio Link Control (RLC) to avoid
88

4.5. LTE Three-Stations Deployment
the use of the automatic repeat request (ARQ) mechanism. However, hybrid automatic repeatrequest (HARQ) was enabled for all the transmissions as it only adds a delay of 24 ms in theworst case. Also, the RLC-UM buffer size was set to 1 MiB to avoid packet drops in thesimulations.
4.5.2 Frequency Reuse
As shown in Fig. 4.8, there is a high channel variability in the tunnel, even when the receiveris very far away from the eNodeB. Hence, the UEs may receive very high interference fromvicinity stations, degrading its SINR and increasing the probability of undesired handovers.Also, the eNodeB will see the interference of the UEs at cell edge. Therefore, using Inter-CellInterference Coordination (ICIC) techniques is required to mitigate these problems.
We considered the Hard Frequency Reuse ICIC technique for this scenario, which is alreadyimplemented in the ns-3 simulator. This is the technique that best reduces the interferencebetween eNodeBs and UEs at the expense of a reduced bandwidth. This technique splits thebandwidth in sub-bands and assigns each sub-band to a cell, so transmissions in each cell onlyuse the assigned sub-band. In our case, the 50 RBs are divided into sub-bands of 16, 16 and 18RBs that are used by the first, second and third eNodeBs, respectively.
However, even with this technique, there is a residual interference affecting the DL signal, assome LTE physical channels have to be transmitted at fixed frequency positions. When the UEsare at the cell edge, we found that the Physical Control Format Indicator Channel (PCFICH)and Physical Downlink Control Channel (PDCCH) signals could not be decoded due to the highinterference of the eNodeBs in several subframes. The loss of these control channels causes thatthe complete subframe in the DL transmission is lost. In addition, the scheduling informationfor an oncoming UL subframe is also lost.
4.5.3 Handover Customization
The LTE handover process is controlled by the source eNodeB and assisted by the UE, whichsends measurement reports to the source eNodeB to decide whether a handover should beperformed. Large SNR variations at the cell edges, as those shown in Fig. 4.8, can provokeping-pong handovers as the conditions for the handover can be met too often, yielding multiplehandovers instead of a single one. We have decided to use the Strongest cell handover algorithmimplemented in the ns-3 LTE module, which is based on [DIM+09]. This algorithm has thefollowing parameters that help to avoid ping-pong handovers:
• Hysteresis: The difference in dB between the Reference Signal Received Power (RSRP)of the source and destination cells. We use the default value of 3 dB.
• Time-to-trigger: The hysteresis condition should be satisfied during this time before thehandover is triggered. We increased the default value from 256 ms to 640 ms.
89

4. System-Level Simulations of Communications in Transportation Systems
A high time-to-trigger parameter helps to avoid the ping-pong handovers but delays thehandover process. If the handover is delayed too long, a radio link failure can be triggered,increasing the delay of the handover process and the probability of packet loss [ZHA+12]. Weincremented the time-to-trigger value as it was required to avoid the ping-pong handovers butalso avoiding radio link failures in all the simulations.
4.5.4 Simulation Results
The duration of the simulations is 110 s, which gives enough time to the trains to reach the nextstation and start the trip to the next one. The trains travel a total distance of about 1300 m or1510 m, depending on their route.
The transmit power of the eNodeBs was set to 18.5 dBm and the noise figure of both theeNodeBs and UEs was set to 2.07 dB to match the configuration of the measurement campaigndescribed in the Section 4.4.2.
4.5.4.1 Throughput
We performed a simulation to obtain the achievable throughput of each UE over time. Weconfigured two custom traffic sources for each UE to saturate both the DL and UL with packetsizes of 1000 bytes. The applications in Table 4.7 were not configured.
Fig. 4.10 shows the results of this throughput simulation. UEs 1 and 2 start with thecomplete bandwidth of their cells to end the simulation sharing the second cell. The oppositehappens to UEs 3 and 4. This behavior can be seen more clearly in the DL figure as the ULis using the power control mechanism which strives to adapt the transmission power to the fastfading channel. We can see how the PF scheduler in the second cell is assigning the resources tothe UEs in a fair way. Also, the differences in the peak throughput are explained by the unequaldivision of RBs between the cells, as explained in Section 4.5.2.
The average PER obtained in the simulation is 1.1 · 10−2 for the DL and 2.5 · 10−4 for theUL. This difference is a consequence of the interference problems in the DL control channels,which can be mitigated with the enhanced PDCCH (ePDCCH) channel used in LTE-Advanced.This enhanced control channel is more flexible in the time-frequency allocation, allowing theeNBs to coordinate between them and minimize the interference in this channel.
4.5.4.2 Packet Delay
This simulation uses the configuration shown in Table 4.7. Fifty runs of the simulation wereperformed with different random seeds to obtain averaged results. This modifies the behavior ofthe traffic sources for each run. Also, the distances between the stations and the initial positionsof the trains are also modified by a random offset of ±10 m, i.e., an U(−10, 10) distributionis used to modify the positions. This is needed as the channel model is deterministic and only
90

4.5. LTE Three-Stations Deployment
Time (s)
0 20 40 60 80 100
Throughput(M
bit/s)
2
4
6
8
10
12
14
UE 1UE 2UE 3UE 4
(a) DL throughput. (b) UL throughput.
Figure 4.10: Throughput for the different UEs for DL and UL. Smoothing of 1 second.
Delay (s)0.001 0.01 0.1 1 10
CCDF
10−7
10−6
10−5
10−4
10−3
10−2
10−1
100
CBTC ULCBTC DLPHONE ULPHONE DLCCTV ULFILE DL
Figure 4.11: CCDF of packet delay for different flows.
depends on the distance. Otherwise, the trains would experience the same channel realizationsat the same time instant in all the simulations and the interference between eNodeBs would alsobe the same.
In Fig. 4.11, the complementary cumulative distribution function (CCDF) of the packetdelay for the different flows is shown. The maximum delay for the CBTC traffic slightlyexceeds 100 ms with a probability of 10−4 and so we can consider that the delay requirementsare fulfilled. Also, VoIP traffic has a maximum delay of 200 ms with low probability. The onlyproblematic case is the CCTV traffic, which has a delay of 1 s with a probability of 10−4. Thisis because the UL channel model is more challenging than that of the DL (has a slightly higherpath loss exponent) and the data rate peak values of the CCTV flows cannot be satisfied at some
91

4. System-Level Simulations of Communications in Transportation Systems
(a) CCDF of packet delay with t-Reordering timer set to40 ms.
(b) CCDF of packet delay with control channel errorsdisabled. t-Reordering timer set to 40 ms.
Figure 4.12: CCDF of packet delay with different configurations.
time instants.Focusing on the CCDF of the CBTC DL traffic shown in Fig. 4.11, the horizontal line with a
10−2 probability indicates that no packets arrived with a delay between 11 and 111 ms, but someoutliers arrived with a delay of 111 ms. The reason for these outliers is a delay due to the packetreordering mechanism at the RLC layer. When a packet is lost and the next packet arrives, thet-Reordering timer at the RLC layer starts to wait for the lost packet as it could arrive out oforder. Only when the timer expires the packet is considered lost and the delayed packet is sentto the upper layer. In the ns-3 simulator, this timer is fixed to wait 100 ms, which explains thedelay of the outliers. In Fig. 4.12a, the CCDF of the delay is shown with this timer set to 40 ms,which is a more appropriate value for these simulations as the delay of all the prioritary flowsis reduced and the PER is not affected.
We can disable the errors in the DL control channels to simulate that the ePDCCHchannel used in LTE-Advanced is activated. Fig. 4.12b shows the delay in this case, withno errors in control channels and only errors in data channels. The delay is clearly reducedfor all the applications, being CCTV the only one that exceeds 100 ms. As explained before,the achievable throughput is not enough in some instants, specially the short periods whenthree UEs are connected to the eNB 2 at the same time. Regarding PER, this enhancementsignificantly reduces the number of lost packets, achieving an average PER of 4.20 · 10−5 forthe DL and 5.58 · 10−4 for the UL.
4.6 Complete Subway-Line Deployment
In this section we consider a complete subway-line based on the line 3 of Bilbao Metro. We usethe deterministic channel model explained in Section 4.4.1 to perform simulations considering
92

4.6. Complete Subway-Line Deployment
Figure 4.13: Simplified map of the subway line. The red arrows indicate antenna positions. Thelocations of the six stations are also shown.
Figure 4.14: Elevation of the subway line.
LTE and Wi-Fi deployments. The complete line is 8 km long with several stations, curves, andslope changes. Fig. 4.13 shows a simplified map of the line with circular curves with radiusbetween 170 and 445 m. The positions in meters of the six stations from the line starting pointare 1632, 2330, 3358, 4375, 5255 and 5770. The proposed initial deployment is also shown,with directive antennas located near emergency exits and stations, facilitating installation andmaintenance.
93

4. System-Level Simulations of Communications in Transportation Systems
We perform LTE and Wi-Fi simulations in this scenario to compare their performance. Theconsidered properties of the deployment are the following:
• Tunnel:– Smooth concrete walls with low tilt. We consider that the root-mean-square
roughness and tilt are γ = 0.01 and θ = 0.1°as in Fig. 4.4.– Arched cross section with a diameter of 8 m and a height of 6 m, as shown in
Fig. 4.2.– A simplified version of the tunnel made up of straight lines and circular curves
(Fig. 4.13) is used for the generation of the propagation channel as explained inSection 4.4.1.
– The elevation along the subway line shown in Fig. 4.14 is also considered for thepropagation channel.
• Antennas:– Tunnel antennas are assumed to be directional with 11.6 dBi and front-to-back-ratio
of 25 dB. This is assumed for both LTE and Wi-Fi deployments.– Tunnel antennas are deployed in pairs to cover both directions.– Tunnel antennas are placed 0.38 m from the walls at a height of 3 m.– Train antennas are assumed to be omnidirectional with a gain of 7.5 dBi for LTE
and 8.5 dBi for Wi-Fi.– Trains only have one antenna installed at the front.– All antennas are assumed to be configured with vertical polarization.
• Signal characteristics:– 20 MHz bandwidth for both LTE and Wi-Fi.– LTE uses the central frequencies 1774.9 MHz (UL) and 1869.9 MHz (DL).
EARFCN 1849.– Wi-Fi can use all the available 5 GHz channels.– The transmission power used in LTE and Wi-Fi is not the same due the different
regulations. In LTE we use 34 dBm of transmission power and in Wi-Fi we use20 dBm of effective isotropic radiated power (EIRP), i.e., we have to take intoaccount the antenna gains to not exceed the EIRP limit.
These parameters are the same as the used for the generation of Fig. 4.4. The only differingparameters are the transmission power and the defined antenna gains for LTE and Wi-Fi. Also,the figure does not show the propagation channel for all the central frequencies as only the LTEDL (1869.9 MHz) and the 5.5 GHz Wi-Fi channel are shown.
Fig. 4.15 shows the simulation setup with the six considered stations and ten trains. Thewayside infrastructure is not shown as it is distributed along all the line. There is a uniquecentral server that sends and receives all the DL and UL packets. The simulation starts with thetrains inside the stations, with two trains in stations 2–5 and one train in stations 1 and 6. Thetrains’ routes are simulated in the same way as in Section 4.5.
94

4.6. Complete Subway-Line Deployment
UEs 3, 5, 7, 9UE 1UEs 10, 8, 6, 4 UE 2
Sta�on 1 Sta�ons 2-5 Sta�on 6
100 m
Figure 4.15: Starting position of the trains in the simulations.
4.6.1 Channel Model for LTE Deployment
This section shows the radio propagation in the tunnel for the LTE deployment taking intoaccount the models described in Section 4.4.1. The deployment uses FDD with transmissionfrequencies 1869.9 MHz and 1774.9 MHz for the DL and UL, respectively.
The propagation channel for one wayside antenna can be easily obtained using themultimode channel model and considering the coupling loss, roughness loss and tilt loss, asshown in Fig. 4.4. Additionally, the effect of curves and slope changes are calculated for eachantenna depending on the position. This will provide us the received power from each antennaalong all the tunnel positions.
Cellular network technologies are usually deployed inside tunnels using distributed antennasystems (DASs) to ensure the coverage along all the tunnel [LIU+17; TOL15]. The usageof DASs allows for deploying cells that cover more distance, minimizing the interferencebetween them and avoiding an excessive number of handovers inside the tunnel. A DASallows for configuring several distant antennas as only one cell, transmitting the same signalin a coordinated way that minimizes the interference between antennas. More details aboutDAS usage in cellular networks can be found in [TOL15; HEJ14].
Fig. 4.16 shows the received power from wayside antennas along a segment of the tunnel.It can be seen how the signal from one antenna (red) will experience high interference from theremaining antennas (blue) if they transmit independent signals in the same frequency. If a DASis configured with these antennas, all the antennas will transmit the same signal at (nearly) thesame time. This way there will be no interference in the receiver and only an artificial multipathchannel will be perceived by the receiver. The complexity of the multipath channel will dependon the separation of the antennas and the synchronization between the antennas. So, the sizeof each configured cell in the tunnel is limited by the distance between the DAS antennas astiming issues may arise [TOL15, Chapter 11].
We assume that the transmission of the same signal by the different antennas is alwaysconstructive unless the delay exceeds the cyclic prefix (CP), which would create inter-symbolinterference. This assumption can be unrealistic in some cases as shown in [HSI+11], where a0 dB echo channel with a delay of half of the CP seriously degrades the throughput in a WiMAXsystem. However, we consider that these situations are very uncommon in this scenario and theywould further complicate the study unnecessarily.
95

4. System-Level Simulations of Communications in Transportation Systems
Figure 4.16: DL received power in a subway segment from one antenna (red). The sum of the receivedpower from the remaining antennas is shown in blue. The green arrows indicate the position of tunnelantennas. The black line indicates a curved segment.
In LTE, the normal CP length is 4.7µs although an extended CP length can be configuredwith 16.7µs. Fig. 4.17 shows the received power and interference in the line if we consider thatall the antennas are used in a DAS. The interference calculation is idealized as only signals withdelay higher than 4.7µs are considered interference. Also, a perfect DAS synchronization isassumed. The perceived interference is very low along all the line except in positions 6000 and8000, as the last three antennas pairs are too separated.
If only one cell is configured, the system capacity will be very limited and radio resourceswill be underused. Very distant trains could use the same time-frequency allocation as they willnot interfere between them but the one-cell configuration does not allow it. A better solutionthat increases the total throughput is to group the antennas into three cells using DASs . Thesethree cells will combine DAS with ICIC techniques to minimize interference in cell limits andincrease system capacity [WAN+16]. The lower size of the configured DAS will help with thepotential timing issues and the artificial multipath channel will be weaker.
The received power from each cell is shown in Fig. 4.18. Frequency reuse techniquesshould be used to mitigate the high interference in the cell edges. The central cell is smallerin size because the deployment is configured so each cell serves two subway stations. Thisconfiguration will be used in the LTE simulations.
To include this channel model in the simulator we had to implement a new propagationmodel in ns-3. This propagation model indicates to the simulator the received signal strengthfor each communication between the devices and the base stations (eNB) based on their positionon the metro line and the frequencies used. This model uses two files generated offline for eacheNB, one for the DL and other for the UL. Each file contains the propagation losses at each
96

4.6. Complete Subway-Line Deployment
Figure 4.17: DL received signal power along the line if all the antennas are part of a DAS and transmitthe same signal at the same instant (blue). The received power of the signal with a delay higher than theCP length is shown in red as it is considered interference. The green arrows indicate the position andorientation of tunnel antennas. The black lines indicate the curves.
Figure 4.18: DL received signal power from each cell along the line. DAS are used to configure threecells. The green arrows indicate the position and orientation of tunnel antennas.
97
4. System-Level Simulations of Communications in Transportation Systems
position in the tunnel and for each physical resource block (PRB). Furthermore, this modelallows for the calculation of interference between devices: on the one hand, each UE receivesthe signal from the eNB to which it is connected in addition to interference from the rest ofeNBs and, on the other hand, each eNB receives the signal from all the UEs connected to thestation and the interference generated by the UEs connected to other stations.
4.6.2 Channel Model for Wi-Fi Deployment
This section shows how radio propagation is for a Wi-Fi deployment taking into account themodels described above. The deployment to be simulated will use one access point for eachantenna deployed in the tunnel. In addition, the 5 GHz band will be used because it has agreater number of independent channels than in the 2.4 GHz band, thus reducing interference.
A significant limitation of Wi-Fi is that the transmission power allowed is quite low. TheEIRP values defined in Europe1 for the 2.4 and 5 GHz bands are:
• 2400–2483.5 MHz: 100 mW.• 5150–5250 MHz: 200 mW. Restricted to indoor.• 5250–5350 MHz: 100 mW. Restricted to indoor. DFS usage is required to avoid
interfering with radar systems.• 5470–5725 MHz: 500 mW. DFS usage is required.• 5725–5875 MHz: 25 mW. Restricted band for short range devices (ETSI EN 300 440-1).
To simplify the analysis we will assume that the transmission power of all Wi-Fi devicesis 100 mW (20 dBm). In addition, it should be noted that antenna gain also influencesEIRP calculation, forcing a reduction of the transmission power to avoid exceeding the limit.Therefore, antenna gain only increases the signal reception power but not the transmissionpower.
The simulations will use 20 MHz Wi-Fi channels to maximize the number of availablechannels and minimize the interference between APs and STAs. In addition, in the case ofWi-Fi, using channels with higher bandwidth would reduce the received signal quality becausethe same transmission power is distributed over a higher band, reducing the power transmittedby subcarrier and, therefore, the SNR. In this subway scenario we use 20 MHz channels tomaximize the coverage distance and minimize the number of APs needed. Moreover, thisconfiguration is able to provide the required throughput for the applications when a minimumSNR is guaranteed.
In contrast to LTE deployment, the low transmission power makes the initially proposedantenna deployment unfeasible. Fig. 4.19 shows the SINR obtained along the line with theantennas deployed for LTE. It can be seen that the SINR is very low at too many points alongthe line.
1https://eur-lex.europa.eu/legal-content/EN/TXT/HTML/?uri=CELEX:32005D0513&from=EN
98

4.6. Complete Subway-Line Deployment
Figure 4.19: SINR along the line in Wi-Fi deployment using the same antenna positions as in the LTEdeployment (blue). The red line is the smoothed SINR.
The noise floor used for the SINR calculation is obtained with the expression:
Pnoise(dBm) = −174 + 10 log10(BW) + NF
where BW is the signal bandwidth and NF is the receiver noise figure . This expression assumesa thermal noise of -174 dBm/Hz. The obtained noise floor for this Wi-Fi case is -93.99 dBm asthe bandwidth is 20 MHz and the receiver noise figure is 7 dB.
To ensure that the SNR does not fall below 10 dB at any point, access points should beplaced every 400 m or less. Fig. 4.20 shows the SNR for an antenna located at the beginning ofthe curve with the highest attenuation (7.65 dB per 100 m). It can be seen that the SNR is notlower than 10 dB until 200 m. If the antennas are placed at 400 m, the train could change theaccess point at 200 m to remain connected with good signal reception.
Therefore, a Wi-Fi deployment will be simulated with two directional antennas every 400 mto provide coverage of the entire line. In total there will be 38 access points on the line (19 pairsof APs) with one directional antenna each. The first AP will be at position 400 m and the lastone at position 7600 m. Every 400 m there will be two access points, each with a directionalantenna pointing in opposite directions. Fig. 4.21 shows the power received along the line withthis deployment and the interference between the access points when using 8 different Wi-Fichannels. This way the APs interfere with a separation of 1600 m allowing interference to staybelow the noise floor and obtaining an SINR higher than 10 dB for all the line.
To simulate this Wi-Fi deployment is necessary to develop a new propagation model in ns-3. This new propagation model takes into account the Wi-Fi channel used and the distancebetween the devices. It uses a file for each Wi-Fi channel containing the propagation loss as afunction of the distance. The model also calculates propagation losses due to curves and slope
99

4. System-Level Simulations of Communications in Transportation Systems
Figure 4.20: SNR vs. distance for a Wi-Fi signal in the curve with the highest attenuation.
Figure 4.21: Reception power for a Wi-Fi deployment with APs every 400 m configured to use eightdifferent Wi-Fi channels. The received power is shown in different colors depending on the used channel.The interference between APs is shown in red. The -93.99 dBm noise floor is represented with thegreen horizontal line. The black and green lines at the top indicate the curves and the APs positions,respectively.
100

4.6. Complete Subway-Line Deployment
Table 4.8: Applications configuration for the complete subway-line deployment. The throughput valuesare all constant, except for the video streams where the mean bitrate is indicated, and the voice streamwhere the active period bitrate is shown.
ApplicationDL
(kbit/s)UL
(kbit/s)Packet Size
(bytes)QoS
priorityTransportprotocol
CBTC 100 100 200 Very high UDP
CCTV 06 ×1000(mean)
variable Best effort UDP
Platform TV2 ×1000(mean)
0 variable Best effort UDP
VoIP (G.711)68.8
(max)68.8
(max)172 High UDP
Maintenance 200 200 200 Best effort UDP
Passenger info 100 0 256 Best effort UDP
changes, taking into account the positions of the devices within the line. This calculation isperformed in simulation time and is necessary because the files only depend on the distance andnot on the position of the devices in the subway line.
Finally, the wayside antennas were configured in the simulator with a radiation pattern thatapplies the considered front-to-back-ratio of 25 dB.
4.6.3 QoS Configuration
The different applications considered for this scenario with their assigned data rates and QoSpriorities are shown in Table 4.8. This configuration considers all the applications analyzedin Section 4.2. The selected data rates are based on Table 4.1, resulting in a more demandingconfiguration in terms of throughput with respect to the configuration used in the three-stationsdeployment (Table 4.7). The total throughput required for each train is 2.47 Mbit/s for the DLand 6.37 Mbit/s for the UL, not taking into account the overhead caused by the headers of thedifferent protocols.
All the applications are simulated using UDP as transport protocol. This allows us tocalculate the packet loss in each application more easily. Although, another protocol such asTCP may be used in real implementations.
The CBTC application is configured to send packets of 200 bytes every 16 ms, for both ULand DL.
Each video stream sent by the CCTV and platform TV applications is generated using avideo file trace with an average bitrate of 1 Mbit/s. The throughput requirements of the videochanges with time as the bitrate fluctuates between 0.4 Mbit/s and 1.7 Mbit/s. The CCTVapplication sends six video streams while the platform TV application sends two. The video
101

4. System-Level Simulations of Communications in Transportation Systems
traces are generated the same way as in Section 4.5.1.
The voice application is configured with the G.711 codec parameters, the same way as inSection 4.5.1, with the same active and silence periods.
The maintenance application has a data rate of 200 kbit/s in DL and UL for telemetry tasksand does not include the file update service. The passenger information application has a lowbitrate to support the PIS and the public announcement service.
Regarding the QoS, it has been decided to give priority to CBTC and VoIP traffic, leavingthe rest of the services with best effort priority. This ensures that these two applications have theminimum delay. Video streams could be given a slightly higher priority, but this could seriouslyimpact the remaining applications due to the high throughput requirements of video streams.
In the LTE case, these priorities are mapped into the QoS classes shown in Table 4.3. CBTCtraffic is assigned to the class with the highest priority (QCI 5 “IMS signaling”). VoIP traffic isassigned to the next class in priority (QCI 1 “conversational voice”). All other applications usethe default best effort class with the lowest priority (QCI 9).
For Wi-Fi, priorities are mapped onto the access categories defined in IEEE 802.11e. CBTCand VoIP will use the voice category (AC_VO), which has the highest priority and lowest delay.The remaining applications will use the best effort category (AC_BE).
4.6.4 LTE Simulations
The ns-3 simulator provides a highly detailed simulation of the behavior of an LTE network.However, there are certain features of LTE-Advanced systems that cannot be simulated suchas the ePDCCH. The PDCCH is a channel that contains the control information needed todecode the rest of the data for each subframe. In the first LTE releases, this channel is alwaystransmitted in the same time slots and at the same frequencies, causing quite a lot of interferencebetween cells. The ePDCCH is more flexible and allows for minimizing the interference on thiscritical data between the different stations. In order to simulate this expected behavior in a realsystem, errors in the control data have been disabled, so it is assumed that base stations willcoordinate to avoid interference in these data.
As explained in Section 4.6.1, the LTE deployment is configured with three eNBs, eachone using a DAS to connect to all its assigned antennas. The three cells cover the subwayline positions 0–3000, 3000–4600 and 4600–8000, respectively. This way, each eNB providescoverage to two metro stations.
As in the three-stations deployment, all the applications use UM RLC to avoid the use ofthe ARQ mechanism, but HARQ is enabled for all the flows.
The eNBs transmit with a power of 34 dBm. UEs use power control and their transmit powerranges between -40 dBm and 23 dBm. The default value for the noise figure is used, so 5 dBand 9 dB are considered for the eNBs and UEs, respectively.
LTE is designed to use a frequency reuse factor of one, i.e., all the cells (or sectors) use
102

4.6. Complete Subway-Line Deployment
the same carrier frequency to maximize the usage of spectral resources. This design requiresthe use of ICIC techniques such as fractional frequency reuse (FFR), where each cell uses asubset of all the available subchannels to communicate with some users (usually the cell-edgeusers). The simulator also allows for the use of different FFR mechanisms explained in the ns-3documentation2. We will perform simulations with three FFR configurations: FFR disabled(NoFR), hard frequency reuse (HFR), and a custom dynamic FFR scheme (DFR):
NoFR FFR is disabled. The three cells are allowed to use all the available spectrum.HFR The hard FFR method distributes the usable spectrum in several sub-bands which are
assigned exclusively to each cell. This way, there is no interference between adjacentcells. This method was also used in the three-stations deployment (Section 4.5.2).
DFR This is a custom FFR method based on the soft frequency reuse (SFR) algorithm. Theprevious methods are static, as the spectrum sharing does not change with time. Thisscheme is dynamic as it adjusts the sub-band size of each cell depending on the numberof users in the cell. The number of assigned RBs per user is configured depending onthe QoS needs and the total number of UEs (which are fixed in our use case). This way,when a UE performs handover, the cells adapt their used sub-band to provide enoughbandwidth for the users, trying to avoid interference with other cells. Like in other FFRmethods, the UEs are also classified into cell-center or cell-edge. This way, the UEs nearthe cell center are allowed to transmit in all the assigned sub-band, but the cell-edge UEsare restricted to use a smaller sub-band to avoid interference in the cell edge. Moreover,different power levels can be used to communicate with cell-center or cell-edge UEs. UEmeasurements are used to classify the UEs into cell-center or cell-edge. In our case, weonly use the Reference Signal Received Quality (RSRQ) measurement.
The HFR method is already implemented in ns-3 for a cellular deployment with reuse factorof 3. Given the unusual cell placement in the tunnel, we adapted this algorithm to use a reusefactor of 2, so more bandwidth can be used by each cell. This way, the first and last cell canuse the same sub-bands since they are far away from each other and the interference is very low(see Fig. 4.18). The DFR algorithm was also customized to define only two sub-bands.
4.6.4.1 Throughput and PER with One Train
These first simulations allow us to obtain the PER and the throughput under ideal conditions,with only one train leaving from the first station.
To obtain the throughput, a single traffic flow is transmitted in each direction (DL, UL)with 80 Mbit/s and a packet size of 1000 bytes. These flows will saturate the communicationsallowing us to obtain the maximum achievable throughput. In order to calculate the PER, it isnecessary to reduce the bitrate so no packets are lost due to network saturation, i.e., packets
2Fractional frequency reuse documentation in ns-3 LTE module: https://www.nsnam.org/docs/models/html/lte-design.html#supported-fr-algorithms
103
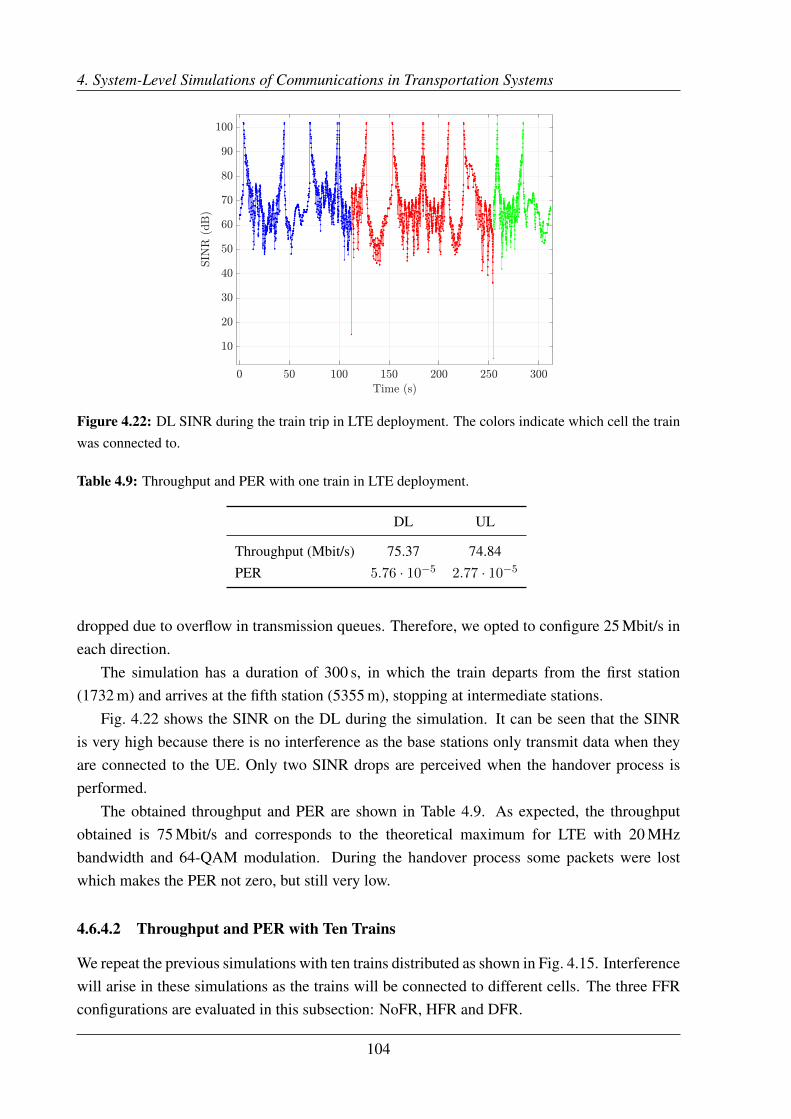
4. System-Level Simulations of Communications in Transportation Systems
Figure 4.22: DL SINR during the train trip in LTE deployment. The colors indicate which cell the trainwas connected to.
Table 4.9: Throughput and PER with one train in LTE deployment.
DL UL
Throughput (Mbit/s) 75.37 74.84PER 5.76 · 10−5 2.77 · 10−5
dropped due to overflow in transmission queues. Therefore, we opted to configure 25 Mbit/s ineach direction.
The simulation has a duration of 300 s, in which the train departs from the first station(1732 m) and arrives at the fifth station (5355 m), stopping at intermediate stations.
Fig. 4.22 shows the SINR on the DL during the simulation. It can be seen that the SINRis very high because there is no interference as the base stations only transmit data when theyare connected to the UE. Only two SINR drops are perceived when the handover process isperformed.
The obtained throughput and PER are shown in Table 4.9. As expected, the throughputobtained is 75 Mbit/s and corresponds to the theoretical maximum for LTE with 20 MHzbandwidth and 64-QAM modulation. During the handover process some packets were lostwhich makes the PER not zero, but still very low.
4.6.4.2 Throughput and PER with Ten Trains
We repeat the previous simulations with ten trains distributed as shown in Fig. 4.15. Interferencewill arise in these simulations as the trains will be connected to different cells. The three FFRconfigurations are evaluated in this subsection: NoFR, HFR and DFR.
104

4.6. Complete Subway-Line Deployment
Table 4.10: Total throughput and PER with ten trains in LTE deployment.
NoFR HFR DFR
DL UL DL UL DL UL
Throughput (Mbit/s) 204.3 185.2 107.7 105.1 144.4 132.2PER 4.50 · 10−4 1.65 · 10−3 1.72 · 10−5 1.91 · 10−4 1.08 · 10−4 8.25 · 10−4
In these simulations, the flows in each direction are configured with 38 Mbit/s to saturatethe cells and calculate the maximum achievable throughput. To correctly calculate the PER, theflows are configured with 7 Mbit/s for NoFR and DFR simulations, and with 5 Mbit/s for HFR.
The simulations have a duration of 140 seconds. The obtained averaged results for 50 runsof the simulations are shown in Table 4.10. Each run of the simulation has a different randomseed, modifying the behavior of the traffic sources, the distances between the stations and theinitial positions of the trains.
The NoFR simulations achieve more total throughput than the simulations of the previoussection. This is because the three eNBs are serving the trains simultaneously. However, theinterference between the cells increases the packet loss.
In HFR simulations, the total throughput is reduced because each cell has one half of theassigned spectrum, but it should be enough to fulfill the application requirements. The achievederror rate is very low because there is no interference between cells.
Finally, DFR obtains intermediate results compared to NoFR and HFR. The obtainedthroughput is higher than in HFR simulations and the error rate is lower than in NoFR. Thisdynamic FFR method provides more bandwidth to each cell only when needed (dependingon the number of users) to increase the achievable throughput without introducing too muchinterference. The DFR algorithm was configured to assign 20 RBs per user for each cell of the100 RBs available. This way, two neighboring cells can interfere each other only when theyhave three or more cell-edge users each (assuming there is no interference between cell-edgeand cell-center users). Also, when five or more users are in a cell, all the available bandwidthcan be used by the cell-center users. Fig. 4.23 shows the number of users assigned to a cellduring the simulation, which is usually three or four and never higher than five. Using a moreconservative configuration of 15 RBs per user reduces PER to 1.77 · 10−5 and 4.27 · 10−4 forDL and UL, respectively.
4.6.4.3 Packet Delay
These simulations have a duration of 140 seconds with ten trains and the traffic configurationof Table 4.8. This implies that with ten trains a total bitrate of 24.7 Mbits/s on the DL and64 Mbit/s on the UL will be required on average. The delay distribution for each applicationis shown in Figs. 4.24 and 4.25 for each FFR configuration. Fifty runs with different random
105

4. System-Level Simulations of Communications in Transportation Systems
Figure 4.23: Number of UEs assigned to each cell during a simulation with ten trains in LTE deployment.
seeds were performed for each configuration.The results of the NoFR configuration are shown in Fig. 4.24 where the priority applications
(CBTC and PHONE) have a low delay. The DL applications without priority (INFO, TVPLATand MAINT) have a slightly higher delay that almost reaches 100 ms. This is becausethere is enough capacity in the DL to transmit all its information during all the simulation.UL applications without priority (CCTV and MAINT) suffer longer delays due to the highthroughput requirements of CCTV traffic, but these delays of 300 ms are perfectly acceptable.The mean PER for the CBTC application is 1.65 · 10−3 for the DL and 1.35 · 10−3 for the UL.These values are slightly higher than the required 0.1% packet loss.
Fig. 4.25a shows the delay using HFR. In these simulations, the DL flows have lower delaythan the NoFR simulations thanks to the very low PER. However, the UL applications sufferlonger delays because the variable throughput demands of CCTV flows cannot be met duringthe whole simulation. This has a small impact on the prioritized applications in the UL suchas CBTC, which exceeds 100 ms delay with a very low probability (5 · 10−6). The CCTV andMAINT UL traffic experienced delays higher than 500 ms with a probability of 9 · 10−4, witha maximum delay of 1.2 seconds. The packet loss requirement for the CBTC application wasfulfilled in these simulations, obtaining a mean PER of 1.9 · 10−5 and 2.10 · 10−4 for DL andUL, respectively.
Fig. 4.25b shows the delay using DFR. The results obtained are analogous to those inFig. 4.24 (NoFR), except that the delay of UL applications is higher. However, the delayrequirements of CBTC and CCTV are still satisfied. A very small number of CBTC and PHONEUL packets were received with more than 100 ms that results in a very low probability of 7·10−7
and 2 · 10−6, which is still acceptable. Regarding CBTC PER, in contrast to the NoFR results,the 0.1% packet loss requirement was satisfied with a mean PER of 4.8 · 10−5 and 6.11 · 10−4
106

4.6. Complete Subway-Line Deployment
Figure 4.24: CCDF of packet delay for each application with FFR disabled (NoFR) in LTE deployment.
(a) Packet delay using HFR configuration. (b) Packet delay using DFR configuration.
Figure 4.25: CCDF of packet delay for each application using FFR in LTE deployment.
107

4. System-Level Simulations of Communications in Transportation Systems
for DL and UL, respectively.
4.6.5 Wi-Fi Simulations
The simulations are performed with the deployment described in Section 4.6.2: 19 pairs of APsseparated every 400 m and using eight different Wi-Fi channels in the 5 GHz. As explained inSection 4.3.2, 802.11a is used to avoid some bugs in the 802.11ac implementation of ns-3.
To evaluate the impact of the handover delay, we perform simulations using two ofthe handover methods explained in Section 4.3.2.1: ActiveProbing (with 20 ms delay) andFastHandover. The STAs are configured to check which is the closest AP every 100 ms andperform a handover if necessary. This handover will be done by switching directly to the Wi-Fichannel used by the destination access point.
The simulated backbone is very simple and contains a switch that interconnects all APs withthe central server via 10 Gbit/s Ethernet connections. IP routing is assumed to be perfect andis done without any delay when the handovers are performed. In addition, all devices have theMAC addresses of the other devices preloaded in their ARP cache, avoiding the delays producedby the ARP protocol.
The simulator allows for the use of several rate control algorithms. Due to the highvariability of the channel during the trains’ route, it is very important to select an algorithmthat adapts quickly to these changes in order to take advantage of the moments with high SNRand avoid losing packets when the SNR drops quickly. The Collision-Aware Rate Adaptation(CARA) algorithm [KIM+06] has been selected because it provides the best results in thesimulations.
Wi-Fi QoS mechanisms are activated in the simulations. Each access category has a separatequeue. Each of these queues cannot transmit data until the other higher priority queues areempty. In some cases this priority queueing mechanism can cause lower priority queues to gounattended for a long time, but in our case the higher priority flows require low throughput.
An FqCoDel3 queue has also been configured for each queue of the Wi-Fi device so that,within the same queue, one type of traffic cannot block the correct operation of the rest. Packetsare classified within each queue according to their destination (IP and port) and are assigned anequivalent priority within their queue.
As for LTE, three types of simulations are performed: with a single train to measurethroughput and PER without interference, with all ten trains to measure throughput and PER,and the final simulation with all applications to measure the delay.
4.6.5.1 Throughput and PER with One Train
These simulations obtain the PER and throughput under ideal conditions, with a single trainleaving from the first station.
3https://www.nsnam.org/docs/release/3.29/models/html/fq-codel.html
108

4.6. Complete Subway-Line Deployment
Figure 4.26: DL SINR during the train trip in Wi-Fi deployment. The color indicates the Wi-Fi channelused. Each AP is configured with one of the eight channels considered in the deployment.
Table 4.11: Throughput and PER with one train in Wi-Fi deployment.
ActiveProbing FastHandover
DL UL DL UL
Throughput (Mbit/s) 11.34 11.60 11.35 11.59PER 1.89 · 10−3 1.80 · 10−3 8.32 · 10−4 4.69 · 10−4
The throughput calculation is performed with a single flow in each direction (DL, UL) at90 Mbit/s, with a packet size of 1000 bytes. The PER simulations use 5 Mbit/s flows. Thesimulation has a duration of 300 seconds.
Fig. 4.26 shows the DL SINR during the simulation. It can be seen that the maximum andminimum values in the graph correspond to Fig. 4.21 and the SINR is almost always higherthan 10 dB.
Table 4.11 shows the throughput and PER results for the two handover mechanisms.
The PER is low in both cases, although the FastHandover mechanism obtains better resultsbecause it performs the handover process faster. In fact, in these simulations no packets are lostin Wi-Fi transmissions thanks to the Wi-Fi retransmission mechanism that allows for sendingthe same frame up to 7 times while the receiver does not confirm its reception. In addition,CARA algorithm uses more robust transmission rates when it is necessary to retransmit frames.This ensures that no packets are lost at the cost of lowering the transmission speed. In thesimulations, packet loss occurs in the following situations:
109

4. System-Level Simulations of Communications in Transportation Systems
Table 4.12: Throughput and PER with ten trains in Wi-Fi deployment.
ActiveProbing FastHandover
DL UL DL UL
Total throughput (Mbit/s) 101.01 109.85 101.07 109.93PER - 2.5 Mbit/s 1.59 · 10−3 1.52 · 10−3 4.40 · 10−4 3.55 · 10−4
PER - 5 Mbit/s 4.86 · 10−3 1.77 · 10−3 3.73 · 10−3 6.09 · 10−4
• During handover process:– The STA is disconnected and any attempt to send an IP packet from the STA is
discarded.– When the STA disconnects from an AP, the packets that are still in the AP queues
are discarded.• When the achieved throughput is too low and the transmission queues are filled. In these
simulations, no packet loss has been detected for this reason.
The throughput results are not affected by the handover mechanism used. Moreover, thetotal obtained throughput (DL + UL) is close to the actual throughput usually obtained with802.11a (around 25 Mbit/s).
4.6.5.2 Throughput and PER with Ten Trains
The above simulations are repeated to calculate the PER and achievable throughput with tentrains distributed over the stations as shown in Fig. 4.15. The flows of each train are configuredin the same way as the previous subsection, but the PER is also obtained using flows of2.5 Mbit/s. The simulations are now 140 seconds long. Fifty runs of each configuration areperformed to obtain averaged results.
Table 4.12 shows the results of PER and throughput. As in the previous simulations, packetloss occurred only during the handover process and no packets were lost in Wi-Fi transmissions.This causes the PER results to be affected by the configured transmission bitrate: the higherthe transmission rate, the higher the number of packets lost during the handover, specially thepackets discarded in the AP queues, which will be more filled. This explains that the PERobtained with 2.5 Mbit/s is lower than with 5 Mbit/s, more notably in the DL.
The throughput obtained by each train is slightly lower than in the one-train simulations(Table 4.11). No degradation due to possible interference is observed, and no AP is overloadedby the simultaneous connection of several trains. It is also observed that the UL obtains a betterbitrate than the DL. This is because the UL obtains a longer transmission time than the DL whentwo trains are connected to the same AP: each device transmits for 1/3 of the time and thereforethe UL transmits 2/3 of the time and the DL only 1/3 of the time. This situation is rare and onlyoccurs during 9% of the simulation time. In addition, the AP antennas have more gain that the
110

4.6. Complete Subway-Line Deployment
(a) Packet delay using ActiveProbing mechanism. (b) Packet delay using FastHandover mechanism.
Figure 4.27: CCDF of packet delay for each application in Wi-Fi deployment.
trains antennas. This allows for receiving with higher quality in the UL than in the DL. In thiscase, the gain of the antennas only benefits the reception of the signal and not the transmissionpower, which is limited by the maximum allowed EIRP.
These results demonstrate that the use of 8 Wi-Fi channels is enough in this scenario toavoid interference between the different access points.
4.6.5.3 Packet Delay
As in the previous subsection, these simulations have a duration of 140 seconds with tentrains, and fifty runs of each configuration were performed with different random seeds. Thesesimulations use the traffic configuration of Table 4.8. Therefore, the deployment shall provide arate of 2.47 Mbits/s on the DL and 6.37 Mbit/s on the UL for each train. In view of the previoussimulations, the average bitrate achieved should be enough, although there can be instants whenthe throughput is not enough for some trains.
Fig. 4.27 shows the delay distribution of each application for the ActiveProbing andFastHandover mechanisms. The two figures are very similar because, in these simulations,the handover process causes packet loss and does not add delay to the transmitted packets. Asexplained in Section 4.3.2.1, the STA transmission queues are disabled during handover and thenew packets are discarded instead of being added to the queues. The packets in the AP queuesare also lost because they are not forwarded to the new AP.
The delay of CBTC traffic is minimal and does not exceed 10 ms. The same applies to theVoIP traffic. The QoS mechanism of Wi-Fi, in which data from the highest priority queues isalways sent first, gives maximum priority to this critical services.
The delay of the remaining applications depends on their throughput requirements. Videoapplications have the longest delay, and exceed the 500 ms with a probability of 10( − 4) and6 · 10( − 4) for CCTV and TVPLAT traffic, respectively. The delay of CCTV traffic is lower
111

4. System-Level Simulations of Communications in Transportation Systems
Table 4.13: PER for each application with ten trains in Wi-Fi deployment.
ActiveProbing FastHandover
DL UL DL UL
CBTC 1.49 · 10−3 1.49 · 10−3 2.91 · 10−4 2.86 · 10−4
CCTV - 3.13 · 10−3 - 1.88 · 10−3
Platform TV 4.33 · 10−3 - 3.28 · 10−3 -VoIP 1.51 · 10−3 1.52 · 10−3 2.91 · 10−4 3.04 · 10−4
Maintenance 2.27 · 10−3 2.34 · 10−3 1.04 · 10−3 1.14 · 10−3
Passenger info 2.23 · 10−3 - 1.03 · 10−3 -
than that of TVPLAT, although its throughput requirements are higher. This is because, on theone hand, the balance between DL and UL traffic in Wi-Fi is adapted to the needs of the devicesand, on the other hand, as there is a greater transmission of data in the UL, it is more commonfor the APs to find the channel occupied when they want to transmit, having to wait for anotheropportunity to transmit the DL data.
As in the previous subsection, the obtained PER is different for each configuration.Moreover, the PER also depends on the application throughput and priority, as the low priorityqueues will be more full with data. Table 4.13 shows the PER of each application for eachconfiguration. The 0.1% packet loss requirement of CBTC traffic was satisfied only in theFastHandover simulations.
4.7 Conclusions
This chapter evaluates the suitability of different communication technologies for subwayenvironments. LTE and Wi-Fi deployments were simulated using tunnel propagation channelsbased on real channel measurements and deterministic models.
The services deployed in subway environments and their communication requirementswere detailed. It was concluded that the CBTC service requires a maximum packet delayof 100 ms and a PER of 0.1%. The VoIP service also requires a low packet delay (150 ms)but the remaining services tolerate higher delays. The video surveillance applications (CCTVand platform TV) have a variable bitrate that demands high data rates from the networkinfrastructure at specific times.
The LTE and Wi-Fi modules of the ns-3 simulator were enhanced to match the subwayscenario conditions and to optimize the performance of typical applications. A QoS-aware LTEscheduler was implemented to allow for prioritizing different flows from the same user whileperforming a fair resource assignment between users, both in DL and UL. An idealized Wi-Fihandover mechanism was implemented assuming that the train devices know their positions andthe APs deployment details, allowing for very fast handovers.
112

4.7. Conclusions
A deterministic and a measurement-based propagation models for tunnel environments weredeveloped. The deterministic channel model combines several works found in the literature,taking into account the dimensions and section of the tunnel and also considering the curvesand slope changes of the tunnel. The model based on real channel measurements allows us toperform the simulations with the exact behavior as in the measurement campaign and it alsoextrapolates the channel data allowing for simulations with longer distances. These channelmodels are suitable for the system-level simulator, but they have some limitations:
• They do not take into account the alterations caused by obstacles such as the trains.However, these obstacles do not significantly affect the simulations given the small sizeof the trains compared with the tunnel size.
• The presence of metro stations that modify the tunnel section is not considered in thedeterministic channel model.
• Only the received power for each frequency band is considered in the simulator. TheDoppler effects produced by the high velocity of trains is not taken into account. It isassumed that the receiver is able to correct the frequency offset caused by the Dopplershift, whereas the inter-carrier interference (ICI) produced by the Doppler spread in theOFDM signal is very low.
We evaluated the suitability of LTE and Wi-Fi in subway environments by performingsystem level simulations in two scenarios with the propagation models developed. The three-stations deployment was designed to match the conditions of the measurement campaign forthe channel model: an eNB at the center of each station configured to use a 10 MHz FDDLTE system. Several LTE deployment parameters were customized, including frequency reuseand the handover algorithm, to ensure the correct operation of the network, minimizing theinterference and avoiding ping-pong handovers. From the obtained results, it can be concludedthat the QoS requirements of the configured applications were satisfied. Only the CCTVflows have problems to maintain the packet delay below 500 ms, exceeding this value with aprobability of 6 · 10−4.
The complete subway-line deployment was used to test the deterministic channel model andto compare the two technologies most used in real systems: a DAS based LTE network and acustom Wi-Fi solution. The distinct characteristics of these solutions such as the frequency ofoperation or the power limitations lead to very different deployments: the LTE network usesthree DASs with the original antenna positions, but a deployment with antennas every 400 mwas needed for Wi-Fi.
For both LTE and Wi-Fi simulations, it was necessary to improve and adapt the ns-3simulator in order to obtain results close to what would be obtained with commercial equipment.The aspects that most differ from a real deployment are the following:
• Only one antenna is installed in each train. However, two antennas are usually placed atthe front and rear of each train. This adds more connection reliability and redundancy astwo transceivers are used. Interference will also be reduced if the installed antennas are
113
4. System-Level Simulations of Communications in Transportation Systems
directional.• The deployment only allows for single-input and single-output (SISO) communications.
Real deployments could install more antennas in the wayside or in the trains so MIMOcould be used. The simulator allows for MIMO techniques by configuring several spatialstreams and by applying a gain to the received signal SINR. The simulator assumes thatthere is no spatial correlation between the antennas, but measurements have shown thatthe correlation can be high, specially at long distances [MAS+12].
• LTE:– The simulator does not support all the features that can be expected from a modern
LTE system. To correct this, it is assumed that there are no errors in the control data(PDCCH).
– The performance of DAS is idealized: it is assumed that the transmission of thesame signal by different antennas will always be constructive as the delay doesnot exceed the cyclic prefix. However, the effects on the propagation channel candegrade the system performance in some cases.
• Wi-Fi:– The 802.11a version of Wi-Fi is used. Although performance would be higher if
802.11ac were considered, the errors in the ns-3 implementation forced us to use802.11a.
– The handover mechanism is idealized. Trains are able to perform this transition atthe right time to the right AP and with very low delay. In addition, they do not needto exchange authentication information because the simulator does not implementWi-Fi security protocols. However, some commercial Wi-Fi solutions for subwayenvironments perform proprietary modifications to the standard similar to these toachieve handovers with very low delay.
Even taking into account the possible inaccuracies of the simulator, the results obtained arerelevant and give an idea of the capacity of the simulator and its versatility to evaluate differentdeployments.
LTE and Wi-Fi performance has been evaluated in terms of throughput, packet loss anddelay. In both cases the requirements defined in Section 4.2 are met:
• Delay: With both LTE and Wi-Fi, the restriction that the delay is always less than 100 msfor CBTC traffic is fulfilled. In Wi-Fi the CBTC and VoIP delay is extremely low. Allother flows have an acceptable delay.
• PER: The CBTC 0.1% packet error rate limit is fulfilled with both technologies. However,a FFR configuration is needed for LTE and the FastHandover method is needed for Wi-Fisimulations. If other flows need error-free communications, they can use protocols suchas TCP, but with a negative impact on delay.
114

Chapter V
Conclusions and Future Work
This work studied the design and real-time implementation of physical (PHY) and mediumaccess control (MAC) layers of 4G communication systems as well as their applicability inrail transport systems. On the one hand, base and mobile station transceivers were implementedusing Mobile WiMAX standard as an orthogonal frequency-division multiple access (OFDMA)reference system. This implementation was carried out in a software-defined radio (SDR)architecture based on reconfigurable hardware. On the other hand, several simulations wereperformed to evaluate the applicability of Long Term Evolution (LTE) communication networksin rail transport systems, focusing on subway scenarios. Special attention was given to radiopropagation modeling in tunnels and to the quality of service (QoS) requirements of theapplications used in subway environments. Wi-Fi networks solutions were also studied as theyare very common in these environments.
This chapter presents the main conclusions of this work and proposes future study lines.
5.1 Conclusions
The first two chapters of this thesis were focused on the design and implementation of PHYand MAC layers of OFDMA-based communications systems. Chapter 2 described how thesesystems work using the IEEE 802.16e standard (Mobile WiMAX) as reference system. Adetailed description of the PHY and MAC layers was presented, focusing on the mandatoryfeatures specified by the WiMAX Forum. The PHY layer has a flexible OFDMA frame structurethat allows for sharing radio resources efficiently among different users. The ranging processallows the different mobile stations (MSs) to synchronize in time and frequency with the basestation (BS) so their transmissions can be correctly decoded minimizing interference betweenMSs. The connection-oriented MAC layer define the packet format and the mechanisms to fillPHY layer bursts. The MAC layer also provides automatic repeat request (ARQ) functionality,which can be enabled for each transport connection. Regarding QoS, several parameters aredefined for each service class that can be used by the scheduler to prioritize the different
115

5. Conclusions and Future Work
connections. The scheduling is centralized in the BS, as it determines the resources grantedto each MS. This information is packed in the downlink map (DL-MAP) and uplink map(UL-MAP) management messages in each frame.
The design and real-time implementation of Mobile WiMAX transceivers was presented inChapter 3. The MAC and PHY layers of the mobile and the base stations were implementedallowing for real-time bidirectional communications using time-division duplexing (TDD). TheBS and MS transceivers are based on a cost-effective SDR hardware architecture made up offield programmable gate array (FPGA) and digital signal processor (DSP) modules that provideall the processing power needed to implement the mandatory functionalities of the WiMAXstandard.
A custom development methodology was followed for the implementation of the PHYlayer. This methodology is appropriate for heterogeneous hardware setups where different tasksneed to be distributed into the modules depending on their requirements and complexity. Thenecessary resources for the operation of each processing block of the system in real time areestimated to appropriately place these blocks in the hardware architecture. The defined FPGAtask template was very helpful, as it provides a communication protocol between tasks and aconfiguration mechanism. The defined PHY and MAC service access points (SAPs) also aidedin determining the responsibilities for each layer and the way in which they interact.
The relevant details of the design and implementation of the PHY and MAC layerswere pointed out. The tasks related with signal filtering, fast Fourier transform (FFT),synchronization and channel coding were implemented in the FPGAs, while the remainingtasks were implemented in the DSPs, including channel equalization and ranging processing.The resource usage in the final implementation was shown, including the FPGA componentsused and the estimated execution time of each DSP task per OFDMA frame. It is worthnoting the high amount of FPGA resources required for the synchronization task in the MS.Moreover, channel estimation and equalization are the most computationally intensive tasks inthe DSP. The utilization of the proposed hardware architecture to implement the WirelessMAN-Advanced Air Interface was also discussed. The modifications in the hardware architecturerequired to implement the evolved version of the standard, known as WirelessMAN-AdvancedAir Interface (802.16m), were also proposed.
Validation and performance evaluation of the transceivers was also carried out with thehelp of a custom-made channel emulator. The correct implementation of the channel codingprocessing was verified in terms of bit error ratio (BER) performance under an additive whiteGaussian noise (AWGN) channel. The expected results for the convolutional decoder with 3soft-bits were achieved. A 10−6 BER was obtained for QPSK 1/2 and 64-QAM 3/4 at 5 and15,5 dB of Eb/N0, respectively.
The developed channel emulator was used to test the complete system in the scenariosrecommended by the WiMAX Forum: Pedestrian A and B, and Vehicular A at 60 and 120 km/h.The timing-offset estimation error of the uplink (UL) synchronization task was first measured
116

5.1. Conclusions
using the 3.5 MHz profile. The implemented algorithm is not excessively impacted by theeffects of the channels. The worst results were obtained for the Pedestrian A channel at 2 dBof average signal-to-noise ratio (SNR), achieving a standard deviation of 6.4 samples (1.6 µs),which is a relatively small offset compared with the 64 samples of the cyclic prefix. Moreover,these small errors are further reduced thanks to the iterative mechanism used by the rangingprocess, i.e., the procedure is repeated until the BS considers that the estimated offset is smallenough.
BER, frame error rate (FER) and throughput measurements were performed for both DL andUL using the channel emulator. Regarding BER and FER results, Pedestrian A channel obtainedthe worst bit error rates, but has good results in terms of FER. This is because this channel hasan almost flat frequency response and the received frames are either error-free or contain manyerrors, which has strong impact on BER performance but not on FER. The rest of the channelshave higher frequency selectivity and it can be seen that the results in the UL are better than inthe DL due to the higher density of pilots and to the fact that the channel estimation in the UL isdone in time and frequency. The results of the Vehicular A channel clearly show the influence ofhigh speeds on the results, which are more affected by inter-carrier interference (ICI) at higherspeeds.
The MAC layer processing with the ARQ mechanism was enabled during the throughputmeasurements, showing the actual performance of the complete WiMAX system in realisticpropagation conditions. The maximum allowed protocol data unit (PDU) size was used (2047bytes) to minimize the header overhead. The obtained results are consistent with the previousFER measurements, achieving the maximum throughput with the QPSK 1/2 configuration. ForPedestrian A channel, it is always better to use QPSK 3/4. For Pedestrian B channel, highertransfer rates are obtained using QPSK 1/2, except for SNRs higher than 29 dB in the UL.Finally, the frequency selectivity and ICI of the Vehicular A channel causes that QPSK 3/4 isnot able to outperform the QPSK 1/2 results with these measurement configuration.
The results could be improved if smaller PDUs were used, especially in the Pedestrian Band Vehicular A channels, where the QPSK 3/4 results are not able to surpass the maximumQPSK 1/2 throughput. Furthermore, the better performance obtained with the UL indicatesthat the DL results could also be improved. The DL channel equalizer only performs a linearinterpolation in the frequency domain and ignores that the channel coherence time is usuallylonger than several OFDM symbols. The implementation does not take advantage of the DLcluster structure (shown in Fig. 2.3) and does not use the pilot subcarriers of the adjacent OFDMsymbols. Finally, if adaptive modulation and coding (AMC) techniques were implemented, thesystem would track the channel conditions to dynamically select the best modulation and coderate for each frame, obtaining much better throughput results.
Chapter 4 evaluated the applicability of different radio communication technologies inrail transport systems considering the reliability and safety requirements of these systems andfocusing on subway environments. The most common services deployed in subway scenarios
117

5. Conclusions and Future Work
that use train-to-wayside radio communications were studied. The configuration and QoSrequirements of these services were analyzed based on different works found in the literature.On the one hand, the communications-based train control (CBTC) signaling system is themost important mission critical service and requires a reliable low-latency radio link withhigh availability. On the other hand, the service that demands more throughput is the videosurveillance system, but the delay and packet error rate requirements are not so stringent.
LTE and Wi-Fi deployments were simulated using the ns-3 system-level network simulatorin order to evaluate and select the most appropriate system configuration for the environment.The ns-3 network simulator was enhanced to match the subway scenario conditions developingtunnel propagation channels based on deterministic models and real channel measurements.Moreover, the LTE scheduler was enhanced to allow for the prioritization of critical services,and an idealized custom fast handover mechanism was implemented in the Wi-Fi module.
A review of the radio propagation models for tunnel environments was performed to proposetwo different models. On the one hand, a deterministic channel model was developed thatcombines several works found in the literature allowing for the definition of complex scenarios,including curved tunnels and different tunnel cross sections. On the other hand, a channel modelbased on measurements was developed using the results of a measurement campaign performedin a modern subway station, with the transmitting antenna placed at the center of the station andan approaching train. Two different scenarios were defined to test the developed propagationmodels.
An LTE three-stations deployment was simulated assuming that an eNodeB was placedin the center of each subway station. This way, the channel model based on measurementscould be used to perform realistic LTE simulations. Three LTE cells were configured with abandwidth of 10 MHz in frequency-division duplexing (FDD) mode and using hard frequencyreuse to minimize interference. The handover algorithm was also configured to avoid ping-pong handovers. The configured applications included the CBTC service and a CCTV streamof 2000 kbit/s sent by each train. The obtained results showed that the QoS requirementswere satisfied. However, the CCTV traffic experienced delays longer than one second witha probability of 10−4. The delay results were improved by reducing the delay added in theRadio Link Control (RLC) layer when packets are lost.
The main issue found in this LTE deployment was the high interference in the downlinkcontrol channel, which was always transmitted in the same time slots and frequencies. Theenhanced control channel defined in LTE-Advanced allows for minimizing the interference incontrol data, but the ns-3 simulator does not support this feature. However, we can disableerrors in the control data and assume that the eNBs are able to coordinate to avoid interferencein this channel. Additional simulations were performed disabling control data errors to verifythe high impact of this interference in the results.
A complete subway-line scenario based on a real deployment (line 3 of Bilbao Metro) wasalso simulated. The deterministic channel model was used in these simulations to evaluate two
118

5.1. Conclusions
common technologies in subway: a distributed antenna system (DAS) based LTE network anda custom Wi-Fi solution. All the defined applications in Section 4.2 were configured in thesimulations. These solutions resulted in very different deployments. The LTE deployment usedthe initially proposed antenna positions configured as three independent DASs, and each one ofthe DAS is connected to an eNodeB. In the Wi-Fi deployment, a maximum separation of 400 mwas needed because the deterministic channel model predicted SINRs lower than 10 dBs forlonger distances, being the 20 dBm of EIRP the most limiting factor.
The LTE and Wi-Fi performance obtained in the simulations was evaluated in terms ofthroughput, packet loss and delay. The defined scenario consisted of 10 trains, each requiring2.47 Mbits/s on the DL and 6.37 Mbit/s on the UL. The Wi-Fi deployment needed more antennasthan the LTE deployment (38 vs 29), but the availability of several channels in the 5 GHz bandallowed for performing a deployment with low interference between all the APs. Moreover,this solution provided a high throughput as, most of the time, the APs are connected to onlyone train which does not have to contend with any other train for transmission opportunities.The frequent handover between APs was not a problem in these simulations as the custommethods implemented in the simulator (Section 4.3.2.1) are idealized and work very well. InLTE, a total bandwidth of 40 MHz was available (20 MHz for DL and 20 MHz for UL) whichprovided a maximum throughput of 75 Mbit/s in both directions, assuming single-input andsingle-output (SISO) communications. The high throughput needed in this scenario could notbe provided using the hard frequency reuse technique. Simulations without frequency reuse andwith soft frequency reuse were performed to show how to satisfy the throughput requirements.
LTE and Wi-Fi performance were evaluated in terms of throughput, packet loss and delay.In both cases the defined requirements were met thanks to the custom modifications forsubway environments. Both technologies achieved a delay lower than 100 ms for CBTC traffic,especially in Wi-Fi, where the CBTC and VoIP delay is extremely low. The low priorityflows experience tolerable delays. Regarding packet error ratio (PER), the 0.1% limit is notexceeded when a custom fractional frequency reuse (FFR) configuration is applied in LTE, orthe FastHandover method is used in Wi-Fi simulations. The remaining flows experience similarPER but, if needed, they can use protocols such as Transmission Control Protocol (TCP) toavoid packet loss, although increasing the delay.
There are some differences between the performed simulations and real deployments thatmay affect the accuracy of the obtained results. Two antennas are usually placed at the frontand rear of each train, but the simulations were performed with only one antenna on each train.Moreover, the simulator does not support the latest Wi-Fi and LTE features, forcing the use ofthe 802.11a version of Wi-Fi, and to assume that there are no errors in LTE control channels.Also, the Wi-Fi handover mechanism is idealized and performed with very low delay, whichis not commonly found in commercial Wi-Fi solutions. Finally, the radio propagation in thereal scenarios may differ from the channel model used. However, the propagation model can beadapted to measurements made on the metro line to obtain more realistic results.
119

5. Conclusions and Future Work
Even taking into account the possible inaccuracies and thanks to the adaptations made to thesimulator, the obtained results predict the behavior of the different technologies appropriatelyand show the versatility of the simulator to evaluate different deployments.
5.2 Future Work
This dissertation focused on both real-time implementation and simulation of differentcommunication systems. In the following subsections we point out some interesting researchlines based on this work.
5.2.1 Real-time Hardware Architecture
The implemented WiMAX transceivers could be enhanced in several ways:Improve current implementation The downlink channel equalization could perform a
bilinear interpolation similar to the method used in the uplink or other method thattakes into account the channel estimation of previous symbols. This should enhancethe results obtained with the ITU-R channels. The ranging algorithms could also supportthe detection of several users and periodic ranging could be implemented. The downlinksynchronization method could also use the timing information of the previous frames torefine its predictions and filter out possible false positives using less resources.
Evaluate the impact of using smaller bursts and packets Sending smaller packets willreduce the PER but the packet header overhead will be increased. Depending on channelstate, it can be better to send several concatenated packets in a burst than one big packet.Furthermore, using several smaller bursts instead of one big burst will also reduce thepacket error rate. This is because if a packet header is corrupted, the remaining packetsof the burst will also be lost, as the start position of the next packet is unknown. It wouldbe useful to find out the burst and packet size selection that optimizes the throughput,depending on the channel model and SNR.
AMC The used modulation and coding are currently fixed in the initial configuration. Thescheduler in the base station could automatically select the appropriate values. The uplinkmodulation and coding can be selected according to the received signal quality in thebase station. The downlink rate adaptation can be performed based on the received signalstrength indication (RSSI) and carrier-to-interference-and-noise ratio (CINR) reports sentby the mobile stations.
New features Implement hybrid automatic repeat request (HARQ) as the standard supportsboth chase combining and incremental redundancy for tail-biting convolutional code(TBCC) and convolutional turbo code (CTC). Peak-to-average power ratio (PAPR)reduction techniques could also be added.
MIMO support Only SISO is currently supported. Supporting multiple-input-multiple-output
120

5.2. Future Work
(MIMO) would improve the performance of the transceivers, but it would require amore complex and sophisticated design. Additional hardware resources that provide therequired processing power would be needed in the PHY layer.
Implement other OFDMA based standardOther communication systems could be implemented using the hardware architecture asa base. The required changes in the architecture to support the 802.16m Advanced AirInterface (AAI) were already analyzed in Section 3.7. The implementation of 5G newradio (NR) could also be studied as it is also based on OFDMA with cyclic prefix. Thesupport of the different numerologies (subcarrier spacing, cyclic prefix, and FFT size) is achallenging task that would need several changes in the FPGA processing tasks, speciallyif single-carrier FDMA (SC-FDMA) is also implemented. The channel coding tasksshould also support the low-density parity check (LDPC) and polar codes. Most likely, tomaintain the SDR design philosophy, the use of newer and more powerful hardware willbe required.
5.2.2 Wireless Communications in Transportation Systems
There are multiple research lines related with the simulation of wireless communications andtransportation systems:
Enhance and publish the ns-3 simulator modifications The modifications performed in thens-3 simulator models can be published so these new features are available to otherresearchers. The developed LTE scheduler provides the ability to prioritize betweentraffic flows of the same user, and can be further improved and combined with other QoS-aware schedulers besides the proportional fair scheduler. The Wi-Fi roaming mechanismcan be enhanced to work in a more realistic way, so it can be used in other applicationsand scenarios.
Infrastructure shared with passengers An agreement between a railway operator and amobile operator could allow for using a public mobile network to carry train signalingdata (or other services). Alternatively, the railway operator may want to offer internetaccess to passengers inside trains and stations. In both cases, the deployed infrastructurewould be shared with the passengers. An analysis can be performed addressing potentialsecurity issues and the impact on the mission critical services. The scheduler should beable to guarantee the QoS requirements even when a high number of passengers overloadsthe network.
Simulations with 5G and Wi-Fi 6 The latest 3GPP and IEEE 802.11 standards can provideremarkable advantages and performance improvements when compared with the currenttechnologies. The ns-3 simulator is progressively being improved to support the featuresof these new standards. This will enable the simulation of transportation scenarios withthese new technologies, evaluating their advantages and performance gain.
121

5. Conclusions and Future Work
5G NR-U: 5G in unlicensed spectrum Several initiatives and amendments were proposed inthe last few years to support the usage of LTE/5G in unlicensed spectrum such as LTE-Unlicensed (LTE-U), LTE Licensed Assisted Access (LTE-LAA), MulteFire and 5G newradio unlicensed (NR-U). Only MulteFire and NR-U allow the deployment of standaloneprivate networks with no need to use licensed spectrum. NR-U, based on LTE-LAA andMulteFire, is going to be included in 3GPP Release 16 and will allow the use of the 5 GHzand 6 GHz unlicensed bands.
Tunnel channel model The developed deterministic channel model for tunnels can beimproved to model the effects of obstacles such as trains or to take into account thepresence of stations. Moreover, the multimode model can be replaced with more flexibleor precise methods such as ray-tracing or vector parabolic equation. The increase incapacity when using several antennas could also be studied using the results of worksthat characterize the MIMO channel in tunnel environments. Finally, ns-3 simulator couldalso be improved to take into account the performance degradation produced by the highvelocity of the trains.
Train-to-train communications Train-to-train communications is an active research area.The trains have more autonomy as they can communicate with the nearby trains to knowtheir position and velocity, allowing them to make decisions without the need of a centralcoordinator. Several channel models and measurements have been published for this kindof communications in different frequencies. These works can be used with our simulatorto compare the classical centralized control systems with this new proposal.
122
Appendix I
Resumen de la Tesis
Los sistemas de comunicaciones inalámbricos han evolucionado mucho desde la apariciónde la primera generación de tecnología celular en los años 80. Las siguientes generacioneshan mejorado de forma significativa las tasas de datos, la eficiencia espectral, la seguridady la cobertura. Las últimas generaciones (4G y 5G) utilizan una capa física (PHY)basada en modulaciones multiportadora para transmitir datos con un gran ancho de banda.Estas modulaciones subdividen la señal en varios canales que son transmitidos en paralelo,permitiendo corregir los efectos de los canales de propagación radio de forma más sencilla.OFDM con prefijo cíclico es la modulación más utilizada y estudiada de las modulacionesmultiportadora. Es la modulación utilizada en estas últimas generaciones debido a su altaeficiencia espectral y baja complejidad de implementación gracias al algoritmo fast Fouriertransform (FFT). Además, se utiliza OFDMA como mecanismo para el reparto del los recursosradio disponibles entre los diferentes usuarios, que se puede realizar tanto en tiempo como enfrecuencia. Esto aporta una gran flexibilidad que permite adaptarse tanto a los requisitos decalidad de servicio (Qos) de los usuarios como al estado del canal radio.
En entornos de investigación, para probar y verificar el rendimiento de los sistemasde comunicaciones es habitual recurrir a la utilización de bancos de pruebas (testbeds) osimulaciones. Sin embargo, no es habitual considerar las restricciones de procesado necesariaspara lograr el funcionamiento en tiempo real del sistema. La implementación en tiempo realdel sistema permite evaluar su rendimiento en condiciones realistas, teniendo en cuenta laslimitaciones de la implementación y el uso de algoritmos de baja complejidad.
Las implementaciones comerciales de estos estándares utilizan chips dedicados o ASICspara reducir al mínimo las necesidades de energía del dispositivo. Estas implementaciones sonmuy eficientes, pero muy inflexibles y no permiten modificar las formas de onda o protocolosutilizados. Los sistemas de radio definida por software (SDR) sustituyen estos elementos ad-hoc por módulos software ejecutados por procesadores más genéricos como DSPs. Esta idea haganado interés gracias al aumento de la potencia de cálculo de los procesadores y a los avancesen la computación heterogénea.
El primer objetivo de esta tesis es estudiar el diseño y la implementación de las capas
123

A. Resumen de la Tesis
de acceso al medio (MAC) y PHY de un sistema de comunicaciones basado en OFDMAutilizando una arquitectura SDR compuesta por DSPs y FPGAs. Tanto WiMAX como LTEfueron las dos tecnologías candidatas a convertirse en el estándar 4G mundial. Aunque LTE fuela seleccionada, Mobile WiMAX es una tecnología similar, basada en una capa física OFDMA ycon mecanismos avanzados de QoS, siendo interesante su estudio y evaluación de rendimiento.Por este motivo, esta tesis se centra en la implementación y evaluación de Mobile WiMAX.
Las tecnologías 4G y 5G son tecnologías muy interesantes para las comunicaciones tren-tierra en entornos ferroviarios. Los sistemas de control y señalización ferroviaria dependen deun sistema de comunicaciones inalámbrico tren-tierra que les permita transmitir su posicióny recibir las indicaciones y limitaciones de velocidad de forma continua. De esta forma,estos sistemas supervisan la conducción del tren y activan el freno de emergencia cuandono se cumplen las condiciones de seguridad. También permiten la conducción automáticade los trenes, sin la intervención del conductor. Los sistemas de control más utilizadosactualmente son European Train Control System (ETCS), que está orientado al transporte demedia y larga distancia, y communications-based train control (CBTC), más utilizado en eltransporte metropolitano. ETCS actualmente utiliza GSM para ferrrocarriles (GSM-R) para lascomunicaciones y está planeado sustituirlo por un estándar basado en 5G. CBTC, en cambio,no requiere una tecnología de comunicaciones específica. Lo habitual es utilizar solucionespropietarias basadas en la tecnología IEEE 802.11 (Wi-Fi) por permitir la utilización de bandasISM. Sin embargo, LTE y su evolución 5G se adaptan mejor a los entornos de metro que Wi-Fi:tienen mayor alcance y eficiencia espectral, soportan mejor la movilidad e incluyen mecanismosde QoS robustos.
El segundo objetivo de este trabajo es evaluar la aplicabilidad de LTE y Wi-Fi en los sistemasde transporte ferroviario utilizando un simulador de red adaptado a entornos de metro. Lossimuladores de red son muy útiles para probar distintas configuraciones de las redes y optimizarsu rendimiendo en diferentes escenarios. Permiten estudiar el comportamiento esperado de lared en entornos complejos donde es muy difícil realizar pruebas reales. Por esta razón, elmodelado y la simulación de despliegues de redes de metro es muy útil, ya que ayuda en laplanificación de la red y permite comprobar si se cumplen los requisitos de los distintos serviciosdesplegados.
Para que los resultados de las simulaciones sean realistas se deben utilizar modelos depropagación radio apropiados. Existen múltiples factores que afectan a la propagación radiodentro de los túneles: sus dimensiones y forma, la posición de las antenas, la frecuenciade transmisión utilizada, el tamaño de los trenes, etc. Es necesario realizar campañas demedición antes de un despliegue para ajustar correctamente el modelo de canal utilizado ypredecir la cobertura en el túnel con precisión. Es importante que el simulador de redes permitautilizar mediciones obtenidas en campañas de medida además de utilizar modelos teóricos depropagación en túneles.
124

A.1. Implementación SDR de las capas PHY y MAC de Mobile WiMAX
A.1 Implementación SDR de las capas PHY y MAC deMobile WiMAX
WiMAX es un estándar de comunicaciones inalámbricas desarrollado para proporcionar accesoinalámbrico de banda ancha a larga distancia. El término WiMAX fue adoptado por elWiMAX Forum, una organización creada para promover la interoperabilidad de los estándaresde comunicaciones IEEE 802.16. En esta memoria nos hemos centrado en la implementacióndel modo TDD de Mobile WiMAX, definido en el estándar 802.16e, y que utiliza OFDMA parasoportar múltiples usuarios en entornos de movilidad.
La mayoría de trabajos existentes que evalúan el rendimiento de WiMAX se centran en lasimulación de sistemas WiMAX, pruebas en exteriores con equipamiento WiMAX comercial,o implementaciones en tiempo real parciales del estándar que solo evalúan comunicacionesunidireccionales.
La capa física de Mobile WiMAX tiene un estructura de trama flexible dividida en ráfagas.Sólo el preámbulo y las ráfagas frame control header (FCH) y downlink map (DL-MAP) tienenuna posición fija dentro de la trama. Se pueden utilizar diferentes estructuras de símboloOFDMA en la trama, permitiendo una disposición contigua o distribuida en frecuencia de lasportadoras de cada usuario. Sin embargo, el WiMAX Forum solo exige la implementación dela estructura de símbolo denominada partial usage of subchannels (PUSC). Los mensajes degestión DL-MAP y uplink map (UL-MAP) especifican la estructura de símbolo a utilizar asícomo las posiciones, tamaños y configuración de las ráfagas de la trama.
La sincronización en tiempo y frecuencia en el enlace descendente (DL) se realiza utilizandoel preámbulo transmitido por la estación base. También es necesario sincronizar las estacionesmóviles para que sus transmisiones lleguen correctamente a la estación base. Para este fin,se reservan regiones dentro de las tramas (regiones de ranging) en las que las estacionesmóviles pueden transmitir códigos de ranging, que la estación base procesa para informar alas estaciones móviles de las correcciones que deben realizar.
La capa MAC WiMAX proporciona una interfaz entre las capas superiores y la capafísica, y está dividida en tres subcapas: convergencia, común y de seguridad. La subcapa deconvergencia clasifica los paquetes de capas superiores (como IP o Ethernet) para poder sertransmitidos por una conexión y los transforma en MAC service data units (MSDUs). EstosMSDUs son procesados por la capa común para generar MAC protocol data units (MPDUs)utilizando los mecanismos de fragmentación (división de paquetes grandes en varios de menortamaño) y empaquetado (unión de varios paquetes en uno). Las ráfagas de la capa físicacontienen estos MPDUs. La capa MAC de WiMAX también se encarga gestionar las diversosflujos de información de cada usuario y proporciona mecanismos de control de errores comoautomatic repeat request (ARQ), que son muy interesantes para poder evaluar el rendimientoreal del sistema.
Con respecto a la QoS, la MAC define varias clases de servicio con distintos parámetros (p.
125

A. Resumen de la Tesis
ej., latencia máxima) que pueden ser configurados para cada conexión. Estos parámetros sonutilizadas por el planificador para asignar recursos a los usuarios y priorizar los paquetes de cadaconexión. La planificación está centralizada en la estación base, ya que determina los recursosconcedidos a cada estación móvil. Sin embargo, el planificador de las estaciones móviles sigueseleccionando qué conexiones se sirven en cada oportunidad de transmisión que les concede laestación base.
Los implementación realizada de las capas PHY y MAC de Mobile WiMAX soportacomunicaciones bidireccionales utilizando TDD. Las funcionalidades implementadas son lasestablecidas como obligatorias por el WiMAX Forum:
• Capa física:– Soporta los cinco perfiles definidos por el WiMAX Forum: 3.5 MHz, 5 MHz,
7.5 MHz, 8.75 MHz, or 10 MHz. Tamaño de FFT de 512 y 1024 subportadoras.– Los prefijos cíclicos se pueden configurar con una longitud de 1/4, 1/8, 1/16 y un
1/32. Es estándar sólo exige una longitud de 1/8.– Estructura de trama TDD con número fijo de símbolos OFDMA con una longitud
total de 5 ms.– Estructura de símbolo PUSC. Este esquema distribuye los datos para cada usuario
por todas las frecuencias.– Codificación de canal:
* Modulaciones y tasa de códigos (convolucionales) soportados: QPSK 1/2,QPSK 3/4, 16-QAM 1/2, 16-QAM 3/4, 64-QAM 1/2, 64-QAM 2/3, and 64-QAM 3/4.
* Decodificación soft (3 soft-bits) con algoritmo de Viterbi.
* Soporte de códigos de repetición.– Sincronización en el DL basada en las propiedades del preámbulo y correlación
cruzada.– Implementado el mecanismo de ranging en el enlace ascendente (UL) para
sincronizar la transmisión del UL en tiempo y frecuencia. También se soporta elenvío de códigos de ranging para hacer solicitudes de ancho de banda.
• Capa MAC:– Clasificación de paquetes y supresión de cabeceras en la subcapa de convergencia.– Conexiones de gestión y transporte.– Soporte para ARQ.– Planificador que respeta los requisitos de QoS.
La implementación se basa en una arquitectura hardware SDR de bajo coste formada pormódulos FPGA y DSP que permite implementar todas las funcionalidades obligatorias delestándar WiMAX. Se siguió una metodología de desarrollo para la capa física pensada parala implementación de tareas de procesado de señal con una arquitectura heterogénea, quepermite aprovechar la potencia de procesado de las FPGAs facilitando la flexibilidad de las
126
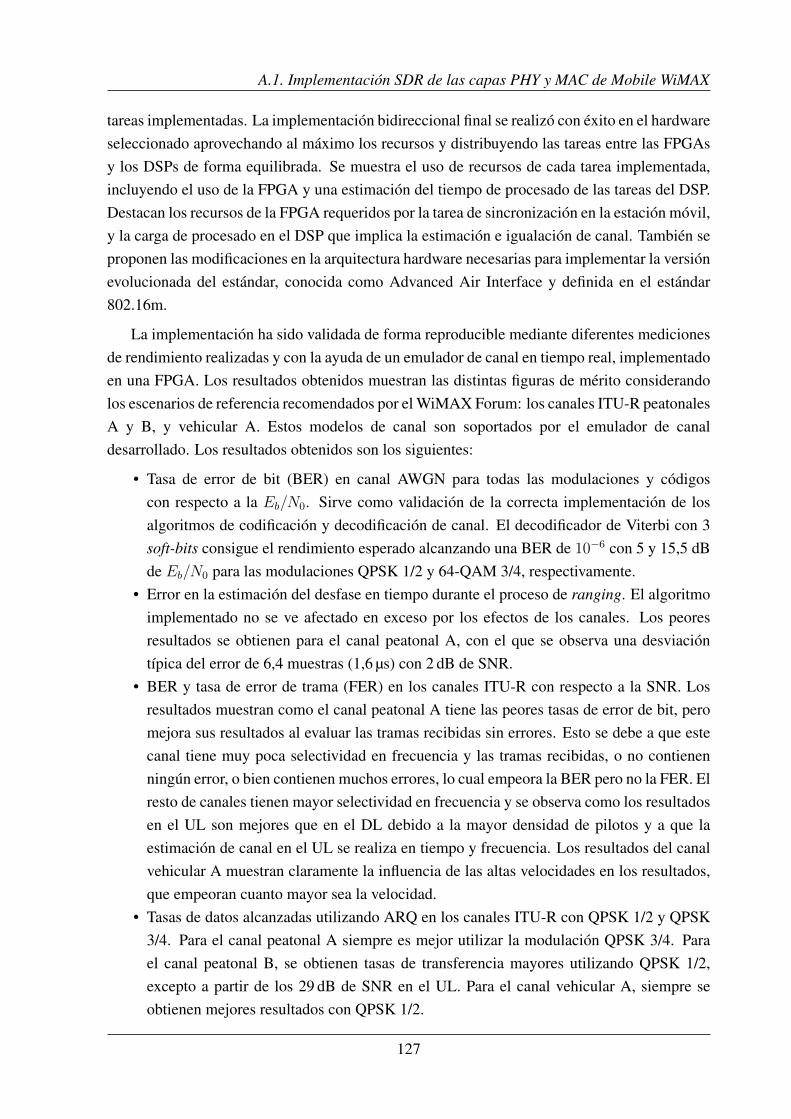
A.1. Implementación SDR de las capas PHY y MAC de Mobile WiMAX
tareas implementadas. La implementación bidireccional final se realizó con éxito en el hardwareseleccionado aprovechando al máximo los recursos y distribuyendo las tareas entre las FPGAsy los DSPs de forma equilibrada. Se muestra el uso de recursos de cada tarea implementada,incluyendo el uso de la FPGA y una estimación del tiempo de procesado de las tareas del DSP.Destacan los recursos de la FPGA requeridos por la tarea de sincronización en la estación móvil,y la carga de procesado en el DSP que implica la estimación e igualación de canal. También seproponen las modificaciones en la arquitectura hardware necesarias para implementar la versiónevolucionada del estándar, conocida como Advanced Air Interface y definida en el estándar802.16m.
La implementación ha sido validada de forma reproducible mediante diferentes medicionesde rendimiento realizadas y con la ayuda de un emulador de canal en tiempo real, implementadoen una FPGA. Los resultados obtenidos muestran las distintas figuras de mérito considerandolos escenarios de referencia recomendados por el WiMAX Forum: los canales ITU-R peatonalesA y B, y vehicular A. Estos modelos de canal son soportados por el emulador de canaldesarrollado. Los resultados obtenidos son los siguientes:
• Tasa de error de bit (BER) en canal AWGN para todas las modulaciones y códigoscon respecto a la Eb/N0. Sirve como validación de la correcta implementación de losalgoritmos de codificación y decodificación de canal. El decodificador de Viterbi con 3soft-bits consigue el rendimiento esperado alcanzando una BER de 10−6 con 5 y 15,5 dBde Eb/N0 para las modulaciones QPSK 1/2 y 64-QAM 3/4, respectivamente.
• Error en la estimación del desfase en tiempo durante el proceso de ranging. El algoritmoimplementado no se ve afectado en exceso por los efectos de los canales. Los peoresresultados se obtienen para el canal peatonal A, con el que se observa una desviacióntípica del error de 6,4 muestras (1,6 µs) con 2 dB de SNR.
• BER y tasa de error de trama (FER) en los canales ITU-R con respecto a la SNR. Losresultados muestran como el canal peatonal A tiene las peores tasas de error de bit, peromejora sus resultados al evaluar las tramas recibidas sin errores. Esto se debe a que estecanal tiene muy poca selectividad en frecuencia y las tramas recibidas, o no contienenningún error, o bien contienen muchos errores, lo cual empeora la BER pero no la FER. Elresto de canales tienen mayor selectividad en frecuencia y se observa como los resultadosen el UL son mejores que en el DL debido a la mayor densidad de pilotos y a que laestimación de canal en el UL se realiza en tiempo y frecuencia. Los resultados del canalvehicular A muestran claramente la influencia de las altas velocidades en los resultados,que empeoran cuanto mayor sea la velocidad.
• Tasas de datos alcanzadas utilizando ARQ en los canales ITU-R con QPSK 1/2 y QPSK3/4. Para el canal peatonal A siempre es mejor utilizar la modulación QPSK 3/4. Parael canal peatonal B, se obtienen tasas de transferencia mayores utilizando QPSK 1/2,excepto a partir de los 29 dB de SNR en el UL. Para el canal vehicular A, siempre seobtienen mejores resultados con QPSK 1/2.
127

A. Resumen de la Tesis
Las pruebas realizadas permiten evaluar el rendimiento real del sistema WiMAX completoen condiciones de propagación realistas. Los resultados de las mediciones confirman que laimplementación propuesta es adecuada para los escenarios modelados con los modelos de canalmencionados.
A.2 Simulación de redes de comunicaciones en sistemas detransporte
En las últimas décadas la industria ferroviaria ha ido evolucionando sus sistemas de señalizaciónconvencionales hacia sistemas basados en comunicaciones que exigen infraestructuras fiables ytolerantes a fallos. En esta memoria nos centramos en los entornos de metro, en los que se sueleutilizar el sistema CBTC para gestionar el tráfico de forma eficiente y segura.
Los sistemas CBTC pueden ser desplegados con cualquier tecnología de comunicacionesque cumpla sus requisitos de fiabilidad y baja latencia de paquetes. Habitualmente se utilizainfraestructura Wi-Fi por su bajo coste y por no necesitar el uso de bandas de transmisiónlicenciadas. Sin embargo, es necesario utilizar soluciones Wi-Fi con modificacionespropietarias para gestionar de forma correcta la transición entre los puntos de accesodesplegados a lo largo de la vía. Además, la tecnología Wi-Fi es susceptible de sufririnterferencias y no proporciona comunicaciones de largo alcance, obligando a la instalación demuchos puntos de acceso. Los estándares 4G y 5G son una buena alternativa que proporcionanmayor alcance y eficiencia espectral, soportan mejor la movilidad e incluyen mecanismos deQoS más robustos que Wi-Fi. Su mayor desventaja es la necesidad de utilizar bandas defrecuencia licenciadas y el mayor coste del equipamiento.
En entornos de metro hay otros servicios que requieren comunicaciones inalámbricas con eltren además de CBTC. Normalmente se utilizan tecnologías radio separadas para proporcionarestos servicios adicionales (por ejemplo, TETRA para la seguridad pública), lo que da lugar aun aumento en los costes de despliegue y mantenimiento de la infraestructura. En este trabajose evalúa el uso de una sola tecnología inalámbrica para todas las aplicaciones, reduciendo loscostes operacionales. Esta infraestructura debe soportar los diferentes requisitos de QoS de lasaplicaciones, especialmente las de misión crítica. Los servicios y requisitos considerados sonlos siguientes:
• Servicios de misión crítica.– CBTC: Sistema de señalización y control. Requiere un retardo máximo de 100 ms
y una pérdida de paquetes menor del 0.1%.– Voz: Servicio de seguridad pública permite comunicarse a los conductores con el
centro de control. Al igual que CBTC, requiere comunicaciones con bajo retardo.Se recomienda que el retardo no sobrepase los 150 ms.
128

A.2. Simulación de redes de comunicaciones en sistemas de transporte
• Aplicaciones para el operador de metro.– Circuito Cerrado de Televisión (CCTV): Videovigilancia de los vagones del tren.
La señal de vídeo se envía desde los trenes al centro de control o de seguridad. Esteservicio necesita un gran ancho de banda pero tolera retardos de hasta 500 ms.
– Videovigilancia de los andenes: Esta señal de vídeo se envía al tren para que elconductor pueda ver el estado del andén antes de que el tren llegue a la estación.Al igual que CCTV, requiere una tasa alta de datos pero permite retardos de mediosegundo.
– Mantenimiento: Telemetría para supervisar el estado de los sensores y equiposdel tren. También se pueden incluir otras operaciones de mantenimiento, como laactualización de los sistemas del tren. En principio, este servicio no tiene requisitosde tiempo real y se puede proporcionar con transmisiones best-effort.
• Servicios para los pasajeros.– Información a los pasajeros: Consiste en los mensajes multimedia mostrados a los
viajeros, como la próxima parada. Si no se muestra información de entretenimiento(noticias, publicidad), el servicio no requerirá grandes transmisiones de datos. Setoleran retardos largos que se pueden satisfacer con una prioridad best-effort.
– Internet a bordo: Proporciona conectividad dentro de los trenes para dar acceso aInternet a los pasajeros. Este servicio no se considera en este trabajo.
Los despliegues de comunicaciones en los metros requieren un gran esfuerzo deplanificación y la realización de campañas de medida para asegurar la cobertura a lo largo detoda la línea. Se pueden utilizar cables radiantes o antenas distribuidas dentro los túneles. Lassoluciones de cable radiante proporcionan una cobertura más estable que el uso de antenas, perotienen mayor coste. La planificación radio es más compleja con las antenas porque hay muchosfactores que afectan a la propagación de las ondas electromagnéticas dentro de los túneles. Poreste motivo se deben realizar mediciones de propagación dentro de los túneles para seleccionary ajustar correctamente los modelos de canal radio utilizados para el cálculo de cobertura.También es importante realizar simulaciones de red para poder evaluar el cumplimiento delos requisitos ante distintas situaciones y prevenir posibles problemas.
Para la realización de estas simulaciones se ha seleccionado el simulador ns-3. Se tratade un simulador de redes de código abierto que se puede modificar totalmente para adaptarse anuestras necesidades. A continuación se describen las funcionalidades destacadas del simuladory las mejoras que se realizaron para adaptarse a entornos ferroviarios:
• Proporciona librerías para facilitar el desarrollo de los modelos y la ejecución de lassimulaciones: gestión de la configuración y parámetros de las simulaciones, generaciónde variables aleatorias, gestión de eventos temporales, generación de tráfico de red, etc.
• Implementa la pila de protocolos IP (IP, UDP, TCP, etc.).• Incluye múltiples modelos de propagación. Permite implementar canales de propagación
selectivos en frecuencia. También se tiene en cuenta el tipo de antenas utilizadas y su
129

A. Resumen de la Tesis
orientación.• Dispone de diversos modelos de movilidad y permite desarrollar modelos propios. Se ha
desarrollado un modelo específico para trenes, que reproduce el recorrido de los trenes enla línea de metro estableciendo las velocidades máximas dentro y fuera de las estaciones,y la aceleración máxima cuando se acelera o frena el tren.
• Módulo LTE. Simula el funcionamiento de una red LTE en modo FDD. Implementa todala pila de protocolos LTE y la red troncal (EPC). Ha sido necesario mejorar este módulocon las siguientes características:
– Planificador con soporte de QoS de cada flujo. Los planificadores disponibles noson capaces de priorizar los distintos flujos de cada usuario, solo son capaces deasignar distintas prioridades entre usuarios. Se ha implementado la priorizaciónde flujos descrita en el estándar para este fin, denominada Logical ChannelPrioritization (LCP).
– Planificador proportional fair (PF) para el UL. El simulador sólo dispone de unplanificador round robin para el enlace ascendente. Se implementó el planificadorPF para repartir los recursos de forma equitativa teniendo en cuenta el estado delcanal de cada usuario. La implementación de este planificador tiene que respetarque las transmisiones de cada usuario deben ser contiguas en frecuencia, debido ala modulación SC-FDMA utilizada en el UL de LTE.
– Se han adaptado los métodos de reúso de frecuencias para los despliegues enel túnel. Como los despliegues se realizan a lo largo de la vía y no en celdashexagonales, se ha modificado el factor de reúso a 2. De esta forma se limitanlas interferencias entre celdas aprovechando mejor el espectro utilizable.
• Módulo Wi-Fi. Es capaz de simular los estándares Wi-Fi hasta 802.11ac. Sin embargo,ha sido necesario utilizar el estándar 802.11a por errores en la implementación de laagregación de paquetes. También se han activado los mecanismos de QoS de 802.11econ colas separadas para cada categoría de acceso. Ha sido necesario añadir soporte paratransiciones rápidas entre puntos de acceso con las siguientes características:
– La implementación está bastante idealizada puesto que se asume que los clientesWi-Fi de los trenes conocen su posición y los detalles del despliegue Wi-Fi (laposición de cada punto de acceso y el canal Wi-Fi en el que opera). De esta forma,los clientes saben cual es el punto de acceso más cercano y a qué canal Wi-Fi debencambiar para conectarse a él.
– Se desarrollaron tres métodos diferentes para conectarse a un punto de acceso unavez que ya se está operando en su canal Wi-Fi:
* PassiveBeaconWait: El cliente recibe paquetes baliza (beacons) enviados porlos puntos de acceso. Pasado un tiempo predeterminado, se conecta al puntode acceso del que se recibió el beacon con mejor SNR.
* ActiveProbing: El cliente envía paquetes especiales (probe requests) que son
130

A.2. Simulación de redes de comunicaciones en sistemas de transporte
respondidos por los puntos de acceso que estén operando en ese canal. Pasadoun tiempo (en nuestro caso 20 ms), se conecta al mejor punto de acceso.
* FastHandover: El cliente se conecta directamente puesto que ya conoce elpunto de acceso más cercano. El proceso de conexión puede durar alrededorde 1 ms si no se pierden paquetes.
– Durante este proceso de handover los paquetes que se quieran enviar desde el clientese perderán. También se pierden los paquetes que están en las colas del punto deacceso que se está dejando puesto que no se reenvían al siguiente punto de acceso.
Este simulador también permite caracterizar de forma precisa el comportamiento de lasaplicaciones y servicios desplegados en el metro. Se han implementado generadores de tráficoadaptados a cada aplicación:
• Flujos con tamaño de paquete y tasa de transmisión fijos. Usado para las aplicacionesCBTC, mantenimiento, e información para los pasajeros.
• Simulación de tráfico de vídeo generado a partir de ficheros de vídeo reales. Se usa paralas aplicaciones de videovigilancia.
• Flujo de voz IP, utilizando un tamaño de paquetes y tasa de datos fijas, pero con periodosde silencio cuya duración sigue una distribución estadística.
Los flujos de información de cada aplicación se mapean en las distintas clases de QoS(LTE) o categorías de acceso (Wi-Fi) en función de sus requisitos. Los servicios críticos tienenprioridad máxima y por tanto se les asignan las prioridades 1 y 2 en LTE y la categoría de voz(AC_VO) en Wi-Fi. El resto de aplicaciones se configura con prioridad best-effort.
También se han desarrollado modelos de propagación radio dentro de los túneles pararealizar las simulaciones de la forma más realista posible. La propagación radio en túneles sesuele caracterizar por el efecto de guía de ondas que tiende a aparecer a partir de determinadasdistancias. Además, la propagación depende en gran medida de las características físicas deltúnel, como sus dimensiones o el material y rugosidad de sus paredes. Además, la presencia decurvas y estaciones de metro, así como las dimensiones de los vagones de los trenes, modificansignificativamente el canal radio.
En la bibliografía hay multitud de artículos centrados en el estudio del modelo depropagación del canal radio en túneles. Los modelos de canal se pueden clasificar en dos grupos:deterministas y empíricos. Los modelos de canal deterministas simulan el comportamiento delas ondas radio para predecir la potencia y el retardo en recepción. Estos modelos pueden estarbasados en la resolución de las ecuaciones de Maxwell, en el análisis del efecto de guía deondas, o en métodos de trazado de rayos. Por otra parte, los modelos empíricos se basan en elanálisis de las medidas obtenidas en túneles. A partir de estas medidas, tratan de generalizarel comportamiento del canal con expresiones matemáticas cuyos parámetros dependen delescenario.
En este trabajo se han desarrollado dos modelos de canal:
• Modelo de canal determinista: Se basa en un modelo de canal determinista que utiliza
131

A. Resumen de la Tesis
el análisis modal para aproximar el efecto de guía de ondas en túneles rectangulares.Además, puede utilizarse en las regiones de propagación cercana y lejana del túnel,proporcionando resultados realistas. Para poder utilizar este modelo en las simulaciones,se ha adaptado y mejorado de la siguiente forma:
– Se ha descrito el método para poder utilizar el modelo con túneles con secciónno rectangular. Este método permite obtener el ancho y alto del túnel rectangularequivalente de túneles arqueados o circulares.
– Se ha añadido al modelo las pérdidas por la rugosidad e inclinación de las paredesdel túnel.
– Se tiene en cuenta la pérdida de acople o inserción de las antenas transmisoras yreceptoras dentro del túnel, en función de la cercanía a las paredes. Cuanto máscerca de las paredes, mayor es la pérdida.
– En los tramos curvos se produce una pérdida de propagación superior. Para modelaresta pérdida adicional, se utiliza un modelo empírico que solo depende del radio decurvatura, la frecuencia de la señal y la polarización de las antenas.
– También se tiene en cuenta los cambios de pendiente del recorrido, que se modelande la misma forma que las curvas.
• Modelo basado en medidas: Este modelo se basa en los resultados de una campaña demedida realizada en una estación del Metro de Madrid. Este modelo está dividido en doscomponentes:
– Pérdida de propagación de gran escala. Se dividen las mediciones en dos tramos(estación y túnel) para ajustar un modelo de propagación logarítmico en cada uno.
– Pérdida a pequeña escala (desvanecimiento). Se procesan las medidas obtenidaspara eliminar la pérdida de propagación a gran escala y se calcula la densidadespectral de potencia recibida para cada distancia y banda de frecuenciaconsiderada.
Se han realizado simulaciones en dos escenarios. Por una parte, se ha estudiado un escenariocon tres estaciones con un despliegue LTE similar al del modelo de propagación basado enmedidas. Por otra parte, se han estudiado los posibles despliegues en una línea completa demetro, utilizando el modelo de canal teórico para LTE y Wi-Fi.
El despliegue LTE con tres estaciones se diseñó para ajustarse a las condiciones de lacampaña de medida: un eNB en el centro de cada estación configurado para utilizar un sistemaLTE en modo FDD de 10+10 MHz de ancho de banda. Se ajustaron diversos parámetros deldespliegue LTE, incluyendo el reúso de frecuencias y el algoritmo de handover. De esta formase minimizaron las interferencias y se evitaron los problemas típicos del handover, como elefecto ping-pong.
El escenario de la línea de metro completa se utilizó para probar el modelo de canalteórico y comparar las dos tecnologías más utilizadas en los sistemas reales: una red LTEbasada en antenas distribuidas (DAS) y una solución Wi-Fi personalizada. La línea de metro
132

A.2. Simulación de redes de comunicaciones en sistemas de transporte
se basa en la línea 3 de Metro Bilbao y se usa su trazado y características para realizar loscálculos de propagación con el modelo teórico. Se plantea un despliegue inicial con antenasdirectivas situadas cerca de las salidas de emergencia y estaciones, facilitando su instalacióny mantenimiento. Las distintas características de las tecnologías Wi-Fi y LTE conducen adespliegues muy diferentes. LTE utiliza el modo FDD con 20+20 MHz de ancho de banda,transmitiendo en las frecuencias de 1869.9 MHz y 1774.9 MHz, y con potencia máxima de34 dBm y 23 dBm en DL y UL, respectivamente. El despliegue Wi-Fi, en cambio, utiliza 8canales de 20 MHz en la banda de 5 GHz, y su potencia de transmisión está limitada a 20 dBm.Estas diferencias hacen que la red LTE pueda utilizar las posiciones iniciales de las antenas,pero para el despliegue Wi-Fi ha sido necesario usar un despliegue diferente con antenas cada400 m.
El rendimiento de LTE y Wi-Fi se ha evaluado en términos de tasa de datos, pérdida depaquetes y latencia. En ambos casos se ha conseguido el cumplimiento de los requisitosdefinidos:
• Latencia: Tanto con LTE como con Wi-Fi se cumple la restricción de que el retardosea siempre inferior a 100 ms para el tráfico CBTC. Los demás servicios cumplen susrequisitos de retardo de forma adecuada.
• PER: El límite del 0,1% establecido para CBTC se cumple con ambas tecnologías. Losdespliegues LTE necesitan una configuración de reúso de frecuencias apropiada paraevitar las interferencias y cumplir este requisito. En el caso de Wi-Fi, solo se respetael límite de paquetes perdidos cuando se utiliza el método de transición entre puntos deacceso FastHandover.
Gracias a las adaptaciones realizadas al simulador, los resultados obtenidos predicen elcomportamiento de las diferentes tecnologías de forma apropiada y muestran la versatilidaddel simulador para evaluar diferentes despliegues.
133


Appendix II
List of Acronyms
3GPP 3rd Generation Partnership Project4G fourth generation5G fifth generationAAI Advanced Air InterfaceAAS adaptive antenna systemABS advanced base stationADC analog-to-digital converterAES advanced encryption standardAMC adaptive modulation and codingAMS advanced mobile stationAP access pointARP Address Resolution ProtocolARQ automatic repeat requestASIC application-specific integrated circuitATM asynchronous transfer modeAWGN additive white Gaussian noiseBER bit error ratioBE best effortBR bandwidth requestBSN block sequence numberBS base stationBTC block turbo codeBWA broadband wireless accessCARA Collision-Aware Rate AdaptationCBTC communications-based train controlCCDF complementary cumulative distribution functionCCTV closed-circuit televisionCDMA code-division multiple access
135

B. List of Acronyms
CFO carrier frequency offsetCID connection identifierCINR carrier-to-interference-and-noise ratioCMAC cipher-based message authentication codeCOTS commercial off-the-shelfCPS common part sublayerCP cyclic prefixCRC cyclic redundancy checkCS convergence sublayerCTC convolutional turbo codeDAC digital-to-analog converterDAS distributed antenna systemDDC digital down-converterDFS Dynamic Frequency SelectionDL-MAP downlink mapDL downlinkDRR deficit round robinDSP digital signal processorDUC digital up-converterEAP Extensible Authentication ProtocolEARFCN E-UTRA Absolute Radio Frequency Channel NumberEIRP effective isotropic radiated powerEPC Evolved Packet CoreePDCCH enhanced PDCCHEPS Evolved Packet switched SystemERTMS European Rail Traffic Management SystemETCS European Train Control SystemEVM error vector magnitudeFCH frame control headerFDD frequency-division duplexingFEC forward error correctionFER frame error rateFFR fractional frequency reuseFFT fast Fourier transformFIFO first-in-first-outFPGA field programmable gate arrayFRMCS Future Railway Mobile Communication SystemFUSC full usage of subchannelsGBR guaranteed bit rate
136
B. List of Acronyms
GO geometric opticsGPP general purpose processorGSM-R GSM for RailwaysGSM Global System for Mobile CommunicationsHARQ hybrid automatic repeat requestHDL hardware description languageHCS header check sequenceHFR hard frequency reuseHLS high-level synthesisHMAC hash-based message authentication codeHST high-speed trainICI inter-carrier interferenceICIC Inter-Cell Interference CoordinationIFFT inverse fast Fourier transformIP Internet ProtocolISM industrial, scientific and medicalITU-R ITU Radiocommunication SectorJML Joint Maximum LikelihoodLC logical channelLCP logical channel prioritizationLDPC low-density parity checkLoS line-of-sightLSB least significant bitLTE-A LTE-AdvancedLTE Long Term EvolutionLTE-U LTE-UnlicensedLTE-LAA LTE Licensed Assisted AccessLoS line-of-sightM2M machine-to-machineMAC medium access control layerMIMO multiple-input-multiple-outputMPDU MAC protocol data unitMRTR Minimum Reserved Traffic RateMSTR Maximum Sustained Traffic RateMSB most significant bitMSDU MAC service data unitMSE mean squared errorMS mobile stationMT maximum throughput
137

B. List of Acronyms
MTU maximum transmission unitMU-MIMO Multiple User MIMONLoS non-line-of-sightNR new radioNR-U new radio unlicensedOCC operational control centerOFDMA orthogonal frequency-division multiple accessOFDM orthogonal frequency-division multiplexingPAPR peak-to-average power ratioPCFICH Physical Control Format Indicator ChannelPCI Peripheral Component InterconnectPC personal computerPDCCH Physical Downlink Control ChannelPDU protocol data unitPER packet error ratioPF proportional fairPGA programmable gain amplifierPGW packet data network gatewayPHS payload header suppressionPHY physical layerPIS Passenger Information SystemPKM privacy key managementPMP point-to-multipointPN packet numberPRB physical resource blockPRBS pseudorandom binary sequencePSD power spectral densityPUSC partial usage of subchannelsQoS quality of serviceQCI QoS Class IdentifierRB resource blockRLC Radio Link ControlROHC RObust Header CompressionRRC Radio Resource ControlRR round robinRSSI received signal strength indicationRSRP Reference Signal Received PowerRSRQ Reference Signal Received QualityRTG receive/transmit transition gap
138

B. List of Acronyms
RTP Real-time Transport ProtocolSAP service access pointSA security associationSC single-carrierSC-FDMA single-carrier FDMASDR software-defined radioSDU service data unitSFR soft frequency reuseSINR signal-to-interference-plus-noise ratioSISO single-input and single-outputSNR signal-to-noise ratioSOFDMA scalable OFDMASS subscriber stationSTA stationSU-MIMO Single User MIMOSoC System-on-ChipTBCC tail-biting convolutional codeTCP Transmission Control ProtocolTDD time-division duplexingTDMA time division multiple accessTETRA Terrestrial Trunked RadioTPC Transmit Power ControlTTG transmit/receive transition gapTUSC tile usage of subchannelsUDP User Datagram ProtocolUE user equipmentUGS unsolicited grant serviceUIC International Union of RailwaysUL-MAP uplink mapUL uplinkUM Unacknowledged ModeUMTS Universal Mobile Telecommunications SystemVoIP voice over Internet ProtocolWLAN wireless local area networkWiMAX Worldwide Interoperability for Microwave AccesseNodeB Evolved Node BertPS extended rtPSnrtPS non-real-time polling servicertPS real-time polling service
139


References
[3GP14] 3GPP. Policy and charging control architecture. TS 23.203, version 8.15.0. 3rdGeneration Partnership Project (3GPP), 2014.
[3GP18] 3GPP. Medium Access Control (MAC) protocol specification. TS 36.321, version15.2.0. 3rd Generation Partnership Project (3GPP), 2018.
[AHM10] Sassan Ahmadi. Mobile WiMAX: A systems approach to understanding IEEE802.16 m radio access technology. Academic Press, 2010. ISBN: 9780123749642.
[AI+16] B. Ai, K. Guan, Z. Zhong, C. F. López, L. Zhang, C. Briso-Rodríguez, and R.He. “Measurement and analysis of extra propagation loss of tunnel curve”. IEEETransactions on Vehicular Technology, vol. 65, no. 4, 2016, pp. 1847–1858. ISSN: 1939-9359.DOI: 10.1109/TVT.2015.2425218.
[ALL18] Ben Allen. User and System Requirements (Telecommunications). Deliverable 3.1.Version 1.1. X2Rail-1, 2018. Online access: https : / /projects . shift2rail .org /download.aspx?id=5a0c552b-eac6-46bf-9f9d-c33df0a980d9.
[ALT06] Altera Corporation. WiMAX OFDMA Ranging. Application Note 430. 2006.Online access: https://www.intel.com/content/dam/www/programmable/us/en/pdfs/literature/technology/dsp/dsp-literature_2.pdf.
[ARH09] A.Q. Ansari, A. Rajput, and M. Hashmani. “WiMAX Network Optimization- Analyzing Effects of Adaptive Modulation and Coding Schemes Used inConjunction with ARQ and HARQ”. Proc. of Seventh Annual CommunicationNetworks and Services Research Conference, 2009. CNSR ’09. 2009, pp. 6–13.DOI: 10.1109/CNSR.2009.12.
[BCA07] C. Briso-Rodriguez, J. M. Cruz, and J. I. Alonso. “Measurements and Modeling ofDistributed Antenna Systems in Railway Tunnels”. IEEE Transactions on VehicularTechnology, vol. 56, no. 5, 2007, pp. 2870–2879. ISSN: 1939-9359.DOI: 10.1109/TVT.2007.900500.
141
[BHA+09] G. Bhanage, R. Mahindra, I. Seskar, and D. Raychaudhuri. “Implication of MACframe aggregation on empirical wireless experimentation”. Proc. of GLOBECOM2009 - 2009 IEEE Global Telecommunications Conference. 2009, pp. 1–7.DOI: 10.1109/GLOCOM.2009.5426069.
[BIT14] Naila Bouchemal, Nora Izri, and Samir Tohmé. “MAC-LTE scheduler modelingand performance evaluation in LTE network”. Proc. of 2014 IEEE 25th AnnualInternational Symposium on Personal, Indoor, and Mobile Radio Communication(PIMRC). 2014, pp. 1007–1012.DOI: 10.1109/PIMRC.2014.7136314.
[BN09] Aymen Belghith and Loutfi Nuaymi. “Scheduling Techniques for WiMax”. CurrentTechnology Developments of WiMax Systems. Ed. by Maode Ma. Dordrecht, SpringerNetherlands, 2009, pp. 61–84. ISBN: 978-1-4020-9300-5.DOI: 10.1007/978-1-4020-9300-5_4.
[CAR+13a] Ángel Carro-Lagoa, Pedro Suárez-Casal, P. Fraga-Lamas, J. A. García-Naya, L.Castedo, and A. Morales-Méndez. “Real-Time Validation of a SDR Implementationof TDD WiMAX Standard”. Proc. of 2013 Wireless Innovation Forum EuropeanConference on Communications Technologies and Software Defined Radio (SDR-WInnComm-Europe 2013). 2013.
[CAR+13b] Ángel Carro-Lagoa, Pedro Suárez-Casal, José A. García-Naya, Paula Fraga-Lamas, Luis Castedo, and Antonio Morales-Méndez. “Design and implementation ofan OFDMA-TDD physical layer for WiMAX applications”. EURASIP Journal onWireless Communications and Networking, vol. 2013, no. 1, 2013, p. 243. ISSN: 1687-1499.DOI: 10.1186/1687-1499-2013-243.
[CAR+19] Ángel Carro-Lagoa, Tomás Domínguez-Bolaño, José Rodríguez-Piñeiro, MiguelGonzález-López, and José A. García-Naya. “Feasibility of LTE for train control insubway environments based on experimental data”. Proc. of 2019 27th EuropeanSignal Processing Conference (EUSIPCO). 2019, pp. 1–5.DOI: 10.23919/EUSIPCO.2019.8903070.
[CHU+11] G.C.H. Chuang, Pang-An Ting, Jen-Yuan Hsu, Jiun-You Lai, Shun-Chang Lo,Ying-Chuan Hsiao, and Tzi-Dar Chiueh. “A MIMO WiMAX SoC in 90nm CMOS for300km/h mobility”. Proc. of IEEE International Solid-State Circuits Conference Digestof Technical Papers (ISSCC), 2011. 2011, pp. 134–136.DOI: 10.1109/ISSCC.2011.5746252.
[CKH11] Bonato Both C., R. Kunst, and F. Henes. “Channel Encoding Block for MobileWiMAX Networks Using Reconfigurable Hardware”. Journal of Applied Computing
142

Research, vol. 1, no. 2, 2011, pp. 69–75.DOI: 10.4013/jacr.2011.12.01.
[CLC07] Kang-Chuan Chang, Jun-Wei Lin, and Tzi-Dar Chiueh. “Design of a downlinkbaseband receiver for IEEE 802.16E OFDMA mode in high mobility”. Proc. of IEEEInternational SOC Conference, 2007. 2007, pp. 301–304.DOI: 10.1109/SOCC.2007.4545479.
[COL+10] Rebeca Colda, Tudor Palade, Emanuel Pucchita, Irina Vermecan, and AncutaMoldovan. “Mobile WiMAX: System performance on a vehicular multipathchannel”. Proc. of Fourth European Conference on Antennas and Propagation (EuCAP),2010. 2010, pp. 1–5.
[COR07] Intel Corporation. OFDMA PHY SAP Interface Specification for 802.16 BroadbandWireless Access Base Stations. Tech. rep. 2007.
[CS94] R.V. Cox and C.E.W. Sundberg. “An efficient adaptive circular Viterbi algorithmfor decoding generalized tailbiting convolutional codes”. IEEE Transactions onVehicular Technology, vol. 43, no. 1, 1994, pp. 57–68. ISSN: 0018-9545.DOI: 10.1109/25.282266.
[DIM+09] K. Dimou, M. Wang, Y. Yang, M. Kazmi, A. Larmo, J. Pettersson, W. Muller, andY. Timner. “Handover within 3gpp lte: design principles and performance”. Proc. of2009 IEEE 70th Vehicular Technology Conference Fall. 2009, pp. 1–5.DOI: 10.1109/VETECF.2009.5378909.
[DOM+16] T. Domínguez-Bolaño, J. Rodríguez-Piñeiro, José A. García-Naya, and L. Castedo.“The GTEC 5G link-level simulator”. Proc. of 1st International Workshop on Link- andSystem Level Simulations (IWSLS). 2016, pp. 1–6.DOI: 10.1109/IWSLS.2016.7801585.
[DOM+18] T. Domínguez-Bolaño, J. Rodríguez-Piñeiro, J. A. García-Naya, X. Yin, and L.Castedo. “Measurement-based characterization of train-to-infrastructure 2.6 GHzpropagation channel in a modern subway station”. IEEE Access, vol. 6, 2018,pp. 52814–52830. ISSN: 2169-3536.DOI: 10.1109/ACCESS.2018.2870564.
[DUD+07] D. G. Dudley, S. F. Mahmoud, M. Lienard, and P. Degauque. “On wirelesscommunication in tunnels”. Proc. of 2007 IEEE Antennas and Propagation SocietyInternational Symposium. 2007, pp. 3305–3308.DOI: 10.1109/APS.2007.4396243.
[EH94] Bradley Efron and D. V. Hinkley. An Introduction to the Bootstrap (CRCMonographs on Statistics & Applied Probability). First. Chapman & Hall, 1994. ISBN:0412042312.
143

[ELS75] A. Emslie, R. Lagace, and P. Strong. “Theory of the propagation of uhf radiowaves in coal mine tunnels”. IEEE Transactions on Antennas and Propagation, vol. 23,no. 2, 1975, pp. 192–205. ISSN: 1558-2221.DOI: 10.1109/TAP.1975.1141041.
[EME17] Hany M. El-Maghrabi, Samir F. Mahmoud, and Mostafa El-Said. “Modal analysisof wave propagation in straight and curved arched tunnel based on equivalentrectangular tunnel model”. ACES JOURNAL, vol. 32, no. 9, 2017. ISSN: 1054-4887.Online access: https://aces-society.org/includes/downloadpaper.php?of=ACES_Journal_September_2017_Paper_3&nf=17-9-3.
[FON+11] O. Font-Bach, N. Bartzoudis, A. Pascual-Iserte, and D. López Bueno. “A real-time MIMO-OFDM mobile WiMAX receiver: Architecture, design and FPGAimplementation”. Computer Networks, vol. 55, no. 16, 2011, pp. 3634–3647. ISSN:1389-1286.DOI: 10.1016/j.comnet.2011.02.018.
[FOR+13] A. E. Forooshani, S. Bashir, D. G. Michelson, and S. Noghanian. “A survey ofwireless communications and propagation modeling in underground mines”. IEEECommunications Surveys Tutorials, vol. 15, no. 4, 2013, pp. 1524–1545. ISSN: 1553-877X.DOI: 10.1109/SURV.2013.031413.00130.
[FS17] J. Farooq and J. Soler. “Radio communication for communications-based traincontrol (CBTC): a tutorial and survey”. IEEE Communications Surveys & Tutorials,vol. 19, no. 3, 2017, pp. 1377–1402. ISSN: 1553-877X.DOI: 10.1109/COMST.2017.2661384.
[GRR17] Juan Moreno García-Loygorri, José Manuel Riera, and Carlos Rodríguez. “UrbanTransport Systems”. Ed. by Hamid Yaghoubi. IntechOpen, 2017. Chap. WirelessCommunication Systems for Urban Transport, pp. 39–60. ISBN: 978-953-51-2873-1.DOI: 10.5772/65585.
[GUA+12] Ke Guan, Zhangdui Zhong, José I Alonso, and Cesar Briso-Rodríguez.“Measurement of distributed antenna systems at 2.4 GHz in a realistic subwaytunnel environment”. IEEE Transactions on Vehicular Technology, vol. 61, no. 2, 2012,pp. 834–837. ISSN: 0018-9545.DOI: 10.1109/TVT.2011.2178623.
[GUA+13] K. Guan, Z. Zhong, B. Ai, R. He, B. Chen, Y. Li, and C. Briso-Rodríguez.“Complete propagation model in tunnels”. IEEE Antennas and Wireless PropagationLetters, vol. 12, 2013, pp. 741–744. ISSN: 1548-5757.DOI: 10.1109/LAWP.2013.2270937.
144
https://aces-society.org/includes/downloadpaper.php?of=ACES_Journal_September_2017_Paper_3&nf=17-9-3

[HCC09] C. Hsiao, Chi-Yun Chen, and T.-D. Chiueh. “Design of a dual-mode basebandreceiver for 802.11n and 802.16e MIMO OFDM/OFDMA”. Proc. of InternationalSymposium on VLSI Design, Automation and Test, 2009. VLSI-DAT ’09. 2009, pp. 331–334.DOI: 10.1109/VDAT.2009.5158162.
[HED09] M. Heddebaut. “Leaky waveguide for train-to-wayside communication-basedtrain control”. IEEE Transactions on Vehicular Technology, vol. 58, no. 3, 2009,pp. 1068–1076. ISSN: 1939-9359.DOI: 10.1109/TVT.2008.928635.
[HEJ14] Seyed Amin Hejazi. “Self-Organized Intelligent Distributed Antenna System in LTE”.PhD thesis. Simon Fraser University, 2014. Online access: http://summit.sfu.ca/item/14020.
[HEM+08] M. Hempel, Wei Wang, H. Sharif, Ting Zhou, and P. Mahasukhon.“Implementation and performance evaluation of Selective Repeat ARQ for WiMAXNS-2 model”. Proc. of IEEE Conference on Local Computer Networks, 2008. LCN 2008.33rd. 2008, pp. 230–235.DOI: 10.1109/LCN.2008.4664174.
[HK09] K. Ho and A. Kwasinski. “Uplink Channel Estimation in WiMAX”. Proc. of 2009IEEE Wireless Communications and Networking Conference. 2009, pp. 1–6.DOI: 10.1109/WCNC.2009.4918011.
[HKJ10] A. Hrovat, G. Kandus, and T. Javornik. “Four-slope channel model for path lossprediction in tunnels at 400 mhz”. IET Microwaves, Antennas Propagation, vol. 4,no. 5, 2010, pp. 571–582. ISSN: 1751-8733.DOI: 10.1049/iet-map.2009.0159.
[HKJ14] A. Hrovat, G. Kandus, and T. Javornik. “A survey of radio propagation modelingfor tunnels”. IEEE Communications Surveys Tutorials, vol. 16, no. 2, 2014, pp. 658–669.ISSN: 1553-877X.DOI: 10.1109/SURV.2013.091213.00175.
[HLR08] Thomas R. Henderson, Mathieu Lacage, and George F. Riley. “Networksimulations with the ns-3 simulator”. Proc. of In Sigcomm (Demo). 2008. Onlineaccess: http://conferences.sigcomm.org/sigcomm/2008/papers/p527-hendersonA.pdf.
[HSI+11] Hsien-Wen Chang, M. Tseng, S. Chen, Ming-Hung Cheng, and S. Wen. “Field trialresults for integrated WiMAX and radio-over-fiber systems on high speed rail”.Proc. of 2011 IEEE 22nd International Symposium on Personal, Indoor and Mobile RadioCommunications. 2011, pp. 2111–2115.DOI: 10.1109/PIMRC.2011.6139887.
145
[HSU+11] Jen-Yuan Hsu, Chien-Yu Kao, Ping-Heng Kuo, and Pangan Ting. “Configurablebaseband designs and implementations of WiMAX/LTE dual systems based onmulti-core DSP”. Proc. of IEEE International SOC Conference (SOCC), 2011. 2011,pp. 265–271.DOI: 10.1109/SOCC.2011.6085146.
[HU+07] Su Hu, Gang Wu, Yong Liang Guan, Choi Look Law, Yanxin Yan, and ShaoqianLi. “Development and performance evaluation of mobile WiMAX testbed”. Proc. ofIEEE Mobile WiMAX Symposium, 2007. 2007, pp. 104–107.DOI: 10.1109/WIMAX.2007.348688.
[IEE04a] IEEE. “IEEE Standard for Communications-Based Train Control (CBTC)Performance and Functional Requirements”. IEEE Std 1474.1-2004 (Revision of IEEEStd 1474.1-1999), 2004, pp. 1–45.DOI: 10.1109/IEEESTD.2004.95746.
[IEE04b] IEEE. “Standard for Local and metropolitan area networks - Part 16: AirInterface for Fixed Broadband Wireless Access Systems”. IEEE Std 802.16-2004(Revision of IEEE Std 802.16-2001), 2004, pp. 1–915.DOI: 10.1109/IEEESTD.2004.8684627.
[IEE06] IEEE. “IEEE Standard for Local and Metropolitan Area Networks - Part 16: AirInterface for Fixed and Mobile Broadband Wireless Access Systems - Amendmentfor Physical and Medium Access Control Layers for Combined Fixed and MobileOperation in Licensed Bands”. IEEE Std 802.16e-2005 and IEEE Std 802.16-2004/Cor1-2005 (Amendment and Corrigendum to IEEE Std 802.16-2004), 2006, pp. 1–822.DOI: 10.1109/IEEESTD.2006.99107.
[IEE08] IEEE. “IEEE Recommended Practice for Communications-Based Train Control(CBTC) System Design and Functional Allocations”. IEEE Std 1474.3-2008, 2008,pp. 1–117.DOI: 10.1109/IEEESTD.2008.4618623.
[IEE09] IEEE. “IEEE Standard for Local and metropolitan area networks Part 16: AirInterface for Broadband Wireless Access Systems”. IEEE Std 802.16-2009 (Revisionof IEEE Std 802.16-2004), 2009, pp. 1–2080.DOI: 10.1109/IEEESTD.2009.5062485.
[IEE11] IEEE. “IEEE Standard for Local and metropolitan area networks Part 16: AirInterface for Broadband Wireless Access Systems Amendment 3: Advanced AirInterface”. IEEE Std 802.16m-2011(Amendment to IEEE Std 802.16-2009), 2011.DOI: 10.1109/IEEESTD.2011.5765736.
146
[IEE12a] IEEE. “IEEE Standard for Air Interface for Broadband Wireless AccessSystems”. IEEE Std 802.16-2012 (Revision of IEEE Std 802.16-2009), 2012, pp. 1–2542.DOI: 10.1109/IEEESTD.2012.6272299.
[IEE12b] IEEE. “IEEE Standard for WirelessMAN-Advanced Air Interface forBroadband Wireless Access Systems”. IEEE Std 802.16.1-2012, 2012, pp. 1–1090.DOI: 10.1109/IEEESTD.2012.6297413.
[IEE12c] IEEE. “IEEE Standard for WirelessMAN-Advanced Air Interface forBroadband Wireless Access Systems Amendment 1: Enhancements to SupportMachine-to-Machine Applications”. IEEE Std 802.16.1b-2012 (Amendment to IEEEStd 802.16.1-2012), 2012, pp. 1–126.DOI: 10.1109/IEEESTD.2012.6328224.
[IEE13] IEEE. “IEEE Standard for WirelessMAN-Advanced Air Interface forBroadband Wireless Access Systems –Amendment 2: Higher Reliability Networks”.IEEE Std 802.16.1a-2013 (Amendment to IEEE Std 802.16.1-2012), 2013, pp. 1–319.DOI: 10.1109/IEEESTD.2013.6547982.
[IEE16] IEEE. “IEEE Standard for Information technology – Telecommunications andinformation exchange between systems Local and metropolitan area networks –Specific requirements - Part 11: Wireless LAN Medium Access Control (MAC) andPhysical Layer (PHY) Specifications”. IEEE Std 802.11-2016 (Revision of IEEE Std802.11-2012), 2016, pp. 1–3534.DOI: 10.1109/IEEESTD.2016.7786995.
[IEE18] IEEE. “IEEE Standard for Air Interface for Broadband Wireless AccessSystems”. IEEE Std 802.16-2017 (Revision of IEEE Std 802.16-2012), 2018, pp. 1–2726.DOI: 10.1109/IEEESTD.2018.8303870.
[IEE20] IEEE. “IEEE Draft Standard for Information Technology – Telecommunicationsand Information Exchange Between Systems Local and Metropolitan AreaNetworks – Specific Requirements Part 11: Wireless LAN Medium Access Control(MAC) and Physical Layer (PHY) Specifications Amendment Enhancements forHigh Efficiency WLAN”. IEEE P802.11ax/D7.0, September 2020, 2020, pp. 1–822.Online access: https://ieeexplore.ieee.org/servlet/opac?punumber=9186914.
[ISC07] P. Imperatore, E. Salvadori, and I. Chlamtac. “Path Loss Measurements at 3.5GHz: A Trial Test WiMAX Based in Rural Environment”. Proc. of 3rd InternationalConference on Testbeds and Research Infrastructure for the Development of Networksand Communities, 2007. TridentCom 2007. 2007, pp. 1–8.DOI: 10.1109/TRIDENTCOM.2007.4444709.
147

[ITU03] ITU-T. Recommendation G.114: One-way transmission time. Recommendations onthe transmission quality for an entire international telephone connection. 2003. Onlineaccess: https://www.itu.int/rec/T-REC-G.114.
[ITU97] ITU-R. Recommendation ITU-R M.1225: Guidelines for Evaluation of RadioTransmission Technologies for IMT-2000. Tech. rep. ITU-R, 1997.
[KAH09] M.S. Khairy, M.M. Abdallah, and S.E.-D. Habib. “EfficientFPGA Implementation of MIMO Decoder for Mobile WiMAX System”. Proc. ofIEEE International Conference on Communications, 2009. ICC ’09. 2009, pp. 1–5.DOI: 10.1109/ICC.2009.5198971.
[KHA+13] Arwa Khayat, Mohamed Kassab, Marion Berbineau, Mohamed Amine Abid,and Abdelfettah Belghith. “LTE based communication system for urban guided-transport: a QoS performance study”. Proc. of Communication Technologies forVehicles. Berlin, Heidelberg, Springer Berlin Heidelberg, 2013, pp. 197–210. ISBN: 978-3-642-37974-1.DOI: 10.1007/978-3-642-37974-1_16.
[KIM+06] J. Kim, S. Kim, S. Choi, and D. Qiao. “CARA: Collision-Aware Rate Adaptationfor IEEE 802.11 WLANs”. Proc. of 25TH IEEE International Conference on ComputerCommunications (IEEE INFOCOM 2006). 2006, pp. 1–11.DOI: 10.1109/INFOCOM.2006.316.
[LB08] H. Lai and S. Boumaiza. “WiMAX baseband processor implementation andvalidation on a FPGA/DSP platform”. Proc. of Canadian Conference on Electricaland Computer Engineering, 2008. CCECE 2008. 2008, pp. 001449–001452.DOI: 10.1109/CCECE.2008.4564781.
[LEE+09] Suk-Bok Lee, Ioannis Pefkianakis, Adam Meyerson, Shugong Xu, and Songwu Lu.“Proportional Fair Frequency-Domain Packet Scheduling for 3GPP LTE Uplink”.Proc. of IEEE INFOCOM 2009. 2009, pp. 2611–2615.DOI: 10.1109/INFCOM.2009.5062197.
[LIU+17] Yu Liu, Ammar Ghazal, Cheng-Xiang Wang, Xiaohu Ge, Yang Yang, andYapei Zhang. “Channel measurements and models for high-speed train wirelesscommunication systems in tunnel scenarios: a survey”. Science China InformationSciences, vol. 60, no. 101301, 2017.DOI: 10.1007/s11432-016-9014-3. Online access: https://arxiv.org/abs/1612.09534.
[LP09] P. Latkoski and B. Popovski. “Delay and throughput analysis of IEEE 802.16ARQ mechanism”. Proc. of International Conference on Wireless and OpticalCommunications Networks, 2009. WOCN ’09. IFIP. 2009, pp. 1–5.DOI: 10.1109/WOCN.2009.5010534.
148
[MAH10] Samir F. Mahmoud. “Wireless transmission in tunnels”. Mobile and WirelessCommunications. Ed. by Salma Ait Fares and Fumiyuki Adachi. Rijeka, IntechOpen,2010. Chap. 1.DOI: 10.5772/7700.
[MAO06] H.A. Mahmoud, H. Arslan, and M.K. Ozdemir. “Initial Ranging for WiMAX(802.16e) OFDMA”. Proc. of IEEE Military Communications Conference, 2006.MILCOM 2006. 2006, pp. 1–7.DOI: 10.1109/MILCOM.2006.302240.
[MAS+12] E. Masson, Y. Cocheril, M. Berbineau, J. Ghys, V. Hovinen, and A.Roivainen. “MIMO channel characterization in subway tunnel for train-to-waysideapplications”. Proc. of 2012 12th International Conference on ITS Telecommunications.2012, pp. 732–736.DOI: 10.1109/ITST.2012.6425278.
[MAT] Mathworks. Simulink – Simulation and Model-Based Design. Online access: https: / /www.mathworks.com/products/simulink.html.
[MB17] Émilie Masson and Marion Berbineau. “Railway Operators Needs in Termsof Wireless Communications”. Broadband Wireless Communications for RailwayApplications: For Onboard Internet Access and Other Applications. Cham, SpringerInternational Publishing, 2017, pp. 1–33. ISBN: 978-3-319-47202-7.DOI: 10.1007/978-3-319-47202-7_1.
[MCR08] Christian Mehlführer, Sebastian Caban, and Markus Rupp. “ExperimentalEvaluation of Adaptive Modulation and Coding in MIMO WiMAX with LimitedFeedback”. EURASIP Journal on Advances in Signal Processing, vol. 2008, 2008.DOI: 10.1155/2008/837102.
[MIT92] J. Mitola. “Software radios-survey, critical evaluation and future directions”.Proc. of [Proceedings] NTC-92: National Telesystems Conference. 1992, pp. 13/15–13/23.DOI: 10.1109/NTC.1992.267870.
[MIT95] J. Mitola. “The software radio architecture”. IEEE Communications Magazine,vol. 33, no. 5, 1995, pp. 26–38. ISSN: 1558-1896.DOI: 10.1109/35.393001.
[MIT99] J. Mitola. “Software radio architecture: a mathematical perspective”. IEEEJournal on Selected Areas in Communications, vol. 17, no. 4, 1999, pp. 514–538. ISSN:1558-0008.DOI: 10.1109/49.761033.
149
[MKP07] M. Morelli, C.-C.J. Kuo, and M.-O. Pun. “Synchronization Techniques forOrthogonal Frequency Division Multiple Access (OFDMA): A Tutorial Review”.Proceedings of the IEEE, vol. 95, no. 7, 2007, pp. 1394–1427. ISSN: 0018-9219.DOI: 10.1109/JPROC.2007.897979.
[MR10] Zaki F.W. Mohamed M.A. and Mosbeh R.H. “Simulation of WiMAX PhysicalLayer: IEEE 802.16e”. IJCSNS International Journal of Computer Science and NetworkSecurity, vol. 10, no. 11, 2010.
[NEG+16] Giovanni Neglia, Sara Alouf, Abdulhalim Dandoush, Sebastien Simoens, PierreDersin, Alina Tuholukova, Jérôme Billion, and Pascal Derouet. Performance Evaluationof Train Moving-Block Control. Research Report RR-8917. Inria Sophia Antipolis, 2016.Online access: https://hal.inria.fr/hal-01323589.
[NOK16] Nokia. Paris metro LTE trial: the SYSTUF project and its results. White Paper. 2016.Online access: https://www.nokia.com/blog/lte-underground-stellar-results-paris-metro-line-14-trial/.
[NUA07] Loutfi Nuaymi. WiMAX: Technology for Broadband Wireless Access. John Wiley& Sons, Ltd, 2007, pp. 69–80. ISBN: 9780470319055.DOI: 10 . 1002 / 9780470319055. Online access: http : / / dx . doi . org / 10 . 1002 /9780470319055.
[OMI07] T. Ohseki, M. Morita, and T. Inoue. “Burst Construction and Packet MappingScheme for OFDMA Downlinks in IEEE 802.16 Systems”. Proc. of IEEE GlobalTelecommunications Conference, 2007. GLOBECOM ’07. 2007, pp. 4307–4311.DOI: 10.1109/GLOCOM.2007.819.
[PAL+10] M. Palkovic, P. Raghavan, M. Li, A. Dejonghe, L. Van der Perre, and F.Catthoor. “Future software-defined radio platforms and mapping flows”. IEEE SignalProcessing Magazine, vol. 27, no. 2, 2010, pp. 22–33. ISSN: 1053-5888.DOI: 10.1109/MSP.2009.935386.
[PAR+10] D. Pareit, V. Petrov, B. Lannoo, E. Tanghe, W. Joseph, I. Moerman, P. Demeester,and L. Martens. “A Throughput Analysis at the MAC Layer of Mobile WiMAX”.Proc. of IEEE Wireless Communications and Networking Conference (WCNC), 2010.2010, pp. 1–6.DOI: 10.1109/WCNC.2010.5506379.
[PAR+12] Daan Pareit, Bart Lannoo, Ingrid Moerman, and Piet Demeester. “The History ofWiMAX: A Complete Survey of the Evolution in Certification and Standardizationfor IEEE 802.16 and WiMAX”. IEEE Communications Surveys Tutorials, vol. 14, no. 4,2012, pp. 1183–1211. ISSN: 1553-877X.DOI: 10.1109/SURV.2011.091511.00129.
150
[PBM11] Giuseppe Piro, Nicola Baldo, and Marco Miozzo. “An LTE module for the ns-3 network simulator”. Proc. of 4th International ICST Conference on SimulationTools and Techniques (SIMUTools). Barcelona, Spain, 2011, pp. 415–422. ISBN: 978-1-936968-00-8.DOI: 10.4108/icst.simutools.2011.245571. Online access: http://dl.acm.org/citation.cfm?id=2151054.2151129.
[PRO21] ns-3 project. Ns-3 model library. 2021. Online access: https://www.nsnam.org/docs/models/html/index.html.
[PW10] Phuong Thi Thu Pham and Tomohisa Wada. “Effective scheme of channel trackingand estimation for mobile WiMAX DL-PUSC system”. J. Comp. Sys., Netw., andComm., vol. 2010, 2010, 6:1–6:9. ISSN: 1687-7381.DOI: 10.1155/2010/806279. Online access: http://dx.doi.org/10.1155/2010/806279.
[ROD+13] José Rodríguez-Piñeiro, José A. García-Naya, Ángel Carro-Lagoa, and LuisCastedo. “A testbed for evaluating LTE in high-speed trains”. Proc. of 16th EuromicroConference on Digital System Design (DSD 2013). 2013, pp. 175–182.DOI: 10.1109/DSD.2013.27.
[ROD+20] Antonio J. Rodríguez, Roland Pastorino, Ángel Carro-Lagoa, Karl Janssens, andMiguel Á. Naya. “Hardware acceleration of multibody simulations for real-timeembedded applications”. Multibody System Dynamics, 2020, pp. 1–19.DOI: 10.1007/s11044-020-09738-w.
[SA10] Z. Sun and I. F. Akyildiz. “Channel modeling and analysis for wireless networksin underground mines and road tunnels”. IEEE Transactions on Communications,vol. 58, no. 6, 2010, pp. 1758–1768. ISSN: 1558-0857.DOI: 10.1109/TCOMM.2010.06.080353.
[SAY+06] Alexander Sayenko, Olli Alanen, Juha Karhula, and Timo Hämäläinen. “Ensuringthe QoS Requirements in 802.16 Scheduling”. Proc. of 9th ACM InternationalSymposium on Modeling Analysis and Simulation of Wireless and Mobile Systems.MSWiM ’06. Torremolinos, Spain, ACM, 2006, pp. 108–117. ISBN: 1-59593-477-4.DOI: 10.1145/1164717.1164737.
[SAY+07] Alexander Sayenko, Vitaliy Tykhomyrov, Henrik Martikainen, and Olli Alanen.“Performance Analysis of the IEEE 802.16 ARQ Mechanism”. Proc. of 10th ACMSymposium on Modeling, analysis, and simulation of wireless and mobile systems.MSWiM ’07. Chania, Crete Island, Greece, ACM, 2007, pp. 314–322. ISBN: 978-1-59593-851-0.DOI: 10.1145/1298126.1298180. Online access: http://doi.acm.org/10.1145/1298126.1298180.
151
[SHE+10] Yushi Shen, Pamela C. Cosman, Laurence B. Milstein, and Eduardo F. Martinez.“On Uplink Channel Estimation in WiMAX Systems”. Int. J. Mob. Comput. Multimed.Commun., vol. 2, no. 2, 2010, pp. 67–77. ISSN: 1937-9412.DOI: 10.4018/jmcmc.2010040105. Online access: http://code.ucsd.edu/pcosman/jmcmc.pdf.
[SJT09] Chakchai So-In, R. Jain, and A.-K. Tamimi. “Scheduling in IEEE 802.16e MobileWiMAX Networks: Key Issues and a Survey”. IEEE Journal on Selected Areas inCommunications, vol. 27, no. 2, 2009, pp. 156–171. ISSN: 0733-8716.DOI: 10.1109/JSAC.2009.090207.
[SUÁ+10] Pedro Suárez-Casal, Ángel Carro-Lagoa, José A. García-Naya, and Luis Castedo.“A Multicore SDR Architecture for Reconfigurable WiMAX Downlink”. Proc. of13th Euromicro Conference on Digital System Design: Architectures, Methods and Tools(DSD), 2010. 2010, pp. 801–804.DOI: 10.1109/DSD.2010.108.
[SUÁ+15a] Francisco J. Suárez, Pelayo Nuño, Juan C. Granda, and Daniel F. García. “Chapter7 - computer networks performance modeling and simulation”. Modeling and Simulationof Computer Networks and Systems. Ed. by Mohammad S. Obaidat, Petros Nicopolitidis,and Faouzi Zarai. Boston, Morgan Kaufmann, 2015, pp. 187–223. ISBN: 978-0-12-800887-4.DOI: https://doi.org/10.1016/B978-0-12-800887-4.00007-9.
[SUÁ+15b] Pedro Suárez-Casal, Ángel Carro-Lagoa, José A. García-Naya, Paula Fraga-Lamas, Luis Castedo, and Antonio Morales-Méndez. “A real-time implementation ofthe Mobile WiMAX ARQ and physical layer”. Journal of Signal Processing Systems,vol. 78, no. 3, 2015, pp. 283–297. ISSN: 1939-8115.DOI: 10.1007/s11265-014-0890-3.
[SV96] M. Shreedhar and G. Varghese. “Efficient fair queuing using deficit round-robin”.IEEE/ACM Transactions on Networking, vol. 4, no. 3, 1996, pp. 375–385. ISSN: 1558-2566.DOI: 10.1109/90.502236.
[TB02] F. Tosato and P. Bisaglia. “Simplified soft-output demapper for binaryinterleaved COFDM with application to HIPERLAN/2”. Proc. of 2002 IEEEInternational Conference on Communications. Conference Proceedings. ICC 2002 (Cat.No.02CH37333). Vol. 2. 2002, 664–668 vol.2.DOI: 10.1109/ICC.2002.996940.
[TEXa] Texas Instruments. 14 bit, 125 MSPS Analog-to-Digital Converter (ADS5500).Online access: http://www.ti.com/product/ads5500.
152
[TEXb] Texas Instruments. 16 bit, 500 MSPS, 2x-16x Interpolating Dual-Channel Digital-to-Analog Converter (DAC5686). Online access: http://www.ti.com/product/dac5686.
[TOL15] Morten Tolstrup. “Tunnel radio planning”. Indoor Radio Planning: A Practical Guidefor GSM, DCS, UMTS, HSPA and LTE. John Wiley & Sons, Ltd, 2015, pp. 423–470.ISBN: 9781118913611.DOI: 10.1002/9781118913611.ch11.
[WAN+16] C. Wang, A. Ghazal, B. Ai, Y. Liu, and P. Fan. “Channel Measurementsand Models for High-Speed Train Communication Systems: A Survey”. IEEECommunications Surveys Tutorials, vol. 18, no. 2, 2016, pp. 974–987. ISSN: 1553-877X.DOI: 10.1109/COMST.2015.2508442.
[WAN+19] Shuo Wang, Li Zhu, Kun Xu, Lin Zhang, and Xuan Wang. “Reliability evaluationfor LTE based CBTC train ground communication systems”. Journal of AdvancedTransportation, 2019. ISSN: 0197-6729.DOI: 10.1155/2019/2689648.
[WEN+15] T. Wen, X. Lyu, D. Kirkwood, L. Chen, C. Constantinou, and C. Roberts. “Co-simulation Testing of Data Communication System Supporting CBTC”. Proc. of2015 IEEE 18th International Conference on Intelligent Transportation Systems. 2015,pp. 2665–2670.DOI: 10.1109/ITSC.2015.428.
[WIM05] WiMAX Forum™. Requirements and Recommendations for WiMAX Forum™Mobility Profiles. Tech. rep. 2005.
[WU+09] Yu-Jen Wu, Jung-Mao Lin, Hsin-Yi Yu, and Hsi-Pin Ma. “A baseband testbedfor uplink mobile MIMO WiMAX communications”. Proc. of IEEE InternationalSymposium on Circuits and Systems, 2009. ISCAS 2009. 2009, pp. 794–797.DOI: 10.1109/ISCAS.2009.5117874.
[WU+10] Yu-Jen Wu, Jung-Mao Lin, Hsin-Yi Yu, Szu-Chi Liu, and Hsi-Pin Ma. “AnSoC evaluation platform for dual link MIMO-OFDMA communications”. Proc.of 5th International ICST Conference on Communications and Networking in China(CHINACOM), 2010. 2010, pp. 1–5.
[WWX08] Ming Wu, Fei Wu, and Changsheng Xie. “The Design and Implementationof WiMAX Base Station MAC Based on Intel Network Processor”. Proc. ofInternational Conference on Embedded Software and Systems Symposia, 2008. ICESSSymposia ’08. 2008, pp. 350–354.DOI: 10.1109/ICESS.Symposia.2008.46.
[XILa] Xilinx. LogiCORE IP - Convolutional Encoder v7.0. Online access: https:/ /www.xilinx.com/support/documentation/ip_documentation/convolution_ds248.pdf.
153

[XILb] Xilinx. LogiCORE IP - Viterbi Decoder v7.0. Online access: https : / /www.xilinx.com/support/documentation/ip_documentation/viterbi_ds247.pdf.
[XILc] Xilinx. LogiCORE IP Fast Fourier Transform v7.1. Online access: http : / / www.xilinx.com/support/documentation/ip_documentation/xfft_ds260.pdf.
[XILd] Xilinx. Xilinx System Generator for DSP. Online access: https : / /www.xilinx . com/products/design-tools/vivado/integration/sysgen.html.
[YAN10] Samuel C. Yang. OFDMA System Analysis and Design. 1st. Norwood, MA, USA,Artech House, Inc., 2010. ISBN: 160807076X, 9781608070763.
[YUC+07] T. Yucek, M.K. Ozdemir, H. Arslan, and F.E. Retnasothie. “A comparative studyof initial downlink channel estimation algorithms for mobile WiMAX”. Proc. ofMobile WiMAX Symposium, 2007. IEEE. 2007, pp. 32–37.DOI: 10.1109/WIMAX.2007.348698.
[ZAI+16] A. A. Zaidi, R. Baldemair, H. Tullberg, H. Bjorkegren, L. Sundstrom, J. Medbo, C.Kilinc, and I. Da Silva. “Waveform and Numerology to Support 5G Services andRequirements”. IEEE Communications Magazine, vol. 54, no. 11, 2016, pp. 90–98.ISSN: 1558-1896.DOI: 10.1109/MCOM.2016.1600336CM.
[ZBM13] Dizhi Zhou, Nicola Baldo, and Marco Miozzo. “Implementation and validationof LTE downlink schedulers for ns-3”. Proc. of 6th International ICST Conferenceon Simulation Tools and Techniques (SIMUTools). Cannes, France, 2013, pp. 211–218.ISBN: 978-1-4503-2464-9.DOI: 10.4108/icst.simutools.2013.251608. Online access: http://dl.acm.org/citation.cfm?id=2512734.2512763.
[ZH97] Y. P. Zhang and Y. Hwang. “Enhancement of rectangular tunnel waveguidemodel”. Proc. of Proceedings of 1997 Asia-Pacific Microwave Conference. Vol. 1. 1997,197–200 vol.1.DOI: 10.1109/APMC.1997.659338.
[ZHA+12] Y. Zhang, M. Wu, S. Ge, L. Luan, and A. Zhang. “Optimization of time-to-triggerparameter on handover performance in LTE high-speed railway networks”. Proc. ofThe 15th International Symposium on Wireless Personal Multimedia Communications.2012, pp. 251–255. Online access: https://ieeexplore.ieee.org/document/6398770.
[ZHA+14] Hongli Zhao, Li Zhu, Hailin Jiang, and Tao Tang. “Design and performancetests in an integrated TD-LTE based train ground communication system”. Proc. of17th International IEEE Conference on Intelligent Transportation Systems (ITSC). 2014,pp. 747–750.DOI: 10.1109/ITSC.2014.6957778.
154
[ZHA+16] Hongli Zhao, Yuan Cao, Li Zhu, and Wei Xu. “Integrated train ground radiocommunication system based TD-LTE”. Chinese Journal of Electronics, vol. 25, no. 4,2016, pp. 740–745.DOI: 10.1049/cje.2016.06.005.
[ZHA03] Y. P. Zhang. “Novel model for propagation loss prediction in tunnels”. IEEETransactions on Vehicular Technology, vol. 52, no. 5, 2003, pp. 1308–1314. ISSN: 1939-9359.DOI: 10.1109/TVT.2003.816647.
[ZTN08] G. Zaggoulos, M. Tran, and A. Nix. “Mobile WiMAX system performance -simulated versus experimental results”. Proc. of IEEE 19th International Symposiumon Personal, Indoor and Mobile Radio Communications, 2008. PIMRC 2008. 2008,pp. 1–5.DOI: 10.1109/PIMRC.2008.4699670.
155