Assessing the impact of human activities on hydrological and sediment changes (1953-2000) in nine...
19
ASSESSING THE IMPACT OF HUMAN ACTIVITIES ON HYDROLOGICAL AND SEDIMENT CHANGES (1953–2000) IN NINE MAJOR CATCHMENTS OF THE LOESS PLATEAU, CHINA TAO YANG, a,b,c CHONG-YU XU, d XI CHEN, a * VIJAY P. SINGH, e QUAN XI SHAO, f ZHEN-CHUN HAO a,b and XIN TAO g a State Key Laboratory of Hydrology-Water Resources and Hydraulics Engineering, Hohai University, Nanjing 210098, China b The Institute of Hydraulic Engineering of Yellow River, Zhengzhou 450003, China c State Key Laboratory of Water Resources and Hydropower Engineering Science, Wuhan University, Wuhan 430072, China d Department of Geosciences, University of Oslo, Oslo, Norway e Department of Biological & Agricultural Engineering, Texas A&M University, TX USA f CSIRO Mathematical & Information Sciences, Private Bag 5, Wembley, WA 6913, Australia g Hydrology Bureau, Yellow River Conservancy Commission, Zhengzhou 450004, China ABSTRACT The Range of Variability Approach (RVA) is employed to investigate thevariability and spatial patterns of hydrological and sediment changes (1953–2000) induced by intensified human activities, i.e. the implementation of water and soil conservation measures, in nine major catchments of the Loess Plateau, China. Results indicate that: (1) streamflow and sediment load regimes were greatly changed by the implementation of conservation measures; (2) similar spatial patterns of high hydrological and sediment changes resulting from the intensive implementation of conservation measures are observed in most catchments of the middle Yellow River. However, slightly different behaviours of changes exist due to the unique complexity of hydrological and sediment processes in this region and (3) the impacts of various conservation measures on hydrological and sediment processes are closely associated with the extent and types of these measures. Engineering works have a quite immediate impact on streamflow and sediment regimes. Considerable vegetation controls are recognized as additional important driving forces for high hydrological and sediment alterations among various soil conservation measures. In vegetation controls, afforestation is the major factor causing the changes of runoff and sediment processes in these nine catchments. The results of the current study will be greatly beneficial to the regional water resources management and restoration of eco-environmental system in the middle Yellow River basin characterized by intensified soil-conservation measures under the changing environment. Copyright # 2009 John Wiley & Sons, Ltd. key words: spatial assessment; range of variability approach (RVA); indicators of hydrologic alteration (IHA); soil-conservation measures; eco-environmental system; the Loess Plateau; the Yellow River Received 17 April 2008; Revised 18 March 2009; Accepted 2 April 2009 INTRODUCTION Catchments in the Loess Plateau (623 586 km 2 ) of China have been widely reported to contribute significantly to the total sediment yield of the Yellow River basin (752 444 km 2 ). The average annual erosion rate (2480 t km 2 ) for the Yellow River basin is recognized as the highest among all major river systems in the world (Ludwig and Probst, 1998; Shi and Shao, 2000), and this is the result of the severe soil erosion of the Loess Plateau where the soil erosion rates ranging from 20 000 to 30 000 t km 2 year are commonly reported (Xu et al., 2004; Mu et al., 2007) and extremely high rates (59 700 t km 2 year) have also been recorded (Shi and Shao, 2000; Mu et al., 2007). Before the 1950s, over 60% of the area in the Loess Plateau suffered from serious soil erosion caused by extensive land use and poor vegetation coverage, which exerted negative impacts on the regional eco-environment (BREST-CAS, 1992; Fu and Gulinck, 1994; Shi and Shao, 2000). The agricultural development resulted in major land reclamation, e.g. deforestation (Chen et al., 2001), which is regarded as one of the major causes accounting for water loss and RIVER RESEARCH AND APPLICATIONS River. Res. Applic. 26: 322–340 (2010) Published online 14 May 2009 in Wiley InterScience (www.interscience.wiley.com) DOI: 10.1002/rra.1267 *Correspondence to: Xi Chen, State Key Laboratory of Hydrology-Water Resources and Hydraulics Engineering, Hohai University, Nanjing 210098, P.R. China. E-mail: [email protected] Copyright # 2009 John Wiley & Sons, Ltd.
-
Upload
independent -
Category
Documents
-
view
2 -
download
0
Transcript of Assessing the impact of human activities on hydrological and sediment changes (1953-2000) in nine...
RIVER RESEARCH AND APPLICATIONS
River. Res. Applic. 26: 322–340 (2010)
Published online 14 May 2009 in Wiley InterScience
ASSESSING THE IMPACT OF HUMAN ACTIVITIES ON HYDROLOGICAL ANDSEDIMENT CHANGES (1953–2000) IN NINE MAJOR CATCHMENTS OF
THE LOESS PLATEAU, CHINA
TAO YANG,a,b,c CHONG-YU XU,d XI CHEN,a* VIJAY P. SINGH,e QUAN XI SHAO,f
ZHEN-CHUN HAOa,b and XIN TAOg
a State Key Laboratory of Hydrology-Water Resources and Hydraulics Engineering, Hohai University, Nanjing 210098, Chinab The Institute of Hydraulic Engineering of Yellow River, Zhengzhou 450003, China
c State Key Laboratory of Water Resources and Hydropower Engineering Science, Wuhan University, Wuhan 430072, Chinad Department of Geosciences, University of Oslo, Oslo, Norway
e Department of Biological & Agricultural Engineering, Texas A&M University, TX USAf CSIRO Mathematical & Information Sciences, Private Bag 5, Wembley, WA 6913, Australia
g Hydrology Bureau, Yellow River Conservancy Commission, Zhengzhou 450004, China
(www.interscience.wiley.com) DOI: 10.1002/rra.1267
ABSTRACT
The Range of Variability Approach (RVA) is employed to investigate the variability and spatial patterns of hydrological andsediment changes (1953–2000) induced by intensified human activities, i.e. the implementation of water and soil conservationmeasures, in nine major catchments of the Loess Plateau, China. Results indicate that: (1) streamflow and sediment load regimeswere greatly changed by the implementation of conservation measures; (2) similar spatial patterns of high hydrological andsediment changes resulting from the intensive implementation of conservation measures are observed in most catchments of themiddle Yellow River. However, slightly different behaviours of changes exist due to the unique complexity of hydrological andsediment processes in this region and (3) the impacts of various conservation measures on hydrological and sediment processesare closely associated with the extent and types of these measures. Engineering works have a quite immediate impact onstreamflow and sediment regimes. Considerable vegetation controls are recognized as additional important driving forces forhigh hydrological and sediment alterations among various soil conservation measures. In vegetation controls, afforestation is themajor factor causing the changes of runoff and sediment processes in these nine catchments. The results of the current study willbe greatly beneficial to the regional water resources management and restoration of eco-environmental system in the middleYellow River basin characterized by intensified soil-conservation measures under the changing environment. Copyright # 2009John Wiley & Sons, Ltd.
key words: spatial assessment; range of variability approach (RVA); indicators of hydrologic alteration (IHA); soil-conservation measures;eco-environmental system; the Loess Plateau; the Yellow River
Received 17 April 2008; Revised 18 March 2009; Accepted 2 April 2009
INTRODUCTION
Catchments in the Loess Plateau (623 586 km2) of China have been widely reported to contribute significantly to the
total sediment yield of the Yellow River basin (752 444 km2). The average annual erosion rate (2480 t km�2) for the
Yellow River basin is recognized as the highest among all major river systems in the world (Ludwig and Probst,
1998; Shi and Shao, 2000), and this is the result of the severe soil erosion of the Loess Plateau where the soil erosion
rates ranging from 20 000 to 30 000 t km�2 � year are commonly reported (Xu et al., 2004; Mu et al., 2007) and
extremely high rates (59 700 t km�2 � year) have also been recorded (Shi and Shao, 2000; Mu et al., 2007). Before
the 1950s, over 60% of the area in the Loess Plateau suffered from serious soil erosion caused by extensive land use
and poor vegetation coverage, which exerted negative impacts on the regional eco-environment (BREST-CAS,
1992; Fu and Gulinck, 1994; Shi and Shao, 2000). The agricultural development resulted in major land reclamation,
e.g. deforestation (Chen et al., 2001), which is regarded as one of the major causes accounting for water loss and
*Correspondence to: Xi Chen, State Key Laboratory of Hydrology-Water Resources and Hydraulics Engineering, Hohai University, Nanjing210098, P.R. China. E-mail: [email protected]
Copyright # 2009 John Wiley & Sons, Ltd.
IMPACT ON HYDROLOGICAL AND SEDIMENT CHANGES 323
soil erosion in the Yellow River basin. In this basin, about 73% of the eroded soil enters the Yellow River, inducing
enormous environmental problems of sedimentation and flooding risks in the downstream of the Yellow River. With
the recognition of the negative impacts of soil erosion on the environment, a number of water and soil conservation
measures have been implemented in the catchments of the Loess Plateau to control soil erosion and maintain
agricultural productivity since the 1950s (Liu 1989). These conservation measures, including building terraces and
sediment trapping dams, changing land cover by afforestation and improving pastures, have led to considerable
hydrological changes and sediment erosion alterations in the past decades.
A number of studies have been reported concerning the impact of various conservation measures on streamflow
regimes of several typical catchments in the Loess Plateau (e.g. Zhan and Yu, 1994; Xu and Niu, 2000; Zhang et al.,
2001, 2002; Mu et al., 2001, 2007; Huang and Zhang, 2004). For instance, Xu and Niu (2000) investigated the
impact of engineering measures (dams) on the mean annual stream flow, and Mu (2002) estimated their impact on
the variability of annual stream flow and floods using time-series analysis. Parametric (regression) and non-
parametric (Mann–Kendall) tests were utilized to detect trends of hydrological annual surface-flow and baseflow in
a moderate-sized and first-tributary catchment of the middle Yellow River (Huang and Zhang, 2004). Mu et al.
(2007) examined the changes in stream flow due to the implementation of soil conservation measures in four major
catchments in the Loess Plateau using the non-parametric Mann–Kendall test, Pettitt test and daily flow duration
curves (FDCs). The results identified significant downward trends and a change point occurred in 1978 in three of
the catchments. Comparison of the daily FDCs between two periods (1957–1978 and 1979–2003) showed that the
reduction in most percentiles of the daily FDCs varied between 20 and 45% with serious decreasing in the low
flows.
However, many of these studies on the impacts of soil conservation measures were conducted in a limited
number of catchments in the Loess Plateau. Meanwhile, only a few addressed sediment change factors which are
crucial to the eco-environment processes in this region (e.g. Cheng et al., 2000; Liu and Dong, 2003). No study has
assessed the governing behaviours of hydrological and sediment changes over all major catchments in the Loess
Plateau from a regional perspective. Furthermore, no discussion has adequately extended to the possible causing
factors and implications. Therefore, the objectives of this paper are to: (1) identify and evaluate the impacts of
conservation measures on the hydrologic and sediment regimes of the nine most typical and major catchments
dominated by extreme high water- and soil-loss in the Loess Plateau, China, after exclusion of the impacts of
climate variability and change; (2) quantify and characterize streamflow and sediment-load variations in those first-
order tributary catchments of the middle Yellow River before and after these measures and (3) map the degree of
hydrological and sediment alterations at and between stream gauges to assess these variations. While the
implications of both spatio-temporal hydrological and sediment alterations to the downstream environment and
ecosystem are important scientific issues, the underlying driving forces dominating the hydrological and sediment
changes in these catchments are also discussed as an important part in this investigation which would significantly
contribute to the regional eco-hydrological system management and planning.
STUDY REGION AND DATA
Study region
The middle Yellow River basin is characterized by semi-arid, continental monsoon climate in the Northern
Temperate Zone (YRCC, 2001, 2002; MWR, 2002). In order to examine the regional patterns of spatio-temporal
changes in streamflow and sediment transport in the catchments with significant land use change, nine major,
typical and first-order tributary catchments (outlet station) of the middle Yellow River in this region with different
areas were investigated in this study: the Huanpuchuan River (HP), the Gushanchuan River (GSY), the Kuye River
(WJC), the Tuwei River (GJC), the Jialu River (SJW), the Wuding River (BJC), the Qinjian River (YC), the Yan
River (GGY) and the Qiu River (LJP) (see Table I and Figure 1 for details). These catchments are dominated by the
different hydrologic and sediment conditions and all have undergone substantial land use changes caused by soil
conservation measures.
These nine first-order tributary catchments have drainage areas ranging from 1121 to 30 261 km2. The climate is
semi-arid, with an average annual precipitation from 319 to 509 mm, of which over 60 per cent falls in the period
Copyright # 2009 John Wiley & Sons, Ltd. River. Res. Applic. 26: 322–340 (2010)
DOI: 10.1002/rra
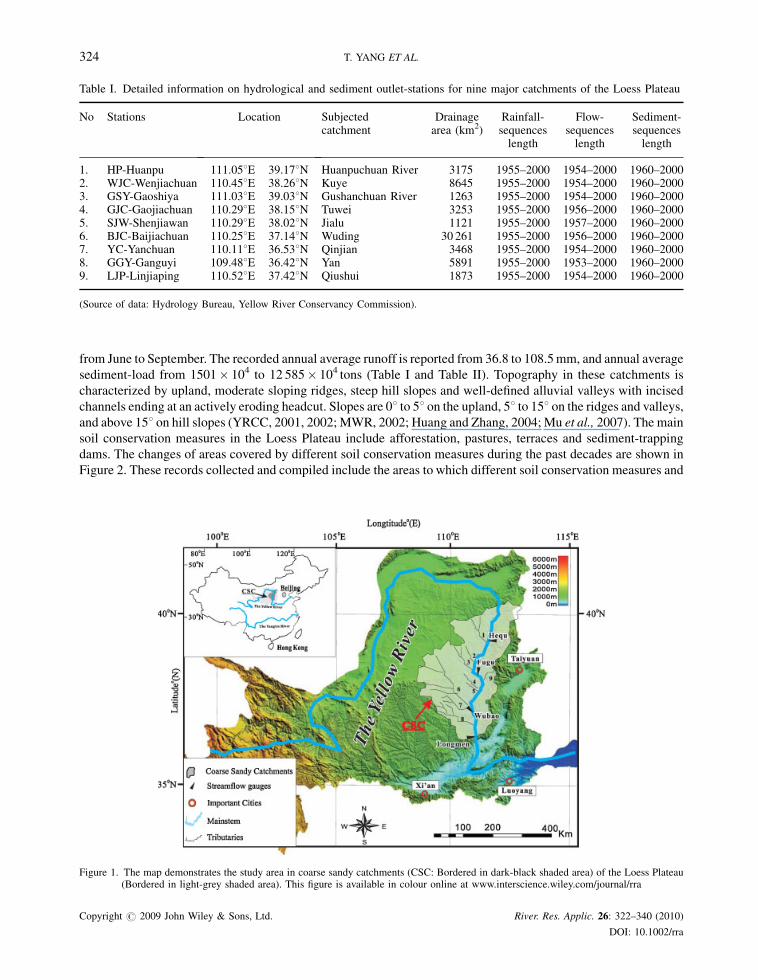
Table I. Detailed information on hydrological and sediment outlet-stations for nine major catchments of the Loess Plateau
No Stations Location Subjectedcatchment
Drainagearea (km2)
Rainfall-sequences
length
Flow-sequences
length
Sediment-sequences
length
1. HP-Huanpu 111.058E 39.178N Huanpuchuan River 3175 1955–2000 1954–2000 1960–20002. WJC-Wenjiachuan 110.458E 38.268N Kuye 8645 1955–2000 1954–2000 1960–20003. GSY-Gaoshiya 111.038E 39.038N Gushanchuan River 1263 1955–2000 1954–2000 1960–20004. GJC-Gaojiachuan 110.298E 38.158N Tuwei 3253 1955–2000 1956–2000 1960–20005. SJW-Shenjiawan 110.298E 38.028N Jialu 1121 1955–2000 1957–2000 1960–20006. BJC-Baijiachuan 110.258E 37.148N Wuding 30 261 1955–2000 1956–2000 1960–20007. YC-Yanchuan 110.118E 36.538N Qinjian 3468 1955–2000 1954–2000 1960–20008. GGY-Ganguyi 109.488E 36.428N Yan 5891 1955–2000 1953–2000 1960–20009. LJP-Linjiaping 110.528E 37.428N Qiushui 1873 1955–2000 1954–2000 1960–2000
(Source of data: Hydrology Bureau, Yellow River Conservancy Commission).
324 T. YANG ET AL.
from June to September. The recorded annual average runoff is reported from 36.8 to 108.5 mm, and annual average
sediment-load from 1501� 104 to 12 585� 104 tons (Table I and Table II). Topography in these catchments is
characterized by upland, moderate sloping ridges, steep hill slopes and well-defined alluvial valleys with incised
channels ending at an actively eroding headcut. Slopes are 08 to 58 on the upland, 58 to 158 on the ridges and valleys,
and above 158 on hill slopes (YRCC, 2001, 2002; MWR, 2002; Huang and Zhang, 2004; Mu et al., 2007). The main
soil conservation measures in the Loess Plateau include afforestation, pastures, terraces and sediment-trapping
dams. The changes of areas covered by different soil conservation measures during the past decades are shown in
Figure 2. These records collected and compiled include the areas to which different soil conservation measures and
Figure 1. The map demonstrates the study area in coarse sandy catchments (CSC: Bordered in dark-black shaded area) of the Loess Plateau(Bordered in light-grey shaded area). This figure is available in colour online at www.interscience.wiley.com/journal/rra
Copyright # 2009 John Wiley & Sons, Ltd. River. Res. Applic. 26: 322–340 (2010)
DOI: 10.1002/rra
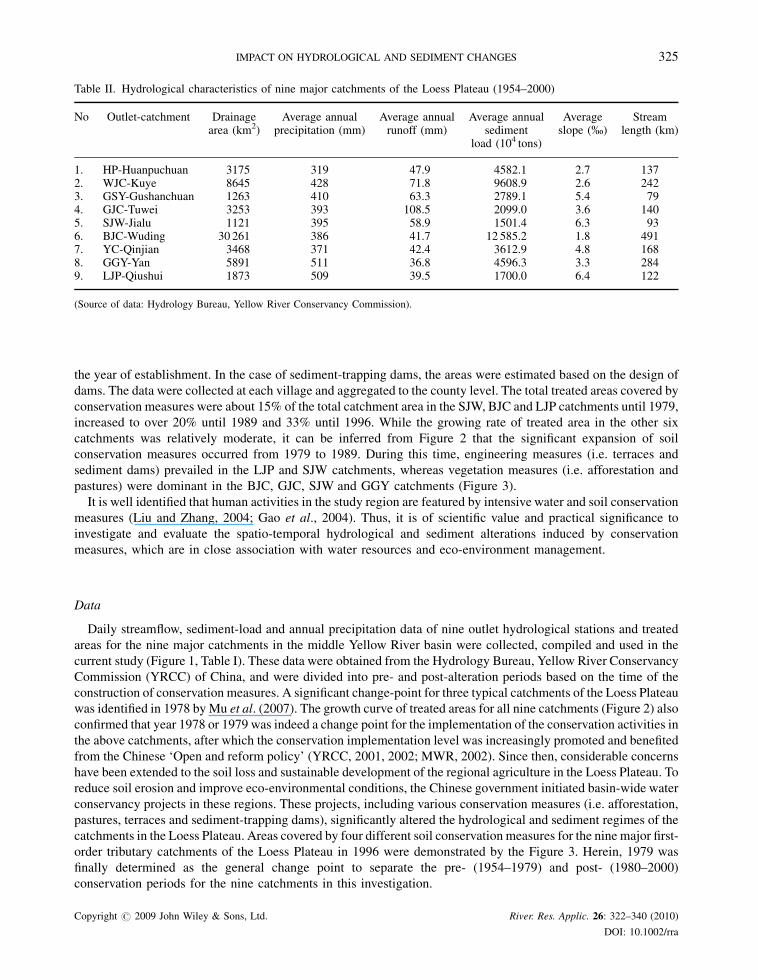
Table II. Hydrological characteristics of nine major catchments of the Loess Plateau (1954–2000)
No Outlet-catchment Drainagearea (km2)
Average annualprecipitation (mm)
Average annualrunoff (mm)
Average annualsediment
load (104 tons)
Averageslope (%)
Streamlength (km)
1. HP-Huanpuchuan 3175 319 47.9 4582.1 2.7 1372. WJC-Kuye 8645 428 71.8 9608.9 2.6 2423. GSY-Gushanchuan 1263 410 63.3 2789.1 5.4 794. GJC-Tuwei 3253 393 108.5 2099.0 3.6 1405. SJW-Jialu 1121 395 58.9 1501.4 6.3 936. BJC-Wuding 30 261 386 41.7 12 585.2 1.8 4917. YC-Qinjian 3468 371 42.4 3612.9 4.8 1688. GGY-Yan 5891 511 36.8 4596.3 3.3 2849. LJP-Qiushui 1873 509 39.5 1700.0 6.4 122
(Source of data: Hydrology Bureau, Yellow River Conservancy Commission).
IMPACT ON HYDROLOGICAL AND SEDIMENT CHANGES 325
the year of establishment. In the case of sediment-trapping dams, the areas were estimated based on the design of
dams. The data were collected at each village and aggregated to the county level. The total treated areas covered by
conservation measures were about 15% of the total catchment area in the SJW, BJC and LJP catchments until 1979,
increased to over 20% until 1989 and 33% until 1996. While the growing rate of treated area in the other six
catchments was relatively moderate, it can be inferred from Figure 2 that the significant expansion of soil
conservation measures occurred from 1979 to 1989. During this time, engineering measures (i.e. terraces and
sediment dams) prevailed in the LJP and SJW catchments, whereas vegetation measures (i.e. afforestation and
pastures) were dominant in the BJC, GJC, SJW and GGY catchments (Figure 3).
It is well identified that human activities in the study region are featured by intensive water and soil conservation
measures (Liu and Zhang, 2004; Gao et al., 2004). Thus, it is of scientific value and practical significance to
investigate and evaluate the spatio-temporal hydrological and sediment alterations induced by conservation
measures, which are in close association with water resources and eco-environment management.
Data
Daily streamflow, sediment-load and annual precipitation data of nine outlet hydrological stations and treated
areas for the nine major catchments in the middle Yellow River basin were collected, compiled and used in the
current study (Figure 1, Table I). These data were obtained from the Hydrology Bureau, Yellow River Conservancy
Commission (YRCC) of China, and were divided into pre- and post-alteration periods based on the time of the
construction of conservation measures. A significant change-point for three typical catchments of the Loess Plateau
was identified in 1978 by Mu et al. (2007). The growth curve of treated areas for all nine catchments (Figure 2) also
confirmed that year 1978 or 1979 was indeed a change point for the implementation of the conservation activities in
the above catchments, after which the conservation implementation level was increasingly promoted and benefited
from the Chinese ‘Open and reform policy’ (YRCC, 2001, 2002; MWR, 2002). Since then, considerable concerns
have been extended to the soil loss and sustainable development of the regional agriculture in the Loess Plateau. To
reduce soil erosion and improve eco-environmental conditions, the Chinese government initiated basin-wide water
conservancy projects in these regions. These projects, including various conservation measures (i.e. afforestation,
pastures, terraces and sediment-trapping dams), significantly altered the hydrological and sediment regimes of the
catchments in the Loess Plateau. Areas covered by four different soil conservation measures for the nine major first-
order tributary catchments of the Loess Plateau in 1996 were demonstrated by the Figure 3. Herein, 1979 was
finally determined as the general change point to separate the pre- (1954–1979) and post- (1980–2000)
conservation periods for the nine catchments in this investigation.
Copyright # 2009 John Wiley & Sons, Ltd. River. Res. Applic. 26: 322–340 (2010)
DOI: 10.1002/rra
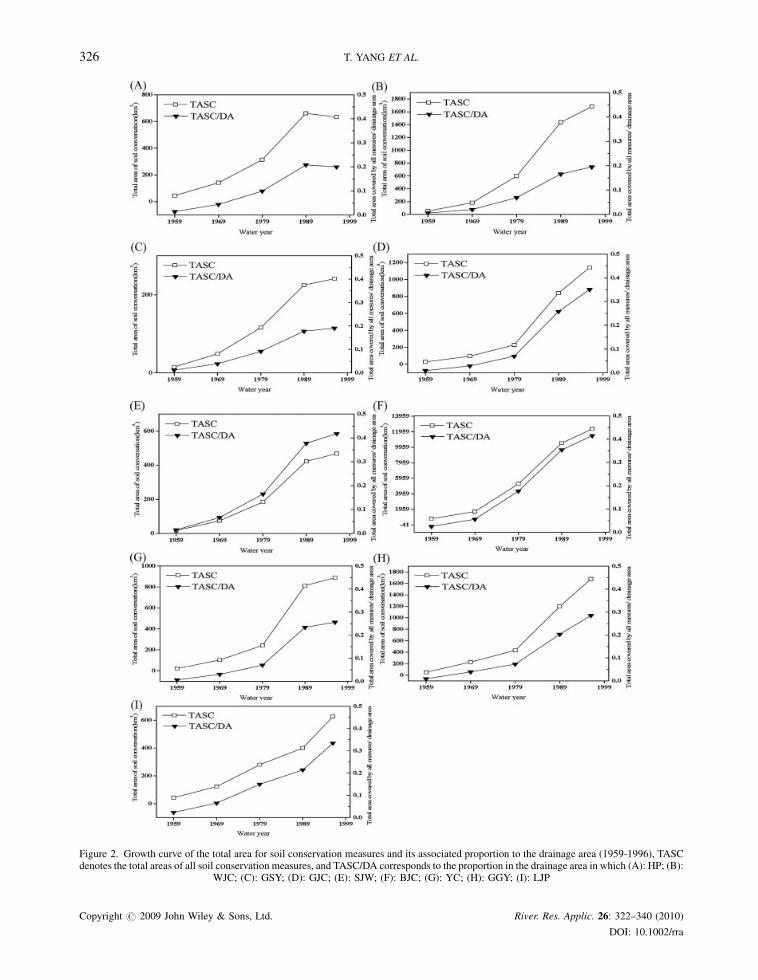
Figure 2. Growth curve of the total area for soil conservation measures and its associated proportion to the drainage area (1959-1996), TASCdenotes the total areas of all soil conservation measures, and TASC/DA corresponds to the proportion in the drainage area in which (A): HP; (B):
WJC; (C): GSY; (D): GJC; (E): SJW; (F): BJC; (G): YC; (H): GGY; (I): LJP
Copyright # 2009 John Wiley & Sons, Ltd. River. Res. Applic. 26: 322–340 (2010)
DOI: 10.1002/rra
326 T. YANG ET AL.
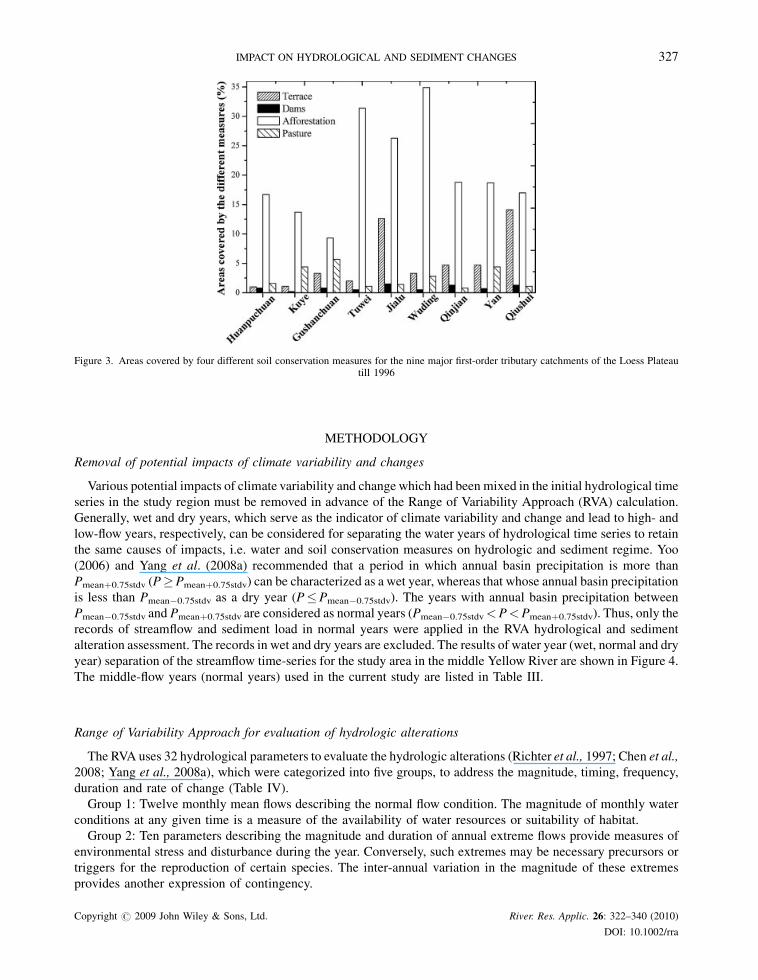
Figure 3. Areas covered by four different soil conservation measures for the nine major first-order tributary catchments of the Loess Plateautill 1996
IMPACT ON HYDROLOGICAL AND SEDIMENT CHANGES 327
METHODOLOGY
Removal of potential impacts of climate variability and changes
Various potential impacts of climate variability and change which had been mixed in the initial hydrological time
series in the study region must be removed in advance of the Range of Variability Approach (RVA) calculation.
Generally, wet and dry years, which serve as the indicator of climate variability and change and lead to high- and
low-flow years, respectively, can be considered for separating the water years of hydrological time series to retain
the same causes of impacts, i.e. water and soil conservation measures on hydrologic and sediment regime. Yoo
(2006) and Yang et al. (2008a) recommended that a period in which annual basin precipitation is more than
Pmeanþ0.75stdv (P�Pmeanþ0.75stdv) can be characterized as a wet year, whereas that whose annual basin precipitation
is less than Pmean�0.75stdv as a dry year (P�Pmean�0.75stdv). The years with annual basin precipitation between
Pmean�0.75stdv and Pmeanþ0.75stdv are considered as normal years (Pmean�0.75stdv<P<Pmeanþ0.75stdv). Thus, only the
records of streamflow and sediment load in normal years were applied in the RVA hydrological and sediment
alteration assessment. The records in wet and dry years are excluded. The results of water year (wet, normal and dry
year) separation of the streamflow time-series for the study area in the middle Yellow River are shown in Figure 4.
The middle-flow years (normal years) used in the current study are listed in Table III.
Range of Variability Approach for evaluation of hydrologic alterations
The RVA uses 32 hydrological parameters to evaluate the hydrologic alterations (Richter et al., 1997; Chen et al.,
2008; Yang et al., 2008a), which were categorized into five groups, to address the magnitude, timing, frequency,
duration and rate of change (Table IV).
Group 1: Twelve monthly mean flows describing the normal flow condition. The magnitude of monthly water
conditions at any given time is a measure of the availability of water resources or suitability of habitat.
Group 2: Ten parameters describing the magnitude and duration of annual extreme flows provide measures of
environmental stress and disturbance during the year. Conversely, such extremes may be necessary precursors or
triggers for the reproduction of certain species. The inter-annual variation in the magnitude of these extremes
provides another expression of contingency.
Copyright # 2009 John Wiley & Sons, Ltd. River. Res. Applic. 26: 322–340 (2010)
DOI: 10.1002/rra
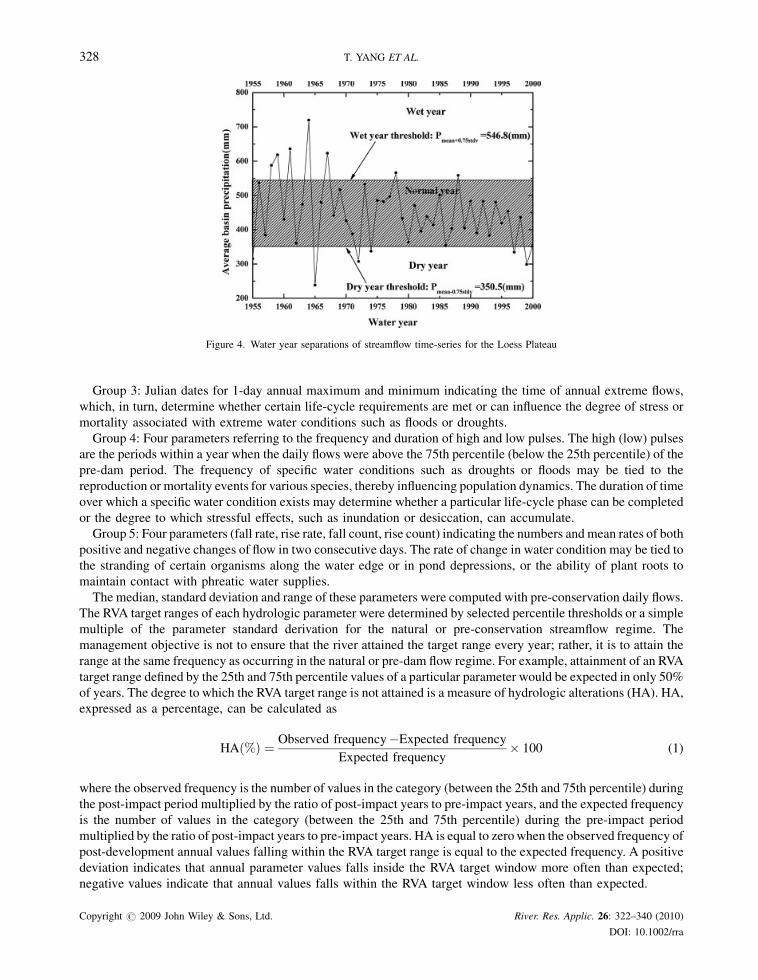
Figure 4. Water year separations of streamflow time-series for the Loess Plateau
328 T. YANG ET AL.
Group 3: Julian dates for 1-day annual maximum and minimum indicating the time of annual extreme flows,
which, in turn, determine whether certain life-cycle requirements are met or can influence the degree of stress or
mortality associated with extreme water conditions such as floods or droughts.
Group 4: Four parameters referring to the frequency and duration of high and low pulses. The high (low) pulses
are the periods within a year when the daily flows were above the 75th percentile (below the 25th percentile) of the
pre-dam period. The frequency of specific water conditions such as droughts or floods may be tied to the
reproduction or mortality events for various species, thereby influencing population dynamics. The duration of time
over which a specific water condition exists may determine whether a particular life-cycle phase can be completed
or the degree to which stressful effects, such as inundation or desiccation, can accumulate.
Group 5: Four parameters (fall rate, rise rate, fall count, rise count) indicating the numbers and mean rates of both
positive and negative changes of flow in two consecutive days. The rate of change in water condition may be tied to
the stranding of certain organisms along the water edge or in pond depressions, or the ability of plant roots to
maintain contact with phreatic water supplies.
The median, standard deviation and range of these parameters were computed with pre-conservation daily flows.
The RVA target ranges of each hydrologic parameter were determined by selected percentile thresholds or a simple
multiple of the parameter standard derivation for the natural or pre-conservation streamflow regime. The
management objective is not to ensure that the river attained the target range every year; rather, it is to attain the
range at the same frequency as occurring in the natural or pre-dam flow regime. For example, attainment of an RVA
target range defined by the 25th and 75th percentile values of a particular parameter would be expected in only 50%
of years. The degree to which the RVA target range is not attained is a measure of hydrologic alterations (HA). HA,
expressed as a percentage, can be calculated as
HAð%Þ ¼ Observed frequency�Expected frequency
Expected frequency� 100 (1)
where the observed frequency is the number of values in the category (between the 25th and 75th percentile) during
the post-impact period multiplied by the ratio of post-impact years to pre-impact years, and the expected frequency
is the number of values in the category (between the 25th and 75th percentile) during the pre-impact period
multiplied by the ratio of post-impact years to pre-impact years. HA is equal to zero when the observed frequency of
post-development annual values falling within the RVA target range is equal to the expected frequency. A positive
deviation indicates that annual parameter values falls inside the RVA target window more often than expected;
negative values indicate that annual values falls within the RVA target window less often than expected.
Copyright # 2009 John Wiley & Sons, Ltd. River. Res. Applic. 26: 322–340 (2010)
DOI: 10.1002/rra
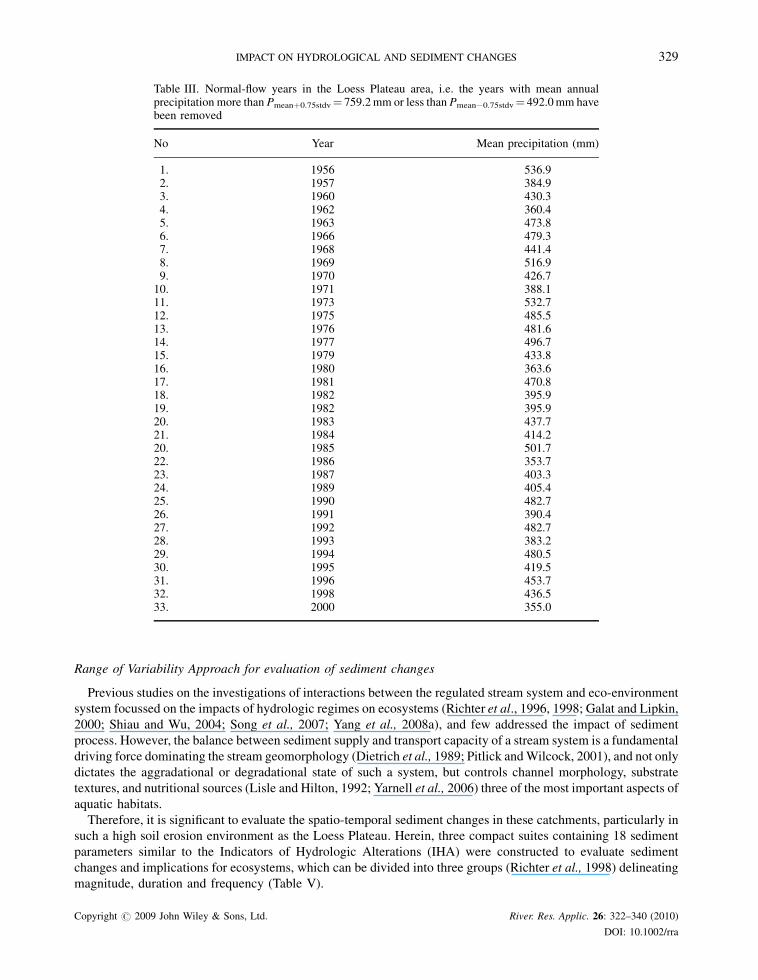
Table III. Normal-flow years in the Loess Plateau area, i.e. the years with mean annualprecipitation more than Pmeanþ0.75stdv¼ 759.2 mm or less than Pmean�0.75stdv¼ 492.0 mm havebeen removed
No Year Mean precipitation (mm)
1. 1956 536.92. 1957 384.93. 1960 430.34. 1962 360.45. 1963 473.86. 1966 479.37. 1968 441.48. 1969 516.99. 1970 426.7
10. 1971 388.111. 1973 532.712. 1975 485.513. 1976 481.614. 1977 496.715. 1979 433.816. 1980 363.617. 1981 470.818. 1982 395.919. 1982 395.920. 1983 437.721. 1984 414.220. 1985 501.722. 1986 353.723. 1987 403.324. 1989 405.425. 1990 482.726. 1991 390.427. 1992 482.728. 1993 383.229. 1994 480.530. 1995 419.531. 1996 453.732. 1998 436.533. 2000 355.0
IMPACT ON HYDROLOGICAL AND SEDIMENT CHANGES 329
Range of Variability Approach for evaluation of sediment changes
Previous studies on the investigations of interactions between the regulated stream system and eco-environment
system focussed on the impacts of hydrologic regimes on ecosystems (Richter et al., 1996, 1998; Galat and Lipkin,
2000; Shiau and Wu, 2004; Song et al., 2007; Yang et al., 2008a), and few addressed the impact of sediment
process. However, the balance between sediment supply and transport capacity of a stream system is a fundamental
driving force dominating the stream geomorphology (Dietrich et al., 1989; Pitlick and Wilcock, 2001), and not only
dictates the aggradational or degradational state of such a system, but controls channel morphology, substrate
textures, and nutritional sources (Lisle and Hilton, 1992; Yarnell et al., 2006) three of the most important aspects of
aquatic habitats.
Therefore, it is significant to evaluate the spatio-temporal sediment changes in these catchments, particularly in
such a high soil erosion environment as the Loess Plateau. Herein, three compact suites containing 18 sediment
parameters similar to the Indicators of Hydrologic Alterations (IHA) were constructed to evaluate sediment
changes and implications for ecosystems, which can be divided into three groups (Richter et al., 1998) delineating
magnitude, duration and frequency (Table V).
Copyright # 2009 John Wiley & Sons, Ltd. River. Res. Applic. 26: 322–340 (2010)
DOI: 10.1002/rra
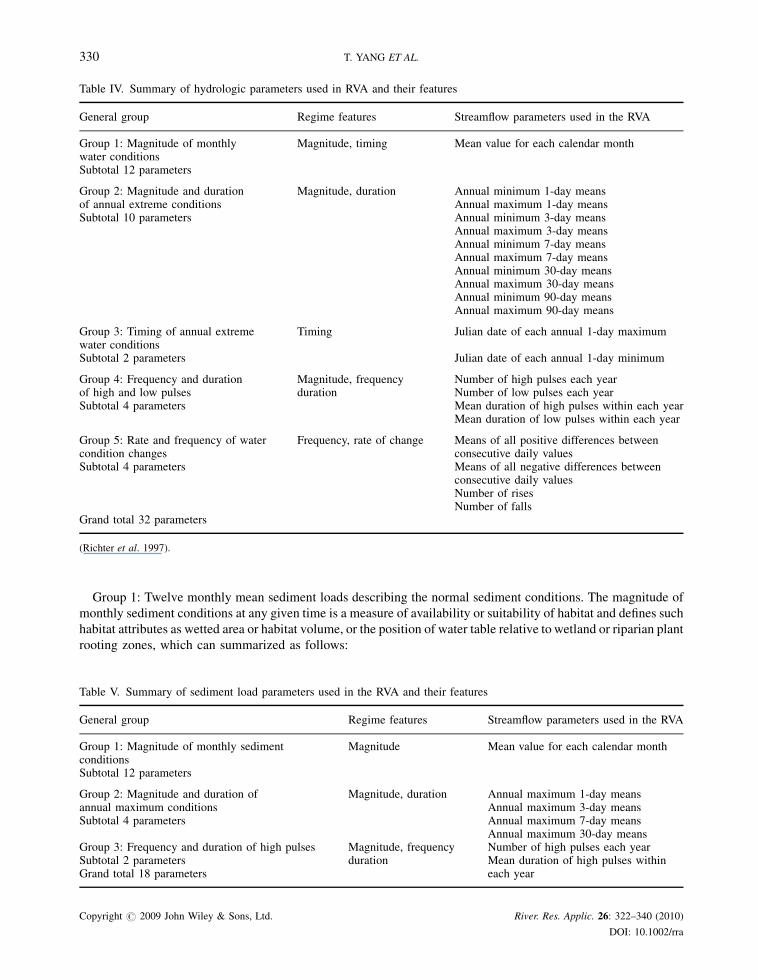
Table IV. Summary of hydrologic parameters used in RVA and their features
General group Regime features Streamflow parameters used in the RVA
Group 1: Magnitude of monthlywater conditions
Magnitude, timing Mean value for each calendar month
Subtotal 12 parameters
Group 2: Magnitude and duration Magnitude, duration Annual minimum 1-day meansof annual extreme conditions Annual maximum 1-day meansSubtotal 10 parameters Annual minimum 3-day means
Annual maximum 3-day meansAnnual minimum 7-day meansAnnual maximum 7-day meansAnnual minimum 30-day meansAnnual maximum 30-day meansAnnual minimum 90-day meansAnnual maximum 90-day means
Group 3: Timing of annual extremewater conditions
Timing Julian date of each annual 1-day maximum
Subtotal 2 parameters Julian date of each annual 1-day minimum
Group 4: Frequency and duration Magnitude, frequency Number of high pulses each yearof high and low pulses duration Number of low pulses each yearSubtotal 4 parameters Mean duration of high pulses within each year
Mean duration of low pulses within each year
Group 5: Rate and frequency of watercondition changes
Frequency, rate of change Means of all positive differences betweenconsecutive daily values
Subtotal 4 parameters Means of all negative differences betweenconsecutive daily valuesNumber of risesNumber of falls
Grand total 32 parameters
(Richter et al. 1997).
330 T. YANG ET AL.
Group 1: Twelve monthly mean sediment loads describing the normal sediment conditions. The magnitude of
monthly sediment conditions at any given time is a measure of availability or suitability of habitat and defines such
habitat attributes as wetted area or habitat volume, or the position of water table relative to wetland or riparian plant
rooting zones, which can summarized as follows:
Table V. Summary of sediment load parameters used in the RVA and their features
General group Regime features Streamflow parameters used in the RVA
Group 1: Magnitude of monthly sedimentconditions
Magnitude Mean value for each calendar month
Subtotal 12 parameters
Group 2: Magnitude and duration of Magnitude, duration Annual maximum 1-day meansannual maximum conditions Annual maximum 3-day meansSubtotal 4 parameters Annual maximum 7-day means
Annual maximum 30-day meansGroup 3: Frequency and duration of high pulses Magnitude, frequency Number of high pulses each yearSubtotal 2 parameters duration Mean duration of high pulses withinGrand total 18 parameters each year
Copyright # 2009 John Wiley & Sons, Ltd. River. Res. Applic. 26: 322–340 (2010)
DOI: 10.1002/rra
IMPACT ON HYDROLOGICAL AND SEDIMENT CHANGES 331
� M
Fig
Co
aintain suitable substrate textures.
� P
rovide necessary nutrition for plants.� S
upport hyporheic organisms (living in saturated sediments).Group 2: Four parameters describing the magnitude and duration of annual extreme flows, including 1-, 3-, 7-
and 30-day annual maxima encompassing daily, weekly, monthly and seasonal cycles. Their influences to eco-
environmental system can be sorted as
� S
hape the physical character of river channel, including floodplains, pools and riffles.� D
etermine the size of streambed substrates (sands, gravel and cobble).� M
aintain suitable potassic, phosphorous and nitrogen conditions to sustain the aquatic habitats.Group 3: Two parameters referring to the frequency and duration of high pulses. The high pulses are periods
within a year when the daily flows are above the 75th percentile of the pre-dam period. The frequency of specific
sediment conditions, such as floods, may be tied to the reproduction or mortality events for various species, thereby
influencing population dynamics. The duration of time over which a specific condition exists may determine
whether a particular life-cycle phase can be completed or the degree to which stressful effects, such as inundation,
can accumulate. The RVA analysis method of the sediment changes herewith is the same as for hydrological
alterations.
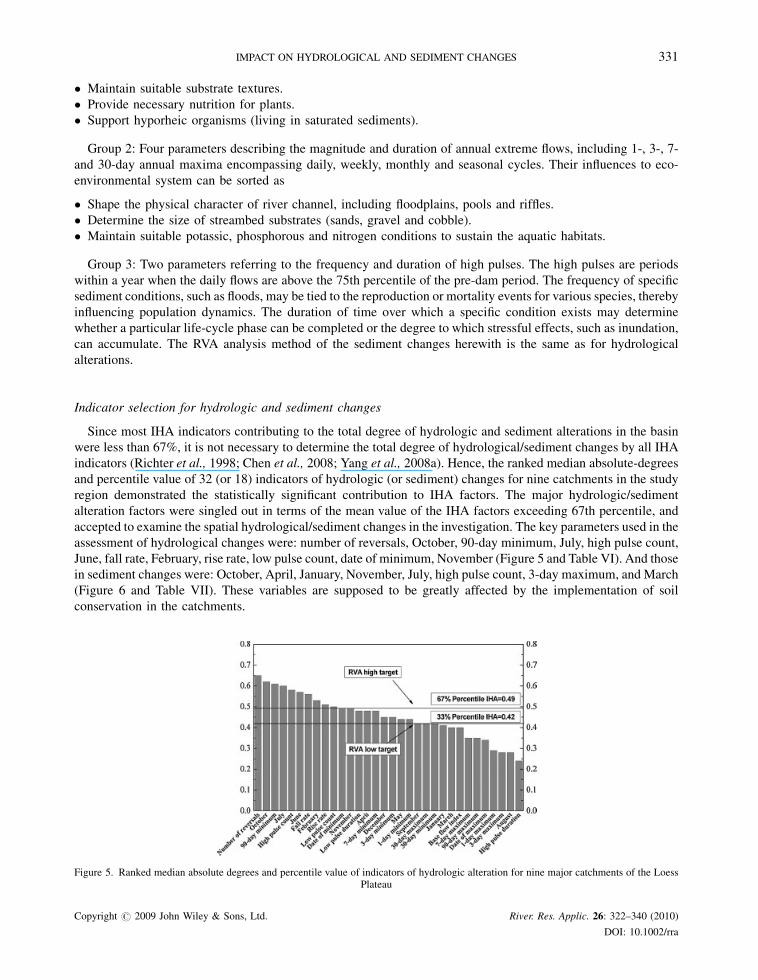
Indicator selection for hydrologic and sediment changes
Since most IHA indicators contributing to the total degree of hydrologic and sediment alterations in the basin
were less than 67%, it is not necessary to determine the total degree of hydrological/sediment changes by all IHA
indicators (Richter et al., 1998; Chen et al., 2008; Yang et al., 2008a). Hence, the ranked median absolute-degrees
and percentile value of 32 (or 18) indicators of hydrologic (or sediment) changes for nine catchments in the study
region demonstrated the statistically significant contribution to IHA factors. The major hydrologic/sediment
alteration factors were singled out in terms of the mean value of the IHA factors exceeding 67th percentile, and
accepted to examine the spatial hydrological/sediment changes in the investigation. The key parameters used in the
assessment of hydrological changes were: number of reversals, October, 90-day minimum, July, high pulse count,
June, fall rate, February, rise rate, low pulse count, date of minimum, November (Figure 5 and Table VI). And those
in sediment changes were: October, April, January, November, July, high pulse count, 3-day maximum, and March
(Figure 6 and Table VII). These variables are supposed to be greatly affected by the implementation of soil
conservation in the catchments.
ure 5. Ranked median absolute degrees and percentile value of indicators of hydrologic alteration for nine major catchments of the LoessPlateau
pyright # 2009 John Wiley & Sons, Ltd. River. Res. Applic. 26: 322–340 (2010)
DOI: 10.1002/rra
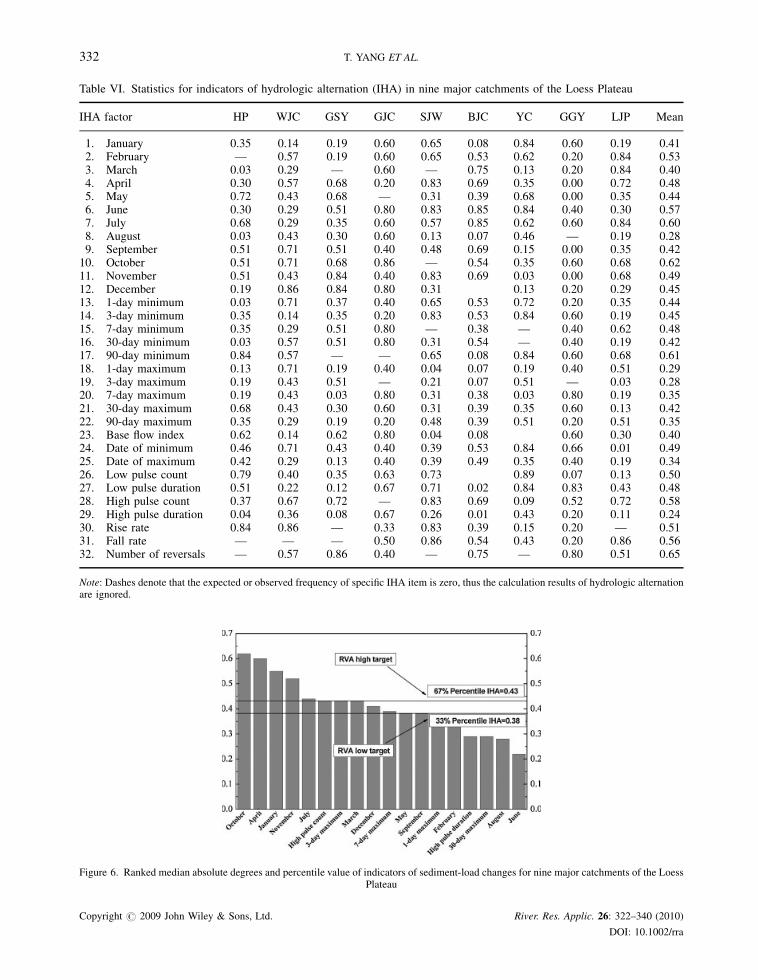
Table VI. Statistics for indicators of hydrologic alternation (IHA) in nine major catchments of the Loess Plateau
IHA factor HP WJC GSY GJC SJW BJC YC GGY LJP Mean
1. January 0.35 0.14 0.19 0.60 0.65 0.08 0.84 0.60 0.19 0.412. February — 0.57 0.19 0.60 0.65 0.53 0.62 0.20 0.84 0.533. March 0.03 0.29 — 0.60 — 0.75 0.13 0.20 0.84 0.404. April 0.30 0.57 0.68 0.20 0.83 0.69 0.35 0.00 0.72 0.485. May 0.72 0.43 0.68 — 0.31 0.39 0.68 0.00 0.35 0.446. June 0.30 0.29 0.51 0.80 0.83 0.85 0.84 0.40 0.30 0.577. July 0.68 0.29 0.35 0.60 0.57 0.85 0.62 0.60 0.84 0.608. August 0.03 0.43 0.30 0.60 0.13 0.07 0.46 — 0.19 0.289. September 0.51 0.71 0.51 0.40 0.48 0.69 0.15 0.00 0.35 0.42
10. October 0.51 0.71 0.68 0.86 — 0.54 0.35 0.60 0.68 0.6211. November 0.51 0.43 0.84 0.40 0.83 0.69 0.03 0.00 0.68 0.4912. December 0.19 0.86 0.84 0.80 0.31 0.13 0.20 0.29 0.4513. 1-day minimum 0.03 0.71 0.37 0.40 0.65 0.53 0.72 0.20 0.35 0.4414. 3-day minimum 0.35 0.14 0.35 0.20 0.83 0.53 0.84 0.60 0.19 0.4515. 7-day minimum 0.35 0.29 0.51 0.80 — 0.38 — 0.40 0.62 0.4816. 30-day minimum 0.03 0.57 0.51 0.80 0.31 0.54 — 0.40 0.19 0.4217. 90-day minimum 0.84 0.57 — — 0.65 0.08 0.84 0.60 0.68 0.6118. 1-day maximum 0.13 0.71 0.19 0.40 0.04 0.07 0.19 0.40 0.51 0.2919. 3-day maximum 0.19 0.43 0.51 — 0.21 0.07 0.51 — 0.03 0.2820. 7-day maximum 0.19 0.43 0.03 0.80 0.31 0.38 0.03 0.80 0.19 0.3521. 30-day maximum 0.68 0.43 0.30 0.60 0.31 0.39 0.35 0.60 0.13 0.4222. 90-day maximum 0.35 0.29 0.19 0.20 0.48 0.39 0.51 0.20 0.51 0.3523. Base flow index 0.62 0.14 0.62 0.80 0.04 0.08 0.60 0.30 0.4024. Date of minimum 0.46 0.71 0.43 0.40 0.39 0.53 0.84 0.66 0.01 0.4925. Date of maximum 0.42 0.29 0.13 0.40 0.39 0.49 0.35 0.40 0.19 0.3426. Low pulse count 0.79 0.40 0.35 0.63 0.73 0.89 0.07 0.13 0.5027. Low pulse duration 0.51 0.22 0.12 0.67 0.71 0.02 0.84 0.83 0.43 0.4828. High pulse count 0.37 0.67 0.72 — 0.83 0.69 0.09 0.52 0.72 0.5829. High pulse duration 0.04 0.36 0.08 0.67 0.26 0.01 0.43 0.20 0.11 0.2430. Rise rate 0.84 0.86 — 0.33 0.83 0.39 0.15 0.20 — 0.5131. Fall rate — — — 0.50 0.86 0.54 0.43 0.20 0.86 0.5632. Number of reversals — 0.57 0.86 0.40 — 0.75 — 0.80 0.51 0.65
Note: Dashes denote that the expected or observed frequency of specific IHA item is zero, thus the calculation results of hydrologic alternationare ignored.
Figure 6. Ranked median absolute degrees and percentile value of indicators of sediment-load changes for nine major catchments of the LoessPlateau
Copyright # 2009 John Wiley & Sons, Ltd. River. Res. Applic. 26: 322–340 (2010)
DOI: 10.1002/rra
332 T. YANG ET AL.
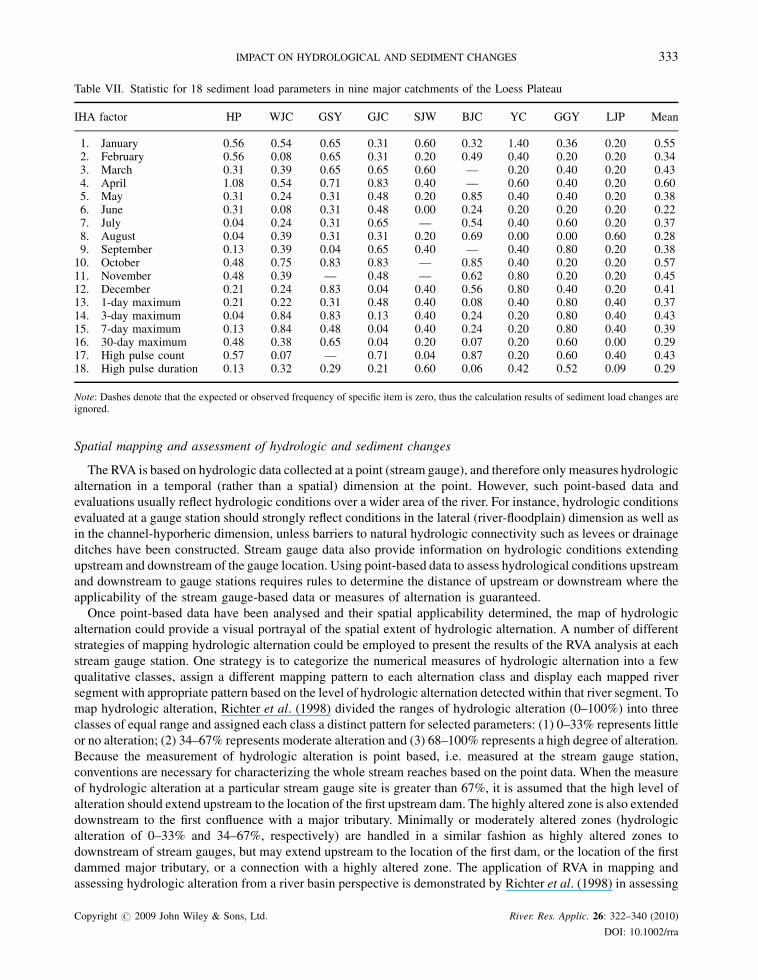
Table VII. Statistic for 18 sediment load parameters in nine major catchments of the Loess Plateau
IHA factor HP WJC GSY GJC SJW BJC YC GGY LJP Mean
1. January 0.56 0.54 0.65 0.31 0.60 0.32 1.40 0.36 0.20 0.552. February 0.56 0.08 0.65 0.31 0.20 0.49 0.40 0.20 0.20 0.343. March 0.31 0.39 0.65 0.65 0.60 — 0.20 0.40 0.20 0.434. April 1.08 0.54 0.71 0.83 0.40 — 0.60 0.40 0.20 0.605. May 0.31 0.24 0.31 0.48 0.20 0.85 0.40 0.40 0.20 0.386. June 0.31 0.08 0.31 0.48 0.00 0.24 0.20 0.20 0.20 0.227. July 0.04 0.24 0.31 0.65 — 0.54 0.40 0.60 0.20 0.378. August 0.04 0.39 0.31 0.31 0.20 0.69 0.00 0.00 0.60 0.289. September 0.13 0.39 0.04 0.65 0.40 — 0.40 0.80 0.20 0.38
10. October 0.48 0.75 0.83 0.83 — 0.85 0.40 0.20 0.20 0.5711. November 0.48 0.39 — 0.48 — 0.62 0.80 0.20 0.20 0.4512. December 0.21 0.24 0.83 0.04 0.40 0.56 0.80 0.40 0.20 0.4113. 1-day maximum 0.21 0.22 0.31 0.48 0.40 0.08 0.40 0.80 0.40 0.3714. 3-day maximum 0.04 0.84 0.83 0.13 0.40 0.24 0.20 0.80 0.40 0.4315. 7-day maximum 0.13 0.84 0.48 0.04 0.40 0.24 0.20 0.80 0.40 0.3916. 30-day maximum 0.48 0.38 0.65 0.04 0.20 0.07 0.20 0.60 0.00 0.2917. High pulse count 0.57 0.07 — 0.71 0.04 0.87 0.20 0.60 0.40 0.4318. High pulse duration 0.13 0.32 0.29 0.21 0.60 0.06 0.42 0.52 0.09 0.29
Note: Dashes denote that the expected or observed frequency of specific item is zero, thus the calculation results of sediment load changes areignored.
IMPACT ON HYDROLOGICAL AND SEDIMENT CHANGES 333
Spatial mapping and assessment of hydrologic and sediment changes
The RVA is based on hydrologic data collected at a point (stream gauge), and therefore only measures hydrologic
alternation in a temporal (rather than a spatial) dimension at the point. However, such point-based data and
evaluations usually reflect hydrologic conditions over a wider area of the river. For instance, hydrologic conditions
evaluated at a gauge station should strongly reflect conditions in the lateral (river-floodplain) dimension as well as
in the channel-hyporheric dimension, unless barriers to natural hydrologic connectivity such as levees or drainage
ditches have been constructed. Stream gauge data also provide information on hydrologic conditions extending
upstream and downstream of the gauge location. Using point-based data to assess hydrological conditions upstream
and downstream to gauge stations requires rules to determine the distance of upstream or downstream where the
applicability of the stream gauge-based data or measures of alternation is guaranteed.
Once point-based data have been analysed and their spatial applicability determined, the map of hydrologic
alternation could provide a visual portrayal of the spatial extent of hydrologic alternation. A number of different
strategies of mapping hydrologic alternation could be employed to present the results of the RVA analysis at each
stream gauge station. One strategy is to categorize the numerical measures of hydrologic alternation into a few
qualitative classes, assign a different mapping pattern to each alternation class and display each mapped river
segment with appropriate pattern based on the level of hydrologic alternation detected within that river segment. To
map hydrologic alteration, Richter et al. (1998) divided the ranges of hydrologic alteration (0–100%) into three
classes of equal range and assigned each class a distinct pattern for selected parameters: (1) 0–33% represents little
or no alteration; (2) 34–67% represents moderate alteration and (3) 68–100% represents a high degree of alteration.
Because the measurement of hydrologic alteration is point based, i.e. measured at the stream gauge station,
conventions are necessary for characterizing the whole stream reaches based on the point data. When the measure
of hydrologic alteration at a particular stream gauge site is greater than 67%, it is assumed that the high level of
alteration should extend upstream to the location of the first upstream dam. The highly altered zone is also extended
downstream to the first confluence with a major tributary. Minimally or moderately altered zones (hydrologic
alteration of 0–33% and 34–67%, respectively) are handled in a similar fashion as highly altered zones to
downstream of stream gauges, but may extend upstream to the location of the first dam, or the location of the first
dammed major tributary, or a connection with a highly altered zone. The application of RVA in mapping and
assessing hydrologic alteration from a river basin perspective is demonstrated by Richter et al. (1998) in assessing
Copyright # 2009 John Wiley & Sons, Ltd. River. Res. Applic. 26: 322–340 (2010)
DOI: 10.1002/rra
334 T. YANG ET AL.
the impacts of dam construction on hydrologic variability of two major rivers in the upper Colorado River basin in
Colorado and Utah, USA. A number of investigations using the RVA approach also proved that it is a practical and
effective approach facilitating the river restoration planning (Shiau and Wu, 2004; Yang et al., 2008a). Using the
mapping method by Richter et al. (1998) and Yang et al. (2008a), we derived the average hydrologic alteration in
the study region, the middle Yellow River basin, based on 12 average hydrologic alteration values.
RESULTS
Quantification and characterization of hydrological and sediment alterations
Three important points of the hydrological and sediment changes can be obtained as follows:
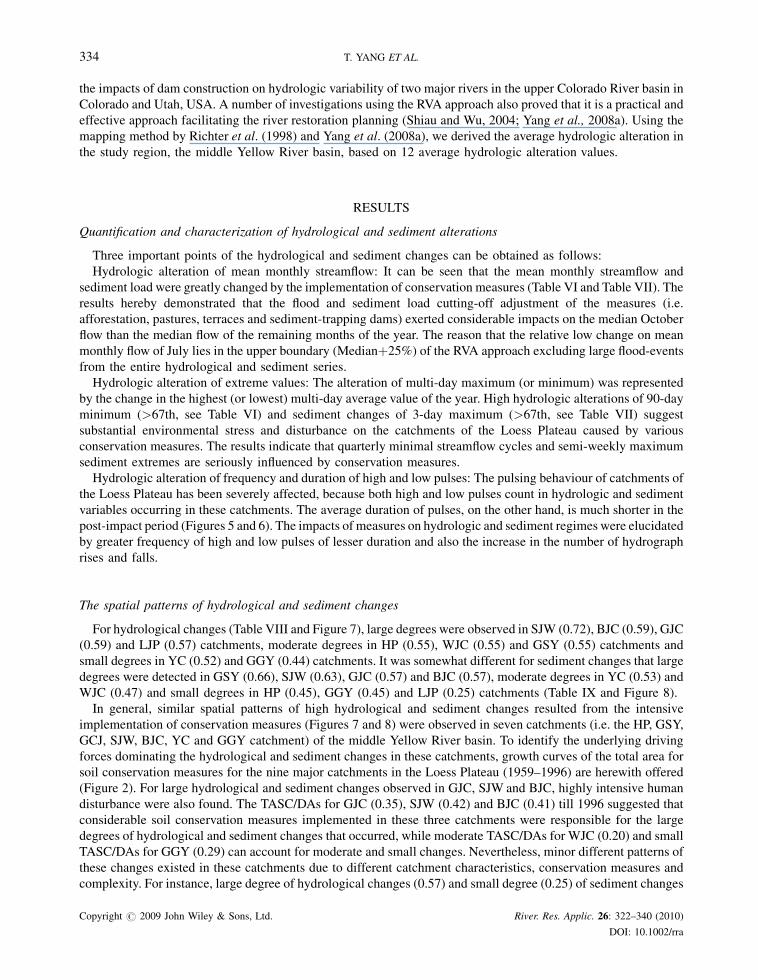
Hydrologic alteration of mean monthly streamflow: It can be seen that the mean monthly streamflow and
sediment load were greatly changed by the implementation of conservation measures (Table VI and Table VII). The
results hereby demonstrated that the flood and sediment load cutting-off adjustment of the measures (i.e.
afforestation, pastures, terraces and sediment-trapping dams) exerted considerable impacts on the median October
flow than the median flow of the remaining months of the year. The reason that the relative low change on mean
monthly flow of July lies in the upper boundary (Medianþ25%) of the RVA approach excluding large flood-events
from the entire hydrological and sediment series.
Hydrologic alteration of extreme values: The alteration of multi-day maximum (or minimum) was represented
by the change in the highest (or lowest) multi-day average value of the year. High hydrologic alterations of 90-day
minimum (>67th, see Table VI) and sediment changes of 3-day maximum (>67th, see Table VII) suggest
substantial environmental stress and disturbance on the catchments of the Loess Plateau caused by various
conservation measures. The results indicate that quarterly minimal streamflow cycles and semi-weekly maximum
sediment extremes are seriously influenced by conservation measures.
Hydrologic alteration of frequency and duration of high and low pulses: The pulsing behaviour of catchments of
the Loess Plateau has been severely affected, because both high and low pulses count in hydrologic and sediment
variables occurring in these catchments. The average duration of pulses, on the other hand, is much shorter in the
post-impact period (Figures 5 and 6). The impacts of measures on hydrologic and sediment regimes were elucidated
by greater frequency of high and low pulses of lesser duration and also the increase in the number of hydrograph
rises and falls.
The spatial patterns of hydrological and sediment changes
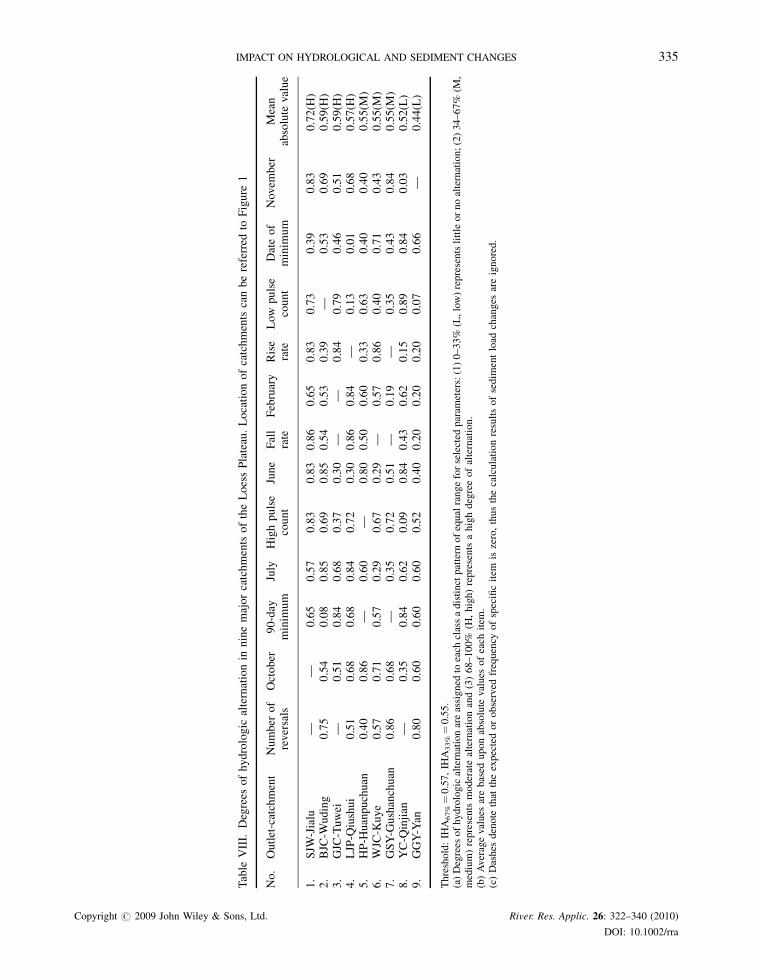
For hydrological changes (Table VIII and Figure 7), large degrees were observed in SJW (0.72), BJC (0.59), GJC
(0.59) and LJP (0.57) catchments, moderate degrees in HP (0.55), WJC (0.55) and GSY (0.55) catchments and
small degrees in YC (0.52) and GGY (0.44) catchments. It was somewhat different for sediment changes that large
degrees were detected in GSY (0.66), SJW (0.63), GJC (0.57) and BJC (0.57), moderate degrees in YC (0.53) and
WJC (0.47) and small degrees in HP (0.45), GGY (0.45) and LJP (0.25) catchments (Table IX and Figure 8).
In general, similar spatial patterns of high hydrological and sediment changes resulted from the intensive
implementation of conservation measures (Figures 7 and 8) were observed in seven catchments (i.e. the HP, GSY,
GCJ, SJW, BJC, YC and GGY catchment) of the middle Yellow River basin. To identify the underlying driving
forces dominating the hydrological and sediment changes in these catchments, growth curves of the total area for
soil conservation measures for the nine major catchments in the Loess Plateau (1959–1996) are herewith offered
(Figure 2). For large hydrological and sediment changes observed in GJC, SJW and BJC, highly intensive human
disturbance were also found. The TASC/DAs for GJC (0.35), SJW (0.42) and BJC (0.41) till 1996 suggested that
considerable soil conservation measures implemented in these three catchments were responsible for the large
degrees of hydrological and sediment changes that occurred, while moderate TASC/DAs for WJC (0.20) and small
TASC/DAs for GGY (0.29) can account for moderate and small changes. Nevertheless, minor different patterns of
these changes existed in these catchments due to different catchment characteristics, conservation measures and
complexity. For instance, large degree of hydrological changes (0.57) and small degree (0.25) of sediment changes
Copyright # 2009 John Wiley & Sons, Ltd. River. Res. Applic. 26: 322–340 (2010)
DOI: 10.1002/rra
Tab
leV
III.
Deg
rees
of
hy
dro
log
ical
tern
atio
nin
nin
em
ajo
rca
tch
men
tso
fth
eL
oes
sP
late
au.
Lo
cati
on
of
catc
hm
ents
can
be
refe
rred
toF
igu
re1
No.
Outl
et-c
atch
men
tN
um
ber
of
rever
sals
Oct
ob
er9
0-d
aym
inim
um
July
Hig
hp
uls
eco
un
tJu
ne
Fal
lra
teF
ebru
ary
Ris
era
teL
ow
pu
lse
cou
nt
Dat
eo
fm
inim
um
Novem
ber
Mea
nab
solu
teval
ue
1.
SJW
-Jia
lu—
—0
.65
0.5
70
.83
0.8
30
.86
0.6
50
.83
0.7
30
.39
0.8
30
.72
(H)
2.
BJC
-Wu
din
g0
.75
0.5
40
.08
0.8
50
.69
0.8
50
.54
0.5
30
.39
—0
.53
0.6
90
.59
(H)
3.
GJC
-Tu
wei
—0
.51
0.8
40
.68
0.3
70
.30
——
0.8
40
.79
0.4
60
.51
0.5
9(H
)4
.L
JP-Q
iush
ui
0.5
10
.68
0.6
80
.84
0.7
20
.30
0.8
60
.84
—0
.13
0.0
10
.68
0.5
7(H
)5
.H
P-H
uan
pu
chu
an0
.40
0.8
6—
0.6
0—
0.8
00
.50
0.6
00
.33
0.6
30
.40
0.4
00
.55
(M)
6.
WJC
-Kuye
0.5
70.7
10.5
70.2
90.6
70.2
9—
0.5
70.8
60.4
00.7
10.4
30.5
5(M
)7
.G
SY
-Gu
shan
chu
an0
.86
0.6
8—
0.3
50
.72
0.5
1—
0.1
9—
0.3
50
.43
0.8
40
.55
(M)
8.
YC
-Qin
jian
—0.3
50.8
40.6
20.0
90.8
40.4
30.6
20.1
50.8
90.8
40.0
30.5
2(L
)9
.G
GY
-Yan
0.8
00
.60
0.6
00
.60
0.5
20
.40
0.2
00
.20
0.2
00
.07
0.6
6—
0.4
4(L
)
Thre
shold
:IH
A67%¼
0.5
7,
IHA
33%¼
0.5
5.
(a)
Deg
rees
of
hydro
logic
alte
rnat
ion
are
assi
gned
toea
chcl
ass
adis
tinct
pat
tern
of
equal
range
for
sele
cted
par
amet
ers:
(1)
0–33%
(L,
low
)re
pre
sen
tsli
ttle
or
no
alte
rnat
ion
;(2
)3
4–
67
%(M
,m
ediu
m)
repre
sents
moder
ate
alte
rnat
ion
and
(3)
68–100%
(H,
hig
h)
repre
sents
ahig
hd
egre
eo
fal
tern
atio
n.
(b)
Aver
age
val
ues
are
bas
edu
po
nab
solu
teval
ues
of
each
item
.(c
)D
ash
esd
eno
teth
atth
eex
pec
ted
or
ob
serv
edfr
equen
cyo
fsp
ecifi
cit
emis
zero
,th
us
the
calc
ula
tio
nre
sult
so
fse
dim
ent
load
chan
ges
are
ign
ore
d.
Copyright # 2009 John Wiley & Sons, Ltd. River. Res. Applic. 26: 322–340 (2010
DOI: 10.1002/rra
IMPACT ON HYDROLOGICAL AND SEDIMENT CHANGES 335
)
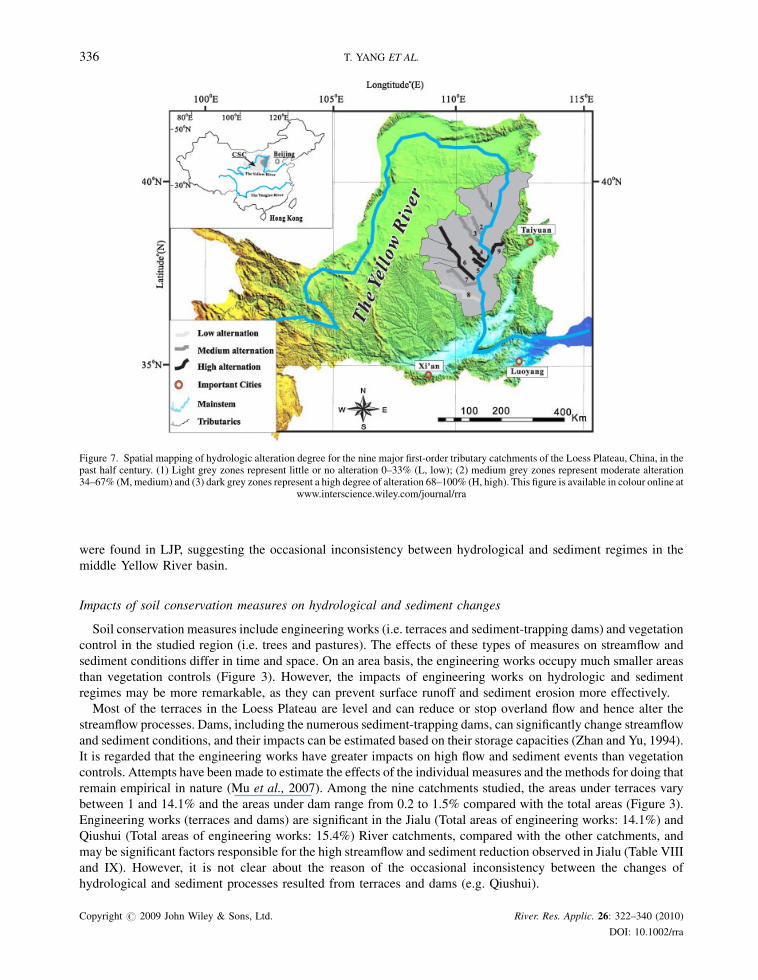
Figure 7. Spatial mapping of hydrologic alteration degree for the nine major first-order tributary catchments of the Loess Plateau, China, in thepast half century. (1) Light grey zones represent little or no alteration 0–33% (L, low); (2) medium grey zones represent moderate alteration34–67% (M, medium) and (3) dark grey zones represent a high degree of alteration 68–100% (H, high). This figure is available in colour online at
www.interscience.wiley.com/journal/rra
336 T. YANG ET AL.
were found in LJP, suggesting the occasional inconsistency between hydrological and sediment regimes in the
middle Yellow River basin.
Impacts of soil conservation measures on hydrological and sediment changes
Soil conservation measures include engineering works (i.e. terraces and sediment-trapping dams) and vegetation
control in the studied region (i.e. trees and pastures). The effects of these types of measures on streamflow and
sediment conditions differ in time and space. On an area basis, the engineering works occupy much smaller areas
than vegetation controls (Figure 3). However, the impacts of engineering works on hydrologic and sediment
regimes may be more remarkable, as they can prevent surface runoff and sediment erosion more effectively.
Most of the terraces in the Loess Plateau are level and can reduce or stop overland flow and hence alter the
streamflow processes. Dams, including the numerous sediment-trapping dams, can significantly change streamflow
and sediment conditions, and their impacts can be estimated based on their storage capacities (Zhan and Yu, 1994).
It is regarded that the engineering works have greater impacts on high flow and sediment events than vegetation
controls. Attempts have been made to estimate the effects of the individual measures and the methods for doing that
remain empirical in nature (Mu et al., 2007). Among the nine catchments studied, the areas under terraces vary
between 1 and 14.1% and the areas under dam range from 0.2 to 1.5% compared with the total areas (Figure 3).
Engineering works (terraces and dams) are significant in the Jialu (Total areas of engineering works: 14.1%) and
Qiushui (Total areas of engineering works: 15.4%) River catchments, compared with the other catchments, and
may be significant factors responsible for the high streamflow and sediment reduction observed in Jialu (Table VIII
and IX). However, it is not clear about the reason of the occasional inconsistency between the changes of
hydrological and sediment processes resulted from terraces and dams (e.g. Qiushui).
Copyright # 2009 John Wiley & Sons, Ltd. River. Res. Applic. 26: 322–340 (2010)
DOI: 10.1002/rra
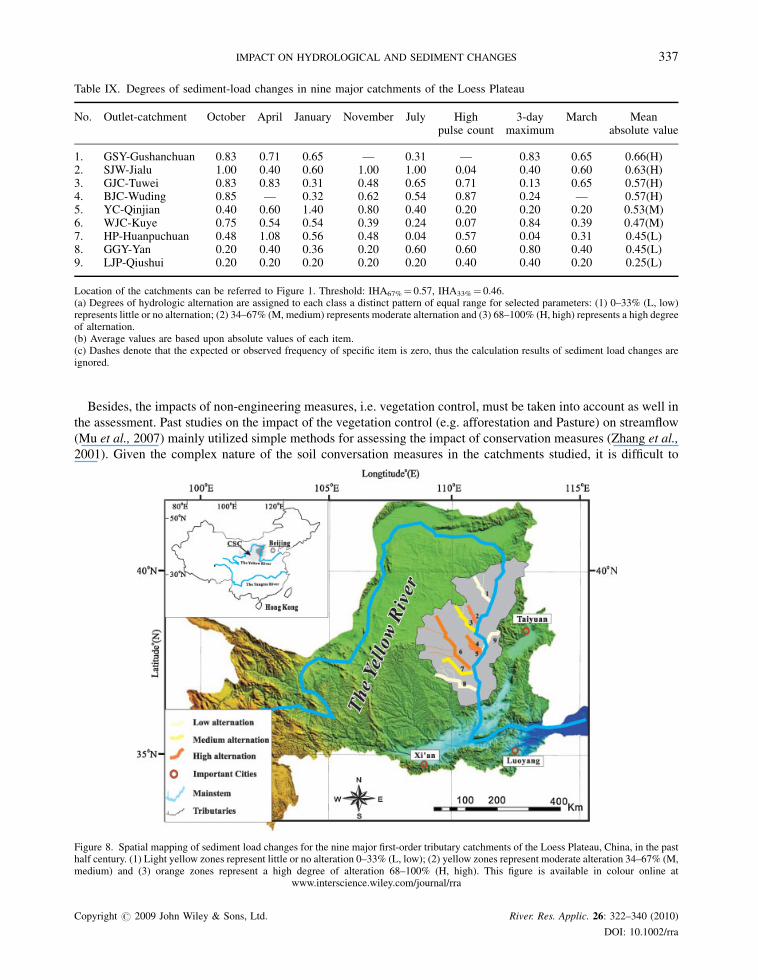
Table IX. Degrees of sediment-load changes in nine major catchments of the Loess Plateau
No. Outlet-catchment October April January November July Highpulse count
3-daymaximum
March Meanabsolute value
1. GSY-Gushanchuan 0.83 0.71 0.65 — 0.31 — 0.83 0.65 0.66(H)2. SJW-Jialu 1.00 0.40 0.60 1.00 1.00 0.04 0.40 0.60 0.63(H)3. GJC-Tuwei 0.83 0.83 0.31 0.48 0.65 0.71 0.13 0.65 0.57(H)4. BJC-Wuding 0.85 — 0.32 0.62 0.54 0.87 0.24 — 0.57(H)5. YC-Qinjian 0.40 0.60 1.40 0.80 0.40 0.20 0.20 0.20 0.53(M)6. WJC-Kuye 0.75 0.54 0.54 0.39 0.24 0.07 0.84 0.39 0.47(M)7. HP-Huanpuchuan 0.48 1.08 0.56 0.48 0.04 0.57 0.04 0.31 0.45(L)8. GGY-Yan 0.20 0.40 0.36 0.20 0.60 0.60 0.80 0.40 0.45(L)9. LJP-Qiushui 0.20 0.20 0.20 0.20 0.20 0.40 0.40 0.20 0.25(L)
Location of the catchments can be referred to Figure 1. Threshold: IHA67%¼ 0.57, IHA33%¼ 0.46.(a) Degrees of hydrologic alternation are assigned to each class a distinct pattern of equal range for selected parameters: (1) 0–33% (L, low)represents little or no alternation; (2) 34–67% (M, medium) represents moderate alternation and (3) 68–100% (H, high) represents a high degreeof alternation.(b) Average values are based upon absolute values of each item.(c) Dashes denote that the expected or observed frequency of specific item is zero, thus the calculation results of sediment load changes areignored.
IMPACT ON HYDROLOGICAL AND SEDIMENT CHANGES 337
Besides, the impacts of non-engineering measures, i.e. vegetation control, must be taken into account as well in
the assessment. Past studies on the impact of the vegetation control (e.g. afforestation and Pasture) on streamflow
(Mu et al., 2007) mainly utilized simple methods for assessing the impact of conservation measures (Zhang et al.,
2001). Given the complex nature of the soil conversation measures in the catchments studied, it is difficult to
Figure 8. Spatial mapping of sediment load changes for the nine major first-order tributary catchments of the Loess Plateau, China, in the pasthalf century. (1) Light yellow zones represent little or no alteration 0–33% (L, low); (2) yellow zones represent moderate alteration 34–67% (M,medium) and (3) orange zones represent a high degree of alteration 68–100% (H, high). This figure is available in colour online at
www.interscience.wiley.com/journal/rra
Copyright # 2009 John Wiley & Sons, Ltd. River. Res. Applic. 26: 322–340 (2010)
DOI: 10.1002/rra
338 T. YANG ET AL.
separate the effects of individual treatments. Nevertheless, it can be argued that afforestation is the dominant
vegetation control on runoff and sediment processes in these catchments, given that the areas occupied by pasture
are much smaller (Figure 3). Considerable afforestation control are observed in Wuding (Areas of afforestation:
37.7%), Tuwei (Areas of afforestation: 32.5%), Jialu (Areas of afforestation: 18.1%) and Qiushui (Areas of
afforestation: 18.1%) River catchments. They are additional important driving forces for high hydrological and
sediment alterations among various soil conservation measures (Table VIII and Table IX). Particularly, the changes
of sediment regimes in Qiushui catchment are more sensitive to the impacts of afforestation than engineering
works.
DISCUSSIONS AND CONCLUSIONS
The impacts of the implementation of soil conservation measures on hydrological and sediment regimes in the nine
most typical and major catchments of the Loess Plateau are studied using the RVA method. Some interesting
conclusions can be summarized as follows:
RVA analysis results showed that the number of reversals ranks first in all hydrologic alteration values followed
by October, 90-day minimum, July, high pulse count, June, fall rate, February, rise rate, low pulse count, date of
minimum and November with IHA percentiles exceeding 67th (�0.57). For sediment changes, the most seriously
changed parameters are: October, April, January, November, July, high pulse count, 3-day maximum, and March
with IHA percentiles exceeding 67th. These variables are supposed to be greatly affected by the implementation of
soil conservation measures and singled out for the spatial assessment of hydrological and sediment changes in the
middle Yellow River basin.
For hydrological changes, large degrees are identified in SJW (0.72), BJC (0.59), GJC (0.59) and LJP (0.57)
catchments, moderate degrees in HP (0.55), WJC (0.55) and GSY (0.55) catchments and small degrees in YC (0.52)
and GGY (0.44) catchments. As for sediment changes large degrees are observed in GSY (0.66), SJW (0.63), GJC
(0.57) and BJC (0.57), moderate degrees in YC (0.53) and WJC (0.47) and small degrees in HP (0.45), GGY (0.45)
and LJP (0.25) catchments. Similar spatial patterns of large hydrological and sediment changes resulting from the
intensive implementation of conservation measures are observed in most catchments of the middle Yellow River
basin. However, slightly different patterns of changes exist due to the unique complexity of hydrological and
sediment processes.
Given the complex nature of the land use change in these catchments, it is very difficult to quantify the impact of
individual measures on streamflow directly. However, it is possible to estimate the combined impact of the
engineering works and biological measures on hydrological and sediment regimes. Engineering works have a quite
immediate impact on streamflow and sediment. Considerable vegetation controls are additional important driving
forces for high hydrological and sediment alterations among various soil conservation measures. Among vegetation
controls, afforestation is the dominant factor for the changes of runoff and sediment processes in these nine
catchments.
The implementation of soil conservation measures, aiming to reduce flood disasters and sediment transport,
inevitably induce various hydrologic and sediment changes, which severely change the natural balance of eco-flow
regime with substantial threat to wildlife species and consequently result in undesirable ecological effects, such as
the disturbances in the habitat of river aquatic organisms, excessive sediment deposition in the rivers (Song et al.,
2007; Yang et al., 2008a), obliged alteration of fish migrating routes (Moog, 1993) and drastic reduction of wild
species (Zincone and Rulifson, 1991). The spatial patterns of hydrologic and sediment alterations caused by the
conservation implementation in the middle Yellow River basin during recent five decades are assessed using the
RVA method. The results by growth curve clearly indicates that the soil conservation measure is a key driving force
for the hydrological and sediment changes in these catchments, significantly contributing to the regional eco-
hydrological system management and planning.
It should be noted here that we attempted to remove possible impacts of climatic variability/changes on
hydrological processes with the aim to focus our attention on the influences of dam regulation and soil conservation
measures on streamflow regimes. However, it is almost impossible to exactly differentiate individual effects of
climatic changes and human activities in hydrological alterations. Complicated climatic changes along with
Copyright # 2009 John Wiley & Sons, Ltd. River. Res. Applic. 26: 322–340 (2010)
DOI: 10.1002/rra
IMPACT ON HYDROLOGICAL AND SEDIMENT CHANGES 339
intensive human activities (e.g. water and soil conservation measures, irrigation engineering, dam or reservoir
construction, groundwater extraction, water withdrawal and diversion) introduce unexpected uncertainties into
assessment of hydrologic and sediment changes (Yang et al., 2008b). Therefore, it is still necessary to further
quantify and address these uncertainties. The current research provides primary investigations on the impact of soil
conservation measures on hydrological and sediment processes. Regional water resources management will be
greatly benefited from the research results. In spite of the advantages mentioned above, it still essential to further
investigate the negative responses of eco-environmental system to hydrological and sediment regime alteration
resulted from intensive conservation measures in the middle Yellow River basin.
ACKNOWLEDGEMENTS
The work was financially supported by the grant from the National Natural Science Foundation of China
(40830639), key research grant from Chinese Ministry of Education (Project No. 308012), open research grant
from State Key Laboratory of Water Resources and Hydropower Engineering Science (2008B041), grant from
Ministry of Water Resources (200701039), National Key Technology R&D Program (2007BAC03A060301), open
research grant from the Key Sediment Lab of the Ministry for Water Resources (2008001) and the Programme of
Introducing Talents of Discipline to Universities—the 111 Project of Hohai University (B08048). Cordial thanks
are extended to the editor, Professor Martin Thoms and three anonymous reviewers for their constructive comments
and suggestions which greatly improved the quality of this paper.
REFERENCES
Bureau of Resource, Environmental Science, Technology, Chinese, Academy of Sciences (BREST-CAS). 1992. Development and Compre-
hensive Treatment on Small Catchment in Loess Plateau. China Science and Technology Literature Press: Beijing (in Chinese with English
Abstract).
Chen LD, Wang J, Fu BJ, Qiu Y. 2001. Land use change in a small catchment of northern Loess Plateau, China. Agriculture Ecosystems and
Environment 86: 163–172.
Chen YD, Yang T, Zhang Q, Xu CY, Chen X. 2008. Evaluating hydrologic alternation along the Dongjiang (East River) basin, south China: a
visually enhanced RVA approach. Stochastic Environment Research and Risk Assessment DOI 10.1007/s00477-008-0294-7.
Cheng XW, Shang HX, Chen FZ, Qian YY. 2000. Sediment treatment and utilization in the lower Yellow River irrigation. Journal of Sediment
Research 2: 10–14. (In Chinese with English abstract).
Dietrich WE, Kirchner JW, Ikeda H, Iseya F. 1989. Sediment supply and the development of the coarse surface layer in gravel-bedded rivers.
Nature 340: 215–217. doi:10.1038/340215a0
Fu B, Gulinck H. 1994. Land evaluation in an area of severe erosion: the Loess Plateau of China. Land Degradation and Rehabilitation 5: 33–40.
Galat DL, Lipkin R. 2000. Restoring ecological integrity of great rivers: historical hydrographs aid in determining reference conditions for the
Missouri River. Hydrobiologia 422/423: 29–48.
Gao F, Li H, Jiang XH. 2004. Water use law of the main irrigational areas in the Yellow River Basin. Journal of Irrigation and Drainage 23(6):
21–24. (In Chinese with English abstract).
Huang M, Zhang L. 2004. Hydrological responses to conservation practices in a catchment of the Loess Plateau, China. Hydrological Processes
18: 1885–1898.
Pitlick J, Wilcock P. 2001. Relations between streamflow, sediment transport, and aquatic habitat in regulated rivers. In: Dorava JM, Montgomery
DR, Palcsak BB and Fitzpatrick FA, (Eds.). Geomorphic Processes and Riverine Habitat, Water Science and Application 4, American
Geophysical Union, Washington, DC, 185–198.
Lisle TE, Hilton S. 1992. The volume of fine sediment in pools: an index of sediment supply in gravel-bed streams. Water Resources Bulletin
28(2): 371–383.
Liu CM. 1989. Problems in management of the Yellow River, regulated rivers. Research and Management 3: 361–369.
Liu CM, Zhang XC. 2004. Causal analysis on actual water reduction in the mainstem of the Yellow River. ACTAGeographica Sinica 59(3): 323–
330. (in Chinese).
Liu ZZ, Dong GB. 2003. The lowest ecological water demand to prevent the river sediment accumulation. Journal of Lake Science 15(4): 313–
318. (in Chinese).
Ludwig W, Probst JL. 1998. River sediment discharge to the oceans: present-day controls and global budgets. American Journal of Science
298(4): 265–295.
Moog O. 1993. Quantification of daily peak hydropower effects on aquatic fauna and management to minimize environmental impacts.
Regulated Rivers: Research and Management 8: 5–14.
Copyright # 2009 John Wiley & Sons, Ltd. River. Res. Applic. 26: 322–340 (2010)
DOI: 10.1002/rra
340 T. YANG ET AL.
Mu XM. 2002. Impacts of soil and water conservation on river flow and soil-hydrology on the Loess Plateau. PhD Thesis, Northwestern Sci-Tech
University of Agriculture and Forestry, Yangling, China.
Mu XM, Xu XX, Chen WQ. 2001. Research of Eco-Hydrology on the Loess Plateau China. China Forestry Publishing House: Beijing (in
Chinese).
Mu XM, Zhang L, McVicar TR, Chille B, Gau P. 2007. Analysis of the impact of conservation measures on stream flow regime in catchments of
the Loess Plateau, China. Hydrological Processes 21: 2124–2134.
MWR, (Ministry of Water Resources). 2002. China Water Resources Bulletins of 1997, 1998, 1999, and 000,’’ MWR website http://
www.mwr.gov.cn/ March 2002. (in Chinese).
Richter BD, Baumgartner JV, Braun DP, Powell J. 1998. A spatial assessment of hydrologic alteration within a river network. Regulated Rivers:
Research and Management 14: 329–340.
Richter BD, Baumgartner JV, Powell J, Braun DP. 1996. A method for assessing hydrologic alteration within ecosystems. Conservation Biology
10: 1163–1174.
Richter BD, Baumgartner JV, Wigington R, Braun DP. 1997. How much water does a river need? Freshwater Biology 37: 231–249.
Shi H, Shao M. 2000. Soil and water loss from the Loess Plateau in China. Journal of Arid Environments 45: 9–20.
Shiau JT, Wu FC. 2004. Assessment of hydrologic alterations caused by Chi-Chi diversion weir in Chou-Shui Creek, Taiwan: opportunities for
restoring natural flow conditions. Regulated Rivers: Research and Management 20: 401–412.
Song JX, Xu ZX, Liu CM, Li HE. 2007. Ecological and environmental instream flow requirements for the Wei River—the largest tributary of the
Yellow River. Hydrological Processes 21: 1066–1073.
Xu JH, Niu YG. 2000. Study on the Impact of Hydraulic Engineering and Soil Water Conservation Works on Stream Flow and Sediment Load in
the Coarse Sandy Hilly Region of the Yellow River Basin. Yellow River Water Conservancy Press: Zhengzhou.
Xu XZ, Zhong HW, Zhong OY. 2004. Development of check-dam systems in gullies on the Loess Plateau. China Environmental Science and
Policy 7: 79–86.
Yang T, Zhang Q, Chen YD, Tao X, Xu CY, Chen X. 2008a. A spatial assessment of hydrologic alteration caused by dam construction in the
middle and lower Yellow River, China, Hydrological Processes 22: 3829–3843. DOI: 10.1002/hyp.6993
Yang T, Chen X, Xu CY, Zhang ZC. 2008b. Spatio-temporal changes of hydrological processes and underlying driving forces in Guizhou Karst
area, China (1956–2000). Stochastic Environment Research and Risk Assessment. DOI: 10.1007/s00477–008–0278–7
Yarnell SM, Mount JF, Larsen EW. 2006. The influence of relative sediment supply on riverine habitat heterogeneity. Geomorphology 80(3–4):
310–324.
Yoo C. 2006. Long term analysis of wet and dry years in Seoul, Korea. Journal of Hydrology 318(1–4): 24–36.
YRCC (Yellow River Conservancy Commission). 2001. Yellow River in the 20th Century, edited by YRCC, Yellow River Water Utilization
Publisher, September 2001.
YRCC (Yellow River Conservancy Commission). 2002. Water resources Planning of the Yellow River Basin. YRCC website. Available online:
http://www.yrcc.gov.cn/ (in Chinese).
Zhan SL, Yu YM. 1994. Methods of Calculating effect of Soil and Water Conservation Measures. China Environmental Sciences Press: Beijing
(in Chinese).
Zhang L, Dawes WR, Walker GR. 2001. The response of mean annual evapotranspiration to vegetation changes at catchment scale. Water
Resources Research 37: 701–708.
Zincone LH Jr, Rulifson RA. 1991. Instream flow and striped bass recruitment in the lower Roanoke River, North Carolina. Rivers 2: 125–137.
Copyright # 2009 John Wiley & Sons, Ltd. River. Res. Applic. 26: 322–340 (2010)
DOI: 10.1002/rra