"Assessing the Impact of Alternative Voting Technologies on Multi-Party Elections: Design Features,...
24
ORIGINAL PAPER Assessing the Impact of Alternative Voting Technologies on Multi-Party Elections: Design Features, Heuristic Processing and Voter Choice Gabriel Katz • R. Michael Alvarez • Ernesto Calvo • Marcelo Escolar • Julia Pomares Published online: 6 August 2010 Ó Springer Science+Business Media, LLC 2010 Abstract This paper analyzes the influence of alternative voting technologies on electoral outcomes in multi-party systems. Using data from a field experiment conducted during the 2005 legislative election in Argentina, we examine the role of information effects associated with alternative voting devices on the support for the competing parties. We find that differences in the type of information displayed and how it was presented across devices favored some parties to the detriment of others. The impact of voting technologies was found to be larger than in two-party systems, and could lead to changes in election results. We conclude that authorities in countries moving to adopt new voting systems should carefully take the potential partisan advantages induced by different technologies into account when evaluating their implementation. Keywords Voting technology Á Multiparty systems Á Field experiments Electronic supplementary material The online version of this article (doi:10.1007/s11109-010-9132-y) contains supplementary material, which is available to authorized users. G. Katz (&) Á R. M. Alvarez California Institute of Technology, Pasadena, CA 91125, USA e-mail: [email protected] E. Calvo University of Houston, Houston, TX, USA M. Escolar Universidad de Buenos Aires, Buenos Aires, Argentina J. Pomares London School of Economics, London, UK 123 Polit Behav (2011) 33:247–270 DOI 10.1007/s11109-010-9132-y
Transcript of "Assessing the Impact of Alternative Voting Technologies on Multi-Party Elections: Design Features,...

ORI GIN AL PA PER
Assessing the Impact of Alternative VotingTechnologies on Multi-Party Elections: DesignFeatures, Heuristic Processing and Voter Choice
Gabriel Katz • R. Michael Alvarez • Ernesto Calvo •
Marcelo Escolar • Julia Pomares
Published online: 6 August 2010
� Springer Science+Business Media, LLC 2010
Abstract This paper analyzes the influence of alternative voting technologies on
electoral outcomes in multi-party systems. Using data from a field experiment
conducted during the 2005 legislative election in Argentina, we examine the role of
information effects associated with alternative voting devices on the support for the
competing parties. We find that differences in the type of information displayed and
how it was presented across devices favored some parties to the detriment of others.
The impact of voting technologies was found to be larger than in two-party systems,
and could lead to changes in election results. We conclude that authorities in
countries moving to adopt new voting systems should carefully take the potential
partisan advantages induced by different technologies into account when evaluating
their implementation.
Keywords Voting technology � Multiparty systems � Field experiments
Electronic supplementary material The online version of this article (doi:10.1007/s11109-010-9132-y)
contains supplementary material, which is available to authorized users.
G. Katz (&) � R. M. Alvarez
California Institute of Technology, Pasadena, CA 91125, USA
e-mail: [email protected]
E. Calvo
University of Houston, Houston, TX, USA
M. Escolar
Universidad de Buenos Aires, Buenos Aires, Argentina
J. Pomares
London School of Economics, London, UK
123
Polit Behav (2011) 33:247–270
DOI 10.1007/s11109-010-9132-y
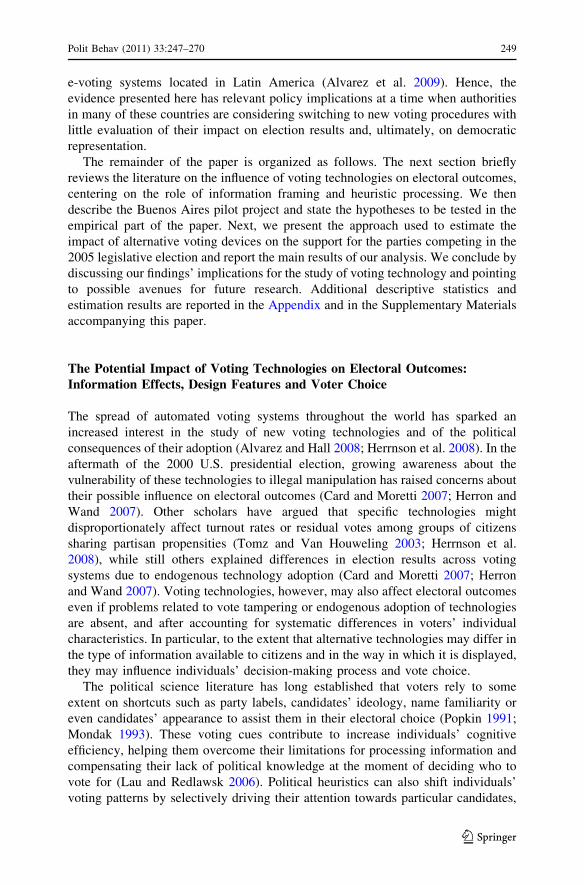
Introduction
An increasing number of countries around the world have adopted automated voting
systems since the 1990s, and many others are currently conducting vote pilot tests
(Alvarez and Hall 2008). While the academic literature has focused mainly on the
reliability and accuracy of these new technologies (Ansolabehere and Stewart
2005), only few studies have directly examined their effect on election outcomes
(Card and Moretti 2007; Herron and Wand 2007). Empirical analyses have even
been fewer in multiparty races, where with a larger number of candidates on the
ballot, voters may be more likely to resort to shortcuts to identify and select their
preferred electoral option (Lau and Redlawsk 2006). Hence, differences in the way
in which information is displayed and accessed across technologies could have a
considerable effect on vote choice in multiparty systems (Calvo et al. 2009).
In this paper, we examine whether and to what extent information effects
embedded in alternative voting technologies can affect the relative support for
candidates in multiparty races and alter election results. In order to do so, we
conducted a large-scale voting experiment during the 2005 legislative election in
Buenos Aires, Argentina, in which almost 14,000 voters in 41 precincts were
randomly assigned to different electronic voting prototypes. Our research design has
the advantage of mitigating concerns that have plagued previous observational
studies in this area, such as vote tampering and endogenous technology adoption
(Card and Moretti 2007; Herron and Wand 2007).1 To account for differences in the
characteristics of the participants and in the treatment assignment across precincts,
we combine parametric and non-parametric statistical methods that allow us to
assess the robustness of our findings and reinforce the validity of our conclusions.
Our estimates indicate that differences between alternative technologies in terms
of what cues are more prominently displayed and how they are presented to voters
can systematically favor some parties to the detriment of others. These findings
expand and complement previous research on the influence of information effects
and cognitive heuristics on electoral outcomes (Bartels 1996; Lau and Redlawsk
2006; Reynolds and Steenbergen 2006) and reveal some unexpected potential
consequences of adopting new voting systems.2 While our conclusions are based
exclusively on data from Argentina, some of the predominant features of the 2005
Buenos Aires legislative races also characterize elections in several other polities. In
transitional and less established democracies, especially in Latin America and
Eastern Europe, voters usually have to select their preferred choice among multiple
competing parties sharing similar labels and relying on diffuse programmatic
appeals, thus enhancing the potential influence of information framing on the
decision-making process (Calvo et al. 2009). It is among these less developed
democracies that the new voting technologies have disseminated more rapidly and
extensively in the last decades, with one-third of the countries currently testing
1 Although other studies also used experimental designs to assess the impact of different technologies on
voter behavior (e.g., Herrnson et al. 2008), none of them focused on their effect on electoral outcomes.2 Throughout this paper, the term ‘‘heuristics’’ refers to cognitive shortcuts and simplifying rules of
thumb individuals resort to in order to make political judgments or inferences with considerably less than
complete information about the different electoral options (Lau and Redlawsk 2006).
248 Polit Behav (2011) 33:247–270
123
e-voting systems located in Latin America (Alvarez et al. 2009). Hence, the
evidence presented here has relevant policy implications at a time when authorities
in many of these countries are considering switching to new voting procedures with
little evaluation of their impact on election results and, ultimately, on democratic
representation.
The remainder of the paper is organized as follows. The next section briefly
reviews the literature on the influence of voting technologies on electoral outcomes,
centering on the role of information framing and heuristic processing. We then
describe the Buenos Aires pilot project and state the hypotheses to be tested in the
empirical part of the paper. Next, we present the approach used to estimate the
impact of alternative voting devices on the support for the parties competing in the
2005 legislative election and report the main results of our analysis. We conclude by
discussing our findings’ implications for the study of voting technology and pointing
to possible avenues for future research. Additional descriptive statistics and
estimation results are reported in the Appendix and in the Supplementary Materials
accompanying this paper.
The Potential Impact of Voting Technologies on Electoral Outcomes:Information Effects, Design Features and Voter Choice
The spread of automated voting systems throughout the world has sparked an
increased interest in the study of new voting technologies and of the political
consequences of their adoption (Alvarez and Hall 2008; Herrnson et al. 2008). In the
aftermath of the 2000 U.S. presidential election, growing awareness about the
vulnerability of these technologies to illegal manipulation has raised concerns about
their possible influence on electoral outcomes (Card and Moretti 2007; Herron and
Wand 2007). Other scholars have argued that specific technologies might
disproportionately affect turnout rates or residual votes among groups of citizens
sharing partisan propensities (Tomz and Van Houweling 2003; Herrnson et al.
2008), while still others explained differences in election results across voting
systems due to endogenous technology adoption (Card and Moretti 2007; Herron
and Wand 2007). Voting technologies, however, may also affect electoral outcomes
even if problems related to vote tampering or endogenous adoption of technologies
are absent, and after accounting for systematic differences in voters’ individual
characteristics. In particular, to the extent that alternative technologies may differ in
the type of information available to citizens and in the way in which it is displayed,
they may influence individuals’ decision-making process and vote choice.
The political science literature has long established that voters rely to some
extent on shortcuts such as party labels, candidates’ ideology, name familiarity or
even candidates’ appearance to assist them in their electoral choice (Popkin 1991;
Mondak 1993). These voting cues contribute to increase individuals’ cognitive
efficiency, helping them overcome their limitations for processing information and
compensating their lack of political knowledge at the moment of deciding who to
vote for (Lau and Redlawsk 2006). Political heuristics can also shift individuals’
voting patterns by selectively driving their attention towards particular candidates,
Polit Behav (2011) 33:247–270 249
123

activating their latent political predispositions or even shaping their political
judgments (Bartels 1996; Schaffner and Streb 2002). Furthermore, it is not only the
specific shortcuts individuals use that influences their voting behavior, but also how
these shortcuts are accessed, processed and integrated into the decision mechanism.
Scholars have shown that the ease or difficulty of finding particular cues and their
relative prominence can affect the nature and quality of the vote (Mondak 1993; Lau
and Redlawsk 2006). For instance, political scientists have underscored that several
features of the ballot design, such as layouts, colors, symbols, and the order in which
candidates are listed, can modify voters’ information-acquisition strategies and
choice (Reynolds and Steenbergen 2006). In the same direction, usability research
on voting technologies has found that slight variations in interfaces and procedures
followed to browse political information across different devices may influence
users’ attitudes and actions (Herrnson et al. 2008).
The relevance of information framing is likely to be enhanced in multiparty
elections. Citizens in multiparty systems have to distinguish and choose between a
large number of parties and candidates that often exhibit subtle ideological
differences and/or share similar labels that cue voters about their platforms. This
imposes substantive cognitive demands on the part of voters, who will have strong
incentives to follow ‘low information’ rationality (Popkin 1991). Previous studies
have concluded that, as the number of available electoral options increases and the
information environment becomes more complex, individuals tend to be more
responsive to simple cues that allow them to reduce the time and effort devoted to
deciding how to vote (Lau and Redlawsk 2006). The influence of political heuristics
will tend to be especially marked in low-information races in which a large number
of parties or candidates with ambiguous policy positions compete for the vote of an
inattentive citizenry (Mondak 1993; Lau and Redlawsk 2006).
Despite this extensive body of research on the role of cognitive shortcuts in
political decision-making, there is very little empirical evidence about the impact
that variations in ballot styles and usability features across voting technologies may
have on citizens’ heuristic-processing strategies and electoral choice. To the best of
our knowledge, there is in fact no work addressing this issue in the case of
multiparty elections. In this sense, the Argentine voting pilot provided an ideal
setting to test for the potential influence of information effects induced by different
voting devices. The field experiment took place simultaneously with the 2005
Buenos Aires legislative election, in which 30 (41) parties presented candidates for
the national Congress (city legislature), many of them with similar generic names
and diffuse policy proposals and ideologies (Amado 2006; Calvo et al. 2009). The
prototypes tested in the pilot used different interfaces and presented different
information to voters, highlighting particular cues and forcing participants to follow
specific search patterns to find their preferred electoral options. Unlike in other
laboratory or field experiments (e.g., Herrnson et al. 2008), participants had to
choose between actual parties and candidates, allowing us to assess if alternative
devices enhance or mitigate partisan advantages present in real world politics and to
examine the relevance of information effects across races with different salience
levels.
250 Polit Behav (2011) 33:247–270
123
The Buenos Aires’ 2005 Pilot Project
In 2003, the Government of the City of Buenos Aires assembled a team of political
scientists, geographers, and computer scientists and assigned them the responsibility
of designing and supervising a field experiment to test four different electronic
voting devices. The voting pilot took place during the legislative election held in
Buenos Aires in October 2005, which elected members for both the national
Congress and the city legislature using a paper-based manual voting system with
party-lists displaying the names of the candidates for all offices. Seats were
allocated using a PR-D’Hont formula with closed party lists of magnitude 13 for the
Congress and 30 for the city legislature.
Three parties captured three-fourths of the vote in the national election and two-
thirds of the ballots cast in the city race: Frente para la Victoria (FPV), Afirmacionpara una Republica Igualitaria (ARI), and Propuesta Republicana (PRO). FPV was
a center-left coalition assembled by President Nestor Kirchner, comprising members
of the ruling Partido Justicialista (PJ) as well as of non-Peronist sectors. ARI was
an opposition party also in the center-left of the ideological spectrum that had
gathered considerable support in the previous (2003) presidential election, while
PRO was a newly created center-right party. None of the other parties—including
the traditional Union Cıvica Radical (UCR)—obtained more than 5% of the vote in
any of the two races.3
The three main parties spent the highest amounts of money during the campaign
for national representatives and accumulated 65% of the paid political TV
advertisement (Buenos Aires Controller’s Office, AGCBA 2006).4 In addition, their
first candidates, Elisa Carrio (ARI), Rafael Bielsa (FPV) and Mauricio Macri
(PRO), were notorious public figures who centralized media interest in the election
cycle.5 According to a study by the media consulting firm Management Press
(2005), they received almost 80% of the radio and TV airtime devoted to the
candidates running for Congress (Fig. 1), and were the only ones who participated
in the single televised political debate organized prior to the election. Among the
remaining candidates, three high-profile candidates, long-term leftist leader Luis
Zamora, of Autodeterminacion y Libertad (AL), former Minister of Labor and
3 A party with over a 100 years of history, the Union Cıvica Radical had traditionally been the main
contender of the Partido Justicialista. However, after the collapse of its last (coalition) government in
2001, which pushed Argentina on the verge of institutional chaos, UCR was harshly punished by voters.
As a result, it lost ground to new political options like ARI and PRO in subsequent elections, especially in
Buenos Aires.4 According to the Buenos Aires Controller’s Office (AGCBA 2006), PRO’s campaign expenditures
totaled 240,000 U.S. dollars, while ARI and FPV spent about 150,000 dollars each. In comparison, UCR’s
expenditures were below 85,000 dollars, while most of the remaining parties spent substantially less than
that.5 Bielsa was President Kirchner’s Foreign Relations Minister at that time. Carrio was a rising political
leader who had been a competitive presidential candidate in 2003, and Macri is a famous businessman
and was the president of one of Argentina’s most popular soccer clubs at that time.
Polit Behav (2011) 33:247–270 251
123

Social Security Patricia Bullrich, of the centrist Union por Todos (UPT), and media
personality Moria Casan, founder and most visible face of the center-right
Movimiento Federal de Centro (MFC), received considerable media coverage
relative to their parties’ meagre electoral support.
A survey conducted by the Universidad de Belgrano (COPUB 2005) in
September–October 2005 showed that Macri (PRO), Carrio (ARI) and Bielsa
(FPV) were, in that order, the three most widely recognized contenders for a seat in
Congress. When asked to name 4 of the aspirants for office, more than 83% of the
respondents selected the candidates of ARI, FPV and PRO. Zamora (AL), Bullrich
(UPT) and Casan (MFC) gathered almost 12% of the mentions, while less than 5% of
the respondents named any of the other hundreds of candidates for Congress. The
survey also revealed that a large proportion of the citizens remained apathetic and
uninformed even as Election Day approached. More than 39% of the respondents
could not bring four candidates to mind, and almost 73% did not recall a single policy
proposal made by any of the parties (COPUB 2005). While virtually no pre-electoral
poll surveyed citizen’s opinions about the election of city legislators, it is reasonable
to assume that average interest and information levels were even lower in this case.
The city election was much less publicized than the national one, with less than 6%
of the political ads on radio and TV featuring any of the competing candidates
(AGCBA 2006). As a result, voters knew very little about these candidates at the
moment of casting their vote (Calvo et al. 2009).
Fig. 1 Distribution of the TV and radio coverage among candidates running for national representativesin Buenos Aires, as percentage of total airtime allocated to the campaign. Source: Management Press(2005) and Amado (2006)
252 Polit Behav (2011) 33:247–270
123

Experimental Design and Procedures
The field experiment was conducted in 41 precincts distributed throughout Buenos
Aires, covering about 6% of the total number of wards (700) in the city. The
selected precincts were chosen so as to guarantee a large and diverse pool of
potential subjects.
Two weeks before the election, an information campaign—consisting of paid
advertisements in the local media, street signs and letters sent to eligible voters—
was mounted to make citizens acquainted with the pilot test. On Election Day, test
site workers approached voters in each precinct after they had cast an official ballot,
handed them a brochure and asked them to participate in a mock election. If a voter
agreed to participate, she was directed to an election desk, where poll workers
assigned her to one of the four prototypes (treatments) tested in the experiment. To
avoid long queues and reduce waiting times, the workers were instructed to allocate
participants to each machine successively. The participant was then walked through
a 5-min orientation session specific to the device she was about to use, after which
she was sent to a voting booth and requested to cast a ballot for each legislative race.
Upon completion of the vote, which took on average less than 2 min, subjects were
required to provide basic socio-demographic information. A quarter of them also
answered a longer exit poll with questions about their patterns of political
participation and usability issues specific to each device.
The number of participants totaled 13,876 out of roughly 175,000 voters in the
precincts in which the test was conducted. Given that subjects were recruited
immediately after the real election, it might be reasonable to assume that they could
have just sought to replicate the vote they had already cast. If that had been the case,
election results in the experiment would have merely mirrored the official outcomes,
rather than reflect the influence of information effects associated with the devices
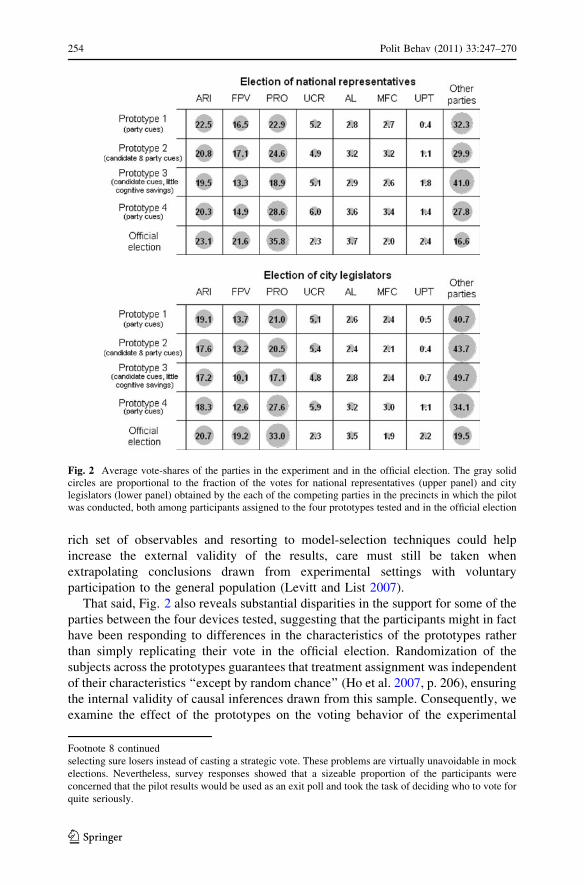
tested.6 However, voting patterns in the pilot were in fact clearly different from
those in the official election. This can be seen in Fig. 2, which plots the vote-shares
of different parties competing in the national and city races.7
Of course, we cannot rule out the possibility that these discrepancies may stem
from differences between the characteristics of the participants and those of the
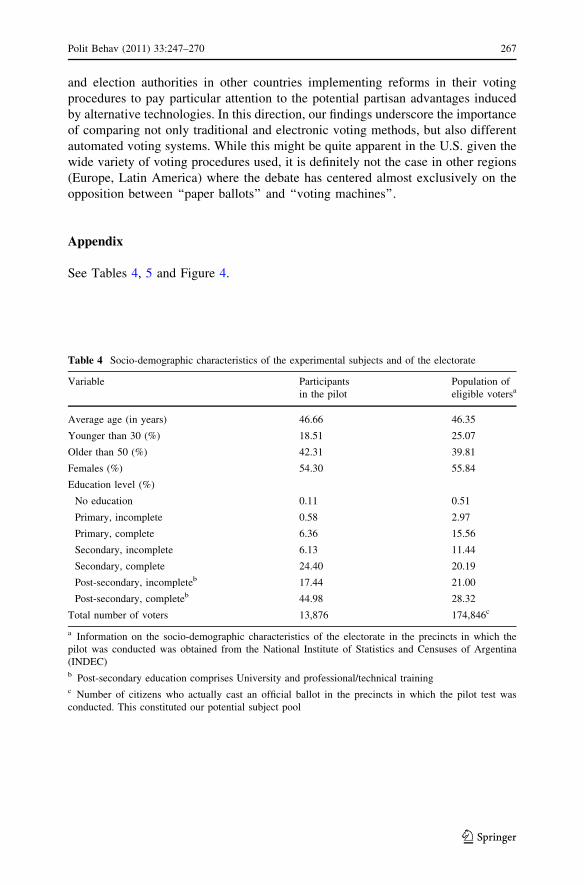
general electorate. In this sense, the data in Table 4 in the Appendix indicates that,
while the distribution of the subjects by age and gender was similar to that of the
population of eligible voters, participants in the pilot tended to be more educated—
and thus, probably more politically ‘‘sophisticated’’ and interested—than the
average voter. Besides this potential sample selection bias, the fact that participants
knew that they were being studied might have led them to—willingly or not—alter
their voting behavior (Lau and Redlawsk 2006).8 Hence, even though including a
6 We thank an anonymous referee for bringing this point to our attention.7 The percentages in Fig. 2 do not take blank ballots into account. The category ‘‘Other parties’’ in Fig. 2
includes 23 parties competing in the election of national representatives and 34 in the election of city
legislators. Figures S.1–S.3 in the Supplementary Materials provides further details about the distribution
of parties’ vote-shares across prototypes and precincts both in the pilot and in the official election.8 For instance, some participants may not have had strong incentives to pay attention during the
information session or to avoid voting errors, while others could have changed their choice—e.g.,
Polit Behav (2011) 33:247–270 253
123
rich set of observables and resorting to model-selection techniques could help
increase the external validity of the results, care must still be taken when
extrapolating conclusions drawn from experimental settings with voluntary
participation to the general population (Levitt and List 2007).
That said, Fig. 2 also reveals substantial disparities in the support for some of the
parties between the four devices tested, suggesting that the participants might in fact
have been responding to differences in the characteristics of the prototypes rather
than simply replicating their vote in the official election. Randomization of the
subjects across the prototypes guarantees that treatment assignment was independent
of their characteristics ‘‘except by random chance’’ (Ho et al. 2007, p. 206), ensuring
the internal validity of causal inferences drawn from this sample. Consequently, we
examine the effect of the prototypes on the voting behavior of the experimental
Fig. 2 Average vote-shares of the parties in the experiment and in the official election. The gray solidcircles are proportional to the fraction of the votes for national representatives (upper panel) and citylegislators (lower panel) obtained by the each of the competing parties in the precincts in which the pilotwas conducted, both among participants assigned to the four prototypes tested and in the official election
Footnote 8 continued
selecting sure losers instead of casting a strategic vote. These problems are virtually unavoidable in mock
elections. Nevertheless, survey responses showed that a sizeable proportion of the participants were
concerned that the pilot results would be used as an exit poll and took the task of deciding who to vote for
quite seriously.
254 Polit Behav (2011) 33:247–270
123

subjects. Even with the caveats mentioned before about the generalizability of the
results from this analysis, it can still shed light on the potential electoral impact of
information effects embedded in alternative technologies.9
Characteristics of the Prototypes: Designs and Information Cues
The four voting devices tested in the pilot differed not only in the type of heuristics
they stressed, but also in the relative accessibility of these voting cues and in the
information-processing demands they imposed on voters (Fig. 2).10
Prototype 1 was a direct recording electronic (DRE) design with two separate
modules. After users inserted a plastic ‘‘smart card’’ in the first module, a screen
presented them with a list of parties’ names, logos and numbers.11 To view the list
of candidates for each party, the voter needed to enter the three-digit party number
using a keypad, which was also used to navigate through the screen and to register
the vote. If the voter recalled the names of her preferred candidates but did not know
their party affiliation, she would need to access each party’s list until finding these
candidates. Thus, this prototype highlighted party-centric information. After casting
her ballot, the participant would remove the smart card from the first module and
insert it into the second one, recording her vote and finishing the process.
Prototype 2 was also a touch-screen DRE machine that primed voters using both
party- and candidate-centric cues. Once the participant activated the system by
inserting a smart card into the reader, the name of the first candidate of each party
appeared prominently on the screen, together with the party’s name, number and
logo. The complete list of candidates was displayed on a second navigation level,
once the voter had selected a party by tapping onto the screen. After the subject had
chosen an option, a voter verifiable paper trail was printed and deposited behind a
glass screen.12 For the two DRE devices, the placement of the party labels on the
screen was randomly rotated, preventing order effect from benefitting the same
party between races.
Prototype 3, which closely resembled the voting system used in the real election,
was an optical scan (OS) device with separate paper ballots for each party and
election. Just as in the official election, the ballots were spread out on tables placed
9 In this sense, Levitt and List (2007) note that, even though experimental results may not translate
exactly to real world settings, they can provide relevant information about the underlying mechanisms
that may be at work when certain data patterns are observed.10 Figure S.4 in the Supplementary Materials depicts the four types of devices tested in the experiment.11 In Argentina, parties are assigned an official number which is often used for advertising during the
electoral campaign, especially in the case of parties—such as UCR—that have kept the same number over
time.12 Providing one of the DRE devices with a verifiable paper trail allowed us to test its effect on subjects’
trust in the accuracy of the voting technologies. The rate of positive answers to a survey item asking
participants whether they believed that their vote had been correctly recorded was similar for Prototypes1 (92.1%) and 2 (94.0%), with no statistically significant effect of the paper trail on the perceived
reliability of the machines.
Polit Behav (2011) 33:247–270 255
123

inside the voting booth following the numbering of the parties.13 These ballots
displayed each party’s name, logo, and identification number, as well as the
complete list of candidates for each race. The names of the first candidates appeared
in larger print than the other information about the parties, so Prototype 3 stressed
primarily candidate-centric features. In order to identify their preferred candidates,
though, users had to go through the stacks of papers and find the correct ballot for
each race, after which they would introduce it into a rolling scanner. As is usually
the case in the official elections, ballots rapidly mixed in the booth, complicating the
search for voters’ favorite candidates.
Finally, Prototype 4 was also an OS device with a single ballot for the two
legislative races. After receiving the ballot, voters recorded their preferences for
each race using a special marker and introduced it into a scanner located next to the
election desk. These ballots displayed the names and numbers of all the parties, in
increasing order by the party numbers. The information about the candidates (names
and party affiliation) was presented in a separate booklet, also sorted according to
the parties’ numbers. Survey data showed that participants could easily find their
preferred party on the ballot, but had more trouble locating the candidates in the
supplementary booklet. Hence, as Prototype 1, Prototype 4 also primed voters using
mainly party-centric cues.
For each prototype, subjects voted for national representatives first and for city
legislators second, with no straight-ticket option. All devices allowed voters to
review the selected ballots and asked them to confirm their choices at the end of the
process, preventing over and under-counts. Participants could nonetheless cast blank
ballots, so they were not forced to vote for a party in any of the races.
Hypotheses
Given that very few empirical studies have addressed questions about the impact of
alternative voting technologies on electoral outcomes, we draw on the more general
literature on the influence of cognitive heuristics and information effects to
formulate five hypotheses to be tested in the empirical section of the paper.
The information displayed to voters was overwhelming, including 71 party
names, logos and numbers and approximately 1,600 candidate names for the two
legislative races under study. Consequently, based on the arguments outlined above,
differences between prototypes in terms of what cues were more noticeable and how
they were presented could have had a strong influence on individuals’ information
processing strategies and voting behavior. In order to explore this issue, Table 1
summarizes participants’ responses to a series of survey questions included in the
longer exit poll inquiring into the number and the types of political heuristics they
used when deciding their vote.
The data shows that the vast majority of the participants relied on only one or two
of the available cues to facilitate their vote decision, with party labels and
candidates’ names being the most frequently used. This is in accordance with Lau
13 Ballots of the same party were stacked on top of each other, and the piles corresponding to the
different parties were laid out on the tables next to each other, following the official list numbers.
256 Polit Behav (2011) 33:247–270
123

and Redlawsk (2006), who found that voters in complex choice situations will tend
to adopt ‘‘intuitive’’ decision rules and to heavily lean on a limited number of
elementary shortcuts to simplify the selection task. As follows from the description
of the devices, the name of the first candidate was a more relevant cue among
participants assigned to Prototype 2 and, to a lesser extent, to Prototype 3, than
among those under Prototypes 1 and 4. Subjects using these latter two devices, on
the other hand, resorted more frequently to parties’ names and numbers than the
rest. As noted before, Prototype 1 required voters to punch the official party
numbers into the keypad to access the complete list of candidates, while the
information about parties and candidates under Prototype 4 was presented in
ascending numerical order. Also, the fraction of participants who guided their vote
using the parties’ logos was substantially lower among those assigned to Prototype4 than between subjects using the other three prototypes. This is consistent with the
fact that only Prototypes 1, 2 and 3 displayed the logos on the ballot.
The inspection of heuristic use patterns among the participants indicates that they
responded primarily to those shortcuts that were more clearly highlighted by each
device. However, there are some differences in this regard between subjects
assigned to Prototypes 1, 2 and 4 and those under Prototype 3. The latter relied
relatively less on candidate- or party-centric heuristics than those under the
remaining three prototypes, and were instead more prone to base their vote on
Table 1 Indicators of participants’ heuristic-processing strategies across prototypes
Prototype
1 (party cues)
Prototype 2
(candidate
and party cues)
Prototype 3
(candidate cues,
little cognitive
savings)
Prototype 4
(party cues)
All
prototypes
Number of candidate- and party-centric cues useda
Zero 3.3 2.1 6.6 4.8 3.9
One 62.9 58.8 63.9 67.7 61.9
Two 22.0 27.9 20.9 18.5 23.7
More than two 11.8 11.2 8.6 9.0 10.5
Type of cues usedb
Party name 51.1 50.7 44.3 53.2 49.3
First candidate’s name 33.5 50.2 47.3 45.3 44.3
Party number 35.4 21.1 19.9 28.4 25.3
Party logo 27.3 30.3 22.4 7.4 25.8
Other 4.1 2.7 7.5 6.3 4.6
N 879 1,158 858 189 3,085
a Distribution of participants according to the number of candidate- or party-centric cues they used to
guide their choice decision, as percentage of the total number of respondentsb Table entries are the percentage of respondents assigned to each prototype who relied on different
voting cues when casting their ballot. Since participants could use several of the voting cues, percentages
do not necessarily sum to 100
Polit Behav (2011) 33:247–270 257
123

‘‘other’’—e.g., ‘‘nonheuristic’’—information.14 As already mentioned, participants
under Prototype 3 had to inspect a large number of ballots in order to actively try to
identify and locate their preferred candidates, and many of them reported having to
go through considerable work to do so. In such conditions, individuals typically find
it difficult to execute coherent search strategies and political heuristics allow for
little cognitive savings in practice, since voters still have to gather and process large
amounts of information (Lau and Redlawsk 2006). Hence, citizens may be forced to
adopt other strategies to simplify the decision-making process, settling for ‘‘good
enough’’ rather than ‘‘the best’’ candidates, using ad-hoc rules to guide their vote,
even making random choices or simply refraining from choosing at all (Mondak
1993; Lau and Redlawsk 2006). This is consistent with preliminary evidence about
subjects’ voting patterns obtained from the exit survey.15 More than 11% of the
subjects using Prototype 3 stated that they were unable to cast a vote for their
favorite candidate in any of the two elections analyzed, against less than 4.5% of
those allocated to the remaining prototypes. In addition, the proportion of blank
ballots under Prototype 3 reached 8.3% in the national election and 10.6% in the
city race, at least twice as high as under any of the other devices.
In an electoral context characterized by parties and candidates that differed
substantially in their name recognition and in the level of public attention they drew
during the campaign, the availability and prominence of specific cues associated
with different voting technologies might have consistently benefitted some parties at
the expense of others. We are mainly—though not only—interested in testing for
systematic differences in the parties’ vote-shares under Prototype 3 vis-a-vis each of
the other three devices. In so far as the ballot design and voting procedures under
this prototype were quite similar to those used in the official election, such
comparisons can provide valuable insights into the potential consequences of
replacing the voting system currently in place with one of the other mechanisms
under consideration by Argentina’s electoral authorities.
Previous research indicates that party labels can have a substantial impact on
voter choice, especially in low information races such as legislative elections
(Schaffner and Streb 2002). In particular, major party cues will tend to be much
more effective as heuristic aids than minor party cues (Coan et al. 2008). Hence, our
first hypothesis (H.1) states that Prototypes 1, 2 and 4 should have increased the
vote-shares of ARI, FPV, and PRO, the parties with higher public prominence and
larger campaign spending, vis-a-vis Prototype 3. While we expect the effect of the
party-centric shortcuts highlighted by these three devices to have been significant in
the two legislative races under study, their influence should have been more marked
in the city election (H.2). As noted by Schaffner and Streb (2002), partisan
heuristics are especially relevant in less salient and relatively unpublicized races in
which there is little information about the candidates besides their party affiliation,
as was the case of the election for the Buenos Aires legislature.
14 The differences in the relative influence of alternative voting cues across prototypes are significant at
the usual confidence levels (Loughin and Scherer 1998).15 See Table S.1 in the Supplementary Materials.
258 Polit Behav (2011) 33:247–270
123

Familiarity with candidates’ names has also been shown to be a relevant
determinant of electoral choice, to the extent that those who vote contrary to their
partisan preferences usually do so in favor of the more renowned candidates (Wolak
2009). In this regard, the main difference between Prototype 2 and the ‘‘purely’’
party-centric devices—Prototypes 1 and 4—was that the former also underscored
candidate-centric cues. Hence, our third hypothesis (H.3) states that Prototype 2should have increased the vote-shares of the parties with easily recognizable
candidates running for Congress relative to Prototypes 1 and 4. In this sense, the
popularity of Carrio, Bielsa and Macri might have contributed not only to further
boost the vote for ARI, FPV and PRO under Prototype 2 vis-a-vis Prototype 3, but
also compared to the technologies that only stressed party-centric information. In
addition, the availability of candidate-centric cues should have benefitted smaller
parties like AL, MFC and UPT as well. These parties’ first candidates, Zamora,
Casan and Bullrich, were notorious personalities in their own right, and were
probably—certainly so in the case of media personality Moria Casan—more widely
known and more easily identified by voters than the corresponding party labels.
Thus, the support for these parties in the national election should have been
considerably higher under Prototype 2 than under any of the two party-centric
devices. We do not expect a significant effect of candidate-centric cues in the
election of city legislators, though, since most of the candidates enjoyed no name
recognition. Hence, Prototype 2 should not have improved the electoral chances of
AL, MFC and UPT in the city race (H.4).
Finally, as discussed before, subjects under Prototype 3 faced a more complex
information environment than the rest, and political heuristics played a less
predominant role for them at the moment of deciding their vote. Hence, our fifth
hypothesis (H.5) states that, comparing Prototype 3 to each of the other devices, we
should see a reduction in the support for the parties more likely to be favored by
these voting cues and, consequently, an increase in the vote-share of the other, lesser
known parties presenting virtually anonymous candidates in both legislative races.
Estimating the Effect of Different Voting Technologies on Election Outcomes
Given our experimental design, simple tests for differences in means could in
principle be used to assess the validity of the hypotheses formulated above (Ho et al.
2007). Nevertheless, randomization of participants across treatment groups balances
their characteristics in expectation only, and thus the possibility of systematic
variations in any observed sample remains. Accounting for these sample-specific
differences is particularly important in the case of the Buenos Aires pilot, since
equipment failures prevented setting up Prototypes 3 and 4 in all the experimental
test sites, as originally planned. Only in 17 precincts were voters randomized
between the four prototypes. In other 23 precincts, they were allocated to Prototypes1, 2 and 3, while in 1 precinct only Prototypes 1 and 2 were tested. In addition, the
number of eligible voters varied over precincts, and the amount of time needed to
complete the vote oscillated across participants and machines. As a result, the
fraction of subjects assigned to each prototype varied both within and between
Polit Behav (2011) 33:247–270 259
123

precincts, with roughly 30% of them allocated to each of the first three prototypes but
less than 10% assigned to Prototype 4.16 This could have led to significant
differences in the characteristics of the participants using alternative technologies,
potentially affecting the estimates of their impact on election results (Ho et al. 2007).
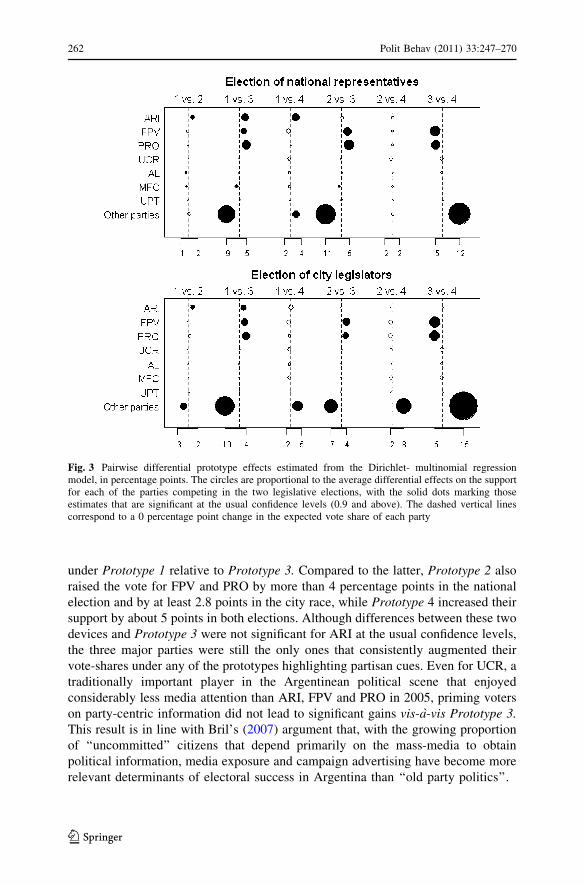
Table 2 presents descriptive statistics for all the pretreatment covariates for
which information was obtained from the post-experimental surveys, discriminated
by voting device.17 These variables aim at capturing differences in participants’
cognitive ability, political sophistication, familiarity with technology and other
background characteristics that might be correlated with their electoral preferences
and/or their propensity to rely on heuristics (Schaffner and Streb 2002; Lau and
Redlawsk 2006). As seen in the table, there was little variation in the characteristics
of the subjects assigned to Prototypes 1, 2 and 3. In contrast, differences in the
distribution of the covariates between participants allocated to Prototype 4 and the
rest tended to be larger. In particular, the fraction of participants with post-
secondary education was significantly higher under Prototype 4, while the levels of
political interest and the proportion of first-time voters were lower.18 To account for
these differences, we combine parametric and non-parametric statistical methods to
test hypotheses H.1–H.5.
Privacy considerations prevented us from linking the individual vote data
obtained from the prototypes’ log files with participants’ responses to the survey
questions. Therefore, we can only analyze the average characteristics of the subjects
assigned to the different prototypes within each precinct. To do so, we defined 139
voting stations by ‘crossing’ the precincts with the number of prototypes tested in
each of them and modeled the number of votes for the different parties in each
voting station as a vector of counts (Mebane and Sekhon 2004). However,
aggregate-level variables typically fail to capture traits that vary across voters
within geographical units, some of which may affect vote choice probabilities. As a
result, vote counts generally exhibit higher variability (over-dispersion) than the
standard multinomial model for count data can account for, which might lead to
underestimate the variance–covariance matrix and to draw incorrect conclusions
about hypothesis tests and confidence intervals for the parameters of interest
(Mebane and Sekhon 2004, Guimaraes and Lindrooth 2007). To overcome this
problem, we fit a Dirichlet-multinomial regression model to examine the
relationship between the parties’ vote-shares and the prototypes tested in the pilot,
including the average characteristics of the participants in each voting station as
additional controls. This allows for a simple and computationally efficient way of
accommodating extra-multinomial variation even in the presence of large choice
sets (Guimaraes and Lindrooth 2007).19
16 Table S.2 in the Supplementary Materials reports the distribution of subjects by prototypes and
precincts.17 Table S.3 and Figure S.5 in the Supplementary Materials provide further details on the distribution of
the covariates across prototypes.18 Table S.4 in the Supplementary Materials summarizes the results from several covariate balance
checks.19 Section 4 in the Supplementary Materials describes the Dirichlet-multinomial regression model.
260 Polit Behav (2011) 33:247–270
123
In order to assess the sensitivity of the results to our modelling assumptions, we
also implemented a non-parametric matching estimator based on Lechner (2001).
This approach extends standard two-state (treatment versus non-treatment) match-
ing methods for causal inference to the case of multiple unordered categorical
treatments, and is thus particularly well suited for our application.20 The matching
estimator avoids imposing distributional and functional form assumptions, although
it relies on the—weaker—assumption that the potential treatment outcomes are
independent of the assignment mechanism conditional on the voting station
covariates (Lechner 2001). The parametric and non-parametric analyses have
alternative strengths and weaknesses, and can thus be viewed as complementary
rather than as substitutes (Herron and Wand 2007).
Results
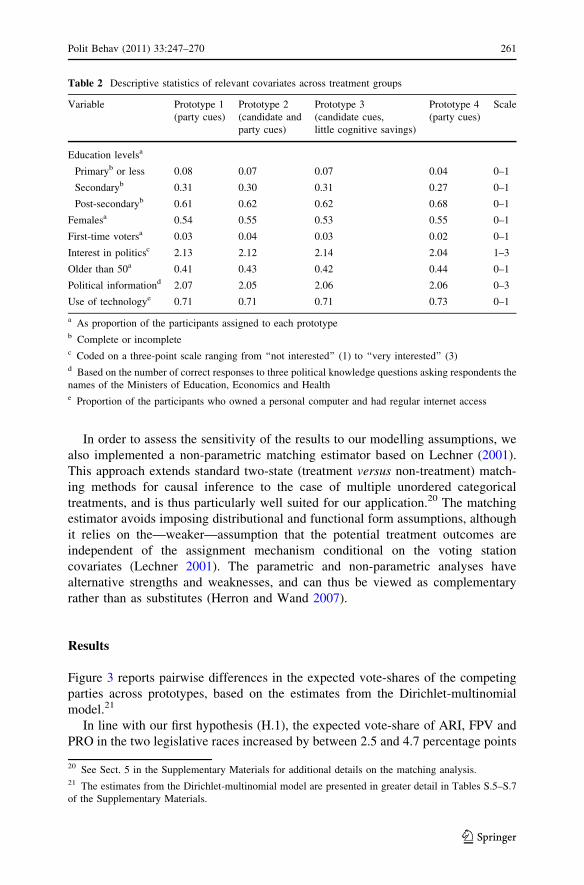
Figure 3 reports pairwise differences in the expected vote-shares of the competing
parties across prototypes, based on the estimates from the Dirichlet-multinomial
model.21
In line with our first hypothesis (H.1), the expected vote-share of ARI, FPV and
PRO in the two legislative races increased by between 2.5 and 4.7 percentage points
Table 2 Descriptive statistics of relevant covariates across treatment groups
Variable Prototype 1
(party cues)
Prototype 2
(candidate and
party cues)
Prototype 3
(candidate cues,
little cognitive savings)
Prototype 4
(party cues)
Scale
Education levelsa
Primaryb or less 0.08 0.07 0.07 0.04 0–1
Secondaryb 0.31 0.30 0.31 0.27 0–1
Post-secondaryb 0.61 0.62 0.62 0.68 0–1
Femalesa 0.54 0.55 0.53 0.55 0–1
First-time votersa 0.03 0.04 0.03 0.02 0–1
Interest in politicsc 2.13 2.12 2.14 2.04 1–3
Older than 50a 0.41 0.43 0.42 0.44 0–1
Political informationd 2.07 2.05 2.06 2.06 0–3
Use of technologye 0.71 0.71 0.71 0.73 0–1
a As proportion of the participants assigned to each prototypeb Complete or incompletec Coded on a three-point scale ranging from ‘‘not interested’’ (1) to ‘‘very interested’’ (3)d Based on the number of correct responses to three political knowledge questions asking respondents the
names of the Ministers of Education, Economics and Healthe Proportion of the participants who owned a personal computer and had regular internet access
20 See Sect. 5 in the Supplementary Materials for additional details on the matching analysis.21 The estimates from the Dirichlet-multinomial model are presented in greater detail in Tables S.5–S.7
of the Supplementary Materials.
Polit Behav (2011) 33:247–270 261
123
under Prototype 1 relative to Prototype 3. Compared to the latter, Prototype 2 also
raised the vote for FPV and PRO by more than 4 percentage points in the national
election and by at least 2.8 points in the city race, while Prototype 4 increased their
support by about 5 points in both elections. Although differences between these two
devices and Prototype 3 were not significant for ARI at the usual confidence levels,
the three major parties were still the only ones that consistently augmented their
vote-shares under any of the prototypes highlighting partisan cues. Even for UCR, a
traditionally important player in the Argentinean political scene that enjoyed
considerably less media attention than ARI, FPV and PRO in 2005, priming voters
on party-centric information did not lead to significant gains vis-a-vis Prototype 3.This result is in line with Bril’s (2007) argument that, with the growing proportion
of ‘‘uncommitted’’ citizens that depend primarily on the mass-media to obtain
political information, media exposure and campaign advertising have become more
relevant determinants of electoral success in Argentina than ‘‘old party politics’’.
Fig. 3 Pairwise differential prototype effects estimated from the Dirichlet- multinomial regressionmodel, in percentage points. The circles are proportional to the average differential effects on the supportfor each of the parties competing in the two legislative elections, with the solid dots marking thoseestimates that are significant at the usual confidence levels (0.9 and above). The dashed vertical linescorrespond to a 0 percentage point change in the expected vote share of each party
262 Polit Behav (2011) 33:247–270
123

We do not find support for hypothesis H.2, though, since the impact of party-
centric shortcuts on the vote for the three major parties in the two elections was
statistically indistinguishable across races.22 The fact that the participants voted for
city legislators after they had cast a ballot for national representatives probably
increased the likelihood of choosing the same party in both elections and mitigated
potential variations in the role of partisan heuristics. It is interesting to note that this
held not only for Prototype 4, which clearly facilitated the recognition of parties
between races, but also for both DRE devices.
Regarding our third hypothesis (H.3), the evidence is quite inconclusive. On the
one hand, Prototype 2 did not significantly raise the expected vote-share of ARI,
FPV and PRO in the national election compared to the ‘‘purely’’ party-centric
Prototypes 1 and 4. Given the high levels of campaign spending and media exposure
of these parties and the ample name recognition of Carrio, Bielsa and Macri, the
availability of candidate-centric cues under Prototype 2 seems to have provided
voters with little supplementary information. On the other hand, candidate priming
did increase the support for AL and MFC by roughly 1 percentage point relative to
Prototype 1, resulting in a 33% jump in AL’s vote-share and more than doubling the
expected vote for MFC. The fact that these parties capitalized on the high name
recognition of Zamora and Casan in the more visible election is also evident from
the fact that, in the city race, differences in their support under Prototypes 1 and 2were statistically insignificant. Thus, as stated in hypothesis H.4, the gains obtained
by AL and MFC due to the prominence of their Congressional candidates did not
spill over to the less salient election. However, even in the national race, the vote-
shares of AL and MFC under Prototype 2 were not higher than under Prototype 4.Finally, consistent with our fifth hypothesis (H.5), the support for ‘‘Other parties’’
under Prototype 3 augmented by roughly 10 percentage points in the national
election and by between 7 and 16 points in the city race compared to each of the
other three devices.23 As expected, the difficulties experienced by users of Prototype3 in guiding their choice by simple cognitive heuristics led to a distribution of votes
that was less strongly concentrated around a few prominent parties and candidates
than under the other prototypes, allowing the remaining contenders to capture
substantially higher vote-shares.
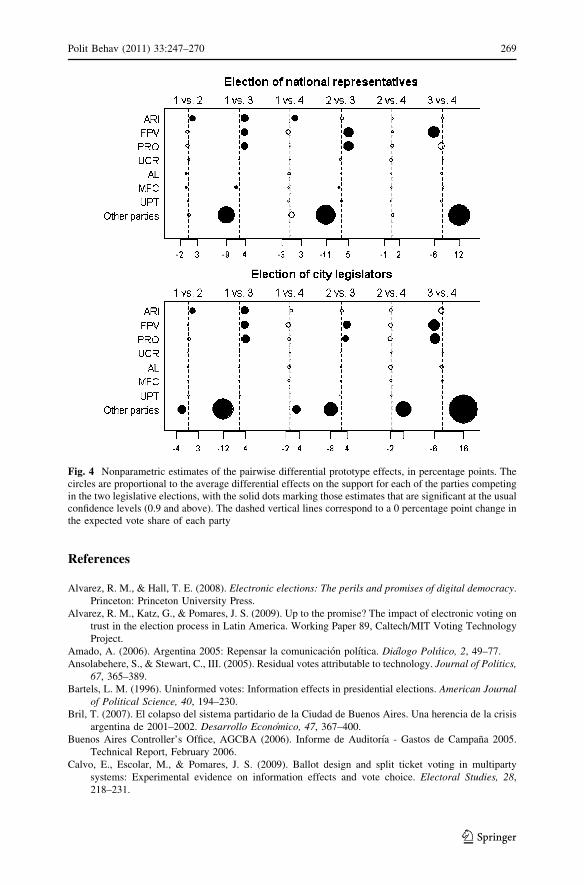
As a robustness check, Fig. 4 in the Appendix presents the differential pairwise
prototype effects obtained using Lechner’s (2001) matching estimator.24 Although
point estimates are not necessarily similar to those from the Dirichlet-multinomial
model, the main substantive findings agree with those reported in Fig. 3. In the two
races considered, prototypes that primed voters to rely on easily available political
22 In the case of Prototype 2, it is plausible that the stronger incidence of party-centric cues in the less
visible election could have been countered by a larger impact of candidate-centric shortcuts in the
election for Congress, thus concealing possible variations in the influence of partisan heuristics across
races. However, even for the two ‘‘purely’’ party-centric Prototypes 1 and 4, differences in the vote-shares
of ARI, FPV and PRO relative to Prototype 3 were not significantly higher in the election of city
legislators.23 These differences were all significant at the 0.01 level.24 These nonparametric estimates are presented in greater detail in Table S.10 of the Supplementary
Materials.
Polit Behav (2011) 33:247–270 263
123

heuristics consistently increased the vote for the three major parties, i.e., those
parties with more campaign funds and more media presence. Some of the small
parties featuring high-profile personalities also benefitted from candidate priming in
the national election. However, the vast majority of the parties running modest
campaigns and featuring little known candidates fared definitely better under the
technology more similar to the current voting system, which required more taxing
information processing efforts from the participants and downplayed the relative
utility of candidate- and party-centric shortcuts.
The magnitude of the estimated prototype effects in the Buenos Aires pilot can be
better appraised in the light of the results from the few studies assessing the impact
of voting technologies on electoral outcomes in two-party systems. For instance,
Card and Moretti (2007) found that the adoption of automated voting led to a
marginally significant gain of 0.2–0.3 percentage points in the Republican two-party
vote-share between the 2000 and 2004 U.S. presidential elections. Other scholars,
such as Herron and Wand (2007), failed to encounter any significant effect of voting
technologies on election returns altogether. Compared to these analyses based on
(observational) data from U.S. elections, our experimental results suggest that, in
the case of elections with a very large number of parties that differ widely in the
visibility of their labels and candidates, alternative voting technologies can lead to
substantial variations in the relative support of the contenders.
To further illustrate this point, we conducted a counterfactual analysis based on
the estimates from the Dirichlet-multinomial model, simulating the election results
assuming only one prototype had been used in all the voting stations. Table 5 in the
Appendix reports the parties’ expected vote-shares in each of these scenarios, while
Table 3 presents the corresponding distribution of legislative seats.
If Prototype 3 had been used in all the test sites, the vote for ‘‘Other parties’’
would have increased by more than 6 percentage points in the pilot, going from 28%
in the national election and 39% in the city race to 36% and 45%, respectively. On
the other hand, the three larger parties would have gathered only 50% (44%) of the
vote in the national (city) election versus the actual 61% (51%) they obtained in the
experiment. Although these differences would not have altered the distribution of
Congressional seats, they would have affected the representation of the parties in the
city legislature, for which the seat allocation formula is more proportional and more
sensitive to marginal changes in vote-shares than the one used to elect national
representatives.25 As seen in Table 3, ARI, FPV and PRO would have obtained 22
of the 30 available seats under Prototypes 1, 2 and 4. In contrast, they would have
captured only 20 seats under Prototype 3, with FPV and PRO losing 1 seat each to
‘‘Other parties’’. While the vote for ARI would also have decreased in this scenario
25 A PR-D’Hont formula is used in Buenos Aires to elect both national representatives and city
legislators. However, the differences in district magnitudes and the fact that a party has to gather the
support of more than 3% of the registered voters to achieve representation in Congress—but not in the
city legislature—determines that seat allocation in the national election is less sensitive to marginal
changes in relative vote-shares. See Calvo and Micozzi (2005) and the references therein for a description
of Argentina’s electoral rules.
264 Polit Behav (2011) 33:247–270
123

(see Table 5 in the Appendix), the redistribution of seats would have left this party
with as many legislators as the actual election winner, PRO.
Interestingly, political actors’ perceptions about the partisan advantages deter-
mined by the different technologies run counter to the empirical evidence presented
here. In recent years, ARI has advocated for a radical change in voting procedures
but, according to the pilot’s results, the party would be relatively better off under the
prototype most similar to the current system (Prototype 3). In contrast, FPV has
strongly opposed the introduction of a single ballot listing the information for all the
parties, which is the main feature of Prototype 4, the voting device that would have
maximized its expected support in the two elections analyzed (Table 5 in the
Appendix). Anecdotal evidence from countries switching to new voting systems
suggests that parties may learn to adjust to changes in voting procedures, adapting
their electoral and campaign communication strategies to the particular technology
used.26 An in-depth analysis of how political elites react to the introduction of new
Table 3 Allocation of legislative seats under different electoral scenarios
Parties Seat allocation for national representatives (13) Seat allocation for city legislators (30)
Prototypesa Pilot
electionbOfficial
electioncPrototypesa Pilot
electionbOfficial
electionc
1 2 3 4 1 2 3 4
ARI 4 4 4 4 4 4 8 7 8 7 8 8
FPV 3 3 3 3 3 3 5 6 4 6 5 7
PRO 4 4 4 4 4 6 9 9 8 9 9 13
UCR 1 1 1 1 1 – 2 2 2 2 2 –
AL – – – – – – 1 1 1 1 1 1
MFC – – – – – – – – – – – –
UPT – – – – – – 1 – 1 1 1 –
Other partiesd 1 1 1 1 1 – 4 5 6 4 4 1
a Based on the parties’ simulated vote-shares in the different electoral scenariosb Seat allocation based on the actual pilot election resultsc Seat allocation in the official electiond The seat assigned to ‘‘Other parties’’ in the simulated Congressional election corresponds to the
Socialist Party, the only party whose expected vote-share would exceed the 3% threshold required to
obtain a seat in Congress according to the Argentine electoral law. In the case of the city race, 4 minor
parties (Socialist Party, Partido Humanista, Partido Socialista Autentico and Movimiento Socialista delos Trabajadores) would achieve representation in the Buenos Aires legislature
26 For instance, in Brazil, the first country in the world to conduct fully electronic elections, the adoption
of new technologies has introduced some changes in parties’ campaign advertising tactics. In particular,
the substitution of paper ballots that allowed voters to write the names of their preferred candidates to
mark their preferences by voting machines that only allow them to type the candidates’ registration
numbers has led parties to heavily publicize these numbers during the electoral season.
Polit Behav (2011) 33:247–270 265
123
voting technologies, a topic that has deserved hardly any academic interest despite
its potentially relevant implications, is left for future research.
Concluding Remarks
Despite growing academic interest in new voting technologies (Alvarez and Hall
2008; Herrnson et al. 2008), few studies have examined their effect on election
results. In this paper, we present the first analysis of the potential impact of
alternative voting systems on electoral outcomes in multiparty races, focusing on
the information effects embedded in different electronic machines tested in a large-
scale voting pilot conducted during the 2005 Buenos Aires legislative election. Our
research design overcomes many of the problems that have plagued previous
observational studies in this area, and our statistical approach combines parametric
and non-parametric methods to account for differences in the composition of the
treatment groups and to assess the robustness of the main findings.
The results from our experiment indicate that the type of information highlighted
by different technologies and the form in which it is presented might have a
significant influence on voter behavior. Prototypes that allowed subjects to simplify
their choice by focusing only on easily available candidate—and party-centric
shortcuts systematically favored those parties with higher campaign spending and
media presence, more recognizable labels and/or more renowned candidates. In
contrast, the electoral chances of lesser known candidates and parties improved
under the device that made it more difficult for individuals to rely exclusively on
political heuristics and forced them to adopt alternative decision-making strategies.
Our findings were less conclusive about the impact of particular voting cues.
Contrary to our expectations, we did not find clear differences in the effect of
candidate and party priming across races. While some authors have argued that
political heuristics play a more relevant role in less salient and relatively
unpublicized elections, our results suggest that their influence may depend
considerably on the complexity of the decision environment and on the character-
istics of the competing parties, pointing to the need for further research in this area.
Future work should also examine how political elites react to differences in
cognitive demands across voting systems, and whether and to what extent these
differences influence parties’ electoral strategies.
Overall, the evidence presented in this paper shows that researchers analyzing the
implications of changes in voting technology should focus not only on the
prospective gains in the efficiency of election administration and on the reduction in
voting errors, but also on their impact on election outcomes. As illustrated by the
analysis of the Buenos Aires pilot, certain technologies may in fact shape election
results, rather than merely record voters’ preferred choices. In a context in which the
need for cognitive savings was substantially increased due to the overwhelming
amount of information voters were exposed to, the variations in election returns
across voting devices were considerably larger than had been previously recorded in
two-party races. Even though caution should be exerted when extrapolating our
conclusions to different settings, we hope that our results will encourage scholars
266 Polit Behav (2011) 33:247–270
123
and election authorities in other countries implementing reforms in their voting
procedures to pay particular attention to the potential partisan advantages induced
by alternative technologies. In this direction, our findings underscore the importance
of comparing not only traditional and electronic voting methods, but also different
automated voting systems. While this might be quite apparent in the U.S. given the
wide variety of voting procedures used, it is definitely not the case in other regions
(Europe, Latin America) where the debate has centered almost exclusively on the
opposition between ‘‘paper ballots’’ and ‘‘voting machines’’.
Appendix
See Tables 4, 5 and Figure 4.
Table 4 Socio-demographic characteristics of the experimental subjects and of the electorate
Variable Participants
in the pilot
Population of
eligible votersa
Average age (in years) 46.66 46.35
Younger than 30 (%) 18.51 25.07
Older than 50 (%) 42.31 39.81
Females (%) 54.30 55.84
Education level (%)
No education 0.11 0.51
Primary, incomplete 0.58 2.97
Primary, complete 6.36 15.56
Secondary, incomplete 6.13 11.44
Secondary, complete 24.40 20.19
Post-secondary, incompleteb 17.44 21.00
Post-secondary, completeb 44.98 28.32
Total number of voters 13,876 174,846c
a Information on the socio-demographic characteristics of the electorate in the precincts in which the
pilot was conducted was obtained from the National Institute of Statistics and Censuses of Argentina
(INDEC)b Post-secondary education comprises University and professional/technical trainingc Number of citizens who actually cast an official ballot in the precincts in which the pilot test was
conducted. This constituted our potential subject pool
Polit Behav (2011) 33:247–270 267
123

Ta
ble
5E
lect
ora
lo
utc
om
esu
nd
erd
iffe
ren
tsi
mu
late
dsc
enar
iosa
Par
ties
Ele
ctio
no
fn
atio
nal
repre
sen
tati
ves
Ele
ctio
no
fci
tyle
gis
lato
rs
Pro
toty
pes
bP
ilo
tte
stc
Pro
toty
pes
bP
ilo
tte
stc
12
34
12
34
AR
I2
2.7
5(1
.08
)2
0.3
5(0
.91
)1
9.2
5(1
.00
)1
9.0
5(1
.79
)2
0.8
91
9.5
3(0
.97
)1
7.3
0(0
.79
)1
7.0
8(0
.91
)1
7.4
4(1
.73
)1
8.0
0
FP
V1
5.9
3(0
.86
)1
7.2
1(0
.84
)1
3.0
9(0
.81
)1
8.1
6(1
.88
)1
5.7
11
3.3
6(0
.87
)1
3.4
8(0
74
)9
.91
(0.8
9)
15
.48
(1.6
4)
12
.50
PR
O2
3.6
9(1
.07
)2
4.3
0(1
.02
)1
9.0
2(0
.98
)2
3.4
5(1
.96
)2
2.8
72
1.3
4(0
.96
)2
0.0
8(0
.81
)1
7.2
1(0
.93
)2
2.4
2(1
.75
)2
0.2
8
UC
R5
.15
(0.4
8)
4.9
3(0
.45
)5
.17
(0.4
9)
6.5
2(1
.11
)5
.12
5.2
1(0
.49
)5
.39
(0.4
6)
4.7
5(0
.47
)6
.61
(1.1
2)
5.1
7
AL
2.6
5(0
.34
)3
.54
(0.4
1)
3.0
4(0
.37
)3
.86
(0.8
3)
3.0
02
.34
(0.3
1)
2.7
7(0
.34
)2
.62
(0.3
4)
3.3
3(0
.76
)2
.63
MF
C0
.50
(0.1
4)
1.2
4(0
.22
)1
.97
(0.3
2)
2.0
4(0
.73
)1
.11
0.6
4(0
.19
)0
.52
(0.1
6)
0.7
0(0
.19
)2
.16
(0.8
4)
0.5
6
UP
T2
.82
(0.3
6)
3.4
2(0
.36
)2
.58
(0.3
4)
3.0
9(0
.69
)2
.90
2.5
6(0
.34
)2
.22
(0.2
8)
2.4
0(0
.33
)2
.65
(0.6
4)
2.3
3
Oth
erp
arti
es2
6.5
0(0
.32
)2
5.0
0(0
.27
)3
5.8
7(0
.44
)2
3.8
3(0
.52
)2
8.3
63
5.0
0(0
.43
)3
8.2
2(0
.45
)4
5.3
1(0
.55
)2
9.8
9(0
.71
)3
8.5
0
aIn
per
centa
ge
poin
ts.
Sta
ndar
ddev
iati
ons
inpar
enth
esis
bP
arti
es’
vo
te-s
har
esas
sum
ing
on
lyo
ne
of
the
pro
toty
pes
was
use
din
all
the
vo
tin
g-s
tati
on
sc
Par
ties
’ac
tual
vo
te-s
har
esin
the
mo
ckel
ecti
on
con
duct
edd
uri
ng
the
pil
ot
268 Polit Behav (2011) 33:247–270
123
References
Alvarez, R. M., & Hall, T. E. (2008). Electronic elections: The perils and promises of digital democracy.
Princeton: Princeton University Press.
Alvarez, R. M., Katz, G., & Pomares, J. S. (2009). Up to the promise? The impact of electronic voting on
trust in the election process in Latin America. Working Paper 89, Caltech/MIT Voting Technology
Project.
Amado, A. (2006). Argentina 2005: Repensar la comunicacion polıtica. Dialogo Polıtico, 2, 49–77.
Ansolabehere, S., & Stewart, C., III. (2005). Residual votes attributable to technology. Journal of Politics,67, 365–389.
Bartels, L. M. (1996). Uninformed votes: Information effects in presidential elections. American Journalof Political Science, 40, 194–230.
Bril, T. (2007). El colapso del sistema partidario de la Ciudad de Buenos Aires. Una herencia de la crisis
argentina de 2001–2002. Desarrollo Economico, 47, 367–400.
Buenos Aires Controller’s Office, AGCBA (2006). Informe de Auditorıa - Gastos de Campana 2005.
Technical Report, February 2006.
Calvo, E., Escolar, M., & Pomares, J. S. (2009). Ballot design and split ticket voting in multiparty
systems: Experimental evidence on information effects and vote choice. Electoral Studies, 28,
218–231.
Fig. 4 Nonparametric estimates of the pairwise differential prototype effects, in percentage points. Thecircles are proportional to the average differential effects on the support for each of the parties competingin the two legislative elections, with the solid dots marking those estimates that are significant at the usualconfidence levels (0.9 and above). The dashed vertical lines correspond to a 0 percentage point change inthe expected vote share of each party
Polit Behav (2011) 33:247–270 269
123
Calvo, E., & Micozzi, J. P. (2005). The governor’s backyard: A seat-vote model of electoral reform for
subnational multiparty races. Journal of Politics, 67, 1050–1074.
Card, D., & Moretti, E. (2007). Does voting technology affect election outcomes? Touch-screen voting
and the 2004 presidential election. Review of Economics and Statistics, 89, 660–673.
COPUB, Centro de Opinion Publica de la Universidad de Belgrano. (2005). Elecciones legislativas 2005:
valoracion que los ciudadanos realizan del proceso electoral. http://www.ub.edu.ar/centros_de_
estudio/copub/. Accessed 8 February 2010.
Coan, T. G., Merolla, J. L., Stephenson, L. B., & Zechmeister, E. J. (2008). It’s not easy being green:
Minor party labels as heuristic aids. Political Psychology, 29, 389–405.
Guimaraes, P., & Lindrooth, R. C. (2007). Controlling for overdispersion in grouped conditional logit
models: A computationally simple application of Dirichlet-multinomial regression. EconometricsJournal, 10, 439–452.
Herrnson, P. S., Niemi, R. G., Hanmer, M. J., Bederson, B. B., & Conrad, F. C. (2008). Votingtechnology: The not-so-simple act of casting a ballot. Washington, DC: Brookings Institution Press.
Herron, M. C., & Wand, J. N. (2007). Assessing partisan bias in voting technology: The case of the 2004
New Hampshire recount. Electoral Studies, 26, 247–261.
Ho, D. E., Imai, K., King, G., & Stuart, E. A. (2007). Matching as nonparametric preprocessing for
reducing dependence in parametric causal inference. Political Analysis, 15, 199–238.
Lau, R., & Redlawsk, D. P. (2006). How voters decide. Information processing during electioncampaigns. New York, NY: Cambridge University Press.
Lechner, M. (2001). Identification and estimation of causal effects of multiple treatments under the
conditional independence assumption. In M. Lechner & F. Pfeiffer (Eds.), Econometric evaluationof labour market policies (pp. 43–58). Heidelberg: Physica.
Levitt, S. D., & List, J. A. (2007). What do laboratory experiments measuring social preferences tell us
about the real world? Journal of Economic Perspectives, 21, 153–174.
Loughin, T. M., & Scherer, P. N. (1998). Testing for association in contingency tables with multiple
column responses. Biometrics, 54, 630–637.
Management Press. (2005). Informe cuantitativo audio-visual. Elecciones 2005. http://www.management
press.com.ar. Accessed 15 October 2008.
Mebane, W. R., & Sekhon, J. S. (2004). Robust estimation and outlier detection for overdispersed
multinomial models of count data. American Journal of Political Science, 48, 391–410.
Mondak, J. J. (1993). Public opinion and heuristic processing of source cues. Political Behavior, 15,
167–192.
Popkin, S. L. (1991). The reasoning voter: Communication and persuasion in presidential campaigns.
Chicago: University of Chicago Press.
Reynolds, A., & Steenbergen, M. (2006). How the world votes: The political consequences of ballot
design, innovation and manipulation. Electoral Studies, 25, 570–598.
Schaffner, B. F., & Streb, M. J. (2002). The partisan heuristic in low-information elections. PublicOpinion Quarterly, 66, 559–581.
Tomz, M., & Van Houweling, R. P. (2003). How does voting equipment affect the racial gap in voided
ballots? American Journal of Political Science, 47, 46–60.
Wolak, J. (2009). The consequences of concurrent campaigns for citizen knowledge of congressional
candidates. Political Behavior, 31, 211–229.
270 Polit Behav (2011) 33:247–270
123