Assessing the economic aspects of solar hot water production in Greece
15
~ ) Pergamon Renewable Energy, Vol. 11, No. 2, pp. 153-167, 1997 ,L) 1997 Elsevier Science Ltd All rights reserved. Printed in Great Britain PII : S0960-1481(96)00126-7 096(~1481/97 $17.00+0.00 ASSESSING THE ECONOMIC ASPECTS OF SOLAR HOT WATER PRODUCTION IN GREECE D. HARALAMBOPOULOS,* G. F. PAPARSENOSt and H. KOVRAS* *University of the Aegean, Dept. of Environmental Studies, 17 Karantoni Street, GR-81100 Mytilene, Greece; t Greek Productivity Center, 18 Kapodistriou St., GR-Athens 106 82, Greece (Received 6 October 1996 ; aecepted 11 November 1996) Abstract--The long-term performance of various systems was determined and the economic aspects of solar hot water production were investigated in this work. The effect of the collector inclination angle, collector area and storage volume was examined for all systems, and various climatic conditions and their payback period was calculated. It was found that the collector inclination angle does not have a significant effect on system performance. Large collector areas have a diminishing effect on the system's overall efficiency. The increase in storage volume has a detrimental effect for small daily load volumes, but a beneficial one when there is a large daily consump- tion. Solar energy was found to be truly competitive when the conventional fuel being substituted is electricity, and it should not replace diesel oil on pure economic grounds. Large daily load volumes and large collector areas are in general associated with shorter payback periods. Overall, the systems are oversized and are economically suitable for large daily hot water load volumes. © 1997 Elsevier Science Ltd. 1. INTRODUCTION Solar domestic hot water production is well established and it has proved a reliable and problem-free alternative to conventional electric heating. Many manufacturers in Europe, especially in the south (Greece, Portugal, Spain and Italy), produce solar water heating systems, which are becoming increasingly common. The technology is mature and the systems have proven that they can withstand the relatively mild weather conditions. Greece, alone, has a total installed capacity of solar domestic hot water systems (SDHWSs) in excess of 1,000,000 m 2 of collector area; they contribute substantially not only to fuel savings but also to pollution abatement, since they substitute lignite- or oil-based electricity. In this work we assess the operational and economic aspects of SDHWSs in Greece. Twenty three systems of the thermosyphon closed-circuit type, representing more than 90% 153
Transcript of Assessing the economic aspects of solar hot water production in Greece
~ ) Pergamon Renewable Energy, Vol. 11, No. 2, pp. 153-167, 1997
,L) 1997 Elsevier Science Ltd All rights reserved. Printed in Great Britain
PII : S0960-1481(96)00126-7 096(~1481/97 $17.00+0.00
A S S E S S I N G THE E C O N O M I C ASPECTS OF S O L A R HOT W A T E R P R O D U C T I O N IN
G R E E C E
D. HARALAMBOPOULOS,* G. F. PAPARSENOSt and H. KOVRAS*
*University of the Aegean, Dept. of Environmental Studies, 17 Karantoni Street, GR-81100 Mytilene, Greece; t Greek Productivity Center, 18 Kapodistriou St.,
GR-Athens 106 82, Greece
(Received 6 October 1996 ; aecepted 11 November 1996)
Abstract--The long-term performance of various systems was determined and the economic aspects of solar hot water production were investigated in this work. The effect of the collector inclination angle, collector area and storage volume was examined for all systems, and various climatic conditions and their payback period was calculated. It was found that the collector inclination angle does not have a significant effect on system performance. Large collector areas have a diminishing effect on the system's overall efficiency. The increase in storage volume has a detrimental effect for small daily load volumes, but a beneficial one when there is a large daily consump- tion. Solar energy was found to be truly competitive when the conventional fuel being substituted is electricity, and it should not replace diesel oil on pure economic grounds. Large daily load volumes and large collector areas are in general associated with shorter payback periods. Overall, the systems are oversized and are economically suitable for large daily hot water load volumes. © 1997 Elsevier Science Ltd.
1. INTRODUCTION Solar domestic hot water production is well established and it has proved a reliable and problem-free alternative to conventional electric heating. Many manufacturers in Europe, especially in the south (Greece, Portugal, Spain and Italy), produce solar water heating systems, which are becoming increasingly common.
The technology is mature and the systems have proven that they can withstand the relatively mild weather conditions. Greece, alone, has a total installed capacity of solar domestic hot water systems (SDHWSs) in excess of 1,000,000 m 2 of collector area; they contribute substantially not only to fuel savings but also to pollution abatement, since they substitute lignite- or oil-based electricity.
In this work we assess the operational and economic aspects of SDHWSs in Greece. Twenty three systems of the thermosyphon closed-circuit type, representing more than 90%
153

154 D. HARALAMBOPOULOS et al.
of the market, are examined and their long-term performance is estimated, based on short- term performance tests [1].
2. SOLAR HOT WATER PRODUCTION
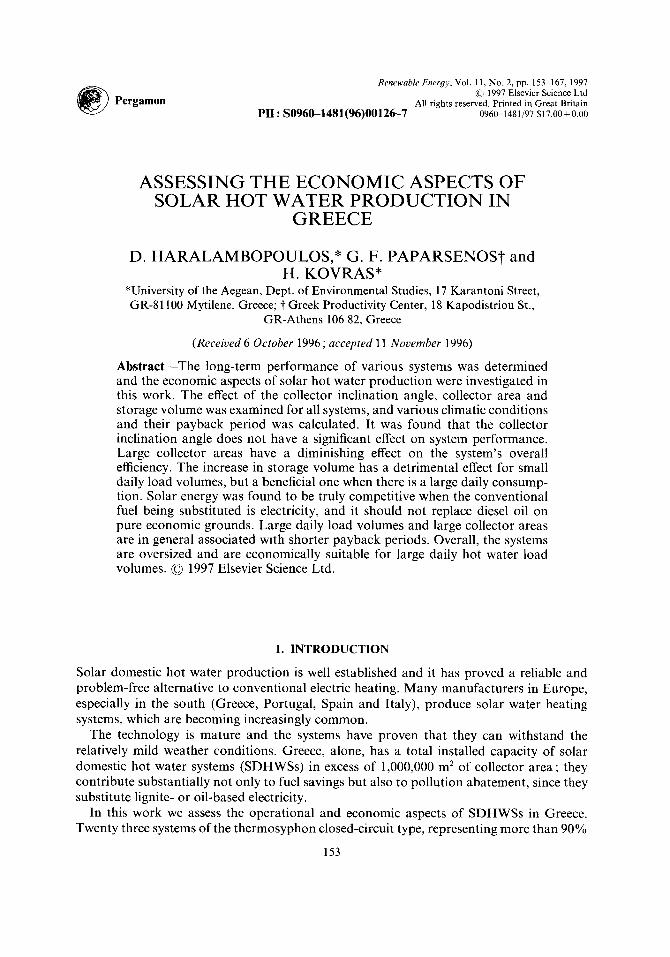
The main components of the SDHWSs are the solar collector, the thermal storage and the heat transfer fluid. The collector area acts as an absorber of solar radiation and transfers the heat thus obtained to the fluid, which carries it to the storage. Cold water mains are heated by the solar heated water to a certain level and, when necessary, an auxiliary electric heater raises it to the desired temperature [2]. The most common systems are the thermosyphon ones, which rely on the natural circulation of the water due to thermal expansion; in these systems the storage tank must be located above the solar collector. More complicated SDHWSs employ a pump to circulate the water, and need a control system to switch the pump on and off. In places where freezing temperatures occur, the primary, i.e. collector circuit must be filled with a non-freezing solution. The auxiliary energy is usually supplied at the top end of the storage tank. Schematics for various SDHWSs are shown in Fig. 1.
For the design of a system the interaction between components and the overall system performance must be understood. The system performance depends not only on equipment, system configuration and control strategy, but also on climate and location, as well as on the load profile. For large systems, detailed computer simulations are required and they usually calculate performance on an hour-by-hour basis ; the program TRNSYS which was developed in the Solar Energy Labora tory at the University of Wisconsin, is the most popular in this category [3]. For systems that fit standard configurations, shorthand pro- cedures, such as the f-chart method, can also be used to calculate the system performance ; these, however, provide estimates of long-term outputs without detailed information on process dynamics [4]. Both approaches require as inputs meteorological data, such as solar radiation, ambient temperature, wind speed, etc. and determine the collector area and storage volume that will enable a certain solar fraction to be attained.
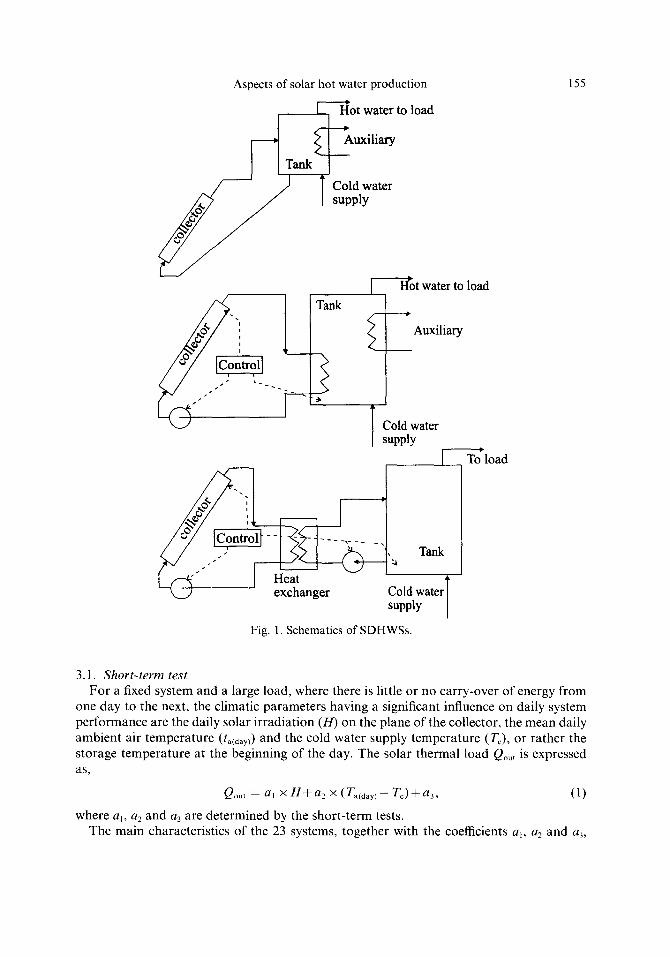
Greece enjoys comparatively high irradiation levels [5] and for design purposes six solar zones have been identified [6] (Fig. 2). The monthly mean solar radiation and ambient air temperature variation for zones 1 and 6 are shown in Fig. 3.
3. LONG-TERM PERFORMANCE OF SDHWSs
In order to assess the long-term performance of the SDHWSs the Greek Standard N ° 879 [7] was employed. It is based on the international standard ISO/DIS 9459-2, and it uses a short term "black-box" approach, where the daily irradiation incident on the system and the energy in the hot water extracted from the system at the end of the day are measured for a series of single test days. In addition, the effect of load volume and the load profile was investigated, as were the overnight heat losses of the storage vessel [8, 9]. The necessary meteorological data for the calculations were taken from Greek Standard 1291 [6].
Aspects of solar hot water production
[ Hot water to load
t ~ A u x i l i a r y
Tar | - / ~ I C°uldlyater
Tank - - - ~ o t water to load
< ( Auxiliary
Cold water supply
---'k._) ' exchanger
lu
[ To load
Tank
Cold water supply
Fig. 1. Schematics of SDHWSs.
155
3.1. Short-term test
For a fixed system and a large load, where there is little or no carry-over of energy from one day to the next, the climatic parameters having a significant influence on daily system performance are the daily solar irradiation (H) on the plane of the collector, the mean daily ambient air temperature (ta(day)) and the cold water supply temperature (To), or rather the storage temperature at the beginning of the day. The solar thermal load Qou~ is expressed as,
Qout = al × H + a 2 × (Ta(day)- Tc) +a3, (1)
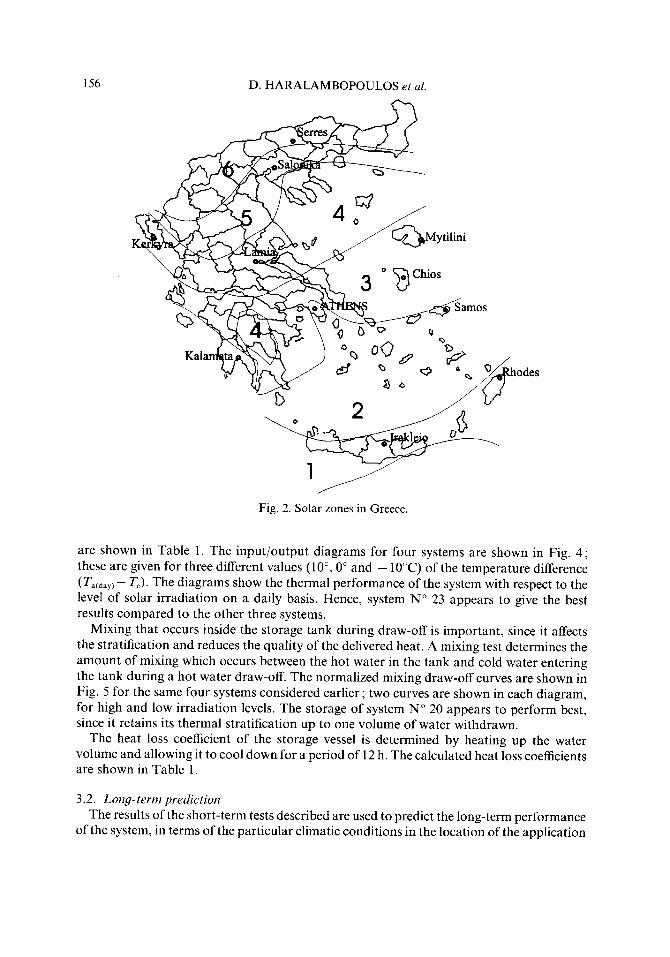
where al, a2 and as are determined by the short-term tests. The main characteristics of the 23 systems, together with the coefficients a~, a2 and a3,
156 D. HARALAMBOPOULOS et al.
Fig. 2. Solar zones in Greece.
~ odes
are shown in Table 1. The input/output diagrams for four systems are shown in Fig. 4; these are given for three different values (10 °, 0 ° and - 10°C) of the temperature difference (Talday~- Tc). The diagrams show the thermal performance of the system with respect to the level of solar irradiation on a daily basis. Hence, system N ° 23 appears to give the best results compared to the other three systems.
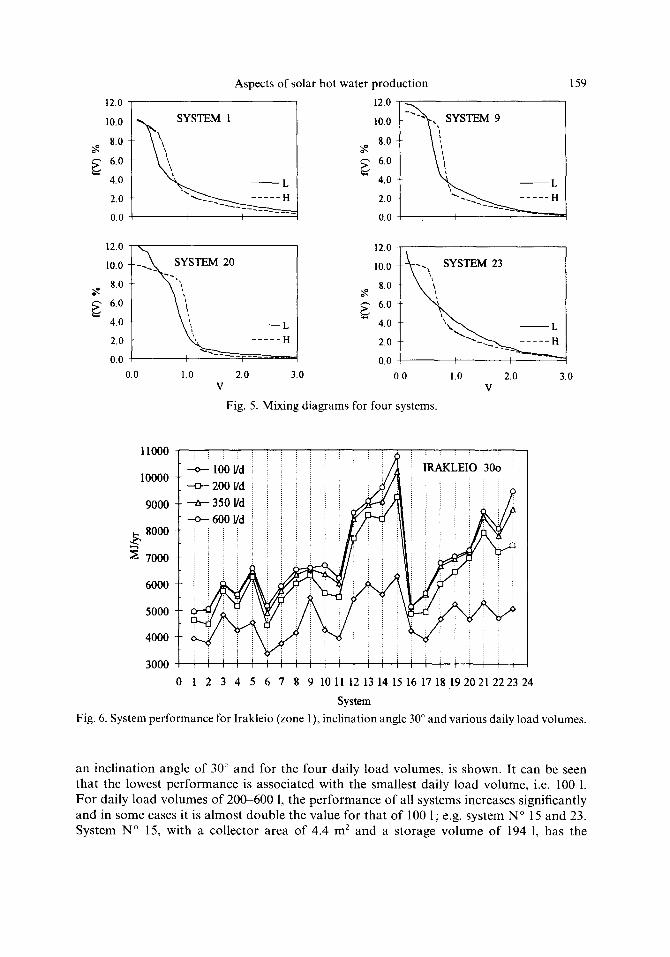
Mixing that occurs inside the storage tank during draw-off is important, since it affects the stratification and reduces the quality of the delivered heat. A mixing test determines the amount of mixing which occurs between the hot water in the tank and cold water entering the tank during a hot water draw-off. The normalized mixing draw-off curves are shown in Fig. 5 for the same four systems considered earlier; two curves are shown in each diagram, for high and low irradiation levels. The storage of system N ° 20 appears to perform best, since it retains its thermal stratification up to one volume of water withdrawn.
The heat loss coefficient of the storage vessel is determined by heating up the water volume and allowing it to cool down for a period of 12 h. The calculated heat loss coefficients are shown in Table 1.
3.2. Long-term prediction The results of the short-term tests described are used to predict the long-term performance
of the system, in terms of the particular climatic conditions in the location of the application

Aspects of solar hot water production 157
30
25
z0
V"
5
- - - 0 - - Z o n e 1
I I I ' I I t I I I I
2 3 4 5 6 7 8 9 10 11 12 Month
=o
O oq
1000
900
800 700
600 500
400
300 200
1 0 0
0
---o- Zone 1 ---q3- Zone 6
t I I I I t I I I I
2 3 4 5 6 7 8 9 10 11 12 Month
Fig. 3. Mean monthly temperature (a) and solar radiation levels (b), for zones N ° 1 and N o 6.
and the load demand . The p rocedure a d o p t e d is a d a y - b y - d a y ca lcu la t ion me thod , and it t akes into account any energy in the system tha t was car r ied over f rom the previous d a y ; it also assumes tha t a single d raw-of f o f wate r occurs in the evening [10]. The m e t h o d is sui table for results ob ta ined f rom any type o f S D H W S , inc luding t h e r m o s y p h o n systems, p u m p e d systems, two-phase systems, and systems with and wi thou t an auxi l iary heater . I t is able to predic t the ou tpu t o f the system for different values o f so lar i r rad ia t ion , ambien t air t empera tu re , ma ins cold water t empera tu re , load vo lume and hot wate r d e m a n d tem- pera ture . These inpu t pa r ame te r s are a l lowed to vary on a dai ly basis. The system ou tpu t over a pe r iod o f n days is the sum o f the dai ly energy ou tpu t and is ca lcu la ted as :
E = Ec(1) + Ec(2) + . . - + Ec(n). (2)
4. ANALYSIS OF PERFORMANCE AND EVALUATION
In the present work the long- te rm pe r fo rmance o f the 23 systems was ca lcu la ted for two col lec tor inc l ina t ion angles (30 ° and 45 °) and for four dai ly load vo lumes (100, 200 350 and 600 1). In Fig. 6 the pe r fo rmance o f all systems, for the town o f I rak le io (zone N ° 1), for
158 D. H A R A L A M B O P O U L O S e t al .
Table 1. Ma in parameters of the 23 S D H W S s
Area Volume Us System (m 2) (1) a, a 2 a 3 (10 6 kW/oC)
1 1.8 113 0.805 0.281 1.248 1.20 2 2.1 120 0.894 0.457 --0.010 1.26 3 2.1 125 1.011 0.355 --0.112 2.12 4 2.0 130 0.934 0.336 0.076 2.10 5 2.1 150 1.056 0.350 0.653 2.41 6 2.1 160 0.963 0.469 -- 1.369 1.87 7 2.0 170 1.002 0.405 --0.222 2.50 8 2.1 200 1.099 0.479 --0.145 2.72 9 2.7 150 1.167 0.139 - 1.441 2.40
10 2.7 160 1.090 0.550 0.437 8.40 11 3.1 160 1.018 0.577 1.192 1.90 12 3.4 150 1.470 0.490 0.330 1.70 13 3.4 200 1.581 0.449 - 1.365 2.93 14 3.6 200 1.530 0.610 0.486 1.47 15 4.4 194 1.710 0.490 1.870 1.81 16 2.0 100 0.840 0.250 0.870 1.70 17 2.0 125 0.940 0.410 --0.100 1.30 18 2.7 130 1.110 0.290 0.430 1.30 19 2.9 130 1.240 0.310 --0.450 1.40 20 2.7 150 1.180 0.470 0.700 1.30 21 3.4 150 1.590 0.500 -- 1.840 2.30 22 3.6 175 1.290 0.440 1.150 1.70 23 4.0 190 1.480 0.670 1.840 1.80
40
35
30
2o
1 0
5
0
4 0
35
30
~ 25 N 20
10
5
0
S Y S T E M 1 S Y S T E M 9
O Ta(day)-T¢= IOK
n Ta(day)-T~= OK O
A Ta(day )-Tc=-IOK O FI
o [] A O r~ A
O [] A [] A A
S Y S T E M 20
O Ta(day)-Te= 10K O
[ ] Ta(day)-T¢= OK O i7
A Ta(day )-T¢=- I OK 0 [ ] A
o Q A
O D A
[] A
5 10 15 20 25 3 0
H (M J /m2)
4 0
3 5
3 0
~ 25
. 2 0
~ 1 5
10
5
0
4 0
3 5
3 0
~ z5 _ 20
~ 15
1 0 :
5
0
O Ta(day)-Tc~ 10K
0 T*(day)-Tc= OK
Ta(day )-Tc=-IOK
S Y S T E M 23 o " i f - -
o [ ] A
o o A
0 0 A 0 Ta(dzy)~Tc- IOK
A A Ta(day )-Tc=-I 0K
5 10 15 ' 20 25 30
H ( M J / m 2 )
Fig. 4. I /O diagrams for four systems.
12.0
10.0
8.0
6.0
4.0
2.0
0.0
Aspects of solar hot water production
STEM 1
L
12.0
10.0
8.0
6.0
4.0
2.0
0.0
- " " . SYSTEM 9
, x . . . L
,
159
12.0
10.0
8.0
6.0
4.0
2.0
0.0 0.0
,ITEM 20
L ' ~ F . . . . . H
1.0 2.0 3.0 V
12.0
10.0
8.0
6.0
4.0
2.0
0.0 0.0
~ TEM 23
~ \ ~ , , , L
I I 1.0 2.0 3.0
V
Fig. 5. Mixing diagrams for four systems.
- - ~ 1 0 0 ~ i i i i i i i ! i !//~ ! IRAKLEIO 300 i:
10~0 "-m--200~ i i i i i i i i i / / ~ i i i i i i i ~ 9000 --~--35°~i i i i i i i ~ A i ! i ! i i i/~
~ 8000
7000
6 0 ~
5000
4000
3 0 ~ i i i i i i i i L i i i i i i i i i i i i i 0 1 2 3 4 5 6 7 8 9 101112131415161718192021222324
System
Fig. 6. System performance for Irakleio (zone 1), inclination angle 30 ° and various daily load volumes.
an inclination angle o f 30 ° and for the four daily load volumes, is shown. It can be seen that the lowest pe r fo rmance is associated with the smallest daily load volume, i.e. 100 1. Fo r daily load volumes of 200-600 1, the pe r fo rmance of all systems increases significantly and in some cases it is a lmost double the value for tha t o f 100 1; e.g. system N ° 15 and 23. System N ° 15, with a collector area of 4.4 m 2 and a s torage vo lume of 194 1, has the
160 D. HARALAMBOPOULOS et al.
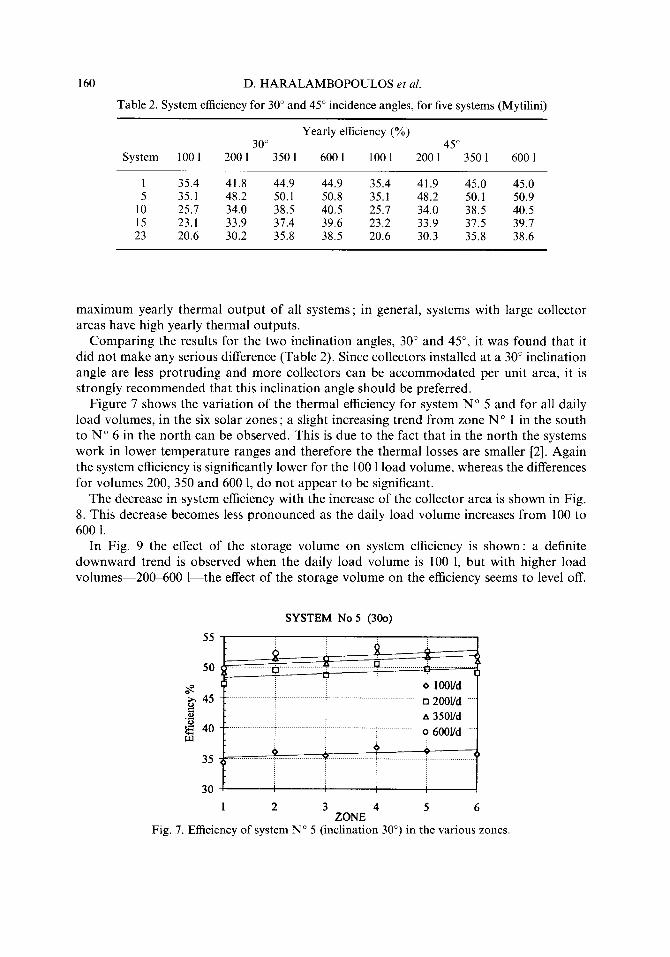
Table 2. System efficiency for 30 ° and 45 ° incidence angles, for five systems (Mytilini)
Yearly efficiency (%) 30 ° 45 °
System 100 1 200 1 350 1 600 1 100 1 200 1 350 1 600 1
l 35.4 41.8 44.9 44.9 35.4 41.9 45.0 45.0 5 35.1 48.2 50.1 50.8 35.1 48.2 50.1 50.9
10 25.7 34.0 38.5 40.5 25.7 34.0 38.5 40.5 15 23.1 33.9 37.4 39.6 23.2 33.9 37.5 39.7 23 20.6 30.2 35.8 38.5 20.6 30.3 35.8 38.6
m a x i m u m year ly the rmal ou tpu t o f all sys tems; in general , systems with large col lector areas have high year ly thermal outputs .
C o m p a r i n g the results for the two inc l ina t ion angles, 30 ° and 45 °, it was found tha t it d id no t make any serious difference (Table 2). Since col lectors insta l led at a 30 ° inc l ina t ion angle are less p r o t r u d i n g and more col lectors can be a c c o m m o d a t e d per uni t area, it is s t rongly r e c o m m e n d e d tha t this inc l ina t ion angle should be preferred.
F igure 7 shows the va r ia t ion o f the the rmal efficiency for system N ° 5 and for all dai ly load volumes , in the six solar zones: a slight increas ing t rend f rom zone N ° 1 in the south to N ° 6 in the nor th can be observed. This is due to the fact tha t in the nor th the systems work in lower t empe ra tu r e ranges and therefore the the rmal losses are smal ler [2]. Aga in the system efficiency is s ignif icantly lower for the 100 1 load volume, whereas the differences for volumes 200, 350 and 600 1, do no t a p p e a r to be significant.
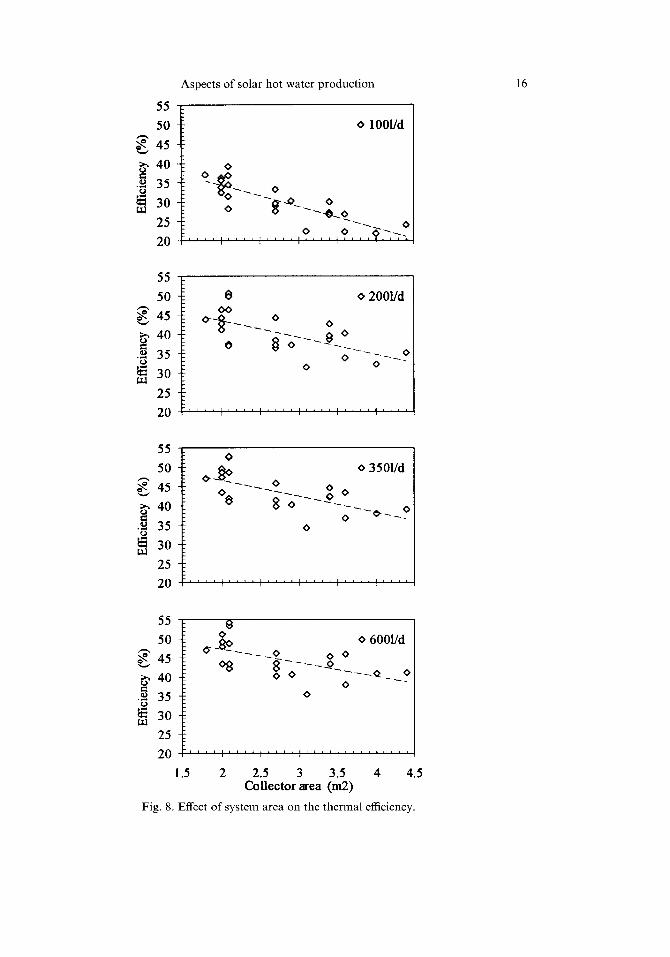
The decrease in system efficiency with the increase o f the col lector a rea is shown in Fig. 8. This decrease becomes less p r o n o u n c e d as the dai ly load vo lume increases f rom 100 to 600 1.
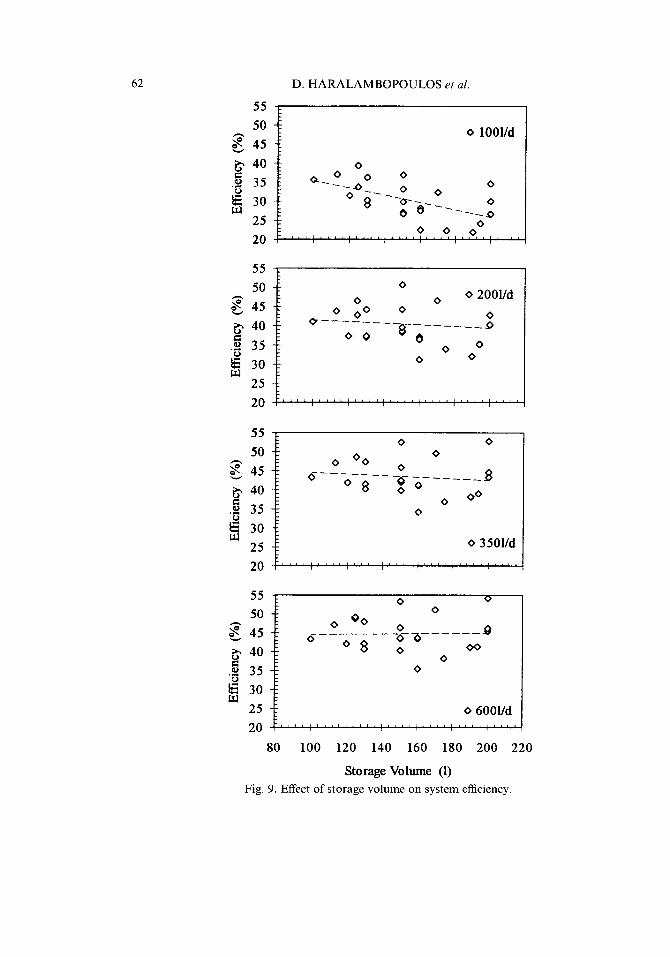
In Fig. 9 the effect o f the s torage vo lume on system efficiency is shown : a definite d o w n w a r d t rend is observed when the da i ly load vo lume is I00 1, but with h igher load v o l u m e s - - 2 0 0 - 6 0 0 1 the effect o f the s torage vo lume on the efficiency seems to level off.
55
50
o~ >, 45
40 Lr..1
35
SYSTEM No 5 (30o)
o 100Vd
........................................................................................ [] 2001/d A 350Vd
......................................................................................... o 6001/d ....
o 0
3O I
1 2 3 4 5 6 ZONE
Fig. 7. Efficiency of system N ° 5 (inclination 30 °) in the various zones.
55
5O
~ 45
~. 40 .o 35
30 ~rd 25
20
Aspects of solar hot water production
o lO01/d
0
16
55
50
~ 45
~-, 40
.o 35 o
~ 30 25
20
0 o 2001/d O 0
o o
o o
. . . . I . . . . I . . . . I . . . . I . . . . ~ . . . .
55
50
45
~-, 40
.o 35
~ 30 25
20
O o 3501/d
% - - - - - ~o 8 0 0 o ~ -?
55
50 °o~ o 6001/d
o8 o8-- .,~ 3540 o - - ~ - o - - ~ _ o
, , o , ,
~ 30 25
20
1.5 2 2.5 3 3.5 4 4.5 Col lec tor area (m2)
Fig. 8. Effect of system area on the thermal efficiency.
62
°.m~
LO
CO
(J
QJ .,.q
CO
D. H A R A L A M B O P O U L O S et al.
55
O 1001/d
4 0 I o E 0.. 0 0 0
35 ] : - - - o o 0 0 4: 0 8 --o--_ o [ o o - - - - - o
0 0 0 0
50
45
30
25
20
55
50
45
4 0
35
30
25
20
55
0 o 2001 / d
0 0 0 0 0 0 0
o - - - 8 - : - - o . . . . . . ° 0 0 0
0 0
. . . . . . . . . . . . . . . . . . . , , , I . . . . I . . . . I . . . .
50 -~ o o 0 O0 0 0 45 s]: . . . . . . s
40 o o o °°
30
25 -~ o 3501 /d
20 . . . . . ', . . . . ', . . . . ', . . . . ', . . . . I . . . . I . . . .
55
50
45
40
35
0
o Oo
o8
O
o ~-~
0 O0 0
0
Fig. 9. Effect o f s to rage vo l ume on sys tem efficiency.
30
25 o 6001 / d
2 0 . . . . I . . . . ', . . . . I . . . . I . . . . I . . . . ~ . . . .
80 1 0 0 120 140 160 180 2 0 0 2 2 0
S t o r a g e V o l u m e (1)
Aspects of solar hot water production 163
This implies that high values for the daily load volume, as well as the storage volume have a beneficial effect on system performance.
5. ECONOMIC ANALYSIS
The objective of the economic analysis is to determine the least cost method of meeting the energy need, considering solar and non-solar alternatives. The problem of finding the lowest-cost solar system design is a multivariable one, with all of the components in the system having some effect on the thermal performance and ultimately on the overall cost.
In practice, however, the two most important parameters are the collector area and the storage capacity. A market survey was conducted in Greece and the following regression equation was found for the one-household SDHWSs :
TC = 52.5 x A +0.587 x V+94.7, (3)
where TC (1000's drachmas) is the total cost of the solar system, A (m 2) is the collector area and V (1) is the storage volume.
In order to evaluate the economic outlook of the SDHWSs, the payback period (PBP) was employed. The PBP is defined as the time need for the cumulative fuel savings to equal the total initial investment. It was calculated using discounted fuel savings :
PBP = In {[TC x ( i - d ) / L x Cv] + 1}/In [(1 + i)/(1 +d)] , (4)
where TC = cost of solar system, i = 8% of the inflation rate, d = 10% of the market discount rate, L = yearly energy load supplied by solar energy and CF = conventional fuel cost. In Greece, solar energy usually substitutes either diesel oil or electricity, therefore these two cases were considered.
The fuel cost Cv is calculated as,
Cv = KD/(• x HHV), (5)
where KD is the unit conventional fuel cost, (KD = 115 drhs/kg for diesel oil and KD = 28 drhs/kWh for electricity), r / = efficiency of the conventional fuel installation (qdiese~ = 0.65-- 0.85 and ~]electricity = 0.904).95) and H H V is the higher heating value of the substituted fuel (HHVdiese~ = 42,705 MJ/kg and HHWelectr ic i ty = 3.6 M J/kWh).
The following values were calculated for the fuel cost :
• for diesel Cv = 15 drhs/kWh • for electricity Cv = 30 drhs/kWh.
In Fig. 10 the PBP was calculated for electricity (a) and diesel oil (b); the PBP for electricity is almost half compared with the case when diesel oil is the fuel being substituted by solar energy. It is also shown that for a daily load volume of 100 1 the PBP is significantly longer than the PBP for the other daily load volumes examined, and the same results apply for all six zones.
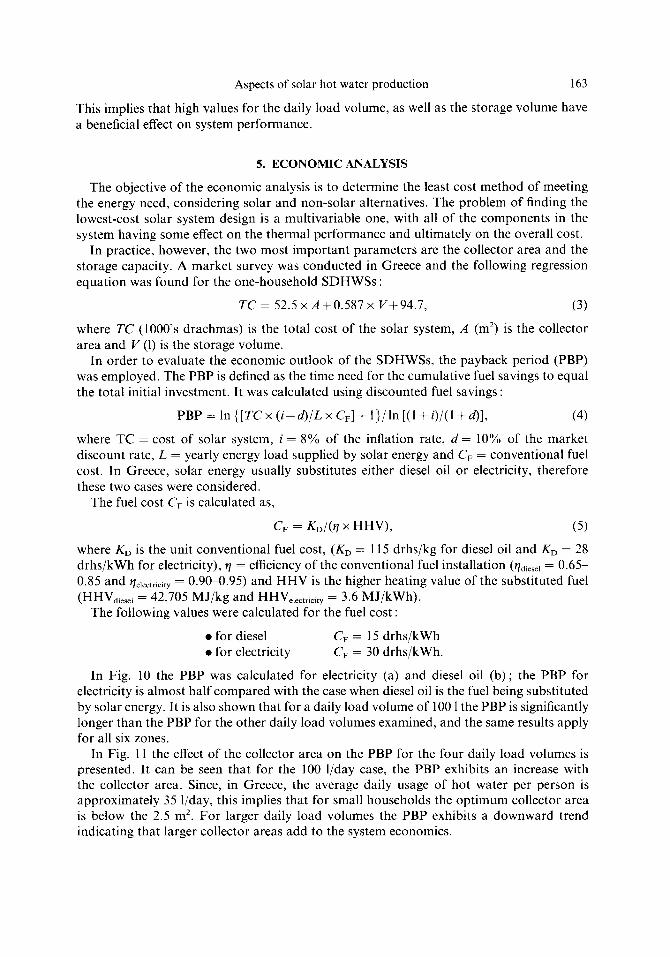
In Fig. 11 the effect of the collector area on the PBP for the four daily load volumes is presented. It can be seen that for the 100 1/day case, the PBP exhibits an increase with the collector area. Since, in Greece, the average daily usage of hot water per person is approximately 35 l/day, this implies that for small households the opt imum collector area is below the 2.5 m 2. For larger daily load volumes the PBP exhibits a downward trend indicating that larger collector areas add to the system economics.

164
12
10-
4 -
2
System 5
1001/d
~ 2 0 0 Vd
350 Vd
---0---- 600 Vd
[] [ ] , ~ . . _ . _ o _ ~ . . . . o - - - - - m
D. HARALAMBOPOULOS e t al.
( a ) S y s t e m 5 ( b )
1 2 -
lO
4
2
- - O - - 1001/d
,3 ~ ~ 200 vd
---,0--- 350 l/d
---0---600 It/d
I I I I I I I I I I I I
1 2 3 Z o n e 4 5 6 1 2 3 Z o n e 4 5 6
Fig. 10. Discounted payback period for system N ° 5 in the six zones. Substituted fuel : (a) electricity, (b) diesel oil.
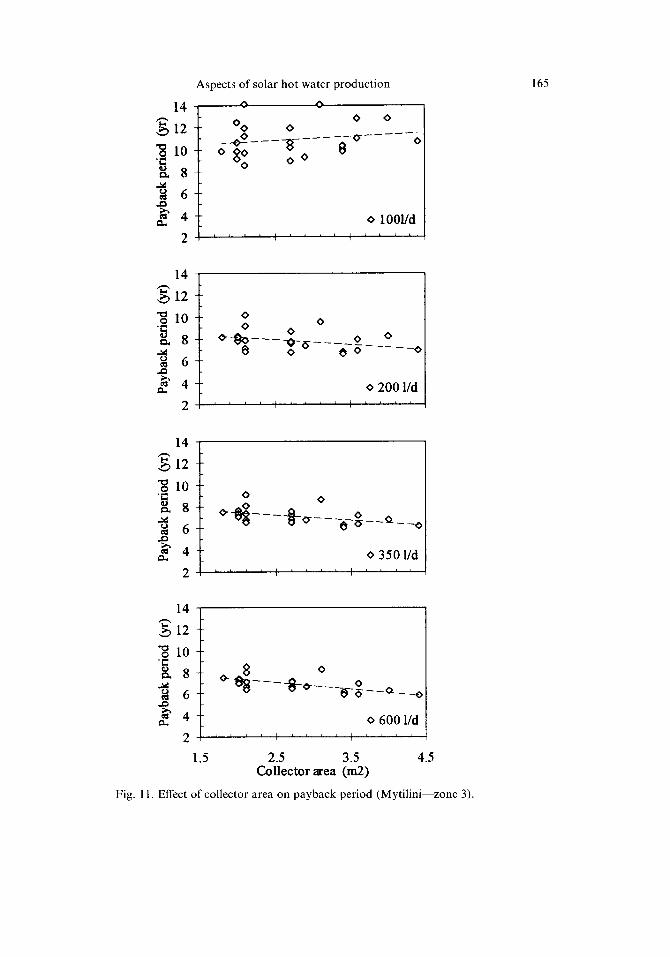
A similar trend is shown for the effect of the storage volume on the PBP in Fig. 12 ; for small daily hot water loads smaller-sized storage is more competitive, i.e. the PBP is shorter, compared to large storage volumes. In the case of large daily hot water loads, the larger the storage volume the shorter the PBP becomes.
Since the results come from the analysis of real systems that are sold widely in the market, it is concluded that the systems on offer are rather oversized, since they are usually promoted for one-household families. For a typical family of four-five people the daily load volume of hot water is ca . 140-175 1/day, therefore the PBP is less than optimum. The SDHWSs on offer are more appropriate for larger families or for installations that supply more than one household.
6. CONCLUSIONS
This work focused on the economic aspects of solar hot water production in Greece. A number of systems that are representative of the market were examined, their long-term performance was determined for all solar zones of the country and their PBP was calculated.
It was found that the collector inclination angle does not have a significant effect on the system performance, therefore the most convenient angle that would allow more non- protruding collectors to be installed, should be chosen each time. The solar system efficiency increases from solar zone N ° 1 (south) to N ° 6 (north) and from small daily load volumes to larger ones. Large collector areas have a diminishing effect on the efficiency and this is more pronounced for small daily load volumes. The increase in storage volume has a detrimental effect for small daily load volumes, but a beneficial effect when there is a large daily consumption.
It is clear that solar energy is truly competitive when the conventional fuel being sub- stituted is electricity, since the PBP is almost half, compared to the PBP when the con- ventional fuel is diesel oil. The PBP is shorter when the daily load volume is large and in this case, large collector areas are associated with shorter PBPs. The increase in storage volume for small daily load volumes results in an increase in the PBP, for large storage volumes, however, the PBP tends to show a decreasing trend.
In conclusion, the systems offered tend to be oversized and are economically suitable for larger daily hot water load volumes compared to those associated with a typical household.
14
~ 1 2
8
6
~ 4
2
Aspects of solar hot water production
O o s s
s s s
S~O sO
o lOOl/d
165
14
,.~ 12
~ 6
~ 4
2
S S
S 0 0
s 200 l/d
. . . . I . . . . I . . . .
14
, ~ 1 2
"~ l0 o ~ 8
~ 6
~ 4
2
S S
o o 0 - ~ " . . . . S
s 350 l/d , , J h I ' ' , , I ' , , ,
14
, .~12
~ 8
e~
~ 4
2
1.5
O
s 600 l/d . . . . I . . . . I . . . .
2.5 3.5 4.5 Co l l ec to r area (m2)
Fig. 11. Effect of collector area on payback period (Mytilini zone 3).
66 D. H A R A L A M B O P O U L O S e t al.
14
~ 1 2
~ 8
, .o
~ 4
2
0
O0 0
0 0 ~ ~ ~ ~ O 0
o lO01/d
' t ' ] ' I ' I ' I ' I '
14
12
o eu 8
~ 6
2
, , 8 __eL.___ 0 0--0__ O^
o 200 l /d
, I ' I ' I ' I ' i , I ' I
14
12
"~ 10 .=
~ 6
~ 4
2
8 0
o. - o - - h a - _ ._o_ _o_o_o_ _~_ _o ~ ' 8 " % 0
o 350 l /d
, i , I , I , I , I , I ' I
14
12
o 10
"~" 8 ~ _ o o 0
, .o
~ 4 * 600 l id
2 ' I ' p ' I ' i , ~ , I , I
80 100 120 140 160 180 200 220 S torage v o l u m e (It)
Fig. 12. Effect of storage volume on payback period (Myti l ini - -zone 3)

Qout Hi H a2 Ta(day) Tc 03 E A V TC PBP i d Cv KD L
Aspects of solar hot water production
NOMENCLATURE
solar energy supplied (M J) coefficient solar irradiation on the collector plane (MJ/m 2) coefficient mean daily temperature (°C) mean daily cold water temperature (°C) coefficient system energy output (M J) collector area (m 2) storage volume (l) total cost (drhs) payback period (years) inflation rate market discount rate conventional fuel cost (drhs) unit conventional fuel cost (drhs/kg) solar load (M J)
Greek symbol t/ efficiency.
167
REFERENCES
1. Pafylias, T. (ed.), Domestic hot water systems-tests according to ELOT 879. Review of results and conclusions, Vol. I & II, ed. T. Pafylias. C.R.E.S. Athens, Greece, 1991.
2. Duffle, J. and Beckman, W. Solar Engineerin9 of Thermal Processes. J. Wiley, U.S.A., 1991.
3. Klein, S. A., et al., TRNSYS users manual, version 13. EES report 38, Univ. Wisconsin, Engineering Experiment Station, 1990.
4. FCHART, Users Manual, f-Chart Software, Middleton, WI, U.S.A., 1985. 5. Kouremenos, D. A., Antonopoulos, K. A. and Domazakis, E. S., Solar radiation
correlations for the Athens, Greece, area. Solar Energy, 1985, 35, 259-270. 6. Hellenic Standard ELOT 879, Test methods for solar domestic hot water systems.
Hellenic Standardization Organization, 1993. 7. Belessiotis, V. and Haralambopoulos, D., Testing solar water heating systems in
Athens-Greece. Solar Energy, 1993, 50, 167-177. 8. Mavros, P., Belessiotis, V. and Haralambopoulos, D., Stratified energy storage vessels.
Characterization of performance and modeling of mixing behaviour. Solar Energy, 1994, 52, 327 336.
9. Hellenic Standard ELOT 1291, Solar energy--meteorological data for towns in Greece. Hellenic Standardization Organization, 1992.
10. Aranovitch, E., Gilliaert, D., Gillett, W. B. and Bates, J. E. (eds), Non nuclear energies, European solar collector and systems testing group. Recommendations for Performance and Durability Tests of Solar Collectors and Water Heatin9 Systems. Commission of the European Communities, 1989.

![“Yunanistan” [Greece]](https://static.fdokumen.com/doc/165x107/63250e4a85efe380f30680d9/yunanistan-greece.jpg)