Assessing pesticide concentrations and fluxes in the stream of a small vineyard catchment – Effect...
40
Assessing pesticide concentrations and fluxes in the stream of a small vineyard catchment - Effect of sampling frequency M. Rabiet*, C. Margoum, V. Gouy, N. Carluer, M. Coquery Cemagref, UR QELY, 3bis quai Chauveau, CP 220, F-69336 Lyon, FRANCE *Corresponding author. Tel.:+33 (0)5 55 45 74 84; fax: +33 (0)5 55 45 72 03. E-mail address. [email protected] Present address: Groupement de Recherche Eau Sol Environnement, University of Limoges, 123 avenue Albert Thomas, F-87060 Limoges, France. Abstract This study reports on the occurrence and behaviour of six pesticides and one metabolite in a small stream draining a vineyard catchment. Base flow and flood events were monitored in order to assess the variability of pesticide concentrations according to the season and to evaluate the role of sampling frequency on the evaluation of fluxes estimates. Results showed that dissolved pesticide concentrations displayed a strong temporal and spatial variability. A large mobilisation of pesticides was observed during floods, with total dissolved pesticide fluxes per event ranging from 5.7·10 -3 g/Ha to 0.34 g/Ha. These results highlight the major role of floods in the transport of pesticides in this small stream which contributed to more than 89% of the total load of diuron during August 2007. The evaluation of pesticide loads using different sampling strategies and method calculation, showed that grab sampling largely underestimated pesticide concentrations and fluxes transiting through the stream. Capsule This work brings new insights about the fluxes of pesticides in surface water of a vineyard catchment, notably during flood events. Keywords Diuron, Flood, Fluxes, Pesticide, Surface water, Vineyard catchment 1 2 3 4 5 6 7 8 9 10 11 12 13 14 15 16 17 18 19 20 21 22 23 24 25 26 27 28 29 30 31 32 33 34 1 Author-produced version of the article published in Environmental Pollution, vol. 158, 3, March 2010, pp. 737-748 The original publication is available at http://www.sciencedirect.com/ doi : 10.1016/j.envpol.2009.10.014 hal-00504970, version 1 - 22 Jul 2010 Author manuscript, published in "Environmental Pollution 158, 3 (2010) p. 737 - p. 748" DOI : 10.1016/j.envpol.2009.10.014
Transcript of Assessing pesticide concentrations and fluxes in the stream of a small vineyard catchment – Effect...

Assessing pesticide concentrations and fluxes in the stream of a small
vineyard catchment - Effect of sampling frequency
M. Rabiet*, C. Margoum, V. Gouy, N. Carluer, M. Coquery
Cemagref, UR QELY, 3bis quai Chauveau, CP 220, F-69336 Lyon, FRANCE
*Corresponding author. Tel.:+33 (0)5 55 45 74 84; fax: +33 (0)5 55 45 72 03.
E-mail address. [email protected]
Present address: Groupement de Recherche Eau Sol Environnement, University of Limoges,
123 avenue Albert Thomas, F-87060 Limoges, France.
Abstract
This study reports on the occurrence and behaviour of six pesticides and one metabolite in a small stream draining a vineyard catchment. Base flow and flood events were monitored in order to assess the variability of pesticide concentrations according to the season and to evaluate the role of sampling frequency on the evaluation of fluxes estimates. Results showed that dissolved pesticide concentrations displayed a strong temporal and spatial variability. A large mobilisation of pesticides was observed during floods, with total dissolved pesticide fluxes per event ranging from 5.7·10-3 g/Ha to 0.34 g/Ha. These results highlight the major role of floods in the transport of pesticides in this small stream which contributed to more than 89% of the total load of diuron during August 2007. The evaluation of pesticide loads using different sampling strategies and method calculation, showed that grab sampling largely underestimated pesticide concentrations and fluxes transiting through the stream.
Capsule
This work brings new insights about the fluxes of pesticides in surface water of a vineyard catchment, notably during flood events.
Keywords
Diuron, Flood, Fluxes, Pesticide, Surface water, Vineyard catchment
1
2
3
4
5
6
7
8
9
10
11
12
131415161718192021222324
25
2627282930
313233
34
1
Author-produced version of the article published in Environmental Pollution, vol. 158, 3, March 2010, pp. 737-748 The original publication is available at http://www.sciencedirect.com/ doi : 10.1016/j.envpol.2009.10.014
hal-0
0504
970,
ver
sion
1 -
22 J
ul 2
010
Author manuscript, published in "Environmental Pollution 158, 3 (2010) p. 737 - p. 748" DOI : 10.1016/j.envpol.2009.10.014

1. Introduction
The intensive use of pesticides for crop protection against diseases led to the widespread
presence of these compounds in all the compartments of the environment (soil, water, air).
The contamination of surface waters by these biologically active chemicals is an important
unwanted side effect of their use. Such contaminations represent a potential risk to aquatic life
particularly in rivers draining agricultural areas. Numerous authors have evaluated the
transport of pesticides from agricultural lands to rivers (e.g., Clark and Goolsby, 2000; Du
Preez et al., 2005; Claver et al., 2006, Blanchoud et al., 2007). Large-scale studies on
pesticide losses to surface waters showed that the transfer of pesticides is largely influenced
by the intrinsic properties of each compound, but also by the weather conditions, the soil
types and land use (Kreuger, 1998; Capel et al., 2001; Riise and al., 2004). The role of
hydrology in non point diffuse pesticide pollution is documented, but hardly quantified.
Several authors emphasized the significance of rainfall-induced surface runoff as a major
source of pesticides in streams (Richards and Baker, 1993; Kuivila and Foe, 1995; Ng and
Clegg, 1997; Kreuger, 1998; Capel et al., 2001; Bach et al., 2001; Schulz, 2001a; Schulz,
2001b; Holvoet et al., 2007; Vryzas et al., 2009). Rapid flow processes drastically reduce the
time available for reactions, such as sorption or degradation, and can lead to a direct transfer
of pesticides towards surface waters (Müller et al., 2003). It is widely recognised that during
floods, fluxes of many pollutants (e.g., nutrients, metals, pesticides) can vary over several
orders of magnitude and may account for the majority of the annual load of pollutants in large
river systems (Meybeck, 2005; Zonta et al., 2005; Eyre and Pont, 2003; House and Warwick,
1998). Much less is known about pesticide transfer dynamics and loads in small stream
systems, where hydrological conditions are subject to fast and considerable variation with
time (Gargouma et al., 1997; Ng and Clegg, 1997; Kreuger, 1998; Louchart et al., 2004; Leu
et al., 2004; Domange, 2005). Surface waters draining vineyard areas are of specific concern
35
36
37
38
39
40
41
42
43
44
45
46
47
48
49
50
51
52
53
54
55
56
57
58
59
2
Author-produced version of the article published in Environmental Pollution, vol. 158, 3, March 2010, pp. 737-748 The original publication is available at http://www.sciencedirect.com/ doi : 10.1016/j.envpol.2009.10.014
hal-0
0504
970,
ver
sion
1 -
22 J
ul 2
010

due to the large quantities and diversity of pesticides applied and the vulnerability of
cultivated land (i.e., shallow soil depth, steep slopes). Indeed, several studies reported the
presence of pesticide residues in surface waters in vineyard areas (Lennartz et al., 1997;
Louchart et al., 2001; Ribolzi et al., 2002; Louchart et al., 2004; Rabiet et al., 2008,
Hildebrandt and al., 2008). In spite of this highlighted vulnerability of vineyard areas, very
few studies reported on the spatio-temporal variability of pesticide concentrations nor on the
evaluation of corresponding fluxes. The assessment of pesticide fluxes is essential to evaluate
the environmental performance of agricultural practices and to improve water quality at a
basin scale. In small stream, Preston et al. (1992) and Cohn (1995) showed that flux estimates
of nutrients or metals were often strongly biaised when water discharge varied greatly with
time.
One of the objectives of the European Water Framework Directive (WFD, European
Commission, 2000) is to reach a “good status” for European rivers by 2015. The
implementation of the WFD implies the intensification of the monitoring of contaminants, the
identification of the causes of degradation and the implementation of corrective actions to
obtain a good chemical and biological status. For this purpose, Member States have to
establish a comprehensive monitoring strategy to establishcontaminant exposure levels in
surface waters and to evaluate the water quality improvement linked to various management
programmes at the catchment scale. Within the WFD, operational monitoring is required for
the 33 priority substances; it should be performed via grab sampling 12 times per year.
Pesticide transfer during flood events are not specifically considered whereas many studies
showed their major role by mobilising great quantity of contaminants. Moreover, several
authors (e.g., Schleppi et al., 2006; Johnes, 2007; Horowitz, 2008) have shown for river
systems and also small streams that an infrequent monitoring programme, with sampling
performed only for a representative range of flow conditions may yield better estimates of
60
61
62
63
64
65
66
67
68
69
70
71
72
73
74
75
76
77
78
79
80
81
82
83
84
3
Author-produced version of the article published in Environmental Pollution, vol. 158, 3, March 2010, pp. 737-748 The original publication is available at http://www.sciencedirect.com/ doi : 10.1016/j.envpol.2009.10.014
hal-0
0504
970,
ver
sion
1 -
22 J
ul 2
010

solute loads (nutrients, sediment-associated trace elements or major elements) than a routine
water quality monitoring programme with sampling at fixed time intervals, regardless of flow
conditions The objectives of this work was on the one hand to evaluate the spatiotemporal
variability of pesticides concentrations and fluxes in an small-sized vineyard catchment
(inferior to 10 km²) and on the other hand to assess the outcome of different sampling
strategies on the estimation of pesticide fluxes. In particular, the effect of sampling frequency
on the evaluation of pesticide loads and concentrations using several sampling strategies was
estimated and discussed.
The Morcille catchment was selected for this study as it is a vineyard’s area and its small size
(8 km²) corresponds to the scale where novel agricultural practices are implemented and
evaluated for their environmental performance towards the protection of water quality. One
site of the Morcille stream was instrumented in order to monitor both flood and between-
flood (base flow) events during one hydrological year. We used various set of monitored data
(weekly or monthly grab, weekly automatic fractionated sampling) to compare concentrations
and fluxes obtained using these different sampling strategies..
2. Material and methods
2.1 Study area
The investigation site is the Morcille catchment, which has been studied for a long-time by
the Cemagref, french agricultural and environmental engineering research institute. It is a
representative catchment of the Beaujolais area for the study of the transport of pesticides
from agricultural parcels to surface water (Gouy and Nivon, 2007; Rabiet et al., 2008). The
Morcille catchment is located about 70 km north of the city of Lyon in France (Fig. 1). Its
small size (8 km²) allows to define a study area where transfers are more easily
comprehensible. The head of the basin is essentially covered by forest, whereas downstream it
85
86
87
88
89
90
91
92
93
94
95
96
97
98
99
100
101
102
103
104
105
106
107
108
109
4
Author-produced version of the article published in Environmental Pollution, vol. 158, 3, March 2010, pp. 737-748 The original publication is available at http://www.sciencedirect.com/ doi : 10.1016/j.envpol.2009.10.014
hal-0
0504
970,
ver
sion
1 -
22 J
ul 2
010

is mainly dedicated to vineyard with the presence of about 70 wine-growers (Gouy and
Nivon, 2007). The vine covers about 70% of the catchment’s total area (Fig. 2). No industrial
activities are present on the site. The hydrology regim of the Morcille stream varies
considerably over the year, with instantaneous water flow ranging from 0.005 m3/s (low-water
mark) to more than 0.5 m3/s (during storms). It is characterised by significant hydrological
events (strong and fast floods). The substratum of the catchment is an altered crystalline
basement of mainly granite, with some rather homogeneous soils varying from sandy loam on
the upper slopes to more clayey soils in the bottom of the valley (Gouy and Nivon, 2007).
Considering the soil texture, the rather steep slopes (varying from 2% to more than 20%) and
the presence of a shallow crystalline basement, it is likely that infiltration and sub-surface
lateral flow are major processes. Surface runoff only appears during high intensity rainstorms
exceeding the soil infiltration capacity. In this area, climatic, geological, topographical and
agricultural conditions concur to potentially create very dynamic hydrological conditions and
a high erosion rate. Thus, pesticide transfer to surface waters may be favoured. In vineyards,
herbicides are applied from the end of March to April, whereas fungicides and insecticides are
used from May to August. Considering both hydrologic conditions and pesticide application
dates, the more critical period as regards to surface water contamination extends from April to
the end of August.
2.2 Water sampling
A monitoring survey was performed from March 2007 to March 2008 during a complete vine
growing season. Three sampling sites along the Morcille stream from upstream (1-St-Joseph),
intermediate (2-Les Versauds) to downstream (3-St-Ennemond) were monitored in order to
approach the spatial variability (Fig. 1 and 2). As for the temporal variability, a sampling
strategy was defined so as to investigate the three sites during one year, focusing on the
110
111
112
113
114
115
116
117
118
119
120
121
122
123
124
125
126
127
128
129
130
131
132
133
134
5
Author-produced version of the article published in Environmental Pollution, vol. 158, 3, March 2010, pp. 737-748 The original publication is available at http://www.sciencedirect.com/ doi : 10.1016/j.envpol.2009.10.014
hal-0
0504
970,
ver
sion
1 -
22 J
ul 2
010

pesticide application periods and the following months. Hence, a more intensive monitoring,
with weekly grab samples, was performed from March to September 2007, which included
the pesticide application period; a monthly grab monitoring was done thereafter (from
October 2007 to March 2008).
In order to better identify pesticide concentration amplitude and fluxes during storm events, a
specific monitoring was performed at the intermediate site (2- Les Versauds) during spring
and summer 2007. Sampling was performed using two refrigerated automated samplers
(Bühler, model 4010) with a capacity of 24 polyethylene (PE) bottles. The high capacity of
each samplers as well as the use of two samplers allowed to minimize the risk of missing a
portion of the flood event. It permitted a fractionated flood sampling at a rate proportional to
the flow, allowing to better estimate fluxes than a time dependant sampling. Automatic
sampling parameterization was designed using knowledge and experience from the previous
two years of flow measurements (2005 and 2006).
In addition, in order to compare various sampling strategies to assess pesticide fluxes and
mean concentrations in this stream, a weekly composite sampling was performed in July and
August 2007 with an additional refrigerated automatic sampler (Bamo, model Aquacell)
equipped with a single PE bottle of 10 L. This sampler was also programmed to be
proportional to the flow. Thus five sampling methods were compared at site 2: grab sampling
(weekly, bi-monthly or monthly), automatic fractionated sampling during storms and
automatic weekly composite sampling.
In parallel, the water depth was continuously recorded at site 2 with a pressure sensor and
converted into water flow values using a sampling-site specific calibration function. Rainfall
was measured using two raingauges (i.e. tipping bucket system) located upstream and in the
middle of the Morcille catchment (Fig. 2). Data obtained with each gauge were similar and
135
136
137
138
139
140
141
142
143
144
145
146
147
148
149
150
151
152
153
154
155
156
157
158
6
Author-produced version of the article published in Environmental Pollution, vol. 158, 3, March 2010, pp. 737-748 The original publication is available at http://www.sciencedirect.com/ doi : 10.1016/j.envpol.2009.10.014
hal-0
0504
970,
ver
sion
1 -
22 J
ul 2
010

didn’t show any significative spatial variability of rainfall. In this study, we reported only the
data obtained with the closest raingauge to site 2.
2.3 Pesticides analysis
Pesticides selection
It was not intended to analyse all the pesticides present in surface water of the Morcille
stream, but rather to select a range of compounds widely used in vineyard catchment and with
various physico-chemical properties. Pesticides were selected among a list resulting from
previous screening analysis in surface water at the same site (Gouy and Nivon, 2007, Rabiet
et al., 2008). Six pesticides and a main metabolite were chosen from different families of
herbicides and fungicides currently used for vineyard treatments: azoxystrobin (AZS),
carbendazim (CBZ), dimetomorph (DMM), procymidone (PCM), tebuconazole (TBZ),
diuron (DIU) and one of its metabolites: 3-(3,4-dichlorophenyl)-1-methyl urea (DCPMU).
Their main physico-chemical properties are presented in Table 1. Diuron, an herbicide largely
used on vineyard, is included in the list of the priority substances of the WFD (European
Commission, 2000, 2008). Insecticides, although widely used in vineyard to protect crop
again pest, were not monitored in this study since occurence as well as concentrations were
found to be negligible in the water bodies of the Morcille watershed (Gouy and Nivon, 2007).
Chemicals
Pure pesticides used for standard solutions or quality controls were of analytical grade and
supplied by Cluzeau Info Labo (Sainte Foy la Grande, France) or Sigma Aldrich (Saint
Quentin Fallavier, France). Organic solvents used were pesticide or HPLC grade (SDS,
Peypin, France).
159
160
161
162
163
164
165
166
167
168
169
170
171
172
173
174
175
176
177
178
179
180
181
182
7
Author-produced version of the article published in Environmental Pollution, vol. 158, 3, March 2010, pp. 737-748 The original publication is available at http://www.sciencedirect.com/ doi : 10.1016/j.envpol.2009.10.014
hal-0
0504
970,
ver
sion
1 -
22 J
ul 2
010
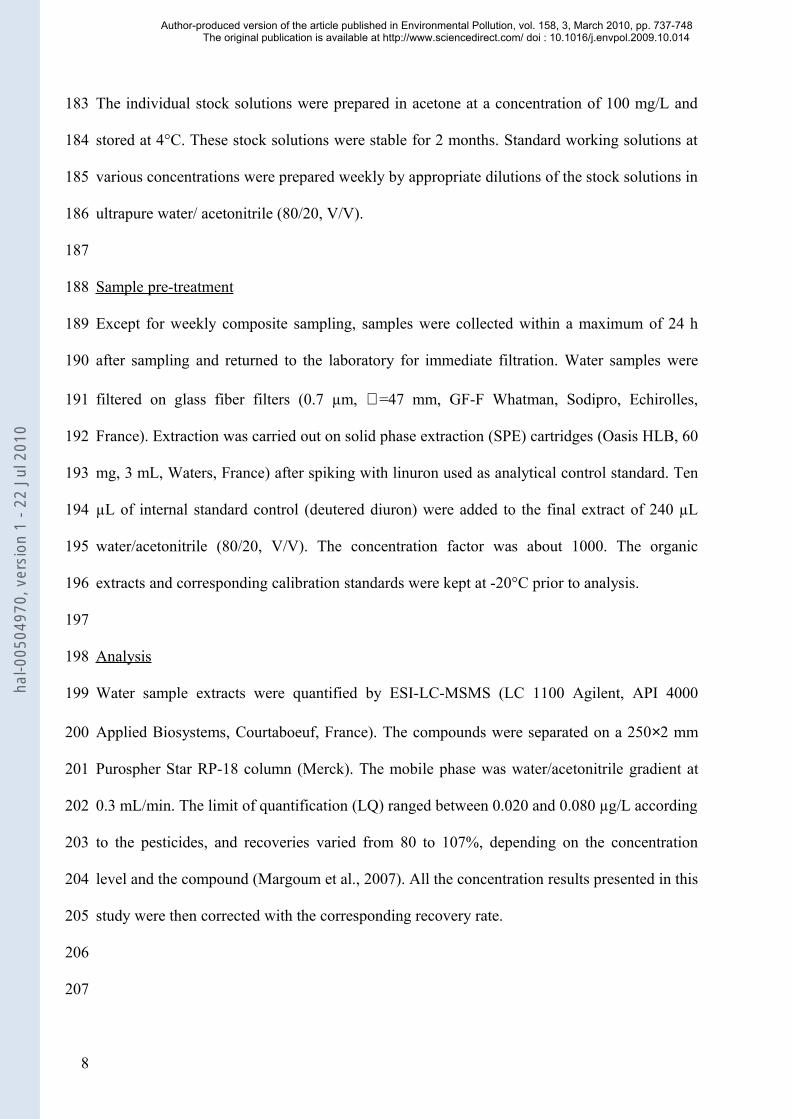
The individual stock solutions were prepared in acetone at a concentration of 100 mg/L and
stored at 4°C. These stock solutions were stable for 2 months. Standard working solutions at
various concentrations were prepared weekly by appropriate dilutions of the stock solutions in
ultrapure water/ acetonitrile (80/20, V/V).
Sample pre-treatment
Except for weekly composite sampling, samples were collected within a maximum of 24 h
after sampling and returned to the laboratory for immediate filtration. Water samples were
filtered on glass fiber filters (0.7 µm, ∅=47 mm, GF-F Whatman, Sodipro, Echirolles,
France). Extraction was carried out on solid phase extraction (SPE) cartridges (Oasis HLB, 60
mg, 3 mL, Waters, France) after spiking with linuron used as analytical control standard. Ten
µL of internal standard control (deutered diuron) were added to the final extract of 240 µL
water/acetonitrile (80/20, V/V). The concentration factor was about 1000. The organic
extracts and corresponding calibration standards were kept at -20°C prior to analysis.
Analysis
Water sample extracts were quantified by ESI-LC-MSMS (LC 1100 Agilent, API 4000
Applied Biosystems, Courtaboeuf, France). The compounds were separated on a 250×2 mm
Purospher Star RP-18 column (Merck). The mobile phase was water/acetonitrile gradient at
0.3 mL/min. The limit of quantification (LQ) ranged between 0.020 and 0.080 µg/L according
to the pesticides, and recoveries varied from 80 to 107%, depending on the concentration
level and the compound (Margoum et al., 2007). All the concentration results presented in this
study were then corrected with the corresponding recovery rate.
183
184
185
186
187
188
189
190
191
192
193
194
195
196
197
198
199
200
201
202
203
204
205
206
207
8
Author-produced version of the article published in Environmental Pollution, vol. 158, 3, March 2010, pp. 737-748 The original publication is available at http://www.sciencedirect.com/ doi : 10.1016/j.envpol.2009.10.014
hal-0
0504
970,
ver
sion
1 -
22 J
ul 2
010

2.4. Quality assurance
Possible losses of compounds by sorption or degradation during sample collection, storage
and transport was evaluated in two separate laboratory studies. First, pesticide stability during
storage in PE bottles was assessed. Mineral Evian water (3 replicates) was spiked with the
studied pesticides (5 µg/L) and then stored in the same conditions as during monitoring (at
4°C in darkness). Pesticides analyses were performed at time 0, 1 h, 24 h, 48 h and 7 days in
order to simulate different time of storage inside the automatic samplers. Results are
presented in Figure 3. Diuron is the most stable compound in PE bottle with losses below 3%,
even over a seven days period. For dimetomorph and DCPMU, losses are below 10% during
storage. It is also the case for procymidone over a 2 days period. However, over a seven days
period, procymidone showed a significant decrease of concentration, with about 40% of
losses. This behaviour could be due to its relatively high Koc (Table 1). Despite their
respectively low half life and high Koc, azoxystrobin and tebuconazol showed a good
stability, with maximum losses reaching a maximum of 15% over 7 days. In conclusion,
stability of all compounds is satisfying over 7 days, expect for procymidone; thus average
weekly concentrations of procymidone might be somewhat underestimated.
In the second study, spiked and unspiked mineral water (Evian) were run through the
automatic sampler (i.e., passing through the tubes and collected in the receiving bottles of the
sampling equipment) in order to verify the potential loss of pesticides and the absence of
contamination, respectively. No significant adsorption or release of pesticides was observed
(i.e., the relative difference of pesticide concentrations before and after the sampler was
below 5%).
Field and analytical blanks (using ultrapure water in PE bottles) were also performed for each
monitoring campaign.
208
209
210
211
212
213
214
215
216
217
218
219
220
221
222
223
224
225
226
227
228
229
230
231
232
9
Author-produced version of the article published in Environmental Pollution, vol. 158, 3, March 2010, pp. 737-748 The original publication is available at http://www.sciencedirect.com/ doi : 10.1016/j.envpol.2009.10.014
hal-0
0504
970,
ver
sion
1 -
22 J
ul 2
010

2.5. Flux calculation
Pesticide fluxes were estimated at site 2 over various periods and using different data and
calculation methods.
The weekly load of pesticides (WL) was calculated for the March-September period, using
the manual weekly sampling data, by multiplying the average weekly stream flow by the total
pesticide concentration (i.e., sum of the concentrations of the 8 studied pesticides) measured
on grab samples as follows:
WL (µg) = Q × Ci × ti equation (1)
where Q is the average weekly stream flow during the considered period ti(L/s); Ci is the
concentration of total pesticides analysed in grab samples collected once a week (µg/L); and ti
is the considered time period (s) (seven days surrounding the sampling day).
For the monthly monitoring, over the October-March period, monthly pesticide fluxes were
estimated in the same way by multiplying the average monthly stream flow by the total
pesticide concentration measured on the samples collected manually once a month.
Concentrations below the LQ were set to half of the LQ for these calculation. Compounds not
detected were set to 0.
The total pesticide load during a flood (FL) was calculated using the following equation:
FL (µg) = Σqi × iC × ti equation (2)
with qi, the instant flow at the time i (L/s); iC , the concentration value linearly interpolated
between both nearest measured pesticide concentrations (µg/L); and ti, the time interval
between the flow measurements (s). This time varied from several seconds to minutes.
233
234
235
236
237
238
239
240
241
242
243
244
245
246
247
248
249
250
251
252
253
254
255
256
257
10
Author-produced version of the article published in Environmental Pollution, vol. 158, 3, March 2010, pp. 737-748 The original publication is available at http://www.sciencedirect.com/ doi : 10.1016/j.envpol.2009.10.014
hal-0
0504
970,
ver
sion
1 -
22 J
ul 2
010

3. Results and discussion
3.1 Hydrological context
Daily rainfall (mm) and water flow (L/s) of the Morcille stream at site 2 for the study period
(from 01/03/2007 to 31/03/2008) are presented in Figure 4. Total annual precipitation during
year 2007 was about 909 mm. This value is not significantly different from the average
annual precipitation during the past fifteen years (860 mm). However, summer was
particularly wet in 2007, with a total precipitation of 426 mm from May to August (Fig. 4),
compared to 290 mm in average (for the past fifteen years) (Meteo France). Especially, the
months of June and August were particularly wet (125 and 101 mm respectively, versus an
average of 67 and 78 mm, respectively). This specific context could contribute to increase
surface water contamination by pesticide: on the one hand, a higher occurrence of storms in
summer is favorable to surface runoff contributing to mobilise more pesticides, and, on the
other hand, wet conditions often lead farmers to use more pesticides than a normal year,
because of a higher risk of crop disease.
3.2. Grab monitoring of pesticide concentrations along the Morcille stream
Dissolved herbicides and fungicides concentrations measured from grab weekly and monthly
samples along the Morcille stream from 6 March 2007 to 18 March 2008 are reported in
Figure 5.
The presence of pesticides was demonstrated throughout the investigation period with a large
seasonal variation, corresponding to the pesticide application calendar. Indeed, total pesticide
concentrations range from below the LQ to 16.4 µg/L. Diuron and DCPMU concentrations
ranged from below the limit of quantification (LQ) to 13.3 µg/L (Fig. 5a). Concentrations
were below 0.2 µg/L in March 2007 and 2008, corresponding to a residual background linked
to previous vineyard treatments. DIU and DCPMU concentrations increased in the stream at
258
259260
261
262
263
264
265
266
267
268
269
270
271
272
273
274
275
276
277
278
279
280
281
282
283
11
Author-produced version of the article published in Environmental Pollution, vol. 158, 3, March 2010, pp. 737-748 The original publication is available at http://www.sciencedirect.com/ doi : 10.1016/j.envpol.2009.10.014
hal-0
0504
970,
ver
sion
1 -
22 J
ul 2
010

the beginning of April 2007, according to the onset of herbicide spreading on vineyard. The
highest herbicide concentration was observed in May and June and at the beginning of July.
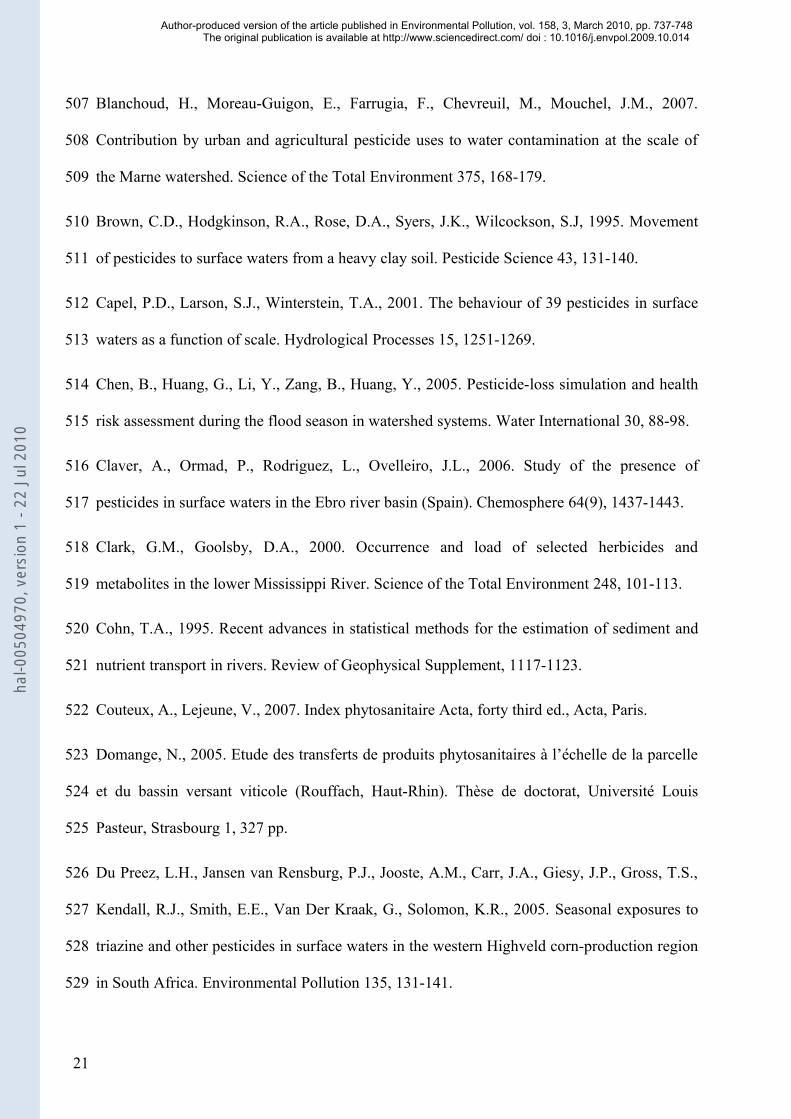
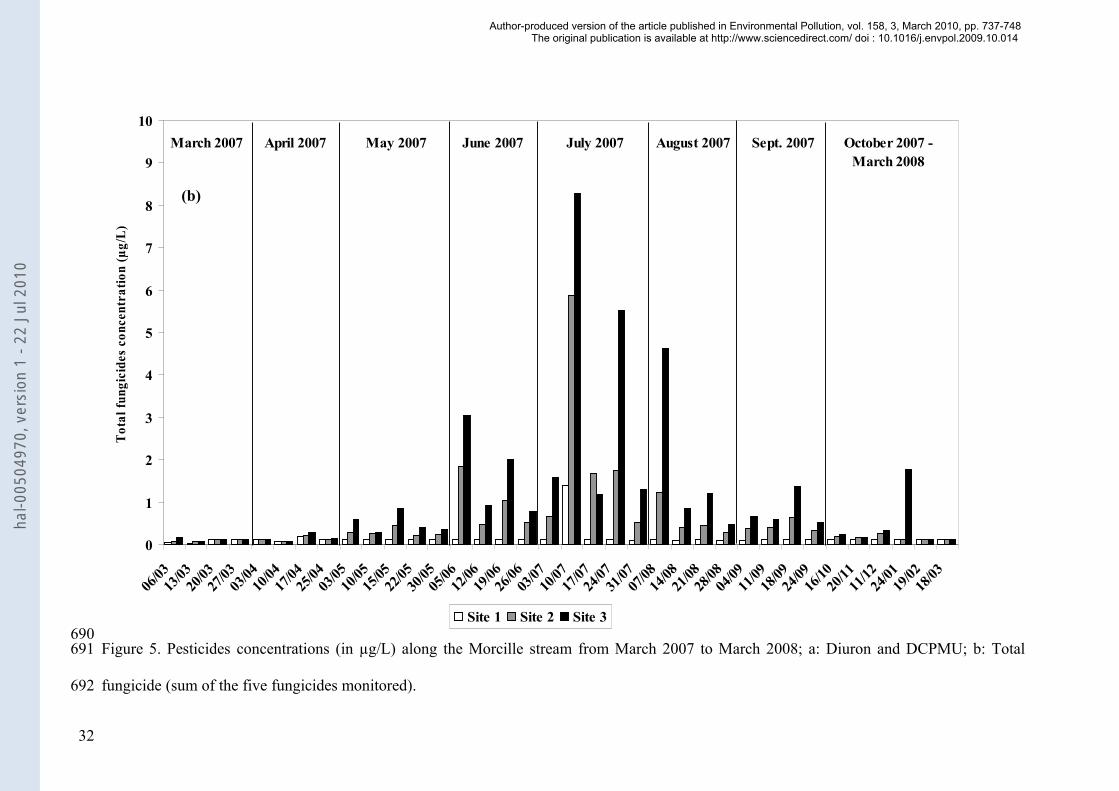
Total fungicide concentrations were very low in March and April 2007 (below 0.3 µg/L). In
May, fungicide concentrations increased slightly with values ranging between 0.3 and 0.9
µg/L at the downstream site. Starting in June, fungicide concentrations rose sharply. The
maximum concentration was observed in July with 8.3 µg/L at site 3 (Fig. 5b).
Herbicide as well as fungicide concentrations decreased in August, but remained at a
detectable level during all year round: this was especially the case for diuron, mainly applied
in late winter but also locally until early summer due to the wet conditions. Thus, surface
water contamination by pesticides largely overstepped the application period, as shown by the
high pesticide concentrations still present in January (up to 2.0 µg/L at site 3).
Besides seasonal variations, we observed a large variability of pesticide concentrations with
time, over very short periods. For instance, between the 30 May 2007 and the 05 June 2007,
diuron and metabolite concentrations at site 3 increase from 0.3 to 13.3 µg/L. This high
reactivity may be related to the rapid pesticide transfer via runoff due to storm events, which
can mobilise a large and variable quantity of pesticides. Indeed, this period of the year was
marked by large rainfall, with about 55 mm during one week (cf. Fig. 4); this led to a shorter
delay between pesticide application and precipitation and favouring the direct transfer to
surface water.
We present in Figure 6 the relationship observed between total dissolved pesticide
concentrations and water flow during grab monitoring at site 2. The positive linear regression
is statistically significant (r²= 0.78; P<0.0001). The low pesticide concentration for high flux
corresponds to a sample collected during a storm event at the end of summer, thus at the end
of the application period.
284
285
286
287
288
289
290
291
292
293
294
295
296
297
298
299
300
301
302
303
304
305
306
307
12
Author-produced version of the article published in Environmental Pollution, vol. 158, 3, March 2010, pp. 737-748 The original publication is available at http://www.sciencedirect.com/ doi : 10.1016/j.envpol.2009.10.014
hal-0
0504
970,
ver
sion
1 -
22 J
ul 2
010

We noted that pesticide concentrations generally increased with water flow during the
application period and the following months as well, when it is likely that pesticide input to
soil and their availability in soil is still significant. This underlined the major role of
hydrological conditions on the mobilisation of pollutant. As for pesticide occurrence during
base flow, it is assumed that it can be related to the slow processes of water movement
through the soil matrix such as subsurface runoff, drainage and exchanges with shallow water
table (Müller et al., 2003).
On a spatial point of view, we measured a large increase of pesticide concentrations from
upstream to downstream, which is coherent with the increasing proportion of vineyard surface
downstream (Fig. 2). Indeed, at the upstream reference site (site 1), only diuron and its
metabolite, as well as dimetomorph and procymidone were quantified and only twice at low
levels (from the LQ up to 2 µg/L). This reflects the small impact of vineyard treatment at the
upstream site, whereas at the outlet, pesticides were systematically quantified with a mean
concentration of total pesticides of 3.2 ± 4.0 µg/L at site 3.
The distribution between the different compounds/molecules at site 2 is reported in Figure 7.
Diuron predominated, with concentrations ranging from 0.01 µg/L to 7.5 µg/L. Thus, the
average concentration of diuron (1.2 ± 2.0 µg/L) largely exceeded the European
environmental quality standard (EQS) of 0.2 µg/L expressed as annual average value
(European Commission, 2008). Moreover, at site 3, the downstream site, more than one third
of the samples exhibited diuron concentrations higher than the maximum allowable
concentration (MAC) of 1.8 µg/L (European Commission, 2008). These results reflect the
strong impact of diuron used in vineyard on the surface water quality all along the year.
Moreover, DCPMU, a main metabolite of diuron, was systematically quantified with
concentrations ranging between 0.01 and 0.5 µg/L at site 2. At site 3, DCPMU concentration
ranged between 0.2 and 1.4 µg/L, with a mean concentration of 0.3 ± 0.3 µg/L. Dimetomorph
308
309
310
311
312
313
314
315
316
317
318
319
320
321
322
323
324
325
326
327
328
329
330
331
332
13
Author-produced version of the article published in Environmental Pollution, vol. 158, 3, March 2010, pp. 737-748 The original publication is available at http://www.sciencedirect.com/ doi : 10.1016/j.envpol.2009.10.014
hal-0
0504
970,
ver
sion
1 -
22 J
ul 2
010
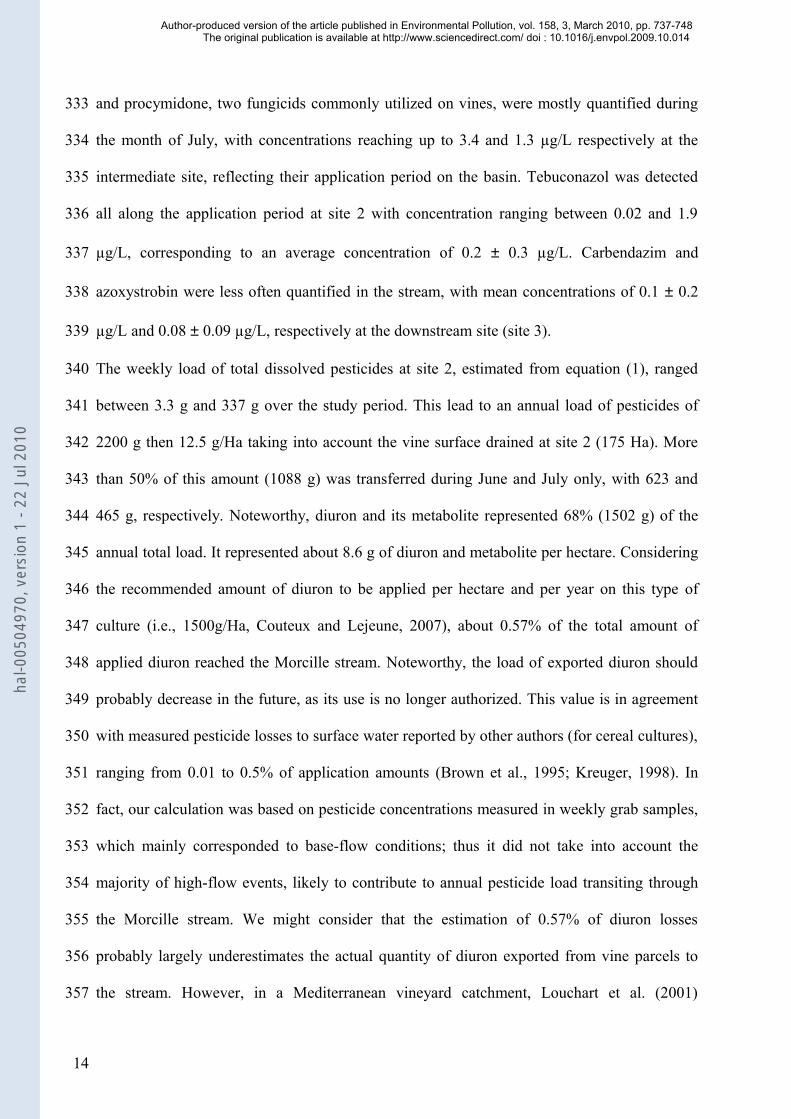
and procymidone, two fungicids commonly utilized on vines, were mostly quantified during
the month of July, with concentrations reaching up to 3.4 and 1.3 µg/L respectively at the
intermediate site, reflecting their application period on the basin. Tebuconazol was detected
all along the application period at site 2 with concentration ranging between 0.02 and 1.9
µg/L, corresponding to an average concentration of 0.2 ± 0.3 µg/L. Carbendazim and
azoxystrobin were less often quantified in the stream, with mean concentrations of 0.1 ± 0.2
µg/L and 0.08 ± 0.09 µg/L, respectively at the downstream site (site 3).
The weekly load of total dissolved pesticides at site 2, estimated from equation (1), ranged
between 3.3 g and 337 g over the study period. This lead to an annual load of pesticides of
2200 g then 12.5 g/Ha taking into account the vine surface drained at site 2 (175 Ha). More
than 50% of this amount (1088 g) was transferred during June and July only, with 623 and
465 g, respectively. Noteworthy, diuron and its metabolite represented 68% (1502 g) of the
annual total load. It represented about 8.6 g of diuron and metabolite per hectare. Considering
the recommended amount of diuron to be applied per hectare and per year on this type of
culture (i.e., 1500g/Ha, Couteux and Lejeune, 2007), about 0.57% of the total amount of
applied diuron reached the Morcille stream. Noteworthy, the load of exported diuron should
probably decrease in the future, as its use is no longer authorized. This value is in agreement
with measured pesticide losses to surface water reported by other authors (for cereal cultures),
ranging from 0.01 to 0.5% of application amounts (Brown et al., 1995; Kreuger, 1998). In
fact, our calculation was based on pesticide concentrations measured in weekly grab samples,
which mainly corresponded to base-flow conditions; thus it did not take into account the
majority of high-flow events, likely to contribute to annual pesticide load transiting through
the Morcille stream. We might consider that the estimation of 0.57% of diuron losses
probably largely underestimates the actual quantity of diuron exported from vine parcels to
the stream. However, in a Mediterranean vineyard catchment, Louchart et al. (2001)
333
334
335
336
337
338
339
340
341
342
343
344
345
346
347
348
349
350
351
352
353
354
355
356
357
14
Author-produced version of the article published in Environmental Pollution, vol. 158, 3, March 2010, pp. 737-748 The original publication is available at http://www.sciencedirect.com/ doi : 10.1016/j.envpol.2009.10.014
hal-0
0504
970,
ver
sion
1 -
22 J
ul 2
010

estimated to 0.52% the total seasonal losses for diuron, including losses by storm flow and
baseflow. This lower value compared to our result is probably due to different caracteristics
of the watershed studied, in particular the slope; alternatively it might result from differences
in the monitoring and calculation methods. In this study, base flow only contributed to 4% of
total losses.
3.3. Storm events monitoring during spring and summer 2007
We monitored 8 floods from April to September 2007. Among them, 5 floods were fully
monitored and 3 floods could only be sampled in the region of the water flow peak. Sampled
flood events were characterised by a maximum water flow ranging between 0.03 and 0.78
m3/s and a duration lasting between 2 and 11 hours. These characteristics are typical of most
events taking place in the Morcille catchment (Taillandier, 2008).
The maximum pesticide concentration recorded during each flood event, as well as the total
flux are presented in Table 3 for each monitored compound. Figure 8 presents the distribution
of diuron concentrations during the 8 monitored floods, as it is the main pesticide quantified
during the study period.
As expected, we observe a large mobilisation of diuron in the stream during the high flow
events. Concentrations rose rapidly, then usually hit the highest point almost at the same time
as water flow peak (Fig. 8). However, a lag time (ranging between few minutes and more than
1 hour according to the event) was sometimes observed before or after the maximal pesticide
concentration, in comparison with the water flow peak. Concentrations declined thereafter.
Maximum pesticide concentration during the 8 monitored floods ranged from 4.8 µg/L (27
September 2007, outside the spreading period) to 140 µg/L (01-02 July 2007, considered as
exceptional) with an average value of 26.7 ± 42.8 µg/L. The 01-02 July storm event was
characterized by very high concentrations of all monitored pesticides (about 10 times higher
358
359
360
361
362
363
364
365
366
367
368
369
370
371
372
373
374
375
376
377
378
379
380
381
382
15
Author-produced version of the article published in Environmental Pollution, vol. 158, 3, March 2010, pp. 737-748 The original publication is available at http://www.sciencedirect.com/ doi : 10.1016/j.envpol.2009.10.014
hal-0
0504
970,
ver
sion
1 -
22 J
ul 2
010

than for other flood events). Thus, we considered this event as exceptional, probably due to
the occurrence of the flood just after pesticides application.. Some authors (Louchart et al.,
2001; Leu et al., 2004; Phillips and Bode, 2004) have indeed shown that the major pesticide
losses occurred during the first rain event after application. Excluding this exceptional event,
as well as the event taking place out of spreading period (end of September), maximum
concentrations during floods were between 7.3 and 21.1 µg/L, with an average value of 12.7
± 4.3 µg/L. Among all the monitored pesticides, diuron was the most mobilised compound
during flood. Its contribution reached up to 76% of the total pesticide load transiting during
flood. Maximum diuron concentrations observed during the flood events were always higher
than the MAC (European Commission, 2008).
Depending on the flood (and excluding the extreme event of 01-02 July 2007), pesticide
maximum pesticide concentrations varied by a factor of 3 only, whereas peak water flows
varied by a factor of up to 30. Thus, maximum pesticide concentrations did not seem to be a
simple function of water flow and it is likely that other processes interfered, such as pesticide
availability via runoff.
During floods, the total dissolved pesticide fluxes ranged from 1.0 to 60 g. When occurring
immediately after application, even a flood of moderate intensity could in fact deliver to the
stream a significant load of pesticides in a very short period.
3.4. Significance of the sampling strategy on the estimation of diuron fluxes and
average concentration
Flux estimation
In order to assess the effect of the sampling strategy on the estimation of diuron fluxes and
average concentration, we used different methods and various set of data monitored at site 2
in August 2007. This specific month was chosen for this exercise since a majority of the
383
384
385
386
387
388
389
390
391
392
393
394
395
396
397
398
399
400
401
402
403
404
405
406
407
16
Author-produced version of the article published in Environmental Pollution, vol. 158, 3, March 2010, pp. 737-748 The original publication is available at http://www.sciencedirect.com/ doi : 10.1016/j.envpol.2009.10.014
hal-0
0504
970,
ver
sion
1 -
22 J
ul 2
010

storm events during this period could be collected (Fig. 9). Besides, pesticide concentrations
during this period were still very significant.
The monthly diuron flux was estimated using weekly, bimonthly or monthly simulated grab
monitoring by choosing either the first, second, third or fourth weekly sample as the reference
concentration for the calculation; or alternatively, by using only 1, 2 or 4 weekly data. In
addition, diuron monthly flux was calculated using the weekly average composite sample
concentrations. Finally, diuron monthly flux was estimated for either base flow only, using
grab samples collected during base flow conditions; or storm flow conditions only, using
automated sampling performed during floods. For the floods that could not be monitored
during this period, we estimated the corresponding diuron fluxes using an empiric linear
model derived from observed data. Indeed, excluding the extreme event of 01-02 July 2007, a
linear regression (r²=0.91) was obtained between diuron fluxes during flood events and the
total volume of water conveyed during the event. Thus, diuron flux during a flood could be
estimated with the following equation:
Diuron flux (g) = [Water volume (m3) × 3.6.10-3] – 0.1 equation (3)
Although only 7 data points were available to derive this relationship (cf. Fig. 10), it allowed
to estimate with less than 30% of bias diuron load during a flood event taking place during the
considered period (Table 4). Due to pesticide decay with time and to the limited range of
water flow values used to build this equation, the validity of this equation is clearly limited to
the study period and it would be incorrect to use it in another context and purpose.
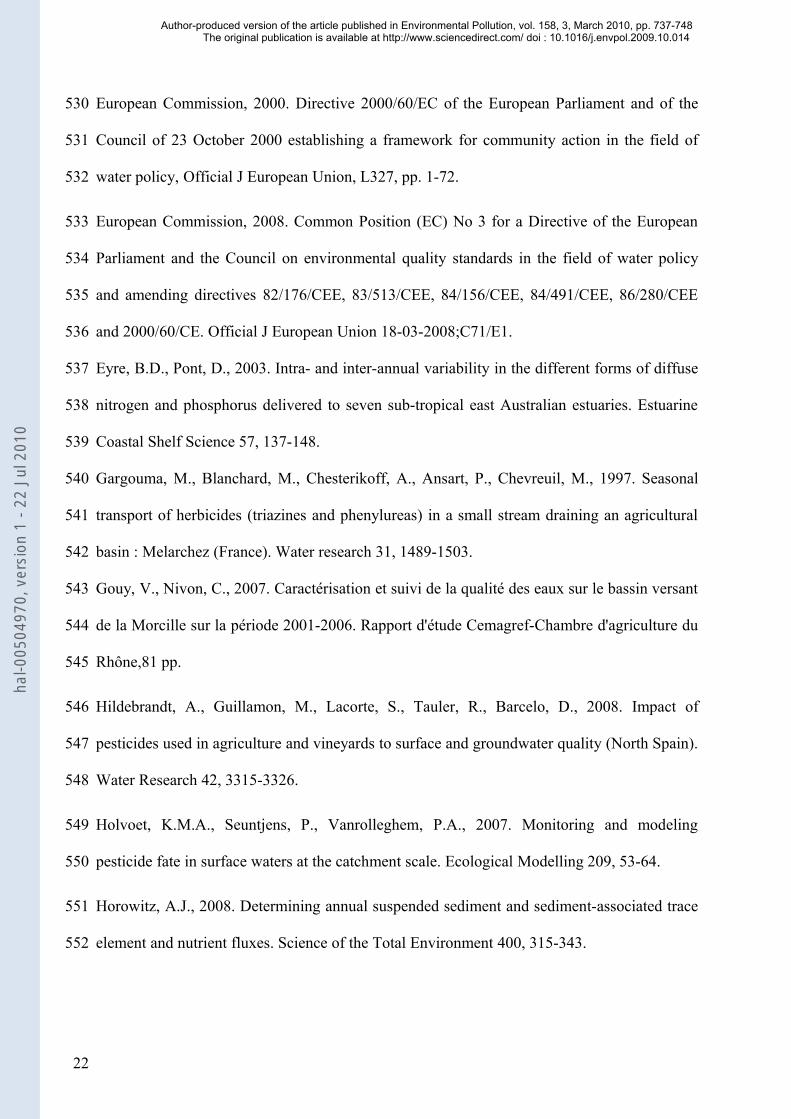
Results are presented in Figure 11. According to the method used, diuron monthly fluxes
ranged from 4.7 to 73.9 g. The highest value corresponded to the calculation using the weekly
composite sampling results, which was considered as the most accurate evaluation. Hence,
this value was used thereafter to estimate the bias due to grab sampling. Monthly diuron
fluxes, estimated from grab monitoring (weekly, bimonthly or monthly) varied between 4.7
408
409
410
411
412
413
414
415
416
417
418
419
420
421
422
423
424
425
426
427
428
429
430
431
432
17
Author-produced version of the article published in Environmental Pollution, vol. 158, 3, March 2010, pp. 737-748 The original publication is available at http://www.sciencedirect.com/ doi : 10.1016/j.envpol.2009.10.014
hal-0
0504
970,
ver
sion
1 -
22 J
ul 2
010

and 41.2 g, which is significantly lower than the “most realistic” flux value (73.9 g). Even the
grab weekly surveys underestimated pesticide flux by a factor of about 5 at most. As a matter
of fact, in August 2007 around 89% of the diuron load were transported during floods, which
in total lasted for less than 5 days (i.e., 15% of the time). These results are similar to those of
Chen et al. (2005) and Louchart et al. (2001) showing that floods contributed to 90% and 84%
(at the field scale) respectively, of the total load (for flood season and annual time scale
respectively) of pesticides. This observation shows the major role of storm events in the
mobilisation of pesticides. Pesticide losses during baseflow appeared to be of minor
importance in comparison with losses during storm flow. A grab monitoring could take into
account only partially at best the rapid pesticide transfers. Thus, it results in non-
representative average concentrations and loads, and in a higher probability of mis-
interpretation of the water quality status, as showed as well by Holvoet et al. (2007). A
combined monitoring survey during base flow and storm flow allowed to evaluate the
temporal variability in pesticide concentrations. Moreover, the total diuron flux could be
derived with a good precision: indeed our estimation reached 53.6 g, that is 72.5% of the
“reference” value (Fig. 11). However, it corresponded to a high technical, material and
analytical cost investment.
Estimation of annual average and monthly average diuron concentration
The annual average diuron concentration ranged between 1.2 ± 2.0 µg/L using weekly
monitoring (4 samples per month during the application period, then one sample per month,
that is n=35 samples), and 1.4 to1.6 ± 2.5 µg/L with monthly monitoring (n=12) (Table 3).
Thus, both sampling methods lead to comparable average and standard deviation results, as
previously showed for flux estimates. Moreover, monthly average diuron concentrations were
calculated for August, using the data obtained through the different monitoring strategies
433
434
435
436
437
438
439
440
441
442
443
444
445
446
447
448
449
450
451
452
453
454
455
456
457
18
Author-produced version of the article published in Environmental Pollution, vol. 158, 3, March 2010, pp. 737-748 The original publication is available at http://www.sciencedirect.com/ doi : 10.1016/j.envpol.2009.10.014
hal-0
0504
970,
ver
sion
1 -
22 J
ul 2
010

(grab and automatic weekly composite samples). Results showed that average diuron
concentration ranged from 0.4 ± 0.4 µg/L using weekly grab sampling data (n=4) to 1.6 ± 1.2
µg/L using average composite sampling (n=4). Combining monitoring during base flow and
storm flow, (using the estimated diuron flux, 53.6 g, cf. Fig. 11, and total water volumes
conveyed during the month,42300 m3) lead to an average diuron concentration of 1.3 µg/L in
August, in good agreement with the average concentration obtained using the composite
weekly sampling. Obviously, grab monitoring, even at a weekly rate, underestimated the
average concentration in the Morcille stream.
4. Conclusion
The present study reported the great spatial and temporal variability of some herbicide and
fungicide concentrations monitored during one year in an agricultural catchment devoted to
vineyard. Their occurrence was closely related to the application calendar and the
hydrological conditions. Pesticide concentrations were higher during the application season,
with maximum concentrations occurring during June and July. Concentrations largely
exceeded water quality criteria for the protection of aquatic life. Pesticides were measured in
surface water for several months after the application and in the case of diuron, throughout
the year. It pointed out their potential to persist in soils and shallow groundwater. The loss of
diuron in the catchment outflow was evaluated at 0.57% of the applied amount, which is in
agreement with literature data. However, as shown by our study on the effect of sampling
strategy, this value is certainly largely underestimated due to grab sampling. Our study of
pesticide behaviour during floods showed the major role of hydrological conditions in the
transport of pesticides. Indeed, floods contributed to more than 89% of the total load of diuron
transiting through the stream during August 2007. These results provided further evidence
that floods are the dominant pathways for the transport of pesticides in a small agricultural
458
459
460
461
462
463
464
465
466
467
468
469
470
471
472
473
474
475
476
477
478
479
480
481
482
19
Author-produced version of the article published in Environmental Pollution, vol. 158, 3, March 2010, pp. 737-748 The original publication is available at http://www.sciencedirect.com/ doi : 10.1016/j.envpol.2009.10.014
hal-0
0504
970,
ver
sion
1 -
22 J
ul 2
010

stream characterized by shallow soils and preponderant surface flow pathways. Using
comprehensive data obtained in August, we showed that the estimated diuron fluxes and
average concentrations were comparable using either weekly composite sampling
(proportional to the flow), or with a combined grab sampling during base flow and automated
sampling during floods.
A major conclusion of this study was that grab monitoring of surface water is not adapted for
an accurate assessment of the contaminant exposure level, especially in dynamic hydro-
systems such as the Morcille stream, where it largely underestimates the pesticides
concentration and fluxes. These observations have important consequences for the monitoring
requirements of pesticides, in the view of the implementation of the WFD.
Acknowledgments
This study was partly financed by the French regional programmes (Rhône-Alpes region-
LTER "Zone atelier bassin du Rhône" and Cluster Environment) and the national research
programmes ANR-EcoGER (Papier) and EC2O (Padyma). We would like to thank N. Ball
and B. Motte for technical field assistance and C. Guillemain for analytical optimization and
analyses of pesticides. Thanks are due to A. Albinet for helpful correction.
References
AFSSA, Direction du végétal et de l’environnement, AGRITOX - Base de données sur les
substances actives phytopharmaceutiques. http://www.dive.afssa.fr/agritox/index.php
(October 2008, online).
Bach, M., Huber, A., Frede, H.G., 2001. Input pathways and river load of pesticides in
Germany – a national scale modeling assessment.Water Science and Technology 43, 261-268.
483
484
485
486
487
488
489
490
491
492
493
494
495
496
497
498
499
500
501
502
503
504
505
506
20
Author-produced version of the article published in Environmental Pollution, vol. 158, 3, March 2010, pp. 737-748 The original publication is available at http://www.sciencedirect.com/ doi : 10.1016/j.envpol.2009.10.014
hal-0
0504
970,
ver
sion
1 -
22 J
ul 2
010
Blanchoud, H., Moreau-Guigon, E., Farrugia, F., Chevreuil, M., Mouchel, J.M., 2007.
Contribution by urban and agricultural pesticide uses to water contamination at the scale of
the Marne watershed. Science of the Total Environment 375, 168-179.
Brown, C.D., Hodgkinson, R.A., Rose, D.A., Syers, J.K., Wilcockson, S.J, 1995. Movement
of pesticides to surface waters from a heavy clay soil. Pesticide Science 43, 131-140.
Capel, P.D., Larson, S.J., Winterstein, T.A., 2001. The behaviour of 39 pesticides in surface
waters as a function of scale. Hydrological Processes 15, 1251-1269.
Chen, B., Huang, G., Li, Y., Zang, B., Huang, Y., 2005. Pesticide-loss simulation and health
risk assessment during the flood season in watershed systems. Water International 30, 88-98.
Claver, A., Ormad, P., Rodriguez, L., Ovelleiro, J.L., 2006. Study of the presence of
pesticides in surface waters in the Ebro river basin (Spain). Chemosphere 64(9), 1437-1443.
Clark, G.M., Goolsby, D.A., 2000. Occurrence and load of selected herbicides and
metabolites in the lower Mississippi River. Science of the Total Environment 248, 101-113.
Cohn, T.A., 1995. Recent advances in statistical methods for the estimation of sediment and
nutrient transport in rivers. Review of Geophysical Supplement, 1117-1123.
Couteux, A., Lejeune, V., 2007. Index phytosanitaire Acta, forty third ed., Acta, Paris.
Domange, N., 2005. Etude des transferts de produits phytosanitaires à l’échelle de la parcelle
et du bassin versant viticole (Rouffach, Haut-Rhin). Thèse de doctorat, Université Louis
Pasteur, Strasbourg 1, 327 pp.
Du Preez, L.H., Jansen van Rensburg, P.J., Jooste, A.M., Carr, J.A., Giesy, J.P., Gross, T.S.,
Kendall, R.J., Smith, E.E., Van Der Kraak, G., Solomon, K.R., 2005. Seasonal exposures to
triazine and other pesticides in surface waters in the western Highveld corn-production region
in South Africa. Environmental Pollution 135, 131-141.
507
508
509
510
511
512
513
514
515
516
517
518
519
520
521
522
523
524
525
526
527
528
529
21
Author-produced version of the article published in Environmental Pollution, vol. 158, 3, March 2010, pp. 737-748 The original publication is available at http://www.sciencedirect.com/ doi : 10.1016/j.envpol.2009.10.014
hal-0
0504
970,
ver
sion
1 -
22 J
ul 2
010
European Commission, 2000. Directive 2000/60/EC of the European Parliament and of the
Council of 23 October 2000 establishing a framework for community action in the field of
water policy, Official J European Union, L327, pp. 1-72.
European Commission, 2008. Common Position (EC) No 3 for a Directive of the European
Parliament and the Council on environmental quality standards in the field of water policy
and amending directives 82/176/CEE, 83/513/CEE, 84/156/CEE, 84/491/CEE, 86/280/CEE
and 2000/60/CE. Official J European Union 18-03-2008;C71/E1.
Eyre, B.D., Pont, D., 2003. Intra- and inter-annual variability in the different forms of diffuse
nitrogen and phosphorus delivered to seven sub-tropical east Australian estuaries. Estuarine
Coastal Shelf Science 57, 137-148.
Gargouma, M., Blanchard, M., Chesterikoff, A., Ansart, P., Chevreuil, M., 1997. Seasonal
transport of herbicides (triazines and phenylureas) in a small stream draining an agricultural
basin : Melarchez (France). Water research 31, 1489-1503.
Gouy, V., Nivon, C., 2007. Caractérisation et suivi de la qualité des eaux sur le bassin versant
de la Morcille sur la période 2001-2006. Rapport d'étude Cemagref-Chambre d'agriculture du
Rhône,81 pp.
Hildebrandt, A., Guillamon, M., Lacorte, S., Tauler, R., Barcelo, D., 2008. Impact of
pesticides used in agriculture and vineyards to surface and groundwater quality (North Spain).
Water Research 42, 3315-3326.
Holvoet, K.M.A., Seuntjens, P., Vanrolleghem, P.A., 2007. Monitoring and modeling
pesticide fate in surface waters at the catchment scale. Ecological Modelling 209, 53-64.
Horowitz, A.J., 2008. Determining annual suspended sediment and sediment-associated trace
element and nutrient fluxes. Science of the Total Environment 400, 315-343.
530
531
532
533
534
535
536
537
538
539
540
541
542
543
544
545
546
547
548
549
550
551
552
22
Author-produced version of the article published in Environmental Pollution, vol. 158, 3, March 2010, pp. 737-748 The original publication is available at http://www.sciencedirect.com/ doi : 10.1016/j.envpol.2009.10.014
hal-0
0504
970,
ver
sion
1 -
22 J
ul 2
010

House, W.A., Warwick, M.S., 1998. Intensive measurements of nutrient dynamics in the
River Swale. Science of the Total Environment 210-211, 111-137.
Johnes, P.J., 2007. Uncertainties in annual riverine phosphorus load estimation: impact of
load estimation methodology, sampling frequency, baseflow index and catchment population
density. Journal of Hydrology 332, 241-258.
Kreuger, J., 1998. Pesticides in stream water within an agricultural catchment in southern
Sweden, 1990-1996. Science of the Total Environment 216, 227-251.
Kuivila, K.M., Foe, C.G., 1995. Concentration, transport and biological effects of dormant
spray pesticides in the San Francisco Estuary, California. Environmental Toxicology and
Chemistry 14, 1141-50.
Lennartz, B., Louchart, P., Andrieux, P., Voltz, M., 1997. Diuron and simazine losses to
runoff water in Mediterranean vineyards. Journal of Environmental Quality 26, 1493-1502.
Leu, C., Singer, H., Stamm, C., Müller, S.R., Schwarzenbach, R.P., 2004. Silmutaneous
assessment of sources, processes and factors influencing herbicides losses to surface waters in
a small agricultural catchment. Environmental Science and Technology 38, 3827-3834.
Louchart, X., Voltz, M., Andrieux, P., Moussa, R., 2001. Herbicide transport to surface
waters at field and watershed scales in a Mediterranean vineyard area. Journal of
Environmental Quality 30, 982-991.
Louchart, X., Voltz, M., Coulouma, G., Andrieux, P., 2004. Oryzalin fate and transport in
runoff water in Mediterranean vineyards. Chemosphere 57, 921-930.
Margoum, C., Guillemain, C., Rabiet, M., Gouy, V., Coquery, M., 2007. Dissipation of
pesticides in surface water and biofilms in a small agricultural catchment: development of a
methodology for studying environmental impact of pesticides. Proceedings XIII Symposium
553
554
555
556
557
558
559
560
561
562
563
564
565
566
567
568
569
570
571
572
573
574
575
23
Author-produced version of the article published in Environmental Pollution, vol. 158, 3, March 2010, pp. 737-748 The original publication is available at http://www.sciencedirect.com/ doi : 10.1016/j.envpol.2009.10.014
hal-0
0504
970,
ver
sion
1 -
22 J
ul 2
010

Pesticide Chemistry, Environmental Fate and Human Health, 3-6 September 2007, Piacenza,
Italy.
Meybeck, M., 2005. Looking for water quality. Hydrological Processes 19, 331-338.
Müller, K., Deurer, M., Hartmann, H., Bach, M., Spiteller, M., Frede, H.G., 2003.
Hydrological characterisation of pesticide loads using hydrograph separation at different
scales in a Gerlan catchment. Journal of Hydrology 273, 1-17.
Ng, H.Y.F., Clegg, S.B., 1997. Atrazine and metolachlor losses in runoff events from an
agricultural watershed the importance of runoff components. Science of the Total
Environment 193, 215–228.
Phillips, P. J., Bode, R. W., 2004. Pesticides in surface water runoff on souh-eastern New
York State, USA: seasonal and stormflow effects on concentrations. Pest Management
Science 60, 531-543.
Preston, S.D., Bierman, V.J., Silliman, S.E., 1992. Impact of flow variability on error in
estimation of tributary mass loads. Journal of Environmental Engineering ASCE 118, 402-
419.
Rabiet, M., Margoum, C., Gouy, V., Carluer, N., Coquery, M., 2008. Transfert des pesticides
et métaux dans un petit bassin versant viticole – Étude préliminaire de l'influence des
conditions hydrologiques sur le transport de ces contaminants, Ingénierie EAT, Special issue
«Azote, phosphore et pesticides: Stratégies et perspectives de réduction des Flux », 65-75.
Ribolzi, O., Valles, V., Gomez, L., Voltz, M., 2002. Speciation and origin of particulate
copper in runoff water from a Mediterranean vineyard catchment. Environmental Pollution
117, 261-271.
Richards, R.P., Baker, D.B., 1993. Pesticide concentration patterns in agricultural drainage
networks in the Lake Erie basin. Environmental Toxicology and Chemistry 12, 13-26.
576
577
578
579
580
581
582
583
584
585
586
587
588
589
590
591
592
593
594
595
596
597
598
599
24
Author-produced version of the article published in Environmental Pollution, vol. 158, 3, March 2010, pp. 737-748 The original publication is available at http://www.sciencedirect.com/ doi : 10.1016/j.envpol.2009.10.014
hal-0
0504
970,
ver
sion
1 -
22 J
ul 2
010

Riise, G., Lundekvam, H., Wu, Q.L., Haugen, L.E., Mulder, J., 2004. Loss of pesticides from
agricultural fields in SE Norway-runoff through surface and drainage water. Environmental
Geochemistry and Health 26, 269-276.
Schleppi, P., Waldner, P.A.., Stähli, M., 2006. Errors of flux integration methods for solutes
in grab samples of runoff water, as compared to flow-proportional sampling. Journal of
Hydrology 319, 266-281.
Schulz, R., 2001a. Rainfall-induced sediment and pesticide input from orchards into the
Lourens River, Western Cape, South Africa: importance of a single event. Water Research 35,
1869-1876.
Schulz, R., 2001b. Comparison of spreaydrift- and runoff-related input of azinphos-methyl
and endosulfan from fruit onchards into the Lourens River, South Africa. Chemosphere 45,
543-551.
Taillandier, P., 2008. Data treatment and study of the hydrological mechanism of the
Morcille's catchment area (In French). Rapport de stage, Institut Polytechnique de Grenoble,
Ecole d'ingénieurs pour l'énergie, l'eau et l'environnement, 85 pp.
Tomlin, C.D.S., 2000. The Pesticide Manual, twelfth ed. British Crop Protection Council,
Farnham, UK.
Vryzas, Z., Vassiliou, G., Alexoudis, C., Papadopoulou-Mourkidou, E., 2009. Spatial and
temporal distribution of pesticide residues in surface waters in northeastern Greece. Water
research 43, 1-10.
Zonta, R., Collavini, F., Zaggia, L., Zuliani, A., 2005. The effect of floods on the transport of
suspended sediments and contaminants: A case study from the estuary of the Dese River
(Venice Lagoon, Italy), Environment 31, 948-958.
600
601
602
603
604
605
606
607
608
609
610
611
612
613
614
615
616
617
618
619
620
621
622
623
25
Author-produced version of the article published in Environmental Pollution, vol. 158, 3, March 2010, pp. 737-748 The original publication is available at http://www.sciencedirect.com/ doi : 10.1016/j.envpol.2009.10.014
hal-0
0504
970,
ver
sion
1 -
22 J
ul 2
010

Figures captions
Figure 1. Location of the Morcille watershed and the sampling sites.
Figure 2. Land use at the three sampling sites on the Morcille watershed.
Figure 3. Study of pesticide stability during storage in PE bottles over a seven days period. Y-
axis is the ratio expressed in percent of the concentration of pesticide at time t (C) over the
concentration at t0 (C0).
Figure 4. Daily rainfall (mm) and water flow (L/s) at site 2 in the Morcille catchment from
March 2007 to March 2008.
Figure 5. Pesticides concentrations (in µg/L) along the Morcilles stream from March 2007 to
March 2008; a: Diuron and DCPMU; b: Total fungicide (sum of the five fungicides
monitored).
Figure 6. Water flow (m3/s) versus total pesticide concentrations (µg/L) in the Morcille stream
at site 2 during weekly monitoring (March 2007 to September 2007).
Figure 7. Dissolved pesticide concentrations (µg/L) at site 2 from March 2007 to March 2008.
Figure 8. Diuron concentrations (µg/L) and water flow (m3/s) at site 2 during flood events for
the April-September 2007 period.
Figure 9. Water flow (m3/s) in the Morcille stream at site 2, with the sampling dates for the
monitoring of grab samples and floods in August 2007 (× : diuron concentration measured
using grab sampling).
Figure 10. Diuron flux (g) versus water volumes (m3) during 7 floods (site 2).
Figure 11. Monthly diuron flux (g) at site 2 in August 2007, estimated using different
methods and monitoring data.
624
625
626
627
628
629
630
631
632
633
634
635
636
637
638
639
640
641
642
643
644
645
26
Author-produced version of the article published in Environmental Pollution, vol. 158, 3, March 2010, pp. 737-748 The original publication is available at http://www.sciencedirect.com/ doi : 10.1016/j.envpol.2009.10.014
hal-0
0504
970,
ver
sion
1 -
22 J
ul 2
010

Morcille watershed
St-Ennemond
St-Joseph
Les Versauds
1
2
3
LYON city
France
Figure 1. Location of the Morcille watershed and the sampling sites.646647
648
649650651652653654655656657658659660
27
Author-produced version of the article published in Environmental Pollution, vol. 158, 3, March 2010, pp. 737-748 The original publication is available at http://www.sciencedirect.com/ doi : 10.1016/j.envpol.2009.10.014
hal-0
0504
970,
ver
sion
1 -
22 J
ul 2
010

St Joseph (Site 1) Les Versauds
(Site 2) St Ennemond (Site 3)
Industrial and urban
Vineyard
Forest
Cultures
Grasslands and heathlands
Figure 2. Land use at the three sampling sites on the Morcille watershed.
661
662663664665666667668669670671672673
674
675
28
Author-produced version of the article published in Environmental Pollution, vol. 158, 3, March 2010, pp. 737-748 The original publication is available at http://www.sciencedirect.com/ doi : 10.1016/j.envpol.2009.10.014
hal-0
0504
970,
ver
sion
1 -
22 J
ul 2
010

0
20
40
60
80
100
0 2 4 6 8Time (days )
C/C
o (%
)
DIU DCPMU AZSTBZ DMM PCM
Figure 3. Study of pesticide stability during storage in PE bottles over a seven days period.
Y-axis is the ratio expressed in percent of the concentration of pesticide at time t (C) over the
concentration at t0 (C0).
676
677
678
679
680681682683684
29
Author-produced version of the article published in Environmental Pollution, vol. 158, 3, March 2010, pp. 737-748 The original publication is available at http://www.sciencedirect.com/ doi : 10.1016/j.envpol.2009.10.014
hal-0
0504
970,
ver
sion
1 -
22 J
ul 2
010

0
50
100
150
200
250
300
01/0
3/07
15/0
3/07
29/0
3/07
12/0
4/07
26/0
4/07
10/0
5/07
24/0
5/07
07/0
6/07
21/0
6/07
05/0
7/07
19/0
7/07
02/0
8/07
16/0
8/07
30/0
8/07
13/0
9/07
27/0
9/07
11/1
0/07
25/1
0/07
08/1
1/07
22/1
1/07
06/1
2/07
20/1
2/07
03/0
1/08
17/0
1/08
31/0
1/08
14/0
2/08
28/0
2/08
13/0
3/08
27/0
3/08
Wat
er fl
ow (L
/s)
0
10
20
30
40
50
60
70
80
90
100
01/0
3/07
15/0
3/07
29/0
3/07
12/0
4/07
26/0
4/07
10/0
5/07
24/0
5/07
07/0
6/07
21/0
6/07
05/0
7/07
19/0
7/07
02/0
8/07
16/0
8/07
30/0
8/07
13/0
9/07
27/0
9/07
11/1
0/07
25/1
0/07
08/1
1/07
22/1
1/07
06/1
2/07
20/1
2/07
03/0
1/08
17/0
1/08
31/0
1/08
14/0
2/08
28/0
2/08
13/0
3/08
27/0
3/08
Dai
ly r
ainf
all (
mm
) rrr
r
March 07 April 07 May 07 June 07 July 07 August 07 S ept. 07 Oct. 07 Nov. 07 Dec. 07 Jan. 08 Feb. 08 March 08
Works
Figure 4. Daily rainfall (mm) and water flow (L/s) at site 2 in the Morcille catchment from March 2007 to March 2008.685686
30
Author-produced version of the article published in Environmental Pollution, vol. 158, 3, March 2010, pp. 737-748 The original publication is available at http://www.sciencedirect.com/ doi : 10.1016/j.envpol.2009.10.014
hal-0
0504
970,
ver
sion
1 -
22 J
ul 2
010

0
2
4
6
8
10
12
14
06/03
13/03
20/03
27/03
03/04
10/04
17/04
25/04
03/05
10/05
15/05
22/05
30/05
05/06
12/06
19/06
26/06
03/07
10/07
17/07
24/07
31/07
07/08
14/08
21/08
28/08
04/09
11/09
18/09
24/09
16/10
20/11
11/12
24/01
19/02
18/03
Diu
ron
and
DC
PMU
con
cent
ratio
n (µ
g/L)
Site 1 Site 2 Site 3
March 2007 April 2007 May 2007 June 2007 July 2007 August 2007 Sept. 2007 October 2007 - March 2008
(a)
687
688689
31
Author-produced version of the article published in Environmental Pollution, vol. 158, 3, March 2010, pp. 737-748 The original publication is available at http://www.sciencedirect.com/ doi : 10.1016/j.envpol.2009.10.014
hal-0
0504
970,
ver
sion
1 -
22 J
ul 2
010
0
1
2
3
4
5
6
7
8
9
10
06/03
13/03
20/03
27/03
03/04
10/04
17/04
25/04
03/05
10/05
15/05
22/05
30/05
05/06
12/06
19/06
26/06
03/07
10/07
17/07
24/07
31/07
07/08
14/08
21/08
28/08
04/09
11/09
18/09
24/09
16/10
20/11
11/12
24/01
19/02
18/03
Tota
l fun
gici
des c
once
ntra
tion
(µg/
L)
Site 1 Site 2 Site 3
March 2007 April 2007 May 2007 June 2007 July 2007 August 2007 Sept. 2007 October 2007 - March 2008
Figure 5. Pesticides concentrations (in µg/L) along the Morcille stream from March 2007 to March 2008; a: Diuron and DCPMU; b: Total
fungicide (sum of the five fungicides monitored).
(b)
690691
692
32
Author-produced version of the article published in Environmental Pollution, vol. 158, 3, March 2010, pp. 737-748 The original publication is available at http://www.sciencedirect.com/ doi : 10.1016/j.envpol.2009.10.014
hal-0
0504
970,
ver
sion
1 -
22 J
ul 2
010

0.00
0.02
0.04
0.06
0.08
0.10
0.12
0 2 4 6 8 10 12 14Pesticide concentrations (µg/L)
Wat
er fl
ow (m
3 /s)
Figure 6. Water flow (m3/s) versus total pesticide concentrations (µg/L) in the Morcille
stream at site 2 during weekly monitoring (March 2007 to September 2007).
693694
695
696
33
Author-produced version of the article published in Environmental Pollution, vol. 158, 3, March 2010, pp. 737-748 The original publication is available at http://www.sciencedirect.com/ doi : 10.1016/j.envpol.2009.10.014
hal-0
0504
970,
ver
sion
1 -
22 J
ul 2
010

0
2
4
6
8
10
12
14
06/03
13/03
20/03
27/03
03/04
10/04
17/04
25/04
03/05
10/05
15/05
22/05
30/05
05/06
12/06
19/06
26/06
03/07
10/07
17/07
24/07
31/07
07/08
14/08
21/08
28/08
04/09
11/09
18/09
24/09
16/10
20/11
11/12
24/01
19/02
18/03
Dis
solv
ed p
estic
ide
conc
entra
tions
at s
ite 2
(µg/
L)
DIU DCPMU AZS TBZ DMM CBZ PCM
March 2007 April 2007 May 2007 June 2007 July 2007 August 2007
September 2007
October 2007 - March 2008
Figure 7. Dissolved pesticide concentrations (µg/L) at site 2 from March 2007 to March 2008.
34
697
698
34
Author-produced version of the article published in Environmental Pollution, vol. 158, 3, March 2010, pp. 737-748 The original publication is available at http://www.sciencedirect.com/ doi : 10.1016/j.envpol.2009.10.014
hal-0
0504
970,
ver
sion
1 -
22 J
ul 2
010

0.00
0.01
0.02
0.03
0.04
0.05
19:40 20:52 22:04 23:16
Wat
er fl
ow (m
3 /s)
0
2
4
6
8
10
12
14
Water flowDiuron
29/04/2007
0
0.01
0.02
0.03
0.04
0.05
0.06
0.07
0.08
0.09
0.1
02:24 14:24 02:24 14:24 02:24 14:240
2
4
6
8
10
12
14
Diur
on c
onen
tratio
n (µ
g/L)
Water flowDiuron
26-27/05/2007
0
0.01
0.02
0.03
0.04
0.05
0.06
0.07
0.08
0.09
0.1
9:36 14:24 19:12 0:00 4:48 9:36 14:24 19:12 0:00-10
10
30
50
70
90
110
130
15001-02/07/2007
0
0.01
0.02
0.03
0.04
0.05
0.06
0.07
0.08
0.09
0.1
00:00 04:48 09:36 14:24 19:12 00:000
2
4
6
8
10
12
1402/08/2007
0
0.02
0.04
0.06
0.08
0.1
0.12
0.14
0.16
0.18
0.2
18:00 22:48 03:36 08:24 13:120
2
4
6
8
10
12
1406-07/08/2007
0.00
0.10
0.20
0.30
0.40
0.50
0.60
0.70
0.80
12:00 13:12 14:24 15:36 16:480
5
10
15
20
2521/08/2007
0.00
0.05
0.10
0.15
0.20
0.25
0.30
19:12 20:24 21:36 22:48 00:00 01:120
2
4
6
8
10
12
1417/09/2007
0.00
0.01
0.02
0.03
0.04
0.05
0.06
0.07
0.08
0.09
0.10
18:00 20:24 22:48 01:12 03:360
2
4
6
8
10
12
1427/09/2007
Figure 8. Diuron concentrations (µg/L) and water flow (m3/s) at site 2 during flood events
for the April-September 2007 period.
699700
701
702703704705706
35
Author-produced version of the article published in Environmental Pollution, vol. 158, 3, March 2010, pp. 737-748 The original publication is available at http://www.sciencedirect.com/ doi : 10.1016/j.envpol.2009.10.014
hal-0
0504
970,
ver
sion
1 -
22 J
ul 2
010

0
0.05
0.1
0.15
0.2
0.25
0.3
01/08 06/08 11/08 16/08 21/08 26/08 31/08
Dis
char
ge (m
3 /s)
0.78 m3/s
× ××
××
× Grab monitoring with [DIU] Floods monitored
0.16 µg/L0.97 µg/L
0.12 µg/L
0.25 µg/L
0.11 µg/L
Figure 9. Water flow (m3/s) in the Morcille stream at site 2, with the sampling dates for the
monitoring of grab samples and floods in August 2007 (× : diuron concentration measured
using grab sampling).
707708
709
710
711712713714715716717718719720721722723724725726727728729730731732733734735736
36
Author-produced version of the article published in Environmental Pollution, vol. 158, 3, March 2010, pp. 737-748 The original publication is available at http://www.sciencedirect.com/ doi : 10.1016/j.envpol.2009.10.014
hal-0
0504
970,
ver
sion
1 -
22 J
ul 2
010

y =3.6.10-3x - 0.1R2 = 0.87
0123456789
0 500 1000 1500 2000 2500Water volumes (m3)
Diur
on fl
ux (g
)
Figure 10. Diuron flux (g) versus water volumes (m3) during 7 floods (site 2).737738
739740741742743744745746747748749750751752753754755756757758759760761762763764765766767768769770
37
Author-produced version of the article published in Environmental Pollution, vol. 158, 3, March 2010, pp. 737-748 The original publication is available at http://www.sciencedirect.com/ doi : 10.1016/j.envpol.2009.10.014
hal-0
0504
970,
ver
sion
1 -
22 J
ul 2
010
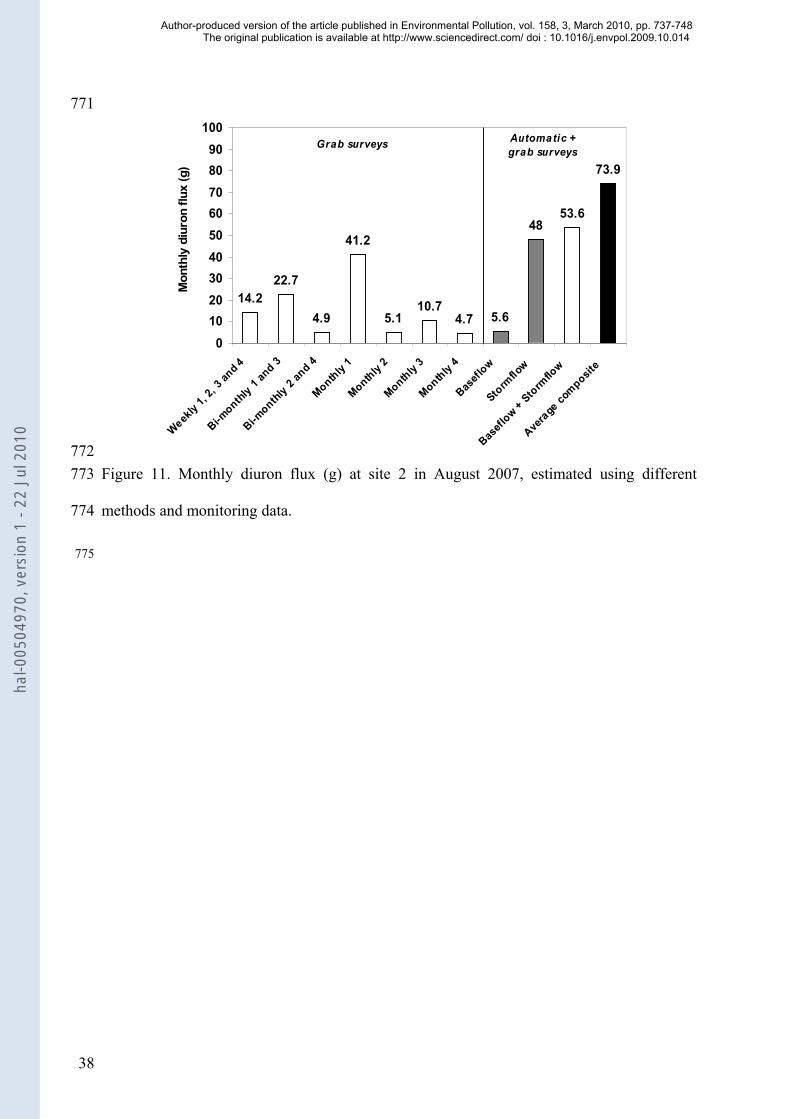
14.222.7
4.9
41.2
5.110.7
4.7 5.6
4853.6
73.9
0102030405060708090
100
Weekly
1, 2,
3 and 4
Bi-monthl
y 1 an
d 3
Bi-monthl
y 2 an
d 4
Monthly 1
Monthly 2
Monthly 3
Monthly 4
Basefl
ow
Storm
flow
Basefl
ow + Storm
flow
Avera
ge co
mposite
Mon
thly
diu
ron
flux
(g)
Grab surveys Automatic + grab surveys
Figure 11. Monthly diuron flux (g) at site 2 in August 2007, estimated using different
methods and monitoring data.
771
772773
774
775
38
Author-produced version of the article published in Environmental Pollution, vol. 158, 3, March 2010, pp. 737-748 The original publication is available at http://www.sciencedirect.com/ doi : 10.1016/j.envpol.2009.10.014
hal-0
0504
970,
ver
sion
1 -
22 J
ul 2
010
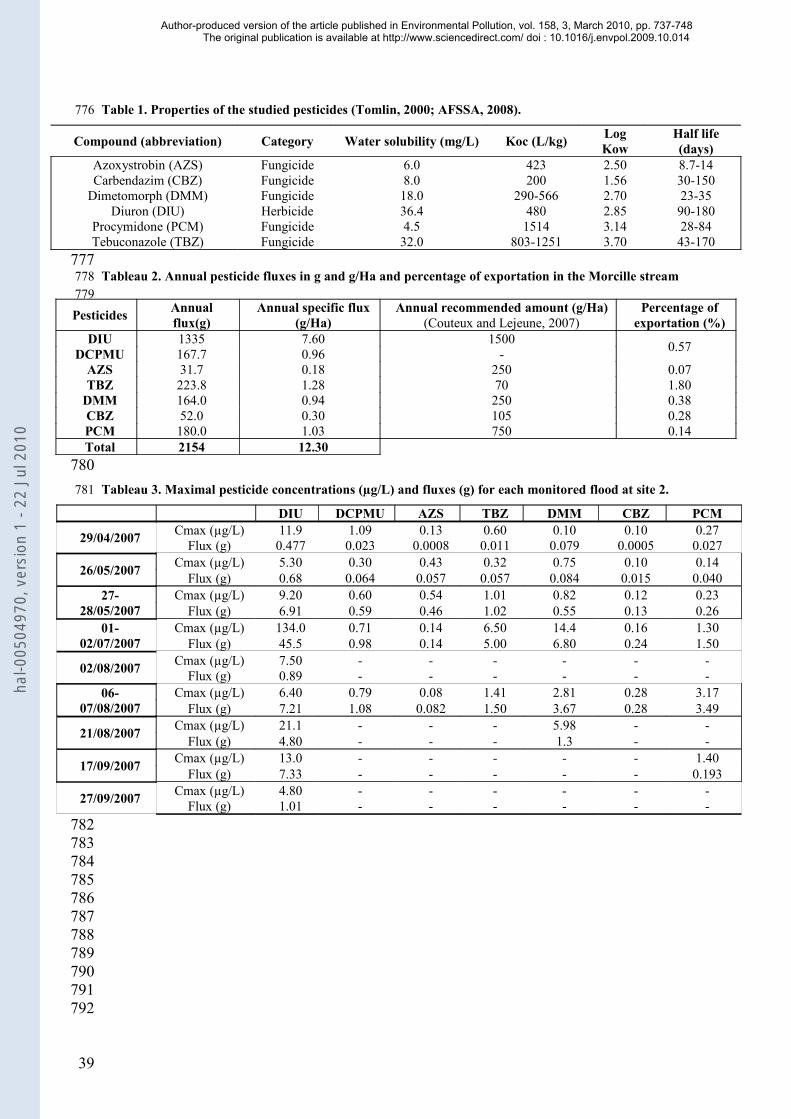
Table 1. Properties of the studied pesticides (Tomlin, 2000; AFSSA, 2008).
Compound (abbreviation) Category Water solubility (mg/L) Koc (L/kg) Log Kow
Half life (days)
Azoxystrobin (AZS)Carbendazim (CBZ)
Dimetomorph (DMM)Diuron (DIU)
Procymidone (PCM)Tebuconazole (TBZ)
FungicideFungicideFungicideHerbicideFungicideFungicide
6.08.018.036.44.532.0
423200
290-5664801514
803-1251
2.501.562.702.853.143.70
8.7-1430-15023-3590-18028-8443-170
Tableau 2. Annual pesticide fluxes in g and g/Ha and percentage of exportation in the Morcille stream
Pesticides Annual flux(g)
Annual specific flux (g/Ha)
Annual recommended amount (g/Ha) (Couteux and Lejeune, 2007)
Percentage of exportation (%)
DIU 1335 7.60 1500 0.57DCPMU 167.7 0.96 -AZS 31.7 0.18 250 0.07TBZ 223.8 1.28 70 1.80
DMM 164.0 0.94 250 0.38CBZ 52.0 0.30 105 0.28PCM 180.0 1.03 750 0.14Total 2154 12.30
Tableau 3. Maximal pesticide concentrations (µg/L) and fluxes (g) for each monitored flood at site 2.
DIU DCPMU AZS TBZ DMM CBZ PCM
29/04/2007 Cmax (µg/L) 11.9 1.09 0.13 0.60 0.10 0.10 0.27Flux (g) 0.477 0.023 0.0008 0.011 0.079 0.0005 0.027
26/05/2007 Cmax (µg/L) 5.30 0.30 0.43 0.32 0.75 0.10 0.14Flux (g) 0.68 0.064 0.057 0.057 0.084 0.015 0.040
27-28/05/2007
Cmax (µg/L) 9.20 0.60 0.54 1.01 0.82 0.12 0.23Flux (g) 6.91 0.59 0.46 1.02 0.55 0.13 0.26
01-02/07/2007
Cmax (µg/L) 134.0 0.71 0.14 6.50 14.4 0.16 1.30Flux (g) 45.5 0.98 0.14 5.00 6.80 0.24 1.50
02/08/2007 Cmax (µg/L) 7.50 - - - - - -Flux (g) 0.89 - - - - - -
06-07/08/2007
Cmax (µg/L) 6.40 0.79 0.08 1.41 2.81 0.28 3.17Flux (g) 7.21 1.08 0.082 1.50 3.67 0.28 3.49
21/08/2007 Cmax (µg/L) 21.1 - - - 5.98 - -Flux (g) 4.80 - - - 1.3 - -
17/09/2007 Cmax (µg/L) 13.0 - - - - - 1.40Flux (g) 7.33 - - - - - 0.193
27/09/2007 Cmax (µg/L) 4.80 - - - - - -Flux (g) 1.01 - - - - - -
776
777778779
780781
782783784785786787788789790791792
39
Author-produced version of the article published in Environmental Pollution, vol. 158, 3, March 2010, pp. 737-748 The original publication is available at http://www.sciencedirect.com/ doi : 10.1016/j.envpol.2009.10.014
hal-0
0504
970,
ver
sion
1 -
22 J
ul 2
010

Table 4. Comparaison of calculated and estimated diuron flux (g) during floods at site 2.
Flood eve Calculated diuron flux (g)
Water volumes (m3)
Estimated diuron flux (g) Bias (%)
26 May 2007 0.68 348 0.80 1327-28 May 2007 6.91 2106 7.1 302 August 2007 0.89 335 0.70 -19
06-07 August 2007 7.21 2263 7.70 621 August 2007 5.88 1970 6.60 12
17 September 2007 7.33 1619 5.30 -2727 September 2007 1.01 621 1.70 73
793
794
795
796
40
Author-produced version of the article published in Environmental Pollution, vol. 158, 3, March 2010, pp. 737-748 The original publication is available at http://www.sciencedirect.com/ doi : 10.1016/j.envpol.2009.10.014
hal-0
0504
970,
ver
sion
1 -
22 J
ul 2
010