On Generalized 2-dimensional Cross Constellations and the Opportunistic Secondary Channel
Assessing Feasibility of IT-enabled NetworkedValue Constellations: A Case Study in the
Electricity Sector
Zsofia Derzsi1,3, Jaap Gordijn1, Koen Kok1,2, Hans Akkermans1, and Yao-HuaTan3
1Free University, FEW/Business Informatics, De Boelelaan 1083a, 1081 HVAmsterdam, The Netherlands. (derzsi, gordijn, elly)@few.vu.nl,
2ECN, Intelligent Energy Grids, PO Box 1, Petten, The Netherlands. [email protected],3Free University, FEWEB, De Boelelaan 1083a, 1081 HV Amsterdam, The
Netherlands. [email protected]
Abstract. Innovative networked value constellations, such as Cisco orDell, are often enabled by Information Technology (IT). The same holdsfor the Distributed Electricity Balancing Service (DBS), which we presentin this case study. To explore feasibility of such constellations while de-signing them, we need at least to develop a financial and technical under-standing of the constellation at hand. In this paper, we take a multipleperspective approach, by taking a business value perspective (using e3-value ) and an information system perspective (using UML-deploymentdiagrams) on the case at hand. We present a novel, structured approachto relate both perspectives, thus enabling a financial and technical feasi-bility assessment of the constellation, using a real-life case study in thefield of electricity supply and consumption.
1 Introduction
Companies increasingly form networked value constellations to jointly satisfycomplex needs. Well known examples include the networked business model ofCisco Systems [17] -actually consisting of a series of well integrated companies-,and the virtual integration of Dell Computers [11]. In a networked value constel-lation, enterprises use each other core-competencies to offer a product or servicethat each individual enterprise could not offer on its own.
Such a constellation requires more than just a few enterprises alone, co-producing things of economic value. To coordinate their processes properly,information and communication technology is indispensable. Actually, for thedistributed electricity balancing service case study, as to be presented in thispaper, information technology is a prerequisite.
To our consulting experience [3, 7, 9], one of the issues in designing a net-worked value constellation is first to find a constellation (in terms of partici-pating enterprises, cross-organizational processes, and interworking informationsystems) that seems to be feasible. Such an explorative feasibility assessment
2
track should be done in a light-weight fashion, to be able to develop a comprehen-sive, yet global, understanding of the constellation at hand, within a reasonabletimeframe (time-to-market is typically just a few months). Such an understand-ing, while shared and agreed upon by the enterprises involved, can then providefurther direction for a more detailed and focused requirements engineering andsystem design track.
In this paper, we consider two types of feasibility: (1) economic feasibility and(2) technical feasibility. Economic feasibility refers to the question whether allenterprises participating in a constellation can be economically sustainable over areasonable period of time with respect to their participation in the constellation.It is then important to know substantial economical effects (in terms of expenses,investments, and revenues). Technical feasibility is about the question whetherwe can find an acceptable solution to put the value constellation into operatione.g. by deploying information technology (the focus of this paper) and inter-organizational business processes.
In this paper we combine two modeling techniques (e3-value and UML de-ployment diagrams) to reason about feasibility. An e3-value model has constructsfor reasoning about financial feasibility by definition; however, since importantfinancial effects can come from investments and expenses in IT, we feed the e3-value model by financial annotations of a UML deployment diagram. Anothercontribution of this paper is that we show that a value model and deploymentmodel, if correctly related, can be used to reason about scalability issues, whichare of importance while considering technical feasibility.
This paper is structured as follows. In section 2 we introduce how to explorefeasibility of networked value constellations and in section 3 we present ourcase study-based research approach. A first step is to explore the networkedconstellation from an economic value perspective (section 4); a second step is tounderstand the information system perspective (section 5) of the case at hand.In section 6, both perspectives are structurally related with each other. Finally,in section 7 we present the lessons learned and conclusions.
2 Perspectives to understand feasibility of IT-enablednetworked value constellations
To our experience [7], to assess feasibility of networked value constellations, mul-tiple perspectives (e.g. strategic goals, value transfers, business processes, andinformation systems) need to be considered. We consider the following perspec-tives, amongst others inspired on frameworks such as TOGAF or Zachman [16,1]. The strategic goal perspective represents the long-term objectives of enter-prises, such as cost leadership or differentiation of products and services (see e.g.[15]). To explore feasible networked value constellations, it is important to knowthat the individual objectives of participating enterprises are aligned, and thatno crucial conflicts exist. For the paper at hand, we do not elaborate on thisperspective; instead the reader is referred to [13, 10, 8, 19]. The economic valuetransfer perspective explores what enterprises offer of economic value to each
3
other, and request what in return. The value transfer perspective shows howthe strategy is put into operation. For feasibility understanding, this perspectiveis useful to assess economic sustainability, in terms of in-going and out-goingmoney flows. In this paper, we employ the e3-value [7] approach for represent-ing the value transfer perspective (see section 3.1); other possibilities are BMO,[12], or REA [6]. The business process perspective shows how value transfersare carried out (e.g. time ordering, parallelism), by processes, including coordi-nating processes between enterprises. For feasibility purposes, this perspective isusable to understand economic feasibility (since resources such as workers costmoney). In this paper, we do not explore this perspective further; the readeris referred to [14, 18]. The information system perspective presents the softwareand hardware components, their communication, etc. In fact, this perspectivemay contain many sub-perspectives, depending on the modeling aim, and con-tributes to the understanding of economic feasibility (e.g. IS-components requireinvestments and expenses for maintenance). Additionally, the perspective maygive a clue regarding technical feasibility; whether it is possible to design an in-formation system that satisfies the requirements expressed by e.g. the economicvalue transfer and business process perspectives. In this paper, we use UML [2],and as we will motivate later on, specifically deployment diagrams to capturethe information system perspective.
3 Research approach
3.1 The e3-value methodology for economical feasibility
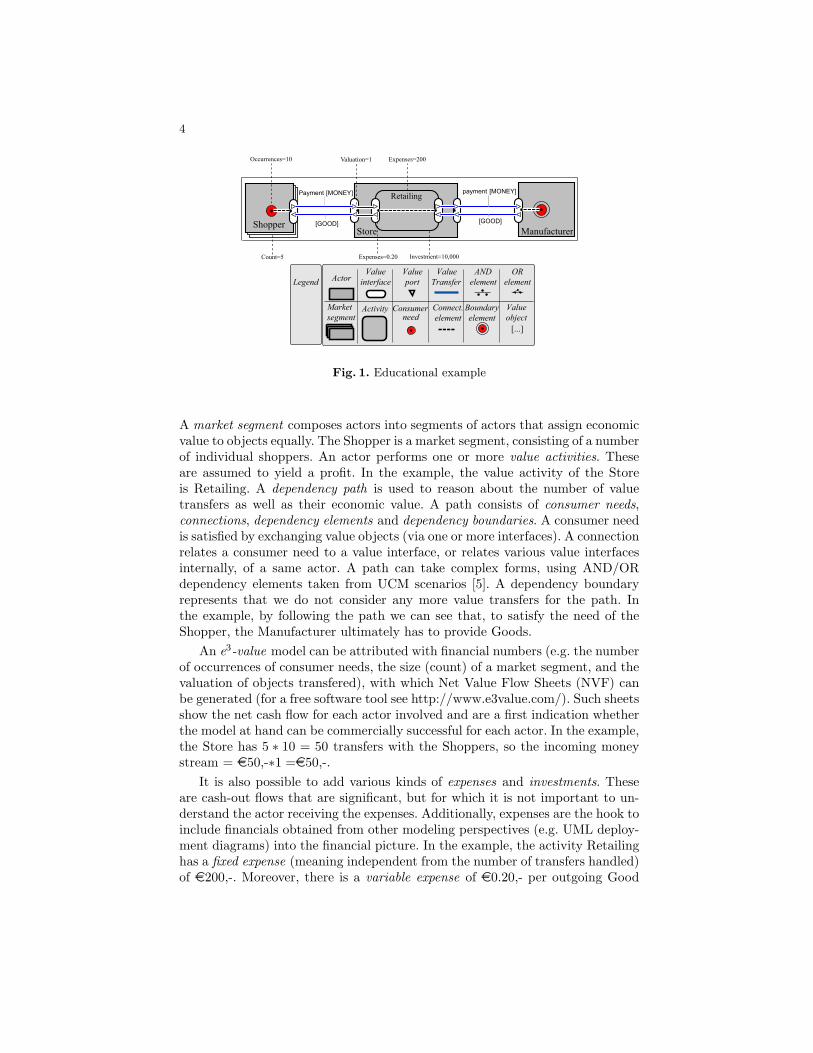
To evaluate feasibility in this paper, we employ e3-value and UML-deploymentdiagrams. To make this paper self-contained, we briefly introduce the e3-valuemodeling concepts below as well as the e3-value way of reasoning about economicfeasibility (see for a more detailed explanation [7]). The e3-value methodologyprovides modeling constructs for representing and analyzing a network of enter-prises, exchanging things of economic value with each other. The methodologyis ontologically well founded and has been expressed as UML classes, Prologcode, RDF/S, and a Java-based graphical e3-value ontology editor and an anal-ysis tool, which is available for download (see http://www.e3value.com/) [7]. Inthe following text, we use an educational example (see Figure 1) to explain theontological constructs.
An actor is perceived by his/her environment as an economically independententity. The Store and Manufacturer are examples of actors. Actors exchangevalue objects (e.g. Money). A value object is a service, a good, money, or even anexperience, which is of economic value for at least one of the actors. An actor usesa value port to provide or request value objects to or from other actors. Actorshave one or more value interfaces, grouping value ports, and showing economicreciprocity. So, in the example, Goods can only be obtained for Money and viceversa. A value transfer is used to connect two value ports with each other. In theexample, a transfer of Good or Payment are both examples of value transfers. Avalue transaction groups value transfers that all should happen, or none at all.
4
[GOOD]
[MONEY] [MONEY]
[GOOD]
Occurrences=10
Count=5
Valuation=1
Expenses=0.20
Expenses=200
Investment=10,000
LegendValue
TransferValueport
Valueinterface
Consumerneed
Connect.element
Actor
Boundaryelement
OR element
AND element
ActivityMarketsegment
Valueobject[...]
Fig. 1. Educational example
A market segment composes actors into segments of actors that assign economicvalue to objects equally. The Shopper is a market segment, consisting of a numberof individual shoppers. An actor performs one or more value activities. Theseare assumed to yield a profit. In the example, the value activity of the Storeis Retailing. A dependency path is used to reason about the number of valuetransfers as well as their economic value. A path consists of consumer needs,connections, dependency elements and dependency boundaries. A consumer needis satisfied by exchanging value objects (via one or more interfaces). A connectionrelates a consumer need to a value interface, or relates various value interfacesinternally, of a same actor. A path can take complex forms, using AND/ORdependency elements taken from UCM scenarios [5]. A dependency boundaryrepresents that we do not consider any more value transfers for the path. Inthe example, by following the path we can see that, to satisfy the need of theShopper, the Manufacturer ultimately has to provide Goods.
An e3-value model can be attributed with financial numbers (e.g. the numberof occurrences of consumer needs, the size (count) of a market segment, and thevaluation of objects transfered), with which Net Value Flow Sheets (NVF) canbe generated (for a free software tool see http://www.e3value.com/). Such sheetsshow the net cash flow for each actor involved and are a first indication whetherthe model at hand can be commercially successful for each actor. In the example,the Store has 5 ∗ 10 = 50 transfers with the Shoppers, so the incoming moneystream = e50,-∗1 =e50,-.
It is also possible to add various kinds of expenses and investments. Theseare cash-out flows that are significant, but for which it is not important to un-derstand the actor receiving the expenses. Additionally, expenses are the hook toinclude financials obtained from other modeling perspectives (e.g. UML deploy-ment diagrams) into the financial picture. In the example, the activity Retailinghas a fixed expense (meaning independent from the number of transfers handled)of e200,-. Moreover, there is a variable expense of e0.20,- per outgoing Good
5
transfer (so for this case the expense is 50∗e0.20,-=e10,-. The e3-value ontologyis capable of assigning the expenses related to activities to the performing actorautomatically. Moreover, fixed and variable expenses can also be attributed toactors directly. It is also possible to include investments. For this purpose, it isimportant to understand that a single e3-value model represents the financialeffects for a certain timeframe, say a day, month, or year. A series of poten-tially different e3-value models can be combined into an e3-timeseries model toconsider a number of timeframes (say many years). An investment is then actu-ally an one-time (often upfront) expense in a specific timeframe that does notoccur in other timeframes. In this example, there is an upfront investment ofe10,000.-. Summing up the financial effects of multiple timeframes is done viathe Discounted Net Present Cash Flow (DNPC) technique [4]. This results in a,hopefully positive, financial number representing the net financial effects for anactor, thereby accounting properly for the time-value of money.
3.2 Explorative case study: Distributed Balancing Services
In this paper, we explore a model-based way of assessing feasibility of networkedvalue constellations, by taking a value transfer and information system perspec-tive (the other perspectives are also important but simply not in the scope ofthis paper due to space restrictions). Our ultimate goal is to arrive at a set ofrelevant, well integrated models that allows for feasibility studies. In this paper,we use a case-study on electricity supply and consumption (see [9]).
Due to the physical nature of electricity power, the amount of electricitysupplied to the network must be exactly equal to the amount of electricity con-sumed, including inevitable transport losses. This balance has to be maintainedat every instance otherwise power outages will occur. This requirement is at alltime ensured by the Transmission System Operator (TSO) The TSO does so byasking large consumers and generators for their consumption/production plansa day ahead, matches these, and returns consumption/production plans thatensure consumption and supply balance. However, at runtime there are alwaysdeviations from the plans since it is impossible to precisely consume/producethe amount of electricity as planned. Since deviation from the plans causes im-balance, and adequate yet costly counter measures have to be taken, suppli-ers/consumers have to pay a penalty fee for causing imbalance to the TSO, whoby default compensates for system imbalance.
The innovative idea for the case at hand is to create an IT-enabled ser-vice that reduces real-time imbalance in a portfolio of generators and consumersby allowing near-real time, distributed control over the electricity productionand consumption of portfolio’s participants: the Distributed Balancing Service(DBS). In case of imbalance, actors are asked to change their level of produc-tion and/or consumption. Because the imbalance is reduced for the portfolio,the penalties decrease also, and thus for the suppliers/consumers participatingin the portfolio. Obviously, such near real-time control is only possible using ad-vanced information technology, giving the time-scale (minutes) and the numberof actors.

6
The aim of this case-study for us is to explore financial- and technical feasibil-ity assessment of an IT-enabled value constellation by considering an economicvalue transfer and information system perspective. We have selected this spe-cific case-study because: (1) The constellation and the information technologyfor imbalance reduction has already been built. We want to focus on the con-ceptual constructs required to understand feasibility issues and not yet on theprocess of assessment itself. (2) We have access to the financial data. (3) Wehave access to the developers of the DBS case. (4) The DBS case relies heavilyon IT. (5) The case-study is of industrial strength. For the DBS case, we firststudy the available materials and do interviews with the domain experts, and weconstruct an e3-value model of the DBS case (see section 4). Also, we constructa UML deployment diagram of the DBS (see section 5). By annotating the UMLdeployment diagram, such that financials related to information systems can berepresented, and by structurally relating these annotations to the elements in thevalue model, we derive comprehensive (discounted) net value flow sheets for bothperspectives. For relating the value and deployment perspectives, we present asub-ontology (see section 6). Finally, we reason about technical feasibility usingthe presented models with an emphasis on scalability.
4 An e3-value model for the distributed balancing service
Figure 2 shows an e3-value model for the DBS case study. The focus is on theparticipating enterprises and what they transfer of economic value, and not onthe required soft- and hardware components yet.
There are ‘electricity generators’ in the form of ‘wind turbines’, ‘CombinedHeat Power generators’ (CHPs) and ‘emergency generators’. All these gener-ators offer ‘electricity’ and request ‘money’ in return. Different types of gen-erators exist because, due the nature of the generator (volume of total elec-tricity power, predictability of this volume), the pricing schemes may be dif-ferent. Additionally, they offer ‘operational flexibility’, meaning that a portfo-lioholder (here the ‘supplier’) may influence the amount of electricity produc-tion, in return for ‘money’. There are also ‘consumers’ who buy ‘electricity’and pay ‘money’ in return. Also, they offer ‘operational flexibility’ so that aportfolioholder can influence their amount of electricity consumption, and theyrequest some ‘money’ in return for that. Normally, the ‘generators’ and ‘con-sumers’ must also pay a fee to the ‘Transmission System Operator’ (TSO), iftheir real-life production/consumption deviates from their forecasted produc-tion/consumption (which is always the case). This balance-responsibility is inthe DBS e3-value model taken over by a ‘supplier’ of which we have one. The‘generators’ and ‘consumers’ are all in the portfolio of the ‘supplier’. The ‘sup-plier’ pays a penalty (‘money’) to the TSO for the amount of imbalance caused.This amount can be reduced by controlling the ‘generators’ and ‘consumers’ nearreal-time. Finally, there is a ‘wholesale market operator’. The role of this oper-ator is to sell electricity to the ‘supplier’ in case of shortage or to buy electricityfrom the ‘supplier’ in case of a surplus.

7
Fig. 2. e3-value model of the Distributed Balance System
8
An e3-value model actually provides a snapshot of the number of value trans-fers for a certain timeframe; here, for 15 minutes. In the DBS-case, this 15minutes is used as a discrete interval to calculate fees, based on the actual pro-duction/consumption. In addition, all needs occur within this timeframe. Now,trace through the ‘A’ dependency path. As can be seen, the ‘consumer’ has aneed for a certain amount of kilowatt-hours (kWh). The ‘wholesale market op-erator’ has also a need for electricity. These needs are satisfied by the ‘supplier’.He buys electricity from the ‘generators’ of his portfolio, and from the ‘wholesalemarket operator’ in case of a shortage, as can be seen from the ‘B’ path. Fromthe ‘C’ path it can be seen that the ‘supply & trade’ activity requires ‘balanc-ing control’, and so control of the ‘generators’ and/or ‘consumers’ in terms ofoperational flexibility. ‘Balancing control’ operates together with the ‘operationcontrol’ activity, which is executed by consumers and generators. Since such acontrol moment is needed once per 15 minutes, for each timeframe, there willbe precisely one occurrence, so one ‘operational flexibility’ transfer between the‘supplier’ and the ‘generators’/‘consumers’. However, due to the fact that mar-ket segments aggregate actors, explosion elements are needed (fork (#2)-(#5))in order to achieve one occurrence per actor in such a market segment. Despitethe efforts of the ‘supplier’, there will always be some imbalance (because the‘supplier’ can control near real-time). This is modeled by the AND fork (#1).
The e3-value model calculates, as shown, the occurrences for each depen-dency path element for the 15-minutes timeframe. We assume that investmentsin generators and in consumption control equipment were done earlier, so wedo not consider these. Investments related to IT are explored in section 5. If weassign pricing schemes (valuation functions) to the model, assume an amountelectricity power needed, assume a number of generators and consumers, andassume how much required electricity power can be satisfied by the portfolio’sparticipants (and the wholesale market), we can derive for each 15 minute time-frame net value sheets for each enterprise involved. With e3-timeseries , it ispossible to concatenate a series of e3-value model snapshots, capturing manysequential timeframes of each 15 minutes. Then, a Discounted Net Present CashFlow [4] sheet per actor can be derived to judge the financial attractiveness ofthe DBS, which we do not discuss in detail due to space restrictions. In table 1,such a sheet is (as an example) given for the ‘CHP generator’, including boththe e3-value and UML-deployment perspective.
5 IS-perspective: A UML deployment diagram annotatedwith expenses and investments
5.1 Why a deployment diagram?
We now take an IS perspective on the DBS case. In this case study, we con-sider an already up-and-running system, for which the designed IS-models areavailable in UML. For our purpose, assessing economic and technical feasibil-ity (in terms of scalability), we restrict ourselves to deployment diagrams for a
9
few reasons. (1) Deployment diagrams show, statically, components and nodeson which these components run. These components and nodes require invest-ments (one-time upfront expenses) and regularly occurring fixed expenses (e.g.for maintenance). So, for annotating UML with financials, deployment diagramsprovide sufficient handles. (2) Components themselves have interfaces which of-fer or request services via ports. Both offering and requesting services may resultin variable expenses. ‘Variable’ means here that the expense relates to the num-ber of service invocations; in case of a ‘fixed’ expense we have to do the expensealways -even if there are zero service invocations. Service invocations are relatedto value transfers on the economic value transfer perspective (see section 6.1).(3) Ports offering and requesting services are annotated, e.g. with the maximumnumber of service invocations per timeframe. If the previously mentioned valuetransfers are related to service invocations, we can reason about scalability is-sues. (4) Deployment diagrams are sufficiently course-grained, so they are of usein a light-weight feasibility assessment approach.
5.2 A DBS deployment diagram
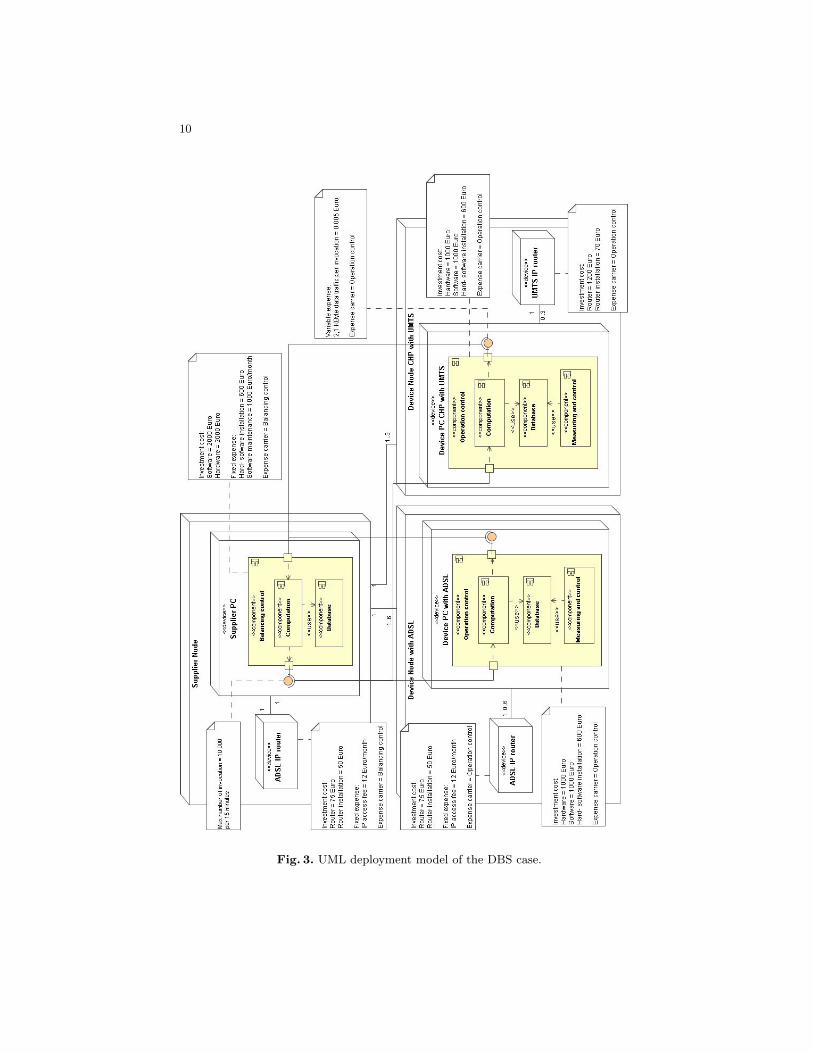
Figure 3 shows a deployment diagram (with components) for the case at hand.The ‘generators’ and ‘consumers’ all have the same, complex components de-rived from the value activity ‘operation control’. They consist of several sub-components, namely (a) a computation component, (b) a database, and (c) ameasuring&control component. The computation component computes for each15-minute timeframe a pricing-function that can be used to calculate, giventhe amount of electricity supplied/required, the price willing to obtain/pay. Forthis calculation, historical data from the local database is used. The measur-ing&control component directly influences the generation/consumption device,e.g. by adjusting the produced/required electricity power.
The ‘supplier’ managing the portfolio operates the ‘balancing control’ compo-nent, which consist of (a) a computation component, and (b) a database compo-nent. These components are used to collect the forementioned pricing-functionsfrom each ‘generator’ and ‘consumer’. Then, supply and demand is balanced, andthe ‘generators’ and ‘consumers’ are each reported back the required/consumedelectricity power.
There are two services: (1) the generators and consumers offer a service thatreturns the forementioned pricing-function, (2) the supplier offers a service thattells the generator/consumer how much electricity they must produce/consumethe coming 15-minutes timeframe by using the above pricing functions. Effec-tively, this controls the generator/consumer behavior.
Components are assigned to devices and eventually to nodes, being physi-cal resources. The nodes, devices and components are classes, which have oneor more instances. So, the deployment diagram tells that one supplier node(instance) is associated with six device nodes (instances) (consumer and gen-erator PC’s) connected via ADSL, and with three device nodes (instances) (inthis specific case, the CHP nodes) connected via wireless-UMTS. The latter
10
Fig. 3. UML deployment model of the DBS case.
11
sub-classification, based on connection technology, is motivated by the very dif-ferent expense-profiles of these technologies. The number of required instancesare derived from the e3-value model, by counting the number of generators andconsumers.
5.3 Annotating the deployment diagram for feasibility reasoning
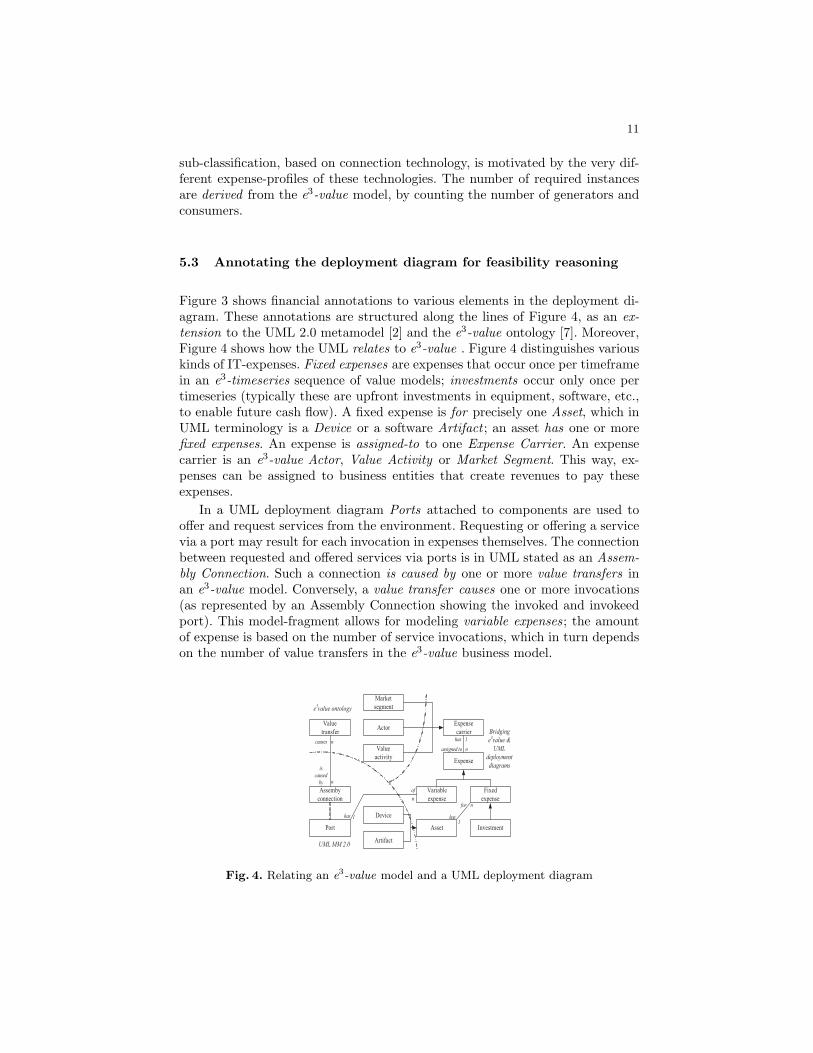
Figure 3 shows financial annotations to various elements in the deployment di-agram. These annotations are structured along the lines of Figure 4, as an ex-tension to the UML 2.0 metamodel [2] and the e3-value ontology [7]. Moreover,Figure 4 shows how the UML relates to e3-value . Figure 4 distinguishes variouskinds of IT-expenses. Fixed expenses are expenses that occur once per timeframein an e3-timeseries sequence of value models; investments occur only once pertimeseries (typically these are upfront investments in equipment, software, etc.,to enable future cash flow). A fixed expense is for precisely one Asset, which inUML terminology is a Device or a software Artifact ; an asset has one or morefixed expenses. An expense is assigned-to to one Expense Carrier. An expensecarrier is an e3-value Actor, Value Activity or Market Segment. This way, ex-penses can be assigned to business entities that create revenues to pay theseexpenses.
In a UML deployment diagram Ports attached to components are used tooffer and request services from the environment. Requesting or offering a servicevia a port may result for each invocation in expenses themselves. The connectionbetween requested and offered services via ports is in UML stated as an Assem-bly Connection. Such a connection is caused by one or more value transfers inan e3-value model. Conversely, a value transfer causes one or more invocations(as represented by an Assembly Connection showing the invoked and invokeedport). This model-fragment allows for modeling variable expenses; the amountof expense is based on the number of service invocations, which in turn dependson the number of value transfers in the e3-value business model.
Port
Assembyconnection
Valuetransfer
Variableexpense
Expense
Fixedexpense
Investment
Expensecarrier
Valueactivity
Actor
Marketsegment
Asset
UML MM 2.0
e3value ontology
causes
is caused
by n
nassigned to
hasn1
has
ofn
1 has
for
1
n
Artifact
Device
Bridginge3value &
UMLdeploymentdiagrams
Fig. 4. Relating an e3-value model and a UML deployment diagram
12
As an example consider investments. The financial annotations of Figure 3show the hard- and software costs related to components that are, as men-tioned before, derived from value activities. By executing value activities (i.e.the ‘Operation control’ activity) e.g. hard- and software investments (e1,000.-and e1,000.- respectively) are required. This can be fed into the e3-value modelfor the appropriate value activity (being an expense carrier). The use of wireless-UMTS routers results in data-traffic accounted on a per KByte basis and thusin extra variable expenses each time services (using the UMTS connection) areinvoked (see Figure 3). In this example, each invocation results in sending of 2,1KB, resulting in an expense of e0.005,-. For this expense, an expense carrier isidentified (here the ‘operation control’ activity of the ‘CHP’).
6 Relating the e3-value and UML deployment perspective
6.1 Financial feasibility
Financial feasibility is assessed by summing up the net cash flow (revenues −expenses − investments) for each actor involved over a series of timeframes.From a value transfer perspective, we consider a series of e3-value models, eachdescribing a (here 15 minutes) timeframe, together forming an e3-timeseries .Each e3-value model, or each timeframe, contributes revenues, expenses, andpossibly investments for each actor.
From an information system perspective, each timeframe may result in (fixedor variable) expenses and investments. Fixed expenses and investments of IT aredirectly assigned to expense carriers (along the lines of of Figure 4). Based onthe number of value transfers (per timeframe, per actor), the amount of variableexpenses is calculated that stem from IT-service invocations.
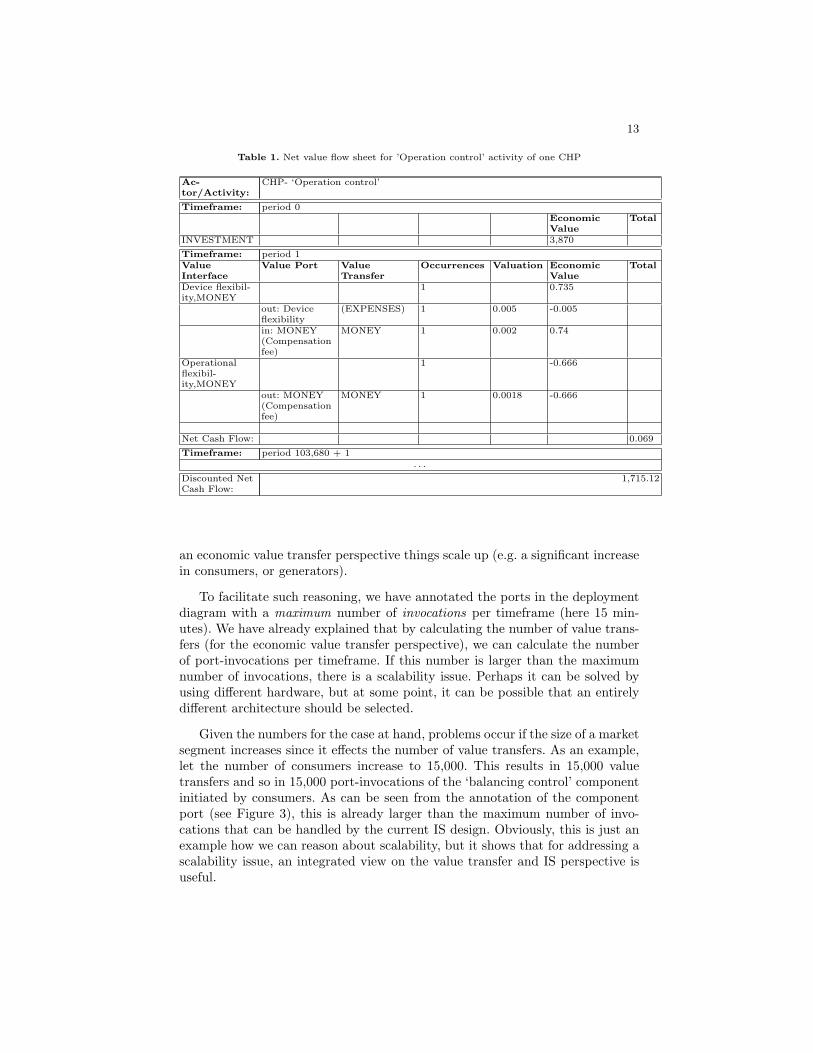
The result of the above calculation is exemplified in table 1 for the ’Oper-ation control’ activity that is executed by a CHP. The table normally lists allconsidered timeframes (here only period 0 -showing the initial investment-, andperiod 1 -in which the first value transfers are done- are shown, for brevity rea-sons). Since many sequential timeframes can be considered as equal, the numberof timeframes with different financials is often much less. For each timeframe,first the cash transferred (both to- and from an actor) is shown as a result ofdoing value transfers according to the stated e3-value model for that timeframe.Then, expenses and investments are shown for that timeframe that result fromthe information system perspective. Hereafter, the net cash flow is calculated foreach timeframe, just by subtracting expenses and investments from revenues. Fi-nally, all net cash flows for all timeframes are summed up using the DiscountedNet Present Cash Flow method [4], thereby accounting properly for the timevalue of money, cost of capital, and risk associated with participating in theconstellation.
6.2 Technical feasibility
The technical feasibility assessment may contain various perspectives; here weexplore scalability only. More specifically the question is: what happens if from
13
Table 1. Net value flow sheet for ’Operation control’ activity of one CHP
Ac-tor/Activity:
CHP- ‘Operation control’
Timeframe: period 0EconomicValue
Total
INVESTMENT 3,870
Timeframe: period 1ValueInterface
Value Port ValueTransfer
Occurrences Valuation EconomicValue
Total
Device flexibil-ity,MONEY
1 0.735
out: Deviceflexibility
(EXPENSES) 1 0.005 -0.005
in: MONEY(Compensationfee)
MONEY 1 0.002 0.74
Operationalflexibil-ity,MONEY
1 -0.666
out: MONEY(Compensationfee)
MONEY 1 0.0018 -0.666
Net Cash Flow: 0.069
Timeframe: period 103,680 + 1. . .
Discounted NetCash Flow:
1,715.12
an economic value transfer perspective things scale up (e.g. a significant increasein consumers, or generators).
To facilitate such reasoning, we have annotated the ports in the deploymentdiagram with a maximum number of invocations per timeframe (here 15 min-utes). We have already explained that by calculating the number of value trans-fers (for the economic value transfer perspective), we can calculate the numberof port-invocations per timeframe. If this number is larger than the maximumnumber of invocations, there is a scalability issue. Perhaps it can be solved byusing different hardware, but at some point, it can be possible that an entirelydifferent architecture should be selected.
Given the numbers for the case at hand, problems occur if the size of a marketsegment increases since it effects the number of value transfers. As an example,let the number of consumers increase to 15,000. This results in 15,000 valuetransfers and so in 15,000 port-invocations of the ‘balancing control’ componentinitiated by consumers. As can be seen from the annotation of the componentport (see Figure 3), this is already larger than the maximum number of invo-cations that can be handled by the current IS design. Obviously, this is just anexample how we can reason about scalability, but it shows that for addressing ascalability issue, an integrated view on the value transfer and IS perspective isuseful.
14
7 Lessons learned and conclusions
In this paper, we have shown how an e3-value model, taking an economic per-spective on networked value constellations, can be structurally related to a cor-responding UML deployment diagram, representing a technical perspective. Asa result, a comprehensive discounted net value flow sheet can be produced foreach actor involved, for the purpose to assess economic feasibility. Additionally,scalability, being an aspect of the larger construct, technical feasibility, can bebe reasoned about.
While doing this case study, we experienced some learnings, of which wearticulate here two (due to space considerations). First, with respect to thenotion of time, it is important that the timeframes as considered by the differentperspectives are indeed about the same timeframe. Specifically, if the timeframeis determined by IT (e.g. timeframe of invocations), the e3-value model shouldpossess the same timeframe as well. This puts certain requirements on the modelsconstructed. Second, we have seen that -for the purpose of feasibility assessment-,the selection of the relevant components and nodes as distinguished by the UMLdeployment diagrams are influenced by the size of expenses of these componentsand nodes. We experienced that these deployment diagrams are sufficient forour purposes; obviously, they need to be detailled if stakeholders really decideto develop the case at hand further.
Many continuing research lines are possible. Deployment diagrams are typ-ically constructed if information system requirements and design are alreadysomewhat clear. Consequently, it is important to understand how e3-value mod-els influence other UML-type of diagrams and vice versa (i.e. use-cases, activ-ity / state transition diagrams, class diagrams) that are usually built in anearlier stage of requirements engineering and system design. Additionally, otheraspects, specifically of technical feasibility need to be addressed, in conjunctionwith the e3-value model (think of flexibility, maintainability, etc.). Another lineof research is the development of guidelines that help to make architectural de-cisions, which are then expressed using the integrated models we have proposed.
On the short term, we continue our research by developing a DBS to beused in Woking/UK. As the current DBS is developed for The Netherlands, weexpect changes in the e3-value model and IS architecture for the Woking case,due to specific UK-regulations about electricity supply. We intend to use thiscase study to develop an integrated view on flexibility, by considering to whatextent the Dutch system is usable for the UK. Additionally, we will work on anentirely different case, a ship container tracking system, to validate our proposedmodel-based feasibility assessment approach for IT-intensive networked valueconstellations.
Acknowledgements. This work has been partly sponsored by the EESD-ISTfunded project FENIX (518272), the JACQUARD/NWO funded project VI-TAL (838.003.407), and the VUA funded project VUBIS.

15
References
1. Togaf enterprise edition, version 8.1. http://www.opengroup.org/architecture/togaf8-doc/arch/, accessed november 2006. accessed november 2006.
2. Unified modeling language: Superstructure. http://www.omg.org/docs/formal/05-07-04.pdf, accessed november 2006. accessed november 2006.
3. J.M. Akkermans, Z. Baida, J. Gordijn, N. Pena, A. Altuna, and I. Laresgoiti. Valuewebs: Using ontologies to bundle real-world services. IEEE Intelligent Systems,19(4):57–66, 2004.
4. Richard Brealey, Stewart Myers, and Franklin Allen. Corporate Finance. McGrawHill Higher Education, 2005.
5. R. J. A. Buhr. Use case maps as architectural entities for complex systems. IEEETransactions on Software Engineering, 24(12):1131–1155, 1998.
6. Guido Geerts and William.E. McCarthy. An accounting object infrastructure forknowledge-based enterprise models. IEEE Intelligent Systems and Their Applica-tions, pages 89–94, 1999.
7. J. Gordijn and J.M. Akkermans. Value-based requirements engineering: Exploringinnovative e-commerce ideas. Requirements Engineering Journal, 8(2):114–134,2003.
8. J. Gordijn, E. Yu, and B. Van der Raadt. e-Service design using i∗ and e3valuemodeling. IEEE Software, 23(3):26–33, 2006.
9. Jaap Gordijn and Hans Akkermans. Business models for distributed energy re-sources in a liberalized market environment. The Electric Power Systems ResearchJournal, 2007. Accepted by the Electric Power Systems Research Journal. Preprintavailable. doi:10.1016/j.epsr.2006.08.008.
10. Jaap Gordijn, Michael Petit, and Roel Wieringa. Understanding business strategiesof networked value constellations using goal- and value modeling. In Martin Glinzand Robyn Lutz, editors, Proceedings of the 14th IEEE International RequirementsEngineering Conference, pages 129–138, Los Alamitos, CA, 2006. IEEE CS.
11. J. Magretta. The power of virtual integration: an interview with dell computersmichael dell. Harvard Business Review, 76(2):72–84, March-April 1998.
12. A. Osterwalder and Y. Pigneur. An ontology for e-Business models. In W.L.Currie, editor, Value Creation From e-Business Models, chapter 4, pages 65–97.Elsevier Butterworth-Heinemann, Oxford, UK, 2004.
13. Vincent Pijpers and Jaap Gordijn. Bridging business value models and businessprocess models in aviation value webs via possession rights. Accepted by HICSS2007, see http://docs.e3value.com/bibtex/pdf/PijpersBridging2007.pdf, 2007.
14. Vincent Pijpers and Jaap Gordijn. e3forces: Understanding the environment ofnetworked value constellations for strategic goal and business model analysis. Sub-mitted, see http://docs.e3value.com/bibtex/pdf/PijpersStrategy2007.pdf, 2007.
15. M. E. Porter. Strategy and the Internet. Harvard Business Review, (march):63–78,2001.
16. J. Sowa and J. Zachman. Extending and formalizing the framework for informationsystems architecture. IBM Systems Journal, 31:590616, 1998.
17. D. Tapscott, D. Ticoll, and A. Lowy. Digital Capital - Harnessing the Power ofBusiness Webs. Nicholas Brealy Publishing, London, UK, 2000.
18. H. Weigand. On the notion of value object. volume 4001 of LNCS, pages 321–335,Berlin, D, 2006. Springer.
19. H. Weigand, Paul Johannesson, Birger Andersson, Maria Bergholtz, AnandaEdirisuriya, and Tharaka Ilayperuma. Strategic analysis using value modeling- the c3-value approach. Accepted by HICSS 2007, 2007.
Copyright © 2022 FDOKUMEN