Assessing bed net use and non-use after long-lasting insecticidal net distribution: a simple...
9
Vanden Eng et al. Malaria Journal 2010, 9:133 http://www.malariajournal.com/content/9/1/133 Open Access RESEARCH © 2010 Eng et al; licensee BioMed Central Ltd. This is an Open Access article distributed under the terms of the Creative Commons At- tribution License (http://creativecommons.org/licenses/by/2.0), which permits unrestricted use, distribution, and reproduction in any medium, provided the original work is properly cited. Research Assessing bed net use and non-use after long-lasting insecticidal net distribution: a simple framework to guide programmatic strategies Jodi L Vanden Eng* 1 , Julie Thwing 1 , Adam Wolkon 1 , Manisha A Kulkarni 2 , Ayub Manya 3 , Marcy Erskine 4 , Allen Hightower 1 and Laurence Slutsker 1 Abstract Background: Insecticide-treated nets (ITNs) are becoming increasingly available to vulnerable populations at risk for malaria. Their appropriate and consistent use is essential to preventing malaria, but ITN use often lags behind ITN ownership. In order to increase ITN use, it is necessary to devise strategies that accurately identify, differentiate, and target the reasons and types of non-use. Methods: A simple method based on the end-user as the denominator was employed to classify each individual into one of four ITN use categories: 1) living in households not owning an ITN; 2) living in households owning, but not hanging an ITN; 3) living in households owning and hanging an ITN, but who are not sleeping under one; and 4) sleeping under an ITN. This framework was applied to survey data designed to evaluate long-lasting insecticidal nets (LLINs) distributions following integrated campaigns in five countries: Togo, Sierra Leone, Madagascar, Kenya and Niger. Results: The percentage of children <5 years of age sleeping under an ITN ranged from 51.5% in Kenya to 81.1% in Madagascar. Among the three categories of non-use, children living in households without an ITN make up largest group (range: 9.4%-30.0%), despite the efforts of the integrated child health campaigns. The percentage of children who live in households that own but do not hang an ITN ranged from 5.1% to 16.1%. The percentage of children living in households where an ITN was suspended, but who were not sleeping under it ranged from 4.3% to 16.4%. Use by all household members in Sierra Leone (39.9%) and Madagascar (60.4%) indicate that integrated campaigns reach beyond their desired target populations. Conclusions: The framework outlined in this paper provides a helpful tool to examine the deficiencies in ITN use. Monitoring and evaluation strategies designed to assess ITN ownership and use can easily incorporate this approach using existing data collection instruments that measure the standard indicators. Background The efficacy and cost-effectiveness of insecticide-treated nets (ITNs) in reducing malaria related morbidity and mortality is well-known [1,2] and in recent years has led to massive efforts to distribute millions of free or highly subsidized ITNs to vulnerable populations in sub-Saha- ran Africa [3-6]. In 2005, the Roll Back Malaria Partner- ship (RBM) set the goal for 2010 to achieve 80% coverage of children <5 years of age and pregnant women with pro- tective measures such as ITNs [7]. More recently, the Global Malaria Action Plan called for rapid scale-up to universal population coverage for all people at risk for malaria [8]. This scale-up in ITN delivery necessitates an equivalent increase in monitoring and evaluation (M&E) efforts in order to determine the impact of ITN distribu- tions as well as prioritize future programmes. Typical M&E strategies report on indicators agreed upon and formalized by the RBM Monitoring and Evalu- ation Reference Group (MERG). Two important core ITN indicators for malaria control programmes are the pro- portion of households owning an ITN and the proportion of vulnerable populations sleeping under an ITN. Using * Correspondence: [email protected] 1 Centers for Disease Control and Prevention, Center for Global Health, Division of Parasitic Diseases and Malaria, 4770 Buford Hwy MS F-22, Atlanta, GA 30341, USA Full list of author information is available at the end of the article
Transcript of Assessing bed net use and non-use after long-lasting insecticidal net distribution: a simple...
Vanden Eng et al. Malaria Journal 2010, 9:133http://www.malariajournal.com/content/9/1/133
Open AccessR E S E A R C H
ResearchAssessing bed net use and non-use after long-lasting insecticidal net distribution: a simple framework to guide programmatic strategiesJodi L Vanden Eng*1, Julie Thwing1, Adam Wolkon1, Manisha A Kulkarni2, Ayub Manya3, Marcy Erskine4, Allen Hightower1 and Laurence Slutsker1
AbstractBackground: Insecticide-treated nets (ITNs) are becoming increasingly available to vulnerable populations at risk for malaria. Their appropriate and consistent use is essential to preventing malaria, but ITN use often lags behind ITN ownership. In order to increase ITN use, it is necessary to devise strategies that accurately identify, differentiate, and target the reasons and types of non-use.
Methods: A simple method based on the end-user as the denominator was employed to classify each individual into one of four ITN use categories: 1) living in households not owning an ITN; 2) living in households owning, but not hanging an ITN; 3) living in households owning and hanging an ITN, but who are not sleeping under one; and 4) sleeping under an ITN. This framework was applied to survey data designed to evaluate long-lasting insecticidal nets (LLINs) distributions following integrated campaigns in five countries: Togo, Sierra Leone, Madagascar, Kenya and Niger.
Results: The percentage of children <5 years of age sleeping under an ITN ranged from 51.5% in Kenya to 81.1% in Madagascar. Among the three categories of non-use, children living in households without an ITN make up largest group (range: 9.4%-30.0%), despite the efforts of the integrated child health campaigns. The percentage of children who live in households that own but do not hang an ITN ranged from 5.1% to 16.1%. The percentage of children living in households where an ITN was suspended, but who were not sleeping under it ranged from 4.3% to 16.4%. Use by all household members in Sierra Leone (39.9%) and Madagascar (60.4%) indicate that integrated campaigns reach beyond their desired target populations.
Conclusions: The framework outlined in this paper provides a helpful tool to examine the deficiencies in ITN use. Monitoring and evaluation strategies designed to assess ITN ownership and use can easily incorporate this approach using existing data collection instruments that measure the standard indicators.
BackgroundThe efficacy and cost-effectiveness of insecticide-treatednets (ITNs) in reducing malaria related morbidity andmortality is well-known [1,2] and in recent years has ledto massive efforts to distribute millions of free or highlysubsidized ITNs to vulnerable populations in sub-Saha-ran Africa [3-6]. In 2005, the Roll Back Malaria Partner-ship (RBM) set the goal for 2010 to achieve 80% coverageof children <5 years of age and pregnant women with pro-
tective measures such as ITNs [7]. More recently, theGlobal Malaria Action Plan called for rapid scale-up touniversal population coverage for all people at risk formalaria [8]. This scale-up in ITN delivery necessitates anequivalent increase in monitoring and evaluation (M&E)efforts in order to determine the impact of ITN distribu-tions as well as prioritize future programmes.
Typical M&E strategies report on indicators agreedupon and formalized by the RBM Monitoring and Evalu-ation Reference Group (MERG). Two important core ITNindicators for malaria control programmes are the pro-portion of households owning an ITN and the proportionof vulnerable populations sleeping under an ITN. Using
* Correspondence: [email protected] Centers for Disease Control and Prevention, Center for Global Health, Division of Parasitic Diseases and Malaria, 4770 Buford Hwy MS F-22, Atlanta, GA 30341, USAFull list of author information is available at the end of the article
© 2010 Eng et al; licensee BioMed Central Ltd. This is an Open Access article distributed under the terms of the Creative Commons At-tribution License (http://creativecommons.org/licenses/by/2.0), which permits unrestricted use, distribution, and reproduction in anymedium, provided the original work is properly cited.
Vanden Eng et al. Malaria Journal 2010, 9:133http://www.malariajournal.com/content/9/1/133
Page 2 of 9
these measures, many studies have shown that efforts toincrease ITN ownership have made tremendous progress;however, most sub-Saharan countries remain well belowRBM targets for ownership [9]. In addition, these evalua-tions have consistently found ITN use (vulnerable groupssleeping under an ITN) lower than household ownership[10-12]. In order to reach the RBM goals for bed net cov-erage and increase ITN use, it will be useful for pro-grammes to identify and address the determinants of ITNuse and non-use.
The two core RBM bed net indicators provide goodmeasures of ITN ownership and use, but in and of them-selves cannot provide measures for non-use. The differ-ence between household ITN ownership and individualuse cannot be used to estimate non-use because theseindicators have different denominators (households andpersons, respectively). As a result, there exists literatureinvestigating determinants of bed net use and non-usewith a variety of different methods. One method is torestrict analyses to households that already own an ITNin order to observe factors of use other than access[12,13]. For example, in households owning ITNs, chil-dren < 5 and women of reproductive age are more likelyto sleep under ITNs than other household members, per-haps confirming the effectiveness of messaging that oftenaccompanies distribution or marketing campaigns target-ing these high risk groups [14,15]. Data on persons whodid not use an ITN the previous night may prove equallyinformative. A bed net study in Kenya looked at reasonsgiven for not hanging a net and factors that increase ordecrease the likelihood that a net will be used; the mostimportant reason for non-adherence was disruption ofsleeping arrangements [16].
Following mass distribution campaigns some malariacontrol programmes implement intervention strategiesaimed at increasing ITN coverage. Information, educa-tion, and communication/behaviour change communica-tion (IEC/BCC) interventions primarily target andencourage people to hang and sleep under existing bednets. Hang-up campaigns, send volunteers to selectedhomes and teach the occupants the importance of sleep-ing under an ITN, demonstrate how to hang a net, andhang one or more of the household's nets. Keep-up distri-butions, social marketing, subsidized nets, and distribu-tion through other public health services such asantenatal care clinics aim to improve access to ITNs.These strategies for increasing ITN coverage can beloosely classified into three groups: 1) those aimed atimproving ITN access, 2) those encouraging hangingITNs, and 3) those targeting individuals to encouragesleeping under an existing ITN. Data obtained from sur-veys evaluating the core RBM bednet indicators can beused to determine what proportion of individuals cur-rently not sleeping under an ITN would be targeted by
each of these three categories. Results identifying specificareas of non-use will enable malaria programmes to makeinformed decisions about which intervention strategiesmay be more cost-effective to improve ITN coverage.
Although population based indicators of ITN non-usecould indeed be programmatically useful, none currentlyexist. This paper presents a simple framework that sup-plements information provided by the two core RBM bednet indicators through applying an easy-to-use method toevaluate the different categories of non-use. This tech-nique can be easily applied to data commonly collectedon national household cluster survey instruments such asMalaria Indicator Surveys (MIS) and Demographic andHealth Surveys (DHS). To demonstrate, this approachwas applied to data from household cluster surveysdesigned to evaluate long-lasting insecticidal net (LLIN)coverage following integrated child health campaigns infive countries.
MethodsIntegrated campaignsNational integrated child health campaigns distributedLLINs and other child health commodities between 2004and 2006 in five countries: Togo, Niger, Kenya, Madagas-car, and Sierra Leone (Table 1). The campaigns werenationwide in Togo, Niger, and Sierra Leone, and in asub-national area of malaria risk in Kenya and Madagas-car. With the exception of Kenya, where ITNs had previ-ously been distributed through a subsidized vouchersystem in antenatal and vaccination clinics and to a lim-ited degree through the private sector, very few ITNswere present in the other countries prior to these cam-paigns. In Niger and Kenya, large numbers of conven-tional nets, usually untreated, were present. Followingmass LLIN distribution, hang-up campaigns were imple-mented in selected areas in each country.
SurveysPost-campaign evaluation surveys were conducted dur-ing the rainy season following the integrated campaignsin these five countries (Table 1) [6,17-19]. These surveysall employed sampling designs and questionnaires thatincorporated rosters of nets and household occupants forassessing net ownership, hanging and use similar to theMIS. These methods have been described in detail else-where [6]. In brief, a community-based, stratified two-stage cluster sample design was used followed by a selec-tion of a simple random sample of households. Data pro-vided by the most recent census that included populationestimates at regional, local, and enumeration area (EA) orvillage level were used as the sampling frame. Probabilityproportional to size sampling (PPS) was used first toselect regions/districts, and again at the second stage ofsampling to choose the primary sampling unit (a village

Vanden Eng et al. Malaria Journal 2010, 9:133http://www.malariajournal.com/content/9/1/133
Page 3 of 9
or EA). If a village/EA was inaccessible for logistical rea-sons, a randomly selected alternate was used. Personaldigital assistants (PDAs) equipped with global position-ing systems (GPS) were used for data collection, as previ-ously described [20]. After GPS-mapping of the selectedcommunity, households were selected for interview usingsimple random sampling implemented on the PDA. Thesame day of the mapping, the teams returned to theselected households to administer the questionnaire byPDA (developed using Visual CE; Syware Inc., Cam-bridge, MA, USA). Households were revisited if no onewas available for interview on the first attempt; if no onewas available after 2 attempts the interviewer continuedto the next randomly selected household on the list untilthe desired number of households was obtained. For eachcluster, the number of households in the sampled list wasincreased in size at the sampling stage to cover potentialnon-response. Therefore, the probability of inclusion fora household within a cluster was the proportion of house-holds selected times the response rate for that cluster. Noalternate was used if a household refused to participate,with the exception of Niger, in which a randomly selectedalternate was used. Refusal information was not recordedfor Kenya and Togo.
All protocols were reviewed and approved by the Cen-ters for Disease Control and Prevention Human SubjectsResearch Office, and ethical clearance was obtained fromthe ethical and human subjects committees in the respec-tive countries. Participants gave verbal informed consentto answer the questionnaire.
Data analysisThe two core RBM outcome indicators were calculatedfollowing standard guidelines [21]. Household ITN pos-session was defined as the number of households sur-veyed with at least one ITN over a denominator of thetotal number of households surveyed. The level of ITNcoverage of children was defined as the number of chil-dren <5 years of age who slept under an ITN the previousnight over a denominator of the total number of children<5 years of age who spent the previous night in surveyedhouseholds. Another commonly used indicator, the pro-portion of ITNs hanging, is also presented here for com-pleteness. This was calculated as the number of ITNssuspended over a sleeping space the previous night, overa denominator of the total number of ITNs in householdssurveyed. Results for the two RBM core indicators inMadagascar and Niger have been published elsewhereand are repeated here for completeness [6,17].
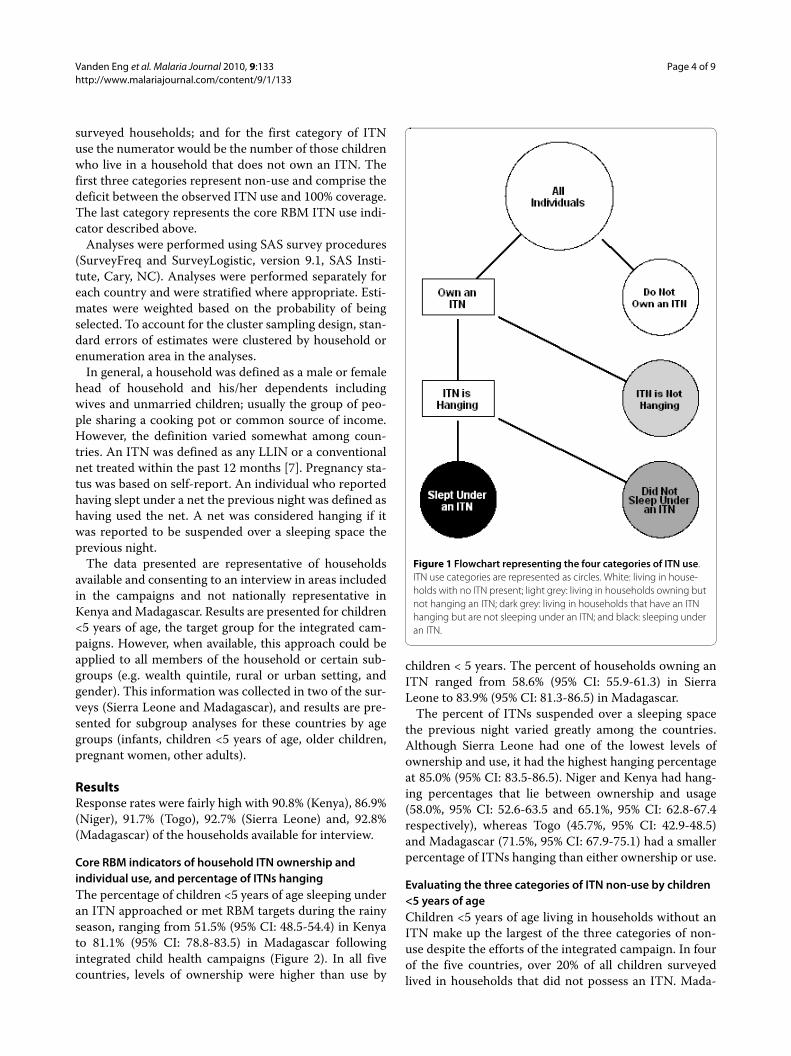
Based on survey responses about ownership, bed netcharacteristics, and individual use, individuals were clas-sified into one of four categories of ITN use: 1) living inhouseholds with no ITN present; 2) living in householdsowning but not hanging an ITN; 3) living in householdsthat have an ITN hanging but who are not sleeping underan ITN; and 4) sleeping under an ITN (Figure 1). Thesefour mutually exclusive categories all use a commondenominator: all members of the target group of interest.For example, with data from child health campaigns thecommon denominator would likely be the number ofchildren < 5 years of age who spent the previous night in
Table 1: Summary of campaigns and surveys in each country
Country Number of LLINs Distributed and Strategy
Population Dates of Campaign
Dates of Survey Number of Households Surveyed
Number of Children (People)* Surveyed
Togo 850,000; one per child 9-59 months
5,548,702 Dec 2004 Sept 12-Oct 7, 2005
3523 4134
Niger 2,100,000; one per mother with ≥ 1 child < 5 years of age
12,525,094 Dec 2005, March 2006
Sept 11-Oct 2, 2006
2450 3113
Kenya 3,400,000; one net per child <5 years of age
34,707,817 July 2006, Sept 2006
Oct 18-Nov 1, 2006
2059 1757
Madagascar 1,500,000; one per child <5 years of age, max 2 per household
20,653,556 Oct 2007 April 11-May 1, 2008
4320 3355(18718)
Sierra Leone 875,000; one per child <5 years of age, max 2 per household
6,294,774 Nov 2006 Oct 29-Nov 17, 2007
5186 4674(22149)
*The numbers in parenthesis provide the total number of people interviewed for Madagascar and Sierra Leone, the two countries in which data on all household members was collected.
Vanden Eng et al. Malaria Journal 2010, 9:133http://www.malariajournal.com/content/9/1/133
Page 4 of 9
surveyed households; and for the first category of ITNuse the numerator would be the number of those childrenwho live in a household that does not own an ITN. Thefirst three categories represent non-use and comprise thedeficit between the observed ITN use and 100% coverage.The last category represents the core RBM ITN use indi-cator described above.
Analyses were performed using SAS survey procedures(SurveyFreq and SurveyLogistic, version 9.1, SAS Insti-tute, Cary, NC). Analyses were performed separately foreach country and were stratified where appropriate. Esti-mates were weighted based on the probability of beingselected. To account for the cluster sampling design, stan-dard errors of estimates were clustered by household orenumeration area in the analyses.
In general, a household was defined as a male or femalehead of household and his/her dependents includingwives and unmarried children; usually the group of peo-ple sharing a cooking pot or common source of income.However, the definition varied somewhat among coun-tries. An ITN was defined as any LLIN or a conventionalnet treated within the past 12 months [7]. Pregnancy sta-tus was based on self-report. An individual who reportedhaving slept under a net the previous night was defined ashaving used the net. A net was considered hanging if itwas reported to be suspended over a sleeping space theprevious night.
The data presented are representative of householdsavailable and consenting to an interview in areas includedin the campaigns and not nationally representative inKenya and Madagascar. Results are presented for children<5 years of age, the target group for the integrated cam-paigns. However, when available, this approach could beapplied to all members of the household or certain sub-groups (e.g. wealth quintile, rural or urban setting, andgender). This information was collected in two of the sur-veys (Sierra Leone and Madagascar), and results are pre-sented for subgroup analyses for these countries by agegroups (infants, children <5 years of age, older children,pregnant women, other adults).
ResultsResponse rates were fairly high with 90.8% (Kenya), 86.9%(Niger), 91.7% (Togo), 92.7% (Sierra Leone) and, 92.8%(Madagascar) of the households available for interview.
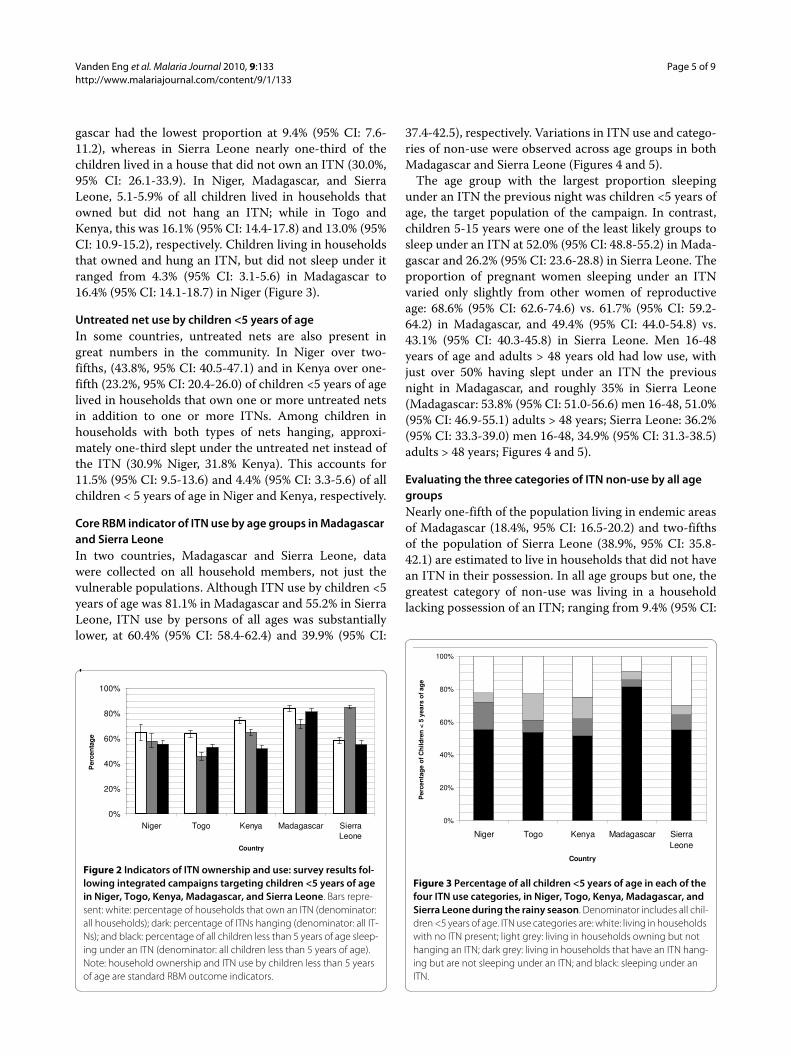
Core RBM indicators of household ITN ownership and individual use, and percentage of ITNs hangingThe percentage of children <5 years of age sleeping underan ITN approached or met RBM targets during the rainyseason, ranging from 51.5% (95% CI: 48.5-54.4) in Kenyato 81.1% (95% CI: 78.8-83.5) in Madagascar followingintegrated child health campaigns (Figure 2). In all fivecountries, levels of ownership were higher than use by
children < 5 years. The percent of households owning anITN ranged from 58.6% (95% CI: 55.9-61.3) in SierraLeone to 83.9% (95% CI: 81.3-86.5) in Madagascar.
The percent of ITNs suspended over a sleeping spacethe previous night varied greatly among the countries.Although Sierra Leone had one of the lowest levels ofownership and use, it had the highest hanging percentageat 85.0% (95% CI: 83.5-86.5). Niger and Kenya had hang-ing percentages that lie between ownership and usage(58.0%, 95% CI: 52.6-63.5 and 65.1%, 95% CI: 62.8-67.4respectively), whereas Togo (45.7%, 95% CI: 42.9-48.5)and Madagascar (71.5%, 95% CI: 67.9-75.1) had a smallerpercentage of ITNs hanging than either ownership or use.
Evaluating the three categories of ITN non-use by children <5 years of ageChildren <5 years of age living in households without anITN make up the largest of the three categories of non-use despite the efforts of the integrated campaign. In fourof the five countries, over 20% of all children surveyedlived in households that did not possess an ITN. Mada-
Figure 1 Flowchart representing the four categories of ITN use. ITN use categories are represented as circles. White: living in house-holds with no ITN present; light grey: living in households owning but not hanging an ITN; dark grey: living in households that have an ITN hanging but are not sleeping under an ITN; and black: sleeping under an ITN.
Vanden Eng et al. Malaria Journal 2010, 9:133http://www.malariajournal.com/content/9/1/133
Page 5 of 9
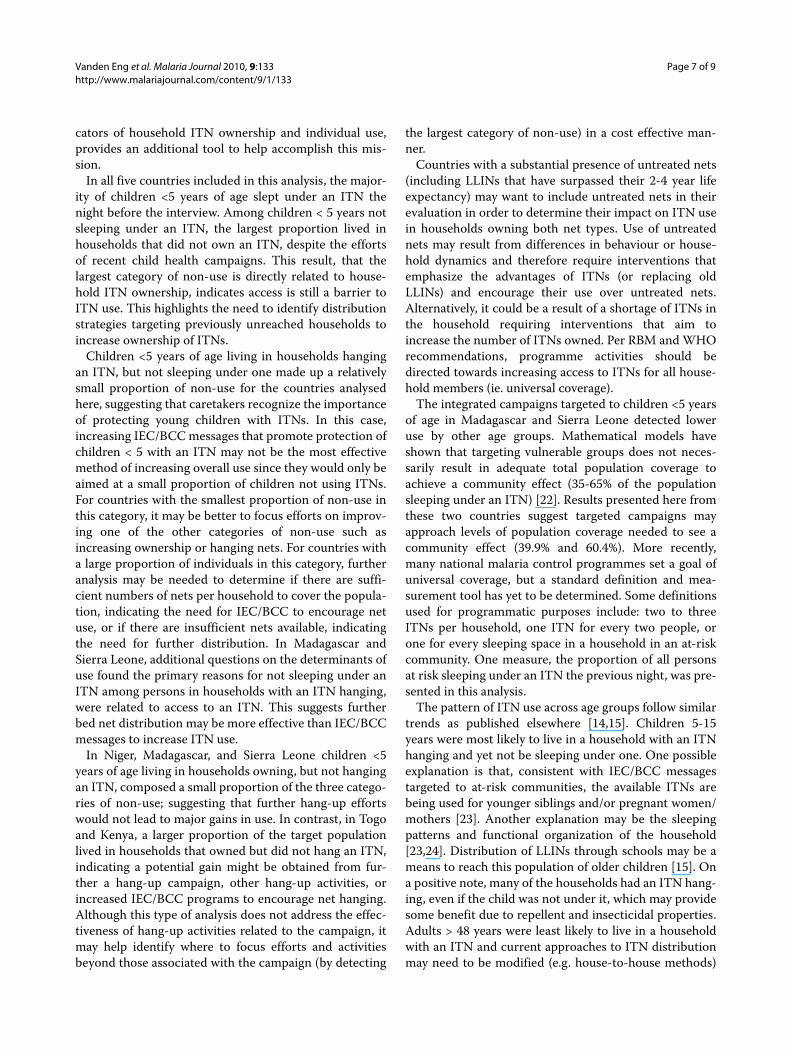
gascar had the lowest proportion at 9.4% (95% CI: 7.6-11.2), whereas in Sierra Leone nearly one-third of thechildren lived in a house that did not own an ITN (30.0%,95% CI: 26.1-33.9). In Niger, Madagascar, and SierraLeone, 5.1-5.9% of all children lived in households thatowned but did not hang an ITN; while in Togo andKenya, this was 16.1% (95% CI: 14.4-17.8) and 13.0% (95%CI: 10.9-15.2), respectively. Children living in householdsthat owned and hung an ITN, but did not sleep under itranged from 4.3% (95% CI: 3.1-5.6) in Madagascar to16.4% (95% CI: 14.1-18.7) in Niger (Figure 3).
Untreated net use by children <5 years of ageIn some countries, untreated nets are also present ingreat numbers in the community. In Niger over two-fifths, (43.8%, 95% CI: 40.5-47.1) and in Kenya over one-fifth (23.2%, 95% CI: 20.4-26.0) of children <5 years of agelived in households that own one or more untreated netsin addition to one or more ITNs. Among children inhouseholds with both types of nets hanging, approxi-mately one-third slept under the untreated net instead ofthe ITN (30.9% Niger, 31.8% Kenya). This accounts for11.5% (95% CI: 9.5-13.6) and 4.4% (95% CI: 3.3-5.6) of allchildren < 5 years of age in Niger and Kenya, respectively.
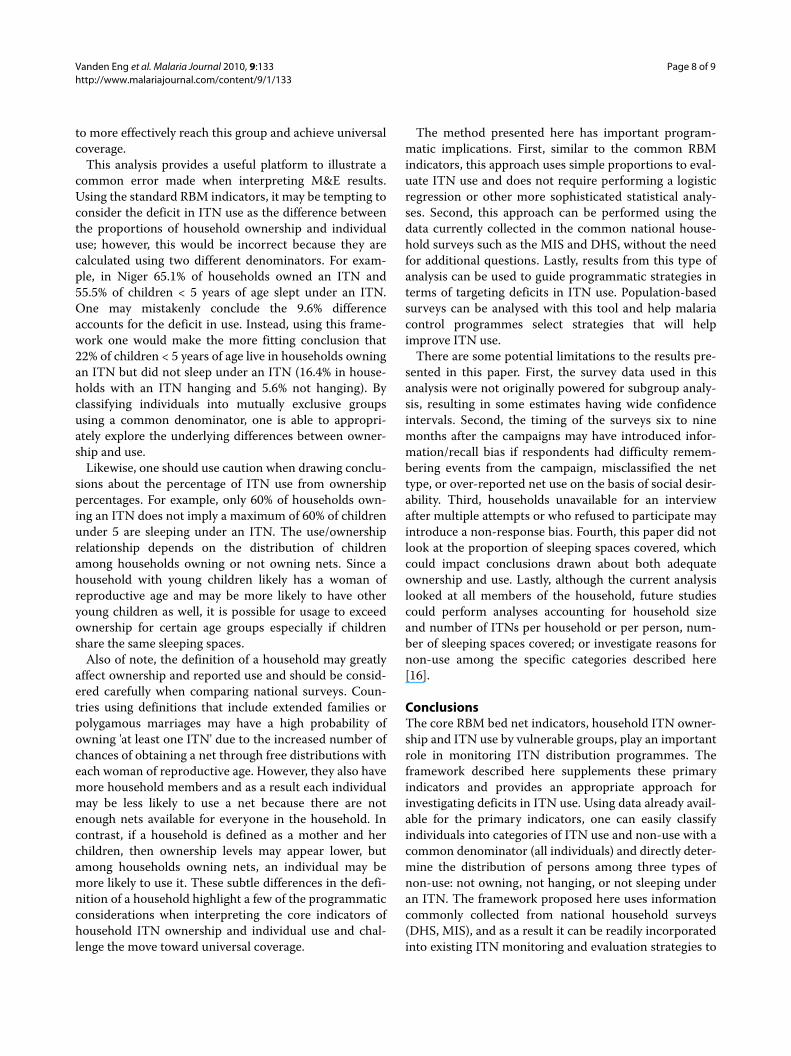
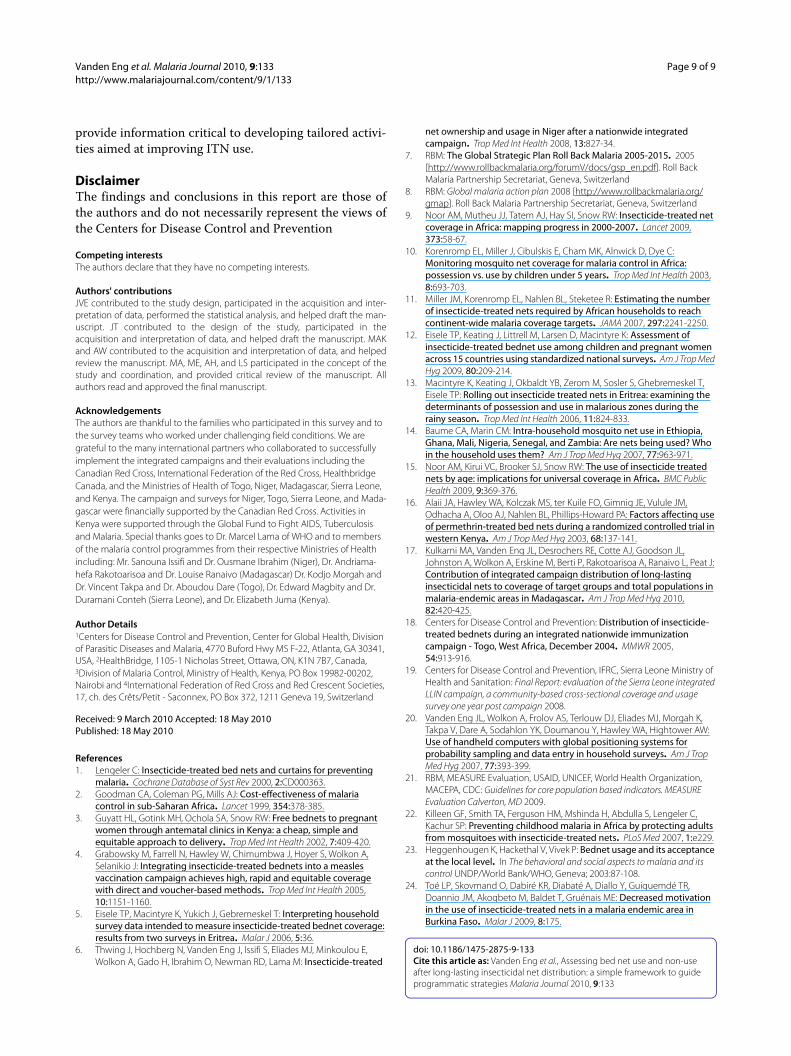
Core RBM indicator of ITN use by age groups in Madagascar and Sierra LeoneIn two countries, Madagascar and Sierra Leone, datawere collected on all household members, not just thevulnerable populations. Although ITN use by children <5years of age was 81.1% in Madagascar and 55.2% in SierraLeone, ITN use by persons of all ages was substantiallylower, at 60.4% (95% CI: 58.4-62.4) and 39.9% (95% CI:
37.4-42.5), respectively. Variations in ITN use and catego-ries of non-use were observed across age groups in bothMadagascar and Sierra Leone (Figures 4 and 5).
The age group with the largest proportion sleepingunder an ITN the previous night was children <5 years ofage, the target population of the campaign. In contrast,children 5-15 years were one of the least likely groups tosleep under an ITN at 52.0% (95% CI: 48.8-55.2) in Mada-gascar and 26.2% (95% CI: 23.6-28.8) in Sierra Leone. Theproportion of pregnant women sleeping under an ITNvaried only slightly from other women of reproductiveage: 68.6% (95% CI: 62.6-74.6) vs. 61.7% (95% CI: 59.2-64.2) in Madagascar, and 49.4% (95% CI: 44.0-54.8) vs.43.1% (95% CI: 40.3-45.8) in Sierra Leone. Men 16-48years of age and adults > 48 years old had low use, withjust over 50% having slept under an ITN the previousnight in Madagascar, and roughly 35% in Sierra Leone(Madagascar: 53.8% (95% CI: 51.0-56.6) men 16-48, 51.0%(95% CI: 46.9-55.1) adults > 48 years; Sierra Leone: 36.2%(95% CI: 33.3-39.0) men 16-48, 34.9% (95% CI: 31.3-38.5)adults > 48 years; Figures 4 and 5).
Evaluating the three categories of ITN non-use by all age groupsNearly one-fifth of the population living in endemic areasof Madagascar (18.4%, 95% CI: 16.5-20.2) and two-fifthsof the population of Sierra Leone (38.9%, 95% CI: 35.8-42.1) are estimated to live in households that did not havean ITN in their possession. In all age groups but one, thegreatest category of non-use was living in a householdlacking possession of an ITN; ranging from 9.4% (95% CI:
Figure 2 Indicators of ITN ownership and use: survey results fol-lowing integrated campaigns targeting children <5 years of age in Niger, Togo, Kenya, Madagascar, and Sierra Leone. Bars repre-sent: white: percentage of households that own an ITN (denominator: all households); dark: percentage of ITNs hanging (denominator: all IT-Ns); and black: percentage of all children less than 5 years of age sleep-ing under an ITN (denominator: all children less than 5 years of age). Note: household ownership and ITN use by children less than 5 years of age are standard RBM outcome indicators.
0%
20%
40%
60%
80%
100%
Niger Togo Kenya Madagascar SierraLeone
Country
Per
cen
tag
e
Figure 3 Percentage of all children <5 years of age in each of the four ITN use categories, in Niger, Togo, Kenya, Madagascar, and Sierra Leone during the rainy season. Denominator includes all chil-dren <5 years of age. ITN use categories are: white: living in households with no ITN present; light grey: living in households owning but not hanging an ITN; dark grey: living in households that have an ITN hang-ing but are not sleeping under an ITN; and black: sleeping under an ITN.
0%
20%
40%
60%
80%
100%
Niger Togo Kenya Madagascar SierraLeone
Country
Per
cen
tag
e o
f C
hild
ren
< 5
yea
rs o
f ag
e

Vanden Eng et al. Malaria Journal 2010, 9:133http://www.malariajournal.com/content/9/1/133
Page 6 of 9
7.6-11.2) and 30.0%(95% CI: 26.1-33.9) of children <5years of age to 29.6% (95% CI: 25.9-33.3) and 46.9% (95%CI: 42.8-51.5) of adults > 49 years in Madagascar andSierra Leone respectively. The exception to this was inMadagascar among children 6-15 years of age where theITN non-use percentage was higher due to not sleepingunder a hanging ITN (24.1%, 95% CI: 21.3-26.9) asopposed to not owning an ITN (17.8%, 95% CI: 15.2-20.4).
In both Madagascar and Sierra Leone, roughly 16% ofthe people lived in households where an ITN was sus-pended over a sleeping space, but did not themselvessleep under an ITN (15.7%, 95% CI: 14.2-17.1 in Mada-gascar; 16.1%, 95% CI: 14.5-17.6 in Sierra Leone). Amongdifferent age groups, children <5 years of age had thesmallest proportion in this category (4.3%, 95% CI: 3.1-5.6 in Madagascar and 8.9%, 95% CI: 7.3-10.5 in SierraLeone), whereas children 5-15 years old had the largest inboth Madagascar (24.1%, 95% CI: 21.3-26.9) and SierraLeone 29.4% (95% CI: 26.3-32.5) (Figures 4 and 5). Themajority of people who lived in households with an ITNhanging but who did not sleep under one were in house-holds that only possessed one ITN (Sierra Leone: 70.7%,Madagascar 60.1%) and approximately 90% lived inhouseholds that owned no more than 2 ITNs (SierraLeone: 92.4%; Madagascar 89.0%).
People living in households that owned but did nothang an ITN made the smallest contribution to non-usein every age group, never reaching 10% (Figures 4 and 5).Overall, this included 5.1% (95% CI: 4.2-5.9) of the totalpopulation in Sierra Leone, and 5.6% (95% CI: 4.5-6.7) inMadagascar.
Reasons for non-use among persons in households with an ITN hangingDuring the interview, if a person responded that they didnot sleep under a net, a follow up question was asked todetermine the reasons why the person was not sleepingunder a net. In Madagascar, 75.2% (95% CI: 70.2-80.2) ofthe persons living in households with ITNs hanging butwho did not sleep under an ITN replied either someoneelse was using the net or there were not enough netsavailable (breakdown: 27.5% said someone else was usingthe net, 42.2% said there were not enough nets available,5.5% gave both reasons). In Sierra Leone, among personsin households with ITNs hanging 33.9% (95% CI: 23.2-44.5) of all people responded the main reason they werenot sleeping under a net was 'someone else was sleepingunder it' and 45.2% (95% CI: 38.9-51.4) responded 'other'('not enough nets available' was not offered as a choice).In both countries, when looking across age groups therewas little variation in reasons for not sleeping under a net,and among the other possible reasons offered, noneexceeded 10% of the respondents.
DiscussionWhile many sub-Saharan African countries have madegreat progress in ITN scale-up, much work remains. Anaccurate assessment to identify the gaps in householdownership and individual use is a crucial step in devisingevidence-based and country-specific strategies toincrease population coverage with ITNs and worktowards the interruption of malaria transmission. Theframework described here, which uses a commondenominator (the individual) to evaluate categories ofITN non-use in addition to evaluating the core RBM indi-
Figure 4 Age specific breakdown of individuals in each of the four ITN use categories during the rainy season following an inte-grated campaign targeting children <5 years of age in Madagas-car. Denominator includes all persons in respective age group. ITN use categories are: white: living in households with no ITN present; light grey: living in households owning but not hanging an ITN; dark grey: living in households that have an ITN hanging but are not sleeping un-der an ITN; and black: sleeping under an ITN. Female 16-48 includes non-pregnant women of reproductive age.
0%
20%
40%
60%
80%
100%
child <5 child 5-15
pregnant female16-48
male 16-48
over 48 All
Age Group
Per
cen
tag
e
Figure 5 Age specific breakdown of individuals in each of the four ITN use categories during rainy season following an inte-grated campaign targeting children <5 years of age in Sierra Le-one. Denominator includes all persons in respective age group. ITN use categories are: white: living in households with no ITN present; light grey: living in households owning but not hanging an ITN; dark grey: living in households that have an ITN hanging but are not sleep-ing under an ITN; and black: sleeping under an ITN. Female 16-48 in-cludes non-pregnant women of reproductive age.
0%
20%
40%
60%
80%
100%
child <5 child 5-15
pregnant female16-48
male 16-48
over 48 All
Age Group
Per
cen
tag
e
Vanden Eng et al. Malaria Journal 2010, 9:133http://www.malariajournal.com/content/9/1/133
Page 7 of 9
cators of household ITN ownership and individual use,provides an additional tool to help accomplish this mis-sion.
In all five countries included in this analysis, the major-ity of children <5 years of age slept under an ITN thenight before the interview. Among children < 5 years notsleeping under an ITN, the largest proportion lived inhouseholds that did not own an ITN, despite the effortsof recent child health campaigns. This result, that thelargest category of non-use is directly related to house-hold ITN ownership, indicates access is still a barrier toITN use. This highlights the need to identify distributionstrategies targeting previously unreached households toincrease ownership of ITNs.
Children <5 years of age living in households hangingan ITN, but not sleeping under one made up a relativelysmall proportion of non-use for the countries analysedhere, suggesting that caretakers recognize the importanceof protecting young children with ITNs. In this case,increasing IEC/BCC messages that promote protection ofchildren < 5 with an ITN may not be the most effectivemethod of increasing overall use since they would only beaimed at a small proportion of children not using ITNs.For countries with the smallest proportion of non-use inthis category, it may be better to focus efforts on improv-ing one of the other categories of non-use such asincreasing ownership or hanging nets. For countries witha large proportion of individuals in this category, furtheranalysis may be needed to determine if there are suffi-cient numbers of nets per household to cover the popula-tion, indicating the need for IEC/BCC to encourage netuse, or if there are insufficient nets available, indicatingthe need for further distribution. In Madagascar andSierra Leone, additional questions on the determinants ofuse found the primary reasons for not sleeping under anITN among persons in households with an ITN hanging,were related to access to an ITN. This suggests furtherbed net distribution may be more effective than IEC/BCCmessages to increase ITN use.
In Niger, Madagascar, and Sierra Leone children <5years of age living in households owning, but not hangingan ITN, composed a small proportion of the three catego-ries of non-use; suggesting that further hang-up effortswould not lead to major gains in use. In contrast, in Togoand Kenya, a larger proportion of the target populationlived in households that owned but did not hang an ITN,indicating a potential gain might be obtained from fur-ther a hang-up campaign, other hang-up activities, orincreased IEC/BCC programs to encourage net hanging.Although this type of analysis does not address the effec-tiveness of hang-up activities related to the campaign, itmay help identify where to focus efforts and activitiesbeyond those associated with the campaign (by detecting
the largest category of non-use) in a cost effective man-ner.
Countries with a substantial presence of untreated nets(including LLINs that have surpassed their 2-4 year lifeexpectancy) may want to include untreated nets in theirevaluation in order to determine their impact on ITN usein households owning both net types. Use of untreatednets may result from differences in behaviour or house-hold dynamics and therefore require interventions thatemphasize the advantages of ITNs (or replacing oldLLINs) and encourage their use over untreated nets.Alternatively, it could be a result of a shortage of ITNs inthe household requiring interventions that aim toincrease the number of ITNs owned. Per RBM and WHOrecommendations, programme activities should bedirected towards increasing access to ITNs for all house-hold members (ie. universal coverage).
The integrated campaigns targeted to children <5 yearsof age in Madagascar and Sierra Leone detected loweruse by other age groups. Mathematical models haveshown that targeting vulnerable groups does not neces-sarily result in adequate total population coverage toachieve a community effect (35-65% of the populationsleeping under an ITN) [22]. Results presented here fromthese two countries suggest targeted campaigns mayapproach levels of population coverage needed to see acommunity effect (39.9% and 60.4%). More recently,many national malaria control programmes set a goal ofuniversal coverage, but a standard definition and mea-surement tool has yet to be determined. Some definitionsused for programmatic purposes include: two to threeITNs per household, one ITN for every two people, orone for every sleeping space in a household in an at-riskcommunity. One measure, the proportion of all personsat risk sleeping under an ITN the previous night, was pre-sented in this analysis.
The pattern of ITN use across age groups follow similartrends as published elsewhere [14,15]. Children 5-15years were most likely to live in a household with an ITNhanging and yet not be sleeping under one. One possibleexplanation is that, consistent with IEC/BCC messagestargeted to at-risk communities, the available ITNs arebeing used for younger siblings and/or pregnant women/mothers [23]. Another explanation may be the sleepingpatterns and functional organization of the household[23,24]. Distribution of LLINs through schools may be ameans to reach this population of older children [15]. Ona positive note, many of the households had an ITN hang-ing, even if the child was not under it, which may providesome benefit due to repellent and insecticidal properties.Adults > 48 years were least likely to live in a householdwith an ITN and current approaches to ITN distributionmay need to be modified (e.g. house-to-house methods)
Vanden Eng et al. Malaria Journal 2010, 9:133http://www.malariajournal.com/content/9/1/133
Page 8 of 9
to more effectively reach this group and achieve universalcoverage.
This analysis provides a useful platform to illustrate acommon error made when interpreting M&E results.Using the standard RBM indicators, it may be tempting toconsider the deficit in ITN use as the difference betweenthe proportions of household ownership and individualuse; however, this would be incorrect because they arecalculated using two different denominators. For exam-ple, in Niger 65.1% of households owned an ITN and55.5% of children < 5 years of age slept under an ITN.One may mistakenly conclude the 9.6% differenceaccounts for the deficit in use. Instead, using this frame-work one would make the more fitting conclusion that22% of children < 5 years of age live in households owningan ITN but did not sleep under an ITN (16.4% in house-holds with an ITN hanging and 5.6% not hanging). Byclassifying individuals into mutually exclusive groupsusing a common denominator, one is able to appropri-ately explore the underlying differences between owner-ship and use.
Likewise, one should use caution when drawing conclu-sions about the percentage of ITN use from ownershippercentages. For example, only 60% of households own-ing an ITN does not imply a maximum of 60% of childrenunder 5 are sleeping under an ITN. The use/ownershiprelationship depends on the distribution of childrenamong households owning or not owning nets. Since ahousehold with young children likely has a woman ofreproductive age and may be more likely to have otheryoung children as well, it is possible for usage to exceedownership for certain age groups especially if childrenshare the same sleeping spaces.
Also of note, the definition of a household may greatlyaffect ownership and reported use and should be consid-ered carefully when comparing national surveys. Coun-tries using definitions that include extended families orpolygamous marriages may have a high probability ofowning 'at least one ITN' due to the increased number ofchances of obtaining a net through free distributions witheach woman of reproductive age. However, they also havemore household members and as a result each individualmay be less likely to use a net because there are notenough nets available for everyone in the household. Incontrast, if a household is defined as a mother and herchildren, then ownership levels may appear lower, butamong households owning nets, an individual may bemore likely to use it. These subtle differences in the defi-nition of a household highlight a few of the programmaticconsiderations when interpreting the core indicators ofhousehold ITN ownership and individual use and chal-lenge the move toward universal coverage.
The method presented here has important program-matic implications. First, similar to the common RBMindicators, this approach uses simple proportions to eval-uate ITN use and does not require performing a logisticregression or other more sophisticated statistical analy-ses. Second, this approach can be performed using thedata currently collected in the common national house-hold surveys such as the MIS and DHS, without the needfor additional questions. Lastly, results from this type ofanalysis can be used to guide programmatic strategies interms of targeting deficits in ITN use. Population-basedsurveys can be analysed with this tool and help malariacontrol programmes select strategies that will helpimprove ITN use.
There are some potential limitations to the results pre-sented in this paper. First, the survey data used in thisanalysis were not originally powered for subgroup analy-sis, resulting in some estimates having wide confidenceintervals. Second, the timing of the surveys six to ninemonths after the campaigns may have introduced infor-mation/recall bias if respondents had difficulty remem-bering events from the campaign, misclassified the nettype, or over-reported net use on the basis of social desir-ability. Third, households unavailable for an interviewafter multiple attempts or who refused to participate mayintroduce a non-response bias. Fourth, this paper did notlook at the proportion of sleeping spaces covered, whichcould impact conclusions drawn about both adequateownership and use. Lastly, although the current analysislooked at all members of the household, future studiescould perform analyses accounting for household sizeand number of ITNs per household or per person, num-ber of sleeping spaces covered; or investigate reasons fornon-use among the specific categories described here[16].
ConclusionsThe core RBM bed net indicators, household ITN owner-ship and ITN use by vulnerable groups, play an importantrole in monitoring ITN distribution programmes. Theframework described here supplements these primaryindicators and provides an appropriate approach forinvestigating deficits in ITN use. Using data already avail-able for the primary indicators, one can easily classifyindividuals into categories of ITN use and non-use with acommon denominator (all individuals) and directly deter-mine the distribution of persons among three types ofnon-use: not owning, not hanging, or not sleeping underan ITN. The framework proposed here uses informationcommonly collected from national household surveys(DHS, MIS), and as a result it can be readily incorporatedinto existing ITN monitoring and evaluation strategies to
Vanden Eng et al. Malaria Journal 2010, 9:133http://www.malariajournal.com/content/9/1/133
Page 9 of 9
provide information critical to developing tailored activi-ties aimed at improving ITN use.
DisclaimerThe findings and conclusions in this report are those ofthe authors and do not necessarily represent the views ofthe Centers for Disease Control and Prevention
Competing interestsThe authors declare that they have no competing interests.
Authors' contributionsJVE contributed to the study design, participated in the acquisition and inter-pretation of data, performed the statistical analysis, and helped draft the man-uscript. JT contributed to the design of the study, participated in theacquisition and interpretation of data, and helped draft the manuscript. MAKand AW contributed to the acquisition and interpretation of data, and helpedreview the manuscript. MA, ME, AH, and LS participated in the concept of thestudy and coordination, and provided critical review of the manuscript. Allauthors read and approved the final manuscript.
AcknowledgementsThe authors are thankful to the families who participated in this survey and to the survey teams who worked under challenging field conditions. We are grateful to the many international partners who collaborated to successfully implement the integrated campaigns and their evaluations including the Canadian Red Cross, International Federation of the Red Cross, Healthbridge Canada, and the Ministries of Health of Togo, Niger, Madagascar, Sierra Leone, and Kenya. The campaign and surveys for Niger, Togo, Sierra Leone, and Mada-gascar were financially supported by the Canadian Red Cross. Activities in Kenya were supported through the Global Fund to Fight AIDS, Tuberculosis and Malaria. Special thanks goes to Dr. Marcel Lama of WHO and to members of the malaria control programmes from their respective Ministries of Health including: Mr. Sanouna Issifi and Dr. Ousmane Ibrahim (Niger), Dr. Andriama-hefa Rakotoarisoa and Dr. Louise Ranaivo (Madagascar) Dr. Kodjo Morgah and Dr. Vincent Takpa and Dr. Aboudou Dare (Togo), Dr. Edward Magbity and Dr. Duramani Conteh (Sierra Leone), and Dr. Elizabeth Juma (Kenya).
Author Details1Centers for Disease Control and Prevention, Center for Global Health, Division of Parasitic Diseases and Malaria, 4770 Buford Hwy MS F-22, Atlanta, GA 30341, USA, 2HealthBridge, 1105-1 Nicholas Street, Ottawa, ON, K1N 7B7, Canada, 3Division of Malaria Control, Ministry of Health, Kenya, PO Box 19982-00202, Nairobi and 4International Federation of Red Cross and Red Crescent Societies, 17, ch. des Crêts/Petit - Saconnex, PO Box 372, 1211 Geneva 19, Switzerland
References1. Lengeler C: Insecticide-treated bed nets and curtains for preventing
malaria. Cochrane Database of Syst Rev 2000, 2:CD000363.2. Goodman CA, Coleman PG, Mills AJ: Cost-effectiveness of malaria
control in sub-Saharan Africa. Lancet 1999, 354:378-385.3. Guyatt HL, Gotink MH, Ochola SA, Snow RW: Free bednets to pregnant
women through antematal clinics in Kenya: a cheap, simple and equitable approach to delivery. Trop Med Int Health 2002, 7:409-420.
4. Grabowsky M, Farrell N, Hawley W, Chimumbwa J, Hoyer S, Wolkon A, Selanikio J: Integrating insecticide-treated bednets into a measles vaccination campaign achieves high, rapid and equitable coverage with direct and voucher-based methods. Trop Med Int Health 2005, 10:1151-1160.
5. Eisele TP, Macintyre K, Yukich J, Gebremeskel T: Interpreting household survey data intended to measure insecticide-treated bednet coverage: results from two surveys in Eritrea. Malar J 2006, 5:36.
6. Thwing J, Hochberg N, Vanden Eng J, Issifi S, Eliades MJ, Minkoulou E, Wolkon A, Gado H, Ibrahim O, Newman RD, Lama M: Insecticide-treated
net ownership and usage in Niger after a nationwide integrated campaign. Trop Med Int Health 2008, 13:827-34.
7. RBM: The Global Strategic Plan Roll Back Malaria 2005-2015. 2005 [http://www.rollbackmalaria.org/forumV/docs/gsp_en.pdf]. Roll Back Malaria Partnership Secretariat, Geneva, Switzerland
8. RBM: Global malaria action plan 2008 [http://www.rollbackmalaria.org/gmap]. Roll Back Malaria Partnership Secretariat, Geneva, Switzerland
9. Noor AM, Mutheu JJ, Tatem AJ, Hay SI, Snow RW: Insecticide-treated net coverage in Africa: mapping progress in 2000-2007. Lancet 2009, 373:58-67.
10. Korenromp EL, Miller J, Cibulskis E, Cham MK, Alnwick D, Dye C: Monitoring mosquito net coverage for malaria control in Africa: possession vs. use by children under 5 years. Trop Med Int Health 2003, 8:693-703.
11. Miller JM, Korenromp EL, Nahlen BL, Steketee R: Estimating the number of insecticide-treated nets required by African households to reach continent-wide malaria coverage targets. JAMA 2007, 297:2241-2250.
12. Eisele TP, Keating J, Littrell M, Larsen D, Macintyre K: Assessment of insecticide-treated bednet use among children and pregnant women across 15 countries using standardized national surveys. Am J Trop Med Hyg 2009, 80:209-214.
13. Macintyre K, Keating J, Okbaldt YB, Zerom M, Sosler S, Ghebremeskel T, Eisele TP: Rolling out insecticide treated nets in Eritrea: examining the determinants of possession and use in malarious zones during the rainy season. Trop Med Int Health 2006, 11:824-833.
14. Baume CA, Marin CM: Intra-household mosquito net use in Ethiopia, Ghana, Mali, Nigeria, Senegal, and Zambia: Are nets being used? Who in the household uses them? Am J Trop Med Hyg 2007, 77:963-971.
15. Noor AM, Kirui VC, Brooker SJ, Snow RW: The use of insecticide treated nets by age: implications for universal coverage in Africa. BMC Public Health 2009, 9:369-376.
16. Alaii JA, Hawley WA, Kolczak MS, ter Kuile FO, Gimnig JE, Vulule JM, Odhacha A, Oloo AJ, Nahlen BL, Phillips-Howard PA: Factors affecting use of permethrin-treated bed nets during a randomized controlled trial in western Kenya. Am J Trop Med Hyg 2003, 68:137-141.
17. Kulkarni MA, Vanden Eng JL, Desrochers RE, Cotte AJ, Goodson JL, Johnston A, Wolkon A, Erskine M, Berti P, Rakotoarisoa A, Ranaivo L, Peat J: Contribution of integrated campaign distribution of long-lasting insecticidal nets to coverage of target groups and total populations in malaria-endemic areas in Madagascar. Am J Trop Med Hyg 2010, 82:420-425.
18. Centers for Disease Control and Prevention: Distribution of insecticide-treated bednets during an integrated nationwide immunization campaign - Togo, West Africa, December 2004. MMWR 2005, 54:913-916.
19. Centers for Disease Control and Prevention, IFRC, Sierra Leone Ministry of Health and Sanitation: Final Report: evaluation of the Sierra Leone integrated LLIN campaign, a community-based cross-sectional coverage and usage survey one year post campaign 2008.
20. Vanden Eng JL, Wolkon A, Frolov AS, Terlouw DJ, Eliades MJ, Morgah K, Takpa V, Dare A, Sodahlon YK, Doumanou Y, Hawley WA, Hightower AW: Use of handheld computers with global positioning systems for probability sampling and data entry in household surveys. Am J Trop Med Hyg 2007, 77:393-399.
21. RBM, MEASURE Evaluation, USAID, UNICEF, World Health Organization, MACEPA, CDC: Guidelines for core population based indicators. MEASURE Evaluation Calverton, MD 2009.
22. Killeen GF, Smith TA, Ferguson HM, Mshinda H, Abdulla S, Lengeler C, Kachur SP: Preventing childhood malaria in Africa by protecting adults from mosquitoes with insecticide-treated nets. PLoS Med 2007, 1:e229.
23. Heggenhougen K, Hackethal V, Vivek P: Bednet usage and its acceptance at the local level. In The behavioral and social aspects to malaria and its control UNDP/World Bank/WHO, Geneva; 2003:87-108.
24. Toé LP, Skovmand O, Dabiré KR, Diabaté A, Diallo Y, Guiguemdé TR, Doannio JM, Akogbeto M, Baldet T, Gruénais ME: Decreased motivation in the use of insecticide-treated nets in a malaria endemic area in Burkina Faso. Malar J 2009, 8:175.
doi: 10.1186/1475-2875-9-133Cite this article as: Vanden Eng et al., Assessing bed net use and non-use after long-lasting insecticidal net distribution: a simple framework to guide programmatic strategies Malaria Journal 2010, 9:133
Received: 9 March 2010 Accepted: 18 May 2010 Published: 18 May 2010This article is available from: http://www.malariajournal.com/content/9/1/133© 2010 Eng et al; licensee BioMed Central Ltd. This is an Open Access article distributed under the terms of the Creative Commons Attribution License (http://creativecommons.org/licenses/by/2.0), which permits unrestricted use, distribution, and reproduction in any medium, provided the original work is properly cited.Malaria Journal 2010, 9:133