Deaf parents with deaf children and hearing parents with ...
MPRAMunich Personal RePEc Archive
As my parents at home? Genderdifferences in childrens’ houseworkbetween Germany and Spain
J. Ignacio Gimenez-Nadal and Jose Alberto Molina and
Raquel Ortega
University of Zaragoza and CTUR, University of Zaragoza and IZA,University of Zaragoza
March 2015
Online at http://mpra.ub.uni-muenchen.de/62699/MPRA Paper No. 62699, posted 10. March 2015 07:20 UTC

1
1. Introduction
Parents and children usually live together and, in consequence, we can presumably
expect transmissions of behaviors. The study of transfers across generations or, in a
more extent way, intergenerational mobility, has been extensively studied in the
literature. Thus, Roemer (2004) formally discuss the relationship between
intergenerational transfers and equality of opportunities and considers three categories
of circumstances through which parents may give their children in advantage. First,
parents may influence life chances through the genetic transmissions of personality,
preferences or health. Second, parents may transmit economic advantages through
social connections facilitating access to jobs or access to sources of human capital.
Third, parents may influence the lifetime earnings of their children through a family
culture and other monetary and non-monetary investments.1
However, the degree of intergenerational mobility will not change significantly
without there being important behavioral changes in parents’ habits and social norms,
like, for instance, time dedicated to housework activities. Thus, we show in this paper
the relationship between the housework time dedicated by parents and the housework
time dedicated by children, by using diary data for two different countries: Germany
(2002) and Spain (2002). 2
We find positive correlations between parents and children’s housework time, which
indicates that the more time parents devote to housework the more time their children
devote to housework. However, we find gender differences in these relationships, and
while in Germany both fathers and mothers’ housework is positively related with the
time devoted to housework by the children, in Spain it is only father’s time in
housework that is positively related to children’s housework time. Thus, it seems that
we find a different relationship between parents and children’s housework time in
Mediterranean countries compared to continental countries. In particular, we find in
1 Transfers can also found between individual of different households, with some evidence analyzing whether these private transfers are driven by altruistic or non-altruistic motives (Molina, 2013 and 2014; Cigno et al., 1998). Transmission behaviors also appear between private and public individuals. 2 The advantage of time-use surveys over stylized-questions, such as those included in the data bases ECHP, the BHPS, and the SOEP (where respondents are asked how much time they have spent, for example, in the previous week, or normally spend each week, on market work or housework) is that diary-based estimates of time use are more reliable and accurate than estimates derived from direct questions (Juster and Stafford, 1985; Robinson, 1985; Robinson and Godbey, 1997; Bianchi et al., 2000; Bonke, 2005; Yee-Kan, 2008).

2
Germany that a difference of 10% in the time devoted to housework by fathers
translates into a difference of 1% in the time devoted to housework by daughters, and
into a difference of 0.3% in the time devoted to housework by sons. In the case of
Spain, we find that a difference of 10% in the time devoted to housework by fathers
translates into a difference of 0.4% and 1.2% for daughters and sons, respectively.
These results are consistent to sample selection issues, as results show similar if we
carry out the analysis considering the labour status, and the educational level of the
parents, and also to unobserved heterogeneity of individuals and households.
These correlations are observed in two-earners households in both countries, while
for one-earner households the mother’s housework correlates with children’s housework
time only in Spain. Considering the educational level of the two parents, for Germany,
we observe that the positive correlation between parents and children’s housework time
applies to households where the two members have secondary and university education.
In the case of Spain, the positive correlation between fathers and children’s housework
time applies to households where the two members have secondary education only.
Furthermore, in Spain we observe that mother’s housework also have statistically
significant correlations with children’s housework time: negative and positive for
daughters and sons in household with members of primary education, and positive for
daughters and sons in household with members of university education.
Our contribution to the literature is threefold. First, we contribute to the existing
research on intergenerational transmission of behaviours and attitudes. Despite the
existence of research on intergenerational transmission of values (Wilhelm et al., 2008;
Gronhoj and Thogersen, 2009; Bulte and Horan, 2011; Dohmen et al., 2012), happiness
(Winkelman, 2005; Clair, 2012; Carlsson et al., 2014) and economic outcomes (Solon,
1999, 2002, 2004; Anger and Heineck, 2010; Black and Devereux, 2011; Holmlund et
al., 2011; Anger, 2012; Tsou et al., 2012; Corak, 2013; Stella, 2013), few papers have
directly analyzed the intergenerational transmission in the uses of time. To the extent
that housework time represents an important proportion of daily life, especially for
women, this paper also refers to the relevant issue of reconciling work and family life
(see, for recent evidence, Molina, 2015) . Second, our paper also expands recent cross-
country studies such as Burda, Hammermesh and Weil (2008), Gershuny (2009),
Gauthier, Smeeding, and Furstenberg (2004), and Gimenez-Nadal and Sevilla (2012)
among others. These studies generally analyze the use of time for a variety of developed

3
economies, and our paper extends these cross-country comparisons by additionally
documenting for the first time the analysis of the time devoted to housework by
European youths. Third, we analyze two European countries with different welfare
regimes (Esping-Andersen, 1999) in an attempt to extract common patterns in the
intergenerational transmission of housework. Different effects of different factors may
imply that national welfare regimes influence how parents transmit roles to their
children.
The rest of the paper is organized as follows. Sections 2 and 3 describe the data and
the empirical strategy, respectively. Section 4 shows the empirical results, and Section 5
sets out the main conclusions.
2. Data
We use the Multinational Time Use Survey (MTUS), which is an ex-post harmonized
cross-time, cross-national, comparative time use database, coordinated by the Centre for
Time Use Research (CTUR) at the University of Oxford.3 It is constructed from
national randomly-sampled time-diary studies, with common series of background
variables, and total time spent in 41 activities (Gershuny, 2009). The MTUS provides us
with information on individual time use, based on diary questionnaires in which
individuals report their activities throughout the 24 hours of the day.
The MTUS includes 41 activities, defined as the ‘primary’ or ‘main’ activity
individuals were doing at the time of the interview. Thus, we are able to add up the time
devoted to any activity of reference (e.g., paid work, leisure, housework) as ‘primary’
activity. It is important to acknowledge that, in this paper, the fact that our analysis is
based on the comparison of a broad definition of housework provides a good basis to
run meaningful comparisons across countries. As Gimenez-Nadal and Sevilla (2012)
point out however, the harmonization exercise by the CTUR team addresses differences
in survey methodologies such as different response rates (especially the lower response
rate of some of the surveys), whether they covered or not the twelve months of the year,
the sampling frame, and differences in activity codes. All the surveys provide weights
designed to ensure that the surveys are nationally representative. 3 Information on the variables, and on how to access the data, is available on the MTUS website: http://www.timeuse.org/mtus. See Fisher, Gershuny and Gauthier (2011) for a full description of the MTUS documentation. We use version W53 (accessed in October 2010) of the MTUS.

4
We select individuals who are 10 years or older who are reported as being a child in
the household, and living with the two heterosexual parents. For the selection of
countries, we choose countries with time use information for all members of the
household 10 or older. Given that we want to analyze how housework time of parents
relates to housework of their children we need time use information for all the members
of the couple, we provide evidence on two countries which have multi-member time use
surveys: Germany (2002) and Spain (2002), countries whose time use surveys have
been harmonized by the CTUR team which allows a cross-country comparison of
patterns.
We consider the time devoted to housework by both parents and their children,
measured in hours per day. Our definition of housework includes the total time devoted
to the following activities: cook, wash up”, “housework”, “odd jobs”, “shopping” and
“domestic travel”. Table 1 shows the time devoted to housework by children and their
parents, by country. A first issue that emerges here is that children seem to devote about
the same time to housework. In this sense, in all countries children devote around 1 hour
per day to these activities. Regarding the time devoted to housework by parents, we find
that fathers in Spain devote a relatively low amount of time to housework (1.39 hours
per day) compared to fathers in Germany (2.04 hours per day). Conversely, mothers in
Spain devote a relatively high amount of time to housework (5.96 hours per day)
compared to mothers in Germany (4.50 hours per day). These results are consistent with
previous studies showing that in the Mediterranean countries there is a large gender gap
in housework favoring women, which makes these countries especially inegalitarian in
the gender distribution of household labor (Sevilla, 2010; Sevilla et al, 2010; Gimenez-
Nadal et al, 2012). Thus, we observe that our analysis includes countries with very
different institutions (e.g., different social/gender norms, Burda et al., 2012), welfare
regimes, and labor market structures, which proves relevant in our analysis for
robustness reasons.
As we focus on the relationship between the time devoted to housework by parents
and that of their children, we consider 3 problems that may arise when studying such
relationship: 1) measurement error, 2) reverse causality, and 3) unobserved
heterogeneity, which have been identified as sources of endogeneity. Regarding
measurement error, the way time use information is collected for individuals reduces the
possible errors individuals may make when they recall the time devoted to the different

5
activities throughout the day. In this sense, the advantage of time-use surveys over
stylized-questions, such as those included in the European Community Household
Panel, the British Household Panel Survey, and the German Socioeconomic Panel
(where respondents are asked how much time they have spent, for example, in the
previous week, or normally spend each week, on market work or housework), is that
diary-based estimates of time use are more reliable and accurate than estimates derived
from direct questions (Juster and Stafford, 1985; Robinson, 1985; Robinson and
Godbey, 1997; Bianchi et al., 2000; Bonke, 2005; Yee-Kan, 2008).
For instance, in the labor supply literature, Klevmarken (2005) argues that
information on actual hours of work from time-use surveys is more relevant than normal
hours or contracted hours generally reported in stylized questions. Thus, in the same
way that money-expenditure diaries have become the gold standard in the consumption
literature, so have time-use diaries become the preferred method of gathering
information on time spent on market work, non-market work, and leisure. Most studies
documenting how individuals use their time are now based on these data sets (Aguiar
and Hurst, 2007; Guryan, Hurst and Kearney, 2008; Gimenez-Nadal and Sevilla, 2012;
Sevilla et al., 2012).4 Likewise, measurement errors in the time devoted to housework
by individuals is not likely to be a problem in the present study, since the fact that each
respondent answers her/his own diary reduces the probability that children’s housework
is influenced by parents’ housework.
Regarding reverse causality, the question here is whether the time devoted to
housework by children depends on the time devoted to housework by their parents,
while the time devoted to housework by the parents is not affected by the time devoted
to housework by their children. If this is the case, e.g., one-way causal relationship, the
results of regressing the time devoted to housework by children on the time devoted to
housework by their parents would be unbiased. However, if there also exists an effect of
children’s housework on the time devoted to housework by their parents, we have
reverse causality as we would have a two-way relationship, and simple econometric
models that do not take into account this two-way relationship would yield biased
estimations. Thus, we need to test for the presence of reverse causality between our
variables of interest. To that end, we have applied the Durbin–Wu–Hausman test (i.e., 4 The MTUS has been widely used across the social sciences (Gershuny, 2000; Gershuny and Sullivan, 2003; Gauthier et al., 2004; Guryan, Hurst and Kearney, 2008; Gershuny, 2009, Gimenez-Nadal and Sevilla-Sanz, 2011;2012; Gimenez-Nadal and Molina, 2013, 2015).

6
augmented regression test) of endogeneity (e.g., reverse causality) between our
variables. Results are shown in Appendix B and we obtain no evidence of reverse
causality between children and parents’ time devoted to housework in Spain. In the case
of Germany, we find no evidence of reverse causality between fathers’ housework time
and that of their children, but we find evidence of reverse causality between mothers’
housework time and that of their children.
Finally, regarding unobserved heterogeneity of individuals and households, this
proves to be the biggest limitation of our analysis as our data is a cross-section of
individuals, and thus we cannot take into account the unobserved heterogeneity of
individuals and households. There may be unobserved factors at the individual and
household level that correlate with both the time children devote to housework, and that
of their parents. Factors such as parents’ heterogeneity in time preferences and in the
outsourcing of household chores, heterogeneity in productivity of individuals in
housework, or differences in gender/social norms across the countries, are just a few
examples of factors that can affect the time devoted to housework by parents and their
children. Despite we test the robustness of our results by using panel-data models, these
results cannot be considered as general, and we cannot thus identify any causal effect of
parents’ housework time on children’s housework time, but we can just explore the
correlational structure of the data. Unfortunately, at present there are no panels of time-
use surveys currently available.
3. Empirical strategy
Using an adaptation from Black et al. (2005) and Stella (2013) who applied to human
capital transfers, we regress the time dedicated to housework by children on the time
devoted to housework by the father and mother of those children. In this sense, we
regress the log of housework time of children on the log of housework time of the father
and the mother. Additionally, with the aim of capture the expected differential impacts
of maternal and parental housework time on children’s dedication depending on the
gender of the parent and the children, we also include the interactions between parental
housework time and the gender dummy for the child ihGender , with this being equal to
one when the child is male. We thus estimate the following model:

7
ih 1 ih 2 ih 3 ih ih
4 ih ih 5 ih ih ih
lnTime =α+β lnFather'sTime +β *Mother'sTime +β lnFather'sTime *Gender
+β lnMother'sTime *Gender +β Gender +γX +ε (1)
where the dependent variable ln ihTime denotes the log of the time devoted to housework
by child “i” in household “h”, with this being expressed as a linear function of (log)
time dedicated for parents to housework in the household respondent. The indicators of
mobility 1 , 2 , 3 and 4 represent the elasticity of children’s time with respect to their
parents’ time, with an elasticity of 0.5 implying that a 10% difference between two
families time translates into an average difference of roughly 5% between their
children’s times. Despite we use the logarithm of housework of parents and their
children, the transformed variables does not follow a normal distribution, which makes
the error terms of regressions not being homoskedastic, and thus we correct our
regressions by obtaining robust standard errors.5
The set of socio-demographic variables ihX includes the children’s characteristics
(gender, age and work status), parent’s characteristics (age, education, work status) and
household characteristics (household size, number of children, whether the household
owns the dwelling and urban residence). We specifically include both parent’s ages
which captures differences in housework time behaviors across parental birth cohorts,
day-of-the-week dummies to scale the day of the week (ref.: Saturday). Finally,
ih represents the robust standard error.
We estimate using OLS regressions. However, as we observe a high proportion of
“zeros” in the time devoted to housework (23% of observations in the pooled sample),
there can be some controversy regarding the selection of alternative models, such as that
of Tobin (1958). According to Frazis and Stewart (2012), OLS models are preferred in
the analysis of time allocation decisions, and Gershuny (2012) argues that traditional
diary studies can still produce accurate estimates of mean times in activities for samples
and subgroups. Foster and Kalenkoski (2013) compare the use of tobit and OLS models
in the analysis of the time devoted to childcare activities, finding that the qualitative
conclusions are similar for the two estimation methods. Thus, we rely on OLS models,
although we have alternatively estimated Tobit models, and our qualitative conclusions
are the same (results available upon request).
5 See Appendix B for a description of the distribution of housework time of parents and their children.
8
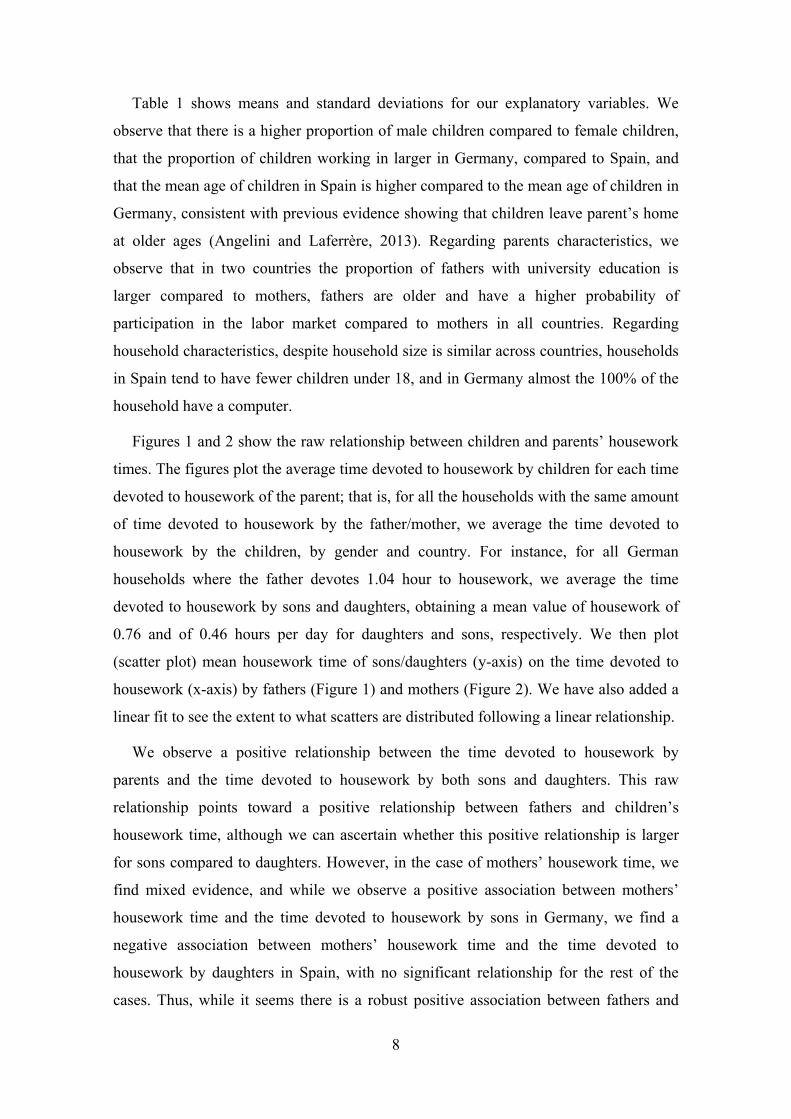
Table 1 shows means and standard deviations for our explanatory variables. We
observe that there is a higher proportion of male children compared to female children,
that the proportion of children working in larger in Germany, compared to Spain, and
that the mean age of children in Spain is higher compared to the mean age of children in
Germany, consistent with previous evidence showing that children leave parent’s home
at older ages (Angelini and Laferrère, 2013). Regarding parents characteristics, we
observe that in two countries the proportion of fathers with university education is
larger compared to mothers, fathers are older and have a higher probability of
participation in the labor market compared to mothers in all countries. Regarding
household characteristics, despite household size is similar across countries, households
in Spain tend to have fewer children under 18, and in Germany almost the 100% of the
household have a computer.
Figures 1 and 2 show the raw relationship between children and parents’ housework
times. The figures plot the average time devoted to housework by children for each time
devoted to housework of the parent; that is, for all the households with the same amount
of time devoted to housework by the father/mother, we average the time devoted to
housework by the children, by gender and country. For instance, for all German
households where the father devotes 1.04 hour to housework, we average the time
devoted to housework by sons and daughters, obtaining a mean value of housework of
0.76 and of 0.46 hours per day for daughters and sons, respectively. We then plot
(scatter plot) mean housework time of sons/daughters (y-axis) on the time devoted to
housework (x-axis) by fathers (Figure 1) and mothers (Figure 2). We have also added a
linear fit to see the extent to what scatters are distributed following a linear relationship.
We observe a positive relationship between the time devoted to housework by
parents and the time devoted to housework by both sons and daughters. This raw
relationship points toward a positive relationship between fathers and children’s
housework time, although we can ascertain whether this positive relationship is larger
for sons compared to daughters. However, in the case of mothers’ housework time, we
find mixed evidence, and while we observe a positive association between mothers’
housework time and the time devoted to housework by sons in Germany, we find a
negative association between mothers’ housework time and the time devoted to
housework by daughters in Spain, with no significant relationship for the rest of the
cases. Thus, while it seems there is a robust positive association between fathers and

9
children’s housework time, there are cross-country and gender differences in the
relationship between mothers and children’s housework time, which clearly indicates
the necessity to take into the gender of the parent and the child in the regressions.
4. Results
Table 2 shows the results of estimating Equation (1) on the time devoted by European
youths in Germany and Spain. In summary, we find positive correlations between
parents and children’s housework time, which indicates that the more time parents
devote to housework the more time their children devote to housework. However, we
find cross-country and gender differences in these relationships, and while in Germany
both fathers and mothers’ housework is positively related with the time devoted to
housework by the children, in Spain it is only father’s time in housework that is
positively related to children’s housework time. Thus, it seems that we find a different
relationship between parents and children’s housework time in Mediterranean countries
compared to continental countries. This evidence is consistent with the intergenerational
transmission of behavior regarding the time devoted to housework, as more housework
time of the parents is related to more housework time of their children.
In particular, for Germany we find a correlation of 0.12 between fathers and
children’s housework time, with no differential effect between sons and daughters. On
the other hand, we find a positive relationship between mothers and daughters’
housework time (e.g., 0.10 in Germany), while the relationship is smaller between
mothers and sons’ housework time (e.g., 0.03 for Germany). Given that children and
parents’ housework time has been transformed to logarithm, we can interpret these
results in terms of elasticities: a difference of 10% in the time devoted to housework by
fathers translates into a difference of 1% in the time devoted to housework by their
children. Furthermore, a difference of 10% in the time devoted to housework by fathers
translates into a difference of 1% in the time devoted to housework by daughters, and
into a difference of 0.3% in the time devoted to housework by sons. All the coefficients
are statistically significant at standard levels.
In the case of Spain, we find a positive correlation between father and children’s
housework time, with a larger correlation for Spanish sons compared to Spanish
daughters. We find a differential correlation between sons and daughters, and while we

10
find a correlation of 0.04 between fathers and daughter’s housework time, the
correlation is 0.12 for sons’ housework time. Thus, a difference of 10% in the time
devoted to housework by fathers translates into a difference of 0.4% and 1.2% for
daughters and sons in Spain, respectively.
For the rest of factors, we observe that male children devoted less time to housework
compared to female children in both countries. Those who are unemployed, and/or have
working parents devote more time to housework, while students and part-time workers
devote less time to housework activities. We do not obtain a clear pattern for parents’
education, while we find an inverted U-shaped effect of age on the time devoted to
housework by children.
Heterogeneous effects
We now analyze the relationship between parents’ and children’s housework time when
we consider that these relationships may vary depending on the economic status of the
parents. For instance, it could be that in those couples where one of the members does
not participate in the labor market, the members of such couple are more concerned
about their children’s behavior and well-being (e.g., one-earner couples have stronger
preferences for raising their children by themselves). As a result, we could expect
different patterns of behavioral transmission, e.g., larger correlations of parents’
housework with the housework on their children. To that end, we consider as a
conditioning the economic and labor status of parents.
First, we consider the labor status of the members of the couple. This analysis is
relevant to the extent that Mediterranean countries have lower Female Labor Force
Participation (FLFP) rates compared to Germany (EUROSTAT, 2013). This lower
FLFP can be a consequence of individual/household preferences for time in the labor
market, on the one hand, and for the attitudes and behaviors they want to transmit to
their children. In this sense, a lower FLFP could reflect a weaker preference for time in
the labor market and a stronger preference towards the rising of children. We thus
consider whether the 2 members of the couple participate in the labor market (e.g., 2-
earners households), or whether only one of the member of the couple participates in the
labor market, on the other hand. To the extent that in one-earner couples it is women
who do not participate, we consider male-earners households.

11
Panels A and B of Table 3 shows the results of estimating Equation (1) for 2-earners
households, and male-earners households, respectively. We observe in Germany that for
both 2-earners and male-earners households the fathers and mothers’ housework is
positively related with the time devoted to housework by the children, results that are
consistent with previous results. However, in the case of Spain, while for 2-earners
households it is only father’s housework time that is related to children’s housework
time, while in male-earners households the mother’s housework correlates with
children’s housework time, particularly, negatively for sons in Spain.
A second factor that may condition the correlations observed in the analysis
including all the couples is education. It could be that more educated parents are more
concerned about the educational and attitudinal behavior of their children, as parents
may consider they have attitudes and characteristics that are better compared to attitudes
and characteristics of less educated parents. On the other hand, it could be that as more
educated parents have a higher opportunity cost, they devote less time to housework,
compared to lower educated parents, which negatively affects the positive correlation
between parents and children’s housework time. Thus, we estimate Equation (1)
considering 3 possible levels of education of the members of the couples: primary
education (e.g., less than high school level), secondary education (e.g., high school
level), and university education (e.g., more than high school level).6
Panels C, D and E of Table 3 shows the results of estimating Equation (1) for couples
where the two members of the household have primary education, secondary education,
and university education, respectively. For Germany, we observe that the positive
correlation between parents and children’s housework time applies to households where
the two members have secondary and university education. In the case of Spain, the
positive correlation between fathers and children’s housework time applies to
households where the two members have secondary education only. Furthermore, in
Spain we observe that mother’s housework also have statistically significant
correlations with children’s housework time: negative and positive for daughters and
sons in household with members of primary education, and positive for daughters and
sons in household with members of university education.
6 To the extent that there is positive assortative matching by education (Oppenheimer, 1988; Mare, 1991; Pencavel, 1998; Lewis and Oppenheimer, 2000; Blossfeld and Timm, 2003), we consider that parents have similar levels of education, and we thus exclude from the analysis those couples where the members of the couple have different levels of education.

12
Results considering unobserved heterogeneity
One of the limitations of the study is that time use surveys are cross-sectional data, and
thus we cannot identify correlations between parents and children’s housework time net
of (permanent) individual and household heterogeneity in preferences. However, we
now exploit the fact that for Germany we have 3 diaries per individual. Comparing the
within-personal and between-personal variation of our dependent variable, we obtain a
within-personal variation of 0.38, while the between-personal variation is 0.41. Thus,
we have enough within-personal variation to apply a Fixed Effects estimator. We thus
estimate the following model:
iht 1 iht 2 iht ihtlnTime =α +β lnFather'sTime +β *Mother'sTime + Day +εi iht (2)
where the dependent variable ln ihtTime denotes the log of the time devoted to
housework by child “i” in household “h” and day “t” (t=1,2,3), with this being
expressed as a linear function of (log) time dedicated for parents to housework in the
household “h” of child “i” in day “t”. Unfortunately, we do not have any time-variant
variable except for days when the diary was answered, which are included in the
regressions, and thus we take these results as complementary and not as main results
given that we cannot control for the observed heterogeneity of children and their
parents.
Table 4 shows the results of estimating Equation (2) for Germany. We observe that
father and mother’s time in housework is positively related to housework time of
children, with these associations being statistically significant at standard levels. Thus,
we find that both fathers and mothers’ housework is positively related with the time
devoted to housework by the children, results that are consistent with previous results
without taking into account the unobserved heterogeneity of individuals. Thus, it seems
that unobserved heterogeneity of individuals and households does not alter our main
results: that in Germany both fathers and mothers’ housework is positively related with
the time devoted to housework by the children.
Interpretation of results
The fact that we find cross-country and gender differences in the correlations between

13
parents and children’s housework time indicates that different mechanisms may lay
behind such observed differences. First, several authors have studied how social norms
influence the time allocation decisions of individuals (Sevilla, 2010; Sevilla et al., 2010;
Burda et al., 2013). In an attempt to transmit those roles to their children, parents may
try to behave following those social norms, which may differ across-countries, on the
one hand, and on the importance given to the housework of the parents, on the other.
For instance, Mediterranean countries have been classified among the most inegalitarian
countries in the gender distribution of household labor. Thus, it may be that in these
countries social norms establish household responsibilities as women’s tasks, while men
are not seen as responsible for household managing. Under this framework, if children
observe that fathers devote more time to the household labor, it has influence on their
behavior, while mother’s housework does not have any influence on children’s behavior
since it is seen as a role that must be done by women. Thus, differences in social norms
regarding the distribution of labor may explain cross-country differences in our results.
Second, institutional factors such as welfare regimes or labor market structures may
also help to explain cross-country differences in the correlations between parents and
children’s housework time. Regarding welfare regimes, Gálvez-Muñoz, Rodríguez-
Modroño and Domínguez-Serrano (2011) classifies Germany in the group of countries
with liberal systems, where state interventions are clearly subordinate to market
mechanisms, while Spain is included in the group of Mediterranean countries with a
strong “familialism”, defined by the maintenance of intergenerational solidarity, weak
institutional support for families, a dual labor market model, and limited female access
to the labor market. As a result, policies regarding the availability of public childcare
services differ between the countries, and female labor force participation rates are
lower in Spain than in Germany (Boeri and Van Ours, 2008; Gálvez-Muñoz,
Rodríguez-Modroño and Domínguez-Serrano, 2011).7 All these differences may
influence how parents interact with their children, and how children observe the
behavior of their parents, which influences how behaviors are transmitted from parents
to their children.
Despite we offer an interpretation of the channels through which the transmission of
behavior in household labor may operate, we cannot disentangle to what extent each 7 Boeri and Van Ours (2008) show that, at the time of the surveys, the percentage of children under age 3 using formal childcare facilities is 34% in the UK and 5% in Spain, indicating a significant difference in the availability of childcare services between the two countries

14
factor contributes to explain cross-country differences in correlation between parents
and children’s housework time.
6. Conclusions
This paper analyzes the relationship between parents’ time devoted to housework and
the time devoted to housework by their children. Using data from the Multinational
Time Use Study for Germany and Spain, we find positive correlations between parents
and children’s housework time, which indicates that the more time parents devote to
housework the more time their children devote to housework. However, we find cross-
country and gender differences in these relationships, and while in Germany both
fathers and mothers’ housework is positively related with the time devoted to
housework by the children, in Spain it is only father’s time in housework that is
positively related to children’s housework time. Thus, we find a different relationship
between parents and children’s housework time in Mediterranean countries compared to
other continental countries. We offer an interpretation of the channels through which
cross-country differences can be explained, although we are not able to disentangle
what channel has more influence. We leave this issue for future research.
These correlations are observed in two-earners households in the two countries,
while for one-earner households the mother’s housework correlates with children’s
housework time in Spain. Considering the educational level of the two parents, for
Germany, we observe that the positive correlation between parents and children’s
housework time applies to households where the two members have secondary and
university education. In the case of Spain, the positive correlation between fathers and
children’s housework time applies to households where the two members have
secondary education only. Furthermore, in Spain we observe that mother’s housework
also have statistically significant correlations with children’s housework time: negative
and positive for daughters and sons in household with members of primary education,
and positive for daughters and sons in household with members of university education.
One limitation of our analysis is that our data is a cross-section of individuals, and it
does not allow us to identify correlations between parents and children’s housework
time net of (permanent) individual and household heterogeneity in preferences. This is
particularly important in our context, as it could be that preferences for housework

15
differ by gender, or by household, or that productivities are different for different types
of individuals. At present there are no panels of time-use surveys currently available.
REFERENCES
Aguiar, M., and E. Hurst (2007). “Measuring trends in leisure: the allocation of time
over five decades,” Quarterly Journal of Economics 122: 969-1006.
Albertini, M., M. Kohli and C. Vogel (2007). “Intergenerational transfers of time and
money in European families: common patterns – different regimes?” Journal of
European Social Policy 17: 319-334.
Altonji, J.G., F. Hayashi and L.J. Kotlikoff (1992). “Is the extended family altruistically
linked? Direct evidence using micro data”. American Economic Review 82: 1177-
1198.
Angelini, V., and A. Laferrère (2013). “Parental altruism and nest leaving in Europe:
evidence from a retrospective survey,” Review of Economics of the Household 11:
393-420.
Anger, S. (2012). “Intergenerational transmission of cognitive and noncognitive skills,” In
From parents to children. The intergenerational transmission of advantage,
Ermisch, Jäntti and Smeeding (eds.), New York: Russell Sage Foundation, pp. 393-421
Anger, S., and G. Heineck (2010). “Do Smart Parents Raise Smart Children? The
Intergenerational Transmission of Cognitive Abilities,” Journal of Population
Economics 23: 1105-1132.
Ayalew, T. (2005). “Parental Preference, Heterogeneity, Human Capital Inequality,”
Economic Development and Cultural Change 53: 381–407.
Becker, G.S. (1981). A Treatise on the Family. Cambridge: Harvard University Press.
Becker, G.S., and R.J. Barro (1988). “A reformulation of the economic theory of
fertility”. Quarterly Journal of Economics 103: 1-25.
Becker, G.S., and N. Tomes (1976). “Child Endowments and the Quantity and Quality
of Children,” Journal of Political Economy 84: 143–162.
Behrman, J.R., R.A Pollak and P. Taubman (1982). “Parental Preferences and Provision

16
for Progeny,” Journal of Political Economy 90: 52–73.
Behrman, J.R., M.R. Rosenzweig and P. Taubman (1994). “Endowments and the
Allocation of Schooling in the Family and in the Marriage Market: The Twins
Experiment,” Journal of Political Economy 102: 1131–1174.
Bianchi, S., M. Milkie, L. Sayer and J.P. Robinson (2000). “Is anyone doing the
housework? Trends in the gender division of household labor,” Social Forces 79:
191–228.
Black, S.E., and P.J. Devereux (2011). “Recent developments in intergenerational
mobility,” In Handbook of Labor Economics, Vol 4b, Card and Ashenfelter (eds.),
Elsevier, pp. 1487-1541.
Blossfeld, H.P., and A. Timm (2003). Who marries whom? Educational systems as
marriage markets in modern societies. Dordrecht: Kluwer Academic Publishers.
Björklund, A., and L. Chadwick (2003). “Intergenerational income mobility in
permanent and separated families,” Economics Letters 80: 239-246.
Boeri, T., and J. Van Ours (2008). The Economics of Imperfect Labor Markets. Princeton
University Press.
Bonke, J. (2005). “Paid work and unpaid work: Diary information versus questionnaire
information,” Social Indicators Research 70: 349–368.
Bulte, E.H., and R.D. Horan (2011). “Intergenerational transmission of preferences,”
Economics Letters 112: 85-87.
Burda, M., D. Hamermesh and P. Weil (2008). “The Distribution of Total Work in the
US and EU,” in Working Hours and Job Sharing in the EU and USA: Are
Americans Crazy? Are Europeans Lazy? Boeri, Burda and Kramarz (eds.),
Oxford Univ. Press.
Burda, M., D. Hamermesh and P. Weil (2013).” Total work and gender: facts and
possible explanations,” Journal of Population Economics 26: 239-261.
Carlsson, F., E. Lampi, W. Li and P. Martinsson (2014). “Subjective well-being among
preadolescents and their parents: Evidence of intergenerational transmission of
well-being from urban China,” Journal of Socio-Economics,
http://dx.doi.org/10.1016/j.socec.2013.10.003.

17
Casas, F., G. Coenders, R.A Cummins, M. Gonzalez, C. Figuer and S. Malo (2008). “Does
subjective well-being show a relationship between parents and their children?”
Journal of Happiness Studies 9: 197-205.
Cigno, A. (1993). “Intergenerational transfers without altruism. Family, market and
state”. European Journal of Political Economy 9: 508-518.
Cigno, A., G.C. Giannelli and F.C. Rosati (1998). “Voluntary transfers among Italian
households: altruistic and non-altruistic explanations,” Structural Change and
Economic Dynamics 9: 435-451.
Clair, A. (2012). “The relationship between parent’s subjective well-being and the life
satisfaction of their children in Britain,” Child Indicators Research 5: 631-650.
Corak, M. (2013). “Income inequality, equality of opportunity, and intergenerational
mobility,” Journal of Economic Perspectives 27: 79-102.
Cox, D. (1990). “Intergenerational Transfers and Liquidity Constraints." Quarterly
Journal of Economics 105: 187–217.
Cox, D., and M. Rank (1992). “Inter-Vivos Transfers and Intergenerational Exchange,”
Review of Economics and Statistics 74: 305–314.
Datar, A., M.R. Kilburn and D.S. Loughran (2010). “Endowments and parental
investements in infancy and early childhood,” Demography 47: 145-162.
Davidson, R. and J. G. MacKinnon (1993). Estimation and Inference in Econometrics.
New York: Oxford University Press
Dohmen, T., A. Falk, D. Huffman and U. Sunde (2012). “The intergenerational
transmission of risk and trust attitudes,” Review of Economic Studies 79: 645-677.
Edgeworth, F. (1881). Mathematical Psychics: An Esssay of the Application of
Mathematics to the Moral Sciences. C. Kegan Paul and Co. London.
Esping-Andersen, G. (1999). Social foundations of postindustrial economies. Oxford:
Oxford University Press.
EUROSTAT (2013). Statistics, Population and Social Conditions.
Fisher K, Gershuny J, Gauthier A (2011). “Multinational Time Use Study: User’s
Guide and Documentation,” http://www.timeuse.org/files/cckpub/858/mtus-user-
guide-r4.pdf. Accessed 1 September 2012.
18
Foster, G., and C. Kalenkoski (2013). “Tobit or OLS? An empirical evaluation under
different diary window lengths,” Applied Economics 45: 2994-3010.
Frazis, H., and J. Stewart (2012). “How to Think About Time-Use Data: What
Inferences Can We Make About Long- and Short-Run Time Use from Time Use
Diaries?” Annals of Economics and Statistics 105/106: 231-246.
Gálvez-Muñoz L, P. Rodríguez-Modroño and M. Domínguez-Serrano (2011). “Work
and Time Use By Gender: A New Clustering of European Welfare Systems,”
Feminist Economics 17: 125-157.
Gauthier, A.H., T.M. Smeeding, and F.F. Furstenberg (2004). “Are parents investing
less time in children? Trends in selected industrialized countries,” Population and
Development Review 30: 647–671.
Gershuny, J. (2000). Changing times, work and leisure in post industrial society.
Oxford: Oxford University Press.
Gershuny, J.I. (2009). “Veblen in Reverse: Evidence from the Multinational Time-Use
Archive,” Social Indicators Research 93: 37–45.
Gershuny, J.I. (2012). “Too Many Zeros: A Method for Estimating Long-term Time-use
from Short Diaries,” Annals of Economics and Statistics 105/106: 247-270.
Gershuny, J., and O. Sullivan (2003). “Time use, gender, and public policy regimes,”
Social Politics: International Studies in Gender, State and Society 10: 205–228.
Giménez-Nadal, J.I., and J.A. Molina (2013). “Parents’ education as determinant of
educational childcare time,” Journal of Population Economics 26: 719-749.
Giménez-Nadal, J.I., and J.A. Molina (2015). “Health status and the allocation of time:
cross-country evidence from Europe,” Economic Modelling 46: 188-203.
Gimenez-Nadal, J.I., and A. Sevilla (2011). “The Time-Crunch Paradox,” Social
Indicators Research 102: 181-196.
Giménez-Nadal, J.I. and A. Sevilla (2012). “Trends in time allocation: A cross-country
analysis,” European Economic Review 56: 1338-1359.
Griliches, Z. (1979). “Sibling Models and Data in Economics: Beginnings of a Survey,”
Journal of Political Economy 87: S37–S64.
Gronhof, A., and J. Thogersen (2009). “Like father, like son? Intergenerational
19
transmission of values, attitudes, and behaviours in the environmental domain,”
Journal of Environmental Psychology 29: 414-421.
Guryan, J., E. Hurst, and M. Kearney (2008). “Parental education and parental time
with children,” Journal of Economic Perspectives 22: 23–46.
Holmlund, H., M. Lindahl and E. Plug (2011). “The causal effects of parent’s education
on children’ schooling: a comparison of estimation methods,” Journal of
Economic Literature 49: 615-651.
Juster, T. and F. Stafford (1985). Time, Goods, and Well-Being. Ann Arbor, MI.
Institute for Social Research.
Klevmarken, N.A. (2005). “Estimates of a labour supply function using alternative
measures of hours of work,” European Economic Review 49: 55–73.
Lewis, S.K., and V.K. Oppenheimer (2000). “Educational assortative mating across
marriage markets: non-Hispanic whites in the United States,” Demography 37: 29–
40.
Mare, R. (1991). “Five decades of educational assortative mating” American
Sociological Review 56: 15–32.
Molina, J.A. (2013). “Altruism in the household: in-kind transfers in the context of kin
selection,” Review of Economics of the Household 11: 309-312.
Molina, J.A. (2014). “Altruism and monetary transfers in the household: inter- and intra
generation issues”, Review of Economics of the Household, 12 (3): 407-410.
Molina, J.A. (2015). “Caring within the family: reconciling work and family life”,
Journal of Family and Economic issues, DOI: 10.1007/s10834-015-9441-8..
Oppenheimer, V.K. (1988). “A theory of marriage timing: Assortative mating under
varying degrees of uncertainty,” American Journal of Sociology 94: 563–591.
Pencavel, J. (1998). “Assortative mating by schooling and the work behavior of wives
and husbands,” American Economic Review 88: 326–329.
Pitt, M.M., M.R. Rosenzweig and M.N. Hassan (1990). “Productivity, Health, and
Inequality in the Intrahousehold Distribution of Food in Low-Income Countries,”
American Economic Review 80: 1139–56.
Robinson, JP (1985). “The validity and reliability of diaries versus alternative time use

20
measures,” in Time, goods, and well-being, Juster and Stafford (eds). Ann Arbor,
MI: The University of Michigan, pp 33–62.
Robinson, J.P., and G. Godbey (1997). Time for Life: The Surprising Ways Americans
Use their Time. University Park, PA. Pennsylvania State University Press.
Roemer, J.E. (2004). “Equal opportunity and intergenerational mobility: going beyond
intergenerational income transition matrices,” In Generational Income Mobility in
north America and Europe, Corak (ed.), Cambridge University Press.
Rosenzweig, M.R., and T.P. Schultz (1982). “Market Opportunities, Genetic
Endowments, and Intrafamily Resource Distribution: Child Survival in Rural
India,” American Economic Review 72: 803–815.
Rosenzweig, M.R., and K.I. Wolpin (1988). “Heterogeneity, Intrafamily Distribution,
and Child Health,” Journal of Human Resources 23: 437-461.
Sevilla, A. (2010). “Household división of labor and cross-country differences in
household formation rates,” Journal of Population Economics 23: 225-249.
Sevilla, A., J.I. Gimenez-Nadal and C. Fernandez (2010). “Gender Roles and the
Division of Unpaid Work in Spanish Households,” Feminist Economics 16: 137-184.
Sevilla, A., J.I. Gimenez-Nadal, and J.I. Gershuny (2012). “Leisure inequality in the
United States: 1965–2003,” Demography 49: 939-964
Smith, A. (1759). The Theory of Moral Sentiments. Printed for A. Millar, in the Strand;
and A. Kincaid and J. Bell, in Edinburgh.
Solon, G. (1999). “Intergenerational mobility in the labor market,” In Handbook of
Labor Economics, Volume 3, Ashenfelter and Card (eds.), Amsterdam: Elsevier
Science, 1761-1800
Solon, G. (2002). “Cross-country differences in intergenerational earnings mobility,” Journal
of Economic Perspectives 16: 56-66.
Solon, G. (2004). “A model of intergenerational mobility variation over time and place,” In
Generational Income Mobility in north America and Europe, Corak (ed.).
Cambridge University Press.
Stella, L. (2013). “Intergenerational transmission of human capital in Europe: evidence
from SHARE,” IZA Journal of European Labor Studies, 2-13.

21
Tobin, J. (1958). “Estimation of relationships for limited dependent variables,” Econometrica
26: 24–36.
Tsou, M.W., J.T. Liu and J.K. Hammitt (2012). “The intergenerational transmission of
education: Evidence from Taiwanese adoptions,” Economics Letters 115: 134-136.
Wilhelm, M.O., E. Brown, P.M. Rooney and R. Steinberg (2008). “The
intergenerational transmission of generosity,” Journal of Public Economics 92:
2146-2156.
Winkelmann, R. (2005). “Subjective Well-Being and the Family: Results from an
Ordered Probit Model with Multiple Random Effects,” Empirical Economics 30:
749-761.
Yee-Kan, M. (2008). “Measuring Housework Participation: The Gap Between
“Stylised” Questionnaire Estimates and Diary-Based Estimates,” Social Indicators
Research 86: 381-400.

22
Figure 1. Mean time devoted to non-market work, fathers and their children 0
12
3N
on-m
arke
t w
ork,
chi
ldre
n
0 1 2 3Non-market work, fathers
Male children, Germany
0.5
11.
52
Non
-mar
ket
wor
k, c
hild
ren
0 1 2 3Non-market work, fathers
Male children, Italy
0.5
11.
52
2.5
Non
-mar
ket
wor
k, c
hild
ren
0 1 2 3Non-market work, fathers
Male children, Spain
0.5
11.
52
Non
-mar
ket
wor
k, c
hild
ren
0 1 2 3Non-market work, fathers
Male children, UK
0.5
11.
52
Non
-mar
ket
wor
k, c
hild
ren
0 1 2 3Non-market work, fathers
Female children, Germany
0.5
11.
52
Non
-mar
ket
wor
k, c
hild
ren
0 1 2 3Non-market work, fathers
Female children, Italy
0.5
11.
52
Non
-mar
ket
wor
k, c
hild
ren
0 1 2 3Non-market work, fathers
Female children, Spain
0.5
11.
52
2.5
Non
-mar
ket
wor
k, c
hild
ren
0 1 2 3Non-market work, fathers
Female children, UK
Note: Sample consists of individuals who are 10 years or older who are reported as being a child in the household, and living with the two heterosexual parents from Germany, Italy, Spain and the United Kingdom. We include fathers of those children Housework includes the total time devoted to the following activities: cook, wash up”, “housework”, “odd jobs”, “shopping” and “domestic travel”, and is measured in (log) hours per day.

23
Figure 2. Mean time devoted to non-market work, mothers and their children 0
.51
1.5
2N
on-m
arke
t w
ork,
chi
ldre
n
0 1 2 3Non-market work, mothers
Male children, Germany
0.5
11.
52
Non
-mar
ket
wor
k, c
hild
ren
0 1 2 3Non-market work, mothers
Male children, Italy
0.5
11.
52
Non
-mar
ket
wor
k, c
hild
ren
0 1 2 3Non-market work, mothers
Male children, Spain
0.5
11.
52
Non
-mar
ket
wor
k, c
hild
ren
0 1 2 3Non-market work, mothers
Male children, UK
0.5
11.
5N
on-m
arke
t w
ork,
chi
ldre
n
0 1 2 3Non-market work, mothers
Female children, Germany
0.2
.4.6
Non
-mar
ket
wor
k, c
hild
ren
0 1 2 3Non-market work, mothers
Female children, Italy
0.2
.4.6
.81
Non
-mar
ket
wor
k, c
hild
ren
0 1 2 3Non-market work, mothers
Female children, Spain
0.5
11.
52
2.5
Non
-mar
ket
wor
k, c
hild
ren
0 1 2 3Non-market work, mothers
Female children, UK
Note: Sample consists of individuals who are 10 years or older who are reported as being a child in the household, and living with the two heterosexual parents from Germany, Italy, Spain and the United Kingdom. We include mothers of those children Housework includes the total time devoted to the following activities: cook, wash up”, “housework”, “odd jobs”, “shopping” and “domestic travel”, and is measured in (log) hours per day.

24
Table 1. Sum stats of variables, by country (1) (2) (3) (4) Germany 2001 Italy 2002 Spain 2002 UK 2000 Children's housework (log) 1.17 0.96 1.08 1.09 (0.02) (0.02) (0.02) (0.03) Father's housework (log) 2.04 1.61 1.39 2.16 (0.03) (0.03) (0.02) (0.05) Mother's housework (log) 4.50 6.58 5.96 4.45 (0.03) (0.04) (0.03) (0.05) Male 0.52 0.54 0.52 0.53 (0.01) (0.01) (0.01) (0.01) Age of respondent 16.30 21.22 21.09 16.52 (0.06) (0.10) (0.09) (0.13) Student 0.63 0.29 0.53 0.68 (0.01) (0.01) (0.01) (0.01) Unemployed 0.01 0.08 0.08 0.04 (0.00) (0.00) (0.00) (0.00) Working part-/full-time 0.35 0.36 0.37 0.35 (0.01) (0.01) (0.01) (0.01) Father's secondary education 0.47 0.65 0.50 0.35 (0.01) (0.01) (0.01) (0.01) Mother's secondary education 0.64 0.66 0.53 0.33 (0.01) (0.01) (0.01) (0.01) Father's university education 0.47 0.07 0.18 0.26 (0.01) (0.00) (0.00) (0.01) Mother's university education 0.24 0.06 0.12 0.24 (0.01) (0.00) (0.00) (0.01) Father's age 47.42 52.76 52.11 46.56 (0.09) (0.12) (0.11) (0.18) Mother's age 44.20 48.84 49.14 44.18 (0.08) (0.12) (0.11) (0.16) Father working part-/full-time 0.90 0.72 0.75 0.81 (0.00) (0.01) (0.01) (0.01) Mother working part-/full-time 0.74 0.41 0.38 0.73 (0.01) (0.01) (0.01) (0.01) Household size 4.22 4.09 4.35 4.42 (0.01) (0.01) (0.01) (0.03) Number of children < 18 1.46 0.85 0.91 1.75 (0.01) (0.01) (0.01) (0.03) Household owns dwelling 0.77 0.80 0.89 0.82 (0.01) (0.01) (0.00) (0.01) Computer at home 0.98 0.65 0.67 0.79 (0.00) (0.01) (0.01) (0.01) Urban residence . 0.62 0.58 0.62
. (0.01) (0.01) (0.03)
Observations 7,074 10,346 8,080 2,703
Notes: Standard deviations in parenthesis. The sample is restricted to include individuals who are reported to be son/daughterof the reference person of the household in the Multinational Time Use Study (MTUS) from Germany, Italy, Spain and the United Kingdom. Housework is measured in hours per day, and is defined as the sum of the time devoted to “cook, wash up”, “housework”, “odd jobs”, “shopping” and “domestic travel.”

25
Table 2. Regression results for housework time of children, by country (1) (2) (3) (4) Log of housework time Germany 2001 Italy 2002 Spain 2002 UK 2000 Father's housework (log) 0.117*** 0.092*** 0.035** 0.122*** (0.02) (0.02) (0.02) (0.03) Mother's housework (log) 0.104*** 0.02 0.00 0.110*** (0.02) (0.02) (0.02) (0.03) Father's housework (log)*Male 0.01 0.00 0.089*** 0.02 (0.02) (0.02) (0.02) (0.03) Mother's housework (log)*Male -0.071*** 0.00 0.00 -0.083** (0.03) (0.03) (0.02) (0.04) Male -0.104** -0.401*** -0.426*** -0.12 (0.04) (0.06) (0.05) (0.07) Age of respondent 0.010*** 0.023*** 0.010*** 0.009** (0.00) (0.00) (0.00) (0.00) Student -0.190** -0.103*** -0.180*** -0.06 (0.10) (0.02) (0.04) (0.05) Unemployed 0.208* 0.184*** 0.162*** 0.224*** (0.11) (0.04) (0.05) (0.09) Working part-/full-time -0.194** -0.257*** -0.301*** -0.155*** (0.09) (0.03) (0.04) (0.05) Father's secondary education 0.049* -0.053*** -0.01 0.03 (0.03) (0.02) (0.02) (0.03) Mother's secondary education -0.038* -0.03 -0.033** 0.03 (0.02) (0.02) (0.02) (0.03) Father's university education 0.04 -0.065** -0.055*** -0.01 (0.03) (0.03) (0.02) (0.03) Mother's university education -0.01 -0.123*** -0.02 -0.01 (0.02) (0.03) (0.02) (0.03) Father's age 0.00 0.00 0.00 0.00 (0.00) (0.00) (0.00) (0.00) Mother's age 0.00 0.00 0.00 0.00 (0.00) (0.00) (0.00) (0.00) Father working part-/full-time 0.067*** 0.073*** 0.036** 0.04 (0.02) (0.02) (0.02) (0.03) Mother working part-/full-time 0.049*** 0.073*** 0.033** 0.04 (0.02) (0.02) (0.01) (0.03) Household size -0.01 0.022** 0.027*** 0.03 (0.01) (0.01) (0.01) (0.02) Number of children < 18 0.01 -0.026** -0.01 -0.03 (0.01) (0.01) (0.01) (0.02) Household owns dwelling 0.02 0.02 0.02 0.04 (0.02) (0.02) (0.02) (0.03) Computer at home -0.01 -0.02 -0.01 -0.02 (0.05) (0.02) (0.01) (0.03) Urban residence - -0.054*** -0.02 -0.01
- (0.01) (0.01) (0.01) Constant 0.524*** 0.382*** 0.604*** 0.269** (0.14) (0.09) (0.09) (0.14) Observations 7,074 10,346 8,080 2,703 R-squared 0.107 0.221 0.211 0.126
Notes: Robust standard errors in parenthesis. The sample is restricted to include individuals who are reported to be son/daughterof the reference person of the household in the Multinational Time Use Study (MTUS) from Germany, Italy, Spain and the United Kingdom. Housework is measured in hours per day, and is defined as the sum of the time devoted to “cook, wash up”, “housework”, “odd jobs”, “shopping” and “domestic travel.” *Significant at the 90% level **Significant at the 95% level ***Significant at the 99%

26
Table 3. Regression results for housework, by country and demographic groups (1) (2) (3) (4) Log of housework time Germany 2001 Italy 2002 Spain 2002 UK 2000 Panel A: 2-earners households Father's housework (log) 0.092*** 0.120*** 0.040* 0.109*** (0.02) (0.03) (0.02) (0.03) Mother's housework (log) 0.136*** 0.01 0.01 0.103*** (0.02) (0.04) (0.03) (0.04) Father's housework (log)*Male 0.03 0.03 0.118*** 0.01 (0.03) (0.03) (0.03) (0.04) Mother's housework (log)*Male -0.083*** 0.04 0.06 -0.093* (0.03) (0.05) (0.04) (0.05) Panel B: male-earner households Father's housework (log) 0.189*** 0.066** 0.069*** 0.199*** (0.04) (0.03) (0.03) (0.07) Mother's housework (log) 0.157*** 0.109** 0.05 0.243** (0.04) (0.05) (0.03) (0.10) Father's housework (log)*Male -0.06 0.067* 0.101*** 0.03 (0.05) (0.03) (0.03) (0.08) Mother's housework (log)*Male -0.173*** -0.05 -0.111** -0.277** (0.06) (0.05) (0.04) (0.13) Panel C: prim educated households Father's housework (log) 0.12 0.07 -0.02 0.139** (0.20) (0.04) (0.04) (0.06) Mother's housework (log) 0.42 0.03 -0.133*** 0.132** (0.25) (0.07) (0.04) (0.07) Father's housework (log)*Male -0.48 0.03 0.133*** 0.02 (0.34) (0.05) (0.04) (0.08) Mother's housework (log)*Male 0.22 -0.03 0.154*** -0.11 (0.32) (0.08) (0.05) (0.09) Panel D: sec educated households Father's housework (log) 0.153*** 0.103*** 0.02 0.114* (0.03) (0.02) (0.02) (0.06) Mother's housework (log) 0.079** 0.01 0.00 0.03 (0.03) (0.03) (0.03) (0.10) Father's housework (log)*Male -0.01 -0.02 0.071** 0.02 (0.03) (0.03) (0.03) (0.09) Mother's housework (log)*Male -0.04 0.04 -0.01 -0.08 (0.04) (0.04) (0.04) (0.12) Panel E: univ educated households Father's housework (log) 0.097*** 0.09 0.107** 0.06 (0.04) (0.07) (0.05) (0.07) Mother's housework (log) 0.105** -0.01 0.157*** 0.382*** (0.05) (0.08) (0.05) (0.09) Father's housework (log)*Male 0.00 0.04 0.09 0.08 (0.05) (0.09) (0.07) (0.10) Mother's housework (log)*Male -0.095* 0.03 -0.114* -0.268** (0.06) (0.12) (0.06) (0.11)
Notes: Robust standard errors in parenthesis. The sample is restricted to include individuals who are reported to be son/daughterof the reference person of the household in the Multinational Time Use Study (MTUS) from Germany, Italy, Spain and the United Kingdom. Housework is measured in hours per day, and is defined as the sum of the time devoted to “cook, wash up”, “housework”, “odd jobs”, “shopping” and “domestic travel.” *Significant at the 90% level **Significant at the 95% level ***Significant at the 99%

27
Table 4. FE Regressions for housework, Germany and the United Kingdom.
(1) (2) (3) (4)
Log of housework time Germany males Germany females UK males UK females
Father's housework (log) 0.097*** 0.077*** 0.184*** 0.084**
(0.02) (0.02) (0.03) (0.03)
Mother's housework (log) 0.071*** 0.141*** 0.071* 0.140***
(0.02) (0.02) (0.04) (0.04)
Diff father's-mother's housework 0.03 -0.06 0.11 -0.06
P-value (0.38) (0.06) (0.05) (0.35)
N. Observations 3,711 3,363 1,366 1,337
R.Squared 0.061 0.078 0.114 0.167
Notes: Robust standard errors in parenthesis. The sample is restricted to include individuals who are reported to be son/daughter of the reference person of the household in the Multinational Time Use Study (MTUS) from Austria, Germany, Italy, Spain and the United Kingdom. Housework is measured in hours per day, and is defined as the sum of the time devoted to “cook, wash up”, “housework”, “odd jobs”, “shopping” and “domestic travel.” *Significant at the 90% level **Significant at the 95% level ***Significant at the 99%.

28
APPENDIX A: Testing for reverse causality
To test for the presence of reverse causality in our estimated regressions, we applied an
augmented regression test (DWH test), proposed by Davidson and MacKinnon (1990), which
can be formed by including the residuals of each endogenous right-hand side variable, as a
function of all exogenous variables, in a regression of the original model. In doing so, in a
first step we estimate the time devoted to housework by fathers and mothers separately, where
we include the demographic and household characteristics as defined in Equation (1).
Additionally, we include variables that can affect the time devoted to housework by parents.
We estimate the following equation as follows:
jh jh jh jhlnTime =α+γX + +εZ (A1)
where lnTimejh represents the time devoted to housework in household “h” by parent “j”
(i=father, mother), and Xjh includes the set of socio-demographic variables as defined in
Equation (1). We estimate separately for fathers and mothers. Additionally, we need to
include variables to identify the system (Zjh), where we use the following information reported
by parents: where parents are cohabiting (1) or not (0), self-reported hours per week devoted
to the labor market, whether the individual cares for a household adult (1) or not (0), and
whether respondent has any disability (1) or not (0). Finally, εjh represents the robust standard
error. Table A1 shows the results of estimating this regression using an OLS estimator.
After estimating Equation (B1) for each country and type of parent (e.g., mothers, fathers),
we obtain the residuals for each regresion, which we then include in an augmented regression
as follows:
ih 1 ih ih ihlnTime =α+β lnFather'sTime +γX + Res_Father'sTime +εih (A2)
ih 1 ih ih ihlnTime =α+β lnMother'sTime +γX + Res_Mother'sTime +εih (A3)
where lnTimeih represents the time devoted to housework in household “h” by child “i”, and
Xih includes the set of socio-demographic variables as defined in Equation (1). Equation (A2)
is estimated when we analyze the relationship between father’ and children’ housework, and
Equation (A3) is estimated when we analyze the relationship between father’ and children’
housework. The 2 equations include the residual of the father’s/mother’s time obtained from
step one. If φ is significantly different from zero, then OLS is not consistent due to reverse
causality. Table A2 shows the results of estimating Equations (A2) and (A3) and we find no

29
evidence of reverse causality between children and parents’ time devoted to housework in
Spain. In the case of Germany, we find no evidence of reverse causality between fathers’
housework time and that of their children, but we find evidence of reverse causality between
mothers’ housework time and that of their children.

30
Table A1. First stage regressions on housework time, fathers and mothers (1) (2) (3) (4) (5) (6) (7) (8)
Log of housework time Fathers
Germany Mothers Germany Fathers Italy
Mothers Italy
Fathers Spain
Mothers Spain Fathers UK Mothers UK
Cohabiting 0.13 -0.21 0.02 -0.03 -0.05 -0.05 0.01 0.017*
(0.09) (0.13) (0.20) (0.09) (0.11) (0.09) (0.01) (0.01)
Weekly work hours -0.010*** -0.008*** 0.001*** -0.003*** 0.00 -0.005*** -0.002** -0.004***
(0.00) (0.00) (0.00) (0.00) (0.00) (0.00) (0.00) (0.00)
Caring for household adult 0.108*** 0.082*** -0.08 0.036** 0.260*** 0.115*** 0.162*** 0.135***
(0.04) (0.02) (0.33) (0.02) (0.04) (0.02) (0.04) (0.03)
Any disability - - -0.03 -0.16 -0.273*** -0.315*** -0.04 -0.104***
- - (0.08) (0.13) (0.04) (0.04) (0.04) (0.03)
Male -0.01 -0.01 0.039*** 0.035*** 0.036*** 0.041*** 0.052** 0.00
(0.02) (0.01) (0.01) (0.01) (0.01) (0.01) (0.03) (0.02)
Age of respondent 0.00 -0.007*** -0.009*** -0.005*** 0.00 -0.012*** 0.00 0.00
(0.00) (0.00) (0.00) (0.00) (0.00) (0.00) (0.00) (0.00)
Student -0.147* -0.02 0.02 0.046*** 0.061* 0.02 0.06 -0.03
(0.08) (0.07) (0.02) (0.01) (0.04) (0.03) (0.05) (0.04)
Unemployed -0.189* -0.05 0.01 0.032* -0.03 0.04 0.04 -0.126*
(0.10) (0.08) (0.03) (0.02) (0.04) (0.04) (0.08) (0.07)
Working part-/full-time -0.12 0.00 0.047** 0.051*** 0.01 0.058* 0.06 0.01
(0.08) (0.07) (0.02) (0.02) (0.04) (0.03) (0.05) (0.04)
Father's secondary education -0.01 0.01 0.042** -0.01 0.091*** -0.01 0.05 -0.03
(0.03) (0.03) (0.02) (0.01) (0.02) (0.01) (0.03) (0.03)
Mother's secondary education 0.03 0.02 0.035* -0.036*** -0.02 0.00 -0.02 0.03
(0.02) (0.02) (0.02) (0.01) (0.02) (0.01) (0.03) (0.02)
Father's university education -0.02 0.00 0.01 -0.02 0.173*** -0.058*** 0.085** -0.078***
(0.03) (0.03) (0.03) (0.02) (0.03) (0.02) (0.04) (0.03)
Mother's university education 0.076*** -0.02 0.099*** -0.138*** 0.02 -0.052** 0.067* -0.04
(0.03) (0.02) (0.03) (0.02) (0.03) (0.02) (0.04) (0.03)
Father's age 0.00 0.003** 0.00 0.00 0.004* -0.004** 0.006** 0.005*
(0.00) (0.00) (0.00) (0.00) (0.00) (0.00) (0.00) (0.00)
Mother's age 0.00 0.00 0.005** 0.00 -0.008*** 0.007*** 0.00 0.005*
(0.00) (0.00) (0.00) (0.00) (0.00) (0.00) (0.00) (0.00)
Father working part-/full-time -0.065* 0.086*** -0.471*** 0.060*** -0.483*** 0.02 -0.111** 0.092***
(0.04) (0.02) (0.02) (0.01) (0.03) (0.02) (0.05) (0.03)
Mother working part-/full-time 0.02 -0.097*** 0.116*** -0.254*** 0.125*** -0.304*** 0.102*** -0.097***
(0.02) (0.02) (0.01) (0.02) (0.02) (0.02) (0.03) (0.03)
Household size -0.022** 0.037*** -0.023*** 0.018*** 0.00 0.015** -0.037* 0.041***
(0.01) (0.01) (0.01) (0.01) (0.01) (0.01) (0.02) (0.01)
Number of children < 18 0.029** -0.019* 0.01 0.01 -0.025** -0.035*** 0.056*** 0.032*
(0.01) (0.01) (0.01) (0.01) (0.01) (0.01) (0.02) (0.02)
Household owns dwelling -0.037** 0.062*** 0.069*** 0.01 0.051** -0.049*** 0.094** 0.066**
(0.02) (0.02) (0.02) (0.01) (0.02) (0.02) (0.04) (0.03)
Computer at home 0.101** -0.02 0.070*** -0.01 0.094*** 0.02 0.03 0.05
(0.05) (0.04) (0.02) (0.01) (0.02) (0.01) (0.04) (0.03)
Urban residence - - 0.066*** 0.019** 0.060*** 0.00 0.022** -0.017***
- - (0.01) (0.01) (0.01) (0.01) (0.01) (0.01)
Constant 1.923*** 1.478*** 1.082*** 2.014*** 1.103*** 2.057*** 0.891*** 1.114***
(0.14) (0.11) (0.08) (0.06) (0.09) (0.07) (0.15) (0.12) Observations 7074 7074 10346 10346 8080 8080 2703 2703 R-squared 0.127 0.151 0.11 0.181 0.112 0.225 0.118 0.109
Notes: Robust standard errors in parenthesis. The sample is restricted to include individuals who are reported to be the reference person/spouse of the reference person of the household in the Multinational Time Use Study (MTUS) from Austria, Germany, Italy, Spain and the United Kingdom. Housework is measured in hours per day, and is defined as the sum of the time devoted to “cook, wash up”, “housework”, “odd jobs”, “shopping” and “domestic travel.” *Significant at the 90% level **Significant at the 95% level ***Significant at the 99%.

31
Table A2. Results for augmented regression on housework time of children, by country (1) (2) (3) (4) (5) (6) (7) (8)
Log of housework time Fathers
Germany Mothers Germany Fathers Italy
Mothers Italy
Fathers Spain
Mothers Spain Fathers UK Mothers UK
Father's housework (log) 0.08 - 0.01 - -0.01 - 0.417** -
(0.05) - (0.25) - (0.09) - (0.18) -
Mother's housework (log) - -0.203*** - 0.06 - -0.06 - -0.01
- (0.06) - (0.21) - (0.08) - (0.13)
Male -0.212*** -0.215*** -0.386*** -0.388*** -0.374*** -0.371*** -0.246*** -0.219***
(0.01) (0.01) (0.02) (0.02) (0.01) (0.01) (0.02) (0.02)
Age of respondent 0.009*** 0.007*** 0.023*** 0.022*** 0.010*** 0.009*** 0.008** 0.009**
(0.00) (0.00) (0.00) (0.00) (0.00) (0.00) (0.00) (0.00)
Student -0.196** -0.211** -0.101*** -0.103*** -0.176*** -0.174*** -0.07 -0.05
(0.10) (0.09) (0.02) (0.02) (0.04) (0.04) (0.05) (0.05)
Unemployed 0.194* 0.17 0.186*** 0.186*** 0.159*** 0.163*** 0.207** 0.224***
(0.11) (0.11) (0.04) (0.04) (0.05) (0.05) (0.09) (0.09)
Working part-/full-time -0.197** -0.203** -0.252*** -0.250*** -0.301*** -0.296*** -0.168*** -0.148***
(0.09) (0.09) (0.03) (0.03) (0.04) (0.04) (0.05) (0.04)
Father's secondary education 0.050* 0.051* -0.050** -0.045** 0.00 0.00 0.02 0.04
(0.03) (0.03) (0.02) (0.02) (0.02) (0.02) (0.03) (0.03)
Mother's secondary education -0.038* -0.03 -0.03 -0.03 -0.034** -0.034** 0.04 0.03
(0.02) (0.02) (0.02) (0.02) (0.02) (0.02) (0.03) (0.03)
Father's university education 0.03 0.03 -0.065** -0.064** -0.042* -0.046** -0.04 -0.01
(0.03) (0.03) (0.03) (0.03) (0.03) (0.02) (0.04) (0.03)
Mother's university education -0.01 -0.02 -0.117*** -0.112** -0.02 -0.02 -0.03 -0.01
(0.02) (0.02) (0.04) (0.04) (0.02) (0.02) (0.03) (0.03)
Father's age 0.00 0.00 0.00 0.00 0.00 0.00 0.00 0.00
(0.00) (0.00) (0.00) (0.00) (0.00) (0.00) (0.00) (0.00)
Mother's age 0.00 0.00 0.00 0.00 0.00 0.00 0.00 0.00
(0.00) (0.00) (0.00) (0.00) (0.00) (0.00) (0.00) (0.00)
Father working part-/full-time 0.057* 0.04 0.04 0.01 0.00 0.00 0.090** 0.01
(0.03) (0.02) (0.11) (0.02) (0.04) (0.02) (0.04) (0.04)
Mother working part-/full-time 0.032** -0.02 0.074** 0.10 0.044*** 0.02 0.00 0.05
(0.02) (0.02) (0.03) (0.07) (0.02) (0.04) (0.03) (0.04)
Household size -0.01 -0.01 0.021* 0.020* 0.027*** 0.028*** 0.043** 0.03
(0.01) (0.01) (0.01) (0.01) (0.01) (0.01) (0.02) (0.02)
Number of children < 18 0.01 0.01 -0.025** -0.025** -0.01 -0.01 -0.043** -0.02
(0.01) (0.01) (0.01) (0.01) (0.01) (0.01) (0.02) (0.02)
Household owns dwelling 0.027* 0.036** 0.03 0.030* 0.02 0.02 0.01 0.05
(0.02) (0.02) (0.02) (0.02) (0.02) (0.02) (0.04) (0.03)
Computer at home -0.01 -0.01 -0.02 -0.02 -0.01 -0.01 -0.03 -0.02
(0.05) (0.05) (0.02) (0.02) (0.02) (0.01) (0.03) (0.03)
Urban residence - ´- -0.047** -0.050*** -0.01 -0.01 -0.017* -0.01
- - (0.02) (0.01) (0.01) (0.01) (0.01) (0.01)
Residual of housework time 0.05 0.299*** 0.09 -0.03 0.09 0.07 -0.29 0.08
(0.05) (0.06) (0.25) (0.21) (0.09) (0.08) (0.18) (0.14)
Constant 0.739*** 1.157*** 0.516* 0.42 0.674*** 0.804*** 0.15 0.523***
(0.17) (0.15) (0.28) (0.43) (0.12) (0.18) (0.20) (0.20)
Observations 7074 7074 10346 10346 8080 8080 2703 2703
R-squared 0.103 0.092 0.221 0.211 0.209 0.201 0.122 0.103
Notes: Robust standard errors in parenthesis. The sample is restricted to include individuals who are reported to be son/daughter of the reference person of the household in the Multinational Time Use Study (MTUS) from Austria, Germany, Italy, Spain and the United Kingdom. Housework is measured in hours per day, and is defined as the sum of the time devoted to “cook, wash up”, “housework”, “odd jobs”, “shopping” and “domestic travel.” *Significant at the 90% level **Significant at the 95% level ***Significant at the 99%.

32
APPENDIX B: Distribution of housework time
Figure B1. Distribution of log (housework) time, children
0.5
11.
5
Den
sity
0 1 2 3Non-market work hours
kernel = epanechnikov, bandwidth = 0.0916
Male children, Germany
01
23
4
Den
sity
0 1 2 3Non-market work hours
kernel = epanechnikov, bandwidth = 0.0483
Male children, Italy
0.5
11.
52
2.5
Den
sity
0 1 2 3Non-market work hours
kernel = epanechnikov, bandwidth = 0.0643
Male children, Spain
0.5
11.
5
Den
sity
0 1 2 3Non-market work hours
kernel = epanechnikov, bandwidth = 0.1147
Male children, UK
0.2
.4.6
.8
Den
sity
0 1 2 3Non-market work hours
kernel = epanechnikov, bandwidth = 0.0985
Female children, Germany
0.2
.4.6
.81
Den
sity
0 1 2 3Non-market work hours
kernel = epanechnikov, bandwidth = 0.1043
Female children, Italy
0.2
.4.6
.8
Den
sity
0 1 2 3Non-market work hours
kernel = epanechnikov, bandwidth = 0.1058
Female children, Spain
0.2
.4.6
.8
Den
sity
0 1 2 3Non-market work hours
kernel = epanechnikov, bandwidth = 0.1231
Female children, UK
Note: Sample consists of individuals who are 10 years or older who are reported as being a child in the household, and living with the two heterosexual parents from Germany, Italy, Spain and the United Kingdom. We include fathers of those children Housework includes the total time devoted to the following activities: cook, wash up”, “housework”, “odd jobs”, “shopping” and “domestic travel”, and is measured in (log) hours per day.

33
Figure B2. Distribution of log (housework) time, parents
0.2
.4.6
Den
sity
0 1 2 3Non-market work hours
kernel = epanechnikov, bandwidth = 0.0990
Fathers, Germany
0.5
11.
5
Den
sity
0 1 2 3Non-market work hours
kernel = epanechnikov, bandwidth = 0.0953
Fathers, Italy0
.51
1.5
Den
sity
0 1 2 3Non-market work hours
kernel = epanechnikov, bandwidth = 0.0972
Fathers, Spain
0.2
.4.6
Den
sity
0 1 2 3Non-market work hours
kernel = epanechnikov, bandwidth = 0.1257
Fathers, UK
0.2
.4.6
.8
Den
sity
0 1 2 3Non-market work hours
kernel = epanechnikov, bandwidth = 0.0759
Mothers, Germany
0.5
1
Den
sity
0 1 2 3Non-market work hours
kernel = epanechnikov, bandwidth = 0.0592
Mothers, Italy
0.2
.4.6
.81
Den
sity
0 1 2 3Non-market work hours
kernel = epanechnikov, bandwidth = 0.0686
Mothers, Spain
0.2
.4.6
.8
Den
sity
0 1 2 3Non-market work hours
kernel = epanechnikov, bandwidth = 0.1016
Mothers, UK
Note: Sample consists of individuals who are 10 years or older who are reported as being the reference person/spouse of reference person in household, living in heterosexual couples with at least one child from Germany, Italy, Spain and the United Kingdom. We include mothers of those children Housework includes the total time devoted to the following activities: cook, wash up”, “housework”, “odd jobs”, “shopping” and “domestic travel”, and is measured in (log) hours per day.
Copyright © 2022 FDOKUMEN