
ArthVeda Alpha L50 Uber-Twin-of-Nifty-50
12
1 ArthVeda - Research and Product Development ArthVeda Alpha L50 is an investment strategy based on the principles of value investing for Ultra-Large-Cap Indian Equities. Alpha L50 invests in all 50 stocks of Nifty 50 with weightages determined by the degree-of-undervaluation as opposed to Nifty’s free-float-adjusted-market-cap weightage. The degree- of-undervaluation is determined by using a proprietary method which uses valuation metrics and fundamental parameters only. All Alpha L50 portfolios are rebalanced annually to take advantage of the current zero income tax liability on long term capital gains in India. See website for more details. ArthVeda Alpha L50 strategy has been evaluated extensively over the 2002- 12 period by creating portfolios on every trading day over the period. The results of evaluation, which have been audited by Ernst & Young, show that the strategy not only generates excess returns over Nifty 50 but also takes lower risks, thereby generating an average alpha of ~5% over different holding periods. In this paper, we take a closer look at the underlying fundamental and valuations of Alpha L50 and Nifty 50 from a business perspective. In the first section, we discuss the fundamental drivers that create value in a business over the long run. We argue that growth is not necessarily the most pertinent driver of value in a business; one should also account for business efficiency. The section also details how a value investor extracts excess return from a business while reducing the overall risks. While value creation at the company level is important, ArthVeda believes that the ability to buy such businesses at reasonable/discount prices presents a low-risk opportunity of wealth creation at the investor level. In the second section, we demonstrate that historically, over 2002-12, Alpha L50 portfolio has fared better as compared to Nifty 50 in terms of long term fundamental value drivers. The study also compared Alpha L50 and Nifty 50 on various valuation metrics and shows that the historical entry level valuations of Alpha L50 have been at an average ~30% discounts to Nifty 50. In effect, Alpha L50 strategy carves out a higher quality business conglomerate available at much cheaper valuations from the same 50 stocks of Nifty 50. Our analysis also shows that the trends observed over the period 2002-12 persist even today. Alpha L50 is still fundamentally superior to Nifty 50 and is available at a much deeper discount of ~35% than its historical average w.r.t Nifty. Towards the end, the report discusses the drivers of excess return of Alpha L50 portfolios over Nifty 50. Not surprisingly, we find that both Alpha L50 and Nifty 50 have similar growth components but the valuation re-rating component for Alpha L50 is superior to Nifty 50, thereby generating excess returns. We believe that excess returns generation from valuation re-rating entails relatively low risk. Alpha L50 – Über Twin of Nifty 50 Safer, Stronger, Cheaper Authors Kshitij Gupta [email protected] Vikas Gupta [email protected] September 19, 2013 Superior fundamentals... Source: Capital Line, ArthVeda. *Excludes extraordi- nary and exceptional items. Above figures are averages over 2002-12 ...at cheaper valuations Source: ArthVeda, Capital Line. *Excludes extraordi- nary and exceptional items. Above figures are averages over 2002-12 18.1 3.2 10.4 12.6 2.0 12.5 2.5 7.1 8.5 1.4 P/E* P/BV EV/EBITDA EV/EBIT P/Sales Alpha L50 Nifty 50 19.6 26.3 11.5 18.5 17.7 21.9 11.2 17.6 ROE* ROCE Net Margin* EBIT Margin Alpha L50 Nifty 50
-
Upload
omnisciencecapital -
Category
Documents
-
view
0 -
download
0
Transcript of ArthVeda Alpha L50 Uber-Twin-of-Nifty-50

1
ArthVeda - Research and Product Development
ArthVeda Alpha L50 is an investment strategy based on the principles of value investing for Ultra-Large-Cap Indian Equities. Alpha L50 invests in all 50 stocks of Nifty 50 with weightages determined by the degree-of-undervaluation as opposed to Nifty’s free-float-adjusted-market-cap weightage. The degree-of-undervaluation is determined by using a proprietary method which uses valuation metrics and fundamental parameters only. All Alpha L50 portfolios are rebalanced annually to take advantage of the current zero income tax liability on long term capital gains in India. See website for more details.
ArthVeda Alpha L50 strategy has been evaluated extensively over the 2002-12 period by creating portfolios on every trading day over the period. The results of evaluation, which have been audited by Ernst & Young, show that the strategy not only generates excess returns over Nifty 50 but also takes lower risks, thereby generating an average alpha of ~5% over different holding periods.
In this paper, we take a closer look at the underlying fundamental and valuations of Alpha L50 and Nifty 50 from a business perspective. In the first section, we discuss the fundamental drivers that create value in a business over the long run. We argue that growth is not necessarily the most pertinent driver of value in a business; one should also account for business efficiency. The section also details how a value investor extracts excess return from a business while reducing the overall risks. While value creation at the company level is important, ArthVeda believes that the ability to buy such businesses at reasonable/discount prices presents a low-risk opportunity of wealth creation at the investor level.
In the second section, we demonstrate that historically, over 2002-12, Alpha L50 portfolio has fared better as compared to Nifty 50 in terms of long term fundamental value drivers. The study also compared Alpha L50 and Nifty 50 on various valuation metrics and shows that the historical entry level valuations of Alpha L50 have been at an average ~30% discounts to Nifty 50. In effect, Alpha L50 strategy carves out a higher quality business conglomerate available at much cheaper valuations from the same 50 stocks of Nifty 50.
Our analysis also shows that the trends observed over the period 2002-12 persist even today. Alpha L50 is still fundamentally superior to Nifty 50 and is available at a much deeper discount of ~35% than its historical average w.r.t Nifty.
Towards the end, the report discusses the drivers of excess return of Alpha L50 portfolios over Nifty 50. Not surprisingly, we find that both Alpha L50 and Nifty 50 have similar growth components but the valuation re-rating component for Alpha L50 is superior to Nifty 50, thereby generating excess returns. We believe that excess returns generation from valuation re-rating entails relatively low risk.
Alpha L50 – Über Twin of Nifty 50Safer, Stronger, Cheaper
Authors
Kshitij [email protected]
Vikas [email protected]
September 19, 2013
Superior fundamentals...
Source: Capital Line, ArthVeda. *Excludes extraordi-nary and exceptional items. Above figures are averages over 2002-12
...at cheaper valuations
Source: ArthVeda, Capital Line. *Excludes extraordi-nary and exceptional items. Above figures are averages over 2002-12
18.1
3.2
10.4
12.6
2.0
12.5
2.5
7.1
8.5
1.4
P/E*
P/BV
EV/EBITDA
EV/EBIT
P/Sales
Alpha L50 Nifty 50
19.6
26.3
11.5
18.5 17.7 21.9
11.2
17.6
ROE* ROCE Net Margin* EBIT Margin
Alpha L50 Nifty 50

Alpha L50 – Über Twin of Nifty 50September 19, 2013
2
Title Page No.
Harvesting excess returns from a business with lower risks 3
Alpha L50, Über Twin of Nifty 50 - Superior business fundamentals, cheaper investment valuations
5
Alpha L50 is even more alluring today – Deeper discounts with better fundamentals than Nifty 50
7
Alpha L50’s excess returns over Nifty 50 entail lower risks 9
Alpha L50 is indeed an Uber Twin of Nifty 50 10
About ArthVeda 11
Disclaimer 11

Alpha L50 – Über Twin of Nifty 50September 19, 2013
3
How do businesses generate value?
Enterprise value of the firm is defined as the sum of market value of equity and market value of net debt of the company and represents the price of acquiring a business. Book value of the enterprise, adjusted for inflation, represents the price at which an investor will be willing to buy a going-concern-business when the business generates normal returns, i.e. returns are commensurate with the business risks and opportunity costs. Equivalently, the book value (the use of the term “book value” here and thereafter refers to inflation-adjusted-book value) represents the replacement cost of the firm’s assets.
When a business generates returns which are disproportionate with respect to business risks and opportunity costs, the cost of acquisition is some multiple (not necessarily greater than 1) of the book value of the enterprise because the positive/negative excess earnings above the normal returns will accrue to the investors and hence at some point in future the current premium/discount paid for the acquisition will be realized. The multiple can be arrived at by using the well-known discounted cash flow (DCF) methods.
Fair market value of the business is fair/reasonable multiple multiplied with the book enterprise value. Discounted cash flow model dictates that a fair/reasonable multiple to pay for acquiring a business is determined by the present
value of the cash flows. Cash flows in turn depend on a lot of parameters such as earnings, working capital requirements, capex requirements, D&A, taxes, change in debt and growth.
How important is growth for generating value?
Higher the cash generated by a business relative to its current asset base, the higher the fair/reasonable multiple because of the ability of the business to repay back the premium quickly to the investor. A business which has a high cash growth but a much larger asset base relative to the present earnings will command a lower premium because no matter how fast the cash grows, it is small as compared to the asset base. For example, contrast two businesses A and B which generated 40% and 5% cash earnings over its asset base last year, respectively. Let us assume that cash earnings of Business A is expected to de-grow at 5% while Business B is expected to grow at an impressive 50% for the next 3 years and that both businesses will distribute their cash earnings. For simplicity, let us also assume that their asset base remains constant for these 3 years. During these 3 years, business A with negative 5% growth would have created more value than business B with 50% growth. At the end of 3rd year, returns over asset base for business A remain higher as compared to business B, though the gap has narrowed.
Harvesting excess returns from a business with lower risks
Figure 1: Value Generation at Business Level
Figure 2: Premium/Discount to Book Value depends on required and realized returns
Source: ArthVeda.*Adjusted for inflation.
Source: ArthVeda
Book Enterprise Value*
Business Operations
Book Debt*
Book Equity*
Book Assets*
Profits
Realized Returns
Required Returns
Opportunity Costs
Business Risks
Investment risks
Profits
Asset Base
Growth

Alpha L50 – Über Twin of Nifty 50September 19, 2013
4
Table 1: Business A with negative 5% growth generates more value than Business B with 50% growth
Source: ArthVeda
Figure 3: Exploitation of low-risk return from mispricing
Source: ArthVeda
A B
Asset 100 100Earning 40 5Growth -5 50
Earning in Year 1 38.0 7.5Earning in Year 2 36.1 11.3Earning in Year 3 34.3 16.9
Returns on asset in 3rd Year 34% 17%
The premium/discount to the current book value, of course, depends on projections of what happens over the entire life of the business and not just the next 3 years. It is worth highlighting that we do not negate the possibility that a high growth company with low cash earnings relative to its capital has the potential to bring its return over assets to a meaningful level. The key takeaway from this discussion, however, is that high growth of a business holds little significance unless otherwise considered in conjunction with the returns generation capability of the business.
How do value investors create wealth from businesses?
Investors will realize value by the same fundamental parameters which create value for the company –
either the growth in the asset base, re-rating of the fair/reasonable multiple or a combination of both. However, there is another source of return generation for investors– mispricing of the multiple in the short term. Very often businesses trade at a multiple different from fair/reasonable multiple and therefore it represents a low-risk wealth creation opportunity at the investor level. Investors who try to exploit these low-risk returns from mispricing are known as value investors. However, such mispricing is known to correct over the long term.
Deviation from the fair/reasonable multiple can be due to many factors. 1) A business can trade below its fair/reasonable multiple because of the negative sentiment even when there is no change to future estimates. 2) Fair/reasonable multiple itself can have a wide range. Recall, that the fair/reasonable multiple depends on the business returns and the growth. Estimates of growth and business returns are provided by the analysts and can have a wide range because of divergence in opinions.
Mispricing due to sentiment definitely presents a low-risk return opportunity but mispricing due to divergence of opinions can be difficult to exploit as the future outlook cannot be ascertained. Value investors, therefore, employ margin-of-safety to protect against the valuation trap by buying businesses at significant discount to their fair value with the most conservative estimates.
How important are margins? - Less for valuations, more for business resilience
Current cash flows are dependent on the absolute levels of sales, margins, interest costs, taxes, change in inventories, trade receivables and payables and other
TimeCurrent Market Value
Current Fair Value
Future Fair Value
Extra return
Fair V
alue

Alpha L50 – Über Twin of Nifty 50September 19, 2013
5
Table 2: Better margins indicate more resilience to shocks
Source: ArthVeda
parameters mentioned earlier. Growth of current cash flows, however, is dependent on sales growth, margin improvement, decrease in leverage (and hence interest costs), decrease in taxes, low working capital and capex requirement for future expansion, etc. It is combination of sales and margins that determines current earnings, while it is a combination of sales growth and margin expansion that determine growth. That brings us to another question whether absolute level of sales, margins, interest cost and taxes are at all important? While they may play little/no significance in determining the fair/reasonable multiple, their absolute levels relative to each other (read margins and coverage ratios) are necessary to evaluate the cushion available against shocks, i.e. to gauge resilience of the business.
Let us contrast two businesses A and B with the details as shows in the Table 2. Business B has more cushion against any downturn/shocks from input cost inflation because of higher margins as compared to A. Similarly, business B is more protected against any increase interest rate because
of its higher EBIT generation relative to the interest costs as compared to business A.
A BSales 100 100EBIT 15 25Interest 5 5PBT 10 20Tax 3 6PAT 7 14
EBIT Margin 15% 25%PAT Margin 7% 14%Interest Coverage 3x 5x
Alpha L50, Über Twin of Nifty 50 Superior business fundamentals, cheaper investment valuations
We evaluated the fundamental strengths and valuations of Alpha L50 vis-à-vis Nifty 50 over an 11 year period of 2002 to 2012. Even though Alpha L50 invests in the same 50 stocks of Nifty 50, it was much superior to Nifty in terms of both fundamentals and valuations.
Alpha L50 has been fundamentally superior to Nifty 50 over 2002-12
DuPont analysis is an important tool to understand the components that generate value for a business. Our study over 2002-12 reveals that Alpha L50 basket had higher efficiency as compared to Nifty 50 in terms of sales generation, on an average, as evidenced by the Asset Turnover (Sales/Assets) ratio. Alpha L50 generated 11.8 ppt higher sales over its assets vis-à-vis Nifty 50.
EBIT margin of Alpha L50 was ~1ppt higher than Nifty 50 stocks, on an average, implying better conversion of sales to profits. It also implies higher downside protection against input cost inflation. Alpha L50’s PBT/EBIT is 1.6ppt higher than Nifty 50, indicating lower interest costs paid by Alpha L50 than Nifty 50, on an average. Taxes paid by Alpha L50, however, are higher than Nifty 50 as indicated by the NPT/PBT ratio. These three factors combined –
EBIT Margin, PBT/EBIT and NP/PBT – determine the Net Margin for a business. Our study shows that Net Margin of Alpha L50 is 30 bps higher than Nifty 50, on an average, over 2002-12.
Figure 4: Components of DuPont Analysis reveal that Alpha L50 is superior to Nifty 50
Source: ArthVeda, Capital Line. *Excludes extraordinary and exception-al items. ppt is percentage point.
-2.9 1.6 1.0
11.8
0.0x
NP/P
BT (p
pt)*
PBT/
EBIT
(ppt)
EBIT
Mar
gin(p
pt)
Sales
/Ass
ets(p
pt)
Asse
ts/Eq
uity(x
)
Average differential between Alpha L50 and Nifty 50 DuPont components over 2002-12

Alpha L50 – Über Twin of Nifty 50September 19, 2013
6
With virtually no difference in Assets/Equity between the two baskets, superior Asset Turnover and Net Margin resulted in ~2ppt better historical ROE average for Alpha L50 than Nifty 50 over 2002-12.We also found that Alpha L50 had 4.4ppt higher ROCE than Nifty 50. Both ROE and ROCE of Alpha L50 were always higher than that of Nifty over 2002-12 with the exception of a 3-month period – Jan-Mar 2002.
Although, Alpha L50 margins were superior to Nifty 50 on an average, we did not find any clear trends on the superiority/inferiority of margins over 2002-12.
On an average, both the baskets had been at roughly the same debt-to-equity levels. Average interest coverage of Alpha L50 was, however, ~1x better than Nifty 50, providing better margin protection from rise in interest costs. We, therefore, conclude that overall Alpha L50 basket was better than Nifty 50 over 2002-12, fundamentally.
Alpha L50 was available at deep discounts of average ~30% to Nifty 50 over 2002-12
Historically, at the entry, Alpha L50 has traded at an average discount of 24-33% as compared to Nifty 50 on various valuation metrics. Alpha L50’s P/E ratio has traded at an average discount of 31% to Nifty 50 with discounts ranging between 18% and 49%. Interestingly, we did not find a single trading day when entry level valuations of Alpha L50 were higher than Nifty 50. Such a deep discount of Alpha L50 w.r.t Nifty 50 inspite of better fundamentals provide opportunities to capture a low-risk profit due to correction of the mispricing.
Long term average P/E, P/BV and EV/EBITDA of Alpha L50 stands at 12.5x, 2.5x and 7.1x respectively. Corresponding metrics of Nifty stands at 18.1x, 3.2x and 10.4x respectively. By definition, P/Es of Alpha L50 and Nifty 50 both remain within 1-standard deviation around their means most of the times and go beyond those limits only under extra-ordinary situations. In other words, P/E ratio of 9.4x and 15.6x act as support and resistance, respectively, for Alpha L50. Similarly, P/E ratio of 14.0x and 22.2x act as support and resistance, respectively, for Nifty 50.
Figure 5: Alpha L50 had better Profitability Ratios and Margins historically than Nifty on an average
Figure 6: Alpha L50 had better Balance Sheet ratios historically than Nifty on an average
Source: Capital Line, ArthVeda. *Excludes extraordinary and exception-al items.
Source: Capital Line, ArthVeda. *Excludes extraordinary and exception-al items.
Figure 7: Entry valuations of Alpha L50 have been at ~30% discount to Nifty 50 over 2002-12
Source: ArthVeda, Capital Line. *Excludes extraordinary and exception-al items.
1.9
4.4
0.3
ROE (ppt)* ROCE (ppt) Net Margin (ppt)*
Average differential between Alpha L50 and Nifty 50 ratios
over 2002-12
0.0x -0.1x
0.9x
Gross Debt toEquity
Net Debt to Equity Int Coverage
Average differential between Alpha L50 and Nifty 50 ratios over 2002-12
31.1%
23.8%
31.2% 32.9%28.2%
P/E* P/BV EV/EBITDA EV/EBIT P/Sales

Alpha L50 – Über Twin of Nifty 50September 19, 2013
7
Alpha L50 is even more alluring today Deeper discounts with better fundamentals than Nifty 50
Fundamentals of Alpha L50 are still superior to Nifty 50
Currently, Alpha L50 has 2.2ppt better profitability on equity (ROE) as compared to Nifty 50, which is higher than the historical average of 1.9ppt. DuPont analysis reveals that the factors contributing to the ROE gap are different than those observed over 2002-12.
For example, gap between the sales generation efficiency (Sales/Assets) of the two baskets has widened significantly to 38ppt from the historical average of 12ppt (Alpha basket is relatively more efficient in terms of sales generation). Alpha L50 is paying lower taxes as compared to Nifty 50, which is opposite of the average trends over 2002-12, when Alpha L50 paid slightly higher taxes than Nifty 50. Alpha L50 continues to pay lower interest costs vis-à-vis Nifty 50, but EBIT margins of Alpha L50 are currently 2.8ppt lower than Nifty 50 against historical superiority of Alpha L50 at average EBIT margin level. However, we would like to re-iterate that there exists no clear trend on superiority/inferiority of margins historically and that the
EBIT margin differential between the two baskets has touched a minimum of negative 5.3ppt also over 2002-12. The negative impact from the relative worsening of EBIT margins of Alpha L50 is more than offset by the widening of gap in the sales efficiency, resulting in better ROE for Alpha L50 than Nifty 50.
ROCE of Alpha L50 is 3.9ppt higher than that of Nifty 50, which is slightly lower than the historical gap of 4.4ppt. While the two baskets have remained at similar average Net-Debt-to-Equity over 2002-12, currently, Alpha L50 has 14ppt lower Net-Debt-to-Equity as compared to Nifty 50. In our view, lower leverage in current environment of rising interest rates presents significant tactical advantages and more downside protection to company earnings. Not surprisingly, interest coverage for Alpha L50 is 1.5x better than that of Nifty 50 against the historical average of 0.9x.
We, therefore, conclude that Alpha L50 maintains its fundamental superiority over Nifty 50 as was observed historically.
Figure 8: Historical PE of Alpha L50 Figure 9: Historical PE of Nifty 50
Source: Capital Line, ArthVeda. P/E excludes extraordinary and exceptional items.
Source: Capital Line, ArthVeda. P/E excludes extraordinary and exceptional items.
9.4
12.5
15.6
579
11131517
Dec-0
1Ju
l-02
Feb-
03Se
p-03
Apr-0
4No
v-04
Jun-
05Ja
n-06
Aug-
06Ma
r-07
Oct-0
7Ma
y-08
Dec-0
8Ju
l-09
Feb-
10Se
p-10
Apr-1
1No
v-11
Jun-
12
L50 P/E -1STD Mean +1STD
14.0
18.1
22.2
9
14
19
24
29
Dec-0
1Ju
l-02
Feb-
03Se
p-03
Apr-0
4No
v-04
Jun-
05Ja
n-06
Aug-
06Ma
r-07
Oct-0
7Ma
y-08
Dec-0
8Ju
l-09
Feb-
10Se
p-10
Apr-1
1No
v-11
Jun-
12
Nifty P/E -1STD Mean +1STD
Alpha L50 – Über Twin of Nifty 50September 19, 2013
8
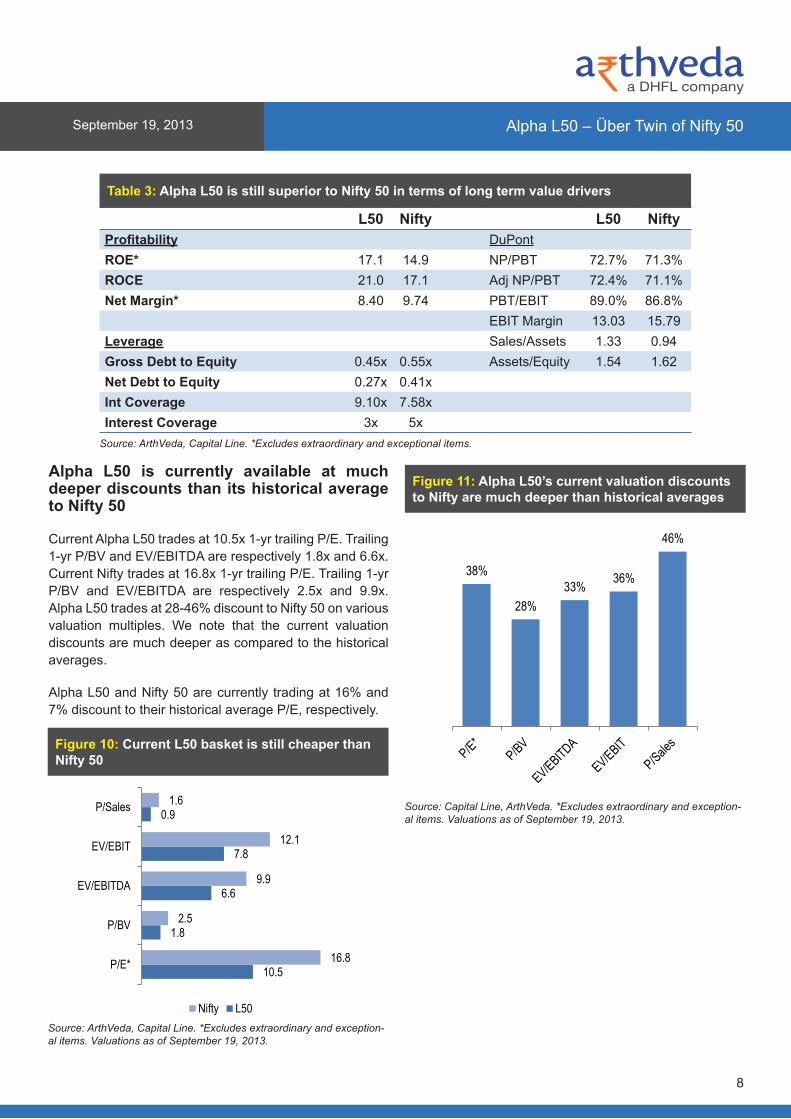
Table 3: Alpha L50 is still superior to Nifty 50 in terms of long term value drivers
L50 Nifty L50 NiftyProfitability DuPontROE* 17.1 14.9 NP/PBT 72.7% 71.3%ROCE 21.0 17.1 Adj NP/PBT 72.4% 71.1%Net Margin* 8.40 9.74 PBT/EBIT 89.0% 86.8%
EBIT Margin 13.03 15.79 Leverage Sales/Assets 1.33 0.94 Gross Debt to Equity 0.45x 0.55x Assets/Equity 1.54 1.62 Net Debt to Equity 0.27x 0.41xInt Coverage 9.10x 7.58xInterest Coverage 3x 5x
Source: ArthVeda, Capital Line. *Excludes extraordinary and exceptional items.
Figure 10: Current L50 basket is still cheaper than Nifty 50
Figure 11: Alpha L50’s current valuation discounts to Nifty are much deeper than historical averages
Source: ArthVeda, Capital Line. *Excludes extraordinary and exception-al items. Valuations as of September 19, 2013.
Source: Capital Line, ArthVeda. *Excludes extraordinary and exception-al items. Valuations as of September 19, 2013.
Alpha L50 is currently available at much deeper discounts than its historical average to Nifty 50
Current Alpha L50 trades at 10.5x 1-yr trailing P/E. Trailing 1-yr P/BV and EV/EBITDA are respectively 1.8x and 6.6x. Current Nifty trades at 16.8x 1-yr trailing P/E. Trailing 1-yr P/BV and EV/EBITDA are respectively 2.5x and 9.9x. Alpha L50 trades at 28-46% discount to Nifty 50 on various valuation multiples. We note that the current valuation discounts are much deeper as compared to the historical averages.
Alpha L50 and Nifty 50 are currently trading at 16% and 7% discount to their historical average P/E, respectively.
10.5
1.8
6.6
7.8
0.9
16.8
2.5
9.9
12.1
1.6
P/E*
P/BV
EV/EBITDA
EV/EBIT
P/Sales
Nifty L50
38%
28%33% 36%
46%

Alpha L50 – Über Twin of Nifty 50September 19, 2013
9
Alpha L50’s excess returns over Nifty 50 entail lower risks
Our return attribution analysis over 5-yr holding periods suggests that most of the Alpha L50 excess returns over Nifty 50 are driven by superior re-rating or lower de-rating of the P/BV multiple for Alpha L50 basket vis-à-vis Nifty 50. Table 4 compares the sources of returns for both Alpha L50 and Nifty 50 over 5-yr holding periods at various P/BV multiple of the market (Nifty).
Growth of book value and dividends are broadly the same for both the baskets and vary from 16-20% p.a. for Alpha L50 and from 16-22% p.a. for Nifty 50. However, P/BV re-rating of Alpha L50 is much superior to Nifty 50 and ranges from -8% to +20% p.a. while that of Nifty ranges from -14% to +19% p.a..
Nifty 50 saw re-rating in the P/BV multiple till P/BV levels of
2.8x beyond which the multiple de-rates. On the contrary, P/BV multiple of Alpha L50 re-rates till the market P/BV of 3.8x beyond which it also starts de-rating, however, at much lower rates as compared to Nifty 50.
We do not find these results surprising because the slightly better fundamentals of Alpha L50 vis-à-vis Nifty 50 did guarantee largely in-line fundamental growth of the two baskets. It is also not surprising that Alpha L50 has superior re-rating than Nifty 50 because the entry level valuations were available at ~30% discount on various valuation multiples. We would like to re-iterate that the excess return due to re-rating of the valuation multiples is a low-risk way of generating returns and the results shown below confirm our assertion that Alpha L50 generates superior returns while taking lower risks.
Table 4: Return attribution of Alpha L50 and Nifty 50 over 5-year holding periods from different P/BV multiples
Starting P/BV Range of Nifty
Alpha L50 Nifty 50 TRIReturn P/BV Re/(de) Rating Book growth* Return P/BV Re/(de) Rating Book growth*
1.8 to 2.0 42.5% 19.6% 19.1% 40.9% 19.1% 18.3%2.0 to 2.2 40.1% 18.3% 18.6% 38.2% 16.1% 19.0%2.2 to 2.4 33.2% 11.1% 20.1% 31.7% 10.9% 18.9%2.4 to 2.6 31.5% 10.2% 19.3% 29.6% 8.9% 19.1%2.6 to 2.8 27.0% 6.9% 18.9% 24.7% 3.9% 20.1%2.8 to 3.0 24.3% 4.6% 18.9% 21.1% -0.6% 21.9%3.0 to 3.2 23.8% 3.8% 19.2% 19.4% -1.7% 21.5%3.2 to 3.4 21.5% 2.7% 18.4% 18.3% -2.8% 21.7%3.4 to 3.6 19.2% 0.6% 18.6% 17.1% -4.0% 22.0%3.6 to 3.8 21.6% 3.2% 17.8% 18.2% -2.6% 21.3%3.8 to 4.0 16.3% -0.8% 17.3% 12.4% -6.2% 19.8%4.0 to 4.2 14.1% -2.5% 17.0% 9.4% -8.0% 18.9%4.2 to 4.4 14.9% -1.5% 16.7% 9.2% -8.6% 19.5%4.4 to 4.6 13.6% -2.2% 16.2% 7.6% -9.9% 19.5%4.6 to 4.8 14.1% -2.0% 16.4% 7.0% -10.5% 19.6%4.8 to 5.0 11.4% -4.2% 16.2% 6.8% -10.6% 19.4%5.0 to 5.2 8.6% -7.1% 16.8% 5.0% -11.6% 18.8%5.2 to 5.4 8.2% -7.6% 17.1% 1.3% -12.8% 16.2%5.4 to 5.6 8.4% -7.6% 17.2% 0.5% -13.4% 16.2%5.6 to 5.8 7.9% -7.9% 17.2% 0.4% -13.5% 16.1%
Source: ArthVeda, Capital Line. *Book Value Growth includes dividends as well. All returns shown above are pre-cost returns and are based on the strategy evaluation done by ArthVeda over 2002-12. Strategy evaluation has been audited by Ernst & Young.

Alpha L50 – Über Twin of Nifty 50September 19, 2013
10
Alpha L50 is indeed an Über Twin of Nifty 50As discussed in the section on value generation, returns generated over asset base are a far more important driver of valuations of a business than the growth component. Our study over the last 10 years shows that Alpha L50 has been a fundamentally better business conglomerate than Nifty 50 in terms of business returns generation capability and business resilience. Inspite of fundamental superiority, at entry, Alpha L50 has been historically available at ~30% discount to Nifty 50, presenting a low-risk profit opportunity for investors.
Current fundamental and valuations are in-line with the historical trends. The ROE gap between Alpha L50 and Nifty 50 is higher than the gap observed historically. Interest coverage ratios of Alpha L50 is superior to Nifty 50, providing better protection from interest rate increases, which is a critical component of business strength in the
current macro-economic environment. On the valuations front, Alpha L50 is available at a much higher discount of ~35% w.r.t. Nifty 50 inspite of superior fundamentals.
Alpha L50 and Nifty 50 both differ greatly in terms of return generation for the investors. Alpha L50 and Nifty 50 book register similar growths, which is not surprising given the marginally better trailing fundamentals of Alpha L50. However, the two baskets vary significantly in terms of multiple re-rating. Alpha L50 shows much better re-rating of the valuations, thereby generating relatively lower-risk returns for investors.
Overall, our study shows that Alpha L50 has been and is a superior way of generating higher returns than Nifty 50 by investing in the same 50 stocks of Nifty.

Alpha L50 – Über Twin of Nifty 50September 19, 2013
11
About ArthVedaArthVeda Fund Management Pvt. Ltd. is in the business of asset management, with a focus on alternative investment funds covering asset classes such as real estate, infrastructure, fixed income, traded markets, agriculture, debt and unlisted equities. ArthVeda is an associate company of Dewan Housing Finance Ltd (DHFL). DHFL is the third largest housing finance company in India and is listed on the Bombay Stock Exchange and National Stock Exchange.
The objective of ArthVeda is to manage funds (designed by our in-house research team) that offer ample opportunities for extracting alpha, i.e. high risk-adjusted returns, from asymmetric risk-return opportunities. The company believes in “Value Investing” and predominantly follows this principle in all its investment-decisions across asset classes. ArthVeda’s investor-focused approach is guided by its belief in transparency and high standards of corporate governance.
DisclaimerThis document is not an offering document for any securities or units of any kind and should not be seen as solicitation for investments. The document is intended for illustration and information purposes for intended user only. Further, the contents of this document are provisional and may be subject to change.
This document is produced solely to the specified recipient for the purpose of its internal use. This document may not be transmitted, reproduced or made available to any other person. The information contained herein is proprietary and confidential and may not be disclosed to third parties or duplicated or used for any purpose other than the purpose for which it has been provided. Any unauthorized use, duplication or disclosure of this document is prohibited by law.
Certain information included in this document is based on information obtained from sources considered to be reliable, however, the accuracy of such information cannot be guaranteed and further such information may be incomplete or condensed. No liability is assumed for the relevance, accuracy, or completeness of the contents of this document.
This document is subject to the more detailed information specified in the disclosure documents and client service agreement. Investors must read and agree to the contents of the documents, including all risks highlighted therein, prior to making any investment related decisions. Before making an investment, each potential investor should make its independent assessment and inquiries.
Document may include predictions, estimates or other information that might be considered forward-looking while
these forward-looking statements represent our current judgment on what the future holds, they are subject to risks and uncertainties that could cause actual results to differ materially. Investors are cautioned not to place undue reliance on these forward-looking statements.
Neither ArthVeda Fund Management Ltd., nor any person connected with it, accepts any liability arising from the use of this material. The recipient of this material should rely on their investigations and take advice from their professional advisors Opinion, if any, expressed are our opinions as of the date appearing on this material only. We endeavour to update the material on a regular basis. However there is no regulatory compulsion for us to do so.
Investments in equity markets are subjected to market risk and there is no guarantee that the investment objective of the strategy will be achieved. Please read the strategy related documents (Disclosure and Client Service Agreement) carefully. Investors should consult their tax and investment advisors before investing.

Alpha L50 – Über Twin of Nifty 50September 19, 2013
12
Wealth from Wisdom
ArthVeda Fund Management Pvt. Ltd.Grd. Floor, HDIL Towers, Anant Kanekar Marg, Bandra (E),
Mumbai 400051, Maharashtra, IndiaContact no.: +91 22 67748558/500; Fax: +91 22 67748585
Email: [email protected]