Arthritis, Occupational Class, and the Aging US Workforce
6
Arthritis, Occupational Class, and the Aging US Workforce Alberto J. Caban-Martinez, MPH, CPH, David J. Lee, PhD, MS, Lora E. Fleming, MD, PhD, MPH, MS, Kristopher L. Arheart, EdD, William G. LeBlanc, PhD, Kathryn E. McCollister, PhD, Sharon L. Christ, PhD, MS, Grant H. Louie, MD, MHS, Daniel J. Tancredi, PhD, and Peter A. Muennig, MD, MPH In the United States, people aged 65 years and older are the fastest growing demographic group. The percentage of people aged 65 years and older is projected to almost double be- tween the present day and 2050, rising from 6% to 11%, and about 1in 5 of these elderly are poor. 1,2 Furthermore, the proportion of employed workers aged 65 years and older is increasing. 3 Over this same period, real earnings will continue to decline primarily because of high health insurance costs for households at or below the median income. 4 Increasing health costs are not only reducing retirement savings, they are also placing a financial burden on the elderly. 2 Therefore, although many el- derly persons continue to work past retirement because they prefer to, a growing segment of this population will continue to work out of financial necessity. 5 -7 Both blue-collar and el- derly people are much more likely than are younger or more affluent people to suffer from disabling conditions and to live shorter lives. 8 -13 We will therefore see an increasing burden of disease and disability among the American workforce, reducing both the quality of life and productivity of lower-income Americans. Arthritis provides a lens through which one can view the convergent social phenomena of aging, workforce globalization, skyrocketing health costs, and a falling quality of life among the middle and lower classes. Arthritis is a common disabling condition that would nor- mally force many workers to leave the work- force. 8,14 From 2007 to 2009, approximately 49 million US adults had arthritis, and 21 million suffered activity limitations as a result. 14 The prevalence of arthritis reaches 50% for persons aged 65 years and older compared with 7.9% for persons aged 18 to 44 years. It is estimated that by the year 2030 approximately 67 million adults aged 18 years and older will have arthri- tis. 14 Although additional longitudinal studies are needed to examine causal pathways, arthritis has been shown to contribute to and arise from poverty 15 ; blue-collar and elderly workers are at increased risk of arthritis, and arthritis is a major risk factor for losing one’s job. 7,16 In this study, we present a snapshot of the burden of disease attributable to arthritis among US workers by age and occupational class. METHODS We used the quality-adjusted life year (QALY) as an outcome measure. 17 The QALY contains 2 dimensions: the time spent alive and one’s health-related quality of life (HRQoL), which is scaled from 0 (death) to 1 (perfect health) and can be used to adjust the amount of time lived in good health to reflect relatively higher or lower morbidity. 17 In this case, we used the EuroQol 5D (EQ-5D), which is an HRQoL measure contained within the Medical Expendi- ture Panel Survey (MEPS). One QALY represents a year of life lived in perfect health. We undertook a 3-step process to estimate quality-adjusted life expectancy (QALE) and to calculate incremental QALYs arising from ar- thritis among employed adults aged 18 years and older relative to employed adults without arthritis. First, we estimated mean EQ-5D scores and mortality probabilities in 1-year age intervals by occupational class. Second, we used the mortality probabilities and these scores to build life tables for each occupational class. 18 Finally, we subtracted QALE by occu- pational class at different age intervals. The difference between QALE values yields the in- cremental QALYs. Study Databases We obtained data from 2 publicly available nationally representative samples of the US adult population: the1997---2004 National Health Interview Survey (NHIS) and the 2001--- 2003 MEPS. The NHIS is an annual popula- tion-based survey of the resident noninstitu- tionalized US civilian population conducted by the National Center for Health Statistics (NCHS). 19 Interviews are conducted in person by trained interviewers. In the Family Core component, information was collected on socio- demographic characteristics and health condi- tions for all members of the household. In the Sample Adult Core component, 1 adult house- hold member was randomly selected to provide more detailed personal health information in the NHIS. We used the NHIS database to obtain data Objectives. The working poor sometimes delay retirement to survive. How- ever, their higher risk of disease and disability threatens both their financial survival and their ability to work through the retirement years. We used the burden of disease attributable to arthritis by occupational class to illustrate the challenges faced by the older poor. Methods. We merged data from the National Health Interview Survey, Medical Expenditure Panel Survey, and the National Death Index into a single database. We then calculated and compared age- and occupational class–specific quality- adjusted life years (QALYs) between workers with and without arthritis by using unabridged life tables. Results. White-collar workers have a higher overall health-related quality of life than do other workers, and suffer fewer QALYs lost to arthritis at all ages. For instance, whereas 65-year-old white-collar workers without arthritis look forward to 17 QALYs of future life, blue-collar workers with arthritis experience only 11, and are much less likely to remain in the workforce than are those in service, farming, or white-collar jobs. Conclusions. To meet the needs of the aging workforce, more extensive health and disability insurance will be needed. (Am J Public Health. Published online ahead of print July 21, 2011: e1–e6. doi:10.2105/AJPH.2011.300173) RESEARCH AND PRACTICE Published online ahead of print July 21, 2011 | American Journal of Public Health Caban-Martinez et al. | Peer Reviewed | Research and Practice | e1 http://ajph.aphapublications.org/cgi/doi/10.2105/AJPH.2011.300173 The latest version is at Published Ahead of Print on July 21, 2011, as 10.2105/AJPH.2011.300173 Copyright 2011 by the American Public Health Association
Transcript of Arthritis, Occupational Class, and the Aging US Workforce
Arthritis, Occupational Class, and the Aging US WorkforceAlberto J. Caban-Martinez, MPH, CPH, David J. Lee, PhD, MS, Lora E. Fleming, MD, PhD, MPH, MS, Kristopher L. Arheart, EdD, William G. LeBlanc, PhD,Kathryn E. McCollister, PhD, Sharon L. Christ, PhD, MS, Grant H. Louie, MD, MHS, Daniel J. Tancredi, PhD, and Peter A. Muennig, MD, MPH
In the United States, people aged 65 years andolder are the fastest growing demographicgroup. The percentage of people aged 65 yearsand older is projected to almost double be-tween the present day and 2050, rising from6% to 11%, and about 1 in 5 of these elderlyare poor.1,2 Furthermore, the proportion ofemployed workers aged 65 years and older isincreasing.3 Over this same period, real earningswill continue to decline primarily because ofhigh health insurance costs for householdsat or below the median income.4 Increasinghealth costs are not only reducing retirementsavings, they are also placing a financial burdenon the elderly.2 Therefore, although many el-derly persons continue to work past retirementbecause they prefer to, a growing segment ofthis population will continue to work out offinancial necessity.5---7 Both blue-collar and el-derly people are much more likely than areyounger or more affluent people to suffer fromdisabling conditions and to live shorter lives.8---13
We will therefore see an increasing burden ofdisease and disability among the Americanworkforce, reducing both the quality of life andproductivity of lower-income Americans.
Arthritis provides a lens through which onecan view the convergent social phenomena ofaging, workforce globalization, skyrocketinghealth costs, and a falling quality of life amongthe middle and lower classes. Arthritis is acommon disabling condition that would nor-mally force many workers to leave the work-force.8,14 From 2007 to 2009, approximately49 million US adults had arthritis, and 21millionsuffered activity limitations as a result.14 Theprevalence of arthritis reaches 50% for personsaged 65 years and older compared with 7.9%for persons aged 18 to 44 years. It is estimatedthat by the year 2030 approximately 67 millionadults aged 18 years and older will have arthri-tis.14 Although additional longitudinal studies areneeded to examine causal pathways, arthritis hasbeen shown to contribute to and arise frompoverty15; blue-collar and elderly workers are atincreased risk of arthritis, and arthritis is a major
risk factor for losing one’s job.7,16 In this study,we present a snapshot of the burden of diseaseattributable to arthritis among US workers by ageand occupational class.
METHODS
We used the quality-adjusted life year(QALY) as an outcome measure.17 The QALYcontains 2 dimensions: the time spent alive andone’s health-related quality of life (HRQoL),which is scaled from 0 (death) to 1 (perfecthealth) and can be used to adjust the amount oftime lived in good health to reflect relativelyhigher or lower morbidity.17 In this case, we usedthe EuroQol 5D (EQ-5D), which is an HRQoLmeasure contained within the Medical Expendi-ture Panel Survey (MEPS). One QALY representsa year of life lived in perfect health.
We undertook a 3-step process to estimatequality-adjusted life expectancy (QALE) and tocalculate incremental QALYs arising from ar-thritis among employed adults aged 18 yearsand older relative to employed adults withoutarthritis. First, we estimated mean EQ-5Dscores and mortality probabilities in 1-year age
intervals by occupational class. Second, weused the mortality probabilities and thesescores to build life tables for each occupationalclass.18 Finally, we subtracted QALE by occu-pational class at different age intervals. Thedifference between QALE values yields the in-cremental QALYs.
Study Databases
We obtained data from 2 publicly availablenationally representative samples of the USadult population: the 1997---2004 NationalHealth Interview Survey (NHIS) and the 2001---2003 MEPS. The NHIS is an annual popula-tion-based survey of the resident noninstitu-tionalized US civilian population conductedby the National Center for Health Statistics(NCHS).19 Interviews are conducted in personby trained interviewers. In the Family Corecomponent, information was collected on socio-demographic characteristics and health condi-tions for all members of the household. In theSample Adult Core component, 1 adult house-hold member was randomly selected to providemore detailed personal health information in theNHIS. We used the NHIS database to obtain data
Objectives. The working poor sometimes delay retirement to survive. How-
ever, their higher risk of disease and disability threatens both their financial
survival and their ability to work through the retirement years. We used the
burden of disease attributable to arthritis by occupational class to illustrate the
challenges faced by the older poor.
Methods. We merged data from the National Health Interview Survey, Medical
Expenditure Panel Survey, and the National Death Index into a single database.
We then calculated and compared age- and occupational class–specific quality-
adjusted life years (QALYs) between workers with and without arthritis by using
unabridged life tables.
Results. White-collar workers have a higher overall health-related quality of
life than do other workers, and suffer fewer QALYs lost to arthritis at all ages. For
instance, whereas 65-year-old white-collar workers without arthritis look forward
to 17 QALYs of future life, blue-collar workers with arthritis experience only 11,
and are much less likely to remain in the workforce than are those in service,
farming, or white-collar jobs.
Conclusions. To meet the needs of the aging workforce, more extensive health
and disability insurance will be needed. (Am J Public Health. Published online
ahead of print July 21, 2011: e1–e6. doi:10.2105/AJPH.2011.300173)
RESEARCH AND PRACTICE
Published online ahead of print July 21, 2011 | American Journal of Public Health Caban-Martinez et al. | Peer Reviewed | Research and Practice | e1
http://ajph.aphapublications.org/cgi/doi/10.2105/AJPH.2011.300173The latest version is at Published Ahead of Print on July 21, 2011, as 10.2105/AJPH.2011.300173
Copyright 2011 by the American Public Health Association
on a participant’s occupation and sociodemo-graphic characteristics. The MEPS is a subsampleof NHIS participants that also generates a na-tionally representative survey of the US civiliannoninstitutionalized population with oversam-pling of Hispanics and Blacks, containing detailedinformation on demographic characteristics,health conditions, and medical expenditures.20
We obtained and linked the EQ-5D scores (ahealth-related quality of life measure) from theNHIS responders that participated in MEPS totheir NHIS data. We also linked data from theNHIS to mortality data from the National DeathIndex to estimate the probability of death.21,22
We pooled data from multiple survey yearsacross each of the study databases to developrobust variance estimates for selected measuresacross each occupational class.
Data Sample and Measures
Occupational and arthritis classification.Employed respondents aged 18 years andolder reported on their occupation for the weekpreceding the NHIS interview.19 Employmentstatus (i.e., employed vs nonemployed) wasspecified as a dichotomous variable based on thequestion ‘‘What is your correct working status?’’Workers were then grouped according to the2000 Standard Occupational Codes into 4major occupational groups––white-collar, ser-vice, farm, and blue-collar workers.23 Thispermitted a classification based on 2000 USCensus codes using a standard 4-category occu-pational status variable commonly used by theNCHS that included the categories of white-collarworkers (census codes 003---389); serviceworkers (403---469); farming, fishing, and for-estry workers (473---499); and blue-collarworkers (503---889).24
In the NHIS, arthritis status among adultsaged 18 years and older was assessed byresponse to the question: ‘‘Have you EVERbeen told by a doctor or other health pro-fessional that you have some form of arthritis,rheumatoid arthritis, gout, lupus, or fibromyal-gia (fy-bro-my-AL-jee-uh)?’’ Participants whoresponded in the affirmative to this questionwere coded as having arthritis.
Health-related quality of life measure. Wederived HRQoL scores from the EQ-5D mea-sure data located in the MEPS. The EQ-5Dconsists of a 5-item descriptive system thatmeasures 5 dimensions of health status (mobility,
self-care, usual activities, pain or discomfort,and anxiety or depression) with 3 levels perdimension (no problem, some problems, andextreme problems).25 The combination of allpossible dimensions and levels resulted in 243unique health states. A multiattribute valuefunction was used to map preferences for thesehealth states.26,27 From this scoring function,an EQ-5D index score based on responses to the5-item questionnaire is calculated and providedby MEPS in the publicly available data set.26
These preference scores are measured on a scalefrom 0 to 1 where 0 represents death and 1represents perfect health. The construct validity,reliability, and responsiveness of the EQ-5D havebeen documented extensively in both generaland specific disease populations.27 The scoringalgorithm for the EQ-5D index descriptive sys-tem used in this research was based on UScommunity preferences.
A total of 17967 individuals aged 18 yearsor older with valid (i.e., nonmissing) EQ-5Dscores, occupation type, and arthritis status inthe 2001---2003 MEPS data were included inthis analysis out of a total of 38473 MEPSparticipants (e.g., unemployed) with EQ-5Dscores in same time period. The sample designof the MEPS Household Component surveyincludes stratification, clustering, multiplestages of selection, and oversampling of mi-nority populations.28 Using the MEPS samplingweights and robust standard error estimators, weadjusted for these factors and for survey non-response when estimating age- and occupation-specific mean EQ-5D scores.
Estimating probability of death. We calculatedage- and occupation-specific probabilities ofdeath by arthritis status by using the NHISlinked with the National Death Index. Wepooled the data from the1997---2004 NHIS forthe adults and linked it with pooled 1997---2004 (with follow up through 2006) mortalitydata from the National Death Index providedby the NCHS.22 During this time period, therewere 16965 deaths among the 242223 NHIS-participating adults identified in the probabi-listically determined matching process.21 Wecalculated the probability of death for all adultsaged 18 to 88 years by arthritis status andoccupational class by using coefficients fromthese pooled logistic regression models.29
Quality-adjusted life expectancy measure. Weconstructed a total of 8 life tables in 1-year age
intervals with US mortality data for each ofthe occupational classes (white-collar, service,farm, and blue-collar workers) by arthritisstatus.18 We let qicr denote the mortality proba-bility (discrete hazard of dying) at age i forworkers in class c (white-collar, service, farm, andblue-collar workers) with arthritis status r (coded1 for present and 0 for absent). Similarly, wedenoted by Nicr the number of populationmembers surviving to age i in worker class c witharthritis status r, and denoted by Bicr the corre-sponding life years lived by these workersbetween the i-th and (i + 1)---th birthdays. Giventhe schedule of mortality hazards and a specifi-cation of Nacr for an initial age a, we can estimateBacr and succeeding values of Njcr and Bjcr (forj=a+1, a+2, . . ., 88) using standard life tableassumptions:
ð1Þ Bicr¼f12ðqicr=2Þg · Nicr and
Ni11;cr ¼Nicr · ð12qicrÞ18
The life expectancy (LE) at age a is the total lifeyears at and beyond age a divided by thepopulation surviving to age a:
ð2Þ LEacr¼X
j ‡ aBjcr=Nacr
Denoting the age, worker-group, and arthritis-status specific mean quality of life scores byXicr, the worker-group, total arthritis-specificQALYs at age i is the product:
ð3Þ Bicr · Xicr
and the QALE at age a is:
ð4Þ QALEacr¼X
j ‡ aBjcr · Xjcr=Nacr
The incremental QALYs lost because of ar-thritis at age a for a worker in class c is simplythe difference QALEac0 --- QALEac1 and repre-sents the expected number of QALYs thata worker with arthritis at age a in class c canexpect to lose going forward, compared with aworker without arthritis.
RESULTS
The 1997---2004 NHIS had 242223 adultparticipants of which there were 16965 deathsreported (follow-up mortality through 2006).Reported employment status, occupation type,and arthritis condition for adult participants
RESEARCH AND PRACTICE
e2 | Research and Practice | Peer Reviewed | Caban-Martinez et al. American Journal of Public Health | Published online ahead of print July 21, 2011
during the same time period was available for19699 workers, representing an estimatedannual 187090449 US workers. The HRQoLmeasure (EQ-5D scores) available in the 2001---2003 MEPS database (a subset of the 1997---2004 NHIS participants) with valid adult datareporting on occupation type and arthritisstatus included 17967 participants. To con-struct the 8 life tables in1-year age intervals foreach of the occupational classes by arthritisstatus we used the HRQoL experience from theMEPS database and used the mortality experi-ence from the NHIS database to estimate theQALE measure as described previously.
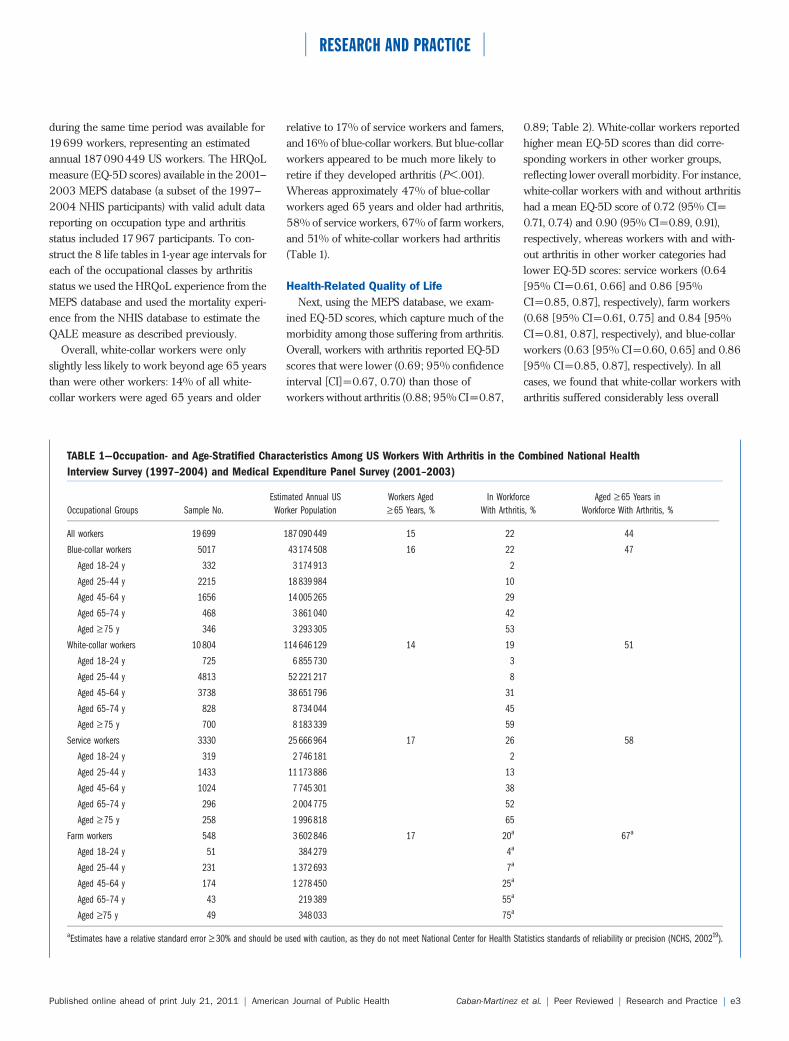
Overall, white-collar workers were onlyslightly less likely to work beyond age 65 yearsthan were other workers: 14% of all white-collar workers were aged 65 years and older
relative to 17% of service workers and famers,and16% of blue-collar workers. But blue-collarworkers appeared to be much more likely toretire if they developed arthritis (P<.001).Whereas approximately 47% of blue-collarworkers aged 65 years and older had arthritis,58% of service workers, 67% of farm workers,and 51% of white-collar workers had arthritis(Table 1).
Health-Related Quality of Life
Next, using the MEPS database, we exam-ined EQ-5D scores, which capture much of themorbidity among those suffering from arthritis.Overall, workers with arthritis reported EQ-5Dscores that were lower (0.69; 95% confidenceinterval [CI]=0.67, 0.70) than those ofworkers without arthritis (0.88; 95% CI=0.87,
0.89; Table 2). White-collar workers reportedhigher mean EQ-5D scores than did corre-sponding workers in other worker groups,reflecting lower overall morbidity. For instance,white-collar workers with and without arthritishad a mean EQ-5D score of 0.72 (95% CI=0.71, 0.74) and 0.90 (95% CI=0.89, 0.91),respectively, whereas workers with and with-out arthritis in other worker categories hadlower EQ-5D scores: service workers (0.64[95% CI=0.61, 0.66] and 0.86 [95%CI=0.85, 0.87], respectively), farm workers(0.68 [95% CI=0.61, 0.75] and 0.84 [95%CI=0.81, 0.87], respectively), and blue-collarworkers (0.63 [95% CI=0.60, 0.65] and 0.86[95% CI=0.85, 0.87], respectively). In allcases, we found that white-collar workers witharthritis suffered considerably less overall
TABLE 1—Occupation- and Age-Stratified Characteristics Among US Workers With Arthritis in the Combined National Health
Interview Survey (1997–2004) and Medical Expenditure Panel Survey (2001–2003)
Occupational Groups Sample No.
Estimated Annual US
Worker Population
Workers Aged
‡ 65 Years, %
In Workforce
With Arthritis, %
Aged ‡ 65 Years in
Workforce With Arthritis, %
All workers 19 699 187 090 449 15 22 44
Blue-collar workers 5017 43 174 508 16 22 47
Aged 18–24 y 332 3 174 913 2
Aged 25–44 y 2215 18 839 984 10
Aged 45–64 y 1656 14 005 265 29
Aged 65–74 y 468 3 861 040 42
Aged ‡ 75 y 346 3 293 305 53
White-collar workers 10 804 114 646 129 14 19 51
Aged 18–24 y 725 6 855 730 3
Aged 25–44 y 4813 52 221 217 8
Aged 45–64 y 3738 38 651 796 31
Aged 65–74 y 828 8 734 044 45
Aged ‡ 75 y 700 8 183 339 59
Service workers 3330 25 666 964 17 26 58
Aged 18–24 y 319 2 746 181 2
Aged 25–44 y 1433 11 173 886 13
Aged 45–64 y 1024 7 745 301 38
Aged 65–74 y 296 2 004 775 52
Aged ‡ 75 y 258 1 996 818 65
Farm workers 548 3 602 846 17 20a 67a
Aged 18–24 y 51 384 279 4a
Aged 25–44 y 231 1 372 693 7a
Aged 45–64 y 174 1 278 450 25a
Aged 65–74 y 43 219 389 55a
Aged ‡75 y 49 348 033 75a
aEstimates have a relative standard error ‡ 30% and should be used with caution, as they do not meet National Center for Health Statistics standards of reliability or precision (NCHS, 200219).
RESEARCH AND PRACTICE
Published online ahead of print July 21, 2011 | American Journal of Public Health Caban-Martinez et al. | Peer Reviewed | Research and Practice | e3
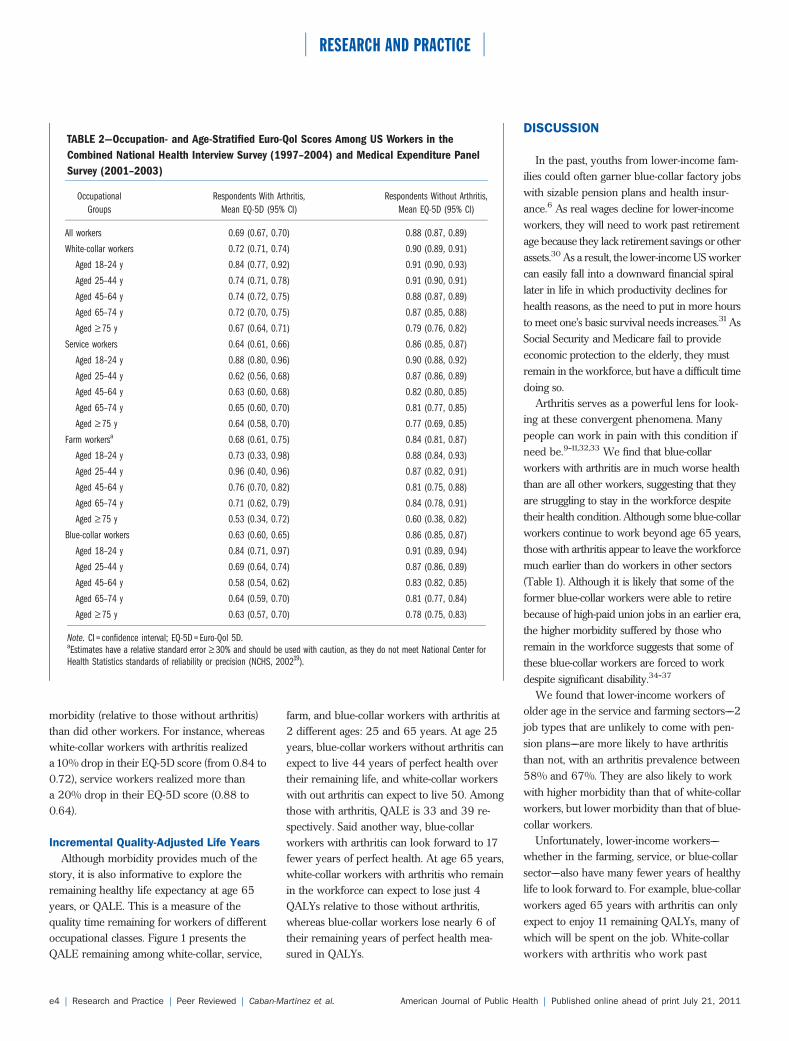
morbidity (relative to those without arthritis)than did other workers. For instance, whereaswhite-collar workers with arthritis realizeda 10% drop in their EQ-5D score (from 0.84 to0.72), service workers realized more thana 20% drop in their EQ-5D score (0.88 to0.64).
Incremental Quality-Adjusted Life Years
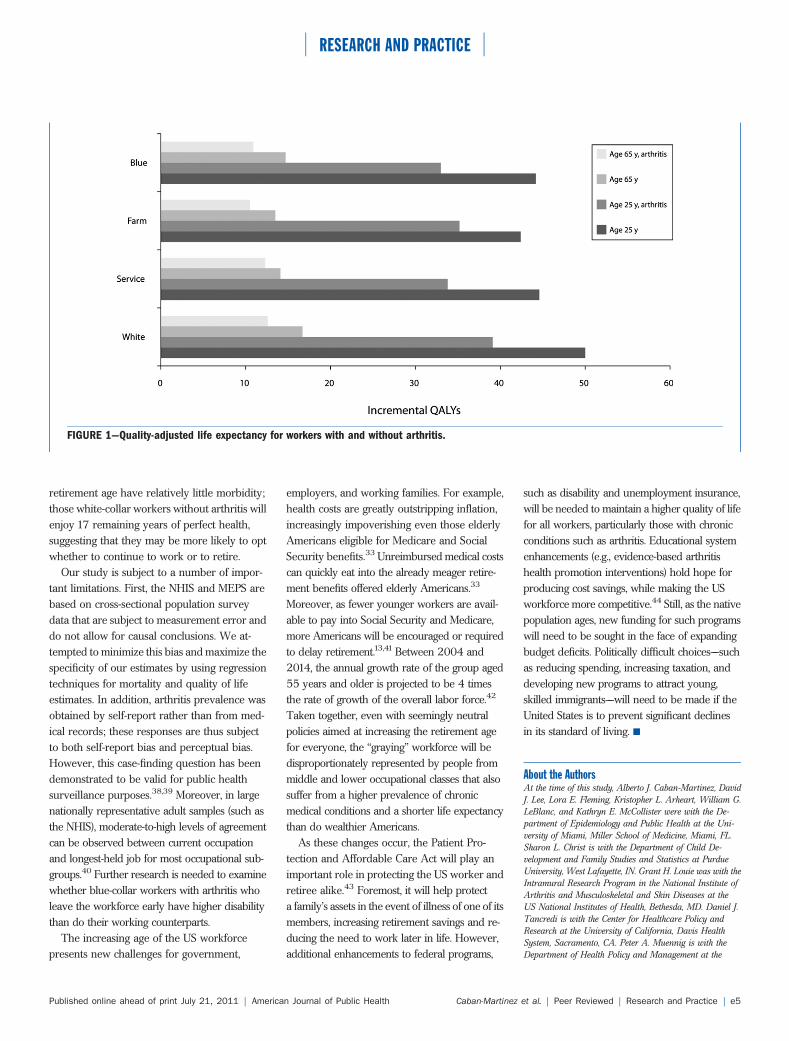
Although morbidity provides much of thestory, it is also informative to explore theremaining healthy life expectancy at age 65years, or QALE. This is a measure of thequality time remaining for workers of differentoccupational classes. Figure 1 presents theQALE remaining among white-collar, service,
farm, and blue-collar workers with arthritis at2 different ages: 25 and 65 years. At age 25years, blue-collar workers without arthritis canexpect to live 44 years of perfect health overtheir remaining life, and white-collar workerswith out arthritis can expect to live 50. Amongthose with arthritis, QALE is 33 and 39 re-spectively. Said another way, blue-collarworkers with arthritis can look forward to 17fewer years of perfect health. At age 65 years,white-collar workers with arthritis who remainin the workforce can expect to lose just 4QALYs relative to those without arthritis,whereas blue-collar workers lose nearly 6 oftheir remaining years of perfect health mea-sured in QALYs.
DISCUSSION
In the past, youths from lower-income fam-ilies could often garner blue-collar factory jobswith sizable pension plans and health insur-ance.6 As real wages decline for lower-incomeworkers, they will need to work past retirementage because they lack retirement savings or otherassets.30 As a result, the lower-income US workercan easily fall into a downward financial spirallater in life in which productivity declines forhealth reasons, as the need to put in more hoursto meet one’s basic survival needs increases.31AsSocial Security and Medicare fail to provideeconomic protection to the elderly, they mustremain in the workforce, but have a difficult timedoing so.
Arthritis serves as a powerful lens for look-ing at these convergent phenomena. Manypeople can work in pain with this condition ifneed be.9---11,32,33 We find that blue-collarworkers with arthritis are in much worse healththan are all other workers, suggesting that theyare struggling to stay in the workforce despitetheir health condition. Although some blue-collarworkers continue to work beyond age 65 years,those with arthritis appear to leave the workforcemuch earlier than do workers in other sectors(Table 1). Although it is likely that some of theformer blue-collar workers were able to retirebecause of high-paid union jobs in an earlier era,the higher morbidity suffered by those whoremain in the workforce suggests that some ofthese blue-collar workers are forced to workdespite significant disability.34---37
We found that lower-income workers ofolder age in the service and farming sectors––2job types that are unlikely to come with pen-sion plans––are more likely to have arthritisthan not, with an arthritis prevalence between58% and 67%. They are also likely to workwith higher morbidity than that of white-collarworkers, but lower morbidity than that of blue-collar workers.
Unfortunately, lower-income workers––whether in the farming, service, or blue-collarsector––also have many fewer years of healthylife to look forward to. For example, blue-collarworkers aged 65 years with arthritis can onlyexpect to enjoy 11 remaining QALYs, many ofwhich will be spent on the job. White-collarworkers with arthritis who work past
TABLE 2—Occupation- and Age-Stratified Euro-Qol Scores Among US Workers in the
Combined National Health Interview Survey (1997–2004) and Medical Expenditure Panel
Survey (2001–2003)
Occupational
Groups
Respondents With Arthritis,
Mean EQ-5D (95% CI)
Respondents Without Arthritis,
Mean EQ-5D (95% CI)
All workers 0.69 (0.67, 0.70) 0.88 (0.87, 0.89)
White-collar workers 0.72 (0.71, 0.74) 0.90 (0.89, 0.91)
Aged 18–24 y 0.84 (0.77, 0.92) 0.91 (0.90, 0.93)
Aged 25–44 y 0.74 (0.71, 0.78) 0.91 (0.90, 0.91)
Aged 45–64 y 0.74 (0.72, 0.75) 0.88 (0.87, 0.89)
Aged 65–74 y 0.72 (0.70, 0.75) 0.87 (0.85, 0.88)
Aged ‡ 75 y 0.67 (0.64, 0.71) 0.79 (0.76, 0.82)
Service workers 0.64 (0.61, 0.66) 0.86 (0.85, 0.87)
Aged 18–24 y 0.88 (0.80, 0.96) 0.90 (0.88, 0.92)
Aged 25–44 y 0.62 (0.56, 0.68) 0.87 (0.86, 0.89)
Aged 45–64 y 0.63 (0.60, 0.68) 0.82 (0.80, 0.85)
Aged 65–74 y 0.65 (0.60, 0.70) 0.81 (0.77, 0.85)
Aged ‡ 75 y 0.64 (0.58, 0.70) 0.77 (0.69, 0.85)
Farm workersa 0.68 (0.61, 0.75) 0.84 (0.81, 0.87)
Aged 18–24 y 0.73 (0.33, 0.98) 0.88 (0.84, 0.93)
Aged 25–44 y 0.96 (0.40, 0.96) 0.87 (0.82, 0.91)
Aged 45–64 y 0.76 (0.70, 0.82) 0.81 (0.75, 0.88)
Aged 65–74 y 0.71 (0.62, 0.79) 0.84 (0.78, 0.91)
Aged ‡ 75 y 0.53 (0.34, 0.72) 0.60 (0.38, 0.82)
Blue-collar workers 0.63 (0.60, 0.65) 0.86 (0.85, 0.87)
Aged 18–24 y 0.84 (0.71, 0.97) 0.91 (0.89, 0.94)
Aged 25–44 y 0.69 (0.64, 0.74) 0.87 (0.86, 0.89)
Aged 45–64 y 0.58 (0.54, 0.62) 0.83 (0.82, 0.85)
Aged 65–74 y 0.64 (0.59, 0.70) 0.81 (0.77, 0.84)
Aged ‡ 75 y 0.63 (0.57, 0.70) 0.78 (0.75, 0.83)
Note. CI = confidence interval; EQ-5D = Euro-Qol 5D.aEstimates have a relative standard error ‡ 30% and should be used with caution, as they do not meet National Center forHealth Statistics standards of reliability or precision (NCHS, 200219).
RESEARCH AND PRACTICE
e4 | Research and Practice | Peer Reviewed | Caban-Martinez et al. American Journal of Public Health | Published online ahead of print July 21, 2011
retirement age have relatively little morbidity;those white-collar workers without arthritis willenjoy 17 remaining years of perfect health,suggesting that they may be more likely to optwhether to continue to work or to retire.
Our study is subject to a number of impor-tant limitations. First, the NHIS and MEPS arebased on cross-sectional population surveydata that are subject to measurement error anddo not allow for causal conclusions. We at-tempted to minimize this bias and maximize thespecificity of our estimates by using regressiontechniques for mortality and quality of lifeestimates. In addition, arthritis prevalence wasobtained by self-report rather than from med-ical records; these responses are thus subjectto both self-report bias and perceptual bias.However, this case-finding question has beendemonstrated to be valid for public healthsurveillance purposes.38,39 Moreover, in largenationally representative adult samples (such asthe NHIS), moderate-to-high levels of agreementcan be observed between current occupationand longest-held job for most occupational sub-groups.40 Further research is needed to examinewhether blue-collar workers with arthritis wholeave the workforce early have higher disabilitythan do their working counterparts.
The increasing age of the US workforcepresents new challenges for government,
employers, and working families. For example,health costs are greatly outstripping inflation,increasingly impoverishing even those elderlyAmericans eligible for Medicare and SocialSecurity benefits.33 Unreimbursed medical costscan quickly eat into the already meager retire-ment benefits offered elderly Americans.33
Moreover, as fewer younger workers are avail-able to pay into Social Security and Medicare,more Americans will be encouraged or requiredto delay retirement.13,41 Between 2004 and2014, the annual growth rate of the group aged55 years and older is projected to be 4 timesthe rate of growth of the overall labor force.42
Taken together, even with seemingly neutralpolicies aimed at increasing the retirement agefor everyone, the ‘‘graying’’ workforce will bedisproportionately represented by people frommiddle and lower occupational classes that alsosuffer from a higher prevalence of chronicmedical conditions and a shorter life expectancythan do wealthier Americans.
As these changes occur, the Patient Pro-tection and Affordable Care Act will play animportant role in protecting the US worker andretiree alike.43 Foremost, it will help protecta family’s assets in the event of illness of one of itsmembers, increasing retirement savings and re-ducing the need to work later in life. However,additional enhancements to federal programs,
such as disability and unemployment insurance,will be needed to maintain a higher quality of lifefor all workers, particularly those with chronicconditions such as arthritis. Educational systemenhancements (e.g., evidence-based arthritishealth promotion interventions) hold hope forproducing cost savings, while making the USworkforce more competitive.44 Still, as the nativepopulation ages, new funding for such programswill need to be sought in the face of expandingbudget deficits. Politically difficult choices––suchas reducing spending, increasing taxation, anddeveloping new programs to attract young,skilled immigrants––will need to be made if theUnited States is to prevent significant declinesin its standard of living. j
About the AuthorsAt the time of this study, Alberto J. Caban-Martinez, DavidJ. Lee, Lora E. Fleming, Kristopher L. Arheart, William G.LeBlanc, and Kathryn E. McCollister were with the De-partment of Epidemiology and Public Health at the Uni-versity of Miami, Miller School of Medicine, Miami, FL.Sharon L. Christ is with the Department of Child De-velopment and Family Studies and Statistics at PurdueUniversity, West Lafayette, IN. Grant H. Louie was with theIntramural Research Program in the National Institute ofArthritis and Musculoskeletal and Skin Diseases at theUS National Institutes of Health, Bethesda, MD. Daniel J.Tancredi is with the Center for Healthcare Policy andResearch at the University of California, Davis HealthSystem, Sacramento, CA. Peter A. Muennig is with theDepartment of Health Policy and Management at the
FIGURE 1—Quality-adjusted life expectancy for workers with and without arthritis.
RESEARCH AND PRACTICE
Published online ahead of print July 21, 2011 | American Journal of Public Health Caban-Martinez et al. | Peer Reviewed | Research and Practice | e5
Mailman School of Public Health, Columbia University,New York, NY.
Correspondence should be sent to Alberto Caban-Martinez,Department of Epidemiology and Public Health, Universityof Miami, Miller School of Medicine, Clinical ResearchBuilding, Room 1075, 1120 NW 14th St, 10th Floor(R-669), Miami, FL 33136 (e-mail: [email protected]). Reprints can be ordered at http://www.ajph.org byclicking the ‘‘Reprints/Eprints’’ link.
This article was accepted December 31, 2010.
ContributorsA. J. Caban-Martinez, P. A. Muennig, D. J. Lee, and L.E.Fleming originated the study, helped with the analysis,and wrote the first draft of the article. K. L. Arheart, W. G.LeBlanc, K.E. McCollister, S. L. Christ, G. H. Louie, andD. J. Tancredi collaborated on the idea, conducted theanalyses, and edited the draft.
AcknowledgmentsThis study was supported in part by the National Instituteof Arthritis and Musculoskeletal and Skin Diseases (grantF31AR057687) and the National Institute for Occupa-tional Safety and Health (grant R01 OH003915).
Human Participation ProtectionThe Human Subjects Research Office at the University ofMiami, Leonard M. Miller School of Medicine approvedthe study protocol.
References1. Hobbs F, Damon BL, Taeuber CM. 65+ in the UnitedStates. Washington, DC: US Department of Commerce,Economics and Statistics Administration; 2006.
2. Rowland D, Lyons B. Medicare, Medicaid, and theelderly poor. Health Care Financ Rev. 1996;18(2):61---85.
3. Older workers [Bureau of Labor Statistics Webpage]. 2008. Available at: http://www.bls.gov/spotlight/2008/older_workers. Accessed November 28, 2010.
4. Polsky D, Grande D. The burden of health care costsfor working families––implications for reform. N Engl JMed. 2009;361(5):437---439.
5. Ghilarducci T, Turner JA. Work Options for OlderAmericans. Notre Dame, IN: University of Notre DamePress; 2007.
6. Hareven TK. Aging and Generational Relations: Life-Course and Cross-Cultural Perspectives. New York, NY:Aldine de Gruyter; 1996.
7. Head L, Baker PM, Bagwell B, Moon NW. Barriers toevidence based practice in accommodations for an agingworkforce. Work. 2006;27(4):391---396.
8. Centers for Disease Control and Prevention. Prevalenceof doctor-diagnosed arthritis and arthritis-attributable activitylimitation––United States, 2007---2009. MMWR Morb MortalWkly Rep. 2010;59(39):1261---1265.
9. Gignac MA. Arthritis and employment: an exami-nation of behavioral coping efforts to manage workplaceactivity limitations. Arthritis Rheum. 2005;53(3):328---336.
10. Gignac MA, Sutton D, Badley EM. Arthritis symp-toms, the work environment, and the future: measuringperceived job strain among employed persons witharthritis. Arthritis Rheum. 2007;57(5):738---747.
11. Kaptein SA, Gignac MA, Badley EM. Differences inthe workforce experiences of women and men witharthritis disability: a population health perspective. Ar-thritis Rheum. 2009;61(5):605---613.
12. Lacaille D, White MA, Backman CL, Gignac MA.Problems faced at work due to inflammatory arthritis:new insights gained from understanding patients’ per-spective. Arthritis Rheum. 2007;57(7):1269---1279.
13. Purcell P. Older Workers: Employment and Retire-ment Trends. Washington, DC: Congressional ResearchService; 2007.
14. Hootman JM, Helmick CG. Projections of USprevalence of arthritis and associated activity limitations.Arthritis Rheum. 2006;54(1):226---229.
15. Maiden N, Capell HA, Madhok R, Hampson R,Thomson EA. Does social disadvantage contribute to theexcess mortality in rheumatoid arthritis patients? AnnRheum Dis. 1999;58(9):525---529.
16. Centers for Disease Control and Prevention. Preva-lence and most common causes of disability amongadults––United States, 2005. MMWR Morb Mortal WklyRep. 2009;58(16):421---426.
17. Khanna D, Tsevat J. Health-related quality of life––anintroduction. Am J Manag Care. 2007;13(Suppl 9):S218---S223.
18. Anderson RN, US National Center for Health Statistics.Method for constructing complete annual U.S. life tables.Hyattsville, MD: US Department of Health and HumanServices, Centers for Disease Control and Prevention; 1999.
19. Data file documentation, National Health InterviewSurvey, 2000. Hyattsville, MD: National Center forHealth Statistics; 2002.
20. Cohen SB. Design strategies and innovations inthe medical expenditure panel survey. Med Care. 2003;41(7 Suppl):III5---III12.
21. The National Health Interview Survey (1986---2004) linked mortality files, mortality follow-up through2006: matching methodology, May 2009. Hyattsville,MD: Office of Analysis and Epidemiology, NationalCenter for Health Statistics; 2009. Available at: http://www.cdc.gov/nchs/data/datalinkage/matching_methodology_nhis_final.pdf. Accessed April 16, 2010.
22. Comparative analysis of the NHIS public-use andrestricted-use linked mortality files: 2010 public-use datarelease. Hyattsville, MD: National Center for HealthStatistics; 2010. Available at: http://www.cdc.gov/nchs/data/datalinkage/nhis_mort_compare_2010_final.pdf.Accessed November 28, 2010.
23. Krieger N, Barbeau EM, Soobader MJ. Class matters:U.S. versus U.K. measures of occupational disparities inaccess to health services and health status in the 2000U.S. National Health Interview Survey. Int J Health Serv.2005;35(2):213---236.
24. NHIS survey description––industry and occupationcoding. 2005. Available at: http://www.cdc.gov/nchs/data/nhis/srvydesc.pdf. Accessed July 22, 2010.
25. Coons SJ, Rao S, Keininger DL, Hays RD. A com-parative review of generic quality-of-life instruments.Pharmacoeconomics. 2000;17(1):13---35.
26. McDowell I. Measuring Health: A Guide to RatingScales and Questionnaires. 3rd ed. New York, NY: OxfordUniversity Press; 2006.
27. Shaw JW, Johnson JA, Coons SJ. US valuation of theEQ-5D health states: development and testing of the D1valuation model. Med Care. 2005;43(3):203---220.
28. Agency for Healthcare Research and Quality.Computing standard errors for MEPS Estimates. 2005.Available at: http://www.meps.ahrq.gov/survey_comp/standard_errors.jsp. Accessed July 22, 2010.
29. Rothman KJ, Greenland S, Lash TL. Modern Epide-miology. 3rd ed. Philadelphia, PA: Lippincott Williams &Wilkins; 2008.
30. Schettkat R, Yocarini L. The shift to servicesemployment: a review of the literature. Struct ChangeEcon Dyn. 2006;17(2):127---147.
31. Birkenmaiera J, Curleya J. Financial credit: socialwork’s role in empowering low-income families. J Com-munity Pract. 2009;17(3):251---268.
32. Chibnall JT, Tait RC. Long-term adjustment to work-related low back pain: associations with socio-demo-graphics, claim processes, and post-settlement adjust-ment. Pain Med. 2009;10(8):1378---1388.
33. De Long DW. Lost Knowledge: Confronting the Threatof an Aging Workforce. Oxford, England; New York, NY:Oxford University Press; 2004.
34. Allaire S, Wolfe F, Niu J, LaValley MP, Zhang B,Reisine S. Current risk factors for work disability associ-ated with rheumatoid arthritis: recent data from a USnational cohort. Arthritis Rheum. 2009;61(3):321---328.
35. Burton W, Morrison A, Maclean R, Ruderman E.Systematic review of studies of productivity loss due torheumatoid arthritis. Occup Med (Lond). 2006;56(1):18---27.
36. Escorpizo R, Bombardier C, Boonen A, et al. Workerproductivity outcome measures in arthritis. J Rheumatol.2007;34(6):1372---1380.
37. Zirkzee EJ, Sneep AC, de Buck PD, et al. Sick leaveand work disability in patients with early arthritis. ClinRheumatol. 2008;27(1):11---19.
38. Bombard JM, Powell KE, Martin LM, Helmick CG,Wilson WH. Validity and reliability of self-reportedarthritis: Georgia senior centers, 2000---2001. Am J PrevMed. 2005;28(3):251---258.
39. Sacks JJ, Harrold LR, Helmick CG, Gurwitz JH,Emani S, Yood RA. Validation of a surveillance casedefinition for arthritis. J Rheumatol. 2005;32(2):340---347.
40. Gomez-Marin O, Fleming LE, Caban A, LeblancWG, Lee DJ, Pitman T. Longest held job in U.S. occupa-tional groups: the National Health Interview Survey. JOccup Environ Med. 2005;47(1):79---90.
41. Smith K, Toder E, Iams H. Lifetime distributionaleffects of Social Security retirement benefits. Soc SecurBull. 2003;65(1):33---61.
42. Toossi M. Labor force projections to 2014: Retiringboomers. Monthly Labor Rev. 2005;128(11):25---44.
43. Department of Health and Human Services. PatientProtection and Affordable Care Act: preexisting condi-tion exclusions, lifetime and annual limits, rescissions, andpatient protections. Interim final rules with request forcomments. Fed Regist. 2010;75(123):37187---37241.
44. Belfield CR, Levin HM. The Price We Pay: Economicand Social Consequences of Inadequate Education. Wash-ington, DC: Brookings Institution Press; 2007.
RESEARCH AND PRACTICE
e6 | Research and Practice | Peer Reviewed | Caban-Martinez et al. American Journal of Public Health | Published online ahead of print July 21, 2011