ARP Announcements
151
ARP Announcements Association of Rheumatology Professionals 2200 Lake Boulevard NE, Atlanta, Georgia 30319 www.rheumatology.org Download the New ACR Publications Mobile App The brand-new ACR Publications app can be downloaded for free from the Apple store or Google Play. ACR members can log in for full-text access to all articles in Arthritis Care & Research and Arthritis & Rheumatology. Nonmembers can access abstracts of all AC&R and A&R articles, the full text of articles published more than one year ago, and select open-access articles published recently, as well as the full text of all articles from ACR Open Rheumatology and The Rheumatologist. ARP Membership The Association of Rheumatology Professionals (ARP), a division of the American College of Rheumatology, appreciates your continued membership and looks forward to serving you another year. Mem- bership costs range from $30 to $140. ARP welcomes nurse practi- tioners, nurses, physician assistants, office staff, researchers, physical therapists, occupational therapists, assistants, and students. Student membership is complimentary; the Annual Meeting registration fee is waived for students who submit the required student veri fication letter. For information, go to www.rheumatology.org and select “Membership” or call 404-633-3777 and ask for an ARP staff member. New ACR Journal Twitter Account (@ACR_Journals) and Social Media Editor The ACR journals are heightening our focus on social media, to benefit authors and readers. Among our first activities is the introduction of an official ACR Journals Twitter account: @ ACR_Journals. Followers will enjoy special features and the op- portunity to engage with authors and other fellow profession- als about studies published in Arthritis Care & Research, Arthritis & Rheumatology, and ACR Open Rheumatology. Authors of pub- lished articles will have the opportunity to use @ACR_Journals to share their work and engage in dialogue with others inter- ested in the research. The journals welcome Dr. Paul Sufka of Minneapolis as our first Social Media Editor. Submissions Invited for 2022 Themed Issue Submissions are invited for the 2022 Themed Issue of Arthritis Care & Research: Rehabilitation Sciences and the Rheumatic Diseases. Arthritis Care & Research is soliciting manuscripts for a themed issue addressing pertinent aspects of Rehabilitation Sciences or Rehabili- tation as related to outcomes and issues in the rheumatic diseases. Rehabilitation Sciences include physical and occupational therapies, as well as varieties or types of rehabilitation activities, uses of technol- ogy to measure rehabilitation levels or outcomes, and community- level rehabilitation activities or clinical trials based on Rehabilitation Sciences. Manuscripts covering a broad range of topics related to the major theme are invited; e.g. the effects and consequences of reha- bilitation interventions in rheumatic diseases (rheumatoid arthritis, lupus, osteoarthritis, psoriatic arthritis, and others), rehabilitation as linked with symptoms and conditions (pain, depression, or disability among persons with rheumatic conditions), and intervention studies addressing improvement in the mechanics of rehabilitation levels, cost-benefit analyses, and outcomes (physical limitations, severity of disease, drug interactions, and health behaviors). Chronic disease management and/or public health strategies in the population that address rheumatic diseases and rehabilitation are also encouraged. Both Original Research and Review articles will be considered. The 2022 Themed Issue will include regular submissions as well, but a certain number of pages will be reserved for manuscripts accepted in response to this solicitation. All manuscripts will be peer reviewed. The Editor will select papers for publication in the themed issue based on reviewer ratings and the balance of subject matter. It is possible that manuscripts submitted for the themed issue may be accepted for publication in a regular issue of Arthritis Care & Research rather than the themed issue. Please follow the formatting requirements found in the Author Guidelines section at https://onlinelibrary.wiley.com/page/journal/ 21514658/homepage/ForAuthors.html. The deadline for submis- sion is March 31, 2021. For further information, contact the Editor of Arthritis Care & Research, Dr. Marian T. Hannan; email: Hannan@hsl. harvard.edu.
-
Upload
khangminh22 -
Category
Documents
-
view
0 -
download
0
Transcript of ARP Announcements
ARP AnnouncementsAssociation of Rheumatology Professionals
2200 Lake Boulevard NE, Atlanta, Georgia 30319www.rheumatology.org
Download the New ACR Publications Mobile App
The brand-new ACR Publications app can be downloaded for free from the Apple store or Google Play. ACR members can log in for full-text access to all articles in Arthritis Care & Research and Arthritis & Rheumatology. Nonmembers can access abstracts of all AC&R and A&R articles, the full text of articles published more than one year ago, and select open-access articles published recently, as well as the full text of all articles from ACR Open Rheumatology and The Rheumatologist.
ARP Membership
The Association of Rheumatology Professionals (ARP), a division of the American College of Rheumatology, appreciates your continued membership and looks forward to serving you another year. Mem-bership costs range from $30 to $140. ARP welcomes nurse practi-tioners, nurses, physician assistants, office staff , researchers, physical therapists, occupational therapists, assistants, and students. Student membership is complimentary; the Annual Meeting registration fee is waived for students who submit the required student verification letter. For information, go to www.rheumatology.org and select “Membership” or call 404-633-3777 and ask for an ARP staff member.
New ACR Journal Twitter Account (@ACR_Journals) and Social Media Editor
The ACR journals are heightening our focus on social media, to benefi t authors and readers. Among our fi rst activities is the introduction of an offi cial ACR Journals Twitter account: @ACR_Journals. Followers will enjoy special features and the op-portunity to engage with authors and other fellow profession-als about studies published in Arthritis Care & Research, Arthritis & Rheumatology, and ACR Open Rheumatology. Authors of pub-lished articles will have the opportunity to use @ACR_Journals to share their work and engage in dialogue with others inter-ested in the research. The journals welcome Dr. Paul Sufka of Minneapolis as our fi rst Social Media Editor.
Submissions Invited for 2022 Themed Issue
Submissions are invited for the 2022 Themed Issue of Arthritis Care & Research: Rehabilitation Sciences and the Rheumatic Diseases.
Arthritis Care & Research is soliciting manuscripts for a themed issue addressing pertinent aspects of Rehabilitation Sciences or Rehabili-tation as related to outcomes and issues in the rheumatic diseases. Rehabilitation Sciences include physical and occupational therapies, as well as varieties or types of rehabilitation activities, uses of technol-ogy to measure rehabilitation levels or outcomes, and community- level rehabilitation activities or clinical trials based on Rehabilitation Sciences.
Manuscripts covering a broad range of topics related to the major theme are invited; e.g. the eff ects and consequences of reha-bilitation interventions in rheumatic diseases (rheumatoid arthritis, lupus, osteoarthritis, psoriatic arthritis, and others), rehabilitation as linked with symptoms and conditions (pain, depression, or disability among persons with rheumatic conditions), and intervention studies addressing improvement in the mechanics of rehabilitation levels, cost-benefi t analyses, and outcomes (physical limitations, severity of disease, drug interactions, and health behaviors). Chronic disease management and/or public health strategies in the population that address rheumatic diseases and rehabilitation are also encouraged. Both Original Research and Review articles will be considered.
The 2022 Themed Issue will include regular submissions as well, but a certain number of pages will be reserved for manuscripts accepted in response to this solicitation. All manuscripts will be peer reviewed. The Editor will select papers for publication in the themed issue based on reviewer ratings and the balance of subject matter. It is possible that manuscripts submitted for the themed issue may be accepted for publication in a regular issue of Arthritis Care & Research rather than the themed issue.
Please follow the formatting requirements found in the Author Guidelines section at https://onlinelibrary.wiley.com/page/journal/ 21514658/homepage/ForAuthors.html. The deadline for submis-sion is March 31, 2021. For further information, contact the Editor of Arthritis Care & Research, Dr. Marian T. Hannan; email: [email protected].
Aims and Scope Arthritis Care & Research is an offi cial journal of the American College of Rheumatology and the Association of Rheumatology
Professionals, a division of the College. Arthritis Care & Research is a peer-reviewed journal that publishes both original research and review articles that promote excellence in the clinical practice of rheumatology. Relevant to the care of individuals with arthritis and related disorders, major topics are evidence-based practice studies, clinical problems, practice guide-lines, health care economics, health care policy, educational, social, and public health issues, and future trends in rheumatology practice.
Volume 73, No. 2, February 2021
Arthritis Care & Research

EditorMarian T. Hannan, DSc, MPHHebrew SeniorLife and Harvard Medical School, Boston
Deputy EditorLeslie J. Crofford, MDVanderbilt University, Nashville
Social Media EditorPaul H. Sufka, MD, St. Paul
American College of Rheumatology JournalPublications Committee
Shervin Assassi, MD, MS, Chair, HoustonAdam Berlinberg, MD, DenverDeborah Feldman, PhD, MontrealMeenakshi Jolly, MD, MS, ChicagoDonnamarie Krause, PhD, OTR/L, Las VegasUyen-Sa Nguyen, MPH, DSc, Fort WorthMichelle Ormseth, MD, NashvilleR. Hal Scofield, MD, Oklahoma City
Associate EditorsCatherine Backman, PhD, OT, VancouverBonnie Bermas, MD, DallasHermine Brunner, MD, MBA, CincinnatiRobert F. DeVellis, PhD, Chapel HillMonique A. M. Gignac, PhD, TorontoSeoyoung C. Kim, MD, ScD, BostonMichael LaValley, PhD, BostonCarlo Marra, PharmD, PhD, DunedinKaleb Michaud, PhD, OmahaPascale Schwab, MD, PortlandDaniel K. White, PT, ScD, MSc, Newark
Editorial StaffMaggie Parry, Managing Editor, AtlantaKristin W. Mitchell, Assistant Managing Editor, AtlantaDavid Hutto, Manuscript Editor, AtlantaJoshua J. Reynolds, Manuscript Editor, AtlantaMargaret Graton, Editorial Assistant, CaryWill Galanis, Production Editor, Boston
Arthritis Care & ResearchAn Offi cial Journal of the American College of Rheumatology
www.arthritiscareres.org and wileyonlinelibrary.com
Editorial BoardJoshua Baker, MD, MSCE, PhiladelphiaCheryl Barnabe, MD, CalgaryJennifer Barton, MD, PortlandBonnie Bermas, MD, DallasTimothy Beukelman, MD, MSCE, BirminghamSusan Blalock, MPH, PhD, Chapel HillTeresa J. Brady, PhD, AtlantaVivian Bykerk, MD, New YorkCecilia P. Chung, MD, MPH, NashvilleJamie E. Collins, PhD, BostonDelphine Courvoisier, PhD, GenevaCynthia Crowson, PhD, RochesterAileen Davis, PhD, TorontoJohn M. Davis, MD, RochesterJeffrey Driban, PhD, BostonAlyssa Dufour, PhD, BostonBryant England, MD, Omaha
Ricardo Ferreira, PhD, CoimbraElizabeth Ferucci, MD, MPH, AnchorageJohn D. FitzGerald, MD, PhD, Los AngelesJames Galloway, PhD, LondonMichael George, MD, MSCE, PhiladelphiaYvonne Golightly, PhD, Chapel HillMeenakshi Jolly, MD, ChicagoKim D. Jones, PhD, FNP, FAAN, PortlandYvonne C. Lee, MD, MMSc, ChicagoLinda Li, PhD, VancouverElena Losina, PhD, BostonErin Macri, PhD, Rotterdam Hiral Master, PT, PhD, MPH, NashvilleNatalie McCormick, MSc, VancouverStephen McKenna, PhD, ManchesterChristopher Mecoli, MD, MHS, BaltimoreHylton B. Menz, PhD, Melbourne
Christian Pagnoux, MD, TorontoAnthony Perruccio, PhD, TorontoFederico Pozzi, PhD, GainesvilleDaniel Riddle, PhD, RichmondGabriela Schmajuk, MD, San FranciscoPascale Schwab, MD, PortlandCarlo Scirè, MD, PhD, MilanJulia Simard, ScD, StanfordKaren L. Smarr, PhD, ColumbiaJeffrey A. Sparks, MD, MMSc BostonJoshua Stefanik, MSPT, PhD, BostonLauren Terhorst, PhD, PittsburghLouise Thoma, PhD, Chapel Hill Martin Thomas, PhD, StaffordshireErnest Vina, MD, MS, TucsonZachary Wallace, MD, MSc, BostonJoseph Zeni, Jr., PhD, Newark
© 2021 American College of Rheumatology. All rights reserved. No part of this publication may be reproduced, stored or transmitted in any form or by any means without the prior permission in writing from the copyright holder. Authorization to copy items for internal and personal use is granted by the copyright holder for libraries and other users registered with their local Reproduction Rights Organization (RRO), e.g. Copyright Clearance Center (CCC), 222 Rosewood Drive, Danvers, MA 01923, USA (www.copyright.com), provided the appropriate fee is paid directly to the RRO. This consent does not extend to other kindsof copying such as copying for general distribution, for advertising or promotional purposes, for creating new collective works or for resale. Special requests should be addressed to: [email protected]
Access Policy: Subject to restrictions on certain backfi les, access to the online version of this issue is available to all registered Wiley InterScience users 12 months after publication. Subscribers and eligible users at subscribing institutions have immediate access in accordance with the relevant subscription type. Please go to onlinelibrary.wiley.com for details.
The views and recommendations expressed in articles, letters, and other communications published in Arthritis Care & Research are those of the authors and do not necessarily refl ect the opinions of the editors, publisher, or American College of Rheumatology. The publisher and the American College of Rheumatology do not investigate the information contained in the classifi ed advertisements in this journal and assume no responsibility concerning them. Further, the publisher and the American College of Rheumatology do not guarantee,warrant, or endorse any product or service advertised in this journal.
Cover design: Sandra Pulmano
This journal is printed on acid-free paper.∞
Christine Stamatos, DNP, ANP-C, Cold Springs, PresidentBarbara Slusher, PA-C, MSW, Galveston, President-ElectKori Dewing, ARNP, DNP, Everett, Member at Large-SecretaryAnna Lawrence, MBA, Lawrenceville, Member at Large-FinanceCarole Dodge, OT, CHT, Saline, eLearning Subcommittee ChairNancy Delnay, MSN, PMHS, CNP, Akron,
Research Committee Chair Daniel Schaff er, MPAS, PA-C, Rochester, Practice Committee Chair
Lisa Robbins, BSN, CPNP, RN, Hershey, Government Aff airs Representative
Ann Biel, MS, PharmD, BCPS, Arlington, Annual Meeting Planning Subcommittee Chair
Hazel L. Breland, PhD, OTR/L, Charleston, Membership & Nominations Chair
Donah Crawford, MA, BS, Philadelphia, Member-at-LargeSara Mohiuddin, PharmD, South Euclid, Member-at-Large
Association of Rheumatology ProfessionalsTami Brehm, CAE, Executive Director, Atlanta
2020–2021 Executive Committee

Rheumatoid Arthritis Coronary Microvascular Dysfunction in Rheumatoid Arthritis Compared to Diabetes Mellitus and Association With All-Cause Mortality
Katherine P. Liao, Jie Huang, Zeling He, Gabrielle Cremone, Ethan Lam, Jon M. Hainer, Victoria Morgan, Courtney Bibbo, and Marcelo Di Carli ..................................................................................................................................................... 159
Improved Pregnancy Outcome in Patients With Rheumatoid Arthritis Who Followed an Ideal Clinical Pathway Alessandra Bortoluzzi, Laura Andreoli, Greta Carrara, Véronique Ramoni, Federica Rumi, Melissa Padovan, Marcello Govoni, Angela Tincani, and Carlo Alberto Scirè, on behalf of the Record-Linkage on Rheumatic Diseases Study of the Italian Society for Rheumatology ....................................................................................................................................... 166
Brief Report: Finger Joint Cartilage Evaluated by Semiquantitative Ultrasound Score in Patients With Rheumatoid Arthritis
Takehisa Ogura, Ayako Hirata, Norihide Hayashi, Chihiro Imaizumi, Hideki Ito, Sayaka Takenaka, Yuki Inoue, Yuto Takakura, Kennosuke Mizushina, Takaharu Katagiri, and Hideto Kameda ............................................................................... 173
Family History of Rheumatic, Autoimmune, and Nonautoimmune Diseases and Risk of Rheumatoid Arthritis Vanessa L. Kronzer, Cynthia S. Crowson, Jeff rey A. Sparks, Elena Myasoedova, and John Davis III ................................................. 180
Roles of Postdiagnosis Accumulation of Morbidities and Lifestyle Changes in Excess Total and Cause-Specifi c Mortality Risk in Rheumatoid Arthritis
Kazuki Yoshida, Tzu-Chieh Lin, Melissa Y. Wei, Susan Malspeis, Su H. Chu, Carlos A. Camargo Jr , Benjamin A. Raby, Hyon K. Choi, Sara K. Tedeschi, Medha Barbhaiya, Bing Lu, Karen H. Costenbader, Elizabeth W. Karlson, and Jeff rey A. Sparks ........................................................................................................................................................................................ 188
Prevalence of Rheumatoid Arthritis and Drug Dispensing Patterns Among Medicaid and Medicaid–Medicare Dually Eligible Benefi ciaries in Puerto Rico
José J. Hernández-Muñoz, Wenfei Wei, and Radames Sierra-Zorita .................................................................................................... 199 Treat-to-Target Approach in Rheumatoid Arthritis: A Quality Improvement Trial
Sonali P. Desai, Cianna Leatherwood, Malka Forman, Eunji Ko, Emma Stevens, Maura Iversen, Chang Xu, Bing Lu, and Daniel H. Solomon ............................................................................................................................................................................. 207
Pediatrics Psoriasis Associated With Tumor Necrosis Factor Inhibitors in Children With Infl ammatory Diseases
Lisa H. Buckley, Rui Xiao, Marissa J. Perman, Andrew B. Grossman, and Pamela F. Weiss .............................................................. 215 Treatment Satisfaction With and Adherence to Disease-Modifying Antirheumatic Drugs in Adult Patients With Juvenile Idiopathic Arthritis
Anita Tollisen, Berit Flatø, Anne M. Selvaag, Astrid Aasland, Trude Ingebrigtsen, Joachim Sagen, and Anners Lerdal .................. 221
Osteoarthritis Eff ects of Neurodynamic Mobilizations on Pain Hypersensitivity in Patients With Hand Osteoarthritis Compared to Robotic Assisted Mobilization: A Randomized Controlled Trial
Paolo Pedersini, Kristin Valdes, Raquel Cantero-Tellez, Joshua A. Cleland, Mark D. Bishop, and Jorge H. Villafañe ..................... 232 Foot Orthoses and Footwear for the Management of Patellofemoral Osteoarthritis: A Pilot Randomized Trial
Narelle Wyndow, Kay M. Crossley, Bill Vicenzino, Kylie Tucker, and Natalie J. Collins ....................................................................... 240 Podiatry Intervention Versus Usual General Practitioner Care for Symptomatic Radiographic Osteoarthritis of the First Metatarsophalangeal Joint: A Randomized Clinical Feasibility Study
Kade L. Paterson, Rana S. Hinman, Ben R. Metcalf, Penny K. Campbell, Hylton B. Menz, David J. Hunter, and Kim L. Bennell ............................................................................................................................................................................................. 250
Systemic Lupus Erythematosus Impact of Systemic Lupus Erythematosus on the Risk of Newly Diagnosed Hip Fracture: A General Population-Based Study
Lingyi Li, Hui Xie, Na Lu, John M. Esdaile, and J. Antonio Aviña-Zubieta .............................................................................................. 259
VOLUME 73 • February 2021 • NO. 2
Arthritis Care & ResearchAn Offi cial Journal of the American College of Rheumatology
www.arthritiscareres.org and wileyonlinelibrary.com
ACR_v73_i2_toc.indd 1ACR_v73_i2_toc.indd 1 1/30/2021 7:46:29 AM1/30/2021 7:46:29 AM
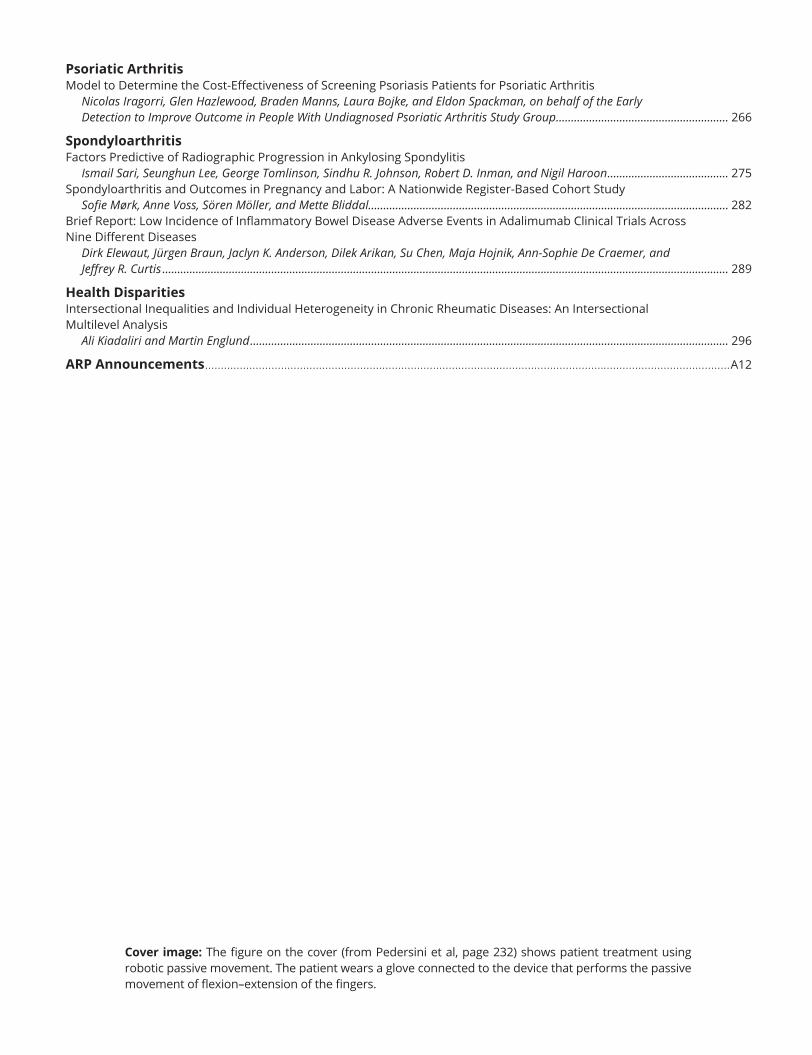
Psoriatic Arthritis Model to Determine the Cost-Eff ectiveness of Screening Psoriasis Patients for Psoriatic Arthritis
Nicolas Iragorri, Glen Hazlewood, Braden Manns, Laura Bojke, and Eldon Spackman , on behalf of the Early Detection to Improve Outcome in People With Undiagnosed Psoriatic Arthritis Study Group ......................................................... 266
Spondyloarthritis Factors Predictive of Radiographic Progression in Ankylosing Spondylitis
Ismail Sari, Seunghun Lee, George Tomlinson, Sindhu R. Johnson, Robert D. Inman, and Nigil Haroon ........................................ 275 Spondyloarthritis and Outcomes in Pregnancy and Labor: A Nationwide Register-Based Cohort Study
Sofi e Mørk, Anne Voss, Sören Möller, and Mette Bliddal ....................................................................................................................... 282 Brief Report: Low Incidence of Infl ammatory Bowel Disease Adverse Events in Adalimumab Clinical Trials Across Nine Diff erent Diseases
Dirk Elewaut, Jürgen Braun, Jaclyn K. Anderson, Dilek Arikan, Su Chen, Maja Hojnik, Ann-Sophie De Craemer, and Jeff rey R. Curtis ........................................................................................................................................................................................... 289
Health Disparities Intersectional Inequalities and Individual Heterogeneity in Chronic Rheumatic Diseases: An Intersectional Multilevel Analysis
Ali Kiadaliri and Martin Englund .............................................................................................................................................................. 296
ARP Announcements ...................................................................................................................................................................... A12
Cover image: The fi gure on the cover (from Pedersini et al, page 232) shows patient treatment using robotic passive movement. The patient wears a glove connected to the device that performs the passive movement of fl exion–extension of the fi ngers.
ACR_v73_i2_toc.indd 2ACR_v73_i2_toc.indd 2 1/30/2021 7:46:30 AM1/30/2021 7:46:30 AM
159
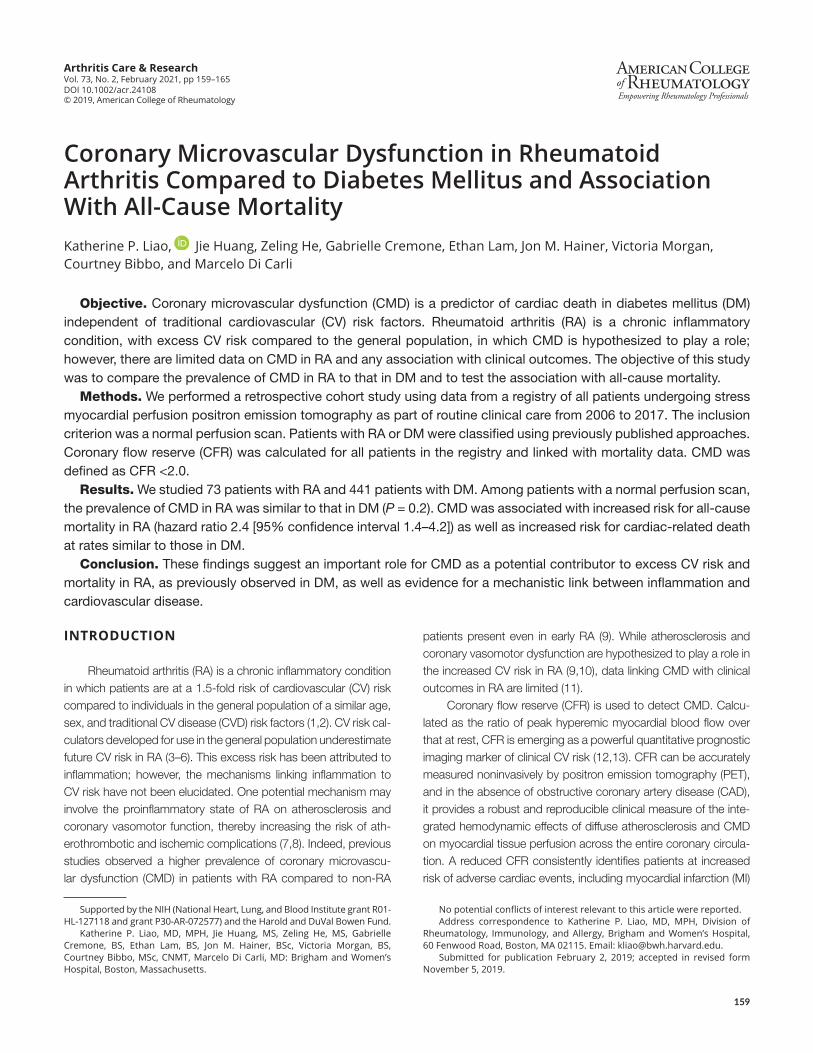
Arthritis Care & ResearchVol. 73, No. 2, February 2021, pp 159–165DOI 10.1002/acr.24108© 2019, American College of Rheumatology
Coronary Microvascular Dysfunction in Rheumatoid Arthritis Compared to Diabetes Mellitus and Association With All-Cause MortalityKatherine P. Liao, Jie Huang, Zeling He, Gabrielle Cremone, Ethan Lam, Jon M. Hainer, Victoria Morgan, Courtney Bibbo, and Marcelo Di Carli
Objective. Coronary microvascular dysfunction (CMD) is a predictor of cardiac death in diabetes mellitus (DM) independent of traditional cardiovascular (CV) risk factors. Rheumatoid arthritis (RA) is a chronic inflammatory condition, with excess CV risk compared to the general population, in which CMD is hypothesized to play a role; however, there are limited data on CMD in RA and any association with clinical outcomes. The objective of this study was to compare the prevalence of CMD in RA to that in DM and to test the association with all-cause mortality.
Methods. We performed a retrospective cohort study using data from a registry of all patients undergoing stress myocardial perfusion positron emission tomography as part of routine clinical care from 2006 to 2017. The inclusion criterion was a normal perfusion scan. Patients with RA or DM were classified using previously published approaches. Coronary flow reserve (CFR) was calculated for all patients in the registry and linked with mortality data. CMD was defined as CFR <2.0.
Results. We studied 73 patients with RA and 441 patients with DM. Among patients with a normal perfusion scan, the prevalence of CMD in RA was similar to that in DM (P = 0.2). CMD was associated with increased risk for all-cause mortality in RA (hazard ratio 2.4 [95% confidence interval 1.4–4.2]) as well as increased risk for cardiac-related death at rates similar to those in DM.
Conclusion. These findings suggest an important role for CMD as a potential contributor to excess CV risk and mortality in RA, as previously observed in DM, as well as evidence for a mechanistic link between inflammation and cardiovascular disease.
INTRODUCTION
Rheumatoid arthritis (RA) is a chronic inflammatory condition in which patients are at a 1.5-fold risk of cardiovascular (CV) risk compared to individuals in the general population of a similar age, sex, and traditional CV disease (CVD) risk factors (1,2). CV risk cal-culators developed for use in the general population underestimate future CV risk in RA (3–6). This excess risk has been attributed to inflammation; however, the mechanisms linking inflammation to CV risk have not been elucidated. One potential mechanism may involve the proinflammatory state of RA on atherosclerosis and coronary vasomotor function, thereby increasing the risk of ath-erothrombotic and ischemic complications (7,8). Indeed, previous studies observed a higher prevalence of coronary microvascu-lar dysfunction (CMD) in patients with RA compared to non-RA
patients present even in early RA (9). While atherosclerosis and coronary vasomotor dysfunction are hypothesized to play a role in the increased CV risk in RA (9,10), data linking CMD with clinical outcomes in RA are limited (11).
Coronary flow reserve (CFR) is used to detect CMD. Calcu-lated as the ratio of peak hyperemic myocardial blood flow over that at rest, CFR is emerging as a powerful quantitative prognostic imaging marker of clinical CV risk (12,13). CFR can be accurately measured noninvasively by positron emission tomography (PET), and in the absence of obstructive coronary artery disease (CAD), it provides a robust and reproducible clinical measure of the inte-grated hemodynamic effects of diffuse atherosclerosis and CMD on myocardial tissue perfusion across the entire coronary circula-tion. A reduced CFR consistently identifies patients at increased risk of adverse cardiac events, including myocardial infarction (MI)
Supported by the NIH (National Heart, Lung, and Blood Institute grant R01-HL-127118 and grant P30-AR-072577) and the Harold and DuVal Bowen Fund.
Katherine P. Liao, MD, MPH, Jie Huang, MS, Zeling He, MS, Gabrielle Cremone, BS, Ethan Lam, BS, Jon M. Hainer, BSc, Victoria Morgan, BS, Courtney Bibbo, MSc, CNMT, Marcelo Di Carli, MD: Brigham and Women’s Hospital, Boston, Massachusetts.
No potential conflicts of interest relevant to this article were reported.Address correspondence to Katherine P. Liao, MD, MPH, Division of
Rheumatology, Immunology, and Allergy, Brigham and Women’s Hospital, 60 Fenwood Road, Boston, MA 02115. Email: [email protected].
Submitted for publication February 2, 2019; accepted in revised form November 5, 2019.
LIAO ET AL 160 |
and death (14,15). For example, patients with diabetes mellitus with impaired CFR without overt obstructive CAD, here reflecting microvascular dysfunction, show a risk of cardiac death compa-rable to, and possibly higher than, that for patients without diabe-tes mellitus with known CAD (16,17). We designed this study to test the hypotheses that RA patients, considered a human model of inflammation, will have a similar burden of CMD compared to patients with DM, and that a reduced CFR reflecting CMD will be associated with higher risk of death.
PATIENTS AND METHODS
Study population. We performed a retrospective cohort study of all patients undergoing rest/stress cardiac PET assessing for obstructive CAD at Brigham and Women’s Hospital between January 1, 2006 and October 28, 2017; all patients were entered into a registry study, as previously described (17). Patients with known CAD, history of MI, coronary revascularization, heart trans-plantation, or moderate or severe valvular disease were excluded, as were those with abnormal myocardial perfusion PET scans reflecting obstructive CAD. Patients with RA were identified using a validated algorithm for RA using electronic medical record data with a positive predictive value of 94% (18). Subjects classified by the algorithm as having RA were further chart reviewed to confirm that the RA diagnosis was present at the time of the cardiac PET scan. Information on DM was available through review of medi-cal history and interviews performed on the day of the scan, as described previously (17).
PET imaging. The rest/stress cardiac PET was performed using a standard Discovery RX or STE LightSpeed 64 PET– computed tomography scanner (GE Healthcare). Details of the protocol are described in Gupta et al (12). Briefly, patients
followed a standardized protocol, including abstaining from caffeine and methylxanthine-containing substances and drugs for 24 hours prior to the scan. Myocardial blood flow (MBF) at rest and at maximal hyperemia were measured with 82rubid-ium (1,480–2,200 MBq) or 13N-ammonia (700–900 MBq) as the flow tracer. The stress agents used included dipyridamole, adenosine, regadenoson, or dobutamine; the choice of stress agent was selected based on the agent preferred by the lab-oratory as well as patient comorbidities. The CFR was cal-culated as the ratio of maximal MBF at peak hyperemia over that at rest for the left ventricle and corrected for differences in baseline heart rate–pressure product, as previously described (19). Measurements of CFR and MBF were not available in the clinical reports during the study period, and therefore did not impact clinical care.
Clinical data assessment. Information regarding both biologic and non-biologic disease-modifying antirheumatic drugs (DMARDs) to treat RA was obtained through medical record review. Data on diabetes mellitus treatments, other traditional CV risk factors such as hypertension and smoking history, as well as medications for primary and secondary prevention of CVD were obtained at the time of the study through patient interview and review of the medical history, as previously described (17).
Outcome data. The primary outcome was corrected global CFR, reflecting coronary vascular health of the entire left ventricle. MBF was quantified by 4 operators with an intraclass correlation of 0.94 (95% confidence interval [95% CI] 0.88–0.98) (17). Mor-tality data were obtained through integrating data from the Part-ners Healthcare Research Patient Data Repository (20), the Social Security Index, the National Death Index, death certificates, and telephone calls. Ascertainment of cause of death was performed using blinded adjudication of these same records (19).
Statistical analysis. Univariate analyses were performed to compare demographic information on the RA population compared to the DM population. The primary analysis was per-formed comparing patients with RA compared to those with DM. If a patient had a concurrent diagnosis of RA and DM, they were included in the RA cohort for the primary analysis. The distribution of CFR was then compared between the 2 populations. Kaplan-Meier survival curves were constructed to compare the rate of all-cause mortality in RA compared to DM and was further strati-fied by CFR <2.0, a cutoff correlated with increased cardiac event rates (21–23). A CFR <2.0 in a patient with a normal perfusion scan is generally considered a sign of CMD.
Using Cox proportional hazards regression models, we tested the association between CFR and all-cause mortality adjusted by age, sex, RA or DM status, and traditional CV risk factors including hypertension, hyperlipidemia, and smoking sta-tus (yes or no) at baseline (model 1). Baseline covariates were
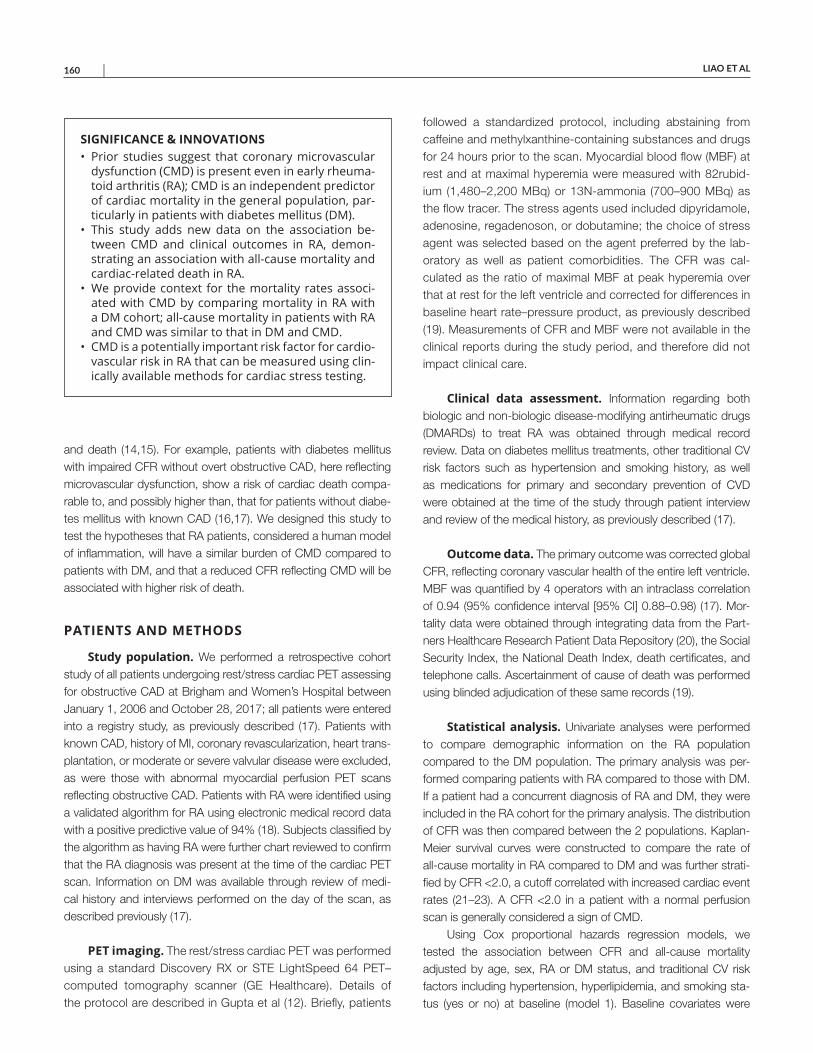
SIGNIFICANCE & INNOVATIONS• Prior studies suggest that coronary microvascular
dysfunction (CMD) is present even in early rheuma-toid arthritis (RA); CMD is an independent predictor of cardiac mortality in the general population, par-ticularly in patients with diabetes mellitus (DM).
• This study adds new data on the association be-tween CMD and clinical outcomes in RA, demon-strating an association with all-cause mortality and cardiac-related death in RA.
• We provide context for the mortality rates associ-ated with CMD by comparing mortality in RA with a DM cohort; all-cause mortality in patients with RA and CMD was similar to that in DM and CMD.
• CMD is a potentially important risk factor for cardio-vascular risk in RA that can be measured using clin-ically available methods for cardiac stress testing.
PREVALENCE OF CORONARY MICROVASCULAR DYSFUNCTION IN RA VERSUS DM | 161
assessed in the 1-year period prior to the scan. A potential con-founder for CFR, rest left ventricular ejection fraction obtained at the time of the scan was also included in model 1. Additionally, we constructed a second model (model 2) that included only covar-iates that resulted in a hazard ratio (HR) change of >5% for the predictor, CFR with mortality, in a base model for age and sex. Finally, a third model (model 3) included covariates in model 1 with the addition of other potential confounders, including statins, ste-roid use (prednisone equivalent 7.5 mg or higher), and body mass index (BMI). A sensitivity analysis was performed excluding sub-jects with a concurrent diagnosis of RA and DM.
Subgroup analyses tested the association between CFR <2 and CVD-related deaths only among patients who died during the study period. We first constructed a 2 × 2 table of CVD-adjudi-cated death versus other causes of death and CFR <2 versus
CFR ≥2. Differences between the groups were tested using the chi-square test. The association between CFR <2 and CVD- related deaths was further adjusted for age, sex, and RA/DM sta-tus in a logistic regression model.
All analyses were performed with SAS, version 9.4. All aspects of this study were approved by the Partners Healthcare Institutional Review Board.
RESULTS
Over the study period, 73 subjects with RA and 441 subjects with DM met the inclusion or exclusion criteria (Table 1). The mean age of both was similar at 63 years. The proportion of women was higher in the RA group than in the DM group (73% versus 56%, respectively). Patients with DM had a higher prevalence of hypertension and dyslipidemia. Eighteen percent of subjects had concurrent RA and DM.
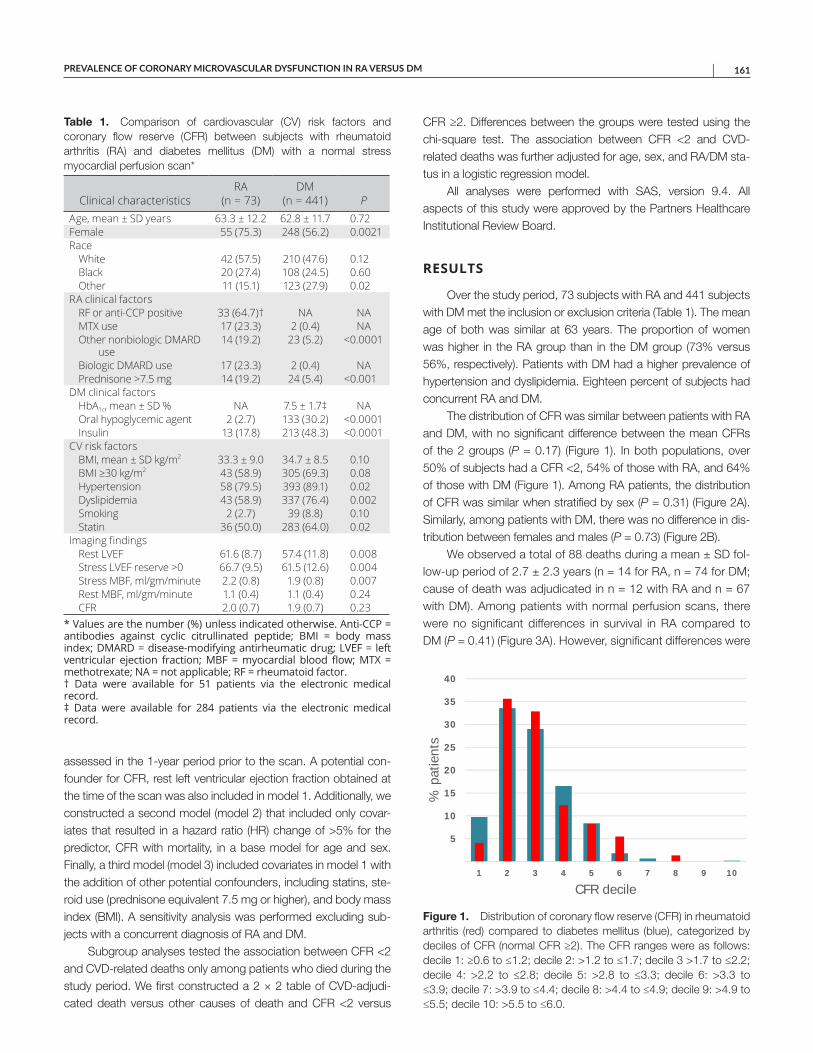
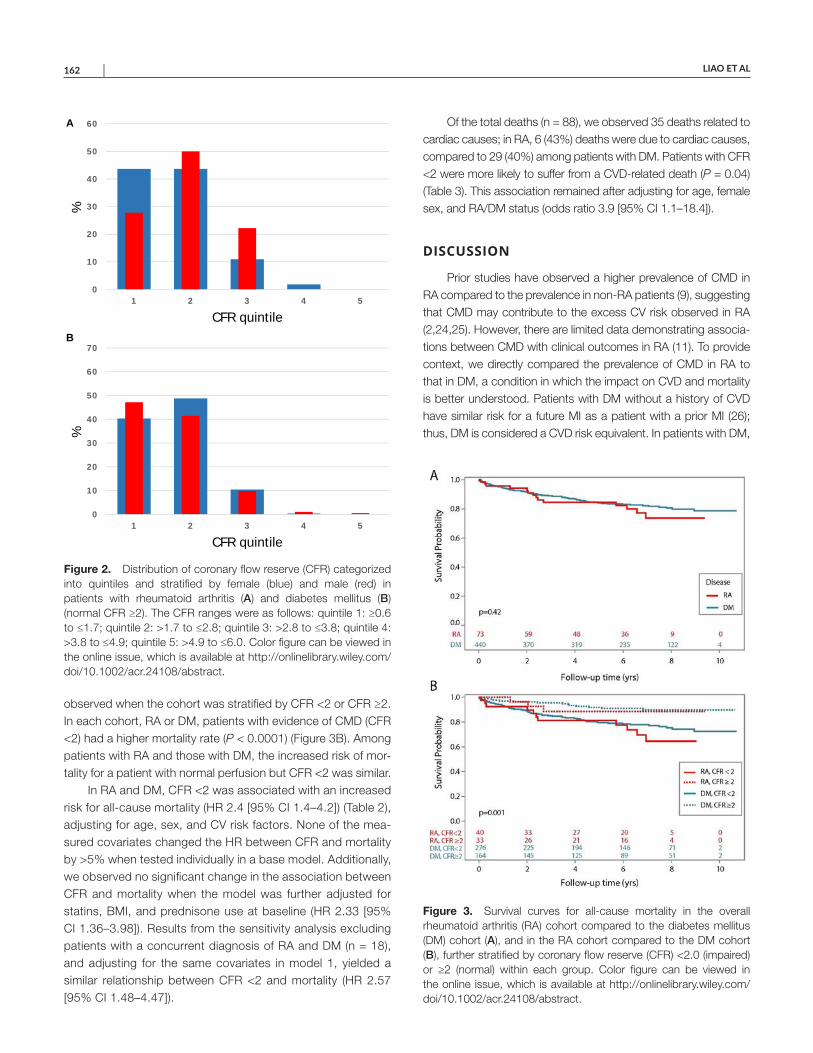
The distribution of CFR was similar between patients with RA and DM, with no significant difference between the mean CFRs of the 2 groups (P = 0.17) (Figure 1). In both populations, over 50% of subjects had a CFR <2, 54% of those with RA, and 64% of those with DM (Figure 1). Among RA patients, the distribution of CFR was similar when stratified by sex (P = 0.31) (Figure 2A). Similarly, among patients with DM, there was no difference in dis-tribution between females and males (P = 0.73) (Figure 2B).
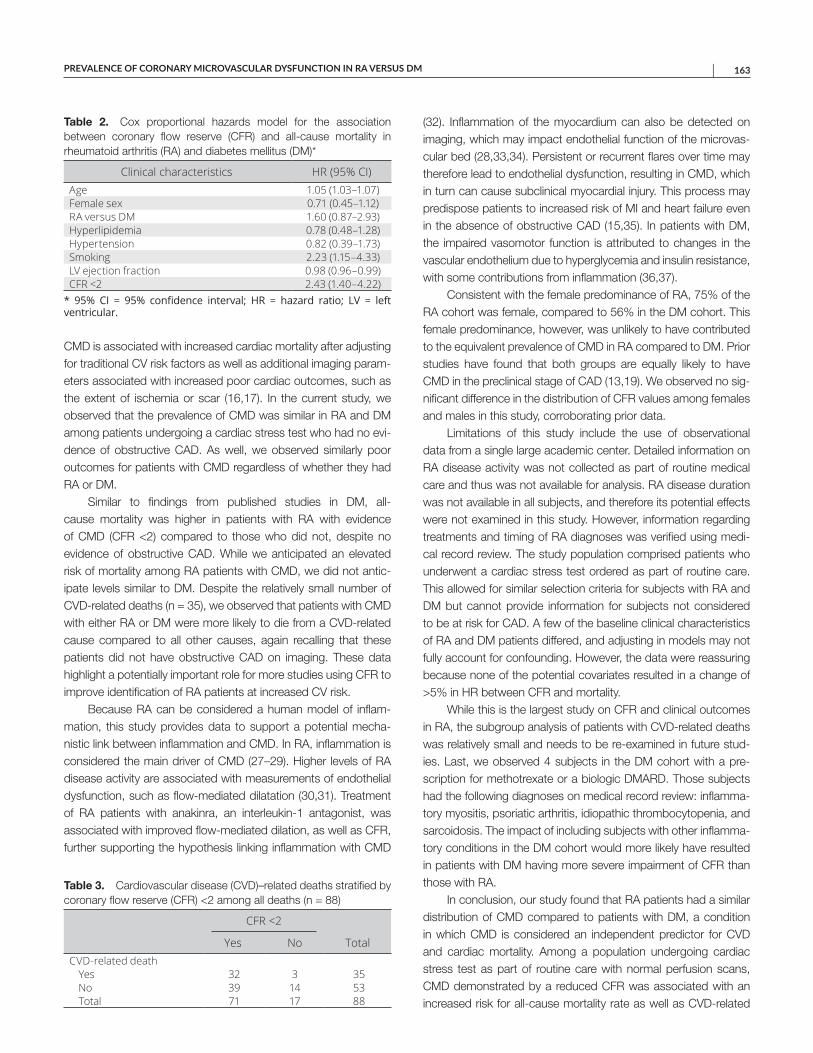
We observed a total of 88 deaths during a mean ± SD fol-low-up period of 2.7 ± 2.3 years (n = 14 for RA, n = 74 for DM; cause of death was adjudicated in n = 12 with RA and n = 67 with DM). Among patients with normal perfusion scans, there were no significant differences in survival in RA compared to DM (P = 0.41) (Figure 3A). However, significant differences were
Table 1. Comparison of cardiovascular (CV) risk factors and coronary flow reserve (CFR) between subjects with rheumatoid arthritis (RA) and diabetes mellitus (DM) with a normal stress myocardial perfusion scan*
Clinical characteristicsRA
(n = 73)DM
(n = 441) PAge, mean ± SD years 63.3 ± 12.2 62.8 ± 11.7 0.72Female 55 (75.3) 248 (56.2) 0.0021Race
White 42 (57.5) 210 (47.6) 0.12Black 20 (27.4) 108 (24.5) 0.60Other 11 (15.1) 123 (27.9) 0.02
RA clinical factorsRF or anti-CCP positive 33 (64.7)† NA NAMTX use 17 (23.3) 2 (0.4) NAOther nonbiologic DMARD
use14 (19.2) 23 (5.2) <0.0001
Biologic DMARD use 17 (23.3) 2 (0.4) NAPrednisone >7.5 mg 14 (19.2) 24 (5.4) <0.001
DM clinical factorsHbA1c, mean ± SD % NA 7.5 ± 1.7‡ NAOral hypoglycemic agent 2 (2.7) 133 (30.2) <0.0001Insulin 13 (17.8) 213 (48.3) <0.0001
CV risk factorsBMI, mean ± SD kg/m2 33.3 ± 9.0 34.7 ± 8.5 0.10BMI ≥30 kg/m2 43 (58.9) 305 (69.3) 0.08Hypertension 58 (79.5) 393 (89.1) 0.02Dyslipidemia 43 (58.9) 337 (76.4) 0.002Smoking 2 (2.7) 39 (8.8) 0.10Statin 36 (50.0) 283 (64.0) 0.02
Imaging findingsRest LVEF 61.6 (8.7) 57.4 (11.8) 0.008Stress LVEF reserve >0 66.7 (9.5) 61.5 (12.6) 0.004Stress MBF, ml/gm/minute 2.2 (0.8) 1.9 (0.8) 0.007Rest MBF, ml/gm/minute 1.1 (0.4) 1.1 (0.4) 0.24CFR 2.0 (0.7) 1.9 (0.7) 0.23
* Values are the number (%) unless indicated otherwise. Anti-CCP = antibodies against cyclic citrullinated peptide; BMI = body mass index; DMARD = disease-modifying antirheumatic drug; LVEF = left ventricular ejection fraction; MBF = myocardial blood flow; MTX = methotrexate; NA = not applicable; RF = rheumatoid factor. † Data were available for 51 patients via the electronic medical record. ‡ Data were available for 284 patients via the electronic medical record.
Figure 1. Distribution of coronary flow reserve (CFR) in rheumatoid arthritis (red) compared to diabetes mellitus (blue), categorized by deciles of CFR (normal CFR ≥2). The CFR ranges were as follows: decile 1: ≥0.6 to ≤1.2; decile 2: >1.2 to ≤1.7; decile 3 >1.7 to ≤2.2; decile 4: >2.2 to ≤2.8; decile 5: >2.8 to ≤3.3; decile 6: >3.3 to ≤3.9; decile 7: >3.9 to ≤4.4; decile 8: >4.4 to ≤4.9; decile 9: >4.9 to ≤5.5; decile 10: >5.5 to ≤6.0.
5
10
15
20
25
30
35
40
1 2 3 4 5 6 7 8 9 10
% p
atie
nts
CFR decile
LIAO ET AL 162 |
observed when the cohort was stratified by CFR <2 or CFR ≥2. In each cohort, RA or DM, patients with evidence of CMD (CFR <2) had a higher mortality rate (P < 0.0001) (Figure 3B). Among patients with RA and those with DM, the increased risk of mor-tality for a patient with normal perfusion but CFR <2 was similar.
In RA and DM, CFR <2 was associated with an increased risk for all-cause mortality (HR 2.4 [95% CI 1.4–4.2]) (Table 2), adjusting for age, sex, and CV risk factors. None of the mea-sured covariates changed the HR between CFR and mortality by >5% when tested individually in a base model. Additionally, we observed no significant change in the association between CFR and mortality when the model was further adjusted for statins, BMI, and prednisone use at baseline (HR 2.33 [95% CI 1.36–3.98]). Results from the sensitivity analysis excluding patients with a concurrent diagnosis of RA and DM (n = 18), and adjusting for the same covariates in model 1, yielded a similar relationship between CFR <2 and mortality (HR 2.57 [95% CI 1.48–4.47]).
Of the total deaths (n = 88), we observed 35 deaths related to cardiac causes; in RA, 6 (43%) deaths were due to cardiac causes, compared to 29 (40%) among patients with DM. Patients with CFR <2 were more likely to suffer from a CVD-related death (P = 0.04) (Table 3). This association remained after adjusting for age, female sex, and RA/DM status (odds ratio 3.9 [95% CI 1.1–18.4]).
DISCUSSION
Prior studies have observed a higher prevalence of CMD in RA compared to the prevalence in non-RA patients (9), suggesting that CMD may contribute to the excess CV risk observed in RA (2,24,25). However, there are limited data demonstrating associa-tions between CMD with clinical outcomes in RA (11). To provide context, we directly compared the prevalence of CMD in RA to that in DM, a condition in which the impact on CVD and mortality is better understood. Patients with DM without a history of CVD have similar risk for a future MI as a patient with a prior MI (26); thus, DM is considered a CVD risk equivalent. In patients with DM,
Figure 3. Survival curves for all-cause mortality in the overall rheumatoid arthritis (RA) cohort compared to the diabetes mellitus (DM) cohort (A), and in the RA cohort compared to the DM cohort (B), further stratified by coronary flow reserve (CFR) <2.0 (impaired) or ≥2 (normal) within each group. Color figure can be viewed in the online issue, which is available at http://onlinelibrary.wiley.com/doi/10.1002/acr.24108/abstract.
Figure 2. Distribution of coronary flow reserve (CFR) categorized into quintiles and stratified by female (blue) and male (red) in patients with rheumatoid arthritis (A) and diabetes mellitus (B) (normal CFR ≥2). The CFR ranges were as follows: quintile 1: ≥0.6 to ≤1.7; quintile 2: >1.7 to ≤2.8; quintile 3: >2.8 to ≤3.8; quintile 4: >3.8 to ≤4.9; quintile 5: >4.9 to ≤6.0. Color figure can be viewed in the online issue, which is available at http://onlinelibrary.wiley.com/doi/10.1002/acr.24108/abstract.
0
10
20
30
40
50
60
1 2 3 4 5
%
CFR quintile
0
10
20
30
40
50
60
70
1 2 3 4 5
%
CFR quintile
A
B
PREVALENCE OF CORONARY MICROVASCULAR DYSFUNCTION IN RA VERSUS DM | 163
CMD is associated with increased cardiac mortality after adjusting for traditional CV risk factors as well as additional imaging param-eters associated with increased poor cardiac outcomes, such as the extent of ischemia or scar (16,17). In the current study, we observed that the prevalence of CMD was similar in RA and DM among patients undergoing a cardiac stress test who had no evi-dence of obstructive CAD. As well, we observed similarly poor outcomes for patients with CMD regardless of whether they had RA or DM.
Similar to findings from published studies in DM, all-cause mortality was higher in patients with RA with evidence of CMD (CFR <2) compared to those who did not, despite no evidence of obstructive CAD. While we anticipated an elevated risk of mortality among RA patients with CMD, we did not antic-ipate levels similar to DM. Despite the relatively small number of CVD-related deaths (n = 35), we observed that patients with CMD with either RA or DM were more likely to die from a CVD-related cause compared to all other causes, again recalling that these patients did not have obstructive CAD on imaging. These data highlight a potentially important role for more studies using CFR to improve identification of RA patients at increased CV risk.
Because RA can be considered a human model of inflam-mation, this study provides data to support a potential mecha-nistic link between inflammation and CMD. In RA, inflammation is considered the main driver of CMD (27–29). Higher levels of RA disease activity are associated with measurements of endothelial dysfunction, such as flow-mediated dilatation (30,31). Treatment of RA patients with anakinra, an interleukin-1 antagonist, was associated with improved flow-mediated dilation, as well as CFR, further supporting the hypothesis linking inflammation with CMD
(32). Inflammation of the myocardium can also be detected on imaging, which may impact endothelial function of the microvas-cular bed (28,33,34). Persistent or recurrent flares over time may therefore lead to endothelial dysfunction, resulting in CMD, which in turn can cause subclinical myocardial injury. This process may predispose patients to increased risk of MI and heart failure even in the absence of obstructive CAD (15,35). In patients with DM, the impaired vasomotor function is attributed to changes in the vascular endothelium due to hyperglycemia and insulin resistance, with some contributions from inflammation (36,37).
Consistent with the female predominance of RA, 75% of the RA cohort was female, compared to 56% in the DM cohort. This female predominance, however, was unlikely to have contributed to the equivalent prevalence of CMD in RA compared to DM. Prior studies have found that both groups are equally likely to have CMD in the preclinical stage of CAD (13,19). We observed no sig-nificant difference in the distribution of CFR values among females and males in this study, corroborating prior data.
Limitations of this study include the use of observational data from a single large academic center. Detailed information on RA disease activity was not collected as part of routine medical care and thus was not available for analysis. RA disease duration was not available in all subjects, and therefore its potential effects were not examined in this study. However, information regarding treatments and timing of RA diagnoses was verified using medi-cal record review. The study population comprised patients who underwent a cardiac stress test ordered as part of routine care. This allowed for similar selection criteria for subjects with RA and DM but cannot provide information for subjects not considered to be at risk for CAD. A few of the baseline clinical characteristics of RA and DM patients differed, and adjusting in models may not fully account for confounding. However, the data were reassuring because none of the potential covariates resulted in a change of >5% in HR between CFR and mortality.
While this is the largest study on CFR and clinical outcomes in RA, the subgroup analysis of patients with CVD-related deaths was relatively small and needs to be re-examined in future stud-ies. Last, we observed 4 subjects in the DM cohort with a pre-scription for methotrexate or a biologic DMARD. Those subjects had the following diagnoses on medical record review: inflamma-tory myositis, psoriatic arthritis, idiopathic thrombocytopenia, and sarcoidosis. The impact of including subjects with other inflamma-tory conditions in the DM cohort would more likely have resulted in patients with DM having more severe impairment of CFR than those with RA.
In conclusion, our study found that RA patients had a similar distribution of CMD compared to patients with DM, a condition in which CMD is considered an independent predictor for CVD and cardiac mortality. Among a population undergoing cardiac stress test as part of routine care with normal perfusion scans, CMD demonstrated by a reduced CFR was associated with an increased risk for all-cause mortality rate as well as CVD-related
Table 2. Cox proportional hazards model for the association between coronary flow reserve (CFR) and all-cause mortality in rheumatoid arthritis (RA) and diabetes mellitus (DM)*
Clinical characteristics HR (95% CI)Age 1.05 (1.03–1.07)Female sex 0.71 (0.45–1.12)RA versus DM 1.60 (0.87–2.93)Hyperlipidemia 0.78 (0.48–1.28)Hypertension 0.82 (0.39–1.73)Smoking 2.23 (1.15–4.33)LV ejection fraction 0.98 (0.96–0.99)CFR <2 2.43 (1.40–4.22)
* 95% CI = 95% confidence interval; HR = hazard ratio; LV = left ventricular.
Table 3. Cardiovascular disease (CVD)–related deaths stratified by coronary flow reserve (CFR) <2 among all deaths (n = 88)
CFR <2
TotalYes NoCVD-related death
Yes 32 3 35No 39 14 53Total 71 17 88
LIAO ET AL 164 |
death. These data suggest that CFR is a promising imaging bio-marker to assist in improving CV risk stratification among patients with RA, in addition to its importance in DM. Our findings also support a mechanistic link between inflammation, CMD, and CV risk in RA. The data on CFR are obtained from clinically available stress myocardial perfusion PET scans, performed as part of clin-ical care in several institutions. Thus, this approach can be easily translated into clinical practice. Studies are underway to deter-mine whether CFR is modifiable by controlling inflammation in RA and to determine the potential overall impact on CV risk.
AUTHOR CONTRIBUTIONS
All authors were involved in drafting the article or revising it critically for important intellectual content, and all authors approved the final version to be submitted for publication. Dr. Liao had full access to all of the data in the study and takes responsibility for the integrity of the data and the accuracy of the data analysis.Study conception and design. Liao, Huang, Di Carli.Acquisition of data. Liao, Cremone, Lam, Hainer, Morgan, Bibbo, Di Carli.Analysis and interpretation of data. Liao, Huang, He, Di Carli.
REFERENCES 1. Aviña-Zubieta JA, Choi HK, Sadatsafavi M, Etminan M, Esdaile JM,
Lacaille D. Risk of cardiovascular mortality in patients with rheu-matoid arthritis: a meta-analysis of observational studies. Arthritis Rheum 2008;59:1690–7.
2. Solomon DH, Curhan GC, Rimm EB, Cannuscio CC, Karlson EW. Cardiovascular risk factors in women with and without rheumatoid arthritis. Arthritis Rheum 2004;50:3444–9.
3. Arts EE, Popa C, Den Broeder AA, Semb AG, Toms T, Kitas GD, et al. Performance of four current risk algorithms in predicting car-diovascular events in patients with early rheumatoid arthritis. Ann Rheum Dis 2015;74:668–74.
4. Arts EE, Popa CD, Den Broeder AA, Donders R, Sandoo A, Toms T, et al. Prediction of cardiovascular risk in rheumatoid arthritis: perfor-mance of original and adapted SCORE algorithms. Ann Rheum Dis 2016;75:674–80.
5. Crowson CS, Matteson EL, Roger VL, Therneau TM, Gabriel SE. Usefulness of risk scores to estimate the risk of cardiovas-cular disease in patients with rheumatoid arthritis. Am J Cardiol 2012;110:420–4.
6. Yu Z, Yang N, Everett BM, Frits M, Iannaccone C, Coblyn J, et al. Impact of changes in inflammation on estimated ten-year cardio-vascular risk in rheumatoid arthritis. Arthritis Rheumatol 2018;70: 1392–8.
7. Libby P, Ridker PM, Hansson GK, Leducq Transatlantic Network on Atherothrombosis. Inflammation in atherosclerosis: from pathophys-iology to practice. J Am Coll Cardiol 2009;54:2129–38.
8. Ross R. Atherosclerosis: an inflammatory disease. N Engl J Med 1999;340:115–26.
9. Atzeni F, Sarzi-Puttini P, De Blasio G, Delfino L, Tomasoni L, Turiel M. Preclinical impairment of coronary flow reserve in patients with rheumatoid arthritis. Ann N Y Acad Sci 2007;1108:392–7.
10. Atzeni F, Turiel M, Hollan I, Meroni P, Sitia S, Tomasoni L, et al. Usefulness of cardiovascular biomarkers and cardiac imaging in sys-temic rheumatic diseases. Autoimmun Rev 2010;9:845–8.
11. Fent GJ, Greenwood JP, Plein S, Buch MH. The role of non-invasive cardiovascular imaging in the assessment of cardiovascular risk in
rheumatoid arthritis: where we are and where we need to be. Ann Rheum Dis 2017;76:1169–75.
12. Gupta A, Taqueti VR, van de Hoef TP, Bajaj NS, Bravo PE, Murthy VL, et al. Integrated noninvasive physiological assessment of coronary circulatory function and impact on cardiovascular mortality in patients with stable coronary artery disease. Circulation 2017;136:2325–36.
13. Taqueti VR, Shaw LJ, Cook NR, Murthy VL, Shah NR, Foster CR, et al. Excess cardiovascular risk in women relative to men referred for coronary angiography is associated with severely impaired coronary flow reserve, not obstructive disease. Circulation 2017;135:566–77.
14. Safdar B, Ong P, Camici PG. Identifying myocardial ischemia due to coronary microvascular dysfunction in the emergency department: introducing a new paradigm in acute chest pain evaluation. Clin Ther 2018;40:1920–30.
15. Camici PG, Crea F. Coronary microvascular dysfunction. N Engl J Med 2007;356:830–40.
16. Murthy VL, Di Carli MF. Non-invasive quantification of coronary vas-cular dysfunction for diagnosis and management of coronary artery disease. J Nucl Cardiol 2012;19:1060–72.
17. Murthy VL, Naya M, Foster CR, Gaber M, Hainer J, Klein J, et al. Association between coronary vascular dysfunction and cardiac mortality in patients with and without diabetes mellitus. Circulation 2012;126:1858–68.
18. Liao KP, Cai T, Gainer V, Goryachev S, Zeng-Treitler Q, Raychaudhuri S, et al. Electronic medical records for discovery research in rheuma-toid arthritis. Arthritis Care Res (Hoboken) 2010;62:1120–7.
19. Murthy VL, Naya M, Taqueti VR, Foster CR, Gaber M, Hainer J, et al. Effects of sex on coronary microvascular dysfunction and cardiac outcomes. Circulation 2014;129:2518–27.
20. Murphy S, Churchill S, Bry L, Chueh H, Weiss S, Lazarus R, et al. Instrumenting the health care enterprise for discovery research in the genomic era. Genome Res 2009;19:1675–81.
21. Miller DD, Donohue TJ, Younis LT, Bach RG, Aguirre FV, Wittry MD, et al. Correlation of pharmacological 99mTc-sestamibi myocardial perfusion imaging with poststenotic coronary flow reserve in patients with angiographically intermediate coronary artery stenoses. Circulation 1994;89:2150–60.
22. Schulman DS, Lasorda D, Farah T, Soukas P, Reichek N, Joye JD. Correlations between coronary flow reserve measured with a Doppler guide wire and treadmill exercise testing. Am Heart J 1997;134:99–104.
23. Chamuleau SA, Meuwissen M, Koch KT, van Eck-Smit BL, Tio RA, Tijssen JG, et al. Usefulness of fractional flow reserve for risk strat-ification of patients with multivessel coronary artery disease and an intermediate stenosis. Am J Cardiol 2002;89:377–80.
24. Avina-Zubieta JA, Thomas J, Sadatsafavi M, Lehman AJ, Lacaille D. Risk of incident cardiovascular events in patients with rheumatoid arthritis: a meta-analysis of observational studies. Ann Rheum Dis 2012;71:1524–9.
25. Del Rincón I, Williams K, Stern MP, Freeman GL, Escalante A. High incidence of cardiovascular events in a rheumatoid arthritis cohort not explained by traditional cardiac risk factors. Arthritis Rheum 2001;44:2737–45.
26. Haffner SM, Lehto S, Ronnemaa T, Pyorala K, Laakso M. Mortality from coronary heart disease in subjects with type 2 diabetes and in nondiabetic subjects with and without prior myocardial infarction. N Engl J Med 1998;339:229–34.
27. Erre GL, Buscetta G, Paliogiannis P, Mangoni AA, Carru C, Passiu G, et al. Coronary flow reserve in systemic rheumatic diseases: a systematic review and meta-analysis. Rheumatol Int 2018;38:1179–90.
28. Raza K, Banks M, Kitas GD. Reversing myocardial microvascu-lar disease in a patient with rheumatoid arthritis. J Rheumatol 2005;32:754–6.
PREVALENCE OF CORONARY MICROVASCULAR DYSFUNCTION IN RA VERSUS DM | 165
29. Recio-Mayoral A, Mason JC, Kaski JC, Rubens MB, Harari OA,Camici PG. Chronic inflammation and coronary microvascular dys-function in patients without risk factors for coronary artery disease.Eur Heart J 2009;30:1837–43.
30. Ormseth MJ, Oeser AM, Cunningham A, Bian A, Shintani A, SolusJ, et al. Reversing vascular dysfunction in rheumatoid arthritis:improved augmentation index but not endothelial function with per-oxisome proliferator–activated receptor γ agonist therapy. ArthritisRheumatol 2014;66:2331–8.
31. Turiel M, Tomasoni L, Sitia S, Cicala S, Gianturco L, Ricci C,et al. Effects of long-term disease-modifying antirheumatic drugson endothelial function in patients with early rheumatoid arthritis.Cardiovasc Ther 2010;28:e53–64.
32. Ikonomidis I, Tzortzis S, Andreadou I, Paraskevaidis I, Katseli C,Katsimbri P, et al. Increased benefit of interleukin-1 inhibition onvascular function, myocardial deformation, and twisting in patientswith coronary artery disease and coexisting rheumatoid arthritis. Circ Cardiovasc Imaging 2014;7:619–28.
33. Kobayashi Y, Giles JT, Hirano M, Yokoe I, Nakajima Y, Bathon JM,et al. Assessment of myocardial abnormalities in rheumatoid arthri-tis using a comprehensive cardiac magnetic resonance approach: apilot study. Arthritis Res Ther 2010;12:R171.
34. Amigues I, Tugcu A, Russo C, Giles JT, Morgenstein R, ZartoshtiA, et al. Myocardial inflammation, measured using 18-fluorodeoxy-glucose positron emission tomography with computed tomography,is associated with disease activity in rheumatoid arthritis. ArthritisRheumatol 2019;71:496–506.
35. Faccini A, Kaski JC, Camici PG. Coronary microvascular dysfunc-tion in chronic inflammatory rheumatoid diseases. Eur Heart J2016;37:1799–806.
36. Di Carli MF, Janisse J, Grunberger G, Ager J. Role of chronic hyper-glycemia in the pathogenesis of coronary microvascular dysfunctionin diabetes. J Am Coll Cardiol 2003;41:1387–93.
37. Quinones MJ, Hernandez-Pampaloni M, Schelbert H, Bulnes-EnriquezI, Jimenez X, Hernandez G, et al. Coronary vasomotor abnormalities ininsulin-resistant individuals. Ann Rheum Dis 2004;140:700–8.
166
Arthritis Care & ResearchVol. 73, No. 2, February 2021, pp 166–172DOI 10.1002/acr.24116© 2020, American College of Rheumatology
Improved Pregnancy Outcome in Patients With Rheumatoid Arthritis Who Followed an Ideal Clinical PathwayAlessandra Bortoluzzi,1 Laura Andreoli,2 Greta Carrara,3 Véronique Ramoni,4 Federica Rumi,3 Melissa Padovan,1 Marcello Govoni,1 Angela Tincani,2 and Carlo Alberto Scirè,5 on behalf of the Record-Linkage on Rheumatic Diseases Study of the Italian Society for Rheumatology
Objective. To assess the effect of optimal management of pregnancy on a composite outcome of miscarriage and complicated birth among women with rheumatoid arthritis (RA).
Methods. Data were extracted from health care databases of the Lombardy Region, Italy (2004–2013) as a part of the Record-Linkage on Rheumatic Diseases Study. Analyses included women with RA identified through a copayment exemption code (International Classification of Diseases, Ninth Revision, Clinical Modification code 714.0) and controls from the general population, ages 18–50 years. Seven health care quality indicators (HCQI) were constructed and summarized in 3 pathway indicators: diagnostic, therapeutic, and prenatal follow-up. Complicated birth or miscarriage were used to identify the adverse pregnancy outcome (APO). The relationship between HCQI and APO was analyzed using logistic models, and the results were presented as odds ratios (ORs) and 95% confidence intervals (95% CIs).
Results. Data from the study cohort included the first pregnancy observed in 443 patients with RA compared with 6,097 women belonging to the general population. In the RA population, patients who followed the 3 pathway indicators had a reduced risk of overall APO, with an OR of 0.60 (95% CI 0.39–0.94), and reduced risk of miscarriage/perinatal death, with an OR of 0.40 (95% CI 0.24–0.69), compared to those who did not follow the pathway indicators. Compared with the general population, patients with RA who met all HCQI during pregnancy displayed a risk of APO with an OR of 0.92 (95% CI 0.61–1.38) and miscarriage/perinatal death with an OR of 0.77 (95% CI 0.47–1.29).
Conclusion. The adherence to an ideal clinical pathway of pregnancy management in women with RA restored the risk of APO to that expected for the general population.
INTRODUCTION
The management of pregnancy in women with rheumatoid arthritis (RA) has substantially changed in the past few decades, along with the milestones in RA treatment, such as biologic and targeted synthetic agents and treat-to-target strategies (1). With the improvement in the management of RA, patients with severe disease have been able to reach remission more frequently and live normal lives, including starting a family. As a consequence, the paradigm that “RA spontaneously improves during preg-nancy” has been defied over the years because nearly half of
pregnant patients with RA can have disease flares (2). There-fore, it has become critical to provide a tool for risk stratification and to develop uniform management plans to improve favorable pregnancy outcomes among women with RA. Preconception counseling should include evaluation of maternal disease activ-ity, modification of treatment, and assessment of general obstet-ric risk factors as performed in routine obstetric care (3). Patients should be informed about specific wash-out periods for terato-genic medications such as methotrexate (MTX) and leflunomide (LEF), and, conversely, about the fact that several antirheumatic drugs are appropriate for use during pregnancy and lactation (4).
Supported by the Italian Society for Rheumatology as part of the Epidemiology Unit Development Program.
1Alessandra Bortoluzzi, MD, PhD, Melissa Padovan, MD, PhD, Marcello Govoni, MD: University of Ferrara, Cona (Ferrara), Italy; 2Laura Andreoli, MD, PhD, Angela Tincani, MD: University of Brescia, Brescia, Italy; 3Greta Carrara, MS, Federica Rumi, MS: Italian Society for Rheumatology, Milan, Italy; 4Véronique Ramoni, MD: Istituto di Ricovero e Cura a Carattere Scientifico San Matteo Foundation, Pavia, Italy; 5Carlo Alberto Scirè, MD, PhD: University of Ferrara, Cona (Ferrara), and Italian Society for Rheumatology, Milan, Italy.
Drs. Bortoluzzi and Andreoli contributed equally to this work.No potential conflicts of interest relevant to this article were
reported.Address correspondence to Carlo Alberto Scirè, MD, PhD, Rheumatology
Unit, Department of Medical Sciences, University of Ferrara, S. Anna Hospital, via A. Moro 8, 44124 Cona (FE), Italy. Email: [email protected].
Submitted for publication May 2, 2019; accepted in revised form November 26, 2019.
HEALTH CARE QUALITY INDICATORS AND PREGNANCY OUTCOME IN RA | 167
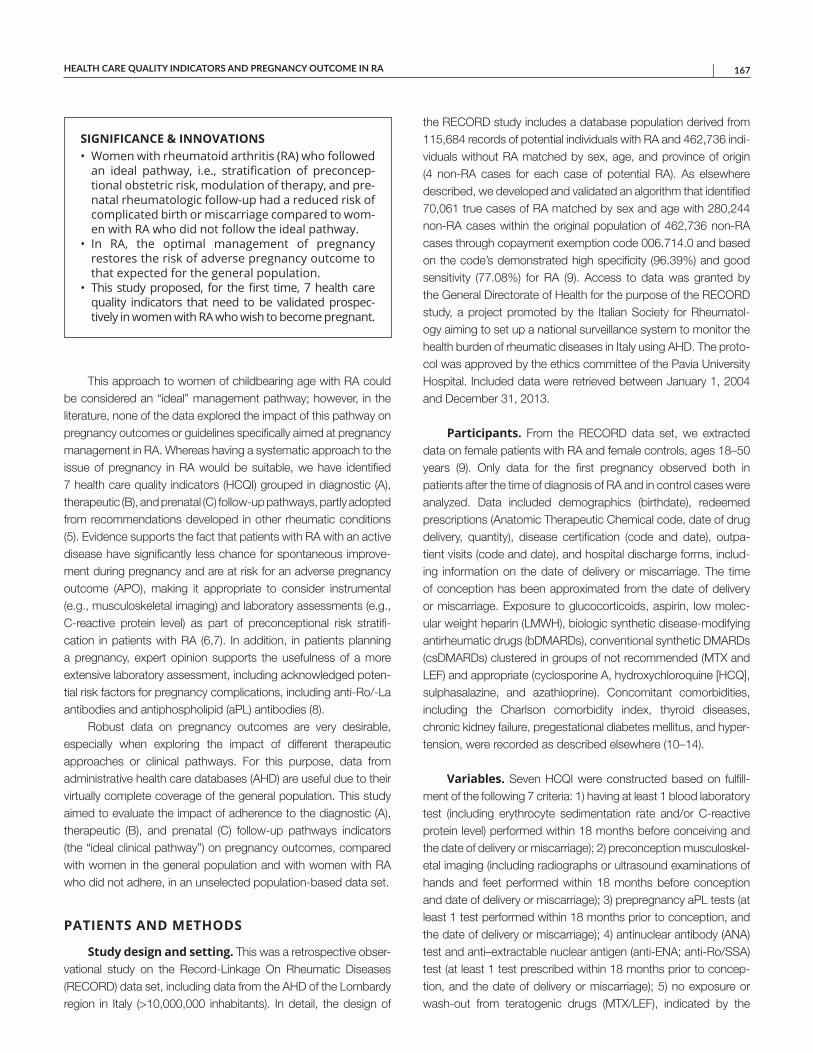
This approach to women of childbearing age with RA could be considered an “ideal” management pathway; however, in the literature, none of the data explored the impact of this pathway on pregnancy outcomes or guidelines specifically aimed at pregnancy management in RA. Whereas having a systematic approach to the issue of pregnancy in RA would be suitable, we have identified 7 health care quality indicators (HCQI) grouped in diagnostic (A), therapeutic (B), and prenatal (C) follow-up pathways, partly adopted from recommendations developed in other rheumatic conditions (5). Evidence supports the fact that patients with RA with an active disease have significantly less chance for spontaneous improve-ment during pregnancy and are at risk for an adverse pregnancy outcome (APO), making it appropriate to consider instrumental (e.g., musculoskeletal imaging) and laboratory assessments (e.g., C-reactive protein level) as part of preconceptional risk stratifi-cation in patients with RA (6,7). In addition, in patients planning a pregnancy, expert opinion supports the usefulness of a more extensive laboratory assessment, including acknowledged poten-tial risk factors for pregnancy complications, including anti-Ro/-La antibodies and antiphospholipid (aPL) antibodies (8).
Robust data on pregnancy outcomes are very desirable, especially when exploring the impact of different therapeutic approaches or clinical pathways. For this purpose, data from administrative health care databases (AHD) are useful due to their virtually complete coverage of the general population. This study aimed to evaluate the impact of adherence to the diagnostic (A), therapeutic (B), and prenatal (C) follow-up pathways indicators (the “ideal clinical pathway”) on pregnancy outcomes, compared with women in the general population and with women with RA who did not adhere, in an unselected population-based data set.
PATIENTS AND METHODS
Study design and setting. This was a retrospective obser-vational study on the Record-Linkage On Rheumatic Diseases (RECORD) data set, including data from the AHD of the Lombardy region in Italy (>10,000,000 inhabitants). In detail, the design of
the RECORD study includes a database population derived from 115,684 records of potential individuals with RA and 462,736 indi-viduals without RA matched by sex, age, and province of origin (4 non-RA cases for each case of potential RA). As elsewhere described, we developed and validated an algorithm that identified 70,061 true cases of RA matched by sex and age with 280,244 non-RA cases within the original population of 462,736 non-RA cases through copayment exemption code 006.714.0 and based on the code’s demonstrated high specificity (96.39%) and good sensitivity (77.08%) for RA (9). Access to data was granted by the General Directorate of Health for the purpose of the RECORD study, a project promoted by the Italian Society for Rheumatol-ogy aiming to set up a national surveillance system to monitor the health burden of rheumatic diseases in Italy using AHD. The proto-col was approved by the ethics committee of the Pavia University Hospital. Included data were retrieved between January 1, 2004 and December 31, 2013.
Participants. From the RECORD data set, we extracted data on female patients with RA and female controls, ages 18–50 years (9). Only data for the first pregnancy observed both in patients after the time of diagnosis of RA and in control cases were analy zed. Data included demographics (birthdate), redeemed prescriptions (Anatomic Therapeutic Chemical code, date of drug delivery, quantity), disease certification (code and date), outpa-tient visits (code and date), and hospital discharge forms, includ-ing information on the date of delivery or miscarriage. The time of conception has been approximated from the date of delivery or miscarriage. Exposure to glucocorticoids, aspirin, low molec-ular weight heparin (LMWH), biologic synthetic disease-modifying antirheumatic drugs (bDMARDs), conventional synthetic DMARDs (csDMARDs) clustered in groups of not recommended (MTX and LEF) and appropriate (cyclosporine A, hydroxychloroquine [HCQ], sulphasalazine, and azathioprine). Concomitant comorbidities, including the Charlson comorbidity index, thyroid diseases, chronic kidney failure, pregestational diabetes mellitus, and hyper-tension, were recorded as described elsewhere (10–14).
Variables. Seven HCQI were constructed based on fulfill-ment of the following 7 criteria: 1) having at least 1 blood laboratory test (including erythrocyte sedimentation rate and/or C-reactive protein level) performed within 18 months before conceiving and the date of delivery or miscarriage); 2) preconception musculoskel-etal imaging (including radiographs or ultrasound examinations of hands and feet performed within 18 months before conception and date of delivery or miscarriage); 3) prepregnancy aPL tests (at least 1 test performed within 18 months prior to conception, and the date of delivery or miscarriage); 4) antinuclear antibody (ANA) test and anti–extractable nuclear antigen (anti-ENA; anti-Ro/SSA) test (at least 1 test prescribed within 18 months prior to concep-tion, and the date of delivery or miscarriage); 5) no exposure or wash-out from teratogenic drugs (MTX/LEF), indicated by the
SIGNIFICANCE & INNOVATIONS• Women with rheumatoid arthritis (RA) who followed
an ideal pathway, i.e., stratification of preconcep-tional obstetric risk, modulation of therapy, and pre-natal rheumatologic follow-up had a reduced risk of complicated birth or miscarriage compared to wom-en with RA who did not follow the ideal pathway.
• In RA, the optimal management of pregnancy restores the risk of adverse pregnancy outcome to that expected for the general population.
• This study proposed, for the first time, 7 health care quality indicators that need to be validated prospec-tively in women with RA who wish to become pregnant.
BORTOLUZZI ET AL 168 |
absence of redemption between 6 months before preconception and date of delivery or miscarriage; 6) no exposure to biologic drugs (no medical prescriptions for abatacept, tocilizumab, rituxi-mab, anakinra, certolizumab, etanercept, infliximab, adalimumab, or golimumab) between the presumed date of conception and date of delivery or miscarriage (at the time the study was con-ducted, targeted synthetic DMARDs were not available in Italy, and exposure to these drugs was not taken into account); 7) rheu-matologic monitoring and follow-up via outpatient visits (at least 1 outpatient visit at the rheumatology department for women with RA). The 7 indicators were summarized in 3 main pathway indi-cators: (A) a diagnostic pathway composed of blood laboratory tests, musculoskeletal imaging, aPL antibodies tests, and ANA and anti-ENA tests); (B) a therapeutic pathway based on no expo-sure or wash-out from MTX/LEF or no exposure to biologic drugs; and (C) a prenatal follow-up pathway consisting of at least 1 rheu-matologic visit. The concomitant presence of all the 3 pathway indicators (A + B + C) defined the ideal clinical pathway.
Statistical methods. The pregnancy outcome was defined on the basis of the Disease-Related Groups (DRG, ver-sion 24) criteria of complicated birth, pregnancy losses (miscar-riage), or perinatal death, collectively defined as APO codes (370: cesarean section due to complications; 372: vaginal delivery with
complications; 374 and 375: vaginal delivery with complications requiring surgical intervention; 378: ectopic pregnancy; 379: threat-ened miscarriage; 380: spontaneous miscarriage; 381: sponta-neous miscarriage requiring surgical intervention) and ICD-9-CM codes (V271–277: perinatal death) (15). Subanalysis on miscar-riage and perinatal death (DRG 380–381, and V271, 273, 274, 276, 277) was also performed. Conception date was estimated 42 days before the date of miscarriage for DRG 378–379 and 380 and 84 days before the date of miscarriage for DRG 381.
The relationship between HCQI and outcome variables was analyzed using crude logistic models and models adjusted for age, Charlson comorbidity index score, thyroid diseases, and hypertension when comparing patients with RA versus the general population, adjusting for age, Charlson comorbidity index score, and thyroid diseases comparing women with RA who followed the ideal pathway versus women who did not. The results are presented as ORs and 95% CIs. All the analyses were performed using R statistical software.
RESULTS
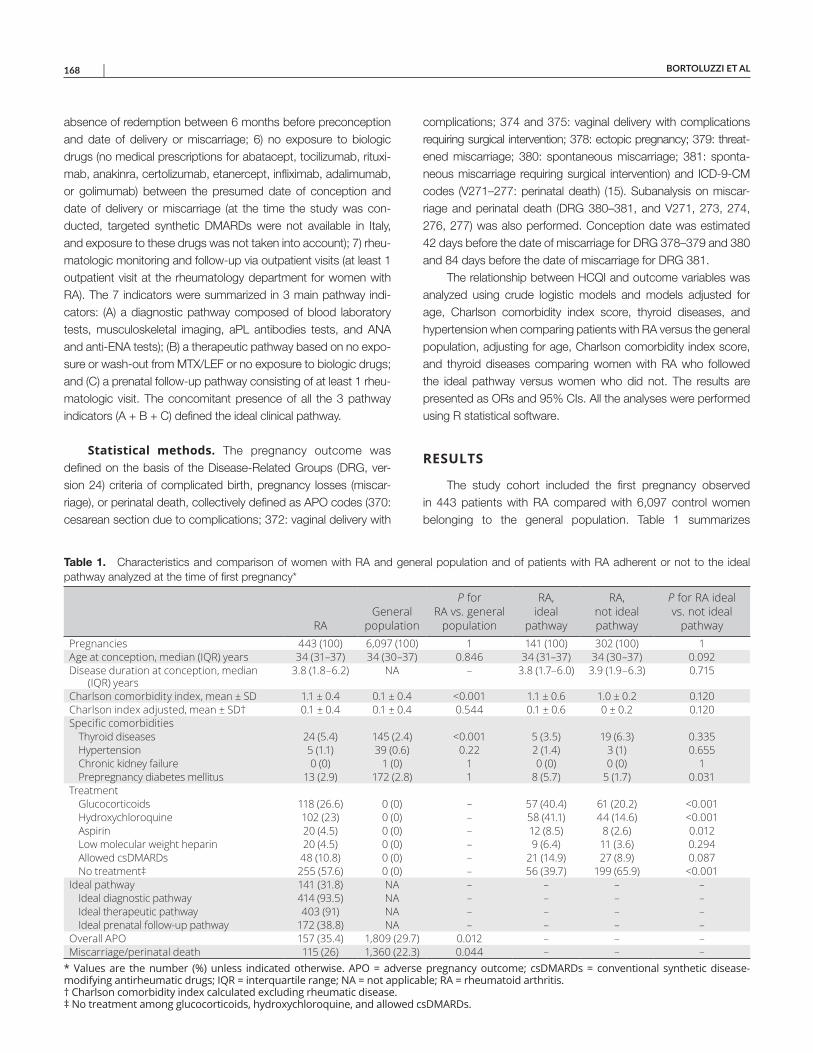
The study cohort included the first pregnancy observed in 443 patients with RA compared with 6,097 control women belonging to the general population. Table 1 summarizes
Table 1. Characteristics and comparison of women with RA and general population and of patients with RA adherent or not to the ideal pathway analyzed at the time of first pregnancy*
RAGeneral
population
P for RA vs. general
population
RA, ideal
pathway
RA, not ideal pathway
P for RA ideal vs. not ideal
pathwayPregnancies 443 (100) 6,097 (100) 1 141 (100) 302 (100) 1Age at conception, median (IQR) years 34 (31–37) 34 (30–37) 0.846 34 (31–37) 34 (30–37) 0.092Disease duration at conception, median
(IQR) years3.8 (1.8–6.2) NA – 3.8 (1.7–6.0) 3.9 (1.9–6.3) 0.715
Charlson comorbidity index, mean ± SD 1.1 ± 0.4 0.1 ± 0.4 <0.001 1.1 ± 0.6 1.0 ± 0.2 0.120Charlson index adjusted, mean ± SD† 0.1 ± 0.4 0.1 ± 0.4 0.544 0.1 ± 0.6 0 ± 0.2 0.120Specific comorbidities
Thyroid diseases 24 (5.4) 145 (2.4) <0.001 5 (3.5) 19 (6.3) 0.335Hypertension 5 (1.1) 39 (0.6) 0.22 2 (1.4) 3 (1) 0.655Chronic kidney failure 0 (0) 1 (0) 1 0 (0) 0 (0) 1Prepregnancy diabetes mellitus 13 (2.9) 172 (2.8) 1 8 (5.7) 5 (1.7) 0.031
TreatmentGlucocorticoids 118 (26.6) 0 (0) – 57 (40.4) 61 (20.2) <0.001Hydroxychloroquine 102 (23) 0 (0) – 58 (41.1) 44 (14.6) <0.001Aspirin 20 (4.5) 0 (0) – 12 (8.5) 8 (2.6) 0.012Low molecular weight heparin 20 (4.5) 0 (0) – 9 (6.4) 11 (3.6) 0.294Allowed csDMARDs 48 (10.8) 0 (0) – 21 (14.9) 27 (8.9) 0.087No treatment‡ 255 (57.6) 0 (0) – 56 (39.7) 199 (65.9) <0.001
Ideal pathway 141 (31.8) NA – – – –Ideal diagnostic pathway 414 (93.5) NA – – – –Ideal therapeutic pathway 403 (91) NA – – – –Ideal prenatal follow-up pathway 172 (38.8) NA – – – –
Overall APO 157 (35.4) 1,809 (29.7) 0.012 – – –Miscarriage/perinatal death 115 (26) 1,360 (22.3) 0.044 – – –
* Values are the number (%) unless indicated otherwise. APO = adverse pregnancy outcome; csDMARDs = conventional synthetic disease-modifying antirheumatic drugs; IQR = interquartile range; NA = not applicable; RA = rheumatoid arthritis. † Charlson comorbidity index calculated excluding rheumatic disease. ‡ No treatment among glucocorticoids, hydroxychloroquine, and allowed csDMARDs.
HEALTH CARE QUALITY INDICATORS AND PREGNANCY OUTCOME IN RA | 169
the demographic and therapeutic features of our cohort. The mean maternal age for all sampled mothers was 34 years (RA interquartile range 31–37 years, general population inter-quartile range 30–37 years). Patients with RA had a significantly higher frequency of thyroid diseases, overall APO and miscar-riage/perinatal death as compared to the general population. Patients with RA adherent to the ideal clinical pathway were sim-ilar to nonadherent patients in sociodemographic and disease characteristics (Table 1). Overall, compared to women with RA who did not adhere to the ideal clinical pathway, patients with RA in the ideal pathway were more exposed to treatment (no treatment in 56 patients in the ideal pathway [39.7%] versus 199 cases not in ideal pathway [65.9%]; P < 0.001), including glu-cocorticoids (57 patients with RA [40.4%] in the ideal pathway versus 61 [20.2%] for those not in the ideal pathway) and HCQ (58 patients [41.1%] in the ideal pathway versus 44 [14.6%] not in the ideal pathway; P < 0.001) (Table 1).
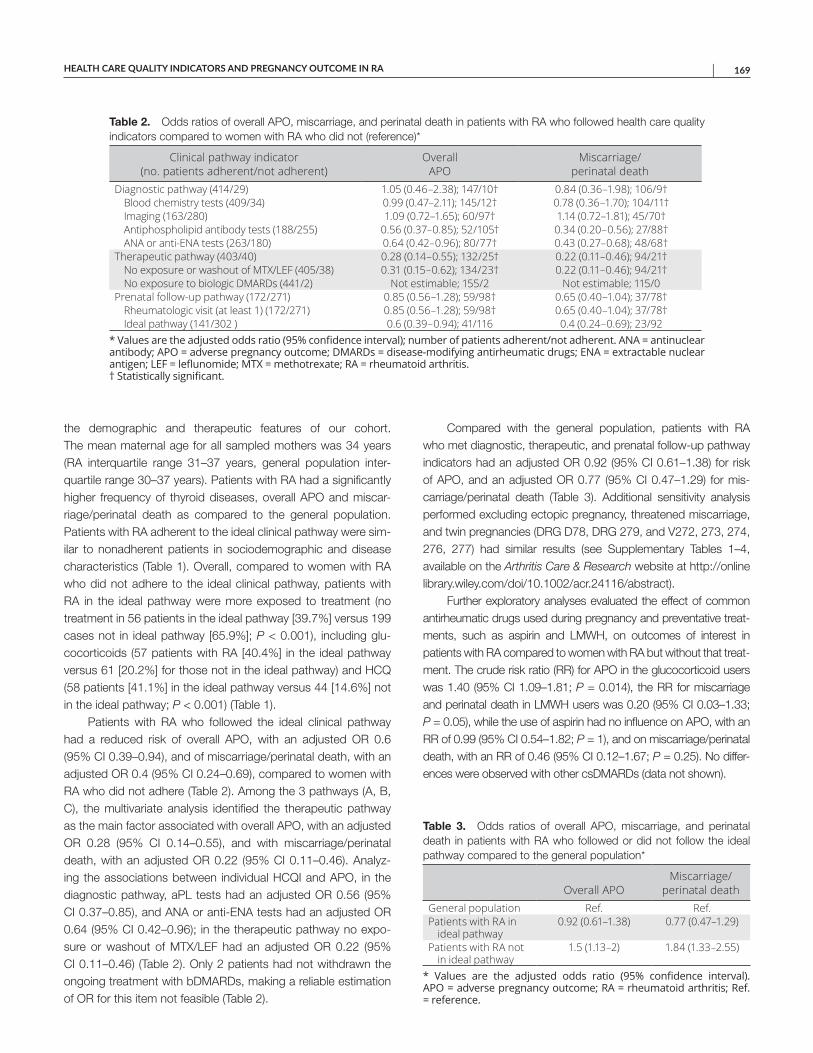
Patients with RA who followed the ideal clinical pathway had a reduced risk of overall APO, with an adjusted OR 0.6 (95% CI 0.39–0.94), and of miscarriage/perinatal death, with an adjusted OR 0.4 (95% CI 0.24–0.69), compared to women with RA who did not adhere (Table 2). Among the 3 pathways (A, B, C), the multi variate analysis identified the therapeutic pathway as the main factor associated with overall APO, with an adjusted OR 0.28 (95% CI 0.14–0.55), and with miscarriage/perinatal death, with an adjusted OR 0.22 (95% CI 0.11–0.46). Analyz-ing the associations between individual HCQI and APO, in the diagnostic pathway, aPL tests had an adjusted OR 0.56 (95% CI 0.37–0.85), and ANA or anti-ENA tests had an adjusted OR 0.64 (95% CI 0.42–0.96); in the therapeutic pathway no expo-sure or washout of MTX/LEF had an adjusted OR 0.22 (95% CI 0.11–0.46) (Table 2). Only 2 patients had not withdrawn the ongoing treatment with bDMARDs, making a reliable estimation of OR for this item not feasible (Table 2).
Compared with the general population, patients with RA who met diagnostic, therapeutic, and prenatal follow-up pathway indicators had an adjusted OR 0.92 (95% CI 0.61–1.38) for risk of APO, and an adjusted OR 0.77 (95% CI 0.47–1.29) for mis-carriage/perinatal death (Table 3). Additional sensitivity analysis performed excluding ectopic pregnancy, threatened miscarriage, and twin pregnancies (DRG D78, DRG 279, and V272, 273, 274, 276, 277) had similar results (see Supplementary Tables 1–4, avail able on the Arthritis Care & Research website at http://onlin e libr ary.wiley.com/doi/10.1002/acr.24116/ abstract).
Further exploratory analyses evaluated the effect of common antirheumatic drugs used during pregnancy and preventative treat-ments, such as aspirin and LMWH, on outcomes of interest in patients with RA compared to women with RA but without that treat-ment. The crude risk ratio (RR) for APO in the glucocorticoid users was 1.40 (95% CI 1.09–1.81; P = 0.014), the RR for miscarriage and perinatal death in LMWH users was 0.20 (95% CI 0.03–1.33; P = 0.05), while the use of aspirin had no influence on APO, with an RR of 0.99 (95% CI 0.54–1.82; P = 1), and on miscarriage/perinatal death, with an RR of 0.46 (95% CI 0.12–1.67; P = 0.25). No differ-ences were observed with other csDMARDs (data not shown).
Table 2. Odds ratios of overall APO, miscarriage, and perinatal death in patients with RA who followed health care quality indicators compared to women with RA who did not (reference)*
Clinical pathway indicator (no. patients adherent/not adherent)
Overall APO
Miscarriage/ perinatal death
Diagnostic pathway (414/29) 1.05 (0.46–2.38); 147/10† 0.84 (0.36–1.98); 106/9†Blood chemistry tests (409/34) 0.99 (0.47–2.11); 145/12† 0.78 (0.36–1.70); 104/11†Imaging (163/280) 1.09 (0.72–1.65); 60/97† 1.14 (0.72–1.81); 45/70†Antiphospholipid antibody tests (188/255) 0.56 (0.37–0.85); 52/105† 0.34 (0.20–0.56); 27/88†ANA or anti-ENA tests (263/180) 0.64 (0.42–0.96); 80/77† 0.43 (0.27–0.68); 48/68†
Therapeutic pathway (403/40) 0.28 (0.14–0.55); 132/25† 0.22 (0.11–0.46); 94/21†No exposure or washout of MTX/LEF (405/38) 0.31 (0.15–0.62); 134/23† 0.22 (0.11–0.46); 94/21†No exposure to biologic DMARDs (441/2) Not estimable; 155/2 Not estimable; 115/0
Prenatal follow-up pathway (172/271) 0.85 (0.56–1.28); 59/98† 0.65 (0.40–1.04); 37/78†Rheumatologic visit (at least 1) (172/271) 0.85 (0.56–1.28); 59/98† 0.65 (0.40–1.04); 37/78†Ideal pathway (141/302 ) 0.6 (0.39–0.94); 41/116 0.4 (0.24–0.69); 23/92
* Values are the adjusted odds ratio (95% confidence interval); number of patients adherent/not adherent. ANA = antinuclearantibody; APO = adverse pregnancy outcome; DMARDs = disease-modifying antirheumatic drugs; ENA = extractable nuclear antigen; LEF = leflunomide; MTX = methotrexate; RA = rheumatoid arthritis. † Statistically significant.
Table 3. Odds ratios of overall APO, miscarriage, and perinatal death in patients with RA who followed or did not follow the ideal pathway compared to the general population*
Overall APOMiscarriage/
perinatal deathGeneral population Ref. Ref.Patients with RA in
ideal pathway0.92 (0.61–1.38) 0.77 (0.47–1.29)
Patients with RA not in ideal pathway
1.5 (1.13–2) 1.84 (1.33–2.55)
* Values are the adjusted odds ratio (95% confidence interval).APO = adverse pregnancy outcome; RA = rheumatoid arthritis; Ref. = reference.
BORTOLUZZI ET AL 170 |
DISCUSSION
This study based on AHD data demonstrated that the optimal management of pregnancy defined as an “ideal clinical pathway” in women with RA was associated with a significantly reduced risk of APO, restoring the risk to that expected for the general population. Overall, we found an increased rate of APO and miscarriage/perinatal death in patients with RA as compared to the general population (APO = 157 cases in patients with RA ver-sus 1,809 cases in the general population, P = 0.012; miscarriage/ perinatal death = 115 cases versus 1,360 cases in the general population, P = 0.044). Nearly one-third of pregnant patients (157 cases, 35.4%) with RA experienced APO, and one-fourth (155 cases, 26%) had a pregnancy loss or miscarriage/perinatal death. Our data agree with some previous studies conducted using AHD. Lin et al (7) demonstrated that compared to unaffected mothers, after adjusting for potential confounders, mothers with RA had ORs of 1.47 (95% CI 1.22–1.78), 1.20 (95% CI 1.05–1.38), 2.22 (95% CI 1.59–3.11), and 1.19 (95% CI 1.07–1.31) to experience low birth weight, small for gestation age infants, preeclampsia, and cesarean sections, respectively. Similarly, a previous study reported that firstborn children of women diagnosed as having chronic inflammatory arthritis were often preterm and had higher perinatal mortality, with an OR of 3.26 (95% CI 1.04–10.24) (16).
We found that between the 3 main pathway indicators of the ideal clinical pathway (stratification of preconceptional obstetric risk, modulation of therapy, and prenatal rheumatologic follow-up), the ideal therapeutic pathway comprising no exposure or wash-out from MTX/LEF and no exposure to biologic drugs conferred a significantly reduced odds of APO and miscarriage/perinatal death. If LEF and MTX are not recommended in women planning and dur-ing pregnancy, and if this recommendation justifies the choice as HCQI, the item related to bDMARD discontinuation deserves an additional thought. We identified the HCQI “no exposure to biologic DMARDs” as a surrogate marker of maternal disease activity and not because of the assumption of teratogenicity/toxicity of these treatments. In our study, only 2 patients continued bDMARDs. In addition, in the period covered by the RECORD study (January 1, 2004 to December 31, 2013), there were sparse data on bDMARD use in pregnancy, and the European League Against Rheumatism (EULAR) and the British Society for Rheumatology had not yet published guidelines for the prescription of pregnancy-compatible medications. The scant data on bDMARD exposure in pregnancy reflects the attitude at the time the study was conducted, but the scenario will likely change as the use of bDMARDs during preg-nancy will consolidate (1).
The significant association between the ideal therapeutic pathway with the outcomes of the study suggests that the women who were not adherent were also not properly treated for their RA. The need for appropriate treatment reinforces the importance of adjustment of therapy for RA before conception and through-out pregnancy because medication use could affect pregnancy
course, not only influencing maternal disease activity but also the gestational outcome. In our study, compared to patients with RA not adherent to the ideal pathway, adherent cases were signifi-cantly more exposed to treatment, including HCQ and glucocor-ticoids. The use of ste roids during pregnancy has been proved to be an independent risk factor for preterm delivery in women with RA when used at high doses (17,18).
Although the current study was conducted on administrative data, we can hypothesize that exposure to therapy represents a marker of high RA disease activity and severity. In our setting, possibly the more active the disease the greater the probability of being included in the ideal clinical pathway, which resulted in a lower OR of APO and miscarriage/perinatal death. If the diagnos-tic and prenatal follow-up pathways appear to have a marginal effect in our study, nevertheless, there might also be a residual confounding, given that patients properly treated could have appropriate stratification of preconceptional obstetric risk and timely prenatal rheumatologic follow-up.
Analyzing individual HCQI in women with RA, we observed that, especially when screening for aPL antibodies, ANA and anti-ENA were associated with a lower OR of APO and miscarriage/perinatal death. Notably, aPL antibodies occur in patients with RA with an estimated prevalence up to 30%, more than expected in the general population, and the presence of significant and persistently positive titers increases the risk of APO, including unexplained spontaneous miscarriage, premature births, pre-eclampsia, placental insufficiency with growth restriction, and pre-maturity, all potential complications of pregnancy that have been described in RA (19). In this view, we have incorporated aPL tests as part of diagnostic HCQI and as advised by EULAR recommen-dation for the prevention and management of aPL syndrome in adults (20). This study might suggest the value of searching for aPL antibodies in patients with RA wishing to become pregnant. In fact, despite the absence of formal recommendation or vali-dated HCQI focused on stratification of preconceptional obstetric risk in patients with RA, we started from the basic and universally accepted assumption that aPL antibodies are pathogenic auto-antibodies and therefore recognized risk factors for APO (20).
In addition, RA pregnancy may have an increased risk of APO; this risk, combined with the increased prevalence of aPL antibodies in RA itself, could have a synergistic effect between RA and aPL antibodies in the determinism of APO (21). RA and aPL antibodies could be 2 distinct factors that must be individually profiled, and the exclusion of one of them would imply a suboptimal risk stratification (5,20,21). This conclusion is undoubtedly speculative, supported only by expert opinion, but our study could be the first to give indirect evidence of the impact of diagnostic pathway indicators on APO that should be proposed and tested in the future.
To our knowledge, this study demonstrates for the first time that adherence to the ideal clinical pathway and especially the modulation of therapy, such as discontinuation of contraindicated medications
HEALTH CARE QUALITY INDICATORS AND PREGNANCY OUTCOME IN RA | 171
like MTX and LEF, is associated with a reduced risk of complicated birth or miscarriage in women with RA. These data were confirmed after adjusting for specific comorbidities that can interfere with gestational outcome, such as thyroid diseases, which are more prevalent and common in patients with RA compared to the gen-eral population. The strength of our study lies in the advantage of providing population-based samples repre sentative of the target population, allowing generalizability of findings. This data source avoids potential referral bias reported from multidisciplinary preg-nancy clinics, where cohorts of subsets of patients are offered inte-grated management of pregnancy that could not be generalizable to the general rheumatic disease population (22).
We acknowledge that our study has limitations that are intrin-sic in the administrative data. First, uncomplicated pregnancy losses that occurred before 15 weeks did not require hospitaliza-tion and may not even be recognized (22). Furthermore, the first pregnancy during the period of data captured is not necessarily the first pregnancy for that particular woman because enrollment periods in health insurance do not cover the entire reproductive history. Our approach based on AHD did not provide variables including lifestyle (maternal socioeconomic status, smoking, alco-hol, or body mass index), results of laboratory examinations, and variables on disease activity, although we considered the use of glucocorticoids as proxies of more active disease, as shown in previous works (9,10). In our study, only 2 patients were receiving bDMARDs during pregnancy; in fact, at the time the data were extracted, the common practice was to stop bDMARDs at pos-itive pregnancy index (23). An additional limitation is the lack of data about the newborn (birth weight, length, and head circum-ference, and neonatal adverse events). Ultimately, we could not account for all possible confounding factors, and some residual confounding intrinsic to observational studies may still modify the risk of APO estimation in our cohort.
The concept of preconception counseling and risk stratifi-cation and multidisciplinary management during pregnancy has gained greater importance in the field of rheumatology, although to date, many women struggle to find adequate counseling on repro-ductive issues to guide them on pregnancy planning, lactation, and early parenting in relation to their chronic condition (3,24). In conclusion, our findings suggest that adherence to an ideal clinical pathway should be strived for as much as possible to offer the best possible chances for a successful pregnancy to women with RA.
AUTHOR CONTRIBUTIONS
All authors were involved in drafting the article or revising it critically for important intellectual content, and all authors approved the final version to be submitted for publication. Dr. Scirè had full access to all of the data in the study and takes responsibility for the integrity of the data and the accuracy of the data analysis.Study conception and design. Bortoluzzi, Andreoli, Ramoni, Scirè.Acquisition of data. Scirè.Analysis and interpretation of data. Bortoluzzi, Andreoli, Carrara, Rumi, Padovan, Govoni, Tincani, Scirè.
REFERENCES 1. Clowse ME. It is time to modify treatment to enable more women with
rheumatoid arthritis to have successful pregnancies. J Rheumatol 2019;46:223–5.
2. Jethwa H, Lam S, Smith C, Giles I. Does rheumatoid arthritis really improve during pregnancy? A systematic review and metaanalysis. J Rheumatol 2019;46:245–50.
3. Birru Talabi M, Clowse ME, Blalock SJ, Hamm M, Borrero S. Perspectives of adult rheumatologists regarding family planning counseling and care: a qualitative study. Arthritis Care Res (Hoboken) 2020;72:452–8.
4. Murray KE, Moore L, O’Brien C, Clohessy A, Brophy C, Minnock P, et al. Updated pharmacological management of rheumatoid arthri-tis for women before, during, and after pregnancy, reflecting recent guidelines. Ir J Med Sci 2019;188:169–72.
5. Andreoli L, Bertsias GK, Agmon-Levin N, Brown S, Cervera R, Costedoat-Chalumeau N, et al. EULAR recommendations for women’s health and the management of family planning, assisted reproduction, pregnancy and menopause in patients with systemic lupus erythema-tosus and/or antiphospholipid syndrome. Ann Rheum Dis 2017;76: 476–85.
6. De Man YA, Bakker-Jonges LE, Dufour-van den Goorbergh CM, Tillemans SP, Hooijkaas H, Hazes JM, et al. Women with rheuma-toid arthritis negative for anti-cyclic citrullinated peptide and rheuma-toid factor are more likely to improve during pregnancy, whereas in autoantibody-positive women autoantibody levels are not influenced by pregnancy. Ann Rheum Dis 2010;69:420–3.
7. Lin HC, Chen SF, Lin HC, Chen YH. Increased risk of adverse preg-nancy outcomes in women with rheumatoid arthritis: a nationwide population-based study. Ann Rheum Dis 2010;69:715–7.
8. Østensen M. Contraception and pregnancy counselling in rheuma-toid arthritis. Curr Opin Rheumatol 2014;26:302–7.
9. Carrara G, Scirè CA, Zambon A, Cimmino MA, Cerra C, Caprioli M, et al. A validation study of a new classification algorithm to identify rheumatoid arthritis using administrative health databases: case-control and cohort diagnostic accuracy studies. Results from the RECord linkage on rheumatic diseases study of the Italian Society for Rheumatology. BMJ Open 2015;5:e006029.
10. Generali E, Carrara G, Selmi C, Verstappen SM, Zambon A, Bortoluzzi A, et al. Comparison of the risks of hospitalisation for cardiovascular events in patients with rheumatoid arthritis treated with tocilizumab and etanercept. Clin Exp Rheumatol 2018;36: 310–3.
11. Generali E, Carrara G, Kallikourdis M, Condorelli G, Bortoluzzi A, Scirè CA, et al. Risk of hospitalization for heart failure in rheumatoid arthritis patients treated with etanercept and abatacept. Rheumatol Int 2019;39:239–43.
12. Silvagni E, Bortoluzzi A, Carrara G, Zanetti A, Govoni M, Scirè CA. Comparative effectiveness of first-line biological monotherapy use in rheumatoid arthritis: a retrospective analysis of the RECord-linkage on rheumatic diseases study on health care administrative data-bases. BMJ Open 2018;8:e021447.
13. Carrara G, Bortoluzzi A, Sakellariou G, Silvagni E, Zanetti A, Govoni M, et al. Risk of hospitalisation for serious bacterial infections in patients with rheumatoid arthritis treated with biologics: analysis from the RECord linkage on rheumatic disease study of the Italian Society for Rheumatology. Clin Exp Rheumatol 2019;37:60–6.
14. Deyo RA, Cherkin DC, Ciol MA. Adapting a clinical comorbidity index for use with ICD-9-CM administrative databases. J Clin Epidemiol 1992;45:613–9.
15. Inpatient quality indicators (IQI) log of ICD-9-CM and DRG coding updates and revisions to IQI documentation and software. URL: https://www.qualityindicators.ahrq.gov.
BORTOLUZZI ET AL 172 |
16. Wallenius M, Skomsvoll JF, Irgens LM, Salvesen KÅ, Nordvåg BY, Koldingsnes W, et al. Pregnancy and delivery in women with chronic inflammatory arthritides with a specific focus on first birth. Arthritis Rheum 2011;63:1534–42.
17. Palmsten K, Rolland M, Hebert MF, Clowse ME, Schatz M, Xu R, et al. Patterns of prednisone use during pregnancy in women with rheumatoid arthritis: daily and cumulative dose. Pharmacoepidemiol Drug Saf 2018;27:430–8.
18. Smith CJ, Förger F, Bandoli G, Chambers CD. Factors associated with preterm delivery among women with rheumatoid arthritis and women with juvenile idiopathic arthritis. Arthritis Care Res (Hoboken) 2019;71:1019–27.
19. Østensen M. Preconception counseling. Rheum Dis Clin North Am 2017;43:189–99.
20. Tektonidou MG, Andreoli L, Limper M, Amoura Z, Cervera R, Costedoat-Chalumeau N, et al. EULAR recommendations for the
management of antiphospholipid syndrome in adults. Ann Rheum Dis 2019;78:1296–304.
21. Olech E, Merrill JT. The prevalence and clinical significance of antiphospholipid antibodies in rheumatoid arthritis. Curr Rheumatol Rep 2006;8:100–8.
22. Vinet E, Chakravarty EF, Clowse ME. Power in numbers. Rheumatology (Oxford) 2018;57:v40–7.
23. Bazzani C, Scrivo R, Andreoli L, Baldissera E, Biggioggero M, Canti V, et al. Prospectively-followed pregnancies in patients with inflam-matory arthritis taking biological drugs: an Italian multicentre study. Clin Exp Rheumatol 2015;33:688–93.
24. Skorpen CG, Hoeltzenbein M, Tincani A, Fischer-Betz R, Elefant E, Chambers C, et al. The EULAR points to consider for use of anti-rheumatic drugs before pregnancy, and during pregnancy and lacta-tion. Ann Rheum Dis 2016;75:795–810.
173
Arthritis Care & ResearchVol. 73, No. 2, February 2021, pp 173–179DOI 10.1002/acr.24101© 2019 The Authors. Arthritis Care & Research published by Wiley Periodicals, Inc. on behalf of American College of Rheumatology.This is an open access article under the terms of the Creative Commons Attribution-NonCommercial License, which permits use, distribution and reproduction in any medium, provided the original work is properly cited and is not used for commercial purposes.
B R I E F R E P O R T
Finger Joint Cartilage Evaluated by Semiquantitative Ultrasound Score in Patients With Rheumatoid ArthritisTakehisa Ogura, Ayako Hirata, Norihide Hayashi, Chihiro Imaizumi, Hideki Ito, Sayaka Takenaka, Yuki Inoue, Yuto Takakura, Kennosuke Mizushina, Takaharu Katagiri, and Hideto Kameda
Objective. Joint destruction in rheumatoid arthritis (RA) includes both bone and cartilage lesions. Since joint space narrowing (JSN) is not a direct evaluation of cartilage using radiography, we aimed to examine the validity of ultrasound (US) cartilage evaluation using a semiquantitative method in patients with RA.
Methods. We enrolled 103 patients with RA who were in remission or showing low disease activity and 42 healthy subjects. The cartilage thickness of the bilateral metacarpophalangeal (MCP) and proximal interphalangeal (PIP) joints of the second to fifth fingers was measured by US, and the recorded images were scored semiquantitatively using a scale of 0–2. In addition, the JSN of the corresponding joints was scored using a hand radiograph. The relationships between total cartilage thickness, its semiquantitative score, and JSN score were assessed using Spearman’s rank correlation coefficients.
Results. Total cartilage thickness was significantly thinner in patients with RA compared to healthy subjects for both the MCP and PIP joints (both P < 0.001). The semiquantitative sum of 16 joints ranged from 2 to 26 (median 8) in patients with RA, which was significantly greater than the 0–11 (median 4) in healthy subjects (P < 0.001). In patients with RA, the semiquantitative score showed a significant negative correlation with cartilage thickness (ρ = −0.64, P < 0.001) and a significant positive correlation with JSN score (ρ = 0.66, P < 0.001). Furthermore, these scores showed a significant correlation with RA disease duration.
Conclusion. A simplified and direct evaluation of finger joint cartilage damage by semiquantitative US score is valid and useful for patients with RA.
INTRODUCTION
Rheumatoid arthritis (RA) is a systemic autoimmune inflammatory disease that mainly affects the peripheral joints, resulting in irreversible and disabling damage to the bone and cartilaginous tissues. Radiographic examination has been the gold standard for evaluating joint destruction, and particularly bone erosion and joint space narrowing (JSN), which are impor-tant indices of bone and cartilage destruction, respectively. Radiographic examination is based on the semiquantitative
Sharp method and its modified score (1), and these are used widely as measures of joint destruction. Joint destruction leads to functional disability, in which JSN is more crucial than bone erosion (2).
JSN is an indirect means of evaluation of cartilage destruction because radiographs are transmitted through the cartilage. Joint subluxation, for example, is scored as 3 for JSN irrespective of the degree of cartilage damage. For that reason, magnetic resonance imaging and ultrasonography (US) may be used for the direct evaluation of cartilage. US-measured thickness of joint cartilage is
Supported in part by the Japan Society for the Promotion of Science (Kakenhi grant JP15K09535), the Ministry of Health, Labour and Welfare (Japan Health and Labour Sciences research grants for research on intractable diseases; research team for autoimmune diseases), and Eisai (research grant 30-347).
Takehisa Ogura, MD, PhD, Ayako Hirata, MD, PhD, Norihide Hayashi, MD, Chihiro Imaizumi, MD, Hideki Ito, MD, PhD, Sayaka Takenaka, MD, Yuki Inoue, MD, Yuto Takakura, MD, Kennosuke Mizushina, MD, Takaharu Katagiri, MD, Hideto Kameda, MD, PhD: Toho University, Tokyo, Japan.
Dr. Kameda has received consulting fees, speaking fees, and/or honoraria from AbbVie, Asahi Kasei Pharma, Bristol Myers Squibb, Chugai Pharmaceutical Company, Janssen Pharmaceuticals, Novartis Pharma,
Sanofi (less than $10,000 each), Eli Lilly and Company Japan, and Mitsubishi Tanabe Pharma (more than $10,000 each), and research grants from AbbVie, Asahi Kasei Pharma, Astellas Pharma, Chugai Pharmaceutical Company, Eisai, Mitsubishi Tanabe Pharma, Novartis Pharma, Sanofi, and UCB Pharma. No other disclosures relevant to this article were reported.
Address correspondence to Hideto Kameda, MD, PhD, Division of Rheumatology, Department of Internal Medicine, Toho University (Ohashi Medical Center), 2-22-36 Ohashi, Meguro-ku, Tokyo 153-8515, Japan. Email: [email protected].
Submitted for publication April 25, 2019; accepted in revised form October 22, 2019.

OGURA ET AL 174 |
closely related to its actual anatomic thickness (3). However, the measurement of cartilage thickness for each joint is not feasible in clinical trials or daily clinical practice.
Semiquantitative methods such as those that measure bone erosion and JSN in radiograph examinations and gray-scale and power Doppler US evaluations have been widely accepted in clin-ical trials and practice because their findings are known to corre-late with quantitative evaluation of structural damage (radiograph and US gray scale) or severity of synovitis (US, especially power Doppler). Although the use of a semiquantitative method for US cartilage evaluation in RA has been proposed, its correlation with cartilage thickness and its clinical significance have not been clarified (4,5). Therefore, we examined the validity of US cartilage evaluation by performing a cross-sectional study of the use of a semiquantitative method in evaluating RA patients in remission or with low disease activity.
SUBJECTS AND METHODS
Patients and healthy subjects. Patients with RA who visited Toho University Ohashi Medical Center between Sep-tember 2011 and July 2015 were considered for inclusion in this study. We enrolled patients who met all of the following criteria: 1) those with a 2010 American College of Rheumatology (ACR)/European League Against Rheumatism (EULAR) and/or 1987 ACR classification for RA (6,7); 2) those with complete US exami-nations of bilateral finger joint cartilage; 3) those with conventional radiographs of each hand and wrist in the standard posteroan-terior projection within 3 months of the US examination; and 4) those in remission or with low disease activity defined by the Disease Activity Score in 28 joints using the C-reactive protein (CRP) level (DAS28-CRP) at the time of US evaluation (to avoid the significant influence of intense synovitis on the joint images and disability assessment). Healthy subjects were screened for history and clinical evidence of joint disease alone. No blood or radiographic tests were performed. Those with obvious osteo-arthritis (OA) determined by clinical examination were excluded. The study protocol was approved by the Ethics Committee of the Toho University Ohashi Medical Center (project approval
number H18016), and informed consent was obtained from all the participants.
Clinical assessments. We obtained the following medical information from medical records: age, sex, height, weight, dis-ease duration from the onset of symptoms to US examination, patient global assessment of disease activity as measured by a 100-mm visual analog scale, results from the Health Assess-ment Questionnaire disability index (HAQ DI), physician-based assessment of the presence of tenderness and swelling in 28 joints, serum levels of CRP, rheumatoid factor, anti–cyclic citrulli-nated peptide antibody and matrix metalloproteinase-3 (MMP-3), and treatment for RA. The JSN of US-examined joints was scored in a blinded manner using the modified Sharp/van der Heijde method with a hand radiograph obtained within 3 months of US examination.
US examination. A Xario (Canon Medical Systems) US machine equipped with a multifrequency linear array probe (7–14 MHz) was used (8,9). The US examination was performed according to EULAR guidelines for musculoskeletal US in rheu-matology (10,11) by 1 of 3 rheumatologists (TO, AH, or NH). All rheumatologists were board certified as ultrasonographers by the Japan College of Rheumatology, and they were blinded to patients’ radiograph findings. Bilateral second to fifth metacarpophalangeal (MCP) and second to fifth proximal interphalangeal (PIP) joints were examined. The cartilage layers of the metacarpal heads and proximal phalangeal heads at the MCP and PIP joints were visu-alized from a longitudinal dorsal view at their midportions, with the joints placed in ~90 degrees flexion (12). The probe was placed such that the US beam was orthogonal to the cartilage. Static US images of all joints were saved as Digital Imaging and Communica-tion in Medicine (DICOM) images. Cartilage thickness was meas-ured using OsiriX software (Pixmeo) with an Apple OS X operating system by calculating the pixel counts on DICOM images.
Cartilage thickness was measured from the base of the car-tilage to the interface artefact at the cartilage surface (outer mar-gins). The outer margins were determined by creating a linear region of interest orthogonal to the cartilage, with reference to the plot graph of distance and brightness shown in 8-bit gray scale (256 gradations from 0 to 255). Since the evaluation was of a semiquantitative method, the cartilage measurement was not corrected for the increased speed of sound within it. Furthermore, one US examiner (TO) who was blinded to other medical infor-mation performed the semiquantitative scoring of the recorded cartilage images using a scale of 0–2 (0 = normal, 1 = minimal, and 2 = severe) (5) (see Supplementary Figure 1, available on the Arthritis Care & Research website at http://onlin elibr ary.wiley.com/doi/10.1002/acr.24101/ abstract).
Intraobserver reliability of the semiquantitative scoring was examined (by TO) using the recorded US findings of 14 randomly selected patients (total of 224 joints) at an interval of >6 months.
SIGNIFICANCE & INNOVATIONS• In patients with rheumatoid arthritis (RA), the semi-
quantitative ultrasound (US) score showed a signif-icant negative correlation with cartilage thickness and a significant positive correlation with joint space narrowing score, and all of those scores showed a significant correlation with RA disease duration.
• This is the first study demonstrating that a simpli-fied and direct evaluation of finger joint cartilage damage by semiquantitative US score is valid and useful for patients with RA.
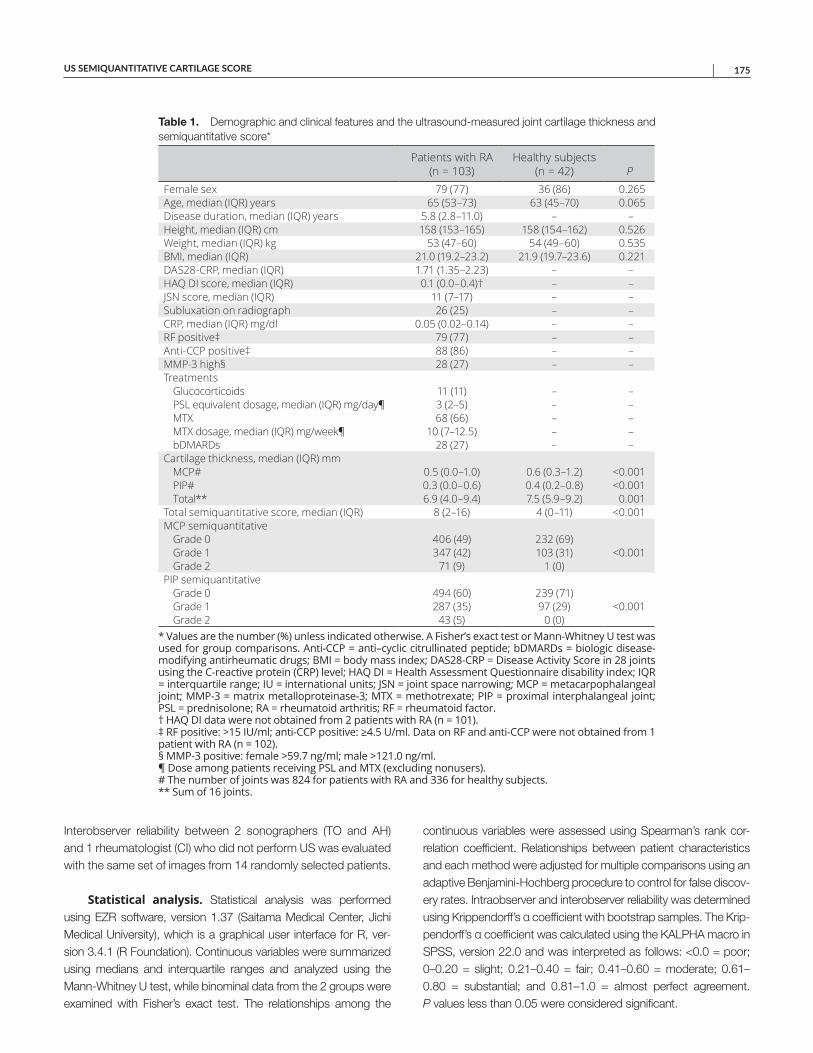
US SEMIQUANTITATIVE CARTILAGE SCORE | 175
Interobserver reliability between 2 sonographers (TO and AH) and 1 rheumatologist (CI) who did not perform US was evaluated with the same set of images from 14 randomly selected patients.
Statistical analysis. Statistical analysis was performed using EZR software, version 1.37 (Saitama Medical Center, Jichi Medical University), which is a graphical user interface for R, ver-sion 3.4.1 (R Foundation). Continuous variables were summarized using medians and interquartile ranges and analyzed using the Mann-Whitney U test, while binominal data from the 2 groups were examined with Fisher’s exact test. The relationships among the
continuous variables were assessed using Spearman’s rank cor-relation coefficient. Relationships between patient characteristics and each method were adjusted for multiple comparisons using an adaptive Benjamini-Hochberg procedure to control for false discov-ery rates. Intraobserver and interobserver reliability was determined using Krippendorff’s α coefficient with bootstrap samples. The Krip-pendorff’s α coefficient was calculated using the KALPHA macro in SPSS, version 22.0 and was interpreted as follows: <0.0 = poor; 0–0.20 = slight; 0.21–0.40 = fair; 0.41–0.60 = moderate; 0.61–0.80 = substantial; and 0.81–1.0 = almost perfect agreement. P values less than 0.05 were considered significant.
Table 1. Demographic and clinical features and the ultrasound-measured joint cartilage thickness and semiquantitative score*
Patients with RA (n = 103)
Healthy subjects (n = 42) P
Female sex 79 (77) 36 (86) 0.265Age, median (IQR) years 65 (53–73) 63 (45–70) 0.065Disease duration, median (IQR) years 5.8 (2.8–11.0) – –Height, median (IQR) cm 158 (153–165) 158 (154–162) 0.526Weight, median (IQR) kg 53 (47–60) 54 (49–60) 0.535BMI, median (IQR) 21.0 (19.2–23.2) 21.9 (19.7–23.6) 0.221DAS28-CRP, median (IQR) 1.71 (1.35–2.23) – –HAQ DI score, median (IQR) 0.1 (0.0–0.4)† – –JSN score, median (IQR) 11 (7–17) – –Subluxation on radiograph 26 (25) – –CRP, median (IQR) mg/dl 0.05 (0.02–0.14) – –RF positive‡ 79 (77) – –Anti-CCP positive‡ 88 (86) – –MMP-3 high§ 28 (27) – –Treatments
Glucocorticoids 11 (11) – –PSL equivalent dosage, median (IQR) mg/day¶ 3 (2–5) – –MTX 68 (66) – –MTX dosage, median (IQR) mg/week¶ 10 (7–12.5) – –bDMARDs 28 (27) – –
Cartilage thickness, median (IQR) mmMCP# 0.5 (0.0–1.0) 0.6 (0.3–1.2) <0.001PIP# 0.3 (0.0–0.6) 0.4 (0.2–0.8) <0.001Total** 6.9 (4.0–9.4) 7.5 (5.9–9.2) 0.001
Total semiquantitative score, median (IQR) 8 (2–16) 4 (0–11) <0.001MCP semiquantitative
Grade 0 406 (49) 232 (69)Grade 1 347 (42) 103 (31) <0.001Grade 2 71 (9) 1 (0)
PIP semiquantitativeGrade 0 494 (60) 239 (71)Grade 1 287 (35) 97 (29) <0.001Grade 2 43 (5) 0 (0)
* Values are the number (%) unless indicated otherwise. A Fisher’s exact test or Mann-Whitney U test wasused for group comparisons. Anti-CCP = anti–cyclic citrullinated peptide; bDMARDs = biologic disease-modifying antirheumatic drugs; BMI = body mass index; DAS28-CRP = Disease Activity Score in 28 joints using the C-reactive protein (CRP) level; HAQ DI = Health Assessment Questionnaire disability index; IQR = interquartile range; IU = international units; JSN = joint space narrowing; MCP = metacarpophalangeal joint; MMP-3 = matrix metalloproteinase-3; MTX = methotrexate; PIP = proximal interphalangeal joint; PSL = prednisolone; RA = rheumatoid arthritis; RF = rheumatoid factor. † HAQ DI data were not obtained from 2 patients with RA (n = 101). ‡ RF positive: >15 IU/ml; anti-CCP positive: ≥4.5 U/ml. Data on RF and anti-CCP were not obtained from 1 patient with RA (n = 102). § MMP-3 positive: female >59.7 ng/ml; male >121.0 ng/ml. ¶ Dose among patients receiving PSL and MTX (excluding nonusers). # The number of joints was 824 for patients with RA and 336 for healthy subjects. ** Sum of 16 joints.
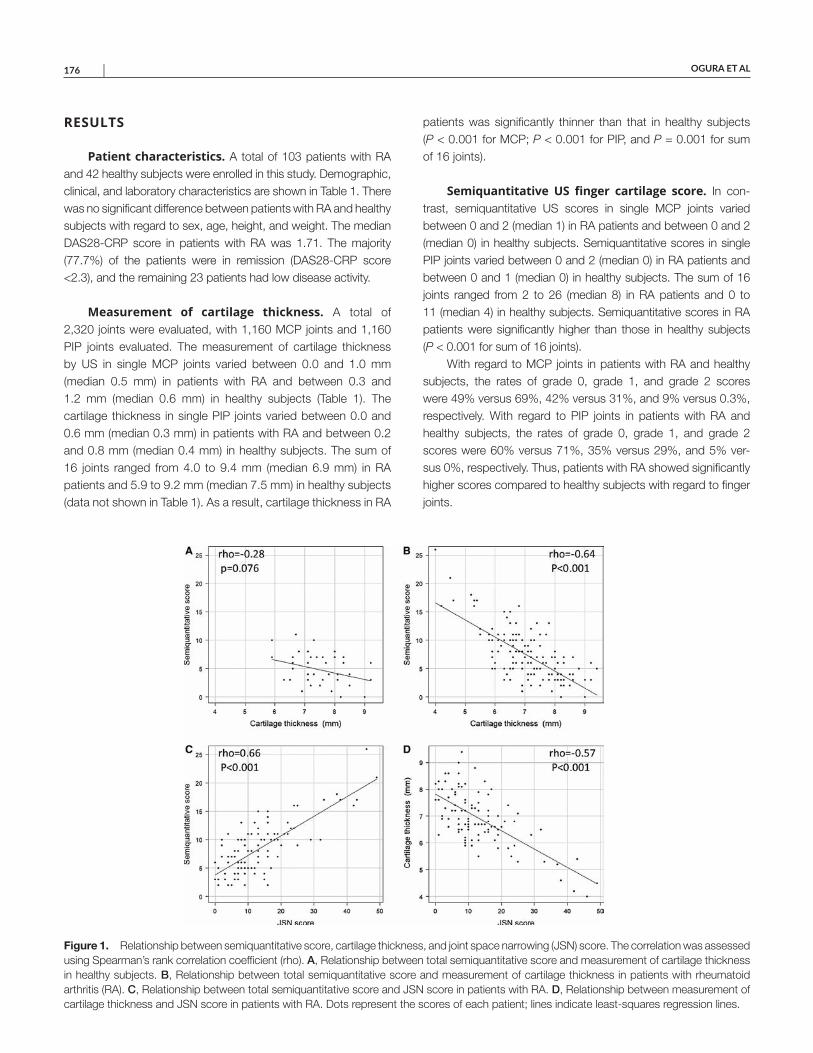
OGURA ET AL 176 |
RESULTS
Patient characteristics. A total of 103 patients with RA and 42 healthy subjects were enrolled in this study. Demographic, clinical, and laboratory characteristics are shown in Table 1. There was no significant difference between patients with RA and healthy subjects with regard to sex, age, height, and weight. The median DAS28-CRP score in patients with RA was 1.71. The majority (77.7%) of the patients were in remission (DAS28-CRP score <2.3), and the remaining 23 patients had low disease activity.
Measurement of cartilage thickness. A total of 2,320 joints were evaluated, with 1,160 MCP joints and 1,160 PIP joints evaluated. The measurement of cartilage thickness by US in single MCP joints varied between 0.0 and 1.0 mm (median 0.5 mm) in patients with RA and between 0.3 and 1.2 mm (median 0.6 mm) in healthy subjects (Table 1). The cartilage thickness in single PIP joints varied between 0.0 and 0.6 mm (median 0.3 mm) in patients with RA and between 0.2 and 0.8 mm (median 0.4 mm) in healthy subjects. The sum of 16 joints ranged from 4.0 to 9.4 mm (median 6.9 mm) in RA patients and 5.9 to 9.2 mm (median 7.5 mm) in healthy subjects (data not shown in Table 1). As a result, cartilage thickness in RA
patients was significantly thinner than that in healthy subjects (P < 0.001 for MCP; P < 0.001 for PIP, and P = 0.001 for sum of 16 joints).
Semiquantitative US finger cartilage score. In con-trast, semiquantitative US scores in single MCP joints varied between 0 and 2 (median 1) in RA patients and between 0 and 2 (median 0) in healthy subjects. Semiquantitative scores in single PIP joints varied between 0 and 2 (median 0) in RA patients and between 0 and 1 (median 0) in healthy subjects. The sum of 16 joints ranged from 2 to 26 (median 8) in RA patients and 0 to 11 (median 4) in healthy subjects. Semiquantitative scores in RA patients were significantly higher than those in healthy subjects (P < 0.001 for sum of 16 joints).
With regard to MCP joints in patients with RA and healthy subjects, the rates of grade 0, grade 1, and grade 2 scores were 49% versus 69%, 42% versus 31%, and 9% versus 0.3%, respectively. With regard to PIP joints in patients with RA and healthy subjects, the rates of grade 0, grade 1, and grade 2 scores were 60% versus 71%, 35% versus 29%, and 5% ver-sus 0%, respectively. Thus, patients with RA showed significantly higher scores compared to healthy subjects with regard to finger joints.
Figure 1. Relationship between semiquantitative score, cartilage thickness, and joint space narrowing (JSN) score. The correlation was assessed using Spearman’s rank correlation coefficient (rho). A, Relationship between total semiquantitative score and measurement of cartilage thickness in healthy subjects. B, Relationship between total semiquantitative score and measurement of cartilage thickness in patients with rheumatoid arthritis (RA). C, Relationship between total semiquantitative score and JSN score in patients with RA. D, Relationship between measurement of cartilage thickness and JSN score in patients with RA. Dots represent the scores of each patient; lines indicate least-squares regression lines.
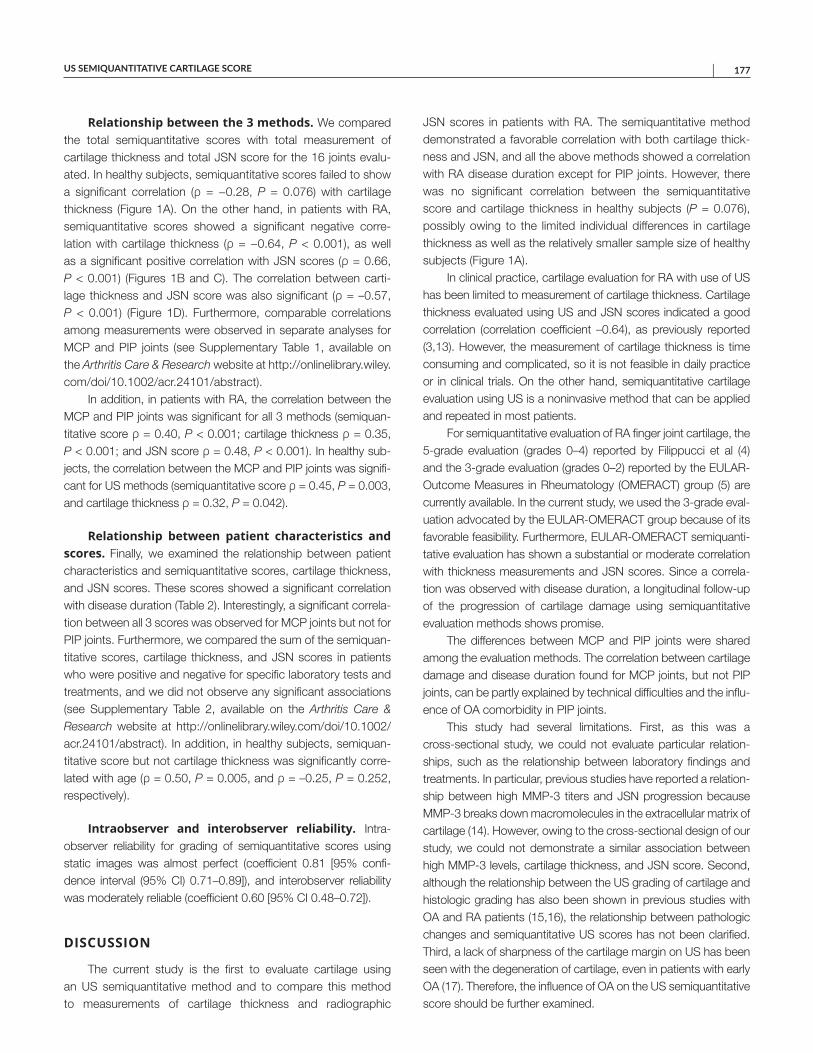
US SEMIQUANTITATIVE CARTILAGE SCORE | 177
Relationship between the 3 methods. We compared the total semiquantitative scores with total measurement of cartilage thickness and total JSN score for the 16 joints evalu-ated. In healthy subjects, semiquantitative scores failed to show a significant correlation (ρ = −0.28, P = 0.076) with cartilage thickness (Figure 1A). On the other hand, in patients with RA, semiquantitative scores showed a significant negative corre-lation with cartilage thickness (ρ = −0.64, P < 0.001), as well as a significant positive correlation with JSN scores (ρ = 0.66, P < 0.001) (Figures 1B and C). The correlation between carti-lage thickness and JSN score was also significant (ρ = –0.57, P < 0.001) (Figure 1D). Furthermore, comparable correlations among measurements were observed in separate analyses for MCP and PIP joints (see Supplementary Table 1, available on the Arthritis Care & Research website at http://onlin elibr ary.wiley.com/doi/10.1002/acr.24101/ abstract).
In addition, in patients with RA, the correlation between the MCP and PIP joints was significant for all 3 methods (semiquan-titative score ρ = 0.40, P < 0.001; cartilage thickness ρ = 0.35, P < 0.001; and JSN score ρ = 0.48, P < 0.001). In healthy sub-jects, the correlation between the MCP and PIP joints was signifi-cant for US methods (semiquantitative score ρ = 0.45, P = 0.003, and cartilage thickness ρ = 0.32, P = 0.042).
Relationship between patient characteristics and scores. Finally, we examined the relationship between patient characteristics and semiquantitative scores, cartilage thickness, and JSN scores. These scores showed a significant correlation with disease duration (Table 2). Interestingly, a significant correla-tion between all 3 scores was observed for MCP joints but not for PIP joints. Furthermore, we compared the sum of the semiquan-titative scores, cartilage thickness, and JSN scores in patients who were positive and negative for specific laboratory tests and treatments, and we did not observe any significant associations (see Supplementary Table 2, available on the Arthritis Care & Research website at http://onlin elibr ary.wiley.com/doi/10.1002/acr.24101/ abstract). In addition, in healthy subjects, semiquan-titative score but not cartilage thickness was significantly corre-lated with age (ρ = 0.50, P = 0.005, and ρ = –0.25, P = 0.252, respectively).
Intraobserver and interobserver reliability. Intra-observer reliability for grading of semiquantitative scores using static images was almost perfect (coefficient 0.81 [95% confi-dence interval (95% CI) 0.71–0.89]), and interobserver reliability was moderately reliable (coefficient 0.60 [95% CI 0.48–0.72]).
DISCUSSION
The current study is the first to evaluate cartilage using an US semiquantitative method and to compare this method to measurements of cartilage thickness and radiographic
JSN scores in patients with RA. The semiquantitative method demonstrated a favorable correlation with both cartilage thick-ness and JSN, and all the above methods showed a correlation with RA disease duration except for PIP joints. However, there was no significant correlation between the semiquantitative score and cartilage thickness in healthy subjects (P = 0.076), possibly owing to the limited individual differences in cartilage thickness as well as the relatively smaller sample size of healthy subjects (Figure 1A).
In clinical practice, cartilage evaluation for RA with use of US has been limited to measurement of cartilage thickness. Cartilage thickness evaluated using US and JSN scores indicated a good correlation (correlation coefficient –0.64), as previously reported (3,13). However, the measurement of cartilage thickness is time consuming and complicated, so it is not feasible in daily practice or in clinical trials. On the other hand, semiquantitative cartilage evaluation using US is a noninvasive method that can be applied and repeated in most patients.
For semiquantitative evaluation of RA finger joint cartilage, the 5-grade evaluation (grades 0–4) reported by Filippucci et al (4) and the 3-grade evaluation (grades 0–2) reported by the EULAR- Outcome Measures in Rheumatology (OMERACT) group (5) are currently available. In the current study, we used the 3-grade eval-uation advocated by the EULAR-OMERACT group because of its favorable feasibility. Furthermore, EULAR-OMERACT semiquanti-tative evaluation has shown a substantial or moderate correlation with thickness measurements and JSN scores. Since a correla-tion was observed with disease duration, a longitudinal follow-up of the progression of cartilage damage using semiquantitative evaluation methods shows promise.
The differences between MCP and PIP joints were shared among the evaluation methods. The correlation between cartilage damage and disease duration found for MCP joints, but not PIP joints, can be partly explained by technical difficulties and the influ-ence of OA comorbidity in PIP joints.
This study had several limitations. First, as this was a cross-sectional study, we could not evaluate particular relation-ships, such as the relationship between laboratory findings and treatments. In particular, previous studies have reported a relation-ship between high MMP-3 titers and JSN progression because MMP-3 breaks down macromolecules in the extracellular matrix of cartilage (14). However, owing to the cross-sectional design of our study, we could not demonstrate a similar association between high MMP-3 levels, cartilage thickness, and JSN score. Second, although the relationship between the US grading of cartilage and histologic grading has also been shown in previous studies with OA and RA patients (15,16), the relationship between pathologic changes and semiquantitative US scores has not been clarified. Third, a lack of sharpness of the cartilage margin on US has been seen with the degeneration of cartilage, even in patients with early OA (17). Therefore, the influence of OA on the US semiquantitative score should be further examined.
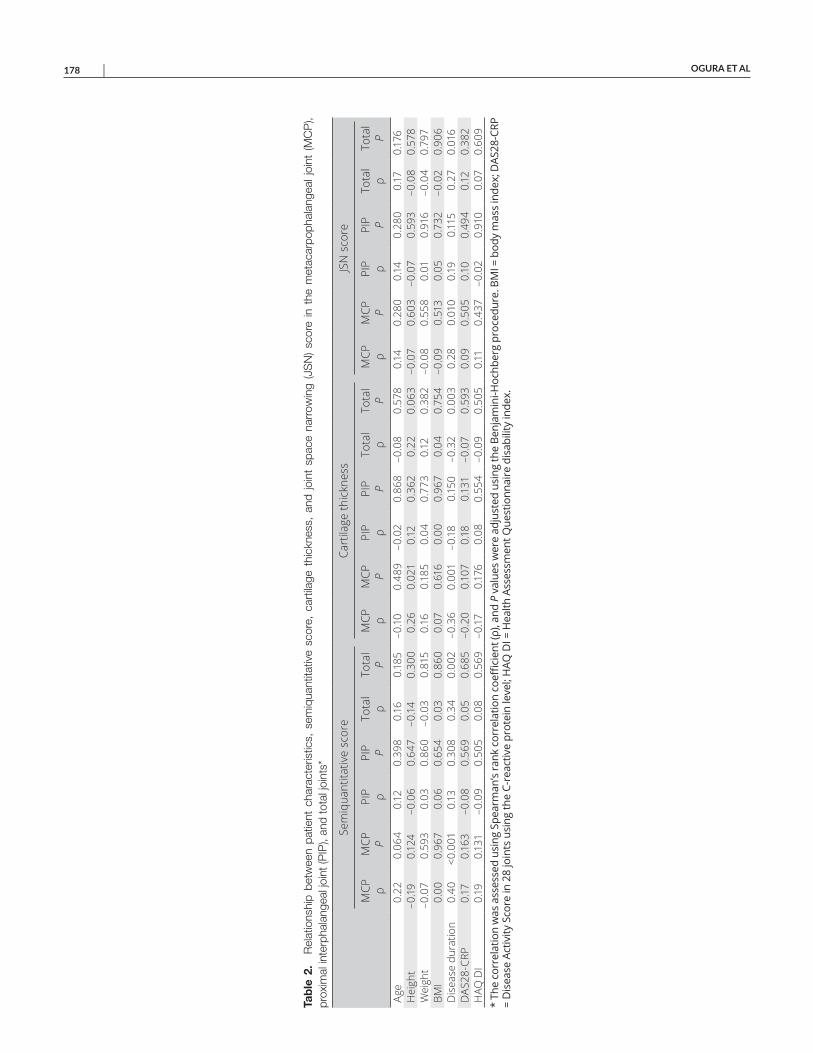
OGURA ET AL 178 |
Tab
le 2
. R
elat
ions
hip
betw
een
patie
nt c
hara
cter
istic
s, s
emiq
uant
itativ
e sc
ore,
car
tilag
e th
ickn
ess,
and
join
t sp
ace
narr
owin
g (J
SN
) sc
ore
in t
he m
etac
arpo
phal
ange
al jo
int
(MC
P),
prox
imal
inte
rpha
lang
eal j
oint
(PIP
), an
d to
tal j
oint
s*
Sem
iqua
ntita
tive
scor
eCa
rtila
ge th
ickn
ess
JSN
sco
re
MCP
ρ
MCP
P
PIP ρ
PIP P
Tota
l ρ
Tota
l P
MCP
ρ
MCP
P
PIP ρ
PIP P
Tota
l ρ
Tota
l P
MCP
ρ
MCP
P
PIP ρ
PIP P
Tota
l ρ
Tota
l P
Age
0.22
0.06
40.
120.
398
0.16
0.18
5–0
.10
0.48
9–0
.02
0.86
8–0
.08
0.57
80.
140.
280
0.14
0.28
00.
170.
176
Hei
ght
–0.19
0.12
4–0
.06
0.64
7–0
.14
0.30
00.
260.
021
0.12
0.36
20.
220.
063
–0.0
70.
603
–0.0
70.
593
–0.0
80.
578
Wei
ght
–0.0
70.
593
0.03
0.86
0–0
.03
0.81
50.
160.
185
0.04
0.77
30.
120.
382
–0.0
80.
558
0.01
0.91
6–0
.04
0.79
7BM
I0.
000.
967
0.06
0.65
40.
030.
860
0.07
0.61
60.
000.
967
0.04
0.75
4–0
.09
0.51
30.
050.
732
–0.0
20.
906
Dis
ease
dur
atio
n0.
40<0
.001
0.13
0.30
80.
340.
002
–0.3
60.
001
–0.1
80.
150
–0.3
20.
003
0.28
0.01
00.
190.
115
0.27
0.01
6D
AS28
-CRP
0.17
0.16
3–0
.08
0.56
90.
050.
685
–0.2
00.
107
0.18
0.13
1–0
.07
0.59
30.
090.
505
0.10
0.49
40.
120.
382
HAQ
DI
0.19
0.13
1–0
.09
0.50
50.
080.
569
–0.17
0.17
60.
080.
554
–0.0
90.
505
0.11
0.43
7–0
.02
0.91
00.
070.
609
* Th
e co
rrel
atio
n w
as a
sses
sed
usin
g Sp
earm
an’s
rank
cor
rela
tion
coeffi
cien
t (ρ)
, and
P v
alue
s w
ere
adju
sted
usi
ng th
e Be
njam
ini-H
ochb
erg
proc
edur
e. B
MI =
bod
y m
ass
inde
x; D
AS28
-CRP
=
Dis
ease
Act
ivity
Sco
re in
28
join
ts u
sing
the
C-re
activ
e pr
otei
n le
vel;
HAQ
DI =
Hea
lth A
sses
smen
t Que
stio
nnai
re d
isab
ility
inde
x.
US SEMIQUANTITATIVE CARTILAGE SCORE | 179
Despite the above limitations, US evaluation of joint cartilage seems to be highly sensitive because 30% of evaluated joints of healthy subjects were graded as score 1. In conclusion, a simpli-fied and direct evaluation of finger joint cartilage damage by semi-quantitative US score is valid and useful in patients with RA.
ACKNOWLEDGMENT
The authors thank Editage Japan for editing the manuscript.
AUTHOR CONTRIBUTIONS
All authors were involved in drafting the article or revising it critically for important intellectual content, and all authors approved the final version to be submitted for publication. Dr. Kameda had full access to all of the data in the study and takes responsibility for the integrity of the data and the accuracy of the data analysis.Study conception and design. Ogura, Kameda.Acquisition of data. Ogura, Hirata, Hayashi, Imaizumi, Ito, Takenaka, Inoue, Takakura, Mizushina, Kameda.Analysis and interpretation of data. Ogura, Hirata, Hayashi, Imaizumi, Katagiri, Kameda.
ROLE OF THE STUDY SPONSOR
Eisai had no role in the study design or in the collection, analysis, or interpretation of the data, the writing of the manuscript, or the decision to submit the manuscript for publication. Publication of this article was not contingent upon approval by Eisai.
REFERENCES 1. Van der Heijde DM, van Riel PL, Nuver-Zwart IH, Gribnau FW, van de
Putte LB. Effects of hydroxychloroquine and sulphasalazine on pro-gression of joint damage in rheumatoid arthritis. Lancet 1989;1:1036–8.
2. Aletaha D, Funovits J, Smolen JS. Physical disability in rheuma-toid arthritis is associated with cartilage damage rather than bonedestruction. Ann Rheum Dis 2011;70:733–9.
3. Mandl P, Supp G, Baksa G, Radner H, Studenic P, Gyebnar J, et al.Relationship between radiographic joint space narrowing, sono-graphic cartilage thickness and anatomy in rheumatoid arthritis andcontrol joints. Ann Rheum Dis 2015;74:2022–7.
4. Filippucci E, da Luz KR, Di Geso L, Salaffi F, Tardella M, CarottiM, et al. Interobserver reliability of ultrasonography in the assess-ment of cartilage damage in rheumatoid arthritis. Ann Rheum Dis2010;69:1845–8.
5. Mandl P, Studenic P, Filippucci E, Bachta A, Bong D, Bruyn G,et al. Development of semiquantitative ultrasound scoring system
to assess cartilage in rheumatoid arthritis. Rheumatology (Oxford) 2019;58:1802–11.
6. Aletaha D, Neogi T, Silman AJ, Funovits J, Felson DT, Bingham COIII, et al. 2010 rheumatoid arthritis classification criteria: an AmericanCollege of Rheumatology/European League Against Rheumatismcollaborative initiative. Arthritis Rheum 2010;62:2569–81.
7. Arnett FC, Edworthy SM, Bloch DA, McShane DJ, Fries JF, CooperNS, et al. The American Rheumatism Association 1987 revised cri-teria for the classification of rheumatoid arthritis. Arthritis Rheum1988;31:315–24.
8. Hirata A, Ogura T, Hayashi N, Takenaka S, Ito H, Mizushina K,et al. Concordance of patient-reported joint symptoms, physician- examined arthritic signs, and ultrasound-detected synovitis in rheu-matoid arthritis. Arthritis Care Res (Hoboken) 2017;69:801–6.
9. Ogura T, Hirata A, Hayashi N, Takenaka S, Ito H, Mizushina K,et al. Comparison of ultrasonographic joint and tendon findingsin hands between early, treatment-naïve patients with systemiclupus erythematosus and rheumatoid arthritis. Lupus 2017;26:707–14.
10. Backhaus M, Burmester GR, Gerber T, Grassi W, Machold KP, Swen WA, et al. Guidelines for musculoskeletal ultrasound in rheumatol-ogy. Ann Rheum Dis 2001;60:641–9.
11. Möller I, Janta I, Backhaus M, Ohrndorf S, Bong DA, Martinoli C,et al. The 2017 EULAR standardised procedures for ultrasoundimaging in rheumatology. Ann Rheum Dis 2017;76:1974–9.
12. Torp-Pedersen S, Bartels EM, Wilhjelm J, Bliddal H. Articular carti-lage thickness measured with US is not as easy as it appears: a sys-tematic review of measurement techniques and image interpretation. Ultraschall Med 2011;32:54–61.
13. Möller B, Bonel H, Rotzetter M, Villiger PM, Ziswiler HR. Measuringfinger joint cartilage by ultrasound as a promising alternative to con-ventional radiograph imaging. Arthritis Rheum 2009;61:435–41.
14. Nawata M, Saito K, Fukuyo S, Hirata S, Tanaka Y. Clinically rele-vant radiographic progression in joint destruction in RA patients withabnormal MMP-3 or high levels of CRP despite 1-year treatmentwith infliximab. Mod Rheumatol 2016;26:807–12.
15. Lee CL, Huang MH, Chai CY, Chen CH, Su JY, Tien YC. The validityof in vivo ultrasonographic grading of osteoarthritic femoral condylarcartilage: a comparison with in vitro ultrasonographic and histologicgradings. Osteoarthritis Cartilage 2008;16:352–8.
16. Onodera T, Kasahara Y, Kasemura T, Suzuki Y, Kondo E, IwasakiN. A comparative study with in vitro ultrasonographic and histologicgrading of metatarsal head cartilage in rheumatoid arthritis. FootAnkle Int 2015;36:774–9.
17. Grassi W, Lamanna G, Farina A, Cervini C. Sonographic imag-ing of normal and osteoarthritic cartilage. Semin Arthritis Rheum1999;28:398–403.
180
Arthritis Care & ResearchVol. 73, No. 2, February 2021, pp 180–187DOI 10.1002/acr.24115© 2020, American College of Rheumatology
Family History of Rheumatic, Autoimmune, and Nonautoimmune Diseases and Risk of Rheumatoid ArthritisVanessa L. Kronzer,1 Cynthia S. Crowson,1 Jeffrey A. Sparks,2 Elena Myasoedova,1 and John Davis III1
Objective. Since comorbidities such as autoimmune diseases may be associated with rheumatoid arthritis (RA) risk, we hypothesized that a family history of these other conditions might also predict RA. Therefore, we aimed to determine the association between family history of 79 comorbidities and RA.
Methods. This case–control study identified 821 cases of RA in the Mayo Clinic Biobank (positive predictive value 95%) and matched 3 controls to each case based on age, sex, recruitment year, and location. Patients self reported family history and characteristics (adjusted). Logistic regression was used to estimate odds ratios (ORs) and 95% confidence intervals (95% CIs) for RA risk according to the presence of family history for each comorbidity, adjusted for body mass index, race, and smoking.
Results. Family history of several conditions was associated with developing RA, including rheumatic autoimmune diseases (ORadj 1.89 [95% CI 1.41–2.52]), pulmonary fibrosis (ORadj 2.12 [95% CI 1.16–3.80]), inflammatory bowel disease (ORadj 1.45 [95% CI 1.05–1.98]), hyper/hypothyroidism (ORadj 1.34 [95% CI 1.10–1.63]), and obstructive sleep apnea (ORadj 1.28 [95% CI 1.05–1.55]). Parkinson’s disease and type 2 diabetes mellitus were associated with a statistically decreased risk of RA that did not reach the prespecified significance threshold of P < 0.01 (ORadj 0.70 [95% CI 0.49–0.98] and ORadj 0.81 [95% CI 0.67–0.97], respectively). Analyses among 143 cases of incident RA were similar and also suggested an association with a family history of autism (OR 10.5 [95% CI 2.51–71.3]).
Conclusion. Family history of several autoimmune and nonautoimmune comorbidities was associated with increased risk of RA, providing an opportunity to identify novel populations at risk for RA.
INTRODUCTION
Family history of rheumatoid arthritis (RA) is known to be an important predictor of RA (1–9), even after accounting for genetic and environmental factors (10,11). Supporting these findings, studies have shown that the heritability of RA is esti-mated to be 50–60% (6,12). Further, first-degree relatives of RA patients have an increased likelihood of having inflammatory joint signs (13), reactivity to multiple anti–cyclic citrullinated protein/peptide antibodies (14), and levels of multiple cytokines com-pared to those from a nonimmune background (15). Identifying individuals at higher risk for RA is important because they are candidates for predictive testing (16,17) and education interven-tions (18,19).
Family history of other comorbidities might also predispose to RA due to overlapping heritability or disease mechanisms, helping to identify those individuals at higher risk for RA. For example, 1 study suggested that family history of other rheumatic autoim-mune diseases like systemic lupus erythematosus and connective tissue disease predicted RA (20). Other studies have shown an association not only between family history of rheumatic auto-immune diseases and RA, but even between other autoimmune diseases such as type 1 diabetes mellitus, thyroid disease, inflam-matory bowel disease (IBD), and multiple sclerosis (6,21,22). However, these studies did not adjust for potential confounders such as smoking. Whether family history of other comorbidities, including nonautoimmune comorbidities, increases the risk of RA is unknown. Investigating this question may prove valuable,
Dr. Kronzer’s work was supported by the Rheumatology Research Foundation Resident Research Preceptorship. Dr. Sparks’ work was supported by the National Institute for Arthritis and Musculoskeletal and Skin Diseases (K23-AR-069688, L30-AR-066953, R03-AR-075886, P30-AR-070253, and P30-AR-072577) and the Rheumatology Research Foundation K Supplement Award.
1Vanessa L. Kronzer, MD, MSCI, Cynthia S. Crowson, PhD, Elena Myasoedova, MD, PhD, John Davis III, MD, MS: Mayo Clinic, Rochester,
Minnesota; 2Jeffrey A. Sparks, MD, MMSc: Brigham and Women’s Hospital, Boston, Massachusetts.
No potential conflicts of interest relevant to this article were reported.Address correspondence to Vanessa L. Kronzer, MD, MSCI, 200 First
Street SW, Rochester, MN 55905. Email: [email protected] for publication July 2, 2019; accepted in revised form
November 26, 2019.
RISK OF RA AND FAMILY HISTORY | 181
because several nonautoimmune conditions have been associ-ated with RA (23–26).
To address these gaps, we performed a study leveraging the Mayo Clinic Biobank (27). Our aims were two-fold. First, we aimed to determine the association between family history of autoimmune diseases and RA. Second, we aimed to define the association between family history of nonautoimmune diseases and RA. We hypothesized that family history of immune-mediated conditions such as autoimmune diseases and cancers would pre-dispose a person to developing RA.
SUBJECTS AND METHODS
Study design and subjects. This case–control study used the Mayo Clinic Biobank’s 55,898 participants, recruited from 2009 to the present, with their self-reported questionnaire data (27). Participants were recruited mainly from primary care loca-tions and filled out the questionnaire at the time of enrollment, either at home or in the clinic. The questionnaire asked partici-pants to report general health, personal and family medical history, health behaviors, and environmental exposures (see Supplemen-tary Appendices A, B, and C, available on the Arthritis Care & Research website at http://onlin elibr ary.wiley.com/doi/10.1002/acr.24115/ abstract). All questionnaires were manually and elec-tronically examined for errors, omissions, and skip patterns and returned to participants for correction if there were >10 errors. Additional details regarding these participants and the question-naires have been described elsewhere (28).
This study received approval from the Mayo Clinic and Olm-sted County Institutional Review Boards and complies with the Declaration of Helsinki. All participants provided written informed consent. This article also follows the Strengthening the Reporting of Observational studies in Epidemiology reporting guidelines for observational studies (29).
RA cases. We identified 821 RA cases using a rules- based algorithm combining 2 occurrences of RA diagnosis International Classification of Diseases, Ninth Revision, codes (714.0 or 714.9) at least 30 days apart with use of a disease- modifying antirheumatic drug (DMARD) (30). DMARD data became
available in the electronic health record (EHR) in 1999. As previ-ously published, this definition had a positive predictive value of 95% for RA by American College of Rheumatology/European League Against Rheumatism 2010 criteria (28,31). Of the identi-fied cases of RA, 143 (17%) had no RA self-report on the baseline or follow-up questionnaire but met the criteria for RA based on 2 diagnosis codes and a DMARD at least 90 days after the most recent questionnaire (defined as “incident RA”). Seropositive RA was defined as positivity for either rheumatoid factor or anti–cyclic citrullinated peptide antibodies. These antibody data became avail-able in the EHR in 1987.
Controls. Eligible controls were participants without self- reported RA or diagnosis codes for RA in the EHR as of Feb-ruary 28, 2018. We matched each RA case to 3 controls at the index date of the baseline questionnaire. Matching factors as of the index date were age (within 5 years), sex, year (within 5 years), recruitment location (Minnesota or Florida), and distance from the recruitment location (within 500 miles).
Family history of comorbidities. Family history for 79 comorbidities was self-reported on the Biobank’s baseline ques-tionnaire. As worded on the questionnaire, these comorbidities included RA; autoimmune diseases such as rheumatic autoim-mune disorder, Crohn’s disease or ulcerative colitis, celiac disease, and hyperthyroidism/hypothyroidism; 22 types of cancer, includ-ing thyroid, lung, breast, esophageal, pancreatic, stomach, colon or rectal, liver, uterine/endometrial, cervical, ovarian, prostate, testicular, bone, kidney, urinary/bladder, melanoma, nonmelanoma skin cancer, sarcoma, leukemia, lymphoma, and other cancer; and nonautoimmune diseases such as osteoarthritis (OA) and obstruc-tive sleep apnea (OSA), among others (see Supplementary Table 1, available on the Arthritis Care & Research website at http://onlin elibr ary.wiley.com/doi/10.1002/acr.24115/ abstract, for a complete list of all comorbidities). Of note, the “rheumatologic autoimmune disorder” comorbidity prompted participants with the examples of systemic lupus erythematosus and scleroderma.
Family history came from the question, “Do or did any of your first-degree relatives (parents, sisters, brothers, children) have this condition?” Participants responded “yes,” “no,” or “don’t know” for each comorbidity. For the primary analysis, responses of “don’t know” were assumed not to have a family member with that par-ticular comorbidity and were coded as “no.” The proportion miss-ing each family history item ranged from 7% to 13%.
Covariates. Potential confounding variables in this study included age, sex, body mass index (BMI; continuous), race (non- Hispanic white versus all others), education (bachelor’s degree or higher versus all others), and smoking status (ever versus never). Race, education, and smoking were self-reported on the ques-tionnaire. EHR data provided sex, age, and BMI at the index date of the baseline questionnaire, along with missing smoking status
SIGNIFICANCE & INNOVATIONS• After adjusting for potential confounders, family
history of rheumatic autoimmune diseases was as-sociated with twice the odds of developing rheuma-toid arthritis (RA).
• Family history of other autoimmune conditions, suchas thyroid disease and inflammatory bowel disease, was also associated with an elevated risk of RA.
• These findings can help identify novel populationsat risk for RA, improve RA risk prediction tools, and uncover RA pathogenesis.
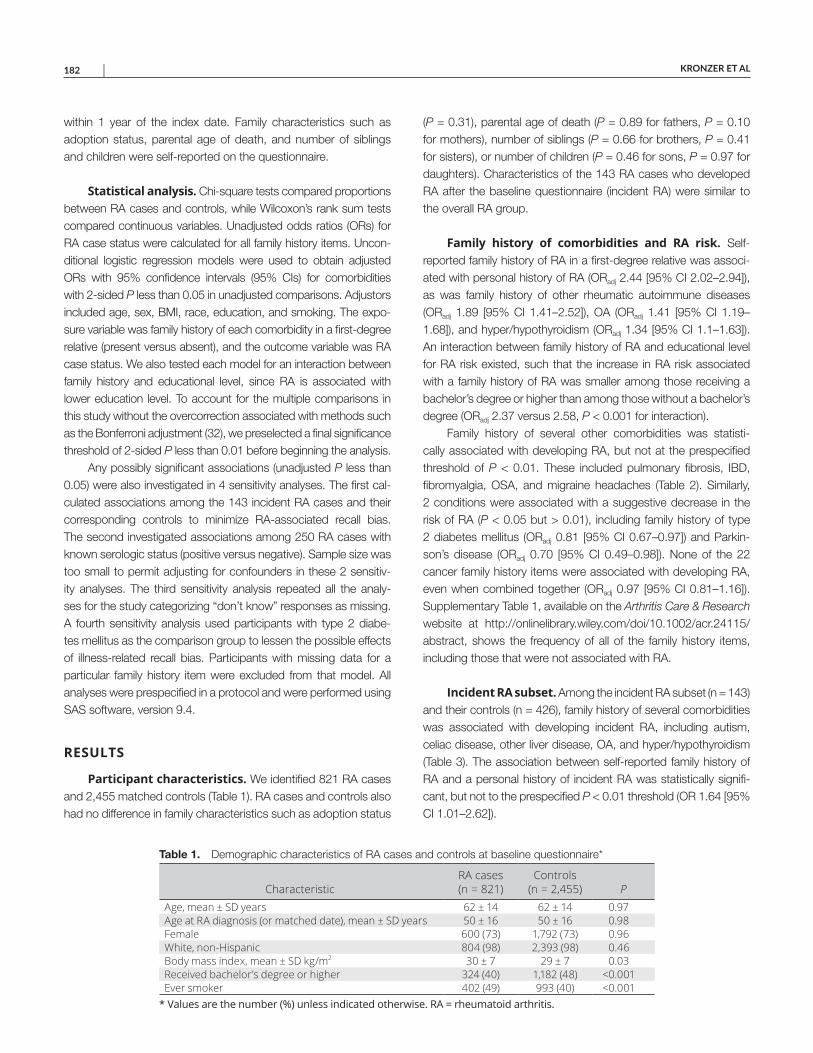
KRONZER ET AL 182 |
within 1 year of the index date. Family characteristics such as adoption status, parental age of death, and number of siblings and children were self-reported on the questionnaire.
Statistical analysis. Chi-square tests compared proportions between RA cases and controls, while Wilcoxon’s rank sum tests compared continuous variables. Unadjusted odds ratios (ORs) for RA case status were calculated for all family history items. Uncon-ditional logistic regression models were used to obtain adjusted ORs with 95% confidence intervals (95% CIs) for comorbidities with 2-sided P less than 0.05 in unadjusted comparisons. Adjustors included age, sex, BMI, race, education, and smoking. The expo-sure variable was family history of each comorbidity in a first-degree relative (present versus absent), and the outcome variable was RA case status. We also tested each model for an interaction between family history and educational level, since RA is associated with lower education level. To account for the multiple comparisons in this study without the overcorrection associated with methods such as the Bonferroni adjustment (32), we preselected a final significance threshold of 2-sided P less than 0.01 before beginning the analysis.
Any possibly significant associations (unadjusted P less than 0.05) were also investigated in 4 sensitivity analyses. The first cal-culated associations among the 143 incident RA cases and their corresponding controls to minimize RA-associated recall bias. The second investigated associations among 250 RA cases with known serologic status (positive versus negative). Sample size was too small to permit adjusting for confounders in these 2 sensitiv-ity analyses. The third sensitivity analysis repeated all the analy-ses for the study categorizing “don’t know” responses as missing. A fourth sensitivity analysis used participants with type 2 diabe-tes mellitus as the comparison group to lessen the possible effects of illness-related recall bias. Participants with missing data for a particular family history item were excluded from that model. All analyses were prespecified in a protocol and were performed using SAS software, version 9.4.
RESULTS
Participant characteristics. We identified 821 RA cases and 2,455 matched controls (Table 1). RA cases and controls also had no difference in family characteristics such as adoption status
(P = 0.31), parental age of death (P = 0.89 for fathers, P = 0.10 for mothers), number of siblings (P = 0.66 for brothers, P = 0.41 for sisters), or number of children (P = 0.46 for sons, P = 0.97 for daughters). Characteristics of the 143 RA cases who developed RA after the baseline questionnaire (incident RA) were similar to the overall RA group.
Family history of comorbidities and RA risk. Self- reported family history of RA in a first-degree relative was associ-ated with personal history of RA (ORadj 2.44 [95% CI 2.02–2.94]), as was family history of other rheumatic autoimmune diseases (ORadj 1.89 [95% CI 1.41–2.52]), OA (ORadj 1.41 [95% CI 1.19–1.68]), and hyper/hypothyroidism (ORadj 1.34 [95% CI 1.1–1.63]). An interaction between family history of RA and educational level for RA risk existed, such that the increase in RA risk associated with a family history of RA was smaller among those receiving a bachelor’s degree or higher than among those without a bachelor’s degree (ORadj 2.37 versus 2.58, P < 0.001 for interaction).
Family history of several other comorbidities was statisti-cally associated with developing RA, but not at the prespecified threshold of P < 0.01. These included pulmonary fibrosis, IBD, fibromyalgia, OSA, and migraine headaches (Table 2). Similarly, 2 conditions were associated with a suggestive decrease in the risk of RA (P < 0.05 but > 0.01), including family history of type 2 diabetes mellitus (ORadj 0.81 [95% CI 0.67–0.97]) and Parkin-son’s disease (ORadj 0.70 [95% CI 0.49–0.98]). None of the 22 cancer family history items were associated with developing RA, even when combined together (ORadj 0.97 [95% CI 0.81–1.16]). Supplementary Table 1, available on the Arthritis Care & Research website at http://onlin elibr ary.wiley.com/doi/10.1002/acr.24115/ abstract, shows the frequency of all of the family history items, including those that were not associated with RA.
Incident RA subset. Among the incident RA subset (n = 143) and their controls (n = 426), family history of several comorbidities was associated with developing incident RA, including autism, celiac disease, other liver disease, OA, and hyper/hypothyroidism (Table 3). The association between self-reported family history of RA and a personal history of incident RA was statistically signifi-cant, but not to the prespecified P < 0.01 threshold (OR 1.64 [95% CI 1.01–2.62]).
Table 1. Demographic characteristics of RA cases and controls at baseline questionnaire*
CharacteristicRA cases (n = 821)
Controls (n = 2,455) P
Age, mean ± SD years 62 ± 14 62 ± 14 0.97Age at RA diagnosis (or matched date), mean ± SD years 50 ± 16 50 ± 16 0.98Female 600 (73) 1,792 (73) 0.96White, non-Hispanic 804 (98) 2,393 (98) 0.46Body mass index, mean ± SD kg/m2 30 ± 7 29 ± 7 0.03Received bachelor’s degree or higher 324 (40) 1,182 (48) <0.001Ever smoker 402 (49) 993 (40) <0.001
* Values are the number (%) unless indicated otherwise. RA = rheumatoid arthritis.

RISK OF RA AND FAMILY HISTORY | 183
Sensitivity analyses. None of the family history items were more associated with 1 of the serologic subtypes compared to the other (see Supplementary Table 2, available on the Arthritis Care
& Research website at http://onlin elibr ary.wiley.com/doi/10.1002/acr.24115/ abstract). Another sensitivity analysis examining the results with “don’t know” responses coded as “missing” showed
Table 2. Association between self-reported family history of comorbidities and developing RA, ordered by strength of association*
ComorbidityCases
(n = 821)Controls
(n = 2,455)Unadjusted OR
(95% CI)Adjusted OR
(95% CI)†Rheumatoid arthritis 272 (36) 379 (18) 2.56 (2.12–3.08)‡ 2.44 (2.02–2.94)‡HIV 9 (1) 11 (0.5) 2.47 (0.99–5.98) –Pulmonary fibrosis 20 (3) 29 (1) 2.10 (1.17–3.72) 2.12 (1.16–3.80)Rheumatic autoimmune disease§ 82 (11) 143 (7) 1.84 (1.38–2.44)‡ 1.89 (1.41–2.52)‡Autism 24 (3) 44 (2) 1.66 (0.99–2.72) 1.62 (0.96–2.67)Tuberculosis 34 (5) 68 (3) 1.52 (0.99–2.30) 1.51 (0.98–2.30)Inflammatory bowel disease 62 (8) 129 (6) 1.49 (1.08–2.03) 1.45 (1.05–1.98)Celiac disease 29 (4) 62 (3) 1.44 (0.91–2.24) 1.45 (0.91–2.27)Osteoarthritis 403 (55) 1,075 (47) 1.36 (1.15–1.61)‡ 1.41 (1.19–1.68)‡Fibromyalgia 74 (10) 168 (8) 1.39 (1.04–1.84) 1.40 (1.04–1.86)Hyper/hypothyroidism 206 (28) 490 (23) 1.34 (1.11–1.62)‡ 1.34 (1.10–1.63)‡Other liver disease 61 (8) 137 (6) 1.36 (0.99–1.85) 1.29 (0.93–1.77)Obstructive sleep apnea 205 (28) 503 (22) 1.32 (1.09–1.59) 1.28 (1.05–1.55)Other mental illness 93 (13) 222 (10) 1.29 (0.99–1.66) 1.24 (0.95–1.61)Migraine headaches 267 (36) 703 (32) 1.22 (1.02–1.45) 1.20 (1.00–1.43)Asthma 232 (31) 607 (27) 1.20 (1.00–1.44) 1.20 (0.99–1.44)COPD 125 (17) 304 (14) 1.27 (1.01–1.59) 1.19 (0.94–1.50)Venous thromboembolism 125 (17) 319 (15) 1.20 (0.95–1.50) 1.18 (0.94–1.48)Type 2 diabetes mellitus 214 (29) 723 (32) 0.85 (0.70–1.01) 0.81 (0.67–0.97)Parkinson’s disease 44 (6) 182 (8) 0.71 (0.50–0.99) 0.70 (0.49–0.98)
* Values are the number (%) unless indicated otherwise. 95% CI = 95% confidence interval; COPD = chronic obstructive pulmonary disease; OR = odds ratio; RA = rheumatoid arthritis. † Adjusted for age, sex, race, body mass index, education, smoking (ever versus never). ‡ Statistically significant at P < 0.01. § Prompted participants with the examples of scleroderma and systemic lupus erythematosus.
Table 3. Subgroup analyses in the 143 cases that developed RA after the questionnaire (incident RA) and their controls*
ComorbidityIncident RA
(n = 143)Controls (n = 426)
Incident RA, unadjusted OR
(95% CI)Rheumatoid arthritis 33 (26) 66 (17) 1.64 (1.01–2.62)HIV 0 (0) 4 (1) –Pulmonary fibrosis 3 (2) 5 (1) 1.74 (0.35–7.21)Rheumatic autoimmune disease 9 (7) 18 (4) 1.56 (0.65–3.47)Autism 7 (5) 2 (0.5) 10.5 (2.51–71.3)†Tuberculosis 5 (4) 9 (2) 1.68 (0.51–4.95)Inflammatory bowel disease 10 (8) 19 (5) 1.64 (0.71–3.55)Celiac disease 10 (8) 7 (2) 4.61 (1.73–12.9)†Osteoarthritis 84 (61) 157 (40) 2.57 (1.70–3.92)†Fibromyalgia 10 (7) 29 (7) 1.03 (0.46–2.10)Hyper/hypothyroidism 43 (33) 62 (16) 2.54 (1.61–4.00)†Other liver disease 16 (12) 15 (4) 3.39 (1.62–7.13)†Obstructive sleep apnea 39 (30) 83 (21) 1.55 (0.99–2.41)Other mental illness 17 (13) 24 (6) 2.18 (1.12–4.17)Migraine headaches 45 (34) 123 (31) 1.14 (0.74–1.72)Asthma 43 (32) 100 (26) 1.39 (0.90–2.12)COPD 18 (14) 51 (13) 1.03 (0.57–1.81)Venous thromboembolism 28 (21) 46 (12) 1.94 (1.14–3.23)Type 2 diabetes mellitus 42 (32) 111 (28) 1.20 (0.78–1.83)Parkinson’s disease 13 (10) 25 (7) 1.58 (0.76–3.14)
* Values are the number (%) unless indicated otherwise. 95% CI = 95% confidence interval; COPD = chronic obstructive pulmonary disease; OR = odds ratio; RA = rheumatoid arthritis. † Statistically significant at P < 0.01.
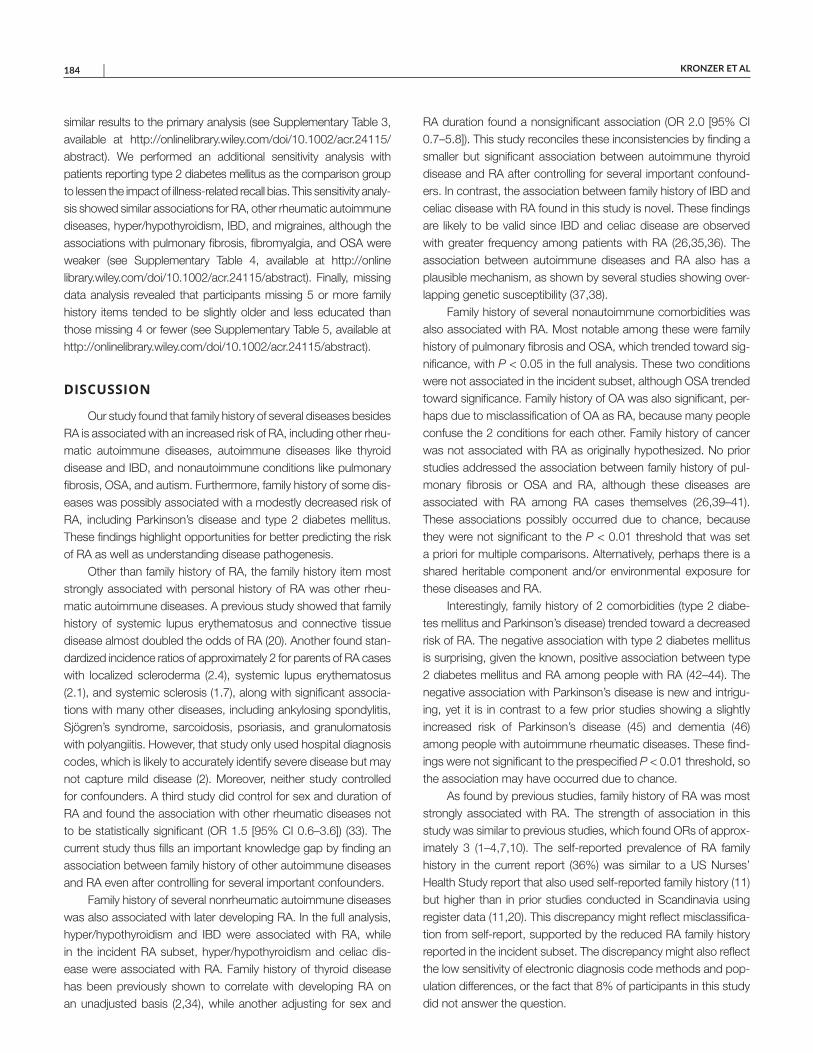
KRONZER ET AL 184 |
similar results to the primary analysis (see Supplementary Table 3, available at http://onlin elibr ary.wiley.com/doi/10.1002/acr.24115/ abstract). We performed an additional sensitivity analysis with patients reporting type 2 diabetes mellitus as the comparison group to lessen the impact of illness-related recall bias. This sensitivity analy-sis showed similar associations for RA, other rheumatic autoimmune diseases, hyper/hypothyroidism, IBD, and migraines, although the associations with pulmonary fibrosis, fibromyalgia, and OSA were weaker (see Supplementary Table 4, available at http://onlin e libr ary.wiley.com/doi/10.1002/acr.24115/ abstract). Finally, missing data analysis revealed that participants missing 5 or more family history items tended to be slightly older and less educated than those missing 4 or fewer (see Supplementary Table 5, available at http://onlin elibr ary.wiley.com/doi/10.1002/acr.24115/ abstract).
DISCUSSION
Our study found that family history of several diseases besides RA is associated with an increased risk of RA, including other rheu-matic autoimmune diseases, autoimmune diseases like thyroid disease and IBD, and nonautoimmune conditions like pulmonary fibrosis, OSA, and autism. Furthermore, family history of some dis-eases was possibly associated with a modestly decreased risk of RA, including Parkinson’s disease and type 2 diabetes mellitus. These findings highlight opportunities for better predicting the risk of RA as well as understanding disease pathogenesis.
Other than family history of RA, the family history item most strongly associated with personal history of RA was other rheu-matic autoimmune diseases. A previous study showed that family history of systemic lupus erythematosus and connective tissue disease almost doubled the odds of RA (20). Another found stan-dardized incidence ratios of approximately 2 for parents of RA cases with localized scleroderma (2.4), systemic lupus erythematosus (2.1), and systemic sclerosis (1.7), along with significant associa-tions with many other diseases, including ankylosing spondylitis, Sjögren’s syndrome, sarcoidosis, psoriasis, and granulomatosis with polyangiitis. However, that study only used hospital diagnosis codes, which is likely to accurately identify severe disease but may not capture mild disease (2). Moreover, neither study controlled for confounders. A third study did control for sex and duration of RA and found the association with other rheumatic diseases not to be statistically significant (OR 1.5 [95% CI 0.6–3.6]) (33). The current study thus fills an important knowledge gap by finding an association between family history of other autoimmune diseases and RA even after controlling for several important confounders.
Family history of several nonrheumatic autoimmune diseases was also associated with later developing RA. In the full analysis, hyper/hypothyroidism and IBD were associated with RA, while in the incident RA subset, hyper/hypothyroidism and celiac dis-ease were associated with RA. Family history of thyroid disease has been previously shown to correlate with developing RA on an unadjusted basis (2,34), while another adjusting for sex and
RA duration found a nonsignificant association (OR 2.0 [95% CI 0.7–5.8]). This study reconciles these inconsistencies by finding a smaller but significant association between autoimmune thyroid disease and RA after controlling for several important confound-ers. In contrast, the association between family history of IBD and celiac disease with RA found in this study is novel. These findings are likely to be valid since IBD and celiac disease are observed with greater frequency among patients with RA (26,35,36). The association between autoimmune diseases and RA also has a plausible mechanism, as shown by several studies showing over-lapping genetic susceptibility (37,38).
Family history of several nonautoimmune comorbidities was also associated with RA. Most notable among these were family history of pulmonary fibrosis and OSA, which trended toward sig-nificance, with P < 0.05 in the full analysis. These two conditions were not associated in the incident subset, although OSA trended toward significance. Family history of OA was also significant, per-haps due to misclassification of OA as RA, because many people confuse the 2 conditions for each other. Family history of cancer was not associated with RA as originally hypothesized. No prior studies addressed the association between family history of pul-monary fibrosis or OSA and RA, although these diseases are associated with RA among RA cases themselves (26,39–41). These associations possibly occurred due to chance, because they were not significant to the P < 0.01 threshold that was set a priori for multiple comparisons. Alternatively, perhaps there is a shared heritable component and/or environmental exposure for these diseases and RA.
Interestingly, family history of 2 comorbidities (type 2 diabe-tes mellitus and Parkinson’s disease) trended toward a decreased risk of RA. The negative association with type 2 diabetes mellitus is surprising, given the known, positive association between type 2 diabetes mellitus and RA among people with RA (42–44). The negative association with Parkinson’s disease is new and intrigu-ing, yet it is in contrast to a few prior studies showing a slightly increased risk of Parkinson’s disease (45) and dementia (46) among people with autoimmune rheumatic diseases. These find-ings were not significant to the prespecified P < 0.01 threshold, so the association may have occurred due to chance.
As found by previous studies, family history of RA was most strongly associated with RA. The strength of association in this study was similar to previous studies, which found ORs of approx-imately 3 (1–4,7,10). The self-reported prevalence of RA family history in the current report (36%) was similar to a US Nurses’ Health Study report that also used self-reported family history (11) but higher than in prior studies conducted in Scandinavia using register data (11,20). This discrepancy might reflect misclassifica-tion from self-report, supported by the reduced RA family history reported in the incident subset. The discrepancy might also reflect the low sensitivity of electronic diagnosis code methods and pop-ulation differences, or the fact that 8% of participants in this study did not answer the question.
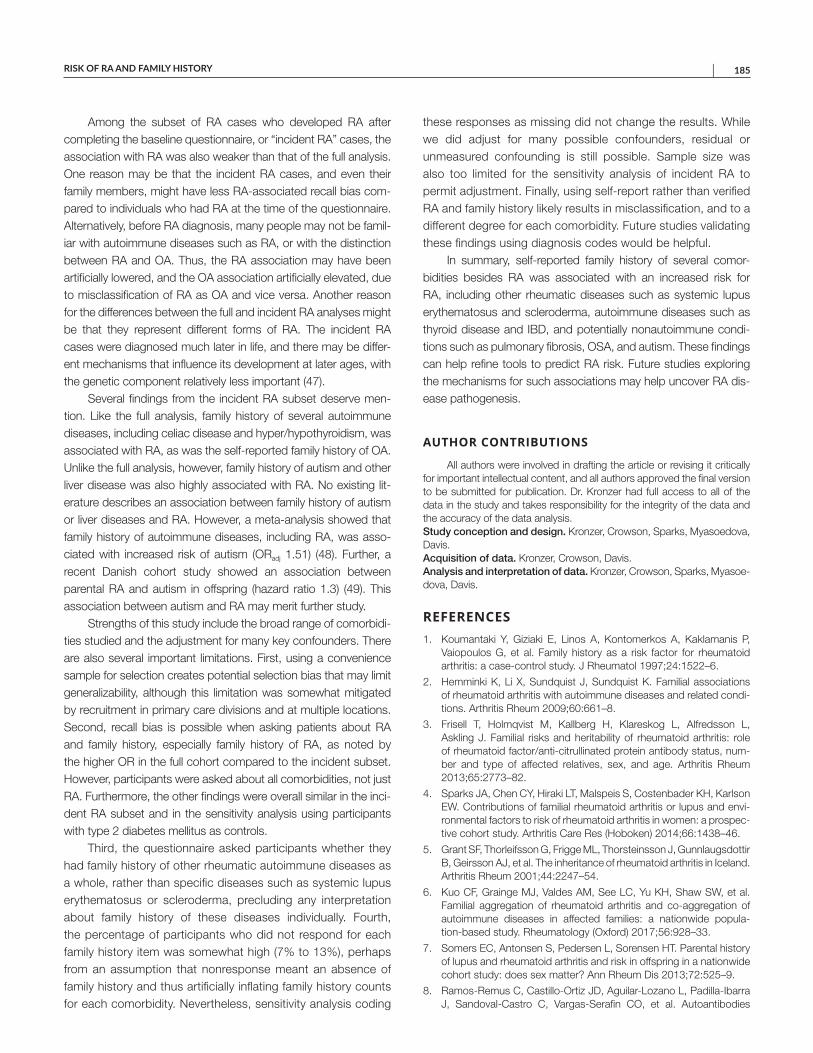
RISK OF RA AND FAMILY HISTORY | 185
Among the subset of RA cases who developed RA after completing the baseline questionnaire, or “incident RA” cases, the association with RA was also weaker than that of the full analysis. One reason may be that the incident RA cases, and even their family members, might have less RA-associated recall bias com-pared to individuals who had RA at the time of the questionnaire. Alternatively, before RA diagnosis, many people may not be famil-iar with autoimmune diseases such as RA, or with the distinction between RA and OA. Thus, the RA association may have been artificially lowered, and the OA association artificially elevated, due to misclassification of RA as OA and vice versa. Another reason for the differences between the full and incident RA analyses might be that they represent different forms of RA. The incident RA cases were diagnosed much later in life, and there may be differ-ent mechanisms that influence its development at later ages, with the genetic component relatively less important (47).
Several findings from the incident RA subset deserve men-tion. Like the full analysis, family history of several autoimmune diseases, including celiac disease and hyper/hypothyroidism, was associated with RA, as was the self-reported family history of OA. Unlike the full analysis, however, family history of autism and other liver disease was also highly associated with RA. No existing lit-erature describes an association between family history of autism or liver diseases and RA. However, a meta-analysis showed that family history of autoimmune diseases, including RA, was asso-ciated with increased risk of autism (ORadj 1.51) (48). Further, a recent Danish cohort study showed an association between parental RA and autism in offspring (hazard ratio 1.3) (49). This association between autism and RA may merit further study.
Strengths of this study include the broad range of comorbidi-ties studied and the adjustment for many key confounders. There are also several important limitations. First, using a convenience sample for selection creates potential selection bias that may limit generalizability, although this limitation was somewhat mitigated by recruitment in primary care divisions and at multiple locations. Second, recall bias is possible when asking patients about RA and family history, especially family history of RA, as noted by the higher OR in the full cohort compared to the incident subset. However, participants were asked about all comorbidities, not just RA. Furthermore, the other findings were overall similar in the inci-dent RA subset and in the sensitivity analysis using participants with type 2 diabetes mellitus as controls.
Third, the questionnaire asked participants whether they had family history of other rheumatic autoimmune diseases as a whole, rather than specific diseases such as systemic lupus erythematosus or scleroderma, precluding any interpretation about family history of these diseases individually. Fourth, the percentage of participants who did not respond for each family history item was somewhat high (7% to 13%), perhaps from an assumption that nonresponse meant an absence of family history and thus artificially inflating family history counts for each comorbidity. Nevertheless, sensitivity analysis coding
these responses as missing did not change the results. While we did adjust for many possible confounders, residual or unmeasured confounding is still possible. Sample size was also too limited for the sensitivity analysis of incident RA to permit adjustment. Finally, using self-report rather than verified RA and family history likely results in misclassification, and to a different degree for each comorbidity. Future studies validating these findings using diagnosis codes would be helpful.
In summary, self-reported family history of several comor-bidities besides RA was associated with an increased risk for RA, including other rheumatic diseases such as systemic lupus erythematosus and scleroderma, autoimmune diseases such as thyroid disease and IBD, and potentially nonautoimmune condi-tions such as pulmonary fibrosis, OSA, and autism. These findings can help refine tools to predict RA risk. Future studies exploring the mechanisms for such associations may help uncover RA dis-ease pathogenesis.
AUTHOR CONTRIBUTIONS
All authors were involved in drafting the article or revising it critically for important intellectual content, and all authors approved the final version to be submitted for publication. Dr. Kronzer had full access to all of the data in the study and takes responsibility for the integrity of the data and the accuracy of the data analysis.Study conception and design. Kronzer, Crowson, Sparks, Myasoedova, Davis.Acquisition of data. Kronzer, Crowson, Davis.Analysis and interpretation of data. Kronzer, Crowson, Sparks, Myasoe -dova, Davis.
REFERENCES 1. Koumantaki Y, Giziaki E, Linos A, Kontomerkos A, Kaklamanis P,
Vaiopoulos G, et al. Family history as a risk factor for rheumatoidarthritis: a case-control study. J Rheumatol 1997;24:1522–6.
2. Hemminki K, Li X, Sundquist J, Sundquist K. Familial associationsof rheumatoid arthritis with autoimmune diseases and related condi-tions. Arthritis Rheum 2009;60:661–8.
3. Frisell T, Holmqvist M, Kallberg H, Klareskog L, Alfredsson L,Askling J. Familial risks and heritability of rheumatoid arthritis: roleof rheumatoid factor/anti-citrullinated protein antibody status, num-ber and type of affected relatives, sex, and age. Arthritis Rheum2013;65:2773–82.
4. Sparks JA, Chen CY, Hiraki LT, Malspeis S, Costenbader KH, Karlson EW. Contributions of familial rheumatoid arthritis or lupus and envi-ronmental factors to risk of rheumatoid arthritis in women: a prospec-tive cohort study. Arthritis Care Res (Hoboken) 2014;66:1438–46.
5. Grant SF, Thorleifsson G, Frigge ML, Thorsteinsson J, Gunnlaugsdottir B, Geirsson AJ, et al. The inheritance of rheumatoid arthritis in Iceland. Arthritis Rheum 2001;44:2247–54.
6. Kuo CF, Grainge MJ, Valdes AM, See LC, Yu KH, Shaw SW, et al.Familial aggregation of rheumatoid arthritis and co-aggregation ofautoimmune diseases in affected families: a nationwide popula-tion-based study. Rheumatology (Oxford) 2017;56:928–33.
7. Somers EC, Antonsen S, Pedersen L, Sorensen HT. Parental historyof lupus and rheumatoid arthritis and risk in offspring in a nationwidecohort study: does sex matter? Ann Rheum Dis 2013;72:525–9.
8. Ramos-Remus C, Castillo-Ortiz JD, Aguilar-Lozano L, Padilla-IbarraJ, Sandoval-Castro C, Vargas-Serafin CO, et al. Autoantibodies
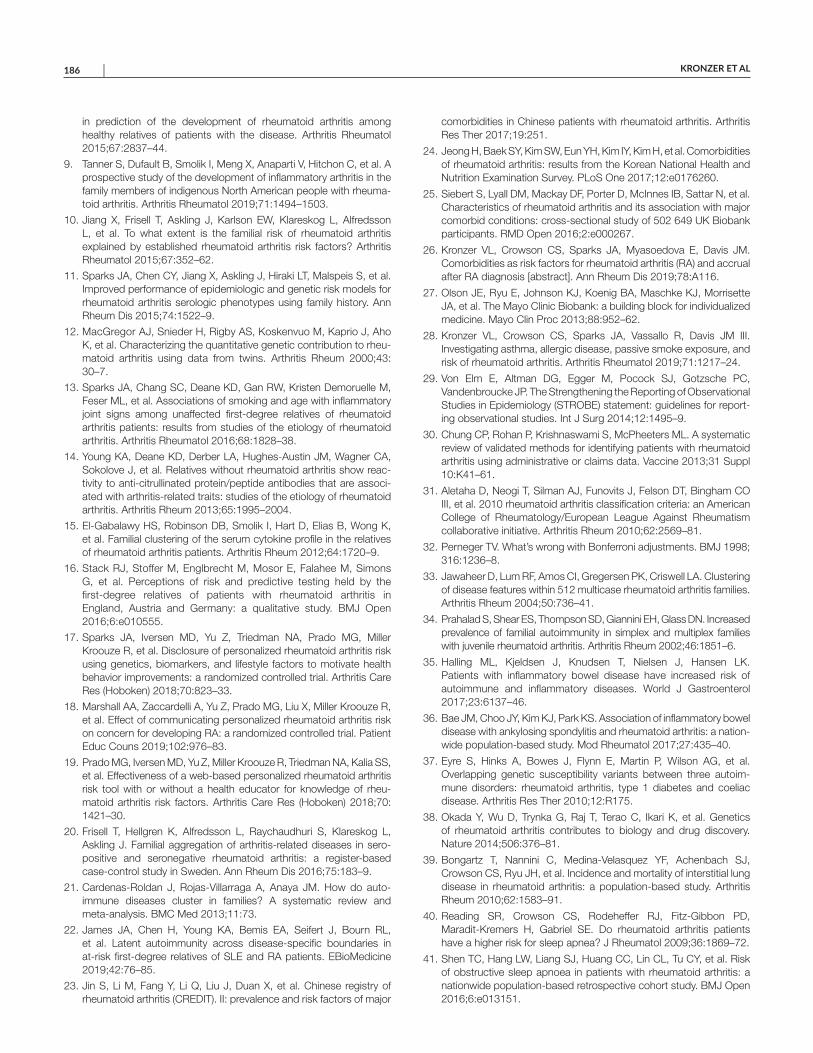
KRONZER ET AL 186 |
in prediction of the development of rheumatoid arthritis among healthy relatives of patients with the disease. Arthritis Rheumatol 2015;67:2837–44.
9. Tanner S, Dufault B, Smolik I, Meng X, Anaparti V, Hitchon C, et al. Aprospective study of the development of inflammatory arthritis in thefamily members of indigenous North American people with rheuma-toid arthritis. Arthritis Rheumatol 2019;71:1494–1503.
10. Jiang X, Frisell T, Askling J, Karlson EW, Klareskog L, AlfredssonL, et al. To what extent is the familial risk of rheumatoid arthritisexplained by established rheumatoid arthritis risk factors? ArthritisRheumatol 2015;67:352–62.
11. Sparks JA, Chen CY, Jiang X, Askling J, Hiraki LT, Malspeis S, et al.Improved performance of epidemiologic and genetic risk models forrheumatoid arthritis serologic phenotypes using family history. AnnRheum Dis 2015;74:1522–9.
12. MacGregor AJ, Snieder H, Rigby AS, Koskenvuo M, Kaprio J, AhoK, et al. Characterizing the quantitative genetic contribution to rheu-matoid arthritis using data from twins. Arthritis Rheum 2000;43:30–7.
13. Sparks JA, Chang SC, Deane KD, Gan RW, Kristen Demoruelle M,Feser ML, et al. Associations of smoking and age with inflammatoryjoint signs among unaffected first-degree relatives of rheumatoidarthritis patients: results from studies of the etiology of rheumatoidarthritis. Arthritis Rheumatol 2016;68:1828–38.
14. Young KA, Deane KD, Derber LA, Hughes-Austin JM, Wagner CA,Sokolove J, et al. Relatives without rheumatoid arthritis show reac-tivity to anti-citrullinated protein/peptide antibodies that are associ-ated with arthritis-related traits: studies of the etiology of rheumatoidarthritis. Arthritis Rheum 2013;65:1995–2004.
15. El-Gabalawy HS, Robinson DB, Smolik I, Hart D, Elias B, Wong K,et al. Familial clustering of the serum cytokine profile in the relativesof rheumatoid arthritis patients. Arthritis Rheum 2012;64:1720–9.
16. Stack RJ, Stoffer M, Englbrecht M, Mosor E, Falahee M, SimonsG, et al. Perceptions of risk and predictive testing held by thefirst-degree relatives of patients with rheumatoid arthritis inEngland, Austria and Germany: a qualitative study. BMJ Open2016;6:e010555.
17. Sparks JA, Iversen MD, Yu Z, Triedman NA, Prado MG, MillerKroouze R, et al. Disclosure of personalized rheumatoid arthritis riskusing genetics, biomarkers, and lifestyle factors to motivate healthbehavior improvements: a randomized controlled trial. Arthritis CareRes (Hoboken) 2018;70:823–33.
18. Marshall AA, Zaccardelli A, Yu Z, Prado MG, Liu X, Miller Kroouze R,et al. Effect of communicating personalized rheumatoid arthritis riskon concern for developing RA: a randomized controlled trial. PatientEduc Couns 2019;102:976–83.
19. Prado MG, Iversen MD, Yu Z, Miller Kroouze R, Triedman NA, Kalia SS, et al. Effectiveness of a web-based personalized rheumatoid arthritisrisk tool with or without a health educator for knowledge of rheu-matoid arthritis risk factors. Arthritis Care Res (Hoboken) 2018;70:1421–30.
20. Frisell T, Hellgren K, Alfredsson L, Raychaudhuri S, Klareskog L,Askling J. Familial aggregation of arthritis-related diseases in sero-positive and seronegative rheumatoid arthritis: a register-basedcase-control study in Sweden. Ann Rheum Dis 2016;75:183–9.
21. Cardenas-Roldan J, Rojas-Villarraga A, Anaya JM. How do auto-immune diseases cluster in families? A systematic review andmeta-analysis. BMC Med 2013;11:73.
22. James JA, Chen H, Young KA, Bemis EA, Seifert J, Bourn RL,et al. Latent autoimmunity across disease-specific boundaries inat-risk first-degree relatives of SLE and RA patients. EBioMedicine2019;42:76–85.
23. Jin S, Li M, Fang Y, Li Q, Liu J, Duan X, et al. Chinese registry ofrheumatoid arthritis (CREDIT). II: prevalence and risk factors of major
comorbidities in Chinese patients with rheumatoid arthritis. Arthritis Res Ther 2017;19:251.
24. Jeong H, Baek SY, Kim SW, Eun YH, Kim IY, Kim H, et al. Comorbidities of rheumatoid arthritis: results from the Korean National Health andNutrition Examination Survey. PLoS One 2017;12:e0176260.
25. Siebert S, Lyall DM, Mackay DF, Porter D, McInnes IB, Sattar N, et al. Characteristics of rheumatoid arthritis and its association with majorcomorbid conditions: cross-sectional study of 502 649 UK Biobankparticipants. RMD Open 2016;2:e000267.
26. Kronzer VL, Crowson CS, Sparks JA, Myasoedova E, Davis JM.Comorbidities as risk factors for rheumatoid arthritis (RA) and accrual after RA diagnosis [abstract]. Ann Rheum Dis 2019;78:A116.
27. Olson JE, Ryu E, Johnson KJ, Koenig BA, Maschke KJ, MorrisetteJA, et al. The Mayo Clinic Biobank: a building block for individualized medicine. Mayo Clin Proc 2013;88:952–62.
28. Kronzer VL, Crowson CS, Sparks JA, Vassallo R, Davis JM III.Investigating asthma, allergic disease, passive smoke exposure, and risk of rheumatoid arthritis. Arthritis Rheumatol 2019;71:1217–24.
29. Von Elm E, Altman DG, Egger M, Pocock SJ, Gotzsche PC,Vandenbroucke JP. The Strengthening the Reporting of Observational Studies in Epidemiology (STROBE) statement: guidelines for report-ing observational studies. Int J Surg 2014;12:1495–9.
30. Chung CP, Rohan P, Krishnaswami S, McPheeters ML. A systematic review of validated methods for identifying patients with rheumatoidarthritis using administrative or claims data. Vaccine 2013;31 Suppl10:K41–61.
31. Aletaha D, Neogi T, Silman AJ, Funovits J, Felson DT, Bingham COIII, et al. 2010 rheumatoid arthritis classification criteria: an AmericanCollege of Rheumatology/European League Against Rheumatismcollaborative initiative. Arthritis Rheum 2010;62:2569–81.
32. Perneger TV. What’s wrong with Bonferroni adjustments. BMJ 1998;316:1236–8.
33. Jawaheer D, Lum RF, Amos CI, Gregersen PK, Criswell LA. Clustering of disease features within 512 multicase rheumatoid arthritis families. Arthritis Rheum 2004;50:736–41.
34. Prahalad S, Shear ES, Thompson SD, Giannini EH, Glass DN. Increased prevalence of familial autoimmunity in simplex and multiplex familieswith juvenile rheumatoid arthritis. Arthritis Rheum 2002;46:1851–6.
35. Halling ML, Kjeldsen J, Knudsen T, Nielsen J, Hansen LK.Patients with inflammatory bowel disease have increased risk ofautoimmune and inflammatory diseases. World J Gastroenterol2017;23:6137–46.
36. Bae JM, Choo JY, Kim KJ, Park KS. Association of inflammatory boweldisease with ankylosing spondylitis and rheumatoid arthritis: a nation-wide population-based study. Mod Rheumatol 2017;27:435–40.
37. Eyre S, Hinks A, Bowes J, Flynn E, Martin P, Wilson AG, et al.Overlapping genetic susceptibility variants between three autoim-mune disorders: rheumatoid arthritis, type 1 diabetes and coeliacdisease. Arthritis Res Ther 2010;12:R175.
38. Okada Y, Wu D, Trynka G, Raj T, Terao C, Ikari K, et al. Geneticsof rheumatoid arthritis contributes to biology and drug discovery.Nature 2014;506:376–81.
39. Bongartz T, Nannini C, Medina-Velasquez YF, Achenbach SJ,Crowson CS, Ryu JH, et al. Incidence and mortality of interstitial lung disease in rheumatoid arthritis: a population-based study. ArthritisRheum 2010;62:1583–91.
40. Reading SR, Crowson CS, Rodeheffer RJ, Fitz-Gibbon PD,Maradit-Kremers H, Gabriel SE. Do rheumatoid arthritis patientshave a higher risk for sleep apnea? J Rheumatol 2009;36:1869–72.
41. Shen TC, Hang LW, Liang SJ, Huang CC, Lin CL, Tu CY, et al. Riskof obstructive sleep apnoea in patients with rheumatoid arthritis: anationwide population-based retrospective cohort study. BMJ Open2016;6:e013151.
RISK OF RA AND FAMILY HISTORY | 187
42. Han C, Robinson DW Jr, Hackett MV, Paramore LC, Fraeman KH, Bala MV. Cardiovascular disease and risk factors in patients with rheumatoid arthritis, psoriatic arthritis, and ankylosing spondylitis. J Rheumatol 2006;33:2167–72.
43. Wolfe F, Michaud K. The risk of myocardial infarction and phar-macologic and nonpharmacologic myocardial infarction predictors in rheumatoid arthritis: a cohort and nested case-control analysis. Arthritis Rheum 2008;58:2612–21.
44. Albrecht K, Luque Ramos A, Hoffmann F, Redeker I, Zink A. High prevalence of diabetes in patients with rheumatoid arthritis: results from a questionnaire survey linked to claims data. Rheumatology (Oxford) 2018;57:329–36.
45. Chang CC, Lin TM, Chang YS, Chen WS, Sheu JJ, Chen YH, et al. Autoimmune rheumatic diseases and the risk of Parkinson disease: a nationwide population-based cohort study in Taiwan. Ann Med 2018;50:83–90.
46. Lin TM, Chen WS, Sheu JJ, Chen YH, Chen JH, Chang CC. Autoimmune rheumatic diseases increase dementia risk in middle-aged patients: a nationwide cohort study. PLoS One 2018;13:e0186475.
47. Chen Y, Mattey DL. Age at onset of rheumatoid arthritis: associa-tion with polymorphisms in the vascular endothelial growth factor A (VEGFA) gene and an intergenic locus between matrix metallo-proteinase (MMP) 1 and 3 genes. Clin Exp Rheumatol 2012;30: 894–8.
48. Wu S, Ding Y, Wu F, Li R, Xie G, Hou J, et al. Family history of auto-immune diseases is associated with an increased risk of autism in children: a systematic review and meta-analysis. Neurosci Biobehav Rev 2015;55:322–32.
49. Rom AL, Wu CS, Olsen J, Jawaheer D, Hetland ML, Morch LS. Parental rheumatoid arthritis and autism spectrum disorders in off-spring: a Danish nationwide cohort study. J Am Acad Child Adolesc Psychiatry 2018;57:28–32.
188
Arthritis Care & ResearchVol. 73, No. 2, February 2021, pp 188–198DOI 10.1002/acr.24120© 2019, American College of Rheumatology
Roles of Postdiagnosis Accumulation of Morbidities and Lifestyle Changes in Excess Total and Cause-Specific Mortality Risk in Rheumatoid ArthritisKazuki Yoshida,1 Tzu-Chieh Lin,2 Melissa Y. Wei,3 Susan Malspeis,2 Su H. Chu,1 Carlos A. Camargo Jr,4 Benjamin A. Raby,5 Hyon K. Choi,6 Sara K. Tedeschi,1 Medha Barbhaiya,7 Bing Lu,1 Karen H. Costenbader,1
Elizabeth W. Karlson,1 and Jeffrey A. Sparks1
Objective. To elucidate how postdiagnosis multimorbidity and lifestyle changes contribute to the excess mortality of rheumatoid arthritis (RA).
Methods. We performed a matched cohort study among women in the Nurses’ Health Study (1976–2018). We identified women with incident RA and matched each by age and year to 10 non-RA comparators at the RA diagnosis index date. Specific causes of death were ascertained via death certificates and medical record review. Lifestyle and morbidity factors were reported biennially; 61 chronic conditions were combined into the Multimorbidity Weighted Index (MWI). After adjusting for baseline confounders, we used inverse probability weighting analysis to examine the mediating influence of postindex MWI scores and lifestyle factors on total, cardiovascular, and respiratory mortality, comparing women with RA to their matched comparators.
Results. We identified 1,007 patients with incident RA and matched them to 10,070 non-RA comparators. After adjusting for preindex confounders, we found that hazard ratios (HRs) and 95% confidence intervals (95% CIs) were higher for total mortality (HR 1.46 [95% CI 1.32, 1.62]), as well as cardiovascular (HR 1.54 [95% CI 1.22, 1.94]) and respiratory (HR 2.75 [95% CI 2.05, 3.71]) mortality in patients with RA compared to non-RA comparators. Adjusting for postindex lifestyle factors (physical activity, body mass index, diet, smoking) attenuated but did not substantially account for this excess RA mortality. After additional adjustment for postindex MWI scores, patients with RA had HRs of 1.18 (95% CI 1.05, 1.32) for total, 1.19 (95% CI 0.94, 1.51) for cardiovascular, and 1.93 (95% CI 1.42, 2.62) for respiratory mortality.
Conclusion. We found that MWI scores substantially accounted for the excess total and cardiovascular mortality among women with RA. This finding underscores the importance of monitoring for the total disease burden as a whole in monitoring patients with RA.
INTRODUCTION
Rheumatoid arthritis (RA) has been associated with an increased incidence of cardiovascular events (1), cancer (2), seri-ous infections (3), and respiratory diseases (4) compared to the general population. Despite advances in RA treatment, a gap
between the mortality of patients with RA and the general popula-tion persists, perhaps due to worsening lifestyle, morbidity burden, disease progression, and medication side effects (5–7).
Although RA is one of the most common autoimmune dis-eases, its annual incidence of 38 per 100,000 is relatively low (8). This fact makes the construction of an inception cohort with appro-
The contents of this article are solely the responsibility of the authors and do not necessarily represent the official views of the National Institutes of Health.
Supported by the Rheumatology Research Foundation K Supplement Award and Investigator Award, and by the NIH (grants L30-AR-066953, K24-AR-052403, R01-AR-049880, R01-AR-057327, R01-AR-119246, R01-HL-034594P30, P30-AR-070253, P30-AR-072577, P30-AR-069625, UM1-CA-186107, U01-HG-008685, 1OT2-OD-026553, R01-AR-059073, and R03-AR-075886). Dr. Yoshida received financial support for his doctoral study from Harvard T. H. Chan School of Public Health (supported by grants from Takeda, Pfizer, Bayer and ASISA) and the Honjo International Scholarship Foundation. Dr. Wei’s work was supported by the NIH (National Institute on Aging grant K23-AG-056638). Dr. Sparks’ work was supported by the NIH (National Institute of Arthritis and Musculoskeletal and Skin Diseases grant K23-AR-069688).
1Kazuki Yoshida, MD, ScD, Su H. Chu, PhD, Sara K. Tedeschi, MD, MPH, Bing Lu, MD, DrPH, Karen H. Costenbader, MD, MPH, Elizabeth W. Karlson, MD, Jeffrey A. Sparks, MD, MMSc: Brigham and Women’s Hospital and Harvard Medical School, Boston, Massachusetts; 2Tzu-Chieh Lin, PhD, Susan Malspeis, MS: Brigham and Women’s Hospital, Boston, Massachusetts; 3Melissa Y. Wei, MD, MPH: University of Michigan, Ann Arbor; 4Carlos A. Camargo Jr, MD, DrPH: Harvard Medical School, Brigham and Women’s Hospital, and Massachusetts General Hospital, Boston, Massachusetts; 5Benjamin A. Raby, MD, MPH: Harvard Medical School, Brigham and Women’s Hospital, and Boston Children’s Hospital, Boston, Massachusetts; 6Hyon K. Choi, MD, DrPH: Harvard Medical School and Massachusetts General Hospital, Boston, Massachusetts; 7Medha Barbhaiya, MD, MPH: Hospital for Special Surgery and Weill Cornell Medical College, New York, New York.
No potential conflicts of interest relevant to this article were reported.
MULTIMORBIDITY AND EXCESS MORTALITY RISK IN RA | 189Arthritis Care & ResearchVol. 73, No. 2, February 2021, pp 188–198DOI 10.1002/acr.24120
priate individual-level comparators and lengthy follow-up difficult. As a result, studies have typically been performed using RA-only cohorts and compared to the expected mortality calculated from age-, sex-, and calendar-year–matched population statistics (standardized mortality ratio [SMR] method) (2,5–7,9). The SMR method does not account for the potential discrepancies between patients with RA and the general population beyond these factors, such as differences in smoking and body mass index (BMI). This absence may result in insufficient control for confounding (10,11) and an inability to study the mediators of excess mortality that are influenced by the RA status and predispose patients with RA to excess mortality.
Multimorbidity, the presence of 2 or more chronic conditions in an individual and representation of an individual’s accumulat-ing morbidity burden (12,13), likely plays a role in excess mor-tality. Various indices have been proposed in efforts to evaluate the multimorbidity burden (14). Quantifying the extent to which the excess mortality is explained by such a measure of multimorbidity is of interest because a comprehensive general measure of multi-morbidity should explain some part of the excess mortality among patients with RA, leaving the rest to RA-specific issues, includ-ing treatment and lifestyle changes. However, challenges exist in providing sufficiently granular information on chronic morbidities to calculate a multimorbidity index both in patients with RA and non-RA comparators without information bias due to differential ascertainment (15).
The Nurses’ Health Study (NHS), an ongoing large pro-spective cohort (n = 121,700) of US female registered nurses with a rich set of covariate history, provided a unique opportunity
to examine this question (16). In this study, we aimed to better understand the extent to which an extensive multimorbidity mea-sure (17) explained the excess mortality among patients with RA. If the excess mortality is explained to a large extent by such a multi-morbidity measure, the index may prove to be useful as a monitor-ing tool. If not, an effort to create a more comprehensive measure of multimorbidity may be warranted.
SUBJECTS AND METHODS
Subjects and eligibility. NHS enrolled 121,700 female registered nurses in 1976, ages 30–55 years. Since then, the prospective follow-up has continued every 2 years to date through mailed questionnaires. The questionnaires collect infor-mation on sociodemographics, anthropometrics, behaviors, med-ications, dietary intake, and health conditions. Only 4.4% of person-years have been lost to follow-up (18). The study protocol was approved by the institutional review boards of the Brigham and Women’s Hospital and the Harvard T. H. Chan School of Pub-lic Health.
Identification of incident RA. Participants who self- reported a new physician diagnosis of RA in the biennial NHS questionnaires received a validated follow-up questionnaire for connective tissue disease screening (19). If the screening was positive, medical records were requested and independently reviewed by 2 physicians to confirm RA based on the 1987 Amer-ican College of Rheumatology (ACR) (20) or 2010 ACR/European League Against Rheumatism (21) classification criteria. We further classified RA cases as seropositive (positivity of rheumatoid fac-tor or anti–cyclic citrullinated peptide antibody [anti–citrullinated protein antibody (ACPA)], if available) and seronegative (both anti-bodies negative) from the results of clinical testing in the record. We excluded women who had prevalent RA in 1976. The index date was defined as the date of diagnosis, as obtained by medical record review. RA cases were identified up to and including the 2014 questionnaire cycle.
Matched non-RA comparators. For each confirmed patient with incident RA, we matched by age and calendar year 10 non-RA comparators who had never self-reported RA at or prior to the index date. To avoid the issue of misalign-ment of the start of the follow-up and eligibility assessment, we did not use comparators’ future RA development status for baseline exclusion. Instead, they were censored at the time of RA development. This censoring only excluded 0.24% of the person-time.
SIGNIFICANCE & INNOVATIONS• We examined the roles that postdiagnosis factors
played in the excess mortality observed in patients with incident rheumatoid arthritis (RA) compared to matched non-RA comparators.
• The parent study, Nurses’ Health Study (NHS), pro-vided a rich set of longitudinal information both before and after the diagnosis of RA.
• Increased hazards persisted after accounting for the postdiagnosis lifestyle factors only.
• Accounting for the postdiagnosis multimorbidity as measured by the Multimorbidity Weighted In-dex mostly eliminated the increased hazards for total and cardiovascular mortality among patients with RA.
• An increased hazard for respiratory mortality remained, suggesting the roles of factors not cap-tured in the NHS, such as interstitial lung diseases.
Address correspondence to Kazuki Yoshida, MD, ScD, Division of Rheumatology, Inflammation, and Immunity, 60 Fenwood Road, Boston, MA 02115 (email: [email protected]); or to Jeffrey A. Sparks, MD, MMSc, Division of Rheumatology, Inflammation, and
Immunity, 60 Fenwood Road, Boston, MA 02115 (email: [email protected]).
Submitted for publication September 27, 2019; accepted in revised form December 3, 2019.
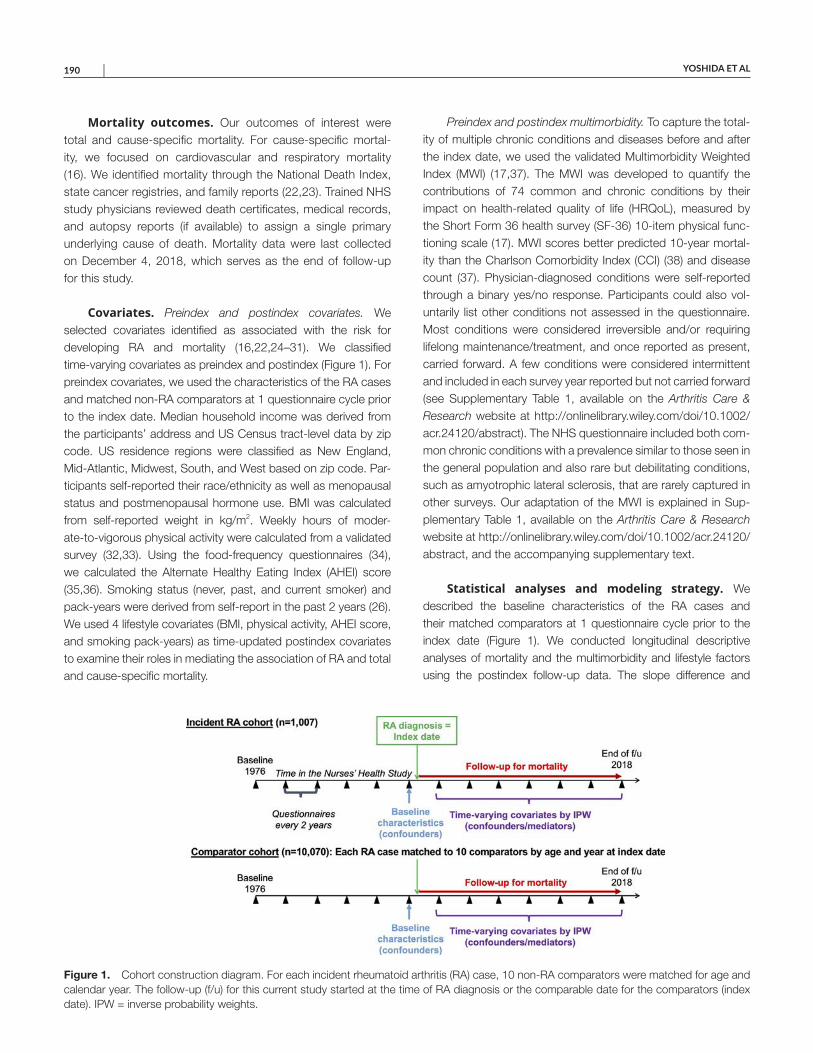
YOSHIDA ET AL 190 |
Mortality outcomes. Our outcomes of interest were total and cause-specific mortality. For cause-specific mortal-ity, we focused on cardiovascular and respiratory mortality (16). We identified mortality through the National Death Index, state cancer registries, and family reports (22,23). Trained NHS study physicians reviewed death certificates, medical records, and autopsy reports (if available) to assign a single primary underlying cause of death. Mortality data were last collected on December 4, 2018, which serves as the end of follow-up for this study.
Covariates. Preindex and postindex covariates. We selected covariates identified as associated with the risk for developing RA and mortality (16,22,24–31). We classified time-varying covariates as preindex and postindex (Figure 1). For preindex covariates, we used the characteristics of the RA cases and matched non-RA comparators at 1 questionnaire cycle prior to the index date. Median household income was derived from the participants’ address and US Census tract-level data by zip code. US residence regions were classified as New England, Mid-Atlantic, Midwest, South, and West based on zip code. Par-ticipants self-reported their race/ethnicity as well as menopausal status and postmenopausal hormone use. BMI was calculated from self-reported weight in kg/m2. Weekly hours of moder-ate-to-vigorous physical activity were calculated from a validated survey (32,33). Using the food-frequency questionnaires (34), we calculated the Alternate Healthy Eating Index (AHEI) score (35,36). Smoking status (never, past, and current smoker) and pack-years were derived from self-report in the past 2 years (26). We used 4 lifestyle covariates (BMI, physical activity, AHEI score, and smoking pack-years) as time-updated postindex covariates to examine their roles in mediating the association of RA and total and cause-specific mortality.
Preindex and postindex multimorbidity. To capture the total-ity of multiple chronic conditions and diseases before and after the index date, we used the validated Multimorbidity Weighted Index (MWI) (17,37). The MWI was developed to quantify the contributions of 74 common and chronic conditions by their impact on health-related quality of life (HRQoL), measured by the Short Form 36 health survey (SF-36) 10-item physical func-tioning scale (17). MWI scores better predicted 10-year mortal-ity than the Charlson Comorbidity Index (CCI) (38) and disease count (37). Physician-diagnosed conditions were self-reported through a binary yes/no response. Participants could also vol-untarily list other conditions not assessed in the questionnaire. Most conditions were considered irreversible and/or requiring lifelong maintenance/treatment, and once reported as present, carried forward. A few conditions were considered intermittent and included in each survey year reported but not carried forward (see Supplementary Table 1, available on the Arthritis Care & Research website at http://onlin elibr ary.wiley.com/doi/10.1002/acr.24120/ abstract). The NHS questionnaire included both com-mon chronic conditions with a prevalence similar to those seen in the general population and also rare but debilitating conditions, such as amyotrophic lateral sclerosis, that are rarely captured in other surveys. Our adaptation of the MWI is explained in Sup-plementary Table 1, available on the Arthritis Care & Research website at http://onlin elibr ary.wiley.com/doi/10.1002/acr.24120/ abstract, and the accompanying supplementary text.
Statistical analyses and modeling strategy. We described the baseline characteristics of the RA cases and their matched comparators at 1 questionnaire cycle prior to the index date (Figure 1). We conducted longitudinal descriptive analyses of mortality and the multimorbidity and lifestyle factors using the postindex follow-up data. The slope difference and
Figure 1. Cohort construction diagram. For each incident rheumatoid arthritis (RA) case, 10 non-RA comparators were matched for age and calendar year. The follow-up (f/u) for this current study started at the time of RA diagnosis or the comparable date for the comparators (index date). IPW = inverse probability weights.
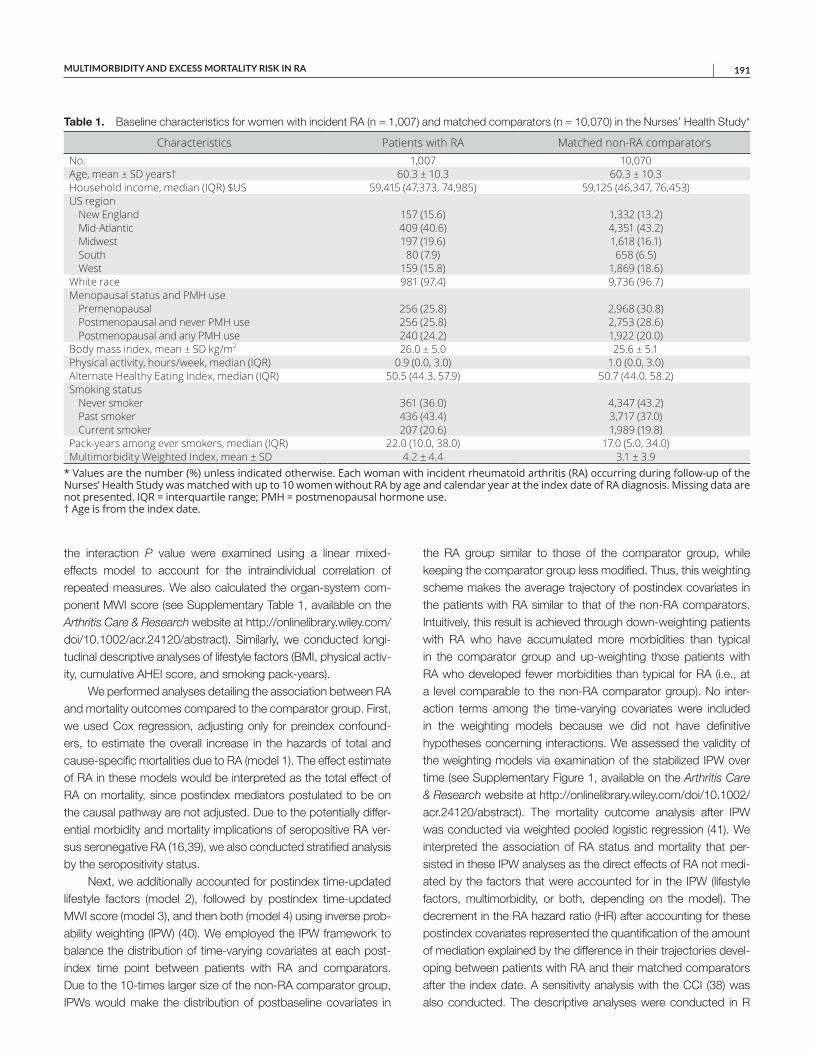
MULTIMORBIDITY AND EXCESS MORTALITY RISK IN RA | 191
the interaction P value were examined using a linear mixed- effects model to account for the intraindividual correlation of repeated measures. We also calculated the organ-system com-ponent MWI score (see Supplementary Table 1, available on the Arthritis Care & Research website at http://onlin elibr ary.wiley.com/doi/10.1002/acr.24120/ abstract). Similarly, we conducted longi-tudinal descriptive analyses of lifestyle factors (BMI, physical activ-ity, cumulative AHEI score, and smoking pack-years).
We performed analyses detailing the association between RA and mortality outcomes compared to the comparator group. First, we used Cox regression, adjusting only for preindex confound-ers, to estimate the overall increase in the hazards of total and cause-specific mortalities due to RA (model 1). The effect estimate of RA in these models would be interpreted as the total effect of RA on mortality, since postindex mediators postulated to be on the causal pathway are not adjusted. Due to the potentially differ-ential morbidity and mortality implications of seropositive RA ver-sus seronegative RA (16,39), we also conducted stratified analysis by the seropositivity status.
Next, we additionally accounted for postindex time-updated lifestyle factors (model 2), followed by postindex time-updated MWI score (model 3), and then both (model 4) using inverse prob-ability weighting (IPW) (40). We employed the IPW framework to balance the distribution of time-varying covariates at each post-index time point between patients with RA and comparators. Due to the 10-times larger size of the non-RA comparator group, IPWs would make the distribution of postbaseline covariates in
the RA group similar to those of the comparator group, while keeping the comparator group less modified. Thus, this weighting scheme makes the average trajectory of postindex covariates in the patients with RA similar to that of the non-RA comparators. Intuitively, this result is achieved through down-weighting patients with RA who have accumulated more morbidities than typical in the comparator group and up-weighting those patients with RA who developed fewer morbidities than typical for RA (i.e., at a level comparable to the non-RA comparator group). No inter-action terms among the time-varying covariates were included in the weighting models because we did not have definitive hypotheses concerning interactions. We assessed the validity of the weighting models via examination of the stabilized IPW over time (see Supplementary Figure 1, available on the Arthritis Care & Research website at http://onlin elibr ary.wiley.com/doi/10.1002/acr.24120/ abstract). The mortality outcome analysis after IPW was conducted via weighted pooled logistic regression (41). We interpreted the association of RA status and mortality that per-sisted in these IPW analyses as the direct effects of RA not medi-ated by the factors that were accounted for in the IPW (lifestyle factors, multimorbidity, or both, depending on the model). The decrement in the RA hazard ratio (HR) after accounting for these postindex covariates represented the quantification of the amount of mediation explained by the difference in their trajectories devel-oping between patients with RA and their matched comparators after the index date. A sensitivity analysis with the CCI (38) was also conducted. The descriptive analyses were conducted in R
Table 1. Baseline characteristics for women with incident RA (n = 1,007) and matched comparators (n = 10,070) in the Nurses’ Health Study*
Characteristics Patients with RA Matched non-RA comparatorsNo. 1,007 10,070Age, mean ± SD years† 60.3 ± 10.3 60.3 ± 10.3Household income, median (IQR) $US 59,415 (47,373, 74,985) 59,125 (46,347, 76,453)US region
New England 157 (15.6) 1,332 (13.2)Mid-Atlantic 409 (40.6) 4,351 (43.2)Midwest 197 (19.6) 1,618 (16.1)South 80 (7.9) 658 (6.5)West 159 (15.8) 1,869 (18.6)
White race 981 (97.4) 9,736 (96.7)Menopausal status and PMH use
Premenopausal 256 (25.8) 2,968 (30.8)Postmenopausal and never PMH use 256 (25.8) 2,753 (28.6)Postmenopausal and any PMH use 240 (24.2) 1,922 (20.0)
Body mass index, mean ± SD kg/m2 26.0 ± 5.0 25.6 ± 5.1Physical activity, hours/week, median (IQR) 0.9 (0.0, 3.0) 1.0 (0.0, 3.0)Alternate Healthy Eating Index, median (IQR) 50.5 (44.3, 57.9) 50.7 (44.0, 58.2)Smoking status
Never smoker 361 (36.0) 4,347 (43.2)Past smoker 436 (43.4) 3,717 (37.0)Current smoker 207 (20.6) 1,989 (19.8)
Pack-years among ever smokers, median (IQR) 22.0 (10.0, 38.0) 17.0 (5.0, 34.0)Multimorbidity Weighted Index, mean ± SD 4.2 ± 4.4 3.1 ± 3.9
* Values are the number (%) unless indicated otherwise. Each woman with incident rheumatoid arthritis (RA) occurring during follow-up of the Nurses’ Health Study was matched with up to 10 women without RA by age and calendar year at the index date of RA diagnosis. Missing data are not presented. IQR = interquartile range; PMH = postmenopausal hormone use. † Age is from the index date.
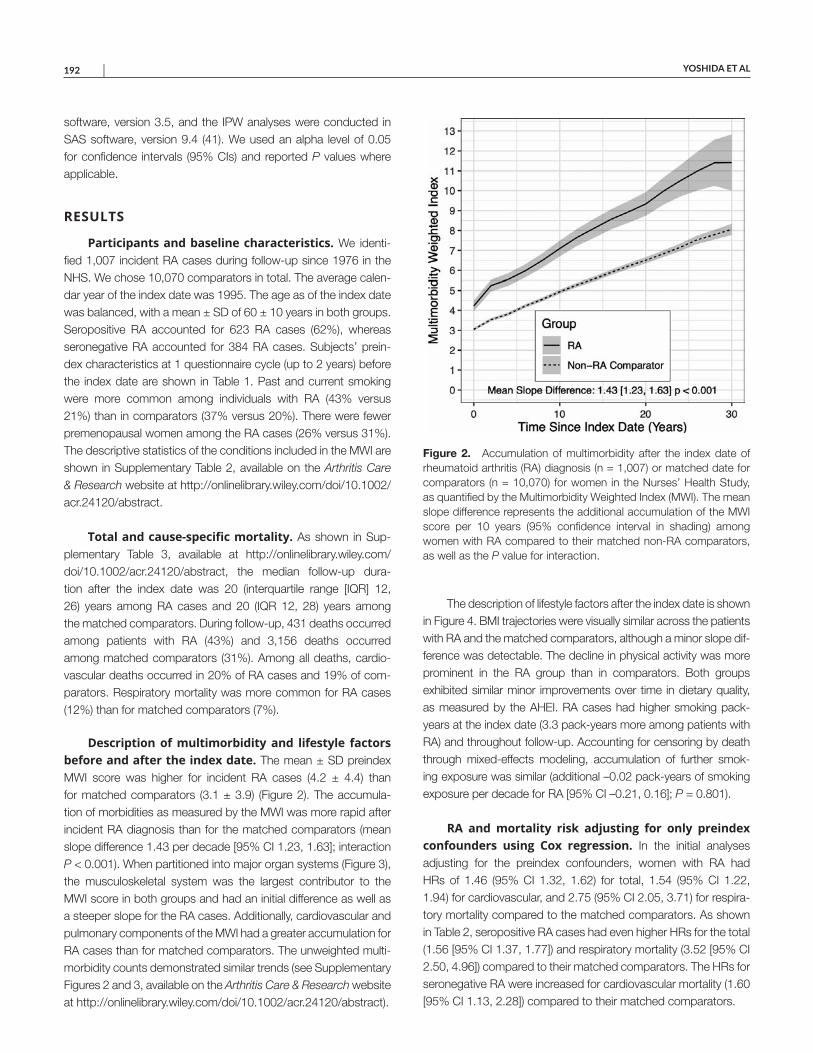
YOSHIDA ET AL 192 |
software, version 3.5, and the IPW analyses were conducted in SAS software, version 9.4 (41). We used an alpha level of 0.05 for confidence intervals (95% CIs) and reported P values where applicable.
RESULTS
Participants and baseline characteristics. We identi-fied 1,007 incident RA cases during follow-up since 1976 in the NHS. We chose 10,070 comparators in total. The average calen-dar year of the index date was 1995. The age as of the index date was balanced, with a mean ± SD of 60 ± 10 years in both groups. Seropositive RA accounted for 623 RA cases (62%), whereas seronegative RA accounted for 384 RA cases. Subjects’ prein-dex characteristics at 1 questionnaire cycle (up to 2 years) before the index date are shown in Table 1. Past and current smoking were more common among individuals with RA (43% versus 21%) than in comparators (37% versus 20%). There were fewer premenopausal women among the RA cases (26% versus 31%). The descriptive statistics of the conditions included in the MWI are shown in Supplementary Table 2, available on the Arthritis Care & Research website at http://onlin elibr ary.wiley.com/doi/10.1002/acr.24120/ abstract.
Total and cause-specific mortality. As shown in Sup-plementary Table 3, available at http://onlin elibr ary.wiley.com/doi/10.1002/acr.24120/ abstract, the median follow-up dura-tion after the index date was 20 (interquartile range [IQR] 12, 26) years among RA cases and 20 (IQR 12, 28) years among the matched comparators. During follow-up, 431 deaths occurred among patients with RA (43%) and 3,156 deaths occurred among matched comparators (31%). Among all deaths, cardio-vascular deaths occurred in 20% of RA cases and 19% of com-parators. Respiratory mortality was more common for RA cases (12%) than for matched comparators (7%).
Description of multimorbidity and lifestyle factors before and after the index date. The mean ± SD preindex MWI score was higher for incident RA cases (4.2 ± 4.4) than for matched comparators (3.1 ± 3.9) (Figure 2). The accumula-tion of morbidities as measured by the MWI was more rapid after incident RA diagnosis than for the matched comparators (mean slope difference 1.43 per decade [95% CI 1.23, 1.63]; interaction P < 0.001). When partitioned into major organ systems (Figure 3), the musculoskeletal system was the largest contributor to the MWI score in both groups and had an initial difference as well as a steeper slope for the RA cases. Additionally, cardiovascular and pulmonary components of the MWI had a greater accumulation for RA cases than for matched comparators. The unweighted multi-morbidity counts demonstrated similar trends (see Supplementary Figures 2 and 3, available on the Arthritis Care & Research website at http://onlin elibr ary.wiley.com/doi/10.1002/acr.24120/ abstract).
The description of lifestyle factors after the index date is shown in Figure 4. BMI trajectories were visually similar across the patients with RA and the matched comparators, although a minor slope dif-ference was detectable. The decline in physical activity was more prominent in the RA group than in comparators. Both groups exhibited similar minor improvements over time in dietary quality, as measured by the AHEI. RA cases had higher smoking pack-years at the index date (3.3 pack-years more among patients with RA) and throughout follow-up. Accounting for censoring by death through mixed-effects modeling, accumulation of further smok-ing exposure was similar (additional –0.02 pack-years of smoking exposure per decade for RA [95% CI –0.21, 0.16]; P = 0.801).
RA and mortality risk adjusting for only preindex confounders using Cox regression. In the initial analyses adjusting for the preindex confounders, women with RA had HRs of 1.46 (95% CI 1.32, 1.62) for total, 1.54 (95% CI 1.22, 1.94) for cardiovascular, and 2.75 (95% CI 2.05, 3.71) for respira-tory mortality compared to the matched comparators. As shown in Table 2, seropositive RA cases had even higher HRs for the total (1.56 [95% CI 1.37, 1.77]) and respiratory mortality (3.52 [95% CI 2.50, 4.96]) compared to their matched comparators. The HRs for seronegative RA were increased for cardiovascular mortality (1.60 [95% CI 1.13, 2.28]) compared to their matched comparators.
Figure 2. Accumulation of multimorbidity after the index date of rheumatoid arthritis (RA) diagnosis (n = 1,007) or matched date for comparators (n = 10,070) for women in the Nurses’ Health Study, as quantified by the Multimorbidity Weighted Index (MWI). The mean slope difference represents the additional accumulation of the MWI score per 10 years (95% confidence interval in shading) among women with RA compared to their matched non-RA comparators, as well as the P value for interaction.
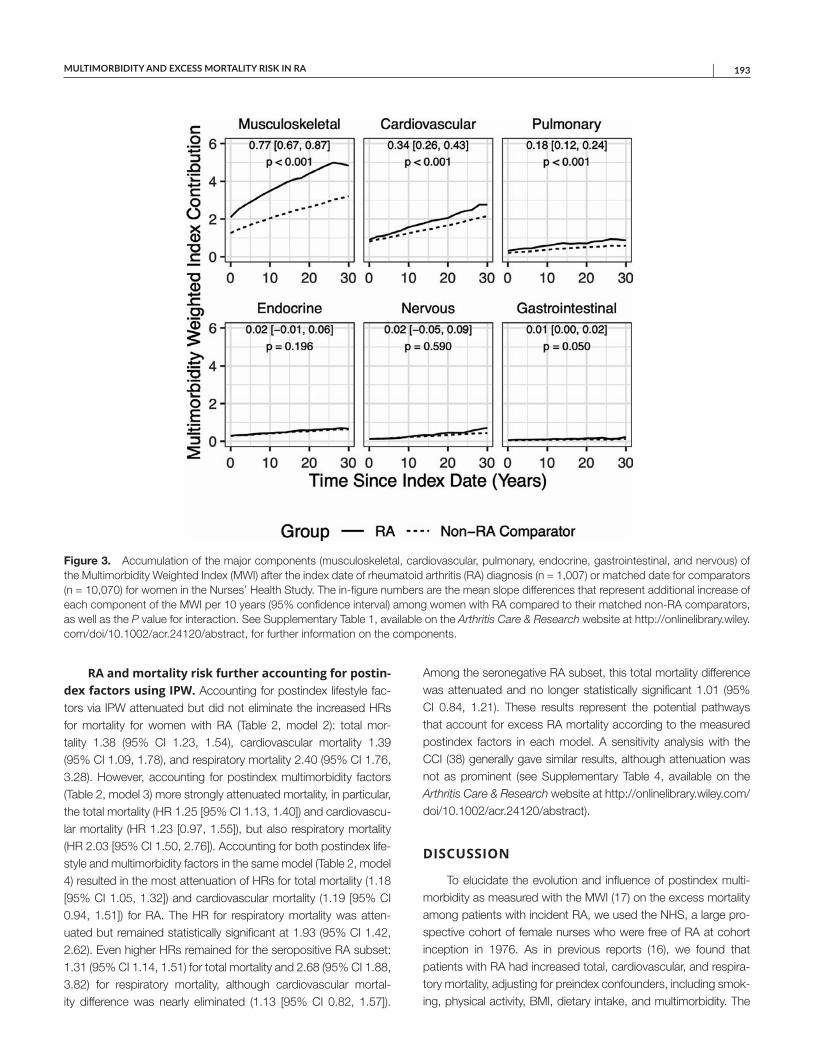
MULTIMORBIDITY AND EXCESS MORTALITY RISK IN RA | 193
RA and mortality risk further accounting for postin-dex factors using IPW. Accounting for postindex lifestyle fac-tors via IPW attenuated but did not eliminate the increased HRs for mortality for women with RA (Table 2, model 2): total mor-tality 1.38 (95% CI 1.23, 1.54), cardiovascular mortality 1.39 (95% CI 1.09, 1.78), and respiratory mortality 2.40 (95% CI 1.76, 3.28). However, accounting for postindex multimorbidity factors (Table 2, model 3) more strongly attenuated mortality, in particular, the total mortality (HR 1.25 [95% CI 1.13, 1.40]) and cardiovascu-lar mortality (HR 1.23 [0.97, 1.55]), but also respiratory mortality (HR 2.03 [95% CI 1.50, 2.76]). Accounting for both postindex life-style and multimorbidity factors in the same model (Table 2, model 4) resulted in the most attenuation of HRs for total mortality (1.18 [95% CI 1.05, 1.32]) and cardiovascular mortality (1.19 [95% CI 0.94, 1.51]) for RA. The HR for respiratory mortality was atten-uated but remained statistically significant at 1.93 (95% CI 1.42, 2.62). Even higher HRs remained for the seropositive RA subset: 1.31 (95% CI 1.14, 1.51) for total mortality and 2.68 (95% CI 1.88, 3.82) for respiratory mortality, although cardiovascular mortal-ity difference was nearly eliminated (1.13 [95% CI 0.82, 1.57]).
Among the seronegative RA subset, this total mortality difference was attenuated and no longer statistically significant 1.01 (95% CI 0.84, 1.21). These results represent the potential pathways that account for excess RA mortality according to the measured postindex factors in each model. A sensitivity analysis with the CCI (38) generally gave similar results, although attenuation was not as prominent (see Supplementary Table 4, available on the Arthritis Care & Research website at http://onlin elibr ary.wiley.com/doi/10.1002/acr.24120/ abstract).
DISCUSSION
To elucidate the evolution and influence of postindex multi-morbidity as measured with the MWI (17) on the excess mortality among patients with incident RA, we used the NHS, a large pro-spective cohort of female nurses who were free of RA at cohort inception in 1976. As in previous reports (16), we found that patients with RA had increased total, cardiovascular, and respira-tory mortality, adjusting for preindex confounders, including smok-ing, physical activity, BMI, dietary intake, and multimorbidity. The
Figure 3. Accumulation of the major components (musculoskeletal, cardiovascular, pulmonary, endocrine, gastrointestinal, and nervous) of the Multimorbidity Weighted Index (MWI) after the index date of rheumatoid arthritis (RA) diagnosis (n = 1,007) or matched date for comparators (n = 10,070) for women in the Nurses’ Health Study. The in-figure numbers are the mean slope differences that represent additional increase of each component of the MWI per 10 years (95% confidence interval) among women with RA compared to their matched non-RA comparators, as well as the P value for interaction. See Supplementary Table 1, available on the Arthritis Care & Research website at http://onlin elibr ary.wiley.com/doi/10.1002/acr.24120/ abstract, for further information on the components.

YOSHIDA ET AL 194 |
results accounting for postindex lifestyle changes and MWI score extend previous studies by allowing us to examine which of these elements may explain excess RA mortality with more substantial-ity. Accounting for postindex lifestyle changes did not explain the excess risk for total, cardiovascular, or respiratory mortality. How-ever, additionally accounting for postindex MWI score attenuated estimates of excess cardiovascular mortality in RA. The excess risk for patients with RA persisted even after accounting for multi-morbidity factors for total mortality and respiratory mortality.
This current report extends our previous study in the NHS that examined the total and cause-specific mortalities in RA (16). In this study, we have more closely examined potential causes of the excess mortalities in RA. In particular, we used the MWI, a novel index to quantify multimorbidity, accounting for importance to physical HRQoL (17,37). Our finding in the models accounting for
postindex MWI scores suggests major contributions from accu-mulating multimorbidity burden as measured by the MWI after RA diagnosis, resulting in increased total and cardiovascular mortality. This extensive 61-condition index accounted for excess mortal-ity more than the 19-condition CCI, as seen in the greater magni-tude of attenuation of excess RA mortality for the MWI compared to CCI. The residual elevation in the respiratory mortality even after accounting for MWI score may indicate the importance of other factors that were not captured in the NHS. These missing factors could include interstitial lung disease, infections, and dis-ease-modifying antirheumatic drug use.
Multimorbidity, defined as the presence of multiple, concur-rent chronic conditions within 1 person, occurs more commonly than the presence of a single chronic disease in the adult popu-lation (42). How we should define the set of conditions that count
Figure 4. Changes in continuous measures of lifestyle factors (body mass index, moderate-to-vigorous physical activity, dietary intake, and smoking) over time after the index date of rheumatoid arthritis (RA) diagnosis (n = 1,007) or matched date for comparators (n = 10,070) for women in the Nurses’ Health Study. The numbers represent the mean slope difference per 10 years (95% confidence interval) comparing women with RA to their matched non-RA comparators, as well as the P value for interaction. AHEI = Alternate Healthy Eating Index; BMI = body mass index; h/wk = hours/week.
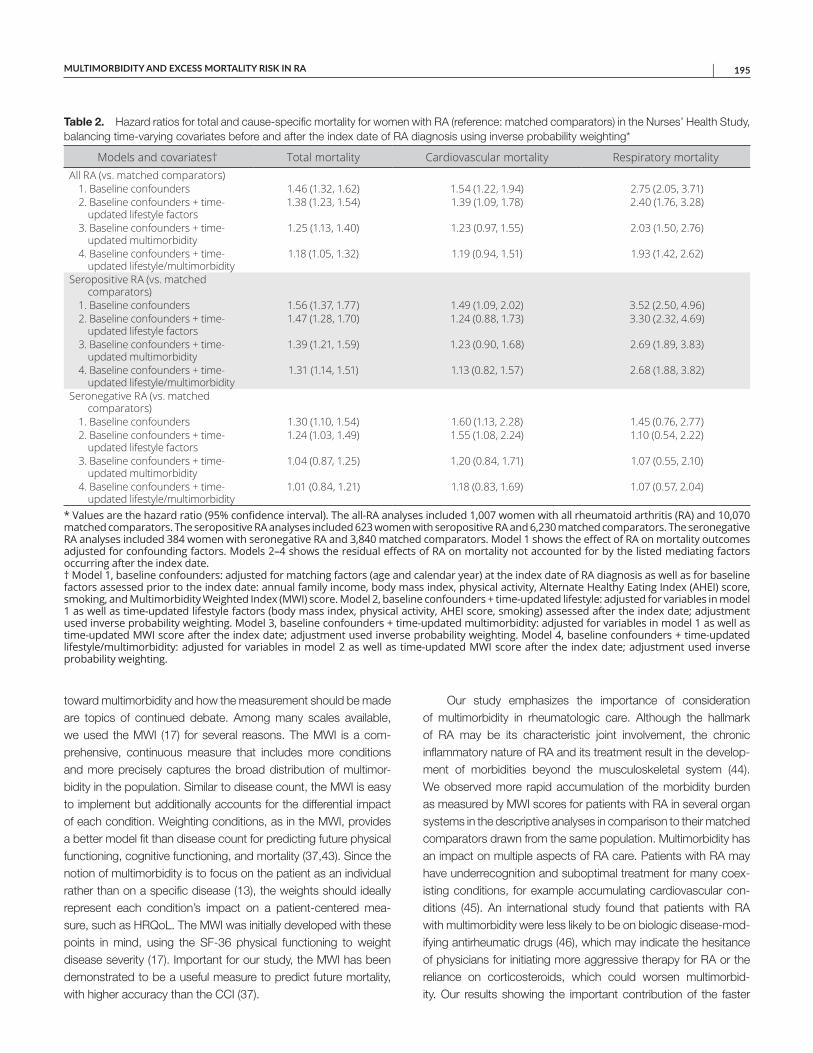
MULTIMORBIDITY AND EXCESS MORTALITY RISK IN RA | 195
toward multimorbidity and how the measurement should be made are topics of continued debate. Among many scales available, we used the MWI (17) for several reasons. The MWI is a com-prehensive, continuous measure that includes more conditions and more precisely captures the broad distribution of multimor-bidity in the population. Similar to disease count, the MWI is easy to implement but additionally accounts for the differential impact of each condition. Weighting conditions, as in the MWI, provides a better model fit than disease count for predicting future physical functioning, cognitive functioning, and mortality (37,43). Since the notion of multimorbidity is to focus on the patient as an individual rather than on a specific disease (13), the weights should ideally represent each condition’s impact on a patient-centered mea-sure, such as HRQoL. The MWI was initially developed with these points in mind, using the SF-36 physical functioning to weight disease severity (17). Important for our study, the MWI has been demonstrated to be a useful measure to predict future mortality, with higher accuracy than the CCI (37).
Our study emphasizes the importance of consideration of multimorbidity in rheumatologic care. Although the hallmark of RA may be its characteristic joint involvement, the chronic inflammatory nature of RA and its treatment result in the develop-ment of morbidities beyond the musculoskeletal system (44). We observed more rapid accumulation of the morbidity burden as measured by MWI scores for patients with RA in several organ systems in the descriptive analyses in comparison to their matched comparators drawn from the same population. Multimorbidity has an impact on multiple aspects of RA care. Patients with RA may have underrecognition and suboptimal treatment for many coex-isting conditions, for example accumulating cardiovascular con-ditions (45). An international study found that patients with RA with multimorbidity were less likely to be on biologic disease-mod-ifying antirheumatic drugs (46), which may indicate the hesitance of physicians for initiating more aggressive therapy for RA or the reliance on corticosteroids, which could worsen multimorbid-ity. Our results showing the important contribution of the faster
Table 2. Hazard ratios for total and cause-specific mortality for women with RA (reference: matched comparators) in the Nurses’ Health Study, balancing time-varying covariates before and after the index date of RA diagnosis using inverse probability weighting*
Models and covariates† Total mortality Cardiovascular mortality Respiratory mortalityAll RA (vs. matched comparators)
1. Baseline confounders 1.46 (1.32, 1.62) 1.54 (1.22, 1.94) 2.75 (2.05, 3.71)2. Baseline confounders + time-
updated lifestyle factors1.38 (1.23, 1.54) 1.39 (1.09, 1.78) 2.40 (1.76, 3.28)
3. Baseline confounders + time-updated multimorbidity
1.25 (1.13, 1.40) 1.23 (0.97, 1.55) 2.03 (1.50, 2.76)
4. Baseline confounders + time-updated lifestyle/multimorbidity
1.18 (1.05, 1.32) 1.19 (0.94, 1.51) 1.93 (1.42, 2.62)
Seropositive RA (vs. matched comparators)
1. Baseline confounders 1.56 (1.37, 1.77) 1.49 (1.09, 2.02) 3.52 (2.50, 4.96)2. Baseline confounders + time-
updated lifestyle factors1.47 (1.28, 1.70) 1.24 (0.88, 1.73) 3.30 (2.32, 4.69)
3. Baseline confounders + time-updated multimorbidity
1.39 (1.21, 1.59) 1.23 (0.90, 1.68) 2.69 (1.89, 3.83)
4. Baseline confounders + time-updated lifestyle/multimorbidity
1.31 (1.14, 1.51) 1.13 (0.82, 1.57) 2.68 (1.88, 3.82)
Seronegative RA (vs. matched comparators)
1. Baseline confounders 1.30 (1.10, 1.54) 1.60 (1.13, 2.28) 1.45 (0.76, 2.77)2. Baseline confounders + time-
updated lifestyle factors1.24 (1.03, 1.49) 1.55 (1.08, 2.24) 1.10 (0.54, 2.22)
3. Baseline confounders + time-updated multimorbidity
1.04 (0.87, 1.25) 1.20 (0.84, 1.71) 1.07 (0.55, 2.10)
4. Baseline confounders + time-updated lifestyle/multimorbidity
1.01 (0.84, 1.21) 1.18 (0.83, 1.69) 1.07 (0.57, 2.04)
* Values are the hazard ratio (95% confidence interval). The all-RA analyses included 1,007 women with all rheumatoid arthritis (RA) and 10,070 matched comparators. The seropositive RA analyses included 623 women with seropositive RA and 6,230 matched comparators. The seronegative RA analyses included 384 women with seronegative RA and 3,840 matched comparators. Model 1 shows the effect of RA on mortality outcomes adjusted for confounding factors. Models 2–4 shows the residual effects of RA on mortality not accounted for by the listed mediating factors occurring after the index date. † Model 1, baseline confounders: adjusted for matching factors (age and calendar year) at the index date of RA diagnosis as well as for baseline factors assessed prior to the index date: annual family income, body mass index, physical activity, Alternate Healthy Eating Index (AHEI) score, smoking, and Multimorbidity Weighted Index (MWI) score. Model 2, baseline confounders + time-updated lifestyle: adjusted for variables in model 1 as well as time-updated lifestyle factors (body mass index, physical activity, AHEI score, smoking) assessed after the index date; adjustment used inverse probability weighting. Model 3, baseline confounders + time-updated multimorbidity: adjusted for variables in model 1 as well as time-updated MWI score after the index date; adjustment used inverse probability weighting. Model 4, baseline confounders + time-updated lifestyle/multimorbidity: adjusted for variables in model 2 as well as time-updated MWI score after the index date; adjustment used inverse probability weighting.
YOSHIDA ET AL 196 |
accumulation of the morbidity burden, as measured by the MWI, to the excess mortality of RA further emphasize the need to care-fully consider how multimorbidity should be detected and treated.
Although their roles may be less prominent than multimorbid-ity in the current study, lifestyle factors should not be disregarded. For example, smoking is an important risk factor for the develop-ment of RA (26,10,47,48), and smoking exposure was consider-ably higher among patients with RA than among their matched comparators at baseline and throughout the follow-up, although their slopes were similar after accounting for survivor bias (prefer-ential censoring by mortality among heavy smokers). The decrease in physical activity with aging among patients with RA may repre-sent barriers to exertion such as dyspnea (49). Therefore, delineat-ing the feedback relationship between multimorbidity and lifestyle factors may be important.
Deriving our study cohort from the NHS allowed us to identify patients with incident RA with systematically collected question-naires extending from the prediagnosis period until decades after diagnosis. Having individual-level matched comparators enabled us to adjust for various preindex factors and to assess the influ-ence of postindex factors.
The major trade-off for a study based on the NHS is the nondiverse nature of the cohort. The NHS is composed only of US female nurses who were ages 30–55 years, mostly white, who were required to be healthy and working at the initiation of the cohort in 1976. Therefore, generalizability to the population of patients with RA beyond this type of demographic remains to be confirmed. Even with the rich data on repeated measures of potential confounders and mediators, there may be inherent inaccuracy of self-reported data. Therefore, residual confounding and unmeasured mediation are possible. While the MWI offered advantages for this analysis of overall morbidity burden, it is true that an overall index does not allow examination of influence on mortality at the individual condition level. We attempted to provide additional insights by demonstrating the organ system–level major contributors of MWI scores.
The NHS is a study among female nurses in general and is not a rheumatology-specific disease or drug registry. As a result, the routine data collection in the NHS has been geared toward lifestyle factors and typical lifestyle-associated diseases such as cancer, cardiovascular disease, and diabetes mellitus. Variables that are relevant to rheumatology practice, but infrequent among the general population, such as interstitial lung diseases and anti-rheumatic medication use, were not captured. However, since the study participants are health professionals, the positive predictive values are known to be high for many of the self-reported condi-tions that were included (50). The inception of the NHS occurred in 1976, but the average calendar year of the index date was 1995, indicating that the diagnosis and follow-up of RA cases in our study extended into the biologic era. Serologic status at RA diagnosis relied on clinical testing, so some older RA cases did not have ACPA testing done.
In summary, accumulating multimorbidity as measured by the MWI after RA diagnosis accounted for much of the excess total and cardiovascular mortality for RA. Patients with seropositive RA had very elevated respiratory mortality, even after accounting for lifestyle factors and common chronic morbidities. Our findings emphasize the need for rheumatologists and primary care pro-viders to actively take part in monitoring for multimorbidity that patients with RA are prone to developing.
ACKNOWLEDGMENTS
The authors thank the participants of the NHS for their dedicated participation in this longitudinal study, as well as the NHS staff members at the Channing Division of Network Medicine (Department of Medicine, Brigham and Women’s Hospital and Harvard Medical School) for their assistance. The authors also thank the following state cancer registries for their help: Alabama, Arizona, Arkansas, California, Colorado, Connecticut, Delaware, Florida, Georgia, Idaho, Illinois, Indiana, Iowa, Kentucky, Louisiana, Maine, Maryland, Massachusetts, Mississippi, Nebraska, New Hampshire, New Jersey, New York, North Carolina, North Dakota, Ohio, Oklahoma, Oregon, Pennsylvania, Rhode Island, South Carolina, Tennessee, Texas, Virginia, Washington, and Wyoming.
AUTHOR CONTRIBUTIONS
All authors were involved in drafting the article or revising it critically for important intellectual content, and all authors approved the final version to be submitted for publication. Dr. Sparks had full access to all of the data in the study and takes responsibility for the integrity of the data and the accuracy of the data analysis.Study conception and design. Yoshida, Lin, Karlson, Sparks.Acquisition of data. Yoshida, Malspeis, Costenbader, Karlson, Sparks.Analysis and interpretation of data. Yoshida, Lin, Wei, Malspeis, Chu, Camargo, Raby, Choi, Tedeschi, Barbhaiya, Lu, Costenbader, Karlson, Sparks.
REFERENCES 1. Solomon DH, Karlson EW, Rimm EB, Cannuscio CC, Mandl LA,
Manson JE, et al. Cardiovascular morbidity and mortality in women diagnosed with rheumatoid arthritis. Circulation 2003;107:1303–7.
2. Mellemkjaer L, Linet MS, Gridley G, Frisch M, Møller H, Olsen JH. Rheumatoid arthritis and cancer risk. Eur J Cancer 1996;32A:1753–7.
3. Doran MF, Crowson CS, Pond GR, O’Fallon WM, Gabriel SE. Frequency of infection in patients with rheumatoid arthritis com-pared with controls: a population-based study. Arthritis Rheum 2002;46:2287–93.
4. Bongartz T, Nannini C, Medina-Velasquez YF, Achenbach SJ, Crowson CS, Ryu JH, et al. Incidence and mortality of interstitial lung disease in rheumatoid arthritis: a population-based study. Arthritis Rheum 2010;62:1583–91.
5. Gabriel SE, Crowson CS, O’Fallon WM. Mortality in rheumatoid arthritis: have we made an impact in 4 decades? J Rheumatol 1999;26:2529–33.
6. Gonzalez A, Maradit Kremers H, Crowson CS, Nicola PJ, Davis JM, Therneau TM, et al. The widening mortality gap between rheuma-toid arthritis patients and the general population. Arthritis Rheum 2007;56:3583–7.
7. Humphreys JH, Warner A, Chipping J, Marshall T, Lunt M, Symmons DP, et al. Mortality trends in patients with early rheumatoid arthri-tis over 20 years: results from the Norfolk Arthritis Register. Arthritis Care Res (Hoboken) 2014;66:1296–301.
8. Alamanos Y, Voulgari PV, Drosos AA. Incidence and prevalence of rheumatoid arthritis, based on the 1987 American College of
MULTIMORBIDITY AND EXCESS MORTALITY RISK IN RA | 197
Rheumatology criteria: a systematic review. Semin Arthritis Rheum 2006;36:182–8.
9. Gabriel SE, Crowson CS, O’Fallon WM. The epidemiology of rheu-matoid arthritis in Rochester, Minnesota, 1955–1985. ArthritisRheum 1999;42:415–40.
10. Sugiyama D, Nishimura K, Tamaki K, Tsuji G, Nakazawa T, MorinobuA, et al. Impact of smoking as a risk factor for developing rheumatoid arthritis: a meta-analysis of observational studies. Ann Rheum Dis2010;69:70–81.
11. Qin B, Yang M, Fu H, Ma N, Wei T, Tang Q, et al. Body mass indexand the risk of rheumatoid arthritis: a systematic review and dose-re-sponse meta-analysis. Arthritis Res Ther 2015;17:86.
12. Van den Akker M, Buntinx F, Knottnerus JA. Comorbidity or multi-morbidity. Eur J Gen Pract 1996;2:65–70.
13. Radner H, Yoshida K, Smolen JS, Solomon DH. Multimorbidity andrheumatic conditions: enhancing the concept of comorbidity. NatRev Rheumatol 2014;10:252–6.
14. Johnston MC, Crilly M, Black C, Prescott GJ, Mercer SW. Definingand measuring multimorbidity: a systematic review of systematicreviews. Eur J Public Health 2019;29:182–9.
15. Catalog of Bias. Ascertainment bias. 2017. URL: https://catal ogofbias.org/biase s/ascer tainm ent-bias/.
16. Sparks JA, Chang SC, Liao KP, Lu B, Fine AR, Solomon DH, et al.Rheumatoid arthritis and mortality among women during 36 yearsof prospective follow-up: results from the Nurses’ Health Study.Arthritis Care Res (Hoboken) 2016;68:753–62.
17. Wei MY, Kawachi I, Okereke OI, Mukamal KJ. Diverse cumulativeimpact of chronic diseases on physical health-related quality of life:implications for a measure of multimorbidity. Am J Epidemiol 2016;184:357–65.
18. Chen WY, Rosner B, Hankinson SE, Colditz GA, Willett WC.Moderate alcohol consumption during adult life, drinking patterns,and breast cancer risk. JAMA 2011;306:1884–90.
19. Karlson EW, Sanchez-Guerrero J, Wright EA, Lew RA, Daltroy LH,Katz JN, et al. A connective tissue disease screening questionnairefor population studies. Ann Epidemiol 1995;5:297–302.
20. Arnett FC, Edworthy SM, Bloch DA, McShane DJ, Fries JF, CooperNS, et al. The American Rheumatism Association 1987 revised cri-teria for the classification of rheumatoid arthritis. Arthritis Rheum1988;31:315–24.
21. Aletaha D, Neogi T, Silman AJ, Funovits J, Felson DT, Bingham COIII, et al. 2010 rheumatoid arthritis classification criteria: an AmericanCollege of Rheumatology/European League Against Rheumatismcollaborative initiative. Arthritis Rheum 2010;62:2569–81.
22. Bao Y, Han J, Hu FB, Giovannucci EL, Stampfer MJ, Willett WC,et al. Association of nut consumption with total and cause-specificmortality. N Engl J Med 2013;369:2001–11.
23. Rich-Edwards JW, Corsano KA, Stampfer MJ. Test of the NationalDeath Index and Equifax Nationwide Death Search. Am J Epidemiol1994;140:1016–9.
24. Pan A, Sun Q, Bernstein AM, Schulze MB, Manson JE, StampferMJ, et al. Red meat consumption and mortality: results from 2 pro-spective cohort studies. Arch Intern Med 2012;172:555–63.
25. Van Dam RM, Li T, Spiegelman D, Franco OH, Hu FB. Combinedimpact of lifestyle factors on mortality: prospective cohort study inUS women. BMJ 2008;337:a1440.
26. Costenbader KH, Feskanich D, Mandl LA, Karlson EW. Smokingintensity, duration, and cessation, and the risk of rheumatoid arthritisin women. Am J Med 2006;119:503.e1–9.
27. Karlson EW, Mandl LA, Hankinson SE, Grodstein F. Do breast-feeding and other reproductive factors influence future risk of rheumatoidarthritis? Results from the Nurses’ Health Study. Arthritis Rheum2004;50:3458–67.
28. Baer HJ, Glynn RJ, Hu FB, Hankinson SE, Willett WC, Colditz GA,et al. Risk factors for mortality in the nurses’ health study: a compet-ing risks analysis. Am J Epidemiol 2011;173:319–29.
29. Sparks JA, Chen CY, Hiraki LT, Malspeis S, Costenbader KH,Karlson EW. Contributions of familial rheumatoid arthritis or lupusand environmental factors to risk of rheumatoid arthritis in women:a prospective cohort study. Arthritis Care Res (Hoboken) 2014;66:1438–46.
30. Lu B, Solomon DH, Costenbader KH, Karlson EW. Alcohol con-sumption and risk of incident rheumatoid arthritis in women: a pro-spective study. Arthritis Rheumatol 2014;66:1998–2005.
31. Lu B, Hiraki LT, Sparks JA, Malspeis S, Chen CY, Awosogba JA,et al. Being overweight or obese and risk of developing rheumatoidarthritis among women: a prospective cohort study. Ann Rheum Dis2014;73:1914–22.
32. Ainsworth BE, Haskell WL, Leon AS, Jacobs DR, Montoye HJ,Sallis JF, et al. Compendium of physical activities: classification ofenergy costs of human physical activities. Med Sci Sports Exerc1993;25:71–80.
33. Liu X, Tedeschi SK, Lu B, Zaccardelli A, Speyer CB, CostenbaderKH, et al. Long-term physical activity and subsequent risk for rheu-matoid arthritis among women: a prospective cohort study. ArthritisRheumatol 2019;71:1460–71.
34. Willett WC, Sampson L, Stampfer MJ, Rosner B, Bain C, WitschiJ, et al. Reproducibility and validity of a semiquantitative food fre-quency questionnaire. Am J Epidemiol 1985;122:51–65.
35. McCullough ML, Feskanich D, Stampfer MJ, Giovannucci EL, RimmEB, Hu FB, et al. Diet quality and major chronic disease risk in menand women: moving toward improved dietary guidance. Am J ClinNutr 2002;76:1261–71.
36. Hu Y, Sparks JA, Malspeis S, Costenbader KH, Hu FB, Karlson EW,et al. Long-term dietary quality and risk of developing rheumatoidarthritis in women. Ann Rheum Dis 2017;76:1357–64.
37. Wei MY, Mukamal KJ. Multimorbidity, mortality, and long-term phys-ical functioning in 3 prospective cohorts of community-dwellingadults. Am J Epidemiol 2018;187:103–12.
38. Charlson ME, Pompei P, Ales KL, MacKenzie CR. A new method ofclassifying prognostic comorbidity in longitudinal studies: develop-ment and validation. J Chronic Dis 1987;40:373–83.
39. Ajeganova S, Huizinga TW. Rheumatoid arthritis: seronegative andseropositive RA. Alike but different? Nat Rev Rheumatol 2015;11:8–9.
40. Robins JM, Hernán MA, Brumback B. Marginal structural models and causal inference in epidemiology. Epidemiology 2000;11:550–60.
41. Harvard Program on Causal Inference. Software. Gformula 3.0: theparametric g-formula in SAS. URL: https://www.hsph.harva rd.edu/causa l/softw are/.
42. Ornstein SM, Nietert PJ, Jenkins RG, Litvin CB. The prevalenceof chronic diseases and multimorbidity in primary care practice: aPPRNet report. J Am Board Fam Med 2013;26:518–24.
43. Wei MY, Levine DA, Zahodne LB, Kabeto MU, Langa KM.Multimorbidity and cognitive decline over 14 years in olderAmericans. J Gerontol A Biol Sci Med Sci 2019;75:1206–13.
44. Cutolo M, Kitas GD, van Riel PL. Burden of disease in treated rheu-matoid arthritis patients: going beyond the joint. Semin ArthritisRheum 2014;43:479–88.
45. Toms TE, Panoulas VF, Douglas KM, Griffiths H, Sattar N, Smith JP,et al. Statin use in rheumatoid arthritis in relation to actual cardiovas-cular risk: evidence for substantial undertreatment of lipid-associ-ated cardiovascular risk? Ann Rheum Dis 2010;69:683–8.
46. Radner H, Yoshida K, Hmamouchi I, Dougados M, Smolen JS,Solomon DH. Treatment patterns of multimorbid patients with rheu-matoid arthritis: results from an international cross-sectional study. JRheumatol 2015;42:1099–104.

YOSHIDA ET AL 198 |
47. Kim K, Jiang X, Cui J, Lu B, Costenbader KH, Sparks JA, et al. Interactions between amino acid-defined major histocompatibility complex class II variants and smoking in seropositive rheumatoid arthritis. Arthritis Rheumatol 2015;67:2611–23.
48. Liu X, Tedeschi SK, Barbhaiya M, Leatherwood CL, Speyer CB, Lu B, et al. Impact and timing of smoking cessation on reducing risk of rheumatoid arthritis among women in the Nurses’ Health Studies. Arthritis Care Res (Hoboken) 2019;71:914–24.
49. Sparks JA, Doyle TJ, He X, Pan B, Iannaccone C, Frits ML, et al. Incidence and predictors of dyspnea on exertion in a prospective cohort of patients with rheumatoid arthritis. ACR Open Rheumatol 2019;1:4–15.
50. Colditz GA, Martin P, Stampfer MJ, Willett WC, Sampson L, Rosner B, et al. Validation of questionnaire information on risk factors and disease outcomes in a prospective cohort study of women. Am J Epidemiol 1986;123:894–900.

199
Arthritis Care & ResearchVol. 73, No. 2, February 2021, pp 199–206DOI 10.1002/acr.24330© 2020, American College of Rheumatology
Prevalence of Rheumatoid Arthritis and Drug Dispensing Patterns Among Medicaid and Medicaid–Medicare Dually Eligible Beneficiaries in Puerto RicoJosé J. Hernández-Muñoz,1 Wenfei Wei,1 and Radames Sierra-Zorita2
Objective. To estimate the prevalence of rheumatoid arthritis (RA) in Puerto Rico, to describe disease-modifying antirheumatic drug (DMARD) dispensing patterns by prescriber specialty, and to illustrate the impact of RA case definition on the estimated prevalence.
Methods. This study estimated the prevalence of RA in Puerto Rico during 2016 among Medicaid and Medicaid–Medicare dually eligible beneficiaries of the Mi Salud health care plan, a federally funded health insurance program. DMARD dispensing and cost patterns were described and stratified by provider specialty. A sensitivity analysis was conducted to evaluate the effect of RA case definition on estimated prevalence.
Results. The prevalence of RA in 2016 was estimated to be 2 cases per 1,000 beneficiaries, with 3 per 1,000 beneficiaries among females, 4.5 times that of males. In total, 44% of beneficiaries received conventional synthetic DMARDs (csDMARDs) only, 32% received biologic or targeted synthetic DMARDs (b/tsDMARDs) only, and 24% received a combination of csDMARDs and b/tsDMARDs. Rheumatologists and a combination of specialties accounted for the highest median number of dispensed DMARDs, with 14 each. A sensitivity analysis revealed that when RA cases with ≥3 medical claims were restricted to having ≥1 DMARD claim, the estimated prevalence changed from 6 to 3 cases per 1,000 beneficiaries.
Conclusion. The prevalence of RA in Puerto Rico in this study is lower than reported in the mainland US, possibly due to more stringent criteria to define RA. DMARD dispensing and cost patterns are similar to those found in other studies. Claims algorithms that identify RA have higher validity when pharmacy data is included.
INTRODUCTION
Numerous studies have reported the prevalence of rheuma-toid arthritis (RA) in different parts of the world. However, these estimates vary as a function of the case definition, data source, patient characteristics, time span, and geographic region used in the study (1–9). A clinical diagnosis using the 2010 American College of Rheumatology and European League Against Rheu-matism criteria is considered the most valid and reliable method to ascertain cases of RA (10,11). However, this process relies on the availability of several clinical indicators, limiting its application to direct physician–patient interactions or data sets with complete clinical information. Therefore, its application is often limited to a small set of patients.
Administrative health claims data sets have emerged as powerful and relatively inexpensive tools to estimate the preva-lence of RA at the national level or in broad geographic regions
(7,12–18). Multiple algorithms that identify RA cases using admin-istrative health claims have been proposed. However, the accu-racy of case ascertainment is highly dependent on the selected administrative claims algorithm (12–14,16,19,20). Most of these algorithms use the International Classification of Diseases (ICD) codes to identify RA-related medical visits during a prespecified period (7,12,14,15,17,18). However, algorithms combining diag-nosis codes and pharmaceutical dispensing of disease-modifying antirheumatic drugs (DMARDs) have shown to improve the posi-tive predictive value of the case ascertainment (20).
Several studies have characterized the prevalence of RA in the US using administrative health claims. The prevalence esti-mates in these studies fluctuate between 4 and 7 cases per 1,000 beneficiaries, increase with age, and are 3 times higher in females than in males (17,18). However, no such studies have been con-ducted in the Commonwealth of Puerto Rico. The most recent attempt to estimate the prevalence of RA in Puerto Rico dates
1José J. Hernández-Muñoz, PhD, Wenfei Wei, PharmD: Texas A&M University, College Station; 2Radames Sierra-Zorita, MD: University of Puerto Rico, San Juan.
No potential conflicts of interest relevant to this article were reported.
Address correspondence to Wenfei Wei, PharmD, 1114 Texas A&M University, Suite 164D, College Station, TX 77843. Email: [email protected].
Submitted for publication October 25, 2019; accepted in revised form May 19, 2020.
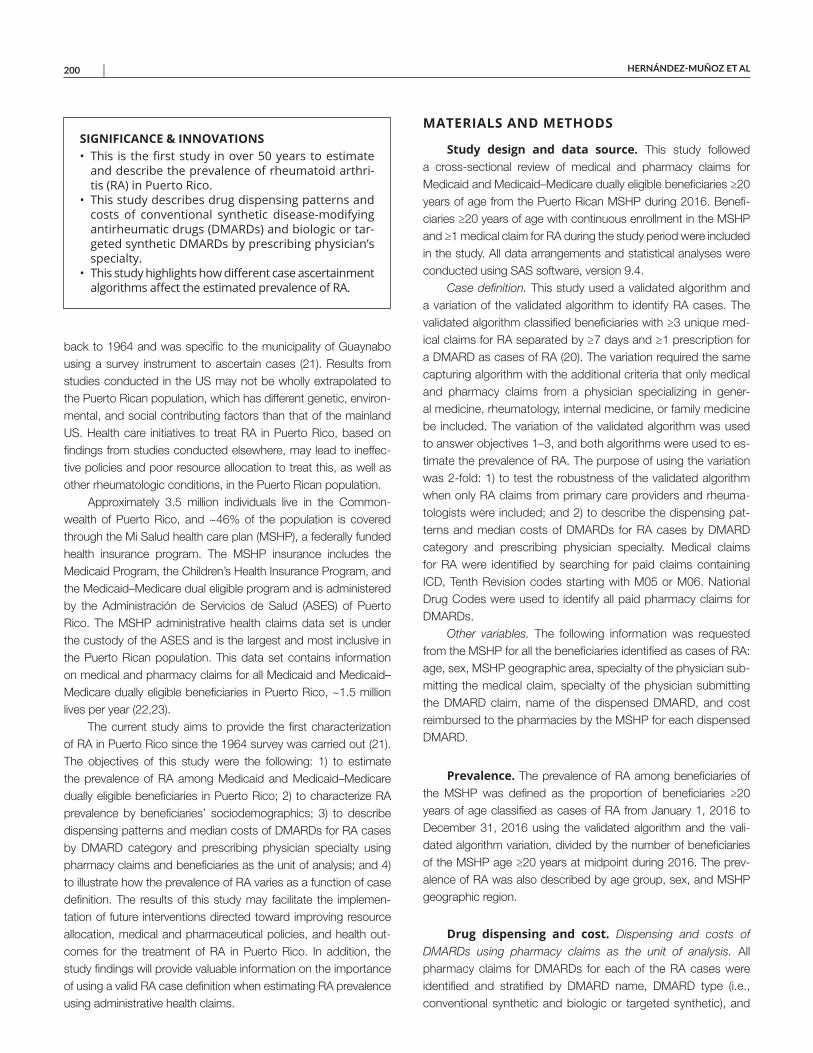
HERNÁNDEZ-MUÑOZ ET AL 200 |
back to 1964 and was specific to the municipality of Guaynabo using a survey instrument to ascertain cases (21). Results from studies conducted in the US may not be wholly extrapolated to the Puerto Rican population, which has different genetic, environ-mental, and social contributing factors than that of the mainland US. Health care initiatives to treat RA in Puerto Rico, based on findings from studies conducted elsewhere, may lead to ineffec-tive policies and poor resource allocation to treat this, as well as other rheumatologic conditions, in the Puerto Rican population.
Approximately 3.5 million individuals live in the Common-wealth of Puerto Rico, and ~46% of the population is covered through the Mi Salud health care plan (MSHP), a federally funded health insurance program. The MSHP insurance includes the Medicaid Program, the Children’s Health Insurance Program, and the Medicaid–Medicare dual eligible program and is administered by the Administración de Servicios de Salud (ASES) of Puerto Rico. The MSHP administrative health claims data set is under the custody of the ASES and is the largest and most inclusive in the Puerto Rican population. This data set contains information on medical and pharmacy claims for all Medicaid and Medicaid–Medicare dually eligible beneficiaries in Puerto Rico, ~1.5 million lives per year (22,23).
The current study aims to provide the first characterization of RA in Puerto Rico since the 1964 survey was carried out (21). The objectives of this study were the following: 1) to estimate the prevalence of RA among Medicaid and Medicaid–Medicare dually eligible beneficiaries in Puerto Rico; 2) to characterize RA prevalence by beneficiaries’ sociodemographics; 3) to describe dispensing patterns and median costs of DMARDs for RA cases by DMARD category and prescribing physician specialty using pharmacy claims and beneficiaries as the unit of analysis; and 4) to illustrate how the prevalence of RA varies as a function of case definition. The results of this study may facilitate the implemen-tation of future interventions directed toward improving resource allocation, medical and pharmaceutical policies, and health out-comes for the treatment of RA in Puerto Rico. In addition, the study findings will provide valuable information on the importance of using a valid RA case definition when estimating RA prevalence using administrative health claims.
MATERIALS AND METHODS
Study design and data source. This study followed a cross-sectional review of medical and pharmacy claims for Medicaid and Medicaid–Medicare dually eligible beneficiaries ≥20 years of age from the Puerto Rican MSHP during 2016. Benefi-ciaries ≥20 years of age with continuous enrollment in the MSHP and ≥1 medical claim for RA during the study period were included in the study. All data arrangements and statistical analyses were conducted using SAS software, version 9.4.
Case definition. This study used a validated algorithm and a variation of the validated algorithm to identify RA cases. The validated algorithm classified beneficiaries with ≥3 unique med-ical claims for RA separated by ≥7 days and ≥1 prescription for a DMARD as cases of RA (20). The variation required the same capturing algorithm with the additional criteria that only medical and pharmacy claims from a physician specializing in gener-al medicine, rheumatology, internal medicine, or family medicine be included. The variation of the validated algorithm was used to answer objectives 1–3, and both algorithms were used to es-timate the prevalence of RA. The purpose of using the variation was 2-fold: 1) to test the robustness of the validated algorithm when only RA claims from primary care providers and rheuma-tologists were included; and 2) to describe the dispensing pat-terns and median costs of DMARDs for RA cases by DMARD category and prescribing physician specialty. Medical claims for RA were identified by searching for paid claims containing ICD, Tenth Revision codes starting with M05 or M06. National Drug Codes were used to identify all paid pharmacy claims for DMARDs.
Other variables. The following information was requested from the MSHP for all the beneficiaries identified as cases of RA: age, sex, MSHP geographic area, specialty of the physician sub-mitting the medical claim, specialty of the physician submitting the DMARD claim, name of the dispensed DMARD, and cost reimbursed to the pharmacies by the MSHP for each dispensed DMARD.
Prevalence. The prevalence of RA among beneficiaries of the MSHP was defined as the proportion of beneficiaries ≥20 years of age classified as cases of RA from January 1, 2016 to December 31, 2016 using the validated algorithm and the vali-dated algorithm variation, divided by the number of beneficiaries of the MSHP age ≥20 years at midpoint during 2016. The prev-alence of RA was also described by age group, sex, and MSHP geographic region.
Drug dispensing and cost. Dispensing and costs of DMARDs using pharmacy claims as the unit of analysis. All pharmacy claims for DMARDs for each of the RA cases were identified and stratified by DMARD name, DMARD type (i.e., conventional synthetic and biologic or targeted synthetic), and
SIGNIFICANCE & INNOVATIONS• This is the first study in over 50 years to estimate
and describe the prevalence of rheumatoid arthri-tis (RA) in Puerto Rico.
• This study describes drug dispensing patterns and costs of conventional synthetic disease-modifying antirheumatic drugs (DMARDs) and biologic or tar-geted synthetic DMARDs by prescribing physician’s specialty.
• This study highlights how different case ascertainment algorithms affect the estimated prevalence of RA.
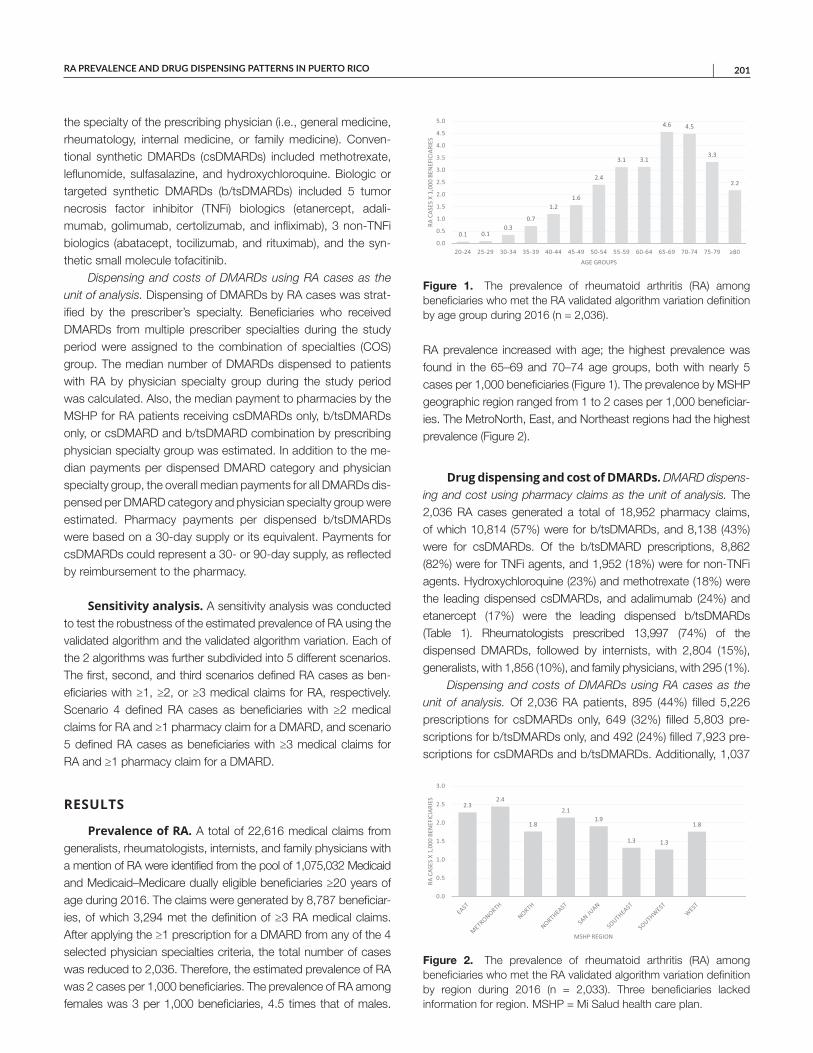
RA PREVALENCE AND DRUG DISPENSING PATTERNS IN PUERTO RICO | 201
the specialty of the prescribing physician (i.e., general medicine, rheumatology, internal medicine, or family medicine). Conven-tional synthetic DMARDs (csDMARDs) included methotrexate, leflunomide, sulfasalazine, and hydroxychloroquine. Biologic or targeted synthetic DMARDs (b/tsDMARDs) included 5 tumor necrosis factor inhibitor (TNFi) biologics (etanercept, adali-mumab, golimumab, certolizumab, and infliximab), 3 non-TNFi biologics (abatacept, tocilizumab, and rituximab), and the syn-thetic small molecule tofacitinib.
Dispensing and costs of DMARDs using RA cases as the unit of analysis. Dispensing of DMARDs by RA cases was strat-ified by the prescriber’s specialty. Beneficiaries who received DMARDs from multiple prescriber specialties during the study period were assigned to the combination of specialties (COS) group. The median number of DMARDs dispensed to patients with RA by physician specialty group during the study period was calculated. Also, the median payment to pharmacies by the MSHP for RA patients receiving csDMARDs only, b/tsDMARDs only, or csDMARD and b/tsDMARD combination by prescribing physician specialty group was estimated. In addition to the me-dian payments per dispensed DMARD category and physician specialty group, the overall median payments for all DMARDs dis-pensed per DMARD category and physician specialty group were estimated. Pharmacy payments per dispensed b/tsDMARDs were based on a 30-day supply or its equivalent. Payments for csDMARDs could represent a 30- or 90-day supply, as reflected by reimbursement to the pharmacy.
Sensitivity analysis. A sensitivity analysis was conducted to test the robustness of the estimated prevalence of RA using the validated algorithm and the validated algorithm variation. Each of the 2 algorithms was further subdivided into 5 different scenarios. The first, second, and third scenarios defined RA cases as ben-eficiaries with ≥1, ≥2, or ≥3 medical claims for RA, respectively. Scenario 4 defined RA cases as beneficiaries with ≥2 medical claims for RA and ≥1 pharmacy claim for a DMARD, and scenario 5 defined RA cases as beneficiaries with ≥3 medical claims for RA and ≥1 pharmacy claim for a DMARD.
RESULTS
Prevalence of RA. A total of 22,616 medical claims from generalists, rheumatologists, internists, and family physicians with a mention of RA were identified from the pool of 1,075,032 Medicaid and Medicaid–Medicare dually eligible beneficiaries ≥20 years of age during 2016. The claims were generated by 8,787 beneficiar-ies, of which 3,294 met the definition of ≥3 RA medical claims. After applying the ≥1 prescription for a DMARD from any of the 4 selected physician specialties criteria, the total number of cases was reduced to 2,036. Therefore, the estimated prevalence of RA was 2 cases per 1,000 beneficiaries. The prevalence of RA among females was 3 per 1,000 beneficiaries, 4.5 times that of males.
RA prevalence increased with age; the highest prevalence was found in the 65–69 and 70–74 age groups, both with nearly 5 cases per 1,000 beneficiaries (Figure 1). The prevalence by MSHP geographic region ranged from 1 to 2 cases per 1,000 beneficiar-ies. The MetroNorth, East, and Northeast regions had the highest prevalence (Figure 2).
Drug dispensing and cost of DMARDs. DMARD dispens-ing and cost using pharmacy claims as the unit of analysis. The 2,036 RA cases generated a total of 18,952 pharmacy claims, of which 10,814 (57%) were for b/tsDMARDs, and 8,138 (43%) were for csDMARDs. Of the b/tsDMARD prescriptions, 8,862 (82%) were for TNFi agents, and 1,952 (18%) were for non-TNFi agents. Hydroxychloroquine (23%) and methotrexate (18%) were the leading dispensed csDMARDs, and adalimumab (24%) and etanercept (17%) were the leading dispensed b/tsDMARDs (Table 1). Rheumatologists prescribed 13,997 (74%) of the dispensed DMARDs, followed by internists, with 2,804 (15%), generalists, with 1,856 (10%), and family physicians, with 295 (1%).
Dispensing and costs of DMARDs using RA cases as the unit of analysis. Of 2,036 RA patients, 895 (44%) filled 5,226 prescriptions for csDMARDs only, 649 (32%) filled 5,803 pre-scriptions for b/tsDMARDs only, and 492 (24%) filled 7,923 pre-scriptions for csDMARDs and b/tsDMARDs. Additionally, 1,037
Figure 1. The prevalence of rheumatoid arthritis (RA) among beneficiaries who met the RA validated algorithm variation definition by age group during 2016 (n = 2,036).
0.1 0.10.3
0.7
1.21.6
2.4
3.1 3.1
4.6 4.5
3.3
2.2
0.0
0.5
1.0
1.5
2.0
2.5
3.0
3.5
4.0
4.5
5.0
20-24 25-29 30-34 35-39 40-44 45-49 50-54 55-59 60-64 65-69 70-74 75-79 ≥80
SEIRAICIFENEB 000,1 X SESAC AR
AGE GROUPS
Figure 2. The prevalence of rheumatoid arthritis (RA) among beneficiaries who met the RA validated algorithm variation definition by region during 2016 (n = 2,033). Three beneficiaries lacked information for region. MSHP = Mi Salud health care plan.
2.32.4
1.8
2.11.9
1.3 1.3
1.8
0.0
0.5
1.0
1.5
2.0
2.5
3.0
SEIRAICIFENEB 000,1 X SESAC AR
MSHP REGION
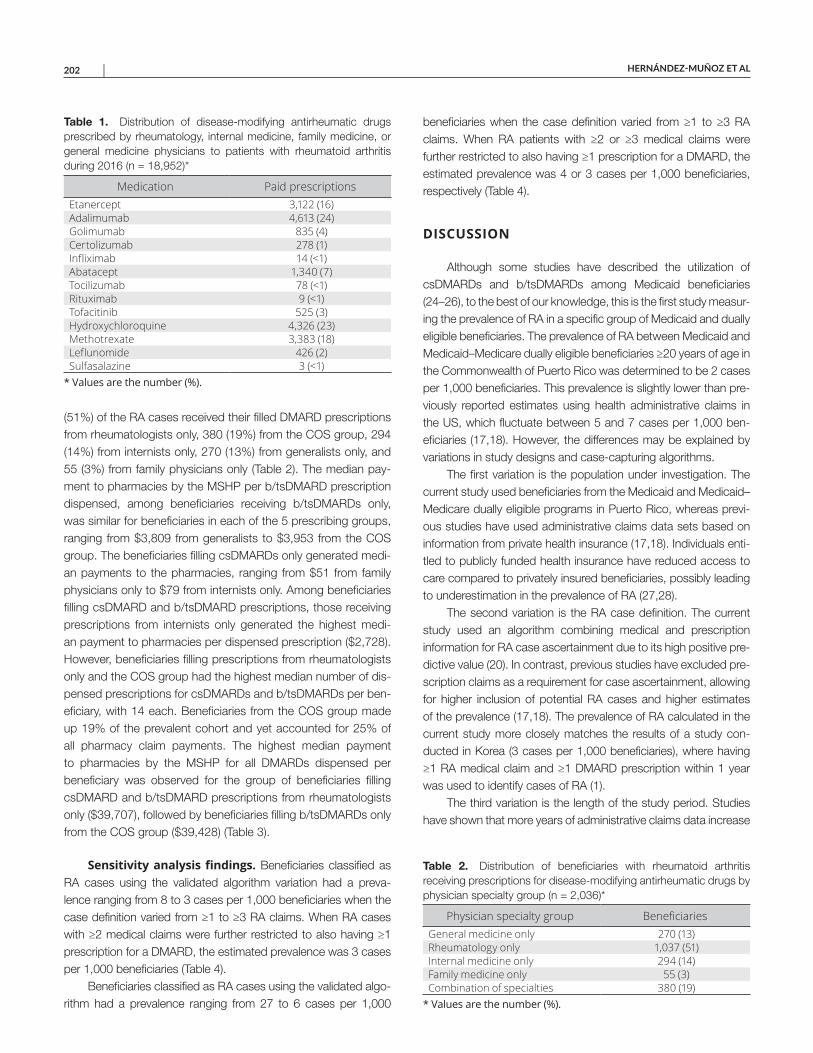
HERNÁNDEZ-MUÑOZ ET AL 202 |
(51%) of the RA cases received their filled DMARD prescriptions from rheumatologists only, 380 (19%) from the COS group, 294 (14%) from internists only, 270 (13%) from generalists only, and 55 (3%) from family physicians only (Table 2). The median pay-ment to pharmacies by the MSHP per b/tsDMARD prescription dispensed, among beneficiaries receiving b/tsDMARDs only, was similar for beneficiaries in each of the 5 prescribing groups, ranging from $3,809 from generalists to $3,953 from the COS group. The beneficiaries filling csDMARDs only generated medi-an payments to the pharmacies, ranging from $51 from family physicians only to $79 from internists only. Among beneficiaries filling csDMARD and b/tsDMARD prescriptions, those receiving prescriptions from internists only generated the highest medi-an payment to pharmacies per dispensed prescription ($2,728). However, beneficiaries filling prescriptions from rheumatologists only and the COS group had the highest median number of dis-pensed prescriptions for csDMARDs and b/tsDMARDs per ben-eficiary, with 14 each. Beneficiaries from the COS group made up 19% of the prevalent cohort and yet accounted for 25% of all pharmacy claim payments. The highest median payment to pharmacies by the MSHP for all DMARDs dispensed per beneficiary was observed for the group of beneficiaries filling csDMARD and b/tsDMARD prescriptions from rheumatologists only ($39,707), followed by beneficiaries filling b/tsDMARDs only from the COS group ($39,428) (Table 3).
Sensitivity analysis findings. Beneficiaries classified as RA cases using the validated algorithm variation had a preva-lence ranging from 8 to 3 cases per 1,000 beneficiaries when the case definition varied from ≥1 to ≥3 RA claims. When RA cases with ≥2 medical claims were further restricted to also having ≥1 prescription for a DMARD, the estimated prevalence was 3 cases per 1,000 beneficiaries (Table 4).
Beneficiaries classified as RA cases using the validated algo-rithm had a prevalence ranging from 27 to 6 cases per 1,000
beneficiaries when the case definition varied from ≥1 to ≥3 RA claims. When RA patients with ≥2 or ≥3 medical claims were further restricted to also having ≥1 prescription for a DMARD, the estimated prevalence was 4 or 3 cases per 1,000 beneficiaries, respectively (Table 4).
DISCUSSION
Although some studies have described the utilization of csDMARDs and b/tsDMARDs among Medicaid beneficiaries (24–26), to the best of our knowledge, this is the first study measur-ing the prevalence of RA in a specific group of Medicaid and dually eligible beneficiaries. The prevalence of RA between Medicaid and Medicaid–Medicare dually eligible beneficiaries ≥20 years of age in the Commonwealth of Puerto Rico was determined to be 2 cases per 1,000 beneficiaries. This prevalence is slightly lower than pre-viously reported estimates using health administrative claims in the US, which fluctuate between 5 and 7 cases per 1,000 ben-eficiaries (17,18). However, the differences may be explained by variations in study designs and case-capturing algorithms.
The first variation is the population under investigation. The current study used beneficiaries from the Medicaid and Medicaid– Medicare dually eligible programs in Puerto Rico, whereas previ-ous studies have used administrative claims data sets based on information from private health insurance (17,18). Individuals enti-tled to publicly funded health insurance have reduced access to care compared to privately insured beneficiaries, possibly leading to underestimation in the prevalence of RA (27,28).
The second variation is the RA case definition. The current study used an algorithm combining medical and prescription information for RA case ascertainment due to its high positive pre-dictive value (20). In contrast, previous studies have excluded pre-scription claims as a requirement for case ascertainment, allowing for higher inclusion of potential RA cases and higher estimates of the prevalence (17,18). The prevalence of RA calculated in the current study more closely matches the results of a study con-ducted in Korea (3 cases per 1,000 beneficiaries), where having ≥1 RA medical claim and ≥1 DMARD prescription within 1 year was used to identify cases of RA (1).
The third variation is the length of the study period. Studies have shown that more years of administrative claims data increase
Table 1. Distribution of disease-modifying antirheumatic drugs prescribed by rheumatology, internal medicine, family medicine, or general medicine physicians to patients with rheumatoid arthritis during 2016 (n = 18,952)*
Medication Paid prescriptionsEtanercept 3,122 (16)Adalimumab 4,613 (24)Golimumab 835 (4)Certolizumab 278 (1)Infliximab 14 (<1)Abatacept 1,340 (7)Tocilizumab 78 (<1)Rituximab 9 (<1)Tofacitinib 525 (3)Hydroxychloroquine 4,326 (23)Methotrexate 3,383 (18)Leflunomide 426 (2)Sulfasalazine 3 (<1)
* Values are the number (%).
Table 2. Distribution of beneficiaries with rheumatoid arthritis receiving prescriptions for disease-modifying antirheumatic drugs by physician specialty group (n = 2,036)*
Physician specialty group BeneficiariesGeneral medicine only 270 (13)Rheumatology only 1,037 (51)Internal medicine only 294 (14)Family medicine only 55 (3)Combination of specialties 380 (19)
* Values are the number (%).
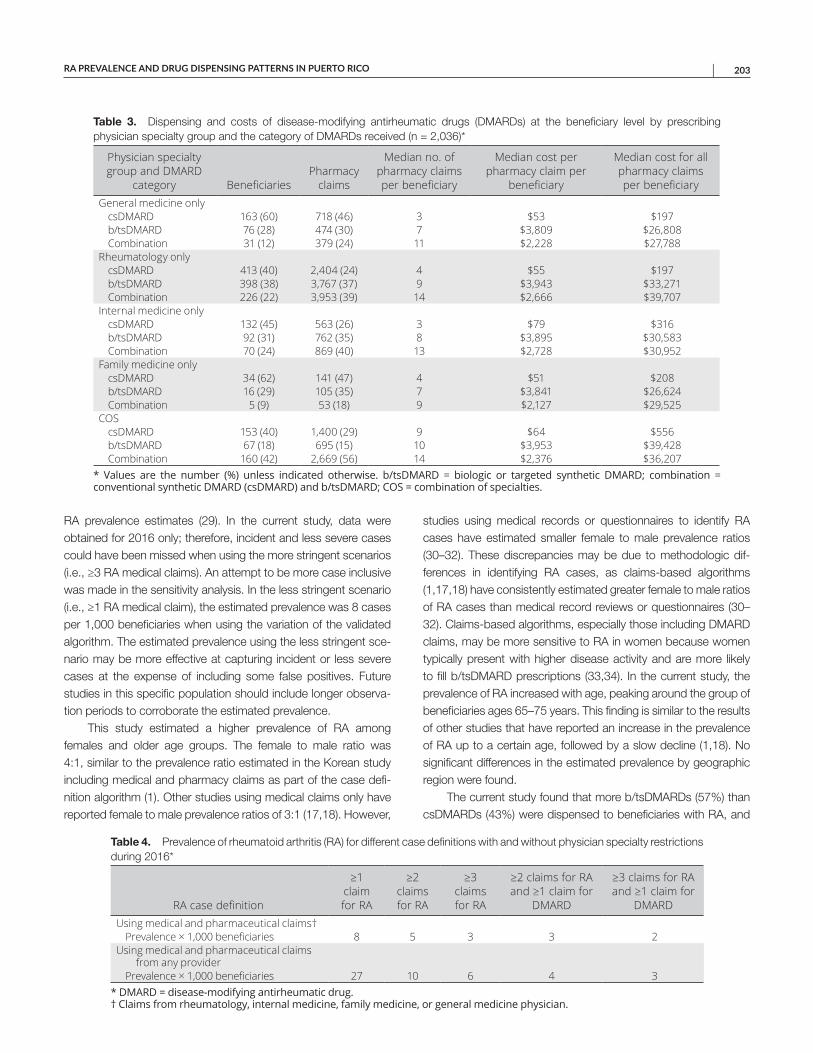
RA PREVALENCE AND DRUG DISPENSING PATTERNS IN PUERTO RICO | 203
RA prevalence estimates (29). In the current study, data were obtained for 2016 only; therefore, incident and less severe cases could have been missed when using the more stringent scenarios (i.e., ≥3 RA medical claims). An attempt to be more case inclusive was made in the sensitivity analysis. In the less stringent scenario (i.e., ≥1 RA medical claim), the estimated prevalence was 8 cases per 1,000 beneficiaries when using the variation of the validated algorithm. The estimated prevalence using the less stringent sce-nario may be more effective at capturing incident or less severe cases at the expense of including some false positives. Future studies in this specific population should include longer observa-tion periods to corroborate the estimated prevalence.
This study estimated a higher prevalence of RA among females and older age groups. The female to male ratio was 4:1, similar to the prevalence ratio estimated in the Korean study including medical and pharmacy claims as part of the case defi-nition algorithm (1). Other studies using medical claims only have reported female to male prevalence ratios of 3:1 (17,18). However,
studies using medical records or questionnaires to identify RA cases have estimated smaller female to male prevalence ratios (30–32). These discrepancies may be due to methodologic dif-ferences in identifying RA cases, as claims-based algorithms (1,17,18) have consistently estimated greater female to male ratios of RA cases than medical record reviews or questionnaires (30–32). Claims-based algorithms, especially those including DMARD claims, may be more sensitive to RA in women because women typically present with higher disease activity and are more likely to fill b/tsDMARD prescriptions (33,34). In the current study, the prevalence of RA increased with age, peaking around the group of beneficiaries ages 65–75 years. This finding is similar to the results of other studies that have reported an increase in the prevalence of RA up to a certain age, followed by a slow decline (1,18). No significant differences in the estimated prevalence by geographic region were found.
The current study found that more b/tsDMARDs (57%) than csDMARDs (43%) were dispensed to beneficiaries with RA, and
Table 3. Dispensing and costs of disease-modifying antirheumatic drugs (DMARDs) at the beneficiary level by prescribing physician specialty group and the category of DMARDs received (n = 2,036)*
Physician specialty group and DMARD
category BeneficiariesPharmacy
claims
Median no. of pharmacy claims per beneficiary
Median cost per pharmacy claim per
beneficiary
Median cost for all pharmacy claims per beneficiary
General medicine onlycsDMARD 163 (60) 718 (46) 3 $53 $197b/tsDMARD 76 (28) 474 (30) 7 $3,809 $26,808Combination 31 (12) 379 (24) 11 $2,228 $27,788
Rheumatology onlycsDMARD 413 (40) 2,404 (24) 4 $55 $197b/tsDMARD 398 (38) 3,767 (37) 9 $3,943 $33,271Combination 226 (22) 3,953 (39) 14 $2,666 $39,707
Internal medicine onlycsDMARD 132 (45) 563 (26) 3 $79 $316b/tsDMARD 92 (31) 762 (35) 8 $3,895 $30,583Combination 70 (24) 869 (40) 13 $2,728 $30,952
Family medicine onlycsDMARD 34 (62) 141 (47) 4 $51 $208b/tsDMARD 16 (29) 105 (35) 7 $3,841 $26,624Combination 5 (9) 53 (18) 9 $2,127 $29,525
COScsDMARD 153 (40) 1,400 (29) 9 $64 $556b/tsDMARD 67 (18) 695 (15) 10 $3,953 $39,428Combination 160 (42) 2,669 (56) 14 $2,376 $36,207
* Values are the number (%) unless indicated otherwise. b/tsDMARD = biologic or targeted synthetic DMARD; combination = conventional synthetic DMARD (csDMARD) and b/tsDMARD; COS = combination of specialties.
Table 4. Prevalence of rheumatoid arthritis (RA) for different case definitions with and without physician specialty restrictions during 2016*
RA case definition
≥1 claim for RA
≥2 claims for RA
≥3 claims for RA
≥2 claims for RA and ≥1 claim for
DMARD
≥3 claims for RA and ≥1 claim for
DMARDUsing medical and pharmaceutical claims†
Prevalence × 1,000 beneficiaries 8 5 3 3 2Using medical and pharmaceutical claims
from any providerPrevalence × 1,000 beneficiaries 27 10 6 4 3
* DMARD = disease-modifying antirheumatic drug. † Claims from rheumatology, internal medicine, family medicine, or general medicine physician.
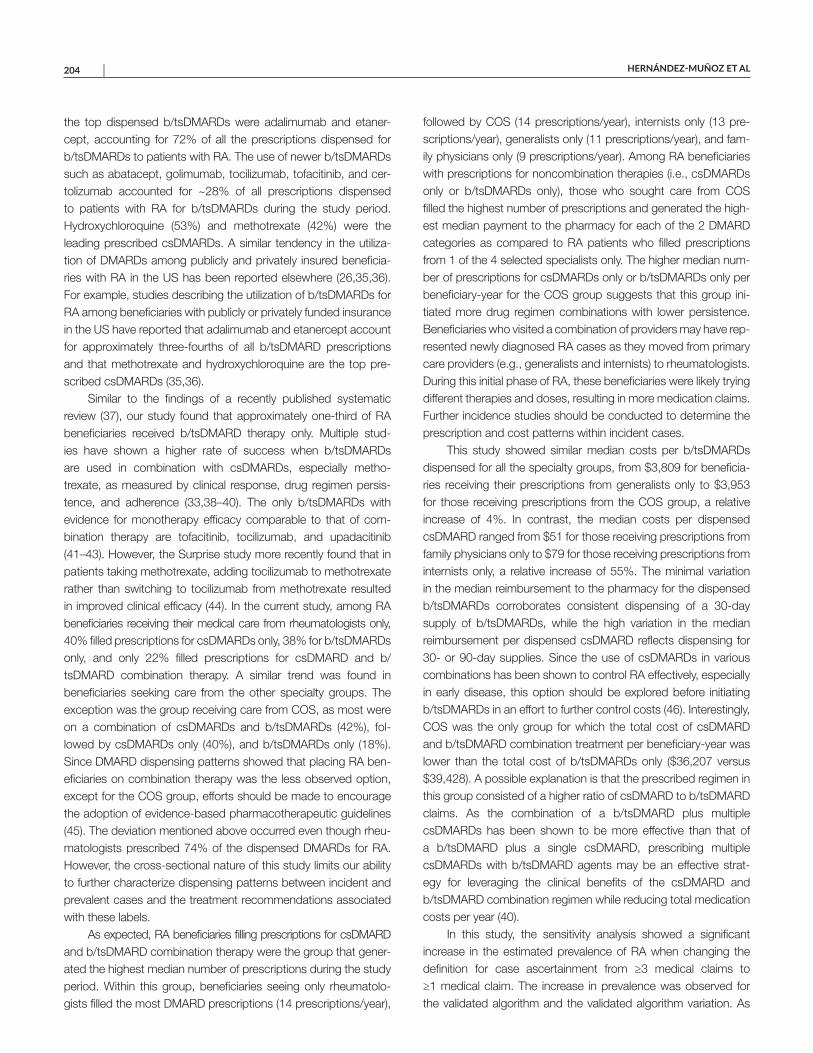
HERNÁNDEZ-MUÑOZ ET AL 204 |
the top dispensed b/tsDMARDs were adalimumab and etaner-cept, accounting for 72% of all the prescriptions dispensed for b/tsDMARDs to patients with RA. The use of newer b/tsDMARDs such as abatacept, golimumab, tocilizumab, tofacitinib, and cer-tolizumab accounted for ~28% of all prescriptions dispensed to patients with RA for b/tsDMARDs during the study period. Hydroxychloroquine (53%) and methotrexate (42%) were the leading prescribed csDMARDs. A similar tendency in the utiliza-tion of DMARDs among publicly and privately insured beneficia-ries with RA in the US has been reported elsewhere (26,35,36). For example, studies describing the utilization of b/tsDMARDs for RA among beneficiaries with publicly or privately funded insurance in the US have reported that adalimumab and etanercept account for approximately three-fourths of all b/tsDMARD prescriptions and that methotrexate and hydroxychloroquine are the top pre-scribed csDMARDs (35,36).
Similar to the findings of a recently published systematic review (37), our study found that approximately one-third of RA beneficiaries received b/tsDMARD therapy only. Multiple stud-ies have shown a higher rate of success when b/tsDMARDs are used in combination with csDMARDs, especially metho-trexate, as measured by clinical response, drug regimen persis-tence, and adherence (33,38–40). The only b/tsDMARDs with evidence for monotherapy efficacy comparable to that of com-bination therapy are tofacitinib, tocilizumab, and upadacitinib (41–43). However, the Surprise study more recently found that in patients taking methotrexate, adding tocilizumab to methotrexate rather than switching to tocilizumab from methotrexate resulted in improved clinical efficacy (44). In the current study, among RA beneficiaries receiving their medical care from rheumatologists only, 40% filled prescriptions for csDMARDs only, 38% for b/tsDMARDs only, and only 22% filled prescriptions for csDMARD and b/tsDMARD combination therapy. A similar trend was found in beneficiaries seeking care from the other specialty groups. The exception was the group receiving care from COS, as most were on a combination of csDMARDs and b/tsDMARDs (42%), fol-lowed by csDMARDs only (40%), and b/tsDMARDs only (18%). Since DMARD dispensing patterns showed that placing RA ben-eficiaries on combination therapy was the less observed option, except for the COS group, efforts should be made to encourage the adoption of evidence-based pharmacotherapeutic guidelines (45). The deviation mentioned above occurred even though rheu-matologists prescribed 74% of the dispensed DMARDs for RA. However, the cross-sectional nature of this study limits our ability to further characterize dispensing patterns between incident and prevalent cases and the treatment recommendations associated with these labels.
As expected, RA beneficiaries filling prescriptions for csDMARD and b/tsDMARD combination therapy were the group that gener-ated the highest median number of prescriptions during the study period. Within this group, beneficiaries seeing only rheumatolo-gists filled the most DMARD prescriptions (14 prescriptions/year),
followed by COS (14 prescriptions/year), internists only (13 pre-scriptions/year), generalists only (11 prescriptions/year), and fam-ily physicians only (9 prescriptions/year). Among RA beneficiaries with prescriptions for noncombination therapies (i.e., csDMARDs only or b/tsDMARDs only), those who sought care from COS filled the highest number of prescriptions and generated the high-est median payment to the pharmacy for each of the 2 DMARD categories as compared to RA patients who filled prescriptions from 1 of the 4 selected specialists only. The higher median num-ber of prescriptions for csDMARDs only or b/tsDMARDs only per beneficiary-year for the COS group suggests that this group ini-tiated more drug regimen combinations with lower persistence. Beneficiaries who visited a combination of providers may have rep-resented newly diagnosed RA cases as they moved from primary care providers (e.g., generalists and internists) to rheumatologists. During this initial phase of RA, these beneficiaries were likely trying different therapies and doses, resulting in more medication claims. Further incidence studies should be conducted to determine the prescription and cost patterns within incident cases.
This study showed similar median costs per b/tsDMARDs dispensed for all the specialty groups, from $3,809 for beneficia-ries receiving their prescriptions from generalists only to $3,953 for those receiving prescriptions from the COS group, a relative increase of 4%. In contrast, the median costs per dispensed csDMARD ranged from $51 for those receiving prescriptions from family physicians only to $79 for those receiving prescriptions from internists only, a relative increase of 55%. The minimal variation in the median reimbursement to the pharmacy for the dispensed b/tsDMARDs corroborates consistent dispensing of a 30-day supply of b/tsDMARDs, while the high variation in the median reimbursement per dispensed csDMARD reflects dispensing for 30- or 90-day supplies. Since the use of csDMARDs in various combinations has been shown to control RA effectively, especially in early disease, this option should be explored before initiating b/tsDMARDs in an effort to further control costs (46). Interestingly, COS was the only group for which the total cost of csDMARD and b/tsDMARD combination treatment per beneficiary-year was lower than the total cost of b/tsDMARDs only ($36,207 versus $39,428). A possible explanation is that the prescribed regimen in this group consisted of a higher ratio of csDMARD to b/tsDMARD claims. As the combination of a b/tsDMARD plus multiple csDMARDs has been shown to be more effective than that of a b/tsDMARD plus a single csDMARD, prescribing multiple csDMARDs with b/tsDMARD agents may be an effective strat-egy for leveraging the clinical benefits of the csDMARD and b/tsDMARD combination regimen while reducing total medication costs per year (40).
In this study, the sensitivity analysis showed a significant increase in the estimated prevalence of RA when changing the definition for case ascertainment from ≥3 medical claims to ≥1 medical claim. The increase in prevalence was observed for the validated algorithm and the validated algorithm variation. As
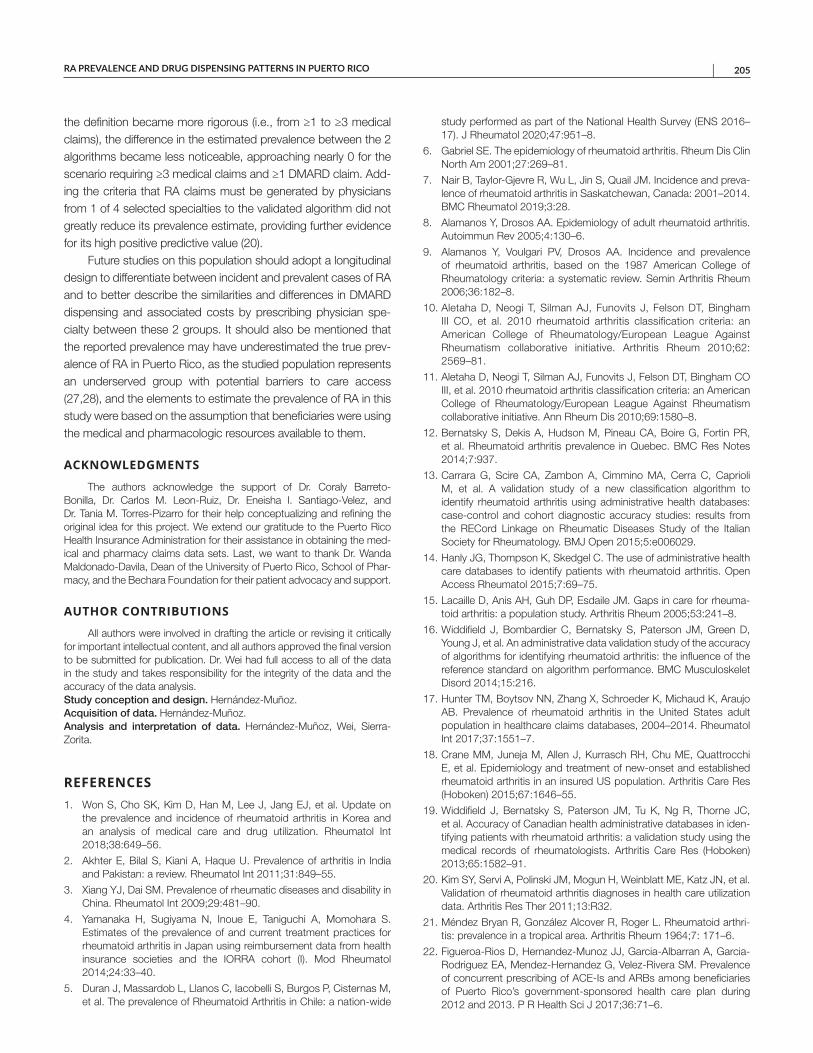
RA PREVALENCE AND DRUG DISPENSING PATTERNS IN PUERTO RICO | 205
the definition became more rigorous (i.e., from ≥1 to ≥3 medical claims), the difference in the estimated prevalence between the 2 algorithms became less noticeable, approaching nearly 0 for the scenario requiring ≥3 medical claims and ≥1 DMARD claim. Add-ing the criteria that RA claims must be generated by physicians from 1 of 4 selected specialties to the validated algorithm did not greatly reduce its prevalence estimate, providing further evidence for its high positive predictive value (20).
Future studies on this population should adopt a longitudinal design to differentiate between incident and prevalent cases of RA and to better describe the similarities and differences in DMARD dispensing and associated costs by prescribing physician spe-cialty between these 2 groups. It should also be mentioned that the reported prevalence may have underestimated the true prev-alence of RA in Puerto Rico, as the studied population represents an underserved group with potential barriers to care access (27,28), and the elements to estimate the prevalence of RA in this study were based on the assumption that beneficiaries were using the medical and pharmacologic resources available to them.
ACKNOWLEDGMENTS
The authors acknowledge the support of Dr. Coraly Barreto- Bonilla, Dr. Carlos M. Leon-Ruiz, Dr. Eneisha I. Santiago-Velez, and Dr. Tania M. Torres-Pizarro for their help conceptualizing and refining the original idea for this project. We extend our gratitude to the Puerto Rico Health Insurance Administration for their assistance in obtaining the med-ical and pharmacy claims data sets. Last, we want to thank Dr. Wanda Maldonado-Davila, Dean of the University of Puerto Rico, School of Phar-macy, and the Bechara Foundation for their patient advocacy and support.
AUTHOR CONTRIBUTIONS
All authors were involved in drafting the article or revising it critically for important intellectual content, and all authors approved the final version to be submitted for publication. Dr. Wei had full access to all of the data in the study and takes responsibility for the integrity of the data and the accuracy of the data analysis.Study conception and design. Hernández-Muñoz.Acquisition of data. Hernández-Muñoz.Analysis and interpretation of data. Hernández-Muñoz, Wei, Sierra-Zorita.
REFERENCES 1. Won S, Cho SK, Kim D, Han M, Lee J, Jang EJ, et al. Update on
the prevalence and incidence of rheumatoid arthritis in Korea andan analysis of medical care and drug utilization. Rheumatol Int2018;38:649–56.
2. Akhter E, Bilal S, Kiani A, Haque U. Prevalence of arthritis in Indiaand Pakistan: a review. Rheumatol Int 2011;31:849–55.
3. Xiang YJ, Dai SM. Prevalence of rheumatic diseases and disability inChina. Rheumatol Int 2009;29:481–90.
4. Yamanaka H, Sugiyama N, Inoue E, Taniguchi A, Momohara S.Estimates of the prevalence of and current treatment practices forrheumatoid arthritis in Japan using reimbursement data from healthinsurance societies and the IORRA cohort (I). Mod Rheumatol2014;24:33–40.
5. Duran J, Massardob L, Llanos C, Iacobelli S, Burgos P, Cisternas M,et al. The prevalence of Rheumatoid Arthritis in Chile: a nation-wide
study performed as part of the National Health Survey (ENS 2016–17). J Rheumatol 2020;47:951–8.
6. Gabriel SE. The epidemiology of rheumatoid arthritis. Rheum Dis Clin North Am 2001;27:269–81.
7. Nair B, Taylor-Gjevre R, Wu L, Jin S, Quail JM. Incidence and preva-lence of rheumatoid arthritis in Saskatchewan, Canada: 2001–2014. BMC Rheumatol 2019;3:28.
8. Alamanos Y, Drosos AA. Epidemiology of adult rheumatoid arthritis.Autoimmun Rev 2005;4:130–6.
9. Alamanos Y, Voulgari PV, Drosos AA. Incidence and prevalenceof rheumatoid arthritis, based on the 1987 American College ofRheumatology criteria: a systematic review. Semin Arthritis Rheum2006;36:182–8.
10. Aletaha D, Neogi T, Silman AJ, Funovits J, Felson DT, BinghamIII CO, et al. 2010 rheumatoid arthritis classification cri teria: anAmerican College of Rheumatology/European League AgainstRheumatism collaborative initiative. Arthritis Rheum 2010;62:2569–81.
11. Aletaha D, Neogi T, Silman AJ, Funovits J, Felson DT, Bingham COIII, et al. 2010 rheumatoid arthritis classification criteria: an AmericanCollege of Rheumatology/European League Against Rheumatismcollaborative initiative. Ann Rheum Dis 2010;69:1580–8.
12. Bernatsky S, Dekis A, Hudson M, Pineau CA, Boire G, Fortin PR,et al. Rheumatoid arthritis prevalence in Quebec. BMC Res Notes2014;7:937.
13. Carrara G, Scire CA, Zambon A, Cimmino MA, Cerra C, CaprioliM, et al. A validation study of a new classification algorithm toidentify rheumatoid arthritis using administrative health databases:case-control and cohort diagnostic accuracy studies: results fromthe RECord Linkage on Rheumatic Diseases Study of the ItalianSociety for Rheumatology. BMJ Open 2015;5:e006029.
14. Hanly JG, Thompson K, Skedgel C. The use of administrative healthcare databases to identify patients with rheumatoid arthritis. OpenAccess Rheumatol 2015;7:69–75.
15. Lacaille D, Anis AH, Guh DP, Esdaile JM. Gaps in care for rheuma-toid arthritis: a population study. Arthritis Rheum 2005;53:241–8.
16. Widdifield J, Bombardier C, Bernatsky S, Paterson JM, Green D,Young J, et al. An administrative data validation study of the accuracy of algorithms for identifying rheumatoid arthritis: the influence of thereference standard on algorithm performance. BMC MusculoskeletDisord 2014;15:216.
17. Hunter TM, Boytsov NN, Zhang X, Schroeder K, Michaud K, AraujoAB. Prevalence of rheumatoid arthritis in the United States adultpopulation in healthcare claims databases, 2004–2014. RheumatolInt 2017;37:1551–7.
18. Crane MM, Juneja M, Allen J, Kurrasch RH, Chu ME, QuattrocchiE, et al. Epidemiology and treatment of new-onset and establishedrheumatoid arthritis in an insured US population. Arthritis Care Res(Hoboken) 2015;67:1646–55.
19. Widdifield J, Bernatsky S, Paterson JM, Tu K, Ng R, Thorne JC,et al. Accuracy of Canadian health administrative databases in iden-tifying patients with rheumatoid arthritis: a validation study using themedical records of rheumatologists. Arthritis Care Res (Hoboken)2013;65:1582–91.
20. Kim SY, Servi A, Polinski JM, Mogun H, Weinblatt ME, Katz JN, et al. Validation of rheumatoid arthritis diagnoses in health care utilizationdata. Arthritis Res Ther 2011;13:R32.
21. Méndez Bryan R, González Alcover R, Roger L. Rheumatoid arthri-tis: prevalence in a tropical area. Arthritis Rheum 1964;7: 171–6.
22. Figueroa-Rios D, Hernandez-Munoz JJ, Garcia-Albarran A, Garcia-Rodriguez EA, Mendez-Hernandez G, Velez-Rivera SM. Prevalenceof concurrent prescribing of ACE-Is and ARBs among beneficia riesof Puerto Rico’s government-sponsored health care plan during2012 and 2013. P R Health Sci J 2017;36:71–6.
HERNÁNDEZ-MUÑOZ ET AL 206 |
23. Velez SM, Hernandez JJ, Davis SM, Almodovar MG, Mercado JR. NSAIDs prescription prevalence after a cardiovascular event related hospitalization in Medicaid beneficiaries from Puerto Rico. P R Health Sci J 2016;35:209–14.
24. Kim G, Barner JC, Rascati K, Richards K. Examining time to initiation of biologic disease-modifying antirheumatic drugs and medication adherence and persistence among Texas Medicaid recipients with rheumatoid arthritis. Clin Ther 2016;38:646–54.
25. Chu LH, Portugal C, Kawatkar AA, Stohl W, Nichol MB. Racial/ethnic differences in the use of biologic disease-modifying antirheu-matic drugs among California Medicaid rheumatoid arthritis patients. Arthritis Care Research (Hoboken) 2013;65:299–303.
26. Desai RJ, Solomon DH, Jin Y, Liu J, Kim SC. Temporal trends in use of biologic DMARDs for rheumatoid arthritis in the United States: a cohort study of publicly and privately insured patients. J Manag Care Spec Pharm 2017;23:809–14.
27. Hsiang WR, Lukasiewicz A, Gentry M, Kim CY, Leslie MP, Pelker R, et al. Medicaid patients have greater difficulty scheduling health care appointments compared with private insurance patients: a meta-analysis. Inquiry 2019;56:46958019838118.
28. Cifaldi M, Renaud J, Ganguli A, Halpern MT. Disparities in care by insurance status for individuals with rheumatoid arthritis: analysis of the medical expenditure panel survey, 2006–2009. Curr Med Res Opin 2016;32:2029–37.
29. Slim ZF, Soares de Moura C, Bernatsky S, Rahme E. Identifying Rheumatoid arthritis cases within the Quebec Health Administrative Database. J Rheumatol 2019;46:1570–6.
30. Gabriel SE, Crowson CS, O’Fallon WM. The epidemiology of rheu-matoid arthritis in Rochester, Minnesota, 1955–1985. Arthritis Rheum 1999;42:415–20.
31. Riise T, Jacobsen BK, Gran JT. Incidence and prevalence of rheuma-toid arthritis in the county of Troms, northern Norway. J Rheumatol 2000;27:1386–9.
32. Symmons D, Turner G, Webb R, Asten P, Barrett E, Lunt M, et al. The prevalence of rheumatoid arthritis in the United Kingdom: new esti-mates for a new century. Rheumatology (Oxford) 2002;41:793–800.
33. Harnett J, Wiederkehr D, Gerber R, Gruben D, Bourret J, Koenig A. Primary nonadherence, associated clinical outcomes, and health care resource use among patients with rheumatoid arthritis pre-scribed treatment with injectable biologic disease-modifying anti-rheumatic drugs. J Manag Care Spec Pharm 2016;22:209–18.
34. Sokka T, Toloza S, Cutolo M, Kautiainen H, Makinen H, Gogus F, et al. Women, men, and rheumatoid arthritis: analyses of disease activity, disease characteristics, and treatments in the QUEST-RA study. Arthritis Res Ther 2009;11:R7.
35. Curtis JR, Schabert VF, Harrison DJ, Yeaw J, Korn JR, Quach C, et al. Estimating effectiveness and cost of biologics for rheumatoid arthritis: application of a validated algorithm to commercial insurance claims. Clin Ther 2014;36:996–1004.
36. Jin Y, Desai RJ, Liu J, Choi NK, Kim SC. Factors associated with initial or subsequent choice of biologic disease-modifying
antirheumatic drugs for treatment of rheumatoid arthritis. Arthritis Res Ther 2017;19:159.
37. Emery P, Pope JE, Kruger K, Lippe R, DeMasi R, Lula S, et al. Efficacy of monotherapy with biologics and JAK inhibitors for the treatment of rheumatoid arthritis: a systematic review. Adv Ther 2018;35:1535–63.
38. Heiberg MS, Koldingsnes W, Mikkelsen K, Rødevand E, Kaufmann C, Mowinckel P, et al. The comparative one-year performance of anti–tumor necrosis factor α drugs in patients with rheumatoid arthritis, psoriatic arthritis, and ankylosing spondylitis: results from a longitudinal, observational, multicenter study. Arthritis Rheum 2008;59:234–40.
39. Klareskog L, van der Heijde D, de Jager JP, Gough A, Kalden J, Malaise M, et al. Therapeutic effect of the combination of etanercept and methotrexate compared with each treatment alone in patients with rheumatoid arthritis: double-blind randomised controlled trial. Lancet 2004;363:675–81.
40. Soliman MM, Ashcroft DM, Watson KD, Lunt M, Symmons DP, Hyrich KL, et al. Impact of concomitant use of DMARDs on the per-sistence with anti-TNF therapies in patients with rheumatoid arthritis: results from the British Society for Rheumatology Biologics Register. Ann Rheum Dis 2011;70:583–9.
41. Dougados M, Kissel K, Sheeran T, Tak PP, Conaghan PG, Mola EM, et al. Adding tocilizumab or switching to tocilizumab mono-therapy in methotrexate inadequate responders: 24-week symp-tomatic and structural results of a 2-year randomised controlled strategy trial in rheumatoid arthritis (ACT-RAY). Ann Rheum Dis 2013;72:43–50.
42. Smolen JS, Breedveld FC, Burmester GR, Bykerk V, Dougados M, Emery P, et al. Treating rheumatoid arthritis to target: 2014 update of the recommendations of an international task force. Ann Rheum Dis 2016;75:3–15.
43. Cohen SB, Pope J, Haraoui B, Irazoque-Palazuelos F, Korkosz M, Diehl A, et al. Methotrexate withdrawal in patients with rheu-matoid arthritis who achieve low disease activity with tofacitinib modified-release 11 mg once daily plus methotrexate (ORAL Shift): a randomised, phase 3b/4, non-inferiority trial. Lancet Rheumatol 2019;1:e23–34.
44. Kaneko Y, Atsumi T, Tanaka Y, Inoo M, Kobayashi-Haraoka H, Amano K, et al. Comparison of adding tocilizumab to methotrex-ate with switching to tocilizumab in patients with rheumatoid arthritis with inadequate response to methotrexate: 52-week results from a prospective, randomised, controlled study (SURPRISE study). Ann Rheum Dis 2016;75:1917–23.
45. Pappas DA, Reed GW, Saunders K, John A, Shewade A, Greenberg JD, et al. Characteristics associated with biologic monotherapy use in biologic-naive patients with rheumatoid arthritis in a US registry population. Rheumatol Ther 2015;2:85–96.
46. Curtis JR, Chastek B, Becker L, Quach C, Harrison DJ, Yun H, et al. Cost and effectiveness of biologics for rheumatoid arthritis in a commercially insured population. J Manag Care Spec Pharm 2015;21:318–29.
207
Arthritis Care & ResearchVol. 73, No. 2, February 2021, pp 207–214DOI 10.1002/acr.24114© 2019, American College of Rheumatology
Treat-to-Target Approach in Rheumatoid Arthritis: A Quality Improvement TrialSonali P. Desai,1 Cianna Leatherwood,2 Malka Forman,1 Eunji Ko,3 Emma Stevens,1 Maura Iversen,4
Chang Xu,1 Bing Lu,1 and Daniel H. Solomon1
Objective. Using a quality improvement approach, our objective was to integrate a treat-to-target approach for rheumatoid arthritis (RA) through routine electronic collection of patient-reported disease activity scores and a multidisciplinary learning collaborative for rheumatologists.
Methods. RA patients completed a patient-reported outcome measure, the Routine Assessment of Patient Index Data 3 (RAPID3), at check-in. Nine rheumatologists and their patients were allocated to a learning collaborative intervention group focused on a treat-to-target approach and 13 were allocated to a control group. The primary outcome was documentation of a treat-to-target implementation score: disease activity score, disease activity score used in the medication change decision, the presence of a treatment target, and an indication of shared decision-making. A primary analysis of patient visits with medication changes was conducted using an interrupted time-series analysis.
Results. We studied 554 individual rheumatology patients with 709 patient visits. Treat-to-target implementation scores among intervention rheumatologists (mean ± SD 44.6% ± 1.63%) were 12.4% higher than in the control group (mean ± SD 32.2% ± 1.50%; P < 0.0001). We observed differences in treat-to-target implementation score components, comparing intervention group to control group rheumatologists: disease activity score present, 77.2% versus 68.0% (P = 0.02); disease activity score used in the medication change decision, 45.2% versus 30.0% (P < 0.01); treatment target, 9.0% versus 0.4% (P < 0.01); and shared decision-making, 46.9% versus 30.0% (P < 0.01). Secondary analysis of patient visits with high RAPID3 scores found that medication changes were 54% less likely in the intervention versus control group (odds ratio 0.46 [95% confidence interval 0.27–0.79], P = 0.005).
Conclusion. This nonrandomized, interrupted time-series trial demonstrated a modest but significant impact of a learning collaborative intervention on rheumatologist documentation of a treat-to-target approach in RA.
INTRODUCTION
The management of rheumatoid arthritis (RA) has changed considerably over the past 20 years, after the approval of etaner-cept in 1998 as the first biologic disease-modifying antirheumatic drug (DMARD) to treat patients in moderate or high disease activity (1). With the advent of over a dozen biologic and targeted thera-pies and the knowledge that early, aggressive treatment strate-gies can improve long-term outcomes in RA, research has shifted focus to the adoption of a treat-to-target (TTT) strategy (2,3). A TTT approach encompasses 4 elements: the presence of a dis-ease activity score, inclusion of the disease activity score in the decision to change the medication, the presence of a treatment
target (i.e., remission, low, moderate, or high), and the presence of shared decision-making.
A recent trial demonstrated that a learning collaborative could improve implementation of TTT across multiple rheumatol-ogy practices without an increase in adverse effects (4,5). How-ever, showing that TTT can be successful and sustainable outside of a randomized controlled trial setting remains a challenge (6). Successful implementation of TTT necessitates multiple practice improvements: the regular use of disease activity measures, the determination of a disease activity target, the use of a disease activity measure in the decision to change medications, and shared decision-making, with incorporation of patient preferences when determining targets and medication changes (7).
Supported by Pfizer.1Sonali P. Desai, MD, MPH, Malka Forman, BS, Emma Stevens, BA, Chang
Xu, MS, Bing Lu, PhD, Daniel H. Solomon, MD, MPH: Brigham and Women’s Hospital, Boston, Massachusetts; 2Cianna Leatherwood, MD, MPH: Kaiser Permanente East Bay, Richmond, California; 3Eunji Ko, Pharm D: Brigham Health and Brigham and Women’s Hospital, Boston, Massachusetts; 4Maura Iversen, MPH, SD: Brigham and Women’s Hospital and Northeastern University, Boston, Massachusetts.
Dr. Solomon has received research support from AbbVie, Amgen, Genentech, Janssen, and Pfizer. No other disclosures relevant to this article were reported.
Address correspondence to Sonali P. Desai, MD, MPH, Division of Rheumatology, Immunology, and Allergy, Brigham Health, Brigham and Women’s Hospital, 60 Fenwood Road, Hale Building for Transformative Medicine, 3rd floor, Boston, MA 02115. Email: [email protected].
Submitted for publication June 25, 2019; accepted in revised form November 19, 2019.
DESAI ET AL 208 |
We sought to integrate a TTT strategy for RA management into our usual academic rheumatology practice through a quality improvement intervention, using 2 key approaches. First, we cre-ated an automated process for electronic patient-reported out-come implementation at the point-of-care, using electronic tablets (i.e., iPads) to collect Routine Assessment of Patient Index Data 3 (RAPID3) questionnaires (8). Second, we used a modified learning collaborative intervention coupled with email reminders, to impact adoption of TTT documentation among rheumatologists and use of a TTT approach at visits when patients were in high disease activity, to assess whether medication changes were made.
SUBJECTS AND METHODS
Study design and patient population. We performed a controlled trial to evaluate the impact of a multidisciplinary learning collaborative on the use of a TTT approach for management of adults with RA. The study was conducted as a quality improve-ment effort, and we allocated rheumatologists and their patients to the learning collaborative intervention or a wait-list control in a nonrandom fashion. Institutional review board approval was sought and waived by the Partners Human Research Committee, including a requirement for written informed consent.
The study setting was a rheumatology practice at a large academic medical center, delivering community-based and tertiary care for RA patients. In May 2017, we deployed a new method
of collecting a patient-reported outcome for RA disease activity using the RAPID3. The RAPID3 is a validated RA disease activity questionnaire completed by patients and includes a patient phys-ical function measure, global health assessment, and global pain score (8). All patients with RA, based on an International Statisti-cal Classification of Diseases and Related Health Problems, Tenth Revision (ICD-10) billing diagnosis code in the electronic medical record, were given a tablet when they checked in for their rheuma-tology visit. Patients filled out the RAPID3 questionnaire electron-ically while in the waiting room or after entering the examination room, and the results of the completed questionnaire were auto-matically uploaded in real-time to the electronic medical record. RAPID3 scores were reported with their raw score and catego-rized into remission, or low, moderate, or high disease activity. These data were available immediately to rheumatologists during office visits with RA patients.
There were 22 rheumatologists who participated; 9 were assigned to the learning collaborative intervention and 13 to the wait-list control group for the study period, from June 2017 to August 2018. During this period, we included all patients with a diagnosis of RA seen during an office visit by a rheumatologist in the intervention or control groups. The RA diagnosis for study inclusion was based on ICD-10 billing diagnosis codes combined with manual chart review of rheumatologist office notes done by trained research staff (MF, EK, and ES). Patients could contribute >1 visit during the study period.
We analyzed 2 overlapping patient populations in this qual-ity improvement effort. The first group of patients, used for the primary analysis, included RA patients with a medication change from June 2017 to August 2018. Medication changes were defined as the addition of a new medication, an increase or decrease in the dose or frequency, or a discontinuation of an exist-ing medication. The second patient group, used for the secondary analysis, included RA patients from July 2017 to May 2018 where the RAPID3 score demonstrated high disease activity. Neither of the study team rheumatologists (SPD and DHS) nor their patients were included in the analyses.
Intervention. The learning collaborative was a modified version of the Institute for Healthcare Improvement’s model for quality improvement, with the goal of increasing the use of the TTT approach for the management of RA (9). During the 9 learning collaborative sessions held between August 2017 and September 2018, a multidisciplinary group consisting of the intervention rheu-matologists, rheumatology clinic nurses, rheumatology adminis-trative leadership, and the study team was assembled for a series of 1-hour meetings. The learning collaborative content included introduction of the TTT strategy for RA, patient-reported out-come measures, shared decision-making, medication adherence, and strategies to promote patient engagement.
Facilitated discussion during the monthly meetings allowed for robust debate and best-practice sharing among the intervention
SIGNIFICANCE & INNOVATIONS• Integrating a treat-to-target approach for rheuma-
toid arthritis management into real-world rheu-matology practice remains a challenge despite promising randomized controlled trial data.
• Our study successfully measured electronic patient- reported outcomes using the Routine Assessment of Patient Index Data 3 on tablets in the waiting room, integrated disease activity measures into the electronic medical record in real-time for use during the office visit, and engaged in shared decision-making with patients when medication changes were made.
• A learning collaborative model provides a quality improvement strategy to educate rheumatologists and clinic staff on treat-to-target, provides data on performance, and debates and discusses the chal-lenges and opportunities around a treat-to-target approach; our study found this model to be effec-tive.
• We unexpectedly found that medication changes were not made by intervention rheumatologists, even when disease activity was high, but most of-ten the reason for not changing medications was due to the perception by the rheumatologist that medication was in fact working, or due to patient comorbidities.
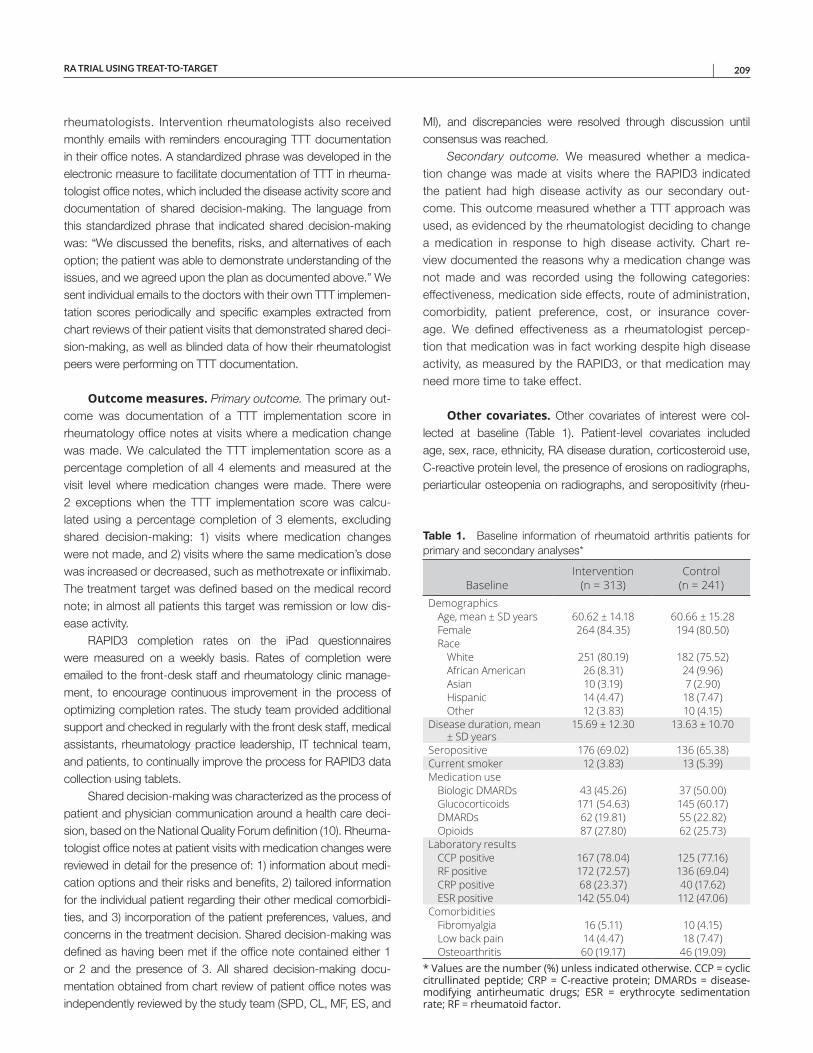
RA TRIAL USING TREAT-TO-TARGET | 209
rheumatologists. Intervention rheumatologists also received monthly emails with reminders encouraging TTT documentation in their office notes. A standardized phrase was developed in the electronic measure to facilitate documentation of TTT in rheuma-tologist office notes, which included the disease activity score and documentation of shared decision-making. The language from this standardized phrase that indicated shared decision-making was: “We discussed the benefits, risks, and alternatives of each option; the patient was able to demonstrate understanding of the issues, and we agreed upon the plan as documented above.” We sent individual emails to the doctors with their own TTT implemen-tation scores periodically and specific examples extracted from chart reviews of their patient visits that demonstrated shared deci-sion-making, as well as blinded data of how their rheumatologist peers were performing on TTT documentation.
Outcome measures. Primary outcome. The primary out-come was documentation of a TTT implementation score in rheumatology office notes at visits where a medication change was made. We calculated the TTT implementation score as a percentage completion of all 4 elements and measured at the visit level where medication changes were made. There were 2 exceptions when the TTT implementation score was calcu-lated using a percentage completion of 3 elements, excluding shared decision-making: 1) visits where medication changes were not made, and 2) visits where the same medication’s dose was increased or decreased, such as methotrexate or infliximab. The treatment target was defined based on the medical record note; in almost all patients this target was remission or low dis-ease activity.
RAPID3 completion rates on the iPad questionnaires were measured on a weekly basis. Rates of completion were emailed to the front-desk staff and rheumatology clinic manage-ment, to encourage continuous improvement in the process of optimizing completion rates. The study team provided additional support and checked in regularly with the front desk staff, medical assistants, rheumatology practice leadership, IT technical team, and patients, to continually improve the process for RAPID3 data collection using tablets.
Shared decision-making was characterized as the process of patient and physician communication around a health care deci-sion, based on the National Quality Forum definition (10). Rheuma-tologist office notes at patient visits with medication changes were reviewed in detail for the presence of: 1) information about medi-cation options and their risks and benefits, 2) tailored information for the individual patient regarding their other medical comorbidi-ties, and 3) incorporation of the patient preferences, values, and concerns in the treatment decision. Shared decision-making was defined as having been met if the office note contained either 1 or 2 and the presence of 3. All shared decision-making docu-mentation obtained from chart review of patient office notes was independently reviewed by the study team (SPD, CL, MF, ES, and
MI), and discrepancies were resolved through discussion until consensus was reached.
Secondary outcome. We measured whether a medica-tion change was made at visits where the RAPID3 indicated the patient had high disease activity as our secondary out-come. This outcome measured whether a TTT approach was used, as evidenced by the rheumatologist deciding to change a medication in response to high disease activity. Chart re-view documented the reasons why a medication change was not made and was recorded using the following categories: effectiveness, medication side effects, route of administration, comorbidity, patient preference, cost, or insurance cover-age. We defined effectiveness as a rheumatologist percep-tion that medication was in fact working despite high disease activity, as measured by the RAPID3, or that medication may need more time to take effect.
Other covariates. Other covariates of interest were col-lected at baseline (Table 1). Patient-level covariates included age, sex, race, ethnicity, RA disease duration, corticosteroid use, C-reactive protein level, the presence of erosions on radiographs, periarticular osteopenia on radiographs, and seropositivity (rheu-
Table 1. Baseline information of rheumatoid arthritis patients for primary and secondary analyses*
BaselineIntervention
(n = 313)Control
(n = 241)Demographics
Age, mean ± SD years 60.62 ± 14.18 60.66 ± 15.28Female 264 (84.35) 194 (80.50)Race
White 251 (80.19) 182 (75.52)African American 26 (8.31) 24 (9.96)Asian 10 (3.19) 7 (2.90)Hispanic 14 (4.47) 18 (7.47)Other 12 (3.83) 10 (4.15)
Disease duration, mean ± SD years
15.69 ± 12.30 13.63 ± 10.70
Seropositive 176 (69.02) 136 (65.38)Current smoker 12 (3.83) 13 (5.39)Medication use
Biologic DMARDs 43 (45.26) 37 (50.00)Glucocorticoids 171 (54.63) 145 (60.17)DMARDs 62 (19.81) 55 (22.82)Opioids 87 (27.80) 62 (25.73)
Laboratory resultsCCP positive 167 (78.04) 125 (77.16)RF positive 172 (72.57) 136 (69.04)CRP positive 68 (23.37) 40 (17.62)ESR positive 142 (55.04) 112 (47.06)
ComorbiditiesFibromyalgia 16 (5.11) 10 (4.15)Low back pain 14 (4.47) 18 (7.47)Osteoarthritis 60 (19.17) 46 (19.09)
* Values are the number (%) unless indicated otherwise. CCP = cycliccitrullinated peptide; CRP = C-reactive protein; DMARDs = disease-modifying antirheumatic drugs; ESR = erythrocyte sedimentation rate; RF = rheumatoid factor.
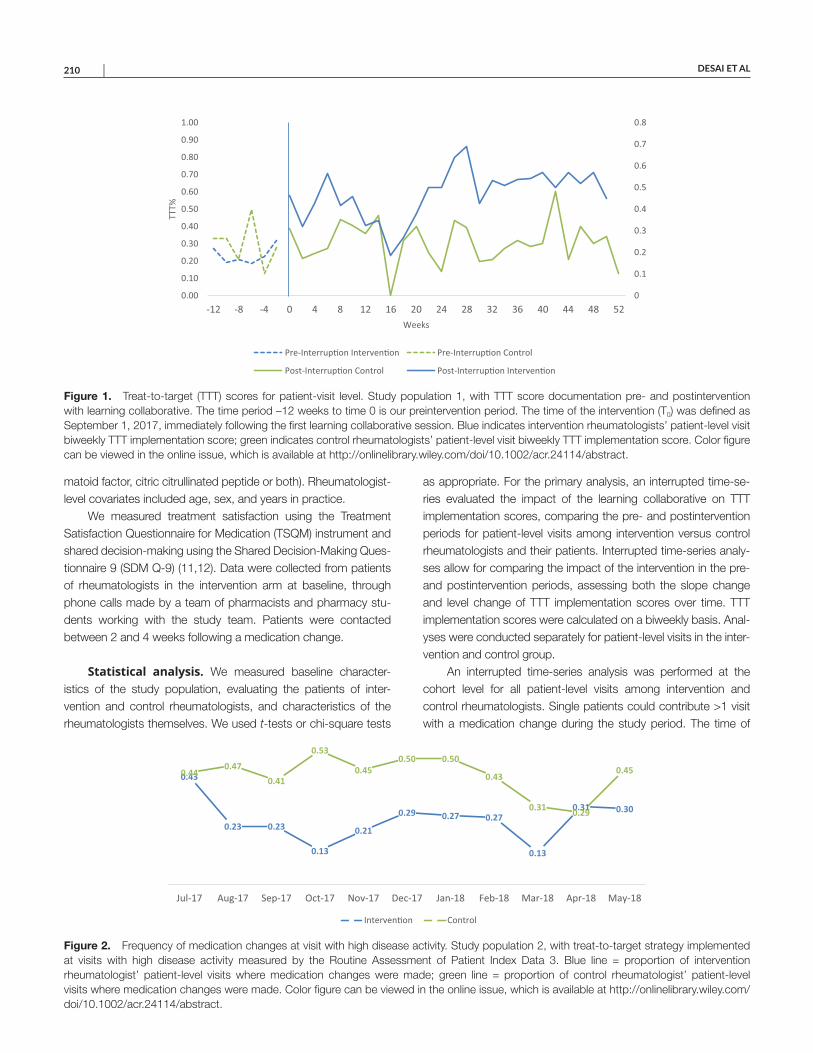
DESAI ET AL 210 |
matoid factor, citric citrullinated peptide or both). Rheumatologist- level covariates included age, sex, and years in practice.
We measured treatment satisfaction using the Treatment Satisfaction Questionnaire for Medication (TSQM) instrument and shared decision-making using the Shared Decision-Making Ques-tionnaire 9 (SDM Q-9) (11,12). Data were collected from patients of rheumatologists in the intervention arm at baseline, through phone calls made by a team of pharmacists and pharmacy stu-dents working with the study team. Patients were contacted between 2 and 4 weeks following a medication change.
Statistical analysis. We measured baseline character-istics of the study population, evaluating the patients of inter-vention and control rheumatologists, and characteristics of the rheumatologists themselves. We used t-tests or chi-square tests
as appropriate. For the primary analysis, an interrupted time-se-ries evaluated the impact of the learning collaborative on TTT implementation scores, comparing the pre- and postintervention periods for patient-level visits among intervention versus control rheumatologists and their patients. Interrupted time-series analy-ses allow for comparing the impact of the intervention in the pre- and postintervention periods, assessing both the slope change and level change of TTT implementation scores over time. TTT implementation scores were calculated on a biweekly basis. Anal-yses were conducted separately for patient-level visits in the inter-vention and control group.
An interrupted time-series analysis was performed at the cohort level for all patient-level visits among intervention and control rheumatologists. Single patients could contribute >1 visit with a medication change during the study period. The time of
Figure 1. Treat-to-target (TTT) scores for patient-visit level. Study population 1, with TTT score documentation pre- and postintervention with learning collaborative. The time period –12 weeks to time 0 is our preintervention period. The time of the intervention (T0) was defined as September 1, 2017, immediately following the first learning collaborative session. Blue indicates intervention rheumatologists’ patient-level visit biweekly TTT implementation score; green indicates control rheumatologists’ patient-level visit biweekly TTT implementation score. Color figure can be viewed in the online issue, which is available at http://onlinelibrary.wiley.com/doi/10.1002/acr.24114/abstract.
0
0.1
0.2
0.3
0.4
0.5
0.6
0.7
0.8
0.00
0.10
0.20
0.30
0.40
0.50
0.60
0.70
0.80
0.90
1.00
-12 -8 -4 0 4 8 12 16 20 24 28 32 36 40 44 48 52
TTT%
Weeks
Pre-Interrup�on Interven�on Pre-Interrup�on Control
Post-Interrup�on Control Post-Interrup�on Interven�on
Figure 2. Frequency of medication changes at visit with high disease activity. Study population 2, with treat-to-target strategy implemented at visits with high disease activity measured by the Routine Assessment of Patient Index Data 3. Blue line = proportion of intervention rheumatologist’ patient-level visits where medication changes were made; green line = proportion of control rheumatologist’ patient-level visits where medication changes were made. Color figure can be viewed in the online issue, which is available at http://onlinelibrary.wiley.com/doi/10.1002/acr.24114/abstract.
0.43
0.23 0.23
0.13
0.21
0.29 0.27 0.27
0.13
0.31 0.30
0.440.47
0.41
0.53
0.450.50 0.50
0.43
0.31 0.29
0.45
Jul-17 Aug-17 Sep-17 Oct-17 Nov-17 Dec-17 Jan-18 Feb-18 Mar-18 Apr-18 May-18
Interven�on Control
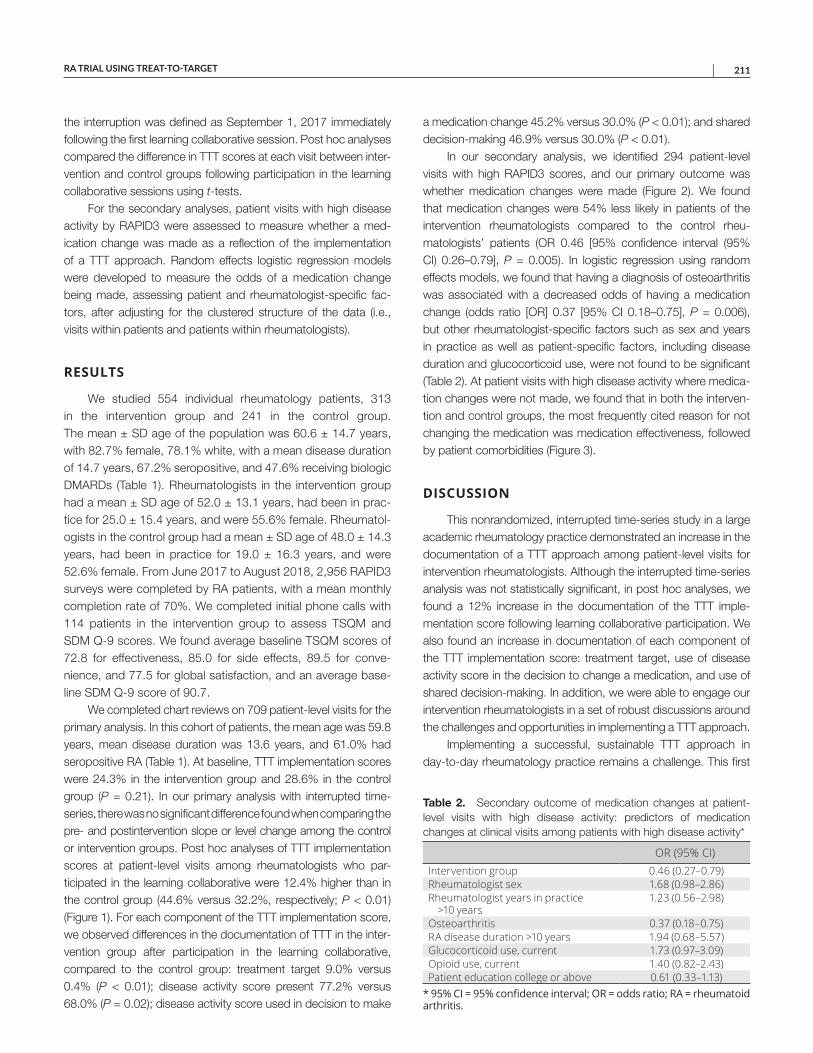
RA TRIAL USING TREAT-TO-TARGET | 211
the interruption was defined as September 1, 2017 immediately following the first learning collaborative session. Post hoc analyses compared the difference in TTT scores at each visit between inter-vention and control groups following participation in the learning collaborative sessions using t-tests.
For the secondary analyses, patient visits with high disease activity by RAPID3 were assessed to measure whether a med-ication change was made as a reflection of the implementation of a TTT approach. Random effects logistic regression models were developed to measure the odds of a medication change being made, assessing patient and rheumatologist-specific fac-tors, after adjusting for the clustered structure of the data (i.e., visits within patients and patients within rheumatologists).
RESULTS
We studied 554 individual rheumatology patients, 313 in the intervention group and 241 in the control group. The mean ± SD age of the population was 60.6 ± 14.7 years, with 82.7% female, 78.1% white, with a mean disease duration of 14.7 years, 67.2% seropositive, and 47.6% receiving biologic DMARDs (Table 1). Rheumatologists in the intervention group had a mean ± SD age of 52.0 ± 13.1 years, had been in prac-tice for 25.0 ± 15.4 years, and were 55.6% female. Rheumatol-ogists in the control group had a mean ± SD age of 48.0 ± 14.3 years, had been in practice for 19.0 ± 16.3 years, and were 52.6% female. From June 2017 to August 2018, 2,956 RAPID3 surveys were completed by RA patients, with a mean monthly completion rate of 70%. We completed initial phone calls with 114 patients in the intervention group to assess TSQM and SDM Q-9 scores. We found average baseline TSQM scores of 72.8 for effectiveness, 85.0 for side effects, 89.5 for conve-nience, and 77.5 for global satisfaction, and an average base-line SDM Q-9 score of 90.7.
We completed chart reviews on 709 patient-level visits for the primary analysis. In this cohort of patients, the mean age was 59.8 years, mean disease duration was 13.6 years, and 61.0% had seropositive RA (Table 1). At baseline, TTT implementation scores were 24.3% in the intervention group and 28.6% in the control group (P = 0.21). In our primary analysis with interrupted time- series, there was no significant difference found when comparing the pre- and postintervention slope or level change among the control or intervention groups. Post hoc analyses of TTT implementation scores at patient-level visits among rheumatologists who par-ticipated in the learning collaborative were 12.4% higher than in the control group (44.6% versus 32.2%, respectively; P < 0.01) (Figure 1). For each component of the TTT implementation score, we observed differences in the documentation of TTT in the inter-vention group after participation in the learning collaborative, compared to the control group: treatment target 9.0% versus 0.4% (P < 0.01); disease activity score present 77.2% versus 68.0% (P = 0.02); disease activity score used in decision to make
a medication change 45.2% versus 30.0% (P < 0.01); and shared decision-making 46.9% versus 30.0% (P < 0.01).
In our secondary analysis, we identified 294 patient-level visits with high RAPID3 scores, and our primary outcome was whether medication changes were made (Figure 2). We found that medication changes were 54% less likely in patients of the intervention rheumatologists compared to the control rheu-matologists’ patients (OR 0.46 [95% confidence interval (95% CI) 0.26–0.79], P = 0.005). In logistic regression using random effects models, we found that having a diagnosis of osteoarthritis was associated with a decreased odds of having a medication change (odds ratio [OR] 0.37 [95% CI 0.18–0.75], P = 0.006), but other rheumatologist-specific factors such as sex and years in practice as well as patient-specific factors, including disease duration and glucocorticoid use, were not found to be significant (Table 2). At patient visits with high disease activity where medica-tion changes were not made, we found that in both the interven-tion and control groups, the most frequently cited reason for not changing the medication was medication effectiveness, followed by patient comorbidities (Figure 3).
DISCUSSION
This nonrandomized, interrupted time-series study in a large academic rheumatology practice demonstrated an increase in the documentation of a TTT approach among patient-level visits for intervention rheumatologists. Although the interrupted time-series analysis was not statistically significant, in post hoc analyses, we found a 12% increase in the documentation of the TTT imple-mentation score following learning collaborative participation. We also found an increase in documentation of each component of the TTT implementation score: treatment target, use of disease activity score in the decision to change a medication, and use of shared decision-making. In addition, we were able to engage our intervention rheumatologists in a set of robust discussions around the challenges and opportunities in implementing a TTT approach.
Implementing a successful, sustainable TTT approach in day-to-day rheumatology practice remains a challenge. This first
Table 2. Secondary outcome of medication changes at patient-level visits with high disease activity: predictors of medication changes at clinical visits among patients with high disease activity*
OR (95% CI)Intervention group 0.46 (0.27–0.79)Rheumatologist sex 1.68 (0.98–2.86)Rheumatologist years in practice
>10 years1.23 (0.56–2.98)
Osteoarthritis 0.37 (0.18–0.75)RA disease duration >10 years 1.94 (0.68–5.57)Glucocorticoid use, current 1.73 (0.97–3.09)Opioid use, current 1.40 (0.82–2.43)Patient education college or above 0.61 (0.33–1.13)
* 95% CI = 95% confidence interval; OR = odds ratio; RA = rheumatoid arthritis.
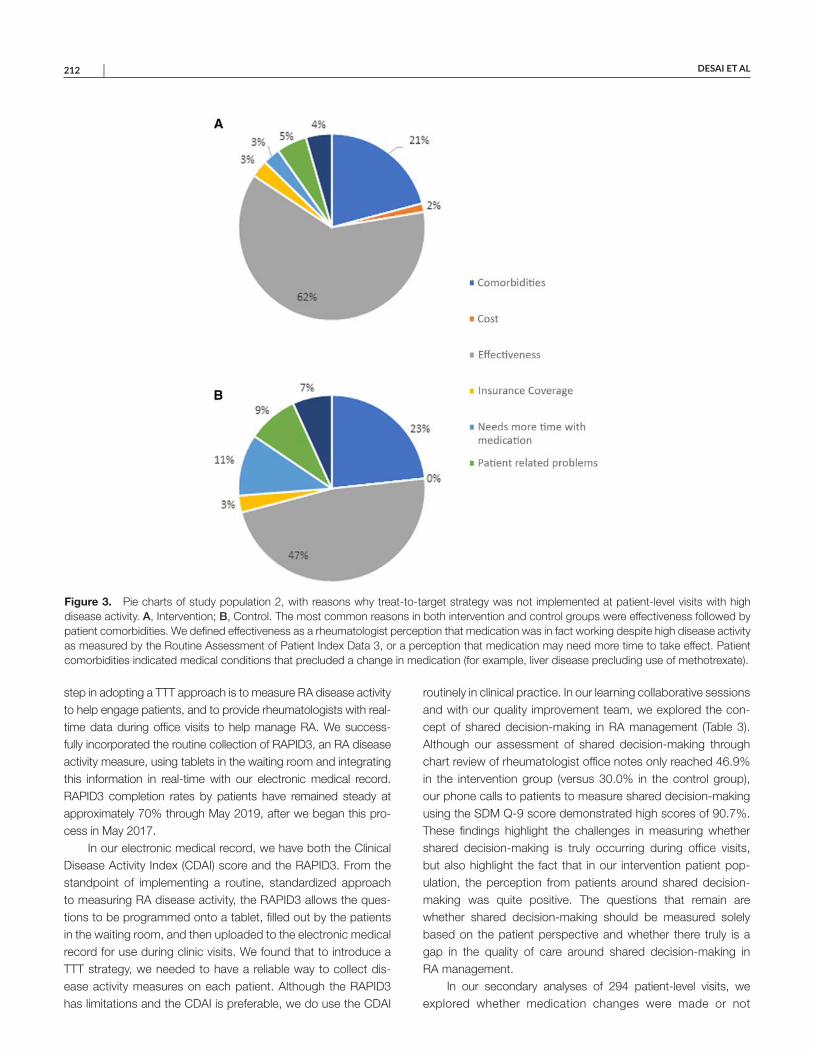
DESAI ET AL 212 |
step in adopting a TTT approach is to measure RA disease activity to help engage patients, and to provide rheumatologists with real-time data during office visits to help manage RA. We success-fully incorporated the routine collection of RAPID3, an RA disease activity measure, using tablets in the waiting room and integrating this information in real-time with our electronic medical record. RAPID3 completion rates by patients have remained steady at approximately 70% through May 2019, after we began this pro-cess in May 2017.
In our electronic medical record, we have both the Clinical Disease Activity Index (CDAI) score and the RAPID3. From the standpoint of implementing a routine, standardized approach to measuring RA disease activity, the RAPID3 allows the ques-tions to be programmed onto a tablet, filled out by the patients in the waiting room, and then uploaded to the electronic medical record for use during clinic visits. We found that to introduce a TTT strategy, we needed to have a reliable way to collect dis-ease activity measures on each patient. Although the RAPID3 has limitations and the CDAI is preferable, we do use the CDAI
routinely in clinical practice. In our learning collaborative sessions and with our quality improvement team, we explored the con-cept of shared decision-making in RA management (Table 3). Although our assessment of shared decision-making through chart review of rheumatologist office notes only reached 46.9% in the intervention group (versus 30.0% in the control group), our phone calls to patients to measure shared decision-making using the SDM Q-9 score demonstrated high scores of 90.7%. These findings highlight the challenges in measuring whether shared decision-making is truly occurring during office visits, but also highlight the fact that in our intervention patient pop-ulation, the perception from patients around shared decision- making was quite positive. The questions that remain are whether shared decision-making should be mea sured solely based on the patient perspective and whether there truly is a gap in the quality of care around shared decision-making in RA management.
In our secondary analyses of 294 patient-level visits, we explored whether medication changes were made or not
Figure 3. Pie charts of study population 2, with reasons why treat-to-target strategy was not implemented at patient-level visits with high disease activity. A, Intervention; B, Control. The most common reasons in both intervention and control groups were effectiveness followed by patient comorbidities. We defined effectiveness as a rheumatologist perception that medication was in fact working despite high disease activity as measured by the Routine Assessment of Patient Index Data 3, or a perception that medication may need more time to take effect. Patient comorbidities indicated medical conditions that precluded a change in medication (for example, liver disease precluding use of methotrexate).
RA TRIAL USING TREAT-TO-TARGET | 213
among patients with high RAPID3 scores, as a reflection of the implementation of a TTT approach. Unexpectedly, we found that a TTT approach was less likely to be used with intervention rheu-matology patients compared to control rheumatology patients. When medication changes were not made, the primary reasons provided in office notes were current medication effectiveness and concern about patient comorbidities and their impact on med-ication options, which is consistent with clinical practice. Our rheumatology practice tends to see more complex patients who have multiple comorbidities such as cardiac disease, pulmonary disease, and liver disease, and patients with long-standing RA (mean disease duration of 16.2 years). In general, these patients have experience with many medications, with approximately 50% receiving biologics, and have more limited options regarding safe yet effective RA treatment options. However, we were surprised to see such a difference in the rate of medication changes among rheumatologists who did and did not participate in our learning collaborative.
Additionally, we found that patients with osteoarthritis were less likely to have RA medication changes made when RAPID3 scores were high. This finding is consistent with the knowledge that since RAPID3 is a completely patient-reported outcome measure for RA disease activity, patients who have OA-related pain may have increased RAPID3 scores (13). Additionally, patients taking glucocorticoids were more likely to have a medication change. This finding is not surprising, because RA management has moved
away from the use of chronic glucocorticoid use, and hence mak-ing medication changes in this context is consistent with current RA management guidelines. In our logistic regression models, hav-ing a female rheumatologist increased the odds of having a medi-cation change when disease activity was high, although this finding did not reach statistical significance.
The main limitations of our study include the nonrand-omized study design and the single-center experience. In quality improvement work, interrupted time-series is an accepted quasi- experimental approach that is often used when true randomiza-tion cannot feasibly be achieved, allowing comparison of both pre- and postintervention time periods between the intervention and control groups. Although we described only 1 academic rheumatology practice, we were able to review 848 RA patient-level visits, spanning care provided by 22 different rheumatology health care professionals.
Quality improvement efforts in the management of RA often focus on adherence to guidelines (14). We found that by integrat-ing continuous quality improvement techniques, to implement a system to routinely collect RA patient-reported outcomes with the RAPID3 on tablets and to use a learning collaborative model with our rheumatologists and clinic staff, we were better able to create stakeholder engagement and trust to adopt a TTT approach (15). The optimal target for treating RA remains elusive, but our goal is to spread our learning to our control rheumatologists and trainees to continue to adopt TTT in our care of RA patients (16).
Table 3. Rheumatoid arthritis learning collaborative content*
Learning collaborative session Content and discussionSession 1 Introduction of TTT concepts
Measuring RA disease activity through RAPID3 collection via tablets in clinicMeasuring shared decision-making through patients’ perspective
Session 2 Baseline pilot data from intervention rheumatologistsDiscussing variable performance between rheumatologists on TTT implementation scoresDeveloping an approach to documentation of TTT implementation score in office notes
Session 3 Overview of patient engagement in RA managementIncreasing patient education through newly developed RA patient packetsImproving the prior authorization process for biologics and small molecule therapiesIntegrating RAPID3 scores with electronic medical record for use in office visits
Session 4 TTT implementation score explanations and documentationReviewing examples of office note documentation which meet and do not meet TTT implementation score
criteriaSession 5 TTT implementation score using standardized phrases in electronic medical record
Reviewing strengths and limitations of use of standardized language to denote TTT in office notesSession 6 Disease activity measurement
Debating RAPID3 versus CDAI as disease activity measureDiscussing limitations of RAPID3 in OA and FM
Session 7 Shared decision-making in RAListening to guest speaker with expertise in shared decision-making and experience as RA patientEngaging in an interactive discussion with rheumatologists on how to truly incorporate patient preferences in
medication decision-makingSession 8 Documenting versus implementing TTT in real-life practice
Reviewing when medication changes are made or not made when RAPID3 score is high, and the caveats that arise in clinical practice
Session 9 Review of preliminary results of study and summary of study accomplishments* CDAI = Clinical Disease Activity Index; FM = fibromyalgia; OA = osteoarthritis; RA = rheumatoid arthritis; RAPID3 = Routine Assessment of Patient Index Data 3; TTT = treat-to-target.
DESAI ET AL 214 |
ACKNOWLEDGMENTS
The authors thank the Brigham and Women’s Hospital Rheumatology and Orthopedics staff and the Department of Quality and Safety pharmacy residents and interns for their efforts.
AUTHOR CONTRIBUTIONS
All authors were involved in drafting the article or revising it critically for important intellectual content, and all authors approved the final version to be submitted for publication. Dr. Desai had full access to all of the data in the study and takes responsibility for the integrity of the data and the accuracy of the data analysis.Study conception and design. Desai, Leatherwood, Forman, Iversen, Xu, Lu, Solomon.Acquisition of data. Desai, Leatherwood, Forman, Ko, Stevens.Analysis and interpretation of data. Desai, Leatherwood, Iversen, Xu, Lu, Solomon.
ROLE OF THE STUDY SPONSOR
Pfizer had no role in the study design or in the collection, analysis, or interpretation of the data, the writing of the manuscript, or the decision to submit the manuscript for publication. Publication of this article was not contingent upon approval by Pfizer.
REFERENCES 1. Moreland LW. Soluble tumor necrosis factor receptor (p75) fusion
protein (ENBREL) as a therapy for rheumatoid arthritis. Rheum DisClin North Am 1998;24:579–91.
2. Smolen JS, Breedveld FC, Burmester GR, Bykerk V, Dougados M,Emery P, et al. Treating rheumatoid arthritis to target: 2014 update of the recommendations of an international task force. Ann Rheum Dis2016;75:3–15.
3. Smolen JS, Aletaha D. Rheumatoid arthritis therapy reappraisal:strategies, opportunities and challenges. Nat Rev Rheumatol2015;11:276–89.
4. Solomon DH, Lee SB, Zak A, Corrigan C, Agosti J, Bitton A, et al.Implementation of treat-to-target in rheumatoid arthritis through alearning collaborative: rationale and design of the TRACTION trial.Semin Arthritis Rheum 2016;46:81–7.
5. Solomon DH, Yu Z, Katz JN, Bitton A, Corrigan C, Fraenkel L, et al.Adverse events and resource use before and after treat-to-target inrheumatoid arthritis: a post hoc analysis of a randomized controlledtrial. Arthritis Care Res (Hoboken) 2019;71:1243–8.
6. Solomon DH, Lu B, Yu Z, Corrigan C, Harrold LR, Smolen JS, et al.Benefits and sustainability of a learning collaborative for implementationof treat-to-target in rheumatoid arthritis: results of a cluster-randomizedcontrolled phase II clinical trial. Arthritis Care Res (Hoboken) 2018;70:1551–6.
7. Anderson J, Caplan L, Yazdany J, Robbins ML, Neogi T, MichaudK, et al. Rheumatoid arthritis disease activity measures: AmericanCollege of Rheumatology recommendations for use in clinical prac-tice. Arthritis Care Res (Hoboken) 2012;64:640–7.
8. Pincus T, Swearingen CJ, Bergman M, Yazici Y. RAPID3 (RoutineAssessment of Patient Index Data 3), a rheumatoid arthri-tis index without formal joint counts for routine care: proposedseverity categories compared to disease activity score and clin-ical disease activity index categories. J Rheumatol 2008;35:2136–47.
9. Institute for Healthcare Improvement. The Breakthrough Series:IHI’s collaborative model for achieving breakthrough improvement.Boston: Institute for Healthcare Improvement; 2003.
10. National Quality Partners shared decision making action brief:a standard of care for all patients. Washington (DC); 2017. URL:https://www.qualityforum.org/Publications/2017/10/NQP_Shared_Decision_Making_Action_Brief.aspx.
11. Atkinson MJ, Sinha A, Hass HL, Colman SS, Kumar RN, Brod M,et al. Validation of a general measure of treatment satisfaction, theTreatment Satisfaction Questionnaire for Medication (TSQM), using anational panel study of chronic disease. Health Qual Life Outcomes2004;2:12.
12. Doherr H, Christalle E, Kriston L, Härter M, Scholl I. Use of the9-item Shared Decision Making Questionnaire (SDM-Q-9 and SDM-Q-Doc) in intervention studies: a systematic review. PLoS One2017;12:e0173904.
13. El-Haddad C, Castrejon I, Gibson KA, Yazici Y, Bergman MJ, PincusT. MDHAQ/RAPID3 scores in patients with osteoarthritis are similarto or higher than in patients with rheumatoid arthritis: a cross-sec-tional study from current routine rheumatology care at four sites.RMD Open 2017;3:e000391.
14. Desai SP, Yazdany J. Quality measurement and improvement inrheumatology: rheumatoid arthritis as a case study. Arthritis Rheum2011;63:3649–60.
15. Chow SL, Shojania KG. “Rheum to Improve”: quality improvement in outpatient rheumatology. J Rheumatol 2017;44:1304–10.
16. Bergstra SA, Allaart CF. What is the optimal target for treat-to-target strategies in rheumatoid arthritis? Curr Opin Rheumatol2018;30:282–7.

215
Arthritis Care & ResearchVol. 73, No. 2, February 2021, pp 215–220DOI 10.1002/acr.24100© 2021, American College of Rheumatology
Psoriasis Associated With Tumor Necrosis Factor Inhibitors in Children With Inflammatory DiseasesLisa H. Buckley,1 Rui Xiao,2 Marissa J. Perman,3 Andrew B. Grossman,4 and Pamela F. Weiss3
Objective. To estimate the incidence rate (IR) of psoriasis in children with inflammatory bowel disease (IBD), juvenile idiopathic arthritis (JIA), and chronic noninfectious osteomyelitis (CNO) with tumor necrosis factor inhibitor (TNFi) exposure as compared to children without TNFi exposure and to the general pediatric population.
Methods. This was a single-center retrospective cohort study of children with IBD, JIA, or CNO from 2008 to 2018. TNFi exposure was defined as a prescription for adalimumab, etanercept, infliximab, certolizumab, or golimumab, and the primary outcome was incident psoriasis. IRs and standardized incidence ratios (SIRs) were calculated. Cox proportional hazards models were used to assess the association of psoriasis with TNFi exposure and other risk factors.
Results. Of the 4,111 children who met inclusion criteria, 1,614 (39%) had TNFi exposure and 2,497 (61%) did not, with 4,705 and 6,604 person-years of follow-up, respectively. There were 58 cases (IR 12.3 per 1,000 person-years) and 25 cases (IR 3.8 per 1,000 person-years) of psoriasis in children with and without TNFi exposure, respectively. The SIR was 18 (95% confidence interval [95% CI] 15–22) overall, 30 (95% CI 23–39) for children with TNFi exposure, and 9.3 (95% CI 6.3–14) for children without TNFi exposure. The hazard ratio of psoriasis comparing TNFi exposure to no TNFi exposure was 3.84 (95% CI 2.28–6.47; P < 0.001).
Conclusion. Children with IBD, JIA, and CNO had an increased rate of psoriasis compared to the general pediatric population, with the highest rate in those with TNFi exposure.
INTRODUCTION
Tumor necrosis factor (TNF) has been repeatedly impli-cated in the pathogenesis of several inflammatory conditions, including inflammatory bowel disease (IBD), juvenile idiopathic arthritis (JIA), chronic noninfectious osteomyelitis (CNO), and psoriasis (1–5). TNF inhibitors (TNFi) have consequently become a cornerstone of therapy for these conditions, result-ing in improved disease control and quality of life (6–8). As their use has become more widespread, there have been increas-ing reports of cutaneous adverse reactions to TNFi, including paradoxical, new-onset psoriasis in adults and children (9–14). Psoriasis has a substantial negative impact on health-related quality of life (15–18) and mental health (19). Furthermore, individuals with TNFi-associated psoriasis often require TNFi discontinuation, placing them at risk of disease reactivation. Understanding the epidemiology and risk factors of psoriasis
associated with TNFi exposure has important implications for the counseling, identification, and management of this adverse event.
The incidence rate (IR) and risk factors of psoriasis in children with IBD, JIA, or CNO who are exposed to TNFi are unknown. Additionally, there is a well-established association between these inflammatory conditions and psoriasis development (20–23). Yet because TNFi can both treat and trigger psoriasis (9–14), how TNFi exposure affects this relationship is not clear. To date, the pediatric literature primarily consists of case reports and series without the use of a comparison group. The primary aim of this study was to determine the IR of psoriasis in children with IBD, JIA, or CNO with TNFi exposure as compared to children without TNFi exposure and to the general pediatric population. The sec-ondary aim was to measure the strength of association between TNFi exposure and incident psoriasis and to identify clinical risk factors for psoriasis development.
1Lisa H. Buckley, MD, MSHP: Children’s Hospital of Philadelphia, Philadelphia, Pennsylvania, and Monroe Carell Jr. Children’s Hospital at Vanderbilt, Nashville, Tennessee; 2Rui Xiao, PhD: Children’s Hospital of Philadelphia and University of Pennsylvania, Philadelphia; 3Marissa J. Perman, MD, Pamela F. Weiss, MD, MSCE: Children’s Hospital of Philadelphia and Perelman School of Medicine at the University of Pennsylvania, Philadelphia; 4Andrew B. Grossman, MD: Children’s Hospital of Philadelphia, Philadelphia, Pennsylvania.
No potential conflicts of interest relevant to this article were reported.
Address correspondence to Lisa H. Buckley, MD, MSHP, 2200 Children’s Way, DOT 11127, Nashville, TN 37232. Email: [email protected].
Submitted for publication July 22, 2019; accepted in revised form October 22, 2019.
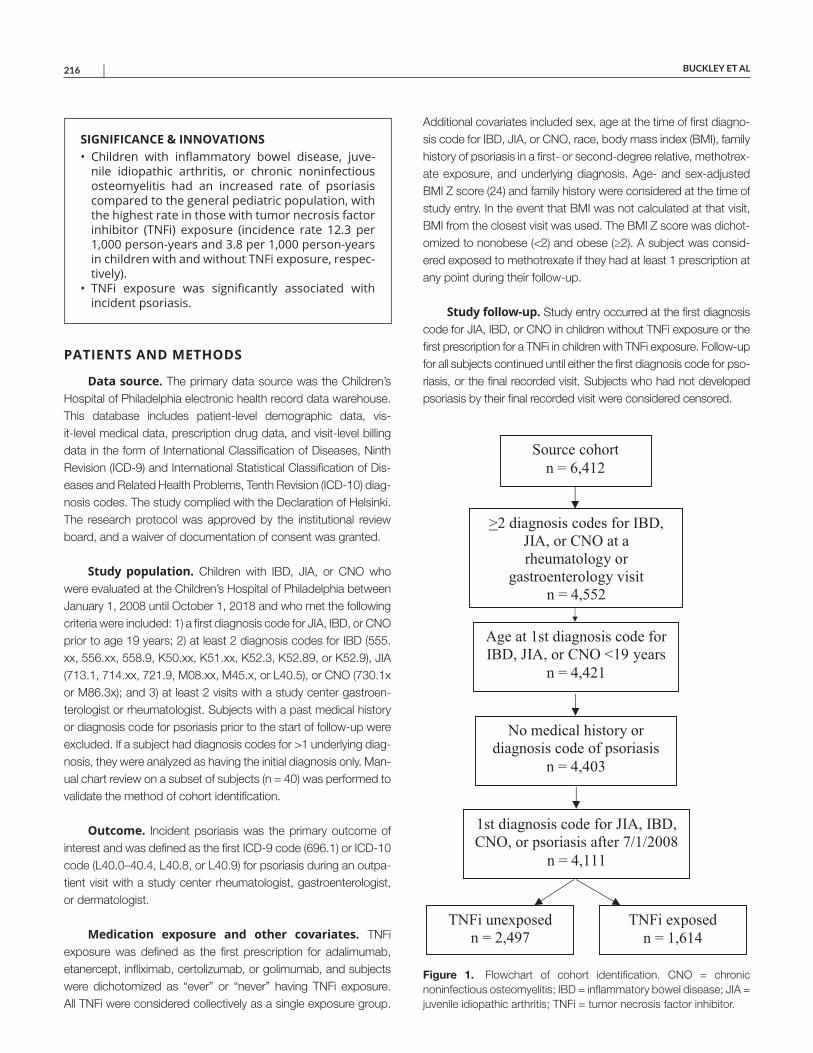
BUCKLEY ET AL 216 |
PATIENTS AND METHODS
Data source. The primary data source was the Children’s Hospital of Philadelphia electronic health record data warehouse. This database includes patient-level demographic data, vis-it-level medical data, prescription drug data, and visit-level billing data in the form of International Classification of Diseases, Ninth Revision (ICD-9) and International Statistical Classification of Dis-eases and Related Health Problems, Tenth Revision (ICD-10) diag-nosis codes. The study complied with the Declaration of Helsinki. The research protocol was approved by the institutional review board, and a waiver of documentation of consent was granted.
Study population. Children with IBD, JIA, or CNO who were evaluated at the Children’s Hospital of Philadelphia between January 1, 2008 until October 1, 2018 and who met the following criteria were included: 1) a first diagnosis code for JIA, IBD, or CNO prior to age 19 years; 2) at least 2 diagnosis codes for IBD (555.xx, 556.xx, 558.9, K50.xx, K51.xx, K52.3, K52.89, or K52.9), JIA (713.1, 714.xx, 721.9, M08.xx, M45.x, or L40.5), or CNO (730.1x or M86.3x); and 3) at least 2 visits with a study center gastroen-terologist or rheumatologist. Subjects with a past medical history or diagnosis code for psoriasis prior to the start of follow-up were excluded. If a subject had diagnosis codes for >1 underlying diag-nosis, they were analyzed as having the initial diagnosis only. Man-ual chart review on a subset of subjects (n = 40) was performed to validate the method of cohort identification.
Outcome. Incident psoriasis was the primary outcome of interest and was defined as the first ICD-9 code (696.1) or ICD-10 code (L40.0–40.4, L40.8, or L40.9) for psoriasis during an outpa-tient visit with a study center rheumatologist, gastroenterologist, or dermatologist.
Medication exposure and other covariates. TNFi exposure was defined as the first prescription for adalimumab, etanercept, infliximab, certolizumab, or golimumab, and subjects were dichotomized as “ever” or “never” having TNFi exposure. All TNFi were considered collectively as a single exposure group.
Additional covariates included sex, age at the time of first diagno-sis code for IBD, JIA, or CNO, race, body mass index (BMI), family history of psoriasis in a first- or second-degree relative, methotrex-ate exposure, and underlying diagnosis. Age- and sex-adjusted BMI Z score (24) and family history were considered at the time of study entry. In the event that BMI was not calculated at that visit, BMI from the closest visit was used. The BMI Z score was dichot-omized to nonobese (<2) and obese (≥2). A subject was consid-ered exposed to methotrexate if they had at least 1 prescription at any point during their follow-up.
Study follow-up. Study entry occurred at the first diagnosis code for JIA, IBD, or CNO in children without TNFi exposure or the first prescription for a TNFi in children with TNFi exposure. Follow-up for all subjects continued until either the first diagnosis code for pso-riasis, or the final recorded visit. Subjects who had not developed psoriasis by their final recorded visit were considered censored.
SIGNIFICANCE & INNOVATIONS• Children with inflammatory bowel disease, juve-
nile idiopathic arthritis, or chronic noninfectious osteomyelitis had an increased rate of psoriasis compared to the general pediatric population, with the highest rate in those with tumor necrosis factor inhibitor (TNFi) exposure (incidence rate 12.3 per 1,000 person-years and 3.8 per 1,000 person-years in children with and without TNFi exposure, respec-tively).
• TNFi exposure was significantly associated with incident psoriasis.
Figure 1. Flowchart of cohort identification. CNO = chronic noninfectious osteomyelitis; IBD = inflammatory bowel disease; JIA = juvenile idiopathic arthritis; TNFi = tumor necrosis factor inhibitor.
Source cohort
n = 6,412
>2 diagnosis codes for IBD,
JIA, or CNO at a
rheumatology or
gastroenterology visit
n = 4,552
Age at 1st diagnosis code for
IBD, JIA, or CNO <19 years
n = 4,421
No medical history or
diagnosis code of psoriasis
n = 4,403
1st diagnosis code for JIA, IBD,
CNO, or psoriasis after 7/1/2008
n = 4,111
TNFi unexposed
n = 2,497
TNFi exposed
n = 1,614
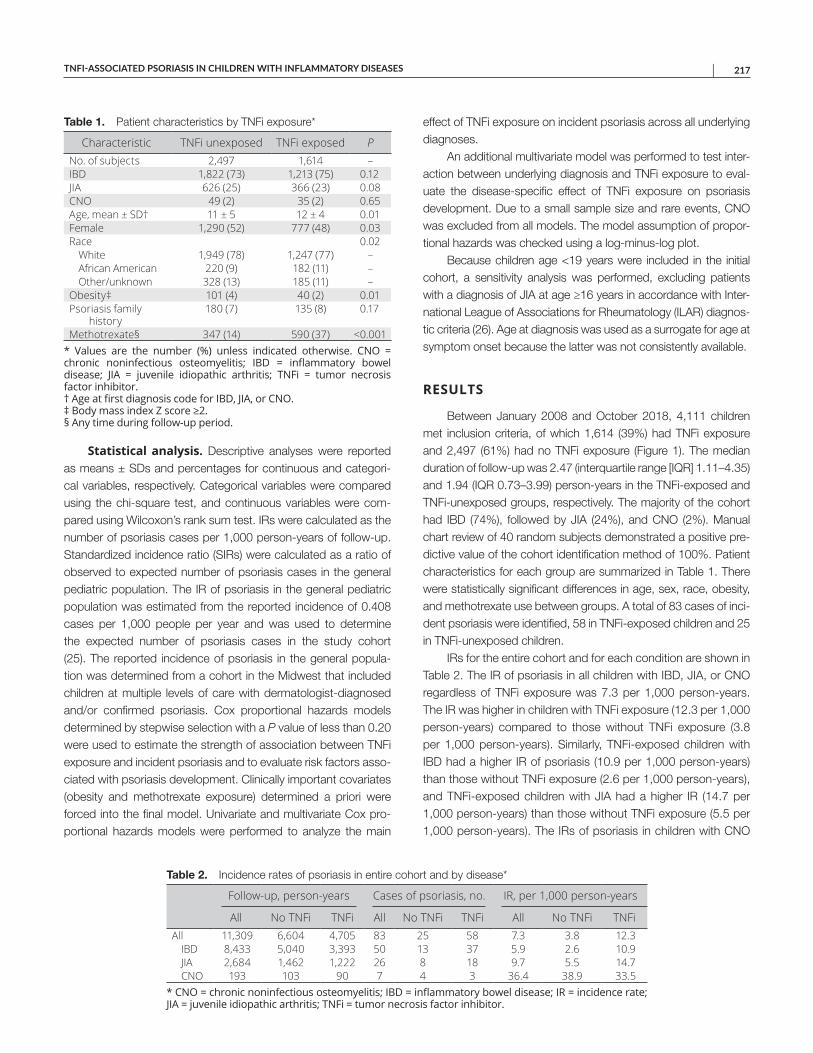
TNFI-ASSOCIATED PSORIASIS IN CHILDREN WITH INFLAMMATORY DISEASES | 217
Statistical analysis. Descriptive analyses were reported as means ± SDs and percentages for continuous and categori-cal variables, respectively. Categorical variables were compared using the chi-square test, and continuous variables were com-pared using Wilcoxon’s rank sum test. IRs were calculated as the number of psoriasis cases per 1,000 person-years of follow-up. Standardized incidence ratio (SIRs) were calculated as a ratio of observed to expected number of psoriasis cases in the general pediatric population. The IR of psoriasis in the general pediatric population was estimated from the reported incidence of 0.408 cases per 1,000 people per year and was used to determine the expected number of psoriasis cases in the study cohort (25). The reported incidence of psoriasis in the general popula-tion was determined from a cohort in the Midwest that included children at multiple levels of care with dermatologist-diagnosed and/or confirmed psoriasis. Cox proportional hazards models determined by stepwise selection with a P value of less than 0.20 were used to estimate the strength of association between TNFi exposure and incident psoriasis and to evaluate risk factors asso-ciated with psoriasis development. Clinically important covariates (obesity and methotrexate exposure) determined a priori were forced into the final model. Univariate and multivariate Cox pro-portional hazards models were performed to analyze the main
effect of TNFi exposure on incident psoriasis across all underlying diagnoses.
An additional multivariate model was performed to test inter-action between underlying diagnosis and TNFi exposure to eval-uate the disease-specific effect of TNFi exposure on psoriasis development. Due to a small sample size and rare events, CNO was excluded from all models. The model assumption of propor-tional hazards was checked using a log-minus-log plot.
Because children age <19 years were included in the initial cohort, a sensitivity analysis was performed, excluding patients with a diagnosis of JIA at age ≥16 years in accordance with Inter-national League of Associations for Rheumatology (ILAR) diagnos-tic criteria (26). Age at diagnosis was used as a surrogate for age at symptom onset because the latter was not consistently available.
RESULTS
Between January 2008 and October 2018, 4,111 children met inclusion criteria, of which 1,614 (39%) had TNFi exposure and 2,497 (61%) had no TNFi exposure (Figure 1). The median duration of follow-up was 2.47 (interquartile range [IQR] 1.11–4.35) and 1.94 (IQR 0.73–3.99) person-years in the TNFi-exposed and TNFi-unexposed groups, respectively. The majority of the cohort had IBD (74%), followed by JIA (24%), and CNO (2%). Manual chart review of 40 random subjects demonstrated a positive pre-dictive value of the cohort identification method of 100%. Patient characteristics for each group are summarized in Table 1. There were statistically significant differences in age, sex, race, obesity, and methotrexate use between groups. A total of 83 cases of inci-dent psoriasis were identified, 58 in TNFi-exposed children and 25 in TNFi-unexposed children.
IRs for the entire cohort and for each condition are shown in Table 2. The IR of psoriasis in all children with IBD, JIA, or CNO regardless of TNFi exposure was 7.3 per 1,000 person-years. The IR was higher in children with TNFi exposure (12.3 per 1,000 person-years) compared to those without TNFi exposure (3.8 per 1,000 person-years). Similarly, TNFi-exposed children with IBD had a higher IR of psoriasis (10.9 per 1,000 person-years) than those without TNFi exposure (2.6 per 1,000 person-years), and TNFi-exposed children with JIA had a higher IR (14.7 per 1,000 person-years) than those without TNFi exposure (5.5 per 1,000 person-years). The IRs of psoriasis in children with CNO
Table 1. Patient characteristics by TNFi exposure*
Characteristic TNFi unexposed TNFi exposed PNo. of subjects 2,497 1,614 –IBD 1,822 (73) 1,213 (75) 0.12JIA 626 (25) 366 (23) 0.08CNO 49 (2) 35 (2) 0.65Age, mean ± SD† 11 ± 5 12 ± 4 0.01Female 1,290 (52) 777 (48) 0.03Race 0.02
White 1,949 (78) 1,247 (77) –African American 220 (9) 182 (11) –Other/unknown 328 (13) 185 (11) –
Obesity‡ 101 (4) 40 (2) 0.01Psoriasis family history
180 (7) 135 (8) 0.17
Methotrexate§ 347 (14) 590 (37) <0.001* Values are the number (%) unless indicated otherwise. CNO = chronic noninfectious osteomyelitis; IBD = inflammatory bowel disease; JIA = juvenile idiopathic arthritis; TNFi = tumor necrosis factor inhibitor. † Age at first diagnosis code for IBD, JIA, or CNO. ‡ Body mass index Z score ≥2. § Any time during follow-up period.
Table 2. Incidence rates of psoriasis in entire cohort and by disease*
Follow-up, person-years Cases of psoriasis, no. IR, per 1,000 person-years
All No TNFi TNFi All No TNFi TNFi All No TNFi TNFiAll 11,309 6,604 4,705 83 25 58 7.3 3.8 12.3
IBD 8,433 5,040 3,393 50 13 37 5.9 2.6 10.9JIA 2,684 1,462 1,222 26 8 18 9.7 5.5 14.7CNO 193 103 90 7 4 3 36.4 38.9 33.5
* CNO = chronic noninfectious osteomyelitis; IBD = inflammatory bowel disease; IR = incidence rate; JIA = juvenile idiopathic arthritis; TNFi = tumor necrosis factor inhibitor.
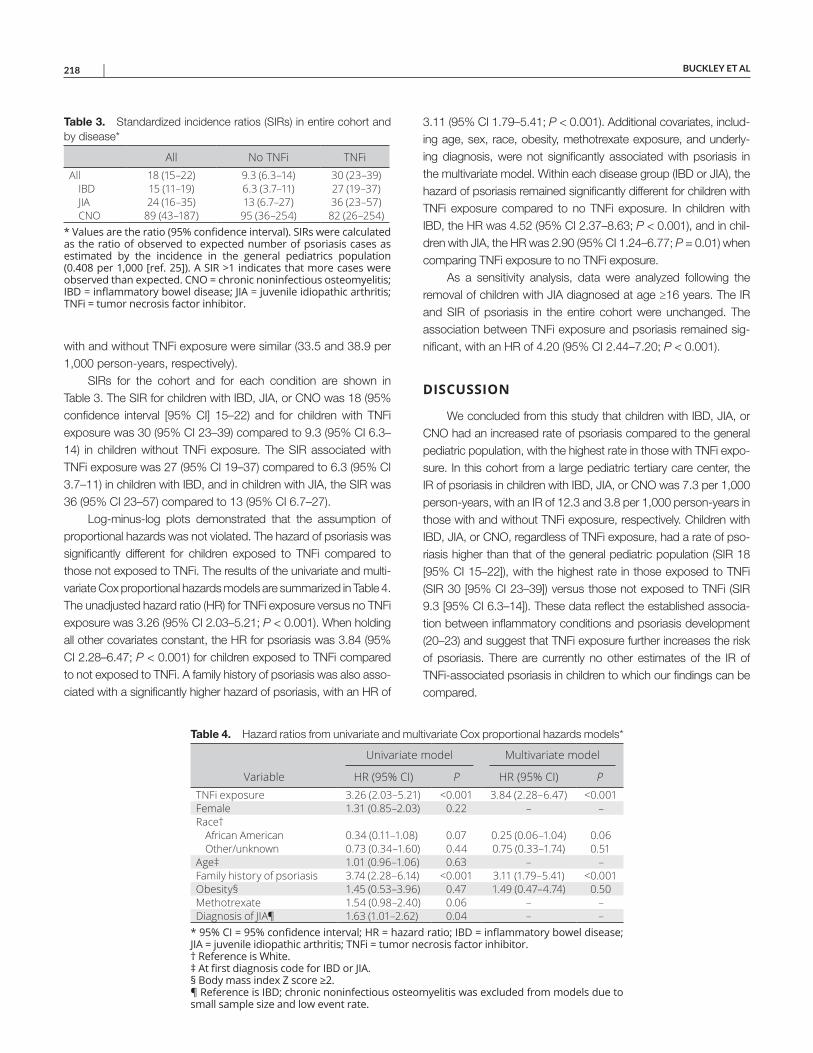
BUCKLEY ET AL 218 |
with and without TNFi exposure were similar (33.5 and 38.9 per 1,000 person-years, respectively).
SIRs for the cohort and for each condition are shown in Table 3. The SIR for children with IBD, JIA, or CNO was 18 (95% confidence interval [95% CI] 15–22) and for children with TNFi exposure was 30 (95% CI 23–39) compared to 9.3 (95% CI 6.3–14) in children without TNFi exposure. The SIR associated withTNFi exposure was 27 (95% CI 19–37) compared to 6.3 (95% CI 3.7–11) in children with IBD, and in children with JIA, the SIR was 36 (95% CI 23–57) compared to 13 (95% CI 6.7–27).
Log-minus-log plots demonstrated that the assumption of proportional hazards was not violated. The hazard of psoriasis was significantly different for children exposed to TNFi compared to those not exposed to TNFi. The results of the univariate and multi-variate Cox proportional hazards models are summarized in Table 4. The unadjusted hazard ratio (HR) for TNFi exposure versus no TNFi exposure was 3.26 (95% CI 2.03–5.21; P < 0.001). When holding all other covariates constant, the HR for psoriasis was 3.84 (95% CI 2.28–6.47; P < 0.001) for children exposed to TNFi compared to not exposed to TNFi. A family history of psoriasis was also asso-ciated with a significantly higher hazard of psoriasis, with an HR of
3.11 (95% CI 1.79–5.41; P < 0.001). Additional covariates, includ-ing age, sex, race, obesity, methotrexate exposure, and underly-ing diagnosis, were not significantly associated with psoriasis in the multivariate model. Within each disease group (IBD or JIA), the hazard of psoriasis remained significantly different for children with TNFi exposure compared to no TNFi exposure. In children with IBD, the HR was 4.52 (95% CI 2.37–8.63; P < 0.001), and in chil-dren with JIA, the HR was 2.90 (95% CI 1.24–6.77; P = 0.01) when comparing TNFi exposure to no TNFi exposure.
As a sensitivity analysis, data were analyzed following the removal of children with JIA diagnosed at age ≥16 years. The IR and SIR of psoriasis in the entire cohort were unchanged. The association between TNFi exposure and psoriasis remained sig-nificant, with an HR of 4.20 (95% CI 2.44–7.20; P < 0.001).
DISCUSSION
We concluded from this study that children with IBD, JIA, or CNO had an increased rate of psoriasis compared to the general pediatric population, with the highest rate in those with TNFi expo-sure. In this cohort from a large pediatric tertiary care center, the IR of psoriasis in children with IBD, JIA, or CNO was 7.3 per 1,000 person-years, with an IR of 12.3 and 3.8 per 1,000 person-years in those with and without TNFi exposure, respectively. Children with IBD, JIA, or CNO, regardless of TNFi exposure, had a rate of pso-riasis higher than that of the general pediatric population (SIR 18 [95% CI 15–22]), with the highest rate in those exposed to TNFi (SIR 30 [95% CI 23–39]) versus those not exposed to TNFi (SIR 9.3 [95% CI 6.3–14]). These data reflect the established associa-tion between inflammatory conditions and psoriasis development (20–23) and suggest that TNFi exposure further increases the risk of psoriasis. There are currently no other estimates of the IR of TNFi-associated psoriasis in children to which our findings can be compared.
Table 3. Standardized incidence ratios (SIRs) in entire cohort and by disease*
All No TNFi TNFiAll 18 (15–22) 9.3 (6.3–14) 30 (23–39)
IBD 15 (11–19) 6.3 (3.7–11) 27 (19–37)JIA 24 (16–35) 13 (6.7–27) 36 (23–57)CNO 89 (43–187) 95 (36–254) 82 (26–254)
* Values are the ratio (95% confidence interval). SIRs were calculated as the ratio of observed to expected number of psoriasis cases as estimated by the incidence in the general pediatrics population (0.408 per 1,000 [ref. 25]). A SIR >1 indicates that more cases were observed than expected. CNO = chronic noninfectious osteomyelitis; IBD = inflammatory bowel disease; JIA = juvenile idiopathic arthritis; TNFi = tumor necrosis factor inhibitor.
Table 4. Hazard ratios from univariate and multivariate Cox proportional hazards models*
Variable
Univariate model Multivariate model
HR (95% CI) P HR (95% CI) PTNFi exposure 3.26 (2.03–5.21) <0.001 3.84 (2.28–6.47) <0.001Female 1.31 (0.85–2.03) 0.22 – –Race†
African American 0.34 (0.11–1.08) 0.07 0.25 (0.06–1.04) 0.06Other/unknown 0.73 (0.34–1.60) 0.44 0.75 (0.33–1.74) 0.51
Age‡ 1.01 (0.96–1.06) 0.63 – –Family history of psoriasis 3.74 (2.28–6.14) <0.001 3.11 (1.79–5.41) <0.001Obesity§ 1.45 (0.53–3.96) 0.47 1.49 (0.47–4.74) 0.50Methotrexate 1.54 (0.98–2.40) 0.06 – –Diagnosis of JIA¶ 1.63 (1.01–2.62) 0.04 – –
* 95% CI = 95% confidence interval; HR = hazard ratio; IBD = inflammatory bowel disease;JIA = juvenile idiopathic arthritis; TNFi = tumor necrosis factor inhibitor. † Reference is White. ‡ At first diagnosis code for IBD or JIA. § Body mass index Z score ≥2. ¶ Reference is IBD; chronic noninfectious osteomyelitis was excluded from models due to small sample size and low event rate.
TNFI-ASSOCIATED PSORIASIS IN CHILDREN WITH INFLAMMATORY DISEASES | 219
This study also helps establish an association between TNFi exposure and incident psoriasis in children independent of potential confounders, including age, sex, race, obesity status, family history of psoriasis, methotrexate exposure, and underlying diagnosis (HR 3.84 [95% CI 2.28–6.47]). Although cases of TNFi-associated pso-riasis have been increasingly reported in children (9–14,27–32), this is the first study to formally evaluate and establish the relationship between TNFi exposure and psoriasis. A family history of psoriasis was also identified as an independent risk factor for the develop-ment of psoriasis in multivariate analysis, which is consistent with established literature (33–35). Yet the rate of having a family his-tory of psoriasis was comparable between groups, indicating that the increased rate of psoriasis in the TNFi-exposed individuals is unlikely to be attributable to their family history alone. We did not identify any additional risk factors, including age, sex, race, obe-sity, methotrexate exposure, or underlying diagnosis (IBD versus JIA). Although findings have been variable, some adult studies have proposed female sex, younger age at diagnosis, and obesity as potential risk factors, but there are no pediatric studies available for comparison (36–39).
To the best of our knowledge, this is the largest pediatric study evaluating TNFi-associated psoriasis and the first to use a retrospective cohort study design with a comparison group. Pediatric literature describing TNFi-associated psoriasis remains sparse and consists primarily of case reports and series in children with IBD (9,10,12–14,27–29) and less commonly JIA (10,30–32) and CNO (11). An additional strength and novelty of the study is the use of statistical analyses to account for right-censored data, particularly because the time to development of psoriasis is highly variable (9–11,12–14,27–32).
There are several important limitations to consider. First, the retrospective nature of the study confers the risk of selection, mis-classification, and indication biases. There were differences in the baseline characteristics across groups, most notably obesity and methotrexate use. Obesity is an established risk factor for the development of psoriasis that could potentially influence the out-come. Yet, the higher incidence of obesity occurred in the TNFi- unexposed group, which would reassuringly bias the results toward the null hypothesis. Additionally, as methotrexate is con-sidered an efficacious treatment of primary psoriasis, we postulate that its higher rate of use in the TNFi-exposed group would also bias the results toward the null hypothesis.
We relied on visit-level diagnosis codes for the identification of psoriasis cases and were unable to verify the accuracy of the diagnosis, particularly because many patients received dermato-logic care outside of the study center. Reassuringly, this lack of verification could result in misclassification to either group, and the same technique was used to identify cases of psoriasis in the TNFi-exposed and TNFi-unexposed groups so that individuals in both groups were equally at risk of misclassification.
The inability to fully control for disease activity raises the con-cern for confounding by indication. While children with high IBD,
JIA, or CNO disease activity are probably more often treated with TNFi, there is no well-established association between high dis-ease activity and psoriasis development. Conversely, individuals who develop psoriasis while receiving a TNFi are more likely to be in remission with low disease activity (9,40).
Second, children age ≥18 years at the time of diagnosis were included in the analysis because our goal was to gen-erate data relevant to patient care provided by most pediatric gastroenterology, rheumatology, and dermatology practices. Reassuringly, sensitivity analysis removing children with a diag-nosis of JIA at age ≥16 years in accordance with ILAR diag-nostic criteria did not significantly alter study results. Finally, the results of this study reflect a 10-year experience of a single large tertiary-care center, which may not be generalizable to the general population.
In conclusion, this study demonstrates that children with IBD, JIA, and CNO had an increased rate of psoriasis compared to the general pediatric population, with the highest rate in children with TNFi exposure. This is the first study to estimate the IR of TNFi-associated psoriasis and to formally evaluate the strength of association between TNFi exposure and psoriasis. There is a paucity of data regarding this adverse cutaneous event in chil-dren; therefore, this study contributes significantly to the current literature. Despite limitations, the results are highly significant and indicate the need for additional studies to include long-term data from large observational registries.
ACKNOWLEDGMENTS
We thank the Children’s Hospital of Philadelphia Rheumatology Research Core research assistants Taylor Goldberg, Jameson Dowling, Elizabeth Mendoza, and Sarah McGuire for their assistance with electronic health record data collection.
AUTHOR CONTRIBUTIONS
All authors were involved in drafting the article or revising it critically for important intellectual content, and all authors approved the final version to be submitted for publication. Dr. Buckley had full access to all of the data in the study and takes responsibility for the integrity of the data and the accuracy of the data analysis.Study conception and design. Buckley, Xiao, Perman, Grossman, Weiss.Acquisition of data. Buckley.Analysis and interpretation of data. Buckley, Xiao, Weiss.
REFERENCES 1. Hofmann SR, Morbach H, Schwarz T, Rosen-Wolff A, Girschick
HJ, Hedrich CM. Attenuated TLR4/MAPK signaling in monocytesfrom patients with CRMO results in impaired IL-10 expression. ClinImmunol 2012;145:69–76.
2. Campa M, Ryan C, Menter A. An overview of developing TNF-α tar-geted therapy for the treatment of psoriasis. Expert Opin InvestigDrugs 2015;24:1343–54.
3. Brennan FM, Jackson A, Chantry D, Maini R, Feldman M. Inhibitoryeffect of TNF-α antibodies on synovial cell interleukin-1 production in rheumatoid arthritis. Lancet 1989;2:244–7.
4. Brennan FM, Maini RN, Feldman M. TNF-α: a pivotal role in rheuma-toid arthritis? Br J Rheumatol 1992;31:293–8.
BUCKLEY ET AL 220 |
5. Breese EJ, Michie CA, Nicholls SW, Murch SH, Williams CB, Domizio P, et al. Tumor necrosis factor alpha-producing cells in the intestinal mucosa of children with inflammatory bowel disease. Gastroenterology 1994;106:1455–66.
6. Feldman DR, Gordon KB, Bala M, Evans R, Li S, Dooley LT, et al. Infliximab treatment results in significant improvement in the qual-ity of life of patients with severe psoriasis: a double-blind placebo- controlled trial. Br J Dermatol 2005;152:954–60.
7. Holdam AS, Bager P, Dahlerup JF. Biological therapy increases the health-related quality of life in patients with inflammatory bowel dis-ease in a clinical setting. Scand J Gastroenterol 2016;51:706–11.
8. Klotsche J, Minden K, Thon A, Ganser G, Urban A, Horneff G. Improvement in health-related quality of life for children with juvenile idiopathic arthritis after start of treatment with etanercept. Arthritis Care Res (Hoboken) 2014;66:253–62.
9. Eickstaedt JB, Killpack L, Tung J, David D, Hand JL, Tollefson MM. Psoriasis and psoriasiform eruptions in pediatric patients with inflam-matory bowel disease treated with anti-tumor necrosis factor alpha agents. Pediatr Dermatol 2017;34:253–60.
10. Perman MJ, Lovell DJ, Denson LA, Farrell MK, Lucky AW. Five cases of anti-tumor necrosis factor alpha-induced psoriasis pre-senting with severe scalp involvement in children. Pediatr Dermatol 2012;39:454–9.
11. Campbell JA, Kodama SS, Gupta D, Zhao Y. Case series of psoriasis associated with tumor necrosis factor-α inhibitors in children with chronic recurrent multifocal osteomyelitis. JAAD Case Rep 2018;4:767–71.
12. Sherlock M, Walters T, Tabbers M, Frost K, Zachos M, Muise A, et al. Infliximab-induced psoriasis and psoriasiform skin lesions in pedi-atric Crohn disease and a potential associated with IL-23 receptor polymorphisms. J Pediatr Gastroenterol Nutr 2013;56:512–8.
13. Hiremath G, Duffy L, Leibowitz I. Infliximab-induced psoriasis in chil-dren with inflammatory bowel disease. J Pediatr Gastroenterol Nutr 2011;52:230–2.
14. Pourciau D, Shwayder T. Occurrence of pustular psoriasis after treatment of Crohn disease with infliximab. Pediatr Dermatol 2010;27:539–40.
15. De Jager ME, van de Kerkhof PC, de Jong EM, Seyger MM. A cross-sectional study using the Children’s Dermatology Life Quality Index (CDLQI) in childhood psoriasis: negative effect on quality of life and moderate correlation of CDLQI with severity scores. Br J Dermatol 2010;163:1099–101.
16. Gelfand JM, Feldman SR, Stern RS, Thomas J, Rolstad T, Margolis DJ. Determinants of quality of life in patients with psoriasis: a study from the US population. J Am Acad Dermatol 2004;51:704–8.
17. Sanchez-Carazo JL, López-Estebaranz JL, Guisado C. Comorbidities and health-related quality of life in Spanish patients with moderate to severe psoriasis: a cross-sectional study (Arizona study). J Dermatol 2014;41:673–8.
18. Rapp SR, Feldman SR, Exum ML, Fleischer AB, Reboussin DM. Psoriasis causes as much disability as other major medical diseases. J Am Acad Dermatol 1999;41:401–7.
19. Kimball AB, Wu EQ, Guerin A, Yu AP, Tsaneva M, Gupta SR, et al. Risks of developing psychiatric disorders in pediatric patients with psoriasis. J Am Acad Dermatol 2012;67:651–7.
20. Lee FI, Bellary SV, Francis C. Increased occurrence of psoriasis in patients with Crohn’s disease and their relatives. Am J Gastroenterol 1990;85:962–3.
21. Cohen AD, Dreiher J, Birkenfeld S. Psoriasis associated with ulcer-ative colitis and Crohn’s disease. J Eur Acad Dermatol Venereol 2009;23:561–5.
22. Laxer RM, Shore AD, Manson D, King S, Silverman ED, Wilmot DM. Chronic recurrent multifocal osteomyelitis and psoriasis: a report of
a new association and review of related disorders. Semin Arthritis Rheum 1988;17:260–70.
23. Bronckers IM, Paller AS, van Geel MJ, van de Kerkhof PC, Seyger MM. Psoriasis in children and adolescents: diagnosis, management, and comorbidities. Paediatr Drugs 2015;17:373–84.
24. World Health Organization. Physical status: the use and interpretation of anthropometry: report of a WHO Expert Committee. WHO Technical Report Series No. 854. Geneva: World Health Organization; 1995.
25. Tolleson MM, Crowson CS, McEvoy MT, Maradit Kremers H. Incidence of psoriasis in children: a population-based study. J Am Acad Dermatol 2010;62:979–87.
26. Petty RE, Southwood TR, Baum J, Bhettay E, Glass DN, Manners P, et al. International League of Associations for Rheumatology clas-sification of juvenile idiopathic arthritis: second revision, Edmonton, 2001. J Rheumatol 2004;31:390–2.
27. Costo-Romero M, Coto-Segura P, Suarez-Saavedra S, Ramos-Polo E, Santos-Juanes J. Guttate psoriasis induced by infliximab in a child with Crohn’s disease. Inflamm Bowel Dis 2008;14:1462–3.
28. Avila Alvarex A, García-Alonso L, Solar Boga A, García-Silva J. Flexural psoriasis induced by infliximab and adalimumab in a patient with Crohn’s disease. An Pediatr (Barc) 2009;70:278–81.
29. Sridhar S, Maltz RM, Boyle B, Kim SC. Dermatological manifesta-tions in pediatric patients with inflammatory bowel disease on anti-TNF therapy. Inflamm Bowel Dis 2018;24:2086–92.
30. Peek R, Scott-Jupp R, Strike H, Clinch J, Ramanan AV. Psoriasis after treatment of juvenile idiopathic arthritis with etanercept. Ann Rheum Dis 2006;65:1259.
31. Pontikaki I, Shahi E, Frasin LA, Gianotti R, Gelmetti C, Gerloni V, et al. Skin manifestations induced by TNF-α inhibitors in juvenile idiopathic arthritis. Clin Rev Allergy Immunol 2012;42:131–4.
32. Groth D, Perez M, Treat JR, Castelo-Soccio L, Nativ S, Weiss PF, et al. Tumor necrosis factor-α inhibitor-induced psoriasis in juvenile idiopathic arthritis patients. Pediatr Dermatol 2019;36:613–7.
33. Naldi L, Peli L, Parazzini F, Carrel CF. Family history of psoriasis, stressful life events, and recent infectious disease are risk factors for a first episode of acute guttate psoriasis: results of a case-control study. J Am Acad Dermatol 2001;44:433–8.
34. Chandran V, Raychaudhuri SP. Geoepidemiology and environmental factors of psoriasis and psoriatic arthritis. J Autoimm 2010;34:314–21.
35. McGonagle D, Palmou Fontana N, Tan AL, Benjamin M. Nailing down the genetic and immunologic basis for psoriatic disease. Dermatology 2010; Suppl 1:15–22.
36. Guerra I, Perez-Jeldres T, Iborra M, Algaba A, Monfort D, Calvet X, et al. Incidence, clinical characteristics, and management of psoriasis induced by anti-TNF therapy in patients with inflammatory bowel dis-ease: a nationwide cohort study. Inflamm Bowel Dis 2016;22:894–901.
37. Protic M, Schoepfer A, Yawalker N, Vavricka S, Seibold F. Development of psoriasis in IBD patients under TNF-antagonist ther-apy is associated neither with anti-TNF-antagonist antibodies nor trough levels. Scand J Gastroenterol 2016;51:1482–8.
38. Freling E, Baumann C, Cuny JF, Bigard MA, Schmutz JL, Barbaud A, et al. Cumulative incidence of, risk factors for, and outcome of derma-tologic complications of anti-TNF therapy in inflammatory bowel dis-ease: a 14-year experience. Am J Gastroenterol 2015;110:1186–96.
39. Tillack C, Ehmann LM, Friedrich M, Laubender RP, Papay P, Vogelsang H, et al. Anti-TNF antibody-induced psoriasiform skin lesions in patients with inflammatory bowel disease are characterized by interferon-γ- expressing Th1 cells and IL-17A/IL-22-expressing Th17 cells and respond to antil-IL-12/IL-23 antibody treatment. Gut 2014;63:567–77.
40. Courbette O, Aupiais C, Viala J, Hugot JP, Louveau B, Chatenoud L, et al. Infliximab paradoxical psoriasis in a cohort of children with inflam-matory bowel disease. J Pediatr Gastroenterol Nutr 2019;69:189–93.
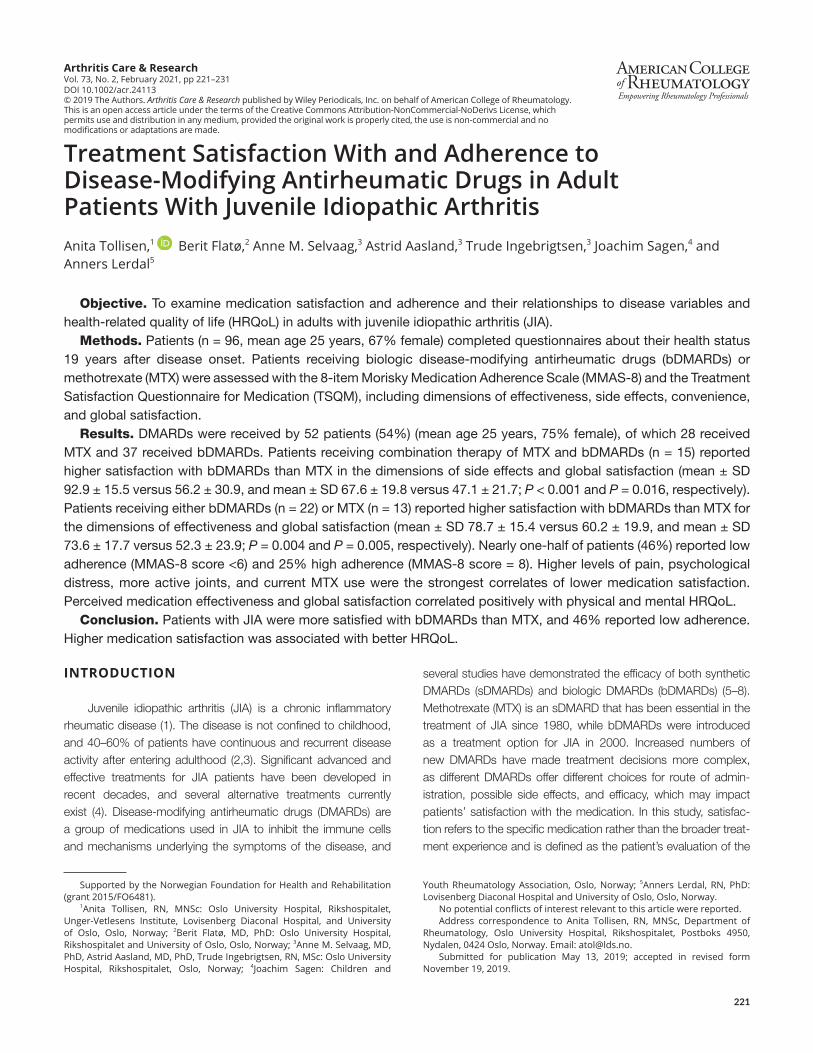
221
Arthritis Care & ResearchVol. 73, No. 2, February 2021, pp 221–231DOI 10.1002/acr.24113© 2019 The Authors. Arthritis Care & Research published by Wiley Periodicals, Inc. on behalf of American College of Rheumatology.This is an open access article under the terms of the Creative Commons Attribution-NonCommercial-NoDerivs License, which permits use and distribution in any medium, provided the original work is properly cited, the use is non-commercial and no modifications or adaptations are made.
Treatment Satisfaction With and Adherence to Disease-Modifying Antirheumatic Drugs in Adult Patients With Juvenile Idiopathic ArthritisAnita Tollisen,1 Berit Flatø,2 Anne M. Selvaag,3 Astrid Aasland,3 Trude Ingebrigtsen,3 Joachim Sagen,4 and Anners Lerdal5
Objective. To examine medication satisfaction and adherence and their relationships to disease variables and health-related quality of life (HRQoL) in adults with juvenile idiopathic arthritis (JIA).
Methods. Patients (n = 96, mean age 25 years, 67% female) completed questionnaires about their health status 19 years after disease onset. Patients receiving biologic disease-modifying antirheumatic drugs (bDMARDs) or methotrexate (MTX) were assessed with the 8-item Morisky Medication Adherence Scale (MMAS-8) and the Treatment Satisfaction Questionnaire for Medication (TSQM), including dimensions of effectiveness, side effects, convenience, and global satisfaction.
Results. DMARDs were received by 52 patients (54%) (mean age 25 years, 75% female), of which 28 received MTX and 37 received bDMARDs. Patients receiving combination therapy of MTX and bDMARDs (n = 15) reported higher satisfaction with bDMARDs than MTX in the dimensions of side effects and global satisfaction (mean ± SD 92.9 ± 15.5 versus 56.2 ± 30.9, and mean ± SD 67.6 ± 19.8 versus 47.1 ± 21.7; P < 0.001 and P = 0.016, respectively). Patients receiving either bDMARDs (n = 22) or MTX (n = 13) reported higher satisfaction with bDMARDs than MTX for the dimensions of effectiveness and global satisfaction (mean ± SD 78.7 ± 15.4 versus 60.2 ± 19.9, and mean ± SD 73.6 ± 17.7 versus 52.3 ± 23.9; P = 0.004 and P = 0.005, respectively). Nearly one-half of patients (46%) reported low adherence (MMAS-8 score <6) and 25% high adherence (MMAS-8 score = 8). Higher levels of pain, psychological distress, more active joints, and current MTX use were the strongest correlates of lower medication satisfaction. Perceived medication effectiveness and global satisfaction correlated positively with physical and mental HRQoL.
Conclusion. Patients with JIA were more satisfied with bDMARDs than MTX, and 46% reported low adherence. Higher medication satisfaction was associated with better HRQoL.
INTRODUCTION
Juvenile idiopathic arthritis (JIA) is a chronic inflammatory rheumatic disease (1). The disease is not confined to childhood, and 40–60% of patients have continuous and recurrent disease activity after entering adulthood (2,3). Significant advanced and effective treatments for JIA patients have been developed in recent decades, and several alternative treatments currently exist (4). Disease-modifying antirheumatic drugs (DMARDs) are a group of medications used in JIA to inhibit the immune cells and mechanisms underlying the symptoms of the disease, and
several studies have demonstrated the efficacy of both synthetic DMARDs (sDMARDs) and biologic DMARDs (bDMARDs) (5–8). Methotrexate (MTX) is an sDMARD that has been essential in the treatment of JIA since 1980, while bDMARDs were introduced as a treatment option for JIA in 2000. Increased numbers of new DMARDs have made treatment decisions more complex, as different DMARDs offer different choices for route of admin-istration, possible side effects, and efficacy, which may impact patients’ satisfaction with the medication. In this study, satisfac-tion refers to the specific medication rather than the broader treat-ment experience and is defined as the patient’s evaluation of the
Supported by the Norwegian Foundation for Health and Rehabilitation (grant 2015/FO6481).
1Anita Tollisen, RN, MNSc: Oslo University Hospital, Rikshospitalet, Unger-Vetlesens Institute, Lovisenberg Diaconal Hospital, and University of Oslo, Oslo, Norway; 2Berit Flatø, MD, PhD: Oslo University Hospital, Rikshospitalet and University of Oslo, Oslo, Norway; 3Anne M. Selvaag, MD, PhD, Astrid Aasland, MD, PhD, Trude Ingebrigtsen, RN, MSc: Oslo University Hospital, Rikshospitalet, Oslo, Norway; 4Joachim Sagen: Children and
Youth Rheumatology Association, Oslo, Norway; 5Anners Lerdal, RN, PhD: Lovisenberg Diaconal Hospital and University of Oslo, Oslo, Norway.
No potential conflicts of interest relevant to this article were reported.Address correspondence to Anita Tollisen, RN, MNSc, Department of
Rheumatology, Oslo University Hospital, Rikshospitalet, Postboks 4950, Nydalen, 0424 Oslo, Norway. Email: [email protected].
Submitted for publication May 13, 2019; accepted in revised form November 19, 2019.
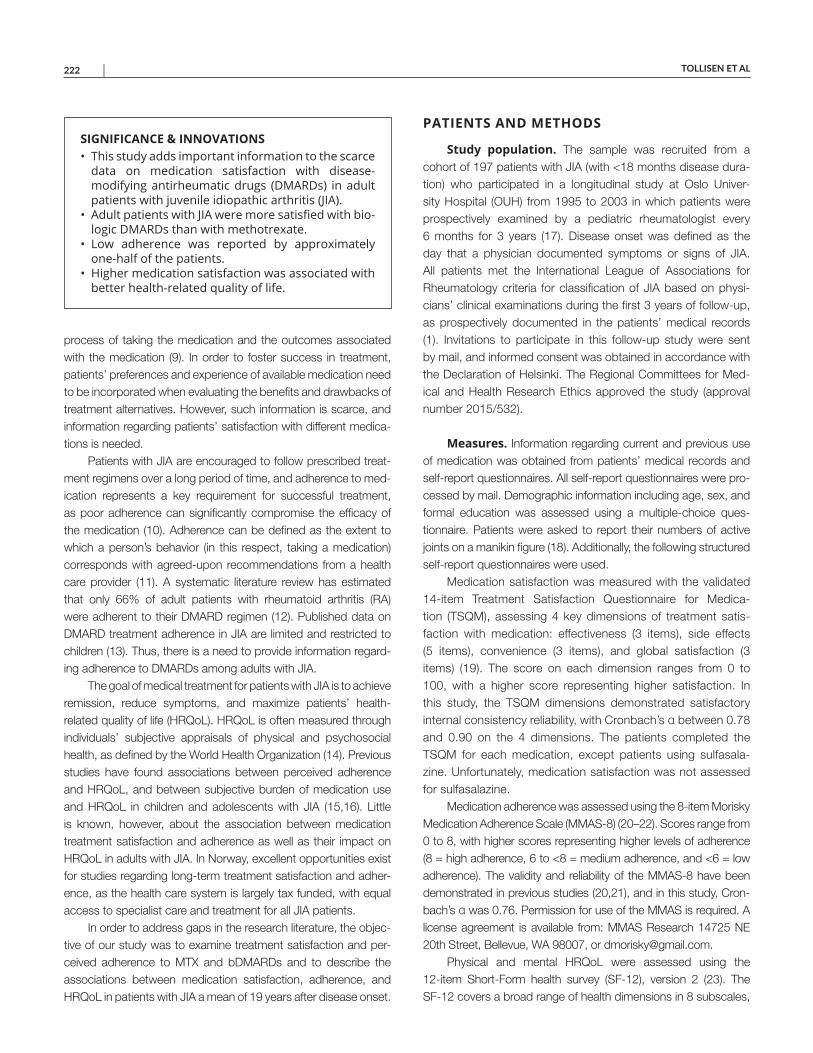
TOLLISEN ET AL 222 |
process of taking the medication and the outcomes associated with the medication (9). In order to foster success in treatment, patients’ preferences and experience of available medication need to be incorporated when evaluating the benefits and drawbacks of treatment alternatives. However, such information is scarce, and information regarding patients’ satisfaction with different medica-tions is needed.
Patients with JIA are encouraged to follow prescribed treat-ment regimens over a long period of time, and adherence to med-ication represents a key requirement for successful treatment, as poor adherence can significantly compromise the efficacy of the medication (10). Adherence can be defined as the extent to which a person’s behavior (in this respect, taking a medication) corresponds with agreed-upon recommendations from a health care provider (11). A systematic literature review has estimated that only 66% of adult patients with rheumatoid arthritis (RA) were adherent to their DMARD regimen (12). Published data on DMARD treatment adherence in JIA are limited and restricted to children (13). Thus, there is a need to provide information regard-ing adherence to DMARDs among adults with JIA.
The goal of medical treatment for patients with JIA is to achieve remission, reduce symptoms, and maximize patients’ health- related quality of life (HRQoL). HRQoL is often measured through individuals’ subjective appraisals of physical and psychosocial health, as defined by the World Health Organization (14). Previous studies have found associations between perceived adherence and HRQoL, and between subjective burden of medication use and HRQoL in children and adolescents with JIA (15,16). Little is known, however, about the association between medication treatment satisfaction and adherence as well as their impact on HRQoL in adults with JIA. In Norway, excellent opportunities exist for studies regarding long-term treatment satisfaction and adher-ence, as the health care system is largely tax funded, with equal access to specialist care and treatment for all JIA patients.
In order to address gaps in the research literature, the objec-tive of our study was to examine treatment satisfaction and per-ceived adherence to MTX and bDMARDs and to describe the associations between medication satisfaction, adherence, and HRQoL in patients with JIA a mean of 19 years after disease onset.
PATIENTS AND METHODS
Study population. The sample was recruited from a cohort of 197 patients with JIA (with <18 months disease dura-tion) who participated in a longitudinal study at Oslo Univer-sity Hospital (OUH) from 1995 to 2003 in which patients were prospectively examined by a pediatric rheumatologist every 6 months for 3 years (17). Disease onset was defined as the day that a physician documented symptoms or signs of JIA. All patients met the International League of Associations for Rheumatology criteria for classification of JIA based on physi-cians’ clinical examinations during the first 3 years of follow-up, as prospectively documented in the patients’ medical records (1). Invitations to participate in this follow-up study were sent by mail, and informed consent was obtained in accordance with the Declaration of Helsinki. The Regional Committees for Med-ical and Health Research Ethics approved the study (approval number 2015/532).
Measures. Information regarding current and previous use of medication was obtained from patients’ medical records and self-report questionnaires. All self-report questionnaires were pro-cessed by mail. Demographic information including age, sex, and formal education was assessed using a multiple-choice ques-tionnaire. Patients were asked to report their numbers of active joints on a manikin figure (18). Additionally, the following structured self-report questionnaires were used.
Medication satisfaction was measured with the validated 14-item Treatment Satisfaction Questionnaire for Medica-tion (TSQM), assessing 4 key dimensions of treatment satis-faction with medication: effectiveness (3 items), side effects (5 items), convenience (3 items), and global satisfaction (3 items) (19). The score on each dimension ranges from 0 to 100, with a higher score representing higher satisfaction. In this study, the TSQM dimensions demonstrated satisfactory internal consistency reliability, with Cronbach’s α between 0.78 and 0.90 on the 4 dimensions. The patients completed the TSQM for each medication, except patients using sulfasala-zine. Unfortunately, medication satisfaction was not assessed for sulfasalazine.
Medication adherence was assessed using the 8-item Morisky Medication Adherence Scale (MMAS-8) (20–22). Scores range from 0 to 8, with higher scores representing higher levels of adherence (8 = high adherence, 6 to <8 = medium adherence, and <6 = low adherence). The validity and reliability of the MMAS-8 have been demonstrated in previous studies (20,21), and in this study, Cron-bach’s α was 0.76. Permission for use of the MMAS is required. A license agreement is available from: MMAS Research 14725 NE 20th Street, Bellevue, WA 98007, or [email protected].
Physical and mental HRQoL were assessed using the 12-item Short-Form health survey (SF-12), version 2 (23). The SF-12 covers a broad range of health dimensions in 8 subscales,
SIGNIFICANCE & INNOVATIONS• This study adds important information to the scarce
data on medication satisfaction with disease- modifying antirheumatic drugs (DMARDs) in adult patients with juvenile idiopathic arthritis (JIA).
• Adult patients with JIA were more satisfied with bio-logic DMARDs than with methotrexate.
• Low adherence was reported by approximatelyone-half of the patients.
• Higher medication satisfaction was associated withbetter health-related quality of life.
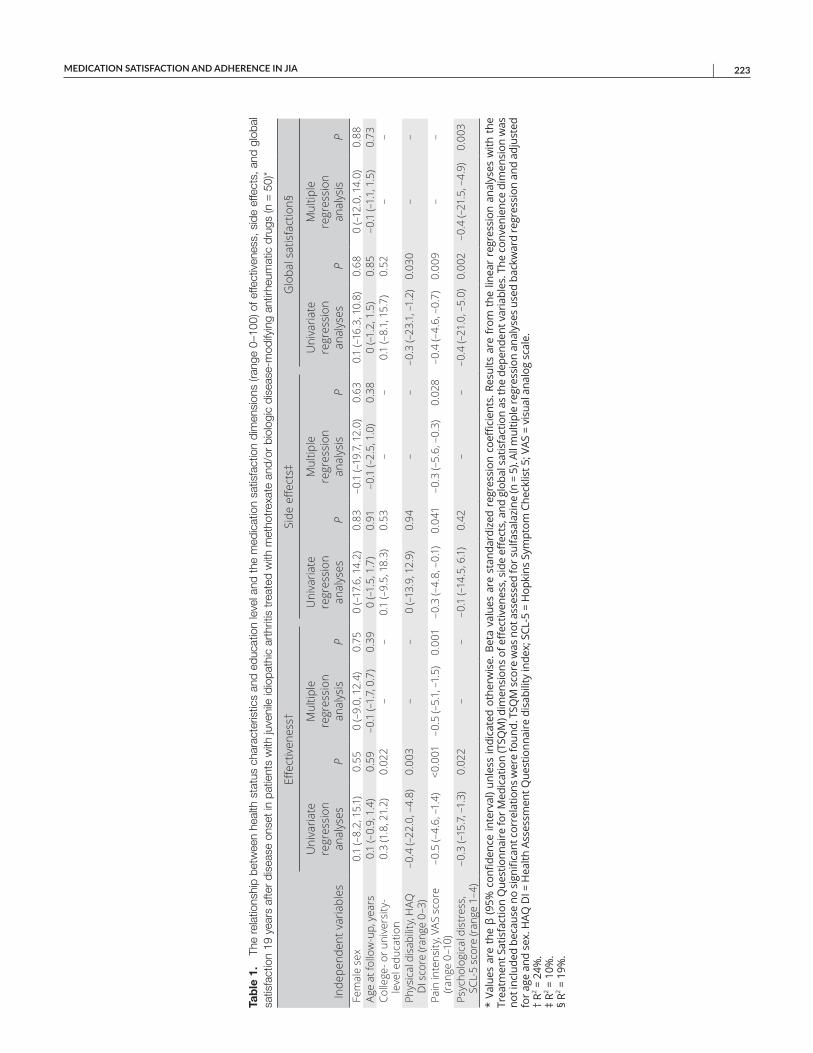
MEDICATION SATISFACTION AND ADHERENCE IN JIA | 223
Tab
le 1
. Th
e re
latio
nshi
p be
twee
n he
alth
sta
tus
char
acte
ristic
s an
d ed
ucat
ion
leve
l and
the
med
icat
ion
satis
fact
ion
dim
ensi
ons
(rang
e 0–
100)
of e
ffect
iven
ess,
sid
e ef
fect
s, a
nd g
loba
l sa
tisfa
ctio
n 19
yea
rs a
fter
dise
ase
onse
t in
patie
nts
with
juve
nile
idio
path
ic a
rthr
itis
trea
ted
with
met
hotr
exat
e an
d/or
bio
logi
c di
seas
e-m
odify
ing
antir
heum
atic
dru
gs (n
= 5
0)*
Inde
pend
ent v
aria
bles
Effe
ctiv
enes
s†Si
de e
ffect
s‡G
loba
l sat
isfa
ctio
n§
Uni
varia
te
regr
essi
on
anal
yses
P
Mul
tiple
re
gres
sion
an
alys
isP
Uni
varia
te
regr
essi
on
anal
yses
P
Mul
tiple
re
gres
sion
an
alys
isP
Uni
varia
te
regr
essi
on
anal
yses
P
Mul
tiple
re
gres
sion
an
alys
isP
Fem
ale
sex
0.1
(–8.
2, 1
5.1)
0.55
0 (–
9.0,
12.
4)0.
750
(–17
.6, 1
4.2)
0.83
–0.1
(–19
.7, 1
2.0)
0.63
0.1
(–16
.3, 1
0.8)
0.68
0 (–
12.0
, 14.
0)0.
88Ag
e at
follo
w-u
p, y
ears
0.1
(–0.
9, 1
.4)
0.59
–0.1
(–1.
7, 0
.7)
0.39
0 (–
1.5,
1.7
)0.
91–0
.1 (–
2.5,
1.0
)0.
380
(–1.
2, 1
.5)
0.85
–0.1
(–1.
1, 1
.5)
0.73
Colle
ge- o
r uni
vers
ity-
leve
l edu
catio
n0.
3 (1
.8, 2
1.2)
0.02
2–
–0.
1 (–
9.5,
18.
3)0.
53–
–0.
1 (–
8.1,
15.
7)0.
52–
–
Phys
ical
dis
abili
ty, H
AQ
DI s
core
(ran
ge 0
–3)
–0.4
(–22
.0, –
4.8)
0.00
3–
–0
(–13
.9, 1
2.9)
0.94
––
–0.3
(–23
.1, –
1.2)
0.03
0–
–
Pain
inte
nsity
, VAS
sco
re
(rang
e 0–
10)
–0.5
(–4.
6, –
1.4)
<0.0
01–0
.5 (–
5.1,
–1.
5)0.
001
–0.3
(–4.
8, –
0.1)
0.04
1–0
.3 (–
5.6,
–0.
3)0.
028
–0.4
(–4.
6, –
0.7)
0.00
9–
–
Psyc
holo
gica
l dis
tres
s,
SCL-
5 sc
ore
(rang
e 1–
4)–0
.3 (–
15.7
, –1.
3)0.
022
––
–0.1
(–14
.5, 6
.1)
0.42
––
–0.4
(–21
.0, –
5.0)
0.00
2–0
.4 (–
21.5
, –4.
9)0.
003
* Va
lues
are
the
β (9
5% c
onfid
ence
inte
rval
) unl
ess
indi
cate
d ot
herw
ise.
Bet
a va
lues
are
sta
ndar
dize
d re
gres
sion
coe
ffici
ents
. Res
ults
are
fro
m t
he li
near
reg
ress
ion
anal
yses
with
the
Tr
eatm
ent S
atis
fact
ion
Que
stio
nnai
re fo
r Med
icat
ion
(TSQ
M) d
imen
sion
s of
eff
ectiv
enes
s, s
ide
effec
ts, a
nd g
loba
l sat
isfa
ctio
n as
the
depe
nden
t var
iabl
es. T
he c
onve
nien
ce d
imen
sion
was
no
t inc
lude
d be
caus
e no
sig
nific
ant c
orre
latio
ns w
ere
foun
d. T
SQM
sco
re w
as n
ot a
sses
sed
for s
ulfa
sala
zine
(n =
5).
All m
ultip
le re
gres
sion
ana
lyse
s us
ed b
ackw
ard
regr
essi
on a
nd a
djus
ted
for a
ge a
nd s
ex. H
AQ D
I = H
ealth
Ass
essm
ent Q
uest
ionn
aire
dis
abili
ty in
dex;
SCL
-5 =
Hop
kins
Sym
ptom
Che
cklis
t 5; V
AS =
vis
ual a
nalo
g sc
ale.
†
R2 = 2
4%.
‡ R2 =
10%
. §
R2 = 1
9%.
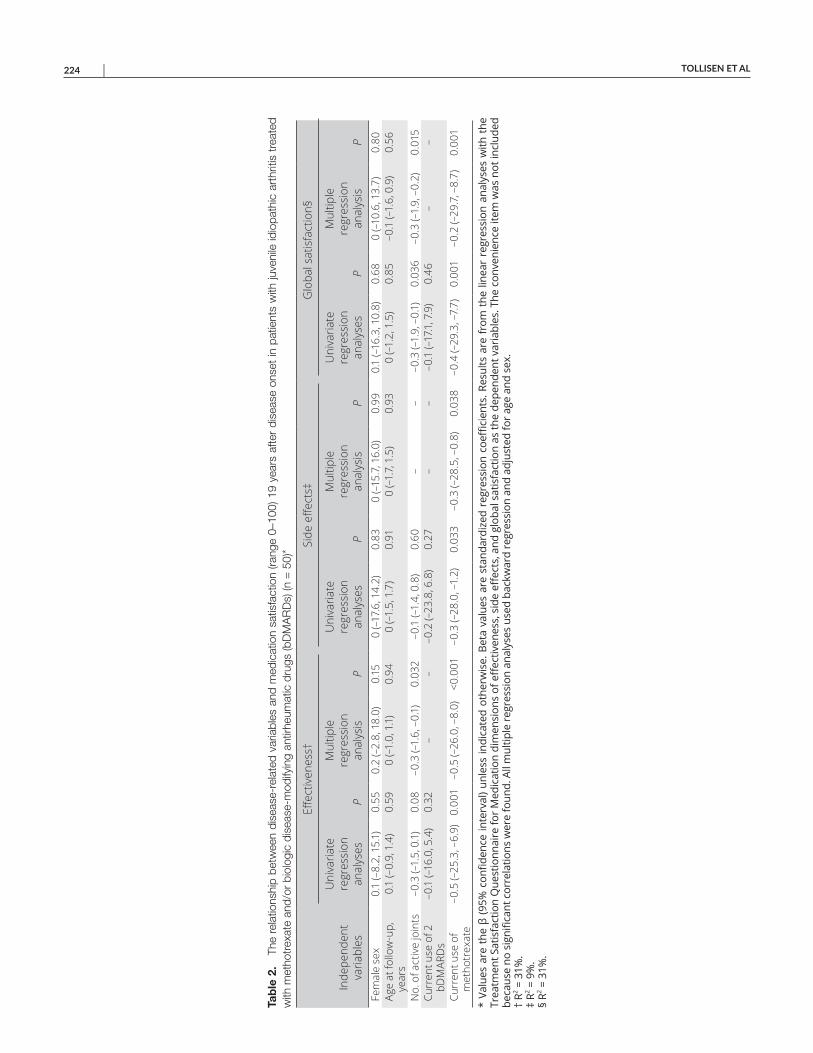
TOLLISEN ET AL 224 |
Tab
le 2
. Th
e re
latio
nshi
p be
twee
n di
seas
e-re
late
d va
riabl
es a
nd m
edic
atio
n sa
tisfa
ctio
n (ra
nge
0–10
0) 1
9 ye
ars
afte
r di
seas
e on
set
in p
atie
nts
with
juve
nile
idio
path
ic a
rthr
itis
trea
ted
with
met
hotr
exat
e an
d/or
bio
logi
c di
seas
e-m
odify
ing
antir
heum
atic
dru
gs (b
DM
AR
Ds)
(n =
50)
*
Inde
pend
ent
varia
bles
Effe
ctiv
enes
s†Si
de e
ffect
s‡G
loba
l sat
isfa
ctio
n§
Uni
varia
te
regr
essi
on
anal
yses
P
Mul
tiple
re
gres
sion
an
alys
isP
Uni
varia
te
regr
essi
on
anal
yses
P
Mul
tiple
re
gres
sion
an
alys
isP
Uni
varia
te
regr
essi
on
anal
yses
P
Mul
tiple
re
gres
sion
an
alys
isP
Fem
ale
sex
0.1
(–8.
2, 1
5.1)
0.55
0.2
(–2.
8, 1
8.0)
0.15
0 (–
17.6
, 14.
2)0.
830
(–15
.7, 1
6.0)
0.99
0.1
(–16
.3, 1
0.8)
0.68
0 (–
10.6
, 13.
7)0.
80Ag
e at
follo
w-u
p,
year
s0.
1 (–
0.9,
1.4
)0.
590
(–1.
0, 1
.1)
0.94
0 (–
1.5,
1.7
)0.
910
(–1.
7, 1
.5)
0.93
0 (–
1.2,
1.5
)0.
85–0
.1 (–
1.6,
0.9
)0.
56
No.
of a
ctiv
e jo
ints
–0.3
(–1.
5, 0
.1)
0.08
–0.3
(–1.
6, –
0.1)
0.03
2–0
.1 (–
1.4,
0.8
)0.
60–
––0
.3 (–
1.9,
–0.
1)0.
036
–0.3
(–1.
9, –
0.2)
0.01
5Cu
rren
t use
of 2
bD
MAR
Ds
–0.1
(–16
.0, 5
.4)
0.32
––
–0.2
(–23
.8, 6
.8)
0.27
––
–0.1
(–17
.1, 7
.9)
0.46
––
Curr
ent u
se o
f m
etho
trex
ate
–0.5
(–25
.3, –
6.9)
0.00
1–0
.5 (–
26.0
, –8.
0)<0
.001
–0.3
(–28
.0, –
1.2)
0.03
3–0
.3 (–
28.5
, –0.
8)0.
038
–0.4
(–29
.3, –
7.7)
0.00
1–0
.2 (–
29.7
, –8.
7)0.
001
* Va
lues
are
the
β (9
5% c
onfid
ence
inte
rval
) unl
ess
indi
cate
d ot
herw
ise.
Bet
a va
lues
are
sta
ndar
dize
d re
gres
sion
coe
ffici
ents
. Res
ults
are
fro
m t
he li
near
reg
ress
ion
anal
yses
with
the
Tr
eatm
ent S
atis
fact
ion
Que
stio
nnai
re fo
r Med
icat
ion
dim
ensi
ons
of e
ffec
tiven
ess,
sid
e eff
ects
, and
glo
bal s
atis
fact
ion
as th
e de
pend
ent v
aria
bles
. The
con
veni
ence
item
was
not
incl
uded
be
caus
e no
sig
nific
ant c
orre
latio
ns w
ere
foun
d. A
ll m
ultip
le re
gres
sion
ana
lyse
s us
ed b
ackw
ard
regr
essi
on a
nd a
djus
ted
for a
ge a
nd s
ex.
† R2 =
31%
. ‡
R2 = 9
%.
§ R2 =
31%
.
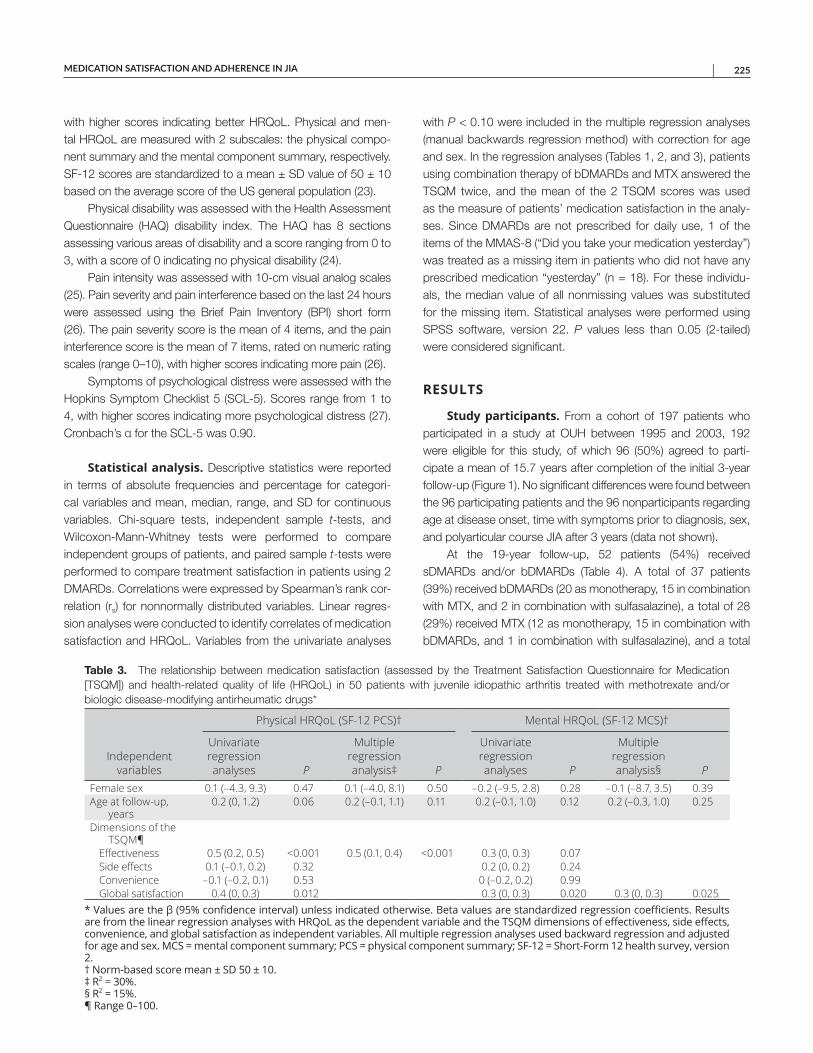
MEDICATION SATISFACTION AND ADHERENCE IN JIA | 225
with higher scores indicating better HRQoL. Physical and men-tal HRQoL are measured with 2 subscales: the physical compo-nent summary and the mental component summary, respectively. SF-12 scores are standardized to a mean ± SD value of 50 ± 10 based on the average score of the US general population (23).
Physical disability was assessed with the Health Assessment Questionnaire (HAQ) disability index. The HAQ has 8 sections assessing various areas of disability and a score ranging from 0 to 3, with a score of 0 indicating no physical disability (24).
Pain intensity was assessed with 10-cm visual analog scales (25). Pain severity and pain interference based on the last 24 hours were assessed using the Brief Pain Inventory (BPI) short form (26). The pain severity score is the mean of 4 items, and the pain interference score is the mean of 7 items, rated on numeric rating scales (range 0–10), with higher scores indicating more pain (26).
Symptoms of psychological distress were assessed with the Hopkins Symptom Checklist 5 (SCL-5). Scores range from 1 to 4, with higher scores indicating more psychological distress (27). Cronbach’s α for the SCL-5 was 0.90.
Statistical analysis. Descriptive statistics were reported in terms of absolute frequencies and percentage for categori-cal variables and mean, median, range, and SD for continuous variables. Chi-square tests, independent sample t-tests, and Wilcoxon-Mann-Whitney tests were performed to compare independent groups of patients, and paired sample t-tests were performed to compare treatment satisfaction in patients using 2 DMARDs. Correlations were expressed by Spearman’s rank cor-relation (rs) for nonnormally distributed variables. Linear regres-sion analyses were conducted to identify correlates of medication satisfaction and HRQoL. Variables from the univariate analyses
with P < 0.10 were included in the multiple regression analyses (manual backwards regression method) with correction for age and sex. In the regression analyses (Tables 1, 2, and 3), patients using combination therapy of bDMARDs and MTX answered the TSQM twice, and the mean of the 2 TSQM scores was used as the measure of patients’ medication satisfaction in the analy-ses. Since DMARDs are not prescribed for daily use, 1 of the items of the MMAS-8 (“Did you take your medication yesterday”) was treated as a missing item in patients who did not have any prescribed medication “yesterday” (n = 18). For these individu-als, the median value of all nonmissing values was substituted for the missing item. Statistical analyses were performed using SPSS software, version 22. P values less than 0.05 (2-tailed) were considered significant.
RESULTS
Study participants. From a cohort of 197 patients who participated in a study at OUH between 1995 and 2003, 192 were eligible for this study, of which 96 (50%) agreed to parti-cipate a mean of 15.7 years after completion of the initial 3-year follow-up (Figure 1). No significant differences were found between the 96 participating patients and the 96 nonparticipants regarding age at disease onset, time with symptoms prior to diagnosis, sex, and polyarticular course JIA after 3 years (data not shown).
At the 19-year follow-up, 52 patients (54%) received sDMARDs and/or bDMARDs (Table 4). A total of 37 patients (39%) received bDMARDs (20 as monotherapy, 15 in combination with MTX, and 2 in combination with sulfasalazine), a total of 28 (29%) received MTX (12 as monotherapy, 15 in combination with bDMARDs, and 1 in combination with sulfasalazine), and a total
Table 3. The relationship between medication satisfaction (assessed by the Treatment Satisfaction Questionnaire for Medication [TSQM]) and health-related quality of life (HRQoL) in 50 patients with juvenile idiopathic arthritis treated with methotrexate and/or biologic disease-modifying antirheumatic drugs*
Independent variables
Physical HRQoL (SF-12 PCS)† Mental HRQoL (SF-12 MCS)†
Univariate regression analyses P
Multiple regression analysis‡ P
Univariate regression analyses P
Multiple regression analysis§ P
Female sex 0.1 (–4.3, 9.3) 0.47 0.1 (–4.0, 8.1) 0.50 –0.2 (–9.5, 2.8) 0.28 –0.1 (–8.7, 3.5) 0.39Age at follow-up,
years0.2 (0, 1.2) 0.06 0.2 (–0.1, 1.1) 0.11 0.2 (–0.1, 1.0) 0.12 0.2 (–0.3, 1.0) 0.25
Dimensions of the TSQM¶
Effectiveness 0.5 (0.2, 0.5) <0.001 0.5 (0.1, 0.4) <0.001 0.3 (0, 0.3) 0.07Side effects 0.1 (–0.1, 0.2) 0.32 0.2 (0, 0.2) 0.24Convenience –0.1 (–0.2, 0.1) 0.53 0 (–0.2, 0.2) 0.99Global satisfaction 0.4 (0, 0.3) 0.012 0.3 (0, 0.3) 0.020 0.3 (0, 0.3) 0.025
* Values are the β (95% confidence interval) unless indicated otherwise. Beta values are standardized regression coefficients. Results are from the linear regression analyses with HRQoL as the dependent variable and the TSQM dimensions of effectiveness, side effects, convenience, and global satisfaction as independent variables. All multiple regression analyses used backward regression and adjusted for age and sex. MCS = mental component summary; PCS = physical component summary; SF-12 = Short-Form 12 health survey, version 2. † Norm-based score mean ± SD 50 ± 10. ‡ R2 = 30%. § R2 = 15%. ¶ Range 0–100.
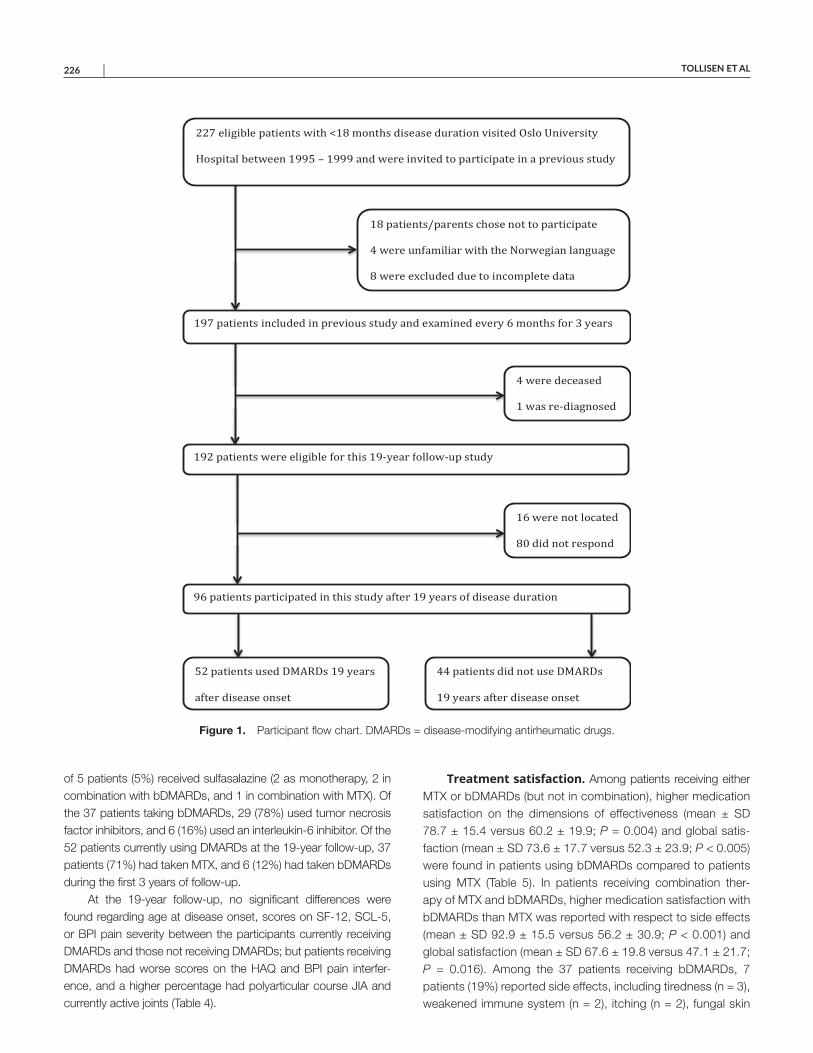
TOLLISEN ET AL 226 |
of 5 patients (5%) received sulfasalazine (2 as monotherapy, 2 in combination with bDMARDs, and 1 in combination with MTX). Of the 37 patients taking bDMARDs, 29 (78%) used tumor necrosis factor inhibitors, and 6 (16%) used an interleukin-6 inhibitor. Of the 52 patients currently using DMARDs at the 19-year follow-up, 37 patients (71%) had taken MTX, and 6 (12%) had taken bDMARDs during the first 3 years of follow-up.
At the 19-year follow-up, no significant differences were found regarding age at disease onset, scores on SF-12, SCL-5, or BPI pain severity between the participants currently receiving DMARDs and those not receiving DMARDs; but patients receiving DMARDs had worse scores on the HAQ and BPI pain interfer-ence, and a higher percentage had polyarticular course JIA and currently active joints (Table 4).
Treatment satisfaction. Among patients receiving either MTX or bDMARDs (but not in combination), higher medication satisfaction on the dimensions of effectiveness (mean ± SD 78.7 ± 15.4 versus 60.2 ± 19.9; P = 0.004) and global satis-faction (mean ± SD 73.6 ± 17.7 versus 52.3 ± 23.9; P < 0.005) were found in patients using bDMARDs compared to patients using MTX (Table 5). In patients receiving combination ther-apy of MTX and bDMARDs, higher medication satisfaction with bDMARDs than MTX was reported with respect to side effects (mean ± SD 92.9 ± 15.5 versus 56.2 ± 30.9; P < 0.001) and global satisfaction (mean ± SD 67.6 ± 19.8 versus 47.1 ± 21.7; P = 0.016). Among the 37 patients receiving bDMARDs, 7 patients (19%) reported side effects, including tiredness (n = 3), weakened immune system (n = 2), itching (n = 2), fungal skin
Figure 1. Participant flow chart. DMARDs = disease-modifying antirheumatic drugs.
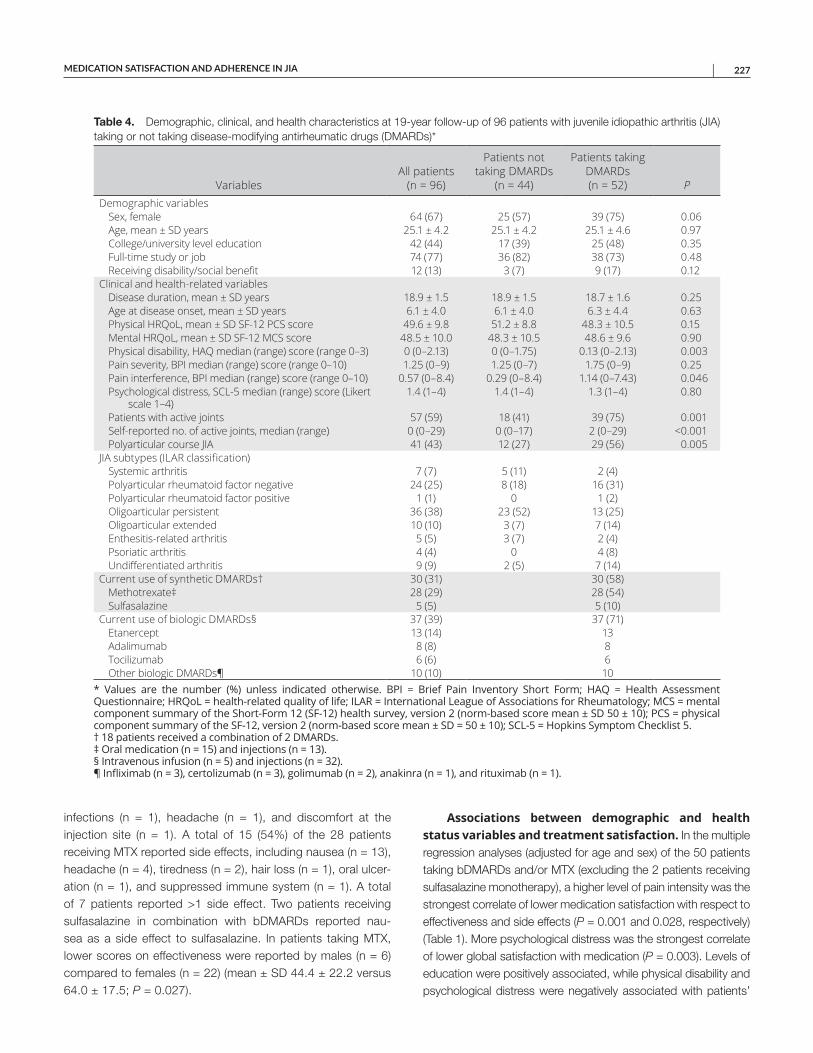
MEDICATION SATISFACTION AND ADHERENCE IN JIA | 227
infections (n = 1), headache (n = 1), and discomfort at the injection site (n = 1). A total of 15 (54%) of the 28 patients receiving MTX reported side effects, including nausea (n = 13), headache (n = 4), tiredness (n = 2), hair loss (n = 1), oral ulcer-ation (n = 1), and suppressed immune system (n = 1). A total of 7 patients reported >1 side effect. Two patients receiving sulfasalazine in combination with bDMARDs reported nau-sea as a side effect to sulfasalazine. In patients taking MTX, lower scores on effectiveness were reported by males (n = 6) compared to females (n = 22) (mean ± SD 44.4 ± 22.2 versus 64.0 ± 17.5; P = 0.027).
Associations between demographic and health status variables and treatment satisfaction. In the multiple regression analyses (adjusted for age and sex) of the 50 patients taking bDMARDs and/or MTX (excluding the 2 patients receiving sulfasalazine monotherapy), a higher level of pain intensity was the strongest correlate of lower medication satisfaction with respect to effectiveness and side effects (P = 0.001 and 0.028, respectively) (Table 1). More psychological distress was the strongest correlate of lower global satisfaction with medication (P = 0.003). Levels of education were positively associated, while physical disability and psychological distress were negatively associated with patients’
Table 4. Demographic, clinical, and health characteristics at 19-year follow-up of 96 patients with juvenile idiopathic arthritis (JIA) taking or not taking disease-modifying antirheumatic drugs (DMARDs)*
VariablesAll patients
(n = 96)
Patients not taking DMARDs
(n = 44)
Patients taking DMARDs (n = 52) P
Demographic variablesSex, female 64 (67) 25 (57) 39 (75) 0.06Age, mean ± SD years 25.1 ± 4.2 25.1 ± 4.2 25.1 ± 4.6 0.97College/university level education 42 (44) 17 (39) 25 (48) 0.35Full-time study or job 74 (77) 36 (82) 38 (73) 0.48Receiving disability/social benefit 12 (13) 3 (7) 9 (17) 0.12
Clinical and health-related variablesDisease duration, mean ± SD years 18.9 ± 1.5 18.9 ± 1.5 18.7 ± 1.6 0.25Age at disease onset, mean ± SD years 6.1 ± 4.0 6.1 ± 4.0 6.3 ± 4.4 0.63Physical HRQoL, mean ± SD SF-12 PCS score 49.6 ± 9.8 51.2 ± 8.8 48.3 ± 10.5 0.15Mental HRQoL, mean ± SD SF-12 MCS score 48.5 ± 10.0 48.3 ± 10.5 48.6 ± 9.6 0.90Physical disability, HAQ median (range) score (range 0–3) 0 (0–2.13) 0 (0–1.75) 0.13 (0–2.13) 0.003Pain severity, BPI median (range) score (range 0–10) 1.25 (0–9) 1.25 (0–7) 1.75 (0–9) 0.25Pain interference, BPI median (range) score (range 0–10) 0.57 (0–8.4) 0.29 (0–8.4) 1.14 (0–7.43) 0.046Psychological distress, SCL-5 median (range) score (Likert
scale 1–4)1.4 (1–4) 1.4 (1–4) 1.3 (1–4) 0.80
Patients with active joints 57 (59) 18 (41) 39 (75) 0.001Self-reported no. of active joints, median (range) 0 (0–29) 0 (0–17) 2 (0–29) <0.001Polyarticular course JIA 41 (43) 12 (27) 29 (56) 0.005
JIA subtypes (ILAR classification)Systemic arthritis 7 (7) 5 (11) 2 (4)Polyarticular rheumatoid factor negative 24 (25) 8 (18) 16 (31)Polyarticular rheumatoid factor positive 1 (1) 0 1 (2)Oligoarticular persistent 36 (38) 23 (52) 13 (25)Oligoarticular extended 10 (10) 3 (7) 7 (14)Enthesitis-related arthritis 5 (5) 3 (7) 2 (4)Psoriatic arthritis 4 (4) 0 4 (8)Undifferentiated arthritis 9 (9) 2 (5) 7 (14)
Current use of synthetic DMARDs† 30 (31) 30 (58)Methotrexate‡ 28 (29) 28 (54)Sulfasalazine 5 (5) 5 (10)
Current use of biologic DMARDs§ 37 (39) 37 (71)Etanercept 13 (14) 13Adalimumab 8 (8) 8Tocilizumab 6 (6) 6Other biologic DMARDs¶ 10 (10) 10
* Values are the number (%) unless indicated otherwise. BPI = Brief Pain Inventory Short Form; HAQ = Health Assessment Questionnaire; HRQoL = health-related quality of life; ILAR = International League of Associations for Rheumatology; MCS = mental component summary of the Short-Form 12 (SF-12) health survey, version 2 (norm-based score mean ± SD 50 ± 10); PCS = physical component summary of the SF-12, version 2 (norm-based score mean ± SD = 50 ± 10); SCL-5 = Hopkins Symptom Checklist 5. † 18 patients received a combination of 2 DMARDs. ‡ Oral medication (n = 15) and injections (n = 13). § Intravenous infusion (n = 5) and injections (n = 32).¶ Infliximab (n = 3), certolizumab (n = 3), golimumab (n = 2), anakinra (n = 1), and rituximab (n = 1).

TOLLISEN ET AL 228 |
satisfaction with medication effectiveness in the univariate analy-ses (P = 0.003–0.022) but not in the multiple regression analysis. Physical disability and pain intensity were negatively associated with patients’ global satisfaction with medication in the univariate but not the multiple regression analyses (P = 0.009–0.03).
Associations between disease-related variables and treatment satisfaction. In the multiple regression analyses, current use of MTX and number of active joints correlated with less medication satisfaction with respect to effectiveness and global satisfaction (P < 0.001–0.038) (Table 2). Current use of MTX was associated with less satisfaction with side effects (P = 0.038). No associations were found between medication satisfaction assessed by the TSQM and polyarticular disease course JIA or disease duration (data not shown).
Associations between medication satisfaction and HRQoL. In the multivariate analysis, lower satisfaction with effec-tiveness of medication was strongly associated with lower physical HRQoL (P < 0.001), and lower global satisfaction with medication was associated with lower mental HRQoL (P = 0.025) (Table 3). An association was also found between lower global satisfaction with medication and lower physical HRQoL in the univariate analy-sis (P = 0.012) but not in the multivariate analysis.
Medication adherence. The median MMAS-8 score was 6.0 (range 0.5–8.0), and 46% of the participants in this study pop-ulation reported low adherence (score <6.0) to DMARDs, while 15 patients (29%) reported medium adherence (score range 6–7.9), and 13 (25%) reported high adherence (score = 8). No associations were found between medication adherence and age, sex, disease duration, polyarticular disease course, self-reported number of active joints, or the medication satisfaction dimensions of effectiveness, side effects, and global satisfaction (data not shown). However, a correlation was found between medication adherence and the convenience dimension (rs = 0.327, P = 0.03). Among the 28 patients taking MTX, 13 (46%) reported problems with nausea in connection with taking the medication; however,
this did not correlate significantly with the MMAS-8 adherence score (data not shown).
DISCUSSION
In our cohort of adults with JIA, 52 patients (54%) were using sDMARDs and/or bDMARDs a mean of 19 years after disease onset. Patients were more satisfied with bDMARDs than MTX as assessed by the TSQM dimensions of effectiveness, side effects, and global satisfaction. Higher levels of physical disability, pain inten-sity, psychological distress, active joints, current use of MTX, and lower education level correlated with poorer medication satisfaction. Forty-six percent reported low adherence to medication, and a cor-relation was found between adherence to medication and the patient satisfaction convenience score. Among patients using DMARDs, associations were found between satisfaction with medication effectiveness and physical HRQoL, and between global medication satisfaction and both physical and mental HRQoL.
We found that patients in our study reported higher medica-tion satisfaction with bDMARDs compared to MTX. To our know-ledge, comparisons of JIA patients’ experiences with bDMARDs and MTX have not previously been explored. Our results con-trast with a study by Wolfe and Michaud on patients with RA (28), which found greater treatment satisfaction with medication among those treated with nonbiologic drugs versus biologics. However, these results were related to nonmedical factors (cost and inconve nience), and the participants were older (median 62.7 years) than those in our study. Younger adults may have other treatment preferences than older adults. In Norway, medication costs are covered by public health and therefore have no major impact on the results in this study.
Patients also reported higher scores on global satisfaction with bDMARDs compared with MTX. We found a strong corre-lation between the effectiveness score and global satisfaction score (rs = 0.8), indicating that effectiveness has a great impact on patient overall satisfaction with a medication.
Patients receiving either MTX or bDMARDs (but not in com-bination) were more satisfied with the effectiveness of bDMARDs
Table 5. Medication satisfaction (measured by the Treatment Satisfaction Questionnaire for Medication [TSQM]) in 50 patients taking methotrexate (MTX) and/or biologic disease-modifying antirheumatic drugs (bDMARDs)*
Dimensions of medication satisfaction (range 0–100)
Medication satisfaction in patients taking either MTX or bDMARDs
(but not in combination) (n = 35)
Medication satisfaction in patients taking MTX and bDMARDs
in combination (n = 15)
MTX (n = 13)
bDMARDs (n = 22) P†
MTX (n = 15)
bDMARDs (n = 15) P‡
Effectiveness 60.2 ± 19.9 78.7 ± 15.4 0.004 59.5 ± 20.1 69.6 ± 15.3 0.11Side effects 73.5 ± 28.6 88.7 ± 23.4 0.10 56.2 ± 30.9 92.9 ± 15.5 <0.001Convenience 65.0 ± 18.5 67.4 ± 14.6 0.66 69.2 ± 18.8 71.5 ± 11.3 0.67Global satisfaction 52.3 ± 23.9 73.6 ± 17.7 0.005 47.1 ± 21.7 67.6 ± 19.8 0.016
* Values are the mean ± SD unless indicated otherwise. TSQM score was not assessed for sulfasalazine (n = 5). † Independent sample t-test. ‡ Paired sample t-test.
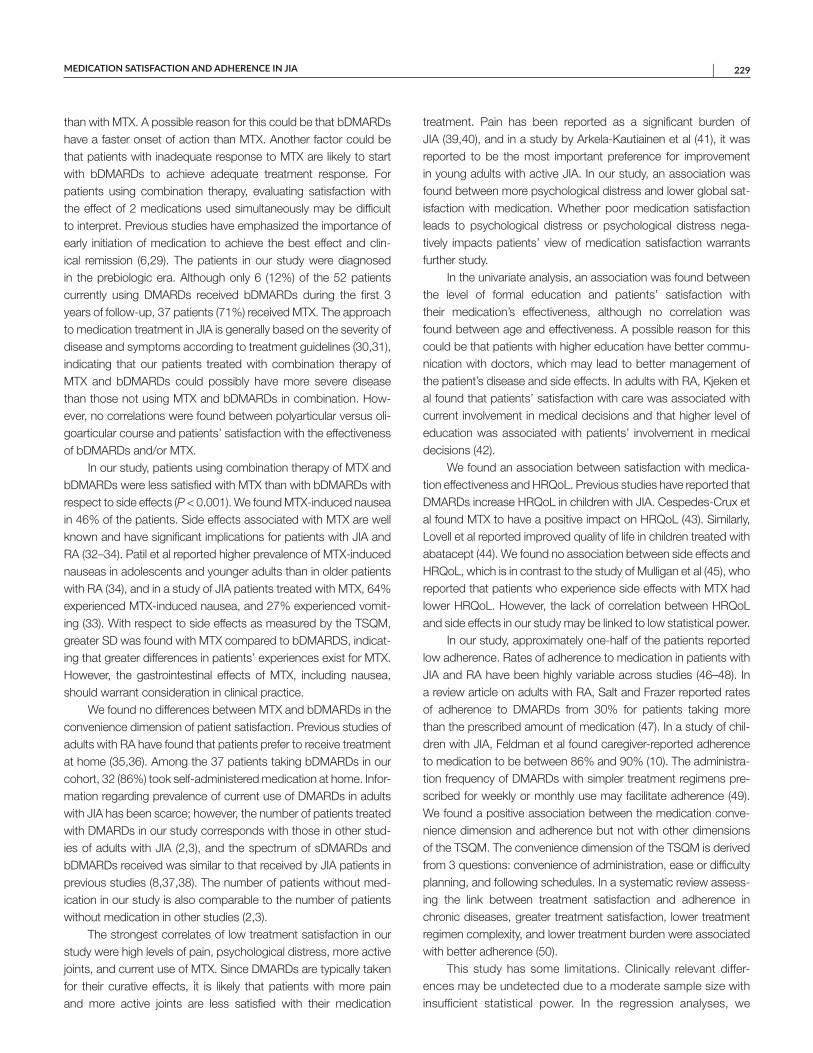
MEDICATION SATISFACTION AND ADHERENCE IN JIA | 229
than with MTX. A possible reason for this could be that bDMARDs have a faster onset of action than MTX. Another factor could be that patients with inadequate response to MTX are likely to start with bDMARDs to achieve adequate treatment response. For patients using combination therapy, evaluating satisfaction with the effect of 2 medications used simultaneously may be difficult to interpret. Previous studies have emphasized the importance of early initiation of medication to achieve the best effect and clin-ical remission (6,29). The patients in our study were diagnosed in the prebiologic era. Although only 6 (12%) of the 52 patients currently using DMARDs received bDMARDs during the first 3 years of follow-up, 37 patients (71%) received MTX. The approach to medication treatment in JIA is generally based on the severity of disease and symptoms according to treatment guidelines (30,31), indicating that our patients treated with combination therapy of MTX and bDMARDs could possibly have more severe disease than those not using MTX and bDMARDs in combination. How-ever, no correlations were found between polyarticular versus oli-goarticular course and patients’ satisfaction with the effectiveness of bDMARDs and/or MTX.
In our study, patients using combination therapy of MTX and bDMARDs were less satisfied with MTX than with bDMARDs with respect to side effects (P < 0.001). We found MTX-induced nausea in 46% of the patients. Side effects associated with MTX are well known and have significant implications for patients with JIA and RA (32–34). Patil et al reported higher prevalence of MTX-induced nauseas in adolescents and younger adults than in older patients with RA (34), and in a study of JIA patients treated with MTX, 64% experienced MTX-induced nausea, and 27% experienced vomit-ing (33). With respect to side effects as measured by the TSQM, greater SD was found with MTX compared to bDMARDS, indicat-ing that greater differences in patients’ experiences exist for MTX. However, the gastrointestinal effects of MTX, including nausea, should warrant consideration in clinical practice.
We found no differences between MTX and bDMARDs in the convenience dimension of patient satisfaction. Previous studies of adults with RA have found that patients prefer to receive treatment at home (35,36). Among the 37 patients taking bDMARDs in our cohort, 32 (86%) took self-administered medication at home. Infor-mation regarding prevalence of current use of DMARDs in adults with JIA has been scarce; however, the number of patients treated with DMARDs in our study corresponds with those in other stud-ies of adults with JIA (2,3), and the spectrum of sDMARDs and bDMARDs received was similar to that received by JIA patients in previous studies (8,37,38). The number of patients without med-ication in our study is also comparable to the number of patients without medication in other studies (2,3).
The strongest correlates of low treatment satisfaction in our study were high levels of pain, psychological distress, more active joints, and current use of MTX. Since DMARDs are typically taken for their curative effects, it is likely that patients with more pain and more active joints are less satisfied with their medication
treatment. Pain has been reported as a significant burden of JIA (39,40), and in a study by Arkela-Kautiainen et al (41), it was reported to be the most important preference for improvement in young adults with active JIA. In our study, an association was found between more psychological distress and lower global sat-isfaction with medication. Whether poor medication satisfaction leads to psychological distress or psychological distress nega-tively impacts patients’ view of medication satisfaction warrants further study.
In the univariate analysis, an association was found between the level of formal education and patients’ satisfaction with their medication’s effectiveness, although no correlation was found between age and effectiveness. A possible reason for this could be that patients with higher education have better commu-nication with doctors, which may lead to better management of the patient’s disease and side effects. In adults with RA, Kjeken et al found that patients’ satisfaction with care was associated with current involvement in medical decisions and that higher level of education was associated with patients’ involvement in medical decisions (42).
We found an association between satisfaction with medica-tion effectiveness and HRQoL. Previous studies have reported that DMARDs increase HRQoL in children with JIA. Cespedes-Crux et al found MTX to have a positive impact on HRQoL (43). Similarly, Lovell et al reported improved quality of life in children treated with abatacept (44). We found no association between side effects and HRQoL, which is in contrast to the study of Mulligan et al (45), who reported that patients who experience side effects with MTX had lower HRQoL. However, the lack of correlation between HRQoL and side effects in our study may be linked to low statistical power.
In our study, approximately one-half of the patients reported low adherence. Rates of adherence to medication in patients with JIA and RA have been highly variable across studies (46–48). In a review article on adults with RA, Salt and Frazer reported rates of adherence to DMARDs from 30% for patients taking more than the prescribed amount of medication (47). In a study of chil-dren with JIA, Feldman et al found caregiver-reported adherence to medication to be between 86% and 90% (10). The administra-tion frequency of DMARDs with simpler treatment regimens pre-scribed for weekly or monthly use may facilitate adherence (49). We found a positive association between the medication conve-nience dimension and adherence but not with other dimensions of the TSQM. The convenience dimension of the TSQM is derived from 3 questions: convenience of administration, ease or difficulty planning, and following schedules. In a systematic review assess-ing the link between treatment satisfaction and adherence in chronic diseases, greater treatment satisfaction, lower treatment regimen complexity, and lower treatment burden were associated with better adherence (50).
This study has some limitations. Clinically relevant differ-ences may be undetected due to a moderate sample size with insufficient statistical power. In the regression analyses, we
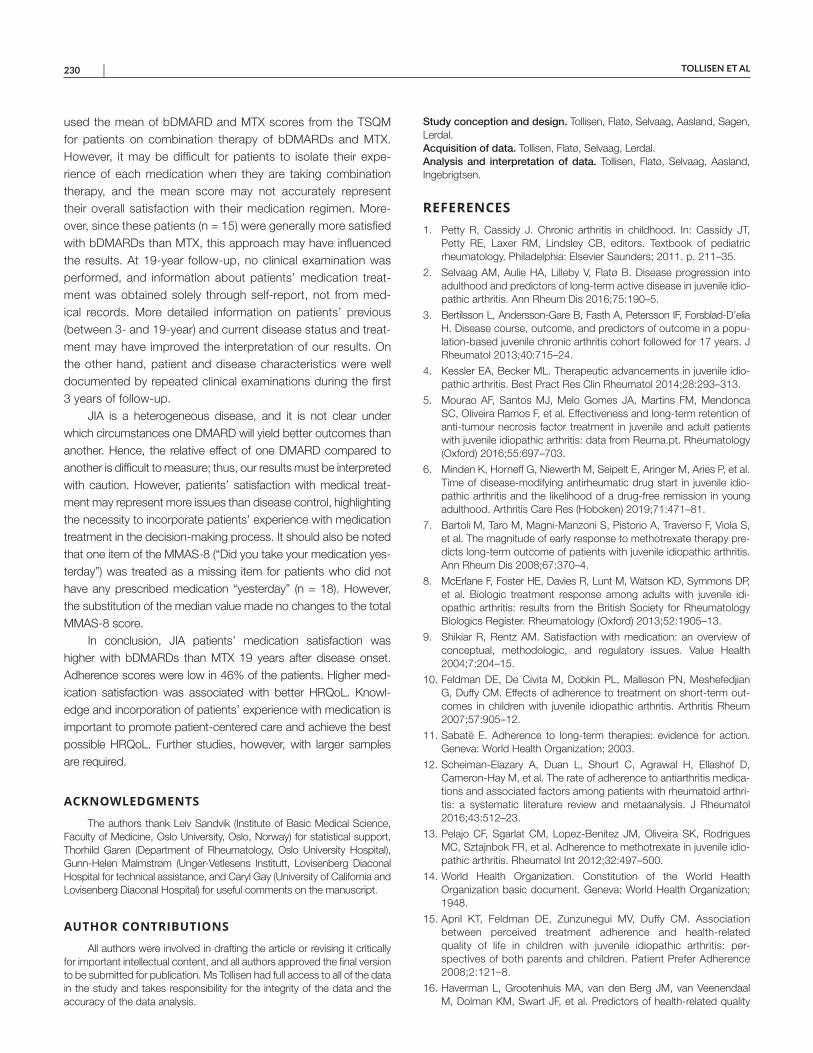
TOLLISEN ET AL 230 |
used the mean of bDMARD and MTX scores from the TSQM for patients on combination therapy of bDMARDs and MTX. However, it may be difficult for patients to isolate their expe-rience of each medication when they are taking combination therapy, and the mean score may not accurately represent their overall satisfaction with their medication regimen. More-over, since these patients (n = 15) were generally more satisfied with bDMARDs than MTX, this approach may have influenced the results. At 19-year follow-up, no clinical examination was performed, and information about patients’ medication treat-ment was obtained solely through self-report, not from med-ical records. More detailed information on patients’ previous (between 3- and 19-year) and current disease status and treat-ment may have improved the interpretation of our results. On the other hand, patient and disease characteristics were well documented by repeated clinical examinations during the first 3 years of follow-up.
JIA is a heterogeneous disease, and it is not clear under which circumstances one DMARD will yield better outcomes than another. Hence, the relative effect of one DMARD compared to another is difficult to measure; thus, our results must be interpreted with caution. However, patients’ satisfaction with medical treat-ment may represent more issues than disease control, highlighting the necessity to incorporate patients’ experience with medication treatment in the decision-making process. It should also be noted that one item of the MMAS-8 (“Did you take your medication yes-terday”) was treated as a missing item for patients who did not have any prescribed medication “yesterday” (n = 18). However, the substitution of the median value made no changes to the total MMAS-8 score.
In conclusion, JIA patients’ medication satisfaction was higher with bDMARDs than MTX 19 years after disease onset. Adherence scores were low in 46% of the patients. Higher med-ication satisfaction was associated with better HRQoL. Knowl-edge and incorporation of patients’ experience with medication is important to promote patient-centered care and achieve the best possible HRQoL. Further studies, however, with larger samples are required.
ACKNOWLEDGMENTS
The authors thank Leiv Sandvik (Institute of Basic Medical Science, Faculty of Medicine, Oslo University, Oslo, Norway) for statistical support, Thorhild Garen (Department of Rheumatology, Oslo University Hospital), Gunn-Helen Malmstrøm (Unger-Vetlesens Institutt, Lovisenberg Diaconal Hospital for technical assistance, and Caryl Gay (University of California and Lovisenberg Diaconal Hospital) for useful comments on the manuscript.
AUTHOR CONTRIBUTIONS
All authors were involved in drafting the article or revising it critically for important intellectual content, and all authors approved the final version to be submitted for publication. Ms Tollisen had full access to all of the data in the study and takes responsibility for the integrity of the data and the accuracy of the data analysis.
Study conception and design. Tollisen, Flatø, Selvaag, Aasland, Sagen, Lerdal.Acquisition of data. Tollisen, Flatø, Selvaag, Lerdal.Analysis and interpretation of data. Tollisen, Flatø, Selvaag, Aasland, Ingebrigtsen.
REFERENCES 1. Petty R, Cassidy J. Chronic arthritis in childhood. In: Cassidy JT,
Petty RE, Laxer RM, Lindsley CB, editors. Textbook of pediatricrheumatology. Philadelphia: Elsevier Saunders; 2011. p. 211–35.
2. Selvaag AM, Aulie HA, Lilleby V, Flatø B. Disease progression intoadulthood and predictors of long-term active disease in juvenile idio-pathic arthritis. Ann Rheum Dis 2016;75:190–5.
3. Bertilsson L, Andersson-Gare B, Fasth A, Petersson IF, Forsblad-D’eliaH. Disease course, outcome, and predictors of outcome in a popu-lation-based juvenile chronic arthritis cohort followed for 17 years. JRheumatol 2013;40:715–24.
4. Kessler EA, Becker ML. Therapeutic advancements in juvenile idio-pathic arthritis. Best Pract Res Clin Rheumatol 2014;28:293–313.
5. Mourao AF, Santos MJ, Melo Gomes JA, Martins FM, MendoncaSC, Oliveira Ramos F, et al. Effectiveness and long-term retention ofanti-tumour necrosis factor treatment in juvenile and adult patientswith juvenile idiopathic arthritis: data from Reuma.pt. Rheumatology(Oxford) 2016;55:697–703.
6. Minden K, Horneff G, Niewerth M, Seipelt E, Aringer M, Aries P, et al. Time of disease-modifying antirheumatic drug start in juvenile idio-pathic arthritis and the likelihood of a drug-free remission in youngadulthood. Arthritis Care Res (Hoboken) 2019;71:471–81.
7. Bartoli M, Taro M, Magni-Manzoni S, Pistorio A, Traverso F, Viola S,et al. The magnitude of early response to methotrexate therapy pre-dicts long-term outcome of patients with juvenile idiopathic arthritis.Ann Rheum Dis 2008;67:370–4.
8. McErlane F, Foster HE, Davies R, Lunt M, Watson KD, Symmons DP,et al. Biologic treatment response among adults with juvenile idi-opathic arthritis: results from the British Society for RheumatologyBiologics Register. Rheumatology (Oxford) 2013;52:1905–13.
9. Shikiar R, Rentz AM. Satisfaction with medication: an overview ofconceptual, methodologic, and regulatory issues. Value Health2004;7:204–15.
10. Feldman DE, De Civita M, Dobkin PL, Malleson PN, MeshefedjianG, Duffy CM. Effects of adherence to treatment on short-term out-comes in children with juvenile idiopathic arthritis. Arthritis Rheum2007;57:905–12.
11. Sabatë E. Adherence to long-term therapies: evidence for action.Geneva: World Health Organization; 2003.
12. Scheiman-Elazary A, Duan L, Shourt C, Agrawal H, Ellashof D,Cameron-Hay M, et al. The rate of adherence to antiarthritis medica-tions and associated factors among patients with rheumatoid arthri-tis: a systematic literature review and metaanalysis. J Rheumatol2016;43:512–23.
13. Pelajo CF, Sgarlat CM, Lopez-Benitez JM, Oliveira SK, RodriguesMC, Sztajnbok FR, et al. Adherence to methotrexate in juvenile idio-pathic arthritis. Rheumatol Int 2012;32:497–500.
14. World Health Organization. Constitution of the World HealthOrganization basic document. Geneva: World Health Organization;1948.
15. April KT, Feldman DE, Zunzunegui MV, Duffy CM. Associationbetween perceived treatment adherence and health-relatedquality of life in children with juvenile idiopathic arthritis: per-spectives of both parents and children. Patient Prefer Adherence2008;2:121–8.
16. Haverman L, Grootenhuis MA, van den Berg JM, van VeenendaalM, Dolman KM, Swart JF, et al. Predictors of health-related quality
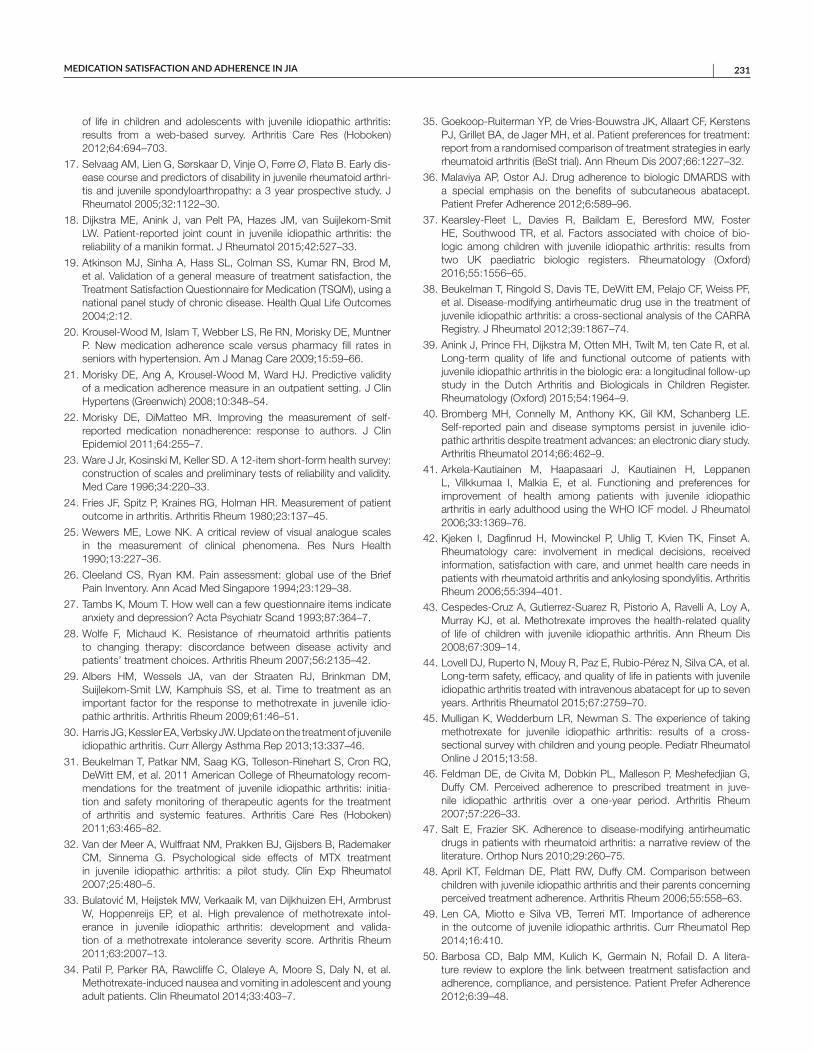
MEDICATION SATISFACTION AND ADHERENCE IN JIA | 231
of life in children and adolescents with juvenile idiopathic arthritis: results from a web-based survey. Arthritis Care Res (Hoboken) 2012;64:694–703.
17. Selvaag AM, Lien G, Sørskaar D, Vinje O, Førre Ø, Flatø B. Early dis-ease course and predictors of disability in juvenile rheumatoid arthri-tis and juvenile spondyloarthropathy: a 3 year prospective study. J Rheumatol 2005;32:1122–30.
18. Dijkstra ME, Anink J, van Pelt PA, Hazes JM, van Suijlekom-Smit LW. Patient-reported joint count in juvenile idiopathic arthritis: the reliability of a manikin format. J Rheumatol 2015;42:527–33.
19. Atkinson MJ, Sinha A, Hass SL, Colman SS, Kumar RN, Brod M, et al. Validation of a general measure of treatment satisfaction, the Treatment Satisfaction Questionnaire for Medication (TSQM), using a national panel study of chronic disease. Health Qual Life Outcomes 2004;2:12.
20. Krousel-Wood M, Islam T, Webber LS, Re RN, Morisky DE, Muntner P. New medication adherence scale versus pharmacy fill rates in seniors with hypertension. Am J Manag Care 2009;15:59–66.
21. Morisky DE, Ang A, Krousel-Wood M, Ward HJ. Predictive validity of a medication adherence measure in an outpatient setting. J Clin Hypertens (Greenwich) 2008;10:348–54.
22. Morisky DE, DiMatteo MR. Improving the measurement of self- reported medication nonadherence: response to authors. J Clin Epidemiol 2011;64:255–7.
23. Ware J Jr, Kosinski M, Keller SD. A 12-item short-form health survey: construction of scales and preliminary tests of reliability and validity. Med Care 1996;34:220–33.
24. Fries JF, Spitz P, Kraines RG, Holman HR. Measurement of patient outcome in arthritis. Arthritis Rheum 1980;23:137–45.
25. Wewers ME, Lowe NK. A critical review of visual analogue scales in the measurement of clinical phenomena. Res Nurs Health 1990;13:227–36.
26. Cleeland CS, Ryan KM. Pain assessment: global use of the Brief Pain Inventory. Ann Acad Med Singapore 1994;23:129–38.
27. Tambs K, Moum T. How well can a few questionnaire items indicate anxiety and depression? Acta Psychiatr Scand 1993;87:364–7.
28. Wolfe F, Michaud K. Resistance of rheumatoid arthritis patients to changing therapy: discordance between disease activity and patients’ treatment choices. Arthritis Rheum 2007;56:2135–42.
29. Albers HM, Wessels JA, van der Straaten RJ, Brinkman DM, Suijlekom-Smit LW, Kamphuis SS, et al. Time to treatment as an important factor for the response to methotrexate in juvenile idio-pathic arthritis. Arthritis Rheum 2009;61:46–51.
30. Harris JG, Kessler EA, Verbsky JW. Update on the treatment of juvenile idiopathic arthritis. Curr Allergy Asthma Rep 2013;13:337–46.
31. Beukelman T, Patkar NM, Saag KG, Tolleson-Rinehart S, Cron RQ, DeWitt EM, et al. 2011 American College of Rheumatology recom-mendations for the treatment of juvenile idiopathic arthritis: initia-tion and safety monitoring of therapeutic agents for the treatment of arthritis and systemic features. Arthritis Care Res (Hoboken) 2011;63:465–82.
32. Van der Meer A, Wulffraat NM, Prakken BJ, Gijsbers B, Rademaker CM, Sinnema G. Psychological side effects of MTX treatment in juvenile idiopathic arthritis: a pilot study. Clin Exp Rheumatol 2007;25:480–5.
33. Bulatović M, Heijstek MW, Verkaaik M, van Dijkhuizen EH, Armbrust W, Hoppenreijs EP, et al. High prevalence of methotrexate intol-erance in juvenile idiopathic arthritis: development and valida-tion of a methotrexate intolerance severity score. Arthritis Rheum 2011;63:2007–13.
34. Patil P, Parker RA, Rawcliffe C, Olaleye A, Moore S, Daly N, et al. Methotrexate-induced nausea and vomiting in adolescent and young adult patients. Clin Rheumatol 2014;33:403–7.
35. Goekoop-Ruiterman YP, de Vries-Bouwstra JK, Allaart CF, Kerstens PJ, Grillet BA, de Jager MH, et al. Patient preferences for treatment: report from a randomised comparison of treatment strategies in early rheumatoid arthritis (BeSt trial). Ann Rheum Dis 2007;66:1227–32.
36. Malaviya AP, Ostor AJ. Drug adherence to biologic DMARDS with a special emphasis on the benefits of subcutaneous abatacept. Patient Prefer Adherence 2012;6:589–96.
37. Kearsley-Fleet L, Davies R, Baildam E, Beresford MW, Foster HE, Southwood TR, et al. Factors associated with choice of bio-logic among children with juvenile idiopathic arthritis: results from two UK paediatric biologic registers. Rheumatology (Oxford) 2016;55:1556–65.
38. Beukelman T, Ringold S, Davis TE, DeWitt EM, Pelajo CF, Weiss PF, et al. Disease-modifying antirheumatic drug use in the treatment of juvenile idiopathic arthritis: a cross-sectional analysis of the CARRA Registry. J Rheumatol 2012;39:1867–74.
39. Anink J, Prince FH, Dijkstra M, Otten MH, Twilt M, ten Cate R, et al. Long-term quality of life and functional outcome of patients with juvenile idiopathic arthritis in the biologic era: a longitudinal follow-up study in the Dutch Arthritis and Biologicals in Children Register. Rheumatology (Oxford) 2015;54:1964–9.
40. Bromberg MH, Connelly M, Anthony KK, Gil KM, Schanberg LE. Self-reported pain and disease symptoms persist in juvenile idio-pathic arthritis despite treatment advances: an electronic diary study. Arthritis Rheumatol 2014;66:462–9.
41. Arkela-Kautiainen M, Haapasaari J, Kautiainen H, Leppanen L, Vilkkumaa I, Malkia E, et al. Functioning and preferences for improvement of health among patients with juvenile idiopathic arthritis in early adulthood using the WHO ICF model. J Rheumatol 2006;33:1369–76.
42. Kjeken I, Dagfinrud H, Mowinckel P, Uhlig T, Kvien TK, Finset A. Rheumatology care: involvement in medical decisions, received information, satisfaction with care, and unmet health care needs in patients with rheumatoid arthritis and ankylosing spondylitis. Arthritis Rheum 2006;55:394–401.
43. Cespedes-Cruz A, Gutierrez-Suarez R, Pistorio A, Ravelli A, Loy A, Murray KJ, et al. Methotrexate improves the health-related quality of life of children with juvenile idiopathic arthritis. Ann Rheum Dis 2008;67:309–14.
44. Lovell DJ, Ruperto N, Mouy R, Paz E, Rubio-Pérez N, Silva CA, et al. Long-term safety, efficacy, and quality of life in patients with juvenile idiopathic arthritis treated with intravenous abatacept for up to seven years. Arthritis Rheumatol 2015;67:2759–70.
45. Mulligan K, Wedderburn LR, Newman S. The experience of taking methotrexate for juvenile idiopathic arthritis: results of a cross- sectional survey with children and young people. Pediatr Rheumatol Online J 2015;13:58.
46. Feldman DE, de Civita M, Dobkin PL, Malleson P, Meshefedjian G, Duffy CM. Perceived adherence to prescribed treatment in juve-nile idiopathic arthritis over a one-year period. Arthritis Rheum 2007;57:226–33.
47. Salt E, Frazier SK. Adherence to disease-modifying antirheumatic drugs in patients with rheumatoid arthritis: a narrative review of the literature. Orthop Nurs 2010;29:260–75.
48. April KT, Feldman DE, Platt RW, Duffy CM. Comparison between children with juvenile idiopathic arthritis and their parents concerning perceived treatment adherence. Arthritis Rheum 2006;55:558–63.
49. Len CA, Miotto e Silva VB, Terreri MT. Importance of adherence in the outcome of juvenile idiopathic arthritis. Curr Rheumatol Rep 2014;16:410.
50. Barbosa CD, Balp MM, Kulich K, Germain N, Rofail D. A litera-ture review to explore the link between treatment satisfaction and adherence, compliance, and persistence. Patient Prefer Adherence 2012;6:39–48.
232
Arthritis Care & ResearchVol. 73, No. 2, February 2021, pp 232–239DOI 10.1002/acr.24103© 2020, American College of Rheumatology
Effects of Neurodynamic Mobilizations on Pain Hypersensitivity in Patients With Hand Osteoarthritis Compared to Robotic Assisted Mobilization: A Randomized Controlled TrialPaolo Pedersini,1 Kristin Valdes,2 Raquel Cantero-Tellez,3 Joshua A. Cleland,4 Mark D. Bishop,5 and Jorge H. Villafañe1
Objective. To evaluate the effectiveness of the neurodynamic mobilization techniques compared with passive robotic physiologic movement in patients with hand osteoarthritis (OA).
Methods. We conducted a randomized controlled trial. A total of 72 patients (mean ± SD age 71 ± 11 years) with dominant symptomatic hand OA were randomized in 2 groups, and both received 12 treatment sessions over 4 weeks. The experimental group received neurodynamic mobilization of the median, radial, and ulnar nerves, and the control group received robotic-assisted passive movement treatment. Both groups also participated in a program of hand stability exercises. Outcome measures included pain intensity, pressure pain thresholds (PPTs), and strength measurements. Group-by-time effects were compared using mixed-model analyses of variance.
Results. After the intervention, the experimental group had statistically significant, higher PPTs than the control group at the thumb carpometacarpal joint by 0.7 kg/cm2 (95% confidence interval [95% CI] 0.6, 0.8), the median nerve by 0.7 kg/cm2 (95% CI 0.6, 0.7), and the radial nerve by 0.5 kg/cm2 (95% CI 0.3, 0.6); however, the difference was not statistically significant at 3 months postintervention. Although mean values in the experimental group were higher than in the control group at all PPT sites at both assessments, these differences were not statistically significant. The experimental group experienced a statistically significant reduction in pain immediately postintervention, but this was not present at the 3-month follow-up. There were no statistically significant differences in pinch or grip strength between groups.
Conclusion. We found that neurodynamic mobilizations decreased hypersensitivity in patients with hand OA immediately after the intervention; however, differences were no longer present at 3 months. The results suggest that these techniques may have some limited value in the short term but do not have lasting effects.
INTRODUCTION
The prevalence of symptomatic osteoarthritis (OA) of the hand is ~67% in the general population (1). The carpometacarpal (CMC) joint of the thumb is most commonly affected by OA, followed by the interphalangeal (IP) joints (2,3). The magnitude of damage or inflammation present in OA is not directly correlated to the pain intensity reported by individuals with OA, particularly those with chronic pain. In individuals with chronic OA pain, the experience is more likely related to central nervous system (CNS)
involvement (4,5), and recent studies suggest that OA is a mixed pain state and that in some individuals, CNS factors play an important role (6,7).
For example, individuals with hand OA who underwent functional magnetic resonance imaging analysis showed increased activation in the thalamus, cingulate, and the frontal and so matosensory cortex, which are the brain’s pain processing centers and have been implicated in central sensitization (8). Chronic OA pain may also lead to allodynia, in which nonpainful stimuli may produce the sensation of pain, or a painful stimulus may be perceived
ClinicalTrials.gov identifier: NCT02701335.Supported by a grant from the Ministry of Health, Italy (project code GR-
2013-02358472).1Paolo Pedersini, MSc, Jorge H. Villafañe, PhD: IRCCS Fondazione
Don Carlo Gnocchi, Milan, Italy; 2Kristin Valdes, OTD: Gannon University, Ruskin, Florida; 3Raquel Cantero-Tellez, PhD: University of Malaga, Malaga, Spain; 4Joshua A. Cleland, PhD: Franklin Pierce University,
Manchester, New Hampshire; 5Mark D. Bishop, PhD: Center for Pain Research and Behavioral Health, University of Florida, Gainesville.
No potential conflicts of interest relevant to this article were reported.Address correspondence to Jorge H. Villafañe, PhD, IRCCS Fondazione
Don Carlo Gnocchi, Milan, Italy. Email: mail@villafañe.it.Submitted for publication May 3, 2019; accepted in revised form October
29, 2019.
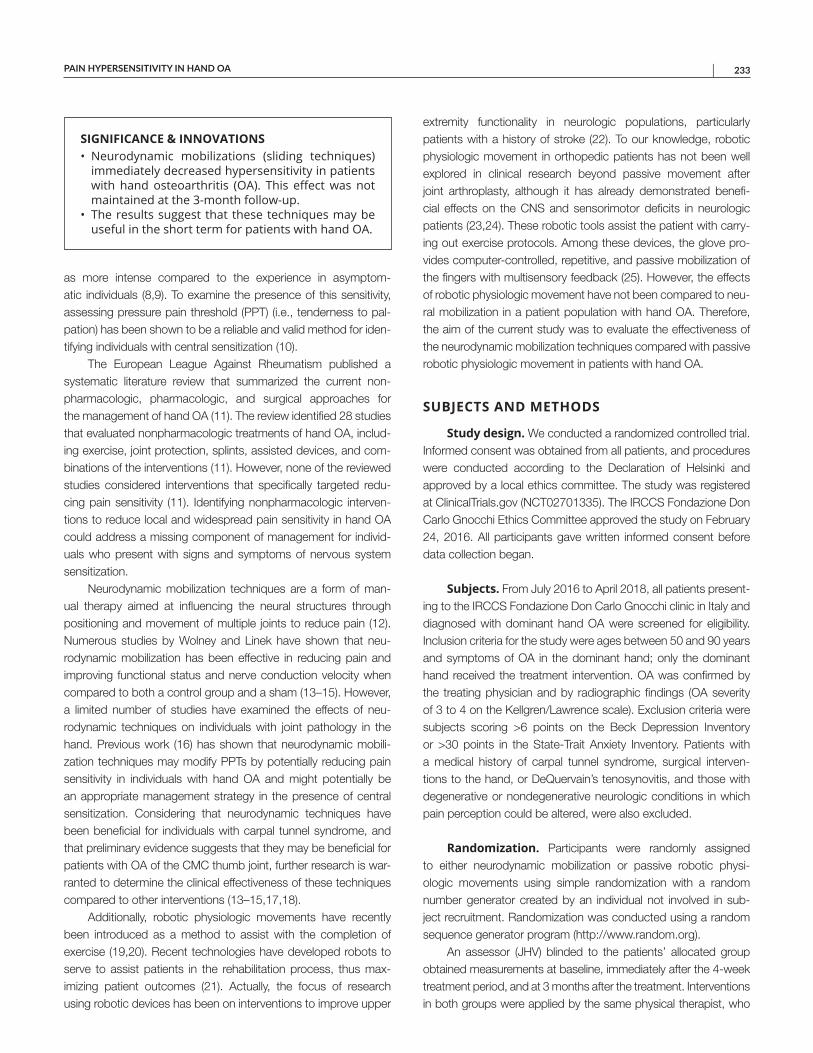
PAIN HYPERSENSITIVITY IN HAND OA | 233Arthritis Care & ResearchVol. 73, No. 2, February 2021, pp 232–239DOI 10.1002/acr.24103
as more intense compared to the experience in asymptomatic individuals (8,9). To examine the presence of this sensitivity, assessing pressure pain threshold (PPT) (i.e., tenderness to palpation) has been shown to be a reliable and valid method for identifying individuals with central sensitization (10).
The European League Against Rheumatism published a systematic literature review that summarized the current nonpharmacologic, pharmacologic, and surgical approaches for the management of hand OA (11). The review identified 28 studies that evaluated nonpharmacologic treatments of hand OA, including exercise, joint protection, splints, assisted devices, and combinations of the interventions (11). However, none of the reviewed studies considered interventions that specifically targeted reducing pain sensitivity (11). Identifying nonpharmacologic interventions to reduce local and widespread pain sensitivity in hand OA could address a missing component of management for individuals who present with signs and symptoms of nervous system sensitization.
Neurodynamic mobilization techniques are a form of manual therapy aimed at influencing the neural structures through positioning and movement of multiple joints to reduce pain (12). Numerous studies by Wolney and Linek have shown that neurodynamic mobilization has been effective in reducing pain and improving functional status and nerve conduction velocity when compared to both a control group and a sham (13–15). However, a limited number of studies have examined the effects of neurodynamic techniques on individuals with joint pathology in the hand. Previous work (16) has shown that neurodynamic mobilization techniques may modify PPTs by potentially reducing pain sensitivity in individuals with hand OA and might potentially be an appropriate management strategy in the presence of central sensitization. Considering that neurodynamic techniques have been beneficial for individuals with carpal tunnel syndrome, and that preliminary evidence suggests that they may be beneficial for patients with OA of the CMC thumb joint, further research is warranted to determine the clinical effectiveness of these techniques compared to other interventions (13–15,17,18).
Additionally, robotic physiologic movements have recently been introduced as a method to assist with the completion of exercise (19,20). Recent technologies have developed robots to serve to assist patients in the rehabilitation process, thus maximizing patient outcomes (21). Actually, the focus of research using robotic devices has been on interventions to improve upper
extremity functionality in neurologic populations, particularly patients with a history of stroke (22). To our knowledge, robotic physiologic movement in orthopedic patients has not been well explored in clinical research beyond passive movement after joint arthroplasty, although it has already demonstrated beneficial effects on the CNS and sensorimotor deficits in neurologic patients (23,24). These robotic tools assist the patient with carrying out exercise protocols. Among these devices, the glove provides computercontrolled, repetitive, and passive mobilization of the fingers with multisensory feedback (25). However, the effects of robotic physiologic movement have not been compared to neural mobilization in a patient population with hand OA. Therefore, the aim of the current study was to evaluate the effectiveness of the neurodynamic mobilization techniques compared with passive robotic physiologic movement in patients with hand OA.
SUBJECTS AND METHODS
Study design. We conducted a randomized controlled trial. Informed consent was obtained from all patients, and procedures were conducted according to the Declaration of Helsinki and approved by a local ethics committee. The study was registered at ClinicalTrials.gov (NCT02701335). The IRCCS Fondazione Don Carlo Gnocchi Ethics Committee approved the study on February 24, 2016. All participants gave written informed consent before data collection began.
Subjects. From July 2016 to April 2018, all patients presenting to the IRCCS Fondazione Don Carlo Gnocchi clinic in Italy and diagnosed with dominant hand OA were screened for eligibility. Inclusion criteria for the study were ages between 50 and 90 years and symptoms of OA in the dominant hand; only the dominant hand received the treatment intervention. OA was confirmed by the treating physician and by radiographic findings (OA severity of 3 to 4 on the Kellgren/Lawrence scale). Exclusion criteria were subjects scoring >6 points on the Beck Depression Inventory or >30 points in the StateTrait Anxiety Inventory. Patients with a medical history of carpal tunnel syndrome, surgical interventions to the hand, or DeQuervain’s tenosynovitis, and those with degenerative or nondegenerative neurologic conditions in which pain perception could be altered, were also excluded.
Randomization. Participants were randomly assigned to either neurodynamic mobilization or passive robotic physiologic movements using simple randomization with a random number generator created by an individual not involved in subject recruitment. Randomization was conducted using a random sequence generator program (http://www.random.org).
An assessor (JHV) blinded to the patients’ allocated group obtained measurements at baseline, immediately after the 4week treatment period, and at 3 months after the treatment. Interventions in both groups were applied by the same physical therapist, who
SIGNIFICANCE & INNOVATIONS• Neurodynamic mobilizations (sliding techniques)
immediately decreased hypersensitivity in patients with hand osteoarthritis (OA). This effect was not maintained at the 3-month follow-up.
• The results suggest that these techniques may beuseful in the short term for patients with hand OA.

PEDERSINI ET AL 234 |
had 3 years of experience in manual therapy and the management of musculoskeletal pain disorders. Both groups were provided with the same instructions regarding effectiveness of the treatment.
Interventions. Neurodynamic intervention group (NIG). The experimental group received a neurodynamic nerve slider technique targeted to the median, radial, and ulnar nerves of the symptomatic extremity for 12 sessions over a 4week timeframe (26). The technique was applied with the physiotherapist standing and the patient positioned in supine. These techniques aim to produce neural sliding in relation to adjacent tissues (12). In order not to produce pain, speed and amplitude of movements were adjusted. These movements were alternated at a rate of ~2 seconds per cycle (1 second into extension, and 1 second into flexion). At each session, the techniques were applied 3 times for 3 minutes separated by 1minute rest periods. These techniques originated in the work of Butler et al (27).
Median nerve technique. The patient was placed in the following position prior to performing the median nerve slider technique: shoulder girdle depression; glenohumeral abduction and external rotation; supination of the forearm; and wrist, thumb, and finger extension. The neurodynamic technique for the median nerve consisted of the following alternating movements: the combination of elbow extension (which increases tension) and wrist flexion (which decreases tension) movement with the combination of elbow flexion (decreasing tension) and wrist extension (increasing tension) movement (28).
Radial nerve technique. The patient was placed in the following position prior to the performance of the radial nerve slider technique: shoulder girdle depression; glenohumeral internal rotation; pronation of the forearm; elbow extension; and wrist, thumb, and finger flexion. The neurodynamic technique for the radial nerve involved alternating the following movements: the combination of elbow flexion–wrist flexion (unloads the radial nerve) with elbow extension–wrist extension (loading) (16,29).
Ulnar nerve technique. For the ulnar nerve, the wrist was placed in extension, the elbow was flexed, and the shoulder abducted. The slider neurodynamic technique for the ulnar nerve involved alternating the following movements: elbow flexion (unloads the ulnar nerve) and shoulder abduction (loads the ulnar nerve) was alternated with elbow extension (loading) and shoulder adduction (unloading) throughout the sliding technique; the wrist was maintained in 60° extension and the forearm in supination (30).
Passive physiologic movement group. Participants received half an hour of robotic passive movement treatment using a Gloreha Workstation (Idrogenet) for 12 sessions over 4 weeks. The patients wore a glove, and every finger was attached to individual thimbles connected through a nylon thread to a device interfaced with a hybrid system (compressed air and oil) that performed the passive movement of flexion–extension of the fingers (Figure 1). Further details of
the intervention are available elsewhere (31). Patients in both groups also received additional standardized exercises, as described by Villafañe et al (32).
Outcome measures. Pain intensity was assessed using a visual analog scale (VAS; 0 = no pain, 10 = maximum pain) for 3 separate pain status conditions: 1) level of pain while executing a key pinch between the thumb and index finger; 2) average level of pain over the last 24 hours; and 3) average level of pain over the last week (31).
The PPT test is a quantitative sensory test of tissue sensitivity, and it is defined as the minimal amount of pressure where the sense of pressure changes to pain. An electronic algometer (Algomed) was used to measure the PPTs (33). The validity and reproducibility of algometry has been described, with higher PPTs indicating lower pain sensitivity. PPTs near the pathologic site are thought to represent the degree of peripheral nociception, whereas decreased PPTs distal to the pathology are markers of hyperexcitability of the CNS (34). An assessor (JHV) blinded to the patient’s group assessed PPT bilaterally over the hand (thumb CMC at the center of the anatomic snuffbox and unciform apophysis of the hamate bone), the C5–C6 zygapophyseal joint, and the median, radial, and ulnar nerves. We assessed widespread pain sensitivity given the evidence for central sensitization in individuals with OA and the recommendations for examining sensitivity at multiple sites. The tested nerve sites were chosen based on the accessibility of the nerve. The median nerve was palpated distally at the wrist between the palmaris longus and flexor carpi radialis longus; the nerve was accessed after moving the tendons laterally. The radial nerve was palpated in the anatomic snuffbox, and the ulnar nerve in the cubital tunnel at the elbow (35). Assessment of PPT in individuals with hand OA has been shown to be very reliable (36), with scores for minimal detectable change (MDC) as follows: C5–C6 joint (95% confidence interval [95% CI] 0.3, 0.5 kg/cm2), thumb CMC joint (95% CI 0.3, 0.5 kg/cm2), hamate bone (95% CI 0.2, 0.4
Figure 1. Robotic passive mobilization treatment.
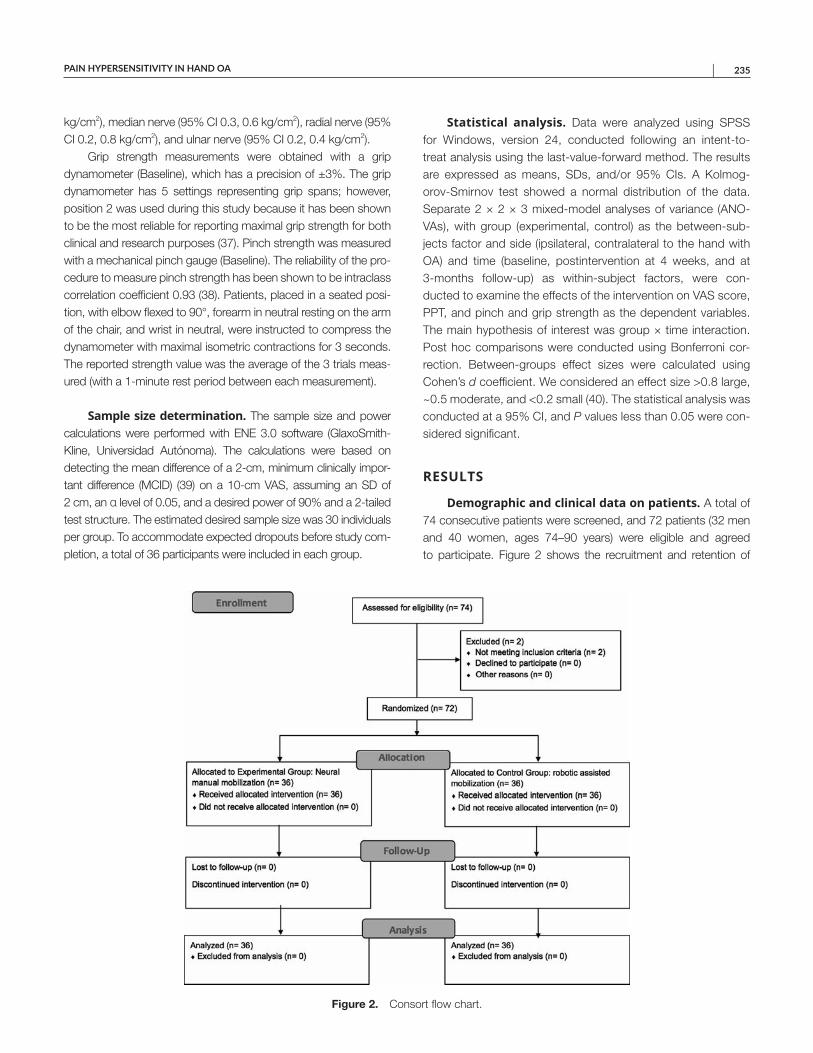
PAIN HYPERSENSITIVITY IN HAND OA | 235
kg/cm2), median nerve (95% CI 0.3, 0.6 kg/cm2), radial nerve (95% CI 0.2, 0.8 kg/cm2), and ulnar nerve (95% CI 0.2, 0.4 kg/cm2).
Grip strength measurements were obtained with a grip dynamometer (Baseline), which has a precision of ±3%. The grip dynamometer has 5 settings representing grip spans; however, position 2 was used during this study because it has been shown to be the most reliable for reporting maximal grip strength for both clinical and research purposes (37). Pinch strength was measured with a mechanical pinch gauge (Baseline). The reliability of the procedure to measure pinch strength has been shown to be intraclass correlation coefficient 0.93 (38). Patients, placed in a seated position, with elbow flexed to 90°, forearm in neutral resting on the arm of the chair, and wrist in neutral, were instructed to compress the dynamometer with maximal isometric contractions for 3 seconds. The reported strength value was the average of the 3 trials measured (with a 1minute rest period between each measurement).
Sample size determination. The sample size and power calculations were performed with ENE 3.0 software (GlaxoSmithKline, Universidad Autónoma). The calculations were based on detecting the mean difference of a 2cm, minimum clinically important difference (MCID) (39) on a 10cm VAS, assuming an SD of 2 cm, an α level of 0.05, and a desired power of 90% and a 2tailed test structure. The estimated desired sample size was 30 individuals per group. To accommodate expected dropouts before study completion, a total of 36 participants were included in each group.
Statistical analysis. Data were analyzed using SPSS for Windows, version 24, conducted following an intenttotreat analysis using the lastvalueforward method. The results are expressed as means, SDs, and/or 95% CIs. A KolmogorovSmirnov test showed a normal distribution of the data. Separate 2 × 2 × 3 mixedmodel analyses of variance (ANOVAs), with group (experimental, control) as the betweensubjects factor and side (ipsilateral, contralateral to the hand with OA) and time (baseline, postintervention at 4 weeks, and at 3months followup) as withinsubject factors, were conducted to examine the effects of the intervention on VAS score, PPT, and pinch and grip strength as the dependent variables. The main hypothesis of interest was group × time interaction. Post hoc comparisons were conducted using Bonferroni correction. Betweengroups effect sizes were calculated using Cohen’s d coefficient. We considered an effect size >0.8 large, ~0.5 moderate, and <0.2 small (40). The statistical analysis was conducted at a 95% CI, and P values less than 0.05 were considered significant.
RESULTS
Demographic and clinical data on patients. A total of 74 consecutive patients were screened, and 72 patients (32 men and 40 women, ages 74–90 years) were eligible and agreed to participate. Figure 2 shows the recruitment and retention of
Figure 2. Consort flow chart.
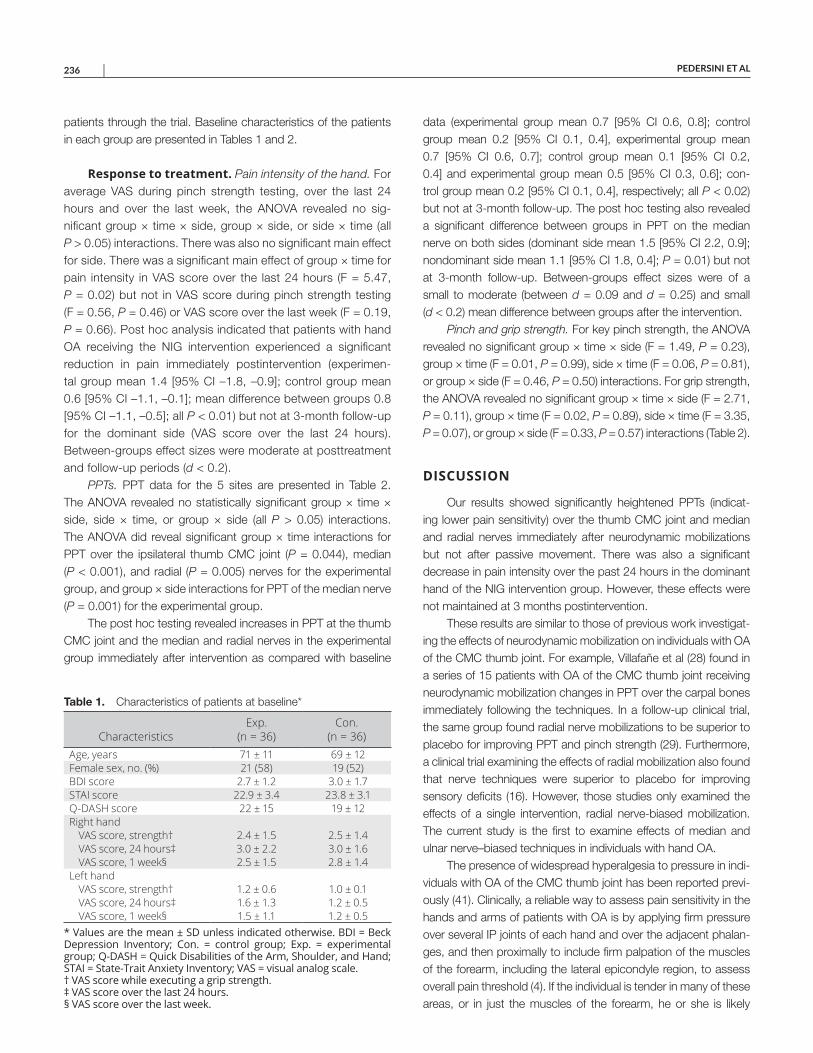
PEDERSINI ET AL 236 |
patients through the trial. Baseline characteristics of the patients in each group are presented in Tables 1 and 2.
Response to treatment. Pain intensity of the hand. For average VAS during pinch strength testing, over the last 24 hours and over the last week, the ANOVA revealed no significant group × time × side, group × side, or side × time (all P > 0.05) interactions. There was also no significant main effect for side. There was a significant main effect of group × time for pain intensity in VAS score over the last 24 hours (F = 5.47, P = 0.02) but not in VAS score during pinch strength testing (F = 0.56, P = 0.46) or VAS score over the last week (F = 0.19, P = 0.66). Post hoc analysis indicated that patients with hand OA receiving the NIG intervention experienced a significant reduction in pain immediately postintervention (experimental group mean 1.4 [95% CI –1.8, –0.9]; control group mean 0.6 [95% CI –1.1, –0.1]; mean difference between groups 0.8 [95% CI –1.1, –0.5]; all P < 0.01) but not at 3month followup for the dominant side (VAS score over the last 24 hours). Betweengroups effect sizes were moderate at posttreatment and followup periods (d < 0.2).
PPTs. PPT data for the 5 sites are presented in Table 2. The ANOVA revealed no statistically significant group × time × side, side × time, or group × side (all P > 0.05) interactions. The ANOVA did reveal significant group × time interactions for PPT over the ipsilateral thumb CMC joint (P = 0.044), median (P < 0.001), and radial (P = 0.005) nerves for the experimental group, and group × side interactions for PPT of the median nerve (P = 0.001) for the experimental group.
The post hoc testing revealed increases in PPT at the thumb CMC joint and the median and radial nerves in the experimental group immediately after intervention as compared with baseline
data (experimental group mean 0.7 [95% CI 0.6, 0.8]; control group mean 0.2 [95% CI 0.1, 0.4], experimental group mean 0.7 [95% CI 0.6, 0.7]; control group mean 0.1 [95% CI 0.2, 0.4] and experimental group mean 0.5 [95% CI 0.3, 0.6]; control group mean 0.2 [95% CI 0.1, 0.4], respectively; all P < 0.02) but not at 3month followup. The post hoc testing also revealed a significant difference between groups in PPT on the median nerve on both sides (dominant side mean 1.5 [95% CI 2.2, 0.9]; nondominant side mean 1.1 [95% CI 1.8, 0.4]; P = 0.01) but not at 3month followup. Betweengroups effect sizes were of a small to moderate (between d = 0.09 and d = 0.25) and small (d < 0.2) mean difference between groups after the intervention.
Pinch and grip strength. For key pinch strength, the ANOVA revealed no significant group × time × side (F = 1.49, P = 0.23), group × time (F = 0.01, P = 0.99), side × time (F = 0.06, P = 0.81), or group × side (F = 0.46, P = 0.50) interactions. For grip strength, the ANOVA revealed no significant group × time × side (F = 2.71, P = 0.11), group × time (F = 0.02, P = 0.89), side × time (F = 3.35, P = 0.07), or group × side (F = 0.33, P = 0.57) interactions (Table 2).
DISCUSSION
Our results showed significantly heightened PPTs (indicating lower pain sensitivity) over the thumb CMC joint and median and radial nerves immediately after neurodynamic mobilizations but not after passive movement. There was also a significant decrease in pain intensity over the past 24 hours in the dominant hand of the NIG intervention group. However, these effects were not maintained at 3 months postintervention.
These results are similar to those of previous work investigating the effects of neurodynamic mobilization on individuals with OA of the CMC thumb joint. For example, Villafañe et al (28) found in a series of 15 patients with OA of the CMC thumb joint receiving neurodynamic mobilization changes in PPT over the carpal bones immediately following the techniques. In a followup clinical trial, the same group found radial nerve mobilizations to be superior to placebo for improving PPT and pinch strength (29). Furthermore, a clinical trial examining the effects of radial mobilization also found that nerve techniques were superior to placebo for improving sensory deficits (16). However, those studies only examined the effects of a single intervention, radial nervebiased mobilization. The current study is the first to examine effects of median and ulnar nerve–biased techniques in individuals with hand OA.
The presence of widespread hyperalgesia to pressure in individuals with OA of the CMC thumb joint has been reported previously (41). Clinically, a reliable way to assess pain sensitivity in the hands and arms of patients with OA is by applying firm pressure over several IP joints of each hand and over the adjacent phalanges, and then proximally to include firm palpation of the muscles of the forearm, including the lateral epicondyle region, to assess overall pain threshold (4). If the individual is tender in many of these areas, or in just the muscles of the forearm, he or she is likely
Table 1. Characteristics of patients at baseline*
CharacteristicsExp.
(n = 36)Con.
(n = 36)Age, years 71 ± 11 69 ± 12Female sex, no. (%) 21 (58) 19 (52)BDI score 2.7 ± 1.2 3.0 ± 1.7STAI score 22.9 ± 3.4 23.8 ± 3.1Q-DASH score 22 ± 15 19 ± 12Right hand
VAS score, strength† 2.4 ± 1.5 2.5 ± 1.4VAS score, 24 hours‡ 3.0 ± 2.2 3.0 ± 1.6VAS score, 1 week§ 2.5 ± 1.5 2.8 ± 1.4
Left handVAS score, strength† 1.2 ± 0.6 1.0 ± 0.1VAS score, 24 hours‡ 1.6 ± 1.3 1.2 ± 0.5VAS score, 1 week§ 1.5 ± 1.1 1.2 ± 0.5
* Values are the mean ± SD unless indicated otherwise. BDI = Beck Depression Inventory; Con. = control group; Exp. = experimental group; Q-DASH = Quick Disabilities of the Arm, Shoulder, and Hand; STAI = State-Trait Anxiety Inventory; VAS = visual analog scale. † VAS score while executing a grip strength. ‡ VAS score over the last 24 hours. § VAS score over the last week.
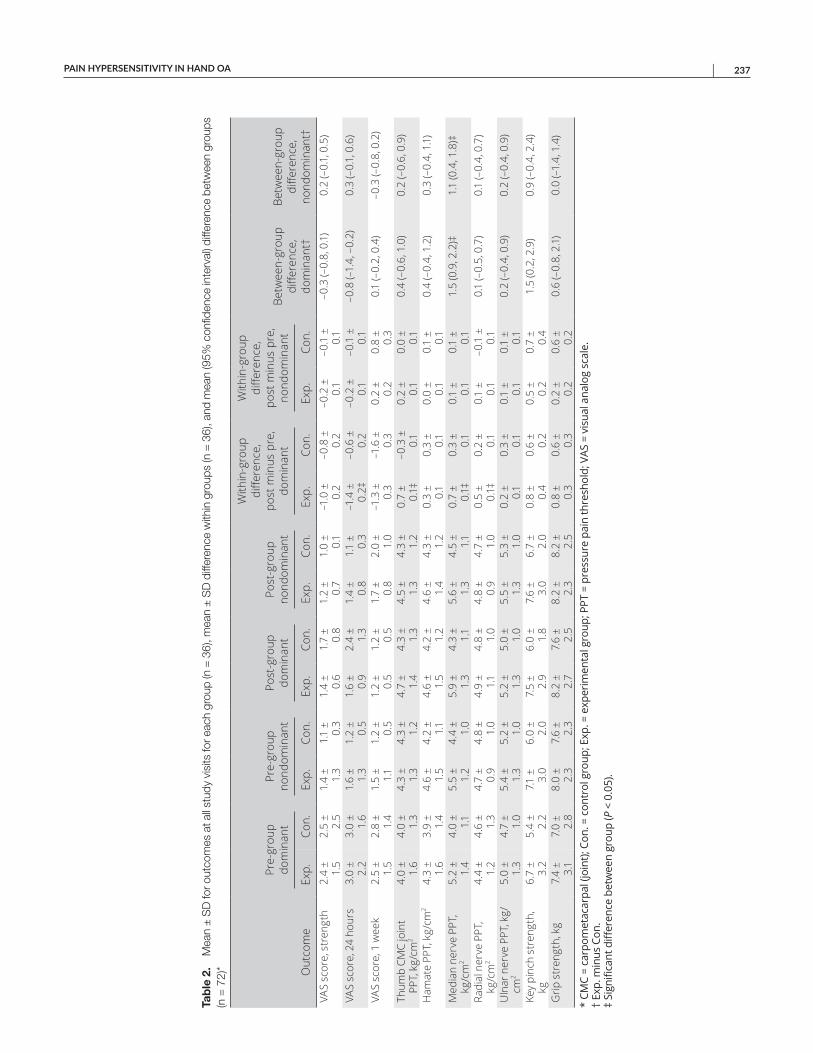
PAIN HYPERSENSITIVITY IN HAND OA | 237
Tab
le 2
. M
ean
± S
D fo
r out
com
es a
t all
stud
y vi
sits
for e
ach
grou
p (n
= 3
6), m
ean
± S
D d
iffer
ence
with
in g
roup
s (n
= 3
6), a
nd m
ean
(95%
con
fiden
ce in
terv
al) d
iffer
ence
bet
wee
n gr
oups
(n
= 7
2)* Out
com
e
Pre-
grou
p do
min
ant
Pre-
grou
p no
ndom
inan
tPo
st-g
roup
do
min
ant
Post
-gro
up
nond
omin
ant
With
in-g
roup
di
ffere
nce,
po
st m
inus
pre
, do
min
ant
With
in-g
roup
di
ffere
nce,
po
st m
inus
pre
, no
ndom
inan
tBe
twee
n-gr
oup
diffe
renc
e,
dom
inan
t†
Betw
een-
grou
p di
ffere
nce,
no
ndom
inan
t†Ex
p.Co
n.Ex
p.Co
n.Ex
p.Co
n.Ex
p.Co
n.Ex
p.Co
n.Ex
p.Co
n.VA
S sc
ore,
str
engt
h2.
4 ±
1.5
2.5
± 2.
51.
4 ±
1.3
1.1
± 0.
31.
4 ±
0.6
1.7
± 0.
81.
2 ±
0.7
1.0
± 0.
1–1
.0 ±
0.
2–0
.8 ±
0.
2–0
.2 ±
0.
1–0
.1 ±
0.
1–0
.3 (–
0.8,
0.1
)0.
2 (–
0.1,
0.5
)
VAS
scor
e, 2
4 ho
urs
3.0
± 2.
23.
0 ±
1.6
1.6
± 1.
31.
2 ±
0.5
1.6
± 0.
92.
4 ±
1.3
1.4
± 0.
81.
1 ±
0.3
–1.4
±
0.2‡
–0.6
±
0.2
–0.2
±
0.1
–0.1
±
0.1
–0.8
(–1.
4, –
0.2)
0.3
(–0.
1, 0
.6)
VAS
scor
e, 1
wee
k2.
5 ±
1.5
2.8
± 1.
41.
5 ±
1.1
1.2
± 0.
51.
2 ±
0.5
1.2
± 0.
51.
7 ±
0.8
2.0
± 1.
0–1
.3 ±
0.
3–1
.6 ±
0.
30.
2 ±
0.2
0.8
± 0.
30.
1 (–
0.2,
0.4
)–0
.3 (–
0.8,
0.2
)
Thum
b CM
C jo
int
PPT,
kg/
cm2
4.0
± 1.
64.
0 ±
1.3
4.3
± 1.
34.
3 ±
1.2
4.7
± 1.
44.
3 ±
1.3
4.5
± 1.
34.
3 ±
1.2
0.7
± 0.
1‡–0
.3 ±
0.
10.
2 ±
0.1
0.0
± 0.
10.
4 (–
0.6,
1.0
)0.
2 (–
0.6,
0.9
)
Ham
ate
PPT,
kg/
cm2
4.3
± 1.
63.
9 ±
1.4
4.6
± 1.
54.
2 ±
1.1
4.6
± 1.
54.
2 ±
1.2
4.6
± 1.
44.
3 ±
1.2
0.3
± 0.
10.
3 ±
0.1
0.0
± 0.
10.
1 ±
0.1
0.4
(–0.
4, 1
.2)
0.3
(–0.
4, 1
.1)
Med
ian
nerv
e PP
T,
kg/c
m2
5.2
± 1.
44.
0 ±
1.1
5.5
± 1.
24.
4 ±
1.0
5.9
± 1.
34.
3 ±
1.1
5.6
± 1.
34.
5 ±
1.1
0.7
± 0.
1‡0.
3 ±
0.1
0.1
± 0.
10.
1 ±
0.1
1.5
(0.9
, 2.2
)‡1.
1 (0
.4, 1
.8)‡
Radi
al n
erve
PPT
, kg
/cm
24.
4 ±
1.2
4.6
± 1.
34.
7 ±
0.9
4.8
± 1.
04.
9 ±
1.1
4.8
± 1.
04.
8 ±
0.9
4.7
± 1.
00.
5 ±
0.1‡
0.2
± 0.
10.
1 ±
0.1
–0.1
±
0.1
0.1
(–0.
5, 0
.7)
0.1
(–0.
4, 0
.7)
Uln
ar n
erve
PPT
, kg/
cm2
5.0
± 1.
34.
7 ±
1.0
5.4
± 1.
35.
2 ±
1.0
5.2
± 1.
35.
0 ±
1.0
5.5
± 1.
35.
3 ±
1.0
0.2
± 0.
10.
3 ±
0.1
0.1
± 0.
10.
1 ±
0.1
0.2
(–0.
4, 0
.9)
0.2
(–0.
4, 0
.9)
Key
pinc
h st
reng
th,
kg6.
7 ±
3.2
5.4
± 2.
27.1
±
3.0
6.0
± 2.
07.
5 ±
2.9
6.0
± 1.
87.
6 ±
3.0
6.7
± 2.
00.
8 ±
0.4
0.6
± 0.
20.
5 ±
0.2
0.7
± 0.
41.
5 (0
.2, 2
.9)
0.9
(–0.
4, 2
.4)
Grip
str
engt
h, k
g7.
4 ±
3.1
7.0
± 2.
88.
0 ±
2.3
7.6
± 2.
38.
2 ±
2.7
7.6
± 2.
58.
2 ±
2.3
8.2
± 2.
50.
8 ±
0.3
0.6
± 0.
30.
2 ±
0.2
0.6
± 0.
20.
6 (–
0.8,
2.1
)0.
0 (–
1.4,
1.4
)
* CM
C =
carp
omet
acar
pal (
join
t); C
on. =
con
trol
gro
up; E
xp. =
exp
erim
enta
l gro
up; P
PT =
pre
ssur
e pa
in th
resh
old;
VAS
= v
isua
l ana
log
scal
e.
† Ex
p. m
inus
Con
. ‡
Sign
ifica
nt d
iffer
ence
bet
wee
n gr
oup
(P <
0.0
5).
PEDERSINI ET AL 238 |
diffusely tender (i.e., has a low central pain threshold) (4), whereas patients who exhibit sharp local tenderness or pain distal to the joint with OA may exhibit CNS hypersensitivity (34).
We agree with previous recommendations that clinicians should take into account the presence of central sensitization and widespread pressure pain hypersensitivity in patients with hand OA by not limiting their intervention to the affected area (18). We used the neurodynamic sliding techniques in our study. Alternative neurodynamic methods (e.g., tensioning techniques) exist that are proposed to affect intraneural pressure, thereby affecting function (12). However, we specifically used sliding techniques to allow large amplitude movements to be performed. This may present the movement in a novel way to the brain, uncoupling previously learned expectations of pain with movement (12). It has also been suggested that the largerrange sliding movements may decrease the fear of movement, assisting in cortical remapping (12) and decreasing sensitivity, as generally seen in the current study. Specifically, we identified improvements in PPT at the median and radial nerves; however, we didn’t see the same effect at the ulnar nerve. Therefore, the true physiologic mechanisms by which sliding techniques alter PPT at the median and radial nerves require further scientific investigation.
In our prior work (36), we identified MDC values for PPT in individuals with hand OA across many of the regions tested in the current study. Changes in PPT that exceeded the MDC were identified for the thumb CMC joint and over the radial and median nerves in this study. What is not known is the MCID for individuals with hand OA. The MCID has been established in patients with hip and knee OA, with a status of “much better” as a reduction of 33%, while 15% reduction was considered “slightly better” (42) for changes in sensitivity measures (i.e., PPT). Our study found that changes in the PPTs of the thumb CMC joint and median and radial nerves ranged from 11% to 13% in the arthritic hand. Although not reaching the benchmark of 15–33% for lower extremity OA, the changes found in the current study surpassed 10% and may potentially be clinically relevant.
Our study did have some limitations. We only used 1 testing measure to determine the presence of pain sensitivity (i.e., PPT). It would be useful to use multiple testing measures to adequately assess painprocessing alterations in hand OA. Also, we assessed outcomes at 4 weeks and then again at 3 months. It would be useful to have a longer followup period. Despite the conflicting evidence for the effect of neurodynamic mobilization on nerve conduction velocity, performing such testing bilaterally might also have provided insight into any changes in central and peripheral neural function. Also, it was impossible to blind the patients to the treatment that they received, although all patients received the same information regarding the efficacy of the treatment. Both groups received a program of hand stability exercises as well. This may be a confounding variable if the combination of treatments (i.e., NIR and exercise) was more important for outcome than the treatments without exercise. Additionally, 1 physical therapist (PP) performed all
treatment techniques, which may limit the generalizability. Another limitation is that we did not assess all outcome domains recommended in the Outcome Measures in Rheumatology–Osteoarthritis Research Society International core sets for outcome measurement in hand OA trials (43); specifically, physical function and health related quality of life. Consequently, we are unable to comment on the impact of observed changes in the proxy measures of sensitization (i.e., PPT) in these areas. Future studies should also consider incorporating a graded motor imagery program, which may provide better insight into the role of peripheral versus central input in the maintenance of sensitization in this disorder.
In conclusion, we found that neurodynamic mobilizations (sliding techniques) and exercise decreased hypersensitivity in patients with hand OA to a greater extent than passive movement combined with exercise immediately after the intervention. We are unable to calculate the effect of the neurodynamic mobilization without the influence of the exercise program. These results were not maintained at the 3month followup. Therefore, future studies should continue to examine the effects of neural mobilization in individuals with hand OA to determine if any true benefits exist.
AUTHOR CONTRIBUTIONS
All authors were involved in drafting the article or revising it critically for important intellectual content, and all authors approved the final version to be submitted for publication. Dr. Villafañe had full access to all of the data in the study and takes responsibility for the integrity of the data and the accuracy of the data analysis.Study conception and design. Villafañe.Acquisition of data. Pedersini, Villafañe.Analysis and interpretation of data. Pedersini, Valdes, CanteroTellez, Cleland, Bishop, Villafañe.
REFERENCES 1. Zhang Y, Niu J, KellyHayes M, Chaisson CE, Aliabadi P, Felson DT.
Prevalence of symptomatic hand osteoarthritis and its impact onfunctional status among the elderly: the Framingham Study. Am JEpidemiol 2002;156:1021–7.
2. Wilder FV, Barrett JP, Farina EJ. Jointspecific prevalence of osteoarthritis of the hand. Osteoarthritis Cartilage 2006;14:953–7.
3. Kroon FB, van Beest S, Ermurat S, Kortekaas MC, Bloem JL,Reijnierse M, et al. In thumb base osteoarthritis structural damageis more strongly associated with pain than synovitis. OsteoarthritisCartilage 2018;26:1196–202.
4. Clauw DJ, Hassett AL. The role of centralised pain in osteoarthritis.Clin Exp Rheumatol 2017;35 Suppl 107:79–84.
5. Villafañe JH, Valdes K, Pedersini P, Berjano P. Osteoarthritis: a callfor research on central pain mechanism and personalized prevention strategies. Clin Rheumatol 2019;38:583–4.
6. Fingleton C, Smart KM, Moloney NA, Fullen BM, Doody CM. Painsensitization in people with knee osteoarthritis: a systematic reviewand metaanalysis. Osteoarthritis Cartilage 2015;23:1043–56.
7. O’Leary H, Smart KM, Moloney NA, Blake C, Doody CM. Pain sensitization associated with nonresponse after physiotherapy in people with knee osteoarthritis. Pain 2018;159:1877–86.
8. Sofat N, Smee C, Hermansson M, Howard M, Baker EH, Howe FA,et al. Functional MRI demonstrates pain perception in hand osteoarthritis has features of central pain processing. J Biomed GraphComput 2013;3:10.5430.
PAIN HYPERSENSITIVITY IN HAND OA | 239
9. He BH, Christin M, MouchbahaniConstance S, Davidova A,SharifNaeini R. Mechanosensitive ion channels in articular nociceptors drive mechanical allodynia in osteoarthritis. OsteoarthritisCartilage 2017;25:2091–9.
10. Greenspan JD, Slade GD, Bair E, Dubner R, Fillingim RB, OhrbachR, et al. Pain sensitivity risk factors for chronic TMD: descriptive data and empirically identified domains from the OPPERA case controlstudy. J Pain 2011;12 Suppl:T61–74.
11. Kroon FP, Carmona L, Schoones JW, Kloppenburg M. Efficacy andsafety of nonpharmacological, pharmacological and surgical treatment for hand osteoarthritis: a systematic literature review informingthe 2018 update of the EULAR recommendations for the management of hand osteoarthritis. RMD Open 2018;4:e000734.
12. Coppieters MW, Butler DS. Do ‘sliders’ slide and ‘tensioners’ tension? An analysis of neurodynamic techniques and considerationsregarding their application. Man Ther 2008;13:213–21.
13. Wolny T, Linek P. The effect of manual therapy including neurodynamic techniques on the overall health status of people with carpal tunnel syndrome: a randomized controlled trial. J ManipulativePhysiol Ther 2018;41:641–9.
14. Wolny T, Linek P. Neurodynamic techniques versus “sham” therapyin the treatment of carpal tunnel syndrome: a randomized placebo controlled trial. Arch Phys Med Rehabil 2018;99:843–54.
15. Wolny T, Linek P. Is manual therapy based on neurodynamic techniques effective in the treatment of carpal tunnel syndrome? A randomized controlled trial. Clin Rehabil 2019;33:408–17.
16. Villafañe JH, Bishop MD, FernandezdeLasPenas C, LangfordD. Radial nerve mobilisation had bilateral sensory effects in peoplewith thumb carpometacarpal osteoarthritis: a randomised trial. JPhysiother 2013;59:25–30.
17. Bertozzi L, Valdes K, Vanti C, Negrini S, Pillastrini P, Villafane JH.Investigation of the effect of conservative interventions in thumb carpometacarpal osteoarthritis: systematic review and metaanalysis.Disabil Rehabil 2015;37:2025–43.
18. Villafañe JH, Valdes K, Berjano P, Wajon A. Clinical update: conservative management of carpometacarpal joint osteoarthritis. JRheumatol 2015;42:1728–9.
19. Borboni A, Villafañe JH, Mulle C, Valdes K, Faglia R, Taveggia G, et al. Robotassisted rehabilitation of hand paralysis after stroke reduceswrist edema and pain: a prospective clinical trial. J ManipulativePhysiol Ther 2017;40:21–30.
20. Bissolotti L, Villafañe JH, Gaffurini P, Orizio C, Valdes K, Negrini S.Changes in skeletal muscle perfusion and spasticity in patients withpoststroke hemiparesis treated by robotic assistance (gloreha) of the hand. J Phys Ther Sci 2016;28:769–73.
21. Bishop L, Stein J. Three upper limb robotic devices for stroke rehabilitation: a review and clinical perspective. NeuroRehabilitation2013;33:3–11.
22. Mehrholz J, Pohl M, Platz T, Kugler J, Elsner B. Electromechanicaland robotassisted arm training for improving activities of daily living, arm function, and arm muscle strength after stroke. CochraneDatabase Syst Rev 2018:CD006876.
23. Gassert R, Dietz V. Rehabilitation robots for the treatment of sensorimotor deficits: a neurophysiological perspective. J NeuroengRehabil 2018;15:46.
24. Hakim RM, Tunis BG, Ross MD. Rehabilitation robotics for the upper extremity: review with new directions for orthopaedic disorders.Disabil Rehabil Assist Technol 2017;12:765–71.
25. Vanoglio F, Bernocchi P, Mule C, Garofali F, Mora C, Taveggia G,et al. Feasibility and efficacy of a robotic device for hand rehabilitation in hemiplegic stroke patients: a randomized pilot controlled study.Clin Rehabil 2017;31:351–60.
26. Hall T, Coppieters MW, Nee R, Schafer A, Ridehalgh C. Neurodynamictreatment improves leg pain, back pain, function and global perceived effect at 4 weeks in patients with chronic nerverelated legpain. J Physiother 2017;63:59.
27. Butler D, Jones M, Gore R. Mobilisation of the nervous system.London: Churchill Livingstone; 1991.
28. Villafañe JH, Silva GB, FernandezCarnero J. Shortterm effects of neurodynamic mobilization in 15 patients with secondary thumb carpometacarpal osteoarthritis. J Manipulative Physiol Ther 2011;34:449–56.
29. Villafañe JH, Silva GB, Bishop MD, FernandezCarnero J. Radial nerve mobilization decreases pain sensitivity and improves motor performance in patients with thumb carpometacarpal osteoarthritis: a randomized controlled trial. Arch Phys Med Rehabil 2012;93:396–403.
30. Oskay D, Meric A, Kirdi N, Firat T, Ayhan C, Leblebicioglu G.Neurodynamic mobilization in the conservative treatment of cubitaltunnel syndrome: longterm followup of 7 cases. J ManipulativePhysiol Ther 2010;33:156–63.
31. Villafañe JH, Valdes K, Imperio G, Borboni A, CanteroTellez R, Galeri S, et al. Neural manual vs. robotic assisted mobilization to improve motion and reduce pain hypersensitivity in hand osteoarthritis: study protocolfor a randomized controlled trial. J Phys Ther Sci 2017;29:801–6.
32. Villafañe JH, Cleland JA, FernandezdeLasPenas C. The effectiveness of a manual therapy and exercise protocol in patients withthumb carpometacarpal osteoarthritis: a randomized controlled trial.J Orthop Sports Phys Ther 2013;43:204–13.
33. Ylinen J. Pressure algometry. Aust J Physiother 2007;53:207. 34. Kamper SJ, Maher CG, Hush JM, Pedler A, Sterling M. Relationship
between pressure pain thresholds and pain ratings in patients withwhiplashassociated disorders. Clin J Pain 2011;27:495–501.
35. Pedersini P, Negrini S, CanteroTellez R, FernadezCarnero J, BishopMD, Villafañe JH. Neural manual mobilization vs. robotic assisted mobilization to reduce pain hypersensitivity in hand osteoarthritis: a randomised controlled pilot trial. Ann Rheum Dis 2019;78 Suppl:1046–7.
36. Pedersini P, Negrini S, CanteroTellez R, Bishop MD, Villafane JH.Pressure algometry and palpation of the upper limb peripheral nervous system in subjects with hand osteoarthritis are repeatable andsuggest central changes. J Hand Ther 2019;33:103–11.
37. Villafañe JH, Valdes K. Letter regarding “conservative treatment ofthumb base osteoarthritis: a systematic review.” J Hand Surg Am2015;40:1058–9.
38. Villafañe JH, Valdes K. Reliability of pinch strength testing in elderlysubjects with unilateral thumb carpometacarpal osteoarthritis.J Phys Ther Sci 2014;26:993–5.
39. Emshoff R, Bertram S, Emshoff I. Clinically important differencethresholds of the visual analog scale: a conceptual model for identifying meaningful intraindividual changes for pain intensity. Pain2011;152:2277–82.
40. Citrome L, Magnusson K. Paging Dr Cohen, paging Dr Cohen...an effect size interpretation is required STAT!: visualising effectsize and an interview with Kristoffer Magnusson. Int J Clin Pract2014;68:533–4.
41. Villafañe JH, Cleland JA, FernandezdeLasPenas C. Bilateral sensory effects of unilateral passive accessory mobilization in patientswith thumb carpometacarpal osteoarthritis. J Manipulative PhysiolTher 2013;36:232–7.
42. Singh JA, Luo R, Landon GC, SuarezAlmazor M. Reliability and clinically important improvement thresholds for osteoarthritis pain andfunction scales: a multicenter study. J Rheumatol 2014;41:509–15.
43. Pham T, van der Heijde D, Altman RD, Anderson JJ, Bellamy N,Hochberg M, et al. OMERACTOARSI Initiative: Osteoarthritis ResearchSociety International set of responder criteria for osteoarthritis clinical trials revisited. Osteoarthritis Cartilage 2004;12:389–99.
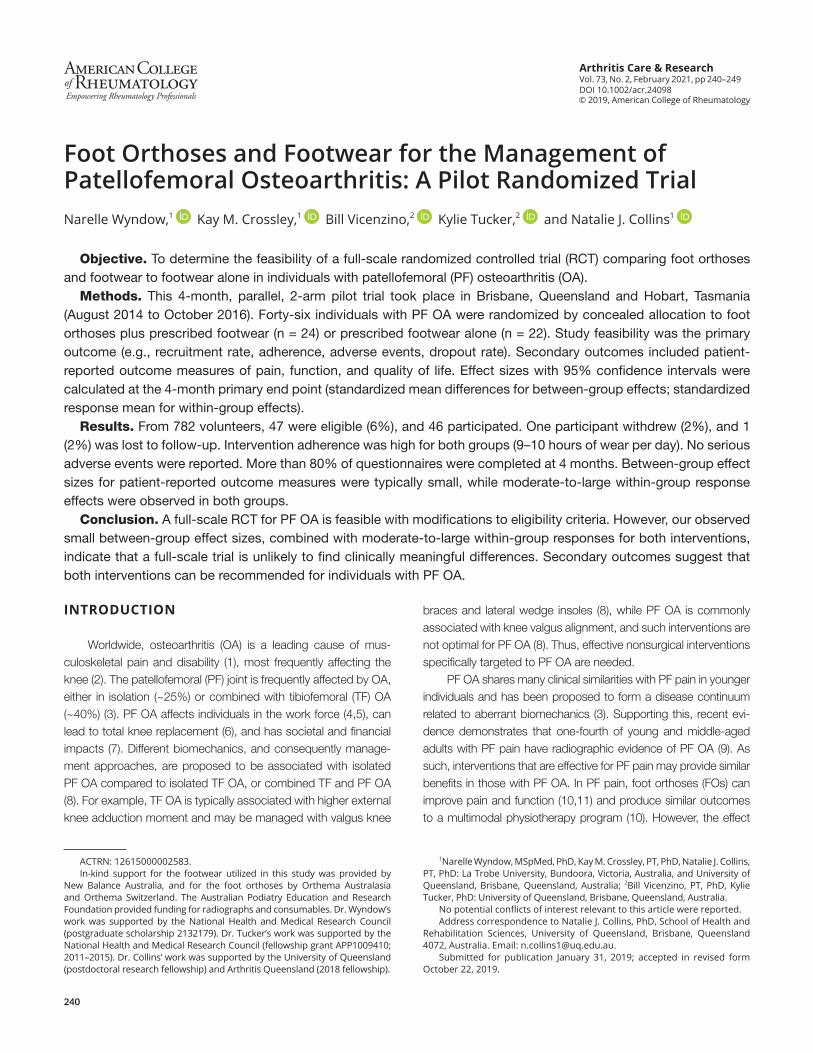
240
Arthritis Care & ResearchVol. 73, No. 2, February 2021, pp 240–249DOI 10.1002/acr.24098© 2019, American College of Rheumatology
Foot Orthoses and Footwear for the Management of Patellofemoral Osteoarthritis: A Pilot Randomized TrialNarelle Wyndow,1 Kay M. Crossley,1 Bill Vicenzino,2 Kylie Tucker,2 and Natalie J. Collins1
Objective. To determine the feasibility of a full-scale randomized controlled trial (RCT) comparing foot orthoses and footwear to footwear alone in individuals with patellofemoral (PF) osteoarthritis (OA).
Methods. This 4-month, parallel, 2-arm pilot trial took place in Brisbane, Queensland and Hobart, Tasmania (August 2014 to October 2016). Forty-six individuals with PF OA were randomized by concealed allocation to foot orthoses plus prescribed footwear (n = 24) or prescribed footwear alone (n = 22). Study feasibility was the primary outcome (e.g., recruitment rate, adherence, adverse events, dropout rate). Secondary outcomes included patient-reported outcome measures of pain, function, and quality of life. Effect sizes with 95% confidence intervals were calculated at the 4-month primary end point (standardized mean differences for between-group effects; standardized response mean for within-group effects).
Results. From 782 volunteers, 47 were eligible (6%), and 46 participated. One participant withdrew (2%), and 1 (2%) was lost to follow-up. Intervention adherence was high for both groups (9–10 hours of wear per day). No serious adverse events were reported. More than 80% of questionnaires were completed at 4 months. Between-group effect sizes for patient-reported outcome measures were typically small, while moderate-to-large within-group response effects were observed in both groups.
Conclusion. A full-scale RCT for PF OA is feasible with modifications to eligibility criteria. However, our observed small between-group effect sizes, combined with moderate-to-large within-group responses for both interventions, indicate that a full-scale trial is unlikely to find clinically meaningful differences. Secondary outcomes suggest that both interventions can be recommended for individuals with PF OA.
INTRODUCTION
Worldwide, osteoarthritis (OA) is a leading cause of mus-culoskeletal pain and disability (1), most frequently affecting the knee (2). The patellofemoral (PF) joint is frequently affected by OA, either in isolation (~25%) or combined with tibiofemoral (TF) OA (~40%) (3). PF OA affects individuals in the work force (4,5), can lead to total knee replacement (6), and has societal and financial impacts (7). Different biomechanics, and consequently manage-ment approaches, are proposed to be associated with isolated PF OA compared to isolated TF OA, or combined TF and PF OA (8). For example, TF OA is typically associated with higher external knee adduction moment and may be managed with valgus knee
braces and lateral wedge insoles (8), while PF OA is commonly associated with knee valgus alignment, and such interventions are not optimal for PF OA (8). Thus, effective nonsurgical interventions specifically targeted to PF OA are needed.
PF OA shares many clinical similarities with PF pain in younger individuals and has been proposed to form a disease continuum related to aberrant biomechanics (3). Supporting this, recent evi-dence demonstrates that one-fourth of young and middle-aged adults with PF pain have radiographic evidence of PF OA (9). As such, interventions that are effective for PF pain may provide similar benefits in those with PF OA. In PF pain, foot orthoses (FOs) can improve pain and function (10,11) and produce similar outcomes to a multimodal physiotherapy program (10). However, the effect
ACTRN: 12615000002583.In-kind support for the footwear utilized in this study was provided by
New Balance Australia, and for the foot orthoses by Orthema Australasia and Orthema Switzerland. The Australian Podiatry Education and Research Foundation provided funding for radiographs and consumables. Dr. Wyndow’s work was supported by the National Health and Medical Research Council (postgraduate scholarship 2132179). Dr. Tucker’s work was supported by the National Health and Medical Research Council (fellowship grant APP1009410; 2011–2015). Dr. Collins’ work was supported by the University of Queensland (postdoctoral research fellowship) and Arthritis Queensland (2018 fellowship).
1Narelle Wyndow, MSpMed, PhD, Kay M. Crossley, PT, PhD, Natalie J. Collins, PT, PhD: La Trobe University, Bundoora, Victoria, Australia, and University of Queensland, Brisbane, Queensland, Australia; 2Bill Vicenzino, PT, PhD, Kylie Tucker, PhD: University of Queensland, Brisbane, Queensland, Australia.
No potential conflicts of interest relevant to this article were reported.Address correspondence to Natalie J. Collins, PhD, School of Health and
Rehabilitation Sciences, University of Queensland, Brisbane, Queensland 4072, Australia. Email: [email protected].
Submitted for publication January 31, 2019; accepted in revised form October 22, 2019.
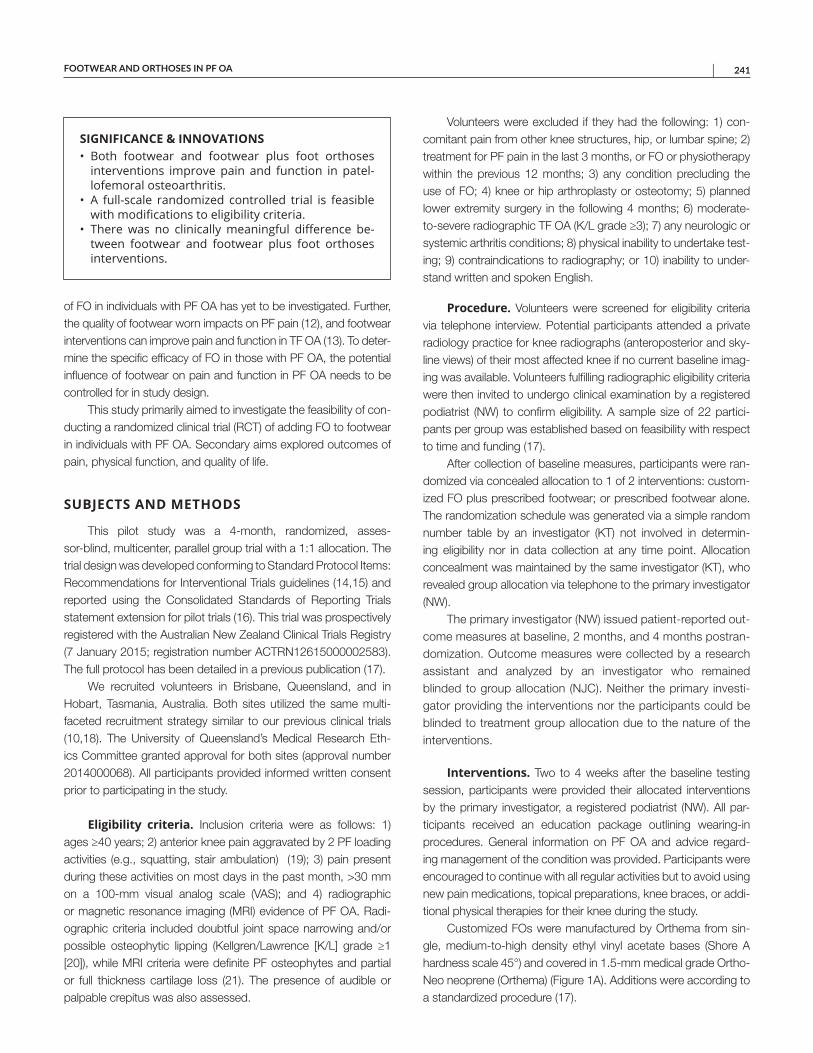
FOOTWEAR AND ORTHOSES IN PF OA | 241
of FO in individuals with PF OA has yet to be investigated. Further, the quality of footwear worn impacts on PF pain (12), and footwear interventions can improve pain and function in TF OA (13). To deter-mine the specific efficacy of FO in those with PF OA, the potential influence of footwear on pain and function in PF OA needs to be controlled for in study design.
This study primarily aimed to investigate the feasibility of con-ducting a randomized clinical trial (RCT) of adding FO to footwear in individuals with PF OA. Secondary aims explored outcomes of pain, physical function, and quality of life.
SUBJECTS AND METHODS
This pilot study was a 4-month, randomized, asses-sor-blind, multicenter, parallel group trial with a 1:1 allocation. The trial design was developed conforming to Standard Protocol Items: Recommendations for Interventional Trials guidelines (14,15) and reported using the Consolidated Standards of Reporting Trials statement extension for pilot trials (16). This trial was prospectively registered with the Australian New Zealand Clinical Trials Registry (7 January 2015; registration number ACTRN12615000002583). The full protocol has been detailed in a previous publication (17).
We recruited volunteers in Brisbane, Queensland, and in Hobart, Tasmania, Australia. Both sites utilized the same multi-faceted recruitment strategy similar to our previous clinical trials (10,18). The University of Queensland’s Medical Research Eth-ics Committee granted approval for both sites (approval number 2014000068). All participants provided informed written consent prior to participating in the study.
Eligibility criteria. Inclusion criteria were as follows: 1) ages ≥40 years; 2) anterior knee pain aggravated by 2 PF loading activities (e.g., squatting, stair ambulation) (19); 3) pain present during these activities on most days in the past month, >30 mm on a 100-mm visual analog scale (VAS); and 4) radiographic or magnetic resonance imaging (MRI) evidence of PF OA. Radi-ographic criteria included doubtful joint space narrowing and/or possible osteophytic lipping (Kellgren/Lawrence [K/L] grade ≥1 [20]), while MRI criteria were definite PF osteophytes and partial or full thickness cartilage loss (21). The presence of audible or palpable crepitus was also assessed.
Volunteers were excluded if they had the following: 1) con-comitant pain from other knee structures, hip, or lumbar spine; 2) treatment for PF pain in the last 3 months, or FO or physiotherapy within the previous 12 months; 3) any condition precluding the use of FO; 4) knee or hip arthroplasty or osteotomy; 5) planned lower extremity surgery in the following 4 months; 6) moderate-to- severe radiographic TF OA (K/L grade ≥3); 7) any neurologic or systemic arthritis conditions; 8) physical inability to undertake test-ing; 9) contraindications to radiography; or 10) inability to under-stand written and spoken English.
Procedure. Volunteers were screened for eligibility criteria via telephone interview. Potential participants attended a private radiology practice for knee radiographs (anteroposterior and sky-line views) of their most affected knee if no current baseline imag-ing was available. Volunteers fulfilling radiographic eligibility criteria were then invited to undergo clinical examination by a registered podiatrist (NW) to confirm eligibility. A sample size of 22 partici-pants per group was established based on feasibility with respect to time and funding (17).
After collection of baseline measures, participants were ran-domized via concealed allocation to 1 of 2 interventions: custom-ized FO plus prescribed footwear; or prescribed footwear alone. The randomization schedule was generated via a simple random number table by an investigator (KT) not involved in determin-ing eligibility nor in data collection at any time point. Allocation concealment was maintained by the same investigator (KT), who revealed group allocation via telephone to the primary investigator (NW).
The primary investigator (NW) issued patient-reported out-come measures at baseline, 2 months, and 4 months postran-domization. Outcome measures were collected by a research assistant and analyzed by an investigator who remained blinded to group allocation (NJC). Neither the primary investi-gator providing the interventions nor the participants could be blinded to treatment group allocation due to the nature of the interventions.
Interventions. Two to 4 weeks after the baseline testing session, participants were provided their allocated interventions by the primary investigator, a registered podiatrist (NW). All par-ticipants received an education package outlining wearing-in procedures. General information on PF OA and advice regard-ing management of the condition was provided. Participants were encouraged to continue with all regular activities but to avoid using new pain medications, topical preparations, knee braces, or addi-tional physical therapies for their knee during the study.
Customized FOs were manufactured by Orthema from sin-gle, medium-to-high density ethyl vinyl acetate bases (Shore A hardness scale 45°) and covered in 1.5-mm medical grade Ortho-Neo neoprene (Orthema) (Figure 1A). Additions were according to a standardized procedure (17).
SIGNIFICANCE & INNOVATIONS• Both footwear and footwear plus foot orthoses
interventions improve pain and function in patel-lofemoral osteoarthritis.
• A full-scale randomized controlled trial is feasiblewith modifications to eligibility criteria.
• There was no clinically meaningful difference be-tween footwear and footwear plus foot orthoses interventions.
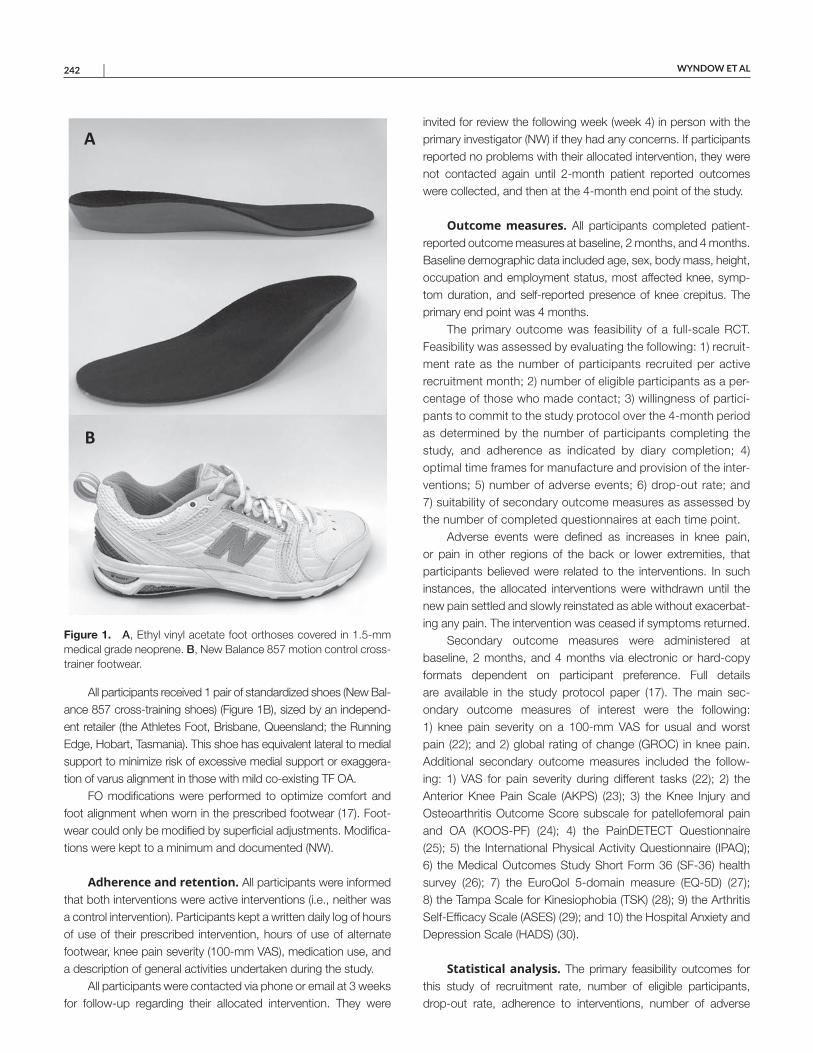
WYNDOW ET AL 242 |
All participants received 1 pair of standardized shoes (New Bal-ance 857 cross-training shoes) (Figure 1B), sized by an independ-ent retailer (the Athletes Foot, Brisbane, Queensland; the Running Edge, Hobart, Tasmania). This shoe has equivalent lateral to medial support to minimize risk of excessive medial support or exaggera-tion of varus alignment in those with mild co-existing TF OA.
FO modifications were performed to optimize comfort and foot alignment when worn in the prescribed footwear (17). Foot-wear could only be modified by superficial adjustments. Modifica-tions were kept to a minimum and documented (NW).
Adherence and retention. All participants were informed that both interventions were active interventions (i.e., neither was a control intervention). Participants kept a written daily log of hours of use of their prescribed intervention, hours of use of alternate footwear, knee pain severity (100-mm VAS), medication use, and a description of general activities undertaken during the study.
All participants were contacted via phone or email at 3 weeks for follow-up regarding their allocated intervention. They were
invited for review the following week (week 4) in person with the primary investigator (NW) if they had any concerns. If participants reported no problems with their allocated intervention, they were not contacted again until 2-month patient reported outcomes were collected, and then at the 4-month end point of the study.
Outcome measures. All participants completed patient- reported outcome measures at baseline, 2 months, and 4 months. Baseline demographic data included age, sex, body mass, height, occupation and employment status, most affected knee, symp-tom duration, and self-reported presence of knee crepitus. The primary end point was 4 months.
The primary outcome was feasibility of a full-scale RCT. Feasibility was assessed by evaluating the following: 1) recruit-ment rate as the number of participants recruited per active recruitment month; 2) number of eligible participants as a per-centage of those who made contact; 3) willingness of partici-pants to commit to the study protocol over the 4-month period as determined by the number of participants completing the study, and adherence as indicated by diary completion; 4) optimal time frames for manufacture and provision of the inter-ventions; 5) number of adverse events; 6) drop-out rate; and 7) suitability of secondary outcome measures as assessed by the number of completed questionnaires at each time point.
Adverse events were defined as increases in knee pain, or pain in other regions of the back or lower extremities, that participants believed were related to the interventions. In such instances, the allocated interventions were withdrawn until the new pain settled and slowly reinstated as able without exacerbat-ing any pain. The intervention was ceased if symptoms returned.
Secondary outcome measures were administered at baseline, 2 months, and 4 months via electronic or hard-copy formats dependent on participant preference. Full details are available in the study protocol paper (17). The main sec-ondary outcome measures of interest were the following: 1) knee pain severity on a 100-mm VAS for usual and worst pain (22); and 2) global rating of change (GROC) in knee pain. Additional secondary outcome measures included the follow-ing: 1) VAS for pain severity during different tasks (22); 2) the Anterior Knee Pain Scale (AKPS) (23); 3) the Knee Injury and Osteoarthritis Outcome Score subscale for patellofemoral pain and OA (KOOS-PF) (24); 4) the PainDETECT Questionnaire (25); 5) the International Physical Activity Questionnaire (IPAQ); 6) the Medical Outcomes Study Short Form 36 (SF-36) health survey (26); 7) the EuroQol 5-domain measure (EQ-5D) (27); 8) the Tampa Scale for Kinesiophobia (TSK) (28); 9) the Arthritis Self-Efficacy Scale (ASES) (29); and 10) the Hospital Anxiety and Depression Scale (HADS) (30).
Statistical analysis. The primary feasibility outcomes for this study of recruitment rate, number of eligible participants, drop-out rate, adherence to interventions, number of adverse
Figure 1. A, Ethyl vinyl acetate foot orthoses covered in 1.5-mm medical grade neoprene. B, New Balance 857 motion control cross-trainer footwear.
A
B
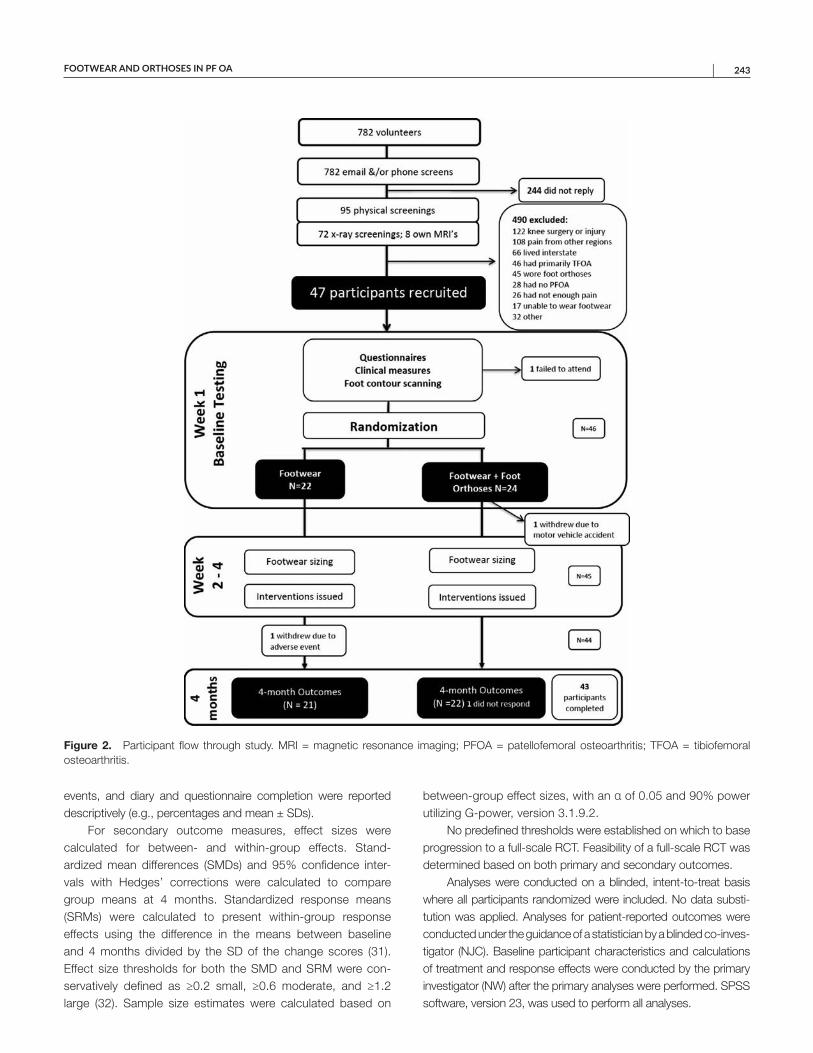
FOOTWEAR AND ORTHOSES IN PF OA | 243
events, and diary and questionnaire completion were reported descriptively (e.g., percentages and mean ± SDs).
For secondary outcome measures, effect sizes were calculated for between- and within-group effects. Stand-ardized mean differences (SMDs) and 95% confidence inter-vals with Hedges’ corrections were calculated to compare group means at 4 months. Standardized response means (SRMs) were calculated to present within-group response effects using the difference in the means between baseline and 4 months divided by the SD of the change scores (31). Effect size thresholds for both the SMD and SRM were con-servatively defined as ≥0.2 small, ≥0.6 moderate, and ≥1.2 large (32). Sample size estimates were calculated based on
between-group effect sizes, with an α of 0.05 and 90% power utilizing G-power, version 3.1.9.2.
No predefined thresholds were established on which to base progression to a full-scale RCT. Feasibility of a full-scale RCT was determined based on both primary and secondary outcomes.
Analyses were conducted on a blinded, intent-to-treat basis where all participants randomized were included. No data substi-tution was applied. Analyses for patient-reported outcomes were conducted under the guidance of a statistician by a blinded co-inves-tigator (NJC). Baseline participant characteristics and calculations of treatment and response effects were conducted by the primary investigator (NW) after the primary analyses were performed. SPSS software, version 23, was used to perform all analyses.
Figure 2. Participant flow through study. MRI = magnetic resonance imaging; PFOA = patellofemoral osteoarthritis; TFOA = tibiofemoral osteoarthritis.
WYNDOW ET AL 244 |
RESULTS
Between August 2014 and October 2016, 782 volunteers contacted the researchers in response to the recruitment strategy (Figure 2). The Queensland campaign was conducted primarily through social media advertisements (6 participants) and univer-sity press releases (7 participants). The Tasmanian campaign was conducted primarily through local flyers and sandwich boards (9 and 6 participants, respectively). The majority of Queensland participants made initial contact via email, while the Tasmanian cohort made initial contact via telephone.
The flow of participants through the study is shown in Figure 2. A total of 244 participants did not reply after making initial email or phone contact (244 of 782, 31%). Forty-seven participants met all inclusion criteria; however, 1 failed to attend baseline testing and was thus excluded. Another participant, who attended for baseline testing and was randomized into the FO plus footwear group, was excluded due to injuries sustained in an accident. The primary rea-sons for exclusion were previous knee surgery (122 of 782, 16%) and pain from other regions (108 of 782, 14%). Recruitment rate was ~1.8 eligible participants per active recruiting month, and the overall percentage of participants entering the study was 5.9% (46 of 782). Participant baseline characteristics are detailed in Table 1. In total, 43 participants completed the 4-month protocol, 22 of 24 in the FO plus footwear group, and 21 of 22 in the footwear group.
At the primary end point (4 months), 41 of the 46 participants (89%) completed the main secondary outcomes of interest (VAS for usual and worst pain; GROC). Of the other secondary out-come measures completed in hard copy, 80% of the PainDETECT Questionnaire, the IPAQ, and the Satisfaction With Treatment questionnaires were completed, while 83% of the HADS and 85% of the EQ-5D were completed (see Supplementary Table 1, avail-able on the Arthritis Care & Research website at http://onlin elibr ary.wiley.com/doi/10.1002/acr.24098/ abstract). The remaining questionnaires were completed online, with 87% of the SF-36, 87% of the pain severity and activity restriction VAS scales, 91% of the AKPS, 85% of the KOOS-PF, 85% of the TSK, and 87% of the ASES completed (see Supplementary Table 1, available at http://onlin elibr ary.wiley.com/doi/10.1002/acr.24098/ abstract). Average diary completion rate was 53% across both groups, with the footwear group returning more diaries than the FO plus foot-wear group (64% and 46%, respectively).
Based on diary completion, participant adherence to the intervention was high, with the FO plus footwear group wearing their intervention for a mean ± SD 9.9 ± 2.1 hours per day, and the footwear group 9.8 ± 3.4 hours per day. A dropout rate of 2% (1 of 46) was recorded, with only 1 participant from the FO plus footwear group not responding at 4 months. Both the footwear and FO interventions could be acquired and delivered to the par-ticipants within a 2-week time frame.
No serious adverse events were reported throughout the study. One participant in the footwear group withdrew due to an
increase in knee pain, which quickly resolved with cessation of the intervention. Two participants experienced new pain. One partici-pant in the footwear group experienced mild unilateral arch pain in the first month of wearing the footwear; however, this did not require additional interventions and resolved completely with no reoccur-rence after 4 weeks. In the FO plus footwear group, 1 participant experienced low back pain from sitting for prolonged periods at a conference. This pain resolved after not per protocol health care and was considered to be unlikely related to the intervention.
Secondary outcomes. Visual inspection revealed no nota-ble differences in baseline measures between groups except for the TSK, where the FO plus footwear group recorded greater fear of movement (Table 2). SMDs revealed mostly small between-group effects at 4 months across secondary outcome measures (Table 2 and Supplementary Table 2, available on the Arthritis Care & Research website at http://onlinelibrary.wiley.com/doi/10.1002/acr.24098/abstract). SRMs ranged from small to large for both groups across secondary outcomes (Table 3). However, the FO plus footwear group tended to demonstrate more moderate response effects than the footwear group. For GROC, 79% (19 of 24) of the FO plus footwear group rated themselves as improved, similar to the 82% (18 of 22) in the footwear group. Two partici-pants in each group reported no change in pain, while 1 participant
Table 1. Participant baseline characteristics*
Foot orthoses + footwear
(n = 24)Footwear (n = 22)
Age, mean ± SD years 58 ± 10 56 ± 10Sex, female 146 (58) 17 (77)BMI, mean ± SD kg/m2 27.5 ± 6.2 28.2 ± 6.4Body mass, mean ± SD kg 76.5 ± 14.5 80.6 ± 22.4Height, mean ± SD cm 167 ± 12.6 168 ± 8.3Duration of symptoms
<3 months 0 03–6 months 1 (5) 2 (9)6–12 months 2 (8) 01–2 years 2 (8) 1 (5)>2 years 19 (79) 19 (86)
Crepitus 22 (92) 20 (91)Occupation
Sedentary 7 (29) 10 (46)Active 9 (38) 4 (18)Not employed 8 (33) 8 (36)Tertiary education completed 20 (83) 13 (59)
Physical activity<2 hours per week 5 (21) 4 (18)2.5–5 hours per week 5 (21) 7 (32)5–10 hours per week 9 (37) 9 (41)>10 hours per week 5 (21) 2 (9)
PainDETECT QuestionnaireNociceptive 21 (88) 18 (82)Unclear 1 (4) 2 (8)Neuropathic 0 (0) 1 (5)Missing data 2 (8) 1 (5)
* Values are the number (%) unless indicated otherwise. BMI = body mass index.
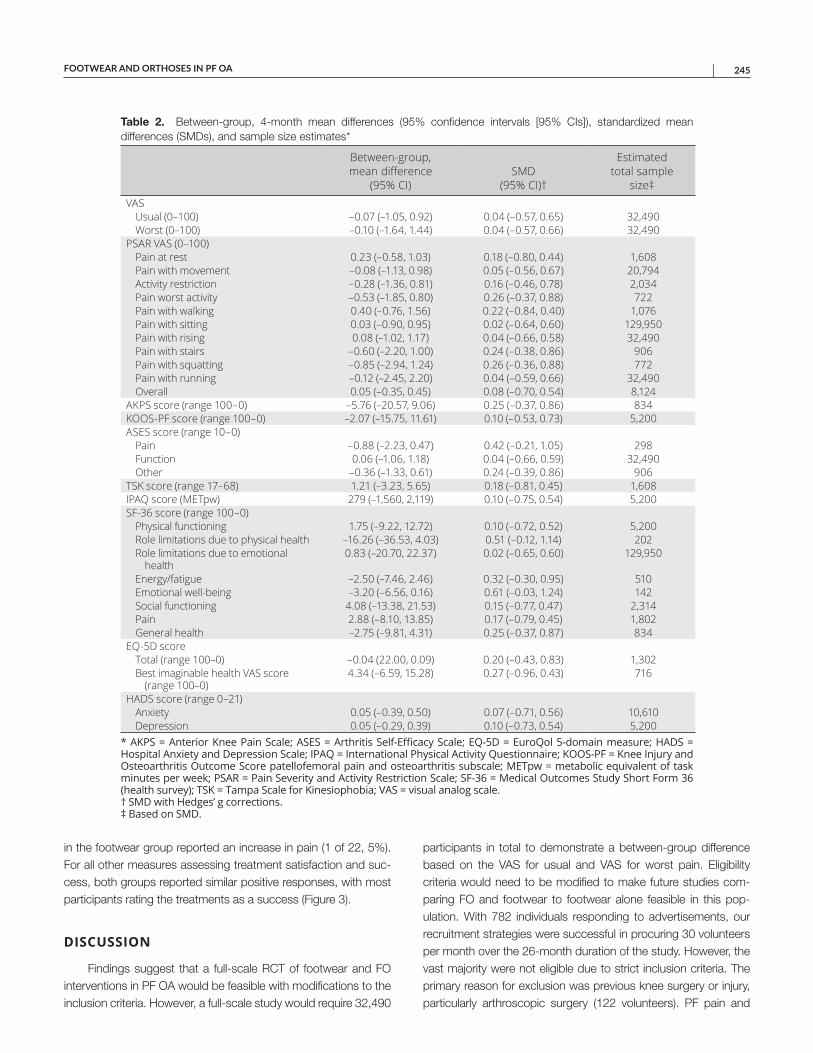
FOOTWEAR AND ORTHOSES IN PF OA | 245
in the footwear group reported an increase in pain (1 of 22, 5%). For all other measures assessing treatment satisfaction and suc-cess, both groups reported similar positive responses, with most participants rating the treatments as a success (Figure 3).
DISCUSSION
Findings suggest that a full-scale RCT of footwear and FO interventions in PF OA would be feasible with modifications to the inclusion criteria. However, a full-scale study would require 32,490
participants in total to demonstrate a between-group difference based on the VAS for usual and VAS for worst pain. Eligibility criteria would need to be modified to make future studies com-paring FO and footwear to footwear alone feasible in this pop-ulation. With 782 individuals responding to advertisements, our recruitment strategies were successful in procuring 30 volunteers per month over the 26-month duration of the study. However, the vast majority were not eligible due to strict inclusion criteria. The primary reason for exclusion was previous knee surgery or injury, particularly arthroscopic surgery (122 volunteers). PF pain and
Table 2. Between-group, 4-month mean differences (95% confidence intervals [95% CIs]), standardized mean differences (SMDs), and sample size estimates*
Between-group, mean difference
(95% CI)SMD
(95% CI)†
Estimated total sample
size‡VAS
Usual (0–100) –0.07 (–1.05, 0.92) 0.04 (–0.57, 0.65) 32,490Worst (0–100) –0.10 (–1.64, 1.44) 0.04 (–0.57, 0.66) 32,490
PSAR VAS (0–100)Pain at rest 0.23 (–0.58, 1.03) 0.18 (–0.80, 0.44) 1,608Pain with movement –0.08 (–1.13, 0.98) 0.05 (–0.56, 0.67) 20,794Activity restriction –0.28 (–1.36, 0.81) 0.16 (–0.46, 0.78) 2,034Pain worst activity –0.53 (–1.85, 0.80) 0.26 (–0.37, 0.88) 722Pain with walking 0.40 (–0.76, 1.56) 0.22 (–0.84, 0.40) 1,076Pain with sitting 0.03 (–0.90, 0.95) 0.02 (–0.64, 0.60) 129,950Pain with rising 0.08 (–1.02, 1.17) 0.04 (–0.66, 0.58) 32,490Pain with stairs –0.60 (–2.20, 1.00) 0.24 (–0.38, 0.86) 906Pain with squatting –0.85 (–2.94, 1.24) 0.26 (–0.36, 0.88) 772Pain with running –0.12 (–2.45, 2.20) 0.04 (–0.59, 0.66) 32,490Overall 0.05 (–0.35, 0.45) 0.08 (–0.70, 0.54) 8,124
AKPS score (range 100–0) –5.76 (–20.57, 9.06) 0.25 (–0.37, 0.86) 834KOOS-PF score (range 100–0) –2.07 (–15.75, 11.61) 0.10 (–0.53, 0.73) 5,200ASES score (range 10–0)
Pain –0.88 (–2.23, 0.47) 0.42 (–0.21, 1.05) 298Function 0.06 (–1.06, 1.18) 0.04 (–0.66, 0.59) 32,490Other –0.36 (–1.33, 0.61) 0.24 (–0.39, 0.86) 906
TSK score (range 17–68) 1.21 (–3.23, 5.65) 0.18 (–0.81, 0.45) 1,608IPAQ score (METpw) 279 (–1,560, 2,119) 0.10 (–0.75, 0.54) 5,200SF-36 score (range 100–0)
Physical functioning 1.75 (–9.22, 12.72) 0.10 (–0.72, 0.52) 5,200Role limitations due to physical health –16.26 (–36.53, 4.03) 0.51 (–0.12, 1.14) 202Role limitations due to emotional
health0.83 (–20.70, 22.37) 0.02 (–0.65, 0.60) 129,950
Energy/fatigue –2.50 (–7.46, 2.46) 0.32 (–0.30, 0.95) 510Emotional well-being –3.20 (–6.56, 0.16) 0.61 (–0.03, 1.24) 142Social functioning 4.08 (–13.38, 21.53) 0.15 (–0.77, 0.47) 2,314Pain 2.88 (–8.10, 13.85) 0.17 (–0.79, 0.45) 1,802General health –2.75 (–9.81, 4.31) 0.25 (–0.37, 0.87) 834
EQ-5D scoreTotal (range 100–0) –0.04 (22.00, 0.09) 0.20 (–0.43, 0.83) 1,302Best imaginable health VAS score
(range 100–0)4.34 (–6.59, 15.28) 0.27 (–0.96, 0.43) 716
HADS score (range 0–21)Anxiety 0.05 (–0.39, 0.50) 0.07 (–0.71, 0.56) 10,610Depression 0.05 (–0.29, 0.39) 0.10 (–0.73, 0.54) 5,200
* AKPS = Anterior Knee Pain Scale; ASES = Arthritis Self-Efficacy Scale; EQ-5D = EuroQol 5-domain measure; HADS = Hospital Anxiety and Depression Scale; IPAQ = International Physical Activity Questionnaire; KOOS-PF = Knee Injury and Osteoarthritis Outcome Score patellofemoral pain and osteoarthritis subscale; METpw = metabolic equivalent of task minutes per week; PSAR = Pain Severity and Activity Restriction Scale; SF-36 = Medical Outcomes Study Short Form 36 (health survey); TSK = Tampa Scale for Kinesiophobia; VAS = visual analog scale. † SMD with Hedges’ g corrections. ‡ Based on SMD.
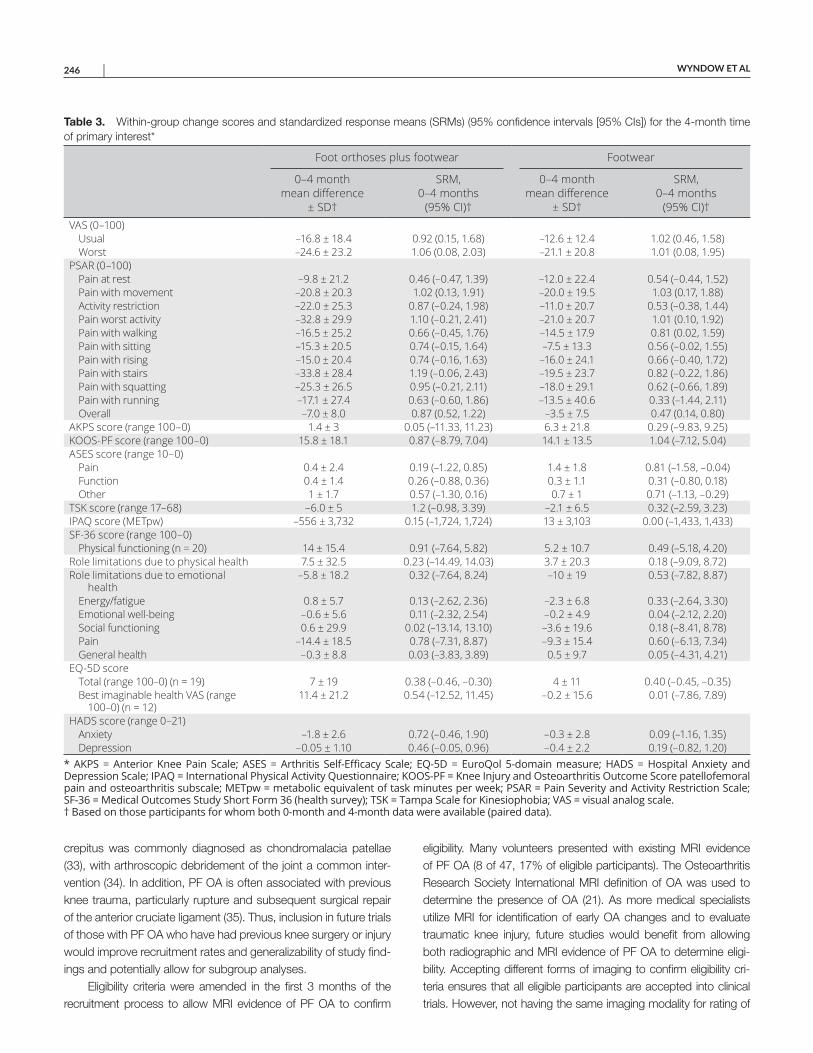
WYNDOW ET AL 246 |
crepitus was commonly diagnosed as chondromalacia patellae (33), with arthroscopic debridement of the joint a common inter-vention (34). In addition, PF OA is often associated with previous knee trauma, particularly rupture and subsequent surgical repair of the anterior cruciate ligament (35). Thus, inclusion in future trials of those with PF OA who have had previous knee surgery or injury would improve recruitment rates and generalizability of study find-ings and potentially allow for subgroup analyses.
Eligibility criteria were amended in the first 3 months of the recruitment process to allow MRI evidence of PF OA to confirm
eligibility. Many volunteers presented with existing MRI evidence of PF OA (8 of 47, 17% of eligible participants). The Osteoarthritis Research Society International MRI definition of OA was used to determine the presence of OA (21). As more medical specialists utilize MRI for identification of early OA changes and to evaluate traumatic knee injury, future studies would benefit from allowing both radiographic and MRI evidence of PF OA to determine eligi-bility. Accepting different forms of imaging to confirm eligibility cri-teria ensures that all eligible participants are accepted into clinical trials. However, not having the same imaging modality for rating of
Table 3. Within-group change scores and standardized response means (SRMs) (95% confidence intervals [95% CIs]) for the 4-month time of primary interest*
Foot orthoses plus footwear Footwear
0–4 month mean difference
± SD†
SRM, 0–4 months
(95% CI)†
0–4 month mean difference
± SD†
SRM, 0–4 months
(95% CI)†VAS (0–100)
Usual –16.8 ± 18.4 0.92 (0.15, 1.68) –12.6 ± 12.4 1.02 (0.46, 1.58)Worst –24.6 ± 23.2 1.06 (0.08, 2.03) –21.1 ± 20.8 1.01 (0.08, 1.95)
PSAR (0–100)Pain at rest –9.8 ± 21.2 0.46 (–0.47, 1.39) –12.0 ± 22.4 0.54 (–0.44, 1.52)Pain with movement –20.8 ± 20.3 1.02 (0.13, 1.91) –20.0 ± 19.5 1.03 (0.17, 1.88)Activity restriction –22.0 ± 25.3 0.87 (–0.24, 1.98) –11.0 ± 20.7 0.53 (–0.38, 1.44)Pain worst activity –32.8 ± 29.9 1.10 (–0.21, 2.41) –21.0 ± 20.7 1.01 (0.10, 1.92)Pain with walking –16.5 ± 25.2 0.66 (–0.45, 1.76) –14.5 ± 17.9 0.81 (0.02, 1.59)Pain with sitting –15.3 ± 20.5 0.74 (–0.15, 1.64) –7.5 ± 13.3 0.56 (–0.02, 1.55)Pain with rising –15.0 ± 20.4 0.74 (–0.16, 1.63) –16.0 ± 24.1 0.66 (–0.40, 1.72)Pain with stairs –33.8 ± 28.4 1.19 (–0.06, 2.43) –19.5 ± 23.7 0.82 (–0.22, 1.86)Pain with squatting –25.3 ± 26.5 0.95 (–0.21, 2.11) –18.0 ± 29.1 0.62 (–0.66, 1.89)Pain with running –17.1 ± 27.4 0.63 (–0.60, 1.86) –13.5 ± 40.6 0.33 (–1.44, 2.11)Overall –7.0 ± 8.0 0.87 (0.52, 1.22) –3.5 ± 7.5 0.47 (0.14, 0.80)
AKPS score (range 100–0) 1.4 ± 3 0.05 (–11.33, 11.23) 6.3 ± 21.8 0.29 (–9.83, 9.25)KOOS-PF score (range 100–0) 15.8 ± 18.1 0.87 (–8.79, 7.04) 14.1 ± 13.5 1.04 (–7.12, 5.04)ASES score (range 10–0)
Pain 0.4 ± 2.4 0.19 (–1.22, 0.85) 1.4 ± 1.8 0.81 (–1.58, –0.04)Function 0.4 ± 1.4 0.26 (–0.88, 0.36) 0.3 ± 1.1 0.31 (–0.80, 0.18)Other 1 ± 1.7 0.57 (–1.30, 0.16) 0.7 ± 1 0.71 (–1.13, –0.29)
TSK score (range 17–68) –6.0 ± 5 1.2 (–0.98, 3.39) –2.1 ± 6.5 0.32 (–2.59, 3.23)IPAQ score (METpw) –556 ± 3,732 0.15 (–1,724, 1,724) 13 ± 3,103 0.00 (–1,433, 1,433)SF-36 score (range 100–0)
Physical functioning (n = 20) 14 ± 15.4 0.91 (–7.64, 5.82) 5.2 ± 10.7 0.49 (–5.18, 4.20)Role limitations due to physical health 7.5 ± 32.5 0.23 (–14.49, 14.03) 3.7 ± 20.3 0.18 (–9.09, 8.72)Role limitations due to emotional
health–5.8 ± 18.2 0.32 (–7.64, 8.24) –10 ± 19 0.53 (–7.82, 8.87)
Energy/fatigue 0.8 ± 5.7 0.13 (–2.62, 2.36) –2.3 ± 6.8 0.33 (–2.64, 3.30)Emotional well-being –0.6 ± 5.6 0.11 (–2.32, 2.54) –0.2 ± 4.9 0.04 (–2.12, 2.20)Social functioning 0.6 ± 29.9 0.02 (–13.14, 13.10) –3.6 ± 19.6 0.18 (–8.41, 8.78)Pain –14.4 ± 18.5 0.78 (–7.31, 8.87) –9.3 ± 15.4 0.60 (–6.13, 7.34)General health –0.3 ± 8.8 0.03 (–3.83, 3.89) 0.5 ± 9.7 0.05 (–4.31, 4.21)
EQ-5D scoreTotal (range 100–0) (n = 19) 7 ± 19 0.38 (–0.46, –0.30) 4 ± 11 0.40 (–0.45, –0.35)Best imaginable health VAS (range
100–0) (n = 12)11.4 ± 21.2 0.54 (–12.52, 11.45) –0.2 ± 15.6 0.01 (–7.86, 7.89)
HADS score (range 0–21)Anxiety –1.8 ± 2.6 0.72 (–0.46, 1.90) –0.3 ± 2.8 0.09 (–1.16, 1.35)Depression –0.05 ± 1.10 0.46 (–0.05, 0.96) –0.4 ± 2.2 0.19 (–0.82, 1.20)
* AKPS = Anterior Knee Pain Scale; ASES = Arthritis Self-Efficacy Scale; EQ-5D = EuroQol 5-domain measure; HADS = Hospital Anxiety and Depression Scale; IPAQ = International Physical Activity Questionnaire; KOOS-PF = Knee Injury and Osteoarthritis Outcome Score patellofemoral pain and osteoarthritis subscale; METpw = metabolic equivalent of task minutes per week; PSAR = Pain Severity and Activity Restriction Scale; SF-36 = Medical Outcomes Study Short Form 36 (health survey); TSK = Tampa Scale for Kinesiophobia; VAS = visual analog scale. † Based on those participants for whom both 0-month and 4-month data were available (paired data).
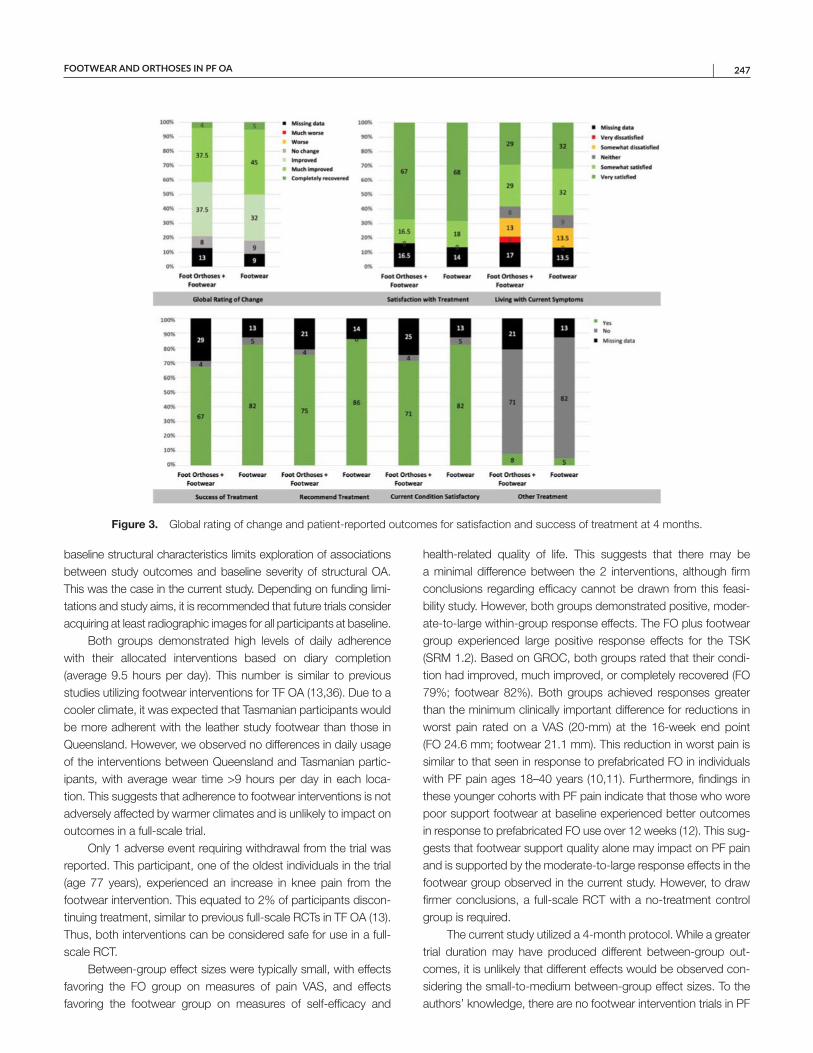
FOOTWEAR AND ORTHOSES IN PF OA | 247
baseline structural characteristics limits exploration of associations between study outcomes and baseline severity of structural OA. This was the case in the current study. Depending on funding limi-tations and study aims, it is recommended that future trials consider acquiring at least radiographic images for all participants at baseline.
Both groups demonstrated high levels of daily adherence with their allocated interventions based on diary completion (average 9.5 hours per day). This number is similar to previous studies utilizing footwear interventions for TF OA (13,36). Due to a cooler climate, it was expected that Tasmanian participants would be more adherent with the leather study footwear than those in Queensland. However, we observed no differences in daily usage of the interventions between Queensland and Tasmanian partic-ipants, with average wear time >9 hours per day in each loca-tion. This suggests that adherence to footwear interventions is not adversely affected by warmer climates and is unlikely to impact on outcomes in a full-scale trial.
Only 1 adverse event requiring withdrawal from the trial was reported. This participant, one of the oldest individuals in the trial (age 77 years), experienced an increase in knee pain from the footwear intervention. This equated to 2% of participants discon-tinuing treatment, similar to previous full-scale RCTs in TF OA (13). Thus, both interventions can be considered safe for use in a full-scale RCT.
Between-group effect sizes were typically small, with effects favoring the FO group on measures of pain VAS, and effects favoring the footwear group on measures of self-efficacy and
health-related quality of life. This suggests that there may be a minimal difference between the 2 interventions, although firm conclusions regarding efficacy cannot be drawn from this feasi-bility study. However, both groups demonstrated positive, moder-ate-to-large within-group response effects. The FO plus footwear group experienced large positive response effects for the TSK (SRM 1.2). Based on GROC, both groups rated that their condi-tion had improved, much improved, or completely recovered (FO 79%; footwear 82%). Both groups achieved responses greater than the minimum clinically important difference for reductions in worst pain rated on a VAS (20-mm) at the 16-week end point (FO 24.6 mm; footwear 21.1 mm). This reduction in worst pain is similar to that seen in response to prefabricated FO in individuals with PF pain ages 18–40 years (10,11). Furthermore, findings in these younger cohorts with PF pain indicate that those who wore poor support footwear at baseline experienced better outcomes in response to prefabricated FO use over 12 weeks (12). This sug-gests that footwear support quality alone may impact on PF pain and is supported by the moderate-to-large response effects in the footwear group observed in the current study. However, to draw firmer conclusions, a full-scale RCT with a no-treatment control group is required.
The current study utilized a 4-month protocol. While a greater trial duration may have produced different between-group out-comes, it is unlikely that different effects would be observed con-sidering the small-to-medium between-group effect sizes. To the authors’ knowledge, there are no footwear intervention trials in PF
Figure 3. Global rating of change and patient-reported outcomes for satisfaction and success of treatment at 4 months.
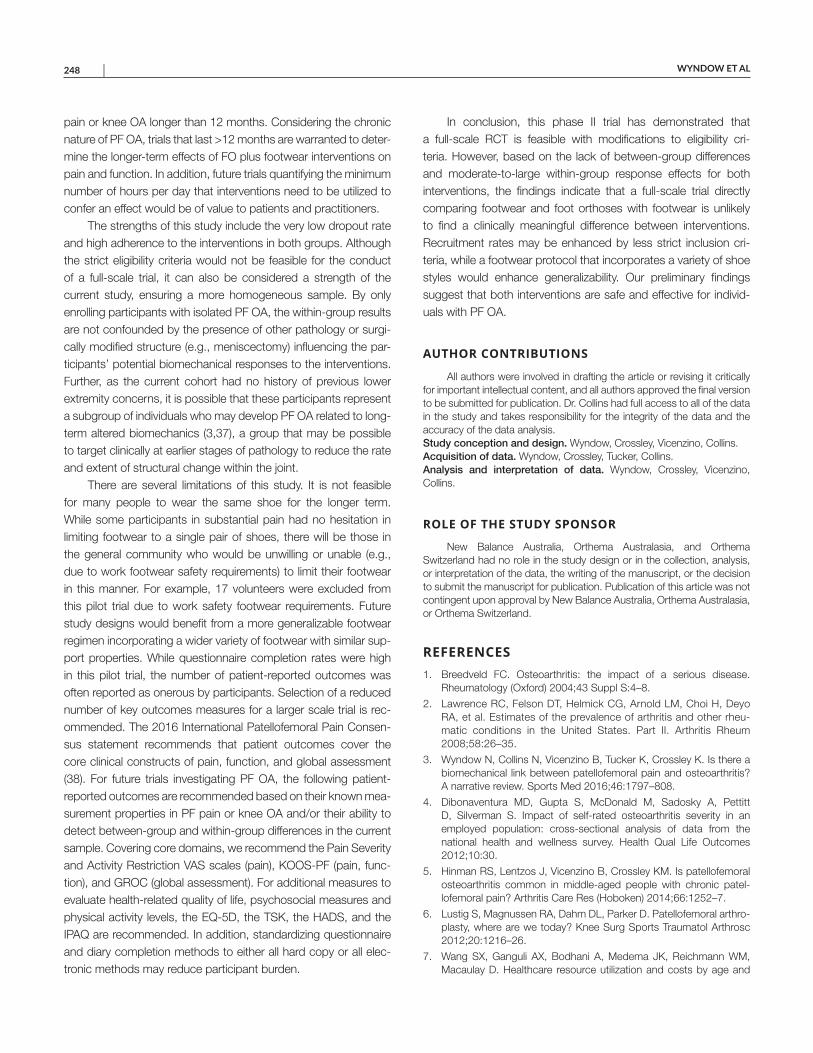
WYNDOW ET AL 248 |
pain or knee OA longer than 12 months. Considering the chronic nature of PF OA, trials that last >12 months are warranted to deter-mine the longer-term effects of FO plus footwear interventions on pain and function. In addition, future trials quantifying the minimum number of hours per day that interventions need to be utilized to confer an effect would be of value to patients and practitioners.
The strengths of this study include the very low dropout rate and high adherence to the interventions in both groups. Although the strict eligibility criteria would not be feasible for the conduct of a full-scale trial, it can also be considered a strength of the current study, ensuring a more homogeneous sample. By only enrolling participants with isolated PF OA, the within-group results are not confounded by the presence of other pathology or surgi-cally modified structure (e.g., meniscectomy) influencing the par-ticipants’ potential biomechanical responses to the interventions. Further, as the current cohort had no history of previous lower extremity concerns, it is possible that these participants represent a subgroup of individuals who may develop PF OA related to long-term altered biomechanics (3,37), a group that may be possible to target clinically at earlier stages of pathology to reduce the rate and extent of structural change within the joint.
There are several limitations of this study. It is not feasible for many people to wear the same shoe for the longer term. While some participants in substantial pain had no hesitation in limiting footwear to a single pair of shoes, there will be those in the general community who would be unwilling or unable (e.g., due to work footwear safety requirements) to limit their footwear in this manner. For example, 17 volunteers were excluded from this pilot trial due to work safety footwear requirements. Future study designs would benefit from a more generalizable footwear regimen incorporating a wider variety of footwear with similar sup-port properties. While questionnaire completion rates were high in this pilot trial, the number of patient-reported outcomes was often reported as onerous by participants. Selection of a reduced number of key outcomes measures for a larger scale trial is rec-ommended. The 2016 International Patellofemoral Pain Consen-sus statement recommends that patient outcomes cover the core clinical constructs of pain, function, and global assessment (38). For future trials investigating PF OA, the following patient- reported outcomes are recommended based on their known mea-surement properties in PF pain or knee OA and/or their ability to detect between-group and within-group differences in the current sample. Covering core domains, we recommend the Pain Severity and Activity Restriction VAS scales (pain), KOOS-PF (pain, func-tion), and GROC (global assessment). For additional measures to evaluate health-related quality of life, psychosocial measures and physical activity levels, the EQ-5D, the TSK, the HADS, and the IPAQ are recommended. In addition, standardizing questionnaire and diary completion methods to either all hard copy or all elec-tronic methods may reduce participant burden.
In conclusion, this phase II trial has demonstrated that a full-scale RCT is feasible with modifications to eligibility cri-teria. However, based on the lack of between-group differences and moderate-to-large within-group response effects for both interventions, the findings indicate that a full-scale trial directly comparing footwear and foot orthoses with footwear is unlikely to find a clinically meaningful difference between interventions. Recruitment rates may be enhanced by less strict inclusion cri-teria, while a footwear protocol that incorporates a variety of shoe styles would enhance generalizability. Our preliminary findings suggest that both interventions are safe and effective for individ-uals with PF OA.
AUTHOR CONTRIBUTIONS
All authors were involved in drafting the article or revising it critically for important intellectual content, and all authors approved the final version to be submitted for publication. Dr. Collins had full access to all of the data in the study and takes responsibility for the integrity of the data and the accuracy of the data analysis.Study conception and design. Wyndow, Crossley, Vicenzino, Collins.Acquisition of data. Wyndow, Crossley, Tucker, Collins.Analysis and interpretation of data. Wyndow, Crossley, Vicenzino, Collins.
ROLE OF THE STUDY SPONSOR
New Balance Australia, Orthema Australasia, and Orthema Switzerland had no role in the study design or in the collection, analysis, or interpretation of the data, the writing of the manuscript, or the decision to submit the manuscript for publication. Publication of this article was not contingent upon approval by New Balance Australia, Orthema Australasia, or Orthema Switzerland.
REFERENCES 1. Breedveld FC. Osteoarthritis: the impact of a serious disease.
Rheumatology (Oxford) 2004;43 Suppl S:4–8.
2. Lawrence RC, Felson DT, Helmick CG, Arnold LM, Choi H, Deyo RA, et al. Estimates of the prevalence of arthritis and other rheu-matic conditions in the United States. Part II. Arthritis Rheum 2008;58:26–35.
3. Wyndow N, Collins N, Vicenzino B, Tucker K, Crossley K. Is there a biomechanical link between patellofemoral pain and osteoarthritis? A narrative review. Sports Med 2016;46:1797–808.
4. Dibonaventura MD, Gupta S, McDonald M, Sadosky A, Pettitt D, Silverman S. Impact of self-rated osteoarthritis severity in an employed population: cross-sectional analysis of data from the national health and wellness survey. Health Qual Life Outcomes 2012;10:30.
5. Hinman RS, Lentzos J, Vicenzino B, Crossley KM. Is patellofemoral osteoarthritis common in middle-aged people with chronic patel-lofemoral pain? Arthritis Care Res (Hoboken) 2014;66:1252–7.
6. Lustig S, Magnussen RA, Dahm DL, Parker D. Patellofemoral arthro-plasty, where are we today? Knee Surg Sports Traumatol Arthrosc 2012;20:1216–26.
7. Wang SX, Ganguli AX, Bodhani A, Medema JK, Reichmann WM, Macaulay D. Healthcare resource utilization and costs by age and
FOOTWEAR AND ORTHOSES IN PF OA | 249
joint location among osteoarthritis patients in a privately insured pop-ulation. J Med Econ 2017;20:1299–306.
8. Hinman RS, Crossley KM. Patellofemoral joint osteoarthritis: an important subgroup of knee osteoarthritis. Rheumatology (Oxford) 2007;46:1057–62.
9. Collins NJ, Oei EH, de Kanter JL, Vicenzino B, Crossley KM. Prevalence of radiographic and magnetic resonance imaging features of patel-lofemoral osteoarthritis in young and middle-aged adults with persistent patellofemoral pain. Arthritis Care Res (Hoboken) 2019;71:1068–73.
10. Collins N, Crossley K, Beller E, Darnell R, McPoil T, Vicenzino B. Foot orthoses and physiotherapy in the treatment of patellofem-oral pain syndrome: randomised clinical trial. Br J Sports Med 2009;43:169–71.
11. Barton CJ, Menz HB, Crossley KM. Effects of prefabricated foot orthoses on pain and function in individuals with patellofemoral pain syndrome: a cohort study. Phys Ther Sport 2011;12:70–5.
12. Barton CJ, Menz HB, Crossley KM. Clinical predictors of foot orthoses efficacy in individuals with patellofemoral pain. Med Sci Sports Exerc 2011;43:1603–10.
13. Hinman RS, Wrigley TV, Metcalf BR, Campbell PK, Paterson KL, Hunter DJ, et al. Unloading shoes for self-management of knee oste-oarthritis: a randomized trial. Ann Intern Med 2016;165:381–9.
14. Chan AW, Tetzlaff JM, Altman DG, Laupacis A, Gøtzsche PC, Krleža-Jerić K, et al. SPIRIT 2013 statement: defining standard protocol items for clinical trials. Ann Intern Med 2013;158:200–7.
15. Chan AW, Tetzlaff JM, Gøtzsche PC, Altman DG, Mann H, Berlin JA, et al. SPIRIT 2013 explanation and elaboration: guidance for proto-cols of clinical trials. BMJ 2013;346:e7586.
16. Eldridge SM, Chan CL, Campbell MJ, Bond CM, Hopewell S, Thabane L, et al. CONSORT 2010 statement: extension to randomised pilot and feasibility trials. Pilot Feasibility Stud 2016;21:2–64.
17. Wyndow N, Crossley KM, Vicenzino B, Tucker K, Collins NJ. A single-blinded, randomized, parallel group superiority trial inves-tigating the effects of footwear and custom foot orthoses versus footwear alone in individuals with patellofemoral joint osteoarthritis: a phase II pilot trial protocol. J Foot Ankle Res 2017;10:19.
18. Crossley KM, Vicenzino B, Lentzos J, Schache AG, Pandy MG, Ozturk H, et al. Exercise, education, manual-therapy and taping compared to education for patellofemoral osteoarthritis: a blinded, randomised clinical trial. Osteoarthritis Cartilage 2015; 23:1457–64.
19. Van Middelkoop M, Bennell K, Callaghan M, Collins N, Conaghan P, Crossley K, et al. International patellofemoral osteoarthritis con-sortium: consensus statement on the diagnosis, burden, outcome measures, prognosis, risk factors and treatment. Semin Arthritis Rheum 2018;47:666–75.
20. Kellgren JH, Lawrence JS. Radiological assessment of osteo- arthrosis. Ann Rheum Dis 1957;16:494–502.
21. Hunter DJ, Arden N, Conaghan PG, Eckstein F, Gold G, Grainger A, et al. Definition of osteoarthritis on MRI: results of a Delphi exercise. Osteoarthritis Cartilage 2011;19:963–9.
22. Crossley KM, Bennell KL, Cowan SM, Green S. Analysis of outcome measures for persons with patellofemoral pain: which are reliable and valid? Arch Phys Med Rehabil 2004;85:815–22.
23. Kujala UM, Jaakkola LH, Koskinen SK, Taimela S, Hurme M, Nelimarkka O. Scoring of patellofemoral disorders. Arthroscopy 1993;9:159–63.
24. Crossley KM, Macri EM, Cowan SM, Collins NJ, Roos EM. The patel-lofemoral pain and osteoarthritis subscale of the KOOS (KOOS-PF): development and validation using the COSMIN checklist. Br J Sports Med 2018;52:1130–6.
25. Hochman JR, Davis AM, Elkayam J, Gagliese L, Hawker GA. Neuropathic pain symptoms on the modified painDETECT correlate with signs of central sensitization in knee osteoarthritis. Osteoarthritis Cartilage 2013;21:1236–42.
26. Ware JE, Sherbourne CD. The MOS 36-item Short-Form Health Survey (SF-36). Part I. conceptual framework and item selection. Med Care 1992;30:473–83.
27. Rabin R, de Charro F. EQ-5D: a measure of health status from the EuroQol Group. Ann Med 2001;33:337–43.
28. Kori SH, Miller R, Todd D. Kinesiophobia: a new view of chronic pain behaviour. Pain Manag 1990;3:35–43.
29. Lorig K, Chastain RL, Ung E, Shoor S, Holman HR. Development and evaluation of a scale to measure perceived self-efficacy in peo-ple with arthritis. Arthritis Rheum 1989;32:37–44.
30. Zigmond AS, Snaith RP. The hospital anxiety and depression scale. Acta Psychiatr Scand 1983;67:361–70.
31. Stucki G, Liang MH, Fossel AH, Katz JN. Relative respon-siveness of condition-specific and generic health status mea-sures in degenerative lumbar spinal stenosis. J Clin Epidemiol 1995;48:1369–78.
32. Hopkins WG. A scale of magnitudes for effect statistics: a new view of statistics. 2002. URL: http://www.sport sci.org/resou rce/stats/ effec tmag.html.
33. Bentley G, Dowd G. Current concepts of etiology and treatment of chondromalacia patellae. Clin Orthop Relat Res 1984;189:209–28.
34. Federico DJ, Reider B. Results of isolated patellar debridement for patellofemoral pain in patients with normal patellar alignment. Am J Sports Med 1997;25:663–9.
35. Hart HF, Stefanik JJ, Wyndow N, Machotka Z, Crossley KM. The prevalence of radiographic and MRI-defined patellofemoral oste-oarthritis and structural pathology: a systematic review and meta- analysis. Br J Sports Med 2017;51:1195–208.
36. Erhart-Hledik JC, Elspas B, Giori NJ, Andriacchi TP. Effect of var iable-stiffness walking shoes on knee adduction moment, pain, and function in subjects with medial compartment knee osteoarthritis after 1 year. J Orthop Res 2012;30:514–21.
37. Powers CM, Witvrouw E, Davis IS, Crossley KM. Evidence-based framework for a pathomechanical model of patellofemoral pain: 2017 patellofemoral pain consensus statement from the 4th International Patellofemoral Pain Research Retreat, Manchester, UK. Part 3. Br J Sports Med 2017;51:1713–23.
38. Crossley KM, Stefanik JJ, Selfe J, Collins NJ, Davis IS, Powers CM, et al. 2016 patellofemoral pain consensus statement from the 4th International Patellofemoral Pain Research Retreat, Manchester, UK. Part 1: terminology, definitions, clinical examination, natural history, patellofemoral osteoarthritis and patient-reported outcome mea-sures. Br J Sports Med 2016;50:839–43.
250
Arthritis Care & ResearchVol. 73, No. 2, February 2021, pp 250–258DOI 10.1002/acr.24107© 2019, American College of Rheumatology
Podiatry Intervention Versus Usual General Practitioner Care for Symptomatic Radiographic Osteoarthritis of the First Metatarsophalangeal Joint: A Randomized Clinical Feasibility StudyKade L. Paterson,1 Rana S. Hinman,1 Ben R. Metcalf,1 Penny K. Campbell,1 Hylton B. Menz,2
David J. Hunter,3 and Kim L. Bennell1
Objective. To determine the feasibility of a clinical trial comparing a podiatry intervention to usual general practitioner (GP) care for people with first metatarsophalangeal (MTP) joint osteoarthritis (OA).
Methods. A 2-arm, participant- and assessor-blinded, randomized feasibility study was conducted over 12 weeks. Participants were age >40 years and had pain and radiographic OA in the first MTP joint. Participants in the podiatry group had 3 visits and received foot orthoses, exercise, manual therapy, and advice. Participants in the GP group had 1 visit and received medication advice/prescription and the same advice as the podiatry group. Primary outcomes were measures of feasibility (recruitment, attendance, and retention rates; percentage of prescribed exercise sessions completed; orthoses wear hours/day; treatment fidelity). Secondary outcomes included self-reported pain, function, satisfaction, adherence, adverse events, and dropouts.
Results. A total of 236 people were screened, and 30 (13%) were included. All except 1 participant in the podiatry group attended the required clinical visits, and retention rates were 93% (podiatry group) and 80% (GP group). Participants completed 66% of the exercise sessions and wore orthoses for an average of 6.3 hours/day. Adherence to medication use was 5.3 on an 11-point numeric rating scale. Both treatment approaches improved pain and function by clinically important differences at 12 weeks.
Conclusion. A clinical trial comparing a podiatry intervention to usual GP care for people with first MTP joint OA is feasible. Given the improvements in pain and function observed, a larger appropriately powered clinical trial is warranted to evaluate the superiority of one treatment approach over the other.
INTRODUCTION
Osteoarthritis (OA) of the foot affects 16.7% of people age >50 years, making it is as prevalent as knee OA, and the most commonly affected foot site is the first metatarsophalangeal (MTP) joint (1). First MTP joint OA is highly debilitating, with most patients (72%) reporting pain described as disabling (1). The condition is characterized by the formation of a dorsal exostosis, with associated joint stiffness and reduced range of motion (2). Combined, the symptoms of first MTP joint OA lead to problems
performing functional weight-bearing activities and impaired quality of life (3).
Despite the high prevalence and disabling nature of first MTP joint OA, there have only been 3 randomized clinical trials (RCTs) evaluating nonsurgical strategies for the condition. Of these, 1 showed no difference between hyaluronic acid and saline injec-tions (4), while another found no superiority of prefabricated foot orthoses over rocker-bottom shoes (5). Within-group analyses from this latter trial showed improvements in pain that exceeded the minimum clinically important difference in both groups,
ACTRN: 12616001290482.Supported by a National Health and Medical Research Council Program
Grant (grant 1091302) and grants from Arthritis Australia and the Australian Podiatry Education and Research Foundation. Dr. Hinman’s work was supported by a National Health and Medical Research Council Senior Research Fellowship (grant 1154217). Dr. Menz’s work was supported by a National Health and Medical Research Council Senior Research Fellowship (grant APP1135995). Dr. Bennell’s work was supported by a National Health and Medical Research Council Principal Research Fellowship (grant APP1058440).
1Kade L. Paterson, PhD, Rana S. Hinman, PhD, Ben R. Metcalf, BSc (Hons), Penny K. Campbell, BAppSci, Kim L. Bennell, PhD: University of
Melbourne, Parkville, Victoria, Australia; 2Hylton B. Menz, PhD: La Trobe University, Melbourne, Victoria, Australia; 3David J. Hunter, PhD: Royal North Shore Hospital and University of Sydney, Sydney, New South Wales, Australia.
No potential conflicts of interest relevant to this article were reported.Address correspondence to Kade L. Paterson, PhD, Centre for Health
Exercise and Sports Medicine, Department of Physiotherapy, School of Health Sciences, University of Melbourne, Parkville, Victoria 3010, Australia. Email: [email protected].
Submitted for publication June 24, 2019; accepted in revised form November 5, 2019.
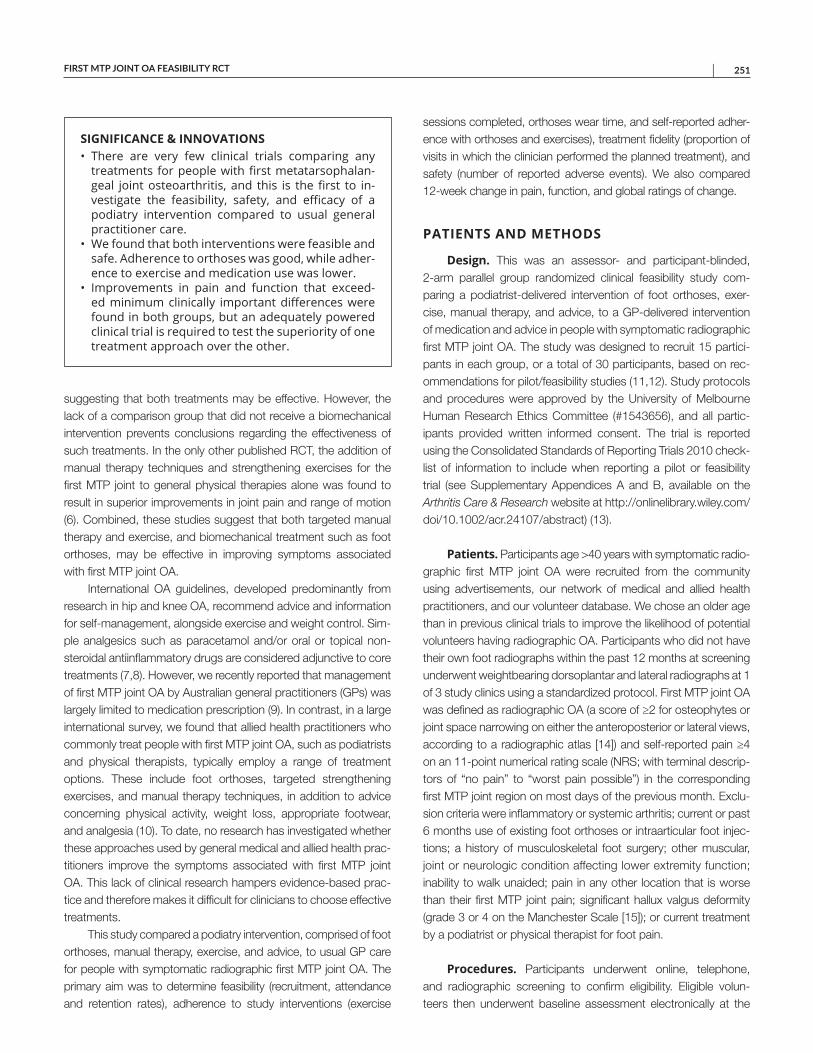
FIRST MTP JOINT OA FEASIBILITY RCT | 251Arthritis Care & ResearchVol. 73, No. 2, February 2021, pp 250–258DOI 10.1002/acr.24107
suggesting that both treatments may be effective. However, the lack of a comparison group that did not receive a biomechanical intervention prevents conclusions regarding the effectiveness of such treatments. In the only other published RCT, the addition of manual therapy techniques and strengthening exercises for the first MTP joint to general physical therapies alone was found to result in superior improvements in joint pain and range of motion (6). Combined, these studies suggest that both targeted manual therapy and exercise, and biomechanical treatment such as foot orthoses, may be effective in improving symptoms associated with first MTP joint OA.
International OA guidelines, developed predominantly from research in hip and knee OA, recommend advice and information for self-management, alongside exercise and weight control. Sim-ple analgesics such as paracetamol and/or oral or topical non-steroidal antiinflammatory drugs are considered adjunctive to core treatments (7,8). However, we recently reported that management of first MTP joint OA by Australian general practitioners (GPs) was largely limited to medication prescription (9). In contrast, in a large international survey, we found that allied health practitioners who commonly treat people with first MTP joint OA, such as podiatrists and physical therapists, typically employ a range of treatment options. These include foot orthoses, targeted strengthening exercises, and manual therapy techniques, in addition to advice concerning physical activity, weight loss, appropriate footwear, and analgesia (10). To date, no research has investigated whether these approaches used by general medical and allied health prac-titioners improve the symptoms associated with first MTP joint OA. This lack of clinical research hampers evidence-based prac-tice and therefore makes it difficult for clinicians to choose effective treatments.
This study compared a podiatry intervention, comprised of foot orthoses, manual therapy, exercise, and advice, to usual GP care for people with symptomatic radiographic first MTP joint OA. The primary aim was to determine feasibility (recruitment, attendance and retention rates), adherence to study interventions (exercise
sessions completed, orthoses wear time, and self-reported adher-ence with orthoses and exercises), treatment fidelity (proportion of visits in which the clinician performed the planned treatment), and safety (number of reported adverse events). We also compared 12-week change in pain, function, and global ratings of change.
PATIENTS AND METHODS
Design. This was an assessor- and participant-blinded, 2-arm parallel group randomized clinical feasibility study com-paring a podiatrist-delivered intervention of foot orthoses, exer-cise, manual therapy, and advice, to a GP-delivered intervention of medication and advice in people with symptomatic radiographic first MTP joint OA. The study was designed to recruit 15 partici-pants in each group, or a total of 30 participants, based on rec-ommendations for pilot/feasibility studies (11,12). Study protocols and procedures were approved by the University of Melbourne Human Research Ethics Committee (#1543656), and all partic-ipants provided written informed consent. The trial is reported using the Consolidated Standards of Reporting Trials 2010 check-list of information to include when reporting a pilot or feasibility trial (see Supplementary Appendices A and B, available on the Arthritis Care & Research website at http://onlin elibr ary.wiley.com/doi/10.1002/acr.24107/ abstract) (13).
Patients. Participants age >40 years with symptomatic radio-graphic first MTP joint OA were recruited from the community using advertisements, our network of medical and allied health practitioners, and our volunteer database. We chose an older age than in previous clinical trials to improve the likelihood of potential volunteers having radiographic OA. Participants who did not have their own foot radiographs within the past 12 months at screening underwent weightbearing dorsoplantar and lateral radiographs at 1 of 3 study clinics using a standardized protocol. First MTP joint OA was defined as radiographic OA (a score of ≥2 for osteophytes or joint space narrowing on either the anteroposterior or lateral views, according to a radiographic atlas [14]) and self-reported pain ≥4 on an 11-point numerical rating scale (NRS; with terminal descrip-tors of “no pain” to “worst pain possible”) in the corresponding first MTP joint region on most days of the previous month. Exclu-sion criteria were inflammatory or systemic arthritis; current or past 6 months use of existing foot orthoses or intraarticular foot injec-tions; a history of musculoskeletal foot surgery; other muscular, joint or neurologic condition affecting lower extremity function; inability to walk unaided; pain in any other location that is worse than their first MTP joint pain; significant hallux valgus deformity (grade 3 or 4 on the Manchester Scale [15]); or current treatment by a podiatrist or physical therapist for foot pain.
Procedures. Participants underwent online, telephone, and radiographic screening to confirm eligibility. Eligible volun-teers then underwent baseline assessment electronically at the
SIGNIFICANCE & INNOVATIONS• There are very few clinical trials comparing any
treatments for people with first metatarsophalan-geal joint osteoarthritis, and this is the first to in-vestigate the feasibility, safety, and efficacy of a podiatry intervention compared to usual general practitioner care.
• We found that both interventions were feasible and safe. Adherence to orthoses was good, while adher-ence to exercise and medication use was lower.
• Improvements in pain and function that exceed-ed minimum clinically important differences were found in both groups, but an adequately powered clinical trial is required to test the superiority of one treatment approach over the other.
PATERSON ET AL 252 |
University of Melbourne. Participants were randomly allocated to either the podiatry group or the usual GP care group. The rando-mization schedule was generated by an independent researcher, concealed in consecutively numbered opaque envelopes, and stored in a centrally accessible locked location. Prior to group allocation and throughout the follow-up period, participants were not informed of the composition of each intervention to ensure participant blinding. Because all outcomes were self-reported, this trial was also assessor blinded.
Interventions. Podiatrist-delivered multifaceted inter-vention. The intervention was developed by an expert panel of podiatrists from Australia (n = 6) and New Zealand (n = 1). To be considered an expert, panel members were required to have a PhD and meet at least 1 of the following criteria: authored at least 2 articles in the past 5 years related to the assessment and/or treatment of a musculoskeletal foot condition; gave an invited conference presentation within the past 5 years related to the assessment and/or treatment of a musculoskeletal foot condition; or obtained nationally competitive grant funding within the previous 5 years for research related to the assessment and/or treatment of a musculoskeletal foot condition. Additionally, we also required a minimum of 3 members of the panel to hold concurrent clinical appointments with a case load that included people with OA of the first MTP joint.
To develop the intervention, the panel was first sent the out-comes of our recent international survey of assessment and treat-ment approaches used by podiatrists and physical therapists for individuals with first MTP joint OA (10). Next, the panel participated in a 1-hour teleconference meeting, during which they discussed the approaches identified in the survey and developed by consen-sus the list of strategies to be included in the intervention protocol for this trial. A summary of the meeting outcomes was sent to all members following the meeting to provide an opportunity for final feedback. The final list of the first MTP joint OA treatment strategies included the items listed below.
Foot orthoses. Respondents to our survey indicated that they mostly prescribe prefabricated foot orthoses for people with first MTP joint OA, and the most common modifications included a varus wedge and either a first ray cutout or first ray extension (10). Thus, participants were issued a pair of me-dium-density (relative density of 180 grams/m2) full-length prefabricated Formthotics (Foot Science International, Ltd., Christchurch, New Zealand), modified by the study podiatrist using a first ray cutout (Figure 1). Our expert panel then agreed that if the participant had no available first MTP joint range of motion or the first ray cutout–elicited pain, a first ray exten-sion was used. The panel also agreed that if participants had a Foot Posture Index (16) score ≥7 (indicative of a pronated foot type) as assessed by the podiatrist, a 4º varus wedge was adhered to the plantar heel cup. Orthoses were fitted to partic-ipants’ footwear at an initial clinic visit, and they were advised
to wear the device for >6 hours/day. Orthoses were reviewed at follow-up visits 1 and 5 weeks later, and additional modifi-cations to address comfort or adverse events were made (and documented) if necessary.
Home management program. This program was demon-strated by the podiatrist during the initial clinic visit and reviewed and progressed at the follow-up visits. The participant was re-quired to perform the program twice daily at home. The program was provided to the participant in a printed booklet and com-prised exercises recommended by podiatrists and physical therapists from our international survey (10) and refined by our expert panel. These included: isometric flexor hallucis longus strength exercises, 3 sets of 10–20 repetitions, first MTP joint distraction (1 minute) and distal glides (1 minute), and soft tis-sue massage to the plantar foot (5 minutes) using a massage ball (see Supplementary Appendices A and B, available on the Arthritis Care & Research website at http://onlin elibr ary.wiley.com/ doi/10.1002/acr.24107/ abstract).
Self-management advice and plan. The study podiatrist provided advice to wear shoes with adequate depth and width, as well as advice on analgesia (a maximum of 4 grams/day of paracetamol if needed), weight management (general advice and dietitian referral if needed), and physical activity (30 minutes on most days).
Treatments were administered and reviewed at 3 clinic visits with the study podiatrist (weeks 0, 1, and 5). The initial visit was 45 minutes, and subsequent visits were 30 minutes. If participants experienced ongoing problems with any component of the treat-ment, they were permitted additional visits, which were also doc-umented. Adherence was assessed through a daily diary to log exercise adherence and orthoses use each day for the past week, recorded retrospectively in monthly log books sent at the end of each month. Outcomes were again completed electronically at the participant’s home 12 weeks following their first intervention visit.
Usual care delivered by GP. Our analysis of national patient-encounter records for foot/ankle OA consultations with Australian GPs showed that the usual GP management is analgesia and antiinflammatory advice and/or prescription (9), supporting published qualitative research (17). Consequently, participants in this treatment group attended one 15-minute visit with a GP at which they received advice and/or prescrip-tion of analgesics and antiinflammatory medication at the dis-cretion of the GP. In addition, the GP also provided advice on weight management (general advice and dietitian referral if needed) and physical activity (30 minutes on most days). Par-ticipants were permitted additional visits if they experienced an ongoing problem related to the treatment, and this addi-tion was documented by the GP. Adherence was assessed through a daily diary to log medication use each day for the past week, recorded in monthly log books sent at the end of each month.
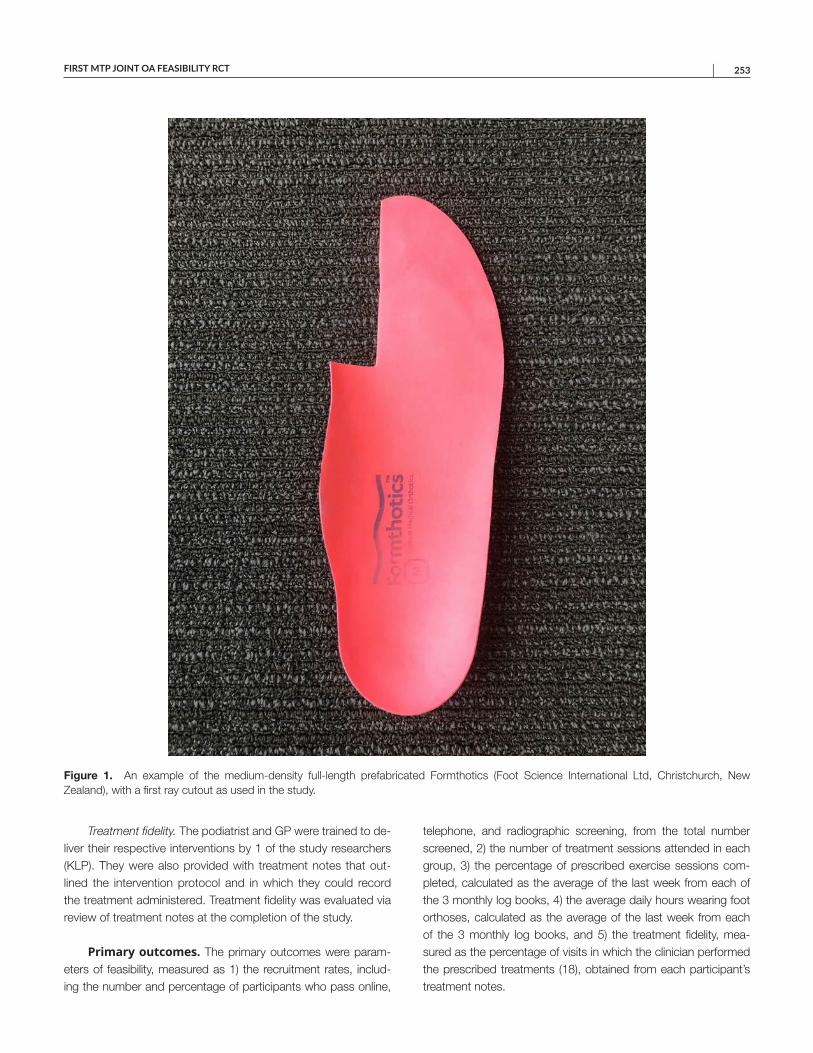
FIRST MTP JOINT OA FEASIBILITY RCT | 253
Treatment fidelity. The podiatrist and GP were trained to de-liver their respective interventions by 1 of the study researchers (KLP). They were also provided with treatment notes that out-lined the intervention protocol and in which they could record the treatment administered. Treatment fidelity was evaluated via review of treatment notes at the completion of the study.
Primary outcomes. The primary outcomes were param-eters of feasibility, measured as 1) the recruitment rates, includ-ing the number and percentage of participants who pass online,
telephone, and radiographic screening, from the total number screened, 2) the number of treatment sessions attended in each group, 3) the percentage of prescribed exercise sessions com-pleted, calculated as the average of the last week from each of the 3 monthly log books, 4) the average daily hours wearing foot orthoses, calculated as the average of the last week from each of the 3 monthly log books, and 5) the treatment fidelity, mea-sured as the percentage of visits in which the clinician performed the prescribed treatments (18), obtained from each participant’s treatment notes.
Figure 1. An example of the medium-density full-length prefabricated Formthotics (Foot Science International Ltd, Christchurch, New Zealand), with a first ray cutout as used in the study.
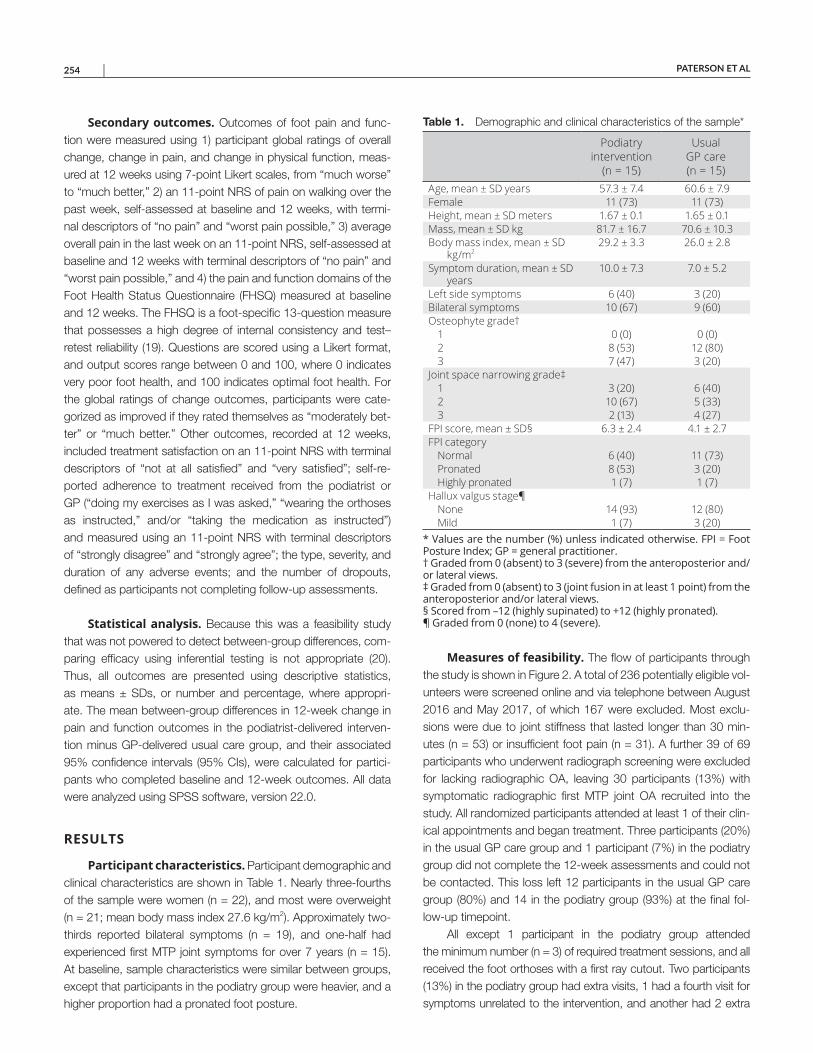
PATERSON ET AL 254 |
Secondary outcomes. Outcomes of foot pain and func-tion were measured using 1) participant global ratings of overall change, change in pain, and change in physical function, meas-ured at 12 weeks using 7-point Likert scales, from “much worse” to “much better,” 2) an 11-point NRS of pain on walking over the past week, self-assessed at baseline and 12 weeks, with termi-nal descriptors of “no pain” and “worst pain possible,” 3) average overall pain in the last week on an 11-point NRS, self-assessed at baseline and 12 weeks with terminal descriptors of “no pain” and “worst pain possible,” and 4) the pain and function domains of the Foot Health Status Questionnaire (FHSQ) measured at baseline and 12 weeks. The FHSQ is a foot-specific 13-question measure that possesses a high degree of internal consistency and test–retest reliability (19). Questions are scored using a Likert format, and output scores range between 0 and 100, where 0 indicates very poor foot health, and 100 indicates optimal foot health. For the global ratings of change outcomes, participants were cate-gorized as improved if they rated themselves as “moderately bet-ter” or “much better.” Other outcomes, recorded at 12 weeks, included treatment satisfaction on an 11-point NRS with terminal descriptors of “not at all satisfied” and “very satisfied”; self-re-ported adherence to treatment received from the podiatrist or GP (“doing my exercises as I was asked,” “wearing the orthoses as instructed,” and/or “taking the medication as instructed”) and measured using an 11-point NRS with terminal descriptors of “strongly disagree” and “strongly agree”; the type, severity, and duration of any adverse events; and the number of dropouts, defined as participants not completing follow-up assessments.
Statistical analysis. Because this was a feasibility study that was not powered to detect between-group differences, com-paring efficacy using inferential testing is not appropriate (20). Thus, all outcomes are presented using descriptive statistics, as means ± SDs, or number and percentage, where appropri-ate. The mean between-group differences in 12-week change in pain and function outcomes in the podiatrist-delivered interven-tion minus GP-delivered usual care group, and their associated 95% confidence intervals (95% CIs), were calculated for partici-pants who completed baseline and 12-week outcomes. All data were analyzed using SPSS software, version 22.0.
RESULTS
Participant characteristics. Participant demographic and clinical characteristics are shown in Table 1. Nearly three-fourths of the sample were women (n = 22), and most were overweight (n = 21; mean body mass index 27.6 kg/m2). Approximately two-thirds reported bilateral symptoms (n = 19), and one-half had experienced first MTP joint symptoms for over 7 years (n = 15). At baseline, sample characteristics were similar between groups, except that participants in the podiatry group were heavier, and a higher proportion had a pronated foot posture.
Measures of feasibility. The flow of participants through the study is shown in Figure 2. A total of 236 potentially eligible vol-unteers were screened online and via telephone between August 2016 and May 2017, of which 167 were excluded. Most exclu-sions were due to joint stiffness that lasted longer than 30 min-utes (n = 53) or insufficient foot pain (n = 31). A further 39 of 69 participants who underwent radiograph screening were excluded for lacking radiographic OA, leaving 30 participants (13%) with symptomatic radiographic first MTP joint OA recruited into the study. All randomized participants attended at least 1 of their clin-ical appointments and began treatment. Three participants (20%) in the usual GP care group and 1 participant (7%) in the podiatry group did not complete the 12-week assessments and could not be contacted. This loss left 12 participants in the usual GP care group (80%) and 14 in the podiatry group (93%) at the final fol-low-up timepoint.
All except 1 participant in the podiatry group attended the minimum number (n = 3) of required treatment sessions, and all received the foot orthoses with a first ray cutout. Two participants (13%) in the podiatry group had extra visits, 1 had a fourth visit for symptoms unrelated to the intervention, and another had 2 extra
Table 1. Demographic and clinical characteristics of the sample*
Podiatry intervention
(n = 15)
Usual GP care (n = 15)
Age, mean ± SD years 57.3 ± 7.4 60.6 ± 7.9Female 11 (73) 11 (73)Height, mean ± SD meters 1.67 ± 0.1 1.65 ± 0.1Mass, mean ± SD kg 81.7 ± 16.7 70.6 ± 10.3Body mass index, mean ± SD
kg/m229.2 ± 3.3 26.0 ± 2.8
Symptom duration, mean ± SD years
10.0 ± 7.3 7.0 ± 5.2
Left side symptoms 6 (40) 3 (20)Bilateral symptoms 10 (67) 9 (60)Osteophyte grade†
1 0 (0) 0 (0)2 8 (53) 12 (80)3 7 (47) 3 (20)
Joint space narrowing grade‡1 3 (20) 6 (40)2 10 (67) 5 (33)3 2 (13) 4 (27)
FPI score, mean ± SD§ 6.3 ± 2.4 4.1 ± 2.7FPI category
Normal 6 (40) 11 (73)Pronated 8 (53) 3 (20)Highly pronated 1 (7) 1 (7)
Hallux valgus stage¶None 14 (93) 12 (80)Mild 1 (7) 3 (20)
* Values are the number (%) unless indicated otherwise. FPI = Foot Posture Index; GP = general practitioner. † Graded from 0 (absent) to 3 (severe) from the anteroposterior and/or lateral views. ‡ Graded from 0 (absent) to 3 (joint fusion in at least 1 point) from the anteroposterior and/or lateral views. § Scored from –12 (highly supinated) to +12 (highly pronated). ¶ Graded from 0 (none) to 4 (severe).
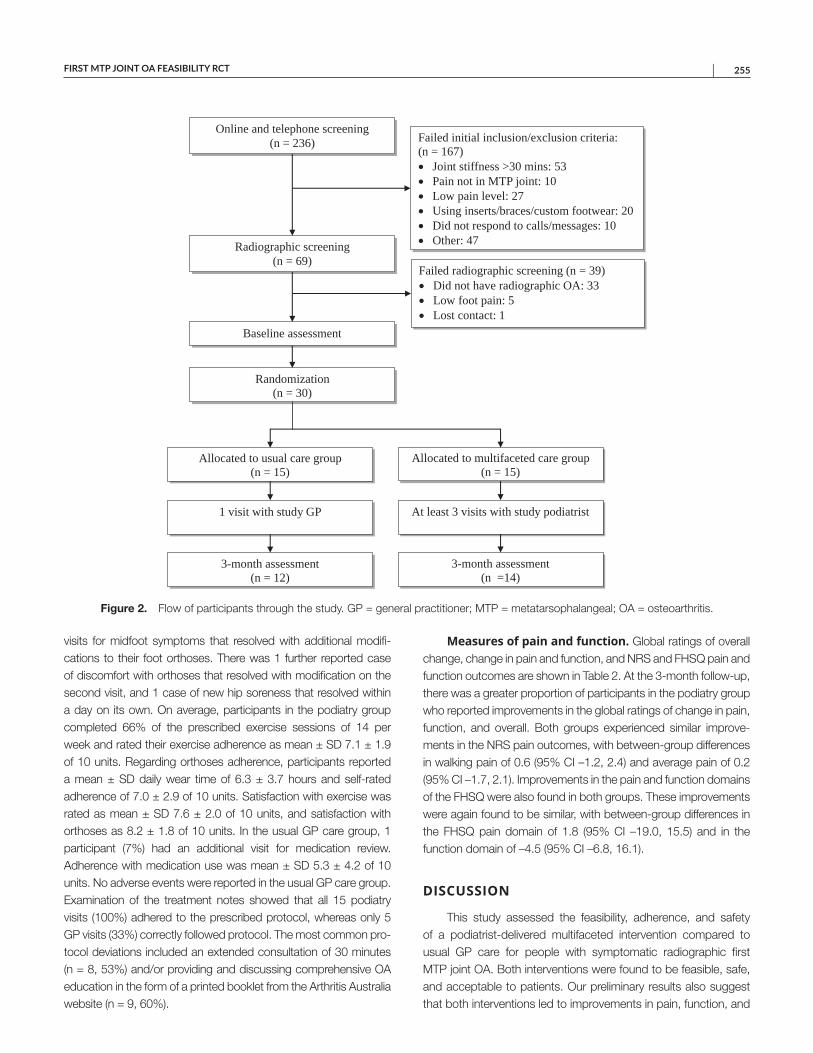
FIRST MTP JOINT OA FEASIBILITY RCT | 255
visits for midfoot symptoms that resolved with additional modifi-cations to their foot orthoses. There was 1 further reported case of discomfort with orthoses that resolved with modification on the second visit, and 1 case of new hip soreness that resolved within a day on its own. On average, participants in the podiatry group completed 66% of the prescribed exercise sessions of 14 per week and rated their exercise adherence as mean ± SD 7.1 ± 1.9 of 10 units. Regarding orthoses adherence, participants reported a mean ± SD daily wear time of 6.3 ± 3.7 hours and self-rated adherence of 7.0 ± 2.9 of 10 units. Satisfaction with exercise was rated as mean ± SD 7.6 ± 2.0 of 10 units, and satisfaction with orthoses as 8.2 ± 1.8 of 10 units. In the usual GP care group, 1 participant (7%) had an additional visit for medication review. Adherence with medication use was mean ± SD 5.3 ± 4.2 of 10 units. No adverse events were reported in the usual GP care group. Examination of the treatment notes showed that all 15 podiatry visits (100%) adhered to the prescribed protocol, whereas only 5 GP visits (33%) correctly followed protocol. The most common pro-tocol deviations included an extended consultation of 30 minutes (n = 8, 53%) and/or providing and discussing comprehensive OA education in the form of a printed booklet from the Arthritis Australia website (n = 9, 60%).
Measures of pain and function. Global ratings of overall change, change in pain and function, and NRS and FHSQ pain and function outcomes are shown in Table 2. At the 3-month follow-up, there was a greater proportion of participants in the podiatry group who reported improvements in the global ratings of change in pain, function, and overall. Both groups experienced similar improve-ments in the NRS pain outcomes, with between-group differences in walking pain of 0.6 (95% CI –1.2, 2.4) and average pain of 0.2 (95% CI –1.7, 2.1). Improvements in the pain and function domains of the FHSQ were also found in both groups. These improvements were again found to be similar, with between-group differences in the FHSQ pain domain of 1.8 (95% CI –19.0, 15.5) and in the function domain of –4.5 (95% CI –6.8, 16.1).
DISCUSSION
This study assessed the feasibility, adherence, and safety of a podiatrist-delivered multifaceted intervention compared to usual GP care for people with symptomatic radiographic first MTP joint OA. Both interventions were found to be feasible, safe, and acceptable to patients. Our preliminary results also suggest that both interventions led to improvements in pain, function, and
Figure 2. Flow of participants through the study. GP = general practitioner; MTP = metatarsophalangeal; OA = osteoarthritis.
Online and telephone screening(n = 236)
Radiographic screening(n = 69)
Failed initial inclusion/exclusion criteria:(n = 167)
Joint stiffness >30 mins: 53Pain not in MTP joint: 10Low pain level: 27Using inserts/braces/custom footwear: 20Did not respond to calls/messages: 10Other: 47
Baseline assessment
Randomization(n = 30)
Failed radiographic screening (n = 39)Did not have radiographic OA: 33Low foot pain: 5Lost contact: 1
Allocated to usual care group (n = 15)
Allocated to multifaceted care group (n = 15)
1 visit with study GP At least 3 visits with study podiatrist
3-month assessment(n = 12)
3-month assessment(n =14)
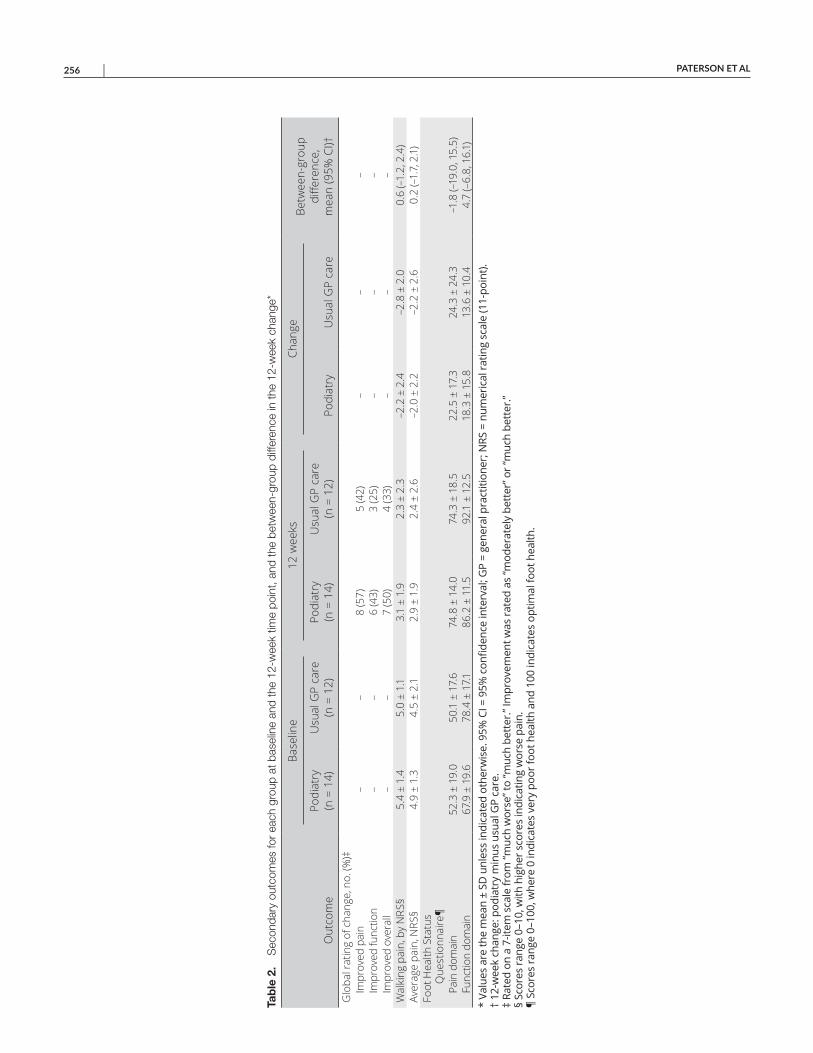
PATERSON ET AL 256 |
Tab
le 2
. S
econ
dary
out
com
es fo
r ea
ch g
roup
at b
asel
ine
and
the
12-w
eek
time
poin
t, an
d th
e be
twee
n-gr
oup
diffe
renc
e in
the
12-w
eek
chan
ge*
Out
com
e
Base
line
12 w
eeks
Chan
geBe
twee
n-gr
oup
diffe
renc
e,
mea
n (9
5% C
I)†Po
diat
ry
(n =
14)
Usu
al G
P ca
re
(n =
12)
Podi
atry
(n
= 1
4)U
sual
GP
care
(n
= 1
2)Po
diat
ryU
sual
GP
care
Glo
bal r
atin
g of
cha
nge,
no.
(%)‡
Impr
oved
pai
n–
–8
(57)
5 (4
2)–
––
Impr
oved
func
tion
––
6 (4
3)3
(25)
––
–Im
prov
ed o
vera
ll–
–7
(50)
4 (3
3)–
––
Wal
king
pai
n, b
y N
RS§
5.4
± 1.
45.
0 ±
1.1
3.1
± 1.
92.
3 ±
2.3
–2.2
± 2
.4–2
.8 ±
2.0
0.6
(–1.
2, 2
.4)
Aver
age
pain
, NRS
§4.
9 ±
1.3
4.5
± 2.
12.
9 ±
1.9
2.4
± 2.
6–2
.0 ±
2.2
–2.2
± 2
.60.
2 (–
1.7,
2.1
)Fo
ot H
ealth
Sta
tus
Que
stio
nnai
re¶
Pain
dom
ain
52.3
± 1
9.0
50.1
± 1
7.6
74.8
± 1
4.0
74.3
± 1
8.5
22.5
± 1
7.3
24.3
± 2
4.3
–1.8
(–19
.0, 1
5.5)
Func
tion
dom
ain
67.9
± 1
9.6
78.4
± 1
7.186
.2 ±
11.
592
.1 ±
12.
518
.3 ±
15.
813
.6 ±
10.
44.
7 (–
6.8,
16.
1)*
Valu
es a
re th
e m
ean
± SD
unl
ess
indi
cate
d ot
herw
ise.
95%
CI =
95%
con
fiden
ce in
terv
al; G
P =
gene
ral p
ract
ition
er; N
RS =
num
eric
al ra
ting
scal
e (1
1-po
int).
† 12
-wee
k ch
ange
: pod
iatr
y m
inus
usu
al G
P ca
re.
‡ Ra
ted
on a
7-it
em s
cale
from
“muc
h w
orse
” to
“muc
h be
tter
.” Im
prov
emen
t was
rate
d as
“mod
erat
ely
bett
er” o
r “m
uch
bett
er.”
§ Sc
ores
rang
e 0–
10, w
ith h
ighe
r sco
res
indi
catin
g w
orse
pai
n.
¶ Sc
ores
rang
e 0–
100,
whe
re 0
indi
cate
s ve
ry p
oor f
oot h
ealth
and
100
indi
cate
s op
timal
foot
hea
lth.
FIRST MTP JOINT OA FEASIBILITY RCT | 257
global ratings of change, but we were not powered to assess between-group differences. The findings of this study support a larger clinical trial to compare the superiority of these 2 interven-tions in treating the symptoms of first MTP joint OA.
We found that a large clinical trial is feasible based on par-ticipant recruitment rates, the number of sessions attended, and adherence with study interventions. Approximately 13% of peo-ple who completed an online screening survey were ultimately recruited into this study. These rates are comparable to other larger RCTs in symptomatic radiographic first MTP joint (4) and knee (21) OA. The main reason for exclusion in our study was joint stiffness that lasted longer than 30 minutes. However, given the fact that we do not know whether this exclusion is required for a diagnosis of first MTP joint OA, future trials may consider removing this criterion to boost recruitment rates. The participants were recruited over 9 months; thus, we would expect to enroll ~4 people per month in a larger trial based on data from this study. All participants attended at least 1 of their clinical appointments, with only 1 participant missing the minimum number of 3 appoint-ments for the podiatry intervention.
Our retention rate for the podiatry group was good, with only 1 person lost to follow-up (retention rate 93%). However, 3 were lost in the usual GP care group and could not be contacted for follow-up assessment (retention rate 80%). Adherence with foot orthoses in the podiatry group was acceptable, with most partic-ipants wearing orthoses for longer than the minimum requested time. Furthermore, our average daily orthoses wear time is higher than in a previous study comparing foot orthoses to rocker-soled shoes in people with first MTP joint OA (5). Adherence to exercise was lower, with participants completing 66% of the total prescribed exercise sessions over 12 weeks, although we acknowledge that the validity of self-reported measures of exercise adherence is questionable when compared with accelerometer-measured exercise completion (22). A future large clinical trial might consider implementing strategies to improve exercise adherence, such as scheduling booster sessions with the prescribing clinician (23).
Self-rated adherence with medication use was lower than adherence to orthoses and exercise, but further examination of the data showed that many participants reported that the study GP did not recommend they take medication (n = 5, 33%). Interestingly, examination of the GP consultation notes showed that all except 1 participant were in fact recommended or prescribed medication. This discrepancy between the consultation notes and participant’s self-report is unclear but may be due to a range of factors. First, some participants may have had poor 12-week recall as to whether the GP recommended they take medication, particularly given that they were also provided advice on several other approaches, such as weight management and physical activity, during the same con-sultation. Second, some participants were already taking analgesic and/or antiinflammatory medications and were advised to continue taking these medications by the study GP. Some of these partici-pants may have incorrectly misinterpreted the adherence question
as querying whether the GP had recommended a new medi-cation. Finally, several participants were recommended to take paracetamol, an over-the-counter analgesic medication. Some participants may have believed that the question referred to pre-scription medications only. A simple rewording of the adherence question about GP medication recommendations would prevent this problem in any future clinical trial.
Both interventions resulted in improvements in all measures of pain and function that exceeded minimum clinically important differences (1.8 for NRS pain [24], 11.1 for the pain domain of the FHSQ, and 9.7 for the function domain [25]). This study was not powered to detect between-group differences, and we observed conflicting findings across outcome measures. The conflicting findings likely reflect the small sample size and thus warrant a fully powered clinical trial to conclusively test whether one approach is superior to the other.
An important issue for consideration in any future large clinical trial was the reduced treatment fidelity in the usual GP care group. Upon review of the treatment consultation notes, we found that more than one-half of patients in the GP group had an extended consultation of 30 minutes, and nearly two-thirds received a comprehensive printed generic instruction booklet from the Arthritis Australia website. The extended time and booklet were contrary to both the clinician training and to the protocol steps outlined in the treatment notes. In fact, this reduced fidelity may partly explain why the findings of our usual GP care group are inconsistent with previous reports that first MTP joint OA symptoms remain relatively stable with usual care (26). Future clinical trials should ensure that the advice is more protocolized and specifies consistent verbal and/or written advice and instructions between the groups. Another limitation to this study is the lack of data on the mechanism of action of the inter-ventions. Collection of mechanistic data in a future RCT may help to optimize treatments such as foot orthoses and exercises to improve efficacy in subsequent trials.
In conclusion, a clinical trial comparing a podiatrist-delivered multifaceted intervention to usual GP care for people with first MTP joint OA is feasible. However, this study has identified some areas for refinement of a future clinical trial protocol, including the modification of inclusion/exclusion criteria to increase recruit-ment rates, implementing strategies to improve exercise adher-ence, refining the question on medication adherence to enhance clarity, and providing consistent verbal and/or written OA advice and instructions to both groups. Given the improvements in pain and function observed, a larger appropriately powered clinical trial is warranted to evaluate the superiority of one treatment approach over the other.
ACKNOWLEDGMENTS
The authors thank Sally Child, Dr. Chance Pistol, our expert panel group, the participants who were involved in the trial, and Foot Science International for supplying the orthoses.
PATERSON ET AL 258 |
AUTHOR CONTRIBUTIONS
All authors were involved in drafting the article or revising it critically for important intellectual content, and all authors approved the final version to be submitted for publication. Dr. Paterson had full access to all of the data in the study and takes responsibility for the integrity of the data and the accuracy of the data analysis.Study conception and design. Paterson, Hinman.Acquisition of data. Paterson.Analysis and interpretation of data. Paterson, Metcalf, Campbell, Menz, Hunter, Bennell.
REFERENCES 1. Roddy E, Thomas MJ, Marshall M, Rathod T, Myers H, Menz HB,
et al. The population prevalence of symptomatic radiographic foot osteoarthritis in community-dwelling older adults: cross-sectional findings from the clinical assessment study of the foot. Ann Rheum Dis 2015;74:156–63.
2. Menz HB, Roddy E, Marshall M, Thomas MJ, Rathod T, Myers H, et al. Demographic and clinical factors associated with radiographic severity of first metatarsophalangeal joint osteoarthritis: cross- sectional findings from the Clinical Assessment Study of the Foot. Osteoarthritis Cartilage 2015;23:77–82.
3. Bergin SM, Munteanu SE, Zammit GV, Nikolopoulos N, Menz HB. Impact of first metatarsophalangeal joint osteoarthritis on health- related quality of life. Arthritis Care Res (Hoboken) 2012;64:1691–8.
4. Munteanu SE, Zammit GV, Menz HB, Landorf KB, Handley CJ, Elzarka A, et al. Effectiveness of intra-articular hyaluronan (Synvisc, hylan G-F 20) for the treatment of first metatarsophalangeal joint osteoarthritis: a randomised placebo-controlled trial. Ann Rheum Dis 2011;70:1838–41.
5. Menz HB, Auhl M, Tan JM, Levinger P, Roddy E, Munteanu SE. Effectiveness of foot orthoses versus rocker-sole footwear for first metatarsophalangeal joint osteoarthritis: randomized trial. Arthritis Care Res (Hoboken) 2016;68:581–9.
6. Shamus J, Shamus E, Gugel RN, Brucker BS, Skaruppa C. The effect of sesamoid mobilization, flexor hallucis strengthening, and gait training on reducing pain and restoring function in individ-uals with hallux limitus: a clinical trial. J Orthop Sports Phys Ther 2004;34:368–76.
7. National Clinical Guideline Centre (UK). Osteoarthritis: care and manage ment in adults. London: National Institute for Health and Care Excellence; 2014.
8. McAlindon TE, Bannuru RR, Sullivan MC, Arden NK, Berenbaum F, Bierma-Zeinstra SM, et al. OARSI guidelines for the non-surgical management of knee osteoarthritis. Osteoarthritis Cartilage 2014;22:363–88.
9. Paterson KL, Harrison C, Britt H, Hinman RS, Bennell KL. Management of foot/ankle osteoarthritis by Australian general practitioners: an analysis of national patient-encounter records. Osteoarthritis Cartilage 2018;26:888–94.
10. Paterson KL, Hinman RS, Menz HB, Bennell KL. The ABC foot study: an international, multi-phase, mixed methods study of the assessment of beliefs and clinical practice for managing first metatarsophalangeal joint osteoarthritis. Osteoarthritis Cartilage 2018;26:S320.
11. Hertzog MA. Considerations in determining sample size for pilot studies. Res Nurs Health 2008;31:180–91.
12. Julious SA. Sample size of 12 per group rule of thumb for a pilot study. Pharm Stat 2005;4:287–91.
13. Eldridge SM, Chan CL, Campbell MJ, Bond CM, Hopewell S, Thabane L, et al. CONSORT 2010 statement: extension to ran-domised pilot and feasibility trials. Pilot Feasibility Stud 2016; 2:64.
14. Menz HB, Munteanu SE, Landorf KB, Zammit GV, Cicuttini FM. Radiographic classification of osteoarthritis in commonly affected joints of the foot. Osteoarthritis Cartilage 2007;15:1333–8.
15. Garrow AP, Papageorgiou A, Silman AJ, Thomas E, Jayson MI, Macfarlane GJ. The grading of hallux valgus: the Manchester Scale. J Am Podiatr Med Assoc 2001;91:74–8.
16. Redmond AC, Crosbie J, Ouvrier RA. Development and valida-tion of a novel rating system for scoring standing foot posture: the Foot Posture Index. Clin Biomech (Bristol, Avon) 2006;21: 89–98.
17. Thomas MJ, Moore A, Roddy E, Peat G. “Somebody to say ‘come on we can sort this’”: a qualitative study of primary care consultation among older adults with symptomatic foot osteoarthritis. Arthritis Care Res (Hoboken) 2013;65:2051–5.
18. Hildebrand MW, Host HH, Binder EF, Carpenter B, Freedland KE, Morrow-Howell N, et al. Measuring treatment fidelity in a rehabilita-tion intervention study. Am J Phys Med Rehabil 2012;91:715–24.
19. Bennett PJ, Patterson C, Wearing S, Baglioni T. Development and validation of a questionnaire designed to measure foot-health status. J Am Podiatr Med Assoc 1998;88:419–28.
20. Abbott JH. The distinction between randomized clinical trials (RCTs) and preliminary feasibility and pilot studies: what they are and are not. J Orthop Sports Phys Ther 2014;44:555–8.
21. Hinman RS, Wrigley TV, Metcalf BR, Campbell PK, Paterson KL, Hunter DJ, et al. Unloading shoes for self-management of knee oste-oarthritis: a randomized trial. Ann Intern Med 2016;165:381–9.
22. Nicolson PJ, Hinman RS, Wrigley TV, Stratford PW, Bennell KL. Self-reported home exercise adherence: a validity and reliability study using concealed accelerometers. J Orthop Sports Phys Ther 2018;48:943–50.
23. Nicolson PJ, Bennell KL, Dobson FL, Van Ginckel A, Holden MA, Hinman RS. Interventions to increase adherence to therapeutic exercise in older adults with low back pain and/or hip/knee oste-oarthritis: a systematic review and meta-analysis. Br J Sports Med 2017;51:791–9.
24. Bellamy N, Carette S, Ford PM, Kean WF, le Riche NG, Lussier A, et al. Osteoarthritis antirheumatic drug trials. III. Setting the delta for clinical trials: results of a consensus development (Delphi) exercise. J Rheumatol 1992;19:451–7.
25. Menz HB, Auhl M, Tan JM, Levinger P, Roddy E, Munteanu SE. Comparative responsiveness of outcome measures for the assess-ment of pain and function in osteoarthritis of the first metatarso-phalangeal joint. Arthritis Care Res (Hoboken) 2020;72:679–84.
26. Downes TJ, Chesterton L, Whittle R, Roddy E, Menz HB, Marshall M, et al. Symptomatic course of foot osteoarthritis phenotypes: an 18-month prospective analysis of community-dwelling older adults. Arthritis Care Res (Hoboken) 2018;70:1107–12.
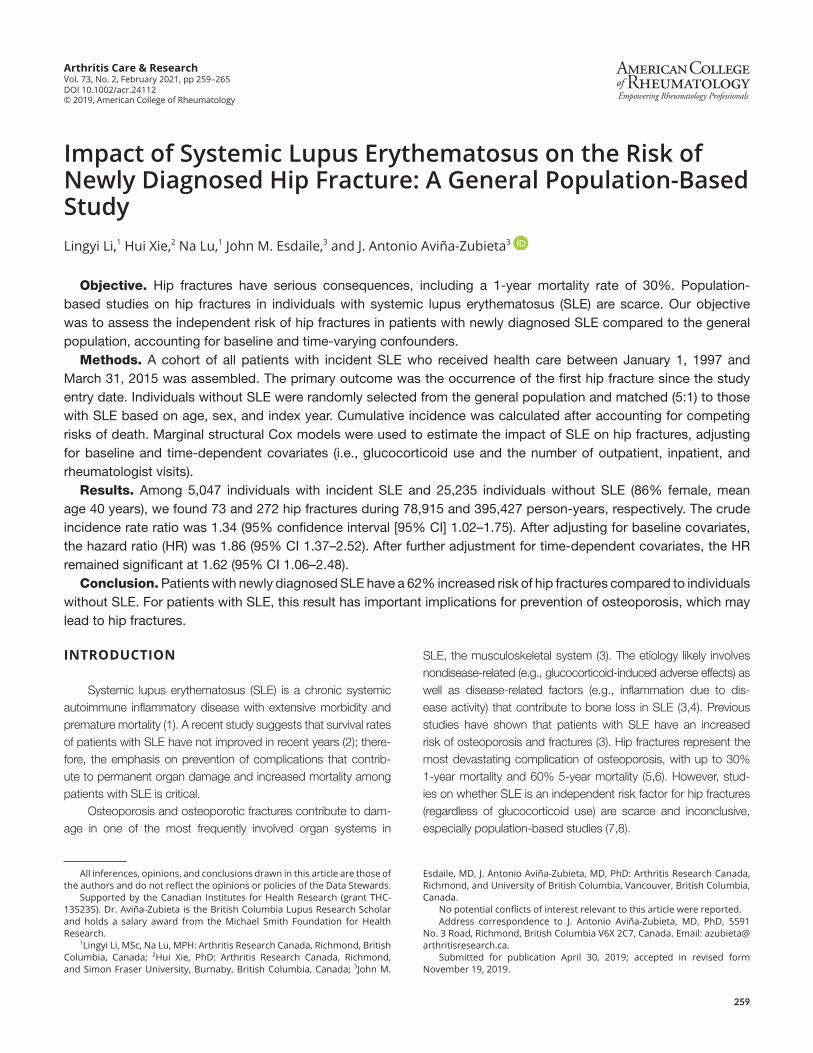
259
Arthritis Care & ResearchVol. 73, No. 2, February 2021, pp 259–265DOI 10.1002/acr.24112© 2019, American College of Rheumatology
Impact of Systemic Lupus Erythematosus on the Risk of Newly Diagnosed Hip Fracture: A General Population-Based StudyLingyi Li,1 Hui Xie,2 Na Lu,1 John M. Esdaile,3 and J. Antonio Aviña-Zubieta3
Objective. Hip fractures have serious consequences, including a 1-year mortality rate of 30%. Population-based studies on hip fractures in individuals with systemic lupus erythematosus (SLE) are scarce. Our objective was to assess the independent risk of hip fractures in patients with newly diagnosed SLE compared to the general population, accounting for baseline and time-varying confounders.
Methods. A cohort of all patients with incident SLE who received health care between January 1, 1997 and March 31, 2015 was assembled. The primary outcome was the occurrence of the first hip fracture since the study entry date. Individuals without SLE were randomly selected from the general population and matched (5:1) to those with SLE based on age, sex, and index year. Cumulative incidence was calculated after accounting for competing risks of death. Marginal structural Cox models were used to estimate the impact of SLE on hip fractures, adjusting for baseline and time-dependent covariates (i.e., glucocorticoid use and the number of outpatient, inpatient, and rheumatologist visits).
Results. Among 5,047 individuals with incident SLE and 25,235 individuals without SLE (86% female, mean age 40 years), we found 73 and 272 hip fractures during 78,915 and 395,427 person-years, respectively. The crude incidence rate ratio was 1.34 (95% confidence interval [95% CI] 1.02–1.75). After adjusting for baseline covariates, the hazard ratio (HR) was 1.86 (95% CI 1.37–2.52). After further adjustment for time-dependent covariates, the HR remained significant at 1.62 (95% CI 1.06–2.48).
Conclusion. Patients with newly diagnosed SLE have a 62% increased risk of hip fractures compared to individuals without SLE. For patients with SLE, this result has important implications for prevention of osteoporosis, which may lead to hip fractures.
INTRODUCTION
Systemic lupus erythematosus (SLE) is a chronic systemic autoimmune inflammatory disease with extensive morbidity and premature mortality (1). A recent study suggests that survival rates of patients with SLE have not improved in recent years (2); there-fore, the emphasis on prevention of complications that contrib-ute to permanent organ damage and increased mortality among patients with SLE is critical.
Osteoporosis and osteoporotic fractures contribute to dam-age in one of the most frequently involved organ systems in
SLE, the musculoskeletal system (3). The etiology likely involves nondisease-related (e.g., glucocorticoid-induced adverse effects) as well as disease-related factors (e.g., inflammation due to dis-ease activity) that contribute to bone loss in SLE (3,4). Previous studies have shown that patients with SLE have an increased risk of osteoporosis and fractures (3). Hip fractures represent the most devastating complication of osteoporosis, with up to 30% 1-year mortality and 60% 5-year mortality (5,6). However, stud-ies on whether SLE is an independent risk factor for hip fractures (regardless of glucocorticoid use) are scarce and inconclusive, especially population-based studies (7,8).
All inferences, opinions, and conclusions drawn in this article are those of the authors and do not reflect the opinions or policies of the Data Stewards.
Supported by the Canadian Institutes for Health Research (grant THC-135235). Dr. Aviña-Zubieta is the British Columbia Lupus Research Scholar and holds a salary award from the Michael Smith Foundation for Health Research.
1Lingyi Li, MSc, Na Lu, MPH: Arthritis Research Canada, Richmond, British Columbia, Canada; 2Hui Xie, PhD: Arthritis Research Canada, Richmond, and Simon Fraser University, Burnaby, British Columbia, Canada; 3John M.
Esdaile, MD, J. Antonio Aviña-Zubieta, MD, PhD: Arthritis Research Canada, Richmond, and University of British Columbia, Vancouver, British Columbia, Canada.
No potential conflicts of interest relevant to this article were reported.Address correspondence to J. Antonio Aviña-Zubieta, MD, PhD, 5591
No. 3 Road, Richmond, British Columbia V6X 2C7, Canada. Email: [email protected].
Submitted for publication April 30, 2019; accepted in revised form November 19, 2019.
LI ET AL 260 |
A case–control study, a cross-sectional study, and a meta-analysis showed a significant association between SLE and hip fractures, with the risk ranging from 1.99 to 5.10 (4,9,10). Furthermore, 1 cohort study that used electronic medical records from primary care physicians in the UK showed an increased risk of hip fractures among patients with rheumatoid arthritis or SLE, with hazard ratios (HRs) ranging from 1.69 to 1.90 (11). However, that study did not test the association between SLE and hip frac-tures alone. Another matched cohort study from Taiwan reported a crude incidence rate ratio of 2.23 (95% confidence interval [95% CI] 1.51–3.32) for the risk of hip fractures in the SLE cohort com-pared to the general population but did not adjust for baseline or time-dependent risk factors (7). A more recent cohort study using Medicaid data from the US with a shorter follow-up time (2007–2010) reported an HR of 3.22 (95% CI 2.33–4.46) (12). In contrast, a substantially smaller and statistically insignificant HR of 1.09 (95% CI 0.65–1.82) was reported in the UK, after adjusting for baseline and time-dependent risk factors using the time- dependent Cox proportional hazards model (8). Existing literature on longitudinal observation data analysis has shown the importance of accounting for time-dependent confounders or mediators via inverse weighting rather than adding them as covariates as in tra-ditional Cox proportional hazards models (13,14). Covariates like glucocorticoids play an important role in the treatment of SLE and can cause glucocorticoid-induced osteoporosis (15); therefore, analysis needs to isolate and account for variables that can be intermediary variables between SLE and hip fracture.
The 4 cohort studies mentioned above used prevalent SLE cohorts, which have an inherent survival bias because the cohorts only included survivors, who may be less susceptible to hip frac-tures (16). Thus, despite the potentially important association between SLE and hip fractures, the current literature is inconclu-sive about the role of SLE-associated chronic inflammation on the risk of hip fractures, and findings are conflicting due to inadequa-cies in the design and analytical approaches, as mentioned above.
The aim of this study was both to estimate the overall risk of hip fractures in an incident SLE cohort compared to the general population and to estimate the independent effect of SLE on the occurrence of hip fractures after adjusting for nondisease-related
factors (e.g., medication-induced adverse effects, particularly from glucocorticoid use) and other traditional hip fracture risk factors at baseline and during follow-up.
SUBJECTS AND METHODS
Universal health care coverage is available for all residents of the province of British Columbia (BC), Canada (population ~4.7 million). Population Data BC encompasses all provincially funded health care service data from January 1, 1990 to March 31, 2015, including all health care professional visits (17), hospi-talizations (18), registration on the provincial medical services plan (19), cancer registry (20), and vital statistics (21). Furthermore, Population Data BC includes the comprehensive prescription drug database PharmaNet (22), which captures all dispensed medica-tions in outpatient settings for all BC residents since 1996. Several population-based studies have been successfully conducted using Population Data BC (23–25).
Study design and cohort definitions. Using Population Data BC, a 1:5 matched cohort study on the risk of incident hip fractures among patients with incident SLE (SLE cohort) com-pared with age-, sex-, and index year–matched individuals who were randomly selected from the general population (non-SLE cohort) was conducted.
SLE cohort. The case definition of incident SLE included: 1) individuals age ≥18 years; 2) 2 principal International Classification of Disease, Ninth Revision, Clinical Modification (ICD-9-CM 710.0) or International Statistical Classification of Diseases and Related Health Problems, Tenth Revision, Clinical Modification (ICD-10-CM M32.1, M32.8, M32.9) codes for SLE at least 2 months apart within 2 years from any type of physician or hospital visit; and 3) no SLE diagnosis in a 7-year run-in period prior to the first ICD code for SLE. The date of the second diagnosis date made within the timeframe (i.e., earliest time on the database after meet-ing the SLE case definition) was defined as the SLE index date. Of the patients with SLE, 99.4% were diagnosed by rheumatologists or from hospitalization. Similar case definitions using Swedish reg-ister data have been validated, with a sensitivity of 97.6% and a positive predictive value of 97.5% (26).
Non-SLE cohort. To assemble the comparison cohort, data for a random sample of ~2 million BC residents registered with the provincial medical services plan during the study period were used. Individuals without any history of SLE diagnosis were selected and matched to patients with SLE (5:1) based on age, sex, and calendar year of the SLE index date. Patients with SLE were also eligible to be selected into the non-SLE cohort prior to their diagnosis. To be comparable with the SLE cohort, all individ-uals in the non-SLE cohort had a 7-year run-in period, the same criterion applied to the SLE cohort.
SIGNIFICANCE & INNOVATIONS• The 62% increased risk of hip fractures in patients
with newly diagnosed systemic lupus erythematosus (SLE) is independent of traditional risk factors, includ-ing glucocorticoid use. This finding provides evidence on the direct role of SLE in the risk of hip fractures.
• SLE and its chronic inflammation should be consid-ered new risk factors for hip fractures.
• Our results call for an increased awareness of and improved strategy to prevent hip fractures in pa-tients with SLE.
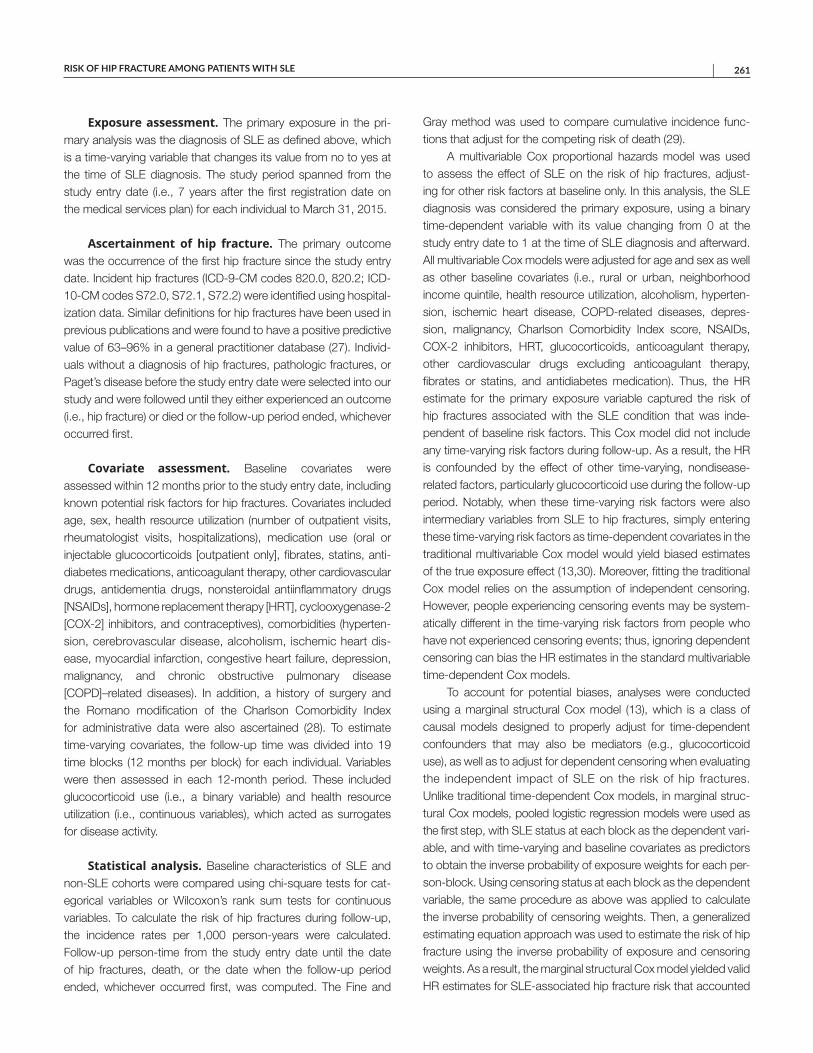
RISK OF HIP FRACTURE AMONG PATIENTS WITH SLE | 261
Exposure assessment. The primary exposure in the pri-mary analysis was the diagnosis of SLE as defined above, which is a time-varying variable that changes its value from no to yes at the time of SLE diagnosis. The study period spanned from the study entry date (i.e., 7 years after the first registration date on the medical services plan) for each individual to March 31, 2015.
Ascertainment of hip fracture. The primary outcome was the occurrence of the first hip fracture since the study entry date. Incident hip fractures (ICD-9-CM codes 820.0, 820.2; ICD-10-CM codes S72.0, S72.1, S72.2) were identified using hospital-ization data. Similar definitions for hip fractures have been used in previous publications and were found to have a positive predictive value of 63–96% in a general practitioner database (27). Individ-uals without a diagnosis of hip fractures, pathologic fractures, or Paget’s disease before the study entry date were selected into our study and were followed until they either experienced an outcome (i.e., hip fracture) or died or the follow-up period ended, whichever occurred first.
Covariate assessment. Baseline covariates were assessed within 12 months prior to the study entry date, including known potential risk factors for hip fractures. Covariates included age, sex, health resource utilization (number of outpatient visits, rheumatologist visits, hospitalizations), medication use (oral or injectable glucocorticoids [outpatient only], fibrates, statins, anti-diabetes medications, anticoagulant therapy, other cardiovascular drugs, antidementia drugs, nonsteroidal antiinflammatory drugs [NSAIDs], hormone replacement therapy [HRT], cyclooxygenase-2 [COX-2] inhibitors, and contraceptives), comorbidities (hyperten-sion, cerebrovascular disease, alcoholism, ischemic heart dis-ease, myocardial infarction, congestive heart failure, depression, malignancy, and chronic obstructive pulmonary disease [COPD]–related diseases). In addition, a history of surgery and the Romano modification of the Charlson Comorbidity Index for administrative data were also ascertained (28). To estimate time-varying covariates, the follow-up time was divided into 19 time blocks (12 months per block) for each individual. Variables were then assessed in each 12-month period. These included glucocorticoid use (i.e., a binary variable) and health resource utilization (i.e., continuous variables), which acted as surrogates for disease activity.
Statistical analysis. Baseline characteristics of SLE and non-SLE cohorts were compared using chi-square tests for cat-egorical variables or Wilcoxon’s rank sum tests for continuous variables. To calculate the risk of hip fractures during follow-up, the incidence rates per 1,000 person-years were calculated. Follow-up person-time from the study entry date until the date of hip fractures, death, or the date when the follow-up period ended, whichever occurred first, was computed. The Fine and
Gray method was used to compare cumulative incidence func-tions that adjust for the competing risk of death (29).
A multivariable Cox proportional hazards model was used to assess the effect of SLE on the risk of hip fractures, adjust-ing for other risk factors at baseline only. In this analysis, the SLE diagnosis was considered the primary exposure, using a binary time-dependent variable with its value changing from 0 at the study entry date to 1 at the time of SLE diagnosis and afterward. All multivariable Cox models were adjusted for age and sex as well as other baseline covariates (i.e., rural or urban, neighborhood income quintile, health resource utilization, alcoholism, hyperten-sion, ischemic heart disease, COPD-related diseases, depres-sion, malignancy, Charlson Comorbidity Index score, NSAIDs, COX-2 inhibitors, HRT, glucocorticoids, anticoagulant therapy, other cardiovascular drugs excluding anticoagulant therapy, fibrates or statins, and antidiabetes medication). Thus, the HR estimate for the primary exposure variable captured the risk of hip fractures associated with the SLE condition that was inde-pendent of baseline risk factors. This Cox model did not include any time-varying risk factors during follow-up. As a result, the HR is confounded by the effect of other time-varying, nondisease- related factors, particularly glucocorticoid use during the follow-up period. Notably, when these time-varying risk factors were also intermediary variables from SLE to hip fractures, simply entering these time-varying risk factors as time-dependent covariates in the traditional multivariable Cox model would yield biased estimates of the true exposure effect (13,30). Moreover, fitting the traditional Cox model relies on the assumption of independent censoring. However, people experiencing censoring events may be system-atically different in the time-varying risk factors from people who have not experienced censoring events; thus, ignoring dependent censoring can bias the HR estimates in the standard multivariable time-dependent Cox models.
To account for potential biases, analyses were conducted using a marginal structural Cox model (13), which is a class of causal models designed to properly adjust for time-dependent confounders that may also be mediators (e.g., glucocorticoid use), as well as to adjust for dependent censoring when evaluating the independent impact of SLE on the risk of hip fractures. Unlike traditional time-dependent Cox models, in marginal struc-tural Cox models, pooled logistic regression models were used as the first step, with SLE status at each block as the dependent vari-able, and with time-varying and baseline covariates as predictors to obtain the inverse probability of exposure weights for each per-son-block. Using censoring status at each block as the dependent variable, the same procedure as above was applied to calculate the inverse probability of censoring weights. Then, a generalized estimating equation approach was used to estimate the risk of hip fracture using the inverse probability of exposure and censoring weights. As a result, the marginal structural Cox model yielded valid HR estimates for SLE-associated hip fracture risk that accounted
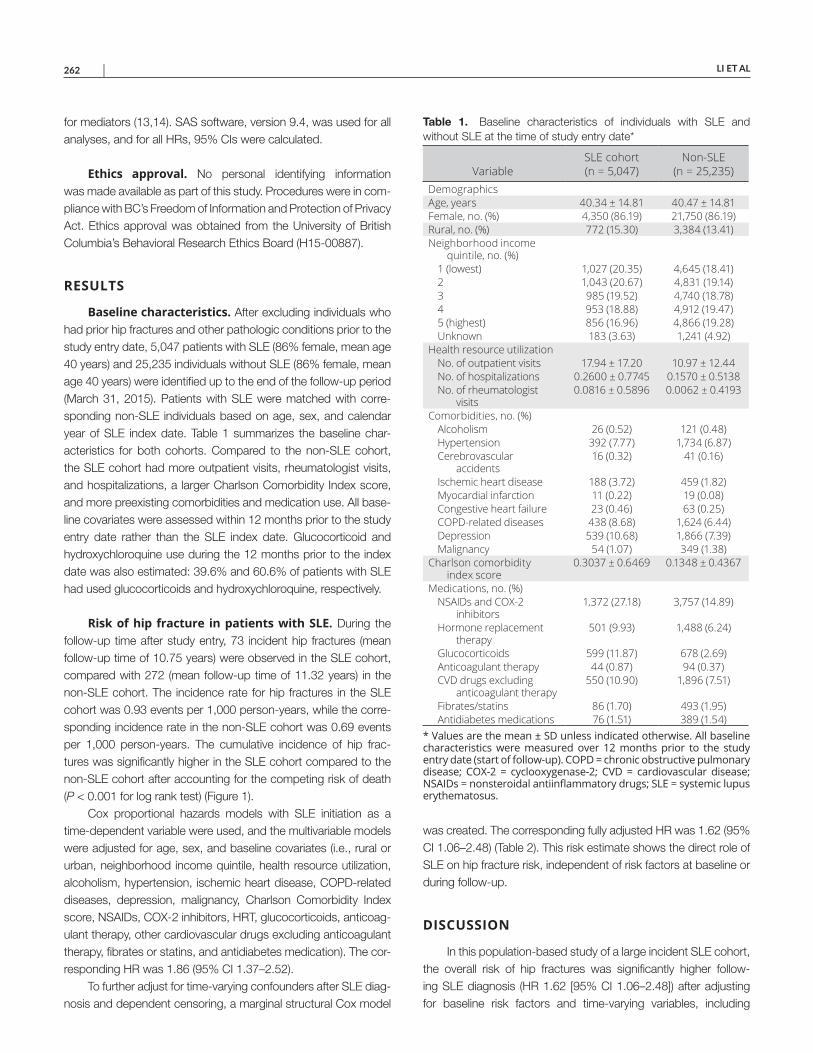
LI ET AL 262 |
for mediators (13,14). SAS software, version 9.4, was used for all analyses, and for all HRs, 95% CIs were calculated.
Ethics approval. No personal identifying information was made available as part of this study. Procedures were in com-pliance with BC’s Freedom of Information and Protection of Privacy Act. Ethics approval was obtained from the University of British Columbia’s Behavioral Research Ethics Board (H15-00887).
RESULTS
Baseline characteristics. After excluding individuals who had prior hip fractures and other pathologic conditions prior to the study entry date, 5,047 patients with SLE (86% female, mean age 40 years) and 25,235 individuals without SLE (86% female, mean age 40 years) were identified up to the end of the follow-up period (March 31, 2015). Patients with SLE were matched with corre-sponding non-SLE individuals based on age, sex, and calendar year of SLE index date. Table 1 summarizes the baseline char-acteristics for both cohorts. Compared to the non-SLE cohort, the SLE cohort had more outpatient visits, rheumatologist visits, and hospitalizations, a larger Charlson Comorbidity Index score, and more preexisting comorbidities and medication use. All base-line covariates were assessed within 12 months prior to the study entry date rather than the SLE index date. Glucocorticoid and hydroxychloroquine use during the 12 months prior to the index date was also estimated: 39.6% and 60.6% of patients with SLE had used glucocorticoids and hydroxychloroquine, respectively.
Risk of hip fracture in patients with SLE. During the follow-up time after study entry, 73 incident hip fractures (mean follow-up time of 10.75 years) were observed in the SLE cohort, compared with 272 (mean follow-up time of 11.32 years) in the non-SLE cohort. The incidence rate for hip fractures in the SLE cohort was 0.93 events per 1,000 person-years, while the corre-sponding incidence rate in the non-SLE cohort was 0.69 events per 1,000 person-years. The cumulative incidence of hip frac-tures was significantly higher in the SLE cohort compared to the non-SLE cohort after accounting for the competing risk of death (P < 0.001 for log rank test) (Figure 1).
Cox proportional hazards models with SLE initiation as a time-dependent variable were used, and the multivariable models were adjusted for age, sex, and baseline covariates (i.e., rural or urban, neighborhood income quintile, health resource utilization, alcoholism, hypertension, ischemic heart disease, COPD-related diseases, depression, malignancy, Charlson Comorbidity Index score, NSAIDs, COX-2 inhibitors, HRT, glucocorticoids, anticoag-ulant therapy, other cardiovascular drugs excluding anticoagulant therapy, fibrates or statins, and antidiabetes medication). The cor-responding HR was 1.86 (95% CI 1.37–2.52).
To further adjust for time-varying confounders after SLE diag-nosis and dependent censoring, a marginal structural Cox model
was created. The corresponding fully adjusted HR was 1.62 (95% CI 1.06–2.48) (Table 2). This risk estimate shows the direct role of SLE on hip fracture risk, independent of risk factors at baseline or during follow-up.
DISCUSSION
In this population-based study of a large incident SLE cohort, the overall risk of hip fractures was significantly higher follow-ing SLE diagnosis (HR 1.62 [95% CI 1.06–2.48]) after adjusting for baseline risk factors and time-varying variables, including
Table 1. Baseline characteristics of individuals with SLE and without SLE at the time of study entry date*
VariableSLE cohort (n = 5,047)
Non-SLE (n = 25,235)
DemographicsAge, years 40.34 ± 14.81 40.47 ± 14.81Female, no. (%) 4,350 (86.19) 21,750 (86.19)Rural, no. (%) 772 (15.30) 3,384 (13.41)Neighborhood income
quintile, no. (%)1 (lowest) 1,027 (20.35) 4,645 (18.41)2 1,043 (20.67) 4,831 (19.14)3 985 (19.52) 4,740 (18.78)4 953 (18.88) 4,912 (19.47)5 (highest) 856 (16.96) 4,866 (19.28)Unknown 183 (3.63) 1,241 (4.92)
Health resource utilizationNo. of outpatient visits 17.94 ± 17.20 10.97 ± 12.44No. of hospitalizations 0.2600 ± 0.7745 0.1570 ± 0.5138No. of rheumatologist
visits0.0816 ± 0.5896 0.0062 ± 0.4193
Comorbidities, no. (%)Alcoholism 26 (0.52) 121 (0.48)Hypertension 392 (7.77) 1,734 (6.87)Cerebrovascular
accidents16 (0.32) 41 (0.16)
Ischemic heart disease 188 (3.72) 459 (1.82)Myocardial infarction 11 (0.22) 19 (0.08)Congestive heart failure 23 (0.46) 63 (0.25)COPD-related diseases 438 (8.68) 1,624 (6.44)Depression 539 (10.68) 1,866 (7.39)Malignancy 54 (1.07) 349 (1.38)
Charlson comorbidity index score
0.3037 ± 0.6469 0.1348 ± 0.4367
Medications, no. (%)NSAIDs and COX-2
inhibitors1,372 (27.18) 3,757 (14.89)
Hormone replacement therapy
501 (9.93) 1,488 (6.24)
Glucocorticoids 599 (11.87) 678 (2.69)Anticoagulant therapy 44 (0.87) 94 (0.37)CVD drugs excluding
anticoagulant therapy550 (10.90) 1,896 (7.51)
Fibrates/statins 86 (1.70) 493 (1.95)Antidiabetes medications 76 (1.51) 389 (1.54)
* Values are the mean ± SD unless indicated otherwise. All baselinecharacteristics were measured over 12 months prior to the study entry date (start of follow-up). COPD = chronic obstructive pulmonary disease; COX-2 = cyclooxygenase-2; CVD = cardiovascular disease; NSAIDs = nonsteroidal antiinflammatory drugs; SLE = systemic lupus erythematosus.
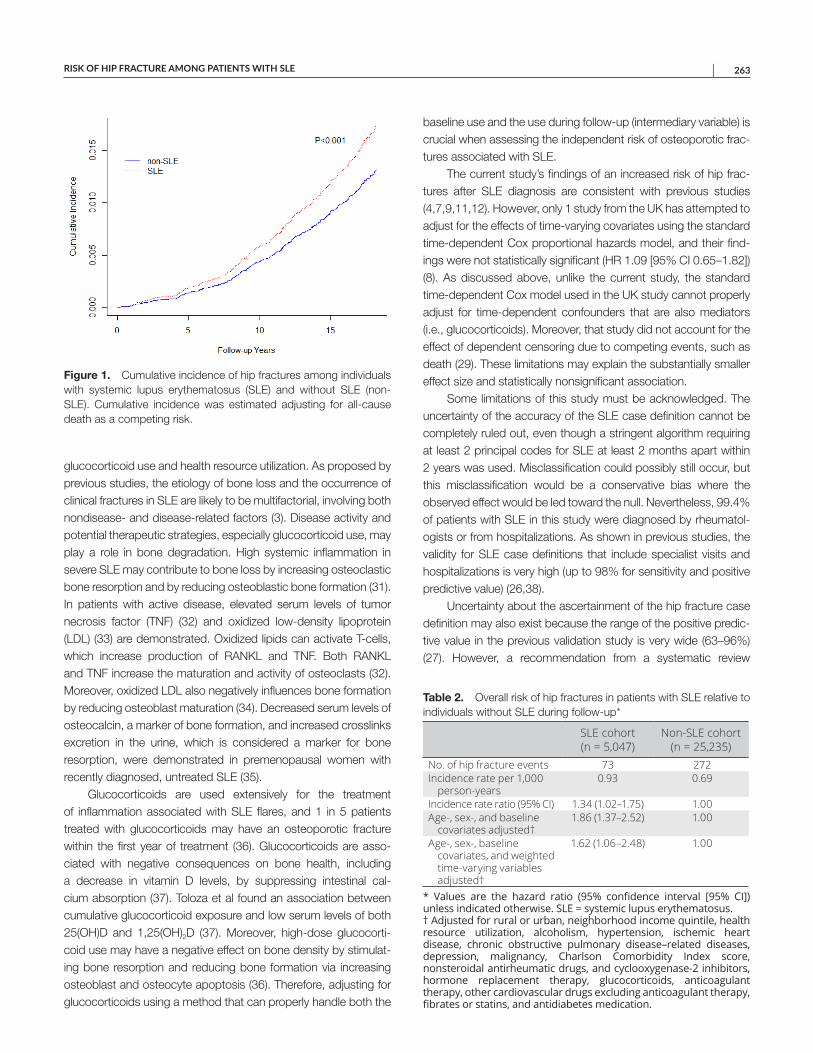
RISK OF HIP FRACTURE AMONG PATIENTS WITH SLE | 263
glucocorticoid use and health resource utilization. As proposed by previous studies, the etiology of bone loss and the occurrence of clinical fractures in SLE are likely to be multifactorial, involving both nondisease- and disease-related factors (3). Disease activity and potential therapeutic strategies, especially glucocorticoid use, may play a role in bone degradation. High systemic inflammation in severe SLE may contribute to bone loss by increasing osteoclastic bone resorption and by reducing osteoblastic bone formation (31). In patients with active disease, elevated serum levels of tumor necrosis factor (TNF) (32) and oxidized low-density lipoprotein (LDL) (33) are demonstrated. Oxidized lipids can activate T-cells, which increase production of RANKL and TNF. Both RANKL and TNF increase the maturation and activity of osteoclasts (32). Moreover, oxidized LDL also negatively influences bone formation by reducing osteoblast maturation (34). Decreased serum levels of osteocalcin, a marker of bone formation, and increased crosslinks excretion in the urine, which is considered a marker for bone resorption, were demonstrated in premenopausal women with recently diagnosed, untreated SLE (35).
Glucocorticoids are used extensively for the treatment of inflammation associated with SLE flares, and 1 in 5 patients treated with glucocorticoids may have an osteoporotic fracture within the first year of treatment (36). Glucocorticoids are asso-ciated with negative consequences on bone health, including a decrease in vitamin D levels, by suppressing intestinal cal-cium absorption (37). Toloza et al found an association between cumulative glucocorticoid exposure and low serum levels of both 25(OH)D and 1,25(OH)2D (37). Moreover, high-dose glucocorti-coid use may have a negative effect on bone density by stimulat-ing bone resorption and reducing bone formation via increasing osteoblast and osteocyte apoptosis (36). Therefore, adjusting for glucocorticoids using a method that can properly handle both the
baseline use and the use during follow-up (intermediary variable) is crucial when assessing the independent risk of osteoporotic frac-tures associated with SLE.
The current study’s findings of an increased risk of hip frac-tures after SLE diagnosis are consistent with previous studies (4,7,9,11,12). However, only 1 study from the UK has attempted to adjust for the effects of time-varying covariates using the standard time-dependent Cox proportional hazards model, and their find-ings were not statistically significant (HR 1.09 [95% CI 0.65–1.82]) (8). As discussed above, unlike the current study, the standard time-dependent Cox model used in the UK study cannot properly adjust for time-dependent confounders that are also mediators (i.e., glucocorticoids). Moreover, that study did not account for the effect of dependent censoring due to competing events, such as death (29). These limitations may explain the substantially smaller effect size and statistically nonsignificant association.
Some limitations of this study must be acknowledged. The uncertainty of the accuracy of the SLE case definition cannot be completely ruled out, even though a stringent algorithm requiring at least 2 principal codes for SLE at least 2 months apart within 2 years was used. Misclassification could possibly still occur, but this misclassification would be a conservative bias where the observed effect would be led toward the null. Nevertheless, 99.4% of patients with SLE in this study were diagnosed by rheumatol-ogists or from hospitalizations. As shown in previous studies, the validity for SLE case definitions that include specialist visits and hospitalizations is very high (up to 98% for sensitivity and positive predictive value) (26,38).
Uncertainty about the ascertainment of the hip fracture case definition may also exist because the range of the positive predic-tive value in the previous validation study is very wide (63–96%) (27). However, a recommendation from a systematic review
Figure 1. Cumulative incidence of hip fractures among individuals with systemic lupus erythematosus (SLE) and without SLE (non-SLE). Cumulative incidence was estimated adjusting for all-cause death as a competing risk.
Table 2. Overall risk of hip fractures in patients with SLE relative to individuals without SLE during follow-up*
SLE cohort (n = 5,047)
Non-SLE cohort (n = 25,235)
No. of hip fracture events 73 272Incidence rate per 1,000
person-years0.93 0.69
Incidence rate ratio (95% CI) 1.34 (1.02–1.75) 1.00Age-, sex-, and baseline
covariates adjusted†1.86 (1.37–2.52) 1.00
Age-, sex-, baseline covariates, and weighted time-varying variables adjusted†
1.62 (1.06–2.48) 1.00
* Values are the hazard ratio (95% confidence interval [95% CI]) unless indicated otherwise. SLE = systemic lupus erythematosus. † Adjusted for rural or urban, neighborhood income quintile, health resource utilization, alcoholism, hypertension, ischemic heart disease, chronic obstructive pulmonary disease–related diseases, depression, malignancy, Charlson Comorbidity Index score, nonsteroidal antirheumatic drugs, and cyclooxygenase-2 inhibitors, hormone replacement therapy, glucocorticoids, anticoagulant therapy, other cardiovascular drugs excluding anticoagulant therapy, fibrates or statins, and antidiabetes medication.

LI ET AL 264 |
suggests that ICD codes are valid to identify hip fractures but not vertebral fractures (27). All known risk factors for hip fractures available in our data were adjusted for; however, some risk factors, such as body mass index and smoking history, were not available in the data set. The absence of ethnicity in the databases is also a limitation because ethnicity may influence hip fracture risk (39).
Certainly, evaluating the effect of having SLE on the risk of complications, such as hip fracture, can be challenging. It is unethical or impossible to manipulate or assign disease conditions to patients to study the SLE effect on hip fractures via randomized clinical trials. Therefore, applying the marginal structural model in this setting may not truly estimate the causal effect of SLE on hip fractures since SLE status is not assigned. However, a compara-ble example is found in a study that evaluated the effect of systolic blood pressure level on the time to renal event (14), in which one cannot assign systolic blood pressure level to patients. In these situations, one must rely on observational data. In our study, state-of-the-art marginal structural model methods were applied to study the effect of having SLE on the risk of hip fractures. The validity of the effect estimate requires the assumption that there are no unobserved confounders, and given the set of baseline and time-varying confounders included in this analysis, the marginal structural model would be satisfied.
Despite these limitations, there are several strengths. A large Canadian administrative data set based on the entire BC popula-tion was used, which makes the findings generalizable. Addition-ally, this is also the first study assessing the risk of hip fractures in SLE after accounting for the impact of time-varying covariates by using a marginal structural Cox model (13). This model can properly adjust for both time-dependent confounders that may also be mediators and dependent censoring. Furthermore, we required at least 7 years of run-in time before the first ICD code for SLE to only include true incident patients and exposures, which avoids the survival bias of using a prevalent cohort.
In summary, this population-based study demonstrates that patients with SLE have an approximately 60% increased risk of sustaining a hip fracture compared to the general population. This result expands on the findings of previous studies and has impor-tant implications for the prevention, screening, and treatment of osteoporosis that may lead to hip fractures. Further studies should clarify the impact of inflammation, glucocorticoid dosage, and duration of use on the risk of hip fractures among patients with SLE.
ACKNOWLEDGMENT
The authors thank Dami Ojo for her editorial assistance in the preparation of this manuscript.
AUTHOR CONTRIBUTIONS
All authors were involved in drafting the article or revising it critically for important intellectual content, and all authors approved the final version to be submitted for publication. Dr. Aviña-Zubieta had full access to all of
the data in the study and takes responsibility for the integrity of the data and the accuracy of the data analysis.Study conception and design. Li, Xie, Esdaile, Aviña-Zubieta.Acquisition of data. Li, Xie, Lu, Aviña-Zubieta.Analysis and interpretation of data. Li, Xie, Lu, Esdaile, Aviña-Zubieta.
REFERENCES 1. Moulton VR, Suarez-Fueyo A, Meidan E, Li H, Mizui M, Tsokos GC.
Pathogenesis of human systemic lupus erythematosus: a cellular perspective. Trends Mol Med 2017;23:615–35.
2. Jorge AM, Lu N, Zhang Y, Rai SK, Choi HK. Unchanging prema-ture mortality trends in systemic lupus erythematosus: a general population-based study (1999–2014). Rheumatology (Oxford) 2018;57:337–44.
3. Bultink IE. Osteoporosis and fractures in systemic lupus erythemato-sus. Arthritis Care Res (Hoboken) 2012;64:2–8.
4. Wang X, Yan S, Liu C, Xu Y, Wan L, Wang Y, et al. Fracture risk and bone mineral density levels in patients with systemic lupus ery-thematosus: a systematic review and meta-analysis. Osteoporos Int 2016;27:1413–23.
5. Dell RM, Greene D, Anderson D, Williams K. Osteoporosis disease management: what every orthopaedic surgeon should know. J Bone Joint Surg Am 2009;91:79–86.
6. Lee YK, Lee YJ, Ha YC, Koo KH. Five-year relative survival of patients with osteoporotic hip fracture. J Clin Endocrinol Metab 2014;99:97–100.
7. Wang SH, Chang YS, Liu CJ, Lai CC, Chen WS, Chen TJ, et al. Association of systemic lupus erythematosus with a higher risk of cervical but not trochanteric hip fracture: a nationwide popula-tion-based study. Arthritis Care Res (Hoboken) 2013;65:1674–81.
8. Bultink IE, Harvey NC, Lalmohamed A, Cooper C, Lems WF, van Staa TP, et al. Elevated risk of clinical fractures and associated risk factors in patients with systemic lupus erythematosus versus matched controls: a population-based study in the United Kingdom. Osteoporos Int 2014;25:1275–83.
9. Ekblom-Kullberg S, Kautiainen H, Alha P, Leirisalo-Repo M, Julkunen H. Frequency of and risk factors for symptomatic bone fractures in patients with systemic lupus erythematosus. Scand J Rheumatol 2013;42:390–3.
10. Weiss RJ, Wick MC, Ackermann PW, Montgomery SM. Increased fracture risk in patients with rheumatic disorders and other inflam-matory diseases: a case-control study with 53,108 patients with fracture. J Rheumatol 2010;37:2247–50.
11. Hippisley-Cox J, Coupland C. Derivation and validation of updated QFracture algorithm to predict risk of osteoporotic fracture in primary care in the United Kingdom: prospective open cohort study. BMJ 2012;344:e3427.
12. Tedeschi SK, Kim SC, Guan H, Grossman JM, Costenbader KH. Comparative fracture risks among United States Medicaid enroll-ees with and those without systemic lupus erythematosus. Arthritis Rheumatol 2019;71:1141–6.
13. Hernán MA, Brumback B, Robins JM. Marginal structural models to estimate the causal effect of zidovudine on the survival of HIV-positive men. Epidemiology 2000;11:561–70.
14. Xie D, Yang W, Jepson C, Roy J, Hsu JY, Shou H, et al. Statistical methods for modeling time-updated exposures in cohort studies of chronic kidney disease. Clin J Am Soc Nephrol 2017;12:1892–9.
15. Buckley L, Guyatt G, Fink HA, Cannon M, Grossman J, Hansen KE, et al. 2017 American College of Rheumatology guideline for the prevention and treatment of glucocorticoid-induced osteoporosis. Arthritis Rheumatol 2017;69:1521–37.
16. Choi HK, Nguyen US, Niu J, Danaei G, Zhang Y. Selection bias in rheumatic disease research. Nat Rev Rheumatol 2014;10:403–12.
RISK OF HIP FRACTURE AMONG PATIENTS WITH SLE | 265
17. British Columbia Ministry of Health. Medical Services Plan (MSP)payment information file, 2017. URL: https://www.popdata.bc.ca/data/health/msp.
18. Canadian Institute for Health Information. Discharge abstract data-base (hospital separations), 2017. URL: https://www.popdata.bc.ca/data/health/dad.
19. British Columbia Ministry of Health. Consolidation file (MSP & premium billing), 2017. URL: https://www.popdata.bc.ca/data/population/consolidationfile.
20. BC Cancer Agency. BC Cancer Agency registry data, 2017. URL:https://www.popdata.bc.ca/data/health/bccancer.
21. BC Vital Statistics Agency. Vital statistics deaths, 2017. URL: https://www.popdata.bc.ca/data/population/ve_deaths.
22. BC Ministry of Health. PharmaNet, 2018. URL: https://www.popdata.bc.ca/data/health/PharmaNet.
23. Lacaille D, Avina-Zubieta JA, Sayre EC, Abrahamowicz M.Improvement in 5-year mortality in incident rheumatoid arthritis com-pared with the general population: closing the mortality gap. AnnRheum Dis 2017;76:1057–63.
24. Etminan M, Forooghian F, Brophy JM, Bird ST, Maberley D.Oral fluoroquinolones and the risk of retinal detachment. JAMA2012;307:1414–9.
25. Solomon DH, Massarotti E, Garg R, Liu J, Canning C, SchneeweissS. Association between disease-modifying antirheumatic drugs anddiabetes risk in patients with rheumatoid arthritis and psoriasis.JAMA 2011;305:2525–31.
26. Arkema EV, Jönsen A, Rönnblom L, Svenungsson E, Sjöwall C,Simard JF. Case definitions in Swedish register data to identify sys-temic lupus erythematosus. BMJ Open 2016;6:e007769.
27. Hudson M, Avina-Zubieta A, Lacaille D, Bernatsky S, Lix L, Jean S.The validity of administrative data to identify hip fractures is high: asystematic review. J Clin Epidemiol 2013;66:278–85.
28. Romano PS, Roos LL, Jollis JG. Adapting a clinical comorbidityindex for use with ICD-9-CM administrative data: differing perspec-tives. J Clin Epidemiol 1993;46:1075–9.
29. Fine JP, Gray RJ. A proportional hazards model for the subdistribu-tion of a competing risk. J Am Stat Assoc 1999;94:496–509.
30. Schisterman EF, Cole SR, Platt RW. Overadjustment bias andunnecessary adjustment in epidemiologic studies. Epidemiology2009;20:488–95.
31. Bultink IE. Bone disease in connective tissue disease/systemic lupus erythematosus. Calcif Tissue Int 2018;102:575–91.
32. Svenungsson E, Fei GZ, Jensen-Urstad K, de Faire U, Hamsten A,Frostegard J. TNF-alpha: a link between hypertriglyceridaemia andinflammation in SLE patients with cardiovascular disease. Lupus2003;12:454–61.
33. Frostegård J, Svenungsson E, Wu R, Gunnarsson I, LundbergIE, Klareskog L, et al. Lipid peroxidation is enhanced in patientswith systemic lupus erythematosus and is associated with arte-rial and renal disease manifestations. Arthritis Rheum 2005;52:192–200.
34. Moerman EJ, Teng K, Lipschitz DA, Lecka-Czernik B. Aging acti-vates adipogenic and suppresses osteogenic programs in mes-enchymal marrow stroma/stem cells: the role of PPAR-gamma2transcription factor and TGF-beta/BMP signaling pathways. AgingCell 2004;3:379–89.
35. Teichmann J, Lange U, Stracke H, Federlin K, Bretzel RG. Bonemetabolism and bone mineral density of systemic lupus erythemato-sus at the time of diagnosis. Rheumatol Int 1999;18:137–40.
36. Seibel MJ, Cooper MS, Zhou H. Glucocorticoid-induced osteopo-rosis: mechanisms, management, and future perspectives. LancetDiabetes Endocrinol 2013;1:59–70.
37. Toloza SM, Cole DE, Gladman DD, Ibañez D, Urowitz MB. Vitamin Dinsufficiency in a large female SLE cohort. Lupus 2010;19:13–9.
38. Bernatsky S, Linehan T, Hanly JG. The accuracy of administrativedata diagnoses of systemic autoimmune rheumatic diseases. JRheumatol 2011;38:1612–6.
39. Sterling RS. Gender and race/ethnicity differences in hip fractureincidence, morbidity, mortality, and function. Clin Orthop Relat Res2011:1913–8.
266
Arthritis Care & ResearchVol. 73, No. 2, February 2021, pp 266–274DOI 10.1002/acr.24110© 2020, American College of Rheumatology
Model to Determine the Cost-Effectiveness of Screening Psoriasis Patients for Psoriatic ArthritisNicolas Iragorri,1 Glen Hazlewood,1 Braden Manns,2 Laura Bojke,3 and Eldon Spackman,1 on behalf of the Early Detection to Improve Outcome in People With Undiagnosed Psoriatic Arthritis Study Group
Objective. Screening psoriasis patients for psoriatic arthritis (PsA) is intended to identify patients at earlier stages of the disease. Early treatment is expected to slow disease progression and delay the need for biologic therapy. Our objective was to determine the cost-effectiveness of screening for PsA in patients with psoriasis in Canada.
Methods. A Markov model was built to estimate the costs and quality-adjusted life years (QALYs) of screening tools for PsA in psoriasis patients. The screening tools included the Toronto Psoriatic Arthritis Screen, Psoriasis Epidemiology Screening Tool, Psoriatic Arthritis Screening and Evaluation, and Early Psoriatic Arthritis Screening Questionnaire (EARP) questionnaires. States of health were defined by disability levels as measured by the Health Assessment Questionnaire. State transitions were modeled based on annual disease progression. Incremental cost-effectiveness ratios and incremental net monetary benefits were estimated. Sensitivity analyses were undertaken to account for parameter uncertainty and to test model assumptions.
Results. Screening was cost-effective compared to no screening. The EARP tool had the lowest total cost ($2,000 per patient per year saved compared to no screening) and the highest total QALYs (additional 0.18 per patient compared to no screening). The results were most sensitive to test accuracy and the efficacy of disease-modifying antirheumatic drugs (DMARDs). No screening was cost-effective (at $50,000 per QALY) relative to screening when DMARDs failed to slow disease progression.
Conclusion. If early therapy with DMARDs delays biologic treatment, implementing screening in patients with psoriasis in Canada is expected to represent a cost savings of $220 million per year and improve the quality of life.
INTRODUCTION
Psoriatic arthritis (PsA) is a chronic inflammatory arthritis that affects the skin and the musculoskeletal system (1). PsA is associated with psoriasis, a chronic skin disease characterized by red plaques that often appear on the elbows, knees, and scalp (2). Manifestations affect the skin, nails, joints, and entheses, or the axial skeleton (3,4). The prevalence of PsA is estimated to be approximately 0.3% in the general population (1) and 30% for patients with psoriasis (5). Close to 20% of cases experience severe pain and deformation of the joints, resulting in impairment and deteriorating quality of life (1).
The cost and health burden of PsA is considerable. The average annual total cost of treatment per patient was estimated at
approximately US $15,000 in Europe (6). Furthermore, late stages of PsA are associated with worse health outcomes and higher treatment costs, mainly due to biologic therapy (7). The introduc-tion of biologics is expected to result in a 3- to 5-fold increase in direct costs (6). Consequently, early treatment with afford-able first-line disease-modifying antirheumatic drugs (DMARDs) is intended to slow disease progression toward late and severe stages of PsA, when biologics are often required (8). Therefore, organized screening programs are expected to increase the pro-portion of patients identified and treated during early stages of disease. However, these programs are expensive to implement due to additional resource utilization and significant start-up costs.
Currently, Canada lacks an organized screening program for PsA. However, recent efforts have been directed toward
The views are those of the authors and not necessarily those of the National Institute for Health Research or the Department of Health and Social Care.
Supported by the National Institute for Health Research, Programme Grants for Applied Research, Early Detection to Improve Outcome in People With Undiagnosed Psoriatic Arthritis (RP-PG-1212-20007).
1Nicolas Iragorri, MSc, Glen Hazlewood, MD, PhD, Eldon Spackman, PhD: Cumming School of Medicine, University of Calgary, Calgary, Alberta, Canada; 2Braden Manns, MD, MSc, FRCPC: Cumming School of Medicine, University
of Calgary, Calgary, and Alberta Health Services, Edmonton, Alberta, Canada; 3Laura Bojke, PhD: University of York, York, UK.
No potential conflicts of interest relevant to this article were reported.Address correspondence to Nicolas Iragorri, MSc, Community Health
Sciences and O’Brien Institute of Public Health, University of Calgary, Teaching, Research and Wellness Building, 3280 Hospital Drive NW, Calgary, Alberta T2N 4Z6, Canada. Email: [email protected].
Submitted for publication June 7, 2019; accepted in revised form November 12, 2019.
COST-UTILITY OF PSORIATIC ARTHRITIS SCREENING | 267Arthritis Care & ResearchVol. 73, No. 2, February 2021, pp 266–274DOI 10.1002/acr.24110
understanding the effect of PsA screening. A meta-analysis compared the accuracy of the most widely used PsA screening tools (9). Additionally, the National Institute for Health Research is conducting a trial to evaluate the effect of screening for PsA on health outcomes (10). However, there is a knowledge gap regarding the health economic impact of implementing an orga-nized screening program. Consequently, this study evaluated the cost-effectiveness of screening for PsA using different validated tools (11–14) among psoriasis patients in Canada.
PATIENTS AND METHODS
Target population, perspective, and time horizon. A hypo thetical cohort of patients age 45 years with psoriasis and without PsA under dermatologic surveillance was modeled. At model initiation, patients have mild psoriasis with a baseline Psoriasis Area Severity Index (PASI) of 3.5 and are receiving top-ical treatment or DMARDs for their skin condition (15). The eval-uation was conducted from the Canadian publicly funded health care payer’s perspective and followed a 40-year time horizon with annual cycles.
Comparators. Screening tools were compared between themselves and against the current standard care (no screen-ing). “No screening” refers to the clinical pathway that the typical patient with PsA (with a previous psoriasis diagnosis) follows in Canada. Because patients are not routinely screened, they are diagnosed following self-referral, once their arthritis symptoms become evident and difficult to ignore (14). In Canada, the majority of patients with PsA start treatment with methotrexate (a DMARD) and initiate biologics if the disease progresses and DMARDs are no longer effective (8).
The PsA screening program is expected to identify dis-ease earlier compared to no screening. Patients with PsA who are screened and diagnosed earlier follow the same treatment pathway as diagnosed patients under no screening, but a few years earlier. This head start is expected to translate to increased time on DMARDs and create a delay in receiving biologic ther-apy. This study compares the following screening questionnaires for PsA: the Toronto Psoriatic Arthritis Screen (ToPAS), the Pso-riasis Epidemiology Screening Tool (PEST), the Psoriatic Arthri-tis Screening and Evaluation tool (PASE), and the Early Psoriatic
Arthritis Screening Questionnaire (EARP), which are all validated for patients with psoriasis (11–14). Although the tools are similar in terms of structure and content, there are a few differences among them: EARP identifies pain and swelling of specific joints (i.e., does your Achilles tendon swell?), while the remaining 3 are more general (i.e., my joints hurt) (9). Furthermore, the ToPAS and PEST have additional visual resources like mannequins or skin and nail images to aid patients with identifying the affected joints. Finally, since all tools are composed of different items, their maximum score and cutoff values vary (9). All questionnaires were assumed to be delivered in dermatology clinics.
Model structure. The Markov model is summarized in Figure 1 and models the progression of the average patient with PsA through different health states. Patients start with psoriasis but not PsA. Each year, based on the annual incidence rate of PsA for psoriasis patients in Canada (16), 2.7% of patients are expected to develop PsA. After PsA onset (T0), the degree of disability is assumed to increase at a higher rate if left untreated. A steady-state model was generated by filling the first health states (Health Assessment Questionnaire [HAQ] scores) according to the annual PsA incidence rate. This ensured that the screening interventions would identify a proportion of currently prevalent and undiagnosed cases. Tunnel states were used to model progres-sion through HAQ states.
In the screening arms, psoriasis patients are screened annually for PsA. It was assumed that the screening tools were not sufficiently sensitive to identify PsA between T0 and T1. Patients could only be identified after their disease had progressed to T1. Positive screening tests are followed by the gold standard rheu-matic assessment, with 100% sensitivity and specificity. False positives are usually diagnosed with similar rheumatic conditions but remain PsA-free. Therefore, PsA is ruled out in false positive patients and they remain in the model as population at risk in T0. Furthermore, patients with PsA who were missed by the screen-ing tool (false negatives) are eventually identified at T2 or the time to average diagnosis. Therefore, the period T2 – T1 represents the sojourn time, or preclinical symptom phase. The base case assumed that screening tools were effective 2 years prior to nor-mal identification, i.e., the sojourn time is 2 years.
Following diagnosis, late or early PsA treatment was modeled based on the European League Against Rheumatism (EULAR) and Canadian recommendations (17,18). DMARDs are used as first-line treatment, with biologics initiated after ineffective use of DMARDs, due to loss of efficacy. Biologics were assumed to have a 5-year period of effectiveness. This was based on an annual 16.5% biologic withdrawal rate (19). Patients who withdrew due to either loss of effect or adverse events rebound to the HAQ score that would have been expected had they not initiated biologic therapy (20). A second biologic therapy was modeled to account for the potential switch between anti–tumor necrosis factor thera-pies to interleukin-17 inhibitors. Additionally, if the second biologic
SIGNIFICANCE & INNOVATIONS• Canada currently lacks an organized psoriatic ar-
thritis screening program.• Screening psoriasis patients for psoriatic arthritis is
expected to delay the initiation of biologic therapy.• An organized screening program for psoriatic ar-
thritis is expected to improve the quality of life and save $2,000 per patient, annually.
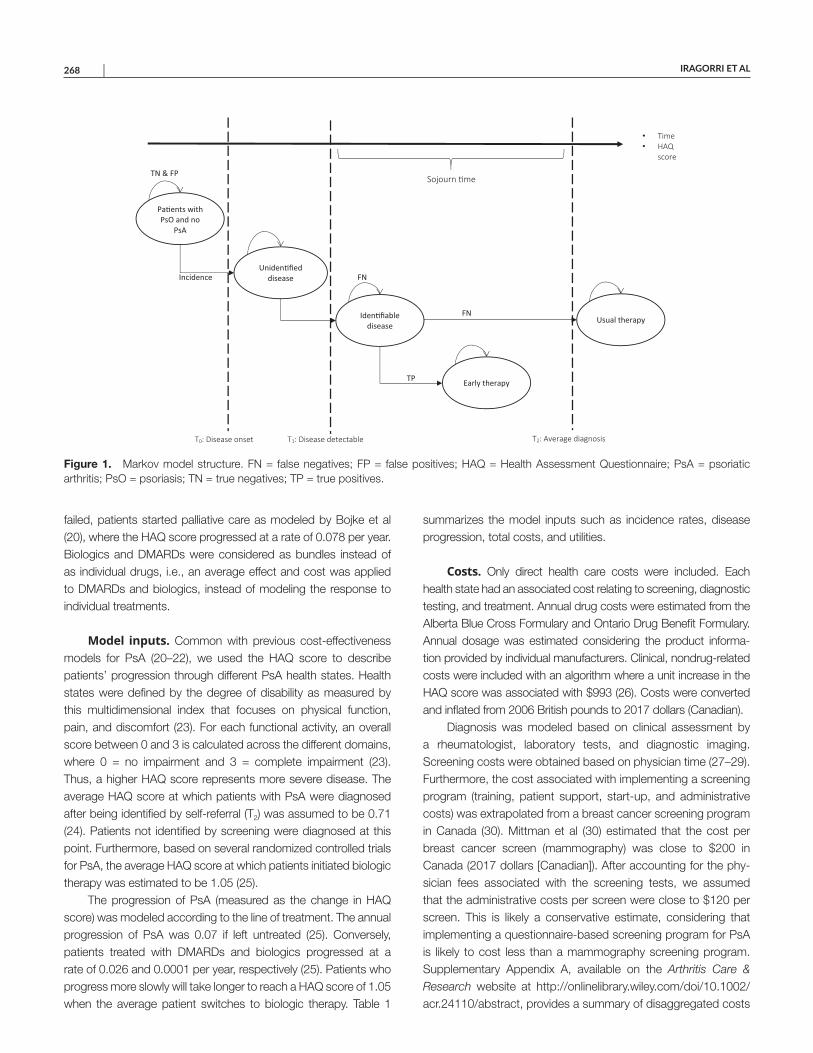
IRAGORRI ET AL 268 |
failed, patients started palliative care as modeled by Bojke et al (20), where the HAQ score progressed at a rate of 0.078 per year. Biologics and DMARDs were considered as bundles instead of as individual drugs, i.e., an average effect and cost was applied to DMARDs and biologics, instead of modeling the response to individual treatments.
Model inputs. Common with previous cost-effectiveness models for PsA (20–22), we used the HAQ score to describe patients’ progression through different PsA health states. Health states were defined by the degree of disability as measured by this multidimensional index that focuses on physical function, pain, and discomfort (23). For each functional activity, an overall score between 0 and 3 is calculated across the different domains, where 0 = no impairment and 3 = complete impairment (23). Thus, a higher HAQ score represents more severe disease. The average HAQ score at which patients with PsA were diagnosed after being identified by self-referral (T2) was assumed to be 0.71 (24). Patients not identified by screening were diagnosed at this point. Furthermore, based on several randomized controlled trials for PsA, the average HAQ score at which patients initiated biologic therapy was estimated to be 1.05 (25).
The progression of PsA (measured as the change in HAQ score) was modeled according to the line of treatment. The annual progression of PsA was 0.07 if left untreated (25). Conversely, patients treated with DMARDs and biologics progressed at a rate of 0.026 and 0.0001 per year, respectively (25). Patients who progress more slowly will take longer to reach a HAQ score of 1.05 when the average patient switches to biologic therapy. Table 1
summarizes the model inputs such as incidence rates, disease progression, total costs, and utilities.
Costs. Only direct health care costs were included. Each health state had an associated cost relating to screening, diagnostic testing, and treatment. Annual drug costs were estimated from the Alberta Blue Cross Formulary and Ontario Drug Benefit Formulary. Annual dosage was estimated considering the product informa-tion provided by individual manufacturers. Clinical, nondrug-related costs were included with an algorithm where a unit increase in the HAQ score was associated with $993 (26). Costs were converted and inflated from 2006 British pounds to 2017 dollars (Canadian).
Diagnosis was modeled based on clinical assessment by a rheumatologist, laboratory tests, and diagnostic imaging. Screening costs were obtained based on physician time (27–29). Furthermore, the cost associated with implementing a screening program (training, patient support, start-up, and administrative costs) was extrapolated from a breast cancer screening program in Canada (30). Mittman et al (30) estimated that the cost per breast cancer screen (mammography) was close to $200 in Canada (2017 dollars [Canadian]). After accounting for the phy-sician fees associated with the screening tests, we assumed that the administrative costs per screen were close to $120 per screen. This is likely a conservative estimate, considering that implementing a questionnaire-based screening program for PsA is likely to cost less than a mammography screening program. Supplementary Appendix A, available on the Arthritis Care & Research website at http://onlin elibr ary.wiley.com/doi/10.1002/acr.24110/ abstract, provides a summary of disaggregated costs
Figure 1. Markov model structure. FN = false negatives; FP = false positives; HAQ = Health Assessment Questionnaire; PsA = psoriatic arthritis; PsO = psoriasis; TN = true negatives; TP = true positives.
Pa�ents with PsO and no
PsA
Uniden�fied disease
Iden�fiable disease
Early therapy
Usual therapy
• Time• HAQ
score
T1: Disease detectable T0: Disease onset
Incidence FN
FN
TN & FP
TP
Sojourn �me
T2: Average diagnosis
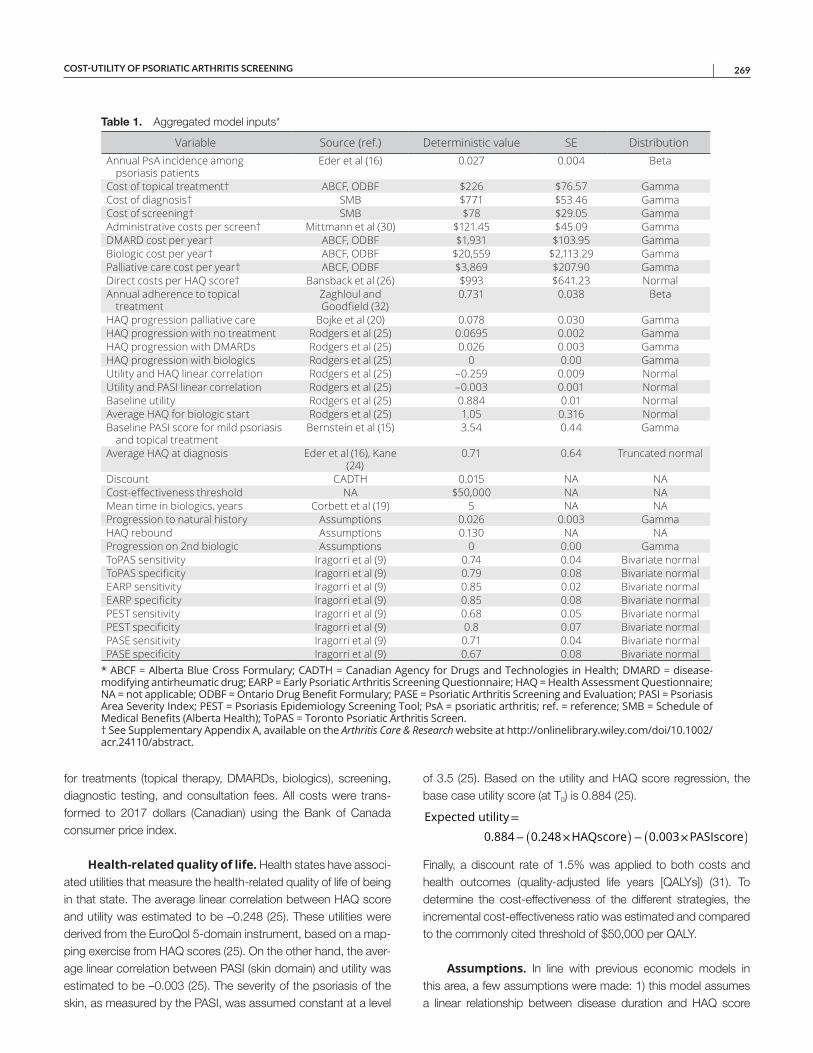
COST-UTILITY OF PSORIATIC ARTHRITIS SCREENING | 269
for treatments (topical therapy, DMARDs, biologics), screening, diagnostic testing, and consultation fees. All costs were trans-formed to 2017 dollars (Canadian) using the Bank of Canada consumer price index.
Health-related quality of life. Health states have associ-ated utilities that measure the health-related quality of life of being in that state. The average linear correlation between HAQ score and utility was estimated to be –0.248 (25). These utilities were derived from the EuroQol 5-domain instrument, based on a map-ping exercise from HAQ scores (25). On the other hand, the aver-age linear correlation between PASI (skin domain) and utility was estimated to be –0.003 (25). The severity of the psoriasis of the skin, as measured by the PASI, was assumed constant at a level
of 3.5 (25). Based on the utility and HAQ score regression, the base case utility score (at T0) is 0.884 (25).
Finally, a discount rate of 1.5% was applied to both costs and health outcomes (quality-adjusted life years [QALYs]) (31). To determine the cost-effectiveness of the different strategies, the incremental cost-effectiveness ratio was estimated and compared to the commonly cited threshold of $50,000 per QALY.
Assumptions. In line with previous economic models in this area, a few assumptions were made: 1) this model assumes a linear relationship between disease duration and HAQ score
Expected utility=
0.884−(
0.248×HAQscore)
−
(
0.003×PASIscore)
Table 1. Aggregated model inputs*
Variable Source (ref.) Deterministic value SE DistributionAnnual PsA incidence among
psoriasis patientsEder et al (16) 0.027 0.004 Beta
Cost of topical treatment† ABCF, ODBF $226 $76.57 GammaCost of diagnosis† SMB $771 $53.46 GammaCost of screening† SMB $78 $29.05 GammaAdministrative costs per screen† Mittmann et al (30) $121.45 $45.09 GammaDMARD cost per year† ABCF, ODBF $1,931 $103.95 GammaBiologic cost per year† ABCF, ODBF $20,559 $2,113.29 GammaPalliative care cost per year† ABCF, ODBF $3,869 $207.90 GammaDirect costs per HAQ score† Bansback et al (26) $993 $641.23 NormalAnnual adherence to topical
treatmentZaghloul and Goodfield (32)
0.731 0.038 Beta
HAQ progression palliative care Bojke et al (20) 0.078 0.030 GammaHAQ progression with no treatment Rodgers et al (25) 0.0695 0.002 GammaHAQ progression with DMARDs Rodgers et al (25) 0.026 0.003 GammaHAQ progression with biologics Rodgers et al (25) 0 0.00 GammaUtility and HAQ linear correlation Rodgers et al (25) –0.259 0.009 NormalUtility and PASI linear correlation Rodgers et al (25) –0.003 0.001 NormalBaseline utility Rodgers et al (25) 0.884 0.01 NormalAverage HAQ for biologic start Rodgers et al (25) 1.05 0.316 NormalBaseline PASI score for mild psoriasis
and topical treatmentBernstein et al (15) 3.54 0.44 Gamma
Average HAQ at diagnosis Eder et al (16), Kane (24)
0.71 0.64 Truncated normal
Discount CADTH 0.015 NA NACost-effectiveness threshold NA $50,000 NA NAMean time in biologics, years Corbett et al (19) 5 NA NAProgression to natural history Assumptions 0.026 0.003 GammaHAQ rebound Assumptions 0.130 NA NAProgression on 2nd biologic Assumptions 0 0.00 GammaToPAS sensitivity Iragorri et al (9) 0.74 0.04 Bivariate normalToPAS specificity Iragorri et al (9) 0.79 0.08 Bivariate normalEARP sensitivity Iragorri et al (9) 0.85 0.02 Bivariate normalEARP specificity Iragorri et al (9) 0.85 0.08 Bivariate normalPEST sensitivity Iragorri et al (9) 0.68 0.05 Bivariate normalPEST specificity Iragorri et al (9) 0.8 0.07 Bivariate normalPASE sensitivity Iragorri et al (9) 0.71 0.04 Bivariate normalPASE specificity Iragorri et al (9) 0.67 0.08 Bivariate normal
* ABCF = Alberta Blue Cross Formulary; CADTH = Canadian Agency for Drugs and Technologies in Health; DMARD = disease-modifying antirheumatic drug; EARP = Early Psoriatic Arthritis Screening Questionnaire; HAQ = Health Assessment Questionnaire; NA = not applicable; ODBF = Ontario Drug Benefit Formulary; PASE = Psoriatic Arthritis Screening and Evaluation; PASI = Psoriasis Area Severity Index; PEST = Psoriasis Epidemiology Screening Tool; PsA = psoriatic arthritis; ref. = reference; SMB = Schedule of Medical Benefits (Alberta Health); ToPAS = Toronto Psoriatic Arthritis Screen. † See Supplementary Appendix A, available on the Arthritis Care & Research website at http://onlin elibr ary.wiley.com/doi/10.1002/acr.24110/ abstract.
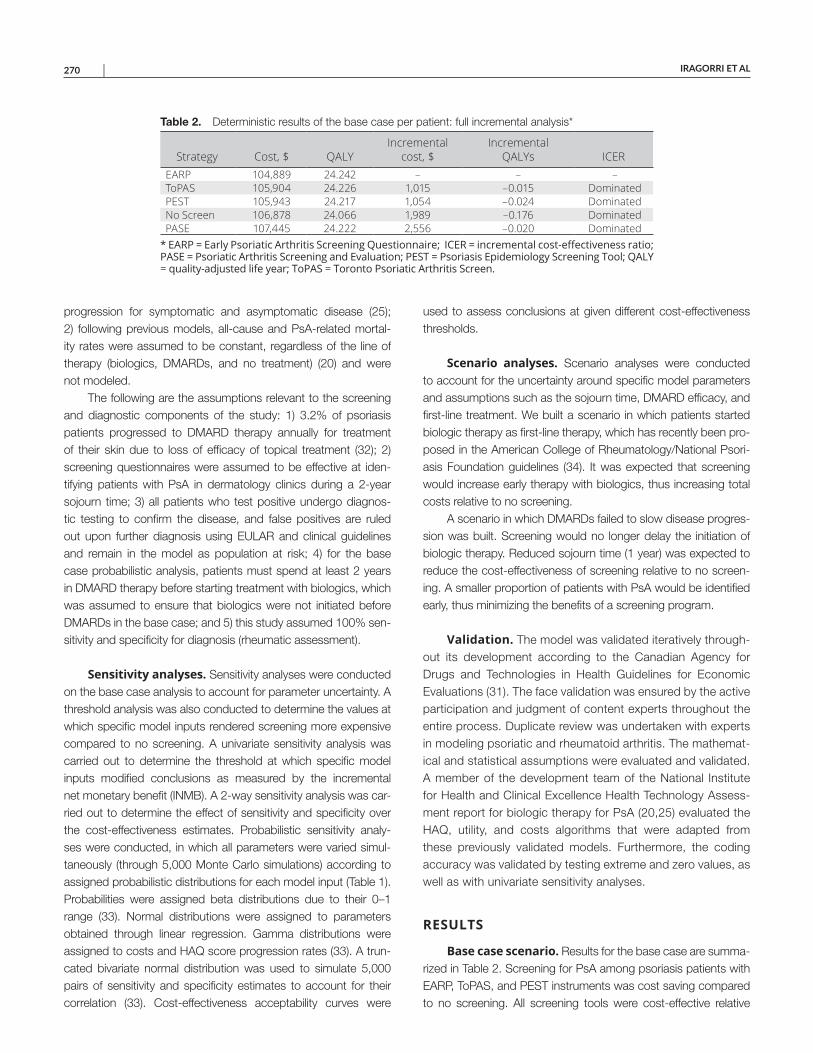
IRAGORRI ET AL 270 |
progression for symptomatic and asymptomatic disease (25); 2) following previous models, all-cause and PsA-related mortal-ity rates were assumed to be constant, regardless of the line of therapy (biologics, DMARDs, and no treatment) (20) and were not modeled.
The following are the assumptions relevant to the screening and diagnostic components of the study: 1) 3.2% of psoriasis patients progressed to DMARD therapy annually for treatment of their skin due to loss of efficacy of topical treatment (32); 2) screening questionnaires were assumed to be effective at iden-tifying patients with PsA in dermatology clinics during a 2-year sojourn time; 3) all patients who test positive undergo diagnos-tic testing to confirm the disease, and false positives are ruled out upon further diagnosis using EULAR and clinical guidelines and remain in the model as population at risk; 4) for the base case probabilistic analysis, patients must spend at least 2 years in DMARD therapy before starting treatment with biologics, which was assumed to ensure that biologics were not initiated before DMARDs in the base case; and 5) this study assumed 100% sen-sitivity and specificity for diagnosis (rheumatic assessment).
Sensitivity analyses. Sensitivity analyses were conducted on the base case analysis to account for parameter uncertainty. A threshold analysis was also conducted to determine the values at which specific model inputs rendered screening more expensive compared to no screening. A univariate sensitivity analysis was carried out to determine the threshold at which specific model inputs modified conclusions as measured by the incremental net monetary benefit (INMB). A 2-way sensitivity analysis was car-ried out to determine the effect of sensitivity and specificity over the cost-effectiveness estimates. Probabilistic sensitivity analy-ses were conducted, in which all parameters were varied simul-taneously (through 5,000 Monte Carlo simulations) according to assigned probabilistic distributions for each model input (Table 1). Probabilities were assigned beta distributions due to their 0–1 range (33). Normal distributions were assigned to parameters obtained through linear regression. Gamma distributions were assigned to costs and HAQ score progression rates (33). A trun-cated bivariate normal distribution was used to simulate 5,000 pairs of sensitivity and specificity estimates to account for their correlation (33). Cost-effectiveness acceptability curves were
used to assess conclusions at given different cost-effectiveness thresholds.
Scenario analyses. Scenario analyses were conducted to account for the uncertainty around specific model parameters and assumptions such as the sojourn time, DMARD efficacy, and first-line treatment. We built a scenario in which patients started biologic therapy as first-line therapy, which has recently been pro-posed in the American College of Rheumatology/National Psori-asis Foundation guidelines (34). It was expected that screening would increase early therapy with biologics, thus increasing total costs relative to no screening.
A scenario in which DMARDs failed to slow disease progres-sion was built. Screening would no longer delay the initiation of biologic therapy. Reduced sojourn time (1 year) was expected to reduce the cost-effectiveness of screening relative to no screen-ing. A smaller proportion of patients with PsA would be identified early, thus minimizing the benefits of a screening program.
Validation. The model was validated iteratively through-out its development according to the Canadian Agency for Drugs and Technologies in Health Guidelines for Economic Evaluations (31). The face validation was ensured by the active participation and judgment of content experts throughout the entire process. Duplicate review was undertaken with experts in modeling psoriatic and rheumatoid arthritis. The mathemat-ical and statistical assumptions were evaluated and validated. A member of the development team of the National Institute for Health and Clinical Excellence Health Technology Assess-ment report for biologic therapy for PsA (20,25) evaluated the HAQ, utility, and costs algorithms that were adapted from these previously validated models. Furthermore, the coding accuracy was validated by testing extreme and zero values, as well as with univariate sensitivity analyses.
RESULTS
Base case scenario. Results for the base case are summa-rized in Table 2. Screening for PsA among psoriasis patients with EARP, ToPAS, and PEST instruments was cost saving compared to no screening. All screening tools were cost-effective relative
Table 2. Deterministic results of the base case per patient: full incremental analysis*
Strategy Cost, $ QALYIncremental
cost, $Incremental
QALYs ICEREARP 104,889 24.242 – – –ToPAS 105,904 24.226 1,015 –0.015 DominatedPEST 105,943 24.217 1,054 –0.024 DominatedNo Screen 106,878 24.066 1,989 –0.176 DominatedPASE 107,445 24.222 2,556 –0.020 Dominated
* EARP = Early Psoriatic Arthritis Screening Questionnaire; ICER = incremental cost-effectiveness ratio; PASE = Psoriatic Arthritis Screening and Evaluation; PEST = Psoriasis Epidemiology Screening Tool; QALY = quality-adjusted life year; ToPAS = Toronto Psoriatic Arthritis Screen.
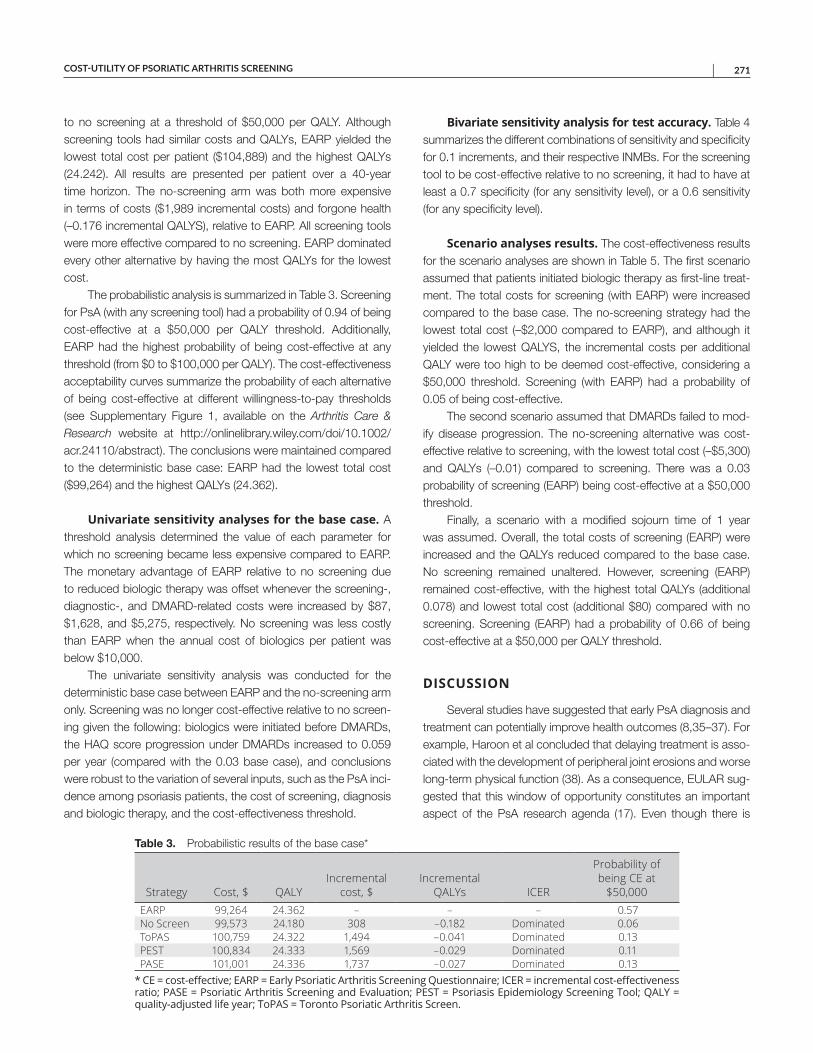
COST-UTILITY OF PSORIATIC ARTHRITIS SCREENING | 271
to no screening at a threshold of $50,000 per QALY. Although screening tools had similar costs and QALYs, EARP yielded the lowest total cost per patient ($104,889) and the highest QALYs (24.242). All results are presented per patient over a 40-year time horizon. The no-screening arm was both more expensive in terms of costs ($1,989 incremental costs) and forgone health (–0.176 incremental QALYS), relative to EARP. All screening tools were more effective compared to no screening. EARP dominated every other alternative by having the most QALYs for the lowest cost.
The probabilistic analysis is summarized in Table 3. Screening for PsA (with any screening tool) had a probability of 0.94 of being cost-effective at a $50,000 per QALY threshold. Additionally, EARP had the highest probability of being cost-effective at any threshold (from $0 to $100,000 per QALY). The cost-effectiveness acceptability curves summarize the probability of each alternative of being cost-effective at different willingness-to-pay thresholds (see Supplementary Figure 1, available on the Arthritis Care & Research website at http://onlin elibr ary.wiley.com/doi/10.1002/acr.24110/ abstract). The conclusions were maintained compared to the deterministic base case: EARP had the lowest total cost ($99,264) and the highest QALYs (24.362).
Univariate sensitivity analyses for the base case. A threshold analysis determined the value of each parameter for which no screening became less expensive compared to EARP. The monetary advantage of EARP relative to no screening due to reduced biologic therapy was offset whenever the screening-, diagnostic-, and DMARD-related costs were increased by $87, $1,628, and $5,275, respectively. No screening was less costly than EARP when the annual cost of biologics per patient was below $10,000.
The univariate sensitivity analysis was conducted for the deterministic base case between EARP and the no-screening arm only. Screening was no longer cost-effective relative to no screen-ing given the following: biologics were initiated before DMARDs, the HAQ score progression under DMARDs increased to 0.059 per year (compared with the 0.03 base case), and conclusions were robust to the variation of several inputs, such as the PsA inci-dence among psoriasis patients, the cost of screening, diagnosis and biologic therapy, and the cost-effectiveness threshold.
Bivariate sensitivity analysis for test accuracy. Table 4 summarizes the different combinations of sensitivity and specificity for 0.1 increments, and their respective INMBs. For the screening tool to be cost-effective relative to no screening, it had to have at least a 0.7 specificity (for any sensitivity level), or a 0.6 sensitivity (for any specificity level).
Scenario analyses results. The cost-effectiveness results for the scenario analyses are shown in Table 5. The first scenario assumed that patients initiated biologic therapy as first-line treat-ment. The total costs for screening (with EARP) were increased compared to the base case. The no-screening strategy had the lowest total cost (–$2,000 compared to EARP), and although it yielded the lowest QALYS, the incremental costs per additional QALY were too high to be deemed cost-effective, considering a $50,000 threshold. Screening (with EARP) had a probability of 0.05 of being cost-effective.
The second scenario assumed that DMARDs failed to mod-ify disease progression. The no-screening alternative was cost- effective relative to screening, with the lowest total cost (–$5,300) and QALYs (–0.01) compared to screening. There was a 0.03 probability of screening (EARP) being cost-effective at a $50,000 threshold.
Finally, a scenario with a modified sojourn time of 1 year was assumed. Overall, the total costs of screening (EARP) were increased and the QALYs reduced compared to the base case. No screening remained unaltered. However, screening (EARP) remained cost-effective, with the highest total QALYs (additional 0.078) and lowest total cost (additional $80) compared with no screening. Screening (EARP) had a probability of 0.66 of being cost-effective at a $50,000 per QALY threshold.
DISCUSSION
Several studies have suggested that early PsA diagnosis and treatment can potentially improve health outcomes (8,35–37). For example, Haroon et al concluded that delaying treatment is asso-ciated with the development of peripheral joint erosions and worse long-term physical function (38). As a consequence, EULAR sug-gested that this window of opportunity constitutes an important aspect of the PsA research agenda (17). Even though there is
Table 3. Probabilistic results of the base case*
Strategy Cost, $ QALYIncremental
cost, $Incremental
QALYs ICER
Probability of being CE at
$50,000EARP 99,264 24.362 – – – 0.57No Screen 99,573 24.180 308 –0.182 Dominated 0.06ToPAS 100,759 24.322 1,494 –0.041 Dominated 0.13PEST 100,834 24.333 1,569 –0.029 Dominated 0.11PASE 101,001 24.336 1,737 –0.027 Dominated 0.13
* CE = cost-effective; EARP = Early Psoriatic Arthritis Screening Questionnaire; ICER = incremental cost-effectiveness ratio; PASE = Psoriatic Arthritis Screening and Evaluation; PEST = Psoriasis Epidemiology Screening Tool; QALY = quality-adjusted life year; ToPAS = Toronto Psoriatic Arthritis Screen.
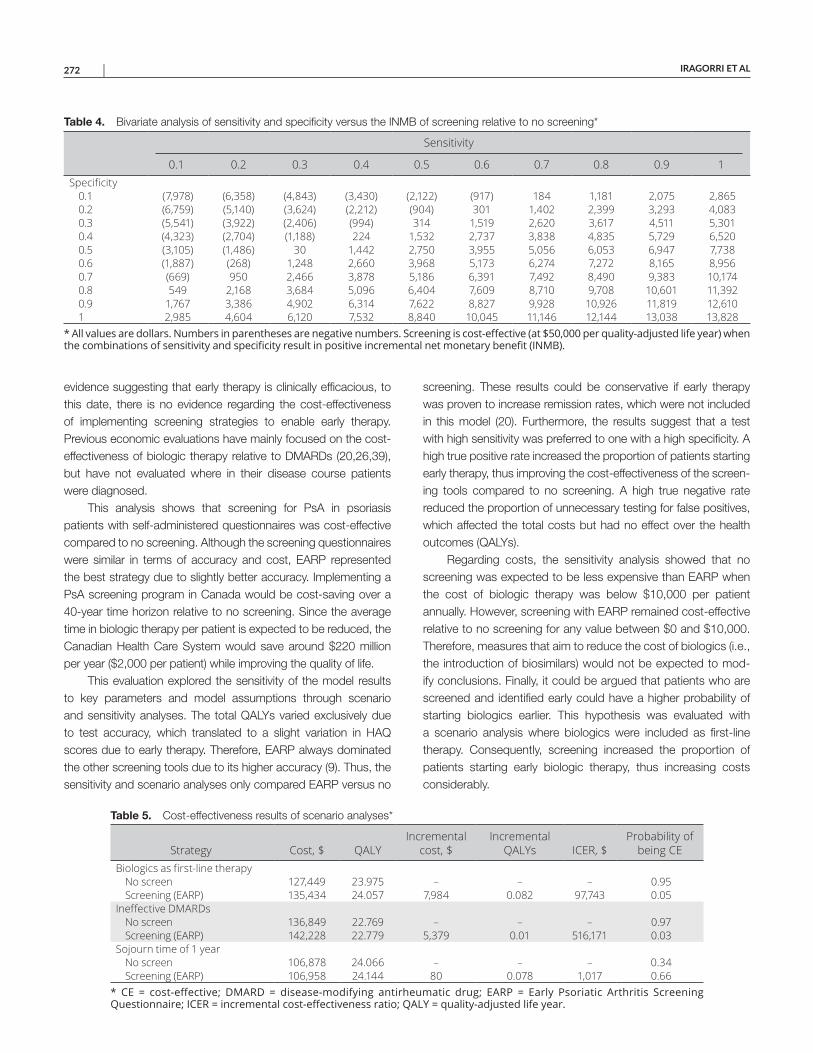
IRAGORRI ET AL 272 |
evidence suggesting that early therapy is clinically efficacious, to this date, there is no evidence regarding the cost- effectiveness of implementing screening strategies to enable early therapy. Previous economic evaluations have mainly focused on the cost- effectiveness of biologic therapy relative to DMARDs (20,26,39), but have not evaluated where in their disease course patients were diagnosed.
This analysis shows that screening for PsA in psoriasis patients with self-administered questionnaires was cost-effective compared to no screening. Although the screening questionnaires were similar in terms of accuracy and cost, EARP represented the best strategy due to slightly better accuracy. Implementing a PsA screening program in Canada would be cost-saving over a 40-year time horizon relative to no screening. Since the average time in biologic therapy per patient is expected to be reduced, the Canadian Health Care System would save around $220 million per year ($2,000 per patient) while improving the quality of life.
This evaluation explored the sensitivity of the model results to key parameters and model assumptions through scenario and sensitivity analyses. The total QALYs varied exclusively due to test accuracy, which translated to a slight variation in HAQ scores due to early therapy. Therefore, EARP always dominated the other screening tools due to its higher accuracy (9). Thus, the sensitivity and scenario analyses only compared EARP versus no
screening. These results could be conservative if early therapy was proven to increase remission rates, which were not included in this model (20). Furthermore, the results suggest that a test with high sensitivity was preferred to one with a high specificity. A high true positive rate increased the proportion of patients starting early therapy, thus improving the cost-effectiveness of the screen-ing tools compared to no screening. A high true negative rate reduced the proportion of unnecessary testing for false positives, which affected the total costs but had no effect over the health outcomes (QALYs).
Regarding costs, the sensitivity analysis showed that no screening was expected to be less expensive than EARP when the cost of biologic therapy was below $10,000 per patient annually. However, screening with EARP remained cost-effective relative to no screening for any value between $0 and $10,000. Therefore, measures that aim to reduce the cost of biologics (i.e., the introduction of biosimilars) would not be expected to mod-ify conclusions. Finally, it could be argued that patients who are screened and identified early could have a higher probability of starting biologics earlier. This hypothesis was evaluated with a scenario analysis where biologics were included as first-line therapy. Consequently, screening increased the proportion of patients starting early biologic therapy, thus increasing costs considerably.
Table 4. Bivariate analysis of sensitivity and specificity versus the INMB of screening relative to no screening*
Sensitivity
0.1 0.2 0.3 0.4 0.5 0.6 0.7 0.8 0.9 1Specificity
0.1 (7,978) (6,358) (4,843) (3,430) (2,122) (917) 184 1,181 2,075 2,8650.2 (6,759) (5,140) (3,624) (2,212) (904) 301 1,402 2,399 3,293 4,0830.3 (5,541) (3,922) (2,406) (994) 314 1,519 2,620 3,617 4,511 5,3010.4 (4,323) (2,704) (1,188) 224 1,532 2,737 3,838 4,835 5,729 6,5200.5 (3,105) (1,486) 30 1,442 2,750 3,955 5,056 6,053 6,947 7,7380.6 (1,887) (268) 1,248 2,660 3,968 5,173 6,274 7,272 8,165 8,9560.7 (669) 950 2,466 3,878 5,186 6,391 7,492 8,490 9,383 10,1740.8 549 2,168 3,684 5,096 6,404 7,609 8,710 9,708 10,601 11,3920.9 1,767 3,386 4,902 6,314 7,622 8,827 9,928 10,926 11,819 12,6101 2,985 4,604 6,120 7,532 8,840 10,045 11,146 12,144 13,038 13,828
* All values are dollars. Numbers in parentheses are negative numbers. Screening is cost-effective (at $50,000 per quality-adjusted life year) when the combinations of sensitivity and specificity result in positive incremental net monetary benefit (INMB).
Table 5. Cost-effectiveness results of scenario analyses*
Strategy Cost, $ QALYIncremental
cost, $Incremental
QALYs ICER, $Probability of
being CEBiologics as first-line therapy
No screen 127,449 23.975 – – – 0.95Screening (EARP) 135,434 24.057 7,984 0.082 97,743 0.05
Ineffective DMARDsNo screen 136,849 22.769 – – – 0.97Screening (EARP) 142,228 22.779 5,379 0.01 516,171 0.03
Sojourn time of 1 yearNo screen 106,878 24.066 – – – 0.34Screening (EARP) 106,958 24.144 80 0.078 1,017 0.66
* CE = cost-effective; DMARD = disease-modifying antirheumatic drug; EARP = Early Psoriatic Arthritis Screening Questionnaire; ICER = incremental cost-effectiveness ratio; QALY = quality-adjusted life year.
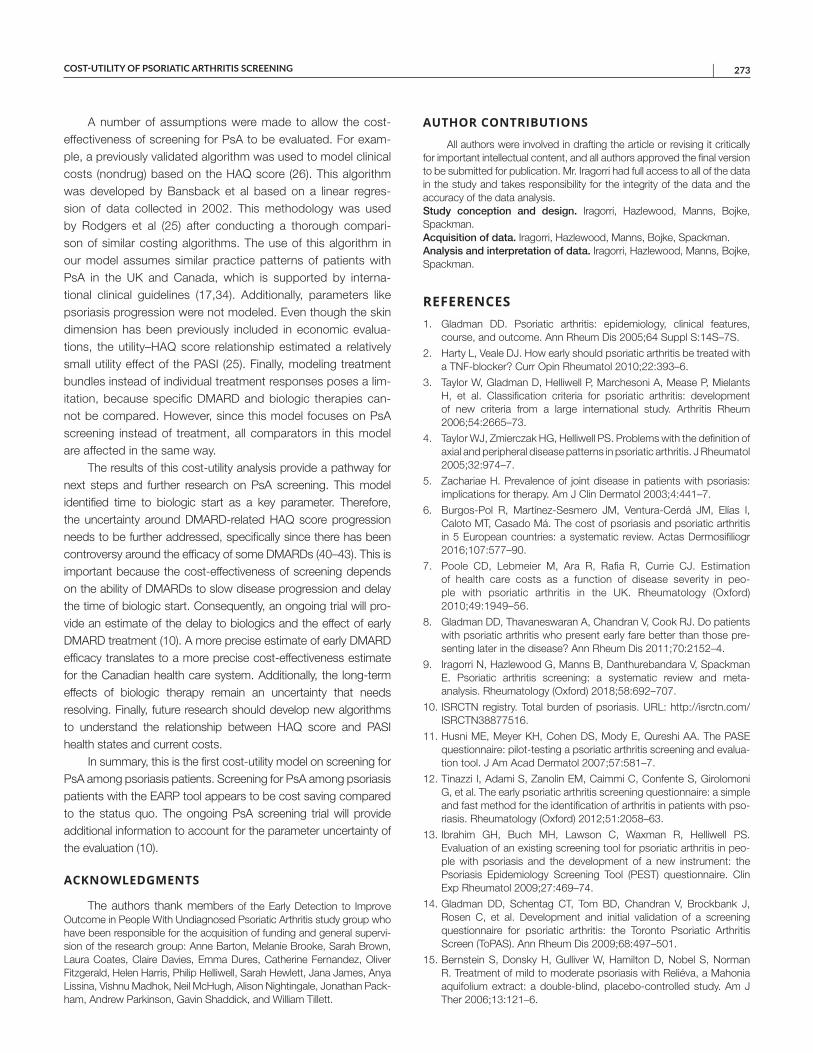
COST-UTILITY OF PSORIATIC ARTHRITIS SCREENING | 273
A number of assumptions were made to allow the cost- effectiveness of screening for PsA to be evaluated. For exam-ple, a previously validated algorithm was used to model clinical costs (nondrug) based on the HAQ score (26). This algorithm was developed by Bansback et al based on a linear regres-sion of data collected in 2002. This methodology was used by Rodgers et al (25) after conducting a thorough compari-son of similar costing algorithms. The use of this algorithm in our model assumes similar practice patterns of patients with PsA in the UK and Canada, which is supported by interna-tional clinical guidelines (17,34). Additionally, parameters like psoriasis progression were not modeled. Even though the skin dimension has been previously included in economic evalua-tions, the utility–HAQ score relationship estimated a relatively small utility effect of the PASI (25). Finally, modeling treatment bundles instead of individual treatment responses poses a lim-itation, because specific DMARD and biologic therapies can-not be compared. However, since this model focuses on PsA screening instead of treatment, all comparators in this model are affected in the same way.
The results of this cost-utility analysis provide a pathway for next steps and further research on PsA screening. This model identified time to biologic start as a key parameter. Therefore, the uncertainty around DMARD-related HAQ score progression needs to be further addressed, specifically since there has been controversy around the efficacy of some DMARDs (40–43). This is important because the cost-effectiveness of screening depends on the ability of DMARDs to slow disease progression and delay the time of biologic start. Consequently, an ongoing trial will pro-vide an estimate of the delay to biologics and the effect of early DMARD treatment (10). A more precise estimate of early DMARD efficacy translates to a more precise cost-effectiveness estimate for the Canadian health care system. Additionally, the long-term effects of biologic therapy remain an uncertainty that needs resolving. Finally, future research should develop new algorithms to understand the relationship between HAQ score and PASI health states and current costs.
In summary, this is the first cost-utility model on screening for PsA among psoriasis patients. Screening for PsA among psoriasis patients with the EARP tool appears to be cost saving compared to the status quo. The ongoing PsA screening trial will provide additional information to account for the parameter uncertainty of the evaluation (10).
ACKNOWLEDGMENTS
The authors thank members of the Early Detection to Improve Outcome in People With Undiagnosed Psoriatic Arthritis study group who have been responsible for the acquisition of funding and general supervi-sion of the research group: Anne Barton, Melanie Brooke, Sarah Brown, Laura Coates, Claire Davies, Emma Dures, Catherine Fernandez, Oliver Fitzgerald, Helen Harris, Philip Helliwell, Sarah Hewlett, Jana James, Anya Lissina, Vishnu Madhok, Neil McHugh, Alison Nightingale, Jonathan Pack-ham, Andrew Parkinson, Gavin Shaddick, and William Tillett.
AUTHOR CONTRIBUTIONS
All authors were involved in drafting the article or revising it critically for important intellectual content, and all authors approved the final version to be submitted for publication. Mr. Iragorri had full access to all of the data in the study and takes responsibility for the integrity of the data and the accuracy of the data analysis.Study conception and design. Iragorri, Hazlewood, Manns, Bojke, Spackman.Acquisition of data. Iragorri, Hazlewood, Manns, Bojke, Spackman.Analysis and interpretation of data. Iragorri, Hazlewood, Manns, Bojke, Spackman.
REFERENCES 1. Gladman DD. Psoriatic arthritis: epidemiology, clinical features,
course, and outcome. Ann Rheum Dis 2005;64 Suppl S:14S–7S.
2. Harty L, Veale DJ. How early should psoriatic arthritis be treated with a TNF-blocker? Curr Opin Rheumatol 2010;22:393–6.
3. Taylor W, Gladman D, Helliwell P, Marchesoni A, Mease P, Mielants H, et al. Classification criteria for psoriatic arthritis: development of new criteria from a large international study. Arthritis Rheum 2006;54:2665–73.
4. Taylor WJ, Zmierczak HG, Helliwell PS. Problems with the definition of axial and peripheral disease patterns in psoriatic arthritis. J Rheumatol 2005;32:974–7.
5. Zachariae H. Prevalence of joint disease in patients with psoriasis: implications for therapy. Am J Clin Dermatol 2003;4:441–7.
6. Burgos-Pol R, Martínez-Sesmero JM, Ventura-Cerdá JM, Elías I, Caloto MT, Casado Má. The cost of psoriasis and psoriatic arthritis in 5 European countries: a systematic review. Actas Dermosifiliogr 2016;107:577–90.
7. Poole CD, Lebmeier M, Ara R, Rafia R, Currie CJ. Estimation of health care costs as a function of disease severity in peo-ple with psoriatic arthritis in the UK. Rheumatology (Oxford) 2010;49:1949–56.
8. Gladman DD, Thavaneswaran A, Chandran V, Cook RJ. Do patients with psoriatic arthritis who present early fare better than those pre-senting later in the disease? Ann Rheum Dis 2011;70:2152–4.
9. Iragorri N, Hazlewood G, Manns B, Danthurebandara V, Spackman E. Psoriatic arthritis screening: a systematic review and meta- analysis. Rheumatology (Oxford) 2018;58:692–707.
10. ISRCTN registry. Total burden of psoriasis. URL: http://isrctn.com/ISRCT N3887 7516.
11. Husni ME, Meyer KH, Cohen DS, Mody E, Qureshi AA. The PASE questionnaire: pilot-testing a psoriatic arthritis screening and evalua-tion tool. J Am Acad Dermatol 2007;57:581–7.
12. Tinazzi I, Adami S, Zanolin EM, Caimmi C, Confente S, Girolomoni G, et al. The early psoriatic arthritis screening questionnaire: a simple and fast method for the identification of arthritis in patients with pso-riasis. Rheumatology (Oxford) 2012;51:2058–63.
13. Ibrahim GH, Buch MH, Lawson C, Waxman R, Helliwell PS. Evaluation of an existing screening tool for psoriatic arthritis in peo-ple with psoriasis and the development of a new instrument: the Psoriasis Epidemiology Screening Tool (PEST) questionnaire. Clin Exp Rheumatol 2009;27:469–74.
14. Gladman DD, Schentag CT, Tom BD, Chandran V, Brockbank J, Rosen C, et al. Development and initial validation of a screening questionnaire for psoriatic arthritis: the Toronto Psoriatic Arthritis Screen (ToPAS). Ann Rheum Dis 2009;68:497–501.
15. Bernstein S, Donsky H, Gulliver W, Hamilton D, Nobel S, Norman R. Treatment of mild to moderate psoriasis with Reliéva, a Mahonia aquifolium extract: a double-blind, placebo-controlled study. Am J Ther 2006;13:121–6.
IRAGORRI ET AL 274 |
16. Eder L, Haddad A, Rosen CF, Lee KA, Chandran V, Cook R, et al. Theincidence and risk factors for psoriatic arthritis in patients with psoria-sis: a prospective cohort study. Arthritis Rheumatol 2016;68:915–23.
17. Gossec L, Smolen JS, Ramiro S, de Wit M, Cutolo M, Dougados M,et al. European League Against Rheumatism (EULAR) recommenda-tions for the management of psoriatic arthritis with pharmacologicaltherapies: 2015 update. Ann Rheum Dis 2016;75:499–510.
18. Rohekar S, Chan J, Tse SML, Haroon N, Chandran V, BessetteL, et al. 2014 update of the Canadian Rheumatology Association/Spondyloarthritis Research Consortium of Canada treatment recom-mendations for the management of spondyloarthritis. Part II: specific management recommendations. J Rheumatol 2015;42:665–81.
19. Corbett M, Chehadah F, Biswas M, Moe-Byrne T, Palmer S,Soares M, et al. Certolizumab pegol and secukinumab for treatingactive psoriatic arthritis following inadequate response to disease- modifying antirheumatic drugs: a systematic review and economicevaluation. Health Technol Assess 2017;21:1–326.
20. Bojke L, Epstein D, Craig D, Rodgers M, Woolacott N, Yang H, et al.Modelling the cost-effectiveness of biologic treatments for psoriaticarthritis. Rheumatology (Oxford) 2011;50 Suppl S:39S–47S.
21. Goeree R, Chiva-Razavi S, Gunda P, Graham CN, Miles L, NikoglouE, et al. Cost-effectiveness analysis of secukinumab for the treat-ment of active psoriatic arthritis: a Canadian perspective. J MedEcon 2018;21:163–73.
22. D’Angiolella LS, Cortesi PA, Lafranconi A, Micale M, Mangano S,Cesana G, et al. Cost and cost effectiveness of treatments for pso-riatic arthritis: a systematic literature review. Pharmacoeconomics2018;36:567–89.
23. Bruce B, Fries JF. The Health Assessment Questionnaire (HAQ). ClinExp Rheumatol 2005;23 Suppl S:14S–18S.
24. Kane D. A prospective, clinical and radiological study of early pso-riatic arthritis: an early synovitis clinic experience. Rheumatology(Oxford) 2003;42:1460–8.
25. Rodgers M, Epstein D, Bojke L, Yang H, Craig D, Fonseca T, et al.Etanercept, infliximab and adalimumab for the treatment of psori-atic arthritis: a systematic review and economic evaluation. HealthTechnol Assess 2011;15:1–395.
26. Bansback NJ. Estimating the cost and health status consequencesof treatment with TNF antagonists in patients with psoriatic arthritis.Rheumatology (Oxford) 2006;45:1029–38.
27. Jiao B, Rosen Z, Bellanger M, Belkin G, Muennig P. The cost- effectiveness of PHQ screening and collaborative care for depression in New York City. Kearns BC, editor. PLOS One 2017;12:e0184210.
28. Paulden M, Palmer S, Hewitt C, Gilbody S. Screening for postna-tal depression in primary care: cost effectiveness analysis. BMJ2009;339:b5203.
29. Maranetra N, Chuaychoo B, Lertakyamanee J, Naruman C,Chierakul N, Dejsomritrutai W, et al. The cost-effectiveness of
a questionnaire as a screening test for chronic obstructive pul-monary disease among the Bangkok elderly. J Med Assoc Thai 2003;86:1033–41.
30. Mittmann N, Stout NK, Lee P, Tosteson AN, Trentham-Dietz A,Alagoz O, et al. Total cost-effectiveness of mammography screeningstrategies. Health Rep 2015;26:16–25.
31. Canadian Agency for Drugs and Technologies in Health. Guidelinesfor the economic evaluation of health technologies. 2017. URL:https://www.cadth.ca/guide lines -econo mic-evalu ation -healt h-techn ologi es-canad a-4th-edition.
32. Zaghloul SS, Goodfield MJ. Objective assessment of compliancewith psoriasis treatment. Arch Dermatol 2004;140:408–14.
33. Briggs AH, Claxton K, Sculpher MJ. Decision modelling for healtheconomic evaluation. Oxford: Oxford University Press; 2006.
34. Singh JA, Guyatt G, Ogdie A, Gladman DD, Deal C, Deodhar A,et al. 2018 American College of Rheumatology/National PsoriasisFoundation guideline for the treatment of psoriatic arthritis. JPsoriasis Psoriatic Arthritis 2019;4:31–58.
35. Kirkham B, de Vlam K, Li W, Boggs R, Mallbris L, Nab HW, et al.Early treatment of psoriatic arthritis is associated with improvedpatient-reported outcomes: findings from the etanercept PRESTAtrial. Clin Exp Rheumatol 2015;33:11–19.
36. Theander E, Husmark T, Alenius GM, Larsson PT, Teleman A,Geijer M, et al. Early psoriatic arthritis: short symptom duration,male gender and preserved physical functioning at presentationpredict favourable outcome at 5-year follow-up. Results from theSwedish Early Psoriatic Arthritis Register (SwePsA). Ann Rheum Dis2014;73:407–13.
37. Tillett W, Shaddick G, Askari A, Cooper A, Creamer P, Clunie G,et al. Factors influencing work disability in psoriatic arthritis: firstresults from a large UK multicentre study. Rheumatology (Oxford)2015;54:157–62.
38. Haroon M, Gallagher P, FitzGerald O. Diagnostic delay of more than6 months contributes to poor radiographic and functional outcomein psoriatic arthritis. Ann Rheum Dis 2015;74:1045–50.
39. Bravo Vergel Y, Hawkins NS, Claxton K, Asseburg C, PalmerS, Woolacott N, et al. The cost-effectiveness of etanercept andinfliximab for the treatment of patients with psoriatic arthritis.Rheumatology (Oxford) 2007;46:1729–35.
40. Kang EJ, Kavanaugh A. Psoriatic arthritis: latest treatments and their place in therapy. Ther Adv Chronic Dis 2015;6:194–203.
41. Anandarajah AP, Ritchlin CT. The diagnosis and treatment of earlypsoriatic arthritis. Nat Rev Rheumatol 2009;5:634–41.
42. Singh YN, Verma KK, Kumar A, Malaviya AN. Methotrexate in psori-atic arthritis. J Assoc Physicians India 1994;42:860–2.
43. Gupta AK, Matteson EL, Ellis CN, Ho VC, Tellner DC, VoorheesJJ, et al. Cyclosporine in the treatment of psoriatic arthritis. ArchDermatol 1989;125:507–10.
275
Arthritis Care & ResearchVol. 73, No. 2, February 2021, pp 275–281DOI 10.1002/acr.24104© 2019, American College of Rheumatology
Factors Predictive of Radiographic Progression in Ankylosing SpondylitisIsmail Sari,1 Seunghun Lee,2 George Tomlinson,3 Sindhu R. Johnson,4 Robert D. Inman,4
and Nigil Haroon4
Objective. Using a longitudinal observational cohort of ankylosing spondylitis (AS) patients, we sought to identify progression rates and factors predictive of spinal progression. As a secondary aim, we analyzed the effect of tumor necrosis factor inhibitor (TNFi) treatment on radiographic progression.
Methods. AS patients who had baseline and follow-up cervical and lumbar radiographs were included in the study. Radiographic damage was assessed by the modified Stoke Ankylosing Spondylitis Spinal Score (mSASSS). A change of 2 mSASSS units in 2 years was defined as progression. The characteristics of the study group such as demographic, clinical, laboratory, and treatment history were collected.
Results. There were 350 patients in the study. The mean ± SD mSASSS increased from 9.3 ± 15.8 units at baseline to 17.7 ± 21.7 units by the sixth year. Mean ± SD changes in mSASSS between the years 0 to 2, 2 to 4, and 4 to 6 were 1.23 ± 2.68, 1.47 ± 2.86, and 1.52 ± 3.7 units, respectively. Overall, 24.3% of the group progressed over 2 years. Male sex (hazard ratio [HR] 2.46 [95% confidence interval (95% CI) 1.05, 5.76]), the presence of baseline damage (HR 7.98 [95% CI 3.98, 16]), increased inflammatory markers (log C-reactive protein level HR 1.35 [95% CI 1.07, 1.70]), and TNFi use (HR 0.82 [95% CI 0.70, 0.96]) were predictive of radiographic progression. There was a 20% reduction in the rate of progression with TNFi.
Conclusion. Male sex, the presence of baseline damage, active disease state, and higher inflammatory markers confer a high risk for disease progression. Treatment with TNFi showed a disease-modifying effect by slowing the rate of radiographic progression.
INTRODUCTION
Ankylosing spondylitis (AS) is a chronic inflammatory disease of the spine and sacroiliac joints with an unknown etiology. The cardinal symptom is the presence of chronic inflammatory back pain, which is seen in up to 80% of patients (1). Aside from spi-nal pain, other clinical features such as peripheral arthritis, uve-itis, and psoriasis may accompany the clinical course of AS (1). Structural spinal damage is a well-known feature of AS, which is characterized by new bone formation (syndesmophytes) in the spine. Currently, conventional radiography is the gold standard for assessment of the extent and severity of spinal disease caused by AS (2). Nearly 20–50% of AS patients have been reported to show some degree of spinal progression in 2 years of follow-up (3–5). Pain and stiffness due to disease activity and structural
damage are the main contributors for physical function impair-ment in AS (6). A number of predictors of spinal disease progres-sion have been described, including baseline structural damage, higher inflammatory burden, male sex, positivity for HLA–B27, and smoking (3–5,7,8). Nonsteroidal antiinflammatory drugs (NSAIDs) and tumor necrosis factor inhibitor (TNFi) treatments are the cor-nerstone therapies in the management of AS (9). Aside from being clinically effective, some reports suggest a beneficial effect on structural damage in AS, particularly with the use of TNFi (10–14).
The assessment of AS-related structural changes longitu-dinally is essential for understanding the natural course of pro-gression and its underlying factors. This assessment could help identify the mechanisms responsible for progression and thereby aid in personalizing treatment. In this study, by using a longitudinal observational cohort of patients with AS, we sought to identify
1Ismail Sari, MD, MSc: Toronto Western Hospital and University of Toronto, Toronto, Ontario, Canada, and Dokuz Eylul University School of Medicine, Izmir, Turkey; 2Seunghun Lee, MD, PhD: Toronto Western Hospital and University of Toronto, Toronto, Ontario, Canada, and Hanyang University Hospital, College of Medicine, Seoul, Korea; 3George Tomlinson, MSc, PhD: University Health Network/Mount Sinai Hospital and Dalla Lana School of Public Health, University of Toronto, Toronto, Ontario; 4Sindhu R. Johnson, MD, FRCPC, PhD, Robert D. Inman, MD, FRCPC, FACP, Nigil Haroon,
MD, PhD, DM, FRCPC: Toronto Western Hospital and University of Toronto, Toronto, Ontario, Canada.
No potential conflicts of interest relevant to this article were reported.Address correspondence to Nigil Haroon, MD, PhD, DM, FRCPC, Toronto
Western Hospital, 399 Bathurst Street, Toronto, Ontario M5T2S8, Canada. Email: [email protected].
Submitted for publication September 26, 2018; accepted in revised form October 29, 2019.
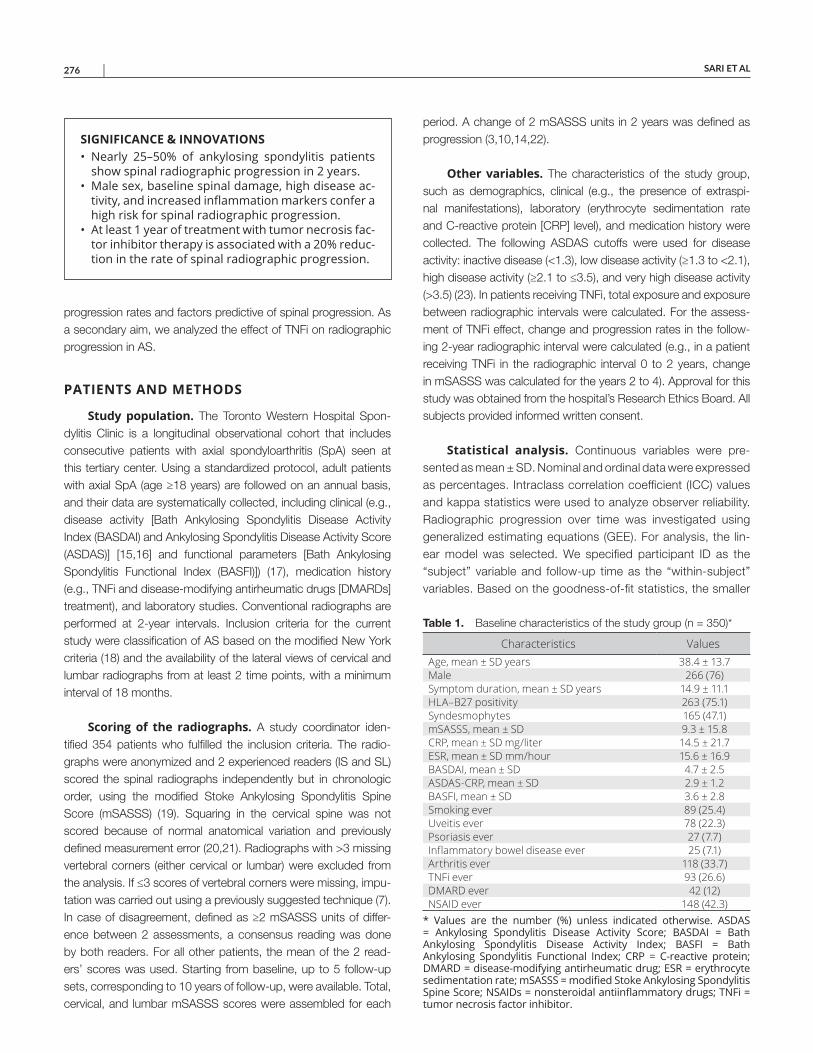
SARI ET AL 276 |
progression rates and factors predictive of spinal progression. As a secondary aim, we analyzed the effect of TNFi on radiographic progression in AS.
PATIENTS AND METHODS
Study population. The Toronto Western Hospital Spon-dylitis Clinic is a longitudinal observational cohort that includes consecutive patients with axial spondyloarthritis (SpA) seen at this tertiary center. Using a standardized protocol, adult patients with axial SpA (age ≥18 years) are followed on an annual basis, and their data are systematically collected, including clinical (e.g., disease activity [Bath Ankylosing Spondylitis Disease Activity Index (BASDAI) and Ankylosing Spondylitis Disease Activity Score (ASDAS)] [15,16] and functional parameters [Bath Ankylosing Spondylitis Functional Index (BASFI)]) (17), medication history (e.g., TNFi and disease-modifying antirheumatic drugs [DMARDs] treatment), and laboratory studies. Conventional radiographs are performed at 2-year intervals. Inclusion criteria for the current study were classification of AS based on the modified New York criteria (18) and the availability of the lateral views of cervical and lumbar radiographs from at least 2 time points, with a minimum interval of 18 months.
Scoring of the radiographs. A study coordinator iden-tified 354 patients who fulfilled the inclusion criteria. The radio-graphs were anonymized and 2 experienced readers (IS and SL) scored the spinal radiographs independently but in chronologic order, using the modified Stoke Ankylosing Spondylitis Spine Score (mSASSS) (19). Squaring in the cervical spine was not scored because of normal anatomical variation and previously defined measurement error (20,21). Radiographs with >3 missing vertebral corners (either cervical or lumbar) were excluded from the analysis. If ≤3 scores of vertebral corners were missing, impu-tation was carried out using a previously suggested technique (7). In case of disagreement, defined as ≥2 mSASSS units of differ-ence between 2 assessments, a consensus reading was done by both readers. For all other patients, the mean of the 2 read-ers’ scores was used. Starting from baseline, up to 5 follow-up sets, corresponding to 10 years of follow-up, were available. Total, cervical, and lumbar mSASSS scores were assembled for each
period. A change of 2 mSASSS units in 2 years was defined as progression (3,10,14,22).
Other variables. The characteristics of the study group, such as demographics, clinical (e.g., the presence of extraspi-nal manifestations), laboratory (erythrocyte sedimentation rate and C-reactive protein [CRP] level), and medication history were collected. The following ASDAS cutoffs were used for disease activity: inactive disease (<1.3), low disease activity (≥1.3 to <2.1), high disease activity (≥2.1 to ≤3.5), and very high disease activity (>3.5) (23). In patients receiving TNFi, total exposure and exposure between radiographic intervals were calculated. For the assess-ment of TNFi effect, change and progression rates in the follow-ing 2-year radiographic interval were calculated (e.g., in a patient receiving TNFi in the radiographic interval 0 to 2 years, change in mSASSS was calculated for the years 2 to 4). Approval for this study was obtained from the hospital’s Research Ethics Board. All subjects provided informed written consent.
Statistical analysis. Continuous variables were pre-sented as mean ± SD. Nominal and ordinal data were expressed as percentages. Intraclass correlation coefficient (ICC) values and kappa statistics were used to analyze observer reliability. Radiographic progression over time was investigated using generalized estimating equations (GEE). For analysis, the lin-ear model was selected. We specified participant ID as the “subject” variable and follow-up time as the “within-subject” variables. Based on the goodness-of-fit statistics, the smaller
SIGNIFICANCE & INNOVATIONS• Nearly 25–50% of ankylosing spondylitis patients
show spinal radiographic progression in 2 years.• Male sex, baseline spinal damage, high disease ac-
tivity, and increased inflammation markers confer a high risk for spinal radiographic progression.
• At least 1 year of treatment with tumor necrosis fac-tor inhibitor therapy is associated with a 20% reduc-tion in the rate of spinal radiographic progression.
Table 1. Baseline characteristics of the study group (n = 350)*
Characteristics ValuesAge, mean ± SD years 38.4 ± 13.7Male 266 (76)Symptom duration, mean ± SD years 14.9 ± 11.1HLA–B27 positivity 263 (75.1)Syndesmophytes 165 (47.1)mSASSS, mean ± SD 9.3 ± 15.8CRP, mean ± SD mg/liter 14.5 ± 21.7ESR, mean ± SD mm/hour 15.6 ± 16.9BASDAI, mean ± SD 4.7 ± 2.5ASDAS-CRP, mean ± SD 2.9 ± 1.2BASFI, mean ± SD 3.6 ± 2.8Smoking ever 89 (25.4)Uveitis ever 78 (22.3)Psoriasis ever 27 (7.7)Inflammatory bowel disease ever 25 (7.1)Arthritis ever 118 (33.7)TNFi ever 93 (26.6)DMARD ever 42 (12)NSAID ever 148 (42.3)
* Values are the number (%) unless indicated otherwise. ASDAS = Ankylosing Spondylitis Disease Activity Score; BASDAI = Bath Ankylosing Spondylitis Disease Activity Index; BASFI = Bath Ankylosing Spondylitis Functional Index; CRP = C-reactive protein; DMARD = disease-modifying antirheumatic drug; ESR = erythrocyte sedimentation rate; mSASSS = modified Stoke Ankylosing Spondylitis Spine Score; NSAIDs = nonsteroidal antiinflammatory drugs; TNFi = tumor necrosis factor inhibitor.
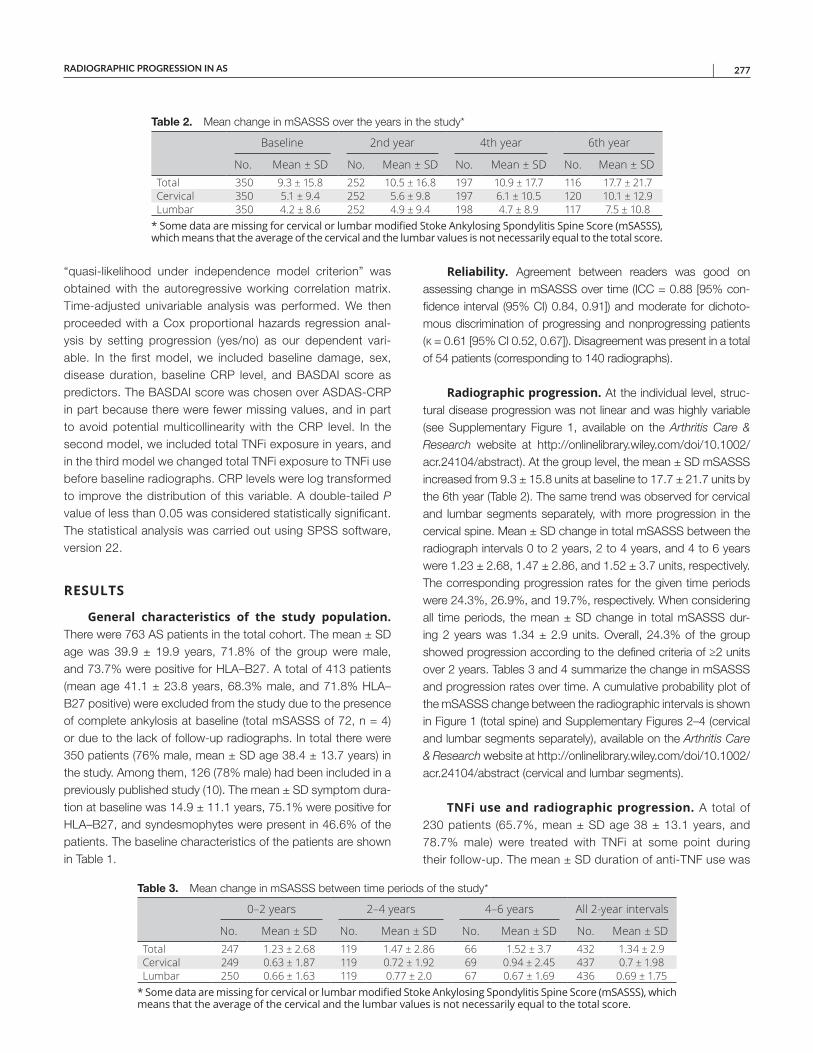
RADIOGRAPHIC PROGRESSION IN AS | 277
“quasi-likelihood under independence model criterion” was obtained with the autoregressive working correlation matrix. Time-adjusted univariable analysis was performed. We then proceeded with a Cox proportional hazards regression anal-ysis by setting progression (yes/no) as our dependent vari-able. In the first model, we included baseline damage, sex, disease duration, baseline CRP level, and BASDAI score as predictors. The BASDAI score was chosen over ASDAS-CRP in part because there were fewer missing values, and in part to avoid potential multicollinearity with the CRP level. In the second model, we included total TNFi exposure in years, and in the third model we changed total TNFi exposure to TNFi use before baseline radiographs. CRP levels were log transformed to improve the distribution of this variable. A double-tailed P value of less than 0.05 was considered statistically significant. The statistical analysis was carried out using SPSS software, version 22.
RESULTS
General characteristics of the study population. There were 763 AS patients in the total cohort. The mean ± SD age was 39.9 ± 19.9 years, 71.8% of the group were male, and 73.7% were positive for HLA–B27. A total of 413 patients (mean age 41.1 ± 23.8 years, 68.3% male, and 71.8% HLA–B27 positive) were excluded from the study due to the presence of complete ankylosis at baseline (total mSASSS of 72, n = 4) or due to the lack of follow-up radiographs. In total there were 350 patients (76% male, mean ± SD age 38.4 ± 13.7 years) in the study. Among them, 126 (78% male) had been included in a previously published study (10). The mean ± SD symptom dura-tion at baseline was 14.9 ± 11.1 years, 75.1% were positive for HLA–B27, and syndesmophytes were present in 46.6% of the patients. The baseline characteristics of the patients are shown in Table 1.
Reliability. Agreement between readers was good on assessing change in mSASSS over time (ICC = 0.88 [95% con-fidence interval (95% CI) 0.84, 0.91]) and moderate for dichoto-mous discrimination of progressing and nonprogressing patients (κ = 0.61 [95% CI 0.52, 0.67]). Disagreement was present in a total of 54 patients (corresponding to 140 radiographs).
Radiographic progression. At the individual level, struc-tural disease progression was not linear and was highly variable (see Supplementary Figure 1, available on the Arthritis Care & Research website at http://onlin elibr ary.wiley.com/doi/10.1002/acr.24104/ abstract). At the group level, the mean ± SD mSASSS increased from 9.3 ± 15.8 units at baseline to 17.7 ± 21.7 units by the 6th year (Table 2). The same trend was observed for cervical and lumbar segments separately, with more progression in the cervical spine. Mean ± SD change in total mSASSS between the radio graph intervals 0 to 2 years, 2 to 4 years, and 4 to 6 years were 1.23 ± 2.68, 1.47 ± 2.86, and 1.52 ± 3.7 units, respectively. The corresponding progression rates for the given time periods were 24.3%, 26.9%, and 19.7%, respectively. When considering all time periods, the mean ± SD change in total mSASSS dur-ing 2 years was 1.34 ± 2.9 units. Overall, 24.3% of the group showed progression according to the defined criteria of ≥2 units over 2 years. Tables 3 and 4 summarize the change in mSASSS and progression rates over time. A cumulative probability plot of the mSASSS change between the radiographic intervals is shown in Figure 1 (total spine) and Supplementary Figures 2–4 (cervical and lumbar segments separately), available on the Arthritis Care & Research website at http://onlin elibr ary.wiley.com/doi/10.1002/acr.24104/ abstract (cervical and lumbar segments).
TNFi use and radiographic progression. A total of 230 patients (65.7%, mean ± SD age 38 ± 13.1 years, and 78.7% male) were treated with TNFi at some point during their follow-up. The mean ± SD duration of anti-TNF use was
Table 2. Mean change in mSASSS over the years in the study*
Baseline 2nd year 4th year 6th year
No. Mean ± SD No. Mean ± SD No. Mean ± SD No. Mean ± SDTotal 350 9.3 ± 15.8 252 10.5 ± 16.8 197 10.9 ± 17.7 116 17.7 ± 21.7Cervical 350 5.1 ± 9.4 252 5.6 ± 9.8 197 6.1 ± 10.5 120 10.1 ± 12.9Lumbar 350 4.2 ± 8.6 252 4.9 ± 9.4 198 4.7 ± 8.9 117 7.5 ± 10.8
* Some data are missing for cervical or lumbar modified Stoke Ankylosing Spondylitis Spine Score (mSASSS), which means that the average of the cervical and the lumbar values is not necessarily equal to the total score.
Table 3. Mean change in mSASSS between time periods of the study*
0–2 years 2–4 years 4–6 years All 2-year intervals
No. Mean ± SD No. Mean ± SD No. Mean ± SD No. Mean ± SDTotal 247 1.23 ± 2.68 119 1.47 ± 2.86 66 1.52 ± 3.7 432 1.34 ± 2.9Cervical 249 0.63 ± 1.87 119 0.72 ± 1.92 69 0.94 ± 2.45 437 0.7 ± 1.98Lumbar 250 0.66 ± 1.63 119 0.77 ± 2.0 67 0.67 ± 1.69 436 0.69 ± 1.75
* Some data are missing for cervical or lumbar modified Stoke Ankylosing Spondylitis Spine Score (mSASSS), which means that the average of the cervical and the lumbar values is not necessarily equal to the total score.
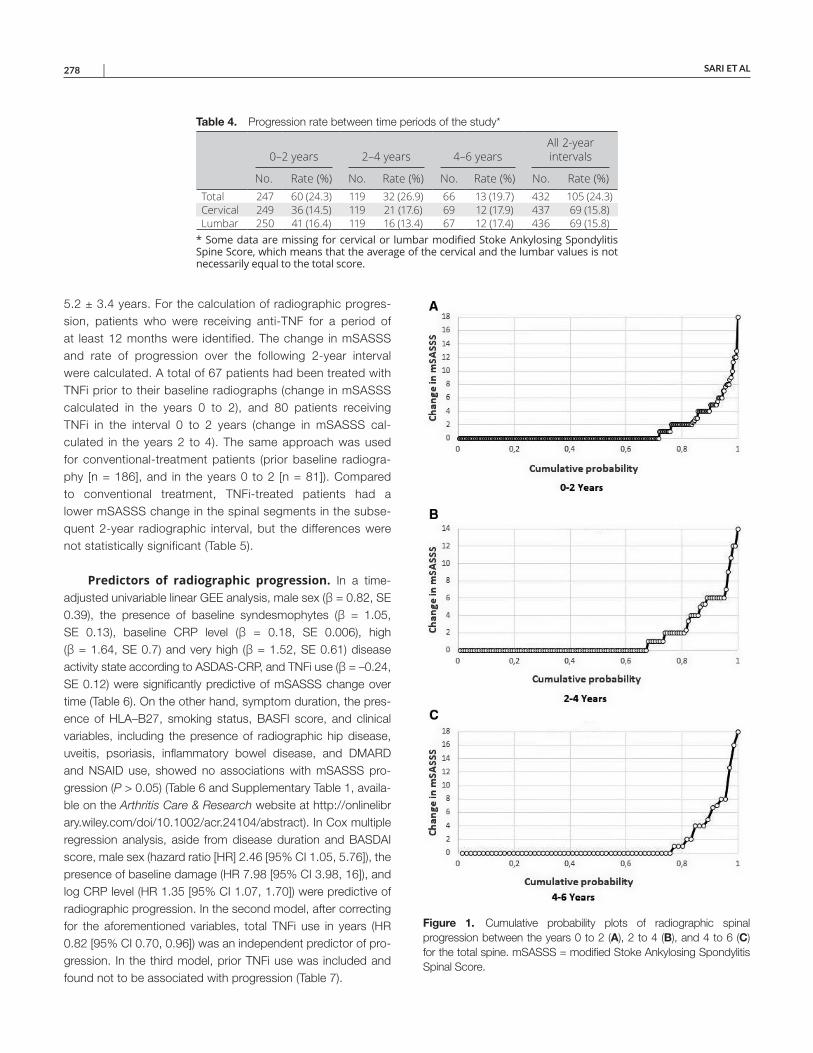
SARI ET AL 278 |
5.2 ± 3.4 years. For the calculation of radiographic progres-sion, patients who were receiving anti-TNF for a period of at least 12 months were identified. The change in mSASSS and rate of progression over the following 2-year interval were calculated. A total of 67 patients had been treated with TNFi prior to their baseline radiographs (change in mSASSS calculated in the years 0 to 2), and 80 patients receiving TNFi in the interval 0 to 2 years (change in mSASSS cal-culated in the years 2 to 4). The same approach was used for conventional-treatment patients (prior baseline radiogra-phy [n = 186], and in the years 0 to 2 [n = 81]). Compared to conventional treatment, TNFi-treated patients had a lower mSASSS change in the spinal segments in the subse-quent 2-year radiographic interval, but the differences were not statistically significant (Table 5).
Predictors of radiographic progression. In a time- adjusted univariable linear GEE analysis, male sex (β = 0.82, SE 0.39), the presence of baseline syndesmophytes (β = 1.05, SE 0.13), baseline CRP level (β = 0.18, SE 0.006), high (β = 1.64, SE 0.7) and very high (β = 1.52, SE 0.61) disease activity state according to ASDAS-CRP, and TNFi use (β = –0.24, SE 0.12) were significantly predictive of mSASSS change over time (Table 6). On the other hand, symptom duration, the pres-ence of HLA–B27, smoking status, BASFI score, and clinical variables, including the presence of radiographic hip disease, uveitis, psoriasis, inflammatory bowel disease, and DMARD and NSAID use, showed no associations with mSASSS pro-gression (P > 0.05) (Table 6 and Supplementary Table 1, availa-ble on the Arthritis Care & Research website at http://onlin elibr ary.wiley.com/doi/10.1002/acr.24104/ abstract). In Cox multiple regression analysis, aside from disease duration and BASDAI score, male sex (hazard ratio [HR] 2.46 [95% CI 1.05, 5.76]), the presence of baseline damage (HR 7.98 [95% CI 3.98, 16]), and log CRP level (HR 1.35 [95% CI 1.07, 1.70]) were predictive of radiographic progression. In the second model, after correcting for the aforementioned variables, total TNFi use in years (HR 0.82 [95% CI 0.70, 0.96]) was an independent predictor of pro-gression. In the third model, prior TNFi use was included and found not to be associated with progression (Table 7).
Table 4. Progression rate between time periods of the study*
0–2 years 2–4 years 4–6 yearsAll 2-year intervals
No. Rate (%) No. Rate (%) No. Rate (%) No. Rate (%)Total 247 60 (24.3) 119 32 (26.9) 66 13 (19.7) 432 105 (24.3)Cervical 249 36 (14.5) 119 21 (17.6) 69 12 (17.9) 437 69 (15.8)Lumbar 250 41 (16.4) 119 16 (13.4) 67 12 (17.4) 436 69 (15.8)
* Some data are missing for cervical or lumbar modified Stoke Ankylosing SpondylitisSpine Score, which means that the average of the cervical and the lumbar values is not necessarily equal to the total score.
Figure 1. Cumulative probability plots of radiographic spinal progression between the years 0 to 2 (A), 2 to 4 (B), and 4 to 6 (C) for the total spine. mSASSS = modified Stoke Ankylosing Spondylitis Spinal Score.
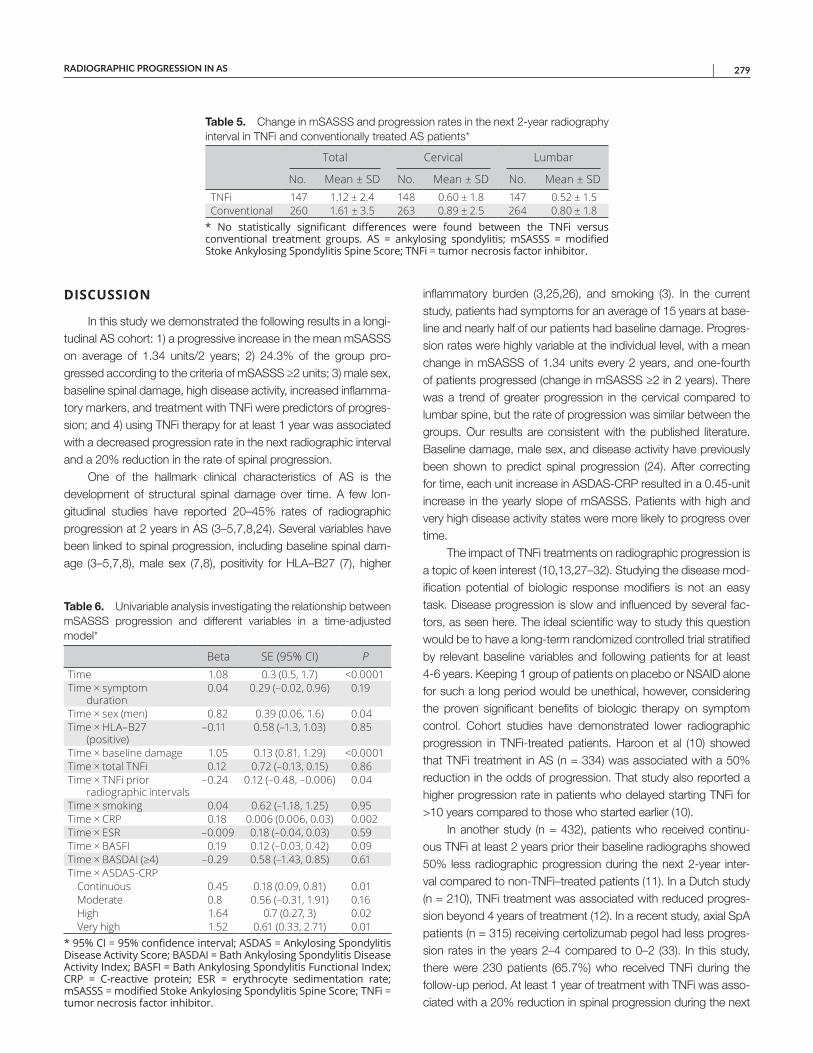
RADIOGRAPHIC PROGRESSION IN AS | 279
DISCUSSION
In this study we demonstrated the following results in a longi-tudinal AS cohort: 1) a progressive increase in the mean mSASSS on average of 1.34 units/2 years; 2) 24.3% of the group pro-gressed according to the criteria of mSASSS ≥2 units; 3) male sex, baseline spinal damage, high disease activity, increased inflamma-tory markers, and treatment with TNFi were predictors of progres-sion; and 4) using TNFi therapy for at least 1 year was associated with a decreased progression rate in the next radiographic interval and a 20% reduction in the rate of spinal progression.
One of the hallmark clinical characteristics of AS is the development of structural spinal damage over time. A few lon-gitudinal studies have reported 20–45% rates of radiographic progression at 2 years in AS (3–5,7,8,24). Several variables have been linked to spinal progression, including baseline spinal dam-age (3–5,7,8), male sex (7,8), positivity for HLA–B27 (7), higher
inflammatory burden (3,25,26), and smoking (3). In the current study, patients had symptoms for an average of 15 years at base-line and nearly half of our patients had baseline damage. Progres-sion rates were highly variable at the individual level, with a mean change in mSASSS of 1.34 units every 2 years, and one-fourth of patients progressed (change in mSASSS ≥2 in 2 years). There was a trend of greater progression in the cervical compared to lumbar spine, but the rate of progression was similar between the groups. Our results are consistent with the published literature. Baseline damage, male sex, and disease activity have previously been shown to predict spinal progression (24). After correcting for time, each unit increase in ASDAS-CRP resulted in a 0.45-unit increase in the yearly slope of mSASSS. Patients with high and very high disease activity states were more likely to progress over time.
The impact of TNFi treatments on radiographic progression is a topic of keen interest (10,13,27–32). Studying the disease mod-ification potential of biologic response modifiers is not an easy task. Disease progression is slow and influenced by several fac-tors, as seen here. The ideal scientific way to study this question would be to have a long-term randomized controlled trial stratified by relevant baseline variables and following patients for at least 4-6 years. Keeping 1 group of patients on placebo or NSAID alone for such a long period would be unethical, however, considering the proven significant benefits of biologic therapy on symptom control. Cohort studies have demonstrated lower radiographic progression in TNFi-treated patients. Haroon et al (10) showed that TNFi treatment in AS (n = 334) was associated with a 50% reduction in the odds of progression. That study also reported a higher progression rate in patients who delayed starting TNFi for >10 years compared to those who started earlier (10).
In another study (n = 432), patients who received continu-ous TNFi at least 2 years prior their baseline radiographs showed 50% less radiographic progression during the next 2-year inter-val compared to non-TNFi–treated patients (11). In a Dutch study (n = 210), TNFi treatment was associated with reduced progres-sion beyond 4 years of treatment (12). In a recent study, axial SpA patients (n = 315) receiving certolizumab pegol had less progres-sion rates in the years 2–4 compared to 0–2 (33). In this study, there were 230 patients (65.7%) who received TNFi during the follow-up period. At least 1 year of treatment with TNFi was asso-ciated with a 20% reduction in spinal progression during the next
Table 5. Change in mSASSS and progression rates in the next 2-year radiography interval in TNFi and conventionally treated AS patients*
Total Cervical Lumbar
No. Mean ± SD No. Mean ± SD No. Mean ± SDTNFi 147 1.12 ± 2.4 148 0.60 ± 1.8 147 0.52 ± 1.5Conventional 260 1.61 ± 3.5 263 0.89 ± 2.5 264 0.80 ± 1.8
* No statistically significant differences were found between the TNFi versus conventional treatment groups. AS = ankylosing spondylitis; mSASSS = modified Stoke Ankylosing Spondylitis Spine Score; TNFi = tumor necrosis factor inhibitor.
Table 6. Univariable analysis investigating the relationship between mSASSS progression and different variables in a time-adjusted model*
Beta SE (95% CI) PTime 1.08 0.3 (0.5, 1.7) <0.0001Time × symptom
duration0.04 0.29 (–0.02, 0.96) 0.19
Time × sex (men) 0.82 0.39 (0.06, 1.6) 0.04Time × HLA–B27
(positive)–0.11 0.58 (–1.3, 1.03) 0.85
Time × baseline damage 1.05 0.13 (0.81, 1.29) <0.0001Time × total TNFi 0.12 0.72 (–0.13, 0.15) 0.86Time × TNFi prior
radiographic intervals–0.24 0.12 (–0.48, –0.006) 0.04
Time × smoking 0.04 0.62 (–1.18, 1.25) 0.95Time × CRP 0.18 0.006 (0.006, 0.03) 0.002Time × ESR –0.009 0.18 (–0.04, 0.03) 0.59Time × BASFI 0.19 0.12 (–0.03, 0.42) 0.09Time × BASDAI (≥4) –0.29 0.58 (–1.43, 0.85) 0.61Time × ASDAS-CRP
Continuous 0.45 0.18 (0.09, 0.81) 0.01Moderate 0.8 0.56 (–0.31, 1.91) 0.16High 1.64 0.7 (0.27, 3) 0.02Very high 1.52 0.61 (0.33, 2.71) 0.01
* 95% CI = 95% confidence interval; ASDAS = Ankylosing Spondylitis Disease Activity Score; BASDAI = Bath Ankylosing Spondylitis Disease Activity Index; BASFI = Bath Ankylosing Spondylitis Functional Index; CRP = C-reactive protein; ESR = erythrocyte sedimentation rate; mSASSS = modified Stoke Ankylosing Spondylitis Spine Score; TNFi = tumor necrosis factor inhibitor.
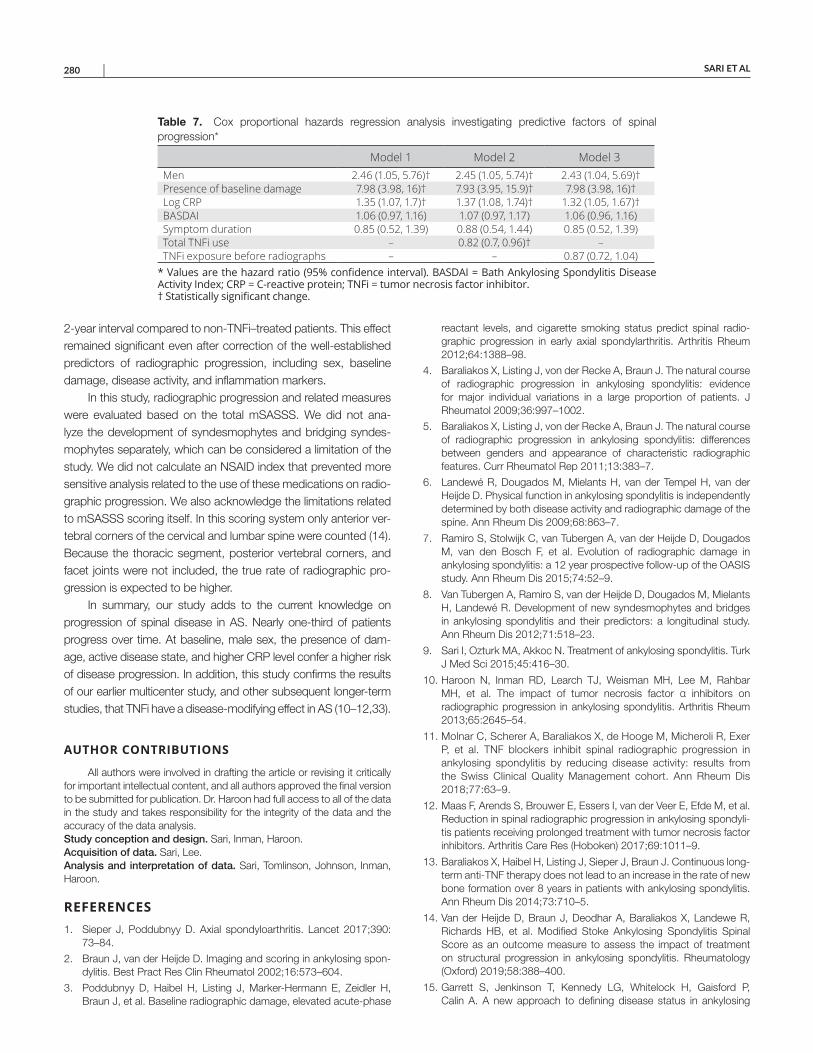
SARI ET AL 280 |
2-year interval compared to non-TNFi–treated patients. This effect remained significant even after correction of the well-established predictors of radiographic progression, including sex, baseline damage, disease activity, and inflammation markers.
In this study, radiographic progression and related measures were evaluated based on the total mSASSS. We did not ana-lyze the development of syndesmophytes and bridging syndes-mophytes separately, which can be considered a limitation of the study. We did not calculate an NSAID index that prevented more sensitive analysis related to the use of these medications on radio-graphic progression. We also acknowledge the limitations related to mSASSS scoring itself. In this scoring system only anterior ver-tebral corners of the cervical and lumbar spine were counted (14). Because the thoracic segment, posterior vertebral corners, and facet joints were not included, the true rate of radiographic pro-gression is expected to be higher.
In summary, our study adds to the current knowledge on progression of spinal disease in AS. Nearly one-third of patients progress over time. At baseline, male sex, the presence of dam-age, active disease state, and higher CRP level confer a higher risk of disease progression. In addition, this study confirms the results of our earlier multicenter study, and other subsequent longer-term studies, that TNFi have a disease-modifying effect in AS (10–12,33).
AUTHOR CONTRIBUTIONS
All authors were involved in drafting the article or revising it critically for important intellectual content, and all authors approved the final version to be submitted for publication. Dr. Haroon had full access to all of the data in the study and takes responsibility for the integrity of the data and the accuracy of the data analysis.Study conception and design. Sari, Inman, Haroon.Acquisition of data. Sari, Lee.Analysis and interpretation of data. Sari, Tomlinson, Johnson, Inman, Haroon.
REFERENCES 1. Sieper J, Poddubnyy D. Axial spondyloarthritis. Lancet 2017;390:
73–84.
2. Braun J, van der Heijde D. Imaging and scoring in ankylosing spon-dylitis. Best Pract Res Clin Rheumatol 2002;16:573–604.
3. Poddubnyy D, Haibel H, Listing J, Marker-Hermann E, Zeidler H, Braun J, et al. Baseline radiographic damage, elevated acute-phase
reactant levels, and cigarette smoking status predict spinal radio-graphic progression in early axial spondylarthritis. Arthritis Rheum 2012;64:1388–98.
4. Baraliakos X, Listing J, von der Recke A, Braun J. The natural course of radiographic progression in ankylosing spondylitis: evidence for major individual variations in a large proportion of patients. J Rheumatol 2009;36:997–1002.
5. Baraliakos X, Listing J, von der Recke A, Braun J. The natural course of radiographic progression in ankylosing spondylitis: differences between genders and appearance of characteristic radiographic features. Curr Rheumatol Rep 2011;13:383–7.
6. Landewé R, Dougados M, Mielants H, van der Tempel H, van der Heijde D. Physical function in ankylosing spondylitis is independently determined by both disease activity and radiographic damage of the spine. Ann Rheum Dis 2009;68:863–7.
7. Ramiro S, Stolwijk C, van Tubergen A, van der Heijde D, Dougados M, van den Bosch F, et al. Evolution of radiographic damage in ankylosing spondylitis: a 12 year prospective follow-up of the OASIS study. Ann Rheum Dis 2015;74:52–9.
8. Van Tubergen A, Ramiro S, van der Heijde D, Dougados M, Mielants H, Landewé R. Development of new syndesmophytes and bridges in ankylosing spondylitis and their predictors: a longitudinal study. Ann Rheum Dis 2012;71:518–23.
9. Sari I, Ozturk MA, Akkoc N. Treatment of ankylosing spondylitis. Turk J Med Sci 2015;45:416–30.
10. Haroon N, Inman RD, Learch TJ, Weisman MH, Lee M, Rahbar MH, et al. The impact of tumor necrosis factor α inhibitors on radio graphic progression in ankylosing spondylitis. Arthritis Rheum 2013;65:2645–54.
11. Molnar C, Scherer A, Baraliakos X, de Hooge M, Micheroli R, Exer P, et al. TNF blockers inhibit spinal radiographic progression in ankylosing spondylitis by reducing disease activity: results from the Swiss Clinical Quality Management cohort. Ann Rheum Dis 2018;77:63–9.
12. Maas F, Arends S, Brouwer E, Essers I, van der Veer E, Efde M, et al. Reduction in spinal radiographic progression in ankylosing spondyli-tis patients receiving prolonged treatment with tumor necrosis factor inhibitors. Arthritis Care Res (Hoboken) 2017;69:1011–9.
13. Baraliakos X, Haibel H, Listing J, Sieper J, Braun J. Continuous long-term anti-TNF therapy does not lead to an increase in the rate of new bone formation over 8 years in patients with ankylosing spondylitis. Ann Rheum Dis 2014;73:710–5.
14. Van der Heijde D, Braun J, Deodhar A, Baraliakos X, Landewe R, Richards HB, et al. Modified Stoke Ankylosing Spondylitis Spinal Score as an outcome measure to assess the impact of treatment on structural progression in ankylosing spondylitis. Rheumatology (Oxford) 2019;58:388–400.
15. Garrett S, Jenkinson T, Kennedy LG, Whitelock H, Gaisford P, Calin A. A new approach to defining disease status in ankylosing
Table 7. Cox proportional hazards regression analysis investigating predictive factors of spinal progression*
Model 1 Model 2 Model 3Men 2.46 (1.05, 5.76)† 2.45 (1.05, 5.74)† 2.43 (1.04, 5.69)†Presence of baseline damage 7.98 (3.98, 16)† 7.93 (3.95, 15.9)† 7.98 (3.98, 16)†Log CRP 1.35 (1.07, 1.7)† 1.37 (1.08, 1.74)† 1.32 (1.05, 1.67)†BASDAI 1.06 (0.97, 1.16) 1.07 (0.97, 1.17) 1.06 (0.96, 1.16)Symptom duration 0.85 (0.52, 1.39) 0.88 (0.54, 1.44) 0.85 (0.52, 1.39)Total TNFi use – 0.82 (0.7, 0.96)† –TNFi exposure before radiographs – – 0.87 (0.72, 1.04)
* Values are the hazard ratio (95% confidence interval). BASDAI = Bath Ankylosing Spondylitis Disease Activity Index; CRP = C-reactive protein; TNFi = tumor necrosis factor inhibitor. † Statistically significant change.
RADIOGRAPHIC PROGRESSION IN AS | 281
spondylitis: the Bath Ankylosing Spondylitis Disease Activity Index. J Rheumatol 1994;21:2286–91.
16. Van der Heijde D, Lie E, Kvien TK, Sieper J, Van den Bosch F, Listing J, et al. ASDAS, a highly discriminatory ASAS-endorsed diseaseactivity score in patients with ankylosing spondylitis. Ann Rheum Dis2009;68:1811–8.
17. Calin A, Garrett S, Whitelock H, Kennedy LG, O’Hea J, MallorieP, et al. A new approach to defining functional ability in ankylos-ing spondylitis: the development of the Bath Ankylosing SpondylitisFunctional Index. J Rheumatol 1994;21:2281–5.
18. Van der Linden S, Valkenburg HA, Cats A. Evaluation of diagnosticcriteria for ankylosing spondylitis. Arthritis Rheum 1984;27:361–8.
19. Creemers MC, Franssen MJ, van’t Hof MA, Gribnau FW,van de Putte LB, van Riel PL. Assessment of outcome in ankylosingspondylitis: an extended radiographic scoring system. Ann RheumDis 2005;64:127–9.
20. Maksymowych WP, Learch T, Lambert RG, Ward M, Haroon N,Inman R, et al. Development and validation of the spondyloarthri-tis radiography module for calibration of readers using the modi-fied Stoke Ankylosing Spondylitis Spine Score. Arthritis Care Res(Hoboken) 2014;66:55–62.
21. Ward MM, Learch TJ, Weisman MH. Cervical vertebral squaring inpatients without spondyloarthritis [letter]. J Rheumatol 2012;39:1900.
22. Rudwaleit M, Jurik AG, Hermann KG, Landewe R, van der Heijde D,Baraliakos X, et al. Defining active sacroiliitis on magnetic resonanceimaging (MRI) for classification of axial spondyloarthritis: a consen-sual approach by the ASAS/OMERACT MRI group. Ann Rheum Dis2009;68:1520–7.
23. Machado P, Landewe R, Lie E, Kvien TK, Braun J, Baker D, et al.Ankylosing Spondylitis Disease Activity Score (ASDAS): defining cut-off values for disease activity states and improvement scores. AnnRheum Dis 2011;70:47–53.
24. Sari I, Haroon N. Radiographic progression in ankylosing spondylitis: from prognostication to disease modification. Curr Rheumatol Rep2018;20:82.
25. Poddubnyy D, Protopopov M, Haibel H, Braun J, Rudwaleit M, Sieper J. High disease activity according to the Ankylosing SpondylitisDisease Activity Score is associated with accelerated radiographicspinal progression in patients with early axial spondyloarthritis:
results from the GErman SPondyloarthritis Inception Cohort. Ann Rheum Dis 2016;75:2114–8.
26. Ramiro S, van der Heijde D, van Tubergen A, Stolwijk C,Dougados M, van den Bosch F, et al. Higher disease activity leadsto more structural damage in the spine in ankylosing spondylitis:12-year longitudinal data from the OASIS cohort. Ann Rheum Dis2014;73:1455–61.
27. Baraliakos X, Listing J, Rudwaleit M, Brandt J, Sieper J, Braun J.Radiographic progression in patients with ankylosing spondylitisafter 2 years of treatment with the tumour necrosis factor alpha anti-body infliximab. Ann Rheum Dis 2005;64:1462–6.
28. Braun J, Baraliakos X, Hermann KG, Deodhar A, van der Heijde D,Inman R, et al. The effect of two golimumab doses on radiographicprogression in ankylosing spondylitis: results through 4 years of theGO-RAISE trial. Ann Rheum Dis 2014;73:1107–13.
29. Kim TJ, Shin JH, Kim S, Sung IH, Lee S, Song Y, et al. Radiographicprogression in patients with ankylosing spondylitis according totumor necrosis factor blocker exposure: Observation Study ofKorean Spondyloarthropathy Registry (OSKAR) data. Joint BoneSpine 2016;83:569–72.
30. Van der Heijde D, Landewe R, Baraliakos X, Houben H, van Tubergen A, Williamson P, et al. Radiographic findings following two years ofinfliximab therapy in patients with ankylosing spondylitis. ArthritisRheum 2008;58:3063–70.
31. Van der Heijde D, Landewe R, Einstein S, Ory P, Vosse D, Ni L,et al. Radiographic progression of ankylosing spondylitis afterup to two years of treatment with etanercept. Arthritis Rheum2008;58:1324–31.
32. Van der Heijde D, Salonen D, Weissman BN, Landewe R,Maksymowych WP, Kupper H, et al. Assessment of radiographicprogression in the spines of patients with ankylosing spondy-litis treated with adalimumab for up to 2 years. Arthritis Res Ther2009;11:R127.
33. Van der Heijde D, Baraliakos X, Hermann KA, Landewe RB,Machado PM, Maksymowych WP, et al. Limited radiographicprogression and sustained reductions in MRI inflammation inpatients with axial spondyloarthritis: 4-year imaging outcomesfrom the RAPID-axSpA phase III randomised trial. Ann Rheum Dis2018;77:699–705.

282
Arthritis Care & ResearchVol. 73, No. 2, February 2021, pp 282–288DOI 10.1002/acr.24111© 2020, American College of Rheumatology
Spondyloarthritis and Outcomes in Pregnancy and Labor: A Nationwide Register-Based Cohort StudySofie Mørk,1 Anne Voss,2 Sören Möller,3 and Mette Bliddal3
Objective. To describe the prevalence of spondyloarthritis (SpA) and subtypes diagnosed prior to delivery in a nationwide population of pregnant women, and to estimate how SpA was associated with adverse pregnancy-related outcomes.
Methods. Using the Danish Medical Birth Register, we identified 1,199,610 singleton pregnancies (1997–2016). Information on SpA and related subtypes (ankylosing spondylitis, psoriatic arthritis, reactive arthritis, arthritis associated with inflammatory bowel diseases, and undifferentiated SpA) was derived from the Danish National Patient Registry. Odds ratios were calculated using logistic regression models. The analyses were performed with overall SpA as exposure and stratified by subtype.
Results. The overall prevalence of SpA diagnosed prior to delivery was 0.31%, increasing from 0.1% in 1997 to 0.6% in 2016. Comparing women without SpA to women with SpA, the adjusted odds ratios were increased for moderately preterm birth (ORadj 1.56 [95% confidence interval (95% CI) 1.33–1.83]), very preterm birth (ORadj 1.47 [95% CI 1.04–2.08]), elective cesarean section (ORadj 1.44 [95% CI 1.26–1.64]), emergency cesarean section (ORadj 1.17 [95% CI 1.04–1.33]), and use of epidural (ORadj 1.11 [95% CI 1.02–1.20]). The odds ratios for small for gestational age birth and preeclampsia were not increased for women with SpA compared to controls. Results were comparable for the subtypes of SpA.
Conclusion. Pregnancies in women with SpA were more often complicated by adverse pregnancy outcomes than pregnancies in women without SpA. Clinicians should be aware of this when advising women with SpA in their childbearing years. Future research should focus on investigating causal relations and possible interventions aimed at preventing these outcomes.
INTRODUCTION
Spondyloarthritis (SpA) comprises a group of inflammatory conditions, including ankylosing spondylitis (AS), psoriatic arthritis (PsA), reactive arthritis (ReA), arthritis associated with inflamma-tory bowel disease (SpA with IBD), and undifferentiated spondy-loarthritis (uSpA) (1). The prevalence of SpA has been estimated at 0.4–1.9% (2). In general, these conditions develop in early adulthood, therefore also affecting women of childbearing age (3). ReA is usually self-limiting, with a duration of <6 months, while others like SpA with IBD are often chronic, demanding longstand-ing immunosuppressive treatment often including tumor necrosis factor inhibitors (4–6). Reduced mobility of the pelvis and spine in women with SpA may lead to malposition of the fetal head (7), with an increased risk of obstructed labor, operative vaginal
delivery, and delivery by cesarean section (CS) as a consequence (8). These complications, in turn, are associated with increased risk of maternal and neonatal morbidity and mortality (9). Addi-tionally, the severity of SpA may also adversely affect pregnancy outcomes (10).
Previous research on women with SpA and pregnancy-re-lated outcomes is sparse and shows conflicting results: one study did not find an increased risk of any adverse outcomes regarding fertility, pregnancy, or infant outcomes except an increased risk of CS in women with AS compared to women without AS (11), whereas a case–control study from Sweden found AS to be asso-ciated with increased risk of preterm birth, CS, and babies born small for gestational age (SGA) (12). A Canadian study investi-gating SpA as a composite exposure found no differences in the prevalence of preterm birth, SGA, hypertensive disorders, or CS
1Sofie Mørk, MS: Odense University Hospital, Svendborg, Denmark, and University of Southern Denmark, Odense, Denmark; 2Anne Voss, MD, PhD: Odense University Hospital, Odense, Denmark; 3Sören Möller, MS, PhD, Mette Bliddal, MS, PhD: Odense University Hospital and University of Southern Denmark, Odense, Denmark.
No potential conflicts of interest relevant to this article were reported.
Address correspondence to Sofie Mørk, MS, Department of Obstetrics and Gynecology, Labor Ward, Odense University Hospital, Baagøes Alle 15, 5700 Svendborg, Denmark. Email: sofie.mork@ rsyd.dk.
Submitted for publication January 24, 2019; accepted in revised form November 19, 2019.
SpA, PREGNANCY, AND LABOR | 283
when women with SpA were compared to women without inflam-matory diseases (13).
These shortcomings call for further investigation into the association between SpA and outcomes in pregnancy and labor, using SpA as a primary exposure and stratified by subtype of dis-ease. The aims of this study were as follows: 1) to determine the prevalence of SpA in a nationwide population of pregnant women; and 2) to examine how SpA and subtypes of the disease were associated with adverse pregnancy outcomes, including preterm birth, delivery by CS, preeclampsia, use of epidural, SGA, stillbirth, and perinatal mortality.
MATERIALS AND METHODS
We used Danish registers to conduct a cohort study describ-ing the prevalence of SpA and subtypes diagnosed prior to delivery and examining whether SpA was associated with preg-nancy-related outcomes in Denmark during the study period of January 1, 1997 to December 31, 2016.
Data sources. Information on pregnancies was extracted from the Danish Medical Birth Register (MBR) (14). The register, established in 1973, contains data on all births in Denmark, including information on characteristics of mothers and children, pregnancy complications, and procedures performed during delivery. Using the unique individual identification number assigned to all inhabit-ants of Denmark at birth or first immigration (15), we linked data from the MBR with data from the Danish National Patient Registry (NPR) (16). All inpatient admissions have been registered in the NPR since 1977, and since 1995, all outpatient visits and emergency contacts have been included. Diagnostic codes in the NPR are clas-sified according to the International Classification of Diseases (ICD), 8th revision (ICD-8, 1997–1993) and 10th Revision (ICD-10, since 1994). Due to the Danish health care system, which provides free tax-funded medical care to all Danish inhabi tants, the registers allow for virtually complete, population-based, cohort studies.
Study population. We included all singleton births identi-fied in the MBR during the study period. We excluded pregnan-cies with missing data on gestational age. Pregnancies served as the study unit, and women were allowed to have >1 birth contrib-uting to the study.
Exposure. Exposure was defined as any primary diagno-sis of SpA prior to the date of delivery. Information on exposure was obtained from the NPR using the ICD-10 codes for SpA and its subtypes (AS, PsA, ReA, SpA with IBD, and uSpA). The specific ICD-10 codes can be found in Supplementary Table 1, available on the Arthritis Care & Research website at http://onlin elibr ary.wiley.com/doi/10.1002/acr.24111/ abstract. The first SpA diagnosis made was used to classify the subtype. To enhance diagnostic validity, we disregarded secondary diagnoses and any diagnoses made at an emergency unit. All singleton pregnancies in women without a diagnosis of SpA prior to delivery served as the reference group.
Outcomes. Data on outcomes of pregnancy and labor were obtained from the NPR and the MBR and included any primary or secondary diagnosis of the respective outcome (for ICD codes, see Supplementary Table 1). Pregnancy outcomes included mode of delivery (vaginal, assisted vaginal delivery, elective and emer-gency CS), preeclampsia (yes/no), and use of epidural (yes/no). Preeclampsia was defined as any case of preeclampsia or eclamptic seizure.
Neonatal outcomes included gestational age at delivery, SGA (yes/no), an Apgar score of <7 at 5 minutes (yes/no), and perina-tal mortality (yes/no). Preterm birth was defined as birth before 37 + 0 weeks and days of gestation and stratified into moderately preterm birth (32 + 0 to 36 + 6) and very preterm birth (<32 + 0). SGA was defined as birth weight below the 10th percentile (less than –1.28 SD) of the expected birth weight (17). We used a fourth-degree polynomial equation fitted to the data on gestational age and sex of the child to calculate the expected birth weight for each child (18). Perinatal mortality was defined as any case of intra uterine death or neonatal death within the first 7 days of life. We identified any outcomes of pregnancy from the day of conception and until 30 days postpartum, as preeclampsia is a condition that may manifest in the postpartum period. The day of conception was calculated by subtracting the gestational age from the day of birth.
Covariates. Information on maternal age (≤19, 20–24, 25–29, 30–34, 35–39, ≥40 years), smoking in early pregnancy (yes/no), body mass index (BMI) (underweight [<18 kg/m2], nor-mal weight [18–24.9 kg/m2], overweight [25–29.9 kg/m2], and obese [≥30 kg/m2]), parity (first-time mothers or women who had given birth before), and year of birth (1997–2001, 2002–2006, 2007–2011, and 2012–2016) was retrieved from the MBR. Data
SIGNIFICANCE & INNOVATIONS• In a nationwide cohort of pregnant women repre-
senting 1,199,610 pregnancies (1997–2016), the prevalence of spondyloarthritis (SpA) was 0.31%.
• SpA in pregnancy was associated with higher odds of both moderately and very preterm birth, elective and emergency cesarean section, and use of epi-dural compared to women without SpA.
• The higher odds were mainly carried by the sub-types of ankylosing spondylitis and SpA related to inflammatory bowel disease.
• Clinicians should be aware of the increased risk of adverse pregnancy and labor outcomes when treat-ing women with SpA in their childbearing years.
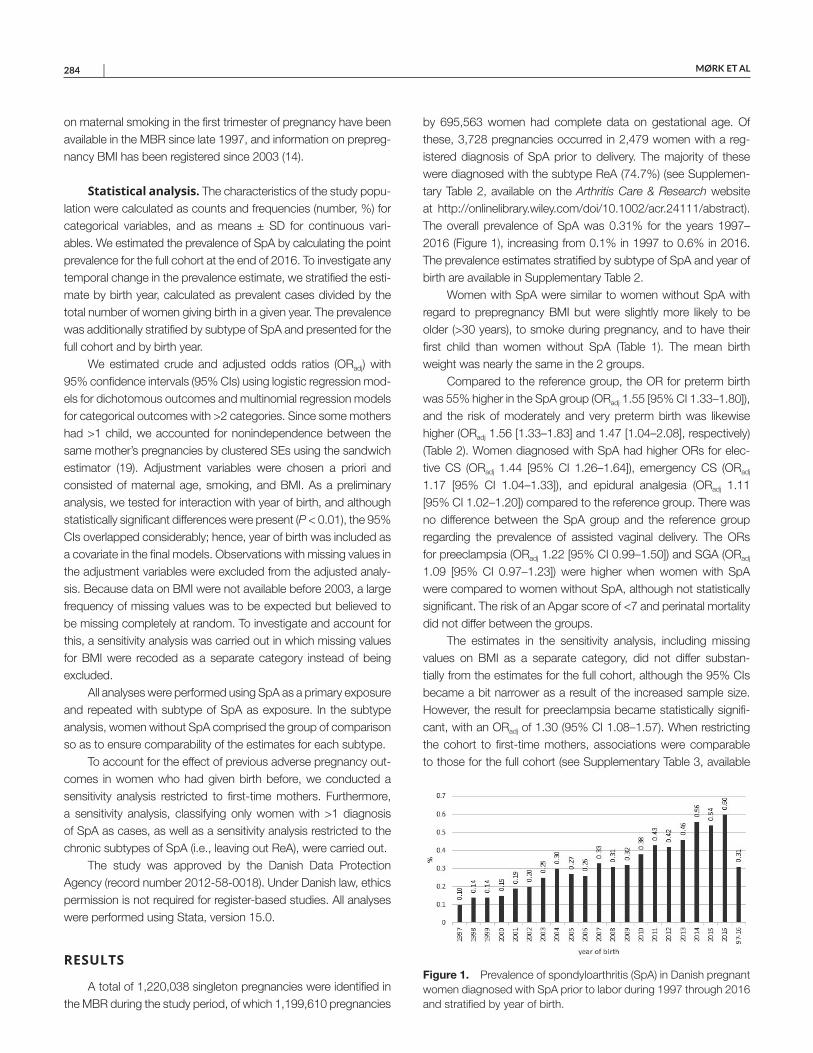
MØRK ET AL 284 |
on maternal smoking in the first trimester of pregnancy have been available in the MBR since late 1997, and information on prepreg-nancy BMI has been registered since 2003 (14).
Statistical analysis. The characteristics of the study popu-lation were calculated as counts and frequencies (number, %) for categorical variables, and as means ± SD for continuous vari -ables. We estimated the prevalence of SpA by calculating the point prevalence for the full cohort at the end of 2016. To investigate any temporal change in the prevalence estimate, we stratified the esti-mate by birth year, calculated as prevalent cases divided by the total number of women giving birth in a given year. The prevalence was additionally stratified by subtype of SpA and presented for the full cohort and by birth year.
We estimated crude and adjusted odds ratios (ORadj) with 95% confidence intervals (95% CIs) using logistic regression mod-els for dichotomous outcomes and multinomial regression models for categorical outcomes with >2 categories. Since some mothers had >1 child, we accounted for nonindependence between the same mother’s pregnancies by clustered SEs using the sandwich estimator (19). Adjustment variables were chosen a priori and consisted of maternal age, smoking, and BMI. As a preliminary analysis, we tested for interaction with year of birth, and although statistically significant differences were present (P < 0.01), the 95% CIs overlapped considerably; hence, year of birth was included as a covariate in the final models. Observations with missing values in the adjustment variables were excluded from the adjusted analy-sis. Because data on BMI were not available before 2003, a large frequency of missing values was to be expected but believed to be missing completely at random. To investigate and account for this, a sensitivity analysis was carried out in which missing values for BMI were recoded as a separate category instead of being excluded.
All analyses were performed using SpA as a primary exposure and repeated with subtype of SpA as exposure. In the subtype analysis, women without SpA comprised the group of comparison so as to ensure comparability of the estimates for each subtype.
To account for the effect of previous adverse pregnancy out-comes in women who had given birth before, we conducted a sensitivity analysis restricted to first-time mothers. Furthermore, a sensitivity analysis, classifying only women with >1 diagnosis of SpA as cases, as well as a sensitivity analysis restricted to the chronic subtypes of SpA (i.e., leaving out ReA), were carried out.
The study was approved by the Danish Data Protection Agency (record number 2012-58-0018). Under Danish law, ethics permission is not required for register-based studies. All analyses were performed using Stata, version 15.0.
RESULTS
A total of 1,220,038 singleton pregnancies were identified in the MBR during the study period, of which 1,199,610 pregnancies
by 695,563 women had complete data on gestational age. Of these, 3,728 pregnancies occurred in 2,479 women with a reg-istered diagnosis of SpA prior to delivery. The majority of these were diagnosed with the subtype ReA (74.7%) (see Supplemen-tary Table 2, available on the Arthritis Care & Research website at http://onlin elibr ary.wiley.com/doi/10.1002/acr.24111/ abstract). The overall prevalence of SpA was 0.31% for the years 1997–2016 (Figure 1), increasing from 0.1% in 1997 to 0.6% in 2016. The prevalence estimates stratified by subtype of SpA and year of birth are available in Supplementary Table 2.
Women with SpA were similar to women without SpA with regard to prepregnancy BMI but were slightly more likely to be older (>30 years), to smoke during pregnancy, and to have their first child than women without SpA (Table 1). The mean birth weight was nearly the same in the 2 groups.
Compared to the reference group, the OR for preterm birth was 55% higher in the SpA group (ORadj 1.55 [95% CI 1.33–1.80]), and the risk of moderately and very preterm birth was likewise higher (ORadj 1.56 [1.33–1.83] and 1.47 [1.04–2.08], respectively) (Table 2). Women diagnosed with SpA had higher ORs for elec-tive CS (ORadj 1.44 [95% CI 1.26–1.64]), emergency CS (ORadj 1.17 [95% CI 1.04–1.33]), and epidural analgesia (ORadj 1.11 [95% CI 1.02–1.20]) compared to the reference group. There was no difference between the SpA group and the reference group regarding the prevalence of assisted vaginal delivery. The ORs for preeclampsia (ORadj 1.22 [95% CI 0.99–1.50]) and SGA (ORadj 1.09 [95% CI 0.97–1.23]) were higher when women with SpA were compared to women without SpA, although not statistically significant. The risk of an Apgar score of <7 and perinatal mortality did not differ between the groups.
The estimates in the sensitivity analysis, including missing values on BMI as a separate category, did not differ substan-tially from the estimates for the full cohort, although the 95% CIs became a bit narrower as a result of the increased sample size. However, the result for preeclampsia became statistically signifi-cant, with an ORadj of 1.30 (95% CI 1.08–1.57). When restricting the cohort to first-time mothers, associations were comparable to those for the full cohort (see Supplementary Table 3, available
Figure 1. Prevalence of spondyloarthritis (SpA) in Danish pregnant women diagnosed with SpA prior to labor during 1997 through 2016 and stratified by year of birth.
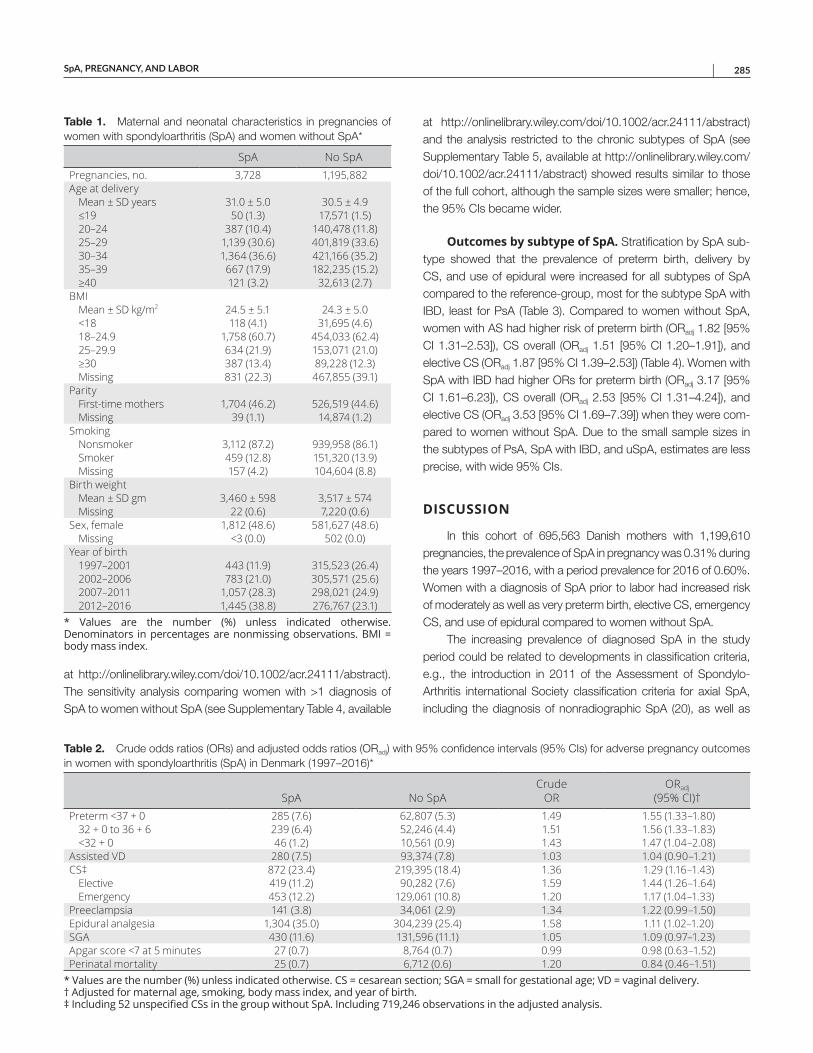
SpA, PREGNANCY, AND LABOR | 285
at http://onlin elibr ary.wiley.com/doi/10.1002/acr.24111/ abstract). The sensitivity analysis comparing women with >1 diagnosis of SpA to women without SpA (see Supplementary Table 4, available
at http://onlin elibr ary.wiley.com/doi/10.1002/acr.24111/ abstract) and the analysis restricted to the chronic subtypes of SpA (see Supplementary Table 5, available at http://onlin elibr ary.wiley.com/doi/10.1002/acr.24111/ abstract) showed results similar to those of the full cohort, although the sample sizes were smaller; hence, the 95% CIs became wider.
Outcomes by subtype of SpA. Stratification by SpA sub-type showed that the prevalence of preterm birth, delivery by CS, and use of epidural were increased for all subtypes of SpA compared to the reference-group, most for the subtype SpA with IBD, least for PsA (Table 3). Compared to women without SpA, women with AS had higher risk of preterm birth (ORadj 1.82 [95% CI 1.31–2.53]), CS overall (ORadj 1.51 [95% CI 1.20–1.91]), and elective CS (ORadj 1.87 [95% CI 1.39–2.53]) (Table 4). Women with SpA with IBD had higher ORs for preterm birth (ORadj 3.17 [95% CI 1.61–6.23]), CS overall (ORadj 2.53 [95% CI 1.31–4.24]), and elective CS (ORadj 3.53 [95% CI 1.69–7.39]) when they were com-pared to women without SpA. Due to the small sample sizes in the subtypes of PsA, SpA with IBD, and uSpA, estimates are less precise, with wide 95% CIs.
DISCUSSION
In this cohort of 695,563 Danish mothers with 1,199,610 pregnancies, the prevalence of SpA in pregnancy was 0.31% during the years 1997–2016, with a period prevalence for 2016 of 0.60%. Women with a diagnosis of SpA prior to labor had increased risk of moderately as well as very preterm birth, elective CS, emergency CS, and use of epidural compared to women without SpA.
The increasing prevalence of diagnosed SpA in the study period could be related to developments in classification cri teria, e.g., the introduction in 2011 of the Assessment of Spondylo-Arthritis international Society classification criteria for axial SpA, including the diagnosis of nonradiographic SpA (20), as well as
Table 2. Crude odds ratios (ORs) and adjusted odds ratios (ORadj) with 95% confidence intervals (95% CIs) for adverse pregnancy outcomes in women with spondyloarthritis (SpA) in Denmark (1997–2016)*
SpA No SpACrude
ORORadj
(95% CI)†Preterm <37 + 0 285 (7.6) 62,807 (5.3) 1.49 1.55 (1.33–1.80)
32 + 0 to 36 + 6 239 (6.4) 52,246 (4.4) 1.51 1.56 (1.33–1.83)<32 + 0 46 (1.2) 10,561 (0.9) 1.43 1.47 (1.04–2.08)
Assisted VD 280 (7.5) 93,374 (7.8) 1.03 1.04 (0.90–1.21)CS‡ 872 (23.4) 219,395 (18.4) 1.36 1.29 (1.16–1.43)
Elective 419 (11.2) 90,282 (7.6) 1.59 1.44 (1.26–1.64)Emergency 453 (12.2) 129,061 (10.8) 1.20 1.17 (1.04–1.33)
Preeclampsia 141 (3.8) 34,061 (2.9) 1.34 1.22 (0.99–1.50)Epidural analgesia 1,304 (35.0) 304,239 (25.4) 1.58 1.11 (1.02–1.20)SGA 430 (11.6) 131,596 (11.1) 1.05 1.09 (0.97–1.23)Apgar score <7 at 5 minutes 27 (0.7) 8,764 (0.7) 0.99 0.98 (0.63–1.52)Perinatal mortality 25 (0.7) 6,712 (0.6) 1.20 0.84 (0.46–1.51)
* Values are the number (%) unless indicated otherwise. CS = cesarean section; SGA = small for gestational age; VD = vaginal delivery.† Adjusted for maternal age, smoking, body mass index, and year of birth. ‡ Including 52 unspecified CSs in the group without SpA. Including 719,246 observations in the adjusted analysis.
Table 1. Maternal and neonatal characteristics in pregnancies of women with spondyloarthritis (SpA) and women without SpA*
SpA No SpAPregnancies, no. 3,728 1,195,882Age at delivery
Mean ± SD years 31.0 ± 5.0 30.5 ± 4.9≤19 50 (1.3) 17,571 (1.5)20–24 387 (10.4) 140,478 (11.8)25–29 1,139 (30.6) 401,819 (33.6)30–34 1,364 (36.6) 421,166 (35.2)35–39 667 (17.9) 182,235 (15.2)≥40 121 (3.2) 32,613 (2.7)
BMIMean ± SD kg/m2 24.5 ± 5.1 24.3 ± 5.0<18 118 (4.1) 31,695 (4.6)18–24.9 1,758 (60.7) 454,033 (62.4)25–29.9 634 (21.9) 153,071 (21.0)≥30 387 (13.4) 89,228 (12.3)Missing 831 (22.3) 467,855 (39.1)
ParityFirst-time mothers 1,704 (46.2) 526,519 (44.6)Missing 39 (1.1) 14,874 (1.2)
SmokingNonsmoker 3,112 (87.2) 939,958 (86.1)Smoker 459 (12.8) 151,320 (13.9)Missing 157 (4.2) 104,604 (8.8)
Birth weightMean ± SD gm 3,460 ± 598 3,517 ± 574Missing 22 (0.6) 7,220 (0.6)
Sex, female 1,812 (48.6) 581,627 (48.6)Missing <3 (0.0) 502 (0.0)
Year of birth1997–2001 443 (11.9) 315,523 (26.4)2002–2006 783 (21.0) 305,571 (25.6)2007–2011 1,057 (28.3) 298,021 (24.9)2012–2016 1,445 (38.8) 276,767 (23.1)
* Values are the number (%) unless indicated otherwise.Denominators in percentages are nonmissing observations. BMI = body mass index.
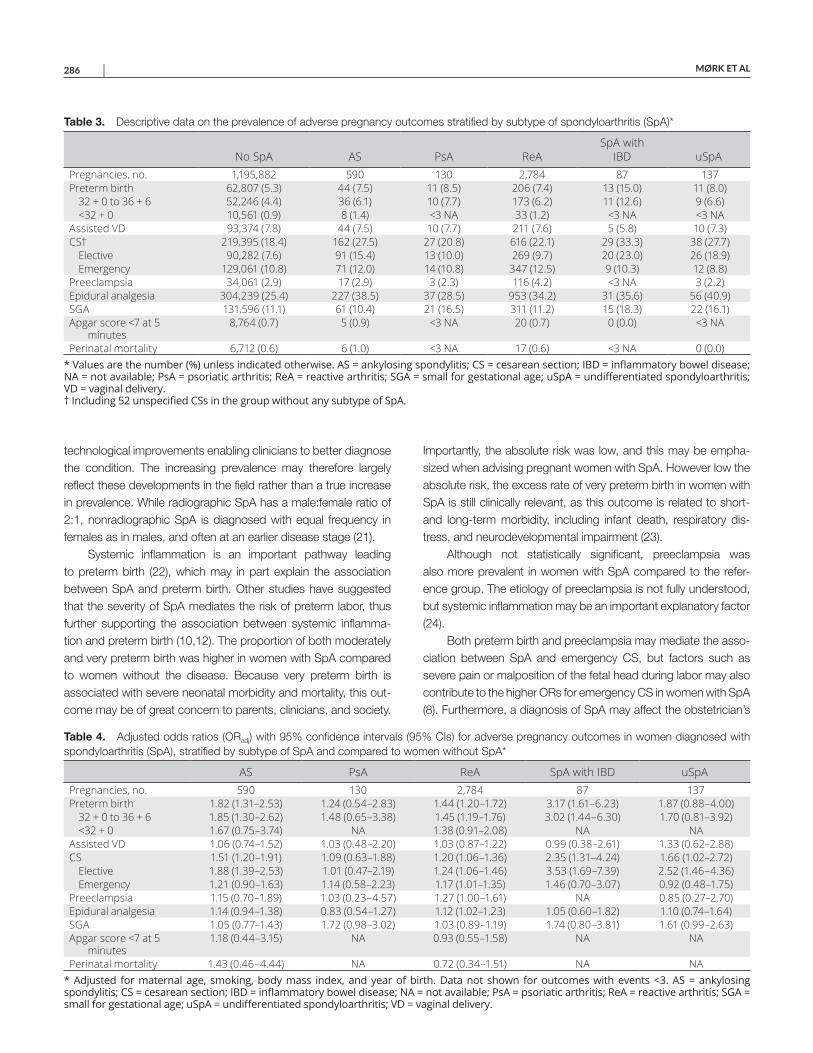
MØRK ET AL 286 |
technological improvements enabling clinicians to better diagnose the condition. The increasing prevalence may therefore largely reflect these developments in the field rather than a true increase in prevalence. While radiographic SpA has a male:female ratio of 2:1, nonradiographic SpA is diagnosed with equal frequency in females as in males, and often at an earlier disease stage (21).
Systemic inflammation is an important pathway leading to preterm birth (22), which may in part explain the association between SpA and preterm birth. Other studies have suggested that the severity of SpA mediates the risk of preterm labor, thus further supporting the association between systemic inflamma-tion and preterm birth (10,12). The proportion of both moderately and very preterm birth was higher in women with SpA compared to women without the disease. Because very preterm birth is associated with severe neonatal morbidity and mortality, this out-come may be of great concern to parents, clinicians, and society.
Importantly, the absolute risk was low, and this may be empha-sized when advising pregnant women with SpA. However low the absolute risk, the excess rate of very preterm birth in women with SpA is still clinically relevant, as this outcome is related to short- and long-term morbidity, including infant death, respiratory dis-tress, and neurodevelopmental impairment (23).
Although not statistically significant, preeclampsia was also more prevalent in women with SpA compared to the refer-ence group. The etiology of preeclampsia is not fully understood, but systemic inflammation may be an important explanatory factor (24).
Both preterm birth and preeclampsia may mediate the asso-ciation between SpA and emergency CS, but factors such as severe pain or malposition of the fetal head during labor may also contribute to the higher ORs for emergency CS in women with SpA (8). Furthermore, a diagnosis of SpA may affect the obstetrician’s
Table 3. Descriptive data on the prevalence of adverse pregnancy outcomes stratified by subtype of spondyloarthritis (SpA)*
No SpA AS PsA ReASpA with
IBD uSpAPregnancies, no. 1,195,882 590 130 2,784 87 137Preterm birth 62,807 (5.3) 44 (7.5) 11 (8.5) 206 (7.4) 13 (15.0) 11 (8.0)
32 + 0 to 36 + 6 52,246 (4.4) 36 (6.1) 10 (7.7) 173 (6.2) 11 (12.6) 9 (6.6)<32 + 0 10,561 (0.9) 8 (1.4) <3 NA 33 (1.2) <3 NA <3 NA
Assisted VD 93,374 (7.8) 44 (7.5) 10 (7.7) 211 (7.6) 5 (5.8) 10 (7.3)CS† 219,395 (18.4) 162 (27.5) 27 (20.8) 616 (22.1) 29 (33.3) 38 (27.7)
Elective 90,282 (7.6) 91 (15.4) 13 (10.0) 269 (9.7) 20 (23.0) 26 (18.9)Emergency 129,061 (10.8) 71 (12.0) 14 (10.8) 347 (12.5) 9 (10.3) 12 (8.8)
Preeclampsia 34,061 (2.9) 17 (2.9) 3 (2.3) 116 (4.2) <3 NA 3 (2.2)Epidural analgesia 304,239 (25.4) 227 (38.5) 37 (28.5) 953 (34.2) 31 (35.6) 56 (40.9)SGA 131,596 (11.1) 61 (10.4) 21 (16.5) 311 (11.2) 15 (18.3) 22 (16.1)Apgar score <7 at 5
minutes8,764 (0.7) 5 (0.9) <3 NA 20 (0.7) 0 (0.0) <3 NA
Perinatal mortality 6,712 (0.6) 6 (1.0) <3 NA 17 (0.6) <3 NA 0 (0.0)* Values are the number (%) unless indicated otherwise. AS = ankylosing spondylitis; CS = cesarean section; IBD = inflammatory bowel disease; NA = not available; PsA = psoriatic arthritis; ReA = reactive arthritis; SGA = small for gestational age; uSpA = undifferentiated spondyloarthritis; VD = vaginal delivery. † Including 52 unspecified CSs in the group without any subtype of SpA.
Table 4. Adjusted odds ratios (ORadj) with 95% confidence intervals (95% CIs) for adverse pregnancy outcomes in women diagnosed with spondyloarthritis (SpA), stratified by subtype of SpA and compared to women without SpA*
AS PsA ReA SpA with IBD uSpAPregnancies, no. 590 130 2,784 87 137Preterm birth 1.82 (1.31–2.53) 1.24 (0.54–2.83) 1.44 (1.20–1.72) 3.17 (1.61–6.23) 1.87 (0.88–4.00)
32 + 0 to 36 + 6 1.85 (1.30–2.62) 1.48 (0.65–3.38) 1.45 (1.19–1.76) 3.02 (1.44–6.30) 1.70 (0.81–3.92)<32 + 0 1.67 (0.75–3.74) NA 1.38 (0.91–2.08) NA NA
Assisted VD 1.06 (0.74–1.52) 1.03 (0.48–2.20) 1.03 (0.87–1.22) 0.99 (0.38–2.61) 1.33 (0.62–2.88)CS 1.51 (1.20–1.91) 1.09 (0.63–1.88) 1.20 (1.06–1.36) 2.35 (1.31–4.24) 1.66 (1.02–2.72)
Elective 1.88 (1.39–2.53) 1.01 (0.47–2.19) 1.24 (1.06–1.46) 3.53 (1.69–7.39) 2.52 (1.46–4.36)Emergency 1.21 (0.90–1.63) 1.14 (0.58–2.23) 1.17 (1.01–1.35) 1.46 (0.70–3.07) 0.92 (0.48–1.75)
Preeclampsia 1.15 (0.70–1.89) 1.03 (0.23–4.57) 1.27 (1.00–1.61) NA 0.85 (0.27–2.70)Epidural analgesia 1.14 (0.94–1.38) 0.83 (0.54–1.27) 1.12 (1.02–1.23) 1.05 (0.60–1.82) 1.10 (0.74–1.64)SGA 1.05 (0.77–1.43) 1.72 (0.98–3.02) 1.03 (0.89–1.19) 1.74 (0.80–3.81) 1.61 (0.99–2.63)Apgar score <7 at 5
minutes1.18 (0.44–3.15) NA 0.93 (0.55–1.58) NA NA
Perinatal mortality 1.43 (0.46–4.44) NA 0.72 (0.34–1.51) NA NA* Adjusted for maternal age, smoking, body mass index, and year of birth. Data not shown for outcomes with events <3. AS = ankylosing spondylitis; CS = cesarean section; IBD = inflammatory bowel disease; NA = not available; PsA = psoriatic arthritis; ReA = reactive arthritis; SGA = small for gestational age; uSpA = undifferentiated spondyloarthritis; VD = vaginal delivery.
SpA, PREGNANCY, AND LABOR | 287
decision to recommend an elective or emergency CS. Future research should investigate the indications for CS and the obste-trician’s reasoning for recommending this mode of delivery. The higher ORs for preterm birth and CS in females diagnosed with SpA with IBD may partly be explained by the SpA manifestations, but the influence of IBD, often requiring intensive antiinflammatory treatment even during pregnancy, may also be of importance (25).
Outcomes of pregnancy and labor in women with SpA have been investigated in other studies. Clowse (26) conducted a cohort study (n = 62) and examined pregnancy-related outcomes in women with SpA compared to women with rheumatoid arthri-tis. The results were comparable between the groups with regard to risk of preterm birth and preeclampsia. However, the findings are difficult to compare to ours, as the control group consisted of women with rheumatoid arthritis and because the study is only available as an abstract. Keeling et al compared 2,416 pregnan-cies in women with SpA with 308,989 pregnancies in healthy con-trols (13). They found that women with SpA were comparable to the healthy controls with regard to hypertension, preterm birth, CS, SGA, and neonatal death. These findings are not in line with ours, which could be explained by differences in obstetrical prac-tices as well as demographic differences between Canada and Denmark.
Stratification by subtype of SpA showed that all subtypes were associated with increased risks of adverse pregnancy out-comes, suggesting a central role of a shared etiology between the subtypes. However, subtype classification was based on the first SpA diagnosis attained, and especially for ReA, misclassifica-tion of subtype is possible, as women with an initially suspected ReA may later be diagnosed with a different chronic SpA subtype, e.g., SpA with IBD. This would partly explain the increased risk of adverse pregnancy outcomes in women with ReA. Subtypes of SpA, mainly AS, have been investigated in other studies, but results have been inconsistent (10,13,26–27). However, a recent case–control study from Sweden, including 388 pregnancies in women with AS, found pregnancies in women with AS to be associated with preterm birth, CS, and SGA when compared to healthy controls (12). The results are in line with ours, although our study did not find an increased risk of SGA in women with AS. This may in part be explained by different definitions of SGA, as the Swedish study used 2 SDs as the cutoff for SGA, whereas we used 1.28 SD, which is in accordance with the recommendations of the World Health Organization (17).
There are several strengths of this study. First, the pop-ulation-based design with complete registration of all births in Denmark ensured a nationwide unselected cohort with the accompanying limited risk of bias due to selection or attrition. Second, the large sample size ensured statistical power and enabled us to explore SpA as an overall exposure, as well as by subtype. Third, we were able to adjust for several potential con-founders, including prepregnancy BMI, smoking status, year of birth, and maternal age.
Some limitations of this study should also be acknow-ledged. First, the ICD-10 codes for SpA have not been validated within the Danish health care system. To ensure validity, we included only SpA given as a primary diagnosis, and ICD-10 codes were selected in accordance with national standards (28). Although the sensitivity analysis restricted to those with >1 SpA diagnosis showed results similar to those of the main analy sis, some bias due to misclassification cannot be ruled out. However, any misclassification of exposure is likely to be nondif-ferential and would have caused bias toward the null. Second, information on disease severity, drug dispensation, and comor-bidities such as IBD, diabetes mellitus, and hypertension were not available, and estimation of any effects mediated by these factors thus was not feasible. Third, we lacked data on some covariates (BMI and smoking status) in the early study period, as the registration was not mandatory. Including missing val-ues on BMI in a sensitivity analysis did not change the results considerably. The missing values were thus considered missing completely at random and their risk of bias introduction negli-gible. Fourth, although the SpA subtypes PsA, SpA with IBD, and uSpA showed higher prevalence estimates for a number of adverse pregnancy outcomes, limitations in sample size and wide 95% CIs warrant some caution when interpreting these estimates. While our results are expected to apply to countries with similar treatment of rheumatic disorders in pregnancy and where obstetrical practices are comparable, generalizability to other settings is unknown.
In conclusion, SpA and all subtypes of the disease diagnosed prior to delivery were associated with increased risk of adverse pregnancy and birth outcomes. Clinicians should be aware of this increased risk when treating women with SpA in their childbearing years. Future research should investigate the pathophysiology of preterm labor in women with SpA and the indications for CS in these women to facilitate development of interventions preventing these outcomes.
AUTHOR CONTRIBUTIONS
All authors were involved in drafting the article or revising it critically for important intellectual content, and all authors approved the final version to be submitted for publication. Ms Mørk had full access to all of the data in the study and takes responsibility for the integrity of the data and the accuracy of the data analysis.Study conception and design. Mørk, Voss, Möller, Bliddal.Acquisition of data. Mørk, Voss, Bliddal.Analysis and interpretation of data. Mørk, Voss, Möller.
REFERENCES 1. Rudwaleit M, Landewé R, van der Heijde D, Listing J, Brandt J,
Braun J, et al. The development of assessment of SpondyloArthritis International Society classification criteria for axial spondyloarthritis (part I): classification of paper patients by expert opinion including uncertainty appraisal. Ann Rheum Dis 2009;68:770–6.
2. Bakland G, Nossent HC. Epidemiology of spondyloarthritis: a review. Curr Rheumatol Rep 2013;15:351.
MØRK ET AL 288 |
3. Rudwaleit M, Haibel H, Baraliakos X, Listing J, Märker-HermannE, Zeidler H, et al. The early disease stage in axial spondylarthritis:results from the German Spondyloarthritis Inception Cohort. ArthritisRheum 2009;60:717–27.
4. Reveille JD. Genetics of spondyloarthritis: beyond the MHC. Nat Rev Rheumatol 2012;8:296.
5. Kaarela K, Jantti J, Kotaniemi K. Similarity between chronic reactivearthritis and ankylosing spondylitis: a 32–35–year follow-up study.Clin Exp Rheumatol 2009;27:325.
6. Lockwood MM, Gensler LS. Nonradiographic axial spondyloarthritis. Best Pract Res Clin Rheumatol 2017;31:816–29.
7. Burden B, Simons M. Anatomy of male and female reproduction.In: Macdonald S, editor. Mayes’ midwifery: a textbook for midwives.Sydney: Bailliere Tindall; 2011. p. 277.
8. Lewis P. Malpositions and malpresentations. In: Macdonald S, editor. Mayes’ midwifery: a textbook for midwives. Sydney: Bailliere Tindall;2011. p. 869–98.
9. Lavender T, Hofmeyr GJ, Neilson JP, Kingdon C, Gyte GM.Caesarean section for non-medical reasons at term. CochraneDatabase Syst Rev 2012;3.
10. Zbinden A, van den Brandt S, Østensen M, Villiger PM, Förger F.Risk for adverse pregnancy outcome in axial spondyloarthritis andrheumatoid arthritis: disease activity matters. Rheumatology (Oxford) 2018;57:1235–42.
11. Ostensen M, Ostensen H. Ankylosing spondylitis: the female aspect. J Rheumatol 1998;25:120–4.
12. Jakobsson GL, Stephansson O, Askling J, Jacobsson LT. Pregnancy outcomes in patients with ankylosing spondylitis: a nationwide regis-ter study. Ann Rheum Dis 2016;75:1838–42.
13. Keeling S, Bowker S, Savu A, Kaul P. A population-level analysis ofthe differing effects of rheumatoid arthritis and spondyloarthritis onperipartum outcomes. J Rheumatol 2020;47:197–203.
14. Bliddal M, Broe A, Pottegard A, Olsen J, Langhoff-Roos J. TheDanish Medical Birth Register. Eur J Epidemiol 2018;33:27–36.
15. Pedersen CB. The Danish Civil Registration System. Scand J PublicHealth 2011;39 Suppl S:22S–5S.
16. Schmidt M, Schmidt SA, Sandegaard JL, Ehrenstein V, PedersenL, Sorensen HT. The Danish National Patient Registry: a reviewof content, data quality, and research potential. Clin Epidemiol2015;7:449–90.
17. World Health Organization. Physical status: the use and interpreta-tion of anthropometry. Report of a WHO expert committee. WorldHealth Organ Tech Rep Ser 1995;854:153. URL: http://apps.who.int/iris/bitst ream/handl e/10665/ 37003/ WHO_TRS_854.pdf;jsess ionid =8C91E 40C24 B3E8D F1507 6A054 2775B E8?seque nce=1.
18. Maršál K, Persson PH, Larsen T, Lilja H, Selbing A, Sultan B.Intrauterine growth curves based on ultrasonically estimated foetalweights. Acta Paediatr 1996;85:843–8.
19. Huber PJ. The behavior of maximum likelihood estimates under non-standard conditions. Proc Fifth Berkeley Symp on Math Statist andProb 1967;1:221–33.
20. Rudwaleit M, van der Heijde D, Landewe R, Akkoc N, Brandt J,Chou CT, et al. The assessment of SpondyloArthritis InternationalSociety classification criteria for peripheral spondyloarthritis and forspondyloarthritis in general. Ann Rheum Dis 2011;70:25–31.
21. Sieper J, Poddubnyy D. Axial spondyloarthritis. Lancet 2017;390:73–84.
22. Goldenberg RL, Culhane JF, Iams JD, Romero R. Epidemiology andcauses of preterm birth. Lancet 2008;371:75–84.
23. Patel RM. Short- and long-term outcomes for extremely preterminfants. Am J Perinatol 2016;33:318–28.
24. Powe CE, Levine RJ, Karumanchi SA. Preeclampsia, a diseaseof the maternal endothelium: the role of anti-angiogenic fac-tors and implications for later cardiovascular disease. Circulation2011;123:2856–69.
25. Wieringa JW, Driessen GJ, Van Der Woude CJ. Pregnant womenwith inflammatory bowel disease: the effects of biologicals on preg-nancy, outcome of infants, and the developing immune system.Expert Rev Gastroenterol Hepatol 2018;12:811–8.
26. Clowse ME. Comparison of rheumatoid arthritis, ankylosingspondylitis, and psoriatic arthritis pregnancies: disease activity,treatment, and outcomes [abstract]. Arthritis Rheumatol 2014;66Suppl 10:S706–7.
27. Timur H, Tokmak A, Turkmen GG, Ali Inal H, Uygur D, Danisman N.Pregnancy outcome in patients with ankylosing spondylitis. J Matern Fetal Neonatal Med 2016;29:2470–4.
28. Dansk Reumatologisk Selskab. National behandlingsvejledning(NBV): Aksial spondylartritis herunder ankyloserende spondylitis.2017. URL: https://danskreumatologi.dk/nbv/sygdomme/aksial- spondyloartritis/.
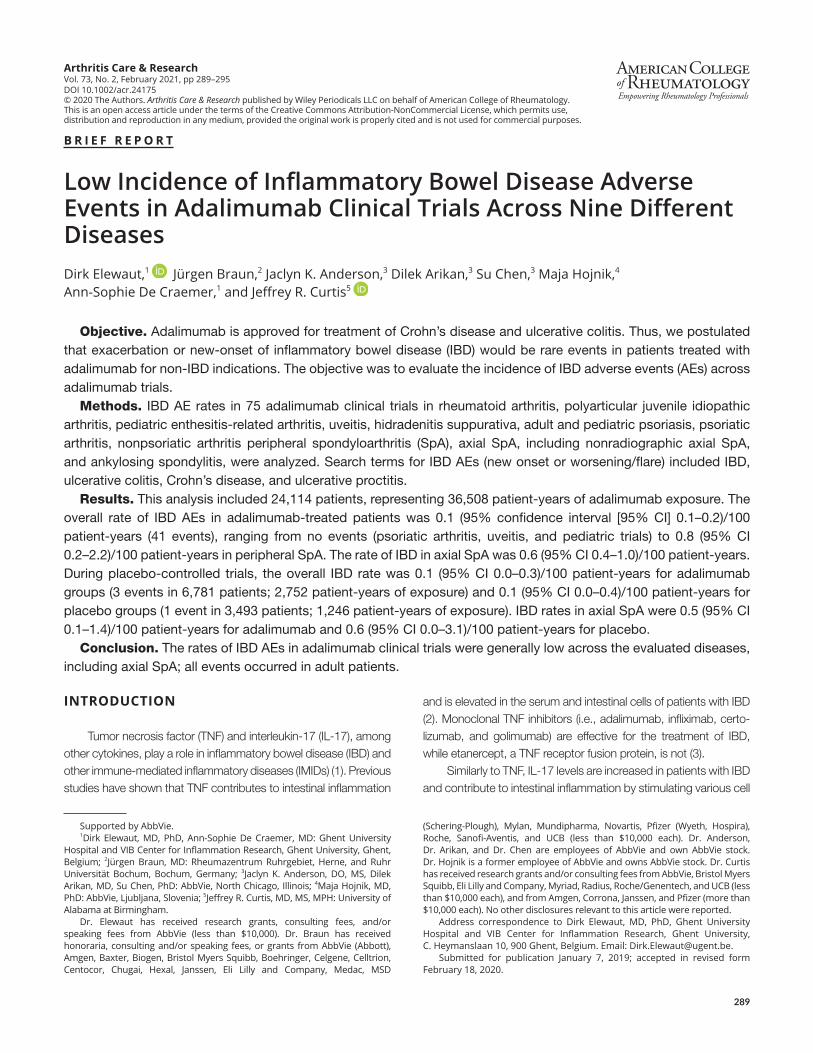
289
Arthritis Care & ResearchVol. 73, No. 2, February 2021, pp 289–295DOI 10.1002/acr.24175© 2020 The Authors. Arthritis Care & Research published by Wiley Periodicals LLC on behalf of American College of Rheumatology.This is an open access article under the terms of the Creative Commons Attribution-NonCommercial License, which permits use, distribution and reproduction in any medium, provided the original work is properly cited and is not used for commercial purposes.
B R I E F R E P O R T
Low Incidence of Inflammatory Bowel Disease Adverse Events in Adalimumab Clinical Trials Across Nine Different DiseasesDirk Elewaut,1 Jürgen Braun,2 Jaclyn K. Anderson,3 Dilek Arikan,3 Su Chen,3 Maja Hojnik,4 Ann-Sophie De Craemer,1 and Jeffrey R. Curtis5
Objective. Adalimumab is approved for treatment of Crohn’s disease and ulcerative colitis. Thus, we postulated that exacerbation or new-onset of inflammatory bowel disease (IBD) would be rare events in patients treated with adalimumab for non-IBD indications. The objective was to evaluate the incidence of IBD adverse events (AEs) across adalimumab trials.
Methods. IBD AE rates in 75 adalimumab clinical trials in rheumatoid arthritis, polyarticular juvenile idiopathic arthritis, pediatric enthesitis-related arthritis, uveitis, hidradenitis suppurativa, adult and pediatric psoriasis, psoriatic arthritis, nonpsoriatic arthritis peripheral spondyloarthritis (SpA), axial SpA, including nonradiographic axial SpA, and ankylosing spondylitis, were analyzed. Search terms for IBD AEs (new onset or worsening/flare) included IBD, ulcerative colitis, Crohn’s disease, and ulcerative proctitis.
Results. This analysis included 24,114 patients, representing 36,508 patient-years of adalimumab exposure. The overall rate of IBD AEs in adalimumab-treated patients was 0.1 (95% confidence interval [95% CI] 0.1–0.2)/100 patient-years (41 events), ranging from no events (psoriatic arthritis, uveitis, and pediatric trials) to 0.8 (95% CI 0.2–2.2)/100 patient-years in peripheral SpA. The rate of IBD in axial SpA was 0.6 (95% CI 0.4–1.0)/100 patient-years. During placebo-controlled trials, the overall IBD rate was 0.1 (95% CI 0.0–0.3)/100 patient-years for adalimumab groups (3 events in 6,781 patients; 2,752 patient-years of exposure) and 0.1 (95% CI 0.0–0.4)/100 patient-years for placebo groups (1 event in 3,493 patients; 1,246 patient-years of exposure). IBD rates in axial SpA were 0.5 (95% CI 0.1–1.4)/100 patient-years for adalimumab and 0.6 (95% CI 0.0–3.1)/100 patient-years for placebo.
Conclusion. The rates of IBD AEs in adalimumab clinical trials were generally low across the evaluated diseases, including axial SpA; all events occurred in adult patients.
INTRODUCTION
Tumor necrosis factor (TNF) and interleukin-17 (IL-17), among other cytokines, play a role in inflammatory bowel disease (IBD) and other immune-mediated inflammatory diseases (IMIDs) (1). Previous studies have shown that TNF contributes to intestinal inflammation
and is elevated in the serum and intestinal cells of patients with IBD (2). Monoclonal TNF inhibitors (i.e., adalimumab, infliximab, certo-lizumab, and golimumab) are effective for the treatment of IBD, while etanercept, a TNF receptor fusion protein, is not (3).
Similarly to TNF, IL-17 levels are increased in patients with IBD and contribute to intestinal inflammation by stimulating various cell
Supported by AbbVie.1Dirk Elewaut, MD, PhD, Ann-Sophie De Craemer, MD: Ghent University
Hospital and VIB Center for Inflammation Research, Ghent University, Ghent, Belgium; 2Jürgen Braun, MD: Rheumazentrum Ruhrgebiet, Herne, and Ruhr Universität Bochum, Bochum, Germany; 3Jaclyn K. Anderson, DO, MS, Dilek Arikan, MD, Su Chen, PhD: AbbVie, North Chicago, Illinois; 4Maja Hojnik, MD, PhD: AbbVie, Ljubljana, Slovenia; 5Jeffrey R. Curtis, MD, MS, MPH: University of Alabama at Birmingham.
Dr. Elewaut has received research grants, consulting fees, and/or speaking fees from AbbVie (less than $10,000). Dr. Braun has received honoraria, consulting and/or speaking fees, or grants from AbbVie (Abbott), Amgen, Baxter, Biogen, Bristol Myers Squibb, Boehringer, Celgene, Celltrion, Centocor, Chugai, Hexal, Janssen, Eli Lilly and Company, Medac, MSD
(Schering-Plough), Mylan, Mundipharma, Novartis, Pfizer (Wyeth, Hospira), Roche, Sanofi-Aventis, and UCB (less than $10,000 each). Dr. Anderson, Dr. Arikan, and Dr. Chen are employees of AbbVie and own AbbVie stock. Dr. Hojnik is a former employee of AbbVie and owns AbbVie stock. Dr. Curtis has received research grants and/or consulting fees from AbbVie, Bristol Myers Squibb, Eli Lilly and Company, Myriad, Radius, Roche/Genentech, and UCB (less than $10,000 each), and from Amgen, Corrona, Janssen, and Pfizer (more than $10,000 each). No other disclosures relevant to this article were reported.
Address correspondence to Dirk Elewaut, MD, PhD, Ghent University Hospital and VIB Center for Inflammation Research, Ghent University, C. Heymanslaan 10, 900 Ghent, Belgium. Email: [email protected].
Submitted for publication January 7, 2019; accepted in revised form February 18, 2020.
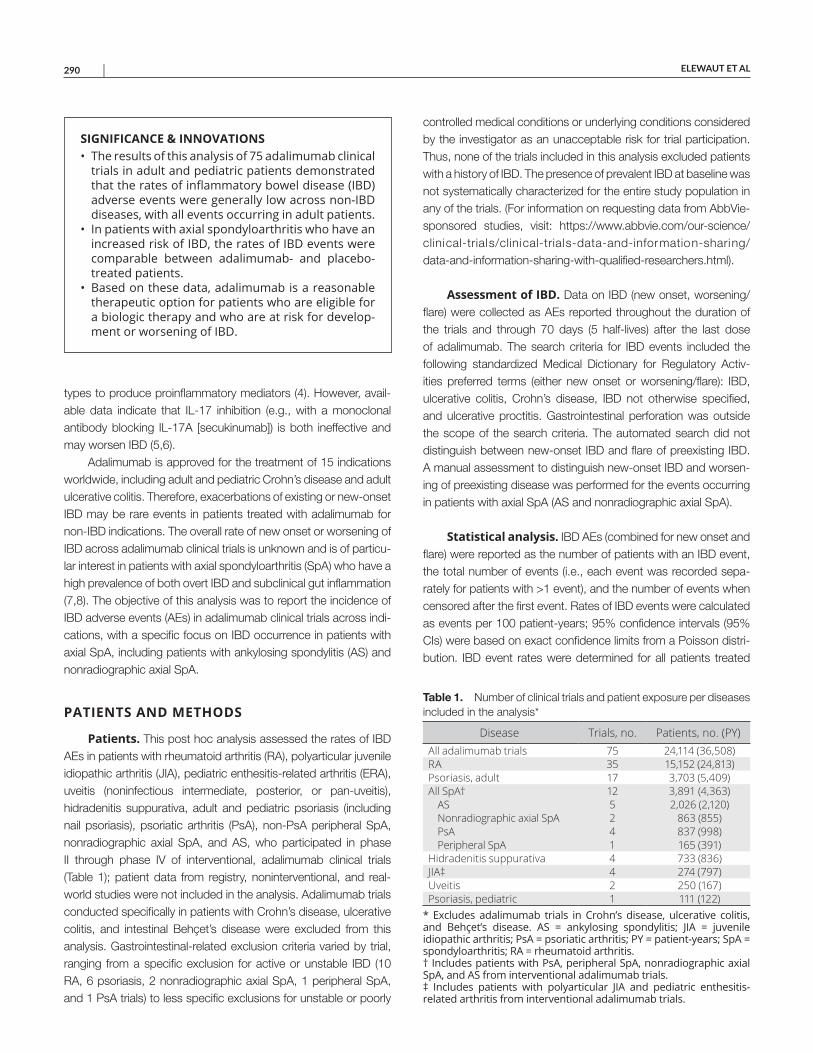
ELEWAUT ET AL 290 |
types to produce proinflammatory mediators (4). However, avail-able data indicate that IL-17 inhibition (e.g., with a monoclonal antibody blocking IL-17A [secukinumab]) is both ineffective and may worsen IBD (5,6).
Adalimumab is approved for the treatment of 15 indications worldwide, including adult and pediatric Crohn’s disease and adult ulcerative colitis. Therefore, exacerbations of existing or new- onset IBD may be rare events in patients treated with adalimumab for non-IBD indications. The overall rate of new onset or worsening of IBD across adalimumab clinical trials is unknown and is of particu-lar interest in patients with axial spondyloarthritis (SpA) who have a high prevalence of both overt IBD and subclinical gut inflammation (7,8). The objective of this analysis was to report the incidence of IBD adverse events (AEs) in adalimumab clinical trials across indi-cations, with a specific focus on IBD occurrence in patients with axial SpA, including patients with ankylosing spondylitis (AS) and nonradiographic axial SpA.
PATIENTS AND METHODS
Patients. This post hoc analysis assessed the rates of IBD AEs in patients with rheumatoid arthritis (RA), polyarticular juvenile idiopathic arthritis (JIA), pediatric enthesitis-related arthritis (ERA), uveitis (noninfectious intermediate, posterior, or pan-uveitis), hidradenitis suppurativa, adult and pediatric psoriasis (including nail psoriasis), psoriatic arthritis (PsA), non-PsA peripheral SpA, nonradiographic axial SpA, and AS, who participated in phase II through phase IV of interventional, adalimumab clinical trials (Table 1); patient data from registry, noninterventional, and real-world studies were not included in the analysis. Adalimumab trials conducted specifically in patients with Crohn’s disease, ulcerative colitis, and intestinal Behçet’s disease were excluded from this analysis. Gastrointestinal-related exclusion criteria varied by trial, ranging from a specific exclusion for active or unstable IBD (10 RA, 6 psoriasis, 2 nonradiographic axial SpA, 1 peripheral SpA, and 1 PsA trials) to less specific exclusions for unstable or poorly
controlled medical conditions or underlying conditions considered by the investigator as an unacceptable risk for trial participation. Thus, none of the trials included in this analysis excluded patients with a history of IBD. The presence of prevalent IBD at baseline was not systematically characterized for the entire study population in any of the trials. (For information on requesting data from AbbVie- sponsored studies, visit: https://www.abbvie.com/our-scien ce/ clini cal-trial s/clini cal-trial s-data-and-infor matio n-shari ng/ data-and-infor matio n-shari ng-with-quali fied-resea rchers.html).
Assessment of IBD. Data on IBD (new onset, worsening/flare) were collected as AEs reported throughout the duration of the trials and through 70 days (5 half-lives) after the last dose of adalimumab. The search criteria for IBD events included the following standardized Medical Dictionary for Regulatory Activ-ities preferred terms (either new onset or worsening/flare): IBD, ulcerative colitis, Crohn’s disease, IBD not otherwise specified, and ulcerative proctitis. Gastrointestinal perforation was outside the scope of the search criteria. The automated search did not distinguish between new-onset IBD and flare of preexisting IBD. A manual assessment to distinguish new-onset IBD and worsen-ing of preexisting disease was performed for the events occurring in patients with axial SpA (AS and nonradiographic axial SpA).
Statistical analysis. IBD AEs (combined for new onset and flare) were reported as the number of patients with an IBD event, the total number of events (i.e., each event was recorded sepa-rately for patients with >1 event), and the number of events when censored after the first event. Rates of IBD events were calculated as events per 100 patient-years; 95% confidence intervals (95% CIs) were based on exact confidence limits from a Poisson distri-bution. IBD event rates were determined for all patients treated
SIGNIFICANCE & INNOVATIONS• The results of this analysis of 75 adalimumab clinical
trials in adult and pediatric patients demonstrated that the rates of inflammatory bowel disease (IBD) adverse events were generally low across non-IBD diseases, with all events occurring in adult patients.
• In patients with axial spondyloarthritis who have an increased risk of IBD, the rates of IBD events were comparable between adalimumab- and placebo- treated patients.
• Based on these data, adalimumab is a reasonable therapeutic option for patients who are eligible for a biologic therapy and who are at risk for develop-ment or worsening of IBD.
Table 1. Number of clinical trials and patient exposure per diseases included in the analysis*
Disease Trials, no. Patients, no. (PY)All adalimumab trials 75 24,114 (36,508)RA 35 15,152 (24,813)Psoriasis, adult 17 3,703 (5,409)All SpA† 12 3,891 (4,363)
AS 5 2,026 (2,120)Nonradiographic axial SpA 2 863 (855)PsA 4 837 (998)Peripheral SpA 1 165 (391)
Hidradenitis suppurativa 4 733 (836)JIA‡ 4 274 (797)Uveitis 2 250 (167)Psoriasis, pediatric 1 111 (122)
* Excludes adalimumab trials in Crohn’s disease, ulcerative colitis, and Behçet’s disease. AS = ankylosing spondylitis; JIA = juvenile idiopathic arthritis; PsA = psoriatic arthritis; PY = patient-years; SpA = spondyloarthritis; RA = rheumatoid arthritis. † Includes patients with PsA, peripheral SpA, nonradiographic axial SpA, and AS from interventional adalimumab trials. ‡ Includes patients with polyarticular JIA and pediatric enthesitis-related arthritis from interventional adalimumab trials.
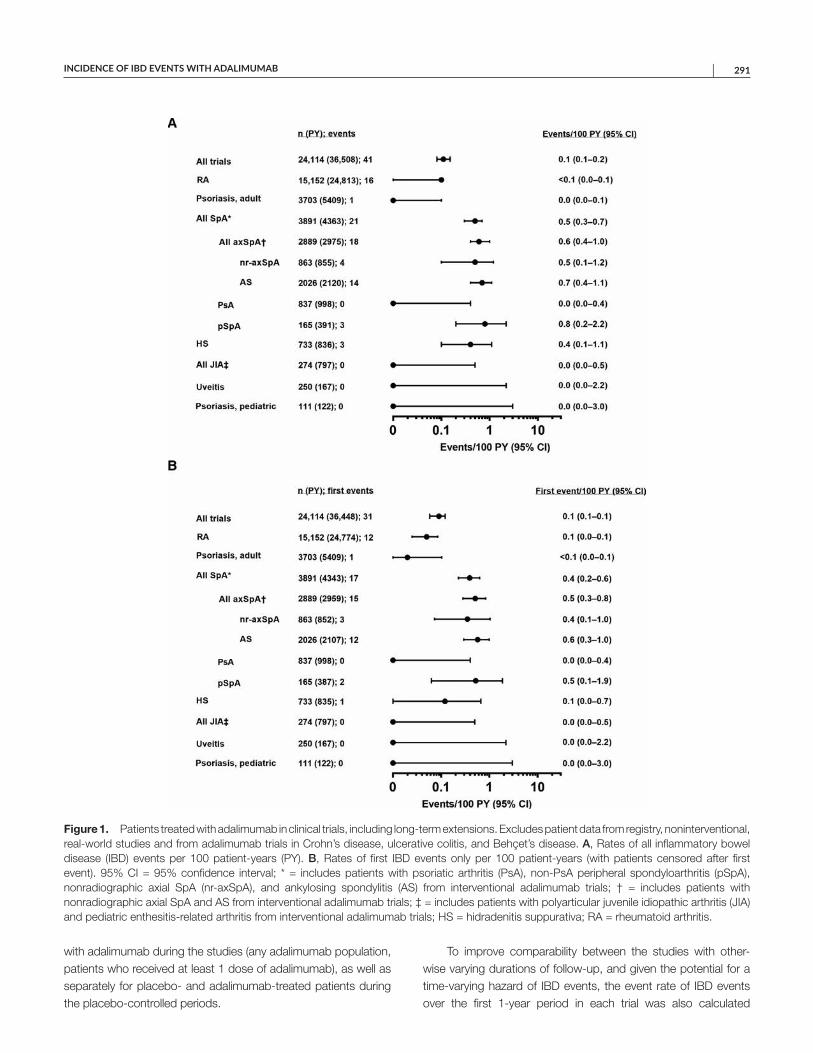
INCIDENCE OF IBD EVENTS WITH ADALIMUMAB | 291
with adalimumab during the studies (any adalimumab population, patients who received at least 1 dose of adalimumab), as well as separately for placebo- and adalimumab-treated patients during the placebo-controlled periods.
To improve comparability between the studies with other-wise varying durations of follow-up, and given the potential for a time-varying hazard of IBD events, the event rate of IBD events over the first 1-year period in each trial was also calculated
Figure 1. Patients treated with adalimumab in clinical trials, including long-term extensions. Excludes patient data from registry, noninterventional, real-world studies and from adalimumab trials in Crohn’s disease, ulcerative colitis, and Behçet’s disease. A, Rates of all inflammatory bowel disease (IBD) events per 100 patient-years (PY). B, Rates of first IBD events only per 100 patient-years (with patients censored after first event). 95% CI = 95% confidence interval; * = includes patients with psoriatic arthritis (PsA), non-PsA peripheral spondyloarthritis (pSpA), nonradiographic axial SpA (nr-axSpA), and ankylosing spondylitis (AS) from interventional adalimumab trials; † = includes patients with nonradiographic axial SpA and AS from interventional adalimumab trials; ‡ = includes patients with polyarticular juvenile idiopathic arthritis (JIA) and pediatric enthesitis-related arthritis from interventional adalimumab trials; HS = hidradenitis suppurativa; RA = rheumatoid arthritis.
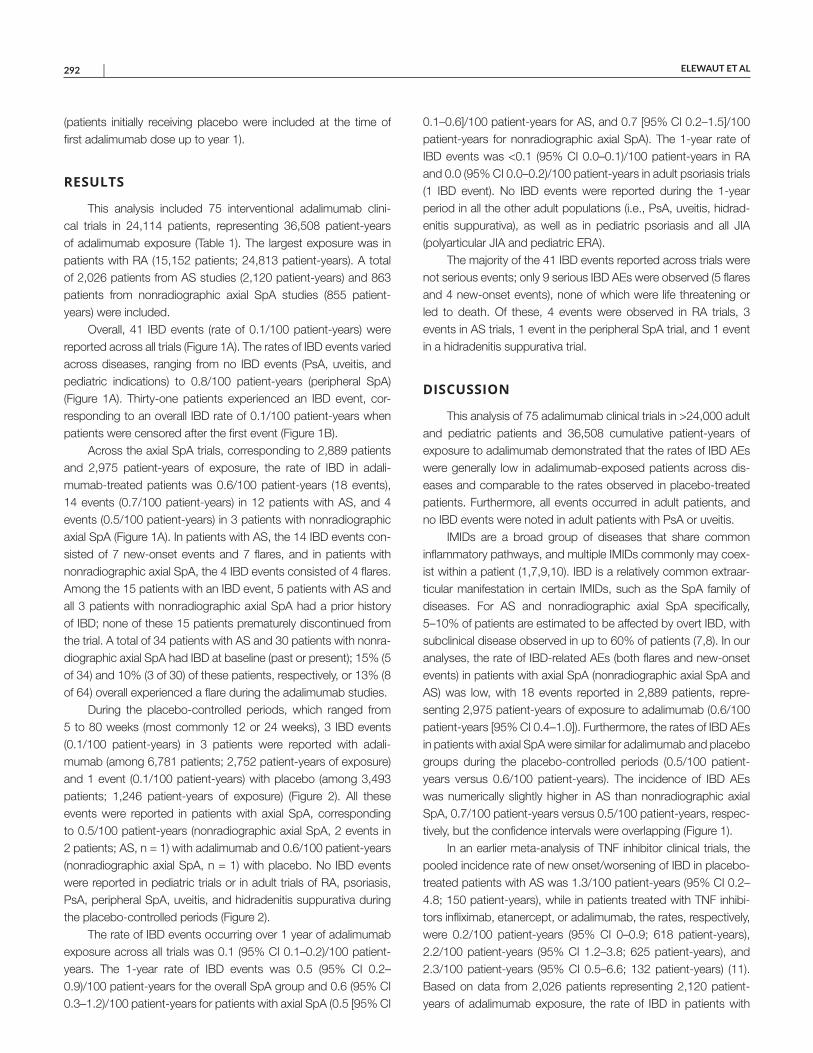
ELEWAUT ET AL 292 |
(patients initially receiving placebo were included at the time of first adalimumab dose up to year 1).
RESULTS
This analysis included 75 interventional adalimumab clini-cal trials in 24,114 patients, representing 36,508 patient-years of adalimumab exposure (Table 1). The largest exposure was in patients with RA (15,152 patients; 24,813 patient-years). A total of 2,026 patients from AS studies (2,120 patient-years) and 863 patients from nonradiographic axial SpA studies (855 patient-years) were included.
Overall, 41 IBD events (rate of 0.1/100 patient-years) were reported across all trials (Figure 1A). The rates of IBD events varied across diseases, ranging from no IBD events (PsA, uveitis, and pediatric indications) to 0.8/100 patient-years (peripheral SpA) (Figure 1A). Thirty-one patients experienced an IBD event, cor-responding to an overall IBD rate of 0.1/100 patient-years when patients were censored after the first event (Figure 1B).
Across the axial SpA trials, corresponding to 2,889 patients and 2,975 patient-years of exposure, the rate of IBD in adali-mumab-treated patients was 0.6/100 patient-years (18 events), 14 events (0.7/100 patient-years) in 12 patients with AS, and 4 events (0.5/100 patient-years) in 3 patients with nonradiographic axial SpA (Figure 1A). In patients with AS, the 14 IBD events con-sisted of 7 new-onset events and 7 flares, and in patients with nonradiographic axial SpA, the 4 IBD events consisted of 4 flares. Among the 15 patients with an IBD event, 5 patients with AS and all 3 patients with nonradiographic axial SpA had a prior history of IBD; none of these 15 patients prematurely discontinued from the trial. A total of 34 patients with AS and 30 patients with nonra-diographic axial SpA had IBD at baseline (past or present); 15% (5 of 34) and 10% (3 of 30) of these patients, respectively, or 13% (8 of 64) overall experienced a flare during the adalimumab studies.
During the placebo-controlled periods, which ranged from 5 to 80 weeks (most commonly 12 or 24 weeks), 3 IBD events (0.1/100 patient-years) in 3 patients were reported with adali-mumab (among 6,781 patients; 2,752 patient-years of exposure) and 1 event (0.1/100 patient-years) with placebo (among 3,493 patients; 1,246 patient-years of exposure) (Figure 2). All these events were reported in patients with axial SpA, corresponding to 0.5/100 patient-years (nonradiographic axial SpA, 2 events in 2 patients; AS, n = 1) with adalimumab and 0.6/100 patient-years (nonradiographic axial SpA, n = 1) with placebo. No IBD events were reported in pediatric trials or in adult trials of RA, psoriasis, PsA, peripheral SpA, uveitis, and hidradenitis suppurativa during the placebo-controlled periods (Figure 2).
The rate of IBD events occurring over 1 year of adalimumab exposure across all trials was 0.1 (95% CI 0.1–0.2)/100 patient-years. The 1-year rate of IBD events was 0.5 (95% CI 0.2–0.9)/100 patient-years for the overall SpA group and 0.6 (95% CI 0.3–1.2)/100 patient-years for patients with axial SpA (0.5 [95% CI
0.1–0.6]/100 patient-years for AS, and 0.7 [95% CI 0.2–1.5]/100 patient-years for nonradiographic axial SpA). The 1-year rate of IBD events was <0.1 (95% CI 0.0–0.1)/100 patient-years in RA and 0.0 (95% CI 0.0–0.2)/100 patient-years in adult psoriasis trials (1 IBD event). No IBD events were reported during the 1-year period in all the other adult populations (i.e., PsA, uveitis, hidrad-enitis suppurativa), as well as in pediatric psoriasis and all JIA (polyarticular JIA and pediatric ERA).
The majority of the 41 IBD events reported across trials were not serious events; only 9 serious IBD AEs were observed (5 flares and 4 new-onset events), none of which were life threatening or led to death. Of these, 4 events were observed in RA trials, 3 events in AS trials, 1 event in the peripheral SpA trial, and 1 event in a hidradenitis suppurativa trial.
DISCUSSION
This analysis of 75 adalimumab clinical trials in >24,000 adult and pediatric patients and 36,508 cumulative patient-years of exposure to adalimumab demonstrated that the rates of IBD AEs were generally low in adalimumab-exposed patients across dis-eases and comparable to the rates observed in placebo-treated patients. Furthermore, all events occurred in adult patients, and no IBD events were noted in adult patients with PsA or uveitis.
IMIDs are a broad group of diseases that share common inflammatory pathways, and multiple IMIDs commonly may coex-ist within a patient (1,7,9,10). IBD is a relatively common extraar-ticular manifestation in certain IMIDs, such as the SpA family of diseases. For AS and nonradiographic axial SpA specifically, 5–10% of patients are estimated to be affected by overt IBD, with subclinical disease observed in up to 60% of patients (7,8). In our analyses, the rate of IBD-related AEs (both flares and new-onset events) in patients with axial SpA (nonradiographic axial SpA and AS) was low, with 18 events reported in 2,889 patients, repre-senting 2,975 patient-years of exposure to adalimumab (0.6/100 patient-years [95% CI 0.4–1.0]). Furthermore, the rates of IBD AEs in patients with axial SpA were similar for adalimumab and placebo groups during the placebo-controlled periods (0.5/100 patient-years versus 0.6/100 patient-years). The incidence of IBD AEs was numerically slightly higher in AS than nonradiographic axial SpA, 0.7/100 patient-years versus 0.5/100 patient-years, respec-tively, but the confidence intervals were overlapping (Figure 1).
In an earlier meta-analysis of TNF inhibitor clinical trials, the pooled incidence rate of new onset/worsening of IBD in placebo- treated patients with AS was 1.3/100 patient-years (95% CI 0.2–4.8; 150 patient-years), while in patients treated with TNF inhibi-tors infliximab, etanercept, or adalimumab, the rates, respectively, were 0.2/100 patient-years (95% CI 0–0.9; 618 patient-years), 2.2/100 patient-years (95% CI 1.2–3.8; 625 patient-years), and 2.3/100 patient-years (95% CI 0.5–6.6; 132 patient-years) (11). Based on data from 2,026 patients representing 2,120 patient-years of adalimumab exposure, the rate of IBD in patients with
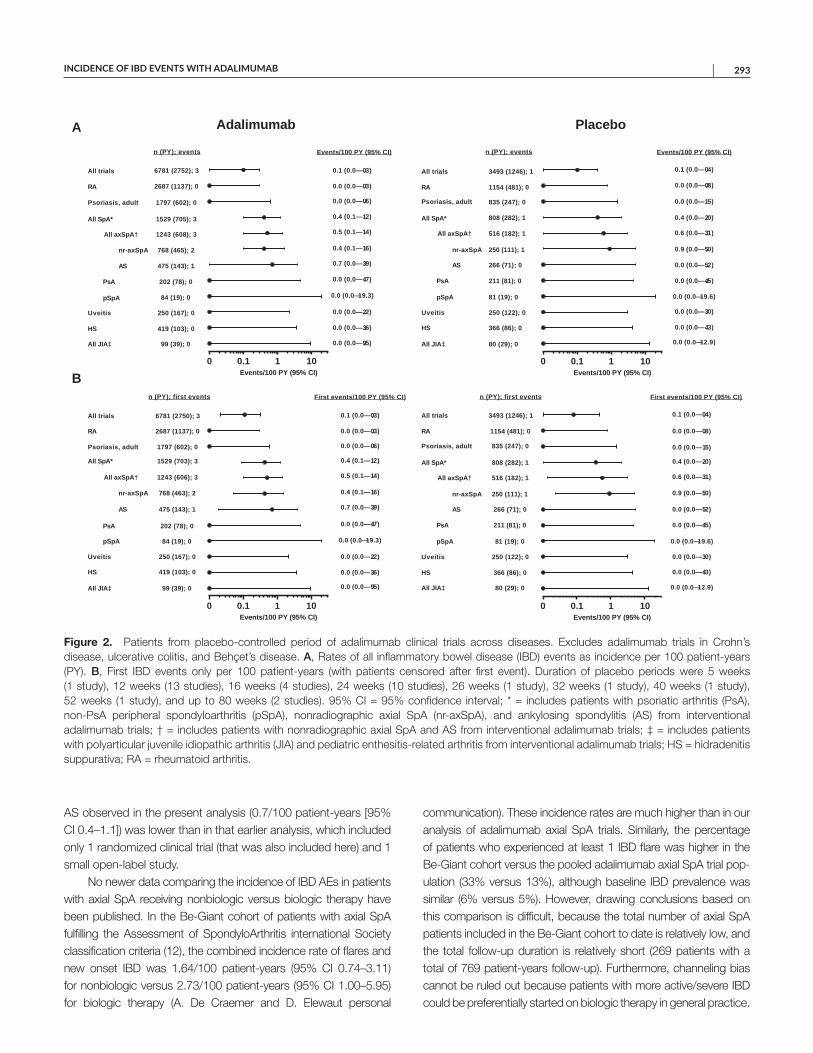
INCIDENCE OF IBD EVENTS WITH ADALIMUMAB | 293
AS observed in the present analysis (0.7/100 patient-years [95% CI 0.4–1.1]) was lower than in that earlier analysis, which included only 1 randomized clinical trial (that was also included here) and 1 small open-label study.
No newer data comparing the incidence of IBD AEs in patients with axial SpA receiving nonbiologic versus biologic therapy have been published. In the Be-Giant cohort of patients with axial SpA fulfilling the Assessment of SpondyloArthritis international Society classification criteria (12), the combined incidence rate of flares and new onset IBD was 1.64/100 patient-years (95% CI 0.74–3.11) for nonbiologic versus 2.73/100 patient-years (95% CI 1.00–5.95) for biologic therapy (A. De Craemer and D. Elewaut personal
communication). These incidence rates are much higher than in our analysis of adalimumab axial SpA trials. Similarly, the percentage of patients who experienced at least 1 IBD flare was higher in the Be-Giant cohort versus the pooled adalimumab axial SpA trial pop-ulation (33% versus 13%), although baseline IBD prevalence was similar (6% versus 5%). However, drawing conclusions based on this comparison is difficult, because the total number of axial SpA patients included in the Be-Giant cohort to date is relatively low, and the total follow-up duration is relatively short (269 patients with a total of 769 patient-years follow-up). Furthermore, channeling bias cannot be ruled out because patients with more active/severe IBD could be preferentially started on biologic therapy in general practice.
Figure 2. Patients from placebo-controlled period of adalimumab clinical trials across diseases. Excludes adalimumab trials in Crohn’s disease, ulcerative colitis, and Behçet’s disease. A, Rates of all inflammatory bowel disease (IBD) events as incidence per 100 patient-years (PY). B, First IBD events only per 100 patient-years (with patients censored after first event). Duration of placebo periods were 5 weeks (1 study), 12 weeks (13 studies), 16 weeks (4 studies), 24 weeks (10 studies), 26 weeks (1 study), 32 weeks (1 study), 40 weeks (1 study), 52 weeks (1 study), and up to 80 weeks (2 studies). 95% CI = 95% confidence interval; * = includes patients with psoriatic arthritis (PsA), non-PsA peripheral spondyloarthritis (pSpA), nonradiographic axial SpA (nr-axSpA), and ankylosing spondylitis (AS) from interventional adalimumab trials; † = includes patients with nonradiographic axial SpA and AS from interventional adalimumab trials; ‡ = includes patients with polyarticular juvenile idiopathic arthritis (JIA) and pediatric enthesitis-related arthritis from interventional adalimumab trials; HS = hidradenitis suppurativa; RA = rheumatoid arthritis.
0.1 1 100
0.1 (0.0—0.3)
0.0 (0.0—0.3)
0.4 (0.1—1.2)
0.5 (0.1—1.4)
0.4 (0.1—1.6)
0.7 (0.0—3.9)
0.0 (0.0—4.7)
0.0 (0.0—19.3)
0.0 (0.0—0.6)
0.0 (0.0—2.2)
0.0 (0.0—3.6)
0.0 (0.0—9.5)
All trials
RA
All SpA*
All axSpA†
nr-axSpA
AS
PsA
pSpA
Psoriasis, adult
Uveitis
HS
All JIA‡
Events/100 PY (95% CI)
6781 (2752); 3
2687 (1137); 0
1529 (705); 3
1243 (608); 3
768 (465); 2
475 (143); 1
202 (78); 0
84 (19); 0
1797 (602); 0
250 (167); 0
419 (103); 0
99 (39); 0
n (PY); events
Events/100 PY (95% CI)0.1 1 100
All trials
RA
All SpA*
All axSpA†
nr-axSpA
AS
PsA
pSpA
Psoriasis, adult
Uveitis
HS
All JIA‡
3493 (1246); 1
1154 (481); 0
808 (282); 1
516 (182); 1
250 (111); 1
266 (71); 0
211 (81); 0
81 (19); 0
835 (247); 0
250 (122); 0
366 (86); 0
80 (29); 0
n (PY); events
0.1 (0.0—0.4)
0.0 (0.0—0.8)
0.4 (0.0—2.0)
0.6 (0.0—3.1)
0.9 (0.0—5.0)
0.0 (0.0—5.2)
0.0 (0.0—4.5)
0.0 (0.0—19.6)
0.0 (0.0—1.5)
0.0 (0.0—3.0)
0.0 (0.0—4.3)
0.0 (0.0—12.9)
Events/100 PY (95% CI)
Events/100 PY (95% CI)
0.1 1 100
0.1 (0.0—0.3)
0.4 (0.1—1.2)
0.5 (0.1—1.4)
0.4 (0.1—1.6)
0.7 (0.0—3.9)
All trials
RA
All SpA*
All axSpA†
nr-axSpA
AS
PsA
pSpA
Psoriasis, adult
Uveitis
HS
All JIA‡
First events/100 PY (95% CI)
6781 (2750); 3
2687 (1137); 0
1529 (703); 3
1243 (606); 3
768 (463); 2
475 (143); 1
202 (78); 0
84 (19); 0
1797 (602); 0
250 (167); 0
419 (103); 0
99 (39); 0
n (PY); first events
Events/100 PY (95% CI)
0.0 (0.0—0.3)
0.0 (0.0—4.7)
0.0 (0.0—19.3)
0.0 (0.0—0.6)
0.0 (0.0—2.2)
0.0 (0.0—3.6)
0.0 (0.0—9.5)
0.1 1 100
All trials
RA
All SpA*
All axSpA†
nr-axSpA
AS
PsA
pSpA
Psoriasis, adult
Uveitis
HS
All JIA‡
3493 (1246); 1
1154 (481); 0
808 (282); 1
516 (182); 1
250 (111); 1
266 (71); 0
211 (81); 0
81 (19); 0
835 (247); 0
250 (122); 0
366 (86); 0
80 (29); 0
n (PY); first events
0.1 (0.0—0.4)
0.4 (0.0—2.0)
0.6 (0.0—3.1)
0.9 (0.0—5.0)
First events/100 PY (95% CI)
Events/100 PY (95% CI)
0.0 (0.0—0.8)
0.0 (0.0—5.2)
0.0 (0.0—4.5)
0.0 (0.0—19.6)
0.0 (0.0—1.5)
0.0 (0.0—3.0)
0.0 (0.0—4.3)
0.0 (0.0—12.9)
Adalimumab PlaceboA
B
ELEWAUT ET AL 294 |
Patients with PsA and psoriasis, who share similar inflam-matory disease pathways with the greater SpA family, are also at increased risk of concomitant IBD (9,10). Up to 33% of patients with PsA may have bowel involvement (overt or subclinical) (9), and the incidence rate (unspecified whether new onset or flare) in patients with psoriasis and PsA of Crohn’s disease (0.032 and 0.057 per 100 patient-years, respectively) and ulcerative colitis (0.079 and 0.11 per 100 patient-years, respectively) was higher compared with the general population (Crohn’s disease 0.017/100 patient-years; ulcerative colitis 0.045/100 patient-years) (10). In our analysis, no IBD cases were observed among patients with PsA, and only 1 event (0.0/100 patient-years) was observed in adult patients with psoriasis.
Because IL-17 inhibition is a therapeutic option for patients with psoriasis, PsA, and AS (patients who are at increased risk of IBD as a manifestation of their disease), it is relevant to dis-cuss findings for drugs with this mechanism of action. Clinical trial data for the IL-17 inhibitor secukinumab suggest no benefit and possible worsening of Crohn’s disease (5). The potential risk of Crohn’s disease and ulcerative colitis events after secukinumab exposure was demonstrated in real-world databases (13), and product labeling recommends caution when treating patients with AS, PsA, or psoriasis who also have IBD due to risk of IBD exac-erbation (6). A recent pooled analysis of 10 secukinumab studies across these 3 indications reported Crohn’s disease and ulcera-tive colitis incidence rates for patients with psoriasis (n = 3,430) of 0.11/100 patient-years (3 events total; 3 flares) and 0.15/100 patient-years (4 events total; 2 flares), respectively; for patients with PsA (n = 974), 0.07/100 patient-years (1 event total; 0 flares) and 0.14/100 patient-years (2 events total; 1 flare), respectively; and for patients with AS (n = 591), 0.77/100 patient-years (8 events total; 3 flares) and 0.29/100 patient-years (3 events total; 1 flare), respectively. Patients with active IBD were excluded from the studies (14). An additional pooled analysis of data from the subset of 3 MEASURE trials in 794 patients (1,706 patient-years) with AS receiving secukinumab for up to 3 years found an IBD rate of 0.7/100 patient-years (15). However, these reports did not specify the severity of IBD AEs in the secukinumab trials. In our analysis, only 9 of 41 IBD AEs across 75 adalimumab trials were serious; 3 occurred in patients with AS, and none in patients with nonra-diographic axial SpA. Further, none of the 15 axial SpA patients who experienced IBD AEs prematurely discontinued from the trial. Risks of new onset or worsening of IBD are largely unknown for other biologic therapies that may work along the IBD pathway.
The strengths of this analysis include the fact that IBD data were obtained from a large, well-characterized clinical trial data-base and included a comparison versus placebo, although place-bo-controlled periods were limited. The limitations of our analysis include lack of systematic identification of concomitant IBD at baseline in diseases other than axial SpA to distinguish new IBD onsets from IBD flares. AE reporting was the mechanism used to identify IBD events, and AEs were not systematically confirmed by
additional diagnostic procedures. This analysis also did not include nonspecific terms that may be related to IBD (such as diarrhea, blood in stool, etc.) because doing so would overestimate the true IBD incidence. It would be useful to know whether subclinical gut inflammation, common in patients with SpA, existed at baseline in patients with new-onset IBD occurring during the trials, but this information was not collected.
In conclusion, the rates of IBD AEs in adalimumab trials were generally low across diseases. In patients with axial SpA, who are known to be at an increased risk of IBD, the rates of IBD events were comparable between adalimumab- and placebo- treated patients, as well as with published pooled placebo rates across multiple AS clinical trials with TNF inhibitors. Based on the observed low rates of IBD and its approved indications for Crohn’s disease and ulcerative colitis, adalimumab is a reasonable thera-peutic option for patients who are eligible for a biologic therapy and who are at risk for development or worsening of IBD. This analysis provides a benchmark for IBD AEs that other therapies, now and in the future, might be compared against.
AUTHOR CONTRIBUTIONS
All authors were involved in drafting the article or revising it critically for important intellectual content, and all authors approved the final version to be submitted for publication. Dr. Elewaut had full access to all of the data in the study and takes responsibility for the integrity of the data and the accuracy of the data analysis.Study conception and design. Elewaut, Anderson, Hojnik, Curtis.Acquisition of data. Elewaut, Braun, Anderson, Hojnik, De Craemer.Analysis and interpretation of data. Elewaut, Anderson, Arikan, Chen, Hojnik, De Craemer.
ROLE OF THE STUDY SPONSOR
AbbVie funded the studies, contributed to their design, and was involved in the collection, analysis, and interpretation of the data, and in the writing and review. Debanjali Dasgupta, PhD, of AbbVie, and Jen-fue Maa, PhD, formerly of AbbVie, provided statistical analysis support. Medical writing support was provided by Maria Hovenden, PhD, and Janet E. Matsuura, PhD, of Complete Publication Solutions, LLC (North Wales, PA), a CHC Group company, and was funded by AbbVie. Publication of this article was contingent upon approval by AbbVie.
REFERENCES 1. Cantaert T, Baeten D, Tak PP, van Baarsen LG. Type I IFN and
TNFalpha cross-regulation in immune-mediated inflammatory dis-ease: basic concepts and clinical relevance. Arthritis Res Ther 2010; 12:219.
2. Holleran G, Lopetuso L, Petito V, Graziani C, Ianiro G, McNamara D, et al. The innate and adaptive immune system as targets for biologic therapies in inflammatory bowel disease. Int J Mol Sci 2017;18:2020.
3. Van der Heijde D, Ramiro S, Landewe R, Baraliakos X, Van den Bosch F, Sepriano A, et al. 2016 update of the ASAS-EULAR manage-ment recommendations for axial spondyloarthritis. Ann Rheum Dis 2017;76:978–91.
4. Fitzpatrick LR. Novel pharmacological approaches for inflammatory bowel disease: targeting key intracellular pathways and the IL-23/IL-17 axis. Int J Inflam 2012;2012:389404.
INCIDENCE OF IBD EVENTS WITH ADALIMUMAB | 295
5. Hueber W, Sands BE, Lewitzky S, Vandemeulebroecke M, Reinisch W,Higgins PD, et al. Secukinumab, a human anti-IL-17A monoclonal anti-body, for moderate to severe Crohn’s disease: unexpected results of a ran-domised, double-blind placebo-controlled trial. Gut 2012;61:1693–700.
6. Cosentyx (secukinumab) full prescribing information. East Hanover(NJ): Novartis Pharmaceuticals Corporation; 2016.
7. Van der Horst-Bruinsma IE, Nurmohamed MT. Management andevaluation of extra-articular manifestations in spondyloarthritis. TherAdv Musculoskelet Dis 2012;4:413–22.
8. Van Praet L, Van den Bosch FE, Jacques P, Carron P, Jans L, Colman R, et al. Microscopic gut inflammation in axial spondyloarthritis: amultiparametric predictive model. Ann Rheum Dis 2013;72:414–7.
9. Peluso R, Iervolino S, Vitiello M, Bruner V, Lupoli G, Di Minno MN.Extra-articular manifestations in psoriatic arthritis patients. Clin Rheu-matol 2015;34:745–53.
10. Egeberg A, Mallbris L, Warren RB, Bachelez H, Gislason GH,Hansen PR, et al. Association between psoriasis and inflammatorybowel disease: a Danish nationwide cohort study. Br J Dermatol2016;175:487–92.
11. Braun J, Baraliakos X, Listing J, Davis J, van der Heijde D, Haibel H,et al. Differences in the incidence of flares or new onset of inflamma-tory bowel diseases in patients with ankylosing spondylitis exposedto therapy with anti–tumor necrosis factor α agents. Arthritis Rheum2007;57:639–47.
12. Varkas G, Vastesaeger N, Cypers H, Colman R, Renson T, VanPraet L, et al. Association of inflammatory bowel disease andacute anterior uveitis, but not psoriasis, with disease durationin patients with axial spondyloarthritis: results from two Belgiannationwide axial spondyloarthritis cohorts. Arthritis Rheumatol2018;70:1588–96.
13. Orrell KA, Murphrey M, Kelm RC, Lee HH, Pease DR, Laumann AE,et al. Inflammatory bowel disease events after exposure to interleukin 17 inhibitors secukinumab and ixekizumab: postmarketing analysisfrom the RADAR ("Research on Adverse Drug events And Reports")program. J Am Acad Dermatol 2018;79:777–8.
14. Schreiber S, Colombel JF, Feagan BG, Reich K, Deodhar AA,McInnes IB, et al. Incidence rates of inflammatory bowel disease inpatients with psoriasis, psoriatic arthritis and ankylosing spondylitistreated with secukinumab: a retrospective analysis of pooled datafrom 21 clinical trials. Ann Rheum Dis 2019;78:473–9.
15. Deodhar AA, Baraliakos X, Marzo-Ortega H, Sieper J, AnderssonM, Porter B, et al. Secukinumab demonstrates consistent safetyover long-term exposure (up to 3 years) in patients with active anky-losing spondylitis: pooled analysis of three phase 3 trials [abstract]. Arthritis Rheumatol 2017;69 Suppl 10. URL: https://acrab-stracts.org/abstract/secukinumab-demonstrates-consistent- safety-over-long-term-exposure-up-to-3-years-in-patients-with-active-ankylosing-spondylitis-pooled-analysis-of-three-phase-3-trials/.
296
Arthritis Care & ResearchVol. 73, No. 2, February 2021, pp 296–304DOI 10.1002/acr.24109© 2019, American College of Rheumatology
Intersectional Inequalities and Individual Heterogeneity in Chronic Rheumatic Diseases: An Intersectional Multilevel AnalysisAli Kiadaliri1 and Martin Englund2
Objective. To examine how intersections of multiple sociodemographic variables explain the individual heterogeneity in risk of being diagnosed with any of following chronic rheumatic diseases (CRDs): osteoarthritis (OA), gout, rheumatoid arthritis (RA), or spondyloarthritis (SpA).
Methods. We identified individuals ages 40–65 years residing in Skåne, Sweden by December 31, 2013 and having done so from January 1, 2000 (n = 342,542). We used a Skåne health care register to identify those with a diagnosis of the CRD of interest between January 1, 2014 and December 31, 2015, with no previous such diagnosis during 2000–2013. We created 144 intersectional social strata (ISS) using categories of age, sex, education, income, civil status, and immigration. For individuals nested within ISS, we applied multilevel logistic regression models to estimate the variance partition coefficient (VPC) as a measure of discriminatory accuracy of the ISS and the predicted absolute risks and 95% credible intervals for each stratum.
Results. Overall, 3.5%, 0.5%, 0.2%, and 0.2% of the study population were diagnosed with OA, gout, RA, and SpA, respectively. The VPC ranged from 16.2% for gout to 0.5% for SpA. Sex explained the largest proportion of between-strata variation in risk of RA, gout, and SpA, while age was the most important factor for OA. The most between-strata differences in risk of these CRDs were due to the additive main effects.
Conclusion. Despite meaningful between-strata inequalities in the risk of being diagnosed with CRDs (except SpA), there were substantial within-strata heterogeneities that remain unexplained. There was limited evidence of intersectional interaction effects.
INTRODUCTION
Chronic rheumatic diseases are among the leading causes of disability globally, entailing a huge health and economic bur-den on individuals and societies (1,2). The burden of chronic rheumatic diseases, however, is unequally distributed along social status dimensions (SSDs) such as sex, ethnicity, and socioeco-nomic status (3–5). The common approach in health inequalities literature (including studies on chronic rheumatic diseases) is to investigate different SSDs in isolation from one another or to treat them as additive distinct processes (6).
However, these approaches are being criticized for the fol-lowing: 1) they prioritize one axis of inequality over others, ignoring the fact that individuals experience both dominant and subordi-nate SSDs simultaneously; 2) they ignore the fact that SSDs are
interdependent, mutually constitutive, and reinforce one another; 3) they treat SSDs as individual-level risk factors rather than prox-ies for social context that influence individuals over and above individual-level characteristics; 4) they fail to capture the heteroge-neous effects of SSDs on individuals; and 5) they concentrate on between-group differences, disregarding the typically significant variations within groups (7–9).
In response to these limitations and a lack of progress in reduc-ing inequalities using existing approaches, there has been a grow-ing interest in the use of an intersectional approach to investigate health inequalities and to identify effective interventions to tackle the inequalities (7,8,10). Intersectionality recognizes simultaneous coex-istence of SSDs and their interactions and acknowledges that inter-actions between these SSDs within social processes and power structures create unique experiences, shaping and influencing
Supported by the Greta and Kocks Foundation, the Crafoord Foundation, the Swedish Research Council, the Österlunds Foundation, the Faculty of Medicine of Lund University, the National Health Service (governmental funding for clinical research), and Region Skåne.
1Ali Kiadaliri, PhD: Lund University, Lund, Sweden; 2Martin Englund, MD, PhD: Lund University, Lund, Sweden, and Boston University School of Medicine, Boston, Massachusetts.
No potential conflicts of interest relevant to this article were reported.
Address correspondence to Ali Kiadaliri, PhD, Skåne University Hospital, Clinical Epidemiology Unit, Remissgatan 4, SE-221 85 Lund, Sweden. Email: [email protected].
Submitted for publication June 29, 2019; accepted in revised form November 12, 2019.
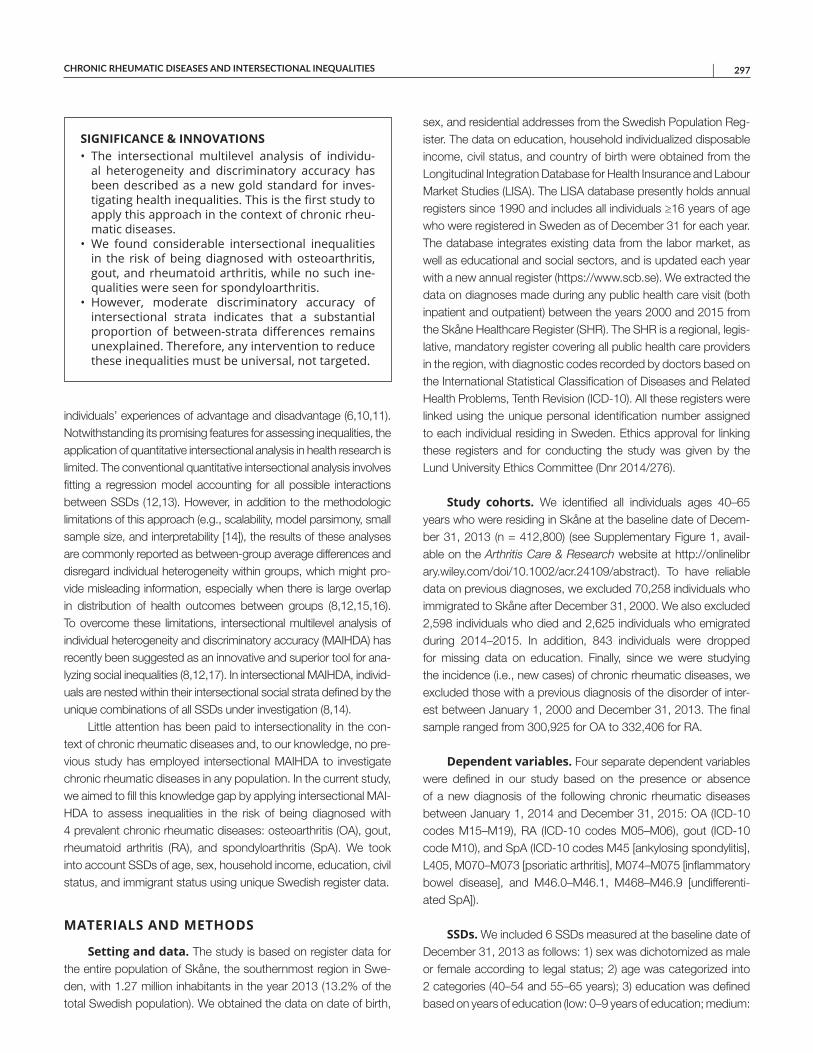
CHRONIC RHEUMATIC DISEASES AND INTERSECTIONAL INEQUALITIES | 297Arthritis Care & ResearchVol. 73, No. 2, February 2021, pp 296–304DOI 10.1002/acr.24109
individuals’ experiences of advantage and disadvantage (6,10,11). Notwithstanding its promising features for assessing inequalities, the application of quantitative intersectional analysis in health research is limited. The conventional quantitative intersectional analysis involves fitting a regression model accounting for all possible interactions between SSDs (12,13). However, in addition to the methodologic limitations of this approach (e.g., scalability, model parsimony, small sample size, and interpretability [14]), the results of these analyses are commonly reported as between-group average differences and disregard individual heterogeneity within groups, which might pro-vide misleading information, especially when there is large overlap in distribution of health outcomes between groups (8,12,15,16). To overcome these limitations, intersectional multilevel analysis of individual heterogeneity and discriminatory accuracy (MAIHDA) has recently been suggested as an innovative and superior tool for ana-lyzing social inequalities (8,12,17). In intersectional MAIHDA, individ-uals are nested within their intersectional social strata defined by the unique combinations of all SSDs under investigation (8,14).
Little attention has been paid to intersectionality in the con-text of chronic rheumatic diseases and, to our knowledge, no pre-vious study has employed intersectional MAIHDA to investigate chronic rheumatic diseases in any population. In the current study, we aimed to fill this knowledge gap by applying intersectional MAI-HDA to assess inequalities in the risk of being diagnosed with 4 prevalent chronic rheumatic diseases: osteoarthritis (OA), gout, rheumatoid arthritis (RA), and spondyloarthritis (SpA). We took into account SSDs of age, sex, household income, education, civil status, and immigrant status using unique Swedish register data.
MATERIALS AND METHODS
Setting and data. The study is based on register data for the entire population of Skåne, the southernmost region in Swe-den, with 1.27 million inhabitants in the year 2013 (13.2% of the total Swedish population). We obtained the data on date of birth,
sex, and residential addresses from the Swedish Population Reg-ister. The data on education, household individualized disposable income, civil status, and country of birth were obtained from the Longitudinal Integration Database for Health Insurance and Labour Market Studies (LISA). The LISA database presently holds annual registers since 1990 and includes all individuals ≥16 years of age who were registered in Sweden as of December 31 for each year. The database integrates existing data from the labor market, as well as educational and social sectors, and is updated each year with a new annual register (https://www.scb.se). We extracted the data on diagnoses made during any public health care visit (both inpatient and outpatient) between the years 2000 and 2015 from the Skåne Healthcare Register (SHR). The SHR is a regional, legis-lative, mandatory register covering all public health care providers in the region, with diagnostic codes recorded by doctors based on the International Statistical Classification of Diseases and Related Health Problems, Tenth Revision (ICD-10). All these registers were linked using the unique personal identification number assigned to each individual residing in Sweden. Ethics approval for linking these registers and for conducting the study was given by the Lund University Ethics Committee (Dnr 2014/276).
Study cohorts. We identified all individuals ages 40–65 years who were residing in Skåne at the baseline date of Decem-ber 31, 2013 (n = 412,800) (see Supplementary Figure 1, avail-able on the Arthritis Care & Research website at http://onlin elibr ary.wiley.com/doi/10.1002/acr.24109/ abstract). To have reliable data on previous diagnoses, we excluded 70,258 individuals who immigrated to Skåne after December 31, 2000. We also excluded 2,598 individuals who died and 2,625 individuals who emigrated during 2014–2015. In addition, 843 individuals were dropped for missing data on education. Finally, since we were studying the incidence (i.e., new cases) of chronic rheumatic diseases, we excluded those with a previous diagnosis of the disorder of inter-est between January 1, 2000 and December 31, 2013. The final sample ranged from 300,925 for OA to 332,406 for RA.
Dependent variables. Four separate dependent variables were defined in our study based on the presence or absence of a new diagnosis of the following chronic rheumatic diseases between January 1, 2014 and December 31, 2015: OA (ICD-10 codes M15–M19), RA (ICD-10 codes M05–M06), gout (ICD-10 code M10), and SpA (ICD-10 codes M45 [ankylosing spondylitis], L405, M070–M073 [psoriatic arthritis], M074–M075 [inflammatory bowel disease], and M46.0–M46.1, M468–M46.9 [undifferenti-ated SpA]).
SSDs. We included 6 SSDs measured at the baseline date of December 31, 2013 as follows: 1) sex was dichotomized as male or female according to legal status; 2) age was categorized into 2 categories (40–54 and 55–65 years); 3) education was defined based on years of education (low: 0–9 years of education; medium:
SIGNIFICANCE & INNOVATIONS• The intersectional multilevel analysis of individu-
al heterogeneity and discriminatory accuracy has been described as a new gold standard for inves-tigating health inequalities. This is the first study to apply this approach in the context of chronic rheu-matic diseases.
• We found considerable intersectional inequalities in the risk of being diagnosed with osteoarthritis, gout, and rheumatoid arthritis, while no such ine-qualities were seen for spondyloarthritis.
• However, moderate discriminatory accuracy of intersectional strata indicates that a substantial proportion of between-strata differences remains unexplained. Therefore, any intervention to reduce these inequalities must be universal, not targeted.
KIADALIRI AND ENGLUND 298 |
10–12 years of education; and high: >12 years of education); 4) “income” refers to household individualized disposable income, which is calculated by dividing the total disposable income of a family by its size, adjusting for the different consumption weights of adults and children (according to Statistics Sweden); individuals were divided into 3 income groups based on the tertile values of the income distribution (low, medium, and high); 5) civil status was constructed in 2 groups (cohabitants [those living together as a married couple, in a registered partnership, or with a com-mon child] and living alone [all other individuals]; and 6) immigrant status was dichotomized as immigrant (born outside Sweden) and native (born in Sweden). Using the possible unique combina-tions of 6 SSDs, we constructed 144 intersectional social strata (144 = 2 × 2 × 3 × 3 × 2 × 2).
Statistical analysis. We conducted intersectional MAI-HDA as a 2-level random-effects model with individuals (level 1) nested within their intersectional social strata (level 2) (8,12). The intersectional MAIHDA partitions the total variance in an outcome into within- and between-intersectional social strata. Following Axelsson Fisk et al (17), we modeled the risk of each chronic rheumatic disorder using 3 successive multilevel logistic regres-sion models. In model 1, we estimated a random intercepts model that included no additive main effects (empty model). From this model, we computed the variance partition coefficient (VPC) as a measure of the discriminatory accuracy of intersectional social strata to correctly discriminate between individuals with or without the outcome of interest. The higher the VPC, the higher the share of individual differences in outcome attributable to intersectional social strata, and the stronger the homogeneity in the outcome within the strata (8,17). Using the latent response formulation of the logistic regression model, we calculated the VPC as:
where �2u indicates the stratum-level variance, and 3.29 is indi-
vidual-level variance equal to the variance of the standard logistic distribution (18). We applied the following grading for assessing discriminatory accuracy of intersectional social strata based on the VPC (17): nonexistent (0–1); poor (>1 to ≤5); fair (>5 to ≤10); good (>10 to ≤20); very good (>20 to ≤30); excellent (>30). In addition, we calculated the predicted absolute risks and 95% credible intervals (95% CrIs) of the outcome of interest for each social intersectional stratum. As a further measure of discrimina-tory accuracy, we plotted a receiver operating characteristic curve and reported the area under the curve (AUC).
In model 2, we estimated a partially adjusted model in which we expanded model 1 by adjusting for 1 SSD at a time. Using this model, we quantified to what extent each SSD contributed to the between-stratum variance observed in model 1 by calculating the proportional change in the between-stratum variance (PCV):
The higher the PCV, the more substantial impact of the SSD in question on the between-stratum variance in outcome across the strata.
In model 3, we estimated a fully adjusted model in which we expanded model 1 by simultaneously including as main (fixed) effects all 6 SDDs used to construct intersectional social strata. In the absence of stratum-specific interactions, this model would completely explain the between-stratum variance, and the stra-tum-level residual would be zero for all strata. Otherwise, the stratum-level residual represents the excess risk due to inter-sectional interaction effects. From this model, we obtained the total predicted probability (based on fixed-effects covariates capturing the main effects of the SDDs and the random stratum effect capturing interaction effects) and the predicted probability based solely on the main effects for each stratum. The difference between these 2 values represents the absolute risk attributable to interaction in each intersectional social stratum. A positive (or negative) interaction effect implies that individuals in that stratum have higher (or lower) risk than expected based on additive main effects. We also obtained adjusted odds ratios (ORadj) for the main effects of all SSDs.
All models were estimated using Markov chain Monte Carlo (MCMC) procedures with diffuse priors in MLwiN, version 3.02 (19,20). We ran MLwiN from within Stata, version 15 using the “runmlwin” command (21). Quasi-likelihood methods were used to provide the MCMC procedure with initialization values. For all models, a burn-in of 5,000 iterations and total length of 50,000 iterations were used. We used Stata codes from Axelsson Fisk et al (17) to estimate our models.
RESULTS
The characteristics of individuals included for each of our 4 selected chronic rheumatic diseases were comparable (Table 1). Overall, 3.5%, 0.2%, 0.5%, and 0.2% of individuals were diag-nosed with OA, RA, gout, and SpA, respectively, during 2014–2015 (see Supplementary Table 1, available on the Arthritis Care & Research website at http://onlin elibr ary.wiley.com/doi/10.1002/acr.24109/ abstract). Model 1 (Table 2) showed that the discrimi-natory accuracy of the intersectional social strata was fair for OA (VPC 7.7% [95% CrI 6.0–9.8]; AUC 0.65) (Figure 1) and RA (VPC 9.2% [95% CrI 5.6–13.5]; AUC 0.69), good for gout (VPC 16.2% [95% CrI 12.0–20.7]; AUC 0.72), and nonexistent for SpA (VPC 0.5% [95% CrI 0.0–1.9]; AUC 0.60).
The total predicted absolute risk obtained from model 1 for OA ranged from 1.09% (95% CrI 0.47–1.95) in immigrant men, ages 40–54 years, with high education and high income who lived alone to 7.37% (95% CrI 5.75–9.19) among immigrant women,
VPC =
�2u
�2u+ 3.29
× 100%
PCV=
�2u(model 1)
−�2u(model 2)
�2u(model 1)
×100%
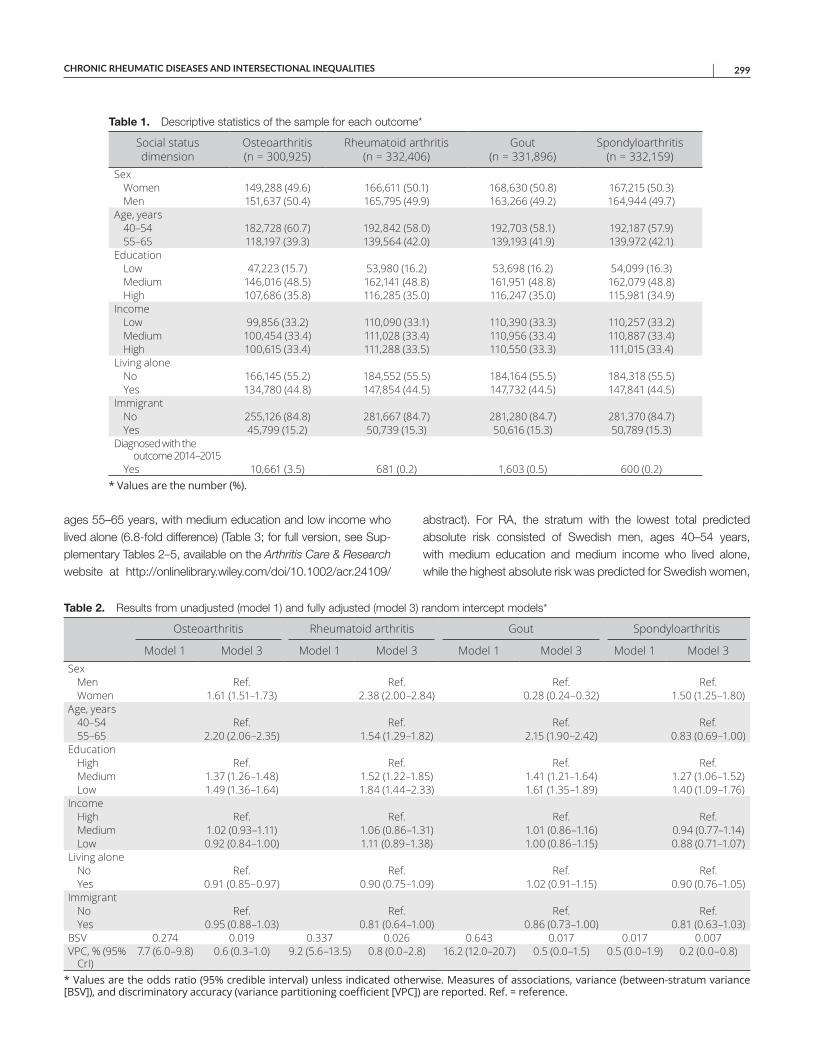
CHRONIC RHEUMATIC DISEASES AND INTERSECTIONAL INEQUALITIES | 299
ages 55–65 years, with medium education and low income who lived alone (6.8-fold difference) (Table 3; for full version, see Sup-plementary Tables 2–5, available on the Arthritis Care & Research website at http://onlin elibr ary.wiley.com/doi/10.1002/acr.24109/
abstract). For RA, the stratum with the lowest total predicted absolute risk consisted of Swedish men, ages 40–54 years, with medium education and medium income who lived alone, while the highest absolute risk was predicted for Swedish women,
Table 1. Descriptive statistics of the sample for each outcome*
Social status dimension
Osteoarthritis (n = 300,925)
Rheumatoid arthritis (n = 332,406)
Gout (n = 331,896)
Spondyloarthritis (n = 332,159)
SexWomen 149,288 (49.6) 166,611 (50.1) 168,630 (50.8) 167,215 (50.3)Men 151,637 (50.4) 165,795 (49.9) 163,266 (49.2) 164,944 (49.7)
Age, years40–54 182,728 (60.7) 192,842 (58.0) 192,703 (58.1) 192,187 (57.9)55–65 118,197 (39.3) 139,564 (42.0) 139,193 (41.9) 139,972 (42.1)
EducationLow 47,223 (15.7) 53,980 (16.2) 53,698 (16.2) 54,099 (16.3)Medium 146,016 (48.5) 162,141 (48.8) 161,951 (48.8) 162,079 (48.8)High 107,686 (35.8) 116,285 (35.0) 116,247 (35.0) 115,981 (34.9)
IncomeLow 99,856 (33.2) 110,090 (33.1) 110,390 (33.3) 110,257 (33.2)Medium 100,454 (33.4) 111,028 (33.4) 110,956 (33.4) 110,887 (33.4)High 100,615 (33.4) 111,288 (33.5) 110,550 (33.3) 111,015 (33.4)
Living aloneNo 166,145 (55.2) 184,552 (55.5) 184,164 (55.5) 184,318 (55.5)Yes 134,780 (44.8) 147,854 (44.5) 147,732 (44.5) 147,841 (44.5)
ImmigrantNo 255,126 (84.8) 281,667 (84.7) 281,280 (84.7) 281,370 (84.7)Yes 45,799 (15.2) 50,739 (15.3) 50,616 (15.3) 50,789 (15.3)
Diagnosed with the outcome 2014–2015Yes 10,661 (3.5) 681 (0.2) 1,603 (0.5) 600 (0.2)
* Values are the number (%).
Table 2. Results from unadjusted (model 1) and fully adjusted (model 3) random intercept models*
Osteoarthritis Rheumatoid arthritis Gout Spondyloarthritis
Model 1 Model 3 Model 1 Model 3 Model 1 Model 3 Model 1 Model 3Sex
Men Ref. Ref. Ref. Ref.Women 1.61 (1.51–1.73) 2.38 (2.00–2.84) 0.28 (0.24–0.32) 1.50 (1.25–1.80)
Age, years40–54 Ref. Ref. Ref. Ref.55–65 2.20 (2.06–2.35) 1.54 (1.29–1.82) 2.15 (1.90–2.42) 0.83 (0.69–1.00)
EducationHigh Ref. Ref. Ref. Ref.Medium 1.37 (1.26–1.48) 1.52 (1.22–1.85) 1.41 (1.21–1.64) 1.27 (1.06–1.52)Low 1.49 (1.36–1.64) 1.84 (1.44–2.33) 1.61 (1.35–1.89) 1.40 (1.09–1.76)
IncomeHigh Ref. Ref. Ref. Ref.Medium 1.02 (0.93–1.11) 1.06 (0.86–1.31) 1.01 (0.86–1.16) 0.94 (0.77–1.14)Low 0.92 (0.84–1.00) 1.11 (0.89–1.38) 1.00 (0.86–1.15) 0.88 (0.71–1.07)
Living aloneNo Ref. Ref. Ref. Ref.Yes 0.91 (0.85–0.97) 0.90 (0.75–1.09) 1.02 (0.91–1.15) 0.90 (0.76–1.05)
ImmigrantNo Ref. Ref. Ref. Ref.Yes 0.95 (0.88–1.03) 0.81 (0.64–1.00) 0.86 (0.73–1.00) 0.81 (0.63–1.03)
BSV 0.274 0.019 0.337 0.026 0.643 0.017 0.017 0.007VPC, % (95%
CrI)7.7 (6.0–9.8) 0.6 (0.3–1.0) 9.2 (5.6–13.5) 0.8 (0.0–2.8) 16.2 (12.0–20.7) 0.5 (0.0–1.5) 0.5 (0.0–1.9) 0.2 (0.0–0.8)
* Values are the odds ratio (95% credible interval) unless indicated otherwise. Measures of associations, variance (between-stratum variance [BSV]), and discriminatory accuracy (variance partitioning coefficient [VPC]) are reported. Ref. = reference.
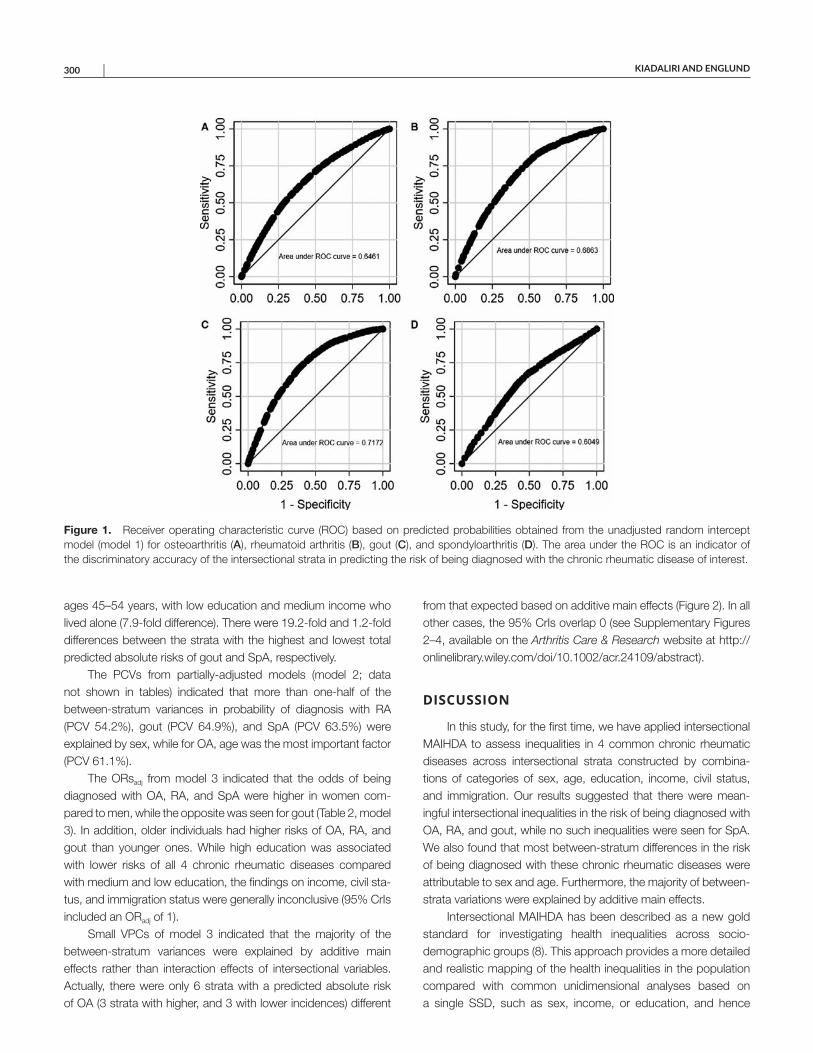
KIADALIRI AND ENGLUND 300 |
ages 45–54 years, with low education and medium income who lived alone (7.9-fold difference). There were 19.2-fold and 1.2-fold differences between the strata with the highest and lowest total predicted absolute risks of gout and SpA, respectively.
The PCVs from partially-adjusted models (model 2; data not shown in tables) indicated that more than one-half of the between-stratum variances in probability of diagnosis with RA (PCV 54.2%), gout (PCV 64.9%), and SpA (PCV 63.5%) were explained by sex, while for OA, age was the most important factor (PCV 61.1%).
The ORsadj from model 3 indicated that the odds of being diagnosed with OA, RA, and SpA were higher in women com-pared to men, while the opposite was seen for gout (Table 2, model 3). In addition, older individuals had higher risks of OA, RA, and gout than younger ones. While high education was associated with lower risks of all 4 chronic rheumatic diseases compared with medium and low education, the findings on income, civil sta-tus, and immigration status were generally inconclusive (95% CrIs included an ORadj of 1).
Small VPCs of model 3 indicated that the majority of the between-stratum variances were explained by additive main effects rather than interaction effects of intersectional variables. Actually, there were only 6 strata with a predicted absolute risk of OA (3 strata with higher, and 3 with lower incidences) different
from that expected based on additive main effects (Figure 2). In all other cases, the 95% CrIs overlap 0 (see Supplementary Figures 2–4, available on the Arthritis Care & Research website at http://onlin elibr ary.wiley.com/doi/10.1002/acr.24109/ abstract).
DISCUSSION
In this study, for the first time, we have applied intersectional MAIHDA to assess inequalities in 4 common chronic rheumatic diseases across intersectional strata constructed by combina-tions of categories of sex, age, education, income, civil status, and immigration. Our results suggested that there were mean-ingful intersectional inequalities in the risk of being diagnosed with OA, RA, and gout, while no such inequalities were seen for SpA. We also found that most between-stratum differences in the risk of being diagnosed with these chronic rheumatic diseases were attributable to sex and age. Furthermore, the majority of between-strata variations were explained by additive main effects.
Intersectional MAIHDA has been described as a new gold standard for investigating health inequalities across socio-demographic groups (8). This approach provides a more detailed and realistic mapping of the health inequalities in the population compared with common unidimensional analyses based on a single SSD, such as sex, income, or education, and hence
Figure 1. Receiver operating characteristic curve (ROC) based on predicted probabilities obtained from the unadjusted random intercept model (model 1) for osteoarthritis (A), rheumatoid arthritis (B), gout (C), and spondyloarthritis (D). The area under the ROC is an indicator of the discriminatory accuracy of the intersectional strata in predicting the risk of being diagnosed with the chronic rheumatic disease of interest.
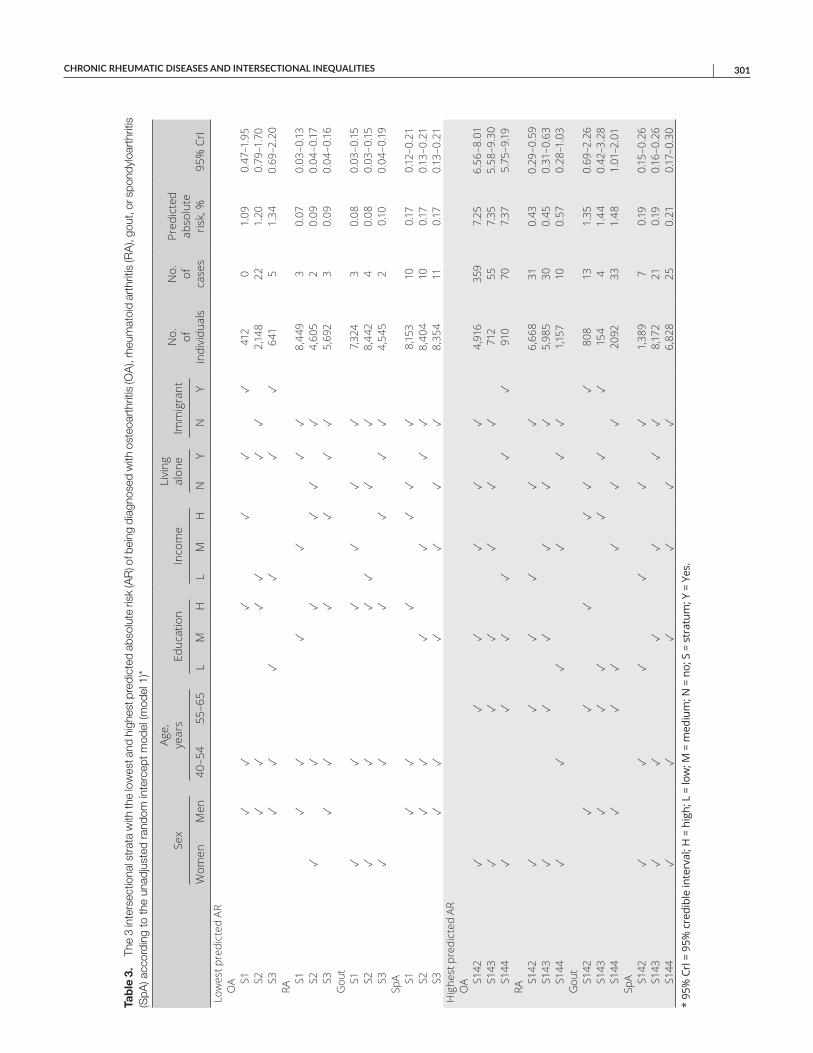
CHRONIC RHEUMATIC DISEASES AND INTERSECTIONAL INEQUALITIES | 301
Tab
le 3
. Th
e 3
inte
rsec
tiona
l str
ata
with
the
low
est a
nd h
ighe
st p
redi
cted
abs
olut
e ris
k (A
R) o
f bei
ng d
iagn
osed
with
ost
eoar
thrit
is (O
A),
rheu
mat
oid
arth
ritis
(RA
), go
ut, o
r spo
ndyl
oart
hriti
s (S
pA) a
ccor
ding
to th
e un
adju
sted
ran
dom
inte
rcep
t mod
el (m
odel
1)*
Sex
Age,
ye
ars
Educ
atio
nIn
com
eLi
ving
al
one
Imm
igra
ntN
o.
of
indi
vidu
als
No.
of
ca
ses
Pred
icte
d ab
solu
te
risk,
%95
% C
rIW
omen
Men
40–5
455
–65
LM
HL
MH
NY
NY
Low
est p
redi
cted
AR
OA S1
✓✓
✓✓
✓✓
412
01.
090.
47–1
.95
S2✓
✓✓
✓✓
✓2,
148
221.
200.
79–1
.70
S3✓
✓✓
✓✓
✓64
15
1.34
0.69
–2.2
0RA
S1✓
✓✓
✓✓
✓8,
449
30.
070.
03–0
.13S2
✓✓
✓✓
✓✓
4,60
52
0.09
0.04
–0.17
S3✓
✓✓
✓✓
✓5,
692
30.
090.
04–0
.16
Gou
tS1
✓✓
✓✓
✓✓
7,32
43
0.08
0.03
–0.15
S2✓
✓✓
✓✓
✓8,
442
40.
080.
03–0
.15S3
✓✓
✓✓
✓✓
4,54
52
0.10
0.04
–0.19
SpA S1
✓✓
✓✓
✓✓
8,15
310
0.17
0.12
–0.2
1S2
✓✓
✓✓
✓✓
8,40
410
0.17
0.13
–0.2
1S3
✓✓
✓✓
✓✓
8,35
411
0.17
0.13
–0.2
1H
ighe
st p
redi
cted
AR
OA S1
42✓
✓✓
✓✓
✓4,
916
359
7.25
6.56
–8.0
1S1
43✓
✓✓
✓✓
✓71
255
7.35
5.58
–9.3
0S1
44✓
✓✓
✓✓
✓91
070
7.37
5.75
–9.19
RAS1
42✓
✓✓
✓✓
✓6,
668
310.
430.
29–0
.59
S143
✓✓
✓✓
✓✓
5,98
530
0.45
0.31
–0.6
3S1
44✓
✓✓
✓✓
✓1,1
5710
0.57
0.28
–1.0
3G
out
S142
✓✓
✓✓
✓✓
808
131.
350.
69–2
.26
S143
✓✓
✓✓
✓✓
154
41.
440.
42–3
.28
S144
✓✓
✓✓
✓✓
2092
331.
481.
01–2
.01
SpA S1
42✓
✓✓
✓✓
✓1,
389
70.
190.
15–0
.26
S143
✓✓
✓✓
✓✓
8,17
221
0.19
0.16
–0.2
6S1
44✓
✓✓
✓✓
✓6,
828
250.
210.
17–0
.30
* 95
% C
rI =
95%
cre
dibl
e in
terv
al; H
= h
igh;
L =
low
; M =
med
ium
; N =
no;
S =
str
atum
; Y =
Yes
.
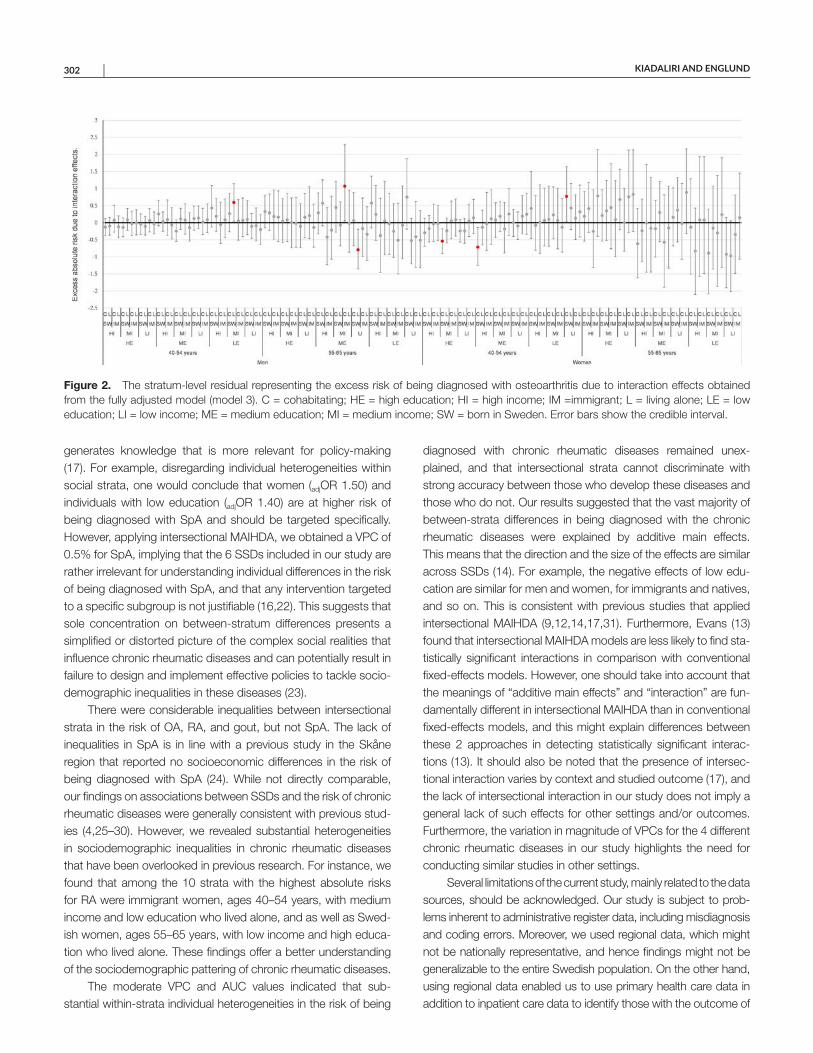
KIADALIRI AND ENGLUND 302 |
generates knowledge that is more relevant for policy-making (17). For example, disregarding individual heterogeneities within social strata, one would conclude that women (adjOR 1.50) and individuals with low education (adjOR 1.40) are at higher risk of being diagnosed with SpA and should be targeted specifically. However, applying intersectional MAIHDA, we obtained a VPC of 0.5% for SpA, implying that the 6 SSDs included in our study are rather irrelevant for understanding individual differences in the risk of being diagnosed with SpA, and that any intervention targeted to a specific subgroup is not justifiable (16,22). This suggests that sole concentration on between-stratum differences presents a simplified or distorted picture of the complex social realities that influence chronic rheumatic diseases and can potentially result in failure to design and implement effective policies to tackle socio-demographic inequalities in these diseases (23).
There were considerable inequalities between intersectional strata in the risk of OA, RA, and gout, but not SpA. The lack of inequalities in SpA is in line with a previous study in the Skåne region that reported no socioeconomic differences in the risk of being diagnosed with SpA (24). While not directly comparable, our findings on associations between SSDs and the risk of chronic rheumatic diseases were generally consistent with previous stud-ies (4,25–30). However, we revealed substantial heterogeneities in sociodemographic inequalities in chronic rheumatic diseases that have been overlooked in previous research. For instance, we found that among the 10 strata with the highest absolute risks for RA were immigrant women, ages 40–54 years, with medium income and low education who lived alone, and as well as Swed-ish women, ages 55–65 years, with low income and high educa-tion who lived alone. These findings offer a better understanding of the sociodemographic pattering of chronic rheumatic diseases.
The moderate VPC and AUC values indicated that sub-stantial within-strata individual heterogeneities in the risk of being
diagnosed with chronic rheumatic diseases remained unex-plained, and that intersectional strata cannot discriminate with strong accuracy between those who develop these diseases and those who do not. Our results suggested that the vast majority of between-strata differences in being diagnosed with the chronic rheumatic diseases were explained by additive main effects. This means that the direction and the size of the effects are similar across SSDs (14). For example, the negative effects of low edu-cation are similar for men and women, for immigrants and natives, and so on. This is consistent with previous studies that applied intersectional MAIHDA (9,12,14,17,31). Furthermore, Evans (13) found that intersectional MAIHDA models are less likely to find sta-tistically significant interactions in comparison with conventional fixed-effects models. However, one should take into account that the meanings of “additive main effects” and “interaction” are fun-damentally different in intersectional MAIHDA than in conventional fixed-effects models, and this might explain differences between these 2 approaches in detecting statistically significant interac-tions (13). It should also be noted that the presence of intersec-tional interaction varies by context and studied outcome (17), and the lack of intersectional interaction in our study does not imply a general lack of such effects for other settings and/or outcomes. Furthermore, the variation in magnitude of VPCs for the 4 different chronic rheumatic diseases in our study highlights the need for conducting similar studies in other settings.
Several limitations of the current study, mainly related to the data sources, should be acknowledged. Our study is subject to prob-lems inherent to administrative register data, including misdiagnosis and coding errors. Moreover, we used regional data, which might not be nationally representative, and hence findings might not be generalizable to the entire Swedish population. On the other hand, using regional data enabled us to use primary health care data in addition to inpatient care data to identify those with the outcome of
Figure 2. The stratum-level residual representing the excess risk of being diagnosed with osteoarthritis due to interaction effects obtained from the fully adjusted model (model 3). C = cohabitating; HE = high education; HI = high income; IM =immigrant; L = living alone; LE = low education; LI = low income; ME = medium education; MI = medium income; SW = born in Sweden. Error bars show the credible interval.
CHRONIC RHEUMATIC DISEASES AND INTERSECTIONAL INEQUALITIES | 303
interest, while no national primary care data are available in Swe-den. Similar to the most quantitative intersectionality studies, data on the gender continuum in the register were lacking, and gen-der was defined as female or male, conflating gender identity with biological sex. No data were available on several important SSDs, such as race/ethnicity, sexual orientation, and disability. In addition, income and education cannot fully capture all aspects of social class. We also were unable to investigate immigrant populations according to length of residence in Sweden, which is an impor-tant factor in the health and social status of those populations. To have reliable data on the diagnosis of chronic rheumatic diseases over a long time period, we excluded subjects who relocated to Skåne after the year 2000. This means that individuals included in this study had been living in the Skåne region for a minimum of 13 years. Hence, the results might not be generalizable to those who have lived in the region for shorter time periods. We studied incidence rather than prevalence due to the potential for reverse causation between income and chronic rheumatic diseases (i.e., the preexistence of a chronic rheumatic disease may lead to lower income). Our approach, however, may cause an underestimation of intersectional inequalities if more individuals were excluded in strata with higher incidence of chronic rheumatic disease compared to more advantageous strata with lower incidence (17). Evans et al (13) found a tendency to detect new points of interaction as more SSDs were included in intersectional MAIHDA. This implies that our results would possibly be different if more SSDs were included.
In conclusion, using a novel approach in assessing inter-sectional inequalities, we found that while there were substantial between-strata inequalities in the risk of being diagnosed with chronic rheumatic diseases (except SpA), a substantial share of within-strata individual heterogeneities remains unexplained. We also found that the vast majority of between-strata differences in being diagnosed with these diseases were explained by addi-tive main effects rather than interactions between SSDs. In line with the concept of proportionate universalism (32), the moderate dis-criminatory accuracy of intersectional strata in our study suggests that any interventions to reduce inequalities in chronic rheumatic diseases must be universal, not targeted, but with a scale and intensity that are proportionate to the degree of disadvantage. We hope that our study encourages others to apply intersectionality in general, and intersectional MAIHDA in particular, when assessing inequalities in health outcomes, including in the chronic rheumatic diseases.
AUTHOR CONTRIBUTIONS
Both authors were involved in drafting the article or revising it critically for important intellectual content, and both authors approved the final version to be submitted for publication. Dr. Kiadaliri had full access to all of the data in the study and takes responsibility for the integrity of the data and the accuracy of the data analysis.Study conception and design. Kiadaliri.Acquisition of data. Englund.Analysis and interpretation of data. Kiadaliri.
REFERENCES 1. GBD 2017 Disease and Injury Incidence and Prevalence
Collaborators. Global, regional, and national incidence, prevalence,and years lived with disability for 354 diseases and injuries for 195countries and territories, 1990–2017: a systematic analysis for theGlobal Burden of Disease Study 2017. Lancet 2018;392:1789–858.
2. March L, Smith EU, Hoy DG, Cross MJ, Sanchez-Riera L, Blyth F,et al. Burden of disability due to musculoskeletal (MSK) disorders.Best Pract Res Clin Rheumatol 2014;28:353–66.
3. Vaughn IA, Terry EL, Bartley EJ, Schaefer N, Fillingim RB. Racial-ethnic differences in osteoarthritis pain and disability: a meta-analy-sis. J Pain 2019;20:629–44.
4. Kiadaliri AA, Petersson IF, Englund M. Educational inequalities in mor-tality associated with rheumatoid arthritis and other musculoskeletaldisorders in Sweden. BMC Musculoskelet Disord 2019;20:83.
5. Guillemin F, Carruthers E, Li LC. Determinants of MSK health anddisability: social determinants of inequities in MSK health. Best PractRes Clin Rheumatol 2014;28:411–33.
6. Larson E, George A, Morgan R, Poteat T. 10 Best resources on..intersectionality with an emphasis on low- and middle-income coun-tries. Health Policy Plan 2016;31:964–9.
7. Bauer GR. Incorporating intersectionality theory into populationhealth research methodology: challenges and the potential toadvance health equity. Soc Sci Med 2014;110:10–7.
8. Merlo J. Multilevel analysis of individual heterogeneity and discrimi-natory accuracy (MAIHDA) within an intersectional framework. SocSci Med 2018;203:74–80.
9. Hernandez-Yumar A, Wemrell M, Abasolo Alesson I, Gonzalez Lopez-Valcarcel B, Leckie G, Merlo J. Socioeconomic differences inbody mass index in Spain: an intersectional multilevel analysis ofindividual heterogeneity and discriminatory accuracy. PLoS One2018;13:e0208624.
10. Bowleg L. The problem with the phrase women and minorities: inter-sectionality: an important theoretical framework for public health. Am J Public Health 2012;102:1267–73.
11. Hankivsky O. Women’s health, men’s health, and gender and health: implications of intersectionality. Soc Sci Med 2012;74:1712–20.
12. Evans CR, Williams DR, Onnela JP, Subramanian SV. A multilevelapproach to modeling health inequalities at the intersection of multi-ple social identities. Soc Sci Med 2018;203:64–73.
13. Evans CR. Adding interactions to models of intersectional health ine-qualities: comparing multilevel and conventional methods. Soc SciMed 2019;221:95–105.
14. Evans CR, Erickson N. Intersectionality and depression in adoles-cence and early adulthood: a MAIHDA analysis of the national longi-tudinal study of adolescent to adult health, 1995–2008. Soc Sci Med 2018;220:1–11.
15. Green MA, Evans CR, Subramanian SV. Can intersectional-ity theory enrich population health research? Soc Sci Med2017;178:214–6.
16. Merlo J. Invited commentary: multilevel analysis of individual hetero-geneity: a fundamental critique of the current probabilistic risk factorepidemiology. Am J Epidemiol 2014;180:208–12.
17. Axelsson Fisk S, Mulinari S, Wemrell M, Leckie G, Perez Vicente R,Merlo J. Chronic obstructive pulmonary disease in Sweden: an inter-sectional multilevel analysis of individual heterogeneity and discrimi-natory accuracy. SSM Popul Health 2018;4:334–46.
18. Goldstein H, Browne W, Rasbash J. Partitioning variation in multi-level models. Understanding Statistics 2002;1:223–31.
19. Browne WJ. MCMC estimation in MLwiN v3.00. Centre for Multilevel Modelling, University of Bristol; 2017.
20. Rasbash J, Steele F, Browne WJ, Goldstein H. A user’s guide to MLwiNv3.00. Centre for Multilevel Modelling, University of Bristol; 2017.
KIADALIRI AND ENGLUND 304 |
21. Leckie G, Charlton C. Runmlwin: a program to run the MLwiNmultilevel modelling software from within STATA. J Stat Softw2013;52:1–40.
22. Merlo J, Wagner P, Austin PC, Subramanian SV, Leckie G. Generaland specific contextual effects in multilevel regression analyses andtheir paradoxical relationship: a conceptual tutorial. SSM PopulHealth 2018;5:33–7.
23. Merlo J, Mulinari S, Wemrell M, Subramanian SV, Hedblad B. Thetyranny of the averages and the indiscriminate use of risk factors inpublic health: the case of coronary heart disease. SSM Popul Health2017;3:684–98.
24. Joud A, Petersson IF, Jordan KP, Lofvendahl S, Grahn B, EnglundM. Socioeconomic status and the risk for being diagnosed withspondyloarthritis and chronic pain: a nested case-control study.Rheumatol Int 2014;34:1291–8.
25. Allen KD, Golightly YM. State of the evidence. Curr Opin Rheumatol2015;27:276–83.
26. Kuo CF, Grainge MJ, Zhang W, Doherty M. Global epidemiology ofgout: prevalence, incidence and risk factors. Nat Rev Rheumatol2015;11:649–62.
27. Kvien TK, Uhlig T, Odegard S, Heiberg MS. Epidemiologicalaspects of rheumatoid arthritis: the sex ratio. Ann N Y Acad Sci2006;1069:212–22.
28. Egeberg A, Kristensen LE, Thyssen JP, Gislason GH, Gottlieb AB,Coates LC, et al. Incidence and prevalence of psoriatic arthritisin Denmark: a nationwide register linkage study. Ann Rheum Dis2017;76:1591–7.
29. Assuncao AA, Abreu MN. Factor associated with self-reportedwork-related musculoskeletal disorders in Brazilian adults. RevSaude Publica 2017;51 Suppl:10S.
30. Jorgensen KT, Pedersen BV, Nielsen NM, Hansen AV, Jacobsen S,Frisch M. Socio-demographic factors, reproductive history and riskof osteoarthritis in a cohort of 4.6 million Danish women and men.Osteoarthritis Cartilage 2011;19:1176–82.
31. Persmark A, Wemrell M, Evans CR, Subramanian SV, Leckie G,Merlo J. Intersectional inequalities and the U.S. opioid crisis: chal-lenging dominant narratives and revealing heterogeneities. CritPublic Health 2019;30:398–414.
32. Marmot M, Bell R. Fair society, healthy lives. Public Health 2012;126Suppl S:4S–10S.