ARCHINA BEGUM.pdf - KC Das Commerce College
74
“A STUDY ON CUSTOMER PERCEPTION TOWARDS POST PAID AND PRE PAID OF VARIOUS SERVICE PROVIDERS AND THEIR SWITCHING BEHAVIOUR AMONG YOUTH WITH SPECIAL REFERENCE TO GUWAHATI CITY „‟ A RESEARCH PAPER SUBMITTED IN PARTIAL FULFILLMENT OF M.COM 3 RD SEMESTER AS PER THE CURRICULUM UNDER GAUHATI UNIVERSITY SESSION – 2020 SUBMITTED BY ARCHINA BEGUM M.COM 3 RD SEMESTER EXAM ROLL NO: PC-191-020-0066 GU REGISTRATION NO: 221409 UNDER THE GUIDANCE OF DR. BHABABHUTI SHARMA ASSOCIATE PROFESSOR DEPARTMENT OF MANAGEMENT K.C. DAS COMMERCE COLLEGE
-
Upload
khangminh22 -
Category
Documents
-
view
1 -
download
0
Transcript of ARCHINA BEGUM.pdf - KC Das Commerce College

“A STUDY ON CUSTOMER PERCEPTION TOWARDS POST PAID AND PRE PAID
OF VARIOUS SERVICE PROVIDERS AND THEIR SWITCHING BEHAVIOUR
AMONG YOUTH WITH SPECIAL REFERENCE TO
GUWAHATI CITY „‟
A RESEARCH PAPER SUBMITTED IN PARTIAL FULFILLMENT OF M.COM 3RD
SEMESTER AS PER THE CURRICULUM UNDER GAUHATI UNIVERSITY
SESSION – 2020
SUBMITTED BY
ARCHINA BEGUM
M.COM 3RD
SEMESTER
EXAM ROLL NO: PC-191-020-0066
GU REGISTRATION NO: 221409
UNDER THE GUIDANCE OF
DR. BHABABHUTI SHARMA
ASSOCIATE PROFESSOR
DEPARTMENT OF MANAGEMENT
K.C. DAS COMMERCE COLLEGE

DEPARTMENT OF MANAGEMENT
K.C. DAS COMMERCE COLLEGECHATRIBARI,
GUWAHATI, ASSAM
CERTIFICATE
This is to certify that ARCHINA BEGUM , student of M.COM 3rd
semester , K.C. DAS
COMMERCE COLLEGE, CHATRIBARI, GUWAHATI- 781006 has submitted her
dissertation under my guidance and supervision on the topic “ A STUDY ON CUSTOMER
PERCEPTION TOWARDS POST PAID AND PRE PAID OF VARIOUS SERVICE
PROVIDERS AND THEIR SWITCHING BEHAVIOUR AMONG YOUTH WITH
SPECIAL REFERENCE TO GUWAHATI CITY ” .
This dissertation has been prepared under my guidance towards the partial fulfillment of
M.Com Degree under Gauhati University. This dissertation has not been submitted to any other
institution or university for award any degree or diploma.
DATE: Signature of guide
PLACE: DR. BHABABHUTI SARMA
Associate Professor
Department of Management
K.C. DAS COMMERCE COLLEG

DECLARATION
I, ARCHINA BEGUM, student of M.Com 3rd
semester of K. C. DAS COMMERCE
COLLEGE, CHATRIBARI, GUWAHATI-781006 hereby declare that the dissertation entitled
“ A STUDY ON CUSTOMER PERCEPTION TOWARDS POST PAID AND PRE PAID
OF VARIOUS SERVICE PROVIDERS AND THEIR SWITCHING BEHAVIOUR
AMONG YOUTH WITH SPECIAL REFERENCE TO GUWAHATI CITY ” submitted by
me under the guidance of Dr. BHABABHUTI SARMA, ASSOCIATE PROFESSOR,
DEPARTMENT OF MANAGEMENT, K.C. DAS COMMERCE COLLEGE is exclusively
prepared and conceptualized by me and the findings are based on the real data collected through
primary and secondary research study. Any literature, data or works done by other has been
given due acknowledgement in the reference section. I further declare that the work report in this
project has not been submitted and will not be submitted either in part or full for the award of
any other degree or diploma in this institute or any other institute or university.
The information submitted is true and original to the best of knowledge.
Date: Signature of the candidate
Place : ARCHINA BEGUM
M.COM 3RD
SEMESTER
ROLL NO: PC-191-020-0066
GU REGISTRATON NO: 221409 of 2016-17

ACKNOWLEDGEMENT
I take this opportunity to place in record my deep sense of gratitude to some persons without
whose help this dissertation would not have materialized so widely.
I hereby take this opportunity to thank Gauhati University for giving me a chance to do this
dissertation.
I would like to express my sincere gratitude to our principle Dr. Hrishikesh Baruah, for
providing me with the opportunity to carry on the dissertation. I also thank my project guide Dr.
Bhababhuti Sarma for the constant monitoring and providing me with all necessary facilities and
conductive condition for the project. I also thank the other teachers for their constant support and
help in completing my dissertation.
I am also grateful to all the respondents without whose support this dissertation would not have
been completed. Lastly my gratitude goes towards my family members and friends who helped
me to make this dissertation a success with their constant support and encouragement.
Thanking you ARCHINA BEGUM
Date:
Place:

EXECUTIVE SUMMARY
1. Title of the project: “A STUDY ON CUSTOMER PERCEPTION
TOWARDS POST PAID AND PRE PAID OF VARIOUS SERVICE
PROVIDERS AND THEIR SWITCHING BEHAVIOUR AMONG
YOUTH WITH SPECIAL REFERENCE TO GUWAHATI CITY”.
2. Investigation Area: Guwahati City
3. Institutional Guide: Dr. Bhababhuti Sarma, Associate Professor
4. Name of the student : Archina Begum
5. Objective of the study:
To study about the post paid and pre paid services of different service
providers.
To identify the different factors affecting the choice of customer
towards post paid and pre paid services.
To find out the reasons for switching between post paid and pre paid.
6. Research tools used:
Primary Data Collection: Questionnaire, Survey, Interaction
Secondary Data Collection: Websites, Articles, News etc.
7. Sampling Method used:
Random Sampling Method.

PREFACE
Research is an important part of human life. Research helps the student to gain knowledge
through objective and systematic method of finding solutions to a problem and sometimes
refreshes the minds if the students. It inculcates scientific and inductive thinking and it
promotes the development of logical habits of thinking and organization.
It is a great feeling for me to conduct this research as per our M.COM 3rd
semester
curriculum which is about “ CUSTOMER PERCEPTION TOWARDS POST PAID AND
PRE PAID OF VARIOUS SERVICE PROVIDERS AND THEIR SWITCHING
BEHAVIOUR AMONG YOUTH WITH SPECIAL REFERENCE TO GUWAHATI
CITY ”. Subject to the limitation of time and resources every possible attempts has been
made to study the Post Paid and Pre Paid of various service providers deeply. The whole
dissertation is measured through the questionnaire, the data further analyzed and interpret and
the result was obtained.
After studying the dissertation one can point out the benefits that are being provided under the
various service provider and can also know the problem faced by the customer using “ post paid
and pre paid of various service provider” so that necessary steps can be taken for the same.
GUWAHATI

ABBREVIATIONS
MNP- Mobile Number Portability
IRT- Indian Radio Telegraph Company
DOT- Department of Telecommunications
VSNL- Videsh Sanchar Nigam Limited
MTNL- Mahanagar Telephone Nigam Limited
BSNL- Bharat Sanchar Nigam Limited
NTP- National Telecom Policy
TRAI- Telecom Regulatory Authority of India
FY21- Financial Year 2021

CONTENTS
Page No
CERTIFICATE I
DECLARATION II
ACKNOWLEDEGEMENT III
EXECUTIVE SUMMARY IV
PREFACE V
ABBREVIATION VI
CONTENT VII
LIST OF TABLES VIII
LIST OF FIGURES IX
CHAPTER-I: INTRODUCTION 1-21
1.1 INTRODUCTION TO THE TOPIC 1-8
1.2 OBJECTIVE OF THE STUDY 9
1.3 SCOPE OF THEV STUDY 10
1.4 INDUSTRY PROFILE 11-13
1.5 LITERATURE REVIEW 14-17
1.6 RESEARCH METHODOLOGY 18-19
1.7 SIGNIFICANCE OF THE STUDY 20
1.8 LIMITATION OF THE STUDY 21
CHAPTER-II: COMPANY PROFILE 22-28
RELIANCE JIO 23-24
VODAFONE IDEA 25-26
AIRTEL 27
BSNL 28
CHAPTER-III: DATA ANALYSIS AND INTERPRETATION 29-52
CHAPTER-IV: FINDINGS, SUGGESTIONS, CONCLUSION 53-58
4.1 FINDINGS 54-55
4.2 SUGGESTIONS 56
4.3 CONCLUSION 57-58
BIBLIOGRAPHY 59
ANNEXURE 60-64

LIST OF TABLES
Table No. Particulars Page No.
3.1 Classification of gender 31
3.2 Grouping the respondents according to their age 32
3.3 Occupation of the respondents 33
3.4 Classification of educational qualification 34
3.5 Kind of mobile connection use by the users 35
3.6 If prepaid, the reason for choosing prepaid connection 36-37
3.7 If postpaid, the reason for choosing postpaid connection 38
3.8 Service provider owned by the users 39
3.9 Reason for choosing a particular service providers 40-41
3.10 Length of duration of availing the services of current
service providers 42
3.11 Important factor for choosing a service providers 43
3.12 Average billing amount of postpaid user 44
3.13 Satisfaction level of billing customer with postpaid billing
services 45
3.14 Satisfaction level of a prepaid user for different prepaid
tariff plans 46
3.15 Challenges facing by the customers with the current service
providers 47
3.16 Switch from one service connection to another
(postpaid/prepaid) 48
3.17 Satisfaction with customer service of present service
providers 49
3.18 Switch from current service providers 50
3.19 Reason for switching 51-52

LIST OF FIGURES
Figures
No.
Particulars Page No.
3.1 Pie diagram of classification of gender 31
3.2 Pie diagram of grouping the respondents to their age 32
3.3 Column diagram for the occupation of the respondents 33
3.4 Column diagram for the classification of educational
qualification 34
3.5 Pie diagram for the kind of mobile connection use by the users 35
3.6 Column diagram for the reason for choosing prepaid
connection 36-37
3.7 Column diagram for the reason for choosing postpaid
connection 38
3.8 Column for the service provider owned by the users 39
3.9 Pie diagram for the reason for choosing a particular service
providers 40-41
3.10 Column diagram for the length of duration of availing the
services of current service provider 42
3.11 Pie diagram for the important factors for choosing a service
providers 43
3.12 Column diagram for the average billing amount of postpaid user 44
3.13 Pie diagram for satisfaction level of billing customer with postpaid
billing services 45
3.14 Column diagram fir satisfaction level of a prepaid user for different
prepaid tariff plans 46
3.15 Column diagram for challenges facing by the customers with the
current service provider 47
3.16 Column diagram for switch from one service connection to
another(postpaid/prepaid) 48
3.17 Pie diagram for satisfaction with customer service of present
service providers 49
3.18 Column diagram for switch current service provider 50
3.19 Bar diagram for the reason for switching 51-52

CHAPTER – I INTRODUCTION
INTRODUCTION TO THE TOPIC
Customer Perception
Post Paid
Pre Paid
Customer Switching Behavior
OBJECTIVE OF THE STUDY
SCOPE OF THE STUDY
INDUSTRY PROFILE
LITERATURE REVIEW
RESEARCH METHODOLOGY
SIGNIFICANCE OF THE STUDY
LIMITATION OF THE STUDY

CUSTOMER PERCEPTION
Perception is the cognitive process which involves the organism selecting,
organizing and interpreting the stimulus. This perception is the process of selecting, organizing
and interpreting or attaching meaning to the events happening in the environment.
According to Robbins, “Perception may be defined as a process by which
individuals organize and interpret their sensory impressions in order to give meaning to the
environment”.
Customer perception is the process to assess how customers perceive services,
how they assess, whether they have experienced quality service and whether they are satisfied or
not. Customer perception is directly related to customer expectation. Due to the dynamic nature
of expectation perception of any person may also shift over time, person, place or culture.
Customers perceive services in terms of the quality of the service and how satisfied they are
overall with their experiences. For understanding customer perception three main features of
customer perception should be understood:
• Intellectual process: Customer perception is an intellectual process through which a person
selects the data from the environment, organizes it and obtains meaning from it
. • Cognitive and psychological process: Perception is the basic cognitive and psychological
process. The manner in which a person perceives the environment affects his behavior. Thus
perception of surrounding of a customer also effects customer’s actions, emotions, thoughts or
feelings.
• Intellectual & Psychological process: Perception is a subjective approach which differs from
person and time to time and according to changing situations.
Mobile Phone Company‟s Strategies for influencing customer perception are:
Measure and manage customer satisfaction and service quality
Aim for customer quality and satisfaction in every service encounter
Plan for effective recovery
1.1 INTRODUCTION TO THE TOPIC

POST PAID
The post paid mobile phone is a mobile phone for which service is provided by a prior
arrangement with a mobile network operator. The user in this situation is billed after the fact
according to their use of mobile services at the end of each month. Typically, the customer’s
contract specifies a limit or “allowance. Any usage above that limit incurs extra charges.
Theoretically, a user in this situation has no limit on use of mobile services and, as a
consequence, unlimited credit. This is better for people with a secured income. Postpaid service
mobile phone typically requires two essential components in order to make the “Post-Usage’
model viable. The various mobile phone service providers offer the post paid schemes to the
customers, Depends upon the usage the customer has to identify the suitable post paid plans.
The following mobile phone service providers offer the post paid schemes they are as
follows-
Airtel
Vodafone Idea (VI)
BSNL
Reliance Jio
The post paid subscribers are nowadays facing so many problems in day to day life. The
customer attitude and their behaviors are not same in the all the times, how the customers are
choosing the post paid schemes and which basis they are preferring the mobile phone service
providers. The following reasons are the customer preferring the network service providers they
are as follows brand image, Post Paid advertising effectiveness, Mobile phone plan tariff, Post
paid offers and ISD activation, Credit Limit Fixation, Billing problem, Network coverage,
Mobile Number Portability Procedure and customer identity proof verification etc
Postpaid service mobile phone typically requires two essential components in order to make the 'post-usage' model viable:

1. Credit history/Contractual commitment: This is the basis on which the service
provider is able to trust the customer with paying their bill when it is due and to have legal
recourse in case of non-payment
2. Service tenure: Most postpaid providers require customers to sign long term (1–3 year)
contracts committing to use of the service. Failure to complete the term would make the
customer liable for early termination fees.
ADVANTAGE OF POST PAID
Following are the advantage of Post Paid connection :
No fluctuations in tariff
Ensures greater security
No need to worry about account balance
Low call charges
Extras and Bonuses
Lots of Entertainment option
Better for exigencies
DISADVANTAGE OF POST PAID
Following are the disadvantage of Post Paid connection:
High billing amount
Lack of control on expenses
Mobile number portability is difficult for post paid
Pro- rata charging

PRE PAID
A prepaid mobile device is a mobile device in which credit is purchased in advance of
service use. The purchased credit is used to pay for telecommunications services at the point the
service is accessed or consumed. If there is no credit, then access is denied by the cellular
network/Intelligent Network. A pre paid mobile phone is commonly referred to as pay-as-you-
go (PAYG), pay-as-you-talk, and pay and go, go-phone or prepay.
In case of pre paid connection a customer has to recharge/refill his mobile phone with a
certain recharge amount and use the amount as and when required up to the validity. Prepaid
connection is the best way to avoid long term commitment with a cell phone service provider.
The best thing about having a prepaid cell phone is that we do not need to pay cancellation
charges, in case you plan to switch. A prepaid cell phone is best suited for those people who
don’t use too much everyday and for those who have a limited budget available.
The following mobile phone service providers offer the prepaid schemes they are as
follows-
Airtel
Vodafone Idea (VI)
BSNL
Reliance Jio
HISTORY:
The history of prepaid mobile phones begins in the 1990s, when larger markets
were being sought after by the mobile phone operators. Before this date, all mobile phone
services were offered on a post-paid basis, which excluded people with a poor credit
rating.
Prepaid mobile service was invented by Subscriber Computing, Inc., an Orange
County company, (1986-1998), founded and directed by Arlene Harris.

ADVANTAGE OF PREPAID:
Prepaid comes with several advantage over postpaid in the current scenario, especially after the
JIO launch.
The prepaid plans have become insanely cheap after telecom operators (JIO, AIRTEL, and
VODAFONE IDEA) launched cheap unlimited calling plans with a high amount of data.
Following are the advantages –
Fast process of activation and commitments
Special package to choose
Portable facility
Fluctuation in tariff
Lack of contract
No credit check required
No service fee
Less documentation
Pre- activated STD and ISD facility
DISADVANTAGE OF PREPAID CONNECTION
Following are the disadvantage of prepaid connection :
Time limit
Prepaid plans often have limited roaming capabilities when travelling in other countries.
In prepaid the call rates are quite high to those of postpaid plans
If there is no unlimited plan on the prepaid phone, it may be hard to monitor the prepaid
balance
Some prepaid plans may have some hidden fees or costs which are likely to go unnoticed.
The hidden cost may be come as a VAT.

CUSTOMER SWITCHING BEHAVIOUR- MOBILE NUMBER
PORTABILITY (MNP)
The growing competition in the global market has made it increasingly important for the
companies to retain their existing customers. The companies are using various strategies and
offering their customers so many offers to retain their customers. Switching process results in
relationship dissolution. When firms loose a customer, they are not only losing their future
earnings but also incurring the cost of finding new customers. Overtime customers become
less price- sensitive therefore, losing loyal customers means giving up high margins. Due to
technological advancement and easy access to new technology to every individual, customers
are becoming intolerants and they can dissolve the relationship as soon as possible. This is
the reason customer retention is the core concern of every organization.
Mobile Number Portability (MNP) is a new development in mobile communication
technology. MNP is a service in which the mobile users can switch to other service providers
without changing their mobile number. Both prepaid and postpaid users can avail the facility
to switch to other favorable service provider. Once a customer changes his/her service
provider and retains the same mobile number they are expected to hold their number with a
given provider for at least 90days, before they decide to move to another service provider.
HISTORY OF IMPLEMENTATION
The Mobile Number Portability (MNP) was first introduced in the world by Singapore in the
year 1997. Thereafter the service was introduced in different countries like Hong Kong,
Australia, Europe, Japan, New Zealand, etc.
After years of debate and delay, the Mobile Number Portability was implemented in India. In
India, the first phase in MNP implementation began in Metros in December 31st, 2009 and
the second phase for the rest of the country by March 2010. On 25th November 2010, MNP
has been implemented in Haryana as field testing to observe implication of MNP on voice as
well as non-voice calls. Finally, 20th
January2011, MNP has been implemented across the
India in intra-circle.

PROCEDURE OF MOBILE NUMBER PORTABILITY (MNP)
Following are the steps which will help you to port your number:
1. First, choose the service provider you wish to port your number to.
2. Send the following text message - PORT followed by your 10-digit mobile number to TRAI's
central number for mobile number portability - 1900.
Example: Send 'PORT 98xxxxxx98' to 1900. You'll receive an SMS back with a port out code
which will remain valid for only 15 days.
3. Visit your nearest operator store and tell them you want to port your sim. They will fill the
porting form and customer acquisition form for port into the network.
Also, carry a passport size photograph and a self attested copy of identity proof. As an address
proof you can submit a copy of the rent agreement, landline bill, electricity bill, or a three month
bank statement.
4. Next step is to submit your duly filled porting form and CAF along with requisite
documentary proof of the mobile service provider to the operator.
5. If you are a postpaid subscriber, submit a paid copy of the last bill issued along with the
porting form and CAF.
6. Once you are done with the necessary formalities, obtain your SIM card from the new service
provider. Depending on the service provider, you'll be charged up to Rs 19 for porting.
7. The process usually takes seven working days to complete. For Jammu & Kashmir, Assam,
and North East, it may take up to 15 days.
Your new mobile service provider will keep you updated about the date and time of porting via
SMS.
8. Replace the old SIM with the new SIM provided by your new mobile service provider after
the specified date and time.
Things to be noted
The services on your current SIM will not be interrupted during porting process. The downtime
is for around 2 hours (during night)
Subscriber can withdraw the porting request within 24 hrs of applying.

To study about the postpaid and prepaid services of different service providers.
To identify the different factors affecting the choice of customer towards
postpaid and prepaid services.
To find out the reason for switching between post paid and prepaid.
1.2 OBJECTIVE OF THE STUDY

The scope of this research is to identify the customers perception towards post paid and prepaid
connection of various service providers and their switching behavior. This research is based on
both primary data and secondary data. Due to Covid-19 only limited number of persons
contacted. This study only focuses customer perception towards post paid and pre paid and their
switching behavior in Guwahati. This study doesn’t say anything about customer perception
towards post paid and pre paid of other place. It is very essential for the mobile service provider
to understand the customer perception and influence of various demographic variables behind
that influences. This study covers and analysis on the measures adopted for the prepaid and post
paid of various service providers and their switching behavior for the purpose, a sample of 100
respondents has been taken by the researcher. This study is confined to cellular service providers
in Guwahati city only.
1.3 SCOPE OF THE STUDY

INDIAN TELECOM INDUSTRY
The telecom industry is one of the fastest growing industries in India. Currently, India is the
world’s second-largest telecommunications market with a subscriber base of 1.16 billion and has
registered strong growth in the last decade. The Indian mobile economy is growing rapidly and
will contribute substantially to India’s Gross Domestic Product (GDP) according to a report
prepared by GSM Association (GSMA) in collaboration with Boston Consulting Group (BCG).
In 2019, India surpassed the US to become the second largest market in terms of number of app
downloads. As of 31st August 2020, the total subscriber base in the country stood at 1,168.66
million with a tele-density of 86.22%. Gross revenue of the telecom sector stood at Rs. 66,858
crore (US$ 9.09 billion) in the first quarter of FY21.
HISTORY
Indian telecommunications started in 1851 when the first operational land lines were laid by the
Government near Calcutta (seat of British Power). Telephone services were introduced in India
in 1881. In 1883 telephone services were merged with the postal system . Indian Radio
Telegraph Company (IRT) was formed in 1923.
After independence in 1947, all the foreign telecommunication companies were nationalized to
form the Posts, Telephone and Telegraph(PTT), a monopoly run by the Government Ministry if
Communications. Telecom sector was considered as a strategic services and the government
considered it best to being under states control.
The first wind of reforms in telecommunications sector began to flow in 1980’s when the private
sector was allowed in telecommunications equipment manufacturing. in 1985, Department of
Telecommunications (DOT) was established. It was an exclusive provider of domestic and long
distance service that would be its own regulator (separate from the postal system). In 1986, two
wholly governments owned companies were created: The Videsh Sanchar Nigam Limited
1.4 INDUSTRY PROFILE

(VSNL) for international telecommunications and Mahanagar Telephone Nigam Limited
(MTNL) for service in metropolitan areas.
In 1990’s telecommunication sector benefited from the general opening up of the economy.
Also, examples of telecom revolution in many other countries, which resulted in better quality of
service and lower tariffs, led Indian policy makers to initiate a chance process finally resulting in
opening up of telecom services sector.
NATIONAL TELECOM POLICY 1994 (NTP 1994):-
The National Telecom Policy was announced in 1994 which aimed at improving India's
competitiveness in the global market and provide a base for a rapid growth in exports. This
policy eventually facilitated the emergence of Internet services in India on the back of
established basic telephony communication network. This policy also paved way for the entry of
the private sector in telephone services.
The main objectives of the policy were:
To ensure telecommunication is within the reach of all, that is, to ensure availability of
telephone on demand as early as possible.
To achieve universal service covering all villages, that is, enable all people to access
certain basic telecom services at affordable and reasonable prices.
The policy also announced a series of specific targets to be achieved by 1997 and
further recognized that to achieve these targets the private sector association and
investment would be required to bridge the resource gap.
Establishment of TRAI
The entry of private players necessitated independent regulation in the sector; therefore, the
TRAI was established in 1997 to regulate telecom services, for fixation/revision of tariffs, and
also to fulfill the commitments made when India joined the World Trade Organization (WTO)

in 1995. TRAI has recently launched MNP to switch to different cellular service provider
retaining his mobile number.
The functions allotted to the TRAI included:
To recommend the need and timing for introduction of new service provider.
To protect the interest of customers of telecom services.
To settle disputes between service providers
To recommend the terms and conditions of license to a service provider
NEW TELECOM POLICY 1999 (NTP 1999):-
In recognition of the fact that the entry of the private sector, which was envisaged during NTP-
94, was not satisfactory and in response to the concerns of the private operators and investors
about the viability of their business due to non realization of targeted revenues the government
decided to come up with a new telecom policy. The most important milestone and instrument of
telecom reforms in India is the New Telecom Policy 1999 (NTP 99). The New Telecom Policy,
1999 (NTP-99) was approved on 26th March 1999, to become effective from 1st April 1999.
Accordingly, the NTP 1999 was framed with the following objectives and targets:
Availability of affordable and effective communication for citizens was at the core of
the vision and goal of the new telecom policy.
Provide a balance between provision of universal service to all uncovered areas,
including rural areas, and the provision of high-level services capable of meeting the
needs of the economy.
Encourage development of telecommunication facilities in remote, hilly and tribal
areas of the nation.
To facilitate India’s journey to becoming an IT superpower by creating a modern and
efficient telecommunication infrastructure taking into account the convergence of IT,
media, telecom and consumer electronics

1. R. Arun Prasath, Research Scholar and Dr. J. Vijayadurai, Associate Professor,
Department of Management Studies, Madurai Kamaraj University, Madurai, India “ A
STUDY ON CONSUMER ATTITUDE TOWARDS MOBILE PHONE SERVICE
PROVIDERS IN TAMIL NADU” (2016) :
This is an article developed by R. Arun
Prasath, Research Scholar and Dr. J.
Vijayadurai, Associate Professor of Madurai
Kamaraj Unuiversity , Madurai. In their
study examined the consumers attitude
towards various service offered by mobile
service provider. They found that prepaid
SIM card was bought by majority of the
respondents. This research aims to
recommend the telecom companies should
focus on connectivity call rate, coverage,
call drops and network quality. This article
published in Paripex Indian Journal of
Research, Vol: 5, Issue 1, January2016, PP
27-28, ISSN-2250-1991.
2. Kumar Ratnesh , Research Scholar, Mewar University, Rajasthan , India and Dr Amit
Kansal, Professor, IIMT Management College, Meerut, India “ AN ANALYTICAL
STUDY OF CUSTOMER SATISFACTION INFLUENCING BRAND LOYALTY AND
FASTER RECOMMENDATION FOR MOBILE SERVICES PROVIDERS OF INDIAN
TELCOM INDUSTRY”(2013): This is an article issued by Kumar Ratnesh ,Research
Scholar and Dr Amit Kansal, Professor . They have
studied the Indian telecom industry by concentrating
on mobile services providers, and observed that there
is high competition among the players in the industry
. All the Players were giving special offers and
schemes as per the market conditions to maximize
their subscriber base competition in telecom industry
was heating up , now it's time for Indian telecom
players to align up in the new dynamic business
environment . The article was published in
International Journal of Engineering Research in
Management & Technology, Volume -2,Issue -12 ,
December 2013 ,ISSN 2278-9359.
1.5 LITERATURE REVIEW

3.Dr. L. Leo Franklin, Assistant Professor & Research Adviser and S. Ambika, Research
Scholar, PG & Research Department of Commerce, JJ College of Arts and Science (Auto),
Pudukkottai, Tamil Nadu, South India “A
COMPARITIVE STUDY ON CUSTOMER
PREFERENCE OF MOBILE SERVICE
PROVIDERS WITH SELECTED
SERVICE PROVIDER” (2015) : Thus is an
article developed by L.Leo Franklin and S.
Ambika. They conducted a comparative study
on Customer Preference of Mobile Service
Providers with selected service providers.
They have stated that there is a staff
competition prevailing among the service
providers. Since there is a marginal
differences between the services rendered by
the cellular service providers there is more
possibility for the subscriber to switch from
one service to another based on convenience.
They have realized that it is very essential for
the moble service provider to understand the
customer preferences and the influence if
various demographic values behind that
influence. They have compared the customer preference on mobile communications with
reference to service provider by private and public sector. This article published in International
Journal of Business Quantitative Economics and Applied Management Research, Vol: 1, Issue 9,
February 2015, PP 51-69, ISSN: 2349-5677
.
4. Debarati Ray and Ishita Chaudhuri “ A STUDY ON MARKET SHARE AND
FACTORS AFFECTING THE CHOICE OF CELLULAR SERVICE PROVIDER
AMONG YOUNG AGE GROUP OF KOLKATA”(2010):
This is an article developed by Dabarati Ray and Ishita Chaudhuri. In their study pointed the
84% of the young users use prepaid services and good network coverage and family , friends
using the same network connection are much more important factors which motivated the
customers to get associated to a particular service providers as they offer to make calls and
send message at lower rates within the same network. Thus cellular service provider should
primarily focus on prevailing good and wide network coverage to its subscribers to retain their
customers as well as to increase their market. This article published in The IUP Journal Of
Marketing, Vol : 9, No-3, August 2010, PP 41-55.

5.Dr. Neelam Dhandha and Dr. Pooja Goel “WHAT IMPINGES THE CHOICE OF CELL
PHONE CONNECTION” (2010):
In their study pointed that prepaid connections are more popular among females while postpaid
connection are more frequently used by the male subscribers. People using prepaid connections
generally were young age groups i.e. less than 20years and the old age group i.e. more than
60years due to their limited usage and professionals, retired, dependents. While more of working
force and customers having more monthly incomes than prefer to use postpaid connections.
According to the study, the service class and business class prefers postpaid connection. This
article was published in Indian Journal of Marketing, Vol: 40, No. 9, September 2010, PP 20-25.
6. M. Sathish , K J Naveen ,V Jeevanantham , PSG Institute of management (PSG College of
Technology) Coimbatore and K.Santosh Kumar , Priyadarshini Engineering College
Vaniyambadi – Vellore “ A STUDY ON CONSUMER SWITCHING BEHAVIOUR IN
CELLULAR SERVICE PROVIDERS: A STUDY WITH REFERENCE TO CHENNAI
”(2011):
This is an article developed by M. Sathish , K.
Santosh Kumar and K. J Naveen., V. Jeevanantham
, they have attempted to identify the factors that
effects the consumers into switching the service
provider .To find the major influences that goes into
the decision of purchasing a SIM card , to find the
likeliness of switching the service provider . The
study reveals that call rates play the important role
in switching the service provider followed my
network coverage; value added service, consumer
care and advertisement which play the least
important role. The article published in Far East Journal of Psychology and Business, Volume –
2, NO- 2, February 2011 , PP 71-81.

7. Muhamed Thayyib. K, Assistant Professor, Department of Management Studies, Mahatma
Gandhi College, Iritty, Kannur, Kerala, India “THE IMPACT OF JIO ON INDIAN
TELECOM INDUSTRY ‟‟(2018): This research
paper reviews the impact of JIO
(Telecommunication Company )on the telecom
sector in India . A paper highlights the introduction
of the JIO on Indian Telecom sector. The paper was
mentioned that the various strategies adopted by Jio
on capturing advantage on other telecom service
providers. It specifies that JIO creates a revolution in
the Indian Telecommunication Industry through
providing additional services to its customers. This
article was published in International Journal of
Research in Management, Economics and
Commerce, Vol: 8, Issue 4, April 2018, PP 78-82, and ISSN 2250-057 X
8.Amjad Iqbal, Mubashar Hassan Zia, Sajid Bashir, Khurram Shahzad and Muhammad
Waqas, Faculty of Management Sciences, Riphah International University
“ANTECEDENTS AND OUTCOMES OF CUSTOMER SATISFACTION IN USING
PREPAID CELLULAR SERVICES IN
PAKISTAN” (2008) : In their study pointed that
perceived quality, perceived value and perceived
expectations are leading variables for customer
satisfaction. While repurchase likelihood, customer
complaints and price tolerance are dependent on actual
satisfaction. Finding suggests that customers have high
expectations that are fulfilled by the cellular service
providers to same extent. This study reveals the
perceptions of Pakistan prepaid cellular service users
in context of value, quality and overall expectation and
at the same time the effectiveness of customer satisfaction on price tolerance, customer
complaints and repurchases likelihood.. This article was published in 2008 (online)

RESEARCH METHODOLOGY
Research methodology is the systematic theoretical analysis of the methods applied in the field
of study. To know the customer perception, a descriptive research work is done and was used to
gain the insight of the customer perception towards postpaid and prepaid of various service
providers and their switching behavior in Guwahati city. Close- ended questions and answer in
brief questions were asked to the samples and data were collected from them.
1. Research Design
A descriptive research design was used in the study , gathering data that describe the
events and organizes, tabulates, depicts, describes the data collections. Descriptive
research includes survey and fact findings of different kinds of problem under study.
Here in the study, a detail research had been done from the selected sample.
2. Area of the study
The study is based on the area of Guwahati city, which is known to be the largest city in
all North-East .
3. Sources of Data
The task of data collection begins after a research problem has been defined. In this study
data was collected through both primary and secondary data sources.
Primary Data: The primary data were collected from the respondents with the
help of a questionnaire and field survey too.
Secondary Data: The secondary data were collected from articles, journals,
magazine, newspaper, company manuals, company website, etc.
1.6 RESEARCH METHODOLOGY
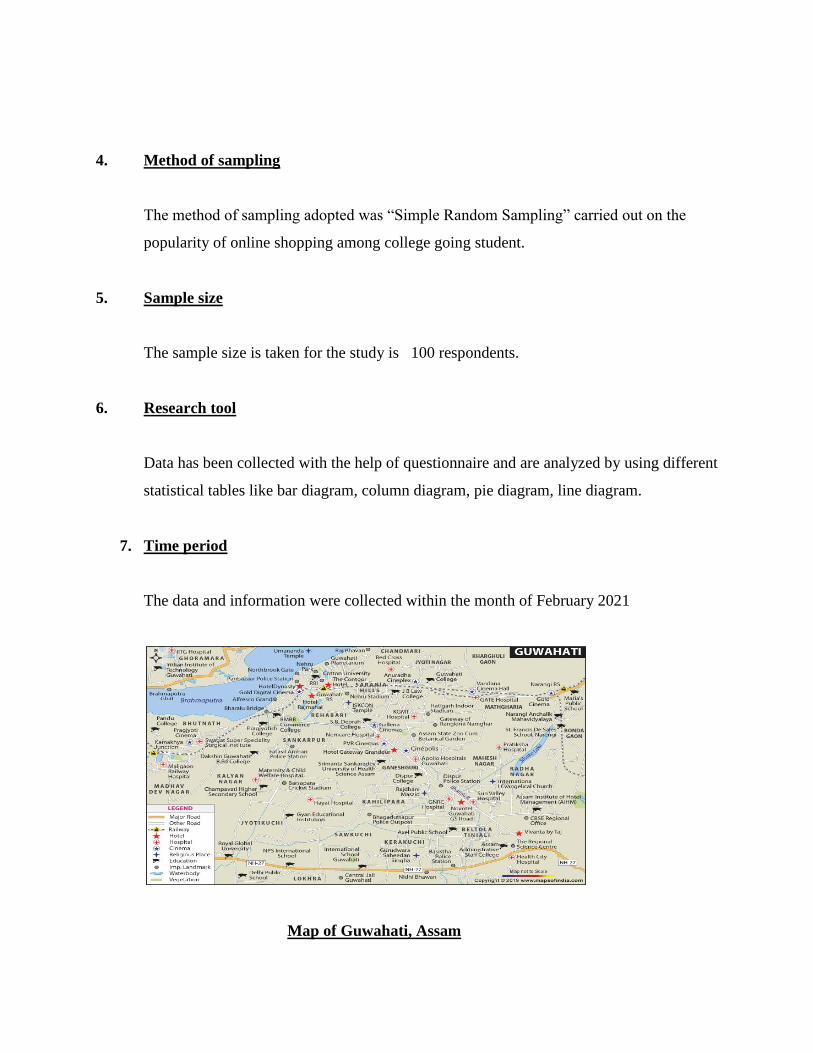
4. Method of sampling
The method of sampling adopted was “Simple Random Sampling” carried out on the
popularity of online shopping among college going student.
5. Sample size
The sample size is taken for the study is 100 respondents.
6. Research tool
Data has been collected with the help of questionnaire and are analyzed by using different
statistical tables like bar diagram, column diagram, pie diagram, line diagram.
7. Time period
The data and information were collected within the month of February 2021
Map of Guwahati, Assam

Perception is the primary goal of every business organization. In this
competitive business scenario every activities begins and ends with the customer
need. In the present scenario, the Telecommunications is lifelihood for every
business activities. Even in this industry there prevails a stiff competition between
the service provider In spite of a well-established network and infrastructure
supporting, certain service providers weren't able to root their footsteps in the
market due to lack in customer service and satisfaction. Further their promotional
initiatives haven’t yielded fruitful results. Since there is a marginal difference
between the services rendered, by the cellular service providers there is more
possibility for the subscribers to switch from one service provider to another based
on their convenience . So it very essential for the service provider to understand the
customer perception and influence of various demographic variables behind that
influence.
1.7 SIGNIFICANCE OFTHE STUDY

There are several limitations found while undergoing the Research, those are stated below :
Some respondents were not willing to fill up the questionnaire and even were not
cooperative. Hence, there may be biasness in the data collection.
During the collection of data some respondent finds it very difficult to answer the
question.
The data given by the respondents are not scientifically true in some cases.
At the time of collecting primary data , due to COVID-19 pandemic it was difficult to
collect the data from the respondent
The data given by Government under their websites are quite old and not updated.
The findings and conclusion are based on knowledge of the respondents which
sometimes may be biased.
1.8 LIMITATION OF THE STUDY

CHAPTER –II COMPANY POFILE
RELIANCE JIO
VODAFONE IDEA (VI)
AIRTEL
BSNL

RELIANCE JIO
Reliance Jio Infocomm Limited, Jio , is an Indian telecommunications company and a
subsidiary of Jio Platforms, headquartered in Mumbai, Maharashtra, India. It operates a
national LTE network with coverage across all 22 telecom circles. It does not
offer 2G or 3G service, and instead uses only voice over LTE to provide voice service on its 4G
network.
Jio soft launched on 27 December 2015 with a beta for partners and employees, and
became publicly available on 5 September 2016. It is the largest mobile network operator in
India and the third largest mobile network operator in the world with over 41.08 core (410.8
million) subscribers
In September 2019, Jio launched a fiber to the home service, offering home broadband,
television, and telephone services. Since April 2020, Reliance Industries has raised ₹152,056
crore (US$21 billion) by selling 32.97% equity stake in Jio Platforms.
Jio's headquarters in RCP, Navi Mumbai
Type Subsidiary of Reliance Industries
Industry Telecommunications
Founded 15 February 2007; 14 years ago
Founder Mukesh Ambani
Headquarters Maker Chambers IV, 222 Nariman
Point, Mumbai, Maharashtra,India
Key people Mukesh Ambani(Chairman)
Sandip Das(Managing Director)
In May 2016, Jio launched a bundle of multimedia apps on Google play such as-
JioPages, JioChat, JioCinema, JioCloud, JioHealth, JioNews, JioMeet, JioMoney, JioSaavn, Jio
Security, JioTV, Jio Voice, MyJio
Products and services
Mobile broadband
JioFiber
LYF smart phones
Jio Phone
Jio net Wi-Fi

VODAFONE IDEA (VI)
Vodafone is a telecommunication company and it was first launched in 1991, Newbury,
United Kingdom. In 1994, Vodafone was launched in India. Vodafone is the Indian subsidiary of
UK-based Vodafone Group plc and was a provider of telecommunications services in India with
its operational head office in Mumbai. As of March 2018, Vodafone India had a market share of
21% and with its merger with Idea. Vodafone Idea is the Third largest mobile
telecommunications network in India.
Merger with Idea Cellular
The entry of Jio in 2016 had led to various mergers and consolidations in the Indian telecom
sector. It was announced in March 2017 that even Idea Cellular and Vodafone India would be
merged. The merger got approval from Department Of Telecommunications in July 2018. On
August 30, 2018, National Company Law Tribunal gave the final nod to the Vodafone-Idea
Vodafone Idea's new brand identity 'Vi' in use since 7
September 2020
Type Public
Industry Telecommunications
Predecessors Vodafone India
Idea Cellular Limited
Founded 31 August 2018; 2 years ago
Headquarters Mumbai (Corp.)
Gandhiangar (Reg.)
Key people Kumar Mangalam Birla(Chairman)
Ravinder Takkar

merger. The merger was completed on 31 August 2018, and the newly merged entity was named
Vodafone Idea Limited.
Products and services
Mobile telephony
Wireless broadband
Internet services

BHARTI AIRTEL LIMITED
Bharti Airtel Limited, also known as Airtel, is an Indian multinational telecommunications
services company based in New Delhi, Delhi NCT, and India. It operates in 18 countries across
South Asia and Africa, and also in the Channel Islands. Airtel provides 2G, 4G LTE, 4G+
mobile services, fixed line broadband and voice services depending upon the country of
operation. Airtel had also rolled out its VoLTE technology across all Indian telecom circles. It is
the second largest mobile network operator in India and the second largest mobile network
operator in the world with over 457.96 million (45.796 crore) subscribers. Airtel was named
India's 2nd most valuable brand in the first ever Brandz ranking by Millward Brown and WPP
plc.
Products and Services
Fixed line telephone
Mobile phone
Broadband
Satellite television and Digital Television
Internet television
Type Public
Key people Sunil Bharti Mittal (Chairman)
Gopal Vittal (MD & CEO)
Industry Telecommunications
Founded 7 July 1995; 25 years ago
Founder Sunil Bharti Mittal
Headquarters Nelson Mandela Road, New Delhi, India

BHARAT SANCHAR NIGAM LIMITED (BSNL)
Bharat Sanchar Nigam Limited (BSNL) is an Indian government owned Telecommunications
Company, headquartered in New Delhi, Delhi, India. It was incorporated by Department of
Telecommunications, Ministry of Communications, and Government of India on 1 October
2000. It provides mobile voice and internet services through its nationwide telecommunications
network across India. It is the largest wire line telecommunications network company in India
with more than 50% market share and fourth largest wireless telecommunications operator.
SERVICES
Fixed line telephone
Mobile phone
Broadband
Internet television
IPTV
BSNL Headquarters, New Delhi
Type Government owned enterprise
Industry Telecommunications
Founded 1 October 2000; 20 years ago
Headquarters New Delhi,
India
Area served India
Key people Pravin Kumar Purwar , ITS
(Chairman & MD)
(interim)

CHAPTER – III
DATA ANALYSIS AND INTERPRETATION

Data Analysis:
Data analysis is a process of inspecting, cleaning, transforming and modeling of
data with the objective of highlighting the useful information, suggesting
conclusion as and supporting decision making. Data analysis has multiple facts and
approaches, encompassing diverse techniques under a variety of names, in
different businesses, science and social science domains.
Data Interpretation:
Interpretation refers to the task of drawing inferences from the data collected after
an analytical or experimental study. The factors that been observed by the
researcher in the course of the study can be better understood through
interpretation and also it provides a theoretical conception which can serve as a
guide for further researches.
The analysis can further be explained with the help of tables and graphs
drawn below:

Table 3.1 Classification of Gender
Gender No. of Respondents Percentage
Male 30 30%
Female 70 70%
Total 100 100%
Source: Field survey
Figure 3. 1 Classification of Gender
Source: Table 3.1
INTERPRETATION:
The Figure Shows the Classification of Gender which indicates that 30% of the
respondents are male and 70% of the respondents are female.
Male30%
Female70%
Gender
Male
Female

Table 3.2 Grouping the respondents according to their age
Ages (in years) Number of Respondent Percentage
Up to 20 25 25%
21-25 70 70%
26-30 5 5%
Total 100 100%
Source: Field survey
Figure3.2 Grouping the respondents according to their age
Source: Table 3.2
INTERPRETATION:
The above figure shows the grouping of the sample used as the research according
to their ages out of 100 respondents. The above table and graph show that the
respondents are from the age of 20- 30. Groups were made in Up to 20 years, 21-
25 years and 26-30 years. It has been found that 70%, 25% and 5% respondents
were from the first, second and third group respectively.
25%
70%
5%
AGE GROUP
up to 20
21-25
26-30

Table 3.3 Occupation of the respondents
Occupation Number of respondents Percentage
Salaried 11 11%
Student 80 80%
Business 4 4%
Others 5 5%
Total 100 100%
Source: Field survey
Figure 3.3 Occupation of the respondents
Sources: Table 3.3
INTERPRETATION:
From the above figure the occupation can be classified as Salaried,
Student, Business and Others. It has been found that 80% of the respondents were
Student, where 11% respondents were Salaried and while business and others
group forms only 4% and 5% respectively.
11 11%
80
80%4 4%5
5%0
102030405060708090
Nu
mb
er
of
resp
on
de
nts
Occupation of the respondent
salaried
student
business
others

Table 3.4 Classification of Education Qualification
Education Qualification Number of respondent Percentage
Up to Matriculation 5 5%
Higher Secondary 5 5%
Graduate 55 55%
Post Graduate 35 35%
Total 100 100%
Source: Field survey
Figure 3.4 4 Classification of Education Qualification
Source: Table 3.4
INTERPRETATION:
From the above figure , it found that higher number of respondent are Graduate
i.e. 55% , 35% of the respondent are Post Graduate and the remaining respondent
are 5% Higher Secondary and 5% Up to Matriculation .
5 5
55
35
0
10
20
30
40
50
60
Education Qualification
Numer of respondents

Table 3.5 .Kind of mobile connection use by the users.
Mobile Connection Number of respondent Percentage
Prepaid 85 85%
Postpaid 15 15%
Total 100 100%
Source: Field survey
Figure 3.5 Kind of mobile connection uses by the users
Source: Table 3.5
INTERPRETATION:
Out of the total respondents 85% are found to be prepaid customers and the
remaining 15% as postpaid customers. Prepaid Connection is more popular among
the users because of large number of offers available to the prepaid users. It also
relieves the users so many formalities and documentation which are found in a
postpaid connection. Moreover it ensures instant activation, better control over
expenses, no monthly rentals and easy switching.
prepaid85%
postpaid15%
Mobile Connection
prepaid
postpaid

Table 3.6 If prepaid, the reason for choosing prepaid connection (out of 85
respondent)
Reason for choosing
prepaid connection
Number of
respondents
Percentage
No monthly commitment/Rental 15 0.176%
Better control over expenses 10 0.117%
Large no. of offers 18 0.212%
Top option available 7 0.082%
Less Documentation 8 0.094%
No security Deposite 5 0.059%
Easy Switching 7 0.082%
Instant Activation 8 0.094%
Pre-activated STD and ISD facility 7 0.082%
Total 85 100%
Source: Field survey

Figure 3.6 If prepaid, the reason for choosing prepaid connection (out of 85
respondent)
Source: Table 3.6
INTERPRETATION:
Prepaid Connection was the most preferred among the respondents.
According to the respondents No monthly rentals, Better control over expenses,
large number of offers and instant activation are the most prominent reasons for
opting for the prepaid connection. 15% of the respondent prefers no monthly
commitment or rental. 10% prefer better control over expenses. 18% choose it
because it offers a large number of offers and choice can be made among them. 7%
of them like top option available, less documentation and security deposited. 7% of
the respondents chose prepaid connection because of easy switching from one
service provider to another and 10% like instant activation . 7% like Pre-activated
STD and ISD facility and they can connected with their friends and family.
0.18%
0.12%
0.21%
0.08%0.09%
0.06%
0.08%0.09%
0.08%
0.00%
0.05%
0.10%
0.15%
0.20%
0.25%
Reason for choosing Preapid Connection
Percentage
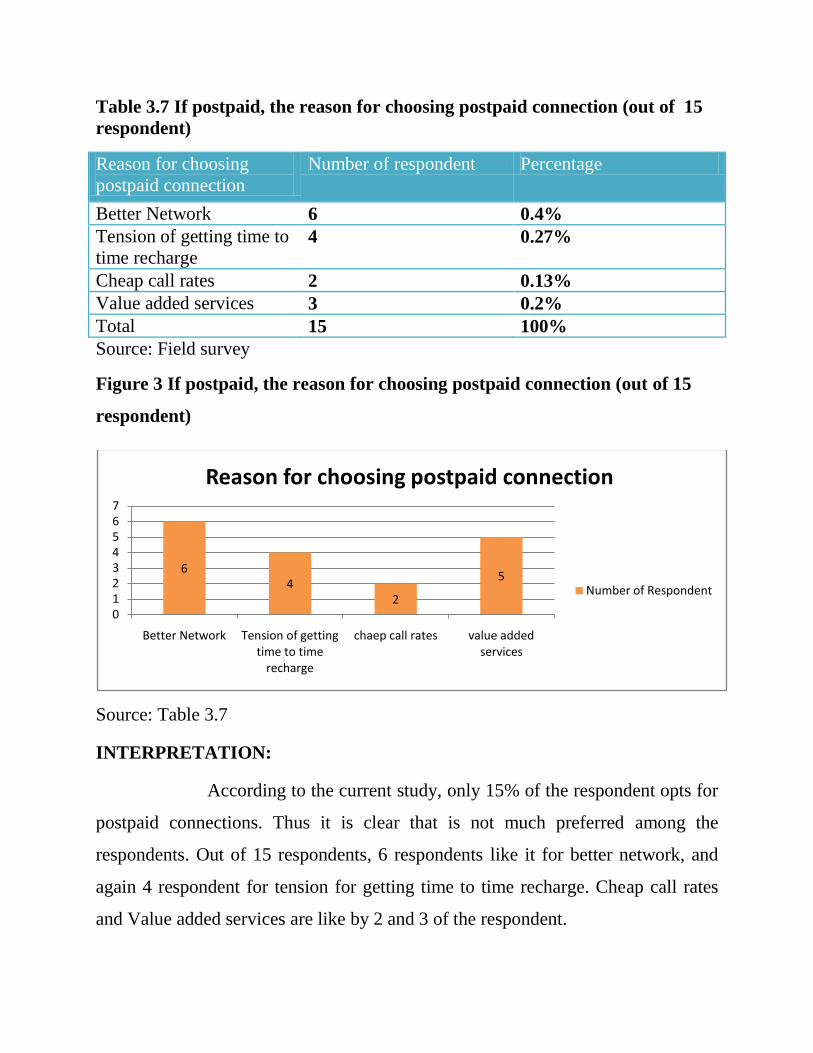
Table 3.7 If postpaid, the reason for choosing postpaid connection (out of 15
respondent)
Reason for choosing
postpaid connection
Number of respondent Percentage
Better Network 6 0.4%
Tension of getting time to
time recharge 4 0.27%
Cheap call rates 2 0.13%
Value added services 3 0.2%
Total 15 100%
Source: Field survey
Figure 3 If postpaid, the reason for choosing postpaid connection (out of 15
respondent)
Source: Table 3.7
INTERPRETATION:
According to the current study, only 15% of the respondent opts for
postpaid connections. Thus it is clear that is not much preferred among the
respondents. Out of 15 respondents, 6 respondents like it for better network, and
again 4 respondent for tension for getting time to time recharge. Cheap call rates
and Value added services are like by 2 and 3 of the respondent.
64
2
5
01234567
Better Network Tension of getting time to time
recharge
chaep call rates value added services
Reason for choosing postpaid connection
Number of Respondent

Table 3.8 Service provider owned by the users
Service provider Number of respondent Percentage
Airtel 30 30%
Vodafone Idea 10 10%
Reliance Jio 50 50%
BSNL 10 10%
Total 100 100%
Source: Field survey
Figure 3.8 Service provider owned by the users
Source: Table 3.8
INTERPRETATION:
From the above figure , it found that Airtel Reliance Jio are the
top choice of the respondents. Airtel forming 30% and Reliance Jio forming 50%
of all the service providers. And the rest service provider Vodafone Idea and
BSNL are forming 10% and 10% respectively.
30%
10%
50%
10%0%
10%
20%
30%
40%
50%
60%
Airtel Vodafone Idea Reliance Jio BSNL
Service provider owned by the users
Number of respondent

Table 3.9 Reason for choosing a particular service provider
Reason for choosing particular
service provider
Number of
respondent
Percentage
Call rate 5 5%
Data plan 10 10%
Calling clarity 5 5%
Mobile network connectivity 10 10%
Net speed 25 25%
Customer Service 5 5%
Offers( receiving free data, talk time
plans) 15 15%
Offers with other app( pay tm,
cards) 15 15%
Others 10 10%
Total 100 100%
Source: Field survey

Figure 3.9 Reason for choosing a particular service provider
Source: Table 3.9
INTERPRETATION:
As per from the above figure, it found that25% of the respondent
choose the service provider because of high net speed , 5% of the users
choose service provider because of call rate, 10% choose it for data plan,
5% for calling clarity, 10% is for because mobile network connectivity,
5% users like for customer care, 15% of the users like because of
various offers receiving or through other app like pay tm, cards etc.
And remaining 10% of the respondent choose it for other various reason
.
5%
10%
5%
10%
25%5%
15%
15%
10%
Reason for various choosing various service provider
Call rate
Data plan
Calling clarity
Mobile network connectivity
Net speed
Customer service
Offers(receiving free data, talktime)
Offers with other App( paytm, cards)

Table 3.10 Length of duration of availing the services of current service
provider.
Length duration of availing the services
of current service provider
Number of respondent Percentage
<1year 20 20%
2years 30 30%
3years 15 15%
>4years 35 35%
Total 100 100%
Source: Field survey
Figure 3.10 Length of duration of availing the services of current service
provider.
Source: Table 3.10
INTERPRETATION:
It is clear from the study that most of the respondent have been using their
current SIM and the service provider for last more than 4 years. 20% of the
respondents have been using the current sim card not more than 1years. 15% of the
respondents using their sim card for 3years. Most and foremost 35% of the
respondent using it for more than 4years.
0
5
10
15
20
25
30
35
40
<1 year 2 years 3 years >4 years
Length duration of availing the service of current service provider
Percentage

Table 3.11 Important factor for choosing a service provider
Factor for choosing a service
provider
Number of Respondent Percentage
Tariff Plans 40 40%
Customer Services 10 10%
Brand image 25 25%
Network Coverage 15 15%
Advertisement 10 10%
Total 100 100%
Source: Field survey
Figure 3.11 Important factors for choosing a service provider
Source: Table 3.11
INTERPRETATION:
Among the various reasons for choosing the current service provider,
respondents preferred to have Better brand image, Better network coverage, and
Tariff plans. 40% give Tariff plans as an important factor for choosing the service
provider. 25% prefer to have Brand image . 15% respondents choose network
coverage And 10% respondent prefer in both advertisement and customer service
40%
10%
25%
15%
10%
Factors for choosing service provider
Tariff plan
Customer Service
Brand image
Network Coverage
Advertisement

Table 3.12 Average billing amount of postpaid user
Billing amount Number of respondent Percentage
Less than Rs 500 10 10%
Between Rs. 500-1000 35 35%
Between Rs. 1000-2000 45 45%
Above Rs. 2000 10 10%
Total 100 100%
Source: Field survey
Figure 3.12 Average billing amount of postpaid user
Source: Table 3.12
INTERPRETATION:
As per the above data , 45% of users billing amount is between Rs1000-
2000, 35% users billing amount is between Rs500-1000, 10% of the respondents
billing amount is less than Rs 500. And than billing amount of above Rs 20000
comes for the billing user .
0
5
10
15
20
25
30
35
40
45
50
Les than Rs 500 Between Rs 500-1000
Between Rs1000-2000
Above Rs 2000
Average billing amount of postpaid user
Number of respondents

Table 3.13 Satisfaction level of the billing customer with the postpaid billing
services
Satisfaction Number of customer Percentage
Strongly satisfied 12 12%
Satisfied 55 55%
Neutral 8 8%
Dis- satisfied 15 15%
Stongly dis-satisfied 10 10%
Total 100 100%
Source: Field survey
Figure 3.13 Satisfaction level of the billing customer with the postpaid billing
services
Source: Table 3.13
INTERPRETATION:
From the above figure, it found that 55% of the billing customers are just
satisfied with the postpaid billing services .While 12% of the customers are
strongly satisfied with the postpaid billing services. And 10% and 15% of the
billing customer are dis-satisfied and strongly dis-satisfied respectively. And the
remaining 8% are just neutrally satisfied i.e. may or may be.
12%
55%
8%
15%
10%
Satisfaction level of the billing customer with the postpaid billing services
Strongly satisfied
Satisfied
Neutral
Dis- satisfied
Strongly dis-satisfied

Table 3.14. Satisfaction level of a prepaid user for different prepaid tariff
plans
Satisfaction level Number of respondent Percentage
Strong Satisfied 50 50%
Satisfied 30 30%
Neutral 10 10%
Dis satisfied 15 15%
Strongly Dissatisfied 5 5%
Total 100 100%
Source: Field survey
Figure 3.14 Satisfaction level of a prepaid user for different prepaid tariff
plans
Source: Table 3.14
INTERPRETATION:
From the above figure, it found 30% of the prepaid users are just satisfied
with the different tariff plans .While 50% of the users are strongly satisfied with
the prepaid tariff plans. And 15% and 5% of the prepaid customer are dis-satisfied
and strongly dis-satisfied respectively. And the remaining 10% are just neutrally
satisfied i.e. may or may be.
0
10
20
30
40
50
60
Strongly satisfied Satisfied Neutral Dis satisfiedStrongly Dis satisfied
Number of Respondent
Satisfaction level of a prepaid user for different prepaid tariff plans

Table 3.15 Challenges facing by the customer with the current service
provider
Challenges Number of Respondent Percentage
No suitable tariff plans 15 15%
Network issues 20 20%
Connection problem 15 15%1
Unnecessary balance out 18 18%
Bill payment option 14 14%
Do not get bill on time 18 18%
None of the above 0 0%
Total 100 100%
Source: Field survey
Figure 3.15 Challenges facing by the customer with the current service
provider
Source: Table 3.15
INTERPRETATION:
It found from the above data that 20% of the customers are facing problem
of network issues. 15% customers face problem from connection problem, 18% of
the customers facing problem when there is a unnecessary balance out, 14%
customers facing problem in bill payment option, 18% faces problem when they
don’t get bill on time. Lastly 15% of the customers facing problem when there is
no suitable tariff plans.
0
5
10
15
20
25
Challenges facing with current service provider
Number of Respondent

Table 3.16 Switch from one service connection to another (postpaid/prepaid)
Switch service connection Number of Respondent Percentage
Yes 30 30%
No 50 50%
Can’t say 20 20%
Total 100 100%
Source: Field survey
Figure 3.16 Switch from one service connection to another (postpaid/prepaid)
Source: Table 3.16
INTERPRETATION:
Among the unsatisfied respondents, 10% of the respondents are sure of
changing their current connection type. Of all the respondents, 70% do not want to
change their connection type. There are also 20% respondents who cannot decide
whether to change their connection type or not. Thus it is found that most of the
respondents are satisfied with their connection type.
10%
70%
20%
YES NO CAN’T SAY
0%
10%
20%
30%
40%
50%
60%
70%
80%
Switch from one service connection to another(postpaid/prepaid)
Percentage

Table 3.17 Satisfaction with customer service of present service provider
Satisfaction Number of Respondent Percentage
Yes 72 72%
No 28 28%
Total 100 100%
Source: Field survey
Figure 3.17 Satisfaction with customer service of present service provider
Source: Table 3.17
INTERPRETATION:
Customer service plays an important role in every service provider. As given
data, it found that 72% respondents are really satisfied with the customer service of
respective service provider. While 28% respondents are not satisfied with the
customer service .
72%
28%
Satisfaction wuith customer services
YES
NO

Chapter 3.18 Switch from current service provider
Switch Number of Respondent Percentage
Yes 18 18%
No 82 82%
Total 100 100%
Source: Field survey
Figure3.18. Switch from current service provider
Source: Table 3.18
INTERPRETATION:
Among the unsatisfied respondents, 18 respondents are sure of changing
their current service provider to another. Of all the respondents, 82 respondents do
not want to change their service provider. Thus it is found that most of the
respondents are satisfied with their current service provider.
18
82
0
10
20
30
40
50
60
70
80
90
YES NO
Number of Respondents
Number of Respondents

Table 3.19. Reason for switching
Reason for switching Number of Respondents Percentage
Poor Network Connectivity 14 14%
Frequent network disruption 6 6%
High call rates 12 12%
Frequent change in plans 3 3%
Impolite response from customer
care executive 7 7%
Better offers from competitors 11 11%
Better services from competitors 13 13%
Low switching cost 5 5%
Influence of friend and family 9 9%
Low roaming charges 4 4%
Better Value added services 8 8%
Bill Payment 8 8%
Total 100 100%
Source: Field survey

Figure 3.19 Reason for switching
Source: Table 3.19
INTERPRETATION:
Various reasons have been analyzed for the switching intentions of the
respondents. Among the various stated reason , poor network connectivity, high
call rates, better services from competitors, better offers from competitors are the
most important reasons that can be considered for switching from the current
service provider. In here 14 respondents choose poor network connectivity to
switch from one service provider to another. 6% respondents choose frequent
network disrupts. 12% choose high call rates, 3% choose frequent change in plans,
7% will switch for impolite response from customer care executive, 11% for better
offers from competitors, 13% for better services from competitors, 5% for low
switching cist, 9% for getting influence from friends and family, 4% for low
roaming charges, 8% for both better value added services and bill payment
respectively.
0 2 4 6 8 10 12 14 16
Poor network connectivity
Frequent network disruption
High call rates
Frequent changes in plans
Impolite response from customer …
Better offers from competitors
Better services from competitors
Low Switching cost
Influence of friend and family
Low roaming charges
Better Value added services
Bill payment
Number of respondent
Number of respondent
CHAPTER-IV FINDINGS, SUGGESTIONS AND CONCLUSION
4.1 FINDING
4.2 SUGGESTIONS
4.3 CONCLUSION

Some of the major findings after the analysis and interpretationof the data are :
From the study the researcher had found that out of the total respondents 85% are using
prepaid connection and the remaining 15% using postpaid connection. Prepaid Connection
is more popular among the users because of large number of offers available to the prepaid
users. It also relieves the users so many formalities and documentation which are found in
a postpaid connection. Moreover it ensures instant activation, better control over expenses,
no monthly rentals and easy switching.
According to the current study, only 15% of the respondent opts for postpaid connections.
Thus it is clear that is not much preferred among the respondents. Out of 15 respondents, 6
respondents like it for better network, and again 4 respondent for tension for getting time
to time recharge. Cheap call rates and Value added services are like by 2 and 3 of the
respondent
From the study the researcher found that Airtel, Reliance Jio are the top choice of the
respondents. Airtel forming 30% and Reliance Jio forming 50% of all the service
providers. And the rest service provider Vodafone Idea and BSNL are forming 10% and
10% respectively.
It found that 25% of the respondent choose the service provider because of high net
speed, 5% of the users choose service provider because of call rate, 10% choose it for
data plan, 5% for calling clarity, 10% is for because mobile network connectivity, 5%
users like for customer care, 15% of the users like because of various offers receiving or
through other app like pay tm, cards etc. And remaining 10% of the respondent chooses
it for other various reasons.
It found from the analysis that 20% of the customers are facing problem of network
issues. 15% customers face problem from connection problem, 18% of the customers
4.1 FINDINGS

facing problem when there is a unnecessary balance out, 14% customers facing problem
in bill payment option, 18% faces problem when they don’t get bill on time. Lastly 15%
of the customers facing problem when there is no suitable tariff plans.
Among the unsatisfied respondents, 10% of the respondents are sure of changing their current
connection type. Of all the respondents, 70% do not want to change their connection type.
There are also 20% respondents who cannot decide whether to change their connection type or
not. Thus it is found that most of the respondents are satisfied with their connection type.
Customer service plays an important role in every service provider. As given data, it
found that 72% respondents are really satisfied with the customer service of respective
service provider. While 28% respondents are not satisfied with the customer service .
Various reasons have been analyzed for the switching intentions of the respondents.
Among the various stated reason , poor network connectivity, high call rates, better
services from competitors, better offers from competitors are the most important reasons
that can be considered for switching from the current service provider. In here 14
respondents choose poor network connectivity to switch from one service provider to
another. 6% respondents choose frequent network disrupts. 12% choose high call rates,
3% choose frequent change in plans, 7% will switch for impolite response from customer
care executive, 11% for better offers from competitors, 13% for better services from
competitors, 5% for low switching cist, 9% for getting influence from friends and family,
4% for low roaming charges, 8% for both better value added services and bill payment
respectively.

With continuous changes taking place and the world becoming more and more dynamic, the
cellular operators need to improve upon their quality of service and render optimized facilities to
the customers to get going.
Following are the suggestions for the service providers to improve and prosper:
Indian mobile operators have to invest in expanding network coverage and providing
technically superior quality services to retain customers. Mobile operators need to
enhance the quality of service at all touch points to ensure loyalty.
Even though all the mobile service providers implement Do Not Disturb (DND) registry
as a mandatory service, it is neither thoroughly popularized nor properly implemented.
Efforts should be made to help penetrate this service among the customer base by the
service providers.
Many times to increase the number of customers, many easy allocations are done without
paper work. The service providers should carry out a proper reference check and then
activate the mobile number of the customers.
Proper connectivity and network availability widely affects the target customers. Service
providers, to Increase their customers, should not follow a mad rush to sell connections
which hampers connectivity and increase network disruptions. Either there should be
restrictions on the allocation limit of every network tower or more towers should be
added to ensure better connectivity.
Service providers need to rebuild relationship with the customers to understand their
changing needs and design appropriate strategies to meet changing needs. Data mining
and CRM practices can be implemented to identify the specific requirements of the
customers and customized plans can be delivered to enhance customer satisfaction and
loyalty. Loyalty programmed for existing, high volume users arc another way to keep
customers.
Mobile operators should lay equal emphasis on retaining customers and finding new
customers.
4.2 SUGGESTION

Mobile phones services becoming popular day by day. The service providers are offering
attractive offers to the customers to attract them and to increase their market share. There is a
tough competition in the cellular market in India and different service providers are not leaving a
single stone unturned and making effort to increase their revenue and market Share and also
satisfaction to their existing customers and to attract new prospect.
The Telecom industry, especially the mobile plane industry is growing at a robust rate.
In 2003, the mobile phone industry captured 28 million subscribers, which increased to
229million in 2007. As of 31st August 2020, the total subscriber base in the country stood at
1,168.66 million. Therefore, it can be said that in the near future cellular service providers are
going to face intensely tough competition thereby introducing different innovative marketing
strategies to survive and it will be very difficult for the new entrants to create any place the
market.
Major conclusions that emerged front the study are customer generally prefer to use
prepaid mobile connection over postpaid connection for the reason of instant activation, no
monthly commitment or rental, Better control over cost and large number of offers. Among the
customers' preferring postpaid connection, the most preferred reasons were better network, no
tension or getting timely recharge and cheap call rates. Reliance Jio is the most preferred choice
among the customers followed by Airtel and Vodafone Idea which were voted as the 2nd
and 3rd
preferred choice respectively.
The main reasons for choosing particular service provider are Tariff charges, network
coverage and customer service. Customers generally prefer to have cheaper call rates. Moreover,
customers have also shown their inclination towards internet usage on mobile phones and Value
Added Services (VAS). Customers are also indifferent towards celebrity endorsement.
The very new concept of MNP, which allows the customers to switch to different service
providers while retaining their current mobile number, has entered the Indian market thought
has already been existent in many other parts of the globe. This is really a revolution in the
cellular industry which allows the customers to easily switch to other service provider of their
4.3 CONCLUSION

choice or to opt for a new scheme with some other service provider if they are dissatisfied with
the current service provider. According to the current study, only few of the respondents were
willing to switch from the current service provider retaining their previous mobile numbers. Poor
network connectivity, frequent network disruptions, better services and offers from competitors
and high tariff charges are the most important factors influencing the respondents to switch. Due
to tough competition, the mobile operators, at one point of time, decreased the call tariffs and
later hiked them indirectly through top-up plans. This compels the customers to look out for
cheaper packages. Frequent juggling of tariff and service charges is not a well paying proposition
for mobile operators.

BOOKS
Kothari C.R., Research Methodology, 2004, New Age International (P) Ltd.,
Publishers, Second Revised Edition.
Market Research – D.D.Sharma
Books and Magazine of mobile communication
NEWSPAPERS
The Times of India
Hindustan Times
WEBSITES
www.trai.gov.in
www.en.wikipedia.org
www.business.mapsofindia.com/india-industry/telecom.html
www.prepaid-loyalty.com/e-Book-Rafi-Kretchmer.pdf
www.uninor.in/pages/home.aspx
www.academicjournals.org/ajbm/pdf/pdf2010/18Sep/Ali%20et%20al.pdf
ARTICLES
Dr. L. Leo Franklin, Assistant Professor & Research Adviser and S. Ambika,
Research Scholar, PG & Research Department of Commerce, JJ College of Arts and
Science (Auto), Pudukkottai, Tamil Nadu, South India “A COMPARITIVE
STUDY ON CUSTOMER PREFERENCE OF MOBILE SERVICE PROVIDERS
WITH SELECTED SERVICE PROVIDER” (2015)
Dr. Neelam Dhandha and Dr. Pooja Goel “WHAT IMPINGES THE CHOICE OF
CELL PHONE CONNECTION” (2010
R. Arun Prasath, Research Scholar and Dr. J. Vijayadurai, Associate Professor,
Department of Management Studies, Madurai Kamaraj University, Madurai, India “
A STUDY ON CONSUMER ATTITUDE TOWARDS MOBILE PHONE
SERVICE PROVIDERS IN TAMIL NADU” (2016)
. M. Sathish , K J Naveen ,V Jeevanantham , PSG Institute of management
(PSG College of Technology) Coimbatore and K.Santosh Kumar ,
Priyadarshini Engineering College Vaniyambadi – Vellore “ A STUDY ON
CONSUMER SWITCHING BEHAVIOUR IN CELLULAR SERVICE
PROVIDERS: A STUDY WITH REFERENCE TO CHENNAI ”(2011):
BIBLIOGRAPHY

ANNEXURE

QUESTIONNAIRE
Dear Respondent,
I am a student of M.com 3rd
semester of K.C. Das Commerce College under Gauhati
University. As an integral part of our course curriculum, I am conducting a survey on the topic, “A
STUDY ON CUSTOMER PERCEPTION TOWARDS POSTPAID AND PREPAID OF VARIOUS
SERVICE PROVIDERS AND THEIR SWITCHINH BEHAVIOUR AMONG YOUTH WITH
SPECIAL REFERENCE TO GUWAHATI CITY”. You are kindly requested to extend your
cooperation in filling this questionnaire which would enable me to attain my study. I assure you that this
information will be kept confidential and will be used for academic purpose only.
Yours Faithfully
Archina Begum
1. Name of the respondent ………………………..
2. Gender
Male
Female
3. Age
Up to 20
21-25
26-30
4. Occupation
Salaried
Business
Student
Others
5. Education Qualification
Up to Matriculation
Higher Secondary
Graduate
Post Graduate

6. Which type of mobile connection do you use?
Post Paid
Prepaid
7. If prepaid, the reason for choosing prepaid connection (Tick Multiple Options)
No monthly commitment/ Rental
Better control over expenses
Large no. of offers
Top option available
Less Documentation
No security Deposit
Easy Switching
Instant Activation
Pre- activated STD and ISD facility
8. If postpaid, the reason for choosing postpaid connection( Tick Multiple options)
Better Network
Tension of getting time to time recharge
Cheap Call rates
Value Added Services
9. Which service provider do you presently own ?
Airtel
BSNL
Vodafone Idea (VI)
Reliance Jio
10. What is the reason for choosing a particular service provider?
Call rate (std and local charge per call)
Data plan
Calling clarity
Mobile network connectivity( availability/reliability of connection)
Net speed (better download/upload speed)
Customer service
Offers (receiving free data, talktime plans )
Offers with other Apps ( paytm, cards)
Other
11. For how long have you been availing the services of your present service provider?

<1year
2years
3years
>4years
12. Which of the following factor are important for you choosing a service provider?
Tariff Plans
Customer Services
Brand Image
Network Coverage
Advertisement
13. If you are a post paid user, than what is your average billing per month?
Less than Rs 500
Between Rs 500-1000
Between Rs 1000-2000
Above 2000
14. If you are a billing customer than are you satisfied with the postpaid billing services?
Strongly Satisfied
Satisfied
Average
Dis- Satisfied
Strongly Dis Satisfied
15. If you are a prepaid customer, are you satisfied with the prepaid tariff plans/recharge coupons
Offered by your service provider?
Strongly Satisfied
Satisfied
Neutral
Dis- Satisfied
Strongly Dis- Satisfied
16. What are the challenges are you facing with the current service provider ?
No suitable tariff plans
Network issues
Connection problems
Unnecessary balance cut

Bill payment option(post paid)
Do not get bill on time (post paid)
None of the above
17. Do you want to switch from your current connection type to another? (prepaid/postpaid)
YES
NO
Can’T Say
18. Are you satisfied with the customer services of your present service provider?
YES
NO
19. Would you like to change your current service provider?
YES
NO
If yes, specify the new provider …………………………………..
20. What is the reason for switching ? (tick multiple option)
Poor Network Connectivity
Frequent Network Disruption
High Call Tariffs
Frequent change in plans
Impolite response from Customer Care Executive
Better offers from competitors
Better services from competitors
Low switching Cost
Influence of friend and family
Low roaming charges
Better Value Added Services
Bill Payment
…………………………………………………………………………………….