Arab Republic of Egypt - World Bank Documents and Reports
111
DRAFT Arab Republic of Egypt May 15, 2008 Social and Economic Development Group Middle East and North Africa Region The World Bank Document of the World Bank 69663 Public Disclosure Authorized Public Disclosure Authorized Public Disclosure Authorized Public Disclosure Authorized Public Disclosure Authorized Public Disclosure Authorized Public Disclosure Authorized Public Disclosure Authorized
-
Upload
khangminh22 -
Category
Documents
-
view
0 -
download
0
Transcript of Arab Republic of Egypt - World Bank Documents and Reports

DRAFT
Arab Republic of Egypt May 15, 2008
Social and Economic Development Group
Middle East and North Africa Region
The World Bank
Document of the World Bank
69663
Pub
lic D
iscl
osur
e A
utho
rized
Pub
lic D
iscl
osur
e A
utho
rized
Pub
lic D
iscl
osur
e A
utho
rized
Pub
lic D
iscl
osur
e A
utho
rized
Pub
lic D
iscl
osur
e A
utho
rized
Pub
lic D
iscl
osur
e A
utho
rized
Pub
lic D
iscl
osur
e A
utho
rized
Pub
lic D
iscl
osur
e A
utho
rized

ACRONYMS AND ABBREVIATIONS
AGES Automated Government Expenditure System
ATM Automated Teller Machine
BOOT Build Operate Own & Transfer
CAO Central Audit Organization
CAPMAS Central Agency for Public Mobilization and Statistics
CBE Central Bank of Egypt
CES Constant-Elasticity-of-Substitution
CFAA Country Financial and Accountability Assessment
CIDA Canadian International Development Agency
CPI Consumer Price Index
DFI Direct Foreign Investment
DPR Development Policy Review
EC European Commission
EU European Union
EdF Electricity de France
EEA Egypt Electricity Authority
EEHC Egyptian Electricity Holding Company
ERA Egyptian Electric Utility and Consumer Protection Regulatory Agency
ELMPS Egyptian Labor Market panel Survey
ERF Economic Research Forum
ERP Effective Rate of Protection
ERSAP Economic Reform and Structural Adjustment Program
FDI Foreign Direct Investment
FSAP Financial Sector Assessment Program
GAFI General Authority for Free Zones and Investment
GCC Gulf Cooperation Council
GDP Gross Domestic Product
GER Gross Enrolment Rates
GFMIS Government Financial Management Information System
GFS Government Finance Statistics
HIECS Household Income and Expenditure and Consumption Survey
ICA Investment Climate Assessment
ICR Implementation Completion Report
IFC International Finance Corporation
IFMCA
ILO International Labor Organization
IMF International Monetary Fund
IPOs Initial Public Offerings
IPP Independent Power Producer
LPG Liquefied Petroleum Gas
M0 Reserve Money
M1 Money Supply -1

M2 Money Supply -2
MED Ministry of Economic Development
MENA Middle East and North Africa
MoF Ministry of Finance
MW Mega Watt
NBER National Bureau of Economic Research
NDA Net Domestic Assets
NFA Net Foreign Assets
NIB National Investment Bank
NPLs Non-Performing Loans
OECD Organization for Economic Co-operation and Development
PBDAC Principal Bank for Development and Agricultural Credit
PC Personnel Computer
PPA Power Purchase Agreement
PPP Public Private Partnership
QIZs Qualified Industrial Zones
SAM Social Accounting Matrix
SAL Structural Adjustment Loan
SAT Scholastic Aptitude Test
SFD Social Fund for Development
SGB State General Budget
SIF Social Insurance Funds
SMEs Small and Medium Enterprises
SPOs Secondary Public Offerings
TAPR
TFP Total Factor Productivity
TIMSS Trends in Mathematics and Science Study
TSA Treasury Single Account
TVET Technical and Vocational Education Training
USAID United States Agency for International Development
VAT Value Added Tax
WAP Working Age Population
WHO World Health Organization
WPI Wholesale Price Index
Vice President: Daniela Gressani
Country Director: Emmanuel Mbi
Sector Director: Ritva S Reinikka
Sector Manager: Miria Pigato
Task Team Leader: S. Ramachandran

This Development Policy Review (DPR) was prepared by the Social and
Economic Management group of the World Bank’s Middle East & North Africa region.
S. Ramachandran led, and Homi Kharas advised, the team that comprised Moez Ben-
Hassine, Sudhir Chitale, Sherine El-Shawarby, Daniel Lederman, SunYoung Lee,
Norman Loayza, Claudia Nassif, Sheela Reddi, Hoda Selim, David Shand, Tihomir
Stucka, Ruslan Yemstov, and Amira Zaky. Ragui Assaad of the Population Council in
Cairo shared his many findings from the survey data that went into the chapter on
employment. Radwan Shaban reviewed the final version of the report. Miria Pigato as
Sector Manager and Mustapha Nabli as Chief Economist & Director oversaw the report’s
preparation, and Ritva Reinikka as the incoming Director participated in the discussions
with the Government. Shahrokh Fardoust and Roberto Zagha were the peer reviewers.
Emmanuel Mbi, Country Director, guided the team in its discussions with the
Government. Several officials, particularly H.E. Mahmoud Mohieldin, the Minister of
Investments and H.E. Osman Mohamed Osman, shared their views and their staff
provided and checked the data the report analyzed. This DPR has also drawn on many
Bank reports and staff working on the different sectors in Egypt at various times
including Zoubida Allaoua, Jamal al-Kibbi, Alexander Berg, David Biggs, Andras Bodor,
Ernesto Cuadra, Xavier Devictor, Anton Dobronogov, Samir El Daher, Jean Fares, James
Hanson, Farrukh Iqbal, Arun Joshi, Sunita Kikeri, Alexander Kremer, Sahar Nasr, David
Robalino, Roberto Rocha, John Speakman, Andrew Stone, Gaiv Tata, Robert Taylor,
Paul Noumba Um, Jonathan Walters, Hisham Waly, Michel Welmond, and JaeHoon
Yoo. Klaus Enders and Cyrus Sassanpour of the IMF shared data and views on macro-
economic and labor issues. Egyptian academics and research centers were generous with
their time and insights including Ahmed Galal, Director of the Economic Research
Forum, and Hanaa Kheir-El-Din, of the Egyptian Centre for Economic Studies.

TABLE OF CONTENTS
E X E C U T I V E S U M M A RY . . . . . . . . . . . . . . . . . . . . . . . . . . . . . . . . . . . . . . . . . . . . . . . . . . . . . . . . . . . . . . . . . . . . . . . I
C H A P T E R 1 : C H A N G I N G E C O N O M I C S T R U C T U R E & I N V E S T M E N T . . . . . . . . . . 1 A. Changing Economic structure ..............................................................................................1
B. Rising Productivity from Private Investment ......................................................................7
C. Improving Investment ..........................................................................................................14
C H A P T E R 2 : P R I VAT E R E S P O N S E T O T R A D E & B U S I N E S S C L I M AT E
C H A N G E S 1 9 A. Trade Reforms and their Effects ..............................................................................................20
B. Privatization & FDI.............................................................................................................27
C. Effects of Business Climate Improvements ..........................................................................30
D. So what does it all imply? ..................................................................................................36
. . . . . . . . . . . . . . . 3 8 A. Main features of the labor market ...................................................................................39
B. Public Sector Employment and Wages .................................................................................47
C. Private Employment and Regulations ............................................................................49
D. Improving Education and Training .......................................................................................53
E. Challenges for the Future .....................................................................................................56
. . . . . . . . . . . . . . . . . . . . . . . . . . . . . . . . . . . . . 5 9 A. Savings and the Flow of Funds ............................................................................................60
B. Intermediation: Role of Banks and Capital Markets ..............................................................64
C. Towards an Intermediation Strategy .....................................................................................70
. . . . . . . . . . . . . . . . . . 7 4 A. Recent Economic Policies..................................................................................................75
B. Improving Budgetary Processes & Decisions....................................................................82
C. The Medium Term Outlook: Debt and Fiscal Sustainability .............................................87
FIGURES
Figure 1.1: Sector Shares in GDP ....................................................................................................2
Figure 1.2: GDP by Sector Constant 1992 LEb ...............................................................................2
Figure 1.3: Private (below) & Public (above) Shares ......................................................................2
Figure 1.4: Egypt Private Sector ......................................................................................................2
Figure 1.5: Correlation of OECD and Egypt’s GDP Growth ..........................................................3
Figure 1.6: Increases in Population and the Poor by Governorates, 1995-2005 ..............................5
Figure 1.7: Real GDP per capita by Region 1992-2004 ..................................................................5
Figure 1.8: Improving Health indicators Everywhere .....................................................................6
Figure 1.9: Investments to GDP.......................................................................................................8
Figure 1.10: Investment Composition by Sector and Category over Time ....................................9
Figure 1.11: Employment by Sector and Category over Time ......................................................10
Figure 1.12: GDP Composition by Sector and Category over Time ............................................11
Figure 1.13: TFP Average Growth and Private Investment Share ................................................12
Figure 1.14: GDP Growth Decomposition ....................................................................................13
Figure 1.15: Growth Decomposition – Public / Private Sectors ....................................................14
Figure 1.16: Investment versus Growth Rates (2000-2005) ..........................................................15
Figure 2.1: Weighted Average Tariffs, Latest Year Available ......................................................20

Figure 2.2: Nominal and Real Effective Exchange Rate Index (2000=100) ................................21
Figure 2.3: Export composition and Real ......................................................................................21
Figure 2.4: Import Composition and Real .....................................................................................21
Figure 2.5: Herfindahl-Hirschmann Index of Export Concentration .............................................24
Figure 2.6: Technology Content of Exports ..................................................................................25
Figure 2.7: Real Privatization Revenue (in 2006 LE m using GDP deflator) ..............................28
Figure 2.8: Bankruptcy Rulings by Preliminary Courts ................................................................32
Figure 2.9: Bankruptcy Rulings by Appeal courts.........................................................................32
Figure 2.10: Top 10 Constraints to Firm Investment in Egypt, 2006 ............................................33
Figure 2.11: Firm Ownership and Number of Employees .............................................................33
Figure 2.12: Firm Age (2006 year of establishment) .....................................................................34
Figure 2.13: SMEs Proportion in Countries ..................................................................................34
Figure 2.14: Skill Composition of Sample Workforce and Number of Employees in the
Sample............................................................................................................................................35
Figure 2.15: Factors That Affect Decision of Changing................................................................35
Figure 2.16: Number of Manufacturing Firms by Size..................................................................36
Figure 2.17: Number of Employees by Firm Size .........................................................................36
Figure 3.1: Age Distribution, 2006 ................................................................................................39
Figure 3.2: Education Level of the WAP.......................................................................................41
Figure 3.3: Education Levels of the Unemployed .........................................................................43
Figure 3.4: Education Levels of the WAP .....................................................................................43
Figure 3.5: Distribution of Employment by Institutional Sector ..................................................45
Figure 3.6: Average Annual Growth by Sector .............................................................................45
Figure 3.7: Proportion of Informal Employment in Private ..........................................................45
Figure 3.8: Remittances as a Share of GDP (1975 – 2006) ...........................................................46
Figure 3.9: Real Wages in Public and Private Sectors, 1995-2004 ...............................................48
Figure 3.11: Total Contribution Rates to Finance Pensions in Middle East ..................................52
Figure 3.12: Gross and Net Enrollment Rates in Egypt by Level, 1996-2003 .............................54
Figure 3.13: International Comparison of TIMSS Score (2004) ...................................................54
Figure 3.14: Flow Chart for Egypt’s Two –Track Education System ...........................................55
Figure 3.15: Technical Plus University Jobs Created and Job Aspirants ......................................57
Figure 4.1: Currency Outside Banks ..............................................................................................64
Figure 4.2: Banking Credit (outstanding stock, by sector) ............................................................65
Figure 4.3: Bank Lending to Private Investment ...........................................................................65
Figure 4.4: Interest rates, 2005–2008 ............................................................................................66
Figure 5.1: Average annual Inflation and monthly range ..............................................................75
Figure 5.2: Money and the Price Level ............................................................................................76
Figure 5.3: Money, Net Domestic & Foreign Assets (NDA& NFA) ............................................76
Figure 5.4: Fiscal Revenue and Expenditure .................................................................................77
Figure 5.5: Budget Balances ..........................................................................................................77
TABLES
Table 1.1: Percentage of Poor and Near-poor, by regions 1995-2005 .............................................4
Table 1.2: Children under 5, percentage stunted (low height for age) 1992-2005 ..........................7
Table 2.1: Nominal and Effective Rates of Protection (in percent) ...............................................23

Table 2.2: Improving the Business Climate ...................................................................................30
Table 3.1: Average Annual Population Growth Rate ....................................................................40
Table 3.2: Employment & Labor Force .........................................................................................40
Table 3.3: Unemployment as a percentage of Labor Force ...........................................................41
Table 3.4: Labor Force Participation for WAP, Market Definitions .............................................42
Table 3.5: Gender composition of Public Sector Employment ,000 Persons ................................47
Table 3.6 Public Sector Employment and Real Wages .............................................................................. 58
Table 3.7: The Labor Laws Compared ..........................................................................................50
Table 3.8: Retirement and Pension Schemes, Total Contributions and Benefits ..........................51
Table 3.9: Elasticities for Total Employment and Wage Employment wrt ...................................56
Table 4.1: Estimated Flow of Funds 2005-2006 ............................................................................62
Table 4.2: Estimated Flow of Funds 2002-2003 ............................................................................63
BOXES
Box 1.1: Egypt’s Independent Power Projects ..............................................................................17
Box 1.2: Building Better Schools ..................................................................................................18
Box 2.1: Trade Agreements & QIZs ..............................................................................................26
Box 2.2: DFI to FDI: Changing Label & Views ............................................................................29
Box 2.3 Recent Laws for Improving the Market Economy ...............................................................
Box 3.1: Measuring Unemployment ..............................................................................................42
Box 4.1:Bank of Alexandria ..........................................................................................................67
Box 4.2: India's "a Hundred Small Steps" 78
Box 4.3: Lengthening Maturities ...................................................................................................72
Box 5.1: Household wealth loss from inflation and low interest rates .........................................78
Box 5.2: More Efficient Subsidies & Transfers.............................................................................80
Box 5.3: Egypt’s Tax Reforms ......................................................................................................81

i
EXECUTIVE SUMMARY
1. Egypt is transforming: over the last two decades the Government has moved towards more
market-oriented policies and while the speed of this move has varied, the direction has been fairly
steady. The resulting economic growth has been healthy but punctuated by episodes of macro-
economic instability. After the last episode in 2003-04, the Government improved macro-economic
management, lowered trade tariffs, and renewed efforts to promote the private sector. Since then, real
GDP growth has risen to 7 percent, up from 3 percent in the three years before, and employment and
private investment have also risen sharply. Ample foreign exchange reserves of over $33 billion now
exceed its external debt (mostly concessional and long term) and help insulate the economy from
adverse external developments. The rise in private investment and the surge in foreign direct
investment inflows (FDI doubled to $6 billion in 2005-06, and again to $11 billion in 2006-07)
suggest favourable market perceptions that augur well for the future.
2. These recent developments have kindled hopes that Egypt could join countries like Korea and
Malaysia that doubled their incomes in a generation by growing steadily at 3.5 percent annually per
capita. This is possible if Egypt continues to grow at current rates, but many are sceptical because
similar spurts of high growth in the past faltered. Some wonder if current growth rates reflect
unusually favourable global conditions rather than a fundamental change in the economy; others are
concerned that the reforms are insufficient and/or that they may not continue, because some long
delayed and needed reforms seem unpopular. A key challenge is the strong perception that benefits
from recent economic reform and growth has disproportionately benefited the rich, with little
improvement in the welfare of the lower classes. This challenge has been amplified by increasing
widespread labour unrest demanding higher wages and recent public protests over clean piped water...
On top of that, inflation has been creeping up to 15.8 percent in March 2008), despite efforts by the
Central Bank, driven by global increase in energy and food prices and increased liquidity, while the
unemployment rate was not coming down until recently.
3. Has the tide turned for Egypt? This Development Policy Review (DPR) examines the
economy and salient policies through the economic lens of the Bank’s global development experience.
Examining the developments in some detail and going back several years when appropriate, the DPR
finds substantial benefits because of allowing a larger role for the private sector. It finds good reasons
for optimism: Egypt is now better integrated with the world economy with stronger trade, investment,
remittance and migration links that complement its historic and cultural ties. The current economic
orientation and policies have been in place since 1991 and the DPR finds that the measures since 2004
were appropriate to the prevailing conditions. Economic growth, employment and investment have
subsequently increased and broad swaths of the economy are thriving. Further growth could be
expected when small firms grow increasing formality, change employment patterns, and reduce
underemployment.
4. Current conditions require additional measures, and those needed to sustain growth largely
overlap with those that would broaden support for the reforms, particularly keeping inflation low,
improving education and other public services. In the medium term, government spending and
staffing should become consistent with its different role in the changed economy, and the DPR
identifies approaches the government could consider adopting. The main findings of the DPR’s five
chapters are summarised before the policies are reviewed.

ii
Main Findings
5. The DPR finds ample evidence that Egypt has prospered as a consequence of giving the
economy a greater market orientation. While favourable global conditions have helped, the structural
changes over the last two decades have been an essential ingredient for Egypt’s success: productivity
rose more in those segments of the economy where the private sector’s share in investment and output
grew most. Empirical estimates done for this report suggest that each dollar of private investment
contributed four times more to output than a dollar of public investment, reflecting in part the poor
choice and maintenance of public investment. Consequently, further increases in output, incomes and
productivity may be expected from the recently rising share of private investment in the total. Public
sector productivity has also increased in recent years, reflecting in part the increased importance of
state owned firms in petroleum and natural gas. Egypt’s economic growth is also now more closely
correlated with that of the OECD countries magnified by a factor of 1.25, and volatility has declined.
This results from many links, not just the direct effect of oil and gas.
6. Trade, both exports and imports, has risen following the elimination of the parallel market
premium in the exchange rate market after the 2003 currency devaluation and the subsequent
reduction in trade tariff rates. The second round of tariff reductions in February 2007 has reduced the
weighted average tariff rates to 6.9 percent, making Egypt among the world’s more open economies.
The standard deviation of tariff protection across Egypt’s sectors is now only 5.1 percent (excluding
beverages). But unlike in other countries, this has not levelled the playing field because Egypt’s
sizeable energy subsidies (6.8 percent of GDP in 2006, 5.5 percent in 2007 and an expected 8.8
percent in 2008) have disparate effects across sectors. The standard deviation of the implicit effective
protection (including the effects of energy subsidies) across sectors is still very high at around 130
percent (excluding beverages). Consequently, eliminating such subsidies would improve both
resource use and the fiscal situation. The Government announced in August 2007 that subsidies for
electricity and gas to the top 40 energy intensive industrial producers would be phased out over the
next three years, and that subsidies for non-energy intensive industries would continue until 2013.
7. Despite recent reforms and increased trade, Egypt has a relatively low propensity to export.
Put differently, the substantial growth of Egypt’s non-oil exports is less than other countries with
similar GDP growth rates. Also, it exports few manufactured goods and at a less aggregated level,
there is little evidence of greater integration into global production chains despite Egypt’s location
and other advantages. This may be expected from an economy which has long had an anti-export bias
and is precisely what recent reforms were designed to correct. The growth and diversification of non-
oil manufactures is a litmus test for the success of Egypt’s trade reforms. Detailed data end in 2004
just when the tariffs were reduced and the currency depreciated; and while intra-industry trade may
have risen since then, there is concern that Egypt’s unusually low proportion of mid-sized firms may
hamper such integration. Smaller firms tend to trade less internationally and are less integrated into
global supply chains that would make it easier for firms to adopt, adapt and diffuse superior
technology and raise productivity. International experience suggests that it takes time and sustained
effort for export orientation to take root in a business friendly environment.
8. Firms perceive improving business conditions. Surveys find that the 2005 reduction in
corporate and personal income tax rates and better administration have improved the perceptions of
firms that report fewer payoffs that often accompany inspections. The Bank’s 2008 Doing Business
report notes that it is now easier to start a business and puts Egypt at the top of the “most improved
business climate” list of countries; but it remains among the bottom third of the 178 countries, despite
iii
moving up to the 126th rank after being 165
th for two years running. It is also note worthy that FDI
inflows began to rise well before Egypt’s ranking did. The DPR finds that the recent changes have
had detectable effects on larger firms, not smaller firms’ numbers and operations.
9. Privatization remains sluggish, despite considerable efforts by the government to find more
capable owners for Law 203 firms, the group slated for privatization since 1991. Privatisation receipts
have risen dramatically, and much of this was from the stock exchange floatation of minority equity
stakes in state firms (e.g. 20 percent of Egypt Telecom) and from the sale of cellular licenses and
banks. Selling the (Law 203) firms would allow their assets to be better deployed and reduce the
likelihood that creditor banks would imprudently finance their shortfalls; but opponents play on public
fears of unemployment, although the firms now employ fewer than two percent of Egypt’s workers,
and employment would rise when firms are better run.
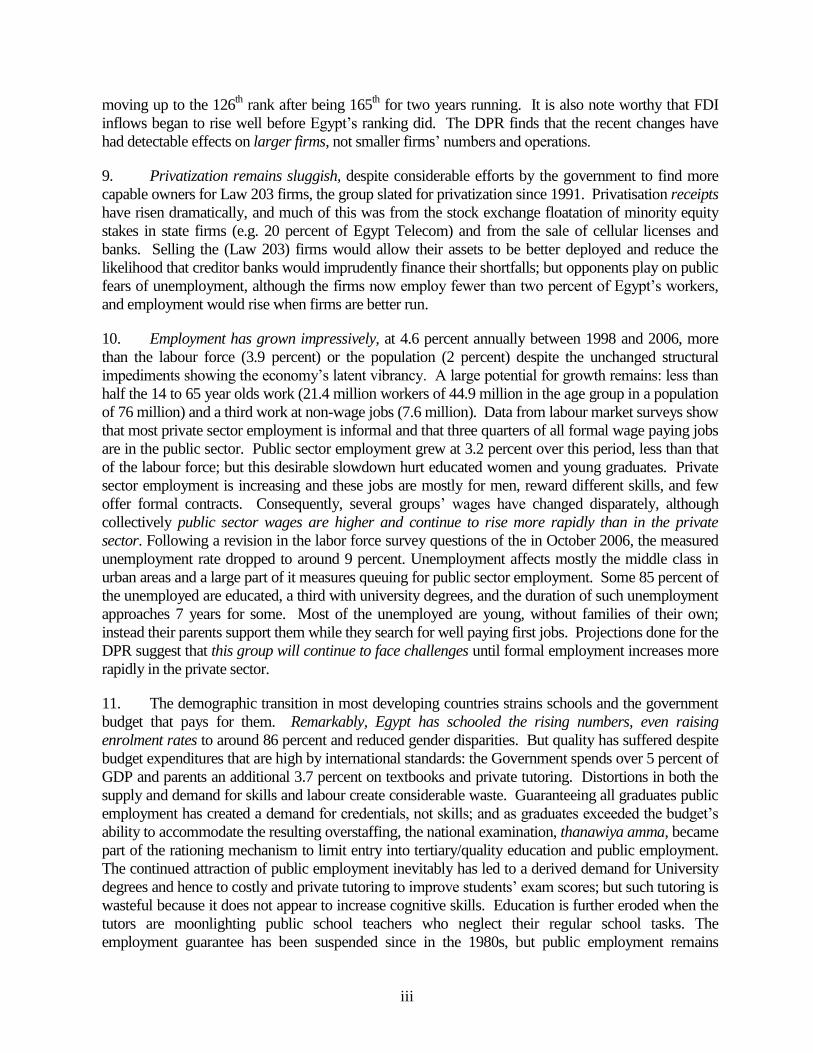
10. Employment has grown impressively, at 4.6 percent annually between 1998 and 2006, more
than the labour force (3.9 percent) or the population (2 percent) despite the unchanged structural
impediments showing the economy’s latent vibrancy. A large potential for growth remains: less than
half the 14 to 65 year olds work (21.4 million workers of 44.9 million in the age group in a population
of 76 million) and a third work at non-wage jobs (7.6 million). Data from labour market surveys show
that most private sector employment is informal and that three quarters of all formal wage paying jobs
are in the public sector. Public sector employment grew at 3.2 percent over this period, less than that
of the labour force; but this desirable slowdown hurt educated women and young graduates. Private
sector employment is increasing and these jobs are mostly for men, reward different skills, and few
offer formal contracts. Consequently, several groups’ wages have changed disparately, although
collectively public sector wages are higher and continue to rise more rapidly than in the private
sector. Following a revision in the labor force survey questions of the in October 2006, the measured
unemployment rate dropped to around 9 percent. Unemployment affects mostly the middle class in
urban areas and a large part of it measures queuing for public sector employment. Some 85 percent of
the unemployed are educated, a third with university degrees, and the duration of such unemployment
approaches 7 years for some. Most of the unemployed are young, without families of their own;
instead their parents support them while they search for well paying first jobs. Projections done for the
DPR suggest that this group will continue to face challenges until formal employment increases more
rapidly in the private sector.
11. The demographic transition in most developing countries strains schools and the government
budget that pays for them. Remarkably, Egypt has schooled the rising numbers, even raising
enrolment rates to around 86 percent and reduced gender disparities. But quality has suffered despite
budget expenditures that are high by international standards: the Government spends over 5 percent of
GDP and parents an additional 3.7 percent on textbooks and private tutoring. Distortions in both the
supply and demand for skills and labour create considerable waste. Guaranteeing all graduates public
employment has created a demand for credentials, not skills; and as graduates exceeded the budget’s
ability to accommodate the resulting overstaffing, the national examination, thanawiya amma, became
part of the rationing mechanism to limit entry into tertiary/quality education and public employment.
The continued attraction of public employment inevitably has led to a derived demand for University
degrees and hence to costly and private tutoring to improve students’ exam scores; but such tutoring is
wasteful because it does not appear to increase cognitive skills. Education is further eroded when the
tutors are moonlighting public school teachers who neglect their regular school tasks. The
employment guarantee has been suspended since in the 1980s, but public employment remains

iv
attractive for several groups. Education and employment are inter-twined and their reforms must be
in tandem. The Bank’s recent regional report on education suggests how this could be remedied1.
12. There are far more workers (21.4 million) than entrants (about 700,000 annually) who would
benefit from improved education; so considerable benefits would follow measures that increase
worker productivity in the private sector. The 2003 Labour Law loosened some of the many
restrictions that, although widely evaded, still have adverse effects. Firms avoid scrutiny by operating
on a small scale and employing workers informally, and this discourages efficiency and staff training.
The Government is considering lowering the effective wage tax rates as part of pension reforms that
would also change the benefit structure and put the pension system on a sounder financial footing; and
these would help increase formality of employment. Greater formality of both firms and employment
would increase on-the-job training, worker productivity and hence wages as well increase firms’
access to finance.
13. Surveys consistently find that private firms, especially the smaller ones, rely mostly on
retained earnings and owners’ funds to finance their operations. When finance limits the ability of
firms to respond to profitable market opportunities, the welfare cost is especially high in an
increasingly globalized economy where first movers gain an advantage that is difficult to overcome.
The level of savings will rise when the budget deficit falls, and the allocation of savings and
investment would improve when intermediaries operate better.
14. The DPR’s estimate of the flow of funds in two recent years confirms this absence of formal
outside financing: households save over 16 percent of GDP (domestic plus foreign savings were
almost 22 percent in 2006) much of it through banks that lend mostly to the public sector and hold
almost all the Government’s outstanding domestic debt. Private firms invest about 11 percent of GDP
but formal intermediaries (banks and capital markets) fund only about a fifth of this, some 2.4 percent
of GDP. So although banks are large with 90 percent of GDP in deposits, they lend little to the private
sector (flows) despite the sizeable stock of credit outstanding. Similarly, the equity market is large in
value, having risen from under 30 percent in 2002 to equalling GDP in January 2008, but provides
little financing to firms: there are few IPOs, and fewer still by private firms. Furthermore, the modest
funding through the capital market in 2005-06 displaced an equivalent amount of bank lending.
15. The authorities have been improving banking, the most important of the formal intermediaries.
Four state banks had dominated the system, both in size and through their control of joint venture
banks. The equity holdings in joint venture banks began to be divested in 2004, and several unviable
banks were closed through mergers. The Government privatised the smallest of the four state banks in
December 2006 and in July 2007 announced its intent to also sell the next smallest state bank.
16. Banking reforms have two potentially competing objectives: making banks sound and lending
to the private sector that is inherently risky. Egyptian bankers became especially cautious lenders after
1999, and banks now mostly finance the public sector holding almost all the outstanding government
paper. This has made the banks more solvent and reduced the government’s contingent liabilities
(stemming from implicitly guaranteeing all banking deposits); but economic growth and efficiency
1 World Bank (2008) The Road Not Travelled: Education Reform in the Middle East and North Africa. Also
available at
http://web.worldbank.org/WBSITE/EXTERNAL/COUNTRIES/MENAEXT/0,,contentMDK:21617643~pagePK:14
6736~piPK:226340~theSitePK:256299,00.html

v
suffer when the private sector relies on informal markets for finance. The DPR finds aggregate credit
flows to the private sector is low, although the decline over the past several years (as a fraction of both
GDP and private investment) is recently being reversed. Disaggregated data were not provided to
confirm whether the increase is from the privatised banks. Banking supervision will become
important as such lending increases, and the 2007 FSAP update reports on the improvements and the
remaining challenges.
17. Egypt would benefit from an intermediation strategy that recognises that some banks will
develop their capacity to appropriately price and manage different risks before others do, and that
these banks could prudently increase lending to the private sector. Banks slower to develop may have
large deposit inflows because of their extensive network of branches, and having them hold safe
government paper until they improve would provide an incentive for banks to improve while
improving the overall allocation of credit. This would be the first of three elements in the strategy.
Second, encourage intermediation by non-banks that have no direct access to household savers by
allowing mutual funds retail access to household savings and/or wholesale access through banks.
Even with such access, however, banks and capital markets are unlikely to serve small firms. The
large spread between deposit and lending rates suggests that such lending is potentially profitable if
lenders innovate and find ways of enforcing their claims cheaply. Such innovation is difficult in any
heavily regulated industry; so the third element allows some room for small unregulated
intermediaries — that now operate informally — provided they pose no systemic risks or infect the
banking system. Formalising existing (and largely unseen) informal intermediation would allow
successful techniques to be imitated, adapted and extended. Additional work is needed to flesh out the
details, and such an intermediation strategy would improve the allocation of investment; the level of
aggregate savings would increase when the budget deficit and government spending fall.
18. The DPR finds that economic management has improved in an increasingly open economy
subject to market sentiments. Foreign currency no longer trades at a premium in a parallel foreign
exchange market, although the nominal price of the dollar has been kept within a narrow band.
Keeping monetary, fiscal and exchange rate policies consistent requires astute management, especially
when capital flows are substantial. These capital inflows have benefited the economy overall, and
keeping interest rates low has helped the fiscal position.
19. Such macroeconomic developments and policies have had significant distributional
implications: when exchange rates are insufficiently flexible, capital inflows increase monetary
aggregates and hence inflationary pressures. Inflation and low real interest rates benefit debtors — the
largest being the Government, although larger firms also borrow from banks — while lenders (mostly
middle class households with bank deposits) are hurt. The DPR estimates this loss in households’
financial assets — banking deposits and substantial currency holdings — at around 4 percent of GDP
in several recent months, rivalling their income gains from economic growth. The surge of FDI also
benefits larger firms and real estate developers. Consequently, Egypt’s recent prosperity may have
bypassed some groups, such as the urban middle class and the poor, fuelling popular discontent.
20. Continued fiscal fragility despite tax reforms. The 2005 tax reform lowered corporate and
individual income tax rates, broadened the base and improved administration: these measures have
reduced distortions, and after a short lived increase, tax revenues have returned to around 15 percent of
GDP, a level that compares well with Mexico’s 12 percent. Raising substantially more tax revenues
will be difficult, because higher rates are inadvisable. With roughly 8 percent of GDP in non-tax
revenues, total budget receipts are substantially lower than the roughly 33 percent of GDP in

vi
spending: grants, non-recurring receipts and borrowings bridge the difference. To improve economic
decision making, the government widened the budget’s coverage and re-classified items in 2005, and
the measured budget deficit rose as a consequence. The Government announced that this overall
government deficit would be reduced by 1 percent of GDP annually over 5 years to 3 percent of GDP
by 2010-11. These targets have been met for two years, albeit with the help of substantial non-
recurring receipts and low interest rates (with the distributional consequences just mentioned).
21. The DPR finds little change in the broad patterns and levels of government revenues and
spending; and the Minister of Finance’s April 2008 announcement that the deficit reduction target for
2008-09 cannot be met reflects this structural imbalance. This missing of the target should not,
however, obscure recent improvements in budget planning, management and control. Parts of the
institutional decision making mechanism are improving with the greater comprehensiveness and
clarity of the budget, and improvements in financial management systems that monitor and control
spending and borrowing (e.g. the Treasury Single Account). Much still remains to be done (e.g.
internal audits and better public financial management): despite these improvements, cutting spending
has proved difficult. Investments and even maintenance (with high rates of return) have been
postponed for several years to the detriment of public infrastructure. Drastic spending cuts during a
crisis rarely last: when pay increases are postponed, they more than catch up later. Wages have
remained 7 to 8 percent of GDP for the last 20 years and although some civil servants earn less than
they could elsewhere, the average level and annual increase of public sector wages are higher than in
the private sector. Phased reductions in staffing over the medium term would reduce the fiscal deficit
in a more lasting manner and raise private sector employment and productivity; but while civil service
reforms are being discussed, as they have been every decade or so, they have not begun. The
Government is also aware of the substantial benefits from cutting poorly directed spending (e.g.
energy subsidies mentioned earlier), but Parliament and the public must consent to specific cuts.
22. Such consent has not been readily forthcoming. Some among the public and in Parliament
know that subsidies are poorly targeted but may be reluctant to cut them for fear of hurting the poor.
The Bank’s recently completed Poverty Assessment Update finds a complex picture that is easily
misunderstood and misreported: the headcount measure fell from 51.4 percent (1995) to 42.6 percent
(2000) and further to 40.5 percent (2005) using the upper poverty line (slightly below the international
$2/day), but the percentage of the extremely poor (less than $1/day) rose slightly between 2000 and
2005. Such headcount measures are sensitive to the defined poverty line when large numbers are
clustered around it. Other indicators such as the rise in consumer durables, access to telephones, etc.
suggest that average living standards of the poor are improving. Direct measures such as stunting
among children also show a welcome decline, and other measures of health show improvement.
23. The poor have benefited from growth, but despite improving averages, pockets of extreme
poverty remain. To properly assess the distributional and poverty impacts of recent economic growth,
the Government has requested CAPMAS to survey living standards (expenditure and incomes) every
two years instead of the earlier five-year cycle. In February 2008 of the same households were re-
surveyed and a full year’s consumption will be collected over April 2008-March 2009. Comparison of
such data with earlier surveys will help identify which various groups benefited from growth. Public
understanding and trust in the findings would increase if the data were made publicly accessible so
others could replicate the results.
24. Subsidies are an increasing fiscal expense, and the Government setting prices of several items
undercuts the functioning of markets. While a portion of the subsidies (less of the energy than the

vii
food) benefit some of the poor, the extremely poor get little because the subsidised items do not always
reach the remote areas where they live and the poor also bear a disproportionate share of inflation’s
costs. The extremely poor are deprived in many ways: they have no land, little or no education, and
cannot find work. The poor would receive a higher share of the benefit form improving health care,
family planning and education than from subsidies because such services cannot be easily purchased
even with more efficiently administered cash transfers. Other countries have found that involving
beneficiaries improves the design and oversight of both subsidy delivery systems and the provision of
public services.
25. Collective decision making has been difficult although parts of the public oversight
mechanism are improving: the budget is now clearer and more comprehensive and while such
improvements permit better public oversight, for this to actually happen, entities outside of
government must also develop. Collective decision making also requires an array of “institutions” that
safeguard public interest: an informed public engaged in civic affairs, Parliamentarians who compete
to represent the public, etc. These will develop with greater access to data, and trust in their accuracy.
The Bank’s 2007 Governance Indicators put Egypt below the 50th percentile of countries; while the
voice and accountability indicators put Egypt below the 20th percentile. Recent Government efforts to
establish a “Transparency and Integrity Committee” with civil society participation, along with effort
to ensure greater access to information and more broadly improve governance indicators are important
initial steps.
26. The DPR finds that notwithstanding the high level of gross public debt (87 percent of GDP),
Egypt’s net public debt (i.e. offset against assets such as the central bank’s foreign exchange reserves)
is more modest and sustainable, especially if reforms and growth continue. With a large stock of
currency in circulation (12 percent of GDP), the substantial seignorage that benefits the government is
now augmented by negative real interest rates on its domestic debts. The large capital inflows have
raised foreign exchange reserves and reduced net external debt. These favourable conditions allow the
Government to take appropriate spending measures in a deliberate and well planned manner.
Development Policies Reviewed
27. The thrust of current economic policies is sound. Broadly speaking, these policies (1) allow
the private sector a larger role and facilitate investment; (2) integrate Egypt globally through lower
trade tariffs and a better business climate that continues to attract capital; and (3) improve macro-
economic management. Egypt has never been isolated from the world — indeed, the Suez Canal, the
large numbers of migrants sending sizeable remittances and capital flows make this impossible — and
the recent reforms explicitly recognise the importance of allowing the private sector to fully participate
in this global economy. Orienting these policies since 1991 has taken considerable effort, and the
ensuing rewards from surging growth have been substantial. The 2004 measures rightly responded to
the pressing needs at the time: eliminating the premium for foreign exchange in the parallel market
that had developed have increased trade and capital flows; more large firms are being established after
the Government made it easier to start a business, and so on. When other parts of the economy also
change — greater formality of firms and employment — both growth and distribution would improve.
28. Egypt’s recent success has spawned other concerns: capital inflows with limited exchange
rate flexibility increase monetary aggregates and inflationary pressures that in turn have adverse
distributional effects because inflation and low real interest rates erode the currency holdings and

viii
banking deposits. Fortunately, there is a large overlap of additional measures needed to sustain
growth and those that broaden support for continued reform.
29. Much remains to be done, especially with long gestation reforms that would have enormous
benefits. Recent reforms are improving physical capital and investment, and similar efforts to improve
human capital would both increase productivity and support for the reforms. With the demographic
transition underway, the creation (education) and deployment (labour markets) of human capital are of
great importance in the medium term. It is difficult for a large bureaucracy to deliver the necessary
public services such as education effectively or efficiently, and improvements require a consensus
over the need and broad support over the direction. A larger role for the private sector — rewarding
individual initiatives and allowing prices to guide the allocation of resources — requires a different
role for the government, and this transformation is still beginning. Policies that need some fine tuning
are discussed before other issues to be addressed are mentioned.
Fine-tuning Policies
30. With lower trade tariffs, “behind the border” improvements such as better customs procedures
and distribution logistics would help firms integrate more closely into global production chains and
benefit from better technology. These changes are beginning and the efforts to improve the business
climate should shift emphasis from starting a business to operating them. Identifying which of the
many hurdles to remove first is not easy, and entities that convey business concerns to the government
(e.g. investment or export promotion boards) have limited or short-lived success in many countries
because they become vehicles for rent-seeking. As lenders become aware of smaller firms’ needs,
they could channel this information to the government through the central bank that could monitor real
sector developments as part of its oversight functions.
31. Banking reforms have begun well and provide the platform for an intermediation strategy to
improve investment allocation (the level would rise with lower government spending that increase
savings). Tailoring the strategy to Egypt’s current situation would (i) restrict a few identified banks to
holding government paper until their credit culture and governance become sufficiently effective, (ii)
increase non-bank intermediation by giving non-banks retail access to household savings and/or
wholesale access to banks, and (iii) extend the protection of formality to unregulated intermediaries
with safeguards against systemic failure. Detailing the strategy requires assessing the current
capabilities of several entities including the central bank, but may not require any additional laws or
authority to implement.
32. Privatisation (of Law 203 firms) has stalled despite the Government’s efforts, and their
continued operations threaten the soundness of creditor banks that have financed their shortfalls. The
government is considering instituting performance contracts to improve the firms, but international
experience is not encouraging. Quickly resuming their privatisation would be better, and meanwhile
subject each firm to a hard budget constraint (to avoid cross-subsidies within and across holding
companies) and make their finances publicly transparent (including financial transactions within
holding companies).
33. Despite these concerns, the Bank projects Egypt’s real growth to remain high, moderating to
6.5 percent by 2011, but there are many risks that current and future policies could mitigate.
Regardless of nominal exchange rate flexibility, the recent real appreciation of the pound will likely

ix
continue because Egypt’s inflation is expected to be higher than its trading partners. Exports will
continue growing, albeit more slowly than recently, helped by a rise in oil and gas exports as more
fields become productive. Capital will continue to flow in, although at more moderate levels; but the
turmoil in international financial markets since August 2007 underscore how quickly global
conditions could deteriorate.
34. Lower government spending would reduce Egypt’s vulnerability and raise aggregate savings
and hence investment. Future growth may be stymied by infrastructure bottlenecks because such
investments have declined over the past decades, and renewals will use a sizeable portion of national
savings. Public infrastructure must be adequately maintained, and despite the risks, PPP is a prudent
approach until Government could ensure that increased spending translates into adequate maintenance
and appropriate investments. The experience from transforming countries in Eastern Europe during
the 1990s show that even after decades of socialism, greater public and beneficiary involvement helps
institutions develop in different forms to ensure effective public spending.
35. A greater role for the private sector implies a smaller, and different, role for the government
— and spending, staffing and what it attempts must all change accordingly. Put differently, structural
reforms have not yet fully reformed the economy’s structure, particularly the government’s size as
well as a shared understanding of the role of the state in a re-defined social contract with the citizens.
Past reform attempts were short lived largely because these issues were not addressed.
Policies Needing Attention
36. The need to improve social policies is becoming urgent. Poverty reduction and improvement
of living standards for the majority of the population is an ultimate outcome of sound economic
policies. Poverty alleviation is consistently an overarching objective of Egypt’s development plans.
The underlying logic of the Government’s policies has been spelled out in the Poverty Reduction
Strategy for Egypt prepared in 2004. It laid out a three-pillar strategy: (i) increasing current incomes
through growth, (ii) increasing future incomes through education, (iii) protecting the vulnerable
through an effective and targeted social safety net. The thrust of the policy action so far focused on
the first pillar of this strategy, and to a lesser extent on the second. Despite the difficulties discussed
above, growth has increased, but the social safety net has yet to be modernized and improved. Only in
2008 the government announced plans to extend the coverage of the targeted social assistance from 1
million to 2 million families, - still a small fraction of Egypt’s poor population. Actions are urgently
needed to reform the outdated, poorly targeted and inefficient subsidies system, whose costs expand
with rising world prices fuelling popular discontent. The technical aspects strengthened social
assistance system have been well studied, though not in this report, but the issue of political decision to
act has yet to be made.
37. Energy and food subsidies are the two big spending categories, and the former is the more
substantial and benefits the rich disproportionately more than the poor. Energy subsidies — at least
5.5 percent of GDP in 2006-07 and expected to be 8.8 percent in 2007-08 — keep the effective rate of
protection high, reducing the benefits of lower trade tariffs. The government announced in August
2007 that energy prices to 40 energy-intensive industrial users would be raised over 3 years, and has
reconfirmed this plan even after the recent increase in world energy prices and the turmoil in the
global financial markets.

x
38. Reducing subsidies on food is more difficult because people observe the direct effect of
raising controlled prices but not the poor paying for them indirectly through taxes and inflation.
Having controls on prices makes it easier to mistake symptoms for the cause because raising the price
directly affects the constructed price index. Unchanged domestic prices of baladi bread and other
food items when world prices are higher increase scarcity and lengthen queues — but the adverse
publicity of the very young and old being trampled upon in the scramble to obtain subsidised bread
increases public pressure on the government to increase subsidies rather than to subsidise the items
less. A better system would have a greater poverty reduction impact and simultaneously lower the
budget.2.
39. Keeping the prices of items in the consumption basket low only affects the inflation measure,
and policies within the Government’s control can reduce the underlying inflationary pressures. The
exchange rate has been insufficiently flexible to prevent an increase in money; but keeping exchange
rate, monetary and fiscal policies consistent requires astute management that would be easier with
lower government spending.
40. Public employment is a challenge that is best tackled in tandem with improving education.
The wage bill of public employees who number 5.6 million (26 percent of the work force) has long
been 7-8 percent of GDP — seemingly modest, but with complex effects. The many required changes
must be sustained over long periods and a broad consensus on the direction is therefore
indispensable. Education is one of the more important of the services the public sector provides, and
improvements would have direct economic benefits and buttress public support for the whole package
of reforms and allow additional measures that boost productivity and growth3. Productivity increases
in the non-traded sector where many of the smaller firms operate on a small scale at the fringes of
formality would improve both income and distribution. This applied in both urban and in rural areas
where farmers contend with a plethora of restrictions (marketing arrangements, irrigation system) that
limit their ability to increase their productivity and income.
41. Egypt’s current challenge is to reduce the size and scope of the Government without
disruption, providing the private sector more room to invest, innovate and grow. This approach and
the associated measures have the President’s support; public support may be more forthcoming when
the people are better informed. Making the budget more comprehensive and comprehensible has been
an important step, and greater confidence in the distributional fairness of government policies would
increase support for better policies. This report outlines measures that help Egypt continue along this
path to prosperity.
2 World Bank (2005) Egypt — Toward a More Effective Social Policy: Subsidies and Social Safety Net Report
No.33550-EG. 3 These are more limited policies than those envisioned by the Commission on Growth and Development that visited
Egypt in late 2006. Discussions on higher education, science and technology spending and similar issues become relevant
when Universities and schools are sufficiently improved. Several papers written during its deliberations are available at:
http://www.growthcommission.org/

1
CHAPTER 1: CHANGING ECONOMIC STRUCTURE &
INVESTMENT
1.1 This chapter examines the salient changes in the economy over the last several years. The
shift in policies giving the private sector a larger role began timidly in the 1970s and more boldly
after 1990. The chapter finds that the increase in the private sector’s role in the economy led to a
substantial increase in productivity. Nevertheless, the Government has an important though different
role than before — and the report as a whole looks at how the government is changing to fill this
new role. This chapter begins by describing the changing economic structure with a detailed look at
physical investment.
1.2 The first section examines the dramatic observable shift in the private sector, especially in
investment. In addition to the larger private sector, Egypt’s growth is increasingly correlated with
that of OECD countries: every percentage point rise in OECD growth is associated with a 1.25
percentage point increase in Egypt’s output. This increased correlation is the result of many links,
not the direct effect of a single factor like oil or tourism. Despite these changes, some parts of the
economy have barely changed, giving rise to concerns over disparities in incomes and the
persistence of poverty especially in rural Upper Egypt. The complex nature of poverty is briefly
described: the poor are employed in low productivity work, and the extremely poor are deprived in
many ways, lacking land and access to public services such as education, health and family
planning. While economic growth may have bypassed some of the extremely poor, economic
growth has benefited the vast majority of Egyptians, although the recent rise in inflation has had
adverse distributional effects.
1.3 The second section examines the role that physical investment has played. Using
disaggregated data that the Ministry of Economic Development carefully collected for nine
segments that constitute the whole economy, the section finds that rising productivity is the result of
private investment. Total factor productivity rose more in those parts of the economy where the
private sector’s share increased: so the relation is causal, not co-incidental. Public investment has
declined as a proportion of GDP without adverse effects on output growth. Indeed, the empirical
analysis finds that a dollar in private investment increased output four times as much as a dollar in
public investment despite the obvious public infrastructure shortcomings. This underscores the poor
choice of past investments both in public enterprises and even in infrastructure where inadequate
maintenance renders such investments less useful.
1.4 The secular decline in public investment has not adversely affected output because Egypt’s
stock of public infrastructure is substantial and built over earlier decades. This infrastructure is
decaying in many areas, and the third section examines how the government is now turning to
public private partnerships to improve public investment. This approach has both merit and risks
and the recent experience both in Egypt (in power generation) and elsewhere are summarized. The
Ministry of Finance has established a unit to promote PPP, and the merit and limitations of the
efforts to improve school building is analyzed.
A. CHANGING ECONOMIC STRUCTURE
1.5 Over the last three decades, Egypt’s economy has changed in three important aspects — and
did not change in one. First, as with development in most countries, the composition of output

2
56 56 59 64 62 66 66
62 61 62 63 64 65 66 69 71 70 70 67
65 63 63 61
13 12 12 12 12 13 17
13 9 9 7 7 8 10 11
8 10 9 9 8 10 12
0
20
40
60
80
FY83 FY85 FY87 FY89 FY91 FY93 FY95 FY97 FY99 FY01 FY03 FY05
Share in total GDP
Private GDP 57
Private investment 21.2
changed with agriculture’s share in output declining. Figure 1.1 shows this for Egypt, and large
share of services reflects Suez Canal traffic and tourism. Despite its declining share, real
agricultural output rose as shown in Figure 1.2; it is just that non-agricultural output grew faster.
1.6 Second, the state’s role in the
economy has declined in general, but not
consistently. Figure 1.3 shows the private-
public split in the economy’s GDP, total
employment and aggregate investment: the
private sector’s share (the portion below
each line) rising considerably for
investment, discernable for output (the
decrease since 2001 reflects the booming
Suez Canal traffic and of oil and gas output
that accrues to the state), and barely
changing for employment.
1.7 Figure 1.4 shows
that private investment to
total GDP varied over
the years, and the recent
sharp rise from 8 percent
in 2004 to an expected
14 percent in 2007 is not
unprecedented. But it is
remarkable because the
investment increase is
despite the private
sector’s declining share
in GDP from about 61
percent in 1991 when
policies permitting
private enterprise were
instituted and peaked around 71 percent in 1999 when Suez Canal traffic and gas production
(accruing to the public sector) began rising rapidly. Natural gas production overtook petroleum in
Figure 1.1: Sector Shares in GDP
0.0
20.0
40.0
60.0
80.0
100.0
FY74 FY76 FY78 FY80 FY82 FY84 FY86 FY88 FY90 FY92 FY94 FY96 FY98 FY00 FY02 FY04 FY06
% o
f G
DP
Agriculture manufacturing nonmanufacturing Services & others
Figure 1.2: GDP by Sector Constant 1992 LEb
0.0
50.0
100.0
150.0
200.0
250.0
300.0
FY74 FY76 FY78 FY80 FY82 FY84 FY86 FY88 FY90 FY92 FY94 FY96 FY98 FY00 FY02 FY04 FY06
Agriculture manufacturing nonmanufacturing Services & others
Figure 1.3: Private (below) & Public (above) Shares
0.0
10.0
20.0
30.0
40.0
50.0
60.0
70.0
80.0
90.0
100.0
1975 1978 1981 1984 1987 1990 1993 1996 1999 2002 2005
Perc
en
tag
e s
hare
s
Investment Employment GDP
Figure 1.4: Egypt Private Sector

3
2005-06, together they account for almost 15 percent of GDP, almost double that in 2000-01.4
Private investment’s share in aggregate investment rose because public investment declined, and
these effects will be examined further later in this chapter.
1.8 A third change is the greater
correlation of Egypt’s growth with
OECD countries. Dobronogov and
Iqbal5 (2004) examined Egypt’s
growth since the 1960s and found
that its correlation with OECD
growth increased substantially since
1991. Figure 1.5 reproduces their
findings showing lower growth
volatility which they take as evidence
of a structural change resulting from
Egypt’s greater openness.
1.9 Two additional years of data
finds that OECD growth explains
almost two thirds of the variation (R2
of 0.63) in Egypt’s real economic growth from 1990 to 2005 — the period after the detected shift
that coincides with the start of structural reforms6. Growth rates of Egypt’s GCC neighbors have no
explanatory power, and the effect of oil prices are also statistically insignificant (p-value 0.81). If
this relation continues to hold, every percentage point increase in OECD growth would raise
Egypt’s growth by 1.25 percentage points. Egypt has greatly benefited from the unusually good
economic conditions in OECD countries now, and this allows the government to undertake further
reforms.
Almost all have benefited from growth, despite regional disparities
1.10 Egypt has less consumption inequality (Gini coefficient is 0.32) than most countries but
some Upper Egyptian governorates have remained poorer than others for decades. This and the
seemingly meager decline in poverty measures between 2000 and 2005 have alarmed some about
the effects of growth on the poor. The Bank’s 2007 Poverty Assessment Update examines
household survey data from 2005: in a country with little inequality and a PPP adjusted GDP per
capita of over $10/day, almost 20 percent are poor (including almost 4 percent extremely poor), and
an additional 20 percent are near poor 7. Table 1.1 shows this total of poor and near poor at 40.5
4 The conventional GDP measures the value of what is produced, but taking the full value of extracted products
without adjusting for depletion overstates incomes. 5 Anton Dobronogov and Farrukh Iqbal (2004) “Economic Growth in Egypt: Constraints and Determinants”
World Bank, Middle East and North Africa Working Paper Series No.42. Also available at ERF’s website:
http://www.erf.org.eg/cms.php?id=publication_details&publication_id=381 6 gE
t = 1.076 + 1.25 g*t + 0.006 pot
(p-value) (0.0005) (0.81)
7 Egypt has multiple poverty definitions, and the calculations are complex, depending on regions, household size
and composition. The poor are those below the national (or lower) poverty line of 1,400 LE/year (about
$1.5/day PPP adjusted), and include the extremely poor (who are a subset of the poor) who consume less than
Figure 1.5: Correlation of OECD and Egypt’s GDP Growth
5 year moving averages
-0.8
-0.6
-0.4
-0.2
0
0.2
0.4
0.6
0.8
1
1960 1965 1970 1975 1980 1985 1990 1995 2000
Year
Co
rrela
tio
n c
oeff
icie
nt

4
percent in 2005; but while poverty has declined, the magnitude has been modest and disparities
across regions remain. This has led to some disappointment and calls for urgent actions.
Table 1.1: Percentage of Poor and Near-poor, by regions 1995-2005
1.11 This section provides a
perspective to these developments
and makes three points: (1) all
groups are benefiting from higher
incomes and standards of living,
some more than others; (2) a few
groups, smaller in number than
even the extremely poor, are
barely prospering and they are
deprived in many ways (no land, education etc.); and (3) public infrastructure such as better roads
could help raise regional incomes, but the extremely poor would benefit more from well-
administered public services such as health care and family planning.
1.12 With large numbers clustered around each poverty line, small changes in the defined line
have large effects on the head count measure. Despite care and effort in the calculations, the price
indices used with the 2005 household survey data are less reliable than in other periods because the
survey followed the large 2003-04 depreciation of the pound in the foreign exchange market and
whipsawing inflation. Other data in the same surveys show improving standards of living even
among the poor: they have more consumer durables, telephones etc.
1.13 But while the poverty decline may be underestimated, disparities have persisted for decades,
and these could be viewed as either rural or regional (Upper Egypt). Rural areas account for 56
percent of the population, 66 percent of the near poor, 78 percent of the poor, and 80 percent of the
extremely poor. Viewed differently, Upper Egypt’s rural areas have 27 percent of the population,
31 percent of its near poor, 51 percent of the poor, and 66 percent of the extremely poor. But while
the poor are more numerous in some parts of Egypt, there is progress even in these regions.
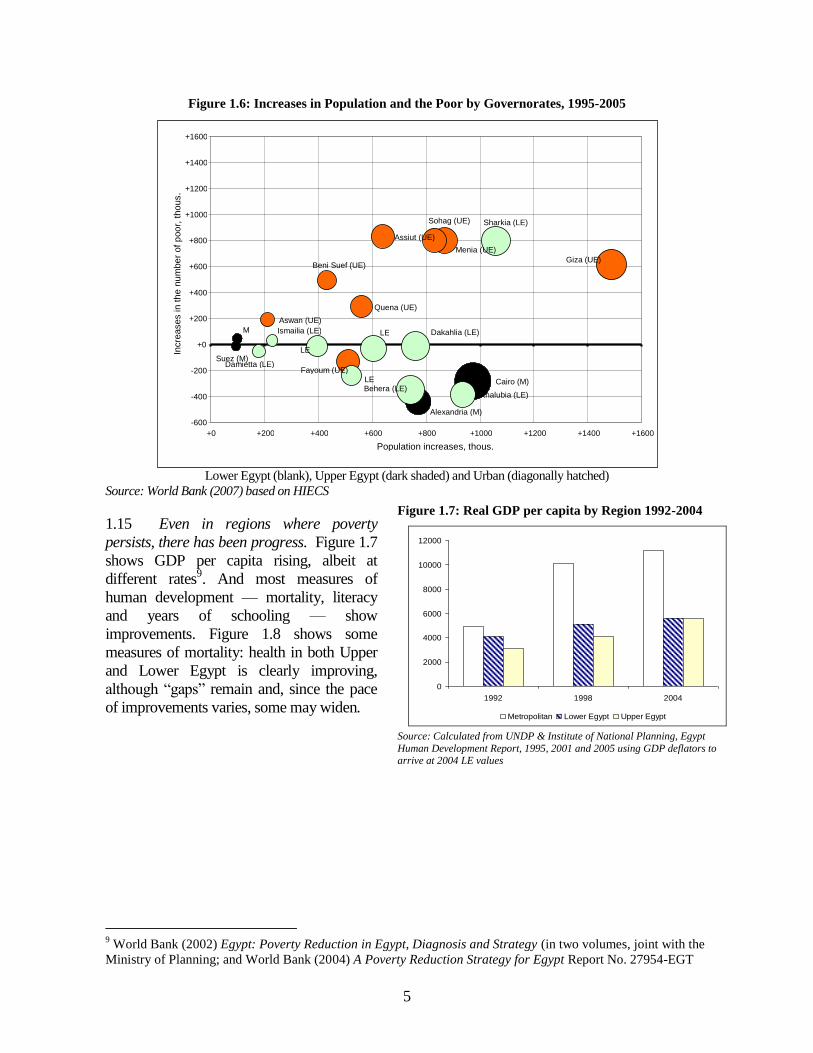
1.14 Figure 1.6 plots the change in population against changes in the poor by governorates: with
the area of the circle representing population size, and shaded for Upper Egypt. Economic growth
pulled people out of poverty in most governorates, but the poor have increased more than the
population in Assiut — and internal migration is probably too small to affect the picture8. So while
poverty has risen in some governorates, it has fallen in others governorates like Fayoum in Upper
Egypt. And poverty declined most in urban areas.
900 LE/year (in 2005 LE, or about $1/day PPP adjusted) just enough for the minimal caloric intake. The near
poor are those above the national poverty line but below the upper poverty line of 1,850 LE/year (just under
$2/day). 8 Jackline Wahba (2007) “An Overview of Internal and International Migration in Egypt” ERF Working paper
(forthcoming) finds that internal migration rates increased between 1998 and 2006, after having slowed in the
1990s following three decades of rapid rural to urban migration. Commuting had risen and has not changed
recently. Wahba also finds evidence that international migration remains an important feature and that returning
migrants are more educated and skilled than non-migrants.
Regions 1995/1996 1999/2000 2004/2005
Metropolitan 35.6 19.6 18.0
Lower Egypt Urban 33.5 27.7 27.2
Lower Egypt Rural 57.1 42.0 41.1
Upper Egypt Urban 44.0 48.9 38.0
Upper Egypt Rural 65.3 63.5 64.6
All Egypt 51.4 42.6 40.5
Source: World Bank (2007) based on HIECS
5
Figure 1.6: Increases in Population and the Poor by Governorates, 1995-2005
Lower Egypt (blank), Upper Egypt (dark shaded) and Urban (diagonally hatched)
Source: World Bank (2007) based on HIECS
1.15 Even in regions where poverty
persists, there has been progress. Figure 1.7
shows GDP per capita rising, albeit at
different rates9. And most measures of
human development — mortality, literacy
and years of schooling — show
improvements. Figure 1.8 shows some
measures of mortality: health in both Upper
and Lower Egypt is clearly improving,
although “gaps” remain and, since the pace
of improvements varies, some may widen.
9 World Bank (2002) Egypt: Poverty Reduction in Egypt, Diagnosis and Strategy (in two volumes, joint with the
Ministry of Planning; and World Bank (2004) A Poverty Reduction Strategy for Egypt Report No. 27954-EGT
Figure 1.7: Real GDP per capita by Region 1992-2004
0
2000
4000
6000
8000
10000
12000
1992 1998 2004
Metropolitan Lower Egypt Upper Egypt
Source: Calculated from UNDP & Institute of National Planning, Egypt
Human Development Report, 1995, 2001 and 2005 using GDP deflators to arrive at 2004 LE values
M Dakahlia (LE) LE
LE
LE Behera (LE)
Quena (UE)
Beni Suef (UE)
Assiut (UE) Sharkia (LE)
Menia (UE)
Sohag (UE)
Aswan (UE)
Cairo (M)
Ismailia (LE)
Giza (UE)
Damietta (LE)
Alexandria (M)
Suez (M) Fayoum (UE)
Khalubia (LE)
-600
-400
-200
+0
+200
+400
+600
+800
+1000
+1200
+1400
+1600
+0 +200 +400 +600 +800 +1000 +1200 +1400 +1600 Population increases, thous.
Incre
ases in th
e n
um
be
r of p
oo
r, t
ho
us.

6
1.16 Poverty is an individual
characteristic, not a regional
aggregate; so group averages do
not measure welfare. Similarly,
poverty rates merely measure how
many are below an arbitrarily
determined line, not how deprived
they are. The detailed findings in
the Poverty Assessment Update
shed some light on the
characteristics of the poor: most
work, often at non-wage jobs and
the extremely poor have no land,
little education and often ill
health. Nevertheless, except for
very few people (a sub-group of the extremely poor), their diets, life expectancy and other human
development indicators are improving — more rapidly for some groups than for others.
How to catch up?
1.17 A low standard of living, especially in developing countries, reflects limited opportunities,
little capital and low technology, not the absence of effort or the temporary effects of business
cycles. Such situations sometimes arise within countries as well, and Governments have found it
difficult to increase growth in such lagging regions.
1.18 Upper Egypt is such a lagging region, although it has more fertile land and better water
(being upstream and unaffected by salinity) than Lower Egypt. Nevertheless, 93 percent of the
cultivated area in Upper Egypt produces low value traditional crops, and subsistence agriculture
accounts for 40 percent of rural incomes and for almost two-thirds of rural employment. Small land
holdings and high transport costs makes farming non-traditional crops (e.g. horticulture serving
export markets) uneconomical: the Bank’s recent Policy Note on Rural Development10
points out
that public investments have not been calibrated to poverty and that almost “90 percent of
government transfers are absorbed by wages at the expense of infrastructure and equipment.” Many
groups would benefit from better physical infrastructure and greater regional trade, especially those
with larger holdings able to invest the greater capital required; but the extremely poor may not
benefit because they do not have land or capital. Indeed, some empirical work using governorate
data for 2000 to 2005 find higher yields per feddan associated with higher poverty rates.
1.19 Public infrastructure investments, discussed later in this report, are therefore not panacea.
Improved roads and other infrastructure that reduce transport costs would help raise incomes in the
lagging regions, but in sparsely populated regions (where the extremely poor live) the expense of
such infrastructure may exceed the additional benefits. Some private investments in refrigeration
and packaging facilities may be worthwhile, and these will occur as the business climate improves
and the growing private sector seeks out and finds these potentially profitable niches. Employment
10
World Bank (2006) Upper Egypt — Challenges and Priorities for Rural Development Policy Note Report No.
36432-EG
Figure 1.8: Improving Health indicators Everywhere
0
50
100
150
200
250
1992 2004 1992 2004 1992 2004
Infant mortality Under-five mortality Maternal Mortality
Lower Egypt Upper Egypt
Source: UNDP Human Development reports, 1995 and 2005.

7
in manufacturing, trade, transportation and services rose by 28 percent between 2000 and 2005 in
rural Upper Egypt adding half a million new jobs to sectors employing a quarter of the 6 million
workforce, but poverty rates did not fall whereas real wages did11. Chapter 3 discusses employment
in detail, but real wages fell because wages in low skilled jobs did not keep pace with inflation. One
clear way for the Government to help the extremely poor in lagging regions is to provide adequate
public services.
Better government services
1.20 The Government is
responsible for providing services
such as public health and education.
Almost 40 percent of residents in
Upper Egypt have no access to
sanitation versus 31 percent in
Lower Egypt. Clean water would
help lower infant mortality rates
(under five mortality is 34.6 per 1,000 versus 20.3 elsewhere), and the Bank’s water sector studies
have many specific suggestions on sewage disposal and maintenance of irrigation canals. Primary
health clinics could tackle preventable diseases and offer family planning services: surveys find that
although the poor in Upper Egypt have more children (7.5 persons in an average poor household
versus 4.4 elsewhere), their preferred numbers are not different. This is not to imply that nothing is
being done: Table 1.2 shows dramatic improvements in one metric of children’s’ health, and the
dramatic narrowing of “the gap” shows what is possible.
1.21 Along with other measures discussed in Chapter 3, a more equitable regional allocation of
education spending would improve schooling: only 73 percent of children complete primary school
in Upper Egypt versus 82 percent in Lower Egypt and 87 percent in urban governorates. Half the
public preparatory schools’ pass rates in Upper Egypt are below the national average while only 27
percent in Lower Egypt and 3 percent in urban governorates fall in this category. Excessive
centralization has been detrimental, but decentralization alone will not improve education and other
measures that would help are discussed later in this report (Chapter 3).
B. RISING PRODUCTIVITY FROM PRIVATE INVESTMENT
1.22 Figure 1.3 had showed the rising share of private investment in aggregate investment, and
Figure 1.9 shows that this rise was primarily because public investment declined over the decades,
lowering aggregate investment fell from an average of 32 percent of GDP in the 1980s, to 25
percent in the 1990s, and even further to 19 percent in the current decade. Output has nevertheless
grown, and this section examines the level and productivity of investment, separating private and
public productivity in nine segments that together encompass the whole economy using data
carefully prepared and made consistent by the Ministry of Economic Development. These data
11
Heba El Laithy (2006) “Non-farm Employment and Inequality in Rural Egypt.” Background Paper for World
Bank Poverty Assessment Update.
Data are from HIECS 1999/2000 and 2004/05, and CAPMAS family income and consumption survey.
World Food Programme (2005) “Vulnerability Analysis and Review of Food Subsidy in Egypt” reports the
lower availability of subsidised food in Upper Egypt.
Table 1.2: Children under 5, percentage stunted
(low height for age) 1992-2005
Regions 1992 2000 2005
Upper Egypt Rural 40 27.2 23.2
All Egypt 26 18.7 17.6
Source: Egypt Demographic and Health Surveys; figures are for children
under age five classified as undernourished if their z-scores are below two
WHO reference population’s standard deviations from the median.

8
conform to the government’s
classification (e.g. Law 203
firms are considered private
although the government owns
their equity) and investment in
“transport” includes railways,
trucks and roads. Figures
showing the public–private split
in investment, employment and
GDP are first presented before
turning to productivity
calculations.
1.23 Without exception, private investment rose in all sectors: in agriculture, industry, and
construction the private sector’s share in investment raised six fold between 1960-83 and 2001-
2006; in services (particularly restaurants/hotels) private investment’s share reached 86 percent; in
finance/insurance and in social services, the public sector remains important, although the private
sector’s share is rising. Figure 1.10 shows that in infrastructure, private investment rose from almost
nothing to 16 percent in electricity and from 12 percent to 36 percent in transport and
communications.
Figure 1.9: Investments to GDP
0
5
10
15
20
25
30
35
40
1975 1977 1979 1981 1983 1985 1987 1989 1991 1993 1995 1997 1999 2001 2003 2005
%
Private
Public + Private

9
1.24 While Figure 1.3 showed little change in the private sector’s share in aggregate
employment, Figure 1.11 shows substantial changes in several segments. Two-thirds of total
employment is in Agriculture and Education, and the private sector’s share in education declined.
The public-private split did not significantly change in Health and General Services which are
shown combined with Education. While the share of private employment in petroleum rose
substantially, it is not as large an employer as industry.
Figure 1.10: Investment Composition by Sector and Category over Time
Agriculture Industry & Mining
Petroleum & Products Electricity Construction &
Building Transportation
(SC) & Communication
Trade, Finance and Insurance
Restaurants & Hotels
Education, Health & General Services
Agriculture Industry & Mining
Petroleum & Products Electricity Construction &
Building Transportation
(SC) & Communication
Trade, Finance and Insurance
Restaurants & Hotels
Education, Health & General Services
1983-1990
40%
41%
79%
1%
40%
17%
61%
87%
47%
60%
59%
21%
99%
60%
83%
39%
13%
53%
1991-2000
47%
59%
62%
53%
16%
58%
80%
32%
53%
41%
38%
94%
47%
84%
42%
20%
68%
6%
2001-2006
59%
68%
72%
16%
77%
36%
53%
86%
42%
41%
32%
28%
23%
64%
47%
14%
58%
84%
1960-1982
28%
0%
13%
12%
21%
39%
32%
91%
90%
72%
100%
87%
88%
79%
61%
68%
9%
10%
Private Sector Public Sector

10
Figure 1.11: Employment by Sector and Category over Time
1.25 This shift towards private sector is also apparent in figure 1.12 showing the sectoral
components of GDP: it was pronounced in transport and communication (from 13 percent private in
1960-82 to 55 percent in 2001-07). Similarly by 2000-2007, the private sector’s share reached 90
percent in Industry and Mining, 75 percent in construction and building, 85 percent in trade, finance
and insurance, and 99 percent in restaurants and hotels. The public sector remains large in energy
(petroleum and electricity).
Agriculture Industry & Mining
Petroleum & Products Electricity Construction &
Building Transportation
(SC) & Communication
Trade, Finance and Insurance
Restaurants & Hotels
Education, Health & General Services
Agriculture Industry & Mining
Petroleum & Products Electricity Construction &
Building Transportation
(SC) & Communication
Trade, Finance and Insurance
Restaurants & Hotels
Education, Health & General Services
1983-1990
97%
48%
29%
77%
38%
79%
93%
35%
52%
71%
100%
23%
62%
21%
7%
65%
0%
3%
1991-2000
98%
65%
28%
0%
85%
51%
88%
96%
29%
37%
72%
100%
16%
50%
13%
70%
4%
2%
2001-2007
99%
83%
69%
91%
67%
90%
99%
31%
17%
31%
9%
33%
10%
69%
0%
1%
1%
100%
1960-1982
98%
39%
79%
49%
75%
72%
39%
61%
97%
100%
21%
51%
25%
28%
61%
0%
3%
2%
Private Sector Public Sector

11
1.26 GDP per worker and per capita do not decline secularly (not shown) despite the large
decline of investment as a proportion of GDP because the capital stock does not decline as rapidly
as investment flows. After a boom and contraction in the first half of the 1980s, GDP per worker
grew at an annual average of 1.59 percent during the remainder of the 1980s, 1.48 percent in the
1990s, and 1.74 percent in the 2000s when for the same periods, GDP per capita grew at 2.02
percent, 2.24 percent, and 2.34 percent respectively. This is the rise in productivity, and how the
economy used capital more efficiently is explored further below.
Figure 1.12: GDP Composition by Sector and Category over Time
Agriculture Industry & Mining
Petroleum & Products Electricity Construction &
Building Transportation
(SC) & Communication
Trade, Finance and Insurance
Restaurants & Hotels
Education, Health & General Services
Agriculture Industry & Mining
Petroleum & Products Electricity Construction &
Building Transportation
(SC) & Communication
Trade, Finance and Insurance
Restaurants & Hotels
Education, Health & General Services
1983-1990
99%
53%
17%
0%
68%
23%
78%
82%
56%
47%
83%
100%
32%
77%
22%
18%
44%
1%
1991-2000
99%
68%
14%
0%
72%
37%
81%
89%
55%
32%
86%
100%
28%
63%
19%
11%
45%
1%
2001-2006
99%
90%
16%
5%
75%
55%
85%
99%
54%
10%
84%
95%
25%
45%
15%
46%
1%
1%
1960-1982
99%
40%
20%
0%
48%
13%
64%
68%
42%
60%
80%
100%
52%
87%
36%
32%
58%
1%
Private Sector Public Sector

12
Factor Productivity Differences and Changes
1.27 Figure 1.13 shows that the rise in total factor productivity (shaded areas estimated by
decades) coincides with increased private share in investment (the line). Causation could run in
either direction, so the relation between productivity and the private sector’s role is explored further
in this section. Turning to the other factors of production, the lower panel shows that labor’s role
increased only slightly (and recently) while capital’s share declined: Egypt accumulated substantial
capital during the 1960s, 1970s and 1980s; but its contribution is more similar to that of labor and
productivity in the 1990s and 2000s.
Figure 1.13: TFP Average Growth and Private Investment Share
TFP Average Growth and Private Investment Share
0.00
0.10
0.20
0.30
0.40
0.50
0.60
0.70
19
60
19
62
19
64
19
66
19
68
19
70
19
72
19
74
19
76
19
78
19
80
19
82
19
84
19
86
19
88
19
90
19
92
19
94
19
96
19
98
20
00
20
02
20
04
20
06
-0.50%
0.00%
0.50%
1.00%
1.50%
2.00%
TFP Average Growth (right scale) Private Investment share (left scale)
GDP Growth Decomposition - Total
4.0%3.3%
1.6%1.1%
1.4%1.6%
1.6%
1.4%
-0.19%
0.43%0.93%
1.64%
1960-1982 1983-1990 1991-2000 2001-2006
CAPITAL LABOR TFP
1.28 This general pattern is also observed when the growth is decomposed at the sectoral level.
Figure 1.14 shows four sectors where this is clearly the case: agriculture; industry and mining;
electricity; and construction and building. The patterns are similar for transport and
communications, and restaurants and hotels (not shown). In contrast, the pattern differs where the
12
A Solow-style decomposition allows an estimate of the contribution of capital accumulation and productivity
improvements to growth. The aggregate capital stock for the whole economy, and that for the private and public sectors,
are calculated by accumulating total and sectoral investment through the perpetual inventory method which assumes the
customary 4 percent annual depreciation rate. GDP growth is decomposed into the contributions of capital, labor, and
total factor productivity growth (TFP, the residual) assuming a Cobb-Douglas production function with 0.6 as labor’s
constant share.

13
public sector continues to dominate investment and/or output (viz. petroleum and derived products;
trade; finance and insurance; and education, health, and general services): in these segments, total
factor productivity has not risen significantly. This suggests that productivity changes may result
from ownership.
Productivity by ownership
1.29 Some interesting similarities and differences arise when growth is examined by ownership:
Figure 1.15 shows that TFP of the private sector rose substantially after 1991 when the economic
policies were reoriented to permit this sector’s growth; but it also shows a remarkable improvement
in the public sector’s total factor productivity in the 2000s following a decline in the 1990s.
Figure 1.14: GDP Growth Decomposition
Agriculture
2.6%
1.9%
1.3%
0.6%
0.6%
0.6%
0.9%
0.4%
0.4%
1.1%
2.0%
0.1%
1960-1982 1983-1990 1991-2000 2001-2006
Industry & Mining
4.2%
3.1%
0.6%
-0.4%
1.8%
1.9%
1.3%
2.7%
-2.0%
3.1%
4.1%
1.4%
1960-1982 1983-1990 1991-2000 2001-2006
Electricity
4.3%
3.9%
1.6%
0.7%
4.5%
2.9%
2.1%
1.3%
-3.2%
4.0%
2.0%
5.0%
1960-1982 1983-1990 1991-2000 2001-2006
Construction & Building
7.3%
1.9%
1.1%
1.5%
2.9%
2.9%
3.0%
1.7%
-2.1%
0.6%
2.4%
-0.1%
1960-1982 1983-1990 1991-2000 2001-2006
1
1 1
Re
1 1
6
1
Capital TFP Labour

14
Capital’s contribution to productivity also diminished in both public and private sector (where it
diminished less): the bulk of productivity gains in the private sector were in the 1990s, although the
most recent period ends before the exchange rate corrections may have worked their way fully
through the economy. These findings point to the benefits resulting from the private sector’s larger
role in investment and output.
1.30 The estimates from a more complex production function (Annex I) suggest that a dollar in
private investment was four times as productive as the same in public investment. This should not
be misinterpreted to mean that private investment suffices or that public infrastructure is excessive.
Rather the estimates show that past public investments have not resulted in commensurate output
increases — either because of a poor choice (e.g. schemes like Toshka or investment in irrigation
instead of on drainage) and/or inadequate maintenance that renders them useless (e.g. potholed
roads). The right choice and execution of public investments that are adequately maintained may
have high economic returns: the findings suggest that these did not materialize in the past.
C. IMPROVING INVESTMENT
1.31 Economic theory links growth to investment, but Figure 1.16 shows a weak empirical
relation between the two: a wide scatter visually dominates a slight positive relation between
Figure 1.15: Growth Decomposition – Public / Private Sectors
5.6%
1.9% 1.9%
0.7% 1.7%
1.4%
2.0%
-0.64% -1.76%
2.56%
0.36%
4.3%
1960-1982 1983-1990 1991-2000 2001-2006
CAPITAL LABOR TFP
3.9% 2.4% 1.5%
0.5%
3.6% 1.4%
1.9%
0.3%
-0.74%
1.21%
2.95%
-2.69%
1960-1982 1983-1990 1991-2000 2001-2006
CAPITAL LABOR TFP

15
investment and growth rates averaged over the most recent five years. The outliers are countries
with unusual circumstances (e.g. acute economic mismanagement in Zimbabwe). China is an
outlier on growth, and its investment rate is also astonishingly high13
. Egypt lies near the middle of
the scatter: many countries with Egypt’s investment rate grow faster (and vice versa).
Figure 1.16: Investment versus Growth Rates (2000-2005)
1.32 Growth would rise if current investment levels were better allocated in Egypt. The
increased productivity described in the earlier section arose because private investments are guided
and motivated by profits. But public infrastructure is also important and much of it is old and parts
are crumbling as the recent spate of tragic railway accidents shows — particularly tragic in a
country that pioneered railways before much of Europe. Public investment has declined to around
4-6 percent of GDP over the past two decades, and several sector specific Bank reports have pointed
out that neglected maintenance is more to blame than low public investment per se.
1.33 The Government has recently sought to involve the private sector in public investment
through public private partnerships, establishing a unit in the Ministry of Finance to promote them.
Such partnerships have the potential both to improve investment and maintenance, but realizing this
potential requires careful management as discussed below.
Public Investment & Private Partnership
1.34 Public Private Partnership (PPP) is a term coined in the 1980s, but the concept of harnessing
each sector’s relative strength is not new — Hansard, a private entity until 1909, has long printed the
great debates at Westminster. Traditionally, the Government provides public goods (i.e. non-
excludable goods and services that create a free rider problem) and the private sector produces other
13
Chong-En Bai, Chang-Tai Hsieh and Yingyi Qian (2007) “The Return to Capital in China” NBER Working
Paper No.12755 examine whether China invests a lot because the returns are high. They find that the rate of
return to capital fell from 25 percent during 1978-93 but still fluctuates around 20% since 1998, and remains
higher than other countries; but they also find evidence of misallocation across provinces and the three major
sectors of the economy. Capital may be misallocated within these categories as well, but establishing this
requires firm and farm level data.
Bhutan
China
Ireland
Egypt Zimbabwe
0%
10%
20%
30%
40%
50%
60%
-10 -5 0 5 10 15 20 Real GDP annual growth (percentage)
Inves
tmen
t/G
DP

16
items efficiently because competition and the drive for profits foster the use and diffusion of the best
production and delivery techniques. What has changed is technology14
in some activities that alters the
demarcation allowing competition among private providers of some hitherto public goods and
services.
1.35 When responding to these changes and “partnering” with the private sector, many
governments have made mistakes with adverse fiscal effects and resulting in poor investments15
.
These can be avoided when governments know where the gains from private sector involvement arise
(and why) and recognize the hidden risks. Indonesian power contracts had “pay regardless of use”
clauses with prices indexed to foreign currency while consumer prices were in local currency saddling
the Government with exchange risk and contingent debts. In Brazil, contracts with privately owned
thermal generators resulted in chaos, not efficiency gains because they ignored the large hydroelectric
power’s links to rainfall and irrigation needs; consequently, a drought required the release of water that
increased hydro power generation adversely affecting the demand on the private thermal generators.
Private toll roads cannot capture the externality of a road network or bear the uncertainty of traffic
projections; so competitive auctions for franchises are plagued by the winner’s curse, and result in ex
post bailouts to maintain public service (e.g. toll roads in Mexico, the tunnel under the English
Channel).
1.36 Box 1.1 describes Egypt’s own recent experience with electric power. As in Indonesia,
foreign developers were guaranteed payment in dollars while electricity users are charged tariffs in
pounds. Consequently, when the pound depreciated and the Egyptian Electricity Transmission
Company made the contracted payments on behalf of EEHC, the state owned firms’ finances were
adversely affected. The EEHC believes the IPPs benefited Egypt because the contracted price of
$0.0254 per kWh is low; but this reflects the low price of contracted gas used to generate electricity.
The economic rates of return may nevertheless be high because the plants were built quickly and
cheaply and Egypt used the power generated, unlike Indonesia where electricity demand fell in the
wake of the 1997 crisis. So Egypt probably benefited from the PPP arrangements despite the
adverse effects on the state-owned electricity firms’ finances. But much of the benefits may have
been dissipated through inefficient power use because electricity prices remain too low.
14
Cellular telephony, for example, changed the large fixed and low marginal cost industry to a competitive
service requiring less and distinctly different regulation. Similarly, technological changes allowing cost effective
electricity generation at lower capacities led to transmission and distribution being separated to permit
competition in power generation. 15
Chapter 6 “Privatization and Deregulation: A Push Too Far?” in Economic Growth in the 1990s: Learning
from a Decade of Reform (World Bank 2005) summarises recent country experiences with increasing the private
sector’s role in diverse sectors.

17
Box 1.1: Egypt’s Independent Power Projects
In 1993, as part of its structural reform efforts, the Bank and bilateral donors made financing power plants contingent on Egypt raising
electricity prices to reflect the utilities’ costs. Finding this unacceptable, and with private operators eager to finance such projects world wide,
the Government opened electric generation to private investment. Doing this required changing several laws, and further reshuffling the state
owned utilities.
The power sector had already been unbundled in 1964; the Egypt Electricity Authority (EEA) had been created in 1976; and the eight
distribution companies had been corporatised under the Ministry of Public Enterprises in 1992. Article 7 of the 1996 Law 100 permitted
public utility concessions to local and foreign investors allowing them to build, operate and maintain power generation stations.
Egypt attracted IPPs for three 682.5 MW generation plants with a total capacity of 2,048 MW (a significant portion of its total
installed capacity of 17,600MW, including the hydro turbines of the Aswan Dam). EEHC acted on the Government’s behalf: first reviewing
the international experience (but the dangers were not perceived until the late 1990s), and developed a strategy based on a risk matrix manual.
EEHC then hired consultants (from Sargent & Lundy, Arthur Andersen and McDermott, Will & Emery) to help manage the process which
included pre-qualification, short listing, the request for proposals, evaluation and selection of the preferred bidder followed by negotiating the
contract.
The gas-fired steam generator in Sidi Krir was the first IPP. The process began in 1996 and the bidding was intensely competitive
with over 50 firms expressing interest at the pre-qualification stage. InterGen (with Edison and Bechtel in the consortium) won the BOOT
contract in 1998 with project (not corporate) financing and an off-taker provision. Furthermore, the Power Purchase Agreement (PPA)
specified EEHC payments denominated in US dollars (with a Central Bank guarantee) and a formula to adjust fuel costs in pounds; so EEHC
bore the exchange risk.
Several laws and regulations were changed during the process. The 1997 investment Law 8 granted tax and other incentives
including Government guarantees. The Government sought to partially privatize seven regional distribution companies through the Cairo
stock exchange, but when there was no investor interest, the publicly owned distribution companies, the generation companies, and the
national transmission company were all put under the Egyptian Electricity Holding Company (EEHC, created in 2000 under Law 164 to
replace the EEA). An internal power pool to permit competitive bidding for power did not work as envisioned because the market was
undercut by ex post price adjustments. A Presidential decree created an independent regulatory agency in 1997, but it proved inadequate and
ineffective. A second Presidential decree in 2000 created the Egyptian Electric Utility and Consumer Protection Regulatory Agency (ERA)
whose mandate includes: setting retail electricity tariffs, review and approve power purchase agreement and license IPPs. But ERA’s statutes
do not allow independence from its line ministry that has the final say.
The second and third plants were built using the same procedure, and although the details differed, the process was quicker.
Electricity de France (EdF, with some IFC financing) won the bid to develop two 683MW plants, one in Port Said and the other in Suez.
Subsequent Developments
After two years of operation, the original project developers sold their Egyptian interests when they no longer fitted their corporate
plans. GlobelEq (an affiliate of the UK’s Commonwealth Development Corporation) bought out InterGen’s interests in December 2004 and
Edison’s in May 2005. Kusas Nusajayas (an affiliate of Tanjong Public Corporation Limited, a Malaysian firm with casino interests seeking
to become a global provider of O&M services) bought EdF’s stake for US$ 935m ($305 for the equity plus $628 in debt) in March 2006.
The Government honoured its IPP contracts, but stopped the twelve additional IPPs planned and modified the requirements. New
projects were to (i) obtain foreign currency financing abroad, (ii) involve local private sector to participate in project construction and
operation, (iii) pay local costs in local currency, (iv) have substantial equity and a local investment component, and (v) have power customers,
not EEHC, sign PPAs. No new IPPs were undertaken, and EEHC is again looking to finance the sector from international financial
institutions (European Investment Bank, Arab Fund for Social & Economic Development, Kuwait Fund, African Development Bank, Islamic
Development Bank etc.) The World Bank approved a $260m loan in 2006 to finance the El-Tebbin steam power plant with two 350MW
units powered by gas and residual oil.
Source: Anton Eberhard and Katharine Nawaal Gratwick (2007) “From state to market and back again: Egypt’s experiment with
Independent Power Projects”, The Energy Journal, Vol.32. Also available as MIR working paper, Graduate School of Business,
University of Cape Town at: http://www.gsb.uct.ac.za/gsbwebb/default.asp?intpagenr=309
1.37 Given this experience, the Ministry of Finance created a PPP unit in 2005 to involve the
private sector in various types of public infrastructure. Box 1.2 analyses the issues in its current
efforts to build better schools. While such contracts could build better school facilities more cheaply,
there are greater potential gains elsewhere in education (as Chapter 3 will discuss): the inefficiency
and waste in operating schools (i.e. hiring teachers, staff, providing other inputs etc.) are
considerable and well documented. These gains could be realized only when schools are better run
— whether directly or through PPP (which require far more complex contracts and more
sophisticated monitoring).
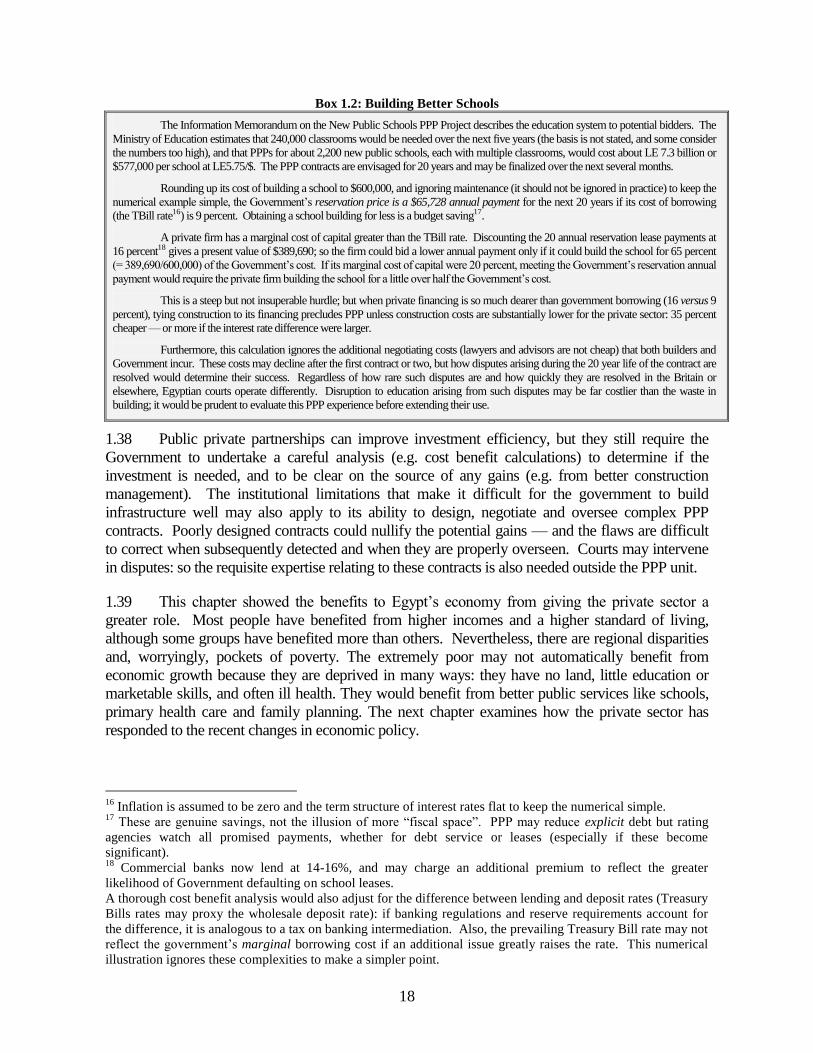
18
Box 1.2: Building Better Schools
The Information Memorandum on the New Public Schools PPP Project describes the education system to potential bidders. The
Ministry of Education estimates that 240,000 classrooms would be needed over the next five years (the basis is not stated, and some consider
the numbers too high), and that PPPs for about 2,200 new public schools, each with multiple classrooms, would cost about LE 7.3 billion or
$577,000 per school at LE5.75/$. The PPP contracts are envisaged for 20 years and may be finalized over the next several months.
Rounding up its cost of building a school to $600,000, and ignoring maintenance (it should not be ignored in practice) to keep the
numerical example simple, the Government’s reservation price is a $65,728 annual payment for the next 20 years if its cost of borrowing
(the TBill rate16) is 9 percent. Obtaining a school building for less is a budget saving17.
A private firm has a marginal cost of capital greater than the TBill rate. Discounting the 20 annual reservation lease payments at
16 percent18 gives a present value of $389,690; so the firm could bid a lower annual payment only if it could build the school for 65 percent
(= 389,690/600,000) of the Government’s cost. If its marginal cost of capital were 20 percent, meeting the Government’s reservation annual
payment would require the private firm building the school for a little over half the Government’s cost.
This is a steep but not insuperable hurdle; but when private financing is so much dearer than government borrowing (16 versus 9
percent), tying construction to its financing precludes PPP unless construction costs are substantially lower for the private sector: 35 percent
cheaper — or more if the interest rate difference were larger.
Furthermore, this calculation ignores the additional negotiating costs (lawyers and advisors are not cheap) that both builders and
Government incur. These costs may decline after the first contract or two, but how disputes arising during the 20 year life of the contract are
resolved would determine their success. Regardless of how rare such disputes are and how quickly they are resolved in the Britain or
elsewhere, Egyptian courts operate differently. Disruption to education arising from such disputes may be far costlier than the waste in
building; it would be prudent to evaluate this PPP experience before extending their use.
1.38 Public private partnerships can improve investment efficiency, but they still require the
Government to undertake a careful analysis (e.g. cost benefit calculations) to determine if the
investment is needed, and to be clear on the source of any gains (e.g. from better construction
management). The institutional limitations that make it difficult for the government to build
infrastructure well may also apply to its ability to design, negotiate and oversee complex PPP
contracts. Poorly designed contracts could nullify the potential gains — and the flaws are difficult
to correct when subsequently detected and when they are properly overseen. Courts may intervene
in disputes: so the requisite expertise relating to these contracts is also needed outside the PPP unit.
1.39 This chapter showed the benefits to Egypt’s economy from giving the private sector a
greater role. Most people have benefited from higher incomes and a higher standard of living,
although some groups have benefited more than others. Nevertheless, there are regional disparities
and, worryingly, pockets of poverty. The extremely poor may not automatically benefit from
economic growth because they are deprived in many ways: they have no land, little education or
marketable skills, and often ill health. They would benefit from better public services like schools,
primary health care and family planning. The next chapter examines how the private sector has
responded to the recent changes in economic policy.
16
Inflation is assumed to be zero and the term structure of interest rates flat to keep the numerical simple. 17
These are genuine savings, not the illusion of more “fiscal space”. PPP may reduce explicit debt but rating
agencies watch all promised payments, whether for debt service or leases (especially if these become
significant). 18
Commercial banks now lend at 14-16%, and may charge an additional premium to reflect the greater
likelihood of Government defaulting on school leases.
A thorough cost benefit analysis would also adjust for the difference between lending and deposit rates (Treasury
Bills rates may proxy the wholesale deposit rate): if banking regulations and reserve requirements account for
the difference, it is analogous to a tax on banking intermediation. Also, the prevailing Treasury Bill rate may not
reflect the government’s marginal borrowing cost if an additional issue greatly raises the rate. This numerical
illustration ignores these complexities to make a simpler point.
19
CHAPTER 2: PRIVATE RESPONSE TO TRADE & BUSINESS
CLIMATE CHANGES
2.1 Chapter 1 showed the overall benefits from giving the private sector a greater role in the
economy, and this chapter examines how the private sector has responded to recent trade and
business climate reforms. The authorities have lowered trade taxes, redoubled privatisation efforts,
and improved the business climate through a variety of measures. While the picture is still blurry —
detailed trade data that permit careful analysis end in 2004 just before the effects of the major tariff
reductions and the currency depreciation — the signs are encouraging.
2.2 The first section examines the effects of trade reforms. Trade volume has grown after the
depreciation in 2003 and the elimination of the premium in the parallel exchange market in 2004.
Trade tariffs were reduced in several steps, the latest in February 2007, and the weighted average
tariff rates are now 6.9 percent making Egypt among the world’s more open economies. The
standard deviation of tariff protection is now only 5.1 percent (excluding beverages), but effective
protection remains high primarily because the sizeable energy subsidies have disparate effects: the
standard deviation of implicit effective protection is around 130 percent (excluding beverages).
Removing these subsidies would both reduce the budget deficit and improve resource allocation.
2.3 Exports have grown both in volume and in the number of items, but the export propensity is
low and the exported items have low technology content. This would change as Egyptian firms
become more integrated into global production chains and better technology gets diffused. There is
concern that Egypt’s unusually low proportion of mid-sized firms may hamper such integration:
smaller firms generally trade less internationally.
2.4 The second section notes the government’s redoubled privatization efforts and the large FDI
inflows. Privatisation proceeds totalled LE33.5 billion ($5.8 billion at current exchange rates)
between July 2004 and November 2007, mostly from the sale of land, cellular licenses, the partial
sale of Egypt Telecom, and, more recently, of the Bank of Alexandria. Few of the firms (Law 203)
that were slated for privatization have been sold because of political opposition. The unsold firms
now employ less than a fiftieth of the labour force and their assets (especially land) could be more
productively used under other owners. Furthermore, their sale or closure would eliminate a
potential financial drain and make banking reform more likely to take root because in the past,
creditor banks accommodated them.
2.5 The third section examines the effects of business climate improvements that made Egypt
the year’s top reformer in the Bank’s latest Doing Business annual survey. It is now easier to start a
business but operating one remains difficult. The chapter examines data from diverse sources to
ascertain business health: births, deaths, and their operation. More larger firms are being registered,
and although the recent surge is abating, this pattern is consistent with a bottleneck being relieved.
Fewer smaller firms are being registered, and the shift to larger firms could be a healthy sign: so also
is the decline in bankruptcies. Several Egyptian firms are now better known internationally, but a
“world class” Egyptian firm (or indeed any from the region) has yet to make its mark with

20
pioneering technology or innovation (e.g. van Agtmael19
). Innovation and ways to promote it are
not discussed in this report.
2.6 The fourth and final sections pull the diverse pieces of evidence together. Despite some de
jure improvements, many de facto hurdles remain. Large private firms, both domestic and foreign
owned, may have the clout to deal with the hurdles, while others prefer to remain small and operate
in (or near) the shadows of informality. The size distribution of firms may be one of several
indicators that the government may find useful to monitor in its efforts to improve the business
climate. Such indicators, like the Doing Business rankings, are useful but become misleading when
countries actively influence them rather than what they seek to measure. It may be useful to have a
channel for businesses to convey their perception of hurdles, and as creditor banks improve, the
central bank could become such a channel if it monitored real business activity better.
A. TRADE REFORMS AND THEIR EFFECTS
Tariff rates lowered gradually
2.7 Egypt steadily lowered its
trade tariffs beginning in the late
1990s under the Uruguay Round.
Tariff bound rates declined from an
average of 45 percent in 1998 to
38.6 percent in 2005 and the
average applied most favoured
nation tariff rate fell from 26.8
percent in 1998 to 20.0 percent in
2005 and the number of tariff bands
was reduced. Tariffs were further
reduced in steps and the weighted
average tariff rate declined from
14.6 percent in 2003 to 9.1 percent
after the 2004 reduction and further
to 6.9 percent after the February
2007 cuts. Consequently, customs
fees plus import-tariff revenues fell
from 17.3 percent of imports in FY
2003/04 to 6.5 percent in FY 2005/06: without customs fees, the rates declined from 13.3 percent to
6.5 percent suggesting that such fees are now negligible. Egypt is now among the countries in the
region most open to trade (Figure 2.1).
2.8 Trade has boomed as a consequence, especially after the government also depreciated the
currency as shown in Figure 2.2. Figure 2.3 shows the rise in merchandise exports, split among
major components and Figure 2.4 shows the same for imports. Egypt generally runs a trade deficit
and a substantial surplus in service exports because of the Suez Canal and tourism. The current
account has been a small surplus.
19
Antoine Van Agtmael (2007) The Emerging Markets Century: How a New Breed of World Class Companies
is Overtaking the World, Simon & Schuster, New York.
Figure 2.1: Weighted Average Tariffs, Latest Year Available Weighted Average Tariffs, Latest year available
3.0
4.5
5.9
5.9
6.2
6.4
6.9
8.8
10.3
10.9
11.4
12.5
14.2
14.5
14.6
14.7
17.3
23.2
24.1
24.1
Chile 2006
Turkey 2003
China 2004
South Africa 2001
Lebanon 2002
Indonesia 2003
Egypt 2007
Bulgaria 2004
Senegal 2004
Jordan 2003
Brazil 2004
Algeria 2003
Mauritius 2002
Mexico 2002
Egypt 2003
Romania 2001
Bangladesh 2004
Tunisia 2004
India 2004
Morocco 2003
Source: UNCTAD database and M inistry of Finance

21
Figure 2.2: Nominal and Real Effective Exchange Rate Index (2000=100)
40
60
80
100
120
140
160
180
Jan-00 Jul-00 Jan-01 Jul-01 Jan-02 Jul-02 Jan-03 Jul-03 Jan-04 Jul-04 Jan-05 Jul-05 Jan-06 Jul-06 Jan-07 Jul-07 Jan-08
LE
NEER REER
Figure 2.3: Export composition and Real
Exchange Rate
0
10
20
30
40
50
60
FY02 FY03 FY04 FY05 FY06 FY07
LE
bill
0
1
2
3
4
5
6
7
LE
/$
Food ManufacturesPrimary including oil Capital goodsConsumption goods Real exchange rate-right axis
Figure 2.4: Import Composition and Real
Exchange Rate
0
20
40
60
80
100
120
140
FY02 FY03 FY04 FY05 FY06 FY07
LE
bill
0
1
2
3
4
5
6
7
LE
/$
Food ManufacturesPrimary including oil Capital goodsConsumption goods Real exchange rate-right axis
Effective Protection remains high
2.9 While trade tariffs are now low, cheap energy and fuel favours the production and use of
energy intensive items and has the same effects as disparate trade tariff rates. To determine the
magnitude of the effects of energy subsidies, we calculate the effective rate of protection (ERP).
The ERP calculates how value added would change without such distortions, assuming unchanged
production technology and input-use, and indicates which industries benefit from the distortions and
by how much.
2.10 The last two rows of Table 2.1 show that energy subsidies substantially increase the
dispersion of the ERPs for domestic producers. The ERPs for 20 segments of the economy are
calculated using the 2005 Social Accounting Matrix (SAM with data on subsidies, indirect taxes,
and indirect subsidies) and the post-February 2007 tariff schedule. These estimates ignore export
subsidies re-introduced in 2006 and subsequently20
, and the ad-valorem subsidies in the 2005 SAM
affect both domestic producers and exporters equally. The energy subsidies used in the ERP
calculations are still an under-estimate. Production sharing (non-public) agreements with foreign oil
or gas companies that operate the field give the government (or the domestic oil/gas company that is
20
In February 2007, for example, Decree 142 imposed export duties of LE160/ton on steel along with other
regulations. These duties were increased to LE180/ton on billets and direct reduced iron while cold rolled steel
products were exempt.

22
state-owned) a portion of physical output that the foreign energy company may sell on its behalf; so
the payment of royalties in kind does not disrupt the physical handling of the product. The
government oil/gas company in turn may sell the refined or processed products domestically at a
low price. The Ministry of Finance pays the government owned oil/gas company for the net
shortfall in its revenues for selling the items cheaply; so this amount in the budget ignores the
revenues earned from the sale of the Government’s share of output (royalty/terms of the production
sharing agreement) and therefore underestimates the subsidy21
. The extent of the underestimate is
sizeable and varies with production and prices: budget’s energy subsidy was LE 41.8 billion in
FY06 ($7.4 billion or about 6.4 percent of GDP) whereas the Bank had estimated total energy
subsidies at $9 billion in 2005. Most of the energy subsidies were for gasoline (39 percent), LPG
(21 percent), natural gas (14 percent) and diesel (14 percent).
2.11 These differences are sizeable, and food, metals and chemical industries are among the
larger beneficiaries of the current energy subsidies, while agriculture and electrical machinery
are least protected. But there are differences within these categories as well: while trade
tariffs for cotton products appear low, the ERP is high when energy subsidies are taken into
account, because growing cotton uses substantial amounts of water pumped using cheap fuel.
This means that energy subsidies undercut the benefits from the recent reduction in trade tariff
rates and their dispersion. Considering their size, reducing these energy subsidies would
benefit the economy more than further reductions in trade tariffs.
2.12 The Government announced in 2004 that it would gradually eliminate energy
subsidies and, in parallel, have a mechanism to protect vulnerable consumers; but the
structure of prices remain riddled with disparities and the government’s role in setting them is
undiminished. Electricity tariffs were raised for the first time since 1992 from an average of
US¢2.2/kwh to US¢2.4/kwh, and while the cabinet endorsed 5 percent annual increases, the
real price declines because the domestic inflation rate is higher. The government announced
in August 2007 that electricity and gas subsidies for the 40 largest industrial users would be
phased out over 3 years and that by 2010, all energy intensive industry would pay market
prices and that subsidies to non-energy intensive industries would continue until 2013. The
Government also increased the prices of petroleum products in July 2006: gasoline prices
were raised by 30 percent as were prices of diesel and kerosene. And in January 2008, the
Government doubled the price of heavy fuel oil to LE1,000/ton, but did not apply the increase
to the electricity sector that consumes 35 percent of the fuel oil.
2.13 It is difficult to raise any controlled price, and inflation makes frequent increases in
nominal prices necessary even if world prices were stable. Egypt has yet to discard the war-
time controls instituted during colonial rule. But to obtain the full benefits of increased trade,
energy prices that act analogously to disparate trade protection should be adjusted continually.
21
More complete and accurate information will be available when the Bank’s proposed Energy Pricing Strategy
study is completed in 2008.
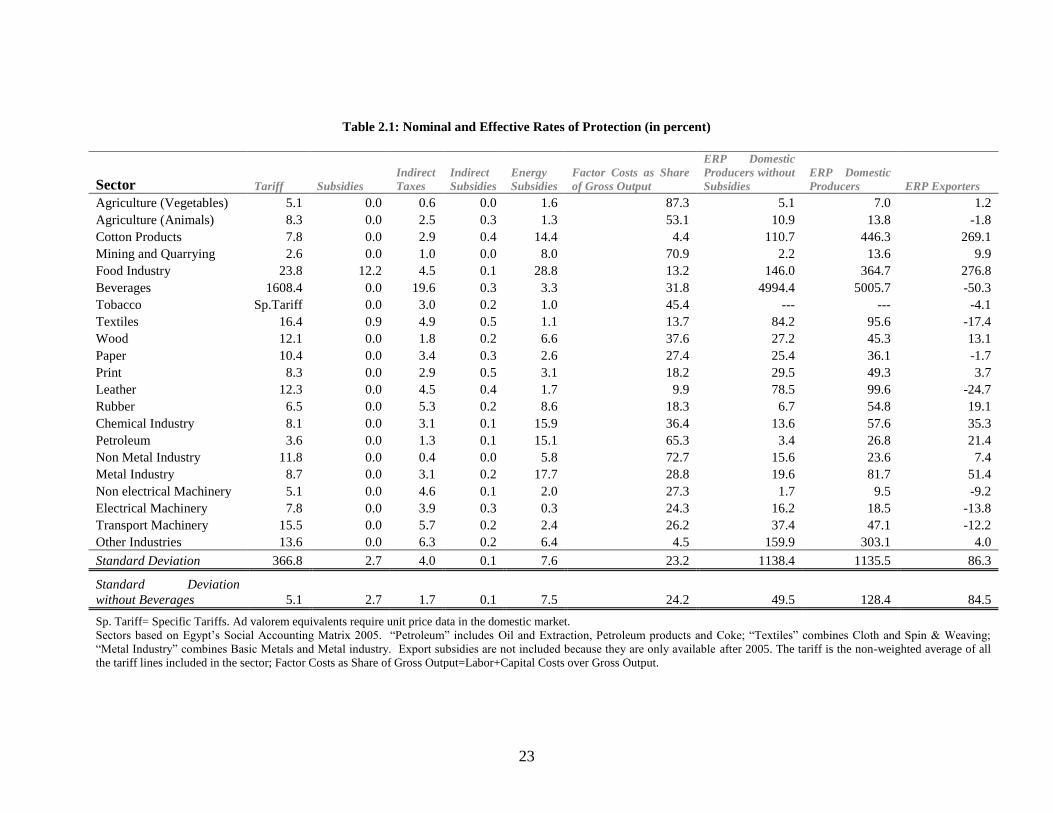
23
Table 2.1: Nominal and Effective Rates of Protection (in percent)
Sector Tariff Subsidies
Indirect
Taxes
Indirect
Subsidies
Energy
Subsidies
Factor Costs as Share
of Gross Output
ERP Domestic
Producers without
Subsidies
ERP Domestic
Producers ERP Exporters
Agriculture (Vegetables) 5.1 0.0 0.6 0.0 1.6 87.3 5.1 7.0 1.2
Agriculture (Animals) 8.3 0.0 2.5 0.3 1.3 53.1 10.9 13.8 -1.8
Cotton Products 7.8 0.0 2.9 0.4 14.4 4.4 110.7 446.3 269.1
Mining and Quarrying 2.6 0.0 1.0 0.0 8.0 70.9 2.2 13.6 9.9
Food Industry 23.8 12.2 4.5 0.1 28.8 13.2 146.0 364.7 276.8
Beverages 1608.4 0.0 19.6 0.3 3.3 31.8 4994.4 5005.7 -50.3
Tobacco Sp.Tariff 0.0 3.0 0.2 1.0 45.4 --- --- -4.1
Textiles 16.4 0.9 4.9 0.5 1.1 13.7 84.2 95.6 -17.4
Wood 12.1 0.0 1.8 0.2 6.6 37.6 27.2 45.3 13.1
Paper 10.4 0.0 3.4 0.3 2.6 27.4 25.4 36.1 -1.7
Print 8.3 0.0 2.9 0.5 3.1 18.2 29.5 49.3 3.7
Leather 12.3 0.0 4.5 0.4 1.7 9.9 78.5 99.6 -24.7
Rubber 6.5 0.0 5.3 0.2 8.6 18.3 6.7 54.8 19.1
Chemical Industry 8.1 0.0 3.1 0.1 15.9 36.4 13.6 57.6 35.3
Petroleum 3.6 0.0 1.3 0.1 15.1 65.3 3.4 26.8 21.4
Non Metal Industry 11.8 0.0 0.4 0.0 5.8 72.7 15.6 23.6 7.4
Metal Industry 8.7 0.0 3.1 0.2 17.7 28.8 19.6 81.7 51.4
Non electrical Machinery 5.1 0.0 4.6 0.1 2.0 27.3 1.7 9.5 -9.2
Electrical Machinery 7.8 0.0 3.9 0.3 0.3 24.3 16.2 18.5 -13.8
Transport Machinery 15.5 0.0 5.7 0.2 2.4 26.2 37.4 47.1 -12.2
Other Industries 13.6 0.0 6.3 0.2 6.4 4.5 159.9 303.1 4.0
Standard Deviation 366.8 2.7 4.0 0.1 7.6 23.2 1138.4 1135.5 86.3
Standard Deviation
without Beverages 5.1 2.7 1.7 0.1 7.5 24.2 49.5 128.4 84.5
Sp. Tariff= Specific Tariffs. Ad valorem equivalents require unit price data in the domestic market. Sectors based on Egypt’s Social Accounting Matrix 2005. “Petroleum” includes Oil and Extraction, Petroleum products and Coke; “Textiles” combines Cloth and Spin & Weaving;
“Metal Industry” combines Basic Metals and Metal industry. Export subsidies are not included because they are only available after 2005. The tariff is the non-weighted average of all
the tariff lines included in the sector; Factor Costs as Share of Gross Output=Labor+Capital Costs over Gross Output.

24
The Content of Trade
2.14 Egypt’s exports are concentrated in a few items. Figure 2.5 shows the Herfindahl-Hirschman
Index of export concentration for several countries including Egypt for 1990 and 2005. Egypt’s oil
exports are large and rising and the concentration index without oil falls from 0.24 to 0.09. Even so,
five items account for over 45 percent of Egypt’s merchandise exports. Manufactured goods were only
one-fourth of merchandise exports in 2005, although manufacturing exports to GDP rose from 1.5
percent in 2001 to 3 percent in 2005. Greater trade diversification per se is not the objective, but
integration into global production chains indicate whether firms are taking full advantage of the lower
trade tariffs.
Figure 2.5: Herfindahl-Hirschmann Index of Export Concentration
0
0.1
0.2
0.3
0.4
0.5
0.6
Algeria
Egypt
Jordan
Lebanon
Morocco
Syria
Tunisia
Turkey
Hungary
PolandRomania
France
Italy
Portugal
Spain
China
India
Mexico
Malaysia
1990 2005
2.15 Egypt’s exports have low technology content. Figure 2.6 shows that only about 6.2 percent of
Egypt’s exports have high or medium technology content, far lower than Jordan’s 26.6 percent or that
of other comparable countries and regions. Recent research finds that diversified economies export
more and grow faster, and a recent Bank study confirms this for the region.22
The underlying force is
technology that raises productivity and spills over to into non-traded activities as well: and integration
into global production chains allows the technology to be adopted, adapted and diffused.
22
The World Bank (2008) “Export Diversification in Egypt, Jordan, Lebanon, Morocco and Tunisia”, report
no. 40497-MNA
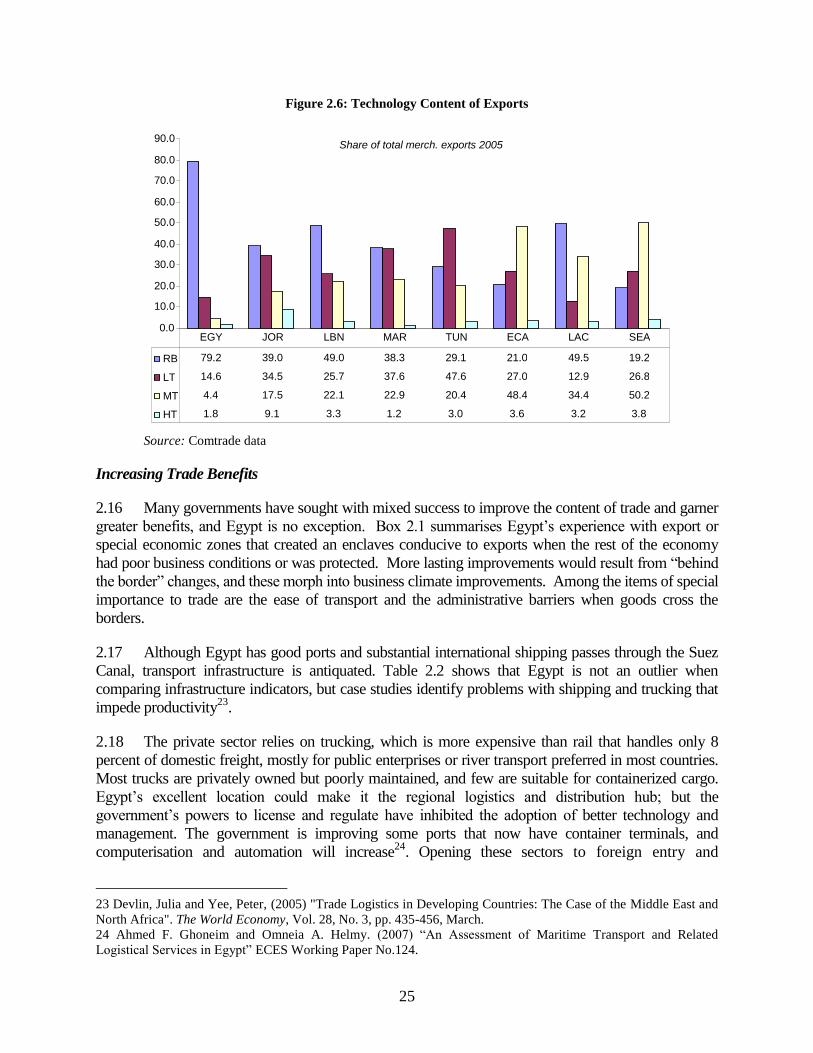
25
Figure 2.6: Technology Content of Exports
Source: Comtrade data
Increasing Trade Benefits
2.16 Many governments have sought with mixed success to improve the content of trade and garner
greater benefits, and Egypt is no exception. Box 2.1 summarises Egypt’s experience with export or
special economic zones that created an enclaves conducive to exports when the rest of the economy
had poor business conditions or was protected. More lasting improvements would result from “behind
the border” changes, and these morph into business climate improvements. Among the items of special
importance to trade are the ease of transport and the administrative barriers when goods cross the
borders.
2.17 Although Egypt has good ports and substantial international shipping passes through the Suez
Canal, transport infrastructure is antiquated. Table 2.2 shows that Egypt is not an outlier when
comparing infrastructure indicators, but case studies identify problems with shipping and trucking that
impede productivity23
.
2.18 The private sector relies on trucking, which is more expensive than rail that handles only 8
percent of domestic freight, mostly for public enterprises or river transport preferred in most countries.
Most trucks are privately owned but poorly maintained, and few are suitable for containerized cargo.
Egypt’s excellent location could make it the regional logistics and distribution hub; but the
government’s powers to license and regulate have inhibited the adoption of better technology and
management. The government is improving some ports that now have container terminals, and
computerisation and automation will increase24
. Opening these sectors to foreign entry and
23 Devlin, Julia and Yee, Peter, (2005) "Trade Logistics in Developing Countries: The Case of the Middle East and
North Africa". The World Economy, Vol. 28, No. 3, pp. 435-456, March.
24 Ahmed F. Ghoneim and Omneia A. Helmy. (2007) “An Assessment of Maritime Transport and Related
Logistical Services in Egypt” ECES Working Paper No.124.
Share of total merch. exports 2005
0.0
10.0
20.0
30.0
40.0
50.0
60.0
70.0
80.0
90.0
RB 79.2 39.0 49.0 38.3 29.1 21.0 49.5 19.2
LT 14.6 34.5 25.7 37.6 47.6 27.0 12.9 26.8
MT 4.4 17.5 22.1 22.9 20.4 48.4 34.4 50.2
HT 1.8 9.1 3.3 1.2 3.0 3.6 3.2 3.8
EGY JOR LBN MAR TUN ECA LAC SEA

26
improving the business climate would help, and the next two sections describe the many recent
developments.
Box 2.1: Trade Agreements & QIZs
Egypt has signed several trade agreements — with 16 Arab countries through the Greater Arab Free Trade Area (1997), with 19
African countries through the Common Market for Easter and Southern Africa (1998), with 25 EU members (2004), with Tunisia,
Morocco & Jordan (2004, coming into force in 2007), with 10 Mediterranean states through the Euro-Mediterranean partnership, and with
EFTA countries (Iceland, Liechtenstein, Norway & Switzerland in 2007) and co-operation agreements with China and Kazakhstan.
These agreements have not resulted in much trade except for the Qualified Industrial Zones (QIZs) established under the 1996
agreement with America and Israel. Exports of industrial products manufactured jointly with Israel (with at least 11.7% Israeli content
and 35% Egyptian value added) enter the United States duty free. Egypt’s government designates, and the US government approves, a
geographic area as a QIZ, and there are now seven QIZs in three regions. But 96% of the exports and 80% of the 467 QIZ firms (fewer
than half actually export) are in apparel and textiles. Egypt’s location and climate are conducive to growing cotton, and while experts
debate the relative superiority of Egyptian long fibre over American Pima, raw materials are tradable and reputation for reliability and
quality determine the location of value added manufacturing. India and Pakistan imported some 70,000 tons of raw Egyptian cotton in
2006, and garments with both “Egyptian Cotton” and “Made in India” labels already garner prime markets. Chinese and Indian global
garment powerhouses own many of the QIZ firms to benefit from duty free access to the US (and to the EU since 2004). These tariff
advantages will disappear when the US fully opens its markets in 2008 (EU in 2007), and this highly mobile apparel industry could shift
operations to countries offering genuine cost and productivity advantages. Almost a third of Egypt’s industrial exports are in textiles, and
but garment exports to the EU declined in the first half of 2006 to 85,391 tonnes from 87,656 tonnes the year before. Although QIZ textile
firms face an uncertain future, if Egypt remains business friendly, other industries would take their place.
Table 2.2: Infrastructure Indicators 2005
EGY JOR LBN MOR TUN EAP ECA MENA
Telephone mainlines (per 1000 people) 127 114 200 44 121 188 242 91
Costs of local phone call (US$ cents/3 min) 2.0 5.0 10.0 0.2 0.0 0.1 0.1 0.1
Telephone average cost of call to US (US$/3 min) 1.5 1.4 2.2 1.4 2.3 1.2 1.6 1.7
Telephone faults (per 100 mainlines) 1.0 13.0 .. 25.0 30.0 32.0 41.0 ..
Internet users (per 1000 people) 57 86 122 117 84 74 138 42
Secure internet servers, 2006 53 23 40 24 23 1900 5925 214
Personal computers (per 1000 people) 22.0 55.0 62.0 16.3 33.5 39.6 77.2 19.6
Broadband subscribers (per 1000 people) 0.4 0.9 7.9 2.1 0.7 13.4 2.4 0.2
Price basket for internet (US$ per month) 5.5 26.3 36.9 25.3 17.3 19.9 2.4 24.5
Road density (km of road per 100 sq. km of land area) 9.3 8.5 .. 12.9 12.4 .. .. ..
Paved roads (%of total roads) 78 100 85 56 65 32 74 66
Railways, goods transported (mio ton/km) 3917 1024 .. 5919 2082 2662 9675 2364
Avg. freight rail tariff (PPPcent/ton-km) 3 .. .. 8 6 13 1114 6
Air transport freight (mio tons/km) 287 224 87 61 18 13730 2139 1104
Air transport, passengers carried (mio) 5 2 1 4 2 203 65 34
Source: World Development Development Indicators (2007), Estache and Goicoechea (2005), data reflect the latest available, earliest begins 2004.
Telecommunication
Internet
Transportation
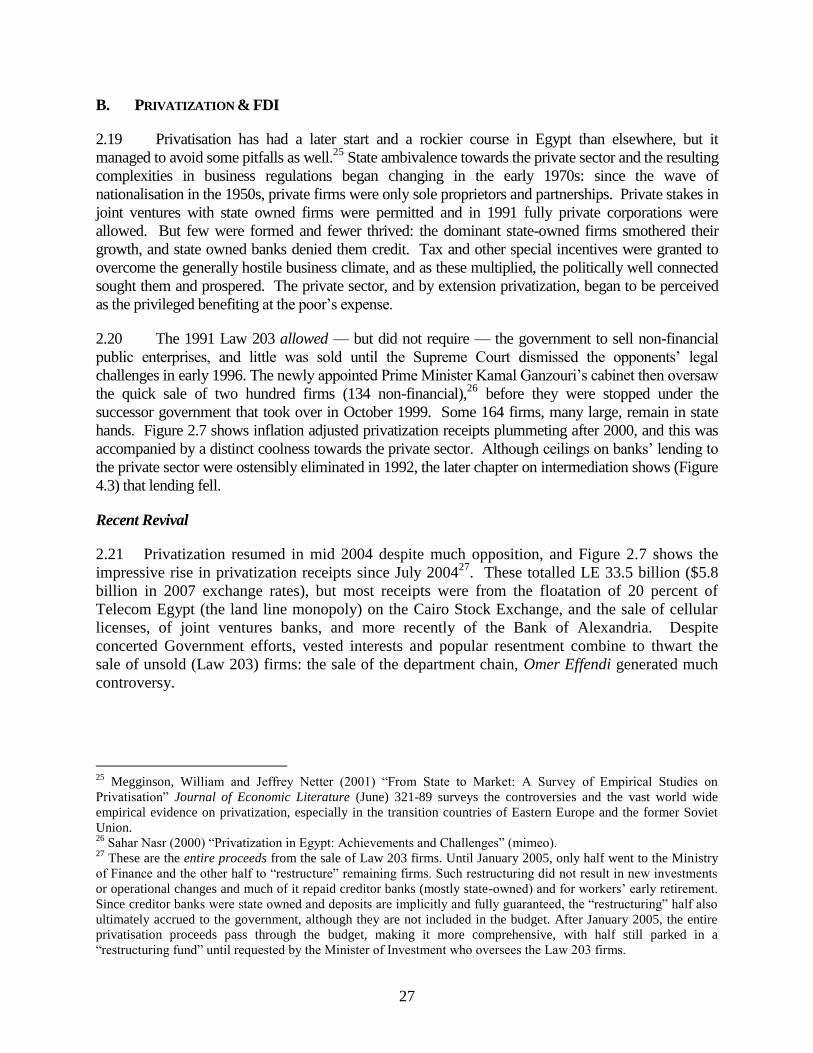
27
B. PRIVATIZATION & FDI
2.19 Privatisation has had a later start and a rockier course in Egypt than elsewhere, but it
managed to avoid some pitfalls as well.25
State ambivalence towards the private sector and the resulting
complexities in business regulations began changing in the early 1970s: since the wave of
nationalisation in the 1950s, private firms were only sole proprietors and partnerships. Private stakes in
joint ventures with state owned firms were permitted and in 1991 fully private corporations were
allowed. But few were formed and fewer thrived: the dominant state-owned firms smothered their
growth, and state owned banks denied them credit. Tax and other special incentives were granted to
overcome the generally hostile business climate, and as these multiplied, the politically well connected
sought them and prospered. The private sector, and by extension privatization, began to be perceived
as the privileged benefiting at the poor’s expense.
2.20 The 1991 Law 203 allowed — but did not require — the government to sell non-financial
public enterprises, and little was sold until the Supreme Court dismissed the opponents’ legal
challenges in early 1996. The newly appointed Prime Minister Kamal Ganzouri’s cabinet then oversaw
the quick sale of two hundred firms (134 non-financial),26
before they were stopped under the
successor government that took over in October 1999. Some 164 firms, many large, remain in state
hands. Figure 2.7 shows inflation adjusted privatization receipts plummeting after 2000, and this was
accompanied by a distinct coolness towards the private sector. Although ceilings on banks’ lending to
the private sector were ostensibly eliminated in 1992, the later chapter on intermediation shows (Figure
4.3) that lending fell.
Recent Revival
2.21 Privatization resumed in mid 2004 despite much opposition, and Figure 2.7 shows the
impressive rise in privatization receipts since July 200427
. These totalled LE 33.5 billion ($5.8
billion in 2007 exchange rates), but most receipts were from the floatation of 20 percent of
Telecom Egypt (the land line monopoly) on the Cairo Stock Exchange, and the sale of cellular
licenses, of joint ventures banks, and more recently of the Bank of Alexandria. Despite
concerted Government efforts, vested interests and popular resentment combine to thwart the
sale of unsold (Law 203) firms: the sale of the department chain, Omer Effendi generated much
controversy.
25
Megginson, William and Jeffrey Netter (2001) “From State to Market: A Survey of Empirical Studies on
Privatisation” Journal of Economic Literature (June) 321-89 surveys the controversies and the vast world wide
empirical evidence on privatization, especially in the transition countries of Eastern Europe and the former Soviet
Union. 26
Sahar Nasr (2000) “Privatization in Egypt: Achievements and Challenges” (mimeo). 27
These are the entire proceeds from the sale of Law 203 firms. Until January 2005, only half went to the Ministry
of Finance and the other half to “restructure” remaining firms. Such restructuring did not result in new investments
or operational changes and much of it repaid creditor banks (mostly state-owned) and for workers’ early retirement.
Since creditor banks were state owned and deposits are implicitly and fully guaranteed, the “restructuring” half also
ultimately accrued to the government, although they are not included in the budget. After January 2005, the entire
privatisation proceeds pass through the budget, making it more comprehensive, with half still parked in a
“restructuring fund” until requested by the Minister of Investment who oversees the Law 203 firms.

28
Figure 2.7: Real Privatization Revenue (in 2006 LE m using GDP deflator)
2.22 The DPR did not examine the finances of the 164 unsold (Law 203) firms that are now held
under 9 holding companies organized by industry under the Minister of Investment’s purview.
Numerous earlier studies28
found their sales revenues do not fully cover their operating costs which are
high because they are overstaffed and poorly run. Some of the firms’ assets, especially land, may be
valuable, but machinery gets obsolete, and the better workers and managers may have long since
moved to other firms with better prospects. A few firms with a cash surplus (e.g. tobacco,
pharmaceuticals) may be cross-subsidising others within and across the nine holding companies. They
collectively employ over 376,000 workers (down from about 437,000 workers in 2001, mostly lost
through retirement and attrition) and are a tiny fraction of the 26 million labour force. While there may
be some truth in the claim that investment in new machines and better technology were neglected, the
experience world wide is that operational restructuring is best left to private owners with the right skills
and incentives. State owned creditor banks have financed their cash shortfall, and as these banks
improve their lending criteria and classify and provision their loans better, the indebted firms’ budget
constraint will harden. Whether this will force their closure, hasten their sale or open other funding
sources remains to be seen.
2.23 The privatized firms, in contrast, have improved. Several reports find productivity and
efficiency increased, and although some initially reduced their overstaffing, subsequent sales increases
28
http://www.carana.com/pcsu/
Workers may claim bonuses in addition to wages based on profits, and many firms may show profits because they
reportedly use a special system of accounting that ignores disputed creditor claims.
0
1,000
2,000
3,000
4,000
5,000
6,000
7,000
8,000
9,000
10,000
199
1-1
994
199
4/1
99
5
199
5/1
99
6
199
6/1
99
7
199
7/1
99
8
199
8/1
99
9
199
9/2
00
0
200
0/2
00
1
200
1/2
00
2
200
2/2
00
3
200
3/2
00
4
200
4/2
00
5
200
5/2
00
6
200
6/2
00
7*
LE m
Law 203 excluding land Land sale Other Pub. Sect. sale Joint Venture sale

29
resulted in more workers being employed29
. This is also the international experience as the Megginson
and Netter (2001) survey of the vast empirical literature finds.
Surging FDI
2.24 Foreign Direct Investment (FDI) to Egypt almost doubled to $ 6.1 billion in 2005-06, and
again in 2006-07 to about $11 billion — the flows are a larger share of GDP than to China or India.
This inflow continues to rise: $7.8 billion in the first half of 2007-08 (versus $7.2 billion in the
corresponding half the year before). There is international evidence that FDI helps technology transfer,
better jobs, promotion of trade, and increased international integration. However, Box 2.2 explains why
FDI is not evidence of a better business climate per se and that poorly functioning markets may
increase FDI (although FDI is not a measure of distortions either). Regardless of the cause, FDI benefits
both source and host countries.
Box 2.2: DFI to FDI: Changing Label & Views
FDI is not a business climate measure
Jean Jacques Servan-Schreiber predicted that American multinationals would takeover European business in his 1967 best seller,
Le Defi Americain (The American Challenge). A decade later, a slew of books warned of the imminent Japanese conquest of corporate
America. Views — and fears — of what was then called Direct Foreign Investment (DFI) have changed more than the volume and
direction of such flows: now Foreign Direct Investment (FDI) is welcomed and celebrated. Host country suspicion and resentment of the
1960s and 70s would seem strange at gatherings in Davos and elsewhere where hopeful recipients seek out foreign investors.
Despite its name, FDI is a type of international capital flow, not physical investment: it differs from other flows (e.g. debt or
portfolio investments) in giving control over the local firm’s operations. FDI has long puzzled economists because running a business
from a distance is an added cost, especially across national boundaries where language, laws, currencies and customs differ. Employing
locals reduce some costs, but entails the additional expense of integrating them into the organization. So FDI occurs only if there were
substantial cost advantages elsewhere, but what could these be? Better technology in production, marketing or some other aspect of the
business is insufficient because a local firm without the cost disadvantage could buy or rent (license) these technologies. Lumpiness of
some inputs or other local scale economies is one explanation but Coase30 (1937) provides the clue: a firm exists because it co-ordinates
some activities internally better than markets. FDI therefore results when some markets do not work well, either because the needed
contracts are too complex to write or impossible to enforce.
Put differently, FDI is the result of some business conditions being poor. Some foreign firms invest directly in China because they
fear that Chinese courts will not fairly enforce their technology licensing contracts with local firms. But FDI could also result when
foreigners are unfairly favoured: Huang31 (2002) finds more FDI in provinces with hostile or avaricious local politicians because the
central government protects large foreign firms from such harassment. Research finds an inverse relation between FDI and business
conditions: Fernandez-Arias and Hausmann (2001) find that higher FDI indicates poorly functioning markets, inadequate institutions and
natural resource rich countries; Loungani and Razin (2001) find FDI share is large in countries with low Moody’s country ratings32.
Consequently, FDI cannot be a litmus test of host countries’ business climate.
29
Mohammed Omran (1997) “Performance Consequences of Privatizing Egyptian State-Owned Enterprises: The Effect of Post
Privatisation Ownership Structure on Firm Performance” Multinational Finance Journal, Vol.1
Available at the Ministry of Investment website
http://www.investment.gov.eg/NR/rdonlyres/C4A1B75C-A7ED-410C-B294-
9DFB3A51CF25/3229/283867EF8821441E8_ASMOmranPrivatizationProofReadin.pdf
Magda Sayed Assaad 2002 Cairo University Ph.D dissertation “The Impact of Privatisation on Employment in Egypt” 30 Ronald Coase (1937) “The Nature of the Firm” Economica pp 386-405. 31 Yasheng Huang (2002) Selling China: Foreign Direct Investment during the Reform Era, Cambridge Modern China Series. 32 Eduardo Fernandez-Arias and Ricardo Hausmann (2001) “Foreign Direct Investment: Good Cholestrol?” in Foreign Direct
Investment Versus Other Flows to Latin America, ed. Jorge Braga de Macedo and Enrique V. Iglesias. OECD, Paris
Prakash Loungani and Assaf Razin (2001) “How Beneficial Is Foreign Direct Investment for Developing Countries?” Finance
and Development, Vol. 38, No.2 International Monetary Fund, Washington DC.

30
2.25 FDI’s effects are as complex as its causes: as with other types of capital inflows, the currency
could appreciate (the dreaded “Dutch disease”) to the extent they are not used for imports
(multinationals often import even office supplies that may be cheaper locally). If FDI purchases the
stake of domestic investors (privatisation, or portfolio investment), then it has the same effects as other
capital inflows: foreign exchange reserves and money rise, leading to inflation. Some economists
favour FDI, considering them less skittish than other types of inflows: but the greater willingness of
FDI investors to “ride out” a bumpy macro-economic stretch is because it is hard to liquidate their stake
(i.e. higher transactions cost than portfolio investors or short term lenders); but if getting out is difficult,
investors would be more cautious getting in. Egypt is among many countries in the region benefiting
from the oil price induced surplus that may lie behind FDI, and an improved business climate will help
ensure that the private sector chooses the best investments.
C. EFFECTS OF BUSINESS CLIMATE IMPROVEMENTS
2.26 The Bank’s 2008 Doing Business annual survey placed Egypt as the world’s top reformer,
and Table 2.3 shows its ranking moved up to 126th place among 178 countries after being 165
th for two
years. While this improvement is well earned, Egypt remains among the bottom third of countries.
Such surveys have their limitations and the rankings neither attract nor deter investment — large
investments flow into Brazil (rank 122 now, 121 a year ago) and China (rank 83 now, 93 a year ago)
while higher ranking Kenya (now 72) gets little. Besides, as the earlier section just discussed, FDI rose
for two years before the ranking changed. Even so, indicators for sound and market friendly
regulations are correlated with economic growth33
.
Table 2.3: Improving the Business Climate
Ease of... 2005 rank 2006 rank 2007 rank
Doing Business 165 165 126
Starting a Business 123 125 55
Dealing with Licenses 169 169 163
Employing Workers 147 144 108
Registering Property 139 141 101
Getting Credit 160 159 115
Protecting Investors 114 118 83
Paying Taxes 155 144 150
Trading Across Borders 94 83 26
Enforcing Contracts 157 157 145
Closing a Business 115 120 125
33
Simeon Djankov, Caralee McLiesh and Rita Ramalho (2006) “Regulation and Growth” World Bank (mimeo) at
http://www.doingbusiness.org/documents/growthpaper_03_17.pdf

31
Easier entry and fewer hassles …
2.27 Births and deaths give some indication of a population’s health, and analogous data on new
registration and bankruptcies are examined for Egyptian firms. Starting a business is now easier, and
more new firms are being created, particularly large ones.
2.28 The data on firm entry reflect the multiplicity of laws and changes that let in the private sector
by the back door, as it were34
. The General Authority for Free Zones and Investment (GAFI) was
created in the early seventies but its functions and reporting arrangements changed over the years: the
1997 Law 8 (that consolidated the many tax breaks in some 20 specified industries) gave GAFI
authority over the firms it registered to ensure they complied with regulations. A separate Companies
Authority was created in 1981 to register private firms, although this also required numerous additional
steps. When GAFI took on the investment promotion role in 2002 (Decrees 79 and 636), it created a
“one stop shop” to help investors navigate the complex process of starting a firm under Law 8. This
was not considered a success, although the general economic conditions may have been more to blame.
Tax breaks ceased in July 2004 (the tax reforms are described in Chapter 5), but other benefits of Law 8
remain (e.g. getting permits to employ foreigners) and in some industries, firms may choose between
Laws 8 and 159 to incorporate. The Companies Authority (responsible for registering Law 159 firms)
was folded into GAFI which now registers most limited liability firms, but the data are still gathered
separately and GAFI’s data include Law 159 firms only back to 2000.
More and larger new firms registered with GAFI
Table 2.4: New Company Registrations 1999-2007 2.29 GAFI’s success in increasing
new firms registered has been widely
reported35
, and Table 2.4 shows their
numbers rising from 2,671 in 2003 to
7,546 in 2007. The total value of
registered capital, part of which is paid
when the firm is registered, continues
to rise in nominal terms; but when
deflated by the price level, the average
is now smaller than before.
2.30 Firms registered in GAFI
are a fraction of all firms: they are
fewer than the proprietorships and
partnerships registered in the
34 Khalid Ikram (2006) The Egyptian Economy, 1952-2000, Routledge, New York describes changes in economic policies, the
orientation of successive cabinets, and the underlying forces that may be responsible. Briefly, sole proprietors and simple
partnerships were always open to the private sector and are governed by the Commercial Code. The more significant laws
relevant to corporations (i.e. with limited liability) are the 1971 Law 65 and 1974 Law 43 allowing private participation in joint
ventures (with state-owned firms), and the 1981 Law159 allowing wholly private corporations. Law 91 in 1995 allowed public
insurance companies to sell their stakes in joint ventures; Law 97 in 1996 allowed the same in banking; and Law 155 in 1998
allowed the state owned banks themselves to be sold. 35 Andrew Stone (2006) “The Case of the Cairo One Stop Shop” World Bank (mimeo).
GAFI Commercial Registry
Number
of new
firms
registered
Registered
capital per
firm (in ,000
2007 LE)
Number
of new
firms
registered
Registered
capital per
firm (in ,000
2007 LE)
1999 2,206 8,242 27,547 41
2000 2,555 6,245 24,544 40
2001 2,909 6,880 21,701 33
2002 2,569 3,630 20,858 27
2003 2,671 3,504 20,674 20
2004 4,053 4,024 22,721 33
2005 5,832 2,777 20,455 24
2006 4,551 6,438 10,653 126
2007 7,546 3,817 11,477 184

32
Commercial Registries36
(different from GAFI &/or Companies Authority). Data for 2006 and
2007 (in Table 2.4) show a sudden decline in the number of new firms registered with the
Commercial Registry and a quadrupling of the value of registered capital. This sharp change
could reflect changes in data collection on a sharp response by firms. Some Government officials
believe these Commercial Registry data are unreliable and it would be worth examining the issue
further.
Fewer exits
2.31 Declining deaths indicate rising population health, but data on bankruptcy must be interpreted
with care. While business downturns increase bankruptcies and vice versa, (1) the lag between filing
and ruling (preliminary and final) vary over time and by firm size and complexity, and (2) bankruptcies
capture legal, not operational demise which could have occurred much earlier. Figures 2.8 and 2.9,
however, are consistent with better business conditions and show a steady decline in preliminary and
final bankruptcy rulings since 1999 after a surge following a change in Egypt’s bankruptcy law.37
Figure 2.8: Bankruptcy Rulings by Preliminary Courts
Figure 2.9: Bankruptcy Rulings by Appeal courts
And little change for existing firms
2.32 Having examined the births and deaths of firms, we turn to how the living fare. The Bank
surveyed firms through Investment Climate Assessments (ICA) in 2004 (pre-reform) and again in
2006. They reveal improved perceptions: Figure 2.10 shows that taxes fell from being perceived as the
top constraint to number 5, and their administration to number 6; “macro-economic instability” rose to
first place, reflecting fears of renewed inflation. In addition, ICAs contain self reported data that, when
36 The Commercial Registry with about 70 offices in Egypt (at least one in each governorate, and many located in local Chambers
of Commerce/Trade) records sole proprietorships and partnerships formed under the Commercial Code, not specific investment
laws (such as Law 159 and Law 8 which GAFI handle). The Commercial Registry issues a certificate allowing business to be
conducted in the area. While the data are totalled centrally, some officials have strong concerns about their completeness and
accuracy. GAFI registers some, not all, financial companies (the Capital Markets Authority is responsible for them) and only
those partnerships and sole proprietorships that invest within the scope of Law 8. 37
Law 17 came into force in October 1999 replacing articles 550-772 in the 1883 Commercial Code dealing with bankruptcy
(Kanoon Al Eflas). Law 17 allows both financial reorganisation and liquidation (tasfeya), but requires a court ruling that could
be preliminary (hukm ibtidai) or final (hukm nehai). The trigger for traders is non-payment of the obligation when due, but for
non-traders the more amorphous criterion of debts exceeding assets is used. Owners often personally guarantee loans (thereby
undoing the advantage of limited liability) and may consequently delay bankruptcy filing.
-
10,000
20,000
30,000
1998 (Aug- Dec)
1999 2000 2001 2002 2003 2004 2005 2006 2007 0
500
1,000
1,500
2,000
2,500
1998 (Aug- Dec)
1999 2000 2001 2002 2003 2004 2005 2006 2007
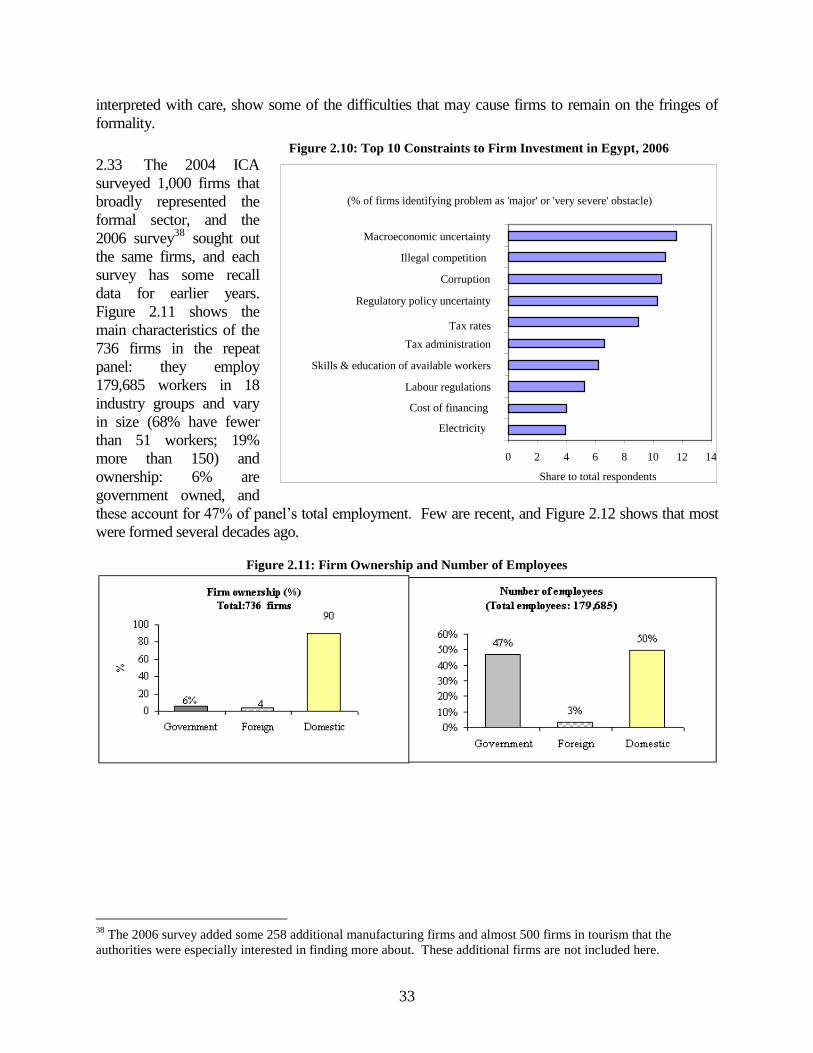
33
interpreted with care, show some of the difficulties that may cause firms to remain on the fringes of
formality.
Figure 2.10: Top 10 Constraints to Firm Investment in Egypt, 2006
2.33 The 2004 ICA
surveyed 1,000 firms that
broadly represented the
formal sector, and the
2006 survey38
sought out
the same firms, and each
survey has some recall
data for earlier years.
Figure 2.11 shows the
main characteristics of the
736 firms in the repeat
panel: they employ
179,685 workers in 18
industry groups and vary
in size (68% have fewer
than 51 workers; 19%
more than 150) and
ownership: 6% are
government owned, and
these account for 47% of panel’s total employment. Few are recent, and Figure 2.12 shows that most
were formed several decades ago.
Figure 2.11: Firm Ownership and Number of Employees
38
The 2006 survey added some 258 additional manufacturing firms and almost 500 firms in tourism that the
authorities were especially interested in finding more about. These additional firms are not included here.
(% of firms identifying problem as 'major' or 'very severe' obstacle)
0 2 4 6 8 10 12 14
Electricity
Cost of financing
Labour regulations
Skills & education of available workers
Tax administration
Tax rates
Regulatory policy uncertainty
Corruption
Illegal competition
Macroeconomic uncertainty
Share to total respondents

34
Figure 2.12: Firm Age (2006 year of establishment)
Firm size may limit productivity
2.34 Since the 2004 firm sample was broadly representative, its firm size distribution is compared
with that of other countries.39
Figure 2.13 shows that Egypt has proportionately more small and mid-
sized firms than countries with comparable incomes (despite the slight survivor bias towards larger
firms in the repeat sample). Figure 2.14 uses ICA data to show that such firms employ more unskilled
labour and spend less on their training.
Figure 2.13: SMEs Proportion in Countries
39
Meghana Ayyagiri, Thorsten Beck and Asli Demirguc-Kunt (March 2005, World Bank mimeo) compile these
data for 76 countries, although each defines size differently (many countries use workers, some use or combine with
asset size or sales). Egypt’s data from the 2006 ICA are plotted with countries in the same income group from their
Table 1 (SME firms generally employ fewer than 250 workers).
(ICA 2006 & Beek et. al. (2005), <250 workers)
Argentina
Brazil
Poland
Mexico
Thailand Egypt
Vietnam
0
10
20
30
50
60
70
80
90
100
0 1,000 2,000 3,000 4,000 5,000 6,000 7,000 8,000
GDP per Capita
0 10 20 30 40 50
0 5 10 15 20 25 30 35 40 45 50 55 60 65 70 75 80 85 90 95 100 105 110 115 120
Age
Number of firms (frequency)
11 year-old firms (39 firms (5.3%) represent the largest group

35
Figure 2.14: Skill Composition of Sample Workforce and Number of Employees in the Sample
Figure 2.15: Factors That Affect Decision of Changing
Number of Workers
2.35 While the next chapter
examines the labour market and
skills, could it be that smaller
firms do not (a) consider on the
job learning as training and (b) do
not train their workers because of
turnover? Unfortunately, the ICA
surveys were not designed to
answer such questions, but Figure
2.15 provides an indication of
how different groups of firms
view de jure requirements that
affect labour. Mostly government
firms responded that laws matter when labour is to be redeployed: domestic (i.e. small private
firms) find unspecified reasons more important than even wage regulations. Put differently,
private firms may have ways to avoid or evade restrictive laws. While few report that minimum
wages are binding, the relatively high numbers of domestic private firms reporting are the larger
firms that adhere to the mandated profit sharing arrangements.
Larger firms growing
2.36 Besides data from the ICA surveys, the national statistical office has some data on the
distribution of employment in manufacturing firms. These are before the recent efforts to improve
business climate, and Figure 2.16 and 2.17 show a slight decrease in total employment overall but that
employment in firms with more than 100 workers rose slightly. So the more recent changes that the
ICA surveys capture continue a trend that began earlier.
Factors that affect decision of changing number of workers
(Gov't:47 firms, Domestic: 662, Foreign:27)
0
10
20
30
40
50
60
70
Laws Union pressure High min.wage Fear of social
sanctions
Others
% Domestic
Gov't
Foreign
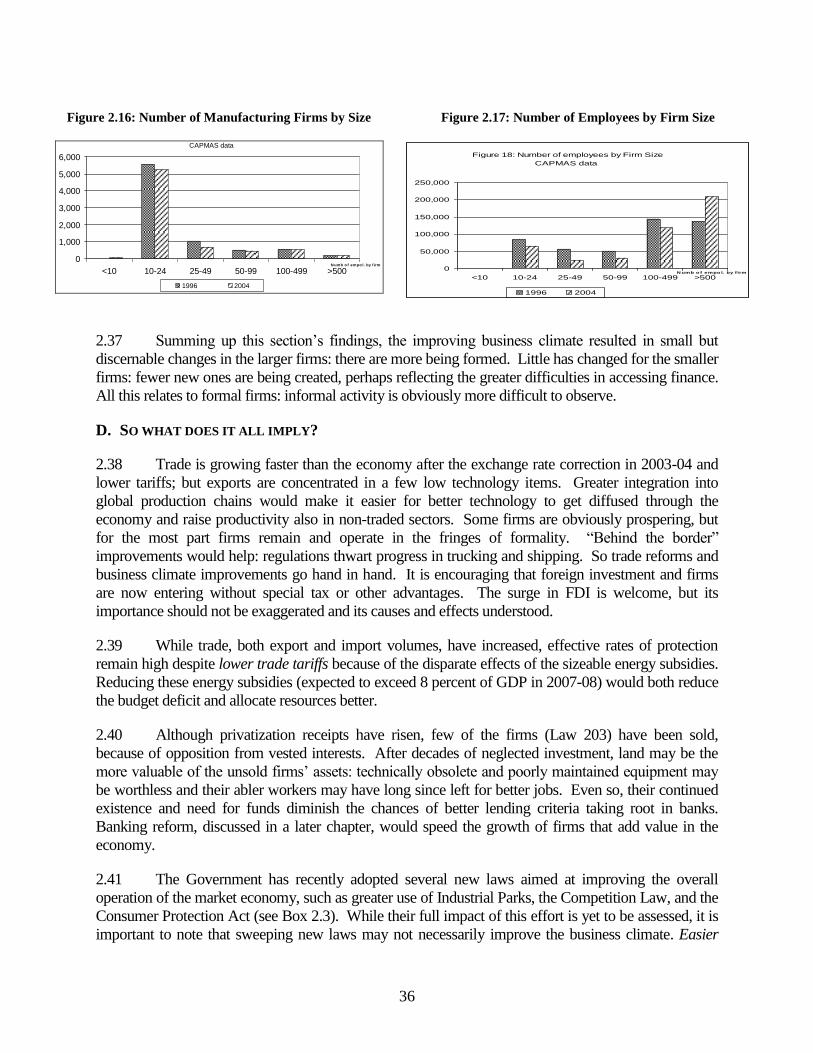
36
2.37 Summing up this section’s findings, the improving business climate resulted in small but
discernable changes in the larger firms: there are more being formed. Little has changed for the smaller
firms: fewer new ones are being created, perhaps reflecting the greater difficulties in accessing finance.
All this relates to formal firms: informal activity is obviously more difficult to observe.
D. SO WHAT DOES IT ALL IMPLY?
2.38 Trade is growing faster than the economy after the exchange rate correction in 2003-04 and
lower tariffs; but exports are concentrated in a few low technology items. Greater integration into
global production chains would make it easier for better technology to get diffused through the
economy and raise productivity also in non-traded sectors. Some firms are obviously prospering, but
for the most part firms remain and operate in the fringes of formality. “Behind the border”
improvements would help: regulations thwart progress in trucking and shipping. So trade reforms and
business climate improvements go hand in hand. It is encouraging that foreign investment and firms
are now entering without special tax or other advantages. The surge in FDI is welcome, but its
importance should not be exaggerated and its causes and effects understood.
2.39 While trade, both export and import volumes, have increased, effective rates of protection
remain high despite lower trade tariffs because of the disparate effects of the sizeable energy subsidies.
Reducing these energy subsidies (expected to exceed 8 percent of GDP in 2007-08) would both reduce
the budget deficit and allocate resources better.
2.40 Although privatization receipts have risen, few of the firms (Law 203) have been sold,
because of opposition from vested interests. After decades of neglected investment, land may be the
more valuable of the unsold firms’ assets: technically obsolete and poorly maintained equipment may
be worthless and their abler workers may have long since left for better jobs. Even so, their continued
existence and need for funds diminish the chances of better lending criteria taking root in banks.
Banking reform, discussed in a later chapter, would speed the growth of firms that add value in the
economy.
2.41 The Government has recently adopted several new laws aimed at improving the overall
operation of the market economy, such as greater use of Industrial Parks, the Competition Law, and the
Consumer Protection Act (see Box 2.3). While their full impact of this effort is yet to be assessed, it is
important to note that sweeping new laws may not necessarily improve the business climate. Easier
Figure 2.16: Number of Manufacturing Firms by Size Figure 2.17: Number of Employees by Firm Size
Figure 17: Number of Manufacturing Firms by size
CAPMAS data
0
1,000
2,000
3,000
4,000
5,000
6,000
<10 10-24 25-49 50-99 100-499 >500N umb o f empo l. by f irm
1996 2004
Figure 18: Number of employees by Firm Size
CAPMAS data
0
50,000
100,000
150,000
200,000
250,000
<10 10-24 25-49 50-99 100-499 >500N umb o f empo l. by f irm
1996 2004

37
entry of firms is generally a sound policy: de novo firms in transition economies generated much of the
economic growth and employment. But Egypt did not have the pervasive controls of pre-1989 China
or the former Soviet Union — and only selectively enforces its regulations. Consequently, private
firms learnt to cope: the larger ones through political connections (that also perpetuated distortions and
bestowed rents to the favoured) and the smaller ones by being invisible — even if it meant forgoing
economies of size and scope. Mid-sized firms are relatively few.
2.42 It may therefore be useful to emphasise policies that enable firms to grow and increase formal
employment than easier entry per se. Size is not the objective since firms of all sizes innovate; but very
small firms have less direct access to “off the shelf” technology that greater international trade provides
access to. There are encouraging signs that there are more large firms, and in time this would help
increase formality of employment that, as the next chapter discusses, would benefit broad swaths of
society.
Box 2.3: Recent Laws to Improve Markets
The Government has adopted several new laws and initiatives to improve the markets and business environment,
the full impact of which is yet to be evaluated. This Box outlines the intent of Industrial Parks (IPs), the Competition Law,
and the Consumer Protection Act.
Industrial Parks: The Industrial Development Authority (affiliated with the Ministry of Foreign Trade and
Industry) is restructuring its Industrial Zone Development Program. The IPs are designed as integrated complexes with a
variety of services providing a single point of contact for all Government/municipal functions, streamlined entry and
operating stages procedures. There is no limit on foreign equity, a 100 percent import tax exemption on machinery and
other project-related products and advantageous payment schemes. Industrial areas of around 42 millions square meter in
different regions in Egypt would later become available. The new generation of IP gives a more leading role to the private
sector through assigning the long term land development, management and operation rights to private investors within
Public Private Partnership (PPPs) arrangements.
The Competition Law of early 2005 applies to state-owned enterprises and private firms, not state-run public
utilities, or public utilities managed by private companies and of basic products (such as (including fuel, sugar, flour and
other basic foodstuffs) whose prices are set by the government. The Law defines a dominant position as a party having a
market share exceeding 25 percent and unfairly influencing the price or volume of the product in the market. It also
encompasses anti- competitive measures, such as the refusal to deal, setting discriminatory pricing or using tie-in
agreements. The Law stipulates enforcement punishments, but the Competition Authority’s role is to advise the
government, not to litigate. The Prime Minister must to initiate litigation and the law does not cover mergers and
acquisitions.
The Consumer Protection Act of May 2006 seeks to protect consumers’ interests, whether products are
provided by private or public enterprises. The Act reaffirms the rights of the consumer as outlined in the UN Guidelines
for Consumer Protection, spells out producer obligations, and enables the setting up of a Consumer Protection Agency,
affiliated with the Ministry of Trade and Industry, to receive consumer complaints. This Act also gives NGOs the right to
file suits and claim compensation on behalf of consumers).

38
3.1 Employment has been growing rapidly: the 4.6 percent annual increase between 1998 and
2006 is robust by any standard and much of this has been in the private sector. Unfortunately, formal
employment remains low: less than one fifth of the working age population, of which for three quarters
are employed in the public sector. To the extent that private firms remain small and avoid many hassles
by operating in the shadows, improving the business climate would allow firms to expand formal
employment and take advantage of other economies of scale and scope. But there are also many
elements that the government could improve in the labor market: reducing overstaffing as an employer
and improving schooling would go a long way. Egypt has increased school enrolments, but quality is
not commensurate with the substantial sums that are spent both by the state and by parents. Egypt’s
current challenge is to increase value creating employment.
3.2 This chapter examines these intertwined issues and suggests how reforms in employment and
education could proceed in tandem. The demographic transition offers the potential for a demographic
dividend. Government policies as an employer and in providing education have long term effects —
and changes also take long to have observable effects. So reforms have to be sustained over lengthy
periods and a consensus over their direction is essential. This chapter highlights some changes that are
needed although it is selective in its coverage: the effects of transport and housing, for example, greatly
influence where people work but are not discussed.
3.3 The first section provides an overview of the labor market. Economic growth has raised
employment: two detailed labor market surveys in 1998 and 2006 found that employment rose and the
unemployment rate dropped despite higher labour participation. Even so, under-employment is
substantial, especially for women and rural residents: consequently, the poverty rate has not fallen
much despite the rise in employment and real wages. Most employment remains informal which
reduces the competitiveness and productivity of Egyptian manufacturing. The extensive and expensive
education and training system has not created a highly skilled workforce needed for a modern
economy.
3.4 There have been some important changes. The public sector employment guarantee for
technical secondary school and university graduates has been suspended and growth of public
employment has slowed. This reduced overall queuing for public sector jobs but raised it for some
groups such as University graduates and young educated women; but queuing should be viewed in
conjunction with labour participation rates which have declined for women. The 2003 Labour Law
allows firms to hire workers directly (i.e. without going through the Ministry of Employment offices)
which, along with other changes like the unlimited renewal of fixed term contracts and collective
bargaining for wages, are an improvement. The Government has sought to improve job search and
placement through their employment offices as well as to improve skills and vocational training. Some
attempts, like the conversion of the Middle Technical Institute into Technical Colleges appear to be
more successful than others such as the Mubarak-Kohl initiative whose sustainability is in doubt.
3.5 Later sections in the chapter project employment creation by economic sectors and by skill.
On the basis of past elasticities, projected GDP growth of around 7 percent p.a. would generate
sufficient jobs in the aggregate; but still the number of new technical secondary school and university

39
graduates entering the labour market will exceed available jobs by about 50,000 per annum over the
next five years. Something more must be done to avoid this potentially productive group being
unemployed, underemployed or working in low quality non-wage jobs.
3.6 A strategy for increasing value creating employment would include three elements. First,
policies that encourage firms to hire workers with formal contracts and to increase their training on the
job. Such policies include the planned pension and social insurance reforms that reduce the tax rate on
wages and eliminating the now “suspended” public sector employment guarantee and holding down
public sector wages (aggregate, although the wage and benefit structure should be re-examined).
Second, improving institutions supporting the labour market such as helping out-migration, job search
and placement, career counselling and students’ advisory services. Third, improving the quality of
education and training. This report will say little about this the complex issue of how to go about it: a
recent regional report40
has just suggested the broad approach, and ongoing sector work is working on
the details with the Government. The current two-track education system is too rigid, and permitting
multiple points to switch stream would better match students with schools and simultaneously
improving the post secondary education would help increase skills that private firms value.
A. MAIN FEATURES OF THE LABOR MARKET
3.7 Figure 3.1 shows the current structure of Egypt’s population and it is apparent that the youth
population will continue to grow
faster than the total. This demographic
transition represents a potential
demographic dividend with the right
policies in place, and a source of
discontent otherwise. The fertility
decline since 1988 has slowed the
population growth rate. Table 3.1
shows the working age and the youth
population (WAP between ages 15
and 64) grew faster than the 2 percent
annual population growth rates over
1998- 200641.
40
The World Bank (2008) The Road Not Travelled: Education Reform in the Middle East and North Africa. Also
available at
http://web.worldbank.org/WBSITE/EXTERNAL/COUNTRIES/MENAEXT/0,,contentMDK:21617643~pagePK:14
6736~piPK:226340~theSitePK:256299,00.html 41
The chapter draws on Ragui Assaad’s analysis of the Egyptian Labor Market Panel Survey (ELMPS) of 2006,
1998 and 1988. CAPMAS has more complete and recent data that are not readily accessible, although data available
on their web site also show employment increases of similar magnitudes. Data from the 2004 Household Income
and Expenditure Survey that were used in the World Bank’s Poverty Assessment Update 2007 supplement the
ELMPS data.
The ELMPS 2006 survey of 8,349 households included 3,684 from the ELMS98, 2,167 that resulted from these
splitting, and a refresher sample of 2,498. Of the 23,997 individuals in 1998, 17,357 (72%) were interviewed again,
forming a panel used in longitudinal analysis.
Ragui Assaad (2007a) “Unemployment and Youth Insertion in Labour Market in Egypt” in The Egyptian Economy:
Current Challenges and Future Prospects Hanaa Kheir-El-Din (editor) The American University in Cairo Press.
Ragui Assaad (2007b) Labour Supply, Employment and Unemployment in the Egyptian Economy, 1988-2006”
Economic Research Forum Working Paper No. 2007-01 available at:
http://www.erf.org.eg/cms.php?id=publication_details&publication_id=823
Figure 3.1: Age Distribution, 2006
Source: World Bank

40
Table 3.1: Average Annual Population Growth Rate
The Labor Force Structure
3.8 Table 3.2 shows that the
2006 WAP was 61 percent of the
population and that about half were in
the labor force, three quarters of
which is male and nearly 60 percent
in “rural areas”42
. The high level of
informality in the economy is reflected in the labor market: only 64 percent of the total employed
(regular and irregular) are wage earners while the remaining 36 percent are in non wage-earning jobs
including household activities and the self-employed. This informality has increased both in magnitude
and as a share of non-wage employment, rising from 29 percent to 36 percent between 1998 and 2006.
Table 3.2: Employment & Labor Force
1998
,000
2006
,000
Growth
1998-06 Percentages
Population 64,000 73,600 2 % of 2006
Population
Total Working Age
Population 36,754 44,901 2.7 61
Labour Force 17,184 23,318 4.2 32
Actively Unemployed 2,007 1,936 8
Total Employed 15,177 21,382 4.6 92
Male 13,291 17,243 3.8 74
Female 3,893 6,075 7.5 26
Of the Total Employed … … …
% of 2006
Employed
Wage work 10,807 13,745 3.2 64
Non-wage work 4,370 7,637 7.4 36
Male 12,361 16,436 5.3 77
Female 2,816 4,946 14.8 23
Source: Assaad 2007a
42
Old administrative definitions establish what is “urban”, and many built up suburbs are classified as rural.
1988-98 1998-2006
Total Population 2.1 2
Working Age Population (15-64) 3 2.7
Youth Population (15-24) 3.4 2.1
Source: Assaad 2007a

41
Figure 3.2: Education Level of the WAP
Source Assaad 2007a
3.9 The labor force is changing rapidly although its education level is fairly low: with only about
48 percent of the WAP in 2006 had a high school diploma but, the proportion of technical (vocation)
secondary school graduates rose sharply over 1988 to 2006. Consequently those without educational
credentials (illiterates and literates) fell and the proportion of university graduates increased from 8.3 to
11.5 percent of the WAP as shown in Figure 3.2. The Figure also shows the low proportion of post-
secondary institute graduates that in many countries outside the region provide the skilled technicians
that industry require.
Unemployment Trends Table 3.3: Unemployment as a percentage of Labor Force
3.10 Unemployment levels and trends
differ by source and measurement, creating
some confusion among commentators, and
Box 3.1 explains the measurement issues that
account for the differences. Until recently,
CAPMAS reported higher unemployment
rates; but labour market survey data show the
unemployment rate using different
definitions declining between 1998 and 2006
after having risen between 1988 and1998
(Table 3.3).
Source Assaad 2007a
1988 1998 2006
Market definition
Male na 7 4.7
Female na 27.6 18.6
Total na 11.7 8.3
Extended market Definition
Male 4 7 4.6
Female 7.7 9.4 8.8
Total 5.3 7.9 6.2
0 5 10 15 20 25 30 35
Illiterate
Reads and Writes Without Diploma
Elementary School
Middle School
General High School
Vocational High School
Post-Secondary Institute
University & Above
Percentage
2006 1998

42
Box 3.1: Measuring Unemployment
Egypt’s unemployment rate reported by CAPMAS was “stuck” above 10% for several quarters despite rising
GDP, and suddenly fell in October 2006 (just over 9 percent in March 2007). Since these rates are widely reported, it
may be useful to explain how the data are gathered and why the rate (that differs slightly by publication both in level and
trend) may have limited use as a guide macro-economic policies as is done in many developed countries. CAPMAS
changed an important question in the Labor Force Sample Survey from October 2006: respondents are now asked
separate questions about their capacity to work, desire to work and availability to work within two weeks of getting a job
offer (these had been in one question earlier, and respondents may have answered differently). Consequently, CAPMAS
unemployment data after October 2006 are not comparable with earlier numbers.
Subsistence workers are considered employed under the extended definition but are considered unemployed
under the market definition. A person is counted as unemployed (under the ILO’s definition that Egypt also uses) if he
never worked even an hour in the previous week and is “seeking work”. “Seeking work” has three definitions: the
narrow definition requires an active search, the standard definition requires some search in the previous three months
(being registered in an employment office suffices) and the broad definition drops the search requirement so as to
include discouraged seekers.
CAPMAS reports the standard definition (and calculates, but not publish, the broad definition), and as this uses
the employment register, some unique features warrant an explanation. The Ministry of Manpower registers job seekers
in person at its 300 local employment offices across the country. Until 2003, firms employing more than 10 people
could only hire workers through these local employment offices. Although the 2003 Labour Law did not change the
system of reporting or recording, it reduced the incentives to comply. A firm may now hire workers directly, and
although all firms must still furnish details of all its employees to the Ministry annually, doing so makes it harder to
evade other requirements: they must pay (in addition to the substantial taxes on wages for pensions, etc.) 1% of the total
wages into an “emergency fund” that ostensibly pays workers wages for 6 months if the firm experiences cash flow
difficulties, but senior officials in the Ministry could not say how many firms availed of this. The 2003 Law gives labour
unions (that replaced the labour management consultative committee which firms with more than 50 workers must have)
the right to strike. Firms, especially private profit-seeking ones, therefore have less reason to report accurately, and with
some 1.5 million firms, the Ministry’s 30,000 inspectors (who also enforce health and safety regulations) cannot ensure
accurate compliance. The Ministry’s registry has some 2 million seeking work — making the roughly 10%
unemployment rate. Note, however that it includes: (1) those seeking work for the first time (reportedly 65% of the
total); (2) the already employed seeking better positions (about 15%); and (3) those who had worked before (and may be
informally employed).
The Ministry’s job register data are reported both to the Ministry of Economic Development (formerly Ministry
of Planning) and to CAPMAS, and each uses the data differently resulting in two published unemployment rates that
differ slightly. CAPMAS also uses data from a quarterly labour survey (since 1957, irregularly until 2003, and now in
the first week of January, April, July & October) of roughly 21,000 housing units in all governorates; but this too uses
the standard definition of job search.
3.11 The fall in the unemployment rate was despite the increase in labour participation:
participation rates rose by nearly 4 percentage points over 1998-2006 (from 47.2 percent to 51.1
percent), similar for both men and women. Table 3.4 shows the particularly large increase for rural
women (the increase is significant even though rural female employment is thought to have been
underestimated in the 1998 survey).
Table 3.4: Labor Force Participation for WAP, Market Definitions
Male Female Total
1998 2006 1998 2006 1998 2006
Urban 71.5 75 25.7 26.2 48.6 50.2
Rural 74.7 78.3 17.8 26.7 46.1 51.8
Total 73.2 76.8 21.4 26.2 47.2 51.1
Source: Assaad 2007a

43
Characteristics of the Unemployed
3.12 As in other countries in the Middle East, Egypt’s unemployed have three characteristics. First,
they are mostly educated youth, not illiterates or unskilled middle-aged workers. The ELMPS 06 data
show low unemployment rates (< 3-4 percent) for those with little education and high rates (12-14
percent range) for technical secondary school and university graduates. The educated constitute over
90 percent of the unemployed: 60 percent have technical secondary or post secondary education, and
over 32 percent have university degrees.
Figure 3.3: Education Levels of the Unemployed
3.13 The large proportion of educated among the unemployed should not obscure the growth of
jobs for the educated: rather, it reflects the large numbers of technical and vocational school graduates
that entered the work force. The proportion of technical secondary school graduates in the WAP
increased sharply from 18 to 28 percent between 1998 and 2006 and their proportion among the
unemployed fell from 25 to 14 percent. This contrasts with university graduates whose proportion in
both the WAP and the unemployed rose (from 9.7 to 14.4 percent and 8.3 to 11.5 percent respectively).
Figure 3.4: Education Levels of the WAP
3.14 Second, the
unemployed are mostly
those seeking their first
job, not those getting back
on the job ladder (Assaad
2007a). New entrants
(first time job seekers)
among the unemployed
rose from 74 in 1998 to 82
percent in 2006, and it
typically takes an entrant
24 months to find work. Surveys find that women using the Government’s search mechanisms are
unemployed the longest: almost 84 months in 2006 (i.e. 7 years, up from 4 years in 1998), and largely
reflects the loss of job opportunities in the public sector and the different needs of the private sector.
Education Level of the WAP
18.3
28.4
8.3 11.5
0
10
20
30
40
50
60
70
80
90
100
1998 2006
University & Above
Post-Secondary
Inst itute
Vocational High
School
General High School
M iddle School
Elementary School
Reads and Writes
Without Diploma
Illiterate
53.0
9.9
6.8
12.7 32.3
57.5
0 10 20 30 40 50 60 70 80 90
100
1998 2006 Percent
University & Above
Post-Secondary Institute
Vocational High School
General High School
Middle School
Elementary School
Read and Write
Illiterate

44
3.15 Third, more women are unemployed, especially in urban areas. The urban unemployment
rate is only modestly higher (10.0 percent versus rural unemployment rate of 7.0 percent using the
market definition) for women, but Table 3.5 shows that their labour participation rate is a third that of
men. In 2006 nearly 18.6 percent43
of women and only 4.7 percent of men were unemployed. Starting
from a much lower employment base, the reduction in unemployment for women has been greater i.e.
from 27.6 percent to 18.6 percent while for men it has been more modest: from 7 percent to 4.7 percent
over 1998-2006. Not only is unemployment higher for women, but their wages are lower: while
salaries for men and women are similar in Government and public enterprises, women earn half of
what men earn in the informal private sector and the irregular wage sector.
The Effects on Poverty
3.16 These differences in earnings have implications for poverty, but (as with the unemployment
rate) one must interpret the data carefully. The Bank’s 2007 Poverty Assessment Update44
finds the
poverty rate for wage and salary workers rose from 16.7 in 2000 to 19.6 in 2005 using the national
poverty line (roughly $1.5/day) based on Household Income, Expenditure and Consumption Survey
(HIECS). In contrast, labour market surveys (ELMPSs) find that real earnings rose.
3.17 The findings are consistent and the apparent contradictions arise from three differences in the
HIECS and ELMPS data. First are differences in survey timing: the ELMPS capture the big jump in
real wages between 1998 and 2000 while real wages increased only modestly between 2000 and 2005
when HIECS was conducted. Second, the ELMPS measures incomes while the HIECS and poverty
lines measure consumption expenditures using indices that may be inaccurate because of high inflation
in 2004. Both the ELMPS and the HIECS find increased spending on consumer durables: ownership
of stereos, colour television, gas stoves, refrigerators and mobile phones rose among both the rural and
urban poor suggesting that they are better off than before. National accounts data also indicate an
increase in per capita consumption. Third, the percentage of near poor (set 30 percent higher than the
poverty line of LE 1,423 p.a.) declined from 46.6 percent in 2000 to 40.5 percent in 2005, and this is
consistent with labour market trends. So the poor have benefited from economic growth,
notwithstanding the slight increase in the poverty head count measure, and Chapter 1 already discussed
how the extremely poor have fared and how they would benefit from the better delivery of public
services such as health care, education and family planning.
3.18 Higher growth and employment may not have benefited a few groups because of the nature
of employment: the poor are employed, but in jobs that involve few hours and pay little. Only 60
percent of the employed worked 45 hours or more a week; and only 21.5 percent of the unemployed are
poor, and the rate is not that different for the 18.7 percent of the self-employed and 16.6 percent of
wage earners who are also poor. While employment grew 4.6 percent annually between 1998 and
2006, most of this was the self-employed and the household enterprise workers, two groups with low
real earnings that account for 36 percent of the total employment. Well paying formal jobs account for
only 10 percent of total employment, and most are in public enterprises and Government where
employment has grown little.
43
These are calculated as a percent of the labor force: actively unemployed (actively unemployed + employed). 44
World Bank (2007) A Poverty Assessment Update, Report No.39885.

45
Figure 3.5: Distribution of Employment by Institutional Sector
Rising informality
3.19 Employment is
considered informal if the
worker has no employment
contract or social insurance.
Figure 3.5 shows that informal
employment (defined as the
sum of self employed,
household workers, irregular
wage workers, informal private
regular and wage workers) rose from 57 percent of the total employed in 1998 to 61 percent in
2006. And this proportion may continue to rise: 75 percent of new entrants in the first five years
of this decade obtained informal work. The panel with numbers (left) shows the increase in
formal private sector wage earners — an encouraging development that is obscured when viewed
as proportions (right panel).
Figure 3.6: Average Annual Growth by Sector
3.20 Figure 3.6 shows that the
formal and informal private wage
sector accounts for nearly 27 percent
of the total employment in 2006.
The extent of informality within the
private wage sector declined from
75 percent to 70 percent of the labor
force over 1998-2006. As indicated
in Figure 3.7, the extent of
informality declines with firm size,
although even larger firms hire
nearly a quarter of their workers
informally. Source: Assaad 2007a
Figure 3.7: Proportion of Informal Employment in Private
Wage Employment by Firm Size (1998 – 2006)
0
2,000
4,000
6,000
8,000
10,000
12,000
14,000
16,000
18,000
20,000
22,000
1998 2006
Th
ou
s.
Self Employed
HH Enterprise Worker
Irregular Wage
Informal PrivateRegular Wage
Formal Private RegularWage
Public Enterprises
Government
0%
10%
20%
30%
40%
50%
60%
70%
80%
90%
100%
1998 2006
Pe
rce
nt
Average Annual Growth by Sector
1.6
-0 .02
7.8
7.7
-1.2
7.8
6 .7
4 .6
-2 0 2 4 6 8 10
Government
Public Enterprises
Formal Private Regular Wage
Informal Private Regular Wage
Irregular Wage
HH Enterprise Worker
Self Employed
Total Employment
Percentage
Proportion of Informal Employment in Private Wage Employment by Firm Size,
1998-2006
88% 89%
68%
44%
25%
80%
75%
82%85%
68%
48%
23%
63%
70%
0%
10%
20%
30%
40%
50%
60%
70%
80%
90%
100%
1-4 5-9 10-29 30-49 50+ DK/miss Total
Number of Workers
Perc
ent
1998
2006

46
International Migration
3.21 Migration from Egypt has been a significant escape valve for the young and a safety net for
their families. Between 3 and 5 million Egyptian migrants were abroad in 2005, according to the 2000
CAPMAS census and 2005 data from Egypt’s Ministry of Manpower and Migration on new work
contracts for the Gulf region. Zohry45
(2006) estimates that about 1.9 million Egyptians work in the
Gulf, half of them in Saudi Arabia, followed by 18 percent in Libya and 12 percent in Jordan. Iraq was
a major host country before its war with Iran and the 1990 Gulf war and subsequent decline in oil
prices and exports changed the pattern also. Of the non-Gulf migrants, over 78 percent were in five
countries: the US with 39 percent, Canada with 13 percent, Italy with 11 percent, Australia with 8.5
percent and Greece with over 7 percent. Egypt also hosts migrants, some legal and many refugees,
from Sudan and other sub-Saharan countries both as a destination and in transit.
3.22 Falling oil prices in the early 2000s reduced migration from Egypt to about 1.2 million, or
about 5 percent of the labour force, down from its 1985 peak of 10-15 percent of the labour force (these
may have subsequently raised again with oil prices). Wahba (2005) notes that migrants are from two
extremes: the highly skilled and unskilled (who work more in Jordan, Iraq and Lebanon as agricultural
and domestic workers). Most migrants are young men (those to the West may have families), and
many return after a few years and send funds home in the interim.
Figure 3.8: Remittances as a Share of GDP (1975 – 2006)
3.23 Figure 3.8 shows that worker
remittances, although significantly lower than
in the 1990s, are still about 4 -5 percent of
GDP. These data may underestimate flows:
the parallel market for exchange, and a high
premium between 2000 and 2004, probably
resulted in substantial remittances outside the
regular banking channels. Bouhga-Hagbe46
(2006) finds that remittances are also inversely
related to agricultural GDP because altruism
prompts migrants to send funds when there is
hardship at home.
3.24 Studies also find that few returning migrants start a business. Although somewhat dated,
Adams47
(1991) surveys three villages in Minya Governorate and finds that younger and better
educated people migrate, that most are male with older brothers who care for the family when they are
away, and that 54 percent of the remittances are spent on non-recurring items such as the construction
or repair of houses: 73 percent of the spending by households with one migrant abroad is for the
45
Ayman Zohry (2006) “Labour Emigration and Insourcing in MENA Countries: A Review of Opportunities &
Challenges. Egypt Case Study” (mimeo)
Jackline Wahba (2005) “International Migration, Education and Market Failure in MENA”, University of
Southampton (mimeo) 46
Jacques Bouhga-Hagbe (2006) “Altruism and Workers’ Remittances: Evidence from Selected Countries in the
Middle East and Central Asia” IMF Working Paper WP/06/130. 47
Richard H. Adams Jr. (1991) “The Effects of International Remittances on Poverty, Inequality and Development
in Rural Egypt” International Food Policy Research Institute, Research Report No.86.
0.0
2.0
4.0
6.0
8.0
10.0
12.0
14.0
16.0
1977 1981 1985 1989 1993 1997 2001 2005
Source: World Bank, 2003 World Development Indicators,
CD-ROM

47
purchase of land. This spending pattern from remittances is not surprising considering the profile of the
typical migrant.
B. PUBLIC SECTOR EMPLOYMENT AND WAGES
3.25 Public Sector employment and wages have major effects on the labour market, and worse, it
is difficult for an overstaffed bureaucracy to provide government services effectively or efficiently. In
the past, the Government guaranteed jobs for all technical secondary school, post secondary school and
university graduates (men and women equally). This has led to:
Excessive numbers in technical secondary school education without marketable skills
Trapped a large proportion of Egypt’s work force in the civil service
Increased the reservation wage for the private sector
Made public sector employment attractive for women, especially in urban areas
3.26 The employment guarantee has been suspended but not revoked or abolished. While this has
slowed public employment growth, abolishing the guarantee would reduce uncertainty and queuing
(that is reflected in unemployment as measured). Public sector employment grew more slowly at 1.6
percent annually between 1998 and 2006 (when overall employment grew 4.6 percent) almost half the
3.3 percent rate between 1988 and 1998. Employment in public enterprises shrank by about 0.2
percent annually. Table 3.5 shows that although men bore the brunt of this slowing, it has been
especially hard on women who find public sector jobs relatively more attractive because they combine
generous medical and retirement benefits, relatively short work hours, employer provided
transportation in many cases, and a measure of safety in workplace with the presence of other women.
The longer wait in public employment (now 7 years) has led many women to drop out of the labour
force altogether. The proportion of females in public sector employment has remained around 30
percent for about 15 years, having doubled from around 15 percent in 198148
. Considering the
differences between public and private employment of women, especially for the educated in urban
areas, reforms in public employment will have significant gender implications.
Table 3.5: Gender composition of Public Sector Employment ,000 Persons
Male Female
1998 2006 Growth
% 1998 2006
Growth
% p.a.
Government 3,310 3,596 1.1 1,472 1,776 2.5
Public Enterprises 916 905 -0.2 123 117 -0.7
Total Employment 12,361 16,436 3.8 2,815 4,944 7.5
3.27 Despite slower employment growth, Table 3.6 shows that the Central Government, Economic
Authorities and public enterprises together employ 5.6 million in 2006 which, along with an additional
1.02 million in public enterprises, is about 30 percent of total and three quarters of Egypt’s formal
employment. Central Administration has grown substantially, and the suspension of the employment
guarantee mostly affected local administration.
48
E.H.Valsan (1997) “Civil Service Systems in Comparative Perspective” Indiana University (mimeo)
http://www.indiana.edu/~csrc/valsan.html

48
Table 3. 6: Public Sector Employment and Real Wages
2001/02 2002/03 2003/04 2004/05 2005/06 2006/07 2007/08 Growth
Actual Actual Actual Actual Actual Projected Budget 01--08
Number of Employees (Thousands)
Central Administration 1,380 1,441 1,497 1,607 1,647 1,719 1,767 4.21
Local Administration 2,798 2,856 2,868 2,955 2,951 3,009 2,982 1.07
Public Service
Authorities 449 443 449 454 461 463 471 0.82
Central Government 4,627 4,739 4,814 5,016 5,059 5,191 5,220 2.03
Economic Authorities 521 495 496 426 426 433 433 -3.04
Central Govt and
Economic Authorities 5,148 5,234 5,310 5,442 5,485 5,624 5,653 1.58
Index of real wages
Central Government 100 104.0 101.0 103.3 107.3 102.0 108.1 1.31
Economic Authorities 100 108.1 101.2 127.2 136.5 130.1 137.1 5.42
Central Govt. and
Economic Authorities 100 104.4 101.0 105.2 109.7 104.4 109.4 1.51
Source: Ministry of Finance
1/ Excludes public sector enterprises
3.28 Wages are higher, and have grown faster in the public sector. Figure 3.9 shows this
increase of wages and all financial benefits over a decade and its effects are increased queuing
(i.e. measured unemployment), higher reservation wages and greater informality in the private
sector. Real private sector
wages fell in the second
half of the 1990s when the
economy stagnated and
began to creep up after
2002; but average public
sector wages grew faster
and exceeded those in the
private sector by a third
by 2004 and this disparity
continues in 200549
.
Source: Hassan & Sassanpour (2007)
49
Hassan and Sassanpour (2007) analyse unpublished CAPMAS data on wages in 14 sectors (e.g. agriculture,
construction, manufacturing, education etc.) using the standard government classification of public and private. In
sectors like education, public is almost all government employment while in manufacturing, public enterprises
(where the pay is higher) are significant. The skill mix differs in each category, but changing employment
composition is not why the difference in public and private pay widens. The divergence continues into 2005, and
data show that weekly nominal wages rose 13 percent in the public sector and declined 3 percent in the private
sector.
Figure 3.9: Real Wages in Public and Private Sectors, 1995-2004
Real Wages (1995=100)
80
100
120
140
160
180
1995 1996 1997 1998 1999 2000 2001 2002 2003 2004
Public Private

49
3.29 There are
differences within the
public sector as well:
Table 3.6 shows real
wages grew by 5.4 percent
annually in the economic
authorities and only by 1.5
percent annually for civil
service employees
between 2001 and 2007.
Wages reported to the
social security system,
analyzed for the Bank’s
pension study, indicate that
civil service wages in 2004 were about 80 percent of the wages in formal private and public enterprises,
but nearly seven times higher than those for casual workers in the informal sector. These data
underscore the substantially higher wages in formal employment and the continued attraction of civil
service jobs especially considering better pension and health benefits, job security, better working
conditions, and shorter working hours. Besides, many Government workers have additional
employment (often simultaneously) to increase their incomes.
C. PRIVATE EMPLOYMENT AND REGULATIONS
3.30 Private employment was mostly in agriculture and in households, but as private firms were
allowed to operate since the 1970s, such employment has risen although it remains mostly informal.
The Labour Law (described later in the section) discourages employers from hiring workers formally:
not only does the law make it difficult to shed workers but it also mandates an annual 7 percent
increase in nominal basic wages regardless of inflation or the profitability of firms. Not surprisingly,
employers commonly under report the wages to the social insurance (they pay lower contributions
without hurting workers whose benefits are determined by the last five years’ wages, and reported
wages would be increased nearer the retirement age) but many also require a signed letter of resignation
(estamara or Form No.6) when hiring a worker. Such widespread practices have allowed labour
market rigidities to be ranked low among constraints (13th and 9
th of 19) that firms list in the 2004 and
2006 investment climate surveys, well below macroeconomic instability, illegal or unfair competition,
corruption, regulatory policy uncertainty, tax rates and cost of finance. Although such regulations
appear to be non-binding, they are nevertheless costly because they discourage a firm from growing to
a size that requires formality and precludes the attendant benefits to its workers.
The 2003 Labor Law
3.31 After discussing draft amendments for nearly 10 years, a revised Labour Law was enacted in
July 2003, and Table 3.7 lists some significant differences with the old. The Labour Law does not
apply to the public sector, agriculture, and other specified activities like domestic help, and is only one
of many regulations that a firm must comply with and which influences whether a worker would be
formally hired.
Figure 3.10: Average Annual Wages
0 1 2 3 4 5 6 7 8 9
Civil service Public and Private Enterprises
Casual Workers
Sector of Employment '0
00 E
gy
pti
an
Po
un
ds
P.A
.

50
Table 3.7: The Labor Laws Compared
Provisions Under the Old Law Revisions in June 2003 Labour Law
Permitted only indefinite contracts after the
probationary period, and employers could
not terminate contracts.
Allows two kinds of labour contracts: indefinite term and fixed term
contracts (that includes contracts for a specific task).
The Law does not mention part time work and temporary agency work.
Dismissal allowed only if the worker
committed one of nine serious errors.
Language for dismissal largely maintained: a worker cannot be dismissed for
financial problems facing the enterprise. In contrast the worker can
terminate the contract due to health, social or economic conditions.
Dismissal reviewed by a tripartite
committee. The decision was advisory.
Dismissal reviewed by a judicial committee whose decision is binding.
Dismissal without valid justification resulted
in reinstatement of the worker with
mandatory back pay.
Termination without valid justification entitles the worker to compensation
only amounting to: one month for every year worked up to five years and
one and half months pay for every year after five years.
Employers with >10 workers were not
allowed to employ directly and were
required to go through the local employment
offices.
Employers may now hire directly (but must notify the local employment
office of the vacancies, and if a suitable candidate is not found within a week,
the employers can hire directly).
Workers were not allowed to strike. Workers may now strike subject to specified procedures.
No collective wage bargaining. Spells out rules for collective wage bargaining. For firms with >50 workers
collective bargaining with firm’s trade union and for firms with <50 workers
collective bargaining with the representatives of the relevant federation of
trade unions.
No procedure to settle disputes. Introduces procedures to settle for disputes.
Source: Assaad 2007b
3.32 While the 2003 Law allows employers some flexibility in adjusting their labour force to
economic conditions, it still requires employers to justify dismissals to a committee of bureaucrats and
specifies indemnities rather than allow these to be negotiated. The Law continues to mandate a 7
percent annual increase in nominal basic wage which creates an incentive for the government to keep
inflation at this level in order to prevent real wages from rising. Furthermore, when shedding workers
is made difficult, firms are reluctant to increase employment — especially formal employment. This
feature and the granting of the right to strike provides firms an incentive to have (or to declare) fewer
than 50 workers.
Social Security/Pension Benefits
3.33 The social insurance system also affects the labour market, including informal employment,
and Table 3.8 summarizes four relevant laws that apply. The scheme now covers 18.7 million workers
which, at nearly 90 percent of the labour force, is substantially greater than the MENA average of 30
percent. This high coverage is because casual workers are covered through a scheme with minimal
contributions covering around 26 percent of the labour force. The four public pension schemes also
provide benefits to almost 2.6 million elderly and 5 million survivors and disabled.

51
Table 3.8: Retirement and Pension Schemes, Total Contributions and Benefits
Scheme Beneficiary Mandatory Contributions Benefits
Law 79/1975: Social
Insurance
Government, Public
Sector and formal
sector employees.
Employers pay between 21 to 24
percent and workers 14 to 16
percent, bringing the total
contribution to between 35 and 40
percent of the salary.
Retirement and disability
pension; survivor
benefits and a lump sum
benefit.
… … …
Unemployment benefits:
60 percent of the last
salary for a maximum of
28 weeks.
Law 108/1976 Employers and self
employed workers. 15 percent of income.
Pension retirement and
disability benefits.
Law 112/1980 Casual workers.
LE 1 per month + Employer’s
contribution of 2 percent of basic
wage.
Flat rate of LE 80 per
month.
Emergency Fund
established by Law
56/2002.
Dismissed worker due
to the closure or
privatization of the
enterprise.
1 percent fee on basic wage of all
workers plus donations and
investment yields.
Lump sum payment
amounting to 75 percent
of the worker’s highest
salary.
Source: Ministry of Finance
3.34 The World Bank’s 2007 Pension Report50
examined the current pension system in detail and
suggested the following improvements:
The income replacement mandates for all contributory schemes are high: the pre-tax
retirement pension of a full career worker is almost 80 percent of pre-retirement income,
and this high replacement mandate requires high contribution rates of 21-24 percent of the
salary for employers and 14-16 percent for workers (see Table 3.7 above). Even if only the
25 percent contribution rate for the main pension scheme is considered, Egypt stands out as
the region’s most expensive country. Consequently, it makes it attractive to hire workers
without a formal contract or with short-term contracts without pension benefits.
Furthermore, such high replacement rates reduce individual incentives to save outside the
public pension system.
Benefit formulae and eligibility conditions distort incentives. For instance, there is now an
insufficient penalty for early retirement and the ceiling on replacement rate (the ratio of
pension at retirement to last salary) encourages early retirement and delays enrollment.
The two pension funds’ financial position will deteriorate rapidly without a change in
contribution rates and benefits. Existing entitlements create implicit pension liabilities of
141 percent of GDP, while reserves are only 48 percent of GDP. Without subsidies, the
pension system generate an annual cash flow deficit of about 0.9 percent of GDP, which
could grow to 3 percent of GDP within the next two decades and surpass 7 percent of GDP
in several years.
50
World Bank (2007) Improving the Welfare of future Generations through Pension Reform: Volume I, II, III (or
“Pension Report”, for short)

52
In addition, the system suffers from problems of circular financing arrangements between
the pension funds and the National Investment Bank (NIB), and the Treasury, weak
administrative and management capacity and inadequate regulation and supervision of the
large number of private pension plans promising benefits to a small segment of the
population. The Bank’s pension report discusses these issues in greater detail.
3.35 The measures being considered are:
Closing the current scheme to new entrants.
Creating a two component contributory scheme with a targeted gross replacement rate of
55-75 percent for the average full career worker requiring a lower total contribution rate
between 17 and 25 percent of the salaries.
A new low means tested basic non-contributory pension guaranteeing incomes for all poor
retired persons 65 years and older.
Rationalize and expand the voluntary and employer-sponsored private pension system to
supplement retirement savings for all workers. This requires new laws that allow workers
to voluntary save through tax favored savings and a supervisory system.
Finally, the report suggests specific improvements in the management and financing
arrangements of pension funds.
Figure 3.11: Total Contribution Rates to Finance Pensions in Middle East
and North Africa
3.36 The proposed
measures would, if
successfully implemented,
improve the labour
market’s functioning. They
would reduce the
replacement rates for
individuals retiring early
without penalizing those
who retire late. The
reduction in replacement
rate would reduce the
contribution rate to the
mandatory pension system for both employers and workers. Such a reduction in rates would reduce
informality in the labour market and permit people to save outside the pension system. A means tested
universal minimum pension would protect the minimum standard of living of the retired poor. These
are discussed in greater detail in the Bank’s pension report.
Employment Services
3.37 The Ministry of Manpower and Migration, with a network of 300 employment offices,
traditionally focused on enforcing the Labour Law, not providing employment services. They now
provide a limited range of employment services (including to the private sector since 1996), mainly
registering new entrants to the labour market, and registering workers with contracts for overseas jobs,

53
but neither employers nor job seekers seek them out because their offices are often difficult to locate,
are poorly equipped and generally unappealing.
3.38 The government has been trying to upgrade Egypt’s employment services over the past 10
years. CIDA began a project in 2003 with the Social Fund for Development (SFD) under which 26
‘demonstration’ employment offices, one in each governorate, were physically upgraded and the ICT
network improved to access job banks. Staff members are being trained to counsel job seekers and
guide their search by providing better access to employment information. An additional 40
employment offices were also developed with US funds and an evaluation of this pilot could help
determine their effectiveness before extending them further.
D. IMPROVING EDUCATION AND TRAINING
3.39 Egypt’s education system grew rapidly through the 1990s and is now the largest in the region.
Primary school enrolment for both girls and boys is now nearly universal, and Figure 3.13 shows the
rising secondary and tertiary enrolments and declining gender disparities. Gross enrolment rates (GER)
for primary education (grades 1-5) stand at 98 percent, the preparatory level (grades 6-8) at 82 percent,
and the secondary level (grades 9-12) at 66 percent which are large for similarly situated middle
income countries. Higher education enrolment is also growing rapidly with a GER currently at 30
percent.
3.40 There are nevertheless two types of inefficiency: one is in the production of education, and the
other in how their talents are being used. The government spent 4.8 percent of GDP in FY06 on
education (5.9 percent in 2002/03), considerably more than the 4 percent in comparable countries.
Much of this spending is on staff salaries, and too little on other items: there are 1.2 million working in
education, of which 800,000 are teachers51
. In addition to what the government spends, parents spend
3.7 percent of GDP on textbooks, school fees, uniforms, supplies — and on private tutoring. The 2005
Human Development Report estimates that 60 percent of students get private tutoring. Total
education spending is therefore around 9 percent of GDP and the Trends in Mathematics and Science
Study (TIMSS) for 8th grade carried out in 2004 showed that Egypt’s student scores were similar to
those in Tunisia and Indonesia that spend much less.
3.41 The second type of inefficiency arises when the graduates are under-employed: nearly 60
percent of the unemployed are secondary school graduates and 30 percent are University graduates.
Every year some 700,000 school graduates chase 450-500,000 suitable jobs. Yet despite the many
TVET graduates and applicants, employers complain that they cannot find adequately trained workers:
35 percent of firms in the recent ICA survey identified the dearth of skills and workers as a major or
severe constraint. This also underscores the first type of inefficiency.
51
Such numbers and classification must be used with care: some teachers are appointed administrators to obtain
higher pay, and absenteeism is widespread, especially in rural schools.

54
Figure 3.12: Gross and Net Enrollment Rates in Egypt by Level, 1996-2003
3.42 Figure 3.13 shows Egypt’s average TIMSS scores, and stark disparities lurk behind these
averages: only 6 percent were “high” performers in mathematics and 10 percent in science, but over 40
percent failed to surmount the “low” benchmark. By comparison, 77 percent surpassed the low
benchmark in science in Iran and 68 percent did so for mathematics in Lebanon. Egypt’s lower
achieving students are numerous and unprepared for the global economy.
Figure 3.13: International Comparison of TIMSS Score (2004)
3.43 These large numbers of poor achievers are the result of disparate schools and an overly
rigid education system that relegates large numbers of students to technical secondary schools of poor
quality at two stages: students who perform poorly on the 6th grade exam, some (5 percent of the total)
are put in vocational (mehani) schools that lead only to technical secondary schools (fanni) that teach
no useful marketable skills and into which two thirds of the students after preparatory school are
channelled. These students cannot move back to general education and hence cannot go to University.
Overall, 30 percent of the male WAP (and nearly 60 percent of the unemployed) are now vocational
secondary school graduates. General education students who do not perform well enough on the 12th
grade thanawiya amma get a “diploma” but cannot attend University. Parents consequently spend
considerable sums on private tuition to help their children avoid the schools with a social stigma,
although such tuition does not appear to improve their cognitive abilities.
G r o s s E n r o lm e n t R a te s , 1 9 9 5 / 9 6 - 2 0 0 3 /0 4
0
2 0
4 0
6 0
8 0
1 0 0
1 2 0
1 9 9 6 /9 7 1 9 9 8 /9 9 2 0 0 0 /0 1 2 0 0 2 /0 3 P r im a r y P r e p a r a to r y S e c _ G e n e r a l S e c _ V o c a t i o n a l T o ta l S e c o n d a y
N e t E n r o lm e n t R a t e s b y G e n d e r in B a s i c E d u c a t io n
7 0
7 2
7 4
7 6
7 8
8 0
8 2
8 4
8 6
8 8
1 9 9 6 /9 7 1 9 9 8 /9 9 2 0 0 0 /0 1 2 0 0 2 /0 3 B a s ic _ B o y s B a s ic _ G i r ls L in e a r ( B a s ic _ B o y s ) L in e a r ( B a s ic _ G i r ls )
300
350
400
450
500
Egypt Jordan Indonesia Tunisia Philippines International Average
Math
Science

55
Figure 3.14: Flow Chart for Egypt’s Two –Track Education System
3.44 This overly rigid two track education system evolved to produce University graduates groomed
for government employment and, when such guaranteed employment became unsustainable, to ration
access. Examinations that do not test for cognitive skills determine entry into tertiary education
and coveted Government employment, so parents seek private tutoring that does not appear to
improve their cognitive skills lest their children be condemned to vocational schools that carry a
stigma. The result is low quality of instruction throughout the education system and no recognition of
needs of the labour market. While the best students may get through the system unscathed, the needs
of the greater numbers mapped irreversibly into the technical track are ignored. The rigid one way
passage between the two separate tracks serves little purpose, especially if examinations could filter the
students into the appropriate track at different stages.
3.45 Besides improving the structure of the education system, the schools themselves and the
delivery of education and the teaching of useful skills need to be improved. Schools “produce” well
educated students from the “raw material” (well nourished children) by applying such “inputs”
as teachers, text books, black boards, and pencils. There is no dearth of teachers and education
administrators: indeed, with one administrator for every two teachers, Egypt has five times as
many as does Fairfax County52
, but requires these “inputs” to be used well. Ministerial edict
cannot automatically ensure this: it requires dedicated school principals and administrators who, in
turn, must have sufficient authority, autonomy and oversight. Unlike shareholders who measure a
firm’s managers by the profit yardstick, parents and officials (who are agents of the funding
entity) must devise ways to discern the quality of education in order to monitor school
administrators. Such systems can be developed with effort but over-centralisation is not
conducive. The Bank’s recent regional report on education53
emphasises the central role of
incentives and public accountability and that central governments would be better advised to
ensure changes in behaviour rather than engineer solutions (like specify where schools should be
built, how many teachers to hire and what curricula to teach). Such changes have yet to begin.
52
The Bank’s (forthcoming) Education Sector Note reports that at the pre-university level, the system has 16 million
students, 800,000 teachers implying an overall student to teacher ratio of 20 that is lower than the 24 in Fairfax
County, a prosperous suburb of Washington DC, which is among the country’s better school districts. Egypt has in
addition, some 400,000 administrators. 53
World Bank (2008) The Road Not Travelled: Education Reform in the Middle East and North Africa. Also
available at
http://web.worldbank.org/WBSITE/EXTERNAL/COUNTRIES/MENAEXT/0,,contentMDK:21617643~pagePK:14
6736~piPK:226340~theSitePK:256299,00.html
Preparatory Secondary University (Grade 6-9) (Grade 9-12)
95% General
66%
5%
4 year Univ.
Technical
(Fanni)
Cohort Entering
School system
95%
2 yr. post secondary inst. 34% General
Labour Market
5% Vocational
(mehani)

56
E. CHALLENGES FOR THE FUTURE
3.46 Will Egypt generate sufficient jobs over the next five years? Table 3.9 shows that jobs overall
grew between 1998 and 2006 at slightly more than the rate of GDP — an employment elasticity of
1.09, which is similar to that in Oman, Jordan and Algeria, but higher than in Iran and Morocco54
. If
Egypt’s economy grows at 7 percent annually over the next few years, this 1.09 elasticity would result
in nearly 1.6 million jobs annually (from a base of about 21 million employed in 2006), in excess of the
700,000 entering the labour force. Not only would all new entrants find work, but all the roughly 2
million now unemployed could be absorbed within 3 years!
3.47 There are two reasons why such employment elasticities are not a good basis for projecting
future job growth. First, Table 3.9 shows that the elasticity of wage jobs for every education category
is lower than the corresponding estimate when non-wage jobs are included. The share of wage
employment has declined between 1998 and 2006 from 72 percent to 65 percent. Most labour market
entrants, especially those with technical and university education, aspire to formal wage employment –
with lower elasticities. Second, with greater investment and productivity, employment elasticity will
decline: the elasticity in rapidly growing economies is lower (India’s is between 0.3 and 0.4).
Table 3.9: Elasticities for Total Employment and Wage Employment wrt
(GDP growth of 4.2 percent p.a. over 1998-2006)
Education Level
Total
Employment
'000 (1998)
Total
Employment
'000 (2006)
Growth of Total
Employment
1998-2006
Elasticity Total
Employment
1998-2006
Growth of
Wage
Employment
1998-2006
Elasticity
Wage
Employment
1998-2006
General High
School and Below
8,274 10,180 2.64 0.629 -0.31 -0.07
Technical
Secondary School
and Two Year
Institute Graduates
4,531 7,479 6.46 1.539 5.34 1.27
University
Graduates and
Above
2,372 3,723 5.80 1.380 5.65 1.35
Total 15,177 21,382 4.6 1 .09 3.06 0.73
Share of Wage
employment in total
Employment 0.71 0.64
… … …
54
Jennifer Keller and Mustapha Nabli , August 2002 Working Paper No. 71, ECES, Cairo report an elasticity for
Egypt as 0.7 which is lower than the one here which is estimated from the two ELMPS survey data.
Mohamed Hassan and Cyrus Sassanpour (2007) “Labor Market Pressures in Egypt: Why is the Unemployment Rate
Stubbornly High?” IMF Working Paper (forthcoming) also note the ability of the economy to absorb workers with
low skills.
C. Rangarajan, Padma Iyer Kaul and Seema, “Revisiting Employment and Growth”, ICRA Bulletin, September
2007 discuss analogous estimates for India.
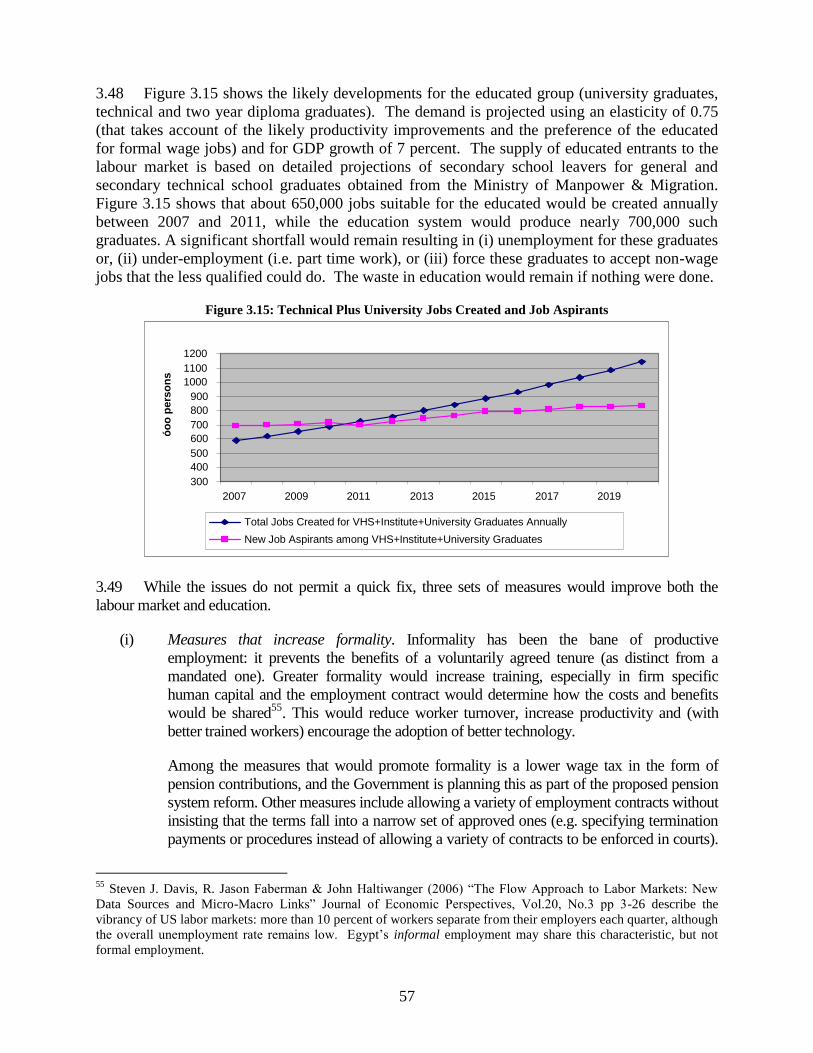
57
3.48 Figure 3.15 shows the likely developments for the educated group (university graduates,
technical and two year diploma graduates). The demand is projected using an elasticity of 0.75
(that takes account of the likely productivity improvements and the preference of the educated
for formal wage jobs) and for GDP growth of 7 percent. The supply of educated entrants to the
labour market is based on detailed projections of secondary school leavers for general and
secondary technical school graduates obtained from the Ministry of Manpower & Migration.
Figure 3.15 shows that about 650,000 jobs suitable for the educated would be created annually
between 2007 and 2011, while the education system would produce nearly 700,000 such
graduates. A significant shortfall would remain resulting in (i) unemployment for these graduates
or, (ii) under-employment (i.e. part time work), or (iii) force these graduates to accept non-wage
jobs that the less qualified could do. The waste in education would remain if nothing were done.
Figure 3.15: Technical Plus University Jobs Created and Job Aspirants
3.49 While the issues do not permit a quick fix, three sets of measures would improve both the
labour market and education.
(i) Measures that increase formality. Informality has been the bane of productive
employment: it prevents the benefits of a voluntarily agreed tenure (as distinct from a
mandated one). Greater formality would increase training, especially in firm specific
human capital and the employment contract would determine how the costs and benefits
would be shared55
. This would reduce worker turnover, increase productivity and (with
better trained workers) encourage the adoption of better technology.
Among the measures that would promote formality is a lower wage tax in the form of
pension contributions, and the Government is planning this as part of the proposed pension
system reform. Other measures include allowing a variety of employment contracts without
insisting that the terms fall into a narrow set of approved ones (e.g. specifying termination
payments or procedures instead of allowing a variety of contracts to be enforced in courts).
55
Steven J. Davis, R. Jason Faberman & John Haltiwanger (2006) “The Flow Approach to Labor Markets: New
Data Sources and Micro-Macro Links” Journal of Economic Perspectives, Vol.20, No.3 pp 3-26 describe the
vibrancy of US labor markets: more than 10 percent of workers separate from their employers each quarter, although
the overall unemployment rate remains low. Egypt’s informal employment may share this characteristic, but not
formal employment.
300 400 500 600 700 800 900
1000 1100 1200
2007 2009 2011 2013 2015 2017 2019
óo
o p
ers
on
s
Total Jobs Created for VHS+Institute+University Graduates Annually New Job Aspirants among VHS+Institute+University Graduates

58
And since public employment casts such a long shadow, especially over private formal
employment, reducing its growth and relative attractiveness would result in overall
benefits, although particular groups (e.g. educated urban women) may be adversely
affected.
(ii) Improving labour institutions. The efforts underway to remake the Ministry’s network of
employment offices into employment service providers should continue and be carefully
evaluated for cost effective service delivery.
Out migration has traditionally relieved unemployment pressures and contributed to the
economy through remittance inflows; but migrants are vulnerable to exploitation when
abroad and away from family and social networks. Protecting their interests and helping
their placement is worthwhile and although potential migrants register with the
employment offices, assistance is minimal. The Ministry of Manpower recently signed an
agreement with the Government of Italy to allow nearly 30,000 “guest workers”, and Egypt
could pursue similar initiatives with other countries.
(iii) Improving Skills & Education. The education system is too important and complex to
either fix in one fell swoop — or postpone improving. Changes must be sustained to be
effective and a consensus on the direction is needed. The two track education system is
overly rigid and in the short term, the Government should consider allowing students to
change streams on the basis of performance and eliminate tracking to vocational
preparatory schools at grade 6. It may also be advisable to allow multiple attempts on the
Thanawiya Amma examination (as is done with the SATs in the United States) from either
the technical or general stream. In the medium term, a new type of secondary school that
blurs the distinction between general and technical education could ensure basic and
versatile skills for all, involving employers when developing educational programs. Post-
secondary Technical-Vocational system could be developed, perhaps with some private
participation, to provide high quality education and compete with University education.
3.50 Each of these changes appears minor but would, when consistently done and carefully
evaluated, would improve the system over time. Changes in the labour market would have earlier
beneficial effects because the work force is considerably larger than the number of entrants. Many of
these entrants will continue to face acute difficulties in finding employment in the next few years.

59
4.1 Greater savings allow more investment, and efficient intermediation improves its allocation.
The banking system is being reformed to improve intermediation and under the Government’s 2004
“Financial Sector Reform Program”, banks are being privatised, their supervision being improved, and
the state owned insurance companies are being restructured. Other Bank reports56
describe these
efforts in detail, and this chapter focuses more on intermediation — the level and allocation — rather
than on the intermediaries themselves. The chapter begins with an estimate of who saves, who invests,
who intermediates, and how much. The private sector saves almost 22 percent of GDP, the bulk of it
by households (around 16 percent of GDP) and banks are the largest intermediaries. The private sector
now invests half the 20 percent of GDP in total physical investment but obtains only 2.4 percent of
GDP from the banking system: the rest is presumably from retained earnings and owners funds that
flow outside formal intermediaries. Banks obtain most of their deposits from households and lend
mostly to the public sector: they hold almost all the outstanding government securities.
4.2 The estimate of flow of funds also finds that although Egypt’s capital (stock) market is large in
value, it does not fund private firms in significant amounts: trading existing shares on the stock
exchange do not constitute flows to the firm, although equity prices may guide their investments and
activities. Firms obtain funds through Initial and Secondary Public Offerings (IPOs and SPOs), but
most recent issues have been the partial sale of state owned firms (e.g. 20 percent of Egypt Telecom)
with the Government getting the proceeds. A few large private firms have raised funds recently, and
the analysis finds that they displaced bank lending pari passu: formal intermediaries of all types
provided a meagre 2.4 percent of GDP to private firms in 2005-06, around the same level as 2002-03.
This substitution of bank lending by the capital market may reflect the savings-investment identity:
much of the aggregate savings funds the large budget deficit, and reducing government spending would
raise aggregate savings and investment.
4.3 The authorities began reforming banks in 2004, the largest intermediaries, by merging unsound
banks, selling stakes in joint venture banks, privatizing the smallest of the four state owned commercial
banks and announcing that the next smallest would also be sold. The three specialised banks, including
the agricultural bank (PBDAC) with a large rural network, have been audited and improvements are
underway. Lending to private firms, however, may not immediately increase: creditors cannot easily
enforce their claims and numerous additional improvements are needed if banks are to make sound
loans, especially to smaller borrowers. Such improvements (e.g. better laws, courts and registries of
liens) will take time. The Government has also sought to improve state owned insurers that were losing
substantial sums because the rates (i.e. insurance premia) were held too low, and to improve their
regulation and bring in private firms. Non-bank intermediation is being encouraged, and the regulation
of capital markets is being improved.
4.4 Earlier chapters have underscored the importance of both the level and allocation of
investments for higher economic growth. While the reforms being undertaken are desirable,
56
World Bank (2006) Financial Sector Development Policy Loan (2006) Report No.36197-EG; Implementation
Completion Report No ICR0000710 (forthcoming 2008); Financial Sector Development Policy Loan II
(forthcoming 2008)

60
lending to the private sector remains low. It may be appropriate to recognise that some banks
may develop their capacity to price and manage different risks appropriately before others do,
and help such banks to lend more. Devising such a strategy requires additional work but the
analysis in the chapter suggests that including three elements would be useful. First, it would be
prudent to have banks that are still struggling to improve their credit culture purchase safe
government securities with any deposit inflows to prevent poor lending. Such banks have a large
branch network and may have large deposit inflows that could be lent poorly, and this restriction
would allow them to continue servicing their depositors while they improve their lending culture.
When these banks buy more government paper, other banks with a better credit culture could
prudently increase private sector lending. This would occur naturally and without interventions.
Second, allow mutual funds retail access to household savings and/or wholesale access through
banks. There are few mutual funds now, and banks could be allowed to promote them without
undue burdens or risks especially if these funds hold Government or CBE paper. Funds
independent of banks, and those that hold other securities such as corporate claims would
develop later when firms raise funds through the capital market. This would encourage
intermediation by non-banks that have no direct access to household savers. Even with such
access, however, banks and capital markets are unlikely to serve small firms although the large
spread between deposit and lending rates suggests that such lending is potentially profitable if
lenders could innovate and enforcing their claims cheaply. Such innovation is difficult in any
heavily regulated industry; so the third element allows small unregulated intermediaries some
room — they now operate informally — provided they pose no systemic risks or infect the
banking system. Extending the protection of formality to existing though unseen informal
intermediation would allow successful techniques to be imitated, adapted and extended.
4.5 Other improvements that enable capital markets to function — such as better accounting and
auditing practice, easier enforcement of contracts — would enable outside equity investment and help
keep corporate debt to equity ratios at their current modest levels. Raising investment, however,
requires more savings, and this in turn requires a lower fiscal deficit and lower government
expenditures.
A. SAVINGS AND THE FLOW OF FUNDS
4.6 National income accounts show that Egypt saves around 20 percent of GDP and obtains
an additional 2 percent in foreign savings. Banking deposits are a substantial 100 percent of
GDP, yet firms do not obtain much banking credit. So two questions naturally arise: (1) how are
firms financing their investments and (2) what are banks doing if not lending to the private
sector?
Where have all the savings gone?
4.7 A flow of funds would answer the question; but the authorities do not have one for Egypt and
Tables 4.1 and 4.2 estimate savings, investment and who intermediates how much in each of two recent
years using available data (some more reliable than others).
4.8 The columns show households, private firms and divide the public sector as general
Government, economic authorities and public (i.e. Law 203) firms. The upper panel shows aggregate
savings (domestic and foreign) and investment, and each row in the lower panel shows the main formal

61
intermediates. Table 4.1 for 2005-06 is more reliable than Table 4.2 for 2002-03 because the authorities
have been improving the accounts of some important entities: the budget is now closer to the GFS-
2001 standards and transactions with the National Investment Bank (NIB) and the Social Insurance
Funds (SIF) are more transparent. Data are from the central bank website does not provide further
details (e.g. separating state owned from private banks), and the requested data necessary for deeper
analysis were not provided.
4.9 The Tables show that the private sector (households and firms) saved 21.8 percent of GDP in
2005-06 and invested 11.4 percent (17.9 and 8.4 percent in 2002-03 in Table 4.2). The row in bold
halfway down Table 4.1 shows that households save 16.1 percent of GDP — comparable to many high
savings East Asian countries — and invest one twentieth of this, mainly to build houses. Private firms
invested 10.6 percent of GDP, over half of which (5.7 percent of GDP) was financed by retained
earnings and/or owner funds (i.e. not going through formal intermediaries)57
. The private sector
surplus of 10.4 percent of GDP (= 21.8 – 11.4) funds the public sector.
4.10 The Tables’ lower panel shows who intermediates, and how much. Commercial banks are the
largest intermediaries: household deposits increase, but banks hold almost all the outstanding Treasury
Bills and Central Bank of Egypt (CBE) paper58
and the public sector gets half the country’s savings
flow. The effects of the single Treasury account being phased in are apparent when comparing Tables
4.1 and 4.2: the increase in general Government deposits and of bank lending to the government are
both lower than before.
4.11 The Tables also show Egypt’s seigniorage (change in the stock of currency): currency
notes in circulation are roughly 12 percent of GDP and represent interest free borrowing (through
the central bank, the note issuer). It is unusual for a country with a large banking system to have
so much currency in circulation, and it is possible that GDP underestimates economic activity;
but while this is large compared with most developing countries outside the region, Figure 4.1
shows that Egypt does not stand out within the region, especially in recent years. The flow
equivalent of this seigniorage is about 2 percent of GDP that the state collects without inflation59
.
57
World Bank (2007) “Egypt’s Investment Climate: A Survey-Based Update” based on a 2006 survey also finds
that internal funds and retained earnings finance 83 percent of new investment and working capital of the surveyed
firms, and that family and friends provide 8 percent. 58
The SIF collects premia from workers and employers and pays pensions which, like the remittances households
receive (part of foreign savings) augment household deposits in banks. Until 2006, SIF kept its deposits in the NIB
which funded public investment. In the Table, the SIF and NIB are shown together because it is difficult to
disentangle the transactions between them. From end 2006, SIF surpluses will be held through government bonds
expressly issued for this purpose and NIB would no longer intermediate them. 59
Both seigniorage and the inflation tax arise from the currency issuer purchasing real resources. Seigniorage does
not require inflation and is a one time revenue except when real economic growth (or payments innovation) raises
the public’s real demand for currency (or monetary base). Real economic growth of 5 percent and unchanged
currency stock of 12 percent of GDP results in 0.6 percent of GDP which is added to the interest 1.44 percent of
GDP (= 12 percent of 12 percent interest rate) saved.
Inflation is analogous to an excise tax on this monetary base and would reduce the real stock outstanding in
equilibrium. As with other tax revenues, those from the inflation tax depend on the elasticity of currency demand: in
addition, inflation may reduce real revenues from other taxes because of collection lags (the Tanzi-Olivera effect).
Inflation also taxes banking intermediation to the extent that banks hold part of the monetary base as vault cash or
non-remunerated reserves.

62
Table 4.1: Estimated Flow of Funds 2005-2006
Table 1
2005-06 Pvt.Total Pvt.Total Gen.Govt. Public firms*
Nominal GDP = 617,770 (LE mil) Savings Investment Savings Investment SavingsInvestment Savings Investment Savings Investment SavingsInvestment Total Inv.
Domestic Saving 86,790 70,754 16,037 -31,415 36,440 -1,768 19,064 110,880
Foreign Saving 47,942 28,658 19,283 -6,598 -15,626 1,018 -15,626 10,091
Physical investment 0 75,881 5,227 65,427 22,506 4,040 18,544 120,971
of which Housing & Construction 0 14,169 5,227 8,942 150 8 342 14,670
Machinery & Inventories 0 61,712 61,712 18,974 3,839 18,202 102,727
Total 134,732 70,654 99,412 5,227 35,320 65,427 -38,013 22,506 20,814 3,290 3,438 18,544 120,971
(as percent of GDP) 21.8 11.4 16.1 0.8 5.7 10.6 -6.2 3.6 3.4 0.5 0.6 3.0 19.6
Intermediaries To From To From To From To From To From To From Total "To"
Commercial banks 50,171 16,513 40,469 8,423 9,702 8,090 -5,612 11,460 5,145 -4,413 0 6,172 49,704
Of which through securities 3,604 3,604 12,481 193 1,686 0
Capital markets 0
IPOs 989 989 989 989 3,830 989
SPOs 2,250 2,250 2,250 2,250 2,250
Equities 3,615 3,615 3,615 3,615 3,615
T Bills & Bonds (dir+mutual funds)4,014 0 4,022 -8 4,011 4,014
Currency 11,363 0 11,363 11,363
SIF/ NIB 16,091 28,159 8,046 28,159 8,046 18,599 29,401 4,623 2,452 3,287 8,335 42,600
Intermediated total 88,493 51,526 70,754 36,582 17,740 14,944 12,987 48,702 9,768 -1,961 3,287 14,507 114,535
(as percent of GDP) 14.3 8.3 11.5 5.9 2.9 2.4 2.1 7.9 1.6 -0.3 0.5 2.3 18.5
*Law 203 firms
Households Private firms
Public sector
Economic Authorities
Private sector

63
Table 4.2: Estimated Flow of Funds 2002-2003
Table 2
2002-03 Pvt.Total Pvt.Total
Nominal GDP = 417,500 (LE mil.) Savings Investment Savings Investment SavingsInvestment Savings Investment Savings Investment SavingsInvestment Total Inv.
Domestic Saving 47,759 60,069 -12,309 -24,794 30,979 7,767 4,731 58,676
Foreign Saving 27,022 17,769 9,253 -2,409 -6,446 10,792 -6,446 11,721
Physical investment 0 35,082 3,004 29,785 21,855 9,081 4,380 70,397
of which Housing & Construction 0 6,717 3,004 3,714 159 0 414
Machinery & Inventories 0 28,365 28,365 16,480 8,872 3,965
Total 74,782 35,082 77,838 3,004 -3,056 29,785 -27,203 21,855 24,533 27,640 -1,715 4,380 70,397
(in percent of GDP) 17.9 8.4 18.6 0.7 -0.7 7.1 -6.5 5.2 5.9 6.6 -0.4 1.0 16.9
Intermediaries To From To From To From To From To From To From Total "to"
Commercial banks 48,031 14,127 44,284 5,631 3,747 8,496 15,959 21,892 3,840 3,994 0 6,945 67,829
Of which through securities 0 1,087 1,087 23,155 -464
Capital markets 0
IPOs 22 22 22 22 0
SPOs 1,391 1,391 1,391 1,391
Equities 0 0 -166 0
T Bills & Bonds (dir+mutual funds) 533 0 419 114 210 533
Currency 6,583 0 6,583 6,583
SIF/ NIB 14,741 19,879 7,371 19,879 7,371 19,436 27,452 4,259 3,939 2,831 3,607 41,267
Intermediated total 71,300 35,418 60,069 25,510 11,232 9,908 35,395 49,554 8,099 7,767 2,831 10,552 116,212
(as percent of GDP) 17.1 8.5 14.4 6.1 2.7 2.4 8.5 11.9 1.9 1.9 0.7 2.5 27.8
*Law 203 firms
Private sector Public sector
Households Private firms Gen.Govt. Economic Authorities Public firms*

64
Figure 4.1: Currency Outside Banks
4.11 Tables 4.1 and 4.2
also show that households do
not fund private firms through
the capital markets in
significant amounts. This may
surprise those familiar with
the high and rising value of
Egypt’s stock market and the
large increase in the numbers
of households with brokerage
accounts, but the focus here is on savings flows: stock exchange trading changes ownership of the
existing stock and does not affect the flows to the firm. New equity issues have been modest, and most
Initial Public Offerings (IPOs) in 2005-06 were the sale of minority stakes in state-owned firms — and
the proceeds went to the Government, not the firms. Some large private firms issued shares mostly in
foreign markets, and these appear in the upper panel as foreign savings. The Capital Markets
Authority’s data on Secondary Public Offerings (SPOs) and new equity issues of listed firms increase
from almost nothing in 2002-03 (Table 4.2) to a significant amount in 2005-06; but there was a
corresponding and offsetting reduction in bank lending. Total financing of private firms (i.e. bank
loans plus capital market issues) remained a meagre 2.4 percent of GDP in both years.
4.12 This observed displacement of bank credit by securities issues could also reflect the aggregate
savings and investment identity60.
The Government could increase aggregate savings — and hence
investment — by reducing expenditures on such items as energy subsidies (discussed in Chapter 2) and
overstaffing (in Chapter 3). Such reductions require broader support, and Chapter 5 describes the
changes underway that help build the needed consensus. Meanwhile, the authorities are improving the
way intermediaries operate.
B. INTERMEDIATION: ROLE OF BANKS AND CAPITAL MARKETS
4.13 Efficient intermediation improves investment allocation. Surveys and data also find that private
firms do not rely much on outside finance without which new firms cannot easily emerge and existing
firms cannot respond quickly to market opportunities that arise. This is especially costly in a more
globally integrated economy where “first movers” have a big advantage.
4.14 The authorities are trying to improve access to finance, and other reports describe these
efforts61
. This section does not repeat or summarize the many banking reform measures and instead
makes three points: (1) bank lending to the private sector has been falling for several years, and efforts
to improve the soundness of banks may exacerbate this decline; (2) capital market’s size and trading
volumes do not affect funding of firms, and even if IPOs increase, they are unlikely to fund smaller
firms that collectively employ many workers; (3) the Government as the largest borrower could and
should help develop diverse instruments and intermediaries (e.g. mutual funds) and an intermediation
60
If banks were the only intermediaries, the displacement reflects the aggregate savings-investment identity: if the
amount of informal intermediation (that is impossible to measure) varies, the observed result is a coincidence. 61
Mahmoud Mohieldin and Sahar Nasr (2007) “On Bank Privatization: The case of Egypt” The Quarterly Review of
Economics and Finance, Vol.46, pp 707-725
World Bank Financial Sector Development Policy Loan Report No. 36197-EG (May 17, 2006)
World Bank “Access to Finance” (2007), Report no. 41305
Currency outside banks
0.0
5.0
10.0
15.0
20.0
25.0
30.0
1961 1965 1969 1973 1977 1981 1985 1989 1993 1997 2001 2005
% o
f G
DP
Egypt
Morocco
Tunisia
Malaysia

65
strategy would help. Developing such a strategy is beyond the scope of this report, but some ideas are
outlined after describing recent developments.
Private sector lending decline Figure 4.2: Banking Credit (outstanding stock, by sector)
4.16 Bank lending has
declined in recent years and
Figure 4.2 shows this decline as
a proportion of total GDP by
sectors. The decline reflects
bankers’ caution since 1999
when several were jailed for
making loans that defaulted.
Courts did not always
understand complex financial
transactions, and held bank
chairmen and credit officers
responsible, even when defaults
resulted from delayed receipts
from Ministries on Government
projects. Although other bankers
were freed after two died while being investigated, this was a harrowing experience, and the
government is considering instituting special economic courts to prevent a recurrence. Prudential
regulations are necessary especially when the Government implicitly guarantees all banking deposits,
but their enforcement has not been smooth: some 2,000 farmers were jailed for defaulting on loans to
the government’s specialised agricultural bank (PBDAC).
4.17 While credit to the private sector may be declining, so is the private sector’s share in GDP as
noted in Chapter 2. When banking credit is plotted as a proportion of private GDP (rather than the
total), Figure 4.3 shows that while bank lending remains low, there has been a recent rise. This is an
encouraging sign provided that these loans are made to sound borrowers who will service them.
4.18 The recent modest rise in
private sector lending may also
reflect the increasing divergence
between TBill rates and bank
lending rates that make such
lending very profitable. The fall in
the TBill rates is shown in Figure
4.4 which plots the evolution of
several interest rates in recent
years. The decline in TBill rates
may reflect the inflows of foreign
capital, and the large, persistent,
and mostly unchanging spread
between the lending and deposit
Figure 4.3: Bank Lending to Private Investment
0
10
20
30
40
50
60
FY 00 FY 01 FY 02 FY 03 FY 04 FY 05 FY 06 FY 07
% G
DP
Industry Trade Services Agriculture
15 14 14 13
13 13 15
20 23
7 3
2 3 6
9 7 9
15
0
5
10
15
20
25
FY99 FY00 FY01 FY02 FY03 FY04 FY05 FY06 FY07
% o
f private
GD
P
Private investment Bank credit to private sector (flow)

66
rates62
shows the potential profitability of bank intermediation — if loans are repaid. Banking reforms
underway (especially eliminating the state banks’ holdings in joint ventures) allow more lending by
entrepreneurial banks. The central bank did not provide data for groups of banks to permit a clearer
understanding of these developments.
Improving banks’ credit culture Figure 4.4: Interest rates, 2005–2008
4.19 Egyptian banks were
not always poor lenders.
That Banque Misr — long
the emblem of national pride
which Talaat Harb63
founded
in 1920 to fund Egypt’s
industrialization — became a
problem bank underscores
their decline since their
nationalization in 1957.
State directed lending does
not require a credit culture
which atrophied as a
consequence. State-owned
banks also became
overstaffed. Banking did not improve when the private sector was allowed to re-enter in the 1970s
through joint ventures because the four state-owned banks, and even the central bank, took equity
stakes and sat on the Board of Directors in many of the joint venture banks compromising both
competition and supervisory enforcement64
. Poor lending and the absence of innovation spread to
many of the joint venture banks. Worse, the modest private stakes allowed self-serving loans to
connected groups in some cases.
4.20 The Financial Sector Assessment (FSAP) in 2002 listed the changes needed to improve the
soundness of the banking system, and the authorities began vigorously implementing them since 2004:
loan classification and reporting is improving, capital requirements were raised65
, small failing banks
were merged with others reducing their number from 57 to 39, and state owned banks were audited (as
have the insurance companies that the authorities want to reform) providing an estimate of losses from
earlier lending decisions; but global experience suggests that more bad loans may be later uncovered.
62
These rates are from the central bank to whom banks report the typical “posted” rates; and they ignore fees and/or
additional charges or discounts that large depositors and favoured borrowers may negotiate. In all countries, these
spreads are indicative but not accurate.
The central bank may have, but has not made available, data to determine the extent to which provisioning for bad
loans may have affected the measure; but the aggregate decline is far more substantial than such provisioning during
this period. 63
Talaat Pasha Harb (1911) “Egyptian Economic Reform and the Nation’s Bank Project” 64
State owned insurance firms and other public enterprises also owned equity in the (then) 23 joint venture banks that had
some 27 percent of aggregate deposits that, along with the four state owned banks’ 55 percent of aggregate banking deposits
share left private foreign banks 18 percent in 2002. 65
Egypt raised the capital requirement as an absolute amount, while prudence requires sufficient capital as a
proportion of loans, assets or deposits. Even if it were true that small banks are inefficient — scale economies
operate at the plant (or branch level in banking), not firm level — competition is a better way to weed out the
inefficient. Small neighbourhood banks are more likely to lend to small firms, and these are now precluded.
5
6
7
8
9
10
11
12
13
Jun-05 Sep-05 Dec-05 Mar-06 Jun-06 Sep-06 Dec-06 Mar-07 Jun-07 Sep-07 Dec-07 Mar-08
Overnight interbank rate 3-month T-bill Interest rate
CBE Overnight rate (top) 3- month deposit rate
CBE Overnight rate (bottom) Lending rate

67
4.21 The dominance of state owned banks fell when the four state banks divested their stakes in joint
venture banks. In 2002, there were 23 joint venture banks accounting for 27 percent of the system’s
deposits: the state held an equity stake in 17 of them, and the state’s holdings in 13 of them have been
sold (the four remaining banks66
account for only 2.8 percent of aggregate banking deposits) The
authorities then cautiously turned to privatization: Box 4.2 describes the privatization of the Bank of
Alexandria with 7 percent of aggregate deposits turning the smallest state owned bank into the largest
private bank in December 2006. The state-owned Banque Misr bought the slightly smaller Banque du
Caire with about 9 percent of aggregate deposits and mainly private sector borrowers in January 2007
but instead of merging them as initially planned, the Government announced in June 2007 that Banque
du Caire would be privatized instead. The three state owned banks now have 39 percent of the
aggregate loans, 51 percent of the deposits, and about 58 percent of the bank branches. In addition, two
specialized state banks (especially PBDAC for agriculture) and the post office bank have an extensive
network of rural branches.
Box 4.1: Bank of Alexandria
4.22 Egypt’s banking reform is now proceeding in the right direction, but reforms do not end
with privatisation: indeed while the benefits may be large, so are the risks that the authorities
must get prepared to cope with. Banks are highly leveraged entities and the modest capital in
banks could be quickly lost, either from mismanagement or macro-economic instability, before
others notice. Inadequate capital distorts incentives especially with Government deposit
guarantees, whether explicit or implicit: any profits accrue to the bank’s shareholders while
losses are borne by depositors (or the Government, if they are guaranteed). This moral hazard
has devastated the finances of many governments — even those like Mexico that successfully
privatised banks. Mexico, like Egypt and several other countries, nationalised banks in the
1950s to the 1970s and then realised the benefits of a privately owned system. Successful
privatisation in 1990 was reversed in 1995 during the (Tequila) crisis in part because supervision
66
The Export Development Bank, one of the four remaining, cannot be sold until Parliament changes the bylaws
that stipulate that the state must own at least 75% of its equity.
The sale of a state owned bank was first announced in 1991 under the ERSAP, but preparations only began in September 2002
with the appointment of a new management team in the Bank of Alexandria which then spent LE1 billion to restructure the bank: almost
half was for an early retirement package for its staff. The bank had 8,500 employees in 185 branches and needed fewer but better
qualified staff. The bank had no ATMs, account statements were handwritten and some 50 PCs were barely used: Infosys, the Indian
software company, was hired to help automate the bank by December 2006. Barclays had owned the bank before it was nationalized in
1957, and its old credit manuals were ignored while the bank accumulated LE 11 billion in non-performing loans (NPLs) to public sector
firms. The bank forgave LE 4 billion after lengthy negotiation with the Government and the indebted firms, bringing NPLs down to LE
6.9 billion that the Government undertook to pay in cash (from general privatization proceeds that were earmarked for this purpose).
By mid 2005, the Bank had $6.6 billion in assets, 6,000 employees and 188 branches across Egypt; but more importantly,
buyers could see that it had a future. Meanwhile, the authorities acquired experience in selling banks when selling partial stakes in 13 of
the 17 joint venture banks: the importance of providing bidders with full information was well understood. Rather than limit a bidder’s
time in the data room, bidders were given electronic access to the Bank of Alexandria data (a first in Egypt).
Eight of the 13 potential bidders submitted proposals to the CBE, 6 were accepted, and 4 bid for the bank. Italy’s Sanpaulo
Bank’s winning bid of LE 11 billion ($1.6 billion) for 80 percent of the bank (valuing the whole bank at $2 billion, or 5.5 times book
value) was substantially greater than the second highest bid by a consortium led by Jordan’s Arab Bank (valuing the whole bank for $1.8
billion). Other bidders were France’s BNP Paribas, and the Dubai based Mashreqbank but the Greek EFG Eurobank Ergasias and
Egypt’s Commercial International Bank decided not to bid. The Government still owns the remaining 20 percent in the Bank of
Alexandria and plans to sell 15 percent on the stock exchange in November 2007 and give employees the remaining 5 percent. IFC
agreed in October 2007 to buy up to 10 percent of the bank’s equity from its new owners (i.e. the $200 million will go to Sanpaulo, not
Egypt), but the purchase has not yet been made.

68
failed to detect self-serving loans that private bankers had made. While banking supervision
should improve, it will likely never be adequate protection, especially when shaky banks are also
buffeted by macro-economic instability.
4.23 India is taking a different approach than Mexico. Box 4.1 outlines recent proposals that
sidestep privatization which, merits aside, is politically contentious.
Box 4.2: India’s “A Hundred Small Steps”
India shares Egypt’s legacy of post-colonial socialism — and its aspirations to increase private sector led
growth by integrating more closely with the world. As in Egypt, India’s banking system is dominated by state-
owned institutions with a large branch network that mostly finances the government. Public sector banks account
for 70 percent of the system. Public opinion is divided on the issue of privatization, and banking employees unions
have adamantly opposed it. The recommendations of numerous committees looking into aspects of the financial
system have not been implemented, and the Planning Commission appointed a high level committee in August 2007
with a dozen bankers and chaired by an internationally renowned Indian academic to outline the direction of future
reforms. Their recommendations, made public in April 200867
, are tailored to India’s current commercial needs, and
while many commission members disagreed with the prevailing political sentiments, it notes:
“Instead of focusing primarily on a few large, and usually politically controversial steps, we also need to
take a hundred small steps in the same direction that will collectively take us very far. …. All this is not to say that
we should not tackle the controversial large issues, and the report does offer comprehensive proposals on them, but
it is to say that progress can be made even otherwise.”
Critics of reform used the 1997 East Asian crisis (that spared India) to justify the status quo and to use the
recent near meltdown of the US financial sector to assert that competition does not work. The commission does not
mince words in noting that these are the wrong lessons, and admits that markets and institutions succumb
occasionally to excesses: the right lesson is that regulators must find the right balance between prudence and risk
taking. It takes issue with legislation “that seem to be exempt of any intellectual influence” and its 35 proposals are
specific to the Indian context. Some examples:
Proposal 11 is simple and unambiguous: “Free banks to set up branches and ATMs anywhere.”68
Proposal 15 is directed at the government’s tendency to close down markets when fraud or manipulation comes to
light, instead of taking action against those suspected of manipulation.
Proposal 18 seeks an innovation friendly environment (analogous to what is being proposed for Egypt) by raising
the regulatory threshold to mainly cover systemic risk and fraud.
These proposals do not seek to correct all the shortcomings in one fell swoop: instead, it seeks to make
important changes that have immediate and lasting benefits. India’s regulatory laws and institutions are of
bewildering complexity — as indeed are those of any country where they are the product of experimentation and
compromise. India’s central bank, for example, monitors the portfolios of co-operative banks, but state governments
(that are fiercely independent of the centre) are responsible for their governance. Yet the committee felt it
“premature to move fully towards a single regulator at the moment, given other pressing regulatory changes that are
needed.” Experts sent by international agencies rarely have the incentive or expertise to make such judgments.
Only the wearer knows where the shoe pinches.
67
“Draft Report of the Committee on Financial Sector Reforms” available at:
http://planningcommission.nic.in/reports/genrep/rep_fr/cfsr_all.pdf 68
Indian law is ambiguous about whether permission is needed; but article 31 of Egypt’s banking law explicitly
states that the central bank’s permission is needed. Neither the 2002 FSAP nor the 2007 update commented on this,
perhaps because there are other more serious issues.

69
4.24 Egypt can avoid Mexico’s bad experience by seeking buyers with both the expertise to run
banks well and a valuable reputation that augments the capital it has at risk. It is to Egypt’s credit that
the Bank of Alexandria was sold to a European bank; but Egypt must also continue to maintain macro-
economic stability and improve its banking supervision and regulations. This takes time: the 2007
FSAP update finds considerable progress in Egypt since 2002, but that much also remains to be
done. Many countries, including the United States have relied less on supervision and more on
monitoring by financial markets. So Egypt’s efforts to improve the capital markets will play a
part when shares in banks are actively traded on well-functioning exchanges. This in turn
requires good accounting, swift disclosure and competing buyers and analysts. The
developments in the capital markets are briefly reviewed.
Capital Market developments
4.25 The authorities are trying to revive capital markets (that finance both equity and debts through
bonds) to augment bank intermediation. The market value of Egypt’s listed equities have been
growing rapidly from 30 percent of GDP in 2001 to about 100 percent in January 2008; but few of the
listed firms were actively traded. Listing proliferated because it exempted firms from corporate taxes.
More stringent listing requirements, lower tax rates and the elimination of tax exemptions in 2004 have
reduced their numbers from 978 in 2003 to 430 in January 200869. Despite fewer listed firms, both
market capitalisation and trading have increased dramatically; but neither of these fund firms, and while
IPOs and SPOs do, Tables 4.1 and 4.2 showed that private firms have not raised much from the capital
market.
4.26 For capital markets to fund firms, non-bank intermediaries must have access to households who
provide the bulk of Egypt’s savings. While increasing numbers of households have brokerage
accounts, there is a danger that if price bubbles develop and burst, there will be pressures on the
government to bail out the investors, especially if the banks are also involved. Banks are now the only
intermediaries with a large retail network, and it is not surprising that Egypt’s few mutual funds in
Egypt are sponsored by banks. Such funds have grown to some 5 percent of aggregate banking
deposits; but the authorities have clamped down on them because some were not properly registered
with the capital markets authority70
.
4.27 Efforts to revive Egypt’s exchange71
should continue, especially if they remove hurdles that
were erected before; but it is business needs, not governments or regulatory adequacy, that create
successful markets. Most stock exchanges that were so expensively created and nurtured with
technical assistance in Eastern Europe and the former Soviet Union have failed to attract much
69
These data are from the Stock Exchange website:
http://www.egyptse.com/index.asp?CurPage=main_market_indicators.asp 70
The details are murky: such funds would not appear in the banks’ balance sheet and, if they only held TBills,
would not entail additional default risk. Only one fund has registered with the Capital Markets Authority, perhaps
because such registration requires the bank (as the fund’s promoter) to own 5 percent of the fund’s issued shares —
which in turn would raise the bank’s own required capital at a time when many banks struggle to be sufficiently
capitalised. The regulation essentially treats a bank’s direct holding of TBills as riskless and an indirect holding
(through the mutual fund) as risky. 71
The Alexandria Stock exchange dates back to 1883 and trading was active well after World War II. An exchange
became pointless when all the firms were nationalized, but it survived as a legal entity and was merged with the
slightly younger but equally moribund Cairo Stock Exchange. They are now being revived although technology
makes a physical trading floor obsolete and far larger and vibrant Dubai exchange dominates the region.

70
trading72
. And what the Government does will alter how financial institutions develop: Rajan and
Zingales73
describe how bond markets developed in the United States more than in Britain, because
laws prevented the emergence of large national banks whereas British banks spanned the Empire
forming syndicates to raise large sums and spread risks. With neighbouring countries having substantial
surpluses, Egypt’s capital markets could develop spectacularly if it found its niche.
4.28 Funding firms, however, is a different matter: larger and better known firms would find the
substantial costs of issuing bonds or equity worthwhile, and they already access global markets.
Chapter 2 showed that Egypt has relatively few mid-sized firms and disproportionately many small
firms on the fringes of formality. Whether such a size distribution of firm could support the expense of
the requisite analysts and traders remain to be seen; but a firm in Ismalia would benefit regardless of
whether its claims are traded in Alexandria, Cairo or Dubai. Nevertheless, the Government could help
the development of Egyptian intermediaries and markets through an appropriate intermediation
strategy.
C. TOWARDS AN INTERMEDIATION STRATEGY
4.29 This chapter has viewed intermediation from a different perspective than other Bank reports:
despite the recent banking reforms, prudent lending to the private sector has not increased.
Privatisation and the other reforms underway are improving the situation but there are also additional
measures that the Government could consider that would help improve intermediation and ultimately
the allocation of private investment that, as Chapter 1 showed, is now growing. The findings in this
Chapter suggest that the three additional elements may be useful.
4.30 First, banks are not identical and the differences among them (e.g. in clientele) will likely
widen as each bank seeks its market niche. Some private banks are surging ahead with better
management but others are grappling with governance and legacy issues, particularly the large state
owned banks. Although all banks ostensibly operate under the same regulatory umbrella, the FSAP
update notes that banking supervisors are still developing their capabilities and may find it difficult to
bring some banks into compliance. Banks with a large branch network may have deposit inflows that it
may lend unwisely, and the Government could consider requiring these non-compliant banks to use
their deposit inflows to hold safer Government paper. Requiring such banks to hold more government
paper (essentially a remunerated higher marginal reserve requirement) would enable other banks with
better lending skills to increase their lending to private firms thereby improving overall credit
allocation. It would also provide an incentive for non-compliant banks to improve their credit culture
without depriving their depositors of the services these banks provide.
4.31 Second, increasing non-bank intermediation requires giving non-banks retail access to
household savings and/or wholesale access to banks. Banks are now best placed to offer money market
funds74
because of their existing branch network and as households become familiar with them, two
72
Stijn Claessens, Ruben Lee and Joseph Zechner (2003) “The Future of Stock Exchanges in European Union
Accession Countries” Corporation of London and the Centre for Economic Policy Research monograph. Also
available at:
http://www1.fee.uva.nl/fm/PAPERS/Claessens/The%20Future%20of%20Stock%20Exchanges%20in%20European
%20Accession%20Countries%202003.htm 73
Raghuram Rajan and Luigi Zingales (2004) Saving Capitalism from the Capitalists Crown Publishing. 74
Money market funds are mutual funds that only hold short term tradable paper with low price and default risk
making them close substitutes for bank deposits. Many hold only TBills.

71
developments are likely: (1) some banks may offer riskier funds (e.g. longer maturities, corporate
bonds, and/or equities), and (2) non-bank funds would enter despite the dominance of banks because
households would already have become familiar with the products. There is ample room for non-
banks: despite the current dominance of banks, Egypt has only 3.6 branches per 100,000 people, a tenth
of a typical OECD country75
. The emergence of mutual funds, promoted by banks and non-banks,
would help the development of informed institutional trading on exchanges and lead to better pricing
since individuals may now be trading on whim and scanty information.
4.32 The third element is to recognize the importance of, and inherent difficulties in, serving the
numerous small firms, many operating in the penumbra of formality (i.e. with many workers
unrecorded, poor book-keeping etc.). Informal credit markets may serve them now (information about
them is obviously difficult to gather); and formality would provide legal protection that would increase
their presence and improve their functioning. Lenders’ desire to increase business provides them with
the incentive to invest in their reputation for fair dealing, and protects borrowers. The large spread
between lending and deposit rates that was charted earlier suggests potential profits if creditors could
collect on their loans easily; but it reportedly takes over three years for lenders to even repossess the
collateral of a secured loan76
. Innovations could lower the cost of enforcing claims, and such innovation
is difficult in any regulated industry77
. In the Philippines, for example, prepaid mobile phones are now
used to send money to relatives and to pay bills, and the regulators have been accommodating this
development by not bringing phone companies under the preview of banking laws. Allowing such
innovation outside regulation ensures that it continues.
4.33 The pretence of regulation when it is ineffective is also damaging. Thailand’s 1997 banking
crisis was precipitated by excessive and unseen banking exposure to Bangkok “offshore” finance
companies. But the authorities permitted regulated banks to book normal business transactions through
these unregulated off-shore markets when overly strict controls resulted in (onshore) banks losing
business. It would have been preferable to reduce these onerous regulations than allow them to be
circumvented this way because the regulated banks suffered when the unregulated market collapsed.
Even when banks are not connected to unregulated intermediation, there are dangers when they
become “too big to fail.” Pyramid schemes in Albania and Romania got so large that “depositors take
the risk” was no longer credible. Such examples underscore the importance of giving some space for
unregulated formal intermediation, provided that (i) the aggregate volumes are small and (ii) such
intermediaries are insulated from regulated banks. Consequently, occasional failures will be small with
Such funds mushroomed in the United States in the late 1970s when rising inflation and nominal rates made
regulation Q (that limited deposit interest rates) binding. Banks lobbied to eliminate reg.Q when their share of
household deposits eroded. 75
Table 4.3 in the World Bank’s Access to Finance (2006) report shows that Jordan and the region’s average is
around 10, while OECD countries have around 35 branches per 100,000 people. 76
Many countries “fix” faulty laws through amendments drafted by international legal experts who, though well
intentioned are never sufficiently well informed, and the result may not meet business needs. Consequently,
commerce relies on self-enforcement of contracts and reputation than legal protection through the court system.
Allowing formal but unregulated intermediation may show the way to better laws. 77
This is true in all industries, including finance: derivatives and options developed in the far less regulated
exchanges; currency swaps in the largely unregulated off shore market etc.
Such innovation is not unique to developed countries: poor aspiring migrants from rural India with no collateral but
a reputation for hard work, for example, surrender their passports to creditors who finance their passage. Despite
some heartbreaking cases of migrants without a social network in an unfamiliar host country being exploited, the
alternative is forgoing a lucrative job. The labour chapter suggests the Egyptian government take a greater role in
helping out-migration and voice migrants’ concerns to host country governments.

72
no systemic effects. Without this space, smaller firms in Egypt will continue to be outside the financial
pale.
4.34 Countries like India and Mexico have recognized the useful role of lightly or un-regulated
intermediaries to serve hard to reach groups in an innovative manner. Poorer households have
traditionally used chit funds, especially in South India: they gather small amounts from among their
members and “sell” them to the highest bidders periodically, often weekly (i.e. borrowers implicitly bid
the interest rates). While many chit funds operate informally, some have become formal and have
grown to have several hundred thousand members. There are failures every now and then, perhaps
originating in some fraud or degenerating into pyramid schemes; but although the state government in
the 1960s and the central government in the 1980s have passed laws to prevent abuse, their business
remains lightly regulated. Poor households benefit when their alternatives are money lenders linked to
criminal gangs that brutally enforce collection — and their occasional failures warn depositors to be
mindful of the chit funds’ reputation. Mexico has recently taken a different tack by giving large
department stores a banking license to take advantage of their location, customers and retailing acumen.
Egypt could benefit from such an approach that suits its own particular needs and circumstances.
Government borrowings
4.35 The Government will remain the country’s largest borrower for some time, even if it reduces its
budget deficit by 1 percentage point of GDP annually and could also pioneer newer instruments. Box
4.3 discusses ways the Government could lengthen maturities in the domestic market; but it has
recently done so abroad responding to foreign investors’ recent eagerness to buy its Treasury Bills. In
June 2007, Egypt issued a LE 6 billion (approx. $1 b), 5 year Eurobond local currency bond rated a
notch below investment grade (BB+) and priced to yield 8.875 percent. Lengthening the maturities of
domestic debt risks creating a maturity mismatch in banks who are now the main buyers (the Eurobond
issue substitutes for the foreign purchase of TBills). Although ideally private participants should
develop suitable instruments, the Government being the largest borrower may have to do so to benefit
Egypt’s capital markets.
Box 4.3: Lengthening Maturities
Most debt in Egypt, both Government and private, are of short maturities. While such short maturity
loans are routinely rolled over, longer maturities reduce the risk of rollover refusal and would benefit some
borrowers. If inflation fears keep maturities short, indexation would help but it is not clear if Egyptian courts
recognize indexed contracts. The experience in other countries (e.g. Brazil) suggests that courts and laws follow
custom and business needs
What would be a suitable index? An inflation index has its drawbacks: almost half the CPI basket has
controlled prices and there are lags in publication and suspicion over their accuracy. The exchange rate is
contemporaneously observable, and may be embraced as an index as memories fade of the thriving parallel
foreign exchange market until 2004. Brazil also had a parallel foreign exchange market until the 1980s, but
exchange indexed contracts quickly became common when controls and penalties were removed.
Short term interest rates could also serve as an index as in floating rate long term bonds, but the
authorities heavily influence both the buy and sell side of Treasury Bills and the central bank’s interest rate
“corridor” casts a long shadow in all markets as it also keeps the exchange rate within a narrow band. The market
may choose or construct other indices, and the authorities could help this by collecting better raw economic data
and quickly making them public because this would allow others to replicate any indices they subsequently report.

73
4.36 Better intermediation of savings would improve investment allocation and the recent banking
reforms provide a good platform for a strategy that would address Egypt’s current needs and remedy
the dearth of private sector lending. Greater competition and giving the private sector a larger role in
banking is an enormous step in the right direction, but it also requires the central bank to more closely
follow developments not just in the banks that it supervises but also in the real sector where problems
often originate. The chapter suggests the usefulness of an intermediation strategy and outlines three
elements that it could contain. Fleshing it out requires considerable analytical work but implementing
it may only require small changes in policies and a sustained and consistent monitoring of subsequent
developments. While this would improve the allocation of credit (and hence investment), raising the
level of investment requires more savings. This in turn requires lower government spending and macro-
economic management is the subject of the next Chapter.

74
5.1 Economic crises take a heavy toll on growth as the crises in Indonesia (1997) and Argentina
(2001) have shown: even when growth subsequently recovers, output does not quite catch up to where
it would have been. Egypt has avoided such catastrophes, but is not immune from periodic large
currency depreciations and spurts of inflation that stoke such fears, and the fear is also damaging.
Surveys find that improved business climate not withstanding, firms are most concerned about macro-
economic instability, specifically inflation — and this doubtless affects their decisions to invest and
hire. Reducing such fears would benefit the economy, and this chapter examines economic
management. Some of the improvements are well-known (e.g. tax reforms), and some unseen ones are
also important (e.g. better spending controls).
5.2 The first section outlines recent economic policies. Economic management since 2004
eliminated the premium for foreign exchange in the parallel market, but containing inflation has been
difficult. The large capital inflows (including FDI), while benefiting Egypt in many ways, resulted in
higher monetary growth and inflation because the authorities kept the pound within a narrow band
against the dollar. The authorities have been allowing the pound to appreciate against the falling dollar
from the last few months of 2007 and are closely monitoring the real effective exchange rate. The
budget deficit has been reduced by the announced 1 percent of GDP. Tax revenues surged after the
reforms of 2005, but buoyancy fell subsequently and low interest rates and non-recurring receipts
helped in meeting the FY07 budget deficit target. The rise in wages and subsidies in the wake of global
price increases in grains creates some concern that the budget reduction targets will continue to be met.
5.3 Looking back over a longer period, successive governments have found it difficult to keep
fiscal, exchange rate and monetary policies consistent mainly because the size and structure of
government are relatively unchanged. Spending has long been greater than recurring revenues making
for fiscal fragility. Consequently, adverse developments become crises. The level and pattern of
government spending have yet to become consistent with giving the private sector a larger role.
Considering that the interest expense has been benefiting from current favourable conditions, Egypt is
vulnerable to a global downturn. Cutting spending has been difficult: attempts during a crisis do not
last, and there is little consensus or a sense of urgency at other times. This may change with better
institutional improvements.
5.4 The second section examines budgetary processes that are an important part of the institutional
mechanism permitting better collective decision making. The budget now has a wider coverage and
items are better classified, and this would help Parliamentarians and the public grasp the choices and
tradeoffs. The section describes improvements in budget preparation, management and oversight that
are underway, and there are encouraging signs of greater Parliamentary participation and oversight.
The Bank’s Governance Indicators (Kaufmann-Kraay) show improvements in some aspects (e.g.
control of corruption), but Egypt is below the median, especially in voice and accountability which is
an important ingredient in collective decision making.
5.5 The third section examines the sustainability of current policies and the debt in the medium
term. Continued growth is likely, considering the region’s prosperity and the shipping through the
Suez Canal, tourism, and Egypt’s rising production of natural gas. The risks arise from regional

75
disruption (political or economic) that would dry up capital inflows, stop the construction boom, curdle
banks’ loan portfolios and double government debts if the guarantees on banking deposits were called.
While such developments are unlikely, the Government could reduce their disruptive effects if it had
more fiscal room to manoeuvre. Crises in other countries, including those in East Asia 1997, shows
that economies are resilient when governments react quickly and appropriately (e.g. Malaysia,
Thailand) and their ability to do so depends more on the public support they command than on the
technical abilities of those in charge (e.g. Indonesia).
5.6 Despite the risks of lower economic growth and high government gross debt (some 87 percent
of GDP), the substantial foreign exchange reserves that the central bank how holds reduces Egypt’s net
debt to modest levels. The debt is sustainable in the medium term. Net debt has declined in recent
years mostly because of growth; and if this were jeopardized, the risks will soon begin to rise again.
A. RECENT ECONOMIC POLICIES
Figure 5.1: Average annual Inflation and monthly range
5.7 Price stability is
one measure of sound
economic management
and the consistency of
fiscal, monetary and
exchange rate policies.
Surveys (e.g. ICA, cited in
Chapter 2) find that firms
fear a recurrence of macro-
economic instability and
such fears are not
groundless. While Egypt’s
annual inflation rate has not been as high on average as many countries in Latin America, there have
been episodes of macro-economic instability. Figure 5.1 plots the range of annualized monthly
inflation rates over the last half century — and periodic bouts of instability are visually apparent. This
section will explore economic management, and the underlying difficulties that the authorities must
contend with.
5.8 Egypt’s price indices have some limitations: the prices of about half the items in the CPI basket
are controlled (less for the WPI which is used in Figure 5.1)78
. The indices jump when such controlled
prices inevitably give way, and inflation is often “explained” by price changes of its constituents —
such as the avian flu raising poultry prices and the US synfuels program raising the international price
of corn. The persistent rise in the price level results from monetary aggregates growing more rapidly
than output, and Figure 5.2 shows how closely the WPI moves with the stock of money. While M2 is
plotted, the different monetary aggregates (M0, M1 etc.) have been growing at very similar rates
especially in recent years.
78
Sherine Al-Shawarby (2007) “Is Egypt’s CPI An Accurate Measure of Inflation?” (ECES mimeo) describes how
the prices are sampled and the indices calculated. Briefly, the prices of some 274 items and 826 commodities
covering 90 percent of what is consumed are sampled monthly in several governorates, but some retail outlets are
unrepresentative and the prices of many items are set by the government. Consequently, the indices adjust with
some delay and may not accurately measure inflation in the short run.
(WPI, annualized )
-100%
-50%
0%
50%
100%
1957 1962 1967 1972 1977 1982 1987 1992 1997 2002 2007
0
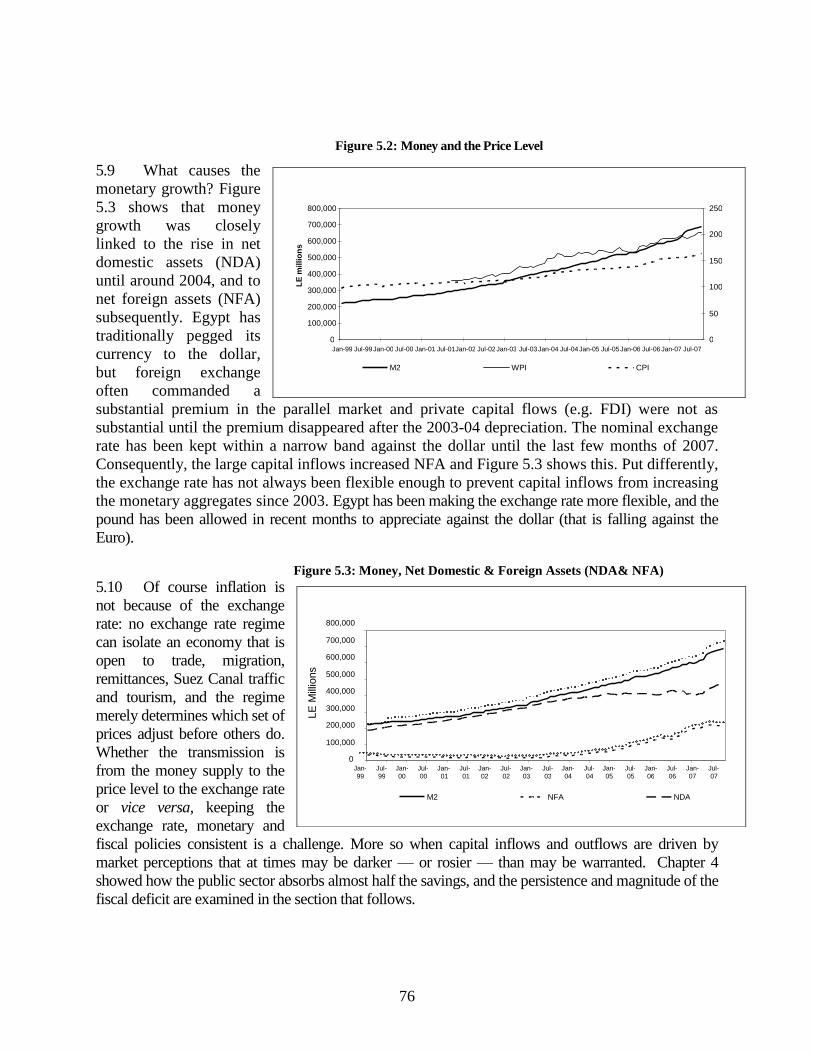
76
Figure 5.2: Money and the Price Level
5.9 What causes the
monetary growth? Figure
5.3 shows that money
growth was closely
linked to the rise in net
domestic assets (NDA)
until around 2004, and to
net foreign assets (NFA)
subsequently. Egypt has
traditionally pegged its
currency to the dollar,
but foreign exchange
often commanded a
substantial premium in the parallel market and private capital flows (e.g. FDI) were not as
substantial until the premium disappeared after the 2003-04 depreciation. The nominal exchange
rate has been kept within a narrow band against the dollar until the last few months of 2007.
Consequently, the large capital inflows increased NFA and Figure 5.3 shows this. Put differently,
the exchange rate has not always been flexible enough to prevent capital inflows from increasing
the monetary aggregates since 2003. Egypt has been making the exchange rate more flexible, and the
pound has been allowed in recent months to appreciate against the dollar (that is falling against the
Euro).
Figure 5.3: Money, Net Domestic & Foreign Assets (NDA& NFA)
5.10 Of course inflation is
not because of the exchange
rate: no exchange rate regime
can isolate an economy that is
open to trade, migration,
remittances, Suez Canal traffic
and tourism, and the regime
merely determines which set of
prices adjust before others do.
Whether the transmission is
from the money supply to the
price level to the exchange rate
or vice versa, keeping the
exchange rate, monetary and
fiscal policies consistent is a challenge. More so when capital inflows and outflows are driven by
market perceptions that at times may be darker — or rosier — than may be warranted. Chapter 4
showed how the public sector absorbs almost half the savings, and the persistence and magnitude of the
fiscal deficit are examined in the section that follows.
0 100,000 200,000 300,000 400,000 500,000 600,000 700,000 800,000
Jan- 99
Jul- 99
Jan- 00
Jul- 00
Jan- 01
Jul- 01
Jan- 02
Jul- 02
Jan- 03
Jul- 03
Jan- 04
Jul- 04
Jan- 05
Jul- 05
Jan- 06
Jul- 06
Jan- 07
Jul- 07
LE
Mill
ions
M2 NFA NDA
0 100,000 200,000 300,000 400,000 500,000 600,000 700,000 800,000
Jan-99 Jul-99 Jan-00 Jul-00 Jan-01 Jul-01 Jan-02 Jul-02 Jan-03 Jul-03 Jan-04 Jul-04 Jan-05 Jul-05 Jan-06 Jul-06 Jan-07 Jul-07
LE
mil
lio
ns
0
50
100
150
200
250
M2 WPI CPI
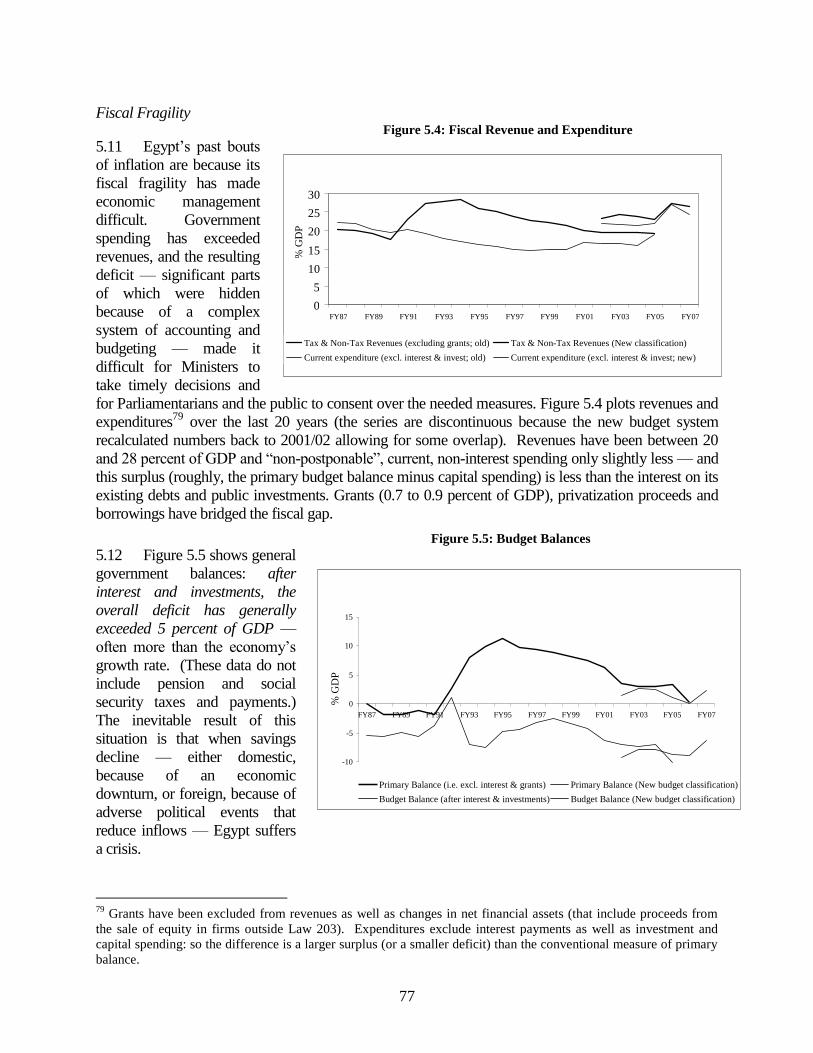
77
Fiscal Fragility Figure 5.4: Fiscal Revenue and Expenditure
5.11 Egypt’s past bouts
of inflation are because its
fiscal fragility has made
economic management
difficult. Government
spending has exceeded
revenues, and the resulting
deficit — significant parts
of which were hidden
because of a complex
system of accounting and
budgeting — made it
difficult for Ministers to
take timely decisions and
for Parliamentarians and the public to consent over the needed measures. Figure 5.4 plots revenues and
expenditures79
over the last 20 years (the series are discontinuous because the new budget system
recalculated numbers back to 2001/02 allowing for some overlap). Revenues have been between 20
and 28 percent of GDP and “non-postponable”, current, non-interest spending only slightly less — and
this surplus (roughly, the primary budget balance minus capital spending) is less than the interest on its
existing debts and public investments. Grants (0.7 to 0.9 percent of GDP), privatization proceeds and
borrowings have bridged the fiscal gap.
Figure 5.5: Budget Balances
5.12 Figure 5.5 shows general
government balances: after
interest and investments, the
overall deficit has generally
exceeded 5 percent of GDP —
often more than the economy’s
growth rate. (These data do not
include pension and social
security taxes and payments.)
The inevitable result of this
situation is that when savings
decline — either domestic,
because of an economic
downturn, or foreign, because of
adverse political events that
reduce inflows — Egypt suffers
a crisis.
79
Grants have been excluded from revenues as well as changes in net financial assets (that include proceeds from
the sale of equity in firms outside Law 203). Expenditures exclude interest payments as well as investment and
capital spending: so the difference is a larger surplus (or a smaller deficit) than the conventional measure of primary
balance.
0
5
10
15
20
25
30
FY87 FY89 FY91 FY93 FY95 FY97 FY99 FY01 FY03 FY05 FY07 %
GD
P
Tax & Non-Tax Revenues (excluding grants; old) Tax & Non-Tax Revenues (New classification) Current expenditure (excl. interest & invest; old) Current expenditure (excl. interest & invest; new)
-10
-5
0
5
10
15
FY87 FY89 FY91 FY93 FY95 FY97 FY99 FY01 FY03 FY05 FY07
% G
DP
Primary Balance (i.e. excl. interest & grants) Primary Balance (New budget classification) Budget Balance (after interest & investments) Budget Balance (New budget classification)

78
5.13 Egypt has been fortunate that these crises have not spiralled into catastrophes. Chapter 4
showed that the government is by far the largest domestic borrower, and that banks (rather than skittish
markets) intermediate by holding most of the government paper outstanding. In addition, the
substantial currency stock, 12 percent of GDP, generates sizeable seignorage (over 1 percent of GDP if
nominal interest rates are around 10 percent). Consequently, considerable inflation tax revenues could
be generated from modest inflation rates — which may explain why Egypt’s inflation rate never rose to
Latin American levels (where currency holdings and banking aggregates a far smaller proportion of
GDP). Inflation and negative real interest rates help the government’s finances but adversely affect
savers, particularly the middle class as Box 5.1 shows.
Box 5.1: Household wealth loss from inflation and low interest rates
Inflation and ex post negative real interest rates benefit borrowers and reduce the wealth of lenders: when the
Government is the largest borrower and households collectively are major lenders by holding banking deposits and cash,
there are substantial distributional
effects.
Households have substantial
banking deposits, and their losses are
estimated using their monthly balances,
the applicable interest rate on each type
of account and by the change in the
price level. These monthly amounts are
added to arrive at the loss for each
quarter. Figure 5.6 shows that
household losses fluctuate and are
substantial: a LE 8 billion quarterly loss
amounts to LE 24 billion for the year.
Currency earns no interest; and
assuming that households hold all the
outstanding currency, they incur an
additional loss of LE 12 billion and
totaling about 5 percent of GDP80
.
These losses are not equally shared among households: the poor have little in banks and the rich have a smaller
fraction of their wealth in bank deposits. All may hold similar amounts of currency, although this would be a larger fraction
of the poor’s wealth. Middle class urban households may therefore have lost more in wealth through inflation and negative
real interest rates than income gains from the 7 percent economic growth. This group is likely to be vocal in its support or
criticism of the economic reform “package”.
5.14 Successive governments have sought to change this; but the problems are deeply rooted, and
public support has not been forthcoming when most needed. Squeezing wages during a crisis may be
one way to keep the fiscal deficit low, but it does not address overstaffing — or elicit public support for
necessary measures. Inflation is therefore the consequence, and when this coincides with attempts at
“structural reforms”, both may get tarred by the same brush. While many “stroke of the pen” changes
like trade tariff reductions have had good results, those that require concerted efforts fail when
these efforts wane. Even if the curtailed efforts are later revived, the momentum and continuity
are lost: banking reform (whose importance was explained in Chapter 4) is an example. The
80
2006-07 GDP was LE 731,200 million. Households borrow very little from banks (and those that do may not be
those with deposits).
Figure 5.6: Effects on Household Wealth
Currency and Banking Deposits
-10,000
-8,000
-6,000
-4,000
-2,000
0
2,000
4,000
2004
Q1
2004
Q2
2004
Q3
2004
Q4
2005
Q1
2005
Q2
2005
Q3
2005
Q4
2006
Q1
2006
Q2
2006
Q3
2006
Q4
2007
Q1
2007
Q2
2007
Q3
2007
Q4
million LE
Currency in Circul. House. deposit House. credit

79
Bank’s 2006 Development Policy Loan has the same objectives and supports many of the same
measures as the 1991 SAL whose benefits appear not to have lasted81
. This dearth of broad
support not only reduces the effectiveness of the attempted reforms, but also restricts what is
attempted: those with a long gestation — and large benefits, as in civil service, education —
have yet to begin.
5.15 These difficulties are not unique to Egypt. The reflections of policy makers from around
the world82
underscore the importance of broad support when ensuring major changes in
economic directions. In many transforming countries of Eastern Europe, former communist and
populist politicians accomplished more than zealous market purists (e.g. Czech versus Slovak
republics) to the surprise of many economists: trust and a reputation for fairness permitted them
to undertake more drastic changes. The same was true of Chile’s dramatic transformation, both
political and economic, in recent decades. Reforms in Egypt have the support of the President
and broader support would allow more to be done in a sustained manner with lasting results.
Such support may yet be forthcoming, especially when policies show greater sensitivity to
distributional issues — which, as mentioned before, are not to be confused with poverty.
Improvements in the Fiscal Fundamentals
5.16 The measured fiscal deficit rose substantially when the budget coverage widened and items
were classified better in 2006. The government announced that it would reduce this overall government
deficit gradually — by about 1 percent of GDP annually — to 3 percent of GDP by FY2011. This was
thought possible because the tax system was being improved, and Box 5.2 summarises the main
elements of the income tax reforms.
5.17 Egypt’s income tax structure is
now less distorting. And while some
groups pay more taxes than before, like
other countries that have undertaken
such tax reforms, tax revenues remain
around 15 percent of GDP — after a
short lived boost because of the publicity
and greater compliance following the
amnesty on back taxes. Tax revenues
rose from around 14 percent of GDP in
2004/05 (pre reform) to 15.8 percent the
next year, and fell slightly to 15.6 percent in 2006/07. Figure 5.7 shows the fluctuation in tax buoyancy
and its recent decline, although and Egypt’s is not markedly different than India’s 1.2.
81
The 2006 Financial Sector Development Policy Loan seeks to build “a sound banking system and insurance industry
strengthen the regulatory and supervisory framework for banks and non-bank financial institutions…”. Para 31 of the
Implementation Completion Report (ICR) of the World Bank’s 1991 Structural Adjustment Loan (SAL) states
“Bank solvency and prudential regulations have been improved, the insurance companies and capital markets
reformed.” The ICR also reports the cancellation of the loan in 1993 before the second tranche was disbursed
without describing the drama behind its cancellation. 82
World Bank (2005) Development Challenges in the 1990s: Leading Policymakers speak from Experience
Figure 5.3: Tax bouyancy
0.9
1.3 1.2
1.9
1.0
0.0
0.5
1.0
1.5
2.0
2.5
FY 03 FY 04 FY 05 FY 06 FY 07
Figure 5.7: Tax Buoyancy

80
Box 5.2: More Efficient Subsidies & Transfers
Government spending on energy and food subsidies has risen in recent years and will exceed 8 percent
of GDP in 2007-08. The poor obtain little of the spending although they pay for much of it through
inflation and other indirect taxes. The richest quintile gets 28 percent, almost twice the 16 percent of total
subsidies that the poorest quintile gets. This disparity is even greater in energy because the rich use more
petroleum products (gasoline, diesel).
A portion of the subsidies helps some of the poor. The Bank conducted a full poverty and social impact
analysis in 2005 and estimated that 25 percent of the population would have been below the national
poverty line (then roughly $1.50/day) without the subsidies instead of roughly 20 percent now. But
eliminating all subsidies and spending a mere 2 percent of GDP on well targeted transfers would have
reduced the headcount measure to 15 percent. Put differently, twice as much could be accomplished with a
quarter of the spending.
Subsidies through price controls are not an efficient way to help the poor. Nor was this their original
purpose: price controls were instituted in World War II, and continued long after they outlived any useful
purpose they may have served. The implied subsidies were not all in the budget and, being hidden, grew
over the decades and officials (and Parliamentarians and the public) did not realize their full magnitude or
incidence. While some subsidies benefit the poor — the Bank estimates that those on low quality flour to
bake baladi bread reduced the poverty rate by 2.7 percentage points, on LPG by 4.4 percentage points, and
on kerosene by 1.1 percentage points — such price controls misallocate resources and allow corruption.
There are reports of baladi bread flour routinely getting diverted, and when diesel and electricity prices are
held artificially low, inefficient motors and pumps are used. Also, the daunting logistics of physically
delivering the subsidized items makes for spotty geographical coverage, and the extremely poor in remote
areas often do not benefit.
Discussions over reform should be over what system better protects the poor, not over the level of
controlled prices or what items should be controlled. Better public services greatly benefit the poor —
especially in education, primary health care and family planning. It has long been known that
infrastructure improves market access permitting the cultivation of more profitable crops, but as earlier
chapters showed, past choices and neglected maintenance make for well-justified caution. A cash transfer
system would augment the purchasing power of recipients without distorting their choice — and Egypt
already has one, albeit small that reduces poverty by 0.6 percentage points — although some countries
intentionally skew choice by tying them to some desired action like sending their children to school
regularly. Such conditional cash transfers are both popular and successful in vibrant democracies like
Mexico and Brazil where local sentiments and preferences percolate into Government decision making.
Other options include geographic targeting, proxy-means testing, payments through electricity bills or a
combination of these. The poor may also benefit from being insured against adverse events (such as job
losses), and governments in many countries provide a safety net through unemployment benefits and/or
features in the pension and social security schemes. Such arrangements, however, are only as sound as the
government’s fiscal position and many countries that introduced such schemes later find unfunded
contingent liabilities an enormous burden. Egypt is also finding this with its pension system, and the
Government is considering ways to avert the problems that are projected to emerge several years hence.
The Government will soon decide what arrangements best suit its current situation after studying the
administrative and informational requirements of each option, and other countries’ experiences. While
Egypt considers how to reduce subsidies while protecting the poor, it is also considering ways to bridge the
growing chasm in its sizeable pension promises. While reducing subsidies should avoid hurting the poor,
lower government spending would also benefit the poor who are most hurt by inflation and because higher
aggregate savings would increase investments that generate better employment. Most of Egypt’s poor are
employed, and would benefit from higher productivity if they had more and better capital to work with.

81
Box 5.3: Egypt’s Tax Reforms
When the cabinet took office in July 2004, the currency had already depreciated and its main goal was
to increase employment and output by encouraging private business and investment. The tax system was
hobbled by high rates and riddled with ad hoc exemptions that had been accumulated over the years. In June
2005 Parliament approved Law 91 under which all companies (including multinationals) paid a uniform tax
of 20 percent on profit (not 32 or 40 percent) plus 2 percent as development duty. Withholding taxes on
interest and royalties was reduced from 32 to 20 percent, and the highest personal tax rate fell as well from
32 to 20 percent. Individuals now get a uniform exemption of LE 4,000 of income although benefits in kind
remain exempt.
Improvements in tax administration accompanied this reduction in tax rates: forms were simplified;
self-assessment replaced the earlier system where the taxpayer was presumed guilty. An abuse of the trust
entails penalties, and company accountants filing fraudulent returns are now criminally liable for tax evasion.
All this was accompanied by a concerted publicity campaign.
The result was a substantial increase in the number of returns: from 1.7 million in 2005 to 2.5 million in
2006 (only those with non-wage incomes need submit returns, since taxes are withheld from salaries) and
collections increased from LE 8.1 to LE 8.3 billion. Corporate tax revenues rose more substantially from LE
22 billion in 2004 to LE 39 billion in 2005; but the economy also did better. Equally important are the
benefits to firms from a reduction in inspections and shakedown — which surveys of firms have found.
5.18 Revenues from corporate and personal income taxes account for about half of all tax revenues
(payroll taxes that pay for pensions and social security are not in the budget), and taxes on sales and
from excise for much of the remainder. In May 2006, the sales and income tax departments were
merged to reduce the burdens on firms that hitherto dealt separately with each. A value added tax
(VAT) will replace the sales tax, but its introduction is proceeding slower than expected. Training tax
offices, computerising the accounts and other administrative changes are taking longer, and the
authorities realize that a delay is less disruptive than mistakes in the conversion.
Figure 5.8: Revenue Composition
5.19 These improvements
have been on the revenue side,
but overall revenues of the
general government remain
between 25 and 30 percent of
GDP. Figure 5.8 shows
revenues as a proportion of
GDP over the last 20 years, and
this may be a reasonable
proportion to expect in the
medium term.
0%
5%
10%
15%
20%
25%
30%
35%
FY87 FY89 FY91 FY93 FY95 FY97 FY99 FY01 FY03 FY05 FY07
%
Tax revenues Tax and non-tax revenues Total revenues

82
Figure 5.9: Expenditure Composition
5.20 Figure 5.9 shows a similar
chart of expenditures and its main
constituents: expenditures have been
substantially higher than revenues,
and their composition reflects
attempts to lower spending by
reducing public investment. The
recent increase in spending on
subsidies reflects their inclusion in
the budget starting 2005/06, not
necessarily a rise. Figures 5.8 and 5.9
make the fiscal fragility clear:
adverse developments give it no
room to manoeuvre.
5.21 Changes on the spending side have yet to occur. Some energy prices (gasoline) were increased
in September 2006 and prevented subsidies rising with world oil prices. Energy subsidies were initially
budgeted at 5.5 percent of GDP (2007-08), and this is a lower bound estimate because as Chapter 2
mentioned, an indeterminate part of the government’s portion of the production sharing agreements are
not reflected in the budget. (The extent of this will become clear when the Bank’s study of energy
pricing is completed.)
B. IMPROVING BUDGETARY PROCESSES & DECISIONS
5.22 Making informed collective spending decisions has been difficult in the past. When fiscal
revenues fall short, spending rises or borrowing becomes difficult, the Government “tightened” budgets
mostly by postponing wage increases — public investment having drastically shrunk already because
of this continual squeeze on spending that also hurt much needed maintenance. Subsequent wage
increases are inevitable, and these have often coincided with the election cycle.83
The Government
employs over a quarter of the entire work force, as noted in Chapter 3 along with their adverse effects
on the labour market, and although wages at over 7 percent of GDP are a major spending item, public
sector employment continues to grow and remains attractive. The Government is now studying civil
service reforms — as it has before, most recently in 199584
. Difficult issues such as civil service
reform and seeing them through require making informed collective choices, and this has been difficult.
5.23 There have been two important changes since 2004 that permit better management of
government finances: (i) the budget is more comprehensive since 2006, and (ii) greater control over
spending after the budget has been approved. These changes also focus of expenditure discussions
around the budget, allowing the cabinet and Parliament make informed decisions knowing the trade
offs involved. The sections that follow describes these developments drawing on the Bank’s Country
83
Lisa Blaydes (2006) “Electoral Budget Cycles under Authoritarianism: Economic Opportunism in Mubarak’s
Egypt”, University of California, Los Angeles Ph.D. dissertation finds that salary and/or bonus increases and
pension eligibility changes have been often used to buy support ahead of Parliamentary elections. She explains that
although the President may have no rivals, greater support in Parliament is useful for a variety of reasons. 84
E.H. Valsan (1995) “Civil Service Systems in Comparative Perspective” provides a historical overview of the
growth and periodic attempts to prune the civil service. Available at http://www.indiana.edu/~csrc/valsan.html
0%
10%
20%
30%
40%
50%
FY87 FY89 FY91 FY93 FY95 FY97 FY99 FY01 FY03 FY05 FY07
%
Wages plus other current spending plus subsidies plus interest & capital spending

83
Financial and Accountability Assessment (CFAA) now underway and the parallel review of Public
Financial Management85
. Bank staff reviewed similar efforts by other institutions, including the IMF,
EC and USAid that advise and assist the government. This description is organized around three
topics: budget management, transparency and execution; the management of non-budget entities; and
public oversight, including that through Parliament. There has been most progress in the first, and
some in the last.
Budget Management, Transparency & Execution
5.24 The Ministry of Finance (MoF) is responsible for the State General Budget (SGB) which is
now more comprehensive but remains narrower in scope that the IMF’s Government Finance Statistics
(GFS) definition of general government. The budget excludes Economic Authorities (NIB, the two
social insurance funds86
), but the MOF routinely reports (e.g. in its monthly publication) separate
columns for the budget sector and general government (close to the GFS definition). SGB is a unitary
budget covering all levels of government: 30 central government ministries; 26 governorates plus the
city of Luxor, each containing a directorate of 14 ministries, plus cities, districts and villages; and 8087
public service agencies (e.g. hospitals, state universities, and research institutes). This is a very good
feature in Egypt and avoids the problems generated by state government deficits that Brazil and India
have to contend with.
5.25 The budget has 8 expenditure and 4 revenue chapters. The Ministry of Economic
Development (MED, previously called Ministry of Planning) administers the investment spending
chapter that is drawn from the five years Socio Economic Development Plan. The major problem with
investment is poor maintenance88
, but performance budgeting (being discussed) will require staffing
changes because expenditure policy analysis skills lies in MED, not MoF. The budget includes donor
assistance (foreign military assistance is not separately reported and may not be included), although
some projects are managed through “ring-fenced” accounting arrangements and donors deal directly
with line ministries. These should now be within the purview of the Treasury Single Account.
5.26 The Treasury Single Account (TSA) was introduced in November 2006 to replace some 5,000
accounts (48,000 sub-accounts) that, although not technically extra-budgetary89
because revenue and
expenditure entries are made in the budget accounting system, allowed spending at the holders’
discretion. The banking laws’ privacy provisions prevented the Ministry of Finance ascertaining the
number or balances in these accounts.90
The 2006/7 Budget Circular requires all entities to report
85
The Aide Memoire of the July 2007 CFAA mission, and the June 2007 Review of Public Financial Management
draft report. These reports in turn built on the 2003 CFAA and the 2005-06 Institutional Financial Management
Capacity Assessments and the Bank’s December 2005 Budget Construction and Decentralization, Policy Note 6,
Egypt Public Expenditure Review, now also available on the Ministry of Finance website:
http://www.mof.gov.eg/English/Main%20Topics/Public%20Expenditure%20Review%20-%20Policy%20Notes 86
Both the MOF and the Minister’s Office state that NIB and the SIFs are now partially consolidated. 87
The MOF’s Budget Department has 142 as the number. 88
Under-funding operating and maintenance expenditures remains a major problem, as noted in several of the
Bank’s PER Policy Notes; but this is not the absence of integration. The 2006/7 Budget Circular (paragraph 27)
enjoins all organizations to provide for adequate maintenance.
The Bank’s draft IFMCA recommends that the MOF be made responsible for the Investment chapter also. 89
The mission received quite contradictory information on this point from the Minister’s Office and from the
Budget Department on whether expenditure from these revenues was previously appropriated. 90
This was despite the provisions of Code 9 of the Budget Law and the annual budget circular that all own source
revenues be reflected in budget submissions from ministries, governorates and agencies.

84
revenues from user charges and details of any special bank accounts still remaining. Revenues flowing
into any sub-accounts will be budget revenues, and expenditure from the sub-accounts will be budget
appropriations. The TSA is already showing improvements: LE35 billion of the estimated LE 82.3
billion in total balances was transferred by December 200691
. Such accounts fund about 30 percent of
total (with the regular budget funding the remaining 70 percent).
5.27 The TSA reduces the government’s borrowing costs and improves the MoF’s cash
management and control; but several issues are still being resolved including compensating Ministries
for lost interest. How these new arrangements change the budget discussions among the MOF,
governorates and line ministries remains to be seen. There have been some implementation problems
also: some bank accounts were frozen delaying disbursements, including in some cases those funding
donor projects. The balances remaining outside the TSA will be transferred gradually to allow the
banking system time to adjust and the Minister of Finance will allow some entities (SIFs, military,
security and intelligence services whose expenditures are a one line budget appropriation) to retain their
bank accounts.
5.28 Another change that improves transparency and control is the MoF’s decision to directly
borrow the SIFs’ cash surplus to fund public investment. This will change NIB’s role from an
intermediary and co-implementer (with MED) of the investment budget into a development bank that
continues lending to the economic authorities.
5.29 The MoF is being reorganized to improve budget development and execution. The current
three budget departments (covering ministries, governorates and agencies) will be merged: this would
permit one unit to consider all education expenditures whether administered by the Ministry of
Education or by governorates. A new Treasury department will take over budget execution, accounting,
cash and debt92
management: about 300 regional offices will manage the existing 3,000 local finance
offices that collect revenues and disburse payments on the requisition of ministries, governorates and
agencies. A MOF financial controller now approves every payment that each of the roughly 5,000
separate spending units (across ministries, governorates and agencies that hold a budget) makes after
first checking that funds are available and that the expenditure is for the authorised purpose. In
practice, these controllers are pressured and even directed to approve the spending because they are
physically located in the unit. This partially explains the “soft budget constraint” or significant over-
expenditures, both in total and individual items which occur in many spending units. The payment
system is decentralized and is paper based, and automation would permit the MOF to systematically
monitor expenditures at ministry, governorate or agency level – or at the level of spending units.
Separate financial inspectors operate as a flying squad to check on the work of financial controllers; but
the CFAA and IFMCA note they are ineffective. A modern internal audit will replace the MOF’s
existing “inspection” function.
5.30 The Government Financial Management Information System (GFMIS) is the glue that binds
many aspects of public financial management. Introducing any complex computer system to replace a
disparate system of manually kept paper records and various obsolete computer based systems is
91
Source; MOF, Egyptian Economic Monitor, December 2006, page 116
Many accounts remain open to transfer revenues but the end of day balances will be transferred to the TSA. 92 MOF is also formalizing its role as the manager and accountant for the public debt, a role previously in part
assumed by CBE and the Ministry of Foreign Investment, both of which published public debt with inconsistent
data.
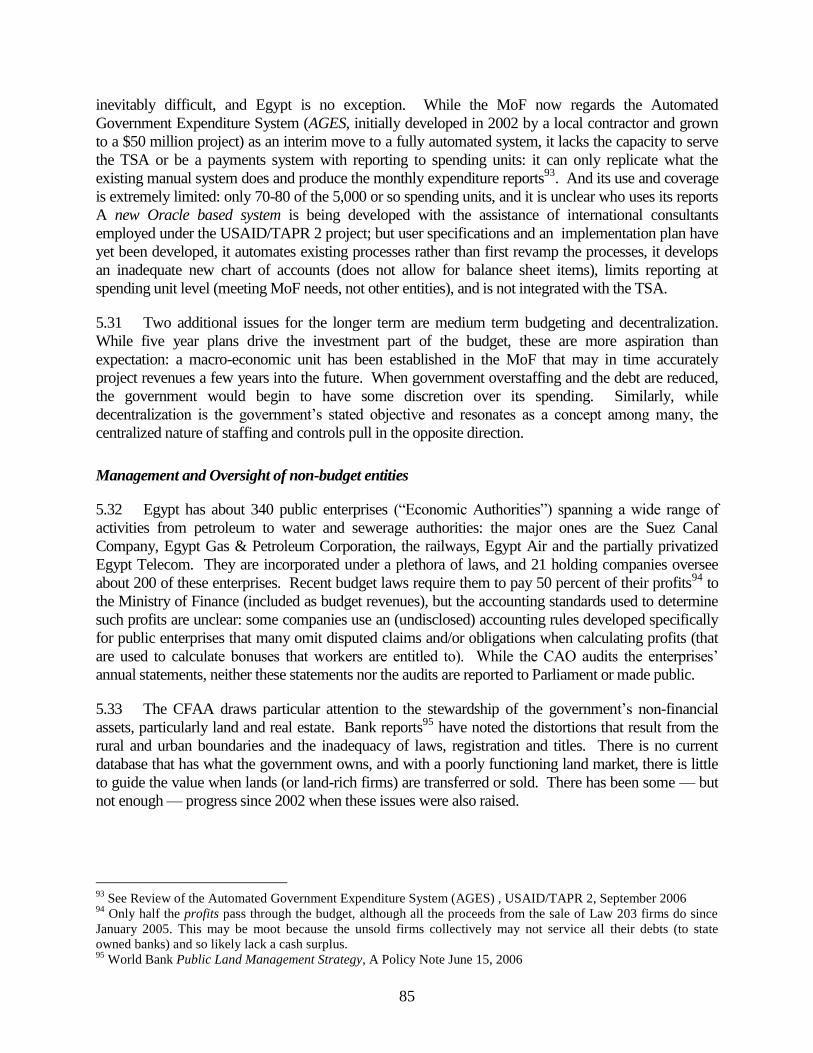
85
inevitably difficult, and Egypt is no exception. While the MoF now regards the Automated
Government Expenditure System (AGES, initially developed in 2002 by a local contractor and grown
to a $50 million project) as an interim move to a fully automated system, it lacks the capacity to serve
the TSA or be a payments system with reporting to spending units: it can only replicate what the
existing manual system does and produce the monthly expenditure reports93
. And its use and coverage
is extremely limited: only 70-80 of the 5,000 or so spending units, and it is unclear who uses its reports
A new Oracle based system is being developed with the assistance of international consultants
employed under the USAID/TAPR 2 project; but user specifications and an implementation plan have
yet been developed, it automates existing processes rather than first revamp the processes, it develops
an inadequate new chart of accounts (does not allow for balance sheet items), limits reporting at
spending unit level (meeting MoF needs, not other entities), and is not integrated with the TSA.
5.31 Two additional issues for the longer term are medium term budgeting and decentralization.
While five year plans drive the investment part of the budget, these are more aspiration than
expectation: a macro-economic unit has been established in the MoF that may in time accurately
project revenues a few years into the future. When government overstaffing and the debt are reduced,
the government would begin to have some discretion over its spending. Similarly, while
decentralization is the government’s stated objective and resonates as a concept among many, the
centralized nature of staffing and controls pull in the opposite direction.
Management and Oversight of non-budget entities
5.32 Egypt has about 340 public enterprises (“Economic Authorities”) spanning a wide range of
activities from petroleum to water and sewerage authorities: the major ones are the Suez Canal
Company, Egypt Gas & Petroleum Corporation, the railways, Egypt Air and the partially privatized
Egypt Telecom. They are incorporated under a plethora of laws, and 21 holding companies oversee
about 200 of these enterprises. Recent budget laws require them to pay 50 percent of their profits94
to
the Ministry of Finance (included as budget revenues), but the accounting standards used to determine
such profits are unclear: some companies use an (undisclosed) accounting rules developed specifically
for public enterprises that many omit disputed claims and/or obligations when calculating profits (that
are used to calculate bonuses that workers are entitled to). While the CAO audits the enterprises’
annual statements, neither these statements nor the audits are reported to Parliament or made public.
5.33 The CFAA draws particular attention to the stewardship of the government’s non-financial
assets, particularly land and real estate. Bank reports95
have noted the distortions that result from the
rural and urban boundaries and the inadequacy of laws, registration and titles. There is no current
database that has what the government owns, and with a poorly functioning land market, there is little
to guide the value when lands (or land-rich firms) are transferred or sold. There has been some — but
not enough — progress since 2002 when these issues were also raised.
93
See Review of the Automated Government Expenditure System (AGES) , USAID/TAPR 2, September 2006 94
Only half the profits pass through the budget, although all the proceeds from the sale of Law 203 firms do since
January 2005. This may be moot because the unsold firms collectively may not service all their debts (to state
owned banks) and so likely lack a cash surplus. 95
World Bank Public Land Management Strategy, A Policy Note June 15, 2006

86
Public Oversight & Institutions
5.34 Public oversight is more than the legal existence of particular entities: their effective functioning
matters greatly. Parliament and the media are two sets of entities that oversee governments in most
countries: and while Parliament has statutory authority, the media help ensure that it functions
effectively by informing the electorate. The Constitutional amendments of March 2007 has increased
Parliament’s role, but curtailed that of the media: Parliament now has 3 months to consider the budget
instead of 2 months, the government must present its final accounts within 6 months instead of 9
months, and the CAO must present its report within 3 months of the government reporting its final
accounts. The 2007 CFAA reports the Speaker’s view that “Parliament was becoming more active in
their oversight role” but also notes the rudimentary member expertise in understanding auditors’ reports
and that the extra time may not lead to a better discussion of the issues.
5.35 The general public’s access to information and data are improving, although there is a
considerable way to go. Perhaps more important (for the limited purpose of better collective decision
making over the budget), the Ministry of Finance publications — a quarterly Economic Monitor, and
Financial Monthly — make relevant data easily available and accessible on their website. The
concerns over the legal legacy of secrecy (e.g. whether budget proposals could be public before
Parliament approved them) may be addressed in the Freedom of Information Law under preparation.
Figure 5.10: Egypt Governance Indicators
5.36 The World Bank
Institute’s Governance Indicators
compile data from a number of
sources including citizens and
experts and while Egypt’s
indicators are generally
improving, Figure 5.10 shows
they are mostly below the 50th
percentile among all countries of
the World. When the
Governance indicators are
broken down along functional
areas, Egypt does relatively
much better in the “rule of law”
than “voice and accountability”
category. The Government has
recently set up a “Transparency
and Integrity Committee”, with
civil society participation and a
mandate to propose measures for
fighting corruption and
improving transparency and
integrity in the public sector. Related to this effort, the Information Decision Support Center, affiliated
with the Cabinet, has conducted large diagnostic surveys of perception of corruption by functional and
organizational structure of Government entities. The results of this survey were publicized, pointing the
way for constructive interventions as well as improving the credibility of the effort to improve
governance.
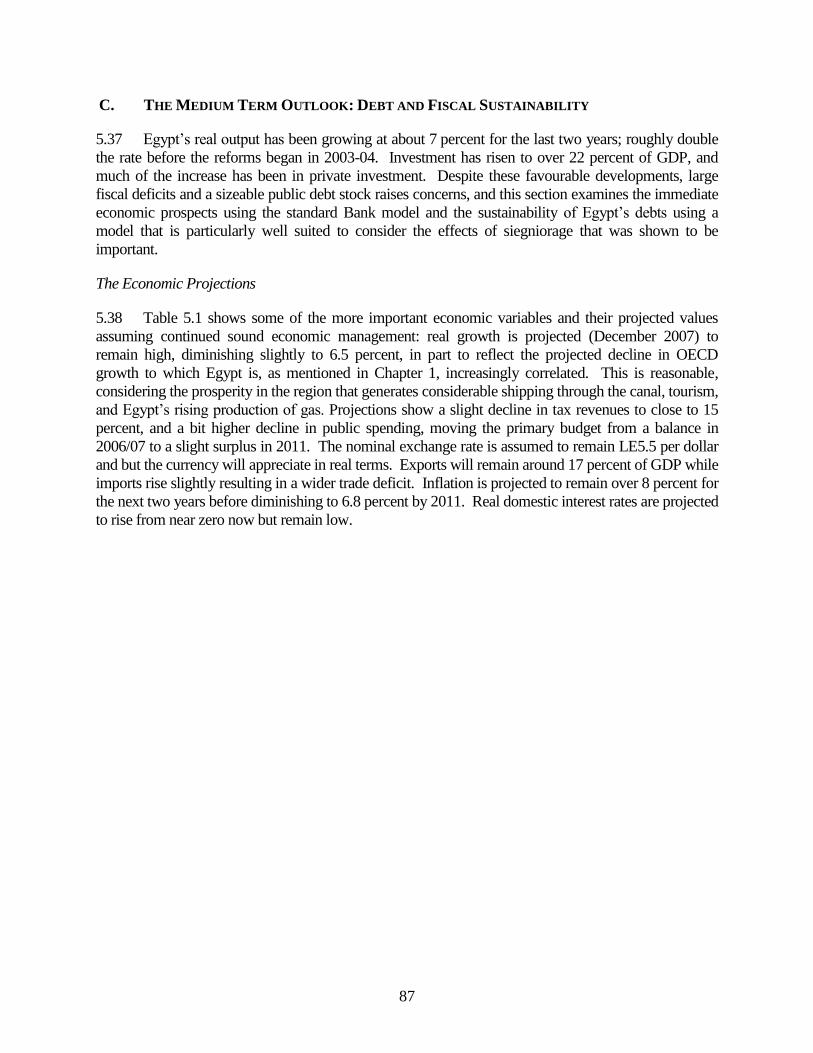
87
C. THE MEDIUM TERM OUTLOOK: DEBT AND FISCAL SUSTAINABILITY
5.37 Egypt’s real output has been growing at about 7 percent for the last two years; roughly double
the rate before the reforms began in 2003-04. Investment has risen to over 22 percent of GDP, and
much of the increase has been in private investment. Despite these favourable developments, large
fiscal deficits and a sizeable public debt stock raises concerns, and this section examines the immediate
economic prospects using the standard Bank model and the sustainability of Egypt’s debts using a
model that is particularly well suited to consider the effects of siegniorage that was shown to be
important.
The Economic Projections
5.38 Table 5.1 shows some of the more important economic variables and their projected values
assuming continued sound economic management: real growth is projected (December 2007) to
remain high, diminishing slightly to 6.5 percent, in part to reflect the projected decline in OECD
growth to which Egypt is, as mentioned in Chapter 1, increasingly correlated. This is reasonable,
considering the prosperity in the region that generates considerable shipping through the canal, tourism,
and Egypt’s rising production of gas. Projections show a slight decline in tax revenues to close to 15
percent, and a bit higher decline in public spending, moving the primary budget from a balance in
2006/07 to a slight surplus in 2011. The nominal exchange rate is assumed to remain LE5.5 per dollar
and but the currency will appreciate in real terms. Exports will remain around 17 percent of GDP while
imports rise slightly resulting in a wider trade deficit. Inflation is projected to remain over 8 percent for
the next two years before diminishing to 6.8 percent by 2011. Real domestic interest rates are projected
to rise from near zero now but remain low.
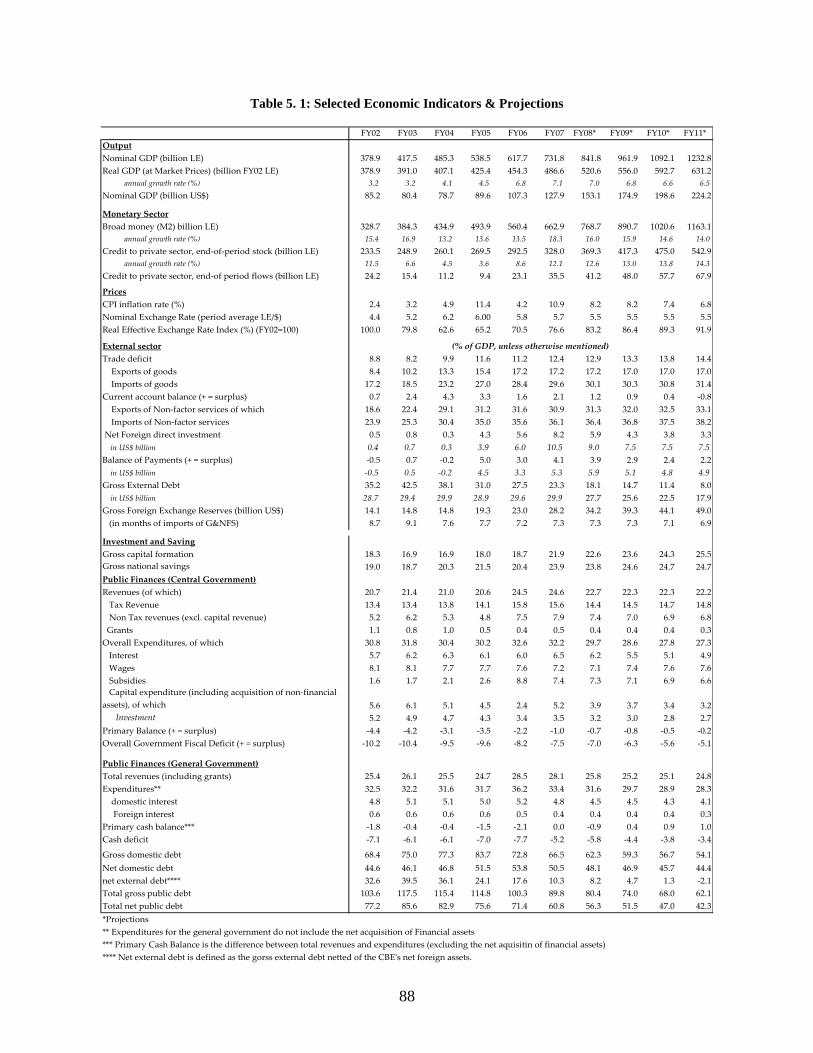
88
Table 5. 1: Selected Economic Indicators & Projections
FY02 FY03 FY04 FY05 FY06 FY07 FY08* FY09* FY10* FY11*
Output
Nominal GDP (billion LE) 378.9 417.5 485.3 538.5 617.7 731.8 841.8 961.9 1092.1 1232.8
Real GDP (at Market Prices) (billion FY02 LE) 378.9 391.0 407.1 425.4 454.3 486.6 520.6 556.0 592.7 631.2
annual growth rate (%) 3.2 3.2 4.1 4.5 6.8 7.1 7.0 6.8 6.6 6.5
Nominal GDP (billion US$) 85.2 80.4 78.7 89.6 107.3 127.9 153.1 174.9 198.6 224.2
Monetary Sector
Broad money (M2) billion LE) 328.7 384.3 434.9 493.9 560.4 662.9 768.7 890.7 1020.6 1163.1
annual growth rate (%) 15.4 16.9 13.2 13.6 13.5 18.3 16.0 15.9 14.6 14.0
Credit to private sector, end-of-period stock (billion LE) 233.5 248.9 260.1 269.5 292.5 328.0 369.3 417.3 475.0 542.9
annual growth rate (%) 11.5 6.6 4.5 3.6 8.6 12.1 12.6 13.0 13.8 14.3
Credit to private sector, end-of period flows (billion LE) 24.2 15.4 11.2 9.4 23.1 35.5 41.2 48.0 57.7 67.9
Prices
CPI inflation rate (%) 2.4 3.2 4.9 11.4 4.2 10.9 8.2 8.2 7.4 6.8
Nominal Exchange Rate (period average LE/$) 4.4 5.2 6.2 6.00 5.8 5.7 5.5 5.5 5.5 5.5
Real Effective Exchange Rate Index (%) (FY02=100) 100.0 79.8 62.6 65.2 70.5 76.6 83.2 86.4 89.3 91.9
External sector
Trade deficit 8.8 8.2 9.9 11.6 11.2 12.4 12.9 13.3 13.8 14.4
Exports of goods 8.4 10.2 13.3 15.4 17.2 17.2 17.2 17.0 17.0 17.0
Imports of goods 17.2 18.5 23.2 27.0 28.4 29.6 30.1 30.3 30.8 31.4
Current account balance (+ = surplus) 0.7 2.4 4.3 3.3 1.6 2.1 1.2 0.9 0.4 -0.8
Exports of Non-factor services of which 18.6 22.4 29.1 31.2 31.6 30.9 31.3 32.0 32.5 33.1
Imports of Non-factor services 23.9 25.3 30.4 35.0 35.6 36.1 36.4 36.8 37.5 38.2
Net Foreign direct investment 0.5 0.8 0.3 4.3 5.6 8.2 5.9 4.3 3.8 3.3
in US$ billion 0.4 0.7 0.3 3.9 6.0 10.5 9.0 7.5 7.5 7.5
Balance of Payments (+ = surplus) -0.5 0.7 -0.2 5.0 3.0 4.1 3.9 2.9 2.4 2.2
in US$ billion -0.5 0.5 -0.2 4.5 3.3 5.3 5.9 5.1 4.8 4.9
Gross External Debt 35.2 42.5 38.1 31.0 27.5 23.3 18.1 14.7 11.4 8.0
in US$ billion 28.7 29.4 29.9 28.9 29.6 29.9 27.7 25.6 22.5 17.9
Gross Foreign Exchange Reserves (billion US$) 14.1 14.8 14.8 19.3 23.0 28.2 34.2 39.3 44.1 49.0
(in months of imports of G&NFS) 8.7 9.1 7.6 7.7 7.2 7.3 7.3 7.3 7.1 6.9
Investment and Saving
Gross capital formation 18.3 16.9 16.9 18.0 18.7 21.9 22.6 23.6 24.3 25.5
Gross national savings 19.0 18.7 20.3 21.5 20.4 23.9 23.8 24.6 24.7 24.7
Public Finances (Central Government)
Revenues (of which) 20.7 21.4 21.0 20.6 24.5 24.6 22.7 22.3 22.3 22.2
Tax Revenue 13.4 13.4 13.8 14.1 15.8 15.6 14.4 14.5 14.7 14.8
Non Tax revenues (excl. capital revenue) 5.2 6.2 5.3 4.8 7.5 7.9 7.4 7.0 6.9 6.8
Grants 1.1 0.8 1.0 0.5 0.4 0.5 0.4 0.4 0.4 0.3
Overall Expenditures, of which 30.8 31.8 30.4 30.2 32.6 32.2 29.7 28.6 27.8 27.3
Interest 5.7 6.2 6.3 6.1 6.0 6.5 6.2 5.5 5.1 4.9
Wages 8.1 8.1 7.7 7.7 7.6 7.2 7.1 7.4 7.6 7.6
Subsidies 1.6 1.7 2.1 2.6 8.8 7.4 7.3 7.1 6.9 6.6
Capital expenditure (including acquisition of non-financial
assets), of which 5.6 6.1 5.1 4.5 2.4 5.2 3.9 3.7 3.4 3.2
Investment 5.2 4.9 4.7 4.3 3.4 3.5 3.2 3.0 2.8 2.7
Primary Balance (+ = surplus) -4.4 -4.2 -3.1 -3.5 -2.2 -1.0 -0.7 -0.8 -0.5 -0.2
Overall Government Fiscal Deficit (+ = surplus) -10.2 -10.4 -9.5 -9.6 -8.2 -7.5 -7.0 -6.3 -5.6 -5.1
Public Finances (General Government)
Total revenues (including grants) 25.4 26.1 25.5 24.7 28.5 28.1 25.8 25.2 25.1 24.8
Expenditures** 32.5 32.2 31.6 31.7 36.2 33.4 31.6 29.7 28.9 28.3
domestic interest 4.8 5.1 5.1 5.0 5.2 4.8 4.5 4.5 4.3 4.1
Foreign interest 0.6 0.6 0.6 0.6 0.5 0.4 0.4 0.4 0.4 0.3
Primary cash balance*** -1.8 -0.4 -0.4 -1.5 -2.1 0.0 -0.9 0.4 0.9 1.0
Cash deficit -7.1 -6.1 -6.1 -7.0 -7.7 -5.2 -5.8 -4.4 -3.8 -3.40.0 0.0 0.0 0.0 0.0 0.0 0.0 0.0 0.0 0.0
Gross domestic debt 68.4 75.0 77.3 83.7 72.8 66.5 62.3 59.3 56.7 54.1
Net domestic debt 44.6 46.1 46.8 51.5 53.8 50.5 48.1 46.9 45.7 44.4
net external debt**** 32.6 39.5 36.1 24.1 17.6 10.3 8.2 4.7 1.3 -2.1
Total gross public debt 103.6 117.5 115.4 114.8 100.3 89.8 80.4 74.0 68.0 62.1
Total net public debt 77.2 85.6 82.9 75.6 71.4 60.8 56.3 51.5 47.0 42.3
** Expenditures for the general government do not include the net acquisition of Financial assets
(% of GDP, unless otherwise mentioned)
*Projections
**** Net external debt is defined as the gorss external debt netted of the CBE's net foreign assets.
*** Primary Cash Balance is the difference between total revenues and expenditures (excluding the net aquisitin of financial assets)

89
5.39 As noted earlier, Egypt has large currency holdings, around 12 percent of GDP, and these
represent interest free borrowings and considerable seigniorage. Anand and van Wijnbergen (1988,
1989) develop a framework that explicitly takes account of seignorage along with new borrowing and
other debt creating factors. In addition, the model allows the central bank to be consolidated with the
government accounts, effectively “netting out” central bank’s net foreign assets from total external
public debt as well as central bank holdings of public deposits from public domestic debt. Such
accounting allows for a more appropriate sustainability assessment as it reflects appropriately limited
risks of a destabilizing debt spiral. Hence, this approach links inflation, monetary and fiscal policy as
well as debt management, ensuring long run policy consistency. Finally, the model allows for the
accounting of windfalls from petroleum or other sources96
. This specific feature has not been used at
this juncture because the transactions between the budget and the state owned petroleum company are
not yet fully transparent.
Debt Sustainability
5.40 Broadly speaking, debt sustainability is assessed in three steps. In the first step, policy variables
such as revenues and spending as well as endogenous variables (growth, interest rates, and exchange
rates) are forecast and included as the most likely baseline scenario (shown in Table 5.1): this assumes
sustained growth and prudent macroeconomic policies. In the second step, stress tests, or model-
independent sensitivity tests, as well as country-specific scenarios measure risks surrounding the
baseline projection. The output of different scenarios sheds light on the additional debt burden implied
by the incremental marginal financing needs emanating from adverse shocks. In the final step,
judgments based on the likelihood of certain shocks and other considerations guide the policy maker in
terms of the country’s vulnerability analysis to a crisis.
5.41 Under the baseline scenario, Figure
5.11 shows net public debt declining to under
40 percent of GDP in 2013, and Figure 5.12
shows the factors that contribute to this
decline. Egypt’s debt outlook remains robust
under various bound tests. The debt-to-GDP
ratios decline over time under all standardized
bound test that include a two standard
deviation shock to real interest rates, real
output growth, and the primary balance for the
first two projection years as well as a
combination of these three shocks with the
average historical values reduced by one
standard deviation.
96
Ritu Anand, Roberto Rocha and Sweder van Wijnbergen (1988) “Inflation, External Debt and Financial Sector
Reform: A Quantitative Approach to Consistent Fiscal Policy with an Application to Turkey” NBER Working Paper
No, 2731.
Nina Budina and Sweder van Wijnbergen (2007) “Quantitative Approaches to Fiscal Sustainability Analysis: A
New World Bank Tool applied to Turkey” World Bank Working Paper No. 4169.
Luca Bandiera, Nina Budina, Michel Klijn and Sweder van Wijnbergen (2007) “The ‘How to’ of Fiscal
Sustainability: A Technical Manuel for Using the Fiscal Sustainability Tool” World Bank Policy Research Working
Paper No.4170.
Figure 5.11 Debt to GDP Ratios, Actual & Projected
Debt-to-GDP Ratio (in percent)
0
20
40
60
80
100
120
140
2002 2003 2004 2005 2006 2007 2008 2009 2010 2011 2012 2013
Baseline
Alternative scenario (country-specific shock)
Second most extreme stress test (B4)
Most extreme stress test (A1)

90
5.42 Under the baseline scenario, Figure 5.11 shows net public debt declining to under 40 percent of
GDP in 2013, and Figure 5.12 shows the factors that contribute to this decline. Egypt’s debt outlook
remains robust under various bound tests. The debt-to-GDP ratios decline over time under all
standardized bound test that include a two standard deviation shock to real interest rates, real output
growth, and the primary balance for the first two projection years as well as a combination of these
three shocks with the average historical values reduced by one standard deviation.
5.43 However, under the alternative scenario, Egypt remains vulnerable to external shocks. The
assumptions and rationale for the shocks in this scenario are as follows: in the first year, growth
declines 6 percentage points in response to a shock affecting either tourism or canal traffic or both, the
currency depreciates by 30 percent while inflation rises to 20 percent. Under these circumstances, the
debt-to-GDP ratio increases to over 120 percent of GDP.
5.44 Such exercises are useful
not because of the accuracy in the
projected outcomes but as a way to
understand factors that are
important. Figure 5.12 shows that
the single most important
contributor to debt stability is real
economic growth. The government
has only limited influence on this in
the short run, although its policies
now influence the level growth in
the medium term. The primary
fiscal deficit in the chart has a
smaller “mechanical” role in the
model, but has a larger effect indirectly through increased savings and growth.
Broader debt strategy
5.45 External finance difficulties that led to the 1991 Paris Club arrangements both reduced the
debts and made the government a reluctant external borrower97
. But as the private sector grows, and
even if domestic banks slowly increase domestic lending, private foreign borrowings will rise. The
central bank data do not measure these borrowings accurately. Private non-guaranteed external debt,
although not the obligation of the government, nevertheless would use some of the central bank’s
97
Many public enterprises borrowed externally and the balance of payments crisis in the late 1980s led to a default.
When the government renegotiated these external borrowings under the aegis of the Paris Club in 1991, it
rescheduled the foreign exchange payments but insisted that the indebted firms repay under the original schedule in
domestic currency to the central bank. The accounting of these amounts remain contentious: the central bank treats
them as the government’s obligations, but the Ministry of Finance data do not record them as such. And since many
of these public firms have loans from state banks that they have difficulties servicing, it is not clear how much of the
promised payments are made by additional borrowings. The Fund has sought to clarify the issue, but it remains
unresolved. The debt statistics are therefore confusing. 97
The World Bank’s estimate of Egypt’s external debt is $39.9 billion (derived in part from creditor reporting to the
Bank of International Settlements) while the central bank reports a substantially lower figure. Some of the
differences are being resolved; but the central bank does not gather adequate data on private non-guaranteed external
debt.
Figure 5.12: Contribution of Various Factors to the Debt Dynamics
-12.0
-10.0
-8.0
-6.0
-4.0
-2.0
0.0
2.0
4.0
2007 2008 2009 2010 2011 2012 2013
Primary Deficit Seignorage
Contribution from real domestic interest rate Contribution from real foreign interest rate
Contribution from real GDP grow th Other identif ied debt-creating f low s
Other debt accumulation Contribution from real exchange rate depreciation
Change in public sector debt

91
foreign exchange reserves, and unexpected calls on such reserves have triggered crises in other
countries before.
5.46 Vulnerability therefore has a broader connotation than simply having the primary budget deficit
be smaller than the interest and some favorable combination of real growth, balance of payments and
current account surpluses. Whether an adverse blip will turn into a crisis largely depends on the
government knowing what is happening (with private firms, not just its own finances) — and being
able to act quickly and appropriately. The various Ministries, the central bank, Parliamentary and other
oversight bodies must respond in concert, and the many changes described in this chapter lay the
groundwork for this, although such a response is untested.
Some concluding comments
5.47 The changes that Egypt’s Government has begun are major, but because they have been
delayed for so long, the results may not be immediately apparent. The recent growth is encouraging,
but even if this falters because of external downturns, the structural reforms should continue. Non-
linearity and “tipping points” characterise the relation between policy inputs and growth and
development outcomes. Important changes in the structure of taxation and management of spending
are less visible than those that capture headlines such as privatization. While this chapter has
emphasized the need to reduce government spending as part of economic management, earlier chapters
showed how this permits the private sector to invest more and create value adding employment.
5.48 The services the government provides must be improved: in particular, educating the
generation that will soon enter the work force is of great importance. Here, the gains arise from a better
administration, not increased spending per se. These improvements must be in tandem with reducing
government overstaffing that both benefits the labour market and the budget. These are difficult
changes that require a consensus and broad support. The government’s reforms, including those that
are less heralded, are helping transform Egypt.

92
ANNEX I: PRIVATE & PUBLIC INVESTMENT: SUBSTITUTES?
Public and private sectors have been either considered together (in the aggregate TFP estimation and by
economic segments) and separately (as in Figure 1.13); but output may require a combination of public and
private capital stock. Two questions arise: (1) are private and public capital substitutes (i.e. could one be replaced
by the other); and (2) which contributes more to generate the output? To answer this, we estimate a production
function where labor combines with “composite capital” that in turn consists of a combination of private and
public capital where the degree of substitution between the two is estimated. More formally,
1
])1([ LKKAYPRIPUB
where Y represents aggregate output, A is the efficiency parameter, K represents capital, the subscripts PUB and
PRI denoting public and private respectively, indicates the relative importance of public capital, is the share
of overall capital in production, and is a parameter directly related to the elasticity of substitution between
private and public capital (more precisely, the elasticity
1
1
). A constant-elasticity-of-substitution (CES)
production function forms the “composite capital” from combining public and private capital; and a Cobb-
Douglas production function combines this composite capital with labor to produce the final output.
As is standard in the literature, the regression equation is estimated in growth rates (not levels expressed above) to
make the series stationary and avoid spurious correlation
L
KK
KKKKAY
PRIPUB
PRIPRI
PUBPUB
)1(
])1([
])1([*
where a dot above a variable denotes growth rate. This function is estimated applying non-linear least squares
with annual data for two periods: 1960-2006 (which has more observations) and 1983-2006 (which includes only
the years with better quality data). For technical reasons, 2
)1( is estimated (not ), from which is
calculated using the restriction that 1
. Table 1.1 shows that the estimates for the two periods
are of similar orders of magnitude.
Table A1. 1: Estimate of Parameters
Period σ
1960-2006 0.35 0.21 1.09e-12 986895.1
(0.091) (0.486) (9.10e-06)
1983-2006 0.29 0.16 1.45e-10 83055.52
(0.165) (0.535) .0001383
Source: Standard Errors in parentheses.
The (capital’s share of output) estimated for the 1960-2006 period is 0.35, close to 0.4 assumed for
the Solow growth decompositions and similar to estimates for other countries. The estimated is small
which implies a very high elasticity of substitution between public and private capital, , and that is
close to unity. The relative contribution of public capital in the formation of composite (or overall)
capital in the economy, , is estimated to be 0.21: in other words, private capital’s contribution to the
economy’s productive capital stock was four times that of public capital. The large elasticity of
substitution (between private and public capital) taken together with the high relative contribution of
private capital implies that the overall productivity gains in Egypt was because of giving the private
sector a greater role.

93
ANNEX II: EGYPT, ARAB REP. AT A GLANCE 10/2/07
M. East Lower Key Development Indicators
& North middle Egypt Africa income
(2006)
Population, mid-year (millions) 75.4 311 2,276 Surface area (thousand sq. km) 1,001 8,990 28,549 Population growth (%) 1.8 1.7 0.9 Urban population (% of total population) 43 57 47
GNI (Atlas method, US$ billions) 106.9 771 4,635 GNI per capita (Atlas method, US$) 1,420 2,481 2,037 GNI per capita (PPP, international $) 4,690 6,447 7,020
GDP growth (%) 6.8 5.4 8.8 GDP per capita growth (%) 4.9 3.6 7.9
(most recent estimate, 2000–2006)
Poverty headcount ratio at $1 a day (PPP, %) 3 1 .. Poverty headcount ratio at $2 a day (PPP, %) 44 20 .. Life expectancy at birth (years) 71 70 71 Infant mortality (per 1,000 live births) 28 43 31 Child malnutrition (% of children under 5) 9 14 13
Adult literacy, male (% of ages 15 and older) 83 83 93 Adult literacy, female (% of ages 15 and older) 59 63 85 Gross primary enrolment, male (% of age group) 103 106 117 Gross primary enrolment, female (% of age group) 98 99 114
Access to an improved water source (% of population) 98 90 81 Access to improved sanitation facilities (% of population) 70 76 55
Net Aid Flows 1980 1990 2000 2006 a
(US$ millions) Net ODA and official aid 1,381 5,426 1,328 926 Top 3 donors (in 2005): United States 834 2,346 635 397 Germany 107 347 65 109 France 33 140 242 80
Aid (% of GNI) 6.4 11.9 1.3 1.0 Aid per capita (US$) 31 97 20 13
Long-Term Economic Trends
Consumer prices (annual % change) .. 10 2.8 4.2 GDP implicit deflator (annual % change) 18.0 18.7 4.9 7.4
Exchange rate (annual average, local per US$) 0.7 2.2 3.4 5.7 Terms of trade index (2000 = 100) .. 97 100 111
1980–90 1990–2000 2000–06
Population, mid-year (millions) 43.9 55.7 67.3 75.4 2.4 1.9 1.9 GDP (US$ millions) 22,912 42,979 99,839 107,484 5.6 4.5 4.0
Agriculture 18.3 19.4 16.7 14.1 2.9 3.1 3.3 Industry 36.8 28.7 33.1 38.4 5.8 4.4 3.6 Manufacturing 12.2 17.8 19.4 16.6 8.4 6.3 3.4 Services 45.0 51.9 50.1 47.5 6.6 4.4 4.6 Household final consumption expenditure 69.2 71.9 75.9 70.6 4.0 4.0 3.4 General gov't final consumption expenditure 15.7 11.4 11.2 12.3 2.5 4.6 3.5 Gross capital formation 27.5 28.9 19.6 18.7 1.7 6.0 3.2
Exports of goods and services 30.5 20.4 16.2 29.9 4.3 3.6 12.6 Imports of goods and services 42.9 32.6 22.8 31.6 -1.1 3.1 8.8 Gross savings .. 23.1 18.7 22.8
Note: Figures in italics are for years other than those specified. 2006 data are preliminary. .. indicates data are not available. a. Aid data are for 2005.
Development Economics, Development Data Group (DECDG).
(average annual growth %)
(% of GDP)
15 10 5 0 5 10 15 0-4
10-14 20-24 30-34 40-44 50-54 60-64 70-74
percent
Age distribution, 2006 Male Female
0 20 40 60 80
100 120
1990 1995 2000 2005 Egypt, Arab Rep. Middle East & North Africa
Under-5 mortality rate (per 1,000)
-6 -4 -2 0 2 4 6 8
90 95 00 05
GDP GDP per capita
Growth of GDP and GDP per capita (%)

94
Egypt, Arab Rep.
Balance of Payments and Trade 2000 2006
(US$ millions)
Total merchandise exports (fob) 6,388 18,455
Total merchandise imports (cif) 17,860 30,441
Net trade in goods and services -6,774 -4,326
Current account balance -1,163 1,752 as a % of GDP -1.2 1.6
Workers' remittances and
compensation of employees (receipts) 2,852 5,017
Reserves, including gold 15,161 26,660
Central Government Finance
(% of GDP)
Current revenue (including grants) 28.2 27.4
Tax revenue 14.6 15.8
Current expenditure 22.4 32.7
Technology and Infrastructure 2000 2005Overall surplus/deficit -1.2 -9.1
Paved roads (% of total) 78.1 81.0
Highest marginal tax rate (%) Fixed line and mobile phone
Individual 32 20 subscribers (per 1,000 people) 102 325
Corporate 40 40 High technology exports (% of manufactured exports) 0.3 0.6
External Debt and Resource Flows
Environment
(US$ millions)
Total debt outstanding and disbursed 29,187 39,861 Agricultural land (% of land area) 3 4
Total debt service 1,832 2,778 Forest area (% of land area) 0.1 0.1
Debt relief (HIPC, MDRI) – – Nationally protected areas (% of land area) .. 5.6
Total debt (% of GDP) 29.2 37.1 Freshwater resources per capita (cu. meters) .. 24
Total debt service (% of exports) 8.9 6.8 Freshwater withdrawal (% of internal resources) 3,794.4 ..
Foreign direct investment (net inflows) 1,235 5,376 CO2 emissions per capita (mt) 2.1 2.0
Portfolio equity (net inflows) 269 729
GDP per unit of energy use
(2000 PPP $ per kg of oil equivalent) 5.2 4.8
Energy use per capita (kg of oil equivalent) 681 783
World Bank Group portfolio 2000 2006
(US$ millions)
IBRD
Total debt outstanding and disbursed 639 492
Disbursements 6 97
Principal repayments 87 77
Interest payments 41 21
IDA
Total debt outstanding and disbursed 1,266 1,420
Disbursements 49 69
Private Sector Development 2000 2006 Total debt service 32 52
Time required to start a business (days) – 19 IFC (fiscal year)
Cost to start a business (% of GNI per capita) – 68.8 Total disbursed and outstanding portfolio 163 460
Time required to register property (days) – 193 of which IFC own account 163 198
Disbursements for IFC own account 25 55
Ranked as a major constraint to business Portfolio sales, prepayments and
(% of managers surveyed who agreed) repayments for IFC own account 14 69
Tax rates .. 80.0
Economic and regulatory policy uncertainty .. 63.8 MIGA
Gross exposure 0 6
Stock market capitalization (% of GDP) 28.8 87.0 New guarantees 0 0
Bank capital to asset ratio (%) 5.6 ..
Note: Figures in italics are for years other than those specified. 2006 data are preliminary. 10/2/07
.. indicates data are not available. – indicates observation is not applicable.
Development Economics, Development Data Group (DECDG).
0 25 50 75 100
Control of corruption
Rule of law
Regulatory quality
Political stability
Voice and accountability
Country's percentile rank (0-100)higher values imply better ratings
2006
2000
Governance indicators, 2000 and 2006
Source: Kaufmann-Kraay-Mastruzzi, World Bank
Short-term, 0IBRD, 492
Other multi-
lateral, 8,284
IMF, 0IDA, 1,420
Private, 4,675
Bilateral, 19,601
Composition of total external debt, 2005
US$ millions
1
1