April 01, 2019 I Ratings Indian Ceramic Tile Industry
22
A versatile architectural resource, with multiple inherent benefits like low maintenance, high durability, affordability and an array of options to choose from, ceramic tiles have gained popularity and is slowly dominating the floor tiles segment globally. Now, with the technological advancements, the global ceramic tile industry has not only scaled up but also launched multiple value-added products like glazed vitrified tiles, polished vitrified tiles, large-size slabs, wall ceramic tiles, etc. The global ceramic tile consumption reached a volume of 13.27 billion square meters (SQM) in CY17 (refers to the period January 01 to December 31), registering a Compounded Annual Growth Rate (CAGR) of around 4% during CY12-CY17. However, the international ceramic tiles industry exhibited a slower pace of growth in CY17, with both production and consumption growth by just 2.2% y-o-y basis. The import-export flows also reduced during CY17 for the first time in nine years. The growth in consumption during CY17, in particular, was buoyed by the recovery in construction activity across Africa (7.2%), European Union (6.3%) and North America (4%). Asia continued to remain the largest consumer at 8.98 billion SQM, equivalent to 68% of the global consumption. Nevertheless, the results for Asia reveal a slowdown in China (production down by 1.5% and exports down by 11.4%) due to the anti-dumping duty imposed by many countries on Chinese tiles. However, it is partially offset by a fresh growth in India, Iran and Vietnam. The annual production in India has already passed the billion SQM mark, while exports saw a further 23% upturn in CY17 following a growth of 39% in the previous year. (Refer Table 1 for the top 5 Consuming countries in the world) Going forward, As per CARE Ratings Limited (CARE) estimates, the global ceramic tile industry is envisaged to grow at a CAGR of 3-5% during CY18-22 on account of increasing residential segment in the Asian & Gulf Cooperation Council (GCC), a rising replacement demand and increasing penetration of the ceramic tiles. April 01, 2019 I Ratings Indian Ceramic Tile Industry: Structural Shift with focus on higher value added products Contact: Ujjwal Patel Senior Manager [email protected] +91-79- 40265649 Purva Agrawal Analyst Purva.agrawal@careratings.com +91-79-40265639 Mradul Mishra (Media Contact) [email protected] +91-22-6837 4424 Disclaimer: This report is prepared by CARE Ratings Ltd. CARE Ratings has taken utmost care to ensure accuracy and objectivity while developing this report based on information available in public domain. However, neither the accuracy nor completeness of information contained in this report is guaranteed. CARE Ratings is not responsible for any errors or omissions in analysis/inferences/views or for results obtained from the use of information contained in this report and especially states that CARE Ratings has no financial liability whatsoever to the user of this report
-
Upload
khangminh22 -
Category
Documents
-
view
0 -
download
0
Transcript of April 01, 2019 I Ratings Indian Ceramic Tile Industry
A versatile architectural resource, with multiple inherent benefits like
low maintenance, high durability, affordability and an array of options
to choose from, ceramic tiles have gained popularity and is slowly
dominating the floor tiles segment globally. Now, with the
technological advancements, the global ceramic tile industry has not
only scaled up but also launched multiple value-added products like
glazed vitrified tiles, polished vitrified tiles, large-size slabs, wall ceramic
tiles, etc.
The global ceramic tile consumption reached a volume of 13.27 billion
square meters (SQM) in CY17 (refers to the period January 01 to
December 31), registering a Compounded Annual Growth Rate (CAGR)
of around 4% during CY12-CY17. However, the international ceramic
tiles industry exhibited a slower pace of growth in CY17, with both
production and consumption growth by just 2.2% y-o-y basis. The
import-export flows also reduced during CY17 for the first time in nine
years. The growth in consumption during CY17, in particular, was
buoyed by the recovery in construction activity across Africa (7.2%),
European Union (6.3%) and North America (4%). Asia continued to
remain the largest consumer at 8.98 billion SQM, equivalent to 68% of
the global consumption. Nevertheless, the results for Asia reveal a
slowdown in China (production down by 1.5% and exports down by
11.4%) due to the anti-dumping duty imposed by many countries on
Chinese tiles. However, it is partially offset by a fresh growth in India,
Iran and Vietnam. The annual production in India has already passed
the billion SQM mark, while exports saw a further 23% upturn in CY17
following a growth of 39% in the previous year. (Refer Table 1 for the
top 5 Consuming countries in the world)
Going forward, As per CARE Ratings Limited (CARE) estimates, the
global ceramic tile industry is envisaged to grow at a CAGR of 3-5%
during CY18-22 on account of increasing residential segment in the
Asian & Gulf Cooperation Council (GCC), a rising replacement demand
and increasing penetration of the ceramic tiles.
April 01, 2019 I Ratings Indian Ceramic Tile Industry:
Structural Shift with focus on
higher value added products
Contact:
Ujjwal Patel Senior Manager [email protected] +91-79- 40265649
Purva Agrawal Analyst [email protected] +91-79-40265639
Mradul Mishra (Media Contact) [email protected] +91-22-6837 4424
Disclaimer: This report is prepared by CARE Ratings Ltd. CARE Ratings has taken utmost care to ensure accuracy and objectivity while developing this report based on information available in public domain. However, neither the accuracy nor completeness of information contained in this report is guaranteed. CARE Ratings is not responsible for any errors or omissions in analysis/inferences/views or for results obtained from the use of information contained in this report and especially states that CARE Ratings has no financial liability whatsoever to the user of this report
Ratings I Indian Ceramic Tile Industry
2
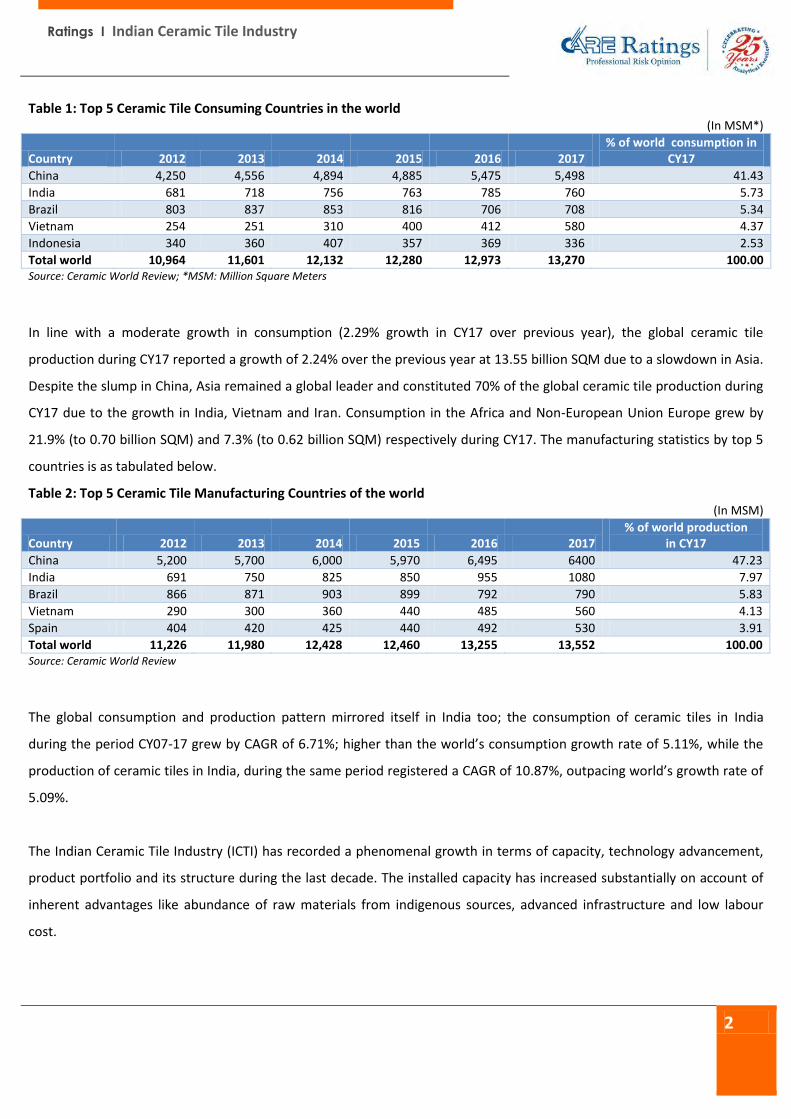
Table 1: Top 5 Ceramic Tile Consuming Countries in the world (In MSM*)
Country 2012 2013 2014 2015 2016 2017 % of world consumption in
CY17
China 4,250 4,556 4,894 4,885 5,475 5,498 41.43
India 681 718 756 763 785 760 5.73
Brazil 803 837 853 816 706 708 5.34
Vietnam 254 251 310 400 412 580 4.37
Indonesia 340 360 407 357 369 336 2.53
Total world 10,964 11,601 12,132 12,280 12,973 13,270 100.00 Source: Ceramic World Review; *MSM: Million Square Meters
In line with a moderate growth in consumption (2.29% growth in CY17 over previous year), the global ceramic tile
production during CY17 reported a growth of 2.24% over the previous year at 13.55 billion SQM due to a slowdown in Asia.
Despite the slump in China, Asia remained a global leader and constituted 70% of the global ceramic tile production during
CY17 due to the growth in India, Vietnam and Iran. Consumption in the Africa and Non-European Union Europe grew by
21.9% (to 0.70 billion SQM) and 7.3% (to 0.62 billion SQM) respectively during CY17. The manufacturing statistics by top 5
countries is as tabulated below.
Table 2: Top 5 Ceramic Tile Manufacturing Countries of the world (In MSM)
Country 2012 2013 2014 2015 2016 2017 % of world production
in CY17
China 5,200 5,700 6,000 5,970 6,495 6400 47.23
India 691 750 825 850 955 1080 7.97
Brazil 866 871 903 899 792 790 5.83
Vietnam 290 300 360 440 485 560 4.13
Spain 404 420 425 440 492 530 3.91
Total world 11,226 11,980 12,428 12,460 13,255 13,552 100.00 Source: Ceramic World Review
The global consumption and production pattern mirrored itself in India too; the consumption of ceramic tiles in India
during the period CY07-17 grew by CAGR of 6.71%; higher than the world’s consumption growth rate of 5.11%, while the
production of ceramic tiles in India, during the same period registered a CAGR of 10.87%, outpacing world’s growth rate of
5.09%.
The Indian Ceramic Tile Industry (ICTI) has recorded a phenomenal growth in terms of capacity, technology advancement,
product portfolio and its structure during the last decade. The installed capacity has increased substantially on account of
inherent advantages like abundance of raw materials from indigenous sources, advanced infrastructure and low labour
cost.
Ratings I Indian Ceramic Tile Industry
3
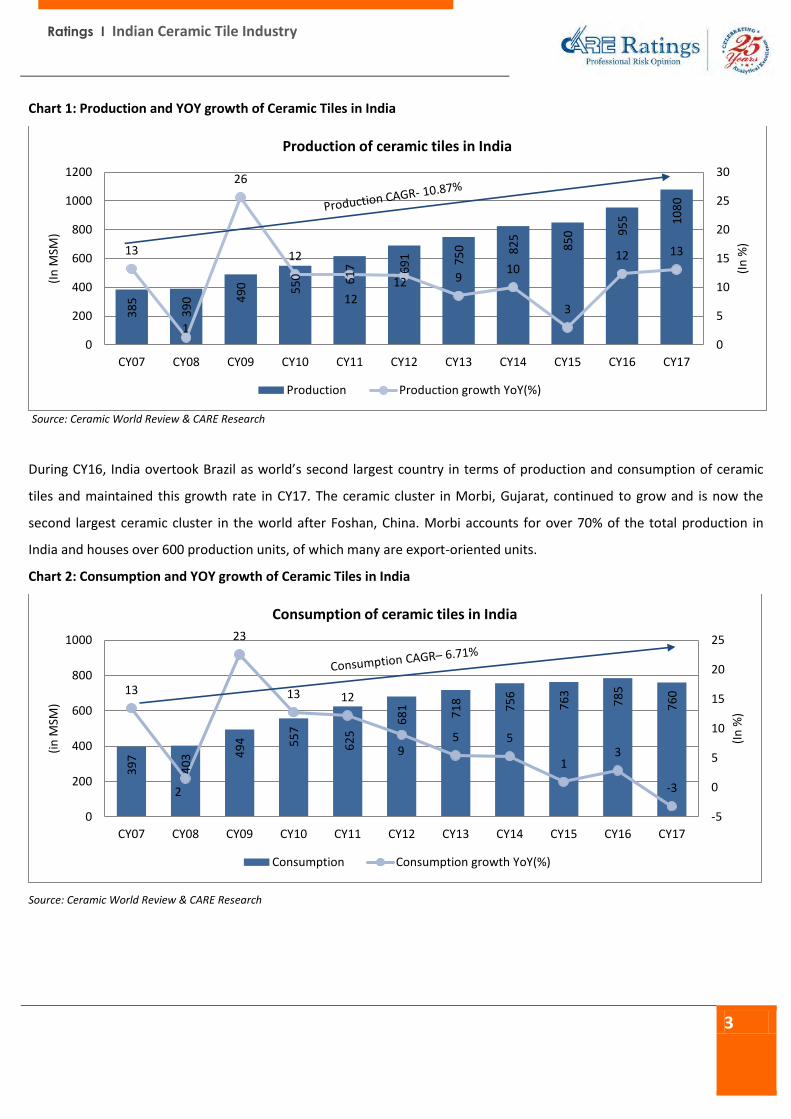
Chart 1: Production and YOY growth of Ceramic Tiles in India
Source: Ceramic World Review & CARE Research
During CY16, India overtook Brazil as world’s second largest country in terms of production and consumption of ceramic
tiles and maintained this growth rate in CY17. The ceramic cluster in Morbi, Gujarat, continued to grow and is now the
second largest ceramic cluster in the world after Foshan, China. Morbi accounts for over 70% of the total production in
India and houses over 600 production units, of which many are export-oriented units.
Chart 2: Consumption and YOY growth of Ceramic Tiles in India
Source: Ceramic World Review & CARE Research
38
5
39
0 49
0 55
0 61
7 69
1 75
0 82
5
85
0 95
5 10
80
13
1
26
12
12
12 910
3
12 13
0
5
10
15
20
25
30
0
200
400
600
800
1000
1200
CY07 CY08 CY09 CY10 CY11 CY12 CY13 CY14 CY15 CY16 CY17
(In
%)
(In
MSM
)
Production of ceramic tiles in India
Production Production growth YoY(%)
39
7
40
3 49
4 55
7
62
5
68
1
71
8
75
6
76
3
78
5
76
013
2
23
13 12
95 5
13
-3
-5
0
5
10
15
20
25
0
200
400
600
800
1000
CY07 CY08 CY09 CY10 CY11 CY12 CY13 CY14 CY15 CY16 CY17
(In
%)
(in
MSM
)
Consumption of ceramic tiles in India
Consumption Consumption growth YoY(%)
Ratings I Indian Ceramic Tile Industry
4
India’s Import and Export statistics of tiles
Adoption of latest technology, low labour cost, changes in the global demand supply dynamics (including imposition of anti-
dumping duty on products manufactured in China) has strengthened India’s position in the global ceramic tile industry.
Furthermore, with the new Foreign Trade Policy (FTP), the inclusion of Middle East countries has a huge significance for
ICTI. Consequently, despite having one of the lowest sales realisation amongst all exporter countries, India is the fourth
largest exporting country in terms of volume.
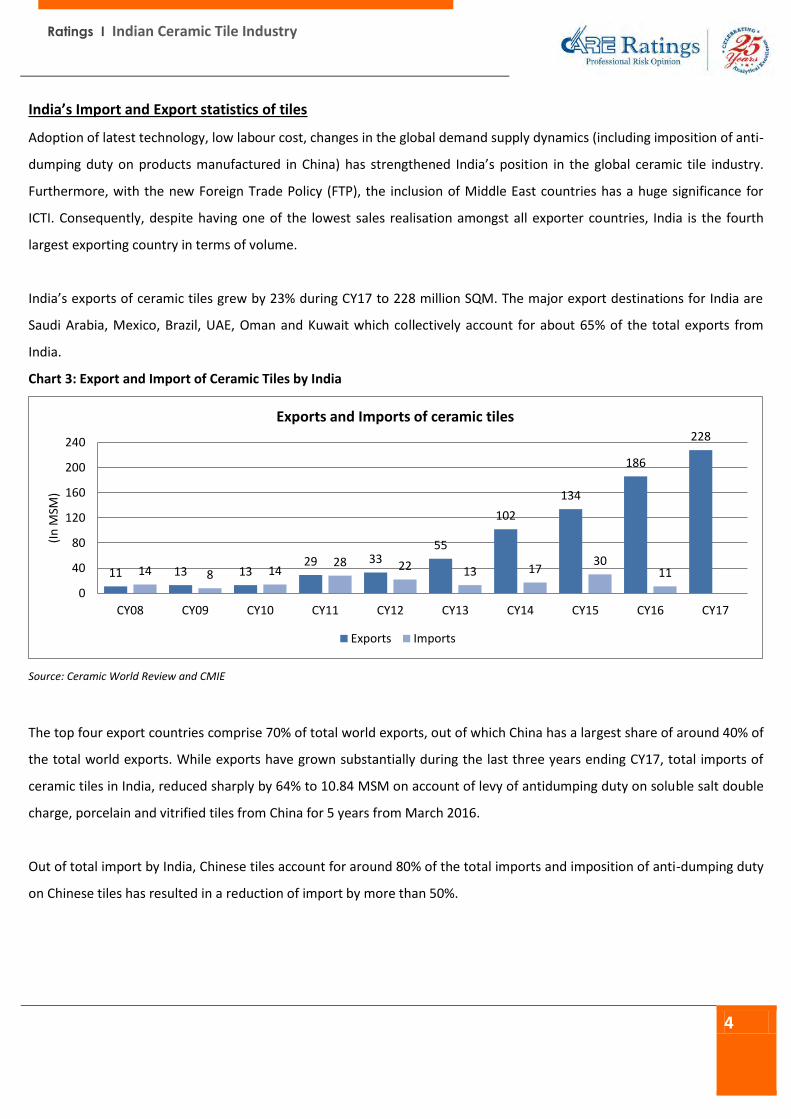
India’s exports of ceramic tiles grew by 23% during CY17 to 228 million SQM. The major export destinations for India are
Saudi Arabia, Mexico, Brazil, UAE, Oman and Kuwait which collectively account for about 65% of the total exports from
India.
Chart 3: Export and Import of Ceramic Tiles by India
Source: Ceramic World Review and CMIE
The top four export countries comprise 70% of total world exports, out of which China has a largest share of around 40% of
the total world exports. While exports have grown substantially during the last three years ending CY17, total imports of
ceramic tiles in India, reduced sharply by 64% to 10.84 MSM on account of levy of antidumping duty on soluble salt double
charge, porcelain and vitrified tiles from China for 5 years from March 2016.
Out of total import by India, Chinese tiles account for around 80% of the total imports and imposition of anti-dumping duty
on Chinese tiles has resulted in a reduction of import by more than 50%.
11 13 1329 33
55
102
134
186
228
14 8 1428 22 13 17
3011
0
40
80
120
160
200
240
CY08 CY09 CY10 CY11 CY12 CY13 CY14 CY15 CY16 CY17
(In
MSM
)
Exports and Imports of ceramic tiles
Exports Imports
Ratings I Indian Ceramic Tile Industry
5
Structural changes in terms of constitution of the industry and product mix of ICTI
The ICTI has been highly fragmented and dominated by small and mid-sized family owned and operated entities. The
industry was fiercely competitive on account of low cost of manufacturing (due to tax arbitrage) and limited product
differentiation with a majority of units in the unorganised segment, engaged in the manufacturing of low value-added,
floor ceramic tiles.
However, during the last decade, organised players have been able to gain a sizable market share on account of their focus
on product innovation, adoption of latest technologies, development of nation-wide distribution channels, aggressive
branding campaigns and robust capacity expansion projects.
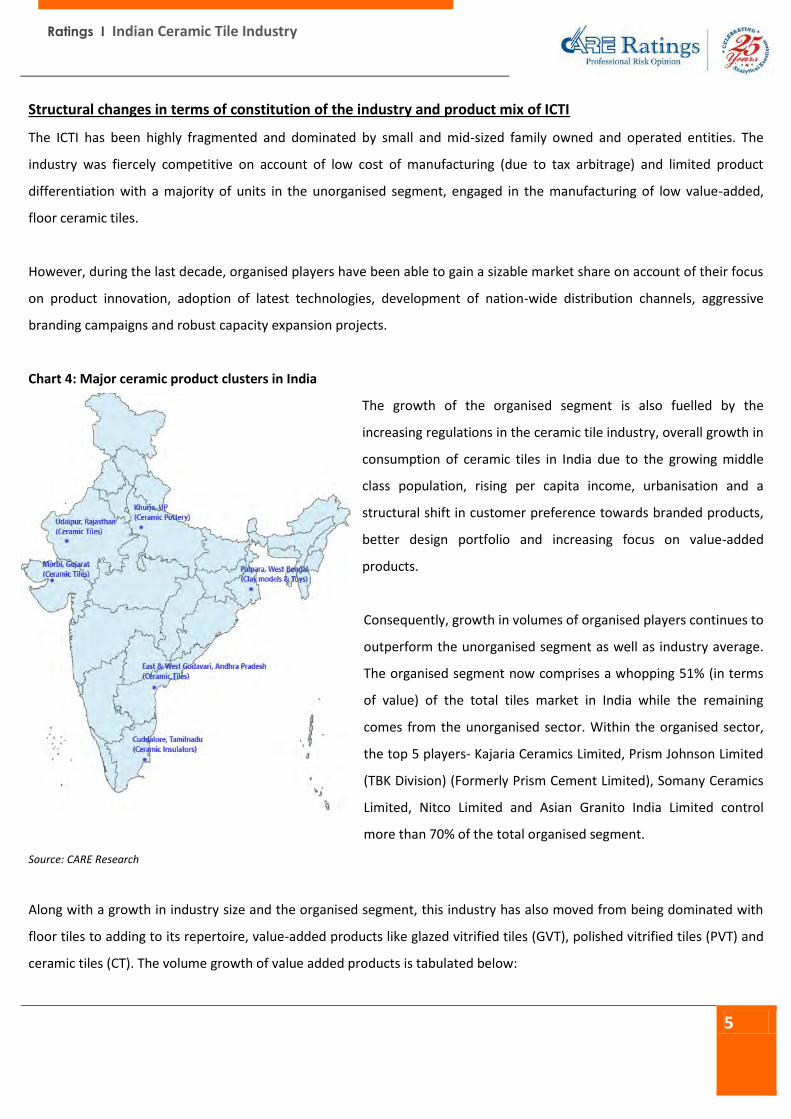
Chart 4: Major ceramic product clusters in India
The growth of the organised segment is also fuelled by the
increasing regulations in the ceramic tile industry, overall growth in
consumption of ceramic tiles in India due to the growing middle
class population, rising per capita income, urbanisation and a
structural shift in customer preference towards branded products,
better design portfolio and increasing focus on value-added
products.
Consequently, growth in volumes of organised players continues to
outperform the unorganised segment as well as industry average.
The organised segment now comprises a whopping 51% (in terms
of value) of the total tiles market in India while the remaining
comes from the unorganised sector. Within the organised sector,
the top 5 players- Kajaria Ceramics Limited, Prism Johnson Limited
(TBK Division) (Formerly Prism Cement Limited), Somany Ceramics
Limited, Nitco Limited and Asian Granito India Limited control
more than 70% of the total organised segment.
Source: CARE Research
Along with a growth in industry size and the organised segment, this industry has also moved from being dominated with
floor tiles to adding to its repertoire, value-added products like glazed vitrified tiles (GVT), polished vitrified tiles (PVT) and
ceramic tiles (CT). The volume growth of value added products is tabulated below:
Ratings I Indian Ceramic Tile Industry
6
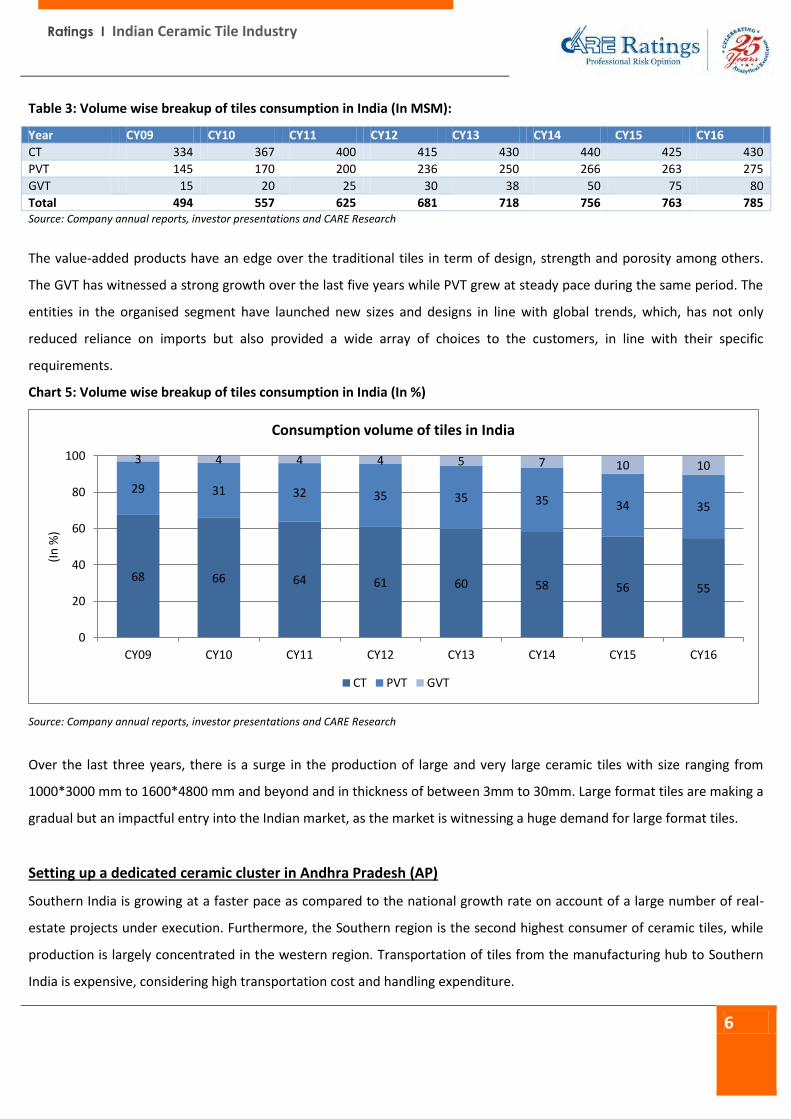
Table 3: Volume wise breakup of tiles consumption in India (In MSM):
Year CY09 CY10 CY11 CY12 CY13 CY14 CY15 CY16
CT 334 367 400 415 430 440 425 430
PVT 145 170 200 236 250 266 263 275
GVT 15 20 25 30 38 50 75 80
Total 494 557 625 681 718 756 763 785 Source: Company annual reports, investor presentations and CARE Research
The value-added products have an edge over the traditional tiles in term of design, strength and porosity among others.
The GVT has witnessed a strong growth over the last five years while PVT grew at steady pace during the same period. The
entities in the organised segment have launched new sizes and designs in line with global trends, which, has not only
reduced reliance on imports but also provided a wide array of choices to the customers, in line with their specific
requirements.
Chart 5: Volume wise breakup of tiles consumption in India (In %)
Source: Company annual reports, investor presentations and CARE Research
Over the last three years, there is a surge in the production of large and very large ceramic tiles with size ranging from
1000*3000 mm to 1600*4800 mm and beyond and in thickness of between 3mm to 30mm. Large format tiles are making a
gradual but an impactful entry into the Indian market, as the market is witnessing a huge demand for large format tiles.
Setting up a dedicated ceramic cluster in Andhra Pradesh (AP)
Southern India is growing at a faster pace as compared to the national growth rate on account of a large number of real-
estate projects under execution. Furthermore, the Southern region is the second highest consumer of ceramic tiles, while
production is largely concentrated in the western region. Transportation of tiles from the manufacturing hub to Southern
India is expensive, considering high transportation cost and handling expenditure.
68 66 64 61 60 58 56 55
29 31 32 35 35 35 34 35
3 4 4 4 5 7 10 10
0
20
40
60
80
100
CY09 CY10 CY11 CY12 CY13 CY14 CY15 CY16
(In
%)
Consumption volume of tiles in India
CT PVT GVT
Ratings I Indian Ceramic Tile Industry
7
The key reasons for setting up a ceramic tile cluster in the Southern India are mentioned below:
Southern region is the second highest consumer of vitrified tiles, after western region due to a high emphasis on
health and hygiene.
Imports from China through ports of Vizag, Chennai and Vishakhapatnam are expensive after the levy of anti-dumping
duty on ceramic tiles.
Ceramic tile are fragile, yet heavy and hence requires higher handling efficiency. Transportation and handling cost is
high for manufacturers since manufacturing units are concentrated in Morbi, Gujarat.
Higher demand from Tier II and Tier III cities.
Low penetration of organised sector in the region.
Considering the above factors and availability of natural resources & clay (primary raw material) in abundance in the
Godavari district, the AP government has established a dedicated ceramic cluster at Thatiparthi in Thottambedu mandal of
Chittoor district. Located in the Southern peninsula, AP has a well-developed industrial and port infrastructure.
The state government has created provisions for uninterrupted supply of power, fuel & water and has allotted land for
setting up ceramic units in the cluster. During the last two years, multiple entities in the organised segment have
announced capacity expansion plans by setting up a manufacturing unit in this ceramic cluster. Refer table 4 for key
projects in AP.
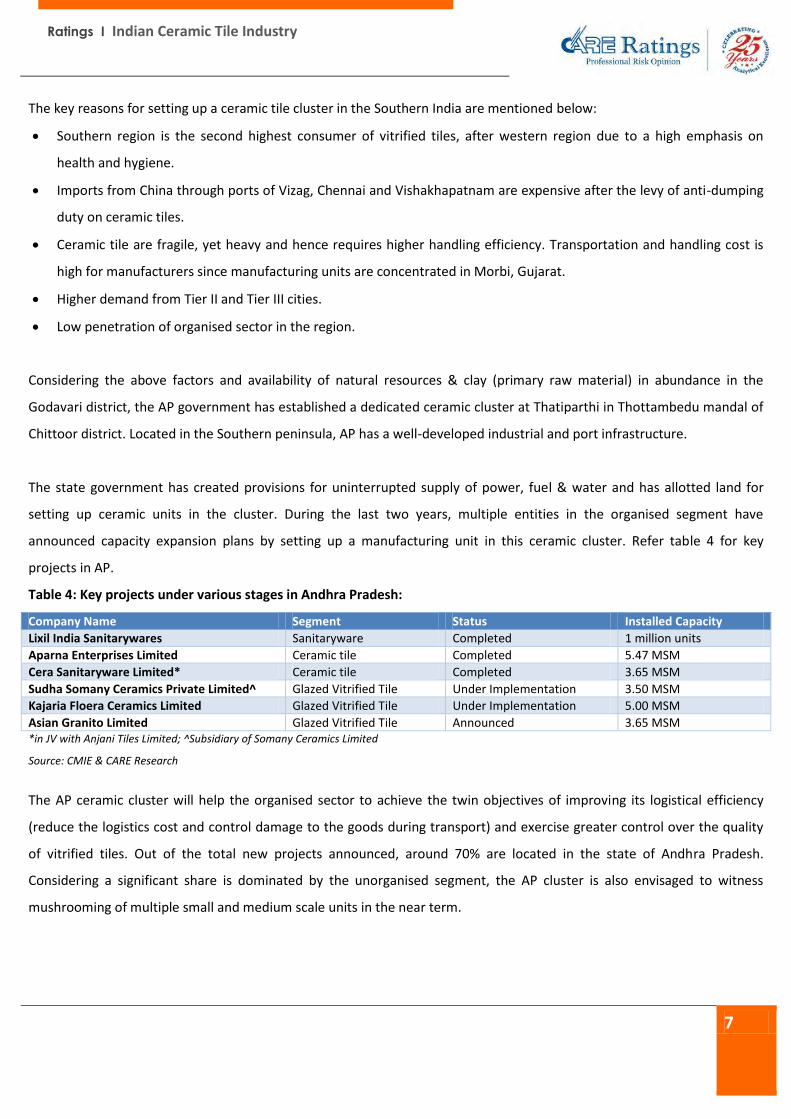
Table 4: Key projects under various stages in Andhra Pradesh:
Company Name Segment Status Installed Capacity
Lixil India Sanitarywares Sanitaryware Completed 1 million units
Aparna Enterprises Limited Ceramic tile Completed 5.47 MSM
Cera Sanitaryware Limited* Ceramic tile Completed 3.65 MSM
Sudha Somany Ceramics Private Limited^ Glazed Vitrified Tile Under Implementation 3.50 MSM
Kajaria Floera Ceramics Limited Glazed Vitrified Tile Under Implementation 5.00 MSM
Asian Granito Limited Glazed Vitrified Tile Announced 3.65 MSM *in JV with Anjani Tiles Limited; ^Subsidiary of Somany Ceramics Limited
Source: CMIE & CARE Research
The AP ceramic cluster will help the organised sector to achieve the twin objectives of improving its logistical efficiency
(reduce the logistics cost and control damage to the goods during transport) and exercise greater control over the quality
of vitrified tiles. Out of the total new projects announced, around 70% are located in the state of Andhra Pradesh.
Considering a significant share is dominated by the unorganised segment, the AP cluster is also envisaged to witness
mushrooming of multiple small and medium scale units in the near term.
Ratings I Indian Ceramic Tile Industry
8
Capacity expansion plans by most of the entities in the organised segment, albeit a slowdown during FY17 and
FY18
A thriving housing sector due to government policies and a continuous increase in the demand of value-added products in
the retail segment resulted in a substantial investment by the entities in the organised segment to increase their installed
capacity, via either organic or inorganic mode (Refer Chart 6 for installed capacity of leading players).
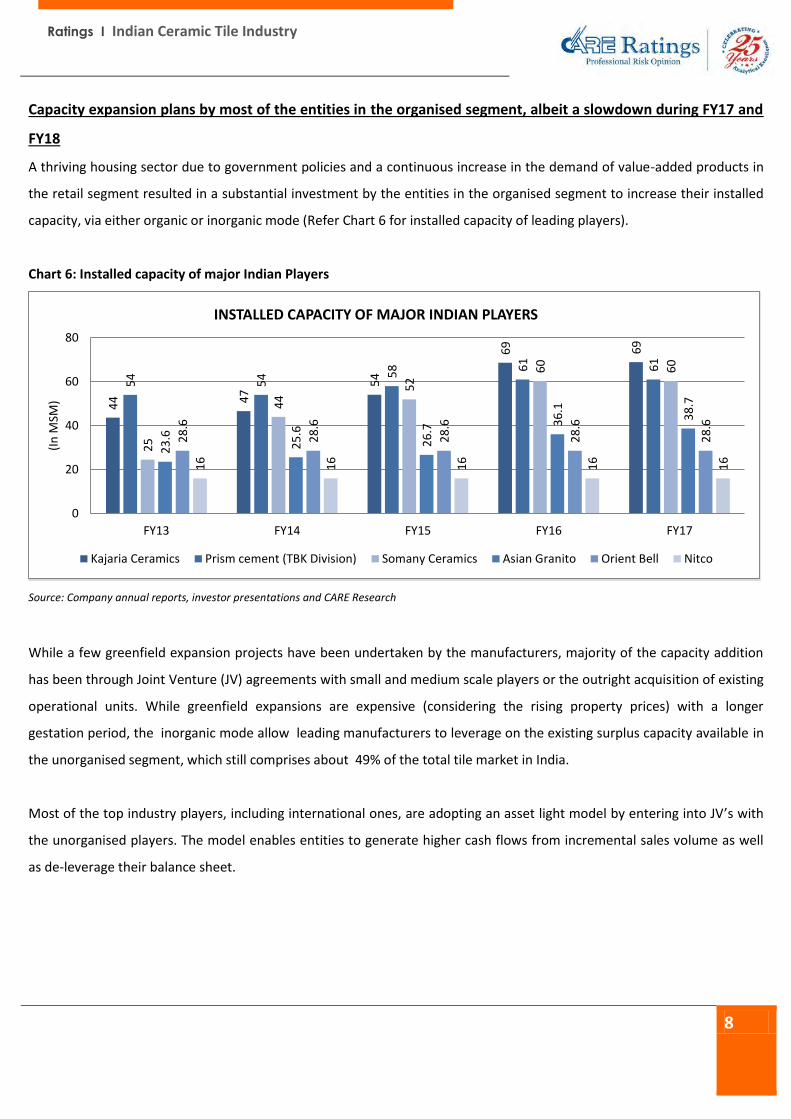
Chart 6: Installed capacity of major Indian Players
Source: Company annual reports, investor presentations and CARE Research
While a few greenfield expansion projects have been undertaken by the manufacturers, majority of the capacity addition
has been through Joint Venture (JV) agreements with small and medium scale players or the outright acquisition of existing
operational units. While greenfield expansions are expensive (considering the rising property prices) with a longer
gestation period, the inorganic mode allow leading manufacturers to leverage on the existing surplus capacity available in
the unorganised segment, which still comprises about 49% of the total tile market in India.
Most of the top industry players, including international ones, are adopting an asset light model by entering into JV’s with
the unorganised players. The model enables entities to generate higher cash flows from incremental sales volume as well
as de-leverage their balance sheet.
44 4
7
54
69 69
54
54 5
8 61
61
25
44
52
60
60
23
.6
25
.6
26
.7
36
.1
38
.7
28
.6
28
.6
28
.6
28
.6
28
.6
16
16
16
16
16
0
20
40
60
80
FY13 FY14 FY15 FY16 FY17
(In
MSM
)
INSTALLED CAPACITY OF MAJOR INDIAN PLAYERS
Kajaria Ceramics Prism cement (TBK Division) Somany Ceramics Asian Granito Orient Bell Nitco

Ratings I Indian Ceramic Tile Industry
9
Chart 7: Production of top 3 ceramic entities through different modes
Source: Company annual reports, investor presentations and CARE Research
Unorganised and small players, too, stand to gain from such partnerships as they are assisted by larger entities in
streamlining their manufacturing operations, generate economies of scale, expand geographical reach through use of well-
established marketing channels of organised players and ensure compliance of stringent pollution control norms of the
State and Central Government Pollution Control Boards.
5652 50 51
56
16 27 3138 33
2821 19
11 11
51 49
39 35 39
13 23 38 4546
3628 23 20 15
75 75 7571 68
15
25 25 25 2917
0
20
40
60
80
100
FY13 FY14 FY15 FY16 FY17
(In
%)
Bifurcation of production of top 3 entitites
Own Manufacturing JV/subsidiary Outsourcing
Kaj
aria Kaj
aria
Kaj
aria
Kaj
aria
Kaj
aria
Kaj
aria
Som
any
Som
any
Som
any
Som
any
Som
any
Ori
ent
Bel
l
Ori
ent
Bel
l
Ori
ent
Bel
l
Ori
ent
Bel
l
Ori
ent
Bel
l
Ratings I Indian Ceramic Tile Industry
10
Financial performance of the entities
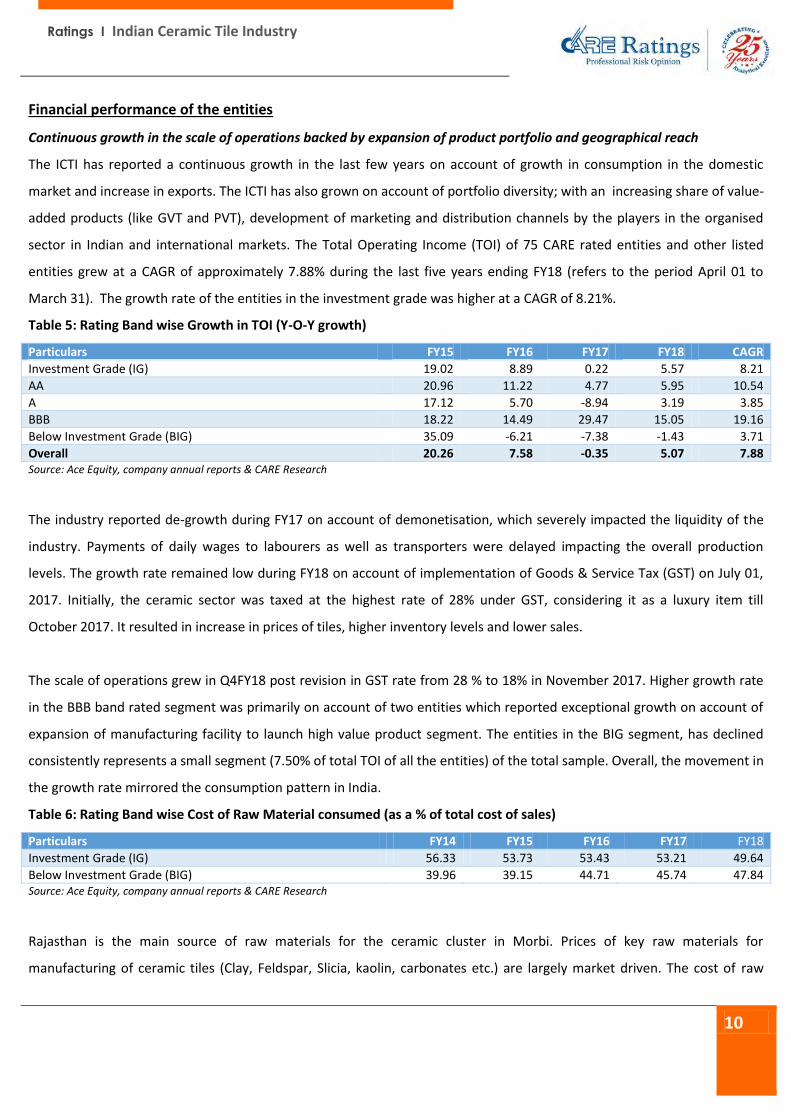
Continuous growth in the scale of operations backed by expansion of product portfolio and geographical reach
The ICTI has reported a continuous growth in the last few years on account of growth in consumption in the domestic
market and increase in exports. The ICTI has also grown on account of portfolio diversity; with an increasing share of value-
added products (like GVT and PVT), development of marketing and distribution channels by the players in the organised
sector in Indian and international markets. The Total Operating Income (TOI) of 75 CARE rated entities and other listed
entities grew at a CAGR of approximately 7.88% during the last five years ending FY18 (refers to the period April 01 to
March 31). The growth rate of the entities in the investment grade was higher at a CAGR of 8.21%.
Table 5: Rating Band wise Growth in TOI (Y-O-Y growth)
Particulars FY15 FY16 FY17 FY18 CAGR
Investment Grade (IG) 19.02 8.89 0.22 5.57 8.21
AA 20.96 11.22 4.77 5.95 10.54
A 17.12 5.70 -8.94 3.19 3.85
BBB 18.22 14.49 29.47 15.05 19.16
Below Investment Grade (BIG) 35.09 -6.21 -7.38 -1.43 3.71
Overall 20.26 7.58 -0.35 5.07 7.88 Source: Ace Equity, company annual reports & CARE Research
The industry reported de-growth during FY17 on account of demonetisation, which severely impacted the liquidity of the
industry. Payments of daily wages to labourers as well as transporters were delayed impacting the overall production
levels. The growth rate remained low during FY18 on account of implementation of Goods & Service Tax (GST) on July 01,
2017. Initially, the ceramic sector was taxed at the highest rate of 28% under GST, considering it as a luxury item till
October 2017. It resulted in increase in prices of tiles, higher inventory levels and lower sales.
The scale of operations grew in Q4FY18 post revision in GST rate from 28 % to 18% in November 2017. Higher growth rate
in the BBB band rated segment was primarily on account of two entities which reported exceptional growth on account of
expansion of manufacturing facility to launch high value product segment. The entities in the BIG segment, has declined
consistently represents a small segment (7.50% of total TOI of all the entities) of the total sample. Overall, the movement in
the growth rate mirrored the consumption pattern in India.
Table 6: Rating Band wise Cost of Raw Material consumed (as a % of total cost of sales)
Particulars FY14 FY15 FY16 FY17 FY18
Investment Grade (IG) 56.33 53.73 53.43 53.21 49.64
Below Investment Grade (BIG) 39.96 39.15 44.71 45.74 47.84 Source: Ace Equity, company annual reports & CARE Research
Rajasthan is the main source of raw materials for the ceramic cluster in Morbi. Prices of key raw materials for
manufacturing of ceramic tiles (Clay, Feldspar, Slicia, kaolin, carbonates etc.) are largely market driven. The cost of raw
Ratings I Indian Ceramic Tile Industry
11
material consumed (as a % of total cost of sales) reflects a declining trend in case of IG segment, primarily on account of
adoption of latest technology, best practices and economies of scale.
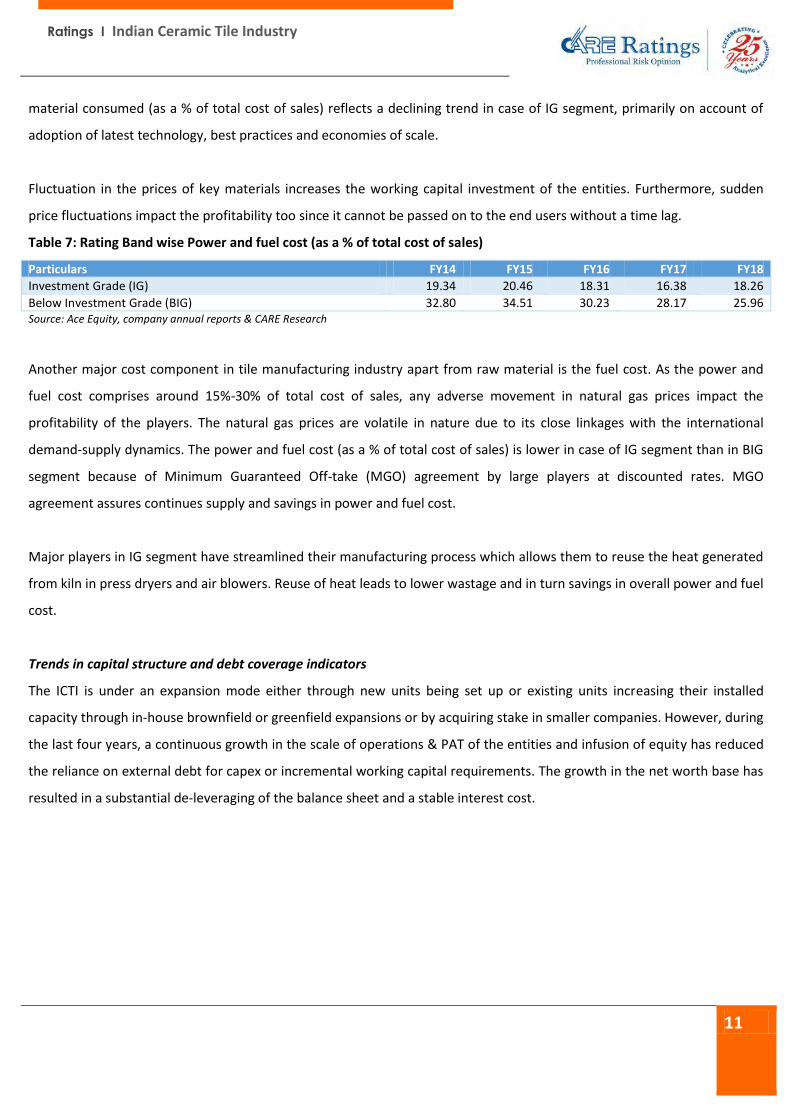
Fluctuation in the prices of key materials increases the working capital investment of the entities. Furthermore, sudden
price fluctuations impact the profitability too since it cannot be passed on to the end users without a time lag.
Table 7: Rating Band wise Power and fuel cost (as a % of total cost of sales)
Particulars FY14 FY15 FY16 FY17 FY18
Investment Grade (IG) 19.34 20.46 18.31 16.38 18.26
Below Investment Grade (BIG) 32.80 34.51 30.23 28.17 25.96 Source: Ace Equity, company annual reports & CARE Research
Another major cost component in tile manufacturing industry apart from raw material is the fuel cost. As the power and
fuel cost comprises around 15%-30% of total cost of sales, any adverse movement in natural gas prices impact the
profitability of the players. The natural gas prices are volatile in nature due to its close linkages with the international
demand-supply dynamics. The power and fuel cost (as a % of total cost of sales) is lower in case of IG segment than in BIG
segment because of Minimum Guaranteed Off-take (MGO) agreement by large players at discounted rates. MGO
agreement assures continues supply and savings in power and fuel cost.
Major players in IG segment have streamlined their manufacturing process which allows them to reuse the heat generated
from kiln in press dryers and air blowers. Reuse of heat leads to lower wastage and in turn savings in overall power and fuel
cost.
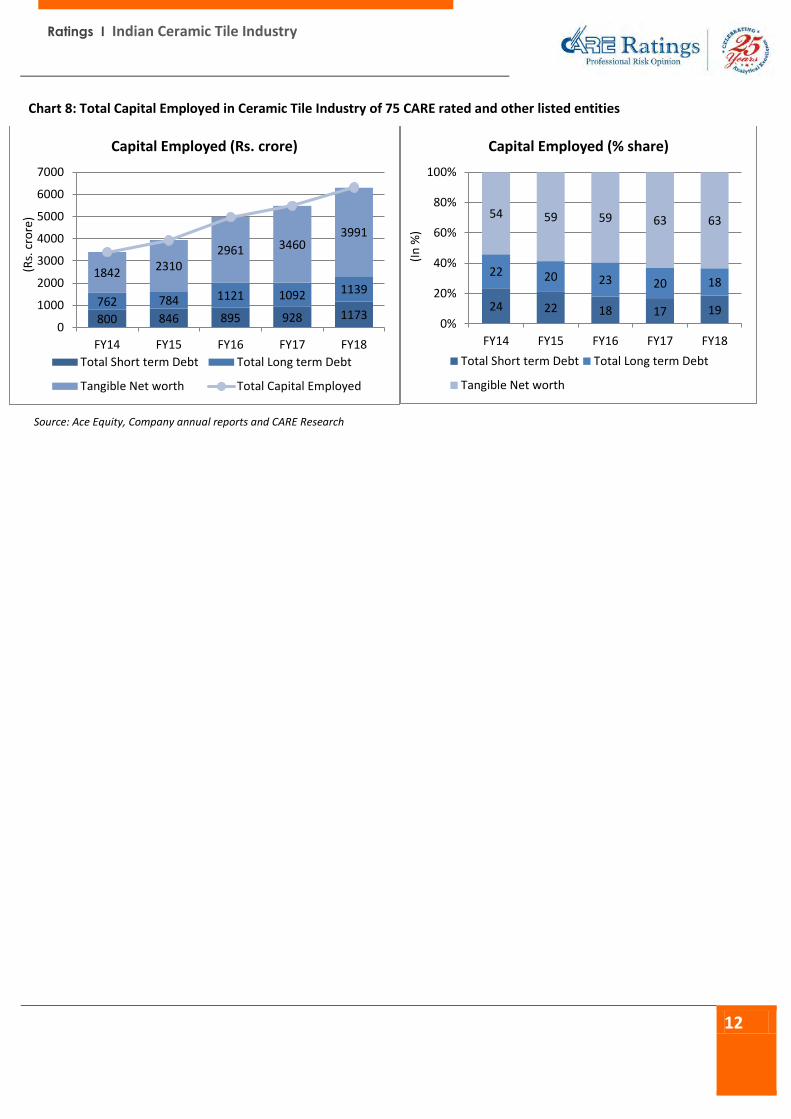
Trends in capital structure and debt coverage indicators
The ICTI is under an expansion mode either through new units being set up or existing units increasing their installed
capacity through in-house brownfield or greenfield expansions or by acquiring stake in smaller companies. However, during
the last four years, a continuous growth in the scale of operations & PAT of the entities and infusion of equity has reduced
the reliance on external debt for capex or incremental working capital requirements. The growth in the net worth base has
resulted in a substantial de-leveraging of the balance sheet and a stable interest cost.
Ratings I Indian Ceramic Tile Industry
12
Chart 8: Total Capital Employed in Ceramic Tile Industry of 75 CARE rated and other listed entities
Source: Ace Equity, Company annual reports and CARE Research
800 846 895 928 1173762 784 1121 1092 1139
18422310
2961 34603991
0
1000
2000
3000
4000
5000
6000
7000
FY14 FY15 FY16 FY17 FY18
(Rs.
cro
re)
Capital Employed (Rs. crore)
Total Short term Debt Total Long term Debt
Tangible Net worth Total Capital Employed
24 22 18 17 19
22 20 23 20 18
54 59 59 63 63
0%
20%
40%
60%
80%
100%
FY14 FY15 FY16 FY17 FY18
(In
%)
Capital Employed (% share)
Total Short term Debt Total Long term Debt
Tangible Net worth
Ratings I Indian Ceramic Tile Industry
13
Key growth drivers
The ICTI enjoys a unique advantage of being largely indigenous with abundance of raw materials, labour, technical skills
and infrastructural facilities. It is estimated that the ICTI employs around 5,50,000 people; out of which, 50,000 are directly
employed and the rest are indirect associations in varying degrees.
Factors such as the low per capita consumption of tiles in India, growth in pace of construction of houses & a stable
replacement demand, changing demography & customer preferences, largely untapped rural market and many macro
initiatives by the government are envisaged to augur well for the ICTI.
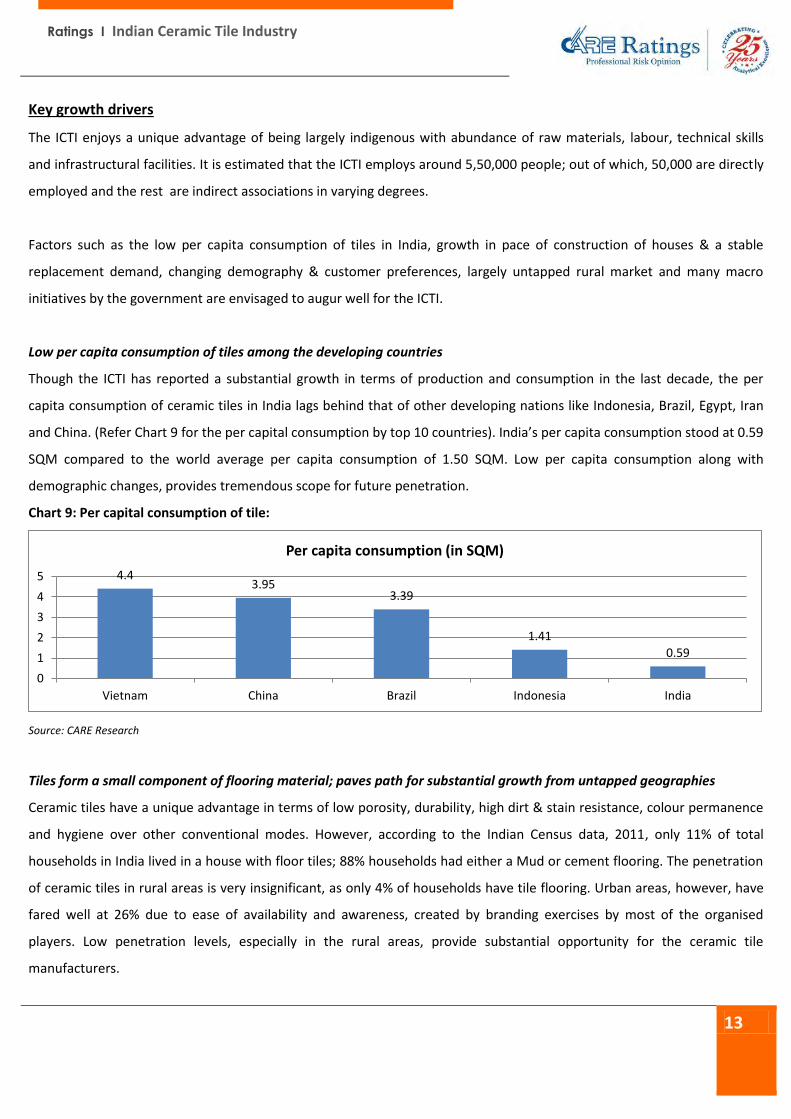
Low per capita consumption of tiles among the developing countries
Though the ICTI has reported a substantial growth in terms of production and consumption in the last decade, the per
capita consumption of ceramic tiles in India lags behind that of other developing nations like Indonesia, Brazil, Egypt, Iran
and China. (Refer Chart 9 for the per capital consumption by top 10 countries). India’s per capita consumption stood at 0.59
SQM compared to the world average per capita consumption of 1.50 SQM. Low per capita consumption along with
demographic changes, provides tremendous scope for future penetration.
Chart 9: Per capital consumption of tile:
Source: CARE Research
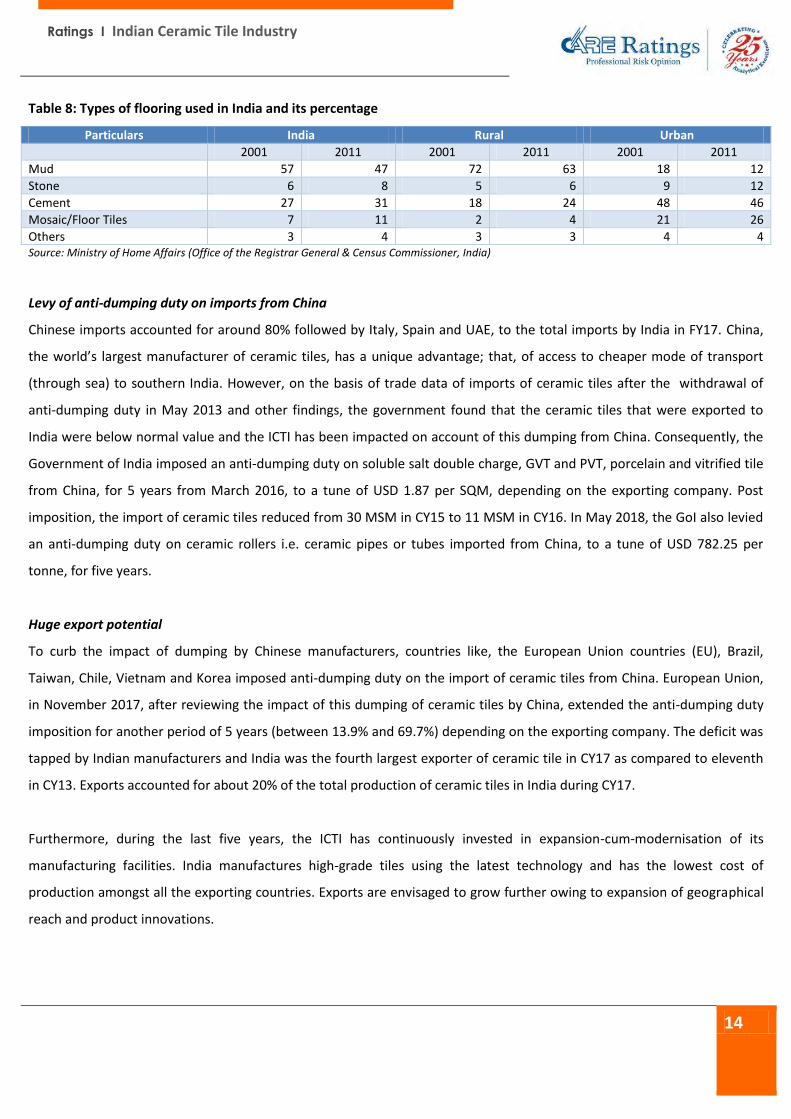
Tiles form a small component of flooring material; paves path for substantial growth from untapped geographies
Ceramic tiles have a unique advantage in terms of low porosity, durability, high dirt & stain resistance, colour permanence
and hygiene over other conventional modes. However, according to the Indian Census data, 2011, only 11% of total
households in India lived in a house with floor tiles; 88% households had either a Mud or cement flooring. The penetration
of ceramic tiles in rural areas is very insignificant, as only 4% of households have tile flooring. Urban areas, however, have
fared well at 26% due to ease of availability and awareness, created by branding exercises by most of the organised
players. Low penetration levels, especially in the rural areas, provide substantial opportunity for the ceramic tile
manufacturers.
4.43.95
3.39
1.41
0.59
0
1
2
3
4
5
Vietnam China Brazil Indonesia India
Per capita consumption (in SQM)
Ratings I Indian Ceramic Tile Industry
14
Table 8: Types of flooring used in India and its percentage
Particulars India Rural Urban
2001 2011 2001 2011 2001 2011
Mud 57 47 72 63 18 12
Stone 6 8 5 6 9 12
Cement 27 31 18 24 48 46
Mosaic/Floor Tiles 7 11 2 4 21 26
Others 3 4 3 3 4 4 Source: Ministry of Home Affairs (Office of the Registrar General & Census Commissioner, India)
Levy of anti-dumping duty on imports from China
Chinese imports accounted for around 80% followed by Italy, Spain and UAE, to the total imports by India in FY17. China,
the world’s largest manufacturer of ceramic tiles, has a unique advantage; that, of access to cheaper mode of transport
(through sea) to southern India. However, on the basis of trade data of imports of ceramic tiles after the withdrawal of
anti-dumping duty in May 2013 and other findings, the government found that the ceramic tiles that were exported to
India were below normal value and the ICTI has been impacted on account of this dumping from China. Consequently, the
Government of India imposed an anti-dumping duty on soluble salt double charge, GVT and PVT, porcelain and vitrified tile
from China, for 5 years from March 2016, to a tune of USD 1.87 per SQM, depending on the exporting company. Post
imposition, the import of ceramic tiles reduced from 30 MSM in CY15 to 11 MSM in CY16. In May 2018, the GoI also levied
an anti-dumping duty on ceramic rollers i.e. ceramic pipes or tubes imported from China, to a tune of USD 782.25 per
tonne, for five years.
Huge export potential
To curb the impact of dumping by Chinese manufacturers, countries like, the European Union countries (EU), Brazil,
Taiwan, Chile, Vietnam and Korea imposed anti-dumping duty on the import of ceramic tiles from China. European Union,
in November 2017, after reviewing the impact of this dumping of ceramic tiles by China, extended the anti-dumping duty
imposition for another period of 5 years (between 13.9% and 69.7%) depending on the exporting company. The deficit was
tapped by Indian manufacturers and India was the fourth largest exporter of ceramic tile in CY17 as compared to eleventh
in CY13. Exports accounted for about 20% of the total production of ceramic tiles in India during CY17.
Furthermore, during the last five years, the ICTI has continuously invested in expansion-cum-modernisation of its
manufacturing facilities. India manufactures high-grade tiles using the latest technology and has the lowest cost of
production amongst all the exporting countries. Exports are envisaged to grow further owing to expansion of geographical
reach and product innovations.
Ratings I Indian Ceramic Tile Industry
15
Favourable demographic profile along with increase in disposable income
India is expected to be the most populous country by 2022, with a majority of the population in the working age group.
India is also expected to be one of the fastest growing economies in the next decade. The rising disposable income levels
among the working class, increasing trend of nuclear families and increasing demand for aesthetic flooring are expected to
augur well for the ICTI.
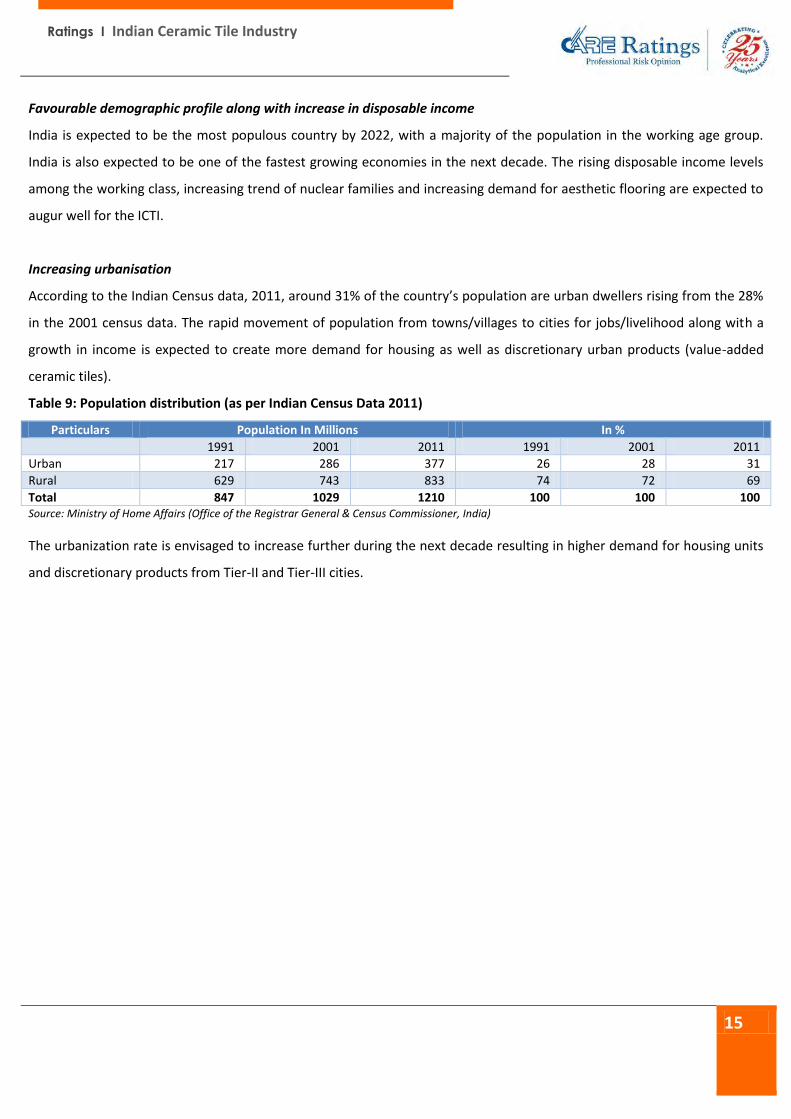
Increasing urbanisation
According to the Indian Census data, 2011, around 31% of the country’s population are urban dwellers rising from the 28%
in the 2001 census data. The rapid movement of population from towns/villages to cities for jobs/livelihood along with a
growth in income is expected to create more demand for housing as well as discretionary urban products (value-added
ceramic tiles).
Table 9: Population distribution (as per Indian Census Data 2011)
Particulars Population In Millions In %
1991 2001 2011 1991 2001 2011
Urban 217 286 377 26 28 31
Rural 629 743 833 74 72 69
Total 847 1029 1210 100 100 100 Source: Ministry of Home Affairs (Office of the Registrar General & Census Commissioner, India)
The urbanization rate is envisaged to increase further during the next decade resulting in higher demand for housing units
and discretionary products from Tier-II and Tier-III cities.
Ratings I Indian Ceramic Tile Industry
16
Recent regulatory developments in the industry and its impact on the ICTI
Demonetisation and Goods & Service Tax (GST)
With almost 50% of the industry comprising of the unorganised segment with a high dependence on the real estate sector,
GST and demonetisation severely impacted the performance of the ICTI. Ceramic tiles were taxed at the highest rate of 28
% under GST until October 2017. In Gujarat, Madhya Pradesh, Chhattisgarh, tax rate was lower in the range of 17-19%
owing to lower Value Added Tax. Consequently, the prices of tiles sold by organised dealers showed a rise of 5-10 % in
these states, while the statistics remained largely unchanged in the rest of the country. Furthermore, replacement of the
old tax structure and a lack of clarity on the new indirect tax reform resulted in an inventory build-up and impacted overall
operations of the units.
However, with revision in the GST rates, from 28 % to 18 % in November 2017, the indirect tax rate is largely in line with
the rates prevalent during the earlier tax structure. GST has created a level playing field as a nationwide levy and has
helped the unorganised sector, which was facing issues due to a slowdown in the real estate industry. The implementation
of GST is a welcome change for organised sector too, as it will lay the path for formalisation of the sector which in turn will
increase the share of organised sector in the total market.
Real- Estate (Regulation & Development) Act, 2016 (RERA)
The real estate sector has benefitted by RERA, which was implemented from May 01, 2017, despite it being subdued for a
few months as developers put their operations on hold, to understand and comply with all the regulations. In the long run,
RERA makes the real estate sector more transparent and process driven. RERA has a direct implication on the ceramic
sector as well. In a medium time frame, RERA is expected to bode well for the organised real estate sector as well as the
ICTI.
Government thrust for infrastructure development
The government’s thrust on pushing infrastructure development continues by ensuring increasing funds for core schemes
such as ‘Smart Cities’, ‘Housing for All by 2022’, ‘Swachh Bharat Abhiyan’, ‘Atal Mission for Rejuvenation and Urban
Transformation (AMRUT)’, which will bolster the construction industry and in turn paves a growth path for the ICTI.
Ratings I Indian Ceramic Tile Industry
17
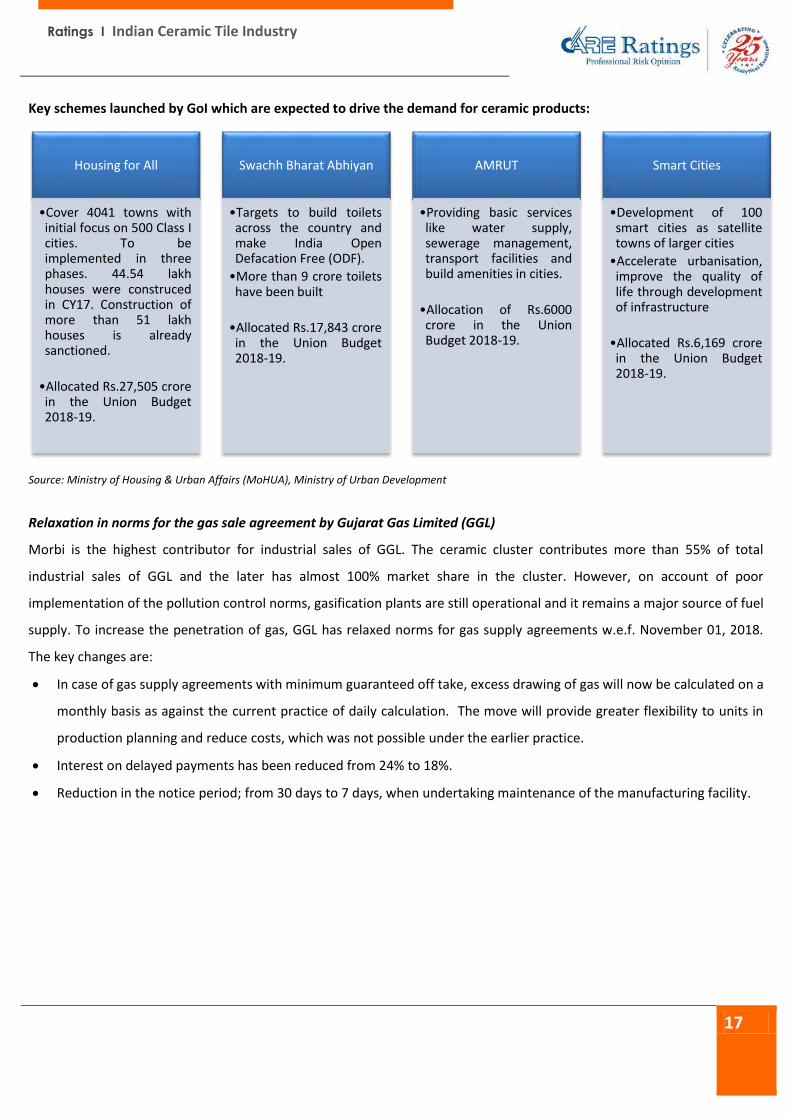
Key schemes launched by GoI which are expected to drive the demand for ceramic products:
Source: Ministry of Housing & Urban Affairs (MoHUA), Ministry of Urban Development
Relaxation in norms for the gas sale agreement by Gujarat Gas Limited (GGL)
Morbi is the highest contributor for industrial sales of GGL. The ceramic cluster contributes more than 55% of total
industrial sales of GGL and the later has almost 100% market share in the cluster. However, on account of poor
implementation of the pollution control norms, gasification plants are still operational and it remains a major source of fuel
supply. To increase the penetration of gas, GGL has relaxed norms for gas supply agreements w.e.f. November 01, 2018.
The key changes are:
In case of gas supply agreements with minimum guaranteed off take, excess drawing of gas will now be calculated on a
monthly basis as against the current practice of daily calculation. The move will provide greater flexibility to units in
production planning and reduce costs, which was not possible under the earlier practice.
Interest on delayed payments has been reduced from 24% to 18%.
Reduction in the notice period; from 30 days to 7 days, when undertaking maintenance of the manufacturing facility.
Housing for All
•Cover 4041 towns withinitial focus on 500 Class Icities. To beimplemented in threephases. 44.54 lakhhouses were construcedin CY17. Construction ofmore than 51 lakhhouses is alreadysanctioned.
•Allocated Rs.27,505 crorein the Union Budget2018-19.
Swachh Bharat Abhiyan
•Targets to build toiletsacross the country andmake India OpenDefacation Free (ODF).
•More than 9 crore toiletshave been built
•Allocated Rs.17,843 crorein the Union Budget2018-19.
AMRUT
•Providing basic serviceslike water supply,sewerage management,transport facilities andbuild amenities in cities.
•Allocation of Rs.6000crore in the UnionBudget 2018-19.
Smart Cities
•Development of 100smart cities as satellitetowns of larger cities
•Accelerate urbanisation,improve the quality oflife through developmentof infrastructure
•Allocated Rs.6,169 crorein the Union Budget2018-19.
Ratings I Indian Ceramic Tile Industry
18
Key Constraints
The key bottleneck for the sector is the volatile natural gas price that accounts for around 15-30% of total cost and basic
infrastructure.
Volatility in fuel prices and high transportation cost
Ceramics is a power-intensive industry; the manufacturing process requires natural gas to fire the kiln and after raw
materials, electricity and fuel cost is the second largest cost element in the total cost of production. The ceramic tile units
in the Morbi cluster use either natural gas or gasification plants (which burn coal to generate gas) or bio waste as a source
of gas. Although, usage of natural gas has inherent advantages like no transit wastage, higher fuel efficiency, cleanliness
and pollution free, it is still not a preferred option considering severe fluctuation in the gas prices.
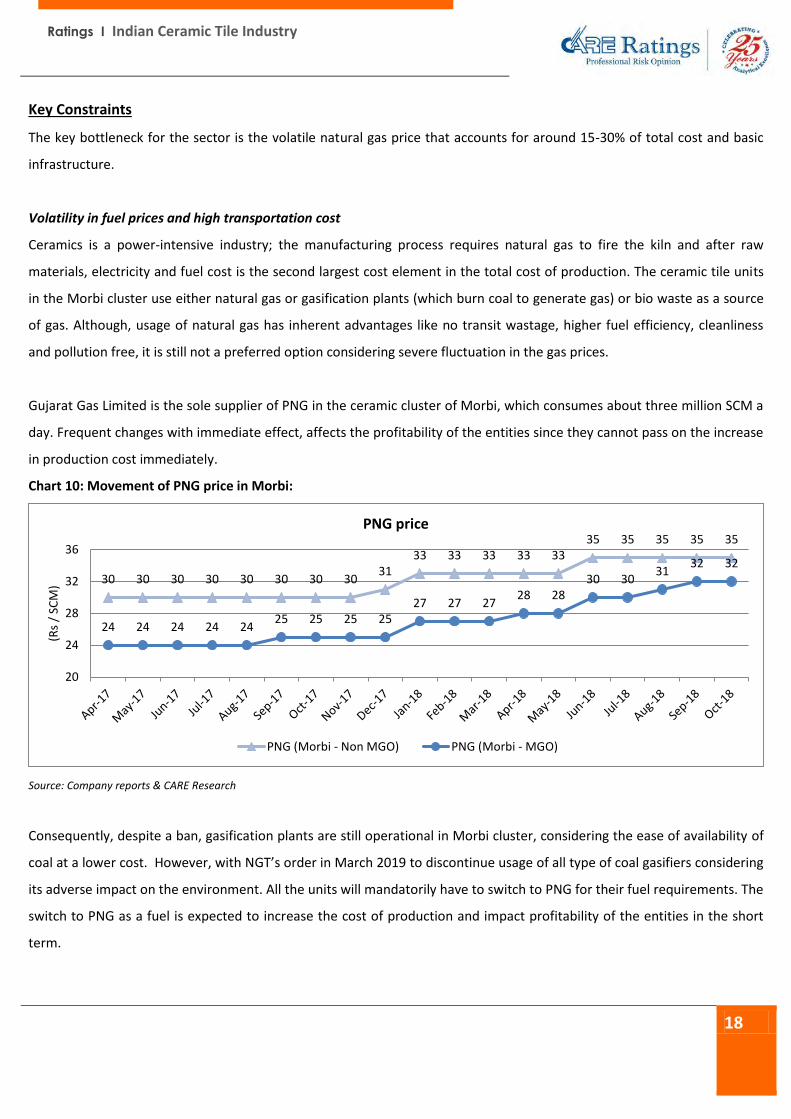
Gujarat Gas Limited is the sole supplier of PNG in the ceramic cluster of Morbi, which consumes about three million SCM a
day. Frequent changes with immediate effect, affects the profitability of the entities since they cannot pass on the increase
in production cost immediately.
Chart 10: Movement of PNG price in Morbi:
Source: Company reports & CARE Research
Consequently, despite a ban, gasification plants are still operational in Morbi cluster, considering the ease of availability of
coal at a lower cost. However, with NGT’s order in March 2019 to discontinue usage of all type of coal gasifiers considering
its adverse impact on the environment. All the units will mandatorily have to switch to PNG for their fuel requirements. The
switch to PNG as a fuel is expected to increase the cost of production and impact profitability of the entities in the short
term.
30 30 30 30 30 30 30 3031
33 33 33 33 3335 35 35 35 35
24 24 24 24 2425 25 25 25
27 27 2728 28
30 3031
32 32
20
24
28
32
36
(Rs
/ SC
M)
PNG price
PNG (Morbi - Non MGO) PNG (Morbi - MGO)
Ratings I Indian Ceramic Tile Industry
19
Although the shift to natural gas is beneficial to the industry in the long run, availability of gas at reasonable rates will be
extremely important for the growth of ICTI. Few players in the organised segment have entered into a minimum
guaranteed off take agreement, for supply at a discounted rate to reduce the total cost of production to a certain extent.
Influx of regional players
Even though the organised segment has captured a majority of the market, the unorganised segment comprising of small
and regional players will always play a pivotal role. As the industry is fragmented, coupled with low entry barriers, low
capital requirements and easy availability of raw material many regional and small players are attracted to it.
Fragmented industry and Low entry barrier
The Morbi ceramic cluster houses more than 600 units and a cumulative industrial investment of over Rs.8,000 crore; it
provides employment to more than 5 lakh people, either directly or indirectly. The ICTI has been growing continuously,
backed by increase in consumption and demand from the international markets. Nevertheless, the ICTI is highly
fragmented with a sizeable number of small and mid-size entities primarily due to:
Low entry barriers
Low fixed capital investment requirement
Shorter gestation period
Easy availability of raw materials and technology
Proximity to ports (Mundra and Kandla)
Laxity in regulatory and compliance norms
Consequently, the unorganised segment has dominated the industry in the past and still accounts for almost 50% of the
total production, primarily manufacturing low value-added floor ceramic tiles.
Proposed imposition of antidumping duty by The Cooperation Council for the Arab States of the Gulf (CCASG)
CCASG also known as Gulf Cooperation Council (GCC) may impose a 15% antidumping duty on ceramic tiles manufactured
in India on a temporary basis, for a period of six months starting January 05, 2019. The move comes after the ceramic tile
manufacturing units in Saudi Arabia complained to the CCASG committee regarding heavily subsidized exports from India.
The proposal, if implemented, is expected to impede the export growth considering approximately >25% of tiles exported
from India is to Gulf region. (CCASG includes Bahrain, Kuwait, Oman, Qatar, Saudi Arabia and United Arab Emirates).
Ratings I Indian Ceramic Tile Industry
20
Outlook
The ICTI has faced a challenging environment in the last two financial years ending FY18 on account of multiple policy
changes and reforms by the government, like demonetisation, implementation of RERA and GST.
In the near term, the vitrified tile segment is envisaged to face further pricing pressure on account of excess production
capacity in the Morbi cluster. The installed capacity has increased significantly on account of commissioning of more than
100 new vitrified tiles manufacturing units in the Morbi cluster during last two financial years ending March 2018.
Consequently, the growth in production capacity has exceeded the growth in demand resulting in pricing pressure not only
in Morbi cluster but also in other ceramic tile manufacturing hubs in India.
Moreover, on March 06, 2019, NGT ordered ceramic units in Morbi to switch to PNG for their fuel requirement and
discontinue usage of coal gasifiers to control air and water pollution in the region.
CARE expects the shift to PNG will increase the production cost of the entities and exert pressure on profitability since the
ceramic entities will not able to pass on the increase in cost without a time lag. Along with pressure on profitability,
working capital intensity of the entities will also increase in the near term due to reduction in credit period on PNG and
increase in procurement cost.
However, the long-term prospects for the industry seem to be favourable on account of:
Rising urbanisation, increase in disposable income and increasing trend of nuclear families.
Revision in the GST rate from 28 % to 18 % in November 2017.
Movement in the real estate sector in terms of new project launches post compliance with RERA norms, albeit with
a time lag.
Impetus of the government, on infrastructure projects (SBA) and Housing for All.
Healthy export demand due to continuance of anti-dumping duty on Chinese vitrified tiles by European Union,
Brazil, Taiwan, Chile, Vietnam and Korea.
In terms of geography, while the domestic demand from the urban sector is more inclined towards high-end value-added
tiles, a major volume growth is expected to be generated from Tier II & Tier III cities and government initiated schemes. In
the domestic market, South India is growing at a faster rate as compared to the national average on account of a greater
number projects under execution.
In terms of market segment, the entities in organised sector are likely to register better growth rates than the industry
average on account of extensive product portfolio and established marketing & distribution channels. Adoption of the
outsourcing model has helped organised players to ramp up production with minimal capital investment. The trend is
Ratings I Indian Ceramic Tile Industry
21
envisaged to continue on the back of proposed and on-going capex plans, by leading tile manufacturers in Morbi and
Andhra Pradesh who intend to capitalize on the inherent manufacturing advantages in India and the foreseen growth in the
domestic demand for ceramic tiles.
In terms of product segment, the premium range of ceramic products is growing on the back of technological innovations
and limited competition. Major organised players, including multinational companies, are envisaged to expand their
premium product portfolio to cater to the growing demand from international markets and urban consumers in the
domestic market. However, the demand for entry-to-medium product segment (polished vitrified tiles) is expected to be
higher on the back of products such as polished vitrified tiles (PVT) and ceramic tiles.
Investment plan: The ceramic cluster at Morbi and the upcoming ceramic cluster in Andhra Pradesh are set to witness high
industrial investment in the near future. Approximately more than 60 units are envisaged to be operational in the medium
term with an industrial investment of around Rs.2,000 crore.
The installed capacity for manufacturing of vitrified segment has already been ramped up and a situation of overproduction
exists. However, the penetration of wall tiles in the domestic market is increasing and is envisaged to continue in the near
term. The outlook of the industry remains stable and is expected to grow in the range of 7-8.5% in FY19-20.
Ratings I Indian Ceramic Tile Industry
22
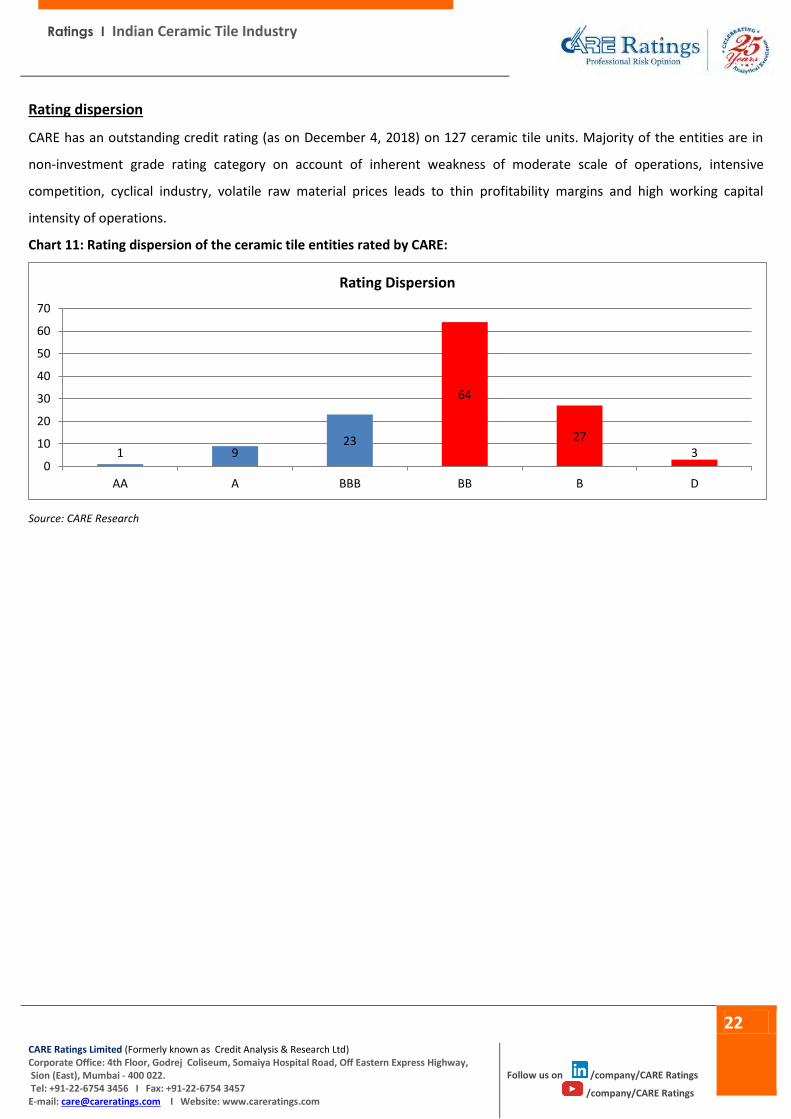
Rating dispersion
CARE has an outstanding credit rating (as on December 4, 2018) on 127 ceramic tile units. Majority of the entities are in
non-investment grade rating category on account of inherent weakness of moderate scale of operations, intensive
competition, cyclical industry, volatile raw material prices leads to thin profitability margins and high working capital
intensity of operations.
Chart 11: Rating dispersion of the ceramic tile entities rated by CARE:
Source: CARE Research
1 923
64
273
0
10
20
30
40
50
60
70
AA A BBB BB B D
Rating Dispersion
CARE Ratings Limited (Formerly known as Credit Analysis & Research Ltd) Corporate Office: 4th Floor, Godrej Coliseum, Somaiya Hospital Road, Off Eastern Express Highway, Sion (East), Mumbai - 400 022. Tel: +91-22-6754 3456 I Fax: +91-22-6754 3457 E-mail: [email protected] I Website: www.careratings.com
Follow us on /company/CARE Ratings
/company/CARE Ratings