Applying the Plan-Do-Check-Act (PDCA) Cycle to Reduce the ...
17
applied sciences Article Applying the Plan-Do-Check-Act (PDCA) Cycle to Reduce the Defects in the Manufacturing Industry. A Case Study Arturo Realyvásquez-Vargas 1 , Karina Cecilia Arredondo-Soto 2, * , Teresa Carrillo-Gutiérrez 2 and Gustavo Ravelo 1 1 Department of Industrial Engineering, Tecnológico Nacional de México/Instituto Tecnológico de Tijuana, Calzada del Tecnológico S/N, Tijuana, Baja California 22414, Mexico; [email protected] (A.R.-V.); [email protected] (G.R.) 2 Chemical Sciences and Engineering Faculty, Universidad Autónoma de Baja California, Calzada Universidad #14418, Parque Industrial Internacional, Tijuana, Baja California 22390, Mexico; [email protected] * Correspondence: [email protected] Received: 16 October 2018; Accepted: 5 November 2018; Published: 7 November 2018 Featured Application: The tool of PDCA cycle, supported by other graphical tools, such as Pareto charts and flowchart, can be applied in the manufacturing industry to delete or reduce occurrence of defects. Abstract: Defects are considered as one of the wastes in manufacturing systems that negatively affect the delivery times, cost and quality of products leading to manufacturing companies facing a critical situation with the customers and to not comply with the IPC-A-610E standard for the acceptability of electronic components. This is the case is a manufacturing company located in Tijuana, Mexico. Due to an increasing demand on the products manufactured by this company, several defects have been detected in the welding process of electronic boards, as well as in the components named Thru-Holes. It is for this reason that this paper presents a lean manufacturing application case study. The objective of this research is to reduce at least 20% the defects that are generated during the welding process. In addition, it is intended to increase 20% the capacity of three double production lines where electronic boards are processed. As method, the Plan-Do-Check-Act (PDCA) cycle, is applied. The Pareto charts and the flowchart are used as support tools. As results, defects decreased 65%, 79%, and 77% in three analyzed product models. As conclusion, the PDCA cycle, the Pareto charts, and the flowchart are excellent quality tools that help to decrease the number of defective components. Keywords: lean manufacturing; Plan-Do-Check-Act (PDCA); defects; pareto chart; flowchart 1. Introduction Lean manufacturing is a philosophy that is applied to production systems [1–3]. This philosophy was developed in the Toyota Production System and rapidly it was stablished in the manufacturing industry around the world [4]. According to Botti et al. [4], the main features of lean manufacturing include just-in-time practices, work-in-progress, and wastes reduction [1–3], improvement strategies, defects-free production, and work standardization. The main goal of lean manufacturing is increasing the company’s profits and adding value by deleting the wastes. It is by this reason that when companies seek improve the effectiveness and efficiency of their production process, they implement lean manufacturing [5,6]. Regarding the wastes, literature mentions that in the manufacturing Appl. Sci. 2018, 8, 2181; doi:10.3390/app8112181 www.mdpi.com/journal/applsci
-
Upload
khangminh22 -
Category
Documents
-
view
4 -
download
0
Transcript of Applying the Plan-Do-Check-Act (PDCA) Cycle to Reduce the ...
applied sciences
Article
Applying the Plan-Do-Check-Act (PDCA) Cycle toReduce the Defects in the Manufacturing Industry.A Case Study
Arturo Realyvásquez-Vargas 1 , Karina Cecilia Arredondo-Soto 2,* , Teresa Carrillo-Gutiérrez 2
and Gustavo Ravelo 1
1 Department of Industrial Engineering, Tecnológico Nacional de México/Instituto Tecnológico de Tijuana,Calzada del Tecnológico S/N, Tijuana, Baja California 22414, Mexico;[email protected] (A.R.-V.); [email protected] (G.R.)
2 Chemical Sciences and Engineering Faculty, Universidad Autónoma de Baja California,Calzada Universidad #14418, Parque Industrial Internacional, Tijuana, Baja California 22390, Mexico;[email protected]
* Correspondence: [email protected]
Received: 16 October 2018; Accepted: 5 November 2018; Published: 7 November 2018�����������������
Featured Application: The tool of PDCA cycle, supported by other graphical tools, such as Paretocharts and flowchart, can be applied in the manufacturing industry to delete or reduce occurrenceof defects.
Abstract: Defects are considered as one of the wastes in manufacturing systems that negativelyaffect the delivery times, cost and quality of products leading to manufacturing companies facinga critical situation with the customers and to not comply with the IPC-A-610E standard for theacceptability of electronic components. This is the case is a manufacturing company located inTijuana, Mexico. Due to an increasing demand on the products manufactured by this company,several defects have been detected in the welding process of electronic boards, as well as in thecomponents named Thru-Holes. It is for this reason that this paper presents a lean manufacturingapplication case study. The objective of this research is to reduce at least 20% the defects that aregenerated during the welding process. In addition, it is intended to increase 20% the capacity of threedouble production lines where electronic boards are processed. As method, the Plan-Do-Check-Act(PDCA) cycle, is applied. The Pareto charts and the flowchart are used as support tools. As results,defects decreased 65%, 79%, and 77% in three analyzed product models. As conclusion, the PDCAcycle, the Pareto charts, and the flowchart are excellent quality tools that help to decrease the numberof defective components.
Keywords: lean manufacturing; Plan-Do-Check-Act (PDCA); defects; pareto chart; flowchart
1. Introduction
Lean manufacturing is a philosophy that is applied to production systems [1–3]. This philosophywas developed in the Toyota Production System and rapidly it was stablished in the manufacturingindustry around the world [4]. According to Botti et al. [4], the main features of lean manufacturinginclude just-in-time practices, work-in-progress, and wastes reduction [1–3], improvement strategies,defects-free production, and work standardization. The main goal of lean manufacturing is increasingthe company’s profits and adding value by deleting the wastes. It is by this reason that whencompanies seek improve the effectiveness and efficiency of their production process, they implementlean manufacturing [5,6]. Regarding the wastes, literature mentions that in the manufacturing
Appl. Sci. 2018, 8, 2181; doi:10.3390/app8112181 www.mdpi.com/journal/applsci
Appl. Sci. 2018, 8, 2181 2 of 17
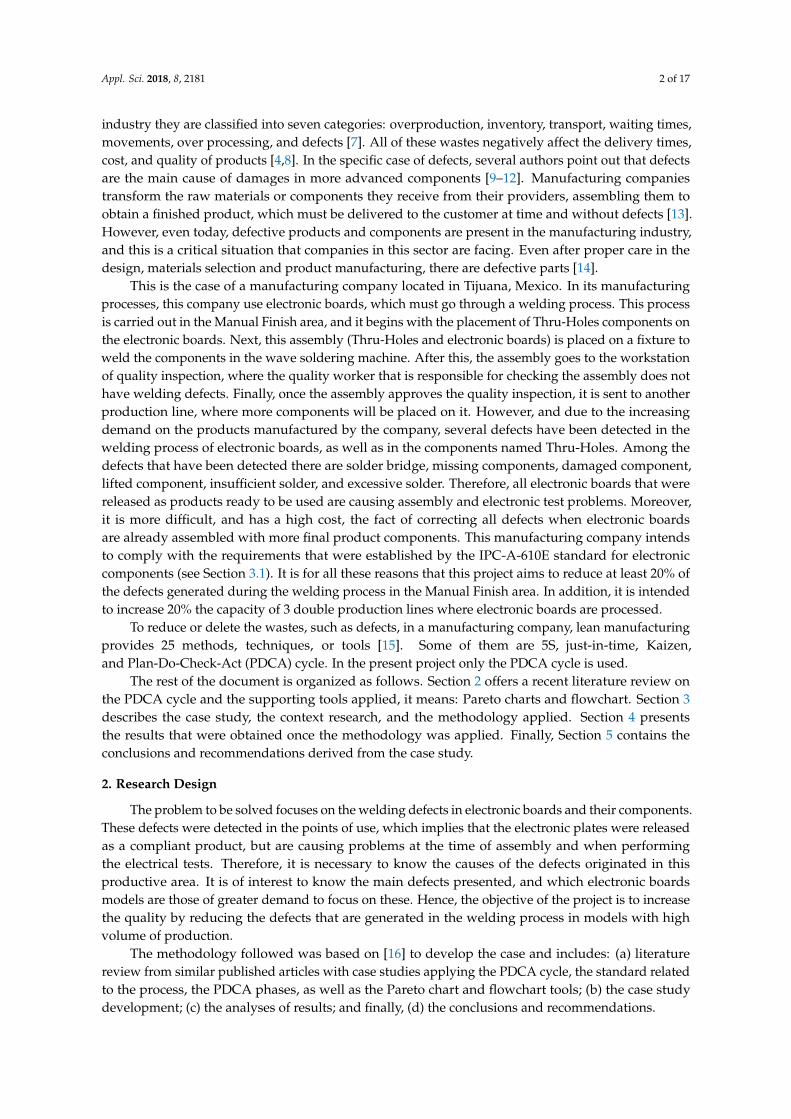
industry they are classified into seven categories: overproduction, inventory, transport, waiting times,movements, over processing, and defects [7]. All of these wastes negatively affect the delivery times,cost, and quality of products [4,8]. In the specific case of defects, several authors point out that defectsare the main cause of damages in more advanced components [9–12]. Manufacturing companiestransform the raw materials or components they receive from their providers, assembling them toobtain a finished product, which must be delivered to the customer at time and without defects [13].However, even today, defective products and components are present in the manufacturing industry,and this is a critical situation that companies in this sector are facing. Even after proper care in thedesign, materials selection and product manufacturing, there are defective parts [14].
This is the case of a manufacturing company located in Tijuana, Mexico. In its manufacturingprocesses, this company use electronic boards, which must go through a welding process. This processis carried out in the Manual Finish area, and it begins with the placement of Thru-Holes components onthe electronic boards. Next, this assembly (Thru-Holes and electronic boards) is placed on a fixture toweld the components in the wave soldering machine. After this, the assembly goes to the workstationof quality inspection, where the quality worker that is responsible for checking the assembly does nothave welding defects. Finally, once the assembly approves the quality inspection, it is sent to anotherproduction line, where more components will be placed on it. However, and due to the increasingdemand on the products manufactured by the company, several defects have been detected in thewelding process of electronic boards, as well as in the components named Thru-Holes. Among thedefects that have been detected there are solder bridge, missing components, damaged component,lifted component, insufficient solder, and excessive solder. Therefore, all electronic boards that werereleased as products ready to be used are causing assembly and electronic test problems. Moreover,it is more difficult, and has a high cost, the fact of correcting all defects when electronic boardsare already assembled with more final product components. This manufacturing company intendsto comply with the requirements that were established by the IPC-A-610E standard for electroniccomponents (see Section 3.1). It is for all these reasons that this project aims to reduce at least 20% ofthe defects generated during the welding process in the Manual Finish area. In addition, it is intendedto increase 20% the capacity of 3 double production lines where electronic boards are processed.
To reduce or delete the wastes, such as defects, in a manufacturing company, lean manufacturingprovides 25 methods, techniques, or tools [15]. Some of them are 5S, just-in-time, Kaizen,and Plan-Do-Check-Act (PDCA) cycle. In the present project only the PDCA cycle is used.
The rest of the document is organized as follows. Section 2 offers a recent literature review onthe PDCA cycle and the supporting tools applied, it means: Pareto charts and flowchart. Section 3describes the case study, the context research, and the methodology applied. Section 4 presentsthe results that were obtained once the methodology was applied. Finally, Section 5 contains theconclusions and recommendations derived from the case study.
2. Research Design
The problem to be solved focuses on the welding defects in electronic boards and their components.These defects were detected in the points of use, which implies that the electronic plates were releasedas a compliant product, but are causing problems at the time of assembly and when performingthe electrical tests. Therefore, it is necessary to know the causes of the defects originated in thisproductive area. It is of interest to know the main defects presented, and which electronic boardsmodels are those of greater demand to focus on these. Hence, the objective of the project is to increasethe quality by reducing the defects that are generated in the welding process in models with highvolume of production.
The methodology followed was based on [16] to develop the case and includes: (a) literaturereview from similar published articles with case studies applying the PDCA cycle, the standard relatedto the process, the PDCA phases, as well as the Pareto chart and flowchart tools; (b) the case studydevelopment; (c) the analyses of results; and finally, (d) the conclusions and recommendations.
Appl. Sci. 2018, 8, 2181 3 of 17
3. Literature Review
A literature review was conducted to analyze the standard to acceptability of electronic assemblies;and different case studies applying PDCA cycle, which has got a diversity of applications, either forcontinuous improvement; when starting a new project; when developing a new or improved designof a process; when defining a repetitive work process; and, when implementing any change [17–21];as well as Pareto chart and Flowchart.
3.1. IPC-A-610E Standard to Acceptability of Electronic Assemblies
Accepted in all the world as the key manufacturing standards for the industries of manufacture ofprinted boards and electronic products, the IPC standards are related to most of the development cyclestages of electronic products. From the design and the purchase to the assembly and packaging, the IPCstandards help to guarantee a better quality, reliability, and consistence on the electronic assembliesthat are part of an electronic product. Among the IPC standards are the following: IPC-A-630,IPC-A-600, IPC-4101, IPC-A-610E, and others. All IPC standards are accredited by the AmericanNational Standards Institute (ANSI).
With regard to the standard IPC-A-610E, it is a collection of visual quality acceptabilityrequirements for electronic assemblies. In this standard, quality acceptability criteria are not focused ondefinite processes to perform assembly operations or authorize the repairing/modification or changeof final product. In the specific case of the components named Thru Holes, the quality acceptabilitycriteria of welding are the following:
• There are no cavities or imperfections on the surface.• The terminal and the track have good wet conditions.• The terminal is discernible.• There is a 100% welding filament around the terminal.• The solder covers the terminal and forms a smooth finish with thin edges on the conductor tracks.• There is no evidence of raised filament.
In this way, all electronic components that go through a welding process must meet thesecriteria [22].
3.2. PDCA Cycle
The PDCA cycle, also known as Deming cycle or Shewhart cycle [23], is a lean manufacturingmethodology that was developed in 1930, when there was no more exclusive products and a morequality management focusing on competitiveness raised in the global market [24,25]. According toseveral authors, the creator of the original PDCA cycle was an American statistician named Walter A.Shewhart [25,26]. However, William Edward Deming was who, in the 1950s, developed this method,which, today, is one of the most worldwide known and applied. In its beginnings, the PDCA cyclewas used as a tool for the quality control of products [25,27]. However, rapidly, it was highlighted as amethod that allowed developing improvements in process at organizational level [25,27,28]. Currently,the PDCA cycle is characterized by its continuous improvement approach [29] and it is recognized asa logic program that allows improving the activities [27,30].
Several authors state that the PDCA cycle is much more than a simple lean manufacturing tool.Instead, they mention that the PDCA cycle is a philosophy of continuous processes improvementintroduced in the organizational culture of companies [20] that is focused in the continuous learningand the knowledge creation [27,31]. The following rows describe the four stages of the PDCA cycle [32]:
• Plan: In this phase improvements opportunities are identified, and later priorities are assignedto them. Likewise, the current situation of the process to be analyzed is defined by means ofconsistent data, the problem causes are determined, and possible solutions are proposed tosolve it.
Appl. Sci. 2018, 8, 2181 4 of 17
• Do: In this phase, it is intended to implement the action plan, select and document the information.Also, unexpected events, learned lessons and the acquired knowledge must be considered.
• Check: In this step, the results of the actions implemented in the before step are analyzed.A before-and-after comparison is performed verifying whether there were improvements andif the stablished objectives were achieved. To this, several graphic support tools, such as Paretochart or Ishikawa diagram, can be used.
• Act: This phase consists in developing methods aimed to standardize the improvements (in thecase objectives had been reached). In addition, the proof is repeated to obtain new data and re-testthe improvement (only if data are insufficient or circumstances had changed), or the project isabandoned and a new one is begun from the first stage (in the case the implemented actions didnot yield effective improvements).
To perform these steps in an effective manner, other quality tools can be required to beused. These quality tools can help mainly to analyze the problem and define the actions to beimplemented [25]. According to several authors [25,33], among the quality tools most used bythe companies, and that serve as support to the PDCA cycle, are the 5S, Failure Mode Analysisand Effects (FMEA), 5W1H o 5W2H, brainstorming, benchmarking; statistical process control (SPC),checklists, Ishikawa diagrams and the Pareto chart, Quality Function Deployment (QFD), the flowchart,histograms, Single Minute Exchange of Die (SMED), Poka Yoke, Servqual, times quality, and Six Sigma.In this project the graphical tools of Pareto chart and the flowchart are used.
Literature shows that different applications of PDCA cycle have been implemented with positiveresults achieving the reduction of costs and defects, as well as improving the quality of process andproducts. In this regard, Hailu, Mengstu, and Hailu [16] developed an integrated literature basedTotal Productive Maintenance (TPM), Toyota Production System (TPS), and Total Quality Management(TQM) model through PDCA cycle, and implementation guideline for the application of the model.Previous very few studies of uniqueness, common practices, and implementation guideline of thethree systems are preserved. The findings of this research, an integrated cutting-edge model of TPM,TPS, and TQM practices and implementation guidelines are developed. The originality/value of thedeveloped model and implementation guideline enable manufacturing industries to be continuouslycompetitive and profitable. Likewise, Pinto and Mendes [34] investigated how environmentalimprovements can be achieved through operational practices of Lean Manufacturing. The adoptedresearch method consisted of a single case study, by providing greater depth and detail of the study.As a result of the study, it was found that there was evidence for the existence of relationship betweenthe practices of Lean (including: Kaizen, PDCA, Ishikawa Diagram, Poka-Yoke, and StandardizedWork), with the reduction of environmental impacts of an organization. The application of thesepractices resulted in the reduction of energy consumption and water consumption. The studypresented, in detail, the application of operational practices of Lean Manufacturing, with an effectiveview to reducing the environmental impact and cost reduction.
From a systemic perspective Luo, Li and Li [35] analyzed the feasibility of integrated managementsystem, and then classifies the integration methods of integrated management system from differentperspectives, namely, from the system level and the operational level. It analyzes the application andthe advantages or disadvantages of a variety of integrated methods, indicating that the more commonsituation at present is taking quality management system as the center to integrate. So, they use thelarge-scale system integration thinking, that is, establish the management system based on PDCA,classify the links and elements of the organization according to the four sections of PDCA from thewhole, large-scale system perspective, and then analyze and distinguish the elements to request andedit documents. Shahar and Salleh [36] used the methodology of PDCA, observation, conceptualgeneration through PUGH method, and design software (CATIA) to analyze the grinding process forproducing cutting tools. The aim of this research was to develop a carbide sludge remover machinethat fits perfectly into ABC Cutting Tool Industries production line. Since carbide sludge will befiltered in the filter machine, a monthly maintenance was necessary for the filter machine that included
Appl. Sci. 2018, 8, 2181 5 of 17
transferring accumulated carbide sludge into the waste barrel. The process of removing carbidesludge from the filter machine required two to three person and took a considerate amount of time.This research contributed to the cost reduction for the carbide sludge removal process over time andalso improved the safety of the operator.
Rosa, Silva, and Ferreira [37] conducted a study developed in order to improve the assemblylines of the steel wire-ropes used to control some of the basic functions in cars, such as the elevationof car-door windows and so on. By applying Lean and PDCA methodologies that are based on anaction plan, it was possible to ensure the implementation of some of the developed solutions, as wellas the subsequent processes, and the registration of these as a record for the future. The performance ofefficiency was dramatically increased by this study. Nabiilah, Hamedon, and Faiz [38,39] utilized thePDCA cycle approach to reduce the defects in the electrodeposition process in two phases. In the firstphase, a systematic quality improvement plan and optimization were performed. The application ofthe PDCA cycle improved 65% of bits and reduced 34% of sanding man hour. In the second phase, theimplementation of filtration system, magnetic separation, and surface adjustment process improved36% of bits and reduced 42% of sanding man hour. Regarding the services sector, Chen and Zhao [40]applied PDCA cycle in a hospital in the Herceptin usage management application. The differences ofdefects rates of Herceptin management in the breast cancer patients before and after PDCA circulationmethod were compared. They concluded that the PDCA cycle management method could significantlyreduce the defect rate of Herceptin management and ensure the drug safety of Herceptin in breastcancer patients. Tahiduzzaman et al. [41] worked in a project to reduce the defects to minimize therework rate; identifying sewing defects for a particular product (knit T-Shirts). Pareto analysis wasperformed to identify top defect positions from all the defects and seven are identified where 80%defects occur, which should be the major concerning areas to minimize defects percentage. Cause-effectdiagrams were constructed to show the root cause, effect, and 5S & PDCA was used to minimize thedefects effectively.
Simialrly, Jagusiak-Kocik [42] presented a case study of the practical use of PDCA-cycle in amanufacturing company as a solution to quality problems that occurred during production of photoframes (discolorations and scorches on the surface of the frame). The number of non- conformantmaterial decreased more than 60%. Kholif et al. [43] implemented PDCA cycle as a method forthe continuous quality improvement in the dairy laboratories. Results showed a reduction in thenumber of the contaminated UHT milk samples from initial 368 to 85. Moreover, the capability index(CP) increased from 0.52 to 1.07. These reductions in the number of contaminated milk samplesand increase in CP increased the efficiency from 68.02% to 74.06% and the effectiveness from 88.95%to 96.85%. Thus, PDCA methodology was successfully applied to reduce the occurrence of errorsand increase the processes capability to enhance the efficiency and effectiveness of dairy laboratory.Likewise, Wazed and Shamsuddin [44] presented a systematic approach and application of the basicand advanced management tools and techniques that are used to solve the part rejection problemsin a plastic moulding manufacturing plant. In order to illustrate this, their study focused on jointapplication of PDCA and 5S approaches. However, implementation of the joint approach resultssignificant improvement and good impressions to the customers and a cleaner and comfortableworking condition for the employees and management. Their research provides approaches to aid inreducing the online rejection during the moulding process.
Based on the successful results that were obtained in all these case studies, we decided to applythe PDCA cycle to delete or decrease the number of defects in the welding process of the ManualFinish area.
3.3. Pareto Chart
The Pareto chart is a special type of bars chart in which each bar represents a different categoryor part of a problem [45]. It raised when the Italian scientist named Wilfredo Pareto found that80% of the wealth was received by 20% of people in Italy [46]. This type of chart illustrates the
Appl. Sci. 2018, 8, 2181 6 of 17
distribution frequency of descriptive data classified in categories. These categories are placed on thehorizontal axe and the frequencies on the vertical axe [45,46]. Talking on categories, they must be indescendent order from left to right, whereas the accumulated percentage of frequencies is representedby a line. The highest bars represent the most contributing categories to the problem. Pareto chartshelp identify how much some specific factors influence on a problem in relation with other factors,i.e., Pareto charts help to identify the best improvement opportunities [47]. Pareto chart has thefollowing advantages [45,48]:
• It decomposes a problem into categories or factors.• It identifies the key categories that contribute the most to a specific problem; this means, prioritize
the vital problems over the trivial ones.• It shows where to focus efforts.
Literature presents successful case studies applying pareto char. For instance, Visveshwar et al. [49]applied the Pareto chart, because it is cost effective when compared to any other complex decision-makingsupport systems. These authors provide an organized and systematic implementation of this toolin a plastic based production industry to achieve the continuous improvement cycle. Additionally,Shailee et al. [50] and Chokkalingam et al. [51] applied Pareto chart in the identification of majordefect sand inclusion in castings The Pareto chart assisted them to check and determine defect priority.As a result, it was possible to eliminate some casting defects as shrinkage. In a parallel way they appliedflowchart. Similarly, Sharma and Suri [52] applied Pareto chart in production process to reducingthe rejection and rework by identifying where highest rejection occurs at and to give suggestions forimprovement. Finally, Nabiilah et al. [53] applied the pareto chart in an electrodeposition process todetect the most frequent defects in such a process. As result, they detected that bits were the mostfrequent defect in electrodeposition process.
As in the case studies of PDCA cycle, literature review shows that the Pareto chart is a useful tool todetect the most frequent defects in a process or product. Therefore, we selected the Pareto chart to detectthe most frequent defects in the welding process of the manual Finish area.
3.4. Flowchart
A flowchart is a visual tool that shows the workflow for a specific work process, facilitating theunderstanding, standardization and improvement of such process. More precisely, a flowchart isa picture that contains the steps of a work process. It uses different symbols to represent differenttypes of activities of a process. For instance, it uses boxes or rectangles to represent the activitiesor steps of the process or task, ovals, or circles to indicate the beginning and the end of the process,diamonds to indicate that decision must be made, as well as arrows to indicate the sequence of saidsteps. The flowchart provides the following advantages [47,54]:
• It allows identify the sequence of necessary steps to perform a task.• It allows identifying the relationships among the steps.• It highlights the transferences, i.e., the places from where the process flows from a person to
another one.• It allows for detecting problems in the analyzed work process.
Although the necessary steps to perform a task can be identified by means of a list, a flowchartis easier to interpret, follow, and remember. Moreover, a flowchart allows identify the process to beanalyzed, the total steps in the process, and the beginning and the end of the process [54].
4. Case Study
Following subsection describes the methodology applied in the present case study.
Appl. Sci. 2018, 8, 2181 7 of 17
4.1. Methodology
The PDCA cycle was used to perform the present project. As mentioned above, the PDCA cyclecomprises four phases: (1) Plan, (2) Do, (3) Check, and (4) Act. Following subsections describe howeach PDCA phase was applied in this project.
4.1.1. Phase 1. Plan
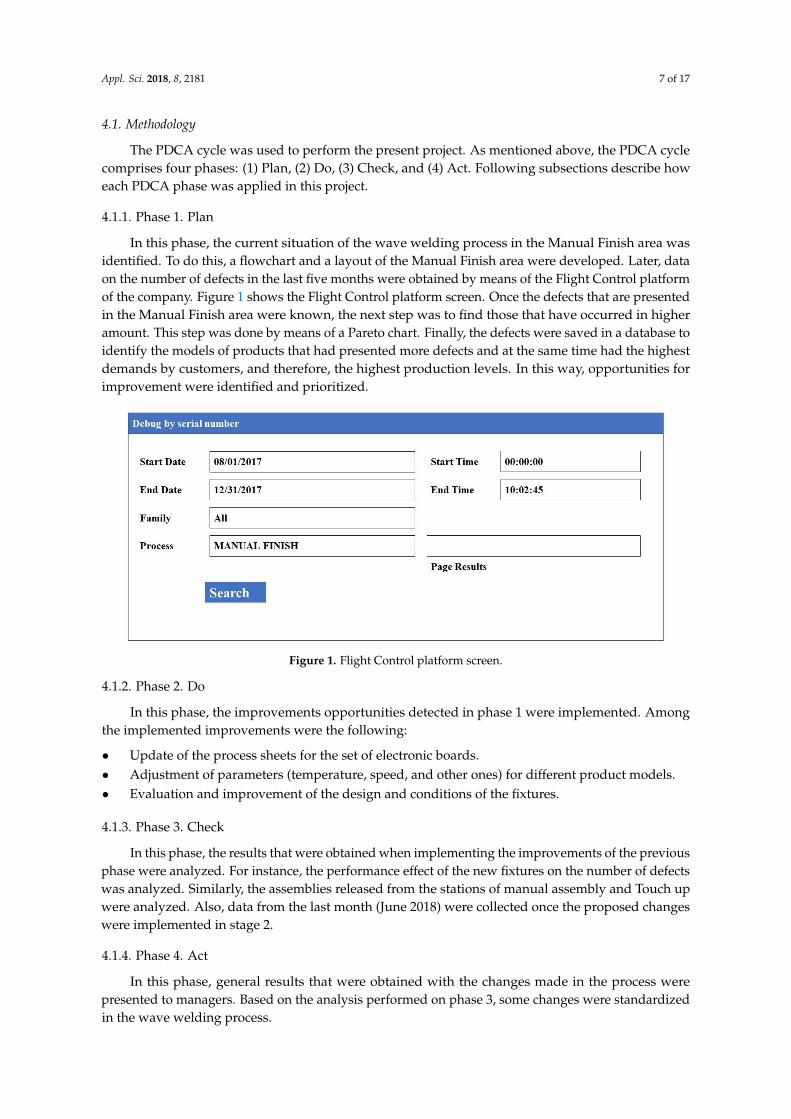
In this phase, the current situation of the wave welding process in the Manual Finish area wasidentified. To do this, a flowchart and a layout of the Manual Finish area were developed. Later, dataon the number of defects in the last five months were obtained by means of the Flight Control platformof the company. Figure 1 shows the Flight Control platform screen. Once the defects that are presentedin the Manual Finish area were known, the next step was to find those that have occurred in higheramount. This step was done by means of a Pareto chart. Finally, the defects were saved in a database toidentify the models of products that had presented more defects and at the same time had the highestdemands by customers, and therefore, the highest production levels. In this way, opportunities forimprovement were identified and prioritized.
Appl. Sci. 2018, 8, x FOR PEER REVIEW 7 of 17
In this phase, the current situation of the wave welding process in the Manual Finish area was
identified. To do this, a flowchart and a layout of the Manual Finish area were developed. Later, data
on the number of defects in the last five months were obtained by means of the Flight Control
platform of the company. Figure 1 shows the Flight Control platform screen. Once the defects that
are presented in the Manual Finish area were known, the next step was to find those that have
occurred in higher amount. This step was done by means of a Pareto chart. Finally, the defects were
saved in a database to identify the models of products that had presented more defects and at the
same time had the highest demands by customers, and therefore, the highest production levels. In
this way, opportunities for improvement were identified and prioritized.
Figure 1. Flight Control platform screen.
4.1.2. Phase 2. Do
In this phase, the improvements opportunities detected in phase 1 were implemented. Among
the implemented improvements were the following:
Update of the process sheets for the set of electronic boards.
Adjustment of parameters (temperature, speed, and other ones) for different product models.
Evaluation and improvement of the design and conditions of the fixtures.
4.1.3. Phase 3. Check
In this phase, the results that were obtained when implementing the improvements of the
previous phase were analyzed. For instance, the performance effect of the new fixtures on the number
of defects was analyzed. Similarly, the assemblies released from the stations of manual assembly and
Touch up were analyzed. Also, data from the last month (June 2018) were collected once the proposed
changes were implemented in stage 2.
4.1.4. Phase 4. Act
In this phase, general results that were obtained with the changes made in the process were
presented to managers. Based on the analysis performed on phase 3, some changes were
standardized in the wave welding process.
5. Results
5.1. Results of Phase 1
Figure 2 shows the layout and flowchart for the Manual Finish area. As can be seen, the
production of electronic boards was performed in eight tasks: (1) Manual in, (2) Manual assembly,
(3) Wave soldering machine, (4) Touch up, (5) Hand soldering, (6) Inspection, (7) Finish out, and (8)
Quality Assurance (Q.A.). Improvement opportunities were detected in the tasks of Manual assembly
Figure 1. Flight Control platform screen.
4.1.2. Phase 2. Do
In this phase, the improvements opportunities detected in phase 1 were implemented. Amongthe implemented improvements were the following:
• Update of the process sheets for the set of electronic boards.• Adjustment of parameters (temperature, speed, and other ones) for different product models.• Evaluation and improvement of the design and conditions of the fixtures.
4.1.3. Phase 3. Check
In this phase, the results that were obtained when implementing the improvements of the previousphase were analyzed. For instance, the performance effect of the new fixtures on the number of defectswas analyzed. Similarly, the assemblies released from the stations of manual assembly and Touch upwere analyzed. Also, data from the last month (June 2018) were collected once the proposed changeswere implemented in stage 2.
4.1.4. Phase 4. Act
In this phase, general results that were obtained with the changes made in the process werepresented to managers. Based on the analysis performed on phase 3, some changes were standardizedin the wave welding process.
Appl. Sci. 2018, 8, 2181 8 of 17
5. Results
5.1. Results of Phase 1
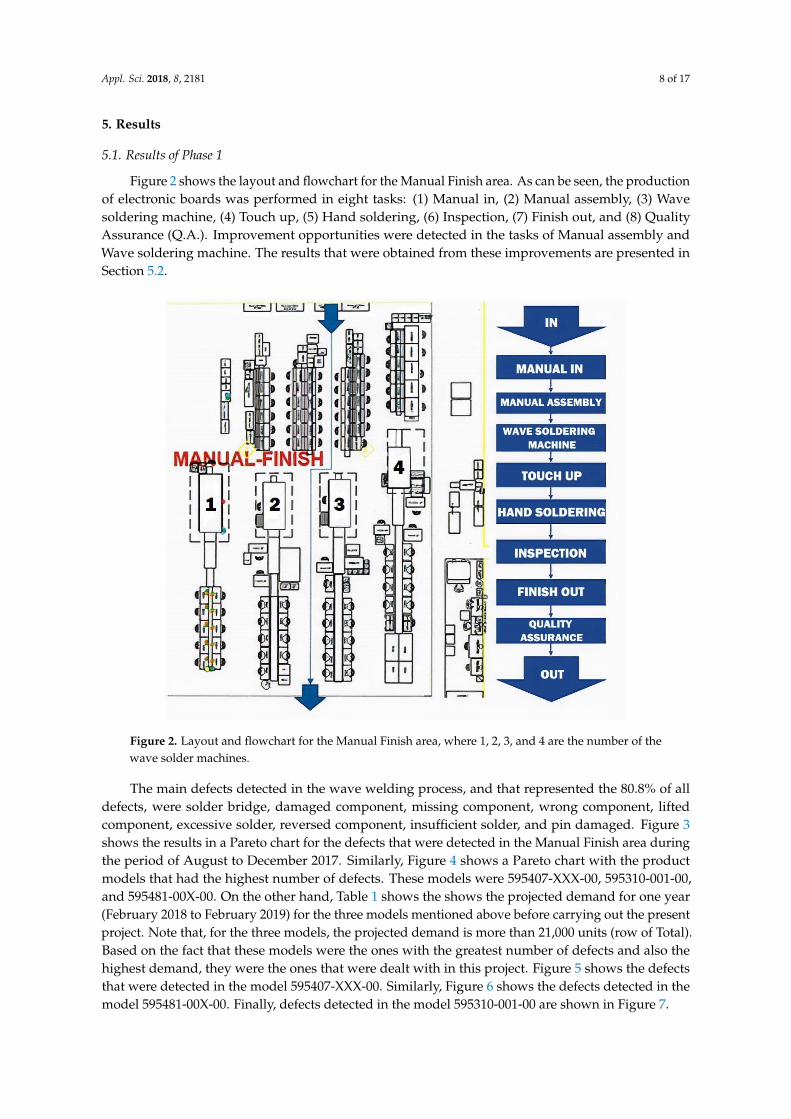
Figure 2 shows the layout and flowchart for the Manual Finish area. As can be seen, the productionof electronic boards was performed in eight tasks: (1) Manual in, (2) Manual assembly, (3) Wavesoldering machine, (4) Touch up, (5) Hand soldering, (6) Inspection, (7) Finish out, and (8) QualityAssurance (Q.A.). Improvement opportunities were detected in the tasks of Manual assembly andWave soldering machine. The results that were obtained from these improvements are presented inSection 5.2.
Appl. Sci. 2018, 8, x FOR PEER REVIEW 8 of 17
and Wave soldering machine. The results that were obtained from these improvements are presented
in Section 5.2.
Figure 2. Layout and flowchart for the Manual Finish area, where 1, 2, 3, and 4 are the number of the
wave solder machines.
The main defects detected in the wave welding process, and that represented the 80.8% of all
defects, were solder bridge, damaged component, missing component, wrong component, lifted
component, excessive solder, reversed component, insufficient solder, and pin damaged. Figure 3
shows the results in a Pareto chart for the defects that were detected in the Manual Finish area during
the period of August to December 2017. Similarly, Figure 4 shows a Pareto chart with the product
models that had the highest number of defects. These models were 595407-XXX-00, 595310-001-00,
and 595481-00X-00. On the other hand, Table 1 shows the shows the projected demand for one year
(February 2018 to February 2019) for the three models mentioned above before carrying out the
present project. Note that, for the three models, the projected demand is more than 21,000 units (row
of Total). Based on the fact that these models were the ones with the greatest number of defects and
also the highest demand, they were the ones that were dealt with in this project. Figure 5 shows the
defects that were detected in the model 595407-XXX-00. Similarly, Figure 6 shows the defects detected
in the model 595481-00X-00. Finally, defects detected in the model 595310-001-00 are shown in Figure
7.
Figure 2. Layout and flowchart for the Manual Finish area, where 1, 2, 3, and 4 are the number of thewave solder machines.
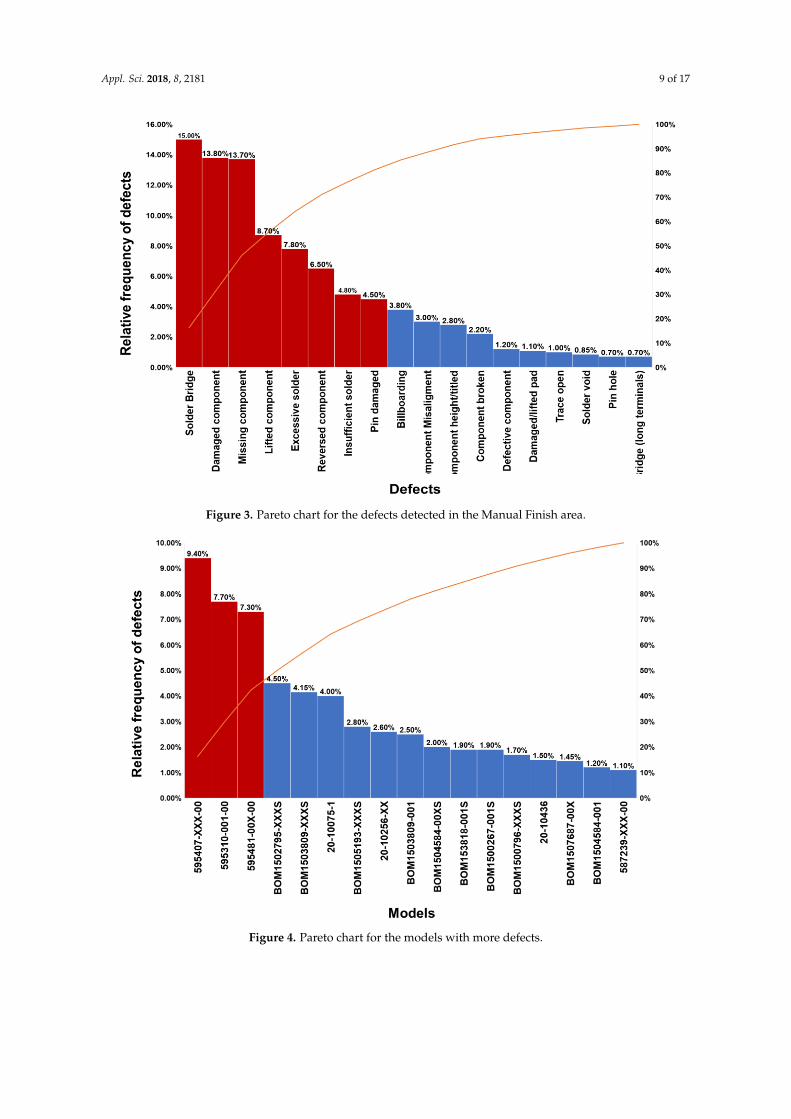
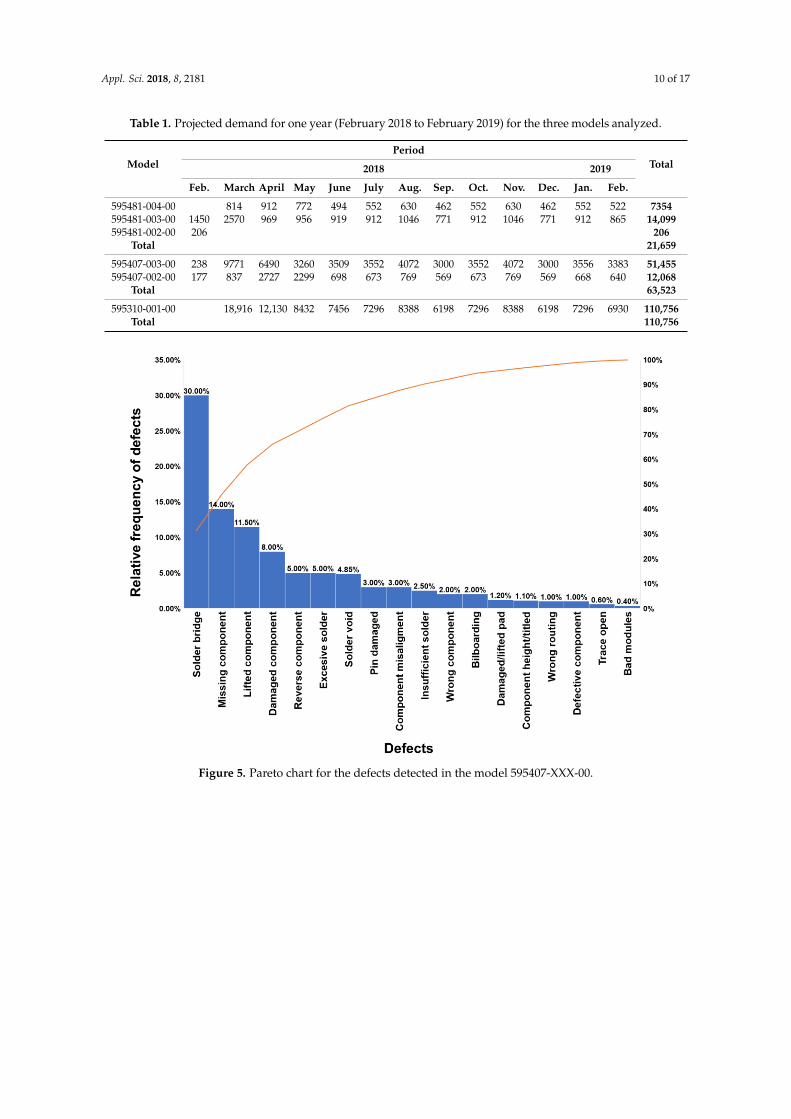
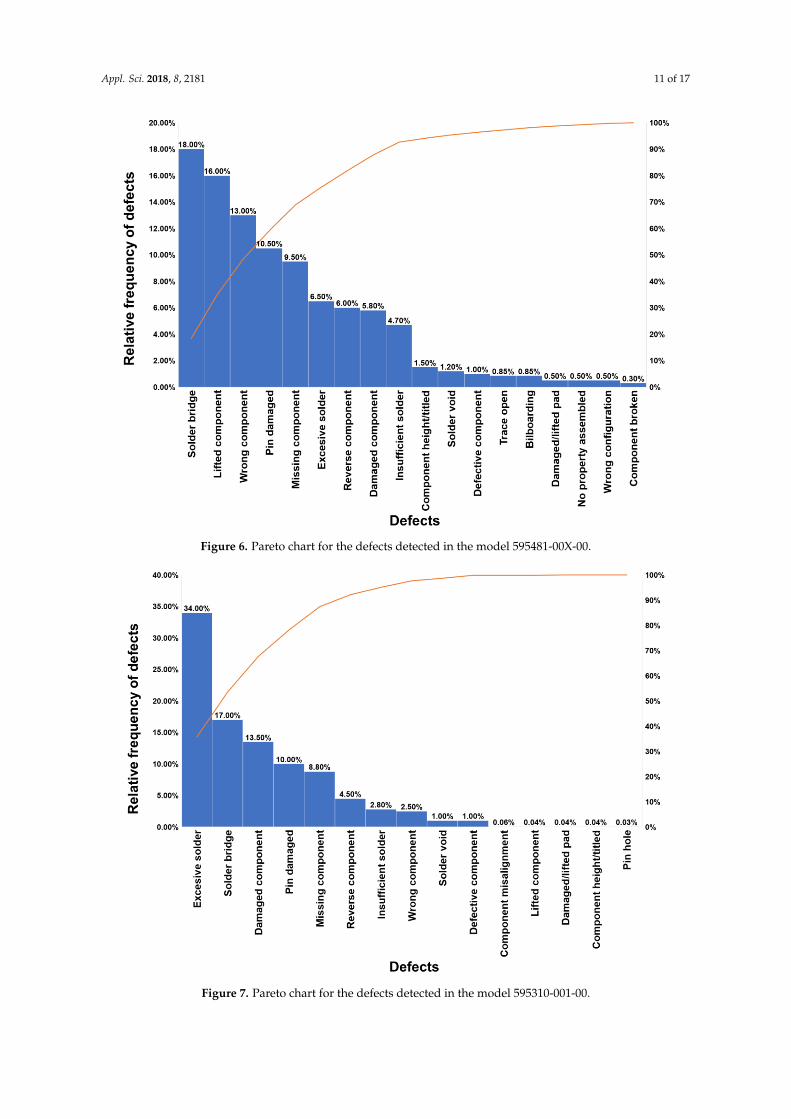
The main defects detected in the wave welding process, and that represented the 80.8% of alldefects, were solder bridge, damaged component, missing component, wrong component, liftedcomponent, excessive solder, reversed component, insufficient solder, and pin damaged. Figure 3shows the results in a Pareto chart for the defects that were detected in the Manual Finish area duringthe period of August to December 2017. Similarly, Figure 4 shows a Pareto chart with the productmodels that had the highest number of defects. These models were 595407-XXX-00, 595310-001-00,and 595481-00X-00. On the other hand, Table 1 shows the shows the projected demand for one year(February 2018 to February 2019) for the three models mentioned above before carrying out the presentproject. Note that, for the three models, the projected demand is more than 21,000 units (row of Total).Based on the fact that these models were the ones with the greatest number of defects and also thehighest demand, they were the ones that were dealt with in this project. Figure 5 shows the defectsthat were detected in the model 595407-XXX-00. Similarly, Figure 6 shows the defects detected in themodel 595481-00X-00. Finally, defects detected in the model 595310-001-00 are shown in Figure 7.
Appl. Sci. 2018, 8, 2181 9 of 17
Appl. Sci. 2018, 8, x FOR PEER REVIEW 9 of 17
Figure 3. Pareto chart for the defects detected in the Manual Finish area.
Figure 4. Pareto chart for the models with more defects.
Figure 3. Pareto chart for the defects detected in the Manual Finish area.
Appl. Sci. 2018, 8, x FOR PEER REVIEW 9 of 17
Figure 3. Pareto chart for the defects detected in the Manual Finish area.
Figure 4. Pareto chart for the models with more defects.
Figure 4. Pareto chart for the models with more defects.
Appl. Sci. 2018, 8, 2181 10 of 17
Table 1. Projected demand for one year (February 2018 to February 2019) for the three models analyzed.
ModelPeriod
Total2018 2019
Feb. March April May June July Aug. Sep. Oct. Nov. Dec. Jan. Feb.
595481-004-00 814 912 772 494 552 630 462 552 630 462 552 522 7354595481-003-00 1450 2570 969 956 919 912 1046 771 912 1046 771 912 865 14,099595481-002-00 206 206
Total 21,659
595407-003-00 238 9771 6490 3260 3509 3552 4072 3000 3552 4072 3000 3556 3383 51,455595407-002-00 177 837 2727 2299 698 673 769 569 673 769 569 668 640 12,068
Total 63,523
595310-001-00 18,916 12,130 8432 7456 7296 8388 6198 7296 8388 6198 7296 6930 110,756Total 110,756
Appl. Sci. 2018, 8, x FOR PEER REVIEW 10 of 17
Table 1. Projected demand for one year (February 2018 to February 2019) for the three models
analyzed.
Model
Period
Total 2018 2019
Feb. March April May June July Aug. Sep. Oct. Nov. Dec. Jan. Feb.
595481-
004-00 814 912 772 494 552 630 462 552 630 462 552 522 7354
595481-
003-00 1450 2570 969 956 919 912 1046 771 912 1046 771 912 865
14,09
9
595481-
002-00 206 206
Total 21,65
9
595407-
003-00 238 9771 6490 3260 3509 3552 4072 3000 3552 4072 3000
355
6 3383
51,45
5
595407-
002-00 177 837 2727 2299 698 673 769 569 673 769 569 668 640
12,06
8
Total 63,52
3
595310-
001-00 18,916
12,13
0 8432 7456 7296 8388 6198 7296 8388 6198
729
6 6930
110,7
56
Total 110,7
56
Figure 5. Pareto chart for the defects detected in the model 595407-XXX-00. Figure 5. Pareto chart for the defects detected in the model 595407-XXX-00.
Appl. Sci. 2018, 8, 2181 11 of 17Appl. Sci. 2018, 8, x FOR PEER REVIEW 11 of 17
Figure 6. Pareto chart for the defects detected in the model 595481-00X-00.
Figure 7. Pareto chart for the defects detected in the model 595310-001-00.
Figure 6. Pareto chart for the defects detected in the model 595481-00X-00.
Appl. Sci. 2018, 8, x FOR PEER REVIEW 11 of 17
Figure 6. Pareto chart for the defects detected in the model 595481-00X-00.
Figure 7. Pareto chart for the defects detected in the model 595310-001-00. Figure 7. Pareto chart for the defects detected in the model 595310-001-00.
Appl. Sci. 2018, 8, 2181 12 of 17
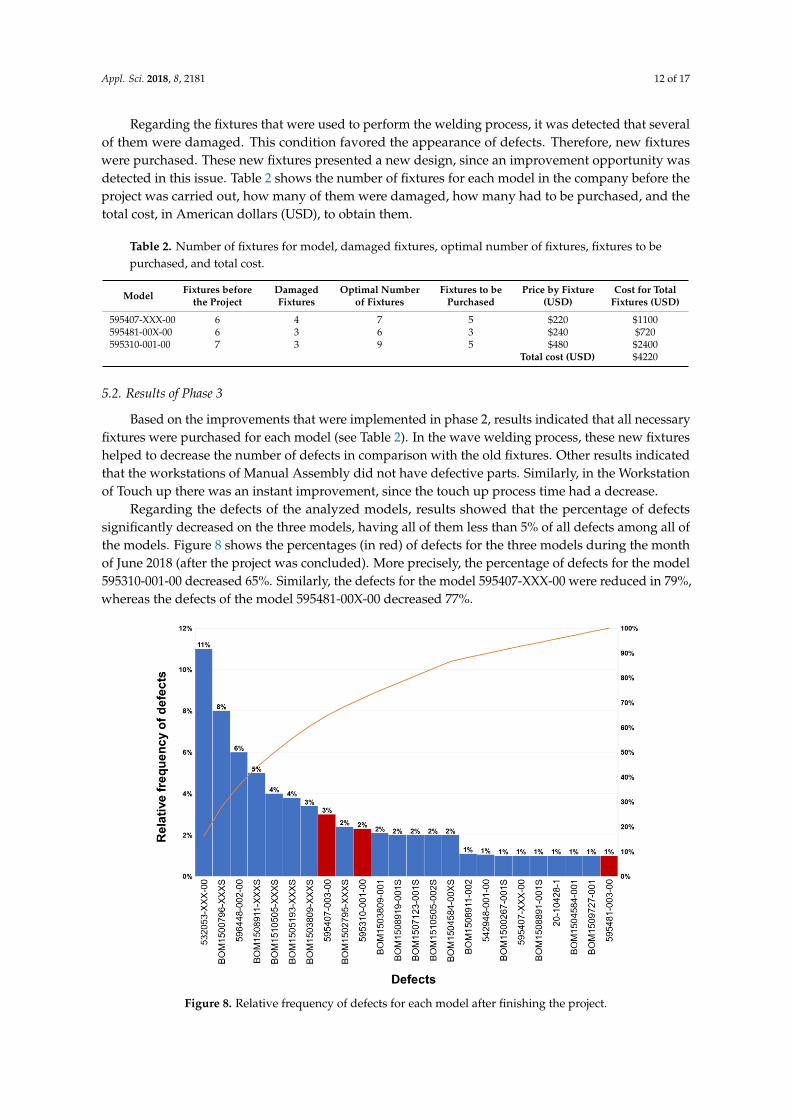
Regarding the fixtures that were used to perform the welding process, it was detected that severalof them were damaged. This condition favored the appearance of defects. Therefore, new fixtureswere purchased. These new fixtures presented a new design, since an improvement opportunity wasdetected in this issue. Table 2 shows the number of fixtures for each model in the company before theproject was carried out, how many of them were damaged, how many had to be purchased, and thetotal cost, in American dollars (USD), to obtain them.
Table 2. Number of fixtures for model, damaged fixtures, optimal number of fixtures, fixtures to bepurchased, and total cost.
Model Fixtures beforethe Project
DamagedFixtures
Optimal Numberof Fixtures
Fixtures to bePurchased
Price by Fixture(USD)
Cost for TotalFixtures (USD)
595407-XXX-00 6 4 7 5 $220 $1100595481-00X-00 6 3 6 3 $240 $720595310-001-00 7 3 9 5 $480 $2400
Total cost (USD) $4220
5.2. Results of Phase 3
Based on the improvements that were implemented in phase 2, results indicated that all necessaryfixtures were purchased for each model (see Table 2). In the wave welding process, these new fixtureshelped to decrease the number of defects in comparison with the old fixtures. Other results indicatedthat the workstations of Manual Assembly did not have defective parts. Similarly, in the Workstationof Touch up there was an instant improvement, since the touch up process time had a decrease.
Regarding the defects of the analyzed models, results showed that the percentage of defectssignificantly decreased on the three models, having all of them less than 5% of all defects among all ofthe models. Figure 8 shows the percentages (in red) of defects for the three models during the monthof June 2018 (after the project was concluded). More precisely, the percentage of defects for the model595310-001-00 decreased 65%. Similarly, the defects for the model 595407-XXX-00 were reduced in 79%,whereas the defects of the model 595481-00X-00 decreased 77%.
Appl. Sci. 2018, 8, x FOR PEER REVIEW 12 of 17
Regarding the fixtures that were used to perform the welding process, it was detected that
several of them were damaged. This condition favored the appearance of defects. Therefore, new
fixtures were purchased. These new fixtures presented a new design, since an improvement
opportunity was detected in this issue. Table 2 shows the number of fixtures for each model in the
company before the project was carried out, how many of them were damaged, how many had to be
purchased, and the total cost, in American dollars (USD), to obtain them.
Table 2. Number of fixtures for model, damaged fixtures, optimal number of fixtures, fixtures to be
purchased, and total cost.
Model Fixtures before
the Project
Damaged
Fixtures
Optimal
Number of
Fixtures
Fixtures to
be
Purchased
Price by
Fixture
(USD)
Cost for Total
Fixtures
(USD)
595407-XXX-00 6 4 7 5 $220 $1100
595481-00X-00 6 3 6 3 $240 $720
595310-001-00 7 3 9 5 $480 $2400
Total cost (USD) $4220
5.2. Results of Phase 3
Based on the improvements that were implemented in phase 2, results indicated that all
necessary fixtures were purchased for each model (see Table 2). In the wave welding process, these
new fixtures helped to decrease the number of defects in comparison with the old fixtures. Other
results indicated that the workstations of Manual Assembly did not have defective parts. Similarly,
in the Workstation of Touch up there was an instant improvement, since the touch up process time
had a decrease.
Regarding the defects of the analyzed models, results showed that the percentage of defects
significantly decreased on the three models, having all of them less than 5% of all defects among all
of the models. Figure 8 shows the percentages (in red) of defects for the three models during the
month of June 2018 (after the project was concluded). More precisely, the percentage of defects for
the model 595310-001-00 decreased 65%. Similarly, the defects for the model 595407-XXX-00 were
reduced in 79%, whereas the defects of the model 595481-00X-00 decreased 77%.
Figure 8. Relative frequency of defects for each model after finishing the project. Figure 8. Relative frequency of defects for each model after finishing the project.
Appl. Sci. 2018, 8, 2181 13 of 17
At the same time, these results led to an increase in the product quality, since the number of timesthe electronic boards were retouched was decreased, which in the beginning caused them to wear out,was reduced. Likewise, an increase in production was obtained in the three analyzed models, sincethe average times in the Touch up stations were reduced. For the model 595310-001-00, the averagetime in the Touch-up station decreased from 2.1 to 0.73 min; for the model 595407-XXX-00, from 2.54 to0.53 min; and, for the model 595481-00X-00, from 3.1 to 0.71 min. Table 3 shows the monthly capacityof the Touch up station before the project was carried out.
Table 3. Monthly capacity of the Touch up station before the project was carried out.
Parameter Number
Shifts per day 2Hours per shift 9Hours of rest 1
Double production lines 3Net time per day (hours) 96Days worked per week 6
Weeks worked per month 4Net time per month (hours) 2304
Table 4 shows the hours earned by model at the Touch up station once the project was completed.
Table 4. Hours won by model at the Touch up station once the project was completed.
ModelTimes of the Touch Up (Hours) Hours Earned per
MonthBefore After Difference
595310-001-00 0.035 0.012 0.023 212.28595407-XXX-00 0.042 0.009 0.033 174.68595481-00X-00 0.052 0.012 0.04 67.36
Total 454.33
Based on the differences that are presented in Tables 3 and 4, the results indicated an increase of19.72% in the capacity of the Touch up station. In economic terms, this percentage represents a savingof $21,027 USD projected to one year, since the cost per operator was $3.87 USD per hour.
5.3. Results of Phase 4
At this stage, results were presented to the managers who approved standardizing some changesin the wave welding process. Some of the standardized changes were the use of fixtures with thenew design, the update of visual aids with real photos of the electronic boards, in which notes for theelectronic boards with polarity were added, specifying the correct positioning of the board. Similarly,some parameters (temperature, fan speed, wave speed, conveyor speed, conveyor width, flux amount)were changed and standardized for the three models.
6. Analysis of Results
If we make a contrast of the results in this project with the results of other projects that alsoapplied Pareto charts and PDCA, we can state that the results obtained are correct. In all the casestudies presented in literature review, Pareto charts were applied to detect the most common defectsof a specific product or process. In our project, we detected the most common defects in the weldingprocess of electronic boards by applying Pareto charts. These defects were solder bridge, damagedcomponent, missing component, wrong component, lifted component, excessive solder, reversedcomponent, insufficient solder, and pin damaged. Also, Pareto charts helped to detect the models withmore defects. Regarding the application of the PDCA cycle, case studies mentioned above showed
Appl. Sci. 2018, 8, 2181 14 of 17
that it is a useful method to decrease the number of defects of different process or products. In ourcase study, results indicated a reduction of defects by 65%, 79%, and 77% in the three models analyzed.These results mean that the application of the PDCA cycle and the Pareto charts was correct. Also, suchresults imply that the defects we analyzed should not appear more or should show a decrease trend inits appearance.
7. Conclusions and Recommendations
In general terms, it is concluded that the PDCA cycle is a tool that facilitates the detection ofimprovement opportunities, as well as the development and implementation of the same in leanmanufacturing projects. This can be further simplified by the application of support tools, as in thiscase study were the Pareto charts and the flowchart. Together, the three tools help to globally increasethe competitiveness of manufacturing companies, as in the case of the case study shown in this project.
With respect to the objectives proposed in this project, it is concluded that the objective of reducing,at least 20%, the defects generated by the wave welding process in the models with the highest salesvolume in the Manual-Finish area was achieved, since the number of defects on the three analyzedmodels decreased by 65%, 79%, and 77%. On the other hand, with regard to the objective of increasingthe capacity in the three double production lines of the electronic boards by at least 20%, it is concludedthat also this objective was achieved, since the result was 19.72%, which had a difference of 0.28%,which it is considered to be non-significant. Finally, these results allow the company to be closerto complying with the IPC-A-610E standard, since a high percentage of the electronic boards of theanalyzed models managed to meet the criteria established by that standard.
Based on the results in this case study, it is recommended to replicate the PDCA cycle in theother models, present more defects, such as 532053-XXX-00, BOM1500796-XXXS, and 596448-002-00,to name a few.
Throughout the project there were different limitations that at that moment made it difficult tocarry out. Among these limitations are the absences of the personnel in charge of carrying out specificactivities within the project. These absences were due to different causes, such as disabilities or tripsoutside the city where the manufacturing company is located. In addition, there were time limitations.This type of limitations arose from the need to buy fixtures with a new design. At the time of placingthe order with the design specifications, the supplier already had an important workload to attendto. This caused the delivery time to delay the project and continue using the fixtures without the newdesign. Both limitations were overcome. In the case of the absence of personnel, another worker wastrained in the specific task of the project. This training lasted a week before the person responsible forthe activity went on a trip. Regarding to absences due to disability, the doubts that arose were resolvedby contacting the responsible person, either by email or by telephone. In the case of the second type oflimitation, this was resolved simply by waiting for the supplier to deliver the new accessories.
Author Contributions: Conceptualization, investigation and writing—original draft preparation, A.R.-V. andG.R.; formal analysis, writing—review and editing, K.C.A.-S.; supervision and funding acquisition, T.C.-G.
Funding: This research received no external funding.
Acknowledgments: The authors want to acknowledge to the Tecnológico Nacional de Mexico/InstitutoTecnológico de Tijuana and to the Universidad Autónoma de Baja California for allowing us to use their facilitiesand resources to develop this paper. Also, the authors want to thank the National Council of Science andtechnology (CONACYT) and PRODEP for their support to continuing performing research.
Conflicts of Interest: Authors declare no conflict of interest.
References
1. Journal of Applied Sciences. Special Issue: Applied Engineering to Lean Manufacturing Production Systems.2018. Available online: https://www.mdpi.com/journal/applsci/special_issues/aelmps (accessed on 3October 2018).
Appl. Sci. 2018, 8, 2181 15 of 17
2. Kumar, M.; Vaishya, R. Parag Real-Time Monitoring System to Lean Manufacturing. Procedia Manuf. 2018,20, 135–140. [CrossRef]
3. Sartal, A.; Llach, J.; Vázquez, X.H.; De Castro, R. How much does Lean Manufacturing need environmentaland information technologies? J. Manuf. Syst. 2017, 45, 260–272. [CrossRef]
4. Botti, L.; Mora, C.; Regattieri, A. Integrating ergonomics and lean manufacturing principles in a hybridassembly line. Comput. Ind. Eng. 2017, 111, 481–491. [CrossRef]
5. Marodin, G.; Frank, A.G.; Tortorella, G.L.; Netland, T. Lean product development and lean manufacturing:Testing moderation effects. Int. J. Prod. Econ. 2018, 203, 301–310. [CrossRef]
6. Womack, J.; Jones, D.; Roos, D. The Machine that Changed the World: The Story of Lean Production; HarperPerennial: New York, NY, USA, 1990.
7. Jadhav, P.K.; Nagare, M.R.; Konda, S. Implementing Lean Manufacturing Principle in Fabrication Process—ACase Study. Int. Res. J. Eng. Technol. 2018, 5, 1843–1847.
8. Walder, J.; Karlin, J.; Kerk, C. Integrated Lean Thinking & Ergonomics: Utilizing Material Handling Assist DeviceSolutions for a Productive Workplace; Material Handling Industry of America: Charlotte, NC, USA, 2007;pp. 1–18.
9. Zhou, X.-Y.; Gosling, P.D. Influence of stochastic variations in manufacturing defects on the mechanicalperformance of textile composites. Compos. Struct. 2018, 194, 226–239. [CrossRef]
10. Buixansky, B.; Fleck, N.A. Compressive failure of fibre Composites. J. Mech. Phys. Solids 1993, 41, 183–211.11. Pinho, S.T.; Iannucci, L.; Robinson, P. Physically-based failure models and criteria for laminated
fibre-reinforced composites with emphasis on fibre kinking: Part I: Development. Compos. Part A Appl.Sci. Manuf. 2006, 37, 63–73. [CrossRef]
12. Gommer, F.; Endruweit, A.; Long, A.C. Quantification of micro-scale variability in fibre bundles. Compos. PartA Appl. Sci. Manuf. 2016, 87, 131–137. [CrossRef]
13. Guiras, Z.; Turki, S.; Rezg, N.; Dolgui, A. Optimization of Two-Level Disassembly/Remanufacturing/AssemblySystem with an Integrated Maintenance Strategy. Appl. Sci. 2018, 8, 666. [CrossRef]
14. Sreedharan, V.R.; Rajasekar, S.; Kannan, S.S.; Arunprasad, P.; Rajeev, T. Defect reduction in an electrical partsmanufacturer: A case study. TQM J. 2018, 30, 650–678. [CrossRef]
15. Karam, A.-A.; Liviu, M.; Cristina, V.; Radu, H. The contribution of lean manufacturing tools to changeovertime decrease in the pharmaceutical industry. A SMED project. Procedia Manuf. 2018, 22, 886–892. [CrossRef]
16. Hailu, H.; Mengstu, S.; Hailu, T. An integrated continuous improvement model of TPM, TPS and TQM forboosting profitability of manufacturing industries: An innovative model & guideline. Manag. Sci. Lett. 2018,8, 33–50. [CrossRef]
17. Jilcha, K.; Beshah, B.; Kitaw, D. The Plan-Do-Check-Act Cycle of Value Addition Theory of constraint forcontinuous improvment View project. Ind. Eng. Manag. 2014, 3, 1. [CrossRef]
18. Ning, J.; Chen, Z.; Liu, G. PDCA process application in the continuous improvement of software quality.In Proceedings of the 2010 IEEE International Conference on Computer, Mechatronics, Control and ElectronicEngineering, Changchun, China, 24–26 August 2010; pp. 61–65.
19. Longaray, A.A.; Laurino, F.C.; Tondolo, V.A.G.; Munhoz, P.R. Proposta de aplicação do ciclo PDCA paramelhoria contínua do sistema de confinamento bovino: Um estudo de caso. Sist. Gest. 2017, 12, 353.[CrossRef]
20. Darmawan, H.; Hasibuan, S.; Hardi-Purba, H. Application of Kaizen Concept with 8 Steps PDCA to Reducein Line Defect at Pasting Process: A Case Study in Automotive Battery. Int. J. Adv. Sci. Res. Eng. 2018, 4,97–107. [CrossRef]
21. Sokovic, M.; Pavletic, D.; Pipan, K.K. Quality improvement methodologies—PDCA cycle, RADAR matrix,DMAIC and DFSS. J. Achiev. Mater. Manuf. Eng. 2010, 43, 476–483.
22. IPC. IPC-A-610E: Acceptability of Electronic Assemblies. 2018. Available online: http://shop.ipc.org/IPC-A-610E-English-D (accessed on 3 October 2018).
23. Strotmann, C.; Göbel, C.; Friedrich, S.; Kreyenschmidt, J.; Ritter, G.; Teitscheid, P. A Participatory Approach toMinimizing Food Waste in the Food Industry—A Manual for Managers. Sustainability 2017, 9, 66. [CrossRef]
24. De Souza, J.M. PDCA and lean manufacturing: Case study in appliance of quality process in alpha graphics.J. Leg. Bus. Sci. 2016, 17, 11–17. (In Portuguese)
25. Silva, A.S.; Medeiros, C.F.; Vieira, R.K. Cleaner Production and PDCA cycle: Practical application forreducing the Cans Loss Index in a beverage company. J. Clean. Prod. 2017, 150, 324–338. [CrossRef]
Appl. Sci. 2018, 8, 2181 16 of 17
26. Tajra, F.S.; Lira, G.V.; Rodrigues, Â.B.; Tajra, R.S. PDCA as associated methodological Audit Health: Reportof Sobral-Ceará. Mag. Tempus Actas Collect Heal 2012, 8, 202–215.
27. Sangpikul, A. Implementing academic service learning and the PDCA cycle in a marketing course:Contributions to three beneficiaries. J. Hosp. Leis. Sport Tour. Educ. 2017, 21, 83–87. [CrossRef]
28. Maruta, R. Maximizing Knowledge Work Productivity: A Time Constrained and Activity Visualized PDCACycle. Knowl. Process Manag. 2012, 19, 203–214. [CrossRef]
29. De Queiroz Albuquerque, A.C.R. Evaluation of the Application of the PDCA Cycle in Decision-Making in IndustrialProcesses; Federal University of Pará: Belém, Brazil, 2015. (In Portuguese)
30. Zhang, X. The research and exploration about teaching reform. In Proceedings of the Conference onEducation Technology and Information System, Sanya, China, 21–22 June 2013.
31. Jones, E.C.; Parast, M.M.; Adams, S.G. A framework for effective six Sigma implementation. Total Qual. Manag.2010, 21, 415–424. [CrossRef]
32. Gorenflo, G.; Moran, J.W. The ABCs of PDCA; Public Health Foundation: New Delhi, India, 2009; Volume 7.33. Khanna, H.K.; Laroiya, S.C.; Sharma, D.D. Quality management in Indian manufacturing organizations:
Some observations and results from a pilot survey. Braz. J. Oper. Prod. Manag. 2010, 7, 141–162.34. Alves-Pinto-Junior, M.J.; Veiga-Mendes, J. Operational practices of lean manufacturing: Potentiating
environmental improvements. J. Ind. Eng. Manag. 2017, 10, 550–580. [CrossRef]35. Luo, H.; Li, G.; Li, C. Research on Integration Method of Integrated Management System. Open Autom.
Control Syst. J. 2015, 7, 1802–1807. [CrossRef]36. Shahar, M.S.; Salleh, N.A.M. Design and Analysis of Tungsten Carbide Sludge Removal Machine for
Maintenance Department in Cutting Tool Manufacturer. Procedia Manuf. 2017, 11, 1396–1403. [CrossRef]37. Rosa, C.; Silva, F.J.G.; Ferreira, L.P. Improving the Quality and Productivity of Steel Wire-rope Assembly
Lines for the Automotive Industry. Procedia Manuf. 2017, 11, 1035–1042. [CrossRef]38. Nabiilah, A.R.; Hamedon, Z.; Faiz, M.T. Improving Quality of Light Commercial Vehicle. Manag. J. Adv.
Manuf. Technol. 2016, 12, 525–534.39. Nabiilah, A.R.; Hamedon, Z.; Faiz, M.T. Bits Reduction in the Electrodeposition Process of a Pickup Truck:
A Case Study. Jordan J. Mech. Ind. Eng. 2017, 11, 27–33.40. Chen, X.-Q.; Zhao, Y.-T. The PDCA Cycle Management Method in the Herceptin Usage Management
Application. J. Taizhou Polytech. Coll. 2017, 1, 22.41. Rahman, M.; Dey, K.; Kapuria, T.K.; Tahiduzzaman, M. Minimization of Sewing Defects of an Apparel
Industry in Bangladesh with 5S & PDCA. Am. J. Ind. Eng. 2018, 5, 17–24. [CrossRef]42. Jagusiak-Kocik, M. PDCA cycle as a part of continuous improvement in the production company—A case
study. Prod. Eng. Arch. 2017, 14, 19. [CrossRef]43. Kholif, A.M.; Abou El Hassan, D.S.; Khorshid, M.A.; Elsherpieny, E.A.; Olafadehan, O.A. Implementation of
model for improvement (PDCA-cycle) in dairy laboratories. J. Food Saf. 2018, 38, e12451. [CrossRef]44. Ahmed, S.; Shahadat, M. Theory Driven Real Time Empirical Investigation on Joint Implementation of
PDCA and 5S for Performance Improvement in Plastic Moulding Industry. Aust. J. Basic Appl. Sci. 2009, 3,3825–3835.
45. Joiner Associates Staff. Pareto Charts: Plain & Simple; Oriel Incorporated: Madison, WI, USA, 1995.46. Beheshti, M.H.; Hajizadeh, R.; Farhang Dehghan, S.; Aghababaei, R.; Jafari, S.M.; Koohpaei, A. Investigation
of the Accidents Recorded at an Emergency Management Center Using the Pareto Chart: A Cross-SectionalStudy in Gonabad, Iran, During 2014–2016. Heal. Emerg. Disasters Q. 2018, 3, 143–150. [CrossRef]
47. Webber, L.; Wallace, M. Quality Control for Dummies; John Wiley & Sons: Indianapolis, IN, USA, 2011.48. Joiner Associates Staff. Introduction to the Tools: Plain & Simple: Learning and Application Guide; Oriel
Incorporated: Madison, WI, USA, 1995.49. Visveshwar, N.; Vishal, V.; Samsingh, R.V.; Karthik, P. Application of Quality Tools in a Plastic Based
Production Industry to achieve the Continuous Improvement Cycle. Qual. Access Success 2017, 18, 61–64.50. Acharya, S.G.; Sheladiya, M.V.; Acharya, G.D. An Application of PARETO Chart for Investigation of Defects
in FNB Casting Process. J. Exp. Appl. Mech. 2018, 9, 33–39.51. Chokkalingam, B.; Raja, V.; Anburaj, J.; Immanual, R.; Dhineshkumar, M. Investigation of Shrinkage Defect
in Castings by Quantitative Ishikawa Diagram. Arch. Foundry Eng. 2017, 17, 174–178. [CrossRef]52. Sharma, H.; Suri, N.M. Implementation of Quality Control Tools and Techniques in Manufacturing Industry
for Process Improvement. Int. Res. J. Eng. Technol. 2017, 4, 1581–1587.

Appl. Sci. 2018, 8, 2181 17 of 17
53. Nabiilah, A.R.; Hamedon, Z.; Faiz, M.T. Improving Quality of Light Commercial Vehicle Using PDCAApproach. J. Adv. Manuf. Technol. 2018, 12, 525–534.
54. Joiner Associates. Flowcharts: Plain and Simple; Oriel Incorporated: Madison, WI, USA, 1995.
© 2018 by the authors. Licensee MDPI, Basel, Switzerland. This article is an open accessarticle distributed under the terms and conditions of the Creative Commons Attribution(CC BY) license (http://creativecommons.org/licenses/by/4.0/).