
Applied Energy - Repositori Obert UdL
18
Applied Energy 304 (2021) 117647 Available online 3 September 2021 0306-2619/© 2021 The Authors. Published by Elsevier Ltd. This is an open access article under the CC BY license (http://creativecommons.org/licenses/by/4.0/). Hybrid high-concentration photovoltaic-thermal solar systems for building applications A. Moreno a , D. Chemisana a, * , E.F. Fern´ andez b a Applied Physics Section of the Environmental Science Department, University of Lleida, Lleida 25001, Spain b Advances in Photovoltaics (AdPVTech) CEACTEMA, University of Ja´ en, Ja´ en 23071, Spain HIGHLIGHTS • A high-concentration photovoltaic-thermal (HCPVT) system for buildings is proposed. • A performance comparison with a standard PVT collector is carried out. • HCPVT and PVT systems are assessed for two different representative locations. • The HCPVT system outperforms the PVT one in terms of total energy generation. • The HCPVT device shows high potential for covering the building energy demands. A R T I C L E INFO Keywords: Solar energy generation Concentrating photovoltaics (CPVs) Hybrid photovoltaic-thermal (PVT) High-concentration photovoltaic (HCPV) systems Building-applied photovolaics (BAPVs) Energy efficiency in buildings ABSTRACT In situ photovoltaic-thermal (PVT) solar energy generation in buildings is an effective way to cover both thermal and electrical energy demands, mimizing losses and costs associated with transportation. High-concentration PVT (HCPVT) collectors present higher electrical conversion efficiencies, lower thermal dependence co- efficients and the possibility of achieving higher temperature heat than conventional PVT systems. These features address the need of maximizing the energy generation in cities where there is very limited available space for renewable energy installations. In the present study, a HCPVT module has been designed, modelled and simu- lated. Simulations have been conducted for two representative cities with different climates but both suitable for solar concentration applications: Almería (Spain) and Lancaster (United States). The results demonstrate a very good performance in both locations, covering from 95% to 100% of the domestic hot water demand, and more than 55% of the space heating and cooling and electricity demands. Additionally, a comparison with a standard PVT solar collector has been carried out, indicating that the HCPVT system clearly outperforms the standard one in terms of the electricity and the thermal energy produced. 1. Introduction The major part of energy consumption is related to buildings, rep- resenting a percentage of 40% in the case of the European Union (EU) [1]. In 2017, in the building sector, households accounted for 27.2% of the total energy consumption in the EU [2]. In order to reverse this situation, the latest Directive of the European Parliament (2018/844) states the objectives to be fulfilled in buildings by 2030: the energy ef- ficiency should be improved by 32.5%, greenhouse gas emissions should be reduced by 40%, and 32% of the energy production should come from renewable energy [3]. These goals should be met by adding or inte- grating renewable energies in buildings. Within renewable energies, solar energy stands as the one with the greatest potential since the solar resource is the most extended and solar modules have adequate features for building applications (weight, size flexibility, cost, colour variability, etc.). Concentrating Photovoltaics (CPVs) is the solar electricity genera- tion technology with the highest electricity conversion efficiency among all the PVs. Cell and module efficiencies of 47.1% and 38.9% enable CPVs to present a very high potential [4–6]. However, the installation cost of a CPV system can be more than double (2.3 times) the cost of an inclined flat PV system [7]. On the other hand, under proper high direct irradiance conditions (>2500 kWh⋅m 2 ⋅year 1 ) and at utility scale, CPVs have proved to be competitive with PVs. Calculations indicated * Corresponding author at: Applied Physics Section of the Environmental Science Department, University of Lleida, Lleida 25001, Spain. Tel.: +34973003711. E-mail address: [email protected] (D. Chemisana). Contents lists available at ScienceDirect Applied Energy journal homepage: www.elsevier.com/locate/apenergy https://doi.org/10.1016/j.apenergy.2021.117647 Received 3 May 2021; Received in revised form 8 August 2021; Accepted 14 August 2021
-
Upload
khangminh22 -
Category
Documents
-
view
4 -
download
0
Transcript of Applied Energy - Repositori Obert UdL
Applied Energy 304 (2021) 117647
Available online 3 September 20210306-2619/© 2021 The Authors. Published by Elsevier Ltd. This is an open access article under the CC BY license (http://creativecommons.org/licenses/by/4.0/).
Hybrid high-concentration photovoltaic-thermal solar systems for building applications
A. Moreno a, D. Chemisana a,*, E.F. Fernandez b
a Applied Physics Section of the Environmental Science Department, University of Lleida, Lleida 25001, Spain b Advances in Photovoltaics (AdPVTech) CEACTEMA, University of Jaen, Jaen 23071, Spain
H I G H L I G H T S
• A high-concentration photovoltaic-thermal (HCPVT) system for buildings is proposed. • A performance comparison with a standard PVT collector is carried out. • HCPVT and PVT systems are assessed for two different representative locations. • The HCPVT system outperforms the PVT one in terms of total energy generation. • The HCPVT device shows high potential for covering the building energy demands.
A R T I C L E I N F O
Keywords: Solar energy generation Concentrating photovoltaics (CPVs) Hybrid photovoltaic-thermal (PVT) High-concentration photovoltaic (HCPV) systems Building-applied photovolaics (BAPVs) Energy efficiency in buildings
A B S T R A C T
In situ photovoltaic-thermal (PVT) solar energy generation in buildings is an effective way to cover both thermal and electrical energy demands, mimizing losses and costs associated with transportation. High-concentration PVT (HCPVT) collectors present higher electrical conversion efficiencies, lower thermal dependence co-efficients and the possibility of achieving higher temperature heat than conventional PVT systems. These features address the need of maximizing the energy generation in cities where there is very limited available space for renewable energy installations. In the present study, a HCPVT module has been designed, modelled and simu-lated. Simulations have been conducted for two representative cities with different climates but both suitable for solar concentration applications: Almería (Spain) and Lancaster (United States). The results demonstrate a very good performance in both locations, covering from 95% to 100% of the domestic hot water demand, and more than 55% of the space heating and cooling and electricity demands. Additionally, a comparison with a standard PVT solar collector has been carried out, indicating that the HCPVT system clearly outperforms the standard one in terms of the electricity and the thermal energy produced.
1. Introduction
The major part of energy consumption is related to buildings, rep-resenting a percentage of 40% in the case of the European Union (EU) [1]. In 2017, in the building sector, households accounted for 27.2% of the total energy consumption in the EU [2]. In order to reverse this situation, the latest Directive of the European Parliament (2018/844) states the objectives to be fulfilled in buildings by 2030: the energy ef-ficiency should be improved by 32.5%, greenhouse gas emissions should be reduced by 40%, and 32% of the energy production should come from renewable energy [3]. These goals should be met by adding or inte-grating renewable energies in buildings. Within renewable energies,
solar energy stands as the one with the greatest potential since the solar resource is the most extended and solar modules have adequate features for building applications (weight, size flexibility, cost, colour variability, etc.).
Concentrating Photovoltaics (CPVs) is the solar electricity genera-tion technology with the highest electricity conversion efficiency among all the PVs. Cell and module efficiencies of 47.1% and 38.9% enable CPVs to present a very high potential [4–6]. However, the installation cost of a CPV system can be more than double (2.3 times) the cost of an inclined flat PV system [7]. On the other hand, under proper high direct irradiance conditions (>2500 kWh⋅m− 2⋅year− 1) and at utility scale, CPVs have proved to be competitive with PVs. Calculations indicated
* Corresponding author at: Applied Physics Section of the Environmental Science Department, University of Lleida, Lleida 25001, Spain. Tel.: +34973003711. E-mail address: [email protected] (D. Chemisana).
Contents lists available at ScienceDirect
Applied Energy
journal homepage: www.elsevier.com/locate/apenergy
https://doi.org/10.1016/j.apenergy.2021.117647 Received 3 May 2021; Received in revised form 8 August 2021; Accepted 14 August 2021
Applied Energy 304 (2021) 117647
2
Levelized Cost of Electricity (LCOE) ranging from 0.08 to 0.12 $⋅kWh− 1
with positive predictions for further reduction by 2030 [8]. Neverthe-less, over the last few years, standard PV modules presented a contin-uous cost reduction that promoted their installation worldwide and, in addition to this, costs are expected to be considerably reduced by 2030. For example, in the case of residential installations, a reduction from 0.18 $⋅kWh− 1 (in 2016) to 0.05 $⋅kWh− 1 (by 2030) was predicted [9]. However, it can also be noted that, over the last few years, the previous predictions are being constrained by a clear flattening of the price per kWp curve (observed since 2017) [10] or even a reversal of the trend was detected in the USA and Japan [11]. These low LCOEs and prices attained by the standard PV modules have relegated CPVs to the point of almost disappear. In 2017, the CPV installed capacity was around 5 MW while in 2013 it was above 120 MW [12].
At present, in a no-land-limitation scenario, standard PVs surpass CPVs due to cost advantages. Nonetheless, in the case of urban solar installations, the scenario could considerably change because of the limited space and, therefore, the value of land or roof area becomes significant. Moreover, as aforementioned, the energy demand in build-ings is regulated to be partly covered by renewables [3], with particular potential of solar energy systems. Bearing in mind that the mean elec-tricity demand is 3713 kWh/dwelling [13] and that ~1500 kWh/kWp is the mean electricity generation of a standard silicon module in the EU [11], the solar photovoltaic power installed to cover this demand should be around 2.47 kWp for each dwelling. The space needed to deliver this power ranges from 13.76 to 24.7 m2 [14], which is hardly achievable in most of the cases, especially in multi-family houses. Additionally to the electricity demand, domestic hot water and space heating and cooling demands should also be considered.
Hybrid photovoltaic-thermal (PVT) solar collectors, able to simul-taneously produce heat and electricity, are an interesting option to satisfy the thermal and electrical energy demands in buildings. It has been reported that PVT collectors require 60% less area to produce the same thermal and electrical yield compared with separate photovoltaic and thermal modules [15]. The greater efficiency in the occupation of the useful area of buildings addresses well the previously mentioned surface limitations in the urban context and installation costs are amortized over the electric and thermal generation of a collector, of-fering reduction in payback times [16]. In addition, modern building heat and electricity requierements are increasing since space heating and cooling (SH&C) and domestic hot water (DHW) demands are continuously increasing. PVT technologies, typically with crystalline silicon solar cells and fixed at an optimal tilt angle, are ideal to satisfy a portion of these demands based on a renewable and distributed source. Distributed generation also has a side benefit of alleviating demand on existing electric and natural gas grids [17]. Regarding operation tem-perature, the range [40–80]◦C is the most usual one for commercial PVTs [18]. These temperatures are adequate for domestic hot water production, certain space heating technologies (such as radiant floor) and represent a trade-off solution between generated heat and electrical efficiency reduction due to temperature. Despite this potential, higher outlet temperatures offer a wider range of possible applications (solar cooling, thermoelectric generation, electricity generation with thermal engine). The most direct solution to increase the operating temperature of a PVT collector is the use of solar concentration.
Concentrating PVTs (CPVTs) have the possibility to produce heat at temperatures above 100 ◦C with less electrical efficiency reduction than standard panels due to the low temperature coefficients of multi- junction solar cells, taking into consideration that these coefficients also decrease with increasing concentration ratios [19,20]. In the case of
multi-junction cells, the temperature coefficient values are one order of magnitude smaller than those of standard silicon solar cells [21].
Based on two of the positive features that CPVTs present, namely higher conversion efficiency and higher operation temperature than conventional PVs, several authors investigated different configurations involving various concentrating-type optics, including thermoelectric generators, utilizing spectral splitting, etc. [22,23]. However, in the specific case of applying CPVTs in buildings, very few studies have been reported in the literature on CPVT, especially in the case of high-concentration PVT (HCPVT) systems (concentration ratios >100X) [24,25,51].
In light of the issues mentioned above, further research supporting the feasibility and suitability of HCPVT systems for building applications should be conducted. This is because these systems offer high potential in urban areas with space limitations because of their high efficiency. In addition, the higher operation temperatures expand the thermal appli-cations of the heat produced (domestic hot water, space heating and cooling), improving the energy efficiency of the building. On the basis of this fact, the present research aims at hybridizing a high-concentration photovoltaic system and assessing its performance by means of a dy-namic energy simulation of the designed collector coupled with the electrical and thermal demands of a single-family house. In addition, the simulations are conducted for two locations, Almería (Spain) and Lan-caster (United States), with different climatic conditions to determine the sensitivity and suitability of the proposed configuration as a function of differential demands and meteorological conditions. To the best of the authors’ knowledge, the present investigation is the first in the literature dealing with the energetic simulation of a HCPVT collector for building applications. Therefore, a unique guide for promoting HCPVT technol-ogy as a suitable solar energy solution to cover both electricity and thermal energy demands with a higher performance compared to con-ventional flat PV systems is proposed.
Regarding the structure of the present article, the manuscript is divided into 5 sections. In Section 1, the topic is introduced. In Section 2, the HCPVT module and the building are described. In Section 3, the methodology adopted is presented. Section 4 contains the results. Finally, in Section 5 the main conclusions are stated.
2. Module and building description
2.1. Module description
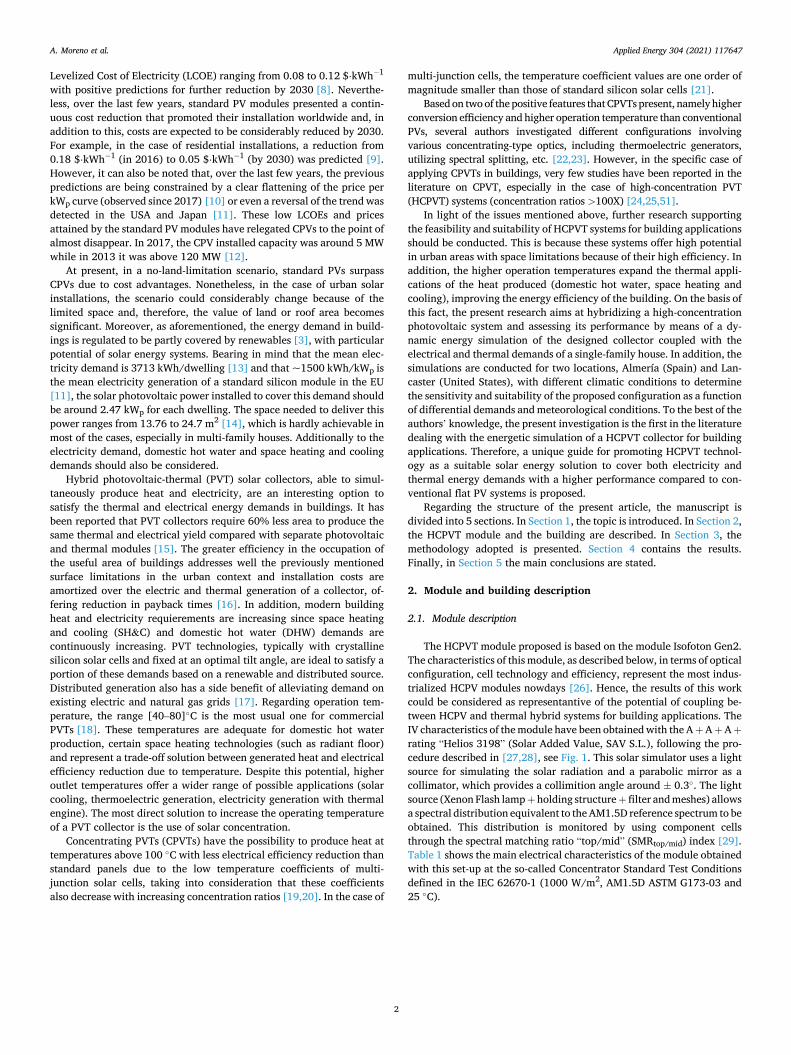
The HCPVT module proposed is based on the module Isofoton Gen2. The characteristics of this module, as described below, in terms of optical configuration, cell technology and efficiency, represent the most indus-trialized HCPV modules nowdays [26]. Hence, the results of this work could be considered as representantive of the potential of coupling be-tween HCPV and thermal hybrid systems for building applications. The IV characteristics of the module have been obtained with the A +A +A +rating “Helios 3198” (Solar Added Value, SAV S.L.), following the pro-cedure described in [27,28], see Fig. 1. This solar simulator uses a light source for simulating the solar radiation and a parabolic mirror as a collimator, which provides a collimition angle around ± 0.3◦. The light source (Xenon Flash lamp +holding structure +filter and meshes) allows a spectral distribution equivalent to the AM1.5D reference spectrum to be obtained. This distribution is monitored by using component cells through the spectral matching ratio “top/mid” (SMRtop/mid) index [29]. Table 1 shows the main electrical characteristics of the module obtained with this set-up at the so-called Concentrator Standard Test Conditions defined in the IEC 62670-1 (1000 W/m2, AM1.5D ASTM G173-03 and 25 ◦C).
A. Moreno et al.
Applied Energy 304 (2021) 117647
3
The passive heatsink has been replaced by an active cooling system that has been designed by utilizing the computational software Comsol Multiphysics. Fig. 2 illustrates the CPV module and the updated version of the cooling system. The module is formed by six concentrating units or submodules that consist of a silicone-on-glass (SoG) Fresnel lens operating as a primary optical element, a BK7 truncated inverted pyr-amid secondary optical element, a triple-junction GaInP/GaInAs/Ge
solar cell, a heatsink per unit and a metallic case that holds and fixes all the elements. The aperture area of the 6-unit module is 6 × 571.21 cm2
and the geometric concentration is 500X. As aforementioned, the fins of the passive heat sink are replaced by a pipe thermally attached to the base beneath the cells. The pipe and the metallic plate (aluminum), where the cells lie, are isolated with a 2 cm rockwool layer at the front and rear sides to assure minimizing heat losses.
Fig. 1. The set-up to obtain the IV characteristics of the HCPV module at the CEACTEMA of the University of Jaen: a) HCPV module, supporting structure and collimator mirror, b) light source (Xenon Flash lamp + holding structure + filter and meshes), and c) component cells to monitor the input spectrum.
Table 1 Main characteristics of the CPV module measured under the solar simulator at Concentrator Standard Test Conditions (CSTC), i.e. direct irradiance = 1000 W/m2, spectrum = SMRtop/mid = 1 ± 0.01, room temperature = 25 ◦C ± 1 ◦C. C is the geometric concentration, ηo is the optical efficiency, Voc is the open-circuit voltage, Isc is the short-circuit current, pmp subscript refers to the parameters at maximum power point (mpp), FF is the fill factor, η is the electrical efficiency, T is the cell tem-perature and γ is the temperature coefficient of the power.
C ηo Voc (V) Isc (A) Pmpp (W) Vmpp (V) Impp (A) FF (-) η T (◦C) γ (%/◦C)
500x 0.83 19.1 5.81 91.1 17.2 5.29 0.82 0.266 24.2 − 0.21
Fig. 2. a) Photograph of the CPV module; b) Original passive cooling system and designed active cooling system (updated version). The insulation layer atop of the cell has been drawn transparent to distinguish the secondary optical element, the cell, the cell holder and the plate.
A. Moreno et al.
Applied Energy 304 (2021) 117647
4
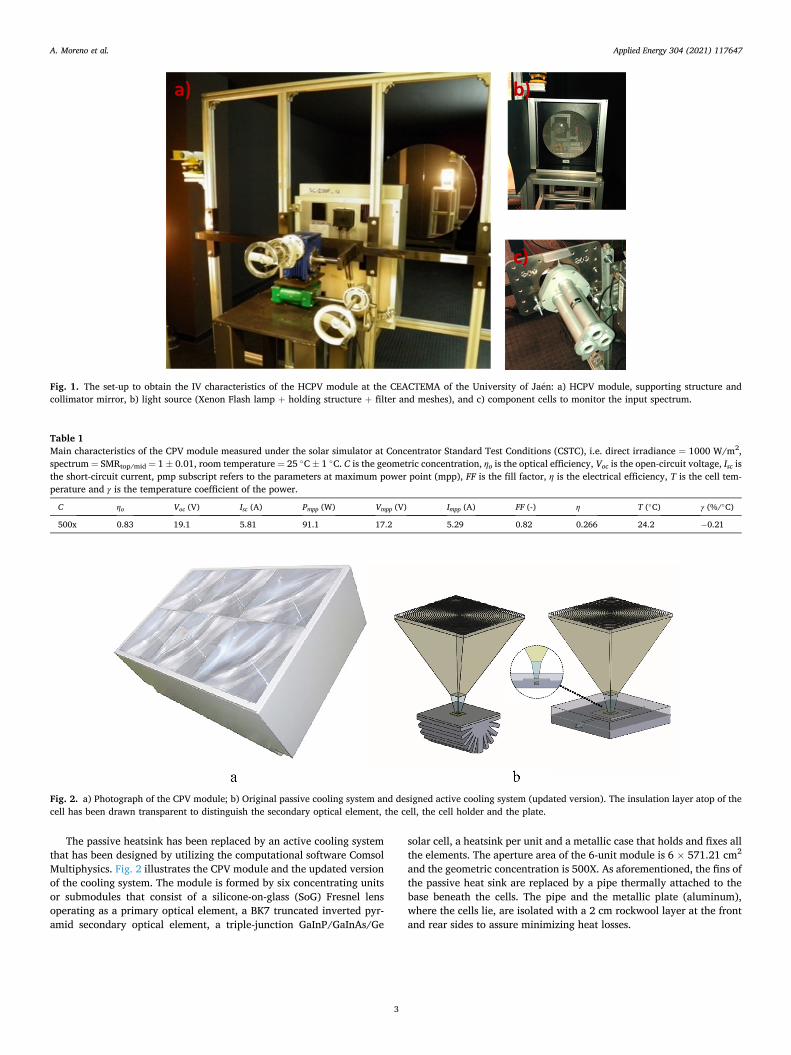
The active cooling system is designed by considering two parallel lines of three cells (units) each. The main target parameters defined for the sensitivity analysis are the temperature of the cells and the outlet fluid temperature. On the other hand, the boundary parameters varied are the inlet temperature, the flow rate and the exterior heat exchange coefficients (included by applying the McAdams correlation [30] as a function of the wind speed). The exterior temperature is set at 25 ◦C and the concentrated DNI considered is applied to the cell as a heat flux boundary of 30 W⋅cm− 2, which is obtained by subtracting the fraction that is converted into electricity from1000 W⋅m− 2 of DNI , e.g. a value experimentally estimated of 27 % has been considered. The HCPVT module has been modelled on the basis of five domains: (i) the Fresnel lenses, (ii) the air in the cavity formed by the lens and the casing, (iii) the PV cell, (iv) the secondary optical element, (v) the insulation layer un-derneath the metallic plate and around the PV cell, (vi) the metallic base
including the pipe and (vii) the liquid flowing through the pipe. The fluid domains (air cavity and liquid through the pipe) are modeled considering the liquid flowing in the pipe (forced convection) in laminar regime and the air in the cavity assuming natural convection (involving temperature and density gradients that cause the movement of the air) and under the shear stress transport (SST) turbulence model. The SST transport model combines the superior behavior of the k-ω model in the near-wall region with the robustness of the k-ε model [31].
The grid-independence study has been carried out for various numbers of grids, ranging from 105 to 106 elements. The optimum mesh size of 7x10⁵ tetrahedral nodes has been obtained and implemented in the geometry illustrated in Fig. 3.
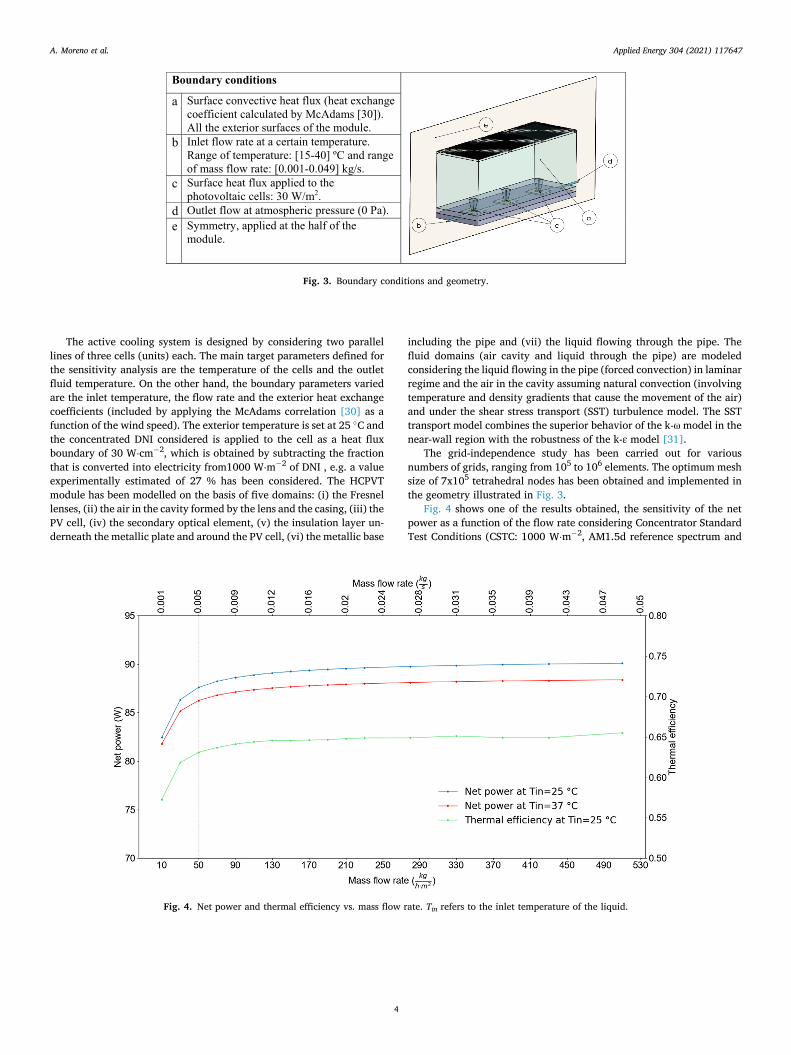
Fig. 4 shows one of the results obtained, the sensitivity of the net power as a function of the flow rate considering Concentrator Standard Test Conditions (CSTC: 1000 W⋅m− 2, AM1.5d reference spectrum and
Fig. 3. Boundary conditions and geometry.
Fig. 4. Net power and thermal efficiency vs. mass flow rate. Tin refers to the inlet temperature of the liquid.
A. Moreno et al.
Applied Energy 304 (2021) 117647
5
25 ◦C cell temperature). In addition, an exterior temperature of 25 ◦C and a wind speed of 1 m⋅s− 1 (heat exchange coefficient of 9.5 W⋅m− 2⋅K− 1) have been considered as boundary conditions. The net power is defined by subtracting the pumping power from the electric power delivered by the cell, considering a linear dependence of the power with the temperature by using the γ coefficient included in Table 1. It should be noted that the obtained pumping power values are negligible with respect to the module electric power (for instance, the pumping power for a flow rate of 50 kg⋅h− 1⋅m− 2 is 0.05 mW). The optimal flow rate has been found to be aournd 50 kg⋅h− 1⋅m− 2, which represents 98% of the maximum thermal efficiency and net electrical power. Net electrical power is provided for two differente inlet tem-peratures (Tin), 25 ◦C and 37 ◦C. Additionally, the thermal efficiency of the HCPVT module for a certain inlet temperature of the liquid is included. The liquid used is a water/ethylene glycol mixture (70/30 % v/v).
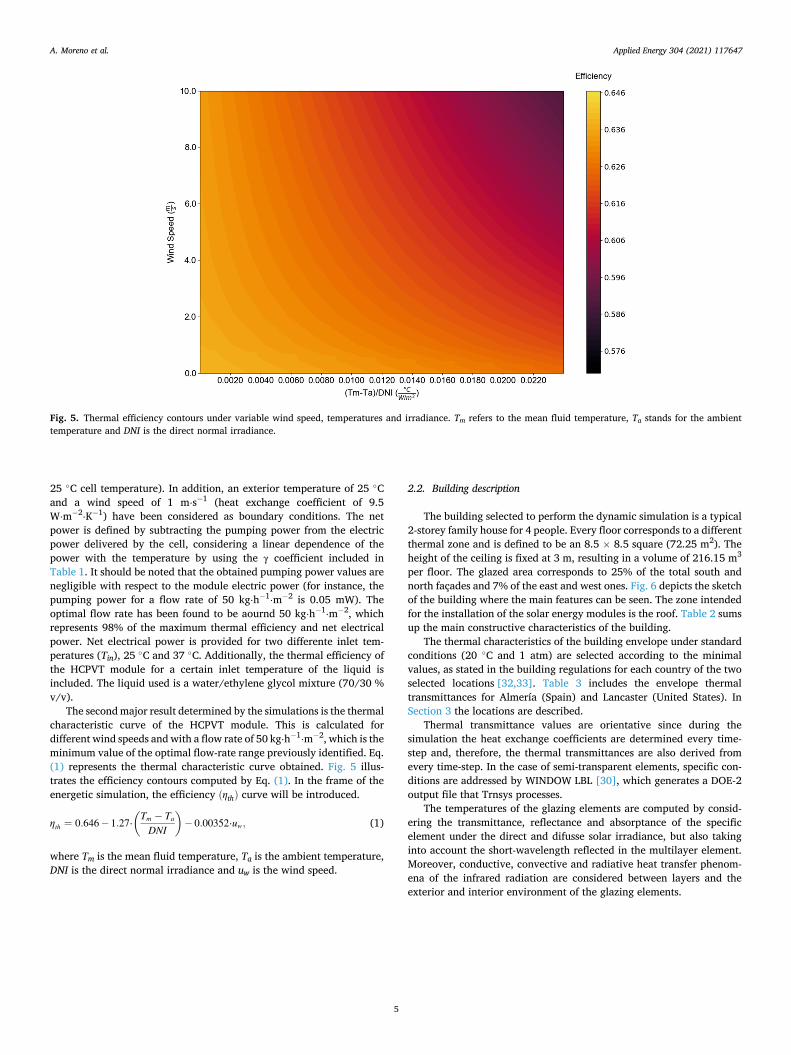
The second major result determined by the simulations is the thermal characteristic curve of the HCPVT module. This is calculated for different wind speeds and with a flow rate of 50 kg⋅h− 1⋅m− 2, which is the minimum value of the optimal flow-rate range previously identified. Eq. (1) represents the thermal characteristic curve obtained. Fig. 5 illus-trates the efficiency contours computed by Eq. (1). In the frame of the energetic simulation, the efficiency (ηth) curve will be introduced.
ηth = 0.646 − 1.27⋅(
Tm − Ta
DNI
)
− 0.00352⋅uw, (1)
where Tm is the mean fluid temperature, Ta is the ambient temperature, DNI is the direct normal irradiance and uw is the wind speed.
2.2. Building description
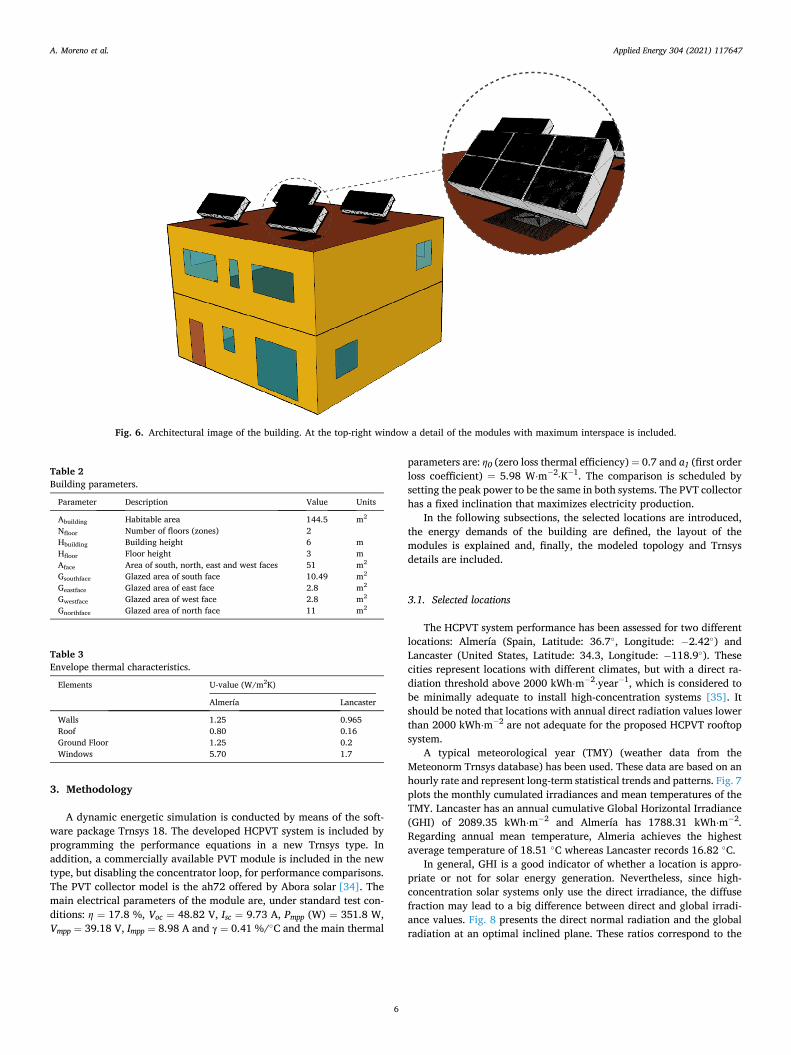
The building selected to perform the dynamic simulation is a typical 2-storey family house for 4 people. Every floor corresponds to a different thermal zone and is defined to be an 8.5 × 8.5 square (72.25 m2). The height of the ceiling is fixed at 3 m, resulting in a volume of 216.15 m3
per floor. The glazed area corresponds to 25% of the total south and north façades and 7% of the east and west ones. Fig. 6 depicts the sketch of the building where the main features can be seen. The zone intended for the installation of the solar energy modules is the roof. Table 2 sums up the main constructive characteristics of the building.
The thermal characteristics of the building envelope under standard conditions (20 ◦C and 1 atm) are selected according to the minimal values, as stated in the building regulations for each country of the two selected locations [32,33]. Table 3 includes the envelope thermal transmittances for Almería (Spain) and Lancaster (United States). In Section 3 the locations are described.
Thermal transmittance values are orientative since during the simulation the heat exchange coefficients are determined every time- step and, therefore, the thermal transmittances are also derived from every time-step. In the case of semi-transparent elements, specific con-ditions are addressed by WINDOW LBL [30], which generates a DOE-2 output file that Trnsys processes.
The temperatures of the glazing elements are computed by consid-ering the transmittance, reflectance and absorptance of the specific element under the direct and difusse solar irradiance, but also taking into account the short-wavelength reflected in the multilayer element. Moreover, conductive, convective and radiative heat transfer phenom-ena of the infrared radiation are considered between layers and the exterior and interior environment of the glazing elements.
Fig. 5. Thermal efficiency contours under variable wind speed, temperatures and irradiance. Tm refers to the mean fluid temperature, Ta stands for the ambient temperature and DNI is the direct normal irradiance.
A. Moreno et al.
Applied Energy 304 (2021) 117647
6
3. Methodology
A dynamic energetic simulation is conducted by means of the soft-ware package Trnsys 18. The developed HCPVT system is included by programming the performance equations in a new Trnsys type. In addition, a commercially available PVT module is included in the new type, but disabling the concentrator loop, for performance comparisons. The PVT collector model is the ah72 offered by Abora solar [34]. The main electrical parameters of the module are, under standard test con-ditions: η = 17.8 %, Voc = 48.82 V, Isc = 9.73 A, Pmpp (W) = 351.8 W, Vmpp = 39.18 V, Impp = 8.98 A and γ = 0.41 %/◦C and the main thermal
parameters are: η0 (zero loss thermal efficiency) = 0.7 and a1 (first order loss coefficient) = 5.98 W⋅m− 2⋅K− 1. The comparison is scheduled by setting the peak power to be the same in both systems. The PVT collector has a fixed inclination that maximizes electricity production.
In the following subsections, the selected locations are introduced, the energy demands of the building are defined, the layout of the modules is explained and, finally, the modeled topology and Trnsys details are included.
3.1. Selected locations
The HCPVT system performance has been assessed for two different locations: Almería (Spain, Latitude: 36.7◦, Longitude: − 2.42◦) and Lancaster (United States, Latitude: 34.3, Longitude: − 118.9◦). These cities represent locations with different climates, but with a direct ra-diation threshold above 2000 kWh⋅m− 2⋅year− 1, which is considered to be minimally adequate to install high-concentration systems [35]. It should be noted that locations with annual direct radiation values lower than 2000 kWh⋅m− 2 are not adequate for the proposed HCPVT rooftop system.
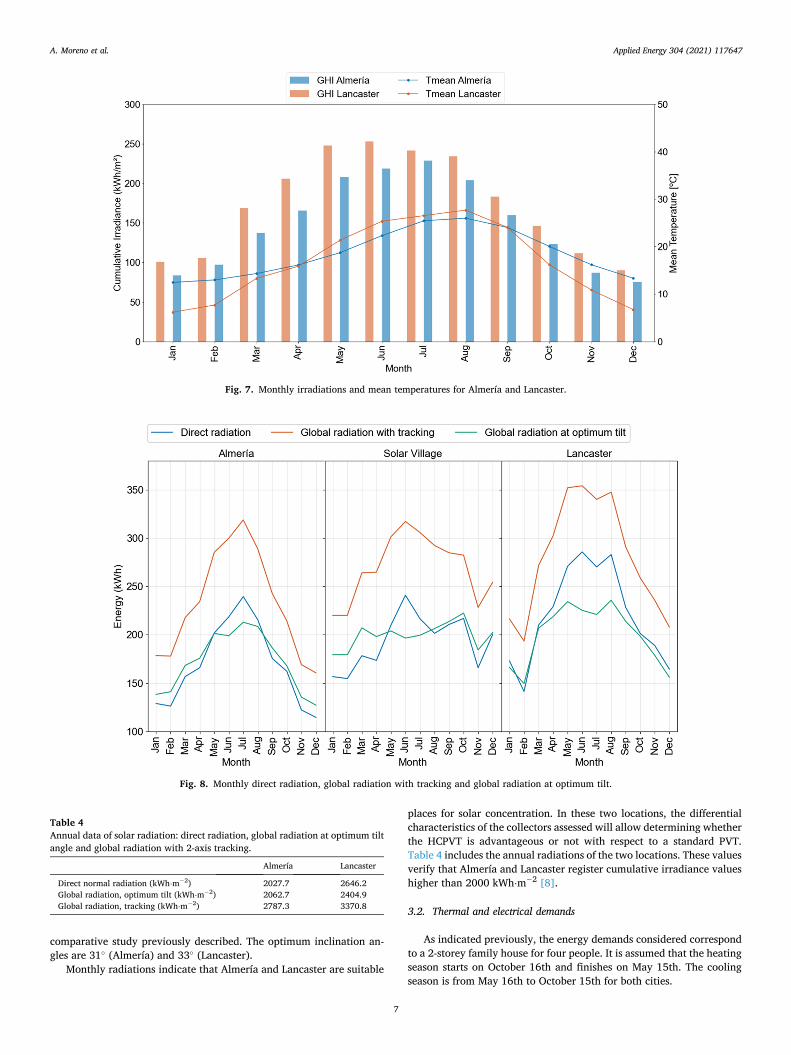
A typical meteorological year (TMY) (weather data from the Meteonorm Trnsys database) has been used. These data are based on an hourly rate and represent long-term statistical trends and patterns. Fig. 7 plots the monthly cumulated irradiances and mean temperatures of the TMY. Lancaster has an annual cumulative Global Horizontal Irradiance (GHI) of 2089.35 kWh⋅m− 2 and Almería has 1788.31 kWh⋅m− 2. Regarding annual mean temperature, Almeria achieves the highest average temperature of 18.51 ◦C whereas Lancaster records 16.82 ◦C.
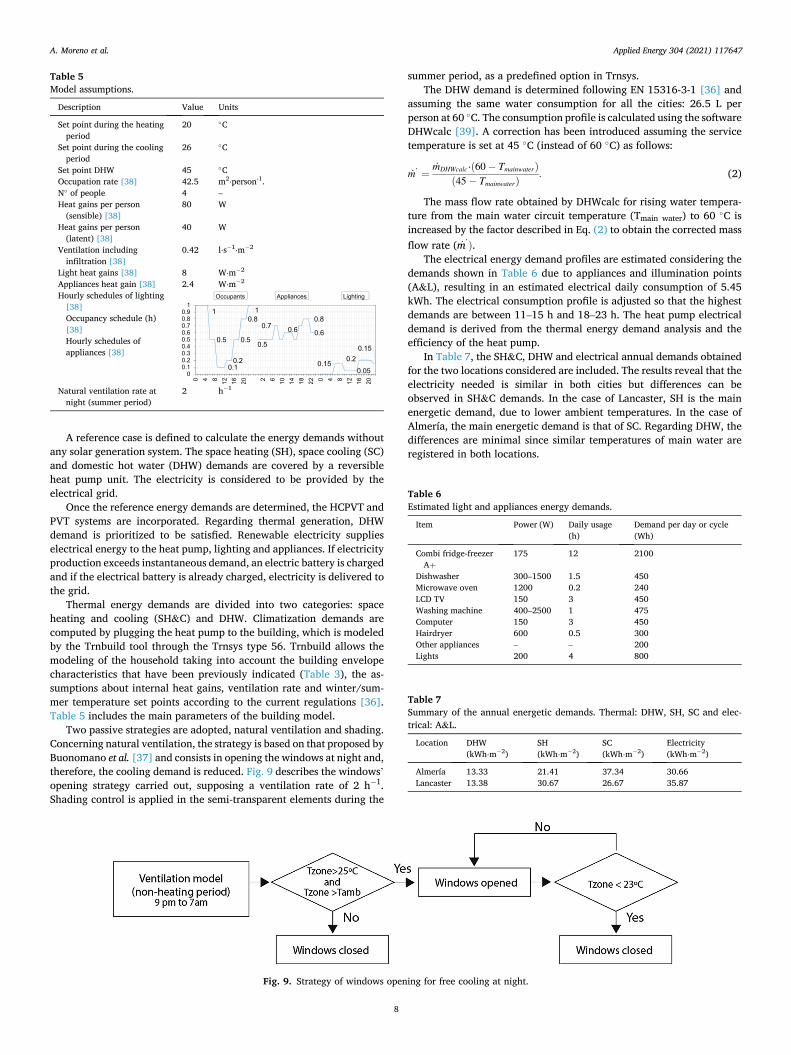
In general, GHI is a good indicator of whether a location is appro-priate or not for solar energy generation. Nevertheless, since high- concentration solar systems only use the direct irradiance, the diffuse fraction may lead to a big difference between direct and global irradi-ance values. Fig. 8 presents the direct normal radiation and the global radiation at an optimal inclined plane. These ratios correspond to the
Table 2 Building parameters.
Parameter Description Value Units
Abuilding Habitable area 144.5 m2
Nfloor Number of floors (zones) 2 Hbuilding Building height 6 m Hfloor Floor height 3 m Aface Area of south, north, east and west faces 51 m2
Gsouthface Glazed area of south face 10.49 m2
Geastface Glazed area of east face 2.8 m2
Gwestface Glazed area of west face 2.8 m2
Gnorthface Glazed area of north face 11 m2
Table 3 Envelope thermal characteristics.
Elements U-value (W/m2K)
Almería Lancaster
Walls 1.25 0.965 Roof 0.80 0.16 Ground Floor 1.25 0.2 Windows 5.70 1.7
Fig. 6. Architectural image of the building. At the top-right window a detail of the modules with maximum interspace is included.
A. Moreno et al.
Applied Energy 304 (2021) 117647
7
comparative study previously described. The optimum inclination an-gles are 31◦ (Almería) and 33◦ (Lancaster).
Monthly radiations indicate that Almería and Lancaster are suitable
places for solar concentration. In these two locations, the differential characteristics of the collectors assessed will allow determining whether the HCPVT is advantageous or not with respect to a standard PVT. Table 4 includes the annual radiations of the two locations. These values verify that Almería and Lancaster register cumulative irradiance values higher than 2000 kWh⋅m− 2 [8].
3.2. Thermal and electrical demands
As indicated previously, the energy demands considered correspond to a 2-storey family house for four people. It is assumed that the heating season starts on October 16th and finishes on May 15th. The cooling season is from May 16th to October 15th for both cities.
Fig. 7. Monthly irradiations and mean temperatures for Almería and Lancaster.
Fig. 8. Monthly direct radiation, global radiation with tracking and global radiation at optimum tilt.
Table 4 Annual data of solar radiation: direct radiation, global radiation at optimum tilt angle and global radiation with 2-axis tracking.
Almería Lancaster
Direct normal radiation (kWh⋅m− 2) 2027.7 2646.2 Global radiation, optimum tilt (kWh⋅m− 2) 2062.7 2404.9 Global radiation, tracking (kWh⋅m− 2) 2787.3 3370.8
A. Moreno et al.
Applied Energy 304 (2021) 117647
8
A reference case is defined to calculate the energy demands without any solar generation system. The space heating (SH), space cooling (SC) and domestic hot water (DHW) demands are covered by a reversible heat pump unit. The electricity is considered to be provided by the electrical grid.
Once the reference energy demands are determined, the HCPVT and PVT systems are incorporated. Regarding thermal generation, DHW demand is prioritized to be satisfied. Renewable electricity supplies electrical energy to the heat pump, lighting and appliances. If electricity production exceeds instantaneous demand, an electric battery is charged and if the electrical battery is already charged, electricity is delivered to the grid.
Thermal energy demands are divided into two categories: space heating and cooling (SH&C) and DHW. Climatization demands are computed by plugging the heat pump to the building, which is modeled by the Trnbuild tool through the Trnsys type 56. Trnbuild allows the modeling of the household taking into account the building envelope characteristics that have been previously indicated (Table 3), the as-sumptions about internal heat gains, ventilation rate and winter/sum-mer temperature set points according to the current regulations [36]. Table 5 includes the main parameters of the building model.
Two passive strategies are adopted, natural ventilation and shading. Concerning natural ventilation, the strategy is based on that proposed by Buonomano et al. [37] and consists in opening the windows at night and, therefore, the cooling demand is reduced. Fig. 9 describes the windows’ opening strategy carried out, supposing a ventilation rate of 2 h− 1. Shading control is applied in the semi-transparent elements during the
summer period, as a predefined option in Trnsys. The DHW demand is determined following EN 15316-3-1 [36] and
assuming the same water consumption for all the cities: 26.5 L per person at 60 ◦C. The consumption profile is calculated using the software DHWcalc [39]. A correction has been introduced assuming the service temperature is set at 45 ◦C (instead of 60 ◦C) as follows:
m’ =mDHWcalc⋅(60 − Tmainwater)
(45 − Tmainwater). (2)
The mass flow rate obtained by DHWcalc for rising water tempera-ture from the main water circuit temperature (Tmain water) to 60 ◦C is increased by the factor described in Eq. (2) to obtain the corrected mass flow rate (m’
). The electrical energy demand profiles are estimated considering the
demands shown in Table 6 due to appliances and illumination points (A&L), resulting in an estimated electrical daily consumption of 5.45 kWh. The electrical consumption profile is adjusted so that the highest demands are between 11–15 h and 18–23 h. The heat pump electrical demand is derived from the thermal energy demand analysis and the efficiency of the heat pump.
In Table 7, the SH&C, DHW and electrical annual demands obtained for the two locations considered are included. The results reveal that the electricity needed is similar in both cities but differences can be observed in SH&C demands. In the case of Lancaster, SH is the main energetic demand, due to lower ambient temperatures. In the case of Almería, the main energetic demand is that of SC. Regarding DHW, the differences are minimal since similar temperatures of main water are registered in both locations.
Table 5 Model assumptions.
Description Value Units
Set point during the heating period
20 ◦C
Set point during the cooling period
26 ◦C
Set point DHW 45 ◦C Occupation rate [38] 42.5 m2⋅person-1. N◦ of people 4 – Heat gains per person
(sensible) [38] 80 W
Heat gains per person (latent) [38]
40 W
Ventilation including infiltration [38]
0.42 l⋅s− 1⋅m− 2
Light heat gains [38] 8 W⋅m− 2
Appliances heat gain [38] 2.4 W⋅m− 2
Hourly schedules of lighting [38] Occupancy schedule (h) [38] Hourly schedules of appliances [38]
Natural ventilation rate at night (summer period)
2 h− 1
Fig. 9. Strategy of windows opening for free cooling at night.
Table 6 Estimated light and appliances energy demands.
Item Power (W) Daily usage (h)
Demand per day or cycle (Wh)
Combi fridge-freezer A+
175 12 2100
Dishwasher 300–1500 1.5 450 Microwave oven 1200 0.2 240 LCD TV 150 3 450 Washing machine 400–2500 1 475 Computer 150 3 450 Hairdryer 600 0.5 300 Other appliances – – 200 Lights 200 4 800
Table 7 Summary of the annual energetic demands. Thermal: DHW, SH, SC and elec-trical: A&L.
Location DHW (kWh⋅m− 2)
SH (kWh⋅m− 2)
SC (kWh⋅m− 2)
Electricity (kWh⋅m− 2)
Almería 13.33 21.41 37.34 30.66 Lancaster 13.38 30.67 26.67 35.87
A. Moreno et al.
Applied Energy 304 (2021) 117647
9
3.3. Simulated system topology
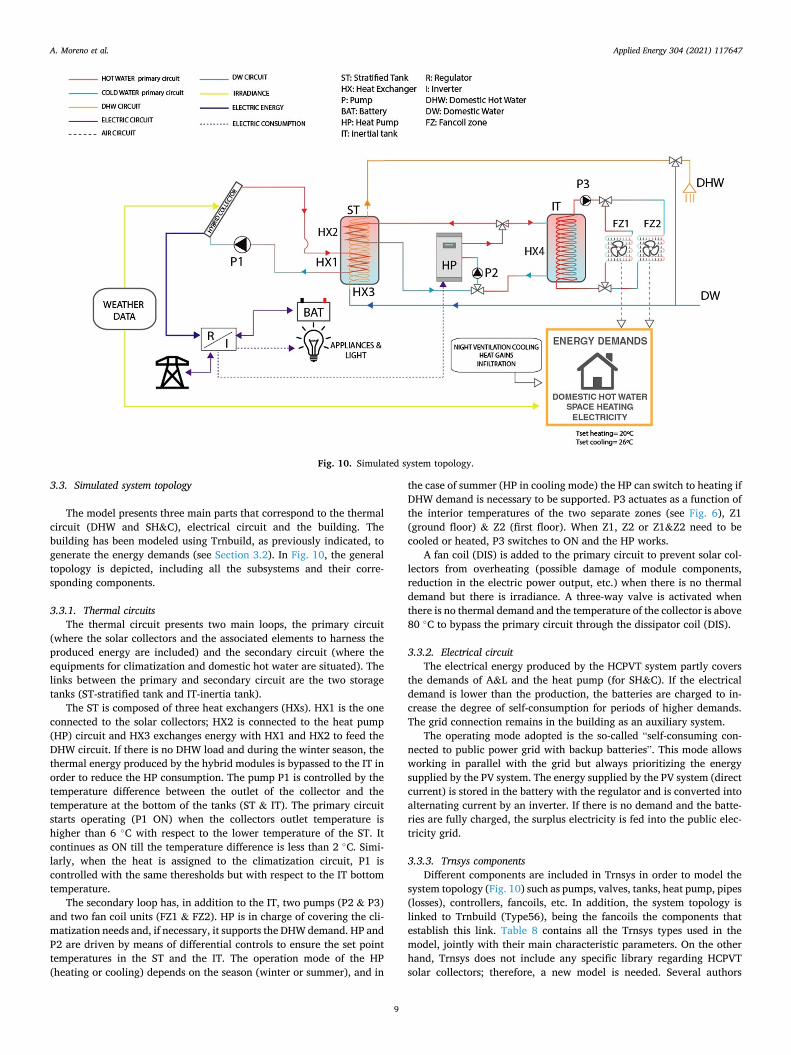
The model presents three main parts that correspond to the thermal circuit (DHW and SH&C), electrical circuit and the building. The building has been modeled using Trnbuild, as previously indicated, to generate the energy demands (see Section 3.2). In Fig. 10, the general topology is depicted, including all the subsystems and their corre-sponding components.
3.3.1. Thermal circuits The thermal circuit presents two main loops, the primary circuit
(where the solar collectors and the associated elements to harness the produced energy are included) and the secondary circuit (where the equipments for climatization and domestic hot water are situated). The links between the primary and secondary circuit are the two storage tanks (ST-stratified tank and IT-inertia tank).
The ST is composed of three heat exchangers (HXs). HX1 is the one connected to the solar collectors; HX2 is connected to the heat pump (HP) circuit and HX3 exchanges energy with HX1 and HX2 to feed the DHW circuit. If there is no DHW load and during the winter season, the thermal energy produced by the hybrid modules is bypassed to the IT in order to reduce the HP consumption. The pump P1 is controlled by the temperature difference between the outlet of the collector and the temperature at the bottom of the tanks (ST & IT). The primary circuit starts operating (P1 ON) when the collectors outlet temperature is higher than 6 ◦C with respect to the lower temperature of the ST. It continues as ON till the temperature difference is less than 2 ◦C. Simi-larly, when the heat is assigned to the climatization circuit, P1 is controlled with the same theresholds but with respect to the IT bottom temperature.
The secondary loop has, in addition to the IT, two pumps (P2 & P3) and two fan coil units (FZ1 & FZ2). HP is in charge of covering the cli-matization needs and, if necessary, it supports the DHW demand. HP and P2 are driven by means of differential controls to ensure the set point temperatures in the ST and the IT. The operation mode of the HP (heating or cooling) depends on the season (winter or summer), and in
the case of summer (HP in cooling mode) the HP can switch to heating if DHW demand is necessary to be supported. P3 actuates as a function of the interior temperatures of the two separate zones (see Fig. 6), Z1 (ground floor) & Z2 (first floor). When Z1, Z2 or Z1&Z2 need to be cooled or heated, P3 switches to ON and the HP works.
A fan coil (DIS) is added to the primary circuit to prevent solar col-lectors from overheating (possible damage of module components, reduction in the electric power output, etc.) when there is no thermal demand but there is irradiance. A three-way valve is activated when there is no thermal demand and the temperature of the collector is above 80 ◦C to bypass the primary circuit through the dissipator coil (DIS).
3.3.2. Electrical circuit The electrical energy produced by the HCPVT system partly covers
the demands of A&L and the heat pump (for SH&C). If the electrical demand is lower than the production, the batteries are charged to in-crease the degree of self-consumption for periods of higher demands. The grid connection remains in the building as an auxiliary system.
The operating mode adopted is the so-called “self-consuming con-nected to public power grid with backup batteries”. This mode allows working in parallel with the grid but always prioritizing the energy supplied by the PV system. The energy supplied by the PV system (direct current) is stored in the battery with the regulator and is converted into alternating current by an inverter. If there is no demand and the batte-ries are fully charged, the surplus electricity is fed into the public elec-tricity grid.
3.3.3. Trnsys components Different components are included in Trnsys in order to model the
system topology (Fig. 10) such as pumps, valves, tanks, heat pump, pipes (losses), controllers, fancoils, etc. In addition, the system topology is linked to Trnbuild (Type56), being the fancoils the components that establish this link. Table 8 contains all the Trnsys types used in the model, jointly with their main characteristic parameters. On the other hand, Trnsys does not include any specific library regarding HCPVT solar collectors; therefore, a new model is needed. Several authors
Fig. 10. Simulated system topology.
A. Moreno et al.
Applied Energy 304 (2021) 117647
10
created their own models for HCPVT collectors, such as those described by Coventry [40], Calise et al. [41] and Moreno et al. [42]. In the present research, the model developed by Calise et al. [35] is used as a reference. The model is based on a simplified method of the Hottel-Whillier model [43] that, in addition, includes the wind speed dependence and couples the thermal performance with the electrical performance through the power temperature dependence defined in reference [44] with the cell temperature calculated as per [45].
Regarding the PVT system, although Trnsys has two libraries
included (types 50 and 563), the model developed by Moreno et al. [35] (modified to be adequate for a PVT system without concentration) is used for a more accurate comparison with the HCPVT system.
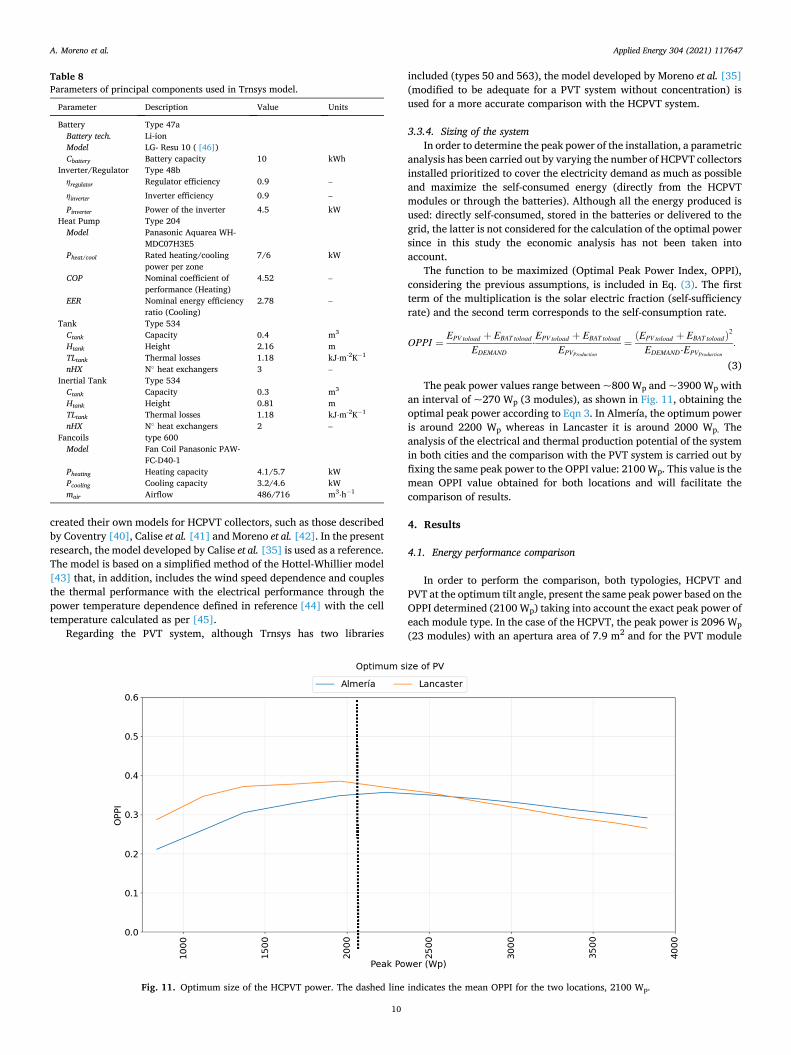
3.3.4. Sizing of the system In order to determine the peak power of the installation, a parametric
analysis has been carried out by varying the number of HCPVT collectors installed prioritized to cover the electricity demand as much as possible and maximize the self-consumed energy (directly from the HCPVT modules or through the batteries). Although all the energy produced is used: directly self-consumed, stored in the batteries or delivered to the grid, the latter is not considered for the calculation of the optimal power since in this study the economic analysis has not been taken into account.
The function to be maximized (Optimal Peak Power Index, OPPI), considering the previous assumptions, is included in Eq. (3). The first term of the multiplication is the solar electric fraction (self-sufficiency rate) and the second term corresponds to the self-consumption rate.
OPPI =EPV toload + EBAT toload
EDEMAND⋅EPV toload + EBAT toload
EPVProduction
=(EPV toload + EBAT toload)
2
EDEMAND⋅EPVProduction
.
(3)
The peak power values range between ~800 Wp and ~3900 Wp with an interval of ~270 Wp (3 modules), as shown in Fig. 11, obtaining the optimal peak power according to Eqn 3. In Almería, the optimum power is around 2200 Wp whereas in Lancaster it is around 2000 Wp. The analysis of the electrical and thermal production potential of the system in both cities and the comparison with the PVT system is carried out by fixing the same peak power to the OPPI value: 2100 Wp. This value is the mean OPPI value obtained for both locations and will facilitate the comparison of results.
4. Results
4.1. Energy performance comparison
In order to perform the comparison, both typologies, HCPVT and PVT at the optimum tilt angle, present the same peak power based on the OPPI determined (2100 Wp) taking into account the exact peak power of each module type. In the case of the HCPVT, the peak power is 2096 Wp (23 modules) with an apertura area of 7.9 m2 and for the PVT module
Fig. 11. Optimum size of the HCPVT power. The dashed line indicates the mean OPPI for the two locations, 2100 Wp.
Table 8 Parameters of principal components used in Trnsys model.
Parameter Description Value Units
Battery Type 47a Battery tech. Li-ion Model LG- Resu 10 ( [46]) Cbattery Battery capacity 10 kWh
Inverter/Regulator Type 48b ηregulator Regulator efficiency 0.9 –
ηinverter Inverter efficiency 0.9 – Pinverter Power of the inverter 4.5 kW
Heat Pump Type 204 Model Panasonic Aquarea WH-
MDC07H3E5 Pheat/cool Rated heating/cooling
power per zone 7/6 kW
COP Nominal coefficient of performance (Heating)
4.52 –
EER Nominal energy efficiency ratio (Cooling)
2.78 –
Tank Type 534 Ctank Capacity 0.4 m3
Htank Height 2.16 m TLtank Thermal losses 1.18 kJ⋅m-2K− 1
nHX N◦ heat exchangers 3 – Inertial Tank Type 534
Ctank Capacity 0.3 m3
Htank Height 0.81 m TLtank Thermal losses 1.18 kJ⋅m-2K− 1
nHX N◦ heat exchangers 2 – Fancoils type 600
Model Fan Coil Panasonic PAW- FC-D40-1
Pheating Heating capacity 4.1/5.7 kW Pcooling Cooling capacity 3.2/4.6 kW mair Airflow 486/716 m3⋅h− 1
A. Moreno et al.
Applied Energy 304 (2021) 117647
11
the peak power is 2111 Wp (6 modules) with an aperture area of 11.3 m2. The systems are compared in terms of monthly and annual energy yield. In addition, the annual DC performance ratio before the inverter, PR (it is the ratio between the actual and the theoretical electrical en-ergy), is also provided. This indicator makes the results independent of the solar radiation and allows a direct comparison of the two systems for the two locations considered. It is defined as follows (Eq. (4)):
PR(%) =
∫EPVreal∫
EPV theoretical. (4)
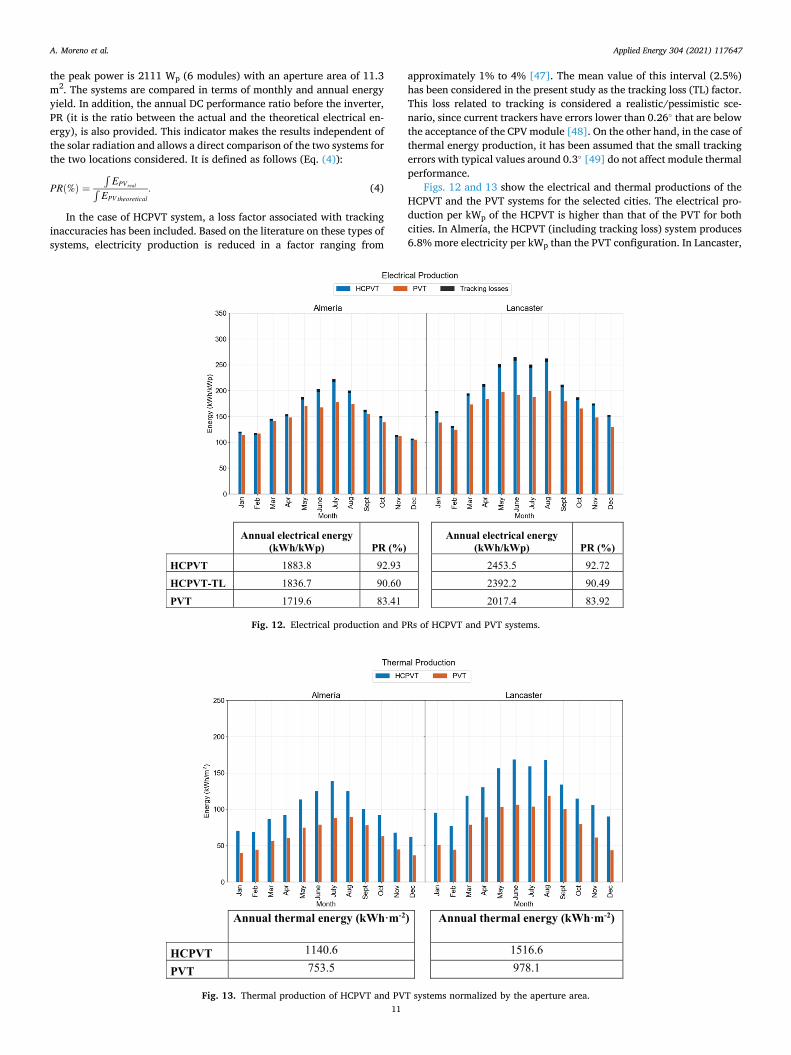
In the case of HCPVT system, a loss factor associated with tracking inaccuracies has been included. Based on the literature on these types of systems, electricity production is reduced in a factor ranging from
approximately 1% to 4% [47]. The mean value of this interval (2.5%) has been considered in the present study as the tracking loss (TL) factor. This loss related to tracking is considered a realistic/pessimistic sce-nario, since current trackers have errors lower than 0.26◦ that are below the acceptance of the CPV module [48]. On the other hand, in the case of thermal energy production, it has been assumed that the small tracking errors with typical values around 0.3◦ [49] do not affect module thermal performance.
Figs. 12 and 13 show the electrical and thermal productions of the HCPVT and the PVT systems for the selected cities. The electrical pro-duction per kWp of the HCPVT is higher than that of the PVT for both cities. In Almería, the HCPVT (including tracking loss) system produces 6.8% more electricity per kWp than the PVT configuration. In Lancaster,
Fig. 12. Electrical production and PRs of HCPVT and PVT systems.
Fig. 13. Thermal production of HCPVT and PVT systems normalized by the aperture area.
A. Moreno et al.
Applied Energy 304 (2021) 117647
12
this difference is even bigger due to a higher percentage of direct radi-ation, obtaining an electrical production per kWp 18.6% higher than the one in the case of the PVT. This higher production of the HCPVT compared to the PVT is due to the effect of obliqueness of incident solar radiation during sunrise and sunset hours, the higher electrical effi-ciency and the lower temperature dependence coefficient. It should be highlighted that the annual global radiation values at the inclination plane of the PVTs are equal or higher than the annual direct normal radiation ones and this verifies the superior performance of the HCPVT system proposed.
Regarding performance ratio (PR), the HCPVT obtains values of around 90% (including tracking errors) and in the case of the PVT, the PR value is less than 84% mainly due to the losses produced by the higher obliquity and the temperature coefficient (0.41 vs. 0.21 %/◦C), as commented above. The higher values of PR of the HCPVT system compared to the PVT are in agreement with those from previous studies, for instance, average values around 0.07 higher compared with fixed PV systems have been reported in [50].
Fig. 13 illustrates the monthly thermal energy delivered by the HCPVT and the PVT systems. Since the thermal yield is highly influ-enced by the thermal demand, for the comparison, the installation has been set to apply a load high enough in order not to limit the thermal production and with a setpoint temperature of 50 ◦C, and therefore, to completely evaluate the potential heat production. The results indicate that, in both locations, the HCPVT collector clearly outperforms the PVT one, with thermal energies per m2 51% higher in Almería and 55% higher in the case of Lancaster. This performance is attributed to a quite
lower loss coefficient of the HCPVT module and higher direct irradiance in the summer months.
In light of the issues mentioned above, the HCPVT system out-performs the PVT system in terms of electrical and thermal energy productions.
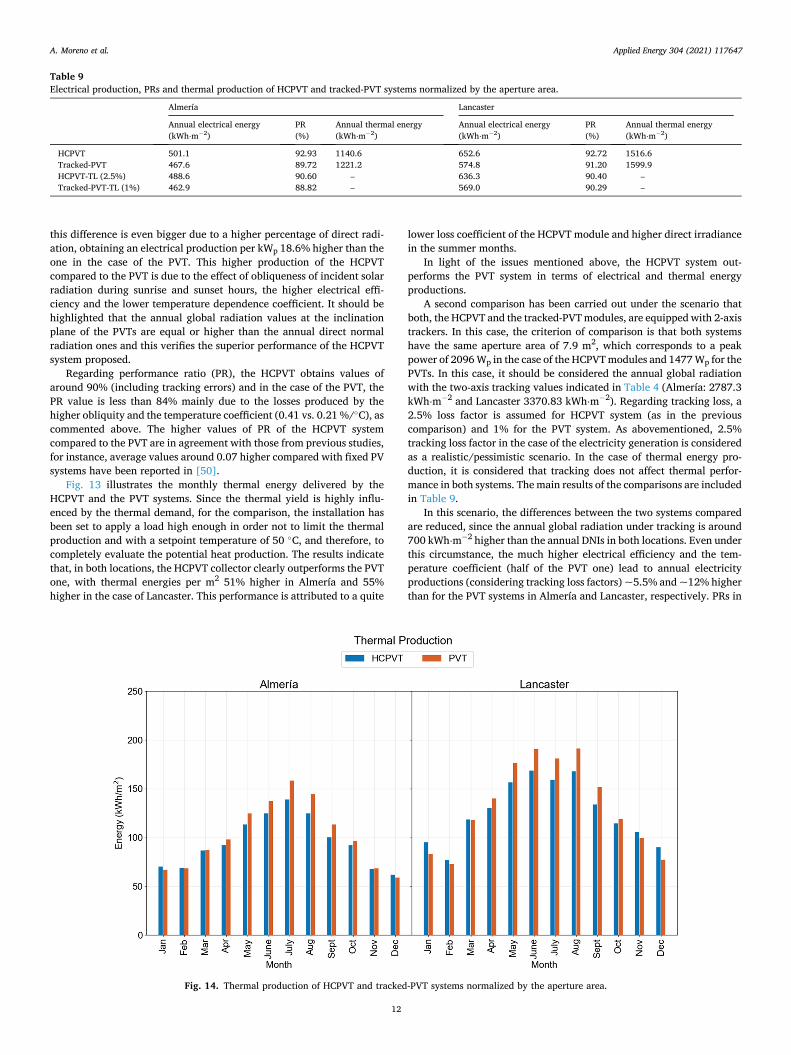
A second comparison has been carried out under the scenario that both, the HCPVT and the tracked-PVT modules, are equipped with 2-axis trackers. In this case, the criterion of comparison is that both systems have the same aperture area of 7.9 m2, which corresponds to a peak power of 2096 Wp in the case of the HCPVT modules and 1477 Wp for the PVTs. In this case, it should be considered the annual global radiation with the two-axis tracking values indicated in Table 4 (Almería: 2787.3 kWh⋅m− 2 and Lancaster 3370.83 kWh⋅m− 2). Regarding tracking loss, a 2.5% loss factor is assumed for HCPVT system (as in the previous comparison) and 1% for the PVT system. As abovementioned, 2.5% tracking loss factor in the case of the electricity generation is considered as a realistic/pessimistic scenario. In the case of thermal energy pro-duction, it is considered that tracking does not affect thermal perfor-mance in both systems. The main results of the comparisons are included in Table 9.
In this scenario, the differences between the two systems compared are reduced, since the annual global radiation under tracking is around 700 kWh⋅m− 2 higher than the annual DNIs in both locations. Even under this circumstance, the much higher electrical efficiency and the tem-perature coefficient (half of the PVT one) lead to annual electricity productions (considering tracking loss factors) ~5.5% and ~12% higher than for the PVT systems in Almería and Lancaster, respectively. PRs in
Table 9 Electrical production, PRs and thermal production of HCPVT and tracked-PVT systems normalized by the aperture area.
Almería Lancaster
Annual electrical energy (kWh⋅m− 2)
PR (%)
Annual thermal energy (kWh⋅m− 2)
Annual electrical energy (kWh⋅m− 2)
PR (%)
Annual thermal energy (kWh⋅m− 2)
HCPVT 501.1 92.93 1140.6 652.6 92.72 1516.6 Tracked-PVT 467.6 89.72 1221.2 574.8 91.20 1599.9 HCPVT-TL (2.5%) 488.6 90.60 – 636.3 90.40 – Tracked-PVT-TL (1%) 462.9 88.82 – 569.0 90.29 –
Fig. 14. Thermal production of HCPVT and tracked-PVT systems normalized by the aperture area.
A. Moreno et al.
Applied Energy 304 (2021) 117647
13
the case of Almería show a difference greater than 3% in the case without tracking error and higher than about 1.8% considering tracking errors. In Lancaster, PRs difference between the two cases is less sig-nificant: ~1.5% (without tracking loss) and ~0.1% (with tracking errors included). On the other hand, annual thermal energy values obtained are slightly higher in the case of the PVT system with differences of 7% and 5% for Almería and Lancaster, respectively. It should be noted that these differences are obtained during the warm months when the pro-duced heat is less useful, but for the rest of the year the thermal pro-duction between both systems is almost identical or the HCPVT slightly outperforms the PVT system. This performance is illustrated in Fig. 14.
Regarding the two comparisons conducted, the one including the HCPVT and the PVT fixed at the optimum tilt angle is considered as the most representative one since both configurations are the typical ones for each type of system. In addition, comparisons between CPVs and PVs are usually carried out under this scenario [35,50].
4.2. Energy performance of the HCPVT system
Once the HCPVT system has been compared with the PVT system, in the following paragraphs the detailed energy performance of the HCPVT system is described.
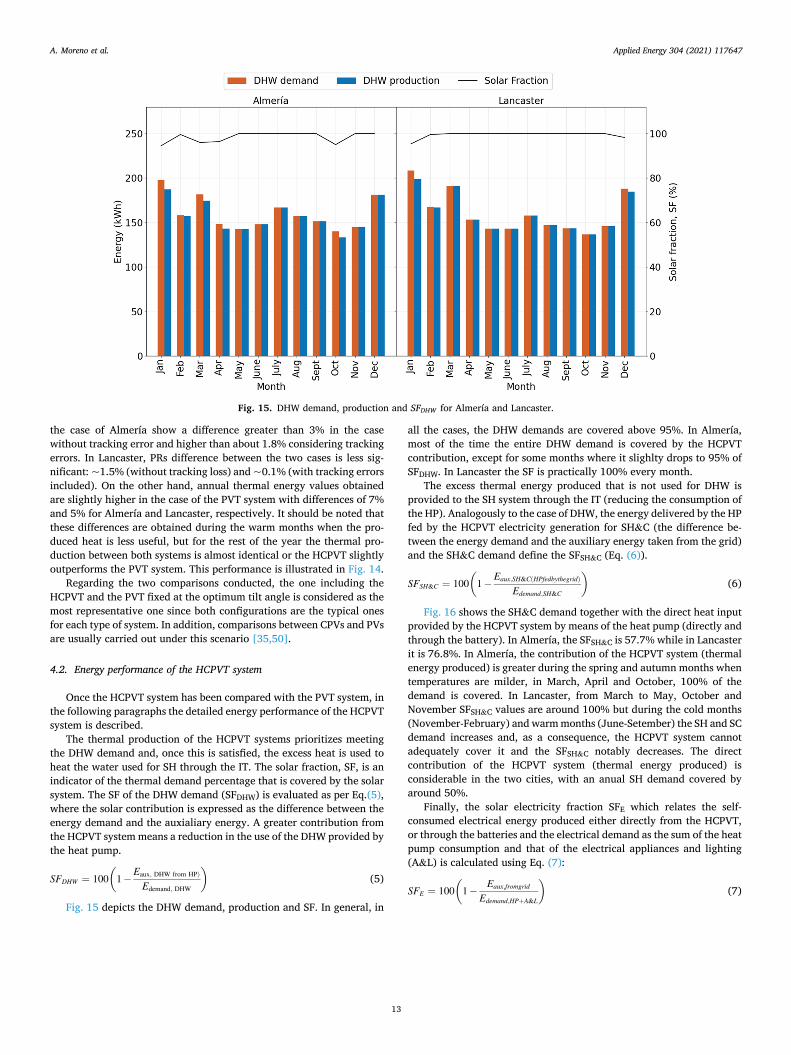
The thermal production of the HCPVT systems prioritizes meeting the DHW demand and, once this is satisfied, the excess heat is used to heat the water used for SH through the IT. The solar fraction, SF, is an indicator of the thermal demand percentage that is covered by the solar system. The SF of the DHW demand (SFDHW) is evaluated as per Eq.(5), where the solar contribution is expressed as the difference between the energy demand and the auxialiary energy. A greater contribution from the HCPVT system means a reduction in the use of the DHW provided by the heat pump.
SFDHW = 100(
1 −Eaux, DHW from HP)
Edemand, DHW
)
(5)
Fig. 15 depicts the DHW demand, production and SF. In general, in
all the cases, the DHW demands are covered above 95%. In Almería, most of the time the entire DHW demand is covered by the HCPVT contribution, except for some months where it slighlty drops to 95% of SFDHW. In Lancaster the SF is practically 100% every month.
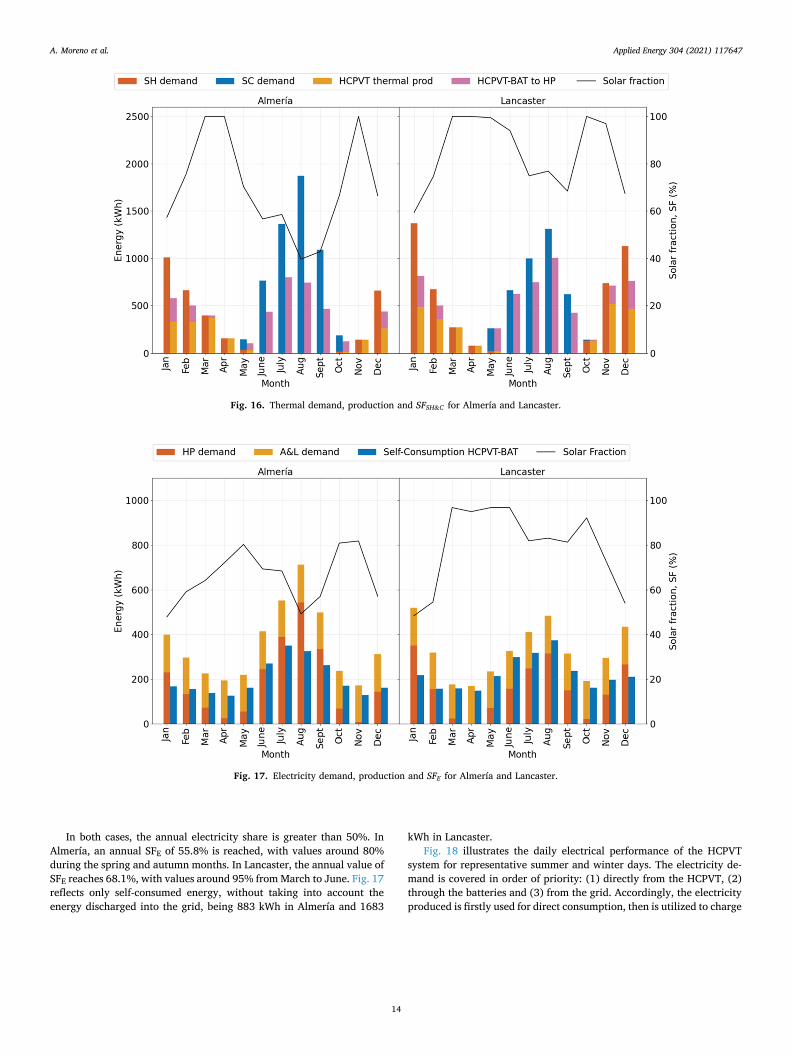
The excess thermal energy produced that is not used for DHW is provided to the SH system through the IT (reducing the consumption of the HP). Analogously to the case of DHW, the energy delivered by the HP fed by the HCPVT electricity generation for SH&C (the difference be-tween the energy demand and the auxiliary energy taken from the grid) and the SH&C demand define the SFSH&C (Eq. (6)).
SFSH&C = 100(
1 −Eaux,SH&C(HPfedbythegrid)
Edemand,SH&C
)
(6)
Fig. 16 shows the SH&C demand together with the direct heat input provided by the HCPVT system by means of the heat pump (directly and through the battery). In Almería, the SFSH&C is 57.7% while in Lancaster it is 76.8%. In Almería, the contribution of the HCPVT system (thermal energy produced) is greater during the spring and autumn months when temperatures are milder, in March, April and October, 100% of the demand is covered. In Lancaster, from March to May, October and November SFSH&C values are around 100% but during the cold months (November-February) and warm months (June-Setember) the SH and SC demand increases and, as a consequence, the HCPVT system cannot adequately cover it and the SFSH&C notably decreases. The direct contribution of the HCPVT system (thermal energy produced) is considerable in the two cities, with an anual SH demand covered by around 50%.
Finally, the solar electricity fraction SFE which relates the self- consumed electrical energy produced either directly from the HCPVT, or through the batteries and the electrical demand as the sum of the heat pump consumption and that of the electrical appliances and lighting (A&L) is calculated using Eq. (7):
SFE = 100(
1 −Eaux,fromgrid
Edemand,HP+A&L
)
(7)
Fig. 15. DHW demand, production and SFDHW for Almería and Lancaster.
A. Moreno et al.
Applied Energy 304 (2021) 117647
14
In both cases, the annual electricity share is greater than 50%. In Almería, an annual SFE of 55.8% is reached, with values around 80% during the spring and autumn months. In Lancaster, the annual value of SFE reaches 68.1%, with values around 95% from March to June. Fig. 17 reflects only self-consumed energy, without taking into account the energy discharged into the grid, being 883 kWh in Almería and 1683
kWh in Lancaster. Fig. 18 illustrates the daily electrical performance of the HCPVT
system for representative summer and winter days. The electricity de-mand is covered in order of priority: (1) directly from the HCPVT, (2) through the batteries and (3) from the grid. Accordingly, the electricity produced is firstly used for direct consumption, then is utilized to charge
Fig. 17. Electricity demand, production and SFE for Almería and Lancaster.
Fig. 16. Thermal demand, production and SFSH&C for Almería and Lancaster.
A. Moreno et al.

Applied Energy 304 (2021) 117647
15
Fig. 18. Hourly energy profile. a) A typical winter day and b) A typical summer day.
A. Moreno et al.
Applied Energy 304 (2021) 117647
16
the batteries and, finally, is delivered to the grid. In Almería (with mild winters), in the periods of high irradiance, it is observed that the configuration HCPVT + batteries is enough to cover all the demand. However, in Lancaster, which has colder winters and, consequently, a higher SH demand, the energy needs are covered by drawing electricity from the grid. On the other hand, in summer, Almería with a higher SC demand, requires electricity from the grid. In Lancaster the whole de-mand is covered by the HCPVT/batteries system.
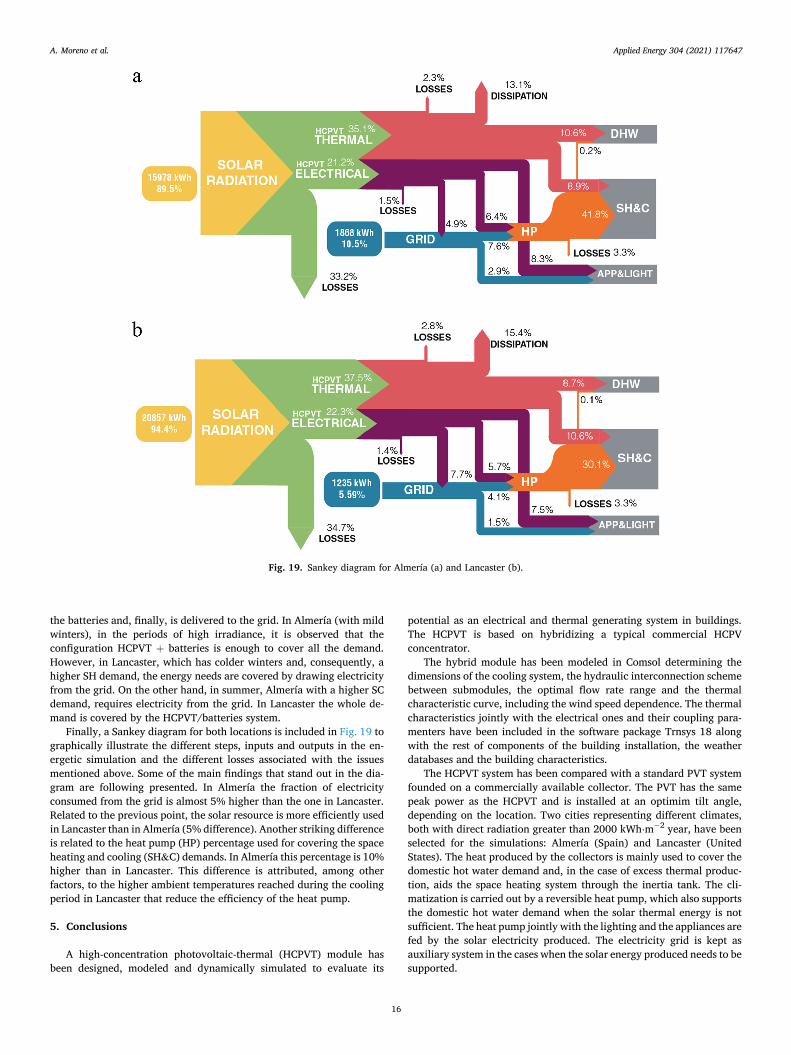
Finally, a Sankey diagram for both locations is included in Fig. 19 to graphically illustrate the different steps, inputs and outputs in the en-ergetic simulation and the different losses associated with the issues mentioned above. Some of the main findings that stand out in the dia-gram are following presented. In Almería the fraction of electricity consumed from the grid is almost 5% higher than the one in Lancaster. Related to the previous point, the solar resource is more efficiently used in Lancaster than in Almería (5% difference). Another striking difference is related to the heat pump (HP) percentage used for covering the space heating and cooling (SH&C) demands. In Almería this percentage is 10% higher than in Lancaster. This difference is attributed, among other factors, to the higher ambient temperatures reached during the cooling period in Lancaster that reduce the efficiency of the heat pump.
5. Conclusions
A high-concentration photovoltaic-thermal (HCPVT) module has been designed, modeled and dynamically simulated to evaluate its
potential as an electrical and thermal generating system in buildings. The HCPVT is based on hybridizing a typical commercial HCPV concentrator.
The hybrid module has been modeled in Comsol determining the dimensions of the cooling system, the hydraulic interconnection scheme between submodules, the optimal flow rate range and the thermal characteristic curve, including the wind speed dependence. The thermal characteristics jointly with the electrical ones and their coupling para-menters have been included in the software package Trnsys 18 along with the rest of components of the building installation, the weather databases and the building characteristics.
The HCPVT system has been compared with a standard PVT system founded on a commercially available collector. The PVT has the same peak power as the HCPVT and is installed at an optimim tilt angle, depending on the location. Two cities representing different climates, both with direct radiation greater than 2000 kWh⋅m− 2 year, have been selected for the simulations: Almería (Spain) and Lancaster (United States). The heat produced by the collectors is mainly used to cover the domestic hot water demand and, in the case of excess thermal produc-tion, aids the space heating system through the inertia tank. The cli-matization is carried out by a reversible heat pump, which also supports the domestic hot water demand when the solar thermal energy is not sufficient. The heat pump jointly with the lighting and the appliances are fed by the solar electricity produced. The electricity grid is kept as auxiliary system in the cases when the solar energy produced needs to be supported.
Fig. 19. Sankey diagram for Almería (a) and Lancaster (b).
A. Moreno et al.
Applied Energy 304 (2021) 117647
17
The comparison results, considering both systems to have the same peak power and the PVT modules to be positioned at the optimal tilt angles, indicate that the HCPVT system always produces more electricity than the PVT one. This is due to the higher electrical efficiency, the lower temperature coefficients and the angular irradiance losses, which tend to increase the performance ratio of the former by around 7%. The HCPVT obtains PR values of around 90% (including tracking errors) and in the case of the PVT, the PR value is less than 84%. In Almería, the HCPVT system produces 6.8% more electricity per kilowatt-peak than the PVT. In Lancaster, the difference mentioned above is greater due to a higher percentage of direct radiation, obtaining an electrical production per kilowatt-peak 18.6% higher than that of the PVT.
In terms of annual thermal production, the HCPVT system clearly outperforms the PVT configuration. In Almería the thermal energy produced by the HCPVT is 51% higher than the one for the PVT configuration and in Lancaster this percentage increases up to 55%. These results prove that the HCPVT system is capable of generating electricity and heat more efficiently than conventional PVTs. Therefore, for rooftop applications HCPVTs are a potential candidate for maxi-mizing the space occupation effectiveness in urban areas.
Once the suitability of the HCPVT is proven, the performance is analyzed in detail for the two locations. Regarding domestic hot water demand, the system covers 95% of the demand in Almería and 100% in Lancaster. In addition, the excess heat produced supports the space heating system (heat pump), covering the 50% of the space heating demands in Almería and Lancaster. Finally, the electricity demand is covered, achieving annual solar fractions above 55% in Almería and 68% in Lancaster.
The results obatained in the Sankey diagram indicate that in Almería the fraction of electricity consumed from the grid is almost 5% higher than the one in Lancaster. Related to the previous point, the solar resource is more efficiently used in Lancaster than in Almería (5% dif-ference). Another striking difference is related to the heat pump per-centage used for covering the space heating and cooling demands. In Almería this percentage is 10% higher than in Lancaster due to, among other factors, the higher summer temperatures reached in Lancaster that reduce the heat pum efficiency.
HCPVT systems for building applications demonstrate to be an effective solar generation system covering a large fraction of the build-ing energy demand. Taking into account space limitation in buildings (related to the installation of renewable energy systems), HCPVT sys-tems can be considered as a suitable alternative or complement to conventional systems. The main drawback of HCPVTs is the need to incorporate a two-axis tracking system that, in the case of buildings, could pose difficulties. On the other hand, advanced tracking systems that are very compact and accurate, minimize movements and re-quirements to ease and extend the use of solar concentrators in buildings were reported in the literature on these types of technologies.
As future work, other building configurations or modes will be investigated to extend the conclusions of the present research. For instance, the possibility of selling electricity to the electrical company or to other users will be considered. At present, the framework and regu-lations of such modes are under elaboration or at initial stages in Spain and in the rest of the countries in general. In relation to the previous point, the next goal is to fabricate, install and assess a prototype of the HCPVT system proposed to obtain cost and performances under real operating conditions.
CRediT authorship contribution statement
A. Moreno: Validation, Investigation, Writing – review & editing. D. Chemisana: Conceptualization, Methodology, Writing – original draft, Supervision, Project administration, Funding acquisition. E.F. Fernan-dez: Conceptualization, Methodology, Writing – review & editing.
Declaration of Competing Interest
The authors declare that they have no known competing financial interests or personal relationships that could have appeared to influence the work reported in this paper.
Acknowledgements
The authors would like to thank ’’Ministerio de Economía y Com-petitividad’’ of Spain , “Ministerio de Ciencia e Innovacion” for the funding (grant references ENE2016-81040-R & PID2019-111536RB- I00) and “AGAUR” (2017 SGR 127). D. Chemisana thanks ’’Institucio Catalana de Recerca i Estudis Avançats (ICREA)’’ for the ICREA Academia award. E.F. Fernandez thanks the Spanish Ministry of Science, Innovation and Universities for the funds received under the Ramon y Cajal program (RYC-2017-21910).
References
[1] European Parliament. The energy performance of buildings directive factsheet; 2019.
[2] Eurostat. Statistics Explained; 2019. [3] DIRECTIVE (EU) 2018/844. Directive 2018/844/EU Energy performance of
buildings. Off J Eur Union 2018, 75–91 (2018). [4] Green MA, Dunlop ED, Hohl-Ebinger J, Yoshita M, Kopidakis N, Ho-Baillie AWY.
Solar cell efficiency tables (Version 55). Prog Photovoltaics Res Appl 2020;28: 3–15.
[5] Geisz JFF, Steiner MAA, Jain N, Schulte KLL, France RMM, McMahon WEE, et al. Building a Six-Junction Inverted Metamorphic Concentrator Solar Cell. IEEE J Photovoltaics 2018;8:626–32.
[6] Van Riesen S, Neubauer M, Boos A, Rico MM, Gourdel C, Wanka S, et al. New module design with 4-junction solar cells for high efficiencies. In: AIP Conference Proceedings; 2015, Vol. 1679.
[7] Kamath HG, Ekins-Daukes NJ, Araki K, Ramasesha SK. The potential for concentrator photovoltaics: A feasibility study in India. Prog Photovoltaics Res Appl 2019;27:316–27.
[8] Schlegl T, Schmidt JA, Hussein NS, Lude S, Nold S, Philipps SP, et al. Levelized cost of electricity: PV and CPV in comparison to other technologies; 2014.
[9] W. J. [National R. E. L. (NREL) Cole Golden, CO (United States)], B. A. [National R. E. L. (NREL) Frew Golden, CO (United States)], P. J. [National R. E. L. (NREL) Gagnon Golden, CO (United States)], J. [National R. E. L. (NREL) Richards Golden, CO (United States)], Y. [National R. E. L. (NREL) Sun Golden, CO (United States)], J. [National R. E. L. (NREL) Zuboy Golden, CO (United States)], M. A. [National R. E. L. (NREL) Woodhouse Golden, CO (United States)], and R. M. [National R. E. L. (NREL) Margolis Golden, CO (United States)]. SunShot 2030 for Photovoltaics (PV): Envisioning a Low-Cost PV Future; 2017.
[10] Feldman D, Zwerling M, Margolis R. Q2/Q3 2019Solar Industry Update; 2019. [11] Jager-Waldau A. PV Status Report 2019; 2019. [12] Philipps SP, Warmuth W. Photovoltaics Report; 2019. [13] Odyssee-Mure, “Sectoral Profile - Households,” https://www.odyssee-mure.eu/
publications/efficiency-by-sector/households/electricity-consumption-dwelling. html.
[14] Hastings SR, Wall M. Sustainable Solar Housing: Volume 2 – Exemplary Buildings and Technologies; 2012, Vol. 9781849772.
[15] da Silva RM, Fernandes JLM. Hybrid photovoltaic/thermal (PV/T) solar systems simulation with Simulink/Matlab. Sol Energy 2010;84:1985–96.
[16] Chow TT. A review on photovoltaic/thermal hybrid solar technology. Appl Energy 2010;87:365–79.
[17] Widyolar B, Jiang L, Brinkley J, Hota SK, Ferry J, Diaz G, et al. Experimental performance of an ultra-low-cost solar photovoltaic-thermal (PVT) collector using aluminum minichannels and nonimaging optics. Appl Energy 2020;268.
[18] Mellor A, Alonso Alvarez D, Guarracino I, Ramos A, Riverola Lacasta A, Ferre Llin L, et al. Roadmap for the next-generation of hybrid photovoltaic-thermal solar energy collectors. Sol Energy 2018;174:386–98.
[19] Kinsey GS, Pien P, Hebert P, Sherif RA. Operating characteristics of multijunction solar cells. Sol Energy Mater Sol Cells 2009;93:950–1.
[20] Vossier A, Zeitouny J, Katz EA, Dollet A, Flamant G, Gordon JM. Performance bounds and perspective for hybrid solar photovoltaic/thermal electricity- generation strategies. Sustain Energy Fuels 2018;2:2060–7.
[21] Cotfas DT, Cotfas PA, Machidon OM. Study of temperature coefficients for parameters of photovoltaic cells. Int J Photoenergy 2018;2018.
[22] Ju X, Xu C, Han X, Du X, Wei G, Yang Y. A review of the concentrated photovoltaic/thermal (CPVT) hybrid solar systems based on the spectral beam splitting technology. Appl Energy 2017;187:534–63.
[23] Sharaf OZOZ, Orhann MFMF. Concentrated photovoltaic thermal (CPVT) solar collector systems: Part II - Implemented systems, performance assessment, and future directions. Renew Sustain Energy Rev 2015;50:1566–633.
[24] Daneshazarian R, Cuce E, Cuce PM, Sher F. zachar. Renew Sustain Energy Rev 2018;81:473–92.
A. Moreno et al.
Applied Energy 304 (2021) 117647
18
[25] Chemisana D, Zacharopoulos A. Building-Integration of High-Concentration Photovoltaic Systems. In: High Concentrator Photovoltaics: Fundamentals, Engineering and Power Plants; 2015, pp. 353–376.
[26] Perez-Higueras P, Ferrer-Rodríguez JP, Almonacid F, Fernandez EF. Efficiency and acceptance angle of High Concentrator Photovoltaic modules: Current status and indoor measurements. Renew Sustain Energy Rev 2018;94:143–53.
[27] Fernandez EF, Ferrer-Rodríguez JP, Almonacid F, Perez-Higueras P. Current- voltage dynamics of multi-junction CPV modules under different irradiance levels. Sol Energy 2017;155:39–50.
[28] Ferrer-Rodríguez JP, Fernandez EF, Baig H, Almonacid F, Mallick T, Perez- Higueras P. Development, indoor characterisation and comparison to optical modelling of four Fresnel-based high-CPV units equipped with refractive secondary optics. Sol Energy Mater Sol Cells 2018;186:273–83.
[29] Barkhouse DAR, Gunawan O, Gokmen T, Todorov TK, Mitzi DB. Yield predictions for photovoltaic power plants:empirical validation, recent advances and remaining uncertainties. Prog Photovoltaics Res Appl 2015;20:6–11.
[30] McAdams WH. Heat Transmission. New York: McGraw-Hill; 1954. [31] Menter FR. Two-equation eddy-viscosity turbulence models for engineering
applications. AIAA J 1994;32:1598–605. [32] CEC, “California Building Energy Efficiency Standards for Residential and
Nonresidential Buildings, 277 (2018). [33] Codigo Tecnico de la Edificacion (CTE), “Documento Basico de Ahorro de Energía
(DB-HE); 2017. [34] “Panel solar híbrido | Abora Solar,” https://abora-solar.com/pdf/AH72SK-ES.pdf. [35] Fraunhofer Institute For Solar Energy Systems & National Renewable Energy
Laboratory, “Current Status of Concentrator Photovoltaik Technology,” (ss.7); 2015.
[36] CEN, “EN 15316-3-1 - Heating systems in buildings - Method for calculation of system energy requirements and system efficiencies - Part 3-1: Domestic hot water systems, characterisation of needs; 2008.
[37] Buonomano A, Calise F, Palombo A, Vicidomini M. BIPVT systems for residential applications: An energy and economic analysis for European climates. Appl Energy 2016;184:1411–31.
[38] CEN, “prEN 16798-1: Energy performance of buildings - Part 1: Indoor environmental input parameters for design and assessment of energy performance of buildings addressing indoor air quality, thermal environment, lighting and acoustics - Module M1-6,” 44, 2015.
[39] Jordan U, Vajen K. DHWcalc: Program to generate domestic hot water profiles with statistical means for user defined conditions. In: ISES Solar World Congress; 2005.
[40] Coventry JS. Simulation of a concentrating PV / thermal collector using TRNSYS Simulation of a concentrating PV / thermal collector using TRNSYS 1 Introduction; 2016.
[41] Calise F, Dentice d’Accadia M, Roselli C, Sasso M, Tariello F. Desiccant-based AHU interacting with a CPVT collector: Simulation of energy and environmental performance. Sol Energy 2014;103:574–94.
[42] Moreno A, Riverola A, Chemisana D. Energetic simulation of a dielectric photovoltaic-thermal concentrator. Sol Energy 2018;169:374–85.
[43] Duffie JA, Beckman WA. Solar Engineering of Thermal Processes. Wiley; 2013. [44] Evans DL. Simplified method for predicting photovoltaic array output. Sol Energy
1981;27:555–60. [45] Sandnes B, Rekstad J. A photovoltaic/thermal (PV/T) collector with a polymer
absorber plate. Experimental study and analytical model. Sol Energy 2002;72: 63–73.
[46] LG CHEM. ESS Battery. [47] Rodrigo P, Velazquez R, Fernandez EF, Almonacid F, Perez-Higueras PJ. Analysis
of electrical mismatches in high-concentrator photovoltaic power plants with distributed inverter configurations. Energy 2016;107:374–87.
[48] Renzi M, Egidi L, Comodi G. Performance analysis of two 3.5 kWp CPV systems under real operating conditions. Appl Energy 2015;160:687–96.
[49] Kim YS, Winston R. Power conversion in concentrating photovoltaic systems: Central, string, and micro-inverters. Prog Photovoltaics Res Appl 2014;22:984–92.
[50] Talavera DL, Perez-Higueras P, Ruíz-Arias JA, Fernandez EF. Levelised cost of electricity in high concentrated photovoltaic grid connected systems: Spatial analysis of Spain. Appl Energy 2015;151:49–59.
[51] Chemisana Daniel. Building integrated concentrating photovoltaics: A review. Renew Sust Energy Rev 2011;15(1):603–11. https://doi.org/10.1016/j. rser.2010.07.017.
A. Moreno et al.