APPLICATIONS OF SYMBOLIC OBJECTS IN OFFICIAL STATISTICS
37
APPLICATIONS OF SYMBOLIC OBJECTS IN OFFICIAL STATISTICS Patricia Calvo Garrido EUSKAL ESTATISTIKA ERAKUNDEA INSTITUTO VASCO DE ESTADISTICA Donostia-San Sebastián, 1 01010 VITORIA-GASTEIZ Tel.: 945 01 75 00 Fax.: 945 01 75 01 E-mail: [email protected] www.eustat.es
-
Upload
independent -
Category
Documents
-
view
2 -
download
0
Transcript of APPLICATIONS OF SYMBOLIC OBJECTS IN OFFICIAL STATISTICS
APPLICATIONS OF SYMBOLIC OBJECTS
IN OFFICIAL STATISTICS
Patricia Calvo Garrido
EUSKAL ESTATISTIKA ERAKUNDEAINSTITUTO VASCO DE ESTADISTICA
Donostia-San Sebastián, 101010 VITORIA-GASTEIZ
Tel.: 945 01 75 00Fax.: 945 01 75 01
E-mail: [email protected]

SUMMARY
APPLICATIONS OF SYMBOLIC OBJECTS IN OFFICIAL STATISTICS
Patricia CALVO GARRIDO
Statistical Assistant Technician at EUSTAT
SUMMARY
This study mainly deals with the definition, creation and visualization of Symbolic Objectsfrom surveys stored in Relational Databases. In addition, a chapter is dedicated to thebasic statistics of these Objects, leaving more detailed analyses for further technicalnotebooks. At each step, the advantages of this new kind of analysis are presented incomparison with a classical analysis.
The use of symbolic objects in Official Statistics provides the capacity to describe datawith a complex structure. Information on the structure will be extracted from the databaseand will be described by means of symbolic objects. These objects may describeindividuals or kinds of individuals.
The structure of the notebook is as follows:
In the Introduction the SODAS project is presented, on which this notebook is based, thebasic notions of the definition of a symbolic object and the origin of this new notation.
Chapter Two describes how knowledge is extracted from a database by means ofqueries and how the result of these queries is transformed into symbolic objects.
In Chapter Three we look at the way to visualize symbolic objects through tables, graphsor the exclusive language of symbolic objects.
Chapter four focuses on the descriptive statistics of symbolic objects
Finally, the conclusions of this study are presented together with the future of this newtheory in official statistics.
KEY WORDS:Symbolic Object, assertion, Boolean object, probabilistic object, relational database,query.
APPLICATIONS OF SYMBOLIC OBJECTS IN OFFICIAL STATISTICS
INDEX 3
IndexAPPLICATIONS OF SIMBOLIC OBJECTS IN OFFICIAL STATISTICS.....................................................1
INDEX.............................................................................................................................................................................3
INTRODUCTION.........................................................................................................................................................4
INTRODUCTION AND OBJECTIVES..........................................................................................................................4
PROJECT DESCRIPTION...........................................................................................................................................4
NEED FOR SYMBOLIC OBJECTS.............................................................................................................................5
DATA TABLES..........................................................................................................................................................6
FORMAL DEFINITION OF SYMBOLIC OBJECT .......................................................................................................7Types of Symbolic Objects .................................................................................................................8Modal Symbolic Objects .....................................................................................................................8
EXAMPLE ..................................................................................................................................................................9
FIRST AND SECOND ORDER SYMBOLIC OBJECTS...............................................................................................9
SYMBOLIC OBJECTS AS AN IMPRECISE MEASURE ............................................................................................10
SOURCE OF SYMBOLIC OBJECTS.........................................................................................................................10
OBTAINING SYMBOLIC OBJECTS FROM DATABASE QUERIES .........................................................12
BUILDING ASSERTIONS.........................................................................................................................................12
BUILDING MOTHER-DAUGHTER VARIABLES OR HIERARCHICAL DEPENDENCIES......................................14
ADDITION OF TAXONOMIES IN THE VARIABLE DOMAIN..................................................................................15
REFINEMENT OF ASSERTIONS..............................................................................................................................16
JOINING ASSERTIONS............................................................................................................................................18
ADVANTAGES OF USING SYMBOLIC OBJECTS...................................................................................................20
VISUALIZATION OF SYMBOLIC OBJECTS. ZOOM STAR. .....................................................................21
VISUALIZATION IN A SYMBOLIC TABLE ............................................................................................................21
ZOOM STAR VISUALIZATION ...............................................................................................................................22
SOL VISUALIZATION............................................................................................................................................24
COMPARISON OF SEVERAL SYMBOLIC OBJECTS...............................................................................................25
ANALYSIS OF EVOLUTION OF SYMBOLIC OBJECTS..........................................................................................27
ADVANTAGES OF USING SYMBOLIC OBJECTS...................................................................................................29
BASIC STATISTICS FOR SYMBOLIC OBJECTS............................................................................................30
FREQUENCIES FOR MULTINOMIAL VARIABLES.................................................................................................30
FREQUENCIES FOR INTERVAL VARIABLES.........................................................................................................31
BIPLOT ....................................................................................................................................................................32
CAPACITIES FOR PROBABILISTIC VARIABLES ...................................................................................................32

INDEX 4
CONCLUSIONS .........................................................................................................................................................33
OTHER USES OF SYMBOLIC OBJECTS..................................................................................................................33
FUTURE OF THE PROJECT ......................................................................................................................................34
REFERENCES ............................................................................................................................................................35

APPLICATIONS OF SYMBOLIC OBJECTS IN OFFICIAL STATISTICS
INTRODUCTION 4
IntroductionIntroduction and objectives
The aim of this paper is an initiation to Symbolic Data Analysis in Statistical Offices. Inthis case, we have applied this new analysis to the study of some EUSTAT surveys toknow the advantages with regard to a classical data analysis.
Classical methods of statistical data analysis were designed for a relatively simplesituation. First, data were obtained for single individuals using interviews, experiments,archives, etc. Second, the variables were well defined and third, these variables had onlya value or category in each individual.
Sometimes, the real world is too complex to be described by these relatively simplemodels. In order to deal with these cases, we will introduce the symbolic object conceptand define various types of symbolic data.
A Symbolic Object is a way of representing complex data that arise when analysinghuge data sets. In Statistical Institutes one of the most important tasks is to summarizethem in shorter sets with new statistical units, losing as little information as possible. Thenew statistical units will be the called Symbolic Objects and will extend the StandardData Analysis to the corresponding Symbolic Data Analysis.
Project Description
The use of Symbolic Objects proposed by E. Diday, has reached its maximumdevelopment in the framework of the European project SODAS.
“SODAS: Symbolic Official Data Analysis System” is project no. 20281 of the EuropeanCommission, General Directory III, Industrial rtd, EUROSTAT, DOSES program.
In this project, several members belonging to Universities, Enterprises, Official Statisticsand Research Centres of the European Union are involved, one which is the EUSTAT,an official statistical office.
The aim of this project is to facilitate the use of Symbolic Data Analysis in statisticaloffices and companies, and consequently demonstrate that these techniques meetseveral user needs:
• Analysis of data with complex structures.
• Better explanations of statistical results.
• Concepts and metadata representation, manipulation and analysis.
Chapter
1

INTRODUCTION 5
• Exchange of data between official statistics community members.
This will be achieved by:
• Developing the software for prototyping and evaluating statistical processing ofsymbolic data.
• Building a concept oriented system for official statistics.
The software will include:
• Generic tools for storing, querying, and updating symbolic objects.
• Tools for acquiring symbolic objects from large databases.
• A collection of data analysis methods dedicated to symbolic objects: univariatedescriptive methods, clustering, decision-tree construction, discrimination, andfactorial analysis.
• Facilities to transform symbolic objects into “standard” objects and then performstandard data analysis methods on them.
Ergonomic tools for presenting to the user the results of the methods.
Need for Symbolic Objects
The following are examples that illustrate the need to use symbolic objects:
For example, for individuals, the variable Y = "Minutes dedicated to practising sport perday" is a variable that allows a non-unitary response, as it varies from day to day. For anindividual k, this variable may be expressed in a non-classical manner:
Y(k) = [20,60] o
Y(k) = 20 minutes (0.15), 30 minutes (0.45), 45 minutes (0.1), 60 minutes (0.3) o
Y(k) = Null Participation (0.1), Low Particip. (0.5), Average Particip. (0.3), High Particip.(0.1).
For groups of individuals, if k denotes the region ‘Álava’, the variable Y = "Relation withthe Activity" may be specified by:
Y(k) = Employed (0.47), Unemployed (0.11), Inactive (0.42),
which means that 47% of the individuals in Álava are employed, 11% unemployed, etc..

INTRODUCTION 6
Data Tables
The creation of Symbolic Objects is based on tables from a Relational Database where,
• There are various related tables at different levels.
• Data and the metadata appear separately, so information is not repeated.
• It is possible to have one data table and several metadata tables in differentlanguages.
The generated symbolic objects will be also stored in tables. These tables, with symbolicobjects in rows and variables in columns, will be the beginning to different algorithms ofSymbolic Data Analysis. Each cell of these tables may contain different types of data,such as:
a) A single quantitative value: age (w) = 23;
b) A single categorical value: sex (w) = woman;
c) Multivalued: marital status (w) = single, married.
d) Interval: age (w) = [20, 25];
e) Multivalued with weights: age (w) = [20 (0.65), 25 (0.35)];
Where age, sex and marital status are variables and w units.
In short, the values that individuals take in the variables can be non-atomic (a group ofvalues, an interval or a probability distribution).
Table 1. Table of Symbolic Objects
Sex Age Relation to Activity
OS 1 woman (0.33), man(0.67) [25:57] employed(0.67),inactive(0.33)
OS 2 woman (0.25), man(0.75) [15:42] employed (0.25), unemployed(0.25), inactive(0.50)
OS n woman (0.5), man(0.5) [27:29] employed (1)
The variables that describe symbolic objects may be:
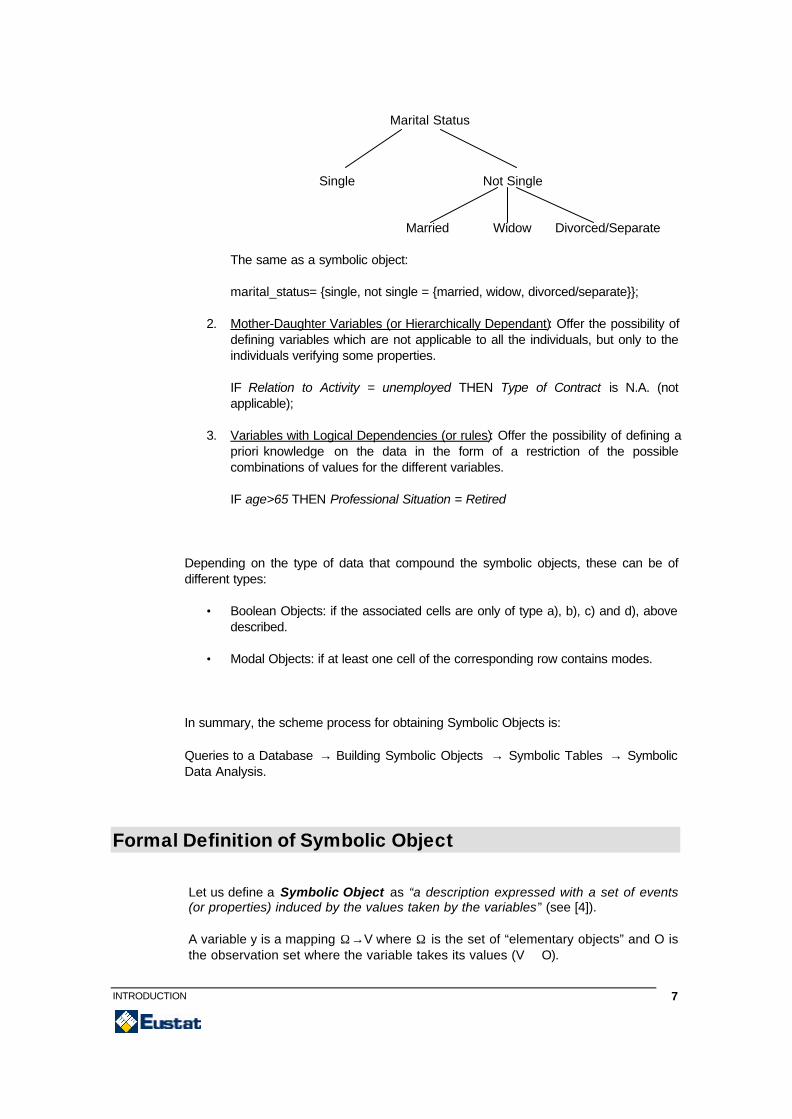
1. Variables with Taxonomic Domain: Offer the possibility of defining a taxonomywithin the values taken by a variable. This taxonomy represents a prioriknowledge on the data.
INTRODUCTION 7
Marital Status
Single Not Single
Married Widow Divorced/Separate
The same as a symbolic object:
marital_status= single, not single = married, widow, divorced/separate;
2. Mother-Daughter Variables (or Hierarchically Dependant): Offer the possibility ofdefining variables which are not applicable to all the individuals, but only to theindividuals verifying some properties.
IF Relation to Activity = unemployed THEN Type of Contract is N.A. (notapplicable);
3. Variables with Logical Dependencies (or rules): Offer the possibility of defining apriori knowledge on the data in the form of a restriction of the possiblecombinations of values for the different variables.
IF age>65 THEN Professional Situation = Retired
Depending on the type of data that compound the symbolic objects, these can be ofdifferent types:
• Boolean Objects: if the associated cells are only of type a), b), c) and d), abovedescribed.
• Modal Objects: if at least one cell of the corresponding row contains modes.
In summary, the scheme process for obtaining Symbolic Objects is:
Queries to a Database → Building Symbolic Objects → Symbolic Tables → SymbolicData Analysis.
Formal Definition of Symbolic Object
Let us define a Symbolic Object as “a description expressed with a set of events(or properties) induced by the values taken by the variables” (see [4]).
A variable y is a mapping Ω→V where Ω is the set of “elementary objects” and O isthe observation set where the variable takes its values (V ⊂ O).

INTRODUCTION 8
Types of Symbolic Objects
- Elementary events: e i = [yi=Vi] It is a mapping ey ivi: Ω→true, false such that ey iVi(w)=true if and only if yi(w) ∈ Vi. Ex. [length = 0.52] or [colour ∈red, blue] - Assertion: a = [y’1=V1] ∧ ...∧ [y’q=Vq] where Vi ⊂ O’i is defined by the mapping ayV:Ω→ true, false such that ayV(w)=true if and only if for all i=1,...,q yi(w)∈ Vi. It is a conjunction of events that have to be true simultaneously for the sameelementary object w ∈ Ω. Ex. [length = 0.52] ∧ [colour ∈red, blue] ∧ [shape = rectangular] - Horda Object: h = [y’1(u1)=V1] ∧ ...∧ [y’p(up)=Vp] is defined by the function hyV: Ωq
→ true, false such that ∀ W = (w’1,...,w’q) ∈ Ωq, hyV(W) = true if and only if ∀ iy’i(w’i)∈ Vi. - Synthesis Object: s = h1∧ ... ∧hk, is the conjunction of k horda objects definedrespectively on each of the groups H1,...,Hk con hi ∈ Hi.
Modal Symbolic Objects
Previously, we defined modal objects as having at least one cell with weights. Now,we are going to classify these objects according to whether the weights (or modes)affect the whole object or only its values. External Modal Objects: the modes affect the event globally. ax = î Mi [yi=Vi] where x refers to the semantic (possibilistic, probabilistic,...). Ex.: often [Age = [16,24]] (possibilistic) Internal Modal Objects: the modes affect the values taken by the variables. ax = î [yi= Mi Vi] where x refers to the semantic. Ex.: [Marital_status = not single (0.7), single (0.3)] (probabilistic) Definition of an Object in Intension and in Extension Definition of an object in Intension: The object is described by the propertiesthat characterize it. Definition of an object in Extension: The extension of a symbolic object is theset of elementary objects of Ω that satisfy it. We denote |s|Ω or Ext(s). In the Boolean case, Ext(s) =w ∈ Ω / a(w) = true In the modal case, given a threshold α, Ext(s) = w ∈ Ω / a(w) ≥ α
In this work, we will use internal modal elementary events and assertions defined inIntension.

INTRODUCTION 9
Example
We have the following table with 4 individuals (in rows) and 3 variables (incolumns):
y1: Sex y2: Age y3: EducationInd1 Woman 25 universityInd2 Woman 60 primaryInd3 Man 38 secondaryInd4 Man 54 secondary
The set of “elementary objects” is Ω =Ind1, Ind2, Ind3, Ind4.The observation set of the variable y1 is O1= woman, man and in the same wayfor y2 and y3.
Then, Ind1 may be described by the following Boolean assertion:Ind1 = [Sex = woman] ∧ [Age = 25] ∧ [Education = university]
To clarify the terms of definition in intension and extension, another symbolic objectcould be:
a = [Sex = man] ∧ [Education = secondary]. This description is a definition in intension. Its definition in extension would be:
Ext(a) = Ind3, Ind4, since individuals 3 and 4 fulfil ‘a’.
First and Second Order Symbolic Objects
First Order Symbolic Objects are first order types when the data refer to single individuals. Let be E = Ω =1,...n a universe of individuals (elementary objects).
For example, the variable Y = "Age" for each pupil k at a school:
Y(k) = 11 o
Y(k) = [4, 13]
Second Order Symbolic Objects are second order types when the data refer to more or lesshomogeneous classes of individuals. As not all individuals of the same class takethe same value in each variable, there might be several categories which applysimultaneously to the class, eventually with specified percentages. Let be E = C1, C2,... a system of classes Ci ⊆ Ω (aggregated objects).
Now k denotes a class of individuals such as a specific year at the school in the aboveexample and the variable Y = "Age" may be specified by:
INTRODUCTION 10
Y(k) = 10 (0.2), 11(0.6), 12(0.2),
which means that 20% of the individuals of this year are aged 10, 60% are 11 years old,etc..
Higher order objects can be defined in an analogous way by successive aggregationsteps (aggregate 2 different years of the same level and compare them on the basis ofage).
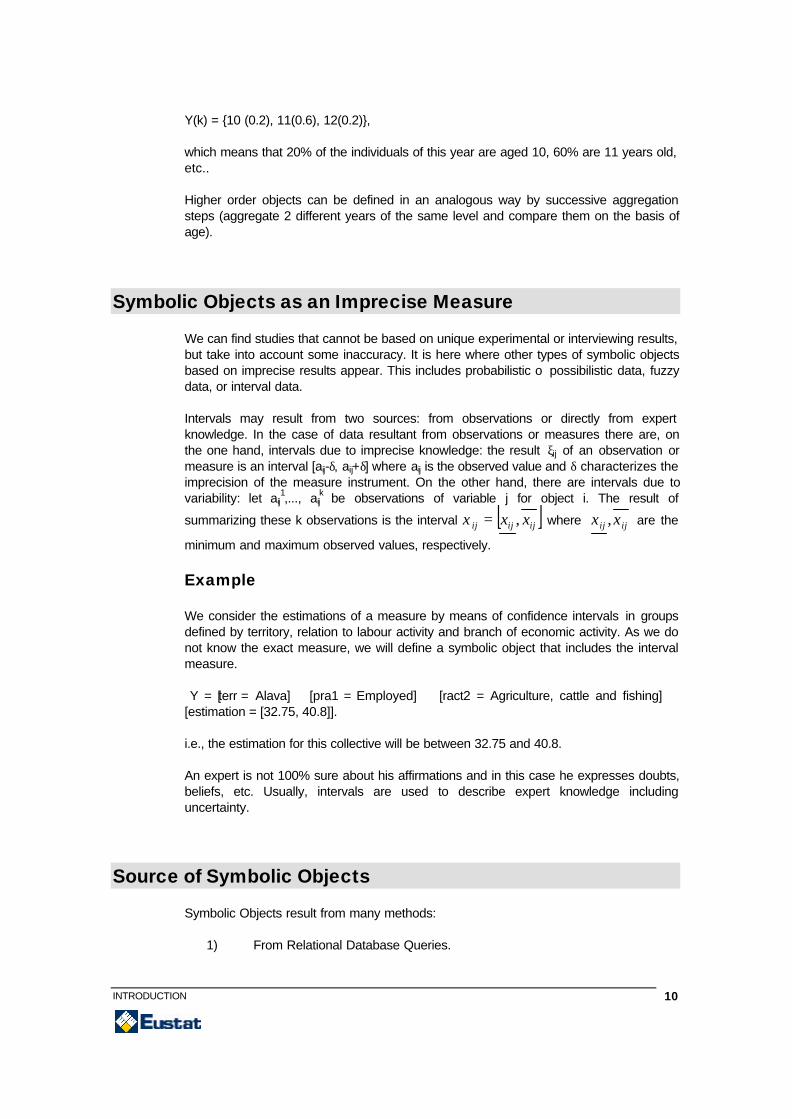
Symbolic Objects as an Imprecise Measure
We can find studies that cannot be based on unique experimental or interviewing results,but take into account some inaccuracy. It is here where other types of symbolic objectsbased on imprecise results appear. This includes probabilistic o possibilistic data, fuzzydata, or interval data.
Intervals may result from two sources: from observations or directly from expertknowledge. In the case of data resultant from observations or measures there are, onthe one hand, intervals due to imprecise knowledge: the result ξij of an observation ormeasure is an interval [aij-δ, aij+δ] where aij is the observed value and δ characterizes theimprecision of the measure instrument. On the other hand, there are intervals due tovariability: let aij
1,..., aijk be observations of variable j for object i. The result of
summarizing these k observations is the interval [ ]ijijij xx ,=ξ where ijij xx , are the
minimum and maximum observed values, respectively.
Example
We consider the estimations of a measure by means of confidence intervals in groupsdefined by territory, relation to labour activity and branch of economic activity. As we donot know the exact measure, we will define a symbolic object that includes the intervalmeasure.
Y = [terr = Alava] ∧ [pra1 = Employed] ∧ [ract2 = Agriculture, cattle and fishing] ∧[estimation = [32.75, 40.8]].
i.e., the estimation for this collective will be between 32.75 and 40.8.
An expert is not 100% sure about his affirmations and in this case he expresses doubts,beliefs, etc. Usually, intervals are used to describe expert knowledge includinguncertainty.
Source of Symbolic Objects
Symbolic Objects result from many methods:
1) From Relational Database Queries.

INTRODUCTION 11
2) From Data Analysis of standard tables to build groups (factorial analysis,clustering, …).
3) From expert knowledge.
4) From time series.
5) From confidential data (to hide initial data by means of less accuracy).
In our case, using some surveys we will generate symbolic objects by means of queriesto the database.
In the following chapters different types of symbolic objects will be developed, insistingon the advantages with respect to traditional methods of data analysis.

APPLICATIONS OF SYMBOLIC OBJECTS IN OFFICIAL STATISTICS
OBTAINING SIMBOLIC OBJECTS FROM DATABASE QUERIES 12
Obtaining Symbolic Objects fromDatabase Queries
The most direct way to obtain symbolic objects is by means of database queries. Thesequeries automatically extract groups of individuals with common characteristics, forexample families, regions, etc. It is really a generalization process of a group of classicaldata stored in a database bearing in mind relations between different tables. Once thesymbolic objects have been created, a process of specialization may be applied to themin order to reduce over-generalization or to join several together by applying a jointoperator.
Building Assertions
A relational database follows a table structure where each tuple represents an individual.
A way to obtain and describe information stored in a relational database is buildingsymbolic objects. These objects are created by aggregating individuals in classes anddescribing the properties of these classes.
In the selection process for the population we take into account data of several relatedtables with additional knowledge such as taxonomies, mother-daughter variables. Thesteps of the process are:
- SQL query in DB2SO of SODAS that specifies which relevant data need to beprocessed and which attributes need to be returned.
The general format of a SQL query is:SELECT id, group attribute, rest of variables, [sampling weight]FROM tableWHERE restrictions;
These queries consist of a unique id for each individual, an attribute that groups theindividuals (group attribute), other variables that show the composition of the group,and optionally a sampling weight. The composition of the group can be given inpercentage or in figures.
The result of a query, i.e. a group of tuples, is considered as the population understudy. If the size of the population is great, random sampling may be carried out.
- Description of each group by an assertion, for future analysis of these groups.
Chapter
2
OBTAINING SIMBOLIC OBJECTS FROM DATABASE QUERIES 13
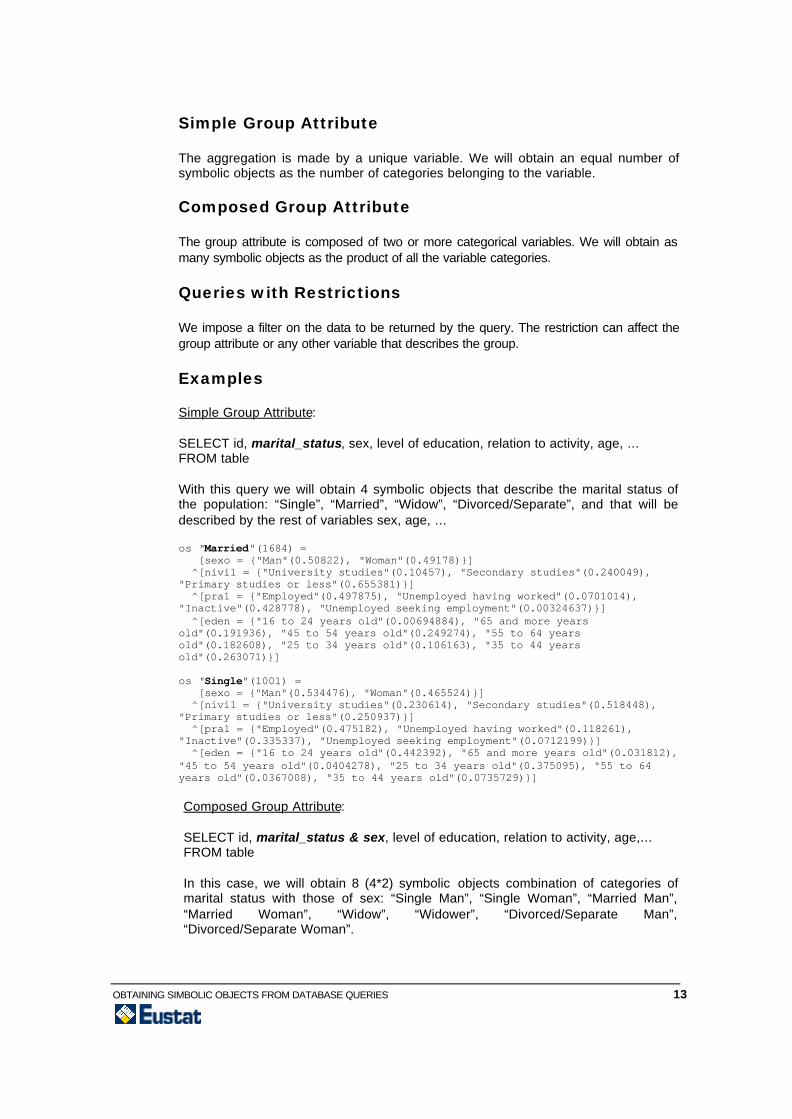
Simple Group Attribute
The aggregation is made by a unique variable. We will obtain an equal number ofsymbolic objects as the number of categories belonging to the variable.
Composed Group Attribute
The group attribute is composed of two or more categorical variables. We will obtain asmany symbolic objects as the product of all the variable categories.
Queries with Restrictions
We impose a filter on the data to be returned by the query. The restriction can affect thegroup attribute or any other variable that describes the group.
Examples
Simple Group Attribute:
SELECT id, marital_status, sex, level of education, relation to activity, age, ...FROM table
With this query we will obtain 4 symbolic objects that describe the marital status ofthe population: “Single”, “Married”, “Widow”, “Divorced/Separate”, and that will bedescribed by the rest of variables sex, age, ...
os "Married"(1684) = [sexo = "Man"(0.50822), "Woman"(0.49178)] ^[nivi1 = "University studies"(0.10457), "Secondary studies"(0.240049),"Primary studies or less"(0.655381)] ^[pra1 = "Employed"(0.497875), "Unemployed having worked"(0.0701014),"Inactive"(0.428778), "Unemployed seeking employment"(0.00324637)] ^[eden = "16 to 24 years old"(0.00694884), "65 and more yearsold"(0.191936), "45 to 54 years old"(0.249274), "55 to 64 yearsold"(0.182608), "25 to 34 years old"(0.106163), "35 to 44 yearsold"(0.263071)]
os "Single"(1001) = [sexo = "Man"(0.534476), "Woman"(0.465524)] ^[nivi1 = "University studies"(0.230614), "Secondary studies"(0.518448),"Primary studies or less"(0.250937)] ^[pra1 = "Employed"(0.475182), "Unemployed having worked"(0.118261),"Inactive"(0.335337), "Unemployed seeking employment"(0.0712199)] ^[eden = "16 to 24 years old"(0.442392), "65 and more years old"(0.031812),"45 to 54 years old"(0.0404278), "25 to 34 years old"(0.375095), "55 to 64years old"(0.0367008), "35 to 44 years old"(0.0735729)]
Composed Group Attribute:
SELECT id, marital_status & sex, level of education, relation to activity, age,...FROM table
In this case, we will obtain 8 (4*2) symbolic objects combination of categories ofmarital status with those of sex: “Single Man”, “Single Woman”, “Married Man”,“Married Woman”, “Widow”, “Widower”, “Divorced/Separate Man”,“Divorced/Separate Woman”.

OBTAINING SIMBOLIC OBJECTS FROM DATABASE QUERIES 14
os "Married / Man"(844) = [nivi1 = "Primary studies or less"(0.622043), "Secondarystudies"(0.25979), "University studies"(0.118167)] ^[pra1 = "Employed"(0.677499), "Unemployed seekingemployment"(0.00130055), "Inactive"(0.287075), "Unemployed havingworked"(0.034125)] ^[eden = "16 to 24 years old"(0.00517072), "55 to 64 years old"(0.188175),"25 to 34 years old"(0.0798497), "65 and more years old"(0.205099), "35 to 44years old"(0.264568), "45 to 54 years old"(0.257138)]
os "Married / Woman"(840) = [nivi1 = "Primary studies or less"(0.689833), "Secondarystudies"(0.219648), "University studies"(0.0905192)] ^[pra1 = "Employed"(0.312245), "Unemployed seekingemployment"(0.00525723), "Inactive"(0.575217), "Unemployed havingworked"(0.10728)] ^[eden = "16 to 24 years old"(0.00878641), "55 to 64 years old"(0.176855),"25 to 34 years old"(0.133355), "65 and more years old"(0.178333), "45 to 54years old"(0.241147), "35 to 44 years old"(0.261524)]
Query with Restrictions:
SELECT id, marital_status, sex, level of education, relation to activity,...FROM tableWHERE 25 < age < 35
We will obtain 4 symbolic objects describing each marital status as in the firstexample, but now individuals are between 25 and 35 years old.
os "Married"(150) = [nivi1 = "Secondary studies"(0.442944), "University studies"(0.13868),"Primary studies or less"(0.418376)] ^[pra1 = "Unemployed seeking employment"(0.0059544), "Inactive"(0.148825),"Employed"(0.665266), "Unemployed having worked"(0.179955)]
os "Single"(329) = [nivi1 = "Secondary studies"(0.517487), "University studies"(0.292927),"Primary studies or less"(0.189587)] ^[pra1 = "Unemployed seeking employment"(0.0723981),"Inactive"(0.0509509), "Employed"(0.684991), "Unemployed havingworked"(0.19166)]
It can be seen that with the restriction on the age, the number in each object decreases.Compare the numbers in brackets from the first example objects with these.
Building Mother-Daughter Variables or HierarchicalDependencies
As we saw in chapter 1, mother-daughter variables define variables that are notapplicable to all individuals, but only to the individuals verifying some properties.
Some of the variables that we treat in the surveys depend on the answer of previousvariables.
For example, the variable busq2 (seeking the first employment or other) in the P.R.Asurvey, is only valid for individuals that have declared that they are seeking employment.It has no sense to apply this variable to an individual if another variable (busq1) showsthat the individual is not looking for employment. The rule in this case will be,

OBTAINING SIMBOLIC OBJECTS FROM DATABASE QUERIES 15
IF busq1 = “Not seeking employment” THEN busq2 = N.A (Not applicable)
Building Mother-Daughter variables transforms the individuals file. The daughter variable(in this case busq2) now depends on the values taken by the mother variable. If themother variable takes the value where the daughter is applicable (seeking employment),then the daughter variable will take one of its possible values (first employment, otheremployment,...). However, if the mother takes values where the daughter is notapplicable (not seeking employment ), the latter will take the value N.A.
The new rule appears in the assertions file and it is made positive, i.e., where it isapplicable instead of where it is not applicable.
busq2 is applicable if busq1 in “Seeking employment”
Addition of Taxonomies in the variable domain
The taxonomic variables allow us to define an order in their values. The definition of thehierarchy of values needs a priori knowledge.
For example, we can define an order in the values of the variable marital status:
Marital Status
Single Not Single
Married Widow Divorced/Separate
Before the SQL query, we have to build a table in the database defining thetaxonomy.
For the previous example about marital status, we show the database table andthe visualization in the DB2SO module once the taxonomy has been created.
Table in the Database Visualization of the taxonomy
In the assertions file, the description of the variable including the taxonomy can beseen.

OBTAINING SIMBOLIC OBJECTS FROM DATABASE QUERIES 16
variable eciv2 nominale "SINGLE", "MARRIED", "DIVORCED, SEPARATE", "WIDOW/WIDOWER","Single", "Not single","root_eciv2" multiple,mode=probabilist; taxonomy "Single" = "SINGLE",
"Not single" = "MARRIED", "DIVORCED, SEPARATE", "WIDOW/WIDOWER",
"root_eciv2" = "Single", "Not single"
Refinement of Assertions
The assertions described above, considering all individuals, even atypical ones, derive inover-generalization. For that reason, we now propose a new approach based on volumewhere the final description rejects atypical individuals.
To obtain more homogeneous assertions, we refine them. This procedure decreases thevolume of assertions removing some individuals in each group with a minimum coveringpower. In addition, the number of overlaps between assertions decreases.
The assertions become more specific, easier to interpret and give a better description ofthe characteristics in terms of homogeneity. The quality of the assertions produced is ofgreat importance as they are used as input for symbolic data analysis methods.
To perform the reduction step, we adapt a volume criterion that measures a generalityindex on the union of individuals:
This volume criterion cannot be applied with both numeric and nominal features. Toovercome problems of scale between numeric and nominal features, we transformnumeric features into ordinals. This coding allows us to have a homogeneous criterionamong all kinds of features without privileging one kind in particular.
We code a numeric domain feature by searching for a uniform distribution over eachinterval of points. So, in the numeric case di is a set of “uniform” intervals, whichgeneralize individual descriptions. We also weight generalization over taxonomicfeatures to privilege the simplicity of description.
We fix a threshold α, which is the minimum covering power of the assertion. Thecovering power of an assertion aC is computed with a , and the function of membershipcorresponding to aC is:
where
∏=
=pi
idcardavol,..1
)()/(
)(
)()(Re
Ccard
aac C
C
∑∈= ω
ω
=otherwise
andescriptiotobelongsifa
01
)(ω
ω

OBTAINING SIMBOLIC OBJECTS FROM DATABASE QUERIES 17
Each step of the algorithm removes from the description the attribute value whichmaximizes the reduction of hyper-cube a under α covering constraint.
Example
We have applied a reduction with a α=85% to the following example:
os "Woman 25 to 34 years old University studies Employed"(39) = [eciv2 = "Married"(0.24562), "Single"(0.75438)] ^[prof2 = "Superior technicians and professionals"(0.179049), "Merchantsand salespersons"(0.0999308), "Other personnel of Services"(0.0241),"Administrative managers"(0.0459999), "Administrative staff"(0.0320081),"Administrative auxiliaries"(0.166976), "Managers"(0.0239909), "Mediumtechnicians and professionals"(0.427945)] ^[spro1 = "Hired in private sector"(0.468736), "Hired in publicadministration"(0.427499), "Self-employed"(0.0258654), "Hired in publiccompany"(0.0778989)] ^[tjor = "Full-time (3 or more h/day)"(1)] ^[tcon = "Others"(0.0494191), "NSP+YT16+Unemployed+Inactive+Not hired,Cooperative member"(0.0258654), "Indefinite fixed (permanent ordiscontinuous)"(0.401042), "Temporary (training, seasonal, occasional orothers)"(0.523673)]
After reduction, the assertion has 5 less individuals considered atypical:
os0.85 "Woman 25 to 34 years old University studies Employed"(34) = [eciv2 = "Single"(0.772791), "Married"(0.227209)] ^[prof2 = "Administrative managers"(0.0528245), "Medium technicians andprofessionals"(0.466286), "Other personnel of Services"(0.0276755),"Merchants and salespersons"(0.0850538), "Superior technicians andprofessionals"(0.176412), "Administrative auxiliaries"(0.191749)] ^[spro1 = "Hired in public administration"(0.461722), "Hired in privatesector"(0.538278)] ^[tjor = "Full-time (3 or more h/day)"(1)] ^[tcon = "Temporary (training, seasonal, occasional or others)"(0.576216),"Indefinite fixed (permanent or discontinuous)"(0.423784)]
Fig.1: Volume matrix before (blank squares) and after refinement. Black squares showthe overlapping between assertions.

OBTAINING SIMBOLIC OBJECTS FROM DATABASE QUERIES 18
Joining Assertions
We consider two different arrays of assertions, but describing the same objects. Forinstance, one array of assertions describes regions by household variables, and theother one describes the same regions by people employment variables.
Let X1 and X2 be two arbitrary symbolic data arrays with individuals corresponding tosets E1 and E2 respectively, and with variables Y11,..., Yip y Y21,...Y2q respectively. Thejoining of X1 and X2 is denoted by join(X1, X2) and is a symbolic data array defined asfollows:
1. E = E1 I E2 (the set of entities or symbolic objects of the resulting symbolic dataarray is the intersection of the two sets of entities on which X1 and X2 are based).
2. The variables describing join(X1, X2) are Y11,..., Yip,Y21,...Y2q (the concatenation ofthe variables describing X1 and X2).
3. For each u ∈ E we define join(X1, X2)(u) := (X1(u), X2(u)). Thus the resulting datamatrix X = join(X1, X2) has the format |E| x (p+q).
4. Possible taxonomies defined on some variables of X1 or X2 are maintained injoin(X1, X2).
5. Possible mother-daughter variables defined by rules on X1 or X2 are maintained injoin(X1, X2).
Entities which show up in X1 (resp. X2), but not in X2 (resp. X1) are lost in join(X1, X2).
Uses of Joining Objects in Official Statistics: Data Fusion
We find a new application of joining symbolic objects that consists of joining assertionscoming from different surveys. This joining enables us to obtain additional information,data imputation, to obtain conclusions about causes and possible effects,...
Fusion using symbolic objects differs from the traditional data fusion in the way ofmatching. Instead of joining record by record of common variables, we join by symbolicobjects each one describing a group.
The fusion allows us to relate independent surveys to some common items. In theSODAS project framework, this comparison will be between surveys of differentcountries of the European Union.
Example
An example showing this new use in EUSTAT, is the fusion of the two independentsurveys Use of Time (EPT) and Living Conditions (ECV). They have common variables(socio-demographic) and it is probable that there is a relation between them.
The first step is to define the common socio-demographic variables and to createassertions for each survey separately. The group attribute for these assertions will be theconcatenation of common variables.

OBTAINING SIMBOLIC OBJECTS FROM DATABASE QUERIES 19
Fig.2: Common part and specific part of two independent surveys.
The common variables chosen for this study were: Sex, Marital status, Age, Relation toActivity and Level of Education.
The second step is to join assertions describing the same group. Then, for the samegroup we will have the description in the specific variables of each survey.
We consider the following data arrays:
X1 is a symbolic data array that describes socio-demographic groups by the followingvariables of Use of Time:
Y11(limp) = Participation in Cleaning
Y12 (prpc) = Participation in Preparing Meals
Y13 (prac) = Sport Practice
Y14 (cuip) = Time used in Personal Care
One of the objects of the array is:
os "Woman Married < 35 years Employed Secondary"(54) = [limp = "Null Particip."(0.347273), "Low Particip."(0.188186), "AverageParticip."(0.346782), "High Particip."(0.117759)] ^[prpc = "Null Particip."(0.0719004), "Low Particip."(0.400066), "AverageParticip."(0.436589), "High Particip."(0.0914451)] ^[prac = "Null Particip."(0.877218), "Low Particip."(0.122782)] ^[cuip = [0:170]]
X2 is a symbolic data array that describes the same socio-demographic groups by thefollowing variables of Living Conditions:
Y21 (jorna) = Length of Working Day
Y22 (comt) = Return home to have lunch
Y23 (distr) = Distance to Place of Work
Y24 (ractp) = Branch of Economic Activity
os "Woman Married < 35 years Employed Secondary"(34) = [jorna = "SPLIT SHIFT"(0.394297), "CONTINUOUS"(0.434047), "NOTAPPLICABLE"(0.171656)]
+CommonVariables
EPT
ECV

OBTAINING SIMBOLIC OBJECTS FROM DATABASE QUERIES 20
^[comt = "RETURN HOME TO LUNCH"(0.637714), "NOT RETURN HOME TOLUNCH"(0.345755), "NOT APPLICABLE"(0.0165312)] ^[ractp2 = "PAPER-GRAPHIC ART"(0.0165312), "CONSTRUCTION AND CIVILWORKS"(0.0235133), "COMMERCE-HOSTELRY-REPARING-RECOVERY"(0.337456),"TRANSPORTS AND COMMUNICATION"(0.0317708), "BANK AND INSURANCES"(0.048266),"NON-COMMERCIAL SERVICES"(0.078488), "PUBLIC ADMINISTRATION-TEACHING"(0.137167), "VEHICLES AND TRANSPORT MATERIAL"(0.0167604),"CHEMISTRY"(0.0331782), "COMMERCIAL SERVICES"(0.140833), "RUBBER AND PLASTICTRANSFORMATIONS"(0.0199348), "AGRICULTURE-CATTLE-FORESTRY-FISHING"(0.0201623), "METALLIC CONSTRUCTION"(0.0246369), "ELECTRIC MATERIALAND MACHINERY"(0.0497522), "WOOD-FURNITURE"(0.0215493)]
Then, the joint symbolic objects is:
os "Woman Married < 35 years Employed Secondary"(88) = [limp = "Null Particip."(0.347273), "Low Particip."(0.188186), "AverageParticip."(0.346782), "High Particip."(0.117759)] ^[prpc = "Null Particip."(0.0719004), "Low Particip."(0.400066),"AverageParticip."(0.436589), "High Particip."(0.0914451)] ^[prac = "Null Particip."(0.877218), "Low Particip."(0.122782)] ^[cuip = [0:170]] ^[jorna = "SPLIT SHIFT"(0.394297), "CONTINUOUS"(0.434047), "NOTAPPLICABLE"(0.171656)] ^[comt = "RETURN HOME TO LUNCH"(0.637714), "NOT RETURN HOME TOLUNCH"(0.345755), "NOT APPLICABLE"(0.0165312)] [ractp2 = "BANK AND INSURANCES"(0.048266), "NON-COMMERCIALSERVICES"(0.078488), "PAPER-GRAPHIC ART"(0.0165312), "COMMERCIALSERVICES"(0.140833), "CHEMISTRY"(0.0331782), "VEHICLES AND TRANSPORTMATERIAL"(0.0167604), "COMMERCE-HOSTELRY-REPARING-RECOVERY"(0.337456), "METALLICCONSTRUCTION"(0.0246369), "ELECTRIC MATERIAL AND MACHINERY"(0.0497522),"TRANSPORTS AND COMMUNICATION"(0.0317708), "WOOD-FURNITURE"(0.0215493),"AGRICULTURE-CATTLE-FORESTRY-FISHING"(0.0201623), "PUBLIC ADMINISTRATION-TEACHING"(0.137167), "CONSTRUCTION AND CIVIL WORKS"(0.0235133), "RUBBER ANDPLASTIC TRANSFORMATIONS"(0.0199348)]
Advantages of using Symbolic Objects
Each tuple resulting from a query to the database is converted into a new statistical unitcalled a symbolic object.
With this new statistical unit, all kind of statistical analyses could be carried out, with theadvantage that we can treat groups instead of individuals. Those groups may containinformation from several related tables.
APPLICATIONS OF SYMBOLIC OBJECTS IN OFFICIAL STATISTICS
VISUALIZATION OF SYMBOLIC OBJECTS. ZOOMSTAR 21
Visualization of Symbolic Objects.Zoom Star.
Symbolic Objects may be visualized in three different ways:
- In a symbolic table,
- By star graphs and
- By the specific language of symbolic objects, SOL (Symbolic Object Language).
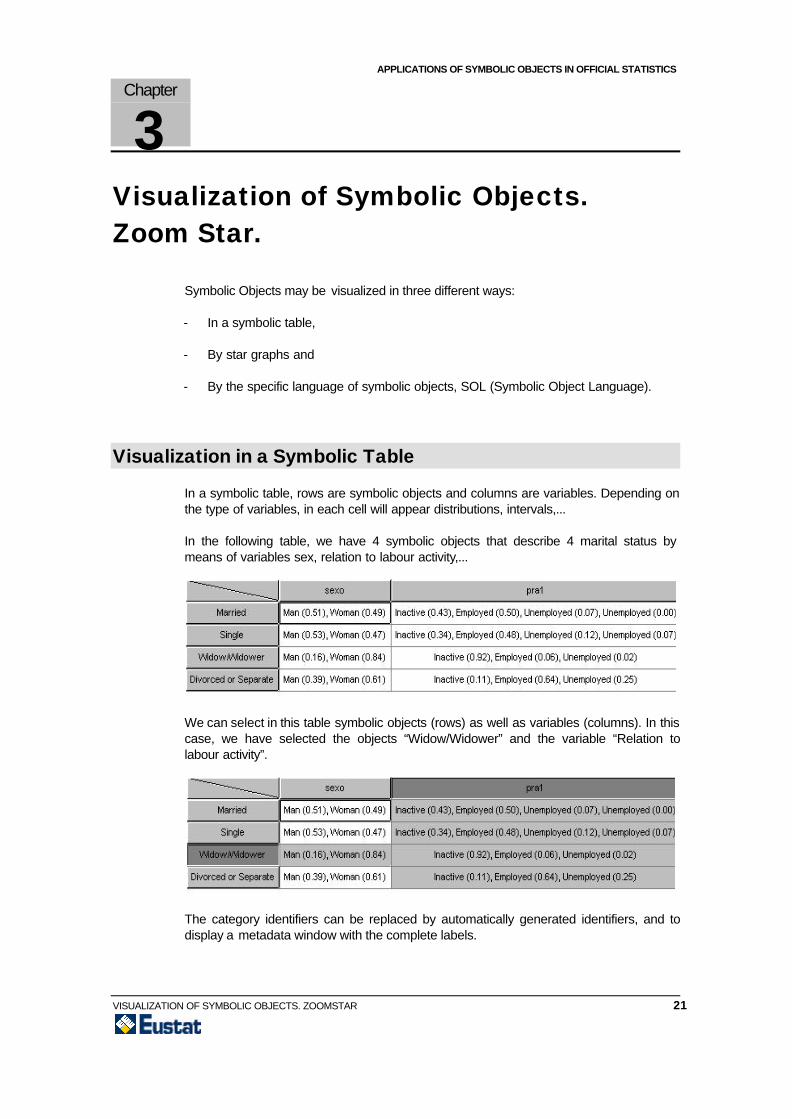
Visualization in a Symbolic Table
In a symbolic table, rows are symbolic objects and columns are variables. Depending onthe type of variables, in each cell will appear distributions, intervals,...
In the following table, we have 4 symbolic objects that describe 4 marital status bymeans of variables sex, relation to labour activity,...
We can select in this table symbolic objects (rows) as well as variables (columns). In thiscase, we have selected the objects “Widow/Widower” and the variable “Relation tolabour activity”.
The category identifiers can be replaced by automatically generated identifiers, and todisplay a metadata window with the complete labels.
Chapter
3

VISUALIZATION OF SYMBOLIC OBJECTS. ZOOMSTAR 22
Zoom Star Visualization
There are two types of zoom star visualization, 2D and 3D, which provide different levelsof detail. The 2D representation provides a global impression of the symbolic object,whereas 3D representation provides much more detailed information.
The Zoom Star representation is derived from Kiviat Diagrams where each axiscorresponds to a variable. In the same graph we can represent categorical variables,intervals, weighted values, taxonomies,... without overloading the graph.
The following table summarizes the representation of each variable depending on itstype.
Variable Type Axis DescriptionQuantitative Graduated axisCategorical Dots equally distributed on the axisCategorical not weighted Axis drawn in blackCategorical weighted Axis drawn in claretNot applicable Axis drawn in grey
The limit for variables to be represented is 24 and for categories is 15.
Selecting an axis with the mouse, we can display the distribution of the chosen variable(histogram). Moreover, we can also display taxonomies and dependencies of a variableby clicking on the icon that appears in the corresponding axis.
Graphics can be moved right, left, up and down for a better visualization.
2D Zoom Star
In the 2D Zoom Star, axes are linked by a line that connects most frequent values ofeach variable. If there were a tie of the most frequent value in several categories, the linewould link all of them.
In the presence of an interval variable, the line is linked to the minimum and maximumlimits and the entire area is filled.

VISUALIZATION OF SYMBOLIC OBJECTS. ZOOMSTAR 23
For instance, we have defined symbolic objects as groups of population defined by sex,age, marital status, level of education and relation to activity in the P.R.A. survey. Wehave obtained 314 symbolic objects, which are the combination of the modalities ofthese variables.
In this case, as we use a survey, the distribution has been calculated taking into accountsampling weights.
In the following graph, we can see two mother-daughter variables. Daughter variablesthat are N.A. appear in the graph as a grey axis. On the right, we can see the distributionof one of the variables.
Fig.3: 2D Visualization with Mother-Daughter variables and associated distributionof one of the axis.
3D Zoom Star
In the 3D representation, we can see distributions corresponding to each variable withweighted values. Numerical variables are represented by rectangles from the minimumto the maximum value.
For example, the distribution of the symbolic object "Woman" in the P.R.A surveycorresponding to a quarter in Alava is the following,

VISUALIZATION OF SYMBOLIC OBJECTS. ZOOMSTAR 24
Fig.4: 3D Visualization with interval variable and taxonomy in variable eciv.
SOL Visualization
SOL is a natural language that can be read (and written) easily by users.
Variable Definition
In the assertions file, firstly there is the definition of the variables used to describethe symbolic objects. The information details the type of variable and its categories.Subsequently, rules among variables are included.
variable busq1 nominale "Seeking employment", "Not seeking employment" multiple,mode=probabilist;
variable busq2nominale "Seeking the first employment", "Seeking other employment (not thefirst one)", "NSP+PY16+ Not seeking employment"
multiple,mode=probabilist;
variable tbus1 real [0:99] interval;
busq2 is applicable if busq1 in "Seeking employment"tbus2 is applicable if busq1 in "Seeking employment"
Symbolic Object Definition
After the definition of variables, all symbolic objects are included in SOL.
Woman / Married / 25 to 34 years old / University studies / Employed =
busq1 = Not seeking employment (1.00)

VISUALIZATION OF SYMBOLIC OBJECTS. ZOOMSTAR 25
And busq2 = Not Applicable
And prof2 = Merchants and salespersons (0.11), Administrative managers(0.19), Medium technicians and professionals (0.19), Superior techniciansand professionals (0.33), Administrative auxiliaries (0.19)
And ract2 = Commerce, hostelry, Repairing and recovering (0.11), Othercommercial services (0.19), Public administration, non commercialeducation (0.50), Other non-commercial services (0.20)
And tbus2 = Not Applicable
And htra2 = No work during the week (0.28), 40 hours (0.34), From 40 to 44hours (0.09), From 15 to 29 hours (0.10), From 30 to 39 hours (0.19)
And spro1 = Hired in private sector (0.19), Self-employed (0.11), Hired in publicadministration (0.62), Hired in public company (0.09)
Comparison of several Symbolic Objects
The comparison of several symbolic objects is easier using the 2D representation. Wecompare if the shapes of the lines that link the axes are similar.
Example
From the survey of Enterprises doing R&D in the Basque Country, we have built somesymbolic objects describing branches of economic activity. From the 18 availablebranches, we have chosen 2 to compare them, “Land, Cattle and Fishing” and“Metallurgy”.
The chosen variables to describe both branches are: Type of Enterprise, Type of R&Dactivity, number of researchers in the activity, size of the enterprise in staff, intramuralexpenses, percentage of researching dedicated to manufacturing products and energy.

VISUALIZATION OF SYMBOLIC OBJECTS. ZOOMSTAR 26
From the graphs we can draw the following conclusions:
The two branches differ in the character of the R&D activities , in “Land, Cattle andFishing” the activities can be both systematic or occasional, whereas in “Metallurgy” theactivities are mostly systematic. Another difference is the size of the enterprises, in themetallurgic industry they are larger than in the “Land, Cattle and Fishing” branch.Moreover, the metallurgic industry uses 100% of intramural expenses for researchingmanufacturing products.
The comparison with histograms (3D representation) also provides relevant informationabout the distributions.
We represent the same 3D graphs of branches of economic activity as in the previousexample, to obtain more information.

VISUALIZATION OF SYMBOLIC OBJECTS. ZOOMSTAR 27
Now, we can observe better the differences between distributions in the two branches. In“Metallurgy”, the distributions of the variables “size of the enterprise” (taman) and“intramural expenses” (gintr) are much more dispersed among all categories, whereas in“Land, Cattle and Fishing” the distributions of these two variables are centred in a uniquevalue.
Analysis of Evolution of Symbolic Objects
The Zoom Star representation can also be used to analyse the evolution of a symbolicobject. The visualization of different versions of the same object would facilitate theidentification of stable values or values that show a large variation from one version toanother.

VISUALIZATION OF SYMBOLIC OBJECTS. ZOOMSTAR 28
Example
Since the P.R.A. survey is a panel survey taken each quarter with a 1/8 rotation, we willstudy the evolution of the same symbolic object in two consecutive quarters.
We have created symbolic objects crossing the variables sex, marital status and age.The chosen object for the study in the two quarters is “Woman / Single / 25 to 34 years”.
For the shape of the line that links the axes, we can observe that there has been anevolution in the level of education (nivi1) of the group. In the first quarter, most of thewomen have Secondary studies, whereas in the second period most of them haveUniversity studies. Another change occurs in the profession (prof2) where in the firstquarter the group belongs mostly to “Other Services personnel” and in the secondquarter mostly to “Administrative Auxiliaries”.
On the contrary, there are no significant changes in the variables “Relation toactivity”, “Search for employment”, “Professional situation”, “Length of workingday” and “Type of contract”.

VISUALIZATION OF SYMBOLIC OBJECTS. ZOOMSTAR 29
Advantages of using Symbolic Objects
The Zoom Star visualization of an object allows complex data to be represented withdifferent levels of detail.
This representation allows one object at a time to be visualized, or possibly severalobjects side by side. This is the main difference with regard to methods which representpoints clouds and which seek to interpret interactions between variables.
APPLICATIONS OF SYMBOLIC OBJECTS IN OFFICIAL STATISTICS
BASIC STATISTICS FOR SYMBOLIC OBJECTS 30
Basic Statistics for Symbolic Objects
Basic Statistics of Symbolic Objects consists of a set of graphs and summary measuresdepending on the type of variable.
If the variables are multinomial, we can draw frequency graphs such as bar graphs andpie charts.
If the variables are interval, we can draw frequency graphs with central tendency anddispersion measures. Moreover, we can represent biplots.
Finally, if the variables are probabilistic, we can draw graphs of capacities.
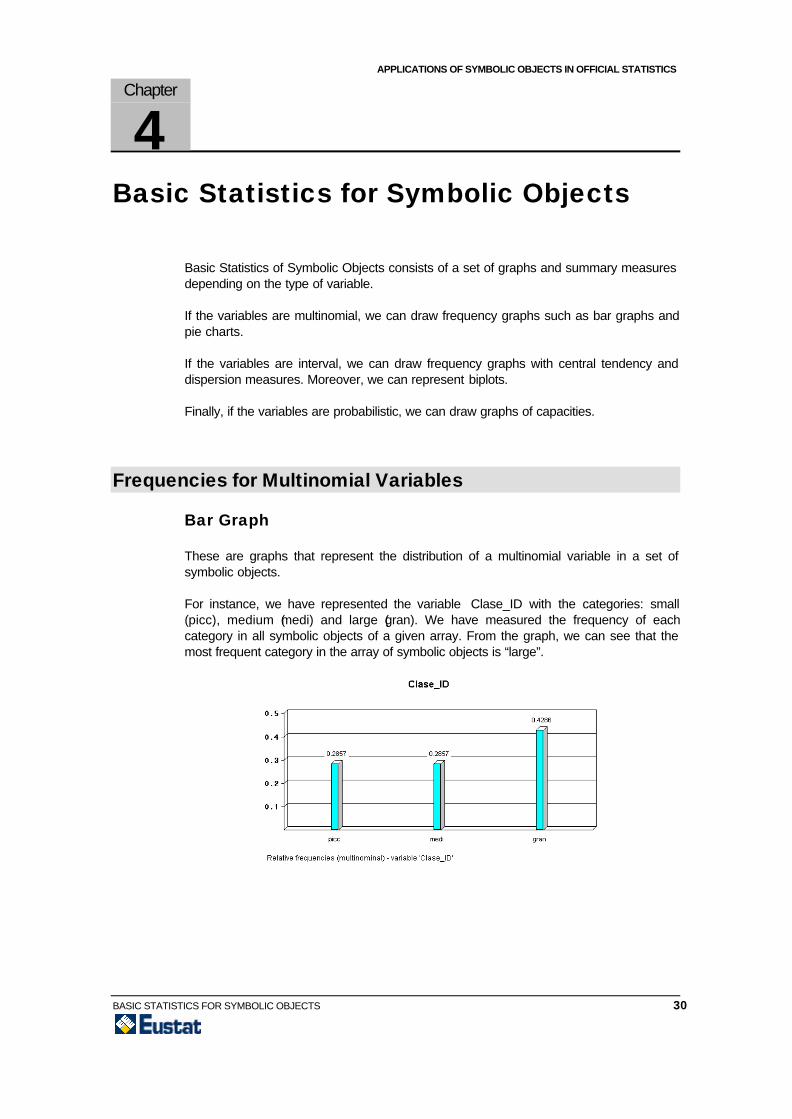
Frequencies for Multinomial Variables
Bar Graph
These are graphs that represent the distribution of a multinomial variable in a set ofsymbolic objects.
For instance, we have represented the variable Clase_ID with the categories: small(picc), medium (medi) and large (gran). We have measured the frequency of eachcategory in all symbolic objects of a given array. From the graph, we can see that themost frequent category in the array of symbolic objects is “large”.
Chapter
4

BASIC STATISTICS FOR SYMBOLIC OBJECTS 31
Pie chart
For the same type of variable, we can also draw the distribution in a pie chart.
Frequencies for Interval Variables
We can study the distribution of a variable building a “symbolic” histogram where thevalues of the variable are intervals. The number of intervals is chosen by the user andvaries from the minimum to the maximum value of the variable chosen.
In the graph, central tendency and dispersion measures are included. In this examplethe interval variable is "Minutes dedicated to Main Job per day” of the Time Use Surveyand 8 classes have been chosen to represent it.

BASIC STATISTICS FOR SYMBOLIC OBJECTS 32
Biplot
This is a graph that represents two interval variables. Each object is a rectangle in theplane defined by the two variables.
We have drawn two variables from the Use of Time survey: “Time dedicated to MainJob” and “Preparation of meals”, both in minutes. The 6 symbolic objects (rectangles)correspond to groups defined by crossing the variables Sex x Relation to Activity.
From the graph, we can observe that the group that dedicates more time to mealpreparation is “Woman Inactive” and less time “Man Inactive”. On the other hand, thegroup that dedicates more time to Main Job is “Man Employed” and the least is “ManUnemployed”.
Capacities for Probabilistic Variables
This graph represents the capacity of the categories to reach 1 in a set of symbolicobjects. In this case, we have represented the variable “Profession” with 8 categories ofsymbolic objects built from the Use of Time survey.

APPLICATIONS OF SYMBOLIC OBJECTS IN OFFICIAL STATISTICS
CONCLUSIONS 33
Conclusions
Traditionally, Official Statistics perform analysis of flat files where the statistical units areindividuals. We have proposed new statistical units here called Symbolic Objects, whichcontain more information than the former.
These new statistical units provide the following advantages in Official Statistics:
a. Statistical Offices from different countries manipulate almost equivalent concepts(such as unemployment data or road accidents), but these concepts are possiblydescribed by some different variables and different official nomenclatures ⇒Symbolic Objects provide a framework for describing, unifying and analysing theseheterogeneous concepts.
b. Dissemination of the results of analyses is one of Statistical Offices main tasks ⇒symbolic objects provide an efficient ergonomic way of presentation of data withcomplex structure.
c. Easiness to transform the data into array structures .
d. Symbolic Objects provide a nice way to represent aggregated and hierarchical data.
Other uses of Symbolic Objects
In addition to the above mentioned uses, new applications of symbolic objects are understudy, such as:
Data Protection
In relation to interval objects, another application will be data protection by means ofguarantee intervals. Thus, sensitive data from a relational database will have its privacyassured if instead of giving the punctual datum as a result to a query, the result will be asymbolic object with an interval variable.
Example:
Query: Years in the enterprise and Salary of Mr. Smith?
As the result of the query is confidential, we can return and interval instead of theexact salary.
Mr. Smith = [Years = 3] ∧ Salary = [3.5, 4.2]
Chapter
5

CONCLUSIONS 34
Future of the Project
The first stage of the SODAS Project closed with the resulting software SODAS version1.04. This software has implemented the modules named in the notebook and severalothers will be explained in successive papers.
A new stage in the project is currently under way, SODAS II, which will improve theresults obtained to date and will include new modules to manage and analyse SymbolicObjects.

APPLICATIONS OF SYMBOLIC OBJECTS IN OFFICIAL STATISTICS
REFERENCES 35
References[1] BERTIER P., BOUROCHE J.M.
Analyse des données multidimensionnelles. ISBN 2 13 0373380. Chapter XI, pages175-192. Presses Universitaires de France (1981).
[2] BOCK H. H., DIDAY E. et al.
Analysis of Symbolic Data. Springer-Verlag (2000).
[3] CHOUAKRIA A.
Mémoire de DEA. Extension de méthodes de réduction de dimension à desdonnées symboliques. Université Paris IX Dauphine- INRIA Rocquencourt (1994).
[4] DIDAY E.
Analyse des données et classification automatique numerique et symbolique.International Seminar of Statistics in the Basque Country. Volume 27. EUSTAT,Euskal Estatistika Erakundea / Instituto Vasco de Estadística (1992).
[5] DIDAY E.
Extracting Information from very Extensive Data Sets by Symbolic Data Analysis.University Paris 9 Dauphine.
[6] DIDAY E.
From data to knowledge, boolean, probabilist and belief objects for symbolic dataanalysis. Une introduction a l’analyse des donnes symboliques. INRIA-Rocquencourt. Domaine de Voluceau. Le Chesnay Cedex. Tutorial at IFCS’93.
[7] DIDAY E.
Users´ taking account report.
[8] EUSTAT.
Metodología de la Encuesta de la Población en Relación con la Actividad en elMercado de Trabajo. EUSTAT, Euskal Estatistika Erakundea/ Instituto Vasco deEstadística (1984,1992 y 1997).
[9] HEBRAIL G., LECHEVALLIER Y., STEPHAN V.
SODAS-RDBMS Interface.
[10] IZTUETA A., CALVO P.
Chapter
6

REFERENCES 36
Utilities and Applications of Symbolic Data Analysis to Official Statistics.Congreso KESDA'98, Luxemburgo.
[11] IZTUETA A., CALVO P., LAAKSONEN S., DIDAY E.
Uses of Symbolic Objects in Official Statistics. Congreso ISI’99, Helsinki.
[12] LEBART L., MORINEAU A., PIRON M.
Statistique exploratoire multidimensionnelle. Chapter 3, Section 5, pages 302-318.Dunod, Paris (1995).
[13] PERINEL E.
Analyse numerique/symbolique des tactiques de pêche artisanale au Senegal.D.E.A. de Mathématiques Appliquées aux Sciences Economiques. Université Paris-IX Dauphine et ORSTOM (1991-92).
[14] REYNER A.
Analyse Symbolique de Scénarios d´Accidents. Université Paris XI Dauphine-INRETS(1991-92).
[15] SODAS Project.
Informes Internos. Contract Nº20821 DG34/D-3/300536.
[16] SODAS Project.
SUM (Software User Manual).
[17] STÉPHAN V.
Creation d’assertions à partir de requêtes ORACLE. (1994).
[18] STÉPHAN V.
Extracting Symbolic Objects from Relational Databases .
[19] STÉPHAN V., HEBRAIL G., LECHEVALLIER Y.
Building Symbolic Objects from Relational Databases.
[20] STÉPHAN V., HEBRAIL G., LECHEVALLIER Y.
Improving Symbolic Descriptions of sets of Individuals: the reduction of assertions .