
Application of Supervisory Control and Data Acquisition ...
129
Application of Supervisory Control and Data Acquisition System in AIT Electrical Distribution Network (22kV 400V/230V) by Abu Salman Shaikat A thesis submitted in partial fulfillment of the requirements for the degree of Master of Engineering in Mechatronics Examination Committee: Assoc. Prof. Erik L.J.Bohez (Chairperson) Dr. Manukid Parnichkun Dr. Weerakorn Ongsakul Nationality: Bangladesh Previous Degree: Bachelor of Science in Electrical and Electronic Engineering Ahsanullah University of Science and Technology Dhaka, Bangladesh Scholarship Donor: AIT Fellowship Asian Institute of Technology School of Engineering and Technology Thailand May 2015
-
Upload
khangminh22 -
Category
Documents
-
view
1 -
download
0
Transcript of Application of Supervisory Control and Data Acquisition ...
Title page Application of Supervisory Control and Data Acquisition System in AIT
Electrical Distribution Network (22kV 400V/230V)
by
Abu Salman Shaikat
A thesis submitted in partial fulfillment of the requirements for the
degree of Master of Engineering in
Mechatronics
Examination Committee: Assoc. Prof. Erik L.J.Bohez (Chairperson)
Dr. Manukid Parnichkun
Dr. Weerakorn Ongsakul
Nationality: Bangladesh
Previous Degree: Bachelor of Science in Electrical and
Electronic Engineering
Ahsanullah University of Science and Technology
Dhaka, Bangladesh
Scholarship Donor: AIT Fellowship
Asian Institute of Technology
School of Engineering and Technology
Thailand
May 2015

i
ACKNOWLEDGEMENTS
First and foremost, I would like to thank Assoc. Prof. Erik L.J. Bohez, my thesis supervisor, for his
valuable guidance, support and the direction without which this research would not have been
possible.
Also, I would like to extend my gratitude towards my thesis committee members-especially Dr.
Weerakorn Ongsakul and Dr. Manukid Parnichkun for their valuable feedback and advice.
Much appreciation for the hard work and commitment shown by ISE staffs and colleagues, especially
express my sincere thanks to laboratory supervisor, Mr. Hoang Hung Manh, for his guidance and
support me with all equipment and facilities in Automation lab and also with my pilot projects.
Finally, I would like to express my sincere and heartfelt appreciation and gratitude to my Family for
their endless support and continuous faith in me.

ii
ABSTRACT
Supervisory Control and Data Acquisition (SCADA) have been applied very successfully in Electrical
network as well as others. Equipment’s have been supervised to help if system detects serious faults
when it’s occurring and system will respond automatically to segregate break point.
In this thesis, SCADA will be applied to distribution station in AIT electrical distribution network. The
whole station can be connected with operating center via Ethernet.
Main function has been constructed by Programmable Logic Controller software SimaticS7-300.
Human Machine Interfaces (WinCC) is studied and applied to monitoring the whole control model.
This work is concerned with path of Ethernet and its simulation information network from peripheral
station to center. This research may also serve as a useful reference for exploring and understanding
basic of electrical network as well as automation network.
Keywords:
Electrical Distribution Network
Programmable Logic Controller (PLC)
Supervisory Control and Data Acquisition (SCADA)
iii
TABLE OF CONTENTS
CHAPTER TITLE PAGE
TITLE PAGE I
ACKNOWLEDGEMENTS I
ABSTRACT II
TABLE OF CONTENTS III
LIST OF FIGURES VII
LIST OF TABLES X
1 INTRODUCTION 1
1.1 Background 1
1.2 Statement of Problem 1
1.3 Objective of the Study 2
1.4 Scope and Limitation of Study 2
2 LITERATURE REVIEW 3
2.1 Overview of substation 3
2.1.1 Overview of Distribution Substation 5
2.2 Review of Literature on Control device and SCADA (Supervisory control 6
and data acquisition)
2.3 Review of Literature on Communication medium 8
2.3.1 Fieldbus 8
2.3.1.1 Introduction 8
2.3.1.2 Benefit of Fieldbus 8
2.3.1.3 Application of fieldbus 8
2.3.2 Profibus 8
2.3.3 OPC 8
2.3.4 ETHERNET 8
iv
2.3.4.1 Introduction 8
2.3.4.2 Broadcast network operation 9
2.3.4.3 Physical layer of Ethernet 9
2.3.4.4 The role of Fiber Media in Industry 9
2.3.4.5 Migrations from Serial Communication to Ethernet 9
2.3.4.6 Benefits of Ethernet 10
2.4 Energy Management Network 10
2.4.1 Function of Energy Management Network 10
2.5 Summary 11
3 METHODOLOGY 13
3.1 Flow Chart 13
3.2 Existing operation 13
3.2.1 AIT One-line Diagram 14
3.2.2 Main distribution board of Substation 11 (Existed) 14
3.3 Evaluating and analyzing the current system 20
3.3.1 Fault History 21
3.4 Data collection 21
3.4.1 Capacity of Substations and installed capacity 22
3.4.2 Location of Substations 23
3.4.3 AIT power supply system 24
4 SYSTEM CONFIGURATION 25
4.1 Hardware configuration 25
4.2 Project 26
4.2.1 Apparatus 26
4.2.2 Diagram 27
4.2.3 Schematic Diagram 29
5 HARDWARE IMPLEMENTATION 30
5.1 List of equipment’s need for real implementation of Substation 11 30
5.2 Proposed model of Substation 11 31
5.3 Proposed hardware configuration 32
v
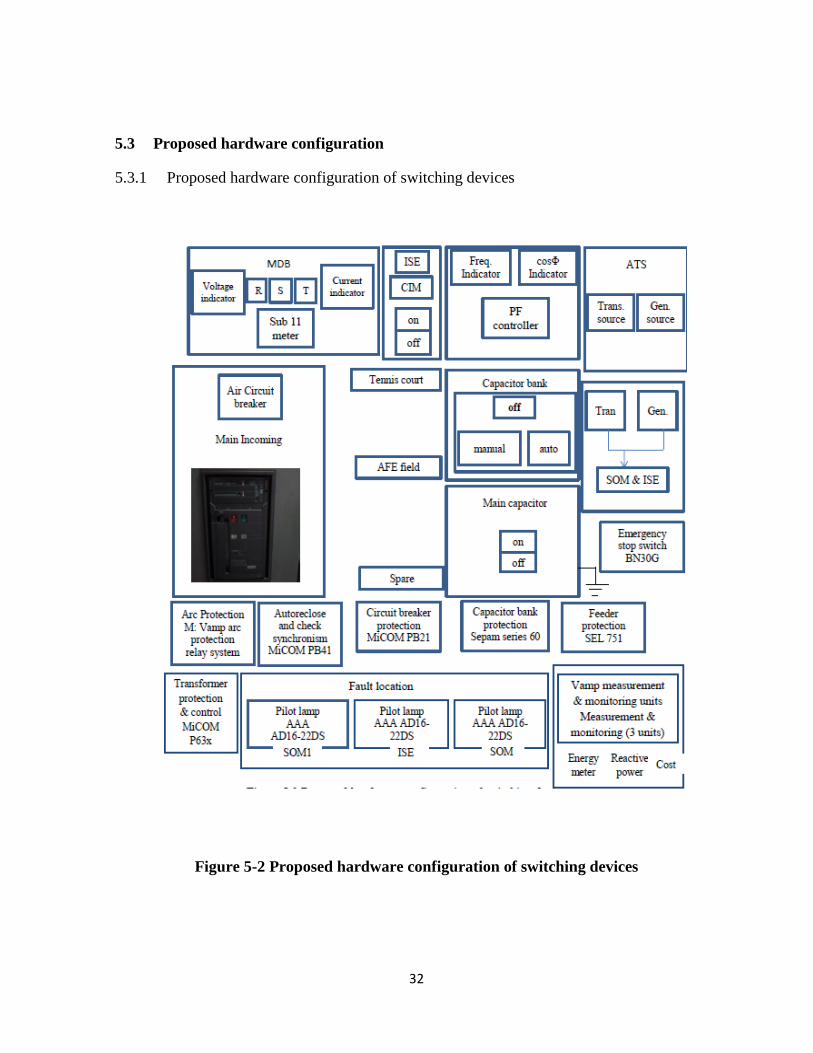
5.3.1 Proposed hardware configuration of switching devices 32
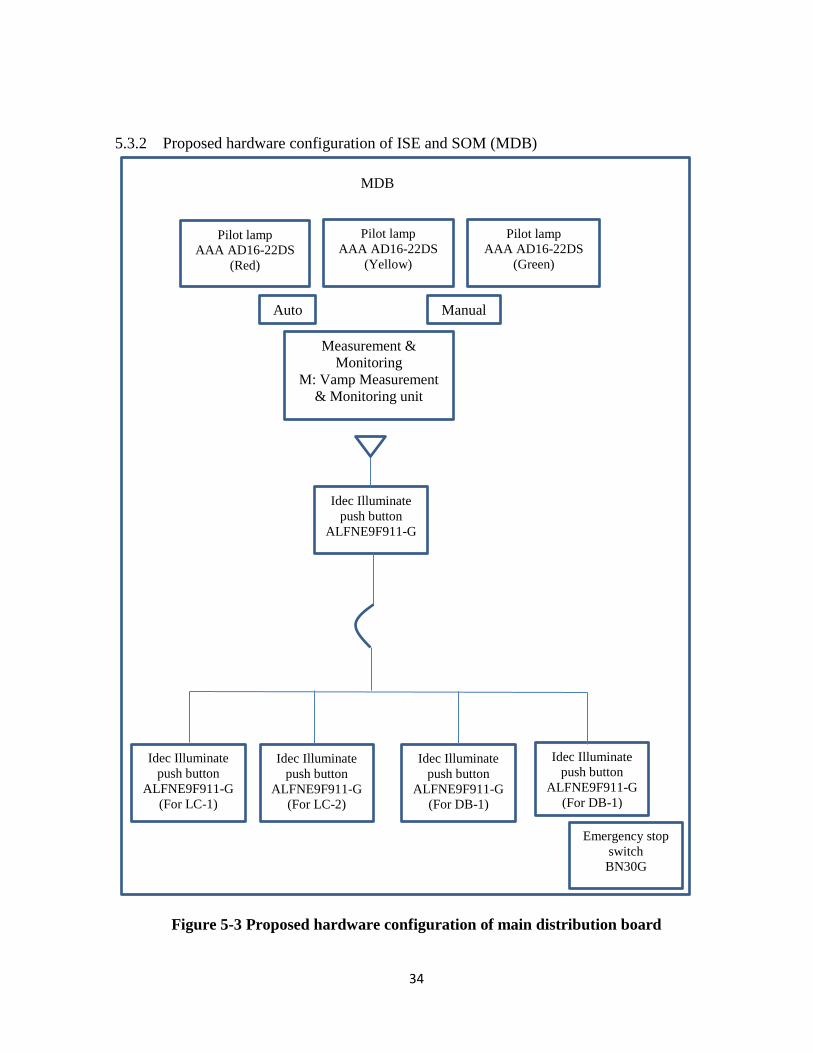
5.3.2 Proposed hardware configuration of ISE and SOM (MDB) 34
5.3.3 Proposed hardware configuration of ISE and SOM (LC) 35
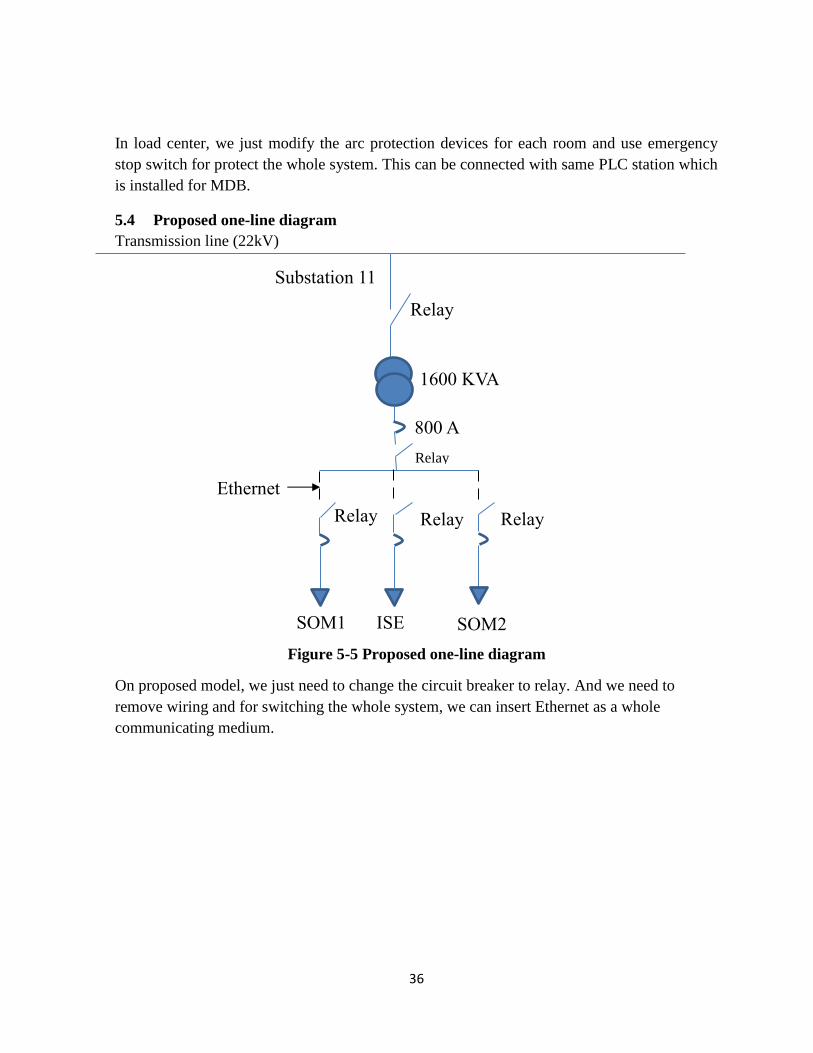
5.4 Proposed one-line diagram 36
5.5 Proposed wiring diagram 37
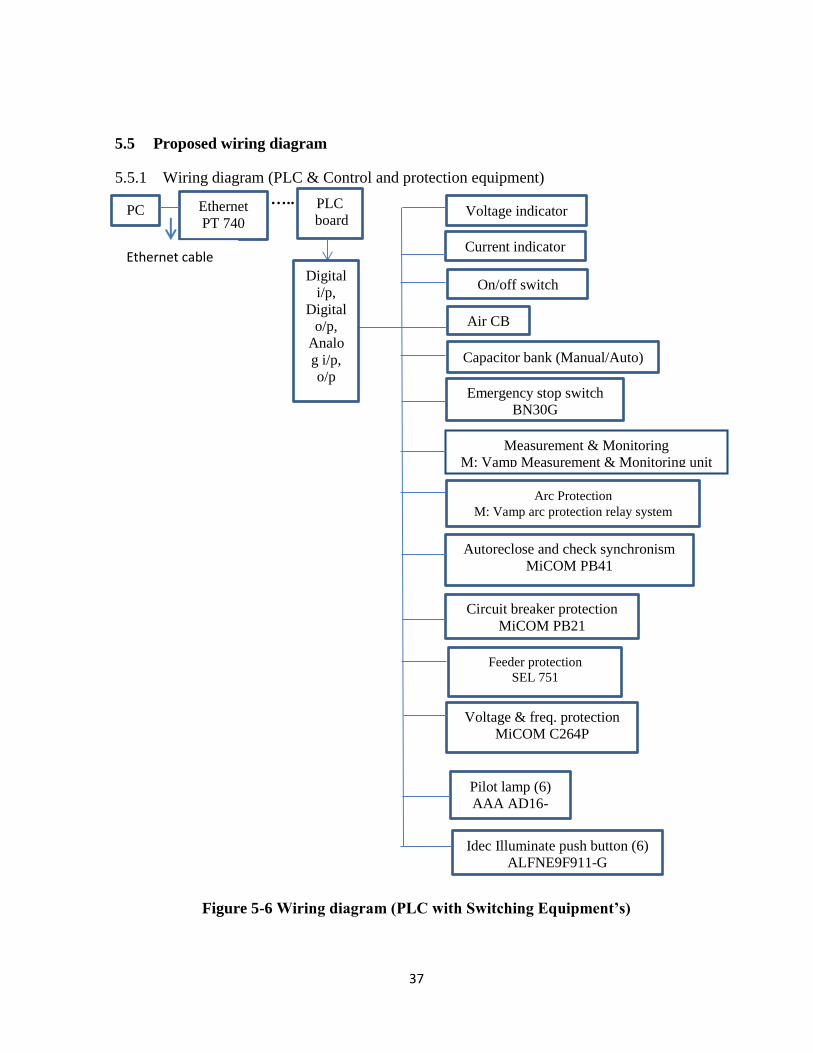
5.5.1 Wiring diagram (PLC & Control and protection equipment) 37
5.5.2 Wiring diagram (PLC & MDB) 38
5.5.3 Wiring diagram (PLC & LC) 38
5.5.4 Wiring Diagram (Monitoring unit) 39
6 CONTROL ALGORITM AND HMI 40
6.1 Control Algorithm 40
6.1.1 S7-300 Program structure 40
6.2 Input/ output parameters connect with PLC 41
6.2.1 Transformer protection 42
6.2.1.1 PLC program for transformer protection 42
6.2.2 Circuit breaker/ Relay protection 43
6.2.2.1 PLC for circuit breaker protection 43
6.2.3 Energy meter, Reactive power, cost estimation 44
6.2.3.1 PLC of Energy meter, Reactive power and cost estimation 45
6.2.4 Voltage estimation 45
6.2.4.1 PLC of voltage estimation 45
6.2.5 Fault location analysis 46
6.2.5.1 PLC of Fault Location Analysis 46
6.2.6 Power factor correction 47
6.2.6.1 PLC of Power factor correction 47
6.3 Create Project Using WINCC (HMI) 48
6.3.1 Function used in program 48
6.3.1.1 Tag manager 48
6.3.1.2 Graphics Designer 49
6.3.1.3 Log Tagging 49
6.3.1.4 Alarm Logging 49
6.3.1.5 Report Design 49
6.3.2 HMI programs 50
6.3.2.1 Transformer screen 50
6.3.2.2 Circuit breaker screen 50
6.3.2.3 Fault Location Analysis 51
6.3.2.4 Real power, Reactive power and cost estimation 52

vi
6.3.2.5 Power factor calculation 52
6.3.2.6 Fault record 53
6.3.3 Conditions using for Temperature fault (Hardware) 54
6.3.4 Analog voltmeter of transformer (Hardware) 55
7 RESULTS AND DISCUSSION 56
7.1 Results of different parameters 56
7.1.1 Bucholtz Alarm 56
7.1.2 Storm Mode 57
7.1.3 Tap Changer 58
7.1.4 Voltage 60
7.1.5 Current 61
7.1.6 Temperature of Transformer 63
7.1.7 Oil level of Transformer 66
7.1.8 Current Alarm of Circuit Breaker 68
7.1.9 Pressure of Circuit Breaker 71
7.1.10 Energy, Reactive power and cost estimation 72
7.1.11 Fault Location Validation 74
7.1.12 Power Factor Correction 75
8 CONCLUSION AND RECOMMENDATION 77
8.1 Summary 77
8.2 Result and Conclusion 77
8.3 Recommendation 77
REFERENCES 79
APPENDIX A 81
APPENDIX B 111
APPENDIX C 114
APPENDIX D 118

vii
LIST OF FIGURES
FIGURE TITLE PAGE
Figure 2-1 Components of a Substation [14] 3
Figure 2-2 Overview of Distribution substation [6] 5
Figure 2-3 Typical Distribution Substation [6] 5
Figure 2-4 SCADA system structure [2] 7
Figure 2-5 Topology with serial lines and Ethernet [4] 9
Figure 3-1 Overview of the study plan 13
Figure 3-2 AIT one line diagram 14
Figure 3-3 Board that provide transformer output 15
Figure 3-4 Schematic diagram of MDB in substation 11 (old) 15
Figure 3-5 Main picture of distribution board in substation 11 17
Figure 3-6 MDB-1 panel of ISE building 18
Figure 3-7 MDB-2 panel for SOM building 19
Figure 3-8 Fault history of last 1 year in AIT [AIT] 21
Figure 3-9 Location of AIT power system substations 23
Figure 3-10 AIT power supply system [AIT] 24
Figure 4-1 Hardware Connection 25
Figure 4-2 Construction of the hardware 27
Figure 4-3 Connection of Profibus OLM with mpi-interface and PC via bus connecter 28
Figure 4-4 Four input (Pushbuttons) and seven outputs (Relays and lamps) connection in PLC board 28
Figure 4-5 Distance measurement using Solidworks 2013 29
Figure 5-1 Proposed model of Substation 11 31
Figure 5-2 Proposed hardware configuration of switching devices 32
Figure 5-3 Proposed hardware configuration of main distribution board 34
Figure 5-4 Proposed hardware configuration of ISE and SOM (Load center) 35
Figure 5-5 Proposed one-line diagram 36
Figure 5-6 Wiring diagram (PLC with Switching Equipment’s) 37
Figure 5-7 Wiring diagram (PLC and MDB) 38
Figure 5-8 Wiring diagram (PLC & LC) 38
Figure 5-9 Wiring diagram (Monitoring unit) 39
Figure 6-1 S7-300 Program structure 40
Figure 6-2 Protection of transformer 43
Figure 6-3 Protection of circuit breaker 44
Figure 6-4 Energy, Reactive power and cost estimation 45
Figure 6-5 Voltage estimation 46
Figure 6-6 Fault Location Analysis 47
Figure 6-7 Power factor correction 48
Figure 6-8 Transformer and voltage interface in WINCC 50
Figure 6-9 CB interface in WINCC 51
Figure 6-10 Fault location analysis 51
viii
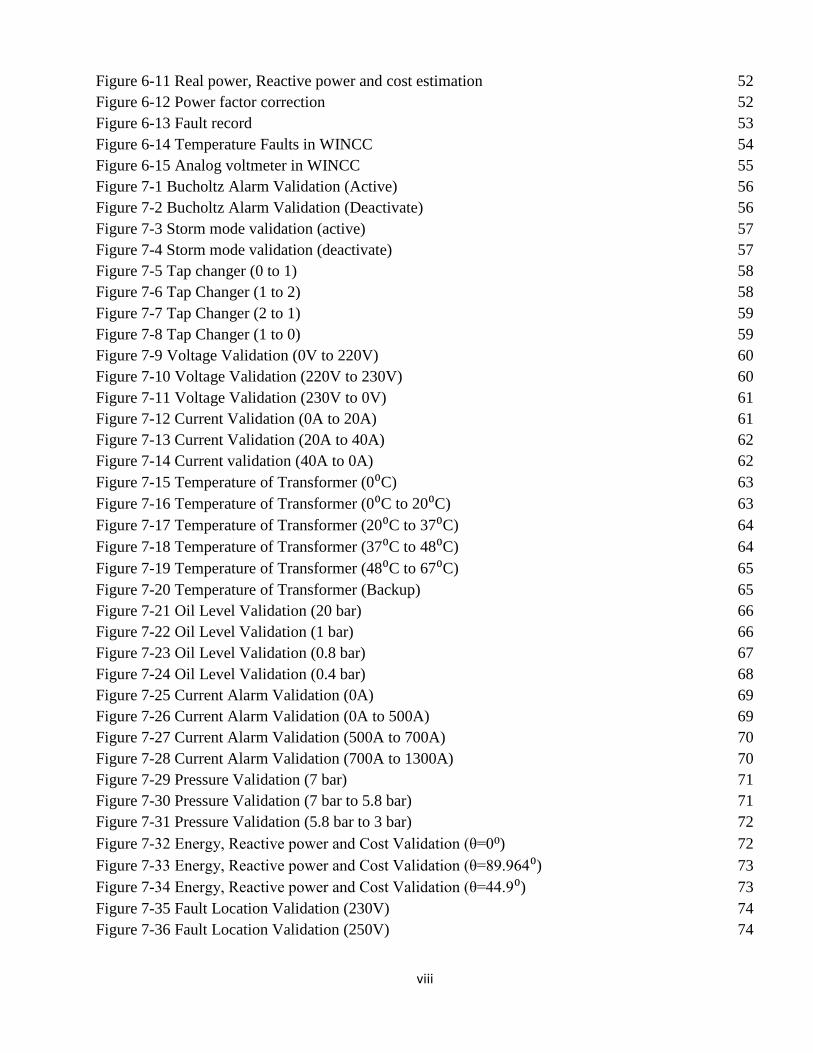
Figure 6-11 Real power, Reactive power and cost estimation 52
Figure 6-12 Power factor correction 52
Figure 6-13 Fault record 53
Figure 6-14 Temperature Faults in WINCC 54
Figure 6-15 Analog voltmeter in WINCC 55
Figure 7-1 Bucholtz Alarm Validation (Active) 56
Figure 7-2 Bucholtz Alarm Validation (Deactivate) 56
Figure 7-3 Storm mode validation (active) 57
Figure 7-4 Storm mode validation (deactivate) 57
Figure 7-5 Tap changer (0 to 1) 58
Figure 7-6 Tap Changer (1 to 2) 58
Figure 7-7 Tap Changer (2 to 1) 59
Figure 7-8 Tap Changer (1 to 0) 59
Figure 7-9 Voltage Validation (0V to 220V) 60
Figure 7-10 Voltage Validation (220V to 230V) 60
Figure 7-11 Voltage Validation (230V to 0V) 61
Figure 7-12 Current Validation (0A to 20A) 61
Figure 7-13 Current Validation (20A to 40A) 62
Figure 7-14 Current validation (40A to 0A) 62
Figure 7-15 Temperature of Transformer (0⁰C) 63
Figure 7-16 Temperature of Transformer (0⁰C to 20⁰C) 63
Figure 7-17 Temperature of Transformer (20⁰C to 37⁰C) 64
Figure 7-18 Temperature of Transformer (37⁰C to 48⁰C) 64
Figure 7-19 Temperature of Transformer (48⁰C to 67⁰C) 65
Figure 7-20 Temperature of Transformer (Backup) 65
Figure 7-21 Oil Level Validation (20 bar) 66
Figure 7-22 Oil Level Validation (1 bar) 66
Figure 7-23 Oil Level Validation (0.8 bar) 67
Figure 7-24 Oil Level Validation (0.4 bar) 68
Figure 7-25 Current Alarm Validation (0A) 69
Figure 7-26 Current Alarm Validation (0A to 500A) 69
Figure 7-27 Current Alarm Validation (500A to 700A) 70
Figure 7-28 Current Alarm Validation (700A to 1300A) 70
Figure 7-29 Pressure Validation (7 bar) 71
Figure 7-30 Pressure Validation (7 bar to 5.8 bar) 71
Figure 7-31 Pressure Validation (5.8 bar to 3 bar) 72
Figure 7-32 Energy, Reactive power and Cost Validation (θ=0⁰) 72
Figure 7-33 Energy, Reactive power and Cost Validation (θ=89.964⁰) 73
Figure 7-34 Energy, Reactive power and Cost Validation (θ=44.9⁰) 73
Figure 7-35 Fault Location Validation (230V) 74
Figure 7-36 Fault Location Validation (250V) 74

ix
Figure 7-37 Fault Location Validation (200V) 75
Figure 7-38 Power Factor Correction Validation (θ=0⁰) 75
Figure 7-39 Power Factor Correction Validation (θ=28⁰) 76
Figure 7-40 Power Factor Correction Validation (θ=57⁰) 76
x
LIST OF TABLES
TABLE TITLE PAGE
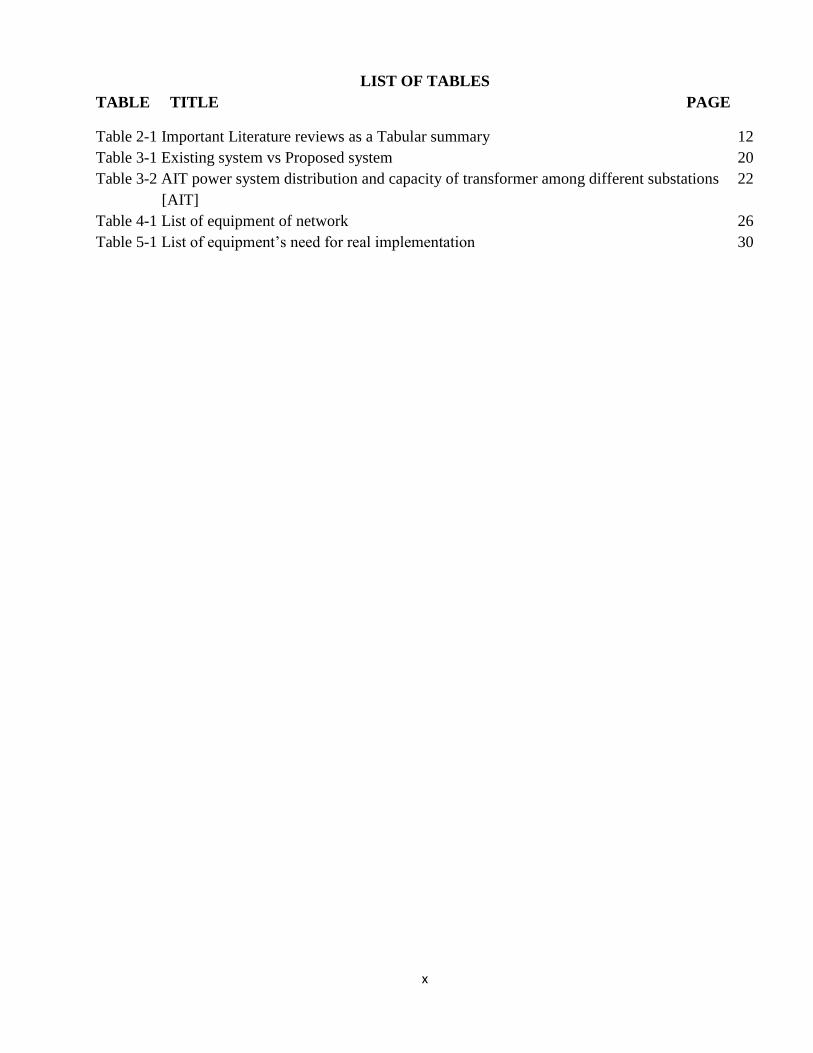
Table 2-1 Important Literature reviews as a Tabular summary 12
Table 3-1 Existing system vs Proposed system 20
Table 3-2 AIT power system distribution and capacity of transformer among different substations 22
[AIT]
Table 4-1 List of equipment of network 26
Table 5-1 List of equipment’s need for real implementation 30
1
1 CHAPTER 1
INTRODUCTION
1.1 Background
A power supply is a device that supplies electrical power to an electrical load. Power supply is
necessary all over the world. It is one of the most valuable resources to the human society.
But, however there are many problems with power system such as controlling, protection,
communication system failure, disturbances and human operation errors. Therefore, it is
necessary for us to maintain the power system stable and reliable. In power system, computer
network and data communication play a very important role in modern world.
In power system, we can use SCADA (Supervisory Control and Data Acquisition System)
system which is referring to the mixture of data acquisition and telemetry. In power system,
we don’t use the full control system, but we focus on the supervisory level, remote
measurement, monitoring, control and protection which are used for power system reliability
and stability. This process consists of many parts. At first, we have to collect all information.
Then taking it back to central site and moving out necessary control and analysis. At last, it
should display these data in operation screens.
The SCADA system is used for control and monitor of plant or equipment. Control system
can be automatic or manual.
1.2 Statement of Problem
In power system, power distribution is one of the most important parts. Electricity should be
distributed in all over the country or state. In modern world, our main challenge is how to
supply electricity without interrupt. So it is a very important matter to distribute power in a
state without any interrupt.
In my thesis, I focus on AIT power system. So I just focus on the distribution of power in
AIT. I also concern about the power consumption.
In this thesis, we have to control power distribution and power consumption with the help of
electrical parameters. So we have to supervise control for detect and solve any fault quickly.
Then acquisition data for analysis which can avoid the previous data and then supply data for
operate the power supply. We can do it easily by SCADA system.
2
1.3 Objective of the Study
To evaluate the benefits of SCADA systems for AIT electrical network compare to the current
system.
Implement and design Human Machine Interface (HMI) for monitoring the whole system.
Implement pilot SCADA (Supervisory Control and Data Acquisition) system.
1.4 Scope and Limitation of Study
In AIT, there are 15 substations. So it is not possible to make SCADA system for all
substations in a limited time. So in this thesis, I choose substation 11 which includes SOM1,
SOM2 and ISE building in AIT. In this substation, it use 800 KVA transformer, 3 phase 22
KV in primary side and for secondary side, it use 400 V for 3 phase and for 1 phase, it use
230 V.
3
2 CHAPTER 2
LITERATURE REVIEW
This chapter explore about some works already done related with this field and different types
of methods, they used for that. At first, the operation of substation is described in brief. After
that, some review about control, SCADA system, Communication medium and energy
management system will describe.
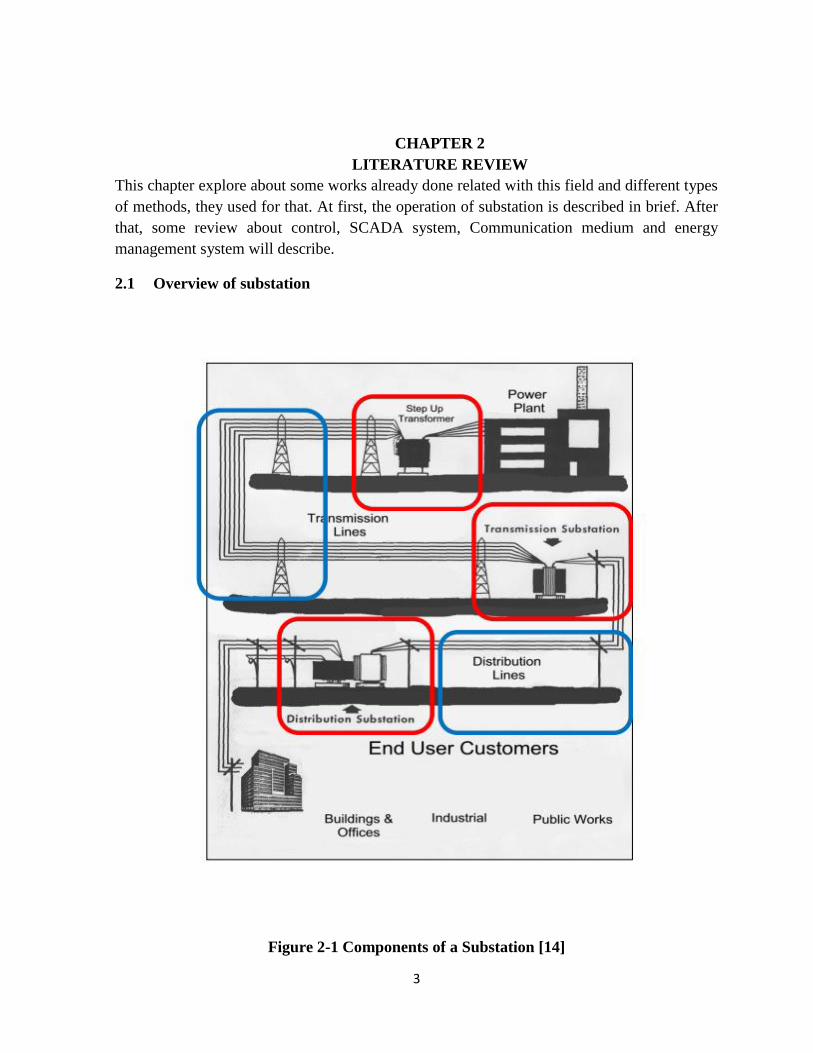
2.1 Overview of substation
Figure 2-1 Components of a Substation [14]

4
Substation mainly consists of three parts: Generation, Transmission and Distribution.
Substation converts high to low voltage using step-down transformer or low to high voltage
using step-up transformer. Normally, we use high to low voltage for factories. After passing
many substations, voltage will go to end user such as buildings, factory, water treatment etc.
There are various components of substation which is shown on Figure 2-1. The basic
functions of these components are written below.
Generation
Power station and switchyard: Generates the power and switchyard is used for
transforming the electricity from one voltage to other.
Transmission
Bulk supply point: Use to make multiple supplies from one point to cover the
whole distribution system.
Sub Transmission substation: Supply voltage to distribution system. It uses
step-down transformer.
Zone substation: Transform primary to secondary voltage.
OH HV (Overhead High Voltage) feeder: Supply voltage to different
substations through overhead.
UG HV (Underground High Voltage) feeder: Supply voltage to different
substations through underground.
Pole transformer substation: Distribution transformer which is climbed on the
pole.
Distribution
Distribute the voltage for different users.
Distribution Transformer: Supply voltage from primary distribution unit to
secondary distribution unit or different areas.
General
Circuit breaker/ Relay: Use as protection devices
Meter/ Indicator: Use in many purposes such as displaying energy, reactive
power, cost etc.

5
2.1.1 Overview of Distribution Substation
Figure 2-2 Overview of Distribution substation [6]
Distribution substation mainly use for residential, commercial and industrial usage. It uses
input voltage which is coming from transmission, and with the help of step-down transformer,
it can produce the distribution voltages which can be used in different purposes.
Figure 2-3 Typical Distribution Substation [6]
6
From Figure 2-3, we can see that, incoming Transmission line is connected with Step-down
transformer. So it creates low voltages and it will provide to distribution buses. Distribution
bus connects with circuit breaker which is connecting to underground line to distribution
circuit. This system protects when there is abnormal condition. Lightening arrestor is located
upper than transmission line to protect the line. Control house connect with circuit breaker
and outgoing low voltage distribution line which will help the voltage to go to different areas.
2.2 Review of Literature on Control device and SCADA (Supervisory control and data
acquisition)
Substation Automation [6] is new concept which interact the existing substation with new
network infrastructure. By doing this, it can easily do the automatic tasks like equipment
control, fault record and data acquisition. Substation automation can include different types of
devices such as relay controller, measuring units, signals, PLC and automation units. It
combines telecommunication, electronic and signal processing to enable the operation. We
can do controlling, monitoring, measuring, management and protection of different devices all
together using substation automation. All primary devices are converted to intelligent
equipment’s and all secondary devices are networked. All the operation and management will
become automated.
Distribution automation system [8] is mainly a combination of distribution substation, user
and customer. For past days, when the fault is coming, then engineers should fix it manually.
At first, they need to locate fault location. It needs a lot of time to find. After coming fault
management, in every location of distribution line, it needs to energize. If the fault location
comes, the relay will trip in that area. This system was automatic and manual. Now a days,
microprocessor and PLC’s are coming which can easily detect fault location automatically
and restore it when the system will become normal again.
Energy meters are used to measure total energy. It’s connected with PLC, controlling each
source locally and measure real time data. PLC network [9] is connected with Profibus
communication. For supervision of the system, it uses SCADA system.
PLC are used as RTU in SCADA because lot of resources and low cost. Also PLC is very
reliable. It can operate in high temperature.
Previously, DCS (Distributed Control System) [10] was used in which control and data
acquisition are done by lots of microprocessor based unit. And it should be located near the
control devices. PLC (Programmable Logic Controller) are widely popular because of it can
use with many input and output. Also, PLC is user-friendly.
7
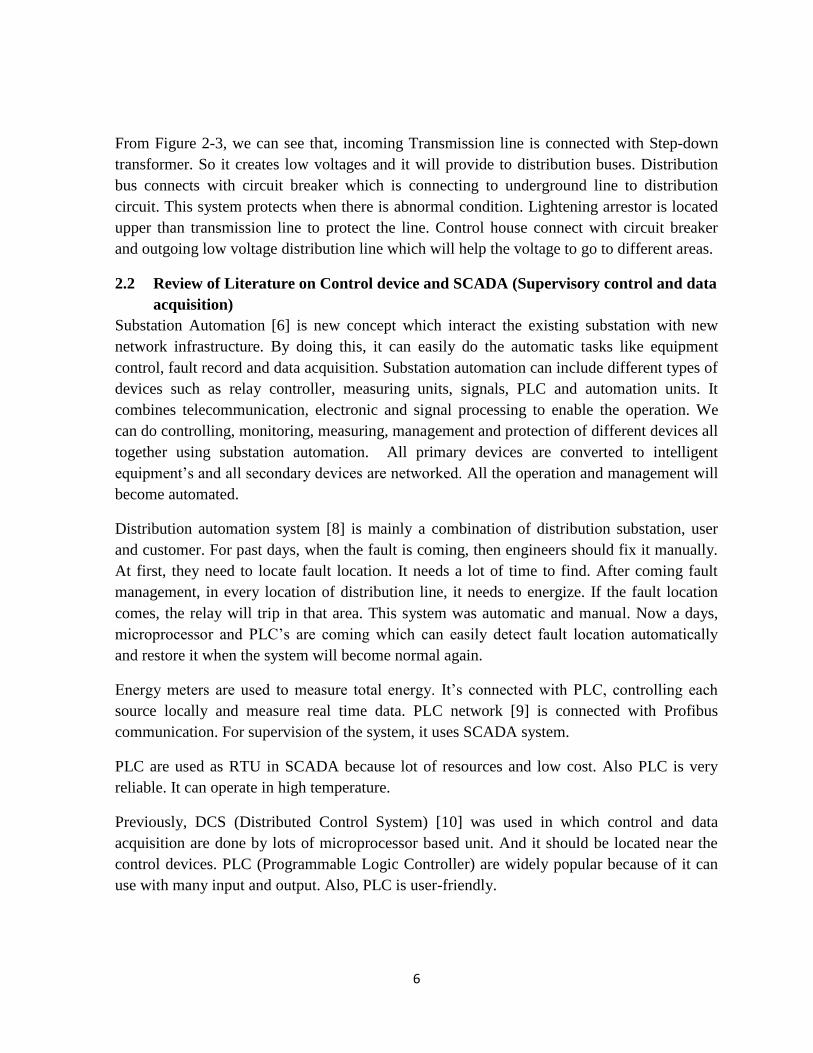
SCADA system can be used not only for monitoring, but also troubleshooting machines and
different processes. Supervisory control can mainly do two things: Energy management and
control.
Figure 2-4 SCADA system structure [2]
Figure 2-4 describes about the structure of SCADA system. At first, we need to collect data.
Then by using these data, we need to make a control algorithm which can control the overall
system. At last, controlling units can be monitored in SCADA system.
The benefits of SCADA systems are described below. [3]
Monitoring and controlling with remote network system
Analysis of faults
Maintain alarm system when there is any fault
Network overview
Attaining and moving of circuit loading
Maintenance work with the help of feeder tagging
Online database management system
Reduce costs
8
2.3 Review of Literature on Communication medium
2.3.1 Fieldbus
2.3.1.1 Introduction
A fieldbus [1] is a serial data transmission system which is used in industries. In this, all data
are digital.
2.3.1.2 Benefit of Fieldbus
1. Easy to use
2. Easy to install
3. It can use in any environments
2.3.1.3 Application of fieldbus
1. Suitable to be used in explosion protected zones
2. Give the operating power to the field devices through bus cable.
2.3.2 Profibus
Profibus [1] (Process Field Bus) is a standard for fieldbus communication in
automation technology and was first invented in 1989 by BMBF (German department
of education and research) and then largely utilizes by Siemens. It has many nodes (up to
126 nodes). It transfers 244 bytes per node per cycle. It’s the maximum capacity to transfer.
Bit rates of profibus are from 9.6 kbit/s to 12 Mbit/s. Between 2 repeaters, cable length is
between 100m to 1200m. It can connect with different types of field devices such as digital
and analog I/O, robots, drivers and transducers etc.
2.3.3 OPC
OPC is the short form of “Open Process Control”. It is industrialized software which specifies
different interface of software server which gathers all the data from PLC and field devices.
OPC server can connect the PLC, monitoring unit, and fieldbus with more than 150 vendors.
For different exchanges [11] of data and accessing different database, OPC server can be
used. OPC contains 3 major components: Access of data, alarm logging and handling and
historical data analysis.
2.3.4 ETHERNET
2.3.4.1 Introduction
Industrial Ethernet [12] is one of the most important parts in substation automation. It can use
not only in industry, but also in office environments too. Many devices can operate with a
single Ethernet. This new Ethernet Technology combined with the sampled values and
GOOSE-message and process-bus applications in tomorrow’s substations.
9
2.3.4.2 Broadcast network operation
Ethernet used broadcast network operation. In broadcast network operation, hosts are
connected to a network via single shared medium. Its main advantage is it doesn’t need to go
for destination, because all hosts are located in shared medium.
2.3.4.3 Physical layer of Ethernet
The physical layer use low level electronic way for transmission of signal. It uses the voltage
level of ±0.85 V which transmits the logic level along the medium.
2.3.4.4 The role of Fiber Media in Industry
Ethernet [4] is coming and expanding with the help of fiber media into different industrial
environments and particularly in power substations. Ethernet is extending because its
resistance power to electrical interference, avoidance of ground loops, high bandwidth & its
capacity for longer distance. Fiber media mostly installed serial lines and used with RTUs,
voice-grade circuits, modems and shifting data from PLCs (Programmable Logic Controllers),
distributed relays, RTUs (Remote Terminal Units), and IEDs (Intelligent Electronic Devices)
to the central control area.
2.3.4.5 Migrations from Serial Communication to Ethernet
In serial communication, it linked with private protocols and limited speed. However,
Ethernet can provide standards-based interoperability and performance.
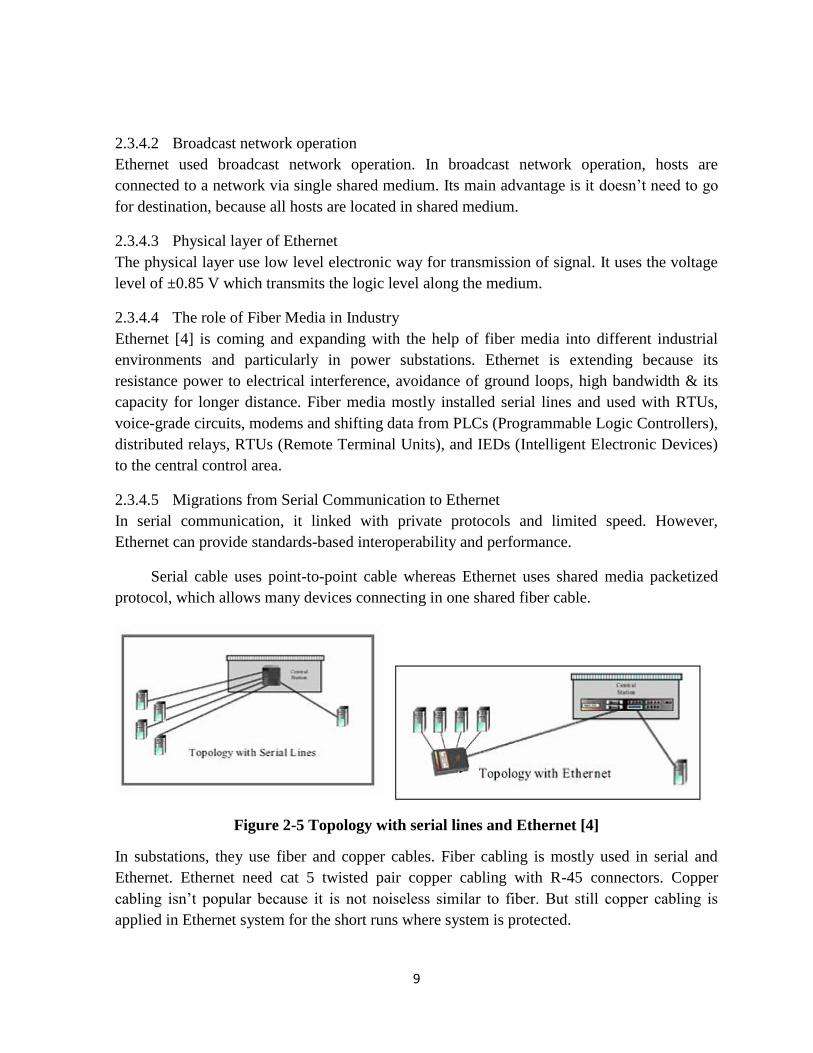
Serial cable uses point-to-point cable whereas Ethernet uses shared media packetized
protocol, which allows many devices connecting in one shared fiber cable.
Figure 2-5 Topology with serial lines and Ethernet [4]
In substations, they use fiber and copper cables. Fiber cabling is mostly used in serial and
Ethernet. Ethernet need cat 5 twisted pair copper cabling with R-45 connectors. Copper
cabling isn’t popular because it is not noiseless similar to fiber. But still copper cabling is
applied in Ethernet system for the short runs where system is protected.
10
2.3.4.6 Benefits of Ethernet
Many nodes can be installed.
This protocol is very good especially with respect to error detection and remove.
High throughput under conditions of light load.
Cabling is easy type and taps are submissive. Without affecting the network, the node
can install and remove.
Low cost.
Reliability.
Redundancy.
Need short response time.
Can use in any conditions.
Power supplies suitable for substations.
2.4 Energy Management Network
2.4.1 Function of Energy Management Network [1]
The functions of energy management network mainly divided into 3 types.
Energy accounting
An efficient system is the mostly needed requirement of energy management system. In
this process, the measuring, analyzing and reporting is done in a continuous basis so that
the system will become more efficient. Actually this process is the monitoring process of
SCADA system.
Energy analysis
A system needs all data in one machine. So system needs to centralize. In standalone
systems, there are following drawbacks which is indicated below.
a) In standalone mode, we normally get readings from raw data which is not effective.
b) In this, data is not correlated in real time which can create a large error when we need
data analysis. Hence efficiency will decrease.
c) In standalone, we can’t get online data. So optimization and energy conservation is
not possible in it.
d) Sometimes, there are some human errors which can give big inaccuracies in
system.So it’s necessary to make a centralized system for better efficiency.

11
Evaluation and decision making
In this process, it includes calculation, assumption and process. We need it for make control
strategies which is based on raw data. If we can build this control strategy, then we can easily
make an efficient system.
2.5 Summary
The literature review shows a brief idea about PLC and SCADA in substation. However, all
the researchers are working with just fault location and energy management whereas, we want
to implement for all the substation devices including those. However, one researcher of PECO
company [12] do with microprocessor based SCADA for substation, but they do it with
microprocessor and they do just with wires. This research is closest with my thesis. But in this
thesis, I use PLC as a control device and profibus, Ethernet as communication medium. Also,
the researcher [17] who is used PLC and SCADA is just for energy meter, but they don’t use
for reactive power or cost measurement whereas I include all in my thesis. Furthermore, a
researcher [18] just based on the difference between PLC and DCS system which is the main
benefit that we choose PLC for my thesis.
The table 2-1 shows the brief summary of my major works and different ideas by many
researchers.

12
Table 2-1 Important Literature reviews as a Tabular summary
Author Proposed idea Pros Cons
David Dolezilek
(2008-2009)
Microprocessor
with PLC in
substation
Cost reduce
IED (Intelligent Electronic Device)
integration
Control and monitoring
Historical data
Don’t use
Ethernet
Moxa
(2011)
Distribution
Substation
Substation
Automation
Distributing voltages to many areas
Combine existing with new system in
Substation
Musse Mohamud
Ahmed
(2010)
Distribution
Automation
System
Fault detect automatically and restore
automatically
Joao M. G.
Figueiredo
2010
Energy meter Can monitor and control Energy meter
clearly
Reactive
power or cost
not included
Cristina Anita
Bejan, Mihai
Iacob and
Gheorghe-Daniel
Andreescu
2008
PLC is better
than DCS
Cost effective
User friendly
Can use many input and output
Hasan A.M. Abu
Meteir
2012
SCADA system
for substation
Brief idea about SCADA system Not
implemented
till now
Le Hong Duong
2003
Fieldbus and
Profibus
Energy
Management
System
Used for faster and cheap
communication medium
Used for monitoring, analyzing and
controlling the raw data
Prof. Dr. H.
Kirrmann
(2007)
OPC Connect with different field devices
and SCADA as a communication
server
Clemens Hoga
(2007)
Industrial
Ethernet in
substation
Substation
automation
Low cost
High reliability
Make the combination of new and old
system
Expensive
Frank Marden
(2004)
Ethernet in
Substation
Use many devices with one Ethernet
Low cost, High throughput
13
3 CHAPTER 3
METHODOLOGY
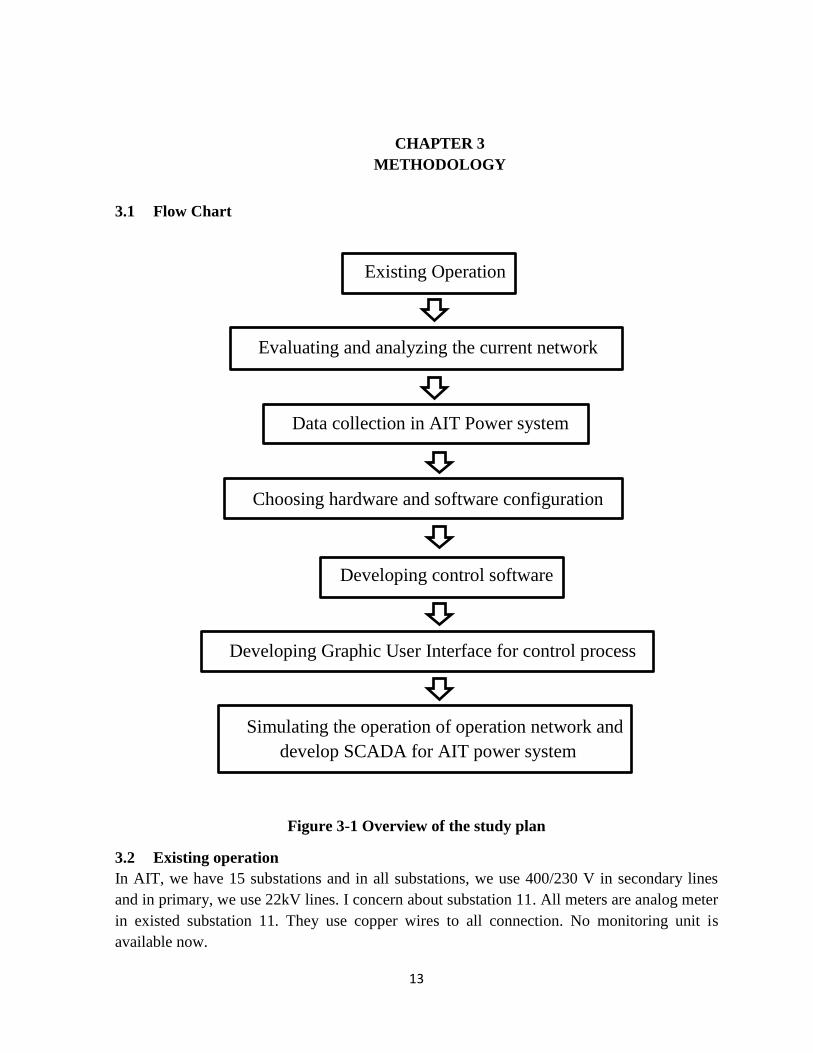
3.1 Flow Chart
Existing Operation
Evaluating and analyzing the current network
Data collection in AIT Power system
Choosing hardware and software configuration
Developing control software
Developing Graphic User Interface for control process
Simulating the operation of operation network and
develop SCADA for AIT power system
Figure 3-1 Overview of the study plan
3.2 Existing operation
In AIT, we have 15 substations and in all substations, we use 400/230 V in secondary lines
and in primary, we use 22kV lines. I concern about substation 11. All meters are analog meter
in existed substation 11. They use copper wires to all connection. No monitoring unit is
available now.
14
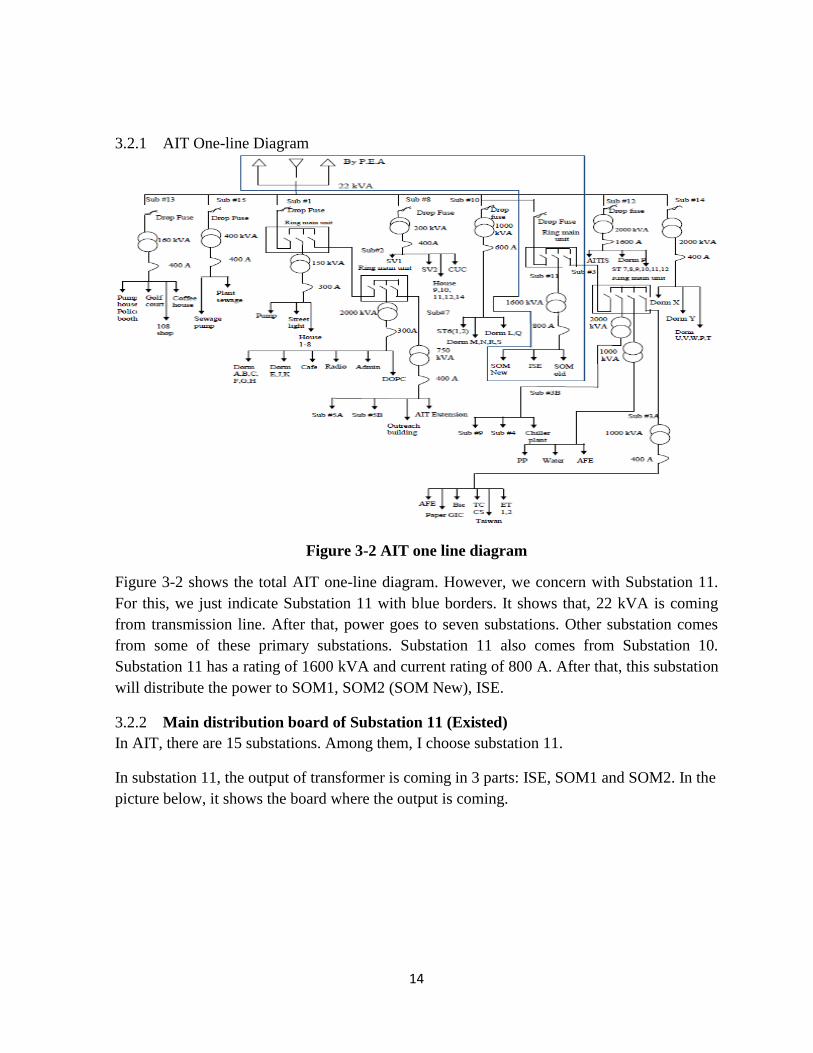
3.2.1 AIT One-line Diagram
Figure 3-2 AIT one line diagram
Figure 3-2 shows the total AIT one-line diagram. However, we concern with Substation 11.
For this, we just indicate Substation 11 with blue borders. It shows that, 22 kVA is coming
from transmission line. After that, power goes to seven substations. Other substation comes
from some of these primary substations. Substation 11 also comes from Substation 10.
Substation 11 has a rating of 1600 kVA and current rating of 800 A. After that, this substation
will distribute the power to SOM1, SOM2 (SOM New), ISE.
3.2.2 Main distribution board of Substation 11 (Existed)
In AIT, there are 15 substations. Among them, I choose substation 11.
In substation 11, the output of transformer is coming in 3 parts: ISE, SOM1 and SOM2. In the
picture below, it shows the board where the output is coming.

15
Figure 3-3 Board that provide transformer output
The main distribution board is looks like the figure 3-4.
Figure 3-4 Schematic diagram of MDB in substation 11 (old)
16
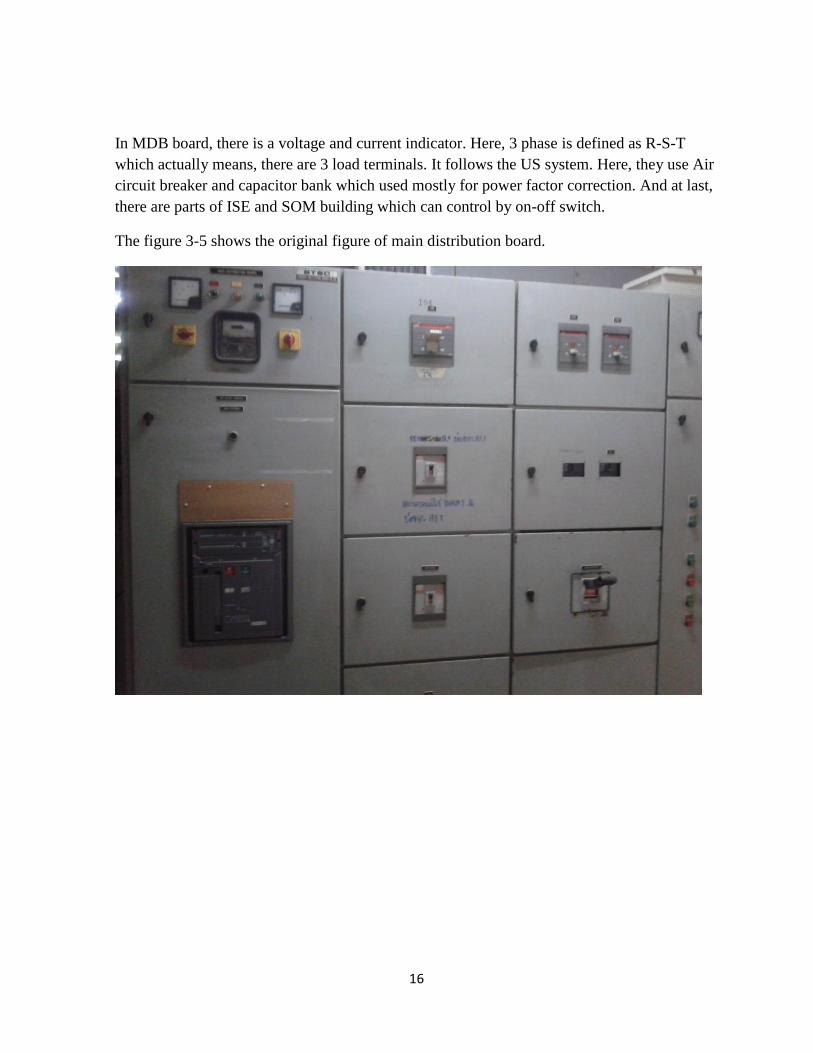
In MDB board, there is a voltage and current indicator. Here, 3 phase is defined as R-S-T
which actually means, there are 3 load terminals. It follows the US system. Here, they use Air
circuit breaker and capacitor bank which used mostly for power factor correction. And at last,
there are parts of ISE and SOM building which can control by on-off switch.
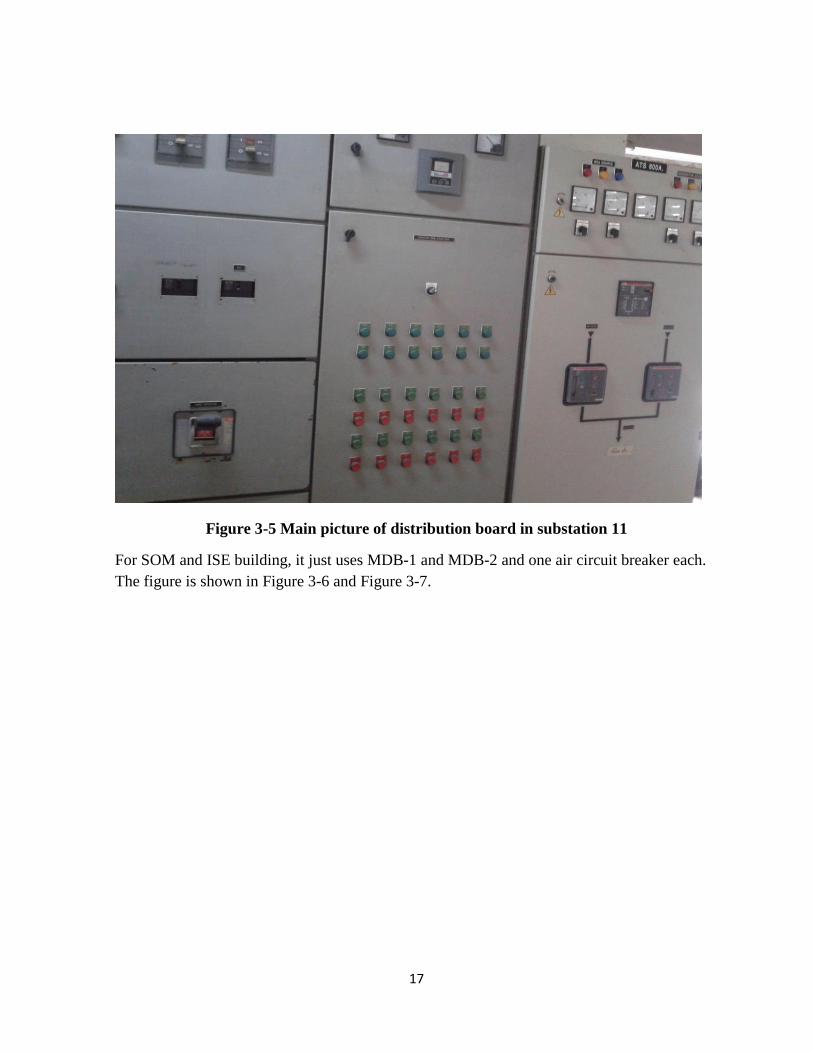
The figure 3-5 shows the original figure of main distribution board.
17
Figure 3-5 Main picture of distribution board in substation 11
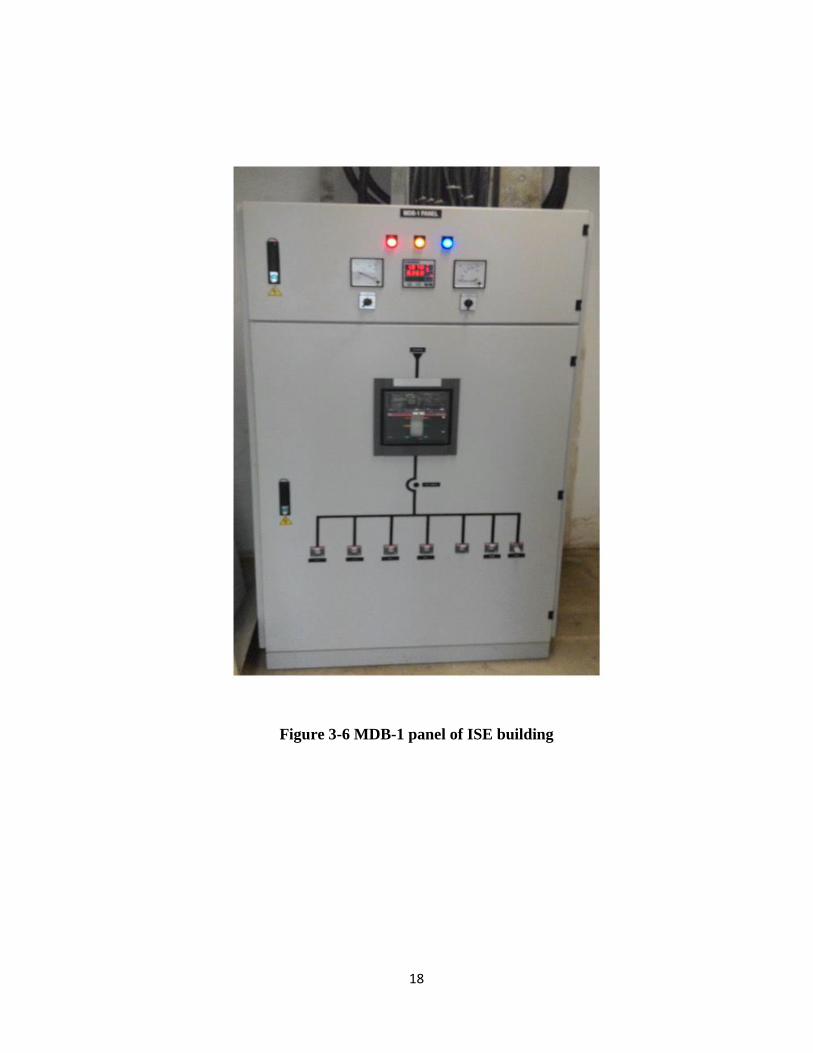
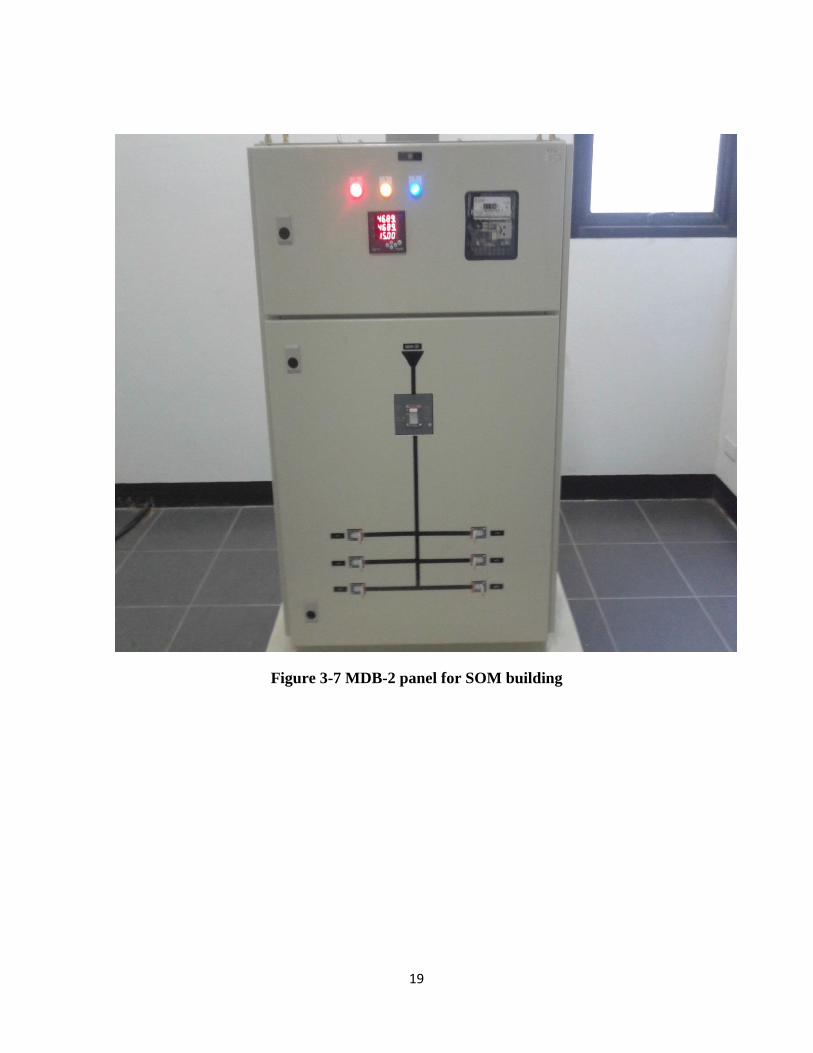
For SOM and ISE building, it just uses MDB-1 and MDB-2 and one air circuit breaker each.
The figure is shown in Figure 3-6 and Figure 3-7.
18
Figure 3-6 MDB-1 panel of ISE building
19
Figure 3-7 MDB-2 panel for SOM building
20
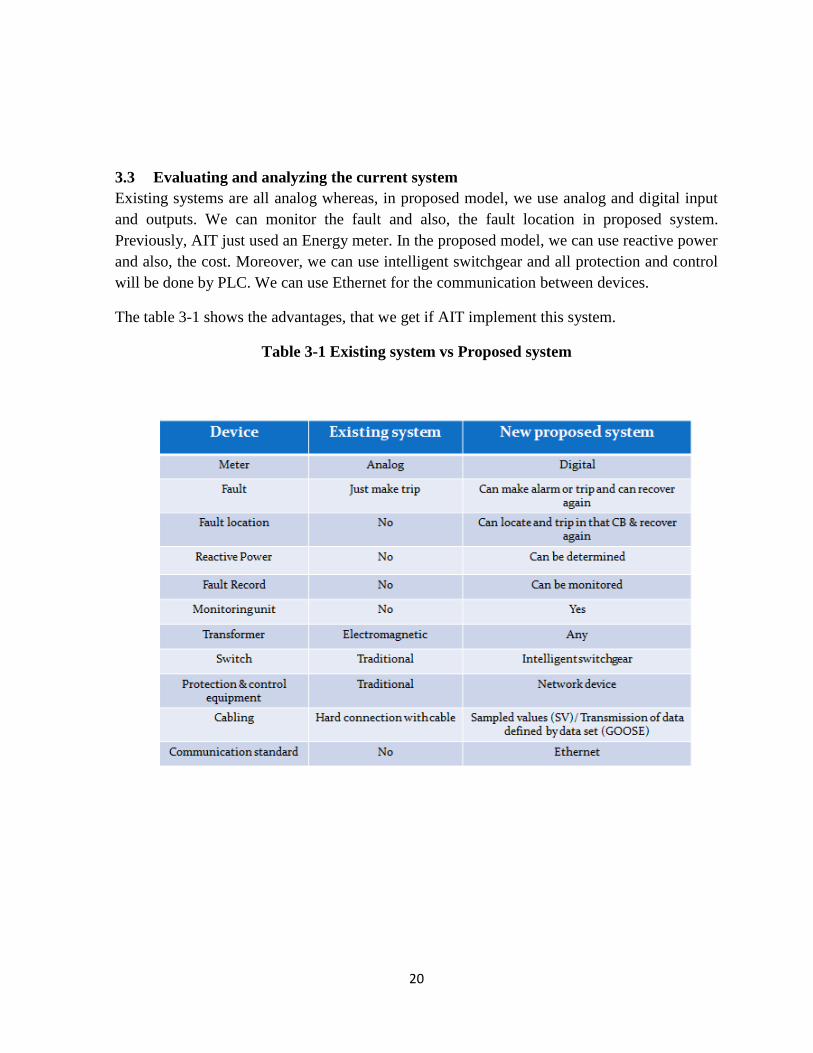
3.3 Evaluating and analyzing the current system
Existing systems are all analog whereas, in proposed model, we use analog and digital input
and outputs. We can monitor the fault and also, the fault location in proposed system.
Previously, AIT just used an Energy meter. In the proposed model, we can use reactive power
and also, the cost. Moreover, we can use intelligent switchgear and all protection and control
will be done by PLC. We can use Ethernet for the communication between devices.
The table 3-1 shows the advantages, that we get if AIT implement this system.
Table 3-1 Existing system vs Proposed system
21
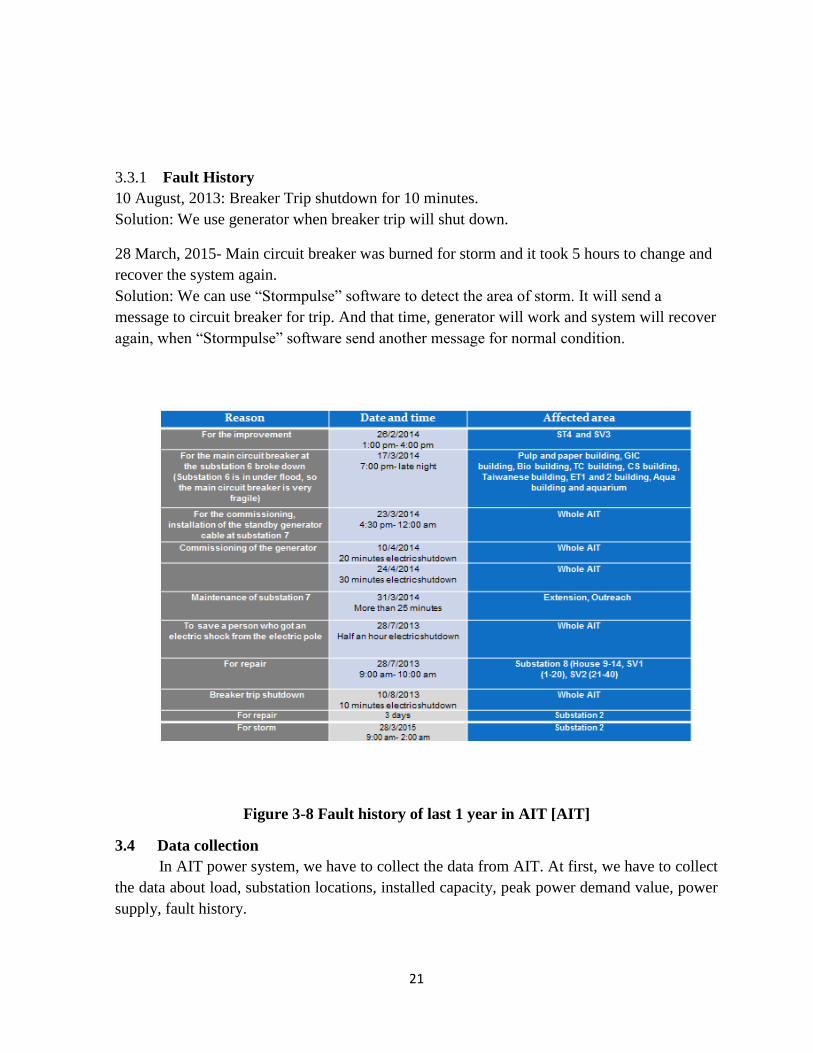
3.3.1 Fault History
10 August, 2013: Breaker Trip shutdown for 10 minutes.
Solution: We use generator when breaker trip will shut down.
28 March, 2015- Main circuit breaker was burned for storm and it took 5 hours to change and
recover the system again.
Solution: We can use “Stormpulse” software to detect the area of storm. It will send a
message to circuit breaker for trip. And that time, generator will work and system will recover
again, when “Stormpulse” software send another message for normal condition.
Figure 3-8 Fault history of last 1 year in AIT [AIT]
3.4 Data collection
In AIT power system, we have to collect the data from AIT. At first, we have to collect
the data about load, substation locations, installed capacity, peak power demand value, power
supply, fault history.
22
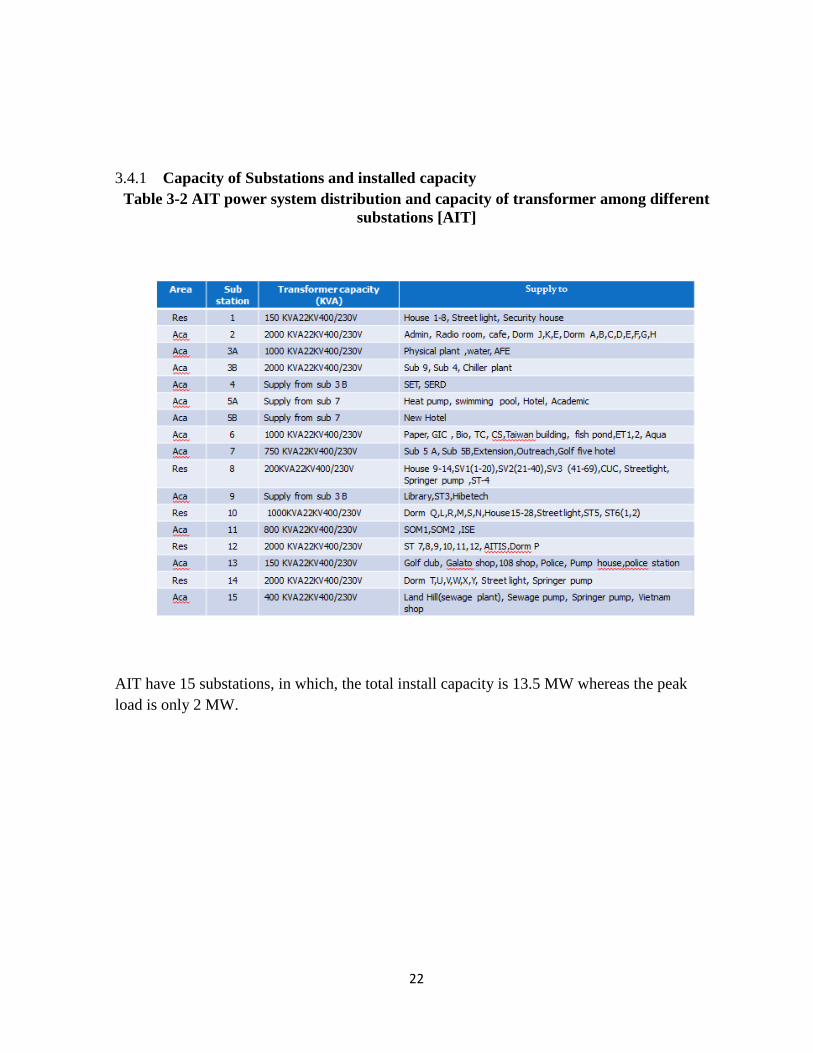
3.4.1 Capacity of Substations and installed capacity
Table 3-2 AIT power system distribution and capacity of transformer among different
substations [AIT]
AIT have 15 substations, in which, the total install capacity is 13.5 MW whereas the peak
load is only 2 MW.
23
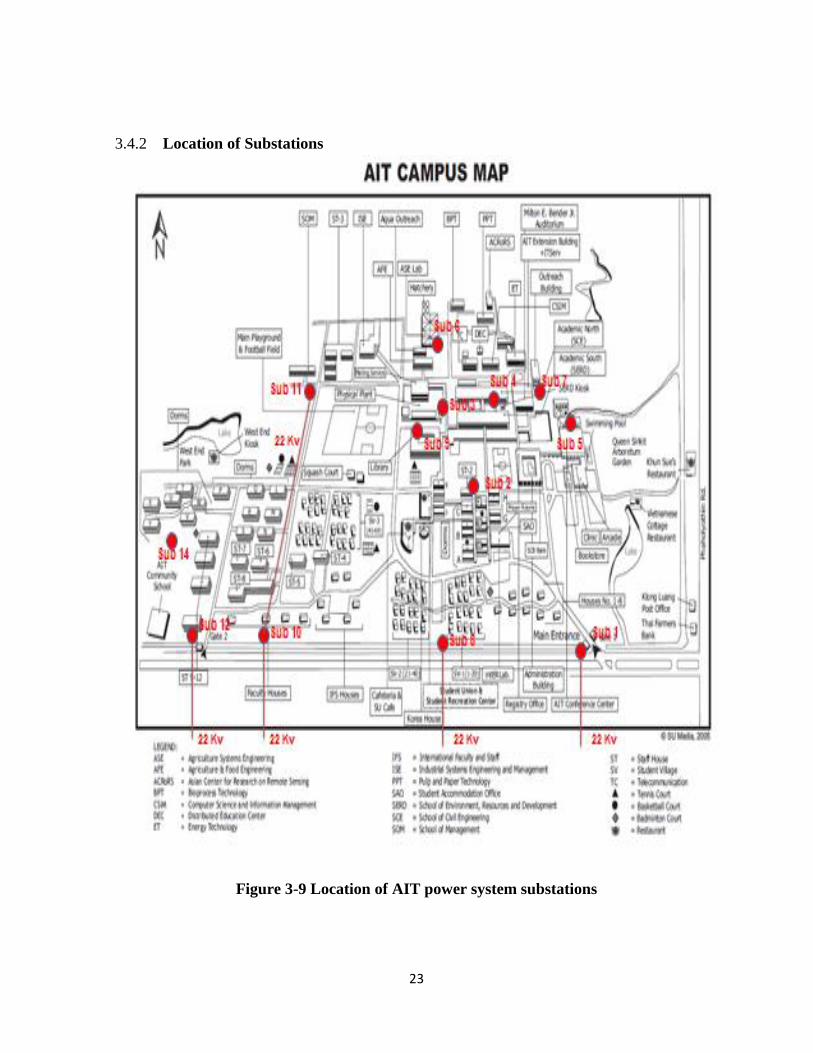
3.4.2 Location of Substations
Figure 3-9 Location of AIT power system substations
24
3.4.3 AIT power supply system
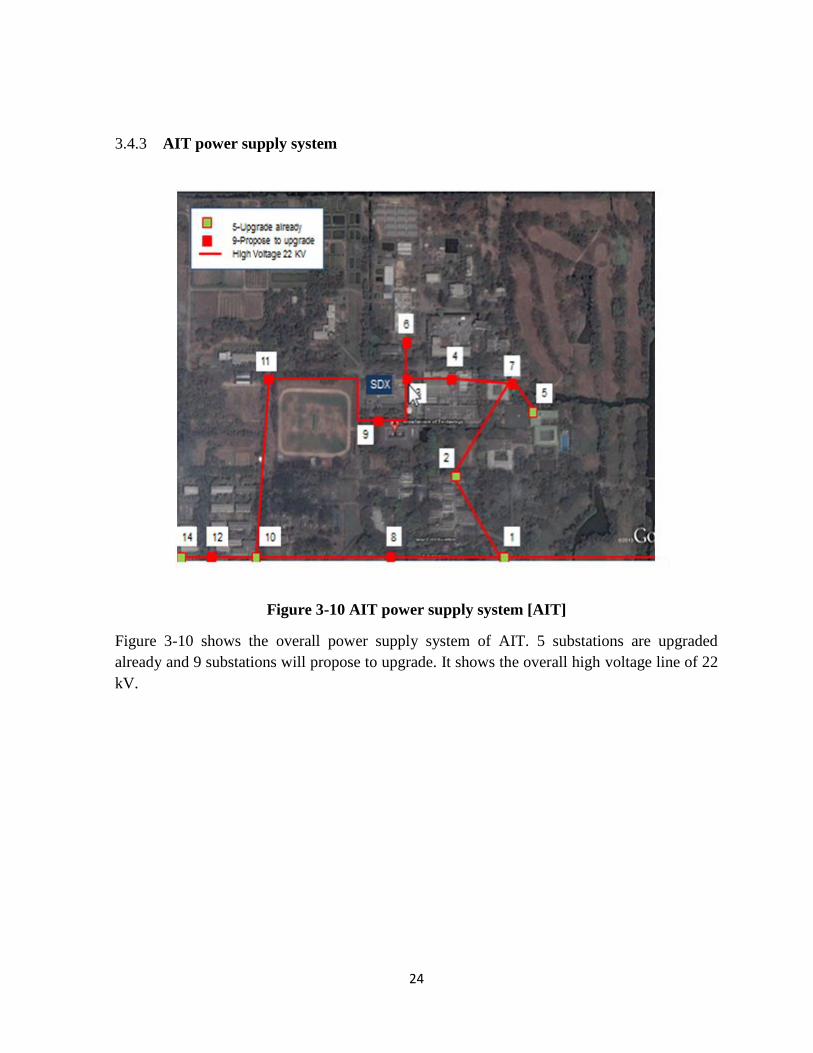
Figure 3-10 AIT power supply system [AIT]
Figure 3-10 shows the overall power supply system of AIT. 5 substations are upgraded
already and 9 substations will propose to upgrade. It shows the overall high voltage line of 22
kV.
25
4 CHAPTER 4
SYSTEM CONFIGURATION
4.1 Hardware configuration
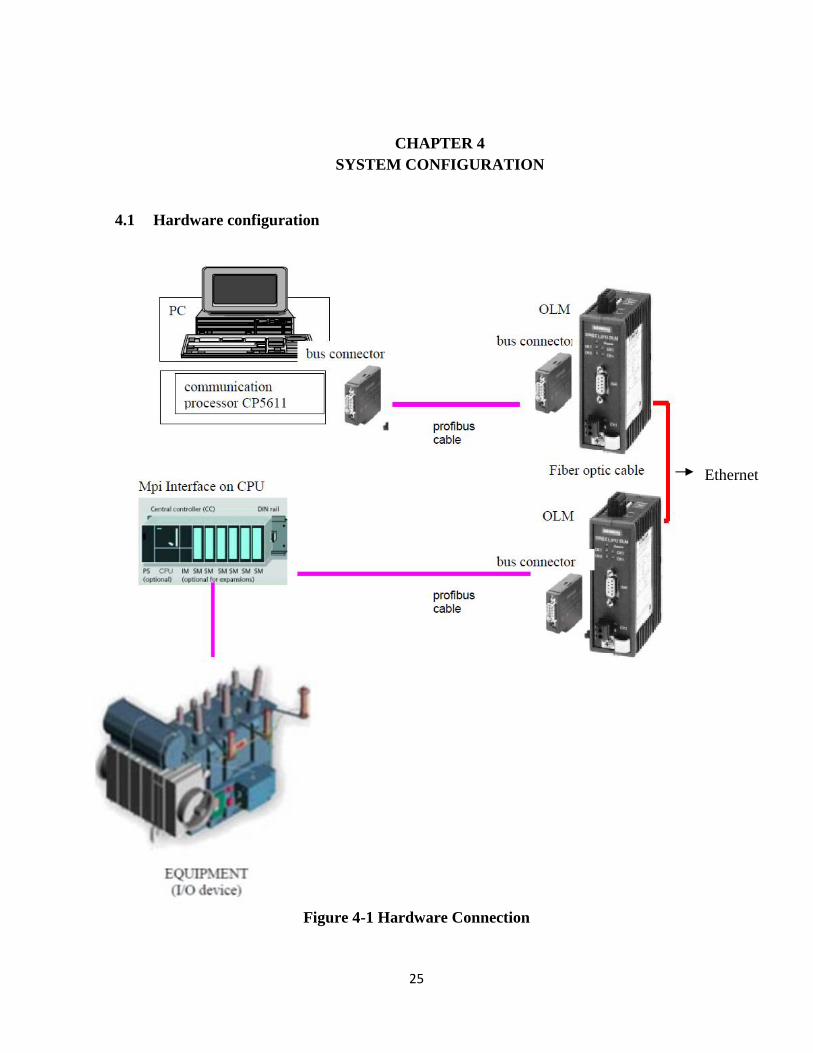
Figure 4-1 Hardware Connection
Ethernet
26
Fiber optic cables are used in both master and slave for replacing RS 485 interfaces. This
technique can be used in PROFIBUS-DP masters and slaves such as SIMATIC programmable
controllers. The PROFIBUS OLM is works like repeater. It uses electrical and optical
interfaces, catching the signal from any transmitted port and then distributed that to all other
ports.
Line, ring and star topologies follow the characteristics of PROFIBUS OLM. It uses signaling
contact to link with HMI and display that status on graphics. Optical fibers, which are
normally used, are made with plastic or glass. For plastic, it can enabling up to 80 kilometers
and for glass, it’s up to 15 kilometers between 2 nodes. Ethernet can also be used in here. For
5 Ethernet switch, we can get 1000 m fiber ring. Sometimes, big distances can come because
of cascading depth of OLMs. OLM can be used in all PROFIBUS applications.
The power supply of PROFIBUS must be lower than IEC 950/ VDE 0805, which is between
+18V to+32V. Normally, it’s 24V. Power supply between OLM and PLC is DC24V.
Transmission reliability is increased a lot with use of optical fiber or Ethernet instead of
twisted 2-wire cable. So it reduces the problems of circuits or higher voltages.
4.2 Project
4.2.1 Apparatus
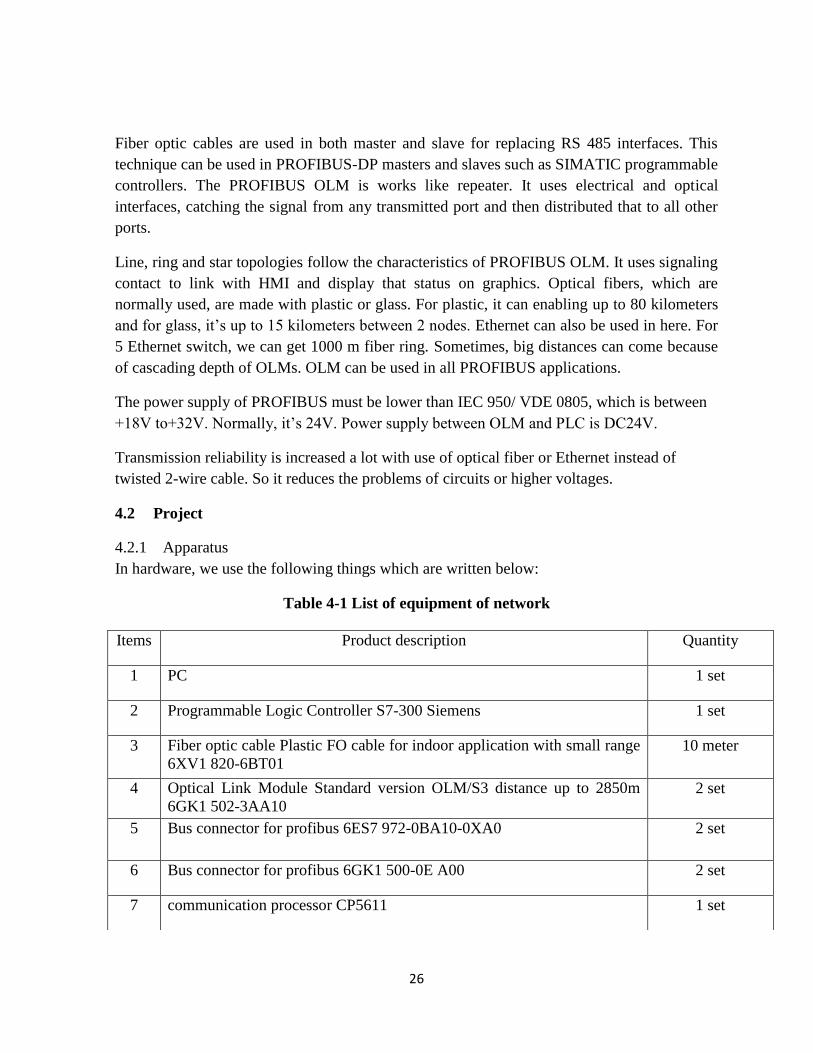
In hardware, we use the following things which are written below:
Table 4-1 List of equipment of network
Items Product description Quantity
1 PC 1 set
2 Programmable Logic Controller S7-300 Siemens 1 set
3 Fiber optic cable Plastic FO cable for indoor application with small range
6XV1 820-6BT01
10 meter
4 Optical Link Module Standard version OLM/S3 distance up to 2850m
6GK1 502-3AA10
2 set
5 Bus connector for profibus 6ES7 972-0BA10-0XA0 2 set
6 Bus connector for profibus 6GK1 500-0E A00 2 set
7 communication processor CP5611 1 set
27
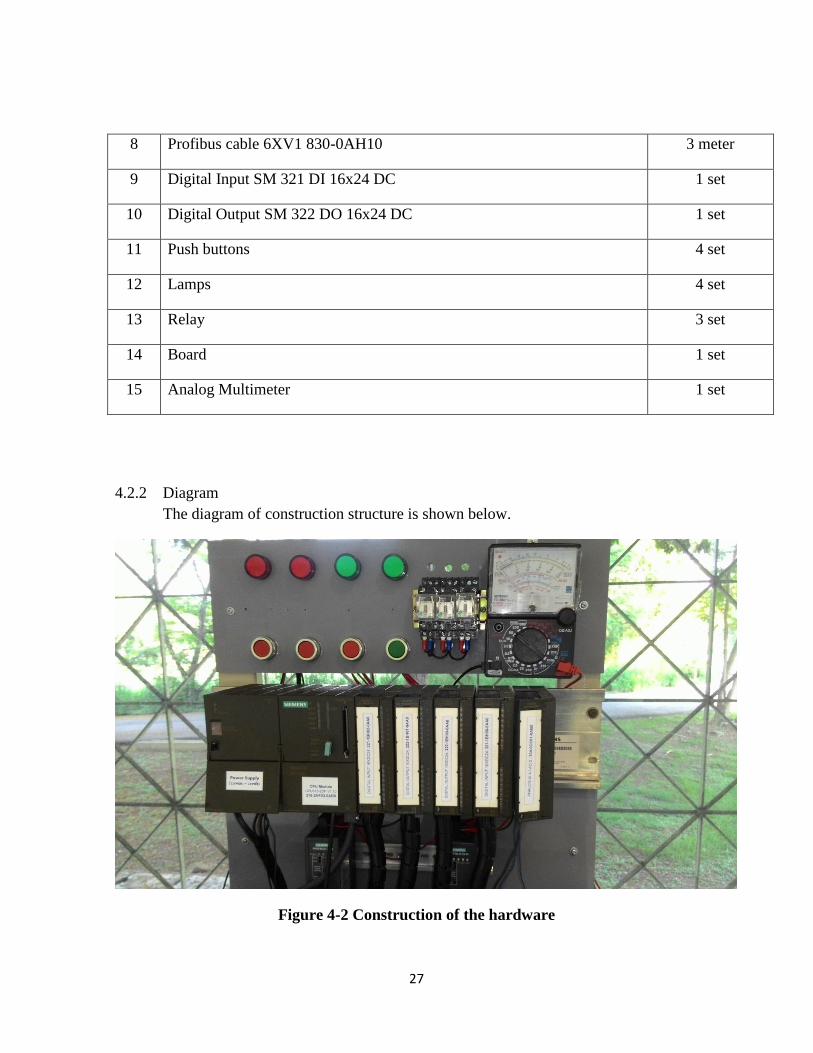
4.2.2 Diagram
The diagram of construction structure is shown below.
Figure 4-2 Construction of the hardware
8 Profibus cable 6XV1 830-0AH10 3 meter
9 Digital Input SM 321 DI 16x24 DC 1 set
10 Digital Output SM 322 DO 16x24 DC 1 set
11 Push buttons 4 set
12 Lamps 4 set
13 Relay 3 set
14 Board 1 set
15 Analog Multimeter 1 set
28
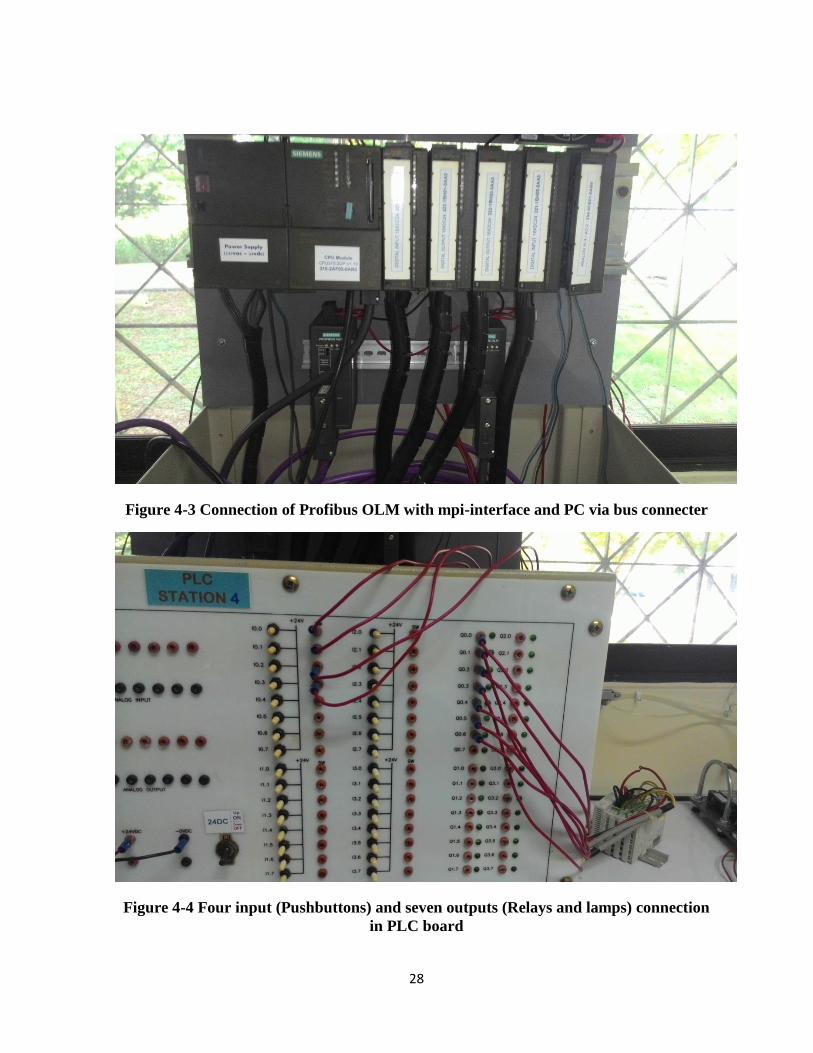
Figure 4-3 Connection of Profibus OLM with mpi-interface and PC via bus connecter
Figure 4-4 Four input (Pushbuttons) and seven outputs (Relays and lamps) connection
in PLC board
29
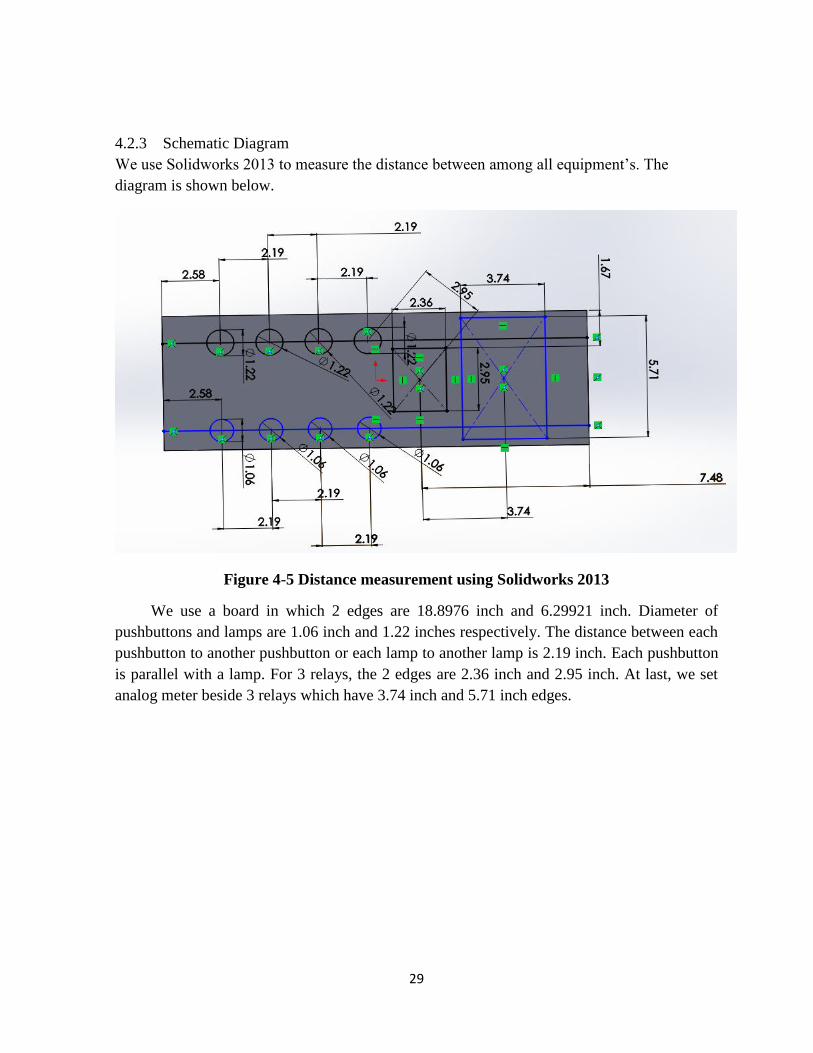
4.2.3 Schematic Diagram
We use Solidworks 2013 to measure the distance between among all equipment’s. The
diagram is shown below.
Figure 4-5 Distance measurement using Solidworks 2013
We use a board in which 2 edges are 18.8976 inch and 6.29921 inch. Diameter of
pushbuttons and lamps are 1.06 inch and 1.22 inches respectively. The distance between each
pushbutton to another pushbutton or each lamp to another lamp is 2.19 inch. Each pushbutton
is parallel with a lamp. For 3 relays, the 2 edges are 2.36 inch and 2.95 inch. At last, we set
analog meter beside 3 relays which have 3.74 inch and 5.71 inch edges.
30
5 CHAPTER 5
HARDWARE IMPLEMENTATION
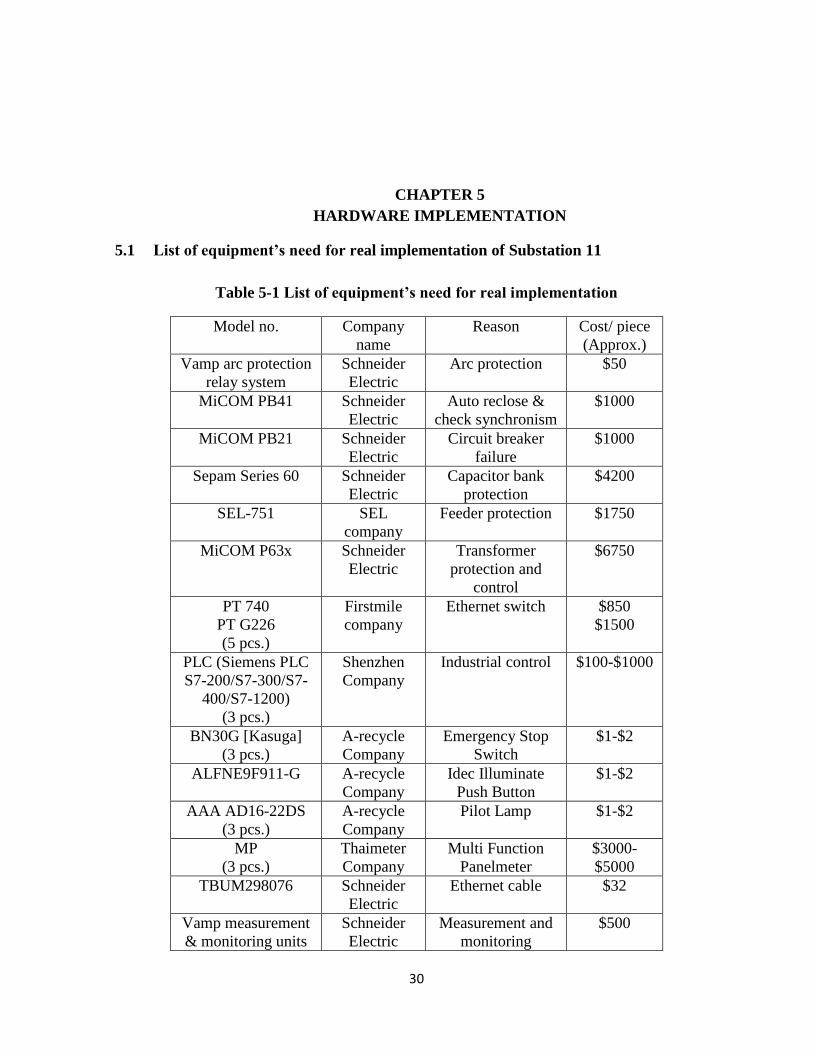
5.1 List of equipment’s need for real implementation of Substation 11
Table 5-1 List of equipment’s need for real implementation
Model no. Company
name
Reason Cost/ piece
(Approx.)
Vamp arc protection
relay system
Schneider
Electric
Arc protection
$50
MiCOM PB41 Schneider
Electric
Auto reclose &
check synchronism
$1000
MiCOM PB21 Schneider
Electric
Circuit breaker
failure
$1000
Sepam Series 60 Schneider
Electric
Capacitor bank
protection
$4200
SEL-751 SEL
company
Feeder protection $1750
MiCOM P63x Schneider
Electric
Transformer
protection and
control
$6750
PT 740
PT G226
(5 pcs.)
Firstmile
company
Ethernet switch $850
$1500
PLC (Siemens PLC
S7-200/S7-300/S7-
400/S7-1200)
(3 pcs.)
Shenzhen
Company
Industrial control
$100-$1000
BN30G [Kasuga]
(3 pcs.)
A-recycle
Company
Emergency Stop
Switch
$1-$2
ALFNE9F911-G A-recycle
Company
Idec Illuminate
Push Button
$1-$2
AAA AD16-22DS
(3 pcs.)
A-recycle
Company
Pilot Lamp $1-$2
MP
(3 pcs.)
Thaimeter
Company
Multi Function
Panelmeter
$3000-
$5000
TBUM298076 Schneider
Electric
Ethernet cable $32
Vamp measurement
& monitoring units
Schneider
Electric
Measurement and
monitoring
$500
31
PTS 740
Digital
meter
MP
PT G226
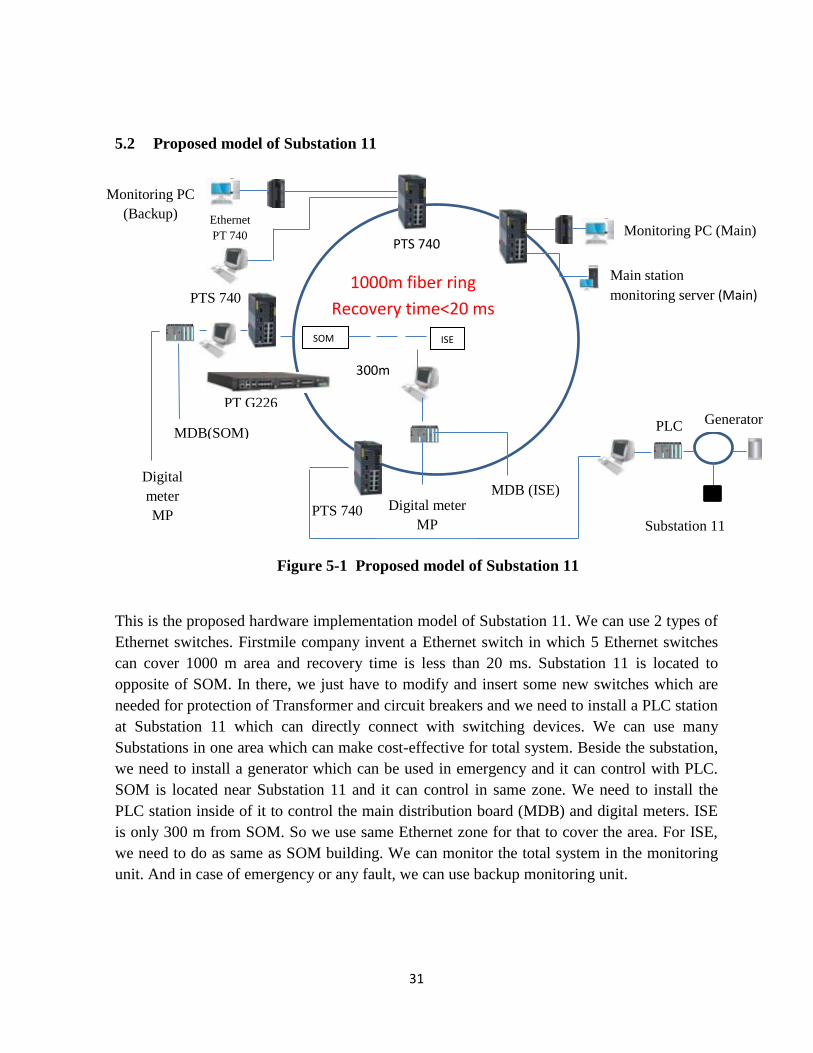
5.2 Proposed model of Substation 11
Figure 5-1 Proposed model of Substation 11
This is the proposed hardware implementation model of Substation 11. We can use 2 types of
Ethernet switches. Firstmile company invent a Ethernet switch in which 5 Ethernet switches
can cover 1000 m area and recovery time is less than 20 ms. Substation 11 is located to
opposite of SOM. In there, we just have to modify and insert some new switches which are
needed for protection of Transformer and circuit breakers and we need to install a PLC station
at Substation 11 which can directly connect with switching devices. We can use many
Substations in one area which can make cost-effective for total system. Beside the substation,
we need to install a generator which can be used in emergency and it can control with PLC.
SOM is located near Substation 11 and it can control in same zone. We need to install the
PLC station inside of it to control the main distribution board (MDB) and digital meters. ISE
is only 300 m from SOM. So we use same Ethernet zone for that to cover the area. For ISE,
we need to do as same as SOM building. We can monitor the total system in the monitoring
unit. And in case of emergency or any fault, we can use backup monitoring unit.
PTS 740
1000m fiber ring
Recovery time<20 ms
Monitoring PC
(Backup)
Monitoring PC (Main)
Main station
monitoring server (Main)
Substation 11
Generator
PTS 740
SOM ISE
PLC
boar
d
Digital meter
MP
MDB (ISE)
Ethernet
PT 740
MDB(SOM)
300m
32
5.3 Proposed hardware configuration
5.3.1 Proposed hardware configuration of switching devices
Figure 5-2 Proposed hardware configuration of switching devices

33
Here, we use existing system with modified system. Existed system was shown in Figure 3-3.
We insert protection devices, sensor for fault location, emergency stop switch which act like a
switch as a modified system and control for tripping the whole system in emergency cases or
in case of any faults. This total system is connected with PLC station for control
automatically. Also, we can use it manually by using these switches. All the system can be
shown in monitoring unit or HMI. We can monitor the unit in the hardware such as Energy
meter, Reactive power and cost.
34
5.3.2 Proposed hardware configuration of ISE and SOM (MDB)
Figure 5-3 Proposed hardware configuration of main distribution board
Idec Illuminate push button
ALFNE9F911-G (For DB-1)
Idec Illuminate push button
ALFNE9F911-G (For DB-2)
MDB
Pilot lamp
AAA AD16-22DS
(Green)
Pilot lamp
AAA AD16-22DS
(Yellow)
Pilot lamp
AAA AD16-22DS
(Red)
Measurement &
Monitoring
M: Vamp Measurement
& Monitoring unit
Auto
Manual
Idec Illuminate
push button
ALFNE9F911-G
Emergency stop
switch
BN30G
Idec Illuminate
push button
ALFNE9F911-G
(For LC-1)
Idec Illuminate
push button
ALFNE9F911-G
(For LC-2)
Idec Illuminate
push button
ALFNE9F911-G
(For DB-1)
Idec Illuminate
push button
ALFNE9F911-G
(For DB-1)

35
In existing system, all is there except emergency stop switch which can be used when there is
fault located at SOM1, SOM2 or ISE individually. We can insert a PLC station which can be
connected with this system. This can control the whole system automatically or manually.
5.3.3 Proposed hardware configuration of ISE and SOM (LC)
…………………….
……………………
Figure 5-4 Proposed hardware configuration of ISE and SOM (Load center)
LC
Pilot lamp
AAA AD16-22DS
(Green)
Pilot lamp
AAA AD16-22DS
(Yellow)
Pilot lamp
AAA AD16-22DS
(Red)
Measurement &
Monitoring
M: Vamp Measurement
& Monitoring unit
Auto
Manual
Idec Illuminate
push button
ALFNE9F911-G
Emergency
stop switch
BN30G
Arc Protection
M: Vamp arc
protection
relay system
(Room2)
Arc Protection
M: Vamp arc
protection
relay system
(Room1)
Arc Protection
M: Vamp arc protection
relay system
(Room N)
……………………….
36
Relay
In load center, we just modify the arc protection devices for each room and use emergency
stop switch for protect the whole system. This can be connected with same PLC station which
is installed for MDB.
5.4 Proposed one-line diagram
Transmission line (22kV)
Figure 5-5 Proposed one-line diagram
On proposed model, we just need to change the circuit breaker to relay. And we need to
remove wiring and for switching the whole system, we can insert Ethernet as a whole
communicating medium.
Relay
SOM1 ISE SOM2
Relay
Substation 11
800 A
1600 KVA
Ethernet
Relay Relay
37
5.5 Proposed wiring diagram
5.5.1 Wiring diagram (PLC & Control and protection equipment)
…..
Figure 5-6 Wiring diagram (PLC with Switching Equipment’s)
PC
PLC
board
Digital
i/p,
Digital
o/p,
Analo
g i/p,
o/p
Ethernet
PT 740
Voltage indicator
Current indicator
On/off switch
Air CB
Capacitor bank (Manual/Auto)
Emergency stop switch
BN30G
Arc Protection
M: Vamp arc protection relay system
Autoreclose and check synchronism
MiCOM PB41
Circuit breaker protection
MiCOM PB21
Feeder protection
SEL 751
Voltage & freq. protection
MiCOM C264P
Pilot lamp (6)
AAA AD16-
22DS
Idec Illuminate push button (6)
ALFNE9F911-G
Ethernet cable
TBUM298076
Measurement & Monitoring
M: Vamp Measurement & Monitoring unit
38
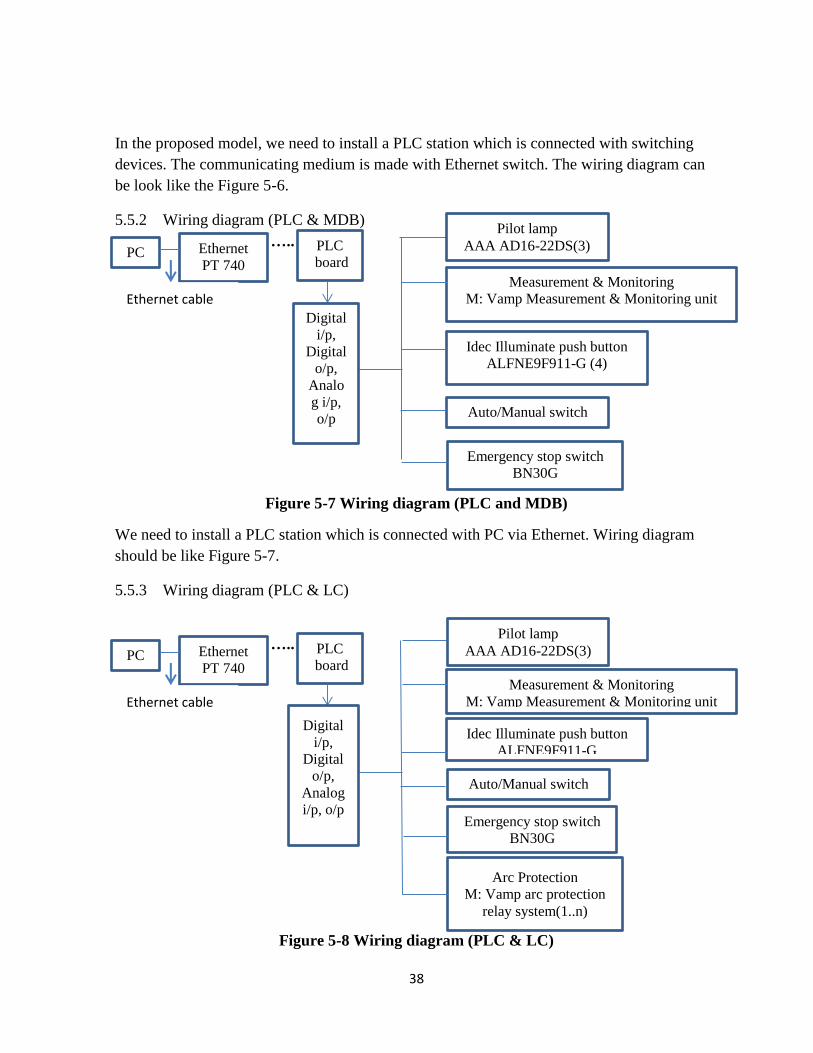
In the proposed model, we need to install a PLC station which is connected with switching
devices. The communicating medium is made with Ethernet switch. The wiring diagram can
be look like the Figure 5-6.
5.5.2 Wiring diagram (PLC & MDB)
…..
Figure 5-7 Wiring diagram (PLC and MDB)
We need to install a PLC station which is connected with PC via Ethernet. Wiring diagram
should be like Figure 5-7.
5.5.3 Wiring diagram (PLC & LC)
…..
Figure 5-8 Wiring diagram (PLC & LC)
PC
PLC
board
Digital
i/p,
Digital
o/p,
Analo
g i/p,
o/p
Ethernet
PT 740
Measurement & Monitoring
M: Vamp Measurement & Monitoring unit
Idec Illuminate push button
ALFNE9F911-G (4)
Auto/Manual switch
Emergency stop switch
BN30G
Arc Protection
M: Vamp arc protection
relay system(1..n)
Ethernet cable
TBUM298076
Pilot lamp
AAA AD16-22DS(3)
PC
PLC
board
Digital
i/p,
Digital
o/p,
Analog
i/p, o/p
Ethernet
PT 740
Measurement & Monitoring
M: Vamp Measurement & Monitoring unit
Idec Illuminate push button
ALFNE9F911-G
Auto/Manual switch
Emergency stop switch
BN30G
Ethernet cable
TBUM298076
Pilot lamp
AAA AD16-22DS(3)
39
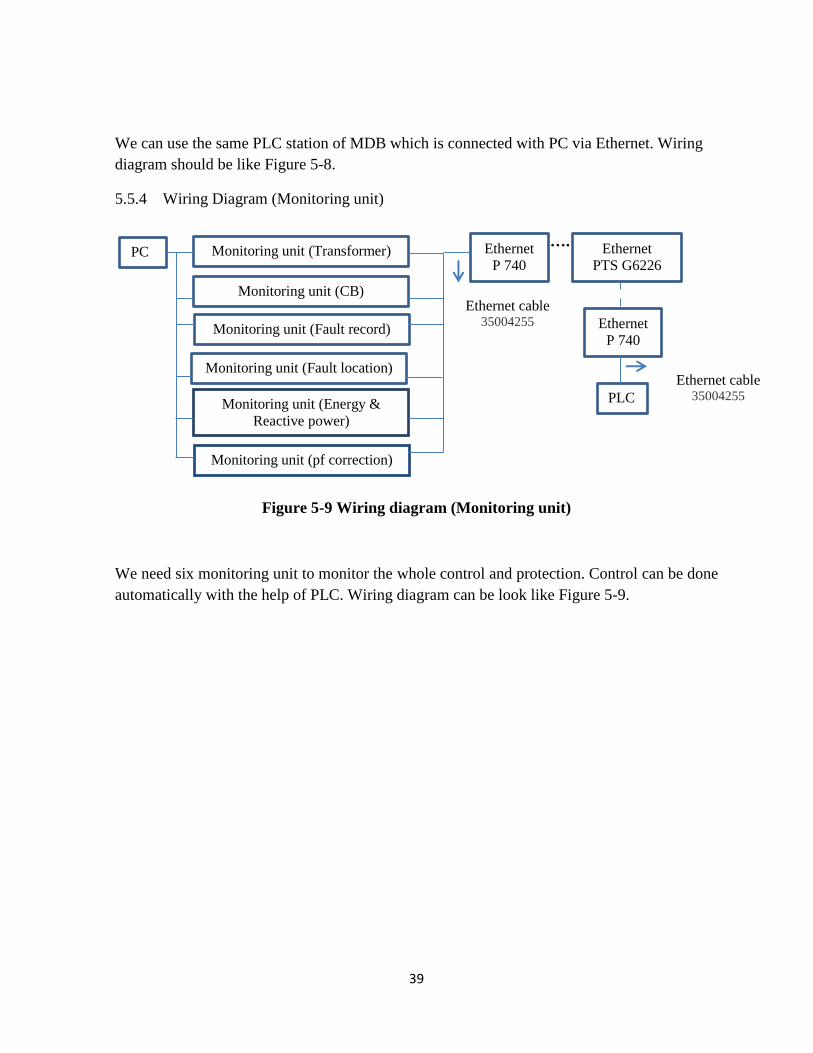
We can use the same PLC station of MDB which is connected with PC via Ethernet. Wiring
diagram should be like Figure 5-8.
5.5.4 Wiring Diagram (Monitoring unit)
….
.
Figure 5-9 Wiring diagram (Monitoring unit)
We need six monitoring unit to monitor the whole control and protection. Control can be done
automatically with the help of PLC. Wiring diagram can be look like Figure 5-9.
PC
Monitoring unit (Transformer)
Monitoring unit (CB)
Monitoring unit (Fault record)
Monitoring unit (Fault location)
Monitoring unit (Energy &
Reactive power)
Ethernet
P 740
Ethernet
PTS G6226
Ethernet
P 740
PLC
Ethernet cable 35004255
Ethernet cable 35004255
Monitoring unit (pf correction)
40
6 CHAPTER 6
CONTROL ALGORITM AND HMI
6.1 Control Algorithm
For control the whole substation, we use Siemens Simatic S7-300 program. In this program,
we use “statement list” or “Ladder logic” format.
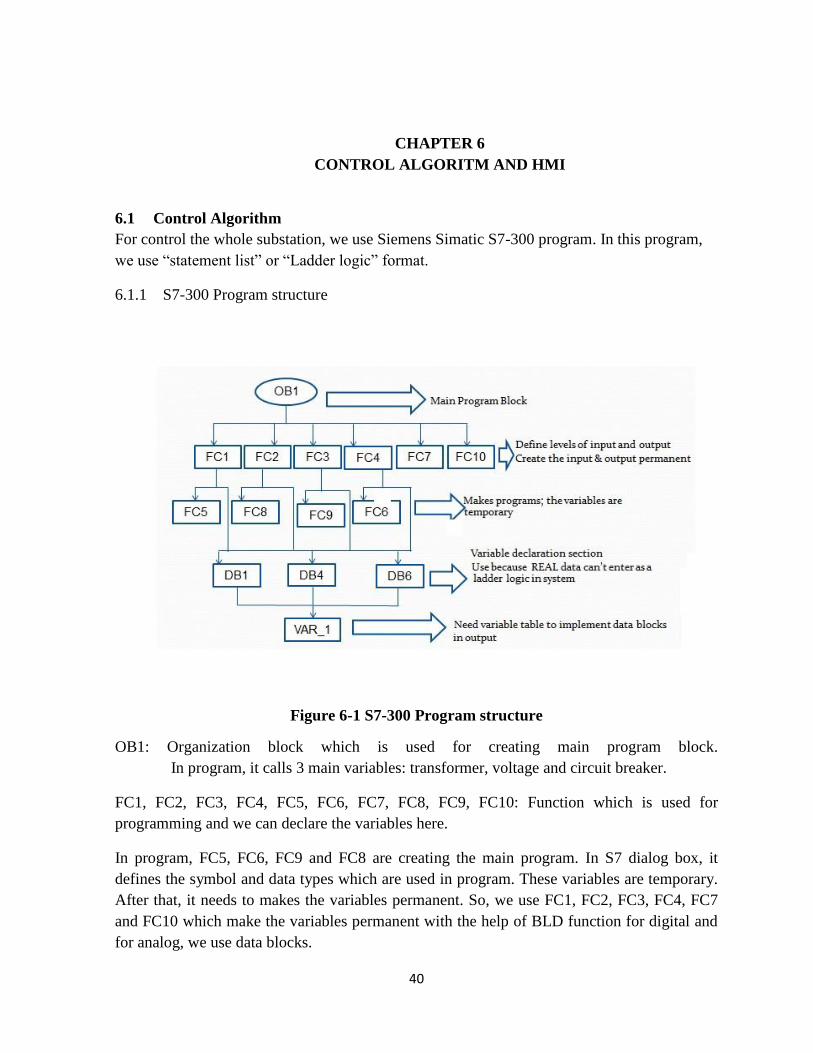
6.1.1 S7-300 Program structure
Figure 6-1 S7-300 Program structure
OB1: Organization block which is used for creating main program block.
In program, it calls 3 main variables: transformer, voltage and circuit breaker.
FC1, FC2, FC3, FC4, FC5, FC6, FC7, FC8, FC9, FC10: Function which is used for
programming and we can declare the variables here.
In program, FC5, FC6, FC9 and FC8 are creating the main program. In S7 dialog box, it
defines the symbol and data types which are used in program. These variables are temporary.
After that, it needs to makes the variables permanent. So, we use FC1, FC2, FC3, FC4, FC7
and FC10 which make the variables permanent with the help of BLD function for digital and
for analog, we use data blocks.

41
DB1, DB4, DB6: It’s mainly a variable declaration section which is used because we can use
analog data in here using REAL.
VAR_1: Variable table uses for implement the result of data in output. It can shows Boolean
data for digital and binary, HEX, decimal and floating point or character data for analog
signal.
6.2 Input/ output parameters connect with PLC
For transformer protection-
1. Bucholtz alarm
2. Storm mode
3. Tap changer
4. Different cooling system fault
5. Oil level fault
6. Tripping network
7. Power estimation
8. Backup protection
For circuit breaker protection-
1. Circuit breaker in operation
2. Manual block switch
3. Circuit breaker mode (auto or manual)
4. Current faults
5. Gas faults
6. Circuit breaker trip
For energy, reactive power and cost estimation-
1. Real power estimation
2. Reactive power estimation
3. Cost estimation
For voltage-
1. Voltage indicator
2. Total Voltage
For fault location-
1. Determining location of fault
2. Determining fault type- high or low voltage

42
For power factor correction-
1. Determining power factor
Determining value of capacitor bank activation
6.2.1 Transformer protection
AIT has 15 substations which have just a main circuit breaker for protection device. Now, we
introduce some protection device such as arc protection relay, capacitor bank protection,
overcurrent protection, auto reclose and check synchronism device, transformer protection
and control, measurement and monitoring unit in the main substation. For fault location, we
use pilot lamp to measure, in which area, fault occurs. In the main distribution board, all the
equipment’s are same as before. For each room, there is one circuit breaker for each room.
6.2.1.1 PLC program for transformer protection
When there is excessive gas, then Bucholtz gas sensor will on, which causes main
circuit breaker trip. It will recover automatically when the gas will become less.
“Stormpulse” software can generate data, which is used to know, when the storm will
come. If the data will come in system, then the sensor, storm modes will on, this
causes the whole transformer trip. It will recover again, when the storm will over.
In substation 11, only 1 tap changer will require. This can automatically show in real
HMI. It can automatically increase or decrease depends upon number of turns.
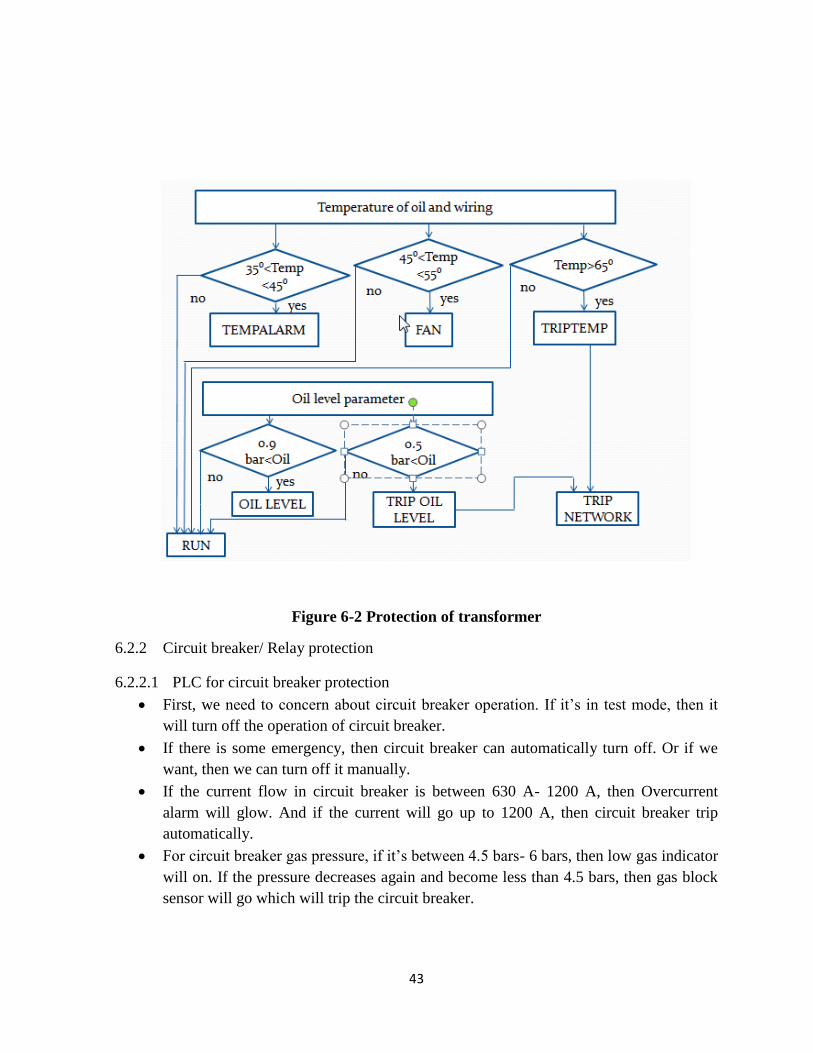
For temperature fault, we use 3 conditions. When it reaches 35⁰C-45⁰C, then alarm
signal will glow. Then when it reaches 45⁰C to 55⁰C, then it opens the fan. Here, it
shows only with a sensor. At last, when temperature reaches up to 55⁰C, then Relay is
on, which trips the total transformer for protection. It will recover automatically when
temperature will become less. We can see figure 6-4 to understand about it.
For oil level fault, we also use 2 conditions. If oil level is less than 0.9 bars, then oil
alarm sensor will glow automatically. Then, when oil level reaches less than 0.5 bars,
then the system will trip and recover again when oil level is ok again. We can see
figure 6-4 to understand about it.
For tripping, we just use one tripping network, which can trip faults.
For knowing about power, we just use voltage*current which is shown in HMI.
For backup protection, we use a generator for whole system. It will work when
tripping network will on.
43
Figure 6-2 Protection of transformer
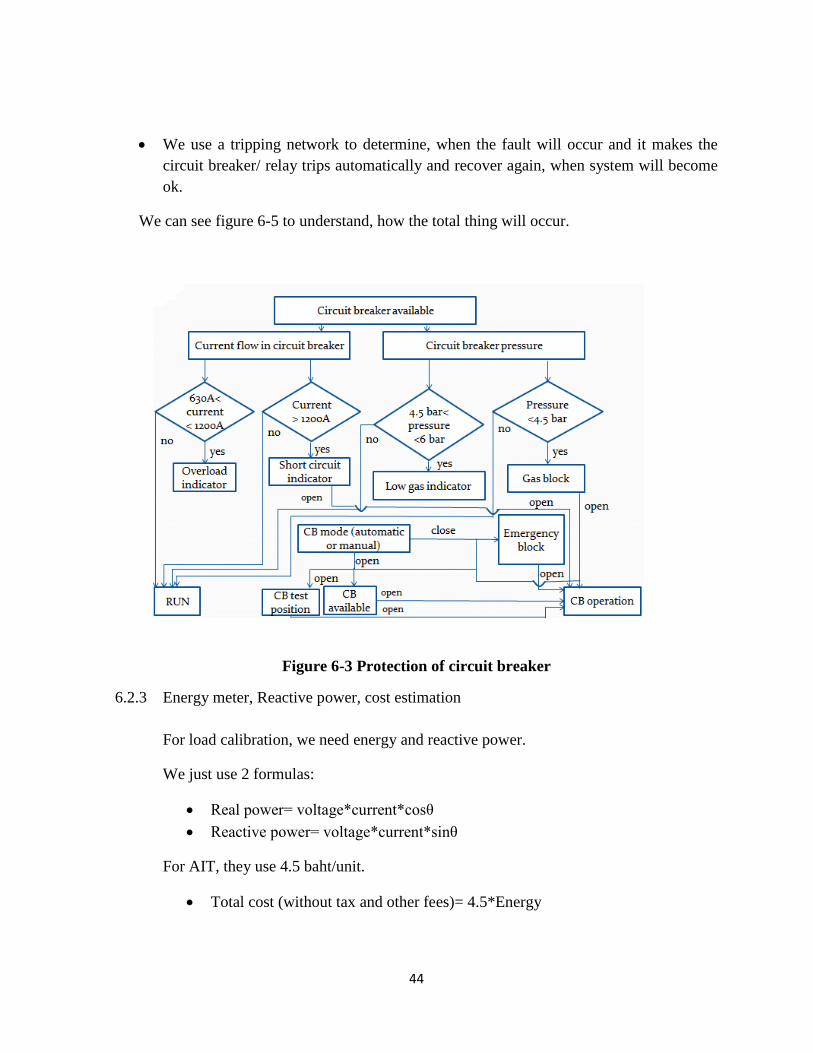
6.2.2 Circuit breaker/ Relay protection
6.2.2.1 PLC for circuit breaker protection
First, we need to concern about circuit breaker operation. If it’s in test mode, then it
will turn off the operation of circuit breaker.
If there is some emergency, then circuit breaker can automatically turn off. Or if we
want, then we can turn off it manually.
If the current flow in circuit breaker is between 630 A- 1200 A, then Overcurrent
alarm will glow. And if the current will go up to 1200 A, then circuit breaker trip
automatically.
For circuit breaker gas pressure, if it’s between 4.5 bars- 6 bars, then low gas indicator
will on. If the pressure decreases again and become less than 4.5 bars, then gas block
sensor will go which will trip the circuit breaker.
44
We use a tripping network to determine, when the fault will occur and it makes the
circuit breaker/ relay trips automatically and recover again, when system will become
ok.
We can see figure 6-5 to understand, how the total thing will occur.
Figure 6-3 Protection of circuit breaker
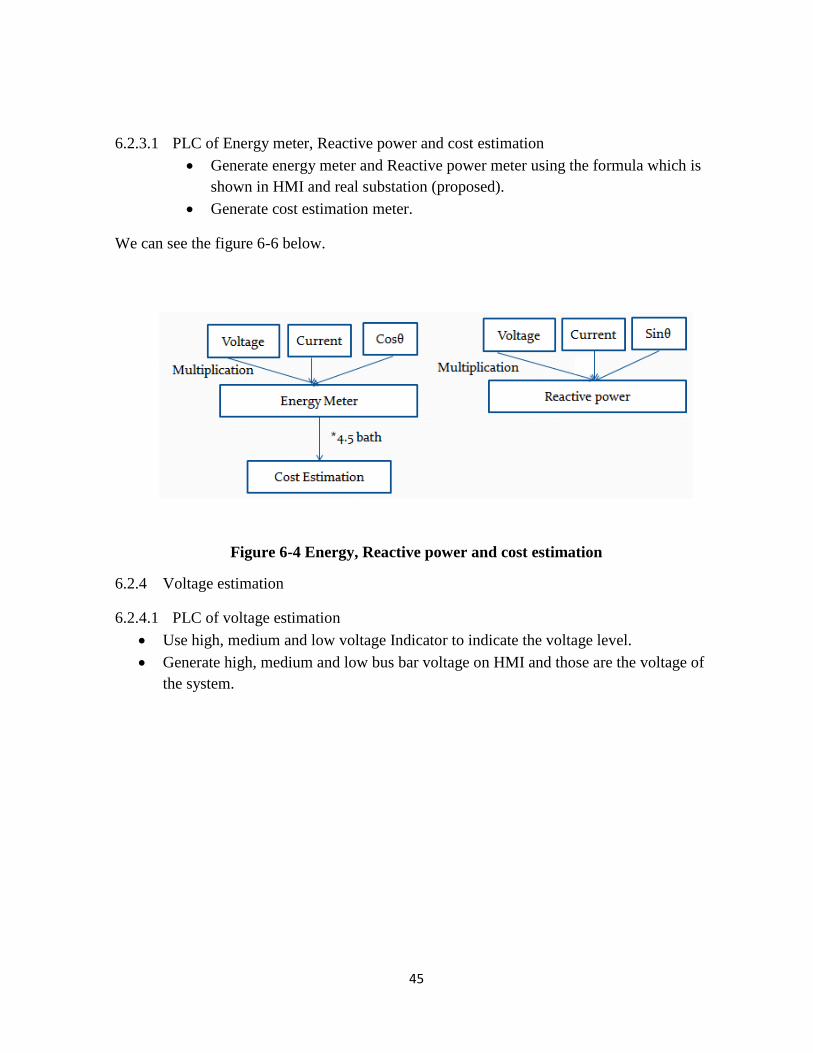
6.2.3 Energy meter, Reactive power, cost estimation
For load calibration, we need energy and reactive power.
We just use 2 formulas:
Real power= voltage*current*cosθ
Reactive power= voltage*current*sinθ
For AIT, they use 4.5 baht/unit.
Total cost (without tax and other fees)= 4.5*Energy
45
6.2.3.1 PLC of Energy meter, Reactive power and cost estimation
Generate energy meter and Reactive power meter using the formula which is
shown in HMI and real substation (proposed).
Generate cost estimation meter.
We can see the figure 6-6 below.
Figure 6-4 Energy, Reactive power and cost estimation
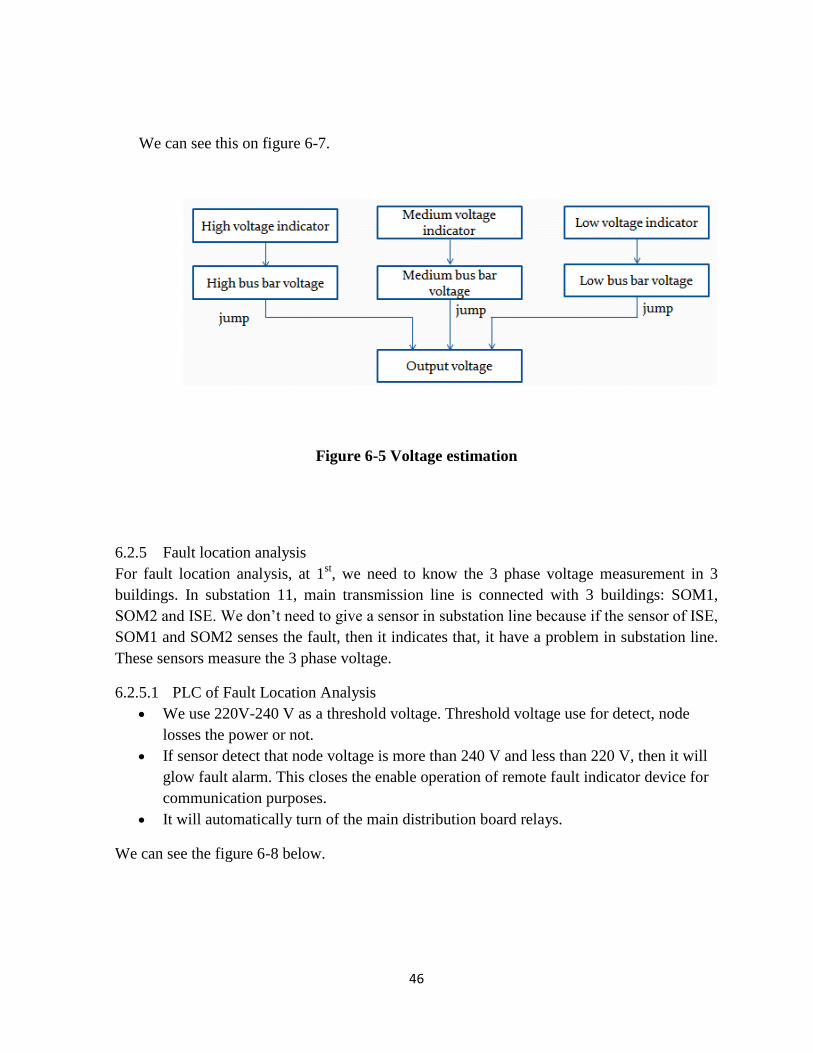
6.2.4 Voltage estimation
6.2.4.1 PLC of voltage estimation
Use high, medium and low voltage Indicator to indicate the voltage level.
Generate high, medium and low bus bar voltage on HMI and those are the voltage of
the system.
46
We can see this on figure 6-7.
Figure 6-5 Voltage estimation
6.2.5 Fault location analysis
For fault location analysis, at 1st, we need to know the 3 phase voltage measurement in 3
buildings. In substation 11, main transmission line is connected with 3 buildings: SOM1,
SOM2 and ISE. We don’t need to give a sensor in substation line because if the sensor of ISE,
SOM1 and SOM2 senses the fault, then it indicates that, it have a problem in substation line.
These sensors measure the 3 phase voltage.
6.2.5.1 PLC of Fault Location Analysis
We use 220V-240 V as a threshold voltage. Threshold voltage use for detect, node
losses the power or not.
If sensor detect that node voltage is more than 240 V and less than 220 V, then it will
glow fault alarm. This closes the enable operation of remote fault indicator device for
communication purposes.
It will automatically turn of the main distribution board relays.
We can see the figure 6-8 below.

47
Figure 6-6 Fault Location Analysis
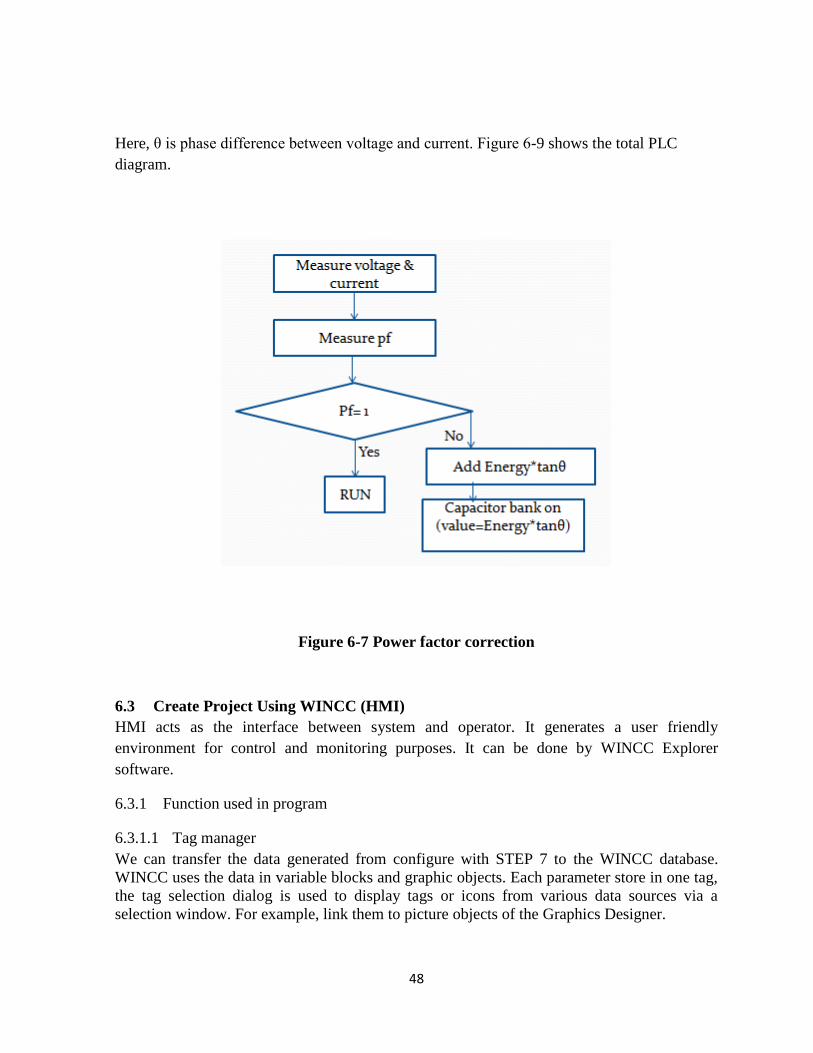
6.2.6 Power factor correction
For power factor protection, we use a capacitor bank which is already existed in substation 11.
First, we need to know, power factor is 1 or not. If it’s not 1, then we can start the capacitor
bank and the value, we need to follow the following formula:
Kvar= kw*tanθ
Here, energy value shows as kw, reactive power shows as a kvar and θ is phase difference
between voltage and current. So here, we just have to insert reactive power of that value,
which will show as kvar.
6.2.6.1 PLC of Power factor correction
If power factor is less than 1, then capacitor bank is activated.
Value of capacitor in capacitor bank= Kvar=Energy*tanθ
48
Here, θ is phase difference between voltage and current. Figure 6-9 shows the total PLC
diagram.
Figure 6-7 Power factor correction
6.3 Create Project Using WINCC (HMI)
HMI acts as the interface between system and operator. It generates a user friendly
environment for control and monitoring purposes. It can be done by WINCC Explorer
software.
6.3.1 Function used in program
6.3.1.1 Tag manager
We can transfer the data generated from configure with STEP 7 to the WINCC database.
WINCC uses the data in variable blocks and graphic objects. Each parameter store in one tag,
the tag selection dialog is used to display tags or icons from various data sources via a
selection window. For example, link them to picture objects of the Graphics Designer.
49
6.3.1.2 Graphics Designer
Process pictures create by Graphics Designer. The features are like below:
Suitable and easy user interface with tool & graphic palettes
Streamlined configuration with integrated object & icon libraries
Configurable dynamic behavior of picture objects with support from an assistant
(Dynamic Wizard)
Objects that have been made dynamic (can be operated), e.g. an I/O field, or possess
picture selection capabilities can be recognized in runtime by a cursor that changes to a flash
if it is positioned over such an object. We draw one picture for main diagram to show all
station’s equipment connect with each other and show general observer of station operate; we
have one picture more to show report, this case is Alarm report: show parameter of fault. Each
station’s equipment have picture to show parameter themselves. All of pictures will connect
with screen picture; this picture was reserved in WinCC like the main picture.
6.3.1.3 Log Tagging
Tag Logging processes some Data which have conducted and makes the data for archiving
and display. These data can provide any information.
Tag Logging is divided into two components: the Configuration System and the Runtime
System. Analog parameter configure in four archives that will setup for groups: transformer
and their level of voltage. Type is process value archives and mode short term archives.
Acquisition time cycle is set-up 1 minute; archives time is set-up 1 hour.
6.3.1.4 Alarm Logging
The editor of "Alarm Logging" is used for archiving and acquiring messages. It carries
functions for accepting messages from different processes, and then for preparing, displaying,
acknowledging, and archiving them.
Currents, oil level and temperature of transformer will monitor and will alarm when fault
occur. Value set upper limit with current and temp; set lower with oil level. Message class
chooses error that has their type alarm, warning, and failure.
6.3.1.5 Report Design
The Report Designer is at part of the WinCC basic package that give functions for the "output
of reports” & "creation".
The following two editors are available for creating reports:
Editor for page layout
Editor for line layout
It use the dynamic objects of the Report Designer for the data output. These dynamic objects
must be connected to the appropriate applications. Depending archives mode to store alarm
data, connect Dynamic table in Layout with short-term archives or long-term archives.
50
6.3.2 HMI programs
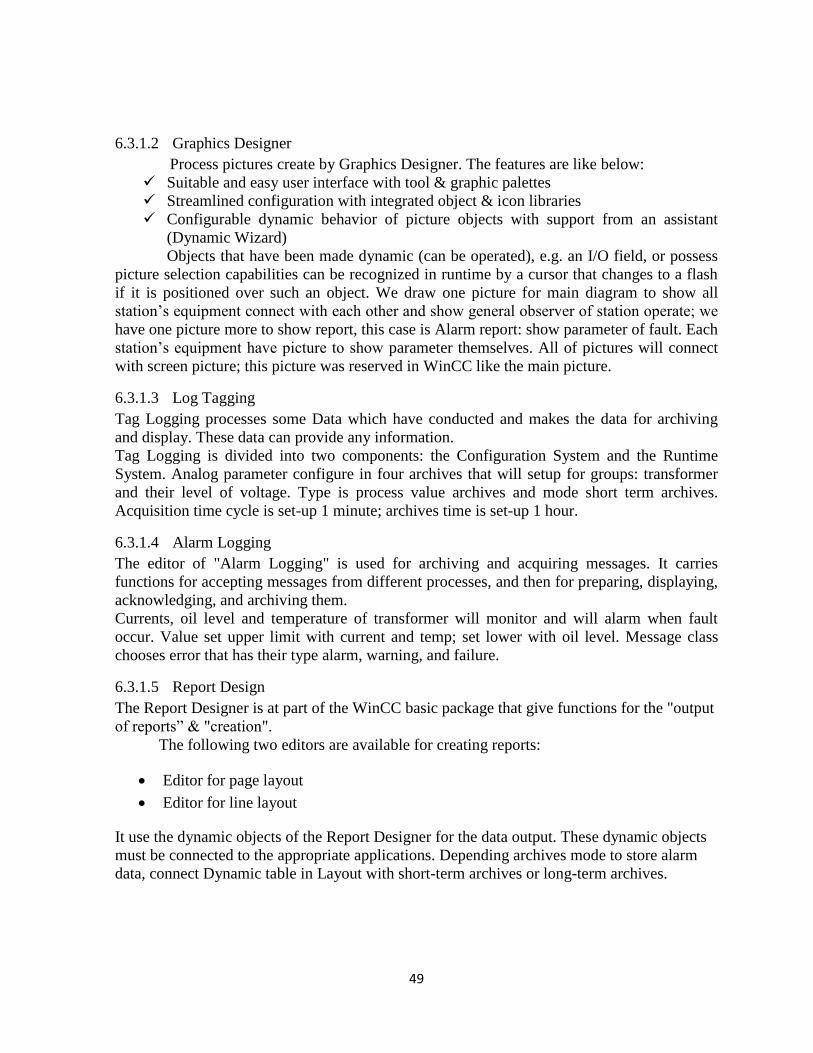
6.3.2.1 Transformer screen
For transformer, we use different type of alarms, tripping functions, number of tap changing,
backup system (generator) and different indicator which is shown in figure 6-10 below.
Figure 6-8 Transformer and voltage interface in WINCC
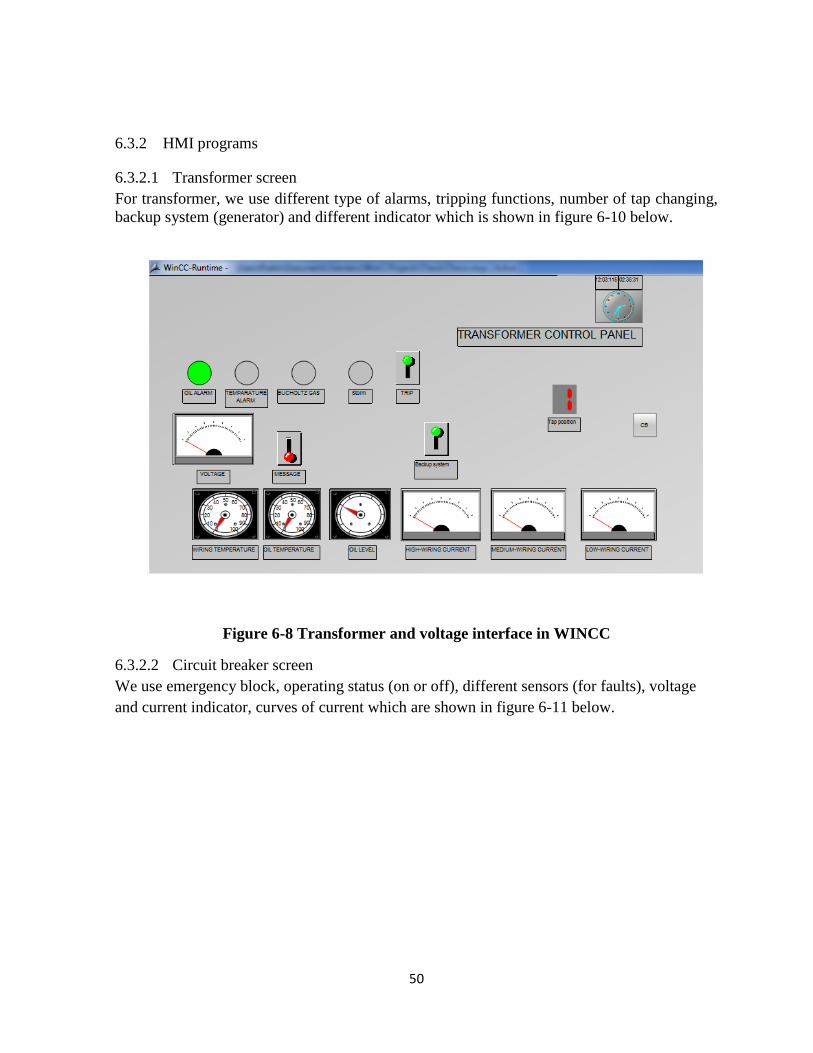
6.3.2.2 Circuit breaker screen
We use emergency block, operating status (on or off), different sensors (for faults), voltage
and current indicator, curves of current which are shown in figure 6-11 below.
51
Figure 6-9 CB interface in WINCC
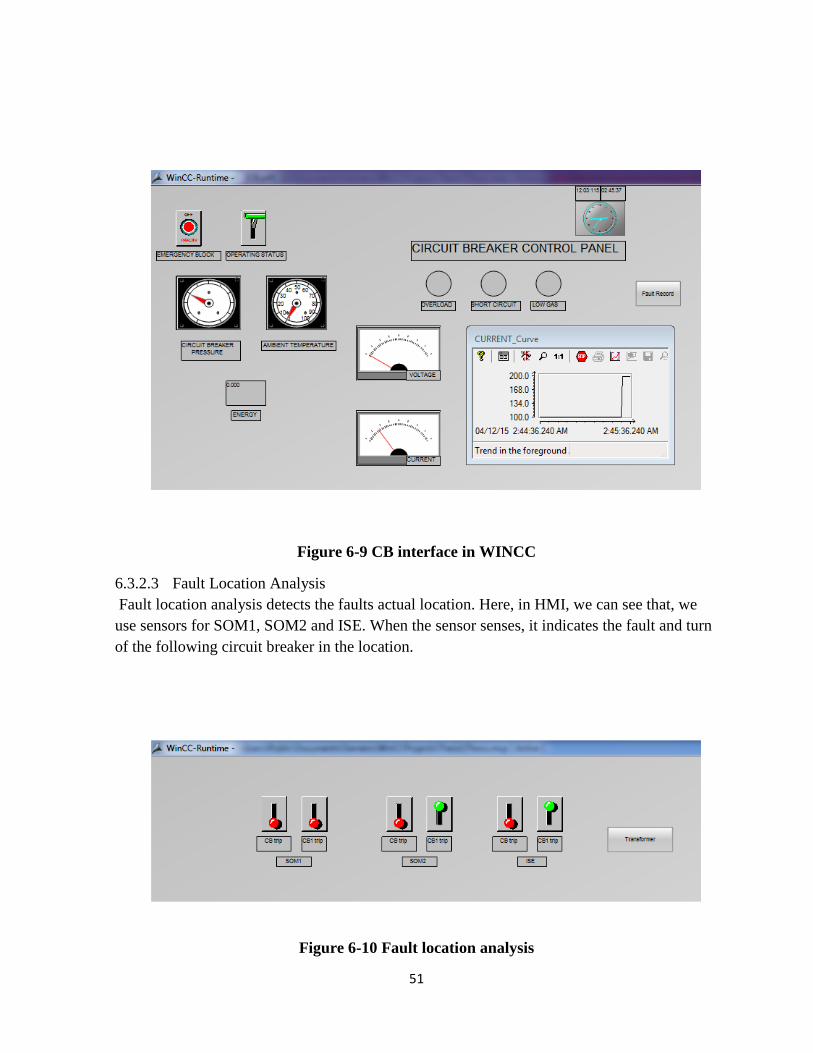
6.3.2.3 Fault Location Analysis
Fault location analysis detects the faults actual location. Here, in HMI, we can see that, we
use sensors for SOM1, SOM2 and ISE. When the sensor senses, it indicates the fault and turn
of the following circuit breaker in the location.
Figure 6-10 Fault location analysis
52
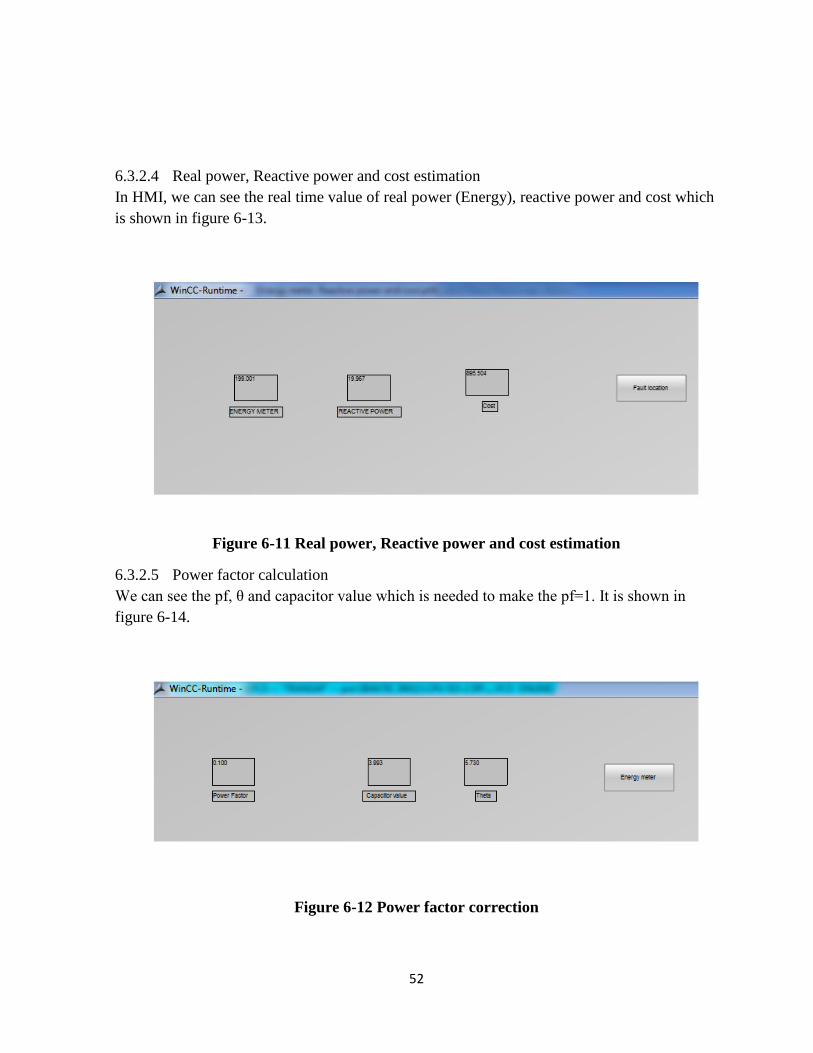
6.3.2.4 Real power, Reactive power and cost estimation
In HMI, we can see the real time value of real power (Energy), reactive power and cost which
is shown in figure 6-13.
Figure 6-11 Real power, Reactive power and cost estimation
6.3.2.5 Power factor calculation
We can see the pf, θ and capacitor value which is needed to make the pf=1. It is shown in
figure 6-14.
Figure 6-12 Power factor correction
53
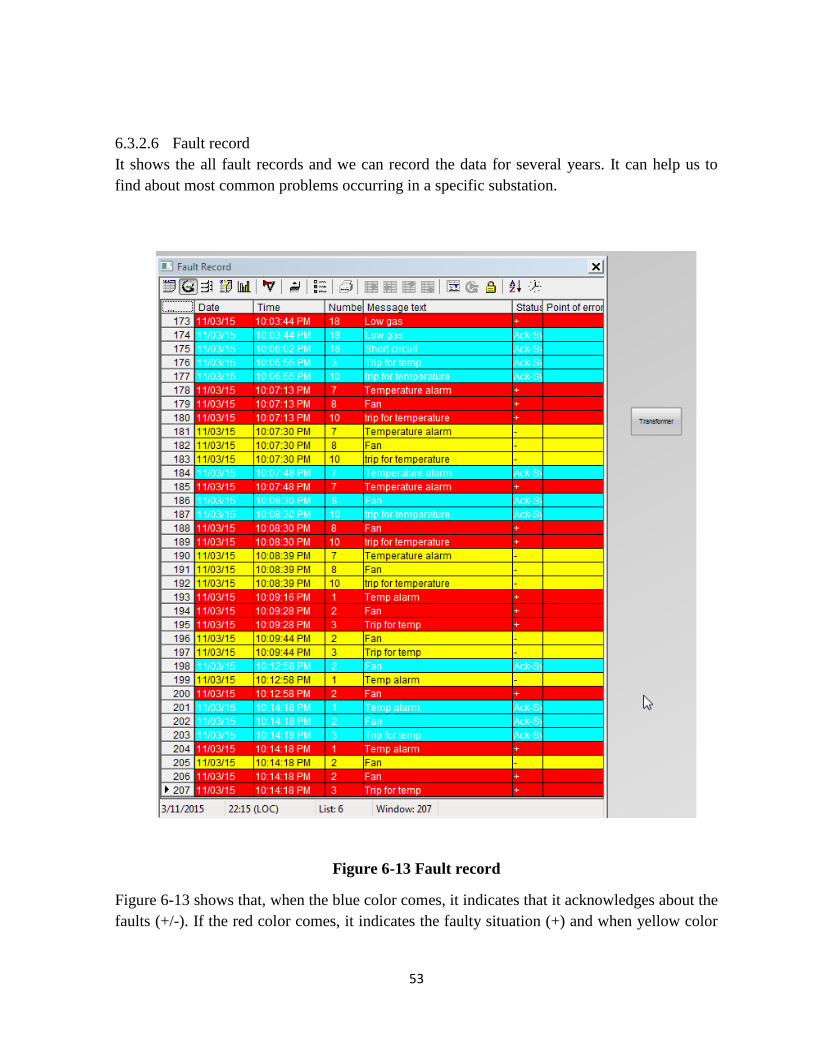
6.3.2.6 Fault record
It shows the all fault records and we can record the data for several years. It can help us to
find about most common problems occurring in a specific substation.
Figure 6-13 Fault record
Figure 6-13 shows that, when the blue color comes, it indicates that it acknowledges about the
faults (+/-). If the red color comes, it indicates the faulty situation (+) and when yellow color
54
glows, it indicate that, the fault is solved (-). Here, we can see the date and time, when the
fault will happen.
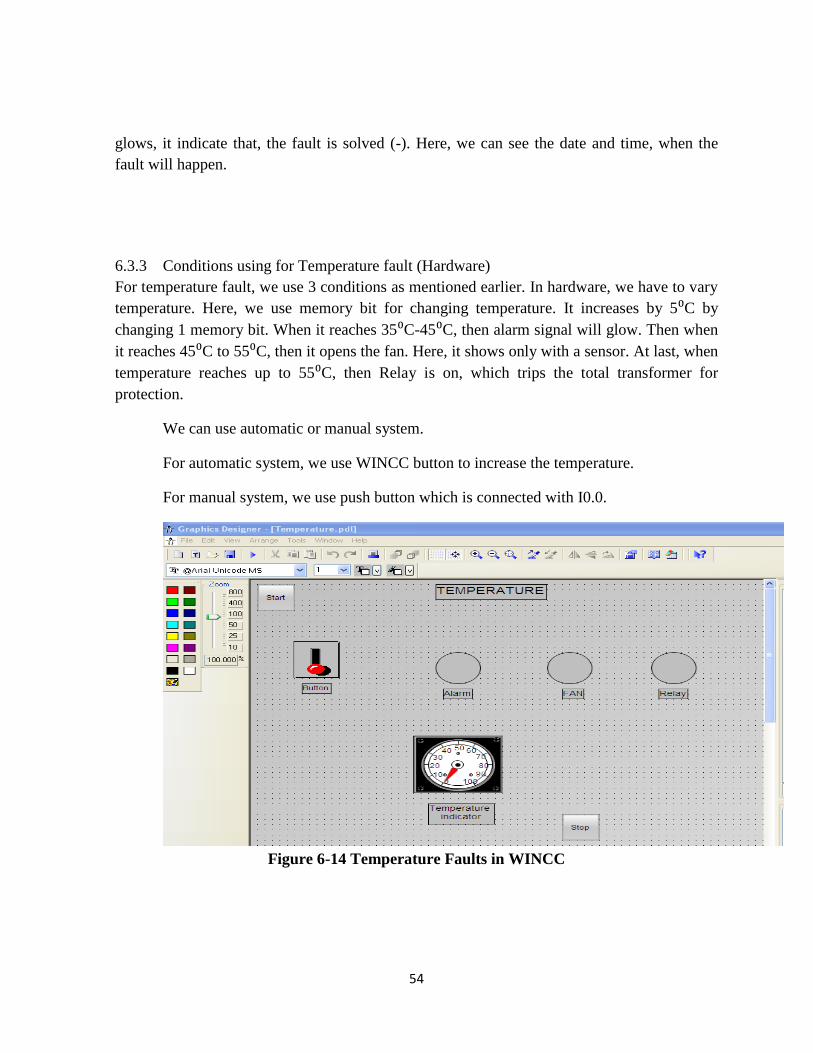
6.3.3 Conditions using for Temperature fault (Hardware)
For temperature fault, we use 3 conditions as mentioned earlier. In hardware, we have to vary
temperature. Here, we use memory bit for changing temperature. It increases by 5⁰C by
changing 1 memory bit. When it reaches 35⁰C-45⁰C, then alarm signal will glow. Then when
it reaches 45⁰C to 55⁰C, then it opens the fan. Here, it shows only with a sensor. At last, when
temperature reaches up to 55⁰C, then Relay is on, which trips the total transformer for
protection.
We can use automatic or manual system.
For automatic system, we use WINCC button to increase the temperature.
For manual system, we use push button which is connected with I0.0.
Figure 6-14 Temperature Faults in WINCC
55
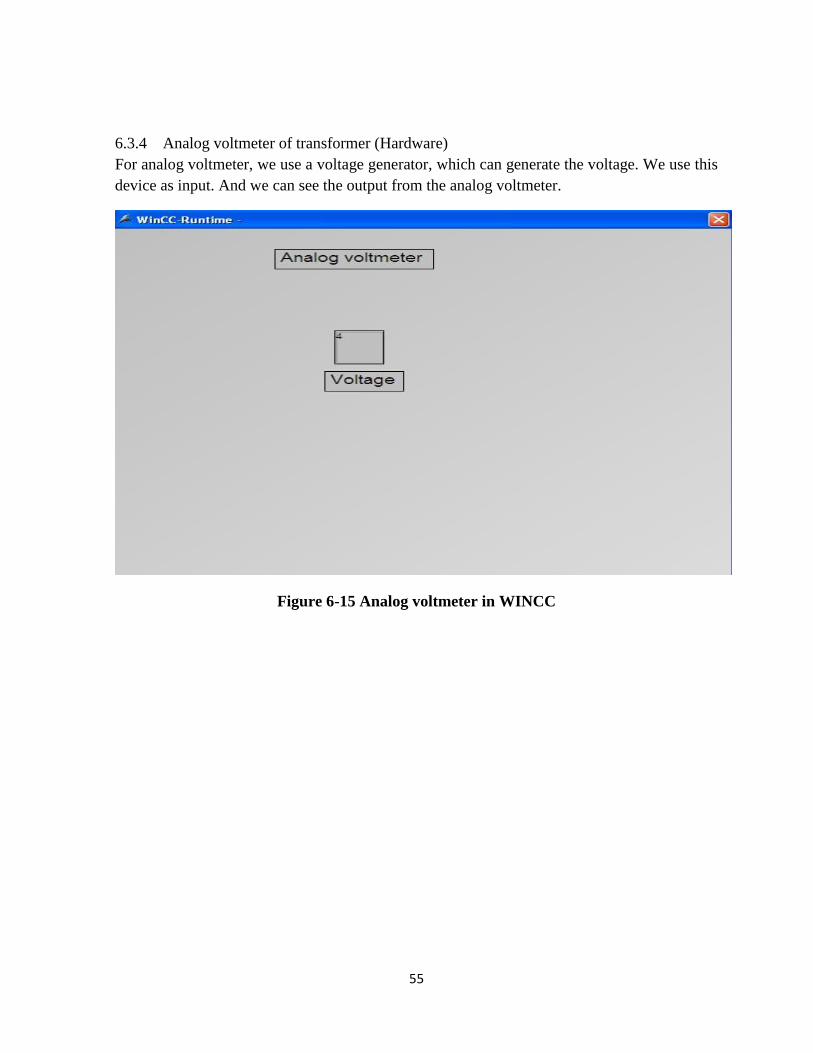
6.3.4 Analog voltmeter of transformer (Hardware)
For analog voltmeter, we use a voltage generator, which can generate the voltage. We use this
device as input. And we can see the output from the analog voltmeter.
Figure 6-15 Analog voltmeter in WINCC
56
7 CHAPTER 7
RESULT AND DISCUSSION
This chapter shows the results of work by different curves and its theoretical analysis related
with the curves.
7.1 Results of different parameters
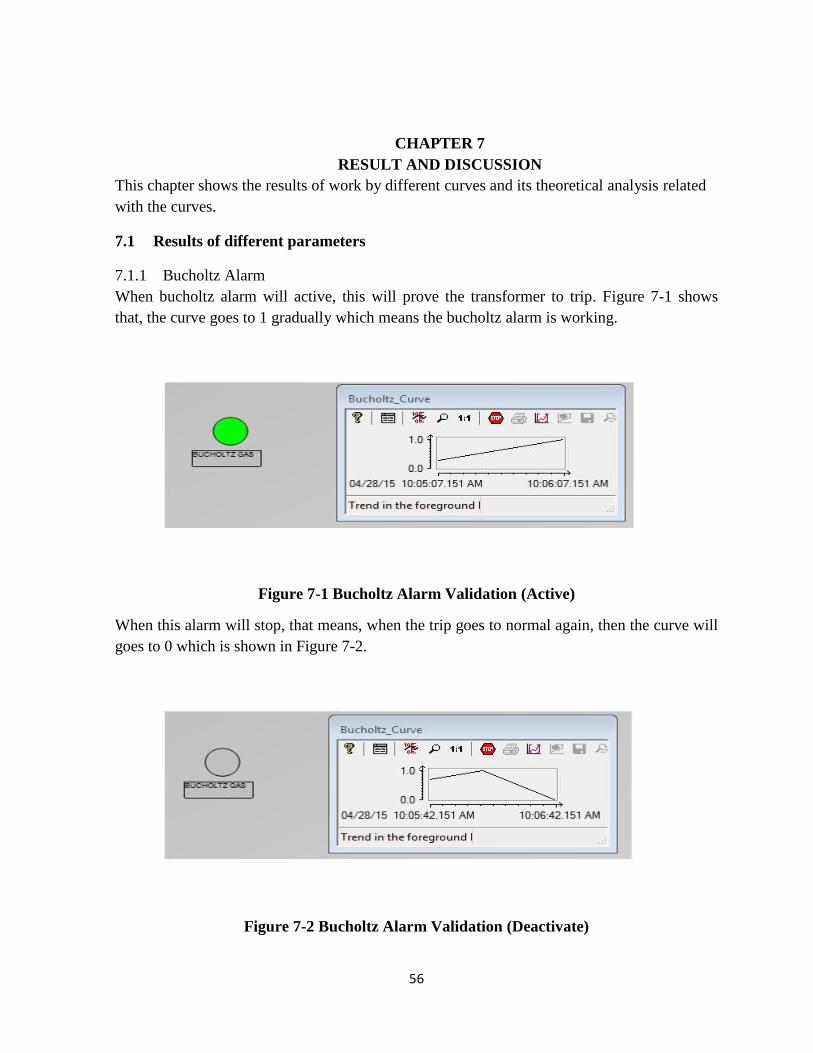
7.1.1 Bucholtz Alarm
When bucholtz alarm will active, this will prove the transformer to trip. Figure 7-1 shows
that, the curve goes to 1 gradually which means the bucholtz alarm is working.
Figure 7-1 Bucholtz Alarm Validation (Active)
When this alarm will stop, that means, when the trip goes to normal again, then the curve will
goes to 0 which is shown in Figure 7-2.
Figure 7-2 Bucholtz Alarm Validation (Deactivate)
57
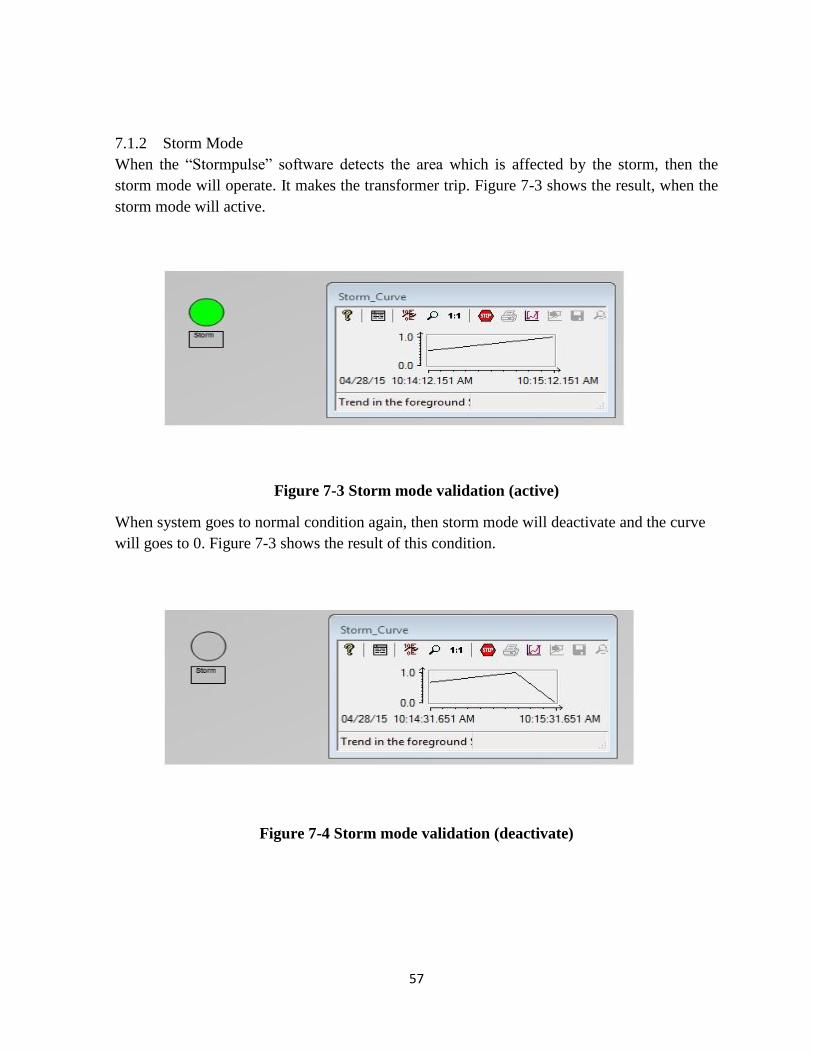
7.1.2 Storm Mode
When the “Stormpulse” software detects the area which is affected by the storm, then the
storm mode will operate. It makes the transformer trip. Figure 7-3 shows the result, when the
storm mode will active.
Figure 7-3 Storm mode validation (active)
When system goes to normal condition again, then storm mode will deactivate and the curve
will goes to 0. Figure 7-3 shows the result of this condition.
Figure 7-4 Storm mode validation (deactivate)
58
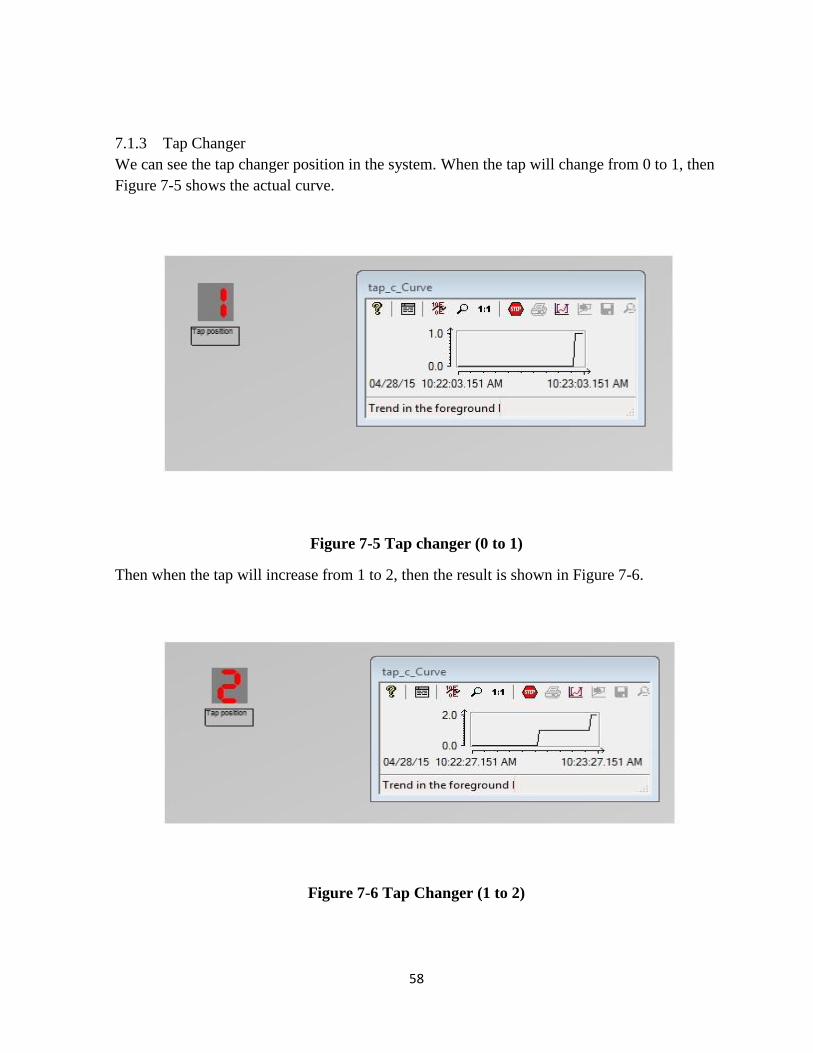
7.1.3 Tap Changer
We can see the tap changer position in the system. When the tap will change from 0 to 1, then
Figure 7-5 shows the actual curve.
Figure 7-5 Tap changer (0 to 1)
Then when the tap will increase from 1 to 2, then the result is shown in Figure 7-6.
Figure 7-6 Tap Changer (1 to 2)
59
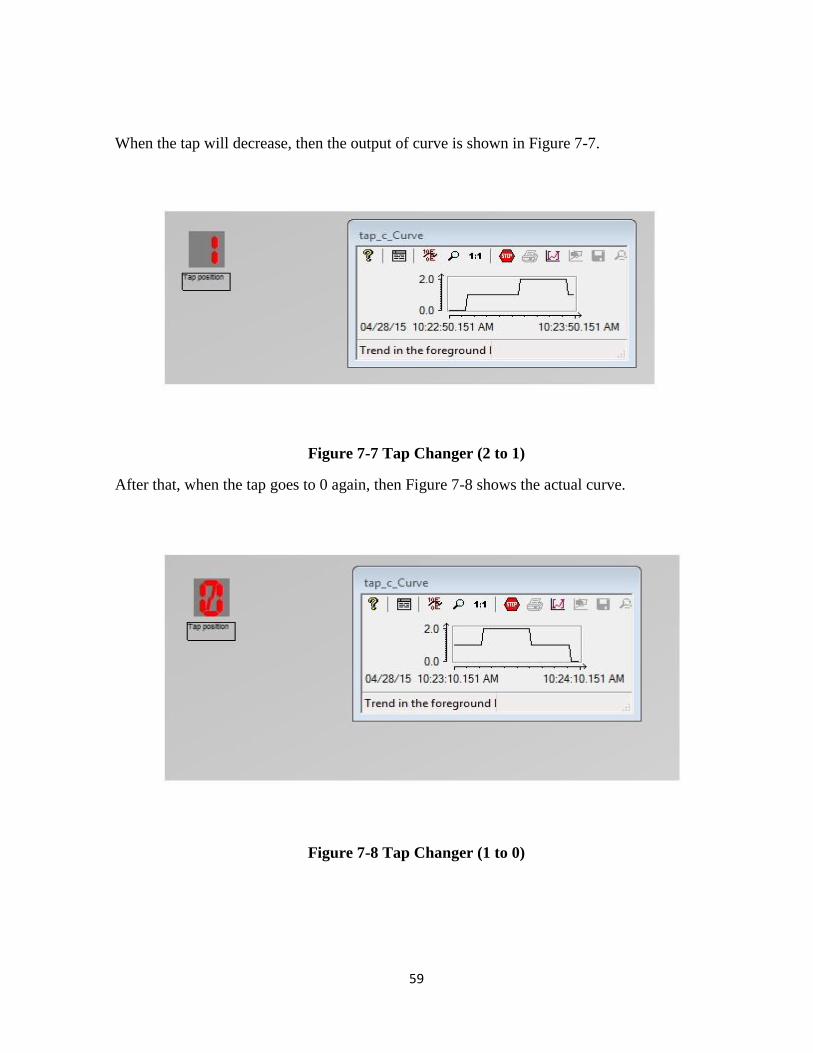
When the tap will decrease, then the output of curve is shown in Figure 7-7.
Figure 7-7 Tap Changer (2 to 1)
After that, when the tap goes to 0 again, then Figure 7-8 shows the actual curve.
Figure 7-8 Tap Changer (1 to 0)
60
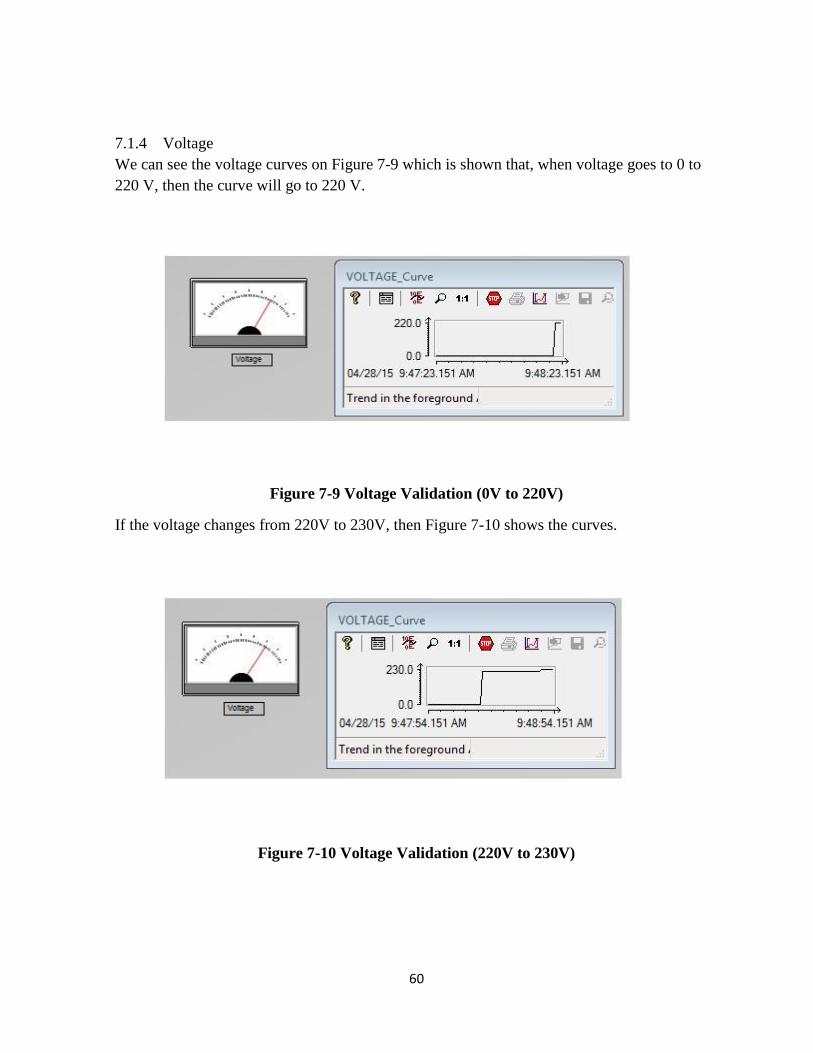
7.1.4 Voltage
We can see the voltage curves on Figure 7-9 which is shown that, when voltage goes to 0 to
220 V, then the curve will go to 220 V.
Figure 7-9 Voltage Validation (0V to 220V)
If the voltage changes from 220V to 230V, then Figure 7-10 shows the curves.
Figure 7-10 Voltage Validation (220V to 230V)

61
After that, if the voltage will again come to 0V, then the curve will goes to 0V again, which is
shown on Figure 7-11.
Figure 7-11 Voltage Validation (230V to 0V)
7.1.5 Current
When the current goes to 0A to 20A, then Figure 7-12 shows the result.
Figure 7-12 Current Validation (0A to 20A)
If the current increases to 40A, then Figure 7-13 shows the result.

62
Figure 7-13 Current Validation (20A to 40A)
After that, if the current come to 0A again, then the Figure 7-14 shows the curve.
Figure 7-14 Current validation (40A to 0A)
63
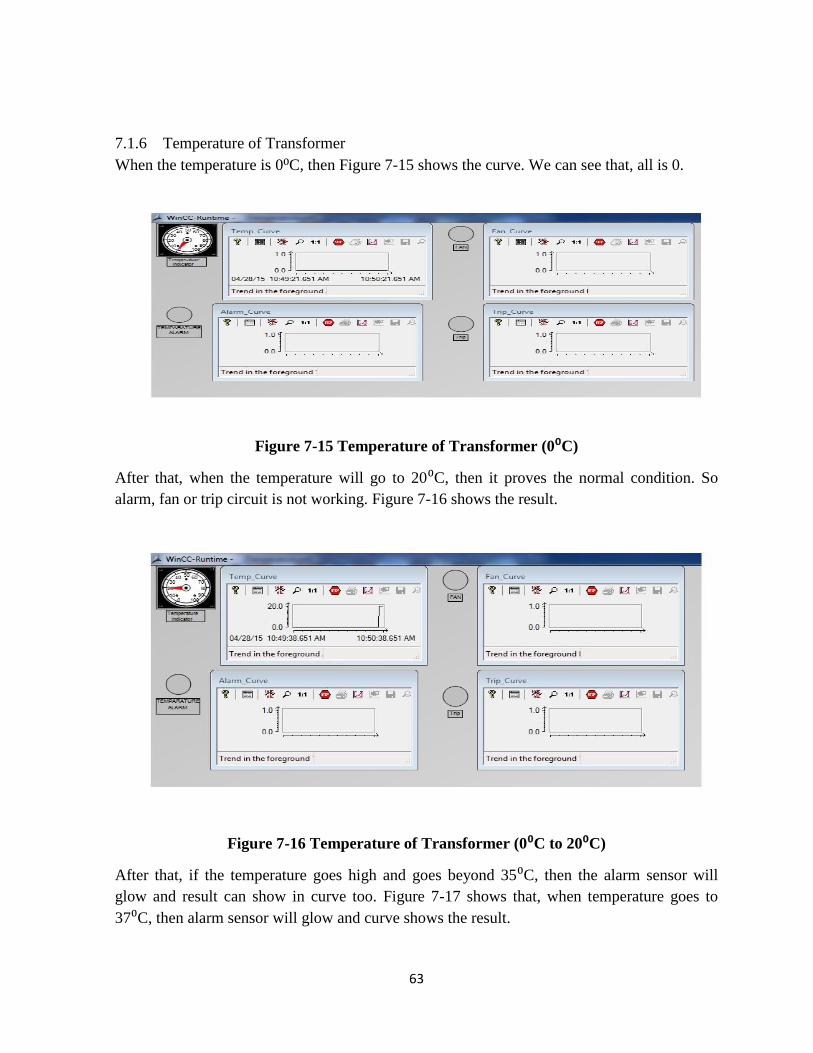
7.1.6 Temperature of Transformer
When the temperature is 0⁰C, then Figure 7-15 shows the curve. We can see that, all is 0.
Figure 7-15 Temperature of Transformer (0⁰C)
After that, when the temperature will go to 20⁰C, then it proves the normal condition. So
alarm, fan or trip circuit is not working. Figure 7-16 shows the result.
Figure 7-16 Temperature of Transformer (0⁰C to 20⁰C)
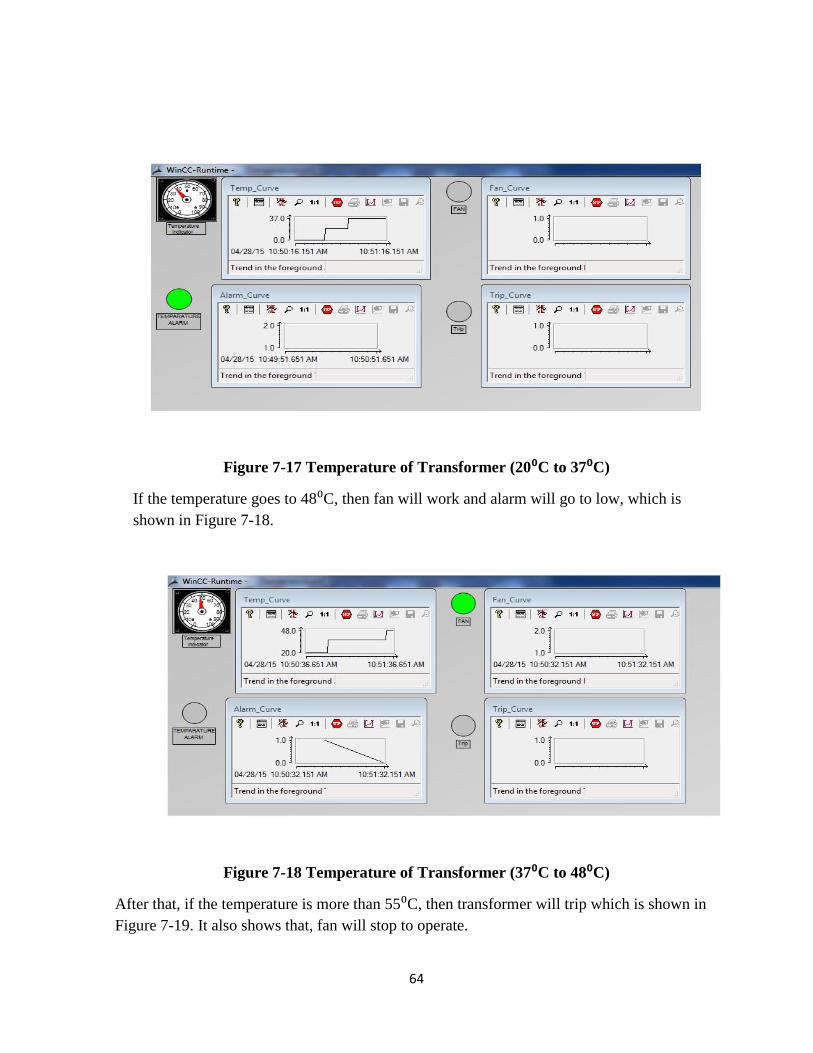
After that, if the temperature goes high and goes beyond 35⁰C, then the alarm sensor will
glow and result can show in curve too. Figure 7-17 shows that, when temperature goes to
37⁰C, then alarm sensor will glow and curve shows the result.
64
Figure 7-17 Temperature of Transformer (20⁰C to 37⁰C)
If the temperature goes to 48⁰C, then fan will work and alarm will go to low, which is
shown in Figure 7-18.
Figure 7-18 Temperature of Transformer (37⁰C to 48⁰C)
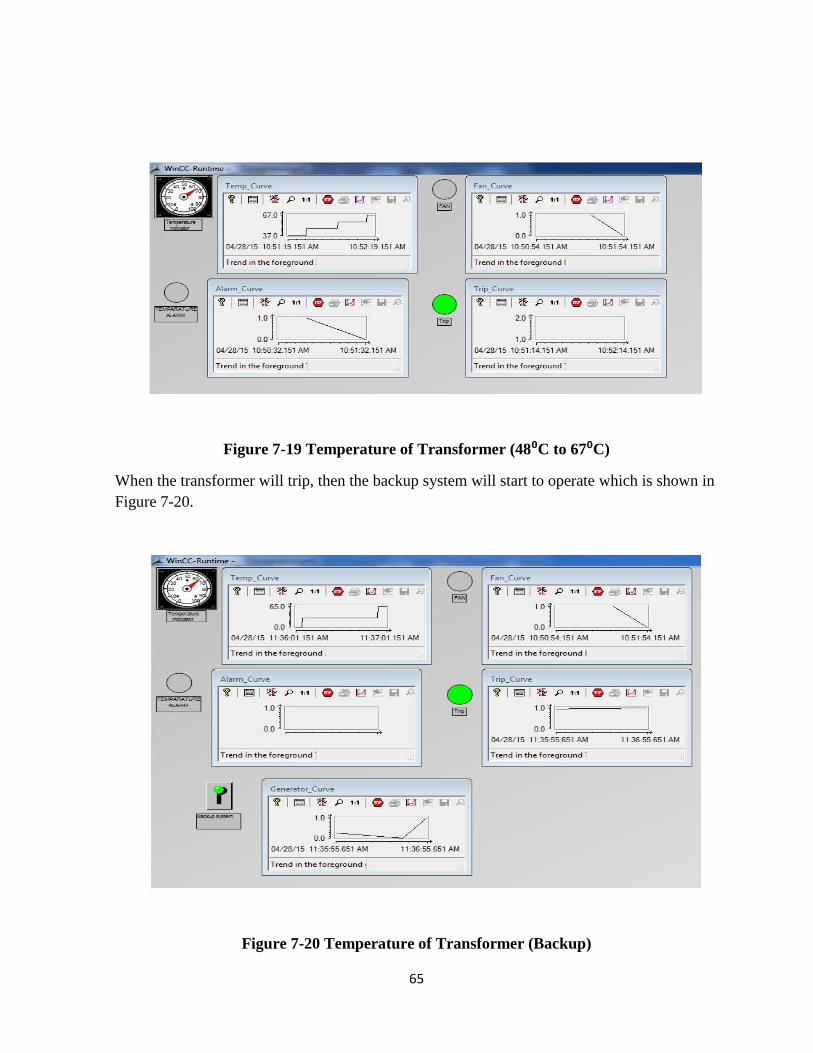
After that, if the temperature is more than 55⁰C, then transformer will trip which is shown in
Figure 7-19. It also shows that, fan will stop to operate.
65
Figure 7-19 Temperature of Transformer (48⁰C to 67⁰C)
When the transformer will trip, then the backup system will start to operate which is shown in
Figure 7-20.
Figure 7-20 Temperature of Transformer (Backup)
66
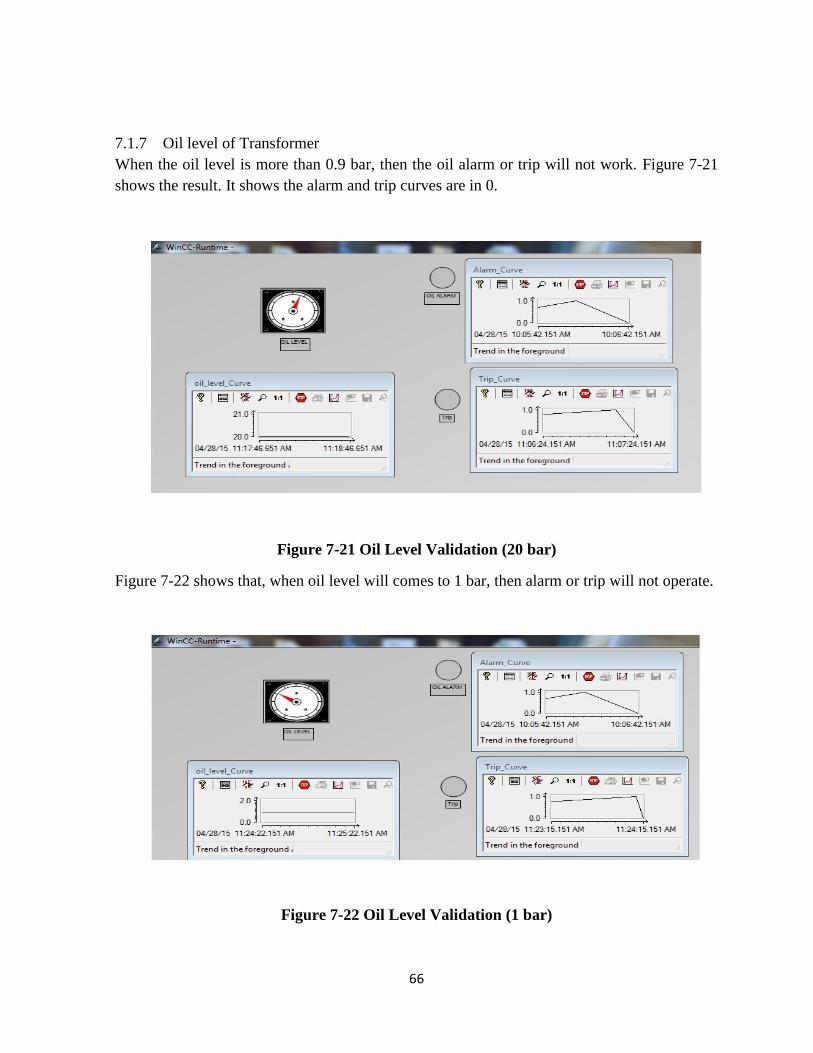
7.1.7 Oil level of Transformer
When the oil level is more than 0.9 bar, then the oil alarm or trip will not work. Figure 7-21
shows the result. It shows the alarm and trip curves are in 0.
Figure 7-21 Oil Level Validation (20 bar)
Figure 7-22 shows that, when oil level will comes to 1 bar, then alarm or trip will not operate.
Figure 7-22 Oil Level Validation (1 bar)
67
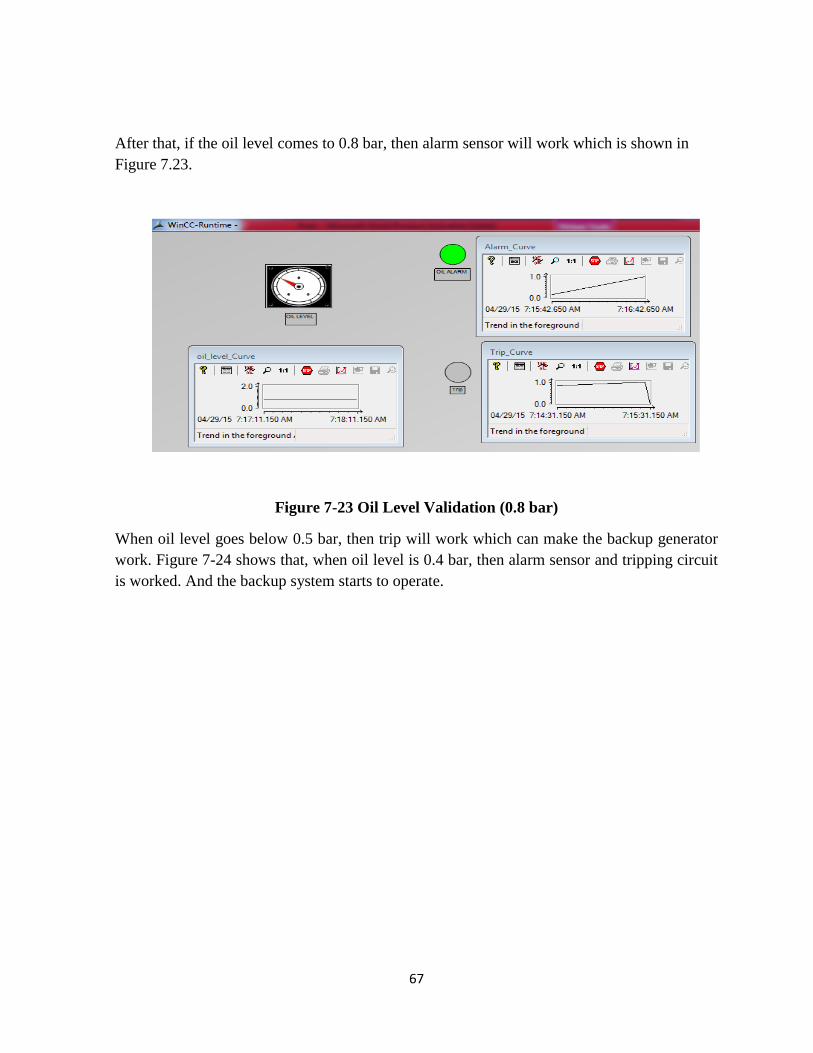
After that, if the oil level comes to 0.8 bar, then alarm sensor will work which is shown in
Figure 7.23.
Figure 7-23 Oil Level Validation (0.8 bar)
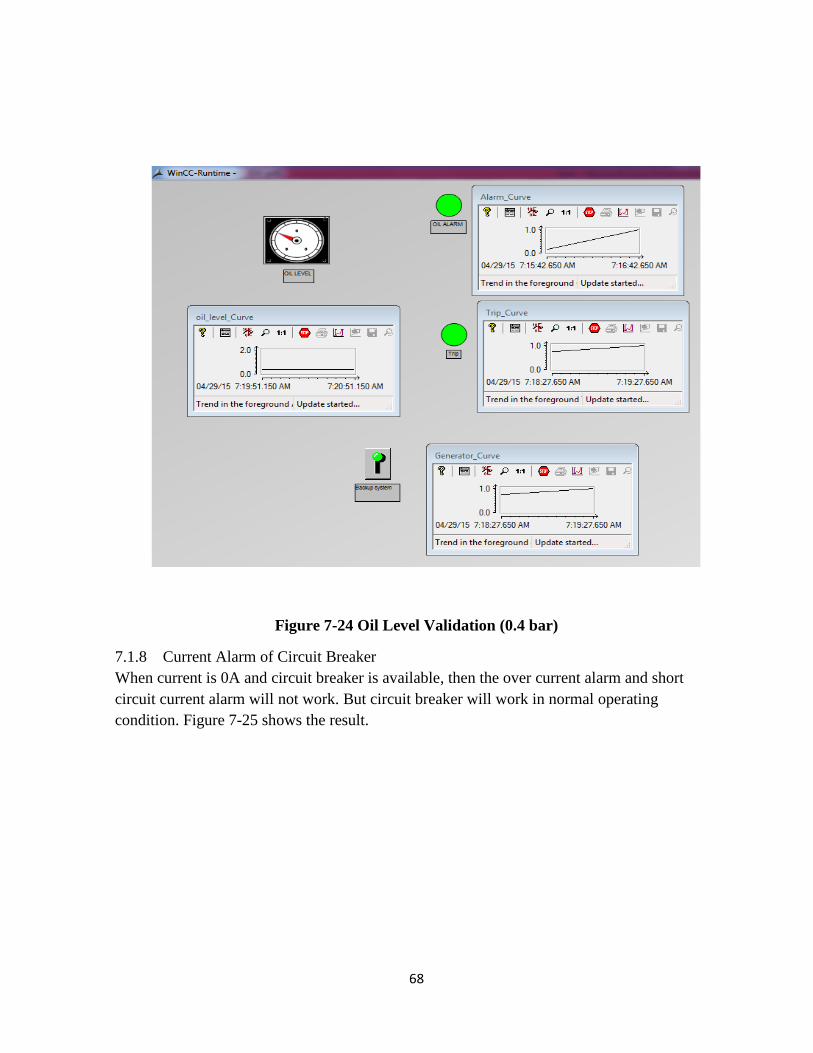
When oil level goes below 0.5 bar, then trip will work which can make the backup generator
work. Figure 7-24 shows that, when oil level is 0.4 bar, then alarm sensor and tripping circuit
is worked. And the backup system starts to operate.
68
Figure 7-24 Oil Level Validation (0.4 bar)
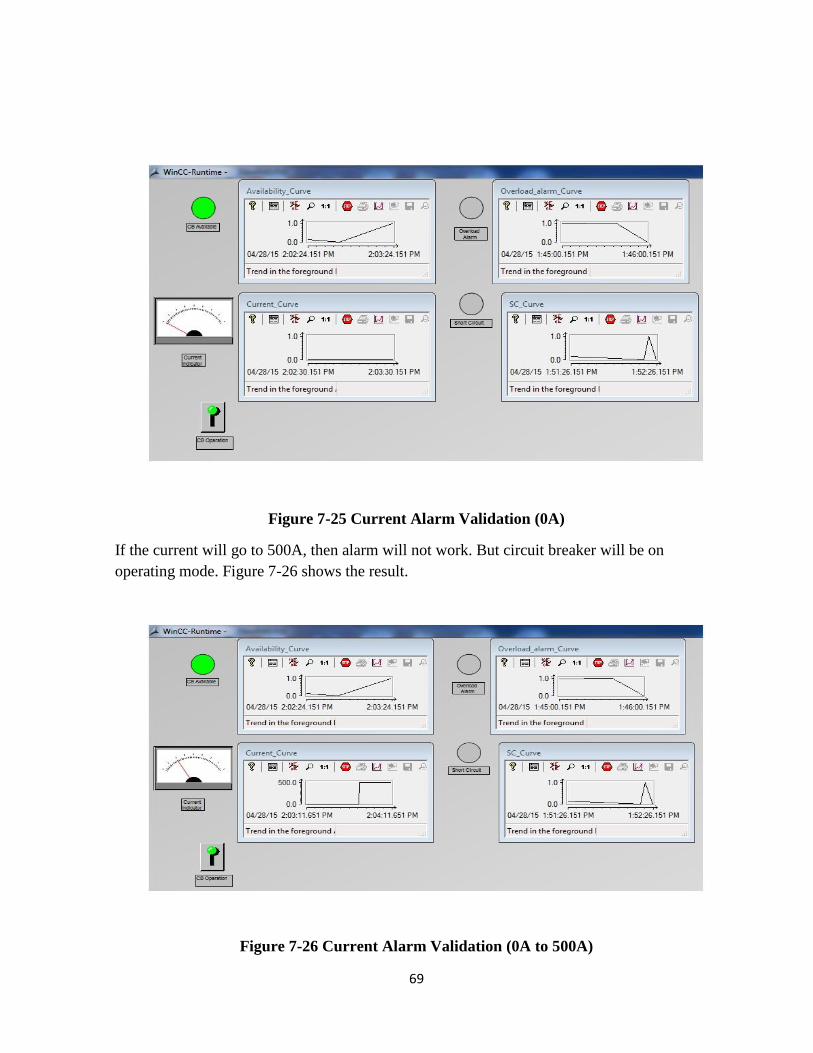
7.1.8 Current Alarm of Circuit Breaker
When current is 0A and circuit breaker is available, then the over current alarm and short
circuit current alarm will not work. But circuit breaker will work in normal operating
condition. Figure 7-25 shows the result.
69
Figure 7-25 Current Alarm Validation (0A)
If the current will go to 500A, then alarm will not work. But circuit breaker will be on
operating mode. Figure 7-26 shows the result.
Figure 7-26 Current Alarm Validation (0A to 500A)

70
If current goes beyond 630A, then Overcurrent alarm will operate. Figure 7-27 shows the
curve and result of overcurrent alarm when current is 700A.
Figure 7-27 Current Alarm Validation (500A to 700A)
At last, if the current will go beyond 1200A, then short circuit alarm will glow which makes
the circuit breaker stop. Figure 7-28 shows the result.
Figure 7-28 Current Alarm Validation (700A to 1300A)
71
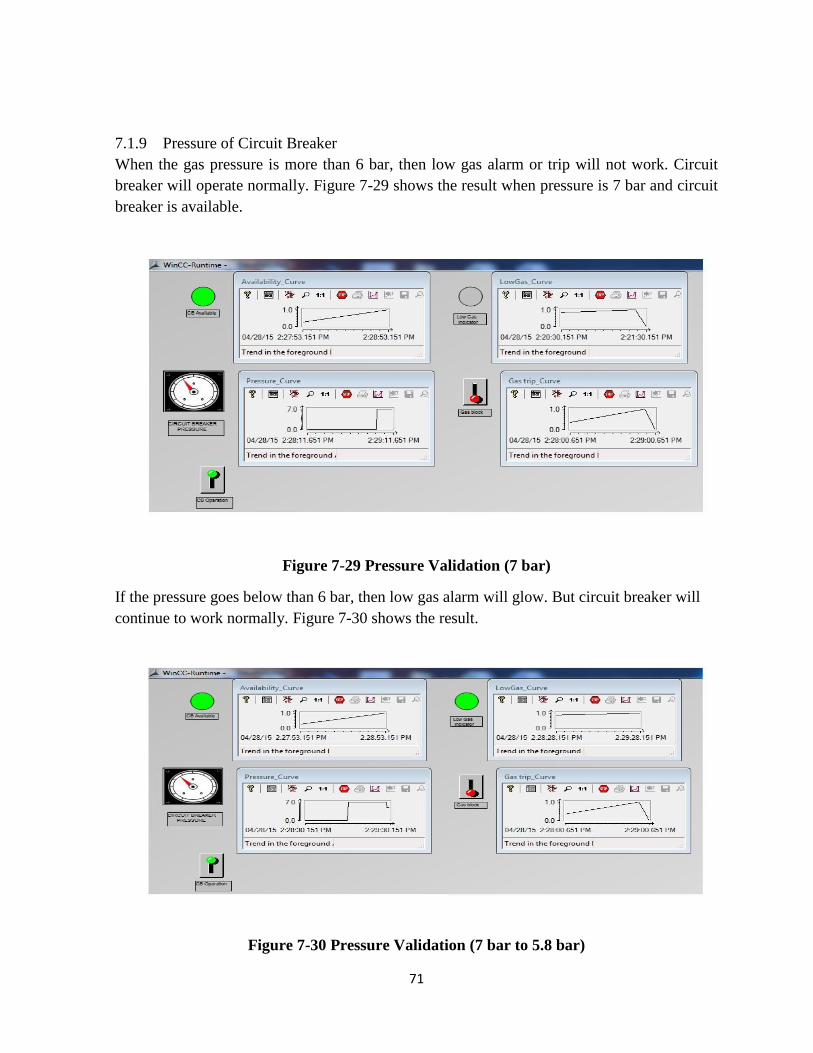
7.1.9 Pressure of Circuit Breaker
When the gas pressure is more than 6 bar, then low gas alarm or trip will not work. Circuit
breaker will operate normally. Figure 7-29 shows the result when pressure is 7 bar and circuit
breaker is available.
Figure 7-29 Pressure Validation (7 bar)
If the pressure goes below than 6 bar, then low gas alarm will glow. But circuit breaker will
continue to work normally. Figure 7-30 shows the result.
Figure 7-30 Pressure Validation (7 bar to 5.8 bar)
72
When pressure goes to 3 bar, then circuit breaker will stop and trip will work. Figure 7-31
shows the result.
Figure 7-31 Pressure Validation (5.8 bar to 3 bar)
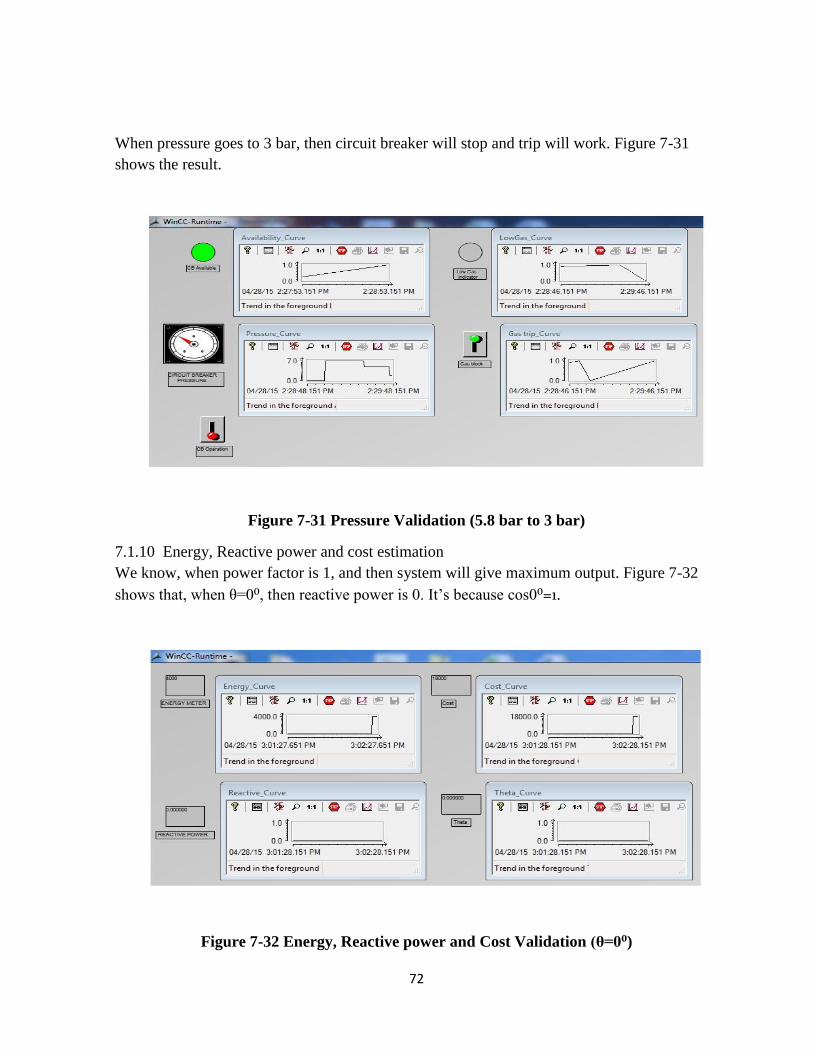
7.1.10 Energy, Reactive power and cost estimation
We know, when power factor is 1, and then system will give maximum output. Figure 7-32
shows that, when θ=0⁰, then reactive power is 0. It’s because cos0⁰=1.
Figure 7-32 Energy, Reactive power and Cost Validation (θ=0⁰)
73
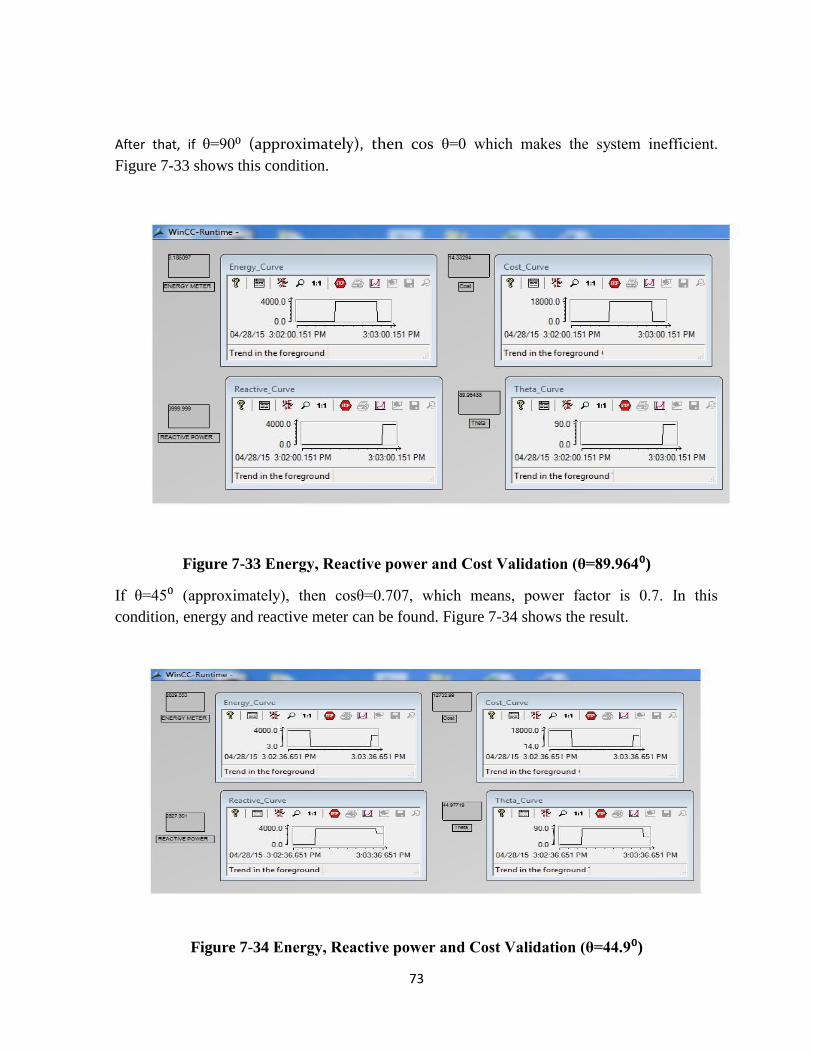
After that, if θ=90⁰ (approximately), then cos θ=0 which makes the system inefficient.
Figure 7-33 shows this condition.
Figure 7-33 Energy, Reactive power and Cost Validation (θ=89.964⁰)
If θ=45⁰ (approximately), then cosθ=0.707, which means, power factor is 0.7. In this
condition, energy and reactive meter can be found. Figure 7-34 shows the result.
Figure 7-34 Energy, Reactive power and Cost Validation (θ=44.9⁰)

74
7.1.11 Fault Location Validation
If the voltage is in normal operating voltage (220V-240V), then circuit breaker will work
normally. Figure 7-35 shows this condition.
Figure 7-35 Fault Location Validation (230V)
If the voltage goes beyond 240V then CB will trip which is shown in Figure 7-36.
Figure 7-36 Fault Location Validation (250V)

75
When voltage goes to below than 220V, then circuit breaker will trip which is shown in
Figure 7-37.
Figure 7-37 Fault Location Validation (200V)
7.1.12 Power Factor Correction
When θ=0⁰, it means the power factor=1. That time, no need to insert the value from
capacitor bank. Figure 7-38 shows the result.
Figure 7-38 Power Factor Correction Validation (θ=0⁰)
76
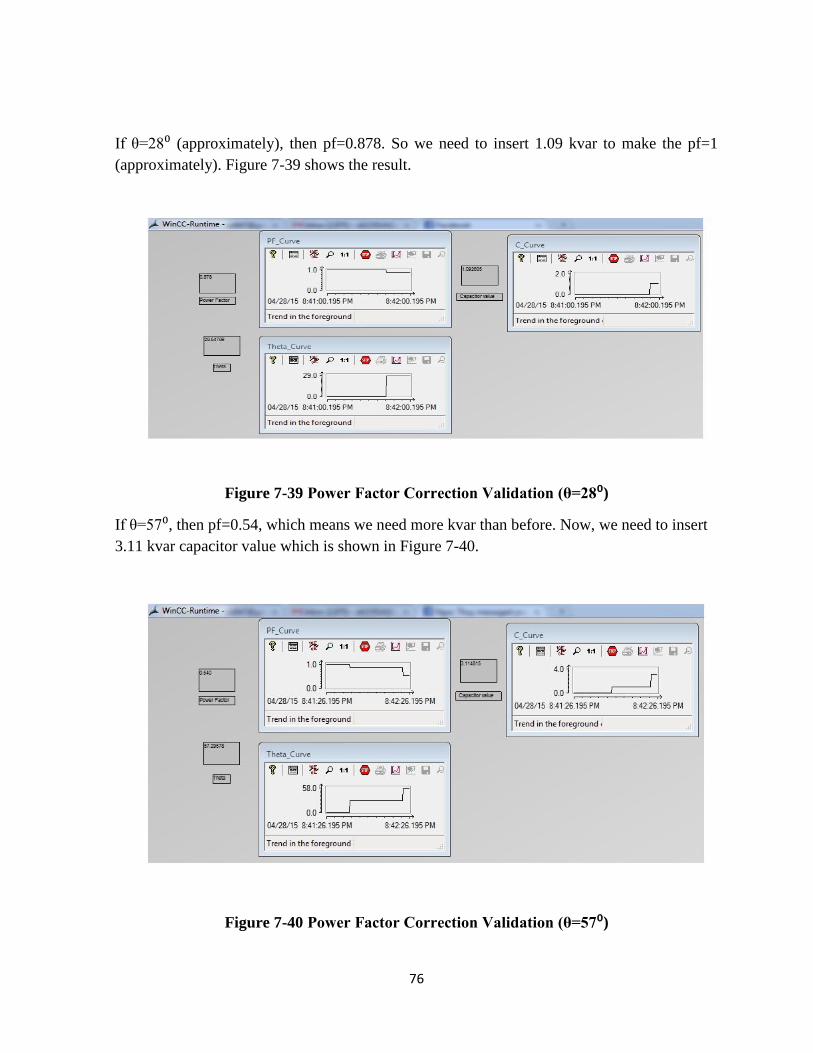
If θ=28⁰ (approximately), then pf=0.878. So we need to insert 1.09 kvar to make the pf=1
(approximately). Figure 7-39 shows the result.
Figure 7-39 Power Factor Correction Validation (θ=28⁰)
If θ=57⁰, then pf=0.54, which means we need more kvar than before. Now, we need to insert
3.11 kvar capacitor value which is shown in Figure 7-40.
Figure 7-40 Power Factor Correction Validation (θ=57⁰)
77
8 CHAPTER 8
CONCLUSION AND RECOMMENDATION
8.1 Summary
The thesis work can be summarized as below:
Study about control and monitoring process of power distribution network.
Analysis of total process to know about control process.
Use S7-300 for programming the control process in PLC which uses LAD and
STL.
Develop Graphic User Interface using Simatic WINCC Explorer.
Setup pilot configuration hardware fiber optic network to connect PC with
peripheral system.
8.2 Result and Conclusion
Hardware and software was designed and develop based on Simatic S7-300 and Window
Control Center– WinCC from Siemens. After development, some experiences have been
gained as following:
In thesis, we concern about one Substation of AIT.
The developed system has covered all the function of SCADA system: control,
monitoring and data acquisition. WinCC is not only support to Siemens’s equipment
but also from other vendors. It provides the flexibility and openness for system.
Using PLCs as remote field devices in SCADA system has covered all the tasks of
RTU devices. PLC is a powerful software and hardware which support many useful
built-in function blocks which are integrated with some other function, so user can use
for their project. Furthermore it is more flexible: control tasks and communication are
easier to be designed and developed in PLCs. The system is best used at the field and
cell levels with distributed peripherals and powerful communication function of PLC.
Integration with SCADA functions based on PLCs network has brought more benefits
to the operators and managers: providing the overview of system status, remote
control abilities and data presentation by alarm, trend, on screen display.
In pilot project, we can see the PLC and SCADA system is worked properly and we
can see the sensor and relay output shown in there.
8.3 Recommendation
Graphical user interfacing through the WinCC and PLC is nearly an unexplored technology
today. It is recommended therefore:
The project can be applied in the whole of AIT power network. AIT has many
substations. Structure and design of each station has to be specified in detail.
In project, we can use thermocouple for temperature sensing. Here, we use only
memory bit for changing the temperature.

78
For watching the value of temperature, we can use 7-segment system or temperature
indicator. Here, we just show it with WINCC interface as temperature indicator.
For real implementation, digital meter (Multi-Function Panel meter, Model no.-MP,
Thaimeter Company) can connect with PLC board. This PLC board can connected with
PC through Profibus OLM and Optical fiber/ Ethernet. And with the help of WINCC,
we can monitor the meter rating. For lot of digital meter connected to a building,
Ethernet can be used to integrate it in 1 PLC board.
We need a remote sensing data which can generate “Stormpulse” software. This
software can detect the storm. We can use that data to link with our PLC, which makes
a sensor to glow and control over it by using the tripping operation.
We don’t use “Energy Consumption” in my thesis.
79
REFERENCES
[1] Le Hong Duong, 2003, Thesis- Application of Supervisory control and Data Acquisition
in Hanoi Electrical Network, ISE, Mechatronics, AIT
[2] Hasan A.M. Abu Meteir, 2012, Thesis- A proposed SCADA system to improve the
condition of the Electricity sector in Gaza strip, Department of Control systems engineering,
The Islamic University of Gaza
http://library.iugaza.edu.ps/thesis/105476.pdf
[3] Mohamed Najeh Lakhoua and Mohamed Kamel Jbira, 2012, Journal title-Project
Management Phases of a SCADA System for Automation of Electrical Distribution Networks
ijcsi.org/papers/IJCSI-9-2-2-157-162.pdf
[4] Frank Marden, President, Garrettcom, Inc., 2004, White paper title- Ethernet in Power
Utilities Substations- The changing role of Fiber Media
garrettcom.com/techsupport/papers/utilities.pdf
[5] David Dolezilek, Schweitzer Engineering Laboratories, Inc., Pullman, WA USA, 1998-
1999, Case study- Large Transmission and distribution substation automation project
http://amarnathreddy.webs.com/Technical/CASE%20Study%20on%20Large%20Trasmission
%20networks%20by%20SEL.pdf
[6] Moxa, IEC 61850-3_IEEE 1588 in Smart Substation, 2011
www.omniray.ch/energie-erzeugung-und-verteilung.html?.../Netzwerkloesungen mit IEC
61850-3_IEEE 1613 von Moxa.pdf
[7] Eng-Kiat Chan, Public Utilities Board, Singapore and Horst Ebenhoh, Siemens AG,
Germany, 1992, The Implementation and Evolution of a SCADA system for a Large
Distribution Network
http://202.120.43.103/downloads2/%7B63E45B2F-6DA2-42C3-BAF5-
071532601E69%7D.The%20implementation%20and%20evolution%20of%20a%20SCADA
%20system%20for%20a%20large%20distribution%20network.pdf
[8] Musse Mohamud Ahmed, Member, IEEE, 11-13 May 2010, Kuala Lumpur, Malaysia,
New Supervisory Control and Data Acquisition (SCADA) Based Fault Isolation System for
Low Voltage Distribution Systems

80
[9] Joao M. G. Figueiredo CEM-IDMEC, Universidade Évora, Mechatronics Group R.
Romão Ramalho, 59; 7000-671 Évora, Portugal, 2010, PLC based Structure for Management
and Control of Distributed Energy Production Units
[10] Cristina Anita Bejan, Mihai Iacob and Gheorghe-Daniel Andreescu, IEEE, 2008,
SCADA Automation System Laboratory, Elements and Applications, “Politehnica”
University of Timisoara, Dept. of Automation and Applied Informatics, Timisoara, Romania
[11] Prof. Dr. H. Kirrmann, ABB Research Centre, Baden, Switzerland-2007 May, HK, OPC
(Open Process Control formerly OLE for Process Control)
[12] Clemens Hoga, Siemens Germany, IEEE, 2007, New Ethernet Technologies for
Substation Automation
[13] Rajib Baran Roy, 2012, paper title- Controlling of Electrical Power System Network by
using SCADA
http://www.ijser.org/researchpaper%5CControlling-of-Electrical-Power-System-Network-by-using-
SCADA.pdf
[14] Dominik Pieniazek, P.E., October 2-3, 2012, HV Substation Design: Applications and
Considerations
http://www.hv-eng.com/IEEE_CED_SubDesign_Full_Size.pdf
All data is from AIT
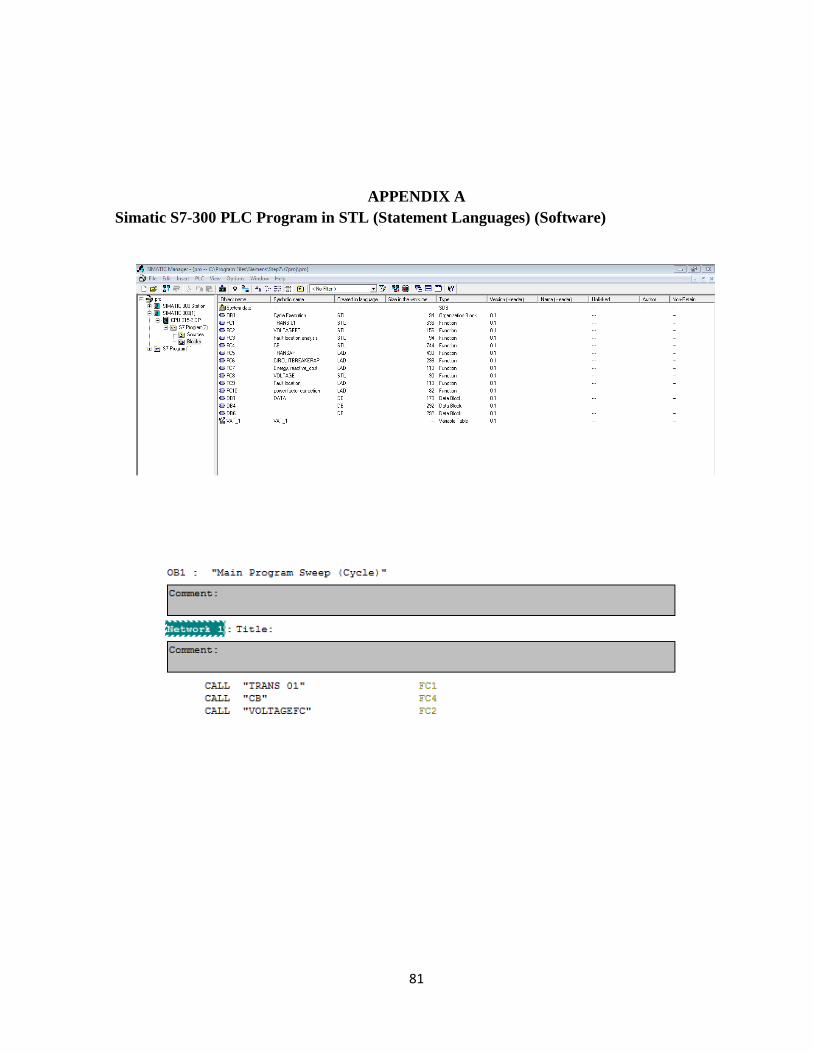
81
APPENDIX A
Simatic S7-300 PLC Program in STL (Statement Languages) (Software)
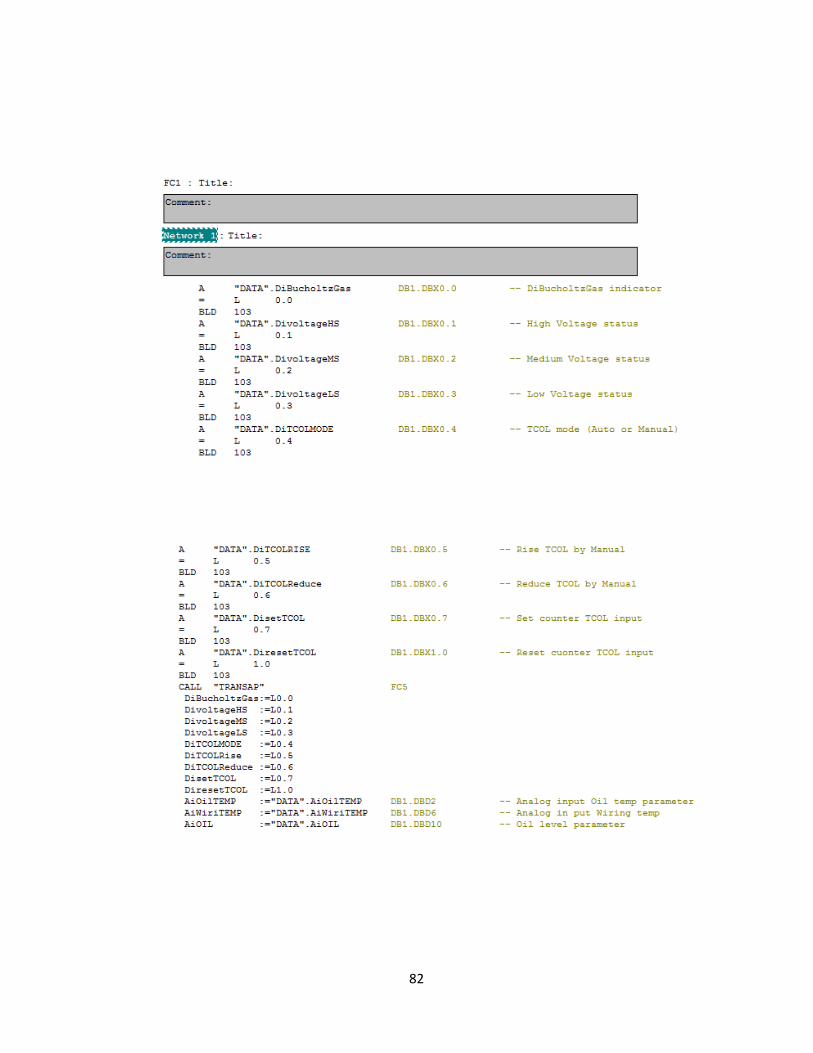
82
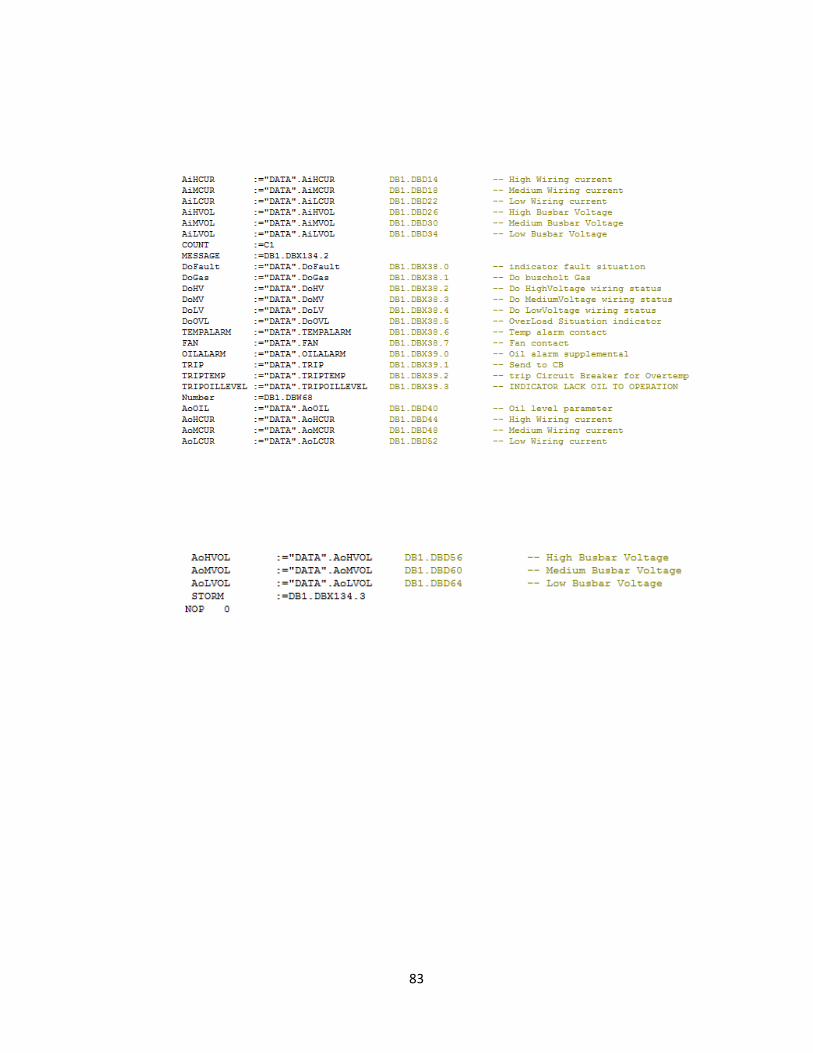
83
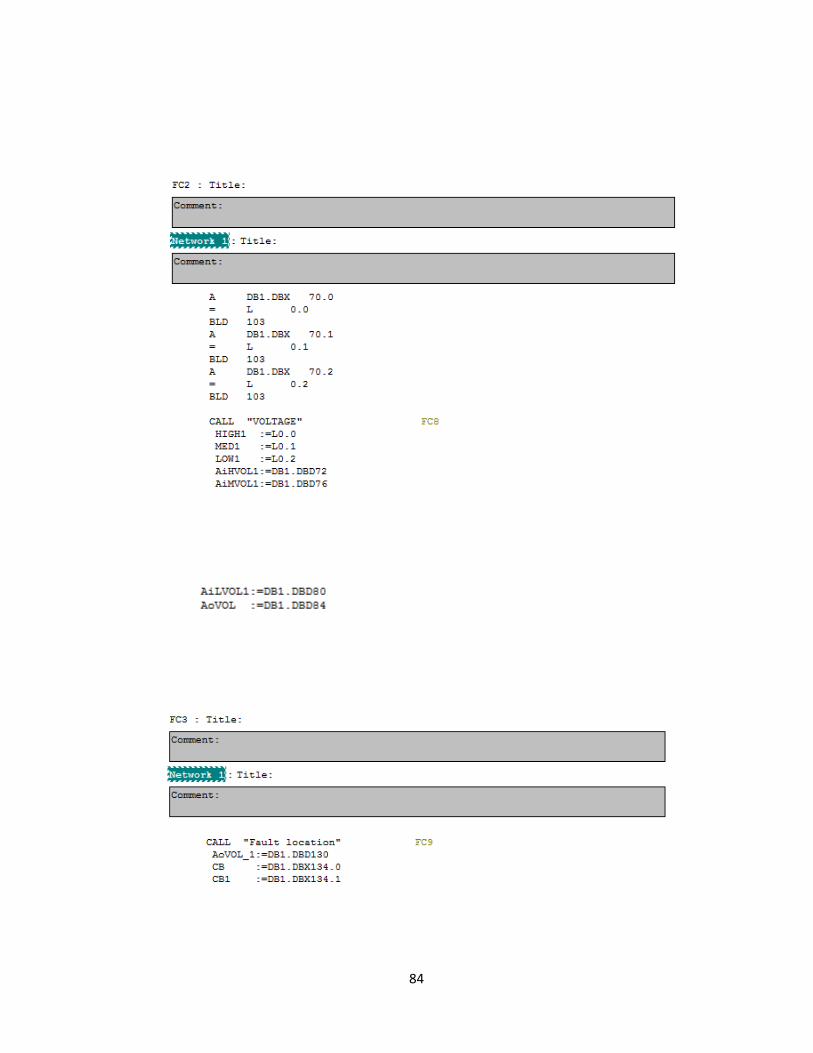
84
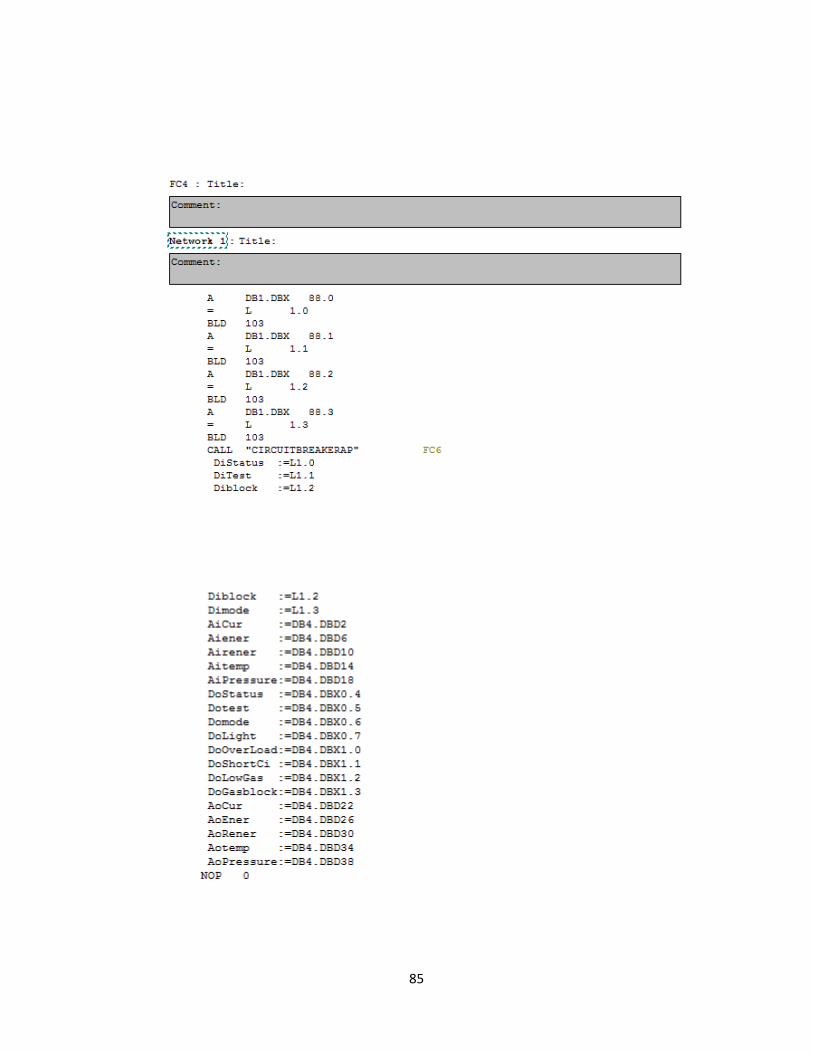
85

86
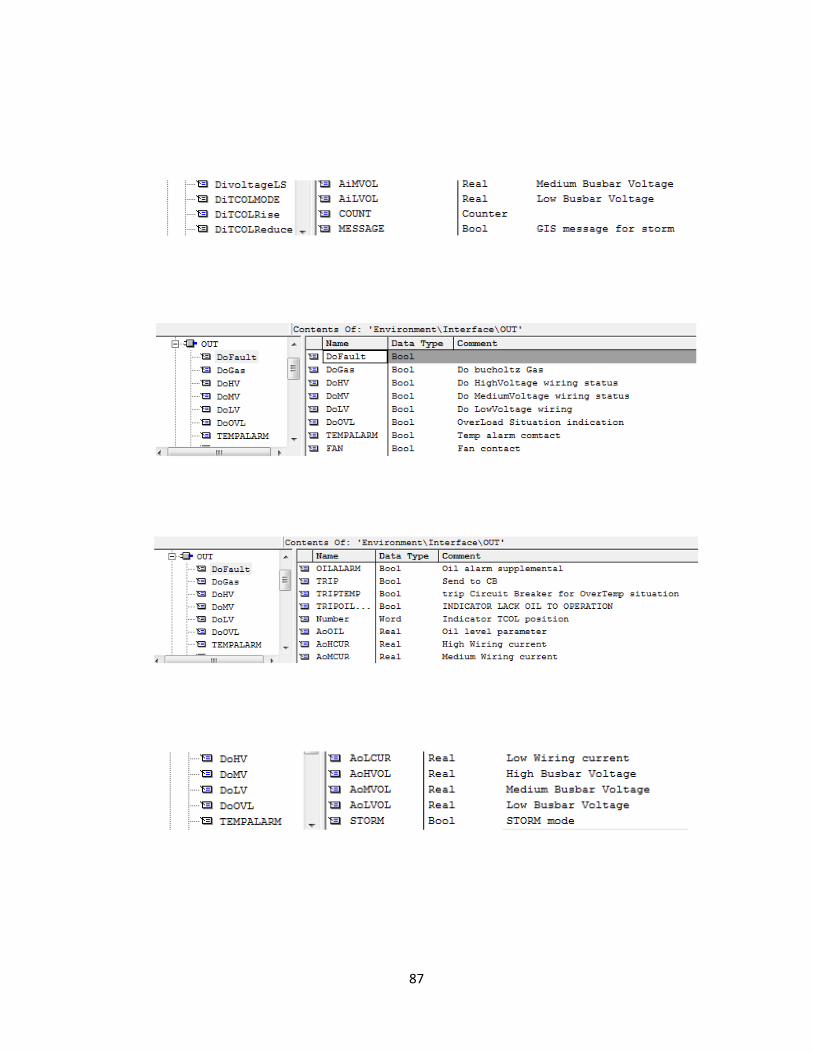
87
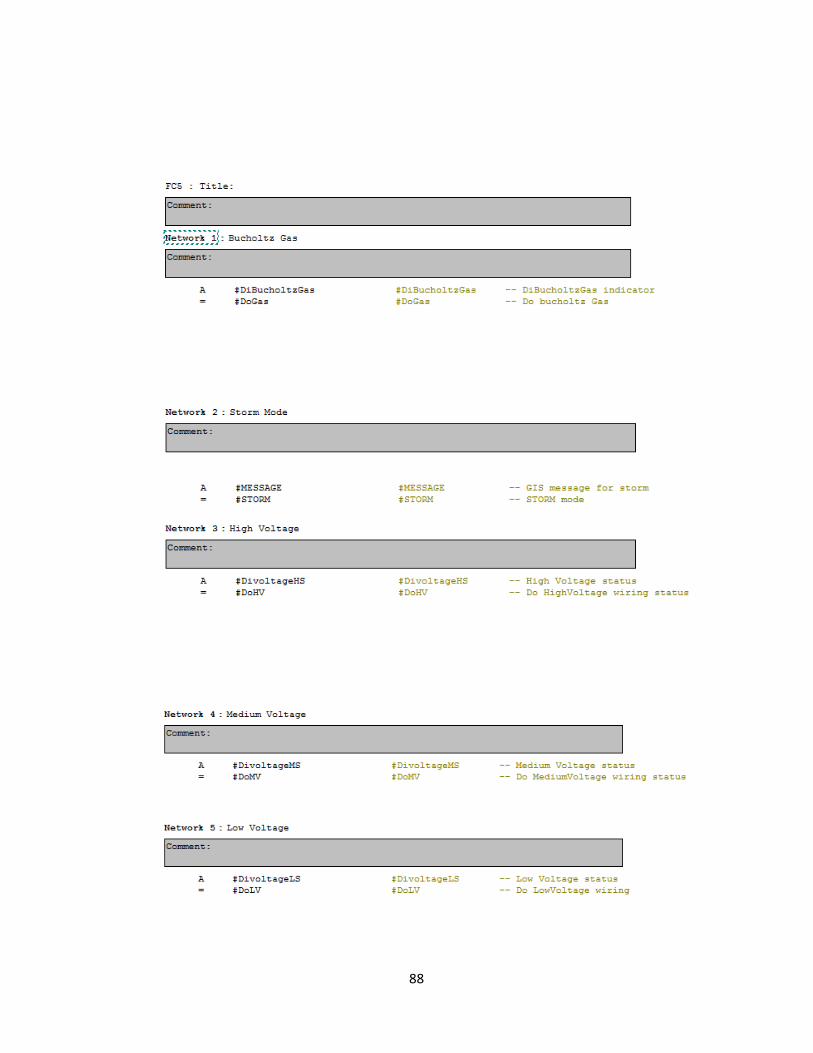
88
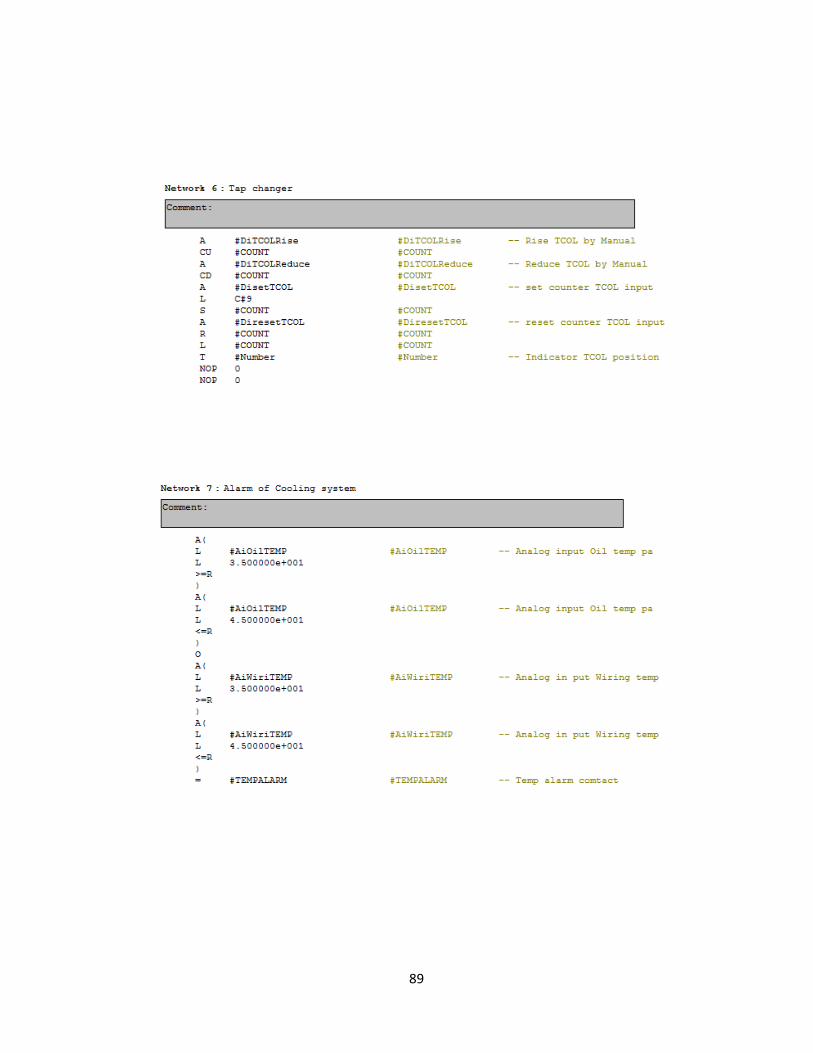
89
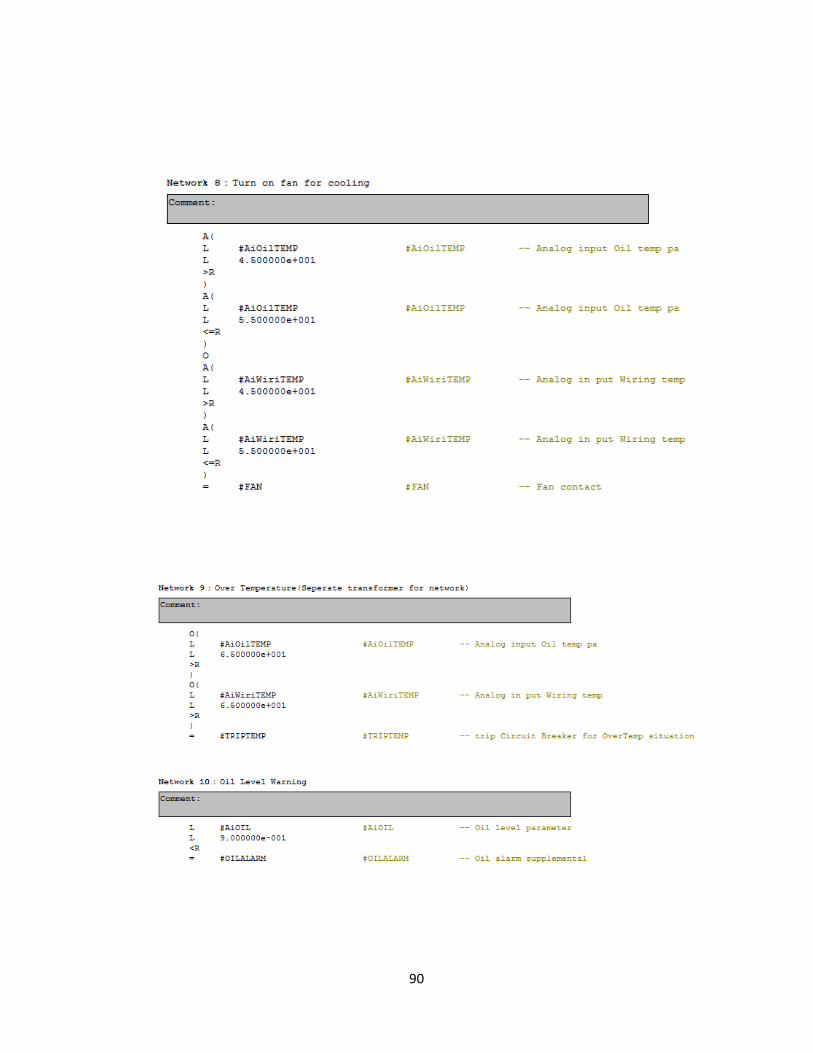
90
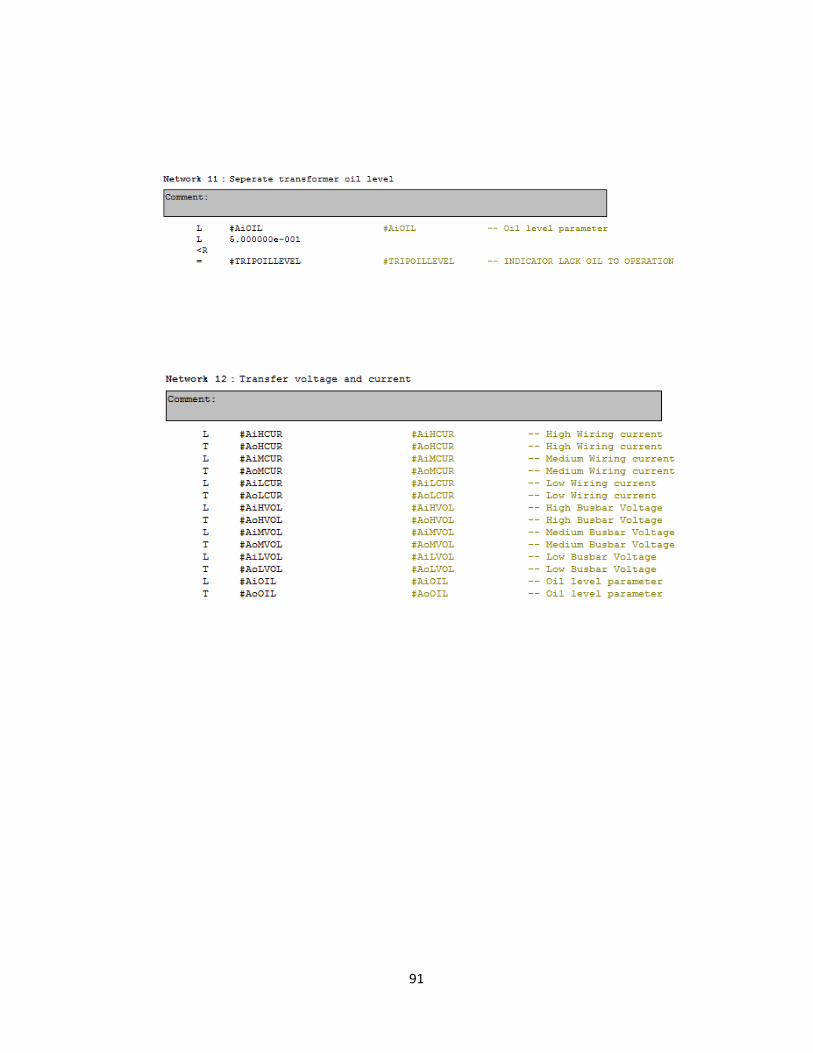
91
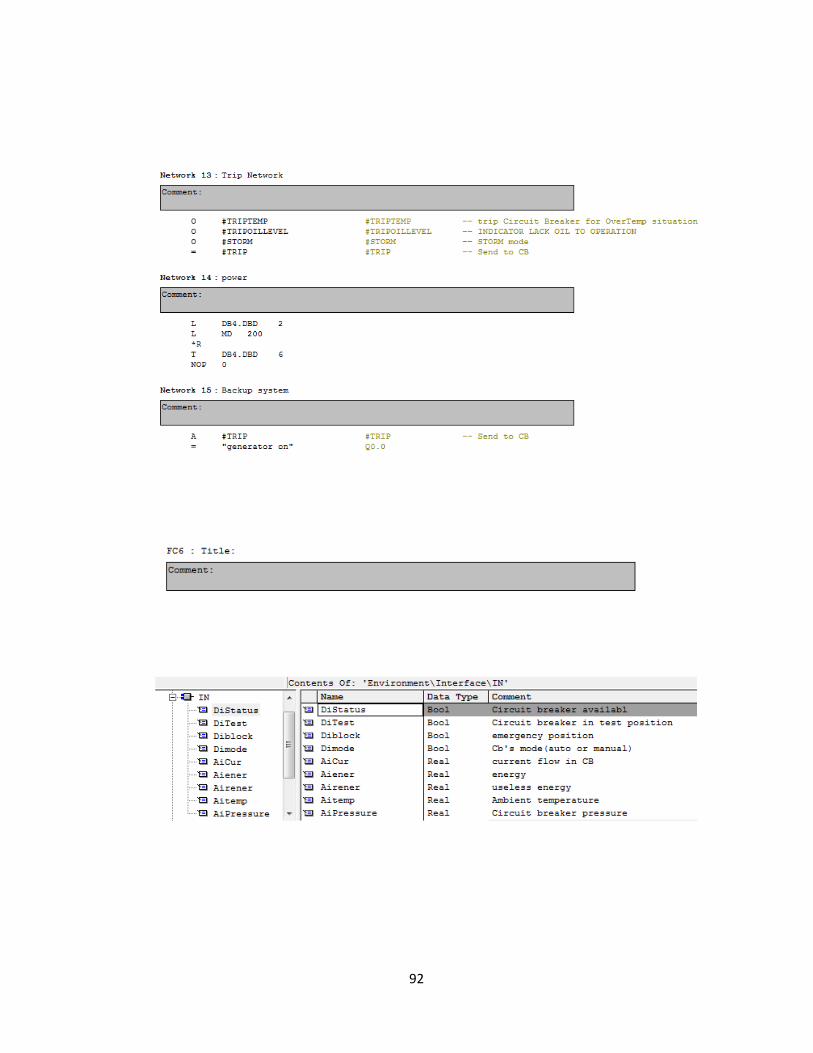
92
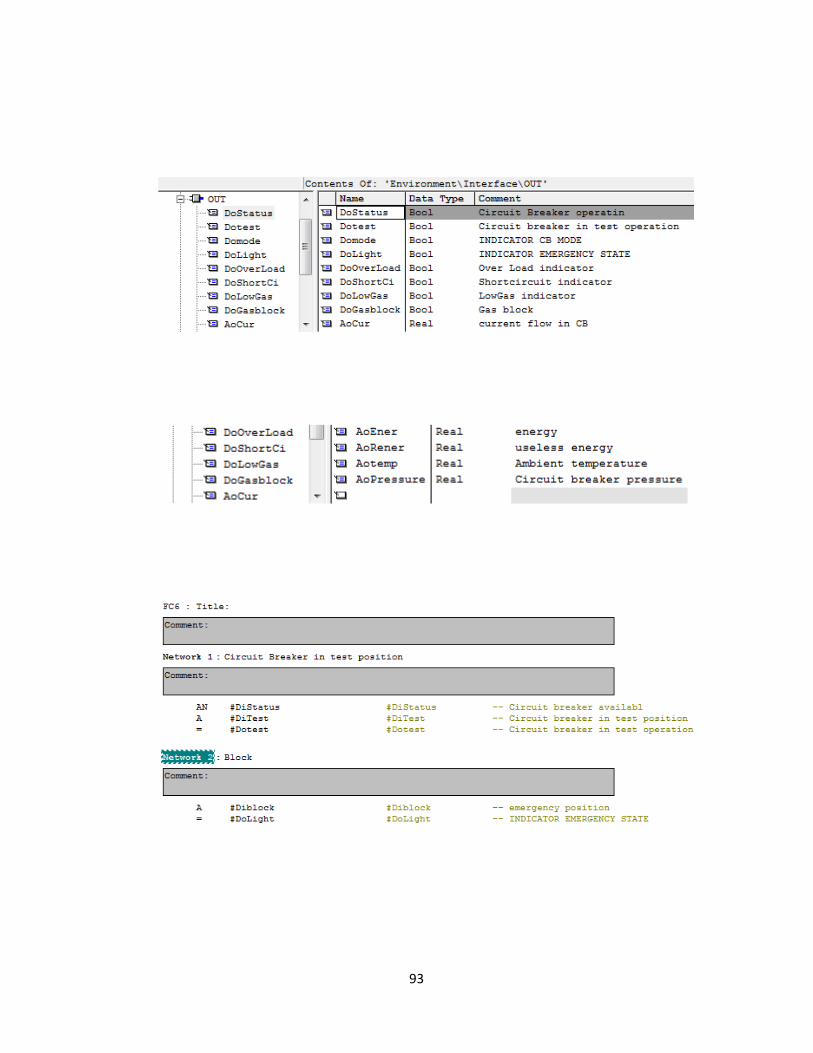
93
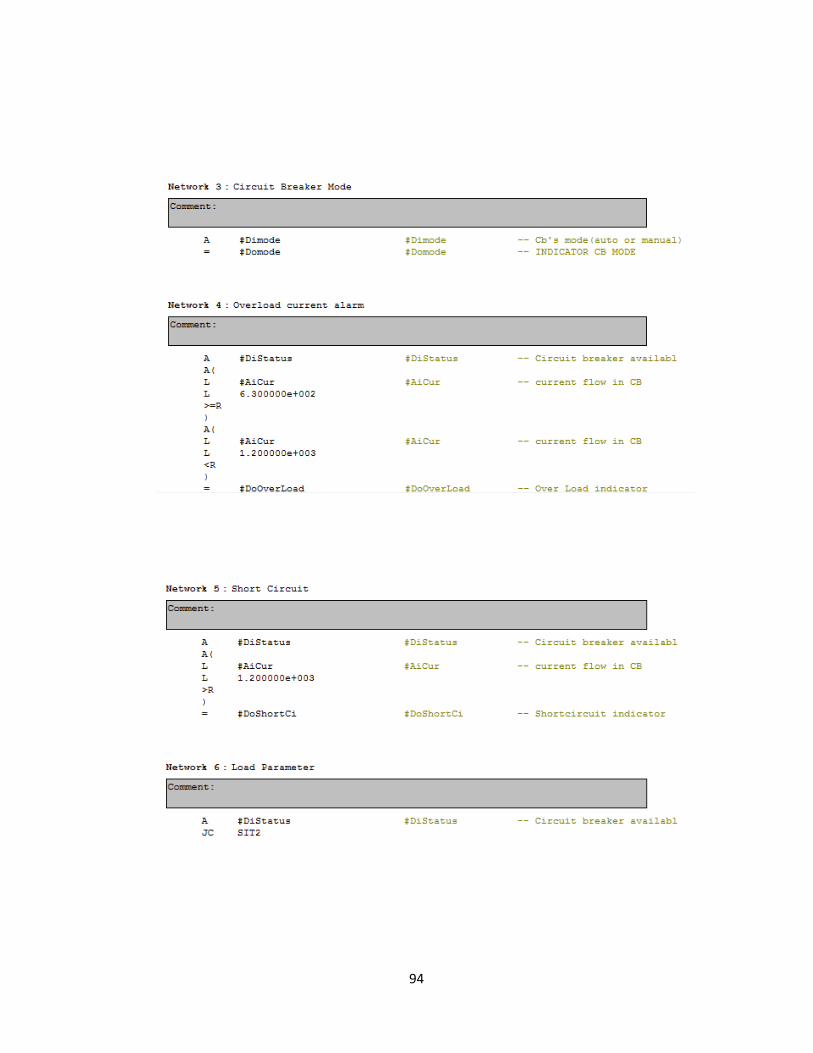
94
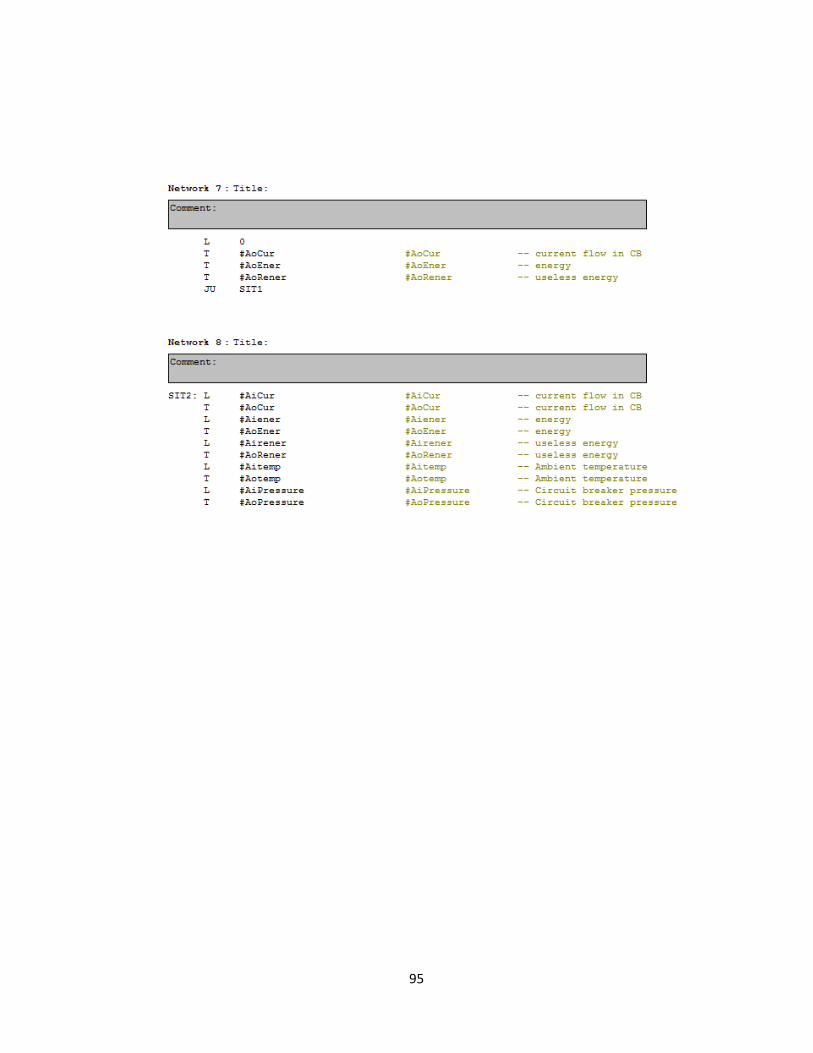
95
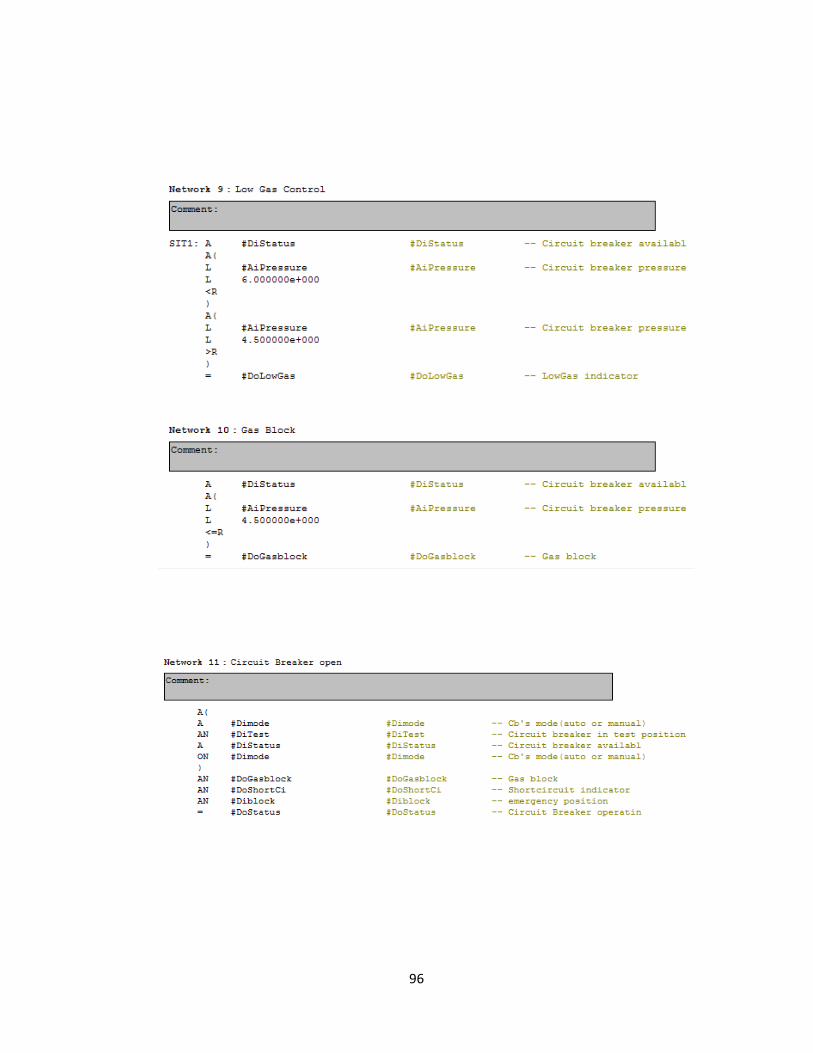
96
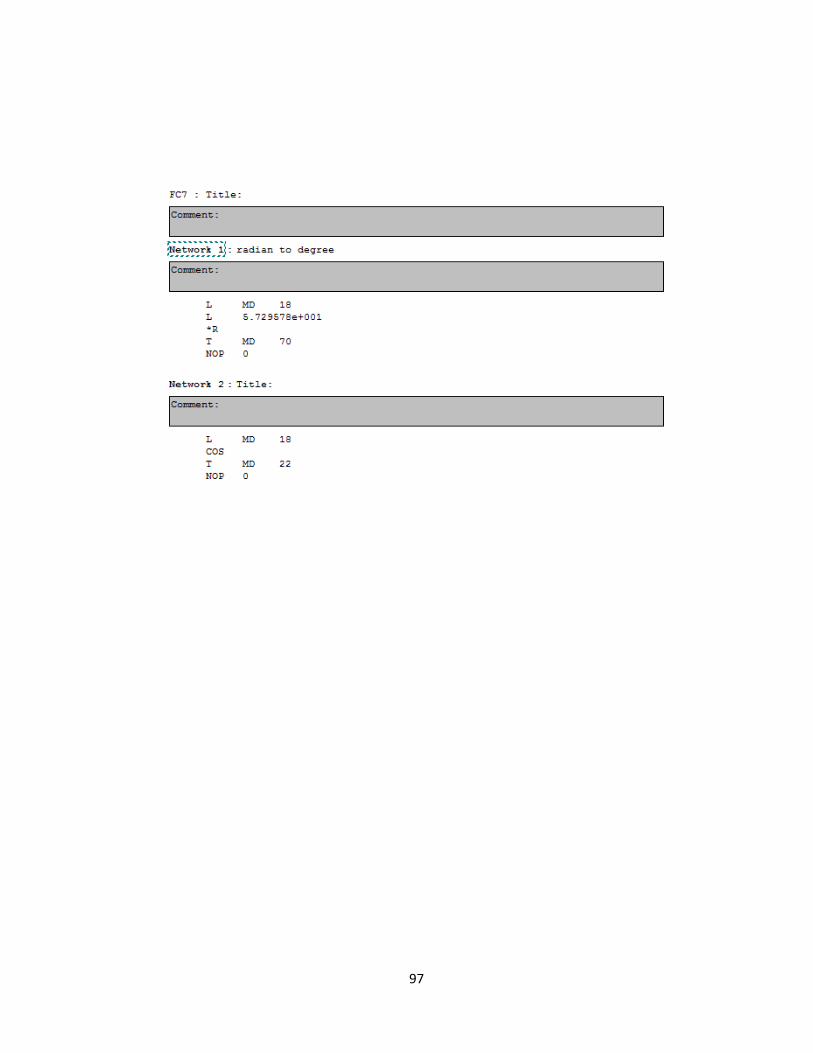
97
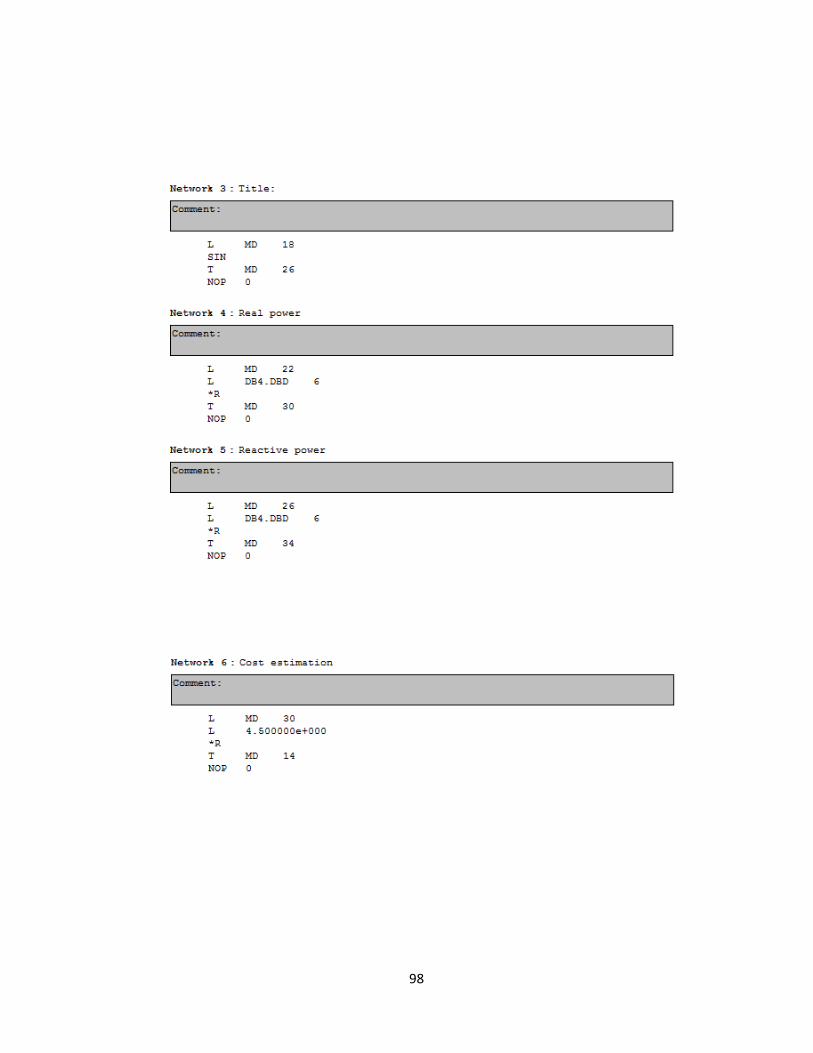
98

99
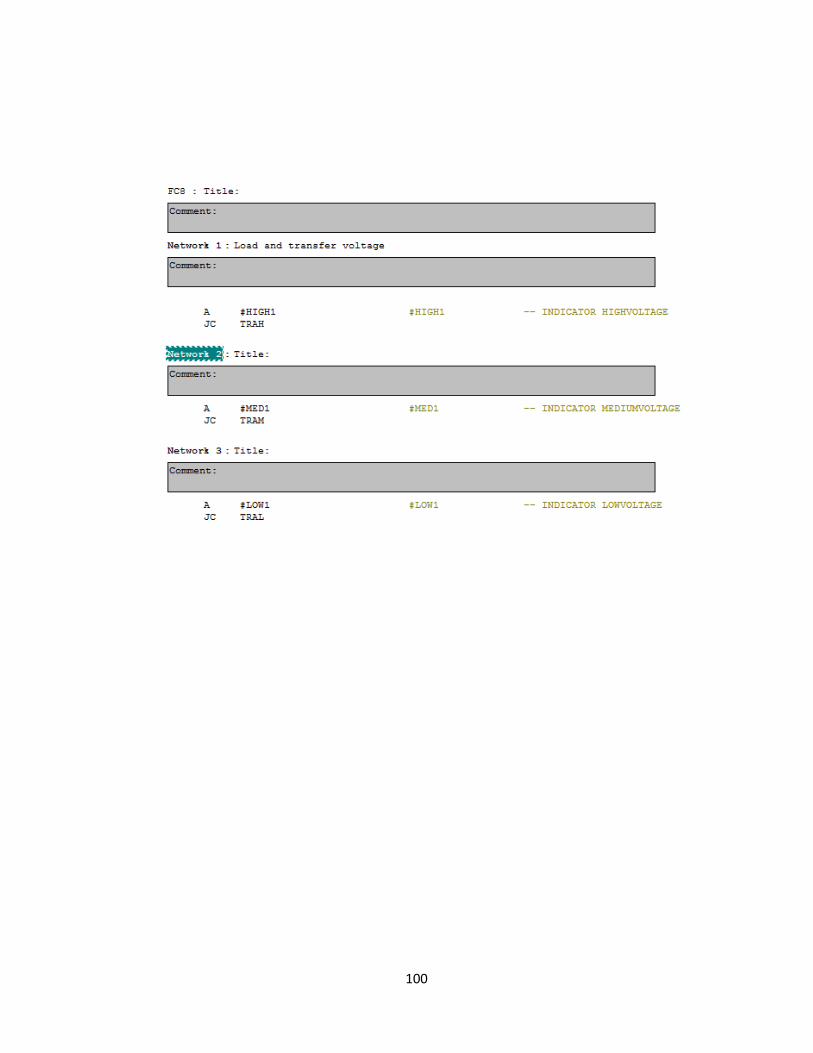
100
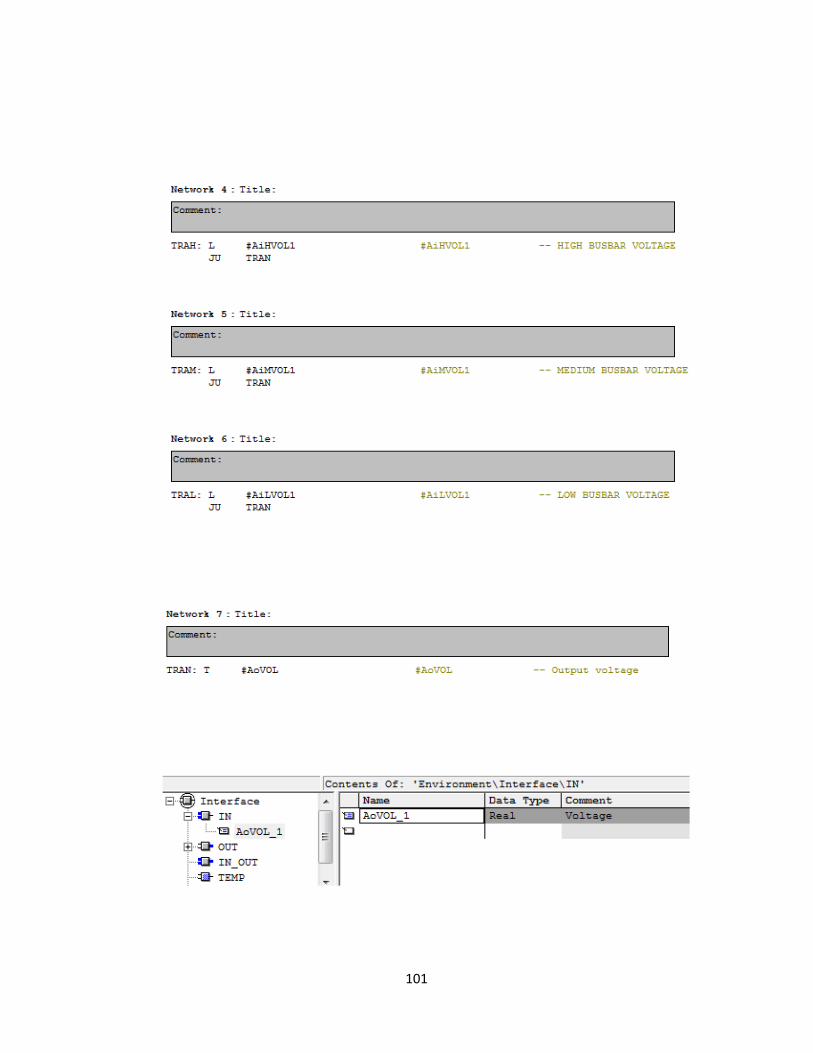
101
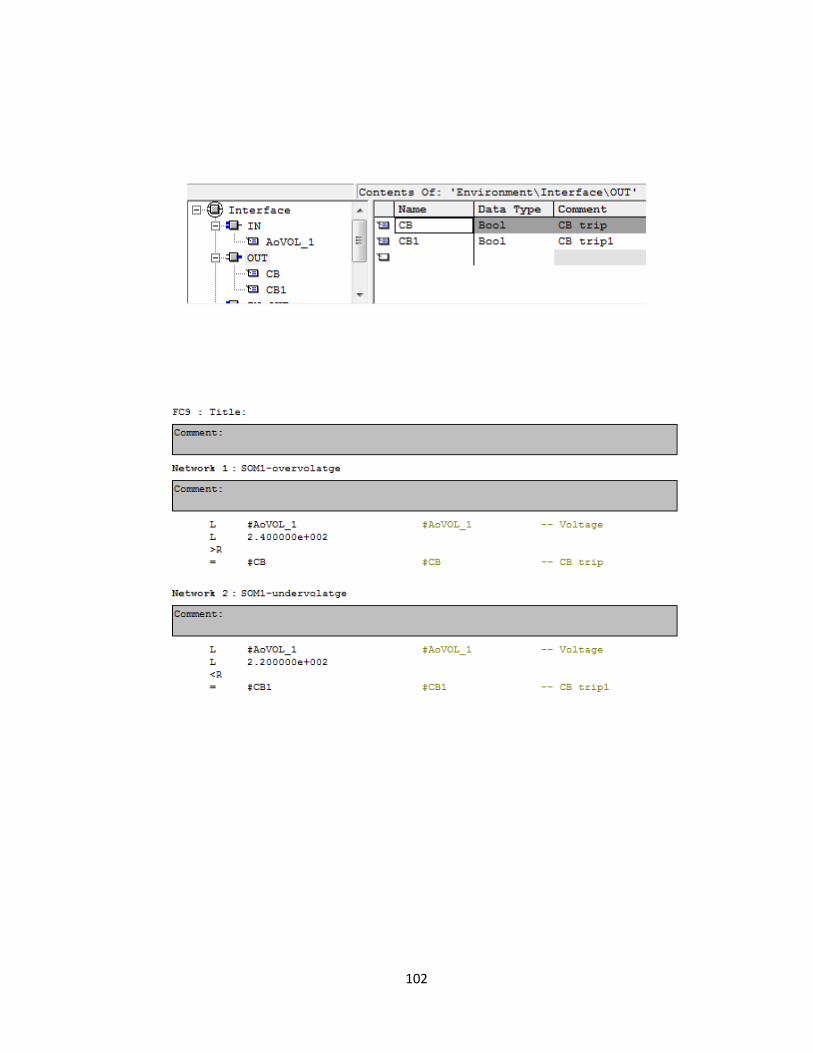
102
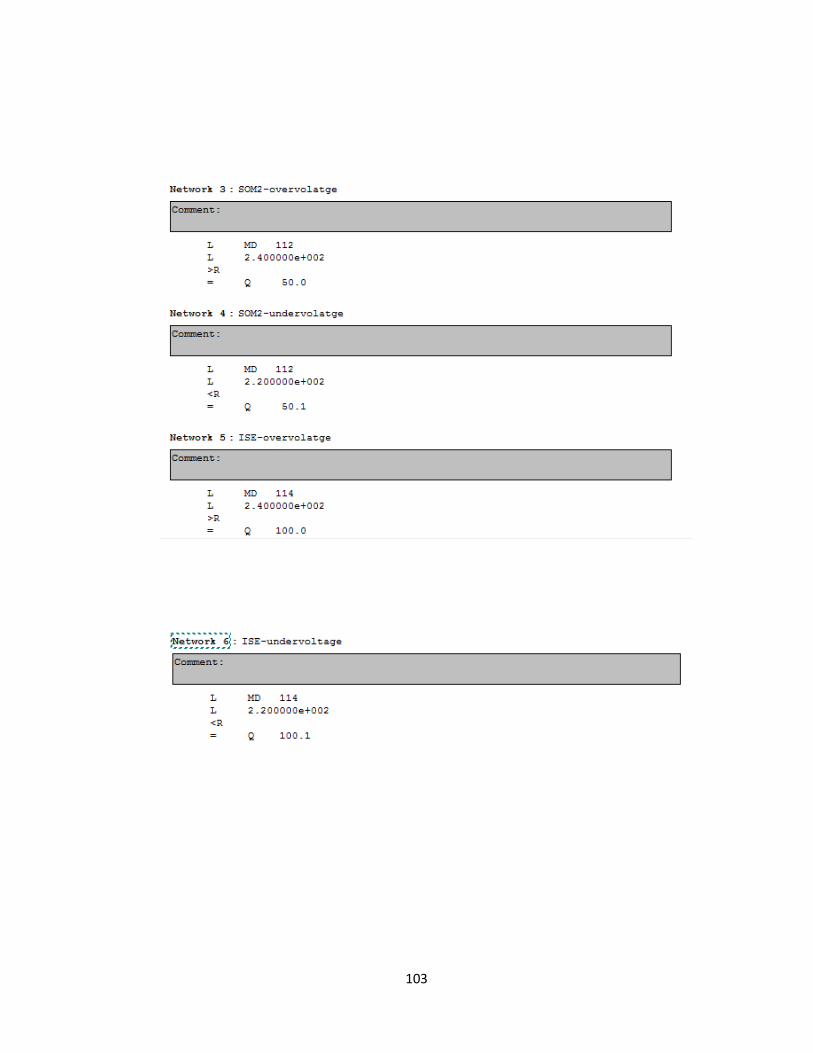
103
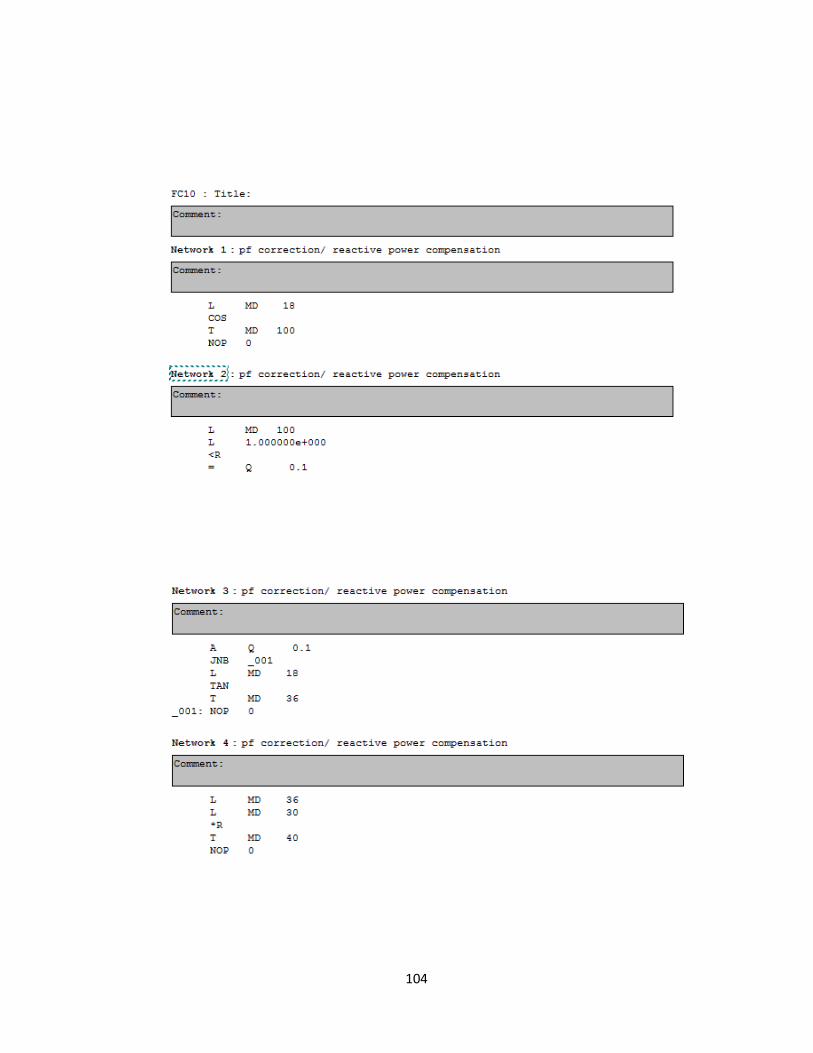
104
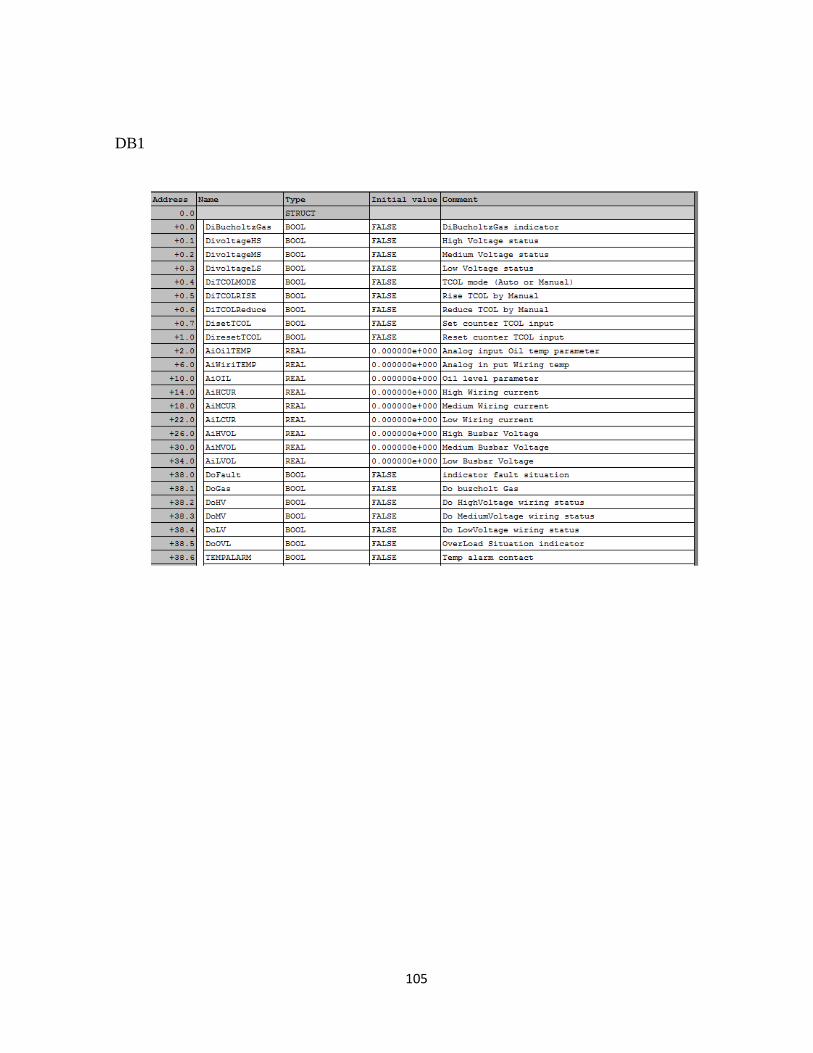
105
DB1
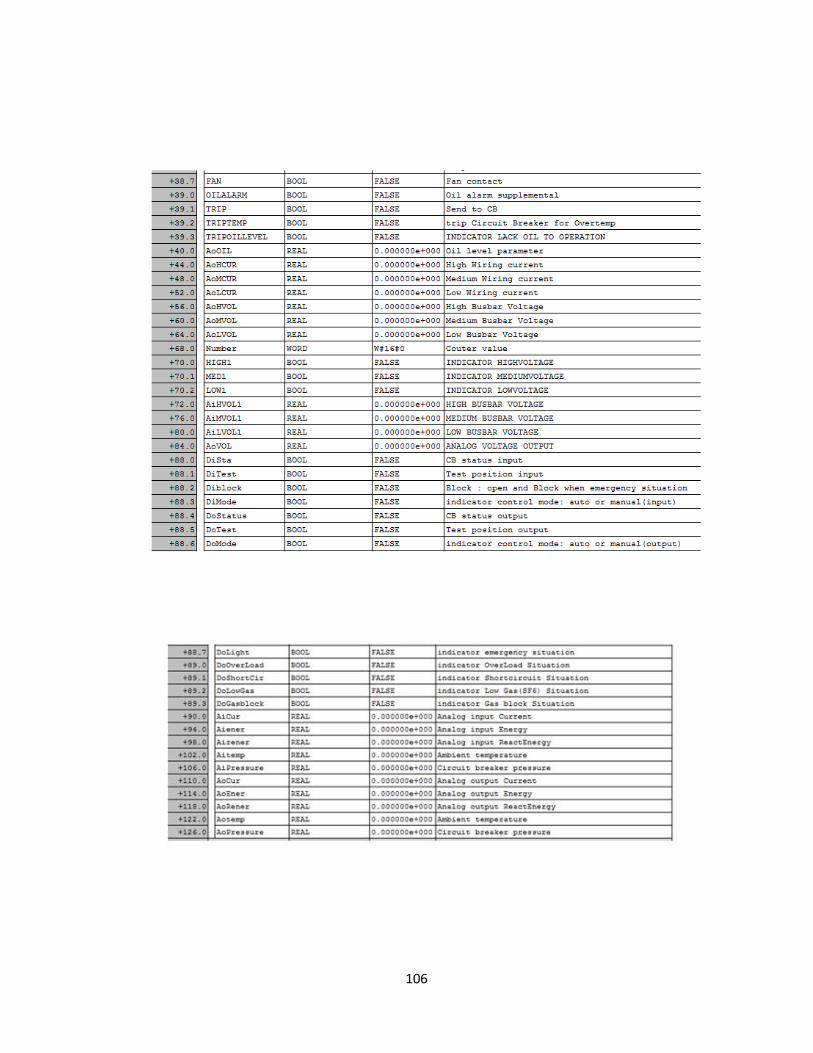
106
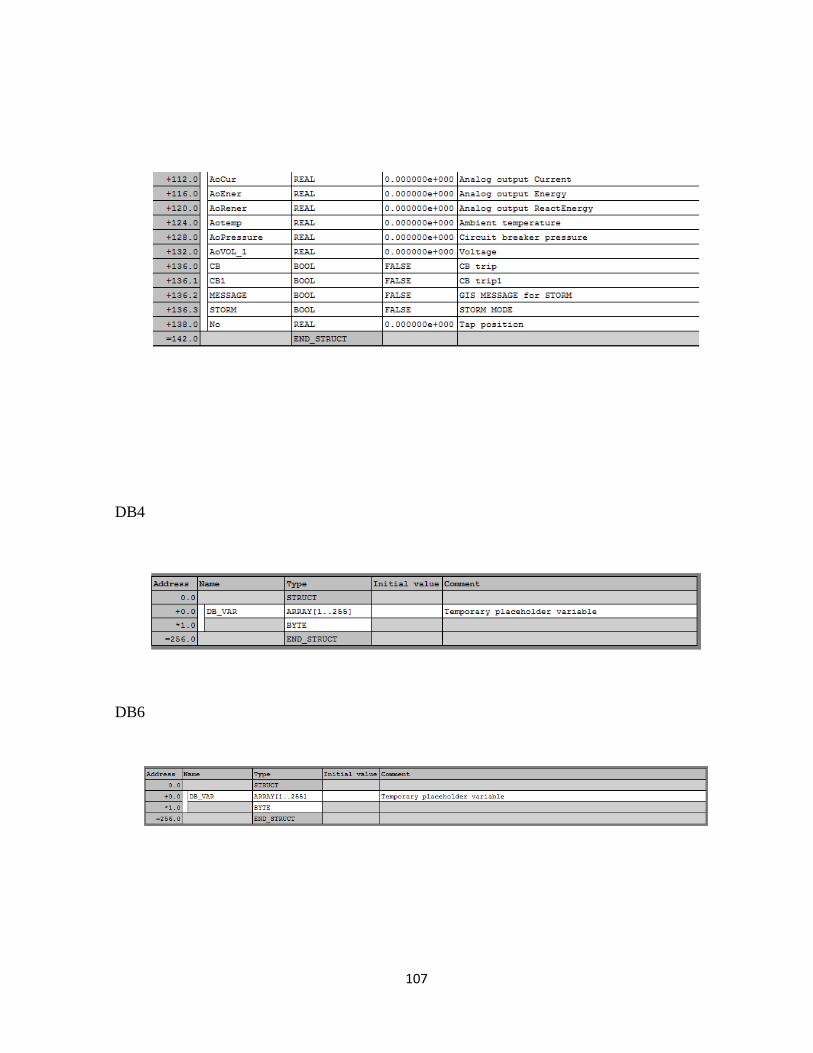
107
DB4
DB6
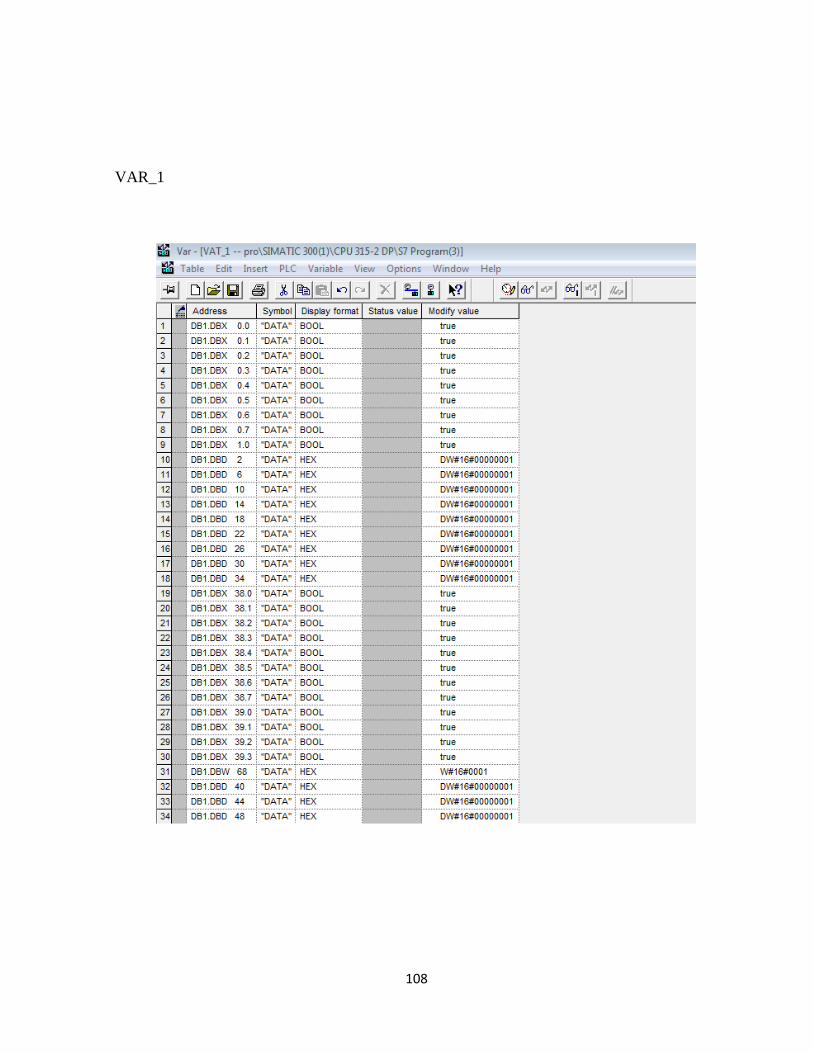
108
VAR_1
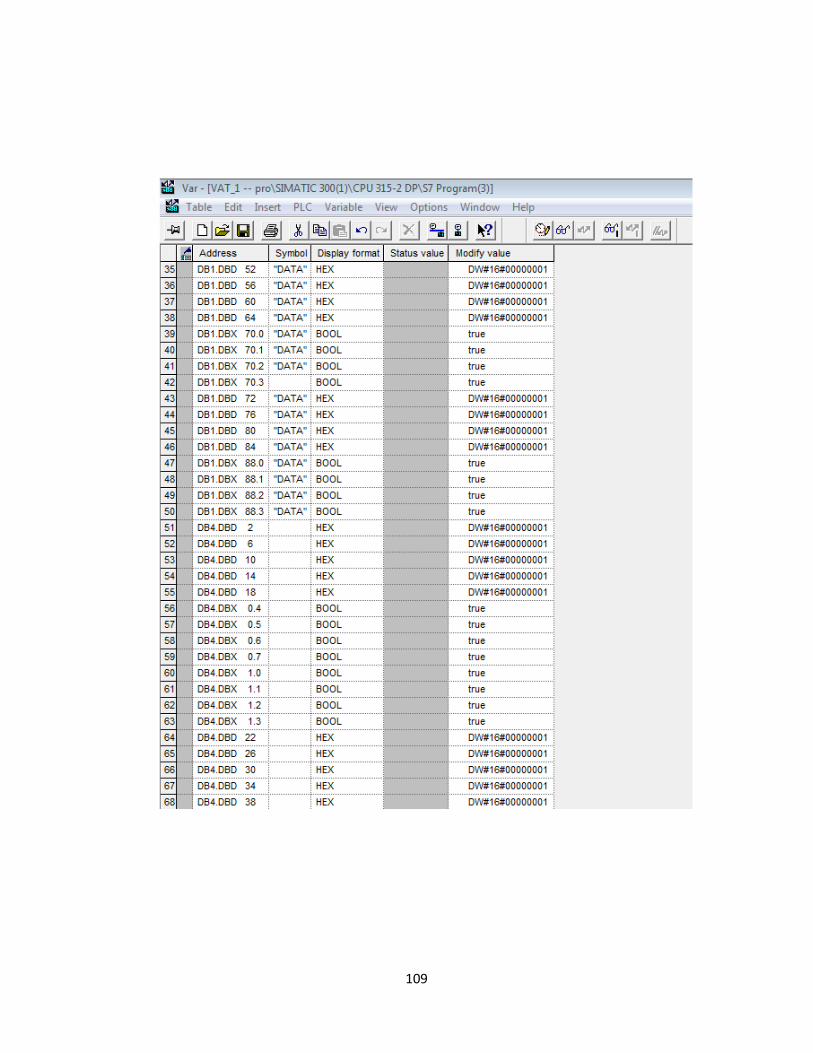
109
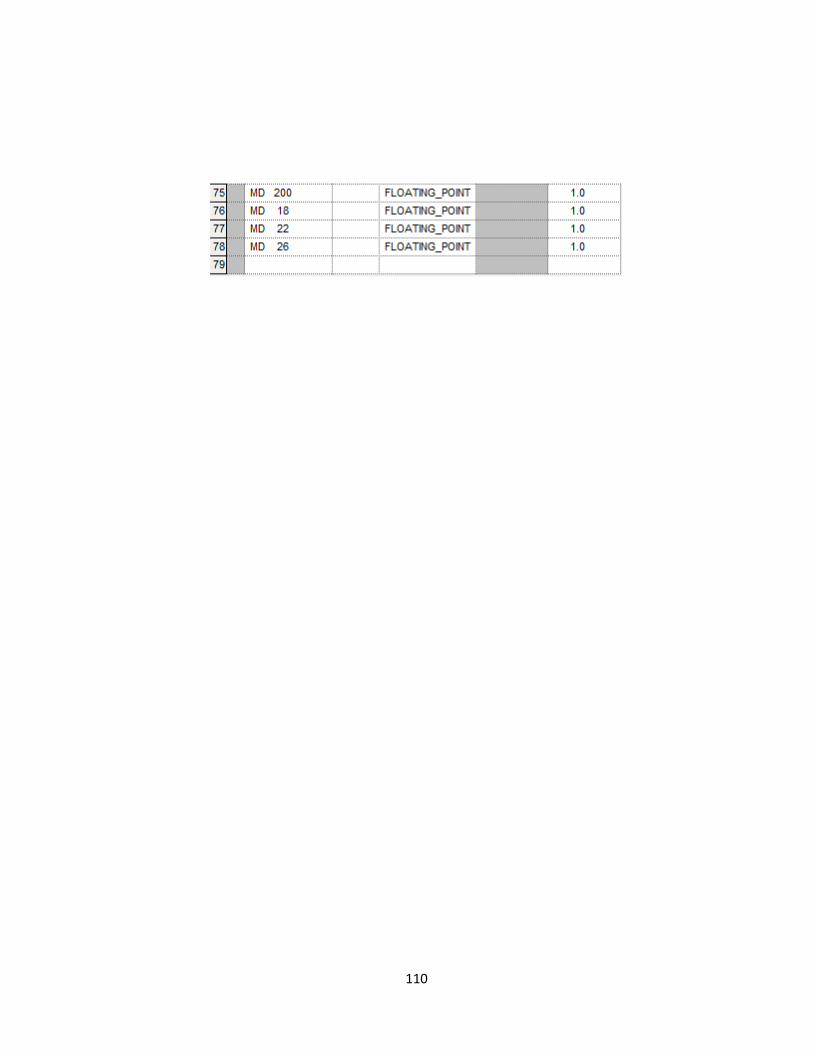
110
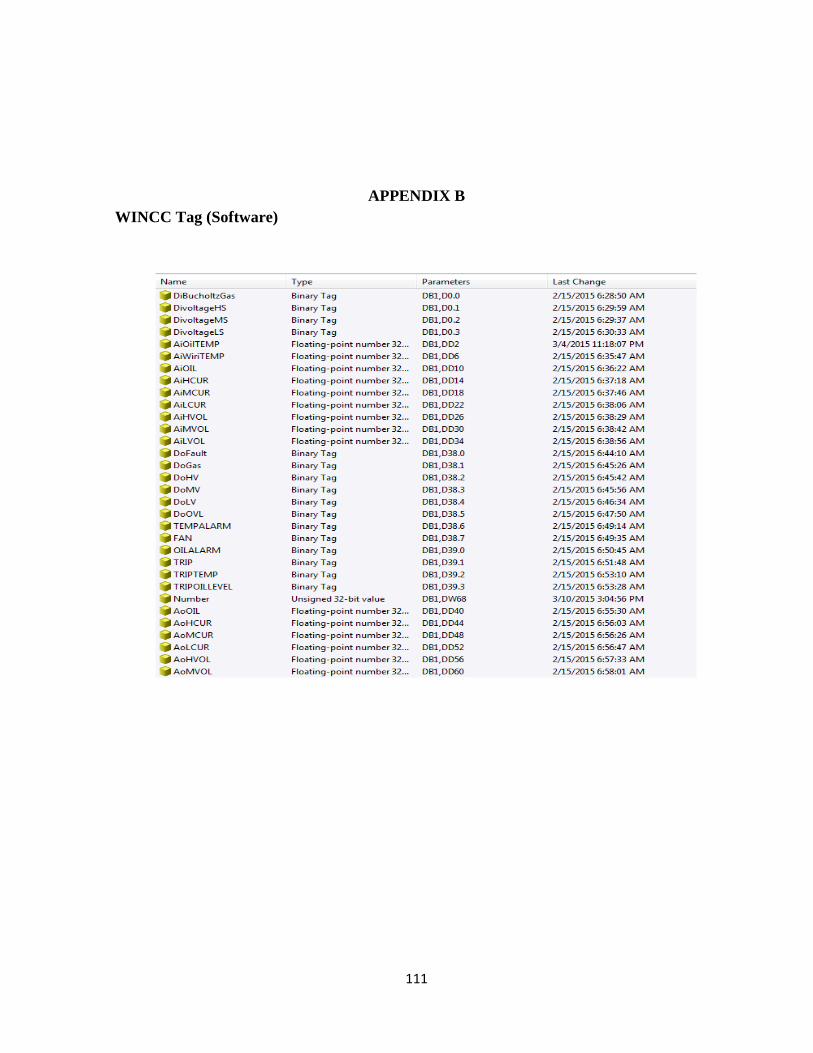
111
APPENDIX B
WINCC Tag (Software)
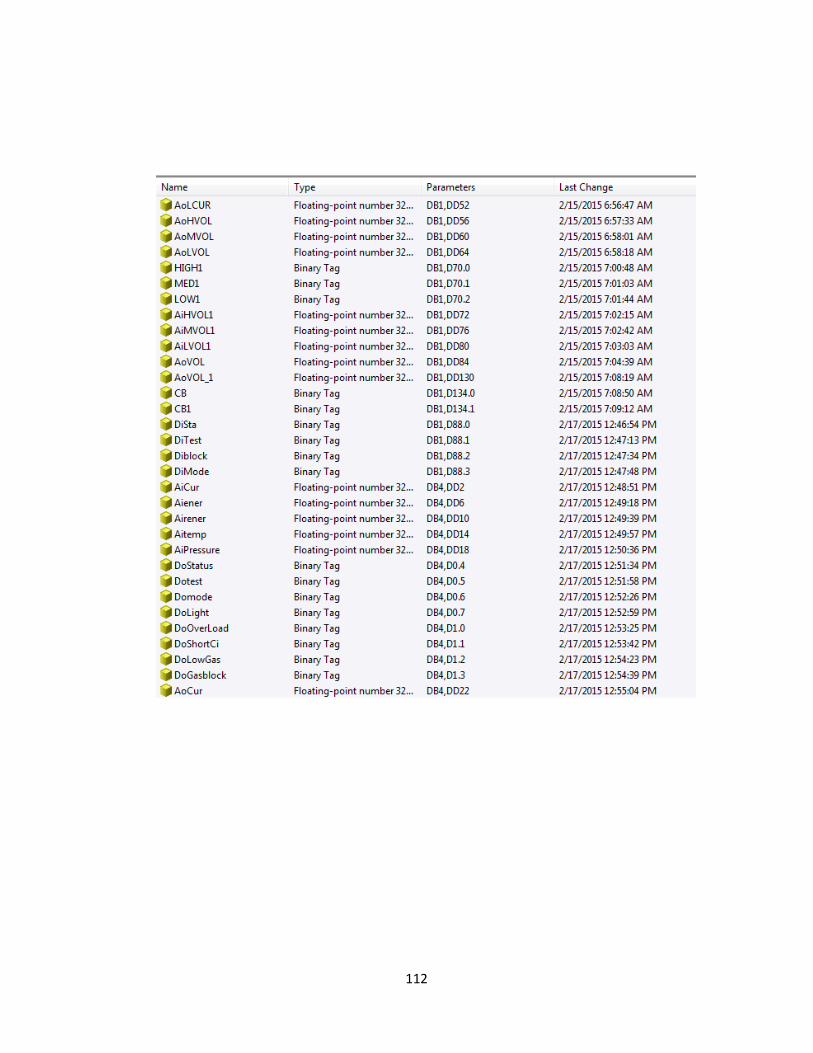
112
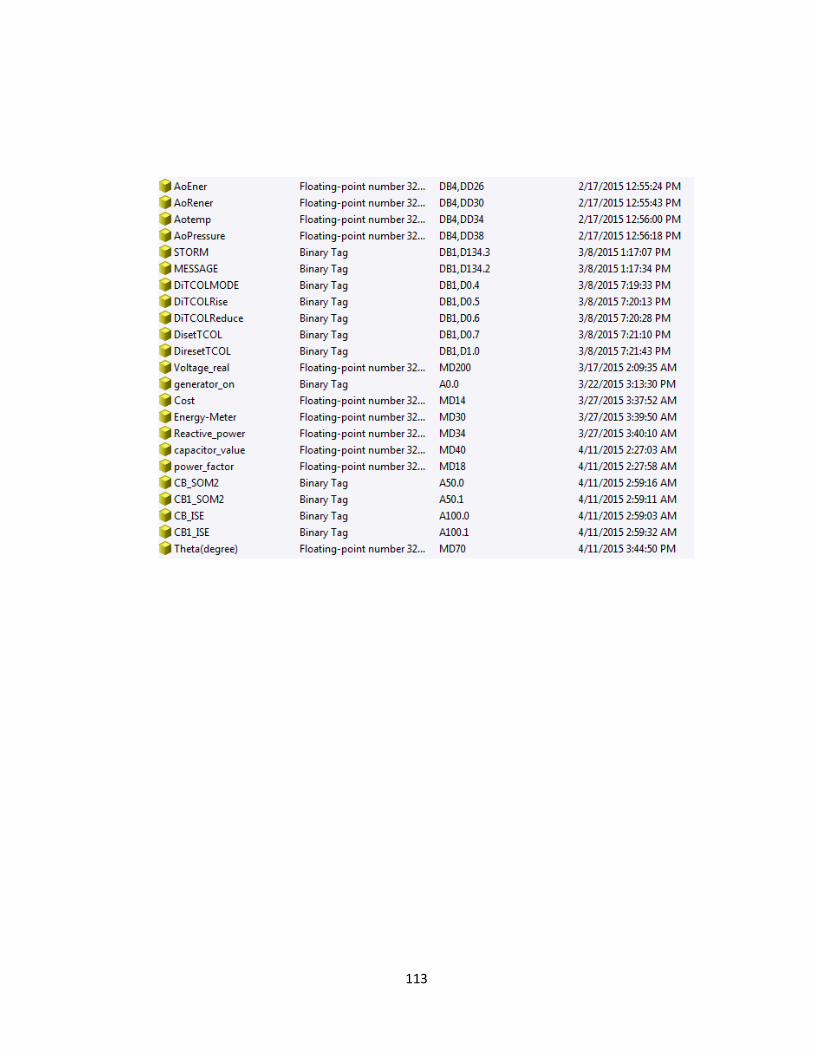
113
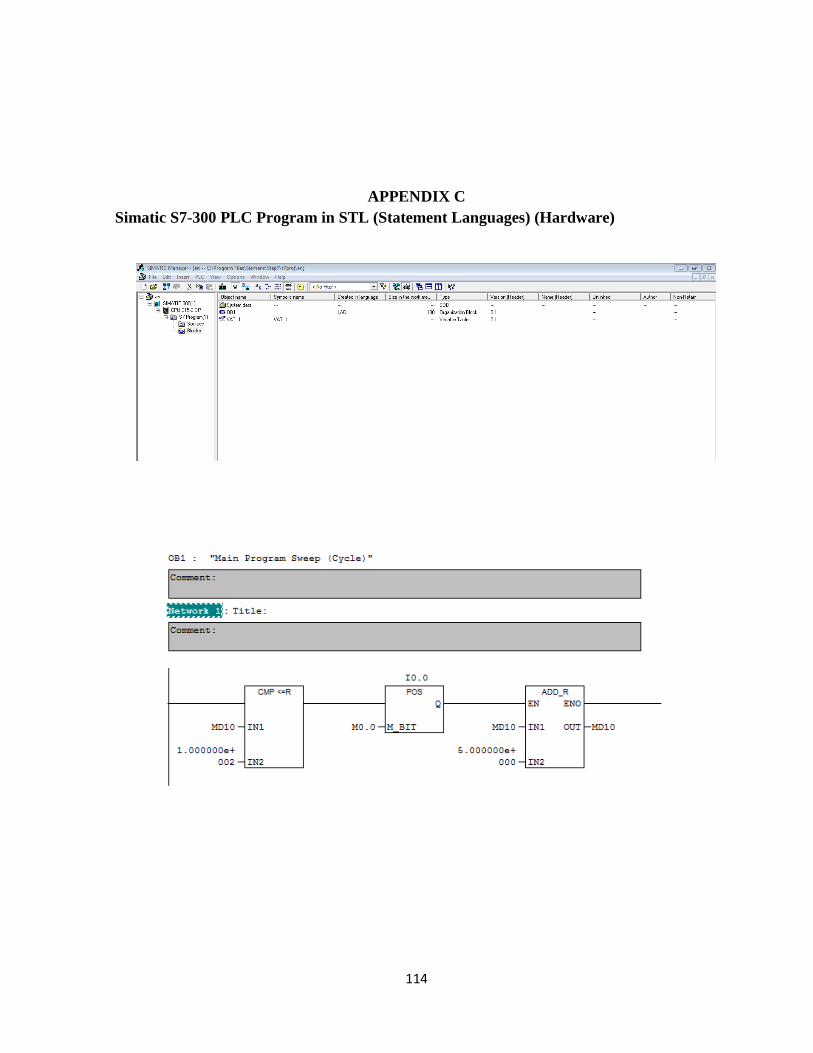
114
APPENDIX C
Simatic S7-300 PLC Program in STL (Statement Languages) (Hardware)
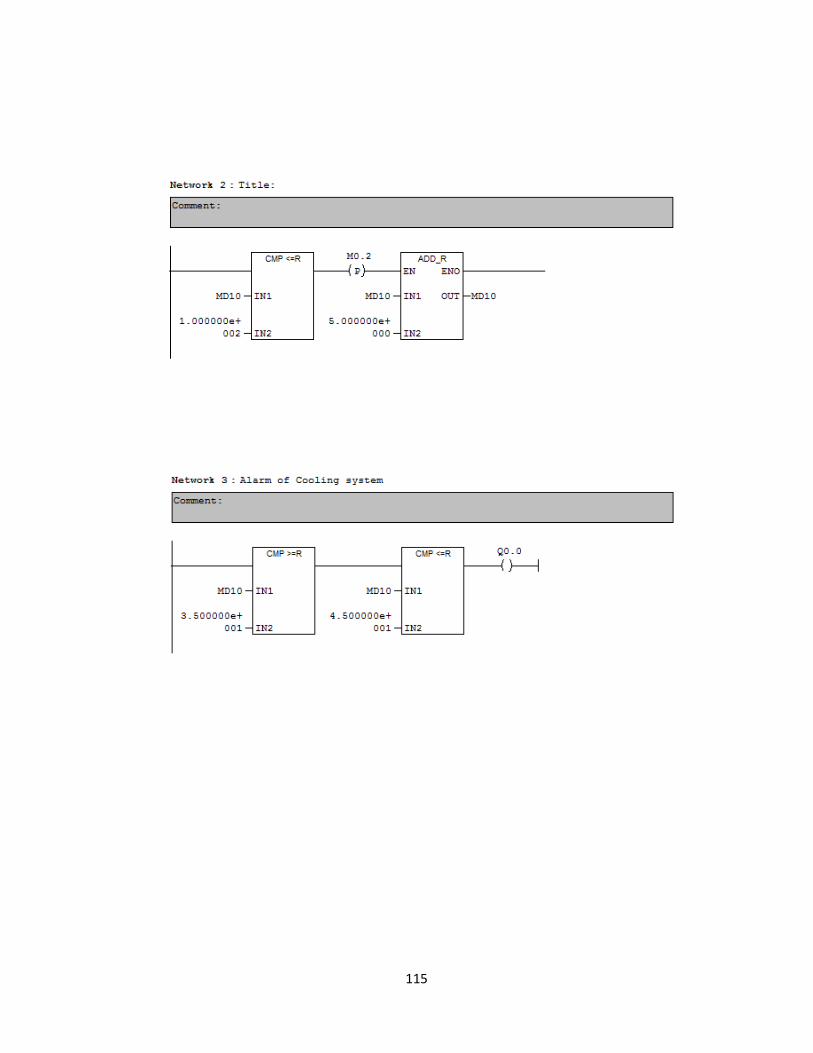
115
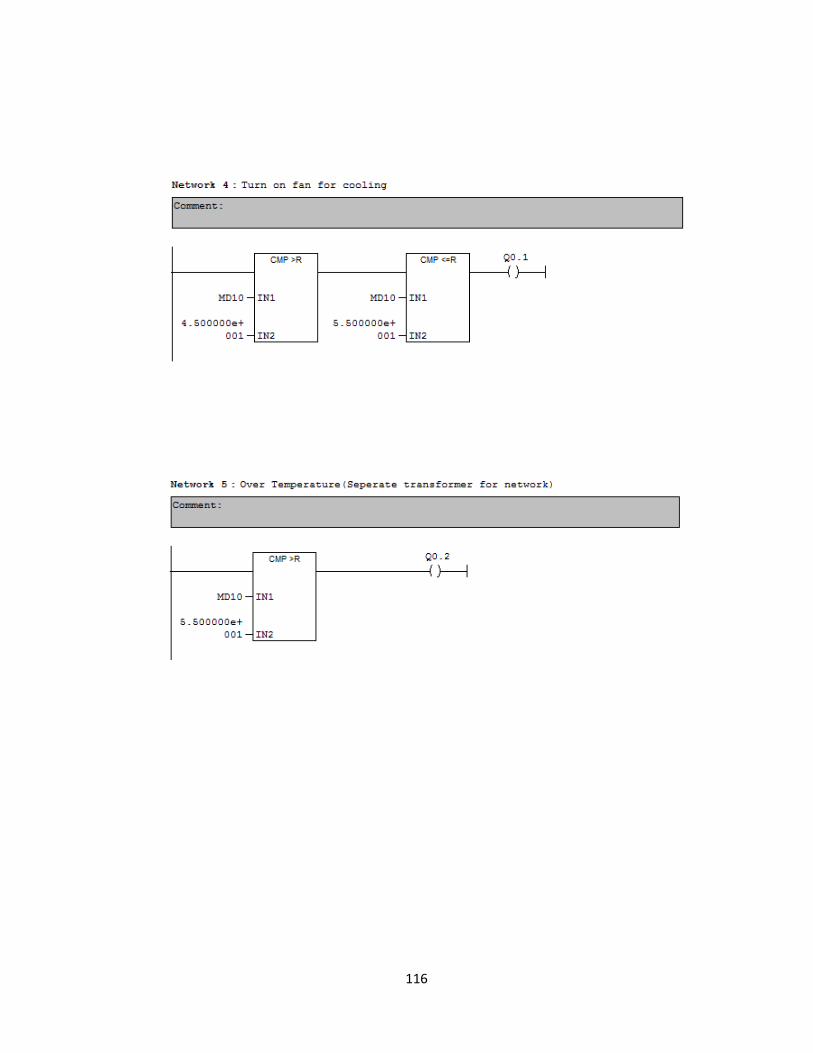
116
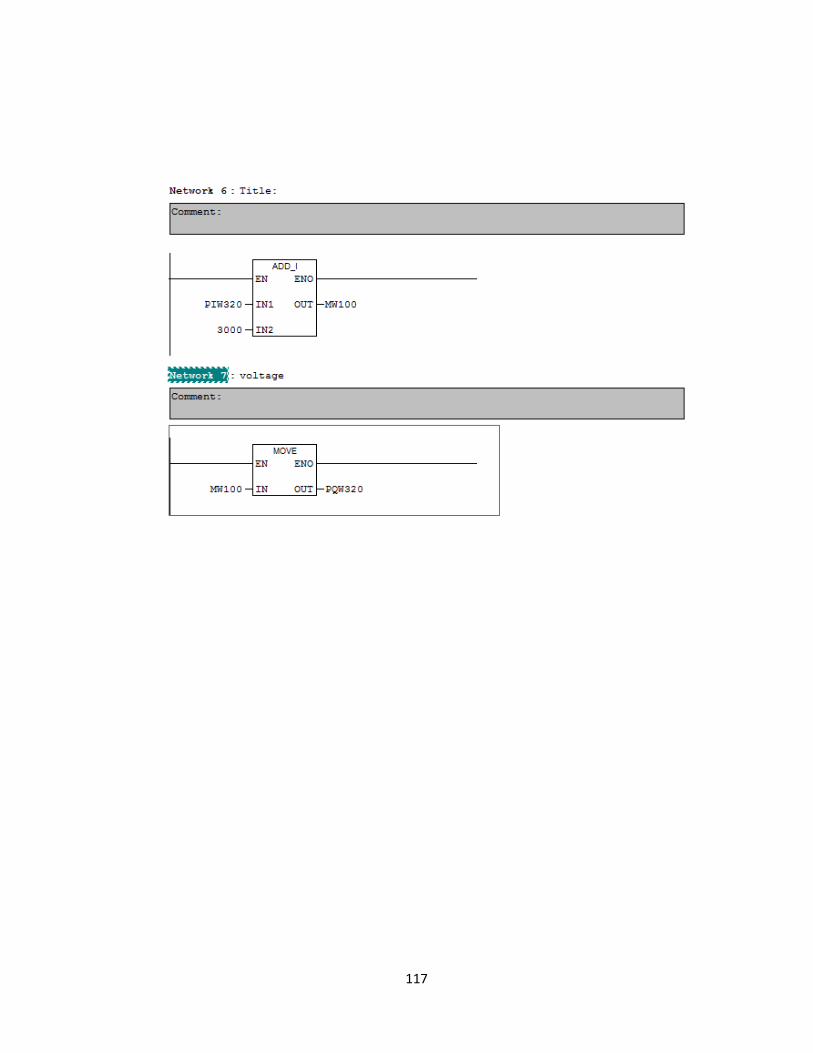
117
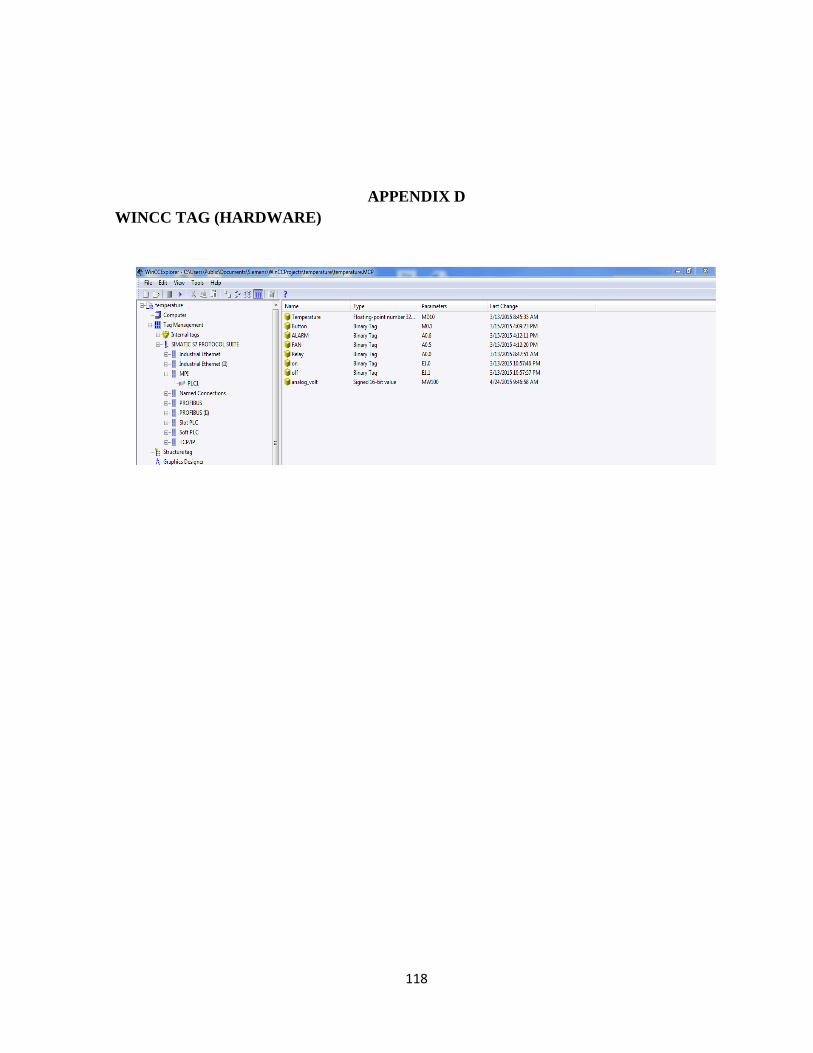
118
APPENDIX D
WINCC TAG (HARDWARE)