Electron backscatter diffraction (EBSD) sample preparation ...
Upload
independentCategory
view
1download
0
Journal of Applied Geophysics 71 (2010) 47–52
Contents lists available at ScienceDirect
Journal of Applied Geophysics
j ourna l homepage: www.e lsev ie r.com/ locate / jappgeo
Application of seismic diffraction imaging for detecting near-surface inhomogeneitiesin the Dead Sea area
S. Keydar ⁎, D. Pelman, M. EzerskyThe Geophysical Institute of Israel, P.O. Box 182, Lod 71100, Israel
⁎ Corresponding author.E-mail address: [email protected] (S. Keydar).
0926-9851/$ – see front matter © 2010 Elsevier B.V. Aldoi:10.1016/j.jappgeo.2010.04.001
a b s t r a c t
a r t i c l e i n f oArticle history:Received 28 October 2008Accepted 13 April 2010
Keywords:Diffraction imagingLocal heterogeneitiesDead Sea sinkholes
Detecting and mapping inhomogeneities localized near surface is an important problem in a variety ofapplications, such as engineering site investigation, environmental studies, archeology and others. Typicalexamples of such inhomogeneous objects are sinkholes, cavities, caves, tunnels, etc. Different geophysicaltechniques have been developed for this purpose. Among them a method utilizes the waves diffracted on, orscattered from, subsurface objects. The method was successfully applied to detect local heterogeneitiesrelated to sinkholes in the Dead Sea coast area.
l rights reserved.
© 2010 Elsevier B.V. All rights reserved.
Contents
1. Introduction . . . . . . . . . . . . . . . . . . . . . . . . . . . . . . . . . . . . . . . . . . . . . . . . . . . . . . . . . . . . . . . 472. The method of diffraction imaging . . . . . . . . . . . . . . . . . . . . . . . . . . . . . . . . . . . . . . . . . . . . . . . . . . . . 48
2.1. Seismic wavefield above an underground heterogeneity . . . . . . . . . . . . . . . . . . . . . . . . . . . . . . . . . . . . . . . 482.2. Detection of diffracted waves . . . . . . . . . . . . . . . . . . . . . . . . . . . . . . . . . . . . . . . . . . . . . . . . . . . 48
3. Implementation of diffraction imaging in the Dead Sea area . . . . . . . . . . . . . . . . . . . . . . . . . . . . . . . . . . . . . . . . 483.1. Introduction . . . . . . . . . . . . . . . . . . . . . . . . . . . . . . . . . . . . . . . . . . . . . . . . . . . . . . . . . . . 483.2. South Nahal Hever . . . . . . . . . . . . . . . . . . . . . . . . . . . . . . . . . . . . . . . . . . . . . . . . . . . . . . . . 49
4. Conclusions . . . . . . . . . . . . . . . . . . . . . . . . . . . . . . . . . . . . . . . . . . . . . . . . . . . . . . . . . . . . . . . 52Acknowledgments . . . . . . . . . . . . . . . . . . . . . . . . . . . . . . . . . . . . . . . . . . . . . . . . . . . . . . . . . . . . . . 52References . . . . . . . . . . . . . . . . . . . . . . . . . . . . . . . . . . . . . . . . . . . . . . . . . . . . . . . . . . . . . . . . . . 52
1. Introduction
One of the pressing problems in the geophysical studies of thesubsurface is the detection and localization of scattering objects suchas karsts, mines, tunnels and other natural and man-made localheterogeneities. One of the methods that may prove very effective forthis purpose is active seismics, which is widely employed by seismicexploration industry in its extensive and detailed studies of thesubsurface. Adaptation of these methods for the purpose of searchingfor local underground heterogeneities is not a straightforward task.The primary aim of seismic exploration is to study geological objectsof large lateral extent, such as boundaries of geologic formations, oiland gas deposits, etc. To this end, seismic exploration (“reflection
seismics”) utilizes seismic waves emitted from man-made (active)seismic sources and reflected from the boundaries of interest back tothe surface. The methodology, the data acquisition, and processingtechniques employed by the reflection seismics are largely based onthe model of the subsurface consisting of a number of layers dividedby smooth curvilinear boundaries with gradual changes of parameterswithin layers.
Virtually the same model of the subsurface is behind the so-calledrefraction seismicmethod, another technology used primarily to studythe shallow part of the subsurface (first tens of meters). Clearly, suchmethods are not directly applicable to a search for local undergroundheterogeneities of small lateral extent (10–100 m). The amount ofenergy reflected by such a small objects would be very small, and itwould be indistinguishable from other geological features of thesubsurface. In order to be effective, the search for local heterogeneitieshas to employ the features of seismic wavefield, which is primarilyassociatedwith the presence of a local heterogeneity in the subsurface.

Fig. 1. Schematic description of the ray path from diffractor C.
48 S. Keydar et al. / Journal of Applied Geophysics 71 (2010) 47–52
Such features are known as scattered (diffracted) waves. In a standardseismic prospecting these waves are usually treated as noise. But forlocating local objects these waves provide the most valuable source ofinformation.
Scattered (diffracted) waves are used in a developed approachcalled “diffraction imaging” (Landa et al., 1987; Kanasevich andPhadke, 1988; Gelchinsky et al., 1993; Landa and Keydar, 1998; Belferet al., 1998; Keydar and Shtivelman, 2005; Shtivelman and Keydar,2005). This approach has been originally proposed for the detection ofgeological fault location. In the framework of this work we haveimproved the existent diffraction-imaging technology for detectingunderground heterogeneities and implemented it on the data thatwas acquired in the Dead Sea.
2. The method of diffraction imaging
We assume that the underground heterogeneity to be detectedand located is an underground object of considerable seismic contrastwith a size smaller than or of the order of the Fresnel zone diameterfor a standard seismic signal with central frequency in the range of20–70 Hz.
2.1. Seismic wavefield above an underground heterogeneity
Let us consider the seismic wavefield observed over a typicalunderground heterogeneity in a typical layered geological environ-ment. This wavefield would typically consist of a number of isolatedwaves (primary and multiple reflections from the layer boundaries),refracted waves from boundaries of high contrast, and a wavescattered (diffracted) by the local heterogeneity. The reflected andrefractedwavefields would only slightly be affected by the presence ofthe heterogeneity, whereas the scattered wave will be caused by theheterogeneity itself, and thus may be used to detect and locate theheterogeneity. The characteristics of the wavefield associated with alocal object depend on the relationship between the size (diameter) ofthe object a, the dominant wavelength λ and the diameter of theFresnel zone d=(L·λ/2)0.5, where L is the distance between thereceiver and the object. Very small objects (a≫d) generate diffractedwaves, which usually have very small amplitudes and cannot bereliably detected on seismic records. When, on the other hand, theobject size is comparable with d, the amplitudes of the wavesgenerated (scattered) by such object approach those of the reflectedwaves, while their kinematic characteristics (traveltimes) are close tothose of diffracted waves. The kinematic properties of this scatteringwave can be described as:
Td =ffiffiffiffiffiffiffiffiffiffiffiffiffiffiffiffiffiffiffiffiffiffiffiffiffiffiffiffiffiffiffiffiffiffiffiffiffiffiffiffiffiffiffiffiffiffiffiffiffiffiffiXD � XSð Þ2 + ZD � ZSð Þ2
q= V +
ffiffiffiffiffiffiffiffiffiffiffiffiffiffiffiffiffiffiffiffiffiffiffiffiffiffiffiffiffiffiffiffiffiffiffiffiffiffiffiffiffiffiffiffiffiffiffiffiffiffiffiffiXR � XDð Þ2 + ZR � ZDð Þ2
q= V ð1Þ
where V is the average velocity of seismic waves in the host medium,XR, XS are the source and receiver locations, respectively and XD, ZD arethe coordinates of a fictitious point (approximately the center of theheterogeneity in our case).
2.2. Detection of diffracted waves
The imaging algorithm for the detection of underground hetero-geneities should emphasize scattering objects and not be too sensitiveto the presence of continuous and smooth interfaces, which generatereflected and/or refracted waves. For example, it is clear that a so-called stacked section, conventionally used in seismic reflectionimaging, cannot be employed here, since the stacking procedureemphasizes reflected waves and tends to eliminate diffraction/scattering events. For the detection of scattering objects we use theso-called D-section (diffraction section) algorithm (Landa and Keydar,1998), which is based on the phase correlation of the diffraction
signals on the observed seismic records. The data are analyzed alongdifferent curves to find the curve closest to the travel time of thesignal.
Let us assume that the wave emitted at source point X0 is diffractedon point C and emerges at point Xk (Fig. 1).
The element of the front caustic (evolute of the front) Esurrounding point E0 is regarded as an image of the wave frontelement surrounding the image point Xim. The time correction, Δτk foran arbitrary trace к corresponding to the image point Xim, source X0
and receiver Xk can be described as:
Δτk = τ X0Cð Þ + τ CXkð Þ−2⋅τ XimCð Þ = X0Do + XkDkð Þ= Vref ð2Þ
where Vref is the near-surface velocity, X0C is the travel pass from thesource X0 to the diffraction point C, CXk is the travel pass from thediffraction point to the receiver Xk, XimC is the travel pass from theimaging point Xim to the diffraction point С.
By choosing a different order of approximation for the wave front,various parameterized relations for time corrections can be obtained.The order of approximation depends on model complexity and thedistance between the image point location and the maximum offsetused. For a wide class of models and moderate offsets, the wave frontcan be approximated as an arc of a circle (spherical approximation).This means that the caustic of the front shrinks to a point; in this casethe radius of the wave front curvature Rim at the point Xim can be usedto compute the local time correction for the k–th trace. The followingsimple relation can be written:
Δτk =ffiffiffiffiffiffiffiffiffiffiffiffiffiffiffiffiffiffiffiffiffiffiffiffiffiffiffiffiffiffiffiffiffiffiffiffiffiffiX0−Ximð Þ2 + R2
im
q+
ffiffiffiffiffiffiffiffiffiffiffiffiffiffiffiffiffiffiffiffiffiffiffiffiffiffiffiffiffiffiffiffiffiffiffiffiffiXk−Ximð Þ2 + R2
im
q� �= Vref−2Rim = Vref ð3Þ
The unknown parameter Rim can be estimated using the wavecorrelation procedure which consists of finding parameter Rim whichmaximizes the semblance functional (Taner and Koehler, 1969)calculated for seismic records in a time window along the traveltime curve defined by expression Eq. (3).
The correlation procedure described above is repeated for eachimage point and for each time sample forming a D-section.
3. Implementation of diffraction imaging in the Dead Sea area
3.1. Introduction
Hazardous sinkholes started to appear in alluvial fans andunconsolidated sediments along the western Dead Sea coast in

49S. Keydar et al. / Journal of Applied Geophysics 71 (2010) 47–52
1990. Since then hundreds of sinkholes have appeared from north tosouth along the shoreline (Fig. 2). All these sinkholes represent adanger to life and property and negative affect development in thearea.
3.2. South Nahal Hever
A schematic presentation of the geological structure of the site isshown in Fig. 3 (Yechieli et al., 2002). The section (borehole SH-2) iscomposed of alluvial fan sediments down to 18 m deep, a 5 m thickmarl layer and an 11 m thick salt layer. The salt layer is underlain byclay and gravel. The elevation of the area is approximately −393 m.The water table in the area was measured at a depth of 17.2 m inOctober 2000 and at 18.5 m in April 2002. The top of the salt layer is ata depth of 24 m from the surface and 5–6 m below the water table. Inborehole SH-3, a mud filled cave was detected at the depth of 23–
Fig. 2. Sinkhole sites along the Dead Sea shore: 1— Palms, 2— Samar Spring, 3— Shalem andNahal Hever southern, 8 — Asa'el, 9 — Nahal Zeelim, 10 — Mezada, 11 — Rahaf, 12 — Mor, 1(From Arkin and Gilat, 2000; Yechieli et al., 2002).
29 m, which is assumed to be the result of the salt layer dissolution.The visible section of sinkholes consists of sand–gravel intercalatingclay–sand layers. There are also signs of iron oxide mineralization. Agroup of sinkholes about 20–50 m apart appeared in July 1998. Thesesinkholes (2.0–3.0 m deep and up to 3 m in diameter) did not changetheir appearance over approximately 8–9 months, but then their sizesbegan to vary over some time and, at present, there are sinkholeclusters up to 50–100 m in diameter. Sinkhole disposition throughoutthe area is represented in Fig. 3.2. Sinkholes are marked by differentcolors with respect to their appearance. These ones existed during theseismic diffraction study are marked by pink. In order to test thefeasibility of the diffraction imaging to detect cavities the data wereacquired in the vicinity of a well in which a water filled cavity wasencountered in a salt layer within the depth range of 21–27 m (Fig. 3).The cavity can be assumed to serve as a diffractor. The seismic surveycarried out at the site. The length of the receiver line was 117.5 m and
Mineral Beach, 4— Ein Gedi and Nahal Arugot, 5— Yesha, 6—Nahal Hever northern, 7—
3 — Newe Zohar, 14 — Nahal Hemar, 15 — Lisan Peninsula, and 16 — Ghor Al-Haditha.
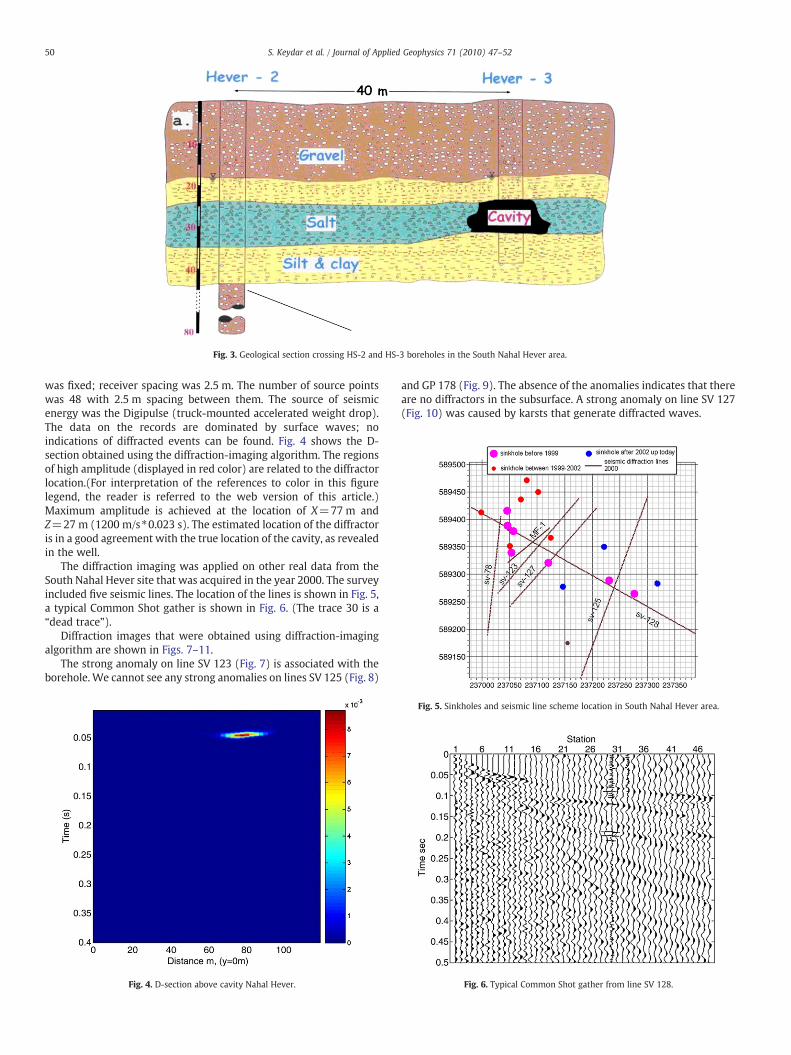
Fig. 3. Geological section crossing HS-2 and HS-3 boreholes in the South Nahal Hever area.
50 S. Keydar et al. / Journal of Applied Geophysics 71 (2010) 47–52
was fixed; receiver spacing was 2.5 m. The number of source pointswas 48 with 2.5 m spacing between them. The source of seismicenergy was the Digipulse (truck-mounted accelerated weight drop).The data on the records are dominated by surface waves; noindications of diffracted events can be found. Fig. 4 shows the D-section obtained using the diffraction-imaging algorithm. The regionsof high amplitude (displayed in red color) are related to the diffractorlocation.(For interpretation of the references to color in this figurelegend, the reader is referred to the web version of this article.)Maximum amplitude is achieved at the location of X=77 m andZ=27 m (1200 m/s⁎0.023 s). The estimated location of the diffractoris in a good agreement with the true location of the cavity, as revealedin the well.
The diffraction imaging was applied on other real data from theSouth Nahal Hever site that was acquired in the year 2000. The surveyincluded five seismic lines. The location of the lines is shown in Fig. 5,a typical Common Shot gather is shown in Fig. 6. (The trace 30 is a“dead trace”).
Diffraction images that were obtained using diffraction-imagingalgorithm are shown in Figs. 7–11.
The strong anomaly on line SV 123 (Fig. 7) is associated with theborehole. We cannot see any strong anomalies on lines SV 125 (Fig. 8)
Fig. 4. D-section above cavity Nahal Hever.
and GP 178 (Fig. 9). The absence of the anomalies indicates that thereare no diffractors in the subsurface. A strong anomaly on line SV 127(Fig. 10) was caused by karsts that generate diffracted waves.
Fig. 5. Sinkholes and seismic line scheme location in South Nahal Hever area.
Fig. 6. Typical Common Shot gather from line SV 128.
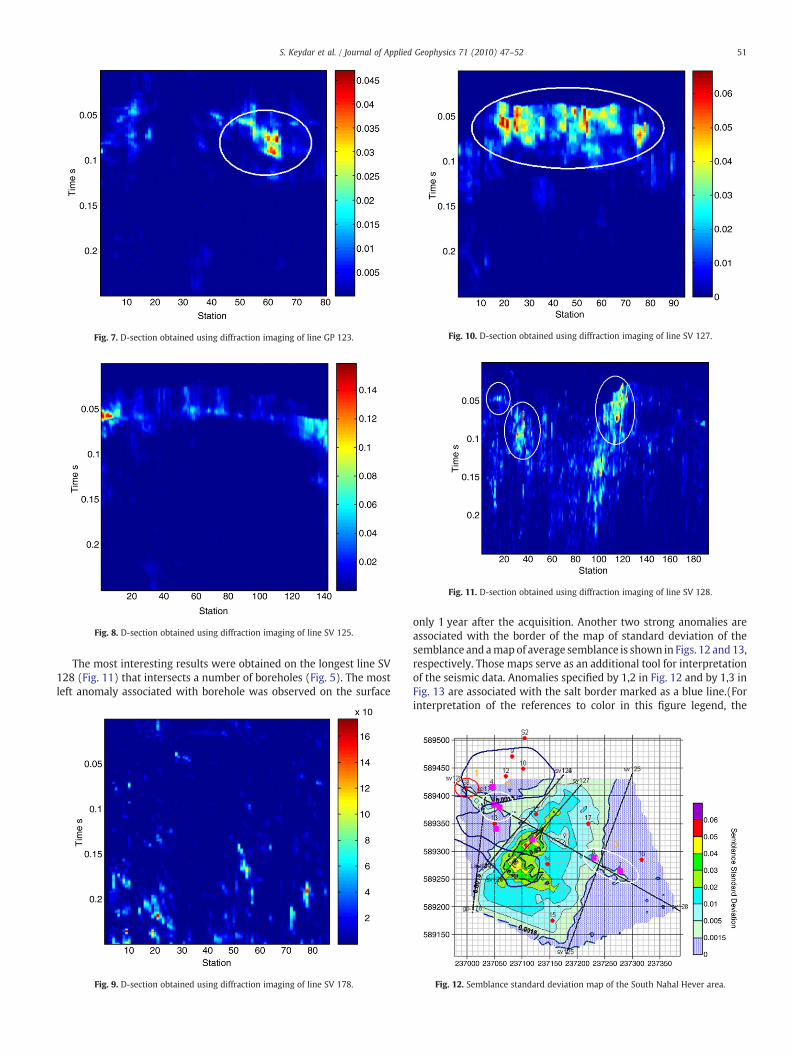
Fig. 7. D-section obtained using diffraction imaging of line GP 123.
Fig. 8. D-section obtained using diffraction imaging of line SV 125.
Fig. 10. D-section obtained using diffraction imaging of line SV 127.
Fig. 11. D-section obtained using diffraction imaging of line SV 128.
51S. Keydar et al. / Journal of Applied Geophysics 71 (2010) 47–52
The most interesting results were obtained on the longest line SV128 (Fig. 11) that intersects a number of boreholes (Fig. 5). The mostleft anomaly associated with borehole was observed on the surface
Fig. 9. D-section obtained using diffraction imaging of line SV 178.
only 1 year after the acquisition. Another two strong anomalies areassociated with the border of the map of standard deviation of thesemblance and amapof average semblance is shown in Figs. 12 and13,respectively. Those maps serve as an additional tool for interpretationof the seismic data. Anomalies specified by 1,2 in Fig. 12 and by 1,3 inFig. 13 are associated with the salt border marked as a blue line.(Forinterpretation of the references to color in this figure legend, the
Fig. 12. Semblance standard deviation map of the South Nahal Hever area.
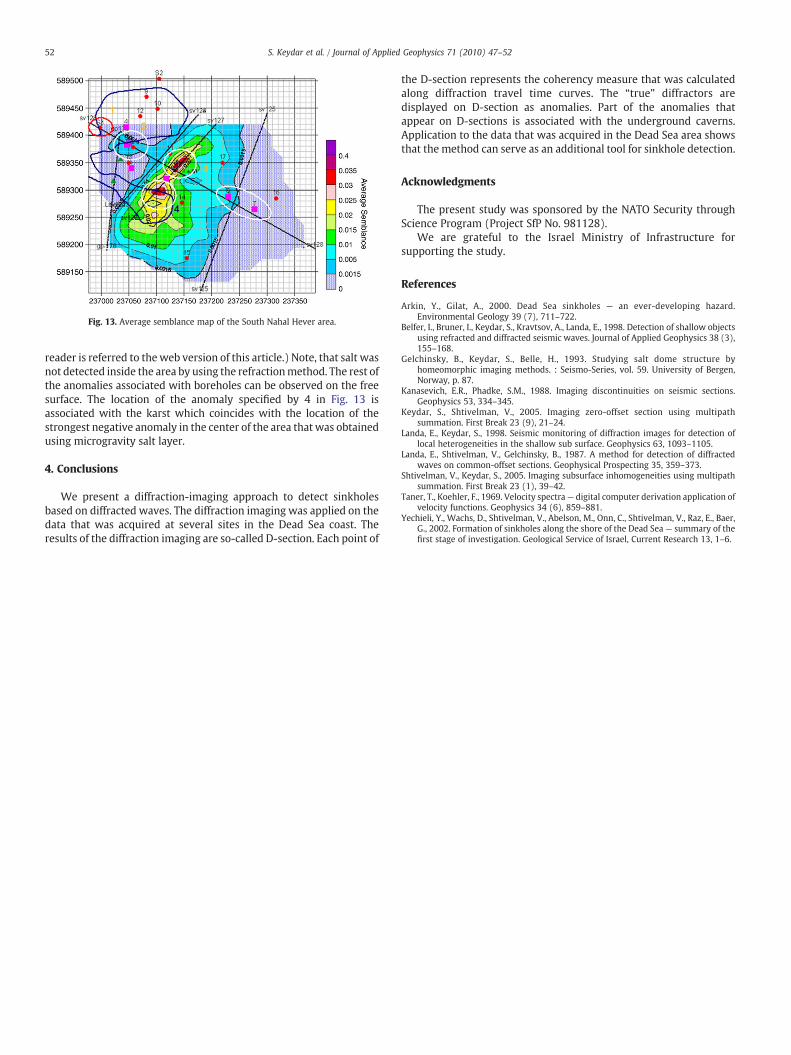
Fig. 13. Average semblance map of the South Nahal Hever area.
52 S. Keydar et al. / Journal of Applied Geophysics 71 (2010) 47–52
reader is referred to theweb version of this article.) Note, that salt wasnot detected inside the area by using the refractionmethod. The rest ofthe anomalies associated with boreholes can be observed on the freesurface. The location of the anomaly specified by 4 in Fig. 13 isassociated with the karst which coincides with the location of thestrongest negative anomaly in the center of the area that was obtainedusing microgravity salt layer.
4. Conclusions
We present a diffraction-imaging approach to detect sinkholesbased on diffracted waves. The diffraction imaging was applied on thedata that was acquired at several sites in the Dead Sea coast. Theresults of the diffraction imaging are so-called D-section. Each point of
the D-section represents the coherency measure that was calculatedalong diffraction travel time curves. The “true” diffractors aredisplayed on D-section as anomalies. Part of the anomalies thatappear on D-sections is associated with the underground caverns.Application to the data that was acquired in the Dead Sea area showsthat the method can serve as an additional tool for sinkhole detection.
Acknowledgments
The present study was sponsored by the NATO Security throughScience Program (Project SfP No. 981128).
We are grateful to the Israel Ministry of Infrastructure forsupporting the study.
References
Arkin, Y., Gilat, A., 2000. Dead Sea sinkholes — an ever-developing hazard.Environmental Geology 39 (7), 711–722.
Belfer, I., Bruner, I., Keydar, S., Kravtsov, A., Landa, E., 1998. Detection of shallow objectsusing refracted and diffracted seismic waves. Journal of Applied Geophysics 38 (3),155–168.
Gelchinsky, B., Keydar, S., Belle, H., 1993. Studying salt dome structure byhomeomorphic imaging methods. : Seismo-Series, vol. 59. University of Bergen,Norway, p. 87.
Kanasevich, E.R., Phadke, S.M., 1988. Imaging discontinuities on seismic sections.Geophysics 53, 334–345.
Keydar, S., Shtivelman, V., 2005. Imaging zero-offset section using multipathsummation. First Break 23 (9), 21–24.
Landa, E., Keydar, S., 1998. Seismic monitoring of diffraction images for detection oflocal heterogeneities in the shallow sub surface. Geophysics 63, 1093–1105.
Landa, E., Shtivelman, V., Gelchinsky, B., 1987. A method for detection of diffractedwaves on common-offset sections. Geophysical Prospecting 35, 359–373.
Shtivelman, V., Keydar, S., 2005. Imaging subsurface inhomogeneities using multipathsummation. First Break 23 (1), 39–42.
Taner, T., Koehler, F., 1969. Velocity spectra— digital computer derivation application ofvelocity functions. Geophysics 34 (6), 859–881.
Yechieli, Y., Wachs, D., Shtivelman, V., Abelson, M., Onn, C., Shtivelman, V., Raz, E., Baer,G., 2002. Formation of sinkholes along the shore of the Dead Sea — summary of thefirst stage of investigation. Geological Service of Israel, Current Research 13, 1–6.
Copyright © 2022 FDOKUMEN