Application of Perception-Promotion Matrix Model—The Case of Kaohsiung City
22
Journal of Travel & Tourism Marketing, 29:163–184, 2012 Copyright © Taylor & Francis Group, LLC ISSN: 1054-8408 print / 1540-7306 online DOI: 10.1080/10548408.2012.648547 APPLICATION OF PERCEPTION-PROMOTION MATRIX MODEL—THE CASE OF KAOHSIUNG CITY Huei-Ju Chen Po-Ju Chen Ming-Hung Wang ABSTRACT. While a substantial amount of destination image research has been performed, few researchers have explored image perception gaps between tourists and government promotions. This study examines the perception gap between blogs and destination marketing organizations (DMOs) pro- motions by introducing a four-quadrant diagnostic tool: the Perception-Promotion Matrix (PPM). This case study collected data from 168 domestic and 64 international blogs, and 70 Chinese and 36 English official Kaohsiung City promotional websites to investigate image gap. The findings revealed signif- icant “Tourist Infrastructure” image perception gaps, both from domestic and international traveler perspectives. The PPM suggests Kaohsiung City DMOs successfully promote an image of culture by hosting events and festivals. However, analysis indicates failure on the part of these DMOs to promote an image of Kaohsiung as an Ocean capital. Recommendations resulting from this study are provided for Kaohsiung City DMO consideration. KEYWORDS. Perception-Promotion Matrix (PPM), image perception gap, destination image, blog, official promotion information INTRODUCTION Previous studies of destination image focused primarily on the perspective of tourists. Some researchers suggested analysis of negative images held by tourists should incorporate the perspectives of both tourists and destina- tion marketing organizations (DMOs; Gallarza, Saura, & Garcia, 2002). Tasci and Gartner Dr. Huei-Ju Chen is Associate Professor in the Department of Leisure, Recreation and Tourism at the National Kaohsiung University of Hospitality and Tourism, No. 1, Sung-Ho Road, Shiao-Kang, Kaohsiung, Taiwan (E-mail: [email protected]). Dr. Po-Ju Chen is Associate Professor in the Rosen College of Hospitality Management at the University of Central Florida in Orlando, FL, USA. Mr. Ming-Hung Wang, is a Research Assistant at the National Kaohsiung University of Hospitality and Tourism in Kaohsiung, Taiwan. The authors would like to thank the National Science Council of the Republic of China for financially supporting this research under Contract No. NSC 96-2415-H-328-003-SS2. Address correspondence to: Dr. Huei-Ju Chen at the above address. (2007) developed a model which provides a functional image incorporating various aspects of tourism supply and demand. Although many researchers have investigated destination image, few have explored whether an image percep- tion gap exists between tourists and government promotions. As such, it is not only important to determine if “image gaps” exist, but also to understand the reason for the disconnect 163
Transcript of Application of Perception-Promotion Matrix Model—The Case of Kaohsiung City
Journal of Travel & Tourism Marketing, 29:163–184, 2012Copyright © Taylor & Francis Group, LLCISSN: 1054-8408 print / 1540-7306 onlineDOI: 10.1080/10548408.2012.648547
APPLICATION OF PERCEPTION-PROMOTIONMATRIX MODEL—THE CASE OF KAOHSIUNG CITY
Huei-Ju ChenPo-Ju Chen
Ming-Hung Wang
ABSTRACT. While a substantial amount of destination image research has been performed, fewresearchers have explored image perception gaps between tourists and government promotions. Thisstudy examines the perception gap between blogs and destination marketing organizations (DMOs) pro-motions by introducing a four-quadrant diagnostic tool: the Perception-Promotion Matrix (PPM). Thiscase study collected data from 168 domestic and 64 international blogs, and 70 Chinese and 36 Englishofficial Kaohsiung City promotional websites to investigate image gap. The findings revealed signif-icant “Tourist Infrastructure” image perception gaps, both from domestic and international travelerperspectives. The PPM suggests Kaohsiung City DMOs successfully promote an image of culture byhosting events and festivals. However, analysis indicates failure on the part of these DMOs to promotean image of Kaohsiung as an Ocean capital. Recommendations resulting from this study are providedfor Kaohsiung City DMO consideration.
KEYWORDS. Perception-Promotion Matrix (PPM), image perception gap, destination image, blog,official promotion information
INTRODUCTION
Previous studies of destination image focusedprimarily on the perspective of tourists. Someresearchers suggested analysis of negativeimages held by tourists should incorporatethe perspectives of both tourists and destina-tion marketing organizations (DMOs; Gallarza,Saura, & Garcia, 2002). Tasci and Gartner
Dr. Huei-Ju Chen is Associate Professor in the Department of Leisure, Recreation and Tourism at theNational Kaohsiung University of Hospitality and Tourism, No. 1, Sung-Ho Road, Shiao-Kang, Kaohsiung,Taiwan (E-mail: [email protected]).
Dr. Po-Ju Chen is Associate Professor in the Rosen College of Hospitality Management at the Universityof Central Florida in Orlando, FL, USA.
Mr. Ming-Hung Wang, is a Research Assistant at the National Kaohsiung University of Hospitality andTourism in Kaohsiung, Taiwan.
The authors would like to thank the National Science Council of the Republic of China for financiallysupporting this research under Contract No. NSC 96-2415-H-328-003-SS2.
Address correspondence to: Dr. Huei-Ju Chen at the above address.
(2007) developed a model which provides afunctional image incorporating various aspectsof tourism supply and demand. Although manyresearchers have investigated destination image,few have explored whether an image percep-tion gap exists between tourists and governmentpromotions. As such, it is not only importantto determine if “image gaps” exist, but alsoto understand the reason for the disconnect
163

164 JOURNAL OF TRAVEL & TOURISM MARKETING
between official government information andtraveler preferences. To this end, an analysistool must be developed to assess the practi-cal managerial implications of this gap. Theproposed Perception-Promotion Matrix (PPM)analysis builds on ideas used in Importance-Performance Analysis (IPA), which has beenused as a popular tool in hospitality and tourismresearch (Oh, 2001) since Martilla and James(1977) first demonstrated the simple techniquemore than 34 years ago. IPA is conceptu-ally rooted in multi-attribute models used toidentify strengths and weaknesses of a marketoffering in terms of two criteria used by con-sumers in decision-making; it combines mea-sures of attribute importance and performanceinto a two-dimensional grid. Application of theIPA technique begins with identification of theattributes relevant to the choice under consider-ation. The list of attributes is typically developedafter reviewing relevant literature, conductingfocus-group interviews, and using managerialjudgment.
However, despite the relevance and popular-ity of IPA in hospitality and tourism studies,“several conceptual and practical issues inher-ent in using the IPA technique” (Oh, 2001,p. 617) are known to exist. Among these are:
1. lack of a clear definition for the concept ofimportance;
2. mixed uses of importance and expectation;3. lack of research focusing on absolute ver-
sus relative importance;4. absence of a clear criterion variable for the
IPA framework as a whole;5. absence of guidelines for developing a set
of attributes to be used;6. use of actual means versus scale means in
constructing the IPA grid;7. potential misclassifications of attributes
on the IPA grid.
Given these known limitations, PPM wasdeveloped with the intent of building upon thestrengths of IPA while mitigating the limita-tions identified by Oh (2001). This study devel-oped PPM to analyze a destination image gapfrom the perspectives of supply and demand.PPM built on IPA’s evaluation and analysis
process by investigating the overall image of adestination based on both government promo-tional websites and tourist blog postings.
The Internet is a popular topic of discussionin the fields of tourism marketing and destina-tion image research (Choi, Lehto, & Morrison,2007). Travel-related purchases account forroughly 37.9% of all e-commerce worldwide(Lo, 2006). In order to increase awareness, manyDMOs are designing government-sponsoredtourism websites (Horng & Tsai, 2010). Thesewebsites are arguably becoming a significantmeans of advertising, allowing tourists to aug-ment the personal opinions of close friends,family members, and co-workers with those ofstrangers located around the world, made avail-able via the Internet (Pan, MacLaurin, & Crotts,2007). The Internet has had a significant impacton communications and information dissemina-tion, for both the government marketing supplyside, as well as for tourists on the demand side.Among digitized word-of-mouth communica-tion mediums, blogs are increasingly gaining inpopularity (Pan et al., 2007).
Added to this economic activity are anestimated 70 million Internet blogs (“blogo-sphere”), a number that is currently doublingsemi-annually (Dave, 2007). Blogs, among themost widely used resources in this century(Scoble & Israel, 2006), provide a readily avail-able means for sharing opinions and experi-ences. On average, bloggers post 50,000 newarticles per hour and 120,000 new entries perday (Huang, Chou, & Lin, 2010); this hasgenerated an emergent communication bridgewherein blogs have become an influentialmedium and a new marketing power (Lee,Im, & Taylor, 2008; Lin & Huang, 2006;Litvin, Goldsmith, & Pan, 2008; Thevenot,2007). To date, few tourism researchers haveutilized blogs to explore destination image ande-commerce trends. Furthermore, blogs and offi-cial government websites have been overlookedas a valuable resource which could furtheraid in the understanding of the relationship(s)between Internet promotion performance anddestination image discrepancies. As such, thisstudy explores this overlooked data-rich envi-ronment by tapping web-based official promo-tional information and tourist blogs to obtain
Chen, Chen, and Wang 165
additional insights into destination image andthe underlying causes of perception gaps.
The purpose of this study was twofold: First,it developed a diagnostic tool (the PPM) forDMOs to assess the gap between image per-ception and tourism marketing programs; andsecond, to demonstrate PPM by applying it toa case study of one destination’s marketingstrategies.
Kaohsiung is the largest city in southernTaiwan and has the sixth-largest harbor in theworld. To generate a better destination image,the Kaohsiung City Government (KCG) hasinvested heavily since 2000 to improve the city’sinfrastructure, renovate landmarks, and hostnumerous festivals and activities. KCG has alsoworked to transform the city’s industrial imageinto that of a safe, healthy, and energetic (SHE)city. KCG has invested considerable manpowerand financial resources in hosting more than50 special events and festivals—including theInternational Flags and Drums Carnival duringthe Lantern Festival, the Dragon Boat Race, theInternational Container Arts Festivals, and oth-ers. It has also encouraged residents to embracecultural changes, such as smiling at interna-tional tourists, and promoted efforts to reducelanguage barriers (Department of Information,KCG, 2007). Due to the city’s rich marineresources and its ranking as the sixth-largestcontainer-service port in the world (M.O.T.C.,Republic of China, 2007), KCG would alsolike for Kaohsiung to be known as the “OceanCapital.” To provide residents and tourists withmore leisure areas, many ports have been ren-ovated to creative new images—such as theSinguang Ferry Wharf, the Pier-2 Art District,and Cijin Seaside Park. To enhance city attrac-tiveness and further improve quality of life, thelocal government has remodeled the areas bor-dering Love River, and transformed the formerBritish Consulate at Dagou into a recreationcenter. A 2007 Tourism Bureau survey rankedthe Love River and Cijin Seaside Park as thesecond and third most popular destinations inTaiwan (Hsu, 2007).
Despite KCG’s best efforts to increasetourism, visits by international tourists toKaohsiung decreased by 11.12% in 2001 and7.69% in 2005 (M.O.T.C., Republic of China,
2007). Previous research suggested KCG’stourism policy is unable to meet the expec-tations and demands of international tourists,and the destination image of Kaohsiung lacksidentity and may be too vague (Cheng, 2004;Chuang, 2004; Fang, 2004; Chiang, 2006).In order to better understand if a relation-ship exists between destination image and thedecrease in tourism, this study investigatedKaohsiung’s destination image from the per-spective of tourists as expressed on the Internet,along with the image promoted by KCG. It istherefore appropriate, given the lack of under-standing and the relative dearth of research inthis specific area, to examine these topics withinthe framework established by this study.
LITERATURE REVIEW
This section reviews the research literaturein three areas: destination image, blog postings,and the city of Kaohsiung, Taiwan. The first sec-tion defines “destination image” as used in thisstudy and clarifies the components used in theformation of a destination image. The secondsection defines and describes the developmentof blogs and their relevance. The third sectiondescribes the application of PPM to a case studyof Kaohsiung City.
Destination Image
Tourism research has extensively examinedimage formation and its importance due to itscomplex nature and its influence on touristdecision-making (Choi et al., 2007). Boulding(1956) first explored the concept of image for-mation in terms of economics, presenting imageformation as an economic activity. He demon-strated that knowledge, information, and imagesimultaneously influence human behavior. Thedefinition of “image” varies among scholars,but it is generally accepted as “a compilationof beliefs and impressions based on process-ing information from a variety of sources overtime” (Hunt, 1975; Crompton, 1979; Fakeye &Crompton, 1991). This means that image is aninternally accepted mental construct represent-ing attributes, and possible benefits, of a productor destination (Crompton, 1979; Gartner, 1993;
166 JOURNAL OF TRAVEL & TOURISM MARKETING
Mackay & Fesenmaier; 2000; Gallarza et al.,2002).
The concept of image was later applied totourism research specifically in terms of “des-tination image” which can be defined as anoverall perception or a series of impressionsregarding a place or a destination (Hunt, 1975;Phelps, 1986). Hunt was the first to exploredestination image in his 1971 research. Themultidisciplinary value of destination imagehas become well-recognized and has spawnednumerous and varied approaches to researchin a variety of fields (Sternquist Witter, 1985;Gartner & Hunt, 1987; Embacher & Buttle,1989; Reilly, 1990; Echtner & Ritchie, 1991;Fakeye & Crompton, 1991; Driscoll, Lawson, &Niven, 1994; Gallarza et al., 2002) suchas anthropology (Selwyn, 1996), sociology(Meethan, 1996), geography (Draper & Minca,1997), semiotics (Sternberg, 1997), and mar-keting (Gunn, 1972). Destination image hasalso been demonstrated to represent tourist atti-tudes toward a destination (Mountinho, 1987)and to influence tourist behaviors (Hunt, 1975;Fakeye & Crompton, 1991). An abundance ofdestination image research, accumulated over3 decades, has thus helped to clarify touristbehaviors (Gallarza et al., 2002).
During the 1970s, destination image researchtended to focus only on states or places, untilCrompton (1979) defined “destination image”as a combination of beliefs, ideas, and impres-sions a person has of a destination; this hasnow become the commonly accepted definition.In the 1980s, researchers assessed destinationimage in terms of an attitude about a desti-nation, dividing it into cognitive and evalua-tive components (Embacher & Buttle, 1989).However, tourist behaviors are the focus, andsince the 1990s destination image has been rec-ognized as the antecedent variable influencingtourist travel behaviors. Gartner (1993) pro-posed a hierarchical relationship in formattingdestination image. According to this model,travel behaviors are comprised of stages—suchas classified as organic, solicited organic, unso-licited organic, autonomous, covert induced, andovert induced. Baloglu and McCleary (1999)also argued that destination image affects touristdecision making. As such, destination image
can be viewed as a holistic concept comprisingbeliefs, ideas, and tourist impressions of a des-tination that influences attitudes and behaviorstoward the destination.
Many studies have thoroughly explored des-tination image, but have generally omitted holis-tic components related to destination image,largely due to the research methods employed(Echtner & Ritchie, 1991). Researchers usu-ally apply common destination attributes torepresent destination image by means of struc-tured methods, such as Likert and semanticdifferential scales (Jenkins, 1999). Beerli andMartin (2004) developed and empirically val-idated a model which explains the differentfactors which form the post-visit image of adestination. The different components of theperceived image, and the factors which influ-enced its formation included both sources ofinformation (primary and secondary), stimuliinfluencing perception formation, pre- and post-destination visit evaluations, motivation, accu-mulated touristic experiences, and sociodemo-graphic characteristics. Nevertheless, Echtnerand Ritchie (1993) argued that destinationimage should be measured not only in quan-titative terms, but in qualitative terms as well.Other researchers have argued both the func-tional image and the psychological dimension ofa destination should be investigated (Choi et al.,2007; Woodside, Cruickshank, & Dehuang,2007). Therefore, this study applied both quanti-tative and qualitative research methodologies toexplore and clarify destination image formation.
As tourists increasingly rely on the Internetas a source of information about travel des-tinations, researchers have increasingly stud-ied the impact of the Internet on destinationimage as well. Frias, Rodriguez, and Castaneda(2007) concluded that destination image isworse when tourists use a travel agency andInternet together, compared with travel agencyuse alone; Choi et al. (2007) studied the onlineimage of Macau from different online infor-mation sources—which underscored the impor-tance of understanding the multiplicity of desti-nation image representations obtained from theweb, and the challenges of managing and deliv-ering the desired image of a destination online;Pan et al. (2007) discovered that travel blogs are
Chen, Chen, and Wang 167
an inexpensive means to gather rich, authentic,and unsolicited customer feedback and providea cost-effective method of monitoring perceivedimage for destination marketers; Govers, Go,and Kumar (2007) utilized online surveys andsuggested that tourism promotion does not havea major impact upon the perceptions of travel-ers, and further suggested that tourism authori-ties need to understand that successful tourismpromotion is dependent on a broad range ofexternal influences.
As few studies have explored differences indestination images held by domestic and foreigntourists, and few destination image studies havediscussed tourists and DMOs simultaneously,this study applied content analysis to exam-ine differences in destination images using dataobtained from DMOs, and domestic and foreigntourists.
Blogs
The Internet increasingly conveys massiveamounts of information to the general public,including information tailored to tourism mar-kets. Destination marketing organizations utilizethe Internet to reach target markets, and stud-ies have found the Internet plays an importantrole in tourism marketing and destination selec-tion (Li & Petrick, 2008; Loda, Coleman, &Backman, 2009; Puhringer & Taylor, 2008).Tourism practitioners and scholars recognize theimpact of the Internet as a paradigm shift fromtraditional tourism.
Xiang and Gretzel (2009) found that travelerswho browse online primarily obtain informationthrough Internet-based applications collectivelydefined as “social media” consisting primar-ily of five categories: virtual community sites,consumer review sites, social networking sites,personal blogs, and blog aggregates.
Blog is short for ”Weblog,” a medium whichallows users to log thoughts and viewpoints ona website (Barger, 1999). Blogs typically con-sist of a personal online journal with reflections,comments, and often hyperlinks provided by theauthor (“Blog,”, 2010). Generally, new infor-mation appears at the top of the page, allow-ing browsers to read from top (newer posts)to bottom (older posts). Essentially, a blog
is a personalized platform used to present anauthor’s opinions and experiences. Blogs pro-vide a user-friendly means to access informa-tion, manage presentation style, and categorizearticles. These features help readers searchfor articles and allow them to respond withtheir own viewpoints and opinions. Accordingto Lin (2004), blogs involve four “spiritualcharacteristics”:
1. They revolve around an author: Articlesare written from an author’s subjectivepoint of view.
2. They emphasize content: Authors attachimportance to data gathering, integrating,and article presentation.
3. They allow interaction: Authors recordtheir experiences and spread news.Authors and browsers interact throughlinkage and replies.
4. They reflect a life attitude: A blog isnot defined by software or a system, butpromotes a user’s right to speak, allow-ing introspection and information sharingwith others. Finally, blogs cultivate posi-tive social coherence.
A survey conducted by Technorati, the largestblog search engine host website, found thatmore than 70 million blogs existed as of April2007. In addition, the number of blogs dou-bled every 6 months, with 120,000 blogs createddaily (Dave, 2007). Various blogging programshave been developed, and increasing numbersof web hosting companies now supply blogservices. The increasing number of blogs willalmost certainly have an impact on knowledgemanagement, education, and virtual platformissues.
Travel blogs are digital forms of travel infor-mation; they are posted on the Internet andallow travelers to share experiences with oth-ers through first-hand narrative. Travel blogginghas become an important way for tourists toshare travel/vacation experiences, feelings, andthoughts about a destination (i.e., their desti-nation image). Blogs, along with online infor-mation from sources such as tourism network-ing sites, affect consumer destination perception(Xiang & Gretzel, 2009). Mack, Blose, and Pan

168 JOURNAL OF TRAVEL & TOURISM MARKETING
(2008) compared the effects of blogs and “word-of-mouth” on consumers and found that blogshave an “authoritativeness” that lends credibil-ity to the information presented. Informationposted by bloggers in consumer-to-consumer(C2C) sites may be perceived as more convinc-ing than information presented by destinationmarketing organizations (DMOs) in mass media(Schmallegger &d Carson, 2008).
Xiang and Gretzel (2009) found that virtualcommunity sites such as igougo.com and lone-lyplanet.com are the primary resources used bytravelers to share online information, with con-sumer review sites second, and personal blogsand blog aggregates third. Although blogs arenot the most dominant form of online travelinformation sharing, they have been recognizedas a “trusted resource that could help in makingpurchase decisions” and have been said to play“a role from the start of the information searchto the choices considered and finalizing pur-chase decisions” (Huang, Chou, & Lin, 2010,p. 514).
After researching tourism marketing, Carson(2005) identified five major functions adoptedby DMOs worldwide: promotion, communica-tion, management, research, and product dis-tribution. Government websites used to com-municate with travel markets have been clas-sified as government-to-consumer (G2C) blogs(Schmallegger & Carson, 2008). Travel blogscould be an alternate source of data forDMOs and businesses wishing to better under-stand their travel markets. For example, Crotts,Mason, and Davis (2009) applied stance-shiftanalysis when exploring Internet blog narrativesto measure guest satisfaction and determine thecompetiveness of three New York City hotels.Pan et al. (2007) analyzed data from major travelblog sites to determine a destination’s strengthsand weaknesses as perceived by bloggers. Theinformation provided by these studies couldbe used by travel-related businesses to refinemarketing strategies.
Although the concept of destination imagehas been examined extensively in tourism liter-ature due to its complex nature and its impor-tant role in influencing tourist decision making,research about the Internet is still in its infancy(Choi et al., 2007). The Internet is becoming
an important medium for tourism marketingand promotion of destination image. Touristscommonly post stories on blogs to express opin-ions and share experiences (Lin, 2004; Chen &Chang, 2003). Given this increasingly rele-vant communication medium, this study utilizeddomestic and foreign tourist blogs to meet itsresearch objectives.
The Application of PPM to KaohsiungCity
Perception-Promotion Matrix (PPM)
This study proposed the Perception-Performance Matrix (PPM) model, derived fromIPA, as a tool for DMOs to map tourist destina-tion image perceptions to promotion efforts.
IPA is conceptually related to the multi-attribute model first introduced in the late1970s (Martilla & James, 1977). IPA identifiesstrengths and weaknesses of a market offer-ing in terms of two criteria consumers use indecision making. One criterion is the relativeimportance of attributes. The other is evaluationof the offering in terms of those attributes.
IPA has been applied to a diverse range ofcontexts including banking (Ennew, Reed, &Binks, 1993), education (Alberty & Mihalik,1989), dentistry (Nitse & Bush, 1993),and health care (Hawes, Kiser, & Rao,1982; Hawes & Rao, 1985; Dolinsky, 1991;Dolinsky & Caputo, 1991). It has also beenapplied to evaluate a diverse set of tourism/
outdoor recreation contexts. Evaluationsinclude ski resorts (Hudson & Shephard, 1998;Uysal, Howard, & Jamrozy, 1991), escortedtours (Duke & Persia, 1996), visitor centers(Mengak, Dottavio, & O’Leary, 1986), cabins(Hollenhorst, Olson, & Fortney, 1992), parkconcessionaires (Burns, 1988), and hotel andhospitality (Lewis, 1985; Hollenhorst et al.,1992; Lewis & Chambers, 1989; Keyt, Yavas, &Riecken, 1994; Hsu, Byun, & Yang, 1998; Go &Zhang, 1997). Additionally, it has been used toformulate and evaluate tourism policy (Evans &Chon, 1989), and even to assess special eventssuch as municipal marathons (Guadagnolo,1985).
The traditional IPA method is based ontwo primary assumptions; performance and
Chen, Chen, and Wang 169
importance of attributes are independent vari-ables (Martilla & James, 1977; Oliver, 1997;Bacon, 2003), and a symmetric and linearrelationship between attribute performance andcustomer satisfaction exists. Previous stud-ies revealed the positive relationship betweenperformance and the importance levels ofattributes using the IPA grid (Mittal et al.,1998; Sampson & Showalter, 1999; Anderson &Mittal, 2000; Mittal & Katrichis, 2000; Mittalet al., 2001; Matzler, Sauerwein, & Heischmidt,2003). The Y-axis of the IPA grid representsthe customers’ perceived importance of selectedattributes, while the X-axis shows the prod-uct’s (or service’s) performance in relation tothese attributes. In addition, the quadrants reflectlevels of concentration of managerial initia-tives. By using a central tendency (i.e., mean ormedian) or a rank-order measure, the attributeimportance and performance scores are orderedand classified into high/low categories. By pair-ing these two sets of rankings, each attribute isthen placed into one of the four quadrants ofthe importance performance grid (Crompton &Duray, 1985). The vertical axis of the grid indi-cates the importance of the attributes from highto low and the horizontal axis represents theirperceived performance from high to low (Keytet al., 1994).
According to Keyt et al. (1994), Oh (2001),Ting and Cheng (2002), and Matzler et al.(2003, 2004), a number of IPA shortcomingsexist. Two inherent weaknesses are mentionedfrequently. First, IPA ignores performance vis-à-vis competitors (Burns, 1986). In other words,the performance measure of IPA needs to beaugmented with a relative performance mea-sure. Second, the importance attribute does notdiscriminate well among competing products(Engle, Blackwell, & Miniard, 1990) and directly
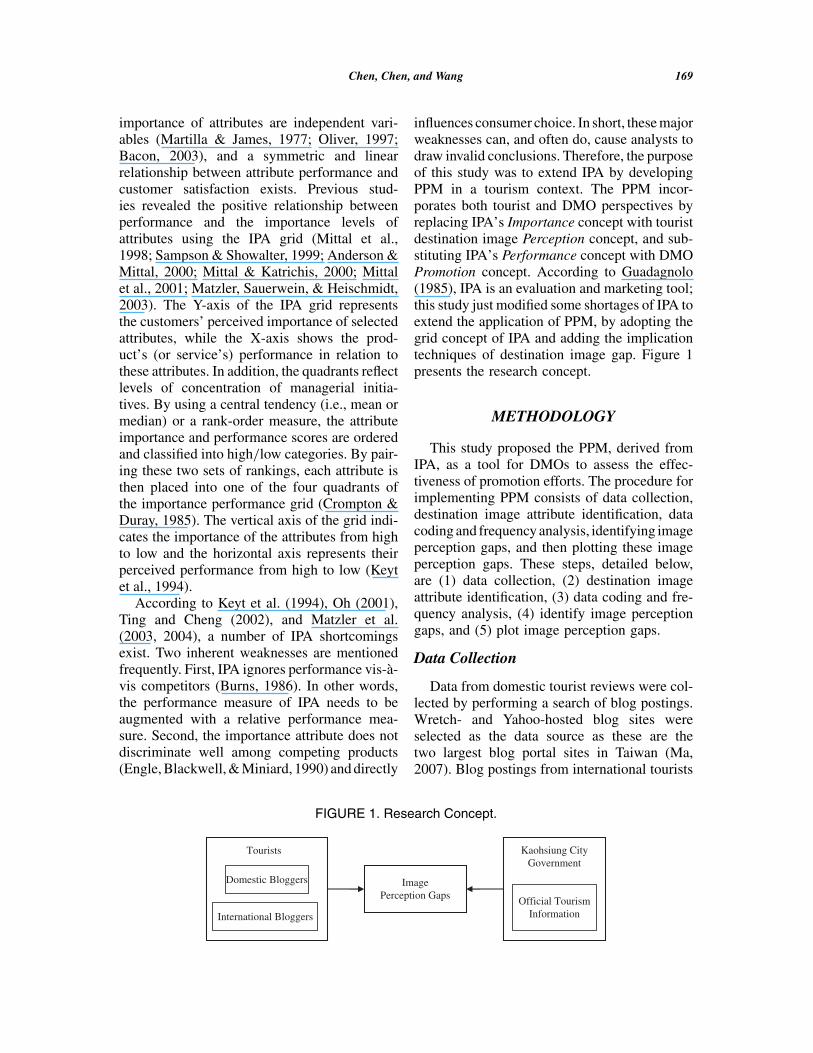
influences consumer choice. In short, these majorweaknesses can, and often do, cause analysts todraw invalid conclusions. Therefore, the purposeof this study was to extend IPA by developingPPM in a tourism context. The PPM incor-porates both tourist and DMO perspectives byreplacing IPA’s Importance concept with touristdestination image Perception concept, and sub-stituting IPA’s Performance concept with DMOPromotion concept. According to Guadagnolo(1985), IPA is an evaluation and marketing tool;this study just modified some shortages of IPA toextend the application of PPM, by adopting thegrid concept of IPA and adding the implicationtechniques of destination image gap. Figure 1presents the research concept.
METHODOLOGY
This study proposed the PPM, derived fromIPA, as a tool for DMOs to assess the effec-tiveness of promotion efforts. The procedure forimplementing PPM consists of data collection,destination image attribute identification, datacoding and frequency analysis, identifying imageperception gaps, and then plotting these imageperception gaps. These steps, detailed below,are (1) data collection, (2) destination imageattribute identification, (3) data coding and fre-quency analysis, (4) identify image perceptiongaps, and (5) plot image perception gaps.
Data Collection
Data from domestic tourist reviews were col-lected by performing a search of blog postings.Wretch- and Yahoo-hosted blog sites wereselected as the data source as these are thetwo largest blog portal sites in Taiwan (Ma,2007). Blog postings from international tourists
FIGURE 1. Research Concept.
Tourists
Domestic Bloggers
International Bloggers
ImagePerception Gaps
Kaohsiung CityGovernment
Official TourismInformation
170 JOURNAL OF TRAVEL & TOURISM MARKETING
were collected from Blogger, Technorati, MSNSpace, and TravelBlog. A total of 232 blogpostings (168 from domestic bloggers and64 from international bloggers) were collectedduring the June 2005 to December 2006 time-frame using keywords such as “Kaohsiung,”“Kaohsiung City,” “Gaoxiung,” etc.
Following collection of traveler data, gov-ernment destination promotional data werecollected from Kaohsiung travel-related infor-mation sources. These data were obtainedfrom 70 Chinese language and 36 Englishlanguage websites run by government tourism-related organizations such as KaohsiungCity Government, Kaohsiung Walking, andKaohsiung Travel Information (see Table 1).
The informational content from these datasources was saved in separate Microsoft Word“.doc” files. The saved files were then inte-grated and subjected to content analysis usingcomputer-assisted qualitative data analysis soft-ware (CAQDAS). CAQDAS was used to obtainfrequency counts of each image attribute foundin the official promotion website and travel blogdata.
Destination Image Attribute Identification
Destination image attribute identification wasconducted using a three-phase procedure. First,this study adopted the revised destination imageattributes suggested by Beerli and Martin
TABLE 1. Official Information Sources of KCG
Category Information sources
Official websites Kaohsiung City Government (http://www.kcg.gov.tw)
Kaohsiung Travel Information (http://www.kcg.gov.tw/travel)
Bureau of Cultural Affairs (http://www.khcc.gov.tw)
Public Works Bureau (http://pwse.kcg.gov.tw)
The World Games 2009 (http://www.worldgames2009.tw)
Kaohsiung Walking (http://kaohsiungwalking.kcg.gov.tw)
E-Paper Kaohsiung E-Paper (http://kaohsiungwalking.kcg.gov.tw/2005/Chinese/EPAPER/paper.htm)
Note. KCG = Kaohsiung City Government.
(2004). Second, the attributes were further ver-ified by tourism key informants. The list ofattributes was submitted to 11 Taiwanese aca-demics for review and approval. The academicswere selected because of their expertise inKaohsiung tourism destination image research.Third, data analysis was conducted usingCAQDAS for coding and analysis. Followingacademic review and approval, nine categoriesof destination image attributes were identified:natural resources; general infrastructure; touristinfrastructure; tourist leisure and recreation; cul-ture, history, and art; political and economic fac-tors; natural environment; social environment;and atmosphere of the area. Each category wasfurther divided into destination image attributesubcategories. For example, “natural resources”was subdivided into weather, beaches, wealth ofcountryside, and variety and uniqueness of floraand fauna.
Data Coding and Frequency Analysis
CAQDAS was initially developed to enhancethe accessibility of qualitative data by overcom-ing the physical limitations of paper data records(Richards & Richards, 1994). In addition to over-coming the limitations associated with paperrecords, computer-based CAQDAS programssupport coding processes. Coding involves thedisaggregation of data into text units that can thenbe categorized within a thematic or descriptiveclassification system (Boyatsis, 1998). The useof CAQDAS to code data enhances the efficiencyand effectiveness of this process in several ways.CAQDAS programs can streamline the mechan-ical aspects of cutting, pasting, and retrievingdata records (Bryman & Burgess, 1994; Mason,1994), freeing researchers to focus on analyticalprocedures (Thompson, 2002). CAQDAS alsoenables researchers to undertake finer-grainedcoding options, such as “line by line coding”(Creswell, 1998). By supporting coding of mul-tiple categories and providing greater flexibilityto represent complex data, researchers are ableto perform deeper, more detailed exploration ofthe data.
Based on the categories and attributes derivedfrom Beerli and Martin (2004) (both posi-tive and negative), the data were coded andcategorized into attribute relationship nodes.
Chen, Chen, and Wang 171
The frequency of each node was coded usingSPSS 12.0 (SPSS, Inc., Chicago, IL, USA) toidentify the destination image attribute distribu-tions contained in the information obtained fromthe domestic and foreign tourist blog postings,and official websites.
Identify Image Perception Gaps
Following CAQDAS coding, domestic andinternational destination image gaps were devel-oped by counting destination image attributefrequency differences between blog entries andDOM promotion websites. This approach, intro-duced by Steele and Fletcher (1991) imple-mented the Management Action Grid to depictperception problems from user and managerperspectives. In order to identify significant dif-ferences in attribute frequency using objectivecriteria, this study adopted non-parametric chi-square analysis, which is suitable for one valuedifference testing between two parties. Thisapproach was deemed an appropriate means todetermine whether a destination image percep-tion gap existed. In other words, the meaning of“gap” was extended to include other contexts,beyond the traditional expectation and percep-tion context. Doing so enabled this study toovercome the shortcomings of IPA by mov-ing beyond the service quality boundary, andproviding a broader operating domain (e.g., con-sumers or tourists).
Plot Image Perception Gaps
Using CAQDAS and SPSS, the mean desti-nation attribute frequencies for both blog andDOM website data were computed for usein establishing the PPM grid lines and defin-ing each quadrant. Afterward, all blogs andDMO attributes were plotted. The plot loca-tions reflect both the strength and weaknesses ofeach attribute and indicate areas for marketingstrategy improvement.
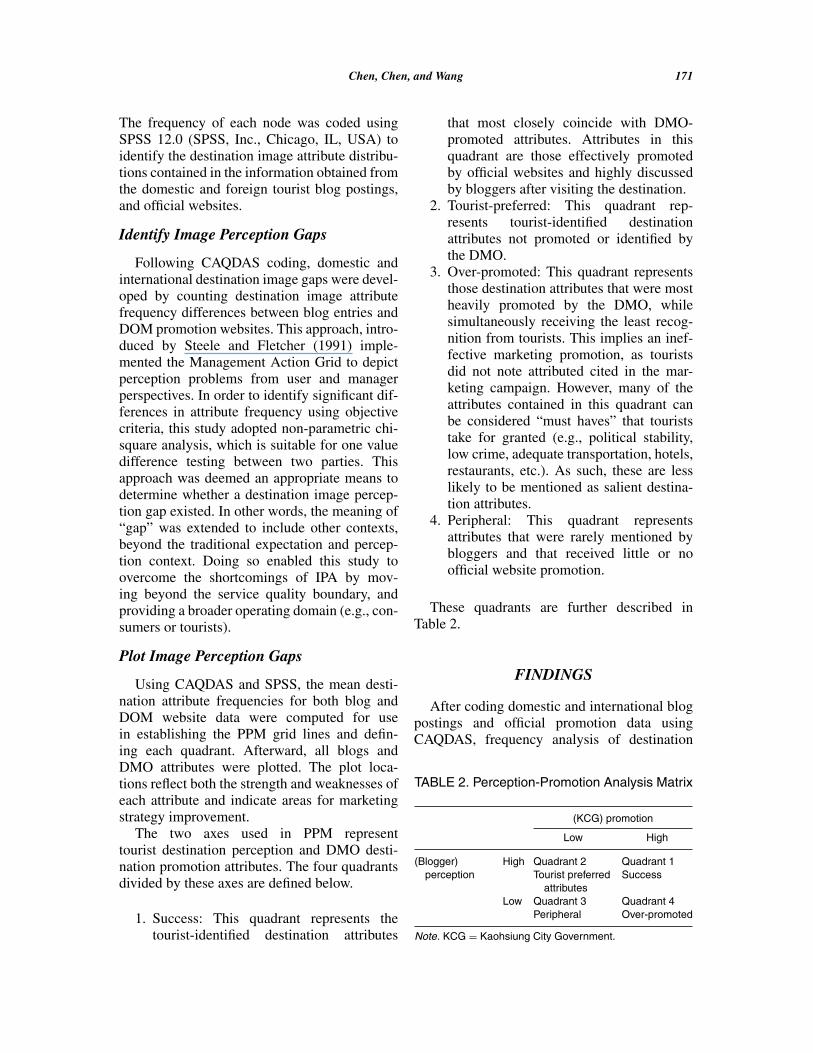
The two axes used in PPM representtourist destination perception and DMO desti-nation promotion attributes. The four quadrantsdivided by these axes are defined below.
1. Success: This quadrant represents thetourist-identified destination attributes
that most closely coincide with DMO-promoted attributes. Attributes in thisquadrant are those effectively promotedby official websites and highly discussedby bloggers after visiting the destination.
2. Tourist-preferred: This quadrant rep-resents tourist-identified destinationattributes not promoted or identified bythe DMO.
3. Over-promoted: This quadrant representsthose destination attributes that were mostheavily promoted by the DMO, whilesimultaneously receiving the least recog-nition from tourists. This implies an inef-fective marketing promotion, as touristsdid not note attributed cited in the mar-keting campaign. However, many of theattributes contained in this quadrant canbe considered “must haves” that touriststake for granted (e.g., political stability,low crime, adequate transportation, hotels,restaurants, etc.). As such, these are lesslikely to be mentioned as salient destina-tion attributes.
4. Peripheral: This quadrant representsattributes that were rarely mentioned bybloggers and that received little or noofficial website promotion.
These quadrants are further described inTable 2.
FINDINGS
After coding domestic and international blogpostings and official promotion data usingCAQDAS, frequency analysis of destination
TABLE 2. Perception-Promotion Analysis Matrix
(KCG) promotion
Low High
(Blogger)perception
High Quadrant 2 Quadrant 1Tourist preferred
attributesSuccess
Low Quadrant 3 Quadrant 4Peripheral Over-promoted
Note. KCG = Kaohsiung City Government.
172 JOURNAL OF TRAVEL & TOURISM MARKETING
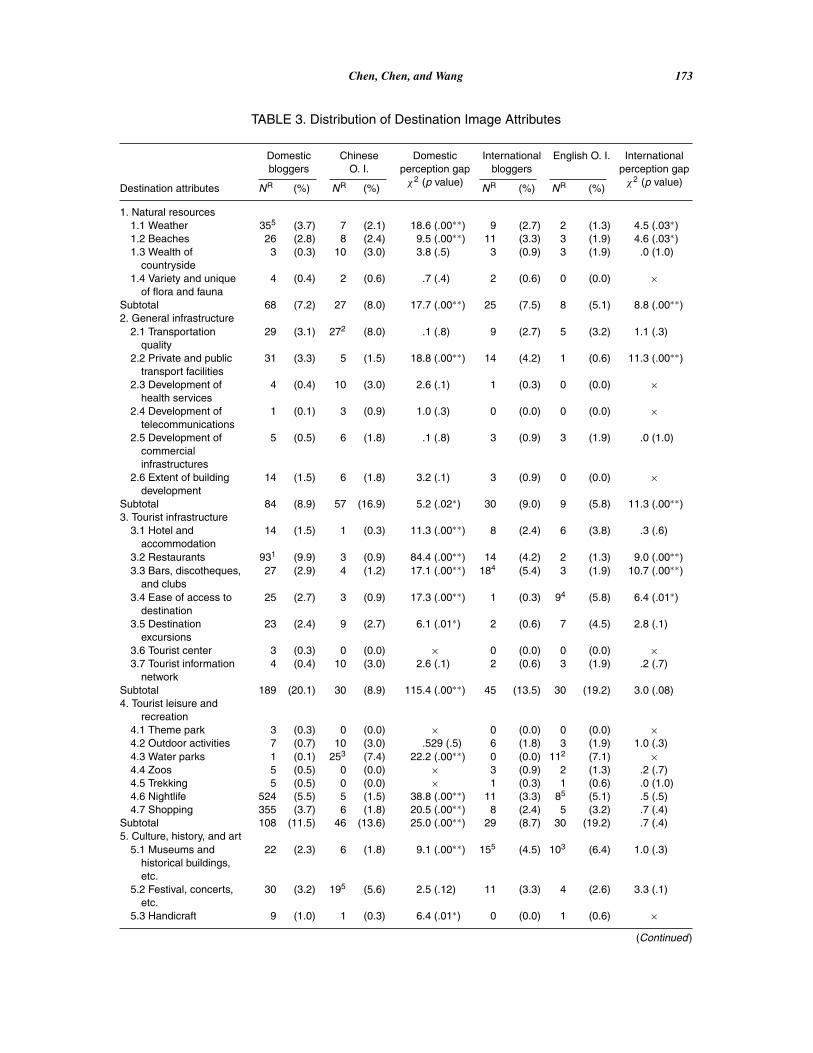
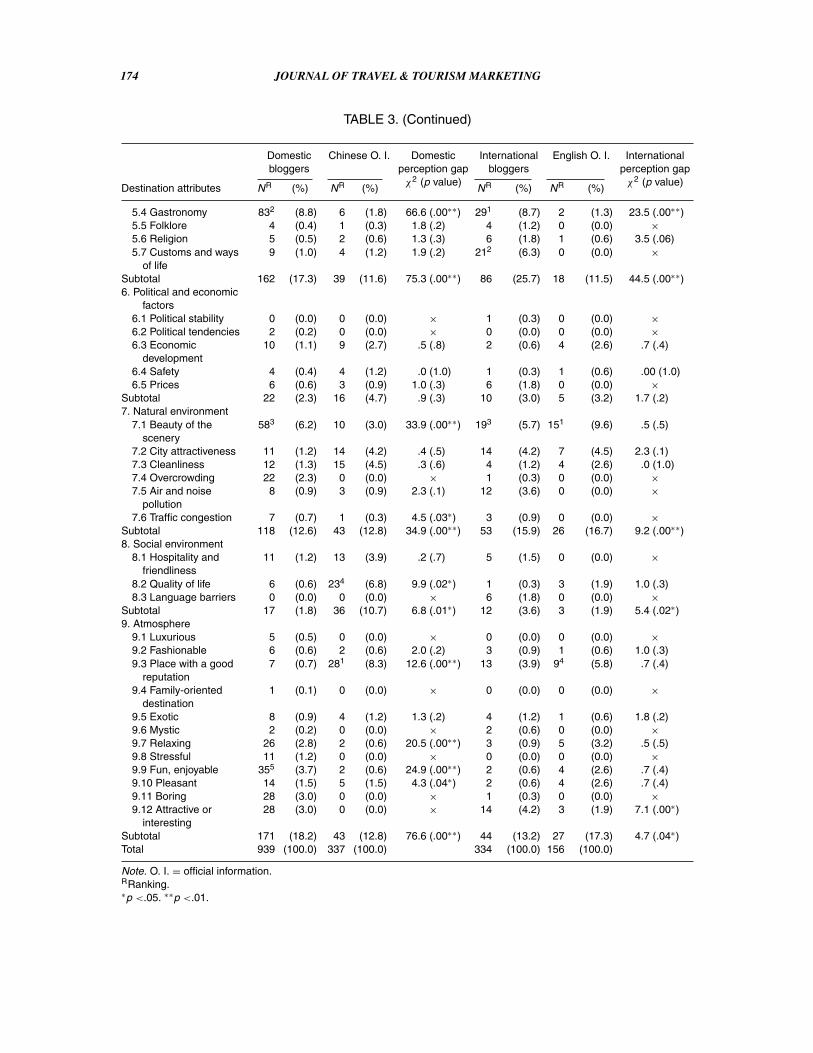
attributes mentioned in the blog postings wasperformed. The same procedure was thenapplied to the destination image attributes pro-moted on DMO websites. The mean desti-nation image attribute frequencies from theblog and DMO website data were then plot-ted along the PPM grid lines for each quad-rant. Once plotted, each attribute then illus-trated the disparity between the perception pro-moted by DMOs and the performance perceivedby tourists (i.e., “bloggers”). Thus, PPM pro-vided a visual representation of the effective-ness of the DMO promotion strategy by map-ping attribute frequency to the Success, Over-Promoted, Tourist-Preferred, and Peripheralquadrants. Once mapped, the effectiveness ofthe marketing strategy was apparent. All blogarticles and official information were analyzedfor content and summarized to identify the des-tination image attributes posted by bloggers andDMO websites. Table 3 lists the results.
The following subsections discuss the find-ings presented in Table 3, first focusing ondomestic image perception gaps derived fromdomestic (Chinese) blog postings and offi-cial website information, then on internationalimage perception gaps derived from foreign(i.e., English language) blogs and official web-site information, and finally, on the results of thePPM analysis.
Domestic Image Perception Gaps
Of the nine categories of destination imageattributes, seven differed significantly betweendomestic Chinese blogs and official web-site promotions, and two (“political and eco-nomic factors” and “social environment”) dif-fered slightly. These results indicate thatfor the majority of images, perceptions dif-fered between the perspectives of domesticbloggers and those of official Chinese-languagewebsites. The most frequent gaps appearedfor “tourist infrastructure”—specifically, “hotelsand accommodations”; “restaurants”; “bars, dis-cotheques, and clubs”; “ease of access to desti-nations”; and “destination excursions” (i.e., fiveof seven attributes differed significantly). Thesecond-most frequent set of gaps appeared for“atmosphere of the area”—specifically, “area
has a good reputation”; “relaxing”; “fun, enjoy-able”; and “pleasant.”
Domestic image gap analysis revealed thatofficial promotional websites did not meet theneeds and wants of travel bloggers with regardto seven image constructs significantly withthe chi-squared (χ2) test: “natural resources”;“general infrastructure”; “tourist infrastruc-ture”; “tourist leisure and recreation”; “culture,history, and art”; “natural environment”; and“atmosphere of the area.”
Domestic blogs included more frequent ref-erences to destination attributes than offi-cial promotion websites. Bloggers also dis-cussed attributes more than official promo-tional websites. Gaps were identified by not-ing differences in the number of referencesto the attribute (i.e., frequency) contained inblogs and official Chinese-language promo-tional websites. For example, bloggers fre-quently referred to “weather”; “beaches”’ “pri-vate and public transportation facilities”; “hotelsand accommodation”; “restaurants”; “bars, dis-cotheques, and clubs”; “ease of access to desti-nations”; “destination excursions”; “nightlife”;“shopping”; “museums and historical build-ings”; “gastronomy”; “scenic beauty”; “relax-ing”; “fun, enjoyable”; and “pleasant” but theofficial websites did not give these attributes asmuch attention. Instead, official websites weremore likely to refer to “quality of life,” “lan-guage barriers,” and “place with a good reputa-tion.” Based on these differences, it appears thatthe official websites do not adequately meet theneeds of tourism bloggers.
International Image Perception Gaps
Of the nine categories of destination imageattributes, only four differed significantlybetween international blogs and officialEnglish-language website promotions. Thisfinding suggests that the image gap betweenforeign bloggers and official websites promot-ing Kaohsiung is small. Significant gaps wereidentified only for “natural resources”; “generalinfrastructure”; “culture, history, and art”; and“natural environment.” The most significantgap appeared for “tourist infrastructure”—specifically, “bars, discotheques, and clubs.” In
Chen, Chen, and Wang 173
TABLE 3. Distribution of Destination Image Attributes
Domesticbloggers
ChineseO. I.
Domesticperception gapχ2 (p value)
Internationalbloggers
English O. I. Internationalperception gapχ2 (p value)
Destination attributes NR (%) NR (%) NR (%) NR (%)
1. Natural resources1.1 Weather 355 (3.7) 7 (2.1) 18.6 (.00∗∗) 9 (2.7) 2 (1.3) 4.5 (.03∗)1.2 Beaches 26 (2.8) 8 (2.4) 9.5 (.00∗∗) 11 (3.3) 3 (1.9) 4.6 (.03∗)1.3 Wealth of
countryside3 (0.3) 10 (3.0) 3.8 (.5) 3 (0.9) 3 (1.9) .0 (1.0)
1.4 Variety and uniqueof flora and fauna
4 (0.4) 2 (0.6) .7 (.4) 2 (0.6) 0 (0.0) ×
Subtotal 68 (7.2) 27 (8.0) 17.7 (.00∗∗) 25 (7.5) 8 (5.1) 8.8 (.00∗∗)2. General infrastructure
2.1 Transportationquality
29 (3.1) 272 (8.0) .1 (.8) 9 (2.7) 5 (3.2) 1.1 (.3)
2.2 Private and publictransport facilities
31 (3.3) 5 (1.5) 18.8 (.00∗∗) 14 (4.2) 1 (0.6) 11.3 (.00∗∗)
2.3 Development ofhealth services
4 (0.4) 10 (3.0) 2.6 (.1) 1 (0.3) 0 (0.0) ×
2.4 Development oftelecommunications
1 (0.1) 3 (0.9) 1.0 (.3) 0 (0.0) 0 (0.0) ×
2.5 Development ofcommercialinfrastructures
5 (0.5) 6 (1.8) .1 (.8) 3 (0.9) 3 (1.9) .0 (1.0)
2.6 Extent of buildingdevelopment
14 (1.5) 6 (1.8) 3.2 (.1) 3 (0.9) 0 (0.0) ×
Subtotal 84 (8.9) 57 (16.9) 5.2 (.02∗) 30 (9.0) 9 (5.8) 11.3 (.00∗∗)3. Tourist infrastructure
3.1 Hotel andaccommodation
14 (1.5) 1 (0.3) 11.3 (.00∗∗) 8 (2.4) 6 (3.8) .3 (.6)
3.2 Restaurants 931 (9.9) 3 (0.9) 84.4 (.00∗∗) 14 (4.2) 2 (1.3) 9.0 (.00∗∗)3.3 Bars, discotheques,
and clubs27 (2.9) 4 (1.2) 17.1 (.00∗∗) 184 (5.4) 3 (1.9) 10.7 (.00∗∗)
3.4 Ease of access todestination
25 (2.7) 3 (0.9) 17.3 (.00∗∗) 1 (0.3) 94 (5.8) 6.4 (.01∗)
3.5 Destinationexcursions
23 (2.4) 9 (2.7) 6.1 (.01∗) 2 (0.6) 7 (4.5) 2.8 (.1)
3.6 Tourist center 3 (0.3) 0 (0.0) × 0 (0.0) 0 (0.0) ×3.7 Tourist information
network4 (0.4) 10 (3.0) 2.6 (.1) 2 (0.6) 3 (1.9) .2 (.7)
Subtotal 189 (20.1) 30 (8.9) 115.4 (.00∗∗) 45 (13.5) 30 (19.2) 3.0 (.08)4. Tourist leisure and
recreation4.1 Theme park 3 (0.3) 0 (0.0) × 0 (0.0) 0 (0.0) ×4.2 Outdoor activities 7 (0.7) 10 (3.0) .529 (.5) 6 (1.8) 3 (1.9) 1.0 (.3)4.3 Water parks 1 (0.1) 253 (7.4) 22.2 (.00∗∗) 0 (0.0) 112 (7.1) ×4.4 Zoos 5 (0.5) 0 (0.0) × 3 (0.9) 2 (1.3) .2 (.7)4.5 Trekking 5 (0.5) 0 (0.0) × 1 (0.3) 1 (0.6) .0 (1.0)4.6 Nightlife 524 (5.5) 5 (1.5) 38.8 (.00∗∗) 11 (3.3) 85 (5.1) .5 (.5)4.7 Shopping 355 (3.7) 6 (1.8) 20.5 (.00∗∗) 8 (2.4) 5 (3.2) .7 (.4)
Subtotal 108 (11.5) 46 (13.6) 25.0 (.00∗∗) 29 (8.7) 30 (19.2) .7 (.4)5. Culture, history, and art
5.1 Museums andhistorical buildings,etc.
22 (2.3) 6 (1.8) 9.1 (.00∗∗) 155 (4.5) 103 (6.4) 1.0 (.3)
5.2 Festival, concerts,etc.
30 (3.2) 195 (5.6) 2.5 (.12) 11 (3.3) 4 (2.6) 3.3 (.1)
5.3 Handicraft 9 (1.0) 1 (0.3) 6.4 (.01∗) 0 (0.0) 1 (0.6) ×(Continued)
174 JOURNAL OF TRAVEL & TOURISM MARKETING
TABLE 3. (Continued)
Domesticbloggers
Chinese O. I. Domesticperception gapχ2 (p value)
Internationalbloggers
English O. I. Internationalperception gapχ2 (p value)
Destination attributes NR (%) NR (%) NR (%) NR (%)
5.4 Gastronomy 832 (8.8) 6 (1.8) 66.6 (.00∗∗) 291 (8.7) 2 (1.3) 23.5 (.00∗∗)5.5 Folklore 4 (0.4) 1 (0.3) 1.8 (.2) 4 (1.2) 0 (0.0) ×5.6 Religion 5 (0.5) 2 (0.6) 1.3 (.3) 6 (1.8) 1 (0.6) 3.5 (.06)5.7 Customs and ways
of life9 (1.0) 4 (1.2) 1.9 (.2) 212 (6.3) 0 (0.0) ×
Subtotal 162 (17.3) 39 (11.6) 75.3 (.00∗∗) 86 (25.7) 18 (11.5) 44.5 (.00∗∗)6. Political and economic
factors6.1 Political stability 0 (0.0) 0 (0.0) × 1 (0.3) 0 (0.0) ×6.2 Political tendencies 2 (0.2) 0 (0.0) × 0 (0.0) 0 (0.0) ×6.3 Economic
development10 (1.1) 9 (2.7) .5 (.8) 2 (0.6) 4 (2.6) .7 (.4)
6.4 Safety 4 (0.4) 4 (1.2) .0 (1.0) 1 (0.3) 1 (0.6) .00 (1.0)6.5 Prices 6 (0.6) 3 (0.9) 1.0 (.3) 6 (1.8) 0 (0.0) ×
Subtotal 22 (2.3) 16 (4.7) .9 (.3) 10 (3.0) 5 (3.2) 1.7 (.2)7. Natural environment
7.1 Beauty of thescenery
583 (6.2) 10 (3.0) 33.9 (.00∗∗) 193 (5.7) 151 (9.6) .5 (.5)
7.2 City attractiveness 11 (1.2) 14 (4.2) .4 (.5) 14 (4.2) 7 (4.5) 2.3 (.1)7.3 Cleanliness 12 (1.3) 15 (4.5) .3 (.6) 4 (1.2) 4 (2.6) .0 (1.0)7.4 Overcrowding 22 (2.3) 0 (0.0) × 1 (0.3) 0 (0.0) ×7.5 Air and noise
pollution8 (0.9) 3 (0.9) 2.3 (.1) 12 (3.6) 0 (0.0) ×
7.6 Traffic congestion 7 (0.7) 1 (0.3) 4.5 (.03∗) 3 (0.9) 0 (0.0) ×Subtotal 118 (12.6) 43 (12.8) 34.9 (.00∗∗) 53 (15.9) 26 (16.7) 9.2 (.00∗∗)8. Social environment
8.1 Hospitality andfriendliness
11 (1.2) 13 (3.9) .2 (.7) 5 (1.5) 0 (0.0) ×
8.2 Quality of life 6 (0.6) 234 (6.8) 9.9 (.02∗) 1 (0.3) 3 (1.9) 1.0 (.3)8.3 Language barriers 0 (0.0) 0 (0.0) × 6 (1.8) 0 (0.0) ×
Subtotal 17 (1.8) 36 (10.7) 6.8 (.01∗) 12 (3.6) 3 (1.9) 5.4 (.02∗)9. Atmosphere
9.1 Luxurious 5 (0.5) 0 (0.0) × 0 (0.0) 0 (0.0) ×9.2 Fashionable 6 (0.6) 2 (0.6) 2.0 (.2) 3 (0.9) 1 (0.6) 1.0 (.3)9.3 Place with a good
reputation7 (0.7) 281 (8.3) 12.6 (.00∗∗) 13 (3.9) 94 (5.8) .7 (.4)
9.4 Family-orienteddestination
1 (0.1) 0 (0.0) × 0 (0.0) 0 (0.0) ×
9.5 Exotic 8 (0.9) 4 (1.2) 1.3 (.2) 4 (1.2) 1 (0.6) 1.8 (.2)9.6 Mystic 2 (0.2) 0 (0.0) × 2 (0.6) 0 (0.0) ×9.7 Relaxing 26 (2.8) 2 (0.6) 20.5 (.00∗∗) 3 (0.9) 5 (3.2) .5 (.5)9.8 Stressful 11 (1.2) 0 (0.0) × 0 (0.0) 0 (0.0) ×9.9 Fun, enjoyable 355 (3.7) 2 (0.6) 24.9 (.00∗∗) 2 (0.6) 4 (2.6) .7 (.4)9.10 Pleasant 14 (1.5) 5 (1.5) 4.3 (.04∗) 2 (0.6) 4 (2.6) .7 (.4)9.11 Boring 28 (3.0) 0 (0.0) × 1 (0.3) 0 (0.0) ×9.12 Attractive or
interesting28 (3.0) 0 (0.0) × 14 (4.2) 3 (1.9) 7.1 (.00∗)
Subtotal 171 (18.2) 43 (12.8) 76.6 (.00∗∗) 44 (13.2) 27 (17.3) 4.7 (.04∗)Total 939 (100.0) 337 (100.0) 334 (100.0) 156 (100.0)
Note. O. I. = official information.RRanking.∗p <.05. ∗∗p <.01.
Chen, Chen, and Wang 175
summary, foreign image gaps were smaller thandomestic image gaps.
International image gaps occurred with lessfrequency than domestic image gaps. This likelymeans attributes discussed by foreign bloggerswere generally addressed on official English-language websites, and may have been of lessinterest to domestic bloggers. For example,domestic bloggers were probably less interestedin “language barrier” than international touristbloggers (as would be expected for native lan-guage speakers), resulting in a low domesticimage gap. Although this is not an area ofconcern or interest for domestic bloggers, theresults clearly indicate that official websitesshould include references to language barri-ers, because this is a concern for internationaltourists.
Only one attribute appeared with more fre-quency on official English-language websitespromoting Kaohsiung than on foreign blogs:“ease of access to destination.” Overall, theresults indicate that official English-languagewebsites promoting Kaohsiung met the needs offoreigner bloggers.
Performance Perception Matrix Analysis
Domestic PPM Analysis
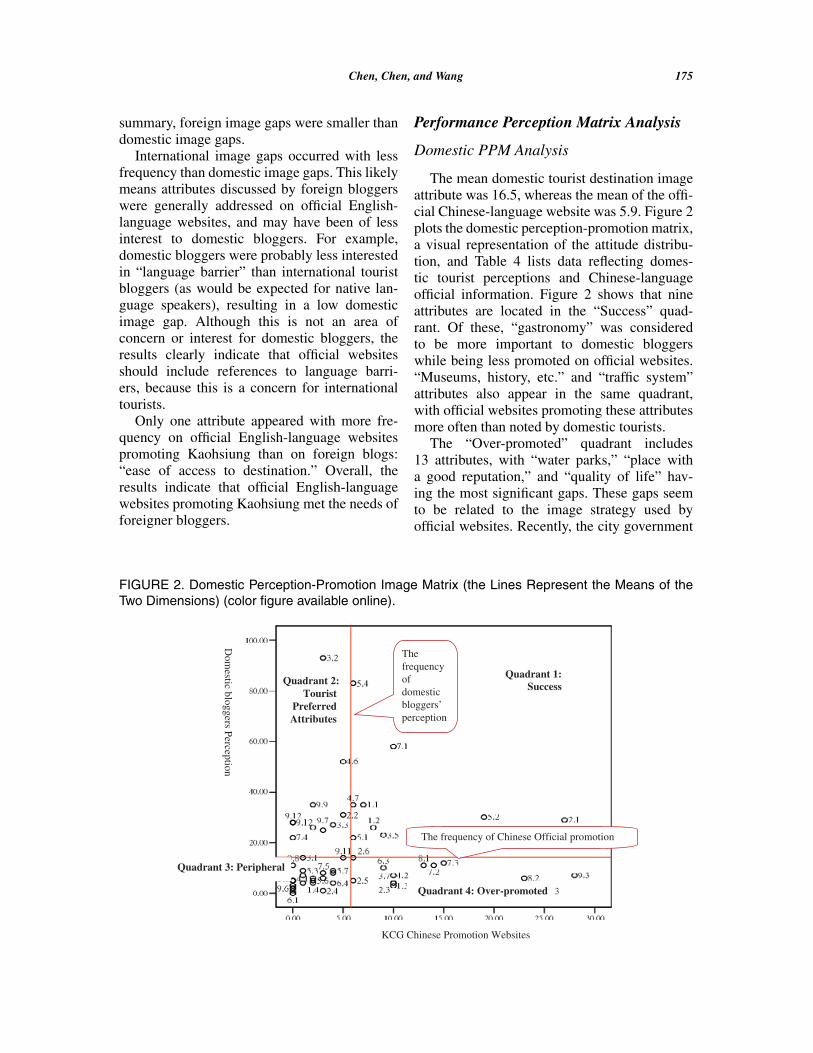
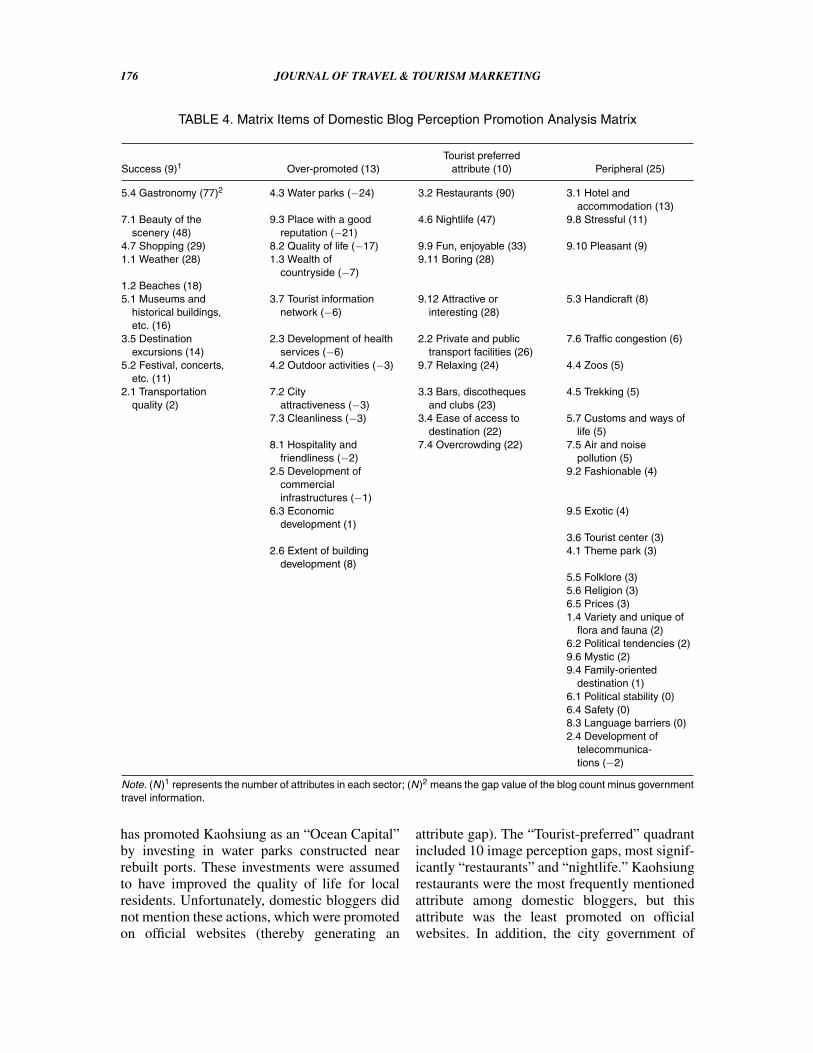
The mean domestic tourist destination imageattribute was 16.5, whereas the mean of the offi-cial Chinese-language website was 5.9. Figure 2plots the domestic perception-promotion matrix,a visual representation of the attitude distribu-tion, and Table 4 lists data reflecting domes-tic tourist perceptions and Chinese-languageofficial information. Figure 2 shows that nineattributes are located in the “Success” quad-rant. Of these, “gastronomy” was consideredto be more important to domestic bloggerswhile being less promoted on official websites.“Museums, history, etc.” and “traffic system”attributes also appear in the same quadrant,with official websites promoting these attributesmore often than noted by domestic tourists.
The “Over-promoted” quadrant includes13 attributes, with “water parks,” “place witha good reputation,” and “quality of life” hav-ing the most significant gaps. These gaps seemto be related to the image strategy used byofficial websites. Recently, the city government
FIGURE 2. Domestic Perception-Promotion Image Matrix (the Lines Represent the Means of theTwo Dimensions) (color figure available online).
Dom
estic bloggers Perception
Quadrant 1: Success Quadrant 2:
Tourist Preferred Attributes
The frequency of domestic bloggers’ perception
The frequency of Chinese Official promotion
Quadrant 4: Over-promoted
Quadrant 3: Peripheral
KCG Chinese Promotion Websites
176 JOURNAL OF TRAVEL & TOURISM MARKETING
TABLE 4. Matrix Items of Domestic Blog Perception Promotion Analysis Matrix
Success (9)1 Over-promoted (13)Tourist preferred
attribute (10) Peripheral (25)
5.4 Gastronomy (77)2 4.3 Water parks (−24) 3.2 Restaurants (90) 3.1 Hotel andaccommodation (13)
7.1 Beauty of thescenery (48)
9.3 Place with a goodreputation (−21)
4.6 Nightlife (47) 9.8 Stressful (11)
4.7 Shopping (29) 8.2 Quality of life (−17) 9.9 Fun, enjoyable (33) 9.10 Pleasant (9)1.1 Weather (28) 1.3 Wealth of
countryside (−7)9.11 Boring (28)
1.2 Beaches (18)5.1 Museums and
historical buildings,etc. (16)
3.7 Tourist informationnetwork (−6)
9.12 Attractive orinteresting (28)
5.3 Handicraft (8)
3.5 Destinationexcursions (14)
2.3 Development of healthservices (−6)
2.2 Private and publictransport facilities (26)
7.6 Traffic congestion (6)
5.2 Festival, concerts,etc. (11)
4.2 Outdoor activities (−3) 9.7 Relaxing (24) 4.4 Zoos (5)
2.1 Transportationquality (2)
7.2 Cityattractiveness (−3)
3.3 Bars, discothequesand clubs (23)
4.5 Trekking (5)
7.3 Cleanliness (−3) 3.4 Ease of access todestination (22)
5.7 Customs and ways oflife (5)
8.1 Hospitality andfriendliness (−2)
7.4 Overcrowding (22) 7.5 Air and noisepollution (5)
2.5 Development ofcommercialinfrastructures (−1)
9.2 Fashionable (4)
6.3 Economicdevelopment (1)
9.5 Exotic (4)
3.6 Tourist center (3)2.6 Extent of building
development (8)4.1 Theme park (3)
5.5 Folklore (3)5.6 Religion (3)6.5 Prices (3)1.4 Variety and unique of
flora and fauna (2)6.2 Political tendencies (2)9.6 Mystic (2)9.4 Family-oriented
destination (1)6.1 Political stability (0)6.4 Safety (0)8.3 Language barriers (0)2.4 Development of
telecommunica-tions (−2)
Note. (N)1 represents the number of attributes in each sector; (N)2 means the gap value of the blog count minus governmenttravel information.
has promoted Kaohsiung as an “Ocean Capital”by investing in water parks constructed nearrebuilt ports. These investments were assumedto have improved the quality of life for localresidents. Unfortunately, domestic bloggers didnot mention these actions, which were promotedon official websites (thereby generating an
attribute gap). The “Tourist-preferred” quadrantincluded 10 image perception gaps, most signif-icantly “restaurants” and “nightlife.” Kaohsiungrestaurants were the most frequently mentionedattribute among domestic bloggers, but thisattribute was the least promoted on officialwebsites. In addition, the city government of
Chen, Chen, and Wang 177
Kaohsiung has been promoting a “water andlight” image for the city since 1998. To furtherthis image, the government has created manynew destinations intended to make the city moreattractive at night. However, more recently, thegovernment seems to have changed its focus andhas begun promoting a new “water park” imageinstead of its previous nightlife theme, result-ing in a slight image conflict and competingpromotional objectives.
International PPM Analysis
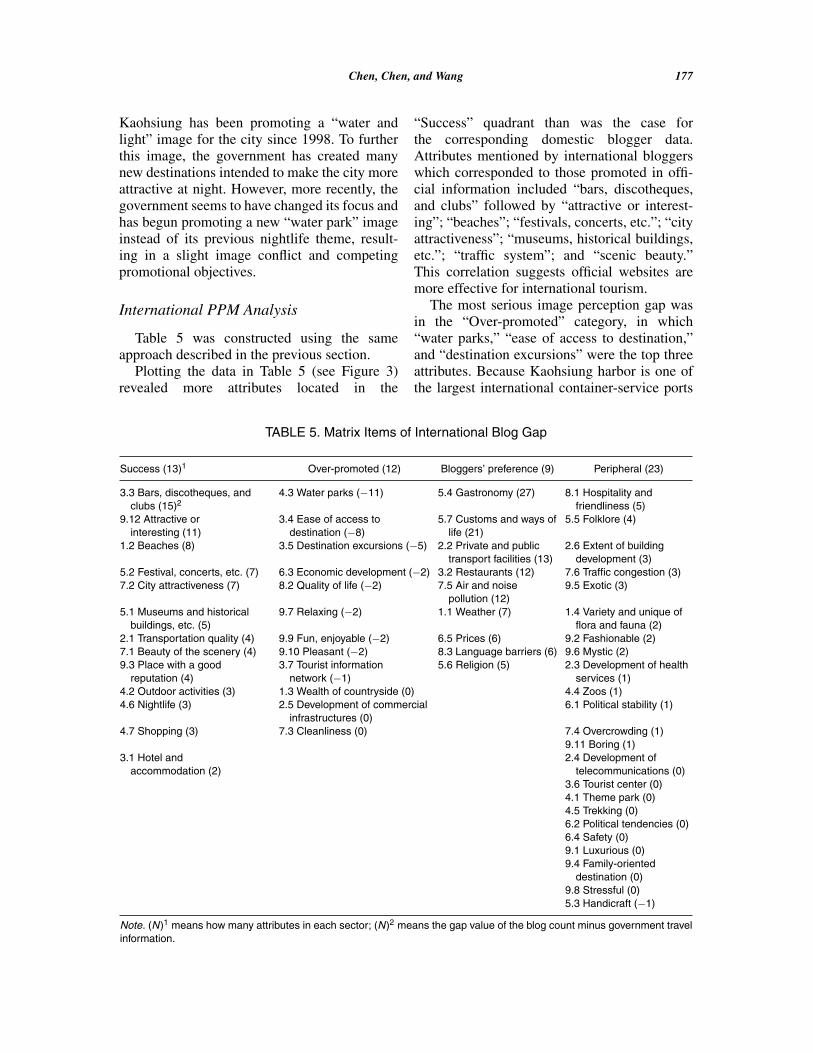
Table 5 was constructed using the sameapproach described in the previous section.
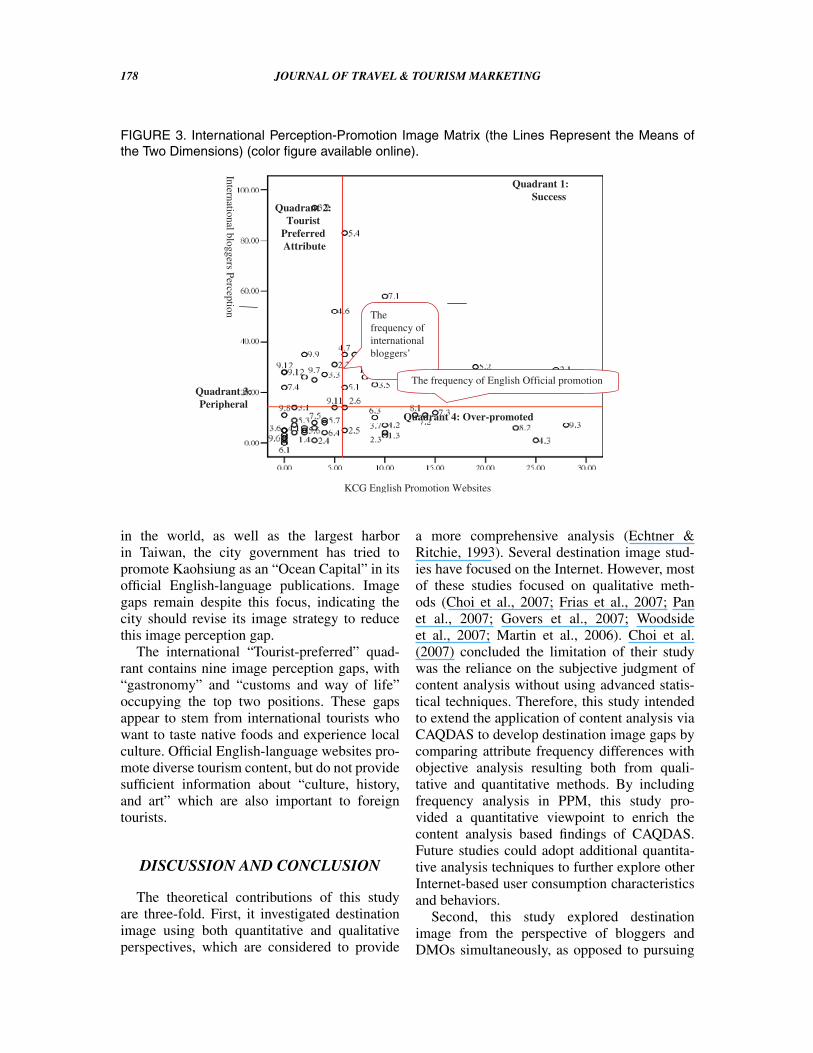
Plotting the data in Table 5 (see Figure 3)revealed more attributes located in the
“Success” quadrant than was the case forthe corresponding domestic blogger data.Attributes mentioned by international bloggerswhich corresponded to those promoted in offi-cial information included “bars, discotheques,and clubs” followed by “attractive or interest-ing”; “beaches”; “festivals, concerts, etc.”; “cityattractiveness”; “museums, historical buildings,etc.”; “traffic system”; and “scenic beauty.”This correlation suggests official websites aremore effective for international tourism.
The most serious image perception gap wasin the “Over-promoted” category, in which“water parks,” “ease of access to destination,”and “destination excursions” were the top threeattributes. Because Kaohsiung harbor is one ofthe largest international container-service ports
TABLE 5. Matrix Items of International Blog Gap
Success (13)1 Over-promoted (12) Bloggers’ preference (9) Peripheral (23)
3.3 Bars, discotheques, andclubs (15)2
4.3 Water parks (−11) 5.4 Gastronomy (27) 8.1 Hospitality andfriendliness (5)
9.12 Attractive orinteresting (11)
3.4 Ease of access todestination (−8)
5.7 Customs and ways oflife (21)
5.5 Folklore (4)
1.2 Beaches (8) 3.5 Destination excursions (−5) 2.2 Private and publictransport facilities (13)
2.6 Extent of buildingdevelopment (3)
5.2 Festival, concerts, etc. (7) 6.3 Economic development (−2) 3.2 Restaurants (12) 7.6 Traffic congestion (3)7.2 City attractiveness (7) 8.2 Quality of life (−2) 7.5 Air and noise
pollution (12)9.5 Exotic (3)
5.1 Museums and historicalbuildings, etc. (5)
9.7 Relaxing (−2) 1.1 Weather (7) 1.4 Variety and unique offlora and fauna (2)
2.1 Transportation quality (4) 9.9 Fun, enjoyable (−2) 6.5 Prices (6) 9.2 Fashionable (2)7.1 Beauty of the scenery (4) 9.10 Pleasant (−2) 8.3 Language barriers (6) 9.6 Mystic (2)9.3 Place with a good
reputation (4)3.7 Tourist information
network (−1)5.6 Religion (5) 2.3 Development of health
services (1)4.2 Outdoor activities (3) 1.3 Wealth of countryside (0) 4.4 Zoos (1)4.6 Nightlife (3) 2.5 Development of commercial
infrastructures (0)6.1 Political stability (1)
4.7 Shopping (3) 7.3 Cleanliness (0) 7.4 Overcrowding (1)9.11 Boring (1)
3.1 Hotel andaccommodation (2)
2.4 Development oftelecommunications (0)
3.6 Tourist center (0)4.1 Theme park (0)4.5 Trekking (0)6.2 Political tendencies (0)6.4 Safety (0)9.1 Luxurious (0)9.4 Family-oriented
destination (0)9.8 Stressful (0)5.3 Handicraft (−1)
Note. (N)1 means how many attributes in each sector; (N)2 means the gap value of the blog count minus government travelinformation.
178 JOURNAL OF TRAVEL & TOURISM MARKETING
FIGURE 3. International Perception-Promotion Image Matrix (the Lines Represent the Means ofthe Two Dimensions) (color figure available online).
Quadrant 1:Success
Quadrant 2: Tourist
Preferred Attribute
Quadrant 4: Over-promoted
Quadrant 3: Peripheral
The frequency of international bloggers’
The frequency of English Official promotion
KCG English Promotion Websites
International bloggers Perception
in the world, as well as the largest harborin Taiwan, the city government has tried topromote Kaohsiung as an “Ocean Capital” in itsofficial English-language publications. Imagegaps remain despite this focus, indicating thecity should revise its image strategy to reducethis image perception gap.
The international “Tourist-preferred” quad-rant contains nine image perception gaps, with“gastronomy” and “customs and way of life”occupying the top two positions. These gapsappear to stem from international tourists whowant to taste native foods and experience localculture. Official English-language websites pro-mote diverse tourism content, but do not providesufficient information about “culture, history,and art” which are also important to foreigntourists.
DISCUSSION AND CONCLUSION
The theoretical contributions of this studyare three-fold. First, it investigated destinationimage using both quantitative and qualitativeperspectives, which are considered to provide
a more comprehensive analysis (Echtner &Ritchie, 1993). Several destination image stud-ies have focused on the Internet. However, mostof these studies focused on qualitative meth-ods (Choi et al., 2007; Frias et al., 2007; Panet al., 2007; Govers et al., 2007; Woodsideet al., 2007; Martin et al., 2006). Choi et al.(2007) concluded the limitation of their studywas the reliance on the subjective judgment ofcontent analysis without using advanced statis-tical techniques. Therefore, this study intendedto extend the application of content analysis viaCAQDAS to develop destination image gaps bycomparing attribute frequency differences withobjective analysis resulting both from quali-tative and quantitative methods. By includingfrequency analysis in PPM, this study pro-vided a quantitative viewpoint to enrich thecontent analysis based findings of CAQDAS.Future studies could adopt additional quantita-tive analysis techniques to further explore otherInternet-based user consumption characteristicsand behaviors.
Second, this study explored destinationimage from the perspective of bloggers andDMOs simultaneously, as opposed to pursuing
Chen, Chen, and Wang 179
separate investigations as generally been donepreviously. Although IPA has been applied tohospitality and tourism for over 3 decades, oneof the limitations of IPA is that only attributesfrom a single source are measured (e.g., con-sumers or end users). To overcome this limi-tation, PPM was developed to build upon thestrengths of IPA, while extending the tech-nique to assess destination image from the per-spective of both tourists (demand) and DMOs(supply). PPM extends the quadrant applica-tion to both demand and supply sides, allowingmore objectivity in formulating feasible market-ing strategies. The resulting attributes, identifiedwithin the four quadrants of the PPM, pro-vide for a more effective means of developingand assessing destination promotion strategies.Furthermore, since IPA relies on the rating loca-tion of attributes on two axes, this leads toambiguity of importance and expectations asidentified by Oh (2001). PPM is designed tocount the frequency of image attributes providedby tourists and DMOs, making it much easierto understand and apply. Therefore, PPM notonly keeps the simplicity advantage of IPA butalso improves the utility of IPA. In addition,previous Internet-related tourism research usingIPA did not focus on the perspectives from bothtourist and government sides, a shortcomingaddressed by PPM. Although previous studiesexamined tourist behavior perspectives relatedto the Internet (Bonn et al., 1998; Woodsideet al., 2007; Martin et al., 2006; Brey et al.,2007; Kim, 2007; Pan et al., 2007; Xiang &Gretzel, 2010; and Huang et al., 2010), fewfocused on government official tourism promo-tion (Choi et al., 2007; Horng & Tsai, 2010).
Finally, PPM is a simple and useful analysistechnique to derive effective marketing strate-gies for future hospitality and tourism research.Based on the destination image attributes iden-tified within the four PPM quadrants, market-ing strategies can be readily developed andassessed for effectiveness. For those imageattributes within the “Over-promoted” quadrant,government promotion should be decreased,and strategies implemented to increase travelinformation for attributes in the “TouristPreferred Attributes” quadrant. For instance,PPM illustrates perception gaps exist between
attributes heavily promoted by KCG and per-ception feedback provided by internationaltourists. These disparities appear in the “Over-promoted” PPM quadrant. KCG has been try-ing to promote Kaohsiung’s existing reputationwhile attempting to cultivate a new reputa-tion as a recreational center based on waterparks. In addition, KCG has heavily pro-moted the development of their traffic sys-tem, which falls under the category of gen-eral infrastructure, by emphasizing Kaohsiung’sMass Rapid Transportation (MRT), Taiwan’sHigh Speed Rail, and the international air-port. To emphasize quality of life, official web-sites also frequently promoted festivals andconcerts, cleanliness, attractiveness of the city,and friendly residents. Unfortunately, theseattributes were not frequently discussed inblogs, making them “Over-promoted” attributesaccording to the perception-promotion imagematrix. For attributes in the “Peripheral” quad-rant, it is recommended these data points becarefully examined as overlooked and poten-tially critical. Furthermore, strategies should bedesigned using the most up-to-date travel infor-mation reflecting the most popular attributes inthe “Success” quadrant. Using this approach,DMOs can develop effective promotion strate-gies that evolve with emerging global supplyand demand trends.
The research in this study revealed three prac-tical ways to implement changes:
(1) Design different promotional strategiesbased on the needs and wants of domesticand international tourists.
Domestic and international perception gaps (seeTable 3) revealed that domestic and interna-tional tourism bloggers have differing travelneeds and wants—i.e., domestic bloggers dis-cussed travel-related information more thaninternational bloggers, especially with regardto attributes such as “hotels and accommo-dation”; “destination excursions”; “nightlife”;“shopping”; “museums, historical buildings,etc.”; and “handicrafts”; while internationalbloggers preferred different attributes such as“gastronomy”; “customs and way of life”;“air and noise pollution”; “weather”; “prices”;
180 JOURNAL OF TRAVEL & TOURISM MARKETING
“language barriers”; and “religion.” Anotherneed identified in this study was English lan-guage signs and billboards in Kaohsiung. UnlikeTaipei, the capital of Taiwan, English-speakingtourists find it difficult to navigate throughKaohsiung, in large part because of the lack ofEnglish street signs, storefront signs, and othertourist information aids. International bloggersdiscussed these attributes frequently, indicatingKCG may not be aware this is an area of concernfor English-speaking tourists.
Therefore, KCG tourism promotion strategiesshould adapt content to meet tourist needs andwants based on their different cultural back-grounds. More specifically, KCG travel websitesand promotional media designs should tailorinformation content and format according totourist needs and wants instead of simply trans-lating Chinese-language versions into English.Domestic travelers expect more detailed travelinformation, whereas international travelers,especially first-time visitors, want more envi-ronmental and weather information.
(2) Some Kaohsiung city promotions weresuccessful, and some failed to accomplishtheir goals.
Since 2000, the city government of Kaohsiunghas tried to rebrand itself. For example, KCGwas focused on promoting a Harbor Cityimage since 2003 and “Light and Shadow”since 2004 (Department of Information, KCG,2004). PPM revealed successes in some areas,but also identified areas needing improve-ment. Tourism strategies that were not success-ful included “water parks,” “development ofcommercial infrastructure,” and “cleanliness”(as these attributes were located within the“Over-promotion” quadrant in both domesticand international perception-promotion matri-ces). This finding suggests bloggers did notperceive Kaohsiung as an “Ocean Capital” oras a “clean city.” However, KCG did achievethe goal of developing an image of a mod-ern and cultured city as attributes including“beaches”; “festivals, concerts, etc.”; “muse-ums and historical buildings”; and “shopping”were all located within the “Success” quadrant
in both domestic and international perception-promotion matrices. Continue to promoteexisting positive images while creating newimages.
(3) Continue to promote existing positiveimages while creating new images.
Culture, history, and art appear to be of the mostinterest to international tourists.
International bloggers expressed great inter-est in experiencing authentic local culture,which can best be represented by local foods,Chinese architecture, Tai-Ke culture, the DragonBoat Festival, the Liouhe Night Market, and sev-eral other destination attributes classified underthe “cultural” category. Thus, it is important topromote local culture and landmarks, which areseen by international tourists as exotic.
Local food is an important factor inattracting foreign tourists. Bloggers perceivedroadside food stands, night markets, andthe seafood at Cijin Island as representa-tive of Kaohsiung’s gastronomic attractions.Gastronomy and restaurants are typically con-sidered essential to attract tourists, but KCG’spromotions did not meet the expectations oftourism bloggers. KCG should therefore focusmore on promoting gastronomy instead of main-taining the focus on Kaohsiung as a HarborCity. KCG should work with the local foodand restaurant community to build a positivegastronomy image instead of focusing on devel-oping an image as a safe, healthy, and energetic(SHE) city.
An inherent limitation of this study is thedata, which was collected from a relativelysmall set of blogs and websites for a singlecity. As blogs are dynamic, with new informa-tion posted daily, if not hourly, and informationposted on DOM websites can be updated atanytime, the findings presented in this studyare a “snapshot in time” and cannot be consid-ered to be predictors of future attitudes whichchange over time. In addition, future studiesshould include multiple data sources (such assurveys, interviews, focus groups, etc.) for othertravel destinations, improving generalization.Because destination images can take months, oreven years to develop, future research should
Chen, Chen, and Wang 181
include long-term perspectives when investi-gating destination images and image percep-tion gaps among different market segments.The study applied the management action gridsadopted from Steele and Fletcher (1991) toidentify the gap between the demand (touristexpectations) and the supply (images presentedon the official websites). Furthermore, this studyextended Steele and Fletcher’s study by incor-porating dual source data collected from bothtourist blogs and government DMO websites.As such, this study deviates from the method-ology defined by Steele and Fletcher which mayintroduce inherent methodology-related limita-tions. Therefore, destination attribute contentanalysis criteria derived from Beerli and Martin(2004) was used to mitigate the aforementionedlimitations. This approach also fulfilled the ser-vice quality gap conceptual model developedby Parasuraman, Zeithaml, and Berry (1985).The remaining limitation consists of identify-ing blogger demographics such as age, gen-der, and occupation. Therefore, further stud-ies designed to address these limitation arerecommended.
REFERENCES
Alberty, S., & Mihalik, B. (1989). The use of importance-performance analysis as an evaluative techniquein adult education. Evaluation Review, 13(1),33–44.
Anderson, E. W., & Mittal, V. (2000). Strengthening thesatisfaction-profit chain. Journal of Service Research,3(2), 107–20.
Bacon, D. R. (2003). A comparison of approachesto importance-performance analysis. InternationalJournal of Market Research, 45(1), 55–71.
Baloglu, S., & McCleary, K. W. (1999). A model of des-tination image formation. Annals of Tourism Research,26(4), 868–897.
Barger, J. (1999). Weblog resources FAQ. Retrieved fromhttp://www.robotwisdom.com/weblogs/
Beerli, A., & Martin, J. D. (2004). Factors influencingdestination image. Annals of Tourism Research, 31(3),657–681.
Blog. (2010). In Merriam-Webster’s online dictionary.Retrieved from http://www.merriam-webster.com/dictionary/blog
Bonn, M. A., Furr, H. L., & Susskind, A. M. (1999).Predicting a behavioral profile for pleasure travelers onthe basis of internet use segmentation. Journal of TravelResearch, 37, 333–340.
Boulding, K. E. (1956). The image. Ann Arbor: TheUniversity of Michigan Press.
Boyatsis, R. E. (1998). Transforming qualitative infor-mation: Thematic analysis and code development.Thousand Oaks, CA: Sage.
Brey, E. T., So, S. I., Kim, D. Y., & Morrison, A. M. (2007).Web-based permission marketing: Segmentation for thelodging industry. Tourism Management, 28(6), 1408–1416.
Bryman, A., & Burgess, R. G. (1994). Reflections of qual-itative data analysis. In A. Bryman & R. G. Burgess(Eds.), Analysing qualitative data. London, UnitedKingdom: Routledge.
Burns, A. C. (1986). Generating marketing strategy prior-ities based on relative competitive position. Journal ofConsumer Marketing, 3(3), 49–56.
Burns, T. (1988). Using importance–performance analy-sis to measure the opinions of national park conces-sioners. In Proceedings of the 19th Conference onTourism Research:Expanding Boundaries. Montreal,QC, Canada: Travel and Tourism Research Association.
Carson, D. (2005). An overview of developing regionaltourism using information communications technology.In S. Marshall, W. Taylor, & X. Yu (Eds.), Encyclopediaof developing regional communities with informationand communication technology. Hershey, PA: IdeaGroup.
Chen, H. T., & Chang, C. P. (2003). Blogs and edu-cation. Retrieved from http://www.being.org.cn/theory/blog-and-et.htm
Cheng, M. Y. (2004). A study on the city imageof Kaohsiung City—A case study of Love River(Unpublished master’s thesis). National Sun Yat-senUniversity, Kaohsiung City, Taiwan.
Chiang, P. Y. (2006). Urban tourism and urban regenera-tion in an industrial city from residents’ perspectives:The case of Kaohsiung (Unpublished master’s thesis).National Kaohsiung Hospitality College, KaohsiungCity, Taiwan.
Choi, S., Lehto, X. Y., & Morrison, A. M. (2007).Destination image representation on the web: Contentanalysis of Macau travel related website. TourismManagement, 28(1), 118–129.
Chuang, S. T. (2004). The factors influencing the desti-nation image of Kaohsiung City—In foreign tourists’points of view (Unpublished master’s thesis). NationalSun Yat-sen University, Kaohsiung City, Taiwan.
Creswell, J. W. (1998). Qualitative inquiry and researchdesign: Choosing among five traditions. London,United Kingdom: Sage.
Crompton, J. L. (1979). An assessment of the image ofMexico as a vacation destination and the influenceof geographical location upon that image. Journal ofTravel Research, 18(4), 18–23.
Crompton, J. L., & Duray, N. A. (1985). An investigationof the relative efficacy of four alternative approachesto importance-performance analysis. Journal of theAcademy of Marketing Science, 13(4), 69–80.
182 JOURNAL OF TRAVEL & TOURISM MARKETING
Crotts, J. C., Mason, P. R., & Davis, B. (2009).Measuring guest satisfaction and competitive positionin the hospitality and tourism industry: An appli-cation of stance-shift analysis to travel blog narra-tives. Journal of Travel Research, 48(2), 139–151. doi:10.1177/0047287508328795
Dave, S. (2007, June 4). State of the blogosphere [Weblog post]. Retrieved from http://technorati.com/weblog/blogosphere/
Department of Information, Kaohsiung City Government.(2004). The map to admire the full moon. Retrievedfrom http://kaohsiungwalking.kcg.gov.tw/chinese/epaper/files/200417/gogo.htm
Department of Information, Kaohsiung City Government.(2007). Brand new image of a harbor city. Retrievedfrom http://kaohsiungwalking.kcg.gov.tw/chinese/epaper/files/94new/no44/
Dolinsky, A. L. (1991). Considering the competi-tion in strategy development: An extension ofimportance-performance analysis. Journal of HealthCare Marketing, 11(1), 31–36.
Dolinsky, A. L., & Caputo, R. K. (1991). Adding a com-petitive dimension to importance-performance analy-sis: An application to traditional health care systems.Health Care Marketing Quarterly, 8(3–4), 61–79.
Draper, D., & Minca, C. (1997). Image and destination: Ageographical approach applied to Banff National Park.The Tourist Review, 52(2), 14–24.
Driscoll, A., Lawson, R., & Niven, B. (1994). Measuringtourist destination perceptions. Annals of TourismResearch, 21(3), 499–511.
Duke, C. R., & Persia, M. A. (1996). Performance-importance analysis of escorted tour evaluations.Journal of Travel & Tourism Marketing, 5, 207–223.
Echtner, C., & Ritchie, J. (1991). The meaning and mea-surement of destination image. The Journal of TourismStudies, 2(2), 2–12.
Echtner, C., & Ritchie, J. (1993). The measurement of des-tination image: An empirical assessment. Journal ofTravel Research, 31(4), 3–13.
Embacher, J., & Buttle, F. (1989). A repertory grid analysisof Austria’s image as a summer vacation destination.Journal of Travel Research, 27(3), 3–7.
Engle, J. F., Blackwell, R. D., & Miniard, P. W. (1990).Consumer behavior. Chicago, IL: Dryden Press.
Ennew, C. T., Reed, G. V., & Binks, M. R. (1993).Importance-performance analysis and the measurementof service quality. European Journal of Marketing, 27,59–70.
Evans, M. R., & Chon, K. S. (1989). Formulating and eval-uating tourism policy using importance-performanceanalysis. Hospitality Education and Research Journal,13, 203–213.
Fakeye, P. C., & Crompton, J. L. (1991). Image differencesbetween prospective, first time and repeat visitors to thelower Rio Grande Valley. Journal of Travel Research,30(2), 10–16.
Fang, H. C. (2004). A study on the perceived image andthe importance and performance of the recreationalquality factors of Kaohsiung City (Unpublished mas-ter’s thesis). National Kaohsiung University of AppliedSciences, Kaohsiung City, Taiwan.
Frias, D. M., Rodriguez, M. A., & Castaneda, J. A.(2007). Internet vs. travel agencies on pre-visit destina-tion image formation: An information processing view.Tourism Management, 29, 163–179.
Gallarza, M., Saura, I. G., & Garcia, H. C. (2002).Destination image: Towards a conceptual framework.Annals of Tourism Research, 29(1), 56–78.
Gartner, W. C. (1993). Image formation process. Journalof Travel and Tourism Marketing, 2(2–3), 191–215.
Gartner, W. C., & Hunt, J. D. (1987). An analysis of stateimage change over a twelve-year period (1971–1983).Journal of Travel Research, 26(2), 15–19.
Go, F., & Zhang, W. (1997). Applying importance-performance analysis to Beijing as an internationalmeeting destination. Journal of Travel Research, 35(4),42–49.
Govers, R., Go, F. M., & Kumar, K. (2007). Virtual desti-nation image: A new measurement approach. Annals ofTourism Research, 34(4), 977–997.
Guadagnolo, F. (1985). The importance-performance anal-ysis: An evaluation and marketing tool. Journal of Parkand Recreation Administration, 3(2), 13–22.
Gunn, C. A. (1972). Vacationscape: Designing touristregions. Austin: University of Texas.
Hawes, J. M., Kiser, G. E., & Rao, C. P. (1982). Analyzingthe market for planned retirement communities in theSouthwest. Baylor Business Studies, 13, 39–46.
Hawes, J. M., & Rao, C. P. (1985). Using importance-performance analysis to develop health care marketingstrategies. Journal of Health Care Marketing, 5(4),19–25.
Hollenhorst, S., Olson, D., & Fortney, R. (1992).Use of importance-performance analysis to evaluatestate park cabins: The case of the West VirginiaState Park System. Journal of Park and RecreationAdministration, 10, 1–11.
Horng, J. S., & Tsai, C. T. (2010). Government web-sites for promoting East Asian culinary tourism: Across-national analysis. Tourism Management, 31(1),74–85.
Hsu, C. H. (2007). The ranking of National Museum ofMarine Biology and Aquarium falls down five positions.Retrieved from http://udn.com/NEWS/DOMESTIC/DOM6/4155186.shtml
Hsu, C. H. C., Byun, S., & Yang, I.-S. (1998). Attitudesof Korean college students towards quick-service,family-style, and fine dining restaurants. Journal ofRestaurant & Foodservice Marketing, 2(4), 65–85.
Huang, C.-Y., Chou, C.-J, & Lin, P.-C. (2010). Involvementtheory in constructing bloggers’ intention to pur-chase travel products. Tourism Management, 31,513–526.
Chen, Chen, and Wang 183
Hudson, S., & Shephard, G. W. H. (1998). Measuringservice quality at tourist destinations: An applicationof importance-performance analysis to an alpine skiresort. Journal of Travel & Tourism Marketing, 7,61–77.
Hunt, J. D. (1975). Image as a factor in tourism develop-ment. Journal of Travel Research, 13(3), 1–7.
Jenkins, O. H. (1999). Understanding and measuringtourist destination images. International Journal ofTourism Research, 1(1), 1–15.
Keyt, J. C., Yavas, U., & Riecken, G. (1994). Importance-performance analysis: A case study in restaurantpositioning. International Journal of Retail andDistribution Management, 22(5), 35–40.
Kim, H. (2007). Persuasive design of tourism Websites in the United States. In Proceedings of theAnnual Conference of the Travel and Tourism ResearchAssociation. Ljubljana, Slovenia: Travel and TourismResearch Association, July, 2007.
Lee, D. H., Im, S., & Taylor, C. (2008). Voluntaryself-disclosure of information on the Internet: Amultimethod study of the motivations and con-sequences of disclosing information on blogs.Psychology & Marketing, 25(7), 692–710.
Lewis, R. C. (1985). Getting the most from marketingresearch [Part V]. Predicting hotel choice: The fac-tors underlying perception. The Cornell Hotel andRestaurant Administration Quarterly, 26(3), 82–96.
Lewis, R. C., & Chambers, R. E. (1989). Marketing lead-ership in hospitality. New York, NY: Van NostrandReinhold.
Li, X., & Petrick, J. (2008). Tourism marketing in anera of paradigm shift. Journal of Travel Research, 46,235–244.
Lin, K. H. (2004, May 11). You have to know what a blogis [Web log post]. Retrieved from http://jedi.org/blog/archives/003856.html
Lin, Y. S., & Huang, J. Y. (2006). Internet blogs as atourism marketing medium: A case study. Journal ofBusiness Research, 59, 1201–1205.
Litvin, S. W., Goldsmith, R. E., & Pan, B. (2008).Electronic word-of-mouth in hospitality and tourismmanagement. Tourism Management, 29(3), 458–468.
Lo, C. C. (2006). Analysis of E-commerce business andtrend in Taiwan. Taipei, Taiwan: Foreseeing InnovativeNew Digiservices.
Loda, M. D., Coleman, B. C., & Backman, K. F.(2009). Walking in Memphis: Testing one DMO’smarketing strategy to Millennials. Journal of TravelResearch. Advance online publication. doi:10.1177/
0047287509336476Ma, P. C. (2007, September 21). Report: Friends influence
the choice of blog platform [Web log post]. Retrievedfrom http://www.zdnet.com.tw/print/?id=20123996
Mack, R, W., Blose, J., & Pan, B. (2008). Believe it ornot: Credibility of blogs in tourism. Journal of VacationMarketing, 14(2), 133–144.
Mackay, K. J., & Fesenmaier, D. R. (2000). An explorationof cross-cultural destination image assessment. Journalof Travel Research, 38(4), 417–423.
Martilla, J. A., & James, J. C. (1977). Importance-performance analysis. Journal of Marketing, 41(1),77–79.
Martin, D., Woodside, A., & Dehuang, N. (2007). Eticinterpreting of naive subjective personal introspec-tions of tourism behavior Analyzing visitors’ storiesabout experiencing, Mumbai, Seoul, Singapore, andTokyo. International Journal of Culture, Tourism andHospitality Research, 1(1), 14–44.
Mason, J. (1994). Linking qualitative and quantitativedata analysis. In A. Bryman & R. G. Burgess (Eds.),Analyzing qualitative data (pp. 146–172). London, UK:Routledge.
Matzler, K., Bailom, F., Hinterhuber, H., Renzl, B.,& Pichler, J. (2004). The asymmetric relation-ship between attribute level performance and over-all customer satisfaction: A reconsideration of theimportance-performance analysis. Industrial MarketingManagement, 33(4), 271–277.
Matzler, K., Sauerwein, E., & Heischmidt, K. A. (2003).Importance-performance analysis revisited: The role ofthe factor structure satisfaction. The Service IndustriesJournal. 23(2), 112–129.
Meethan, K. (1996). Place, image and power: Brighton asresort. In T. Selwyn (Ed.), The tourist image: Mythsand myth making in tourism (pp. 180–196). Chichester,United Kingdom: Wiley.
Mengak, K. K., Dottavio, F. D., & O’Leary, J. T. (1986).Use of importance- performance analysis to evalu-ate a visitor center. Journal of Interpretation, 11,1–13.
Mittal, V., & Katrichis, J. M. (2000). Distinctionbetween new and loyal customers. Marketing Research,12(Spring), 26–32.
Mittal, V., Katrichis, J. M., & Kumar, P. (2001). Attributesperformance and customer satisfaction over time:Evidence from two field studies. Journal of ServiceMarketing, 15(5), 343–356.
Mittal, V., Ross, W., & Baldasare, P. M. (1998).The asymmetric impact of negative and positiveattribute-level performance on overall satisfaction andrepurchase intentions. Journal of Marketing, 62(1),33–47.
M.O.T.C., Republic of China. (2007). The ranking of con-tainer service ports in 2006. Retrieved from http://www.motc.gov.tw/ana/20070515171605_960509r.doc
Moutinho, L. (1987). Consumer behaviour in Tourism.European Journal of Marketing, 21(10), 5–44.
Nitse, P. S., & Bush, R. P. (1993). An examination of retaildental practices versus private dental practices usingan importance-performance analysis. Health MarketingQuarterly, 11, 207–221.
Oh, H. (2001). Revisiting importance-performance analy-sis. Tourism Management, 22(6), 617–627.

184 JOURNAL OF TRAVEL & TOURISM MARKETING
Oliver, R. L. (1997). Satisfaction: A behavioral perspectiveon the customer. Boston, MA: McGraw-Hill.
Pan, B., MacLaurin, T., & Crotts, J. (2007). Travelblogs and their implications for destination marketing.Journal of Travel Research, 46(1), 35–45.
Parasuraman, A., Zeithaml, V. A., & Berry, L. L. (1985). Aconceptual model of service quality and its implicationsfor future research. Journal of Marketing, 49(4), 41–50.
Phelps, A. (1986). Holiday destination image—Theproblem of assessment. Tourism Management, 7(3),168–180.
Puhringer, S., & Taylor, A. (2008). A practitioner’s reporton blogs as a potential sources of destination market-ing intelligence. Journal of Vacation Marketing, 14(2),177–187.
Reilly, M. D. (1990). Free elicitation of descriptive adjec-tives for tourism image assessment. Journal of TravelResearch, 28(4), 21–26.
Richards L., & Richards T. (1994). From filing cabinetto computer. In A. Bryman & R. G. Burgess (Eds.),Analysing qualitative data (pp. 146–172). London,United Kingdom: Routledge.
Sampson, S. E., & Showalter, M. J. (1999). The per-formance-importance response function: Observationsand implications. The Service Industries Journal, 19(3),1–25.
Schmallegger, D., & Carson, D. (2008). Blogs in tourism:Changing approaches to information exchange. Journalof Vacation Marketing, 14(2), 99–110.
Scoble, Robert, & Israel, Shel. (2006). Naked conversa-tions: How blogs are changing the way businesses talkwith customers. Hoboken, NJ: John Wiley & Sons.
Selwyn, T. (1996). Introduction. In T. Selwyn (Ed.), Thetourist image: Myths and myth making in tourism (pp.1–32). Chichester, United Kingdom: Wiley.
Steele, R. J. & Fletcher, J. E. (1991). Use of pairedmanagement action grids for ease in depicting differ-ences between users’ and managers’ perceptions ofproblems. In G. A. Vander Stoep (Ed.), Proceedingsof the Northeastern Recreation Research Symposium(Gen. Tech. Rep. NE-160, pp. 122–126). Radnor,
PA: U.S. Department of Agriculture, Forest Service,Northeastern Forest Experiment Station.
Sternberg, E. (1997). The iconography of the tourism expe-rience. Annals of Tourism Research, 24(4), 951–969.
Sternquist Witter, B. (1985). Attitudes about a resort area:A comparison of tourists and local retailers. Journal ofTravel Research, 24(1), 14–19.
Tasci, A. D., & Gartner, W. C. (2007). Destination imageand its functional relationships. Journal of TravelResearch, 45(4), 413–425.
Thevenot, G. (2007). Blogging as a social media. Tourismand Hospitality Research, 7(3–4), 282–289.
Thompson, R. (2002). Reporting the results of a computer-assisted analysis of qualitative research data. ForumQualitative Sosialforschung/Forum: Qualitative SocialResearch, 3(2). Retrieved from http://www.qualitative-research.net/fqs-texte/2-02/2-02thompson-e.htm
Ting, S. C., & Cheng, C. N. (2002). The asymmetricaland non-linear effects of store quality attributes on cus-tomer satisfaction. Total Quality Management, 13(14),547–569.
Uysal, M., Howard, G., & Jamrozy, U. (1991). An applica-tion of importance- performance analysis to a ski resort:A case study in North Carolina. Visions in Leisure andBusiness, 10, 16–25.
Woodside, A. G., Cruickshank, B. F., & Dehuang, N.(2007). Stories visitors tell about Italian cities as des-tination icons. Tourism Management, 28(1), 162–174.
Xiang, Z., & Gretzel, U. (2010). Role of social media inonline travel information search. Tourism Management,31(2), 179–188.
SUBMITTED: February 15, 2011FIRST REVISION SUBMITTED:
June 1, 2011FINAL REVISION SUBMITTED:
September 27, 2011ACCEPTED: October 25, 2011
REFEREED ANONYMOUSLY