
Application of nano iron in the remediation of Cr-contaminated
153
I "Application of nano iron in the remediation of Cr-contaminated soil and its effect on plant growth and soil bacteria " " م وتأثير ميوثه بعنصر الكروملونظيف التربة الد في تانوحدي استخدام النك على ذل التربةريا وبكتيلنبات نمو ا" Prepared by Shireen Tariq Zedany 1125354 Supervisor Prof. Talal Shahwan Members of examination committee Dr. Hani Awad Prof. Jamil Harb Date of defense: September 3 ed 2015 This Thesis was submitted in partial fulfilment of the requirements for the Master’s Degree in Applied Chemistry from the Faculty of Graduate Studies at Birzeit University, Palestine.
-
Upload
khangminh22 -
Category
Documents
-
view
1 -
download
0
Transcript of Application of nano iron in the remediation of Cr-contaminated

I
"Application of nano iron in the remediation of Cr-contaminated
soil and its effect on plant growth and soil bacteria"
ذلك على استخدام النانوحديد في تنظيف التربة الملوثه بعنصر الكروميوم وتأثير "
"نمو النبات وبكتيريا التربة
Prepared by
Shireen Tariq Zedany
1125354
Supervisor
Prof. Talal Shahwan
Members of examination committee
Dr. Hani Awad Prof. Jamil Harb
Date of defense: September 3ed
2015
This Thesis was submitted in partial fulfilment of the
requirements for the Master’s Degree in Applied Chemistry from
the Faculty of Graduate Studies at Birzeit University, Palestine.

II

III
اهداء
السيد طارق خيري عبد هللا زيداني الحبيب لى والديإ
هديه تخرجي من املاجستير أخذه القدر ولم يعطيني الفرصة حتى أ, 5182-4-81الذي توفي بتاريخ
الذي أحصل عليه مع إنهائي " ألاستاذ"تمنيت لو أنني أستطيع أن أمنحه لقب .بوجوده بيننا
إالى , أن أمنحه هذا اللقب بشكل رمزي على ألاقل أستطيع ولكنني , للماجستير بشكل رسمي
. أبي ومعلمي ألاول " ألاستاذ طارق زيداني"
عيش معنا الىتخوتي سإداخلي وداخل اي زرعهتال تعاليمه غاب جسده ولكن روحه و , أبي الحبيب
, التواجد معههؤالء الذين لم تكن الحياة عادلة معهم بحيث لم يعرفوه ولم يعرفو روعة , ألابد
بروعة وسمو كونه ألاب الذي عشت في كنفه وظله حتى شاء هللا وأخذه وتركني من لقد عرفته
أحاول كل يوم يا أبي , بعده أحاول جبر الكسر الذي خلفه فقده في قلبي وعقلي وكياني وكل وجودي
ريق علم في ط أسال هللا أن يرحمك وأن يجعل سعيي في كل, فأجدني منكسرة في غيابك أكثر فأكثر
. وأن يجعل كل ما بذلته في سبيل تربيتي و تعليمي سببا لدخولك الجنة, ميزان أعمالك وحسناتك

IV
Acknowledgments
I would like to express my deep thanks and appreciation to my
supervisor Dr. Talal Shahwan for his support and patience throughout
the research project, he is a great example to look for academically
and personally.
A special thanks to Prof. Jamil Harb for his help in the plant part of
this thesis. I also want to thank Dr. Emilia Rappocciolo, the head of
the biology and biochemistry department, the lab technician Mr. Rateb
Muhamad for their help in the bacteria experiment.
I want to thank the members of the thesis committee Dr. Hani Awad
and Prof. Jamil Harb for their time.
I also want to thank all the members of the department of chemistry,
lab technicians Mr. Ibrahem shalash and Mr.Asem Mubarak, the
secretary of the department Mrs.Ghadeer Tayem, all teaching
assistants especially Mrs.Sadieh Abu-SirriAh, Mrs.Asia Shalash,
Mrs.Manal Zahran and Miss Raheeq Nasser, for their help and support
through the project.

V
I am thankful to the members of the materials research center at Izmir
Institute of Technology in Turkey for their support in XRD, SEM,
EDX & BET analysis.
Deep thanks to Prof. Paul Walther and Mrs. Montaha Almasri for thier
help in the SEM and TEM analysis that was done in Ulm University
in Germany.
Finally, but most importantly, to my family, my mother Mrs. Liana
Ajloni for being the strongest, most supporting mother. My brothers
Nael and Mohammed, my sisters Loreen, Tasneem and my third sister
Sabreen and her angels Tariq and Lolo, thanks for being always by my
side, love and care that I am surrounded by will always be my light in
the darkness.
To my husband Mr. Mazen Zahran for his love and care, to my unborn
baby boy “Ameer”, my closest partner in this journey, thanks for
being my joy.
Lastly, to my father Mr. Tariq Zedany, he passed on 18.4.2015,
destiny took him and left me alone standing in empty room with
nothing to hold on. My father, friend, first teacher and guide in life,
my hard work throughout my studying years is dedicated to your soul

VI
knowing it’s nothing and not enough to pay back even one billion of
your grace on me. May his soul rest in peace and sense my bride and
honor.

VII
Table of Contents
1. Introduction .................................................................................. 1
1.1 Pollution of Cr(VI) in soil and water ......................................... 1
1.2 Nano iron-general characteristics and applications .................... 4
1.3 Literature review of similar studies ......................................... 12
1.3.1 Removal of Cr(VI) from water and Soil ............................ 12
1.3.2 Effect of nano iron on plant growth ................................... 14
1.3.3 Effect of Fe NPs on soil bacteria ....................................... 18
1.4 Purpose of this study ............................................................... 23
2. Experimental ................................................................................ 25
2.1 Preparation of Iron Nanoparticles (nZVI) ............................... 25
2.2 Preparation of zeolite-iron nanoparticles ................................. 25
2.3 Preparation of GT-Fe NPs ....................................................... 26
2.4 Preparation of Cr(VI) solution ................................................. 27
2.5 Characterization techniques ..................................................... 27
2.5.1 BET surface area analysis .................................................. 31
2.5.2 XRD .................................................................................. 31

VIII
2.5.3 SEM/EDX ......................................................................... 32
2.5.4 XRF................................................................................... 33
2.5.6 HR-TEM ........................................................................... 34
2.6 Removal of Cr (VI) from aqueous solution ............................. 35
2.6.1 Effect of time..................................................................... 35
2.6.2 The effect of initial Cr (VI) concentration ......................... 36
2.6.3 Effect of initial pH on the Cr (VI) removal ...................... 37
2.7 Plant experiments - Effect of Fe NPs on Corn growth ............. 37
2.7.1 The experiment layout ....................................................... 37
2.7.2 Preparing soil for planting ................................................. 41
2.7.3 Planting ............................................................................. 41
2.7.4 ICP-OES analysis for soil samples .................................... 42
2.8 Effect of Fe NPs on bacteria .................................................... 43
2.8.1 Procedure .......................................................................... 46
3. Results & Discussion ................................................................... 48
3.1 Characterization of Fe nanomaterials ...................................... 48
3.1.1 Characterization of nZVI ................................................... 48

XI
3.1.2 Characterization of zeolite-nZVI composite ...................... 52
3.1.3 Characterization of “greener” nano iron ............................ 54
3.1.4. Characterization of the soil samples ................................. 57
3.2 Removal of chromium (VI) from aqueous solution ................. 61
3.2.1 Calibration curve ............................................................... 61
3.2.2 Effect of time..................................................................... 62
3.2.3 The effect of initial Cr (VI) concentration ......................... 66
3.2.4 Effect of pH of the Cr (VI) solution ................................. 71
3.3 Effect of Cr(VI) removal from soil mixed with Fe NPs on Corn
growth ........................................................................................... 76
3.3.1 Removal of Cr(VI) from soil mixed with Fe NPs .............. 76
3.3.2 Effect of Cr(VI) remediation from soil on Corn growth..... 81
3.4 Effect of iron nanoparticles on bacteria growth ....................... 95
3.4.1 Staphylococcus aureus ...................................................... 96
3.4.2 Klebsiella pneumonia ........................................................ 98
3.4.3 Bacillus subtilis ................................................................. 99
3.4.4 Escherichia coli ............................................................... 100

X
4. Conclusions ................................................................................ 105
5. References................................................................................ 107
APPENDIX A – λmax. Scan & calibration curve ............................. 107
APPENDIX B --- ICP analysis results ............................................ 126

XI
List of Tables
Table 1 Standard reduction potential of Fe2+
and Fe3+
[28] ................. 9
Table 2 Description of samples characterized at Izmir Institute of
Technology. ..................................................................................... 29
Table 3 Description of samples characterized at Ulm University ...... 30
Table 4 Treatments included in the plant experiment ....................... 40
Table 5 Samples which were tested in the bacteria experiments ....... 44
Table 6 Types of tested Bacteria....................................................... 44
Table 7 Presentation of the type and order in which chemicals were
added to the 24 well plates ( each well contains the tested bacteria) . 45
Table 8 XRF analysis results for nZVI ............................................. 52
Table 9 XRF analysis results for GT-Fe NPs. ................................... 57
Table 10 pH values measured at the beginning and the end of the
reaction of Cr(VI) with nZVI ........................................................... 69
Table 11 pH values measured at the beginning and the end of the
reaction of Cr(VI) with Z-nZVI ........................................................ 70
Table 12 Summary of the quantities of Cr and remediating substances
mixed with soil, and the effect of the process on plant progress
through two months of planting. ....................................................... 84
Table 13 Summary of the ICP-OES analysis results for Fe............... 89

XII
Table 14 Summary of the ICP-OES analysis results for Cr............... 90
Table 15 The Δ values obtained from the ICP analysis for Cr(VI) in a
descending order .............................................................................. 92
Table 16 The Δ values obtained from the ICP-OES analysis for Fe in a
descending order .............................................................................. 93
XIII
List of Figures
Figure 1 Schematic representation of the synthesis of nano-iron
materials by borohydride reduction [22]. ............................................ 7
Figure 2 The core-shell model of nZVI and schematic representations
of the reaction mechanisms for the removal of several contaminants
[27]. ................................................................................................... 8
Figure 3 The plant experiment layout (RCBD) ................................. 38
Figure 4 An image of the planting site .............................................. 39
Figure 5 Different pictures of the 24 well plates used in the bacteria
experiments ...................................................................................... 46
Figure 6 SEM image of nZVI aggregates showing its chain like
structure. .......................................................................................... 49
Figure 7 TEM images of nZVI at two different scales (a-200 nm, b-
100 nm) ............................................................................................ 50
Figure 8 XRD pattern of nZVI ......................................................... 51
Figure 9 SEM image of Z-nZVI (1:1 ratio of zeolite and Fe2+
ions) . 53
Figure 10 XRD pattern of Z-nZVI ................................................... 54
Figure 11 TEM image of GT-Fe NPs. .............................................. 55
Figure 12 XRD pattern of GT-Fe NPs. ............................................ 56
Figure 13 A typical SEM image of soil grains. ................................. 58

XIV
Figure 14 XRD pattern of a soil sample........................................... 59
Figure 15 Elemental content of a typical soil sample. ....................... 59
Figure 16 A SEM image of a mixture of soil and GT-Fe NPs. ......... 60
Figure 17 Variation of Cr(VI) aqueous concentration with time upon
contact with nZVI. ........................................................................... 63
Figure 18 Variation in the adsorbed amount of Cr(VI) on nZVI with
time. ................................................................................................. 63
Figure 19 Variation of Cr(VI) aqueous concentration with time upon
contact with Z-nZVI. ........................................................................ 64
Figure 20 Pseudo-first order plot of the removal of Cr(VI) by Z-nZVI
......................................................................................................... 66
Figure 21 The effect of initial Cr(VI) concentration on the removal of
Cr(VI) by nZVI. ............................................................................... 67
Figure 22 The effect of initial Cr(VI) concentration on the removal of
Cr(VI) by Z-nZVI. ........................................................................... 68
Figure 23 Effect of initial solution pH on the extent of Cr(VI) removal
by nZVI. ........................................................................................... 71
Figure 24 Effect of initial solution pH on Cr(VI) removal by Z-nZVI.
......................................................................................................... 72

XV
Figure 25 A schematic representation of (a) monodentate and
bidentate ((b) mononuclear and (c) binuclear) inner sphere complexes
that Cr(VI) can form with iron hydrous oxide surface [76]. .............. 75
Figure 26 EDX mapping of a sample containing soil, Cr(VI) and GT-
Fe NPs. ............................................................................................. 79
Figure 27 XRD pattern of a sample of Soil –GT-Fe NPs loaded with
Cr (VI) ions. ..................................................................................... 80
Figure 28 TEM image of GT-Fe NPs after the reaction with Cr(VI)
ions. ................................................................................................. 80
Figure 29 Some plants that didn’t grow. ........................................... 82
Figure 30 Some plants that grew normally. ...................................... 82
Figure 31, Figure 32 Corn cops that appeared in plants with normal
growth at the end of the planting cycle. ............................................ 83
Figure 33 Inhibition of S. aureus bacterial growth in a descending
order ................................................................................................. 97
Figure 34 Inhibition of K. Pneumonia bacterial growth by various
solutions in a descending order......................................................... 99
Figure 35 Inhibition of B. Subtilis bacterial growth by different
solutions in a descending order....................................................... 100

XVI
Figure 36 Inhibition of E. coli bacterial growth in a descending order
....................................................................................................... 101
XVII
Abstract
Recently, a huge amount of laboratory-scale research and field tests
are being carried out internationally in order to assess the
effectiveness of iron nanotechnology in environmental cleanup.
Published results have shown that nano iron is an effective tool for
remediation of water and soil from various kinds of organic and
inorganic pollutants. Together with this, increasing attention is also
paid to the impact of nano iron on the biosphere.
In this study, nano iron was applied to remediate soil samples
contaminated with chromium. Hexavalent chromium is a well known
pollutant in water and soil, particularly in the vicinity of industrial
regions. In addition to this, the effect of nano iron on plant growth and
soil bacteria was investigated.
This research was conducted in cooperation between Chemistry
department and department of Biology and Biochemistry at Birzeit
University. Nano iron was synthesized, and its efficiency toward
Cr(VI) removal was tested using laboratory scale experiments under
various experimental conditions. The assessment of nano iron impact

XVIII
on plant growth and soil bacteria was realized using the facilities
found at the department of Biology and Biochemistry.
The results indicate that both of nZVI and Z-nZVI materials are very
effective in Cr(VI) removal, as the percentage removal exceeded 90
percent for most of the studied concentrations. For nZVI, equilibrium
of Cr(VI) removal is approached in about one hour of contact between
liquid and solid phases. For Z-nZVI, the process was slower and more
than four hours were required to attain equilibrium. The data of Z-
nZVI obeyed pseudo first order kinetics, with k1 (rate constant)
calculated as min-1
, and Qmax (maximum
sorbable amount) found as mg/g.
The removal of Cr(VI) is high over a wide range of pH values, the
removal was seen to decrease in the alkaline medium. Generally, the
removal of Cr(VI) by Z-nZVI is more pH-dependent than that of
nZVI.
The results of EDX mapping analysis showed that the Cr signals are
associated with the Fe signals, not with Si, indicating that Cr ions
favors binding to iron nanoparticles more than soil.

XIX
No negative effect of nZVI and GT-Fe on Corn growth at the lower
applied dose (0.1 mg/Kg) on soil fertility and plant nutrition was
observed, however, high concentrations of Fe NPs can be harmful to
the corn plants.
The results of bacteria tests showed that Cr(VI) solutions have little
effect on the tested bacteria types at low concentrations, but
detrimental effects at higher concentrations. nZVI (and Cr-nZVI)
demonstrated the highest detrimental effect, GT-Fe NPs had less
detrimental effect than nZVI. The extent of the effect will depend
significantly on the applied concentration.

XX
ملخص
في اآلونة األخيرة، يجري تنفيذ كمية كبيرة من البحوث واالختبارات الميدانية من أجل تقييم
وقد أظهرت النتائج التي نشرت أن نانو . فعالية تكنولوجيا النانو الحديد في تنظيف البيئة
لمعالجة المياه والتربة من أنواع مختلفة من الملوثات العضوية وغير الحديد هو أداة فعالة
مع هذا، يولى اهتمام متزايد أيضا لتأثير نانو الحديد على المحيط الحيوي. العضوية .
الكروم . في هذه الدراسة، تم استخدام نانو الحديد لتنظيف عينات من التربة الملوثة مع الكروم
(VI )وفة في الماء والتربة، وخاصة في المناطق القريبة من المنشات هو من الملوثات المعر
.باإلضافة إلى ذلك، تم دراسة تأثير نانو الحديد على نمو النبات و بكتيريا التربة. الصناعية
أجريت هذه الدراسة بالتعاون بين قسم الكيمياء وقسم األحياء والكيمياء الحيوية في جامعة
باستخدام تجارب (VI) ديد، واختبار كفاءتها نحو إزالة الكرومتم تصنيع نانو الح. بيرزيت
وقد تم . وأجريت التجارب تحت ظروف مخبرية مختلفة. على نطاق المختبر في قسم الكيمياء
تقييم تأثير نانو الحديد على نمو النبات و بكتيريا التربة باستخدام مرافق وجدت في قسم
.األحياء والكيمياء الحيوية
المنهجية المستخدمة في هذا البحث هي محاولة لتقييم االستفادة من نانو الحديد واختبارها
أيضا ومعرفة إلى أي مدى قد يكون لها آثار سلبية على البيئة المحيطة، إن وجدت، على
المعارف العالمية حول الفوائد ومن المتوقع أن تسهم النتائج في . التربة والنباتات والبكتيريا
.فضال عن المخاوف بشأن التطبيقات من نانو الحديد في تنظيف البيئة

1
1. Introduction
1.1 Pollution of Cr(VI) in soil and water
Chromium, discovered in 1797, took its name from the Greek ward
‘chroma’ which means color, because of the many different colors
found in its compounds. This element is the earth’s 21st most abundant
element, and the sixth most abundant transition metal [1].
The metal content in soil is a sum of metals originating from natural
processes and human activities [2]. Natural processes result in heavy
metal content derived from parent rocks, while anthropogenic
contamination includes agrochemicals, organic amendments, animal
manure, mineral fertilizer, sewage sludge, and industrial wastes [3].
Heavy metals are among the most significant soil contaminants, due
to their long-term toxicity effects [4] as they are non biodegradable
and non thermodegradable [5]. In general, increase in metal content in
soils is observed in areas of intense industrial activities [2],[4],[6].
Moreover, effluent slurries with high heavy metal content is a
common waste liquid which have been frequently disposed by a
variety of industrial processes. It is reported that heavy metal
contamination of water sources may last for decades [6].
2
Heavy metals can accumulate to toxic levels because they are non
biodegradable and non thermodegradable [5]. It is well known that
heavy metals are essential for living thing at certain levels but that
toxic effects appear if the intake exceeds the limit values. Soil and
water contaminants can penetrate into the food chain by plants and
through direct consumption by animals feeding on them. High doses
of heavy metals are known to cause carcinogenic, teratogenic, toxic,
or cardiovascular problems. Therefore, metal pollution in areas of
agricultural activities forms a great concern [4]. Moreover, the toxicity
of heavy metals to organisms can affect the microbiology of the soil
ecosystem [7],[8], [9].
Industrial activities that can increase Cr concentration in soils include
steel production, leather tanning and corrosion prevention [7]. In
addition, soils irrigated by wastewater can accumulate heavy metals
such as Cr and can release heavy metals into ground water available
for plant uptake [5].
As is known from basic Chemistry, transition metals exist in different
oxidation states due to the presence of empty ‘d’ orbitals in transition
metal ions, and thus can form various species in solution [8]. The most

3
stable oxidation states of Cr in soil and water are Cr(III) and Cr(VI).
Each of them exhibit markedly different mobility and toxicity; Cr(VI)
is well known to be more toxic and more mobile than Cr(III). In
addition to these forms of Cr, other valence states which are unstable
and short lived can exist in biological systems [10].
The reduction of Cr(VI) ions is environmentally beneficial because it
decreases the threat of these ions to human health [7]. According to
World Health Organization (WHO) regulations, the maximum
permissible limit of total Cr in drinking water is 50 ppb [8].
The high toxicity of Cr(VI) is results from being both a mutagen and
a suspected carcinogen, and being quite soluble in water almost over
the entire pH range. In acidic soil, however, Cr(VI) may be adsorbed
and reduced to the far less mobile Cr(III) in presence of ferrous iron
[11].
Soil quality and content can affect productivity of crops and livestock,
environmental quality of natural resources, in addition to health of
plants, animals, and humans [12]. In spite of the the useful
applications of Cr, the impact of its industry on the local environment
is extensive, complicated and not fully quantified [13]. Moreover, the
4
natural occurrence of Cr ranges from 10 to 50 mg/kg depending on
the parental material [10].
Due to its serious hazards, it is necessary to remove Cr(VI) from
wastewaters prior to their discharge into the environment. Various
remediation technologies such as membrane filtration, electrodialysis,
ion exchange and adsorption have been developed and employed so
far to remove Cr(VI) from wastewaters. However, each of these
methods has its own limitations, which makes it necessary to test and
develop new materials and more efficient technologies [14].
1.2 Nanoscale iron; general characteristics and applications
Nanomaterials and nanoparticles can be defined as materials
manufactured or produced with at least one dimension under 100 nm
size. These materials are known to display novel properties
depending on their small size [15].
Engineered nanoparticles (ENPs) term is used to refer to nanoparticles
manufactured with novel properties. These materials possess different
optical, electrical, magnetic, chemical and mechanical properties from
their bulk counterparts. In nanoscale range quantum effects start to
predominate and the surface-area-to-volume (SA/V) ratio becomes
very large. The increase in SA/V ratio results in increased surface

5
activity of the material and changes their properties and behaviour
[16].
The increased surface activity enhances the tendency of nanomaterials
to adsorb, interact and react with other atoms, molecules and
complexes to achieve charge stabilization. Such unique properties
have been shown as beneficial for a wide range of applications [17].
As a result of size reduction, properties are modified. For example,
opaque substances become transparent (copper); stable materials
become combustible (aluminum); inert materials become catalysts
(platinum); insulators become conductors (silicon); and solids turn
into liquids at room temperature (gold) [16].
Iron is the fourth most abundant element in the Earth's crust [18].
Since the introduction of zero-valent iron (ZVI) for water purification
in 1990, many contaminants have been successfully removed by
reductive transformation [19]. ZVI is a well known remediation agent
because of its use in permeable reactive barriers, which are used in the
treatment of contaminated soil and groundwater with distinct
contaminants such as halogenated hydrocarbons or heavy metals [20].
Nanoscale zero-valent iron (nZVI) technology has been widely
investigated for the treatment of environmental pollutants in the last
6
two decades. The material has the advantage of a large specific
surface area and great intrinsic reactivity of surface sites [21]. The
effectiveness of the material is due to the small particle size and low
standard potential and easiness of preparation. In addition, Fe is
known to possess a relatively high recommended safety limit and
daily intake requirement, compared with other metals [22]. A typical
schematic representation of the preparation method of nZVI is shown
in Fig. 1.
It has also been reported that ZVI nanotechnology is cost effective for
in situ and ex situ remediation. By virtue of their high surface/volume
ratios, nZVI possess enormous amount of energy that brings about a
high sequestration capacity and provide a kinetic advantage in the
uptake process [23].
One important limitation of nZVI technology is caused by the rapid
aggregarion/agglomeration of individual iron nanoparticles prepared
using traditional methods. The material tends also to react quickly
with the surrounding media (e.g. dissolved oxygen or water), resulting
in rapid loss in reactivity. Because agglomerated ZVI particles are
often in the range of micron scale, they are essentially not
transportable or deliverable in soils, and thus, cannot be used for in

7
situ applications. Several methods have been proposed to solve this
problem. One approach is attaching nZVI to a support material [24].
Figure 1 Schematic representation of the synthesis of nano-iron
materials by borohydride reduction [22].
During the last few years, ‘green synthesis’ has been presented as a
serious alternative for the chemical preparation of iron nanoparticles,
It has received considerable attention due to its eco-friendly
characteristics. In this method, plant extracts and materials represent
an alternative to chemical and physical methods for the synthesis of
NPs [25].
Green synthesis has additional advantages because it is easily
scrabbled up for large scale synthesis, and in this method there is no

8
need to use high energy, temperature, and toxic chemicals. Green
synthesis offers better influence, control over crystal growth and their
steadiness [26].
Bare nZVI particles are typically less than 100 nm in diameter. In
aqueous solutions, all nZVI particles react with water and oxygen to
form an outer iron (hydr)oxide layer. As a result, nZVI particles are
well known to have a core-shell structure [6], as shown in fig. 2,
which proposes conceptually a structural model of nZVI and its
reactions with several contaminants [27].
Figure 2 The core-shell model of nZVI and schematic representations
of the reaction mechanisms for the removal of several contaminants
[27].
9
The core forms an electron source that can reduce a wide range of
inorganic and organic pollutants, while the shell surface has the ability
to adsorb many ions or molecules through physical or chemical
sorption. The oxide layer is thought to comprise of mixed
Fe(II)/Fe(III) oxides near the interface with Fe0 and mostly Fe(III)
oxide near the oxide/water interface. This core-shell structure has
important implications for the chemical properties of nZVI [27].
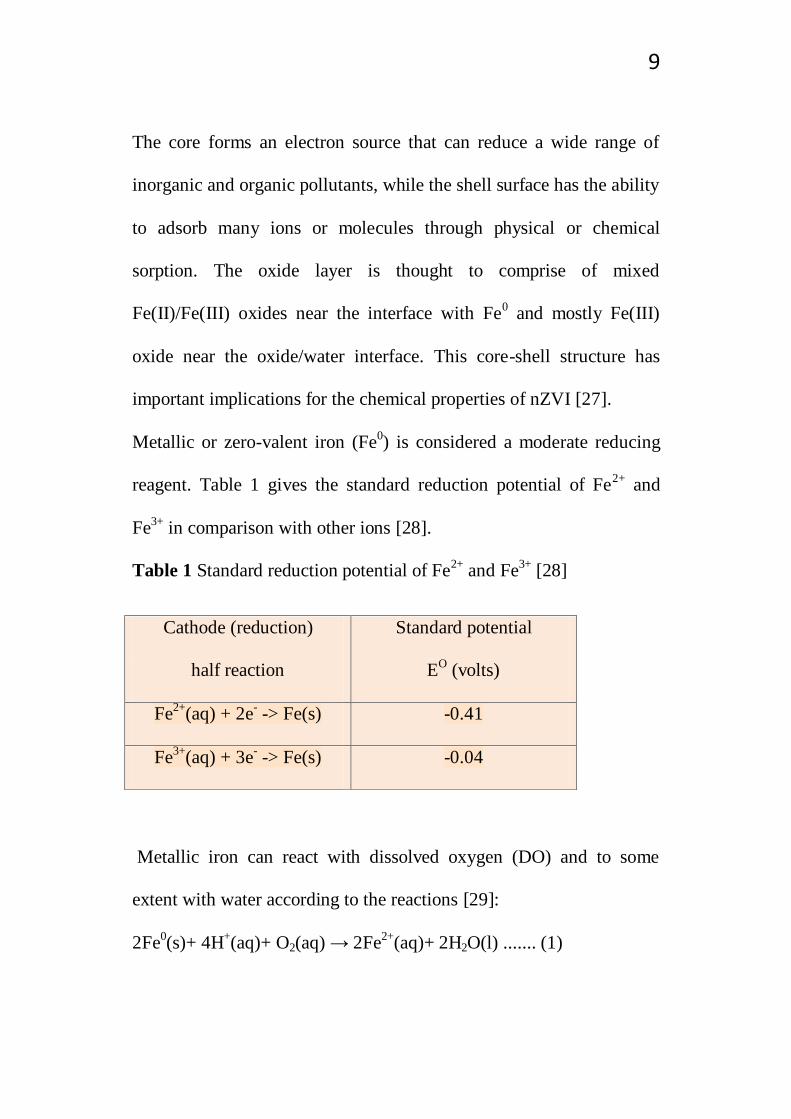
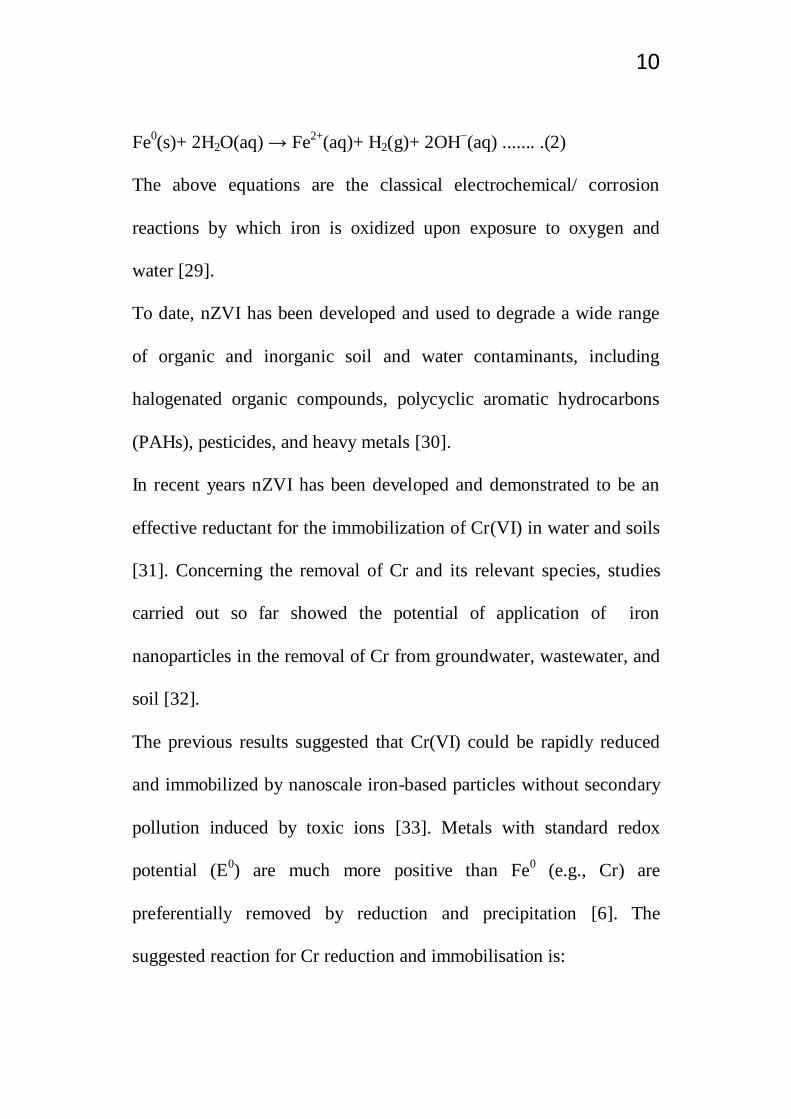
Metallic or zero-valent iron (Fe0) is considered a moderate reducing
reagent. Table 1 gives the standard reduction potential of Fe2+
and
Fe3+
in comparison with other ions [28].
Table 1 Standard reduction potential of Fe2+
and Fe3+
[28]
Cathode (reduction)
half reaction
Standard potential
EO (volts)
Fe2+
(aq) + 2e- -> Fe(s) -0.41
Fe3+
(aq) + 3e- -> Fe(s) -0.04
Metallic iron can react with dissolved oxygen (DO) and to some
extent with water according to the reactions [29]:
2Fe0(s)+ 4H
+(aq)+ O2(aq) → 2Fe
2+(aq)+ 2H2O(l) ....... (1)
10
Fe0(s)+ 2H2O(aq) → Fe
2+(aq)+ H2(g)+ 2OH
−(aq) ....... .(2)
The above equations are the classical electrochemical/ corrosion
reactions by which iron is oxidized upon exposure to oxygen and
water [29].
To date, nZVI has been developed and used to degrade a wide range
of organic and inorganic soil and water contaminants, including
halogenated organic compounds, polycyclic aromatic hydrocarbons
(PAHs), pesticides, and heavy metals [30].
In recent years nZVI has been developed and demonstrated to be an
effective reductant for the immobilization of Cr(VI) in water and soils
[31]. Concerning the removal of Cr and its relevant species, studies
carried out so far showed the potential of application of iron
nanoparticles in the removal of Cr from groundwater, wastewater, and
soil [32].
The previous results suggested that Cr(VI) could be rapidly reduced
and immobilized by nanoscale iron-based particles without secondary
pollution induced by toxic ions [33]. Metals with standard redox
potential (E0) are much more positive than Fe
0 (e.g., Cr) are
preferentially removed by reduction and precipitation [6]. The
suggested reaction for Cr reduction and immobilisation is:

11
Fe+2
+ CrO4−2
+ 4H2O → (Fex, Cr1−x)(OH)3 + 5OH−
in which the toxic or carcinogenic hexavalent form of Cr is reduced to
the less toxic Cr(III) form, which readily precipitates as Cr(OH)3 or as
the solid solution FexCr1 − x(OH)3 [18], (a solid solution is a solid-
state solution of one or more solutes in a solvent. Such a mixture is
considered a solution rather than a compound, when the crystal
structure of the solvent remains unchanged by addition of the solutes,
and when the mixture remains in a single homogeneous phase).
In addition to the redox mechanism, some Cr(VI) can be directly
adsorbed on the hydr(oxide) shell of nZVI [6].
In the context of soil remediation, trace elements cannot be destroyed
like organic contaminants, they can only be relocated. To decrease
contaminant bioavailability and mobility, various strategies have been
used [34]. The in-situ chemical reduction of Cr(VI) by nZVI
represents a potentially more effective, lower cost alternative to other
remediation techniques such as pump and treat, permeable reactive
barriers (PRB) and natural attenuation via bio- and phytoremediation
[24]. Stabilization of contaminated soil is a remediation technique that
reduces the mobile fraction of trace elements, which could
contaminate groundwater or be taken up by soil organisms [35].

12
1.3 Literature review of similar studies
1.3.1 Removal of Cr(VI) from water and Soil
This section summarizes the findings of previous studies about the
applications of Fe NPs and its composite materials in the removal of
Cr(VI) ions.
The application of Fe NPs and its composite materials in the removal
of Cr(VI) was examined in a number of studies. The reduction and
precipitation of Cr(VI) by nZVI was reported to be rapid with a
removal capacity ranging from 180 to 50 mg Cr/g nZVI in the pH
range of 4 to 8 [36]. In another study effective removal of Cr(VI) by
nZVI was reported, and the reaction products were composed of iron
oxides, Cr–Fe (oxy)hydroxide and/or the unreacted Fe0 [37].
Various materials were used as supports of Fe NPs to assess the
removal capacity of Cr(VI) ions. Silica fume-supported Fe0 NPs was
reported to be reactive in remediation of Cr(VI), and its removal
ability was higher than unsupported Fe0 under the studied conditions
[24]. In another study, nZVI loaded on epichlorohydrin/chitosan beads
was reported to be an effective and promising remediation material to
remove Cr(VI) from wastewater, and the rate of reaction was a first

13
order [17]. nZVI supported on a pillared bentonite (Al-bent) was
reported to yield almost a complete removal of Cr(VI) ions after 120
min of contact [38]. Bentonite was proven to be an effective
dispersant and stabilizer of nZVI, and thus was superior to nZVI in
removing Cr(VI) from aqueous solution. Kinetics studies
demonstrated that the reduction of Cr(VI) by B-nZVI followed a
pseudo-first-order model with almost a complete removal [39]. In
another study, nZVI-Fe3O4 composites were used in Cr(VI) removal,
and the reaction was reported to be more efficient when the
temperature increased from 10 °C to 40 °C [40].
The application of Fe NPs was also investigated for the removal of
Cr(VI) from soil. For this purpose a new class of sodium carboxy
methyl cellulose (CMC)-stabilized nZVI was tested for the in situ
remediation of Cr(VI) contaminated soils. The results for the removal
of aqueous-bound Cr(VI) indicated that the reduction efficiency was
proportional to the CMC-nZVI dosage and inversely related to the
initial Cr(VI) concentration, with slightly better performance for
acidic or neutral soil remediation [41]. In another study, contaminated
soil was stabilized with 1% iron grit. This treatment decreased Cr
concentrations in leachates (by 98%), in soil pore water (by 99%) and
14
in plant shoots (by 84%) [35]. A comparative column study was
conducted for the treatment of Cr(VI)-contaminated soil at a Cr
plating facility using two agents: calcium polysulfide and Fe NPs
stabilized with a polyphenol rich green tea extract. It was concluded
from this study that CPS has more favorable properties as injectable
reductant for Cr(VI) treatment in soils compared to GT-nZVI [42].
In further applications, stabilized nZVI was applied in the remediation
of a simulated Cr(VI)-polluted river. The results showed that the
remediation effectiveness was improved with the increasing nZVI
dose, decreasing initial concentration of pollution source and water
flow rate [43]. In a different work, nZVI was used to reduce Cr(VI)
content in Chromite ore processing residue (COPR). The results
implied that remediation approaches using nZVI to immobilize Cr(VI)
in COPR is successful with sufficient water content to facilitate
electron transfer between Cr(VI) and nZVI [31].
1.3.2 Effect of nano iron on plant growth
Iron is one of the essential elements for plant growth and plays an
important role in the photosynthetic reactions. Iron activates several
enzymes and contributes in RNA synthesis and improves the
15
performance of photosystems [44]. An important parameter that
contributes to this is the existence of two stable, inter-convertible
forms of this metal, which take part in fundamental processes
involving electron transfer reactions, including respiration and
photosynthesis [45].
Plants are an essential base component of all ecosystems and play a
critical role in the fate and transport of engineered nanoparticles in the
environment through plant uptake and bioaccumulation [46].
The major factors affecting uptake of minerals by plants include soil
factors and plant factors. With respect to soil factors, the availability
of trace elements as nutrients depends on several parameters, such as
lithosphere (base-rock), soil age, soil type and the covering flora. In
general, heavy metals can accumulate in higher amounts in the
sorption complex of soils rich with organic matter. But the release
those metals to soil solution is much slower than in mineral soils due
to high affinity of soil organic compounds to heavy metals. Thus, the
availability of nutrient metals to plants is controlled also by soil pH,
type of mineral colloids and other important factors, like microbial
activity, redox potential and aeration [47].
16
With respect to plant factors, almost all heavy metals can be taken up
by plants in two ways, which are mostly concentration-dependent; i)
Non-metabolic uptake - by energy independent mechanisms, in which
solutes can diffuse down the concentration gradient with the aid of
membrane carriers or even aqueous pores. ii) Metabolic uptake - by
energy dependent mechanisms. Here, active uptake is involved in
taking up ions against their concentration gradient [47].
One of the important consequences of the large increase in the
utilization of manufactured nanomaterials is the concern that the
release of these materials into the environment may pose a serious
threat for the environment [48].
Engineered nanoparticles (ENPs) closely interact with their
surrounding environment including plants, and the uptake and
accumulation in plant biomass will greatly affect the fate and transport
of ENPs in the environment. ENPs could also adhere to plant roots
and exert physical or chemical toxicity on plants [46].
Some studies showed that nanoparticles can be beneficial to plants
(seedling growth and development) or non-beneficial (to prevent root
growth) [44]. However, most studies with ENPs indicated certain
degree of phytotoxicity, especially at high concentrations [46]. Other

17
researchers reported that nZVI particles do not have a significant
negative effect on indigenous microbial communities or certain plant
species over a long period [49]. It is reported that, for most
nanoparticles, relatively high concentrations are needed to cause
observable toxicity on plants and that the toxicity threshold is species
dependent [50].
The inhibition of plant growth may not be derived directly from
chemical phytotoxicity of nanoparticles. Instead, toxicity may result
from the physical interactions between nanoparticles and plant cell
transport pathways i.e. by inhibiting apoplastic trafficking by blockage
of the intercellular spaces in the cell wall or cell wall pores, or the
symplastic connections between cells through blockage of the nano-
sized plasmodesmata. [46].
It was reported that nZVI at the concentrations used in field conditions
could lead to phytotoxic effects on plants and that the extent of
toxicity is dependent upon plant species. The result indicated that
large scale introduction of nZVI to the environment could lead to
serious environmental consequences and thus the environmental
impact of such application warrants further attention [51].

18
The phytotoxicity of nZVI could be explained by several mechanisms.
The formation of black coating on the root surface could effectively
block the root membrane pores and interfere with the water and
nutrient uptake process. Moreover, under reduced conditions, ferrous
iron (Fe2+
) which is a by-product of iron oxidation, could be further
oxidized to its less soluble form of ferric iron (Fe3+
) by the oxidative
agents released from plant roots and as a result form a cover of an
insoluble Fe3+
compound on the root surface [51].
Furthermore, the introduction of nZVI could shift the redox condition
in the local environment and affect the oxygen release rate of plant
roots [51].
1.3.3 Effect of Fe NPs on soil bacteria
Microorganisms exposed to various metal ions in their environment
can interact with them. This can be beneficial or detrimental
depending on the chemical/ physical nature and oxidation state of the
metal ion. Like other heavy metals, chromium can induce multiple
toxic effects on tissues and it may affect immune response to bacterial
pathogen. Chromium is a unique transition metal ion, which has been

19
established to be biologically significant at all the levels of living
organisms [52].
High concentration of iron is extremely toxic and may enhance
bactericide effects of antimicrobial agent or noxious substances, Fe
(III) as well as Fe (II) has an inhibitory effect. It is also revealed that
other trace elements such as chromium are toxic and could interact
with iron metabolism in bacteria. The toxic effects of the trace
elements could partially be removed in combination with other
elements [52].
Microbes in soil have important impacts on soil and plant. They play
significant roles in recycling plant nutrients, maintenance of soil
structure, detoxification of noxious chemicals, and the control of plant
pests and plant alterations. Being in intimate contact with the soil's
environment, soil microorganisms are very sensitive to any ecosystem
perturbation, and are therefore considered to be the best indicators of
soil pollution [53].
On the other hand, heavy metals exhibit toxic effects on soil biota, and
can affect key microbial processes and decrease the number and
activity of soil microorganisms [9]. In situ treatment of heavy metal
pollution might be expected to affect the plants and the

20
microorganisms in soil. Microbial toxicity has been reported for metal
NPs, like elemental Ag, Au, Fe; oxides of Ti, Fe, Co–Zn–Fe etc [54].
However, other reports on the relative toxicities of heavy metals and
metal oxide NPs are contradictory [16].
So far little information is available about the effect of ENPs on the
soil microbial community. It is believed that ENPs may have an
impact on soil microorganisms via four ways; (1) a direct effect
(toxicity), (2) changes in the bioavailability of toxins or nutrients, (3)
indirect effects resulting from their interaction with natural organic
compounds, and (4) interaction with toxic organic compounds which
would amplify or alleviate their toxicity [16].
Many of the reactions involving Fe in soils, sediments, and
groundwater are microbially-mediated, with Fe(III) acting as the
dominant electron acceptor for microbial respiration in many
subsurface environments [18].
Generally, elemental iron itself, such as zero-valent iron, has no
known toxic effect, and is one of the most common metals on earth
[49]. However, the generated Fe2+
ions from the reaction between
nZVI and H2O could be toxic to microorganism, and it is necessary to

21
investigate the potential releasing toxic ions from nZVI or its reaction
product [55].
Recently, however, a study showed that bacterial exposure to nZVI
would cause significant disruption to the cell membranes and leakage
of the intracellular content [49]. In another study, nZVI was proved to
be non-toxic to microorganism in a long term, and the issue of safety
caused by anthropogenic injection of nZVI could be avoided [43].
Another work stated that nZVI might be toxic to indigenous bacteria
and hinder their participation in the cleanup process [56]. Several
studies have shown that iron nanoparticles are cytotoxic to pure
cultures of bacteria, such as Escherichia coli [57] and Bacillus subtilis
var. Niger [58].
Like in the case of plants, toxicity mechanisms on bacteria and
microorganisms have not yet been completely elucidated for most
ENPs. However, it is believed that possible mechanisms include
disruption of membranes or membrane potential, oxidation of
proteins, genotoxicity, interruption of energy transduction, formation
of reactive oxygen species, and release of toxic constituents [16].
Nanoecotoxicology is an emerging discipline with useful progress
mainly with regards to toxicity occurring in plant, fish and

22
invertebrate species. However, important gaps remain in the
knowledge of other ecological receptors, such as soil microbial
communities [34]. Ethical and environmental concern for organisms
living in soil and surface water has led to questions of possible
negative secondary effects which have scarcely been addressed so far
[59]. This issue remains and important one that needs further research
and consideration.
Staphylococcus aureus is a type of bacteria. It stains Gram positive
and is round shaped. It is called Staphylococcus as its found in grape-
like (staphylo-) clusters. Staphylococcus is one of the five most
common causes of infections after injury or
surgery.[60] Staphylococcus aureus can be found in a wide variety of
locations such as soil, human skin, and public places like hospitals and
prisons [61].
Klebsiella pneumoniae is a Gram-negative, rod-shaped bacterium. It
naturally occurs in soil, and can fix nitrogen in anaerobic conditions.
K. pneumoniae has been demonstrated to increase crop yields in
agricultural conditions [62].
Bacillus subtilis cells are rod-shaped, Gram-positive bacteria that are
naturally found in soil and vegetation [63],[64].

23
Escherichia coli (E. coli) bacteria normally live in the intestines of
people and animals. Most E. coli are harmless and actually are
an important part of a healthy human intestinal tract.[65] Escherichia
coli is a gram-negative, anaerobic, rod-shaped bacterium [66].
1.4 Purpose of this study
In this study, Fe NPs were prepared using two methods; nano-zero-
valent iron (nZVI) prepared by sodium borohydride reduction method,
and ‘greener’ iron nanoparticles (GT-Fe) prepared by using green tea
extract as a reducing and stabilizing agent. In addition, nZVI
supported on zeolite was also used.
The materials were characterized using Scanning Electron Microscopy
(SEM) and Transmission Electron Microscopy (TEM) to investigate
and compare their nanoscale morphology. X-Ray powder Diffraction
(XRD) was used to determine the mineralogical structure of the
materials. Energy Dispersive X-Ray Analysis (EDX) and X-ray
Fluorescence (XRF) were employed to determine the quantitative
elemental surface composition. BET technique was used to determine
the specific areas of the prepared materials.

24
The prepared materials were then used in the removal of Cr(VI) from
aqueous solution. The removal capacities were investigated under
various contact times, initial Cr(VI) concentrations, and pH values to
determine and compare the removal kinetics and extent of removal.
Cr(VI) concentration was determined using UV-visible
spectrophotometry.
The prepared materials were then used to remove Cr(VI) from soil.
The effect of the remediation process on plant growth was
investigated with Corn used as a model plant. Soil samples were
analyzed at the beginning and after two months of planting with ICP-
OES to determine the Cr and Fe concentration in soil.
Furthermore, the effect of the prepared materials on bacteria growth
was investigated. For this purpose, four different types of bacteria that
are usually available in soil were tested, two of them are gram positive
(Staphylococcus aureus and Bacillus subtilis) the other two are gram
negative (Klebsiella pneumonia and Escherichia coli).

25
2. Experimental
2.1 Preparation of Iron Nanoparticles (nZVI)
The procedure applied for this purpose was also reported in earlier
studies [1,2]. It relies on the liquid phase reduction method utilizing
borohydride as a reducing agent of iron ions. In order to prepare nZVI,
5.34 g sample of ferrous chloride (FeCl2.4H2O) was dissolved in 25.0
ml solution of absolute ethanol and water (4:1 v/v ). A 2.54 g sample
of sodium borohydride (NaBH4) was separately dissolved in 70.0 mL
water, it was then added dropwise onto the Fe2+
solution kept under
well stirring.
After the addition of all the borohydride solution, the iron sample was
separated using suction filtration, and subsequently washed three
times with absolute ethanol (this is an important step to avoid
oxidation of Fe0). The nZVI powder was then dried for about 6 hours
in the oven ( LDO 030E,060E,100E) which was kept at 90 oC.
2.2 Preparation of zeolite-iron nanoparticles
The composite of iron nanoparticles supported on zeolite (Z-nZVI)
was prepared using the borohydride reduction method in accordance
with the procedure reported earlier [1,2]. Z-nZVI was prepared in 1:1

26
zeolite / Fe2+
mass ratio by dissolving 5.34 g of FeCl2.4H2O (Aldrich
22029-9) in 25.0 mL (4:1 ethanol/water) solution. Subsequently, 1.5 g
of zeolite (obtained from Inamarble Company) was added to the
solution and mixed on a magnetic stirrer for 15 min. NaBH4 (Merck
8.06373.0025) solution was prepared separately by dissolving 2.54 g
in 70.0 mL deionized water, then it was added using a burette to the
iron–zeolite solution under continuous stirring. Following the
borohydride addition, the solution was kept under continuous stirring
for another 15 min then filtered under suction and washed 3 times
with absolute ethanol. Finally, the Z-nZVI composite was dried in the
oven at 90°C for 6 h.
2.3 Preparation of GT-Fe NPs
The samples were prepared in accordance with a procedure reported
earlier [69]. For this purpose, green tea extract was obtained by
heating 60.0 g L−1
green tea (Alwald Brand) until boiling. After
settling for 1.0 h, the extract was vacuum-filtered. Separately, a
solution of 0.10 M FeCl2·4H2O was prepared by adding 19.9 g of
solid FeCl2·4H2O (Aldrich 22029-9) in 1.0 L of deionized water.
Subsequently, 0.10 M FeCl2·4H2O solution was added to 60.0 g L−1
green tea in 2:3 volume ratio. Following this, 1.0 M NaOH solution

27
was added until the pH reached 6.0 and the formation of GT-Fe NPs
was marked by the appearance of an intense black precipitate.
The solid phase was separated in two step; first by evaporating water
from the iron solution on a hot plate (Freed Electric), and then by
drying it overnight in a fume hood.
2.4 Preparation of hexavalent chromium Cr(VI) solution
A 500 mg/L stock Cr(VI) solution was prepared by dissolving 141.4
mg of potassium dichromate (K2Cr2O7, Aldrich 20924-4) in 100 ml
distilled water. The solution was used to prepare other solutions at
concentrations of 0.1, 0.2, 0.4. 0.6, 0.8, 1.0, 10.0, 20.0, 30.0 mg/L.
The UV-visible absorbance readings of these solutions were recorded
(at λmax = 350 nm) and a calibration curve was constructed. The
instrument used for the UV-Vis. measurements was a Varian Cary 50
Spectrophotometer. The scanned curve containing λmax of chromium
solution and the calibration curve are provided in appendix A.
2.5 Characterization techniques
Appropriate physical and chemical characterization of natural and
manufactured NMs is fundamental to determine their intrinsic
properties [70].

28
The solid samples used in this study were characterized using
Scanning Electrom Microscopy/Energy Dispersive X-ray Analysis
(SEM/EDX), powder X-ray Diffraction (XRD), X-ray Flourescence
(XRF), Surface area analysis (BET-N2), and Fourier Transform-
Infrared Spectroscopy (FT-IR). All the soil samples were taken at the
beginning of the planting experiments. All the above instruments,
except the FTIR, are located at Izmir Institute of Technology in
Turkey. The samples characterized using these techniques are given in
Table 2.

29
Table 2 Description of samples characterized at Izmir Institute of
Technology.
# Sample Description Symbol
1 Zero valent iron NPs nZVI
2 Zeolite supported iron NPs Z-nZVI
3 Greener iron NPs GT-Fe
4 Soil only Soil
5 Soil containing Chromium Soil + Cr
6 Mixture of Soil and Greener iron NPs Soil + GT-Fe
7 Mixture of Soil, Chromium, and Greener iron
NPs
Soil+Cr+GT-Fe
In addition, the samples given in Table 3 were characterized with
SEM & TEM instruments located at Ulm University in Germany.

30
Table 3 Description of samples characterized at Ulm University
# Sample Description Symbol
1 Soil only Soil
2 Greener iron NPs GT-Fe
3 Zero valent iron NPs nZVI
4 Soil after the reaction with Cr(VI) Soil*
5 Mixture of Soil and Greener iron NPs after the reaction
with Cr(VI)
Soil + GT-Fe *
6 Greener iron NPs after the reaction with Cr(VI), initial pH
= 2
GT-Fe – 2
7 Greener iron NPs after the reaction with Cr(VI), initial pH
= 4
GT-Fe – 4
Sample 4 in Table 3 was prepared by mixing 100-ml of 500 mg/L Cr
(VI) solution with 15.0 g soil. To prepare sample 5, 5.0 g of GT-Fe
were added to the Cr(VI) solution with the 15.0 g soil. For samples 6
and 7, 5.0 g of GT-Fe were added to the Cr (VI) solution, and the pH
of the Cr (VI) solution was adjusted with 0.1 M HCl and 0.1 M NaOH
at pH=2 for sample 6, and pH=4 for sample 7. All samples were then

31
left in contact for 48 hrs, then filtered and dried in the oven at 90oC for
3 hrs.
2.5.1 BET surface area analysis
Brunauer–Emmett–Teller (BET) theory explains the
physical adsorption of gas molecules on a solid surface and serves as
the basis for an important analysis technique for the measurement of
the specific surface area of a material [71].
Samples 4, 5, 6 and 7 given in Table 2 were analyzed for their surface
areas using the BET-N2 method. For this purpose, a Micromeritics
Gemini V (Georgia, USA) type instrument was employed.
2.5.2 XRD
X-ray diffraction (XRD) relies on the dual wave/particle nature of X-
rays to obtain information about the structure of crystalline materials.
A primary use of the technique is the identification and
characterization of compounds based on their diffraction patterns [72].
XRD analysis was performed using a Philips X’Pert Pro (Almelo,
Netherlands) instrument. The source consisted of Cu K radiation

32
(=1.54 Å), and each of the analyzed samples was scanned within the
2 theta range of 20-80.
Samples 1 through 7 in Table 2 were all characterized with XRD. The
obtained data were processed and analyzed using MS Origin Pro. 9
software.
2.5.3 SEM/EDX
The scanning electron microscope (SEM) employs a focused beam of
high-energy electrons to generate signals from the surface of solid
specimens, in order to reveal information about the sample including
external morphology (texture), chemical composition, and crystalline
structure and orientation of materials making up the sample [73].
Energy Dispersive X-Ray Analysis (EDX), is an x-ray technique used
to identify the elemental composition of materials. EDX systems are
attachments to SEM or TEM instruments (in this study EDX is
attachment to the SEM instrument). Elemental mapping of a sample
and image analysis are also possible [74].
SEM/EDX analysis was obtained using a FEI Quanta 250 FEG
(Oregon, USA) type instrument. The solid samples were first
33
sprinkled onto adhesive metallic disks, and the images of the sample
surfaces were recorded at different magnifications.
This analysis was performed for all samples in Table 2. In addition to
the above, elemental and mapping EDX analysis was performed using
the same instrument for sample 7 (Table 2) at randomly selected areas
to determine the atomic distribution of elements on the surface of the
solids.
SEM analysis was performed for all samples given in Table 3. The
instrument used in analysis was a Hitachi, S-5200 field-emission
scanning electron microscope, Hitachi, Tokyo, Japan. The
accelerating voltage was 10 kV, and the images were taken with the
secondary electron detector.
2.5.4 XRF
X-ray fluorescence (XRF) is an elemental analysis technique with
broad application in science and industry. XRF is based on the
principle that individual atoms, when excited by an external energy
source, emit x-ray photons of a characteristic energy or wavelength.
By counting the number of photons of each energy emitted from a
sample, the elements present may be identified and quantified [75].

34
XRF measurements were performed using a METEC spectro IQ II
(Kleve, Germany) type instrument. The Samples were pulverized in a
mortar and thoroughly milled powder was stored in plastic mini
centrifuge tubes. During the analysis, the samples were mounted on
glass slides and placed in the XRF sample holder.
This analysis was performed for all samples in Table 2.
2.5.6 HR-TEM
High resolution transmission electron microscopy (HR-TEM) is a
valuable tool which allows the corroboration of structure,
morphology, as well as diffraction data for nanomaterials [76].
The instrument type was a Jeol-1400 transmission electron
microscope, Jeol, Tokyo, Japan. The accelerating voltage was 120 kV,
bright field signal. A very small amount of each sample was taken in a
plastic tube and mixed with a resin. Samples were then centrifuged
and left to dry for two days.
A cross section to ultra thin layers was prepared under the
microscope. Then the thin section was placed on a copper grid and
fixed on the device holder, the parameters were finally adjusted to
obtain clear images. This analysis was done for all samples in Table 3.

35
2.6 Removal of Cr (VI) from aqueous solution
All the experiments were performed under atmospheric pressure in a
thermostated water bath equipped with a shaker (Electra medical
corporation , SWB 402). The water bath was adjusted at 25oC. In all
the experiments, the solid and liquid samples were placed in sealed
polypropylene tubes.
The UV-Visible absorbance readings of the liquid and supernatant
phases were recorded using a Varian carry 50 spectrophotometer at
λmax of 350 nm. The concentrations of chromium were determined
from the calibration curve prepared previously (Appendix A).
2.6.1 Effect of time
In the kinetic experiments, 0.10 g samples of Fe NPs (nZVI) were
mixed with 25.0 ml aliquots of 100 mg/L Cr (VI) solution, and were
contacted for 1 min, 5 min, 30 min, 1 hr ,4 hr and 24 hr.
The Cr (VI) solutions were separated from Fe NPs by centrifugation
(Labo fuge 200) and / or filtration. The supernatant solutions were
analyzed by measuring the UV-Visible absorbance of the solutions.

36
In addition to the previous experiment, a blank experiment was also
carried out in parallel at the same Cr (VI) concentration (100 mg/L),
using zeolite and Z-nZVI composites. The contact times were kept as
above, and the Cr (VI) solutions were separated and analyzed in the
same way as in the nZVI experiment.
2.6.2 The effect of initial Cr (VI) concentration
In the related experiments, the initial Cr (VI) concentrations were 5.0,
10.0, 25.0, 50.0, 100.0 mg/L. In each trial, 0.1 g samples of nZVI
were added to 25.0 ml Cr (VI) solution portions and were mixed for 1
hr in a shaker kept at 25oC.
The Cr (VI) solutions were then separated from nZVI using
centrifugation and/or filtration, and were analyzed by measuring the
UV-Visible absorbance. The pH of the solutions was measured using
a pH-meter (HANNA instrument, HI 98129, HI 98130).
The effect of concentration was studied also for pure zeolite and Z-
nZVI composites. The same initial Cr (VI) concentrations and time of
contact were used and the solutions were separated and analyzed in
the same way reported in the previous section.
37
2.6.3 Effect of initial pH on the Cr (VI) removal
The effect of the pH on the removal of Cr (VI) by nZVI was studied at
100 mg/L initial concentration. In each trial 0.1 g of nZVI was added
to 25.0 ml of the Cr (VI) solution and the pH was adjusted to 2.0, 4.0,
6.0, 8.0 and 10.0. The samples were left in contact with the solutions
for 2 hr, the solutions were then separated via filtration, and the
supernatants were analyzed by measuring the UV-Visible absorbance
and pH of the samples.
The experiment reported above was repeated in the same way by
replacing nZVI with Z-nZVI.
2.7 Plant experiments - Effect of Fe NPs on Corn growth
2.7.1 The experiment layout
The corresponding experiments were performed using 25-L pots made
from polyethylene plastic which is usually used in farming.
The experimental design used was a randomized completely blocks
design (RCBD), with twelve treatments each replicated five times
(there were 60 experimental units as shown in Figure 3 and Figure 4).

38
Experimental Layout (5 block)
Figure 3 The plant experiment layout (RCBD)

39
Figure 4 An image of the planting site
Table 4 shows the twelve treatments included.

40
Table 4 Treatments included in the plant experiment
Treatment Classification
1 Positive control (soil + Cr (VI))
2 Negative control (only soil)
3 Zeolite 0.1 mg / Kg + Cr (VI) 200 mg / Kg
4 Zeolite-nZVI 0.2 mg / Kg + Cr (VI) 200 mg / Kg
5 nZVI 0.1 mg / Kg + Cr (VI) 200 mg / Kg
6 GT-Fe 0.1 mg / Kg + Cr (VI) 200 mg / Kg
7 GT-Fe 1 mg / Kg + Cr (VI) 200 mg / Kg
8 Zeolite 0.1 mg / Kg
9 Zeolite-nZVI 0.2 mg / Kg
10 nZVI 0.1 mg / Kg
11 GT-Fe 0.1 mg / Kg
12 GT-Fe 1 mg / Kg
41
2.7.2 Preparing soil for planting
Pots were filled with a soil-sand-pitmos mixture (soil mix) at a ratio of
4:1:0.5, respectively. The capacity of the planting pot was determined
and calculated as 24.5 Kg. For each treatment, the amount of soil mix
and the exact weights of chemicals needed in each treatment were
calculated and weighed, then mixed manually after adding enough
amount of tap water to result in as possible as a homogenous mixture
in a large vessel. Then the mixtures were distributed in the five pots
related to the five replicates of the treatments. The pots were then left
for one week to allow the soil mix and chemicals to equilibrate with
each other as much as possible.
2.7.3 Planting
Corn was chosen as a model plant in the corresponding experiments.
Corn seeds were planted on 9/7/2014, with two seeds planted in each
pot. The first set of soil samples was collected in the same day at the
beginning of the planting. The pots were irrigated regularly with tap
water 2-3 times per week. In each time, for each pot, 2-3 L of water
was added.

42
After about two months (on 18/9/2014), at the middle of the planting
period, the second set of soil samples were collected, and observations
on the plant growth and progress were recorded for future
comparisons.
2.7.4 ICP-OES analysis for soil samples
Inductively Coupled Plasma-Optical Emission Spectrometry (ICP-
OES) analysis was performed at the Center of Birzeit University
Testing Labs.
Soil samples were collected at the beginning and at the middle period
of planting (after two months). All samples were collected from the
top soil sections and were analyzed with ICP-OES to determine and
compare the concentrations of iron and chromium in the twelve
treatments.
The metal analysis for the soil samples was performed as follows; the
soil samples were dried to remove moisture (each soil sample was
kept in a tray at 70°C over night), and the samples were then sieved at
60 mesh sieve (0.250 mm) to allow 200 mg from the soil to pass
through the sieve into a crucible.

43
Each sample was digested with around 20 ml of Aqua-regia
(HCl+HNO3 at 3:1 v/v ratio), and boiled on a hot plate. Volume
reduction in each sample occurred (sample size with aqua regia
became below 5 ml due to evaporation and digestion).
After digestion was completed, the crucible was cooled and the
remaining was filtered with a 0.45 micrometer filter, and transferred to
50 ml volumetric flask. Distilled water was added to the filtrates up to
total volume of 50 ml (total volume of sample and distilled water),
and the samples were then analyzed by ICP-OES.
2.8 Effect of Fe NPs on Bacteria
The antibacterial activity of Fe NPs (nZVI) was investigated on
bacteria types present in soil.
The samples, solution concentrations and bacteria types used in these
experiments are given in Tables 5 and 6, and pictures of the well
plates are shown in Fig. 5.

44
Table 5 Samples which were tested in the bacteria experiments
Sample Concentration (mg/L)
Chromium solution (Cr(VI)) 10
Chromium solution (Cr(VI)) 100
nZVI slurry 10
nZVI slurry 50
GT-Fe slurry 10
GT-Fe slurry 50
(Cr(VI)) solution + nZVI 100 Cr/50 iron
(Cr(VI)) solution + GT-Fe 100 Cr/50 iron
Table 6 Types of tested Bacteria
# Bacteria name
1 Escherichia coli
2 Klebsiella pneumonia
4 Staphylococcus aureus
5 Bacillus subtilis
The chemicals were added to bacteria as shown in Table 7.
45
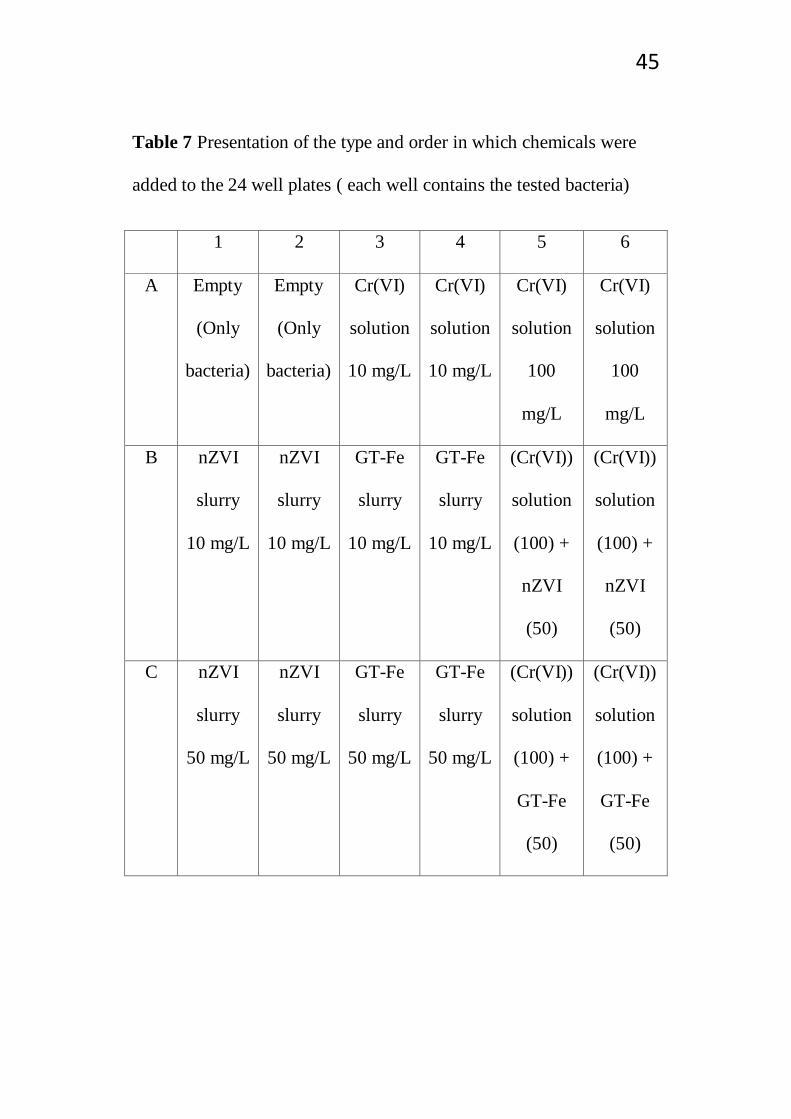
Table 7 Presentation of the type and order in which chemicals were
added to the 24 well plates ( each well contains the tested bacteria)
1 2 3 4 5 6
A Empty
(Only
bacteria)
Empty
(Only
bacteria)
Cr(VI)
solution
10 mg/L
Cr(VI)
solution
10 mg/L
Cr(VI)
solution
100
mg/L
Cr(VI)
solution
100
mg/L
B nZVI
slurry
10 mg/L
nZVI
slurry
10 mg/L
GT-Fe
slurry
10 mg/L
GT-Fe
slurry
10 mg/L
(Cr(VI))
solution
(100) +
nZVI
(50)
(Cr(VI))
solution
(100) +
nZVI
(50)
C nZVI
slurry
50 mg/L
nZVI
slurry
50 mg/L
GT-Fe
slurry
50 mg/L
GT-Fe
slurry
50 mg/L
(Cr(VI))
solution
(100) +
GT-Fe
(50)
(Cr(VI))
solution
(100) +
GT-Fe
(50)
46
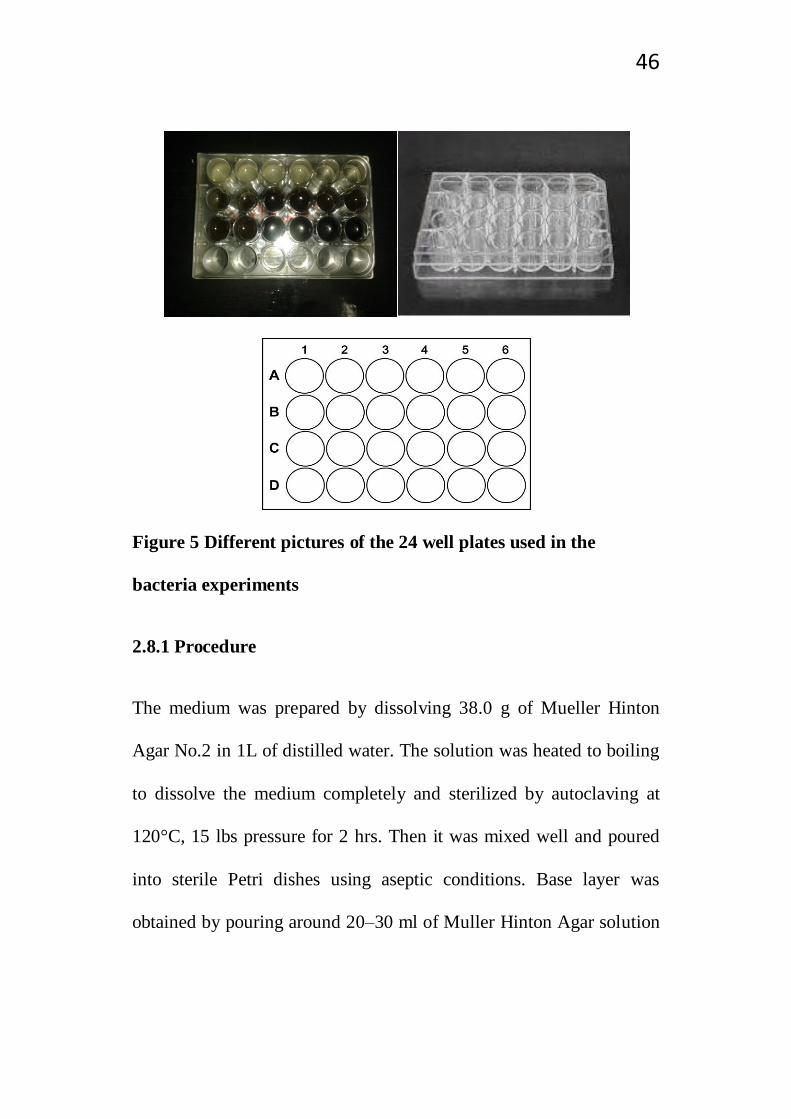
Figure 5 Different pictures of the 24 well plates used in the
bacteria experiments
2.8.1 Procedure
The medium was prepared by dissolving 38.0 g of Mueller Hinton
Agar No.2 in 1L of distilled water. The solution was heated to boiling
to dissolve the medium completely and sterilized by autoclaving at
120°C, 15 lbs pressure for 2 hrs. Then it was mixed well and poured
into sterile Petri dishes using aseptic conditions. Base layer was
obtained by pouring around 20–30 ml of Muller Hinton Agar solution

47
to obtain a thickness of 4 mm. It was then kept for solidification.
Subsequently, the following steps were performed:
1- Bacterial suspension was prepared and standardized to a 0.5
Mcfarland density in 0.9 % saline (1.5 X 10^8 CFU/ml).
2- 0.5 ml of Muller Hinton Broth were taken in each well in the 24
well plate (Fig. 2-3), 100 μl of the standardized prepared
bacteria were added to each well, then the specific chemicals
were added to the plate as described in Table 2-6.
3- The four 24 plate well, each containing one type of the
mentioned bacteria types were incubated at 37°C with shaking
overnight.
4- In the next day, serial dilution of bacteria were done before
spreading 50 μl of each well on muller Hinton Agar for
counting.
Finally, counting was performed.

48
3. Results & Discussion
3.1 Characterization of Fe nanomaterials
This section is devoted to providing the results of the characterization
experiments performed for Fe nanomaterials and soil samples used in
this work. The results include SEM/EDX, TEM, XRD, and XRF
results.
3.1.1 Characterization of nZVI
Nano-zero-valent iron produced using borohydride reduction method
was characterized to reveal its morphology, phase type(s), and
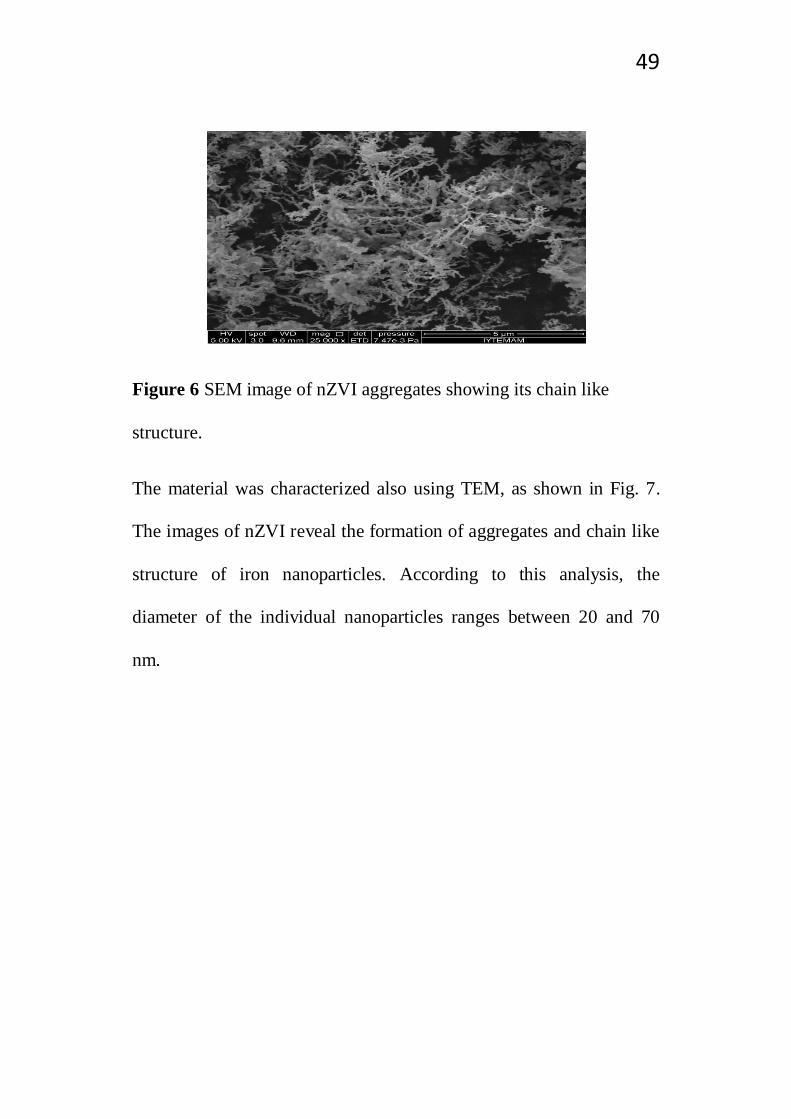
elemental content. The SEM image provided in Fig. 6 indicate that the
material posses its chain-like structure, in accordance with previous
results [22]. nZVI is well known to demonstrate this morphology due
to the strong magnetic attractive forces between the nanoparticles,
each of which has a core-shell structure, with the core consisting of
Fe0, while the shell is composed of iron oxides and oxyhydroxides
[77].
49
Figure 6 SEM image of nZVI aggregates showing its chain like
structure.
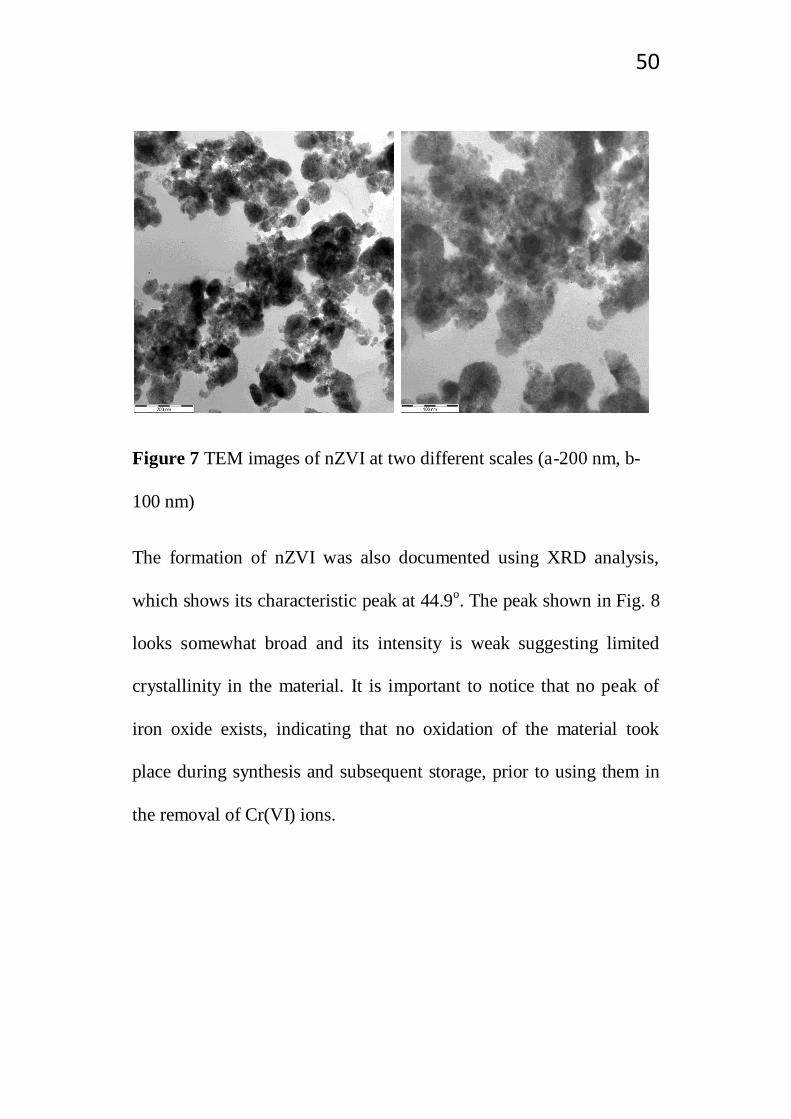
The material was characterized also using TEM, as shown in Fig. 7.
The images of nZVI reveal the formation of aggregates and chain like
structure of iron nanoparticles. According to this analysis, the
diameter of the individual nanoparticles ranges between 20 and 70
nm.
50
Figure 7 TEM images of nZVI at two different scales (a-200 nm, b-
100 nm)
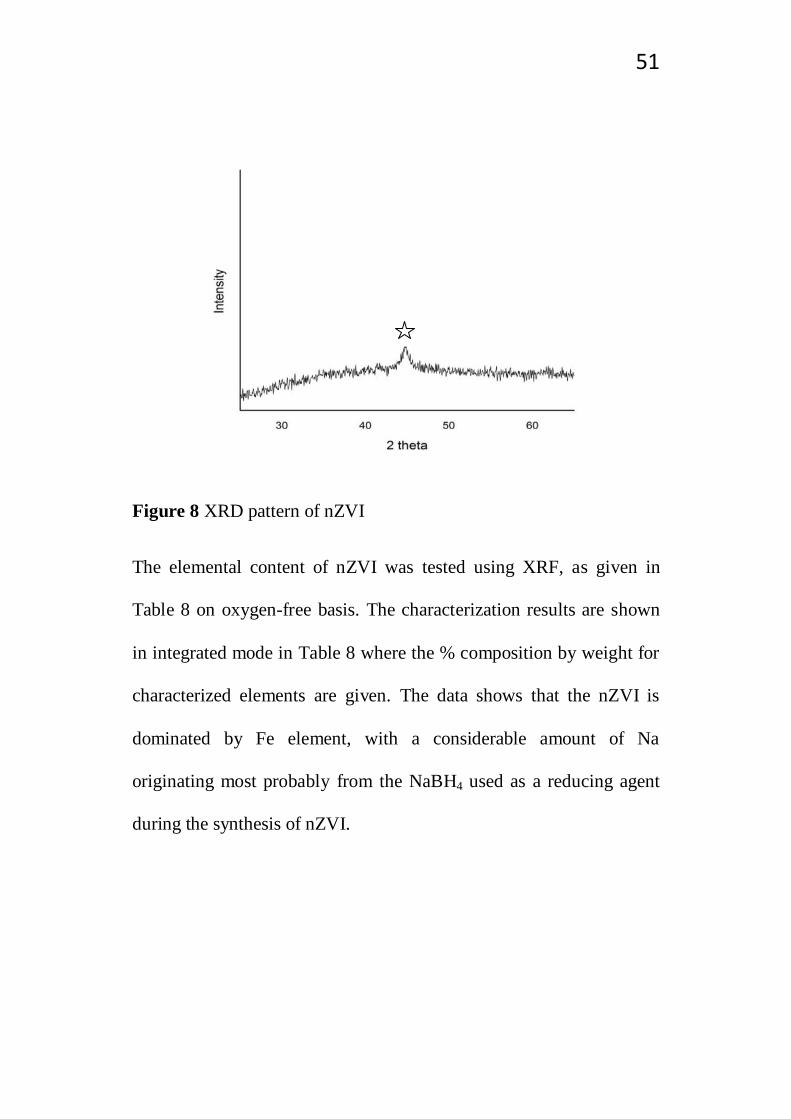
The formation of nZVI was also documented using XRD analysis,
which shows its characteristic peak at 44.9o. The peak shown in Fig. 8
looks somewhat broad and its intensity is weak suggesting limited
crystallinity in the material. It is important to notice that no peak of
iron oxide exists, indicating that no oxidation of the material took
place during synthesis and subsequent storage, prior to using them in
the removal of Cr(VI) ions.
51
Figure 8 XRD pattern of nZVI
The elemental content of nZVI was tested using XRF, as given in
Table 8 on oxygen-free basis. The characterization results are shown
in integrated mode in Table 8 where the % composition by weight for
characterized elements are given. The data shows that the nZVI is
dominated by Fe element, with a considerable amount of Na
originating most probably from the NaBH4 used as a reducing agent
during the synthesis of nZVI.

52
Table 8 XRF analysis results for nZVI
Element % Composition by weight
Sodium (Na) 8.9
Chromium (Cr) 0.0
Iron (Fe) 86.9
Others * 4.2
Sum 100.0
*Others are elements found in the sample in very small amount (less
than 1 %).
3.1.2 Characterization of zeolite-nZVI composite
The synthesis procedure of this material (named shortly as Z-nZVI)
was reported earlier by Muath Nairat and coworkers, and detailed
characterization has been performed [67]. This material was employed
in this work to compare its behavior with that of nZVI when used
alone.
Zeolite used in this study as a solid support for nZVI was obtained
from a natural source located in Turkey. The chemical structure
consists mainly of sodium, potassium, calcium, and aluminasilicate.

53
The mineralogical structure is composed mainly of Clinoptilolite,
which is the most widely available natural zeolite [68].
As shown in Fig. 9, nZVI retains its characteristic chain-like structure
when synthesized in the presence of zeolite material, however, the
main advantage of using zeolite is to decrease the nZVI aggregation in
aqueous media, as nZVI is well known to aggregate tremendously and
settles down in water very rapidly when used alone.
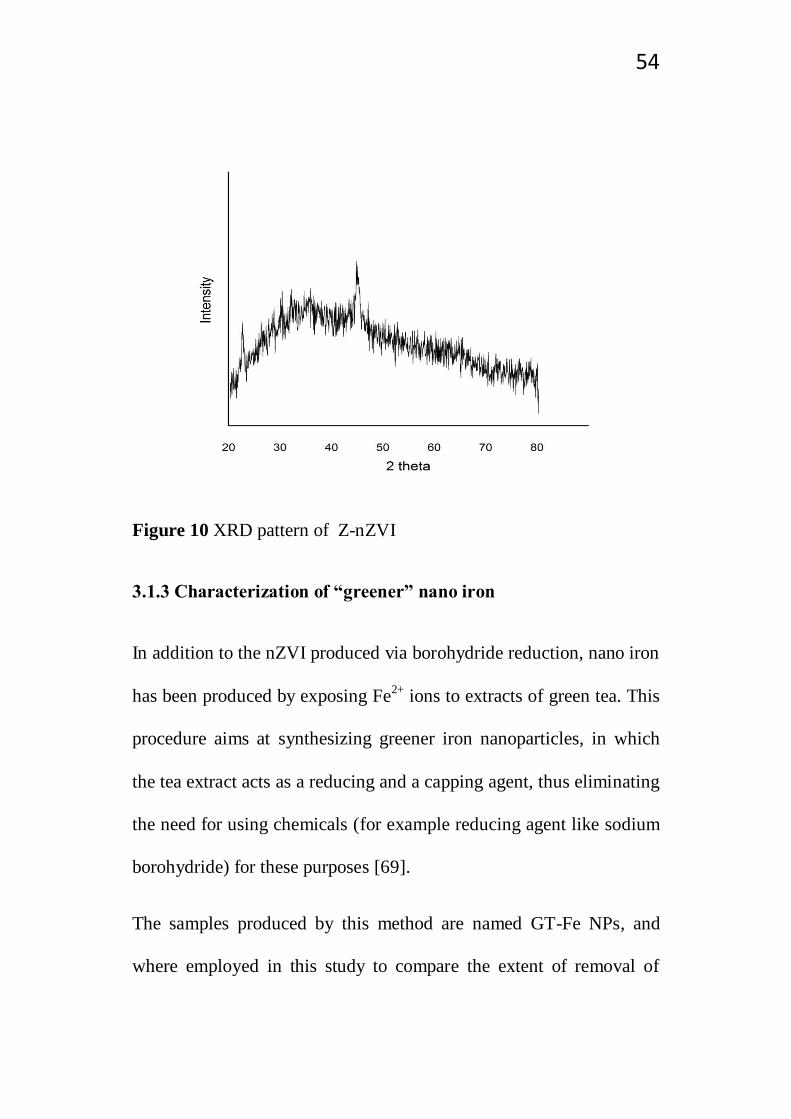
The formation of nZVI in its Fe0 state is also verified using XRD, as
shown in Fig. 10. The major feature arising at 44.9o is indicative of
that.
Figure 9 SEM image of Z-nZVI (1:1 ratio of zeolite and Fe2+
ions)
54
Figure 10 XRD pattern of Z-nZVI
3.1.3 Characterization of “greener” nano iron
In addition to the nZVI produced via borohydride reduction, nano iron
has been produced by exposing Fe2+
ions to extracts of green tea. This
procedure aims at synthesizing greener iron nanoparticles, in which
the tea extract acts as a reducing and a capping agent, thus eliminating
the need for using chemicals (for example reducing agent like sodium
borohydride) for these purposes [69].
The samples produced by this method are named GT-Fe NPs, and
where employed in this study to compare the extent of removal of
55
Cr(VI) from soil once when nZVI is applied, and once when GT-Fe
NPs is applied, in search of a better remediation.
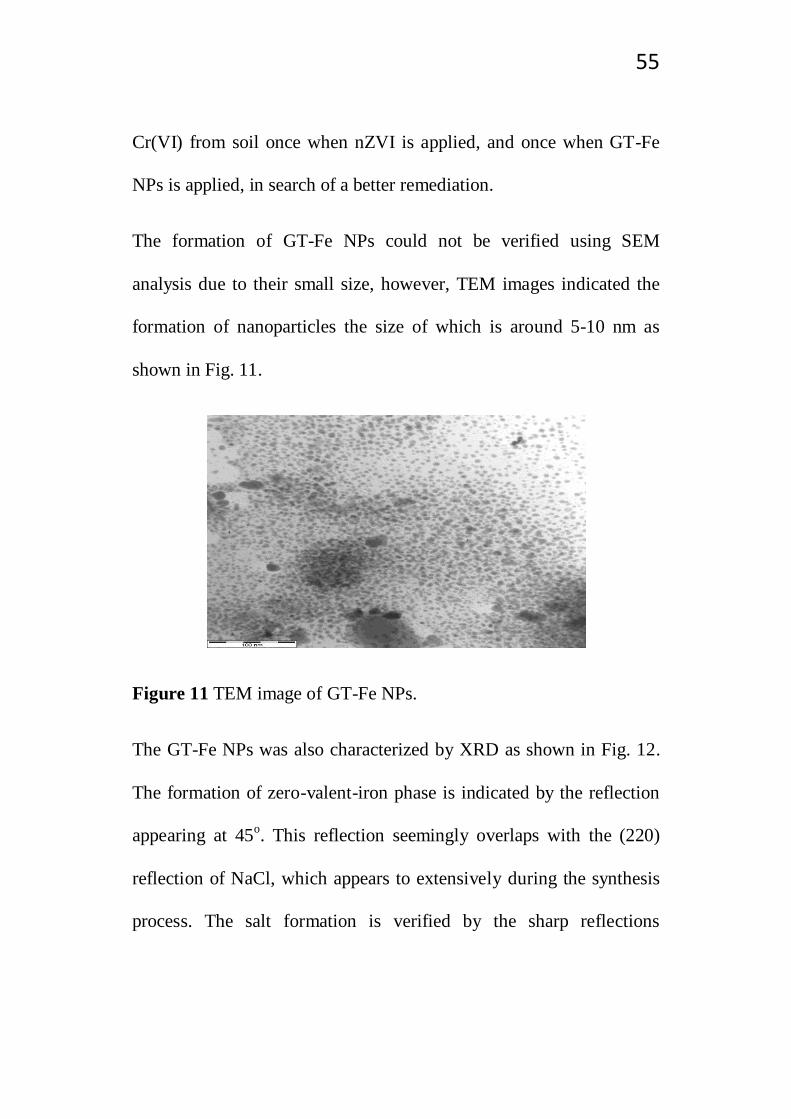
The formation of GT-Fe NPs could not be verified using SEM
analysis due to their small size, however, TEM images indicated the
formation of nanoparticles the size of which is around 5-10 nm as
shown in Fig. 11.
Figure 11 TEM image of GT-Fe NPs.
The GT-Fe NPs was also characterized by XRD as shown in Fig. 12.
The formation of zero-valent-iron phase is indicated by the reflection
appearing at 45o. This reflection seemingly overlaps with the (220)
reflection of NaCl, which appears to extensively during the synthesis
process. The salt formation is verified by the sharp reflections

56
appearing at 2 values of 27.2, 31.5, 45.3, 56.3, 66.1, 75.1 standing
for the hkl planes of 111, 200, 220, 222, 400, 420, respectively [78].
The XRF analysis of the elemental content indicates, in addition to Fe,
a rich content of Na (originating from NaOH used during the
synthesis) and Cl (originating from the chloride salt of iron) elements,
and small amounts of K, Mg, Al originating mainly from the green tea
extract.
Figure 12 XRD pattern of GT-Fe NPs.

57
Table 9 XRF analysis results for GT-Fe NPs.
Element % Composition by weight
Sodium )Na( 52.4
Magnesium )Mg( 4.2
Aluminium )Al( 2.1
Chlorine )Cl( 17.4
Potassium )K( 5.0
Chromium )Cr( 0.0
Iron )Fe( 17.9
Others 1.0
Sum 100.0
3.1.4. Characterization of the soil samples
A typical SEM image of the soil grains is shown in Fig. 13, and an
XRD diagram is given in Fig. 14. The XRD analysis reveals multiple
reflections which points to the complex mineralogical content of the
soil, but it is readily distinguished that the main component is quartz

58
(SiO2), as evident from the major reflections occurring at 2 values of
20.8, 26.6, 36.5, 50.1, and 59.9 [79].
The elemental content analysis performed using EDX and shown in
Fig. 15 indicates the presence of the major elements O, C, Si, Al, Fe,
Ca, Mg, K, with atomic percentages of 59.1, 23.7, 7.7, 3.8, 1.4, 1.9,
1.5, 0.5, respectively.
Figure 13 A typical SEM image of soil grains.

59
Figure 14 XRD pattern of a soil sample.
Figure 15 Elemental content of a typical soil sample.

60
In addition, the BET and Langmuir surface areas of soil were
determined. The obtained values were 29.8 and 38.6 m2/g. When the
soil samples were mixed with GT-Fe NPs, the surface area increased
to 37.8 (BET) and 48.8 m2/g (Langmuir). Moreover, SEM images
showed that mixing the soil samples with GT-Fe NPs resulted in
increasing the surface roughness of soil, and so the soil surface
increased. A typical image is given in Fig. 16.
Figure 16 A SEM image of a mixture of Soil and GT-Fe NPs.
In the following sections, the removal of Cr(VI) using iron
nanomaterials will be presented and discussed. First, the removal
studies of Cr(VI) in aqueous solutions will be considered. Then, the
removal of Cr(VI) from soil mixed with Fe NPs will be addressed, and

61
the effect of these NPs on corn growth will be discussed. Corn was
selected as a model plant. Finally the effect of Fe NPs on bacteria
types (commonly found in soil) will be addressed.
3.2 Removal of Cr (VI) from aqueous solution
In this part of the study, the extent of removal of aqueous Cr(VI) ions
by nZVI has been investigated as a function of time, concentration and
pH. For the sake of comparison with nZVI, the experiments were also
repeated using Z-nZVI as an adsorbent.
The concentration of Cr(VI) in aqueous solutions was determined
using UV-Visible spectrophotometry. The details are given in the
following sections.
3.2.1 Calibration curve
The calibration curve constructed and used in this study is provided in
appendix A. The linear relationship of this curve is given as: y =
0.030x - 0.002, where x stands for the concentration of Cr(VI) in
mg/L, and y stands for the UV-Vis. Absorbance. The coefficient of
determination (R2) for the linear relationship was 0.9990, indicating
very high linear correlation in the applied concentration range.
62
3.2.2 Effect of time
The effect of time on the extent of removal of aqueous Cr(VI) ions
was studied at initial ion concentration of 100 mg/L for a period
ranging from several minutes up to 24 hours. The change in
concentration with time is given in Fig. 17, and the change in the
amount of adsorbed Cr(VI) on nZVI with time is given in Fig. 18.
This amount was calculated using the well known mass balance
equation [80],[81] :
............................. (1)
Here Q is the adsorbed concentration of Cr(VI) in mg/g, Co and C are
the initial and final concentrations of aqueous Cr(VI) ions in mg/L, V
is the solution volume (L), and m is the mass of nZVI (g).
As seen from the data, equilibrium is approached rapidly, in about one
hour of contact between liquid and solid phases.

63
Figure 17 Variation of Cr(VI) aqueous concentration with time upon
contact with nZVI.
Figure 18 Variation in the adsorbed amount of Cr(VI) on nZVI with
time.
-20
0
20
40
60
80
100
120
0 200 400 600 800 1000 1200 1400 1600
Co
nc.
of
Cr(
VI)
(mg/
l)
Time (min)
0
5
10
15
20
25
30
0 200 400 600 800 1000 1200 1400 1600
Q (
mg/
l)
t (min)
Q vs. t

64
The same experiment was repeated using Z-nZVI instead of nZVI.
The variation of aqueous Cr(VI) concentration with time is shown in
Fig. 19. The obtained results indicate that the removal process is
slower in this case compared with nZVI, as more than four hours
seems to be required to attain equilibrium (after these four hours of
contact, no significant change in the Cr(VI) concentration occurred).
This is most probably caused by the large internal area of the zeolite
material which leads to a diffusion barrier.
Figure 19 Variation of Cr(VI) aqueous concentration with time upon
contact with Z-nZVI.
The sorption data were fitted to pseudo first order kinetics expressed
in the following equations [81] :
0
10
20
30
40
50
60
70
80
90
100
0 200 400 600 800 1000 1200 1400 1600
Co
nc.
of
Cr(
VI)
(mg/
l)
Time (min)

65
.................. (2)
Here, k1 stands for the rate constant, t is the time, and Qmax is the
maximum sorbable amount, given by the relation:
............................. (3)
The data is plotted in Fig. 20. The coefficient of determination (R2)
was 0.9980, indicating a very well linear correlation. The value of k1
was calculated as min-1
, and Qmax (maximum
sorbable amount) found as mg/g.
For a first order reaction, the half life time t1/2 is ln2/k1, and using this
relation t1/2 of the removal reaction was found to be 231 min. This
was confirmed experimentally by performing a time effect experiment
with the same parameters and time of contact equal to t1/2, the
equilibrium concentration measured after this time decreased from
100.0 mg/L to 45.9 mg/L, almost half the initial concentration.

66
Figure 20 Pseudo-first order plot of the removal of Cr(VI) by Z-nZVI
It must be mentioned that another experimental set was performed
using pure zeolite in order to check the contribution of zeolite to the
removal process. The results showed negligible removal of Cr(VI) by
zeolite under the studied conditions. This observation leads to the
conclusion that Cr(VI) removal by Z-nZVI composite is achieved by
virtue of iron nanoparticles.
3.2.3 The effect of initial Cr (VI) concentration
In this section, the effect of loading of Cr(VI) ions was studied at the
initial concentrations of 5.0, 10.0, 25.0, 50.0, and 100.0 mg/L.
Throughout these experiments the time of contact was kept as 1 hr.
y = -0.003x + 3.189
R² = 0.998
-2
-1
0
1
2
3
4
0 200 400 600 800 1000 1200 1400 1600
ln(Q
max
- Q
)
t (min)

67
The experiments were performed using nZVI as a sorbent, and were
then repeated using Z-nZVI under the same conditions.
The results of the experiments are provided in Figs. 21 and 22.
Figure 21 The effect of initial Cr(VI) concentration on the removal of
Cr(VI) by nZVI.
89.2 95.9 98.2 99.2
82.8
0.0
10.0
20.0
30.0
40.0
50.0
60.0
70.0
80.0
90.0
100.0
5 10 25 50 100
% R
emo
val
Concentration (mg/l)
nZVI
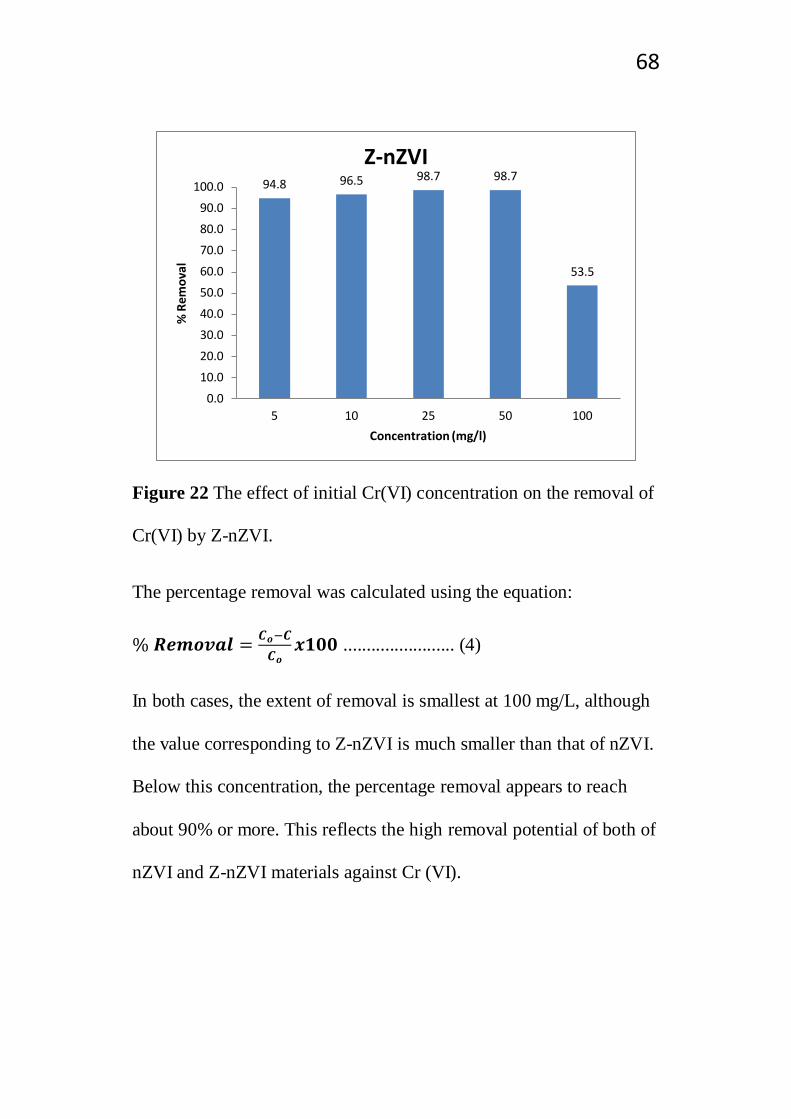
68
Figure 22 The effect of initial Cr(VI) concentration on the removal of
Cr(VI) by Z-nZVI.
The percentage removal was calculated using the equation:
........................ (4)
In both cases, the extent of removal is smallest at 100 mg/L, although
the value corresponding to Z-nZVI is much smaller than that of nZVI.
Below this concentration, the percentage removal appears to reach
about 90% or more. This reflects the high removal potential of both of
nZVI and Z-nZVI materials against Cr (VI).
94.8 96.5 98.7 98.7
53.5
0.0
10.0
20.0
30.0
40.0
50.0
60.0
70.0
80.0
90.0
100.0
5 10 25 50 100
% R
emo
val
Concentration (mg/l)
Z-nZVI

69
Tables 10 and 11 show the pH values for Cr(VI) solutions measured at
the beginning and at the end of the reaction with nZVI and Z-nZVI
respectively, with changing the initial Cr(VI) concentration each time.
Table 10 pH values measured at the beginning and the end of the
reaction of Cr(VI) with nZVI
Cr(VI) conc.
(mg/L)
pH initial pH final
100 5.31 9.15
50 5.53 9.09
25 5.77 8.90
10 6.06 8.87
5 6.13 8.82

70
Table 11 pH values measured at the beginning and the end of the
reaction of Cr(VI) with Z-nZVI
Cr(VI) conc.
(mg/L)
pH initial pH final
100 5.31 8.75
50 5.53 8.81
25 5.77 8.71
10 6.06 8.52
5 6.13 8.45
The pH values for both nZVI and Z-nZVI increased at the end of the
reaction, this is an indication that iron was oxidized through the
reactions.[49]
The oxidation of Fe0 in aqueous systems releases OH
- ions, increasing
the pH of the system (>8.0) as shown in Eq. (5) [6].
2Fe0 + O2 + 2H2O 2Fe
+2 + 4OH
- ------------------ (5)
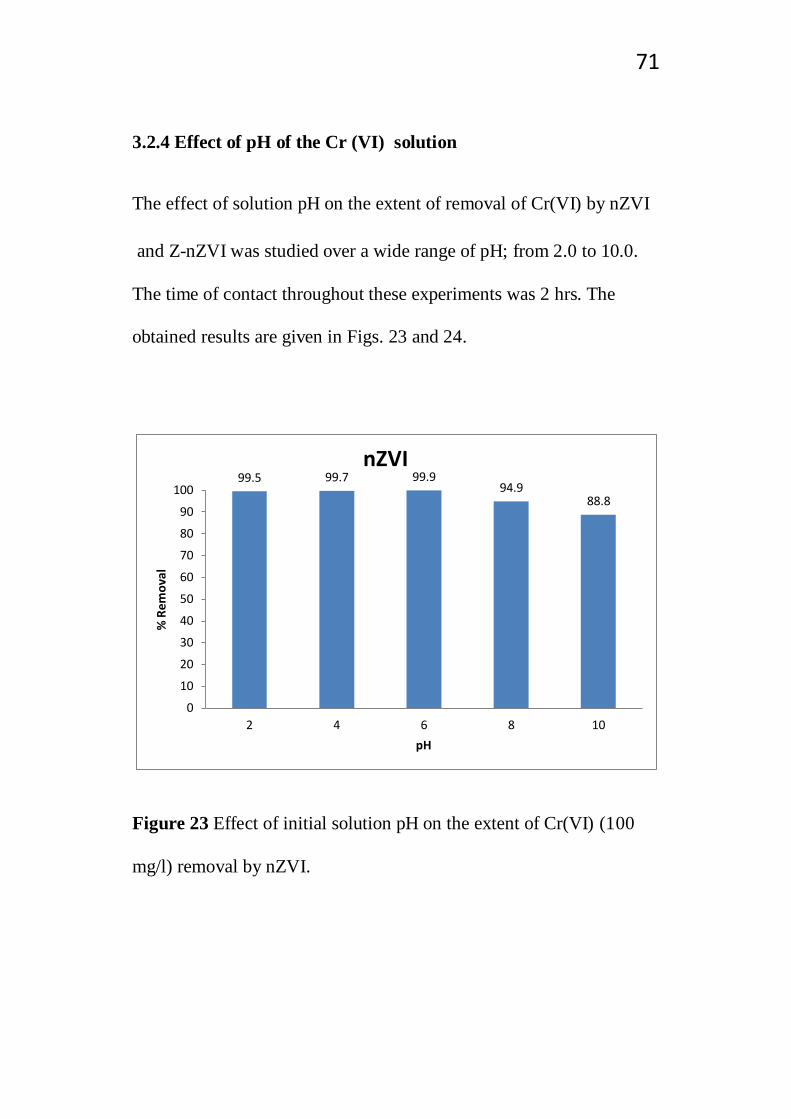
71
3.2.4 Effect of pH of the Cr (VI) solution
The effect of solution pH on the extent of removal of Cr(VI) by nZVI
and Z-nZVI was studied over a wide range of pH; from 2.0 to 10.0.
The time of contact throughout these experiments was 2 hrs. The
obtained results are given in Figs. 23 and 24.
Figure 23 Effect of initial solution pH on the extent of Cr(VI) (100
mg/l) removal by nZVI.
99.5 99.7 99.9 94.9
88.8
0
10
20
30
40
50
60
70
80
90
100
2 4 6 8 10
% R
emo
val
pH
nZVI

72
Figure 24 Effect of initial solution pH on Cr(VI) (100 mg/l) removal
by Z-nZVI.
As seen in Fig. 23, the removal percentage of Cr(VI) decreased from
99.5% to 88.8 % when the initial pH of solution was increased from
2.0 to 10.0. This suggest that the removal of Cr(VI) is slightly
dependent on the initial pH of the solution [83].
The effect of pH on the % of removal of Cr(VI) is obvious when pH is
increased beyond 6.0. The %removal was around 99.5% for pH 2, 4
and 6, indicating almost complete removal under the studied
conditions. But for pH=8.0, the % removal decreased to about 95%,
and continued to decrease to 89% at pH=10.0.
99.6 99.0
62.9 58.8
79.0
0
10
20
30
40
50
60
70
80
90
100
2 4 6 8 10
% R
em
ova
l
pH
Z-nZVI
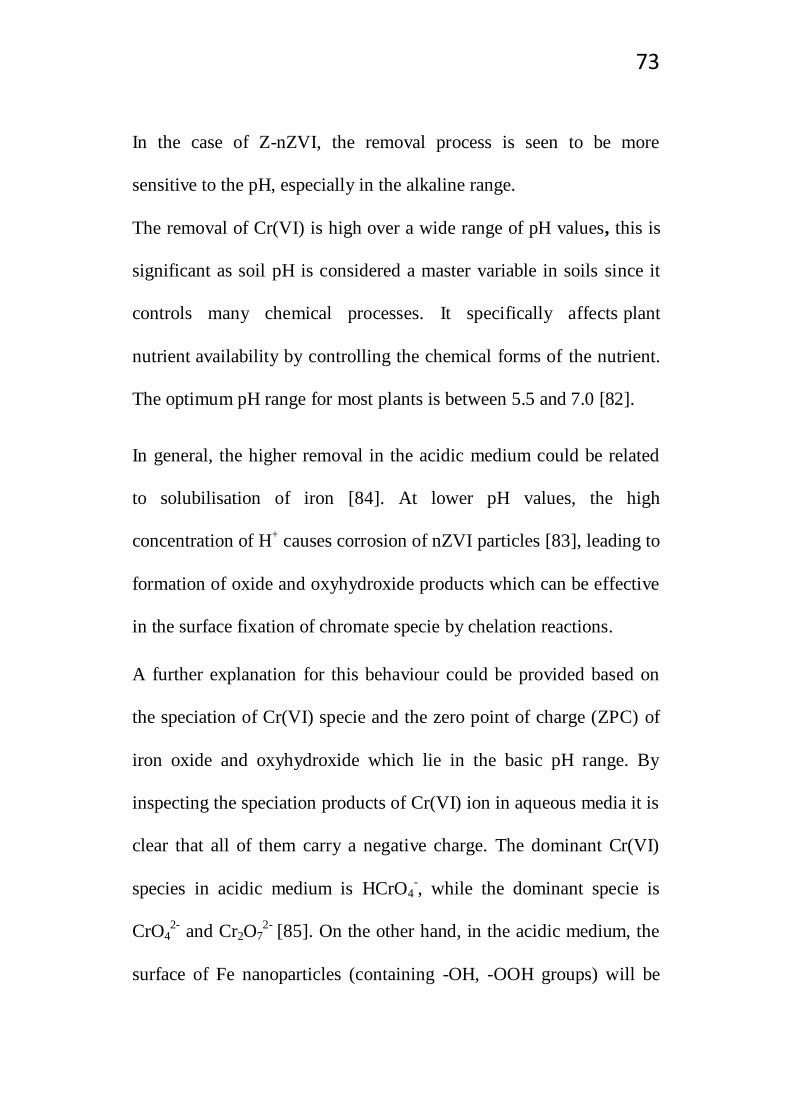
73
In the case of Z-nZVI, the removal process is seen to be more
sensitive to the pH, especially in the alkaline range.
The removal of Cr(VI) is high over a wide range of pH values, this is
significant as soil pH is considered a master variable in soils since it
controls many chemical processes. It specifically affects plant
nutrient availability by controlling the chemical forms of the nutrient.
The optimum pH range for most plants is between 5.5 and 7.0 [82].
In general, the higher removal in the acidic medium could be related
to solubilisation of iron [84]. At lower pH values, the high
concentration of H+ causes corrosion of nZVI particles [83], leading to
formation of oxide and oxyhydroxide products which can be effective
in the surface fixation of chromate specie by chelation reactions.
A further explanation for this behaviour could be provided based on
the speciation of Cr(VI) specie and the zero point of charge (ZPC) of
iron oxide and oxyhydroxide which lie in the basic pH range. By
inspecting the speciation products of Cr(VI) ion in aqueous media it is
clear that all of them carry a negative charge. The dominant Cr(VI)
species in acidic medium is HCrO4-, while the dominant specie is
CrO42-
and Cr2O72-
[85]. On the other hand, in the acidic medium, the
surface of Fe nanoparticles (containing -OH, -OOH groups) will be

74
protonated, i.e. carry a positive charge, and this makes it possible for
chromate specie to be attracted by the surface and eventually
adsorbed.
The removal mechanism of Cr(VI) ions by nZVI is a complex one. In
addition to the pH-dependent removal of Cr(VI) by surface groups of
nZVI, pH-independent removal of Cr(VI) can take place. It has been
reported that Cr(VI) can form monodentate and bidentate
(mononuclear and binuclear) inner sphere complexes with iron
hydrous oxide surface [86]. A schematic representation of this is
shown in Fig. 25.
Another reported mechanism for Cr(VI) removal by nZVI is its
reduction to Cr(III) by the electron supported from the core of iron
nanoparticles [87]. nZVI is well-known for its core-shell structure,
with the core composed of Fe0, and the shell composed of iron oxide
and oxyhydroxide groups, as mentioned above. The core forms a
source of electrons (Fe0 Fe
+2 + 2e
-), and these electrons can
reduce a wide range of inorganic ions as reported in literature. The
precondition for this is that the particular ion possesses an electrode
potential that is higher than that of Fe. In the case of Cr(VI), this
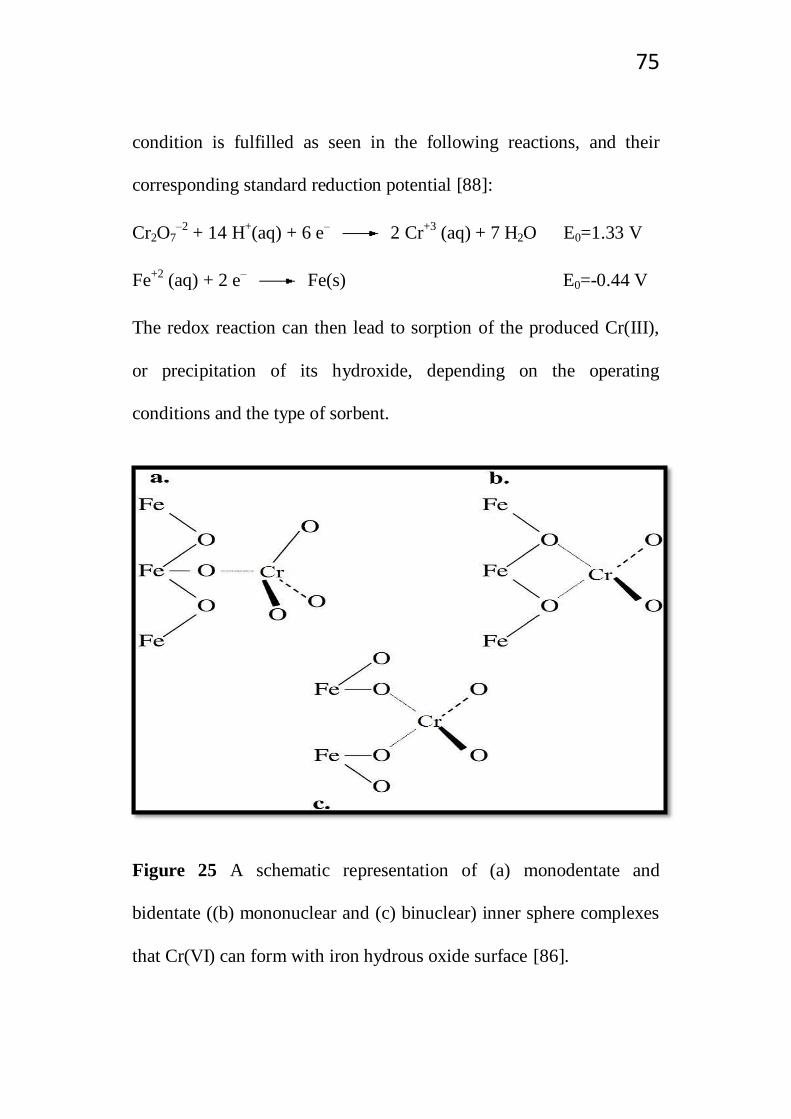
75
condition is fulfilled as seen in the following reactions, and their
corresponding standard reduction potential [88]:
Cr2O7–2
+ 14 H+(aq) + 6 e
– 2 Cr
+3 (aq) + 7 H2O E0=1.33 V
Fe+2
(aq) + 2 e– Fe(s) E0=-0.44 V
The redox reaction can then lead to sorption of the produced Cr(III),
or precipitation of its hydroxide, depending on the operating
conditions and the type of sorbent.
Figure 25 A schematic representation of (a) monodentate and
bidentate ((b) mononuclear and (c) binuclear) inner sphere complexes
that Cr(VI) can form with iron hydrous oxide surface [86].

76
3.3 Effect of Cr(VI) removal from soil mixed with Fe NPs on Corn
growth
In this part of the study, the removal of Cr(VI) from soil was studied,
and the effect of the removal process on plant growth was
investigated. Corn was selected as a model plant for this purpose.
3.3.1 Removal of Cr(VI) from soil mixed with Fe NPs
Prior to examining the effect of Cr(VI) contamination and iron
nanoparticles on the growth of corn, the soil samples mixed with GT-
Fe NPs were characterized by surface techniques to check the fixation
of Cr(VI) by Fe NPs.
As was mentioned previously, BET and Langmuir surface areas of
soil increased upon mixing it with GT-Fe NPs from 29.8 m2/g to 37.8
m2/g for BET, and from 38.6 m
2/g 48.8 m
2/g for Langmuir, increased
surface area result in higher removal efficiency against Cr(VI).
Moreover, SEM images showed that mixing the soil samples with GT-
Fe NPs resulted in increasing the surface roughness of soil, as was
shown in Fig. 16.

77
Mixture of soil and Fe NPs were analyzed before and after Cr(VI)
removal using EDX, XRD, and TEM.
The EDX analysis was performed using the electron mapping mode in
order to reveal the distribution of Cr(VI) on the sample mixture of soil
and Fe NPs. Here, the positions of specific elements emitting
characteristic x-rays within an inspection field can be indicated by
unique color. The results are shown in Fig. 26 where the maps of Si,
Fe, and Cr are shown individually. The Si element represents the soil
part as it was found to be the major element in soil. The results
showed that the Cr signals are better associated with the Fe signals
than with Si.
Cr(VI) is known to be very mobile in soil. The specie of Cr(VI)
include CrO42-
, HCrO4-, and Cr2O7
2-, and due to the anionic nature of
these specie, Cr(VI) cannot be retained by the anionic groups of soil
(SiO2). Its sorption on soil is largely related with the Fe and Al
hydrous oxide content of the soil [89].
In light of the above, it is reasonable to state that Cr prefers binding to
Fe NPs more than it does to soil, and thus may illustrates the potential
of Fe NPs as a remediation material of soil against organic and

78
inorganic pollutants. This issue was a subject of intensive research
during the last decade [18],[20].
The XRD analysis of the sample of soil-Fe NPs after exposure to
Cr(VI) ions shows the formation of iron oxides and iron
oxyhydroxide, indicating that Fe NPs has undergone corrosion, a
typical XRD diagram of soil-Fe NPs after exposure to Cr(VI) ions is
given in Fig. 27. The corrosion reaction can help create sorption sites
on the surface of Fe NPs for Cr(VI) ions, and can also release iron
ions that can be absorbed by soil. The corrosion reaction of GT-Fe
NPs also verified by contacting the material with Cr(VI) ions. As
shown by the TEM image in Fig. 28, the corrosion reaction yields
clusters of iron oxide materials.

79
Figure 26 EDX mapping of a sample containing soil, Cr(VI) and GT-
Fe NPs showing elemental maps for Fe, Si and Cr.

80
Figure 27 XRD pattern of a sample of Soil –GT-Fe NPs loaded with
Cr (VI) ions.
Figure 28 TEM image of GT-Fe NPs after the reaction with Cr(VI)
ions.

81
3.3.2 Effect of Cr(VI) remediation from soil on Corn growth
In these experiments, soil was first mixed with Cr(VI) solutions, then
it was mixed with nZVI, GT-Fe NPs, Z-nZVI, and zeolite. The
quantities of each of the mixed materials are provided in Table 12.
The table provides also the effect of the remediation process on the
plant growth, expressed as percentage of plants that survived (the rate
of survival). The percentage was calculated for each treatment by
dividing the number of plants found (normal growth) by the total
number of plants (total of 5 plants, each treatment was repeated five
times).
The positive and negative controls stands for soil mixed with Cr(VI)
and soil alone without added chemicals, respectively.
Figures 29 through 32 give some pictures for different plants showing
different progress in their growth.
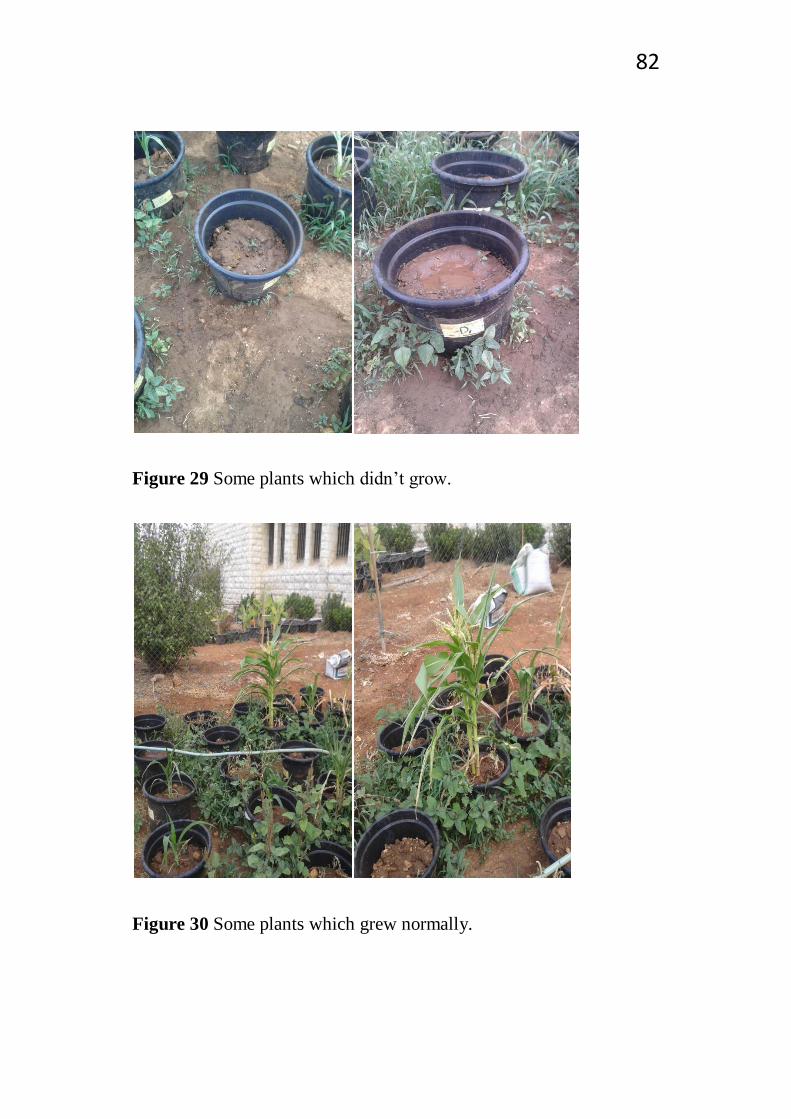
82
Figure 29 Some plants which didn’t grow.
Figure 30 Some plants which grew normally.

83
Figure 31, Figure 32 Corn cops that appeared in plants with normal
growth at the end of the planting cycle.
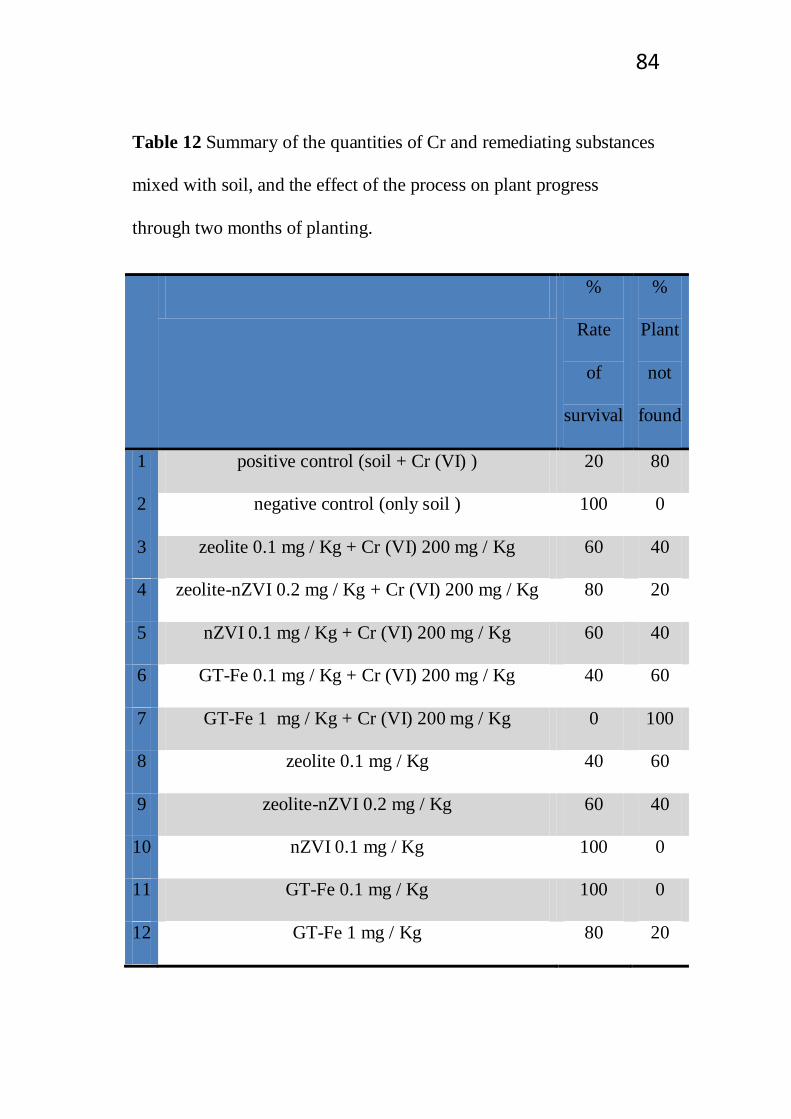
84
Table 12 Summary of the quantities of Cr and remediating substances
mixed with soil, and the effect of the process on plant progress
through two months of planting.
%
Rate
of
survival
%
Plant
not
found
1 positive control (soil + Cr (VI) ) 20 80
2 negative control (only soil ) 100 0
3 zeolite 0.1 mg / Kg + Cr (VI) 200 mg / Kg 60 40
4 zeolite-nZVI 0.2 mg / Kg + Cr (VI) 200 mg / Kg 80 20
5 nZVI 0.1 mg / Kg + Cr (VI) 200 mg / Kg 60 40
6 GT-Fe 0.1 mg / Kg + Cr (VI) 200 mg / Kg 40 60
7 GT-Fe 1 mg / Kg + Cr (VI) 200 mg / Kg 0 100
8 zeolite 0.1 mg / Kg 40 60
9 zeolite-nZVI 0.2 mg / Kg 60 40
10 nZVI 0.1 mg / Kg 100 0
11 GT-Fe 0.1 mg / Kg 100 0
12 GT-Fe 1 mg / Kg 80 20

85
Based on the observed plant growth, the following conclusions can be
drawn:
a. When no Cr or Fe material was added to the soil, the plant was
normal, 100% all the plants grew normally.
b. When only Cr was added, only 20% of the plants grew. The fact
that a single plant survived out of five suggests that Cr caused
toxicity to the plants.
c. Addition of nZVI (0.1 mg/Kg) to soil contaminated with Cr
enhanced the plant growth, as the rate of survival was 60%,
higher than 20% for Cr alone. This has happened by virtue of
reducing the Cr concentration in soil as a result of sorption on
nZVI.
d. When GT-Fe NPs (0.1 mg/Kg) was added to Cr-contaminated
soil, the rate of survival increased to 40%. This confirms that
GT-Fe NPs contributed to reducing the soil contamination but it
was not as effective as nZVI in doing so. When the GT-Fe
concentration was increased to (1.0 mg/Kg), the rate of survival
was found to increase to 60%, confirming the remediation effect
of GT-Fe NPs.

86
e. When the Cr-contaminated soil was mixed with Z-nZVI, the
rate of survival was 80%, higher than the 60% for nZVI alone.
A possible explanation of this comes from the effect of the
addition of zeolite to nano iron, as zeolite addition was
observed to decrease the aggregation of nano iron and so
increase its efficiency in Cr removal. Another possible
explanation could be that the zeolite material acted as a
scavenger of Cr by virtue of its large surface area.
f. Upon addition of zeolite to Cr-contaminated soil, the rate of
survival was 60%.
The final result might lead to the conclusion that zeolite can be as
effective as nZVI in soil remediation, and better than GT-Fe NPs.
However, this approach ignores any diverse effects of these
remediation materials on the soil free of Cr contamination.
In order to assess if the remediation materials have adverse effects
on uncontaminated soil, each was added to soil and their effects on
plant growth was observed. The obtained results can be
summarized as follows:

87
a. The addition of zeolite to the soil resulted in only 40%
survival of plants, indicating that zeolite can harm the soil
fertility. The reason for this could be holding ions and
nutrients necessary for the plant growth inside the channels
of zeolite structure.
b. When nZVI was added to soil, the plant growth was normal,
100% of plants grew unaffected, indicating no negative
effect of this material at the applied dose on soil fertility and
plant nutrition.
c. The addition of Z-nZVI to soil lead to 60% plant survival,
confirming the diverse effect of zeolite on the plant growth.
d. When GT-Fe NPs (0.1 mg/Kg) were added to soil, no
negative effect was noticed on the plant growth as all the
plants grew normally, suggesting that this dose of GT-Fe is
not harmful to the plants. When the GT-Fe NPs
concentration increased from 0.1 to 1.0 mg/Kg, some
inhibition in the plant growth was noticed and the rate of
survival decreased from 100% to 80%. This indicates that
high concentration of Fe NPs can be harmful to the corn
plants.
88
As a further assessment, the soil samples before and after planting
were analyzed using ICP-OES for their Cr and Fe contents. The
detailed ICP analysis results for Fe and Cr found in appendix B, and a
summary of the results is provided in Tables 13 and 14. As the tables
show, the average concentrations were calculated for the five
replicates of each treatment, at the beginning of the planting (before)
and after two months of planting (after).

89
Table 13 Summary of the ICP-OES analysis results for Fe
Fe
Avg.
Before
(mg/L)
Avg.
After
(mg/L)
Before
– After
(mg/L)
positive control 15132.2 5673.3 9458.9
negative control 12900.8 6111.0 6789.7
zeolite 0.1 mg / Kg + Cr (VI) 200 mg / Kg 16009.7 6753.9 9255.8
zeolite-nZVI 0.2 mg / Kg + Cr (VI) 200 mg / Kg 15222.7 5956.2 9266.5
nZVI 0.1 mg / Kg + Cr (VI) 200 mg / Kg 15334.5 5404.5 9930.0
GT-Fe 0.1 mg / Kg + Cr (VI) 200 mg / Kg 15797.8 6180.8 9617.1
GT-Fe 1 mg / Kg + Cr (VI) 200 mg / Kg 15432.7 5729.6 9703.1
zeolite 0.1 mg / Kg 15107.3 3009.7 12097.6
zeolite-nZVI 0.2 mg / Kg 14690.3 2770.2 11920.1
nZVI 0.1 mg / Kg 13880.9 2943.6 10937.3
GT-Fe 0.1 mg / Kg 15104.8 2896.6 12208.3
GT-Fe 1 mg / Kg 14168.6 2741.8 11426.8
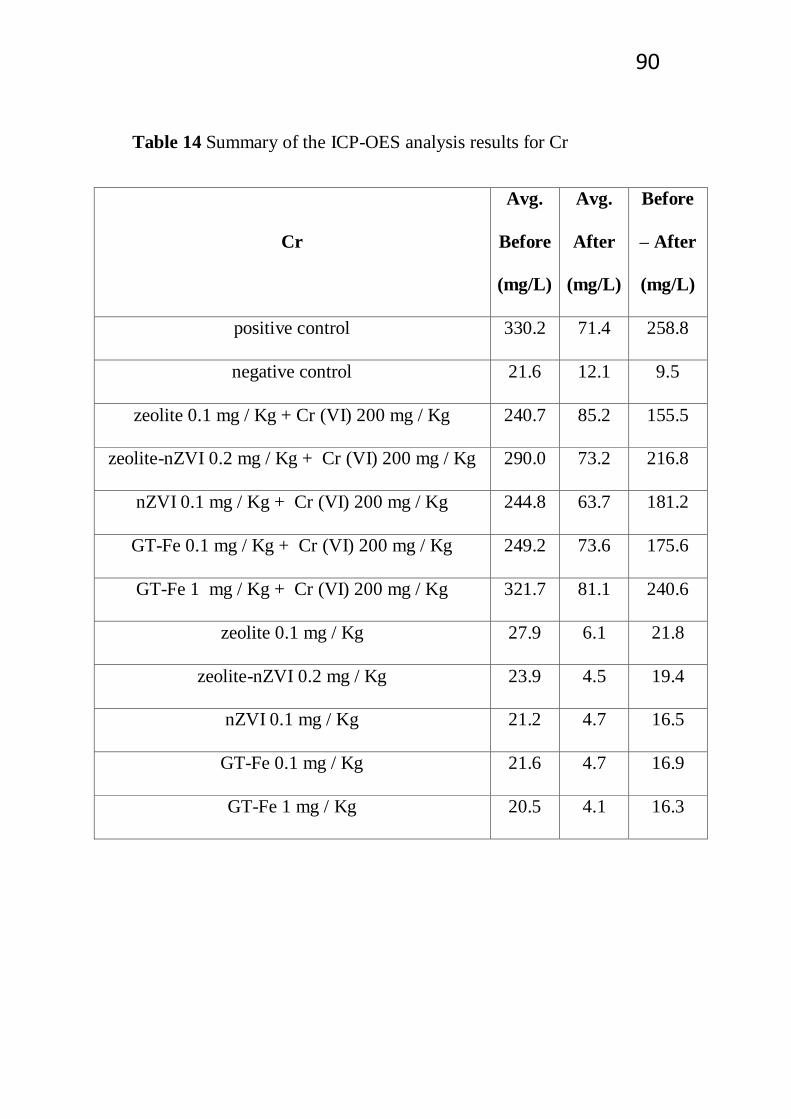
90
Table 14 Summary of the ICP-OES analysis results for Cr
Cr
Avg.
Before
(mg/L)
Avg.
After
(mg/L)
Before
– After
(mg/L)
positive control 330.2 71.4 258.8
negative control 21.6 12.1 9.5
zeolite 0.1 mg / Kg + Cr (VI) 200 mg / Kg 240.7 85.2 155.5
zeolite-nZVI 0.2 mg / Kg + Cr (VI) 200 mg / Kg 290.0 73.2 216.8
nZVI 0.1 mg / Kg + Cr (VI) 200 mg / Kg 244.8 63.7 181.2
GT-Fe 0.1 mg / Kg + Cr (VI) 200 mg / Kg 249.2 73.6 175.6
GT-Fe 1 mg / Kg + Cr (VI) 200 mg / Kg 321.7 81.1 240.6
zeolite 0.1 mg / Kg 27.9 6.1 21.8
zeolite-nZVI 0.2 mg / Kg 23.9 4.5 19.4
nZVI 0.1 mg / Kg 21.2 4.7 16.5
GT-Fe 0.1 mg / Kg 21.6 4.7 16.9
GT-Fe 1 mg / Kg 20.5 4.1 16.3

91
In order to analyze the ICP results, as an attempt to relate them with
the plant growth and progress, the differences between the chromium
and iron concentrations were calculated as follows:
… (5)
The depletion in Cr can occur in two ways; fixation by nano iron
materials, and/or accumulation in the plant itself as reported in
another study [90].
Table 15 shows the ICP analysis results (Δ values) for Cr in a
descending order for samples to which Cr was added.
Table 16 shows the Δ values calculated in the same way for Fe in a
descending order.

92
Table 15 The Δ values obtained from the ICP analysis for Cr(VI) in a
descending order
( at the
beginning of the planting (before), after two months of planting
(after)).
Cr Δ
1 258.8 positive control (soil + Cr 200 mg / Kg)
7 240.6 GT-Fe 1.0 mg / Kg + Cr (VI) 200 mg / Kg
4 216.8 zeolite-nZVI 0.2 mg / Kg + Cr (VI) 200 mg / Kg
5 181.2 nZVI 0.1 mg / Kg + Cr (VI) 200 mg / Kg
6 175.6 GT-Fe 0.1 mg / Kg + Cr (VI) 200 mg / Kg
3 155.5 zeolite 0.1 mg / Kg + Cr (VI) 200 mg / Kg
8 21.8 zeolite 0.1 mg / Kg
9 19.4 zeolite-nZVI 0.2 mg / Kg
11 16.9 GT-Fe 0.1 mg / Kg
10 16.5 nZVI 0.1 mg / Kg
12 16.3 GT-Fe 1.0 mg / Kg
2 9.5 negative control
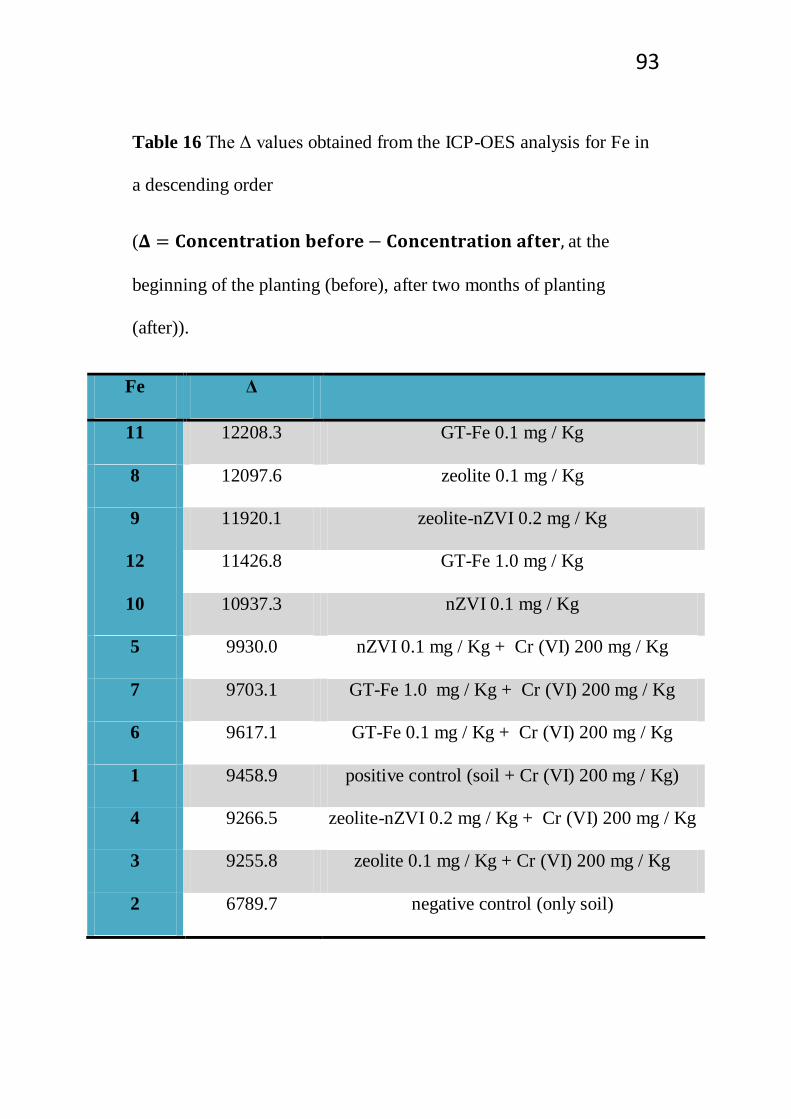
93
Table 16 The Δ values obtained from the ICP-OES analysis for Fe in
a descending order
( at the
beginning of the planting (before), after two months of planting
(after)).
Fe Δ
11 12208.3 GT-Fe 0.1 mg / Kg
8 12097.6 zeolite 0.1 mg / Kg
9 11920.1 zeolite-nZVI 0.2 mg / Kg
12 11426.8 GT-Fe 1.0 mg / Kg
10 10937.3 nZVI 0.1 mg / Kg
5 9930.0 nZVI 0.1 mg / Kg + Cr (VI) 200 mg / Kg
7 9703.1 GT-Fe 1.0 mg / Kg + Cr (VI) 200 mg / Kg
6 9617.1 GT-Fe 0.1 mg / Kg + Cr (VI) 200 mg / Kg
1 9458.9 positive control (soil + Cr (VI) 200 mg / Kg)
4 9266.5 zeolite-nZVI 0.2 mg / Kg + Cr (VI) 200 mg / Kg
3 9255.8 zeolite 0.1 mg / Kg + Cr (VI) 200 mg / Kg
2 6789.7 negative control (only soil)
94
From the results in Tables 13 - 16, the following conclusions arise:
a. The soil contained a relatively high Fe concentration as evident
from the values in Table 13 for the soil samples to which no Fe
nanomaterial was added (samples 1,2,8). The iron content was
also detected by the EDX and XRF analysis of the soil.
b. Upon addition of Fe nanomaterials, the Fe content of the soil
showed some increase, which is in line with the limited
amounts of added nano iron materials.
c. In all cases there is a depletion of Cr and Fe elements. This is a
strong indication that both elements are absorbed by the plant.
d. As Table 15 shows, the highest Δ value for Cr is observed for
the positive control to which no nano iron or zeolite material
was added, hence it is logical to assume that Cr in this case was
removed by accumulation into the plant, in line with previous
studies [90].
e. When nano iron materials are added to soil, the observed
amount of depleted Cr is seen to decrease. This could be
indicative that some Cr was immobilized on the nano iron
materials and migrated into the soil, and/or the discrepancies in
the results could be arising from sampling errors.

95
f. Assuming that the smaller value of depleted Cr is due to
immobilization by nano-iron materials, it can be seen that
supported nano iron Z-nZVI is more efficient than nZVI alone
as it showed a higher Δ value. This matches the observation in
the plant progress part.
g. It can be noticed that the lowest Δ value of Cr is observed for
the negative control sample, here, no Cr or remediation
substances were added to the soil.
h. The depression of iron amount can be assumed to arise from the
plant need for it as a nutrient. Plants require Fe to complete
their life cycle. The importance of Fe is due to the existence of
two stable, inter-convertible forms of this metal, which take part
in fundamental processes involving electron transfer reactions,
including respiration and photosynthesis [45].
3.4 Effect of iron nanoparticles on bacteria growth
In the following sections, the results of bacteria treatment with
different Fe NP samples at different concentrations are presented in a
descending order, with the highest bacterial growth being in the
bottom. In the relevant experiments, the effect of Fe NPs on 4 bacteria
types which are abundant in soil was examined. These bacteria types

96
are two gram positive bacteria (Staphylococcus aureus and Bacillus
subtilis) and two are gram negative (Klebsiella pneumonia and
Escherichia coli). The Fe NP samples which were tested were nZVI,
GT-Fe, both in two different concentrations, in addition to Cr(VI)
solution, and Cr(VI) mixed with Fe NPs.
The control sample (empty) in all experiments was bacteria alone
without any added chemicals.
3.4.1 Staphylococcus aureus
The order of action of the tested solutions against this bacteria is
shown in Fig. 33.
Based on the obtained results and trend for bacterial growth and
inhibition, the following comments can be written:
1. The small concentration of Cr(VI) solution (10 mg/l) have a
small negative effect on bacterial growth.
2. GT-Fe NPs inhibit the growth of bacteria to the same extent
regardless of its concentration (GT-Fe 10 and GT-Fe 50 gave
the same result).

97
3. nZVI inhibits the bacterial growth more than GT-Fe NPs, the
higher the nZVI concentration, the higher the inhibition (nZVI
50 ˃ nZVI 10).
4. The inhibition made by Cr + nZVI was higher than nZVI alone
and Cr alone (Cr + nZVI ˃ nZVI 50 ˃ Cr 100), this may
confirm that Cr(VI) has an adverse effect on the bacteria that
adds to the adverse effect of nZVI.
Figure 33 Inhibition of S. aureus bacterial growth in a descending
order
nZVI 50 ˃ GT-Fe 50 GT-Fe 10 nZVI 10 ˃ Empty
Cr+nZVI
nZVI 50
Cr 10, Cr 100, nZVI 10, GT-Fe 10, GT-Fe 50, Cr+GT-Fe
Empty
98
3.4.2 Klebsiella pneumonia
Based on the results, shown in Fig. 34, the following comments can be
written:
1. Cr(VI) solution at small concentration (10 mg/l) has no effect
on bacterial growth, when the concentration increased to (100
mg/l), a small inhibition in the growth was observed.
2. Higher concentrations of Fe NPs (nZVI 50, GT-Fe 50) have
higher negative effect on the bacteria growth than small
concentrations (GT-Fe 10, nZVI 10).
3. nZVI 50 has a higher inhibition than GT-Fe 50.
4. Both of Cr + GT-Fe and Cr + nZVI results are almost the same
as GT-Fe 50. This may be because Cr alone has a small effect
on the bacteria growth.

99
Figure 34 Inhibition of K. Pneumonia bacterial growth by various
solutions in a descending order
nZVI 50 ˃ GT-Fe 50 ˃ GT-Fe 10 nZVI 10 ˃ Empty
3.4.3 Bacillus subtilis
According to the results, which are summarized in Fig. 35, the
followings can be concluded:
1. Cr(VI) solution has no effect on bacterial growth on either
concentrations.
2. GT-Fe in general is less toxic to B. subtilis than nZVI.
3. GT-Fe 50 and Cr + GT-Fe, nZVI 50 and Cr + nZVI, have the
same results, and this seems to confirm that Cr alone has no
effect on bacteria.
nZVI 50
GT-Fe 50, Cr+GT-Fe, Cr+nZVI
Cr 100, GT-Fe 10, nZVI 10
Empty, Cr 10

100
4. GT-Fe NPs have the same results on both concentrations, but
for nZVI, nZVI 50 have a more negative effect on the bacteria
growth than nZVI 10.
Figure 35 Inhibition of B. Subtilis bacterial growth by different
solutions in a descending order
nZVI 50 ˃ nZVI 10 ˃ GT-Fe 50 GT-Fe 10 ˃ Empty
3.4.4 Escherichia coli
Fig. 36 suggests that:
1. Small concentrations of Fe NPs (nZVI 10, GT-Fe 10) have no
effect on this bacteria.
nZVI 50, Cr+nZVI
nZVI 10
GT-Fe 50, Cr+GT-Fe
GT-Fe 10
Empty, Cr 10, Cr 100

101
2. Higher concentration of Fe NPs have a negative effect on the
growth of bacteria, with GT-Fe 50 having the higher inhibition
than nZVI 50.
3. The effect of Cr(VI) is not very clear, but as the effects of Cr +
GT-Fe and Cr + nZVI are higher than GT-Fe and nZVI
respectively, it can be predicted that Cr alone has its own
negative effect on bacteria growth.
Figure 36 Inhibition of E. coli bacterial growth in a descending order
GT-Fe 50 ˃ nZVI 50 ˃ GT-Fe 10 nZVI 10 Empty
Cr+
GT-Fe
GT-Fe 50
Cr 10
Cr+nZVI
nZVI 50
Empty, GT-Fe 10, nZVI 10, Cr 100

102
Based on the collective results of the tested bacteria the following
conclusions can be made:
i. Cr(VI) solutions have little effect on the tested bacteria types at
low concentrations, and the detrimental effect is more obvious
at higher concentrations. This seems to confirm the data
reported in literature which suggest that Cr(VI) can cause shifts
in the composition of soil microbial populations, and has
detrimental effects on microbial cell metabolism at high
concentrations [9].
ii. nZVI (and Cr-nZVI) demonstrated the highest detrimental
effect on all the bacteria types.
iii. GT-Fe NPs have less detrimental effects than nZVI. This might
be due to the fact that the organic groups coming from green tea
occupies an important portion of the nanoparticles and thus
reduces the Fe content in the nanoparticle.
The detrimental effects of various types of nanoparticles on bacteria
types were reported in literature. For examples, Ag, Cu, MgO, ZnO,
and TiO2 NPs have been used to inactivate various biological agents
including B. subtilis [16]. Both Ag and Cu nanoparticles inactivated
B. subtilis and Escherichia coli, and B. subtilis was shown more
103
susceptible to the treatment. Also, it was found that the inactivation is
depended on the concentrations of nanoparticles used [91].
It should be mentioned, however, that the reports on toxicities of
metal and metal oxide NPs can be contradictory [16]. For example,
some results show a lack of toxicity of nZVI on the cells of the Gram
negative strain tested (K. planticola), even at the higher concentrations
(10 mg/ml) after 24 h of exposure. In contrast, an inhibitory effect by
the nanomaterial was observed on the Gram positive strain (B.
nealsonii) [34]. nZVI particles were also reported to inactivate gram-
negative E. coli [57].
Moreover, in a previous study, green-synthesized iron nanoparticles
were reported to show good antibacterial activity against Escherichia
coli and Staphylococcus aureus [26]. In other study, Fe2O3 NPs
showed no significant antibacterial activities against Escherichia coli
[54].
The size of nanoparticles can affect their antimicrobial activities [91].
Depending on synthesis methods for nZVI, and solution chemistries,
different shell compositions such as FeO, maghemite (γ-
104
Fe2O3)/partially oxidized magnetite could be formed. The observed
coating of iron oxides on bacterial membranes could block porins in
the outer membrane of gram-negative, preventing their uptake of
nutrients. For Gram positive bacteria, lipoteichoic acid, a component
of the cell wall, might have formed a chelating complex with nZVI.
Also, the anionic structures like in B. subtilis walls promote ferric
hydroxide formation [92].
To conclude, it is evident from this study that Fe NPs demonstrate
serious inhibition effects on the studied bacteria types. This leads to
the result that treating the soil with iron nanoparticles will seriously
affect its bacteria content. The extent of the effect will depend
significantly on the applied concentration.

105
4. Conclusions
Both of nZVI and Z-nZVI materials are very effective in Cr(VI)
removal, for nZVI, equilibrium of Cr(VI) removal is approached in
about one hour of contact between liquid and solid phases. For Z-
nZVI, the process was slower and more than four hours were required
to attain equilibrium. The data of Z-nZVI obeyed pseudo first order
kinetics, with k1 (rate constant) calculated as
min-1
, and Qmax (maximum sorbable amount) found as mg/g.
The removal of Cr(VI) is high over a wide range of pH values
although the removal decrease in the alkaline medium. Generally, the
removal of Cr(VI) by Z-nZVI is more pH-dependent than that of
nZVI.
Cr signals from the EDX mapping analysis appear to be associated
with the Fe signals, not with Si, indicating that Cr ions favors binding
to iron nanoparticles more than to soil particles.
XRD analysis of the sample of soil-Fe NPs after exposure to Cr(VI)
ions shows formation of iron oxides and iron oxyhydroxide, indicating
that Fe NPs has undergone corrosion.
106
No negative effect of nZVI and GT-Fe on Corn growth at the lower
applied dose (0.1 mg/Kg) on soil fertility and plant nutrition was
observed, however, high concentrations of Fe NPs can be harmful to
the corn plants. Cr and Fe elements are highly depleted from soil,
most probably through uptake by plants.
Cr(VI) solutions at low levels had slight effect on the tested bacteria
types. GT-Fe NPs negative impact was lower than nZVI.
Similar studies are required to test the effect of Fe NPs on other plants
and optimize the amount of this material such that remediation of
pollutants can be achieved without harming the soil and plants.

107
5. References
(1) Mohan, D.; Pittman, C. U. Activated Carbons and Low Cost
Adsorbents for Remediation of Tri- and Hexavalent Chromium
from Water. J. Hazard. Mater. 2006, 137 (2), 762–811.
(2) Loska, K.; Wiechulła, D.; Korus, I. Metal Contamination of
Farming Soils Affected by Industry. Environ. Int. 2004, 30 (2),
159–165.
(3) Li, X.; Liu, L.; Wang, Y.; Luo, G.; Chen, X.; Yang, X.; Hall, M.
H. P.; Guo, R.; Wang, H.; Cui, J.; et al. Heavy Metal
Contamination of Urban Soil in an Old Industrial City
(Shenyang) in Northeast China. Geoderma 2013, 192 (1), 50–58.
(4) Yaylali-Abanuz, G. Heavy Metal Contamination of Surface Soil
around Gebze Industrial Area, Turkey. Microchem. J. 2011, 99
(1), 82–92.
(5) Kumar Sharma, R.; Agrawal, M.; Marshall, F. Heavy Metal
Contamination of Soil and Vegetables in Suburban Areas of
Varanasi, India. Ecotoxicol. Environ. Saf. 2007, 66 (2), 258–266.
(6) O’Carroll, D.; Sleep, B.; Krol, M.; Boparai, H.; Kocur, C.
Nanoscale Zero Valent Iron and Bimetallic Particles for

108
Contaminated Site Remediation. Adv. Water Resour. 2013, 51,
104–122.
(7) Zhong, L.; Yang, J. Reduction of Cr(VI) by Malic Acid in
Aqueous Fe-Rich Soil Suspensions. Chemosphere 2012, 86 (10),
973–978.
(8) Economou-Eliopoulos, M.; Antivachi, D.; Vasilatos, C.;
Megremi, I. Evaluation of the Cr(VI) and Other Toxic Element
Contamination and Their Potential Sources: The Case of the
Thiva Basin (Greece). Geosci. Front. 2012, 3 (4), 523–539.
(9) Huang, S. H.; Peng, B.; Yang, Z. H.; Chai, L. Y.; Zhou, L. C.
Chromium Accumulation, Microorganism Population and
Enzyme Activities in Soils around Chromium-Containing Slag
Heap of Steel Alloy Factory. Trans. Nonferrous Met. Soc. China
(English Ed. 2009, 19 (1), 241–248.
(10) Shanker, A. K.; Cervantes, C.; Loza-Tavera, H.;
Avudainayagam, S. Chromium Toxicity in Plants. Environ. Int.
2005, 31 (5), 739–753.
(11) Zhang, J.; Xu, Y.; Li, W.; Zhou, J.; Zhao, J.; Qian, G.; Xu, Z. P.
Enhanced Remediation of Cr(VI)-Contaminated Soil by

109
Incorporating a Calcined-Hydrotalcite-Based Permeable
Reactive Barrier with Electrokinetics. J. Hazard. Mater. 2012,
239-240, 128–134.
(12) Mijangos, I.; Pérez, R.; Albizu, I.; Garbisu, C. Effects of
Fertilization and Tillage on Soil Biological Parameters. Enzyme
Microb. Technol. 2006, 40 (1), 100–106.
(13) Beukes, J. P.; Pienaar, J. J.; Lachmann, G. The Reduction of
Hexavalent Chromium by Sulphite in Wastewater - An
Explanation of the Observed Reactivity Pattern. Water SA 2000,
26 (3), 393–395.
(14) Liu, T.; Wang, Z.-L.; Zhao, L.; Yang, X. Enhanced
chitosan/Fe0-Nanoparticles Beads for Hexavalent Chromium
Removal from Wastewater. Chem. Eng. J. 2012, 189-190, 196–
202.
(15) Cullen, L. G.; Tilston, E. L.; Mitchell, G. R.; Collins, C. D.;
Shaw, L. J. Assessing the Impact of Nano- and Micro-Scale
Zerovalent Iron Particles on Soil Microbial Activities: Particle
Reactivity Interferes with Assay Conditions and Interpretation of
Genuine Microbial Effects. Chemosphere 2011, 82 (11), 1675–

110
1682.
(16) Dinesh, R.; Anandaraj, M.; Srinivasan, V.; Hamza, S.
Engineered Nanoparticles in the Soil and Their Potential
Implications to Microbial Activity. Geoderma 2012, 173-174,
19–27.
(17) Crane, R. a.; Scott, T. B. Nanoscale Zero-Valent Iron: Future
Prospects for an Emerging Water Treatment Technology. J.
Hazard. Mater. 2012, 211-212, 112–125.
(18) Cundy, A. B.; Hopkinson, L.; Whitby, R. L. D. Use of Iron-
Based Technologies in Contaminated Land and Groundwater
Remediation: A Review. Sci. Total Environ. 2008, 400 (1-3),
42–51.
(19) Liu, H.; Chen, T.; Zou, X.; Xie, Q.; Qing, C.; Chen, D.; Frost, R.
L. Removal of Phosphorus Using NZVI Derived from Reducing
Natural Goethite. Chem. Eng. J. 2013, 234, 80–87.
(20) Machado, S.; Stawiński, W.; Slonina, P.; Pinto, a. R.; Grosso, J.
P.; Nouws, H. P. a; Albergaria, J. T.; Delerue-Matos, C.
Application of Green Zero-Valent Iron Nanoparticles to the
Remediation of Soils Contaminated with Ibuprofen. Sci. Total

111
Environ. 2013, 461-462, 323–329.
(21) Chen, J.; Qiu, X.; Fang, Z.; Yang, M.; Pokeung, T.; Gu, F.;
Cheng, W.; Lan, B. Removal Mechanism of Antibiotic
Metronidazole from Aquatic Solutions by Using Nanoscale
Zero-Valent Iron Particles. Chem. Eng. J. 2012, 181-182, 113–
119.
(22) Unal Yesiller, S.; Eroĝlu, a. E.; Shahwan, T. Removal of
Aqueous Rare Earth Elements (REEs) Using Nano-Iron Based
Materials. J. Ind. Eng. Chem. 2013, 19 (3), 898–907.
(23) Efecan, N.; Shahwan, T.; Eroǧlu, A. E.; Lieberwirth, I.
Characterization of the Uptake of Aqueous Ni2+ Ions on
Nanoparticles of Zero-Valent Iron (nZVI). Desalination 2009,
249 (3), 1048–1054.
(24) Li, Y.; Li, T.; Jin, Z. Stabilization of Fe 0 Nanoparticles with
Silica Fume for Enhanced Transport and Remediation of
Hexavalent Chromium in Water and Soil. J. Environ. Sci. 2011,
23 (7), 1211–1218.
(25) Huang, L.; Weng, X.; Chen, Z.; Megharaj, M.; Naidu, R.
Synthesis of Iron-Based Nanoparticles Using Oolong Tea

112
Extract for the Degradation of Malachite Green. Spectrochim.
Acta - Part A Mol. Biomol. Spectrosc. 2014, 117, 801–804.
(26) Naseem, T.; Farrukh, M. A. Antibacterial Activity of Green
Synthesis of Iron Nanoparticles Using Lawsonia Inermis and
Gardenia Jasminoides Leaves Extract. J. Chem. 2015, 2015
(Article ID 912342, 7 pages), doi:10.1155/2015/912342.
(27) Yan, W.; Herzing, A. a.; Kiely, C. J.; Zhang, W. X. Nanoscale
Zero-Valent Iron (nZVI): Aspects of the Core-Shell Structure
and Reactions with Inorganic Species in Water. J. Contam.
Hydrol. 2010, 118 (3-4), 96–104.
(28) University, G. S. Table of Standard Electrode Potentials
http://hyperphysics.phy-astr.gsu.edu/hbase/tables/electpot.html
(accessed Aug 8, 2015).
(29) Zhang, W.-X. Nanoscale Iron Particles for Enviornmental
Remediation: An Overview. J. Nanoparticle Res. 2003, 5, 323–
332.
(30) Grieger, K. D.; Fjordbøge, A.; Hartmann, N. B.; Eriksson, E.;
Bjerg, P. L.; Baun, A. Environmental Benefits and Risks of
Zero-Valent Iron Nanoparticles (nZVI) for in Situ Remediation:

113
Risk Mitigation or Trade-Off? J. Contam. Hydrol. 2010, 118 (3-
4), 165–183.
(31) Du, J.; Lu, J.; Wu, Q.; Jing, C. Reduction and Immobilization of
Chromate in Chromite Ore Processing Residue with Nanoscale
Zero-Valent Iron. J. Hazard. Mater. 2012, 215-216, 152–158.
(32) Araújo, R.; Castro, A. C. M.; Fiúza, A. The Use of
Nanoparticles in Soil and Water Remediation Processes. Mater.
Today Proc. 2015, 2 (1), 315–320.
(33) Fang, Z.; Qiu, X.; Huang, R.; Qiu, X.; Li, M. Removal of
Chromium in Electroplating Wastewater by Nanoscale Zero-
Valent Metal with Synergistic Effect of Reduction and
Immobilization. Desalination 2011, 280 (1-3), 224–231.
(34) Fajardo, C.; Ortíz, L. T.; Rodríguez-Membibre, M. L.; Nande,
M.; Lobo, M. C.; Martin, M. Assessing the Impact of Zero-
Valent Iron (ZVI) Nanotechnology on Soil Microbial Structure
and Functionality: A Molecular Approach. Chemosphere 2012,
86 (8), 802–808.
(35) Kumpiene, J.; Ore, S.; Renella, G.; Mench, M.; Lagerkvist, A.;
Maurice, C. Assessment of Zerovalent Iron for Stabilization of

114
Chromium, Copper, and Arsenic in Soil. Environ. Pollut. 2006,
144 (1), 62–69.
(36) Li, X.; Cao, J.; Zhang, W. Stoichiometry of Cr ( VI )
Immobilization Using Nanoscale Zerovalent Iron ( nZVI ): A
Study with High-Resolution X-Ray Photoelectron Spectroscopy
( HR-XPS ). Ind. Eng. Chem. Res. 2008, 47, 2131–2139.
(37) Qiu, X.; Fang, Z.; Yan, X.; Cheng, W.; Lin, K. Chemical
Stability and Toxicity of Nanoscale Zero-Valent Iron in the
Remediation of Chromium-Contaminated Watershed. Chem.
Eng. J. 2013, 220, 61–66.
(38) Li, Y.; Li, J.; Zhang, Y. Mechanism Insights into Enhanced
Cr(VI) Removal Using Nanoscale Zerovalent Iron Supported on
the Pillared Bentonite by Macroscopic and Spectroscopic
Studies. J. Hazard. Mater. 2012, 227-228, 211–218.
(39) Shi, L. N.; Lin, Y. M.; Zhang, X.; Chen, Z. L. Synthesis,
Characterization and Kinetics of Bentonite Supported nZVI for
the Removal of Cr(VI) from Aqueous Solution. Chem. Eng. J.
2011, 171 (2), 612–617.
(40) Lv, X.; Hu, Y.; Tang, J.; Sheng, T.; Jiang, G.; Xu, X. Effects of

115
Co-Existing Ions and Natural Organic Matter on Removal of
Chromium (VI) from Aqueous Solution by Nanoscale Zero
Valent Iron (nZVI)-Fe3O4 Nanocomposites. Chem. Eng. J.
2013, 218, 55–64.
(41) Wang, Y.; Fang, Z.; Liang, B.; Tsang, E. P. Remediation of
Hexavalent Chromium Contaminated Soil by Stabilized
Nanoscale Zero-Valent Iron Prepared from Steel Pickling Waste
Liquor. Chem. Eng. J. 2014, 247, 283–290.
(42) Chrysochoou, M.; Johnston, C. P.; Dahal, G. A Comparative
Evaluation of Hexavalent Chromium Treatment in Contaminated
Soil by Calcium Polysulfide and Green-Tea Nanoscale Zero-
Valent Iron. J. Hazard. Mater. 2012, 201-202, 33–42.
(43) Qiu, X.; Fang, Z.; Yan, X.; Gu, F.; Jiang, F. Emergency
Remediation of Simulated Chromium (VI)-Polluted River by
Nanoscale Zero-Valent Iron: Laboratory Study and Numerical
Simulation. Chem. Eng. J. 2012, 193-194, 358–365.
(44) Sheykhbaglou, R.; Sedghi, M. Effects of Nano-Iron Oxide
Particles on Agronomic Traits of Soybean. Not. Sci. Biol. 2010,
2 (2), 112–113.
116
(45) De Nisi, P.; Vigani, G.; Dell’Orto, M.; Zocchi, G. Application of
the Split Root Technique to Study Iron Uptake in Cucumber
Plants. Plant Physiol. Biochem. 2012, 57, 168–174.
(46) Ma, X.; Geiser-lee, J.; Deng, Y.; Kolmakov, A. Science of the
Total Environment Interactions between Engineered
Nanoparticles ( ENPs ) and Plants : Phytotoxicity , Uptake and
Accumulation. Sci. Total Environ. 2010, 408 (16), 3053–3061.
(47) Prasad, M. N. V. deficiency and toxicity symptoms Contents :
http://nsdl.niscair.res.in/jspui/bitstream/123456789/340/1/Forma
tted - Revised Plant mineral nutrition.pdf (accessed Jan 3, 2016).
(48) Quik, J. T. K.; Vonk, J. A.; Hansen, S. F.; Baun, A.; Van De
Meent, D. How to Assess Exposure of Aquatic Organisms to
Manufactured Nanoparticles? Environ. Int. 2011, 37 (6), 1068–
1077.
(49) Yin, K.; Lo, I. M. C.; Dong, H.; Rao, P.; Mak, M. S. H. Lab-
Scale Simulation of the Fate and Transport of Nano Zero-Valent
Iron in Subsurface Environments: Aggregation, Sedimentation,
and Contaminant Desorption. J. Hazard. Mater. 2012, 227-228,
118–125.
117
(50) Lin, D.; Xing, B. Phytotoxicity of Nanoparticles: Inhibition of
Seed Germination and Root Growth. Environ. Pollut. 2007, 150
(2), 243–250.
(51) Ma, X.; Gurung, A.; Deng, Y. Phytotoxicity and Uptake of
Nanoscale Zero-Valent Iron (nZVI) by Two Plant Species. Sci.
Total Environ. 2013, 443, 844–849.
(52) Kalantari, N. Evaluation of Toxicity of Iron , Chromium and
Cadmium on Bacillus Cereus Growth. Iran. J. Basic Med. Sci.
2008, 10 (4), 222–228.
(53) Serrano, a.; Tejada, M.; Gallego, M.; Gonzalez, J. L. Evaluation
of Soil Biological Activity after a Diesel Fuel Spill. Sci. Total
Environ. 2009, 407 (13), 4056–4061.
(54) Wang, Z.; Lee, Y.-H.; Wu, B.; Horst, A.; Kang, Y.; Tang, Y. J.;
Chen, D.-R. Anti-Microbial Activities of Aerosolized Transition
Metal Oxide Nanoparticles. Chemosphere 2010, 80 (5), 525–
529.
(55) Qiu, X.; Fang, Z.; Yan, X.; Cheng, W.; Lin, K. Chemical
Stability and Toxicity of Nanoscale Zero-Valent Iron in the
Remediation of Chromium-Contaminated Watershed. Chem.
118
Eng. J. 2013, 220, 61–66.
(56) Chen, J.; Xiu, Z.; Lowry, G. V.; Alvarez, P. J. J. Effect of
Natural Organic Matter on Toxicity and Reactivity of Nano-
Scale Zero-Valent Iron. Water Res. 2011, 45 (5), 1995–2001.
(57) Auffan, M.; Achouak, W.; Rose, J.; Roncato, M. A.; Chanéac,
C.; Waite, D. T.; Masion, A.; Woicik, J. C.; Wiesner, M. R.;
Bottero, J. Y. Relation between the Redox State of Iron-Based
Nanoparticles and Their Cytotoxicity toward Escherichia Coli.
Environ. Sci. Technol. 2008, 42 (17), 6730–6735.
(58) Diao, M.; Yao, M. Use of Zero-Valent Iron Nanoparticles in
Inactivating Microbes. Water Res. 2009, 43 (20), 5243–5251.
(59) El-Temsah, Y. S.; Joner, E. J. Ecotoxicological Effects on
Earthworms of Fresh and Aged Nano-Sized Zero-Valent Iron
(nZVI) in Soil. Chemosphere 2012, 89 (1), 76–82.
(60) What is Staphylococcus Aureus http://www.news-
medical.net/health/What-is-Staphylococcus-Aureus.aspx
(accessed Aug 5, 2015).
(61) Staphylococcus aureus_ USA_300 - MicrobeWiki
https://microbewiki.kenyon.edu/index.php/Staphylococcus_aure

119
us:_USA:300 (accessed Aug 5, 2015).
(62) Klebsiella pneumoniae - Wikipedia, the free encyclopedia
https://en.wikipedia.org/wiki/Klebsiella_pneumoniae (accessed
Aug 5, 2015).
(63) Bacillus subtilis - MicrobeWiki
https://microbewiki.kenyon.edu/index.php/Bacillus_subtilis
(accessed Aug 5, 2015).
(64) Bacillus subtilis - Wikipedia, the free encyclopedia
https://en.wikipedia.org/wiki/Bacillus_subtilis (accessed Aug 5,
2015).
(65) General information of Oil palm.pdf
http://www.cdc.gov/ecoli/general/index.html (accessed Aug 5,
2015).
(66) Escherichia coli - Wikipedia, the free encyclopedia
https://en.wikipedia.org/wiki/Escherichia_coli (accessed Aug 5,
2015).
(67) Nairat, M.; Shahwan, T.; Erog, A. E.; Fuchs, H. Incorporation of
Iron Nanoparticles into Clinoptilolite and Its Application for the
Removal of Cationic and Anionic Dyes. J. Ind. Eng. Chem.

120
2015, 21, 1143–1151.
(68) Nairat, M. Synthesis and Characterization of Nano-Iron Based
Materials and Their Application for the Removal of Anionic and
Cationic Dyes. Master Thesis in Applied Chemistry, Birzeit
university, 2013.
(69) Shahwan, T.; Sirriah, S. A.; Nairat, M.; Boyacı, E.; Ero, A. E.;
Scott, T. B.; Hallam, K. R. Green Synthesis of Iron
Nanoparticles and Their Application as a Fenton-like Catalyst
for the Degradation of Aqueous Cationic and Anionic Dyes.
Chem. Eng. J. 2011, 172, 258–266.
(70) Ju-Nam, Y.; Lead, J. R. Manufactured Nanoparticles: An
Overview of Their Chemistry, Interactions and Potential
Environmental Implications. Sci. Total Environ. 2008, 400 (1-3),
396–414.
(71) BET theory - Wikipedia, the free encyclopedia
http://en.wikipedia.org/wiki/BET_theory (accessed Aug 3,
2015).
(72) X-ray Diffraction (XRD) | XOS
http://www.xos.com/techniques/xrd/ (accessed Aug 3, 2015).

121
(73) Swapp, S. Scanning Electron Microscopy (SEM)
http://serc.carleton.edu/research_education/geochemsheets/techn
iques/SEM.html (accessed Aug 3, 2015).
(74) Intertek Group plc. Energy Dispersive X-Ray Analysis (EDX)
http://www.intertek.com/analysis/microscopy/edx/ (accessed
Aug 3, 2015).
(75) Overview of XRF
http://archaeometry.missouri.edu/xrf_overview.html (accessed
Aug 3, 2015).
(76) Peralta-Videa, J. R.; Zhao, L.; Lopez-Moreno, M. L.; de la Rosa,
G.; Hong, J.; Gardea-Torresdey, J. L. Nanomaterials and the
Environment: A Review for the Biennium 2008-2010. J.
Hazard. Mater. 2011, 186 (1), 1–15.
(77) Singh, R.; Misra, V.; Singh, R. P. Synthesis, Characterization
and Role of Zero-Valent Iron Nanoparticle in Removal of
Hexavalent Chromium from Chromium-Spiked Soil. J.
Nanoparticle Res. 2011, 13 (9), 4063–4073.
(78) R Riley. Bragg’s Law for X-Ray Crystal Diffraction. production
1970, 5 (6), 371–372.

122
(79) Singh, V.; Agrawal, H. M. Qualitative Soil Mineral Analysis by
EDXRF, XRD and AAS Probes. Radiat. Phys. Chem. 2012, 81
(12), 1796–1803.
(80) Shahwan, T. Sorption Kinetics: Obtaining a Pseudo-Second
Order Rate Equation Based on a Mass Balance Approach. J.
Environ. Chem. Eng. 2014, 2 (2), 1001–1006.
(81) Shahwan, T. Lagergren Equation: Can Maximum Loading of
Sorption Replace Equilibrium Loading? Chem. Eng. Res. Des.
2015, 96, 172–176.
(82) Ramazanpour Esfahani, A.; Hojati, S.; Azimi, A.; Farzadian, M.;
Khataee, A. Enhanced Hexavalent Chromium Removal from
Aqueous Solution Using a Sepiolite-Stabilized Zero-Valent Iron
Nanocomposite: Impact of Operational Parameters and Artificial
Neural Network Modeling. J. Taiwan Inst. Chem. Eng. 2015, 49,
172–182.
(83) Soil pH - Wikipedia, the free encyclopedia
http://en.wikipedia.org/wiki/Soil_pH#Determining_pH
(accessed Jan 3, 2016).
(84) Mitra, P.; Sarkar, D.; Chakrabarti, S.; Dutta, B. K. Reduction of
123
Hexa-Valent Chromium with Zero-Valent Iron: Batch Kinetic
Studies and Rate Model. Chem. Eng. J. 2011, 171 (1), 54–60.
(85) Kumral, E. “Speciation of Chromium in Waters Via Sol-Gel
Preconcentration Prior To Atomic Spectrometric
Determination”. Master Degree in Chemistry, Izmir Institute of
Technology, 2007.
(86) Fendorf M.J. AU3 - Grossl, P. AU4 - Sparks, D.L., S. A.-E.
Arsenate and Chromate Retention Mechanisms on Goethite.
Environ. Sci. Technol. 1997, 31 (2), 315–320.
(87) Petala, E.; Dimos, K.; Douvalis, A.; Bakas, T.; Tucek, J.
Nanoscale Zero-Valent Iron Supported on Mesoporous Silica :
Characterization and Reactivity for Cr ( VI ) Removal from
Aqueous Solution. J. Hazard. Mater. 2013, 261, 295–306.
(88) Potentials, S. R. Standard Reduction Potential Table Standard
Reduction Potential Table
http://www.chemeddl.org/services/moodle/media/QBank/GenCh
em/Tables/EStandardTable.htm (accessed Jul 23, 2015).
(89) Fendorf, S. E. Surface Reactions of Chromium in Soils and
Waters. Geoderma 1995, 67 (1-2), 55–71.

124
(90) Alhousani, M. Phytoremediation of Agricultural Land Polluted
with Heavy Metals in Wadi Alsamin - Hebron-Palestine. Master
Thesis in Environment and Water Sciences, Birzeit university,
2012.
(91) Yoon, K. Y.; Hoon Byeon, J.; Park, J. H.; Hwang, J.
Susceptibility Constants of Escherichia Coli and Bacillus
Subtilis to Silver and Copper Nanoparticles. Sci. Total Environ.
2007, 373 (2-3), 572–575.
(92) Chen, Q.; Gao, M.; Li, J.; Shen, F.; Wu, Y.; Xu, Z.; Yao, M.
Inactivation and Magnetic Separation of Bacteria from Liquid
Suspensions Using Electrosprayed and Nonelectrosprayed nZVI
Particles: Observations and Mechanisms. Environ. Sci. Technol.
2012, 46 (4), 2360–2367.
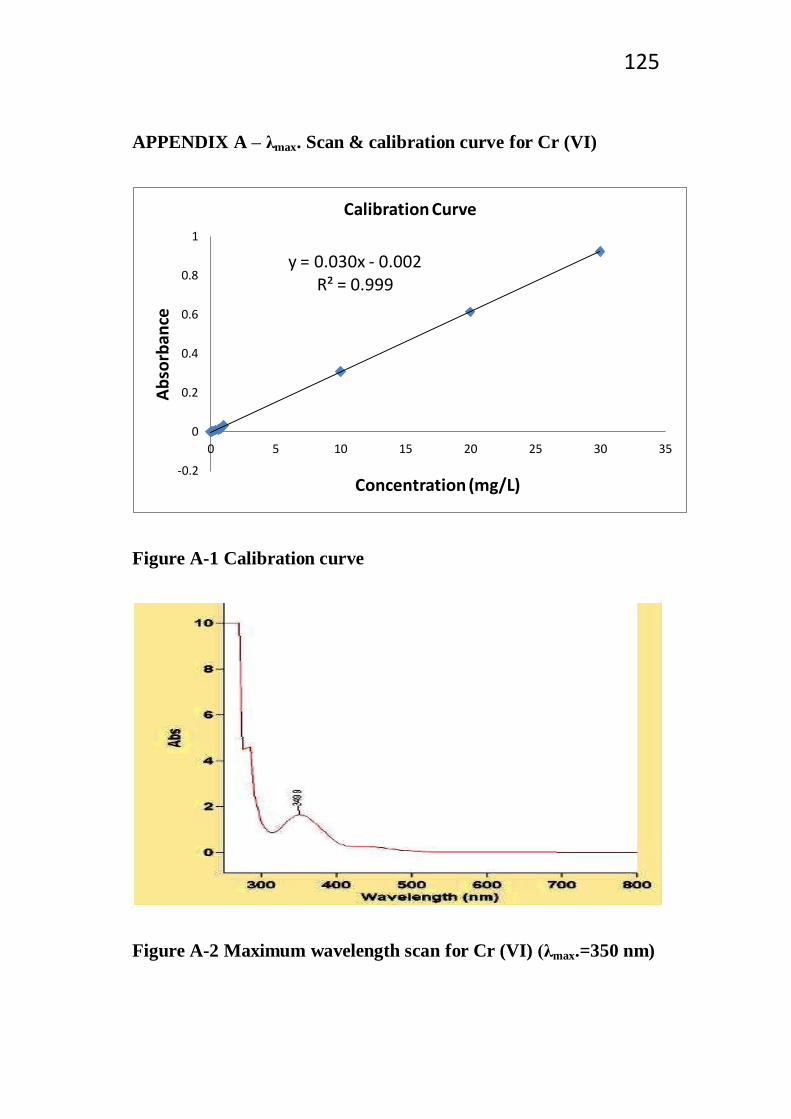
125
APPENDIX A – λmax. Scan & calibration curve for Cr (VI)
Figure A-1 Calibration curve
Figure A-2 Maximum wavelength scan for Cr (VI) (λmax.=350 nm)
y = 0.030x - 0.002 R² = 0.999
-0.2
0
0.2
0.4
0.6
0.8
1
0 5 10 15 20 25 30 35
Ab
sorb
ance
Concentration (mg/L)
Calibration Curve
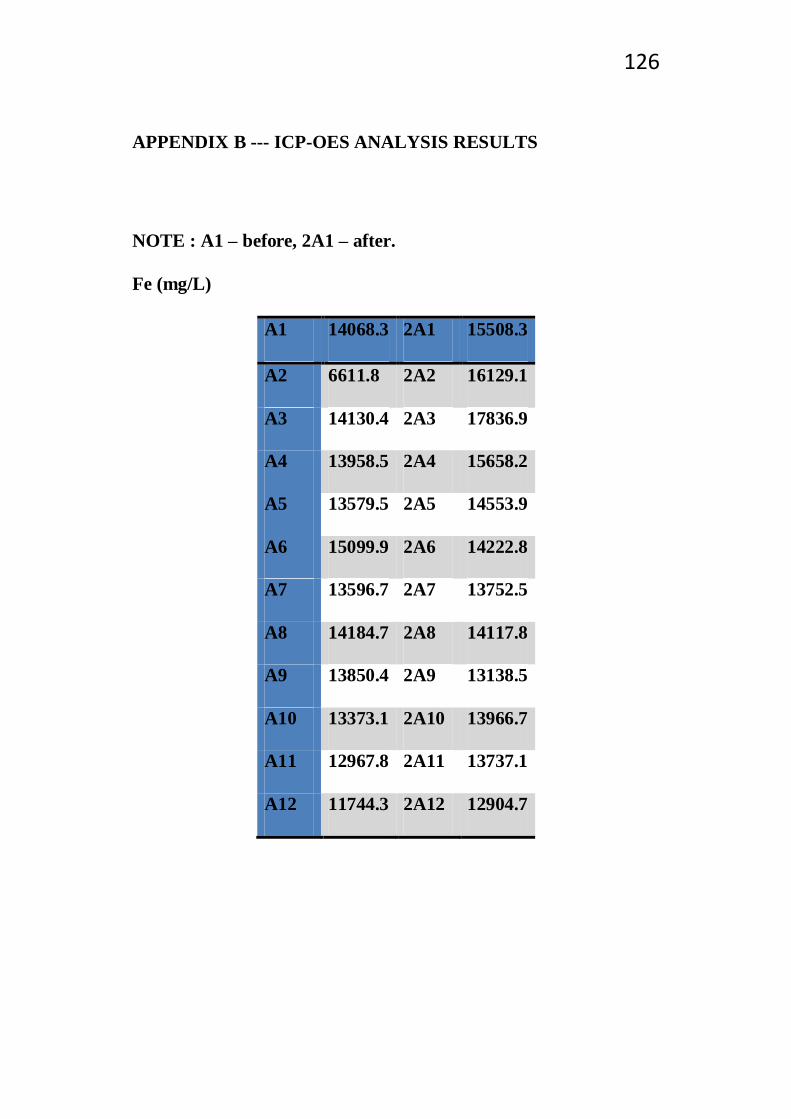
126
APPENDIX B --- ICP-OES ANALYSIS RESULTS
NOTE : A1 – before, 2A1 – after.
Fe (mg/L)
A1 14068.3 2A1 15508.3
A2 6611.8 2A2 16129.1
A3 14130.4 2A3 17836.9
A4 13958.5 2A4 15658.2
A5 13579.5 2A5 14553.9
A6 15099.9 2A6 14222.8
A7 13596.7 2A7 13752.5
A8 14184.7 2A8 14117.8
A9 13850.4 2A9 13138.5
A10 13373.1 2A10 13966.7
A11 12967.8 2A11 13737.1
A12 11744.3 2A12 12904.7
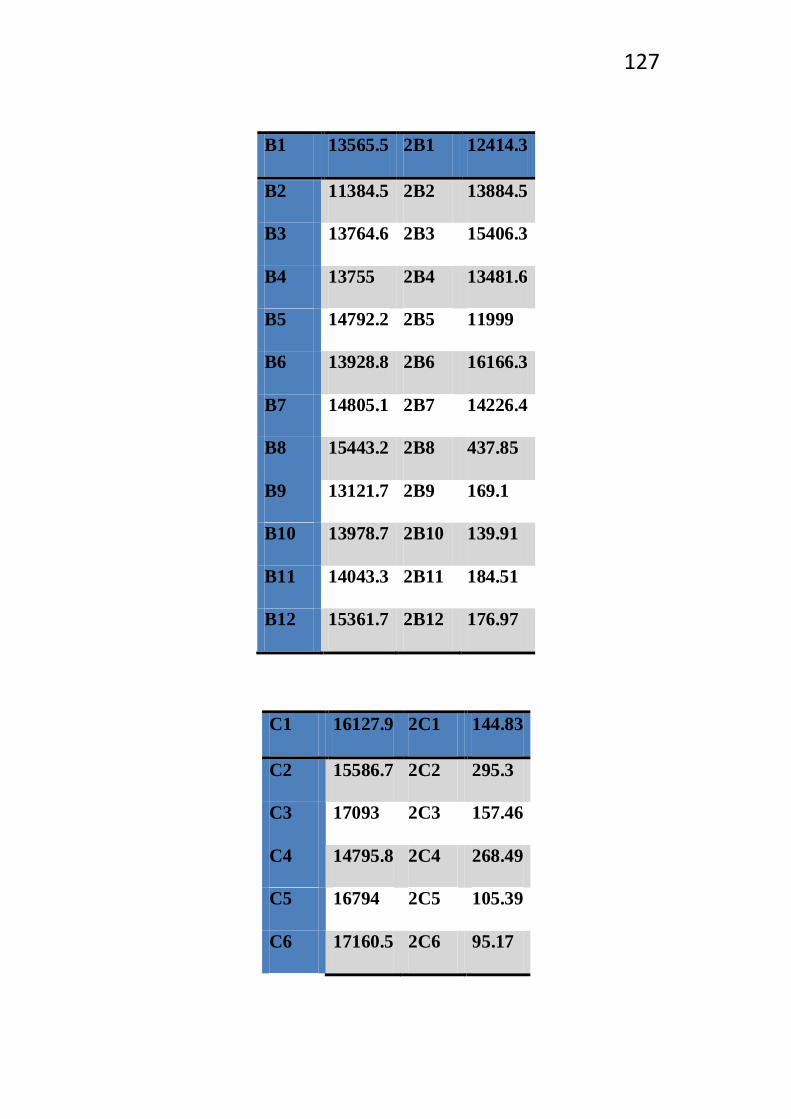
127
B1 13565.5 2B1 12414.3
B2 11384.5 2B2 13884.5
B3 13764.6 2B3 15406.3
B4 13755 2B4 13481.6
B5 14792.2 2B5 11999
B6 13928.8 2B6 16166.3
B7 14805.1 2B7 14226.4
B8 15443.2 2B8 437.85
B9 13121.7 2B9 169.1
B10 13978.7 2B10 139.91
B11 14043.3 2B11 184.51
B12 15361.7 2B12 176.97
C1 16127.9 2C1 144.83
C2 15586.7 2C2 295.3
C3 17093 2C3 157.46
C4 14795.8 2C4 268.49
C5 16794 2C5 105.39
C6 17160.5 2C6 95.17

128
C7 15108 2C7 293.04
C8 15761.2 2C8 171.5
C9 14466.6 2C9 251.91
C10 15969.7 2C10 204.26
C11 15626.2 2C11 144.4
C12 13772.9 2C12 218.17
D1 15954.6 2D1 166.72
D2 14165.8 2D2 120.8
D3 17010.7 2D3 159.47
D4 16204.2 2D4 153.54
D5 15268.3 2D5 110.83
D6 15916.7 2D6 172.39
D7 16637.2 2D7 159.02
D8 15506.7 2D8 114.96
D9 15758.1 2D9 101.03
D10 15079.9 2D10 153.26
D11 16566.8 2D11 146.62
D12 14560 2D12 147.82
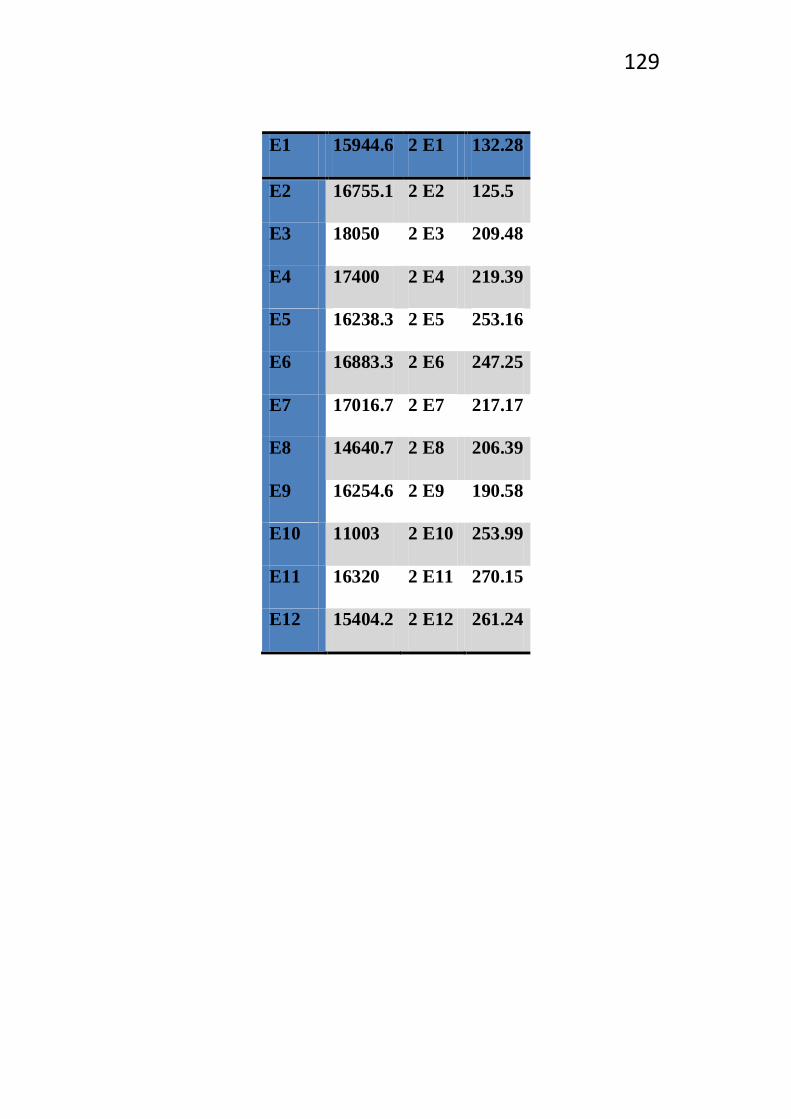
129
E1 15944.6 2 E1 132.28
E2 16755.1 2 E2 125.5
E3 18050 2 E3 209.48
E4 17400 2 E4 219.39
E5 16238.3 2 E5 253.16
E6 16883.3 2 E6 247.25
E7 17016.7 2 E7 217.17
E8 14640.7 2 E8 206.39
E9 16254.6 2 E9 190.58
E10 11003 2 E10 253.99
E11 16320 2 E11 270.15
E12 15404.2 2 E12 261.24

130
Cr (mg/L)
A1 310.67 2A1 204.67
A2 15.47 2A2 32.95
A3 238.13 2A3 227.45
A4 352.16 2A4 185.18
A5 248.59 2A5 193.58
A6 261.41 2A6 173.7
A7 390.83 2A7 159.47
A8 30.78 2A8 30.46
A9 25 2A9 22.31
A10 23.53 2A10 23.67
A11 22.4 2A11 23.4
A12 19.95 2A12 20.65
B1 395.03 2B1 152.51
B2 22.77 2B2 27.72
B3 209.62 2B3 198.34
B4 289.45 2B4 180.88
B5 249.17 2B5 124.67
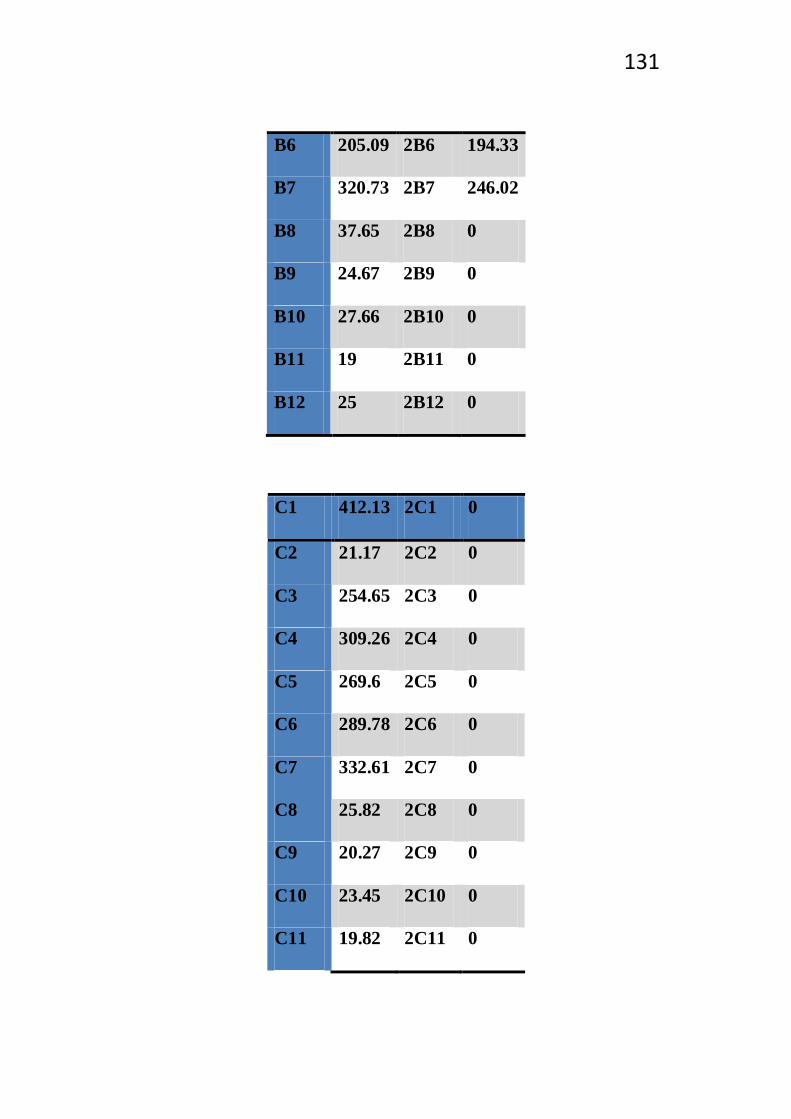
131
B6 205.09 2B6 194.33
B7 320.73 2B7 246.02
B8 37.65 2B8 0
B9 24.67 2B9 0
B10 27.66 2B10 0
B11 19 2B11 0
B12 25 2B12 0
C1 412.13 2C1 0
C2 21.17 2C2 0
C3 254.65 2C3 0
C4 309.26 2C4 0
C5 269.6 2C5 0
C6 289.78 2C6 0
C7 332.61 2C7 0
C8 25.82 2C8 0
C9 20.27 2C9 0
C10 23.45 2C10 0
C11 19.82 2C11 0
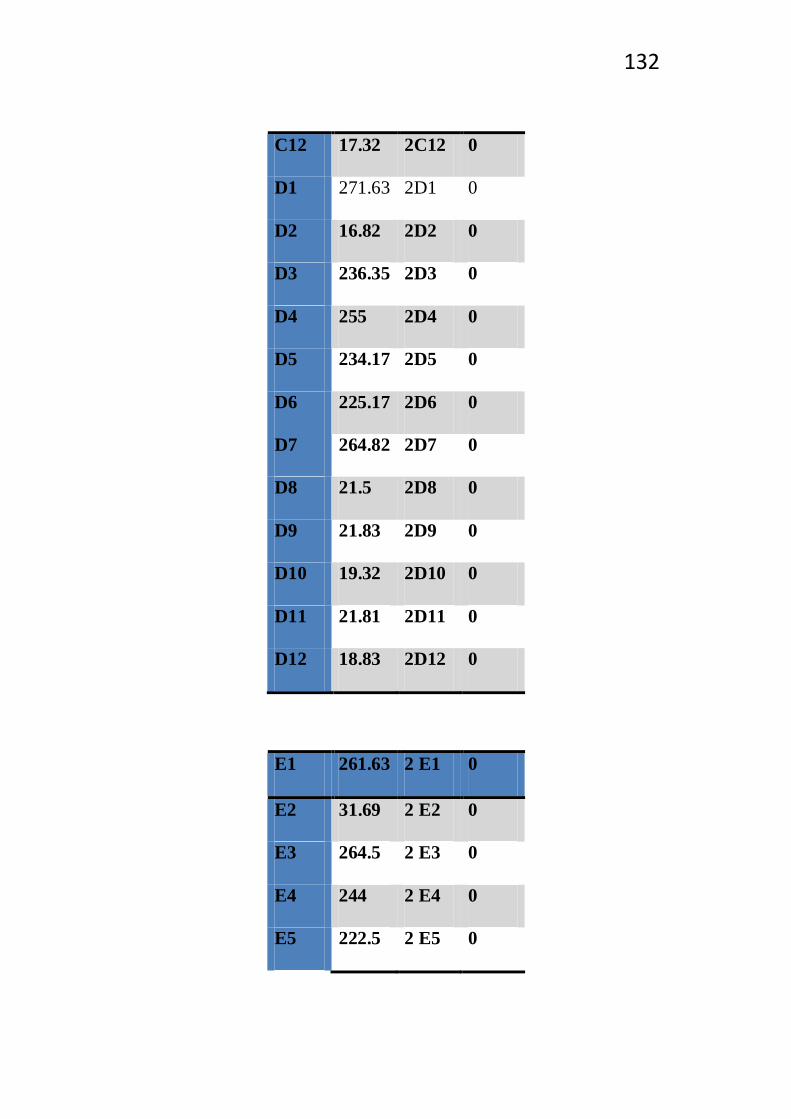
132
C12 17.32 2C12 0
D1 271.63 2D1 0
D2 16.82 2D2 0
D3 236.35 2D3 0
D4 255 2D4 0
D5 234.17 2D5 0
D6 225.17 2D6 0
D7 264.82 2D7 0
D8 21.5 2D8 0
D9 21.83 2D9 0
D10 19.32 2D10 0
D11 21.81 2D11 0
D12 18.83 2D12 0
E1 261.63 2 E1 0
E2 31.69 2 E2 0
E3 264.5 2 E3 0
E4 244 2 E4 0
E5 222.5 2 E5 0
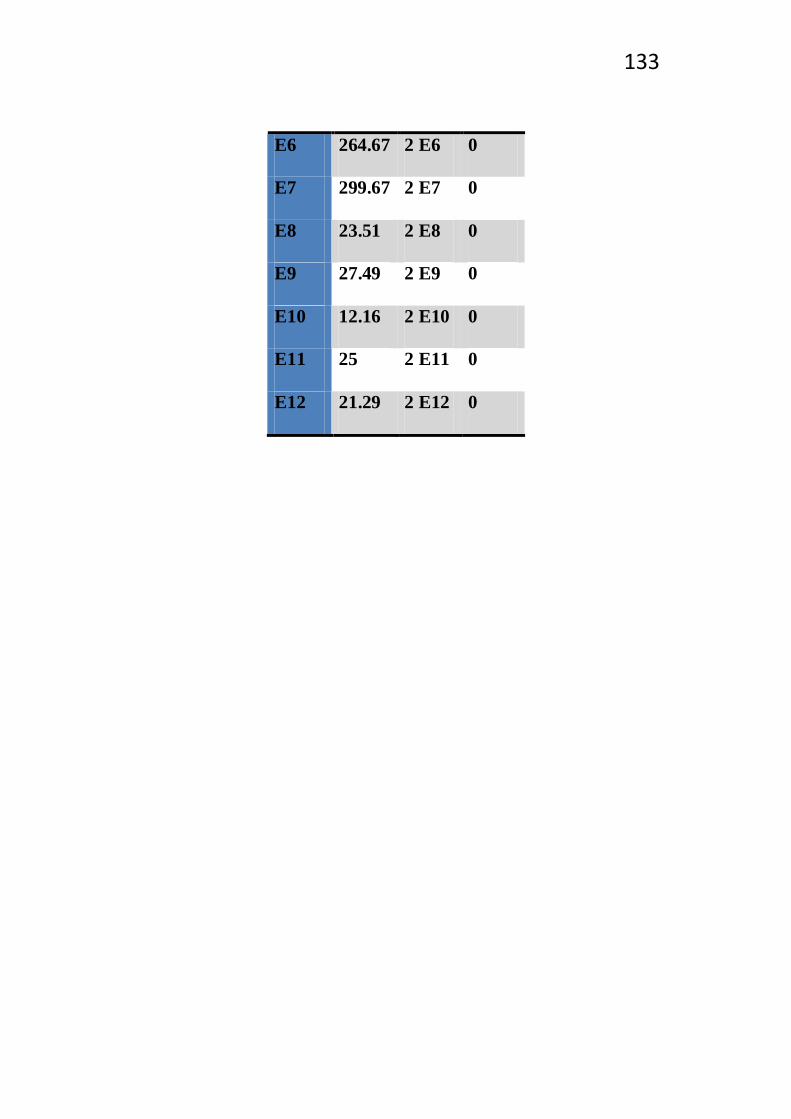
133
E6 264.67 2 E6 0
E7 299.67 2 E7 0
E8 23.51 2 E8 0
E9 27.49 2 E9 0
E10 12.16 2 E10 0
E11 25 2 E11 0
E12 21.29 2 E12 0