Application of modified Hoek-Brown transition relationships for assessing strength and post yield...
14
T r a n s a c t i o n P a p e r Introduction Support design for mining or civil purposes relies heavily on use of rock mass classifi- cation procedures, not just as a tool for empirical support assessment but also for characterizing rock mass strength. However, for many deep mines and deep tunnels where high stress states can be problematic, it frequently becomes quite difficult to accurately characterize rock mass strength and develop appropriate support designs through the use of conventional rock mass classification based support charts or through application of the generalized Hoek-Brown criteria relationships, (as originally introduced in 1980, with various updates through to Hoek et al., 2002). In general, characterizing rock mass strength through use of the Hoek-Brown relationships as the basis for design of support systems is fundamentally based on the principle that structure within a rock mass acts to reduce both the cohesion and frictional properties, represented by downgrading ‘s’ and ‘m’ respectively in the Hoek-Brown criterion. Within rock mass classification systems the premise is also made that structure exerts most control on rock mass behaviour, and hence worst case classification parameter values and overall lowest rock mass strengths are typically associated with the most heavily fractured rock masses. Although the four most commonly used classification systems, RMR, Q, RMi and GSI (Bieniawski, 1973, 1976, Barton et al., 1974 and Barton, 1976, Palmström, 1995 and Marinos and Hoek, 2000) have some input parameter relationships that directly or indirectly reflect intact rock strength, the importance given to rock strength in all of these classifications is generally limited. For the mid-range of the rock mass competency scale, where block size and incipient strength are such that rockmass behaviour tends to be controlled by interblock shear strength rather than by material strength, the empirical Q-system and Mathews-Potvin type support design charts (Grimstad and Barton, 1993, Potvin et al., 1989) and most numerical modelling tools function well. However, towards the two ends of the rock competence scale (i.e., for very low strength rocks and also, for spall-prone, high GSI rock masses) difficulties can be experienced in not only properly classifying such rock masses, but also in application of the Hoek-Brown criterion for determining rock mass strength. Application of modified Hoek-Brown transition relationships for assessing strength and post yield behaviour at both ends of the rock competence scale by T.G. Carter*, M.S. Diederichs † , and J.L. Carvalho* Synopsis Support system design for tunnels and underground excavations has for many years relied heavily on the use of rock mass classifi- cation systems and the Hoek-Brown failure criterion as a means for characterizing rock mass behaviour. Because of their development, both the GSI system and the Hoek-Brown criterion admirably characterize most ‘normal’ rockmasses from the viewpoint of their behaviour for rock excavations. They, however, run into difficulties when applied at the two ends of the rock competence scale. This is largely because block size and incipient strength are such that rock mass behaviour in these domains tends not to be controlled by interblock shear strength but rather by material strength. At the low end of the rock competence scale (UCSi << 15 MPa and GSI generally <30) discontinuities play less of a role and rock mass strength tends to matrix strength. Similarly, at the high end of the scale (GSI >> 65, m i >> 15), because discontinuities are now widely spaced, block size becomes so significant that again, intact material behaviour rather than the fracturing becomes the dominant factor controlling rock mass strength. In this paper several case examples are presented to illustrate the application of the high-end (spalling) and low-end (weak ground) transition Hoek-Brown relationships proposed by Carter, Diederichs and Carvalho (2007) as a basis for better defining rock mass behaviour at the extreme ends of the rock competence scale. * Rock Mechanics Group, Golder Associates, Toronto, Canada. † GeoEngineering Centre, Queen’s University, Kingston, Ontario, Canada. © The Southern African Institute of Mining and Metallurgy, 2008. SA ISSN 0038–223X/3.00 + 0.00. This paper was first published at the SAIMM Symposium, Ground Support in Mining and Civil Engineering Construction, 30 March–3 April 2008. 325 The Journal of The Southern African Institute of Mining and Metallurgy VOLUME 108 REFEREED PAPER JUNE 2008 ▲
-
Upload
independent -
Category
Documents
-
view
0 -
download
0
Transcript of Application of modified Hoek-Brown transition relationships for assessing strength and post yield...

Transaction
Paper
Introduction
Support design for mining or civil purposesrelies heavily on use of rock mass classifi-cation procedures, not just as a tool forempirical support assessment but also forcharacterizing rock mass strength. However,for many deep mines and deep tunnels wherehigh stress states can be problematic, itfrequently becomes quite difficult to accuratelycharacterize rock mass strength and developappropriate support designs through the use ofconventional rock mass classification basedsupport charts or through application of thegeneralized Hoek-Brown criteria relationships,(as originally introduced in 1980, with variousupdates through to Hoek et al., 2002). Ingeneral, characterizing rock mass strengththrough use of the Hoek-Brown relationshipsas the basis for design of support systems isfundamentally based on the principle that
structure within a rock mass acts to reduceboth the cohesion and frictional properties,represented by downgrading ‘s’ and ‘m’respectively in the Hoek-Brown criterion.
Within rock mass classification systemsthe premise is also made that structure exertsmost control on rock mass behaviour, andhence worst case classification parametervalues and overall lowest rock mass strengthsare typically associated with the most heavilyfractured rock masses. Although the four mostcommonly used classification systems, RMR,Q, RMi and GSI (Bieniawski, 1973, 1976,Barton et al., 1974 and Barton, 1976,Palmström, 1995 and Marinos and Hoek,2000) have some input parameterrelationships that directly or indirectly reflectintact rock strength, the importance given torock strength in all of these classifications isgenerally limited. For the mid-range of therock mass competency scale, where block sizeand incipient strength are such that rockmassbehaviour tends to be controlled by interblockshear strength rather than by materialstrength, the empirical Q-system andMathews-Potvin type support design charts(Grimstad and Barton, 1993, Potvin et al.,1989) and most numerical modelling toolsfunction well. However, towards the two endsof the rock competence scale (i.e., for very lowstrength rocks and also, for spall-prone, highGSI rock masses) difficulties can beexperienced in not only properly classifyingsuch rock masses, but also in application ofthe Hoek-Brown criterion for determining rockmass strength.
Application of modified Hoek-Browntransition relationships for assessingstrength and post yield behaviour atboth ends of the rock competence scaleby T.G. Carter*, M.S. Diederichs†, and J.L. Carvalho*
Synopsis
Support system design for tunnels and underground excavationshas for many years relied heavily on the use of rock mass classifi-cation systems and the Hoek-Brown failure criterion as a means forcharacterizing rock mass behaviour. Because of their development,both the GSI system and the Hoek-Brown criterion admirablycharacterize most ‘normal’ rockmasses from the viewpoint of theirbehaviour for rock excavations. They, however, run into difficultieswhen applied at the two ends of the rock competence scale. This islargely because block size and incipient strength are such that rockmass behaviour in these domains tends not to be controlled byinterblock shear strength but rather by material strength. At the lowend of the rock competence scale (UCSi << 15 MPa and GSIgenerally <30) discontinuities play less of a role and rock massstrength tends to matrix strength. Similarly, at the high end of thescale (GSI >> 65, mi >> 15), because discontinuities are now widelyspaced, block size becomes so significant that again, intact materialbehaviour rather than the fracturing becomes the dominant factorcontrolling rock mass strength.
In this paper several case examples are presented to illustratethe application of the high-end (spalling) and low-end (weakground) transition Hoek-Brown relationships proposed by Carter,Diederichs and Carvalho (2007) as a basis for better defining rockmass behaviour at the extreme ends of the rock competence scale.
* Rock Mechanics Group, Golder Associates,Toronto, Canada.
† GeoEngineering Centre, Queen’s University,Kingston, Ontario, Canada.
© The Southern African Institute of Mining andMetallurgy, 2008. SA ISSN 0038–223X/3.00 +0.00. This paper was first published at the SAIMM Symposium, Ground Support in Miningand Civil Engineering Construction, 30 March–3 April 2008.
325The Journal of The Southern African Institute of Mining and Metallurgy VOLUME 108 REFEREED PAPER JUNE 2008 ▲

Application of modified Hoek-Brown transition relationships
This difficulty arises largely because, outside this‘normal’ mid-range of rock mass competence, behaviourbecomes less discontinuity controlled (Figure 1). At the low end of the scale (for very weak rocks with UCSi < 10–15MPa) rock mass strength conforms to matrix strength andstructure has minimal impact. Similarly, at the high end ofthe rock competence scale (GSI >> 65 and mi >> 15) in siturock mass strength for a given rock type again is controlledby material strength, reaching a maximum strengthconsistent with spontaneous crack propagation (spalling)after crack initiation for rocks with high mi values and withcrack accumulation, interaction and coalescence (resulting inmatrix shearing) for high GSI rocks with low or moderate mi values.
Extended Hoek-Brown parameter appicabilityThis paper builds on three recent publications (Carter et al.,2007, Carvalho et al., 2007 and Diederichs et al., 2007) thataddress the fact that at both ends of the rock masscompetence scale current classification-based strength criteriaface limitations in characterizing a rock mass in a way that isconsistent with its behaviour.
Transition relationshipsThe nature of the two proposed transitions that bound therange of typical rockmass behaviour through the normallyencountered mid-range of rock block size conditions,(30<GSI>70) approximately, differ markedly. At the low end of the rock competency scale, (when UCSi<15MPa), thetransition from interblock shear failure (which is wellmodelled by the Hoek-Brown failure criterion and the GSIsystem) downwards as rock mass behaviour becomes morematrix controlled, is quite gradual, as illustrated in the left
plot on Figure 2, as compared to the transition at the high GSI end of the scale, which is quite abrupt and variabledepending on mi. This variability reflects in large part themajor changes in material behaviour occurring at the upperend transition as shown in Figure 2(b).
This difference in behaviour between the two transitionsis clearly evident when the two relationships are plottedalongside each other with reference to the Hoek-Brown‘normal’ behaviour response. As illustrated in Figure 3,which plots normalized rock mass strength against GSI, thelow strength transition curves (which are plotted as dashedlines across the graph and which re-plot the curves from theleft hand diagram on Figure 2) fan out fairly uniformly fromthe Hoek-Brown conventional GSI curve to the Mohr-Coulomb line (across the top of the chart), suggesting a fairlysmooth transition in behaviour. The curves show theappreciable rock mass strength gain predicted to develop withdecreasing intact matrix strength as compared with theconventional Hoek-Brown inferred strength.
The form of the relationships for the more abrupt uppertransition, particularly for high mi rock masses (i.e., for mi ≈σci/σt = UCSi/T >15) is much more complex. As shown by thecurves on the right side of Figure 3, this upper end spallingtransition predicts significantly lower rock mass strengths foressentially intact in situ rock masses with moderate to highmi values at high GSI, than suggested by application of theconventional Hoek-Brown—GSI relationships. In this, theupper end transition function replicates fairly faithfullyobservations from deep mining and tunnelling situationswhere a large body of evidence suggests that application ofthe Hoek-Brown criterion routinely overestimates rock massstrength. The curves on Figure 3 also illustrate anotherfrequently noted observation that for moderately jointed rock
▲
326 JUNE 2008 VOLUME 108 REFEREED PAPER The Journal of The Southern African Institute of Mining and Metallurgy
Figure 1—Transition from standard GSI and Hoek-Brown m, s and a parameter applicability to proposed transitions—between (top right) high GSI, high mi
spall-prone rockmasses (mi >> 15 and GSI >> 65), subject to brittle spalling and strainbursting failure behaviour and (lower left) very low strength rocks(UCSi = σci < 10–15 MPa), subject to shear failure and squeezing behaviour (ref. also lower photo, courtesy E. Hoek)

with GSI values as low as 55 but with very high mi values;i.e., mostly for rocks that are brittle in nature and principallyin the class of so-called hard rocks (granites, norites,crystalline limestone, gneisses, quartzites, etc.), much higherrock mass strengths are suggested than would be predictedusing the conventional Hoek-Brown—GSI relationships.
Low-end transition
In order to develop the low-end transition function, two basicbounding limit assumptions have made on the basis ofavailable laboratory data and numerical modellingevaluations (as discussed in Carvalho et al., 2007). Thesebounding limits, which are clearly shown on Figure 3, are (i)that material behaves as a ‘normal’ Hoek-Brown rock massat intact matrix strengths of greater than about 15 MPa and
(ii) that UCSi = σci = 0.5 MPa can be considered a practicalupper ‘soil strength’ limit, below which it is difficult forphysically meaningful structural discontinuities to exist.Between these limits, up to of the order of 10–15 MPa intactstrength, after which structural features are discrete anddominant, there is increasing control due to remnantstructure. Given these limits, and as discussed by Carvalho et al., 2007 because the more soil-like the material the moreit tends to linear strength behaviour (a→1) compared to amuch more non-linear strength envelope for rock, the low-end transition expression has been developed to fit thesecriteria with the following form:
[1]
Application of modified Hoek-Brown transition relationshipsTransaction
Paper
327The Journal of The Southern African Institute of Mining and Metallurgy VOLUME 108 REFEREED PAPER JUNE 2008 ▲
Figure 2—Transition behaviour (a) low-end soil–rock transition with rock mass strength, UCSrm = σcrm plotted with respect to intact UCSi = σci and GSI,(from Carvalho et al., 2007); (b) high-end behaviour showing damage initiation and propagation limits for spalling in high GSI, spall-prone rockmasses withstrength reduction in situ from the long-term lab strength (crack coalescence) to the damage initiation threshold (from Diederichs, 2003)
Figure 3—Normalized rockmass strength (UCSrm/UCSi) as a function of rock quality (GSI) illustrating marked differences between conventional Hoek-Brown behaviour and transition functions. (Spall transition threshold set at typical value, UCS*=0.45UCSi)
(a)
(b)
GSI
UC
Srm
/UC
Si

Application of modified Hoek-Brown transition relationships
where pa is atmospheric pressure. (It should be noted (i) thatthe numerator in the exponent term in this transitionfunction was erroneously reported in Carvalho et al., 2007and in Carter et al., 2007 as GSI instead of UCSi; and (ii) thatthe transition function limits are expressed in terms ofatmospheric pressure so that the function is independent ofthe unit system. Because most practitioners work with rockmass strengths in MPa, this relationship has been dimension-alized in Table II (presented subsequently). Incorporating thistransition relationship into the Hoek-Brown criterion issimply accomplished, as follows:
[2]
[3]
[4]
In the above expressions the parameter mb* in thelinearized form of the envelope is a more complex expressiondue to the adjustment made from the original Hoek-Brownformulation in order to maintain the 1/3 mi relationshipobtained by classical Hoek-Brown fitting with the exponent a = 0.5.
High-end transition
Damage initiation and hard rock strength
For hard rock materials, extensile cracking rather than shearis the primary form of damage, even under compression,(Stacey 1981; Tapponier and Brace 1976; and Griffith 1921,for example). Under low confinement, the propagation ofextensile cracks leads to spalling, such as observed at deptharound hard rock openings of high rock mass quality in theimmediate vicinity of an excavation boundary. Thismechanism is predominantly tensile in nature, and thusdiffers markedly from more ‘normal’ shear behaviourassumed throughout the rest of the GSI range.
Hard rock lower and upper bound strength
Lower bound in situ compressive strength for excavations inhard rocks corresponds to an extension crack damageinitiation threshold that is a function of the nature anddensity of internal flaws and heterogeneity. Numerous
researchers (Pelli et al. 1991, Martin et al. 1999, Brace et al.1966, Wagner 1987 and Castro et al. 1996) have shown thatfailure in massive hard rock excavations begins when thetangential stress limit at the excavation boundary exceeds33% to 50% of the rock’s intact UCSi. This threshold (UCS*)when expressed relative to laboratory unconfinedcompressive strength (UCSi) can be as low as 1/3 for igneousrocks (Lajtai and Dzik, 1996) and as high as 1/2 for denseclastics, (Pestman and Van Munster, 1996).
The mechanisms illustrated in the diagrams in the lowerleft part of Figure 4 can occur even at moderate confiningstresses, but they can only propagate under conditions oflocally low confinement. At high confinements crack accumu-lation (recorded as acoustic emissions or microseismicevents) must occur before crack coalescence can lead topropagation. In this case the upper bound yield strength insitu corresponds to the long-term strength of laboratorysamples (ref. left-hand dashed curve in Figure 2 (b)).
At low confining stress near an excavation boundary,however, spontaneous propagation of initiating extensioncracks is possible. In this case the yield strength in situcollapses to the damage initiation threshold line as shown inthe lower right-hand part of Figure 2 (b).
Hard rock strength using Hoek-Brown empiricalcriteriaIn order to apply the Hoek-Brown criterion in its generalizednon-linear form for rock masses with GSI >> 65 again adifferent approach needs to be taken for parameter definitionthan just the normal GSI and UCSi determination, and consid-eration needs to be given to spalling processes and tensilecracking behaviour. As outlined by Diederichs et al., 2007,definition of spalling behaviour for modelling in an inelasticHoek-Brown formulation can be readily achieved by carrying through the following steps with reference toFigure 5:
(i) Determine UCS*, the onset of ‘systematic cracking’(B in Figure 5), from acoustic emission or radialstrain data
(ii) Obtain a reliable estimate of tensile strength, T (eg.,from carefully executed Brazilian testing with closeinspection during and after testing to ensure correctend bearing and clean initiation of a medialfracture)
▲
328 JUNE 2008 VOLUME 108 REFEREED PAPER The Journal of The Southern African Institute of Mining and Metallurgy
Figure 4—(clockwise from top-left); (a) Shear failure around a tunnel; (b) spalling damage in hard rocks at high GSI; (c) example of brittle spalling andstrainbursting in a deep mine opening; and (d) mechanisms of crack initiation in hard rock

(iii) Set aSP = 0.25 (i.e., assuming ‘peak’ conditions –spalling initiation),
(iv) Knowing the basic laboratory unconfinedcompressive strength (USCi) for the rock material,calculate appropriate values of sSP and mSP from:
[5]
[6]
Note that these parameters apply only to the onset ofsystematic cracking and thus they define the ‘peak’ orspalling initiation threshold curve (as shown by the lowerslope gradient curve on Figure 6).
However, as initiating spall cracks can propagate onlyunder low confinement a second limit (defined here as the‘residual’ state) is therefore needed, defining the conditionconstraining spalling behaviour. Based on the experimentalwork of Hoek (1968) and on numerical simulations describedby Diederichs (2007), a limit can be postulated to create atransition between spalling behaviour at low confinement,controlled by the initiation threshold, and a shear strength
closer to the long-term strength limit for the intact rock (asextensile crack propagation is suppressed) at higherconfinements. This, the ‘residual’ spalling limit can beapproximated using aSP = 0.75, sSP = 0 and a residual mresvalue of approximately mi /3 (typically 5–10).
Substituting these spalling parameter values into thegeneralized non-linear Hoek-Brown formulation results inthe two curves shown on Figure 6. Equivalent Mohr-Coulombthresholds, as also shown in Figure 6 can also be defined,with the ‘peak’ parameter Mohr-Coulomb envelope linedefining the damage initiation threshold and the ‘residual’parameter envelope line defining the spalling confinementlimit.
As might be expected, the shape of the ‘residual’ limitcurve is very sensitive to confinement, as provided by naturalinterleaving of spalled material, by rock reinforcement or byany other constraint method. Determining the absolutemagnitude of applicable constraint in any given situation isnot always straightforward, but some measure of natural orapplied constraint degree can, however, be achieved throughuse of the Hoek-Brown dilation parameter, D in thegeneralized relationships (Hoek et al., 2002). Forunrestrained fallout or for loose retention (i.e., simulatingminimal feedback pressure against unyielded rock), dilationshould be set to zero. For light support (mesh, spot bolts,etc.), dilation can be set according to an appropriate non-associative flow rule substituting mdil for mb using anappropriate value of mdil ≈ mres /(8 to 10) consistent withRyder and Jager (2002) and Vermeer and de Borst (1984)where mres is the value specified in the yield function for‘residual strength’ (i.e., approximately mi./3, consistent withaSP = 0.75).
Unfortunately, such constant dilation flow rules in manycodes present difficulties with convergence in brittlemodelling. A practical alternative is therefore to model thedepth of failure with no dilation (i.e., assuming minimalretention/support) or with the dilation parameters asspecified above where moderate support pressure is assumed.Once the failure depth is determined, a better approximationof likely displacements can then be obtained from the depthof failure and the empirical support-dependent bulking factor,B.F. relationship, simplified from Kaiser et al. (1995), namely
[7]&[8]
and where P is the applied support pressure in kPa, DOFis the depth of failure and the factor G accounts for a gradientof dilation from the wall to the edge of the yielding zone,which, for a linear assumption, can be specified with G=0.5.
In using this approach for evaluating the extent of likelyinelastic radial displacement, it is important to look at plasticshear strain gradients within the ‘yielded’ rock mass todetermine if the rock is actually failing or merely damaged.The region enclosed by significantly elevated plastic straincontours should be considered as spalling, while apparentlyyielded regions with very low relative strain values wouldmore likely correspond to stress paths above the damagethreshold but below the spalling limit. Note: only rock depthwith significantly elevated shear strain should be considered.
Application of modified Hoek-Brown transition relationshipsTransaction
Paper
The Journal of The Southern African Institute of Mining and Metallurgy VOLUME 108 REFEREED PAPER JUNE 2008 329 ▲
Figure 5—Determination of damage initiation thresholds for rock undercompressive loading using strain and acoustic emissions (afterDiederichs et al., 2004)
Figure 6—Example of ‘peak’ and small strain ‘residual’ strengthparameters for damage initiation and spalling limits (Diederichs 2007)
σ1
MP
a
σ3 MPa

Application of modified Hoek-Brown transition relationships
Transition between conventional behaviour andspalling
The transition from conventional Hoek-Brown shearbehaviour to spalling behaviour, as proposed by Diederichs et al., 2007 considers rock mass quality, (as indicated byGSI), and the ratio between compressive strength and tensilestrength (as estimated by the Hoek-Brown parameter mi) andtakes the following form:
[9]
and where the X’s represent the values of a, s and m,according to their subscripts, ‘GSI’ for conventionalassessment (as per Hoek et al., 2002) and ‘SP’ corresponds totheir values for spalling assessment, both for ‘peak’ and‘residual’ conditions.
Application limits are specified discretely in Table I belowor for most practical cases can be estimated from the plot ofthe transition function as presented in Figure 3.
Case examples—high GSI rock mass
To illustrate the application of these types of analysesassuming hard rock spalling parameters and using currentlyavailable computer modelling codes, several examples frommining and deep tunnelling situations have been chosen, asfollows:
AECL-URL tunnel in massive granodiorite
For this case (Figure 7) the Hoek-Brown spalling parameters,summarized in Figure 6, were used to simulate the breakoutobserved in the URL test tunnel (Martin, 1997). In order toindirectly model the influence of moderate support (retention)versus no support, use was made of the dilation parameter asa constraint approach.
Figure 7 illustrates, on the left, the results of the spallingsimulation analyses compared with the observed conditions.The roof (modelled without dilation) was essentially
unsupported whereas the floor was constrained underaggregate fill (modelled with dilation, D = mres /8 to simulatefeedback confinement due to the retained material). In boththe floor and the roof cases, the modelled failure depth andangular extent is accurately simulated. As a secondcomparison, for the same case record, the equivalent Mohr-Coulomb parameters derived from Figure 6 were used inFLAC3D to simulate the tunnel but in this case withoutdilation, but with a transition based on the plastic shearstrain parameter relationships shown on the left of Figure 8.
Hard rock mine pillars—McCreedy East Mine,SudburyThe choice of Mohr-Coulomb or generalized Hoek-Brownparameters to simulate progressive failure (Figure 6, Figure 9) is one of preference. Both produce acceptableresults in most situations, but with the Mohr-Coulombapproach tending to better reproduce expected tensilebehaviour for rectangular openings whereas the Hoek-Brownapproach tends to produce less spurious and more reliableresults for circular geometries, where tension is not such amajor factor.
Figure 9 illustrates a simulation of pillar failure atMcCreedy East Mine in Sudbury using equivalent Hoek-Brown and Mohr-Coulomb parameters. The overall failure(extent and initiation with respect to depth) is similar in bothsimulations although the geometry and dominant mode ofrupture differs. In the Mohr-Coulomb analysis (top right) thenon-dilatant and low-strain region bounded by a zone of
▲
330 JUNE 2008 VOLUME 108 REFEREED PAPER The Journal of The Southern African Institute of Mining and Metallurgy
Figure 7—Example of non-linear modelling of URL Test Tunnel
0.3 m
ObservedProfile
Observed Floor Spalling
0.5 mShear YieldTensile Yield
Table I
Application ranges for spalling (SP) and conventional GSI approach
Strength GSI GSI GSI GSIratio UCSi/T <55 55 to 65 65 to 80 >80
>8 GSI GSI GSI GSI9 to 15 GSI GSI GSI GSI/SP15 to 20 GSI GSI/SP SP/GSI SP>20 GSI GSI/SP SP SP

high plastic strain, typical of square openings, is wellindicated. The failure mechanism observed in the field is acombination of extensional spalling (initiating away from thewall boundary) and dilatant shear in the corners. Such aresultant arch and relatively undisturbed roof or wall masspartitioned by the failing zone is commonly encountered innon-circular openings and was termed ‘baggage’ by Kaiser et al. (1995), due to its influence as non-bulking deadweight. Both behaviours reflected in the analysis can befound in the same rock mass in the same stress andgeometrical environment, as shown by the examples.
Nathpa Jhakri Project, India
As part of the construction works for the 1 500 MW NathpaJhakri hydropower scheme through the Himalayas ofNorthern India, excavation was required of significantstretches of the 10.5 m diameter headrace tunnel at depths
well in excess of 1 000 m, (Hoek, 2001, Carter et al., 2005,Kumar and Dhawan, 1999). As explained in some detail inCarter et al., 2005, much of the tunnelling was through veryvariable geology, with some zones of highly silicified gneissthat exhibited face spalling and typical strain burst behaviourboth during and subsequent to excavation.
In one of these tunnel sections, severe slabbing of thesidewalls and breakout of the crown and haunches developedsome 50–60 m behind the face, with multiple strain releaseevents occurring soon after face blasting. In this zoneapproximately 400 resin and cement grouted rock bolts losttheir heads and face plates due to the significant slabbingand onion-skin spalling of 50–100 mm thick slabs thatdeveloped mainly in the right haunch (Figure 10). Asoriginally installed, (see inset photo), the grouted bolts wereplaced at 1.5 m spacing longitudinally and transverselyacross the tunnel drivage, giving a nominal support pressureof approximately 50 kPa.
Two sections of this breakout have been chosen foranalysis here: a section in a more competent gneiss unit withUCS = 160 MPa, (mi = 28) and GSI approximately 65 and asection with more intense foliation and a lower intactstrength (UCS=110 MPa). The depths exceed 1 300 m but acombination of high tectonic stress, topography and faultoccurrence results in a maximum stress of approximately 55to 60 MPa inclined at 25 degrees from the horizontal with 20to 25 MPa as the minimum orthogonal stress.
The non-linear spalling Hoek-Brown approach wasapplied first for the more competent rock mass, as shown inthe principal stress plot in the top left of Figure 10. As isevident from the cross-section in the lower left of the figure,the right haunch shows significant shear strain (whichindicates active yielding as opposed to distributed damage).Using Equation [8], with the depth of yielding indicated bythe plastic strain contours, a maximum bulking factor of 15%is estimated for the right haunch. Assuming a linear bulkinggradient in Equation [7], this translates to a wall displace-ment of approximately 10 cm distributed over 1.3 m,sufficient to snap stiff rebar.
A little further along the same segment of the headrace,the tunnel encountered a more foliated, somewhat lowerquality rock mass, with GSIs of 50 to 60 and a weaker intact
Application of modified Hoek-Brown transition relationshipsTransaction
Paper
The Journal of The Southern African Institute of Mining and Metallurgy VOLUME 108 REFEREED PAPER JUNE 2008 331 ▲
Figure 8—Application of equivalent Mohr-Coulomb parameters in FLAC3D
Figure 9—Pillars (McCreedy Mine) modelled using spalling Hoek-Brown(left) and equivalent Mohr-Coulomb (right) parameters. Both modelscapture observed behaviour
PLASTIC (SHEAR) STRAIN
FO
R A
XIS
UN
ITS
-SE
E G
RA
PH
LIN
ES
Application of modified Hoek-Brown transition relationships
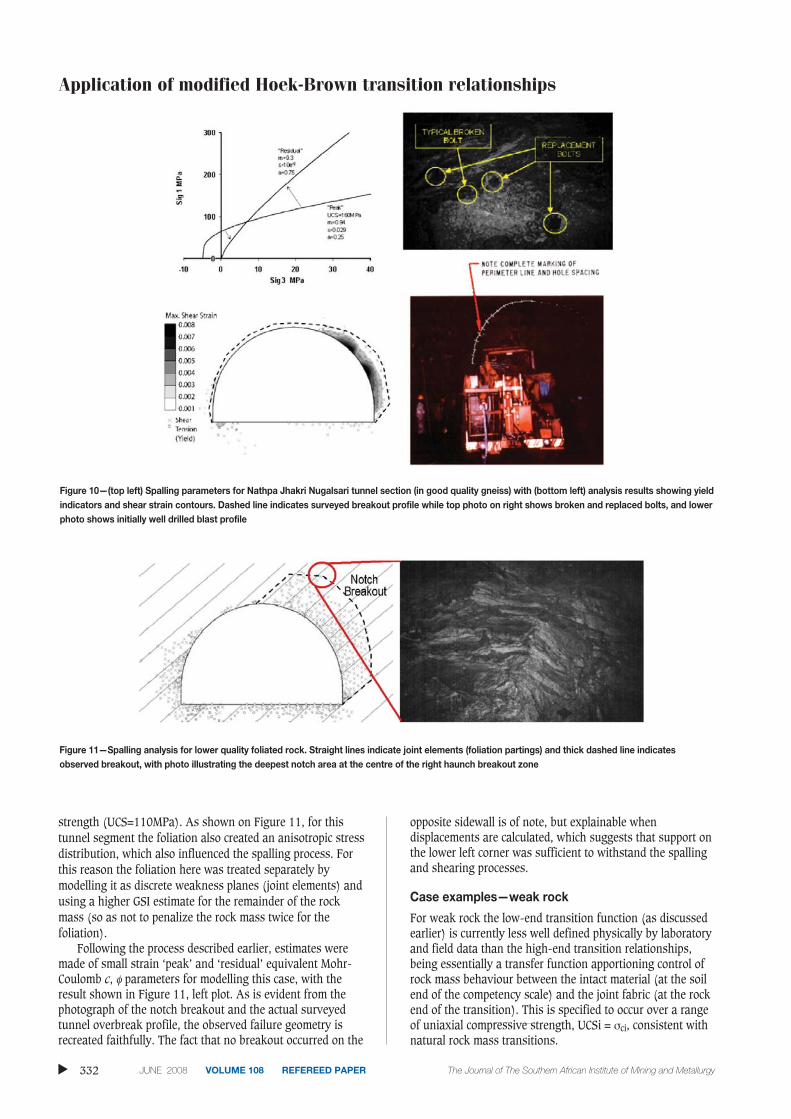
strength (UCS=110MPa). As shown on Figure 11, for thistunnel segment the foliation also created an anisotropic stressdistribution, which also influenced the spalling process. Forthis reason the foliation here was treated separately bymodelling it as discrete weakness planes (joint elements) andusing a higher GSI estimate for the remainder of the rockmass (so as not to penalize the rock mass twice for thefoliation).
Following the process described earlier, estimates weremade of small strain ‘peak’ and ‘residual’ equivalent Mohr-Coulomb c, φ parameters for modelling this case, with theresult shown in Figure 11, left plot. As is evident from thephotograph of the notch breakout and the actual surveyedtunnel overbreak profile, the observed failure geometry isrecreated faithfully. The fact that no breakout occurred on the
opposite sidewall is of note, but explainable whendisplacements are calculated, which suggests that support onthe lower left corner was sufficient to withstand the spallingand shearing processes.
Case examples—weak rock
For weak rock the low-end transition function (as discussedearlier) is currently less well defined physically by laboratoryand field data than the high-end transition relationships,being essentially a transfer function apportioning control ofrock mass behaviour between the intact material (at the soilend of the competency scale) and the joint fabric (at the rockend of the transition). This is specified to occur over a rangeof uniaxial compressive strength, UCSi = σci, consistent withnatural rock mass transitions.
▲
332 JUNE 2008 VOLUME 108 REFEREED PAPER The Journal of The Southern African Institute of Mining and Metallurgy
Figure 11—Spalling analysis for lower quality foliated rock. Straight lines indicate joint elements (foliation partings) and thick dashed line indicatesobserved breakout, with photo illustrating the deepest notch area at the centre of the right haunch breakout zone
Figure 10—(top left) Spalling parameters for Nathpa Jhakri Nugalsari tunnel section (in good quality gneiss) with (bottom left) analysis results showing yieldindicators and shear strain contours. Dashed line indicates surveyed breakout profile while top photo on right shows broken and replaced bolts, and lowerphoto shows initially well drilled blast profile

The choice of strength limits for the transition range—thelower-bound based on a review of cohesive soils, and theupper-bound ascribed to a strength limit considered valid forthe material to completely behave as a rock, althoughreasonably well verified by the numerical modellingdiscussed in Carvalho et al., 2007, are still in need ofadditional field verification. Nevertheless, the trends seemappropriate and effective, as illustrated by analysis of threefault zones from the Nathpa Jhakri headrace tunnelalignment (designated A, B and C on Figure 12), At each ofthese fault locations and at several other faults along thealignment (Hoek, 2001) quite wide gouge zones wereencountered, comprising in the main granulated gneissand/or mylonitized schist of such low strength that in severalinstances where high water pressures were also encountered,significant mudflows occurred (Carter et al., 2005).
Characterization of the fault material
Although distinct differences were found in the character ofeach of the various major faults intersected in the tunnelling,in most cases a zone of soil-like gouge within margins ofcompletely crushed rock was encountered. These gougezones were often associated with or formed part of analternating series of bands of good and bad rock consisting ofschistose and granulated quartz-mica mylonite alternatingwith zones of more competent gneissic material. In all casesthe wider gouge zones, which were of the order of 5–10 mthickness, could be described as more soil-like than thegneissic rock-like material, that was often intensely foliatedwhen not completely mylonitized.
Classical Hoek-Brown parameters
Typical rock mass classification field assessment of one ofthese encountered fault zones, and checking against otherHimalayan experience (Singh et al., 1992) using the NGI-Q-system descriptor codes, yielded the following parameterdescriptions for the overall fault zone, based on typicalmargin zone conditions to the fault gouge shears:
RQD = 20% – for the margin zones to the gouge infills Jn = 20 – crushed rock, earth-likeJr = 1 – zone containing clay minerals, or crushed
materialJa = 13 – thick continuous zones or bands of clay
20 1giving Q′ = 20 x 13 = 0.0769 = approximately
equivalent to GSI=20
This rock quality estimate reflects overall mass conditionsof the total fault fabric, not the specifics of just the cohesivegouge infills themselves, although such zones, in large partoften dominate the strength behaviour of an entire fault. Ifconsidering just the gouge zones, intact ‘undegraded’ muchhigher RQDs might be applicable within the transitionequations, but using a much lower UCSi value consistentwith the gouge material itself. Here, however, for thepurposes of modelling the entire fault behaviour (asdiscussed in the evaluations presented subsequently), acontrolling strength of 5 MPa along with typical values of mifor schists in the range 7–10 have been ascribed. Thesevalues, which are considered reasonable mean estimatesapplicable for each overall fault zone, are based on the factthat core samples were largely unobtainable from the worstmaterial in these faults and UCSi values of the order of 8.5 MPa were measured on mylonitized core from withinfault margin zones away from the gouge sections. Based onthese UCSi and mi values, conventional Hoek-Brown mb, sand a parameters of 0.402, 0.000138, and 0.54 were respec-tively estimated.
Transition adjustment
Taking these conventional parameters and applying thetransition function fT.(σci) (Equation [1]), with a UCS valueof 5 MPa, assumed characteristic for the overall fault, weobtain:
This suggests that intact properties should account fornearly 50% of the rock mass behaviour. Adjustmentaccording to the transition function then results in thefollowing modified H-B parameter values: s* = 0.445; a* = 0.747; mb* = 2.691
Comparing these modified values with the conventionallycalculated H-B values the most significant change occurs in s,(namely, s = 0.000138 by conventional calculation to s* =0.445 through the transition relationship). As the s valueprovides the main control on strength under very low to noconfinement, this change has a significant impact on thecomputed extent of the plastic zone. Pushing the envelope tolinearization by taking a* = 0.747 versus a = 0.544 andincreasing mb from 0.4 to mb* = 2.7 results also in anincrease in friction angle of about 15° at confinements
Application of modified Hoek-Brown transition relationshipsTransaction
Paper
The Journal of The Southern African Institute of Mining and Metallurgy VOLUME 108 REFEREED PAPER JUNE 2008 333 ▲
Figure 12—Location of analyzed fault zones along Nathpa-Jhakri Headrace Tunnel

Application of modified Hoek-Brown transition relationships
greater than 2 MPa (i.e., increasing φ from an unrealisticallylow 8° for the conventional Hoek-Brown envelope to a moreprobable 23° for the transition envelope).
Fault modelling – Nathpa fault
At the location of the Nathpa-Sungra fault, (Tunnel Station Aon Figure 12) the cover is of the order of 650 m, resulting inthe following stress field (resolved in the plane of theanalysis section): σ1 = 19.43 MPa; σ3 = 15.95 MPa; σz = 7.17 MPa; θ = 11.7° where θ is the angle between σ1 andthe horizontal (x-axis).
As is evident from the excavation sequence shown inFigure 13 and the photographs and modelling results of theexcavation stages illustrated in Figure 14, advance throughthis fault was difficult and extremely slow (in the order of 0.3 m/day overall). As this tunnel was driven under Indiancontract arrangements and NATM methods and equipmentwere not foreseen in the contract, excavation of the fault was
carried out in a conventional 1940s style pilot heading layoutwith steel set supports rather than shotcrete shells, althoughNATM staged advance approaches were applied for both ofthe sidewall slash developments.
For the Nathpa fault, excavation of the initial headings,although difficult, proceeded largely without incident untilexcavation of the central roadway cut (Figures 13 and14–Stage 4) when large deformations began to be observed.In attempts to control the deformations and prevent the ribsfrom buckling and kicking in, the feet of the main arch ribswere bolted back and in the worst zone of the fault the steelarch ribs were doubled up before slashing down the sidewallsand extending the feet to form the new arch profile (Figures13 and 14–Stage 5).
This ‘sudden’ onset of significant convergence is wellreplicated by the modelling results, which quite closely matchwith the convergence behaviour experienced during drivingof the tunnel through the fault zone. As shown in the
▲
334 JUNE 2008 VOLUME 108 REFEREED PAPER The Journal of The Southern African Institute of Mining and Metallurgy
Figure 14—Comparison results of modelling of Nathpa fault zone behaviour using modified Hoek-Brown Transition m*, s* and a* parameters
(a) Supported top drift and crown slash—roof displacement ~ 30cm
(b) Removal of the crib and excavation of central roadway—radial displacement ~ 1 m
Figure 13—Excavation sequence through Nathpa fault

diagrams on the right side of Figure 14, the modellingmatches well with field observations that deformation of thetop heading was successfully contained by the supportsystem until it had to be removed for the roadway deepening.At this stage, just prior to benching down for the roadway,even with the installed heavy set support in place, wideningto full section and placing the central steel crib arrangementhad resulted in crown displacements of about 30 cm while the side walls had converged by approximately 50 cm (Figure 14a).
After removal of the support crib and excavating down tocreate the central roadway section, the crown and sidewallsfurther converged by about a metre (Figure 14b). What isalso interesting and important is that after extending thedouble steel ribs to the current invert, the depth of the plasticzone above the crown is suggested by the modelling to haveextended out to about 8 m, a depth which is consistent withthe roof caving experienced at the Nugalsari fault (Figures 15and 16) in similar quality ground and also under about thesame overburden cover depth (Figure 12)
Nugalsari fault
Excavation experience through the Nugalsari fault zonediffered from that for the Nathpa fault, as, at Nugalsari, dueto the foliation dip and in particular the behaviour of thebiotite schist, a significant amount of geologically-controlledoverbreak developed almost instantly on face exposure, asshown by the roof surveys in Figures 15 and 16.
Again the modelling of this fault zone using the lowstrength Hoek-Brown modified transition parameters m*, s*and a* shows good replication with observed conditions, withthe depth of the yielded plastic zone matching very closelythe overbreak profile, even to the extent of the slight skew indamage due to stress obliquity (Figure 16).
Wadhal faulting
The last fault zone analysed is one of a set of three sub-parallel major structures encountered in the Wadhal sectionof the headrace tunnel, all of which gave problems duringexcavation. The location of the particular fault chosen for
Application of modified Hoek-Brown transition relationshipsTransaction
Paper
The Journal of The Southern African Institute of Mining and Metallurgy VOLUME 108 REFEREED PAPER JUNE 2008 335 ▲
Figure 15—Longitudinal section through Nugalsari Fault (Location B on Figure 12), showing surveyed overbreak profile controlled by weak biotite schistgouge. (ref. Figure 16 for section)
Figure 16—Major principal stress contours and plastic zone computed with Phase2 based on Hoek-Brown transition m*, s* and a* parameters, ascompared with actual surveyed overbreak profile at Station RD 0+202 (see Section location in Figure 15)

Application of modified Hoek-Brown transition relationships
analysis, which is sited at Tunnel Station C (as indicated onFigure 12) was encountered under the highest cover (of theorder of 1 000 m), resulting in the following stress field(resolved in the plane of the analysis section):
σ1 = 24.46 MPa; σ3 = 16.63 MPa; σz = 10.06 MPa; θ = 11.7°
where θ is again the angle between σ1 and the horizontal (x-axis).
Again, as with the Nathpa fault, excavation of all of thefaults at Wadhal was carried out using an initial small topheading drift, fully supported with steel ribs with the sidesthen slashed and the crown ribs extended to the full tunnelspringline geometry. This was again followed with a centralbench cut to create a main roadway through the faultedsection for access purposes prior to removing the sidewallabutment material supporting the feet of the crown arch ribs.Unfortunately, as benching to widen and deepen the tunnelto full section was underway in a segment of the tunnelapproaching, but not directly within the fault margin,buckling and kick-in of a part of the main fault supportsystem occurred, as illustrated in Figure 17. At the time itwas presumed that this might well have resulted from stressreadjustment ahead of the benching.
Modelling of this fault using the transition functionssuggests not only that the plastic zone extended very deepinto the crown (~ 14 m), but, as is evident from the twodisplacement plots on the right side of Figure 17, a majorchange in tunnel deformation behaviour is predicted to haveoccurred with final benching, with convergences increasingby 0.5 m in the crown (from 1.15 m to 1.65 m) and withalmost a metre of additional heave in the invert and sidewallabutment support zones, at the toe of the steel ribs (sidewalls). It is therefore not surprising that significantdisruption occurred to the support system. It is alsoencouraging that with the use of the modified transitionparameters m*, s* and a*, very good modelling replication ofactual failure behaviour is achieved.
Conclusions
Use of rock mass classification systems and the associated m,s and a parameter relationships linking GSI with the Hoek-
Brown failure criterion provides a proven, effective andreliable approach for strength prediction for undergroundexcavation design and support selection for most ‘normal’rock masses:
– with intact rock material strength, UCSi > 10–15MPa,and
– with matrix yield behaviour dominated by shearmechanisms for (mi < 15) for the full GSI range and for (mi > 15 ) for GSI < 65.
Outside these limits, some discrepancies can arisebetween predicted and observed yield behaviour, which theuse of the two transition relationships, previously proposedby Carter, Diederichs and Carvalho (2007) are largely aimedto solve. The intended GSI and strength ranges for optimumapplicability of these two transition relationships as comparedwith the generalized Hoek-Brown formulation are outlined inTable II.
Taken together, and used in combination with theoriginal Hoek-Brown formulation for the ‘normal range offractured rock masses’ it is hoped that use of these twoproposed transition relationships will reliably extend thelimits of applicability of GSI and the Hoek-Brown criterion forrock mass strength definition for rock masses previouslyconsidered inappropriately handled by the Hoek-Brownrelationships.
Acknowledgements
Much of the behavioural understanding of weak rock underhigh stress has come from experience with the difficultHimalayan geology of the Nathpa Jhakri scheme in India onbehalf of AECON (formerly the Foundation Company ofCanada) and from numerous discussions with Harjit Dhillonand Doug Steels and the expert panel (Evert Hoek andSiegmund Babendererde, in particular). Thanks are also dueto Ted Brown and to Evert Hoek again for their recent inputin discussions on the high GSI, high strength aspects andalso to Peter Kaiser, Derek Martin, Erik Eberhardt and LuizCastro for their earlier work on understanding spallingbehaviour.
▲
336 JUNE 2008 VOLUME 108 REFEREED PAPER The Journal of The Southern African Institute of Mining and Metallurgy
Figure 17—Predicted displacements before and after excavation of central bench

References
BARTON, N., LIEN, R., and LUNDE, J. Engineering Classification of Rock Masses
for the Design of Tunnel Support, Rock Mechanics. vol. 6, 1974.
pp.183–236.
BARTON, N., LIEN, R., and LUNDE, J. Estimating Support Requirements for
Underground Excavations, in Design methods in Rock Mechanics. Proc.16th US Symp. On Rock Mechanics, Minneapolis, USA, 1977.
pp.163–177.
BiENIAWSKI, Z.T. Engineering classification of rock masses. Trans. S. AfricanInst. Civ. Engrs., vol. 15, no. 12, 1973. pp. 335–344.
BIENIAWSKI, Z.T. (1976). Rock mass classification in rock engineering.
Bieniawski (ed.), Proc. of the Symp. Exploration for Rock Engineering, 1: Cape Town. pp. 97–106.
BRACE, W.F., PAULDING, B.W., and SCHOLZ, C. 1966. Dilatancy in the fracture of
crystalline rocks. Journal of Geophysical Research, vol. 71, 1966.
pp. 3939–3953.
CARTER, T.G., STEELS, D., DHILLON, H.S., and BROPHY, D. Difficulties of Tunnelling
under High Cover in Mountainous Regions. Proc. Int. AFTES Congress,
Tunnelling for a Sustainable Europe, Chambery, 2005. pp. 349–358
CARTER, T.G., DIEDERICHS, M.S., and CARVALHO, J.L. A unified procedure for
prediction of strength and post yield behaviour for rockmasses at the
extreme ends of the integrated GSI and UCS rock competence scale. Proc.11th Congress of International Society for Rock Mechanics (ISRM),
Lisbon, Portugal. 2007. pp.161–164.
CARVALHO, J.L., CARTER, T.G., and DIEDERICHS, M.S. An approach for prediction of
strength and post yield behaviour for rock masses of low intact strength.
Proc. 1st Can-US Rock Symp. Meeting Society’s Challenges and Demands.
Vancouver. 2007. pp. 249–257
CASTRO, L., MCCREATH, D., and KAISER, P.K. Rockmass strength determination
from breakouts in tunnels and boreholes. Proceedings of the 8th ISRMCongress, Tokyo, vol. 2, 1995. pp. 531–536.
DIEDERICHS, M.S. Rock fracture and collapse under low confinement conditions.
Rock Mechanics and Rock Engineering, vol. 36 no. 5, 2003. pp. 339–381
DIEDERICHS, M.S. Mechanistic Validation and Practical Application of Damage
and Spalling Prediction Criteria for Deep Tunnelling. The 2003 Canadian
Geotechnical Colloquium. Canadian Geotechnical Journal. vol. 44, no. 9,
2007. pp. 1082–1116.
Application of modified Hoek-Brown transition relationshipsTransaction
Paper
The Journal of The Southern African Institute of Mining and Metallurgy VOLUME 108 REFEREED PAPER JUNE 2008 337 ▲
Table II
Modified Hoek-Brown parameter relationships for differing rock conditions
UCSi = uniaxial compressive strength; T = tensile strength; UCS* = crack initiation threshold strength; GSI = geological strength index; and fSP and fT (σci) arethe spalling and weak rock transition function relationships; mi, mb, s, a and D = Hoek-Brown generalized intact and rock mass friction and cohesion, exponentand damage parameters, respectively
>>
SAIMM_41-54:Template Journal 6/30/08 3:22 PM Page 337

Application of modified Hoek-Brown transition relationships
DIEDERICHS, M.S., CARVALHO, J.L., and CARTER, T.G. A modified approach for
prediction of strength and post yield behaviour for high GSI rockmasses in
strong, brittle ground. Proc. 1st Can-US Rock Symposium, Vancouver.
2007. pp. 277–28.
DIEDERICHS, M.S., KAISER, P.K., and EBERHARDT, E. Damage initiation and
propagation in hard rock tunnelling and the influence of near-face stress
rotation. Int. J. Rock Mech. & Min. Sci., vol. 41, 2004. pp. 785–812.
GRIFFITH, A.A. The phenomena of rupture and flow in solids. Phil. Trans. RoyalSoc. of London, 221A: 1921. pp. 163–198.
GRIMSTAD, E. and BARTON, N. Updating the Q-System for NMT. Proc. Int. Symp.On Sprayed Concrete, Fragernes. 1993.
HOEK, E. Brittle failure of rock. Rock Mechanics in Engineering Practice. Stagg
and Zienkiewicz (eds). London. Wiley and Sons. 1968. pp. 99–124.
HOEK, E. Big Tunnels in Bad Rock, Terzaghi Lecture, ASCE Journal ofGeotechnical and Geoenvironmental Engineering, vol. 127, no. 9, 2001.
pp. 726–740.
HOEK, E., CARRANZA-TORRES, C.T., and CORKUM, B.T. Hoek-Brown failure criterion
Hammah, Bawden, Curran and Telesnicki (eds.), Proc. of the 5th NorthAmerican Rock Mech. Symp. Toronto, 7–10 July. University of Toronto
Press. 2002. pp. 267–274.
KAISER, P.K., MCCREATH, D., and TANNANT, D. Canadian Rockburst SupportHandbook. Sudbury. Geomechanics Research Centre and CAMIRO. 1995.
KUMAR, R. and DHAWAN, A.K. Geotechnical Investigations of Nathpa Jhakri
Hydro Electric Project Proc. Workshop on Rock Mech. & Tunnelling,
Shimla. 1999.
LAJTAI, E.Z. and DZIK, E.J. Searching for the damage threshold in intact rock.
NARMS ’96, Rotterdam. Balkema. 1996. pp. 701–708.
LEE, S.M., PARK, B.S., and LEE, S.W. Analysis of rock-bursts that have occurred
in a waterway tunnel in Korea. Int. J. Rock Mech. & Min. Sci., vol. 41,
no. 3, 2004. 6 pp.
MARINOS, P. and HOEK, E. GSI—A geologically friendly tool for rock mass
strength estimation. Proc. GeoEng2000 Conference, Melbourne. 2000.
pp.1422–1442.
MARTIN, C.D. The effect of cohesion loss and stress path on brittle rock strength.
Can. Geotech. J., vol. 34, no. 5, 1997. pp.698–725.
MARTIN, C.D., KAISER, P.K., and MCCREATH, D.R. Hoek-Brown parameters for
predicting the depth of brittle failure around tunnels. Can. Geot. J., vol. 36,
no. 1, 1999. pp. 136–151.
PALMSTRÖM, A. RMi a rock mass characterization system for rock engineering
purposes. Ph.D. Thesis, University of Oslo, 1995. 400 pp.
PELLI, F., KAISER, P.K., and MORGENSTERN, N.R. Interpretation of ground
movements recorded during construction of the Donkin-Morien tunnel.
Can. Geotech. Jour., vol. 28, no. 2, 1991. pp.239–254.
PESTMAN, B.J. and VANMUNSTER, J.G. An acoustic emission study of damage
development and stress-memory effects in sandstone. Int.J.Rock Mech.&
Min.Sci. vol. 33, no. 6, 1996. pp. 585–593.
POTVIN, Y., HUDYMA, M.R., and MILLER, H.D.S. Design guidelines for open stope
support. CIM Bulletin, vol. 82, no. 926. 1989.
RYDER, J.A. and JAGER, A.J. Rock Mechanics for Tabular Hard Rock Mines.
SIMRAC, Braamfontein. 2002.
SinGH, B., JETHWA, J.L., and DUBE, A.K. Correlation between Observed Support
Pressure and Rock Mass Quality. J. Tunnelling and Underground Space
Technology, vol. 7, no. 1, 1992. pp. 59–74.
STACEY, T.R. A simple extension strain criterion for fracture of brittle rock. Int.
J. of Fracture, vol. 18, 1981. pp. 469–474.
TAPPONIER, P. and BRACE, W.F. Development of stress induced microcracks in
Westerly granite. Int. J. Rock Mech. & Min. Sci. and Geomech. Absrt., 13:
1976. pp. 103–112.
VEMEER, P.A. and DE BORST, R. Non-associated plasticity for soils, concrete and
rock. Heron, vol. 29, no. 3. 1984.
WAGNER,H. Design and support of underground excavations in highly stressed
rock. Proc. 6th ISRM Congress, Montreal. Balkema, Rotterdam, vol. 3,
1987. pp. 1443–1457. ◆
▲
338 JUNE 2008 VOLUME 108 REFEREED PAPER The Journal of The Southern African Institute of Mining and Metallurgy