Application of importance-performance analysis (IPA) to formulate customer satisfaction strategies...
11
Business Strategy Series Application of importance-performance analysis (IPA) to formulate customer satisfaction strategies in the direct sales industry in Malaysia Rosidah Musa John Pallister Matthew Robson Norzaidi Mohd Daud Article information: To cite this document: Rosidah Musa John Pallister Matthew Robson Norzaidi Mohd Daud, (2010),"Application of importance-performance analysis (IPA) to formulate customer satisfaction strategies in the direct sales industry in Malaysia", Business Strategy Series, Vol. 11 Iss 5 pp. 277 - 285 Permanent link to this document: http://dx.doi.org/10.1108/17515631011080687 Downloaded on: 11 January 2015, At: 01:13 (PT) References: this document contains references to 35 other documents. To copy this document: [email protected] The fulltext of this document has been downloaded 1140 times since 2010* Access to this document was granted through an Emerald subscription provided by 434496 [] For Authors If you would like to write for this, or any other Emerald publication, then please use our Emerald for Authors service information about how to choose which publication to write for and submission guidelines are available for all. Please visit www.emeraldinsight.com/ authors for more information. About Emerald www.emeraldinsight.com Emerald is a global publisher linking research and practice to the benefit of society. The company manages a portfolio of more than 290 journals and over 2,350 books and book series volumes, as well as providing an extensive range of online products and additional customer resources and services. Emerald is both COUNTER 4 and TRANSFER compliant. The organization is a partner of the Committee on Publication Ethics (COPE) and also works with Portico and the LOCKSS initiative for digital archive preservation. *Related content and download information correct at time of download. Downloaded by Universiti Teknologi MARA At 01:13 11 January 2015 (PT)
-
Upload
uitmshahalam -
Category
Documents
-
view
1 -
download
0
Transcript of Application of importance-performance analysis (IPA) to formulate customer satisfaction strategies...

Business Strategy SeriesApplication of importance-performance analysis (IPA) to formulate customer satisfaction strategies in the direct salesindustry in MalaysiaRosidah Musa John Pallister Matthew Robson Norzaidi Mohd Daud
Article information:To cite this document:Rosidah Musa John Pallister Matthew Robson Norzaidi Mohd Daud, (2010),"Application of importance-performance analysis (IPA) toformulate customer satisfaction strategies in the direct sales industry in Malaysia", Business Strategy Series, Vol. 11 Iss 5 pp. 277 - 285Permanent link to this document:http://dx.doi.org/10.1108/17515631011080687
Downloaded on: 11 January 2015, At: 01:13 (PT)References: this document contains references to 35 other documents.To copy this document: [email protected] fulltext of this document has been downloaded 1140 times since 2010*
Access to this document was granted through an Emerald subscription provided by 434496 []
For AuthorsIf you would like to write for this, or any other Emerald publication, then please use our Emerald for Authors service information abouthow to choose which publication to write for and submission guidelines are available for all. Please visit www.emeraldinsight.com/authors for more information.
About Emerald www.emeraldinsight.comEmerald is a global publisher linking research and practice to the benefit of society. The company manages a portfolio of more than290 journals and over 2,350 books and book series volumes, as well as providing an extensive range of online products and additionalcustomer resources and services.
Emerald is both COUNTER 4 and TRANSFER compliant. The organization is a partner of the Committee on Publication Ethics (COPE) andalso works with Portico and the LOCKSS initiative for digital archive preservation.
*Related content and download information correct at time of download.
Dow
nloa
ded
by U
nive
rsiti
Tek
nolo
gi M
AR
A A
t 01:
13 1
1 Ja
nuar
y 20
15 (
PT)
Application of importance-performanceanalysis (IPA) to formulate customersatisfaction strategies in the direct salesindustry in Malaysia
Rosidah Musa, John Pallister, Matthew Robson and Norzaidi Mohd Daud
Introduction
A number of studies have provided evidence validating the importance of satisfaction as a
means to strategic ends; such as customer loyalty and customer retention, that directly
affects company’s profits (Bernhardt et al., 2000; Burnham et al., 2003; Rosidah et al., 2010;
Zeithaml, 2000). In view of this, it comes as no surprise that customer satisfaction has
received much attention in the marketing literature and is the primary focus of our research
endeavor. Whilst there has been resurgent interest in this research area, the critical issue of
identifying the key factors that drive customer satisfaction has not been an easy task,
specifically to the practitioners. Customer satisfaction findings particularly from the
academic community have been criticized for being operationally irrelevant and difficult to
be translated into managerial actions (Piercy, 2002; Westbrook, 1997, 2000). In a similar
voice, Patterson et al. (1997) assert that considerable research has focused on modeling the
influence of perceived performance on satisfaction at the aggregate construct level;
examining the effect of individual attribute performance on satisfaction judgment is more
useful as it provides more diagnostic and actionable decisions for practicing managers
(Roszkowski, 2003). Accordingly, Westbrook (1997) suggests that to improve customer
satisfaction measurement, research should address specific product or service
features/dimensions and demonstrate how the key attributes are associated with overall
customer satisfaction.
In this sense, it is no surprise that issues such as how and why direct and derived methods
may differ has long been debated and is a major concern among several authors (Bacon,
2003; Oh, 2001; Matzler et al., 2003). Indeed, the validity of importance-performance
analysis (IPA) as a managerial analytical tool has been frequently questioned (Bacon, 2003;
Oh, 2001; Matzler et al., 2003). Recognizing the aforementioned drawbacks and unresolved
disagreements associated with the classical IPA, which primarily relies on the stated
importance, it is thus clear that a modified or an alternative approach be proposed. The
primary purpose of our paper is to compare the importance ratings and rankings of the two
importance measurements (stated and derived approach), and demonstrate the critical
differences when the key attributes are visually plotted on the IPA grids.
Research methodology
The target population criteria for this study were adult consumers (over 16 years of age) who
have purchased beauty or healthcare products from the direct seller within the 12 months
prior to the data collection period, and who live or work within the selected geographic
locations; in this case three designated districts (Petaling, Kelang and the Federal Territory
of Kuala Lumpur). A sample of 400 survey respondents was obtained based on a quota
sampling technique. Initially, 34 items were assessed individually to determine the relative
DOI 10.1108/17515631011080687 VOL. 11 NO. 5 2010, pp. 277-285, Q Emerald Group Publishing Limited, ISSN 1751-5637 j BUSINESS STRATEGY SERIES j PAGE 277
Rosidah Musa is an
Associate Professor at the
Faculty of Business
Management, Universiti
Teknologi MARA, Selangor,
Malaysia. John Pallister and
Matthew Robson are based
at the Cardiff Business
School, Cardiff University,
Cardiff, UK.
Norzaidi Mohd Daud is an
Associate Professor at the
Faculty of Business
Management/Institute of
Business Excellence/
Accounting Research
Institute, Universiti
Teknologi MARA, Selangor,
Malaysia.
Dow
nloa
ded
by U
nive
rsiti
Tek
nolo
gi M
AR
A A
t 01:
13 1
1 Ja
nuar
y 20
15 (
PT)
importance and perceived performance respondents attached to these. Specifically, the
informants were asked to rate the importance of the items (attributes) in fulfilling their
satisfaction, while in the performance measurement, respondents were requested to
indicate their level of satisfaction with the items (attributes). Performance evaluation
employed a five-point satisfaction-dissatisfaction scale anchored with (1) ‘‘very dissatisfied’’
to (5) ‘‘not applicable’’. The importance rating is measured on a five-point scale anchored
with (1) ‘‘not at all important’’, to (5) ‘‘very important’’. The IPA grids are visually displayed in
the form quadrant chart for each aspect of the direct sales marketing channel system. The
pool of 34 items for performance measurement were assessed for item-total correlations and
adjusted using exploratory factor analysis and subsequently validated using confirmatory
factor analysis (structural equation modeling technique via AMOS 5 program). The
item-to-total correlation scores were in the range of 0.35 to 0.67, which signifies a reasonably
good item performance. The measures yielded a reliability coefficient (Cronbach’s alpha)
ranging from 0.80 to 0.88, which is greater than the recommended threshold of 0.70
(Nunnally, 1978).
It is widely recognized that more robust statistical tests such as confirmatory factor analysis
(CFA) should be employed to confirm and verify the dimensions underlying the factors
derived from EFA (Gerbing and Anderson, 1988). Parallel to this suggestion, CFA was
performed on the remaining 24 items using structural equation modeling and this resulted in
a deletion of three more items. The estimation of the measurement model yielded
respectable goodness-of-fit index (0.91), comparative fit index (0.93) and incremental fit
index (0.93) values. The Root Mean Square Residuals value of 0.03 confirmed a good fit,
which exceeded the posited cut-off value (,0.05) (Norzaidi et al., 2009, 2007). The Root
Mean Square Error of Approximation value of 0.06 was satisfactory. Overall, the results of the
fit indices indicate that the measurement model adequately fits the data (Norzaidi and Intan
Salwani, 2009). Hence, it is reasonable to believe that the measures utilized in our analysis
have adequately met the unidimensionality, validity and reliability criteria applied.
Results and discussions
The initial analysis performed was that of assessing the attributes performance and degree
of importance and subsequently the satisfaction gaps were computed (performance mean
values minus stated importance mean values). In order to illustrate the differences between
self-stated and derived importance, the rankings of attributes were compared. We compare
importance rating and ranking of individual attribute, which were assessed by self-stated
approach and two derived importance assessment methods (multiple regression and
correlation analysis). Table I displays the summarized results of the analysis. The results of
the comparison of ratings, rankings and satisfaction gap across the three methods are
organized according to the dimensions of direct sales channel.
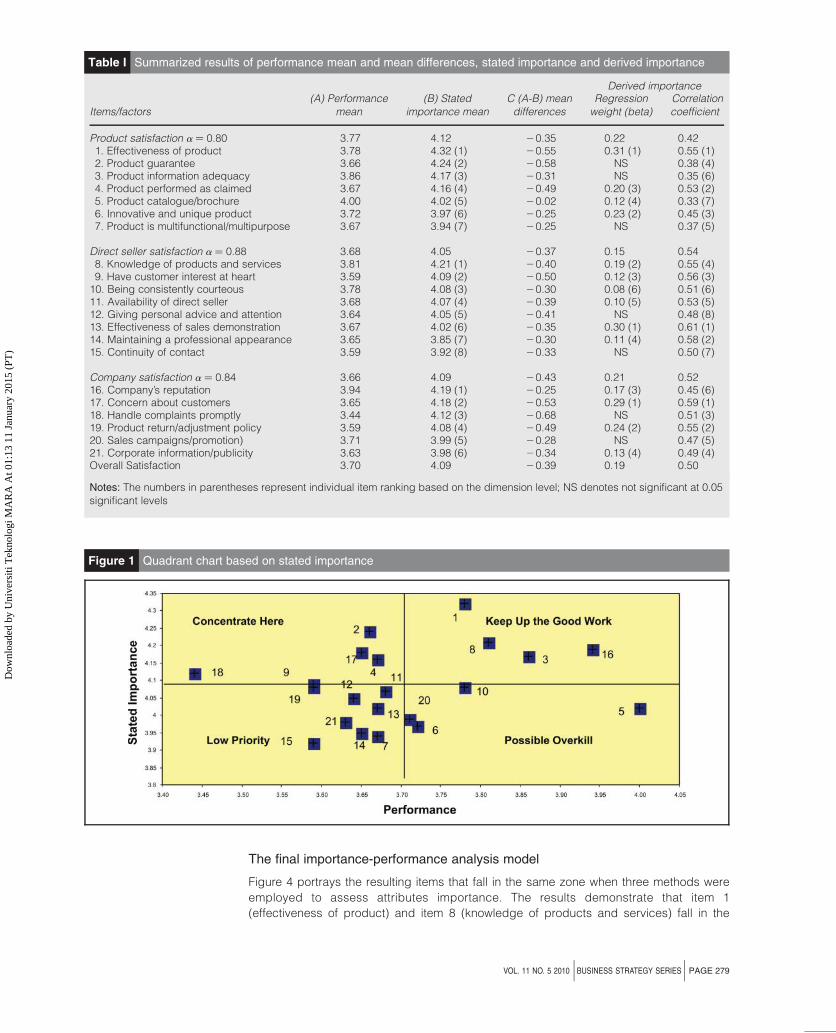
Importance-performance analysis results
Figures 1, 2 and 3 illustrate an importance – performance chart (grid), which was used to
highlight and demonstrate clearly the four classifications of strategies. More importantly, in
this section we will demonstrate that the outcome of an IPA is very sensitive to the
assessment of attributes importance method employed. Figure 1 exhibits the IPA using the
direct rating scale as a measure for attribute importance. The mean values for overall
importance (4.09) and overall satisfaction (3.70) were used to split the axes, this produced
four strategies. The summarized results of the IPA are illustrated in Table II. Table III
represents items used in the quadrant charts (see Figures 1, 2 and 3).
Figure 2 portrays a quadrant chart which is based on the multiple regression analysis in the
assessment of the attributes importance. Whilst Figure 3 depicts a quadrant chart derived
from attribute importance via correlation analysis. The summarized results of the analysis of
the IPA are presented on Table III. The discussion on the IPA results is illustrated and
interpreted with the aid of four classifications of strategies.
PAGE 278 jBUSINESS STRATEGY SERIESj VOL. 11 NO. 5 2010
Dow
nloa
ded
by U
nive
rsiti
Tek
nolo
gi M
AR
A A
t 01:
13 1
1 Ja
nuar
y 20
15 (
PT)
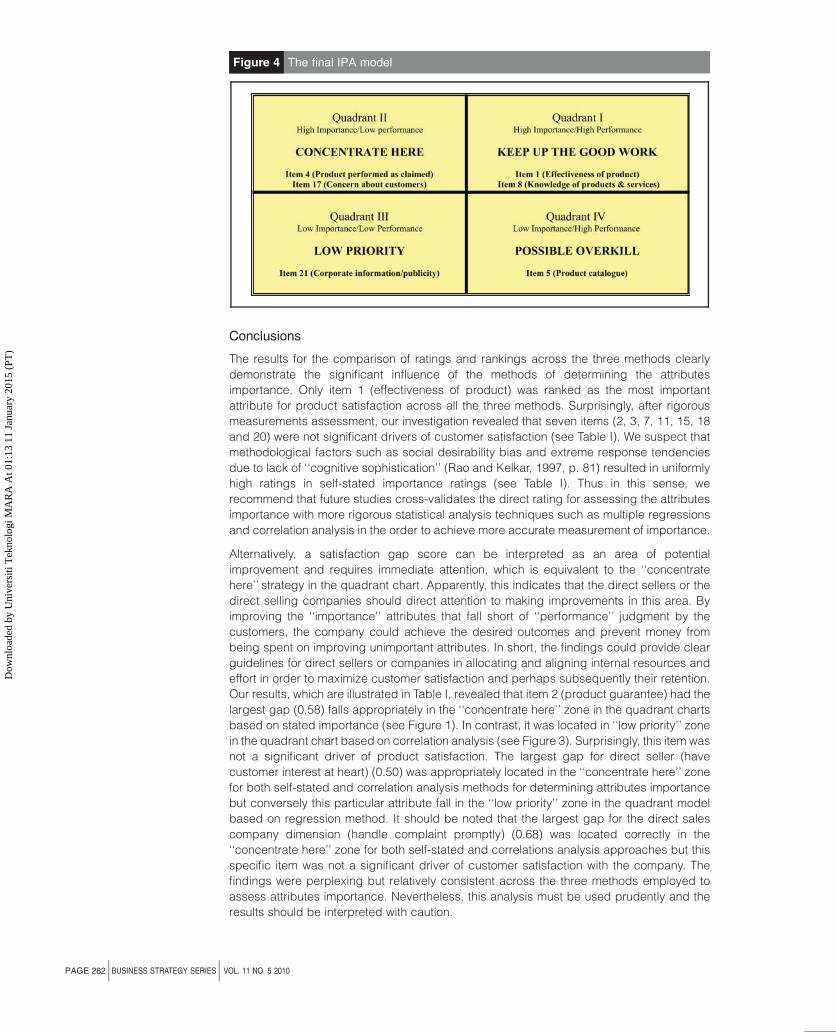
The final importance-performance analysis model
Figure 4 portrays the resulting items that fall in the same zone when three methods were
employed to assess attributes importance. The results demonstrate that item 1
(effectiveness of product) and item 8 (knowledge of products and services) fall in the
Table I Summarized results of performance mean and mean differences, stated importance and derived importance
Derived importance
Items/factors(A) Performance
mean(B) Stated
importance meanC (A-B) meandifferences
Regressionweight (beta)
Correlationcoefficient
Product satisfaction a ¼ 0.80 3.77 4.12 20.35 0.22 0.421. Effectiveness of product 3.78 4.32 (1) 20.55 0.31 (1) 0.55 (1)2. Product guarantee 3.66 4.24 (2) 20.58 NS 0.38 (4)3. Product information adequacy 3.86 4.17 (3) 20.31 NS 0.35 (6)4. Product performed as claimed 3.67 4.16 (4) 20.49 0.20 (3) 0.53 (2)5. Product catalogue/brochure 4.00 4.02 (5) 20.02 0.12 (4) 0.33 (7)6. Innovative and unique product 3.72 3.97 (6) 20.25 0.23 (2) 0.45 (3)7. Product is multifunctional/multipurpose 3.67 3.94 (7) 20.25 NS 0.37 (5)
Direct seller satisfaction a ¼ 0.88 3.68 4.05 20.37 0.15 0.548. Knowledge of products and services 3.81 4.21 (1) 20.40 0.19 (2) 0.55 (4)9. Have customer interest at heart 3.59 4.09 (2) 20.50 0.12 (3) 0.56 (3)
10. Being consistently courteous 3.78 4.08 (3) 20.30 0.08 (6) 0.51 (6)11. Availability of direct seller 3.68 4.07 (4) 20.39 0.10 (5) 0.53 (5)12. Giving personal advice and attention 3.64 4.05 (5) 20.41 NS 0.48 (8)13. Effectiveness of sales demonstration 3.67 4.02 (6) 20.35 0.30 (1) 0.61 (1)14. Maintaining a professional appearance 3.65 3.85 (7) 20.30 0.11 (4) 0.58 (2)15. Continuity of contact 3.59 3.92 (8) 20.33 NS 0.50 (7)
Company satisfaction a ¼ 0.84 3.66 4.09 20.43 0.21 0.5216. Company’s reputation 3.94 4.19 (1) 20.25 0.17 (3) 0.45 (6)17. Concern about customers 3.65 4.18 (2) 20.53 0.29 (1) 0.59 (1)18. Handle complaints promptly 3.44 4.12 (3) 20.68 NS 0.51 (3)19. Product return/adjustment policy 3.59 4.08 (4) 20.49 0.24 (2) 0.55 (2)20. Sales campaigns/promotion) 3.71 3.99 (5) 20.28 NS 0.47 (5)21. Corporate information/publicity 3.63 3.98 (6) 20.34 0.13 (4) 0.49 (4)Overall Satisfaction 3.70 4.09 20.39 0.19 0.50
Notes: The numbers in parentheses represent individual item ranking based on the dimension level; NS denotes not significant at 0.05significant levels
Figure 1 Quadrant chart based on stated importance
VOL. 11 NO. 5 2010 jBUSINESS STRATEGY SERIESj PAGE 279
Dow
nloa
ded
by U
nive
rsiti
Tek
nolo
gi M
AR
A A
t 01:
13 1
1 Ja
nuar
y 20
15 (
PT)
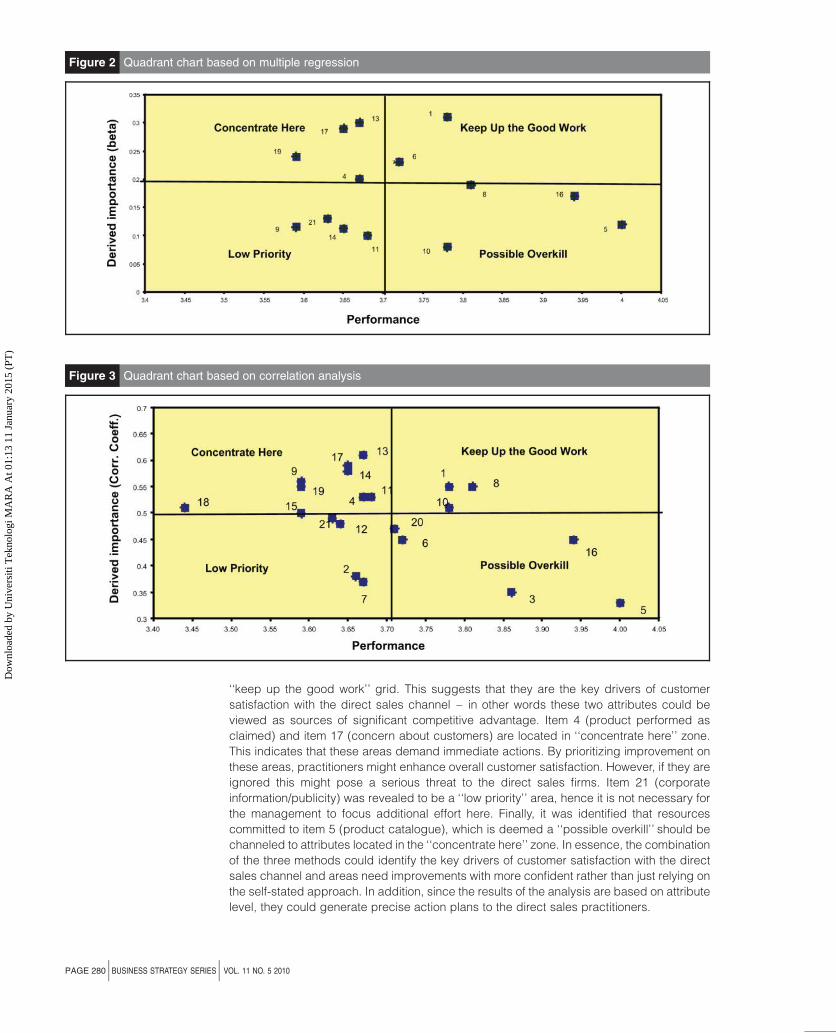
‘‘keep up the good work’’ grid. This suggests that they are the key drivers of customer
satisfaction with the direct sales channel – in other words these two attributes could be
viewed as sources of significant competitive advantage. Item 4 (product performed as
claimed) and item 17 (concern about customers) are located in ‘‘concentrate here’’ zone.
This indicates that these areas demand immediate actions. By prioritizing improvement on
these areas, practitioners might enhance overall customer satisfaction. However, if they are
ignored this might pose a serious threat to the direct sales firms. Item 21 (corporate
information/publicity) was revealed to be a ‘‘low priority’’ area, hence it is not necessary for
the management to focus additional effort here. Finally, it was identified that resources
committed to item 5 (product catalogue), which is deemed a ‘‘possible overkill’’ should be
channeled to attributes located in the ‘‘concentrate here’’ zone. In essence, the combination
of the three methods could identify the key drivers of customer satisfaction with the direct
sales channel and areas need improvements with more confident rather than just relying on
the self-stated approach. In addition, since the results of the analysis are based on attribute
level, they could generate precise action plans to the direct sales practitioners.
Figure 2 Quadrant chart based on multiple regression
Figure 3 Quadrant chart based on correlation analysis
PAGE 280 jBUSINESS STRATEGY SERIESj VOL. 11 NO. 5 2010
Dow
nloa
ded
by U
nive
rsiti
Tek
nolo
gi M
AR
A A
t 01:
13 1
1 Ja
nuar
y 20
15 (
PT)
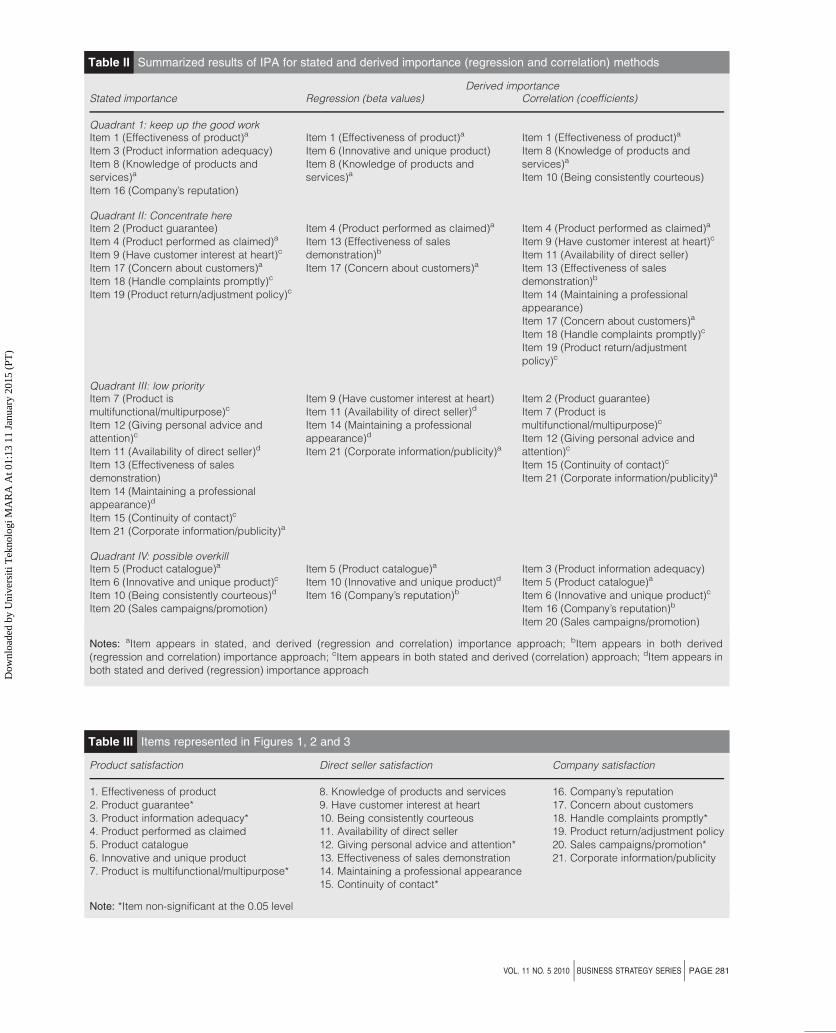
Table II Summarized results of IPA for stated and derived importance (regression and correlation) methods
Derived importanceStated importance Regression (beta values) Correlation (coefficients)
Quadrant 1: keep up the good workItem 1 (Effectiveness of product)a
Item 3 (Product information adequacy)Item 8 (Knowledge of products andservices)a
Item 16 (Company’s reputation)
Item 1 (Effectiveness of product)a
Item 6 (Innovative and unique product)Item 8 (Knowledge of products andservices)a
Item 1 (Effectiveness of product)a
Item 8 (Knowledge of products andservices)a
Item 10 (Being consistently courteous)
Quadrant II: Concentrate hereItem 2 (Product guarantee)Item 4 (Product performed as claimed)a
Item 9 (Have customer interest at heart)c
Item 17 (Concern about customers)a
Item 18 (Handle complaints promptly)c
Item 19 (Product return/adjustment policy)c
Item 4 (Product performed as claimed)a
Item 13 (Effectiveness of salesdemonstration)b
Item 17 (Concern about customers)a
Item 4 (Product performed as claimed)a
Item 9 (Have customer interest at heart)c
Item 11 (Availability of direct seller)Item 13 (Effectiveness of salesdemonstration)b
Item 14 (Maintaining a professionalappearance)Item 17 (Concern about customers)a
Item 18 (Handle complaints promptly)c
Item 19 (Product return/adjustmentpolicy)c
Quadrant III: low priorityItem 7 (Product ismultifunctional/multipurpose)c
Item 12 (Giving personal advice andattention)c
Item 11 (Availability of direct seller)d
Item 13 (Effectiveness of salesdemonstration)Item 14 (Maintaining a professionalappearance)d
Item 15 (Continuity of contact)c
Item 21 (Corporate information/publicity)a
Item 9 (Have customer interest at heart)Item 11 (Availability of direct seller)d
Item 14 (Maintaining a professionalappearance)d
Item 21 (Corporate information/publicity)a
Item 2 (Product guarantee)Item 7 (Product ismultifunctional/multipurpose)c
Item 12 (Giving personal advice andattention)c
Item 15 (Continuity of contact)c
Item 21 (Corporate information/publicity)a
Quadrant IV: possible overkillItem 5 (Product catalogue)a
Item 6 (Innovative and unique product)c
Item 10 (Being consistently courteous)d
Item 20 (Sales campaigns/promotion)
Item 5 (Product catalogue)a
Item 10 (Innovative and unique product)d
Item 16 (Company’s reputation)b
Item 3 (Product information adequacy)Item 5 (Product catalogue)a
Item 6 (Innovative and unique product)c
Item 16 (Company’s reputation)b
Item 20 (Sales campaigns/promotion)
Notes: aItem appears in stated, and derived (regression and correlation) importance approach; bItem appears in both derived(regression and correlation) importance approach; cItem appears in both stated and derived (correlation) approach; dItem appears inboth stated and derived (regression) importance approach
Table III Items represented in Figures 1, 2 and 3
Product satisfaction Direct seller satisfaction Company satisfaction
1. Effectiveness of product2. Product guarantee*3. Product information adequacy*4. Product performed as claimed5. Product catalogue6. Innovative and unique product7. Product is multifunctional/multipurpose*
8. Knowledge of products and services9. Have customer interest at heart10. Being consistently courteous11. Availability of direct seller12. Giving personal advice and attention*13. Effectiveness of sales demonstration14. Maintaining a professional appearance15. Continuity of contact*
16. Company’s reputation17. Concern about customers18. Handle complaints promptly*19. Product return/adjustment policy20. Sales campaigns/promotion*21. Corporate information/publicity
Note: *Item non-significant at the 0.05 level
VOL. 11 NO. 5 2010 jBUSINESS STRATEGY SERIESj PAGE 281
Dow
nloa
ded
by U
nive
rsiti
Tek
nolo
gi M
AR
A A
t 01:
13 1
1 Ja
nuar
y 20
15 (
PT)
Conclusions
The results for the comparison of ratings and rankings across the three methods clearly
demonstrate the significant influence of the methods of determining the attributes
importance. Only item 1 (effectiveness of product) was ranked as the most important
attribute for product satisfaction across all the three methods. Surprisingly, after rigorous
measurements assessment, our investigation revealed that seven items (2, 3, 7, 11, 15, 18
and 20) were not significant drivers of customer satisfaction (see Table I). We suspect that
methodological factors such as social desirability bias and extreme response tendencies
due to lack of ‘‘cognitive sophistication’’ (Rao and Kelkar, 1997, p. 81) resulted in uniformly
high ratings in self-stated importance ratings (see Table I). Thus in this sense, we
recommend that future studies cross-validates the direct rating for assessing the attributes
importance with more rigorous statistical analysis techniques such as multiple regressions
and correlation analysis in the order to achieve more accurate measurement of importance.
Alternatively, a satisfaction gap score can be interpreted as an area of potential
improvement and requires immediate attention, which is equivalent to the ‘‘concentrate
here’’ strategy in the quadrant chart. Apparently, this indicates that the direct sellers or the
direct selling companies should direct attention to making improvements in this area. By
improving the ‘‘importance’’ attributes that fall short of ‘‘performance’’ judgment by the
customers, the company could achieve the desired outcomes and prevent money from
being spent on improving unimportant attributes. In short, the findings could provide clear
guidelines for direct sellers or companies in allocating and aligning internal resources and
effort in order to maximize customer satisfaction and perhaps subsequently their retention.
Our results, which are illustrated in Table I, revealed that item 2 (product guarantee) had the
largest gap (0.58) falls appropriately in the ‘‘concentrate here’’ zone in the quadrant charts
based on stated importance (see Figure 1). In contrast, it was located in ‘‘low priority’’ zone
in the quadrant chart based on correlation analysis (see Figure 3). Surprisingly, this item was
not a significant driver of product satisfaction. The largest gap for direct seller (have
customer interest at heart) (0.50) was appropriately located in the ‘‘concentrate here’’ zone
for both self-stated and correlation analysis methods for determining attributes importance
but conversely this particular attribute fall in the ‘‘low priority’’ zone in the quadrant model
based on regression method. It should be noted that the largest gap for the direct sales
company dimension (handle complaint promptly) (0.68) was located correctly in the
‘‘concentrate here’’ zone for both self-stated and correlations analysis approaches but this
specific item was not a significant driver of customer satisfaction with the company. The
findings were perplexing but relatively consistent across the three methods employed to
assess attributes importance. Nevertheless, this analysis must be used prudently and the
results should be interpreted with caution.
Figure 4 The final IPA model
PAGE 282 jBUSINESS STRATEGY SERIESj VOL. 11 NO. 5 2010
Dow
nloa
ded
by U
nive
rsiti
Tek
nolo
gi M
AR
A A
t 01:
13 1
1 Ja
nuar
y 20
15 (
PT)
Generally, the results of IPA presented by the current investigation reflect that the matrix is
sensitive to the importance measure used. These empirical findings further support the
similar evidence drawn by previous researchers (see, for example, Matzler et al., 2003).
Clearly, this research has demonstrated that classical IPA could be misleading even when
valid and reliable measures were used. Only one or two attributes fall into the same zone
when the attributes importance was assessed across three methods. Thus, we strongly
encourage users not only to employ direct importance ratings but to cross-validate it with
other methods of assessing the attributes’ importance such as regression and correlation
analysis as presented by our final IPA model (see Figure 4). In addition, we suggest
researchers and practitioners employ valid and reliable measures when conducting IPA, as
our results demonstrate that several items fall into the same zone even though different
methods of assessing the attributes’ importance were utilized supported by findings from
prior studies (see, for example, Bacon, 2003; Matzler et al. 2003). IPA approach as
suggested by our study may not be a simple analytical technique, when compared to its
classical version, however it is still considered applicable and relevant to the practicing
manager. The crucial question is how valid is IPA as a tool that yields prescriptions for
courses of action that a company can pursue in the aim to manage customer satisfaction. In
our view, if IPA is to be employed confidently, this difficulty-accuracy trade-off is certainly
worth strong consideration.
It should be noted that a limitation of this study is that the ratings of the attributes’
performance and importance might be influenced by respondents’ demographic
backgrounds and experiences. It is reasonable to speculate that as a consequence, IPA
yielded mixed results where clear and logical trends could be recognized. In this regard, this
could offer a fruitful future research direction; IPA needs further examination coupled with a
theoretical explanation. Specifically, future research should develop IPA models based on
different customer segments. It is possible and reasonable to suspect that demographic
segments such as gender and age or level of customer experience could produce
significantly different results. Perhaps, precise area of improvement could be determined
and immediate managerial plans and actions might be effectively tailored to these customer
segments.
References
Bacon, D.R. (2003), ‘‘A comparison of approaches to importance-performance analysis’’, The Market
Research Society, Vol. 45 No. 1, pp. 55-71.
Bernhardt, L.K., Donthu, N. and Kenneth, A.P. (2000), ‘‘A longitudinal analysis of satisfaction and
profitability’’, Journal of Business Research, Vol. 47, pp. 161-71.
Burnham, A.T., Frels, K.J. and Mahajan, V. (2003), ‘‘Consumer switching costs: a typology, antecedents,
and consequences’’, Journal of the Academy of Marketing Science, Vol. 31 No. 2, pp. 109-26.
Gerbing, D.W. and Anderson, C.J. (1988), ‘‘An updated paradigm for scale development incorporating
unidimensionality and its assessment’’, Journal of Marketing Research, Vol. 25, May, pp. 186-92.
Matzler, K., Sauerwein, E. and Heischmidt, K.A. (2003), ‘‘Importance-performance analysis revisited:
the role of factor structure of customer satisfaction’’, The Service Industries Journal, Vol. 23 No. 2,
pp. 112-29.
Norzaidi, M.D. and Intan Salwani, M. (2009), ‘‘Evaluating technology resistance and technology
satisfaction on students’ performance’’, Campus Wide Information Systems, Vol. 26 No. 4, pp. 298-312.
Norzaidi, M.D., Chong, S.C. and Intan Salwani, M. (2009), ‘‘Intranet usage, managerial satisfaction and
performance impact: an empirical study’’, International Journal of Business and Systems Research,
Vol. 3 No. 4, pp. 481-96.
Norzaidi, M.D., Chong, S.C., Murali, R. and Intan Salwani, M. (2007), ‘‘Intranet usage and managers’
performance in the port industry’’, Industrial Management and Data Systems, Vol. 107 No. 8,
pp. 1227-50.
Nunnally, C.J. (1978), Psychometric Theory, 2nd ed., McGraw-Hill Book Company, New York, NY.
VOL. 11 NO. 5 2010 jBUSINESS STRATEGY SERIESj PAGE 283
Dow
nloa
ded
by U
nive
rsiti
Tek
nolo
gi M
AR
A A
t 01:
13 1
1 Ja
nuar
y 20
15 (
PT)
Oh, H. (2001), ‘‘Revisiting importance-performance analysis’’, Tourism Management, Vol. 22,
pp. 617-27.
Patterson, P.G., Johnson, L.W. and Spreng, R.A. (1997), ‘‘Modelling the determinants of customer
satisfaction for business-to-business professional services’’, Journal of Academy of Marketing Science,
Vol. 25 No. 1, pp. 4-17.
Piercy, N.F. (2002), ‘‘Research in marketing: theory with trivial or risking relevance?’’, European Journal
of Marketing, Vol. 14 No. 4, pp. 257-67.
Rao, C.P. and Kelkar, M.M. (1997), ‘‘Relative impact of performance and importance ratings on
measurement of service quality’’, Journal of Professional Services Marketing, Vol. 15 No. 2, pp. 69-86.
Rosidah, M., Faridah, H., Jamaliah, M.Y. and Norzaidi, M.D. (2010), ‘‘Examining market accessibility of
Malaysia’s Harumanis mango in Japan: challenges and potentials’’, Business Strategy Series, Vol. 11
No. 1, pp. 3-12.
Roszkowski, M.J. (2003), ‘‘The nature of the importance-satisfaction relationship in ratings: evidence
from the normative data of the Noel-Levitz student satisfaction inventory’’, Journal of Consumer
Satisfaction, Dissatisfaction and Complaining Behaviour, Vol. 16, pp. 23-33.
Westbrook, R.A. (1997), ‘‘Observations on applied CS/D research’’, Journal of Customer Satisfaction,
Dissatisfaction and Complaining Behaviour, Vol. 10, pp. 1-6.
Westbrook, R.A. (2000), ‘‘Towards a managerial research agenda for customer satisfaction’’, Journal of
Customer Satisfaction, Dissatisfaction and Complaining Behaviour, Vol. 13, pp. 17-25.
Zeithaml, V.A. (2000), ‘‘Service quality, profitability and the economic worth of customers: what we know
and what we need to learn’’, Journal of the Academy of Marketing Science, Vol. 28 No. 1, pp. 67-85.
Further reading
Barsky, J.D. and Labagh, R. (1992), ‘‘A strategy for customer satisfaction’’, Cornell Hotel and Restaurant
Administration Quarterly, Vol. 33 No. 5, pp. 32-9.
Chen, D.R., Jeng, L.J. and Chou, C.C. (1998), ‘‘A study of consumers who buy from MLM channel in
Taiwan’’, pp. 17-23, Proceedings of the 3rd Asia Pacific Decision Science Institute Conference,
Grand Hotel, Taipei, Taiwan, ROC.
Ching, C.Y. (2003), ‘‘Improvement actions based on the customers’ satisfaction survey’’, Total Quality
Management and Business Excellence, Vol. 14 No. 8, pp. 919-30.
Churchill, G.A. (1979), ‘‘A paradigm for developing better measures of marketing constructs’’, Journal of
Marketing Research, Vol. xvi, February, pp. 64-73.
Cronin, J.J. and Taylor, S.A. (1992), ‘‘Measuring service quality: a reexamination and extension’’, Journal
of Marketing, Vol. 56, July, pp. 55-68.
Duke, C.R. and Mount, S.A. (1996), ‘‘Rediscovering performance-importance analysis of products’’,
Journal of Product and Brand Management, Vol. 5 No. 2, pp. 43-54.
Endut, W. (1999), ‘‘Direct selling industry in Malaysia: customers and challenges in 21st century’’,
Malaysian Journal of Consumer and Family Economics, Vol. 2, pp. 73-88.
Green, P.E., Goldberg, S.M. and Montemayor, M. (1981), ‘‘A hybrid utility estimation model for conjoint
analysis’’, Journal of Marketing, Vol. 45, Winter, pp. 33-41.
Lambert, D.M., Adams, R.J. and Emmelhainz, M.A. (1997), ‘‘Supplier selection criteria in the healthcare
industry: a comparison of importance and performance’’, International Journal of Purchasing Materials
Management, Vol. 33 No. 1, pp. 16-22.
Mittal, V., Kumar, P. and Tsiros, M. (1999), ‘‘Attribute level performance, satisfaction, and behavioural
intentions over time: a consumption-system approach’’, Journal of Marketing, Vol. 63, pp. 88-101.
Oliver, R.L. (1980), ‘‘A cognitive model of the antecedents and consequences of consumer satisfaction
decisions’’, Journal of Marketing Research, Vol. 42, November, pp. 460-9.
Oliver, R.L. (1997), Satisfaction: A Behavioural Perspective on the Customer, McGraw-Hill, New York, NY.
PAGE 284 jBUSINESS STRATEGY SERIESj VOL. 11 NO. 5 2010
Dow
nloa
ded
by U
nive
rsiti
Tek
nolo
gi M
AR
A A
t 01:
13 1
1 Ja
nuar
y 20
15 (
PT)
Parasuraman, A., Zeithaml, A.V. and Leonard, L.B. (1988), ‘‘SERVQUAL: a multiple-item scale for
measuring customer perception’’, Journal of Retailing, Vol. 64 No. 1, pp. 12-41.
Rentz, O.J., Shepherd, C.D., Tashchian, A., Dabholkar, P.A. and Ladd, R.T. (2002), ‘‘A measure of selling
skill: scale development and validation’’, Journal of Personal Selling and Sales Management, Vol. 22
No. 1, pp. 13-21.
Robbins, S.P. (2002), Management, 7th ed., Prentice Hall, Upper Saddle River, NJ.
Sargeant, A. and Msweli, P. (1999), ‘‘Network marketing in South Africa: an exploratory study of
consumer perceptions’’, Journal of International Consumer Marketing, Vol. 11 No. 3, pp. 51-66.
Woodruff, R.B. (1993), ‘‘Developing and applying consumer satisfaction knowledge: implications for
future research’’, Journal of Consumer Satisfaction, Dissatisfaction and Complaining Behaviour, Vol. 6,
pp. 1-11.
Corresponding author
Norzaidi Mohd Daud can be contacted at: [email protected]
VOL. 11 NO. 5 2010 jBUSINESS STRATEGY SERIESj PAGE 285
To purchase reprints of this article please e-mail: [email protected]
Or visit our web site for further details: www.emeraldinsight.com/reprints
Dow
nloa
ded
by U
nive
rsiti
Tek
nolo
gi M
AR
A A
t 01:
13 1
1 Ja
nuar
y 20
15 (
PT)

This article has been cited by:
1. Ivan Ka Wai Lai, Michael Hitchcock. 2015. Importance–performance analysis in tourism: A framework for researchers. TourismManagement 48, 242-267. [CrossRef]
2. Evangelos Psomas, Dimitrios Kafetzopoulos. 2014. Performance measures of ISO 9001 certified and non-certified manufacturingcompanies. Benchmarking: An International Journal 21:5, 756-774. [Abstract] [Full Text] [PDF]
Dow
nloa
ded
by U
nive
rsiti
Tek
nolo
gi M
AR
A A
t 01:
13 1
1 Ja
nuar
y 20
15 (
PT)


![[2] PEMETAAN SK IPA](https://static.fdokumen.com/doc/165x107/633c91a2c5cd707353005e44/2-pemetaan-sk-ipa.jpg)