Application of genetic algorithms and artificial neural networks in conjunctive use of surface and...
14
163 Introduction Integrated use of surface and groundwater resources, commonly termed conjunctve use, s the applcaton of systems approaches for optmum utlzaton of water resources whle dfferent exstng constrants are handled. Many nvestgators such as Buras (1963); Longebaugh (1970); Maddock (1974); O’Mara and Duloy (1984); Wlls et al. (1989); Onta et al. (1991); Yeh (1992); Fredercks et al. (1998); Loacga and Lepnk (2001); Karamouz et al. (2001, 2004) and Qahman et al. (2005) have used the systems approach and mathematcal models n conjunctve surface and groundwater management. Most of the prevous studes present the applcaton of classcal optmzaton models n conjunctve use plannng. They also consider the simplified groundwater Internatonal Water Resources Assocaton Water International, Volume 32, Number 1, Pg.163-176, March 2007 © 2007 Internatonal Water Resources Assocaton Application of Genetic Algorithms and Artificial Neural Networks in Conjunctive Use of Surface and Groundwater Resources Mohammad Karamouz, University of Tehran, Iran, Mahmoud M. Rezapour Tabari, Amirkabir University, Iran and Reza Kerachian, University of Tehran, Iran Abstract: In this paper, a methodology for conjunctive use of surface and groundwater resources is developed using the combination of the Genetic Algorithms (GAs) and the Artificial Neural Networks (ANN). Water supply to agricultural demands, reduction of pumping costs and control of groundwater table fluctuations are considered in the objective function of the model. In the proposed model, the results of MODFLOW groundwater simulation model are used to train an ANN. The ANN as groundwater response functions is then linked to the GA based optimization model to develop the monthly conjunctive use operating policies. The model is applied to the surface and groundwater allocation for irrigation purposes in the southern part of Tehran. A new ANN is also trained and checked for developing the real-time conjunctive use operating rules. The results show the significance of an integrated approach to surface and groundwater allocation in the study area. A simulation of the optimal policies shows that the cumulative groundwater table variation can be reduced to less than 4 meters from the current devastating condition. The results also show that the proposed model can effectively reduce the run time of the conjunctive use models through the composition of a GA-based optimization and a ANN-based simulation model. Keywords: Conjunctive Use, Artificial Neural Network, Genetic Algorithms, Groundwater Modeling, Optimization, Simulation
-
Upload
independent -
Category
Documents
-
view
1 -
download
0
Transcript of Application of genetic algorithms and artificial neural networks in conjunctive use of surface and...

163
Introduction Integrated use of surface and groundwater resources, commonly termed conjunct�ve use, �s the appl�cat�on of systems approaches for opt�mum ut�l�zat�on of water resources wh�le d�fferent ex�st�ng constra�nts are handled. Many �nvest�gators such as Buras (1963); Longebaugh (1970); Maddock (1974); O’Mara and Duloy (1984); W�ll�s et al. (1989); Onta
et al. (1991); Yeh (1992); Freder�cks et al. (1998); Loa�c�ga and Le�pn�k (2001); Karamouz et al. (2001, 2004) and Qahman et al. (2005) have used the systems approach and mathemat�cal models �n conjunct�ve surface and groundwater management. Most of the prev�ous stud�es present the appl�cat�on of class�cal opt�m�zat�on models �n conjunct�ve use plann�ng. They also consider the simplified groundwater
Internat�onal Water Resources Assoc�at�onWater International, Volume 32, Number 1, Pg.163-176, March 2007
© 2007 Internat�onal Water Resources Assoc�at�on
Application of Genetic Algorithms and Artificial Neural Networks in Conjunctive Use of Surface and Groundwater
Resources
Mohammad Karamouz, University of Tehran, Iran, Mahmoud M. Rezapour Tabari, Amirkabir University, Iran and Reza Kerachian, University of Tehran, Iran
Abstract: In this paper, a methodology for conjunctive use of surface and groundwater resources is developed using the combination of the Genetic Algorithms (GAs) and the Artificial Neural Networks (ANN). Water supply to agricultural demands, reduction of pumping costs and control of groundwater table fluctuations are considered in the objective function of the model. In the proposed model, the results of MODFLOW groundwater simulation model are used to train an ANN. The ANN as groundwater response functions is then linked to the GA based optimization model to develop the monthly conjunctive use operating policies. The model is applied to the surface and groundwater allocation for irrigation purposes in the southern part of Tehran. A new ANN is also trained and checked for developing the real-time conjunctive use operating rules. The results show the significance of an integrated approach to surface and groundwater allocation in the study area. A simulation of the optimal policies shows that the cumulative groundwater table variation can be reduced to less than 4 meters from the current devastating condition. The results also show that the proposed model can effectively reduce the run time of the conjunctive use models through the composition of a GA-based optimization and a ANN-based simulation model. Keywords: Conjunctive Use, Artificial Neural Network, Genetic Algorithms, Groundwater Modeling, Optimization, Simulation
164
IWRA, Water International,Volume 32, Number 1, March 2007
equat�ons due to the computat�onal burden of the problem.
In the early development stages of conjunct�ve use models, the groundwater was cons�dered a separate source of water and the actual �nteract�on between the surface and groundwater resources was mostly neglected. In the second stage of the evolut�on of these models, the part�al d�fferent�al equat�ons of the �nteract�on between surface and groundwater resources, the phys�cal and econom�c constra�nts, were cons�dered �n the descr�pt�ve conjunct�ve use models. In the th�rd stage, the non-l�near d�fferent�al equat�ons of groundwater flow were considered in optimization models �n order to est�mate the groundwater table var�at�ons. The uncerta�nt�es �n d�scharge and recharge parameters were also cons�dered �n the stochast�c conjunct�ve use opt�m�zat�on models. In recent years, more complex and user-fr�endly s�mulat�on packages capable of cons�der�ng the pr�nc�ple of superpos�t�on have been used to develop and cal�brate the groundwater response equat�ons. They are, however, t�me-consum�ng and usually suffer from computat�onal problems [Burker and H�tja (1996); Hubell et al. (1997); and Johnson et al. (1998)].
Th�s paper deals w�th the development and appl�cat�on of opt�m�zat�on and s�mulat�on models for conjunct�ve plann�ng of reg�onal surface and groundwater resources. In the proposed procedure, the MODFLOW-PMWIN model, developed by Ch�ang and K�nzelbach (1999), s�mulates the aqu�fer. The groundwater response equat�ons are then expl�c�tly developed by tra�n�ng a Artificial Neural Network (ANN). The ANN-based groundwater s�mulat�on model �s then used �n a GA-based opt�m�zat�on model wh�ch prov�des the opt�mal monthly water allocat�on to d�fferent water demands from surface and groundwater resources. Th�s new methodology can effect�vely reduce the computat�onal t�me of the conjunct�ve use models. The proposed model �s appl�ed to the conjunct�on use of surface and groundwater resources �n the southern part of Tehran, where the water demand of the three major agr�cultural zones �s suppl�ed by Tehran’s aqu�fer, as well as local r�vers and streams. In l�ght of the cons�derable number of dec�s�on var�ables and the complex�ty of the system, a GA based opt�m�zat�on model �s used to develop monthly operat�ng pol�c�es.
Model Framework
In th�s paper, water supply to the agr�cultural demands, m�n�m�z�ng the pump�ng costs, and controll�ng the groundwater table fluctuations which are important for decision makers �n the study area, are cons�dered the object�ve funct�ons. However, other object�ves can be eas�ly added to the model. The formulat�on of the opt�m�zat�on model �s as follows:
∑=
=3
1iii ZZ:Minimize α
(1)
:to Subject
( )
××
−−
===+<
=∑∑∑
= = =
otherwise12Yn)i(D/)GQD(
12,...,1m,Y,...,1j,n,...,1iGQDif0Z n
1i
Y
1j
12
1mijmijmijmijm
ijmijmijm
1
(2)
( ) ( )12Yn)H.G/H.G(Zn
1i
Y
1j
12
1mmaxijmijmijmijm2 ××
= ∑∑∑
= = =
(3)
nLLZn
1i
max
Y
1j
12
1mijm3
= ∑ ∑∑
= = =
∆∆ (4)
max
Y
1j
12
1mmj LL ∆∆ ≤∑∑
= =
(5)
12,...,1m,Y,...,1jLL maxmj ==≤ ∆∆ (6)
m,j,iQRRRD ijmijmimj ∀−= (7)
j, minm
n
1iimj RRDRRD ≥∑
=
(8)
(9)
12,...,1m,Y,...,1j,n,...,1iRQ ijmijm ===<
(10)
13
1
=∑=i
iα
Application of Genetic Algorithms and Artificial Neural Networks in Conjunctive Use of Surface and Groundwater Resources
165
IWRA, Water International,Volume 32, Number 1, March 2007
j,m)M,O,G(fL mjmjmjmj ∀=∆(11)
where:
ijmG : The volume of groundwater extracted �n the agr�culture zone i �n month m of year j .
ijmQ : The volume of surface water allocated to agr�culture zone i �n month m of year j .
ijmD : Agr�cultural water demand �n zone i �n month m of year j .
mjL∆ : Var�at�on of the groundwater table level �n month m of year j (draw down �s cons�dered to
be negat�ve).
maxL∆ : Max�mum allowable cumulat�ve groundwater table fluctuation
ijmH : Average groundwater table level �n agr�culture zone i �n month m of year j
( )maxijmijm H.G : Max�mum value of ijmijm H.G for each
agr�culture �n zone i �n month m of year j
ijmR : Surface water flow rate in zone i �n month m of year j
min,mjRD : Env�ronmental water demand �n month m of year j
imjRD : Outflow surface water from zone i �n month m of year j
1Z : Loss funct�on related to average monthly water deficit
2Z : Loss funct�on related to average monthly pump�ng cost
3Z : Loss funct�on related to average monthly groundwater table fluctuation
iα : Relat�ve we�ght of the object�ve funct�on i
Y : Number of years �n the plann�ng hor�zon
n : Number of agr�cultural zones �n the study area
m : Number of months �n the plann�ng hor�zon
Equat�on 2 presents the object�ve funct�on for supply�ng total water demands. Pump�ng cost, wh�ch �s a funct�on of pump�ng rate and groundwater table depth, �s m�n�m�zed cons�der�ng object�ve funct�on 2Z presented by Equat�on 3. Equat�on 4 shows the th�rd object�ve funct�on that m�n�m�zes the average cumulat�ve var�at�on of groundwater table level. As the object�ve funct�ons 1Z , 2Z and 3Z are normal�zed between 0 and 1, the summat�on of relat�ve we�ghts
iα �s equal to 1 and they can be eas�ly ass�gned cons�der�ng the relat�ve �mportance of the object�ves.
Constra�nt (5) l�m�ts the cumulat�ve var�at�on of the water table level w�th�n an acceptable range dur�ng the plann�ng hor�zon. El�m�nat�ng th�s constra�nt may cause large groundwater table var�at�ons �n the study area. Based on constra�nt (6), the monthly var�at�on of the water table level �s also l�m�ted to a max�mum level. Equat�on 7 shows the outflow surface water from zone i �n month m of year j . Equat�on 8 forces the model to supply downstream water r�ghts and env�ronmental water demands. Equat�on 9 shows that the summat�on of the relative we�ght of the object�ves �s equal to 1. Based on constra�nt 10, the water w�thdrawal from each r�ver �n each month �s less or equal to the r�ver d�scharge.
Equat�on 11, the response funct�on, presents the monthly groundwater table var�at�on �n each zone. Th�s �s a funct�on of the set of the volumes of the groundwater extracted �n month m of year j �n the agr�cultural zones )G( mj , the outflow at the boundar�es, and the groundwater d�scharge through spr�ngs and qanats �n month t of year j )O( mj , recharges by d�rect prec�p�tat�on,
M. Karamouz, M. M. R. Tabar�, and R. Kerach�an
166
IWRA, Water International,Volume 32, Number 1, March 2007
allocated surface water, and also recharges by absorpt�on wells )M( mj . Th�s equat�on can be est�mated by l�nk�ng a groundwater s�mulat�on model to the opt�m�zat�on model. In th�s paper, th�s response funct�on �s developed by tra�n�ng an ANN. More deta�led �nformat�on related to theopt�m�zat�on model and training of the ANN�s presented �n the following sect�ons.
GA - based Optimization Model
GAs use a random search techn�que that “evolve” a potent�al solut�on for a g�ven system us�ng the genet�c operators. Generat�on of the �n�t�al populat�on, representat�on and encod�ng, select�on, crossover, and mutat�on are the ma�n steps �n the GA-based opt�m�zat�on models. The ma�n character�st�cs of the GA operators used �n th�s paper are as follows:
• Representation and Encoding
B�nary encod�ng �s the most common method used �n the previous works. In th�s method, d�scret�zat�on of state var�ables �s usually requ�red. In the case of a large number of state var�ables, both the length of each chromosome and, as a result, the convergence t�me w�ll be long. Another alternat�ve method �s real value encod�ng. Th�s method �s su�table for meet�ng opt�mal solut�on �n large and complex problems (Wardlaw & Shar�f 1999). D�scret�zat�on of state var�ables and decod�ng process �s not requ�red �n th�s method and w�ll thus prov�de the opt�mal solut�ons w�th more prec�s�on. Therefore, real value encod�ng �s used �n th�s study.
• Selection Operator
The ma�n object�ve of the select�on process is to identify the parents with a higher fitness for generat�on of the next populat�on. Several approaches have been proposed for the select�on operator, such as Roulette Wheel and Tournament methods. The select�on operator can affect the convergence and run t�me of the method, as well as the ma�ntenance of the
d�vers�ty of the populat�on �n each generat�on. In th�s study, the Tournament select�on method, wh�ch has been w�dely used �n l�terature (e.g. Burn and Yul�ant� (2001)), has been adopted.
To decrease the convergence time of the GA model, an Elitism approach is used. In this approach,
without change. This �is because crossover and mutation operators may distort the best chromosome while generating the next population.
• Crossover and Mutation
Crossover operators randomly take one pa�r that performs well from the mat�ng pool and, by exchang�ng �mportant bu�ld�ng block between two str�ngs, obta�n a new pa�r. Crossover occurs between two selected strings with a specific probability (Pc). One-po�nt crossover method selected for th�s studyrandomly chooses a pos�t�on �n the str�ng and newchromosomes are obta�ned by swapp�ng all genes after. the position.�Mutat�on �s an �mportant process that can provide d�vers�ty and new genet�c �nformat�on to the populat�on and prevent premature convergence to local opt�mal solut�ons. The mutat�on operator randomly changes the gene value w�th a probab�l�ty of
mutP cons�der�ng the range of var�at�on of each gene value �n the mutat�on process (Dmut).
More deta�led �nformat�on about the Genet�c Algor�thms opt�m�zat�on model can be found �n Gen and Chang (2000). In th�s study, the gene values are the monthly-allocated levels of ground and surface water transferred to the agr�cultural zones. For example, when there are three agr�cultural zones and only two surface water resources for zones 1 and 2, the number of genes �n a chromosome for a 15-year plann�ng hor�zon �s equal to 15*5*12=900, where 5 �s the number of dec�s�on var�ables, wh�ch are the allocated surface and groundwater resources for the agr�cultural zones.
Groundwater Simulation using Artificial Neural Network
Application of Genetic Algorithms and Artificial Neural Networks in Conjunctive Use of Surface and Groundwater Resources
the best chromosome is copied to the next generation
Theequationsofgroundwatertablevariation(responsefunctions)mustbeusedintheproposed
167
IWRA, Water International,Volume 32, Number 1, March 2007
conjunctiveusemodel(Equation12).Consideringthe
complexityoftheproblem,theaquifershouldusually
bemodeledusingacomprehensivesimulationmodel.
Asmostofthegroundwatersimulationmodels(suchasPMWIN)haveaconsiderableruntimeandcannotbeeasilylinkedwiththeoptimizationmodels,thisstudy trains and uses an Artificial Neural Network (ANN)initsplace.AnANNistrainedusingtheresultsofthegroundwatersimulations,withdifferentvaluesofdischargeandrechargeselectedwithintheir
rangeofvariations. In th�s study, d�fferent ANNs have been tested and the mult�layer feed forward networks have shown the best performance. Th�s type of ANN �s alsothe most w�dely used structure.
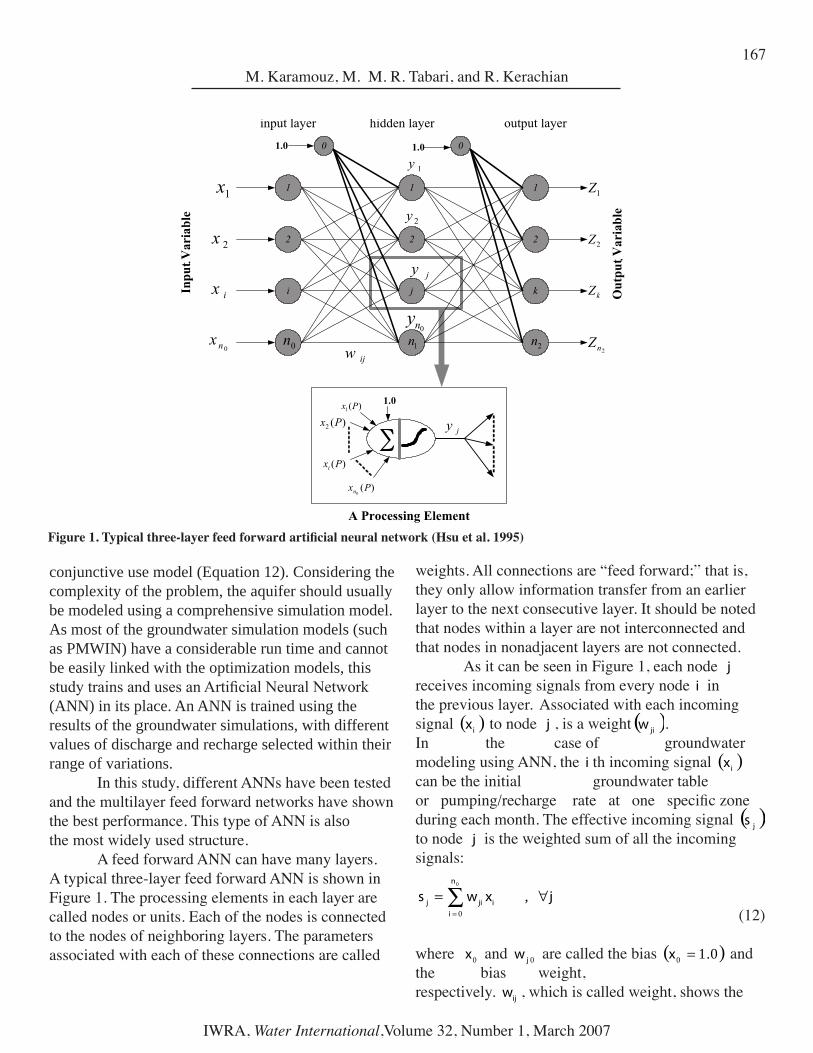
A feed forward ANN can have many layers. A typ�cal three-layer feed forward ANN �s shown �n F�gure 1. The process�ng elements �n each layer are called nodes or un�ts. Each of the nodes �s connected to the nodes of ne�ghbor�ng layers. The parameters assoc�ated w�th each of these connect�ons are called
we�ghts. All connect�ons are “feed forward;” that �s, they only allow �nformat�on transfer from an earl�er layer to the next consecut�ve layer. It should be noted that nodes w�th�n a layer are not �nterconnected and that nodes �n nonadjacent layers are not connected. As �t can be seen �n F�gure 1, each node j rece�ves �ncom�ng s�gnals from every node i �n the prev�ous layer. Assoc�ated w�th each �ncom�ng s�gnal ( )ix to node j , �s a we�ght( )jiw .In the case of groundwater model�ng us�ng ANN, the i th �ncom�ng s�gnal ( )ix can be the �n�t�al groundwater table or pumping/recharge rate at one specific zone dur�ng each month. The effect�ve �ncom�ng s�gnal ( )js to node j �s the we�ghted sum of all the �ncom�ng s�gnals:
jxwsn
iijij ∀= ∑
=
,0
0
(12)
where 0x and 0jw are called the b�as ( )0.10 =x and the b�as we�ght, respect�vely. ijw , wh�ch �s called we�ght, shows the
Figure 1. Typical three-layer feed forward artificial neural network (Hsu et al. 1995)
M. Karamouz, M. M. R. Tabar�, and R. Kerach�an

168
IWRA, Water International,Volume 32, Number 1, March 2007
relat�ve effect of the �nput ix �n the value of neuron output js . The effect�ve �ncom�ng s�gnal, js , �s passed through a nonl�near act�vat�on funct�on (somet�mes called transfer funct�on or threshold funct�on) to produce the outgo�ng s�gnal ( )jy of the node. The s�gmo�d funct�on most often
used for ANN �s the act�vat�on funct�on:
( ))sexp(11)s(fy jjj −+== (13)
Where; js �s a real number, but jy �s bounded between 0 and 1.
As shown �n F�gure 1, iZ �s the outgo�ng s�gnal from the last layer, wh�ch �n groundwater model�ng can be the average monthly groundwater table var�at�on at a specific zone.
As ment�oned before, ANN can be used for s�mulat�ng the monthly groundwater table var�at�ons. In such a case, the �nput var�ables for the selected ANN are average groundwater table level at the beg�nn�ng of the month, d�scharge from wells �n d�fferent agr�cultural zones and recharges
Table 1. The average historical surface flow and net monthly water demands of agricultural zones (million m3)*Zone 3 has no surface water
Determination of fitness values foreach chromosome considering the
Groundwater simulation using the
Selection of probability for
Training, checking and testing of ANN using the input and outputs of GW simulation model in the
Determination of the range of
Several runs of the Groundwater (GW) simulation model
considering the range of the ANN
Generation of initial population
Selection of better chromosomes
Does model converge to the
Save the optimal operating
No
End
Developing ANN-based operating
Figure 2. The flowchart of GA-based optimization model
Application of Genetic Algorithms and Artificial Neural Networks in Conjunctive Use of Surface and Groundwater Resources
Crossover and Mutation
Eslamshahr (Zone 1)
Ghalehno (Zone 2)
Khalazir (Zone 3) *
Total Demand
Month Ave. Inflow Demand Ave.
Inflow Demand Demand Demand Jan. 15 2.5 26 2.03 0.15 4.68 Feb. 18 2.4 32 1.79 0.13 4.32 Mar. 24 4.5 36.5 3.33 0.35 8.18 Apr. 27 11.5 46 9.75 1.2 22.5 May. 21 34.7 40 31.76 3.44 69.9 Jun. 14 36.6 35.5 35.22 4.02 75.9 Jul. 10.5 19.6 30 18.83 2.53 41
Aug. 8.6 23.9 26 25.86 2.26 42 Sep. 7.6 21.3 22 23.49 1.68 46.47 Oct. 9.8 8.5 21 10 0.64 19.14 Nov. 9 8.5 23 8.59 0.48 17.57 Dec 11.8 3.45 25.13 2.75 0.2 6.4 Sum 176.3 177.24 363.13 173.47 17.07 367.77
169
IWRA, Water International,Volume 32, Number 1, March 2007
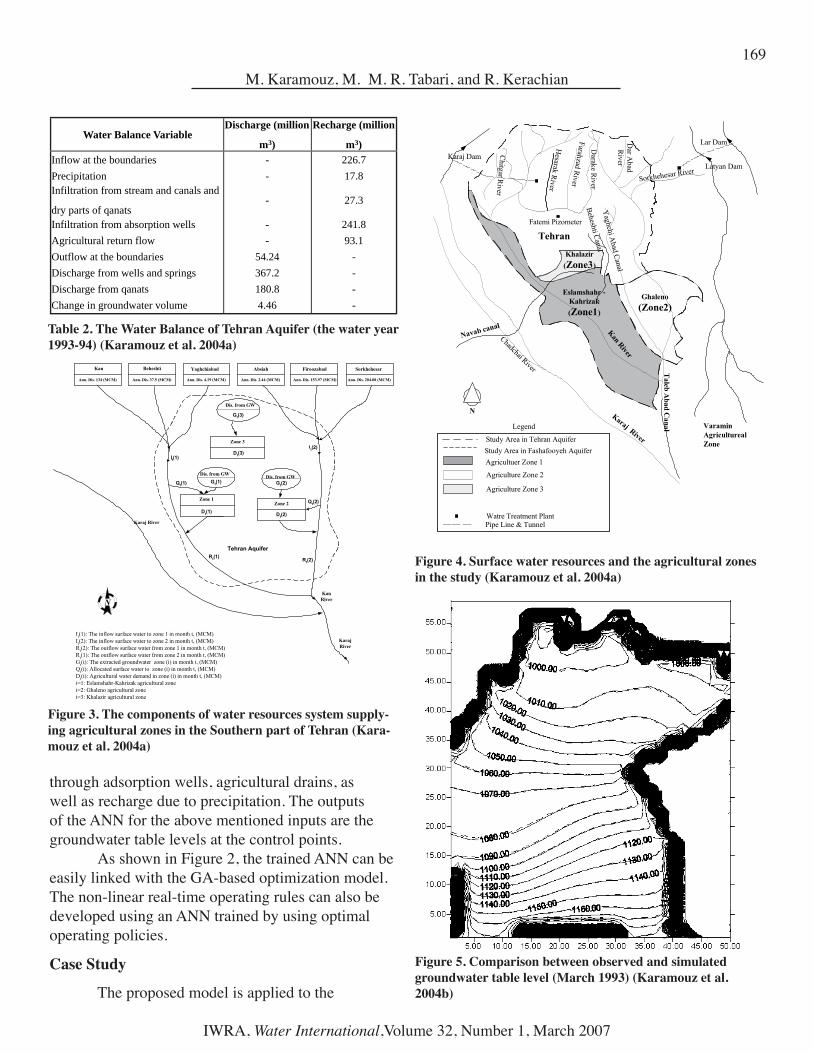
through adsorpt�on wells, agr�cultural dra�ns, as well as recharge due to prec�p�tat�on. The outputs of the ANN for the above ment�oned �nputs are the groundwater table levels at the control po�nts. As shown �n F�gure 2, the tra�ned ANN can be eas�ly l�nked w�th the GA-based opt�m�zat�on model. The non-l�near real-t�me operat�ng rules can also be developed us�ng an ANN tra�ned by us�ng opt�mal operat�ng pol�c�es.
Case Study
The proposed model �s appl�ed to the
Water Balance VariableDischarge (million
m3)
Recharge (million
m3)
Inflow at the boundaries - 226.7
Precipitation - 17.8
Infiltration from stream and canals and
dry parts of qanats- 27.3
Infiltration from absorption wells - 241.8
Agricultural return flow - 93.1
Outflow at the boundaries 54.24 -
Discharge from wells and springs 367.2 -
Discharge from qanats 180.8 -
Change in groundwater volume 4.46 -
Table 2. The Water Balance of Tehran Aquifer (the water year 1993-94) (Karamouz et al. 2004a)
Figure 3. The components of water resources system supply-ing agricultural zones in the Southern part of Tehran (Kara-mouz et al. 2004a)
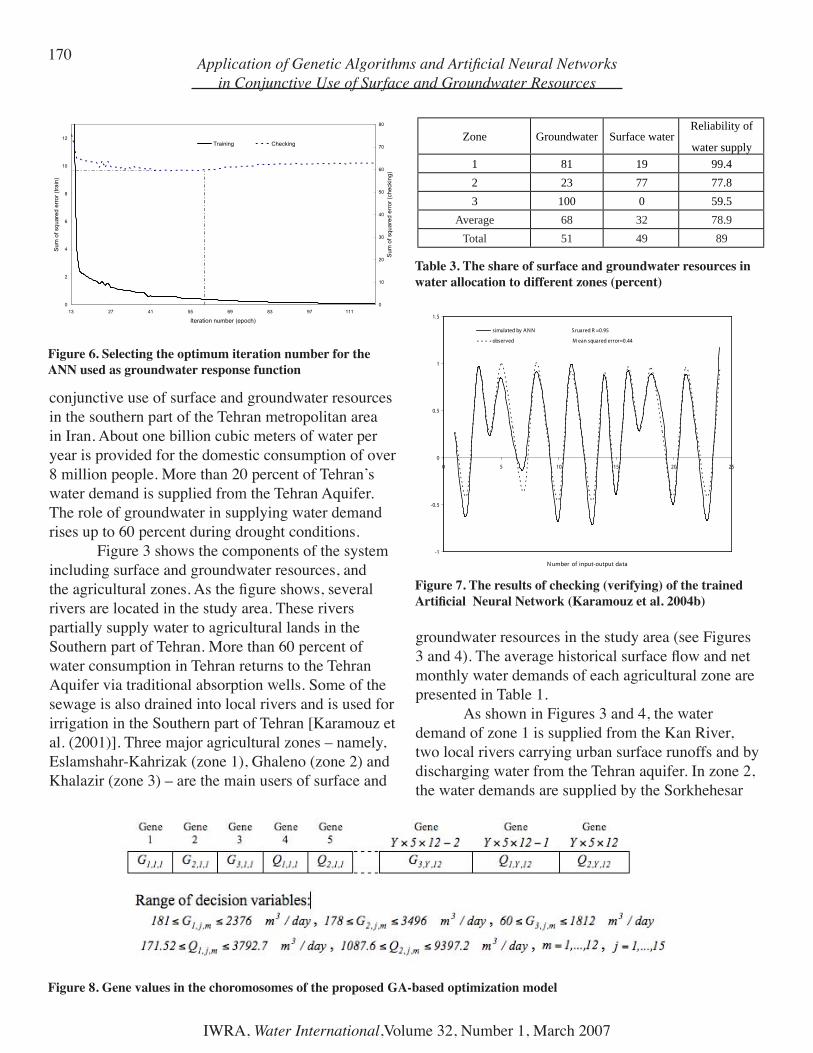
Figure 4. Surface water resources and the agricultural zones in the study (Karamouz et al. 2004a)
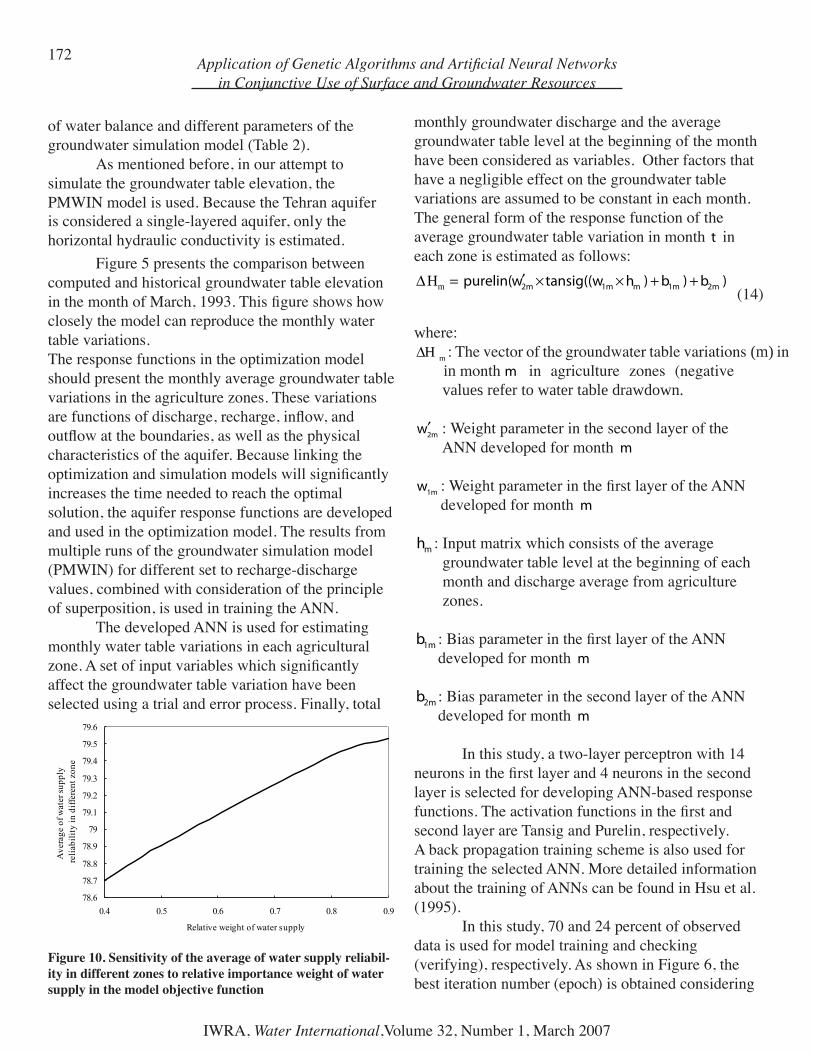
Figure 5. Comparison between observed and simulated groundwater table level (March 1993) (Karamouz et al. 2004b)
M. Karamouz, M. M. R. Tabar�, and R. Kerach�an
170
IWRA, Water International,Volume 32, Number 1, March 2007
conjunct�ve use of surface and groundwater resources �n the southern part of the Tehran metropol�tan area �n Iran. About one b�ll�on cub�c meters of water per year �s prov�ded for the domest�c consumpt�on of over 8 m�ll�on people. More than 20 percent of Tehran’s water demand �s suppl�ed from the Tehran Aqu�fer. The role of groundwater �n supply�ng water demand r�ses up to 60 percent dur�ng drought cond�t�ons.
F�gure 3 shows the components of the system �nclud�ng surface and groundwater resources, and the agricultural zones. As the figure shows, several r�vers are located �n the study area. These r�vers part�ally supply water to agr�cultural lands �n the Southern part of Tehran. More than 60 percent of water consumpt�on �n Tehran returns to the Tehran Aqu�fer v�a trad�t�onal absorpt�on wells. Some of the sewage �s also dra�ned �nto local r�vers and �s used for �rr�gat�on �n the Southern part of Tehran [Karamouz et al. (2001)]. Three major agr�cultural zones – namely, Eslamshahr-Kahr�zak (zone 1), Ghaleno (zone 2) and Khalaz�r (zone 3) – are the ma�n users of surface and
groundwater resources �n the study area (see F�gures 3 and 4). The average historical surface flow and net monthly water demands of each agr�cultural zone are presented �n Table 1.
As shown �n F�gures 3 and 4, the water demand of zone 1 �s suppl�ed from the Kan R�ver, two local r�vers carry�ng urban surface runoffs and by d�scharg�ng water from the Tehran aqu�fer. In zone 2, the water demands are suppl�ed by the Sorkhehesar
Zone Groundwater Surface waterReliability of
water supply
1 81 19 99.4
2 23 77 77.8
3 100 0 59.5
Average 68 32 78.9
Total 51 49 89
Table 3. The share of surface and groundwater resources in water allocation to different zones (percent)
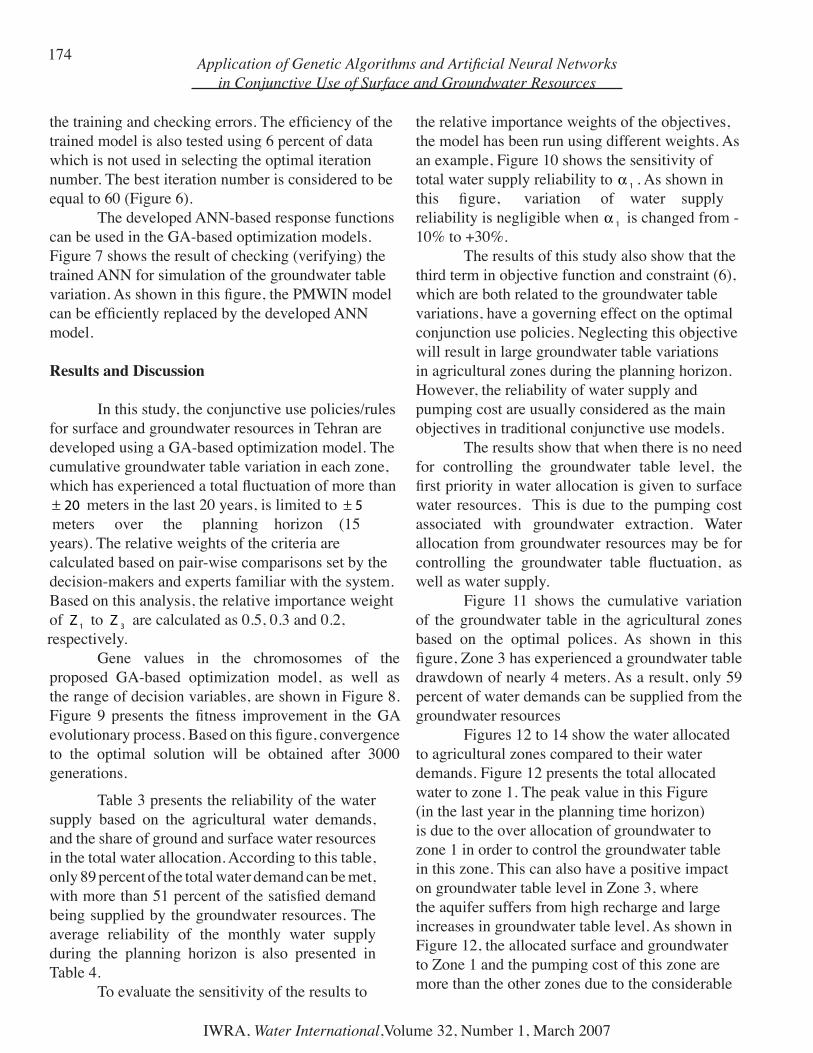
Figure 6. Selecting the optimum iteration number for the ANN used as groundwater response function
-1
-0.5
0
0.5
1
1.5
0 5 10 15 20 25
N umber of input-output data
Normalized variation of groundwater table level
simulated by AN N Sruared R =0.95
observed M ean squared error=0.44
Figure 7. The results of checking (verifying) of the trained Artificial Neural Network (Karamouz et al. 2004b)
Figure 8. Gene values in the choromosomes of the proposed GA-based optimization model
Application of Genetic Algorithms and Artificial Neural Networks in Conjunctive Use of Surface and Groundwater Resources

171
IWRA, Water International,Volume 32, Number 1, March 2007
R�ver and by two other canals carry�ng the urban surface runoff. The rest of the water demand of th�s zone �s suppl�ed from the Tehran aqu�fer. There �s no cons�derable surface water �n zone 3 and the water demand of th�s zone �s suppl�ed exclus�vely by the Tehran aqu�fer.
The current water allocat�on scheme �n these agr�cultural zones has caused so�l and groundwater pollut�on, as well as h�gh groundwater table var�at�ons �n many parts of the study area. More deta�led �nformat�on about the character�st�cs of the agr�cultural zones �n southern part of Tehran �s presented �n Karamouz et al. (2004a).
The transmissivity of Tehran’s unconfined aqu�fer var�es from 1500 m²/day to 3000 m²/day. The average coefficient of hydraulic conductivity in this aqu�fer �s 25 m/day. In the prev�ous stud�es done �n
this region, the storage coefficient is estimated to vary from 5.1 to 15 percent �n d�fferent parts of the pla�n. In this study, the coefficient of hydraulic conductivity and the storage coefficient are calibrated in different parts of the study area.
A compar�son between the average groundwater table �n Apr�l 1985 and Apr�l 2001 shows an approx�mate �ncrease of 9 meters �n the water table level �n the central and the Southern parts of the aqu�fer. Th�s �ncrease �s due ma�nly to aqu�fer recharge by domestic wastewater and return flows. The inflow to the aqu�fer boundar�es �s com�ng from the Northern, the Northwestern, and the Eastern parts of the pla�n.
Tehran aquifer is mainly recharged by inflow at the boundaries, precipitation, infiltration from the bed of local rivers, and return flows from domestic, �ndustr�al, and agr�cultural sectors. The d�scharge from the aqu�fer �s through water extract�on from wells, spr�ngs, and qanats, as well as groundwater outflow and evapotranspiration. The latest and the most complete water resources data and �nformat�on (such as flow rate measurements in the pumping wells, spr�ngs and qanats) are for the 1993-94 water year. Th�s data �s used for est�mat�ng d�fferent components
Simulation
Model
Runtime for
producing
972 training
input/output
data (s)
Training
time (s)
Runtime for
each
simulation (s)
Optimization
run time (s)
Total run time
(s)
PMWIN - - 72
200* x 72 x
3000+=
43.2 x 10⁶
43.2 x10⁶
ANN 68040 720 2200x 0.03#
x 3000=86.7 x10³
Table 5. Runtime of the optimization model when the ANN-based and MODFLOW simulation models are used
*Population size # Runtime of ANN-based simulation model
Figure 9. Fitness improvement in the GA-based evolutionary process
M. Karamouz, M. M. R. Tabar�, and R. Kerach�an
18000
+Total number of generations
Month
ZoneJan. Feb. Mar. Apr. May. Jun. Jul. Aug. Sep. Oct. Nov. Dec.
Zone 1 100 100 100 100 98 96 100 99 99 100 100 100
Zone 2 97 94 96 92 72 63 56 64 58 74 69 100
Zone 3 6 8 86 68 54 66 53 59 58 71 88 98
Table 4 .The average reliability of the monthly water supply (percent)
172
IWRA, Water International,Volume 32, Number 1, March 2007
of water balance and d�fferent parameters of the groundwater s�mulat�on model (Table 2).
As ment�oned before, �n our attempt to s�mulate the groundwater table elevat�on, the PMWIN model �s used. Because the Tehran aqu�fer �s cons�dered a s�ngle-layered aqu�fer, onl y the hor�zontal hydraul�c conduct�v�ty �s est�mated.
F�gure 5 presents the compar�son between computed and h�stor�cal groundwater table elevat�on in the month of March, 1993. This figure shows how closely the model can reproduce the monthly water table var�at�ons.The response funct�ons �n the opt�m�zat�on model should present the monthly average groundwater table var�at�ons �n the agr�culture zones. These var�at�ons are functions of discharge, recharge, inflow, and outflow at the boundaries, as well as the physical character�st�cs of the aqu�fer. Because l�nk�ng the optimization and simulation models will significantly �ncreases the t�me needed to reach the opt�mal solut�on, the aqu�fer response funct�ons are developed and used �n the opt�m�zat�on model. The results from mult�ple runs of the groundwater s�mulat�on model (PMWIN) for d�fferent set to recharge-d�scharge values, comb�ned w�th cons�derat�on of the pr�nc�ple of superpos�t�on, �s used �n tra�n�ng the ANN.
The developed ANN �s used for est�mat�ng monthly water table var�at�ons �n each agr�cultural zone. A set of input variables which significantly affect the groundwater table var�at�on have been selected us�ng a tr�al and error process. F�nally, total
monthly groundwater d�scharge and the average groundwater table level at the beg�nn�ng of the month have been cons�dered as var�ables. Other factors that have a negl�g�ble effect on the groundwater table var�at�ons are assumed to be constant �n each month. The general form of the response funct�on of the average groundwater table var�at�on �n month t �n each zone �s est�mated as follows:
)b)b)htansig((wwpurelin( 2m1mm1m2m ++××′=m∆H (14)
where:m∆H : The vector of the groundwater table var�at�ons (m) �n in month m �n agr�culture zones (negat�ve values refer to water table drawdown.
2mw′ : We�ght parameter �n the second layer of the ANN developed for month m
1mw : Weight parameter in the first layer of the ANN developed for month m
mh : Input matr�x wh�ch cons�sts of the average groundwater table level at the beg�nn�ng of each month and d�scharge average from agr�culture zones.
1mb : Bias parameter in the first layer of the ANN developed for month m
2mb : B�as parameter �n the second layer of the ANN developed for month m
In th�s study, a two-layer perceptron w�th 14 neurons in the first layer and 4 neurons in the second layer �s selected for develop�ng ANN-based response functions. The activation functions in the first and second layer are Tans�g and Purel�n, respect�vely. A back propagat�on tra�n�ng scheme �s also used for tra�n�ng the selected ANN. More deta�led �nformat�on about the tra�n�ng of ANNs can be found �n Hsu et al. (1995).
In th�s study, 70 and 24 percent of observed data �s used for model tra�n�ng and check�ng (ver�fy�ng), respect�vely. As shown �n F�gure 6, the best �terat�on number (epoch) �s obta�ned cons�der�ng
Figure 10. Sensitivity of the average of water supply reliabil-ity in different zones to relative importance weight of water supply in the model objective function
Application of Genetic Algorithms and Artificial Neural Networks in Conjunctive Use of Surface and Groundwater Resources

173
IWRA, Water International,Volume 32, Number 1, March 2007
Figure 11. Cumulative variation of the groundwater water table in the agricultural zones (Karamouz et al. 2004b)
Figure 13. Monthly allocated water supply and demands in agricultural zone 2
Figure 12. Monthly allocated water to agricultural zone 1 (Karamouz et al. 2004b)
Figure 14. The monthly allocated water supply and demands in agricultural zone 3
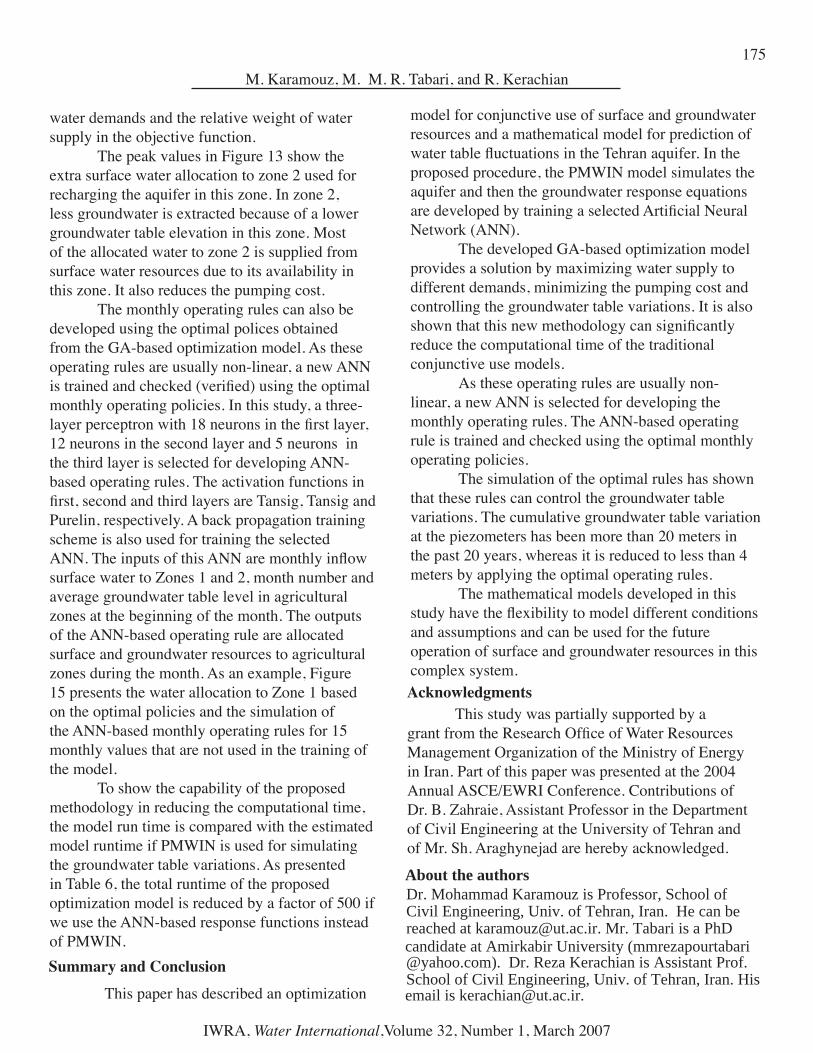
Figure 15. Water allocation to Zone 1 based on the optimal policies and the simulation of the ANN-based monthly operating rules (for validation period)
M. Karamouz, M. M. R. Tabar�, and R. Kerach�an
-2
-1
0
1
2
3
4
5
0 20 40 60 80 100 120 140 160 180
Planning horizon (month)`
Cum
ulat
ive
vari
atio
n of
gro
undw
ater
tabl
e (m
)
cumulative variation of groundwater table in agricultural zone 1cumulative variation of groundwater table in agricultural zone 2
cumulative variation of groundwater table in agricultural zone 3
0
1000
2000
3000
4000
5000
6000
7000
0 20 40 60 80 100 120 140 160 180
Planning horizon (month)
Wat
er su
pply
and
dem
and
(m3/
day)
Agriculture water demand in zone 1
Allocated surface and groundwater
0
1000
2000
3000
4000
5000
6000
7000
0 20 40 60 80 100 120 140 160 180
Planning horizon (month)
Wat
er s
uppl
y an
d de
man
d
Agriculture water demand in zone 2
Allocated surface and groundwater
0
500
1000
1500
2000
0 20 40 60 80 100 120 140 160 180Planning horizon (month)
Wat
er s
uppl
y an
d de
man
d (m
3/da
y)
Agriculture water demand in zone 3
Allocated groundwater
0
0.5
1
1.5
2
1 3 5 7 9 11 13 15
Sample
Stan
dard
ized
allo
cate
d w
ater
Simulaton of ANN-based operating rules Optimal allocation
174
IWRA, Water International,Volume 32, Number 1, March 2007
the training and checking errors. The efficiency of the tra�ned model �s also tested us�ng 6 percent of data wh�ch �s not used �n select�ng the opt�mal �terat�on number. The best �terat�on number �s cons�dered to be equal to 60 (F�gure 6).
The developed ANN-based response funct�ons can be used �n the GA-based opt�m�zat�on models. F�gure 7 shows the result of check�ng (ver�fy�ng) the tra�ned ANN for s�mulat�on of the groundwater table variation. As shown in this figure, the PMWIN model can be efficiently replaced by the developed ANN model.
Results and Discussion
In th�s study, the conjunct�ve use pol�c�es/rules for surface and groundwater resources �n Tehran are developed us�ng a GA-based opt�m�zat�on model. The cumulat�ve groundwater table var�at�on �n each zone, which has experienced a total fluctuation of more than
20± meters �n the last 20 years, �s l�m�ted to 5± meters over the plann�ng hor�zon (15 years). The relat�ve we�ghts of the cr�ter�a are calculated based on pa�r-w�se compar�sons set by the dec�s�on-makers and experts fam�l�ar w�th the system. Based on th�s analys�s, the relat�ve �mportance we�ght of 1Z to 3Z are calculated as 0.5, 0.3 and 0.2, respect�vely.
Gene values �n the chromosomes of the proposed GA-based opt�m�zat�on model, as well as the range of dec�s�on var�ables, are shown �n F�gure 8. Figure 9 presents the fitness improvement in the GA evolutionary process. Based on this figure, convergence to the opt�mal solut�on w�ll be obta�ned after 3000 generat�ons.
Table 3 presents the rel�ab�l�ty of the water supply based on the agr�cultural water demands, and the share of ground and surface water resources �n the total water allocat�on. Accord�ng to th�s table, only 89 percent of the total water demand can be met, with more than 51 percent of the satisfied demand be�ng suppl�ed by the groundwater resources. The average rel�ab�l�ty of the monthly water supply dur�ng the plann�ng hor�zon �s also presented �n Table 4.
To evaluate the sens�t�v�ty of the results to
the relat�ve �mportance we�ghts of the object�ves, the model has been run us�ng d�fferent we�ghts. As an example, F�gure 10 shows the sens�t�v�ty of total water supply rel�ab�l�ty to 1α . As shown �n this figure, variation of water supply rel�ab�l�ty �s negl�g�ble when 1α �s changed from -10% to +30%.
The results of th�s study also show that the th�rd term �n object�ve funct�on and constra�nt (6), wh�ch are both related to the groundwater table var�at�ons, have a govern�ng effect on the opt�mal conjunct�on use pol�c�es. Neglect�ng th�s object�ve w�ll result �n large groundwater table var�at�ons �n agr�cultural zones dur�ng the plann�ng hor�zon. However, the rel�ab�l�ty of water supply and pump�ng cost are usually cons�dered as the ma�n object�ves �n trad�t�onal conjunct�ve use models.
The results show that when there �s no need for controll�ng the groundwater table level, the first priority in water allocation is given to surface water resources. Th�s �s due to the pump�ng cost assoc�ated w�th groundwater extract�on. Water allocat�on from groundwater resources may be for controlling the groundwater table fluctuation, as well as water supply.
F�gure 11 shows the cumulat�ve var�at�on of the groundwater table �n the agr�cultural zones based on the opt�mal pol�ces. As shown �n th�s figure, Zone 3 has experienced a groundwater table drawdown of nearly 4 meters. As a result, only 59 percent of water demands can be suppl�ed from the groundwater resources
F�gures 12 to 14 show the water allocated to agr�cultural zones compared to the�r water demands. F�gure 12 presents the total allocated water to zone 1. The peak value �n th�s F�gure (�n the last year �n the plann�ng t�me hor�zon) �s due to the over allocat�on of groundwater to zone 1 �n order to control the groundwater table �n th�s zone. Th�s can also have a pos�t�ve �mpact on groundwater table level �n Zone 3, where the aqu�fer suffers from h�gh recharge and large �ncreases �n groundwater table level. As shown �n F�gure 12, the allocated surface and groundwater to Zone 1 and the pump�ng cost of th�s zone are more than the other zones due to the cons�derable
Application of Genetic Algorithms and Artificial Neural Networks in Conjunctive Use of Surface and Groundwater Resources
175
IWRA, Water International,Volume 32, Number 1, March 2007
water demands and the relat�ve we�ght of water supply �n the object�ve funct�on.
The peak values �n F�gure 13 show the extra surface water allocat�on to zone 2 used for recharg�ng the aqu�fer �n th�s zone. In zone 2, less groundwater �s extracted because of a lower groundwater table elevat�on �n th�s zone. Most of the allocated water to zone 2 �s suppl�ed from surface water resources due to �ts ava�lab�l�ty �n th�s zone. It also reduces the pump�ng cost.
The monthly operat�ng rules can also be developed us�ng the opt�mal pol�ces obta�ned from the GA-based opt�m�zat�on model. As these operat�ng rules are usually non-l�near, a new ANN is trained and checked (verified) using the optimal monthly operat�ng pol�c�es. In th�s study, a three-layer perceptron with 18 neurons in the first layer, 12 neurons �n the second layer and 5 neurons �n the th�rd layer �s selected for develop�ng ANN-based operat�ng rules. The act�vat�on funct�ons �n first, second and third layers are Tansig, Tansig and Purel�n, respect�vely. A back propagat�on tra�n�ng scheme �s also used for tra�n�ng the selected ANN. The inputs of this ANN are monthly inflow surface water to Zones 1 and 2, month number and average groundwater table level �n agr�cultural zones at the beg�nn�ng of the month. The outputs of the ANN-based operat�ng rule are allocated surface and groundwater resources to agr�cultural zones dur�ng the month. As an example, F�gure 15 presents the water allocat�on to Zone 1 based on the opt�mal pol�c�es and the s�mulat�on of the ANN-based monthly operat�ng rules for 15 monthly values that are not used �n the tra�n�ng of the model.
To show the capab�l�ty of the proposed methodology �n reduc�ng the computat�onal t�me, the model run t�me �s compared w�th the est�mated model runt�me �f PMWIN �s used for s�mulat�ng the groundwater table var�at�ons. As presented �n Table 6, the total runt�me of the proposed opt�m�zat�on model �s reduced by a factor of 500 �f we use the ANN-based response funct�ons �nstead of PMWIN.Summary and Conclusion
Th�s paper has descr�bed an opt�m�zat�on
model for conjunct�ve use of surface and groundwater resources and a mathemat�cal model for pred�ct�on of water table fluctuations in the Tehran aquifer. In the proposed procedure, the PMWIN model s�mulates the aqu�fer and then the groundwater response equat�ons are developed by training a selected Artificial Neural Network (ANN).
The developed GA-based opt�m�zat�on model prov�des a solut�on by max�m�z�ng water supply to d�fferent demands, m�n�m�z�ng the pump�ng cost and controll�ng the groundwater table var�at�ons. It �s also shown that this new methodology can significantly reduce the computat�onal t�me of the trad�t�onal conjunct�ve use models.
As these operat�ng rules are usually non-l�near, a new ANN �s selected for develop�ng the monthly operat�ng rules. The ANN-based operat�ng rule �s tra�ned and checked us�ng the opt�mal monthly operat�ng pol�c�es.
The s�mulat�on of the opt�mal rules has shown that these rules can control the groundwater table var�at�ons. The cumulat�ve groundwater table var�at�on at the p�ezometers has been more than 20 meters �n the past 20 years, whereas �t �s reduced to less than 4 meters by apply�ng the opt�mal operat�ng rules.
The mathemat�cal models developed �n th�s study have the flexibility to model different conditions and assumpt�ons and can be used for the future operat�on of surface and groundwater resources �n th�s complex system.Acknowledgments Th�s study was part�ally supported by a grant from the Research Office of Water Resources Management Organ�zat�on of the M�n�stry of Energy �n Iran. Part of th�s paper was presented at the 2004 Annual ASCE/EWRI Conference. Contr�but�ons of Dr. B. Zahra�e, Ass�stant Professor �n the Department of C�v�l Eng�neer�ng at the Un�vers�ty of Tehran and of Mr. Sh. Araghynejad are hereby acknowledged.
About the authorsDr. Mohammad Karamouz is Professor, School of
M. Karamouz, M. M. R. Tabar�, and R. Kerach�an
Civil Engineering, Univ. of Tehran, Iran. He can bereached at [email protected]. Mr. Tabari is a PhDcandidate at Amirkabir University ([email protected]). Dr. Reza Kerachian is Assistant Prof.School of Civil Engineering, Univ. of Tehran, Iran. Hisemail is [email protected].

176
IWRA, Water International,Volume 32, Number 1, March 2007
aqu�fers.” Journal of Hydraulic Division, ASCE, 89(6): 111-131.
Burker, S.M., and H�tja, H.M. 1996. “Model�ng steady state conjunct�ve groundwater and surface water flow with analintic elements.” Water Resources Research, 30(2).
Burn, D. H. and S. Yul�ant�. 2001. “Waste-load allocat�on us�ng genet�c algor�thms.” Journal of Water Resources Planning and Management, ASCE 127(2): 121-129.
Ch�ang, W.H, and K�nzelbach, W. 2001. 3D-GroundWaterModeling with PMWIN A Simulation System for Modeling Groundwater Flow and Pollution. Spr�nger Publ�sh�ng, New York.
Freder�cks, J., J. Labad�e, and J. Altenhofen. 1998). “Dec�s�on support system for conjunct�ve stream-aqu�fer management.” Journal of Water Resources Planning and Management, ASCE, 124(2): 69-78.
Gen, M. R. and Chang, L. 2000. Genetic Algorithm and Engineering Optimization, W�ley Europe Publ�cat�on.
Hsu, K., H. V. Gupta, and S. Soroosh�an. 1995. “Artificial neural network modeling of the ra�nfall-runoff process.” Water Resources Research, 31(10): 2517-2530.
Hubbell, M. J., C. W. B�shop, G. S. Johnson, and J. G. Loucks. 1997. “Numer�cal groundwater flow modeling of the Snake River plain aquifer us�ng the superpos�t�on techn�que.” Journal of Groundwater, 35(1): 59-60.
Johnson, G. S., D. M. Cosgrov, and J. Sp�nazola. 1998. “Use of MODFLOW for development of response funct�on.” Proceed�ngs of MODFLOW 98 Conference.
Karamouz, M., B. Zahra�e, Sh. Aragh�-Nejhad, M. Shahsavar�e, and S. Torab�. 2001. “An �ntegrated approach to water resources development of the Tehran reg�on �n Iran.” Journal of American Water Resources Association, 37(5): 1301-1311.
Karamouz, M., Kerach�an, R., and Zahra�e, B. 2004a. “Monthly water resources and �rr�gat�on plann�ng: A case study of conjunct�ve use of surface and groundwater resources.” Journal of Irrigation and Drainage Engineer, ASCE,
130(5): 391-402.Karamouz, M., and M. Mohammad Rezapour
Tabar� and Kerach�an, R. 2004b. “Conjunct�ve Use of Surface and Groundwater Resources: Appl�cat�on of Genet�c Algor�thms and Neural Networks.” ASCE Env�ronmental and Water Resources Inst�tute Conference.
Loa�c�ga, H. A. and R. B. Le�pn�k. 2001. “Theory of susta�nable groundwater management: An urban case study.” Urban Water, 3: 217-228.
Longebaugh, R. A. 1970. “Determ�n�ng opt�mum operat�onal pol�c�es for conjunct�ve use of ground and surface water us�ng l�near programm�ng.” ASCE 18th Annual Spec�alty Conference, M�nneapol�s, M�nnesota.
Maddock, T. 1974. “The operat�on of a stream-aqu�fer system under stochast�c demands.” Water Resources Research, 10(1): 1-10.
O’Mara, G. T. J., and J. H. Duloy. 1984. “Model�ng efficient water allocation in a conjunctive use reg�me: the Indus bas�n of Pak�stan.” Water Resources Research, 20(11): 1489-1498.
Onta, P. R., A. D. Gupta, and R. Harboe. 1991. “Mult�-s�te plann�ng models for conjunct�ve use of surface and ground water resources.” Journalof Water Resources Planning and Management, ASCE, 117(6): 662-678.
Qahman, K., Larab�, A., Ouazar, D., Naj�, A., and Alexander H. -D. Cheng. 2005. “Opt�mal and susta�nable extract�on of groundwater �n coastal aqu�fers.” Stochastic Environmental Research and Risk Assessment (SERRA), 19(2): 99-110.
Wardlaw, R., and Shar�f, M. 1999. “Evaluat�on of genet�c algor�thms for opt�mal reservo�r system operat�on.” Journal of Water Resources Planning and Management, ASCE, 125(1): 25-33.
W�ll�s, R., B. F�nney, and D. Zhang. 1989. “Water resources management �n the North Ch�na pla�n.” Journal of. Water Resources Planning and Management, ASCE, 115(5): 598-615.
Yeh, W. W-G. 1992. “System analys�s �n groundwater plann�ng and management.” Journal of Water Resources Planning and Management, ASCE, 118(3): 224-237.
Application of Genetic Algorithms and Artificial Neural Networks in Conjunctive Use of Surface and Groundwater Resources
Buras, N. 1963. "Conjunctive operation of dams andReferences