Applicability of ToF-SIMS for monitoring compositional changes in bone in a long-term animal model
12
rsif.royalsocietypublishing.org Research Cite this article: Henss A, Rohnke M, El Khassawna T, Govindarajan P, Schlewitz G, Heiss C, Janek J. 2013 Applicability of ToF-SIMS for monitoring compositional changes in bone in a long-term animal model. J R Soc Interface 10: 20130332. http://dx.doi.org/10.1098/rsif.2013.0332 Received: 12 April 2013 Accepted: 24 June 2013 Subject Areas: chemical biology Keywords: mass spectrometry, chemical imaging, bone imaging, collagen, calcium distribution in bone Author for correspondence: Marcus Rohnke e-mail: [email protected] giessen.de Applicability of ToF-SIMS for monitoring compositional changes in bone in a long-term animal model Anja Henss 1 , Marcus Rohnke 1 , Thaqif El Khassawna 2 , Parameswari Govindarajan 2 , Gudrun Schlewitz 2,3 , Christian Heiss 2,3 and Juergen Janek 1 1 Institute for Physical Chemistry, Justus-Liebig-University of Giessen, Heinrich-Buff-Ring 58, 35392 Giessen, Germany 2 Laboratory of Experimental Trauma Surgery, University of Giessen, Kerkrader Strasse 9, 35394 Giessen, Germany 3 Department of Trauma Surgery, University Hospital of Giessen-Marburg, Rudolf-Buchheim-Strasse 7, 35385 Giessen, Germany Time-of-flight secondary ion mass spectrometry (ToF-SIMS) is a well- established technique in material sciences but has not yet been widely explored for implementation in life sciences. Here, we demonstrate the applicability and advantages of ToF-SIMS analysis for the study of minerals and biomolecules in osseous tissue. The locally resolved analysis of fragment ions deriving from the sample surface enables imaging and differentiation of bone tissue and facili- tates histology on non-stained cross sections. In a rat model, bilateral ovariectomy combined with either a multi-deficiency diet or steroid treatment was carried out to create osteoporotic conditions. We focused our study on the Ca content of the mineralized tissue and monitored its decline. Calcium mass images of cross sections show the progressive degenerative changes in the bone. We observed a decreased Ca concentration in the edge region of the trabeculae and a decline in the Ca/P ratio. Additionally, we focused on the non-mineralized matrix and identified fragment ions that are characteristic for the collagen matrix. We observed trabeculae with wide ranges of non- mineralized collagen for the diet group owing to an impaired mineralization process. Here, the advantage of coeval monitoring of collagen and minerals indicated an osteomalacic model rather than an osteoporotic one. 1. Introduction For analysing osseous tissue, a wide variety of in and ex vivo methods are well established and unquestionable in their ability to assess bone quality. Standard techniques such as dual-energy X-ray absorptiometry (DEXA) measurements, quantitative computed tomography and X-ray micro-tomography (mCT) are widely used to determine bone mineral density (BMD) [1–3]. BMD represents acalculated mean value of bone mineral content in a given area (usually given as area density in mg mm 22 ). Clinically, a reduced BMD assessed by X-ray absorptiometry is considered to be the first indicator of osteoporosis [1]. However, the BMD does not account for the bone structure and composition in detail [2–4]. A more significant and accurate fingerprint value for the characterization of bone quality is the bone mineral density distribution (BMDD), which was introduced by Roschger and co-workers [5,6]. The BMDD is determined by quan- titative backscattered electron imaging and is validated for clinical use [7]. The macro- and micro-structure of bone can be determined non-destructively by using mCT with a lateral resolution in vitro of 10 mm [2,3,8]. Microbeam X-ray dif- fraction and the more recent synchrotron-based small and wide-angle X-ray scattering (SAXS and WAXS) are well-established diffraction methods for the structural and textural analysis of biological tissue such as bone with a spatial resolution of 1 mm [9,10]. Supplementary information includes the elemental analysis and mapping by X-ray fluorescence imaging (XRF) and m-XRF for & 2013 The Author(s) Published by the Royal Society. All rights reserved.
-
Upload
independent -
Category
Documents
-
view
0 -
download
0
Transcript of Applicability of ToF-SIMS for monitoring compositional changes in bone in a long-term animal model
rsif.royalsocietypublishing.org
ResearchCite this article: Henss A, Rohnke M, El
Khassawna T, Govindarajan P, Schlewitz G,
Heiss C, Janek J. 2013 Applicability of ToF-SIMS
for monitoring compositional changes in bone
in a long-term animal model. J R Soc Interface
10: 20130332.
http://dx.doi.org/10.1098/rsif.2013.0332
Received: 12 April 2013
Accepted: 24 June 2013
Subject Areas:chemical biology
Keywords:mass spectrometry, chemical imaging, bone
imaging, collagen, calcium distribution in bone
Author for correspondence:Marcus Rohnke
e-mail: [email protected]
giessen.de
& 2013 The Author(s) Published by the Royal Society. All rights reserved.
Applicability of ToF-SIMS for monitoringcompositional changes in bone in along-term animal model
Anja Henss1, Marcus Rohnke1, Thaqif El Khassawna2,Parameswari Govindarajan2, Gudrun Schlewitz2,3, Christian Heiss2,3
and Juergen Janek1
1Institute for Physical Chemistry, Justus-Liebig-University of Giessen, Heinrich-Buff-Ring 58, 35392 Giessen,Germany2Laboratory of Experimental Trauma Surgery, University of Giessen, Kerkrader Strasse 9, 35394 Giessen, Germany3Department of Trauma Surgery, University Hospital of Giessen-Marburg, Rudolf-Buchheim-Strasse 7, 35385Giessen, Germany
Time-of-flight secondary ion mass spectrometry (ToF-SIMS) is a well-
established technique in material sciences but has not yet been widely explored
for implementation in life sciences. Here, we demonstrate the applicability and
advantages of ToF-SIMS analysis for the study of minerals and biomolecules in
osseous tissue. The locally resolved analysis of fragment ions deriving from the
sample surface enables imaging and differentiation of bone tissue and facili-
tates histology on non-stained cross sections. In a rat model, bilateral
ovariectomy combined with either a multi-deficiency diet or steroid treatment
was carried out to create osteoporotic conditions. We focused our study on the
Ca content of the mineralized tissue and monitored its decline. Calcium mass
images of cross sections show the progressive degenerative changes in the
bone. We observed a decreased Ca concentration in the edge region of
the trabeculae and a decline in the Ca/P ratio. Additionally, we focused on
the non-mineralized matrix and identified fragment ions that are characteristic
for the collagen matrix. We observed trabeculae with wide ranges of non-
mineralized collagen for the diet group owing to an impaired mineralization
process. Here, the advantage of coeval monitoring of collagen and minerals
indicated an osteomalacic model rather than an osteoporotic one.
1. IntroductionFor analysing osseous tissue, a wide variety of in and ex vivo methods are well
established and unquestionable in their ability to assess bone quality. Standard
techniques such as dual-energy X-ray absorptiometry (DEXA) measurements,
quantitative computed tomography and X-ray micro-tomography (mCT) are
widely used to determine bone mineral density (BMD) [1–3]. BMD represents
a calculated mean value of bone mineral content in a given area (usually given
as area density in mg mm22). Clinically, a reduced BMD assessed by X-ray
absorptiometry is considered to be the first indicator of osteoporosis [1]. However,
the BMD does not account for the bone structure and composition in detail [2–4].
A more significant and accurate fingerprint value for the characterization of
bone quality is the bone mineral density distribution (BMDD), which was
introduced by Roschger and co-workers [5,6]. The BMDD is determined by quan-
titative backscattered electron imaging and is validated for clinical use [7]. The
macro- and micro-structure of bone can be determined non-destructively by
using mCT with a lateral resolution in vitro of 10 mm [2,3,8]. Microbeam X-ray dif-
fraction and the more recent synchrotron-based small and wide-angle X-ray
scattering (SAXS and WAXS) are well-established diffraction methods for the
structural and textural analysis of biological tissue such as bone with a spatial
resolution of 1 mm [9,10]. Supplementary information includes the elemental
analysis and mapping by X-ray fluorescence imaging (XRF) and m-XRF for

primary ion gun
primary ions
yx
secondary ions
mass/charge
mass/charge
inte
nsity
inte
nsity
local mass spectrumstage scan, vertebra
x,y raster
500 × 500 mm2, trabeculae
49.5 × 49.5 mm2, ROI
Ca+
C4H8N+
CaxPOy+
Bi3+
Figure 1. Principles and schematic of time-of-flight secondary ion mass spectrometry.
rsif.royalsocietypublishing.orgJR
SocInterface10:20130332
2
higher Z-elements. By means of focusing capillary optics, a
spatial resolution of 10 mm can be achieved [11]. In 2010, the
value of the combination of SAXS, WAXS and m-XRF for the
analysis of the structural and compositional properties of
bone was successfully demonstrated by Mahamid et al. [12].
Furthermore, transmission electron microscopy (TEM) also
provides structural information on the atomic level of small
sample areas in vitro [13]. Raman microscopy and Fourier
transform–infrared microspectroscopy (FT-IR) are used to
characterize both the organic and inorganic matrix of bone
with a spatial resolution of 1 and 10 mm, and FT-IR also
provides information about the collagen cross-linking [14–16].
In addition, histochemical and immunohistochemical tech-
niques such as stains and indicators have been optimized over
decades and enable the identification of biological tissue, cell
types and activity. However, staining and marker reagents
are limited in number and combination, and the well-known
compounds can be applied only in a targeted manner to
visualize structures in biological tissues. Hence, each of the
different methods provides essential information for bone
characterization and is indispensable in clinical use (DEXA)
or for biologists (histology).
To understand the complexity of the material composi-
tion better and to assess chemical and structural changes in
diseased bone, methods are required that offer detailed chemi-
cal information and enable us to define tissue types, mineral
content and distribution with high sensitivity and a high
spatial resolution. In the present paper, we demonstrate that
time-of-flight secondary ion mass spectrometry (ToF-SIMS)
provides this information and that its supplementary use
helps to bridge the gap between tissue and mineral analysis.
ToF-SIMS was originally developed as a technique for the
analysis of inorganic solids and in particular for the evaluation
of concentration differences with very high depth resolution.
In recent years, several studies have been performed to explore
and prove the capability of ToF-SIMS for surface analysis and
structural investigations in biological samples [17]. The tech-
nique has been used to characterize phospholipids, peptides
and other biomolecules on the cellular level [18–22]. The
value of two-dimensional imaging as well as three-dimen-
sional analytical reconstruction has been demonstrated [17].
In medicine, ToF-SIMS can be used to localize drugs and to
explore their distribution in different types of tissue. Based
on earlier studies on pure hydroxyapatite, for example, Malm-
berg et al. and Eriksson et al. characterized bone tissue by ToF-
SIMS and analysed the incorporation behaviour of titanium
implants [23–26]. Furthermore, ToF-SIMS studies on bone
and implant materials have been published by Ni et al. [27]
and Lu et al. [28]. In a more recent study, Zoehrer et al. [29]
applied ToF-SIMS as a supplementary method to characterize
human femoral bone. Up to now, ToF-SIMS has not been
applied to study affected bone in a manner as detailed as we
present herein.
In the following, we report systematic results on the use of
ToF-SIMS mass spectra and images of high spatial resolution
(less than 300 nm) for the analysis and characterization of dis-
eased and normal bone in a long-term small animal rat
model, where pathological changes are induced by ovari-
ectomy combined with either a special multi-deficiency diet
or a steroid medication. We reveal the advantages of ToF-
SIMS using embedded but non-stained cross sections and
use the chemical information to image and characterize sim-
ultaneously the inorganic and organic matrix.
The main objective of this paper is to demonstrate
the wealth of information that we can obtain by using ToF-
SIMS in addition to well-established techniques.
2. Results2.1. Bone tissue analysis2.1.1. Mass spectraThe procedure of ToF-SIMS analyses of bone samples carried
out in our study is shown schematically in figure 1. A typical
positive mass spectrum of trabecular area is depicted in

Ca+
(a) (b)
(c) (d)
(e) ( f )
5 × 10⁴ 8 × 10³
6 × 10³
4 × 10³
2 × 10³
7 × 101
6 × 101
5 × 101
4 × 101
3 × 101
2 × 101
1 × 101
6 × 10⁻³ 3.0 × 10⁴
12 months sham
12 months diet
5 × 10⁻³
4 × 10⁻³
3 × 10⁻³
2 × 10⁻³
1 × 10⁻³
0
39.95 39.96 39.97
0
4 × 10⁴
3 × 10⁴
2 × 10⁴
1 × 10⁴
0
1500
1250
1000
750
500
250
0200 250 300 350
10 20 30 40 50 60 70 80 90 100
10 20 30 40 50 60 70 80 90 100
100 110 120 130 140 150 160 170 180 190 200
C4H8N+CH4N+
CNO–
CN–
PO2– PO3
–
inte
nsity
(co
unts
)
inte
nsity
(co
unts
)
inte
nsity
(co
unts
)
inte
nsity
(co
unts
)in
tens
ity (
coun
ts)
norm
. int
ensi
ty (
coun
ts)
m/z m/z
C4H6N+
CaF+
C4H8NO+
CaPO2+
Ca2PO+3
Ca2PO+4
Ca3PO+5
Ca4PO+6
Ca5PO+6
Ca5PO+7
Ca6PO+8
Ca6PO+8
Ca6P3O13
Ca5P3O12Ca7P3O14
Ca8P3O15Ca9P3O16
400 400450 500 500 600 700
reference
2.5 × 10⁴
2.0 × 10⁴
1.5 × 10⁴
1.0 × 10⁴
5.0 × 10³
0
+
++
+
+
Figure 2. Positive ion mass spectra from mineralized bone tissue of a rat obtained with Bi3þ primary ions. Mass spectra are shown in the ranges (a) 1 , m/z , 100, (b)
100 , m/z , 200, (c) 200 , m/z , 500, (d ) 350 , m/z , 750. (e) Caþ signal for the reference—12 months sham—and 12 months diet groups and ( f ) negativeion mass spectrum 1 , m/z , 100.
rsif.royalsocietypublishing.orgJR
SocInterface10:20130332
3
figure 2a–d. Several fragment ions were found to be derived
from a Ca10(PO4)6(OH)2 precursor species (ion, m/z value, in
the following always given in Da; Caþ, 39.96; Ca2PO3þ, 158.89;
Ca2PO4þ, 174.88; Ca5P3O12
þ , 484.12; Ca6P3O13þ , 540.04;
Ca7P3O14þ , 595.87; Ca8P3O15
þ , 651.79; Ca9P3O16þ , 707.65). Separ-
ation of the hydroxyl ion OH2 from Ca5(PO4)3OH yields the
mass fragment Ca5(PO4)3þ, 484.12. The fragment CaFþ, 58.96,
could also be identified in the mass spectrum. The fragments
CH4Nþ, 30.03; C4H6Nþ, 68.05; C4H8Nþ, 70.07, are known resi-
dues of the amino acid proline, one of the main components of
collagen type 1 [30]. C4H8NOþ, 86.06, can be assigned as a
hydroxyproline fragment. Figure 2e shows representative
mass spectra for the reference—12 months sham—and 12
months diet groups for the Ca signal. An intense Ca signal
was found for the 12 months sham group. An excerpt from a
typical negative mass spectrum is depicted in figure 2f. PO32,
79.96; PO22, 62.94, were found to derive primarily from the
mineralized areas, CN2, 26.10, from non-mineralized organic
compounds in spectra obtained in the negative ion mode.
2.1.2. Chemical imagingUsing the chemical information, we were able to visualize
the bone specimen morphology and its composition similar
to histology, but without the need for staining. In figure 3,
the microscopic view of the bone tissue (figure 3a) and the
corresponding ToF-SIMS image (figure 3b) are shown. The
cross section, which has been prepared to visualize bone
quality in a histological investigation, shows part of an osteo-
porotic rat vertebra. Trabeculae (Tb), osteoid (Os), bone

microscopic view(a)
At
At
75 mm 40 mm
40 mm100 mm300 mm
ToF-SIMS image 1positive
2positive 2negative
1negative
At
At At
Tb
Tb
Tb
Tb Tb
OsOs
300 mm
100 mm 100 mm
100 mm 100 mm
1
2
AtTb
Tb
TbOs
Tb
1
2
(b)
Figure 3. Light optical view (a) and corresponding ToF-SIMS image (b) of impaired bone quality in the spine of the ovariectomized þ diet group at 12 months (Tb,trabecular bone; At, adipose tissue; Os, osteoid). (a) Microscopic view: toluidine blue histological staining on EPON-embedded samples used to visualize bone quality.Adipose tissue (At) appears in large regions (red boxes). Wide areas of non-mineralized tissue within and around the borders of trabecular bone indicate increased osteoidregions (Os; red arrow, black boxes). (b) ToF-SIMS image: histology by mass spectrometry. ToF-SIMS image (overview) recorded in the positive ion mode, Bi3
þ, showing theoverlay of Caþ (green), C4H8Nþ (red) and C4H9
þ (blue) mass signals. The dashed line indicates the corresponding microscopic view. Detailed images recorded in thepositive ion mode, Bi1
þ, showing the overlay of 1positive Caþ (green), C4H8Nþ (red), C4H9þ (blue) and 2positive Caþ(green), C4H8Nþ (red). Detailed images recorded
in negative ion mode showing the overlay of 1negative PO32 (green), CN2 (red), sum of C16Hx ¼ 29237O2 (blue) and 2negative PO3
2 (green), CN2 (red).
rsif.royalsocietypublishing.orgJR
SocInterface10:20130332
4
marrow, connective tissue and adipose tissue (At) can be dis-
criminated. The ToF-SIMS image recorded in the positive ion
mode, collecting all positive SIs, gives an overview using the
information from the lateral distribution of the Caþ signal in
green, the C4H8Nþ signal in red and the C4H9þ signal in blue
(figure 3b). Here, the C4H9þ signal represents residues of the
adipose tissue. These three mass signals suffice to identify
unambiguously the mineralized trabecular area, the non-
mineralized connective tissue as well as the cell membranes
of the adipose tissue. In addition to the overview image, two
smaller regions (1 and 2) have been analysed in the positive
as well as in the negative ion mode. The images recorded in
the positive mode show an overlay of the Caþ (green) signal,
the C4H8Nþ(red) signal and the C4H9þ(blue) signal (1positive
and 2positive). The detail image 2positive allows a distinct deter-
mination of the trabeculae (Tb) in green and the surrounding
non-mineralized border, the so-called osteoid (Os), in red.
The corresponding negative ion mode images show the overlay
of PO32 signals in green (Tb), CN2 signals in red (Os) and sig-
nals of various long-chain fatty acid fragments such as
C16H29O2 in blue. Mapping signals of long-chain fatty acid
fragments identifies the cellular membrane structure of adi-
pose tissue in the negative ion mode. However, the images
recorded in the negative ion mode also allow distinct discrimi-
nation between trabeculae (green), non-mineralized areas such
as osteoid (red) and adipose tissue (blue).
2.1.3. Characterization of boneFrom the positive SIs, we gain information about the local dis-
tribution of minerals as well as of the organic compounds in
the bone. The Ca images shown in figure 4c,g,h exhibit a
quite heterogeneous distribution of Ca all over the trabecular
meshwork. In addition, numerous microfractures within the
trabecular bone are visible. In the immediate vicinity of
some fractures, calcium is accumulated, or the fractures are
located particularly in areas of high Ca content. Furthermore,
the fibril structure of collagen type 1 can be recognized to
some extent. The mass images of Caþ and C4H8Nþ provide
complementary information about the distribution of hydro-
xyapatite and collagen, as shown in figure 4e,f.
2.2. Analysis of diseased bone2.2.1. Scans of vertebraeThe mass images of Caþ and C4H8Nþ depict the structure of
rat vertebrae from the 12 months sham group (figure 5a,b)

(a)
(b)
(c)
(d)
(g)
(h)
(e)
( f )
100 mm
1 2
4 3
100 mm
100 mm
10 mm
100 mm
100 mm
20 mm
20 mm
Figure 4. ToF-SIMS images (a) of an osteoporotic trabecula showing the Caþ distribution (500 � 500 mm2, Bi3þ, high-current bunched mode) and the contour of
the collagen structure (white). (b) Corresponding C4H8Nþ image representing the collagen structure of the trabecula (a). (c) 500 � 500 mm2, Bi3þ, image of the
trabecular meshwork obtained in the unbunched mode for high lateral resolution showing numerous trabecular microfractures. (d ) 49.5 � 49.5 mm2 image, Biþ,obtained in the unbunched burst mode for the determination of the Ca content of the edge and centre regions of the trabecula. (e,f ) Detailed view of (c), 99 �99 mm2, Bi3
þ, obtained in the unbunched mode for high lateral resolution showing the Caþ (e) and C4H8Nþ ( f ) distribution representing the fibril structure ofcollagen. (g,h) Caþ images, 500 � 500 mm2, Bi3
þ, showing numerous trabecular microfractures and accumulation of Ca adjacent to the fractures (white arrow) forreference group (g) and 12 months diet group (h).
Ca+
Ca+
C4H8N+
C4H8N+
1mm 1mm
1mm 1mm
(a) (b)
(c) (d)
Figure 5. ToF-SIMS images of the whole vertebra of (a,b) the 12 months sham group and (c,d) the 12 months diet group showing the Caþ (a,c) and the C4H8Nþ
(b,d) distribution, Bi3þ, high-current bunched mode, stage scans 9 � 9 (a,b) and 6 � 6 mm2 (c,d).
rsif.royalsocietypublishing.orgJR
SocInterface10:20130332
5
100 mm 100 mm 100 mm 100 mm
100 mm100 mm100 mm
3 months sham
12 months diet3 months diet 14 months diet
12 months sham 14 months sham0 months reference40
30
20
10
040
30
20
10
0
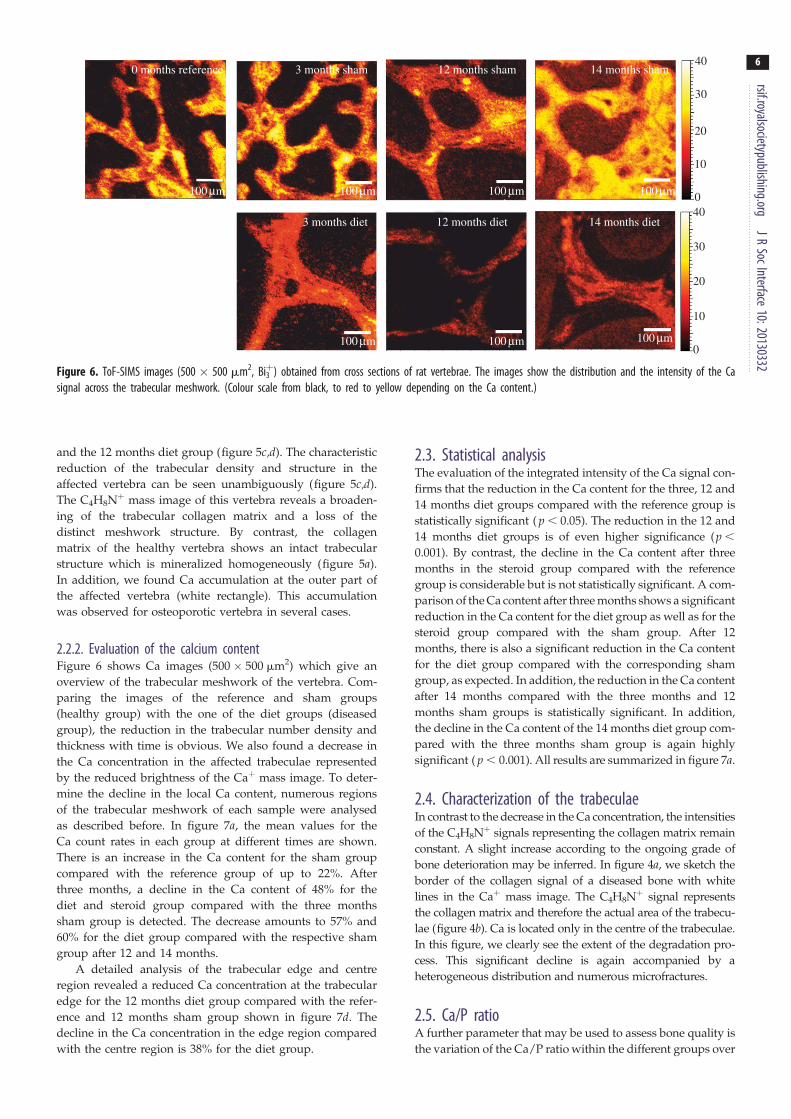
Figure 6. ToF-SIMS images (500 � 500 mm2, Bi3þ) obtained from cross sections of rat vertebrae. The images show the distribution and the intensity of the Ca
signal across the trabecular meshwork. (Colour scale from black, to red to yellow depending on the Ca content.)
rsif.royalsocietypublishing.orgJR
SocInterface10:20130332
6
and the 12 months diet group (figure 5c,d). The characteristic
reduction of the trabecular density and structure in the
affected vertebra can be seen unambiguously (figure 5c,d).
The C4H8Nþ mass image of this vertebra reveals a broaden-
ing of the trabecular collagen matrix and a loss of the
distinct meshwork structure. By contrast, the collagen
matrix of the healthy vertebra shows an intact trabecular
structure which is mineralized homogeneously (figure 5a).
In addition, we found Ca accumulation at the outer part of
the affected vertebra (white rectangle). This accumulation
was observed for osteoporotic vertebra in several cases.
2.2.2. Evaluation of the calcium contentFigure 6 shows Ca images (500 � 500 mm2) which give an
overview of the trabecular meshwork of the vertebra. Com-
paring the images of the reference and sham groups
(healthy group) with the one of the diet groups (diseased
group), the reduction in the trabecular number density and
thickness with time is obvious. We also found a decrease in
the Ca concentration in the affected trabeculae represented
by the reduced brightness of the Caþ mass image. To deter-
mine the decline in the local Ca content, numerous regions
of the trabecular meshwork of each sample were analysed
as described before. In figure 7a, the mean values for the
Ca count rates in each group at different times are shown.
There is an increase in the Ca content for the sham group
compared with the reference group of up to 22%. After
three months, a decline in the Ca content of 48% for the
diet and steroid group compared with the three months
sham group is detected. The decrease amounts to 57% and
60% for the diet group compared with the respective sham
group after 12 and 14 months.
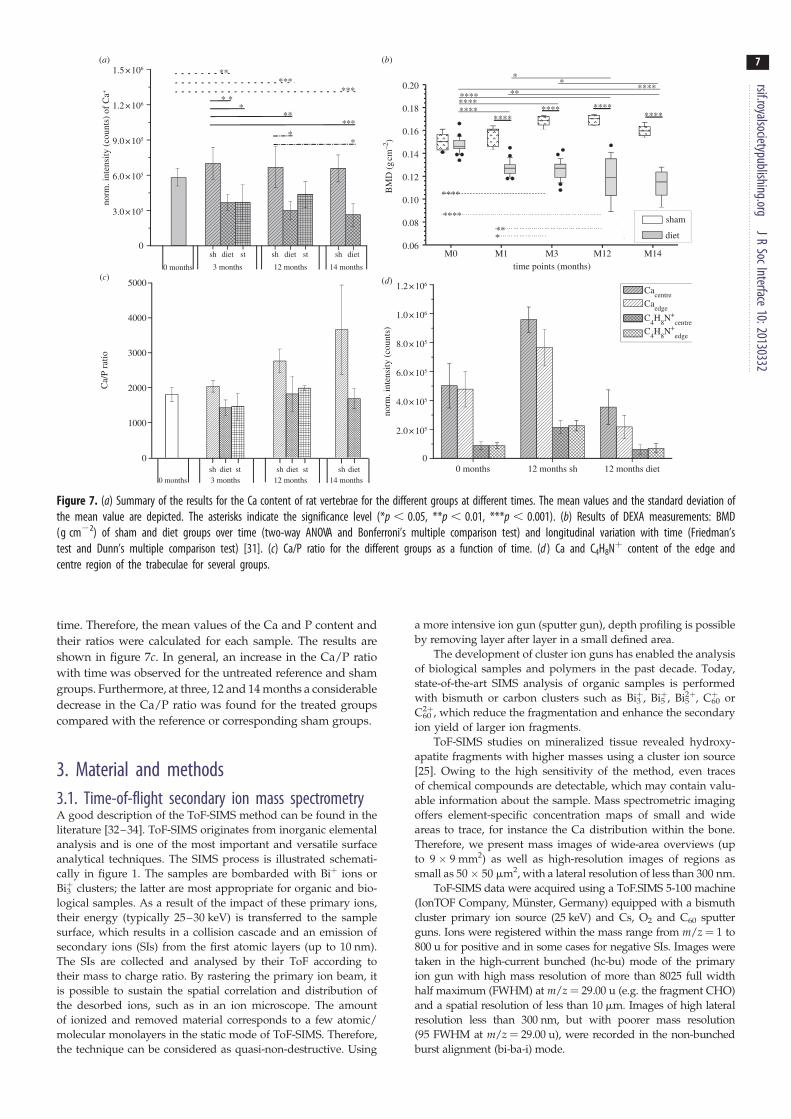
A detailed analysis of the trabecular edge and centre
region revealed a reduced Ca concentration at the trabecular
edge for the 12 months diet group compared with the refer-
ence and 12 months sham group shown in figure 7d. The
decline in the Ca concentration in the edge region compared
with the centre region is 38% for the diet group.
2.3. Statistical analysisThe evaluation of the integrated intensity of the Ca signal con-
firms that the reduction in the Ca content for the three, 12 and
14 months diet groups compared with the reference group is
statistically significant ( p , 0.05). The reduction in the 12 and
14 months diet groups is of even higher significance (p ,
0.001). By contrast, the decline in the Ca content after three
months in the steroid group compared with the reference
group is considerable but is not statistically significant. A com-
parison of the Ca content after three months shows a significant
reduction in the Ca content for the diet group as well as for the
steroid group compared with the sham group. After 12
months, there is also a significant reduction in the Ca content
for the diet group compared with the corresponding sham
group, as expected. In addition, the reduction in the Ca content
after 14 months compared with the three months and 12
months sham groups is statistically significant. In addition,
the decline in the Ca content of the 14 months diet group com-
pared with the three months sham group is again highly
significant ( p , 0.001). All results are summarized in figure 7a.
2.4. Characterization of the trabeculaeIn contrast to the decrease in the Ca concentration, the intensities
of the C4H8Nþ signals representing the collagen matrix remain
constant. A slight increase according to the ongoing grade of
bone deterioration may be inferred. In figure 4a, we sketch the
border of the collagen signal of a diseased bone with white
lines in the Caþ mass image. The C4H8Nþ signal represents
the collagen matrix and therefore the actual area of the trabecu-
lae (figure 4b). Ca is located only in the centre of the trabeculae.
In this figure, we clearly see the extent of the degradation pro-
cess. This significant decline is again accompanied by a
heterogeneous distribution and numerous microfractures.
2.5. Ca/P ratioA further parameter that may be used to assess bone quality is
the variation of the Ca/P ratio within the different groups over
time points (months)
BM
D (
g cm
–2)
M0 M1 M3 M12 M14
Cacentre
Caedge
C4H
8N+
centreC
4H
8N+
edge
0.06
0.08
0.10
0.12
0.14
0.16
0.18
0.20
******** ****
****
****
**
****
************
****
*
*
***
(a) (b)
(d)(c)
1.5 × 10⁶
1.2 × 10⁶
9.0 × 10⁵
6.0 × 10⁵
3.0 × 10⁵
0
1.0 × 10⁶
1.2 × 10⁶
8.0 × 10⁵
6.0 × 10⁵
4.0 × 10⁵
2.0 × 10⁵
00 months 12 months sh 12 months diet
0
1000
2000
3000
4000
5000
0 months 3 months
sh diet st
*
*
**
*
***
**
***
**
sham
diet
norm
. int
ensi
ty (
coun
ts)
of C
a+C
a/P
ratio
norm
. int
ensi
ty (
coun
ts)
**
*
12 months 14 months
sh diet sh dietst
0 months 3 monthssh diet st
12 months 14 monthssh diet sh dietst
Figure 7. (a) Summary of the results for the Ca content of rat vertebrae for the different groups at different times. The mean values and the standard deviation ofthe mean value are depicted. The asterisks indicate the significance level (*p , 0.05, **p , 0.01, ***p , 0.001). (b) Results of DEXA measurements: BMD(g cm22) of sham and diet groups over time (two-way ANOVA and Bonferroni’s multiple comparison test) and longitudinal variation with time (Friedman’stest and Dunn’s multiple comparison test) [31]. (c) Ca/P ratio for the different groups as a function of time. (d ) Ca and C4H8Nþ content of the edge andcentre region of the trabeculae for several groups.
rsif.royalsocietypublishing.orgJR
SocInterface10:20130332
7
time. Therefore, the mean values of the Ca and P content and
their ratios were calculated for each sample. The results are
shown in figure 7c. In general, an increase in the Ca/P ratio
with time was observed for the untreated reference and sham
groups. Furthermore, at three, 12 and 14 months a considerable
decrease in the Ca/P ratio was found for the treated groups
compared with the reference or corresponding sham groups.
3. Material and methods3.1. Time-of-flight secondary ion mass spectrometryA good description of the ToF-SIMS method can be found in the
literature [32–34]. ToF-SIMS originates from inorganic elemental
analysis and is one of the most important and versatile surface
analytical techniques. The SIMS process is illustrated schemati-
cally in figure 1. The samples are bombarded with Biþ ions or
Bi3þ clusters; the latter are most appropriate for organic and bio-
logical samples. As a result of the impact of these primary ions,
their energy (typically 25–30 keV) is transferred to the sample
surface, which results in a collision cascade and an emission of
secondary ions (SIs) from the first atomic layers (up to 10 nm).
The SIs are collected and analysed by their ToF according to
their mass to charge ratio. By rastering the primary ion beam, it
is possible to sustain the spatial correlation and distribution of
the desorbed ions, such as in an ion microscope. The amount
of ionized and removed material corresponds to a few atomic/
molecular monolayers in the static mode of ToF-SIMS. Therefore,
the technique can be considered as quasi-non-destructive. Using
a more intensive ion gun (sputter gun), depth profiling is possible
by removing layer after layer in a small defined area.
The development of cluster ion guns has enabled the analysis
of biological samples and polymers in the past decade. Today,
state-of-the-art SIMS analysis of organic samples is performed
with bismuth or carbon clusters such as Bi3þ, Bi5
þ, Bi52þ, C60
þ or
C602þ, which reduce the fragmentation and enhance the secondary
ion yield of larger ion fragments.
ToF-SIMS studies on mineralized tissue revealed hydroxy-
apatite fragments with higher masses using a cluster ion source
[25]. Owing to the high sensitivity of the method, even traces
of chemical compounds are detectable, which may contain valu-
able information about the sample. Mass spectrometric imaging
offers element-specific concentration maps of small and wide
areas to trace, for instance the Ca distribution within the bone.
Therefore, we present mass images of wide-area overviews (up
to 9 � 9 mm2) as well as high-resolution images of regions as
small as 50 � 50 mm2, with a lateral resolution of less than 300 nm.
ToF-SIMS data were acquired using a ToF.SIMS 5-100 machine
(IonTOF Company, Munster, Germany) equipped with a bismuth
cluster primary ion source (25 keV) and Cs, O2 and C60 sputter
guns. Ions were registered within the mass range from m/z ¼ 1 to
800 u for positive and in some cases for negative SIs. Images were
taken in the high-current bunched (hc-bu) mode of the primary
ion gun with high mass resolution of more than 8025 full width
half maximum (FWHM) at m/z ¼ 29.00 u (e.g. the fragment CHO)
and a spatial resolution of less than 10 mm. Images of high lateral
resolution less than 300 nm, but with poorer mass resolution
(95 FWHM at m/z ¼ 29.00 u), were recorded in the non-bunched
burst alignment (bi-ba-i) mode.

rsif.royalsocietypublishing.orgJR
SocInterface10:20130332
8
Bi3þ primary ions were supplied with a target current of 0.2–0.5 pA for the hc-bu mode and of 0.02 –0.1 pA for the bi-ba-i
mode. The fields of view ranged from wide-area overviews of the
whole vertebra of 9 � 9 mm2 (figure 5a–d), medium-sized areas of
500 � 500 mm2 (figures 3a,b, 4a–c,h,i and 6) to small-area images
of 99� 99 mm2 (figure 4e,f) and of 49.5 � 49.5 mm2 (figure 4d).
The small-area images of 49.5 � 49.5 mm2 size were taken in the
hc-bu mode to analyse the Caþ concentration. The resolution was
128 � 128 pixels for small-area images as well as for the 500�500 mm2 images (figure 6). The resolution of the 99� 99 mm2
images (figure 4e,f) and for 500 � 500 mm2 image (figure 4c) was
512 � 512 pixels. The resolution of the 500� 500 mm2 images
shown in figure 3a,b, taken in the bi-ba-i mode, was 1024 � 1024
pixels. All images except for those in figure 3 are presented in a
colour scale ranging from black to red to bright yellow depending
on the mass signal intensity. Bright colours represent high signal
intensities, i.e. large SI yields. During all measurements, charge com-
pensation was applied. All SI yields are normalized to the applied
primary ion current. For data evaluation, the IonTOF software SUR-
FACELAB v. 6.3 was used.
For a semi-quantitative comparison of the Ca concentration of
affected and normal bone, we defined three to five measurement
areas with a size of 49.5� 49.5 mm2 on the trabeculae of each
sample and calculated the average count rates for Ca (figure 7a),
normalized to the primary ion current. The error is given as the
average deviation from the calculated mean value. In addition,
the averaged count rates for P were also calculated to give the
Ca/P ratio for all examined groups of samples (figure 7c).
A semi-quantitative analysis of the Ca concentration of the
edge and centre regions of the trabeculae was carried out for
the sham (12 months), reference and diet (12 months) group of
animals (figure 7d ). Therefore, areas of 49.5 � 49.5 mm2 were
analysed using Biþ, bi-ba-i-burst mode, at a resolution of 256 �256 pixels over 500 scans. Afterwards, the area was divided
into four equal regions of interest (ROIs), and the Ca content of
each ROI was calculated by data reconstruction. For each case,
edge and centre, two ROIs and the corresponding averaged
count rate of Ca were calculated and compared (figure 4d ).
3.2. Statistical analysisStatistical analysis was performed using the one-way ANOVA test
accompanied by Games–Howell pairwise multiple comparison to
determine the variation of the Ca content in each group and among
groups at particular times as well as over the whole duration of the
experiment. The asterisks indicate the significance level (*p , 0.05,
**p , 0.01, ***p , 0.001). The results were expressed as the mean
and standard error (figure 7a). The evaluation was conducted
using the software IBM SPSS STATISTICS v. 20.
3.3. Sample preparation of the cross sectionsThe protocol and procedures used in the animal experiment have
been reported previously in detail [31]. This experimental study
was performed in full compliance with German and our insti-
tution’s animal protection laws and was approved by the ethics
commission of the local governmental institution (‘Regierung-
sprasidium’ Giessen/Germany, permit number: 89/2009 and
20/10-Nr.A31/2009).
Vertebrae were collected after euthanasia at distinct times
(three, 12 and 14 months). Fifty-six samples were embedded
in polymethylmethacrylate (Technovit 9100; Heraeus Kulzer,
Hanau, Germany). The embedded samples were cut and
ground into slices of 20–50 mm thickness. The quality of the sur-
face finish was examined under the optical microscope. One
additional sample was embedded in EPON resin mix, as pre-
viously described [35], sectioned and stained with toluidine
blue. Images were taken using a light microscope (Axioplan 2
imaging with photo module Axiophot 2, Carl Zeiss, Jena,
Germany) using 1 Leica DC500 camera (Leica, Bensheim,
Germany), acquired with Leica IM1000 software and processed
using Adobe PHOTOSHOP CS3 Extended, v. 10.0.1.
For the ToF-SIMS analysis, we used samples from 19 animals
in the sham group (time of euthanasia in months, number of ani-
mals; 3, 7; 12, 6; 14, 6), from 23 animals in the diet group (3, 7; 12,
7; 14, 9), from nine animals in the steroid group (3, 7; 12, 2) and
from eight animals in the reference group at the beginning of the
experiment (0, 8).
4. DiscussionToF-SIMS as a non-routine method in medicine was applied
to analyse osseous tissue and to study the ongoing grade of
bone deterioration in an animal model. We analysed affected
and normal bone and therefore focused on the main
components of the bone, Ca and collagen.
The analysis of mineralized areas reveals typical hydroxy-
apatite fragments characterized by a sequence of masses
separated by the mass of CaO (m/z ¼ 55.96 Da), as recently
reported by Malmberg et al. [25]. Molecular organic frag-
ments, such as CH4Nþ, 30.03; C4H6Nþ, 68.05; C4H8Nþ,
70.07; and C4H8NOþ, 86.06, were detected and identified to
be characteristic residues of glycine, proline and hydroxypro-
line, the main amino acids of collagen [30,36]. We consider
these signals also to be characteristics for the collagen
matrix of the composite material bone. This is supported by
the analysis and interpretation of numerous mass images
of the trabeculae. The spatially resolved detection of these
fragments provides information on the localization of the col-
lagen matrix within the bone. The good lateral resolution
allows imaging of the fibril structure in high-resolution
mass images (figure 4e,f ). Areas of non-mineralized osteoid
at the interface of trabeculae and bone marrow could be
localized (figure 3). By mapping the collagen signals, we
identified regions of high and low collagen content (always
complementary to the Ca distribution). The complementary
characteristics of the collagen matrix and the hydroxyapatite
correlate well with the deposition process of hydroxyapa-
tite along the collagen fibrils [37]. In addition, negatively
charged ions such as PO32, PO2
2, CN2 or long-chain fatty
acid fragments were used to identify cellular structures
within the osseous tissue. In particular, the PO32 ion as well
as the PO22 ion provide rich information: on the one hand,
these ions originate from the mineralized part of the bone,
represented by hydroxyapatite (Ca5(PO4)3OH), whereas, on
the other hand, these ions are characteristic of cellular parts
of the bone tissue being residues from the phospholipids of
the cell membrane and also of the phosphate groups of the
chromosomes in the cell nucleus.
The distribution of Ca within the bone tissue is an impor-
tant parameter to assess bone quality [29,38]. It is known
from the literature that heterogeneity of mineralization affects
the local material properties and therefore bone quality.
Contradictory studies on the distribution of minerals and
the associated fracture risk in osteoporotic bone can be
found in the literature [29,39,40]. We determined the spatial
distribution of calcium, phosphate and several calcium
phosphate ion fragments originating from hydroxyapatite.
Our results confirm a heterogeneous distribution of Ca for
the healthy as well as for the affected bone. However, an
increased heterogeneity for the treated groups could not be
determined. For the reference group, we observed the

rsif.royalsocietypublishing.orgJR
SocInterface10:20130332
9
collagen matrix on average being covered homogeneouslywith Ca but with local increased concentrations especially
at interfaces of microfractures. These small accumulations
appear to be characteristic for young and healthy bone. The
microfractures, which are scattered all over the trabeculae,
are the result of mechanical stress and have already been
described in the literature [41–43]. Microcracks release
strain and avoid complete fracture. The occurrence of micro-
fractures and the subsequent remodelling are consequences
of the normal functional loading of the skeleton and its adap-
tation to individual physical demand. While an increased
number of microfractures in the case of older age or osteo-
porosis is described for human trabeculae [39], our study
on rat bones does not confirm this. We cannot show unequi-
vocally a significant increase in microcracks for the groups
with osteoporotic phenotype. This might be due to the fact
that physical stress, on the one hand, and altered mechanical
conditions, on the other hand (hyper-mineralization for
example), have a lower impact on microspecimens (rats)
than on macrospecimens (humans).
Nevertheless, the microcracks exhibit different character-
istics for the reference and sham groups than for the treated
groups. For the non-affected trabeculae, a Ca accumulation
directly localized at the microcracks is found (figure 4g).
Apparently, those microcracks arise in the areas of higher
mineral content with reduced elasticity and higher brittle-
ness. The increased Ca concentration suggests increased
remodelling activity at the location of the crack. In the case
of diseased trabeculae, Ca accumulations along the fractures
are more expanded and randomized (figure 4h). Although
the dehydration step during the preparation process also
causes fractures, the exclusive appearance of microcracks as
artefacts can be excluded. The characteristic accumulation
of Ca and the complementary structure of the collagen
matrix right at those fractures allow the distinct differen-
tiation between microfractures and artefacts. A heightened
Ca intensity as a result of edge effects can be excluded for
the same reasons.
Furthermore, a remarkable decrease in the Ca content can
be documented from the centre to the edge region for the diet
group with time in a semi-quantitative analysis. We suggest
that this is caused by the disturbed mineralization process
owing to osteoporotic conditions. An unbalanced remodel-
ling process may account for overactivity of the osteoclasts,
which release hydroxyapatite and the collagen matrix.
We suppose that the enzymatic dissolution of the collagen
matrix is not complete, hence parts of the collagen matrix
remain unchanged. In the following step of the remodelling
process, osteoblasts start to rebuild new bone by expressing
extracellular matrix as a scaffold for the crystallization of cal-
cium phosphate crystals. Owing to the calcium, phosphoros
and vitamin D deficiency caused by the deficit in nutrition,
the mineralization process is extenuated or even impossible
[44]. The result is a heterogeneous distribution of Ca, some-
times leading to a complete absence of minerals in wide
regions. The extent of non-mineralized collagen might be
an argument for an induced osteomalacia rather than osteo-
porosis. This has to be confirmed by further studies. Stage
scans of the whole vertebra clearly show the extent of the
pathological degradation process. The release of the minerals
leads to a trabecular meshwork consisting mainly of collagen,
as shown in figure 5d. Considering the whole vertebra, it
becomes apparent that, in unstressed regions of the inner
part, an extended Ca depletion can be found. By contrast,
an accumulation of calcified tissue is found in the outer
region. This part of the vertebra sustains the largest portion
of physical strain. As remodelling and mineralization is
adapted to stress-related strain, these burdened regions exhi-
bit an increased content of calcium [45,46].
Ca mass images of the trabecular meshwork also showed
a remarkable reduction in the trabecular number and thick-
ness, which would be in accordance with an osteoporotic
disease pattern [47]. In addition, the semi-quantitative evalu-
ation of the Ca content revealed a significant decline in Ca for
the affected groups. Here, the ToF-SIMS data show the same
tendencies as the corresponding DEXA measurements, as
shown in figure 7b. But, the decline of Ca (in terms of per-
centage) clearly exceeds the decrease in BMD obtained by
DEXA measurements. This is probably due to the selectivity
of ToF-SIMS, which allows the exclusive evaluation of the
Ca signal, whereas DEXA integrates all X-ray absorbing
components such as Si, Mg or Sr. Furthermore, the natural
growth of the animals’ skeletons has to be considered as
it results in increasing bone thickness and bone volume. For
the DEXA data evaluation, it was not possible to account
for the parameter bone thickness sufficiently. Therefore, the
calculated BMD values are systematically too high with
ongoing age of the rats. It has to be noted that SIMS
does not a priori offer direct information on absolute concen-
trations. The count rates of the mass signals are proportional
to the surface concentrations of the respective species, but
they also depend on a number of other sample properties,
which influence the ionization process. A substantial
decrease in the Ca content owing to pathological modifi-
cations of the bone influences the composition of the matrix
and therefore the ionization probability for Ca. So, for a
semi-quantitative comparison of the Ca concentration of
affected and normal bone, all samples have been prepared
in the same way, and identical measurement conditions
were applied to give good reproducibility. For a quantitative
interpretation of the measured mass signal intensities, the
matrix effect has to be considered, and calibration with suit-
able standards is necessary. We are currently defining such
standards and are aiming for a reliable quantification of the
Ca content using ToF-SIMS in a future study. Our own pre-
liminary measurements showed a linear correlation of the
Ca signal with the Ca content within the range of 40–80%
Ca in a collagen matrix.
As known from the literature, the building of hydroxy-
apatite Ca10(PO4)6(OH)2 proceeds via several stages with
various calcium phosphate phases as precursors [48]. Amor-
phous calcium phosphate as well as octa calcium phosphate
are discussed as potential biologically relevant precursors
of hydroxyapatite in bone [48]. The different calcium phos-
phate phases are characterized by their chemical formula
and their Ca/P ratio [49]. The local Ca/P ratio of the bone
indicates the stage of mineralization and allows the assess-
ment of bone quality. Therefore, the analysis of the Ca/P
ratio with time can provide supplementary information
about the mineralization process and its alteration in systemi-
cally diseased bone. Diverging results have been published so
far on this subject. While Zoehrer et al. [29] found an
increased Ca/P ratio based on imbalance and decrease of P
in the case of osteoporosis, the study by Basle et al. [50]
showed no differences. By contrast, Tzaphlidou et al. as
well as Kourkoumelis et al. reported a correlation of
rsif.royalsocietypublishing.orgJR
SocInterface10:20130332
10
osteoporosis with decreased Ca/P ratio in various studies[51–53]. We evaluated the Ca/P ratio for the different
groups after defined time intervals. For the untreated and
healthy groups (reference and sham), we observed an increas-
ing Ca/P ratio with time. This is explained by the advancing
age of the animals and crystallization of young to mature
bone, respectively. The density of densely mineralized
regions increases with age [5,6,54]. The study by Zoehrer
et al. [29] reveals that areas of higher mineralization exhibit
an increased Ca/P ratio, and our results are in accord with
this. By contrast, the Ca/P ratio of the corresponding diet
groups shows a decrease in the Ca/P ratio with time. As
we did not observe regions of high calcium content and
areas of low Ca content in particular, as Zoehrer et al. [29]
reported for human bone, the decrease in the Ca/P ratio
appears to be characteristic for the treated groups, indicating
lower bone quality and therefore osteoporotic patterns.
We could confirm, in the present study, that alterations
of the chemical composition of the inorganic and organic
matrix have to be taken into account when estimating bone
quality [16,37,53]. Our study also emphasizes the need for
imaging methods, which facilitate the examination of both
to elucidate disease patterns in more detail. Owing to the
higher spatial resolution than FT-IR [16] (300 nm), good
mass resolution (R . 8000) and high sensitivity (in the ppm
range), ToF-SIMS has been found to be a valuable technique
to address this task. So, the results presented herein show
typical osteoporotic characteristics referred to the minerals
but compelling arguments for osteomalacic patterns when
considering the organic matrix. Therefore, our ToF-SIMS
study revealed that the experimental set-up did not induce
osteoporosis in the diet group unambiguously, but osteoma-
lacia. Clearly, technical improvements will further advance
the application of ToF-SIMS; for example, the development
of standards for the quantitative analysis of bone components
and a distinct mapping of the calcium phosphate phases to
assess and track the mineralization process in more detail.
Using the chemical information obtained by the mass
spectra, it will be possible to learn more about the mechan-
isms taking place in bone such as the complex bone
remodelling process. The parallel detection of all chemical
information deriving from the sample surface offers a wide
range of promising opportunities. Messenger molecules can
be detected, and special biomarkers and drugs can be
traced, once their fragments are identified unequivocally
and if the local concentration of those compounds is high
enough. The characterization of modified implant surfaces
and the analysis of the interface between the implant and
bone tissue will support the development of improved
materials and drugs for patients with systemically diseased
bones. Nevertheless, two important and critical aspects
should be noted. First, sample preparation has to be per-
formed carefully and, second, the low concentration of
biomolecules with high masses, large molar volume and
low ionization probability has to be taken in consideration.
We can overcome this problem if either the concentration of
the species of interest is sufficiently high or we leave the
static SIMS limit. In any case, ToF-SIMS facilitates the collec-
tion of valuable compositional and structural information of
complex biological tissues such as bone as a complement to
other techniques.
Acknowledgements. This study is part of the project M5 and T1 withinthe collaborative research centre SFB/TRR 79—‘Materials for tissueregeneration within systemically altered bone’, funded by theGerman Research Foundation (DFG) and by the State of Hessen.We gratefully acknowledge the financial support within this project.We thank Prof. Dr Ing. habil. H. Worch for fruitful discussions andcareful comments on the manuscript. A.H. performed the ToF-SIMS analysis, data evaluation and interpretation, and wrote andedited the first draft of the manuscript. M.R. advised on the interpret-ation of the data, edited the manuscript together with J.J. and wrotethe grant application that supported the study. T.E.K. performed thelight microscope histomorphometry and edited the manuscript. G.P.did the evaluation of the DEXA measurements. G.S. performed theanimal experiment and edited the manuscript. C.H. developed theanimal experiment design, coordinated the animal experiment per-formance, the sample preparation and with M.R. and J.J. wrote thegrant application that supported the study. J.J. wrote the grant appli-cation that supported the study, coordinated the ToF-SIMS studyperformance and edited the final version of the manuscript. Allauthors state that they have no conflicts of interest.
References
1. Blake GM, Fogelman I. 2007 The role of DXA bonedensity scans in the diagnosis and treatment ofosteoporosis. Postgrad. Med. J. 83, 509 – 517.(doi:10.1136/pgmj.2007.057505)
2. Engelke K, Libanati C, Liu Y, Wang H, Austin M,Fuerst T, Stampa B, Timm W, Genant HK. 2009Quantitative computed tomography (QCT) of theforearm using general purpose spiral whole-body CTscanners: accuracy, precision and comparison withdual-energy X-ray absorptiometry (DXA). Bone 45,110 – 118. (doi:10.1016/j.bone.2009.03.669)
3. Perilli E, Briggs AM, Kantor S, Codrington J, WarkJD, Parkinson IH, Fazzalari NL. 2012 Failure strengthof human vertebrae: prediction using bone mineraldensity measured by DXA and bone volume bymicro-CT. Bone 50, 1416 – 1425. (doi:10.1016/j.bone.2012.03.002)
4. Heuck F, Vanselow K. 2005 Radiologische Analysedes Knochens. Berlin, Germany: Springer.
5. Roschger P, Paschalis EP, Fratzl P, Klaushofer K.2008 Bone mineralization density distribution inhealth and disease. Bone 42, 456 – 466. (doi:10.1016/j.bone.2007.10.021)
6. Ruffoni D, Fratzl P, Roschger P, Klaushofer K,Weinkamer R. 2007 The bone mineralization densitydistribution as a fingerprint of the mineralizationprocess. Bone 40, 1308 – 1319. (doi:10.1016/j.bone.2007.01.012)
7. Roschger P, Fratzl P, Eschberger J, Klaushofer K.1998 Validation of quantitative backscatteredelectron imaging for the measurement of mineraldensity distribution in human bone biopsies.Bone 23, 319 – 326. (doi:10.1016/S8756-3282(98)00112-4)
8. Ito M. 2011 Recent progress in boneimaging for osteoporosis research. J. BoneMiner. Metab. 29, 131 – 140. (doi:10.1007/s00774-010-0258-0)
9. Wagermaier W, Gupta HS, Gourrier A, Paris O,Roschger P, Burghammer M, Riekel C, Fratzl P. 2007Scanning texture analysis of lamellar bone usingmicrobeam synchrotron X-ray radiation. J. Appl.Crystallogr. 40, 115 – 120. (doi:10.1107/S0021889806044888)
10. Zizak I et al. 2000 Investigation of bone andcartilage by synchrotron scanning-SAXS and -WAXDwith micrometer spatial resolution. J. Appl.Crystallogr. 33, 820 – 823. (doi:10.1107/S0021889800001321)
11. Roschger P et al. 2010 Bone material quality intransiliac bone biopsies of postmenopausal
rsif.royalsocietypublishing.orgJR
SocInterface10:20130332
11
osteoporotic women after 3 years of strontiumranelate treatment. J. Bone Miner. Res. 25,891 – 900. (doi:10.1359/jbmr.090702)12. Mahamid J et al. 2010 Mapping amorphous calciumphosphate transformation into crystalline mineralfrom the cell to the bone in zebrafish fin rays. Proc.Natl Acad. Sci. USA 107, 6316 – 6321. (doi:10.1073/pnas.0914218107)
13. Suvorova EI, Petrenko PP, Buffat PA. 2007Scanning and transmission electron microscopyfor evaluation of order/disorder in bonestructure. Scanning 29, 162 – 170. (doi:10.1002/sca.20058)
14. Kazanci M, Fratzl P, Klaushofer K, Paschalis EP.2006 Complementary information on in vitroconversion of amorphous ( precursor) calciumphosphate to hydroxyapatite from Ramanmicrospectroscopy and wide-angle X-ray scattering.Calcif. Tissue Int. 79, 354 – 359. (doi:10.1007/s00223-006-0011-9)
15. Gamsjaeger S, Buchinger B, Zoehrer R, Phipps R,Klaushofer K, Paschalis EP. 2011 Effects of one yeardaily teriparatide treatment on trabecular bonematerial properties in postmenopausal osteoporoticwomen previously treated with alendronate orrisedronate. Bone 49, 1160 – 1165. (doi:10.1016/j.bone.2011.08.015)
16. Paschalis EP, Glass EV, Donley DW, Eriksen EF. 2005Bone mineral and collagen quality in iliac crestbiopsies of patients given teriparatide: newresults from the fracture prevention trial. J. Clin.Endocrinol. Metab. 90, 4644 – 4649. (doi:10.1210/jc.2004-2489)
17. Fletcher JS, Vickerman JC. 2010 A new SIMSparadigm for 2D and 3D molecular imaging of bio-systems. Anal. Bioanal. Chem. 396, 85 – 104.(doi:10.1007/s00216-009-2986-3)
18. Wu L, Lu X, Kulp K, Knize M, Berman E, Nelson E,Felton J, Wu K. 2007 Imaging and differentiation ofmouse embryo tissues by ToF-SIMS. Int. J. MassSpectrom. 260, 137 – 145. (doi:10.1016/j.ijms.2006.09.029)
19. Debois D, Bralet M-P, Le Naour F, Brunelle A,Laprevote O. 2009 In situ lipodemic analysis ofnonalcoholic fatty liver by cluster TOF-SIMSimaging. Anal. Chem. 81, 2823 – 2831. (doi:10.1021/ac900045m)
20. Heim C, Sjovall P, Lausmaa J, Leefmann T, Thiel V.2009 Spectral characterisation of eight glycerolipidsand their detection in natural samples using time-of-flight secondary ion mass spectrometry. RapidCommun. Mass Spectrom. 23, 2741 – 2753. (doi:10.1002/rcm.4183)
21. Magnusson Y, Friberg P, Malmberg P, Chen Y. 2008Application of multivariate analysis of TOF-SIMSspectra for studying the effect of highglucose intake on aortic lipid profile. Appl. SurfaceSci. 254, 6580 – 6585. (doi:10.1016/j.apsusc.2008.04.035)
22. Brunelle A, Laprevote O. 2008 Lipid imaging withcluster time-of-flight secondary ion massspectrometry. Anal. Bioanal. Chem. 393, 31 – 35.(doi:10.1007/s00216-008-2367-3)
23. Malmberg P, Nygren H. 2008 Methods for theanalysis of the composition of bone tissue, with afocus on imaging mass spectrometry (TOF-SIMS).Proteomics 8, 3755 – 3762. (doi:10.1002/pmic.200800198)
24. Eriksson C, Malmberg P, Nygren H. 2008 Time-of-flight secondary ion mass spectrometric analysis ofthe interface between bone and titanium implants.Rapid Commun. Mass Spectrom. 22, 943 – 949.(doi:10.1002/rcm.3445)
25. Malmberg P, Bexell U, Eriksson C, Nygren H, RichterK. 2007 Analysis of bone minerals by time-of-flightsecondary ion mass spectrometry: a comparativestudy using monoatomic and cluster ions sources.Rapid Commun. Mass Spectrom. 21, 745 – 749.(doi:10.1002/rcm.2890)
26. Eriksson C, Ohlson K, Richter K, Billerdahl N,Johansson M, Nygren H. 2007 Callus formation andremodeling at titanium implants. J. Biomed.Mater. Res. A 83, 1062 – 1069. (doi:10.1002/jbm.a.31433)
27. Ni GX, Lu WW, Xu B, Chiu KY, Yang C, Li ZY,Lam WM, Luk KD. 2006 Interfacial behaviour ofstrontium-containing hydroxyapatite cement withcancellous and cortical bone. Biomaterials 27,5127 – 5133. (doi:10.1016/j.biomaterials.2006.05.030)
28. Lu X, Leng Y, Weng LT. 2004 TOF-SIMS study ofbone mineralization on alkali-treated Ti alloy.J. Mater. Sci. 39, 6809 – 6811. (doi:10.1023/B:JMSC.0000045608.64178.55)
29. Zoehrer R, Perilli E, Kuliwaba JS, Shapter JG,Fazzalari NL, Voelcker NH. 2012 Human bonematerial characterization: integrated imagingsurface investigation of male fragility fractures.Osteoporosis Int. 23, 1297 – 1309. (doi:10.1007/s00198-011-1688-9)
30. Sanni OD, Wagner MS, Briggs D, Castner DG,Vickerman JC. 2002 Classification of adsorbedprotein static ToF-SIMS spectra by principalcomponent analysis and neural networks.Surface Interface Anal. 33, 715 – 728. (doi:10.1002/sia.1438)
31. Heiss C et al. 2012 Induction of osteoporosiswith its influence on osteoporoticdeterminants and their interrelationships in ratsby DEXA. Med. Sci. Monit. 18, 199 – 207. (doi:10.12659/MSM.882895)
32. Vickerman J, Gilmore IS. 2009 Surface analysis:principal techniques. London, UK: John Wileyand Sons.
33. De Souza RA, Manfred M. 2007 Secondary ion massspectrometry (SIMS): a powerful tool for studyingmass transport over various length scales. Phys.Status Solidi C 4, 1785 – 1801. (doi:10.1002/pssc.200675227)
34. Sodhi RNS. 2004 Time of flight secondary ion massspectrometry (TOF-SIMS): versatility in chemical andimaging surface analysis. Analyst 129, 483 – 487.(doi:10.1039/b402607c)
35. Xiang Z, Markel MD. 1995 Bromodeoxyuridineimmunohistochemistry of EPON-embeddedundecalcified bone in a canine fracture healing
model. J. Histochem. Cytochem. 43, 629 – 635.(doi:10.1177/43.6.7769234)
36. Wagner M, Castner DG. 2004 Analysis ofadsorbed proteins by static time-of-flightsecondary ion mass spectrometry. Appl. Surface Sci.231 – 232, 366 – 376. (doi:10.1016/j.apsusc.2004.03.100)
37. Rey C, Combes C, Drouet C, Glimcher MJ. 2009 Bonemineral: update on chemical composition andstructure. Osteoporosis Int. 20, 1013 – 1021. (doi:10.1007/s00198-009-0860-y)
38. Fratzl P, Gupta HS, Paschalis EP, Roschger P.2004 Structure and mechanical quality of thecollagen-mineral nano-composite in bone.J. Mater. Chem. 14, 2115 – 2123. (doi:10.1039/b402005g)
39. Busse B, Hahn M, Soltau M, Zustin J, Puschel K,Duda GN, Amling M. 2009 Increased calciumcontent and inhomogeneity of mineralization renderbone toughness in osteoporosis: mineralization,morphology and biomechanics of human singletrabeculae. Bone 45, 1034 – 1043. (doi:10.1016/j.bone.2009.08.002)
40. Bousson V, Bergot C, Wu Y, Jolivet E, Zhou LQ,Laredo J-D. 2011 Greater tissue mineralizationheterogeneity in femoral neck cortex from hip-fractured females than controls. A microradiographicstudy. Bone 48, 1252 – 1259. (doi:10.1016/j.bone.2011.03.673)
41. Nagaraja S, Lin ASP, Guldberg RE. 2007 Age-relatedchanges in trabecular bone microdamage initiation.Bone 40, 973 – 980. (doi:10.1016/j.bone.2006.10.028)
42. Burr D. 2003 Microdamage and bone strength.Osteoporosis Int. 14, S67 – S72. (doi:10.1007/s00198-003-1476-2)
43. Seeman E. 2008 Bone quality: the material andstructural basis of bone strength. J. BoneMiner. Metab. 26, 1 – 8. (doi:10.1007/s00774-007-0793-5)
44. Sivas F, Gunesen O, Ozoran K, Alemdaroglu E.2007 Osteomalacia from Mg-containing antacid:a case report of bilateral hip fracture. Rheumatol.Int. 27, 679 – 681. (doi:10.1007/s00296-006-0273-6)
45. Goodship AE, Lanyon LE, McFie H. 1979Functional adaption of bone to increased stress. Anexperimental study. J. Bone Joint Surg. Am. 61,539 – 546.
46. Rubin CT, Lanyon LE. 1985 Regulation of bonemass by mechanical strain magnitude.Calcif. Tissue Int. 37, 411 – 417. (doi:10.1007/BF02553711)
47. Rachner TD, Khosla S, Hofbauer LC. 2011Osteoporosis: now and the future. Lancet377, 1276 – 1287. (doi:10.1016/S0140-6736(10)62349-5)
48. Campi G, Ricci A, Guagliardi A, Giannini C,Lagomarsino S, Cancedda R, Mastrogiacomo M,Cedola A. 2012 Early stage mineralization in tissueengineering mapped by high resolution X-raymicrodiffraction. Acta Biomater. 8, 3411 – 3418.(doi:10.1016/j.actbio.2012.05.034)

rsif.royalsocietypublishing.org
12
49. Lu HB, Campbell CT, Graham DJ, Ratner BD. 2000Surface characterization of hydroxyapatite and relatedcalcium phosphates by XPS and TOF-SIMS. Anal.Chem. 72, 2886 – 2894. (doi:10.1021/ac990812h)50. Basle MF, Mauras Y, Audran M, Clochon P, Rebel A,Allain P. 1990 Concentration of bone elements inosteoporosis. J. Bone Miner. Res. 5, 41 – 47. (doi:10.1002/jbmr.5650050108)
51. Tzaphlidou M, Berillis P, Matthopoulos D. 2005Bone calcium, phosphorus detection by Auger
electron spectroscopy. Micron 36, 706 – 709. (doi:10.1016/j.micron.2005.05.013)
52. Tzaphlidou M, Zaichick V. 2004 Sex and agerelated Ca/P ratio in cortical bone of iliac crest ofhealthy humans. J. Radioanal. Nucl. Chem. 259,347 – 349. (doi:10.1023/B:JRNC.0000017316.20693.45)
53. Kourkoumelis N, Balatsoukas I, Tzaphlidou M. 2012Ca/P concentration ratio at different sites of normaland osteoporotic rabbit bones evaluated byAuger and energy dispersive X-ray spectroscopy.
J. Biol. Phys. 38, 279 – 291. (doi:10.1007/s10867-011-9247-3)
54. Fratzl-Zelman N, Roschger P, Misof BM, Nawrot-Wawrzyniak K, Poetter-Lang S, Muschitz C, Resch H,Klaushofer K, Zwettler E. 2011 Fragility fractures inmen with idiopathic osteoporosis are associatedwith undermineralization of the bone matrixwithout evidence of increased bone turnover. Calcif.Tissue Int. 88, 378 – 387. (doi:10.1007/s00223-011-9466-4)
J
RSocInterface10:20130332