Understanding safety management system applicability in community sport
Upload
independentCategory
view
4download
0
Applicability of “SCS” Method for Small BasinsPeak Flow Calculation – Theoretical aspects
Ivan Blinkov
“Ss. Cyril and Methodius” University in Skopje, Faculty of Forestry, Skopje, bul. AleksandarMakedonski bb, MK-1000 Skopje, Republic of Macedonia
Abstract
In the complex of tasks required to design various hydraulic structures, the estimation of maximumwater discharge (peak flow) with different returning period, for ungauged basins is one of the mostdifficult ones, and could be the key problem and a base of other estimations and further designing.Understanding the accuracy of commonly used methods for estimating peak stream flows isimportant because the designs of bridges, culverts, and other river structures are based on theseflows. There are a lot of known empirical methods in use spread all over the world. Some of them areonly for local use, but some methods are to be universal, but calibration on local conditions beforeuse is required. SCS method is one of the most spread. The origin and evolution of the USDA SCS curvenumber method for estimating runoff from small ungauged rural catchments is traced. The purposeof this paper is to test theoretical applicability of SCS method for small basin peak flow estimation inMacedonian conditions. !% probability Peak flow was done on 30 small torrents and 2 additionalmethods (Concentration time, Gavrilovic method) were used for compassion. Results got by SCSmethod were lower then other. Then was tested all range of CN compared with effective precipitation(Pe). Values for effective precipitation were maximal estimated for Macedonian conditions (8pluviographic gauge stations) by Skoklevski & Todorovski. This analyze show that through crossing Tk(time of concentration), suitable precipitation values for it (Pe) and CN could be got some illogical andpractically unreal results in a pat of the range of CN. It depend on the value of CN. It showed limitedapplicability of this method.
Keywords: SCS, synthetic unit hydrogram, CN (curve number), run-off coefficient, peak flow
Background
Due to all features, the small stream hydrology, especially torrenthydrology, where no permanent measuring of water and sediment dischargeexists, use to be among ones the least explored and determined parts ofhydrological sciences. In the complex of tasks required to design varioushydraulic structures, the estimation of maximum water discharge (peak flow)with different returning period is one of the most difficult ones, andcould be the key problem and a base of other estimations and furtherdesigning.
There are a lot of empirical methods in use spread all over the world. Someof them are only for local use, but some methods are to be universal, butcalibration on local conditions before use is required. Various methodswere and are in use in the Republic of Macedonia our country, from hoarymethods in deep past (by Wister , Kresnik, Iskowski , Melli, etc. ) ,
BALWOIS 2012 - Ohrid, Republic of Macedonia - 28 May, 2 June 2012 1

through recent methods ( US SCS method , method of Sokolovski, Rationalmethod, method of concentration time…), up to local (regional) methods (byGavrilovic, Lazarev, Angelovski …). Each of the above methods has its ownpreconditions, merits and failures In the last 30 yeas, US SCS method waswidely used even in the Republic of Macedonia. This method is a subject ofthis study.
Short essence of US SCS Curve Number Method
The runoff curve number (also called a curve number or simply CN) is an empirical parameter used inhydrology for predicting direct runoff or infiltration from rainfall excess. The curve number methodwas developed by the USDA Natural Resources Conservation Service, which was formerly called theSoil Conservation Service or SCS — the number is still popularly known as a "SCS runoff curvenumber" in the literature. The runoff curve number was developed from an empirical analysis ofrunoff from small basins and hillslope plots monitored by the USDA. It is widely used and efficientmethod for determining the approximate amount of direct runoff from a rainfall event in a particulararea The runoff curve number is based on the area's hydrologic soil group, land use, treatment andhydrologic condition. References, such as from USDA indicate the runoff curve numbers forcharacteristic land cover descriptions and a hydrologic soil group. The basic assumption of the SCScurve number method is that, for a single storm, the ratio of actual soil retention after runoff beginsto potential maximum retention is equal to the ratio of direct runoff to available rainfall. Thisrelationship, after algebraic manipulation and inclusion of simplifying assumptions, results in thefollowing equation found in Section 4 of the National Engineering Handbook (NEH-4) (USDA-SCS,1985), where curve number (CN) represents a convenient representation of the potential maximumsoil retention, S (Ponce and Hawkins, 1996) .(1)
This method is based on transformation of the real curve hydrogram into 3-angle hydrogram considering it as with a same volume of the direct runoffand an equal water discharge as the real (curve shape) hydrogram.Parameters of this hydrogram are as follows:
- the basin area ( F ) ;- the basin spreading length (L) ; - the distance from the outlet to a point on the stream nearest the
center of the basin (Lc) ; - the average river bed slope (J) ;- the leveled river bed slope (Jmax) ;- the water concentration factor (Kk); - the concentration time (Tc) ; - the Duration of effective rainfalls (Tk) ;- the time of flood wave rise (Tp) ; - the time of recession (Tr) ; - the base time of the hydrogram (Tb) ; - the hydrogram shape coefficient – (k) ;- the specific discharge ( q ) - the maximum water discharge (Q).
Transformation of total rainfalls to “effective rainfalls” i.e. to runoff,is the essential part of this method.Due to the creators of this method, total precipitation - P(mm) is comprised of :
1 – surface runoff (effective rainfalls) – Pe (mm)
BALWOIS 2012 - Ohrid, Republic of Macedonia - 28 May, 2 June 2012 2

2 – retention on the basin area – F (km2)3 – initial deficit – I
(1) F = ( P – I ) - Pe
(2) I = 0,2 d
(3)
d – humidity deficit (maximum retention in the basin area)… (mm)The final formula for the effective rainfalls is:
Pe = (4)
For purposes of practical use, a special curve number (CN) is introduced. The interval of CN values theoretically varies in a rank of (25 ÷94) -- dueto the authors-- or from (0 ÷ 100) (2) . This number is a feature of the hydrological land complex i.e. hydrologicalsoil type, land cover and land use. As known, there are proper “tables” for CN determination The final formula for d – is expressed as :
d = 25,4 ( (5)
A basic precondition to obtain real results of this expression is : P > 0,2 d. If not such a case, then the value of the runoff coefficientappears as 0, or near to.
qmax =
(6)
Q = Pe qmax [m3 s-1] (7)Aims, objectives and research methodology
During application of this method, were noticed some illogical results orlower results compared to results got by other method. It was the reasonfor beginning this study.
The aim of this study was to check applicability of SCS method for smallbasins peak flow estimation Objectives of this study were: - Estimation peak flow of a 30 various small basins using SCSmethod and other methods..
- Defining duration of effective rainfalls (Tk) and adequate maximalintensive rainfalls in Macedonia
BALWOIS 2012 - Ohrid, Republic of Macedonia - 28 May, 2 June 2012 3

- Estimation of runoff coefficient in all range of Curve Number (CN)and time (duration) of effective rainfalls
- Defining real range of CN for using SCS for small basins inMacedonia
Preliminary calculations were carried out for 30 torrent basins spread alover Republic of Macedonia (15 from Eastern and Northern part of RM, 7 fromCentral part, and 8 from Western part). There are big differences in allenvironmental parameters (such as geology, soil types, climate conditions,relief elements, hydraulic characteristics ….) featuring the differentparts of Macedonia. For estimation of peak flow beside SCS method, wereused Gavrilovic method and Method of Concentration time. For each of thesemethods, were calculated needed parameters. Geospatial parameters weremeasured as follow: topographic parameters on topographical map 1:25.000,but other parameters on geological map, soil map, in a scale 1: 50.000 or1: 100.000.
Various expression types of precipitation are necessary for differentmethod. As a base were used results about intensive rainfalls in Macedoniadone by Skoklevski and Todoovski (3) and official data about total annualrainfalls for rainfall gauges Macedonia Skoklevski & Todorovski studydefined intensive precipitation for 8 pluviograph stations with long-term(> 30 years) measuring. They used Gumbel distribution for probabilitycalculation.
In a case of SCS method, results by Skoklevski & Todorovski (3) aboutintensive rainfalls (P – mm) was directly used, of course depend onpreviously estimated duration of effective rainfalls (Tk).
Method of Concentration time need intensive rainfalls expressed in [l sec-
1ha-1] . This data was used by previous calculation of this parameter forMacedonia by Blinkov et al, (4) (table 1), based on Skoklevski & Todorovskiresearch. According to the methodology procedure in a case of absence ofgauge station in the basin, was used formula for estimation intensiverainfalls based on total sum of annual precipitation.
Table 1. Formulas for calculation rainfall intensity [mm min-1] with 1% probability of occurrence depend on the duration of effective rainfalls [Tk– min] , Gauge station
1% Usage of formulas:Y – i [mm min1]
x –Duration of effective rainfalls[min]
An example:Torrent is located near Skopje
Tk = x = 117’ then i = Y = i1% = 0.572 [mm min-1]
If rainfall intensity is expressed as I – [l sec-1 ha-1],: I = 166.667* i I1%
Bitola Y = -0.5849 Ln(x) + 3.4101Demir Kapija
Y = -0.7441 Ln(x) + 4.0490
Kriva Palanka
Y = -0.6614 Ln(x) + 3.6448
Lazaropole Y = -0.5251 Ln(x) + 2.9892Ohrid Y = -0.7125 Ln(x) +3.9022Prilep Y = -0.5168 Ln(x) + 2.9433Skopje Y = -0.8521 Ln(x) + 4.6301
BALWOIS 2012 - Ohrid, Republic of Macedonia - 28 May, 2 June 2012 4

= 95.39 [l sec-1ha-1],Stip Y = -0.6773 Ln(x) + 3.6169
Precipitation in Gavrilovic methodology are differently expressed (heightof intensive rainfall) and were estimated combining isohyetic map and datafrom Skoklevski & Todorovski study.
After all preliminary data collection, measuring on topographic or thematicmaps and calculations, the maximum peak flow with 1% probability (returnperiod of 100 years) were estimated for all torrents using 3 methods. Thenext step was crucial for this study. Influence of some elements (in theirtheoretical interval -- rank) to the maximum discharge was tested. A crossanalyze has been done. Cross analyze was done using Curve Number andsuitable Tk and Pe. Analyze was launched for all range of CN from 25 -99and Tk from 5-300” (that is suitable for small basins). Beside it were tested various formulas for calculation Tk (duration ofeffective rainfalls) based on Tc concentration time.
Results and Discussion
Peak flow estimation by thee methods
Results by estimation of all parameters needed for different 3 methods(SCS, Concentration time and Gavrilovic) as well as peak flow estimationfor all 30 torrents are presented in a format from-to in the table below. .
Table 2 - Hydrological characteristics of selected basins
parameter sign measureunit
from-to note(method)
basin area F km2 0,8 - 27,2
basin length L km 2,2 – 8,8watershed perimeter S km 4,5 – 24,1
mean basin inclination Isr % 6,1 – 36,7mean altitude difference Dsr m 70 – 462
basin form coefficient A km 0,38 – 0,69 Gavr.permeability coeff by Gavrilovic S1 0,44 – 0,8 Gavr.
land cover coeff. by Gavrilovic S2 0,68 – 0,91 Gavr.basin area retention W m2 km-1 1,87 – 9,46 Gavr.
energetic potential for runoff (2gDF)-1 m km s-1 22,7 –233,9
Gavr.
concentration speed Vk m s-1 0,27 – 0,61 Conc.t.concentration time Tk min 73 - 215 Conc.t.
rainfall intensity i l s-1 ha-1 47,2 –104,1
Conc.t.
specific discharge q m3 s-1 km-
21,02 – 5,34 Conc.t.
Curve Number CN 61 - 91 SCS
BALWOIS 2012 - Ohrid, Republic of Macedonia - 28 May, 2 June 2012 5

concentration time Tc min 22 – 84 SCStime of effective rainfalls Tk min 55 – 195 SCS
time base of the hydrogram Tb hours 2,07 - 7,15 SCS
maximum water discharge with 1% probability Q max
(1%)m3 s-1
2.37 – 68.1 Gav0.42 - 60.2 Conc.T0.09 - 32.5 SCS
Results obtained by SCS are generally lower then other and created suspicious in validity.
Runoff calculation in all range of CN
During the preliminary analyzes, some doubts about the relations among CN , d , Pe , P and - appeared and a detail analyze of these has been done.
- CN interval ( from 25 – 99 ) step – 2 - rainfalls, 20-135 mm ( step 5 mm) ; 150 – 300 mm ( step 10 mm)
Needed parameters were calculated as: - d - soil moisture deficit - by formula (5) - Pe – effective rainfalls - by formula (4)
- - run-off coefficient =
(8)Usually in practice in Macedonia is accepted that real runoff coefficientin natural basins vary between 0,10 and 0,77.. Using the approach presentedabove, tables for all possible values of rainfalls and CN were produced andare presented in the annex fo the study. This table presents intervals ofsome values of CN, on what the run-off coefficient - , dependsextentially got:
C - theoretically unreal valuesB- - theoretically real but practically unreal (low) valuesA - theoretically and practically real and applicable valuesB+ - theoretically real but practically unreal (very high ) values
Table 3. Intervals of reality of runoff coefficient -
rainfalls Values of CN ( from -to)Pe-mm C B- A B+
20 25 - 67 68 - 83 84 - 98 99 - 10030 25 - 59 60 - 78 79 - 97 98 - 10040 25 - 51 52 - 71 72 - 96 97 - 10050 25 - 48 49 - 68 69 - 95 96 - 10060 25 - 46 47 - 65 66 - 95 96 - 10070 25 - 45 46 - 59 60 - 93 94 - 10080 25 - 41 42 - 57 58 - 93 94 - 10090 25 - 39 40 - 53 54 - 92 93 - 100
BALWOIS 2012 - Ohrid, Republic of Macedonia - 28 May, 2 June 2012 6

100 25 - 37 38 - 51 52 - 92 93 - 100120 25 - 33 34 - 48 49 - 90 91 - 100150 25 - 27 28 - 41 42 - 88 89 - 100200 - 25 - 34 35 - 85 86 - 100250 - 25 - 34 35 - 82 83 - 100300 - 25 - 26 27 - 79 80 - 100
Depend of effective rainfalls, If CN have values in red or blue diapasonthen finale result for peak flow would be unreal.
Runoff calculation in all range of CN in Macedonian conditions
Time for concentration (Tc) of rainfalls of small currents ( A < 30 km2) inthe Republic of Macedonia is so short . Analogical to it , Duration ofeffective rainfalls (Tk) is short too , from 20 – 300’.
In a table bellow are presented maximum values calculated by Skoklevski &Todoovski on various gauge stations in Macedonia for different duration ofrainfalls. .
Table4.Maximalvaluesofrainfallswit1%probabilityinMacedoniaduratio
n min 20 40 60 90 150 300
gauge Skopje Skopje Bitola Bitola Bitola K.PalankaPe mm 39,49 48,27 54,64 62,27 70,52 76,31
i’mm min-
1 1,32 1,21 0,91 0,69 0,47 0,26
il s-1
ha-1219,3
9 201,12 151,78 115,31 78,36 43,51
Table 5. Accepted maximum values of effective rainfalls depend of adequateduration in RM (an extact from Skoklevski & Todorovski study, 1993 )
Tk (‘) 30 40 60 90 120 150 200 300P (mm) 44 48 55 62 67 71 73 76
Based on these values, the following figures have been done.
BALWOIS 2012 - Ohrid, Republic of Macedonia - 28 May, 2 June 2012 7
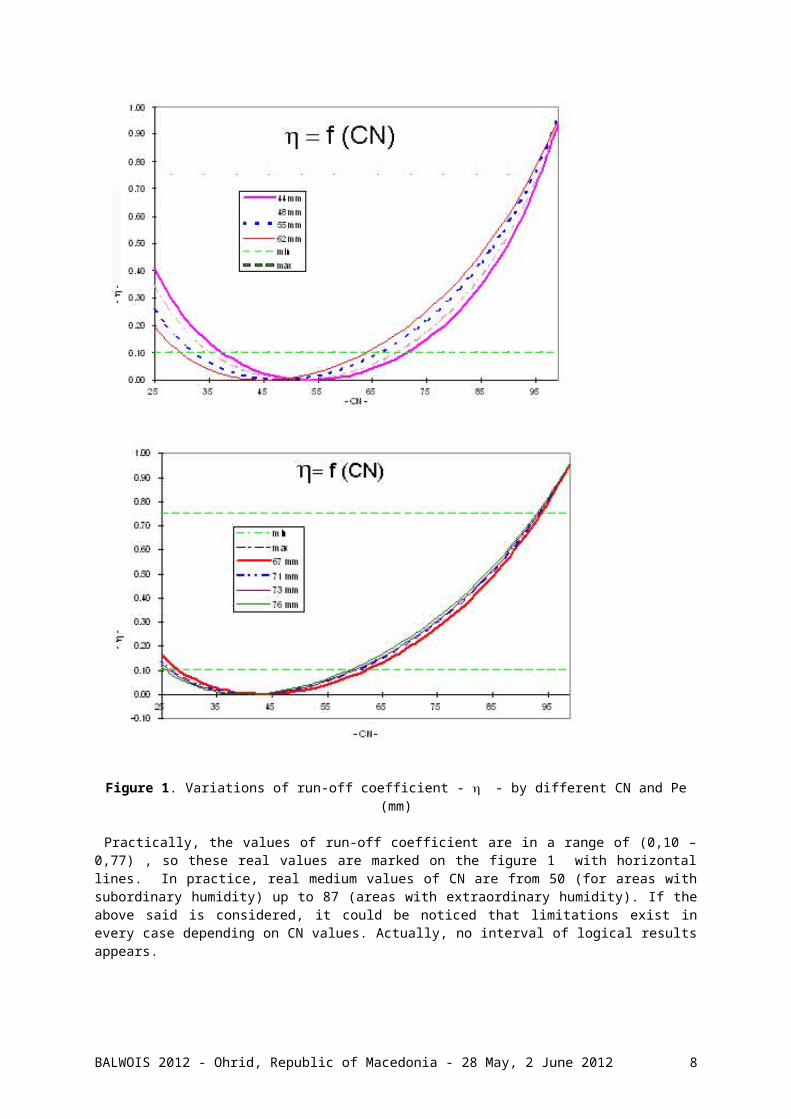
Figure 1. Variations of run-off coefficient - - by different CN and Pe(mm)
Practically, the values of run-off coefficient are in a range of (0,10 –0,77) , so these real values are marked on the figure 1 with horizontallines. In practice, real medium values of CN are from 50 (for areas withsubordinary humidity) up to 87 (areas with extraordinary humidity). If theabove said is considered, it could be noticed that limitations exist inevery case depending on CN values. Actually, no interval of logical resultsappears.
BALWOIS 2012 - Ohrid, Republic of Macedonia - 28 May, 2 June 2012 8

Table 6.Minimum values of CN depending on TK & P, of what the followingis obtained:
B – theoretical real result of run-off coefficient ( A – practical real result of run-off coefficient ( 1
Tk (min) P (mm) B A
30 44 59 7140 48 48 6860 55 44 6790 62 41 64
120 67 39 62150 71 38 61200 73 37 60300 76 36 58
An example of simulated case is presented bellow:
Basin area : A = 3 km2 , where Tk = 30’ analog to it, the intensity of therainfall with return period 100 years for Macedonia is 40 mm ; and if thepresent soil classes are both B, covered with arable land and C coveredwith pastures, the average values of CN is 70. In this case, values ofrunoff coefficient could be so low .. meaning that practically norunoff occurs. Due to previous analyzes and data from literature anarable land runoff could be 0,70. There are a lot of cases where CN isnear to the low limit so it always results with low values of runoff andwater discharge. Above facts show the limited area of implementation of this method.
Calculation of Tk – duration of effective rainfalls
There are some possible reasons for it. One of them is correct formula forestimation of Tk (time of effective rainfalls). There are three formulasexisting, as: Tk = 2 ....... (by US SCS) (9)
Tk = Tc ( 1 + Tc ) - 0,2 (10)
Tk = Tc / 5,5 ........ ( by Snyder ) (11)
An estimation of Tk by the above three formulas was done. Differentresults were obtained, being presented in the Table 6 and figure 2bellow:
Table 7. Duration of effective rainfalls - Tk – estimated by three formulas
Tc - (h) 0.50 1.00 1.50 2.00 2.50 3.00 3.50 4.00 4.50 5.00 5.50
BALWOIS 2012 - Ohrid, Republic of Macedonia - 28 May, 2 June 2012 9

Tk(h)
SCS 1.41
2.00
2.45
2.83
3.16
3.46
3.74
4.00
4.24
4.47
4.69
* 0.46
0.87
1.25
1.61
1.95
2.27
2.59
2.90
3.20
3.49
3.78
Snyder 0.09
0.18
0.27
0.36
0.45
0.55
0.64
0.73
0.82
0.91
1.00
Figure. 2. Duration of effective rainfalls - Tk - estimated by 3 formulasThere is a big difference between the results obtained by three differentformulas so it has repercussion to next calculation. If we presume theformula 9 (by SCS) results as correct ones, then those obtained by otherformulas are undervalued to. These results are shown in table 6.
Table 8. Percentage of error in estimation of Tk by the formulas 8 and 9
Tc - (h) 0.5 1.0 1.5 2.0 2.5 3.0 3.5 4.0 4.5 5.0 5.50error
%by (8) -
67-56 -
49-43
-38
-34
-31
-28
-25 -22
-19
by (9) -94
-91 -89
-87
-86
-84
-83
-82
-81 -80
-79
Conclusion
US SCS method is not recommended to be used for small basin peak flowestimations in Macedonia and everywhere, where:
- there aren’t enough rainfall intensity data from pluviographstations
- time of concentration ( Tc) is so short and there are low values ofannual rainfall
References
(1) http://zonums.com/online/hydrology/curve_number.php
BALWOIS 2012 - Ohrid, Republic of Macedonia - 28 May, 2 June 2012 10

(2) Ristic, R., (1993) : Determination of CN in different humiditycondition, monograph, Reasons and consequences of soil erosion and possibility forcombating erosion , Beograd, Yugoslavia
(3) Skoklevski, Z., Todorovski B, (1993) : Intensive rainfalls inMacedonia ,The Civil engineering faculty – Skopje , Republic of Macedonia
(4) Blinkov , I., Jagev V., (1997a) : An intensity of the rainfalls withdifferent duration and returning period in the Republic of Macedonia , Faculty offorestry – Skopje - Annual proceeding 1997 , Skopje , Republic of Macedonia
ANNEX
Tables with whole range of applicability of CSC method are presented inannex
Tab. 9a - Runoff coefficient - - various CN (25-99) and various Tk(20-55’)
CN d(mm)Duration of effective precipitation – Tk [minutes]20 25 30 35 40 45 50 55
25 762.00 1.39 1.02 0.78 0.61 0.49 0.39 0.32 0.26 27 686.74 1.21 0.88 0.66 0.51 0.40 0.32 0.25 0.20 29 621.86 1.05 0.76 0.56 0.43 0.33 0.26 0.20 0.16 31 565.35 0.92 0.65 0.48 0.36 0.27 0.21 0.16 0.12 33 515.70 0.80 0.56 0.40 0.30 0.22 0.16 0.12 0.09
BALWOIS 2012 - Ohrid, Republic of Macedonia - 28 May, 2 June 2012 11

35 471.71 0.70 0.48 0.34 0.24 0.18 0.13 0.09 0.07 37 432.49 0.60 0.41 0.28 0.20 0.14 0.10 0.07 0.04 39 397.28 0.52 0.35 0.23 0.16 0.11 0.07 0.05 0.03 41 365.51 0.45 0.29 0.19 0.13 0.08 0.05 0.03 0.02 43 336.70 0.39 0.24 0.16 0.10 0.06 0.04 0.02 0.01 45 310.44 0.33 0.20 0.12 0.07 0.04 0.02 0.01 0.00 47 286.43 0.28 0.16 0.10 0.05 0.03 0.01 0.00 0.00 49 264.37 0.23 0.13 0.07 0.04 0.02 0.01 0.00 0.00 51 244.04 0.19 0.10 0.05 0.02 0.01 0.00 0.00 0.00 53 225.25 0.16 0.08 0.04 0.01 0.00 0.00 0.00 0.01 55 207.82 0.12 0.06 0.02 0.01 0.00 0.00 0.01 0.01 57 191.61 0.10 0.04 0.01 0.00 0.00 0.00 0.01 0.02 59 176.51 0.07 0.03 0.01 0.00 0.00 0.01 0.02 0.04 61 162.39 0.05 0.01 0.00 0.00 0.01 0.02 0.03 0.05 63 149.17 0.03 0.01 0.00 0.00 0.02 0.03 0.05 0.07 65 136.77 0.02 0.00 0.00 0.01 0.03 0.04 0.06 0.08 67 125.10 0.01 0.00 0.01 0.02 0.04 0.06 0.08 0.11 69 114.12 0.00 0.00 0.01 0.03 0.06 0.08 0.10 0.13 71 103.75 0.00 0.01 0.03 0.05 0.08 0.10 0.13 0.15 73 93.95 0.00 0.02 0.04 0.07 0.10 0.13 0.16 0.18 75 84.67 0.01 0.03 0.06 0.09 0.12 0.16 0.19 0.21 77 75.87 0.01 0.05 0.08 0.12 0.15 0.19 0.22 0.25 79 67.52 0.03 0.07 0.11 0.15 0.19 0.22 0.26 0.29 81 59.58 0.05 0.09 0.14 0.18 0.22 0.26 0.30 0.33 83 52.02 0.07 0.13 0.18 0.23 0.27 0.31 0.34 0.37 85 44.82 0.11 0.17 0.22 0.27 0.32 0.36 0.39 0.42 87 37.95 0.15 0.22 0.28 0.33 0.37 0.41 0.45 0.48 89 31.39 0.21 0.28 0.34 0.39 0.44 0.48 0.51 0.54 91 25.12 0.28 0.35 0.42 0.47 0.51 0.55 0.58 0.60 93 19.12 0.37 0.45 0.50 0.55 0.59 0.62 0.65 0.68 95 13.37 0.49 0.56 0.61 0.65 0.69 0.71 0.74 0.76 97 7.86 0.65 0.70 0.74 0.77 0.80 0.82 0.83 0.85 99 2.57 0.86 0.89 0.90 0.92 0.93 0.93 0.94 0.95
Note: Red colored– theoretically impossible values of -- Blue colored– theoretically possible but practically unreal values of -- - Black colored and bold – theoretically and practically real values of - Tab. 9b - Runoff coefficient - - various CN (25-99) and various Tk(60-95’)
CN d(mm)Duration of effective precipitation – Tk [minutes]
60 65 70 75 80 85 90 95 25 762.00 0.21 0.17 0.14 0.12 0.10 0.08 0.06 0.05 27 686.74 0.16 0.13 0.10 0.08 0.07 0.05 0.04 0.03 29 621.86 0.12 0.10 0.07 0.06 0.04 0.03 0.02 0.02 31 565.35 0.09 0.07 0.05 0.04 0.03 0.02 0.01 0.01 33 515.70 0.07 0.05 0.03 0.02 0.01 0.01 0.00 0.00
BALWOIS 2012 - Ohrid, Republic of Macedonia - 28 May, 2 June 2012 12

35 471.71 0.04 0.03 0.02 0.01 0.01 0.00 0.00 0.00 37 432.49 0.03 0.02 0.01 0.00 0.00 0.00 0.00 0.00 39 397.28 0.02 0.01 0.00 0.00 0.00 0.00 0.00 0.01 41 365.51 0.01 0.00 0.00 0.00 0.00 0.00 0.01 0.01 43 336.70 0.00 0.00 0.00 0.00 0.01 0.01 0.02 0.02 45 310.44 0.00 0.00 0.00 0.01 0.01 0.02 0.03 0.03 47 286.43 0.00 0.00 0.01 0.01 0.02 0.03 0.04 0.05 49 264.37 0.00 0.01 0.01 0.02 0.03 0.04 0.05 0.06 51 244.04 0.01 0.02 0.02 0.03 0.04 0.05 0.07 0.08 53 225.25 0.02 0.02 0.04 0.05 0.06 0.07 0.08 0.10 55 207.82 0.03 0.04 0.05 0.06 0.07 0.09 0.10 0.12 57 191.61 0.04 0.05 0.06 0.08 0.09 0.11 0.12 0.14 59 176.51 0.05 0.07 0.08 0.10 0.11 0.13 0.14 0.16 61 162.39 0.07 0.08 0.10 0.12 0.13 0.15 0.17 0.18 63 149.17 0.08 0.10 0.12 0.14 0.16 0.18 0.19 0.21 65 136.77 0.10 0.13 0.14 0.16 0.18 0.20 0.22 0.24 67 125.10 0.13 0.15 0.17 0.19 0.21 0.23 0.25 0.26 69 114.12 0.15 0.18 0.20 0.22 0.24 0.26 0.28 0.29 71 103.75 0.18 0.20 0.23 0.25 0.27 0.29 0.31 0.33 73 93.95 0.21 0.23 0.26 0.28 0.30 0.32 0.34 0.36 75 84.67 0.24 0.27 0.29 0.31 0.34 0.36 0.38 0.39 77 75.87 0.28 0.30 0.33 0.35 0.37 0.39 0.41 0.43 79 67.52 0.32 0.34 0.37 0.39 0.41 0.43 0.45 0.47 81 59.58 0.36 0.38 0.41 0.43 0.45 0.47 0.49 0.51 83 52.02 0.40 0.43 0.45 0.48 0.50 0.52 0.53 0.55 85 44.82 0.45 0.48 0.50 0.52 0.54 0.56 0.58 0.60 87 37.95 0.51 0.53 0.55 0.58 0.59 0.61 0.63 0.64 89 31.39 0.57 0.59 0.61 0.63 0.65 0.66 0.68 0.69 91 25.12 0.63 0.65 0.67 0.69 0.70 0.72 0.73 0.74 93 19.12 0.70 0.72 0.73 0.75 0.76 0.77 0.78 0.79 95 13.37 0.77 0.79 0.80 0.81 0.82 0.83 0.84 0.85 97 7.86 0.86 0.87 0.88 0.88 0.89 0.90 0.90 0.91 99 2.57 0.95 0.95 0.96 0.96 0.96 0.96 0.97 0.97
Note: Red colored– theoretically impossible values of -- Blue colored– theoretically possible but practically unreal values of -- - Black colored and bold – theoretically and practically real values of - Tab. 9c - Runoff coefficient - - various CN (25-99) and various Tk(100-135’)
CN d(mm)Duration of effective precipitation – Tk [minutes]
100 105 110 115 120 125 130 135 25 762.00 0.04 0.03 0.02 0.02 0.01 0.01 0.01 0.00 27 686.74 0.02 0.02 0.01 0.01 0.00 0.00 0.00 0.00 29 621.86 0.01 0.01 0.00 0.00 0.00 0.00 0.00 0.00 31 565.35 0.00 0.00 0.00 0.00 0.00 0.00 0.00 0.01 33 515.70 0.00 0.00 0.00 0.00 0.00 0.01 0.01 0.01 35 471.71 0.00 0.00 0.00 0.01 0.01 0.01 0.02 0.02
BALWOIS 2012 - Ohrid, Republic of Macedonia - 28 May, 2 June 2012 13

37 432.49 0.00 0.01 0.01 0.02 0.02 0.03 0.03 0.04 39 397.28 0.01 0.01 0.02 0.03 0.03 0.04 0.04 0.05 41 365.51 0.02 0.02 0.03 0.04 0.04 0.05 0.06 0.07 43 336.70 0.03 0.04 0.04 0.05 0.06 0.07 0.08 0.08 45 310.44 0.04 0.05 0.06 0.07 0.08 0.08 0.09 0.10 47 286.43 0.06 0.06 0.07 0.08 0.09 0.10 0.11 0.12 49 264.37 0.07 0.08 0.09 0.10 0.11 0.12 0.13 0.14 51 244.04 0.09 0.10 0.11 0.12 0.13 0.15 0.16 0.17 53 225.25 0.11 0.12 0.13 0.14 0.16 0.17 0.18 0.19 55 207.82 0.13 0.14 0.15 0.17 0.18 0.19 0.20 0.21 57 191.61 0.15 0.16 0.18 0.19 0.20 0.22 0.23 0.24 59 176.51 0.17 0.19 0.20 0.22 0.23 0.24 0.25 0.27 61 162.39 0.20 0.21 0.23 0.24 0.26 0.27 0.28 0.29 63 149.17 0.22 0.24 0.25 0.27 0.28 0.30 0.31 0.32 65 136.77 0.25 0.27 0.28 0.30 0.31 0.33 0.34 0.35 67 125.10 0.28 0.30 0.31 0.33 0.34 0.36 0.37 0.38 69 114.12 0.31 0.33 0.34 0.36 0.37 0.39 0.40 0.41 71 103.75 0.34 0.36 0.38 0.39 0.40 0.42 0.43 0.44 73 93.95 0.38 0.39 0.41 0.42 0.44 0.45 0.46 0.48 75 84.67 0.41 0.43 0.44 0.46 0.47 0.48 0.50 0.51 77 75.87 0.45 0.46 0.48 0.49 0.51 0.52 0.53 0.54 79 67.52 0.49 0.50 0.52 0.53 0.54 0.56 0.57 0.58 81 59.58 0.53 0.54 0.55 0.57 0.58 0.59 0.60 0.61 83 52.02 0.57 0.58 0.59 0.61 0.62 0.63 0.64 0.65 85 44.82 0.61 0.62 0.64 0.65 0.66 0.67 0.68 0.69 87 37.95 0.66 0.67 0.68 0.69 0.70 0.71 0.72 0.73 89 31.39 0.70 0.71 0.72 0.73 0.74 0.75 0.76 0.77 91 25.12 0.75 0.76 0.77 0.78 0.79 0.79 0.80 0.81 93 19.12 0.80 0.81 0.82 0.82 0.83 0.84 0.84 0.85 95 13.37 0.86 0.86 0.87 0.87 0.88 0.88 0.89 0.89 97 7.86 0.91 0.92 0.92 0.92 0.93 0.93 0.93 0.93 99 2.57 0.97 0.97 0.97 0.97 0.97 0.98 0.98 0.98
Note: Red colored– theoretically impossible values of -- Blue colored– theoretically possible but practically unreal values of -- - Black colored and bold – theoretically and practically real values of - Tab. 9d - Runoff coefficient - - various CN (25-99) and various Tk(100-135’)
CN d(mm)Duration of effective precipitation – Tk [minutes]
140 150 160 170 180 200 250 300 25 762.00 0.00 0.00 0.00 0.00 0.01 0.01 0.04 0.08 27 686.74 0.00 0.00 0.00 0.01 0.01 0.03 0.06 0.10 29 621.86 0.00 0.01 0.01 0.02 0.03 0.04 0.08 0.13 31 565.35 0.01 0.02 0.02 0.03 0.04 0.06 0.11 0.15 33 515.70 0.02 0.03 0.04 0.05 0.06 0.08 0.13 0.18
BALWOIS 2012 - Ohrid, Republic of Macedonia - 28 May, 2 June 2012 14

35 471.71 0.03 0.04 0.05 0.06 0.07 0.10 0.15 0.21 37 432.49 0.04 0.05 0.07 0.08 0.09 0.12 0.18 0.24 39 397.28 0.06 0.07 0.08 0.10 0.11 0.14 0.20 0.26 41 365.51 0.07 0.09 0.10 0.12 0.13 0.16 0.23 0.29 43 336.70 0.09 0.11 0.12 0.14 0.16 0.19 0.26 0.32 45 310.44 0.11 0.13 0.15 0.16 0.18 0.21 0.28 0.34 47 286.43 0.13 0.15 0.17 0.19 0.20 0.24 0.31 0.37 49 264.37 0.15 0.17 0.19 0.21 0.23 0.26 0.34 0.40 51 244.04 0.18 0.20 0.22 0.24 0.25 0.29 0.36 0.42 53 225.25 0.20 0.22 0.24 0.26 0.28 0.32 0.39 0.45 55 207.82 0.23 0.25 0.27 0.29 0.31 0.34 0.42 0.48 57 191.61 0.25 0.27 0.30 0.32 0.33 0.37 0.44 0.50 59 176.51 0.28 0.30 0.32 0.34 0.36 0.40 0.47 0.53 61 162.39 0.31 0.33 0.35 0.37 0.39 0.43 0.50 0.55 63 149.17 0.33 0.36 0.38 0.40 0.42 0.45 0.52 0.58 65 136.77 0.36 0.39 0.41 0.43 0.45 0.48 0.55 0.61 67 125.10 0.39 0.42 0.44 0.46 0.48 0.51 0.58 0.63 69 114.12 0.42 0.45 0.47 0.49 0.51 0.54 0.60 0.65 71 103.75 0.46 0.48 0.50 0.52 0.54 0.57 0.63 0.68 73 93.95 0.49 0.51 0.53 0.55 0.57 0.60 0.66 0.70 75 84.67 0.52 0.54 0.56 0.58 0.60 0.63 0.68 0.73 77 75.87 0.55 0.58 0.59 0.61 0.63 0.66 0.71 0.75 79 67.52 0.59 0.61 0.63 0.64 0.66 0.68 0.74 0.77 81 59.58 0.62 0.64 0.66 0.68 0.69 0.71 0.76 0.80 83 52.02 0.66 0.68 0.69 0.71 0.72 0.74 0.79 0.82 85 44.82 0.70 0.71 0.73 0.74 0.75 0.77 0.81 0.84 87 37.95 0.74 0.75 0.76 0.77 0.79 0.80 0.84 0.86 89 31.39 0.77 0.79 0.80 0.81 0.82 0.83 0.86 0.88 91 25.12 0.81 0.82 0.83 0.84 0.85 0.86 0.89 0.91 93 19.12 0.85 0.86 0.87 0.88 0.88 0.89 0.91 0.93 95 13.37 0.89 0.90 0.91 0.91 0.92 0.92 0.94 0.95 97 7.86 0.94 0.94 0.94 0.95 0.95 0.95 0.96 0.97 99 2.57 0.98 0.98 0.98 0.98 0.98 0.98 0.99 0.99
Note: Red colored– theoretically impossible values of -- Blue colored– theoretically possible but practically unreal values of -- - Black colored and bold – theoretically and practically real values of -
BALWOIS 2012 - Ohrid, Republic of Macedonia - 28 May, 2 June 2012 15
Copyright © 2022 FDOKUMEN